UNITED STATES
SECURITIES AND EXCHANGE COMMISSION
Washington, D.C. 20549
FORM N-CSR
CERTIFIED SHAREHOLDER REPORT OF REGISTERED
MANAGEMENT INVESTMENT COMPANIES
Investment Company Act file number 811-09997
Baird Funds, Inc.
(Exact name of Registrant as specified in charter)
777 East Wisconsin Avenue
Milwaukee, WI 53202
(Address of principal executive offices) (Zip code)
Andrew D. Ketter
Robert W. Baird & Co. Incorporated
777 East Wisconsin Avenue
Milwaukee, WI 53202
(Name and address of agent for service)
1-866-442-2473
Registrant's telephone number, including area code
Date of fiscal year end: December 31
Date of reporting period: December 31, 2018
Item 1. Reports to Stockholders.
Annual Report –
Baird Funds
December 31, 2018
| Taxable Bond Funds | |
| Baird Ultra Short Bond Fund | Baird Aggregate Bond Fund |
| Baird Short-Term Bond Fund | Baird Core Plus Bond Fund |
| Baird Intermediate Bond Fund | |
Municipal Bond Funds
Baird Short-Term Municipal Bond Fund
Baird Quality Intermediate Municipal Bond Fund
Baird Core Intermediate Municipal Bond Fund
Beginning on January 1, 2021, as permitted by regulations adopted by the U.S. Securities and Exchange Commission, paper copies of the Funds’ annual and semi-annual shareholder reports will no longer be sent by mail, unless you specifically request paper copies of the reports from the Funds or from your financial intermediary, such as a broker-dealer or bank. Instead, the reports will be made available on the Funds’ website (www.bairdassetmanagement.com/baird-funds/funds-and-performance#Literature) and you will be notified by mail each time a report is posted and provided with a website link to access the report.
If you already elected to receive shareholder reports electronically, you will not be affected by this change and you need not take any action. You may elect to receive shareholder reports and other communications from the Funds electronically anytime by contacting your financial intermediary or, if you are a direct investor, by calling 1-866-442-2473, or sending an e-mail request to prospectus@bairdfunds.com.
You may elect to receive all future reports in paper free of charge. If you invest through a financial intermediary, you can contact your financial intermediary to request that you continue to receive paper copies of your shareholder reports. If you invest directly with a Fund, you can call 1-866-442-2473 or send an email request to prospectus@bairdfunds.com to let the Fund know you wish to continue receiving paper copies of your shareholder reports. Your election to receive reports in paper will apply to all Funds held in your account if you invest through your financial intermediary or all Funds held with the fund complex if you invest directly with the Funds.
| Go Green. |  | Go Paperless. |
Sign up to receive your Baird Funds’ prospectuses and reports online.
Table of Contents
| Letter to Shareholders | 1 |
| 2018 Bond Market Overview | 2 |
| Baird Ultra Short Bond Fund | 7 |
| Baird Short-Term Bond Fund | 17 |
| Baird Intermediate Bond Fund | 27 |
| Baird Aggregate Bond Fund | 37 |
| Baird Core Plus Bond Fund | 46 |
| 2018 Municipal Bond Market Overview | 55 |
| Baird Short-Term Municipal Bond Fund | 59 |
| Baird Quality Intermediate Municipal Bond Fund | 72 |
| Baird Core Intermediate Municipal Bond Fund | 84 |
| Additional Information on Fund Expenses | 97 |
| Statements of Assets and Liabilities | 99 |
| Statements of Operations | 102 |
| Statements of Changes in Net Assets | 105 |
| Financial Highlights | 113 |
| Notes to the Financial Statements | 129 |
| Report of Independent Registered Public Accounting Firm | 144 |
| Directors and Officers | 145 |
| Disclosure Regarding the Board of Directors’ Approval | |
| of the Investment Advisory Agreement for Baird Bond Funds | 148 |
| Additional Information | 151 |
| Privacy Notice | A-1 |
This report has been prepared for shareholders and may be distributed to others only if preceded or accompanied by a current prospectus.
Cautionary Note on Analyses, Opinions and Outlooks: In this report we offer analyses and opinions on the performance of individual securities, companies, industries, sectors, markets, interest rates, asset classes, types of fixed income securities and governmental policies, including predictions, forecasts and outlooks regarding possible future events. These can generally be identified as such because the context of the statements may include such words as “believe,” “should,” “will,” “expects,” “anticipates,” “hopes” and words of similar effect. These statements reflect the portfolio managers’ good faith beliefs and judgments and involve risks and uncertainties, including the risk that the portfolio managers’ analyses, opinions and outlooks are or will prove to be inaccurate. It is inherently difficult to correctly assess and explain the performance of particular securities, sectors, markets, interest rate movements, governmental actions or general economic trends and conditions, and many unforeseen factors contribute to the performance of Baird Funds. Investors are, therefore, cautioned not to place undue reliance on subjective judgments contained in this report.

Baird Funds
1-866-442-2473
www.bairdfunds.com
February 27, 2019
Dear Shareholder,
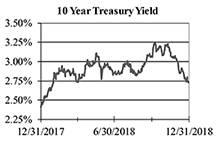
2018 was a challenging year for the financial markets and investors. Volatility rose and prices of financial assets softened overall as the Fed continued to normalize monetary policy by raising short-term rates and shrinking its balance sheet. A shift in outlook from synchronized global growth early in the year to slowing global growth mixed with recession fears later in the year added to uncertainty, as did unresolved trade negotiations between the U.S. and China. The S&P 500 Index was up by nearly 10% from the end of 2017 in September and then down by as much as -12% in December before finishing the year at -4.4%. Starting the year at 2.41%, the yield on the 10-year U.S. Treasury note rose to as high as 3.24% in early November and then tumbled back to just 2.68% at year end.
Amidst this volatile environment, the Baird Bond Funds tracked or exceeded their benchmarks on a gross basis, but fell just short of the index returns net of fund expenses. The Funds’ long-term track records remain very competitive and we believe the portfolios are positioned well as we enter 2019.
Our commitment to the long-term principles of generating competitive, risk-controlled returns over full market cycles, delivering outstanding service, providing competitively priced products and maintaining our long-tenured and seasoned investment team, helped drive assets under management in the Baird Bond Funds to $45.4 billion at year end.
We want to express our team’s sincere appreciation for your confidence in our work and assure you that we never lose sight of the fact that our long-term success rests on the trust you have placed in us to be effective stewards of your assets.
Thank you for your continued investment in the Baird Bond Funds.
Sincerely,
Mary Ellen Stanek, CFA
President
Baird Funds
2018 Bond Market Overview
(Unaudited)
Strong U.S. Economy Led to Higher Interest Rates; Fed Policy and Politics Created Higher Volatility
Treasury yields rose in 2018 and the yield curve flattened, as stronger economic growth allowed the Fed to continue normalizing monetary policy. The pace of U.S. economic growth rose from 2.2% in 2017 to an estimated 3.0% level for all of 2018, as tax cuts and higher fiscal spending began to impact economic data. The U.S. job market also improved as the November unemployment rate fell to 3.7% from 4.1% to start the year and jobless claims hit the lowest level in 49 years. Average hourly earnings rose 3.1%, a welcomed modest increase from 2.7% in December 2017. The market entered 2018 anticipating three fed funds rate hikes of 25 bps each, but the strength of the U.S. economy allowed the Fed to hike by 25 bps a fourth time in December to the 2.25% - 2.50% target range, generally considered the bottom end of their estimated “neutral” range of 2.5% - 3.0%. The last hike was not without controversy, however, given recent signs of slowing growth in the U.S. and continued weak growth abroad. Furthermore, broad inflation data remained well contained (November core PCE price index +1.9% YoY) and many cyclically sensitive commodity prices have been falling, led by a sharp decline in oil. In tandem with rate normalization, the Fed continued its balance sheet normalization, allowing $213B of Treasuries and $128B of Agency MBS issues to roll off its balance sheet over the course of the year. Overseas, the European Central Bank slowed asset purchases in October and ended balance sheet expansion completely in December, removing an additional source of liquidity in the market and undoubtedly contributing to higher financial market volatility. Treasury yields moved higher in two distinct phases in 2018, first in January/February and then again in September/October when the 10-year yield peaked at 3.23%, before falling sharply in the last eight weeks of the year as equity markets fell into negative territory for the year and credit spreads widened significantly. A continued hostile geopolitical environment also added to higher financial market volatility in 2018. Throughout the year, tensions flared between President Trump and trading partners, particularly China. Rather than fuel inflation concerns, the tariff and trade uncertainty were seen as a potential drag on global growth at a time when Europe and China were already slowing. Europe spent the year caught in a series of challenges, including the unresolved exit of Britain from the EU, the budget and spending battle between Italy and the European Commission, and the “yellow vest” protests in France. In the U.S., Democrats regained control of the House in November, creating a division of power in Congress, and reducing the odds of major legislation going forward.
Treasury Yields
Maturity | 12/31/17 | 9/30/18 | 12/31/18 | Q4 Change | 2018 Change |
| 1 | 1.73% | 2.56% | 2.60% | 0.04% | 0.87% |
| 2 | 1.88% | 2.82% | 2.49% | -0.33% | 0.61% |
| 3 | 1.97% | 2.88% | 2.46% | -0.42% | 0.49% |
| 5 | 2.21% | 2.95% | 2.51% | -0.44% | 0.30% |
| 7 | 2.33% | 3.02% | 2.59% | -0.43% | 0.26% |
| 10 | 2.41% | 3.06% | 2.68% | -0.38% | 0.27% |
| 30 | 2.74% | 3.20% | 3.02% | -0.18% | 0.28% |
Flows Turned Negative in Q4, 2018 Ended Well Below 2017 Record Inflows
Flows into fixed income funds and ETFs ended 2018 at about $120B, down nearly 70% from a record-setting 2017 (see chart below). January started with over $45B of inflows, but the pace of inflows declined sharply from there and turned negative in the last three months of the year as investors pulled $71B from taxable fixed
2018 Bond Market Overview
(Unaudited)
income. The ICI data set doesn’t fully capture demand from all market participants – such as insurance companies, pensions, and foreign investors. However, data from the Fed showed that foreign net buying of investment grade corporate bonds in the first nine months of the year was running at roughly a quarter of the prior year’s pace as the cost of currency hedging rose to new highs. Net corporate supply for 2018 came in at $339B, down over 40% according to Barclays data.
Option-Adjusted Spreads (in bps)
| | | | | Q4 | 2018 |
| | 12/31/17 | 9/30/18 | 12/31/18 | Chg | Chg |
| U.S. Aggregate Index | 36 | 39 | 54 | 15 | 18 |
| U.S. Agency (non-mortgage) | 14 | 12 | 16 | 4 | 2 |
| Mortgage and ABS Sectors | | | | | |
| U.S. Agency Pass-throughs | 25 | 28 | 35 | 7 | 10 |
| U.S. Agency CMBS | 35 | 39 | 55 | 16 | 20 |
| U.S. Non-Agency CMBS | 79 | 73 | 107 | 34 | 28 |
| Asset-Backed Securities | 36 | 38 | 53 | 15 | 17 |
| Corporate Sectors | | | | | |
| U.S. Investment Grade | 93 | 106 | 153 | 47 | 60 |
| Industrial | 98 | 108 | 157 | 49 | 59 |
| Utility | 92 | 106 | 144 | 38 | 52 |
| Financial Institutions | 85 | 102 | 147 | 45 | 62 |
| Other Govt. Related | 68 | 69 | 90 | 21 | 22 |
| U.S. High Yield Corporates | 343 | 316 | 526 | 210 | 183 |
| Emerging Market Debt | 352 | 485 | 560 | 75 | 208 |
Source: Bloomberg Barclays Indices
Declining Investor Demand and Recession Worries Pushed Spreads Wider in 2018
Softening investor demand for fixed income and late-cycle recession worries drove yield spreads wider in 2018, accelerating in Q4 as fund flows turned negative. U.S. Investment Grade Corporates ended the year 60 bps wider at +153 bps, with 47 bps of that widening coming in the last quarter of the year. Lower-rated credits widened more than higher-rated, as BBB-rated corporates widened 73 bps to +197 bps, while A-rated bonds widened 46 bps to end the year at +119 bps. High-quality securitized sectors such as Asset-Backed Securities held in much better, widening only 17 bps and ending at +53 bps. Outflows in Q4 hit High Yield Corporates especially hard as spreads widened 210 bps in the quarter, ending the year at +526 bps.
High-Quality ABS and Municipals Outperformed in 2018
ABS (+1.77%) and Municipals (+1.28%) were two of the higher-returning investment-grade sectors in 2018. Both benefitted from higher quality outperforming lower quality, and the shorter-duration of ABS kept prices relatively stable as rates rose. Munis benefitted from light supply, solid demand from individual investors, and rising tax revenues. U.S. Investment Grade Corporate returns (-2.51%) lagged as this longer-duration sector came under supply/demand pressure, and the market grew more concerned about the possibility of a recession in coming years. Emerging Market Debt (-4.39%) suffered in the summer as the value of the Turkish Lira and Argentinian Peso declined sharply against the U.S. Dollar. After outperforming Investment Grade Corporates for the first three quarters of the year, High Yield (-4.53% Q4, -2.08% YTD) was the worst performing sector in Q4, as outflows picked up and West Texas Intermediate (WTI) oil declined below $50/barrel.
2018 Bond Market Overview
(Unaudited)
Total Returns of Selected Barclays Indices and Subsectors
| | | | | | Effective |
| | Bloomberg Barclays Index/Sector | December | Q4 | 2018 | Duration (yrs) |
| | U.S. Aggregate Index | 1.84% | 1.64% | 0.01% | 5.87 |
| | U.S. Gov’t/Credit Index | 1.86% | 1.46% | -0.42% | 6.38 |
| | U.S. Intermediate Gov’t/Credit Index | 1.34% | 1.65% | 0.88% | 3.87 |
| | U.S. 1-3 Yr. Gov’t/Credit Index | 0.78% | 1.18% | 1.60% | 1.90 |
| | U.S. Treasury | 2.15% | 2.57% | 0.86% | 6.10 |
| | U.S. Agency (non-mortgage) | 1.42% | 1.90% | 1.34% | 4.01 |
| | U.S. Agency Pass-throughs | 1.81% | 2.08% | 0.99% | 4.73 |
| | CMBS (Commercial Mortgage Backed Securities) | 1.62% | 1.72% | 0.78% | 5.30 |
| | ABS (Asset-Backed Securities) | 0.79% | 1.25% | 1.77% | 2.15 |
| | U.S. Corporate Investment Grade | 1.47% | -0.18% | -2.51% | 7.10 |
| | U.S. High Yield Corporates | -2.14% | -4.53% | -2.08% | 3.96 |
| | Emerging Market Debt | 0.93% | -0.67% | -4.39% | 4.49 |
| | Municipal Bond Index | 1.20% | 1.69% | 1.28% | 6.19 |
| | TIPS (Treasury Inflation Protected Securities) | 0.55% | -0.42% | -1.26% | 5.25 |
2019 Outlook
As we start the New Year, the outlook for Fed policy and interest rates is more uncertain than it was a year ago. Last year, while it was clear that the Fed was very likely to have both the ability and desire to continue normalizing monetary policy, it is unclear if the same need or desire is now present. As of year-end the market anticipates no fed funds rate move in 2019, and the balance sheet unwind will likely be more data-dependent, despite Fed Chair Powell’s comments after the December Federal Open Market Committee meeting that it remains on “autopilot.” Moderate slowing, perhaps returning to the 2% pace experienced for most of this cycle, rather than recession, is our base case expectation for the U.S. economy in 2019. A strong U.S. consumer and a well-capitalized banking system should support solid overall U.S. growth. However, diminished fiscal stimulus and the lagged impact of the Fed’s 2018 rate hikes should reduce growth from the strong, arguably unsustainable, 3% pace experienced this year. We expect that the economic expansion will become the longest on record in the post-WWII era as a result.
While higher volatility is likely to persist, slower economic growth, moderate inflation, and a risk-aware, data-dependent Fed lead us to expect only modest upward pressure on yields in 2019 with the yield curve likely to remain relatively flat with slight inversions possible along select maturity segments. One factor expected to put upward pressure on market yields is the significant borrowing expected by the Treasury, both to fund the rising budget deficit and to refinance maturing federal debt. The heightened deficit means net Treasury issuance is estimated to be $840B in 2019, up nearly 15% from 2018 and roughly double the 2017 level. In addition, approximately $270B of Treasury maturities are poised to run off the Fed’s balance sheet, adding to net supply for the private market.
From a fundamental perspective, the backdrop for corporate credit remains favorable. In 2018 corporate earnings and cash flow grew markedly and overall leverage remained stable - albeit at higher levels than earlier in the cycle due to issuers targeting BBB ratings. Furthermore, M&A activity led to higher leverage in select sectors such as food & beverage. Earnings growth will likely slow from an extraordinary 2018 as one-time tax cut benefits fade, while investors and rating agencies watch for issuers in recent M&A transactions to use strong cash flows to reduce leverage toward pre-transaction levels. The probability of a near-term recession remains relatively low and we expect corporate earnings growth to remain positive, growing at a moderate pace. We remain cautious on the prospects for Agency Pass-through securities, as the Fed continues its balance sheet reduction. An estimated $200B of MBS will run off the Fed’s balance sheet, requiring more MBS purchases by the private market. We anticipate MBS spreads will continue their gradual widening toward pre-QE levels. We are more optimistic on the outlook for other securitized sectors, such as Non-Agency RMBS, CMBS and ABS, which we expect to outperform equivalent-duration Treasuries in 2019.
2018 Bond Market Overview
(Unaudited)
Disclosures
Fixed income is generally considered to be a more conservative investment than stocks, but bonds and other fixed income investments still carry a variety of risks such as interest rate risk, credit risk, inflation risk, and liquidity risk. In a rising interest rate environment, the value of fixed-income securities generally declines and conversely, in a falling interest rate environment, the value of fixed-income securities generally increases. High yield securities may be subject to heightened market, interest rate or credit risk and should not be purchased solely because of the stated yield.
The Bloomberg Barclays Aggregate Bond Index is an index comprised of approximately 6000 publicly traded bonds including U.S. Government, mortgage-backed, corporate, and Yankee bonds with an average maturity of approximately 10 years.
The Bloomberg Barclays Government/Credit Index is a combination of the Government Index which measures government-bond general and Treasury funds, and the Credit Bond Index, which is a market value-weighted index which tracks the returns of all publicly issued, fixed-rate, nonconvertible, dollar-denominated, SEC registered, investment grade Corporate Debt.
The Bloomberg Barclays Intermediate Government/Credit Index is a combination of the Government Index which measures government-bond general and Treasury funds, and the Credit Bond Index, which is a market value-weighted index which tracks the returns of all publicly issued, fixed-rate, nonconvertible, dollar-denominated, SEC registered, investment grade Corporate Debt with maturities between one and ten years.
The Bloomberg Barclays Government/Credit Intermediate Index (1 – 3 yr.) is a combination of the Government Index which measures government-bond general and Treasury funds, and the Credit Bond Index, which is a market value-weighted index which tracks the returns of all publicly issued, fixed-rate, nonconvertible, dollar-denominated, SEC registered, investment grade Corporate Debt with maturities between zero and three years.
The Bloomberg Barclays U.S. Treasury Index includes public obligations of the U.S. Treasury. Treasury bills are excluded by the maturity constraint of at least one year but are part of a separate Short Treasury Index. In addition, certain special issues, such as state and local government series bonds (SLGs), as well as U.S. Treasury TIPS, are excluded. STRIPS are excluded from the index because their inclusion would result in double-counting. Securities in the Index roll up to the U.S. Aggregate, U.S. Universal, and Global Aggregate Indices. The U.S. Treasury Index was launched on January 1, 1973.
U.S. Agency: This index is the U.S. Agency component of the U.S. Government/Credit Index. Publicly issued debt of U.S. Government agencies, quasi-federal corporations, and corporate or foreign debt guaranteed by the U.S. Government (such as USAID securities). The largest issues are Fannie Mae, Freddie Mac, and the Federal Home Loan Bank System (FHLB). The index includes both callable and non-callable agency securities.
U.S Corporate – Investment Grade: This index is the Corporate component of the U.S. Credit Index. It includes publicly issued U.S. corporate and specified foreign debentures and secured notes that meet the specified maturity, liquidity, and quality requirements. To qualify, bonds must be SEC-registered.
CMBS (Commercial Mortgage-Backed Securities): This index is the CMBS component of the U.S. Aggregate Index. The Bloomberg Barclays CMBS ERISA-Eligible Index is the ERISA-eligible component of the Bloomberg Barclays CMBS Index. This index, which includes investment grade securities that are ERISA eligible under the underwriter’s exemption, is the only CMBS sector that is included in the U.S. Aggregate Index.
MBS (Mortgage-Backed Securities): This index is the U.S. MBS component of the U.S. Aggregate Index. The MBS Index covers the mortgage-backed pass-through securities of Ginnie Mae (GNMA), Fannie Mae (FNMA), and Freddie Mac (FHLMC). The MBS Index is formed by grouping the universe of over 600,000 individual fixed rate MBS pools into approximately 3,500 generic aggregates.
ABS (Asset-Backed Securities): This index is the ABS component of the U.S. Aggregate Index. The ABS Index has three subsectors: credit and charge cards, autos, and utility. The index includes pass-through, bullet, and controlled amortization structures. The ABS Index includes only the senior class of each ABS issue and the ERISA-eligible B and C tranche. The Manufactured Housing sector was removed as of January 1, 2008, and the Home Equity Loan sector was removed as of October 1, 2009.
2018 Bond Market Overview
(Unaudited)
Corporate High Yield: The Bloomberg Barclays U.S. High Yield Index covers the universe of fixed rate, non-investment grade debt. Eurobonds and debt issues from countries designated as emerging markets (sovereign rating of Baa1/BBB+/BBB+ and below using the middle of Moody’s, S&P, and Fitch) are excluded, but Canadian and global bonds (SEC registered) of issuers in non-EMG countries are included. Original issue zeroes, step-up coupon structures, 144As and, as of October 1, 2009, pay-in-kind bonds (PIKs) are also included.
Emerging Market: Bloomberg uses a fixed list of countries defined as emerging markets countries for index inclusion purposes that is based on World Bank Income group definitions (Low/Middle), IMF country classifications (Non-Advanced Economies), and other advanced economies that may be less accessible or investable for global debt investors.
The Bloomberg Barclays Municipal Bond Index is a broad-based, total-return index. The bonds are all investment-grade, tax-exempt, and fixed-rate securities with long-term maturities (greater than 2 years). They are selected from issues larger than $50 million.
The Bloomberg Barclays TIPS Index consists of Treasury Inflation Protected Securities (TIPS). TIPS are securities whose principal is tied to the Consumer Price Index. TIPS pay interest semi-annually, based on the fixed rate applied to the adjusted principal.
Ratings are measured on a scale that ranges from AAA or Aaa (highest) to D or C (lowest). Investment grade investments are those rated from highest down to BBB- or Baa3.
Robert W. Baird & Co. Incorporated. This is not a complete analysis of every material fact regarding any company, industry or security. The information has been obtained from sources we consider to be reliable, but we cannot guarantee the accuracy. Indices are unmanaged, and are not available for direct investment. Past performance is not a guarantee of future results.
Baird Ultra Short Bond Fund
December 31, 2018 (Unaudited)
The Baird Ultra Short Bond Fund seeks current income consistent with preservation of capital. The Fund’s primary benchmark index against which it measures performance is the Bloomberg Barclays U.S. Short-Term Government/Corporate Index. The Bloomberg Barclays U.S. Short-Term Government/Corporate Index is an unmanaged, market value weighted index of investment grade fixed debt, including government and corporate securities, with maturities of less than one year.
Economic growth in 2018 accelerated in the U.S., allowing the Fed to continue normalizing monetary policy, boosting overnight rates by a total of 200 bps and reducing over $450B of assets on its balance sheet. As a result, Treasury yields moved higher with short-term yields rising more than longer-term rates, leading to a flatter curve. Demand for fixed income assets was favorable through most of the year, but softened in the fourth quarter due primarily to asset allocation rebalancing trades that sold bonds and bought stocks after the 15-20% decline in the equity markets. A strong rally ensued in Treasuries near year end, but corporate credit spreads widened on late-cycle recession worries. Performance varied across the market sectors as higher quality credits and well-structured securitized issues outperformed lower-quality issues for the year.
During a challenging 2018, the Fund generated strong absolute returns and tracked its benchmark.
The primary factors contributing to the Fund’s absolute and relative performance in 2018 include:
| | • | While the Fund’s overweight to investment grade credit was a neutral factor to relative performance, its security selection and overweight to BBB Credit were positive contributors |
| | | |
| | • | The Fund’s Exposure to Non-Agency Residential Mortgage-Backed Securities (RMBS) and Asset-Backed Securities (ABS) was also a modest positive contributor |
Market expectations are certainly different than they were a year ago. Economic growth is expected to slow, both in the U.S. and abroad, and inflation measures are well contained even with low unemployment levels. As a result, the market currently expects no rate hikes from the Fed in 2019, although the Fed’s official outlook suggests as many as two 25 bps rate hikes. We expect GDP growth to remain positive in 2019, likely reverting back toward a 2.0% pace, from 3.0% in 2018, as the benefits of fiscal stimulus fade and the impact of rate hikes already in the pipeline become more impactful along with continued elevated uncertainty around US/China trade and Brexit. However, the employment backdrop remains favorable and income levels continue to rise, leaving the consumer in a strong position. Corporate debt as a percentage of GDP is only modestly higher this cycle and bottom-up fundamental credit measures remain constructive at the same time that credit spreads are significantly wider than a year ago. Government borrowing is elevated and rising, with net Treasury issuance expected to increase to $840B this year, up nearly 15% from 2018 which may continue to put modest upward pressure on yields in 2019.
We remain duration neutral with an overweight to Investment Grade corporate credit, particularly Financials. We maintain an allocation to the MBS/ABS sectors due to favorable risk/reward characteristics and the broad sector diversification benefits they provide. As a reminder, we only purchase U.S. dollar denominated securities in the cash bond market (no derivatives). We believe the Fund is well positioned to add value relative to its benchmark.
Baird Ultra Short Bond Fund
December 31, 2018 (Unaudited)
Portfolio Characteristics
Quality Distribution(1)(2)
 | | Net Assets | $1,047,044,218 | |
| | | | |
| | SEC 30-Day | | |
| | Yield(3) | | |
| | Institutional Class | | |
| | (after waivers) | 2.81% | |
| | Institutional Class | | |
| | (before waivers) | 2.66% | |
| | Investor Class | | |
| | (after waivers) | 2.62% | |
| | Investor Class | | |
| | (before waivers) | 2.47% | |
| | | | |
| | Average | | |
| | Effective | | |
| | Duration | 0.51 years | |
| | | | |
| | Average | | |
| | Effective | | |
| | | Maturity | 0.94 years | |
Sector Weightings(1) | | | | |
| | | Annualized | | |
 | | Expense Ratio(4) | | |
| | Gross | | |
| | Institutional Class | 0.30% | |
| | Investor Class | 0.55% | (5) |
| | | | |
| | Net | | |
| | Institutional Class | 0.15% | |
| | Investor Class | 0.40% | (5) |
| | | | |
| | Portfolio | | |
| | Turnover Rate | 66% | |
| | | | |
| | Number of | | |
| | Holdings | 280 | |
| | | | |
| | | | |
| | | | |
| | | | |
| | | | |
| | | | |
| | | | | |
(1) | Percentages shown are based on the Fund’s total investments. |
(2) | The quality profile is calculated on a market value-weighted basis using the highest credit quality rating for each security held by the Fund given by S&P, Moody’s or Fitch, each of which is a Nationally Recognized Statistical Rating Organization (NRSRO). NRSROs rate the credit quality of securities using a scale that generally ranges from AAA (highest) to D (lowest). |
(3) | SEC yields are based on SEC guidelines and are calculated for the 30 days ended December 31, 2018. |
(4) | Reflects expense ratios as stated in the Fund’s current prospectus. The Advisor has contractually agreed to waive management fees in an amount equal to an annual rate of 0.15% of average daily net assets for the Fund, at least through April 30, 2020. The agreement may only be terminated prior to the end of this term by or with the consent of the Board of Directors of Baird Funds, Inc. |
(5) | Includes 0.25% 12b-1 fee. |
Baird Ultra Short Bond Fund
December 31, 2018 (Unaudited)
Institutional ClassValue of a $25,000 Investment
Growth of a hypothetical investment of $25,000 made on the Fund’s inception date (12/31/13), assuming reinvestment of all distributions.
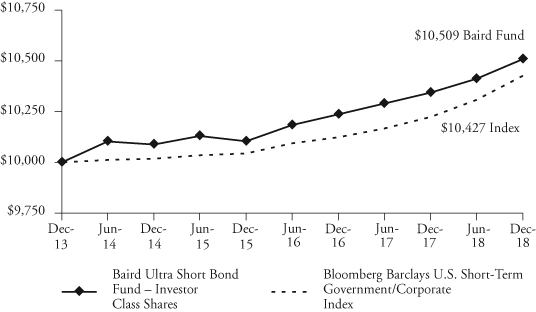
Investor Class
Value of a $10,000 Investment
Growth of a hypothetical investment of $10,000 made on the Fund’s inception date (12/31/13), assuming reinvestment of all distributions.
Baird Ultra Short Bond Fund
December 31, 2018 (Unaudited)
Total Returns
| | | Average Annual |
| | One | Three | Five | Since |
| For the Periods Ended December 31, 2018 | Year | Years | Years | Inception(1) |
| Institutional Class Shares | 1.95% | 1.60% | 1.26% | 1.26% |
| Investor Class Shares | 1.60% | 1.32% | 1.00% | 1.00% |
| Bloomberg Barclays U.S. Short-Term | | | | |
Government/Corporate Index(2) | 1.99% | 1.26% | 0.84% | 0.84% |
| (1) | For the period from December 31, 2013 (inception date) through December 31, 2018. |
| (2) | The Bloomberg Barclays U.S. Short-Term Government/Corporate Index is an unmanaged, market value weighted index of investment grade, fixed debt including government and corporate securities with maturities less than one year. This Index does not reflect any deduction for fees, expenses or taxes. A direct investment in an index is not possible. |
The line graph on the previous page and the returns shown in the table above reflect reinvestment of dividends and/or capital gains distributions in additional shares. The returns do not reflect the deduction of taxes that a shareholder would pay on Fund distributions or the redemption of Fund shares. The returns reflect the actual performance for each period and do not include the impact of trades executed on the last business day of the period that were recorded on the first business day of the next period.
The Fund’s gross expense ratio for each Class, as reflected in the Fund’s current prospectus, is set forth under “Portfolio Characteristics”.
The Fund may invest up to 10% of its net assets in non-investment grade debt securities (commonly referred to as “high yield” bonds). While these types of securities typically offer higher yields than investment grade securities, they also include greater risks including increased credit risk and the increased risk of default or bankruptcy. The Fund may also invest in U.S. dollar denominated foreign securities which involve additional risks such as political and economic instability, and different and sometimes less strict financial reporting standards and regulation. The Fund may also invest in mortgage- and asset-backed securities, which include interest rate and prepayment risks more pronounced than those of other fixed income securities.
Past performance does not guarantee future results. Investment return and principal value will fluctuate so that an investor’s shares, when redeemed, may be worth more or less than their original cost.
For information about the performance of the Fund as of the most recent month-end, please call 1-866-44BAIRD or visit www.bairdfunds.com. Mutual fund performance changes over time and current performance may be lower or higher than that stated.
Baird Ultra Short Bond Fund
Summary Schedule of Investments, December 31, 2018
This schedule summarizes the Fund’s holdings by asset type. Details are reported for each of the Fund’s 50 largest individual holdings and for investments that, in total for any issuer, represent more than 1% of the Fund’s net assets. The total value of smaller holdings is reported as a single amount within each category.
The Fund reports a complete list of its holdings in regulatory filings four times in each fiscal year, at the quarter end. For the second and fourth fiscal quarters, the complete listing of the Fund’s holdings is available electronically at http://www.bairdassetmanagement.com/baird-funds/funds-and-performance#Literature and in the Fund’s Form N-CSR on the Securities and Exchange Commission’s website (www.sec.gov) or you can have it mailed to you without charge by calling 1-866-44BAIRD. For the first and third fiscal quarters, the Fund files the lists with the SEC on Form N-Q or, beginning with filings after March 31, 2019, on Part F of Form N-PORT. Shareholders can look up the Fund’s Forms N-CSR, N-Q or Part F of Form N-PORT on the SEC’s website (www.sec.gov).
Long-Term Investments
| | | Principal | | | | | | % of | |
| | | Amount | | | Value | | | Net Assets | |
| U.S. Treasury Securities | | | | | | | | | |
| U.S. Treasury Bonds: | | | | | | | | | |
| 0.875%, 04/15/2019 | | $ | 22,000,000 | | | $ | 21,903,326 | | | | 2.1 | % |
| 0.875%, 06/15/2019 | | | 112,000,000 | | | | 111,181,875 | | | | 10.6 | % |
| 0.875%, 09/15/2019 | | | 44,000,000 | | | | 43,456,875 | | | | 4.2 | % |
| 1.375%, 12/15/2019 | | | 119,000,000 | | | | 117,582,227 | | | | 11.2 | % |
| Total U.S. Treasury Securities | | | | | | | | | | | | |
| (Cost $294,120,351) | | | | | | | 294,124,303 | | | | 28.1 | % |
| Other Government Related Securities | | | | | | | | | | | | |
Other Government Related Securities(1)(2)(3)(6) | | | | | | | 5,796,099 | | | | 0.6 | % |
| Total Other Government Related Securities | | | | | | | | | | | | |
| (Cost $5,794,442) | | | | | | | 5,796,099 | | | | 0.6 | % |
| Corporate Bonds | | | | | | | | | | | | |
| Industrials | | | | | | | | | | | | |
| Air Liquide Finance SA, | | | | | | | | | | | | |
1.375%, 09/27/2019(1)(2) | | | 5,564,000 | | | | 5,496,448 | | | | 0.5 | % |
| Anadarko Petroleum Corp., | | | | | | | | | | | | |
| 6.950%, 06/15/2019 | | | 4,165,000 | | | | 4,223,089 | | | | 0.4 | % |
| AT&T, Inc., | | | | | | | | | | | | |
| 3.956%, 06/12/2024 | | | | | | | | | | | | |
(3 Month LIBOR USD + 1.180%)(3) | | | 6,000,000 | | | | 5,819,952 | | | | 0.6 | % |
| Boardwalk Pipelines LP, | | | | | | | | | | | | |
| 5.750%, 09/15/2019 | | | 6,450,000 | | | | 6,525,894 | | | | 0.6 | % |
| Boston Scientific Corp., | | | | | | | | | | | | |
| 6.000%, 01/15/2020 | | | 5,025,000 | | | | 5,151,953 | | | | 0.5 | % |
| Broadcom Corp. / Broadcom Cayman Finance Ltd., | | | | | | | | | | | | |
| 2.375%, 01/15/2020 | | | 4,500,000 | | | | 4,443,800 | | | | 0.4 | % |
| Campbell Soup Co., | | | | | | | | | | | | |
| 3.418%, 03/15/2021 | | | | | | | | | | | | |
(3 Month LIBOR USD + 0.630%)(3) | | | 4,275,000 | | | | 4,192,152 | | | | 0.4 | % |
| Canadian Pacific Railway Co., | | | | | | | | | | | | |
7.250%, 05/15/2019(1) | | | 4,775,000 | | | | 4,842,521 | | | | 0.5 | % |
The accompanying notes are an integral part of these financial statements.
Baird Ultra Short Bond Fund
Summary Schedule of Investments, December 31, 2018
Long-Term Investments (cont.)
| | | Principal | | | | | | % of | |
| | | Amount | | | Value | | | Net Assets | |
| CVS Health Corp., | | | | | | | | | |
| 3.487%, 03/09/2021 | | | | | | | | | |
(3 Month LIBOR USD + 0.720%)(3) | | $ | 5,485,000 | | | $ | 5,440,781 | | | | 0.5 | % |
| Diamond 1 Finance Corp. / Diamond 2 Finance Corp., | | | | | | | | | | | | |
3.480%, 06/01/2019(2) | | | 4,900,000 | | | | 4,885,519 | | | | 0.5 | % |
| Dollar Tree, Inc., | | | | | | | | | | | | |
| 3.149%, 04/17/2020 | | | | | | | | | | | | |
(3 Month LIBOR USD + 0.700%)(3) | | | 5,800,000 | | | | 5,763,007 | | | | 0.6 | % |
| EI du Pont de Nemours & Co., | | | | | | | | | | | | |
| 3.071%, 05/01/2020 | | | | | | | | | | | | |
(3 Month LIBOR USD + 0.530%)(3) | | | 5,000,000 | | | | 5,002,527 | | | | 0.5 | % |
| Fresenius Medical Care US Finance II, Inc., | | | | | | | | | | | | |
5.625%, 07/31/2019(2) | | | 4,500,000 | | | | 4,551,323 | | | | 0.4 | % |
| Kellogg Co., | | | | | | | | | | | | |
| 4.150%, 11/15/2019 | | | 5,000,000 | | | | 5,037,398 | | | | 0.5 | % |
| LyondellBasell Industries NV, | | | | | | | | | | | | |
5.000%, 04/15/2019(1) | | | 4,550,000 | | | | 4,554,951 | | | | 0.4 | % |
| Marriott International, Inc., | | | | | | | | | | | | |
| 3.229%, 12/01/2020 | | | | | | | | | | | | |
(3 Month LIBOR USD + 0.600%)(3) | | | 4,775,000 | | | | 4,763,514 | | | | 0.5 | % |
| Martin Marietta Materials, Inc., | | | | | | | | | | | | |
| 3.292%, 12/20/2019 | | | | | | | | | | | | |
(3 Month LIBOR USD + 0.500%)(3) | | | 4,500,000 | | | | 4,487,073 | | | | 0.4 | % |
| Mylan NV, | | | | | | | | | | | | |
2.500%, 06/07/2019(1) | | | 5,088,000 | | | | 5,064,071 | | | | 0.5 | % |
| Nissan Motor Acceptance Corp., | | | | | | | | | | | | |
| 3.420%, 09/21/2021 | | | | | | | | | | | | |
(3 Month LIBOR USD + 0.630%)(2)(3) | | | 4,800,000 | | | | 4,705,366 | | | | 0.4 | % |
| Penske Truck Leasing Co. Lp / PTL Finance Corp., | | | | | | | | | | | | |
3.050%, 01/09/2020(2) | | | 5,000,000 | | | | 4,978,671 | | | | 0.5 | % |
| Shire Acquisitions Investments Ireland DAC, | | | | | | | | | | | | |
1.900%, 09/23/2019(1) | | | 5,000,000 | | | | 4,929,929 | | | | 0.5 | % |
| Smithfield Foods, Inc., | | | | | | | | | | | | |
2.700%, 01/31/2020(2) | | | 4,600,000 | | | | 4,537,720 | | | | 0.4 | % |
| Suntory Holdings Ltd., | | | | | | | | | | | | |
2.550%, 09/29/2019(1)(2) | | | 4,900,000 | | | | 4,867,313 | | | | 0.5 | % |
| Tyco Electronics Group SA, | | | | | | | | | | | | |
| 3.201%, 06/05/2020 | | | | | | | | | | | | |
(3 Month LIBOR USD + 0.450%)(1)(3) | | | 5,000,000 | | | | 4,988,562 | | | | 0.5 | % |
| Volkswagen Group of America Finance LLC, | | | | | | | | | | | | |
| 3.558%, 11/12/2021 | | | | | | | | | | | | |
(3 Month LIBOR USD + 0.940%)(2)(3) | | | 6,000,000 | | | | 5,941,290 | | | | 0.6 | % |
| Vulcan Materials Co., | | | | | | | | | | | | |
| 3.388%, 03/01/2021 | | | | | | | | | | | | |
(3 Month LIBOR USD + 0.650%)(3) | | | 5,000,000 | | | | 4,962,468 | | | | 0.5 | % |
The accompanying notes are an integral part of these financial statements.
Baird Ultra Short Bond Fund
Summary Schedule of Investments, December 31, 2018
Long-Term Investments (cont.)
| | | Principal | | | | | | % of | |
| | | Amount | | | Value | | | Net Assets | |
| Walgreens Boots Alliance, Inc., | | | | | | | | | |
| 2.700%, 11/18/2019 | | $ | 5,165,000 | | | $ | 5,135,522 | | | | 0.5 | % |
Other Industrials(1)(2)(3)(6) | | | | | | | 173,601,879 | | | | 16.6 | % |
| Total Industrials | | | | | | | | | | | | |
| (Cost $310,352,891) | | | | | | | 308,894,693 | | | | 29.7 | % |
| Utilities | | | | | | | | | | | | |
| Niagara Mohawk Power Corp., | | | | | | | | | | | | |
4.881%, 08/15/2019(2) | | | 4,500,000 | | | | 4,539,858 | | | | 0.4 | % |
Other Utilities(1)(2)(3)(6) | | | | | | | 20,488,645 | | | | 2.0 | % |
| Total Utilities | | | | | | | | | | | | |
| (Cost $25,083,386) | | | | | | | 25,028,503 | | | | 2.4 | % |
| Financials | | | | | | | | | | | | |
| ABN AMRO Bank NV, | | | | | | | | | | | | |
| 3.085%, 01/18/2019 | | | | | | | | | | | | |
(3 Month LIBOR USD + 0.640%)(1)(2)(3) | | | 4,500,000 | | | | 4,500,513 | | | | 0.4 | % |
| Compass Bank, | | | | | | | | | | | | |
| 3.501%, 06/11/2021 | | | | | | | | | | | | |
(3 Month LIBOR USD + 0.730%)(3) | | | 4,750,000 | | | | 4,675,778 | | | | 0.4 | % |
| First Tennessee Bank NA, | | | | | | | | | | | | |
| 2.950%, 12/01/2019 | | | 5,250,000 | | | | 5,209,305 | | | | 0.5 | % |
| Morgan Stanley, | | | | | | | | | | | | |
| 5.500%, 01/26/2020 | | | 7,500,000 | | | | 7,670,389 | | | | 0.7 | % |
| Sumitomo Mitsui Banking Corp., | | | | | | | | | | | | |
2.514%, 01/17/2020(1) | | | 4,500,000 | | | | 4,466,887 | | | | 0.4 | % |
| Toronto-Dominion Bank, | | | | | | | | | | | | |
1.900%, 10/24/2019(1) | | | 6,000,000 | | | | 5,948,405 | | | | 0.6 | % |
Other Financials(1)(2)(3)(6) | | | | | | | 144,393,196 | | | | 13.8 | % |
| Total Financials | | | | | | | | | | | | |
| (Cost $177,541,175) | | | | | | | 176,864,473 | | | | 16.8 | % |
| Total Corporate Bonds | | | | | | | | | | | | |
| (Cost $512,977,452) | | | | | | | 510,787,669 | | | | 48.9 | % |
| Municipal Bonds | | | | | | | | | | | | |
Other Municipal Bonds(6) | | | | | | | 997,670 | | | | 0.1 | % |
| Total Municipal Bonds | | | | | | | | | | | | |
| (Cost $998,322) | | | | | | | 997,670 | | | | 0.1 | % |
| Residential Mortgage-Backed Securities | | | | | | | | | | | | |
| U.S. Government Agency Issues | | | | | | | | | | | | |
Other U.S. Government Agency Issues(6) | | | | | | | 37,198 | | | | 0.0 | % |
| Total U.S. Government Agency Issues | | | | | | | | | | | | |
| (Cost $36,602) | | | | | | | 37,198 | | | | 0.0 | % |
The accompanying notes are an integral part of these financial statements.
Baird Ultra Short Bond Fund
Summary Schedule of Investments, December 31, 2018
Long-Term Investments (cont.)
| | | Principal | | | | | | % of | |
| | | Amount | | | Value | | | Net Assets | |
| Non-U.S. Government Agency Issues | | | | | | | | | |
Other Non-U.S. Government Agency Issues(2)(3)(6) | | | | | $ | 26,541,052 | | | | 2.5 | % |
| Total Non-U.S. Government Agency Issues | | | | | | | | | | | |
| (Cost $26,493,932) | | | | | | 26,541,052 | | | | 2.5 | % |
| Commercial Mortgage-Backed Securities | | | | | | | | | | | |
| U.S. Government Agency Issues | | | | | | | | | | | |
Other U.S. Government Agency Issues(6) | | | | | | 487,477 | | | | 0.0 | % |
| Total U.S. Government Agency Issues | | | | | | | | | | | |
| (Cost $488,682) | | | | | | 487,477 | | | | 0.0 | % |
| Non-U.S. Government Agency Issues | | | | | | | | | | | |
Other Non-U.S. Government Agency Issues(6) | | | | | | 3,465,793 | | | | 0.3 | % |
| Total Non-U.S. Government Agency Issues | | | | | | | | | | | |
| (Cost $3,463,883) | | | | | | 3,465,793 | | | | 0.3 | % |
| Asset Backed Securities | | | | | | | | | | | |
| Barclays Dryrock Issuance Trust, | | | | | | | | | | | |
| Series 2014-3, Class A, 2.410%, 07/15/2022 | | $ | 6,870,000 | | | | 6,839,279 | | | | 0.7 | % |
| Capital One Multi-Asset Execution Trust, | | | | | | | | | | | | |
| Series 2016-A3, Class A3, 1.340%, 04/15/2022 | | | 5,700,000 | | | | 5,656,117 | | | | 0.5 | % |
| CarMax Auto Owner Trust, | | | | | | | | | | | | |
| Series 2015-2, 1.800%, 03/15/2021 | | | 4,327,930 | | | | 4,307,881 | | | | 0.4 | % |
| Citibank Credit Card Issuance Trust, | | | | | | | | | | | | |
| Series 2017-A9, Class A9, 1.800%, 09/20/2021 | | | 4,700,000 | | | | 4,662,096 | | | | 0.4 | % |
| Discover Card Execution Note Trust, | | | | | | | | | | | | |
| Series 2014-A4, Class A4, 2.120%, 12/15/2021 | | | 5,200,000 | | | | 5,180,615 | | | | 0.5 | % |
| Ford Credit Floorplan Master Owner Trust, | | | | | | | | | | | | |
| Series 2016-3, Class A1, 1.550%, 07/15/2021 | | | 4,545,000 | | | | 4,509,797 | | | | 0.4 | % |
| GM Financial Automobile Leasing Trust, | | | | | | | | | | | | |
| Series 2018-1, Class A3, 2.610%, 01/20/2021 | | | 4,275,000 | | | | 4,254,543 | | | | 0.4 | % |
| Hyundai Auto Lease Securitization Trust, | | | | | | | | | | | | |
Series 2017-B, Class A3, 1.970%, 07/15/2020(2) | | | 5,350,000 | | | | 5,320,947 | | | | 0.5 | % |
| Master Credit Card Trust II, | | | | | | | | | | | | |
Series 2017-1A, Class A, 2.260%, 07/21/2021(1)(2) | | | 5,550,000 | | | | 5,501,599 | | | | 0.5 | % |
| Synchrony Credit Card Master Note Trust, | | | | | | | | | | | | |
| Series 2016-3, Class A, 1.580%, 09/15/2022 | | | 6,370,000 | | | | 6,307,286 | | | | 0.6 | % |
| World Financial Network Credit Card Master Trust: | | | | | | | | | | | | |
| Series 2012-A, Class A, 3.140%, 01/17/2023 | | | 5,320,000 | | | | 5,319,432 | | | | 0.5 | % |
| Series 2017-B, Class A, 1.980%, 06/15/2023 | | | 8,688,000 | | | | 8,629,153 | | | | 0.8 | % |
Other Asset Backed Securities(2)(3)(4)(6) | | | | | | | 93,521,870 | | | | 9.0 | % |
| Total Asset Backed Securities | | | | | | | | | | | | |
| (Cost $160,047,462) | | | | | | | 160,010,615 | | | | 15.2 | % |
| Total Long-Term Investments | | | | | | | | | | | | |
| (Cost $1,004,421,128) | | | | | | | 1,002,247,876 | | | | 95.7 | % |
The accompanying notes are an integral part of these financial statements.
Baird Ultra Short Bond Fund
Summary Schedule of Investments, December 31, 2018
Short-Term Investment
| | | | | | | | | % of | |
| | | Shares | | | Value | | | Net Assets | |
| Money Market Mutual Fund | | | | | | | | | |
| Fidelity Institutional Money Market Fund – | | | | | | | | | |
Government Portfolio, Institutional Class, 2.29%(5) | | | 39,534,338 | | | $ | 39,534,338 | | | | 3.8 | % |
| Total Short-Term Investment | | | | | | | | | | | | |
| (Cost $39,534,338) | | | | | | | 39,534,338 | | | | 3.8 | % |
| Total Investments | | | | | | | | | | | | |
| (Cost $1,043,955,466) | | | | | | | 1,041,782,214 | | | | 99.5 | % |
| Other Assets in Excess of Liabilities | | | | | | | 5,262,004 | | | | 0.5 | % |
| TOTAL NET ASSETS | | | | | | $ | 1,047,044,218 | | | | 100.0 | % |
Notes to Summary Schedule of Investments
| (1) | Foreign security, or group of securities contain a foreign security. |
| (2) | Security, or group of securities contain a security, issued under Rule 144A under the Securities Act of 1933 and determined to be liquid. Purchased in a private placement transaction; resale to the public may require registration or may extend only to qualified institutional buyers. At December 31, 2018, the value of these securities total $220,834,421, which represents 21.09% of total net assets. |
| (3) | Variable rate security, or group of securities contain a variable rate security, based on a reference index and spread. The rate reported is the rate in effect as of December 31, 2018. |
| (4) | Variable rate security, or group of securities contain a variable rate security. The coupon is based on an underlying pool of loans. The rate reported is the rate in effect as of December 31, 2018. |
| (5) | Seven-day yield. |
| (6) | Represents the aggregate value, by category, of securities that are not among the 50 largest holdings and, in total for any issuer, represent 1% or less of net assets. |
Summary of Fair Value Exposure at December 31, 2018
The Fund has adopted authoritative fair valuation accounting standards which establish a definition of fair value and set out a hierarchy for measuring fair value. These standards require additional disclosures about the various inputs and valuation techniques used to develop the measurements of fair value and a discussion on changes in valuation techniques and related inputs during the period. These standards define fair value as the price that would be received to sell an asset or paid to transfer a liability in an orderly transaction between market participants at the measurement date.
The accompanying notes are an integral part of these financial statements.
Baird Ultra Short Bond Fund
Summary Schedule of Investments, December 31, 2018
Summary of Fair Value Exposure at December 31, 2018 (cont.)
The fair value hierarchy is organized into three levels based upon the assumptions (referred to as “inputs”) used in pricing the asset or liability. These standards state that “observable inputs” reflect the assumptions market participants would use in pricing the asset or liability based on market data obtained from independent sources and “unobservable inputs” reflect an entity’s own assumptions about the assumptions market participants would use in pricing the asset or liability. These inputs are summarized into three broad levels and described below:
Level 1 – | Unadjusted quoted prices in active markets for identical unrestricted securities. |
Level 2 – | Other significant observable inputs (including quoted prices for similar securities, quoted prices in inactive markets, dealer indications, interest rates, yield curves, prepayment speeds, credit risk, default rates, inputs corroborated by observable market data, etc.). |
Level 3 – | Significant unobservable inputs (including the Fund’s own assumptions about the factors that market participants would use in valuing the security) based on the best information available. |
The inputs or methodology used for valuing securities are not necessarily an indication of the risk associated with investing in those securities.
The following is a summary of the inputs used to value the Fund’s investments as of December 31, 2018:
| | | Level 1 | | | Level 2 | | | Level 3 | | | Total | |
| Long-Term Investments | | | | | | | | | | | | |
| U.S. Treasury Securities | | $ | — | | | $ | 294,124,303 | | | $ | — | | | $ | 294,124,303 | |
| Other Government Related Securities | | | — | | | | 5,796,099 | | | | — | | | | 5,796,099 | |
| Corporate Bonds | | | — | | | | 510,787,669 | | | | — | | | | 510,787,669 | |
| Municipal Bonds | | | — | | | | 997,670 | | | | — | | | | 997,670 | |
| Residential Mortgage-Backed Securities – | | | | | | | | | | | | | | | | |
| U.S. Government Agency Issues | | | — | | | | 37,198 | | | | — | | | | 37,198 | |
| Residential Mortgage-Backed Securities – | | | | | | | | | | | | | | | | |
| Non-U.S. Government Agency Issues | | | — | | | | 26,541,052 | | | | — | | | | 26,541,052 | |
| Commercial Mortgage-Backed Securities – | | | | | | | | | | | | | | | | |
| U.S. Government Agency Issues | | | — | | | | 487,477 | | | | — | | | | 487,477 | |
| Commercial Mortgage-Backed Securities – | | | | | | | | | | | | | | | | |
| Non-U.S. Government Agency Issues | | | — | | | | 3,465,793 | | | | — | | | | 3,465,793 | |
| Asset Backed Securities | | | — | | | | 160,010,615 | | | | — | | | | 160,010,615 | |
| Total Long-Term Investments | | | — | | | | 1,002,247,876 | | | | — | | | | 1,002,247,876 | |
| Short-Term Investment | | | | | | | | | | | | | | | | |
| Money Market Mutual Fund | | | 39,534,338 | | | | — | | | | — | | | | 39,534,338 | |
| Total Short-Term Investment | | | 39,534,338 | | | | — | | | | — | | | | 39,534,338 | |
| Total Investments | | $ | 39,534,338 | | | $ | 1,002,247,876 | | | $ | — | | | $ | 1,041,782,214 | |
Changes in valuation techniques may result in transfers into or out of assigned levels within the fair value hierarchy. There were no transfers into or out of Level 3 during the reporting period, as compared to the security classifications from the prior year’s annual report. See Fund’s Valuation Policy in Note 2a to the financial statements.
The accompanying notes are an integral part of these financial statements.
Baird Short-Term Bond Fund
December 31, 2018 (Unaudited)
The Baird Short-Term Bond Fund seeks an annual rate of total return, before Fund expenses, greater than the annual rate of total return of the Bloomberg Barclays 1-3 Year U.S. Government/Credit Bond Index. The Bloomberg Barclays 1-3 Year U.S. Government/Credit Bond Index is an unmanaged, market value weighted index of investment grade, fixed rate debt issues, including government and credit securities, with maturities between one and three years.
Economic growth in 2018 accelerated in the U.S., allowing the Fed to continue normalizing monetary policy, boosting overnight rates by a total of 200 bps and reducing over $450B of assets on its balance sheet. As a result, Treasury yields moved higher with short-term yields rising more than longer-term rates, leading to a flatter curve. Demand for fixed income assets was favorable through most of the year, but softened in the fourth quarter due primarily to asset allocation rebalancing trades that sold bonds and bought stocks after the 15-20% decline in the equity markets. A strong rally ensued in Treasuries near year end, but corporate credit spreads widened on late-cycle recession worries. Performance varied across the market sectors as higher quality credits and well-structured securitized issues outperformed lower-quality issues for the year.
During a challenging 2018, the Fund generated strong absolute returns and modestly lagged its benchmark.
The primary factors contributing to the Fund’s absolute and relative performance in 2018 include:
| | • | The Fund benefited from its Credit positioning particularly with respect to security selection |
| | | |
| | • | The Fund’s exposure to Asset-Backed Securities (ABS) was a modest detractor while it benefited from its exposure to Non-Agency Commercial Mortgage-Backed Securities (CMBS) |
| | | |
| | • | The Fund benefited from its positioning for a modest flattening in the front end of the yield curve |
Market expectations are certainly different than they were a year ago. Economic growth is expected to slow, both in the U.S. and abroad, and inflation measures are well contained even with low unemployment levels. As a result, the market currently expects no rate hikes from the Fed in 2019, although the Fed’s official outlook suggests as many as two 25 bps rate hikes. We expect growth to remain positive in 2019, likely reverting back toward a 2.0% pace, from 3.0% in 2018, as the benefits of fiscal stimulus fade and the impact of rate hikes already in the pipeline become more impactful along with continued elevated uncertainty around U.S./China trade and Brexit. However, the employment backdrop remains favorable and income levels continue to rise, leaving the consumer in a strong position. Corporate debt as a percentage of GDP is only modestly higher this cycle and bottom-up fundamental credit measures remain constructive at the same time that credit spreads are significantly wider than a year ago. Government borrowing is elevated and rising, with net Treasury issuance expected to increase to $840B this year, up nearly 15% from 2018 which may continue to put modest upward pressure on yields in 2019.
We remain duration neutral with an overweight to Investment Grade corporate credit, particularly Financials. We maintain an allocation to the MBS/ABS sectors due to favorable risk/reward characteristics and the broad sector diversification benefits they provide. As a reminder, we only purchase investment grade, U.S. dollar denominated securities in the cash bond market (no derivatives). The Fund remains duration neutral to its benchmark and we believe it is well positioned to add value relative to its benchmark.
Baird Short-Term Bond Fund
December 31, 2018 (Unaudited)
Portfolio Characteristics
Quality Distribution(1)(2)
 | | Net Assets | $5,741,236,759 | |
| | | | |
| | SEC 30-Day | | |
| | Yield(3) | | |
| | Institutional Class | 3.03% | |
| | Investor Class | 2.76% | |
| | | | |
| | Average | | |
| | Effective | | |
| | Duration | 1.90 years | |
| | | | |
| | Average | | |
| | Effective | | |
| | Maturity | 2.09 years | |
| | | | |
| | Annualized | | |
| | | Expense | | |
Sector Weightings(1) | | Ratio(4) | | |
| | | Institutional Class | 0.30% | |
 | | Investor Class | 0.55% | (5) |
| | | | |
| | Portfolio | | |
| | Turnover Rate | 58% | |
| | | | |
| | Number of | | |
| | Holdings | 520 | |
| | | | |
| | | | |
| | | | |
| | | | |
| | | | |
| | | | |
| | | | |
| | | | |
| | | | |
| | | | |
| | | | |
| | | | |
| | | | |
| | | | |
| | | | |
| | | | |
| | | | | |
(1) | Percentages shown are based on the Fund’s total investments. |
(2) | The quality profile is calculated on a market value-weighted basis using the highest credit quality rating for each security held by the Fund given by S&P, Moody’s or Fitch, each of which is a Nationally Recognized Statistical Rating Organization (NRSRO). NRSROs rate the credit quality of securities using a scale that generally ranges from AAA (highest) to D (lowest). |
(3) | SEC yields are based on SEC guidelines and are calculated for the 30 days ended December 31, 2018. |
(4) | Reflects expense ratios as stated in the Fund’s current prospectus. |
(5) | Includes 0.25% 12b-1 fee. |
Baird Short-Term Bond Fund
December 31, 2018 (Unaudited)
Institutional ClassValue of a $25,000 Investment
Growth of a hypothetical investment of $25,000 made on 12/31/08, assuming reinvestment of all distributions.
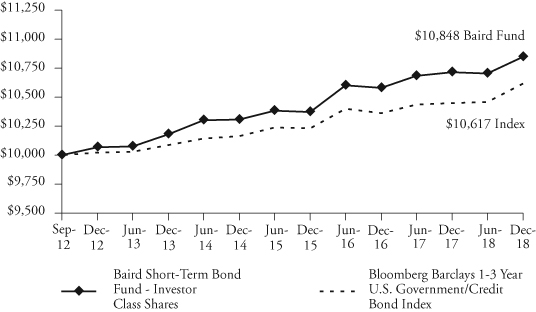
Investor Class
Value of a $10,000 Investment
Growth of a hypothetical investment of $10,000 made on the Fund’s inception date (9/19/12), assuming reinvestment of all distributions.
Baird Short-Term Bond Fund
December 31, 2018 (Unaudited)
Total Returns
| | | Average Annual |
| | | | | Since | Since |
| | One | Five | Ten | Inception | Inception |
| For the Periods Ended December 31, 2018 | Year | Years | Years | (8/31/04) | (9/19/12) |
| Institutional Class Shares | 1.49% | 1.53% | 2.75% | 2.67% | N/A |
| Investor Class Shares | 1.24% | 1.28% | N/A | N/A | 1.30% |
| Bloomberg Barclays 1-3 Year U.S. | | | | | |
Government/Credit Bond Index(1) | 1.60% | 1.03% | 1.52% | 2.30% | 0.96% |
| (1) | The Bloomberg Barclays 1-3 Year U.S. Government/Credit Bond Index is an unmanaged, market value weighted index of investment grade, fixed-rate debt issues, including government and corporate securities, with maturities between one and three years. This Index does not reflect any deduction for fees, expenses or taxes. A direct investment in an index is not possible. |
The line graph on the previous page and the returns shown in the table above reflect reinvestment of dividends and/or capital gains distributions in additional shares. Returns do not reflect the deduction of taxes that a shareholder would pay on Fund distributions or the redemption of Fund shares. The returns reflect the actual performance for each period and do not include the impact of trades executed on the last business day of the period that were recorded on the first business day of the next period.
The Fund’s gross expense ratio for each Class, as reflected in the Fund’s current prospectus, is set forth under “Portfolio Characteristics”.
The Fund may invest in U.S. dollar denominated foreign securities which involve additional risks such as political and economic instability, and different and sometimes less strict financial reporting standards and regulation. The Fund may also invest in mortgage- and asset-backed securities, which include interest rate and prepayment risks more pronounced than those of other fixed income securities.
Past performance does not guarantee future results. Investment returns and principal value will fluctuate so that an investor’s shares, when redeemed, may be worth more or less than their original cost.
For information about the performance of the Fund as of the most recent month-end, please call 1-866-44BAIRD or visit www.bairdfunds.com. Mutual fund performance changes over time and current performance may be lower or higher than that stated.
Baird Short-Term Bond Fund
Summary Schedule of Investments, December 31, 2018
This schedule summarizes the Fund’s holdings by asset type. Details are reported for each of the Fund’s 50 largest individual holdings and for investments that, in total for any issuer, represent more than 1% of the Fund’s net assets. The total value of smaller holdings is reported as a single amount within each category.
The Fund reports a complete list of its holdings in regulatory filings four times in each fiscal year, at the quarter end. For the second and fourth fiscal quarters, the complete listing of the Fund’s holdings is available electronically at http://www.bairdassetmanagement.com/baird-funds/funds-and-performance#Literature and in the Fund’s Form N-CSR on the Securities and Exchange Commission’s website (www.sec.gov) or you can have it mailed to you without charge by calling 1-866-44BAIRD. For the first and third fiscal quarters, the Fund files the lists with the SEC on Form N-Q or, beginning with filings after March 31, 2019, on Part F of Form N-PORT. Shareholders can look up the Fund’s Forms N-CSR, N-Q or Part F of Form N-PORT on the SEC’s website (www.sec.gov).
Long-Term Investments
| | | Principal | | | | | | % of | |
| | | Amount | | | Value | | | Net Assets | |
| U.S. Treasury Securities | | | | | | | | | |
| U.S. Treasury Bonds: | | | | | | | | | |
| 2.000%, 08/31/2021 | | $ | 514,225,000 | | | $ | 507,837,359 | | | | 8.9 | % |
| 1.125%, 09/30/2021 | | | 747,225,000 | | | | 720,692,677 | | | | 12.6 | % |
| 1.750%, 03/31/2022 | | | 64,375,000 | | | | 62,931,591 | | | | 1.1 | % |
| 1.875%, 03/31/2022 | | | 110,000,000 | | | | 107,937,500 | | | | 1.9 | % |
| 2.125%, 12/31/2022 | | | 105,000,000 | | | | 103,519,336 | | | | 1.8 | % |
| Total U.S. Treasury Securities | | | | | | | | | | | | |
| (Cost $1,496,906,502) | | | | | | | 1,502,918,463 | | | | 26.3 | % |
| Other Government Related Securities | | | | | | | | | | | | |
| Japan Bank for International Cooperation, | | | | | | | | | | | | |
2.125%, 07/21/2020(1) | | | 20,900,000 | | | | 20,692,126 | | | | 0.4 | % |
Other Government Related Securities(1)(2)(3)(8) | | | | | | | 80,929,968 | | | | 1.4 | % |
| Total Other Government Related Securities | | | | | | | | | | | | |
| (Cost $102,376,584) | | | | | | | 101,622,094 | | | | 1.8 | % |
| Corporate Bonds | | | | | | | | | | | | |
| Industrials | | | | | | | | | | | | |
| Anglo American Capital PLC, | | | | | | | | | | | | |
4.125%, 04/15/2021(1)(2) | | | 22,700,000 | | | | 22,622,139 | | | | 0.4 | % |
| Bayer US Finance II LLC, | | | | | | | | | | | | |
3.500%, 06/25/2021(2) | | | 24,700,000 | | | | 24,525,151 | | | | 0.4 | % |
| Becton Dickinson and Co., | | | | | | | | | | | | |
| 2.894%, 06/06/2022 | | | 19,500,000 | | | | 18,886,139 | | | | 0.3 | % |
| Broadcom Corp. / Broadcom Cayman Finance Ltd., | | | | | | | | | | | | |
| 2.375%, 01/15/2020 | | | 27,000,000 | | | | 26,662,800 | | | | 0.5 | % |
| CK Hutchison International Ltd., | | | | | | | | | | | | |
2.250%, 09/29/2020(1)(2) | | | 20,000,000 | | | | 19,666,871 | | | | 0.4 | % |
| Conagra Brands, Inc., | | | | | | | | | | | | |
| 2.908%, 10/09/2020 | | | | | | | | | | | | |
(3 Month LIBOR USD + 0.500%)(3) | | | 20,000,000 | | | | 19,775,889 | | | | 0.4 | % |
| CVS Health Corp., | | | | | | | | | | | | |
| 3.350%, 03/09/2021 | | | 19,550,000 | | | | 19,494,184 | | | | 0.3 | % |
| Diamond 1 Finance Corp. / Diamond 2 Finance Corp., | | | | | | | | | | | | |
3.480%, 06/01/2019(2) | | | 19,135,000 | | | | 19,078,451 | | | | 0.3 | % |
The accompanying notes are an integral part of these financial statements.
Baird Short-Term Bond Fund
Summary Schedule of Investments, December 31, 2018
Long-Term Investments (cont.)
| | | Principal | | | | | | % of | |
| | | Amount | | | Value | | | Net Assets | |
| DXC Technology Co., | | | | | | | | | |
| 2.875%, 03/27/2020 | | $ | 18,714,000 | | | $ | 18,552,277 | | | | 0.3 | % |
| ERAC USA Finance LLC, | | | | | | | | | | | | |
2.350%, 10/15/2019(2) | | | 19,000,000 | | | | 18,871,516 | | | | 0.3 | % |
| Forest Laboratories, Inc., | | | | | | | | | | | | |
5.000%, 12/15/2021(2) | | | 20,000,000 | | | | 20,577,982 | | | | 0.4 | % |
| Fresenius Medical Care US Finance II, Inc., | | | | | | | | | | | | |
4.125%, 10/15/2020(2) | | | 19,325,000 | | | | 19,347,417 | | | | 0.3 | % |
| General Electric Co., | | | | | | | | | | | | |
| 3.150%, 09/07/2022 | | | 25,000,000 | | | | 23,626,989 | | | | 0.4 | % |
| Grupo Bimbo SAB de CV, | | | | | | | | | | | | |
4.875%, 06/30/2020(1)(2) | | | 28,075,000 | | | | 28,636,434 | | | | 0.5 | % |
| HCA, Inc., | | | | | | | | | | | | |
| 6.500%, 02/15/2020 | | | 22,263,000 | | | | 22,819,575 | | | | 0.4 | % |
| Keurig Dr Pepper, Inc., | | | | | | | | | | | | |
3.551%, 05/25/2021(2) | | | 24,700,000 | | | | 24,662,582 | | | | 0.4 | % |
| Keysight Technologies, Inc., | | | | | | | | | | | | |
| 3.300%, 10/30/2019 | | | 28,625,000 | | | | 28,538,282 | | | | 0.5 | % |
| Kinder Morgan Energy Partners LP, | | | | | | | | | | | | |
| 6.500%, 04/01/2020 | | | 22,320,000 | | | | 23,114,786 | | | | 0.4 | % |
| Microchip Technology, Inc., | | | | | | | | | | | | |
3.922%, 06/01/2021(2) | | | 28,643,000 | | | | 28,413,503 | | | | 0.5 | % |
| Molex Electronic Technologies LLC, | | | | | | | | | | | | |
2.878%, 04/15/2020(2) | | | 31,303,000 | | | | 31,000,833 | | | | 0.5 | % |
| Nissan Motor Acceptance Corp., | | | | | | | | | | | | |
2.150%, 07/13/2020(2) | | | 20,000,000 | | | | 19,520,178 | | | | 0.3 | % |
| Shire Acquisitions Investments Ireland DAC, | | | | | | | | | | | | |
2.400%, 09/23/2021(1) | | | 19,450,000 | | | | 18,807,836 | | | | 0.3 | % |
| Verisk Analytics, Inc., | | | | | | | | | | | | |
| 4.875%, 01/15/2019 | | | 19,150,000 | | | | 19,156,664 | | | | 0.3 | % |
| Verizon Communications, Inc., | | | | | | | | | | | | |
| 2.946%, 03/15/2022 | | | 30,880,000 | | | | 30,554,666 | | | | 0.5 | % |
| Volkswagen Group of America Finance LLC, | | | | | | | | | | | | |
4.000%, 11/12/2021(2) | | | 24,700,000 | | | | 24,684,660 | | | | 0.4 | % |
| Zimmer Holdings, Inc., | | | | | | | | | | | | |
| 2.700%, 04/01/2020 | | | 27,610,000 | | | | 27,346,513 | | | | 0.5 | % |
Other Industrials(1)(2)(3)(8) | | | | | | | 1,191,000,907 | | | | 20.7 | % |
| Total Industrials | | | | | | | | | | | | |
| (Cost $1,808,540,830) | | | | | | | 1,789,945,224 | | | | 30.9 | % |
| Utilities | | | | | | | | | | | | |
| Southern Co., | | | | | | | | | | | | |
| 2.750%, 06/15/2020 | | | 19,000,000 | | | | 18,789,485 | | | | 0.3 | % |
Other Utilities(1)(2)(3)(7)(8) | | | | | | | 79,108,604 | | | | 1.4 | % |
| Total Utilities | | | | | | | | | | | | |
| (Cost $99,061,097) | | | | | | | 97,898,089 | | | | 1.7 | % |
The accompanying notes are an integral part of these financial statements.
Baird Short-Term Bond Fund
Summary Schedule of Investments, December 31, 2018
Long-Term Investments (cont.)
| | | Principal | | | | | | % of | |
| | | Amount | | | Value | | | Net Assets | |
| Financials | | | | | | | | | |
| Bank of Nova Scotia, | | | | | | | | | |
3.125%, 04/20/2021(1) | | $ | 20,000,000 | | | $ | 19,968,464 | | | | 0.4 | % |
| Banque Federative du Credit Mutuel SA, | | | | | | | | | | | | |
2.000%, 04/12/2019(1)(2) | | | 18,600,000 | | | | 18,538,853 | | | | 0.3 | % |
| Jackson National Life Global Funding, | | | | | | | | | | | | |
2.200%, 01/30/2020(2) | | | 24,125,000 | | | | 23,897,963 | | | | 0.4 | % |
| JPMorgan Chase & Co., | | | | | | | | | | | | |
| 3.514%, 06/18/2022 | | | | | | | | | | | | |
(3 Month LIBOR USD + 0.610%)(3) | | | 23,000,000 | | | | 23,052,040 | | | | 0.4 | % |
| National Australia Bank Ltd., | | | | | | | | | | | | |
2.250%, 01/10/2020(1) | | | 24,600,000 | | | | 24,391,390 | | | | 0.4 | % |
| National Bank of Canada, | | | | | | | | | | | | |
2.150%, 06/12/2020(1) | | | 23,525,000 | | | | 23,183,701 | | | | 0.4 | % |
| Principal Life Global Funding II, | | | | | | | | | | | | |
2.150%, 01/10/2020(2) | | | 19,100,000 | | | | 18,900,396 | | | | 0.3 | % |
| Stifel Financial Corp., | | | | | | | | | | | | |
| 3.500%, 12/01/2020 | | | 27,373,000 | | | | 27,370,166 | | | | 0.5 | % |
| Sumitomo Mitsui Trust Bank Ltd., | | | | | | | | | | | | |
2.050%, 03/06/2019(1)(2) | | | 22,400,000 | | | | 22,361,116 | | | | 0.4 | % |
Other Financials(1)(2)(3)(8) | | | | | | | 1,145,871,772 | | | | 20.0 | % |
| Total Financials | | | | | | | | | | | | |
| (Cost $1,360,751,380) | | | | | | | 1,347,535,861 | | | | 23.5 | % |
| Total Corporate Bonds | | | | | | | | | | | | |
| (Cost $3,268,353,307) | | | | | | | 3,235,379,174 | | | | 56.1 | % |
| Municipal Bonds | | | | | | | | | | | | |
Other Municipal Bonds(1)(8) | | | | | | | 63,107,697 | | | | 1.1 | % |
| Total Municipal Bonds | | | | | | | | | | | | |
| (Cost $63,801,021) | | | | | | | 63,107,697 | | | | 1.1 | % |
| Residential Mortgage-Backed Securities | | | | | | | | | | | | |
| Non-U.S. Government Agency Issues | | | | | | | | | | | | |
Other Non-U.S. Government Agency Issues(2)(3)(4)(6)(7)(8) | | | | | | | 180,862,213 | | | | 3.2 | % |
| Total Non-U.S. Government Agency Issues | | | | | | | | | | | | |
| (Cost $182,440,697) | | | | | | | 180,862,213 | | | | 3.2 | % |
| Commercial Mortgage-Backed Securities | | | | | | | | | | | | |
| U.S. Government Agency Issues | | | | | | | | | | | | |
| Freddie Mac Multifamily Structured | | | | | | | | | | | | |
| Pass Through Certificates, | | | | | | | | | | | | |
| Series K008, Class A2, 3.531%, 06/25/2020 | | | 27,325,000 | | | | 27,466,380 | | | | 0.5 | % |
Other U.S. Government Agency Issues(4)(8) | | | | | | | 25,332,799 | | | | 0.4 | % |
| Total U.S. Government Agency Issues | | | | | | | | | | | | |
| (Cost $52,988,922) | | | | | | | 52,799,179 | | | | 0.9 | % |
The accompanying notes are an integral part of these financial statements.
Baird Short-Term Bond Fund
Summary Schedule of Investments, December 31, 2018
Long-Term Investments (cont.)
| | | Principal | | | | | | % of | |
| | | Amount | | | Value | | | Net Assets | |
| Non-U.S. Government Agency Issues | | | | | | | | | |
Other Non-U.S. Government Agency Issues(4)(8) | | | | | $ | 95,474,052 | | | | 1.7 | % |
| Total Non-U.S. Government Agency Issues | | | | | | | | | | | |
| (Cost $97,529,485) | | | | | | 95,474,052 | | | | 1.7 | % |
| Asset Backed Securities | | | | | | | | | | | |
| BA Credit Card Trust, | | | | | | | | | | | |
| Series 2018-A2, Class A2, 3.000%, 09/15/2023 | | $ | 29,775,000 | | | | 29,859,135 | | | | 0.5 | % |
| Capital One Multi-Asset Execution Trust, | | | | | | | | | | | | |
| Series 2017-A4, Class A4, 1.990%, 07/17/2023 | | | 42,500,000 | | | | 41,840,183 | | | | 0.7 | % |
| Ford Credit Auto Owner Trust, | | | | | | | | | | | | |
Series 2015-1, Class A, 2.120%, 07/15/2026(2) | | | 21,170,000 | | | | 20,953,414 | | | | 0.4 | % |
| Master Credit Card Trust II, | | | | | | | | | | | | |
Series 2017-1A, Class A, 2.260%, 07/21/2021(1)(2) | | | 35,475,000 | | | | 35,165,626 | | | | 0.6 | % |
| Synchrony Card Issuance Trust, | | | | | | | | | | | | |
| Series 2018-A1, Class A, 3.380%, 09/15/2024 | | | 33,645,000 | | | | 33,950,705 | | | | 0.6 | % |
| Verizon Owner Trust, | | | | | | | | | | | | |
Series 2018-1A, Class A1A, 2.820%, 09/20/2022(2) | | | 28,600,000 | | | | 28,517,680 | | | | 0.5 | % |
| World Financial Network Credit Card Master Trust, | | | | | | | | | | | | |
| Series 2017-C, Class A, 2.310%, 08/15/2024 | | | 19,279,000 | | | | 19,009,728 | | | | 0.3 | % |
Other Asset Backed Securities(1)(2)(8) | | | | | | | 234,248,099 | | | | 4.1 | % |
| Total Asset Backed Securities | | | | | | | | | | | | |
| (Cost $444,901,806) | | | | | | | 443,544,570 | | | | 7.7 | % |
| Total Long-Term Investments | | | | | | | | | | | | |
| (Cost $5,709,298,324) | | | | | | | 5,675,707,442 | | | | 98.8 | % |
The accompanying notes are an integral part of these financial statements.
Baird Short-Term Bond Fund
Summary Schedule of Investments, December 31, 2018
Short-Term Investment
| | | | | | | | | % of | |
| | | Shares | | | Value | | | Net Assets | |
| Money Market Mutual Fund | | | | | | | | | |
| Fidelity Institutional Money Market Fund – | | | | | | | | | |
Government Portfolio, Institutional Class, 2.29%(5) | | | 95,794,117 | | | $ | 95,794,117 | | | | 1.7 | % |
| Total Short-Term Investment | | | | | | | | | | | | |
| (Cost $95,794,117) | | | | | | | 95,794,117 | | | | 1.7 | % |
| Total Investments | | | | | | | | | | | | |
| (Cost $5,805,092,441) | | | | | | | 5,771,501,559 | | | | 100.5 | % |
| Liabilities in Excess of Other Assets | | | | | | | (30,264,800 | ) | | | (0.5 | )% |
| TOTAL NET ASSETS | | | | | | $ | 5,741,236,759 | | | | 100.0 | % |
Notes to Summary Schedule of Investments
| (1) | Foreign security, or group of securities contain a foreign security. |
| (2) | Security, or group of securities contain a security, issued under Rule 144A under the Securities Act of 1933 and determined to be liquid. Purchased in a private placement transaction; resale to the public may require registration or may extend only to qualified institutional buyers. At December 31, 2018, the value of these securities total $1,458,367,499, which represents 25.40% of total net assets. |
| (3) | Variable rate security, or group of securities contain a variable rate security, based on a reference index and spread. The rate reported is the rate in effect as of December 31, 2018. |
| (4) | Variable rate security, or group of securities contain a variable rate security. The coupon is based on an underlying pool of loans. The rate reported is the rate in effect as of December 31, 2018. |
| (5) | Seven-day yield. |
| (6) | Security, or group of securities contain a security, that, on the last payment date, missed a partial principal or interest payment. |
| (7) | Step-up bond, or group of securities contain a step-up bond; the interest rate shown is the rate in effect as of December 31, 2018. |
| (8) | Represents the aggregate value, by category, of securities that are not among the 50 largest holdings and, in total for any issuer, represent 1% or less of net assets. |
Summary of Fair Value Exposure at December 31, 2018
The Fund has adopted authoritative fair valuation accounting standards which establish a definition of fair value and set out a hierarchy for measuring fair value. These standards require additional disclosures about the various inputs and valuation techniques used to develop the measurements of fair value and a discussion on changes in valuation techniques and related inputs during the period. These standards define fair value as the price that would be received to sell an asset or paid to transfer a liability in an orderly transaction between market participants at the measurement date.
The accompanying notes are an integral part of these financial statements.
Baird Short-Term Bond Fund
Summary Schedule of Investments, December 31, 2018
Summary of Fair Value Exposure at December 31, 2018 (cont.)
The fair value hierarchy is organized into three levels based upon the assumptions (referred to as “inputs”) used in pricing the asset or liability. These standards state that “observable inputs” reflect the assumptions market participants would use in pricing the asset or liability based on market data obtained from independent sources and “unobservable inputs” reflect an entity’s own assumptions about the assumptions market participants would use in pricing the asset or liability. These inputs are summarized into three broad levels and described below:
Level 1 – | Unadjusted quoted prices in active markets for identical unrestricted securities. |
Level 2 – | Other significant observable inputs (including quoted prices for similar securities, quoted prices in inactive markets, dealer indications, interest rates, yield curves, prepayment speeds, credit risk, default rates, inputs corroborated by observable market data, etc.). |
Level 3 – | Significant unobservable inputs (including the Fund’s own assumptions about the factors that market participants would use in valuing the security) based on the best information available. |
The inputs or methodology used for valuing securities are not necessarily an indication of the risk associated with investing in those securities.
The following is a summary of the inputs used to value the Fund’s investments as of December 31, 2018:
| | | Level 1 | | | Level 2 | | | Level 3 | | | Total | |
| Long-Term Investments | | | | | | | | | | | | |
| U.S. Treasury Securities | | $ | — | | | $ | 1,502,918,463 | | | $ | — | | | $ | 1,502,918,463 | |
| Other Government Related Securities | | | — | | | | 101,622,094 | | | | — | | | | 101,622,094 | |
| Corporate Bonds | | | — | | | | 3,235,379,174 | | | | — | | | | 3,235,379,174 | |
| Municipal Bonds | | | — | | | | 63,107,697 | | | | — | | | | 63,107,697 | |
| Residential Mortgage-Backed Securities – | | | | | | | | | | | | | | | | |
| Non-U.S. Government Agency Issues | | | — | | | | 180,862,213 | | | | — | | | | 180,862,213 | |
| Commercial Mortgage-Backed Securities – | | | | | | | | | | | | | | | | |
| U.S. Government Agency Issues | | | — | | | | 52,799,179 | | | | — | | | | 52,799,179 | |
| Commercial Mortgage-Backed Securities – | | | | | | | | | | | | | | | | |
| Non-U.S. Government Agency Issues | | | — | | | | 95,474,052 | | | | — | | | | 95,474,052 | |
| Asset Backed Securities | | | — | | | | 443,544,570 | | | | — | | | | 443,544,570 | |
| Total Long-Term Investments | | | — | | | | 5,675,707,442 | | | | — | | | | 5,675,707,442 | |
| Short-Term Investment | | | | | | | | | | | | | | | | |
| Money Market Mutual Fund | | | 95,794,117 | | | | — | | | | — | | | | 95,794,117 | |
| Total Short-Term Investment | | | 95,794,117 | | | | — | | | | — | | | | 95,794,117 | |
| Total Investments | | $ | 95,794,117 | | | $ | 5,675,707,442 | | | $ | — | | | $ | 5,771,501,559 | |
Changes in valuation techniques may result in transfers into or out of assigned levels within the fair value hierarchy. There were no transfers into or out of Level 3 during the reporting period, as compared to the security classifications from the prior year’s annual report. See Fund’s Valuation Policy in Note 2a to the financial statements.
The accompanying notes are an integral part of these financial statements.
Baird Intermediate Bond Fund
December 31, 2018 (Unaudited)
The Baird Intermediate Bond Fund seeks an annual rate of total return, before Fund expenses, greater than the annual rate of total return of the Bloomberg Barclays Intermediate U.S. Government/Credit Bond Index. The Bloomberg Barclays Intermediate U.S. Government/Credit Bond Index is an unmanaged, market value weighted index of investment grade, fixed-rate debt issues, including government and credit securities, with maturities between one and ten years.
Economic growth in 2018 accelerated in the U.S., allowing the Fed to continue normalizing monetary policy, boosting overnight rates by a total of 200 bps and reducing over $450B of assets on its balance sheet. As a result, Treasury yields moved higher with short-term yields rising more than longer-term rates, leading to a flatter curve. Demand for fixed income assets was favorable through most of the year, but softened in the fourth quarter due primarily to asset allocation rebalancing trades that sold bonds and bought stocks after the 15-20% decline in the equity markets. A strong rally ensued in Treasuries near year end, but corporate credit spreads widened on late-cycle recession worries. Performance varied across the market sectors as higher quality credits and well-structured securitized issues outperformed lower-quality issues for the year.
During a challenging 2018, the Fund generated positive absolute returns though underperformed its benchmark.
The primary factors contributing to the Fund’s absolute and relative performance in 2018 include:
| | • | An overweight to Investment Grade Credit was the primary detractor and was partially mitigated by the Fund’s Credit positioning, which was shorter than the benchmark |
| | | |
| | • | The Fund benefited from positioning for a flattening in the front end of the yield curve |
| | | |
| | • | The Fund modestly benefited from exposure to Agency and Non-Agency Commercial Mortgage-Backed Securities (CMBS) |
Market expectations are certainly different than they were a year ago. Economic growth is expected to slow, both in the U.S. and abroad, and inflation measures are well contained even with low unemployment levels. As a result, the market currently expects no rate hikes from the Fed in 2019, although the Fed’s official outlook suggests as many as two 25 bps rate hikes. We expect growth to remain positive in 2019, likely reverting back toward a 2.0% pace, from 3.0% in 2018, as the benefits of fiscal stimulus fade and the impact of rate hikes already in the pipeline become more impactful along with continued elevated uncertainty around U.S./China trade and Brexit. However, the employment backdrop remains favorable and income levels continue to rise, leaving the consumer in a strong position. Corporate debt as a percentage of GDP is only modestly higher this cycle and bottom-up fundamental credit measures remain constructive at the same time that credit spreads are significantly wider than a year ago. Government borrowing is elevated and rising, with net Treasury issuance expected to increase to $840B this year, up nearly 15% from 2018 which may continue to put modest upward pressure on yields in 2019.
We remain duration neutral with a modest overweight to Investment Grade corporate credit, particularly Financials. We maintain an allocation to the MBS/ABS sectors due to favorable risk/reward characteristics and the broad sector diversification benefits they provide. As a reminder, we only purchase investment grade, U.S. dollar denominated securities in the cash bond market (no derivatives). The Fund remains duration neutral to its benchmark and we believe it is well positioned to add value relative to its benchmark.
Baird Intermediate Bond Fund
December 31, 2018 (Unaudited)
Portfolio Characteristics
Quality Distribution(1)(2)
 | | Net Assets | $3,312,206,677 | |
| | | | |
| | SEC 30-Day | | |
| | Yield(3) | | |
| | Institutional Class | 3.17% | |
| | Investor Class | 2.92% | |
| | | | |
| | Average | | |
| | Effective | | |
| | Duration | 3.87 years | |
| | | | |
| | Average | | |
| | Effective | | |
| | Maturity | 4.37 years | |
| | | | |
| | Annualized | | |
| | Expense | | |
| | | Ratio(4) | | |
Sector Weightings(1) | | Institutional Class | 0.30% | |
| | | Investor Class | 0.55% | (5) |
 | | | | |
| | Portfolio | | |
| | Turnover Rate | 32% | |
| | | | |
| | Number of | | |
| | Holdings | 487 | |
| | | | |
| | | | |
| | | | |
| | | | |
| | | | |
| | | | |
| | | | |
| | | | |
| | | | |
| | | | |
| | | | |
| | | | |
| | | | |
| | | | |
| | | | |
| | | | |
| | | | |
| | | | | |
(1) | Percentages shown are based on the Fund’s total investments. |
(2) | The quality profile is calculated on a market value-weighted basis using the highest credit quality rating for each security held by the Fund given by S&P, Moody’s or Fitch, each of which is a Nationally Recognized Statistical Rating Organization (NRSRO). NRSROs rate the credit quality of securities using a scale that generally ranges from AAA (highest) to D (lowest). |
(3) | SEC yields are based on SEC guidelines and are calculated for the 30 days ended December 31, 2018. |
(4) | Reflects expense ratios as stated in the Fund’s current prospectus. |
(5) | Includes 0.25% 12b-1 fee. |
Baird Intermediate Bond Fund
December 31, 2018 (Unaudited)
Institutional ClassValue of a $25,000 Investment
Growth of a hypothetical investment of $25,000 made on 12/31/08, assuming reinvestment of all distributions.
Investor Class
Value of a $10,000 Investment
Growth of a hypothetical investment of $10,000 made on 12/31/08, assuming reinvestment of all distributions.
Baird Intermediate Bond Fund
December 31, 2018 (Unaudited)
Total Returns
| | | Average Annual |
| | One | Five | Ten | Since |
| For the Periods Ended December 31, 2018 | Year | Years | Years | Inception(1) |
| Institutional Class Shares | 0.58% | 2.12% | 4.18% | 4.63% |
| Investor Class Shares | 0.30% | 1.89% | 3.93% | 4.37% |
| Bloomberg Barclays Intermediate | | | | |
U.S. Government/Credit Bond Index(2) | 0.88% | 1.86% | 2.90% | 4.20% |
| (1) | For the period from September 29, 2000 (inception date) through December 31, 2018. |
| (2) | The Bloomberg Barclays Intermediate U.S. Government/Credit Bond Index is an unmanaged, market value weighted index of investment grade, fixed-rate debt issues, including government and corporate securities, with maturities between one and ten years. This Index does not reflect any deduction for fees, expenses or taxes. A direct investment in an index is not possible. |
The line graph on the previous page and the returns shown in the table above reflect reinvestment of dividends and/or capital gains distributions in additional shares. The returns do not reflect the deduction of taxes that a shareholder would pay on Fund distributions or the redemption of Fund shares. The returns reflect the actual performance for each period and do not include the impact of trades executed on the last business day of the period that were recorded on the first business day of the next period.
The Fund’s gross expense ratio for each Class, as reflected in the Fund’s current prospectus, is set forth under “Portfolio Characteristics”.
The Fund may invest in U.S. dollar denominated foreign securities which involve additional risks such as political and economic instability, and different and sometimes less strict financial reporting standards and regulation. The Fund may also invest in mortgage- and asset-backed securities, which include interest rate and prepayment risks more pronounced than those of other fixed income securities.
Past performance does not guarantee future results. Investment return and principal value will fluctuate so that an investor’s shares, when redeemed, may be worth more or less than their original cost.
For information about the performance of the Fund as of the most recent month-end, please call 1-866-44BAIRD or visit www.bairdfunds.com. Mutual fund performance changes over time and current performance may be lower or higher than that stated.
Baird Intermediate Bond Fund
Summary Schedule of Investments, December 31, 2018
This schedule summarizes the Fund’s holdings by asset type. Details are reported for each of the Fund’s 50 largest individual holdings and for investments that, in total for any issuer, represent more than 1% of the Fund’s net assets. The total value of smaller holdings is reported as a single amount within each category.
The Fund reports a complete list of its holdings in regulatory filings four times in each fiscal year, at the quarter end. For the second and fourth fiscal quarters, the complete listing of the Fund’s holdings is available electronically at http://www.bairdassetmanagement.com/baird-funds/funds-and-performance#Literature and in the Fund’s Form N-CSR on the Securities and Exchange Commission’s website (www.sec.gov) or you can have it mailed to you without charge by calling 1-866-44BAIRD. For the first and third fiscal quarters, the Fund files the lists with the SEC on Form N-Q or, beginning with filings after March 31, 2019, on Part F of Form N-PORT. Shareholders can look up the Fund’s Forms N-CSR, N-Q or Part F of Form N-PORT on the SEC’s website (www.sec.gov).
Long-Term Investments
| | | Principal | | | | | | % of | |
| | | Amount | | | Value | | | Net Assets | |
| U.S. Treasury Securities | | | | | | | | | |
| U.S. Treasury Bonds: | | | | | | | | | |
| 1.375%, 08/31/2020 | | $ | 157,725,000 | | | $ | 154,749,173 | | | | 4.7 | % |
| 1.750%, 03/31/2022 | | | 239,300,000 | | | | 233,934,444 | | | | 7.1 | % |
| 1.875%, 03/31/2022 | | | 295,550,000 | | | | 290,008,438 | | | | 8.7 | % |
| 2.500%, 05/15/2024 | | | 282,800,000 | | | | 282,280,796 | | | | 8.5 | % |
| 2.250%, 11/15/2025 | | | 152,875,000 | | | | 149,501,001 | | | | 4.5 | % |
| 2.000%, 11/15/2026 | | | 109,975,000 | | | | 104,978,870 | | | | 3.2 | % |
| 2.250%, 11/15/2027 | | | 133,225,000 | | | | 128,692,227 | | | | 3.9 | % |
| Total U.S. Treasury Securities | | | | | | | | | | | | |
| (Cost $1,345,737,549) | | | | | | | 1,344,144,949 | | | | 40.6 | % |
| Other Government Related Securities | | | | | | | | | | | | |
Other Government Related Securities(1)(2)(8) | | | | | | | 37,657,262 | | | | 1.1 | % |
| Total Other Government Related Securities | | | | | | | | | | | | |
| (Cost $37,776,055) | | | | | | | 37,657,262 | | | | 1.1 | % |
| Corporate Bonds | | | | | | | | | | | | |
| Industrials | | | | | | | | | | | | |
| CH Robinson Worldwide, Inc., | | | | | | | | | | | | |
| 4.200%, 04/15/2028 | | | 12,300,000 | | | | 12,334,519 | | | | 0.4 | % |
| Diamond 1 Finance Corp. / Diamond 2 Finance Corp., | | | | | | | | | | | | |
3.480%, 06/01/2019(2) | | | 10,900,000 | | | | 10,867,788 | | | | 0.3 | % |
| DXC Technology Co., | | | | | | | | | | | | |
| 4.450%, 09/18/2022 | | | 14,000,000 | | | | 14,285,683 | | | | 0.4 | % |
| Energy Transfer Partners LP, | | | | | | | | | | | | |
| 4.750%, 01/15/2026 | | | 10,206,000 | | | | 9,916,765 | | | | 0.3 | % |
| MPLX LP, | | | | | | | | | | | | |
| 4.875%, 06/01/2025 | | | 10,192,000 | | | | 10,285,385 | | | | 0.3 | % |
| Nvent Finance Sarl, | | | | | | | | | | | | |
3.950%, 04/15/2023(1) | | | 15,800,000 | | | | 15,686,976 | | | | 0.5 | % |
| Penske Truck Leasing Co. LP / PTL Finance Corp., | | | | | | | | | | | | |
3.950%, 03/10/2025(2) | | | 12,000,000 | | | | 11,755,479 | | | | 0.4 | % |
| Sabine Pass Liquefaction LLC, | | | | | | | | | | | | |
| 5.875%, 06/30/2026 | | | 9,730,000 | | | | 10,302,164 | | | | 0.3 | % |
The accompanying notes are an integral part of these financial statements.
Baird Intermediate Bond Fund
Summary Schedule of Investments, December 31, 2018
Long-Term Investments (cont.)
| | | Principal | | | | | | % of | |
| | | Amount | | | Value | | | Net Assets | |
| Zimmer Biomet Holdings, Inc., | | | | | | | | | |
| 3.700%, 03/19/2023 | | $ | 10,000,000 | | | $ | 9,893,268 | | | | 0.3 | % |
Other Industrials(1)(2)(3)(8)(9) | | | | | | | 535,971,104 | | | | 16.2 | % |
| Total Industrials | | | | | | | | | | | | |
| (Cost $653,885,699) | | | | | | | 641,299,131 | | | | 19.4 | % |
| Utilities | | | | | | | | | | | | |
| Edison International, | | | | | | | | | | | | |
| 4.125%, 03/15/2028 | | | 13,600,000 | | | | 12,871,869 | | | | 0.4 | % |
| EDP Finance BV, | | | | | | | | | | | | |
4.125%, 01/15/2020(1)(2) | | | 15,000,000 | | | | 15,015,600 | | | | 0.5 | % |
| Enel Finance International NV, | | | | | | | | | | | | |
3.500%, 04/06/2028(1)(2) | | | 13,550,000 | | | | 11,616,149 | | | | 0.3 | % |
Other Utilities(1)(2)(3)(8) | | | | | | | 34,967,069 | | | | 1.0 | % |
| Total Utilities | | | | | | | | | | | | |
| (Cost $77,316,478) | | | | | | | 74,470,687 | | | | 2.2 | % |
| Financials | | | | | | | | | | | | |
| Anthem, Inc., | | | | | | | | | | | | |
| 3.350%, 12/01/2024 | | | 10,000,000 | | | | 9,741,953 | | | | 0.3 | % |
| Bank of America Corp., | | | | | | | | | | | | |
| 2.369%, 07/21/2021 | | | | | | | | | | | | |
(3 Month LIBOR USD + 0.660%)(3) | | | 11,000,000 | | | | 10,803,150 | | | | 0.3 | % |
| BNP Paribas SA, | | | | | | | | | | | | |
3.500%, 03/01/2023(1)(2) | | | 10,000,000 | | | | 9,695,124 | | | | 0.3 | % |
| BNZ International Funding Ltd., | | | | | | | | | | | | |
2.100%, 09/14/2021(1)(2) | | | 10,000,000 | | | | 9,649,212 | | | | 0.3 | % |
| Boston Properties LP, | | | | | | | | | | | | |
| 3.200%, 01/15/2025 | | | 12,175,000 | | | | 11,625,591 | | | | 0.3 | % |
| BPCE SA, | | | | | | | | | | | | |
4.625%, 07/11/2024(1)(2) | | | 10,000,000 | | | | 9,833,252 | | | | 0.3 | % |
| Capital One NA, | | | | | | | | | | | | |
| 2.650%, 08/08/2022 | | | 12,150,000 | | | | 11,667,698 | | | | 0.4 | % |
| First Horizon National Corp., | | | | | | | | | | | | |
| 3.500%, 12/15/2020 | | | 13,196,000 | | | | 13,195,198 | | | | 0.4 | % |
| HSBC Holdings PLC, | | | | | | | | | | | | |
| 3.262%, 03/13/2023 | | | | | | | | | | | | |
(3 Month LIBOR USD + 1.055%)(1)(3) | | | 10,140,000 | | | | 9,923,587 | | | | 0.3 | % |
| Jackson National Life Global Funding, | | | | | | | | | | | | |
3.250%, 01/30/2024(2) | | | 10,000,000 | | | | 9,805,200 | | | | 0.3 | % |
| John Hancock Life Insurance Co., | | | | | | | | | | | | |
7.375%, 02/15/2024(2) | | | 11,325,000 | | | | 13,106,562 | | | | 0.4 | % |
| Massachusetts Mutual Life Insurance Co., | | | | | | | | | | | | |
7.625%, 11/15/2023(2) | | | 9,906,000 | | | | 11,250,469 | | | | 0.3 | % |
| Nordea Bank AB, | | | | | | | | | | | | |
4.250%, 09/21/2022(1)(2) | | | 10,000,000 | | | | 10,051,166 | | | | 0.3 | % |
The accompanying notes are an integral part of these financial statements.
Baird Intermediate Bond Fund
Summary Schedule of Investments, December 31, 2018
Long-Term Investments (cont.)
| | | Principal | | | | | | % of | |
| | | Amount | | | Value | | | Net Assets | |
| Prudential Insurance Co. of America, | | | | | | | | | |
8.300%, 07/01/2025(2) | | $ | 8,300,000 | | | $ | 10,244,379 | | | | 0.3 | % |
| Standard Chartered PLC, | | | | | | | | | | | | |
3.050%, 01/15/2021(1)(2) | | | 10,000,000 | | | | 9,850,920 | | | | 0.3 | % |
| Sumitomo Mitsui Trust Bank Ltd., | | | | | | | | | | | | |
2.050%, 03/06/2019(1)(2) | | | 12,000,000 | | | | 11,979,169 | | | | 0.4 | % |
Other Financials(1)(2)(3)(8)(9) | | | | | | | 599,121,375 | | | | 18.1 | % |
| Total Financials | | | | | | | | | | | | |
| (Cost $786,735,312) | | | | | | | 771,544,005 | | | | 23.3 | % |
| Total Corporate Bonds | | | | | | | | | | | | |
| (Cost $1,517,937,489) | | | | | | | 1,487,313,823 | | | | 44.9 | % |
| Municipal Bonds | | | | | | | | | | | | |
Other Municipal Bonds(8) | | | | | | | 48,470,960 | | | | 1.5 | % |
| Total Municipal Bonds | | | | | | | | | | | | |
| (Cost $48,304,922) | | | | | | | 48,470,960 | | | | 1.5 | % |
| Residential Mortgage-Backed Securities | | | | | | | | | | | | |
| U.S. Government Agency Issues | | | | | | | | | | | | |
Other U.S. Government Agency Issues(8) | | | | | | | 53,850 | | | | 0.0 | % |
| Total U.S. Government Agency Issues | | | | | | | | | | | | |
| (Cost $52,231) | | | | | | | 53,850 | | | | 0.0 | % |
| Non-U.S. Government Agency Issues | | | | | | | | | | | | |
| Towd Point Mortgage Trust, | | | | | | | | | | | | |
Series 2017-1, Class A1, 2.750%, 10/25/2056(2)(4) | | | 10,021,647 | | | | 9,803,217 | | | | 0.3 | % |
Other Non-U.S. Government Agency Issues(2)(3)(4)(6)(7)(8) | | | | | | | 58,485,936 | | | | 1.8 | % |
| Total Non-U.S. Government Agency Issues | | | | | | | | | | | | |
| (Cost $67,891,906) | | | | | | | 68,289,153 | | | | 2.1 | % |
| Commercial Mortgage-Backed Securities | | | | | | | | | | | | |
| U.S. Government Agency Issues | | | | | | | | | | | | |
| Freddie Mac Multifamily Structured Pass Through Certificates: | | | | | | | | | | | | |
| Series K720, Class A2, 2.716%, 06/25/2022 | | | 15,850,000 | | | | 15,748,904 | | | | 0.5 | % |
| Series K028, Class A2, 3.111%, 02/25/2023 | | | 13,850,000 | | | | 13,945,175 | | | | 0.4 | % |
Series K050, Class A2, 3.334%, 08/25/2025(4) | | | 12,150,000 | | | | 12,310,528 | | | | 0.4 | % |
| 2.946%-3.350%, 07/25/2024-01/25/2028 | | | 25,245,000 | | | | 25,248,466 | | | | 0.8 | % |
| Total U.S. Government Agency Issues | | | | | | | | | | | | |
| (Cost $68,181,489) | | | | | | | 67,253,073 | | | | 2.1 | % |
| Non-U.S. Government Agency Issues | | | | | | | | | | | | |
| Citigroup Commercial Mortgage Trust: | | | | | | | | | | | | |
| Series 2013-GC11, Class A4, 3.093%, 04/10/2046 | | | 11,100,000 | | | | 11,020,058 | | | | 0.3 | % |
| Series 2015-GC27, Class A5, 3.137%, 02/10/2048 | | | 11,675,000 | | | | 11,475,341 | | | | 0.3 | % |
| COMM Mortgage Trust, | | | | | | | | | | | | |
| Series 2013-CR11, Class A4, 4.258%, 08/10/2050 | | | 10,000,000 | | | | 10,413,191 | | | | 0.3 | % |
The accompanying notes are an integral part of these financial statements.
Baird Intermediate Bond Fund
Summary Schedule of Investments, December 31, 2018
Long-Term Investments (cont.)
| | | Principal | | | | | | % of | |
| | | Amount | | | Value | | | Net Assets | |
| Morgan Stanley Bank of America Merrill Lynch Trust, | | | | | | | | | |
| Series 2014-C16, Class A4, 3.600%, 06/15/2047 | | $ | 12,975,000 | | | $ | 13,090,533 | | | | 0.4 | % |
| Wells Fargo Commercial Mortgage Trust: | | | | | | | | | | | | |
| Series 2014-LC18, Class ASB, 3.244%, 12/15/2047 | | | 16,400,000 | | | | 16,462,488 | | | | 0.5 | % |
| Series 2015-P2, Class ASB, 3.656%, 12/15/2048 | | | 11,175,000 | | | | 11,316,263 | | | | 0.3 | % |
| WFRBS Commercial Mortgage Trust, | | | | | | | | | | | | |
| Series 2014-C24, Class ASB, 3.324%, 11/15/2047 | | | 9,852,000 | | | | 9,937,100 | | | | 0.3 | % |
Other Non-U.S. Government Agency Issues(8) | | | | | | | 43,520,171 | | | | 1.3 | % |
| Total Non-U.S. Government Agency Issues | | | | | | | | | | | | |
| (Cost $129,519,035) | | | | | | | 127,235,145 | | | | 3.7 | % |
| Asset Backed Securities | | | | | | | | | | | | |
| Capital One Multi-Asset Execution Trust, | | | | | | | | | | | | |
| Series 2017-A4, Class A4, 1.990%, 07/17/2023 | | | 20,275,000 | | | | 19,960,228 | | | | 0.6 | % |
| Dell Equipment Finance Trust, | | | | | | | | | | | | |
Series 2018-1, Class A3, 3.180%, 06/22/2023(2) | | | 15,935,000 | | | | 15,940,141 | | | | 0.5 | % |
| PFS Financing Corp., | | | | | | | | | | | | |
Series 2017-D, Class A, 2.400%, 10/17/2022(2) | | | 14,555,000 | | | | 14,356,853 | | | | 0.4 | % |
| Verizon Owner Trust, | | | | | | | | | | | | |
Series 2017-3A, Class A1A, 2.060%, 04/20/2022(2) | | | 12,250,000 | | | | 12,102,699 | | | | 0.4 | % |
Other Asset Backed Securities(2)(8) | | | | | | | 26,338,191 | | | | 0.8 | % |
| Total Asset Backed Securities | | | | | | | | | | | | |
| (Cost $89,020,856) | | | | | | | 88,698,112 | | | | 2.7 | % |
| Total Long-Term Investments | | | | | | | | | | | | |
| (Cost $3,304,421,532) | | | | | | | 3,269,116,327 | | | | 98.7 | % |
The accompanying notes are an integral part of these financial statements.
Baird Intermediate Bond Fund
Summary Schedule of Investments, December 31, 2018
Short-Term Investment
| | | | | | | | | % of | |
| | | Shares | | | Value | | | Net Assets | |
| Money Market Mutual Fund | | | | | | | | | |
| Fidelity Institutional Money Market Fund – | | | | | | | | | |
Government Portfolio, Institutional Class, 2.29%(5) | | | 48,868,118 | | | $ | 48,868,118 | | | | 1.5 | % |
| Total Short-Term Investment | | | | | | | | | | | | |
| (Cost $48,868,118) | | | | | | | 48,868,118 | | | | 1.5 | % |
| Total Investments | | | | | | | | | | | | |
| (Cost $3,353,289,650) | | | | | | | 3,317,984,445 | | | | 100.2 | % |
| Liabilities in Excess of Other Assets | | | | | | | (5,777,768 | ) | | | (0.2 | )% |
| TOTAL NET ASSETS | | | | | | $ | 3,312,206,677 | | | | 100.0 | % |
Notes to Summary Schedule of Investments
| (1) | Foreign security, or group of securities contain a foreign security. |
| (2) | Security, or group of securities contain a security, issued under Rule 144A under the Securities Act of 1933 and determined to be liquid. Purchased in a private placement transaction; resale to the public may require registration or may extend only to qualified institutional buyers. At December 31, 2018, the value of these securities total $672,604,116, which represents 20.31% of total net assets. |
| (3) | Variable rate security, or group of securities contain a variable rate security, based on a reference index and spread. The rate reported is the rate in effect as of December 31, 2018. |
| (4) | Variable rate security, or group of securities contain a variable rate security. The coupon is based on an underlying pool of loans. The rate reported is the rate in effect as of December 31, 2018. |
| (5) | Seven-day yield. |
| (6) | Security, or group of securities contain a security, that, on the last payment date, missed a partial principal or interest payment. |
| (7) | Step-up bond, or group of securities contain a step-up bond; the interest rate shown is the rate in effect as of December 31, 2018. |
| (8) | Represents the aggregate value, by category, of securities that are not among the 50 largest holdings and, in total for any issuer, represent 1% or less of net assets. |
| (9) | Security in default, or group of securities contain a security in default. |
Summary of Fair Value Exposure at December 31, 2018
The Fund has adopted authoritative fair valuation accounting standards which establish a definition of fair value and set out a hierarchy for measuring fair value. These standards require additional disclosures about the various inputs and valuation techniques used to develop the measurements of fair value and a discussion on changes in valuation techniques and related inputs during the period. These standards define fair value as the price that would be received to sell an asset or paid to transfer a liability in an orderly transaction between market participants at the measurement date.
The accompanying notes are an integral part of these financial statements.
Baird Intermediate Bond Fund
Summary Schedule of Investments, December 31, 2018
Summary of Fair Value Exposure at December 31, 2018 (cont.)
The fair value hierarchy is organized into three levels based upon the assumptions (referred to as “inputs”) used in pricing the asset or liability. These standards state that “observable inputs” reflect the assumptions market participants would use in pricing the asset or liability based on market data obtained from independent sources and “unobservable inputs” reflect an entity’s own assumptions about the assumptions market participants would use in pricing the asset or liability. These inputs are summarized into three broad levels and described below:
Level 1 – | Unadjusted quoted prices in active markets for identical unrestricted securities. |
Level 2 – | Other significant observable inputs (including quoted prices for similar securities, quoted prices in inactive markets, dealer indications, interest rates, yield curves, prepayment speeds, credit risk, default rates, inputs corroborated by observable market data, etc.). |
Level 3 – | Significant unobservable inputs (including the Fund’s own assumptions about the factors that market participants would use in valuing the security) based on the best information available. |
The inputs or methodology used for valuing securities are not necessarily an indication of the risk associated with investing in those securities.
The following is a summary of the inputs used to value the Fund’s investments as of December 31, 2018:
| | | Level 1 | | | Level 2 | | | Level 3 | | | Total | |
| Long-Term Investments | | | | | | | | | | | | |
| U.S. Treasury Securities | | $ | — | | | $ | 1,344,144,949 | | | $ | — | | | $ | 1,344,144,949 | |
| Other Government Related Securities | | | — | | | | 37,657,262 | | | | — | | | | 37,657,262 | |
| Corporate Bonds | | | — | | | | 1,487,313,823 | | | | — | | | | 1,487,313,823 | |
| Municipal Bonds | | | — | | | | 48,470,960 | | | | — | | | | 48,470,960 | |
| Residential Mortgage-Backed Securities – | | | | | | | | | | | | | | | | |
| U.S. Government Agency Issues | | | — | | | | 53,850 | | | | — | | | | 53,850 | |
| Residential Mortgage-Backed Securities – | | | | | | | | | | | | | | | | |
| Non-U.S. Government Agency Issues | | | — | | | | 68,289,153 | | | | — | | | | 68,289,153 | |
| Commercial Mortgage-Backed Securities – | | | | | | | | | | | | | | | | |
| U.S. Government Agency Issues | | | — | | | | 67,253,073 | | | | — | | | | 67,253,073 | |
| Commercial Mortgage-Backed Securities – | | | | | | | | | | | | | | | | |
| Non-U.S. Government Agency Issues | | | — | | | | 127,235,145 | | | | — | | | | 127,235,145 | |
| Asset Backed Securities | | | — | | | | 88,698,112 | | | | — | | | | 88,698,112 | |
| Total Long-Term Investments | | | — | | | | 3,269,116,327 | | | | — | | | | 3,269,116,327 | |
| Short-Term Investment | | | | | | | | | | | | | | | | |
| Money Market Mutual Fund | | | 48,868,118 | | | | — | | | | — | | | | 48,868,118 | |
| Total Short-Term Investment | | | 48,868,118 | | | | — | | | | — | | | | 48,868,118 | |
| Total Investments | | $ | 48,868,118 | | | $ | 3,269,116,327 | | | $ | — | | | $ | 3,317,984,445 | |
Changes in valuation techniques may result in transfers into or out of assigned levels within the fair value hierarchy. There were no transfers into or out of Level 3 during the reporting period, as compared to the security classifications from the prior year’s annual report. See Fund’s Valuation Policy in Note 2a to the financial statements.
The accompanying notes are an integral part of these financial statements.
Baird Aggregate Bond Fund
December 31, 2018 (Unaudited)
The Baird Aggregate Bond Fund seeks an annual rate of total return, before Fund expenses, greater than the annual rate of total return of the Bloomberg Barclays U.S. Aggregate Bond Index. The Bloomberg Barclays U.S. Aggregate Bond Index is an unmanaged, market value weighted index of investment grade, fixed-rate debt issues, including government, credit, asset-backed (ABS), mortgage-backed (MBS) and commercial mortgage-backed (CMBS) securities with maturities of at least one year.
Economic growth in 2018 accelerated in the U.S., allowing the Fed to continue normalizing monetary policy, boosting overnight rates by a total of 200 bps and reducing over $450B of assets on its balance sheet. As a result, Treasury yields moved higher with short-term yields rising more than longer-term rates, leading to a flatter curve. Demand for fixed income assets was favorable through most of the year, but softened in the fourth quarter due primarily to asset allocation rebalancing trades that sold bonds and bought stocks after the 15-20% decline in the equity markets. A strong rally ensued in Treasuries near year end, but corporate credit spreads widened on late-cycle recession worries. Performance varied across the market sectors as higher quality credits and well-structured securitized issues outperformed lower-quality issues for the year.
During a challenging 2018, the Fund modestly underperformed its benchmark.
The primary factors contributing to the Fund’s performance in 2018 include:
| | • | An overweight to Investment Grade Credit was the primary detractor and was partially mitigated by the Fund’s Credit positioning, which was shorter than the benchmark. |
| | | |
| | • | The Fund benefited from its underweight to Agency Residential Mortgage-Backed Securities (RMBS). |
| | | |
| | • | The Fund benefited from its positioning for a flattening in the front end of the yield curve as well as an overall positive convexity tilt versus the benchmark. |
Market expectations are certainly different than they were a year ago. Economic growth is expected to slow, both in the U.S. and abroad, and inflation measures are well contained even with low unemployment levels. As a result, the market currently expects no rate hikes from the Fed in 2019, although the Fed’s official outlook suggests as many as two 25 bps rate hikes. We expect growth to remain positive in 2019, likely reverting back toward a 2.0% pace, from 3.0% in 2018, as the benefits of fiscal stimulus fade and the impact of rate hikes already in the pipeline become more impactful along with continued elevated uncertainty around U.S./China trade and Brexit. However, the employment backdrop remains favorable and income levels continue to rise, leaving the consumer in a strong position. Corporate debt as a percentage of GDP is only modestly higher this cycle and bottom-up fundamental credit measures remain constructive at the same time that credit spreads are significantly wider than a year ago. Government borrowing is elevated and rising, with net Treasury issuance expected to increase to $840B this year, up nearly 15% from 2018 which may continue to put modest upward pressure on yields in 2019.
We remain duration neutral with a modest overweight to Investment Grade corporate credit, particularly Financials. We will continue to underweight Agency RMBS and prefer the risk/reward characteristics of Non-Agency RMBS, Agency CMBS, Non-Agency senior CMBS structures and select short-duration ABS. As a reminder, we only purchase investment grade, U.S. dollar denominated securities in the cash bond market (no derivatives). The Fund remains duration neutral to its benchmark and we believe it is well positioned to add value relative to its benchmark.
Baird Aggregate Bond Fund
December 31, 2018 (Unaudited)
Portfolio Characteristics
Quality Distribution(1)(2)
 | | Net Assets | $15,615,682,357 | |
| | | | |
| | SEC 30-Day | | |
| | Yield(3) | | |
| | Institutional Class | 3.36% | |
| | Investor Class | 3.10% | |
| | | | |
| | Average | | |
| | Effective | | |
| | Duration | 5.87 years | |
| | | | |
| | Average | | |
| | Effective | | |
| | Maturity | 8.09 years | |
| | | | |
| | Annualized | | |
| | | Expense | | |
Sector Weightings(1) | | Ratio(4) | | |
| | | Institutional Class | 0.30% | |
 | | Investor Class | 0.55% | (5) |
| | | | |
| | Portfolio | | |
| | Turnover Rate | 24% | |
| | | | |
| | Number of | | |
| | Holdings | 1,101 | |
| | | | |
| | | | |
| | | | |
| | | | |
| | | | |
| | | | |
| | | | |
| | | | |
| | | | |
| | | | |
| | | | |
| | | | |
| | | | |
| | | | |
| | | | |
| | | | | |
(1) | Percentages shown are based on the Fund’s total investments. |
(2) | The quality profile is calculated on a market value-weighted basis using the highest credit quality rating for each security held by the Fund given by S&P, Moody’s or Fitch, each of which is a Nationally Recognized Statistical Rating Organization (NRSRO). NRSROs rate the credit quality of securities using a scale that generally ranges from AAA (highest) to D (lowest). |
(3) | SEC yields are based on SEC guidelines and are calculated for the 30 days ended December 31, 2018. |
(4) | Reflects expense ratios as stated in the Fund’s current prospectus. |
(5) | Includes 0.25% 12b-1 fee. |
Baird Aggregate Bond Fund
December 31, 2018 (Unaudited)
Institutional Class
Value of a $25,000 Investment
Growth of a hypothetical investment of $25,000 made on 12/31/08, assuming reinvestment of all distributions.
Investor Class
Value of a $10,000 Investment
Growth of a hypothetical investment of $10,000 made on 12/31/08, assuming reinvestment of all distributions.
Baird Aggregate Bond Fund
December 31, 2018 (Unaudited)
Total Returns
| | | Average Annual |
| | One | Five | Ten | Since |
| For the Periods Ended December 31, 2018 | Year | Years | Years | Inception(1) |
| Institutional Class Shares | -0.30% | 2.94% | 4.78% | 5.12% |
| Investor Class Shares | -0.54% | 2.69% | 4.52% | 4.87% |
| Bloomberg Barclays U.S. | | | | |
Aggregate Bond Index(2) | 0.01% | 2.52% | 3.48% | 4.65% |
| (1) | For the period from September 29, 2000 (inception date) through December 31, 2018. |
| (2) | The Bloomberg Barclays U.S. Aggregate Bond Index is an unmanaged, market value weighted index of investment grade, fixed-rate debt issues, including government, corporate, asset-backed and mortgage-backed securities, with maturities of at least one year. This Index does not reflect any deduction for fees, expenses or taxes. A direct investment in an index is not possible. |
The line graph on the previous page and the returns shown in the table above reflect reinvestment of dividends and/or capital gains distributions in additional shares. The returns do not reflect the deduction of taxes that a shareholder would pay on Fund distributions or the redemption of Fund shares. The returns reflect the actual performance for each period and do not include the impact of trades executed on the last business day of the period that were recorded on the first business day of the next period.
The Fund’s gross expense ratio for each Class, as reflected in the Fund’s current prospectus, is set forth under “Portfolio Characteristics”.
The Fund maintains securities with longer maturities in order to provide a greater potential for return. Generally, the longer a bond’s maturity, the greater the interest rate risk. The Fund may also invest in U.S. dollar denominated foreign securities which involve additional risks such as political and economic instability, and different and sometimes less strict financial reporting standards and regulation. The Fund may also invest in mortgage- and asset-backed securities, which include interest rate and prepayment risks more pronounced than those of other fixed income securities.
Past performance does not guarantee future results. Investment return and principal value will fluctuate so that an investor’s shares, when redeemed, may be worth more or less than their original cost.
For information about the performance of the Fund as of the most recent month-end, please call 1-866-44BAIRD or visit www.bairdfunds.com. Mutual fund performance changes over time and current performance may be lower or higher than that stated.
Baird Aggregate Bond Fund
Summary Schedule of Investments, December 31, 2018
This schedule summarizes the Fund’s holdings by asset type. Details are reported for each of the Fund’s 50 largest individual holdings and for investments that, in total for any issuer, represent more than 1% of the Fund’s net assets. The total value of smaller holdings is reported as a single amount within each category.
The Fund reports a complete list of its holdings in regulatory filings four times in each fiscal year, at the quarter end. For the second and fourth fiscal quarters, the complete listing of the Fund’s holdings is available electronically at http://www.bairdassetmanagement.com/baird-funds/funds-and-performance#Literature and in the Fund’s Form N-CSR on the Securities and Exchange Commission’s website (www.sec.gov) or you can have it mailed to you without charge by calling 1-866-44BAIRD. For the first and third fiscal quarters, the Fund files the lists with the SEC on Form N-Q or, beginning with filings after March 31, 2019, on Part F of Form N-PORT. Shareholders can look up the Fund’s Forms N-CSR, N-Q or Part F of Form N-PORT on the SEC’s website (www.sec.gov).
Long-Term Investments
| | | Principal | | | | | | % of | |
| | | Amount | | | Value | | | Net Assets | |
| U.S. Treasury Securities | | | | | | | | | |
| U.S. Treasury Bonds: | | | | | | | | | |
| 1.750%, 03/31/2022 | | $ | 310,830,000 | | | $ | 303,860,607 | | | | 1.9 | % |
| 1.875%, 03/31/2022 | | | 376,950,000 | | | | 369,882,188 | | | | 2.4 | % |
| 2.500%, 05/15/2024 | | | 542,225,000 | | | | 541,229,507 | | | | 3.5 | % |
| 2.250%, 11/15/2025 | | | 405,625,000 | | | | 396,672,731 | | | | 2.5 | % |
| 2.000%, 11/15/2026 | | | 319,050,000 | | | | 304,555,657 | | | | 2.0 | % |
| 2.250%, 11/15/2027 | | | 159,725,000 | | | | 154,290,606 | | | | 1.0 | % |
| 3.500%, 02/15/2039 | | | 487,880,900 | | | | 533,638,791 | | | | 3.4 | % |
| 2.875%, 05/15/2043 | | | 663,750,000 | | | | 647,960,011 | | | | 4.1 | % |
| 2.500%, 02/15/2045 | | | 125,800,000 | | | | 114,006,250 | | | | 0.7 | % |
| Total U.S. Treasury Securities | | | | | | | | | | | | |
| (Cost $3,371,881,416) | | | | | | | 3,366,096,348 | | | | 21.5 | % |
| Other Government Related Securities | | | | | | | | | | | | |
Other Government Related Securities(1)(2)(9) | | | | | | | 153,939,967 | | | | 1.0 | % |
| Total Other Government Related Securities | | | | | | | | | | | | |
| (Cost $157,988,359) | | | | | | | 153,939,967 | | | | 1.0 | % |
| Corporate Bonds | | | | | | | | | | | | |
| Industrials | | | | | | | | | | | | |
| Diamond 1 Finance Corp. / Diamond 2 Finance Corp., | | | | | | | | | | | | |
4.420%, 06/15/2021(2) | | | 50,575,000 | | | | 50,491,566 | | | | 0.3 | % |
| Sabine Pass Liquefaction LLC, | | | | | | | | | | | | |
| 5.875%, 06/30/2026 | | | 38,000,000 | | | | 40,234,558 | | | | 0.2 | % |
| Solvay Finance America LLC, | | | | | | | | | | | | |
4.450%, 12/03/2025(2) | | | 43,329,000 | | | | 42,965,844 | | | | 0.3 | % |
Other Industrials(1)(2)(3)(7)(8)(9) | | | | | | | 2,978,557,967 | | | | 19.1 | % |
| Total Industrials | | | | | | | | | | | | |
| (Cost $3,217,382,382) | | | | | | | 3,112,249,935 | | | | 19.9 | % |
| Utilities | | | | | | | | | | | | |
Other Utilities(1)(2)(9) | | | | | | | 180,273,593 | | | | 1.1 | % |
| Total Utilities | | | | | | | | | | | | |
| (Cost $196,847,168) | | | | | | | 180,273,593 | | | | 1.1 | % |
The accompanying notes are an integral part of these financial statements.
Baird Aggregate Bond Fund
Summary Schedule of Investments, December 31, 2018
Long-Term Investments (cont.)
| | | Principal | | | | | | % of | |
| | | Amount | | | Value | | | Net Assets | |
| Financials | | | | | | | | | |
| Australia & New Zealand Banking Group Ltd., | | | | | | | | | |
4.500%, 03/19/2024(1)(2) | | $ | 44,423,000 | | | $ | 44,394,871 | | | | 0.3 | % |
| Capital One NA, | | | | | | | | | | | | |
| 3.375%, 02/15/2023 | | | 41,962,000 | | | | 40,517,190 | | | | 0.3 | % |
| ING Bank NV, | | | | | | | | | | | | |
5.800%, 09/25/2023(1)(2) | | | 43,525,000 | | | | 45,463,112 | | | | 0.3 | % |
Other Financials(1)(2)(3)(7)(9) | | | | | | | 2,881,738,353 | | | | 18.4 | % |
| Total Financials | | | | | | | | | | | | |
| (Cost $3,091,356,298) | | | | | | | 3,012,113,526 | | | | 19.3 | % |
| Total Corporate Bonds | | | | | | | | | | | | |
| (Cost $6,505,585,848) | | | | | | | 6,304,637,054 | | | | 40.3 | % |
| Municipal Bonds | | | | | | | | | | | | |
Other Municipal Bonds(9) | | | | | | | 146,085,239 | | | | 0.9 | % |
| Total Municipal Bonds | | | | | | | | | | | | |
| (Cost $144,587,168) | | | | | | | 146,085,239 | | | | 0.9 | % |
| Residential Mortgage-Backed Securities | | | | | | | | | | | | |
| U.S. Government Agency Issues | | | | | | | | | | | | |
| Federal Gold Loan Mortgage Corp. (FGLMC): | | | | | | | | | | | | |
| 3.000%, 02/01/2032 | | | 74,319,443 | | | | 74,070,571 | | | | 0.5 | % |
| 4.000%, 01/01/2041 | | | 48,348,346 | | | | 49,747,246 | | | | 0.3 | % |
| 3.000%, 01/01/2043 | | | 42,826,350 | | | | 42,027,087 | | | | 0.3 | % |
| 3.500%, 04/01/2043 | | | 66,877,732 | | | | 67,312,123 | | | | 0.4 | % |
| 3.500%, 02/01/2044 | | | 43,060,771 | | | | 43,381,853 | | | | 0.3 | % |
| 3.500%, 05/01/2044 | | | 43,614,393 | | | | 43,937,778 | | | | 0.3 | % |
| 3.000%, 10/01/2045 | | | 43,648,888 | | | | 42,883,149 | | | | 0.3 | % |
| 3.500%, 01/01/2046 | | | 41,886,570 | | | | 42,028,693 | | | | 0.3 | % |
| 3.000%, 10/01/2046 | | | 88,829,707 | | | | 86,737,711 | | | | 0.5 | % |
| 3.000%, 05/01/2047 | | | 71,697,025 | | | | 69,996,188 | | | | 0.4 | % |
| 4.000%, 08/01/2048 | | | 53,840,903 | | | | 55,091,188 | | | | 0.3 | % |
| 2.500%-6.500%, 06/01/2020-08/01/2046 | | | 642,634,334 | | | | 650,757,724 | | | | 4.2 | % |
| Federal National Mortgage Association (FNMA): | | | | | | | | | | | | |
| 3.500%, 01/01/2032 | | | 51,071,777 | | | | 52,021,153 | | | | 0.3 | % |
| 4.000%, 05/01/2037 | | | 54,551,796 | | | | 56,215,407 | | | | 0.3 | % |
| 3.500%, 12/01/2041 | | | 40,795,258 | | | | 41,113,401 | | | | 0.3 | % |
| 4.000%, 02/01/2042 | | | 48,603,077 | | | | 49,976,179 | | | | 0.3 | % |
| 3.500%, 07/01/2042 | | | 105,620,411 | | | | 106,444,739 | | | | 0.7 | % |
| 3.000%, 03/01/2043 | | | 44,654,957 | | | | 43,882,394 | | | | 0.3 | % |
| 3.000%, 05/01/2043 | | | 59,115,449 | | | | 58,137,879 | | | | 0.4 | % |
| 3.500%, 09/01/2043 | | | 57,261,546 | | | | 57,792,892 | | | | 0.4 | % |
| 3.500%, 10/01/2043 | | | 63,333,302 | | | | 63,827,571 | | | | 0.4 | % |
| 3.500%, 02/01/2045 | | | 44,623,299 | | | | 44,971,488 | | | | 0.3 | % |
| 4.000%, 11/01/2045 | | | 40,272,433 | | | | 41,098,429 | | | | 0.3 | % |
| 3.500%, 05/01/2046 | | | 66,350,551 | | | | 66,543,208 | | | | 0.4 | % |
| 3.500%, 11/01/2046 | | | 58,734,619 | | | | 58,941,499 | | | | 0.4 | % |
| 2.500%-6.000%, 11/01/2021-07/01/2048 | | | 1,021,734,840 | | | | 1,038,107,628 | | | | 6.6 | % |
The accompanying notes are an integral part of these financial statements.
Baird Aggregate Bond Fund
Summary Schedule of Investments, December 31, 2018
Long-Term Investments (cont.)
| | | Principal | | | | | | % of | |
| | | Amount | | | Value | | | Net Assets | |
| Government National Mortgage Association (GNMA): | | | | | | | | | |
| 3.000%, 08/20/2046 | | $ | 44,638,463 | | | $ | 44,023,620 | | | | 0.3 | % |
| 4.500%, 06/20/2047 | | | 64,507,059 | | | | 66,792,275 | | | | 0.4 | % |
| 3.000%-6.000%, 11/20/2033-07/20/2047 | | | 244,283,799 | | | | 248,016,033 | | | | 1.6 | % |
Other U.S. Government Agency Issues(4)(9) | | | | | | | 15,610,921 | | | | 0.1 | % |
| Total U.S. Government Agency Issues | | | | | | | | | | | | |
| (Cost $3,462,519,215) | | | | | | | 3,421,488,027 | | | | 21.9 | % |
| Non-U.S. Government Agency Issues | | | | | | | | | | | | |
| Towd Point Mortgage Trust, | | | | | | | | | | | | |
Series 2017-6, Class A1, 2.750%, 10/25/2057(2)(4) | | | 41,221,564 | | | | 40,262,738 | | | | 0.3 | % |
Other Non-U.S. Government Agency Issues(2)(3)(4)(6)(8)(9) | | | | | | | 474,856,610 | | | | 3.0 | % |
| Total Non-U.S. Government Agency Issues | | | | | | | | | | | | |
| (Cost $515,874,207) | | | | | | | 515,119,348 | | | | 3.3 | % |
| Commercial Mortgage-Backed Securities | | | | | | | | | | | | |
| U.S. Government Agency Issues | | | | | | | | | | | | |
| Freddie Mac Multifamily Structured Pass Through Certificates: | | | | | | | | | | | | |
| Series K028, Class A2, 3.111%, 02/25/2023 | | | 47,010,000 | | | | 47,333,043 | | | | 0.3 | % |
| Series K037, Class A2, 3.490%, 01/25/2024 | | | 68,125,000 | | | | 69,665,913 | | | | 0.4 | % |
Series K050, Class A2, 3.334%, 08/25/2025(4) | | | 72,374,000 | | | | 73,330,220 | | | | 0.5 | % |
Series K063, Class A2, 3.430%, 01/25/2027(4) | | | 49,560,000 | | | | 50,167,298 | | | | 0.3 | % |
| 2.653%-3.850%, 06/25/2022-06/25/2033 | | | 246,596,000 | | | | 246,324,018 | | | | 1.6 | % |
Other U.S. Government Agency Issues(4)(9) | | | | | | | 11,120,820 | | | | 0.1 | % |
| Total U.S. Government Agency Issues | | | | | | | | | | | | |
| (Cost $503,590,109) | | | | | | | 497,941,312 | | | | 3.2 | % |
| Non-U.S. Government Agency Issues | | | | | | | | | | | | |
| BANK, | | | | | | | | | | | | |
| Series 2017-BNK9, Class A4, 3.538%, 11/15/2054 | | | 44,971,000 | | | | 44,641,214 | | | | 0.3 | % |
| Wells Fargo Commercial Mortgage Trust, | | | | | | | | | | | | |
| Series 2015-P2, Class A3, 3.541%, 12/15/2048 | | | 44,050,000 | | | | 44,322,749 | | | | 0.3 | % |
Other Non-U.S. Government Agency Issues(4)(9) | | | | | | | 612,379,727 | | | | 3.9 | % |
| Total Non-U.S. Government Agency Issues | | | | | | | | | | | | |
| (Cost $717,787,997) | | | | | | | 701,343,690 | | | | 4.5 | % |
| Asset Backed Securities | | | | | | | | | | | | |
| Ford Credit Auto Owner Trust: | | | | | | | | | | | | |
Series 2016-2, Class A, 2.030%, 12/15/2027(2) | | | 43,505,000 | | | | 42,438,445 | | | | 0.3 | % |
Series 2018-1, Class A, 3.190%, 07/15/2031(2) | | | 40,550,000 | | | | 40,226,415 | | | | 0.3 | % |
Other Asset Backed Securities(2)(9) | | | | | | | 124,603,202 | | | | 0.8 | % |
| Total Asset Backed Securities | | | | | | | | | | | | |
| (Cost $208,483,827) | | | | | | | 207,268,062 | | | | 1.4 | % |
| Total Long-Term Investments | | | | | | | | | | | | |
| (Cost $15,588,298,146) | | | | | | | 15,313,919,047 | | | | 98.0 | % |
The accompanying notes are an integral part of these financial statements.
Baird Aggregate Bond Fund
Summary Schedule of Investments, December 31, 2018
Short-Term Investment
| | | | | | | | | % of | |
| | | Shares | | | Value | | | Net Assets | |
| Money Market Mutual Fund | | | | | | | | | |
| Fidelity Institutional Money Market Fund – | | | | | | | | | |
Government Portfolio, Institutional Class, 2.29%(5) | | | 259,568,092 | | | $ | 259,568,092 | | | | 1.7 | % |
| Total Short-Term Investment | | | | | | | | | | | | |
| (Cost $259,568,092) | | | | | | | 259,568,092 | | | | 1.7 | % |
| Total Investments | | | | | | | | | | | | |
| (Cost $15,847,866,238) | | | | | | | 15,573,487,139 | | | | 99.7 | % |
| Other Assets in Excess of Liabilities | | | | | | | 42,195,218 | | | | 0.3 | % |
| TOTAL NET ASSETS | | | | | | $ | 15,615,682,357 | | | | 100.0 | % |
Notes to Summary Schedule of Investments
| (1) | Foreign security, or group of securities contain a foreign security. |
| (2) | Security, or group of securities contain a security, issued under Rule 144A under the Securities Act of 1933 and determined to be liquid. Purchased in a private placement transaction; resale to the public may require registration or may extend only to qualified institutional buyers. At December 31, 2018, the value of these securities total $2,440,596,968, which represents 15.63% of total net assets. |
| (3) | Variable rate security, or group of securities contain a variable rate security, based on a reference index and spread. The rate reported is the rate in effect as of December 31, 2018. |
| (4) | Variable rate security, or group of securities contain a variable rate security. The coupon is based on an underlying pool of loans. The rate reported is the rate in effect as of December 31, 2018. |
| (5) | Seven-day yield. |
| (6) | Security, or group of securities contain a security, that, on the last payment date, missed a partial principal or interest payment. |
| (7) | Security in default, or group of securities contain a security in default. |
| (8) | Step-up bond or group of securities contain a step-up bond; the interest rate shown is the rate in effect as of December 31, 2018. |
| (9) | Represents the aggregate value, by category, of securities that are not among the 50 largest holdings and, in total for any issuer, represent 1% or less of net assets. |
Summary of Fair Value Exposure at December 31, 2018
The Fund has adopted authoritative fair valuation accounting standards which establish a definition of fair value and set out a hierarchy for measuring fair value. These standards require additional disclosures about the various inputs and valuation techniques used to develop the measurements of fair value and a discussion on changes in valuation techniques and related inputs during the period. These standards define fair value as the price that would be received to sell an asset or paid to transfer a liability in an orderly transaction between market participants at the measurement date.
The accompanying notes are an integral part of these financial statements.
Baird Aggregate Bond Fund
Summary Schedule of Investments, December 31, 2018
Summary of Fair Value Exposure at December 31, 2018 (cont.)
The fair value hierarchy is organized into three levels based upon the assumptions (referred to as “inputs”) used in pricing the asset or liability. These standards state that “observable inputs” reflect the assumptions market participants would use in pricing the asset or liability based on market data obtained from independent sources and “unobservable inputs” reflect an entity’s own assumptions about the assumptions market participants would use in pricing the asset or liability. These inputs are summarized into three broad levels and described below:
Level 1 – | Unadjusted quoted prices in active markets for identical unrestricted securities. |
Level 2 – | Other significant observable inputs (including quoted prices for similar securities, quoted prices in inactive markets, dealer indications, interest rates, yield curves, prepayment speeds, credit risk, default rates, inputs corroborated by observable market data, etc.). |
Level 3 – | Significant unobservable inputs (including the Fund’s own assumptions about the factors that market participants would use in valuing the security) based on the best information available. |
The inputs or methodology used for valuing securities are not necessarily an indication of the risk associated with investing in those securities.
The following is a summary of the inputs used to value the Fund’s investments as of December 31, 2018:
| | | Level 1 | | | Level 2 | | | Level 3 | | | Total | |
| Long-Term Investments | | | | | | | | | | | | |
| U.S. Treasury Securities | | $ | — | | | $ | 3,366,096,348 | | | $ | — | | | $ | 3,366,096,348 | |
| Other Government Related Securities | | | — | | | | 153,939,967 | | | | — | | | | 153,939,967 | |
| Corporate Bonds | | | — | | | | 6,304,637,054 | | | | — | | | | 6,304,637,054 | |
| Municipal Bonds | | | — | | | | 146,085,239 | | | | — | | | | 146,085,239 | |
| Residential Mortgage-Backed Securities – | | | | | | | | | | | | | | | | |
| U.S. Government Agency Issues | | | — | | | | 3,421,488,027 | | | | — | | | | 3,421,488,027 | |
| Residential Mortgage-Backed Securities – | | | | | | | | | | | | | | | | |
| Non-U.S. Government Agency Issues | | | — | | | | 515,119,348 | | | | — | | | | 515,119,348 | |
| Commercial Mortgage-Backed Securities – | | | | | | | | | | | | | | | | |
| U.S. Government Agency Issues | | | — | | | | 497,941,312 | | | | — | | | | 497,941,312 | |
| Commercial Mortgage-Backed Securities – | | | | | | | | | | | | | | | | |
| Non-U.S. Government Agency Issues | | | — | | | | 701,343,690 | | | | — | | | | 701,343,690 | |
| Asset Backed Securities | | | — | | | | 207,268,062 | | | | — | | | | 207,268,062 | |
| Total Long-Term Investments | | | — | | | | 15,313,919,047 | | | | — | | | | 15,313,919,047 | |
| Short-Term Investment | | | | | | | | | | | | | | | | |
| Money Market Mutual Fund | | | 259,568,092 | | | | — | | | | — | | | | 259,568,092 | |
| Total Short-Term Investment | | | 259,568,092 | | | | — | | | | — | | | | 259,568,092 | |
| Total Investments | | $ | 259,568,092 | | | $ | 15,313,919,047 | | | $ | — | | | $ | 15,573,487,139 | |
Changes in valuation techniques may result in transfers into or out of assigned levels within the fair value hierarchy. There were no transfers into or out of Level 3 during the reporting period, as compared to the security classifications from the prior year’s annual report. See Fund’s Valuation Policy in Note 2a to the financial statements.
The accompanying notes are an integral part of these financial statements.
Baird Core Plus Bond Fund
December 31, 2018 (Unaudited)
The Baird Core Plus Bond Fund seeks an annual rate of total return, before Fund expenses, greater than the annual rate of total return of the Bloomberg Barclays U.S. Universal Bond Index. The Bloomberg Barclays U.S. Universal Bond Index is an unmanaged, market value weighted index of fixed income securities issued in U.S. dollars, including U.S. government, investment grade and non-investment grade credit, emerging market debt, asset-backed and mortgage-backed securities, Eurobonds, 144A securities and commercial mortgage- backed securities (CMBS) with maturities of at least one year.
Economic growth in 2018 accelerated in the U.S., allowing the Fed to continue normalizing monetary policy, boosting overnight rates by a total of 200 bps and reducing over $450B of assets on its balance sheet. As a result, Treasury yields moved higher with short-term yields rising more than longer-term rates, leading to a flatter curve. Demand for fixed income assets was favorable through most of the year, but softened in the fourth quarter due primarily to asset allocation rebalancing trades that sold bonds and bought stocks after the 15-20% decline in the equity markets. A strong rally ensued in Treasuries near year end, but corporate credit spreads widened on late-cycle recession worries. Performance varied across the market sectors as higher quality credits and well-structured securitized issues outperformed lower-quality issues for the year.
During a challenging 2018, the Fund modestly underperformed its benchmark.
The primary factors contributing to the Fund’s performance in 2018 include:
| | • | An overweight to Investment Grade Credit was the primary detractor and was partially mitigated by the Fund’s Credit positioning, which was shorter than the benchmark. |
| | | |
| | • | The Fund benefited from its exposure to Non-Agency Residential Mortgage-Backed securities (RMBS) and underweight to Agency Residential Mortgage-Backed securities (RMBS). |
| | | |
| | • | The Fund benefited from its positioning for a flattening in the front end of the yield curve as well as an overall positive convexity tilt versus the benchmark. |
Market expectations are certainly different than they were a year ago. Economic growth is expected to slow, both in the U.S. and abroad, and inflation measures are well contained even with low unemployment levels. As a result, the market currently expects no rate hikes from the Fed in 2019, although the Fed’s official outlook suggests as many as two 25 bps rate hikes. We expect growth to remain positive in 2019, likely reverting back toward a 2.0% pace, from 3.0% in 2018, as the benefits of fiscal stimulus fade and the impact of rate hikes already in the pipeline become more impactful along with continued elevated uncertainty around U.S./China trade and Brexit. However, the employment backdrop remains favorable and income levels continue to rise, leaving the consumer in a strong position. Corporate debt as a percentage of GDP is only modestly higher this cycle and bottom-up fundamental credit measures remain constructive at the same time that credit spreads are significantly wider than a year ago. Government borrowing is elevated and rising, with net Treasury issuance expected to increase to $840B this year, up nearly 15% from 2018 which may continue to put modest upward pressure on yields in 2019.
We remain duration neutral with a modest overweight to Investment Grade corporate credit, particularly Financials. We will continue to underweight Agency RMBS and prefer the risk/reward characteristics of Non-Agency RMBS, Agency CMBS, Non-Agency senior CMBS structures and select short-duration ABS. As a reminder, we only purchase U.S. dollar denominated securities in the cash bond market (no derivatives). The Fund remains duration neutral to its benchmark and we believe it is well positioned to add value relative to its benchmark.
Baird Core Plus Bond Fund
December 31, 2018 (Unaudited)
Portfolio Characteristics
Quality Distribution(1)(2)
 | | Net Assets | $17,806,320,666 | |
| | | | |
| | SEC 30-Day | | |
| | Yield(3) | | |
| | Institutional Class | 3.63% | |
| | Investor Class | 3.37% | |
| | | | |
| | Average | | |
| | Effective | | |
| | Duration | 5.67 years | |
| | | | |
| | Average | | |
| | Effective | | |
| | Maturity | 7.82 years | |
| | | | |
| | Annualized | | |
| | Expense Ratio(4) | | |
| | Institutional Class | 0.30% | |
| | | Investor Class | 0.55% | (5) |
Sector Weightings(1) | | | | |
| | | Portfolio | | |
 | | Turnover Rate | 26% | |
| | | | |
| | Number of | | |
| | Holdings | 1,312 | |
| | | | |
| | | | |
| | | | |
| | | | |
| | | | |
| | | | |
| | | | |
| | | | |
| | | | |
| | | | |
| | | | |
| | | | |
| | | | |
| | | | |
| | | | |
| | | | |
| | | | |
| | | | |
| | | | |
| | | | | |
(1) | Percentages shown are based on the Fund’s total investments. |
(2) | The quality profile is calculated on a market value-weighted basis using the highest credit quality rating for each security held by the Fund given by S&P, Moody’s or Fitch, each of which is a Nationally Recognized Statistical Rating Organization (NRSRO). NRSROs rate the credit quality of securities using a scale that generally ranges from AAA (highest) to D (lowest). |
(3) | SEC yields are based on SEC guidelines and are calculated for the 30 days ended December 31, 2018. |
(4) | Reflects expense ratios as stated in the Fund’s current prospectus. |
(5) | Includes 0.25% 12b-1 fee. |
Baird Core Plus Bond Fund
December 31, 2018 (Unaudited)
Institutional ClassValue of a $25,000 Investment
Growth of a hypothetical investment of $25,000 made on 12/31/08, assuming reinvestment of all distributions.
Investor Class
Value of a $10,000 Investment
Growth of a hypothetical investment of $10,000 made on 12/31/08, assuming reinvestment of all distributions.
Baird Core Plus Bond Fund
December 31, 2018 (Unaudited)
Total Returns
| | | Average Annual |
| | One | Five | Ten | Since |
| For the Periods Ended December 31, 2018 | Year | Years | Years | Inception(1) |
| Institutional Class Shares | -0.51% | 3.08% | 5.41% | 5.58% |
| Investor Class Shares | -0.74% | 2.84% | 5.16% | 5.32% |
| Bloomberg Barclays U.S. | | | | |
Universal Bond Index(2) | -0.25% | 2.72% | 4.06% | 4.90% |
| (1) | For the period from September 29, 2000 (inception date) through December 31, 2018. |
| (2) | The Bloomberg Barclays U.S. Universal Bond Index is an unmanaged, market value weighted index of fixed income securities issued in U.S. dollars, including U.S. government and investment grade debt, non-investment grade debt, asset-backed and mortgage-backed securities, Eurobonds, 144A securities and emerging market debt, with maturities of at least one year. This Index does not reflect any deduction for fees, expenses or taxes. A direct investment in an index is not possible. |
The line graph on the previous page and the returns shown in the table above reflect reinvestment of dividends and/or capital gains distributions in additional shares. The returns do not reflect the deduction of taxes that a shareholder would pay on Fund distributions or the redemption of Fund shares. The returns reflect the actual performance for each period and do not include the impact of trades executed on the last business day of the period that were recorded on the first business day of the next period.
The Fund’s gross expense ratio for each Class, as reflected in the Fund’s current prospectus, is set forth under “Portfolio Characteristics”.
The Fund may invest up to 20% of its net assets in non-investment grade debt securities (commonly referred to as “high yield” bonds). While these types of debt securities typically offer higher yields than investment grade securities, they also include greater risks including increased credit risk and the increased risk of default or bankruptcy. The Fund maintains securities with longer maturities in order to provide a greater potential for return. Generally, the longer a bond’s maturity, the greater the interest rate risk. The Fund may also invest in U.S. dollar denominated foreign securities which involve additional risks such as political and economic instability, and different and sometimes less strict financial reporting standards and regulation. The Fund may also invest in mortgage- and asset-backed securities, which include interest rate and prepayment risks more pronounced than those of other fixed income securities.
Past performance does not guarantee future results. Investment return and principal value will fluctuate so that an investor’s shares, when redeemed, may be worth more or less than their original cost.
For information about the performance of the Fund as of the most recent month-end, please call 1-866-44BAIRD or visit www.bairdfunds.com. Mutual fund performance changes over time and current performance may be lower or higher than that stated.
Baird Core Plus Bond Fund
Summary Schedule of Investments, December 31, 2018
This schedule summarizes the Fund’s holdings by asset type. Details are reported for each of the Fund’s 50 largest individual holdings and for investments that, in total for any issuer, represent more than 1% of the Fund’s net assets. The total value of smaller holdings is reported as a single amount within each category.
The Fund reports a complete list of its holdings in regulatory filings four times in each fiscal year, at the quarter end. For the second and fourth fiscal quarters, the complete listing of the Fund’s holdings is available electronically at http://www.bairdassetmanagement.com/baird-funds/funds-and-performance#Literature and in the Fund’s Form N-CSR on the Securities and Exchange Commission’s website (www.sec.gov) or you can have it mailed to you without charge by calling 1-866-44BAIRD. For the first and third fiscal quarters, the Fund files the lists with the SEC on Form N-Q or, beginning with filings after March 31, 2019, on Part F of Form N-PORT. Shareholders can look up the Fund’s Forms N-CSR, N-Q or Part F of Form N-PORT on the SEC’s website (www.sec.gov).
Long-Term Investments
| | | Principal | | | | | | % of | |
| | | Amount | | | Value | | | Net Assets | |
| U.S. Treasury Securities | | | | | | | | | |
| U.S. Treasury Bonds: | | | | | | | | | |
| 1.750%, 03/31/2022 | | $ | 185,175,000 | | | $ | 181,023,028 | | | | 1.0 | % |
| 1.875%, 03/31/2022 | | | 318,025,000 | | | | 312,062,031 | | | | 1.8 | % |
| 2.500%, 05/15/2024 | | | 99,425,000 | | | | 99,242,462 | | | | 0.6 | % |
| 2.250%, 11/15/2025 | | | 214,425,000 | | | | 209,692,574 | | | | 1.2 | % |
| 2.000%, 11/15/2026 | | | 202,025,000 | | | | 192,847,067 | | | | 1.1 | % |
| 2.250%, 11/15/2027 | | | 253,525,000 | | | | 244,899,207 | | | | 1.4 | % |
| 3.500%, 02/15/2039 | | | 364,345,000 | | | | 398,516,575 | | | | 2.2 | % |
| 2.875%, 05/15/2043 | | | 654,400,000 | | | | 638,832,439 | | | | 3.6 | % |
| 2.500%, 02/15/2045 | | | 228,175,000 | | | | 206,783,594 | | | | 1.2 | % |
| Total U.S. Treasury Securities | | | | | | | | | | | | |
| (Cost $2,487,087,546) | | | | | | | 2,483,898,977 | | | | 14.1 | % |
| Other Government Related Securities | | | | | | | | | | | | |
Other Government Related Securities(1)(2)(8) | | | | | | | 219,103,700 | | | | 1.2 | % |
| Total Other Government Related Securities | | | | | | | | | | | | |
| (Cost $226,270,792) | | | | | | | 219,103,700 | | | | 1.2 | % |
| Corporate Bonds | | | | | | | | | | | | |
| Industrials | | | | | | | | | | | | |
| Forest Laboratories, Inc., | | | | | | | | | | | | |
5.000%, 12/15/2021(2) | | | 41,397,000 | | | | 42,593,336 | | | | 0.2 | % |
| Genpact Luxembourg Sarl, | | | | | | | | | | | | |
3.700%, 04/01/2022(1) | | | 43,005,000 | | | | 42,677,971 | | | | 0.2 | % |
| Sabine Pass Liquefaction LLC, | | | | | | | | | | | | |
| 5.875%, 06/30/2026 | | | 50,315,000 | | | | 53,273,731 | | | | 0.3 | % |
| Seagate HDD Cayman, | | | | | | | | | | | | |
4.250%, 03/01/2022(1) | | | 52,944,000 | | | | 50,597,621 | | | | 0.3 | % |
| Shire Acquisitions Investments Ireland DAC, | | | | | | | | | | | | |
2.875%, 09/23/2023(1) | | | 54,946,000 | | | | 51,941,390 | | | | 0.3 | % |
| Western Digital Corp., | | | | | | | | | | | | |
| 4.750%, 02/15/2026 | | | 57,075,000 | | | | 49,512,563 | | | | 0.3 | % |
The accompanying notes are an integral part of these financial statements.
Baird Core Plus Bond Fund
Summary Schedule of Investments, December 31, 2018
Long-Term Investments (cont.)
| | | Principal | | | | | | % of | |
| | | Amount | | | Value | | | Net Assets | |
| Williams Companies, Inc., | | | | | | | | | |
| 3.700%, 01/15/2023 | | $ | 44,375,000 | | | $ | 43,288,269 | | | | 0.2 | % |
Other Industrials(1)(2)(3)(8)(9) | | | | | | | 4,362,018,601 | | | | 24.5 | % |
| Total Industrials | | | | | | | | | | | | |
| (Cost $4,860,976,522) | | | | | | | 4,695,903,482 | | | | 26.3 | % |
| Utilities | | | | | | | | | | | | |
Other Utilities(1)(2)(8) | | | | | | | 252,967,421 | | | | 1.4 | % |
| Total Utilities | | | | | | | | | | | | |
| (Cost $272,174,825) | | | | | | | 252,967,421 | | | | 1.4 | % |
| Financials | | | | | | | | | | | | |
| ING Bank NV, | | | | | | | | | | | | |
5.800%, 09/25/2023(1)(2) | | | 39,680,000 | | | | 41,446,899 | | | | 0.2 | % |
| Nationwide Building Society, | | | | | | | | | | | | |
4.000%, 09/14/2026(1)(2) | | | 53,541,000 | | | | 48,734,239 | | | | 0.3 | % |
| Royal Bank of Scotland Group PLC, | | | | | | | | | | | | |
| 3.498%, 05/15/2023 | | | | | | | | | | | | |
(3 Month LIBOR USD + 1.480%)(1)(3) | | | 62,335,000 | | | | 59,942,419 | | | | 0.3 | % |
Other Financials(1)(2)(3)(8)(9) | | | | | | | 3,684,221,869 | | | | 20.7 | % |
| Total Financials | | | | | | | | | | | | |
| (Cost $3,935,519,428) | | | | | | | 3,834,345,426 | | | | 21.5 | % |
| Total Corporate Bonds | | | | | | | | | | | | |
| (Cost $9,068,670,775) | | | | | | | 8,783,216,329 | | | | 49.2 | % |
| Municipal Bonds | | | | | | | | | | | | |
Other Municipal Bonds(8) | | | | | | | 101,663,723 | | | | 0.6 | % |
| Total Municipal Bonds | | | | | | | | | | | | |
| (Cost $98,882,608) | | | | | | | 101,663,723 | | | | 0.6 | % |
| Residential Mortgage-Backed Securities | | | | | | | | | | | | |
| U.S. Government Agency Issues | | | | | | | | | | | | |
| Federal Gold Loan Mortgage Corp. (FGLMC): | | | | | | | | | | | | |
| 3.000%, 02/01/2032 | | | 54,645,686 | | | | 54,462,695 | | | | 0.3 | % |
| 3.500%, 07/01/2042 | | | 64,866,500 | | | | 65,347,646 | | | | 0.4 | % |
| 3.000%, 11/01/2042 | | | 51,207,578 | | | | 50,367,959 | | | | 0.3 | % |
| 3.500%, 08/01/2044 | | | 59,878,567 | | | | 60,263,152 | | | | 0.3 | % |
| 3.500%, 01/01/2046 | | | 57,675,844 | | | | 57,871,541 | | | | 0.3 | % |
| 3.500%, 08/01/2046 | | | 86,480,930 | | | | 86,962,100 | | | | 0.5 | % |
| 3.000%, 10/01/2046 | | | 117,909,441 | | | | 115,153,448 | | | | 0.6 | % |
| 3.000%, 05/01/2047 | | | 82,980,874 | | | | 81,012,355 | | | | 0.5 | % |
| 4.000%, 08/01/2048 | | | 44,051,648 | | | | 45,074,608 | | | | 0.3 | % |
| 3.000%-6.500%, 12/01/2020-08/01/2047 | | | 696,472,606 | | | | 702,171,600 | | | | 3.9 | % |
| Federal National Mortgage Association (FNMA): | | | | | | | | | | | | |
| 3.500%, 01/01/2032 | | | 46,531,180 | | | | 47,396,151 | | | | 0.3 | % |
| 4.000%, 05/01/2037 | | | 72,101,972 | | | | 74,300,793 | | | | 0.4 | % |
| 3.500%, 08/01/2037 | | | 45,999,903 | | | | 46,418,532 | | | | 0.3 | % |
The accompanying notes are an integral part of these financial statements.
Baird Core Plus Bond Fund
Summary Schedule of Investments, December 31, 2018
Long-Term Investments (cont.)
| | | Principal | | | | | | % of | |
| | | Amount | | | Value | | | Net Assets | |
| Federal National Mortgage Association (FNMA): | | | | | | | | | |
| 3.500%, 07/01/2042 | | $ | 123,270,571 | | | $ | 124,232,651 | | | | 0.7 | % |
| 3.500%, 09/01/2043 | | | 41,169,397 | | | | 41,551,420 | | | | 0.2 | % |
| 3.500%, 02/01/2045 | | | 55,380,293 | | | | 55,812,419 | | | | 0.3 | % |
| 4.000%, 02/01/2045 | | | 53,015,079 | | | | 54,384,146 | | | | 0.3 | % |
| 4.000%, 11/01/2045 | | | 55,519,317 | | | | 56,658,031 | | | | 0.3 | % |
| 3.500%, 12/01/2045 | | | 43,983,305 | | | | 44,083,785 | | | | 0.2 | % |
| 2.500%-6.500%, 11/01/2021-11/01/2047 | | | 999,963,771 | | | | 1,018,273,862 | | | | 5.7 | % |
| Government National Mortgage Association (GNMA): | | | | | | | | | | | | |
| 3.500%, 10/20/2045 | | | 80,078,299 | | | | 80,743,418 | | | | 0.5 | % |
| 3.000%, 08/20/2046 | | | 52,956,665 | | | | 52,227,249 | | | | 0.3 | % |
| 3.000%-6.500%, 12/20/2028-07/20/2047 | | | 245,901,563 | | | | 251,320,166 | | | | 1.4 | % |
Other U.S. Government Agency Issues(8) | | | | | | | 186,037 | | | | 0.0 | % |
| Total U.S. Government Agency Issues | | | | | | | | | | | | |
| (Cost $3,300,680,563) | | | | | | | 3,266,275,764 | | | | 18.3 | % |
| Non-U.S. Government Agency Issues | | | | | | | | | | | | |
| GS Mortgage Securities Trust, | | | | | | | | | | | | |
Series 2018-RPL1, Class A1A, 3.750%, 10/25/2057(2) | | | 51,035,041 | | | | 51,219,037 | | | | 0.3 | % |
Other Non-U.S. Government Agency Issues(2)(3)(4)(6)(7)(8) | | | | | | | 978,892,914 | | | | 5.5 | % |
| Total Non-U.S. Government Agency Issues | | | | | | | | | | | | |
| (Cost $1,032,937,215) | | | | | | | 1,030,111,951 | | | | 5.8 | % |
| Commercial Mortgage-Backed Securities | | | | | | | | | | | | |
| U.S. Government Agency Issues | | | | | | | | | | | | |
| Freddie Mac Multifamily Structured Pass Through Certificates: | | | | | | | | | | | | |
Series K029, Class A2, 3.320%, 02/25/2023(4) | | | 64,407,000 | | | | 65,338,660 | | | | 0.4 | % |
| Series K037, Class A2, 3.490%, 01/25/2024 | | | 66,950,000 | | | | 68,464,335 | | | | 0.4 | % |
Series K048, Class A2, 3.284%, 06/25/2025(4) | | | 53,680,000 | | | | 54,261,376 | | | | 0.3 | % |
Series K050, Class A2, 3.334%, 08/25/2025(4) | | | 82,951,000 | | | | 84,046,965 | | | | 0.5 | % |
Series K061, Class A2, 3.347%, 11/25/2026(4) | | | 57,140,000 | | | | 57,518,210 | | | | 0.3 | % |
| 3.243%-3.900%, 04/25/2027-10/25/2033 | | | 53,884,000 | | | | 55,016,070 | | | | 0.3 | % |
Other U.S. Government Agency Issues(4)(8) | | | | | | | 29,061,032 | | | | 0.2 | % |
| Total U.S. Government Agency Issues | | | | | | | | | | | | |
| (Cost $417,789,378) | | | | | | | 413,706,648 | | | | 2.4 | % |
| Non-U.S. Government Agency Issues | | | | | | | | | | | | |
| BANK, | | | | | | | | | | | | |
| Series 2017-BNK8, Class A4, 3.488%, 11/15/2050 | | | 50,056,751 | | | | 49,514,992 | | | | 0.3 | % |
| Citigroup Commercial Mortgage Trust, | | | | | | | | | | | | |
| Series 2015-GC27, Class A5, 3.137%, 02/10/2048 | | | 49,189,111 | | | | 48,347,909 | | | | 0.3 | % |
| Morgan Stanley Bank of America Merrill Lynch Trust: | | | | | | | | | | | | |
| Series 2012-C5, Class A4, 3.176%, 08/15/2045 | | | 41,590,000 | | | | 41,407,000 | | | | 0.2 | % |
Series 2013-C10, Class A3, 3.967%, 07/15/2046(4) | | | 43,057,040 | | | | 44,313,001 | | | | 0.2 | % |
Other Non-U.S. Government Agency Issues(4)(8) | | | | | | | 712,270,692 | | | | 4.0 | % |
| Total Non-U.S. Government Agency Issues | | | | | | | | | | | | |
| (Cost $911,943,315) | | | | | | | 895,853,594 | | | | 5.0 | % |
The accompanying notes are an integral part of these financial statements.
Baird Core Plus Bond Fund
Summary Schedule of Investments, December 31, 2018
Long-Term Investments (cont.)
| | | Principal | | | | | | % of | |
| | | Amount | | | Value | | | Net Assets | |
| Asset Backed Securities | | | | | | | | | |
| Ford Credit Auto Owner Trust, | | | | | | | | | |
Series 2016-2, Class A, 2.030%, 12/15/2027(2) | | $ | 74,240,000 | | | $ | 72,419,954 | | | | 0.4 | % |
Other Asset Backed Securities(2)(8) | | | | | | | 217,038,083 | | | | 1.2 | % |
| Total Asset Backed Securities | | | | | | | | | | | | |
| (Cost $290,917,157) | | | | | | | 289,458,037 | | | | 1.6 | % |
| Total Long-Term Investments | | | | | | | | | | | | |
| (Cost $17,835,179,349) | | | | | | | 17,483,288,723 | | | | 98.2 | % |
| Short-Term Investment | | | | | | | | | | | | |
| | | Shares | | | | | | | | | |
| Money Market Mutual Fund | | | | | | | | | | | | |
| Fidelity Institutional Money Market Fund – | | | | | | | | | | | | |
Government Portfolio, Institutional Class, 2.29%(5) | | | 283,206,904 | | | | 283,206,904 | | | | 1.6 | % |
| Total Short-Term Investment | | | | | | | | | | | | |
| (Cost $283,206,904) | | | | | | | 283,206,904 | | | | 1.6 | % |
| Total Investments | | | | | | | | | | | | |
| (Cost $18,118,386,253) | | | | | | | 17,766,495,627 | | | | 99.8 | % |
| Other Assets in Excess of Liabilities | | | | | | | 39,825,039 | | | | 0.2 | % |
| TOTAL NET ASSETS | | | | | | $ | 17,806,320,666 | | | | 100.0 | % |
Notes to Summary Schedule of Investments
| (1) | Foreign security, or group of securities contain a foreign security. |
| (2) | Security, or group of securities contain a security, issued under Rule 144A under the Securities Act of 1933 and determined to be liquid. Purchased in a private placement transaction; resale to the public may require registration or may extend only to qualified institutional buyers. At December 31, 2018, the value of these securities total $3,292,336,537, which represents 18.49% of total net assets. |
| (3) | Variable rate security, or group of securities contain a variable rate security, based on a reference index and spread. The rate reported is the rate in effect as of December 31, 2018. |
| (4) | Variable rate security, or group of securities contain a variable rate security. The coupon is based on an underlying pool of loans. The rate reported is the rate in effect as of December 31, 2018. |
| (5) | Seven-day yield. |
| (6) | Security, or group of securities contain a security, that, on the last payment date, missed a partial principal or interest payment. |
| (7) | Step-up bond, or group of securities contain a step-up bond; the interest rate shown is the rate in effect as of December 31, 2018. |
| (8) | Represents the aggregate value, by category, of securities that are not among the 50 largest holdings and, in total for any issuer, represent 1% or less of net assets. |
| (9) | Security in default, or group of securities contain a security in default. |
The accompanying notes are an integral part of these financial statements.
Baird Core Plus Bond Fund
Summary Schedule of Investments, December 31, 2018
Summary of Fair Value Exposure at December 31, 2018
The Fund has adopted authoritative fair valuation accounting standards which establish a definition of fair value and set out a hierarchy for measuring fair value. These standards require additional disclosures about the various inputs and valuation techniques used to develop the measurements of fair value and a discussion on changes in valuation techniques and related inputs during the period. These standards define fair value as the price that would be received to sell an asset or paid to transfer a liability in an orderly transaction between market participants at the measurement date.
The fair value hierarchy is organized into three levels based upon the assumptions (referred to as “inputs”) used in pricing the asset or liability. These standards state that “observable inputs” reflect the assumptions market participants would use in pricing the asset or liability based on market data obtained from independent sources and “unobservable inputs” reflect an entity’s own assumptions about the assumptions market participants would use in pricing the asset or liability. These inputs are summarized into three broad levels and described below:
Level 1 – | Unadjusted quoted prices in active markets for identical unrestricted securities. |
Level 2 – | Other significant observable inputs (including quoted prices for similar securities, quoted prices in inactive markets, dealer indications, interest rates, yield curves, prepayment speeds, credit risk, default rates, inputs corroborated by observable market data, etc.). |
Level 3 – | Significant unobservable inputs (including the Fund’s own assumptions about the factors that market participants would use in valuing the security) based on the best information available. |
The inputs or methodology used for valuing securities are not necessarily an indication of the risk associated with investing in those securities.
The following is a summary of the inputs used to value the Fund’s investments as of December 31, 2018:
| | | Level 1 | | | Level 2 | | | Level 3 | | | Total | |
| Long-Term Investments | | | | | | | | | | | | |
| U.S. Treasury Securities | | $ | — | | | $ | 2,483,898,977 | | | $ | — | | | $ | 2,483,898,977 | |
| Other Government Related Securities | | | — | | | | 219,103,700 | | | | — | | | | 219,103,700 | |
| Corporate Bonds | | | — | | | | 8,783,216,329 | | | | — | | | | 8,783,216,329 | |
| Municipal Bonds | | | — | | | | 101,663,723 | | | | — | | | | 101,663,723 | |
| Residential Mortgage-Backed Securities – | | | | | | | | | | | | | | | | |
| U.S. Government Agency Issues | | | — | | | | 3,266,275,764 | | | | — | | | | 3,266,275,764 | |
| Residential Mortgage-Backed Securities – | | | | | | | | | | | | | | | | |
| Non-U.S. Government Agency Issues | | | — | | | | 1,030,111,951 | | | | — | | | | 1,030,111,951 | |
| Commercial Mortgage-Backed Securities – | | | | | | | | | | | | | | | | |
| U.S. Government Agency Issues | | | — | | | | 413,706,648 | | | | — | | | | 413,706,648 | |
| Commercial Mortgage-Backed Securities – | | | | | | | | | | | | | | | | |
| Non-U.S. Government Agency Issues | | | — | | | | 895,853,594 | | | | — | | | | 895,853,594 | |
| Asset Backed Securities | | | — | | | | 289,458,037 | | | | — | | | | 289,458,037 | |
| Total Long-Term Investments | | | — | | | | 17,483,288,723 | | | | — | | | | 17,483,288,723 | |
| Short-Term Investment | | | | | | | | | | | | | | | | |
| Money Market Mutual Fund | | | 283,206,904 | | | | — | | | | — | | | | 283,206,904 | |
| Total Short-Term Investment | | | 283,206,904 | | | | — | | | | — | | | | 283,206,904 | |
| Total Investments | | $ | 283,206,904 | | | $ | 17,483,288,723 | | | $ | — | | | $ | 17,766,495,627 | |
Changes in valuation techniques may result in transfers into or out of assigned levels within the fair value hierarchy. There were no transfers into or out of Level 3 during the reporting period, as compared to the security classifications from the prior year’s annual report. See Fund’s Valuation Policy in Note 2a to the financial statements.
The accompanying notes are an integral part of these financial statements.
2018 Municipal Bond Market Overview
(Unaudited)
Higher Tax-Free Yields and Steeper Curve in 20182018 was a year in which the fundamental backdrop for municipal credit improved, interest rates moved modestly higher, but investors received positive returns across all segments of the market. Municipal yields were pulled higher by strong U.S. growth and rising Treasury yields. Although broad inflation measures remained at or below the Fed’s 2.0% target, the faster pace of economic growth provided sufficient cover for the Fed to raise the federal funds rate four times in 2018. Short and intermediate term municipal yields rose 25 – 30 bps, less than the 47 bp increase in long-term tax-free yields. The steepening of the municipal yield curve was due primarily to varying levels of demand across the curve. For example, individual investors, whose tax rates were little changed by the 2017 tax bill, demonstrated steady demand for much of the year with purchases focused primarily in the 1 – 10 year maturity range, helping to mute the upward yield trend in that segment. Individual demand waned in the fourth quarter as investors sought to harvest tax losses through the sale of municipal funds and individual bonds. Institutional investors, on the other hand, which are typically less duration sensitive than individuals and invest on the longer end of the curve, were less committed to the municipal market in 2018 following the significant cut in corporate income tax rates in late-2017. Banks reduced their allocation to municipals over the course of the year, redirecting a portion of both maturing debt and sale proceeds into taxable alternatives instead. The most recent data shows bank holdings of municipal bonds fell by $40B YTD through September, or roughly 7%. In contrast, municipal holdings for property and casualty insurers actually rose by $9B, or nearly 3%, over the same time frame. While some of the largest P&C insurance companies were net sellers of tax-free bonds, in total, the diversification benefits of municipals apparently were viewed as sufficient to offset the reduced tax benefits.
AAA Municipal Yields
| | Dec 31, | Sep 30, | Nov 30, | Dec 31, | | | |
Maturity | 2017 | 2018 | 2018 | 2018 | 1Mo | Q4 | 2018 |
| 1 | 1.44% | 1.92% | 1.87% | 1.74% | -0.13% | -0.18% | 0.30% |
| 2 | 1.56% | 1.98% | 1.98% | 1.80% | -0.18% | -0.18% | 0.24% |
| 3 | 1.59% | 2.07% | 2.03% | 1.85% | -0.18% | -0.22% | 0.26% |
| 5 | 1.70% | 2.23% | 2.16% | 1.96% | -0.20% | -0.27% | 0.26% |
| 7 | 1.80% | 2.42% | 2.31% | 2.09% | -0.22% | -0.33% | 0.29% |
| 10 | 2.01% | 2.62% | 2.55% | 2.32% | -0.23% | -0.30% | 0.31% |
| 30 | 2.62% | 3.26% | 3.27% | 3.09% | -0.18% | -0.17% | 0.47% |
Light Supply Year
New municipal supply throughout 2018 was consistently below prior year levels, as expected, following the passage of the tax reform bill which eliminated the advanced refunding of outstanding debt. Partially offsetting the decline in supply was a rise in new money borrowing, which rose by $33B YoY (+16%), helping to finance infrastructure spending needs. Nonetheless, total supply for 2018 fell by $110B (from $448B to $338B), or -24%. The largest YoY drop occurred in the fourth quarter where supply fell by $69B alone from the record pre-tax reform issuance late in 2017. Some of the largest issuing states, such as California, had noticeably less issuance last year than in 2017. California supply fell by nearly $21B, or -30% YoY, which caused California debt to trade at relatively rich valuations compared to debt in other states throughout the year. Strengthening
2018 Municipal Bond Market Overview
(Unaudited)
fundamentals also contributed to California’s trading value as strong tax revenues and a conservative fiscal focus by outgoing Governor Jerry Brown limited new borrowing. Certain market sectors experienced notable declines in issuance as well. Two sectors that stood out for their decrease in supply were Education (-33%) and Healthcare (-43%). Both sectors face near-term margin pressures as well as longer term secular challenges, the combination of which has restricted recent borrowing.
Strong Tax Revenues Led to Strengthening Municipal Credits and Stable Credit Spreads
Another favorable development in the municipal market last year was the strengthening of municipal credits and the relative stability of municipal credit spreads. State and local tax revenues are leveraged to the pace of economic growth and with growth estimated at 3.0% for all of 2018, combined with the near record length of this expansion, municipalities continued to benefit. State and local tax revenues have grown in 32 of the last 35 quarters and, according to the National Association of State Budget Officers (NASBO), state general fund revenues grew 6.4% in fiscal year 2018. The largest contributor to the increase in state revenues was a 9.8% increase in personal income tax revenues, reflecting the strong labor market and rising income levels. Some of the strongest revenue growth occurred in fossil fuel focused states, such as Alaska, where revenues grew nearly 30% YoY, and North Dakota, which saw revenues rise over 28%. This benefit may work against these same states in 2019 if oil/energy prices remain near the lower closing levels at year-end (~$45/bbl for West Texas Intermediate). Nonetheless, the tax revenue boost last year was broad based, evidenced by solid improvements even in some of the more fiscally challenged states, such as Connecticut (+13.6%), Illinois (+5.8%) and New Jersey (+4.8%). State rainy day reserves as a percentage of general fund expenditures also grew 6.4% in fiscal year 2018 to reach a new all-time high. The solid credit backdrop and favorable market technical led to relatively stable municipal credit spreads, particularly in contrast to the widening spreads which occurred in the taxable corporate market. According to Bloomberg data, the yield differential between BBB and AAA municipal yields in the 10-year maturity widened by 13 bps in Q4 in the midst of the heightened volatility in the financial markets, but ended the year 1 bp tighter than where they began (+93 vs. +94).
Other Key Municipal Developments in 2018
| | • | In November, Democrats regained control of the House, while Republicans increased their majority in the Senate. A divided Congress makes additional tax changes less likely over the next two years. In addition, the new Chairman of the House Ways and Means Committee, Richard Neal (D-MA), is the former mayor of Springfield, MA and has expressed support for the municipal market. He has also pledged to give municipal market advocates a voice in how the 2017 tax reform may have negatively impacted municipalities to see if revisions are needed. |
| | | |
| | • | Several rulings from the U.S. Supreme Court proved favorable to the municipal market. In May, the Court legalized gambling on sports, providing a new potential revenue source for states inclined to allow this activity. Then in June, the Court ruled that states can now collect sales tax on online transactions from retailers who do not have a physical presence in the state. Finally, the Court ruled in a third case that non-union government employees can opt-out of paying union dues, which may provide municipalities more flexibility in future labor negotiations. |
| | | |
| | • | One other notable item that did not happen was passage of a bipartisan federal infrastructure plan. While both political parties continue to realize the need for a plan and the benefits that would accrue from passing a comprehensive infrastructure bill, unfortunately the two sides remain far apart as to the funding approach. Instead, state and local governments continue to take the lead on the most necessary and worthy projects. In the midterm elections $31B of new borrowing was authorized to help finance infrastructure needs, of which $8.7B alone was approved in the rapidly growing state of Texas. |
Positive Returns Across the Market
The strong rally in Q4 helped to push all municipal returns into positive territory for the year. Intermediate and long-term maturities moved into the black despite a steepening of the curve in 2018, but shorter maturities were the performance leader for the year. Lower quality credits underperformed in Q4, particularly
2018 Municipal Bond Market Overview
(Unaudited)
High Yield municipals, as credit spreads widened modestly. Yet, for the full year lower quality, investment grade credits (BBBs) were the performance leaders. The Prerefunded sector benefited both from its growing scarcity value given the lack of new advance refundings, but also from the shorter average maturity focus relative to other market sectors.
Total Returns of Selected Barclays Municipal Indices and Subsectors
| Bloomberg | | | | Bloomberg | | | |
| Barclays | | | | Barclays | | | |
Index/Sector | Dec | Q4 | 2018 | Quality | Dec | Q4 | 2018 |
| Municipal Bond Index | 1.20% | 1.69% | 1.28% | AAA | 1.22% | 1.84% | 1.05% |
| General Obligation bonds | 1.23% | 1.82% | 1.33% | AA | 1.21% | 1.74% | 1.22% |
| Revenue bonds | 1.22% | 1.67% | 1.20% | A | 1.21% | 1.60% | 1.34% |
| Prerefunded bonds | 0.70% | 1.19% | 1.67% | BBB | 1.06% | 1.35% | 1.96% |
| Long maturities (22+ yrs.) | 1.37% | 1.49% | 0.34% | High Yield | 0.86% | 0.30% | 4.76% |
| Intermediate | | | | HY, ex- | | | |
| maturities (1 – 17 yrs.) | 1.11% | 1.71% | 1.58% | Puerto Rico | 0.96% | 0.28% | 3.70% |
| Short maturities (1 – 5 yrs.) | 0.64% | 1.10% | 1.77% | | | | |
2019 Outlook
The municipal market enters 2019 with a solid fundamental and supply/demand technical backdrop. Although the economy is expected to grow, albeit at a slower pace, we expect state and local tax revenues to continue to rise. A slower pace of growth, combined with moderate inflation expectations, has moved the market’s base case forecast to an unchanged federal funds rate this year, although probabilities of either a cut or rate hike are also assigned. Fortunately, most municipalities have been relatively frugal regarding borrowing in recent years and are not highly levered if the economy does slow; however, rising pension and healthcare costs continue to present long-term fiscal challenges. Pension reforms have been enacted where the political will has existed and courts have allowed, and further reforms are likely. To meet these rising fiscal challenges, there will likely be ongoing pressure to find additional tax and other revenues to offset them. Demand for municipal debt should remain steady. The aging demographics in the U.S. and the relative safety of municipals when compared to other, more volatile asset classes should provide solid support for the market. It is our view that the municipal market has largely adjusted to less corporate demand following the 2017 tax reform, and the steeper municipal curve that has resulted will be a draw for investors of all types seeking to capitalize on the roll-down benefits the municipal curve offers. From a supply perspective, issuance levels will likely rise an estimated 10% YoY, which would be very manageable for investors to digest. Within the 2019 supply, taxable municipal issuance is also expected to increase, perhaps as much as 20% YoY. While the taxable municipal sector remains a small component of the total municipal market (roughly 10% of the total debt outstanding), new taxable supply in 2019 could rise to $45B next year even without a federal infrastructure plan, or approximately 12% of the estimated $370B of total municipal issuance this year. With interest rates higher than a year ago, the curve steeper, a modest increase in supply expected, along with solid credit fundamentals, the backdrop for the municipals in 2019 is favorable.
2018 Municipal Bond Market Overview
(Unaudited)
Disclosures
Fixed income is generally considered to be a more conservative investment than stocks, but bonds and other fixed income investments still carry a variety of risks such as interest rate risk, credit risk, inflation risk, and liquidity risk. In a rising interest rate environment, the value of fixed-income securities generally declines and conversely, in a falling interest rate environment, the value of fixed-income securities generally increases. High yield securities may be subject to heightened market, interest rate or credit risk and should not be purchased solely because of the stated yield.
The Bloomberg Barclays Municipal Bond Index is a broad-based, total-return index. The bonds are all investment-grade, tax-exempt, and fixed-rate securities with long-term maturities (greater than 2 years). They are selected from issues larger than $50 million. The components listed below the Municipal Bond Index (long maturities, intermediate maturities, short maturities, prefunded bonds, general obligation bonds and revenue bonds) are subsectors of the Bloomberg Barclays Municipal Bond Index and do not represent separate indices.
The Bloomberg Barclays High Yield Municipal Index includes bonds with a par value of at least $3 million and must be issued as part of a transaction of at least $20 million. The maximum rating for inclusion is Ba1/BB+/BB+ using the middle rating.
For more information about the Bloomberg Barclays Municipal Bond Index or Bloomberg Barclays High Yield Municipal Index, please visit https://index.barcap.com/Home/Guides_and_Factsheets.
Municipal securities investments are not appropriate for all investors, especially those taxed at lower rates. The alternative minimum tax (AMT) may be applicable, even for securities identified as tax exempt. Past performance is not a guarantee of future results.
Ratings are measured on a scale that ranges from AAA or Aaa (highest) to D or C (lowest). Investment grade investments are those rated from highest down to BBB- or Baa3.
Robert W. Baird & Co. Incorporated. This is not a complete analysis of every material fact regarding any company, industry or security. The information has been obtained from sources we consider to be reliable, but we cannot guarantee the accuracy. Indices are unmanaged, and are not available for direct investment. Past performance is not a guarantee of future results.
Baird Short-Term Municipal Bond Fund
December 31, 2018 (Unaudited)
The Baird Short-Term Municipal Bond Fund seeks current income that is exempt from federal income tax and is consistent with the preservation of capital.
Investors achieved positive returns in the tax-free municipal market in 2018 even with interest rates moving higher. The adjustment in rates was not uniform, however, as longer-term yields rose more than short-term yields. The steeper yield curve was driven by varying levels of demand along the curve; steady demand was evident from individual investors, minimizing the rise in short-term rates, while the appetite for longer-term bonds from institutional investors waned when corporate income tax rates fell to 21% from 35%. Another consequence of the tax law changes was the lack of advanced refunding issues in 2018, reducing municipal supply by one-quarter on a year-over-year basis. Fortunately, the credit backdrop for the municipal market improved on strong tax revenue growth, allowing municipalities to rebuild rainy-day reserves to record levels and municipal spreads to remain relatively stable.
During a challenging 2018, the Fund generated strong absolute returns and tracked its benchmark.
Positive contributors to the Fund’s relative performance include:
| | • | Favorable positioning along the yield curve |
| | | |
| | • | Security selection |
| | | |
| | • | Modest overweight to credit |
| | | |
| | • | An underweight to Pre-Refunded and General Obligation (GO) bonds |
We hold a favorable outlook for the municipal market in 2019. We expect the level of supply to rise by an estimated 10% this year as the amount of new money borrowing continues to grow, helping finance necessary state and local infrastructure projects. The demand for municipals should also be more than sufficient for the available supply. For investors, interest rates are higher than they were a year ago and the tax-free yield curve is steeper, both of which should add to the appeal of the municipal market. If financial market volatility in the fourth quarter of 2018 is any indication of what may be in store for financial markets in 2019, then the relative stability and safety of the municipal market may be an attractive alternative for certain investors. The backdrop for municipal credit is also favorable and should continue to improve this year. If the U.S. economy continues to grow, even at a slowing pace, this will lead to higher tax revenues for state and local governments. Most municipalities have remained fiscally frugal in the post-financial crisis era, limiting new borrowing to only the most essential projects and directing any excess revenues into rainy day funds, when possible. In fact, reserve levels as a percentage of total expenditures reached a record high in 2018. In this uncertain environment, we believe the Fund is well positioned to continue to provide shareholders with high-quality access to the municipal market.
The Fund will maintain a neutral duration posture relative to the benchmark with a curve allocation that seeks to optimize the roll-down benefit of the relatively steep municipal curve. Sector weightings favor an overweight to revenue-backed issues over general obligation debt. A neutral credit posture overall is appropriate given relatively narrow credit spreads. Opportunities for additional yield will be sought through bottom-up credit analysis as well as through security structure and cash flow optionality.
Baird Short-Term Municipal Bond Fund
December 31, 2018 (Unaudited)
Portfolio Characteristics
Quality Distribution(1)(2)
 | | Net Assets | $345,178,402 | |
| | | | |
| | SEC 30-Day | | |
| | Yield(4) | | |
| | Institutional Class | 2.21% | |
| | Investor Class | 2.02% | |
| | | | |
| | Average | | |
| | Effective | | |
| | Duration | 2.44 years | |
| | | | |
| | Average | | |
| | Effective | | |
| | Maturity | 2.76 years | |
| | | | |
| | Annualized | | |
| | Expense | | |
| | | Ratio(5) | | |
Sector Weightings(1) | | Institutional Class | 0.30% | |
| | | Investor Class | 0.55% | (6) |
 | | | | |
| | Portfolio | | |
| | Turnover Rate | 107% | |
| | | | |
| | Number of | | |
| | Holdings | 980 | |
| | | | |
| | | | |
| | | | |
| | | | |
| | | | |
| | | | |
| | | | |
| | | | |
| | | | |
| | | | | |
(1) | Percentages shown are based on the Fund’s total investments. |
(2) | The quality profile is calculated on a market value-weighted basis using the highest credit quality rating for each security held by the Fund given by S&P, Moody’s or Fitch, each of which is a Nationally Recognized Statistical Rating Organization (NRSRO). NRSROs rate the credit quality of securities using a scale that generally ranges from AAA (highest) to D (lowest). |
(3) | Includes pre-refunded and escrowed-to-maturity (ETM) bonds. |
(4) | SEC yields are based on SEC guidelines and are calculated for the 30 days ended December 31, 2018. |
(5) | Reflects expense ratios as stated in the Fund’s current prospectus. |
(6) | Includes 0.25% 12b-1 fee. |
Baird Short-Term Municipal Bond Fund
December 31, 2018 (Unaudited)
Institutional ClassValue of a $25,000 Investment
Growth of a hypothetical investment of $25,000 made on the Fund’s inception date (8/31/15), assuming reinvestment of all distributions.
Investor Class
Value of a $10,000 Investment
Growth of a hypothetical investment of $10,000 made on the Fund’s inception date (8/31/15), assuming reinvestment of all distributions.
Baird Short-Term Municipal Bond Fund
December 31, 2018 (Unaudited)
Total Returns
| | | Average Annual |
| | One | Three | Since |
| For the Periods Ended December 31, 2018 | Year | Years | Inception(1) |
| Institutional Class Shares | 1.75% | 1.76% | 1.87% |
| Investor Class Shares | 1.52% | 1.45% | 1.57% |
Bloomberg Barclays Short (1-5 Year) Municipal Bond Index(2) | 1.77% | 1.15% | 1.15% |
| (1) | For the period from August 31, 2015 (inception date) through December 31, 2018. |
| (2) | The Bloomberg Barclays Short (1-5 Year) Municipal Bond Index is an unmanaged, market value weighted index that measures the performance of investment-grade, tax-exempt, and fixed-rated municipal securities with time to maturity of more than one year and less than five years. Securities must have an outstanding par value of at least $7 million and be issued as part of a transaction of at least $75 million. The bonds must be fixed rate, have a dated-date after December 31, 1990, and must be at least one year from their maturity date. This Index does not reflect any deduction for fees, expenses or taxes. A direct investment in an index is not possible. |
The line graph on the previous page and the returns shown in the table above reflect reinvestment of dividends and/or capital gains distributions in additional shares. The returns do not reflect the deduction of taxes that a shareholder would pay on Fund distributions or the redemption of Fund shares. The returns reflect the actual performance for each period and do not include the impact of trades executed on the last business day of the period that were recorded on the first business day of the next period.
The Fund’s gross expense ratio for each Class, as reflected in the Fund’s current prospectus, is set forth under “Portfolio Characteristics”.
The Fund may invest up to 10% of its net assets in non-investment grade debt securities (commonly referred to as “high yield” bonds). While these types of debt securities typically offer higher yields than investment grade securities, they also include greater risks including increased credit risk and the increased risk of default or bankruptcy. The Fund may invest up to 25% of its total assets in municipal obligations issued by persons in the same state. As a result, changes in economic, business or political conditions of a particular state may have a disproportionate impact on the Fund’s share price. Municipal securities investments are not appropriate for all investors, especially those taxed at lower rates.
Past performance does not guarantee future results. Investment return and principal value will fluctuate so that an investor’s shares, when redeemed, may be worth more or less than their original cost.
For information about the performance of the Fund as of the most recent month-end, please call 1-866-44BAIRD or visit www.bairdfunds.com. Mutual fund performance changes over time and current performance may be lower or higher than that stated.
Baird Short-Term Municipal Bond Fund
Summary Schedule of Investments, December 31, 2018
This schedule summarizes the Fund’s holdings by asset type. Details are reported for each of the Fund’s 50 largest individual holdings and for investments that, in total for any issuer, represent more than 1% of the Fund’s net assets. The total value of smaller holdings is reported as a single amount within each category.
The Fund reports a complete list of its holdings in regulatory filings four times in each fiscal year, at the quarter end. For the second and fourth fiscal quarters, the complete listing of the Fund’s holdings is available electronically at http://www.bairdassetmanagement.com/baird-funds/funds-and-performance#Literature and in the Fund’s Form N-CSR on the Securities and Exchange Commission’s website (www.sec.gov) or you can have it mailed to you without charge by calling 1-866-44BAIRD. For the first and third fiscal quarters, the Fund files the lists with the SEC on Form N-Q or, beginning with filings after March 31, 2019, on Part F of Form N-PORT. Shareholders can look up the Fund’s Forms N-CSR, N-Q or Part F of Form N-PORT on the SEC’s website (www.sec.gov).
Long-Term Investments
| | | Principal | | | | | | % of | |
| | | Amount | | | Value | | | Net Assets | |
| Municipal Bonds | | | | | | | | | |
| Alabama | | | | | | | | | |
| Total Alabama | | | | | | | | | |
(Cost $3,199,043)(1)(8) | | | | | $ | 3,181,411 | | | | 0.9 | % |
| Alaska | | | | | | | | | | | |
| Alaska Housing Finance Corp. | | | | | | | | | | | |
| 4.000%, 12/01/2048(Callable 06/01/2027) | | $ | 1,485,000 | | | | 1,568,472 | | | | 0.5 | % |
Other Alaska(8) | | | | | | | 755,625 | | | | 0.2 | % |
| Total Alaska | | | | | | | | | | | | |
| (Cost $2,325,847) | | | | | | | 2,324,097 | | | | 0.7 | % |
| Arizona | | | | | | | | | | | | |
| Total Arizona | | | | | | | | | | | | |
(Cost $5,400,270)(1)(2)(3)(8) | | | | | | | 5,375,706 | | | | 1.6 | % |
| Arkansas | | | | | | | | | | | | |
| City of Little Rock AR | | | | | | | | | | | | |
| 2.375%, 04/01/2028(Callable 10/01/2022) | | | 1,390,000 | | | | 1,408,695 | | | | 0.4 | % |
| City of Rogers AR | | | | | | | | | | | | |
| 3.250%, 11/01/2043(Callable 11/01/2026) | | | 2,000,000 | | | | 2,022,260 | | | | 0.6 | % |
Other Arkansas(1)(8) | | | | | | | 7,023,020 | | | | 2.0 | % |
| Total Arkansas | | | | | | | | | | | | |
| (Cost $10,393,208) | | | | | | | 10,453,975 | | | | 3.0 | % |
| California | | | | | | | | | | | | |
| California Health Facilities Financing Authority | | | | | | | | | | | | |
| 1.000%, 08/15/2053 | | | 2,000,000 | | | | 1,985,980 | | | | 0.6 | % |
Other California(1)(2)(5)(8) | | | | | | | 9,159,312 | | | | 2.7 | % |
| Total California | | | | | | | | | | | | |
| (Cost $11,084,367) | | | | | | | 11,145,292 | | | | 3.3 | % |
| Colorado | | | | | | | | | | | | |
| Total Colorado | | | | | | | | | | | | |
(Cost $9,988,055)(1)(2)(8) | | | | | | | 9,973,866 | | | | 2.9 | % |
The accompanying notes are an integral part of these financial statements.
Baird Short-Term Municipal Bond Fund
Summary Schedule of Investments, December 31, 2018
Long-Term Investments (cont.)
| | | Principal | | | | | | % of | |
| | | Amount | | | Value | | | Net Assets | |
| Connecticut | | | | | | | | | |
| State of Connecticut | | | | | | | | | |
| 5.000%, 10/01/2027(Callable 10/01/2023) | | $ | 1,000,000 | | | $ | 1,101,270 | | | | 0.3 | % |
| Town of Hamden CT | | | | | | | | | | | | |
| 5.000%, 08/15/2021(ETM) | | | 1,080,000 | | | | 1,163,894 | | | | 0.3 | % |
Other Connecticut(1)(8) | | | | | | | 4,665,675 | | | | 1.4 | % |
| Total Connecticut | | | | | | | | | | | | |
| (Cost $6,921,005) | | | | | | | 6,930,839 | | | | 2.0 | % |
| District of Columbia | | | | | | | | | | | | |
| Total District of Columbia | | | | | | | | | | | | |
(Cost $2,760,285)(1)(8) | | | | | | | 2,766,876 | | | | 0.8 | % |
| Florida | | | | | | | | | | | | |
| Escambia County Health Facilities Authority | | | | | | | | | | | | |
| 1.770%, 11/15/2029 | | | | | | | | | | | | |
(Optional Put Date 01/02/2019)(Insured by AGC)(1) | | | 1,110,000 | | | | 1,110,000 | | | | 0.3 | % |
| Highlands County Health Facilities Authority | | | | | | | | | | | | |
| 1.710%, 11/15/2037(Callable 01/02/2019) | | | | | | | | | | | | |
(Optional Put Date 01/07/2019)(1) | | | 2,000,000 | | | | 2,000,000 | | | | 0.6 | % |
| Jacksonville Housing Finance Authority | | | | | | | | | | | | |
| 2.250%, 12/01/2021 | | | | | | | | | | | | |
(Mandatory Tender Date 12/01/2020)(1) | | | 1,500,000 | | | | 1,499,430 | | | | 0.4 | % |
| St. Lucie County School Board | | | | | | | | | | | | |
| 5.000%, 07/01/2027(Callable 07/01/2023) | | | 1,150,000 | | | | 1,266,357 | | | | 0.4 | % |
Other Florida(1)(8) | | | | | | | 12,367,868 | | | | 3.6 | % |
| Total Florida | | | | | | | | | | | | |
| (Cost $18,261,259) | | | | | | | 18,243,655 | | | | 5.3 | % |
| Georgia | | | | | | | | | | | | |
| Gainesville & Hall County Hospital Authority | | | | | | | | | | | | |
| 2.660%, 08/15/2035 (SIFMA Municipal | | | | | | | | | | | | |
| Swap Index + 0.950%)(Callable 08/22/2019) | | | | | | | | | | | | |
(Mandatory Tender Date 02/18/2020)(2) | | | 1,225,000 | | | | 1,226,053 | | | | 0.3 | % |
Other Georgia(1)(2)(8) | | | | | | | 4,340,465 | | | | 1.3 | % |
| Total Georgia | | | | | | | | | | | | |
| (Cost $5,573,826) | | | | | | | 5,566,518 | | | | 1.6 | % |
| Idaho | | | | | | | | | | | | |
| University of Idaho | | | | | | | | | | | | |
| 5.250%, 04/01/2041 | | | | | | | | | | | | |
(Mandatory Tender Date 04/01/2021)(1) | | | 1,475,000 | | | | 1,569,931 | | | | 0.5 | % |
| Total Idaho | | | | | | | | | | | | |
| (Cost $1,590,711) | | | | | | | 1,569,931 | | | | 0.5 | % |
| Illinois | | | | | | | | | | | | |
| Chicago Park District | | | | | | | | | | | | |
| 5.000%, 01/01/2024 | | | 1,305,000 | | | | 1,423,964 | | | | 0.4 | % |
| City of Burbank IL | | | | | | | | | | | | |
| 4.000%, 12/01/2021(Insured by BAM) | | | 1,500,000 | | | | 1,543,980 | | | | 0.4 | % |
The accompanying notes are an integral part of these financial statements.
Baird Short-Term Municipal Bond Fund
Summary Schedule of Investments, December 31, 2018
Long-Term Investments (cont.)
| | | Principal | | | | | | % of | |
| | | Amount | | | Value | | | Net Assets | |
| Cook County School District No. 130 | | | | | | | | | |
| 5.000%, 12/01/2025(Insured by AGM) | | $ | 1,320,000 | | | $ | 1,491,560 | | | | 0.4 | % |
| Illinois Finance Authority | | | | | | | | | | | | |
| 1.750%, 07/01/2042 | | | | | | | | | | | | |
(Mandatory Tender Date 05/06/2020)(1) | | | 1,205,000 | | | | 1,196,119 | | | | 0.3 | % |
| Southern Illinois University | | | | | | | | | | | | |
| 5.250%, 04/01/2019(Insured by NATL) | | | 1,390,000 | | | | 1,398,729 | | | | 0.4 | % |
Other Illinois(1)(2)(5)(6)(8) | | | | | | | 34,451,296 | | | | 10.0 | % |
| Total Illinois | | | | | | | | | | | | |
| (Cost $41,478,510) | | | | | | | 41,505,648 | | | | 11.9 | % |
| Indiana | | | | | | | | | | | | |
| Total Indiana | | | | | | | | | | | | |
(Cost $13,690,438)(1)(2)(8) | | | | | | | 13,694,286 | | | | 4.0 | % |
| Iowa | | | | | | | | | | | | |
| Total Iowa | | | | | | | | | | | | |
(Cost $4,748,739)(1)(2)(5)(8) | | | | | | | 4,780,437 | | | | 1.4 | % |
| Kansas | | | | | | | | | | | | |
| Public Building Commission of Johnson County | | | | | | | | | | | | |
| 5.000%, 09/01/2023 | | | 1,310,000 | | | | 1,484,034 | | | | 0.4 | % |
Other Kansas(2)(8) | | | | | | | 1,450,200 | | | | 0.4 | % |
| Total Kansas | | | | | | | | | | | | |
| (Cost $2,929,534) | | | | | | | 2,934,234 | | | | 0.8 | % |
| Kentucky | | | | | | | | | | | | |
| Total Kentucky | | | | | | | | | | | | |
(Cost $4,440,039)(1)(8) | | | | | | | 4,431,512 | | | | 1.3 | % |
| Louisiana | | | | | | | | | | | | |
| Louisiana Local Government Environmental | | | | | | | | | | | | |
| Facilities & Community Development Authority | | | | | | | | | | | | |
| 5.500%, 10/01/2025(Pre-refunded to 10/01/2020) | | | 1,050,000 | | | | 1,114,522 | | | | 0.3 | % |
| Louisiana Public Facilities Authority | | | | | | | | | | | | |
| 5.500%, 05/15/2027(Pre-refunded to 05/15/2026) | | | 2,000,000 | | | | 2,376,940 | | | | 0.7 | % |
Other Louisiana(8) | | | | | | | 2,927,043 | | | | 0.8 | % |
| Total Louisiana | | | | | | | | | | | | |
| (Cost $6,411,890) | | | | | | | 6,418,505 | | | | 1.8 | % |
| Maine | | | | | | | | | | | | |
| Total Maine | | | | | | | | | | | | |
(Cost $538,519)(8) | | | | | | | 528,733 | | | | 0.2 | % |
| Maryland | | | | | | | | | | | | |
| Maryland Health & Higher Educational Facilities Authority | | | | | | | | | | | | |
| 5.000%, 07/01/2027(ETM)(Insured by AMBAC) | | | 2,300,000 | | | | 2,604,313 | | | | 0.8 | % |
Other Maryland(8) | | | | | | | 516,588 | | | | 0.1 | % |
| Total Maryland | | | | | | | | | | | | |
| (Cost $3,112,454) | | | | | | | 3,120,901 | | | | 0.9 | % |
The accompanying notes are an integral part of these financial statements.
Baird Short-Term Municipal Bond Fund
Summary Schedule of Investments, December 31, 2018
Long-Term Investments (cont.)
| | | Principal | | | | | | % of | |
| | | Amount | | | Value | | | Net Assets | |
| Massachusetts | | | | | | | | | |
| Massachusetts Housing Finance Agency | | | | | | | | | |
| 2.400%, 12/01/2023 | | | | | | | | | |
(Mandatory Tender Date 12/01/2021)(1) | | $ | 1,745,000 | | | $ | 1,748,403 | | | | 0.5 | % |
Other Massachusetts(1)(2)(8) | | | | | | | 3,038,067 | | | | 0.9 | % |
| Total Massachusetts | | | | | | | | | | | | |
| (Cost $4,791,814) | | | | | | | 4,786,470 | | | | 1.4 | % |
| Michigan | | | | | | | | | | | | |
| Michigan Finance Authority | | | | | | | | | | | | |
| 5.000%, 07/01/2025(Callable 07/01/2024) | | | | | | | | | | | | |
| (Insured by AGM) | | | 1,475,000 | | | | 1,672,930 | | | | 0.5 | % |
| Michigan State Housing Development Authority | | | | | | | | | | | | |
| 4.000%, 06/01/2046(Callable 12/01/2024) | | | 1,060,000 | | | | 1,100,354 | | | | 0.3 | % |
Other Michigan(1)(2)(8) | | | | | | | 6,249,556 | | | | 1.8 | % |
| Total Michigan | | | | | | | | | | | | |
| (Cost $8,997,658) | | | | | | | 9,022,840 | | | | 2.6 | % |
| Minnesota | | | | | | | | | | | | |
| Jordan Independent School District No. 717 | | | | | | | | | | | | |
| 5.000%, 02/01/2035(Callable 02/01/2023) | | | | | | | | | | | | |
| (Insured by SD CRED PROG) | | | 1,000,000 | | | | 1,107,380 | | | | 0.3 | % |
Other Minnesota(1)(5)(8) | | | | | | | 9,687,843 | | | | 2.8 | % |
| Total Minnesota | | | | | | | | | | | | |
| (Cost $10,798,518) | | | | | | | 10,795,223 | | | | 3.1 | % |
| Mississippi | | | | | | | | | | | | |
| Mississippi Home Corp. | | | | | | | | | | | | |
| 2.400%, 02/01/2022 | | | | | | | | | | | | |
(Mandatory Tender Date 08/01/2021)(1) | | | 2,500,000 | | | | 2,498,725 | | | | 0.7 | % |
Other Mississippi(1)(2)(8) | | | | | | | 2,226,426 | | | | 0.6 | % |
| Total Mississippi | | | | | | | | | | | | |
| (Cost $4,730,989) | | | | | | | 4,725,151 | | | | 1.3 | % |
| Missouri | | | | | | | | | | | | |
| Total Missouri | | | | | | | | | | | | |
(Cost $4,358,312)(1)(5)(8) | | | | | | | 4,361,150 | | | | 1.3 | % |
| Montana | | | | | | | | | | | | |
| Montana Board of Housing | | | | | | | | | | | | |
| 4.000%, 12/01/2043(Callable 12/01/2027) | | | 1,110,000 | | | | 1,165,400 | | | | 0.3 | % |
| 4.000%, 06/01/2049(Callable 12/01/2027) | | | | | | | | | | | | |
| (Insured by FHA) | | | 1,270,000 | | | | 1,335,011 | | | | 0.4 | % |
Other Montana(8) | | | | | | | 128,256 | | | | 0.0 | % |
| Total Montana | | | | | | | | | | | | |
| (Cost $2,642,837) | | | | | | | 2,628,667 | | | | 0.7 | % |
The accompanying notes are an integral part of these financial statements.
Baird Short-Term Municipal Bond Fund
Summary Schedule of Investments, December 31, 2018
Long-Term Investments (cont.)
| | | Principal | | | | | | % of | |
| | | Amount | | | Value | | | Net Assets | |
| Nebraska | | | | | | | | | |
| Central Plains Energy Project | | | | | | | | | |
| 5.000%, 09/01/2042(Callable 09/01/2022) | | $ | 1,035,000 | | | $ | 1,105,856 | | | | 0.3 | % |
Other Nebraska(1)(8) | | | | | | | 2,255,041 | | | | 0.7 | % |
| Total Nebraska | | | | | | | | | | | | |
| (Cost $3,364,092) | | | | | | | 3,360,897 | | | | 1.0 | % |
| Nevada | | | | | | | | | | | | |
| Total Nevada | | | | | | | | | | | | |
(Cost $1,225,598)(1)(8) | | | | | | | 1,235,613 | | | | 0.4 | % |
| New Jersey | | | | | | | | | | | | |
| Total New Jersey | | | | | | | | | | | | |
(Cost $7,812,343)(1)(8) | | | | | | | 7,824,333 | | | | 2.3 | % |
| New Mexico | | | | | | | | | | | | |
| New Mexico Municipal Energy Acquisition Authority | | | | | | | | | | | | |
| 2.324%, 11/01/2039 (1 Month | | | | | | | | | | | | |
| LIBOR USD + 0.750%)(Callable 02/01/2019) | | | | | | | | | | | | |
(Mandatory Tender Date 08/01/2019)(2) | | | 1,360,000 | | | | 1,360,231 | | | | 0.4 | % |
Other New Mexico(2)(8) | | | | | | | 1,093,264 | | | | 0.3 | % |
| Total New Mexico | | | | | | | | | | | | |
| (Cost $2,453,413) | | | | | | | 2,453,495 | | | | 0.7 | % |
| New York | | | | | | | | | | | | |
| Total New York | | | | | | | | | | | | |
(Cost $6,864,242)(1)(2)(8) | | | | | | | 6,859,518 | | | | 2.0 | % |
| North Carolina | | | | | | | | | | | | |
| State of North Carolina | | | | | | | | | | | | |
| 5.000%, 05/01/2024(Callable 05/01/2023) | | | 1,250,000 | | | | 1,403,587 | | | | 0.4 | % |
Other North Carolina(1)(8) | | | | | | | 3,772,813 | | | | 1.1 | % |
| Total North Carolina | | | | | | | | | | | | |
| (Cost $5,166,414) | | | | | | | 5,176,400 | | | | 1.5 | % |
| North Dakota | | | | | | | | | | | | |
| City of Williston ND | | | | | | | | | | | | |
| 4.500%, 11/01/2026(Callable 11/01/2023) | | | 2,150,000 | | | | 2,291,878 | | | | 0.6 | % |
Other North Dakota(8) | | | | | | | 5,061,262 | | | | 1.5 | % |
| Total North Dakota | | | | | | | | | | | | |
| (Cost $7,314,321) | | | | | | | 7,353,140 | | | | 2.1 | % |
| Ohio | | | | | | | | | | | | |
| Ohio Higher Educational Facility Commission | | | | | | | | | | | | |
| 1.600%, 01/01/2039 | | | 1,250,000 | | | | 1,250,000 | | | | 0.4 | % |
| Ohio Turnpike & Infrastructure Commission | | | | | | | | | | | | |
| 5.500%, 02/15/2024 | | | 1,185,000 | | | | 1,342,878 | | | | 0.4 | % |
Other Ohio(1)(2)(8) | | | | | | | 7,377,347 | | | | 2.1 | % |
| Total Ohio | | | | | | | | | | | | |
| (Cost $9,951,183) | | | | | | | 9,970,225 | | | | 2.9 | % |
The accompanying notes are an integral part of these financial statements.
Baird Short-Term Municipal Bond Fund
Summary Schedule of Investments, December 31, 2018
Long-Term Investments (cont.)
| | | Principal | | | | | | % of | |
| | | Amount | | | Value | | | Net Assets | |
| Oklahoma | | | | | | | | | |
| Total Oklahoma | | | | | | | | | |
(Cost $3,531,257)(1)(2)(8) | | | | | $ | 3,541,177 | | | | 1.0 | % |
| Oregon | | | | | | | | | | | |
| State of Oregon Housing & Community Services Department | | | | | | | | | | | |
| 2.200%, 12/01/2021 | | | | | | | | | | | |
(Mandatory Tender Date 12/01/2020)(1) | | $ | 2,450,000 | | | | 2,449,069 | | | | 0.7 | % |
| 4.500%, 01/01/2049(Callable 07/01/2027) | | | 1,480,000 | | | | 1,589,683 | | | | 0.5 | % |
| 3.500%-4.500%, 07/01/2036-07/01/2049 | | | 600,000 | | | | 638,520 | | | | 0.2 | % |
Other Oregon(1)(8) | | | | | | | 2,891,197 | | | | 0.8 | % |
| Total Oregon | | | | | | | | | | | | |
| (Cost $7,589,705) | | | | | | | 7,568,469 | | | | 2.2 | % |
| Pennsylvania | | | | | | | | | | | | |
| Pennsylvania Economic Development Financing Authority | | | | | | | | | | | | |
| 0.450%, 12/01/2030 | | | 2,000,000 | | | | 2,000,000 | | | | 0.6 | % |
| Pennsylvania Housing Finance Agency | | | | | | | | | | | | |
| 2.450%, 07/01/2022 | | | | | | | | | | | | |
(Mandatory Tender Date 07/01/2021)(1) | | | 2,500,000 | | | | 2,503,600 | | | | 0.7 | % |
Other Pennsylvania(1)(2)(8) | | | | | | | 9,353,029 | | | | 2.7 | % |
| Total Pennsylvania | | | | | | | | | | | | |
| (Cost $13,851,693) | | | | | | | 13,856,629 | | | | 4.0 | % |
| Puerto Rico | | | | | | | | | | | | |
| Total Puerto Rico | | | | | | | | | | | | |
(Cost $985,002)(7)(8) | | | | | | | 989,162 | | | | 0.3 | % |
| Rhode Island | | | | | | | | | | | | |
| Total Rhode Island | | | | | | | | | | | | |
(Cost $1,137,306)(8) | | | | | | | 1,137,009 | | | | 0.3 | % |
| South Carolina | | | | | | | | | | | | |
| Greenwood Fifty School Facilities, Inc. | | | | | | | | | | | | |
| 5.000%, 12/01/2027 | | | 1,000,000 | | | | 1,154,980 | | | | 0.3 | % |
| South Carolina Jobs-Economic Development Authority | | | | | | | | | | | | |
| 6.500%, 08/01/2039(Pre-refunded to 08/01/2021) | | | | | | | | | | | | |
| (Insured by AGM) | | | 1,550,000 | | | | 1,728,513 | | | | 0.5 | % |
Other South Carolina(1)(8) | | | | | | | 5,377,691 | | | | 1.6 | % |
| Total South Carolina | | | | | | | | | | | | |
| (Cost $8,252,577) | | | | | | | 8,261,184 | | | | 2.4 | % |
| Tennessee | | | | | | | | | | | | |
| Total Tennessee | | | | | | | | | | | | |
(Cost $5,555,497)(1)(8) | | | | | | | 5,541,550 | | | | 1.6 | % |
| Texas | | | | | | | | | | | | |
| Dallas Independent School District | | | | | | | | | | | | |
| 5.000%, 02/15/2036(Mandatory Tender Date | | | | | | | | | | | | |
02/15/2022)(PSF Guaranteed)(1) | | | 1,560,000 | | | | 1,695,751 | | | | 0.5 | % |
| Decatur Hospital Authority | | | | | | | | | | | | |
| 5.750%, 09/01/2029(ETM) | | | 1,610,000 | | | | 1,927,025 | | | | 0.6 | % |
The accompanying notes are an integral part of these financial statements.
Baird Short-Term Municipal Bond Fund
Summary Schedule of Investments, December 31, 2018
Long-Term Investments (cont.)
| | | Principal | | | | | | % of | |
| | | Amount | | | Value | | | Net Assets | |
| Mansfield Independent School District | | | | | | | | | |
| 2.500%, 08/01/2042(Mandatory Tender Date | | | | | | | | | |
08/01/2021)(PSF Guaranteed)(1) | | $ | 1,515,000 | | | $ | 1,525,560 | | | | 0.4 | % |
| Wink-Loving Independent School District | | | | | | | | | | | | |
| 5.000%, 02/15/2026(Callable 02/15/2023) | | | | | | | | | | | | |
| (PSF Guaranteed) | | | 1,970,000 | | | | 2,193,319 | | | | 0.6 | % |
| 5.000%, 02/15/2027(Callable 02/15/2023) | | | | | | | | | | | | |
| (PSF Guaranteed) | | | 2,350,000 | | | | 2,613,435 | | | | 0.8 | % |
Other Texas(1)(2)(5)(6)(8) | | | | | | | 30,439,137 | | | | 8.8 | % |
| Total Texas | | | | | | | | | | | | |
| (Cost $40,268,401) | | | | | | | 40,394,227 | | | | 11.7 | % |
| Utah | | | | | | | | | | | | |
| Total Utah | | | | | | | | | | | | |
(Cost $875,348)(1)(8) | | | | | | | 874,929 | | | | 0.3 | % |
| Vermont | | | | | | | | | | | | |
| Vermont Housing Finance Agency | | | | | | | | | | | | |
| 4.000%, 11/01/2048(Callable 05/01/2027) | | | 1,500,000 | | | | 1,577,670 | | | | 0.5 | % |
Other Vermont(1)(8) | | | | | | | 1,386,095 | | | | 0.4 | % |
| Total Vermont | | | | | | | | | | | | |
| (Cost $2,974,342) | | | | | | | 2,963,765 | | | | 0.9 | % |
| Virgin Islands | | | | | | | | | | | | |
| Total Virgin Islands | | | | | | | | | | | | |
(Cost $104,777)(8) | | | | | | | 103,263 | | | | 0.0 | % |
| Virginia | | | | | | | | | | | | |
| Total Virginia | | | | | | | | | | | | |
(Cost $978,767)(1)(8) | | | | | | | 980,034 | | | | 0.3 | % |
| Washington | | | | | | | | | | | | |
| Total Washington | | | | | | | | | | | | |
(Cost $2,253,980)(1)(2)(8) | | | | | | | 2,250,691 | | | | 0.7 | % |
| West Virginia | | | | | | | | | | | | |
| Total West Virginia | | | | | | | | | | | | |
(Cost $122,696)(8) | | | | | | | 122,105 | | | | 0.0 | % |
| Wisconsin | | | | | | | | | | | | |
| Public Finance Authority | | | | | | | | | | | | |
| 8.375%, 06/01/2037(Pre-refunded to 06/01/2022) | | | 1,075,000 | | | | 1,276,337 | | | | 0.4 | % |
| 8.625%, 06/01/2047(Pre-refunded to 06/01/2022) | | | 1,250,000 | | | | 1,500,363 | | | | 0.4 | % |
| 3.000%-4.000%, 01/01/2020-11/15/2022 | | | 1,415,000 | | | | 1,426,800 | | | | 0.4 | % |
| Village of Sussex WI | | | | | | | | | | | | |
| 3.000%, 06/01/2023(Callable 06/01/2022) | | | 1,155,000 | | | | 1,179,209 | | | | 0.3 | % |
| Wisconsin Health & Educational Facilities Authority | | | | | | | | | | | | |
| 2.650%-5.500%, 02/15/2019-11/15/2043 | | | 5,340,000 | | | | 5,553,576 | | | | 1.6 | % |
Other Wisconsin(1)(8) | | | | | | | 5,377,182 | | �� | | 1.6 | % |
| Total Wisconsin | | | | | | | | | | | | |
| (Cost $16,323,942) | | | | | | | 16,313,467 | | | | 4.7 | % |
The accompanying notes are an integral part of these financial statements.
Baird Short-Term Municipal Bond Fund
Summary Schedule of Investments, December 31, 2018
Long-Term Investments (cont.)
| | | Principal | | | | | | % of | |
| | | Amount | | | Value | | | Net Assets | |
| Wyoming | | | | | | | | | |
| Wyoming Community Development Authority | | | | | | | | | |
| 4.000%, 12/01/2043(Callable 06/01/2027) | | $ | 1,500,000 | | | $ | 1,565,805 | | | | 0.5 | % |
| Total Wyoming | | | | | | | | | | | | |
| (Cost $1,570,189) | | | | | | | 1,565,805 | | | | 0.5 | % |
| Total Long-Term Investments | | | | | | | | | | | | |
| (Cost $341,695,212) | | | | | | | 341,963,010 | | | | 99.1 | % |
| Short-Term Investment | | | | | | | | | | | | |
| | | Shares | | | | | | | | | |
| Money Market Mutual Fund | | | | | | | | | | | | |
| Fidelity Institutional Money Market Fund – | | | | | | | | | | | | |
Government Portfolio, Institutional Class, 2.29%(4) | | | 1,826,316 | | | | 1,826,316 | | | | 0.5 | % |
| Total Short-Term Investment | | | | | | | | | | | | |
| (Cost $1,826,316) | | | | | | | 1,826,316 | | | | 0.5 | % |
| Total Investments | | | | | | | | | | | | |
| (Cost $343,521,528) | | | | | | | 343,789,326 | | | | 99.6 | % |
| Other Assets in Excess of Liabilities | | | | | | | 1,389,076 | | | | 0.4 | % |
| TOTAL NET ASSETS | | | | | | $ | 345,178,402 | | | | 100.0 | % |
Notes to Summary Schedule of Investments
AGC – Assured Guaranty Corp.
AGM – Assured Guaranty Municipal
AMBAC – Ambac Assurance Corp.
BAM – Build America Mutual Assurance Co.
FHA – Federal Housing Administration
NATL – National Public Finance Guarantee Corp.
SD CRED PROG – State Credit Enhancement Program
| (1) | Variable rate security, or group of securities contain a variable rate security. The rate reported is the rate in effect as of December 31, 2018. |
| (2) | Variable rate security, or group of securities contain a variable rate security, based on a reference index and spread. The rate reported is the rate in effect as of December 31, 2018. |
| (3) | Security, or group of securities contain a security, issued under Rule 144A under the Securities Act of 1933 and determined to be liquid. Purchased in a private placement transaction; resale to the public may require registration or may extend only to qualified institutional buyers. At December 31, 2018, the value of these securities total $219,364, which represents 0.06% of total net assets. |
| (4) | 7-Day Yield. |
| (5) | Auction Rate Security, or group of securities contain an auction rate security. An Auction Rate Security is a debt instrument with a long nominal maturity for which the interest rate is regularly reset through a Dutch auction. The rate presented is either the rate set through the auction or the maximum interest rate provided for in the security issuance provision. |
| (6) | Security or a portion of the security, or group of securities contain a security, purchased on a when-issued or delayed delivery basis. |
| (7) | Security in default, or group of securities contain a security in default. |
| (8) | Represents the aggregate value, by category, of securities that are not among the 50 largest holdings and, in total for any issuer, represent 1% or less of net assets. |
The accompanying notes are an integral part of these financial statements.
Baird Short-Term Municipal Bond Fund
Summary Schedule of Investments, December 31, 2018
Summary of Fair Value Exposure at December 31, 2018
The Fund has adopted authoritative fair valuation accounting standards which establish a definition of fair value and set out a hierarchy for measuring fair value. These standards require additional disclosures about the various inputs and valuation techniques used to develop the measurements of fair value and a discussion on changes in valuation techniques and related inputs during the period. These standards define fair value as the price that would be received to sell an asset or paid to transfer a liability in an orderly transaction between market participants at the measurement date.
The fair value hierarchy is organized into three levels based upon the assumptions (referred to as “inputs”) used in pricing the asset or liability. These standards state that “observable inputs” reflect the assumptions market participants would use in pricing the asset or liability based on market data obtained from independent sources and “unobservable inputs” reflect an entity’s own assumptions about the assumptions market participants would use in pricing the asset or liability. These inputs are summarized into three broad levels and described below:
Level 1 – | Unadjusted quoted prices in active markets for identical unrestricted securities. |
Level 2 – | Other significant observable inputs (including quoted prices for similar securities, quoted prices in inactive markets, dealer indications, interest rates, yield curves, prepayment speeds, credit risk, default rates, inputs corroborated by observable market data, etc.). |
Level 3 – | Significant unobservable inputs (including the Fund’s own assumptions about the factors that market participants would use in valuing the security) based on the best information available. |
The inputs or methodology used for valuing securities are not necessarily an indication of the risk associated with investing in those securities.
The following is a summary of the inputs used to value the Fund’s investments as of December 31, 2018:
| | | Level 1 | | | Level 2 | | | Level 3 | | | Total | |
| Long-Term Investments | | | | | | | | | | | | |
| Municipal Bonds | | $ | — | | | $ | 341,963,010 | | | $ | — | | | $ | 341,963,010 | |
| Total Long-Term Investments | | | — | | | | 341,963,010 | | | | — | | | | 341,963,010 | |
| Short-Term Investment | | | | | | | | | | | | | | | | |
| Money Market Mutual Fund | | | 1,826,316 | | | | — | | | | — | | | | 1,826,316 | |
| Total Short-Term Investment | | | 1,826,316 | | | | — | | | | — | | | | 1,826,316 | |
| Total Investments | | $ | 1,826,316 | | | $ | 341,963,010 | | | $ | — | | | $ | 343,789,326 | |
Changes in valuation techniques may result in transfers into or out of assigned levels within the fair value hierarchy. There were no transfers into or out of Level 3 during the reporting period, as compared to the security classifications from the prior year’s annual report. See Fund’s Valuation Policy in Note 2a to the financial statements.
The accompanying notes are an integral part of these financial statements.
Baird Quality Intermediate Municipal Bond Fund
December 31, 2018 (Unaudited)
The Baird Quality Intermediate Municipal Bond Fund seeks current income that is exempt from federal income tax. As a reminder, the Fund maintains a quality focus and there are several key strategies employed on an ongoing basis that differentiate it from others in the intermediate municipal fund space. These include a consistent overweight among higher quality issues, with particular emphasis on AAA rated securities, a persistent overweight to U.S. government backed issues, and minimization of maturity extension risk.
Investors achieved positive returns in the tax-free municipal market in 2018 even with interest rates moving higher. The adjustment in rates was not uniform, however, as longer-term yields rose more than short-term yields. The steeper yield curve was driven by varying levels of demand along the curve; steady demand was evident from individual investors, minimizing the rise in short-term rates, while the appetite for longer-term bonds from institutional investors waned when corporate income tax rates fell to 21% from 35%. Another consequence of the tax law changes was the lack of advanced refunding issues in 2018, reducing municipal supply by one-quarter on a year-over-year basis. Fortunately, the credit backdrop for the municipal market improved on strong tax revenue growth, allowing municipalities to rebuild rainy-day reserves to record levels and municipal spreads to remain relatively stable.
During a challenging 2018, the Fund generated positive absolute returns and lagged its benchmark.
Positive contributors to the Fund’s relative performance include:
| | • | Sector weighting, particularly Pre-Refunded, General Obligation (GO) and Housing bonds |
| | | |
| | • | Favorable positioning along the yield curve |
Detractors from the Fund’s relative performance include:
| | • | Security selection |
| | | |
| | • | The overweight to higher quality issues. |
We hold a favorable outlook for the municipal market in 2019. We expect the level of supply to rise by an estimated 10% this year as the amount of new money borrowing continues to grow, helping finance necessary state and local infrastructure projects. The demand for municipals should also be more than sufficient for the available supply. For investors, interest rates are higher than they were a year ago and the tax-free yield curve is steeper, both of which should add to the appeal of the municipal market. If financial market volatility in the fourth quarter of 2018 is any indication of what may be in store for financial markets in 2019, then the relative stability and safety of the municipal market may be an attractive alternative for certain investors. The backdrop for municipal credit is also favorable and should continue to improve this year. If the U.S. economy continues to grow, even at a slowing pace, this will lead to higher tax revenues for state and local governments. Most municipalities have remained fiscally frugal in the post-financial crisis era, limiting new borrowing to only the most essential projects and directing any excess revenues into rainy day funds, when possible. In fact, reserve levels as a percentage of total expenditures reached a record high in 2018. In this uncertain environment, we believe the Fund is well positioned to continue to provide shareholders with high-quality access to the municipal market.
The Fund will maintain a neutral duration posture relative to the benchmark with a curve allocation that seeks to optimize the roll-down benefit of the relatively steep municipal curve. Sector weightings will strongly favor a focus on AAA-rated issues and the pre-refunded sector of the market. As available, the Fund will seek to also add high-quality tax-exempt Housing revenue bonds, which have U.S. Federal Agency support. Finally, the Fund will seek to add yield through security structure and cash flow optionality rather than credit.
Baird Quality Intermediate Municipal Bond Fund
December 31, 2018 (Unaudited)
Portfolio Characteristics
Quality Distribution(1)(2)
 | | Net Assets | $1,120,005,184 | |
| | | | |
| | SEC 30-Day | | |
| | Yield(4) | | |
| | Institutional Class | 2.23% | |
| | Investor Class | 1.96% | |
| | | | |
| | Average | | |
| | Effective | | |
| | Duration | 4.50 years | |
| | | | |
| | Average | | |
| | Effective | | |
| | Maturity | 4.86 years | |
| | | | |
| | | Annualized | | |
Sector Weightings(1) | | Expense | | |
| | | Ratio(5) | | |
 | | Institutional Class | 0.30% | |
| | Investor Class | 0.55% | (6) |
| | | | |
| | Portfolio | | |
| | Turnover Rate | 40% | |
| | | | |
| | Number of | | |
| | Holdings | 453 | |
| | | | |
| | | | |
| | | | |
| | | | |
| | | | |
| | | | |
| | | | |
| | | | | |
(1) | Percentages shown are based on the Fund’s total investments. |
(2) | The quality profile is calculated on a market value-weighted basis using the highest credit quality rating for each security held by the Fund given by S&P, Moody’s or Fitch, each of which is a Nationally Recognized Statistical Rating Organization (NRSRO). NRSROs rate the credit quality of securities using a scale that generally ranges from AAA (highest) to D (lowest). |
(3) | Includes pre-refunded and escrowed-to-maturity (ETM) bonds. |
(4) | SEC yields are based on SEC guidelines and are calculated for the 30 days ended December 31, 2018. |
(5) | Reflects expense ratios as stated in the Fund’s current prospectus. |
(6) | Includes 0.25% 12b-1 fee. |
Baird Quality Intermediate Municipal Bond Fund
December 31, 2018 (Unaudited)
Institutional ClassValue of a $25,000 Investment
Growth of a hypothetical investment of $25,000 made on 12/31/08, assuming reinvestment of all distributions.
Investor Class
Value of a $10,000 Investment
Growth of a hypothetical investment of $10,000 made on 12/31/08, assuming reinvestment of all distributions.
Baird Quality Intermediate Municipal Bond Fund
December 31, 2018 (Unaudited)
Total Returns
| | | Average Annual |
| | One | Five | Ten | Since |
| For the Periods Ended December 31, 2018 | Year | Years | Years | Inception(1) |
| Institutional Class Shares | 1.19% | 2.10% | 2.93% | 3.87% |
| Investor Class Shares | 0.90% | 1.85% | 2.68% | 3.60% |
| Bloomberg Barclays Quality Intermediate | | | | |
Municipal Bond Index(2) | 1.51% | 2.56% | 3.51% | 3.92% |
| (1) | For the period from March 30, 2001 (inception date) through December 31, 2018. |
| (2) | The Bloomberg Barclays Quality Intermediate Municipal Bond Index is an unmanaged, market value weighted index consisting of tax-exempt, fixed-rate securities that are rated A3 or better, with maturities between 2 and 12 years. Securities must have an outstanding par value of at least $7 million and be issued as part of a transaction of at least $75 million. The bonds must be fixed rate and have a dated-date after December 31, 1990. This Index does not reflect any deduction for fees, expenses or taxes. A direct investment in an index is not possible. |
The line graph on the previous page and the returns shown in the table above reflect reinvestment of dividends and/or capital gains distributions in additional shares. The returns do not reflect the deduction of taxes that a shareholder would pay on Fund distributions or the redemption of Fund shares. The returns reflect the actual performance for each period and do not include the impact of trades executed on the last business day of the period that were recorded on the first business day of the next period.
The Fund’s gross expense ratio for each Class, as reflected in the Fund’s current prospectus, is set forth under “Portfolio Characteristics”.
The Fund may invest up to 25% of its total assets in municipal obligations issued by persons in the same state. As a result, changes in economic, business or political conditions of a particular state may have a disproportionate impact on the Fund’s share price. Municipal securities investments are not appropriate for all investors, especially those taxed at lower rates.
Past performance does not guarantee future results. Investment return and principal value will fluctuate so that an investor’s shares, when redeemed, may be worth more or less than their original cost.
For information about the performance of the Fund as of the most recent month-end, please call 1-866-44BAIRD or visit www.bairdfunds.com. Mutual fund performance changes over time and current performance may be lower or higher than that stated.
Baird Quality Intermediate Municipal Bond Fund
Summary Schedule of Investments, December 31, 2018
This schedule summarizes the Fund’s holdings by asset type. Details are reported for each of the Fund’s 50 largest individual holdings and for investments that, in total for any issuer, represent more than 1% of the Fund’s net assets. The total value of smaller holdings is reported as a single amount within each category.
The Fund reports a complete list of its holdings in regulatory filings four times in each fiscal year, at the quarter end. For the second and fourth fiscal quarters, the complete listing of the Fund’s holdings is available electronically at http://www.bairdassetmanagement.com/baird-funds/funds-and-performance#Literature and in the Fund’s Form N-CSR on the Securities and Exchange Commission’s website (www.sec.gov) or you can have it mailed to you without charge by calling 1-866-44BAIRD. For the first and third fiscal quarters, the Fund files the lists with the SEC on Form N-Q or, beginning with filings after March 31, 2019, on Part F of Form N-PORT. Shareholders can look up the Fund’s Forms N-CSR, N-Q or Part F of Form N-PORT on the SEC’s website (www.sec.gov).
Long-Term Investments
| | | Principal | | | | | | % of | |
| | | Amount | | | Value | | | Net Assets | |
| Municipal Bonds | | | | | | | | | |
| Alaska | | | | | | | | | |
| Total Alaska | | | | | | | | | |
(Cost $2,802,015)(4) | | | | | $ | 2,798,945 | | | | 0.2 | % |
| Arizona | | | | | | | | | | | |
| Total Arizona | | | | | | | | | | | |
(Cost $1,650,836)(4) | | | | | | 1,659,593 | | | | 0.1 | % |
| Arkansas | | | | | | | | | | | |
| Total Arkansas | | | | | | | | | | | |
(Cost $9,702,397)(4) | | | | | | 9,613,289 | | | | 0.9 | % |
| California | | | | | | | | | | | |
| City of Bakersfield CA | | | | | | | | | | | |
| 0.000%, 04/15/2021(ETM) | | $ | 12,380,000 | | | | 11,864,868 | | | | 1.1 | % |
| Rio Hondo Community College District | | | | | | | | | | | | |
| 0.000%, 08/01/2042(Callable 08/01/2034) | | | 6,445,000 | | | | 6,748,044 | | | | 0.6 | % |
| San Joaquin Hills Transportation Corridor Agency | | | | | | | | | | | | |
| 0.000%, 01/01/2020(ETM) | | | 6,865,000 | | | | 6,750,423 | | | | 0.6 | % |
| 0.000%, 01/01/2023(ETM) | | | 14,005,000 | | | | 12,975,773 | | | | 1.2 | % |
| 0.000%, 01/01/2027-01/01/2028 | | | 2,150,000 | | | | 1,757,788 | | | | 0.2 | % |
| San Marcos Public Facilities Authority | | | | | | | | | | | | |
| 0.000%, 09/01/2019(ETM) | | | 17,495,000 | | | | 17,290,134 | | | | 1.5 | % |
Other California(1)(3)(4) | | | | | | | 25,388,712 | | | | 2.3 | % |
| Total California | | | | | | | | | | | | |
| (Cost $80,579,358) | | | | | | | 82,775,742 | | | | 7.5 | % |
| Colorado | | | | | | | | | | | | |
| Colorado Health Facilities Authority | | | | | | | | | | | | |
| 0.000%, 07/15/2022(ETM) | | | 6,505,000 | | | | 6,016,865 | | | | 0.5 | % |
| Dawson Ridge Metropolitan District No. 1 | | | | | | | | | | | | |
| 0.000%, 10/01/2022(ETM) | | | 38,235,000 | | | | 35,318,817 | | | | 3.2 | % |
| 0.000%, 10/01/2022(ETM) | | | 23,665,000 | | | | 21,860,070 | | | | 2.0 | % |
| Regional Transportation District | | | | | | | | | | | | |
| 4.375%, 06/01/2039(Callable 06/01/2023) | | | 5,725,000 | | | | 5,999,571 | | | | 0.5 | % |
Other Colorado(4) | | | | | | | 3,912,041 | | | | 0.3 | % |
| Total Colorado | | | | | | | | | | | | |
| (Cost $71,464,618) | | | | | | | 73,107,364 | | | | 6.5 | % |
The accompanying notes are an integral part of these financial statements.
Baird Quality Intermediate Municipal Bond Fund
Summary Schedule of Investments, December 31, 2018
Long-Term Investments (cont.)
| | | Principal | | | | | | % of | |
| | | Amount | | | Value | | | Net Assets | |
| Connecticut | | | | | | | | | |
| Total Connecticut | | | | | | | | | |
(Cost $3,342,102)(4) | | | | | $ | 3,320,866 | | | | 0.3 | % |
| District of Columbia | | | | | | | | | | | |
| Total District of Columbia | | | | | | | | | | | |
(Cost $1,007,741)(4) | | | | | | 1,019,777 | | | | 0.1 | % |
| Florida | | | | | | | | | | | |
| County of Miami-Dade FL | | | | | | | | | | | |
| 4.500%, 10/01/2020 | | | 7,100,000 | | | | 7,416,305 | | | | 0.7 | % |
| School District of Broward County | | | | | | | | | | | | |
| 5.250%, 07/01/2022(Pre-refunded to 07/01/2021) | | | 8,445,000 | | | | 9,146,104 | | | | 0.8 | % |
| 5.250%, 07/01/2023(Pre-refunded to 07/01/2021) | | | 4,915,000 | | | | 5,323,043 | | | | 0.5 | % |
| State of Florida | | | | | | | | | | | | |
| 5.000%, 06/01/2022(Callable 06/01/2019) | | | 13,800,000 | | | | 13,976,364 | | | | 1.2 | % |
Other Florida(1)(4) | | | | | | | 34,667,054 | | | | 3.1 | % |
| Total Florida | | | | | | | | | | | | |
| (Cost $69,283,040) | | | | | | | 70,528,870 | | | | 6.3 | % |
| Georgia | | | | | | | | | | | | |
| Forsyth County Hospital Authority | | | | | | | | | | | | |
| 6.375%, 10/01/2028(ETM) | | | 8,050,000 | | | | 9,768,353 | | | | 0.9 | % |
Other Georgia(4) | | | | | | | 11,761,773 | | | | 1.0 | % |
| Total Georgia | | | | | | | | | | | | |
| (Cost $21,289,220) | | | | | | | 21,530,126 | | | | 1.9 | % |
| Illinois | | | | | | | | | | | | |
| Illinois Development Finance Authority | | | | | | | | | | | | |
| 0.000%, 07/15/2023(ETM) | | | 26,755,000 | | | | 24,087,794 | | | | 2.2 | % |
| 0.000%, 07/15/2025(ETM) | | | 45,085,000 | | | | 38,404,305 | | | | 3.4 | % |
| Illinois Finance Authority | | | | | | | | | | | | |
| 5.000%, 12/01/2030(Pre-refunded to 12/01/2021) | | | 6,825,000 | | | | 7,403,146 | | | | 0.7 | % |
| 5.000%-6.625%, 05/01/2022-11/01/2039 | | | 4,145,000 | | | | 4,466,227 | | | | 0.4 | % |
| Kendall Kane & Will Counties | | | | | | | | | | | | |
| Community Unit School District No. 308 | | | | | | | | | | | | |
| 0.000%, 02/01/2021(Insured by AGM) | | | 13,625,000 | | | | 12,974,134 | | | | 1.2 | % |
| Southwestern Illinois Development Authority | | | | | | | | | | | | |
| 7.625%, 11/01/2048(Pre-refunded to 11/01/2023) | | | 6,085,000 | | | | 7,614,221 | | | | 0.7 | % |
| Village of Schaumburg IL | | | | | | | | | | | | |
| 4.000%, 12/01/2024(Callable 12/01/2022) | | | 5,750,000 | | | | 6,140,195 | | | | 0.5 | % |
Other Illinois(4) | | | | | | | 55,141,539 | | | | 4.9 | % |
| Total Illinois | | | | | | | | | | | | |
| (Cost $153,751,085) | | | | | | | 156,231,561 | | | | 14.0 | % |
| Indiana | | | | | | | | | | | | |
| Total Indiana | | | | | | | | | | | | |
(Cost $9,444,684)(4) | | | | | | | 9,469,271 | | | | 0.8 | % |
The accompanying notes are an integral part of these financial statements.
Baird Quality Intermediate Municipal Bond Fund
Summary Schedule of Investments, December 31, 2018
Long-Term Investments (cont.)
| | | Principal | | | | | | % of | |
| | | Amount | | | Value | | | Net Assets | |
| Iowa | | | | | | | | | |
| Total Iowa | | | | | | | | | |
(Cost $5,384,229)(4) | | | | | $ | 5,398,358 | | | | 0.5 | % |
| Kansas | | | | | | | | | | | |
| Total Kansas | | | | | | | | | | | |
(Cost $1,242,648)(4) | | | | | | 1,226,696 | | | | 0.1 | % |
| Kentucky | | | | | | | | | | | |
| Total Kentucky | | | | | | | | | | | |
(Cost $238,282)(4) | | | | | | 235,100 | | | | 0.0 | % |
| Louisiana | | | | | | | | | | | |
| Louisiana Public Facilities Authority | | | | | | | | | | | |
| 5.500%, 05/15/2027(Pre-refunded to 05/15/2026) | | $ | 26,690,000 | | | | 31,720,264 | | | | 2.8 | % |
| 5.500%, 05/15/2032(Pre-refunded to 05/15/2026) | | | 22,180,000 | | | | 27,014,131 | | | | 2.4 | % |
Other Louisiana(4) | | | | | | | 2,691,389 | | | | 0.2 | % |
| Total Louisiana | | | | | | | | | | | | |
| (Cost $58,382,084) | | | | | | | 61,425,784 | | | | 5.4 | % |
| Maryland | | | | | | | | | | | | |
| State of Maryland | | | | | | | | | | | | |
| 4.000%, 06/01/2030(Callable 06/01/2024) | | | 5,790,000 | | | | 6,199,643 | | | | 0.5 | % |
| 5.000%, 08/01/2031(Callable 08/01/2028) | | | 9,835,000 | | | | 11,898,875 | | | | 1.1 | % |
Other Maryland(4) | | | | | | | 3,256,992 | | | | 0.3 | % |
| Total Maryland | | | | | | | | | | | | |
| (Cost $21,344,565) | | | | | | | 21,355,510 | | | | 1.9 | % |
| Massachusetts | | | | | | | | | | | | |
| Commonwealth of Massachusetts | | | | | | | | | | | | |
| 4.000%, 12/01/2022(Pre-refunded to 12/01/2019) | | | 15,000,000 | | | | 15,295,350 | | | | 1.4 | % |
Other Massachusetts(4) | | | | | | | 4,962,970 | | | | 0.4 | % |
| Total Massachusetts | | | | | | | | | | | | |
| (Cost $20,236,224) | | | | | | | 20,258,320 | | | | 1.8 | % |
| Michigan | | | | | | | | | | | | |
| Total Michigan | | | | | | | | | | | | |
(Cost $23,421,564)(4) | | | | | | | 23,690,677 | | | | 2.1 | % |
| Minnesota | | | | | | | | | | | | |
| University of Minnesota | | | | | | | | | | | | |
| 5.500%, 07/01/2021(ETM) | | | 11,260,000 | | | | 11,847,772 | | | | 1.1 | % |
Other Minnesota(4) | | | | | | | 4,786,577 | | | | 0.4 | % |
| Total Minnesota | | | | | | | | | | | | |
| (Cost $16,828,134) | | | | | | | 16,634,349 | | | | 1.5 | % |
| Mississippi | | | | | | | | | | | | |
| Total Mississippi | | | | | | | | | | | | |
(Cost $5,860,139)(1)(4) | | | | | | | 5,891,991 | | | | 0.5 | % |
The accompanying notes are an integral part of these financial statements.
Baird Quality Intermediate Municipal Bond Fund
Summary Schedule of Investments, December 31, 2018
Long-Term Investments (cont.)
| | | Principal | | | | | | % of | |
| | | Amount | | | Value | | | Net Assets | |
| Missouri | | | | | | | | | |
| Total Missouri | | | | | | | | | |
(Cost $8,265,318)(4) | | | | | $ | 8,181,622 | | | | 0.7 | % |
| Montana | | | | | | | | | | | |
| Total Montana | | | | | | | | | | | |
(Cost $1,379,197)(4) | | | | | | 1,368,057 | | | | 0.1 | % |
| Nebraska | | | | | | | | | | | |
| Total Nebraska | | | | | | | | | | | |
(Cost $4,637,168)(4) | | | | | | 4,514,940 | | | | 0.4 | % |
| Nevada | | | | | | | | | | | |
| Total Nevada | | | | | | | | | | | |
(Cost $2,135,335)(4) | | | | | | 2,148,627 | | | | 0.2 | % |
| New Hampshire | | | | | | | | | | | |
| Total New Hampshire | | | | | | | | | | | |
(Cost $1,821,861)(4) | | | | | | 1,844,720 | | | | 0.2 | % |
| New Jersey | | | | | | | | | | | |
| Total New Jersey | | | | | | | | | | | |
(Cost $8,807,663)(4) | | | | | | 8,915,692 | | | | 0.8 | % |
| New Mexico | | | | | | | | | | | |
| Total New Mexico | | | | | | | | | | | |
(Cost $4,730,377)(4) | | | | | | 4,665,588 | | | | 0.4 | % |
| New York | | | | | | | | | | | |
| Metropolitan Transportation Authority | | | | | | | | | | | |
| 6.000%, 04/01/2020(ETM)(Insured by NATL) | | $ | 7,225,000 | | | | 7,428,601 | | | | 0.7 | % |
| New York City Water & Sewer System | | | | | | | | | | | | |
| 5.000%, 06/15/2032(Callable 12/15/2025) | | | 6,500,000 | | | | 7,499,375 | | | | 0.7 | % |
| New York State Dormitory Authority | | | | | | | | | | | | |
| 5.000%, 03/15/2030(Callable 03/15/2024) | | | 6,685,000 | | | | 7,554,117 | | | | 0.7 | % |
| 5.000%, 03/15/2033(Callable 03/15/2025) | | | 5,000,000 | | | | 5,646,200 | | | | 0.5 | % |
| 5.000%, 02/15/2030(Callable 08/15/2026) | | | 700,000 | | | | 815,388 | | | | 0.1 | % |
| New York State Urban Development Corp. | | | | | | | | | | | | |
| 5.000%, 03/15/2032(Callable 03/15/2024) | | | 6,000,000 | | | | 6,745,620 | | | | 0.6 | % |
Other New York(4) | | | | | | | 13,004,252 | | | | 1.2 | % |
| Total New York | | | | | | | | | | | | |
| (Cost $48,340,346) | | | | | | | 48,693,553 | | | | 4.5 | % |
| North Carolina | | | | | | | | | | | | |
| North Carolina Eastern Municipal Power Agency | | | | | | | | | | | | |
| 5.000%, 01/01/2021(Callable 01/31/2019)(ETM) | | | 10,385,000 | | | | 10,855,441 | | | | 1.0 | % |
| 4.500%, 01/01/2024(Pre-refunded to 01/01/2022) | | | 12,170,000 | | | | 12,833,873 | | | | 1.1 | % |
| 6.400%, 01/01/2021(ETM) | | | 2,592,000 | | | | 2,703,715 | | | | 0.2 | % |
Other North Carolina(4) | | | | | | | 1,687,245 | | | | 0.2 | % |
| Total North Carolina | | | | | | | | | | | | |
| (Cost $28,246,594) | | | | | | | 28,080,274 | | | | 2.5 | % |
The accompanying notes are an integral part of these financial statements.
Baird Quality Intermediate Municipal Bond Fund
Summary Schedule of Investments, December 31, 2018
Long-Term Investments (cont.)
| | | Principal | | | | | | % of | |
| | | Amount | | | Value | | | Net Assets | |
| North Dakota | | | | | | | | | |
| Total North Dakota | | | | | | | | | |
(Cost $7,035,730)(4) | | | | | $ | 6,911,233 | | | | 0.6 | % |
| Ohio | | | | | | | | | | | |
| State of Ohio | | | | | | | | | | | |
| 5.000%, 06/15/2021 | | $ | 6,740,000 | | | | 7,247,859 | | | | 0.6 | % |
Other Ohio(4) | | | | | | | 8,167,914 | | | | 0.7 | % |
| Total Ohio | | | | | | | | | | | | |
| (Cost $15,346,665) | | | | | | | 15,415,773 | | | | 1.3 | % |
| Oklahoma | | | | | | | | | | | | |
| Total Oklahoma | | | | | | | | | | | | |
(Cost $885,000)(1)(4) | | | | | | | 883,982 | | | | 0.1 | % |
| Oregon | | | | | | | | | | | | |
| Total Oregon | | | | | | | | | | | | |
(Cost $11,557,372)(1)(4) | | | | | | | 11,396,709 | | | | 1.0 | % |
| Pennsylvania | | | | | | | | | | | | |
| Total Pennsylvania | | | | | | | | | | | | |
(Cost $25,350,499)(1)(4) | | | | | | | 25,155,619 | | | | 2.2 | % |
| Puerto Rico | | | | | | | | | | | | |
| Puerto Rico Public Finance Corp. | | | | | | | | | | | | |
| 5.125%, 06/01/2024(Insured by AMBAC) | | | 5,490,000 | | | | 5,986,516 | | | | 0.5 | % |
| 5.500%, 08/01/2027(ETM)(Insured by AMBAC) | | | 6,500,000 | | | | 7,985,705 | | | | 0.7 | % |
| 6.000%, 08/01/2026-08/01/2026 | | | 5,495,000 | | | | 6,836,494 | | | | 0.6 | % |
Other Puerto Rico(4) | | | | | | | 1,275,131 | | | | 0.1 | % |
| Total Puerto Rico | | | | | | | | | | | | |
| (Cost $22,024,671) | | | | | | | 22,083,846 | | | | 1.9 | % |
| Rhode Island | | | | | | | | | | | | |
| State of Rhode Island | | | | | | | | | | | | |
| 5.000%, 08/01/2024 | | | 5,000,000 | | | | 5,750,850 | | | | 0.5 | % |
| Total Rhode Island | | | | | | | | | | | | |
| (Cost $5,636,664) | | | | | | | 5,750,850 | | | | 0.5 | % |
| South Carolina | | | | | | | | | | | | |
| Piedmont Municipal Power Agency | | | | | | | | | | | | |
| 6.750%, 01/01/2020(ETM) | | | 6,450,000 | | | | 6,758,697 | | | | 0.6 | % |
| 5.375%, 01/01/2025(ETM)(Insured by NATL) | | | 5,645,000 | | | | 6,582,578 | | | | 0.6 | % |
Other South Carolina(4) | | | | | | | 5,472,618 | | | | 0.5 | % |
| Total South Carolina | | | | | | | | | | | | |
| (Cost $18,657,300) | | | | | | | 18,813,893 | | | | 1.7 | % |
| South Dakota | | | | | | | | | | | | |
| Total South Dakota | | | | | | | | | | | | |
(Cost $909,720)(4) | | | | | | | 898,758 | | | | 0.1 | % |
The accompanying notes are an integral part of these financial statements.
Baird Quality Intermediate Municipal Bond Fund
Summary Schedule of Investments, December 31, 2018
Long-Term Investments (cont.)
| | | Principal | | | | | | % of | |
| | | Amount | | | Value | | | Net Assets | |
| Tennessee | | | | | | | | | |
| Total Tennessee | | | | | | | | | |
(Cost $8,453,020)(1)(4) | | | | | $ | 8,475,790 | | | | 0.8 | % |
| Texas | | | | | | | | | | | |
| City of Houston TX | | | | | | | | | | | |
| 0.000%, 12/01/2019(ETM)(Insured by AGM) | | $ | 13,355,000 | | | | 13,124,493 | | | | 1.2 | % |
| 5.500%, 12/01/2029(ETM)(Insured by NATL) | | | 16,050,000 | | | | 19,562,703 | | | | 1.7 | % |
| 5.750%, 12/01/2032(ETM)(Insured by AGM) | | | 6,715,000 | | | | 9,011,933 | | | | 0.8 | % |
| 5.500%, 12/01/2024(ETM)(Insured by NATL) | | | 1,835,000 | | | | 2,121,241 | | | | 0.2 | % |
| Harris County Health Facilities Development Corp. | | | | | | | | | | | | |
| 5.750%, 07/01/2027(ETM) | | | 4,850,000 | | | | 5,769,900 | | | | 0.5 | % |
| Tarrant County Health Facilities Development Corp. | | | | | | | | | | | | |
| 6.000%, 09/01/2024(ETM) | | | 5,340,000 | | | | 6,006,913 | | | | 0.5 | % |
| The University of Texas System | | | | | | | | | | | | |
| 5.000%, 08/15/2022 | | | 8,595,000 | | | | 9,515,524 | | | | 0.8 | % |
Other Texas(1)(4) | | | | | | | 117,068,702 | | | | 10.5 | % |
| Total Texas | | | | | | | | | | | | |
| (Cost $180,673,056) | | | | | | | 182,181,409 | | | | 16.2 | % |
| Utah | | | | | | | | | | | | |
| Total Utah | | | | | | | | | | | | |
(Cost $9,686,038)(4) | | | | | | | 9,828,205 | | | | 0.9 | % |
| Vermont | | | | | | | | | | | | |
| Total Vermont | | | | | | | | | | | | |
(Cost $3,600,636)(4) | | | | | | | 3,523,527 | | | | 0.3 | % |
| Virginia | | | | | | | | | | | | |
| Total Virginia | | | | | | | | | | | | |
(Cost $1,847,645)(4) | | | | | | | 1,749,916 | | | | 0.2 | % |
| Washington | | | | | | | | | | | | |
| State of Washington | | | | | | | | | | | | |
| 5.500%, 07/01/2023 | | | 5,040,000 | | | | 5,643,893 | | | | 0.5 | % |
| 5.000%, 07/01/2032(Callable 01/01/2025) | | | 6,005,000 | | | | 6,782,407 | | | | 0.6 | % |
| 5.000%, 08/01/2029-08/01/2038 | | | 5,850,000 | | | | 6,644,575 | | | | 0.6 | % |
| Washington State Housing Finance Commission | | | | | | | | | | | | |
| 2.550%, 07/01/2022 | | | | | | | | | | | | |
(Mandatory Tender Date 07/01/2021)(1) | | | 6,250,000 | | | | 6,260,500 | | | | 0.6 | % |
Other Washington(1)(4) | | | | | | | 20,790,499 | | | | 1.9 | % |
| Total Washington | | | | | | | | | | | | |
| (Cost $45,729,225) | | | | | | | 46,121,874 | | | | 4.2 | % |
The accompanying notes are an integral part of these financial statements.
Baird Quality Intermediate Municipal Bond Fund
Summary Schedule of Investments, December 31, 2018
Long-Term Investments (cont.)
| | | Principal | | | | | | % of | |
| | | Amount | | | Value | | | Net Assets | |
| Wisconsin | | | | | | | | | |
| State of Wisconsin Clean Water | | | | | | | | | |
| Fund Leveraged Loan Portfolio | | | | | | | | | |
| 5.000%, 06/01/2028(Pre-refunded to 06/01/2024) | | $ | 5,305,000 | | | $ | 6,084,994 | | | | 0.5 | % |
| 5.000%, 06/01/2030(Pre-refunded to 06/01/2024) | | | 10,500,000 | | | | 12,043,815 | | | | 1.1 | % |
| 5.000%, 06/01/2031(Pre-refunded to 06/01/2024) | | | 7,975,000 | | | | 9,147,564 | | | | 0.8 | % |
Other Wisconsin(4) | | | | | | | 22,719,655 | | | | 2.0 | % |
| Total Wisconsin | | | | | | | | | | | | |
| (Cost $50,412,946) | | | | | | | 49,996,028 | | | | 4.4 | % |
| Wyoming | | | | | | | | | | | | |
| Total Wyoming | | | | | | | | | | | | |
(Cost $732,755)(4) | | | | | | | 730,709 | | | | 0.1 | % |
| Total Long-Term Investments | | | | | | | | | | | | |
| (Cost $1,094,157,766) | | | | | | | 1,106,503,383 | | | | 98.7 | % |
| Short-Term Investment | | | | | | | | | | | | |
| | | Shares | | | | | | | | | |
| Money Market Mutual Fund | | | | | | | | | | | | |
| Fidelity Institutional Money Market Fund – | | | | | | | | | | | | |
Government Portfolio, Institutional Class, 2.29%(2) | | | 571,064 | | | | 571,064 | | | | 0.1 | % |
| Total Short-Term Investment | | | | | | | | | | | | |
| (Cost $571,064) | | | | | | | 571,064 | | | | 0.1 | % |
| Total Investments | | | | | | | | | | | | |
| (Cost $1,094,728,830) | | | | | | | 1,107,074,447 | | | | 98.8 | % |
| Other Assets in Excess of Liabilities | | | | | | | 12,930,737 | | | | 1.2 | % |
| TOTAL NET ASSETS | | | | | | $ | 1,120,005,184 | | | | 100.0 | % |
Notes to Summary Schedule of Investments
AGM – Assured Guaranty Municipal
AMBAC – Ambac Assurance Corp.
NATL – National Public Finance Guarantee Corp.
| (1) | Variable rate security, or group of securities contain a variable rate security. The rate reported is the rate in effect as of December 31, 2018. |
| (2) | 7-Day Yield. |
| (3) | Security or a portion of the security, or group of securities contain a security, purchased on a when-issued or delayed delivery basis. |
| (4) | Represents the aggregate value, by category, of securities that are not among the 50 largest holdings and, in total for any issuer, represent 1% or less of net assets. |
The accompanying notes are an integral part of these financial statements.
Baird Quality Intermediate Municipal Bond Fund
Summary Schedule of Investments, December 31, 2018
Summary of Fair Value Exposure at December 31, 2018
The Fund has adopted authoritative fair valuation accounting standards which establish a definition of fair value and set out a hierarchy for measuring fair value. These standards require additional disclosures about the various inputs and valuation techniques used to develop the measurements of fair value and a discussion on changes in valuation techniques and related inputs during the period. These standards define fair value as the price that would be received to sell an asset or paid to transfer a liability in an orderly transaction between market participants at the measurement date.
The fair value hierarchy is organized into three levels based upon the assumptions (referred to as “inputs”) used in pricing the asset or liability. These standards state that “observable inputs” reflect the assumptions market participants would use in pricing the asset or liability based on market data obtained from independent sources and “unobservable inputs” reflect an entity’s own assumptions about the assumptions market participants would use in pricing the asset or liability. These inputs are summarized into three broad levels and described below:
Level 1 – | Unadjusted quoted prices in active markets for identical unrestricted securities. |
Level 2 – | Other significant observable inputs (including quoted prices for similar securities, quoted prices in inactive markets, dealer indications, interest rates, yield curves, prepayment speeds, credit risk, default rates, inputs corroborated by observable market data, etc.). |
Level 3 – | Significant unobservable inputs (including the Fund’s own assumptions about the factors that market participants would use in valuing the security) based on the best information available. |
The inputs or methodology used for valuing securities are not necessarily an indication of the risk associated with investing in those securities.
The following is a summary of the inputs used to value the Fund’s investments as of December 31, 2018:
| | | Level 1 | | | Level 2 | | | Level 3 | | | Total | |
| Long-Term Investments | | | | | | | | | | | | |
| Municipal Bonds | | $ | — | | | $ | 1,106,503,383 | | | $ | — | | | $ | 1,106,503,383 | |
| Total Long-Term Investments | | | — | | | | 1,106,503,383 | | | | — | | | | 1,106,503,383 | |
| Short-Term Investment | | | | | | | | | | | | | | | | |
| Money Market Mutual Fund | | | 571,064 | | | | — | | | | — | | | | 571,064 | |
| Total Short-Term Investment | | | 571,064 | | | | — | | | | — | | | | 571,064 | |
| Total Investments | | $ | 571,064 | | | $ | 1,106,503,383 | | | $ | — | | | $ | 1,107,074,447 | |
Changes in valuation techniques may result in transfers into or out of assigned levels within the fair value hierarchy. There were no transfers into or out of Level 3 during the reporting period, as compared to the security classifications from the prior year’s annual report. See Fund’s Valuation Policy in Note 2a to the financial statements.
The accompanying notes are an integral part of these financial statements.
Baird Core Intermediate Municipal Bond Fund
December 31, 2018 (Unaudited)
The Baird Core Intermediate Municipal Bond Fund seeks a high level of current income that is exempt from federal income tax and is consistent with preservation of capital.
Investors achieved positive returns in the tax-free municipal market in 2018 even with interest rates moving higher. The adjustment in rates was not uniform, however, as longer-term yields rose more than short-term yields. The steeper yield curve was driven by varying levels of demand along the curve; steady demand was evident from individual investors, minimizing the rise in short-term rates, while the appetite for longer-term bonds from institutional investors waned when corporate income tax rates fell to 21% from 35%. Another consequence of the tax law changes was the lack of advanced refunding issues in 2018, reducing municipal supply by one-quarter on a year-over-year basis. Fortunately, the credit backdrop for the municipal market improved on strong tax revenue growth, allowing municipalities to rebuild rainy-day reserves to record levels and municipal spreads to remain relatively stable.
During a challenging 2018, the Fund generated positive absolute returns and lagged its benchmark.
The primary factors contributing to the Fund’s performance in 2018 include:
| | • | The Fund benefited from favorable positioning along the yield curve |
| | | |
| | • | The Fund benefited from an overweight to credit |
| | | |
| | • | The Fund benefited from an overweight to the Housing sector |
We hold a favorable outlook for the municipal market in 2019. We expect the level of supply to rise by an estimated 10% this year as the amount of new money borrowing continues to grow, helping finance necessary state and local infrastructure projects. The demand for municipals should also be more than sufficient for the available supply. For investors, interest rates are higher than they were a year ago and the tax-free yield curve is steeper, both of which should add to the appeal of the municipal market. If financial market volatility in the fourth quarter of 2018 is any indication of what may be in store for financial markets in 2019, then the relative stability and safety of the municipal market may be an attractive alternative for certain investors. The backdrop for municipal credit is also favorable and should continue to improve this year. If the U.S. economy continues to grow, even at a slowing pace, this will lead to higher tax revenues for state and local governments. Most municipalities have remained fiscally frugal in the post-financial crisis era, limiting new borrowing to only the most essential projects and directing any excess revenues into rainy day funds, when possible. In fact, reserve levels as a percentage of total expenditures reached a record high in 2018. In this uncertain environment, we believe the Fund is well positioned to continue to provide shareholders with high-quality access to the municipal market.
The Fund will maintain a neutral duration posture relative to the benchmark with a curve allocation that seeks to optimize the roll-down benefit of the relatively steep municipal curve. Sector weightings favor an overweight to revenue-backed issues over general obligation debt. A neutral credit posture overall is appropriate given relatively narrow credit spreads, despite a strong fundamental backdrop. Opportunities for additional yield will be sought through bottom-up credit analysis as well as through security structure and cash flow optionality.
Baird Core Intermediate Municipal Bond Fund
December 31, 2018 (Unaudited)
Portfolio Characteristics
Quality Distribution(1)(2)
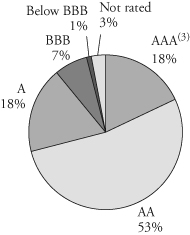 | | Net Assets | $380,056,515 | |
| | | | |
| | SEC 30-Day | | |
| | Yield(4) | | |
| | Institutional Class | 2.49% | |
| | Investor Class | 2.25% | |
| | | | |
| | Average | | |
| | Effective | | |
| | Duration | 4.71 years | |
| | | | |
| | Average | | |
| | Effective | | |
| | Maturity | 5.11 years | |
| | | | |
| | Annualized | | |
| | Expense | | |
| | | Ratio(5) | | |
Sector Weightings(1) | | Institutional Class | 0.30% | |
| | | Investor Class | 0.55% | (6) |
 | | | | |
| | Portfolio | | |
| | Turnover Rate | 70% | |
| | | | |
| | Number of | | |
| | Holdings | 805 | |
| | | | |
| | | | |
| | | | |
| | | | |
| | | | |
| | | | |
| | | | |
| | | | |
| | | | |
| | | | | |
(1) | Percentages shown are based on the Fund’s total investments. |
(2) | The quality profile is calculated on a market value-weighted basis using the highest credit quality rating for each security held by the Fund given by S&P, Moody’s or Fitch, each of which is a Nationally Recognized Statistical Rating Organization (NRSRO). NRSROs rate the credit quality of securities using a scale that generally ranges from AAA (highest) to D (lowest). |
(3) | Includes pre-refunded and escrowed-to-maturity (ETM) bonds. |
(4) | SEC yields are based on SEC guidelines and are calculated for the 30 days ended December 31, 2018. |
(5) | Reflects expense ratios as stated in the Fund’s current prospectus. |
(6) | Includes 0.25% 12b-1 fee. |
Baird Core Intermediate Municipal Bond Fund
December 31, 2018 (Unaudited)
Institutional ClassValue of a $25,000 Investment
Growth of a hypothetical investment of $25,000 made on the Fund’s inception date (8/31/15), assuming reinvestment of all distributions.
Investor Class
Value of a $10,000 Investment
Growth of a hypothetical investment of $10,000 made on the Fund’s inception date (8/31/15), assuming reinvestment of all distributions.
Baird Core Intermediate Municipal Bond Fund
December 31, 2018 (Unaudited)
Total Returns
| | | Average Annual |
| | One | Three | Since |
| For the Periods Ended December 31, 2018 | Year | Years | Inception(1) |
| Institutional Class Shares | 1.30% | 2.55% | 2.89% |
| Investor Class Shares | 1.05% | 2.30% | 2.65% |
Bloomberg Barclays Municipal Bond (1-15 Year) Index(2) | 1.58% | 1.96% | 2.32% |
| (1) | For the period from August 31, 2015 (inception date) through December 31, 2018. |
| (2) | The Bloomberg Barclays Municipal Bond (1-15 Year) Index is an unmanaged, market value weighted index of investment-grade, tax-exempt, and fixed-rate securities with maturities between 1 and 17 years. Securities must have an outstanding par value of at least $7 million and be issued as part of a transaction of at least $75 million. The bonds must be fixed rate, have a dated-date after December 31, 1990, and must be at least one year from their maturity date. This Index does not reflect any deduction for fees, expenses or taxes. A direct investment in an index is not possible. |
The line graph on the previous page and the returns shown in the table above reflect reinvestment of dividends and/or capital gains distributions in additional shares. The returns do not reflect the deduction of taxes that a shareholder would pay on Fund distributions or the redemption of Fund shares. The returns reflect the actual performance for each period and do not include the impact of trades executed on the last business day of the period that were recorded on the first business day of the next period.
The Fund’s gross expense ratio for each Class, as reflected in the Fund’s current prospectus, is set forth under “Portfolio Characteristics”.
The Fund may invest up to 10% of its net assets in non-investment grade debt securities (commonly referred to as “high yield” bonds). While these types of debt securities typically offer higher yields than investment grade securities, they also include greater risks including increased credit risk and the increased risk of default or bankruptcy. The Fund may invest up to 25% of its total assets in municipal obligations issued by persons in the same state. As a result, changes in economic, business or political conditions of a particular state may have a disproportionate impact on the Fund’s share price. Municipal securities investments are not appropriate for all investors, especially those taxed at lower rates.
Past performance does not guarantee future results. Investment return and principal value will fluctuate so that an investor’s shares, when redeemed, may be worth more or less than their original cost.
For information about the performance of the Fund as of the most recent month-end, please call 1-866-44BAIRD or visit www.bairdfunds.com. Mutual fund performance changes over time and current performance may be lower or higher than that stated.
Baird Core Intermediate Municipal Bond Fund
Summary Schedule of Investments, December 31, 2018
This schedule summarizes the Fund’s holdings by asset type. Details are reported for each of the Fund’s 50 largest individual holdings and for investments that, in total for any issuer, represent more than 1% of the Fund’s net assets. The total value of smaller holdings is reported as a single amount within each category.
The Fund reports a complete list of its holdings in regulatory filings four times in each fiscal year, at the quarter end. For the second and fourth fiscal quarters, the complete listing of the Fund’s holdings is available electronically at http://www.bairdassetmanagement.com/baird-funds/funds-and-performance#Literature and in the Fund’s Form N-CSR on the Securities and Exchange Commission’s website (www.sec.gov) or you can have it mailed to you without charge by calling 1-866-44BAIRD. For the first and third fiscal quarters, the Fund files the lists with the SEC on Form N-Q or, beginning with filings after March 31, 2019, on Part F of Form N-PORT. Shareholders can look up the Fund’s Forms N-CSR, N-Q or Part F of Form N-PORT on the SEC’s website (www.sec.gov).
Long-Term Investments
| | | Principal | | | | | | % of | |
| | | Amount | | | Value | | | Net Assets | |
| Municipal Bonds | | | | | | | | | |
| Alabama | | | | | | | | | |
| City of Birmingham AL | | | | | | | | | |
| 0.000%, 03/01/2045(Callable 09/01/2025) | | $ | 1,175,000 | | | $ | 1,266,615 | | | | 0.3 | % |
Other Alabama(1)(7) | | | | | | | 4,697,261 | | | | 1.2 | % |
| Total Alabama | | | | | | | | | | | | |
| (Cost $5,908,089) | | | | | | | 5,963,876 | | | | 1.5 | % |
| Alaska | | | | | | | | | | | | |
| Alaska Industrial Development & Export Authority | | | | | | | | | | | | |
| 3.500%, 12/01/2020(Callable 12/01/2019) | | | 1,250,000 | | | | 1,259,375 | | | | 0.3 | % |
Other Alaska(7) | | | | | | | 2,441,215 | | | | 0.6 | % |
| Total Alaska | | | | | | | | | | | | |
| (Cost $3,698,673) | | | | | | | 3,700,590 | | | | 0.9 | % |
| Arizona | | | | | | | | | | | | |
| Total Arizona | | | | | | | | | | | | |
(Cost $7,895,660)(1)(2)(3)(7) | | | | | | | 7,924,134 | | | | 2.1 | % |
| Arkansas | | | | | | | | | | | | |
| City of Little Rock AR | | | | | | | | | | | | |
| 2.375%, 04/01/2028(Callable 10/01/2022) | | | 2,000,000 | | | | 2,026,900 | | | | 0.5 | % |
| City of Rogers AR | | | | | | | | | | | | |
| 3.250%, 11/01/2043(Callable 11/01/2026) | | | 2,000,000 | | | | 2,022,260 | | | | 0.5 | % |
| City of Springdale AR | | | | | | | | | | | | |
| 3.000%, 04/01/2043(Callable 04/01/2024) | | | | | | | | | | | | |
| (Insured by BAM) | | | 1,415,000 | | | | 1,419,839 | | | | 0.4 | % |
Other Arkansas(7) | | | | | | | 11,026,101 | | | | 2.9 | % |
| Total Arkansas | | | | | | | | | | | | |
| (Cost $16,416,936) | | | | | | | 16,495,100 | | | | 4.3 | % |
| California | | | | | | | | | | | | |
| California Health Facilities Financing Authority | | | | | | | | | | | | |
| 1.000%, 08/15/2053 | | | 1,970,000 | | | | 1,956,190 | | | | 0.5 | % |
Other California(1)(2)(5)(6)(7) | | | | | | | 17,071,546 | | | | 4.5 | % |
| Total California | | | | | | | | | | | | |
| (Cost $18,639,668) | | | | | | | 19,027,736 | | | | 5.0 | % |
The accompanying notes are an integral part of these financial statements.
Baird Core Intermediate Municipal Bond Fund
Summary Schedule of Investments, December 31, 2018
Long-Term Investments (cont.)
| | | Principal | | | | | | % of | |
| | | Amount | | | Value | | | Net Assets | |
| Colorado | | | | | | | | | |
| City of Sheridan CO | | | | | | | | | |
| 5.000%, 12/01/2042(Callable 12/01/2025) | | $ | 1,130,000 | | | $ | 1,279,883 | | | | 0.3 | % |
| Colorado Educational & Cultural Facilities Authority | | | | | | | | | | | | |
| 4.000%, 12/15/2025 | | | 1,340,000 | | | | 1,370,807 | | | | 0.4 | % |
| Colorado Housing & Finance Authority | | | | | | | | | | | | |
| 1.850%, 04/01/2020 | | | | | | | | | | | | |
(Mandatory Tender Date 10/01/2019)(1) | | | 1,500,000 | | | | 1,495,800 | | | | 0.4 | % |
| Grand River Hospital District | | | | | | | | | | | | |
| 5.250%, 12/01/2031(Callable 12/01/2028) | | | | | | | | | | | | |
| (Insured by AGM) | | | 1,190,000 | | | | 1,399,083 | | | | 0.4 | % |
| Woodmen Road Metropolitan District | | | | | | | | | | | | |
| 3.000%, 12/01/2027(Insured by BAM) | | | 1,605,000 | | | | 1,640,037 | | | | 0.4 | % |
Other Colorado(1)(2)(7) | | | | | | | 15,093,286 | | | | 4.0 | % |
| Total Colorado | | | | | | | | | | | | |
| (Cost $22,083,428) | | | | | | | 22,278,896 | | | | 5.9 | % |
| Connecticut | | | | | | | | | | | | |
| City of New Haven CT | | | | | | | | | | | | |
| 3.000%, 04/03/2019 | | | 2,000,000 | | | | 2,004,440 | | | | 0.5 | % |
Other Connecticut(7) | | | | | | | 6,479,113 | | | | 1.7 | % |
| Total Connecticut | | | | | | | | | | | | |
| (Cost $8,450,955) | | | | | | | 8,483,553 | | | | 2.2 | % |
| District of Columbia | | | | | | | | | | | | |
| District of Columbia | | | | | | | | | | | | |
| 5.000%, 06/01/2035(Callable 06/01/2024) | | | 2,000,000 | | | | 2,229,020 | | | | 0.6 | % |
Other District of Columbia(1)(7) | | | | | | | 4,045,279 | | | | 1.1 | % |
| Total District of Columbia | | | | | | | | | | | | |
| (Cost $6,207,415) | | | | | | | 6,274,299 | | | | 1.7 | % |
| Florida | | | | | | | | | | | | |
| City of Tallahassee FL | | | | | | | | | | | | |
| 5.000%, 10/01/2033(Callable 10/01/2025) | | | 1,250,000 | | | | 1,431,950 | | | | 0.4 | % |
| 5.000%, 10/01/2034(Callable 10/01/2023) | | | 1,225,000 | | | | 1,360,007 | | | | 0.4 | % |
| Florida Department of Management Services | | | | | | | | | | | | |
| 5.000%, 11/01/2029 | | | 2,000,000 | | | | 2,467,400 | | | | 0.6 | % |
| Highlands County Health Facilities Authority | | | | | | | | | | | | |
| 1.710%, 11/15/2037(Callable 01/02/2019) | | | | | | | | | | | | |
(Optional Put Date 01/07/2019)(1) | | | 2,350,000 | | | | 2,350,000 | | | | 0.6 | % |
Other Florida(1)(5)(7) | | | | | | | 16,780,315 | | | | 4.4 | % |
| Total Florida | | | | | | | | | | | | |
| (Cost $24,193,805) | | | | | | | 24,389,672 | | | | 6.4 | % |
| Georgia | | | | | | | | | | | | |
| Total Georgia | | | | | | | | | | | | |
(Cost $4,225,796)(1)(7) | | | | | | | 4,225,791 | | | | 1.1 | % |
The accompanying notes are an integral part of these financial statements.
Baird Core Intermediate Municipal Bond Fund
Summary Schedule of Investments, December 31, 2018
Long-Term Investments (cont.)
| | | Principal | | | | | | % of | |
| | | Amount | | | Value | | | Net Assets | |
| Illinois | | | | | | | | | |
| Bureau County Township High School District No. 502 | | | | | | | | | |
| 4.000%, 12/01/2031(Callable 12/01/2027) | | | | | | | | | |
| (Insured by BAM) | | $ | 1,330,000 | | | $ | 1,412,965 | | | | 0.4 | % |
| Cook County School District No. 130 | | | | | | | | | | | | |
| 5.000%, 12/01/2027(Callable 12/01/2025) | | | | | | | | | | | | |
| (Insured by AGM) | | | 1,195,000 | | | | 1,336,034 | | | | 0.4 | % |
| Cook County School District No. 163 | | | | | | | | | | | | |
| 6.000%, 12/15/2027(Insured by BAM) | | | 1,150,000 | | | | 1,404,783 | | | | 0.4 | % |
| Cook County School District No. 63 | | | | | | | | | | | | |
2.375%, 12/01/2028(Callable 12/01/2023)(1) | | | 1,500,000 | | | | 1,532,505 | | | | 0.4 | % |
| Illinois Finance Authority | | | | | | | | | | | | |
1.720%-6.625%, 10/01/2019-12/01/2043(8) | | | 6,360,000 | | | | 6,209,663 | | | | 1.6 | % |
| Knox & Warren Counties Community | | | | | | | | | | | | |
| Unit School District No. 205 | | | | | | | | | | | | |
| 6.125%, 01/01/2036(Callable 01/01/2021) | | | 1,400,000 | | | | 1,495,032 | | | | 0.4 | % |
| Metropolitan Water Reclamation | | | | | | | | | | | | |
| District of Greater Chicago | | | | | | | | | | | | |
| 5.000%, 12/01/2034(Callable 12/01/2026) | | | 1,500,000 | | | | 1,676,235 | | | | 0.4 | % |
| Sales Tax Securitization Corp. | | | | | | | | | | | | |
| 5.000%, 01/01/2028 | | | 1,500,000 | | | | 1,705,815 | | | | 0.4 | % |
| 5.000%, 01/01/2029 | | | 2,500,000 | | | | 2,861,600 | | | | 0.8 | % |
| State of Illinois | | | | | | | | | | | | |
| 5.000%, 06/15/2027(Callable 06/15/2021) | | | 1,500,000 | | | | 1,558,800 | | | | 0.4 | % |
| 4.000%, 06/15/2038(Callable 06/15/2028) | | | | | | | | | | | | |
| (Insured by BAM) | | | 2,500,000 | | | | 2,446,975 | | | | 0.6 | % |
| 0.000%-6.000%, 08/01/2019-07/01/2033 | | | 3,480,000 | | | | 3,645,396 | | | | 1.0 | % |
Other Illinois(1)(2)(7) | | | | | | | 30,441,241 | | | | 8.0 | % |
| Total Illinois | | | | | | | | | | | | |
| (Cost $57,809,959) | | | | | | | 57,727,044 | | | | 15.2 | % |
| Indiana | | | | | | | | | | | | |
| Total Indiana | | | | | | | | | | | | |
(Cost $11,889,741)(1)(2)(7) | | | | | | | 11,956,883 | | | | 3.1 | % |
| Iowa | | | | | | | | | | | | |
| Total Iowa | | | | | | | | | | | | |
(Cost $205,539)(7) | | | | | | | 201,140 | | | | 0.1 | % |
| Kansas | | | | | | | | | | | | |
| Total Kansas | | | | | | | | | | | | |
(Cost $2,369,723)(2)(7) | | | | | | | 2,375,984 | | | | 0.6 | % |
| Kentucky | | | | | | | | | | | | |
| Total Kentucky | | | | | | | | | | | | |
(Cost $2,035,535)(1)(7) | | | | | | | 2,018,571 | | | | 0.5 | % |
The accompanying notes are an integral part of these financial statements.
Baird Core Intermediate Municipal Bond Fund
Summary Schedule of Investments, December 31, 2018
Long-Term Investments (cont.)
| | | Principal | | | | | | % of | |
| | | Amount | | | Value | | | Net Assets | |
| Louisiana | | | | | | | | | |
| Total Louisiana | | | | | | | | | |
(Cost $2,091,778)(7) | | | | | $ | 2,129,500 | | | | 0.6 | % |
| Maine | | | | | | | | | | | |
| Total Maine | | | | | | | | | | | |
(Cost $833,331)(7) | | | | | | 815,905 | | | | 0.2 | % |
| Massachusetts | | | | | | | | | | | |
| Massachusetts Housing Finance Agency | | | | | | | | | | | |
| 4.500%, 12/01/2048(Callable 12/01/2027) | | $ | 2,000,000 | | | | 2,148,420 | | | | 0.6 | % |
Other Massachusetts(7) | | | | | | | 2,104,664 | | | | 0.6 | % |
| Total Massachusetts | | | | | | | | | | | | |
| (Cost $4,265,921) | | | | | | | 4,253,084 | | | | 1.2 | % |
| Michigan | | | | | | | | | | | | |
| Lake Orion Community School District | | | | | | | | | | | | |
| 5.000%, 05/01/2025(Insured by Q-SBLF) | | | 1,635,000 | | | | 1,895,619 | | | | 0.5 | % |
Other Michigan(1)(7) | | | | | | | 6,831,786 | | | | 1.8 | % |
| Total Michigan | | | | | | | | | | | | |
| (Cost $8,593,097) | | | | | | | 8,727,405 | | | | 2.3 | % |
| Minnesota | | | | | | | | | | | | |
| Total Minnesota | | | | | | | | | | | | |
(Cost $5,918,652)(7) | | | | | | | 5,895,247 | | | | 1.6 | % |
| Mississippi | | | | | | | | | | | | |
| Total Mississippi | | | | | | | | | | | | |
(Cost $5,110,394)(1)(7) | | | | | | | 5,165,658 | | | | 1.4 | % |
| Missouri | | | | | | | | | | | | |
| Total Missouri | | | | | | | | | | | | |
(Cost $4,379,677)(1)(5)(7) | | | | | | | 4,388,396 | | | | 1.2 | % |
| Montana | | | | | | | | | | | | |
| Total Montana | | | | | | | | | | | | |
(Cost $1,525,643)(7) | | | | | | | 1,536,509 | | | | 0.4 | % |
| Nebraska | | | | | | | | | | | | |
| Village of Boys Town NE | | | | | | | | | | | | |
| 3.000%, 09/01/2028 | | | 1,675,000 | | | | 1,680,561 | | | | 0.5 | % |
Other Nebraska(1)(7) | | | | | | | 3,903,959 | | | | 1.0 | % |
| Total Nebraska | | | | | | | | | | | | |
| (Cost $5,603,212) | | | | | | | 5,584,520 | | | | 1.5 | % |
| Nevada | | | | | | | | | | | | |
| Total Nevada | | | | | | | | | | | | |
(Cost $4,512,804)(7) | | | | | | | 4,498,175 | | | | 1.2 | % |
The accompanying notes are an integral part of these financial statements.
Baird Core Intermediate Municipal Bond Fund
Summary Schedule of Investments, December 31, 2018
Long-Term Investments (cont.)
| | �� | Principal | | | | | | % of | |
| | | Amount | | | Value | | | Net Assets | |
| New Jersey | | | | | | | | | |
| New Jersey Housing & Mortgage Finance Agency | | | | | | | | | |
| 4.500%, 10/01/2048(Callable 10/01/2027) | | $ | 1,660,000 | | | $ | 1,782,292 | | | | 0.5 | % |
Other New Jersey(1)(2)(5)(7) | | | | | | | 8,885,835 | | | | 2.3 | % |
| Total New Jersey | | | | | | | | | | | | |
| (Cost $10,633,663) | | | | | | | 10,668,127 | | | | 2.8 | % |
| New Mexico | | | | | | | | | | | | |
| Total New Mexico | | | | | | | | | | | | |
(Cost $851,994)(2)(7) | | | | | | | 853,555 | | | | 0.2 | % |
| New York | | | | | | | | | | | | |
| MTA Hudson Rail Yards Trust Obligations | | | | | | | | | | | | |
| 5.000%, 11/15/2046(Callable 11/15/2019) | | | 1,250,000 | | | | 1,273,887 | | | | 0.3 | % |
| New York City Transitional Finance Authority | | | | | | | | | | | | |
1.790%, 11/01/2022(Optional Put Date 01/02/2019)(1) | | | 1,600,000 | | | | 1,600,000 | | | | 0.4 | % |
| 5.000%, 08/01/2038(Callable 08/01/2028) | | | 1,295,000 | | | | 1,496,360 | | | | 0.4 | % |
| 5.000%, 08/01/2031-08/01/2039 | | | 805,000 | | | | 918,383 | | | | 0.2 | % |
| New York State Thruway Authority | | | | | | | | | | | | |
| 5.000%, 03/15/2029(Callable 09/15/2021) | | | 1,275,000 | | | | 1,369,784 | | | | 0.4 | % |
Other New York(1)(7) | | | | | | | 5,088,074 | | | | 1.3 | % |
| Total New York | | | | | | | | | | | | |
| (Cost $11,667,296) | | | | | | | 11,746,488 | | | | 3.0 | % |
| North Carolina | | | | | | | | | | | | |
| North Carolina Turnpike Authority | | | | | | | | | | | | |
| 4.000%, 01/01/2041(Callable 01/01/2029) | | | | | | | | | | | | |
| (Insured by AGM) | | | 2,000,000 | | | | 1,997,100 | | | | 0.5 | % |
Other North Carolina(1)(7) | | | | | | | 2,229,355 | | | | 0.6 | % |
| Total North Carolina | | | | | | | | | | | | |
| (Cost $4,206,134) | | | | | | | 4,226,455 | | | | 1.1 | % |
| North Dakota | | | | | | | | | | | | |
| City of Williston ND | | | | | | | | | | | | |
| 4.250%, 07/15/2025(Callable 07/15/2022) | | | 1,750,000 | | | | 1,812,685 | | | | 0.5 | % |
| Jamestown Park District | | | | | | | | | | | | |
| 2.900%, 07/01/2035(Callable 01/16/2019) | | | 1,435,000 | | | | 1,414,049 | | | | 0.4 | % |
Other North Dakota(7) | | | | | | | 4,460,083 | | | | 1.2 | % |
| Total North Dakota | | | | | | | | | | | | |
| (Cost $7,653,480) | | | | | | | 7,686,817 | | | | 2.1 | % |
| Ohio | | | | | | | | | | | | |
| Little Miami Local School District | | | | | | | | | | | | |
| 5.000%, 11/01/2036(Callable 11/01/2025) | | | | | | | | | | | | |
| (Insured by SD CRED PROG) | | | 1,845,000 | | | | 2,071,215 | | | | 0.5 | % |
| Ohio Higher Educational Facility Commission | | | | | | | | | | | | |
| 1.600%, 01/01/2039 | | | 1,250,000 | | | | 1,250,000 | | | | 0.3 | % |
Other Ohio(2)(7) | | | | | | | 9,698,609 | | | | 2.6 | % |
| Total Ohio | | | | | | | | | | | | |
| (Cost $12,988,394) | | | | | | | 13,019,824 | | | | 3.4 | % |
The accompanying notes are an integral part of these financial statements.
Baird Core Intermediate Municipal Bond Fund
Summary Schedule of Investments, December 31, 2018
Long-Term Investments (cont.)
| | | Principal | | | | | | % of | |
| | | Amount | | | Value | | | Net Assets | |
| Oklahoma | | | | | | | | | |
| Total Oklahoma | | | | | | | | | |
(Cost $982,053)(7) | | | | | $ | 975,987 | | | | 0.3 | % |
| Oregon | | | | | | | | | | | |
| State of Oregon Housing & Community Services Department | | | | | | | | | | | |
| 2.200%, 12/01/2021 | | | | | | | | | | | |
(Mandatory Tender Date 12/01/2020)(1) | | $ | 2,000,000 | | | | 1,999,240 | | | | 0.5 | % |
Other Oregon(1)(7) | | | | | | | 2,000,623 | | | | 0.5 | % |
| Total Oregon | | | | | | | | | | | | |
| (Cost $3,950,209) | | | | | | | 3,999,863 | | | | 1.0 | % |
| Pennsylvania | | | | | | | | | | | | |
| Commonwealth Financing Authority | | | | | | | | | | | | |
| 4.000%, 06/01/2039(Callable 06/01/2028) | | | | | | | | | | | | |
| (Insured by AGM) | | | 1,500,000 | | | | 1,518,765 | | | | 0.4 | % |
| Westmoreland County Municipal Authority | | | | | | | | | | | | |
| 5.000%, 08/15/2028(Callable 08/15/2027) | | | | | | | | | | | | |
| (Insured by BAM) | | | 1,540,000 | | | | 1,800,322 | | | | 0.5 | % |
Other Pennsylvania(1)(2)(3)(7) | | | | | | | 9,479,879 | | | | 2.5 | % |
| Total Pennsylvania | | | | | | | | | | | | |
| (Cost $12,707,044) | | | | | | | 12,798,966 | | | | 3.4 | % |
| Rhode Island | | | | | | | | | | | | |
| Total Rhode Island | | | | | | | | | | | | |
(Cost $1,222,798)(7) | | | | | | | 1,254,903 | | | | 0.3 | % |
| South Carolina | | | | | | | | | | | | |
| Total South Carolina | | | | | | | | | | | | |
(Cost $2,840,815)(7) | | | | | | | 2,894,089 | | | | 0.8 | % |
| South Dakota | | | | | | | | | | | | |
| Total South Dakota | | | | | | | | | | | | |
(Cost $702,539)(7) | | | | | | | 694,350 | | | | 0.2 | % |
| Tennessee | | | | | | | | | | | | |
| Total Tennessee | | | | | | | | | | | | |
(Cost $2,850,202)(1)(7) | | | | | | | 2,847,495 | | | | 0.7 | % |
| Texas | | | | | | | | | | | | |
| City of San Antonio TX | | | | | | | | | | | | |
| 2.750%, 02/01/2048 | | | | | | | | | | | | |
(Mandatory Tender Date 12/01/2022)(1) | | | 1,500,000 | | | | 1,521,150 | | | | 0.4 | % |
| Dallas Independent School District | | | | | | | | | | | | |
| 5.000%, 02/15/2036(Mandatory Tender | | | | | | | | | | | | |
Date 02/15/2022)(PSF Guaranteed)(1) | | | 2,000,000 | | | | 2,174,040 | | | | 0.6 | % |
| Mansfield Independent School District | | | | | | | | | | | | |
| 5.000%, 02/15/2047 | | | | | | | | | | | | |
| (Callable 02/15/2020)(PSF Guaranteed) | | | 1,400,000 | | | | 1,442,658 | | | | 0.4 | % |
The accompanying notes are an integral part of these financial statements.
Baird Core Intermediate Municipal Bond Fund
Summary Schedule of Investments, December 31, 2018
Long-Term Investments (cont.)
| | | Principal | | | | | | % of | |
| | | Amount | | | Value | | | Net Assets | |
| New Caney Independent School District | | | | | | | | | |
| 4.000%, 02/15/2029 | | | | | | | | | |
| (Callable 02/15/2025)(PSF Guaranteed) | | $ | 1,450,000 | | | $ | 1,558,982 | | | | 0.4 | % |
| San Angelo Independent School District | | | | | | | | | | | | |
| 5.000%, 02/15/2029 | | | | | | | | | | | | |
| (Callable 02/15/2024)(PSF Guaranteed) | | | 1,250,000 | | | | 1,409,425 | | | | 0.4 | % |
Other Texas(1)(5)(7) | | | | | | | 31,017,488 | | | | 8.2 | % |
| Total Texas | | | | | | | | | | | | |
| (Cost $39,028,060) | | | | | | | 39,123,743 | | | | 10.4 | % |
| Utah | | | | | | | | | | | | |
| Total Utah | | | | | | | | | | | | |
(Cost $3,395,650)(1)(7) | | | | | | | 3,426,245 | | | | 0.9 | % |
| Vermont | | | | | | | | | | | | |
| Total Vermont | | | | | | | | | | | | |
(Cost $1,435,620)(7) | | | | | | | 1,420,850 | | | | 0.4 | % |
| Virgin Islands | | | | | | | | | | | | |
| Total Virgin Islands | | | | | | | | | | | | |
(Cost $419,106)(7) | | | | | | | 413,052 | | | | 0.1 | % |
| Virginia | | | | | | | | | | | | |
| Total Virginia | | | | | | | | | | | | |
(Cost $409,038)(7) | | | | | | | 411,282 | | | | 0.1 | % |
| Washington | | | | | | | | | | | | |
| Mason & Kitsap Counties School District No. 403 | | | | | | | | | | | | |
| 5.000%, 12/01/2037(Callable 12/01/2023) | | | | | | | | | | | | |
| (Insured by SCH BD GTY) | | | 1,430,000 | | | | 1,594,922 | | | | 0.4 | % |
Other Washington(7) | | | | | | | 4,311,037 | | | | 1.1 | % |
| Total Washington | | | | | | | | | | | | |
| (Cost $5,844,049) | | | | | | | 5,905,959 | | | | 1.5 | % |
| West Virginia | | | | | | | | | | | | |
| Total West Virginia | | | | | | | | | | | | |
(Cost $255,000)(7) | | | | | | | 254,748 | | | | 0.1 | % |
| Wisconsin | | | | | | | | | | | | |
| Wisconsin Health & Educational Facilities Authority | | | | | | | | | | | | |
| 2.650%, 11/01/2020(Callable 11/01/2019) | | | 1,625,000 | | | | 1,622,384 | | | | 0.4 | % |
| 1.375%-5.250%, 09/15/2019-10/15/2039 | | | 4,975,000 | | | | 5,365,876 | | | | 1.4 | % |
Other Wisconsin(1)(7) | | | | | | | 7,709,648 | | | | 2.0 | % |
| Total Wisconsin | | | | | | | | | | | | |
| (Cost $14,614,854) | | | | | | | 14,697,908 | | | | 3.8 | % |
| Total Long-Term Investments | | | | | | | | | | | | |
| (Cost $373,523,429) | | | | | | | 375,358,374 | | | | 98.8 | % |
The accompanying notes are an integral part of these financial statements.
Baird Core Intermediate Municipal Bond Fund
Summary Schedule of Investments, December 31, 2018
Short-Term Investment
| | | | | | | | | % of | |
| | | Shares | | | Value | | | Net Assets | |
| Money Market Mutual Fund | | | | | | | | | |
| Fidelity Institutional Money Market Fund – | | | | | | | | | |
Government Portfolio, Institutional Class, 2.29%(4) | | | 826,495 | | | $ | 826,495 | | | | 0.2 | % |
| Total Short-Term Investment | | | | | | | | | | | | |
| (Cost $826,495) | | | | | | | 826,495 | | | | 0.2 | % |
| Total Investments | | | | | | | | | | | | |
| (Cost $374,349,924) | | | | | | | 376,184,869 | | | | 99.0 | % |
| Other Assets in Excess of Liabilities | | | | | | | 3,871,646 | | | | 1.0 | % |
| TOTAL NET ASSETS | | | | | | $ | 380,056,515 | | | | 100.0 | % |
Notes to Summary Schedule of Investments
AGM – Assured Guaranty Municipal
BAM – Build America Mutual Assurance Co.
Q-SBLF – Qualified School Building Loan Fund
SCH BD GTY – School Board Guaranty
SD CRED PROG – State Credit Enhancement Program
| (1) | Variable rate security, or group of securities contain a variable rate security. The rate reported is the rate in effect as of December 31, 2018. |
| (2) | Variable rate security, or group of securities contain a variable rate security, based on a reference index and spread. The rate reported is the rate in effect as of December 31, 2018. |
| (3) | Security, or group of securities contain a security, issued under Rule 144A under the Securities Act of 1933 and determined to be liquid. Purchased in a private placement transaction; resale to the public may require registration or may extend only to qualified institutional buyers. At December 31, 2018, the value of these securities total $423,882, which represents 0.11% of total net assets. |
| (4) | 7-Day Yield. |
| (5) | Auction Rate Security, or group of securities contain an auction rate security. An Auction Rate Security is a debt instrument with a long nominal maturity for which the interest rate is regularly reset through a Dutch auction. The rate presented is either the rate set through the auction or the maximum interest rate provided for in the security issuance provision. |
| (6) | Security or a portion of the security, or group of securities contain a security, purchased on a when-issued or delayed delivery basis. |
| (7) | Represents the aggregate value, by category, of securities that are not among the 50 largest holdings and, in total for any issuer, represent 1% or less of net assets. |
| (8) | Security in default, or group of securities contain a security in default. |
The accompanying notes are an integral part of these financial statements.
Baird Core Intermediate Municipal Bond Fund
Summary Schedule of Investments, December 31, 2018
Summary of Fair Value Exposure at December 31, 2018
The Fund has adopted authoritative fair valuation accounting standards which establish a definition of fair value and set out a hierarchy for measuring fair value. These standards require additional disclosures about the various inputs and valuation techniques used to develop the measurements of fair value and a discussion on changes in valuation techniques and related inputs during the period. These standards define fair value as the price that would be received to sell an asset or paid to transfer a liability in an orderly transaction between market participants at the measurement date.
The fair value hierarchy is organized into three levels based upon the assumptions (referred to as “inputs”) used in pricing the asset or liability. These standards state that “observable inputs” reflect the assumptions market participants would use in pricing the asset or liability based on market data obtained from independent sources and “unobservable inputs” reflect an entity’s own assumptions about the assumptions market participants would use in pricing the asset or liability. These inputs are summarized into three broad levels and described below:
Level 1 – | Unadjusted quoted prices in active markets for identical unrestricted securities. |
Level 2 – | Other significant observable inputs (including quoted prices for similar securities, quoted prices in inactive markets, dealer indications, interest rates, yield curves, prepayment speeds, credit risk, default rates, inputs corroborated by observable market data, etc.). |
Level 3 – | Significant unobservable inputs (including the Fund’s own assumptions about the factors that market participants would use in valuing the security) based on the best information available. |
The inputs or methodology used for valuing securities are not necessarily an indication of the risk associated with investing in those securities.
The following is a summary of the inputs used to value the Fund’s investments as of December 31, 2018:
| | | Level 1 | | | Level 2 | | | Level 3 | | | Total | |
| Long-Term Investments | | | | | | | | | | | | |
| Municipal Bonds | | $ | — | | | $ | 375,358,374 | | | $ | — | | | $ | 375,358,374 | |
| Total Long-Term Investments | | | — | | | | 375,358,374 | | | | — | | | | 375,358,374 | |
| Short-Term Investment | | | | | | | | | | | | | | | | |
| Money Market Mutual Fund | | | 826,495 | | | | — | | | | — | | | | 826,495 | |
| Total Short-Term Investment | | | 826,495 | | | | — | | | | — | | | | 826,495 | |
| Total Investments | | $ | 826,495 | | | $ | 375,358,374 | | | $ | — | | | $ | 376,184,869 | |
Changes in valuation techniques may result in transfers into or out of assigned levels within the fair value hierarchy. There were no transfers into or out of Level 3 during the reporting period, as compared to the security classifications from the prior year’s annual report. See Fund’s Valuation Policy in Note 2a to the financial statements.
The accompanying notes are an integral part of these financial statements.
Additional Information on Fund Expenses
December 31, 2018 (Unaudited)
As a shareholder of a mutual fund, you incur two types of costs: (1) transaction costs, which may include sales charges (loads) on purchase payments, reinvested dividends, or other distributions; redemption fees; and exchange fees; and (2) ongoing costs, such as management fees; distribution and/or service (12b-1) fees; and other fund expenses. Although the Funds do not charge any sales loads, redemption fees, or other transaction fees, you will be assessed fees for outgoing wire transfers, returned checks and stop payment orders at prevailing rates charged by U.S. Bancorp Fund Services, LLC, doing business as U.S. Bank Global Fund Services, the Funds’ transfer agent. If you request that a redemption be made by wire transfer, currently the Funds’ transfer agent charges a $15.00 fee.
This Example is intended to help you understand your ongoing costs (in dollars) of investing in each Fund and to compare these costs with the ongoing costs of investing in other mutual funds. The Example is based on an investment of $1,000 invested at the beginning of the period and held for the entire period (7/1/18 – 12/31/18).
Actual Expenses
The third and fourth columns of the following table provide information about account values based on actual returns and actual expenses. You may use the information in these columns, together with the amount you invested, to estimate the expenses that you paid over the period. Simply divide your account value by $1,000 (for example, an $8,600 account value divided by $1,000 = 8.6), then multiply the result by the number in the fourth column entitled “Expenses Paid During Period’’ to estimate the expenses you paid on your account during this period.
Hypothetical Example for Comparison Purposes
The fifth and sixth columns of the following table provide information about hypothetical account values and hypothetical expenses based on the Funds’ actual expense ratios and an assumed rate of return of 5% per year before expenses, which is not the Funds’ actual return. The hypothetical account values and expenses may not be used to estimate the actual ending account balance or expenses you paid for the period. You may use this information to compare the ongoing costs of investing in the Funds and other mutual funds. To do so, compare this 5% hypothetical example with the 5% hypothetical examples that appear in the shareholder reports of the other mutual funds. Please note that the expenses shown in the table are meant to highlight your ongoing costs only and do not reflect any transactional costs. Therefore, the sixth column of the table (entitled “Expenses Paid During Period”) is useful in comparing ongoing costs only, and will not help you determine the relative total costs of owning different mutual funds. In addition, if these transactional costs were included, your costs could have been higher.
Additional Information on Fund Expenses
December 31, 2018 (Unaudited)
Actual vs. Hypothetical Returns
| | | | | | Hypothetical |
| | | | | | (5% return |
| | | | Actual | before expenses) |
| | Fund’s | Beginning | Ending | Expenses | Ending | Expenses |
| | Annualized | Account | Account | Paid | Account | Paid |
| | Expense | Value | Value | During | Value | During |
| | Ratio(1) | 7/1/18 | 12/31/18 | Period(1) | 12/31/18 | Period(1) |
| Baird Ultra Short | | | | | | |
| Bond Fund | | | | | | |
| Institutional Class | 0.15% | $1,000.00 | $1,010.70 | $0.76 | $1,024.45 | $0.77 |
| Investor Class | 0.40% | $1,000.00 | $1,009.40 | $2.03 | $1,023.19 | $2.04 |
| | | | | | | |
| Baird Short-Term | | | | | | |
| Bond Fund | | | | | | |
| Institutional Class | 0.30% | $1,000.00 | $1,013.70 | $1.52 | $1,023.69 | $1.53 |
| Investor Class | 0.55% | $1,000.00 | $1,013.50 | $2.79 | $1,022.43 | $2.80 |
| | | | | | | |
| Baird Intermediate | | | | | | |
| Bond Fund | | | | | | |
| Institutional Class | 0.30% | $1,000.00 | $1,017.60 | $1.53 | $1,023.69 | $1.53 |
| Investor Class | 0.55% | $1,000.00 | $1,016.40 | $2.80 | $1,022.43 | $2.80 |
| | | | | | | |
| Baird Aggregate | | | | | | |
| Bond Fund | | | | | | |
| Institutional Class | 0.30% | $1,000.00 | $1,014.80 | $1.52 | $1,023.69 | $1.53 |
| Investor Class | 0.55% | $1,000.00 | $1,013.90 | $2.79 | $1,022.43 | $2.80 |
| | | | | | | |
| Baird Core Plus | | | | | | |
| Bond Fund | | | | | | |
| Institutional Class | 0.30% | $1,000.00 | $1,012.50 | $1.52 | $1,023.69 | $1.53 |
| Investor Class | 0.55% | $1,000.00 | $1,011.60 | $2.79 | $1,022.43 | $2.80 |
| | | | | | | |
| Baird Short-Term | | | | | | |
| Municipal Bond Fund | | | | | | |
| Institutional Class | 0.30% | $1,000.00 | $1,011.60 | $1.52 | $1,023.69 | $1.53 |
| Investor Class | 0.55% | $1,000.00 | $1,010.30 | $2.79 | $1,022.43 | $2.80 |
| | | | | | | |
| Baird Quality Intermediate | | | | | | |
| Municipal Bond Fund | | | | | | |
| Institutional Class | 0.30% | $1,000.00 | $1,014.50 | $1.52 | $1,023.69 | $1.53 |
| Investor Class | 0.55% | $1,000.00 | $1,013.70 | $2.79 | $1,022.43 | $2.80 |
| | | | | | | |
| Baird Core Intermediate | | | | | | |
| Municipal Bond Fund | | | | | | |
| Institutional Class | 0.30% | $1,000.00 | $1,015.10 | $1.52 | $1,023.69 | $1.53 |
| Investor Class | 0.55% | $1,000.00 | $1,013.70 | $2.79 | $1,022.43 | $2.80 |
| (1) | Expenses are equal to the Fund’s annualized net expense ratio multiplied by the average account value over the period, multiplied by 184 days, and divided by 365 to reflect the one-half year period. |
Statements of Assets and Liabilities
December 31, 2018
| | | Baird | | | Baird | | | Baird | |
| | | Ultra Short | | | Short-Term | | | Intermediate | |
| | | Bond Fund | | | Bond Fund | | | Bond Fund | |
| ASSETS: | | | | | | | | | |
| Investments, at value | | | | | | | | | |
| (cost $1,043,955,466, $5,805,092,441 | | | | | | | | | |
| and $3,353,289,650, respectively) | | $ | 1,041,782,214 | | | $ | 5,771,501,559 | | | $ | 3,317,984,445 | |
| Interest receivable | | | 4,417,840 | | | | 37,443,556 | | | | 22,479,666 | |
| Receivable for Fund shares sold | | | 116,785,040 | | | | 18,906,221 | | | | 11,613,830 | |
| Prepaid expenses and other assets | | | — | | | | 290 | | | | 157,176 | |
| Total assets | | | 1,162,985,094 | | | | 5,827,851,626 | | | | 3,352,235,117 | |
| LIABILITIES: | | | | | | | | | | | | |
| Payable for securities purchased | | | 114,523,200 | | | | 78,917,213 | | | | 33,539,506 | |
| Payable for Fund shares redeemed | | | 1,294,352 | | | | 6,189,935 | | | | 5,621,192 | |
| Payable to Advisor, net (Note 5) | | | 76,914 | | | | 1,212,206 | | | | 705,632 | |
| Accrued Rule 12b-1 fees (Note 7) | | | 7,953 | | | | 53,072 | | | | 20,984 | |
| Accrued expenses and other liabilities | | | 38,457 | | | | 242,441 | | | | 141,126 | |
| Total liabilities | | | 115,940,876 | | | | 86,614,867 | | | | 40,028,440 | |
| NET ASSETS | | $ | 1,047,044,218 | | | $ | 5,741,236,759 | | | $ | 3,312,206,677 | |
| NET ASSETS CONSIST OF: | | | | | | | | | | | | |
| Paid-in capital | | $ | 1,049,669,553 | | | $ | 5,806,507,235 | | | $ | 3,373,348,480 | |
| Total distributable earnings (loss) | | | (2,625,335 | ) | | | (65,270,476 | ) | | | (61,141,803 | ) |
| NET ASSETS | | $ | 1,047,044,218 | | | $ | 5,741,236,759 | | | $ | 3,312,206,677 | |
| INSTITUTIONAL CLASS SHARES | | | | | | | | | | | | |
| Net Assets | | $ | 1,031,469,705 | | | $ | 5,596,249,218 | | | $ | 3,264,923,905 | |
| Shares outstanding ($0.01 par value, | | | | | | | | | | | | |
| unlimited shares authorized) | | | 103,091,271 | | | | 584,612,351 | | | | 302,408,104 | |
| Net asset value, offering and | | | | | | | | | | | | |
| redemption price per share | | $ | 10.01 | | | $ | 9.57 | | | $ | 10.80 | |
| INVESTOR CLASS SHARES | | | | | | | | | | | | |
| Net Assets | | $ | 15,574,513 | | | $ | 144,987,541 | | | $ | 47,282,772 | |
| Shares outstanding ($0.01 par value, | | | | | | | | | | | | |
| unlimited shares authorized) | | | 1,557,130 | | | | 15,149,504 | | | | 4,188,580 | |
| Net asset value, offering and | | | | | | | | | | | | |
| redemption price per share | | $ | 10.00 | | | $ | 9.57 | | | $ | 11.29 | |
The accompanying notes are an integral part of these financial statements.
Statements of Assets and Liabilities
December 31, 2018
| | | Baird | | | Baird | |
| | | Aggregate | | | Core Plus | |
| | | Bond Fund | | | Bond Fund | |
| ASSETS: | | | | | | |
| Investments, at value | | | | | | |
| (cost $15,847,866,238 and | | | | | | |
| $18,118,386,253, respectively) | | $ | 15,573,487,139 | | | $ | 17,766,495,627 | |
| Interest receivable | | | 103,127,654 | | | | 131,256,333 | |
| Receivable for investments sold | | | 48,847,295 | | | | 47,658,026 | |
| Receivable for Fund shares sold | | | 32,605,415 | | | | 50,992,014 | |
| Prepaid expenses and other assets | | | 162,618 | | | | 8,037 | |
| Total assets | | | 15,758,230,121 | | | | 17,996,410,037 | |
| LIABILITIES: | | | | | | | | |
| Payable for securities purchased | | | 84,785,232 | | | | 157,361,280 | |
| Payable for Fund shares redeemed | | | 53,469,726 | | | | 27,286,273 | |
| Payable to Advisor, net (Note 5) | | | 3,316,984 | | | | 3,786,129 | |
| Accrued Rule 12b-1 fees (Note 7) | | | 312,425 | | | | 898,463 | |
| Accrued expenses and other liabilities | | | 663,397 | | | | 757,226 | |
| Total liabilities | | | 142,547,764 | | | | 190,089,371 | |
| NET ASSETS | | $ | 15,615,682,357 | | | $ | 17,806,320,666 | |
| NET ASSETS CONSIST OF: | | | | | | | | |
| Paid-in capital | | $ | 16,006,651,265 | | | $ | 18,275,582,701 | |
| Total distributable earnings (loss) | | | (390,968,908 | ) | | | (469,262,035 | ) |
| NET ASSETS | | $ | 15,615,682,357 | | | $ | 17,806,320,666 | |
| INSTITUTIONAL CLASS SHARES | | | | | | | | |
| Net Assets | | $ | 14,897,474,227 | | | $ | 15,635,305,128 | |
| Shares outstanding ($0.01 par value, | | | | | | | | |
| unlimited shares authorized) | | | 1,414,973,444 | | | | 1,444,559,576 | |
| Net asset value, offering and | | | | | | | | |
| redemption price per share | | $ | 10.53 | | | $ | 10.82 | |
| INVESTOR CLASS SHARES | | | | | | | | |
| Net Assets | | $ | 718,208,130 | | | $ | 2,171,015,538 | |
| Shares outstanding ($0.01 par value, | | | | | | | | |
| unlimited shares authorized) | | | 65,952,577 | | | | 192,536,434 | |
| Net asset value, offering and | | | | | | | | |
| redemption price per share | | $ | 10.89 | | | $ | 11.28 | |
The accompanying notes are an integral part of these financial statements.
Statements of Assets and Liabilities
December 31, 2018
| | | | | | Baird | | | Baird | |
| | | Baird | | | Quality | | | Core | |
| | | Short-Term | | | Intermediate | | | Intermediate | |
| | | Municipal | | | Municipal | | | Municipal | |
| | | Bond Fund | | | Bond Fund | | | Bond Fund | |
| ASSETS: | | | | | | | | | |
| Investments, at value | | | | | | | | | |
| (cost $343,521,528, $1,094,728,830 | | | | | | | | | |
| and $374,349,924, respectively) | | $ | 343,789,326 | | | $ | 1,107,074,447 | | | $ | 376,184,869 | |
| Interest receivable | | | 3,034,934 | | | | 10,356,231 | | | | 3,402,140 | |
| Receivable for Fund shares sold | | | 18,853,266 | | | | 6,410,488 | | | | 10,336,300 | |
| Total assets | | | 365,677,526 | | | | 1,123,841,166 | | | | 389,923,309 | |
| LIABILITIES: | | | | | | | | | | | | |
| Payable for securities purchased | | | 20,037,319 | | | | 588,344 | | | | 9,701,526 | |
| Payable for Fund shares redeemed | | | 337,302 | | | | 2,883,054 | | | | 73,070 | |
| Payable to Advisor, net (Note 5) | | | 63,164 | | | | 232,387 | | | | 75,932 | |
| Accrued interest expense (Note 6) | | | 84 | | | | 2,093 | | | | — | |
| Accrued Rule 12b-1 fees (Note 7) | | | 48,428 | | | | 83,627 | | | | 1,080 | |
| Accrued expenses and other liabilities | | | 12,827 | | | | 46,477 | | | | 15,186 | |
| Total liabilities | | | 20,499,124 | | | | 3,835,982 | | | | 9,866,794 | |
| NET ASSETS | | $ | 345,178,402 | | | $ | 1,120,005,184 | | | $ | 380,056,515 | |
| NET ASSETS CONSIST OF: | | | | | | | | | | | | |
| Paid-in capital | | $ | 345,293,186 | | | $ | 1,117,325,845 | | | $ | 378,746,139 | |
| Total distributable earnings (loss) | | | (114,784 | ) | | | 2,679,339 | | | | 1,310,376 | |
| NET ASSETS | | $ | 345,178,402 | | | $ | 1,120,005,184 | | | $ | 380,056,515 | |
| INSTITUTIONAL CLASS SHARES | | | | | | | | | | | | |
| Net Assets | | $ | 281,188,205 | | | $ | 1,009,219,286 | | | $ | 378,073,352 | |
| Shares outstanding ($0.01 par value, | | | | | | | | | | | | |
| unlimited shares authorized) | | | 27,961,548 | | | | 88,685,346 | | | | 36,992,418 | |
| Net asset value, offering and | | | | | | | | | | | | |
| redemption price per share | | $ | 10.06 | | | $ | 11.38 | | | $ | 10.22 | |
| INVESTOR CLASS SHARES | | | | | | | | | | | | |
| Net Assets | | $ | 63,990,197 | | | $ | 110,785,898 | | | $ | 1,983,163 | |
| Shares outstanding ($0.01 par value, | | | | | | | | | | | | |
| unlimited shares authorized) | | | 6,372,065 | | | | 9,503,482 | | | | 194,109 | |
| Net asset value, offering and | | | | | | | | | | | | |
| redemption price per share | | $ | 10.04 | | | $ | 11.66 | | | $ | 10.22 | |
The accompanying notes are an integral part of these financial statements.
Statements of Operations
Year Ended December 31, 2018
| | | Baird | | | Baird | | | Baird | |
| | | Ultra Short | | | Short-Term | | | Intermediate | |
| | | Bond Fund | | | Bond Fund | | | Bond Fund | |
| INVESTMENT INCOME: | | | | | | | | | |
| Interest income, including paydowns | | $ | 16,419,534 | | | $ | 142,659,087 | | | $ | 91,348,632 | |
| Other income | | | 3,295 | | | | 13,562 | | | | 643 | |
| Total investment income | | | 16,422,829 | | | | 142,672,649 | | | | 91,349,275 | |
EXPENSES: | | | | | | | | | | | | |
| Investment advisory fees (Note 5) | | | 1,714,780 | | | | 14,237,543 | | | | 8,122,715 | |
| Administration fees (Note 5) | | | 342,956 | | | | 2,847,509 | | | | 1,624,543 | |
| Rule 12b-1 fees – Investor Class Shares (Note 7) | | | 31,771 | | | | 350,284 | | | | 118,995 | |
| Total expenses | | | 2,089,507 | | | | 17,435,336 | | | | 9,866,253 | |
| Fee waiver by Advisor (Note 5) | | | (1,028,868 | ) | | | — | | | | — | |
| Net expenses | | | 1,060,639 | | | | 17,435,336 | | | | 9,866,253 | |
| NET INVESTMENT INCOME | | | 15,362,190 | | | | 125,237,313 | | | | 81,483,022 | |
| | | | | | | | | | | | | |
| REALIZED AND UNREALIZED | | | | | | | | | | | | |
| LOSS ON INVESTMENTS: | | | | | | | | | | | | |
| Net realized loss on investments | | | (122,230 | ) | | | (26,235,503 | ) | | | (22,545,628 | ) |
| Net change in unrealized | | | | | | | | | | | | |
| depreciation on investments | | | (2,121,702 | ) | | | (14,447,406 | ) | | | (36,023,033 | ) |
| Net realized and unrealized loss on investments | | | (2,243,932 | ) | | | (40,682,909 | ) | | | (58,568,661 | ) |
| NET INCREASE IN NET | | | | | | | | | | | | |
| ASSETS RESULTING FROM OPERATIONS | | $ | 13,118,258 | | | $ | 84,554,404 | | | $ | 22,914,361 | |
The accompanying notes are an integral part of these financial statements.
Statements of Operations
Year Ended December 31, 2018
| | | Baird | | | Baird | |
| | | Aggregate | | | Core Plus | |
| | | Bond Fund | | | Bond Fund | |
| INVESTMENT INCOME: | | | | | | |
| Interest income, including paydowns | | $ | 472,095,643 | | | $ | 577,480,846 | |
| Other income | | | — | | | | 22,014 | |
| Total investment income | | | 472,095,643 | | | | 577,502,860 | |
| EXPENSES: | | | | | | | | |
| Investment advisory fees (Note 5) | | | 38,442,384 | | | | 43,649,899 | |
| Administration fees (Note 5) | | | 7,688,477 | | | | 8,729,980 | |
| Rule 12b-1 fees – Investor Class Shares (Note 7) | | | 1,927,963 | | | | 5,837,847 | |
| Total expenses | | | 48,058,824 | | | | 58,217,726 | |
| NET INVESTMENT INCOME | | | 424,036,819 | | | | 519,285,134 | |
| | | | | | | | | |
| REALIZED AND UNREALIZED | | | | | | | | |
| LOSS ON INVESTMENTS: | | | | | | | | |
| Net realized loss on investments | | | (69,510,689 | ) | | | (74,445,293 | ) |
| Net change in unrealized depreciation on investments | | | (390,719,147 | ) | | | (513,615,666 | ) |
| Net realized and unrealized loss on investments | | | (460,229,836 | ) | | | (588,060,959 | ) |
| NET DECREASE IN NET | | | | | | | | |
| ASSETS RESULTING FROM OPERATIONS | | $ | (36,193,017 | ) | | $ | (68,775,825 | ) |
The accompanying notes are an integral part of these financial statements.
Statements of Operations
Year Ended December 31, 2018
| | | | | | Baird | | | Baird | |
| | | Baird | | | Quality | | | Core | |
| | | Short-Term | | | Intermediate | | | Intermediate | |
| | | Municipal | | | Municipal | | | Municipal | |
| | | Bond Fund | | | Bond Fund | | | Bond Fund | |
| INVESTMENT INCOME: | | | | | | | | | |
| Interest income, including paydowns | | $ | 5,457,253 | | | $ | 30,772,375 | | | $ | 7,409,646 | |
| Other income | | | — | | | | 238 | | | | — | |
| Total investment income | | | 5,457,253 | | | | 30,772,613 | | | | 7,409,646 | |
| EXPENSES: | | | | | | | | | | | | |
| Investment advisory fees (Note 5) | | | 584,901 | | | | 2,859,227 | | | | 713,344 | |
| Administration fees (Note 5) | | | 116,980 | | | | 571,845 | | | | 142,669 | |
| Interest expense (Note 6) | | | 84 | | | | 2,093 | | | | — | |
| Rule 12b-1 fees – Investor Class Shares (Note 7) | | | 152,741 | | | | 241,638 | | | | 4,650 | |
| Total expenses | | | 854,706 | | | | 3,674,803 | | | | 860,663 | |
| NET INVESTMENT INCOME | | | 4,602,547 | | | | 27,097,810 | | | | 6,548,983 | |
| | | | | | | | | | | | | |
| REALIZED AND UNREALIZED | | | | | | | | | | | | |
| GAIN (LOSS) ON INVESTMENTS: | | | | | | | | | | | | |
| Net realized loss on investments | | | (395,641 | ) | | | (2,660,074 | ) | | | (512,079 | ) |
| Net change in unrealized | | | | | | | | | | | | |
| appreciation (depreciation) on investments | | | 363,342 | | | | (12,531,513 | ) | | | (1,082,758 | ) |
| Net realized and unrealized loss on investments | | | (32,299 | ) | | | (15,191,587 | ) | | | (1,594,837 | ) |
| NET INCREASE IN NET ASSETS | | | | | | | | | | | | |
| RESULTING FROM OPERATIONS | | $ | 4,570,248 | | | $ | 11,906,223 | | | $ | 4,954,146 | |
The accompanying notes are an integral part of these financial statements.
Statements of Changes in Net Assets
Baird Ultra Short Bond Fund
| | | Year Ended | | | Year Ended | |
| | | December 31, 2018 | | | December 31, 2017 | |
| OPERATIONS: | | | | | | |
| Net investment income | | $ | 15,362,190 | | | $ | 7,160,829 | |
| Net realized loss on investments | | | (122,230 | ) | | | (22,182 | ) |
| Net change in unrealized depreciation on investments | | | (2,121,702 | ) | | | (182,448 | ) |
| Net increase in net assets resulting from operations | | | 13,118,258 | | | | 6,956,199 | |
| | | | | | | | | |
| CAPITAL SHARE TRANSACTIONS: | | | | | | | | |
| Proceeds from shares sold | | | 808,716,290 | | | | 528,472,904 | |
| Shares issued to holders in reinvestment of distributions | | | 14,355,617 | | | | 6,842,101 | |
| Cost of shares redeemed | | | (313,355,931 | ) | | | (387,950,353 | ) |
| Net increase in net assets resulting | | | | | | | | |
| from capital share transactions | | | 509,715,976 | | | | 147,364,652 | |
| | | | | | | | | |
| DISTRIBUTIONS TO SHAREHOLDERS: | | | | | | | | |
| Net distributions to shareholders: | | | | | | | | |
| Institutional Class | | | (15,083,798 | ) | | | (7,173,958 | ) |
| Investor Class | | | (253,414 | ) | | | (104,571 | ) |
| Total net distributions to shareholders (a) | | | (15,337,212 | ) | | | (7,278,529 | ) |
| | | | | | | | | |
| TOTAL INCREASE IN NET ASSETS | | | 507,497,022 | | | | 147,042,322 | |
| | | | | | | | | |
| NET ASSETS: | | | | | | | | |
| Beginning of year | | | 539,547,196 | | | | 392,504,874 | |
| End of year (b) | | $ | 1,047,044,218 | | | $ | 539,547,196 | |
| (a) | Distributions from net investment income and from net realized gains are no longer required to be separately disclosed. See Note 2. For the year ended December 31, 2017, total distributions to shareholders represented distributions from net investment income of $7,173,958 and $104,571 for the Institutional Class and Investor Class, respectively. |
| (b) | Parenthetical disclosure of accumulated undistributed net investment income is no longer required. See Note 2. For the year ended December 31, 2017, end of year net assets included accumulated undistributed net investment income of $8,078. |
The accompanying notes are an integral part of these financial statements.
Statements of Changes in Net Assets
Baird Short-Term Bond Fund
| | | Year Ended | | | Year Ended | |
| | | December 31, 2018 | | | December 31, 2017 | |
| OPERATIONS: | | | | | | |
| Net investment income | | $ | 125,237,313 | | | $ | 83,559,859 | |
| Net realized loss on investments | | | (26,235,503 | ) | | | (4,735,685 | ) |
| Net change in unrealized depreciation on investments | | | (14,447,406 | ) | | | (11,850,257 | ) |
| Net increase in net assets resulting from operations | | | 84,554,404 | | | | 66,973,917 | |
| | | | | | | | | |
| CAPITAL SHARE TRANSACTIONS: | | | | | | | | |
| Proceeds from shares sold | | | 2,286,737,726 | | | | 3,358,426,214 | |
| Shares issued to holders in reinvestment of distributions | | | 116,729,687 | | | | 79,531,658 | |
| Cost of shares redeemed | | | (2,156,148,560 | ) | | | (1,759,494,811 | ) |
| Net increase in net assets resulting | | | | | | | | |
| from capital share transactions | | | 247,318,853 | | | | 1,678,463,061 | |
| | | | | | | | | |
| DISTRIBUTIONS TO SHAREHOLDERS: | | | | | | | | |
| Net distributions to shareholders: | | | | | | | | |
| Institutional Class | | | (122,547,112 | ) | | | (83,080,452 | ) |
| Investor Class | | | (2,757,574 | ) | | | (1,877,799 | ) |
| Total net distributions to shareholders (a) | | | (125,304,686 | ) | | | (84,958,251 | ) |
| | | | | | | | | |
| TOTAL INCREASE IN NET ASSETS | | | 206,568,571 | | | | 1,660,478,727 | |
| | | | | | | | | |
| NET ASSETS: | | | | | | | | |
| Beginning of year | | | 5,534,668,188 | | | | 3,874,189,461 | |
| End of year (b) | | $ | 5,741,236,759 | | | $ | 5,534,668,188 | |
| (a) | Distributions from net investment income and from net realized gains are no longer required to be separately disclosed. See Note 2. For the year ended December 31, 2017, total distributions to shareholders represented distributions from net investment income of $82,179,140 and $1,855,366 for the Institutional Class and Investor Class, respectively, and distributions from net realized gains of $901,312 and $22,433 for the Institutional Class and Investor Class, respectively. |
| (b) | Parenthetical disclosure of accumulated undistributed net investment income is no longer required. See Note 2. For the year ended December 31, 2017, end of year net assets included accumulated undistributed net investment income of $103,316. |
The accompanying notes are an integral part of these financial statements.
Statements of Changes in Net Assets
Baird Intermediate Bond Fund
| | | Year Ended | | | Year Ended | |
| | | December 31, 2018 | | | December 31, 2017 | |
| OPERATIONS: | | | | | | |
| Net investment income | | $ | 81,483,022 | | | $ | 60,914,051 | |
| Net realized loss on investments | | | (22,545,628 | ) | | | (1,847,622 | ) |
| Net change in unrealized appreciation | | | | | | | | |
| (depreciation) on investments | | | (36,023,033 | ) | | | 7,084,033 | |
| Net increase in net assets resulting from operations | | | 22,914,361 | | | | 66,150,462 | |
| | | | | | | | | |
| CAPITAL SHARE TRANSACTIONS: | | | | | | | | |
| Proceeds from shares sold | | | 1,314,966,726 | | | | 1,044,007,511 | |
| Shares issued to holders in reinvestment of distributions | | | 67,024,736 | | | | 53,812,675 | |
| Cost of shares redeemed | | | (966,939,949 | ) | | | (453,075,192 | ) |
| Net increase in net assets resulting | | | | | | | | |
| from capital share transactions | | | 415,051,513 | | | | 644,744,994 | |
| | | | | | | | | |
| DISTRIBUTIONS TO SHAREHOLDERS: | | | | | | | | |
| Net distributions to shareholders: | | | | | | | | |
| Institutional Class | | | (80,653,988 | ) | | | (60,410,768 | ) |
| Investor Class | | | (1,007,749 | ) | | | (1,748,383 | ) |
| Total net distributions to shareholders (a) | | | (81,661,737 | ) | | | (62,159,151 | ) |
| | | | | | | | | |
| TOTAL INCREASE IN NET ASSETS | | | 356,304,137 | | | | 648,736,305 | |
| | | | | | | | | |
| NET ASSETS: | | | | | | | | |
| Beginning of year | | | 2,955,902,540 | | | | 2,307,166,235 | |
| End of year (b) | | $ | 3,312,206,677 | | | $ | 2,955,902,540 | |
| (a) | Distributions from net investment income and from net realized gains are no longer required to be separately disclosed. See Note 2. For the year ended December 31, 2017, total distributions to shareholders represented distributions from net investment income of $59,422,061 and $1,731,195 for the Institutional Class and Investor Class, respectively, and distributions from net realized gains of $988,707 and $17,188 for the Institutional Class and Investor Class, respectively. |
| (b) | Parenthetical disclosure of accumulated undistributed net investment income is no longer required. See Note 2. For the year ended December 31, 2017, end of year net assets included accumulated undistributed net investment income of $133,837. |
The accompanying notes are an integral part of these financial statements.
Statements of Changes in Net Assets
Baird Aggregate Bond Fund
| | | Year Ended | | | Year Ended | |
| | | December 31, 2018 | | | December 31, 2017 | |
| OPERATIONS: | | | | | | |
| Net investment income | | $ | 424,036,819 | | | $ | 304,027,795 | |
| Net realized loss on investments | | | (69,510,689 | ) | | | (976,549 | ) |
| Net change in unrealized appreciation | | | | | | | | |
| (depreciation) on investments | | | (390,719,147 | ) | | | 207,542,499 | |
| Net increase (decrease) in net assets | | | | | | | | |
| resulting from operations | | | (36,193,017 | ) | | | 510,593,745 | |
| | | | | | | | | |
| CAPITAL SHARE TRANSACTIONS: | | | | | | | | |
| Proceeds from shares sold | | | 4,982,753,257 | | | | 5,511,985,366 | |
| Shares issued to holders in reinvestment of distributions | | | 390,774,288 | | | | 292,491,935 | |
| Cost of shares redeemed | | | (3,688,839,933 | ) | | | (2,160,707,258 | ) |
| Net increase in net assets resulting | | | | | | | | |
| from capital share transactions | | | 1,684,687,612 | | | | 3,643,770,043 | |
| | | | | | | | | |
| DISTRIBUTIONS TO SHAREHOLDERS: | | | | | | | | |
| Net distributions to shareholders: | | | | | | | | |
| Institutional Class | | | (421,718,399 | ) | | | (306,556,891 | ) |
| Investor Class | | | (19,304,710 | ) | | | (18,620,382 | ) |
| Total net distributions to shareholders (a) | | | (441,023,109 | ) | | | (325,177,273 | ) |
| | | | | | | | | |
| TOTAL INCREASE IN NET ASSETS | | | 1,207,471,486 | | | | 3,829,186,515 | |
| | | | | | | | | |
| NET ASSETS: | | | | | | | | |
| Beginning of year | | | 14,408,210,871 | | | | 10,579,024,356 | |
| End of year (b) | | $ | 15,615,682,357 | | | $ | 14,408,210,871 | |
| (a) | Distributions from net investment income and from net realized gains are no longer required to be separately disclosed. See Note 2. For the year ended December 31, 2017, total distributions to shareholders represented distributions from net investment income of $306,556,891 and $18,620,382 for the Institutional Class and Investor Class, respectively. |
| (b) | Parenthetical disclosure of accumulated undistributed net investment income is no longer required. See Note 2. For the year ended December 31, 2017, end of year net assets included accumulated undistributed net investment income of $411,465. |
The accompanying notes are an integral part of these financial statements.
Statements of Changes in Net Assets
Baird Core Plus Bond Fund
| | | Year Ended | | | Year Ended | |
| | | December 31, 2018 | | | December 31, 2017 | |
| OPERATIONS: | | | | | | |
| Net investment income | | $ | 519,285,134 | | | $ | 382,254,125 | |
| Net realized gain (loss) on investments | | | (74,445,293 | ) | | | 4,924,250 | |
| Net change in unrealized appreciation | | | | | | | | |
| (depreciation) on investments | | | (513,615,666 | ) | | | 255,225,834 | |
| Net increase (decrease) in net assets | | | | | | | | |
| resulting from operations | | | (68,775,825 | ) | | | 642,404,209 | |
| | | | | | | | | |
| CAPITAL SHARE TRANSACTIONS: | | | | | | | | |
| Proceeds from shares sold | | | 5,741,152,956 | | | | 6,092,321,719 | |
| Shares issued to holders in reinvestment of distributions | | | 500,610,919 | | | | 382,795,347 | |
| Cost of shares redeemed | | | (4,179,926,706 | ) | | | (3,265,688,109 | ) |
| Net increase in net assets resulting | | | | | | | | |
| from capital share transactions | | | 2,061,837,169 | | | | 3,209,428,957 | |
| | | | | | | | | |
| DISTRIBUTIONS TO SHAREHOLDERS: | | | | | | | | |
| Net distributions to shareholders: | | | | | | | | |
| Institutional Class | | | (474,634,516 | ) | | | (338,748,094 | ) |
| Investor Class | | | (63,272,584 | ) | | | (67,363,694 | ) |
| Total net distributions to shareholders (a) | | | (537,907,100 | ) | | | (406,111,788 | ) |
| | | | | | | | | |
| TOTAL INCREASE IN NET ASSETS | | | 1,455,154,244 | | | | 3,445,721,378 | |
| | | | | | | | | |
| NET ASSETS: | | | | | | | | |
| Beginning of year | | | 16,351,166,422 | | | | 12,905,445,044 | |
| End of year (b) | | $ | 17,806,320,666 | | | $ | 16,351,166,422 | |
| (a) | Distributions from net investment income and from net realized gains are no longer required to be separately disclosed. See Note 2. For the year ended December 31, 2017, total distributions to shareholders represented distributions from net investment income of $338,748,094 and $67,363,694 for the Institutional Class and Investor Class, respectively. |
| (b) | Parenthetical disclosure of accumulated undistributed net investment income is no longer required. See Note 2. For the year ended December 31, 2017, end of year net assets included accumulated undistributed net investment income of $726,500. |
The accompanying notes are an integral part of these financial statements.
Statements of Changes in Net Assets
Baird Short-Term Municipal Bond Fund
| | | Year Ended | | | Year Ended | |
| | | December 31, 2018 | | | December 31, 2017 | |
| OPERATIONS: | | | | | | |
| Net investment income | | $ | 4,602,547 | | | $ | 1,422,218 | |
| Net realized gain (loss) on investments | | | (395,641 | ) | | | 87,302 | |
| Net change in unrealized appreciation on investments | | | 363,342 | | | | 379,262 | |
| Net increase in net assets resulting from operations | | | 4,570,248 | | | | 1,888,782 | |
| | | | | | | | | |
| CAPITAL SHARE TRANSACTIONS: | | | | | | | | |
| Proceeds from shares sold | | | 350,521,712 | | | | 102,613,395 | |
| Shares issued to holders in reinvestment of distributions | | | 3,718,376 | | | | 1,032,531 | |
| Cost of shares redeemed | | | (134,819,382 | ) | | | (36,966,769 | ) |
| Net increase in net assets resulting | | | | | | | | |
| from capital share transactions | | | 219,420,706 | | | | 66,679,157 | |
| | | | | | | | | |
| DISTRIBUTIONS TO SHAREHOLDERS: | | | | | | | | |
| Net distributions to shareholders: | | | | | | | | |
| Institutional Class | | | (3,476,137 | ) | | | (1,406,898 | ) |
| Investor Class | | | (1,140,216 | ) | | | (51,130 | ) |
| Total net distributions to shareholders (a) | | | (4,616,353 | ) | | | (1,458,028 | ) |
| | | | | | | | | |
| TOTAL INCREASE IN NET ASSETS | | | 219,374,601 | | | | 67,109,911 | |
| | | | | | | | | |
| NET ASSETS: | | | | | | | | |
| Beginning of year | | | 125,803,801 | | | | 58,693,890 | |
| End of year (b) | | $ | 345,178,402 | | | $ | 125,803,801 | |
| (a) | Distributions from net investment income and from net realized gains are no longer required to be separately disclosed. See Note 2. For the year ended December 31, 2017, total distributions to shareholders represented distributions from net investment income of $1,369,931 and $49,506 for the Institutional Class and Investor Class, respectively, and distributions from net realized gains of $36,967 and $1,624 for the Institutional Class and Investor Class, respectively. |
| (b) | Parenthetical disclosure of accumulated undistributed net investment income is no longer required. See Note 2. For the year ended December 31, 2017, end of year net assets included accumulated undistributed net investment income of $5,226. |
The accompanying notes are an integral part of these financial statements.
Statements of Changes in Net Assets
Baird Quality Intermediate Municipal Bond Fund
| | | Year Ended | | | Year Ended | |
| | | December 31, 2018 | | | December 31, 2017 | |
| OPERATIONS: | | | | | | |
| Net investment income | | $ | 27,097,810 | | | $ | 24,318,881 | |
| Net realized loss on investments | | | (2,660,074 | ) | | | (953,373 | ) |
| Net change in unrealized appreciation | | | | | | | | |
| (depreciation) on investments | | | (12,531,513 | ) | | | 8,751,823 | |
| Net increase in net assets resulting from operations | | | 11,906,223 | | | | 32,117,331 | |
| | | | | | | | | |
| CAPITAL SHARE TRANSACTIONS: | | | | | | | | |
| Proceeds from shares sold | | | 480,971,362 | | | | 456,788,210 | |
| Shares issued to holders in reinvestment of distributions | | | 23,445,969 | | | | 21,217,912 | |
| Cost of shares redeemed | | | (520,681,280 | ) | | | (406,613,328 | ) |
| Net increase (decrease) in net assets resulting | | | | | | | | |
| from capital share transactions | | | (16,263,949 | ) | | | 71,392,794 | |
| | | | | | | | | |
| DISTRIBUTIONS TO SHAREHOLDERS: | | | | | | | | |
| Net distributions to shareholders: | | | | | | | | |
| Institutional Class | | | (25,039,480 | ) | | | (21,803,402 | ) |
| Investor Class | | | (2,013,625 | ) | | | (2,515,479 | ) |
| Total net distributions to shareholders (a) | | | (27,053,105 | ) | | | (24,318,881 | ) |
| Return of capital distributions: | | | | | | | | |
| Institutional Class | | | — | | | | (53,232 | ) |
| Investor Class | | | — | | | | (6,141 | ) |
| Total return of capital distributions | | | — | | | | (59,373 | ) |
| | | | | | | | | |
| TOTAL INCREASE (DECREASE) IN NET ASSETS | | | (31,410,831 | ) | | | 79,131,871 | |
| | | | | | | | | |
| NET ASSETS: | | | | | | | | |
| Beginning of year | | | 1,151,416,015 | | | | 1,072,284,144 | |
| End of year (b) | | $ | 1,120,005,184 | | | $ | 1,151,416,015 | |
| (a) | Distributions from net investment income and from net realized gains are no longer required to be separately disclosed. See Note 2. For the year ended December 31, 2017, total distributions to shareholders represented distributions from net investment income of $21,803,402 and $2,515,479 for the Institutional Class and Investor Class, respectively. |
| (b) | Parenthetical disclosure of accumulated undistributed net investment income is no longer required. See Note 2. For the year ended December 31, 2017, end of year net assets included accumulated undistributed net investment income of $0. |
The accompanying notes are an integral part of these financial statements.
Statements of Changes in Net Assets
Baird Core Intermediate Municipal Bond Fund
| | | Year Ended | | | Year Ended | |
| | | December 31, 2018 | | | December 31, 2017 | |
| OPERATIONS: | | | | | | |
| Net investment income | | $ | 6,548,983 | | | $ | 3,113,852 | |
| Net realized gain (loss) on investments | | | (512,079 | ) | | | 289,925 | |
| Net change in unrealized appreciation | | | | | | | | |
| (depreciation) on investments | | | (1,082,758 | ) | | | 3,775,908 | |
| Net increase in net assets resulting from operations | | | 4,954,146 | | | | 7,179,685 | |
| | | | | | | | | |
| CAPITAL SHARE TRANSACTIONS: | | | | | | | | |
| Proceeds from shares sold | | | 260,403,608 | | | | 154,074,208 | |
| Shares issued to holders in reinvestment of distributions | | | 4,380,739 | | | | 1,974,464 | |
| Cost of shares redeemed | | | (119,644,249 | ) | | | (21,309,164 | ) |
| Net increase in net assets resulting | | | | | | | | |
| from capital share transactions | | | 145,140,098 | | | | 134,739,508 | |
| | | | | | | | | |
| DISTRIBUTIONS TO SHAREHOLDERS: | | | | | | | | |
| Net distributions to shareholders: | | | | | | | | |
| Institutional Class | | | (6,517,792 | ) | | | (3,078,238 | ) |
| Investor Class | | | (38,214 | ) | | | (27,172 | ) |
| Total net distributions to shareholders (a) | | | (6,556,006 | ) | | | (3,105,410 | ) |
| | | | | | | | | |
| TOTAL INCREASE IN NET ASSETS | | | 143,538,238 | | | | 138,813,783 | |
| | | | | | | | | |
| NET ASSETS: | | | | | | | | |
| Beginning of year | | | 236,518,277 | | | | 97,704,494 | |
| End of year (b) | | $ | 380,056,515 | | | $ | 236,518,277 | |
| (a) | Distributions from net investment income and from net realized gains are no longer required to be separately disclosed. See Note 2. For the year ended December 31, 2017, total distributions to shareholders represented distributions from net investment income of $3,078,238 and $27,172 for the Institutional Class and Investor Class, respectively. |
| (b) | Parenthetical disclosure of accumulated undistributed net investment income is no longer required. See Note 2. For the year ended December 31, 2017, end of year net assets included accumulated undistributed net investment income of $11,590. |
The accompanying notes are an integral part of these financial statements.
Financial Highlights
Baird Ultra Short Bond Fund – Institutional Class
| | | Year Ended December 31, | |
| | | 2018 | | | 2017 | | | 2016 | | | 2015 | | | 2014 | |
| Per Share Data: | | | | | | | | | | | | | | | |
| Net asset value, beginning of year | | $ | 10.03 | | | $ | 10.03 | | | $ | 9.98 | | | $ | 10.03 | | | $ | 10.00 | |
| Income from investment operations: | | | | | | | | | | | | | | | | | | | | |
| Net investment income | | | 0.23 | (1) | | | 0.13 | (1) | | | 0.11 | (1) | | | 0.08 | (1) | | | 0.09 | |
| Net realized and unrealized | | | | | | | | | | | | | | | | | | | | |
| gains (losses) on investments | | | (0.04 | ) | | | 0.00 | (2)(3) | | | 0.04 | | | | (0.05 | ) | | | 0.03 | (2) |
| Total from investment operations | | | 0.19 | | | | 0.13 | | | | 0.15 | | | | 0.03 | | | | 0.12 | |
| Less distributions: | | | | | | | | | | | | | | | | | | | | |
| Distributions from | | | | | | | | | | | | | | | | | | | | |
| net investment income | | | (0.21 | ) | | | (0.13 | ) | | | (0.10 | ) | | | (0.08 | ) | | | (0.09 | ) |
| Total distributions | | | (0.21 | ) | | | (0.13 | ) | | | (0.10 | ) | | | (0.08 | ) | | | (0.09 | ) |
| Net asset value, end of year | | $ | 10.01 | | | $ | 10.03 | | | $ | 10.03 | | | $ | 9.98 | | | $ | 10.03 | |
| Total return | | | 1.95 | % | | | 1.30 | % | | | 1.56 | % | | | 0.30 | % | | | 1.21 | % |
| Supplemental data and ratios: | | | | | | | | | | | | | | | | | | | | |
| Net assets, end of year (millions) | | $ | 1,031.5 | | | $ | 532.0 | | | $ | 387.3 | | | $ | 189.3 | | | $ | 84.5 | |
| Ratio of expenses to average net assets | | | 0.15 | % | | | 0.15 | % | | | 0.15 | % | | | 0.15 | % | | | 0.15 | % |
| Ratio of expenses to average | | | | | | | | | | | | | | | | | | | | |
| net assets (before waivers) | | | 0.30 | % | | | 0.30 | % | | | 0.30 | % | | | 0.30 | % | | | 0.30 | % |
| Ratio of net investment income | | | | | | | | | | | | | | | | | | | | |
| to average net assets | | | 2.24 | % | | | 1.31 | % | | | 1.05 | % | | | 0.78 | % | | | 0.93 | % |
| Ratio of net investment income | | | | | | | | | | | | | | | | | | | | |
| to average net assets (before waivers) | | | 2.09 | % | | | 1.16 | % | | | 0.90 | % | | | 0.63 | % | | | 0.78 | % |
Portfolio turnover rate(4) | | | 66 | % | | | 83 | % | | | 97 | % | | | 66 | % | | | 58 | % |
| (1) | Calculated using average shares outstanding during the year. |
| (2) | Due to timing of capital share transactions, the per share amount of net realized and unrealized gain (loss) on investments varies from the amounts shown in the statement of operations. |
| (3) | Amount less than $0.005. |
| (4) | Portfolio turnover is calculated on the basis of the Fund as a whole without distinguishing between the classes of shares issued. |
The accompanying notes are an integral part of these financial statements.
Financial Highlights
Baird Ultra Short Bond Fund – Investor Class
| | | Year Ended December 31, | |
| | | 2018 | | | 2017 | | | 2016 | | | 2015 | | | 2014 | |
| Per Share Data: | | | | | | | | | | | | | | | |
| Net asset value, beginning of year | | $ | 10.03 | | | $ | 10.03 | | | $ | 9.98 | | | $ | 10.02 | | | $ | 10.00 | |
| Income from investment operations: | | | | | | | | | | | | | | | | | | | | |
| Net investment income | | | 0.20 | (1) | | | 0.11 | (1) | | | 0.08 | (1) | | | 0.05 | (1) | | | 0.07 | |
| Net realized and unrealized | | | | | | | | | | | | | | | | | | | | |
| gains (losses) on investments | | | (0.04 | ) | | | (0.01 | ) | | | 0.05 | | | | (0.03 | ) | | | 0.02 | (2) |
| Total from investment operations | | | 0.16 | | | | 0.10 | | | | 0.13 | | | | 0.02 | | | | 0.09 | |
| Less distributions: | | | | | | | | | | | | | | | | | | | | |
| Distributions from | | | | | | | | | | | | | | | | | | | | |
| net investment income | | | (0.19 | ) | | | (0.10 | ) | | | (0.08 | ) | | | (0.06 | ) | | | (0.07 | ) |
| Total distributions | | | (0.19 | ) | | | (0.10 | ) | | | (0.08 | ) | | | (0.06 | ) | | | (0.07 | ) |
| Net asset value, end of year | | $ | 10.00 | | | $ | 10.03 | | | $ | 10.03 | | | $ | 9.98 | | | $ | 10.02 | |
| Total return | | | 1.60 | % | | | 1.05 | % | | | 1.32 | % | | | 0.16 | % | | | 0.88 | % |
| Supplemental data and ratios: | | | | | | | | | | | | | | | | | | | | |
| Net assets, end of year (millions) | | $ | 15.6 | | | $ | 7.6 | | | $ | 5.2 | | | $ | 1.2 | | | $ | 0.9 | |
| Ratio of expenses to average net assets | | | 0.40 | % | | | 0.40 | % | | | 0.40 | % | | | 0.40 | % | | | 0.40 | % |
| Ratio of expenses to average | | | | | | | | | | | | | | | | | | | | |
| net assets (before waivers) | | | 0.55 | % | | | 0.55 | % | | | 0.55 | % | | | 0.55 | % | | | 0.55 | % |
| Ratio of net investment income | | | | | | | | | | | | | | | | | | | | |
| to average net assets | | | 1.99 | % | | | 1.06 | % | | | 0.80 | % | | | 0.53 | % | | | 0.68 | % |
| Ratio of net investment income | | | | | | | | | | | | | | | | | | | | |
| to average net assets (before waivers) | | | 1.84 | % | | | 0.91 | % | | | 0.65 | % | | | 0.38 | % | | | 0.53 | % |
Portfolio turnover rate(3) | | | 66 | % | | | 83 | % | | | 97 | % | | | 66 | % | | | 58 | % |
| (1) | Calculated using average shares outstanding during the year. |
| (2) | Due to timing of capital share transactions, the per share amount of net realized and unrealized gain (loss) on investments varies from the amounts shown in the statement of operations. |
| (3) | Portfolio turnover is calculated on the basis of the Fund as a whole without distinguishing between the classes of shares issued. |
The accompanying notes are an integral part of these financial statements.
Financial Highlights
Baird Short-Term Bond Fund – Institutional Class
| | | Year Ended December 31, | |
| | | 2018 | | | 2017 | | | 2016 | | | 2015 | | | 2014 | |
| Per Share Data: | | | | | | | | | | | | | | | |
| Net asset value, beginning of year | | $ | 9.64 | | | $ | 9.66 | | | $ | 9.60 | | | $ | 9.67 | | | $ | 9.69 | |
| Income from investment operations: | | | | | | | | | | | | | | | | | | | | |
| Net investment income | | | 0.21 | (1) | | | 0.17 | (1) | | | 0.15 | (1) | | | 0.13 | (1) | | | 0.16 | |
| Net realized and unrealized | | | | | | | | | | | | | | | | | | | | |
| gains (losses) on investments | | | (0.07 | ) | | | (0.02 | ) | | | 0.06 | | | | (0.05 | ) | | | (0.01 | ) |
| Total from investment operations | | | 0.14 | | | | 0.15 | | | | 0.21 | | | | 0.08 | | | | 0.15 | |
| Less distributions: | | | | | | | | | | | | | | | | | | | | |
| Distributions from | | | | | | | | | | | | | | | | | | | | |
| net investment income | | | (0.21 | ) | | | (0.17 | ) | | | (0.15 | ) | | | (0.15 | ) | | | (0.16 | ) |
| Distributions from net realized gains | | | — | | | | (0.00 | )(2) | | | (0.00 | )(2) | | | (0.00 | )(2) | | | (0.01 | ) |
| Total distributions | | | (0.21 | ) | | | (0.17 | ) | | | (0.15 | ) | | | (0.15 | ) | | | (0.17 | ) |
| Net asset value, end of year | | $ | 9.57 | | | $ | 9.64 | | | $ | 9.66 | | | $ | 9.60 | | | $ | 9.67 | |
| Total return | | | 1.49 | % | | | 1.53 | % | | | 2.25 | % | | | 0.89 | % | | | 1.49 | % |
| Supplemental data and ratios: | | | | | | | | | | | | | | | | | | | | |
| Net assets, end of year (millions) | | $ | 5,596.2 | | | $ | 5,399.7 | | | $ | 3,769.3 | | | $ | 2,976.0 | | | $ | 2,640.9 | |
| Ratio of expenses to average net assets | | | 0.30 | % | | | 0.30 | % | | | 0.30 | % | | | 0.30 | % | | | 0.30 | % |
| Ratio of net investment income | | | | | | | | | | | | | | | | | | | | |
| to average net assets | | | 2.21 | % | | | 1.73 | % | | | 1.57 | % | | | 1.30 | % | | | 1.56 | % |
Portfolio turnover rate(3) | | | 58 | % | | | 55 | % | | | 44 | % | | | 38 | % | | | 51 | % |
| (1) | Calculated using average shares outstanding during the year. |
| (2) | Amount is less than $0.005. |
| (3) | Portfolio turnover is calculated on the basis of the Fund as a whole without distinguishing between the classes of shares issued. |
The accompanying notes are an integral part of these financial statements.
Financial Highlights
Baird Short-Term Bond Fund – Investor Class
| | | Year Ended December 31, | |
| | | 2018 | | | 2017 | | | 2016 | | | 2015 | | | 2014 | |
| Per Share Data: | | | | | | | | | | | | | | | |
| Net asset value, beginning of year | | $ | 9.64 | | | $ | 9.66 | | | $ | 9.60 | | | $ | 9.67 | | | $ | 9.69 | |
| Income from investment operations: | | | | | | | | | | | | | | | | | | | | |
| Net investment income | | | 0.19 | (1) | | | 0.14 | (1) | | | 0.13 | (1) | | | 0.10 | (1) | | | 0.14 | |
| Net realized and unrealized | | | | | | | | | | | | | | | | | | | | |
| gains (losses) on investments | | | (0.07 | ) | | | (0.02 | ) | | | 0.06 | | | | (0.04 | ) | | | (0.02 | ) |
| Total from investment operations | | | 0.12 | | | | 0.12 | | | | 0.19 | | | | 0.06 | | | | 0.12 | |
| Less distributions: | | | | | | | | | | | | | | | | | | | | |
| Distributions from | | | | | | | | | | | | | | | | | | | | |
| net investment income | | | (0.19 | ) | | | (0.14 | ) | | | (0.13 | ) | | | (0.13 | ) | | | (0.13 | ) |
| Distributions from net realized gains | | | — | | | | (0.00 | )(2) | | | (0.00 | )(2) | | | (0.00 | )(2) | | | (0.01 | ) |
| Total distributions | | | (0.19 | ) | | | (0.14 | ) | | | (0.13 | ) | | | (0.13 | ) | | | (0.14 | ) |
| Net asset value, end of year | | $ | 9.57 | | | $ | 9.64 | | | $ | 9.66 | | | $ | 9.60 | | | $ | 9.67 | |
| Total return | | | 1.24 | % | | | 1.28 | % | | | 2.00 | % | | | 0.64 | % | | | 1.25 | % |
| Supplemental data and ratios: | | | | | | | | | | | | | | | | | | | | |
| Net assets, end of year (millions) | | $ | 145.0 | | | $ | 134.9 | | | $ | 104.9 | | | $ | 40.6 | | | $ | 35.8 | |
| Ratio of expenses to average net assets | | | 0.55 | % | | | 0.55 | % | | | 0.55 | % | | | 0.55 | % | | | 0.55 | % |
| Ratio of net investment income | | | | | | | | | | | | | | | | | | | | |
| to average net assets | | | 1.96 | % | | | 1.48 | % | | | 1.32 | % | | | 1.05 | % | | | 1.31 | % |
Portfolio turnover rate(3) | | | 58 | % | | | 55 | % | | | 44 | % | | | 38 | % | | | 51 | % |
| (1) | Calculated using average shares outstanding during the year. |
| (2) | Amount is less than $0.005. |
| (3) | Portfolio turnover is calculated on the basis of the Fund as a whole without distinguishing between the classes of shares issued. |
The accompanying notes are an integral part of these financial statements.
Financial Highlights
Baird Intermediate Bond Fund – Institutional Class
| | | Year Ended December 31, | |
| | | 2018 | | | 2017 | | | 2016 | | | 2015 | | | 2014 | |
| Per Share Data: | | | | | | | | | | | | | | | |
| Net asset value, beginning of year | | $ | 11.01 | | | $ | 10.97 | | | $ | 10.93 | | | $ | 11.10 | | | $ | 11.00 | |
| Income from investment operations: | | | | | | | | | | | | | | | | | | | | |
Net investment income(1) | | | 0.27 | | | | 0.26 | | | | 0.25 | | | | 0.24 | | | | 0.26 | |
| Net realized and unrealized | | | | | | | | | | | | | | | | | | | | |
| gains (losses) on investments | | | (0.21 | ) | | | 0.04 | | | | 0.06 | | | | (0.13 | ) | | | 0.13 | |
| Total from investment operations | | | 0.06 | | | | 0.30 | | | | 0.31 | | | | 0.11 | | | | 0.39 | |
| Less distributions: | | | | | | | | | | | | | | | | | | | | |
| Distributions from | | | | | | | | | | | | | | | | | | | | |
| net investment income | | | (0.27 | ) | | | (0.26 | ) | | | (0.25 | ) | | | (0.25 | ) | | | (0.27 | ) |
| Distributions from net realized gains | | | — | | | | (0.00 | )(2) | | | (0.02 | ) | | | (0.03 | ) | | | (0.02 | ) |
| Total distributions | | | (0.27 | ) | | | (0.26 | ) | | | (0.27 | ) | | | (0.28 | ) | | | (0.29 | ) |
| Net asset value, end of year | | $ | 10.80 | | | $ | 11.01 | | | $ | 10.97 | | | $ | 10.93 | | | $ | 11.10 | |
| Total return | | | 0.58 | % | | | 2.74 | % | | | 2.83 | % | | | 0.99 | % | | | 3.50 | % |
| Supplemental data and ratios: | | | | | | | | | | | | | | | | | | | | |
| Net assets, end of year (millions) | | $ | 3,264.9 | | | $ | 2,902.0 | | | $ | 2,209.1 | | | $ | 1,787.0 | | | $ | 1,468.2 | |
| Ratio of expenses to average net assets | | | 0.30 | % | | | 0.30 | % | | | 0.30 | % | | | 0.30 | % | | | 0.30 | % |
| Ratio of net investment income | | | | | | | | | | | | | | | | | | | | |
| to average net assets | | | 2.51 | % | | | 2.32 | % | | | 2.21 | % | | | 2.14 | % | | | 2.37 | % |
Portfolio turnover rate(3) | | | 32 | % | | | 31 | % | | | 30 | % | | | 39 | % | | | 29 | % |
| (1) | Calculated using average shares outstanding during the year. |
| (2) | Amount is less than $0.005. |
| (3) | Portfolio turnover is calculated on the basis of the Fund as a whole without distinguishing between the classes of shares issued. |
The accompanying notes are an integral part of these financial statements.
Financial Highlights
Baird Intermediate Bond Fund – Investor Class
| | | Year Ended December 31, | |
| | | 2018 | | | 2017 | | | 2016 | | | 2015 | | | 2014 | |
| Per Share Data: | | | | | | | | | | | | | | | |
| Net asset value, beginning of year | | $ | 11.50 | | | $ | 11.44 | | | $ | 11.39 | | | $ | 11.56 | | | $ | 11.43 | |
| Income from investment operations: | | | | | | | | | | | | | | | | | | | | |
Net investment income(1) | | | 0.25 | | | | 0.24 | | | | 0.23 | | | | 0.22 | | | | 0.25 | |
| Net realized and unrealized | | | | | | | | | | | | | | | | | | | | |
| gains (losses) on investments | | | (0.22 | ) | | | 0.04 | | | | 0.06 | | | | (0.14 | ) | | | 0.14 | |
| Total from investment operations | | | 0.03 | | | | 0.28 | | | | 0.29 | | | | 0.08 | | | | 0.39 | |
| Less distributions: | | | | | | | | | | | | | | | | | | | | |
| Distributions from | | | | | | | | | | | | | | | | | | | | |
| net investment income | | | (0.24 | ) | | | (0.22 | ) | | | (0.22 | ) | | | (0.22 | ) | | | (0.24 | ) |
| Distributions from net realized gains | | | — | | | | (0.00 | )(2) | | | (0.02 | ) | | | (0.03 | ) | | | (0.02 | ) |
| Total distributions | | | (0.24 | ) | | | (0.22 | ) | | | (0.24 | ) | | | (0.25 | ) | | | (0.26 | ) |
| Net asset value, end of year | | $ | 11.29 | | | $ | 11.50 | | | $ | 11.44 | | | $ | 11.39 | | | $ | 11.56 | |
| Total return | | | 0.30 | % | | | 2.53 | % | | | 2.55 | % | | | 0.79 | % | | | 3.29 | % |
| Supplemental data and ratios: | | | | | | | | | | | | | | | | | | | | |
| Net assets, end of year (millions) | | $ | 47.3 | | | $ | 53.9 | | | $ | 98.1 | | | $ | 103.4 | | | $ | 115.6 | |
| Ratio of expenses to average net assets | | | 0.55 | % | | | 0.55 | % | | | 0.55 | % | | | 0.55 | % | | | 0.55 | % |
| Ratio of net investment income | | | | | | | | | | | | | | | | | | | | |
| to average net assets | | | 2.26 | % | | | 2.07 | % | | | 1.96 | % | | | 1.89 | % | | | 2.12 | % |
Portfolio turnover rate(3) | | | 32 | % | | | 31 | % | | | 30 | % | | | 39 | % | | | 29 | % |
| (1) | Calculated using average shares outstanding during the year. |
| (2) | Amount is less than $0.005. |
| (3) | Portfolio turnover is calculated on the basis of the Fund as a whole without distinguishing between the classes of shares issued. |
The accompanying notes are an integral part of these financial statements.
Financial Highlights
Baird Aggregate Bond Fund – Institutional Class
| | | Year Ended December 31, | |
| | | 2018 | | | 2017 | | | 2016 | | | 2015 | | | 2014 | |
| Per Share Data: | | | | | | | | | | | | | | | |
| Net asset value, beginning of year | | $ | 10.87 | | | $ | 10.70 | | | $ | 10.61 | | | $ | 10.81 | | | $ | 10.41 | |
| Income from investment operations: | | | | | | | | | | | | | | | | | | | | |
| Net investment income | | | 0.29 | (1) | | | 0.26 | (1) | | | 0.25 | (1) | | | 0.24 | (1) | | | 0.30 | |
| Net realized and unrealized | | | | | | | | | | | | | | | | | | | | |
| gains (losses) on investments | | | (0.33 | ) | | | 0.19 | | | | 0.12 | | | | (0.18 | ) | | | 0.41 | |
| Total from investment operations | | | (0.04 | ) | | | 0.45 | | | | 0.37 | | | | 0.06 | | | | 0.71 | |
| Less distributions: | | | | | | | | | | | | | | | | | | | | |
| Distributions from | | | | | | | | | | | | | | | | | | | | |
| net investment income | | | (0.30 | ) | | | (0.28 | ) | | | (0.26 | ) | | | (0.26 | ) | | | (0.31 | ) |
| Distributions from net realized gains | | | — | | | | — | | | | (0.02 | ) | | | — | | | | — | |
| Total distributions | | | (0.30 | ) | | | (0.28 | ) | | | (0.28 | ) | | | (0.26 | ) | | | (0.31 | ) |
| Net asset value, end of year | | $ | 10.53 | | | $ | 10.87 | | | $ | 10.70 | | | $ | 10.61 | | | $ | 10.81 | |
| Total return | | | (0.30 | )% | | | 4.20 | % | | | 3.52 | % | | | 0.55 | % | | | 6.89 | % |
| Supplemental data and ratios: | | | | | | | | | | | | | | | | | | | | |
| Net assets, end of year (millions) | | $ | 14,897.5 | | | $ | 13,582.8 | | | $ | 9,769.9 | | | $ | 6,318.4 | | | $ | 3,448.6 | |
| Ratio of expenses to average net assets | | | 0.30 | % | | | 0.30 | % | | | 0.30 | % | | | 0.30 | % | | | 0.30 | % |
| Ratio of net investment income | | | | | | | | | | | | | | | | | | | | |
| to average net assets | | | 2.77 | % | | | 2.40 | % | | | 2.25 | % | | | 2.24 | % | | | 2.81 | % |
Portfolio turnover rate(2) | | | 24 | % | | | 28 | % | | | 36 | % | | | 40 | % | | | 32 | % |
| (1) | Calculated using average shares outstanding during the year. |
| (2) | Portfolio turnover is calculated on the basis of the Fund as a whole without distinguishing between the classes of shares issued. |
The accompanying notes are an integral part of these financial statements.
Financial Highlights
Baird Aggregate Bond Fund – Investor Class
| | | Year Ended December 31, | |
| | | 2018 | | | 2017 | | | 2016 | | | 2015 | | | 2014 | |
| Per Share Data: | | | | | | | | | | | | | | | |
| Net asset value, beginning of year | | $ | 11.23 | | | $ | 11.05 | | | $ | 10.94 | | | $ | 11.15 | | | $ | 10.72 | |
| Income from investment operations: | | | | | | | | | | | | | | | | | | | | |
| Net investment income | | | 0.27 | (1) | | | 0.24 | (1) | | | 0.23 | (1) | | | 0.22 | (1) | | | 0.28 | |
| Net realized and unrealized | | | | | | | | | | | | | | | | | | | | |
| gains (losses) on investments | | | (0.33 | ) | | | 0.19 | | | | 0.14 | | | | (0.20 | ) | | | 0.43 | |
| Total from investment operations | | | (0.06 | ) | | | 0.43 | | | | 0.37 | | | | 0.02 | | | | 0.71 | |
| Less distributions: | | | | | | | | | | | | | | | | | | | | |
| Distributions from | | | | | | | | | | | | | | | | | | | | |
| net investment income | | | (0.28 | ) | | | (0.25 | ) | | | (0.24 | ) | | | (0.23 | ) | | | (0.28 | ) |
| Distributions from net realized gains | | | — | | | | — | | | | (0.02 | ) | | | — | | | | — | |
| Total distributions | | | (0.28 | ) | | | (0.25 | ) | | | (0.26 | ) | | | (0.23 | ) | | | (0.28 | ) |
| Net asset value, end of year | | $ | 10.89 | | | $ | 11.23 | | | $ | 11.05 | | | $ | 10.94 | | | $ | 11.15 | |
| Total return | | | (0.54 | )% | | | 3.90 | % | | | 3.34 | % | | | 0.21 | % | | | 6.71 | % |
| Supplemental data and ratios: | | | | | | | | | | | | | | | | | | | | |
| Net assets, end of year (millions) | | $ | 718.2 | | | $ | 825.4 | | | $ | 809.1 | | | $ | 429.6 | | | $ | 241.7 | |
| Ratio of expenses to average net assets | | | 0.55 | % | | | 0.55 | % | | | 0.55 | % | | | 0.55 | % | | | 0.55 | % |
| Ratio of net investment income | | | | | | | | | | | | | | | | | | | | |
| to average net assets | | | 2.52 | % | | | 2.15 | % | | | 2.00 | % | | | 1.99 | % | | | 2.56 | % |
Portfolio turnover rate(2) | | | 24 | % | | | 28 | % | | | 36 | % | | | 40 | % | | | 32 | % |
| (1) | Calculated using average shares outstanding during the year. |
| (2) | Portfolio turnover is calculated on the basis of the Fund as a whole without distinguishing between the classes of shares issued. |
The accompanying notes are an integral part of these financial statements.
Financial Highlights
Baird Core Plus Bond Fund – Institutional Class
| | | Year Ended December 31, | |
| | | 2018 | | | 2017 | | | 2016 | | | 2015 | | | 2014 | |
| Per Share Data: | | | | | | | | | | | | | | | |
| Net asset value, beginning of year | | $ | 11.22 | | | $ | 11.03 | | | $ | 10.85 | | | $ | 11.14 | | | $ | 10.77 | |
| Income from investment operations: | | | | | | | | | | | | | | | | | | | | |
| Net investment income | | | 0.33 | (1) | | | 0.30 | (1) | | | 0.29 | (1) | | | 0.28 | (1) | | | 0.32 | |
| Net realized and unrealized | | | | | | | | | | | | | | | | | | | | |
| gains (losses) on investments | | | (0.39 | ) | | | 0.21 | | | | 0.22 | | | | (0.26 | ) | | | 0.38 | |
| Total from investment operations | | | (0.06 | ) | | | 0.51 | | | | 0.51 | | | | 0.02 | | | | 0.70 | |
| Less distributions: | | | | | | | | | | | | | | | | | | | | |
| Distributions from | | | | | | | | | | | | | | | | | | | | |
| net investment income | | | (0.34 | ) | | | (0.32 | ) | | | (0.31 | ) | | | (0.31 | ) | | | (0.33 | ) |
| Distributions from net realized gains | | | — | | | | — | | | | (0.02 | ) | | | — | | | | — | |
| Total distributions | | | (0.34 | ) | | | (0.32 | ) | | | (0.33 | ) | | | (0.31 | ) | | | (0.33 | ) |
| Net asset value, end of year | | $ | 10.82 | | | $ | 11.22 | | | $ | 11.03 | | | $ | 10.85 | | | $ | 11.14 | |
| Total return | | | (0.51 | )% | | | 4.65 | % | | | 4.73 | % | | | 0.14 | % | | | 6.59 | % |
| Supplemental data and ratios: | | | | | | | | | | | | | | | | | | | | |
| Net assets, end of year (millions) | | $ | 15,635.3 | | | $ | 13,920.2 | | | $ | 10,023.6 | | | $ | 7,199.8 | | | $ | 4,520.9 | |
| Ratio of expenses to average net assets | | | 0.30 | % | | | 0.30 | % | | | 0.30 | % | | | 0.30 | % | | | 0.30 | % |
| Ratio of net investment income | | | | | | | | | | | | | | | | | | | | |
| to average net assets | | | 3.01 | % | | | 2.68 | % | | | 2.61 | % | | | 2.50 | % | | | 2.89 | % |
Portfolio turnover rate(2) | | | 26 | % | | | 30 | % | | | 33 | % | | | 34 | % | | | 35 | % |
| (1) | Calculated using average shares outstanding during the year. |
| (2) | Portfolio turnover is calculated on the basis of the Fund as a whole without distinguishing between the classes of shares issued. |
The accompanying notes are an integral part of these financial statements.
Financial Highlights
Baird Core Plus Bond Fund – Investor Class
| | | Year Ended December 31, | |
| | | 2018 | | | 2017 | | | 2016 | | | 2015 | | | 2014 | |
| Per Share Data: | | | | | | | | | | | | | | | |
| Net asset value, beginning of year | | $ | 11.68 | | | $ | 11.46 | | | $ | 11.26 | | | $ | 11.55 | | | $ | 11.16 | |
| Income from investment operations: | | | | | | | | | | | | | | | | | | | | |
| Net investment income | | | 0.31 | (1) | | | 0.28 | (1) | | | 0.27 | (1) | | | 0.26 | (1) | | | 0.29 | |
| Net realized and unrealized | | | | | | | | | | | | | | | | | | | | |
| gains (losses) on investments | | | (0.40 | ) | | | 0.23 | | | | 0.23 | | | | (0.27 | ) | | | 0.40 | |
| Total from investment operations | | | (0.09 | ) | | | 0.51 | | | | 0.50 | | | | (0.01 | ) | | | 0.69 | |
| Less distributions: | | | | | | | | | | | | | | | | | | | | |
| Distributions from | | | | | | | | | | | | | | | | | | | | |
| net investment income | | | (0.31 | ) | | | (0.29 | ) | | | (0.28 | ) | | | (0.28 | ) | | | (0.30 | ) |
| Distributions from net realized gains | | | — | | | | — | | | | (0.02 | ) | | | — | | | | — | |
| Total distributions | | | (0.31 | ) | | | (0.29 | ) | | | (0.30 | ) | | | (0.28 | ) | | | (0.30 | ) |
| Net asset value, end of year | | $ | 11.28 | | | $ | 11.68 | | | $ | 11.46 | | | $ | 11.26 | | | $ | 11.55 | |
| Total return | | | (0.74 | )% | | | 4.47 | % | | | 4.47 | % | | | (0.11 | )% | | | 6.27 | % |
| Supplemental data and ratios: | | | | | | | | | | | | | | | | | | | | |
| Net assets, end of year (millions) | | $ | 2,171.0 | | | $ | 2,431.0 | | | $ | 2,881.8 | | | $ | 2,183.5 | | | $ | 2,195.7 | |
| Ratio of expenses to average net assets | | | 0.55 | % | | | 0.55 | % | | | 0.55 | % | | | 0.55 | % | | | 0.55 | % |
| Ratio of net investment income | | | | | | | | | | | | | | | | | | | | |
| to average net assets | | | 2.76 | % | | | 2.43 | % | | | 2.36 | % | | | 2.25 | % | | | 2.64 | % |
Portfolio turnover rate(2) | | | 26 | % | | | 30 | % | | | 33 | % | | | 34 | % | | | 35 | % |
| (1) | Calculated using average shares outstanding during the year. |
| (2) | Portfolio turnover is calculated on the basis of the Fund as a whole without distinguishing between the classes of shares issued. |
The accompanying notes are an integral part of these financial statements.
Financial Highlights
Baird Short-Term Municipal Bond Fund – Institutional Class
| | | | | | | | | | | | Period Ended | |
| | | Year Ended December 31, | | | December 31, | |
| | | 2018 | | | 2017 | | | 2016 | | | 2015(1) | |
| Per Share Data: | | | | | | | | | | | | |
| Net asset value, beginning of period | | $ | 10.08 | | | $ | 9.97 | | | $ | 10.04 | | | $ | 10.00 | |
| Income from investment operations: | | | | | | | | | | | | | | | | |
Net investment income(2) | | | 0.20 | | | | 0.18 | | | | 0.15 | | | | 0.05 | |
| Net realized and unrealized | | | | | | | | | | | | | | | | |
| gains (losses) on investments | | | (0.03 | ) | | | 0.10 | | | | (0.08 | ) | | | 0.04 | |
| Total from investment operations | | | 0.17 | | | | 0.28 | | | | 0.07 | | | | 0.09 | |
| Less distributions: | | | | | | | | | | | | | | | | |
| Distributions from | | | | | | | | | | | | | | | | |
| net investment income | | | (0.19 | ) | | | (0.17 | ) | | | (0.14 | ) | | | (0.04 | ) |
| Distributions from net realized gains | | | (0.00 | )(3) | | | (0.00 | )(3) | | | (0.00 | )(3) | | | (0.01 | ) |
| Total distributions | | | (0.19 | ) | | | (0.17 | ) | | | (0.14 | ) | | | (0.05 | ) |
| Net asset value, end of period | | $ | 10.06 | | | $ | 10.08 | | | $ | 9.97 | | | $ | 10.04 | |
| Total return | | | 1.75 | % | | | 2.84 | % | | | 0.71 | % | | | 0.94 | %(4) |
| Supplemental data and ratios: | | | | | | | | | | | | | | | | |
| Net assets, end of period (millions) | | $ | 281.2 | | | $ | 120.9 | | | $ | 52.4 | | | $ | 12.3 | |
| Ratio of expenses to average net assets | | | 0.30 | % | | | 0.30 | % | | | 0.30 | % | | | 0.30 | %(5) |
| Ratio of net investment income | | | | | | | | | | | | | | | | |
| to average net assets | | | 2.03 | % | | | 1.74 | % | | | 1.44 | % | | | 1.42 | %(5) |
Portfolio turnover rate(6) | | | 107 | % | | | 54 | % | | | 38 | % | | | 41 | %(4) |
| (1) | Inception was close of business on August 31, 2015. |
| (2) | Calculated using average shares outstanding during the period. |
| (3) | Amount is less than $0.005. |
| (4) | Not annualized. |
| (5) | Annualized. |
| (6) | Portfolio turnover is calculated on the basis of the Fund as a whole without distinguishing between the classes of shares issued. |
The accompanying notes are an integral part of these financial statements.
Financial Highlights
Baird Short-Term Municipal Bond Fund – Investor Class
| | | | | | | | | | | | Period Ended | |
| | | Year Ended December 31, | | | December 31, | |
| | | 2018 | | | 2017 | | | 2016 | | | 2015(1) | |
| Per Share Data: | | | | | | | | | | | | |
| Net asset value, beginning of period | | $ | 10.06 | | | $ | 9.96 | | | $ | 10.04 | | | $ | 10.00 | |
| Income from investment operations: | | | | | | | | | | | | | | | | |
Net investment income(2) | | | 0.18 | | | | 0.15 | | | | 0.12 | | | | 0.04 | |
| Net realized and unrealized | | | | | | | | | | | | | | | | |
| gains (losses) on investments | | | (0.03 | ) | | | 0.09 | | | | (0.08 | ) | | | 0.05 | |
| Total from investment operations | | | 0.15 | | | | 0.24 | | | | 0.04 | | | | 0.09 | |
| Less distributions: | | | | | | | | | | | | | | | | |
| Distributions from | | | | | | | | | | | | | | | | |
| net investment income | | | (0.17 | ) | | | (0.14 | ) | | | (0.12 | ) | | | (0.04 | ) |
| Distributions from net realized gains | | | (0.00 | )(3) | | | (0.00 | )(3) | | | (0.00 | )(3) | | | (0.01 | ) |
| Total distributions | | | (0.17 | ) | | | (0.14 | ) | | | (0.12 | ) | | | (0.05 | ) |
| Net asset value, end of period | | $ | 10.04 | | | $ | 10.06 | | | $ | 9.96 | | | $ | 10.04 | |
| Total return | | | 1.52 | % | | | 2.45 | % | | | 0.40 | % | | | 0.86 | %(4) |
| Supplemental data and ratios: | | | | | | | | | | | | | | | | |
| Net assets, end of period (millions) | | $ | 64.0 | | | $ | 4.9 | | | $ | 6.3 | | | $ | 0.1 | |
| Ratio of expenses to average net assets | | | 0.55 | % | | | 0.55 | % | | | 0.55 | % | | | 0.55 | %(5) |
| Ratio of net investment income | | | | | | | | | | | | | | | | |
| to average net assets | | | 1.78 | % | | | 1.49 | % | | | 1.19 | % | | | 1.17 | %(5) |
Portfolio turnover rate(6) | | | 107 | % | | | 54 | % | | | 38 | % | | | 41 | %(4) |
| (1) | Inception was close of business on August 31, 2015. |
| (2) | Calculated using average shares outstanding during the period. |
| (3) | Amount is less than $0.005. |
| (4) | Not annualized. |
| (5) | Annualized. |
| (6) | Portfolio turnover is calculated on the basis of the Fund as a whole without distinguishing between the classes of shares issued. |
The accompanying notes are an integral part of these financial statements.
Financial Highlights
Baird Quality Intermediate Municipal Bond Fund – Institutional Class
| | | Year Ended December 31, | |
| | | 2018 | | | 2017 | | | 2016 | | | 2015 | | | 2014 | |
| Per Share Data: | | | | | | | | | | | | | | | |
| Net asset value, beginning of year | | $ | 11.52 | | | $ | 11.43 | | | $ | 11.74 | | | $ | 11.77 | | | $ | 11.55 | |
| Income from investment operations: | | | | | | | | | | | | | | | | | | | | |
| Net investment income | | | 0.27 | (1) | | | 0.27 | (1) | | | 0.26 | (1) | | | 0.28 | (1) | | | 0.30 | |
| Net realized and unrealized | | | | | | | | | | | | | | | | | | | | |
| gains (losses) on investments | | | (0.14 | ) | | | 0.09 | | | | (0.31 | ) | | | (0.03 | ) | | | 0.22 | |
| Total from investment operations | | | 0.13 | | | | 0.36 | | | | (0.05 | ) | | | 0.25 | | | | 0.52 | |
| Less distributions: | | | | | | | | | | | | | | | | | | | | |
| Distributions from | | | | | | | | | | | | | | | | | | | | |
| net investment income | | | (0.27 | ) | | | (0.27 | ) | | | (0.26 | ) | | | (0.28 | ) | | | (0.30 | ) |
| Distributions from return of capital | | | — | | | | (0.00 | )(2) | | | — | | | | — | | | | — | |
| Total distributions | | | (0.27 | ) | | | (0.27 | ) | | | (0.26 | ) | | | (0.28 | ) | | | (0.30 | ) |
| Net asset value, end of year | | $ | 11.38 | | | $ | 11.52 | | | $ | 11.43 | | | $ | 11.74 | | | $ | 11.77 | |
| Total return | | | 1.19 | % | | | 3.12 | % | | | (0.46 | )% | | | 2.19 | % | | | 4.54 | % |
| Supplemental data and ratios: | | | | | | | | | | | | | | | | | | | | |
| Net assets, end of year (millions) | | $ | 1,009.2 | | | $ | 1,044.1 | | | $ | 936.2 | | | $ | 988.4 | | | $ | 918.9 | |
| Ratio of expenses to average net assets | | | 0.30 | % | | | 0.30 | % | | | 0.30 | % | | | 0.30 | % | | | 0.30 | % |
| Ratio of net investment income | | | | | | | | | | | | | | | | | | | | |
| to average net assets | | | 2.39 | % | | | 2.29 | % | | | 2.19 | % | | | 2.42 | % | | | 2.56 | % |
Portfolio turnover rate(3) | | | 40 | % | | | 31 | % | | | 22 | % | | | 9 | % | | | 5 | % |
| (1) | Calculated using average shares outstanding during the year. |
| (2) | Amount is less than $0.005. |
| (3) | Portfolio turnover is calculated on the basis of the Fund as a whole without distinguishing between the classes of shares issued. |
The accompanying notes are an integral part of these financial statements.
Financial Highlights
Baird Quality Intermediate Municipal Bond Fund – Investor Class
| | | Year Ended December 31, | |
| | | 2018 | | | 2017 | | | 2016 | | | 2015 | | | 2014 | |
| Per Share Data: | | | | | | | | | | | | | | | |
| Net asset value, beginning of year | | $ | 11.80 | | | $ | 11.69 | | | $ | 12.00 | | | $ | 12.03 | | | $ | 11.80 | |
| Income from investment operations: | | | | | | | | | | | | | | | | | | | | |
| Net investment income | | | 0.25 | (1) | | | 0.24 | (1) | | | 0.23 | (1) | | | 0.26 | (1) | | | 0.28 | |
| Net realized and unrealized | | | | | | | | | | | | | | | | | | | | |
| gains (losses) on investments | | | (0.15 | ) | | | 0.11 | | | | (0.31 | ) | | | (0.04 | ) | | | 0.22 | |
| Total from investment operations | | | 0.10 | | | | 0.35 | | | | (0.08 | ) | | | 0.22 | | | | 0.50 | |
| Less distributions: | | | | | | | | | | | | | | | | | | | | |
| Distributions from | | | | | | | | | | | | | | | | | | | | |
| net investment income | | | (0.24 | ) | | | (0.24 | ) | | | (0.23 | ) | | | (0.25 | ) | | | (0.27 | ) |
| Distributions from return of capital | | | — | | | | (0.00 | )(2) | | | — | | | | — | | | | — | |
| Total distributions | | | (0.24 | ) | | | (0.24 | ) | | | (0.23 | ) | | | (0.25 | ) | | | (0.27 | ) |
| Net asset value, end of year | | $ | 11.66 | | | $ | 11.80 | | | $ | 11.69 | | | $ | 12.00 | | | $ | 12.03 | |
| Total return | | | 0.90 | % | | | 2.97 | % | | | (0.70 | )% | | | 1.89 | % | | | 4.27 | % |
| Supplemental data and ratios: | | | | | | | | | | | | | | | | | | | | |
| Net assets, end of year (millions) | | $ | 110.8 | | | $ | 107.3 | | | $ | 136.1 | | | $ | 160.3 | | | $ | 186.7 | |
| Ratio of expenses to average net assets | | | 0.55 | % | | | 0.55 | % | | | 0.55 | % | | | 0.55 | % | | | 0.55 | % |
| Ratio of net investment income | | | | | | | | | | | | | | | | | | | | |
| to average net assets | | | 2.14 | % | | | 2.00 | % | | | 1.94 | % | | | 2.17 | % | | | 2.31 | % |
Portfolio turnover rate(3) | | | 40 | % | | | 31 | % | | | 22 | % | | | 9 | % | | | 5 | % |
| (1) | Calculated using average shares outstanding during the year. |
| (2) | Amount is less than $0.005. |
| (3) | Portfolio turnover is calculated on the basis of the Fund as a whole without distinguishing between the classes of shares issued. |
The accompanying notes are an integral part of these financial statements.
Financial Highlights
Baird Core Intermediate Municipal Bond Fund – Institutional Class
| | | | | | | | | | | | Period Ended | |
| | | Year Ended December 31, | | | December 31, | |
| | | 2018 | | | 2017 | | | 2016 | | | 2015(1) | |
| Per Share Data: | | | | | | | | | | | | |
| Net asset value, beginning of period | | $ | 10.32 | | | $ | 10.01 | | | $ | 10.13 | | | $ | 10.00 | |
| Income from investment operations: | | | | | | | | | | | | | | | | |
Net investment income(2) | | | 0.23 | | | | 0.21 | | | | 0.18 | | | | 0.06 | |
| Net realized and unrealized | | | | | | | | | | | | | | | | |
| gains (losses) on investments | | | (0.10 | ) | | | 0.30 | | | | (0.05 | ) | | | 0.14 | |
| Total from investment operations | | | 0.13 | | | | 0.51 | | | | 0.13 | | | | 0.20 | |
| Less distributions: | | | | | | | | | | | | | | | | |
| Distributions from | | | | | | | | | | | | | | | | |
| net investment income | | | (0.23 | ) | | | (0.20 | ) | | | (0.18 | ) | | | (0.06 | ) |
| Distributions from net realized gains | | | — | | | | — | | | | (0.07 | ) | | | (0.01 | ) |
| Total distributions | | | (0.23 | ) | | | (0.20 | ) | | | (0.25 | ) | | | (0.07 | ) |
| Net asset value, end of period | | $ | 10.22 | | | $ | 10.32 | | | $ | 10.01 | | | $ | 10.13 | |
| Total return | | | 1.30 | % | | | 5.15 | % | | | 1.14 | % | | | 1.98 | %(3) |
| Supplemental data and ratios: | | | | | | | | | | | | | | | | |
| Net assets, end of period (millions) | | $ | 378.1 | | | $ | 234.8 | | | $ | 96.3 | | | $ | 50.8 | |
| Ratio of expenses to average net assets | | | 0.30 | % | | | 0.30 | % | | | 0.30 | % | | | 0.30 | %(4) |
| Ratio of net investment income | | | | | | | | | | | | | | | | |
| to average net assets | | | 2.30 | % | | | 2.04 | % | | | 1.79 | % | | | 1.75 | %(4) |
Portfolio turnover rate(5) | | | 70 | % | | | 66 | % | | | 95 | % | | | 108 | %(3) |
| (1) | Inception was close of business on August 31, 2015. |
| (2) | Calculated using average shares outstanding during the period. |
| (3) | Not annualized. |
| (4) | Annualized. |
| (5) | Portfolio turnover is calculated on the basis of the Fund as a whole without distinguishing between the classes of shares issued. |
The accompanying notes are an integral part of these financial statements.
Financial Highlights
Baird Core Intermediate Municipal Bond Fund – Investor Class
| | | | | | | | | | | | Period Ended | |
| | | Year Ended December 31, | | | December 31, | |
| | | 2018 | | | 2017 | | | 2016 | | | 2015(1) | |
| Per Share Data: | | | | | | | | | | | | |
| Net asset value, beginning of period | | $ | 10.32 | | | $ | 10.00 | | | $ | 10.13 | | | $ | 10.00 | |
| Income from investment operations: | | | | | | | | | | | | | | | | |
Net investment income(2) | | | 0.21 | | | | 0.18 | | | | 0.16 | | | | 0.05 | |
| Net realized and unrealized | | | | | | | | | | | | | | | | |
| gains (losses) on investments | | | (0.11 | ) | | | 0.32 | | | | (0.06 | ) | | | 0.14 | |
| Total from investment operations | | | 0.10 | | | | 0.50 | | | | 0.10 | | | | 0.19 | |
| Less distributions: | | | | | | | | | | | | | | | | |
| Distributions from | | | | | | | | | | | | | | | | |
| net investment income | | | (0.20 | ) | | | (0.18 | ) | | | (0.16 | ) | | | (0.05 | ) |
| Distributions from net realized gains | | | — | | | | — | | | | (0.07 | ) | | | (0.01 | ) |
| Total distributions | | | (0.20 | ) | | | (0.18 | ) | | | (0.23 | ) | | | (0.06 | ) |
| Net asset value, end of period | | $ | 10.22 | | | $ | 10.32 | | | $ | 10.00 | | | $ | 10.13 | |
| Total return | | | 1.05 | % | | | 5.00 | % | | | 0.91 | % | | | 1.91 | %(3) |
| Supplemental data and ratios: | | | | | | | | | | | | | | | | |
| Net assets, end of period (millions) | | $ | 2.0 | | | $ | 1.7 | | | $ | 1.4 | | | $ | 0.2 | |
| Ratio of expenses to average net assets | | | 0.55 | % | | | 0.55 | % | | | 0.55 | % | | | 0.55 | %(4) |
| Ratio of net investment income | | | | | | | | | | | | | | | | |
| to average net assets | | | 2.05 | % | | | 1.79 | % | | | 1.54 | % | | | 1.50 | %(4) |
Portfolio turnover rate(5) | | | 70 | % | | | 66 | % | | | 95 | % | | | 108 | %(3) |
| (1) | Inception was close of business on August 31, 2015. |
| (2) | Calculated using average shares outstanding during the period. |
| (3) | Not annualized. |
| (4) | Annualized. |
| (5) | Portfolio turnover is calculated on the basis of the Fund as a whole without distinguishing between the classes of shares issued. |
The accompanying notes are an integral part of these financial statements.
Notes to the Financial Statements
December 31, 2018
Baird Funds, Inc. (the “Corporation”) was incorporated on June 9, 2000, as a Wisconsin corporation and is registered as an open-end investment management company under the Investment Company Act of 1940, as amended (the “1940 Act”). The accompanying financial statements include the Baird Ultra Short Bond Fund, Baird Short-Term Bond Fund, Baird Intermediate Bond Fund, Baird Aggregate Bond Fund, Baird Core Plus Bond Fund, Baird Short-Term Municipal Bond Fund, Baird Quality Intermediate Municipal Bond Fund and Baird Core Intermediate Municipal Bond Fund (each, a “Fund” and collectively, the “Funds”), eight of the 14 active funds in the series comprising the Corporation, each of which is diversified within the meaning of the 1940 Act. Robert W. Baird & Co. Incorporated (“Baird” or the “Advisor”) serves as investment advisor to the Funds. The Funds are investment companies and therefore follow the investment company accounting and reporting guidance of the Financial Accounting Standards Board (“FASB”) Accounting Standards Codification Topic 946, Financial Services – Investment Companies.
The following table presents the class-specific inception dates for each of the Funds:
| | Inception Date |
Fund | Institutional Class | Investor Class |
| Baird Ultra Short Bond Fund | December 31, 2013 | December 31, 2013 |
| Baird Short-Term Bond Fund | August 31, 2004 | September 19, 2012 |
| Baird Intermediate Bond Fund | September 29, 2000 | September 29, 2000 |
| Baird Aggregate Bond Fund | September 29, 2000 | September 29, 2000 |
| Baird Core Plus Bond Fund | September 29, 2000 | September 29, 2000 |
| Baird Short-Term Municipal Bond Fund | August 31, 2015 | August 31, 2015 |
| Baird Quality Intermediate Municipal Bond Fund | March 30, 2001 | March 30, 2001 |
| Baird Core Intermediate Municipal Bond Fund | August 31, 2015 | August 31, 2015 |
Institutional Class shares are not subject to a distribution and service (12b-1) fee, while Investor Class shares are subject to a distribution and service (12b-1) fee of 0.25%. See Note 7.
The investment objective of the Baird Ultra Short Bond Fund is to seek current income consistent with preservation of capital. The Fund’s benchmark index, the Bloomberg Barclays U.S. Short-Term Government/Corporate Index, is an unmanaged, market value weighted index of investment grade, fixed-rate debt issues including government and corporate securities with maturities less than one year.
The investment objective of the Baird Short-Term Bond Fund is to seek an annual rate of total return, before Fund expenses, greater than the annual rate of total return of the Bloomberg Barclays 1-3 Year U.S. Government/Credit Bond Index. The Bloomberg Barclays 1-3 Year U.S. Government/Credit Bond Index is an unmanaged, market value weighted index of investment grade, fixed-rate debt issues including government and corporate securities with maturities between one and three years.
The investment objective of the Baird Intermediate Bond Fund is to seek an annual rate of total return, before Fund expenses, greater than the annual rate of total return of the Bloomberg Barclays Intermediate U.S. Government/Credit Bond Index. The Bloomberg Barclays Intermediate U.S. Government/Credit Bond Index is an unmanaged, market value weighted index of investment grade, fixed-rate debt issues, including government and corporate securities, with maturities between one and ten years.
The investment objective of the Baird Aggregate Bond Fund is to seek an annual rate of total return, before Fund expenses, greater than the annual rate of total return of the Bloomberg Barclays U.S. Aggregate Bond Index. The Bloomberg Barclays U.S. Aggregate Bond Index is an unmanaged, market value weighted index of investment grade, fixed-rate debt issues, including government, corporate, asset-backed and mortgage-backed securities, with maturities of at least one year.
Notes to the Financial Statements
December 31, 2018
The investment objective of the Baird Core Plus Bond Fund is to seek an annual rate of total return, before Fund expenses, greater than the annual rate of total return of the Bloomberg Barclays U.S. Universal Bond Index. The Bloomberg Barclays U.S. Universal Bond Index is an unmanaged, market value weighted index of fixed income securities issued in U.S. dollars, including U.S. government and investment grade debt, non-investment grade debt, asset-backed and mortgage-backed securities, Eurobonds, 144A securities and emerging market debt, with maturities of at least one year.
The investment objective of the Baird Short-Term Municipal Bond Fund is to seek current income that is exempt from federal income tax and is consistent with the preservation of capital.
The primary investment objective of the Baird Quality Intermediate Municipal Bond Fund is to seek current income that is substantially exempt from federal income tax. A secondary objective is to seek total return with relatively low volatility of principal.
The investment objective of the Baird Core Intermediate Municipal Bond Fund is to seek a high level of current income that is exempt from federal income tax and is consistent with preservation of capital.
| 2. | Significant Accounting Policies |
The following is a summary of significant accounting policies consistently followed by the Funds in the preparation of their financial statements. These policies are in conformity with accounting principles generally accepted in the United States of America (“GAAP”).
| a) | Investment Valuation – Section 2(a)(41) of the 1940 Act, together with the rules and interpretations of the U.S. Securities and Exchange Commission (the “SEC”), require the Funds, in computing net asset value, to value their portfolio securities using market quotations when they are “readily available.” When market quotations are not readily available (e.g., because there is no regular market quotation for such securities, the market for such security is limited, the validity of quotations is questionable or the Funds’ independent pricing service does not provide a price), the Board of Directors (the “Board”) of the Corporation must value the securities at “fair value determined in good faith.” The Board has delegated such responsibility to the Advisor pursuant to pricing policies and procedures that the Board has adopted and regularly reviews. In general, the “fair value” of a security means the price that would be received to sell a security in an orderly transaction between market participants at the measurement date. |
| | |
| | The Funds determine the fair value of their investments and compute their net asset value per share as of the close of regular trading of the New York Stock Exchange (4:00 p.m. EST). |
| | |
| | Consistent with Section 2(a)(41) of the 1940 Act, the Funds price their securities as follows: debt securities are valued at their evaluated bid prices as provided by an independent pricing service using valuation methods that are designed to represent fair value, such as matrix pricing and other analytical pricing models, market transactions and dealer quotations. Debt securities purchased with maturities of 60 days or less are valued as described above unless an evaluated price is not available, in which case such security is valued at acquisition cost, plus or minus any amortized discount or premium (“amortized cost”), or, if the Advisor does not believe amortized cost is reflective of the fair value of the security, the security is priced at fair value as described below. Investments in mutual funds, including money market funds, are valued at their stated net asset value (“NAV”). Common stocks that are listed on a securities exchange (other than NASDAQ) are valued at the last quoted sales price. Securities traded on NASDAQ are valued at the NASDAQ Official Closing Price. Price information on listed stocks is taken from the exchange where the security is primarily traded. Securities that were not traded on the valuation date, as well as stocks that are not listed on an exchange, including NASDAQ, are valued at the average of the current bid and ask price. Other assets and securities for which market quotations are not readily available are valued at fair value as determined in good faith by the Advisor in accordance |
Notes to the Financial Statements
December 31, 2018
| 2. | Significant Accounting Policies (cont.) |
| | with procedures approved by the Corporation’s Board. In accordance with such procedures, the Advisor may, under certain circumstances, use alternative valuation methodologies, or it may use broker quotes or prices obtained from alternative independent pricing services or, if broker quotes or prices from alternative pricing services are unavailable or deemed to be unreliable, fair value will be determined by a valuation committee of the Advisor. In determining fair value, the valuation committee takes into account factors deemed relevant by the valuation committee and available information. Consequently, the price of the security used by a Fund to calculate its NAV may differ from quoted or published prices for the same security. Fair value pricing involves subjective judgments and there is no single standard for determining a security’s fair value. As a result, different mutual funds could reasonably arrive at a different fair value for the same security. It is possible that the fair value determined for a security is materially different from the value that could be realized upon the sale of that security or from the values that other mutual funds may determine. In addition, given the volatility and periodic illiquidity experienced in recent years, the prices determined for any individual security on any given day may vary significantly from the amount that can be obtained in an actual sale of that security, and the Funds’ NAVs may fluctuate significantly from day to day or from period to period. |
| | |
| b) | Unregistered Securities – Seven of the Funds own certain investment securities which are unregistered. The value of such securities for the Baird Ultra Short Bond, Baird Short-Term Bond, Baird Intermediate Bond, Baird Aggregate Bond, Baird Core Plus Bond, Baird Short-Term Municipal Bond and Baird Core Intermediate Municipal Bond Funds were $220,834,421 (21.09% of net assets), $1,458,367,499 (25.40% of net assets), $672,604,116 (20.31% of net assets), $2,440,596,968 (15.63% of net assets), $3,292,336,537 (18.49% of net assets), $219,364 (0.06% of net assets) and $423,882 (0.11% of net assets), respectively, at December 31, 2018. Unregistered securities may be deemed to be liquid as determined by the Advisor based on several factors. All of the unregistered securities held by the Funds as of December 31, 2018 consist of securities issued pursuant to Rule 144A under the Securities Act of 1933 and all have been deemed to be liquid. |
| | |
| c) | Foreign Securities – Foreign securities are defined as securities of issuers that are organized outside the United States. The Funds may invest in U.S. dollar-denominated debt obligations of foreign companies and foreign governments. Investing in securities of foreign companies and foreign governments involves special risks and considerations not typically associated with investing in U.S. companies and the U.S. government. These risks include foreign currency fluctuations, political and economic instability and differences in financial reporting standards and less strict regulation of securities markets. Moreover, securities of many foreign companies and foreign governments and their markets may be less liquid and their prices more volatile than those of securities of comparable U.S. companies and the U.S. government. Occasionally, events that affect these values and exchange rates may occur after the close of the exchange on which such securities are traded. If such events materially affect the value of a Fund’s securities, these securities may be valued at their fair value pursuant to procedures adopted by the Board. |
| | |
| d) | Income Tax Status – The Funds intend to continue to qualify as regulated investment companies as provided in subchapter M of the Internal Revenue Code and to distribute substantially all of their taxable income to their shareholders in a manner which results in no tax expense to the Funds. Therefore, no federal income or excise tax provision is recorded. |
| | |
| | There is no tax liability resulting from unrecognized tax benefits relating to uncertain income tax positions taken or expected to be taken on the tax return for the fiscal year ended December 31, 2018, or for any other tax years which are open for exam. As of December 31, 2018, open tax years include the tax years ended December 31, 2015 through 2018. The Funds are not aware of any tax positions for which it is reasonably possible that the total amounts of unrecognized tax benefits will significantly change in the next 12 months. The Funds recognize interest and penalties, if any, related to |
Notes to the Financial Statements
December 31, 2018
| 2. | Significant Accounting Policies (cont.) |
| | unrecognized tax benefits as interest and other expense, respectively, in the Statement of Operations. During the year, the Funds did not incur any interest or penalties. |
| | |
| e) | Allocation of Income and Expenses – Each Fund is charged for those expenses directly attributable to it. Expenses directly attributable to a class of shares, such as Rule 12b-1 distribution fees, are charged to that class of shares. Income, expenses and realized and unrealized gains and losses are allocated to the classes based on their respective net assets. Expenses that are not directly attributable to a Fund are allocated among the Funds in the series in proportion to their assets or are divided equally amongst the Funds. |
| | |
| f) | Shareholder Transactions and Distributions – Shareholder transactions are recorded on the trade date. Dividends from net investment income are declared and paid monthly. Distributions of net realized capital gains, if any, are declared and paid at least annually. All distributions to shareholders are recorded on the ex-dividend date. The book basis character of distributions may differ from their ultimate characterization for Federal income tax purposes. GAAP requires that permanent financial reporting and tax differences be reclassified in the capital accounts. |
| | |
| g) | Use of Estimates – The preparation of financial statements in conformity with GAAP requires management to make estimates and assumptions that affect the reported amounts of assets and liabilities and disclosure of contingent assets and liabilities at the date of the financial statements and the reported amounts of revenues and expenses during the reporting period. Actual results could differ from those estimates. |
| | |
| h) | Securities Transactions and Investment Income – Investment transactions are recorded on the trade date. The Funds determine the gain or loss realized from investment transactions using the identified cost basis. Dividend income is recognized on the ex-dividend date and interest income is recognized on an accrual basis. Premiums and discounts on the purchase of securities are amortized/accreted using the effective interest method. Paydown gains and losses are recorded as interest income on the Statements of Operations for financial reporting purposes. |
| | |
| i) | Guarantees and Indemnifications – In the normal course of business, the Funds enter into contracts with service providers that contain general indemnification clauses. The Funds’ maximum exposure under these arrangements is unknown and would involve future claims against the Funds that have not yet occurred. Based on experience, the Funds would expect the risk of loss to be remote. |
| | |
| j) | Regulatory Matters – In August 2018, the SEC issued Final Rule Release No. 33-10532, Disclosure Update and Simplification, which in part amends certain disclosure requirements of Regulation S-X that have become redundant, duplicative, overlapping, outdated, or superseded, in light of other SEC disclosure requirements, GAAP, or changes in the information environment. The amendments are intended to facilitate the disclosure of information to investors and simplify compliance without significantly altering the total mix of information provided to investors. The effective date for these disclosures was November 5, 2018. Management has adopted these amendments as currently required and these are reflected in the Funds’ financial statements and related disclosures. Certain prior year information has been adjusted to conform with these amendments. |
| | |
| k) | New Accounting Pronouncements – In August 2018, FASB issued Accounting Standards Update (“ASU”) 2018-13, Fair Value Measurement (Topic 820): Disclosure Framework—Changes to the Disclosure Requirements for Fair Value Measurement (“ASU 2018-13”). The primary focus of ASU 2018-13 is to improve the effectiveness of the disclosure requirements for fair value measurements. The changes affect all companies that are required to include fair value measurement disclosures. In general, the amendments in ASU 2018-13 are effective for all entities for fiscal years and interim periods within those fiscal years, beginning after December 15, 2019. An entity is permitted to early adopt the removed or modified disclosures upon the issuance of ASU 2018-13 and may delay adoption of the additional disclosures, |
Notes to the Financial Statements
December 31, 2018
| 2. | Significant Accounting Policies (cont.) |
| | which are required for public companies only, until their effective date. Management has evaluated ASU 2018-13 and has early adopted the relevant provisions of the disclosure framework. |
| | |
| | In March 2017, FASB issued ASU 2017-08, Receivables — Nonrefundable Fees and Other Costs (Subtopic 310-20): Premium Amortization on Purchased Callable Debt Securities (“ASU 2017-08”). The amendments in the ASU 2017-08 shorten the amortization period for certain callable debt securities, held at a premium, to be amortized to the earliest call date. The ASU 2017-08 does not require an accounting change for securities held at a discount; which continues to be amortized to maturity. The ASU 2017-08 is effective for fiscal years and interim periods within those fiscal years beginning after December 15, 2018. Management is currently evaluating the impact, if any, of applying this provision. |
| | |
| 3. | Capital Share Transactions |
The following table summarizes the capital share transactions of each Fund for the past two fiscal years:
Baird Ultra Short Bond Fund
| | | Year Ended | | | Year Ended | |
| | | December 31, 2018 | | | December 31, 2017 | |
| Institutional Class Shares | | Shares | | | Amount | | | Shares | | | Amount | |
| Shares sold | | | 78,659,234 | | | $ | 788,724,253 | | | | 50,742,505 | | | $ | 509,543,616 | |
| Shares issued to shareholders | | | | | | | | | | | | | | | | |
| in reinvestment of distributions | | | 1,414,830 | | | | 14,179,791 | | | | 675,449 | | | | 6,779,811 | |
| Shares redeemed | | | (30,030,843 | ) | | | (301,247,845 | ) | | | (36,975,717 | ) | | | (371,276,731 | ) |
| Net increase | | | 50,043,221 | | | $ | 501,656,199 | | | | 14,442,237 | | | $ | 145,046,696 | |
| Shares Outstanding: | | | | | | | | | | | | | | | | |
| Beginning of year | | | 53,048,050 | | | | | | | | 38,605,813 | | | | | |
| End of year | | | 103,091,271 | | | | | | | | 53,048,050 | | | | | |
| | | | | | | | | | | | | | | | | |
| | | Year Ended | | | Year Ended | |
| | | December 31, 2018 | | | December 31, 2017 | |
| Investor Class Shares | | Shares | | | Amount | | | Shares | | | Amount | |
| Shares sold | | | 1,993,690 | | | $ | 19,992,037 | | | | 1,885,948 | | | $ | 18,929,288 | |
| Shares issued to shareholders | | | | | | | | | | | | | | | | |
| in reinvestment of distributions | | | 17,550 | | | | 175,826 | | | | 6,209 | | | | 62,290 | |
| Shares redeemed | | | (1,207,904 | ) | | | (12,108,086 | ) | | | (1,660,556 | ) | | | (16,673,622 | ) |
| Net increase | | | 803,336 | | | $ | 8,059,777 | | | | 231,601 | | | $ | 2,317,956 | |
| Shares Outstanding: | | | | | | | | | | | | | | | | |
| Beginning of year | | | 753,794 | | | | | | | | 522,193 | | | | | |
| End of year | | | 1,557,130 | | | | | | | | 753,794 | | | | | |
| Total net increase | | | | | | $ | 509,715,976 | | | | | | | $ | 147,364,652 | |
Notes to the Financial Statements
December 31, 2018
| 3. | Capital Share Transactions (cont.) |
Baird Short-Term Bond Fund
| | | Year Ended | | | Year Ended | |
| | | December 31, 2018 | | | December 31, 2017 | |
| Institutional Class Shares | | Shares | | | Amount | | | Shares | | | Amount | |
| Shares sold | | | 230,490,656 | | | $ | 2,205,699,257 | | | | 336,282,834 | | | $ | 3,259,977,948 | |
| Shares issued to shareholders | | | | | | | | | | | | | | | | |
| in reinvestment of distributions | | | 11,941,081 | | | | 114,094,971 | | | | 8,032,465 | | | | 77,769,745 | |
| Shares redeemed | | | (217,774,767 | ) | | | (2,083,542,157 | ) | | | (174,417,332 | ) | | | (1,689,788,863 | ) |
| Net increase | | | 24,656,970 | | | $ | 236,252,071 | | | | 169,897,967 | | | $ | 1,647,958,830 | |
| Shares Outstanding: | | | | | | | | | | | | | | | | |
| Beginning of year | | | 559,955,381 | | | | | | | | 390,057,414 | | | | | |
| End of year | | | 584,612,351 | | | | | | | | 559,955,381 | | | | | |
| | | | | | | | | | | | | | | | | |
| | | Year Ended | | | Year Ended | |
| | | December 31, 2018 | | | December 31, 2017 | |
| Investor Class Shares | | Shares | | | Amount | | | Shares | | | Amount | |
| Shares sold | | | 8,470,183 | | | $ | 81,038,469 | | | | 10,154,639 | | | $ | 98,448,266 | |
| Shares issued to shareholders | | | | | | | | | | | | | | | | |
| in reinvestment of distributions | | | 275,815 | | | | 2,634,716 | | | | 182,007 | | | | 1,761,913 | |
| Shares redeemed | | | (7,591,407 | ) | | | (72,606,403 | ) | | | (7,193,481 | ) | | | (69,705,948 | ) |
| Net increase | | | 1,154,591 | | | $ | 11,066,782 | | | | 3,143,165 | | | $ | 30,504,231 | |
| Shares Outstanding: | | | | | | | | | | | | | | | | |
| Beginning of year | | | 13,994,913 | | | | | | | | 10,851,748 | | | | | |
| End of year | | | 15,149,504 | | | | | | | | 13,994,913 | | | | | |
| Total net increase | | | | | | $ | 247,318,853 | | | | | | | $ | 1,678,463,061 | |
| | | | | | | | | | | | | | | | | |
| Baird Intermediate Bond Fund | | | | | | | | | | | | | | | | |
| | | Year Ended | | | Year Ended | |
| | | December 31, 2018 | | | December 31, 2017 | |
| Institutional Class Shares | | Shares | | | Amount | | | Shares | | | Amount | |
| Shares sold | | | 120,674,917 | | | $ | 1,302,127,327 | | | | 90,088,038 | (1) | | $ | 996,848,306 | |
| Shares issued to shareholders | | | | | | | | | | | | | | | | |
| in reinvestment of distributions | | | 6,139,768 | | | | 66,041,602 | | | | 4,712,946 | | | | 52,099,400 | |
| Shares redeemed | | | (88,027,083 | ) | | | (947,396,828 | ) | | | (32,466,170 | ) | | | (359,023,210 | ) |
| Net increase | | | 38,787,602 | | | $ | 420,772,101 | | | | 62,334,814 | | | $ | 689,924,496 | |
| Shares Outstanding: | | | | | | | | | | | | | | | | |
| Beginning of year | | | 263,620,502 | | | | | | | | 201,285,688 | | | | | |
| End of year | | | 302,408,104 | | | | | | | | 263,620,502 | | | | | |
| (1) | In the third quarter of 2017, the Baird Intermediate Bond Fund satisfied a purchase in kind request made by a large institutional shareholder by transferring cash and securities into the Fund in the amount of $50,366,919 in exchange for 4,537,560 shares of the Fund. The transfer was effected in accordance with policies and procedures approved by the Board. |
Notes to the Financial Statements
December 31, 2018
| 3. | Capital Share Transactions (cont.) |
Baird Intermediate Bond Fund (cont.)
| | | Year Ended | | | Year Ended | |
| | | December 31, 2018 | | | December 31, 2017 | |
| Investor Class Shares | | Shares | | | Amount | | | Shares | | | Amount | |
| Shares sold | | | 1,141,775 | | | $ | 12,839,399 | | | | 4,090,053 | | | $ | 47,159,205 | |
| Shares issued to shareholders | | | | | | | | | | | | | | | | |
| in reinvestment of distributions | | | 87,422 | | | | 983,134 | | | | 148,473 | | | | 1,713,275 | |
| Shares redeemed | | | (1,732,469 | ) | | | (19,543,121 | ) | | | (8,119,282 | ) | | | (94,051,982 | ) |
| Net decrease | | | (503,272 | ) | | $ | (5,720,588 | ) | | | (3,880,756 | ) | | $ | (45,179,502 | ) |
| Shares Outstanding: | | | | | | | | | | | | | | | | |
| Beginning of year | | | 4,691,852 | | | | | | | | 8,572,608 | | | | | |
| End of year | | | 4,188,580 | | | | | | | | 4,691,852 | | | | | |
| Total net increase | | | | | | $ | 415,051,513 | | | | | | | $ | 644,744,994 | |
| | | | | | | | | | | | | | | | | |
| Baird Aggregate Bond Fund | | | | | | | | | | | | | | | | |
| | | Year Ended | | | Year Ended | |
| | | December 31, 2018 | | | December 31, 2017 | |
| Institutional Class Shares | | Shares | | | Amount | | | Shares | | | Amount | |
| Shares sold | | | 451,737,547 | | | $ | 4,778,349,475 | | | | 479,982,655 | | | $ | 5,203,154,861 | |
| Shares issued to shareholders | | | | | | | | | | | | | | | | |
| in reinvestment of distributions | | | 35,450,954 | | | | 372,654,044 | | | | 25,337,673 | | | | 274,844,157 | |
| Shares redeemed | | | (321,463,235 | ) | | | (3,384,434,780 | ) | | | (169,229,148 | ) | | | (1,836,019,516 | ) |
| Net increase | | | 165,725,266 | | | $ | 1,766,568,739 | | | | 336,091,180 | | | $ | 3,641,979,502 | |
| Shares Outstanding: | | | | | | | | | | | | | | | | |
| Beginning of year | | | 1,249,248,178 | | | | | | | | 913,156,998 | | | | | |
| End of year | | | 1,414,973,444 | | | | | | | | 1,249,248,178 | | | | | |
| | | | | | | | | | | | | | | | | |
| | | Year Ended | | | Year Ended | |
| | | December 31, 2018 | | | December 31, 2017 | |
| Investor Class Shares | | Shares | | | Amount | | | Shares | | | Amount | |
| Shares sold | | | 18,687,127 | | | $ | 204,403,782 | | | | 27,558,187 | | | $ | 308,830,505 | |
| Shares issued to shareholders | | | | | | | | | | | | | | | | |
| in reinvestment of distributions | | | 1,666,727 | | | | 18,120,244 | | | | 1,575,612 | | | | 17,647,778 | |
| Shares redeemed | | | (27,868,733 | ) | | | (304,405,153 | ) | | | (28,907,779 | ) | | | (324,687,742 | ) |
| Net increase (decrease) | | | (7,514,879 | ) | | $ | (81,881,127 | ) | | | 226,020 | | | $ | 1,790,541 | |
| Shares Outstanding: | | | | | | | | | | | | | | | | |
| Beginning of year | | | 73,467,456 | | | | | | | | 73,241,436 | | | | | |
| End of year | | | 65,952,577 | | | | | | | | 73,467,456 | | | | | |
| Total net increase | | | | | | $ | 1,684,687,612 | | | | | | | $ | 3,643,770,043 | |
Notes to the Financial Statements
December 31, 2018
| 3. | Capital Share Transactions (cont.) |
Baird Core Plus Bond Fund
| | | Year Ended | | | Year Ended | |
| | | December 31, 2018 | | | December 31, 2017 | |
| Institutional Class Shares | | Shares | | | Amount | | | Shares | | | Amount | |
| Shares sold | | | 472,086,657 | (1)(2) | | $ | 5,150,580,845 | | | | 462,309,185 | (3) | | $ | 5,184,855,364 | |
| Shares issued to shareholders | | | | | | | | | | | | | | | | |
| in reinvestment of distributions | | | 40,365,062 | | | | 437,833,773 | | | | 28,241,952 | | | | 316,106,641 | |
| Shares redeemed | | | (308,270,771 | ) | | | (3,351,887,450 | ) | | | (159,221,421 | ) | | | (1,781,332,511 | ) |
| Net increase | | | 204,180,948 | | | $ | 2,236,527,168 | | | | 331,329,716 | | | $ | 3,719,629,494 | |
| Shares Outstanding: | | | | | | | | | | | | | | | | |
| Beginning of year | | | 1,240,378,628 | | | | | | | | 909,048,912 | | | | | |
| End of year | | | 1,444,559,576 | | | | | | | | 1,240,378,628 | | | | | |
| (1) | In the first quarter of 2018, the Baird Core Plus Bond Fund satisfied a purchase in kind request made by a large institutional shareholder by transferring cash and securities into the Fund in the amount of $21,780,947 in exchange for 1,987,313 shares of the Fund. The transfer was effected in accordance with policies and procedures approved by the Board. |
| (2) | In the fourth quarter of 2018, the Baird Core Plus Bond Fund satisfied a purchase in kind request made by a large institutional shareholder by transferring cash and securities into the Fund in the amount of $40,044,307 in exchange for 3,742,459 shares of the Fund. The transfer was effected in accordance with policies and procedures approved by the Board. |
| (3) | In the second quarter of 2017, the Baird Core Plus Bond Fund satisfied a purchase in kind request made by a large institutional shareholder by transferring cash and securities into the Fund in the amount of $51,694,000 in exchange for 4,599,110 shares of the Fund. The transfer was effected in accordance with policies and procedures approved by the Board. |
| | | Year Ended | | | Year Ended | |
| | | December 31, 2018 | | | December 31, 2017 | |
| Investor Class Shares | | Shares | | | Amount | | | Shares | | | Amount | |
| Shares sold | | | 51,876,241 | | | $ | 590,572,111 | | | | 78,014,225 | | | $ | 907,466,355 | |
| Shares issued to shareholders | | | | | | | | | | | | | | | | |
| in reinvestment of distributions | | | 5,554,417 | | | | 62,777,146 | | | | 5,734,364 | | | | 66,688,706 | |
| Shares redeemed | | | (73,078,935 | ) | | | (828,039,256 | ) | | | (127,027,988 | ) | | | (1,484,355,598 | ) |
| Net decrease | | | (15,648,277 | ) | | $ | (174,689,999 | ) | | | (43,279,399 | ) | | $ | (510,200,537 | ) |
| Shares Outstanding: | | | | | | | | | | | | | | | | |
| Beginning of year | | | 208,184,711 | | | | | | | | 251,464,110 | | | | | |
| End of year | | | 192,536,434 | | | | | | | | 208,184,711 | | | | | |
| Total net increase | | | | | | $ | 2,061,837,169 | | | | | | | $ | 3,209,428,957 | |
Notes to the Financial Statements
December 31, 2018
| 3. | Capital Share Transactions (cont.) |
Baird Short-Term Municipal Bond Fund
| | | Year Ended | | | Year Ended | |
| | | December 31, 2018 | | | December 31, 2017 | |
| Institutional Class Shares | | Shares | | | Amount | | | Shares | | | Amount | |
| Shares sold | | | 25,801,037 | | | $ | 259,079,339 | | | | 9,757,294 | | | $ | 98,511,265 | |
| Shares issued to shareholders | | | | | | | | | | | | | | | | |
| in reinvestment of distributions | | | 259,265 | | | | 2,599,466 | | | | 98,091 | | | | 990,417 | |
| Shares redeemed | | | (10,102,773 | ) | | | (101,396,304 | ) | | | (3,102,014 | ) | | | (31,318,541 | ) |
| Net increase | | | 15,957,529 | | | $ | 160,282,501 | | | | 6,753,371 | | | $ | 68,183,141 | |
| Shares Outstanding: | | | | | | | | | | | | | | | | |
| Beginning of year | | | 12,004,019 | | | | | | | | 5,250,648 | | | | | |
| End of year | | | 27,961,548 | | | | | | | | 12,004,019 | | | | | |
| | | | | | | | | | | | | | | | | |
| | | Year Ended | | | Year Ended | |
| | | December 31, 2018 | | | December 31, 2017 | |
| Investor Class Shares | | Shares | | | Amount | | | Shares | | | Amount | |
| Shares sold | | | 9,118,983 | | | $ | 91,442,373 | | | | 405,390 | | | $ | 4,102,130 | |
| Shares issued to shareholders | | | | | | | | | | | | | | | | |
| in reinvestment of distributions | | | 111,800 | | | | 1,118,910 | | | | 4,181 | | | | 42,114 | |
| Shares redeemed | | | (3,341,533 | ) | | | (33,423,078 | ) | | | (562,293 | ) | | | (5,648,228 | ) |
| Net increase (decrease) | | | 5,889,250 | | | $ | 59,138,205 | | | | (152,722 | ) | | $ | (1,503,984 | ) |
| Shares Outstanding: | | | | | | | | | | | | | | | | |
| Beginning of year | | | 482,815 | | | | | | | | 635,537 | | | | | |
| End of year | | | 6,372,065 | | | | | | | | 482,815 | | | | | |
| Total net increase | | | | | | $ | 219,420,706 | | | | | | | $ | 66,679,157 | |
| | | | | | | | | | | | | | | | | |
| Baird Quality Intermediate Municipal Bond Fund | | | | | |
| | | Year Ended | | | Year Ended | |
| | | December 31, 2018 | | | December 31, 2017 | |
| Institutional Class Shares | | Shares | | | Amount | | | Shares | | | Amount | |
| Shares sold | | | 38,663,007 | | | $ | 438,949,320 | | | | 36,085,214 | | | $ | 418,858,383 | |
| Shares issued to shareholders | | | | | | | | | | | | | | | | |
| in reinvestment of distributions | | | 1,901,388 | | | | 21,546,361 | | | | 1,628,106 | | | | 18,869,338 | |
| Shares redeemed | | | (42,485,313 | ) | | | (481,361,176 | ) | | | (29,045,900 | ) | | | (335,980,419 | ) |
| Net increase (decrease) | | | (1,920,918 | ) | | $ | (20,865,495 | ) | | | 8,667,420 | | | $ | 101,747,302 | |
| Shares Outstanding: | | | | | | | | | | | | | | | | |
| Beginning of year | | | 90,606,264 | | | | | | | | 81,938,844 | | | | | |
| End of year | | | 88,685,346 | | | | | | | | 90,606,264 | | | | | |
Notes to the Financial Statements
December 31, 2018
| 3. | Capital Share Transactions (cont.) |
Baird Quality Intermediate Municipal Bond Fund (cont.)
| | | Year Ended | | | Year Ended | |
| | | December 31, 2018 | | | December 31, 2017 | |
| Investor Class Shares | | Shares | | | Amount | | | Shares | | | Amount | |
| Shares sold | | | 3,624,325 | | | $ | 42,022,042 | | | | 3,191,345 | | | $ | 37,929,827 | |
| Shares issued to shareholders | | | | | | | | | | | | | | | | |
| in reinvestment of distributions | | | 163,656 | | | | 1,899,608 | | | | 197,982 | | | | 2,348,574 | |
| Shares redeemed | | | (3,379,869 | ) | | | (39,320,104 | ) | | | (5,935,197 | ) | | | (70,632,909 | ) |
| Net increase (decrease) | | | 408,112 | | | $ | 4,601,546 | | | | (2,545,870 | ) | | $ | (30,354,508 | ) |
| Shares Outstanding: | | | | | | | | | | | | | | | | |
| Beginning of year | | | 9,095,370 | | | | | | | | 11,641,240 | | | | | |
| End of year | | | 9,503,482 | | | | | | | | 9,095,370 | | | | | |
| Total net increase (decrease) | | | | | | $ | (16,263,949 | ) | | | | | | $ | 71,392,794 | |
| | | | | | | | | | | | | | | | | |
| Baird Core Intermediate Municipal Bond Fund | | | | | |
| | | Year Ended | | | Year Ended | |
| | | December 31, 2018 | | | December 31, 2017 | |
| Institutional Class Shares | | Shares | | | Amount | | | Shares | | | Amount | |
| Shares sold | | | 25,471,835 | | | $ | 258,784,030 | | | | 14,997,642 | | | $ | 153,589,205 | |
| Shares issued to shareholders | | | | | | | | | | | | | | | | |
| in reinvestment of distributions | | | 428,102 | | | | 4,347,957 | | | | 190,250 | | | | 1,949,009 | |
| Shares redeemed | | | (11,656,645 | ) | | | (118,274,571 | ) | | | (2,068,659 | ) | | | (21,112,103 | ) |
| Net increase | | | 14,243,292 | | | $ | 144,857,416 | | | | 13,119,233 | | | $ | 134,426,111 | |
| Shares Outstanding: | | | | | | | | | | | | | | | | |
| Beginning of year | | | 22,749,126 | | | | | | | | 9,629,893 | | | | | |
| End of year | | | 36,992,418 | | | | | | | | 22,749,126 | | | | | |
| | | | | | | | | | | | | | | | | |
| | | Year Ended | | | Year Ended | |
| | | December 31, 2018 | | | December 31, 2017 | |
| Investor Class Shares | | Shares | | | Amount | | | Shares | | | Amount | |
| Shares sold | | | 159,205 | | | $ | 1,619,578 | | | | 47,604 | | | $ | 485,003 | |
| Shares issued to shareholders | | | | | | | | | | | | | | | | |
| in reinvestment of distributions | | | 3,228 | | | | 32,782 | | | | 2,491 | | | | 25,455 | |
| Shares redeemed | | | (134,593 | ) | | | (1,369,678 | ) | | | (19,260 | ) | | | (197,061 | ) |
| Net increase | | | 27,840 | | | $ | 282,682 | | | | 30,835 | | | $ | 313,397 | |
| Shares Outstanding: | | | | | | | | | | | | | | | | |
| Beginning of year | | | 166,269 | | | | | | | | 135,434 | | | | | |
| End of year | | | 194,109 | | | | | | | | 166,269 | | | | | |
| Total net increase | | | | | | $ | 145,140,098 | | | | | | | $ | 134,739,508 | |
Notes to the Financial Statements
December 31, 2018
| 4. | Investment Transactions and Income Tax Information |
During the year ended December 31, 2018, purchases and sales of investment securities (excluding short-term investments and any in-kind transactions) were as follows:
| | | U.S. Government Obligations | | | All Other | |
| | | Purchases | | | Sales | | | Purchases | | | Sales | |
| Baird Ultra Short Bond Fund | | $ | 375,431,834 | | | $ | 197,578,680 | | | $ | 301,916,715 | | | $ | 134,750,694 | |
| Baird Short-Term Bond Fund | | | 1,891,240,160 | | | | 1,543,763,240 | | | | 1,679,113,244 | | | | 1,703,468,695 | |
| Baird Intermediate Bond Fund | | | 837,310,725 | | | | 565,537,425 | | | | 595,091,365 | | | | 443,204,803 | |
| Baird Aggregate Bond Fund | | | 2,702,654,460 | | | | 1,954,055,469 | | | | 2,641,252,633 | | | | 1,715,749,511 | |
| Baird Core Plus Bond Fund | | | 2,838,429,420 | | | | 2,621,577,830 | | | | 3,660,425,248 | | | | 1,893,178,809 | |
| Baird Short-Term | | | | | | | | | | | | | | | | |
| Municipal Bond Fund | | | — | | | | — | | | | 442,808,630 | | | | 235,434,519 | |
| Baird Quality Intermediate | | | | | | | | | | | | | | | | |
| Municipal Bond Fund | | | — | | | | — | | | | 449,233,803 | | | | 447,944,527 | |
| Baird Core Intermediate | | | | | | | | | | | | | | | | |
| Municipal Bond Fund | | | — | | | | — | | | | 326,612,938 | | | | 189,389,585 | |
At December 31, 2018, gross unrealized appreciation and depreciation of investments and distributable income and long-term capital gains for federal tax purposes were as follows:
| | | Baird | | | Baird | | | Baird | |
| | | Ultra Short | | | Short-Term | | | Intermediate | |
| | | Bond Fund | | | Bond Fund | | | Bond Fund | |
| Cost of investments | | $ | 1,043,955,466 | | | $ | 5,805,957,936 | | | $ | 3,359,565,378 | |
| Gross unrealized appreciation | | $ | 320,022 | | | $ | 11,505,650 | | | $ | 13,924,200 | |
| Gross unrealized depreciation | | | (2,493,274 | ) | | | (45,962,027 | ) | | | (55,505,133 | ) |
| Net unrealized appreciation (depreciation) | | | (2,173,252 | ) | | | (34,456,377 | ) | | | (41,580,933 | ) |
| Undistributed ordinary income | | | 57,931 | | | | 643,320 | | | | 200,149 | |
| Total distributable earnings, | | | | | | | | | | | | |
| before other accumulated losses | | | 57,931 | | | | 643,320 | | | | 200,149 | |
| Other accumulated losses | | | (510,014 | ) | | | (31,457,419 | ) | | | (19,761,019 | ) |
| Total distributable loss | | $ | (2,625,335 | ) | | $ | (65,270,476 | ) | | $ | (61,141,803 | ) |
| | | | | | | | | | | | | |
| | | | | | | Baird | | | Baird | |
| | | | | | | Aggregate | | | Core Plus | |
| | | | | | | Bond Fund | | | Bond Fund | |
| Cost of investments | | | | | | $ | 15,873,989,964 | | | $ | 18,132,436,174 | |
| Gross unrealized appreciation | | | | | | $ | 71,577,576 | | | $ | 85,200,828 | |
| Gross unrealized depreciation | | | | | | | (372,080,401 | ) | | | (451,141,375 | ) |
| Net unrealized appreciation (depreciation) | | | | | | | (300,502,825 | ) | | | (365,940,547 | ) |
| Undistributed ordinary income | | | | | | | 405,277 | | | | 1,047,051 | |
| Total distributable earnings, | | | | | | | | | | | | |
| before other accumulated losses | | | | | | | 405,277 | | | | 1,047,051 | |
| Other accumulated losses | | | | | | | (90,871,360 | ) | | | (104,368,539 | ) |
| Total distributable loss | | | | | | $ | (390,968,908 | ) | | $ | (469,262,035 | ) |
Notes to the Financial Statements
December 31, 2018
| 4. | Investment Transactions and Income Tax Information (cont.) |
| | | Baird | | | Baird Quality | | | Baird Core | |
| | | Short-Term | | | Intermediate | | | Intermediate | |
| | | Municipal | | | Municipal | | | Municipal | |
| | | Bond Fund | | | Bond Fund | | | Bond Fund | |
| Cost of investments | | $ | 343,542,791 | | | $ | 1,094,771,314 | | | $ | 374,352,842 | |
| Gross unrealized appreciation | | $ | 1,192,252 | | | $ | 18,346,470 | | | $ | 3,668,227 | |
| Gross unrealized depreciation | | | (945,717 | ) | | | (6,043,337 | ) | | | (1,836,200 | ) |
| Net unrealized appreciation (depreciation) | | | 246,535 | | | | 12,303,133 | | | | 1,832,027 | |
| Undistributed tax-exempt income | | | 20,096 | | | | 44,705 | | | | 4,567 | |
| Total distributable earnings, | | | | | | | | | | | | |
| before other accumulated losses | | | 20,096 | | | | 44,705 | | | | 4,567 | |
| Other accumulated losses | | | (381,415 | ) | | | (9,668,499 | ) | | | (526,218 | ) |
| Total distributable earnings (loss) | | $ | (114,784 | ) | | $ | 2,679,339 | | | $ | 1,310,376 | |
The difference between book-basis and tax-basis unrealized appreciation is attributed primarily to the tax deferral of losses on wash sales.
Additionally, U.S. generally accepted accounting principles require that certain components of net assets relating to permanent differences be reclassified between financial and tax reporting. These reclassifications are primarily due to differing treatments for paydowns. These reclassifications have no effect on net assets or net asset value per share. For the year ended December 31, 2018, the following table shows the reclassifications made:
| | | Accumulated | | | | | | | |
| | | Undistributed | | | Accumulated | | | | |
| | | Net Investment | | | Net Realized | | | Paid-in | |
Fund | | Income (Loss) | | | Gains (Losses) | | | Capital | |
| Baird Ultra Short Bond Fund | | $ | 24,875 | | | $ | (24,875 | ) | | $ | — | |
| Baird Short-Term Bond Fund | | | 607,377 | | | | (607,377 | ) | | | — | |
| Baird Intermediate Bond Fund | | | 378,864 | | | | (378,864 | ) | | | — | |
| Baird Aggregate Bond Fund | | | 16,980,102 | | | | (16,980,102 | ) | | | — | |
| Baird Core Plus Bond Fund | | | 18,942,517 | | | | (18,942,517 | ) | | | — | |
| Baird Short-Term Municipal Bond Fund | | | 1,689 | | | | (1,689 | ) | | | — | |
| Baird Quality Intermediate Municipal Bond Fund | | | (16 | ) | | | 16 | | | | — | |
| Baird Core Intermediate Municipal Bond Fund | | | — | | | | — | | | | — | |
Distributions to Shareholders
Each Fund generally pays dividends monthly from net investment income and distributes net realized capital gains, if any, at least annually. Income and capital gain distributions are determined in accordance with income tax regulations, which may differ from GAAP. Certain Funds also utilize earnings and profits distributed to shareholders on redemptions of shares as part of the dividends paid deduction.
Notes to the Financial Statements
December 31, 2018
| 4. | Investment Transactions and Income Tax Information (cont.) |
The tax components of distributions paid during the periods shown below were as follows:
| | | Year Ended December 31, 2018 | |
| | | Ordinary | | | Tax-Exempt | | | | |
Fund | | Income | | | Income | | | Total | |
| Baird Ultra Short Bond Fund | | $ | 15,337,212 | | | $ | — | | | $ | 15,337,212 | |
| Baird Short-Term Bond Fund | | | 125,304,686 | | | | — | | | | 125,304,686 | |
| Baird Intermediate Bond Fund | | | 81,661,737 | | | | — | | | | 81,661,737 | |
| Baird Aggregate Bond Fund | | | 441,023,109 | | | | — | | | | 441,023,109 | |
| Baird Core Plus Bond Fund | | | 537,907,100 | | | | — | | | | 537,907,100 | |
| Baird Short-Term Municipal Bond Fund | | | 56,689 | | | | 4,559,664 | | | | 4,616,353 | |
| Baird Quality Intermediate Municipal Bond Fund | | | 13,436 | | | | 27,039,669 | | | | 27,053,105 | |
| Baird Core Intermediate Municipal Bond Fund | | | 44,297 | | | | 6,511,709 | | | | 6,556,006 | |
| | | Year Ended December 31, 2017 | |
| | | Ordinary | | | Long-Term | | | Return of | | | Tax-Exempt | | | | |
Fund | | Income | | | Capital Gains | | | Capital | | | Income | | | Total | |
| Baird Ultra Short Bond Fund | | $ | 7,278,529 | | | $ | — | | | $ | — | | | $ | — | | | $ | 7,278,529 | |
| Baird Short-Term Bond Fund | | | 84,958,251 | | | | — | | | | — | | | | — | | | | 84,958,251 | |
| Baird Intermediate Bond Fund | | | 61,473,435 | | | | 685,716 | | | | — | | | | — | | | | 62,159,151 | |
| Baird Aggregate Bond Fund | | | 325,177,273 | | | | — | | | | — | | | | — | | | | 325,177,273 | |
| Baird Core Plus Bond Fund | | | 406,111,788 | | | | — | | | | — | | | | — | | | | 406,111,788 | |
| Baird Short-Term | | | | | | | | | | | | | | | | | | | | |
| Municipal Bond Fund | | | 40,518 | | | | 21,644 | | | | — | | | | 1,395,866 | | | | 1,458,028 | |
| Baird Quality Intermediate | | | | | | | | | | | | | | | | | | | | |
| Municipal Bond Fund | | | — | | | | — | | | | 59,373 | | | | 24,318,881 | | | | 24,378,254 | |
| Baird Core Intermediate | | | | | | | | | | | | | | | | | | | | |
| Municipal Bond Fund | | | 34,999 | | | | — | | | | — | | | | 3,070,411 | | | | 3,105,410 | |
At December 31, 2018, accumulated net realized capital loss carryovers, if any, and the year(s) in which the capital loss carryovers expire were:
| | | Capital Loss Carryover | | Year of Expiration |
Fund | | Short-term | | | Long-term | | Short-term | | Long-term |
| Baird Ultra Short Bond Fund | | $ | 396,643 | | | $ | 113,371 | | Indefinite | | Indefinite |
| Baird Short-Term Bond Fund | | | 16,811,463 | | | | 14,645,956 | | Indefinite | | Indefinite |
| Baird Intermediate Bond Fund | | | 2,791,882 | | | | 16,969,137 | | Indefinite | | Indefinite |
| Baird Aggregate Bond Fund | | | 44,777,539 | | | | 46,093,821 | | Indefinite | | Indefinite |
| Baird Core Plus Bond Fund | | | 60,857,667 | | | | 43,510,872 | | Indefinite | | Indefinite |
| Baird Short-Term Municipal Bond Fund | | | 170,394 | | | | 211,021 | | Indefinite | | Indefinite |
| Baird Quality Intermediate Municipal Bond Fund | | | 4,820,535 | | | | 4,847,964 | | Indefinite | | Indefinite |
| Baird Core Intermediate Municipal Bond Fund | | | 482,653 | | | | 43,565 | | Indefinite | | Indefinite |
At December 31, 2018, no Funds deferred, on a tax basis, qualified late year losses.
Notes to the Financial Statements
December 31, 2018
| 5. | Investment Advisory and Other Agreements |
The Funds have entered into an Investment Advisory Agreement with Baird for the provision of investment advisory services. Pursuant to the Investment Advisory Agreement, the Advisor is entitled to receive a fee, calculated daily and payable monthly, at the annual rate of 0.25% for the Funds as applied to the respective Fund’s average daily net assets. Certain officers and employees of the Advisor are also officers of the Funds.
For Baird Ultra Short Bond Fund, the Advisor has contractually agreed to waive management fees in an amount equal to an annual rate of 0.15% of average daily net assets for the Fund, at least through April 30, 2019. The agreement may only be terminated prior to the end of this term by or with the consent of the Board.
For the year ended December 31, 2018, the Advisor waived the following amount pursuant to the fee waiver agreement between the Advisor and the Corporation on behalf of the Baird Ultra Short Bond Fund:
Fund | Waived Amount |
| Baird Ultra Short Bond Fund | $1,028,868 |
These fees are not subject to recoupment by the Advisor.
The Funds have entered into an Administration Agreement with Baird. Under the Administration Agreement, the Advisor assumes and pays all expenses of the applicable Fund other than the investment advisory fees, fees under the 12b-1 plan, costs related to portfolio securities transactions and extraordinary or non-recurring expenses. Pursuant to the Administration Agreement, the Advisor is entitled to receive a fee, calculated daily and payable monthly, at the annual rate of 0.05% for the Funds as applied to the respective Fund’s average daily net assets.
U.S. Bancorp Fund Services, LLC, doing business as U.S. Bank Global Fund Services, serves as transfer agent, administrator, and accounting services agent for the Funds. U.S. Bank, N.A. (“U.S. Bank”) serves as custodian for the Funds.
Baird (the “Distributor”) is the distributor of the Funds pursuant to a distribution agreement.
No commissions were earned by the Distributor for services rendered as a registrered broker-dealer in securities transactions for the year ended December 31, 2018 for the Funds.
The Corporation maintains an uncommitted line of credit (“LOC”) with U.S. Bank to provide the Funds a temporary liquidity source to meet unanticipated redemptions. The LOC is unsecured at all times, including any period during which U.S. Bank is an affiliate of the Funds, and is subject to certain restrictions and covenants. Under the terms of the LOC, borrowings for each Fund are limited to one-third of the total eligible net assets (including the amount borrowed) of the respective Fund, or $550,000,000 of total borrowings for all Funds, whichever is less. U.S. Bank charges interest at the U.S. Prime Rate less 2%, but in no event less than a net rate of 1% per annum. The LOC matures on May 26, 2019, unless renewed. The Funds have authorized U.S. Bank to charge any of the accounts of the borrowing Fund subject to the agreement for any missed payments.
For the year ended December 31, 2018, the Baird Short-Term Municipal Bond Fund incurred interest charges of $84 on the average daily loan balance and weighted average borrowing rate of $2,773 and 3.04%, respectively, and the maximum amount borrowed during the year occurred on August 1, 2018 in the amount of $1,012,000. For the year ended December 31, 2018, the Baird Quality Intermediate Municipal Bond Fund incurred interest charges of $2,093 on the average daily loan balance and weighted average borrowing rate of $59,942 and 3.49%, respectively, and the maximum amount borrowed during the year occurred on December 24, 2018 in the amount of $8,484,000.
Notes to the Financial Statements
December 31, 2018
6. Line of Credit (cont.)
The Baird Ultra Short Bond Fund, the Baird Short-Term Bond Fund, the Baird Intermediate Bond Fund, the Baird Aggregate Bond Fund, the Baird Core Plus Bond Fund and the Baird Core Intermediate Municipal Bond Fund did not borrow from the LOC during the year. As of December 31, 2018, the Prime Rate was 5.50%. At December 31, 2018, the Funds did not have any outstanding borrowings under the LOC.
7. Distribution and Shareholder Service Plan
The Funds have adopted a distribution and shareholder service plan (the “Plan”) pursuant to Rule 12b-1 under the 1940 Act. The Plan allows the Funds to compensate the Distributor for the costs incurred in distributing the Funds’ Investor Class Shares, including amounts paid to brokers or dealers, at an annual rate of 0.25% of the average daily net assets of the Funds’ Investor Class Shares. The Baird Ultra Short Bond, Baird Short-Term Bond, Baird Intermediate Bond, Baird Aggregate Bond, Baird Core Plus Bond, Baird Short-Term Municipal Bond Fund, Baird Quality Intermediate Municipal Bond and Baird Core Intermediate Municipal Bond Funds incurred $31,771, $350,284, $118,995, $1,927,963, $5,837,847, $152,741, $241,638 and $4,650, respectively, in fees pursuant to the Plan during the year ended December 31, 2018.
8. Subsequent Events
In preparing these financial statements, management has evaluated events after December 31, 2018. There were no subsequent events since December 31, 2018, through the date the financial statements were issued that would require adjustment to or additional disclosure in these financial statements.
Report of Independent Registered Public
Accounting Firm
To the Shareholders and Board of Directors of
Baird Funds, Inc.
Opinion on the Financial Statements
We have audited the accompanying statements of assets and liabilities, including the summary schedules of investments, of Baird Ultra Short Bond Fund, Baird Short-Term Bond Fund, Baird Intermediate Bond Fund, Baird Aggregate Bond Fund, Baird Core Plus Bond Fund, Baird Short-Term Municipal Bond Fund, Baird Quality Intermediate Municipal Bond Fund, and Baird Core Intermediate Municipal Bond Fund (the “Funds”), each a series of Baird Funds, Inc., as of December 31, 2018, the related statements of operations for the year then ended, the statements of changes in net assets, including the related notes, and the financial highlights for each of the two years in the period then ended (collectively referred to as the “financial statements”). In our opinion, the financial statements present fairly, in all material respects, the financial position of the each of the Funds as of December 31, 2018, the results of their operations for the year then ended, and the changes in their net assets and the financial highlights for each of the two years in the period then ended, in conformity with accounting principles generally accepted in the United States of America.
The Funds’ financial highlights for the periods ended December 31, 2016 and prior, were audited by other auditors whose report dated February 27, 2017, expressed an unqualified opinion on those financial highlights.
Basis for Opinion
These financial statements are the responsibility of the Funds’ management. Our responsibility is to express an opinion on the Funds’ financial statements based on our audits. We are a public accounting firm registered with the Public Company Accounting Oversight Board (United States) (“PCAOB”) and are required to be independent with respect to the Funds in accordance with the U.S. federal securities laws and the applicable rules and regulations of the Securities and Exchange Commission and the PCAOB.
We conducted our audits in accordance with the standards of the PCAOB. Those standards require that we plan and perform the audit to obtain reasonable assurance about whether the financial statements are free of material misstatement, whether due to error or fraud.
Our audits included performing procedures to assess the risks of material misstatement of the financial statements, whether due to error or fraud, and performing procedures that respond to those risks. Such procedures included examining, on a test basis, evidence regarding the amounts and disclosures in the financial statements. Our procedures included confirmation of securities owned as of December 31, 2018, by correspondence with the custodian and brokers. Our audits also included evaluating the accounting principles used and significant estimates made by management, as well as evaluating the overall presentation of the financial statements. We believe that our audits provide a reasonable basis for our opinion.
We have served as the Funds’ auditor since 2017.
COHEN & COMPANY, LTD.
Milwaukee, Wisconsin
February 27, 2019
Directors & Officers
As of December 31, 2018 (Unaudited)
Independent Directors
John W. Feldt
Independent Director
Term of Office: Indefinite
Length of Time Served: Since September 2000
Age: 76
c/o Robert W. Baird & Co. Incorporated
777 East Wisconsin Avenue
Milwaukee, WI 53202
Principal Occupation(s) During the Past 5 Years: Retired.
Number of Active Portfolios in Complex Overseen by Director: 14
Other Directorships Held by Director: Director of Thompson IM Funds, Inc., a mutual fund complex (3 portfolios) (1987-2018).
Darren R. Jackson
Independent Director
Term of Office: Indefinite
Length of Time Served: Since November 2018
Age: 54
c/o Robert W. Baird & Co. Incorporated
777 East Wisconsin Avenue
Milwaukee, WI 53202
Principal Occupation(s) During the Past 5 Years: Retired; President, CEO and Director, Advance Auto Parts, Inc. (2008-2016).
Number of Active Portfolios in Complex Overseen by Director: 14
Other Directorships Held by Director: Director of Fastenal Company, a tool and supply distributor, since 2012; Director of Cree, Inc., a lighting manufacturer, since 2016.
Frederick P. Stratton, Jr.
Independent Director
Term of Office: Indefinite
Length of Time Served: Since May 2004
Age: 79
c/o Robert W. Baird & Co. Incorporated
777 East Wisconsin Avenue
Milwaukee, WI 53202
Principal Occupation(s) During the Past 5 Years: Retired; Chairman Emeritus, Briggs & Stratton Corporation, a manufacturing company, since 2003.
Number of Active Portfolios in Complex Overseen by Director: 14
Other Directorships Held by Director: Director of Weyco Group, Inc., a men’s footwear distributor, since 1976.
Marlyn J. Spear, CFA
Independent Director
Term of Office: Indefinite
Length of Time Served: Since January 2008
Age: 65
c/o Robert W. Baird & Co. Incorporated
777 East Wisconsin Avenue
Milwaukee, WI 53202
Principal Occupation(s) During the Past 5 Years: Retired; Chief Investment Officer, Building Trades United Pension Trust Fund (July 1989-February 2017).
Number of Active Portfolios in Complex Overseen by Director: 14
Other Directorships Held by Director: Management Trustee of AFL-CIO Housing Investment Trust, a mutual fund complex (1 portfolio) (1995-2018).
Directors & Officers
As of December 31, 2018 (Unaudited) (Continued)
Interested Directors and Officers
Cory L. Nettles*
Interested Director
Term of Office: Indefinite
Length of Time Served: Since January 2008
Age: 48
c/o Generation Growth Capital, Inc.
411 East Wisconsin Avenue, Suite 1710
Milwaukee, WI 53202
Principal Occupation(s) During the Past 5 Years: Managing Director, Generation Growth Capital, Inc., a private equity fund, since March 2007; Of Counsel, Quarles & Brady LLP, a law firm (January 2005-December 2016).
Number of Active Portfolios in Complex Overseen by Director: 14
Other Directorships Held by Director: Director of Weyco Group, Inc., a men’s footwear distributor, since 2007; Director of Associated Banc-Corp, since 2013.
Mary Ellen Stanek
President
Term of Office: Re-elected by Board annually
Length of Time Served: Since September 2000
Age: 62
777 East Wisconsin Avenue
Milwaukee, WI 53202
Principal Occupation(s) During the Past 5 Years: Managing Director, the Advisor, and Chief Investment Officer, Baird Advisors, a department of the Advisor, since March 2000.
Charles B. Groeschell
Vice President
Term of Office: Re-elected by Board annually
Length of Time Served: Since January 2010
Age: 65
777 East Wisconsin Avenue
Milwaukee, WI 53202
Principal Occupation(s) During the Past 5 Years: Managing Director, the Advisor, and Senior Portfolio Manager, Baird Advisors, a department of the Advisor, since February 2000.
Angela M. Palmer
Chief Compliance Officer and
AML Compliance Officer
Term of Office: Re-elected by Board annually
Length of Time Served: Since March 2014
Age: 46
777 East Wisconsin Ave
Milwaukee, WI 53202
Principal Occupation(s) During the Past 5 Years:
Chief Compliance Officer, the Advisor, since March 2014; Anti-Money Laundering Compliance Officer since May 2015; Director, the Advisor, since July 2014; Senior Vice President, the Advisor (March 2014-June 2014); Chief Compliance Officer, RIAs US, BMO Financial Group (January 2013-March 2014); Vice President, BMO Harris Bank, N.A. (July 2011-March 2014); Chief Compliance Officer, Taplin, Canida & Habacht, LLC (December 2008-March 2014).
Heidi L. Schneider
Treasurer
Term of Office: Re-elected by Board annually
Length of Time Served: Since August 2017
Age: 47
777 East Wisconsin Avenue
Milwaukee, WI 53202
Principal Occupation(s) During the Past 5 Years: Managing Director, the Advisor, since December 2013; Senior Business Analyst, Stein’s Garden & Home, a family-owned garden center and home goods retailer (July 2012-December 2013).
Directors & Officers
As of December 31, 2018 (Unaudited) (Continued)
Interested Directors and Officers
Charles M. Weber
Secretary
Term of Office: Re-elected by Board annually
Length of Time Served: Since September 2005
Age: 55
777 East Wisconsin Avenue
Milwaukee, WI 53202
Principal Occupation(s) During the Past 5 Years: Senior Associate General Counsel, the Advisor, since January 2013; Managing Director, the Advisor, since January 2009.
Peter J. Hammond
Vice President
Term of Office: Re-elected by Board annually
Length of Time Served: Since August 2012
Age: 55
777 East Wisconsin Avenue
Milwaukee, WI 53202
Principal Occupation(s) During the Past 5 Years:
Senior Vice President, the Advisor, since March 2012.
Dustin J. Hutter
Assistant Treasurer
Term of Office: Re-elected by Board annually
Length of Time Served: Since February 2011
Age: 42
777 East Wisconsin Avenue
Milwaukee, WI 53202
Principal Occupation(s) During the Past 5 Years: Senior Business Analyst, the Advisor, since September 2017; Director of Finance Services, the Advisor (August 2015-August 2017); Director of Reporting and Analysis, Capital Markets Finance, the Advisor (February 2013-August 2015).
Andrew D. Ketter
Assistant Secretary
Term of Office: Re-elected by Board annually
Length of Time Served: Since February 2011
Age: 44
777 East Wisconsin Avenue
Milwaukee, WI 53202
Principal Occupation(s) During the Past 5 Years: Associate General Counsel, the Advisor, since September 2010; Director, the Advisor, since July 2014; Senior Vice President, the Advisor (January 2014-June 2014); First Vice President, the Advisor (September 2010 to December 2013).
| * | Mr. Nettles was considered an “interested person” of the Corporation (as defined in the 1940 Act) as of December 31, 2018 because of his previous association with the law firm, Quarles & Brady LLP, which provides legal services to the Advisor. The legal services that Quarles & Brady LLP has provided to the Advisor include litigation, real estate, trademark and miscellaneous securities related matters that did not relate to the Corporation or the Funds. Mr. Nettles is considered an Independent Director as of January 1, 2019. |
Additional information about the Funds’ Directors is available in the Statement of Additional Information which may be obtained without charge, upon request, by calling 1-866-44BAIRD, or at www.bairdfunds.com.
Baird Funds, Inc.
Disclosure Regarding the Board of Directors’ Approval of the Investment Advisory Agreement for Baird Bond Funds (Unaudited)
The Board of Directors (the “Board”) of Baird Funds, Inc. (the “Corporation”), including the directors who are not “interested persons” of the Corporation within the meaning of the Investment Company Act of 1940 (the “Independent Directors”), met on August 1 and August 21, 2018 to consider the annual renewal of the investment advisory agreement between Robert W. Baird & Co. Incorporated (“Baird” or the “Advisor”) and the Corporation on behalf of the Baird Ultra Short Bond Fund, Baird Short-Term Bond Fund, Baird Intermediate Bond Fund, Baird Aggregate Bond Fund, Baird Core Plus Bond Fund, Baird Short-Term Municipal Bond Fund, Baird Quality Intermediate Municipal Bond Fund, and Baird Core Intermediate Municipal Bond Fund (the “Funds”). The Board, including a majority of the Independent Directors, approved the investment advisory agreement through a process that concluded at the August 21, 2018 meeting. In connection with its consideration of the investment advisory agreement, the Board reviewed and discussed various information that had been provided prior to the meeting, including the investment advisory agreement, a memorandum provided by legal counsel summarizing the guidelines relevant to the Board’s consideration of the renewal of the investment advisory agreement, a memorandum and other information provided in response to a request from the Board, including the Independent Directors, from the Advisor (including the Advisor’s Form ADV Part 1A, brochures and brochure supplements, annual report and audited financial statements), a profitability analysis, comparative information about the Funds’ performance for periods ended June 30, 2018, management fees and expense ratios, composite performance of similar accounts managed by the Advisor, trading and commission information and other pertinent information.
The Board considered the Advisor’s 15(c) response and discussed various questions and information with representatives of the Advisor at the August 1, 2018 meeting. At the August 21 meeting, the Board met in executive session with the Funds’ legal counsel to consider the investment advisory agreement and also met in executive session with a representative of Baird Advisors. The Board also took into account information reviewed periodically throughout the year that was relevant to its consideration of the investment advisory agreement, including performance, management fee and other expense information and discussions with the Funds’ portfolio managers. Based on its evaluation of this information, the Board, including a majority of the Independent Directors, approved the continuation of the investment advisory agreement for an additional one-year period.
In considering the investment advisory agreement and reaching its conclusions, the Board reviewed and analyzed various factors that it determined were relevant, including the factors below. In deciding to approve the investment advisory agreement for each Fund, the Board did not identify any single factor as determinative but considered all factors together.
Nature, Extent and Quality of Services Provided to the Funds
The Board considered the nature, extent and quality of the services provided by the Advisor to the Funds. The Board noted the Advisor’s overall reputation and depth of the Advisor’s personnel, resources and commitment to the Funds and the experience and credentials of the portfolio management teams employed to manage the Funds’ investments. The Board considered the credentials and continuity of the portfolio management teams for the Funds and noted that the Advisor has added resources in support of the Funds, including investments in personnel, technology, research, trading, risk controls and systems.
The Board considered the Advisor’s disciplined investment decision making process used for the Funds. The Board also considered other services that the Advisor provides the Funds in its capacity as their investment advisor, such as making some of its key personnel available to serve as officers of the Funds, selecting broker dealers for execution of portfolio transactions, ensuring adherence to the Funds’ investment policies and restrictions, compliance, risk management services, valuation, providing support services to the Board and the committees of the Board and overseeing the Funds’ other service providers. The Board noted the growth in net assets in the Funds and the Advisor’s effective management of the Funds’ cash flows. The Board also considered the strength of the Advisor’s compliance department, including the Funds’ chief compliance officer, as well as the Advisor’s risk management system. The Board concluded that the nature, extent and quality of
Baird Funds, Inc.
Disclosure Regarding the Board of Directors’ Approval of the Investment Advisory Agreement for Baird Bond Funds (Unaudited) (Continued)
the services provided by the Advisor to the Funds were appropriate and that each Fund was likely to continue to benefit from services provided under the respective investment advisory agreement.
Investment Performance of the Advisor and the Funds
In considering the investment performance of each of the Funds, the Board reviewed information as of June 30, 2018, regarding the performance of each class of the Fund for applicable one-year, three-year, five-year, ten-year and since-inception periods in comparison to its benchmark index and its peer group as determined by Lipper. The Board also considered composite investment performance of Baird Advisors with respect to accounts managed by the Advisor that are comparable to the Funds.
The Board noted that the Funds have maintained competitive short term and long term returns during periods of strong asset growth, and that the performance for most of the Funds has been in the first or second quartile of the respective Lipper peer group. The Board noted that the returns of the Institutional Class of the Ultra Short Bond Fund, the Aggregate Bond Fund and the Core Plus Bond Fund have exceeded the returns of the benchmark index and the Lipper peer group average over all applicable time periods. The returns of the Institutional Class of the Short Term Bond Fund exceeded the benchmark index for all time periods and the Lipper peer group average over most time periods. The returns of the Intermediate Bond Fund exceeded the benchmark index for all applicable time periods but trailed the Lipper peer group average for the three- and five-year periods. The Board considered the Advisor’s commentary regarding the Fund’s underperformance versus its Lipper category during these periods. While the Quality Intermediate Municipal Bond Fund has generally trailed its benchmark index and Lipper peer group average, the Board noted the Advisor’s commentary regarding the Fund’s underperformance versus its Lipper peer group. The Board considered the performance of the Short-Term Municipal Bond Fund and the Core Intermediate Municipal Bond since they were launched in 2015, noting that the Institutional Class of each Fund exceeded the benchmark and Lipper peer group average for the one-year and since-inception periods.
The Board also considered the Advisor’s quarterly portfolio commentaries and reviews explaining the Funds’ performance, the Advisor’s consistent and disciplined investment decision process and the investment strategies it employs for the Funds. After considering all of the information, the Board concluded that, although past performance is not a guarantee of future results, each Fund and its shareholders were likely to benefit from the continued management by the Advisor.
Fee Information, Costs of Services Provided and Profits Realized by the Advisor
The Board examined the fee and expense information for each of the Funds, including a comparison of such information to comparable mutual funds as determined by Morningstar and comparative information for certain peer funds identified by the Advisor. The Board noted that each Fund’s advisory fee was significantly lower than the average advisory fee for all mutual funds in its Morningstar category, and each Fund’s total expense ratio (for both its Investor Class and Institutional Class shares) was lower than the Morningstar category average. With respect to the Ultra Short Bond Fund, the Board considered the Advisor’s contractual agreement to waive management fees of 0.15% until April 30, 2019. In addition, the Board considered that under the administration agreement between the Advisor and the Corporation on behalf of the Funds (the “Administration Agreement”), each of the Funds pays administrative fees to the Advisor at an annual rate of 0.05% of each Fund’s average daily net assets, and the Advisor is responsible for paying each Fund’s custody, transfer agency, accounting, printing, auditing, legal and director fees and other ordinary expenses (except for advisory and 12b-1 fees and certain other costs), which has the effect of capping the Funds’ expense ratios at 0.55% and 0.30% for Investor and Institutional Class Shares, respectively.
The Board also reviewed and considered investment management fees charged by the Advisor to other investment advisory clients and found that the fee paid by the Funds (0.25%) was less than the fee that the Advisor charges on the first $100 million (0.30%) of a separately managed account. The Board noted that the Advisor maintains subadvisory arrangements with certain unaffiliated fixed income funds and a collective investment trust, but did not consider the subadvisory fee to be a material factor given the difference in services provided by the Advisor.
Baird Funds, Inc.
Disclosure Regarding the Board of Directors’ Approval of the Investment Advisory Agreement for Baird Bond Funds (Unaudited) (Continued)
The Board noted the extent of the significant additional services provided to the Funds that the Advisor did not provide in the other advisory relationships. Those services included operational support, valuation services, oversight of the Funds’ other service providers, director support, preparation of regulatory filings, implementation of the Funds’ compliance program including employment of the Funds’ Chief Compliance Officer and other compliance staff, and various other services. In addition, the Board noted that the provision of investment advisory services to the Funds requires more effort than it does for separately managed accounts due to daily sales and redemption activity and additional regulatory and compliance requirements.
The Board considered the fees realized, and the costs incurred, by the Advisor in providing investment management and administrative services to the Funds and a profitability analysis with respect to each Fund. The Board noted the expense structure of the Funds whereby shareholders are charged only a management fee and an administration fee in addition to the Rule 12b-1 fee charged to the Investor Class, and the Advisor assumes almost all of the other expenses on behalf of each Fund. The Board noted that the Advisor’s profitability information does not reflect certain internal resources provided by the Advisor to the Funds, such as legal, finance and compliance support. The Board reviewed and considered the general financial condition of the Advisor and determined it to be sound. The Board also noted that all marketing and distribution fees other than the Rule 12b-1 fee payable by the Investor Class shares of the Funds were paid by the Advisor from its reasonable profits. In light of all of the information that it received and considered, the Board concluded that the management fee and total expense ratio of each Fund were reasonable and the profits realized by the Advisor from its relationship with the Funds were reasonable.
Economies of Scale and Fee Levels Reflecting Those Economies
The Board reviewed the extent to which economies of scale may be realized as the Funds increase in size. The Board noted that the Funds continue to experience strong growth in assets. While the Funds’ advisory fee structure does not contain any breakpoint reductions as the Funds grow in size, the Board recognized that the Advisor factored in the concept of breakpoints when setting a low advisory fee when the Funds were originally organized. The advisory fee was designed to be comparable to the second or third breakpoint advisory fee levels paid by other comparable mutual funds. In addition, the Board noted that the Advisor bears almost all of the Funds’ expenses other than management, 12b-1 and administration fees. The Board also considered the Advisor’s analysis of Morningstar data demonstrating that the Funds have extremely low management fees and expense ratios and that Fund shareholders benefit from a favorable pricing structure when compared to larger peer funds. The Board recognized that the advisory fee rates paid by the Funds were designed to be lower than the fees otherwise charged by the Advisor to its separately managed account clients. The Directors considered the Advisor’s commitment to continue to evaluate breakpoints with respect to the Funds. The Directors concluded that the current fee structure of each Fund was reasonable.
Benefits Derived from the Relationship with the Funds
The Board considered other benefits to the Advisor from serving as advisor to the Funds (in addition to the advisory fee). The Board considered the administration fees received by the Advisor under the Administration Agreement, noting that historically the Advisor has paid more in Fund expenses under the agreement than it has received in administration fees. The Board also noted that the Advisor, in its capacity as distributor to the Funds, and its financial advisors receive 12b-1 payments for selling Investor Class shares of the Funds. The Board noted that the Advisor’s asset management and other businesses may experience indirect benefits from the Advisor’s association with the Funds. The Board concluded that the other benefits realized by the Advisor from its relationship with the Funds were appropriate.
Based on its evaluation of the above factors, as well as other factors relevant to their consideration of the investment advisory agreement, the Board, including all of the Independent Directors, concluded that the continuation of the investment advisory agreement was in the best interest of each Fund and its shareholders.
Additional Information (Unaudited)
Proxy Voting
A description of the policies and procedures that the Funds use to determine how to vote proxies relating to portfolio securities is available without charge, upon request, by calling toll free, 1-866-44BAIRD, or by accessing the Funds’ website at www.bairdfunds.com; and by accessing the SEC’s website at www.sec.gov.
Each Fund’s proxy voting record for the most recent 12-month period ended June 30, if applicable, is available without charge, upon request, by calling toll free, 1-866-44BAIRD, or by accessing the Funds’ website at www.bairdfunds.com; and by accessing the SEC’s website at www.sec.gov. The Funds generally do not vote proxies because the securities held in their portfolios, consisting of bonds and other fixed-income securities, are not entitled to vote.
Portfolio Holdings Disclosure
The Funds file a complete schedule of portfolio holdings with the U.S. Securities and Exchange Commission (the “SEC”) for the first and third quarters of each fiscal year on Form N-Q or, beginning with filings after March 31, 2019, on Part F of Form N-PORT. The Funds’ Forms N-Q or Part F of Form N-PORT are available on the SEC’s website at www.sec.gov. The Funds’ Forms N-Q or Part F of Form N-PORT may also be obtained by calling toll-free 1-866-44BAIRD.
Tax Information
The percentage of taxable ordinary income distributions that are designated as short-term capital gain distributions under Internal Revenue Section 871(k)(2)(c) for the Baird Short-Term Municipal Bond Fund was 48.53%.
Baird Funds, Inc. Privacy Policy
| | FACTS | | WHAT DOES BAIRD FUNDS DO WITH YOUR PERSONAL INFORMATION? | |
| | | | | |
| | Why? | | Financial companies choose how they share your personal information. Federal law gives consumers the right to limit some but not all sharing. Federal law also requires us to tell you how we collect, share, and protect your personal information. Please read this notice carefully to understand what we do. | |
| | | | | |
| | What? | | The types of personal information we collect and share depend on the product or service you have with us. This information can include: | |
| | | | • Social Security number | |
| | | | • Account balances, transaction history and assets | |
| | | | • Checking account information and wire transfer instructions | |
| | | | | |
| | How? | | All financial companies need to share customers’ personal information to run their everyday business. In the section below, we list the reasons financial companies can share their customers’ personal information; the reasons Baird Funds, Inc. chooses to share; and whether you can limit this sharing. | |
| | | Does Baird | Can you limit |
| | Reasons we can share your personal information | Funds, Inc. share? | this sharing? |
| | For our everyday business purposes— | Yes | No |
| | such as to process your transactions, maintain | | |
| | your account(s), respond to court orders and | | |
| | legal investigations, or report to credit bureaus | | |
| | For our marketing purposes— | Yes | No |
| | to offer our products and services to you | | |
| | For joint marketing with other financial companies | No | We do not share |
| | For our affiliates’ everyday business purposes— | Yes | No |
| | information about your transactions and experiences | | |
| | For our affiliates’ everyday business purposes— | No | We do not share |
| | information about your creditworthiness | | |
| | For our affiliates to market to you | No | We do not share |
| | For nonaffiliates to market to you | No | We do not share |
| | Questions? | | Call (toll free) 1-866-442-2473, Email prospectus@bairdfunds.com or go to www.bairdfunds.com | |
Baird Funds, Inc. Privacy Policy
| | Who we are | | | | |
| | Who is providing | | Baird Funds, Inc. | |
| | this notice? | | | | |
| | What we do | | | | |
| | How does Baird | | To protect your personal information from unauthorized access and | |
| | Funds, Inc. protect my | | use, we use security measures that comply with federal law. These | |
| | personal information? | | measures include computer safeguards and secured files and buildings. | |
| | How does Baird | | We collect your personal information, for example, when you | |
| | Funds, Inc. collect | | • | open an account or give us your contact information | |
| | my personal | | • | make a wire transfer or provide account information | |
| | information? | | • | make deposits or withdrawals from your account | |
| | | | We also collect your personal information from other companies. | |
| | Why can’t I limit | | Federal law gives you the right to limit only | |
| | all sharing? | | • | sharing for affiliates’ everyday business purposes—information about your creditworthiness | |
| | | | • | affiliates from using your information to market to you | |
| | | | • | sharing for nonaffiliates to market to you | |
| | | | State laws and individual companies may give you additional rights to limit sharing. | |
| | Definitions | | | | |
| | Affiliates | | Companies related by common ownership or control. They can be financial and nonfinancial companies. | |
| | | | • | Robert W. Baird & Co Incorporated (the investment adviser and distributor to the Baird Funds) and its affiliates may share information among each other. | |
| | Nonaffiliates | | Companies not related by common ownership or control. They can be financial and nonfinancial companies. | |
| | | | • | Baird Funds, Inc. does not share with nonaffiliates so they can market to you. | |
| | Joint marketing | | A formal agreement between nonaffiliated financial companies that together market financial products or services to you. We do not have any joint marketing partners. | |
| | | | • | Baird Funds, Inc. does not have any joint marketing partners. | |
Baird Funds, Inc.
c/o U.S. Bancorp Fund Services, LLC
P.O. Box 701
Milwaukee, WI 53201-0701
1-866-44BAIRD
Board of Directors
John W. Feldt
Darren R. Jackson
Cory L. Nettles
Marlyn J. Spear (Chair)
Frederick P. Stratton, Jr.
Investment Advisor and Distributor
Robert W. Baird & Co. Incorporated
777 East Wisconsin Avenue
Milwaukee, WI 53202
Administrator and Transfer Agent
U.S. Bancorp Fund Services, LLC
P.O. Box 701
615 East Michigan Street
Milwaukee, WI 53202
Custodian
U.S. Bank, N.A.
1555 N. RiverCenter Drive, Suite 302
Milwaukee, WI 53212
Legal Counsel
Godfrey & Kahn, S.C.
833 East Michigan Street, Suite 1800
Milwaukee, WI 53202
Independent Registered Public
Accounting Firm
Cohen & Company, Ltd.
342 North Water Street, Suite 830
Milwaukee, WI 53202
Annual Report –
Baird Funds
December 31, 2018
Baird MidCap Fund
Baird Small/Mid Cap Growth Fund
Baird Small/Mid Cap Value Fund
Baird SmallCap Value Fund
Chautauqua International Growth Fund
Chautauqua Global Growth Fund
Beginning on January 1, 2021, as permitted by regulations adopted by the U.S. Securities and Exchange Commission, paper copies of the Funds’ annual and semi-annual shareholder reports will no longer be sent by mail, unless you specifically request paper copies of the reports from the Funds or from your financial intermediary, such as a broker-dealer or bank. Instead, the reports will be made available on the Funds’ website (www.bairdassetmanagement.com/baird-funds/funds-and-performance#Literature) and you will be notified by mail each time a report is posted and provided with a website link to access the report.
If you already elected to receive shareholder reports electronically, you will not be affected by this change and you need not take any action. You may elect to receive shareholder reports and other communications from the Funds electronically anytime by contacting your financial intermediary or, if you are a direct investor, by calling 1-866-442-2473, or sending an e-mail request to prospectus@bairdfunds.com.
You may elect to receive all future reports in paper free of charge. If you invest through a financial intermediary, you can contact your financial intermediary to request that you continue to receive paper copies of your shareholder reports. If you invest directly with a Fund, you can call 1-866-442-2473 or send an email request to prospectus@bairdfunds.com to let the Fund know you wish to continue receiving paper copies of your shareholder reports. Your election to receive reports in paper will apply to all Funds held in your account if you invest through your financial intermediary or all Funds held with the fund complex if you invest directly with the Funds.
| Go Green. | | Go Paperless. |
Sign up to receive your Baird Funds’ prospectuses and reports online.
Table of Contents
| Letter to Shareholders | 1 |
| Baird MidCap Fund | 2 |
| Baird Small/Mid Cap Growth Fund | 11 |
| Baird Small/Mid Cap Value Fund | 20 |
| Baird SmallCap Value Fund | 29 |
| Chautauqua International Growth Fund | 37 |
| Chautauqua Global Growth Fund | 46 |
| Additional Information on Fund Expenses | 56 |
| Statements of Assets and Liabilities | 58 |
| Statements of Operations | 61 |
| Statements of Changes in Net Assets | 64 |
| Financial Highlights | 70 |
| Notes to the Financial Statements | 82 |
| Report of Independent Registered Public Accounting Firm | 95 |
| Directors and Officers | 96 |
| Disclosure Regarding the Board of Directors’ Approval of the Investment | |
| Advisory Agreement for Baird Equity Funds | 99 |
| Additional Information | 103 |
| Privacy Notice | A-1 |
This report has been prepared for shareholders and may be distributed to others only if preceded or accompanied by a current prospectus.
Cautionary Note on Analyses, Opinions and Outlooks: In this report we offer analyses and opinions on the performance of individual securities, companies, industries, sectors, markets, interest rates and governmental policies, including predictions, forecasts and outlooks regarding possible future events. These can generally be identified as such because the context of the statements may include such words as “believe,” “should,” “will,” “expects,” “anticipates,” “hopes” and words of similar effect. These statements reflect the portfolio managers’ good faith beliefs and judgments and involve risks and uncertainties, including the risk that the portfolio managers’ analyses, opinions and outlooks are or will prove to be inaccurate. It is inherently difficult to correctly assess and explain the performance of particular securities, sectors, markets, interest rate movements, governmental actions or general economic trends and conditions, and many unforeseen factors contribute to the performance of Baird Funds. Investors are, therefore, cautioned not to place undue reliance on subjective judgments contained in this report.
Baird Funds
1-866-442-2473
www.bairdfunds.com
February 27, 2019
Dear Shareholder,
2018 was a challenging year for the financial markets and investors. Volatility rose and prices of financial assets softened overall as the Fed continued to normalize monetary policy by raising short-term rates and shrinking its balance sheet. A shift in outlook from synchronized global growth early in the year to slowing global growth mixed with recession fears later in the year added to uncertainty, as did unresolved trade negotiations between the U.S. and China. The S&P 500 Index was up by nearly 10% from the end of 2017 in September and then down by as much as -12% in December before finishing the year at -4.4%. Starting the year at 2.41%, the yield on the 10-year U.S. Treasury note rose to as high as 3.24% in early November and then tumbled back to just 2.68% at year end.
The Baird Equity Funds’ long-term portfolio track records remain very competitive, and we believe the portfolios are positioned well as we enter 2019.
Our commitment to the long-term principles of generating competitive, risk-controlled returns over full market cycles, delivering outstanding service, providing competitively priced products and maintaining our long-tenured and seasoned investment team, helped drive assets under management in the Baird Equity Funds to just over $1.6 billion at year end.
We want to express our team’s sincere appreciation for your confidence in our work and assure you that we never lose sight of the fact that our long-term success rests on the trust you have placed in us to be effective stewards of your assets.
Thank you for your continued investment in the Baird Equity Funds.
Sincerely,
Mary Ellen Stanek, CFA
President
Baird Funds
Baird MidCap Fund
December 31, 2018 (Unaudited)
Portfolio Managers’ Commentary
For the year ended December 31, 2018, the Baird MidCap Fund Institutional Class posted a total return of -1.61% as compared to -4.75% for the Russell Midcap® Growth Index, the Fund’s benchmark index.
Domestic equities responded favorably to strong corporate earnings and a step up in GDP, posting a solid advance through the first three quarters of the year. However, a challenging combination of slowing global growth, limited progress on trade negotiations, and additional Federal Reserve tightening led to increased concern about the sustainability of the U.S. expansion. Volatility increased and equities experienced a sharp sell-off in the fourth quarter. All major domestic stock indices finished down for the year, the first time since the Great Recession.
Much like recent years, the Fund’s 2018 positioning rested on continued economic growth, increasing corporate earnings, and the likelihood of Federal Reserve tightening. While the Fund experienced a negative return for the year, we were pleased with the outperformance compared to the benchmark. We believe our long-standing investment philosophy, which focuses on the quality of a business as well as its growth potential, should provide a favorable relative return profile when markets are challenging.
The consumer discretionary sector played an important role in driving relative performance. The backdrop for consumer spending remained positive during the year due to continued job and wage growth amid low unemployment. However, returns within the sector were quite varied. Good stock picking in several industries made positive contributions, including off-price retail, cable television services, restaurants, apparel, and auto-parts related retail. The Fund’s limited exposure to housing and related industries proved helpful as these areas struggled due to uneven demand and rising input costs. Absolute and relative consumer discretionary sector exposure increased during the year due to good performance and opportunistic purchases.
As a partial offset to strength in the consumer discretionary sector, the Fund’s holdings in the producer durables and materials sectors trailed benchmark performance. We are grouping our discussion of these two sectors given that characteristics influencing performance were similar. While domestic economic activity increased in 2018, Fund holdings within economically sensitive industries, particularly those with revenue exposure to China or subject to tariff risk, such as commercial vehicle manufacturing, machinery, and electrical instruments, performed poorly. In addition, one holding operating in the power transmission equipment industry declined meaningfully as it struggled with contract timing and unexpected repair costs on a portion of its business. The distribution models in the materials sector fell sharply on the impact of a more challenged pricing environment amid rising costs. This negative dynamic impacted the Fund’s holdings in the building materials and specialty chemicals industries. The Fund carried lower exposure in the basic materials sector at year end compared to January in response to a drop in benchmark weight and an effort to moderate cyclical exposure within the Fund.
The financial services sector positively contributed to relative performance. Payments and processing businesses stood out as they collectively advanced in a down market. The Fund’s holding in the insurance brokerage industry delivered good fundamentals that were rewarded despite the market sell-off. Also, exposure to a company providing a leading electronic bond trading platform proved beneficial as higher volatility led to increased revenue and stock price appreciation. Credit and market-sensitive financials continued to struggle, but the Fund weights in these areas were limited.
The Fund’s returns on technology holdings mostly matched corresponding benchmark returns, falling a few basis points on the positive side of the ledger. An overweight position in the software and services industry, the strongest group in the technology sector, in combination with strong performance from the Fund’s holding in the computer technology industry, were enough to keep pace.
For much of the year, healthcare sector returns led the overall market as the stocks responded to positive revenue environment for many companies. The sharp market pullback in the fourth quarter wiped away most
Baird MidCap Fund
December 31, 2018 (Unaudited)
of those gains, though returns remained positive for the year. Fund holdings more than kept pace thanks to strong performance in the healthcare services industry and several companies in the medical and dental instrument industry.
Unlike 2017, when consumer staples sector returns were more muted and trailed a market advance, the defensive nature of the sector companies proved helpful in 2018 amid negative market returns. Fund performance was positive, driven early in the year as two holdings, one in the beverage industry and the other in the food industry, were acquired at premiums in fairly short order. Given the low overall weight of the sector, we were comfortable holding just one company for the balance of the year in this small-weighted sector.
Strong U.S. oil production and slowing global growth combined to push oil prices down sharply during the latter part of the year and provided a challenging investment backdrop for the energy sector. The energy sector detracted modestly from relative performance as the Fund’s exposure to an oil and gas production company lagged others in the sector. We continue to believe this particular holding can add value due to its advantaged geographic position and favorable cost of oil production.
The long-standing investment process underlying the Fund remains focused on identifying high-quality companies that deliver attractive returns and above average growth relative to peers. Seeking to control risk at the sector and position level is also a priority of our process, with the goal of providing lower volatility of returns for the Fund compared to its benchmark index.
Portfolio Managers:
Charles F. Severson
Kenneth M. Hemauer
Baird MidCap Fund
December 31, 2018 (Unaudited)
Portfolio Characteristics
A December 31, 2018 summary of the Fund’s top 10 holdings and equity sector analysis compared to the Russell Midcap® Growth Index is shown below.
Top 10 Holdings(1) | | | Equity Sector Analysis(2) |
| | | |  |
| Dollar General Corp. | 3.2% | |
| O’Reilly Automotive, Inc. | 2.9% | |
| Burlington Stores, Inc. | 2.8% | |
| Verisk Analytics, Inc. | 2.6% | |
| Euronet Worldwide, Inc. | 2.5% | |
| Pool Corp. | 2.5% | |
| Arthur J. Gallagher & Co. | 2.4% | |
| Edwards Lifesciences Corp. | 2.4% | |
| ServiceNow, Inc. | 2.3% | |
| Henry Schein, Inc. | 2.3% | |
| | | |
| Net Assets: | $1,432,832,582 | |
| Portfolio Turnover Rate: | 38% | |
| Number of Equity Holdings: | 59 | |
| | | |
Annualized Portfolio Expense Ratio(3): | | |
Gross | | |
| Institutional Class: | 0.84% | |
| Investor Class: | 1.09% | (4) |
| | | |
Net | | |
| Institutional Class: | 0.84% | |
| Investor Class: | 1.09% | (4) | |
(1) | The Fund’s portfolio composition is subject to change and there is no assurance that the Fund will continue to hold any particular security. Percentages shown relate to the Fund’s total net assets as of December 31, 2018. |
(2) | Percentages shown in parentheses relate to the Fund’s total value of investments as of December 31, 2018, and may not add up to 100% due to rounding. |
(3) | Reflects expense ratios as stated in the Fund’s current prospectus. The Advisor has contractually agreed to limit the Fund’s total annual fund operating expenses to 0.85% of average daily net assets for the Institutional Class shares and 1.10% of average daily net assets for the Investor Class shares, at least through April 30, 2020. |
(4) | Includes 0.25% 12b-1 fee. |
Baird MidCap Fund
December 31, 2018 (Unaudited)
Institutional Class
Value of a $25,000 Investment
Growth of a hypothetical investment of $25,000 made on 12/31/08, assuming reinvestment of all distributions.
Investor Class
Value of a $10,000 Investment
Growth of a hypothetical investment of $10,000 made on 12/31/08, assuming reinvestment of all distributions.
Baird MidCap Fund
December 31, 2018 (Unaudited)
Total Returns
| | | Average Annual |
| For the Periods Ended | | | | Since |
| December 31, 2018 | One Year | Five Year | Ten Year | Inception(1) |
| Institutional Class Shares | -1.61% | 5.87% | 14.52% | 6.83% |
| Investor Class Shares | -1.86% | 5.62% | 14.25% | 6.58% |
Russell Midcap® Growth Index(2) | -4.75% | 7.42% | 15.12% | 6.30% |
| (1) | For the period from December 29, 2000 (inception date) through December 31, 2018. |
| (2) | The Russell Midcap® Growth Index measures the performance of the mid-cap growth segment of the U.S. equity universe. It includes those Russell Midcap® Index companies with higher price-to-book ratios and higher forecasted growth values. This index does not reflect any deduction for fees, expenses or taxes. A direct investment in the index is not possible. |
The line graph on the previous page and the returns shown in the table above reflect reinvestment of dividends and/or capital gains distributions in additional shares. The returns do not reflect the deduction of taxes that a shareholder would pay on Fund distributions or the redemption of Fund shares. The returns reflect the actual performance for each period and do not include the impact of trades executed on the last business day of the period that were recorded on the first business day of the next period.
The gross expense ratio for each Class, as reflected in the Fund’s current prospectus, is set forth under “Portfolio Characteristics”.
The Fund focuses on growth-style stocks and therefore the performance of the Fund will typically be more volatile than the performance of funds that focus on types of stocks that have a broader investment style. The Fund may invest up to 15% of its total assets in U.S. dollar denominated foreign securities and ADRs. Foreign investments involve additional risks such as currency rate fluctuations, political and economic instability, and different and sometimes less strict financial reporting standards and regulation. The Fund invests a substantial portion of its assets in the stocks of mid-capitalization companies. Mid-capitalization companies often are more volatile and face greater risks than larger, more established companies.
Past performance does not guarantee future results. Investment return and principal value will fluctuate so that an investor’s shares, when redeemed, may be worth more or less than their original cost.
For information about the performance of the Fund as of the most recent month-end, please call 1-866-44BAIRD or visit www.bairdfunds.com. Mutual fund performance changes over time and current performance may be lower or higher than that stated.
Baird MidCap Fund
Schedule of Investments, December 31, 2018
Common Stocks
| | | | | | | | | % of | |
| | | Shares | | | Value | | | Net Assets | |
| Aerospace & Defense | | | | | | | | | |
| BWX Technologies, Inc. | | | 451,785 | | | $ | 17,271,741 | | | | 1.2 | % |
Mercury Systems, Inc.(1) | | | 316,211 | | | | 14,953,618 | | | | 1.0 | % |
| | | | | | | | 32,225,359 | | | | 2.2 | % |
| Auto Components | | | | | | | | | | | | |
Visteon Corp.(1) | | | 122,131 | | | | 7,362,057 | | | | 0.5 | % |
| Banks | | | | | | | | | | | | |
| East West Bancorp, Inc. | | | 467,750 | | | | 20,361,157 | | | | 1.4 | % |
| Biotechnology | | | | | | | | | | | | |
Alexion Pharmaceuticals, Inc.(1) | | | 184,151 | | | | 17,928,941 | | | | 1.3 | % |
| Building Products | | | | | | | | | | | | |
| AO Smith Corp. | | | 566,128 | | | | 24,173,666 | | | | 1.7 | % |
| Capital Markets | | | | | | | | | | | | |
| Affiliated Managers Group, Inc. | | | 123,353 | | | | 12,019,516 | | | | 0.8 | % |
| MarketAxess Holdings, Inc. | | | 95,400 | | | | 20,158,974 | | | | 1.4 | % |
| | | | | | | | 32,178,490 | | | | 2.2 | % |
| Commercial Services & Supplies | | | | | | | | | | | | |
| Cintas Corporation | | | 162,536 | | | | 27,304,423 | | | | 1.9 | % |
| Distributors | | | | | | | | | | | | |
| Pool Corp. | | | 235,248 | | | | 34,969,615 | | | | 2.5 | % |
| Electrical Equipment | | | | | | | | | | | | |
| Rockwell Automation, Inc. | | | 156,044 | | | | 23,481,501 | | | | 1.6 | % |
| Electronic Equipment, Instruments & Components | | | | | | | | | | | | |
| CDW Corp. | | | 386,023 | | | | 31,287,164 | | | | 2.2 | % |
| Cognex Corp. | | | 349,820 | | | | 13,527,539 | | | | 0.9 | % |
Keysight Technologies, Inc.(1) | | | 243,070 | | | | 15,089,786 | | | | 1.1 | % |
| Littelfuse, Inc. | | | 109,070 | | | | 18,703,324 | | | | 1.3 | % |
Trimble Navigation Ltd.(1) | | | 704,677 | | | | 23,190,920 | | | | 1.6 | % |
| | | | | | | | 101,798,733 | | | | 7.1 | % |
| Food Products | | | | | | | | | | | | |
| Lamb Weston Holdings, Inc. | | | 363,565 | | | | 26,743,841 | | | | 1.9 | % |
| Health Care Equipment & Supplies | | | | | | | | | | | | |
ABIOMED, Inc.(1) | | | 44,529 | | | | 14,473,706 | | | | 1.0 | % |
| The Cooper Cos., Inc. | | | 60,798 | | | | 15,473,091 | | | | 1.1 | % |
Edwards Lifesciences Corp.(1) | | | 224,327 | | | | 34,360,167 | | | | 2.4 | % |
IDEXX Laboratories, Inc.(1) | | | 117,699 | | | | 21,894,368 | | | | 1.5 | % |
| | | | | | | | 86,201,332 | | | | 6.0 | % |
| Health Care Providers & Services | | | | | | | | | | | | |
Henry Schein, Inc.(1) | | | 412,068 | | | | 32,355,579 | | | | 2.3 | % |
| Health Care Technology | | | | | | | | | | | | |
Veeva Systems, Inc.(1) | | | 317,436 | | | | 28,353,383 | | | | 2.0 | % |
The accompanying notes are an integral part of these financial statements.
Baird MidCap Fund
Schedule of Investments, December 31, 2018
Common Stocks (cont.)
| | | | | | | | | % of | |
| | | Shares | | | Value | | | Net Assets | |
| Hotels, Restaurants & Leisure | | | | | | | | | |
| Dominos Pizza, Inc. | | | 59,347 | | | $ | 14,717,463 | | | | 1.0 | % |
| Vail Resorts, Inc. | | | 136,949 | | | | 28,871,588 | | | | 2.0 | % |
| | | | | | | | 43,589,051 | | | | 3.0 | % |
| Household Durables | | | | | | | | | | | | |
| DR Horton, Inc. | | | 513,655 | | | | 17,803,282 | | | | 1.2 | % |
| Insurance | | | | | | | | | | | | |
| Arthur J Gallagher & Co. | | | 473,555 | | | | 34,901,003 | | | | 2.4 | % |
| Internet & Direct Marketing Retail | | | | | | | | | | | | |
Etsy, Inc.(1) | | | 466,680 | | | | 22,199,967 | | | | 1.5 | % |
GrubHub, Inc.(1) | | | 321,175 | | | | 24,669,452 | | | | 1.7 | % |
| | | | | | | | 46,869,419 | | | | 3.2 | % |
| IT Services | | | | | | | | | | | | |
| Broadridge Financial Solutions, Inc. | | | 312,395 | | | | 30,068,019 | | | | 2.1 | % |
EPAM Systems, Inc.(1) | | | 271,531 | | | | 31,500,312 | | | | 2.2 | % |
Euronet Worldwide, Inc.(1) | | | 349,435 | | | | 35,775,155 | | | | 2.5 | % |
Fiserv, Inc.(1) | | | 413,518 | | | | 30,389,438 | | | | 2.1 | % |
Gartner, Inc.(1) | | | 179,186 | | | | 22,907,138 | | | | 1.6 | % |
| Global Payments, Inc. | | | 285,355 | | | | 29,428,661 | | | | 2.1 | % |
| | | | | | | | 180,068,723 | | | | 12.6 | % |
| Life Sciences Tools & Services | | | | | | | | | | | | |
ICON PLC(1)(2) | | | 211,190 | | | | 27,287,860 | | | | 1.9 | % |
| Machinery | | | | | | | | | | | | |
| Graco, Inc. | | | 596,906 | | | | 24,980,516 | | | | 1.7 | % |
| IDEX Corporation | | | 122,590 | | | | 15,478,214 | | | | 1.1 | % |
WABCO Holdings, Inc.(1) | | | 152,912 | | | | 16,413,574 | | | | 1.2 | % |
| Xylem, Inc. | | | 280,695 | | | | 18,727,970 | | | | 1.3 | % |
| | | | | | | | 75,600,274 | | | | 5.3 | % |
| Media | | | | | | | | | | | | |
| Cable One, Inc. | | | 37,273 | | | | 30,567,587 | | | | 2.1 | % |
| Multiline Retail | | | | | | | | | | | | |
| Dollar General Corp. | | | 418,181 | | | | 45,197,003 | | | | 3.2 | % |
Ollie’s Bargain Outlet Holdings, Inc.(1) | | | 278,403 | | | | 18,516,584 | | | | 1.3 | % |
| | | | | | | | 63,713,587 | | | | 4.5 | % |
| Oil, Gas & Consumable Fuels | | | | | | | | | | | | |
| Diamondback Energy, Inc. | | | 238,687 | | | | 22,126,285 | | | | 1.5 | % |
| Pharmaceuticals | | | | | | | | | | | | |
Jazz Pharmaceuticals PLC(1)(2) | | | 162,536 | | | | 20,147,963 | | | | 1.4 | % |
| Professional Services | | | | | | | | | | | | |
Verisk Analytics, Inc.(1) | | | 336,073 | | | | 36,645,400 | | | | 2.6 | % |
The accompanying notes are an integral part of these financial statements.
Baird MidCap Fund
Schedule of Investments, December 31, 2018
Common Stocks (cont.)
| | | | | | | | | % of | |
| | | Shares | | | Value | | | Net Assets | |
| Semiconductors & Semiconductor Equipment | | | | | | | | | |
| Microchip Technology, Inc. | | | 371,585 | | | $ | 26,724,393 | | | | 1.9 | % |
| Monolithic Power Systems, Inc. | | | 226,082 | | | | 26,282,033 | | | | 1.8 | % |
| | | | | | | | 53,006,426 | | | | 3.7 | % |
| Software | | | | | | | | | | | | |
RealPage, Inc.(1) | | | 292,915 | | | | 14,115,574 | | | | 1.0 | % |
ServiceNow, Inc.(1) | | | 185,222 | | | | 32,978,777 | | | | 2.3 | % |
Synopsys, Inc.(1) | | | 298,873 | | | | 25,177,061 | | | | 1.8 | % |
Tyler Technologies, Inc.(1) | | | 154,745 | | | | 28,754,716 | | | | 2.0 | % |
The Ultimate Software Group, Inc.(1) | | | 108,459 | | | | 26,558,355 | | | | 1.9 | % |
| | | | | | | | 127,584,483 | | | | 9.0 | % |
| Specialty Retail | | | | | | | | | | | | |
Burlington Stores, Inc.(1) | | | 249,915 | | | | 40,653,673 | | | | 2.8 | % |
O’Reilly Automotive, Inc.(1) | | | 118,694 | | | | 40,869,905 | | | | 2.9 | % |
| | | | | | | | 81,523,578 | | | | 5.7 | % |
| Trading Companies & Distributors | | | | | | | | | | | | |
| Fastenal Co. | | | 318,962 | | | | 16,678,523 | | | | 1.2 | % |
Univar, Inc.(1) | | | 841,320 | | | | 14,925,017 | | | | 1.0 | % |
| Watsco, Inc. | | | 101,356 | | | | 14,102,674 | | | | 1.0 | % |
| | | | | | | | 45,706,214 | | | | 3.2 | % |
| Total Common Stocks | | | | | | | | | | | | |
| (Cost $1,154,947,247) | | | | | | | 1,402,579,212 | | | | 97.9 | % |
| Short-Term Investment | | | | | | | | | | | | |
| Money Market Mutual Fund | | | | | | | | | | | | |
| Fidelity Institutional Money Market Fund – | | | | | | | | | | | | |
Government Portfolio, Institutional Class 2.29%(3) | | | 44,945,317 | | | | 44,945,317 | | | | 3.1 | % |
| Total Short-Term Investment | | | | | | | | | | | | |
| (Cost $44,945,317) | | | | | | | 44,945,317 | | | | 3.1 | % |
| Total Investments | | | | | | | | | | | | |
| (Cost $1,199,892,564) | | | | | | | 1,447,524,529 | | | | 101.0 | % |
| Liabilities in Excess of Other Assets | | | | | | | (14,691,947 | ) | | | (1.0 | )% |
| TOTAL NET ASSETS | | | | | | $ | 1,432,832,582 | | | | 100.0 | % |
Notes to Schedule of Investments
| (1) | Non-Income Producing. |
| (2) | Foreign Security. |
| (3) | 7-Day Yield. |
Industry classifications shown in the Schedule of Investments are based off of the Global Industry Classification Standard (GICS®). GICS® was developed by and/or is the exclusive property of MSCI, Inc. and Standard & Poor Financial Services LLC (“S&P”). GICS® is a service mark of MSCI and S&P and has been licensed for use by U.S. Bank Global Fund Services.
The accompanying notes are an integral part of these financial statements.
Baird MidCap Fund
Schedule of Investments, December 31, 2018
Summary of Fair Value Exposure at December 31, 2018
The Fund has adopted authoritative fair valuation accounting standards which establish a definition of fair value and set out a hierarchy for measuring fair value. These standards require additional disclosures about the various inputs and valuation techniques used to develop the measurements of fair value and a discussion on changes in valuation techniques and related inputs during the period. These standards define fair value as the price that would be received to sell an asset or paid to transfer a liability in an orderly transaction between market participants at the measurement date. Management has determined that these standards have no material impact on the Fund’s financial statements. The fair value hierarchy is organized into three levels based upon the assumptions (referred to as “inputs”) used in pricing the asset or liability. These standards state that “observable inputs” reflect the assumptions market participants would use in pricing the asset or liability based on market data obtained from independent sources and “unobservable inputs” reflect an entity’s own assumptions about the assumptions market participants would use in pricing the asset or liability. These inputs are summarized into three broad levels and described below:
| Level 1 – | Unadjusted quoted prices in active markets for identical unrestricted securities. |
| Level 2 – | Other significant observable inputs (including quoted prices for similar securities, quoted prices in inactive markets, dealer indications, interest rates, yield curves, prepayment speeds, credit risk, default rates, inputs corroborated by observable market data, etc.). |
| Level 3 – | Significant unobservable inputs (including the Fund’s own assumptions about the factors that market participants would use in valuing the security) based on the best information available. |
The inputs or methodology used for valuing securities are not necessarily an indication of the risk associated with investing in those securities.
The following is a summary of the inputs used to value the Fund’s investments as of December 31, 2018:
| | | Level 1 | | | Level 2 | | | Level 3 | | | Total | |
| Equity | | | | | | | | | | | | |
| Common Stocks | | $ | 1,402,579,212 | | | $ | — | | | $ | — | | | $ | 1,402,579,212 | |
| Total Equity | | | 1,402,579,212 | | | | — | | | | — | | | | 1,402,579,212 | |
| Short-Term Investment | | | | | | | | | | | | | | | | |
| Money Market Mutual Fund | | | 44,945,317 | | | | — | | | | — | | | | 44,945,317 | |
| Total Short-Term Investment | | | 44,945,317 | | | | — | | | | — | | | | 44,945,317 | |
| Total Investments* | | $ | 1,447,524,529 | | | $ | — | | | $ | — | | | $ | 1,447,524,529 | |
| * | Additional information regarding the industry classifications of these investments is disclosed in the Schedule of Investments. |
Changes in valuation techniques may result in transfers into or out of assigned levels within the fair value hierarchy. There were no transfers into or out of Level 3 during the reporting period, as compared to the security classifications from the prior year’s annual report. See the Fund’s Valuation Policy in Note 2a to the financial statements.
The accompanying notes are an integral part of these financial statements.
Baird Small/Mid Cap Growth Fund
December 31, 2018 (Unaudited)
Portfolio Managers’ Commentary
For the two-month period ended December 31, 2018, the Baird Small/Mid Growth Fund Institutional Class posted a total return of -10.50% as compared to -9.17% for the Russell 2500® Growth Index, the Fund’s benchmark index. As a reminder, the Fund launched on October 31, 2018, although the strategy has been in existence as a separate account since September 30, 2015.
Domestic equities responded favorably to strong corporate earnings and a step up in GDP, posting a solid advance through the first three quarters of the year. However, a challenging combination of slowing global growth, limited progress on trade negotiations, and additional Federal Reserve tightening led to increased concern about the sustainability of the U.S. expansion. Volatility increased and equities experienced a sharp sell-off in the fourth quarter. All major domestic stock indices finished down for the year, the first time since the Great Recession.
Much like recent years, the Fund’s 2018 positioning rested on continued economic growth, increasing corporate earnings, and the likelihood of Federal Reserve tightening. We believe our long-standing investment philosophy, which focuses on the quality of a business as well as its growth potential, should provide a favorable relative return profile when markets are challenging.
The Fund’s relative underperformance in the last two months of the year was primarily from two sectors: healthcare and technology. The market selloff in December negatively impacted our higher growth and higher multiple stocks in both of those sectors. Prior to the significant market volatility in the 4th quarter, those two sectors were two of the three strongest in terms of relative outperformance. Quarterly results that did not exceed analysts’ consensus estimates were punished in our view, which we viewed more as a shorter term reaction rather than an event that should change our investment thesis.
Sectors that contributed positively to relative performance were Energy, Producer Durables, and Consumer Discretionary. Strong U.S. oil production and slowing global growth combined to push oil prices down sharply during the latter part of the year and provided a challenging investment backdrop for the energy sector. The energy sector added modestly to relative performance as the Fund’s exposure to an oil and gas production company held up better than others in the sector. We continue to believe this particular holding can add value due to its advantaged geographic position and favorable cost of oil production. Regarding producer durables, our bias to higher quality businesses with better revenue growth and less leverage on the balance sheet provided modest downside protection. We also gained relative outperformance from two of our long time consumer holdings, which declined less than the benchmark.
The long-standing investment process underlying the Fund remains focused on identifying high-quality companies that deliver attractive returns and above average growth relative to peers. Seeking to control risk at the sector and position level is also a priority of our process, with the goal of providing lower volatility of returns for the Fund compared to its benchmark index.
Portfolio Manager:
Jonathan L. Good
Baird Small/Mid Cap Growth Fund
December 31, 2018 (Unaudited)
Portfolio Characteristics
A December 31, 2018 summary of the Fund’s top 10 holdings and equity sector analysis compared to the Russell 2500® Growth Index is shown below.
Top 10 Holdings(1) | | | Equity Sector Analysis(2) |
| | | |  |
| Burlington Stores, Inc. | 2.7% | |
| CDW Corp. | 2.6% | |
| Cable One, Inc. | 2.6% | |
| Euronet Worldwide, Inc. | 2.6% | |
| Monolithic Power Systems, Inc. | 2.5% | |
| Pool Corp. | 2.5% | |
| IDEX Corp. | 2.4% | |
| Broadridge Financial Solutions, Inc. | 2.4% | |
| PRA Health Science, Inc. | 2.3% | |
| The Cooper Cos., Inc. | 2.3% | |
| | | |
| Net Assets: | $7,290,105 | |
| Portfolio Turnover Rate: | 9% | (5) |
| Number of Equity Holdings: | 66 | |
| | | |
Annualized Portfolio Expense Ratio(3): | | |
Gross | | |
| Institutional Class: | 3.15% | |
| Investor Class: | 3.40% | (4) |
| | | |
Net | | |
| Institutional Class: | 0.85% | |
| Investor Class: | 1.10% | (4) | |
(1) | The Fund’s portfolio composition is subject to change and there is no assurance that the Fund will continue to hold any particular security. Percentages shown relate to the Fund’s total net assets as of December 31, 2018. |
(2) | Percentages shown in parentheses relate to the Fund’s total value of investments as of December 31, 2018, and may not add up to 100% due to rounding. |
(3) | Reflects expense ratios as stated in the Fund’s current prospectus. The Advisor has contractually agreed to limit the Fund’s total annual fund operating expenses to 0.85% of average daily net assets for the Institutional Class shares and 1.10% of average daily net assets for the Investor Class shares, at least through April 30, 2020. |
(4) | Includes 0.25% 12b-1 fee. |
(5) | Not Annualized. |
Baird Small/Mid Cap Growth Fund
December 31, 2018 (Unaudited)
Institutional Class
Value of a $25,000 Investment
Growth of a hypothetical investment of $25,000 made on the Fund’s inception date (10/31/18), assuming reinvestment of all distributions.
Investor Class
Value of a $10,000 Investment
Growth of a hypothetical investment of $10,000 made on the Fund’s inception date (10/31/18), assuming reinvestment of all distributions.
Baird Small/Mid Cap Growth Fund
December 31, 2018 (Unaudited)
Total Returns
| | | Since |
| For the Periods Ended December 31, 2018 | One Month | Inception(1) |
| Institutional Class Shares | -11.21% | -10.50% |
| Investor Class Shares | -11.31% | -10.60% |
Russell 2500® Growth Index(2) | -10.85% | -9.17% |
| (1) | For the period from October 31, 2018 (inception date) through December 31, 2018. |
| (2) | The Russell 2500® Growth Index measures the performance of the Small-to-Mid Cap Growth segment of the U.S. equity universe. It includes those Russell 2500® Index companies with higher price-to-book ratios and higher forecasted growth values. This index does not reflect any deduction for fees, expenses or taxes. A direct investment in the index is not possible. |
The line graph on the previous page and the returns shown in the table above reflect reinvestment of dividends and/or capital gains distributions in additional shares. The returns do not reflect the deduction of taxes that a shareholder would pay on Fund distributions or the redemption of Fund shares. The returns reflect the actual performance for each period and do not include the impact of trades executed on the last business day of the period that were recorded on the first business day of the next period.
The gross expense ratio for each Class, as reflected in the Fund’s current prospectus, is set forth under “Portfolio Characteristics”.
The Fund focuses on growth-style stocks and therefore the performance of the Fund will typically be more volatile than the performance of funds that focus on types of stocks that have a broader investment style. The Fund may invest up to 15% of its total assets in U.S. dollar denominated foreign securities and ADRs. Foreign investments involve additional risks such as currency rate fluctuations, political and economic instability, and different and sometimes less strict financial reporting standards and regulation. The Fund invests a substantial portion of its assets in the stocks of small- and mid-capitalization companies. Small- and mid-capitalization companies often are more volatile and face greater risks than larger, more established companies.
Past performance does not guarantee future results. Investment return and principal value will fluctuate so that an investor’s shares, when redeemed, may be worth more or less than their original cost.
For information about the performance of the Fund as of the most recent month-end, please call 1-866-44BAIRD or visit www.bairdfunds.com. Mutual fund performance changes over time and current performance may be lower or higher than that stated.
Baird Small/Mid Cap Growth Fund
Schedule of Investments, December 31, 2018
Common Stocks
| | | | | | | | | % of | |
| | | Shares | | | Value | | | Net Assets | |
| Aerospace & Defense | | | | | | | | | |
| BWX Technologies, Inc. | | | 1,847 | | | $ | 70,610 | | | | 1.0 | % |
| HEICO Corp. | | | 1,215 | | | | 94,138 | | | | 1.3 | % |
| | | | | | | | 164,749 | | | | 2.3 | % |
| Auto Components | | | | | | | | | | | | |
Visteon Corp.(1) | | | 926 | | | | 55,819 | | | | 0.8 | % |
| Banks | | | | | | | | | | | | |
Western Alliance Bancorp(1) | | | 2,396 | | | | 94,618 | | | | 1.3 | % |
| Biotechnology | | | | | | | | | | | | |
Exact Sciences Corp.(1) | | | 1,123 | | | | 70,861 | | | | 1.0 | % |
Flexion Therapeutics, Inc.(1) | | | 4,386 | | | | 49,650 | | | | 0.7 | % |
Heron Therapeutics, Inc.(1) | | | 2,078 | | | | 53,903 | | | | 0.7 | % |
Ligand Pharmaceuticals, Inc.(1) | | | 594 | | | | 80,606 | | | | 1.1 | % |
| | | | | | | | 255,020 | | | | 3.5 | % |
| Building Products | | | | | | | | | | | | |
| AO Smith Corp. | | | 2,492 | | | | 106,408 | | | | 1.5 | % |
Trex Co, Inc.(1) | | | 1,322 | | | | 78,474 | | | | 1.1 | % |
| | | | | | | | 184,882 | | | | 2.6 | % |
| Capital Markets | | | | | | | | | | | | |
| MarketAxess Holdings, Inc. | | | 670 | | | | 141,578 | | | | 1.9 | % |
| Commercial Services & Supplies | | | | | | | | | | | | |
| Rollins, Inc. | | | 3,782 | | | | 136,512 | | | | 1.9 | % |
| Containers & Packaging | | | | | | | | | | | | |
| AptarGroup, Inc. | | | 1,692 | | | | 159,166 | | | | 2.2 | % |
| Distributors | | | | | | | | | | | | |
| Pool Corp. | | | 1,207 | | | | 179,421 | | | | 2.5 | % |
| Electronic Equipment, Instruments & Components | | | | | | | | | | | | |
| CDW Corp. | | | 2,344 | | | | 189,981 | | | | 2.6 | % |
| Cognex Corp. | | | 2,822 | | | | 109,127 | | | | 1.5 | % |
Keysight Technologies, Inc.(1) | | | 1,362 | | | | 84,553 | | | | 1.2 | % |
| Littelfuse, Inc. | | | 534 | | | | 91,570 | | | | 1.2 | % |
Trimble Navigation Ltd.(1) | | | 2,133 | | | | 70,197 | | | | 1.0 | % |
| | | | | | | | 545,428 | | | | 7.5 | % |
| Equity Real Estate Investment Trusts (REITs) | | | | | | | | | | | | |
| National Storage Affiliates Trust | | | 3,849 | | | | 101,845 | | | | 1.4 | % |
| Food Products | | | | | | | | | | | | |
| Calavo Growers, Inc. | | | 1,352 | | | | 98,642 | | | | 1.4 | % |
| Lamb Weston Holdings, Inc. | | | 1,438 | | | | 105,779 | | | | 1.4 | % |
| | | | | | | | 204,421 | | | | 2.8 | % |
The accompanying notes are an integral part of these financial statements.
Baird Small/Mid Cap Growth Fund
Schedule of Investments, December 31, 2018
Common Stocks (cont.)
| | | | | | | | | % of | |
| | | Shares | | | Value | | | Net Assets | |
| Health Care Equipment & Supplies | | | | | | | | | |
| The Cooper Cos., Inc. | | | 665 | | | $ | 169,242 | | | | 2.3 | % |
Inogen, Inc.(1) | | | 717 | | | | 89,030 | | | | 1.2 | % |
Insulet Corp.(1) | | | 1,020 | | | | 80,906 | | | | 1.1 | % |
Integra LifeSciences Holdings Corp.(1) | | | 2,820 | | | | 127,182 | | | | 1.7 | % |
Novocure Ltd.(1)(2) | | | 1,032 | | | | 34,551 | | | | 0.5 | % |
Quidel Corp.(1) | | | 1,278 | | | | 62,392 | | | | 0.9 | % |
Tactile Systems Technology, Inc.(1) | | | 1,936 | | | | 88,185 | | | | 1.2 | % |
Tandem Diabetes Care, Inc.(1) | | | 1,935 | | | | 73,472 | | | | 1.0 | % |
| | | | | | | | 724,960 | | | | 9.9 | % |
| Health Care Providers & Services | | | | | | | | | | | | |
HealthEquity, Inc.(1) | | | 1,761 | | | | 105,044 | | | | 1.4 | % |
| Health Care Technology | | | | | | | | | | | | |
Veeva Systems, Inc.(1) | | | 1,591 | | | | 142,108 | | | | 1.9 | % |
| Hotels, Restaurants & Leisure | | | | | | | | | | | | |
| Vail Resorts, Inc. | | | 712 | | | | 150,104 | | | | 2.1 | % |
| Insurance | | | | | | | | | | | | |
| Kinsale Capital Group, Inc. | | | 2,332 | | | | 129,566 | | | | 1.8 | % |
| Internet & Direct Marketing Retail | | | | | | | | | | | | |
Etsy, Inc.(1) | | | 2,807 | | | | 133,529 | | | | 1.9 | % |
GrubHub, Inc.(1) | | | 1,551 | | | | 119,132 | | | | 1.6 | % |
| | | | | | | | 252,661 | | | | 3.5 | % |
| IT Services | | | | | | | | | | | | |
| Broadridge Financial Solutions, Inc. | | | 1,825 | | | | 175,656 | | | | 2.4 | % |
EPAM Systems, Inc.(1) | | | 1,199 | | | | 139,096 | | | | 1.9 | % |
Euronet Worldwide, Inc.(1) | | | 1,837 | | | | 188,073 | | | | 2.6 | % |
WNS Holdings Ltd.(1)(2) | | | 2,413 | | | | 99,560 | | | | 1.4 | % |
| | | | | | | | 602,385 | | | | 8.3 | % |
| Life Sciences Tools & Services | | | | | | | | | | | | |
PRA Health Sciences, Inc.(1) | | | 1,847 | | | | 169,850 | | | | 2.3 | % |
| Machinery | | | | | | | | | | | | |
| IDEX Corp. | | | 1,399 | | | | 176,639 | | | | 2.4 | % |
| Toro Co. | | | 1,465 | | | | 81,864 | | | | 1.1 | % |
| | | | | | | | 258,503 | | | | 3.5 | % |
| Media | | | | | | | | | | | | |
| Cable One, Inc. | | | 231 | | | | 189,443 | | | | 2.6 | % |
| New York Times Co. | | | 5,450 | | | | 121,481 | | | | 1.7 | % |
| | | | | | | | 310,924 | | | | 4.3 | % |
The accompanying notes are an integral part of these financial statements.
Baird Small/Mid Cap Growth Fund
Schedule of Investments, December 31, 2018
Common Stocks (cont.)
| | | | | | | | | % of | |
| | | Shares | | | Value | | | Net Assets | |
| Multiline Retail | | | | | | | | | |
Ollie’s Bargain Outlet Holdings, Inc.(1) | | | 1,419 | | | $ | 94,378 | | | | 1.3 | % |
| Oil, Gas & Consumable Fuels | | | | | | | | | | | | |
| Diamondback Energy, Inc. | | | 1,318 | | | | 122,179 | | | | 1.7 | % |
| Pharmaceuticals | | | | | | | | | | | | |
Jazz Pharmaceuticals PLC(1)(2) | | | 1,032 | | | | 127,927 | | | | 1.8 | % |
| Professional Services | | | | | | | | | | | | |
| TransUnion | | | 1,332 | | | | 75,658 | | | | 1.0 | % |
| Road & Rail | | | | | | | | | | | | |
| Schneider National, Inc. | | | 2,706 | | | | 50,521 | | | | 0.7 | % |
| Semiconductors & Semiconductor Equipment | | | | | | | | | | | | |
| Monolithic Power Systems, Inc. | | | 1,559 | | | | 181,234 | | | | 2.5 | % |
| Software | | | | | | | | | | | | |
Coupa Software, Inc.(1) | | | 1,212 | | | | 76,186 | | | | 1.0 | % |
Descartes Systems Group, Inc.(1)(2) | | | 2,598 | | | | 68,743 | | | | 0.9 | % |
Fair Isaac Corp.(1) | | | 598 | | | | 111,826 | | | | 1.5 | % |
HubSpot, Inc.(1) | | | 542 | | | | 68,146 | | | | 0.9 | % |
Proofpoint, Inc.(1) | | | 919 | | | | 77,021 | | | | 1.1 | % |
Q2 Holdings, Inc.(1) | | | 1,798 | | | | 89,091 | | | | 1.2 | % |
RingCentral, Inc.(1) | | | 946 | | | | 77,988 | | | | 1.1 | % |
Tyler Technologies, Inc.(1) | | | 594 | | | | 110,377 | | | | 1.5 | % |
The Ultimate Software Group, Inc.(1) | | | 673 | | | | 164,798 | | | | 2.3 | % |
Upland Software, Inc.(1) | | | 3,302 | | | | 89,748 | | | | 1.2 | % |
| | | | | | | | 933,924 | | | | 12.7 | % |
| Specialty Retail | | | | | | | | | | | | |
Burlington Stores, Inc.(1) | | | 1,223 | | | | 198,945 | | | | 2.7 | % |
Hudson Ltd.(1)(2) | | | 7,262 | | | | 124,543 | | | | 1.7 | % |
| | | | | | | | 323,488 | | | | 4.4 | % |
| Trading Companies & Distributors | | | | | | | | | | | | |
SiteOne Landscape Supply, Inc.(1) | | | 825 | | | | 45,598 | | | | 0.6 | % |
| Watsco, Inc. | | | 841 | | | | 117,016 | | | | 1.6 | % |
| | | | | | | | 162,614 | | | | 2.2 | % |
| Total Common Stocks | | | | | | | | | | | | |
| (Cost $7,831,509) | | | | | | | 7,141,487 | | | | 98.0 | % |
The accompanying notes are an integral part of these financial statements.
Baird Small/Mid Cap Growth Fund
Schedule of Investments, December 31, 2018
Short-Term Investment
| | | | | | | | | % of | |
| | | Shares | | | Value | | | Net Assets | |
| Money Market Mutual Fund | | | | | | | | | |
| Fidelity Institutional Money Market Fund – | | | | | | | | | |
Government Portfolio, Institutional Class 2.29%(3) | | | 298,908 | | | $ | 298,908 | | | | 4.1 | % |
| Total Short-Term Investment | | | | | | | | | | | | |
| (Cost $298,908) | | | | | | | 7,440,395 | | | | 4.1 | % |
| Total Investments | | | | | | | | | | | | |
| (Cost $8,130,417) | | | | | | | 7,440,395 | | | | 102.1 | % |
| Liabilities in Excess of Other Assets | | | | | | | (150,290 | ) | | | (2.1 | )% |
| TOTAL NET ASSETS | | | | | | $ | 7,290,105 | | | | 100.0 | % |
Notes to Schedule of Investments
| (1) | Non-Income Producing. |
| (2) | Foreign Security. |
| (3) | 7-Day Yield. |
Industry classifications shown in the Schedule of Investments are based off of the Global Industry Classification Standard (GICS®). GICS® was developed by and/or is the exclusive property of MSCI, Inc. and Standard & Poor Financial Services LLC(“S&P”). GICS® is a service mark of MSCI and S&P and has been licensed for use by U.S. Bank Global Fund Services.
The accompanying notes are an integral part of these financial statements.
Baird Small/Mid Cap Growth Fund
Schedule of Investments, December 31, 2018
Summary of Fair Value Exposure at December 31, 2018
The Fund has adopted authoritative fair valuation accounting standards which establish a definition of fair value and set out a hierarchy for measuring fair value. These standards require additional disclosures about the various inputs and valuation techniques used to develop the measurements of fair value and a discussion on changes in valuation techniques and related inputs during the period. These standards define fair value as the price that would be received to sell an asset or paid to transfer a liability in an orderly transaction between market participants at the measurement date. Management has determined that these standards have no material impact on the Fund’s financial statements. The fair value hierarchy is organized into three levels based upon the assumptions (referred to as “inputs”) used in pricing the asset or liability. These standards state that “observable inputs” reflect the assumptions market participants would use in pricing the asset or liability based on market data obtained from independent sources and “unobservable inputs” reflect an entity’s own assumptions about the assumptions market participants would use in pricing the asset or liability. These inputs are summarized into three broad levels and described below:
| Level 1 – | Unadjusted quoted prices in active markets for identical unrestricted securities. |
| Level 2 – | Other significant observable inputs (including quoted prices for similar securities, quoted prices in inactive markets, dealer indications, interest rates, yield curves, prepayment speeds, credit risk, default rates, inputs corroborated by observable market data, etc.). |
| Level 3 – | Significant unobservable inputs (including the Fund’s own assumptions about the factors that market participants would use in valuing the security) based on the best information available. |
The inputs or methodology used for valuing securities are not necessarily an indication of the risk associated with investing in those securities.
The following is a summary of the inputs used to value the Fund’s investments as of December 31, 2018:
| | | Level 1 | | | Level 2 | | | Level 3 | | | Total | |
| Equity | | | | | | | | | | | | |
| Common Stocks | | $ | 7,141,487 | | | $ | — | | | $ | — | | | $ | 7,141,487 | |
| Total Equity | | | 7,141,487 | | | | — | | | | — | | | | 7,141,487 | |
| Short-Term Investment | | | | | | | | | | | | | | | | |
| Money Market Mutual Fund | | | 298,908 | | | | — | | | | — | | | | 298,908 | |
| Total Short-Term Investment | | | 298,908 | | | | — | | | | — | | | | 298,908 | |
| Total Investments* | | $ | 7,440,395 | | | $ | — | | | $ | — | | | $ | 7,440,395 | |
| * | Additional information regarding the industry classifications of these investments is disclosed in the Schedule of Investments. |
Changes in valuation techniques may result in transfers into or out of assigned levels within the fair value hierarchy. There were no transfers into or out of Level 3 during the reporting period, as compared to the security classifications from the prior year’s annual report. See the Fund’s Valuation Policy in Note 2a to the financial statements.
The accompanying notes are an integral part of these financial statements.
Baird Small/Mid Cap Value Fund
December 31, 2018 (Unaudited)
Portfolio Manager’s Commentary
As the new year begins, we take this opportunity to review our investment philosophy and process:
| • | We are a Small/Mid Cap Value equity manager with a bias toward quality |
| | |
| • | We seek to invest in companies with superior returns on equity, identifiable catalysts for earnings surprise and compelling valuations |
| | |
| • | We believe high quality companies with attractive valuations provide above-average return potential in rising equity markets and offer risk management during market declines |
| | |
| • | We employ a macro-economic overlay to our investment process to help identify individual stock catalysts and sector rotations in the market |
| | |
| • | We typically have a 3-5 year investment time horizon |
| | |
| • | We use a concentrated, low-turnover approach |
| | |
| • | Our goal is to provide superior performance to our investors through the market cycle while protecting assets during market declines |
It is worth noting that we manage a Fund of 40-50 stocks that we believe offer exceptional value and an ability to outperform the market’s profitability expectations. As we are benchmarked against an Index with roughly 1,700 constituents, it should be expected that our performance can and likely will vary meaningfully from the benchmark. Indeed, that is how we expect to achieve our goal of outperformance through the market cycle.
During 2018, stocks within our benchmark with the lowest valuations (as measured by the price/earnings ratio) significantly underperformed the stocks with the highest price/earnings ratio, particularly in the second quarter of the year. Most of the Fund’s relative underperformance occurred during the second quarter of the year, given its low valuation bias.
Core to our philosophy is the belief that buying stocks with stable earnings growth and positive earnings revisions at low valuations will deliver superior returns over time. As such, we anticipate a reversal of this trend, which has disproportionately favored expensive equities.
Review
2018 marked a return of volatility as U.S. equity markets vacillated between gains and losses before dipping into bear market territory during the final quarter of the year. Global synchronized growth soured to global synchronized deceleration as the year progressed. This global economic growth slow-down, along with the specter of monetary tightening as the Federal Reserve both raised the Federal Funds rate and shrank the balance sheet, was more than bulls could bear. In this environment, growth stocks generally outperformed value stocks and large capitalization stocks outperformed smaller company stocks.
We expect heightened volatility to continue as we begin the new year and expect such an environment to present exceptional opportunities for active managers. As we enter 2019, analysts have begun to reduce corporate earnings estimates after raising them steadily most of last year. Should profit expectations disappoint, we would expect our positioning to be advantageous to relative performance. The Fund has historically exhibited strong capital preservation characteristics in down markets.
Baird Small/Mid Cap Value Fund
December 31, 2018 (Unaudited)
Portfolio Highlights
For the year ended December 31, 2018, the Baird Small/Mid Value Fund Institutional Class posted a total return of -15.11% as compared to -12.36% return for the Russell 2000® Value Index, the Fund’s benchmark.
In terms of economic sectors, Real Estate Investment Trusts, Information Technology, Communications Services, and Consumer Staples were the best absolute and relative contributors to performance. Standout individual securities in the sectors included Integrated Device Technology, Verisign, Agree Realty and Lamb Weston. The Fund’s intentional underweight to Energy also contributed positively by insulating it from the benchmark sector’s 38% plunge during the year.
Industrials, Financials, and Consumer Discretionary sectors held back relative returns for the year. A few individual stocks were responsible for underperformance in these sectors including Spartan Motor and Atlas Financial Holdings, both of which we exited due to a deteriorating outlook for profitability. Other individual stocks in these sectors that underperformed continue to represent compelling value in our opinion, including Deluxe Corporation, Zagg Inc and Meta Financial.
Guide points signal that we are in the late innings of this economic cycle, which calls for more defensive posturing. As such, we have raised our exposure to Real Estate Investment Trusts, Utilities, and companies with exceptionally stable cash flows. To fund new purchases, we trimmed holdings in some stocks where our investment thesis had played out and rewarded us with higher stock prices, primarily in the Industrial and Information Technology sectors.
Portfolio Manager:
Michelle Stevens, CFA
Baird Small/Mid Cap Value Fund
December 31, 2018 (Unaudited)
Portfolio Characteristics
A December 31, 2018 summary of the Fund’s top 10 holdings and equity sector analysis compared to the Russell 2500® Value Index is shown below.
Top 10 Holdings(1) | | | Equity Sector Analysis(2) |
| | | |  |
| Boingo Wireless, Inc. | 5.0% | |
| ICU Medical, Inc. | 3.8% | |
| Physicians Realty Trust | 3.7% | |
| Lamb Weston Holdings, Inc. | 3.4% | |
| Agree Realty Corp. | 3.3% | |
| American Financial Group, Inc. | 3.2% | |
| Integrated Device Technology | 2.9% | |
| Blackstone Mortgage Trust, Inc. – Class A | 2.8% | |
| Axos Financial, Inc. | 2.6% | |
| Air Transport Service Group, Inc. | 2.6% | |
| | | |
| Net Assets: | $17,402,141 | |
| Portfolio Turnover Rate: | 34% | |
| Number of Equity Holdings: | 40 | |
| | | |
Annualized Portfolio Expense Ratio(3): | | |
Gross | | |
| Institutional Class: | 1.92% | |
| Investor Class: | 2.17% | (4) |
| | | |
Net | | |
| Institutional Class: | 0.85% | |
| Investor Class: | 1.10% | (4) | |
(1) | The Fund’s portfolio composition is subject to change and there is no assurance that the Fund will continue to hold any particular security. Percentages shown relate to the Fund’s total net assets as of December 31, 2018. |
(2) | Percentages shown in parentheses relate to the Fund’s total value of investments as of December 31, 2018, and may not add up to 100% due to rounding. |
(3) | Reflects expense ratios as stated in the Fund’s current prospectus. The Advisor has contractually agreed to limit the Fund’s total annual fund operating expenses to 0.85% of average daily net assets for the Institutional Class shares and 1.10% of average daily net assets for the Investor Class shares, at least through April 30, 2020. |
(4) | Includes 0.25% 12b-1 fee. |
Baird Small/Mid Cap Value Fund
December 31, 2018 (Unaudited)
Institutional Class
Value of a $25,000 Investment
Growth of a hypothetical investment of $25,000 made on the Fund’s inception date (11/30/15), assuming reinvestment of all distributions.
Investor Class
Value of a $10,000 Investment
Growth of a hypothetical investment of $10,000 made on the Fund’s inception date (11/30/15), assuming reinvestment of all distributions.
Baird Small/Mid Cap Value Fund
December 31, 2018 (Unaudited)
Total Returns
| | | Average Annual |
| | | | Since |
| For the Periods Ended December 31, 2018 | One Year | Three Year | Inception(1) |
| Institutional Class Shares | -15.11% | 3.94% | 2.24% |
| Investor Class Shares | -15.25% | 3.69% | 1.99% |
Russell 2500® Value Index(2) | -12.36% | 6.59% | 4.80% |
| (1) | For the period from November 30, 2015 (inception date) through December 31, 2018. |
| (2) | The Russell 2500® Value Index measures the performance of the small cap value segment of the U.S. equity universe. It includes those Russell 2500® Index companies with lower price-to-book ratios and lower forecasted growth values. This index does not reflect any deduction for fees, expenses or taxes. A direct investment in the index is not possible. |
The line graph on the previous page and the returns shown in the table above reflect reinvestment of dividends and/or capital gains distributions in additional shares. The returns do not reflect the deduction of taxes that a shareholder would pay on Fund distributions or the redemption of Fund shares. The returns reflect the actual performance for each period and do not include the impact of trades executed on the last business day of the period that were recorded on the first business day of the next period.
The gross expense ratio for each Class, as reflected in the Fund’s current prospectus, is set forth under “Portfolio Characteristics”.
The Fund focuses on small to mid cap value style stocks and therefore the performance of the Fund may be more volatile than the performance of funds that focus on types of stocks that have a broader investment style. The Fund may invest up to 15% of its total assets in U.S. dollar denominated foreign securities and ADRs. Foreign investments involve additional risks such as currency rate fluctuations and the potential for political and economic instability, and different and sometimes less strict financial reporting standards and regulation. The Fund invests a substantial portion of its assets in the stocks of small- and mid-capitalization companies. Small- and mid-capitalization companies often are more volatile and face greater risks than larger, more established companies.
Past performance does not guarantee future results. Investment return and principal value will fluctuate so that an investor’s shares, when redeemed, may be worth more or less than their original cost.
For information about the performance of the Fund as of the most recent month-end, please call 1-866-44BAIRD or visit www.bairdfunds.com. Mutual fund performance changes over time and current performance may be lower or higher than that stated.
Baird Small/Mid Cap Value Fund
Schedule of Investments, December 31, 2018
Common Stocks
| | | | | | | | | % of | |
| | | Shares | | | Value | | | Net Assets | |
| Aerospace & Defense | | | | | | | | | |
| Hexcel Corp. | | | 6,435 | | | $ | 368,983 | | | | 2.1 | % |
| Air Freight & Logistics | | | | | | | | | | | | |
Air Transport Services Group, Inc.(1) | | | 19,759 | | | | 450,702 | | | | 2.5 | % |
Atlas Air Worldwide Holdings, Inc.(1) | | | 6,689 | | | | 282,209 | | | | 1.6 | % |
| | | | | | | | 732,911 | | | | 4.1 | % |
| Commercial Services & Supplies | | | | | | | | | | | | |
| Deluxe Corp. | | | 4,911 | | | | 188,779 | | | | 1.1 | % |
| Communications Equipment | | | | | | | | | | | | |
Resonant, Inc.(1) | | | 44,791 | | | | 59,572 | | | | 0.3 | % |
| Distributors | | | | | | | | | | | | |
LKQ Corp.(1) | | | 13,717 | | | | 325,504 | | | | 1.9 | % |
| Electric Utilities | | | | | | | | | | | | |
| Pinnacle West Capital Corp. | | | 5,165 | | | | 440,058 | | | | 2.5 | % |
| Electronic Equipment, Instruments & Components | | | | | | | | | | | | |
| Dolby Laboratories, Inc. – Class A | | | 6,689 | | | | 413,648 | | | | 2.4 | % |
| Energy Equipment & Services | | | | | | | | | | | | |
| Solaris Oilfield Infrastructure, Inc. | | | 25,317 | | | | 306,083 | | | | 1.8 | % |
| Equity Real Estate Investment Trusts (REITs) | | | | | | | | | | | | |
| Agree Realty Corp. | | | 9,737 | | | | 575,651 | | | | 3.3 | % |
| CareTrust REIT, Inc. | | | 23,212 | | | | 428,494 | | | | 2.5 | % |
| CyrusOne, Inc. | | | 8,467 | | | | 447,734 | | | | 2.6 | % |
| National Retail Properties, Inc. | | | 8,140 | | | | 394,871 | | | | 2.3 | % |
| Physicians Realty Trust | | | 40,069 | | | | 642,307 | | | | 3.7 | % |
| Ryman Hospitality Properties, Inc. | | | 4,911 | | | | 327,515 | | | | 1.9 | % |
| | | | | | | | 2,816,572 | | | | 16.3 | % |
| Food Products | | | | | | | | | | | | |
| Lamb Weston Holdings, Inc. | | | 7,959 | | | | 585,464 | | | | 3.4 | % |
| Gas Utilities | | | | | | | | | | | | |
| Atmos Energy Corp. | | | 3,983 | | | | 369,304 | | | | 2.1 | % |
| Southwest Gas Holdings, Inc. | | | 2,294 | | | | 175,491 | | | | 1.0 | % |
| | | | | | | | 544,795 | | | | 3.1 | % |
| Health Care Equipment & Supplies | | | | | | | | | | | | |
ICU Medical, Inc.(1) | | | 2,879 | | | | 661,105 | | | | 3.8 | % |
| Health Care Providers & Services | | | | | | | | | | | | |
DaVita, Inc.(1) | | | 6,012 | | | | 309,377 | | | | 1.8 | % |
Laboratory Corp. of America Holdings(1) | | | 2,371 | | | | 299,600 | | | | 1.7 | % |
| | | | | | | | 608,977 | | | | 3.5 | % |
The accompanying notes are an integral part of these financial statements.
Baird Small/Mid Cap Value Fund
Schedule of Investments, December 31, 2018
Common Stocks (cont.)
| | | | | | | | | % of | |
| | | Shares | | | Value | | | Net Assets | |
| Household Durables | | | | | | | | | |
ZAGG, Inc.(1) | | | 45,045 | | | $ | 440,541 | | | | 2.5 | % |
| Insurance | | | | | | | | | | | | |
| American Financial Group, Inc. | | | 6,096 | | | | 551,871 | | | | 3.2 | % |
| Old Republic International Corp. | | | 21,895 | | | | 450,380 | | | | 2.5 | % |
| | | | | | | | 1,002,251 | | | | 5.7 | % |
| Internet & Direct Marketing Retail | | | | | | | | | | | | |
Stamps.com, Inc.(1) | | | 2,810 | | | | 437,348 | | | | 2.5 | % |
| IT Services | | | | | | | | | | | | |
| Leidos Holdings, Inc. | | | 8,248 | | | | 434,835 | | | | 2.5 | % |
VeriSign, Inc.(1) | | | 2,794 | | | | 414,322 | | | | 2.4 | % |
| | | | | | | | 849,157 | | | | 4.9 | % |
| Mortgage Real Estate Investment Trusts (REITs) | | | | | | | | | | | | |
| Blackstone Mortgage Trust, Inc. – Class A | | | 15,071 | | | | 480,162 | | | | 2.8 | % |
| Multi-Utilities | | | | | | | | | | | | |
Algonquin Power & Utilities Corp.(2) | | | 41,997 | | | | 422,070 | | | | 2.4 | % |
| Pharmaceuticals | | | | | | | | | | | | |
Jazz Pharmaceuticals PLC(1)(2) | | | 2,371 | | | | 293,909 | | | | 1.7 | % |
| Semiconductors & Semiconductor Equipment | | | | | | | | | | | | |
| Cypress Semiconductor Corp. | | | 13,870 | | | | 176,426 | | | | 1.0 | % |
Integrated Device Technology, Inc.(1) | | | 10,499 | | | | 508,467 | | | | 2.9 | % |
Silicon Motion Technology Corp. – ADR(2) | | | 7,242 | | | | 249,849 | | | | 1.4 | % |
| | | | | | | | 934,742 | | | | 5.3 | % |
| Software | | | | | | | | | | | | |
| j2 Global, Inc. | | | 6,181 | | | | 428,838 | | | | 2.5 | % |
| Thrifts & Mortgage Finance | | | | | | | | | | | | |
Axos Financial, Inc. (1) | | | 18,120 | | | | 456,261 | | | | 2.6 | % |
Essent Group Ltd.(1)(2) | | | 8,636 | | | | 295,178 | | | | 1.7 | % |
| Meta Financial Group, Inc. | | | 19,813 | | | | 384,174 | | | | 2.2 | % |
NMI Holdings, Inc.(1) | | | 19,390 | | | | 346,112 | | | | 2.0 | % |
| | | | | | | | 1,481,725 | | | | 8.5 | % |
| Wireless Telecommunication Services | | | | | | | | | | | | |
Boingo Wireless, Inc.(1) | | | 42,081 | | | | 865,606 | | | | 5.0 | % |
| Total Common Stocks | | | | | | | | | | | | |
| (Cost $14,933,840) | | | | | | | 15,688,800 | | | | 90.1 | % |
The accompanying notes are an integral part of these financial statements.
Baird Small/Mid Cap Value Fund
Schedule of Investments, December 31, 2018
Short-Term Investment
| | | | | | | | | % of | |
| | | Shares | | | Value | | | Net Assets | |
| Money Market Fund | | | | | | | | | |
| Fidelity Institutional Money Market Fund – | | | | | | | | | |
Government Portfolio, Institutional Class, 2.29%(3) | | | 1,701,658 | | | $ | 1,701,658 | | | | 9.8 | % |
| Total Short-Term Investment | | | | | | | | | | | | |
| (Cost $1,701,658) | | | | | | | 1,701,658 | | | | 9.8 | % |
| Total Investments | | | | | | | | | | | | |
| (Cost $16,635,498) | | | | | | | 17,390,458 | | | | 99.9 | % |
| Other Assets in Excess of Liabilities | | | | | | | 11,683 | | | | 0.1 | % |
| TOTAL NET ASSETS | | | | | | $ | 17,402,141 | | | | 100.0 | % |
Notes to Schedule of Investments
| (1) | Non-Income Producing. |
| (2) | Foreign Security. |
| (3) | 7-Day Yield. |
ADR – American Depository Receipt
Industry classifications shown in the Schedule of Investments are based off of the Global Industry Classification Standard (GICS®). GICS® was developed by and/or is the exclusive property of MSCI, Inc. and Standard & Poor Financial Services LLC(“S&P”). GICS® is a service mark of MSCI and S&P and has been licensed for use by U.S. Bank Global Fund Services.
The accompanying notes are an integral part of these financial statements.
Baird Small/Mid Cap Value Fund
Schedule of Investments, December 31, 2018
Summary of Fair Value Exposure at December 31, 2018
The Fund has adopted authoritative fair valuation accounting standards which establish a definition of fair value and set out a hierarchy for measuring fair value. These standards require additional disclosures about the various inputs and valuation techniques used to develop the measurements of fair value and a discussion on changes in valuation techniques and related inputs during the period. These standards define fair value as the price that would be received to sell an asset or paid to transfer a liability in an orderly transaction between market participants at the measurement date. Management has determined that these standards have no material impact on the Fund’s financial statements. The fair value hierarchy is organized into three levels based upon the assumptions (referred to as “inputs”) used in pricing the asset or liability. These standards state that “observable inputs” reflect the assumptions market participants would use in pricing the asset or liability based on market data obtained from independent sources and “unobservable inputs” reflect an entity’s own assumptions about the assumptions market participants would use in pricing the asset or liability. These inputs are summarized into three broad levels and described below:
| Level 1 – | Unadjusted quoted prices in active markets for identical unrestricted securities. |
| Level 2 – | Other significant observable inputs (including quoted prices for similar securities, quoted prices in inactive markets, dealer indications, interest rates, yield curves, prepayment speeds, credit risk, default rates, inputs corroborated by observable market data, etc.). |
| Level 3 – | Significant unobservable inputs (including the Fund’s own assumptions about the factors that market participants would use in valuing the security) based on the best information available. |
The inputs or methodology used for valuing securities are not necessarily an indication of the risk associated with investing in those securities.
The following is a summary of the inputs used to value the Fund’s investments as of December 31, 2018:
| | | Level 1 | | | Level 2 | | | Level 3 | | | Total | |
| Equity | | | | | | | | | | | | |
| Common Stocks | | $ | 15,688,800 | | | $ | — | | | $ | — | | | $ | 15,688,800 | |
| Total Equity | | | 15,688,800 | | | | — | | | | — | | | | 15,688,800 | |
| Short-Term Investment | | | | | | | | | | | | | | | | |
| Money Market Fund | | | 1,701,658 | | | | — | | | | — | | | | 1,701,658 | |
| Total Short-Term Investment | | | 1,701,658 | | | | — | | | | — | | | | 1,701,658 | |
| Total Investments* | | $ | 17,390,458 | | | $ | — | | | $ | — | | | $ | 17,390,458 | |
| * | Additional information regarding the industry classifications of these investments is disclosed in the Schedule of Investments. |
Changes in valuation techniques may result in transfers into or out of assigned levels within the fair value hierarchy. There were no transfers into or out of Level 3 during the reporting period, as compared to the security classifications from the prior year’s annual report. See the Fund’s Valuation Policy in Note 2a to the financial statements.
The accompanying notes are an integral part of these financial statements.
Baird SmallCap Value Fund
December 31, 2018 (Unaudited)
Portfolio Manager’s Commentary
As the new year begins, we take this opportunity to review our investment philosophy and process:
| • | We are a Small/Mid Cap Value equity manager with a bias toward quality |
| | |
| • | We seek to invest in companies with superior returns on equity, identifiable catalysts for earnings surprise and compelling valuations |
| | |
| • | We believe high quality companies with attractive valuations provide above-average return potential in rising equity markets and offer risk management during market declines |
| | |
| • | We employ a macro-economic overlay to our investment process to help identify individual stock catalysts and sector rotations in the market |
| | |
| • | We typically have a 3-5 year investment time horizon |
| | |
| • | We use a concentrated, low-turnover approach |
| | |
| • | Our goal is to provide superior performance to our investors through the market cycle while protecting assets during market declines |
It is worth noting that we manage a Fund of 40-50 stocks that we believe offer exceptional value and an ability to outperform the market’s profitability expectations. As we are benchmarked against an Index with roughly 1,700 constituents, it should be expected that our performance can and likely will vary meaningfully from the benchmark. Indeed, that is how we expect to achieve our goal of outperformance through the market cycle.
During 2018, stocks within our benchmark with the lowest valuations (as measured by the price/earnings ratio) significantly underperformed the stocks with the highest price/earnings ratio, particularly in the second quarter of the year. Most of the Fund’s relative underperformance occurred during the second quarter of the year, given its low valuation bias.
Core to our philosophy is the belief that buying stocks with stable earnings growth and positive earnings revisions at low valuations will deliver superior returns over time. As such, we anticipate a reversal of this trend, which has disproportionately favored expensive equities.
Review
2018 marked a return of volatility as U.S. equity markets vacillated between gains and losses before dipping into bear market territory during the final quarter of the year. Global synchronized growth soured to global synchronized deceleration as the year progressed. This global economic growth slow-down, along with the specter of monetary tightening as the Federal Reserve both raised the Federal Funds rate and shrank the balance sheet, was more than bulls could bear. In this environment, growth stocks generally outperformed value stocks and large capitalization stocks outperformed smaller company stocks.
We expect heightened volatility to continue as we begin the new year and expect such an environment to present exceptional opportunities for active managers. As we enter 2019, analysts have begun to reduce corporate earnings estimates after raising them steadily most of last year. Should profit expectations disappoint, we would expect our positioning to be advantageous to relative performance. The Fund has historically exhibited strong capital preservation characteristics in down markets.
Baird SmallCap Value Fund
December 31, 2018 (Unaudited)
Portfolio Highlights
For the year ended December 31, 2018, the Baird SmallCap Value Fund Institutional Class posted a total return of -16.45% as compared to -12.86% return for the Russell 2000® Value Index, the Fund’s benchmark.
In terms of economic sectors, Real Estate Investment Trusts, Consumer Staples, Healthcare and Utilities were the best absolute and relative contributors to performance. Not surprisingly, these characteristically defensive sectors earned most of their relative outperformance during the market weakness in the fourth quarter of the year. Standout individual securities in the sectors include Agree Realty, ICU Medical and Lamb Weston. The Fund’s intentional underweight to Energy also contributed positively by insulating it from the benchmark sector’s 38% plunge during the year.
Industrials, Financials, and Consumer Discretionary sectors held back relative returns for the year. A few individual stocks were responsible for underperformance in these sectors including Spartan Motor and Atlas Financial Holdings, both of which we exited due to a deteriorating outlook for profitability. Other individual stocks in these sectors that underperformed continue to represent compelling value in our opinion, including Deluxe Corporation, Zagg Inc. and Meta Financial.
Guide points signal that we are in the late innings of this economic cycle, which calls for more defensive posturing. As such, we have raised our exposure to Real Estate Investment Trusts, Utilities, and companies with exceptionally stable cash flows. To fund new purchases, we trimmed holdings in some stocks where our investment thesis had played out and rewarded us with higher stock prices, primarily in the Industrial and Information Technology sectors.
Portfolio Manager:
Michelle Stevens
Baird SmallCap Value Fund
December 31, 2018 (Unaudited)
Portfolio Characteristics
A December 31, 2018 summary of the Fund’s top 10 holdings and equity sector analysis compared to the Russell 2000® Value Index is shown below.
Top 10 Holdings(1) | | | Equity Sector Analysis(2) |
| | | | 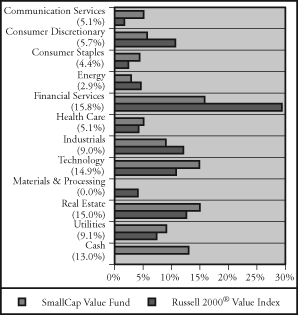 |
| Boingo Wireless, Inc. | 5.1% | |
| Lamb Weston Holdings, Inc. | 4.4% | |
| Agree Realty Corp. | 4.0% | |
| ICU Medical, Inc. | 4.0% | |
| Physicians Realty Trust | 3.8% | |
| Algonquin Power & Utilities Corp. | 3.5% | |
| Integrated Device Technology | 3.5% | |
| j2 Global, Inc. | 3.2% | |
| Stamps.com, Inc. | 3.0% | |
| Blackstone Mortgage Trust, Inc. – Class A | 3.0% | |
| | | |
| Net Assets: | $29,512,665 | |
| Portfolio Turnover Rate: | 36% | |
| Number of Equity Holdings: | 34 | |
| | | |
Annualized Portfolio Expense Ratio(3): | | |
Gross | | |
| Institutional Class: | 1.35% | |
| Investor Class: | 1.60% | (4) |
| | | |
Net | | |
| Institutional Class: | 0.95% | | |
| Investor Class: | 1.20%( | 4) | |
(1) | The Fund’s portfolio composition is subject to change and there is no assurance that the Fund will continue to hold any particular security. Percentages shown relate to the Fund’s total net assets as of December 31, 2018. |
(2) | Percentages shown in parentheses relate to the Fund’s total value of investments as of December 31, 2018, and may not add up to 100% due to rounding. |
(3) | Reflects expense ratios as stated in the Fund’s current prospectus. The Advisor has contractually agreed to limit the Fund’s total annual fund operating expenses to 0.95% of average daily net assets for the Institutional Class shares and 1.20% of average daily net assets for the Investor Class shares, at least through April 30, 2020. |
(4) | Includes 0.25% 12b-1 fee. |
Baird SmallCap Value Fund
December 31, 2018 (Unaudited)
Institutional Class
Value of a $25,000 Investment
Growth of a hypothetical investment of $25,000 made on the Fund’s inception date (5/1/12), assuming reinvestment of all distributions.
Investor Class
Value of a $10,000 Investment
Growth of a hypothetical investment of $10,000 made on the Fund’s inception date (5/1/12), assuming reinvestment of all distributions.
Baird SmallCap Value Fund
December 31, 2018 (Unaudited)
Total Returns
| | | Average Annual |
| | | | Since |
| For the Periods Ended December 31, 2018 | One Year | Five Year | Inception(1) |
| Institutional Class Shares | -16.45% | 1.58% | 6.96% |
| Investor Class Shares | -16.71% | 1.32% | 6.68% |
Russell 2000® Value Index(2) | -12.86% | 3.61% | 8.50% |
| (1) | For the period from May 1, 2012 (inception date) through December 31, 2018. |
| (2) | The Russell 2000® Value Index measures the performance of the small-cap value segment of the U.S. equity universe. It includes those Russell 2000® Index companies with lower price-to-book ratios and lower forecasted growth values. This index does not reflect any deduction for fees, expenses or taxes. A direct investment in the index is not possible. |
The line graph on the previous page and the returns shown in the table above reflect reinvestment of dividends and/or capital gains distributions in additional shares. The returns do not reflect the deduction of taxes that a shareholder would pay on Fund distributions or the redemption of Fund shares. The returns reflect the actual performance for each period and do not include the impact of trades executed on the last business day of the period that were recorded on the first business day of the next period.
The gross expense ratio for each Class, as reflected in the Fund’s current prospectus, is set forth under “Portfolio Characteristics”.
The Fund focuses on small cap value style stocks and therefore the performance of the Fund may be more volatile than the performance of funds that focus on types of stocks that have a broader investment style. The Fund may invest up to 15% of its total assets in U.S. dollar denominated foreign securities and ADRs. Foreign investments involve additional risks such as currency rate fluctuations and the potential for political and economic instability, and different and sometimes less strict financial reporting standards and regulation. The Fund invests a substantial portion of its assets in the stocks of small-capitalization companies. Small-capitalization companies often are more volatile and face greater risks than larger, more established companies.
Past performance does not guarantee future results. Investment return and principal value will fluctuate so that an investor’s shares, when redeemed, may be worth more or less than their original cost.
For information about the performance of the Fund as of the most recent month-end, please call 1-866-44BAIRD or visit www.bairdfunds.com. Mutual fund performance changes over time and current performance may be lower or higher than that stated.
Baird SmallCap Value Fund
Schedule of Investments, December 31, 2018
Common Stocks
| | | | | | | | | % of | |
| | | Shares | | | Value | | | Net Assets | |
| Aerospace & Defense | | | | | | | | | |
| Hexcel Corp. | | | 12,965 | | | $ | 743,413 | | | | 2.5 | % |
| Air Freight & Logistics | | | | | | | | | | | | |
Air Transport Services Group, Inc.(1) | | | 34,303 | | | | 782,451 | | | | 2.7 | % |
Atlas Air Worldwide Holdings, Inc.(1) | | | 17,699 | | | | 746,721 | | | | 2.5 | % |
| | | | | | | | 1,529,172 | | | | 5.2 | % |
| Biotechnology | | | | | | | | | | | | |
Eagle Pharmaceuticals, Inc.(1) | | | 8,003 | | | | 322,441 | | | | 1.1 | % |
| Commercial Services & Supplies | | | | | | | | | | | | |
| Deluxe Corp. | | | 10,244 | | | | 393,779 | | | | 1.3 | % |
| Electric Utilities | | | | | | | | | | | | |
| Alliant Energy Corp. | | | 20,168 | | | | 852,098 | | | | 2.9 | % |
| Energy Equipment & Services | | | | | | | | | | | | |
Select Energy Services, Inc.(1) | | | 36,970 | | | | 233,650 | | | | 0.8 | % |
| Solaris Oilfield Infrastructure, Inc. | | | 52,020 | | | | 628,922 | | | | 2.1 | % |
| | | | | | | | 862,572 | | | | 2.9 | % |
| Equity Real Estate Investment Trusts (REITs) | | | | | | | | | | | | |
| Agree Realty Corp. | | | 20,008 | | | | 1,182,873 | | | | 4.0 | % |
| CareTrust REIT, Inc. | | | 39,513 | | | | 729,410 | | | | 2.5 | % |
| CyrusOne, Inc. | | | 14,939 | | | | 789,974 | | | | 2.7 | % |
| Physicians Realty Trust | | | 69,562 | | | | 1,115,079 | | | | 3.8 | % |
| Ryman Hospitality Properties, Inc. | | | 8,963 | | | | 597,743 | | | | 2.0 | % |
| | | | | | | | 4,415,079 | | | | 15.0 | % |
| Food Products | | | | | | | | | | | | |
| Lamb Weston Holdings, Inc. | | | 17,767 | | | | 1,306,941 | | | | 4.4 | % |
| Gas Utilities | | | | | | | | | | | | |
| Southwest Gas Holdings, Inc. | | | 10,470 | | | | 800,955 | | | | 2.7 | % |
| Health Care Equipment & Supplies | | | | | | | | | | | | |
ICU Medical, Inc.(1) | | | 5,117 | | | | 1,175,017 | | | | 4.0 | % |
| Household Durables | | | | | | | | | | | | |
ZAGG, Inc.(1) | | | 81,951 | | | | 801,481 | | | | 2.7 | % |
| Internet & Direct Marketing Retail | | | | | | | | | | | | |
Stamps.com, Inc.(1) | | | 5,764 | | | | 897,109 | | | | 3.0 | % |
| IT Services | | | | | | | | | | | | |
CACI International, Inc. – Class A(1) | | | 5,116 | | | | 736,857 | | | | 2.5 | % |
| Mortgage Real Estate Investment Trusts (REITs) | | | | | | | | | | | | |
| Blackstone Mortgage Trust, Inc. – Class A | | | 27,851 | | | | 887,333 | | | | 3.0 | % |
| Multi-Utilities | | | | | | | | | | | | |
Algonquin Power & Utilities Corp.(2) | | | 103,879 | | | | 1,043,984 | | | | 3.5 | % |
The accompanying notes are an integral part of these financial statements.
Baird SmallCap Value Fund
Schedule of Investments, December 31, 2018
Common Stocks (cont.)
| | | | | | | | | % of | |
| | | Shares | | | Value | | | Net Assets | |
| Semiconductors & Semiconductor Equipment | | | | | | | | | |
| Cypress Semiconductor Corp. | | | 51,703 | | | $ | 657,662 | | | | 2.2 | % |
Integrated Device Technology, Inc.(1) | | | 21,549 | | | | 1,043,618 | | | | 3.5 | % |
Silicon Motion Technology Corp. – ADR(2) | | | 18,154 | | | | 626,313 | | | | 2.1 | % |
| | | | | | | | 2,327,593 | | | | 7.8 | % |
| Software | | | | | | | | | | | | |
| j2 Global, Inc. | | | 13,605 | | | | 943,915 | | | | 3.2 | % |
| Technology Hardware, Storage & Peripherals | | | | | | | | | | | | |
Immersion Corp.(1) | | | 43,826 | | | | 392,681 | | | | 1.3 | % |
| Thrifts & Mortgage Finance | | | | | | | | | | | | |
Axos Financial, Inc.(1) | | | 32,012 | | | | 806,062 | | | | 2.7 | % |
Essent Group Ltd.(1)(2) | | | 17,030 | | | | 582,086 | | | | 2.0 | % |
| Merchants Bancorp | | | 28,946 | | | | 577,762 | | | | 2.0 | % |
| Meta Financial Group, Inc. | | | 35,535 | | | | 689,024 | | | | 2.4 | % |
NMI Holdings, Inc.(1) | | | 34,905 | | | | 623,054 | | | | 2.1 | % |
| | | | | | | | 3,277,988 | | | | 11.2 | % |
| Trading Companies & Distributors | | | | | | | | | | | | |
| Air Lease Corp. | | | 16,166 | | | | 488,375 | | | | 1.8 | % |
| Wireless Telecommunication Services | | | | | | | | | | | | |
Boingo Wireless, Inc.(1) | | | 73,188 | | | | 1,505,477 | | | | 5.1 | % |
| Total Common Stocks | | | | | | | | | | | | |
| (Cost $21,945,297) | | | | | | | 25,704,260 | | | | 87.1 | % |
| Short-Term Investment | | | | | | | | | | | | |
| Money Market Mutual Fund | | | | | | | | | | | | |
| Fidelity Institutional Money Market Fund – | | | | | | | | | | | | |
Government Portfolio, Institutional Class, 2.29%(3) | | | 3,093,347 | | | | 3,093,347 | | | | 10.5 | % |
| Total Short-Term Investment | | | | | | | | | | | | |
| (Cost $3,093,347) | | | | | | | 3,093,347 | | | | 10.5 | % |
| Total Investments | | | | | | | | | | | | |
| (Cost $25,038,644) | | | | | | | 28,797,607 | | | | 97.6 | % |
| Other Assets in Excess of Liabilities | | | | | | | 715,058 | | | | 2.4 | % |
| TOTAL NET ASSETS | | | | | | $ | 29,512,665 | | | | 100.0 | % |
Notes to Schedule of Investments
| (1) | Non-Income Producing. |
| (2) | Foreign Security. |
| (3) | 7-Day Yield. |
ADR – American Depository Receipt
Industry classifications shown in the Schedule of Investments are based off of the Global Industry Classification Standard (GICS®). GICS® was developed by and/or is the exclusive property of MSCI, Inc. and Standard & Poor Financial Services LLC(“S&P”). GICS® is a service mark of MSCI and S&P and has been licensed for use by U.S. Bank Global Fund Services.
The accompanying notes are an integral part of these financial statements.
Baird SmallCap Value Fund
Schedule of Investments, December 31, 2018
Summary of Fair Value Exposure at December 31, 2018
The Fund has adopted authoritative fair valuation accounting standards which establish a definition of fair value and set out a hierarchy for measuring fair value. These standards require additional disclosures about the various inputs and valuation techniques used to develop the measurements of fair value and a discussion on changes in valuation techniques and related inputs during the period. These standards define fair value as the price that would be received to sell an asset or paid to transfer a liability in an orderly transaction between market participants at the measurement date. Management has determined that these standards have no material impact on the Fund’s financial statements. The fair value hierarchy is organized into three levels based upon the assumptions (referred to as “inputs”) used in pricing the asset or liability. These standards state that “observable inputs” reflect the assumptions market participants would use in pricing the asset or liability based on market data obtained from independent sources and “unobservable inputs” reflect an entity’s own assumptions about the assumptions market participants would use in pricing the asset or liability. These inputs are summarized into three broad levels and described below:
| Level 1 – | Unadjusted quoted prices in active markets for identical unrestricted securities. |
| Level 2 – | Other significant observable inputs (including quoted prices for similar securities, quoted prices in inactive markets, dealer indications, interest rates, yield curves, prepayment speeds, credit risk, default rates, inputs corroborated by observable market data, etc.). |
| Level 3 – | Significant unobservable inputs (including the Fund’s own assumptions about the factors that market participants would use in valuing the security) based on the best information available. |
The inputs or methodology used for valuing securities are not necessarily an indication of the risk associated with investing in those securities.
The following is a summary of the inputs used to value the Fund’s investments as of December 31, 2018:
| | | Level 1 | | | Level 2 | | | Level 3 | | | Total | |
| Equity | | | | | | | | | | | | |
| Common Stocks | | $ | 25,704,260 | | | $ | — | | | $ | — | | | $ | 25,704,260 | |
| Total Equity | | | 25,704,260 | | | | — | | | | — | | | | 25,704,260 | |
| Short-Term Investment | | | | | | | | | | | | | | | | |
| Money Market Mutual Fund | | | 3,093,347 | | | | — | | | | — | | | | 3,093,347 | |
| Total Short-Term Investment | | | 3,093,347 | | | | — | | | | — | | | | 3,093,347 | |
| Total Investments* | | $ | 28,797,607 | | | $ | — | | | $ | — | | | $ | 28,797,607 | |
| * | Additional information regarding the industry classifications of these investments is disclosed in the Schedule of Investments. |
Changes in valuation techniques may result in transfers into or out of assigned levels within the fair value hierarchy. There were no transfers into or out of Level 3 during the reporting period, as compared to the security classifications from the prior year’s annual report. See the Fund’s Valuation Policy in Note 2a to the financial statements.
The accompanying notes are an integral part of these financial statements.
Chautauqua International Growth Fund
December 31, 2018 (Unaudited)
Portfolio Manager’s Commentary
For 2018, the Chautauqua International Growth Fund underperformed its benchmark index, the MSCI ACWI ex USA Index (ND). As 2018 began, the Fund was positioned to cautiously participate in an extended but pro-growth economic environment. For the first two thirds of the year this positioning was successful as the Fund out-performed the benchmark. Then, in the last three months of the year, market appetite for longer duration equity assets rapidly de-rated amid pressure from continued “quantitative tightening” by the U.S. Federal Reserve (Fed), heightened tensions around U.S. and China trade and the ongoing complexity surrounding Brexit. The multiple compressions were swift despite healthy earnings and a benign economic environment. As a result, that performance advantage became a performance disadvantage by year end. We take the trust that has been placed in us by Fund investors very seriously. We are not satisfied with the results of 2018 and wish that we had been more cautious in our allocations to provide better downside protection. That said, we have taken advantage of the valuation dislocations of the last third of 2018 and as a result believe the portfolio is better positioned than it has been in the past two years.
Review
In the face of negative global equity returns, 2018 saw growth style investing hold up better than value style investing in the developed markets but it substantially underperformed in the emerging markets. This divergence in growth’s performance across regions was particularly pronounced when comparing the -3.0% return for the MSCI USA Growth Index versus the -19.6% return for the MSCI Emerging Markets Growth Index during the year. Small capitalization stocks generally underperformed large capitalization stocks in both emerging and developed markets.
The Fund’s sector performance was mixed during 2018. Much of this resulted from the aforementioned de-rating by the global financial markets in the final quarter of 2018. Growth stocks, which are justifiably priced at premium valuation multiples and whose cash flows can be long-dated, were the worst performers as rising interest rates caused multiple compressions. Areas of stock strength at the end of the year were low duration investments which lie in stark contrast to the long duration growth companies that Chautauqua invests in: low beta, high dividend, low growth. During the full calendar year of 2018, Chautauqua’s overweight to the outperforming health care sector, along with positive stock selection in the health care and financials sector, was a source of relative strength during the period. Conversely, Chautauqua’s overweight to the underperforming, longer duration, information technology sector held back returns, as did stock selection in the information technology and energy sectors.
The Fund’s aggregate investments in the Asia & Pacific Basin, taken as a whole, had a positive effect on performance during the year while European exposure, on the whole, held back returns. Investments within the emerging market countries were mixed given notable contributions from holdings in Indonesia and India alongside weakness from select Chinese names.
Portfolio Highlights
U.S. tax reform, enacted in December 22, 2017, largely went into effect in 2018. Combined with an infrastructure spending bill, U.S. fiscal spending lurched forward at a time when the U.S. economy had reached full output. The attendant projected debt and the more than one trillion dollar increase in U.S. federal debt put further pressure on the Fed to hike rates to a neutral level and normalize the Fed’s balance sheet after years of bond buying. Higher interest rates and an accelerating economy in the U.S. resulted in dollar appreciation versus most world currencies. Currency strength typically favors import consumption and makes exports less competitive. The strong dollar also had repercussions for other economies. In the emerging markets, the rising dollar became problematic as their central bankers needed to adjust benchmark rates higher in line with the U.S. Doing so creates a higher credit cost drag on their economies. Not doing so would lead to import price inflation and put all dollar-denominated borrowers in a tight spot. As the Fed moved away from monetary accommodation, the European Central Bank (ECB) and the Bank of Japan (BOJ)
Chautauqua International Growth Fund
December 31, 2018 (Unaudited)
continued their financial asset buying programs. These programs put downward pressure on interest rates which added to the comparative attractiveness of the dollar. While 2017 was a rare moment of global synchronized growth, in 2018 the cracks began to appear. As economic expansions go, the great financial crisis recovery that began in 2009 has been a long one. Policy missteps are evident around the globe. We continue to populate the portfolio with companies that we believe benefit from long-term trends, have the business model advantages to exploit these to a greater degree than the competition and that can be assembled in a diversified way. After a significant sell off, valuations of these companies seem more reasonable than they have in two years.
During the year we initiated new investments in Atlassian, Fanuc, Pirelli and Schlumberger. We also eliminated positions in Encana, Eni, Line, Lululemon, Reckitt Benckiser and Roche.
Outlook
In November of 2018, Democrats took control of the House of Representatives. The President, seeking to make good on a campaign promise, moved to get $5 billion in congressional funding for border wall construction. Unable to do so before the Democrats took office in January, he carried out a partial government shutdown which became historic in its length. In the U.K., Prime Minister May negotiated long and hard for an agreement for the U.K. to leave the E.U., only to fail to get her Parliament to ratify the agreement. The delay of tariff implementation between the U.S. and China ends on March 1, 2019. In the face of policy missteps, governments, ranging from France, Germany, India, Spain, the U.K. and the U.S., have experienced diminished levels of support. Since September of 2018, equity markets have been more focused on policy as opposed to individual company performance.
Populism and nationalism continue to erode the foundation of “globalism.” Recent elections in Brazil (tilting to the right) and Mexico (tilting toward the left) are further indications of voter discontent with globalization and international cooperation. International collaboration and coordination to address long-term worldwide problems has become much more difficult.
We believe transitory monetary policy will continue to fuel volatility in 2019. The U.S. Fed is expected to carry out two additional rate hikes to give themselves some breathing room should a rate cut be necessary in the future. Meanwhile, the ECB formally announced that it ended its bond buying program in December and the BOJ has hinted that their program may come to an end. Over nearly ten years, these stimulative programs, which have produced artificially low interest rates, have encouraged massive borrowing. High government debt levels in countries with aging demographics are a very significant problem. If changes are not made, support for the aged will crowd out other spending.
In anticipation of higher after-tariff prices, businesses in the U.S. stockpiled Chinese-made goods. Some have noted that absent the inventory buildup in 2018, the U.S. economy grew only at its Fed projected long-term rate (1.9%). Moreover, as businesses work off those inventories there will likely be fewer and smaller orders in 2019. This may result in the U.S. experiencing two consecutive quarters of negative economic growth in the latter half of the year. Although this would technically constitute a recession, we do not anticipate a major layoff and plant closing style recession because businesses have not expanded capacity at a high rate over the past several years.
European growth has moderated. Some specific sectors like German autos have been under significant pressure. The E.U. has created a political and monetary union but fiscal policy is determined, with limitations, at the member nation level. As a result, there are continued distortions where weak countries are encouraged to borrow at lower rates than would otherwise be available and stronger countries get an export advantage as the Euro trades at a lower valuation than their home currency would on its own.
Latin America will likely grow slowly in 2019 as it is late in the global economic expansion and many of these economies are highly influenced by commodity prices. However, Brazil and Argentina are experiencing a resumption in growth after painful recessions.
Chautauqua International Growth Fund
December 31, 2018 (Unaudited)
Broadly, Asia is sensitive to the economy of China. China’s economy is decelerating after decades of extraordinary growth. As China seeks to expand markets for its products within the region and address rising wage costs within China, it is becoming more integrated with its neighbors. The “Belt and Road Initiative” is adding needed infrastructure to facilitate the movement of goods.
After struggling with the effects of U.S. dollar strength, emerging markets countries are getting a reprieve. As the Fed slows the pace of rate increases, with an end in sight, emerging markets central bankers who have had to raise benchmark rates can pause. Moderate energy prices are beneficial for most of the emerging market countries. Valuations came down materially in 2018. These countries, generally, have a younger workforce and more potential for productivity gains. Add to this lower levels of indebtedness (excluding China) and it is easy to understand why we are optimistic about the category.
We anticipate that 2019 will be a volatile year. Geopolitical events will likely come to a head early and tensions may rise broadly. The final resolution of the U.S. government shut-down, U.S./China trade dispute and final Brexit terms should be settled by the end of the first quarter. The lifting or further implementation of U.S. sanctions on Iran will be announced in May. The result of this could mean the addition of one million barrels of oil per day, if sanctions are lifted, or a further reduction of one million barrels if the temporary exemptions are halted. One million barrels of oil swing factor will surely impact the price of oil.
Rather than try to outguess other investors as to the outcome of these events, we monitor the developments and structure the Fund to minimize the direct impact of their outcome. And, we populate the portfolio with shares in companies that are expected to have a high level of durability. We seek businesses that offer a very attractive value proposition to their customers. As a result, demand for their products is more predictable and the companies have the ability to increase prices if needed. Although the Fund is not impervious to market gyrations that result from geopolitical events, we believe we can take advantage of near term volatility for the long-term benefit of our investors.
Respectfully Submitted,
Brian Beitner, CFA
Portfolio Manager
Chautauqua International Growth Fund
December 31, 2018 (Unaudited)
Portfolio Characteristics
A December 31, 2018 summary of the Fund’s top 10 holdings and equity sector analysis compared to the MSCI ACWI ex USA Index is shown below.
Top 10 Holdings(1) | | | | | | |
| | | | | | | |
| Temenos Group AG | 5.8% | | Net Assets: | $87,527,490 | | |
| Genmab A/S | 5.8% | | Portfolio Turnover Rate: | 42% | | |
| Novo Nordisk A/S – ADR | 5.3% | | Number of Equity Holdings: | 28 | | |
| Naspers Ltd. | 5.2% | | | | | |
| DBS Group Holdings Ltd. | 5.1% | | Annualized Portfolio Expense Ratio(3): | | | |
| Keyence Corp. | 5.0% | | Gross | | | |
| TAL Education Group | 4.8% | | Institutional Class: | 1.21% | | |
| HDFC Bank Ltd. – ADR | 4.8% | | Investor Class: | 1.46% | (4) | |
| Toronto-Dominion Bank | 4.7% | | | | | |
| Wirecard AG | 4.1% | | Net | | | |
| | | | Institutional Class: | 0.80% | | |
| | | | Investor Class: | 1.05% | (4) | |
| | | | | | | |
Equity Sector Analysis(2) | | | Country Allocation(2) | | | |
 | | |  | | | |
 | | | |
(1) | The Fund’s portfolio composition is subject to change and there is no assurance that the Fund will continue to hold any particular security. Percentages shown relate to the Fund’s total net assets as of December 31, 2018. |
(2) | Percentages shown in parentheses relate to the Fund’s total value of investments as of December 31, 2018, and may not add up to 100% due to rounding. |
(3) | Reflects expense ratios as stated in the Fund’s current prospectus. The Advisor has contractually agreed to limit the Fund’s total annual fund operating expenses to 0.80% of average daily net assets for the Institutional Class shares and 1.05% of average daily net assets for the Investor Class shares, at least through April 30, 2020. |
(4) | Includes 0.25% 12b-1 fee. |
Chautauqua International Growth Fund
December 31, 2018 (Unaudited)
Institutional Class
Value of a $25,000 Investment
Growth of a hypothetical investment of $25,000 made on the Fund’s inception date (04/15/16), assuming reinvestment of all distributions.
Investor Class
Value of a $10,000 Investment
Growth of a hypothetical investment of $10,000 made on the Fund’s inception date (04/15/16), assuming reinvestment of all distributions.
Chautauqua International Growth Fund
December 31, 2018 (Unaudited)
Total Returns
| | | Average |
| | | Annual |
| | | Since |
| For the Periods Ended December 31, 2018 | One Year | Inception(1) |
| Institutional Class Shares | -16.94% | 2.94% |
| Investor Class Shares | -17.21% | 2.71% |
MSCI ACWI ex USA Index(2) | -14.20% | 4.41% |
| (1) | For the period from April 15, 2016 (inception date) through December 31, 2018. |
| (2) | The MSCI ACWI ex USA Index is a market-capitalization-weighted index maintained by MSCI, Inc. and designed to provide a broad measure of stock performance throughout the world, with the exception of U.S.-based companies. The MSCI ACWI ex USA Index includes both developed and emerging markets. This index does not reflect any deduction for fees, expenses or taxes. A direct investment in the index is not possible. |
The line graph on the previous page and the returns shown in the table above reflect reinvestment of dividends and/or capital gains distributions in additional shares. The returns do not reflect the deduction of taxes that a shareholder would pay on Fund distributions or the redemption of Fund shares. The returns reflect the actual performance for each period and do not include the impact of trades executed on the last business day of the period that were recorded on the first business day of the next period.
The gross expense ratio for each Class, as reflected in the Fund’s current prospectus, is set forth under “Portfolio Characteristics”.
The Fund focuses on both U.S. and non-U.S. stocks with medium to large market capitalizations and therefore the performance of the Fund may be more volatile than the performance of funds that focus on types of stocks that have a broader investment style. Under normal market conditions, the Fund will invest at least 65% of its total assets in non-U.S. companies. Foreign investments involve additional risks such as currency rate fluctuations and the potential for political and economic instability, and different and sometimes less strict financial reporting standards and regulation. In June 2016, the United Kingdom (UK) voted to leave the European Union (EU) following a referendum referred to as “Brexit.” The exact timeframe for the UK’s exit is unknown. There is significant market uncertainty regarding Brexit’s ramifications, and the range of possible political, regulatory, economic, and market outcomes are difficult to predict. The negative impact could be significant, potentially resulting in increased volatility and illiquidity and lower economic growth for companies that rely significantly on Europe for their business activities and revenues. Other geopolitical events may also cause market disruptions. The portfolio manager for the Fund has over 30 years of experience investing in the global markets and will attempt to minimize the negative impact of these events. However, it is possible that geopolitical events could have an adverse effect on the value of the Fund’s investments.
Past performance does not guarantee future results. Investment return and principal value will fluctuate so that an investor’s shares, when redeemed, may be worth more or less than their original cost.
For information about the performance of the Fund as of the most recent month-end, please call 1-866-44BAIRD or visit www.bairdfunds.com. Mutual fund performance changes over time and current performance may be lower or higher than that stated.
Chautauqua International Growth Fund
Schedule of Investments, December 31, 2018
Common Stocks
| | | | | | | | | % of | |
| | | Shares | | | Value | | | Net Assets | |
| Application Software | | | | | | | | | |
Atlassian Corp. PLC (Australia)(1) | | | 20,209 | | | $ | 1,798,197 | | | | 2.1 | % |
Temenos Group AG (Switzerland)(2) | | | 42,393 | | | | 5,094,064 | | | | 5.8 | % |
| | | | | | | | 6,892,261 | | | | 7.9 | % |
| Asset Management & Custody Banks | | | | | | | | | | | | |
Julius Baer Group Ltd. (Switzerland)(2) | | | 84,492 | | | | 3,011,001 | | | | 3.4 | % |
| Automobile Manufacturers | | | | | | | | | | | | |
BYD Co. Ltd. (China)(2) | | | 277,766 | | | | 1,779,207 | | | | 2.0 | % |
| Biotechnology | | | | | | | | | | | | |
Genmab A/S (Denmark)(1)(2) | | | 30,708 | | | | 5,049,027 | | | | 5.8 | % |
| Cable & Satellite | | | | | | | | | | | | |
Naspers Ltd. (South Africa)(2) | | | 22,575 | | | | 4,519,886 | | | | 5.2 | % |
| Data Processing & Outsourced Services | | | | | | | | | | | | |
Wirecard AG (Germany)(2) | | | 23,682 | | | | 3,570,118 | | | | 4.1 | % |
| Diversified Banks | | | | | | | | | | | | |
Bank Rakyat Indonesia Persero Tbk PT (Indonesia)(2) | | | 13,529,151 | | | | 3,446,664 | | | | 3.9 | % |
DBS Group Holdings Ltd. (Singapore)(2) | | | 257,008 | | | | 4,469,331 | | | | 5.1 | % |
Toronto-Dominion Bank (Canada)(1) | | | 83,308 | | | | 4,140,991 | | | | 4.7 | % |
| | | | | | | | 12,056,986 | | | | 13.7 | % |
| Diversified Support Services | | | | | | | | | | | | |
Recruit Holdings Co. Ltd. (Japan)(2) | | | 76,617 | | | | 1,850,970 | | | | 2.1 | % |
| Education Services | | | | | | | | | | | | |
TAL Education Group (China)(1) | | | 158,574 | | | | 4,230,754 | | | | 4.8 | % |
| Electronic Equipment & Instruments | | | | | | | | | | | | |
Keyence Corp. (Japan)(2) | | | 8,712 | | | | 4,403,445 | | | | 5.0 | % |
| Healthcare Distributors | | | | | | | | | | | | |
Sinopharm Group Co. Ltd. (China)(2) | | | 684,922 | | | | 2,883,697 | | | | 3.3 | % |
| Industrial Machinery | | | | | | | | | | | | |
FANUC Corp. (Japan)(2) | | | 9,624 | | | | 1,460,535 | | | | 1.7 | % |
| Internet Retail | | | | | | | | | | | | |
Alibaba Group Holding Ltd. – ADR (China)(1) | | | 24,592 | | | | 3,370,826 | | | | 3.9 | % |
Ctrip.com International Ltd. – ADR (China)(1) | | | 77,971 | | | | 2,109,895 | | | | 2.4 | % |
| | | | | | | | 5,480,721 | | | | 6.3 | % |
| Oil & Gas Equipment & Services | | | | | | | | | | | | |
| Core Laboratories NV (Netherlands) | | | 52,310 | | | | 3,120,815 | | | | 3.6 | % |
| Schlumberger Limited (Curacao) | | | 47,306 | | | | 1,706,800 | | | | 1.9 | % |
| | | | | | | | 4,827,615 | | | | 5.5 | % |
| Personal Products | | | | | | | | | | | | |
Amorepacific Corp. (Republic of Korea)(2) | | | 8,751 | | | | 1,646,550 | | | | 1.9 | % |
The accompanying notes are an integral part of these financial statements.
Chautauqua International Growth Fund
Schedule of Investments, December 31, 2018
Common Stocks (cont.)
| | | | | | | | | % of | |
| | | Shares | | | Value | | | Net Assets | |
| Pharmaceuticals | | | | | | | | | |
| Allergan PLC (Ireland) | | | 6,198 | | | $ | 828,425 | | | | 0.9 | % |
| Novo Nordisk A/S – ADR (Denmark) | | | 100,633 | | | | 4,636,162 | | | | 5.3 | % |
| | | | | | | | 5,464,587 | | | | 6.2 | % |
| Regional Banks | | | | | | | | | | | | |
| HDFC Bank Ltd. – ADR (India) | | | 40,306 | | | | 4,175,299 | | | | 4.8 | % |
| Semiconductor Equipment | | | | | | | | | | | | |
| ASML Holding NV (Netherlands) | | | 22,371 | | | | 3,481,375 | | | | 4.0 | % |
| Semiconductors | | | | | | | | | | | | |
AMS AG (Austria)(2) | | | 113,910 | | | | 2,742,981 | | | | 3.1 | % |
| Taiwan Semiconductor Manufacturing | | | | | | | | | | | | |
| Co. Ltd. – ADR (Taiwan) | | | 79,587 | | | | 2,937,556 | | | | 3.4 | % |
| | | | | | | | 5,680,537 | | | | 6.5 | % |
| Tires & Rubber | | | | | | | | | | | | |
Pirelli & C SpA (Italy)(1)(2) | | | 145,413 | | | | 934,450 | | | | 1.1 | % |
| Total Common Stocks | | | | | | | | | | | | |
| (Cost $91,058,326) | | | | | | | 83,399,021 | | | | 95.3 | % |
| Short-Term Investment | | | | | | | | | | | | |
| Money Market Mutual Fund | | | | | | | | | | | | |
| Fidelity Institutional Money Market Fund – | | | | | | | | | | | | |
Government Portfolio, Institutional Class 2.29%(3) | | | 2,946,819 | | | | 2,946,819 | | | | 3.4 | % |
| Total Short-Term Investment | | | | | | | | | | | | |
| (Cost $2,946,819) | | | | | | | 2,946,819 | | | | 3.4 | % |
| Total Investments | | | | | | | | | | | | |
| (Cost $94,005,145) | | | | | | | 86,345,840 | | | | 98.7 | % |
| Other Assets in Excess of Liabilities | | | | | | | 1,181,650 | | | | 1.3 | % |
| TOTAL NET ASSETS | | | | | | $ | 87,527,490 | | | | 100.0 | % |
Notes to Schedule of Investments
| (1) | Non-Income Producing. |
| (2) | Level 2 security – See Note 2a to the financial statements. |
| (3) | 7-Day Yield. |
ADR – American Depository Receipt
Industry classifications shown in the Schedule of Investments are based off of the Global Industry Classification Standard (GICS®). GICS® was developed by and/or is the exclusive property of MSCI, Inc.(“MSCI”) and Standard & Poor Financial Services LLC(“S&P”). GICS® is a service mark of MSCI and S&P and has been licensed for use by U.S. Bank Global Fund Services.
The accompanying notes are an integral part of these financial statements.
Chautauqua International Growth Fund
Schedule of Investments, December 31, 2018
Summary of Fair Value Exposure at December 31, 2018
The Fund has adopted authoritative fair valuation accounting standards which establish a definition of fair value and set out a hierarchy for measuring fair value. These standards require additional disclosures about the various inputs and valuation techniques used to develop the measurements of fair value and a discussion on changes in valuation techniques and related inputs during the period. These standards define fair value as the price that would be received to sell an asset or paid to transfer a liability in an orderly transaction between market participants at the measurement date. Management has determined that these standards have no material impact on the Fund’s financial statements. The fair value hierarchy is organized into three levels based upon the assumptions (referred to as “inputs”) used in pricing the asset or liability. These standards state that “observable inputs” reflect the assumptions market participants would use in pricing the asset or liability based on market data obtained from independent sources and “unobservable inputs” reflect an entity’s own assumptions about the assumptions market participants would use in pricing the asset or liability. These inputs are summarized into three broad levels and described below:
| Level 1 – | Unadjusted quoted prices in active markets for identical unrestricted securities. |
| Level 2 – | Other significant observable inputs (including quoted prices for similar securities, quoted prices in inactive markets, dealer indications, interest rates, yield curves, prepayment speeds, credit risk, default rates, inputs corroborated by observable market data, etc.). |
| Level 3 – | Significant unobservable inputs (including the Fund’s own assumptions about the factors that market participants would use in valuing the security) based on the best information available. |
The inputs or methodology used for valuing securities are not necessarily an indication of the risk associated with investing in those securities.
The following is a summary of the inputs used to value the Fund’s investments as of December 31, 2018:
| | | Level 1 | | | Level 2 | | | Level 3 | | | Total | |
| Equity | | | | | | | | | | | | |
| Common Stocks | | $ | 36,537,095 | | | $ | 46,861,926 | | | $ | — | | | $ | 83,399,021 | |
| Total Equity | | | 36,537,095 | | | | 46,861,926 | | | | — | | | | 83,399,021 | |
| Short-Term Investment | | | | | | | | | | | | | | | | |
| Money Market Mutual Funds | | | 2,946,819 | | | | — | | | | — | | | | 2,946,819 | |
| Total Short-Term Investment | | | 2,946,819 | | | | — | | | | — | | | | 2,946,819 | |
| Total Investments* | | $ | 39,483,914 | | | $ | 46,861,926 | | | $ | — | | | $ | 86,345,840 | |
| * | Additional information regarding the industry classifications of these investments is disclosed in the Schedule of Investments. |
Changes in valuation techniques may result in transfers into or out of assigned levels within the fair value hierarchy. There were no transfers into or out of Level 3 during the reporting period, as compared to the security classifications from the prior year’s annual report. See the Fund’s Valuation Policy in Note 2a to the financial statements.
The accompanying notes are an integral part of these financial statements.
Chautauqua Global Growth Fund
December 31, 2018 (Unaudited)
Portfolio Manager’s Commentary
For 2018, the Chautauqua Global Growth Fund underperformed its benchmark index, the MSCI ACWI Index (ND). As 2018 began, the Fund was positioned to cautiously participate in an extended but pro-growth economic environment. For the first two thirds of the year this positioning was successful as the Fund out-performed the benchmark. Then, in the last three months of the year, the market appetite for longer duration equity assets rapidly de-rated amid pressure from continued “quantitative tightening” by the U.S. Federal Reserve (Fed), heightened tensions around U.S. and China trade and the ongoing complexity surrounding Brexit. The multiple compressions were swift despite healthy earnings and a benign economic environment. As a result that performance advantage became a performance disadvantage by year end. We take the trust that has been placed in us by Fund investors very seriously. We are not satisfied with the results of 2018 and wish that we had been more cautious in our allocations to provide better downside protection. That said, we have taken advantage of the valuation dislocations of the last third of 2018 and as a result believe the portfolio is better positioned than it has been in the past two years.
Review
In the face of negative global equity returns, 2018 saw growth style investing hold up better than value style investing in the developed markets but it substantially underperformed in the emerging markets. This divergence in growth’s performance across regions was particularly pronounced when comparing the -3.0% return for the MSCI USA Growth Index versus the -19.6% return for the MSCI Emerging Markets Growth Index during the year. Small capitalization stocks generally underperformed large capitalization stocks in both emerging and developed markets.
The Fund’s sector performance was mixed during 2018. Much of this resulted from the aforementioned de-rating by the global financial markets in the final quarter of 2018. Growth stocks, which are justifiably priced at premium valuation multiples and whose cash flows can be long-dated, were the worst performers as rising interest rates caused multiple compressions. Areas of stock strength at the end of the year were low duration investments which lie in stark contrast to the long duration growth companies that Chautauqua invests in: low beta, high dividend, low growth. During the full calendar year of 2018, Chautauqua’s overweight to the health care sector, along with positive stock selection in the consumer discretionary and financials sector, was a source of relative strength during the period. Conversely, Chautauqua’s longer duration growth holdings held back returns, most notably in the information technology and energy sectors.
The Fund’s aggregate investments in the Asia & Pacific Basin, taken as a whole, had a positive effect on performance during the year while European and North American exposure, on the whole, held back returns. Investments within the emerging market countries were mixed given notable contributions from holdings in Indonesia and India alongside weakness from select Chinese names.
Portfolio Highlights
U.S. tax reform, enacted in December 22, 2017, largely went into effect in 2018. Combined with an infrastructure spending bill, U.S. fiscal spending lurched forward at a time when the U.S. economy had reached full output. The attendant projected debt and the more than one trillion dollar increase in U.S. federal debt put further pressure on the Fed to hike rates to a neutral level and normalize the Fed’s balance sheet after years of bond buying. Higher interest rates and an accelerating economy in the U.S. resulted in dollar appreciation versus most world currencies. Currency strength typically favors import consumption and makes exports less competitive. The strong dollar also had repercussions for other economies. In the emerging markets, the rising dollar became problematic as their central bankers needed to adjust benchmark rates higher in line with the U.S. Doing so creates a higher credit cost drag on their economy. Not doing so would lead to import price inflation and put all dollar-denominated borrowers in a tight spot. As the Fed moved away from monetary accommodation, the European Central Bank (ECB) and the Bank of Japan (BOJ) continued their financial asset buying programs. These programs put downward pressure on interest rates which added to the
Chautauqua Global Growth Fund
December 31, 2018 (Unaudited)
comparative attractiveness of the dollar. While 2017 was a rare moment of global synchronized growth, in 2018 the cracks began to appear. As economic expansions go, the great financial crisis recovery that began in 2009 has been a long one. Policy missteps are evident around the globe. We continue to populate the portfolio with companies that we believe benefit from long-term trends, have the business model advantages to exploit these to a greater degree than the competition and that can be assembled in a diversified way. After a significant sell off, valuations of these companies seem more reasonable than they have in two years.
During the year we initiated new investments in Atlassian, Fanuc, Pirelli and Schlumberger. We also eliminated positions in Encana, Eni, Line, Lululemon, Pioneer Natural Resources, Reckitt Benckiser and Roche from the Fund.
Outlook
In November of 2018 Democrats took control of the House of Representatives. The President, seeking to make good on a campaign promise, moved to get $5 billion in congressional funding for border wall construction. Unable to do so before the Democrats took office in January, he carried out a partial government shutdown which became historic in its length. In the U.K., Prime Minister May negotiated long and hard for an agreement for the U.K. to leave the E.U., only to fail to get her Parliament to ratify the agreement. The delay of tariff implementation between the U.S. and China ends on March 1, 2019. In the face of policy missteps, governments, ranging from France, Germany, India, Spain, the U.K. and the U.S., have experienced diminished levels of support. Since September of 2018, equity markets have been more focused on policy as opposed to individual company performance.
Populism and nationalism continue to erode the foundation of “globalism.” Recent elections in Brazil (tilting to the right) and Mexico (tilting toward the left) are further indications of voter discontent with globalization and international cooperation. International collaboration and coordination to address long-term worldwide problems has become much more difficult.
We believe transitory monetary policy will continue to fuel volatility in 2019. The U.S. Fed is expected to carry out two additional rate hikes to give themselves some breathing room should a rate cut be necessary in the future. Meanwhile, the ECB formally announced that it ended its bond buying program in December and the BOJ has hinted that their program may come to an end. Over nearly ten years, these stimulative programs, which have produced artificially low interest rates, have encouraged massive borrowing. High government debt levels in countries with aging demographics are a very significant problem. If changes are not made, support for the aged will crowd out other spending.
In anticipation of higher after-tariff prices, businesses in the U.S. stockpiled Chinese made goods. Some have noted that absent the inventory buildup in 2018, the U.S. economy grew only at its Fed projected long-term rate (1.9%). Moreover, as businesses work off those inventories there will likely be fewer and smaller orders in 2019. This may result in the U.S. experiencing two consecutive quarters of negative economic growth in the latter half of the year.
Although this would technically constitute a recession, we do not anticipate a major layoff and plant closing style recession because businesses have not expanded capacity at a high rate over the past several years.
European growth has moderated. Some specific sectors like German autos have been under significant pressure. The E.U. has created a political and monetary union but fiscal policy is determined, with limitations, at the member nation level. As a result, there are continued distortions where weak countries are encouraged to borrow at lower rates than would otherwise be available and stronger countries get an export advantage as the Euro trades at a lower valuation then their home currency would on its own.
Latin America will likely grow slowly in 2019 as it is late in the global economic expansion and many of these economies are highly influenced by commodity prices. However, Brazil and Argentina are experiencing a resumption in growth after painful recessions.
Chautauqua Global Growth Fund
December 31, 2018 (Unaudited)
Broadly, Asia is sensitive to the economy of China. China’s economy is decelerating after decades of extraordinary growth. As China seeks to expand markets for its products within the region and address rising wage costs within China it is becoming more integrated with its neighbors. The “Belt and Road Initiative” is adding needed infrastructure to facilitate the movement of goods.
After struggling with the effects of U.S. dollar strength, emerging markets countries are getting a reprieve. As the Fed slows the pace of rate increases, with an end in sight, emerging markets central bankers who have had to raise benchmark rates can pause. Moderate energy prices are beneficial for most of the emerging market countries. Valuations came down materially in 2018. These countries, generally, have a younger workforce and more potential for productivity gains. Add to this, lower levels of indebtedness (excluding China) and it is easy to understand why we are optimistic about the category.
We anticipate that 2019 will be a volatile year. Geopolitical events will likely come to a head early and tensions may rise broadly. The U.S. government shut-down, U.S./China trade dispute and final Brexit terms should be settled by the end of the first quarter. The lifting or further implementation of U.S. sanctions on Iran will be announced in May. The result of this could mean the addition of one million barrels of oil per day, if sanctions are lifted or a further reduction of one million barrels if the temporary exemptions are halted. One million barrels of oil swing factor will surely impact the price of oil.
Rather than try to outguess other investors as to the outcome of these events, we monitor the developments and structure the Funds to minimize the direct impact of their outcome. And, we populate the portfolio with shares in companies that are expected to have a high level of durability. We seek businesses that offer a very attractive value proposition to their customers. As a result, demand for their products is more predictable and the companies have the ability to increase prices if needed. Although the Fund is not impervious to market gyrations that result from geopolitical events, we believe we can take advantage of near term volatility for the long-term benefit of our investors.
Respectfully Submitted,
Brian Beitner, CFA
Portfolio Manager
Chautauqua Global Growth Fund
December 31, 2018 (Unaudited)
Portfolio Characteristics
A December 31, 2018 summary of the Fund’s top 10 holdings and equity sector analysis compared to the MSCI ACWI Index is shown below.
Top 10 Holdings(1) | | | | | | |
| | | | | | | |
| Temenos Group AG | 5.3% | | Net Assets: | $37,545,390 | | |
| Genmab A/S | 5.0% | | Portfolio Turnover Rate: | 38% | | |
| MasterCard, Inc. | 4.3% | | Number of Equity Holdings: | 42 | | |
| Novo Nordisk A/S – ADR | 4.1% | | | | | |
| NVIDIA Corp. | 3.7% | | Annualized Portfolio Expense Ratio(3): | | | |
| Keyence Corp. | 3.6% | | Gross | | | |
| Regeneron Pharmaceuticals, Inc. | 3.5% | | Institutional Class: | 2.26% | | |
| Incyte Corp. | 3.3% | | Investor Class: | 2.51% | (4) | |
| Wirecard AG | 3.3% | | | | | |
| Toronto-Dominion Bank | 3.1% | | Net | | | |
| | | | Institutional Class: | 0.80% | | |
| | | | Investor Class: | 1.05% | (4) | |
| | | | | | | |
Equity Sector Analysis(2) | | | Country Allocation(2) | | | |
 | | |  | | | |
 | | | |
(1) | The Fund’s portfolio composition is subject to change and there is no assurance that the Fund will continue to hold any particular security. Percentages shown relate to the Fund’s total net assets as of December 31, 2018. |
(2) | Percentages shown in parentheses relate to the Fund’s total value of investments as of December 31, 2018, and may not add up to 100% due to rounding. |
(3) | Reflects expense ratios as stated in the Fund’s current prospectus. The Advisor has contractually agreed to limit the Fund’s total annual fund operating expenses to 0.80% of average daily net assets for the Institutional Class shares and 1.05% of average daily net assets for the Investor Class shares, at least through April 30, 2020. |
(4) | Includes 0.25% 12b-1 fee. |
Chautauqua Global Growth Fund
December 31, 2018 (Unaudited)
Institutional Class
Value of a $25,000 Investment
Growth of a hypothetical investment of $25,000 made on the Fund’s inception date (04/15/16), assuming reinvestment of all distributions.
Investor Class
Value of a $10,000 Investment
Growth of a hypothetical investment of $10,000 made on the Fund’s inception date (04/15/16), assuming reinvestment of all distributions.
Chautauqua Global Growth Fund
December 31, 2018 (Unaudited)
Total Returns
| | | Average |
| | | Annual |
| | | Since |
| For the Periods Ended December 31, 2018 | One Year | Inception(1) |
| Institutional Class Shares | -14.70% | 6.48% |
| Investor Class Shares | -14.86% | 6.23% |
| MSCI ACWI Index | -9.42% | 6.66% |
| (1) | For the period from April 15, 2016 (inception date) through December 31, 2018. |
| (2) | The MSCI ACWI Index is a market-capitalization-weighted index maintained by MSCI, Inc. and designed to provide a broad measure of stock performance throughout the world. The MSCI ACWI Index includes both developed and emerging markets. This index does not reflect any deduction for fees, expenses or taxes. A direct investment in the index is not possible. |
The line graph on the previous page and the returns shown in the table above reflect reinvestment of dividends and/or capital gains distributions in additional shares. The returns do not reflect the deduction of taxes that a shareholder would pay on Fund distributions or the redemption of Fund shares. The returns reflect the actual performance for each period and do not include the impact of trades executed on the last business day of the period that were recorded on the first business day of the next period.
The gross expense ratio for each Class, as reflected in the Fund’s current prospectus, is set forth under “Portfolio Characteristics”.
The Fund focuses on both U.S. and non-U.S. stocks with medium to large market capitalizations and therefore the performance of the Fund may be more volatile than the performance of funds that focus on types of stocks that have a broader investment style. Under normal market conditions, the Fund will invest at least 40% of its total assets in non-U.S. companies. Foreign investments involve additional risks such as currency rate fluctuations and the potential for political and economic instability, and different and sometimes less strict financial reporting standards and regulation. In June 2016, the United Kingdom (UK) voted to leave the European Union (EU) following a referendum referred to as “Brexit.” The exact timeframe for the UK’s exit is unknown. There is significant market uncertainty regarding Brexit’s ramifications, and the range of possible political, regulatory, economic, and market outcomes are difficult to predict. The negative impact could be significant, potentially resulting in increased volatility and illiquidity and lower economic growth for companies that rely significantly on Europe for their business activities and revenues. Other geopolitical events may also cause market disruptions. The portfolio manager for the Fund has over 30 years of experience investing in the global markets and will attempt to minimize the negative impact of these events. However, it is possible that geopolitical events could have an adverse effect on the value of the Fund’s investments.
Past performance does not guarantee future results. Investment return and principal value will fluctuate so that an investor’s shares, when redeemed, may be worth more or less than their original cost.
For information about the performance of the Fund as of the most recent month-end, please call 1-866-44BAIRD or visit www.bairdfunds.com. Mutual fund performance changes over time and current performance may be lower or higher than that stated.
Chautauqua Global Growth Fund
Schedule of Investments, December 31, 2018
Common Stocks
| | | | | | | | | % of | |
| | | Shares | | | Value | | | Net Assets | |
| Apparel Retail | | | | | | | | | |
| TJX Cos, Inc. (United States) | | | 16,122 | | | $ | 721,298 | | | | 1.9 | % |
| Application Software | | | | | | | | | | | | |
Atlassian Corp. PLC (Australia)(1) | | | 7,827 | | | | 696,446 | | | | 1.9 | % |
Temenos Group AG (Switzerland)(2) | | | 16,430 | | | | 1,974,276 | | | | 5.3 | % |
| | | | | | | | 2,670,722 | | | | 7.2 | % |
| Asset Management & Custody Banks | | | | | | | | | | | | |
Julius Baer Group Ltd. (Switzerland)(2) | | | 15,850 | | | | 564,839 | | | | 1.5 | % |
| Automobile Manufacturers | | | | | | | | | | | | |
BYD Co Ltd. (China)(2) | | | 102,639 | | | | 657,446 | | | | 1.8 | % |
| Biotechnology | | | | | | | | | | | | |
Celgene Corp. (United States)(1) | | | 6,112 | | | | 391,718 | | | | 1.0 | % |
Genmab A/S (Denmark)(1)(2) | | | 11,466 | | | | 1,885,246 | | | | 5.0 | % |
Incyte Corp. (United States)(1) | | | 19,351 | | | | 1,230,530 | | | | 3.3 | % |
Regeneron Pharmaceuticals, Inc. (United States)(1) | | | 3,478 | | | | 1,299,033 | | | | 3.5 | % |
| | | | | | | | 4,806,527 | | | | 12.8 | % |
| Cable & Satellite | | | | | | | | | | | | |
Naspers Ltd. (South Africa)(2) | | | 5,753 | | | | 1,151,845 | | | | 3.1 | % |
| Data Processing & Outsourced Services | | | | | | | | | | | | |
Wirecard AG (Germany)(2) | | | 8,121 | | | | 1,224,260 | | | | 3.3 | % |
| Diversified Banks | | | | | | | | | | | | |
Bank Rakyat Indonesia Persero Tbk PT (Indonesia)(2) | | | 2,954,599 | | | | 752,709 | | | | 2.0 | % |
Toronto-Dominion Bank (Canada)(1) | | | 24,511 | | | | 1,218,368 | | | | 3.1 | % |
| | | | | | | | 1,971,077 | | | | 5.1 | % |
| Education Services | | | | | | | | | | | | |
TAL Education Group (China)(1) | | | 33,241 | | | | 886,870 | | | | 2.4 | % |
| Electronic Equipment & Instruments | | | | | | | | | | | | |
Coherent, Inc. (United States)(1) | | | 2,980 | | | | 315,016 | | | | 0.8 | % |
Keyence Corp. (Japan)(2) | | | 2,670 | | | | 1,349,541 | | | | 3.6 | % |
| Universal Display Corp. (United States) | | | 8,718 | | | | 815,743 | | | | 2.2 | % |
| | | | | | | | 2,480,300 | | | | 6.6 | % |
| Healthcare Distributors | | | | | | | | | | | | |
Sinopharm Group Co. Ltd. (China)(2) | | | 100,701 | | | | 423,977 | | | | 1.1 | % |
| Industrial Machinery | | | | | | | | | | | | |
FANUC Corp. (Japan)(2) | | | 3,451 | | | | 523,723 | | | | 1.4 | % |
| Interactive Media & Services | | | | | | | | | | | | |
Alphabet, Inc. – Class A (United States)(1) | | | 744 | | | | 777,450 | | | | 2.1 | % |
The accompanying notes are an integral part of these financial statements.
Chautauqua Global Growth Fund
Schedule of Investments, December 31, 2018
Common Stocks (cont.)
| | | | | | | | | % of | |
| | | Shares | | | Value | | | Net Assets | |
| Internet Retail | | | | | | | | | |
Amazon.com, Inc. (United States)(1) | | | 542 | | | $ | 814,068 | | | | 2.2 | % |
Ctrip.com International Ltd. – ADR (China)(1) | | | 18,405 | | | | 498,039 | | | | 1.3 | % |
| | | | | | | | 1,312,107 | | | | 3.5 | % |
| Investment Banking & Brokerage | | | | | | | | | | | | |
DBS Group Holdings Ltd. (Singapore)(2) | | | 68,390 | | | | 1,189,292 | | | | 3.2 | % |
| IT Consulting & Other Services | | | | | | | | | | | | |
Alibaba Group Holding Ltd. – ADR (China)(1) | | | 4,186 | | | | 573,775 | | | | 1.5 | % |
| MasterCard, Inc. – Class A (United States) | | | 8,828 | | | | 1,665,402 | | | | 4.3 | % |
| | | | | | | | 2,239,177 | | | | 5.8 | % |
| Life Sciences Tools & Services | | | | | | | | | | | | |
Illumina, Inc. (United States)(1) | | | 1,997 | | | | 598,960 | | | | 1.5 | % |
| Oil & Gas Equipment & Services | | | | | | | | | | | | |
| Core Laboratories NV (Netherlands) | | | 19,427 | | | | 1,159,015 | | | | 3.1 | % |
| Schlumberger Limited (Curacao) | | | 14,680 | | | | 529,654 | | | | 1.4 | % |
| | | | | | | | 1,688,669 | | | | 4.5 | % |
| Other Diversified Financial Services | | | | | | | | | | | | |
| Charles Schwab Corp. (United States) | | | 18,546 | | | | 770,215 | | | | 2.1 | % |
| Personal Products | | | | | | | | | | | | |
Amorepacific Corp. (Republic of Korea)(2) | | | 860 | | | | 161,814 | | | | 0.4 | % |
| Pharmaceuticals | | | | | | | | | | | | |
| Allergan PLC (Ireland) | | | 2,429 | | | | 324,660 | | | | 0.9 | % |
| Novo Nordisk A/S – ADR (Denmark) | | | 33,264 | | | | 1,532,473 | | | | 4.1 | % |
| | | | | | | | 1,857,133 | | | | 5.0 | % |
| Professional Services | | | | | | | | | | | | |
Recruit Holdings Co. Ltd. (Japan)(2) | | | 35,281 | | | | 852,344 | | | | 2.3 | % |
| Regional Banks | | | | | | | | | | | | |
| HDFC Bank Ltd. – ADR (India) | | | 10,417 | | | | 1,079,097 | | | | 2.9 | % |
SVB Financial Group (United States)(1) | | | 3,529 | | | | 670,228 | | | | 1.7 | % |
| | | | | | | | 1,749,325 | | | | 4.6 | % |
| Semiconductor Equipment | | | | | | | | | | | | |
| ASML Holding NV (Netherlands) | | | 2,879 | | | | 448,030 | | | | 1.2 | % |
| NVIDIA Corp. (United States) | | | 10,305 | | | | 1,375,717 | | | | 3.7 | % |
| | | | | | | | 1,823,747 | | | | 4.9 | % |
| Semiconductors | | | | | | | | | | | | |
AMS AG (Austria)(2) | | | 38,062 | | | | 916,543 | | | | 2.4 | % |
| Taiwan Semiconductor Manufacturing | | | | | | | | | | | | |
| Co. Ltd. – ADR (Taiwan) | | | 17,340 | | | | 640,019 | | | | 1.7 | % |
| | | | | | | | 1,556,562 | | | | 4.1 | % |
The accompanying notes are an integral part of these financial statements.
Chautauqua Global Growth Fund
Schedule of Investments, December 31, 2018
Common Stocks (cont.)
| | | | | | | | | % of | |
| | | Shares | | | Value | | | Net Assets | |
| Systems Software | | | | | | | | | |
Red Hat, Inc. (United States)(1) | | | 1,631 | | | $ | 286,469 | | | | 0.8 | % |
| Tires & Rubber | | | | | | | | | | | | |
Pirelli & C SpA (Italy)(1)(2) | | | 56,659 | | | | 364,101 | | | | 1.0 | % |
| Total Common Stocks | | | | | | | | | | | | |
| (Cost $39,300,031) | | | | | | | 35,310,249 | | | | 94.0 | % |
| Short-Term Investment | | | | | | | | | | | | |
| Money Market Fund | | | | | | | | | | | | |
| Fidelity Institutional Money Market Fund – | | | | | | | | | | | | |
Government Portfolio, Institutional Class, 2.29%(3) | | | 1,714,455 | | | | 1,714,455 | | | | 4.6 | % |
| Total Short-Term Investment | | | | | | | | | | | | |
| (Cost $1,714,455) | | | | | | | 1,714,455 | | | | 4.6 | % |
| Total Investments | | | | | | | | | | | | |
| (Cost $41,014,486) | | | | | | | 37,024,704 | | | | 98.6 | % |
| Other Assets in Excess of Liabilities | | | | | | | 520,686 | | | | 1.4 | % |
| TOTAL NET ASSETS | | | | | | $ | 37,545,390 | | | | 100.0 | % |
Notes to Schedule of Investments
| (1) | Non-Income Producing. |
| (2) | Level 2 security – See Note 2a to the financial statements. |
| (3) | 7-Day Yield. |
ADR – American Depository Receipt
Industry classifications shown in the Schedule of Investments are based off of the Global Industry Classification Standard (GICS®). GICS® was developed by and/or is the exclusive property of MSCI, Inc.(“MSCI”) and Standard & Poor Financial Services LLC(“S&P”). GICS® is a service mark of MSCI and S&P and has been licensed for use by U.S. Bank Global Fund Services.
The accompanying notes are an integral part of these financial statements.
Chautauqua Global Growth Fund
Schedule of Investments, December 31, 2018
Summary of Fair Value Exposure at December 31, 2018
The Fund has adopted authoritative fair valuation accounting standards which establish a definition of fair value and set out a hierarchy for measuring fair value. These standards require additional disclosures about the various inputs and valuation techniques used to develop the measurements of fair value and a discussion on changes in valuation techniques and related inputs during the period. These standards define fair value as the price that would be received to sell an asset or paid to transfer a liability in an orderly transaction between market participants at the measurement date. Management has determined that these standards have no material impact on the Fund’s financial statements. The fair value hierarchy is organized into three levels based upon the assumptions (referred to as “inputs”) used in pricing the asset or liability. These standards state that “observable inputs” reflect the assumptions market participants would use in pricing the asset or liability based on market data obtained from independent sources and “unobservable inputs” reflect an entity’s own assumptions about the assumptions market participants would use in pricing the asset or liability. These inputs are summarized into three broad levels and described below:
| Level 1 – | Unadjusted quoted prices in active markets for identical unrestricted securities. |
| Level 2 – | Other significant observable inputs (including quoted prices for similar securities, quoted prices in inactive markets, dealer indications, interest rates, yield curves, prepayment speeds, credit risk, default rates, inputs corroborated by observable market data, etc.). |
| Level 3 – | Significant unobservable inputs (including the Fund’s own assumptions about the factors that market participants would use in valuing the security) based on the best information available. |
The inputs or methodology used for valuing securities are not necessarily an indication of the risk associated with investing in those securities.
The following is a summary of the inputs used to value the Fund’s investments as of December 31, 2018:
| | | Level 1 | | | Level 2 | | | Level 3 | | | Total | |
| Equity | | | | | | | | | | | | |
| Common Stocks | | $ | 21,318,293 | | | $ | 13,991,956 | | | $ | — | | | $ | 35,310,249 | |
| Total Equity | | | 21,318,293 | | | | 13,991,956 | | | | — | | | | 35,310,249 | |
| Short-Term Investment | | | | | | | | | | | | | | | | |
| Money Market Fund | | | 1,714,455 | | | | — | | | | — | | | | 1,714,455 | |
| Total Short-Term Investment | | | 1,714,455 | | | | — | | | | — | | | | 1,714,455 | |
| Total Investments* | | $ | 23,032,748 | | | $ | 13,991,956 | | | $ | — | | | $ | 37,024,704 | |
| * | Additional information regarding the industry classifications of these investments is disclosed in the Schedule of Investments. |
Changes in valuation techniques may result in transfers into or out of assigned levels within the fair value hierarchy. There were no transfers into or out of Level 3 during the reporting period, as compared to the security classifications from the prior year’s annual report. See the Fund’s Valuation Policy in Note 2a to the financial statements.
The accompanying notes are an integral part of these financial statements.
Additional Information on Fund Expenses
December 31, 2018 (Unaudited)
Example
As a shareholder of a mutual fund, you incur two types of costs: (1) transaction costs, which may include sales charges (loads) on purchase payments, reinvested dividends, or other distributions; redemption fees; and exchange fees; and (2) ongoing costs, such as management fees; distribution and/or service (12b-1) fees; and other fund expenses. Although, with the exception of the Chautauqua International Growth and Chautauqua Global Growth Funds which charge redemption fees, the Funds do not charge any sales loads, redemption fees, or other transaction fees, you will be assessed fees for outgoing wire transfers, returned checks and stop payment orders at prevailing rates charged by U.S. Bancorp Fund Services, LLC, doing business as U.S. Bank Global Fund Services, the Funds’ transfer agent. If you request that a redemption be made by wire transfer, currently the Funds’ transfer agent charges a $15.00 fee.
This Example is intended to help you understand your ongoing costs (in dollars) of investing in each Fund and to compare these costs with the ongoing costs of investing in other mutual funds. The Example is based on an investment of $1,000 invested at the beginning of the period and held for the entire period (7/1/18 – 12/31/18).
Actual Expenses
The third and fourth columns of the following table provide information about account values based on actual returns and actual expenses. You may use the information in these columns, together with the amount you invested, to estimate the expenses that you paid over the period. Simply divide your account value by $1,000 (for example, an $8,600 account value divided by $1,000 = 8.6), then multiply the result by the number in the fourth column entitled “Expenses Paid During Period” to estimate the expenses you paid on your account during this period.
Hypothetical Example for Comparison Purposes
The fifth and sixth columns of the following table provide information about hypothetical account values and hypothetical expenses based on the Funds’ actual expense ratios and an assumed rate of return of 5% per year before expenses, which is not the Funds’ actual return. The hypothetical account values and expenses may not be used to estimate the actual ending account balance or expenses you paid for the period. You may use this information to compare the ongoing costs of investing in the Funds and other mutual funds. To do so, compare this 5% hypothetical example with the 5% hypothetical examples that appear in the shareholder reports of the other mutual funds. Please note that the expenses shown in the table are meant to highlight your ongoing costs only and do not reflect any transactional costs. Therefore, the sixth column of the table (entitled “Expenses Paid During Period”) is useful in comparing ongoing costs only, and will not help you determine the relative total costs of owning different mutual funds. In addition, if these transactional costs were included, your costs could have been higher.
Additional Information on Fund Expenses
December 31, 2018 (Unaudited)
Actual vs. Hypothetical Returns
For the Six Months Ended December 31, 2018
| | | | | | | Hypothetical |
| | | | | | | (5% return |
| | | | | Actual | before expenses) |
| | | Fund’s | Beginning | Ending | Expenses | Ending | Expenses |
| | | Annualized | Account | Account | Paid | Account | Paid |
| | | Expense | Value | Value | During | Value | During |
| | | Ratio(1) | 7/1/18 | 12/31/18 | Period(1) | 12/31/18 | Period(1) |
| Baird MidCap Fund | | | | | | |
| | Institutional Class | 0.81% | $1,000.00 | $920.50 | $3.92 | $1,021.12 | $4.13 |
| | Investor Class | 1.06% | $1,000.00 | $919.40 | $5.13 | $1,019.86 | $5.40 |
| | | | | | | |
| Baird Small/Mid Cap | | | | | | |
| Growth Fund | | | | | | |
| | Institutional Class | 0.85% | $1,000.00 | $895.00 | $1.35(2) | $1,020.92 | $4.33 |
| | Investor Class | 1.10% | $1,000.00 | $894.00 | $1.74(2) | $1,019.66 | $5.60 |
| | | | | | | |
| Baird Small/Mid Cap | | | | | | |
Value Fund(3) | | | | | | |
| | Institutional Class | 0.93% | $1,000.00 | $848.90 | $4.33 | $1,020.52 | $4.74 |
| | Investor Class | 1.18% | $1,000.00 | $848.20 | $5.50 | $1,019.26 | $6.01 |
| | | | | | | |
| Baird SmallCap | | | | | | |
Value Fund(3) | | | | | | |
| | Institutional Class | 0.99% | $1,000.00 | $823.80 | $4.55 | $1,020.21 | $5.04 |
| | Investor Class | 1.24% | $1,000.00 | $822.30 | $5.70 | $1,018.95 | $6.31 |
| | | | | | | |
| Chautauqua International | | | | | | |
Growth Fund(3) | | | | | | |
| | Institutional Class | 0.93% | $1,000.00 | $824.00 | $4.28 | $1,020.52 | $4.74 |
| | Investor Class | 1.18% | $1,000.00 | $822.60 | $5.42 | $1,019.26 | $6.01 |
| | | | | | | |
| Chautauqua Global | | | | | | |
Growth Fund(3) | | | | | | |
| | Institutional Class | 0.93% | $1,000.00 | $846.70 | $4.33 | $1,020.52 | $4.74 |
| | Investor Class | 1.18% | $1,000.00 | $846.30 | $5.49 | $1,019.26 | $6.01 |
| (1) | For each fund except the Baird Small/Mid Cap Growth Fund expenses are equal to the Fund’s annualized net expense ratio multiplied by the average account value over the period, multiplied by 184 days and divided by 365 to reflect the one-half year period. |
| (2) | Expenses are equal to the Baird Small/Mid Cap Growth Fund’s annualized net expense ratio multiplied by the average account value over the period, multiplied by 61/365 to reflect the period since the Fund’s inception on October 31, 2018. For comparative purposes only, the actual expenses would be $4.06 and $5.25 for the Institutional Class and Investor Class, respectively, reflecting the one-half year period (184/365). |
| (3) | Effective December 1, 2018, the Fund’s expense limit was reduced during the period, which affected the expense ratio. See Note 5. |
Statements of Assets and Liabilities
December 31, 2018
| | | | | | Baird | |
| | | Baird | | | Small/Mid | |
| | | MidCap | | | Cap Growth | |
| | | Fund | | | Fund | |
| ASSETS: | | | | | | |
| Investments, at value (cost $1,199,892,564 | | | | | | |
| and $8,130,417, respectively) | | $ | 1,447,524,529 | | | $ | 7,440,395 | |
| Dividends receivable | | | 421,309 | | | | 2,495 | |
| Interest receivable | | | 103,219 | | | | 869 | |
| Receivable for Fund shares sold | | | 4,600,964 | | | | — | |
| Receivable from Advisor, net (Note 5) | | | — | | | | 12,278 | |
| Prepaid expenses and other assets | | | 16,725 | | | | — | |
| Total assets | | | 1,452,666,746 | | | | 7,456,037 | |
| LIABILITIES: | | | | | | | | |
| Payable for securities purchased | | | 14,827,183 | | | | 133,732 | |
| Payable for Fund shares redeemed | | | 3,886,994 | | | | — | |
| Payable to Advisor, net (Note 5) | | | 931,693 | | | | — | |
| Payable to Directors | | | 170 | | | | 4,203 | |
| Accrued Rule 12b-1 fees (Note 7) | | | 44,689 | | | | 4 | |
| Accrued fund accounting and administration fees | | | 24,327 | | | | 2,196 | |
| Accrued shareholder servicing fees | | | 64,002 | | | | 1,891 | |
| Accrued professional fees | | | 16,798 | | | | 16,592 | |
| Accrued expenses and other liabilities | | | 38,308 | | | | 7,314 | |
| Total liabilities | | | 19,834,164 | | | | 165,932 | |
| NET ASSETS | | $ | 1,432,832,582 | | | $ | 7,290,105 | |
| NET ASSETS CONSIST OF: | | | | | | | | |
| Paid-in capital | | $ | 1,169,880,571 | | | $ | 8,010,856 | |
| Total distributable earnings (loss) | | | 262,952,011 | | | | (720,751 | ) |
| NET ASSETS | | $ | 1,432,832,582 | | | $ | 7,290,105 | |
| INSTITUTIONAL CLASS SHARES | | | | | | | | |
| Net Assets | | $ | 1,337,351,279 | | | $ | 7,281,163 | |
| Shares outstanding ($0.01 par value, | | | | | | | | |
| unlimited shares authorized) | | | 75,459,579 | | | | 813,957 | |
| Net asset value, offering and redemption price per share | | $ | 17.72 | | | $ | 8.95 | |
| INVESTOR CLASS SHARES | | | | | | | | |
| Net Assets | | $ | 95,481,303 | | | $ | 8,942 | |
| Shares outstanding ($0.01 par value, | | | | | | | | |
| unlimited shares authorized) | | | 5,697,191 | | | | 1,000 | |
| Net asset value, offering and redemption price per share | | $ | 16.76 | | | $ | 8.94 | |
The accompanying notes are an integral part of these financial statements.
Statements of Assets and Liabilities
December 31, 2018
| | | Baird | | | | |
| | | Small/Mid | | | Baird | |
| | | Cap Value | | | SmallCap | |
| | | Fund | | | Value Fund | |
| ASSETS: | | | | | | |
| Investments, at value (cost $16,635,498 | | | | | | |
| and $25,038,644, respectively) | | $ | 17,390,458 | | | $ | 28,797,607 | |
| Dividends receivable | | | 35,025 | | | | 73,329 | |
| Interest receivable | | | 3,508 | | | | 7,587 | |
| Receivable for investments sold | | | — | | | | 740,448 | |
| Receivable from Advisor, net (Note 5) | | | 357 | | | | — | |
| Prepaid expenses and other assets | | | 17,125 | | | | 5,424 | |
| Total assets | | | 17,446,473 | | | | 29,624,395 | |
| LIABILITIES: | | | | | | | | |
| Payable for securities purchased | | | — | | | | — | |
| Payable for Fund shares redeemed | | | 17,497 | | | | 71,720 | |
| Payable to Advisor, net (Note 5) | | | — | | | | 9,378 | |
| Payable to Directors | | | 169 | | | | 153 | |
| Accrued Rule 12b-1 fees (Note 7) | | | 122 | | | | 707 | |
| Accrued fund accounting and administration fees | | | 2,937 | | | | 3,045 | |
| Accrued shareholder servicing fees | | | 2,583 | | | | 2,742 | |
| Accrued professional fees | | | 16,764 | | | | 16,747 | |
| Accrued expenses and other liabilities | | | 4,260 | | | | 7,238 | |
| Total liabilities | | | 44,332 | | | | 111,730 | |
| NET ASSETS | | $ | 17,402,141 | | | $ | 29,512,665 | |
| NET ASSETS CONSIST OF: | | | | | | | | |
| Paid-in capital | | $ | 17,448,726 | | | $ | 26,532,863 | |
| Total distributable earnings (loss) | | | (46,585 | ) | | | 2,979,802 | |
| NET ASSETS | | $ | 17,402,141 | | | $ | 29,512,665 | |
| INSTITUTIONAL CLASS SHARES | | | | | | | | |
| Net Assets | | $ | 17,060,597 | | | $ | 28,754,062 | |
| Shares outstanding ($0.01 par value, | | | | | | | | |
| unlimited shares authorized) | | | 1,622,751 | | | | 2,118,010 | |
| Net asset value, offering and redemption price per share | | $ | 10.51 | | | $ | 13.58 | |
| INVESTOR CLASS SHARES | | | | | | | | |
| Net Assets | | $ | 341,544 | | | $ | 758,603 | |
| Shares outstanding ($0.01 par value, | | | | | | | | |
| unlimited shares authorized) | | | 32,587 | | | | 55,851 | |
| Net asset value, offering and redemption price per share | | $ | 10.48 | | | $ | 13.58 | |
The accompanying notes are an integral part of these financial statements.
Statements of Assets and Liabilities
December 31, 2018
| | | Chautauqua | | | Chautauqua | |
| | | International | | | Global | |
| | | Growth Fund | | | Growth Fund | |
| ASSETS: | | | | | | |
| Investments, at value (cost $94,005,145 | | | | | | |
| and $41,014,486, respectively) | | $ | 86,345,840 | | | $ | 37,024,704 | |
| Foreign Currency, at value (cost $64,595 | | | | | | | | |
| and $36,596, respectively) | | | 59,619 | | | | 37,024 | |
| Dividends receivable | | | 74,963 | | | | 12,077 | |
| Interest receivable | | | 11,643 | | | | 2,650 | |
| Receivable for Fund shares sold | | | 1,460,521 | | | | 550,832 | |
| Prepaid expenses and other assets | | | 9,434 | | | | 7,181 | |
| Total assets | | | 87,962,020 | | | | 37,634,468 | |
| LIABILITIES: | | | | | | | | |
| Payable for Fund shares redeemed | | | 363,894 | | | | 51,274 | |
| Payable to Advisor, net (Note 5) | | | 29,332 | | | | 6,437 | |
| Payable to Directors | | | 147 | | | | 156 | |
| Payable for distributions | | | 654 | | | | — | |
| Accrued Rule 12b-1 fees (Note 7) | | | 1,566 | | | | 490 | |
| Accrued fund accounting and administration fees | | | 2,470 | | | | 2,754 | |
| Accrued shareholder servicing fees | | | 2,229 | | | | 1,880 | |
| Accrued professional fees | | | 18,811 | | | | 18,809 | |
| Accrued expenses and other liabilities | | | 15,427 | | | | 7,278 | |
| Total liabilities | | | 434,530 | | | | 89,078 | |
| NET ASSETS | | $ | 87,527,490 | | | $ | 37,545,390 | |
| NET ASSETS CONSIST OF: | | | | | | | | |
| Paid-in capital | | $ | 95,778,466 | | | $ | 41,460,788 | |
| Total distributable earnings (loss) | | | (8,250,976 | ) | | | (3,915,398 | ) |
| NET ASSETS | | $ | 87,527,490 | | | $ | 37,545,390 | |
| INSTITUTIONAL CLASS SHARES | | | | | | | | |
| Net Assets | | $ | 85,380,463 | | | $ | 36,831,533 | |
| Shares outstanding ($0.01 par value, | | | | | | | | |
| unlimited shares authorized) | | | 8,395,206 | | | | 3,261,643 | |
| Net asset value, offering and redemption price per share* | | $ | 10.17 | | | $ | 11.29 | |
| INVESTOR CLASS SHARES | | | | | | | | |
| Net Assets | | $ | 2,147,027 | | | $ | 713,857 | |
| Shares outstanding ($0.01 par value, | | | | | | | | |
| unlimited shares authorized) | | | 211,470 | | | | 63,636 | |
| Net asset value, offering and redemption price per share* | | $ | 10.15 | | | $ | 11.22 | |
| * | Redemptions made within 90 days of purchase may be assessed a redemption fee of 2.00% (See Note 8). |
The accompanying notes are an integral part of these financial statements.
Statements of Operations
Year Ended December 31, 2018
| | | | | | Baird | |
| | | Baird | | | Small/Mid | |
| | | MidCap | | | Cap Growth | |
| | | Fund | | | Fund^ | |
| INVESTMENT INCOME: | | | | | | |
| Dividends | | $ | 9,091,342 | | | $ | 7,372 | |
| Interest | | | 913,791 | | | | 1,358 | |
| Total investment income | | | 10,005,133 | | | | 8,730 | |
| | | | | | | | | |
| EXPENSES: | | | | | | | | |
| Investment advisory fees (Note 5) | | | 11,334,757 | | | | 8,010 | |
| Fund accounting and administration fees | | | 148,612 | | | | 2,196 | |
| Shareholder servicing fees | | | 545,850 | | | | 1,891 | |
| Professional fees | | | 31,835 | | | | 16,592 | |
| Federal and state registration | | | 62,954 | | | | 6,222 | |
| Directors fees | | | 58,980 | | | | 5,002 | |
| Custody fees | | | 20,609 | | | | 671 | |
| Reports to shareholders | | | 78,513 | | | | 610 | |
| Miscellaneous expenses | | | 2,315 | | | | 161 | |
| Rule 12b-1 Fees- Investor Class Shares (Note 7) | | | 280,653 | | | | 4 | |
| Total expenses | | | 12,565,078 | | | | 41,359 | |
| Fee waiver by Advisor (Note 5) | | | — | | | | (32,277 | ) |
| Net expenses | | | 12,565,078 | | | | 9,082 | |
| NET INVESTMENT LOSS | | | (2,559,945 | ) | | | (352 | ) |
| | | | | | | | | |
| REALIZED AND UNREALIZED | | | | | | | | |
| GAIN (LOSS) ON INVESTMENTS: | | | | | | | | |
| Net realized gain (loss) on investments | | | 100,449,663 | | | | (30,729 | ) |
| Net change in unrealized depreciation on investments | | | (128,172,350 | ) | | | (690,022 | ) |
| Net realized and unrealized loss on investments | | | (27,722,687 | ) | | | (720,751 | ) |
| NET DECREASE IN NET ASSETS | | | | | | | | |
| RESULTING FROM OPERATIONS | | $ | (30,282,632 | ) | | $ | (721,103 | ) |
| ^ | For the period from close of business on October 31, 2018 (inception date) through December 31, 2018. |
The accompanying notes are an integral part of these financial statements.
Statements of Operations
Year Ended December 31, 2018
| | | Baird | | | | |
| | | Small/Mid | | | Baird | |
| | | Cap Value | | | SmallCap | |
| | | Fund | | | Value Fund | |
| INVESTMENT INCOME: | | | | | | |
| Dividends (net of issuance fees and/or foreign taxes | | | | | | |
| withheld of $3,269 and $8,271, respectively) | | $ | 221,310 | | | $ | 420,386 | |
| Interest | | | 19,272 | | | | 37,017 | |
| Total investment income | | | 240,582 | | | | 457,403 | |
| | | | | | | | | |
| EXPENSES: | | | | | | | | |
| Investment advisory fees (Note 5) | | | 149,761 | | | | 300,726 | |
| Fund accounting and administration fees | | | 19,941 | | | | 21,510 | |
| Shareholder servicing fees | | | 15,622 | | | | 16,943 | |
| Professional fees | | | 31,834 | | | | 31,927 | |
| Federal and state registration | | | 46,123 | | | | 44,454 | |
| Directors fees | | | 59,287 | | | | 59,239 | |
| Custody fees | | | 3,957 | | | | 2,240 | |
| Reports to shareholders | | | 1,462 | | | | 1,553 | |
| Miscellaneous expenses | | | 1,037 | | | | 9,472 | |
| Rule 12b-1 Fees- Investor Class Shares (Note 7) | | | 416 | | | | 4,818 | |
| Total expenses | | | 329,440 | | | | 492,882 | |
| Fee waiver by Advisor (Note 5) | | | (151,826 | ) | | | (135,562 | ) |
| Net expenses | | | 177,614 | | | | 357,320 | |
| NET INVESTMENT INCOME | | | 62,968 | | | | 100,083 | |
| | | | | | | | | |
| REALIZED AND UNREALIZED | | | | | | | | |
| LOSS ON INVESTMENTS: | | | | | | | | |
| Net realized loss on investments | | | (769,328 | ) | | | (267,801 | ) |
| Net change in unrealized depreciation on investments | | | (2,354,666 | ) | | | (5,801,768 | ) |
| Net realized and unrealized loss on investments | | | (3,123,994 | ) | | | (6,069,569 | ) |
| NET DECREASE IN NET ASSETS | | | | | | | | |
| RESULTING FROM OPERATIONS | | $ | (3,061,026 | ) | | $ | (5,969,486 | ) |
The accompanying notes are an integral part of these financial statements.
Statements of Operations
Year Ended December 31, 2018
| | | Chautauqua | | | Chautauqua | |
| | | International | | | Global | |
| | | Growth Fund | | | Growth Fund | |
| INVESTMENT INCOME: | | | | | | |
| Dividends (net of issuance fees and/or foreign taxes | | | | | | |
| withheld of $130,951 and $32,818, respectively) | | $ | 1,197,261 | | | $ | 334,584 | |
| Interest | | | 99,269 | | | | 31,936 | |
| Other income | | | 1,371 | | | | 439 | |
| Total investment income | | | 1,297,901 | | | | 366,959 | |
| | | | | | | | | |
| EXPENSES: | | | | | | | | |
| Investment advisory fees (Note 5) | | | 713,668 | | | | 306,607 | |
| Fund accounting and administration fees | | | 29,465 | | | | 25,772 | |
| Shareholder servicing fees | | | 25,515 | | | | 14,892 | |
| Professional fees | | | 33,857 | | | | 33,857 | |
| Federal and state registration | | | 59,803 | | | | 53,396 | |
| Directors fees | | | 58,964 | | | | 59,148 | |
| Custody fees | | | 28,410 | | | | 20,372 | |
| Reports to shareholders | | | 3,479 | | | | 1,737 | |
| Miscellaneous expenses | | | 4,013 | | | | 1,292 | |
| Rule 12b-1 Fees- Investor Class Shares (Note 7) | | | 6,614 | | | | 2,184 | |
| Total expenses | | | 963,788 | | | | 519,257 | |
| Fee waiver by Advisor (Note 5) | | | (116,439 | ) | | | (155,834 | ) |
| Net expenses | | | 847,349 | | | | 363,423 | |
| NET INVESTMENT INCOME | | | 450,552 | | | | 3,536 | |
| | | | | | | | | |
| REALIZED AND UNREALIZED | | | | | | | | |
| GAIN (LOSS) ON INVESTMENTS AND | | | | | | | | |
| FOREIGN CURRENCY TRANSLATION: | | | | | | | | |
| Net realized gain (loss) on: | | | | | | | | |
| Investments | | | 269,360 | | | | 183,394 | |
| Foreign currency translation | | | (4,658 | ) | | | 3,022 | |
| Net change in unrealized appreciation (depreciation) on: | | | | | | | | |
| Investments | | | (18,733,075 | ) | | | (6,873,910 | ) |
| Foreign currency translation | | | (5,373 | ) | | | 583 | |
| Net realized and unrealized loss on investments | | | | | | | | |
| and foreign currency translation | | | (18,473,746 | ) | | | (6,686,911 | ) |
| NET DECREASE IN NET ASSETS | | | | | | | | |
| RESULTING FROM OPERATIONS | | $ | (18,023,194 | ) | | $ | (6,683,375 | ) |
The accompanying notes are an integral part of these financial statements.
Statements of Changes in Net Assets
Baird MidCap Fund
| | | Year Ended | | | Year Ended | |
| | | December 31, 2018 | | | December 31, 2017 | |
| OPERATIONS: | | | | | | |
| Net investment loss | | $ | (2,559,945 | ) | | $ | (2,569,252 | ) |
| Net realized gain on investments | | | 100,449,663 | | | | 143,972,259 | |
| Net change in unrealized appreciation | | | | | | | | |
| (depreciation) on investments | | | (128,172,350 | ) | | | 183,589,368 | |
| Net increase (decrease) in net | | | | | | | | |
| assets resulting from operations | | | (30,282,632 | ) | | | 324,992,375 | |
| | | | | | | | | |
| CAPITAL SHARE TRANSACTIONS: | | | | | | | | |
| Proceeds from shares sold | | | 392,164,539 | | | | 349,351,022 | |
| Shares issued to holders in reinvestment of distributions | | | 66,692,305 | | | | 47,937,259 | |
| Cost of shares redeemed | | | (301,065,629 | ) | | | (511,066,587 | ) |
| Net increase (decrease) in net assets resulting | | | | | | | | |
| from capital share transactions | | | 157,791,215 | | | | (113,778,306 | ) |
| | | | | | | | | |
| DISTRIBUTIONS TO SHAREHOLDERS: | | | | | | | | |
| Net distributions to shareholders: | | | | | | | | |
| Institutional Class | | | (79,739,254 | ) | | | (57,234,919 | ) |
| Investor Class | | | (5,918,540 | ) | | | (5,225,266 | ) |
| Total net distributions to shareholders (a) | | | (85,657,794 | ) | | | (62,460,185 | ) |
| | | | | | | | | |
| TOTAL INCREASE IN NET ASSETS | | | 41,850,789 | | | | 148,753,884 | |
| | | | | | | | | |
| NET ASSETS: | | | | | | | | |
| Beginning of year | | | 1,390,981,793 | | | | 1,242,227,909 | |
| End of year (b) | | $ | 1,432,832,582 | | | $ | 1,390,981,793 | |
| (a) | Distributions from net investment income and from net realized gains are no longer required to be separately disclosed. See Note 2. For the year ended December 31, 2017, total distributions to shareholders represented distributions from net realized gains of $57,234,919 and $5,225,266 for the Institutional Class and Investor Class, respectively. |
| (b) | Parenthetical disclosure of accumulated undistributed net investment income is no longer required. See Note 2. For the year ended December 31, 2017, end of year net assets included accumulated undistributed net investment income of $0. |
The accompanying notes are an integral part of these financial statements.
Statement of Changes in Net Assets
Baird Small/Mid Cap Growth Fund
| | | October 31, 2018^ | |
| | | through | |
| | | December 31, 2018 | |
| OPERATIONS: | | | |
| Net investment loss | | $ | (352 | ) |
| Net realized loss on investments | | | (30,729 | ) |
| Net change in unrealized depreciation on investments | | | (690,022 | ) |
| Net decrease in net assets resulting from operations | | | (721,103 | ) |
| | | | | |
| CAPITAL SHARE TRANSACTIONS: | | | | |
| Proceeds from shares sold | | | 8,011,208 | |
| Net increase in net assets resulting from capital share transactions | | | 8,011,208 | |
| | | | | |
| TOTAL INCREASE IN NET ASSETS | | | 7,290,105 | |
| | | | | |
| NET ASSETS: | | | | |
| Beginning of period | | | — | |
| End of period | | $ | 7,290,105 | |
| ^ | Inception was the close of business on October 31, 2018. |
The accompanying notes are an integral part of these financial statements.
Statements of Changes in Net Assets
Baird Small/Mid Cap Value Fund
| | | Year Ended | | | Year Ended | |
| | | December 31, 2018 | | | December 31, 2017 | |
| OPERATIONS: | | | | | | |
| Net investment income | | $ | 62,968 | | | $ | 83,134 | |
| Net realized gain (loss) on investments | | | (769,328 | ) | | | 412,449 | |
| Net change in unrealized appreciation | | | | | | | | |
| (depreciation) on investments | | | (2,354,666 | ) | | | 2,099,758 | |
| Net increase (decrease) in net | | | | | | | | |
| assets resulting from operations | | | (3,061,026 | ) | | | 2,595,341 | |
| | | | | | | | | |
| CAPITAL SHARE TRANSACTIONS: | | | | | | | | |
| Proceeds from shares sold | | | 4,915,798 | | | | 6,798,695 | |
| Shares issued to holders in reinvestment of distributions | | | 57,485 | | | | 75,423 | |
| Cost of shares redeemed | | | (1,387,954 | ) | | | (4,405,931 | ) |
| Net increase in net assets resulting | | | | | | | | |
| from capital share transactions | | | 3,585,329 | | | | 2,468,187 | |
| | | | | | | | | |
| DISTRIBUTIONS TO SHAREHOLDERS: | | | | | | | | |
| Net distributions to shareholders: | | | | | | | | |
| Institutional Class | | | (66,490 | ) | | | (84,938 | ) |
| Investor Class | | | (916 | ) | | | (324 | ) |
| Total net distributions to shareholders (a) | | | (67,406 | ) | | | (85,262 | ) |
| | | | | | | | | |
| TOTAL INCREASE IN NET ASSETS | | | 456,897 | | | | 4,978,266 | |
| | | | | | | | | |
| NET ASSETS: | | | | | | | | |
| Beginning of year | | | 16,945,244 | | | | 11,966,978 | |
| End of year (b) | | $ | 17,402,141 | | | $ | 16,945,244 | |
| (a) | Distributions from net investment income and from net realized gains are no longer required to be separately disclosed. See Note 2. For the year ended December 31, 2017, total distributions to shareholders represented distributions from net investment income of $81,188 and $310 for the Institutional Class and Investor Class, respectively, and distributions from net realized gains of $3,750 and $14 for the Institutional Class and Investor Class, respectively. |
| (b) | Parenthetical disclosure of accumulated undistributed net investment income is no longer required. See Note 2. For the year ended December 31, 2017, end of year net assets included accumulated undistributed net investment income of $0. |
The accompanying notes are an integral part of these financial statements.
Statements of Changes in Net Assets
Baird SmallCap Value Fund
| | | Year Ended | | | Year Ended | |
| | | December 31, 2018 | | | December 31, 2017 | |
| OPERATIONS: | | | | | | |
| Net investment income | | $ | 100,083 | | | $ | 185,540 | |
| Net realized gain (loss) on investments | | | (267,801 | ) | | | 1,935,024 | |
| Net change in unrealized appreciation | | | | | | | | |
| (depreciation) on investments | | | (5,801,768 | ) | | | 3,236,935 | |
| Net increase (decrease) in net | | | | | | | | |
| assets resulting from operations | | | (5,969,486 | ) | | | 5,357,499 | |
| | | | | | | | | |
| CAPITAL SHARE TRANSACTIONS: | | | | | | | | |
| Proceeds from shares sold | | | 5,898,926 | | | | 4,358,641 | |
| Shares issued to holders in reinvestment of distributions | | | 1,080,830 | | | | 879,036 | |
| Cost of shares redeemed | | | (6,447,965 | ) | | | (4,203,475 | ) |
| Net increase in net assets resulting | | | | | | | | |
| from capital share transactions | | | 531,791 | | | | 1,034,202 | |
| | | | | | | | | |
| DISTRIBUTIONS TO SHAREHOLDERS: | | | | | | | | |
| Net distributions to shareholders: | | | | | | | | |
| Institutional Class | | | (1,237,636 | ) | | | (951,323 | ) |
| Investor Class | | | (29,670 | ) | | | (71,607 | ) |
| Total net distributions to shareholders (a) | | | (1,267,306 | ) | | | (1,022,930 | ) |
| | | | | | | | | |
| TOTAL INCREASE (DECREASE) IN NET ASSETS | | | (6,705,001 | ) | | | 5,368,771 | |
| | | | | | | | | |
| NET ASSETS: | | | | | | | | |
| Beginning of year | | | 36,217,666 | | | | 30,848,895 | |
| End of year (b) | | $ | 29,512,665 | | | $ | 36,217,666 | |
| (a) | Distributions from net investment income and from net realized gains are no longer required to be separately disclosed. See Note 2. For the year ended December 31, 2017, total distributions to shareholders represented distributions from net investment income of $173,048 and $8,072 for the Institutional Class and Investor Class, respectively, and distributions from net realized gains of $778,275 and $63,535 for the Institutional Class and Investor Class, respectively. |
| (b) | Parenthetical disclosure of accumulated undistributed net investment income is no longer required. See Note 2. For the year ended December 31, 2017, end of year net assets included accumulated undistributed net investment income of $0. |
The accompanying notes are an integral part of these financial statements.
Statements of Changes in Net Assets
Chautauqua International Growth Fund
| | | Year Ended | | | Year Ended | |
| | | December 31, 2018 | | | December 31, 2017 | |
| OPERATIONS: | | | | | | |
| Net investment income | | $ | 450,552 | | | $ | 163,385 | |
| Net realized gain on investments | | | | | | | | |
| and foreign currency translation | | | 264,702 | | | | 3,676,719 | |
| Net change in unrealized appreciation (depreciation) | | | | | | | | |
| on investments and foreign currency translation | | | (18,738,448 | ) | | | 11,425,067 | |
| Net increase (decrease) in net assets | | | | | | | | |
| resulting from operations | | | (18,023,194 | ) | | | 15,265,171 | |
| | | | | | | | | |
| CAPITAL SHARE TRANSACTIONS: | | | | | | | | |
| Proceeds from shares sold | | | 48,697,664 | | | | 54,726,978 | |
| Shares issued to holders in reinvestment of distributions | | | 2,166,040 | | | | 2,307,063 | |
| Cost of shares redeemed | | | (18,778,472 | ) | | | (9,195,880 | ) |
| Redemption fees | | | 20,170 | | | | 11,284 | |
| Net increase in net assets resulting | | | | | | | | |
| from capital share transactions | | | 32,105,402 | | | | 47,849,445 | |
| | | | | | | | | |
| DISTRIBUTIONS TO SHAREHOLDERS: | | | | | | | | |
| Net distributions to shareholders: | | | | | | | | |
| Institutional Class | | | (2,302,815 | ) | | | (2,415,633 | ) |
| Investor Class | | | (56,232 | ) | | | (51,956 | ) |
| Total net distributions to shareholders (a) | | | (2,359,047 | ) | | | (2,467,589 | ) |
| | | | | | | | | |
| TOTAL INCREASE IN NET ASSETS | | | 11,723,161 | | | | 60,647,027 | |
| | | | | | | | | |
| NET ASSETS: | | | | | | | | |
| Beginning of year | | | 75,804,329 | | | | 15,157,302 | |
| End of year (b) | | $ | 87,527,490 | | | $ | 75,804,329 | |
| (a) | Distributions from net investment income and from net realized gains are no longer required to be separately disclosed. See Note 2. For the year ended December 31, 2017, total distributions to shareholders represented distributions from net investment income of $121,984 and $555 for the Institutional Class and Investor Class, respectively, and distributions from net realized gains of $2,293,649 and $51,401 for the Institutional Class and Investor Class, respectively. |
| (b) | Parenthetical disclosure of accumulated undistributed net investment income is no longer required. See Note 2. For the year ended December 31, 2017, end of year net assets included accumulated undistributed net investment income of $9,553. |
The accompanying notes are an integral part of these financial statements.
Statements of Changes in Net Assets
Chautauqua Global Growth Fund
| | | Year Ended | | | Year Ended | |
| | | December 31, 2018 | | | December 31, 2017 | |
| OPERATIONS: | | | | | | |
| Net investment income (loss) | | $ | 3,536 | | | $ | (40,268 | ) |
| Net realized gain on investments | | | | | | | | |
| and foreign currency translation | | | 186,416 | | | | 1,239,743 | |
| Net change in unrealized appreciation (depreciation) | | | | | | | | |
| on investments and foreign currency translation | | | (6,873,327 | ) | | | 2,700,039 | |
| Net increase (decrease) in net | | | | | | | | |
| assets resulting from operations | | | (6,683,375 | ) | | | 3,899,514 | |
| | | | | | | | | |
| CAPITAL SHARE TRANSACTIONS: | | | | | | | | |
| Proceeds from shares sold | | | 26,064,150 | | | | 13,308,152 | |
| Shares issued to holders in reinvestment of distributions | | | 479,031 | | | | 582,584 | |
| Cost of shares redeemed | | | (5,699,015 | ) | | | (1,065,485 | ) |
| Redemption fees | | | 6,311 | | | | 965 | |
| Net increase in net assets resulting | | | | | | | | |
| from capital share transactions | | | 20,850,477 | | | | 12,826,216 | |
| | | | | | | | | |
| DISTRIBUTIONS TO SHAREHOLDERS: | | | | | | | | |
| Net distributions to shareholders: | | | | | | | | |
| Institutional Class | | | (518,434 | ) | | | (645,449 | ) |
| Investor Class | | | (10,060 | ) | | | (22,310 | ) |
| Total net distributions to shareholders (a) | | | (528,494 | ) | | | (667,759 | ) |
| | | | | | | | | |
| TOTAL INCREASE IN NET ASSETS | | | 13,638,608 | | | | 16,057,971 | |
| | | | | | | | | |
| NET ASSETS: | | | | | | | | |
| Beginning of year | | | 23,906,782 | | | | 7,848,811 | |
| End of year (b) | | $ | 37,545,390 | | | $ | 23,906,782 | |
| (a) | Distributions from net investment income and from net realized gains are no longer required to be separately disclosed. See Note 2. For the year ended December 31, 2017, total distributions to shareholders represented distributions from net realized gains of $645,449 and $22,310 for the Institutional Class and Investor Class, respectively. |
| (b) | Parenthetical disclosure of accumulated undistributed net investment income is no longer required. See Note 2. For the year ended December 31, 2017, end of year net assets included accumulated undistributed net investment loss of $228. |
The accompanying notes are an integral part of these financial statements.
Financial Highlights
Baird MidCap Fund – Institutional Class
| | | Year Ended December 31, | |
| | | 2018 | | | 2017 | | | 2016 | | | 2015 | | | 2014 | |
| Per Share Data: | | | | | | | | | | | | | | | |
| Net asset value, beginning of year | | $ | 19.16 | | | $ | 15.80 | | | $ | 14.99 | | | $ | 15.57 | | | $ | 15.00 | |
| Income from investment operations: | | | | | | | | | | | | | | | | | | | | |
Net investment loss(1) | | | (0.03 | ) | | | (0.03 | ) | | | (0.02 | ) | | | (0.03 | ) | | | (0.03 | ) |
| Net realized and unrealized | | | | | | | | | | | | | | | | | | | | |
| gains (losses) on investments | | | (0.30 | ) | | | 4.28 | | | | 0.83 | | | | (0.53 | ) | | | 0.76 | |
| Total from investment operations | | | (0.33 | ) | | | 4.25 | | | | 0.81 | | | | (0.56 | ) | | | 0.73 | |
| Less distributions: | | | | | | | | | | | | | | | | | | | | |
| Distributions from net realized gains | | | (1.11 | ) | | | (0.89 | ) | | | — | | | | (0.02 | ) | | | (0.16 | ) |
| Total distributions | | | (1.11 | ) | | | (0.89 | ) | | | — | | | | (0.02 | ) | | | (0.16 | ) |
| Net asset value, end of year | | $ | 17.72 | | | $ | 19.16 | | | $ | 15.80 | | | $ | 14.99 | | | $ | 15.57 | |
| Total return | | | (1.61 | )% | | | 26.88 | % | | | 5.40 | % | | | (3.59 | )% | | | 4.85 | % |
| Supplemental data and ratios: | | | | | | | | | | | | | | | | | | | | |
| Net assets, end of year (millions) | | $ | 1,337.4 | | | $ | 1,279.6 | | | $ | 1,105.1 | | | $ | 1,035.0 | | | $ | 910.9 | |
| Ratio of expenses to average net assets | | | 0.81 | % | | | 0.83 | % | | | 0.82 | % | | | 0.80 | % | | | 0.85 | % |
| Ratio of expenses to average | | | | | | | | | | | | | | | | | | | | |
| net assets (before waivers) | | | 0.81 | % | | | 0.83 | % | | | 0.82 | % | | | 0.80 | % | | | 0.87 | % |
| Ratio of net investment loss | | | | | | | | | | | | | | | | | | | | |
| to average net assets | | | (0.15 | )% | | | (0.17 | )% | | | (0.14 | )% | | | (0.18 | )% | | | (0.17 | )% |
| Ratio of net investment loss to | | | | | | | | | | | | | | | | | | | | |
| average net assets (before waivers) | | | (0.15 | )% | | | (0.17 | )% | | | (0.14 | )% | | | (0.18 | )% | | | (0.19 | )% |
Portfolio turnover rate(2) | | | 38 | % | | | 45 | % | | | 57 | % | | | 53 | % | | | 37 | % |
| (1) | Calculated using average shares outstanding during the year. |
| (2) | Portfolio turnover is calculated on the basis of the Fund as a whole without distinguishing between the classes of shares issued. |
The accompanying notes are an integral part of these financial statements.
Financial Highlights
Baird MidCap Fund – Investor Class
| | | Year Ended December 31, | |
| | | 2018 | | | 2017 | | | 2016 | | | 2015 | | | 2014 | |
| Per Share Data: | | | | | | | | | | | | | | | |
| Net asset value, beginning of year | | $ | 18.23 | | | $ | 15.10 | | | $ | 14.36 | | | $ | 14.96 | | | $ | 14.45 | |
| Income from investment operations: | | | | | | | | | | | | | | | | | | | | |
Net investment loss(1) | | | (0.08 | ) | | | (0.07 | ) | | | (0.06 | ) | | | (0.06 | ) | | | (0.06 | ) |
| Net realized and unrealized | | | | | | | | | | | | | | | | | | | | |
| gains (losses) on investments | | | (0.28 | ) | | | 4.09 | | | | 0.80 | | | | (0.52 | ) | | | 0.73 | |
| Total from investment operations | | | (0.36 | ) | | | 4.02 | | | | 0.74 | | | | (0.58 | ) | | | 0.67 | |
| Less distributions: | | | | | | | | | | | | | | | | | | | | |
| Distributions from net realized gains | | | (1.11 | ) | | | (0.89 | ) | | | — | | | | (0.02 | ) | | | (0.16 | ) |
| Total distributions | | | (1.11 | ) | | | (0.89 | ) | | | — | | | | (0.02 | ) | | | (0.16 | ) |
| Net asset value, end of year | | $ | 16.76 | | | $ | 18.23 | | | $ | 15.10 | | | $ | 14.36 | | | $ | 14.96 | |
| Total return | | | (1.86 | )% | | | 26.61 | % | | | 5.08 | % | | | (3.80 | )% | | | 4.62 | % |
| Supplemental data and ratios: | | | | | | | | | | | | | | | | | | | | |
| Net assets, end of year (millions) | | $ | 95.5 | | | $ | 111.4 | | | $ | 137.2 | | | $ | 184.1 | | | $ | 205.4 | |
| Ratio of expenses to average net assets | | | 1.06 | % | | | 1.08 | % | | | 1.07 | % | | | 1.05 | % | | | 1.10 | % |
| Ratio of expenses to average | | | | | | | | | | | | | | | | | | | | |
| net assets (before waivers) | | | 1.06 | % | | | 1.08 | % | | | 1.07 | % | | | 1.05 | % | | | 1.12 | % |
| Ratio of net investment loss | | | | | | | | | | | | | | | | | | | | |
| to average net assets | | | (0.40 | )% | | | (0.42 | )% | | | (0.39 | )% | | | (0.43 | )% | | | (0.42 | )% |
| Ratio of net investment loss to | | | | | | | | | | | | | | | | | | | | |
| average net assets (before waivers) | | | (0.40 | )% | | | (0.42 | )% | | | (0.39 | )% | | | (0.43 | )% | | | (0.44 | )% |
Portfolio turnover rate(2) | | | 38 | % | | | 45 | % | | | 57 | % | | | 53 | % | | | 37 | % |
| (1) | Calculated using average shares outstanding during the year. |
| (2) | Portfolio turnover is calculated on the basis of the Fund as a whole without distinguishing between the classes of shares issued. |
The accompanying notes are an integral part of these financial statements.
Financial Highlights
Baird Small/Mid Cap Growth Fund – Institutional Class
| | | Period Ended | |
| | | December 31, 2018(1) | |
| Per Share Data: | | | |
| Net asset value, beginning of period | | $ | 10.00 | |
| Income from investment operations: | | | | |
Net investment loss(2) | | | (0.00 | )(3) |
| Net realized and unrealized losses on investments | | | (1.05 | ) |
| Total from investment operations | | | (1.05 | ) |
| Net asset value, end of period | | $ | 8.95 | |
| Total return | | | (10.50 | )%(4) |
| Supplemental data and ratios: | | | | |
| Net assets, end of period (millions) | | $ | 7.3 | |
| Ratio of expenses to average net assets | | | 0.85 | %(5) |
| Ratio of expenses to average net assets (before waivers) | | | 3.88 | %(5) |
| Ratio of net investment loss to average net assets | | | (0.03 | )%(5) |
| Ratio of net investment loss to average net assets (before waivers) | | | (3.06 | )%(5) |
Portfolio turnover rate(6) | | | 9 | %(4) |
| (1) | Inception was close of business on October 31, 2018. |
| (2) | Calculated using average shares outstanding during the period. |
| (3) | Amount is less than $0.005. |
| (4) | Not annualized. |
| (5) | Annualized. |
| (6) | Portfolio turnover is calculated on the basis of the Fund as a whole without distinguishing between the classes of shares issued. |
The accompanying notes are an integral part of these financial statements.
Financial Highlights
Baird Small/Mid Cap Growth Fund – Investor Class
| | | Period Ended | |
| | | December 31, 2018(1) | |
| Per Share Data: | | | |
| Net asset value, beginning of period | | $ | 10.00 | |
| Income from investment operations: | | | | |
Net investment loss(2) | | | (0.00 | )(3) |
| Net realized and unrealized losses on investments | | | (1.06 | ) |
| Total from investment operations | | | (1.06 | ) |
| Net asset value, end of period | | $ | 8.94 | |
| Total return | | | (10.60 | )%(4) |
| Supplemental data and ratios: | | | | |
| Net assets, end of period (thousands) | | $ | 8.9 | |
| Ratio of expenses to average net assets | | | 1.10 | %(5) |
| Ratio of expenses to average net assets (before waivers) | | | 4.13 | %(5) |
| Ratio of net investment loss to average net assets | | | (0.28 | )%(5) |
| Ratio of net investment loss to average net assets (before waivers) | | | (3.31 | )%(5) |
Portfolio turnover rate(6) | | | 9 | %(4) |
| (1) | Inception was close of business on October 31, 2018. |
| (2) | Calculated using average shares outstanding during the period. |
| (3) | Amount is less than $0.005. |
| (4) | Not annualized. |
| (5) | Annualized. |
| (6) | Portfolio turnover is calculated on the basis of the Fund as a whole without distinguishing between the classes of shares issued. |
The accompanying notes are an integral part of these financial statements.
Financial Highlights
Baird Small/Mid Cap Value Fund – Institutional Class
| | | | | | | | | | | | Period Ended | |
| | | Year Ended December 31, | | | December 31, | |
| | | 2018 | | | 2017 | | | 2016 | | | 2015(1) | |
| Per Share Data: | | | | | | | | | | | | |
| Net asset value, beginning of period | | $ | 12.43 | | | $ | 10.29 | | | $ | 9.52 | | | $ | 10.00 | |
| Income from investment operations: | | | | | | | | | | | | | | | | |
Net investment income(2) | | | 0.04 | | | | 0.07 | | | | 0.13 | | | | 0.02 | |
| Net realized and unrealized | | | | | | | | | | | | | | | | |
| gains (losses) on investments | | | (1.92 | ) | | | 2.14 | | | | 0.72 | | | | (0.49 | ) |
| Total from investment operations | | | (1.88 | ) | | | 2.21 | | | | 0.85 | | | | (0.47 | ) |
| Less distributions: | | | | | | | | | | | | | | | | |
| Distributions from net investment income | | | (0.04 | ) | | | (0.07 | ) | | | (0.08 | ) | | | (0.01 | ) |
| Distributions from net realized gains | | | (0.00 | )(3) | | | (0.00 | )(3) | | | — | | | | — | |
| Total distributions | | | (0.04 | ) | | | (0.07 | ) | | | (0.08 | ) | | | (0.01 | ) |
| Net asset value, end of period | | $ | 10.51 | | | $ | 12.43 | | | $ | 10.29 | | | $ | 9.52 | |
| Total return | | | (15.11 | )% | | | 21.48 | % | | | 8.91 | % | | | (4.66 | )%(4) |
| Supplemental data and ratios: | | | | | | | | | | | | | | | | |
| Net assets, end of period (millions) | | $ | 17.1 | | | $ | 16.9 | | | $ | 11.9 | | | $ | 4.7 | |
| Ratio of expenses to average net assets | | | 0.94 | %(5) | | | 0.95 | % | | | 0.95 | % | | | 0.95 | %(6) |
| Ratio of expenses to average | | | | | | | | | | | | | | | | |
| net assets (before waivers) | | | 1.75 | % | | | 1.91 | % | | | 2.86 | % | | | 6.88 | %(6) |
| Ratio of net investment income | | | | | | | | | | | | | | | | |
| to average net assets | | | 0.34 | % | | | 0.62 | % | | | 1.35 | % | | | 1.96 | %(6) |
| Ratio of net investment loss to | | | | | | | | | | | | | | | | |
| average net assets (before waivers) | | | (0.47 | )% | | | (0.34 | )% | | | (0.56 | )% | | | (3.97 | )%(6) |
Portfolio turnover rate(7) | | | 34 | % | | | 60 | % | | | 38 | % | | | 15 | %(4) |
| (1) | Inception was close of business on November 30, 2015. |
| (2) | Calculated using average shares outstanding during the period. |
| (3) | Amount is less than $0.005. |
| (4) | Not annualized. |
| (5) | Blended rate. See Note 5. |
| (6) | Annualized. |
| (7) | Portfolio turnover is calculated on the basis of the Fund as a whole without distinguishing between the classes of shares issued. |
The accompanying notes are an integral part of these financial statements.
Financial Highlights
Baird Small/Mid Cap Value Fund – Investor Class
| | | | | | | | | | | | Period Ended | |
| | | Year Ended December 31, | | | December 31, | |
| | | 2018 | | | 2017 | | | 2016 | | | 2015(1) | |
| Per Share Data: | | | | | | | | | | | | |
| Net asset value, beginning of period | | $ | 12.40 | | | $ | 10.28 | | | $ | 9.52 | | | $ | 10.00 | |
| Income from investment operations: | | | | | | | | | | | | | | | | |
Net investment income(2) | | | 0.01 | | | | 0.04 | | | | 0.11 | | | | 0.01 | |
| Net realized and unrealized | | | | | | | | | | | | | | | | |
| gains (losses) on investments | | | (1.90 | ) | | | 2.13 | | | | 0.71 | | | | (0.48 | ) |
| Total from investment operations | | | (1.89 | ) | | | 2.17 | | | | 0.82 | | | | (0.47 | ) |
| Less distributions: | | | | | | | | | | | | | | | | |
| Distributions from net investment income | | | (0.03 | ) | | | (0.05 | ) | | | (0.06 | ) | | | (0.01 | ) |
| Distributions from net realized gains | | | (0.00 | )(3) | | | (0.00 | )(3) | | | — | | | | — | |
| Total distributions | | | (0.03 | ) | | | (0.05 | ) | | | (0.06 | ) | | | (0.01 | ) |
| Net asset value, end of period | | $ | 10.48 | | | $ | 12.40 | | | $ | 10.28 | | | $ | 9.52 | |
| Total return | | | (15.25 | )% | | | 21.08 | % | | | 8.64 | % | | | (4.67 | )%(4) |
| Supplemental data and ratios: | | | | | | | | | | | | | | | | |
| Net assets, end of period (thousands) | | $ | 341.5 | | | $ | 86.1 | | | $ | 53.2 | | | $ | 19.0 | |
| Ratio of expenses to average net assets | | | 1.19 | %(5) | | | 1.20 | % | | | 1.20 | % | | | 1.20 | %(6) |
| Ratio of expenses to average | | | | | | | | | | | | | | | | |
| net assets (before waivers) | | | 2.00 | % | | | 2.16 | % | | | 3.11 | % | | | 7.13 | %(6) |
| Ratio of net investment income | | | | | | | | | | | | | | | | |
| to average net assets | | | 0.09 | % | | | 0.37 | % | | | 1.10 | % | | | 1.71 | %(6) |
| Ratio of net investment loss to | | | | | | | | | | | | | | | | |
| average net assets (before waivers) | | | (0.72 | )% | | | (0.59 | )% | | | (0.81 | )% | | | (4.22 | )%(6) |
Portfolio turnover rate(7) | | | 34 | % | | | 60 | % | | | 38 | % | | | 15 | %(4) |
| (1) | Inception was close of business on November 30, 2015. |
| (2) | Calculated using average shares outstanding during the period. |
| (3) | Amount is less than $0.005. |
| (4) | Not annualized. |
| (5) | Blended rate. See Note 5. |
| (6) | Annualized. |
| (7) | Portfolio turnover is calculated on the basis of the Fund as a whole without distinguishing between the classes of shares issued. |
The accompanying notes are an integral part of these financial statements.
Financial Highlights
Baird SmallCap Value Fund – Institutional Class
| | | Year Ended December 31, | |
| | | 2018 | | | 2017 | | | 2016 | | | 2015 | | | 2014 | |
| Per Share Data: | | | | | | | | | | | | | | | |
| Net asset value, beginning of year | | $ | 16.99 | | | $ | 14.83 | | | $ | 13.03 | | | $ | 13.82 | | | $ | 14.01 | |
| Income from investment operations: | | | | | | | | | | | | | | | | | | | | |
Net investment income(1) | | | 0.05 | | | | 0.09 | | | | 0.21 | | | | 0.11 | | | | 0.05 | |
| Net realized and unrealized | | | | | | | | | | | | | | | | | | | | |
| gains (losses) on investments | | | (2.85 | ) | | | 2.59 | | | | 1.76 | | | | (0.82 | ) | | | 0.01 | |
| Total from investment operations | | | (2.80 | ) | | | 2.68 | | | | 1.97 | | | | (0.71 | ) | | | 0.06 | |
| Less distributions: | | | | | | | | | | | | | | | | | | | | |
| Distributions from | | | | | | | | | | | | | | | | | | | | |
| net investment income | | | (0.06 | ) | | | (0.09 | ) | | | (0.17 | ) | | | (0.08 | ) | | | (0.05 | ) |
| Distributions from net realized gains | | | (0.55 | ) | | | (0.43 | ) | | | — | | | | — | | | | (0.20 | ) |
| Total distributions | | | (0.61 | ) | | | (0.52 | ) | | | (0.17 | ) | | | (0.08 | ) | | | (0.25 | ) |
| Net asset value, end of year | | $ | 13.58 | | | $ | 16.99 | | | $ | 14.83 | | | $ | 13.03 | | | $ | 13.82 | |
| Total return | | | (16.45 | )% | | | 18.05 | % | | | 15.11 | % | | | (5.11 | )% | | | 0.42 | % |
| Supplemental data and ratios: | | | | | | | | | | | | | | | | | | | | |
| Net assets, end of year (millions) | | $ | 28.8 | | | $ | 33.6 | | | $ | 28.2 | | | $ | 23.1 | | | $ | 23.5 | |
| Ratio of expenses to average net assets | | | 1.00 | %(2) | | | 1.00 | % | | | 1.00 | % | | | 1.00 | % | | | 1.00 | % |
| Ratio of expenses to average | | | | | | | | | | | | | | | | | | | | |
| net assets (before waivers) | | | 1.38 | % | | | 1.35 | % | | | 1.43 | % | | | 1.51 | % | | | 1.55 | % |
| Ratio of net investment income | | | | | | | | | | | | | | | | | | | | |
| to average net assets | | | 0.29 | % | | | 0.61 | % | | | 1.58 | % | | | 0.79 | % | | | 0.36 | % |
| Ratio of net investment income (loss) | | | | | | | | | | | | | | | | | | | | |
| to average net assets (before waivers) | | | (0.09 | )% | | | 0.26 | % | | | 1.15 | % | | | 0.28 | % | | | (0.19 | )% |
Portfolio turnover rate(3) | | | 36 | % | | | 30 | % | | | 49 | % | | | 42 | % | | | 42 | % |
| (1) | Calculated using average shares outstanding during the year. |
| (2) | Blended rate. See Note 5. |
| (3) | Portfolio turnover is calculated on the basis of the Fund as a whole without distinguishing between the classes of shares issued. |
The accompanying notes are an integral part of these financial statements.
Financial Highlights
Baird SmallCap Value Fund – Investor Class
| | | Year Ended December 31, | |
| | | 2018 | | | 2017 | | | 2016 | | | 2015 | | | 2014 | |
| Per Share Data: | | | | | | | | | | | | | | | |
| Net asset value, beginning of year | | $ | 16.97 | | | $ | 14.81 | | | $ | 12.99 | | | $ | 13.78 | | | $ | 13.98 | |
| Income from investment operations: | | | | | | | | | | | | | | | | | | | | |
Net investment income(1) | | | 0.01 | | | | 0.06 | | | | 0.18 | | | | 0.07 | | | | 0.02 | |
| Net realized and unrealized | | | | | | | | | | | | | | | | | | | | |
| gains (losses) on investments | | | (2.85 | ) | | | 2.58 | | | | 1.75 | | | | (0.81 | ) | | | 0.00 | (2) |
| Total from investment operations | | | (2.84 | ) | | | 2.64 | | | | 1.93 | | | | (0.74 | ) | | | 0.02 | |
| Less distributions: | | | | | | | | | | | | | | | | | | | | |
| Distributions from | | | | | | | | | | | | | | | | | | | | |
| net investment income | | | — | | | | (0.05 | ) | | | (0.11 | ) | | | (0.05 | ) | | | (0.02 | ) |
| Distributions from net realized gains | | | (0.55 | ) | | | (0.43 | ) | | | — | | | | — | | | | (0.20 | ) |
| Total distributions | | | (0.55 | ) | | | (0.48 | ) | | | (0.11 | ) | | | (0.05 | ) | | | (0.22 | ) |
| Net asset value, end of year | | $ | 13.58 | | | $ | 16.97 | | | $ | 14.81 | | | $ | 12.99 | | | $ | 13.78 | |
| Total return | | | (16.71 | )% | | | 17.78 | % | | | 14.84 | % | | | (5.37 | )% | | | 0.13 | % |
| Supplemental data and ratios: | | | | | | | | | | | | | | | | | | | | |
| Net assets, end of year (millions) | | $ | 0.8 | | | $ | 2.6 | | | $ | 2.6 | | | $ | 2.0 | | | $ | 2.1 | |
| Ratio of expenses to average net assets | | | 1.25 | %(3) | | | 1.25 | % | | | 1.25 | % | | | 1.25 | % | | | 1.25 | % |
| Ratio of expenses to average | | | | | | | | | | | | | | | | | | | | |
| net assets (before waivers) | | | 1.63 | % | | | 1.60 | % | | | 1.68 | % | | | 1.76 | % | | | 1.80 | % |
| Ratio of net investment income | | | | | | | | | | | | | | | | | | | | |
| to average net assets | | | 0.04 | % | | | 0.36 | % | | | 1.33 | % | | | 0.54 | % | | | 0.11 | % |
| Ratio of net investment income (loss) | | | | | | | | | | | | | | | | | | | | |
| to average net assets (before waivers) | | | (0.34 | )% | | | 0.01 | % | | | 0.90 | % | | | 0.03 | % | | | (0.44 | )% |
Portfolio turnover rate(4) | | | 36 | % | | | 30 | % | | | 49 | % | | | 42 | % | | | 42 | % |
| (1) | Calculated using average shares outstanding during the year. |
| (2) | Amount is less than $0.005. |
| (3) | Blended rate. See Note 5. |
| (4) | Portfolio turnover is calculated on the basis of the Fund as a whole without distinguishing between the classes of shares issued. |
The accompanying notes are an integral part of these financial statements.
Financial Highlights
Chautauqua International Growth Fund – Institutional Class
| | | | | | | | | Period Ended | |
| | | Year Ended December 31, | | | December 31, | |
| | | 2018 | | | 2017 | | | 2016(1) | |
| Per Share Data: | | | | | | | | | |
| Net asset value, beginning of period | | $ | 12.59 | | | $ | 9.57 | | | $ | 10.00 | |
| Income from investment operations: | | | | | | | | | | | | |
Net investment income(2) | | | 0.06 | | | | 0.04 | | | | 0.00 | (3) |
| Net realized and unrealized gains (losses) on | | | | | | �� | | | | | | |
| investments and foreign currency translation | | | (2.19 | ) | | | 3.41 | | | | (0.43 | ) |
| Total from investment operations | | | (2.13 | ) | | | 3.45 | | | | (0.43 | ) |
| Less distributions: | | | | | | | | | | | | |
| Distributions from net investment income | | | (0.06 | ) | | | (0.02 | ) | | | — | |
| Distributions from net realized gains | | | (0.23 | ) | | | (0.41 | ) | | | — | |
| Total distributions | | | (0.29 | ) | | | (0.43 | ) | | | — | |
| Paid in capital from redemption fees | | | 0.00 | (3) | | | 0.00 | (3) | | | — | |
| Net asset value, end of period | | $ | 10.17 | | | $ | 12.59 | | | $ | 9.57 | |
| Total return | | | (16.94 | )% | | | 36.11 | % | | | (4.30 | )%(4) |
| Supplemental data and ratios: | | | | | | | | | | | | |
| Net assets, end of period (millions) | | $ | 85.4 | | | $ | 74.2 | | | $ | 14.8 | |
| Ratio of expenses to average net assets | | | 0.94 | %(5) | | | 0.95 | % | | | 0.95 | %(6) |
| Ratio of expenses to average | | | | | | | | | | | | |
| net assets (before waivers) | | | 1.07 | % | | | 1.20 | % | | | 2.32 | %(6) |
| Ratio of net investment income | | | | | | | | | | | | |
| to average net assets | | | 0.51 | % | | | 0.30 | % | | | 0.06 | %(6) |
| Ratio of net investment income (loss) | | | | | | | | | | | | |
| to average net assets (before waivers) | | | 0.38 | % | | | 0.05 | % | | | (1.31 | )%(6) |
Portfolio turnover rate(7) | | | 42 | % | | | 71 | % | | | 73 | %(4) |
| (1) | Inception was close of business on April 15, 2016. |
| (2) | Calculated using average shares outstanding during the period. |
| (3) | Amount is less than $0.005. |
| (4) | Not annualized. |
| (5) | Blended rate. See Note 5. |
| (6) | Annualized. |
| (7) | Portfolio turnover is calculated on the basis of the Fund as a whole without distinguishing between the classes of shares issued. |
The accompanying notes are an integral part of these financial statements.
Financial Highlights
Chautauqua International Growth Fund – Investor Class
| | | | | | | | | Period Ended | |
| | | Year Ended December 31, | | | December 31, | |
| | | 2018 | | | 2017 | | | 2016(1) | |
| Per Share Data: | | | | | | | | | |
| Net asset value, beginning of period | | $ | 12.57 | | | $ | 9.56 | | | $ | 10.00 | |
| Income from investment operations: | | | | | | | | | | | | |
Net investment income (loss)(2) | | | 0.03 | | | | 0.01 | | | | (0.01 | ) |
| Net realized and unrealized gains (losses) on | | | | | | | | | | | | |
| investments and foreign currency translation | | | (2.19 | ) | | | 3.41 | | | | (0.44 | ) |
| Total from investment operations | | | (2.16 | ) | | | 3.42 | | | | (0.45 | ) |
| Less distributions: | | | | | | | | | | | | |
| Distributions from net investment income | | | (0.03 | ) | | | (0.00 | )(3) | | | — | |
| Distributions from net realized gains | | | (0.23 | ) | | | (0.41 | ) | | | — | |
| Total distributions | | | (0.26 | ) | | | (0.41 | ) | | | — | |
| Paid in capital from redemption fees | | | 0.00 | (3) | | | 0.00 | (3) | | | 0.01 | |
| Net asset value, end of period | | $ | 10.15 | | | $ | 12.57 | | | $ | 9.56 | |
| Total return | | | (17.21 | )% | | | 35.86 | % | | | (4.40 | )%(4) |
| Supplemental data and ratios: | | | | | | | | | | | | |
| Net assets, end of period (millions) | | $ | 2.1 | | | $ | 1.6 | | | $ | 0.3 | |
| Ratio of expenses to average net assets | | | 1.19 | %(5) | | | 1.20 | % | | | 1.20 | %(6) |
| Ratio of expenses to average | | | | | | | | | | | | |
| net assets (before waivers) | | | 1.32 | % | | | 1.45 | % | | | 2.58 | %(6) |
| Ratio of net investment income (loss) | | | | | | | | | | | | |
| to average net assets | | | 0.26 | % | | | 0.05 | % | | | (0.19 | )%(6) |
| Ratio of net investment income (loss) | | | | | | | | | | | | |
| to average net assets (before waivers) | | | 0.13 | % | | | (0.20 | )% | | | (1.57 | )%(6) |
Portfolio turnover rate(7) | | | 42 | % | | | 71 | % | | | 73 | %(4) |
| (1) | Inception was close of business on April 15, 2016. |
| (2) | Calculated using average shares outstanding during the period. |
| (3) | Amount is less than $0.005. |
| (4) | Not annualized. |
| (5) | Blended rate. See Note 5. |
| (6) | Annualized. |
| (7) | Portfolio turnover is calculated on the basis of the Fund as a whole without distinguishing between the classes of shares issued. |
The accompanying notes are an integral part of these financial statements.
Financial Highlights
Chautauqua Global Growth Fund – Institutional Class
| | | | | | | | | Period Ended | |
| | | Year Ended December 31, | | | December 31, | |
| | | 2018 | | | 2017 | | | 2016(1) | |
| Per Share Data: | | | | | | | | | |
| Net asset value, beginning of period | | $ | 13.43 | | | $ | 10.09 | | | $ | 10.00 | |
| Income from investment operations: | | | | | | | | | | | | |
Net investment income (loss)(2) | | | 0.00 | (3) | | | (0.04 | ) | | | (0.01 | ) |
| Net realized and unrealized gains (losses) on | | | | | | | | | | | | |
| investments and foreign currency translation | | | (1.98 | ) | | | 3.85 | | | | 0.10 | |
| Total from investment operations | | | (1.98 | ) | | | 3.81 | | | | 0.09 | |
| Less distributions: | | | | | | | | | | | | |
| Distributions from net investment income | | | (0.00 | )(3) | | | — | | | | — | |
| Distributions from net realized gains | | | (0.16 | ) | | | (0.47 | ) | | | — | |
| Total distributions | | | (0.16 | ) | | | (0.47 | ) | | | — | |
| Paid in capital from redemption fees | | | 0.00 | (3) | | | 0.00 | (3) | | | — | |
| Net asset value, end of period | | $ | 11.29 | | | $ | 13.43 | | | $ | 10.09 | |
| Total return | | | (14.70 | )% | | | 37.75 | % | | | 0.90 | %(4) |
| Supplemental data and ratios: | | | | | | | | | | | | |
| Net assets, end of period (millions) | | $ | 36.8 | | | $ | 23.2 | | | $ | 7.6 | |
| Ratio of expenses to average net assets | | | 0.94 | %(5) | | | 0.95 | % | | | 0.95 | %(6) |
| Ratio of expenses to average | | | | | | | | | | | | |
| net assets (before waivers) | | | 1.34 | % | | | 2.26 | % | | | 3.65 | %(6) |
| Ratio of net investment income (loss) | | | | | | | | | | | | |
| to average net assets | | | 0.01 | % | | | (0.30 | )% | | | (0.16 | )%(6) |
| Ratio of net investment loss to | | | | | | | | | | | | |
| average net assets (before waivers) | | | (0.39 | )% | | | (1.61 | )% | | | (2.86 | )%(6) |
Portfolio turnover rate(7) | | | 38 | % | | | 61 | % | | | 69 | %(4) |
| (1) | Inception was close of business on April 15, 2016. |
| (2) | Calculated using average shares outstanding during the period. |
| (3) | Amount is less than $0.005. |
| (4) | Not annualized. |
| (5) | Blended rate. See Note 5. |
| (6) | Annualized. |
| (7) | Portfolio turnover is calculated on the basis of the Fund as a whole without distinguishing between the classes of shares issued. |
The accompanying notes are an integral part of these financial statements.
Financial Highlights
Chautauqua Global Growth Fund – Investor Class
| | | | | | | | | Period Ended | |
| | | Year Ended December 31, | | | December 31, | |
| | | 2018 | | | 2017 | | | 2016(1) | |
| Per Share Data: | | | | | | | | | |
| Net asset value, beginning of period | | $ | 13.37 | | | $ | 10.08 | | | $ | 10.00 | |
| Income from investment operations: | | | | | | | | | | | | |
Net investment loss(2) | | | (0.03 | ) | | | (0.07 | ) | | | (0.03 | ) |
| Net realized and unrealized gains (losses) on | | | | | | | | | | | | |
| investments and foreign currency translation | | | (1.96 | ) | | | 3.83 | | | | 0.11 | |
| Total from investment operations | | | (1.99 | ) | | | 3.76 | | | | 0.08 | |
| Less distributions: | | | | | | | | | | | | |
| Distributions from net realized gains | | | (0.16 | ) | | | (0.47 | ) | | | — | |
| Total distributions | | | (0.16 | ) | | | (0.47 | ) | | | — | |
| Paid in capital from redemption fees | | | 0.00 | (3) | | | 0.00 | (3) | | | 0.00 | (3) |
| Net asset value, end of period | | $ | 11.22 | | | $ | 13.37 | | | $ | 10.08 | |
| Total return | | | (14.86 | )% | | | 37.29 | % | | | 0.80 | %(4) |
| Supplemental data and ratios: | | | | | | | | | | | | |
| Net assets, end of period (millions) | | $ | 0.7 | | | $ | 0.7 | | | $ | 0.2 | |
| Ratio of expenses to average net assets | | | 1.19 | %(5) | | | 1.20 | % | | | 1.20 | %(6) |
| Ratio of expenses to average | | | | | | | | | | | | |
| net assets (before waivers) | | | 1.59 | % | | | 2.51 | % | | | 3.90 | %(6) |
| Ratio of net investment loss to average net assets | | | (0.24 | )% | | | (0.55 | )% | | | (0.41 | )%(6) |
| Ratio of net investment loss to average | | | | | | | | | | | | |
| net assets (before waivers) | | | (0.64 | )% | | | (1.86 | )% | | | (3.11 | )%(6) |
Portfolio turnover rate(7) | | | 38 | % | | | 61 | % | | | 69 | %(4) |
| (1) | Inception was close of business on April 15, 2016. |
| (2) | Calculated using average shares outstanding during the period. |
| (3) | Amount is less than $0.005. |
| (4) | Not annualized. |
| (5) | Blended rate. See Note 5. |
| (6) | Annualized. |
| (7) | Portfolio turnover is calculated on the basis of the Fund as a whole without distinguishing between the classes of shares issued. |
The accompanying notes are an integral part of these financial statements.
Notes to the Financial Statements
December 31, 2018
Baird Funds, Inc. (the “Corporation”) was incorporated on June 9, 2000, as a Wisconsin corporation and is registered as an open-end management investment company under the Investment Company Act of 1940, as amended (the “1940 Act”). The accompanying financial statements include the Baird MidCap Fund, the Baird Small/Mid Cap Growth Fund, the Baird Small/Mid Cap Value Fund, the Baird SmallCap Value Fund, the Chautauqua International Growth Fund and the Chautauqua Global Growth Fund (each a “Fund” and collectively the “Funds”), six of the 14 active funds in the series comprising the Corporation. Pursuant to the 1940 Act, the Funds are “diversified” series of the Corporation. The investment advisor to the Funds is Robert W. Baird & Co. Incorporated (“Baird” or the “Advisor”). The Funds are investment companies and therefore follow the investment company accounting and reporting guidance of the Financial Accounting Standards Board (“FASB”) Accounting Standards Codification Topic 946, Financial Services – Investment Companies.
Organizational costs were incurred to establish the Baird Small/Mid Cap Growth Fund and enable it to legally do business. These expenses were paid by the Advisor and are not subject to reimbursement by the Fund.
The following table presents the class-specific inception dates for each of the Funds:
| | Inception Date |
Fund | Institutional Class | Investor Class |
| Baird MidCap Fund | December 29, 2000 | December 29, 2000 |
| Baird Small/Mid Cap Growth Fund | October 31, 2018 | October 31, 2018 |
| Baird Small/Mid Cap Value Fund | November 30, 2015 | November 30, 2015 |
| Baird SmallCap Value Fund | May 1, 2012 | May 1, 2012 |
| Chautauqua International Growth Fund | April 15, 2016 | April 15, 2016 |
| Chautauqua Global Growth Fund | April 15, 2016 | April 15, 2016 |
Institutional Class shares are not subject to a distribution and service (12b-1) fee, while Investor Class shares are subject to a distribution and service (12b-1) fee up to 0.25%. See Note 7.
The Baird MidCap Fund seeks long-term growth of capital through investments in equity securities of mid-capitalization companies.
The Baird Small/Mid Cap Growth Fund seeks long-term growth of capital through investments in equity securities of small- to mid-capitalization companies.
The Baird Small/Mid Cap Value Fund seeks long-term capital appreciation through investments in equity securities of small- to mid-capitalization companies.
The Baird SmallCap Value Fund seeks long-term capital appreciation through investments in equity securities of small-capitalization companies.
The Chautauqua International Growth Fund seeks to provide long-term capital appreciation through investment in equity securities of both U.S. and non-U.S. companies with medium to large market capitalization.
The Chautauqua Global Growth Fund seeks to provide long-term capital appreciation through investment in equity securities of both U.S. and non-U.S. companies with medium to large market capitalization.
The beneficial ownership, either directly or indirectly, of more than 25% of the voting securities of a fund creates a presumption of control of the fund, under Section 2(a)(9) of the 1940 Act. On December 31, 2018, shareholders affiliated with the Advisor held 60% of the Baird Small/Mid Growth Fund, 59% of the Baird Small/Mid Cap Value Fund, 51% of the Baird SmallCap Value Fund, and 53% of the Chautauqua Global Growth Fund. These shareholders included the Baird Foundation.
Notes to the Financial Statements
December 31, 2018
| 2. | Significant Accounting Policies |
The following is a summary of significant accounting policies consistently followed by the Funds in the preparation of their financial statements. These policies are in conformity with accounting principles generally accepted in the United States of America (“GAAP”).
| a) | Investment Valuation – Section 2(a)(41) of the 1940 Act, together with the rules and interpretations of the U.S. Securities and Exchange Commission (the “SEC”) require the Funds, in computing net asset value, to value their portfolio securities using market quotations when they are “readily available.” When market quotations are not readily available (e.g., because there is no regular market quotation for such securities, the market for such security is limited, the validity of quotations is questionable or, for debt securities, the Funds’ independent pricing service does not provide a price), the Board of Directors (the “Board”) of the Corporation must value the securities at “fair value determined in good faith.” The Board has delegated such responsibility to the Advisor pursuant to pricing policies and procedures that the Board has adopted and regularly reviews. In general, the “fair value” of a security means the price that would be received to sell a security in an orderly transaction between market participants at the measurement date. |
| | |
| | The Funds determine the fair value of their investments and compute their net asset value per share as of the close of regular trading of the New York Stock Exchange (4:00 p.m. EST). |
| | |
| | Consistent with Section 2(a)(41) of the 1940 Act, the Funds price their securities as follows: common stocks that are listed on a securities exchange (other than NASDAQ) are valued at the last quoted sale price. Securities traded on NASDAQ are valued at the NASDAQ Official Closing Price. Price information on listed stocks is taken from the exchange where the security is primarily traded. Securities that were not traded on the valuation date, as well as stocks that are not listed on an exchange, including NASDAQ, are valued at the average of the current bid and ask price. Debt securities are valued at their evaluated bid prices as provided by an independent pricing service using valuation methods that are designed to represent fair value, such as matrix pricing and other analytical pricing models, market transactions and dealer quotations. Debt securities purchased with maturities of 60 days or less are valued as described above unless an evaluated price is not available, in which case such security is valued at acquisition cost, plus or minus any amortized discount or premium (“amortized cost”), or, if the Advisor does not believe amortized cost is reflective of the fair value of the security, the security is priced at fair value as described below. Investments in mutual funds, including money market funds, are valued at their stated net asset value (“NAV”). Other assets and securities for which market quotations are not readily available are valued at fair value as determined in good faith by the Advisor in accordance with procedures approved by the Corporation’s Board. In accordance with such procedures, the Advisor may, under certain circumstances, use alternative valuation methodologies, or it may use broker quotes or prices obtained from alternative independent pricing services or, if broker quotes or prices from alternative pricing services are unavailable or deemed to be unreliable, fair value will be determined by a valuation committee of the Advisor. In determining fair value, the valuation committee takes into account factors deemed relevant by the valuation committee and available information. Consequently, the price of the security used by a Fund to calculate its NAV may differ from quoted or published prices for the same security. Fair value pricing involves subjective judgments and there is no single standard for determining a security’s fair value. As a result, different mutual funds could reasonably arrive at a different fair value for the same security. It is possible that the fair value determined for a security is materially different from the value that could be realized upon the sale of that security or from the values that other mutual funds may determine. The prices determined for any individual security on any given day may vary significantly from the amount that can be obtained in an actual sale of that security, and the Funds’ NAV may fluctuate significantly from day to day or from period to period. |
| | |
| | The Chautauqua International Growth and Chautauqua Global Growth Funds have retained an independent fair value pricing service to assist in valuing foreign securities in order to adjust for possible changes in value that may occur between the close of the foreign exchange and the time at which the Funds |
Notes to the Financial Statements
December 31, 2018
| 2. | Significant Accounting Policies (cont.) |
| | calculate their NAVs. The fair value pricing service uses statistical data based on historical performance of securities and markets, and other data in developing factors used to estimate fair value for that day. |
| | |
| b) | Foreign Securities – For purposes of these financial statements, foreign securities are defined as securities issued by companies that are organized outside the United States. Investing in securities of foreign companies and foreign governments involves special risks and considerations not typically associated with investing in U.S. companies and the U.S. government. These risks include foreign currency fluctuations and adverse political and economic developments. Moreover, securities of many foreign companies and foreign governments and their markets may be less liquid and their prices more volatile than those of securities of comparable U.S. companies and the U.S. government. Occasionally, events that affect these values and exchange rates may occur after the close of the exchange on which such securities are traded. If such events materially affect the value of a Fund’s securities, these securities may be valued at their fair value pursuant to procedures adopted by the Board. |
| | |
| c) | Foreign Currency Translation – Portfolio securities and other assets and liabilities denominated in foreign currencies are translated into U.S. dollar amounts at date of valuation. Purchases and sales of portfolio securities and income items denominated in foreign currencies are translated into U.S. dollar amounts on the respective dates of such transactions. When a Fund purchases or sells a foreign security, it will customarily enter into a foreign exchange contract to minimize foreign exchange risk from the trade date to the settlement date of such transaction. The Funds do not isolate the portion of the results of operations resulting from changes in foreign exchange rates on investments from the fluctuations arising from changes in market prices of securities held nor currency gains or losses realized between the trade and settlement dates on securities transactions. Such fluctuations are included with the net realized and unrealized gain or loss from investments. Net realized gain (loss) on foreign currency translations include those gains and losses arising from the sale of foreign currencies, currency gains or losses realized between the trade and settlement dates on foreign currency transactions, the differences between the amounts of dividends, and foreign withholding taxes recorded on a Fund’s books, and the U.S. dollar equivalent of the amounts actually received or paid. Net unrealized appreciation (depreciation) on investments includes changes in the value of investments resulting from exchange rates. |
| | |
| d) | Income Tax Status – The Funds intend to continue to qualify as regulated investment companies as provided in subchapter M of the Internal Revenue Code and to distribute substantially all of their taxable income to their shareholders in a manner which results in no tax expense to the Funds. Therefore, no federal income or excise tax provision is recorded. |
| | |
| | There is no tax liability resulting from unrecognized tax benefits relating to uncertain income tax positions taken or expected to be taken on the tax return for the fiscal year ended December 31, 2018, or for any other tax years which are open for exam. As of December 31, 2018, open tax years include the tax years ended December 31, 2015 through 2018. The Funds are not aware of any tax positions for which it is reasonably possible that the total amounts of unrecognized tax benefits will significantly change in the next 12 months. The Funds recognize interest and penalties, if any, related to unrecognized tax benefits as interest expense and other expense, respectively, in the Statement of Operations. During the year, the Funds did not incur any interest or penalties. |
| | |
| e) | Shareholder Transactions and Distributions – Shareholder transactions are recorded on trade date. Dividends from net investment income, if any, are declared and paid annually. Distributions of net realized capital gains, if any, are declared and paid at least annually. All distributions to shareholders are recorded on the ex-dividend date. The book basis character of distributions may differ from their ultimate characterization for Federal income tax purposes. GAAP requires that permanent financial reporting and tax differences be reclassified in the capital accounts. |
Notes to the Financial Statements
December 31, 2018
| 2. | Significant Accounting Policies (cont.) |
| f) | Allocation of Income and Expenses – Each Fund is charged for those expenses directly attributable to it. Expenses directly attributable to a class of shares, such as Rule 12b-1 distribution fees, are charged to that class of shares. Income, expenses and realized and unrealized gains and losses are allocated to the classes based on their respective net assets. Expenses that are not directly attributable to a Fund are allocated among the Funds in the series in proportion to their respective assets or are divided equally amongst the Funds. |
| | |
| g) | Use of Estimates – The preparation of financial statements in conformity with GAAP requires management to make estimates and assumptions that affect the reported amounts of assets and liabilities and disclosure of contingent assets and liabilities at the date of the financial statements and the reported amounts of revenues and expenses during the reporting period. Actual results could differ from those estimates. |
| | |
| h) | Securities Transactions and Investment Income – Net realized gains and losses on sales of securities are computed using the identified cost basis. For financial reporting purposes, investment transactions are recorded on the trade date. Dividend income is recognized on the ex-dividend date net of withholding taxes, if any, and interest income is recognized on an accrual basis. Withholding taxes on foreign dividends have been accounted for in accordance with the Funds’ interpretation of applicable tax laws of the countries in which they invest. |
| | |
| i) | Guarantees and Indemnifications – In the normal course of business, the Funds enter into contracts with service providers that contain general indemnification clauses. The Funds’ maximum exposure under these arrangements is unknown and would involve future claims against the Funds that have not yet occurred. Based on experience, the Funds would expect the risk of loss to be remote. |
| | |
| j) | Regulatory Matters – In August 2018, the SEC issued Final Rule Release No. 33-10532, Disclosure Update and Simplification, which in part amends certain disclosure requirements of Regulation S-X that have become redundant, duplicative, overlapping, outdated, or superseded, in light of other SEC disclosure requirements, GAAP, or changes in the information environment. The amendments are intended to facilitate the disclosure of information to investors and simplify compliance without significantly altering the total mix of information provided to investors. The effective date for these disclosures was November 5, 2018. Management has adopted these amendments as currently required and these are reflected in the Funds’ financial statements and related disclosures. Certain prior year information has been adjusted to conform with these amendments. |
| | |
| k) | New Accounting Pronouncements – In August 2018, FASB issued Accounting Standards Update (“ASU”) 2018-13, Fair Value Measurement (Topic 820): Disclosure Framework—Changes to the Disclosure Requirements for Fair Value Measurement (“ASU 2018-13”). The primary focus of ASU 2018-13 is to improve the effectiveness of the disclosure requirements for fair value measurements. The changes affect all companies that are required to include fair value measurement disclosures. In general, the amendments in ASU 2018-13 are effective for all entities for fiscal years and interim periods within those fiscal years, beginning after December 15, 2019. An entity is permitted to early adopt the removed or modified disclosures upon the issuance of ASU 2018-13 and may delay adoption of the additional disclosures, which are required for public companies only, until their effective date. Management has evaluated ASU 2018-13 and has early adopted the relevant provisions of the disclosure framework. |
| | |
| | In March 2017, the FASB issued ASU No. 2017-08, Receivables – Nonrefundable Fees and Other Costs (Subtopic 310-20): Premium Amortization on Purchased Callable Debt Securities. The amendments in the ASU shorten the amortization period for certain callable debt securities, held at a premium, to be amortized to the earliest call date. The ASU does not require an accounting change for securities held at a discount; which continues to be amortized to maturity. The ASU is effective for fiscal years and interim periods within those fiscal years beginning after December 15, 2018. Management is currently evaluating the impact, if any, of applying this provision. |
Notes to the Financial Statements
December 31, 2018
| 3. | Capital Share Transactions |
The following table summarizes the capital share transactions of each Fund for the past two fiscal periods:
Baird MidCap Fund
| | | Year Ended | | | Year Ended | |
| | | December 31, 2018 | | | December 31, 2017 | |
| Institutional Class Shares | | Shares | | | Amount | | | Shares | | | Amount | |
| Shares sold | | | 18,178,809 | | | $ | 370,633,367 | | | | 18,813,638 | | | $ | 334,054,013 | |
| Shares issued to shareholders | | | | | | | | | | | | | | | | |
| in reinvestment of distributions | | | 3,505,031 | | | | 60,882,398 | | | | 2,234,984 | | | | 42,822,289 | |
| Shares redeemed | | | (12,994,679 | ) | | | (263,687,717 | ) | | | (24,239,199 | ) | | | (440,804,306 | ) |
| Net increase (decrease) | | | 8,689,161 | | | $ | 167,828,048 | | | | (3,190,577 | ) | | $ | (63,928,004 | ) |
| Shares Outstanding: | | | | | | | | | | | | | | | | |
| Beginning of year | | | 66,770,418 | | | | | | | | 69,960,995 | | | | | |
| End of year | | | 75,459,579 | | | | | | | | 66,770,418 | | | | | |
| | | | | | | | | | | | | | | | | |
| | | Year Ended | | | Year Ended | |
| | | December 31, 2018 | | | December 31, 2017 | |
| Investor Class Shares | | Shares | | | Amount | | | Shares | | | Amount | |
| Shares sold | | | 1,107,823 | | | $ | 21,531,172 | | | | 894,614 | | | $ | 15,297,009 | |
| Shares issued to shareholders | | | | | | | | | | | | | | | | |
| in reinvestment of distributions | | | 353,616 | | | | 5,809,907 | | | | 280,580 | | | | 5,114,970 | |
| Shares redeemed | | | (1,875,673 | ) | | | (37,377,912 | ) | | | (4,149,619 | ) | | | (70,262,281 | ) |
| Net decrease | | | (414,234 | ) | | $ | (10,036,833 | ) | | | (2,974,425 | ) | | $ | (49,850,302 | ) |
| Shares Outstanding: | | | | | | | | | | | | | | | | |
| Beginning of year | | | 6,111,425 | | | | | | | | 9,085,850 | | | | | |
| End of year | | | 5,697,191 | | | | | | | | 6,111,425 | | | | | |
| Total net increase (decrease) | | | | | | $ | 157,791,215 | | | | | | | $ | (113,778,306 | ) |
| | | | | | | | | | | | | | | | | |
| Baird Small/Mid Cap Growth Fund | | | | | | | | | | | | | | | | |
| | | Period Ended | | | | | | | | | |
| | | December 31, 2018^ | | | | | | | | | |
| Institutional Class Shares | | Shares | | | Amount | | | | | | | | | |
| Shares sold | | | 813,957 | | | $ | 8,001,208 | | | | | | | | | |
| Net increase | | | 813,957 | | | $ | 8,001,208 | | | | | | | | | |
| Shares Outstanding: | | | | | | | | | | | | | | | | |
| Beginning of period | | | — | | | | | | | | | | | | | |
| End of period | | | 813,957 | | | | | | | | | | | | | |
| | | | | | | | | | | | | | | | | |
| | | Period Ended | | | | | | | | | |
| | | December 31, 2018^ | | | | | | | | | |
| Investor Class Shares | | Shares | | | Amount | | | | | | | | | |
| Shares sold | | | 1,000 | | | $ | 10,000 | | | | | | | | | |
| Net increase | | | 1,000 | | | $ | 10,000 | | | | | | | | | |
| Shares Outstanding: | | | | | | | | | | | | | | | | |
| Beginning of period | | | — | | | | | | | | | | | | | |
| End of period | | | 1,000 | | | | | | | | | | | | | |
| Total net increase | | | | | | $ | 8,011,208 | | | | | | | | | |
^ Inception was the close of business on October 31, 2018.
Notes to the Financial Statements
December 31, 2018
| 3. | Capital Share Transactions (cont.) |
Baird Small/Mid Cap Value Fund
| | | Year Ended | | | Year Ended | |
| | | December 31, 2018 | | | December 31, 2017 | |
| Institutional Class Shares | | Shares | | | Amount | | | Shares | | | Amount | |
| Shares sold | | | 370,436 | | | $ | 4,588,085 | | | | 603,626 | | | $ | 6,750,704 | |
| Shares issued to shareholders | | | | | | | | | | | | | | | | |
| in reinvestment of distributions | | | 5,478 | | | | 56,691 | | | | 6,045 | | | | 75,148 | |
| Shares redeemed | | | (109,927 | ) | | | (1,359,260 | ) | | | (410,676 | ) | | | (4,379,094 | ) |
| Net increase | | | 265,987 | | | $ | 3,285,516 | | | | 198,995 | | | $ | 2,446,758 | |
| Shares Outstanding: | | | | | | | | | | | | | | | | |
| Beginning of year | | | 1,356,764 | | | | | | | | 1,157,769 | | | | | |
| End of year | | | 1,622,751 | | | | | | | | 1,356,764 | | | | | |
| | | | | | | | | | | | | | | | | |
| | | Year Ended | | | Year Ended | |
| | | December 31, 2018 | | | December 31, 2017 | |
| Investor Class Shares | | Shares | | | Amount | | | Shares | | | Amount | |
| Shares sold | | | 27,878 | | | $ | 327,713 | | | | 4,201 | | | $ | 47,991 | |
| Shares issued to shareholders | | | | | | | | | | | | | | | | |
| in reinvestment of distributions | | | 77 | | | | 794 | | | | 22 | | | | 275 | |
| Shares redeemed | | | (2,310 | ) | | | (28,694 | ) | | | (2,457 | ) | | | (26,837 | ) |
| Net increase | | | 25,645 | | | $ | 299,813 | | | | 1,766 | | | $ | 21,429 | |
| Shares Outstanding: | | | | | | | | | | | | | | | | |
| Beginning of year | | | 6,942 | | | | | | | | 5,176 | | | | | |
| End of year | | | 32,587 | | | | | | | | 6,942 | | | | | |
| Total net increase | | | | | | $ | 3,585,329 | | | | | | | $ | 2,468,187 | |
| | | | | | | | | | | | | | | | | |
| Baird SmallCap Value Fund | | | | | | | | | | | | | | | | |
| | | Year Ended | | | Year Ended | |
| | | December 31, 2018 | | | December 31, 2017 | |
| Institutional Class Shares | | Shares | | | Amount | | | Shares | | | Amount | |
| Shares sold | | | 326,678 | | | $ | 5,628,102 | | | | 264,962 | | | $ | 4,207,425 | |
| Shares issued to shareholders | | | | | | | | | | | | | | | | |
| in reinvestment of distributions | | | 79,232 | | | | 1,059,328 | | | | 49,706 | | | | 844,993 | |
| Shares redeemed | | | (267,481 | ) | | | (4,447,469 | ) | | | (238,354 | ) | | | (3,638,071 | ) |
| Net increase | | | 138,429 | | | $ | 2,239,961 | | | | 76,314 | | | $ | 1,414,347 | |
| Shares Outstanding: | | | | | | | | | | | | | | | | |
| Beginning of year | | | 1,979,581 | | | | | | | | 1,903,267 | | | | | |
| End of year | | | 2,118,010 | | | | | | | | 1,979,581 | | | | | |
Notes to the Financial Statements
December 31, 2018
| 3. | Capital Share Transactions (cont.) |
Baird SmallCap Value Fund (cont.)
| | | Year Ended | | | Year Ended | |
| | | December 31, 2018 | | | December 31, 2017 | |
| Investor Class Shares | | Shares | | | Amount | | | Shares | | | Amount | |
| Shares sold | | | 15,815 | | | $ | 270,824 | | | | 9,963 | | | $ | 151,216 | |
| Shares issued to shareholders | | | | | | | | | | | | | | | | |
| in reinvestment of distributions | | | 1,607 | | | | 21,502 | | | | 2,005 | | | | 34,043 | |
| Shares redeemed | | | (113,998 | ) | | | (2,000,496 | ) | | | (36,704 | ) | | | (565,404 | ) |
| Net decrease | | | (96,576 | ) | | $ | (1,708,170 | ) | | | (24,736 | ) | | $ | (380,145 | ) |
| Shares Outstanding: | | | | | | | | | | | | | | | | |
| Beginning of year | | | 152,427 | | | | | | | | 177,163 | | | | | |
| End of year | | | 55,851 | | | | | | | | 152,427 | | | | | |
| Total net increase | | | | | | $ | 531,791 | | | | | | | $ | 1,034,202 | |
| | | | | | | | | | | | | | | | | |
| Chautauqua International Growth Fund | | | | | | | | | |
| | | Year Ended | | | Year Ended | |
| | | December 31, 2018 | | | December 31, 2017 | |
| Institutional Class Shares | | Shares | | | Amount | | | Shares | | | Amount | |
| Shares sold | | | 3,757,570 | | | $ | 46,499,046 | | | | 4,943,182 | (1) | | $ | 53,609,498 | |
| Shares issued to shareholders | | | | | | | | | | | | | | | | |
| in reinvestment of distributions | | | 209,939 | | | | 2,118,285 | | | | 180,405 | | | | 2,258,668 | |
| Shares redeemed | | | (1,463,773 | ) | | | (17,658,561 | ) | | | (783,790 | ) | | | (9,147,273 | ) |
| Redemption fees | | | — | | | | 20,078 | | | | — | | | | 10,830 | |
| Net increase | | | 2,503,736 | | | $ | 30,978,848 | | | | 4,339,797 | | | $ | 46,731,723 | |
| Shares Outstanding: | | | | | | | | | | | | | | | | |
| Beginning of year | | | 5,891,470 | | | | | | | | 1,551,673 | | | | | |
| End of year | | | 8,395,206 | | | | | | | | 5,891,470 | | | | | |
(1) | In the first quarter of 2017, the Chautauqua International Growth Fund satisfied a transfer in kind request made by a large institutional shareholder by transferring cash and securities into the Fund in the amount of $23,394,877 in exchange for 2,269,144 shares of the Fund. The transfer was effected in accordance with policies and procedures approved by the Board. |
| | | Year Ended | | | Year Ended | |
| | | December 31, 2018 | | | December 31, 2017 | |
| Investor Class Shares | | Shares | | | Amount | | | Shares | | | Amount | |
| Shares sold | | | 177,197 | | | $ | 2,198,618 | | | | 96,790 | | | $ | 1,117,480 | |
| Shares issued to shareholders | | | | | | | | | | | | | | | | |
| in reinvestment of distributions | | | 4,738 | | | | 47,755 | | | | 3,874 | | | | 48,395 | |
| Shares redeemed | | | (99,219 | ) | | | (1,119,911 | ) | | | (4,458 | ) | | | (48,607 | ) |
| Redemption fees | | | — | | | | 92 | | | | — | | | | 454 | |
| Net increase | | | 82,716 | | | $ | 1,126,554 | | | | 96,206 | | | $ | 1,117,722 | |
| Shares Outstanding: | | | | | | | | | | | | | | | | |
| Beginning of year | | | 128,754 | | | | | | | | 32,548 | | | | | |
| End of year | | | 211,470 | | | | | | | | 128,754 | | | | | |
| Total net increase | | | | | | $ | 32,105,402 | | | | | | | $ | 47,849,445 | |
Notes to the Financial Statements
December 31, 2018
| 3. | Capital Share Transactions (cont.) |
Chautauqua Global Growth Fund
| | | Year Ended | | | Year Ended | |
| | | December 31, 2018 | | | December 31, 2017 | |
| Institutional Class Shares | | Shares | | | Amount | | | Shares | | | Amount | |
| Shares sold | | | 1,906,230 | | | $ | 25,534,158 | | | | 1,014,140 | | | $ | 12,886,555 | |
| Shares issued to shareholders | | | | | | | | | | | | | | | | |
| in reinvestment of distributions | | | 41,947 | | | | 468,971 | | | | 41,625 | | | | 560,274 | |
| Shares redeemed | | | (417,200 | ) | | | (5,362,851 | ) | | | (82,794 | ) | | | (1,020,496 | ) |
| Redemption fees | | | — | | | | 6,272 | | | | — | | | | 965 | |
| Net increase | | | 1,530,977 | | | $ | 20,646,550 | | | | 972,971 | | | $ | 12,427,298 | |
| Shares Outstanding: | | | | | | | | | | | | | | | | |
| Beginning of year | | | 1,730,666 | | | | | | | | 757,695 | | | | | |
| End of year | | | 3,261,643 | | | | | | | | 1,730,666 | | | | | |
| | | | | | | | | | | | | | | | | |
| | | Year Ended | | | Year Ended | |
| | | December 31, 2018 | | | December 31, 2017 | |
| Investor Class Shares | | Shares | | | Amount | | | Shares | | | Amount | |
| Shares sold | | | 38,349 | | | $ | 529,992 | | | | 32,048 | | | $ | 421,597 | |
| Shares issued to shareholders | | | | | | | | | | | | | | | | |
| in reinvestment of distributions | | | 905 | | | | 10,060 | | | | 1,663 | | | | 22,310 | |
| Shares redeemed | | | (25,595 | ) | | | (336,164 | ) | | | (3,723 | ) | | | (44,989 | ) |
| Redemption fees | | | — | | | | 39 | | | | — | | | | — | |
| Net increase | | | 13,659 | | | $ | 203,927 | | | | 29,988 | | | $ | 398,918 | |
| Shares Outstanding: | | | | | | | | | | | | | | | | |
| Beginning of year | | | 49,977 | | | | | | | | 19,989 | | | | | |
| End of year | | | 63,636 | | | | | | | | 49,977 | | | | | |
| Total net increase | | | | | | $ | 20,850,477 | | | | | | | $ | 12,826,216 | |
| 4. | Investment Transactions and Income Tax Information |
Purchases and sales of investment securities (excluding short-term investments) were as follows:
| | Baird | Baird | Baird | Baird | Chautauqua | Chautauqua |
| | MidCap | Small/Mid Cap | Small/Mid Cap | SmallCap | International | Global Growth |
| | Fund(1) | Growth Fund(2) | Value Fund(1) | Value Fund(1) | Growth Fund(1) | Fund(1) |
| Purchases: | $629,844,272 | $8,422,057 | $10,061,343 | $11,855,404 | $66,339,853 | $36,549,846 |
| Sales: | $554,561,104 | $ 559,528 | $ 5,931,654 | $14,108,330 | $35,356,817 | $13,604,763 |
(1) | For the year ended December 31, 2018. |
(2) | For the period from close of business on October 31, 2018 (inception date) through December 31, 2018. |
The Funds did not purchase or sell U.S. Government securities during the period ended December 31, 2018.
Notes to the Financial Statements
December 31, 2018
| 4. | Investment Transactions and Income Tax Information (cont.) |
As of December 31, 2018, the components of distributable earnings (losses) for income tax purposes were as follows:
| | | Baird | | | Baird | | | Baird | |
| | | MidCap | | | Small/Mid Cap | | | Small/Mid Cap | |
| | | Fund | | | Growth Fund | | | Value Fund | |
| Cost of investments | | $ | 1,201,047,423 | | | $ | 8,132,032 | | | $ | 16,658,731 | |
| Gross unrealized appreciation | | $ | 338,528,051 | | | $ | 46,693 | | | $ | 2,369,078 | |
| Gross unrealized depreciation | | | (92,050,945 | ) | | | (738,330 | ) | | | (1,637,351 | ) |
| Net unrealized appreciation (depreciation) | | | 246,477,106 | | | | (691,637 | ) | | | 731,727 | |
| Undistributed ordinary income | | | — | | | | — | | | | 1,979 | |
| Undistributed long-term capital gains | | | 20,671,361 | | | | — | | | | — | |
| Total distributable earnings, | | | | | | | | | | | | |
| before other accumulated losses | | | 20,671,361 | | | | — | | | | 1,979 | |
| Other accumulated losses | | | (4,196,456 | ) | | | (29,114 | ) | | | (780,291 | ) |
| Total distributable earnings (loss) | | $ | 262,952,011 | | | $ | (720,751 | ) | | $ | (46,585 | ) |
| | | | | | | | | | | | | |
| | | Baird | | | Chautauqua | | | Chautauqua | |
| | | SmallCap | | | International | | | Global | |
| | | Value Fund | | | Growth Fund | | | Growth Fund | |
| Cost of investments | | $ | 25,060,992 | | | $ | 94,274,545 | | | $ | 41,168,706 | |
| Gross unrealized appreciation | | $ | 6,014,746 | | | $ | 7,962,317 | | | $ | 3,170,469 | |
| Gross unrealized depreciation | | | (2,278,131 | ) | | | (15,891,022 | ) | | | (7,314,471 | ) |
| Net unrealized appreciation (depreciation) | | | 3,736,615 | | | | (7,928,705 | ) | | | (4,144,002 | ) |
| Undistributed ordinary income | | | — | | | | 6,382 | | | | 204,652 | |
| Undistributed long-term capital gains | | | — | | | | — | | | | 24,923 | |
| Total distributable earnings, | | | | | | | | | | | | |
| before other accumulated losses | | | — | | | | 6,382 | | | | 229,575 | |
| Other accumulated losses | | | (756,813 | ) | | | (328,653 | ) | | | (971 | ) |
| Total distributable earnings (loss) | | $ | 2,979,802 | | | $ | (8,250,976 | ) | | $ | (3,915,398 | ) |
The difference between book-basis and tax-basis unrealized appreciation is attributable primarily to the tax deferral of losses on wash sales.
Additionally, U.S. generally accepted accounting principles require that certain components of net assets relating to permanent differences be reclassified between financial and tax reporting. These reclassifications are primarily due to differing treatments for equalization accounting for tax purposes, the disallowance of a net operating loss, redesignation of dividends, capital gain distributions received from underlying REIT securities, and the reclassification of foreign currency gains and losses. These reclassifications have no effect on net assets or net asset value per share. For the year ended December 31, 2018, the following table shows the reclassifications made:
| | | Accumulated | | | | | | | |
| | | Undistributed | | | Accumulated | | | | |
| | | Net Investment | | | Net Realized | | | Paid-in | |
Fund | | Income (Loss) | | | Gains (Losses) | | | Capital | |
| Baird MidCap Fund | | $ | 2,559,945 | | | $ | (11,029,228 | ) | | $ | 8,469,283 | |
| Baird Small/MidCap Growth Fund | | | 352 | | | | — | | | | (352 | ) |
| Baird Small/MidCap Value Fund | | | (567 | ) | | | 567 | | | | — | |
| Baird SmallCap Value Fund | | | 18,988 | | | | (120,402 | ) | | | 101,414 | |
| Chautauqua International Growth Fund | | | 11,278 | | | | (138,704 | ) | | | 127,426 | |
| Chautauqua Global Growth Fund | | | 6,935 | | | | (6,935 | ) | | | — | |
Notes to the Financial Statements
December 31, 2018
| 4. | Investment Transactions and Income Tax Information (cont.) |
Distributions to Shareholders
Each Fund generally pays dividends from net investment income and distributes net realized capital gains, if any, at least annually. Income and capital gain distributions are determined in accordance with income tax regulations, which may differ from GAAP. Certain Funds also utilize earnings and profits distributed to shareholders on redemptions of shares as part of the dividends paid deduction.
The tax components of distributions paid during the periods shown below were as follows:
| | | Year Ended December 31, 2018 | | | Year Ended December 31, 2017 | |
| | | Ordinary | | | Long-Term | | | | | | Ordinary | | | Long-Term | | | | |
Fund | | Income | | | Capital Gains | | | Total | | | Income | | | Capital Gains | | | Total | |
| Baird MidCap Fund | | $ | 1,973,593 | | | $ | 83,684,201 | | | $ | 85,657,794 | | | $ | — | | | $ | 62,460,185 | | | $ | 62,460,185 | |
| Baird Small/MidCap | | | | | | | | | | | | | | | | | | | | | | | | |
| Value Fund | | | 60,428 | | | | 6,978 | | | | 67,406 | | | | 81,498 | | | | 3,764 | | | | 85,262 | |
| Baird SmallCap Value Fund | | | 99,147 | | | | 1,168,159 | | | | 1,267,306 | | | | 181,120 | | | | 841,810 | | | | 1,022,930 | |
| Chautauqua International | | | | | | | | | | | | | | | | | | | | | | | | |
| Growth Fund | | | 2,231,961 | | | | 127,086 | | | | 2,359,047 | | | $ | 2,196,544 | | | | 271,045 | | | | 2,467,589 | |
| Chautauqua Global | | | | | | | | | | | | | | | | | | | | | | | | |
| Growth Fund | | | 279,792 | | | | 248,702 | | | | 528,494 | | | | 483,916 | | | | 183,843 | | | | 667,759 | |
The Funds in the table below designated as long-term capital gain dividend, pursuant to Internal Revenue Code Section 852(b)(3), the amount necessary to reduce the earnings and profits of the Funds related to net capital gain to zero for the tax year ended December 31, 2018. To the extent necessary to fully distribute such capital gains, the Funds also designate earnings and profits distributed to shareholders on the redemption of shares.
At December 31, 2018, the following Funds deferred, on a tax basis, qualified late year losses:
| Fund | | Loss Deferral | |
| Baird MidCap Fund | | $ | 4,196,456 | |
| Baird SmallCap Value Fund | | | 756,813 | |
| Chautauqua International Growth Fund | | | 323,018 | |
| Chautauqua Global Growth Fund | | | 1,314 | |
At December 31, 2018, accumulated net realized capital loss carryovers, if any, and the year(s) in which the capital loss carryovers expire were:
| | | Capital Loss Carryover | | Year of Expiration |
| Fund | | Short-term | | | Long-term | | Short-term | | Long-term |
| Baird Small/Mid Cap Growth Fund | | $ | 29,114 | | | $ | — | | Indefinite | | Indefinite |
| Baird Small/Mid Cap Value Fund | | | 436,595 | | | | 343,696 | | Indefinite | | Indefinite |
Notes to the Financial Statements
December 31, 2018
| 5. | Investment Advisory and Other Agreements |
The Funds have entered into an Investment Advisory Agreement with Baird for the provision of investment advisory services. Pursuant to the Investment Advisory Agreement, the Advisor is entitled to receive a fee, calculated daily and payable monthly, at the annual rates as follows:
| | Investment Advisory Fees |
| | Effective December 1, 2018 | Effective January 1, 2018 |
Fund | through December 31, 2018 | through November 30, 2018 |
| Baird MidCap Fund | 0.75% | 0.75% |
| Baird Small/Mid Cap Growth Fund | 0.75% | 0.75%(1) |
| Baird Small/Mid Cap Value Fund | 0.75% | 0.80% |
| Baird SmallCap Value Fund | 0.85% | 0.85% |
| Chautauqua International Growth Fund | 0.75% | 0.80% |
| Chautauqua Global Growth Fund | 0.75% | 0.80% |
(1) | For the period from close of business on October 31, 2018 (inception date) through November 30, 2018. |
For the periods presented below, the Advisor has contractually agreed to waive its investment advisory fee and/or reimburse the Funds’ operating expenses, including interest expense and the fees and expenses incurred by the Funds in connection with the Funds’ investments in other investment companies (exclusive of taxes, brokerage commissions and extraordinary expenses) to the extent necessary to ensure that each Fund’s total operating expenses do not exceed the following annual percentages of average daily net assets:
| | Effective December 1, 2018 | Effective January 1, 2018 |
| | through December 31, 2018(1) | through November 30, 2018 |
| | Institutional | Investor | Institutional | Investor |
Fund | Class | Class | Class | Class |
| Baird MidCap Fund | 0.85% | 1.10% | 0.85% | 1.10% |
| Baird Small/Mid Cap Growth Fund | 0.85% | 1.10% | 0.85%(2) | 1.10%(2) |
| Baird Small/Mid Cap Value Fund | 0.85% | 1.10% | 0.95% | 1.20% |
| Baird SmallCap Value Fund | 0.95% | 1.20% | 1.00% | 1.25% |
| Chautauqua International Growth Fund | 0.80% | 1.05% | 0.95% | 1.20% |
| Chautauqua Global Growth Fund | 0.80% | 1.05% | 0.95% | 1.20% |
(1) | Agreement in effect through at least April 30, 2020. |
(2) | For the period from close of business on October 31, 2018 (inception date) through November 30, 2018. |
To the extent that the Advisor reimburses or absorbs fees and expenses, it may seek payment of such amounts for three years after the year in which expenses were reimbursed or absorbed. A Fund will make no such payment, however, if its total annual operating expenses exceed the expense limits in effect at the time the expenses were reimbursed or at the time these payments are proposed.
| | | Fiscal Year Ended December 31, | |
| Fees waived by Advisor for the Year Ended December 31, | | 2018 | | | 2017 | | | 2016 | |
| | | | | | | | | | |
| Subject to Recovery on or before Fiscal Year Ending December 31, | | 2021 | | | 2020 | | | 2019 | |
Fund | | | | | | | | | |
| Baird Small/Mid Cap Growth Fund | | $ | 32,277 | (1) | | | N/A | | | | N/A | |
| Baird Small/Mid Cap Value Fund | | | 151,826 | | | $ | 129,251 | | | $ | 156,332 | |
| Baird SmallCap Value Fund | | | 135,562 | | | | 110,672 | | | | 116,311 | |
| Chautauqua International Growth Fund | | | 116,439 | | | | 137,404 | | | | 95,476 | |
| Chautauqua Global Growth Fund | | | 155,834 | | | | 170,958 | | | | 102,142 | |
(1) | For the period from close of business on October 31, 2018 (inception date) through December 31, 2018. |
Notes to the Financial Statements
December 31, 2018
| 5. | Investment Advisory and Other Agreements (cont.) |
For the period from close of business on November 30, 2015 (inception date) through December 31, 2015, fees waived by the Advisor of $23,659 for the Baird Small/MidCap Value Fund expired on December 31, 2018, and are no longer eligible for recovery by the Advisor.
For the year ended December 31, 2015, fees waived by the Advisor of $131,370 for the Baird SmallCap Value Fund expired on December 31, 2018, and are no longer eligible for recovery by the Advisor.
U.S. Bancorp Fund Services, LLC, doing business as U.S. Bank Global Fund Services, serves as transfer agent, administrator, and accounting services agent for the Funds. U.S. Bank, N.A. (“U.S. Bank”) serves as custodian for the Funds.
Robert W. Baird & Co. Incorporated (the “Distributor”) is the sole distributor of the Funds pursuant to a distribution agreement.
No commissions were earned by the Distributor for services rendered as a registered broker-dealer in securities transactions for the year ended December 31, 2018 for the Funds.
Certain officers and employees of the Advisor are also officers of the Funds.
The Corporation maintains an uncommitted line of credit (“LOC”) with U.S. Bank to provide the Funds a temporary liquidity source to meet unanticipated redemptions. The LOC is unsecured at all times, and is subject to certain restrictions and covenants. Under the terms of the LOC, borrowings for each Fund are limited to one-third of the total eligible net assets (including the amount borrowed) of the respective Fund, or $550,000,000 of total borrowings for all Funds, whichever is less. U.S. Bank charges interest at the U.S. Bank’s Prime Rate less 2%, but in no event less than a net rate of 1% per annum. The LOC matures on May 26, 2019, unless renewed. The Funds have authorized U.S. Bank to charge any of the accounts of the borrowing Fund subject to the agreement for any missed payments.
The Funds did not borrow from the LOC during the year. As of December 31, 2018, the Prime Rate was 5.50%. At December 31, 2018, the Funds did not have any outstanding borrowings under the LOC.
| 7. | Distribution and Shareholder Service Plan |
The Funds have adopted a distribution and shareholder service plan (the “Plan”) pursuant to Rule 12b-1 under the 1940 Act. The Plan allows the Funds to compensate the Distributor for the costs incurred in distributing the Funds’ Investor Class Shares, including amounts paid to brokers or dealers, at an annual rate of 0.25% of the average daily net assets of the Funds’ Investor Class Shares.
For the year ended December 31, 2018, the Funds incurred fees pursuant to the Plan as follows:
| Baird MidCap Fund | | | $280,653 | |
| Baird Small/Mid Cap Growth Fund | | | 4 | * |
| Baird Small/Mid Cap Value Fund | | | 416 | |
| Baird SmallCap Value Fund | | | 4,818 | |
| Chautauqua International Growth Fund | | | 6,614 | |
| Chautauqua Global Growth Fund | | | 2,184 | |
| * | Period from close of business on October 31, 2018 (inception date) through December 31, 2018. |
Notes to the Financial Statements
December 31, 2018
A redemption fee of 2.00% will be assessed on Institutional and Investor Class shares of the Chautauqua International Growth Fund and Chautauqua Global Growth Fund if redeemed (including in connection with an exchange) 90 days or less from their date of purchase, determined on a first-in, first-out (“FIFO”) basis. The redemption fee is paid directly to the Funds and is designed to offset brokerage commissions, market impact and other costs associated with fluctuations in Fund asset levels and cash flow caused by short-term shareholder trading.
For the year ended December 31, 2018, the Funds charged redemption fees as follows:
| Chautauqua International Growth Fund | $20,170 |
| Chautauqua Global Growth Fund | $ 6,311 |
The Baird MidCap Fund, Baird Small/Mid Cap Growth Fund, Baird Small/Mid Cap Value Fund and Baird SmallCap Value Fund do not charge redemption fees.
In preparing these financial statements, management has evaluated events after December 31, 2018. There were no other subsequent events since December 31, 2018, through the date the financial statements were issued that would warrant adjustment to or additional disclosure in these financial statements.
Report of Independent Registered Public
Accounting Firm
To the Shareholders and Board of Directors of
Baird Funds, Inc.
Opinion on the Financial Statements
We have audited the accompanying statements of assets and liabilities, including the schedules of investments, of Baird MidCap Fund, Baird Small/Mid Cap Growth Fund, Baird Small/Mid Cap Value Fund, Baird SmallCap Value Fund, Chautauqua International Growth Fund, and Chautauqua Global Growth Fund (the “Funds”), each a series of Baird Funds, Inc., as of December 31, 2018, the related statements of operations and changes in net assets, including the related notes, and the financial highlights, for the period October 31, 2018 (commencement of operations) through December 31, 2018, for Baird Small/Mid Cap Growth Fund, and the related statements of operations for the year then ended, the statements of changes in net assets, including the related notes, and the financial highlights for each of the two years in the period then ended for the remainder of the Funds (collectively, for all Funds, referred to as the “financial statements”). In our opinion, the financial statements present fairly, in all material respects, the financial position of the each of the Funds as of December 31, 2018, and the results of their operations, the changes in their net assets, and the financial highlights for each of the periods indicated above, in conformity with accounting principles generally accepted in the United States of America.
The Funds’ financial highlights for the periods ended December 31, 2016 and prior, were audited by other auditors whose report dated February 27, 2017, expressed an unqualified opinion on those financial highlights.
Basis for Opinion
These financial statements are the responsibility of the Funds’ management. Our responsibility is to express an opinion on the Funds’ financial statements based on our audits. We are a public accounting firm registered with the Public Company Accounting Oversight Board (United States) (“PCAOB”) and are required to be independent with respect to the Funds in accordance with the U.S. federal securities laws and the applicable rules and regulations of the Securities and Exchange Commission and the PCAOB.
We conducted our audits in accordance with the standards of the PCAOB. Those standards require that we plan and perform the audit to obtain reasonable assurance about whether the financial statements are free of material misstatement, whether due to error or fraud.
Our audits included performing procedures to assess the risks of material misstatement of the financial statements, whether due to error or fraud, and performing procedures that respond to those risks. Such procedures included examining, on a test basis, evidence regarding the amounts and disclosures in the financial statements. Our procedures included confirmation of securities owned as of December 31, 2018, by correspondence with the custodian and brokers. Our audits also included evaluating the accounting principles used and significant estimates made by management, as well as evaluating the overall presentation of the financial statements. We believe that our audits provide a reasonable basis for our opinion.
We have served as the Funds’ auditor since 2017.
COHEN & COMPANY, LTD.
Milwaukee, Wisconsin
February 27, 2019
Directors & Officers
As of December 31, 2018 (Unaudited)
Independent Directors
John W. Feldt
Independent Director
Term of Office: Indefinite
Length of Time Served: Since September 2000
Age: 76
c/o Robert W. Baird & Co. Incorporated
777 East Wisconsin Avenue
Milwaukee, WI 53202
Principal Occupation(s) During the Past 5 Years: Retired.
Number of Active Portfolios in Complex Overseen by Director: 14
Other Directorships Held by Director: Director of Thompson IM Funds, Inc., a mutual fund complex (3 portfolios) (1987-2018).
Darren R. Jackson
Independent Director
Term of Office: Indefinite
Length of Time Served: Since November 2018
Age: 54
c/o Robert W. Baird & Co. Incorporated
777 East Wisconsin Avenue
Milwaukee, WI 53202
Principal Occupation(s) During the Past 5 Years: Retired; President, CEO and Director, Advance Auto Parts, Inc. (2008-2016).
Number of Active Portfolios in Complex Overseen by Director: 14
Other Directorships Held by Director: Director of Fastenal Company, a tool and supply distributor, since 2012; Director of Cree, Inc., a lighting manufacturer, since 2016.
Frederick P. Stratton, Jr.
Independent Director
Term of Office: Indefinite
Length of Time Served: Since May 2004
Age: 79
c/o Robert W. Baird & Co. Incorporated
777 East Wisconsin Avenue
Milwaukee, WI 53202
Principal Occupation(s) During the Past 5 Years: Retired; Chairman Emeritus, Briggs & Stratton Corporation, a manufacturing company, since 2003.
Number of Active Portfolios in Complex Overseen by Director: 14
Other Directorships Held by Director: Director of Weyco Group, Inc., a men’s footwear distributor, since 1976.
Marlyn J. Spear, CFA
Independent Director
Term of Office: Indefinite
Length of Time Served: Since January 2008
Age: 65
c/o Robert W. Baird & Co. Incorporated
777 East Wisconsin Avenue
Milwaukee, WI 53202
Principal Occupation(s) During the Past 5 Years: Retired; Chief Investment Officer, Building Trades United Pension Trust Fund (July 1989-February 2017).
Number of Active Portfolios in Complex Overseen by Director: 14
Other Directorships Held by Director: Management Trustee of AFL-CIO Housing Investment Trust, a mutual fund complex (1 portfolio) (1995-2018).
Directors & Officers
As of December 31, 2018 (Unaudited) (Continued)
Interested Directors and Officers
Cory L. Nettles*
Interested Director
Term of Office: Indefinite
Length of Time Served: Since January 2008
Age: 48
c/o Generation Growth Capital, Inc.
411 East Wisconsin Avenue, Suite 1710
Milwaukee, WI 53202
Principal Occupation(s) During the Past 5 Years: Managing Director, Generation Growth Capital, Inc., a private equity fund, since March 2007; Of Counsel, Quarles & Brady LLP, a law firm (January 2005-December 2016).
Number of Active Portfolios in Complex Overseen by Director: 14
Other Directorships Held by Director: Director of Weyco Group, Inc., a men’s footwear distributor, since 2007; Director of Associated Banc-Corp,
since 2013.
Mary Ellen Stanek
President
Term of Office: Re-elected by Board annually
Length of Time Served: Since September 2000
Age: 62
777 East Wisconsin Avenue
Milwaukee, WI 53202
Principal Occupation(s) During the Past 5 Years: Managing Director, the Advisor, and Chief Investment Officer, Baird Advisors, a department of the Advisor, since March 2000.
Charles B. Groeschell
Vice President
Term of Office: Re-elected by Board annually
Length of Time Served: Since January 2010
Age: 65
777 East Wisconsin Avenue
Milwaukee, WI 53202
Principal Occupation(s) During the Past 5 Years: Managing Director, the Advisor, and Senior Portfolio Manager, Baird Advisors, a department of the Advisor, since February 2000.
Angela M. Palmer
Chief Compliance Officer and
AML Compliance Officer
Term of Office: Re-elected by Board annually
Length of Time Served: Since March 2014
Age: 46
777 East Wisconsin Ave
Milwaukee, WI 53202
Chief Compliance Officer, the Advisor, since March 2014; Anti-Money Laundering Compliance Officer since May 2015; Director, the Advisor, since July 2014; Senior Vice President, the Advisor (March 2014-June 2014); Chief Compliance Officer, RIAs US, BMO Financial Group (January 2013-March 2014); Vice President, BMO Harris Bank, N.A. (July 2011-March 2014); Chief Compliance Officer, Taplin, Canida & Habacht, LLC (December 2008-March 2014).
Heidi L. Schneider
Treasurer
Term of Office: Re-elected by Board annually
Length of Time Served: Since August 2017
Age: 47
777 East Wisconsin Avenue
Milwaukee, WI 53202
Principal Occupation(s) During the Past 5 Years: Managing Director, the Advisor, since December 2013; Senior Business Analyst, Stein’s Garden & Home, a family-owned garden center and home goods retailer (July 2012-December 2013).
Directors & Officers
As of December 31, 2018 (Unaudited) (Continued)
Interested Directors and Officers
Charles M. Weber
Secretary
Term of Office: Re-elected by Board annually
Length of Time Served: Since September 2005
Age: 55
777 East Wisconsin Avenue
Milwaukee, WI 53202
Principal Occupation(s) During the Past 5 Years: Senior Associate General Counsel, the Advisor, since January 2013; Managing Director, the Advisor, since January 2009.
Peter J. Hammond
Vice President
Term of Office: Re-elected by Board annually
Length of Time Served: Since August 2012
Age: 55
777 East Wisconsin Avenue
Milwaukee, WI 53202
Principal Occupation(s) During the Past 5 Years:
Senior Vice President, the Advisor, since March 2012.
Dustin J. Hutter
Assistant Treasurer
Term of Office: Re-elected by Board annually
Length of Time Served: Since February 2011
Age: 42
777 East Wisconsin Avenue
Milwaukee, WI 53202
Principal Occupation(s) During the Past 5 Years: Senior Business Analyst, the Advisor, since September 2017; Director of Finance Services, the Advisor (August 2015-August 2017); Director of Reporting and Analysis, Capital Markets Finance, the Advisor (February 2013-August 2015).
Andrew D. Ketter
Assistant Secretary
Term of Office: Re-elected by Board annually
Length of Time Served: Since February 2011
Age: 44
777 East Wisconsin Avenue
Milwaukee, WI 53202
Principal Occupation(s) During the Past 5 Years: Associate General Counsel, the Advisor, since September 2010; Director, the Advisor, since July 2014; Senior Vice President, the Advisor (January 2014-June 2014); First Vice President, the Advisor (September 2010 to December 2013).
| * | Mr. Nettles was considered an “interested person” of the Corporation (as defined in the 1940 Act) as of December 31, 2018 because of his previous association with the law firm, Quarles & Brady LLP, which provides legal services to the Advisor. The legal services that Quarles & Brady LLP has provided to the Advisor include litigation, real estate, trademark and miscellaneous securities related matters that did not relate to the Corporation or the Funds. Mr. Nettles is considered an Independent Director as of January 1, 2019. |
Additional information about the Funds’ Directors is available in the Statement of Additional Information which may be obtained without charge, upon request, by calling 1-866-44BAIRD, or at www.bairdfunds.com.
Baird Funds, Inc.
Disclosure Regarding the Board of Directors’ Approval of the Investment Advisory Agreement for Baird Equity Funds (Unaudited)
The Board of Directors (the “Board”) of Baird Funds, Inc. (the “Corporation”), including the directors who are not “interested persons” of the Corporation within the meaning of the Investment Company Act of 1940 (the “Independent Directors”), met on August 1 and August 21, 2018 to consider the annual renewal of the investment advisory agreement between Robert W. Baird & Co. Incorporated (“Baird” or the “Advisor”) and the Corporation on behalf of the Baird MidCap Fund, Baird Small/Mid Cap Value Fund, Baird SmallCap Value Fund, Chautauqua International Growth Fund, and Chautauqua Global Growth Fund (the “Existing Equity Funds”). At the meetings held on August 1 and August 21, 2018, the Board also considered the approval of the investment advisory agreement between the Advisor and the Corporation on behalf of the Baird Small/Mid Cap Growth Fund (the “SMID Fund”). The Board, including a majority of the Independent Directors, approved the investment advisory agreement for the SMID Fund and approved the continuation of the investment advisory agreement for the Existing Equity Funds through a process that concluded at the August 21, 2018 meeting. In connection with its consideration of the investment advisory agreement, the Board reviewed and discussed various information that had been provided prior to the meeting, including the investment advisory agreement, a memorandum provided by legal counsel summarizing the guidelines relevant to the Board’s consideration of the approval or renewal of the investment advisory agreement, a memorandum and other information provided in response to a request from the Board, including the Independent Directors, from the Advisor (including the Advisor’s Form ADV Part 1A, brochures and brochure supplements, annual report and audited financial statements), a profitability analysis, comparative information about the Funds’ performance for periods ended June 30, 2018, management fees and expense ratios, composite performance of similar accounts managed by the Advisor, trading and commission information and other pertinent information. The Board also considered the Advisor’s response to the 15(c) request from the Board with respect to the SMID Fund.
The Board considered the Advisor’s 15(c) response and discussed various questions and information with representatives of the Advisor at the August 1, 2018 special meeting. At the August 21 meeting, the Board met in executive session with the Funds’ legal counsel to consider the investment advisory agreement and also met in executive session with a representative of Baird Equity Asset Management. The Board also took into account information reviewed periodically throughout the year that was relevant to its consideration of the investment advisory agreement, including performance, management fee and other expense information and discussions with the Funds’ portfolio managers. Based on its evaluation of this information, the Board, including a majority of the Independent Directors, approved the investment advisory agreement for the SMID Fund and approved the continuation of the investment advisory agreement for the Existing Equity Funds for an additional one-year period.
In considering the investment advisory agreement and reaching its conclusions, the Board reviewed and analyzed various factors that it determined were relevant, including the factors below. In deciding to approve the investment advisory agreement for each Fund, the Board did not identify any single factor as determinative but considered all factors together.
Approval of Investment Advisory Agreement – SMID Fund
Nature, Extent and Quality of Services to be Provided to the Fund
The Board analyzed the nature, extent and quality of the services to be provided by the Advisor to the Fund. The Board discussed the experience and resources of the Advisor, as well as the depth and qualifications of the SMID Growth investment team. The Board noted that the Fund’s proposed portfolio manager, Jonathan Good, is an experienced member of the portfolio management team, and would be supported by the existing Growth team. The Board also considered their cumulative experience with the Advisor in its management of the MidCap Fund, of which the SMID Fund would be an extension. The Board further noted that the Advisor, in its capacity as a registered broker-dealer, was proposed to serve as distributor and principal underwriter of shares of the Fund and would assist in marketing the Fund. The Board also considered other services the Advisor would provide the Fund, such as providing compliance support and overseeing the Fund’s other service providers. The Board concluded that the nature, extent and quality of the services to be provided by the Advisor to the Fund were appropriate and that the Fund was likely to benefit from services provided under the investment advisory agreement.
Baird Funds, Inc.
Disclosure Regarding the Board of Directors’ Approval of the Investment Advisory Agreement for Baird Equity Funds (Unaudited) (Continued)
Investment Performance
Because the Fund had not yet commenced operations, the Board did not consider any performance information with respect to the Fund. The Board reviewed the composite performance for the SMID Growth investment strategy, and concluded that, although past performance is not a guarantee of future results, the SMID Growth team appeared to have an effective investment process for this strategy.
Expense Information
The Board examined the proposed fee and expense information for the Fund, including a comparison of such information to other mutual funds in the mid-cap growth Morningstar category. The Board considered that the Advisor has agreed to a contractual expense limitation for the Fund through at least April 30, 2020. The Board noted that the Fund’s proposed advisory fee was in line with the Morningstar category average and the Fund’s total expense ratio for the Institutional Class and Investor Class was below and slightly below, respectively, the category average, taking into effect the expense cap agreement.
The Board also considered advisory fees currently charged and to be charged by the Advisor to other investment advisory clients in the Small/Mid Cap Value strategy. The Board recognized the extent of the significant additional services to be provided to the Fund that the Advisor does not provide to its other clients, such as certain administrative services, oversight of the Fund’s other service providers, director support, risk management, regulatory compliance and various other services.
Costs of Services Provided and Profitability
The Board considered information about the financial condition of the Advisor, including the Advisor’s annual report and financial statements, and determined that the Advisor’s financial condition was sound. The Board did not consider any specific information regarding the costs of services to be provided or the profits the Advisor might realize because the Fund had not yet commenced operations.
In light of all of the information that it received and considered, the Board concluded that the proposed advisory fee and total expense ratio of the Fund were reasonable.
Economies of Scale and Fee Levels Reflecting Those Economies
Because the Fund had not yet commenced operations, the Board did not consider whether any alternative fee structures, such as breakpoint fees, would be appropriate to reflect any economies of scale that may result from increases in the Fund’s assets.
Benefits to be Derived from the Relationship with the Fund
The Board considered other potential benefits to the Advisor from serving as advisor to the Fund (in addition to the advisory fee). The Board noted that the Advisor would derive ancillary benefits from its association with the Fund in the form of research products and services received from unaffiliated broker-dealers who execute portfolio trades for the Funds. The Board noted that the Advisor’s asset management and other businesses may experience indirect benefits from the Advisor’s association with the Funds. The Board concluded that other benefits that may be realized by the Advisor from its relationship with the Fund were appropriate.
Based on their evaluation of the above factors, as well as other factors relevant to their consideration of the investment advisory agreement, the Board, including a majority of the Independent Directors, concluded that the approval of the investment advisory agreement was in the best interests of the Fund.
Approval of Investment Advisory Agreement – Existing Equity Funds
Nature, Extent and Quality of Services Provided to the Funds
The Board considered the nature, extent and quality of the services provided by the Advisor to the Funds. The Board noted the Advisor’s overall reputation and depth of the Advisor’s personnel, resources and commitment to the Funds and the experience and credentials of the portfolio management teams employed to manage the Funds’ investments. The Board considered the credentials and continuity of the portfolio management teams for the Funds and noted that the Advisor has added resources in support of the Funds, including investments in personnel, technology, research, trading, risk controls and systems.
The Board considered the Advisor’s disciplined investment decision making process used for the Funds. The Board also considered other services that the Advisor provides the Funds in its capacity as their investment advisor, such as making some of its key personnel available to serve as officers of the Funds, selecting broker
Baird Funds, Inc.
Disclosure Regarding the Board of Directors’ Approval of the Investment Advisory Agreement for Baird Equity Funds (Unaudited) (Continued)
dealers for execution of portfolio transactions, ensuring adherence to the Funds’ investment policies and restrictions, compliance, risk management services, valuation, providing support services to the Board and the committees of the Board and overseeing the Funds’ other service providers. The Board also considered the strength of the Advisor’s compliance department, including the Funds’ chief compliance officer, as well as the Advisor’s risk management system. The Board concluded that the nature, extent and quality of the services provided by the Advisor to the Funds were appropriate and that each Fund was likely to continue to benefit from services provided under the respective investment advisory agreement.
Investment Performance of the Advisor and the Funds
In considering the investment performance of each of the Funds, the Board reviewed information as of June 30, 2018, regarding the performance of each class of the Fund for applicable one-year, three-year, five-year, ten-year and since-inception periods in comparison to its benchmark index and its peer group as determined by Lipper. The Board also considered composite investment performance of Baird Equity Asset Management with respect to accounts managed by the Advisor that are comparable to the Funds.
The Board noted that the performance of the Institutional Class of the Baird MidCap Fund exceeded the benchmark and Lipper peer group average for the ten-year and since-inception periods but trailed the benchmark index and peer group average for the one-year, three-year and five-year periods. The Board noted the strong performance of the SmallCap Value Fund and Small/Mid Cap Value Fund during calendar year 2017, with the Institutional Class of each Fund exceeding the benchmark index and the Lipper peer group average for the one-year period, but noted that the Funds trailed benchmark index and peer group average for other periods. The Board considered the reasons for each Fund’s underperformance during such periods as discussed by the Advisor.
The Board considered the performance of the Chautauqua International Growth Fund and Chautauqua Global Growth Fund since they were launched in 2016, noting that the performance of the Institutional Class of the International Growth Fund and the Global Growth Fund each exceeded the benchmark index and Lipper peer group average for the one-year and since-inception periods.
The Board also considered the Advisor’s quarterly portfolio commentaries and reviews explaining the Funds’ performance, the Advisor’s consistent and disciplined investment decision process and the investment strategies it employs for the Funds. After considering all of the information, the Board concluded that, although past performance is not a guarantee of future results, each Fund and its shareholders were likely to benefit from the continued management by the Advisor.
Fee Information, Costs of Services Provided and Profits Realized by the Advisor
The Board examined the fee and expense information for each of the Funds, including a comparison of such information to other similarly situated mutual funds as determined by Morningstar. The Board noted that the advisory fee for each of the MidCap Fund, the Small/Mid Cap Value Fund and the International Growth Fund was in line with the Morningstar average and the advisory fee for the SmallCap Value Fund and the Global Growth Fund was above the Morningstar average. The Board also reviewed and considered management fees charged by the Advisor to other investment advisory clients and noted that the advisory fee paid by the MidCap Fund was 10 basis points (or 0.10%) less than what the Advisor charges on the first $10 million of a separately managed account. With respect to the Small/Mid Cap and SmallCap Value Funds, the Fund’s advisory fee was 15 basis points (or 0.15%) less than what the Advisor charges on the first $20 million of a separately managed account. With respect to the International Growth and Global Growth Funds, the Fund’s advisory fee was 10 basis points (or 0.10%) less than what the Advisor charges on the first $50 million of a separately managed account.
The Board noted that the Advisor maintains subadvisory arrangements with other unaffiliated equity mutual funds as well as two private limited partnerships managed in strategies similar to the International Growth Fund and the Global Growth Fund, but did not consider the comparative fees to be a material factor given the difference in services provided by the Advisor.
The Board noted the extent of the significant additional services provided to the Funds that the Advisor did not provide in the other advisory relationships. Those services included operational support, valuation services, oversight of the Funds’ other service providers, director support, preparation of regulatory filings,
Baird Funds, Inc.
Disclosure Regarding the Board of Directors’ Approval of the Investment Advisory Agreement for Baird Equity Funds (Unaudited) (Continued)
implementation of the Funds’ compliance program including employment of the Funds’ Chief Compliance Officer and other compliance staff, and various other services. In addition, the Board noted that the provision of investment advisory services to the Funds requires more effort than it does for separately managed accounts due to daily sales and redemption activity and additional regulatory and compliance requirements.
The Board also considered the total expense ratio of each Fund, after fee waivers and expense reimbursements by the Advisor, relative to all other mutual funds in its Morningstar category. The Board noted that the net expense ratio for the Institutional Class of each Fund was below the Morningstar category average; the net expense ratio for the Investor Class of the MidCap Fund and the Small/Mid Cap Value Fund was below or in line with, respectively, the Morningstar category average; and the net expense ratio for the Investor Class of the SmallCap Value Fund, the International Growth Fund and the Global Growth Fund was above the Morningstar category average.
The Board considered the fees realized, and the costs incurred, by the Advisor in providing investment management services to the Funds and the profitability to the Advisor of having a relationship with the Funds. The Board noted that the Advisor has waived fees for each of the Funds under the expense cap agreement, other than the MidCap Fund (due to its expense ratio being below the expense cap). The Board noted that the Advisor’s profitability information does not reflect certain internal resources provided by the Advisor to the Funds, such as legal, finance and compliance support. The Board reviewed and considered the general financial condition of the Advisor and determined it to be sound. The Board also noted that all marketing and distribution fees other than the Rule 12b-1 fee payable by the Investor Class shares of the Funds were paid by the Advisor from its reasonable profits. In light of all of the information that it received and considered, the Board concluded that the management fee and total expense ratio of each Fund were reasonable and the profits realized by the Advisor from its relationship with the Funds were reasonable.
Economies of Scale and Fee Levels Reflecting Those Economies
The Board reviewed the extent to which economies of scale may be realized as the Funds increase in size. The Board recognized that the Advisor has committed to waive fees and/or reimburse expenses for the Funds pursuant to the expense cap agreement. Other than the MidCap Fund, the Board did not consider economies of scale to be a material factor due to the current asset size of each Fund. With respect to the MidCap Fund, the Fund has shared economies of scale with shareholders by virtue of the reduced expense ratio. In addition, the Board noted that the Fund compares favorably with other funds in its Morningstar category in terms of expenses. The Directors concluded that the absence of breakpoints in the management fee for the MidCap Fund is reasonable at this time.
The Board recognized that the advisory fee rates paid by the Funds were designed to be lower than the fees otherwise charged by the Advisor to its separately managed account clients. The Directors considered the Advisor’s commitment to continue to evaluate breakpoints with respect to the MidCap Fund. The Directors concluded that the current fee structure of each Fund was reasonable.
Benefits Derived from the Relationship with the Funds
The Board considered other benefits to the Advisor from serving as advisor to the Funds (in addition to the advisory fee). The Board noted that the Advisor derives ancillary benefits from its association with the Funds in the form of research products and services received from unaffiliated broker dealers who execute portfolio trades for the Funds. The Board determined such products and services have been used for legitimate purposes relating to the Funds by providing assistance in the investment decision-making process. The Board also noted that the Advisor, in its capacity as the Funds’ distributor, and its financial advisors receive 12b-1 payments for selling Investor Class shares of the Funds. The Board noted that the Advisor’s asset management and other businesses may experience indirect benefits from the Advisor’s association with the Funds. The Board concluded that the other benefits realized by the Advisor from its relationship with the Funds were appropriate.
Based on its evaluation of the above factors, as well as other factors relevant to their consideration of the investment advisory agreement, the Board, including all of the Independent Directors, concluded that the continuation of the investment advisory agreement was in the best interest of each Fund and its shareholders.
Additional Information
Proxy Voting
A description of the policies and procedures that the Funds use to determine how to vote proxies relating to portfolio securities is available without charge, upon request, by calling toll free, 1-866-44BAIRD, or by accessing the Funds’ website at www.bairdfunds.com; and by accessing the SEC’s website at www.sec.gov.
Each Fund’s proxy voting record for the most recent 12-month period ended June 30 is available without charge, upon request, by calling toll free, 1-866-44BAIRD, or by accessing the Funds’ website at www.bairdfunds.com; and by accessing the SEC’s website at www.sec.gov.
Portfolio Holdings Disclosure
The Funds file a complete schedule of portfolio holdings with the U.S. Securities and Exchange Commission (the “SEC”) for the first and third quarters of each fiscal year on Form N-Q or Part F of Form N-PORT (beginning with filings after March 31, 2019). The Funds’ Forms N-Q or, beginning with filings after March 31, 2019, on Part F of Form N-PORT are available on the SEC’s website at www.sec.gov. The Funds’ Forms N-Q or Part F of Form N-PORT may also be obtained by calling toll-free 1-866-44BAIRD.
Qualified Dividend Income/Dividends Received Deduction
For the fiscal year ended December 31, 2018, certain dividends paid by the Funds may be subject to a maximum tax rate of 15%, as provided for by the Jobs and Growth Tax Relief Reconciliation Act of 2003. The percentage of dividends declared from ordinary income designated as qualified dividend income was as follows:
| Baird MidCap Fund | 100.00% |
| Baird Small/MidCap Value Fund | 100.00% |
| Baird SmallCap Value Fund | 100.00% |
| Chautauqua International Growth Fund | 52.54% |
| Chautauqua Global Growth Fund | 16.09% |
For corporate shareholders, the percent of ordinary income distributions qualifying for the corporate dividends received deduction for the fiscal year ended December 31, 2018 was as follows:
| Baird MidCap Fund | 100.00% |
| Baird Small/MidCap Value Fund | 100.00% |
| Baird SmallCap Value Fund | 100.00% |
| Chautauqua International Growth Fund | 0.64% |
| Chautauqua Global Growth Fund | 3.35% |
The percentage of taxable ordinary income distributions that are designated as short-term capital gain distributions under Internal Revenue Section 871(k)(2)(C) for each Fund were as follows:
| Baird MidCap Fund | 100.00% |
| Chautauqua International Growth Fund | 79.17% |
| Chautauqua Global Growth Fund | 96.21% |
Baird Funds, Inc. Privacy Policy
| | FACTS | | WHAT DOES BAIRD FUNDS DO WITH YOUR PERSONAL INFORMATION? | |
| | | | | |
| | Why? | | Financial companies choose how they share your personal information. Federal law gives consumers the right to limit some but not all sharing. Federal law also requires us to tell you how we collect, share, and protect your personal information. Please read this notice carefully to understand what we do. | |
| | | | | |
| | What? | | The types of personal information we collect and share depend on the product or service you have with us. This information can include: | |
| | | | • Social Security number | |
| | | | • Account balances, transaction history and assets | |
| | | | • Checking account information and wire transfer instructions | |
| | | | | |
| | How? | | All financial companies need to share customers’ personal information to run their everyday business. In the section below, we list the reasons financial companies can share their customers’ personal information; the reasons Baird Funds, Inc. chooses to share; and whether you can limit this sharing. | |
| | | Does Baird | Can you limit |
| | Reasons we can share your personal information | Funds, Inc. share? | this sharing? |
| | For our everyday business purposes— | Yes | No |
| | such as to process your transactions, maintain | | |
| | your account(s), respond to court orders and | | |
| | legal investigations, or report to credit bureaus | | |
| | For our marketing purposes— | Yes | No |
| | to offer our products and services to you | | |
| | For joint marketing with other financial companies | No | We do not share |
| | For our affiliates’ everyday business purposes— | Yes | No |
| | information about your transactions and experiences | | |
| | For our affiliates’ everyday business purposes— | No | We do not share |
| | information about your creditworthiness | | |
| | For our affiliates to market to you | No | We do not share |
| | For nonaffiliates to market to you | No | We do not share |
| | Questions? | | Call (toll free) 1-866-442-2473, Email prospectus@bairdfunds.com or go to www.bairdfunds.com | |
Baird Funds, Inc. Privacy Policy
| | Who we are | | | | |
| | Who is providing | | Baird Funds, Inc. | |
| | this notice? | | | | |
| | What we do | | | | |
| | How does Baird | | To protect your personal information from unauthorized access and | |
| | Funds, Inc. protect my | | use, we use security measures that comply with federal law. These | |
| | personal information? | | measures include computer safeguards and secured files and buildings. | |
| | How does Baird | | We collect your personal information, for example, when you | |
| | Funds, Inc. collect | | • | open an account or give us your contact information | |
| | my personal | | • | make a wire transfer or provide account information | |
| | information? | | • | make deposits or withdrawals from your account | |
| | | | We also collect your personal information from other companies. | |
| | Why can’t I limit | | Federal law gives you the right to limit only | |
| | all sharing? | | • | sharing for affiliates’ everyday business purposes—information about your creditworthiness | |
| | | | • | affiliates from using your information to market to you | |
| | | | • | sharing for nonaffiliates to market to you | |
| | | | State laws and individual companies may give you additional rights to limit sharing. | |
| | Definitions | | | | |
| | Affiliates | | Companies related by common ownership or control. They can be financial and nonfinancial companies. | |
| | | | • | Robert W. Baird & Co Incorporated (the investment adviser and distributor to the Baird Funds) and its affiliates may share information among each other. | |
| | Nonaffiliates | | Companies not related by common ownership or control. They can be financial and nonfinancial companies. | |
| | | | • | Baird Funds, Inc. does not share with nonaffiliates so they can market to you. | |
| | Joint marketing | | A formal agreement between nonaffiliated financial companies that together market financial products or services to you. We do not have any joint marketing partners. | |
| | | | • | Baird Funds, Inc. does not have any joint marketing partners. | |
Baird Funds, Inc.
c/o U.S. Bancorp Fund Services, LLC
P.O. Box 701
Milwaukee, WI 53201-0701
1-866-44BAIRD
Board of Directors
John W. Feldt
Darren R. Jackson
Cory L. Nettles
Marlyn J. Spear (Chair)
Frederick P. Stratton, Jr.
Investment Advisor and Distributor
Robert W. Baird & Co. Incorporated
777 East Wisconsin Avenue
Milwaukee, WI 53202
Administrator and Transfer Agent
U.S. Bancorp Fund Services, LLC
P.O. Box 701
615 East Michigan Street
Milwaukee, WI 53202
Custodian
U.S. Bank, N.A.
1555 N. RiverCenter Drive, Suite 302
Milwaukee, WI 53212
Legal Counsel
Godfrey & Kahn, S.C.
833 East Michigan Street, Suite 1800
Milwaukee, WI 53202
Independent Registered Public
Accounting Firm
Cohen & Company, Ltd.
342 North Water Street, Suite 830
Milwaukee, WI 53202
Item 2. Code of Ethics.
As of the end of the period covered by this report, the Registrant has adopted a code of ethics that applies to the President, Treasurer and Assistant Treasurer of the Registrant. The Registrant has not made any substantive amendments to its code of ethics during the period covered by this report. The Registrant has not granted any waivers from any provisions of the code of ethics during the period covered by this report.
Item 3. Audit Committee Financial Expert.
The Registrant’s board of directors has determined that John W. Feldt, Frederick P. Stratton, Jr., Marlyn J. Spear, and Darren R. Jackson, members of the audit committee, each qualify as an “audit committee financial expert” as such term is defined in paragraph (b) of Item 3 of Form N-CSR. Mr. Feldt, Mr. Stratton, Ms. Spear, and Mr. Jackson are each “independent” as such term is defined in paragraph (a)(2) of Item 3 of Form N‑CSR.
Item 4. Principal Accountant Fees and Services.
Fees billed by Cohen & Company, Ltd. (“Cohen”), the Registrant’s principal accountant, during the last two fiscal years were as follows:
| | FYE 12/31/2018 | FYE 12/31/2017 |
| Audit Fees | $199,000 | $248,021 |
| Audit-Related Fees | | |
Tax Fees All Other Fees | $63,000 | $63,000 |
In the above table, “audit fees” are fees billed for professional services for the audit of the Registrant’s annual financial statements or for services that are normally provided by the accountant in connection with statutory and regulatory filings or engagements. “Tax fees” are fees billed for professional services rendered for tax compliance, tax advice and tax planning, and specifically relate to Cohen’s review of the Registrant’s federal and state tax returns.
The audit committee has adopted pre-approval policies and procedures that require the audit committee to pre‑approve all audit and non‑audit services rendered to the Registrant, as well as all non-audit services provided to the Registrant’s investment adviser and any entity affiliated with the Registrant’s investment adviser with respect to any engagement that relates directly to the operations and financial reporting of the Registrant. In accordance with its policies and procedures, the audit committee pre-approved all audit and tax services provided by Cohen to the Registrant during fiscal 2018. During the past two fiscal years, the Registrant did not receive any non-audit services from Cohen pursuant to any waivers of the pre-approval requirement under paragraph (c)(7)(i)(C) of Rule 2-01 of Regulation S-X. All of Cohen’s hours spent on auditing the Registrant’s financial statements were attributed to work performed by full-time permanent employees of Cohen.
Item 5. Audit Committee of Listed Registrants.
Not applicable because the Registrant is not a “listed issuer” within the meaning of Rule 10A-3 under the Securities Exchange Act of 1934.
Item 6. Investments.
| (a) | The complete Schedules of Investments in securities of unaffiliated issuers as of the close of the reporting period for the Baird MidCap Fund, Baird Small/ Mid Cap Growth Fund, Baird Small/Mid Cap Value Fund, Baird SmallCap Value Fund, Chautauqua International Growth Fund and Chautauqua Global Growth Fund are included as part of the report to shareholders filed under Item 1. The Summary Schedules of Investments in securities of unaffiliated issuers as of the close of the reporting period for the Baird Ultra Short Bond Fund, Baird Short-Term Bond Fund, Baird Intermediate Bond Fund, Baird Aggregate Bond Fund, Baird Core Plus Bond Fund, Baird Short-Term Municipal Bond Fund, Baird Quality Intermediate Municipal Bond Fund and Baird Core Intermediate Municipal Bond Fund are included as part of the report to shareholders filed under Item 1. The complete Schedule of Investments in securities of unaffiliated issuers as of the close of the reporting period for Baird Ultra Short Bond Fund, Baird Short-Term Bond Fund, Baird Intermediate Bond Fund, Baird Aggregate Bond Fund, Baird Core Plus Bond, Baird Short-Term Municipal Bond Fund, Baird Quality Intermediate Municipal Bond Fund and Baird Core Intermediate Municipal Bond Fund are listed below. |
| Baird Ultra Short Bond Fund | | | | | | | | | |
| Schedule of Investments | | | | | | | | | |
| December 31, 2018 | | | | | | | | | |
| | | | | | | | | | |
| | | Principal | | | | | | % of | |
| | | Amount | | | Value | | | Net Assets | |
| LONG-TERM INVESTMENTS | | | | | | | | | |
| U.S. Treasury Securities | | | | | | | | | |
| U.S. Treasury Bonds: | | | | | | | | | |
| 0.875%, 04/15/2019 | | $ | 22,000,000 | | | $ | 21,903,326 | | | | |
| 0.875%, 06/15/2019 | | | 112,000,000 | | | | 111,181,875 | | | | |
| 0.875%, 09/15/2019 | | | 44,000,000 | | | | 43,456,875 | | | | |
| 1.375%, 12/15/2019 | | | 119,000,000 | | | | 117,582,227 | | | | |
| | | | | | | | 294,124,303 | | | | 28.1 | % |
| Other Government Related Securities | | | | | | | | | | | | |
| Industrial Bank of Korea, | | | | | | | | | | | | |
| 3.159%, 08/02/2021 (3 Month LIBOR USD + 0.600%) (1)(2)(3) | | | 4,000,000 | | | | 4,002,136 | | | | | |
| Sinopec Group Overseas Development [2016] Ltd., | | | | | | | | | | | | |
| 2.125%, 05/03/2019 (1)(2) | | | 1,800,000 | | | | 1,793,963 | | | | | |
| | | | | | | | 5,796,099 | | | | 0.6 | % |
| Corporate Bonds | | | | | | | | | | | | |
| Industrials | | | | | | | | | | | | |
| Actavis Funding SCS: | | | | | | | | | | | | |
| 3.000%, 03/12/2020 (1) | | | 3,500,000 | | | | 3,487,162 | | | | | |
| 4.031%, 03/12/2020 (3 Month LIBOR USD + 1.255%) (1)(3) | | | 1,500,000 | | | | 1,504,556 | | | | | |
| Air Liquide Finance SA, | | | | | | | | | | | | |
| 1.375%, 09/27/2019 (1)(2) | | | 5,564,000 | | | | 5,496,448 | | | | | |
| Alimentation Couche-Tard, Inc., | | | | | | | | | | | | |
| 3.279%, 12/13/2019 (3 Month LIBOR USD + 0.500%) (1)(2)(3) | | | 3,500,000 | | | | 3,490,691 | | | | | |
| American Honda Finance Corp., | | | | | | | | | | | | |
| 3.502%, 02/22/2019 (3 Month LIBOR USD + 0.825%) (3) | | | 200,000 | | | | 200,160 | | | | | |
| Amgen, Inc., | | | | | | | | | | | | |
| 1.900%, 05/10/2019 | | | 480,000 | | | | 477,994 | | | | | |
| Anadarko Petroleum Corp.: | | | | | | | | | | | | |
| 8.700%, 03/15/2019 | | | 1,750,000 | | | | 1,768,022 | | | | | |
| 6.950%, 06/15/2019 | | | 4,165,000 | | | | 4,223,089 | | | | | |
| Andeavor Logistics LP / Tesoro Logistics Finance Corp., | | | | | | | | | | | | |
| 5.500%, 10/15/2019 | | | 1,655,000 | | | | 1,668,936 | | | | | |
| Anheuser-Busch InBev Finance, Inc., | | | | | | | | | | | | |
| 2.941%, 02/01/2019 (3 Month LIBOR USD + 0.400%) (3) | | | 1,165,000 | | | | 1,164,827 | | | | | |
| AT&T, Inc.: | | | | | | | | | | | | |
| 5.200%, 03/15/2020 | | | 1,000,000 | | | | 1,021,637 | | | | | |
| 3.956%, 06/12/2024 (3 Month LIBOR USD + 1.180%) (3) | | | 6,000,000 | | | | 5,819,952 | | | | | |
| Bayer US Finance II LLC, | | | | | | | | | | | | |
| 3.452%, 06/25/2021 (3 Month LIBOR USD + 0.630%) (2)(3) | | | 3,000,000 | | | | 2,960,039 | | | | | |
| Becton Dickinson and Co.: | | | | | | | | | | | | |
| 2.133%, 06/06/2019 | | | 1,200,000 | | | | 1,193,010 | | | | | |
| 2.675%, 12/15/2019 | | | 1,500,000 | | | | 1,485,736 | | | | | |
| 3.678%, 12/29/2020 (3 Month LIBOR USD + 0.875%) (3) | | | 3,000,000 | | | | 2,969,848 | | | | | |
| Boardwalk Pipelines LP, | | | | | | | | | | | | |
| 5.750%, 09/15/2019 | | | 6,450,000 | | | | 6,525,894 | | | | | |
| Boston Scientific Corp., | | | | | | | | | | | | |
| 6.000%, 01/15/2020 | | | 5,025,000 | | | | 5,151,953 | | | | | |
| Broadcom Corp. / Broadcom Cayman Finance Ltd., | | | | | | | | | | | | |
| 2.375%, 01/15/2020 | | | 4,500,000 | | | | 4,443,800 | | | | | |
| Buckeye Partners LP, | | | | | | | | | | | | |
| 5.500%, 08/15/2019 | | | 3,890,000 | | | | 3,931,539 | | | | | |
| Campbell Soup Co., | | | | | | | | | | | | |
| 3.418%, 03/15/2021 (3 Month LIBOR USD + 0.630%) (3) | | | 4,275,000 | | | | 4,192,152 | | | | | |
| Canadian Pacific Railway Co., | | | | | | | | | | | | |
| 7.250%, 05/15/2019 (1) | | | 4,775,000 | | | | 4,842,521 | | | | | |
| Cenovus Energy, Inc., | | | | | | | | | | | | |
| 5.700%, 10/15/2019 (1) | | | 440,385 | | | | 448,268 | | | | | |
| Chevron Phillips Chemical Co. LLC / Chevron Phillips Chemical Co. LP, | | | | | | | | | | | | |
| 3.291%, 05/01/2020 (3 Month LIBOR USD + 0.750%) (2)(3) | | | 1,500,000 | | | | 1,503,039 | | | | | |
| CNH Industrial Capital LLC, | | | | | | | | | | | | |
| 3.375%, 07/15/2019 | | | 1,548,000 | | | | 1,536,390 | | | | | |
| Conagra Brands, Inc., | | | | | | | | | | | | |
| 3.219%, 10/22/2020 (3 Month LIBOR USD + 0.750%) (3) | | | 3,000,000 | | | | 2,991,572 | | | | | |
| Constellation Brands, Inc., | | | | | | | | | | | | |
| 3.875%, 11/15/2019 | | | 700,000 | | | | 702,602 | | | | | |
| CVS Health Corp., | | | | | | | | | | | | |
| 3.487%, 03/09/2021 (3 Month LIBOR USD + 0.720%) (3) | | | 5,485,000 | | | | 5,440,781 | | | | | |
| Daimler Finance North America LLC, | | | | | | | | | | | | |
| 3.127%, 02/22/2021 (3 Month LIBOR USD + 0.450%) (2)(3) | | | 3,500,000 | | | | 3,456,785 | | | | | |
| Danone SA, | | | | | | | | | | | | |
| 1.691%, 10/30/2019 (1)(2) | | | 1,000,000 | | | | 986,242 | | | | | |
| Deutsche Telekom International Finance BV: | | | | | | | | | | | | |
| 1.500%, 09/19/2019 (1)(2) | | | 3,000,000 | | | | 2,959,845 | | | | | |
| 3.029%, 01/17/2020 (3 Month LIBOR USD + 0.580%) (1)(2)(3) | | | 2,000,000 | | | | 2,003,833 | | | | | |
| Diamond 1 Finance Corp. / Diamond 2 Finance Corp., | | | | | | | | | | | | |
| 3.480%, 06/01/2019 (2) | | | 4,900,000 | | | | 4,885,519 | | | | | |
| Dollar Tree, Inc., | | | | | | | | | | | | |
| 3.149%, 04/17/2020 (3 Month LIBOR USD + 0.700%) (3) | | | 5,800,000 | | | | 5,763,007 | | | | | |
| EI du Pont de Nemours & Co., | | | | | | | | | | | | |
| 3.071%, 05/01/2020 (3 Month LIBOR USD + 0.530%) (3) | | | 5,000,000 | | | | 5,002,527 | | | | | |
| Enable Oklahoma Intrastate Transmission LLC, | | | | | | | | | | | | |
| 6.250%, 03/15/2020 (2) | | | 1,700,000 | | | | 1,748,774 | | | | | |
| Encana Corp., | | | | | | | | | | | | |
| 6.500%, 05/15/2019 (1) | | | 2,700,000 | | | | 2,727,757 | | | | | |
| EnLink Midstream Partners LP, | | | | | | | | | | | | |
| 2.700%, 04/01/2019 | | | 3,615,000 | | | | 3,592,408 | | | | | |
| Express Scripts Holding Co., | | | | | | | | | | | | |
| 2.250%, 06/15/2019 | | | 3,500,000 | | | | 3,485,103 | | | | | |
| Florida Gas Transmission Co. LLC, | | | | | | | | | | | | |
| 7.900%, 05/15/2019 (2) | | | 3,000,000 | | | | 3,045,071 | | | | | |
| Ford Motor Credit Co. LLC: | | | | | | | | | | | | |
| 1.897%, 08/12/2019 | | | 1,761,000 | | | | 1,743,674 | | | | | |
| 3.566%, 06/12/2020 (3 Month LIBOR USD + 0.790%) (3) | | | 2,000,000 | | | | 1,971,876 | | | | | |
| Fresenius Medical Care US Finance II, Inc., | | | | | | | | | | | | |
| 5.625%, 07/31/2019 (2) | | | 4,500,000 | | | | 4,551,323 | | | | | |
| General Electric Co., | | | | | | | | | | | | |
| 6.000%, 08/07/2019 | | | 4,000,000 | | | | 4,043,084 | | | | | |
| General Mills, Inc., | | | | | | | | | | | | |
| 2.976%, 04/16/2021 (3 Month LIBOR USD + 0.540%) (3) | | | 3,500,000 | | | | 3,445,708 | | | | | |
| General Motors Co., | | | | | | | | | | | | |
| 3.667%, 09/10/2021 (3 Month LIBOR USD + 0.900%) (3) | | | 1,500,000 | | | | 1,458,418 | | | | | |
| General Motors Financial Co., Inc.: | | | | | | | | | | | | |
| 4.051%, 05/09/2019 (3 Month LIBOR USD + 1.450%) (3) | | | 2,000,000 | | | | 2,002,546 | | | | | |
| 2.350%, 10/04/2019 | | | 2,000,000 | | | | 1,982,576 | | | | | |
| Gilead Sciences, Inc., | | | | | | | | | | | | |
| 1.850%, 09/20/2019 | | | 519,000 | | | | 514,360 | | | | | |
| Glencore Funding LLC: | | | | | | | | | | | | |
| 3.796%, 01/15/2019 (3 Month LIBOR USD + 1.360%) (2)(3) | | | 2,000,000 | | | | 2,000,320 | | | | | |
| 3.125%, 04/29/2019 (2) | | | 2,100,000 | | | | 2,089,168 | | | | | |
| Harley-Davidson Financial Services, Inc., | | | | | | | | | | | | |
| 2.400%, 09/15/2019 (2) | | | 3,500,000 | | | | 3,470,922 | | | | | |
| Harris Corp., | | | | | | | | | | | | |
| 2.700%, 04/27/2020 | | | 4,110,000 | | | | 4,074,998 | | | | | |
| HCA, Inc., | | | | | | | | | | | | |
| 4.250%, 10/15/2019 | | | 3,000,000 | | | | 2,992,500 | | | | | |
| Hewlett Packard Enterprise Co., | | | | | | | | | | | | |
| 2.100%, 10/04/2019 (2) | | | 3,000,000 | | | | 2,966,196 | | | | | |
| Holcim US Finance Sarl & Cie SCS, | | | | | | | | | | | | |
| 6.000%, 12/30/2019 (1)(2) | | | 4,000,000 | | | | 4,096,516 | | | | | |
| HP, Inc., | | | | | | | | | | | | |
| 3.376%, 01/14/2019 (3 Month LIBOR USD + 0.940%) (3) | | | 737,000 | | | | 737,117 | | | | | |
| Hyundai Capital America, Inc.: | | | | | | | | | | | | |
| 3.597%, 04/03/2020 (3 Month LIBOR USD + 0.800%) (2)(3) | | | 3,000,000 | | | | 2,989,072 | | | | | |
| 3.348%, 07/08/2021 (3 Month LIBOR USD + 0.940%) (2)(3) | | | 1,825,000 | | | | 1,819,672 | | | | | |
| Kellogg Co., | | | | | | | | | | | | |
| 4.150%, 11/15/2019 | | | 5,000,000 | | | | 5,037,398 | | | | | |
| Keurig Dr Pepper, Inc., | | | | | | | | | | | | |
| 2.600%, 01/15/2019 | | | 3,500,000 | | | | 3,499,082 | | | | | |
| Keysight Technologies, Inc., | | | | | | | | | | | | |
| 3.300%, 10/30/2019 | | | 4,130,000 | | | | 4,117,488 | | | | | |
| Kinder Morgan Energy Partners LP: | | | | | | | | | | | | |
| 2.650%, 02/01/2019 | | | 3,125,000 | | | | 3,123,330 | | | | | |
| 6.850%, 02/15/2020 | | | 2,000,000 | | | | 2,070,833 | | | | | |
| LyondellBasell Industries NV, | | | | | | | | | | | | |
| 5.000%, 04/15/2019 (1) | | | 4,550,000 | | | | 4,554,951 | | | | | |
| Marriott International, Inc., | | | | | | | | | | | | |
| 3.229%, 12/01/2020 (3 Month LIBOR USD + 0.600%) (3) | | | 4,775,000 | | | | 4,763,514 | | | | | |
| Martin Marietta Materials, Inc., | | | | | | | | | | | | |
| 3.292%, 12/20/2019 (3 Month LIBOR USD + 0.500%) (3) | | | 4,500,000 | | | | 4,487,073 | | | | | |
| Molex Electronic Technologies LLC, | | | | | | | | | | | | |
| 2.878%, 04/15/2020 (2) | | | 1,232,000 | | | | 1,220,108 | | | | | |
| Molson Coors Brewing Co., | | | | | | | | | | | | |
| 1.900%, 03/15/2019 | | | 3,700,000 | | | | 3,689,470 | | | | | |
| Mondelez International Holdings Netherlands BV, | | | | | | | | | | | | |
| 1.625%, 10/28/2019 (1)(2) | | | 2,990,000 | | | | 2,948,365 | | | | | |
| Mondelez International, Inc., | | | | | | | | | | | | |
| 3.061%, 02/01/2019 (3 Month LIBOR USD + 0.520%) (3) | | | 500,000 | | | | 500,007 | | | | | |
| Mylan NV, | | | | | | | | | | | | |
| 2.500%, 06/07/2019 (1) | | | 5,088,000 | | | | 5,064,071 | | | | | |
| NBCUniversal Enterprise, Inc., | | | | | | | | | | | | |
| 1.974%, 04/15/2019 (2) | | | 775,000 | | | | 772,533 | | | | | |
| Newell Brands, Inc., | | | | | | | | | | | | |
| 2.600%, 03/29/2019 | | | 1,332,000 | | | | 1,329,780 | | | | | |
| Nissan Motor Acceptance Corp., | | | | | | | | | | | | |
| 3.420%, 09/21/2021 (3 Month LIBOR USD + 0.630%) (2)(3) | | | 4,800,000 | | | | 4,705,366 | | | | | |
| Orange SA, | | | | | | | | | | | | |
| 1.625%, 11/03/2019 (1) | | | 4,045,000 | | | | 3,994,396 | | | | | |
| Penske Truck Leasing Co. Lp / PTL Finance Corp., | | | | | | | | | | | | |
| 3.050%, 01/09/2020 (2) | | | 5,000,000 | | | | 4,978,671 | | | | | |
| Penske Truck Leasing Co. LP / PTL Finance Corp., | | | | | | | | | | | | |
| 2.500%, 06/15/2019 (2) | | | 470,000 | | | | 467,774 | | | | | |
| Pentair Finance SA, | | | | | | | | | | | | |
| 2.650%, 12/01/2019 (1) | | | 2,339,000 | | | | 2,321,157 | | | | | |
| Phillips 66: | | | | | | | | | | | | |
| 2.646%, 02/15/2020 | | | 1,000,000 | | | | 991,382 | | | | | |
| 3.186%, 04/15/2020 (3 Month LIBOR USD + 0.750%) (2)(3) | | | 3,000,000 | | | | 3,000,517 | | | | | |
| Qualcomm, Inc., | | | | | | | | | | | | |
| 3.195%, 05/20/2020 (3 Month LIBOR USD + 0.550%) (3) | | | 1,500,000 | | | | 1,499,684 | | | | | |
| Roche Holdings, Inc., | | | | | | | | | | | | |
| 2.250%, 09/30/2019 (2) | | | 450,000 | | | | 447,037 | | | | | |
| Shire Acquisitions Investments Ireland DAC, | | | | | | | | | | | | |
| 1.900%, 09/23/2019 (1) | | | 5,000,000 | | | | 4,929,929 | | | | | |
| Siemens Financieringsmaatschappij NV, | | | | | | | | | | | | |
| 1.300%, 09/13/2019 (1)(2) | | | 2,500,000 | | | | 2,469,630 | | | | | |
| Smithfield Foods, Inc., | | | | | | | | | | | | |
| 2.700%, 01/31/2020 (2) | | | 4,600,000 | | | | 4,537,720 | | | | | |
| Spirit AeroSystems, Inc., | | | | | | | | | | | | |
| 3.588%, 06/15/2021 (3 Month LIBOR USD + 0.800%) (3) | | | 4,000,000 | | | | 3,969,575 | | | | | |
| Suntory Holdings Ltd., | | | | | | | | | | | | |
| 2.550%, 09/29/2019 (1)(2) | | | 4,900,000 | | | | 4,867,313 | | | | | |
| Telecom Italia Capital SA, | | | | | | | | | | | | |
| 7.175%, 06/18/2019 (1) | | | 2,623,000 | | | | 2,641,204 | | | | | |
| Telefonica Emisiones SA, | | | | | | | | | | | | |
| 5.877%, 07/15/2019 (1) | | | 1,728,000 | | | | 1,748,703 | | | | | |
| Tencent Holdings Ltd., | | | | | | | | | | | | |
| 3.375%, 05/02/2019 (1)(2) | | | 2,500,000 | | | | 2,502,671 | | | | | |
| Time Warner Cable LLC, | | | | | | | | | | | | |
| 5.000%, 02/01/2020 | | | 1,825,000 | | | | 1,850,595 | | | | | |
| TransCanada PipeLines Ltd., | | | | | | | | | | | | |
| 3.125%, 01/15/2019 (1) | | | 1,000,000 | | | | 999,911 | | | | | |
| TTX Co., | | | | | | | | | | | | |
| 2.250%, 02/01/2019 (2) | | | 3,800,000 | | | | 3,795,826 | | | | | |
| Tyco Electronics Group SA, | | | | | | | | | | | | |
| 3.201%, 06/05/2020 (3 Month LIBOR USD + 0.450%) (1)(3) | | | 5,000,000 | | | | 4,988,562 | | | | | |
| United Technologies Corp., | | | | | | | | | | | | |
| 3.279%, 08/16/2021 (3 Month LIBOR USD + 0.650%) (3) | | | 4,000,000 | | | | 3,984,967 | | | | | |
| Verizon Communications, Inc., | | | | | | | | | | | | |
| 3.716%, 05/15/2025 (3 Month LIBOR USD + 1.100%) (3) | | | 4,000,000 | | | | 3,878,515 | | | | | |
| Volkswagen Group of America Finance LLC, | | | | | | | | | | | | |
| 3.558%, 11/12/2021 (3 Month LIBOR USD + 0.940%) (2)(3) | | | 6,000,000 | | | | 5,941,290 | | | | | |
| Vulcan Materials Co., | | | | | | | | | | | | |
| 3.388%, 03/01/2021 (3 Month LIBOR USD + 0.650%) (3) | | | 5,000,000 | | | | 4,962,468 | | | | | |
| Wabtec Corp., | | | | | | | | | | | | |
| 3.838%, 09/15/2021 (3 Month LIBOR USD + 1.050%) (3) | | | 3,800,000 | | | | 3,800,605 | | | | | |
| Walgreens Boots Alliance, Inc., | | | | | | | | | | | | |
| 2.700%, 11/18/2019 | | | 5,165,000 | | | | 5,135,522 | | | | | |
| Yara International ASA, | | | | | | | | | | | | |
| 7.875%, 06/11/2019 (1)(2) | | | 3,000,000 | | | | 3,056,165 | | | | | |
| | | | | | | | 308,894,693 | | | | 29.7 | % |
| Utilities | | | | | | | | | |
| DTE Gas Co., | | | | | | | | | |
| 5.000%, 10/01/2019 | | | 3,700,000 | | | | 3,754,311 | | | | |
| EDP Finance BV, | | | | | | | | | | | |
| 4.125%, 01/15/2020 (1)(2) | | | 3,625,000 | | | | 3,628,770 | | | | |
| Iberdrola Finance Ireland Ltd., | | | | | | | | | | | |
| 5.000%, 09/11/2019 (1)(2) | | | 3,000,000 | | | | 3,028,363 | | | | |
| Mississippi Power Co., | | | | | | | | | | | |
| 3.472%, 03/27/2020 (3 Month LIBOR USD + 0.650%) (3) | | | 2,000,000 | | | | 1,996,617 | | | | |
| Niagara Mohawk Power Corp., | | | | | | | | | | | |
| 4.881%, 08/15/2019 (2) | | | 4,500,000 | | | | 4,539,858 | | | | |
| Sempra Energy, | | | | | | | | | | | |
| 2.400%, 02/01/2020 | | | 3,615,000 | | | | 3,566,390 | | | | |
| Southern Co. Gas Capital Corp., | | | | | | | | | | | |
| 5.250%, 08/15/2019 | | | 1,000,000 | | | | 1,009,338 | | | | |
| United Utilities PLC, | | | | | | | | | | | |
| 5.375%, 02/01/2019 (1) | | | 3,500,000 | | | | 3,504,856 | | | | |
| | | | | | | | 25,028,503 | | | | 2.4 | % |
| Financials | | | | | | | | | | | | |
| ABN AMRO Bank NV: | | | | | | | | | | | | |
| 3.085%, 01/18/2019 (3 Month LIBOR USD + 0.640%) (1)(2)(3) | | | 4,500,000 | | | | 4,500,513 | | | | | |
| 3.261%, 08/27/2021 (3 Month LIBOR USD + 0.570%) (1)(2)(3) | | | 1,000,000 | | | | 994,270 | | | | | |
| Air Lease Corp., | | | | | | | | | | | | |
| 3.375%, 01/15/2019 | | | 3,009,000 | | | | 3,008,731 | | | | | |
| Australia & New Zealand Banking Group Ltd., | | | | | | | | | | | | |
| 2.250%, 06/13/2019 (1) | | | 3,700,000 | | | | 3,687,427 | | | | | |
| Bank of America Corp.: | | | | | | | | | | | | |
| 3.447%, 10/01/2021 (3 Month LIBOR USD + 0.650%) (3) | | | 1,965,000 | | | | 1,950,559 | | | | | |
| 3.472%, 06/25/2022 (3 Month LIBOR USD + 0.650%) (3) | | | 4,000,000 | | | | 3,949,074 | | | | | |
| Banque Federative du Credit Mutuel SA, | | | | | | | | | | | | |
| 2.000%, 04/12/2019 (1)(2) | | | 3,250,000 | | | | 3,239,316 | | | | | |
| Barclays PLC, | | | | | | | | | | | | |
| 2.750%, 11/08/2019 (1) | | | 4,000,000 | | | | 3,970,896 | | | | | |
| BB&T Corp., | | | | | | | | | | | | |
| 3.201%, 02/01/2019 (3 Month LIBOR USD + 0.660%) (3) | | | 880,000 | | | | 880,000 | | | | | |
| BPCE SA, | | | | | | | | | | | | |
| 2.500%, 07/15/2019 (1) | | | 4,000,000 | | | | 3,984,644 | | | | | |
| Capital One Financial Corp.: | | | | | | | | | | | | |
| 2.450%, 04/24/2019 | | | 1,476,000 | | | | 1,473,623 | | | | | |
| 3.378%, 05/12/2020 (3 Month LIBOR USD + 0.760%) (3) | | | 1,700,000 | | | | 1,700,000 | | | | | |
| Capital One NA, | | | | | | | | | | | | |
| 1.850%, 09/13/2019 | | | 750,000 | | | | 741,789 | | | | | |
| Cigna Corp., | | | | | | | | | | | | |
| 3.438%, 09/17/2021 (3 Month LIBOR USD + 0.650%) (2)(3) | | | 2,000,000 | | | | 1,971,750 | | | | | |
| Citibank NA, | | | | | | | | | | | | |
| 1.850%, 09/18/2019 | | | 3,000,000 | | | | 2,975,000 | | | | | |
| Citigroup, Inc., | | | | | | | | | | | | |
| 2.050%, 06/07/2019 | | | 1,000,000 | | | | 995,785 | | | | | |
| Citizens Bank NA, | | | | | | | | | | | | |
| 3.278%, 03/02/2020 (3 Month LIBOR USD + 0.540%) (3) | | | 2,000,000 | | | | 1,997,055 | | | | | |
| Compass Bank, | | | | | | | | | | | | |
| 3.501%, 06/11/2021 (3 Month LIBOR USD + 0.730%) (3) | | | 4,750,000 | | | | 4,675,778 | | | | | |
| Cooperatieve Rabobank UA, | | | | | | | | | | | | |
| 2.250%, 01/14/2019 (1) | | | 3,500,000 | | | | 3,498,869 | | | | | |
| Credit Agricole CIB, | | | | | | | | | | | | |
| 3.422%, 10/03/2021 (3 Month LIBOR USD + 0.625%) (1)(3) | | | 4,000,000 | | | | 3,970,387 | | | | | |
| Credit Agricole SA, | | | | | | | | | | | | |
| 3.737%, 06/10/2020 (3 Month LIBOR USD + 0.970%) (1)(2)(3) | | | 1,000,000 | | | | 1,005,130 | | | | | |
| Credit Suisse AG, | | | | | | | | | | | | |
| 2.300%, 05/28/2019 (1) | | | 3,450,000 | | | | 3,439,788 | | | | | |
| 5.400%, 01/14/2020 (1) | | | 2,000,000 | | | | 2,030,936 | | | | | |
| Deutsche Bank AG: | | | | | | | | | | | | |
| 3.895%, 01/18/2019 (3 Month LIBOR USD + 1.450%) (1)(3) | | | 1,000,000 | | | | 999,539 | | | | | |
| 2.850%, 05/10/2019 (1) | | | 3,064,000 | | | | 3,045,583 | | | | | |
| Discover Bank, | | | | | | | | | | | | |
| 7.000%, 04/15/2020 | | | 1,000,000 | | | | 1,041,091 | | | | | |
| Fifth Third Bank, | | | | | | | | | | | | |
| 2.300%, 03/15/2019 | | | 1,380,000 | | | | 1,378,273 | | | | | |
| First Tennessee Bank NA, | | | | | | | | | | | | |
| 2.950%, 12/01/2019 | | | 5,250,000 | | | | 5,209,305 | | | | | |
| FMR LLC, | | | | | | | | | | | | |
| 7.490%, 06/15/2019 (2) | | | 2,500,000 | | | | 2,546,904 | | | | | |
| The Goldman Sachs Group, Inc.: | | | | | | | | | | | | |
| 2.550%, 10/23/2019 | | | 2,455,000 | | | | 2,439,492 | | | | | |
| 4.459%, 02/25/2021 (3 Month LIBOR USD + 1.770%) (3) | | | 2,285,000 | | | | 2,320,316 | | | | | |
| HSBC Holdings PLC: | | | | | | | | | | | | |
| 3.240%, 05/18/2021 (3 Month LIBOR USD + 0.600%) (1)(3) | | | 3,000,000 | | | | 2,955,481 | | | | | |
| 3.426%, 09/11/2021 (3 Month LIBOR USD + 0.650%) (1)(3) | | | 2,000,000 | | | | 1,973,557 | | | | | |
| HSBC USA, Inc., | | | | | | | | | | | | |
| 3.228%, 11/13/2019 (3 Month LIBOR USD + 0.610%) (3) | | | 250,000 | | | | 250,231 | | | | | |
| ING Bank NV, | | | | | | | | | | | | |
| 3.954%, 03/22/2019 (3 Month LIBOR USD + 1.130%) (1)(2)(3) | | | 800,000 | | | | 801,385 | | | | | |
| International Lease Finance Corp., | | | | | | | | | | | | |
| 6.250%, 05/15/2019 | | | 2,025,000 | | | | 2,042,913 | | | | | |
| JPMorgan Chase & Co.: | | | | | | | | | | | | |
| 3.139%, 01/28/2019 (3 Month LIBOR USD + 0.630%) (3) | | | 250,000 | | | | 250,040 | | | | | |
| 6.300%, 04/23/2019 | | | 1,000,000 | | | | 1,009,776 | | | | | |
| 3.432%, 01/23/2020 (3 Month LIBOR USD + 0.955%) (3) | | | 1,000,000 | | | | 1,003,778 | | | | | |
| 3.411%, 06/18/2022 (3 Month LIBOR USD + 0.610%) (3) | | | 3,000,000 | | | | 2,967,029 | | | | | |
| KEB Hana Bank, | | | | | | | | | | | | |
| 3.133%, 04/05/2020 (3 Month LIBOR USD + 0.725%) (1)(2)(3) | | | 3,000,000 | | | | 3,000,930 | | | | | |
| LeasePlan Corp. NV, | | | | | | | | | | | | |
| 2.875%, 01/22/2019 (1)(2) | | | 1,800,000 | | | | 1,799,329 | | | | | |
| Lloyds Bank Plc, | | | | | | | | | | | | |
| 3.079%, 05/07/2021 (3 Month LIBOR USD + 0.490%) (1)(3) | | | 3,665,000 | | | | 3,628,054 | | | | | |
| Macquarie Group Ltd., | | | | | | | | | | | | |
| 7.625%, 08/13/2019 (1)(2) | | | 3,725,000 | | | | 3,821,435 | | | | | |
| Mitsubishi UFJ Trust & Banking Corp., | | | | | | | | | | | | |
| 2.450%, 10/16/2019 (1)(2) | | | 2,984,000 | | | | 2,966,988 | | | | | |
| Mizuho Financial Group, Inc., | | | | | | | | | | | | |
| 3.905%, 04/12/2021 (3 Month LIBOR USD + 1.480%) (1)(2)(3) | | | 1,500,000 | | | | 1,517,658 | | | | | |
| Morgan Stanley: | | | | | | | | | | | | |
| 3.337%, 01/24/2019 (3 Month LIBOR USD + 0.850%) (3) | | | 250,000 | | | | 250,068 | | | | | |
| 5.500%, 01/26/2020 | | | 7,500,000 | | | | 7,670,389 | | | | | |
| 3.649%, 01/27/2020 (3 Month LIBOR USD + 1.140%) (3) | | | 500,000 | | | | 502,054 | | | | | |
| MUFG Union Bank NA, | | | | | | | | | | | | |
| 2.250%, 05/06/2019 | | | 700,000 | | | | 697,762 | | | | | |
| National Bank of Canada, | | | | | | | | | | | | |
| 3.336%, 06/12/2020 (3 Month LIBOR USD + 0.560%) (1)(3) | | | 4,000,000 | | | | 4,000,877 | | | | | |
| Nationwide Building Society, | | | | | | | | | | | | |
| 2.350%, 01/21/2020 (1)(2) | | | 3,500,000 | | | | 3,464,986 | | | | | |
| Nomura Holdings, Inc., | | | | | | | | | | | | |
| 2.750%, 03/19/2019 (1) | | | 2,210,000 | | | | 2,208,106 | | | | | |
| Nordea Bank Abp: | | | | | | | | | | | | |
| 2.375%, 04/04/2019 (1)(2) | | | 2,700,000 | | | | 2,695,967 | | | | | |
| 1.625%, 09/30/2019 (1)(2) | | | 1,005,000 | | | | 993,900 | | | | | |
| 3.423%, 09/30/2019 (3 Month LIBOR USD + 0.620%) (1)(2)(3) | | | 1,500,000 | | | | 1,503,031 | | | | | |
| PNC Bank NA, | | | | | | | | | | | | |
| 2.200%, 01/28/2019 | | | 2,240,000 | | | | 2,238,862 | | | | | |
| Regions Bank, | | | | | | | | | | | | |
| 3.118%, 08/13/2021 (3 Month LIBOR USD + 0.500%) (3) | | | 3,500,000 | | | | 3,437,070 | | | | | |
| Royal Bank of Scotland Group PLC, | | | | | | | | | | | | |
| 6.400%, 10/21/2019 (1) | | | 670,000 | | | | 683,995 | | | | | |
| Santander Holdings USA, Inc., | | | | | | | | | | | | |
| 2.650%, 04/17/2020 | | | 3,225,000 | | | | 3,183,273 | | | | | |
| Santander UK PLC, | | | | | | | | | | | | |
| 3.276%, 11/15/2021 (3 Month LIBOR USD + 0.660%) (1)(3) | | | 2,750,000 | | | | 2,724,482 | | | | | |
| Standard Chartered PLC: | | | | | | | | | | | | |
| 2.100%, 08/19/2019 (1)(2) | | | 450,000 | | | | 446,048 | | | | | |
| 3.558%, 01/20/2023 (3 Month LIBOR USD + 1.150%) (1)(2)(3) | | | 3,000,000 | | | | 2,974,350 | | | | | |
| Sumitomo Mitsui Banking Corp.: | | | | | | | | | | | | |
| 2.514%, 01/17/2020 (1) | | | 4,500,000 | | | | 4,466,887 | | | | | |
| 2.799%, 01/17/2020 (3 Month LIBOR USD + 0.350%) (1)(3) | | | 1,250,000 | | | | 1,248,901 | | | | | |
| Sumitomo Mitsui Trust Bank Ltd, | | | | | | | | | | | | |
| 3.249%, 03/06/2019 (3 Month LIBOR USD + 0.510%) (1)(2)(3) | | | 2,000,000 | | | | 2,000,529 | | | | | |
| Svenska Handelsbanken AB: | | | | | | | | | | | | |
| 3.278%, 06/17/2019 (3 Month LIBOR USD + 0.490%) (1)(3) | | | 850,000 | | | | 850,803 | | | | | |
| 3.159%, 05/24/2021 (3 Month LIBOR USD + 0.470%) (1)(3) | | | 3,725,000 | | | | 3,691,282 | | | | | |
| Synchrony Financial: | | | | | | | | | | | | |
| 2.600%, 01/15/2019 | | | 2,400,000 | | | | 2,399,182 | | | | | |
| 3.812%, 02/03/2020 (3 Month LIBOR USD + 1.230%) (3) | | | 1,000,000 | | | | 999,244 | | | | | |
| Toronto-Dominion Bank, | | | | | | | | | | | | |
| 1.900%, 10/24/2019 (1) | | | 6,000,000 | | | | 5,948,405 | | | | | |
| UBS Group Funding Switzerland AG: | | | | | | | | | | | | |
| 4.264%, 09/24/2020 (3 Month LIBOR USD + 1.440%) (1)(2)(3) | | | 500,000 | | | | 506,631 | | | | | |
| 4.071%, 02/01/2022 (3 Month LIBOR USD + 1.530%) (1)(2)(3) | | | 2,450,000 | | | | 2,473,843 | | | | | |
| WEA Finance LLC / Westfield UK & Europe Finance PLC, | | | | | | | | | | | | |
| 2.700%, 09/17/2019 (2) | | | 2,000,000 | | | | 1,991,144 | | | | | |
| Wells Fargo & Co., | | | | | | | | | | | | |
| 3.200%, 01/30/2020 (3 Month LIBOR USD + 0.680%) (3) | | | 1,000,000 | | | | 1,001,995 | | | | | |
| | | | | | | | 176,864,473 | | | | 16.8 | % |
| Total Corporate Bonds | | | | | | | 510,787,669 | | | | 48.9 | % |
| | | | | | | | | | | | | |
| Municipal Bonds | | | | | | | | | | | | |
| Public Finance Authority, | | | | | | | | | | | | |
| 2.875%, 06/01/2019 (Callable 1/22/2019) | | | 1,000,000 | | | | 997,670 | | | | | |
| | | | | | | | 997,670 | | | | 0.1 | % |
| Residential Mortgage-Backed Securities | | | | | | | | | | | | |
| U.S. Government Agency Issues | | | | | | | | | | | | |
| Federal National Mortgage Association (FNMA): | | | | | | | | | | | | |
| 5.000%, 12/01/2019 | | | 11,450 | | | | 11,649 | | | | | |
| 4.500%, 04/01/2020 | | | 85 | | | | 86 | | | | | |
| 5.000%, 04/01/2020 | | | 25,008 | | | | 25,463 | | | | | |
| | | | | | | | 37,198 | | | | 0.0 | % |
| Non-U.S. Government Agency Issues | | | | | | | | | | | | |
| Aames Mortgage Investment Trust, | | | | | | | | | | | | |
| Series 2006-1, Class A3, 2.826%, 04/25/2036 (1 Month LIBOR USD + 0.320%) (3) | | | 220,625 | | | | 220,583 | | | | | |
| Accredited Mortgage Loan Trust, | | | | | | | | | | | | |
| Series 2005-4, Class A2D, 2.826%, 12/25/2035 (1 Month LIBOR USD + 0.320%) (3) | | | 321,142 | | | | 319,417 | | | | | |
| Aegis Asset Backed Securities Trust, | | | | | | | | | | | | |
| Series 2005-4, Class M1, 2.956%, 10/25/2035 (1 Month LIBOR USD + 0.450%) (3) | | | 2,706,698 | | | | 2,709,061 | | | | | |
| Carrington Mortgage Loan Trust: | | | | | | | | | | | | |
| Series 2005-NC1, Class M2, 3.286%, 02/25/2035 (1 Month LIBOR USD + 0.780%) (3) | | | 1,721,671 | | | | 1,720,289 | | | | | |
| Series 2006-NC1, Class A3, 2.716%, 01/25/2036 (1 Month LIBOR USD + 0.210%) (3) | | | 242,448 | | | | 242,347 | | | | | |
| Series 2007-HE1, Class A2, 2.656%, 06/25/2037 (1 Month LIBOR USD + 0.150%) (3) | | | 1,095,086 | | | | 1,085,715 | | | | | |
| Citigroup Mortgage Loan Trust, Inc.: | | | | | | | | | | | | |
| Series 2007-WFH2, Class A4, 2.856%, 03/25/2037 (1 Month LIBOR USD + 0.350%) (3) | | | 1,063,335 | | | | 1,061,199 | | | | | |
| Series 2007-AMC4, Class A2C, 2.676%, 05/25/2037 (1 Month LIBOR USD + 0.170%) (3) | | | 511,860 | | | | 507,836 | | | | | |
| Countrywide Asset-Backed Certificates, | | | | | | | | | | | | |
| Series 2006-BC4, Class 2A2, 2.666%, 11/25/2036 (1 Month LIBOR USD + 0.160%) (3) | | | 434,589 | | | | 434,136 | | | | | |
| CWABS Asset-Backed Certificates Trust, | | | | | | | | | | | | |
| Series 2006-14, Class 2A2, 2.656%, 02/25/2037 (1 Month LIBOR USD + 0.150%) (3) | | | 683,239 | | | | 681,226 | | | | | |
| First Franklin Mortgage Loan Trust, | | | | | | | | | | | | |
| Series 2006-FF4, Class A2, 2.695%, 03/25/2036 (1 Month LIBOR USD + 0.190%) (3) | | | 1,683,668 | | | | 1,679,991 | | | | | |
| GSAMP Trust: | | | | | | | | | | | | |
| Series 2005-WMC2, Class A2C, 3.206%, 11/25/2035 (1 Month LIBOR USD + 0.700%) (3) | | | 891,821 | | | | 891,592 | | | | | |
| Series 2006-HE4, Class A2C, 2.656%, 06/25/2036 (1 Month LIBOR USD + 0.150%) (3) | | | 1,848,915 | | | | 1,830,750 | | | | | |
| Home Equity Asset Trust: | | | | | | | | | | | | |
| Series 2006-2, Class 2A4, 2.816%, 05/25/2036 (1 Month LIBOR USD + 0.310%) (2)(3) | | | 2,158,806 | | | | 2,158,118 | | | | | |
| Series 2006-3, Class 1A1, 2.706%, 07/25/2036 (1 Month LIBOR USD + 0.200%) (3) | | | 1,027,412 | | | | 1,024,589 | | | | | |
| Series 2007-2, Class 2A2, 2.691%, 07/25/2037 (1 Month LIBOR USD + 0.185%) (3) | | | 985,969 | | | | 984,161 | | | | | |
| HSI Asset Securitization Corp. Trust, | | | | | | | | | | | | |
| Series 2007-WF1, Class 2A3, 2.676%, 05/25/2037 (1 Month LIBOR USD + 0.170%) (3) | | | 31,708 | | | | 31,699 | | | | | |
| JP Morgan Mortgage Acquisition Trust, | | | | | | | | | | | | |
| Series 2007-CH5, Class A4, 2.666%, 06/25/2036 (1 Month LIBOR USD + 0.160%) (3) | | | 143,339 | | | | 142,986 | | | | | |
| MASTR Alternative Loan Trust, | | | | | | | | | | | | |
| Series 2004-13, Class 8A1, 5.500%, 01/25/2025 | | | 39,789 | | | | 39,879 | | | | | |
| Park Place Securities, Inc., | | | | | | | | | | | | |
| Series 2005-WCW1, Class M1, 2.956%, 09/25/2035 (1 Month LIBOR USD + 0.450%) (3) | | | 36,581 | | | | 36,589 | | | | | |
| RAMP Series Trust, | | | | | | | | | | | | |
| Series 2007-RZ1, Class A2, 2.666%, 02/25/2037 (1 Month LIBOR USD + 0.160%) (3) | | | 2,098,570 | | | | 2,082,096 | | | | | |
| RASC Series Trust, | | | | | | | | | | | | |
| Series 2005-KS11, Class M1, 2.906%, 12/25/2035 (1 Month LIBOR USD + 0.400%) (3) | | | 3,861,402 | | | | 3,866,296 | | | | | |
| Soundview Home Loan Trust, | | | | | | | | | | | | |
| Series 2006-OPT2, Class A3, 2.686%, 05/25/2036 (1 Month LIBOR USD + 0.180%) (3) | | | 1,498,315 | | | | 1,492,806 | | | | | |
| Towd Point Mortgage Trust, | | | | | | | | | | | | |
| Series 2017-5, Class A1, 2.915%, 02/25/2057 (1 Month LIBOR USD + 0.600%) (2)(3) | | | 1,304,815 | | | | 1,297,691 | | | | | |
| | | | | | | | 26,541,052 | | | | 2.5 | % |
| Total Residential Mortgage-Backed Securities | | | | | | | 26,578,250 | | | | 2.5 | % |
| | | | | | | | | | | | | |
| Commercial Mortgage-Backed Securities | | | | | | | | | | | | |
| U.S. Government Agency Issues | | | | | | | | | | | | |
| Freddie Mac Multifamily Structured Pass Through Certificates: | | | | | | | | | | | | |
| Series K008, Class A1, 2.746%, 12/25/2019 | | | 319,696 | | | | 318,981 | | | | | |
| Series K009, Class A1, 2.757%, 05/25/2020 | | | 168,854 | | | | 168,496 | | | | | |
| | | | | | | | 487,477 | | | | 0.0 | % |
| Non-U.S. Government Agency Issues | | | | | | | | | | | | |
| COMM Mortgage Trust, | | | | | | | | | | | | |
| Series 2012-CR2, Class ASB, 2.752%, 08/15/2045 | | | 3,492,808 | | | | 3,465,793 | | | | | |
| | | | | | | | 3,465,793 | | | | 0.3 | % |
| Total Commercial Mortgage-Backed Securities | | | | | | | 3,953,270 | | | | 0.3 | % |
| | | | | | | | | | | | | |
| Other Asset Backed Securities | | | | | | | | | | | | |
| Ally Auto Receivables Trust, | | | | | | | | | | | | |
| Series 2018-2, Class A2, 2.640%, 02/16/2021 | | | 1,832,278 | | | | 1,829,416 | | | | | |
| American Express Credit Account Master Trust: | | | | | | | | | | | | |
| Series 2017-4, Class A, 1.640%, 12/15/2021 | | | 2,575,000 | | | | 2,562,974 | | | | | |
| Series 2017-1, Class A, 1.930%, 09/15/2022 | | | 1,245,000 | | | | 1,230,275 | | | | | |
| Barclays Dryrock Issuance Trust, | | | | | | | | | | | | |
| Series 2014-3, Class A, 2.410%, 07/15/2022 | | | 6,870,000 | | | | 6,839,279 | | | | | |
| BMW Vehicle Lease Trust, | | | | | | | | | | | | |
| Series 2016-2, Class A4, 1.570%, 02/20/2020 | | | 2,450,000 | | | | 2,440,875 | | | | | |
| Capital Auto Receivables Asset Trust, | | | | | | | | | | | | |
| Series 2016-3, Class A3, 1.540%, 08/20/2020 | | | 662,290 | | | | 660,774 | | | | | |
| Capital One Multi-Asset Execution Trust, | | | | | | | | | | | | |
| Series 2016-A3, Class A3, 1.340%, 04/15/2022 | | | 5,700,000 | | | | 5,656,117 | | | | | |
| CarMax Auto Owner Trust: | | | | | | | | | | | | |
| Series 2015-2, 1.800%, 03/15/2021 | | | 4,327,930 | | | | 4,307,881 | | | | | |
| Series 2016-3, Class A3, 1.390%, 05/17/2021 | | | 1,455,729 | | | | 1,442,851 | | | | | |
| Series 2016-4, Class A3, 1.400%, 08/15/2021 | | | 2,704,541 | | | | 2,673,136 | | | | | |
| Chase Issuance Trust: | | | | | | | | | | | | |
| Series 2016-A2, Class A, 1.370%, 06/15/2021 | | | 4,025,000 | | | | 3,994,733 | | | | | |
| Series 2016-A5, Class A5, 1.270%, 07/15/2021 | | | 4,070,000 | | | | 4,034,324 | | | | | |
| Chesapeake Funding II LLC, | | | | | | | | | | | | |
| Series 2016-2A, Class A1, 1.880%, 06/15/2028 (2) | | | 3,083,260 | | | | 3,069,844 | | | | | |
| Citibank Credit Card Issuance Trust: | | | | | | | | | | | | |
| Series 2014-A6, Class A6, 2.150%, 07/15/2021 | | | 3,600,000 | | | | 3,585,176 | | | | | |
| Series 2017-A9, Class A9, 1.800%, 09/20/2021 | | | 4,700,000 | | | | 4,662,096 | | | | | |
| Conseco Financial Corp., | | | | | | | | | | | | |
| Series 1998-4, Class A6, 6.530%, 04/01/2030 (4) | | | 297,145 | | | | 309,529 | | | | | |
| Dell Equipment Finance Trust: | | | | | | | | | | | | |
| Series 2017-2, Class A2A, 1.970%, 02/24/2020 (2) | | | 1,098,225 | | | | 1,094,518 | | | | | |
| Series 2018-1, Class A2A, 2.970%, 10/22/2020 (2) | | | 1,500,000 | | | | 1,499,368 | | | | | |
| Discover Card Execution Note Trust: | | | | | | | | | | | | |
| Series 2014-A4, Class A4, 2.120%, 12/15/2021 | | | 5,200,000 | | | | 5,180,615 | | | | | |
| Series 2016-A4, Class A4, 1.390%, 03/15/2022 | | | 460,000 | | | | 454,925 | | | | | |
| First National Master Note Trust, | | | | | | | | | | | | |
| Series 2017-1, Class A, 2.855%, 04/18/2022 (1 Month LIBOR USD + 0.400%) (3) | | | 4,150,000 | | | | 4,149,999 | | | | | |
| Ford Credit Auto Lease Trust, | | | | | | | | | | | | |
| Series 2017-A, Class A3, 1.880%, 04/15/2020 | | | 2,007,702 | | | | 2,002,727 | | | | | |
| Ford Credit Auto Owner Trust: | | | | | | | | | | | | |
| Series 2015-A, Class A4, 1.640%, 06/15/2020 | | | 336,409 | | | | 336,050 | | | | | |
| Series 2016-A, Class A4, 1.600%, 06/15/2021 | | | 2,540,000 | | | | 2,516,632 | | | | | |
| Series 2014-1, Class A, 2.260%, 11/15/2025 (2) | | | 3,765,000 | | | | 3,753,419 | | | | | |
| Series 2014-2, Class A, 2.310%, 04/15/2026 (2) | | | 925,000 | | | | 918,510 | | | | | |
| Series 2015-2, Class A, 2.440%, 01/15/2027 (2) | | | 2,905,000 | | | | 2,880,589 | | | | | |
| Ford Credit Floorplan Master Owner Trust, | | | | | | | | | | | | |
| Series 2016-3, Class A1, 1.550%, 07/15/2021 | | | 4,545,000 | | | | 4,509,797 | | | | | |
| GM Financial Automobile Leasing Trust: | | | | | | | | | | | | |
| Series 2017-1A, Class A2A, 1.510%, 03/16/2020 (2) | | | 175,262 | | | | 175,143 | | | | | |
| Series 2017-2, Class A3, 2.020%, 09/21/2020 | | | 3,773,000 | | | | 3,744,172 | | | | | |
| Series 2018-1, Class A3, 2.610%, 01/20/2021 | | | 4,275,000 | | | | 4,254,543 | | | | | |
| Honda Auto Receivables Owner Trust, | | | | | | | | | | | | |
| Series 2016-1, Class A3, 1.220%, 12/18/2019 | | | 125,229 | | | | 124,943 | | | | | |
| Hyundai Auto Lease Securitization Trust, | | | | | | | | | | | | |
| Series 2017-B, Class A3, 1.970%, 07/15/2020 (2) | | | 5,350,000 | | | | 5,320,947 | | | | | |
| Master Credit Card Trust II, | | | | | | | | | | | | |
| Series 2017-1A, Class A, 2.260%, 07/21/2021 (1)(2) | | | 5,550,000 | | | | 5,501,599 | | | | | |
| MMAF Equipment Finance LLC, | | | | | | | | | | | | |
| Series 2014-AA, Class A4, 1.590%, 02/08/2022 (2) | | | 1,415,237 | | | | 1,404,347 | | | | | |
| Nissan Auto Lease Trust: | | | | | | | | | | | | |
| Series 2017-A, Class A2A, 1.640%, 09/16/2019 | | | 845,448 | | | | 844,339 | | | | | |
| Series 2017-B, Class A2A, 1.830%, 12/16/2019 | | | 1,357,388 | | | | 1,352,629 | | | | | |
| Nissan Auto Receivables Owner Trust: | | | | | | | | | | | | |
| Series 2015-C, Class A3, 1.370%, 05/15/2020 | | | 614,423 | | | | 612,468 | | | | | |
| Series 2017-B, Class A2A, 1.560%, 05/15/2020 | | | 1,144,528 | | | | 1,141,160 | | | | | |
| Series 2016-C, Class A3, 1.180%, 01/15/2021 | | | 3,651,859 | | | | 3,617,594 | | | | | |
| PFS Financing Corp.: | | | | | | | | | | | | |
| Series 2017-A, 3.035%, 03/15/2021 (2) | | | 3,770,000 | | | | 3,769,633 | | | | | |
| Series 2016-BA, Class A, 1.870%, 10/15/2021 (2) | | | 3,312,000 | | | | 3,278,764 | | | | | |
| Santander Retail Auto Lease Trust, | | | | | | | | | | | | |
| Series 2017-A, Class A2A, 2.020%, 03/20/2020 (2) | | | 2,378,946 | | | | 2,370,170 | | | | | |
| SoFi Consumer Loan Program LLC, | | | | | | | | | | | | |
| Series 2016-2, Class A, 3.090%, 10/27/2025 (2) | | | 675,300 | | | | 673,879 | | | | | |
| SoFi Consumer Loan Program Trust, | | | | | | | | | | | | |
| Series 2018-2, Class A1, 2.930%, 04/26/2027 (2) | | | 2,249,366 | | | | 2,243,664 | | | | | |
| Series 2018-4, Class A, 3.540%, 11/26/2027 (2) | | | 2,472,607 | | | | 2,475,249 | | | | | |
| Springleaf Funding Trust, | | | | | | | | | | | | |
| Series 2015-AA, Class A, 3.160%, 11/15/2024 (2) | | | 408,283 | | | | 407,719 | | | | | |
| Synchrony Credit Card Master Note Trust: | | | | | | | | | | | | |
| Series 2016-1, Class A, 2.040%, 03/15/2022 | | | 2,700,000 | | | | 2,694,519 | | | | | |
| Series 2016-3, Class A, 1.580%, 09/15/2022 | | | 6,370,000 | | | | 6,307,286 | | | | | |
| Tesla Auto Lease Trust: | | | | | | | | | | | | |
| Series 2018-A, Class A, 2.320%, 12/20/2019 (2) | | | 1,335,694 | | | | 1,332,021 | | | | | |
| Series 2018-B, Class A, 3.710%, 08/20/2021 (2) | | | 3,050,000 | | | | 3,057,293 | | | | | |
| Toyota Auto Receivables Owner Trust: | | | | | | | | | | | | |
| Series 2017-C, Class A2A, 1.580%, 07/15/2020 | | | 1,081,418 | | | | 1,077,073 | | | | | |
| Series 2017-B, Class A3, 1.760%, 07/15/2021 | | | 4,000,000 | | | | 3,963,099 | | | | | |
| Verizon Owner Trust: | | | | | | | | | | | | |
| Series 2016-1A, Class A, 1.420%, 01/20/2021 (2) | | | 2,547,237 | | | | 2,534,768 | | | | | |
| Series 2016-2A, Class A, 1.680%, 05/20/2021 (2) | | | 3,204,872 | | | | 3,186,580 | | | | | |
| World Financial Network Credit Card Master Trust: | | | | | | | | | | | | |
| Series 2012-A, Class A, 3.140%, 01/17/2023 | | | 5,320,000 | | | | 5,319,432 | | | | | |
| Series 2017-B, Class A, 1.980%, 06/15/2023 | | | 8,688,000 | | | | 8,629,153 | | | | | |
| | | | | | | | 160,010,615 | | | | 15.2 | % |
| Total Long-Term Investments (Cost $1,004,421,128) | | | | | | | 1,002,247,876 | | | | 95.7 | % |
| | | | | | | | | | | | | |
| SHORT-TERM INVESTMENT | | Shares | | | | | | | | | |
| Money Market Mutual Fund | | | | | | | | | | | | |
| Fidelity Institutional Money Market Fund - Government Portfolio, Institutional Class, 2.29% (5) | | | 39,534,338 | | | | 39,534,338 | | | | | |
| Total Short-Term Investment (Cost $39,534,338) | | | | | | | 39,534,338 | | | | 3.8 | % |
| Total Investments (Cost $1,043,955,466) | | | | | | | 1,041,782,214 | | | | 99.5 | % |
| Other Assets in Excess of Liabilities | | | | | | | 5,262,004 | | | | 0.5 | % |
| TOTAL NET ASSETS | | | | | | $ | 1,047,044,218 | | | | 100.0 | % |
Notes to Schedule of Investments | | | | | | |
| (1) | | Foreign security. | | | | | | |
| (2) | | Security issued under Rule 144A under the Securities Act of 1933 and determined to be liquid. Purchased in a private placement transaction; resale to the public may require registration or may extend only to qualified institutional buyers. At December 31, 2018, the value of these securities total $220,834,421, which represents 21.09% of total net assets. |
| (3) | | Variable rate security based on a reference index and spread. The rate reported is the rate in effect as of December 31, 2018. | | |
| (4) | | Variable rate security. The coupon is based on an underlying pool of loans. The rate reported is the rate in effect as of December 31, 2018. |
| (5) | | Seven-day yield. | | | | | | |
| Baird Ultra Short Bond Fund | | | | | | | | |
| Schedule of Investments, December 31, 2018 | | | | | | | |
| Summary of Fair Value Exposure at December 31, 2018 | | | | | | |
| | | | | | | | | |
| The Fund has adopted authoritative fair valuation accounting standards which establish a definition of fair value and set out a hierarchy for measuring fair value. These standards require additional disclosures about the various inputs and valuation techniques used to develop the measurements of fair value and a discussion on changes in valuation techniques and related inputs during the period. These standards define fair value as the price that would be received to sell an asset or paid to transfer a liability in an orderly transaction between market participants at the measurement date. |
| | | | | | | | | |
| The fair value hierarchy is organized into three levels based upon the assumptions (referred to as "inputs") used in pricing the asset or liability. These standards state that "observable inputs" reflect the assumptions market participants would use in pricing the asset or liability based on market data obtained from independent sources and "unobservable inputs" reflect an entity's own assumptions about the assumptions market participants would use in pricing the asset or liability. These inputs are summarized into three broad levels and described below: |
| | Level 1 - | Unadjusted quoted prices in active markets for identical unrestricted securities. | |
| | Level 2 - | Other significant observable inputs (including quoted prices for similar securities, quoted prices in inactive markets, dealer indications, interest rates, yield curves, prepayment speeds, credit risk, default rates, inputs corroborated by observable market data, etc.). | |
| | Level 3 - | Significant unobservable inputs (including the Fund's own assumptions about the factors that market participants would use in valuing the security) based on the best information available. | |
| The inputs or methodology used for valuing securities are not necessarily an indication of the risk associated with investing in those securities. |
| | | | | | | | | |
| The following is a summary of the inputs used to value the Fund's investments as of December 31, 2018: | | | | |
| | | Level 1 | | | Level 2 | | | Level 3 | | | Total | |
| Long-Term Investments | | | | | | | | | | | | |
| U.S. Treasury Securities | | $ | – | | | $ | 294,124,303 | | | $ | – | | | $ | 294,124,303 | |
| Other Government Related Securities | | | – | | | | 5,796,099 | | | | – | | | | 5,796,099 | |
| Corporate Bonds | | | – | | | | 510,787,669 | | | | – | | | | 510,787,669 | |
| Municipal Bonds | | | – | | | | 997,670 | | | | – | | | | 997,670 | |
| Residential Mortgage-Backed Securities - U.S. Government Agency Issues | | | – | | | | 37,198 | | | | – | | | | 37,198 | |
| Residential Mortgage-Backed Securities - Non-U.S. Government Agency Issues | | | – | | | | 26,541,052 | | | | – | | | | 26,541,052 | |
| Commercial Mortgage-Backed Securities - U.S. Government Agency Issues | | | – | | | | 487,477 | | | | – | | | | 487,477 | |
| Commercial Mortgage-Backed Securities - Non-U.S. Government Agency Issues | | | – | | | | 3,465,793 | | | | – | | | | 3,465,793 | |
| Asset Backed Securities | | | – | | | | 160,010,615 | | | | – | | | | 160,010,615 | |
| Total Long-Term Investments | | | – | | | | 1,002,247,876 | | | | – | | | | 1,002,247,876 | |
| Short-Term Investment | | | | | | | | | | | | | | | | |
| Money Market Mutual Fund | | | 39,534,338 | | | | – | | | | – | | | | 39,534,338 | |
| Total Short-Term Investment | | | 39,534,338 | | | | – | | | | – | | | | 39,534,338 | |
| Total Investments | | $ | 39,534,338 | | | $ | 1,002,247,876 | | | $ | – | | | $ | 1,041,782,214 | |
| Changes in valuation techniques may result in transfers into or out of assigned levels within the fair value hierarchy. There were no transfers into or out of Level 3 during the reporting period, as compared to the security classifications from the prior year's annual report. |
| | | | | | | | | |
| Baird Short-Term Bond Fund | | | | | | | | | |
| Schedule of Investments | | | | | | | | | |
| December 31, 2018 | | | | | | | | | |
| | | | | | | | | | |
| | | Principal | | | | | | % of | |
| | | Amount | | | Value | | | Net Assets | |
| LONG-TERM INVESTMENTS | | | | | | | | | |
| U.S. Treasury Securities | | | | | | | | | |
| U.S. Treasury Bonds: | | | | | | | | | |
| 2.000%, 08/31/2021 | | $ | 514,225,000 | | | $ | 507,837,359 | | | | |
| 1.125%, 09/30/2021 | | | 747,225,000 | | | | 720,692,677 | | | | |
| 1.750%, 03/31/2022 | | | 64,375,000 | | | | 62,931,591 | | | | |
| 1.875%, 03/31/2022 | | | 110,000,000 | | | | 107,937,500 | | | | |
| 2.125%, 12/31/2022 | | | 105,000,000 | | | | 103,519,336 | | | | |
| | | | | | | | 1,502,918,463 | | | | 26.3 | % |
| Other Government Related Securities | | | | | | | | | | | | |
| CNOOC Finance 2012 Ltd., | | | | | | | | | | | | |
| 3.875%, 05/02/2022 (1)(2) | | | 14,112,000 | | | | 14,219,096 | | | | | |
| Electricite de France SA, | | | | | | | | | | | | |
| 4.600%, 01/27/2020 (1)(2) | | | 2,926,000 | | | | 2,968,592 | | | | | |
| Industrial Bank of Korea, | | | | | | | | | | | | |
| 3.159%, 08/02/2021 (3 Month LIBOR USD + 0.600%) (1)(2)(3) | | | 2,150,000 | | | | 2,151,148 | | | | | |
| Japan Bank for International Cooperation, | | | | | | | | | | | | |
| 2.125%, 07/21/2020 (1) | | | 20,900,000 | | | | 20,692,126 | | | | | |
| Korea Development Bank, | | | | | | | | | | | | |
| 3.000%, 03/17/2019 (1) | | | 2,475,000 | | | | 2,475,690 | | | | | |
| Nexen Energy ULC, | | | | | | | | | | | | |
| 6.200%, 07/30/2019 (1) | | | 2,065,000 | | | | 2,100,648 | | | | | |
| Petroleos Mexicanos: | | | | | | | | | | | | |
| 8.000%, 05/03/2019 (1) | | | 9,963,000 | | | | 10,072,593 | | | | | |
| 6.375%, 02/04/2021 (1) | | | 5,000,000 | | | | 5,055,000 | | | | | |
| Sinopec Group Overseas Development [2015] Ltd., | | | | | | | | | | | | |
| 2.500%, 04/28/2020 (1)(2) | | | 8,000,000 | | | | 7,901,696 | | | | | |
| Sinopec Group Overseas Development [2016] Ltd.: | | | | | | | | | | | | |
| 2.125%, 05/03/2019 (1)(2) | | | 7,000,000 | | | | 6,976,522 | | | | | |
| 1.750%, 09/29/2019 (1)(2) | | | 2,375,000 | | | | 2,350,041 | | | | | |
| Sinopec Group Overseas Development [2017] Ltd., | | | | | | | | | | | | |
| 2.375%, 04/12/2020 (1)(2) | | | 10,125,000 | | | | 10,004,796 | | | | | |
| Syngenta Finance NV: | | | | | | | | | | | | |
| 3.933%, 04/23/2021 (1)(2) | | | 10,000,000 | | | | 9,863,363 | | | | | |
| 3.125%, 03/28/2022 (1) | | | 5,000,000 | | | | 4,790,783 | | | | | |
| | | | | | | | 101,622,094 | | | | 1.8 | % |
| Corporate Bonds | | | | | | | | | | | | |
| Industrials | | | | | | | | | | | | |
| 21st Century Fox America, Inc., | | | | | | | | | | | | |
| 6.900%, 03/01/2019 | | | 10,950,000 | | | | 11,012,825 | | | | | |
| Abbott Laboratories, | | | | | | | | | | | | |
| 2.900%, 11/30/2021 | | | 4,350,000 | | | | 4,312,210 | | | | | |
| Actavis Funding SCS: | | | | | | | | | | | | |
| 3.000%, 03/12/2020 (1) | | | 3,900,000 | | | | 3,885,695 | | | | | |
| 4.031%, 03/12/2020 (3 Month LIBOR USD + 1.255%) (1)(3) | | | 1,000,000 | | | | 1,003,037 | | | | | |
| Alimentation Couche-Tard, Inc., | | | | | | | | | | | | |
| 2.700%, 07/26/2022 (1)(2) | | | 14,010,000 | | | | 13,519,350 | | | | | |
| Allergan Funding SCS, | | | | | | | | | | | | |
| 3.450%, 03/15/2022 (1) | | | 2,850,000 | | | | 2,804,522 | | | | | |
| Anadarko Petroleum Corp., | | | | | | | | | | | | |
| 8.700%, 03/15/2019 | | | 2,970,000 | | | | 3,000,586 | | | | | |
| Anglo American Capital PLC: | | | | | | | | | | | | |
| 4.125%, 04/15/2021 (1)(2) | | | 22,700,000 | | | | 22,622,139 | | | | | |
| 3.750%, 04/10/2022 (1)(2) | | | 5,000,000 | | | | 4,881,150 | | | | | |
| ArcelorMittal, | | | | | | | | | | | | |
| 6.250%, 02/25/2022 (1) | | | 13,031,000 | | | | 13,773,767 | | | | | |
| AT&T, Inc.: | | | | | | | | | | | | |
| 2.300%, 03/11/2019 | | | 9,682,000 | | | | 9,664,767 | | | | | |
| 3.733%, 06/30/2020 (3 Month LIBOR USD + 0.930%) (3) | | | 4,000,000 | | | | 3,996,368 | | | | | |
| 2.800%, 02/17/2021 | | | 11,025,000 | | | | 10,887,294 | | | | | |
| AutoNation, Inc.: | | | | | | | | | | | | |
| 5.500%, 02/01/2020 | | | 3,369,000 | | | | 3,442,441 | | | | | |
| 3.350%, 01/15/2021 | | | 4,203,000 | | | | 4,170,769 | | | | | |
| Bayer US Finance II LLC, | | | | | | | | | | | | |
| 3.500%, 06/25/2021 (2) | | | 24,700,000 | | | | 24,525,151 | | | | | |
| Beam Suntory, Inc., | | | | | | | | | | | | |
| 3.250%, 05/15/2022 | | | 8,875,000 | | | | 8,796,708 | | | | | |
| Becton Dickinson and Co.: | | | | | | | | | | | | |
| 2.404%, 06/05/2020 | | | 10,350,000 | | | | 10,188,475 | | | | | |
| 3.125%, 11/08/2021 | | | 1,000,000 | | | | 986,257 | | | | | |
| 2.894%, 06/06/2022 | | | 19,500,000 | | | | 18,886,139 | | | | | |
| Bemis Co., Inc., | | | | | | | | | | | | |
| 6.800%, 08/01/2019 | | | 9,075,000 | | | | 9,271,186 | | | | | |
| Boardwalk Pipelines LP, | | | | | | | | | | | | |
| 5.750%, 09/15/2019 | | | 10,750,000 | | | | 10,876,490 | | | | | |
| Boral Finance Pty Ltd., | | | | | | | | | | | | |
| 3.000%, 11/01/2022 (1)(2) | | | 2,475,000 | | | | 2,391,162 | | | | | |
| Broadcom Corp. / Broadcom Cayman Finance Ltd., | | | | | | | | | | | | |
| 2.375%, 01/15/2020 | | | 27,000,000 | | | | 26,662,800 | | | | | |
| Bunge Limited Finance Corp., | | | | | | | | | | | | |
| 3.500%, 11/24/2020 | | | 9,750,000 | | | | 9,726,420 | | | | | |
| Campbell Soup Co., | | | | | | | | | | | | |
| 3.300%, 03/15/2021 | | | 9,550,000 | | | | 9,500,358 | | | | | |
| Cardinal Health, Inc., | | | | | | | | | | | | |
| 1.948%, 06/14/2019 | | | 14,700,000 | | | | 14,624,315 | | | | | |
| Carlisle Cos, Inc., | | | | | | | | | | | | |
| 5.125%, 12/15/2020 | | | 2,950,000 | | | | 3,022,591 | | | | | |
| Celgene Corp., | | | | | | | | | | | | |
| 2.875%, 02/19/2021 | | | 7,000,000 | | | | 6,927,936 | | | | | |
| Cenovus Energy, Inc., | | | | | | | | | | | | |
| 5.700%, 10/15/2019 (1) | | | 7,692,308 | | | | 7,830,004 | | | | | |
| Charter Communications Operating LLC: | | | | | | | | | | | | |
| 3.579%, 07/23/2020 | | | 3,000,000 | | | | 2,996,766 | | | | | |
| 4.464%, 07/23/2022 | | | 5,000,000 | | | | 5,048,028 | | | | | |
| Chevron Phillips Chemical Co. LLC / Chevron Phillips Chemical Co. LP, | | | | | | | | | | | | |
| 3.291%, 05/01/2020 (3 Month LIBOR USD + 0.750%) (2)(3) | | | 5,050,000 | | | | 5,060,232 | | | | | |
| CK Hutchison International Ltd., | | | | | | | | | | | | |
| 2.250%, 09/29/2020 (1)(2) | | | 20,000,000 | | | | 19,666,871 | | | | | |
| CNH Industrial Capital LLC: | | | | | | | | | | | | |
| 3.375%, 07/15/2019 | | | 921,000 | | | | 914,092 | | | | | |
| 4.375%, 11/06/2020 | | | 9,810,000 | | | | 9,863,955 | | | | | |
| 4.875%, 04/01/2021 | | | 2,554,000 | | | | 2,595,119 | | | | | |
| 3.875%, 10/15/2021 | | | 10,560,000 | | | | 10,489,248 | | | | | |
| 4.375%, 04/05/2022 | | | 4,102,000 | | | | 4,119,639 | | | | | |
| Columbia Pipeline Group, Inc., | | | | | | | | | | | | |
| 3.300%, 06/01/2020 | | | 6,575,000 | | | | 6,552,389 | | | | | |
| Conagra Brands, Inc.: | | | | | | | | | | | | |
| 4.950%, 08/15/2020 | | | 4,500,000 | | | | 4,600,498 | | | | | |
| 2.908%, 10/09/2020 (3 Month LIBOR USD + 0.500%) (3) | | | 20,000,000 | | | | 19,775,889 | | | | | |
| 3.800%, 10/22/2021 | | | 4,825,000 | | | | 4,826,702 | | | | | |
| Constellation Brands, Inc., | | | | | | | | | | | | |
| 3.209%, 11/15/2021 (3 Month LIBOR USD + 0.700%) (3) | | | 10,000,000 | | | | 9,880,218 | | | | | |
| CVS Health Corp.: | | | | | | | | | | | | |
| 2.800%, 07/20/2020 | | | 6,725,000 | | | | 6,664,322 | | | | | |
| 3.350%, 03/09/2021 | | | 19,550,000 | | | | 19,494,184 | | | | | |
| 2.125%, 06/01/2021 | | | 5,000,000 | | | | 4,824,323 | | | | | |
| Daimler Finance North America LLC: | | | | | | | | | | | | |
| 1.500%, 07/05/2019 (2) | | | 5,700,000 | | | | 5,643,860 | | | | | |
| 2.200%, 05/05/2020 (2) | | | 5,000,000 | | | | 4,918,062 | | | | | |
| 3.350%, 05/04/2021 (2) | | | 15,000,000 | | | | 14,954,505 | | | | | |
| Deutsche Telekom International Finance BV, | | | | | | | | | | | | |
| 3.029%, 01/17/2020 (3 Month LIBOR USD + 0.580%) (1)(2)(3) | | | 8,000,000 | | | | 8,015,333 | | | | | |
| Diamond 1 Finance Corp. / Diamond 2 Finance Corp.: | | | | | | | | | | | | |
| 3.480%, 06/01/2019 (2) | | | 19,135,000 | | | | 19,078,451 | | | | | |
| 4.420%, 06/15/2021 (2) | | | 11,550,000 | | | | 11,530,946 | | | | | |
| Discovery Communications LLC: | | | | | | | | | | | | |
| 2.200%, 09/20/2019 | | | 10,000,000 | | | | 9,895,379 | | | | | |
| 4.375%, 06/15/2021 | | | 4,650,000 | | | | 4,731,965 | | | | | |
| DowDuPont, Inc., | | | | | | | | | | | | |
| 3.766%, 11/15/2020 | | | 10,000,000 | | | | 10,095,872 | | | | | |
| DXC Technology Co.: | | | | | | | | | | | | |
| 2.875%, 03/27/2020 | | | 18,714,000 | | | | 18,552,277 | | | | | |
| 3.688%, 03/01/2021 (3 Month LIBOR USD + 0.950%) (3) | | | 1,538,000 | | | | 1,536,290 | | | | | |
| 4.450%, 09/18/2022 | | | 12,900,000 | | | | 13,163,236 | | | | | |
| Eastman Chemical Co., | | | | | | | | | | | | |
| 3.500%, 12/01/2021 | | | 7,600,000 | | | | 7,638,104 | | | | | |
| Elanco Animal Health, Inc., | | | | | | | | | | | | |
| 3.912%, 08/27/2021 (2) | | | 8,000,000 | | | | 8,049,777 | | | | | |
| EMD Finance LLC, | | | | | | | | | | | | |
| 2.950%, 03/19/2022 (2) | | | 12,000,000 | | | | 11,822,865 | | | | | |
| Enable Midstream Partners LP, | | | | | | | | | | | | |
| 2.400%, 05/15/2019 | | | 3,000,000 | | | | 2,982,997 | | | | | |
| Enbridge Energy Partners LP: | | | | | | | | | | | | |
| 9.875%, 03/01/2019 | | | 4,150,000 | | | | 4,192,613 | | | | | |
| 4.375%, 10/15/2020 | | | 9,805,000 | | | | 9,919,515 | | | | | |
| Energy Transfer Partners LP: | | | | | | | | | | | | |
| 9.700%, 03/15/2019 | | | 6,994,000 | | | | 7,077,095 | | | | | |
| 4.150%, 10/01/2020 | | | 12,500,000 | | | | 12,575,439 | | | | | |
| Energy Transfer Partners LP / Regency Energy Finance Corp., | | | | | | | | | | | | |
| 5.750%, 09/01/2020 | | | 1,175,000 | | | | 1,205,893 | | | | | |
| EQT Corp., | | | | | | | | | | | | |
| 2.500%, 10/01/2020 | | | 15,000,000 | | | | 14,667,544 | | | | | |
| ERAC USA Finance LLC: | | | | | | | | | | | | |
| 2.350%, 10/15/2019 (2) | | | 19,000,000 | | | | 18,871,516 | | | | | |
| 2.600%, 12/01/2021 (2) | | | 1,450,000 | | | | 1,410,821 | | | | | |
| Express Scripts Holding Co.: | | | | | | | | | | | | |
| 2.250%, 06/15/2019 | | | 2,157,000 | | | | 2,147,819 | | | | | |
| 2.600%, 11/30/2020 | | | 14,425,000 | | | | 14,199,421 | | | | | |
| 3.457%, 11/30/2020 (3 Month LIBOR USD + 0.750%) (3) | | | 7,000,000 | | | | 7,000,091 | | | | | |
| 3.300%, 02/25/2021 | | | 5,000,000 | | | | 4,981,645 | | | | | |
| Federal Express Corp. Pass Through Trust, | | | | | | | | | | | | |
| 6.845%, 01/15/2019 | | | 459,836 | | | | 460,345 | | | | | |
| FedEx Corp., | | | | | | | | | | | | |
| 2.300%, 02/01/2020 | | | 2,000,000 | | | | 1,982,001 | | | | | |
| Fidelity National Information Services, Inc.: | | | | | | | | | | | | |
| 3.625%, 10/15/2020 | | | 1,673,000 | | | | 1,680,605 | | | | | |
| 2.250%, 08/15/2021 | | | 12,000,000 | | | | 11,588,192 | | | | | |
| Fiserv, Inc., | | | | | | | | | | | | |
| 2.700%, 06/01/2020 | | | 3,500,000 | | | | 3,473,985 | | | | | |
| FMC Corp.: | | | | | | | | | | | | |
| 5.200%, 12/15/2019 | | | 4,496,000 | | | | 4,546,272 | | | | | |
| 3.950%, 02/01/2022 | | | 12,335,000 | | | | 12,403,365 | | | | | |
| Ford Motor Credit Co. LLC: | | | | | | | | | | | | |
| 2.021%, 05/03/2019 | | | 7,000,000 | | | | 6,971,709 | | | | | |
| 1.897%, 08/12/2019 | | | 10,000,000 | | | | 9,901,609 | | | | | |
| 2.681%, 01/09/2020 | | | 5,000,000 | | | | 4,917,171 | | | | | |
| 3.200%, 01/15/2021 | | | 4,505,000 | | | | 4,368,745 | | | | | |
| 3.470%, 04/05/2021 | | | 2,500,000 | | | | 2,429,795 | | | | | |
| Forest Laboratories, Inc., | | | | | | | | | | | | |
| 5.000%, 12/15/2021 (2) | | | 20,000,000 | | | | 20,577,982 | | | | | |
| Fortive Corp., | | | | | | | | | | | | |
| 1.800%, 06/15/2019 | | | 537,000 | | | | 530,579 | | | | | |
| Fresenius Medical Care US Finance II, Inc., | | | | | | | | | | | | |
| 4.125%, 10/15/2020 (2) | | | 19,325,000 | | | | 19,347,417 | | | | | |
| Fresenius Medical Care US Finance, Inc., | | | | | | | | | | | | |
| 5.750%, 02/15/2021 (2) | | | 4,782,000 | | | | 4,925,460 | | | | | |
| Fresenius US Finance II, Inc., | | | | | | | | | | | | |
| 4.500%, 01/15/2023 (2) | | | 1,525,000 | | | | 1,540,973 | | | | | |
| General Electric Co., | | | | | | | | | | | | |
| 3.150%, 09/07/2022 | | | 25,000,000 | | | | 23,626,989 | | | | | |
| General Mills, Inc., | | | | | | | | | | | | |
| 3.200%, 04/16/2021 | | | 4,850,000 | | | | 4,823,367 | | | | | |
| General Motors Financial Co., Inc.: | | | | | | | | | | | | |
| 3.100%, 01/15/2019 | | | 2,825,000 | | | | 2,824,888 | | | | | |
| 2.400%, 05/09/2019 | | | 4,000,000 | | | | 3,984,967 | | | | | |
| 2.650%, 04/13/2020 | | | 3,425,000 | | | | 3,367,813 | | | | | |
| 3.389%, 08/07/2020 (3 Month LIBOR USD + 0.800%) (3) | | | 7,000,000 | | | | 6,929,404 | | | | | |
| 3.700%, 11/24/2020 | | | 1,409,000 | | | | 1,403,303 | | | | | |
| 4.200%, 03/01/2021 | | | 1,215,000 | | | | 1,214,347 | | | | | |
| 3.550%, 04/09/2021 | | | 4,750,000 | | | | 4,684,592 | | | | | |
| 3.200%, 07/06/2021 | | | 8,500,000 | | | | 8,302,853 | | | | | |
| Georgia-Pacific LLC: | | | | | | | | | | | | |
| 2.539%, 11/15/2019 (2) | | | 8,750,000 | | | | 8,683,741 | | | | | |
| 5.400%, 11/01/2020 (2) | | | 9,968,000 | | | | 10,328,585 | | | | | |
| Glencore Finance (Canada) Ltd.: | | | | | | | | | | | | |
| 4.950%, 11/15/2021 (1)(2) | | | 10,000,000 | | | | 10,213,636 | | | | | |
| 4.250%, 10/25/2022 (1)(2) | | | 5,760,000 | | | | 5,741,773 | | | | | |
| Glencore Funding LLC: | | | | | | | | | | | | |
| 2.500%, 01/15/2019 (2) | | | 600,000 | | | | 599,748 | | | | | |
| 3.796%, 01/15/2019 (3 Month LIBOR USD + 1.360%) (2)(3) | | | 6,395,000 | | | | 6,396,023 | | | | | |
| 3.125%, 04/29/2019 (2) | | | 5,154,000 | | | | 5,127,416 | | | | | |
| Grupo Bimbo SAB de CV, | | | | | | | | | | | | |
| 4.875%, 06/30/2020 (1)(2) | | | 28,075,000 | | | | 28,636,434 | | | | | |
| Harris Corp., | �� | | | | | | | | | | | |
| 2.700%, 04/27/2020 | | | 1,000,000 | | | | 991,484 | | | | | |
| HCA, Inc., | | | | | | | | | | | | |
| 6.500%, 02/15/2020 | | | 22,263,000 | | | | 22,819,575 | | | | | |
| Hewlett Packard Enterprise Co.: | | | | | | | | | | | | |
| 2.100%, 10/04/2019 (2) | | | 5,000,000 | | | | 4,943,659 | | | | | |
| 3.500%, 10/05/2021 | | | 5,000,000 | | | | 5,013,768 | | | | | |
| Holcim US Finance Sarl & Cie SCS, | | | | | | | | | | | | |
| 6.000%, 12/30/2019 (1)(2) | | | 6,657,000 | | | | 6,817,627 | | | | | |
| HP, Inc., | | | | | | | | | | | | |
| 3.376%, 01/14/2019 (3 Month LIBOR USD + 0.940%) (3) | | | 5,700,000 | | | | 5,700,903 | | | | | |
| Hutchison Whampoa International Ltd., | | | | | | | | | | | | |
| 4.625%, 01/13/2022 (1)(2) | | | 8,000,000 | | | | 8,254,216 | | | | | |
| Hyundai Capital America: | | | | | | | | | | | | |
| 2.500%, 03/18/2019 (2) | | | 3,000,000 | | | | 2,995,009 | | | | | |
| 1.750%, 09/27/2019 (2) | | | 5,000,000 | | | | 4,934,617 | | | | | |
| 2.750%, 09/18/2020 (2) | | | 10,000,000 | | | | 9,845,821 | | | | | |
| 3.450%, 03/12/2021 (2) | | | 5,000,000 | | | | 4,946,237 | | | | | |
| Hyundai Capital Services, Inc., | | | | | | | | | | | | |
| 1.625%, 08/30/2019 (1)(2) | | | 1,455,000 | | | | 1,439,943 | | | | | |
| IDEX Corp., | | | | | | | | | | | | |
| 4.200%, 12/15/2021 | | | 10,725,000 | | | | 10,882,278 | | | | | |
| JM Smucker Co., | | | | | | | | | | | | |
| 2.500%, 03/15/2020 | | | 2,725,000 | | | | 2,698,126 | | | | | |
| Keurig Dr Pepper, Inc., | | | | | | | | | | | | |
| 3.551%, 05/25/2021 (2) | | | 24,700,000 | | | | 24,662,582 | | | | | |
| Keysight Technologies, Inc., | | | | | | | | | | | | |
| 3.300%, 10/30/2019 | | | 28,625,000 | | | | 28,538,282 | | | | | |
| Kinder Morgan Energy Partners LP: | | | | | | | | | | | | |
| 9.000%, 02/01/2019 | | | 2,692,000 | | | | 2,703,613 | | | | | |
| 6.500%, 04/01/2020 | | | 22,320,000 | | | | 23,114,786 | | | | | |
| Kraft Heinz Foods Co.: | | | | | | | | | | | | |
| 5.375%, 02/10/2020 | | | 2,250,000 | | | | 2,301,415 | | | | | |
| 3.188%, 02/10/2021 (3 Month LIBOR USD + 0.570%) (3) | | | 15,000,000 | | | | 14,875,418 | | | | | |
| Lennar Corp., | | | | | | | | | | | | |
| 8.375%, 01/15/2021 | | | 2,337,000 | | | | 2,483,062 | | | | | |
| LyondellBasell Industries NV: | | | | | | | | | | | | |
| 5.000%, 04/15/2019 (1) | | | 2,260,000 | | | | 2,262,459 | | | | | |
| 6.000%, 11/15/2021 (1) | | | 5,675,000 | | | | 5,998,581 | | | | | |
| Marathon Petroleum Corp., | | | | | | | | | | | | |
| 3.400%, 12/15/2020 | | | 15,000,000 | | | | 14,995,447 | | | | | |
| Martin Marietta Materials, Inc.: | | | | | | | | | | | | |
| 3.292%, 12/20/2019 (3 Month LIBOR USD + 0.500%) (3) | | | 1,250,000 | | | | 1,246,409 | | | | | |
| 3.327%, 05/22/2020 (3 Month LIBOR USD + 0.650%) (3) | | | 5,400,000 | | | | 5,370,868 | | | | | |
| Masco Corp.: | | | | | | | | | | | | |
| 7.125%, 03/15/2020 | | | 40,000 | | | | 41,785 | | | | | |
| 3.500%, 04/01/2021 | | | 3,881,000 | | | | 3,862,885 | | | | | |
| 5.950%, 03/15/2022 | | | 10,275,000 | | | | 10,888,126 | | | | | |
| McKesson Corp., | | | | | | | | | | | | |
| 3.650%, 11/30/2020 | | | 9,850,000 | | | | 9,897,100 | | | | | |
| Medtronic, Inc., | | | | | | | | | | | | |
| 3.588%, 03/15/2020 (3 Month LIBOR USD + 0.800%) (3) | | | 2,250,000 | | | | 2,259,837 | | | | | |
| Microchip Technology, Inc., | | | | | | | | | | | | |
| 3.922%, 06/01/2021 (2) | | | 28,643,000 | | | | 28,413,503 | | | | | |
| Molex Electronic Technologies LLC, | | | | | | | | | | | | |
| 2.878%, 04/15/2020 (2) | | | 31,303,000 | | | | 31,000,833 | | | | | |
| Mondelez International Holdings Netherlands BV, | | | | | | | | | | | | |
| 1.625%, 10/28/2019 (1)(2) | | | 9,750,000 | | | | 9,614,233 | | | | | |
| Motiva Enterprises LLC, | | | | | | | | | | | | |
| 5.750%, 01/15/2020 (2) | | | 3,106,000 | | | | 3,160,432 | | | | | |
| Mylan NV: | | | | | | | | | | | | |
| 2.500%, 06/07/2019 (1) | | | 3,847,000 | | | | 3,828,907 | | | | | |
| 3.750%, 12/15/2020 (1) | | | 1,873,000 | | | | 1,872,128 | | | | | |
| Mylan, Inc., | | | | | | | | | | | | |
| 3.125%, 01/15/2023 (2) | | | 3,000,000 | | | | 2,813,191 | | | | | |
| NetApp, Inc., | | | | | | | | | | | | |
| 2.000%, 09/27/2019 | | | 5,000,000 | | | | 4,945,122 | | | | | |
| Newell Brands, Inc., | | | | | | | | | | | | |
| 2.600%, 03/29/2019 | | | 798,000 | | | | 796,670 | | | | | |
| Nissan Motor Acceptance Corp.: | | | | | | | | | | | | |
| 2.150%, 07/13/2020 (2) | | | 20,000,000 | | | | 19,520,178 | | | | | |
| 2.150%, 09/28/2020 (2) | | | 4,300,000 | | | | 4,178,460 | | | | | |
| Norfolk Southern Railway Co., | | | | | | | | | | | | |
| 9.750%, 06/15/2020 | | | 2,000,000 | | | | 2,186,447 | | | | | |
| Northern Border Pipeline Co., | | | | | | | | | | | | |
| 7.500%, 09/15/2021 | | | 4,500,000 | | | | 4,869,832 | | | | | |
| Nutrien Ltd.: | | | | | | | | | | | | |
| 6.500%, 05/15/2019 (1) | | | 13,500,000 | | | | 13,654,504 | | | | | |
| 4.875%, 03/30/2020 (1) | | | 13,000,000 | | | | 13,226,596 | | | | | |
| ONEOK Partners LP: | | | | | | | | | | | | |
| 8.625%, 03/01/2019 | | | 1,500,000 | | | | 1,510,623 | | | | | |
| 3.800%, 03/15/2020 | | | 2,800,000 | | | | 2,805,031 | | | | | |
| Pentair Finance SA, | | | | | | | | | | | | |
| 2.650%, 12/01/2019 (1) | | | 10,353,000 | | | | 10,274,020 | | | | | |
| Pernod Ricard SA, | | | | | | | | | | | | |
| 5.750%, 04/07/2021 (1)(2) | | | 6,375,000 | | | | 6,681,577 | | | | | |
| Perrigo Finance Unlimited Co.: | | | | | | | | | | | | |
| 3.500%, 03/15/2021 (1) | | | 3,138,000 | | | | 3,084,666 | | | | | |
| 3.500%, 12/15/2021 (1) | | | 5,855,000 | | | | 5,629,540 | | | | | |
| Reliance Holding USA, Inc., | | | | | | | | | | | | |
| 4.500%, 10/19/2020 (2) | | | 16,778,000 | | | | 16,971,253 | | | | | |
| Republic Services, Inc., | | | | | | | | | | | | |
| 5.500%, 09/15/2019 | | | 6,446,000 | | | | 6,545,864 | | | | | |
| Rockies Express Pipeline LLC, | | | | | | | | | | | | |
| 5.625%, 04/15/2020 (2) | | | 1,400,000 | | | | 1,400,000 | | | | | |
| Rolls-Royce PLC, | | | | | | | | | | | | |
| 2.375%, 10/14/2020 (1)(2) | | | 5,000,000 | | | | 4,918,767 | | | | | |
| Royal Caribbean Cruises Ltd., | | | | | | | | | | | | |
| 2.650%, 11/28/2020 (1) | | | 5,000,000 | | | | 4,908,267 | | | | | |
| Ryder System, Inc., | | | | | | | | | | | | |
| 3.500%, 06/01/2021 | | | 6,150,000 | | | | 6,157,935 | | | | | |
| Sabine Pass Liquefaction LLC, | | | | | | | | | | | | |
| 5.625%, 02/01/2021 | | | 16,550,000 | | | | 17,051,929 | | | | | |
| Seagate HDD Cayman, | | | | | | | | | | | | |
| 4.250%, 03/01/2022 (1) | | | 14,461,000 | | | | 13,820,116 | | | | | |
| Sherwin-Williams Co.: | | | | | | | | | | | | |
| 7.250%, 06/15/2019 | | | 2,513,000 | | | | 2,557,020 | | | | | |
| 2.250%, 05/15/2020 | | | 6,200,000 | | | | 6,105,075 | | | | | |
| Shire Acquisitions Investments Ireland DAC: | | | | | | | | | | | | |
| 1.900%, 09/23/2019 (1) | | | 9,775,000 | | | | 9,638,011 | | | | | |
| 2.400%, 09/23/2021 (1) | | | 19,450,000 | | | | 18,807,836 | | | | | |
| Smithfield Foods, Inc.: | | | | | | | | | | | | |
| 2.700%, 01/31/2020 (2) | | | 14,875,000 | | | | 14,673,607 | | | | | |
| 2.650%, 10/03/2021 (2) | | | 16,000,000 | | | | 15,291,258 | | | | | |
| Solvay Finance America LLC, | | | | | | | | | | | | |
| 3.400%, 12/03/2020 (2) | | | 8,790,000 | | | | 8,785,245 | | | | | |
| Spirit AeroSystems, Inc., | | | | | | | | | | | | |
| 3.588%, 06/15/2021 (3 Month LIBOR USD + 0.800%) (3) | | | 9,300,000 | | | | 9,229,262 | | | | | |
| Stryker Corp., | | | | | | | | | | | | |
| 2.000%, 03/08/2019 | | | 6,250,000 | | | | 6,240,186 | | | | | |
| Suntory Holdings Ltd., | | | | | | | | | | | | |
| 2.550%, 06/28/2022 (1)(2) | | | 600,000 | | | | 575,067 | | | | | |
| Tech Data Corp., | | | | | | | | | | | | |
| 3.700%, 02/15/2022 | | | 10,000,000 | | | | 9,811,153 | | | | | |
| Telefonica Emisiones SAU, | | | | | | | | | | | | |
| 5.462%, 02/16/2021 (1) | | | 12,577,000 | | | | 13,034,161 | | | | | |
| Teva Pharmaceutical Finance Netherlands III BV: | | | | | | | | | | | | |
| 1.700%, 07/19/2019 (1) | | | 7,000,000 | | | | 6,891,340 | | | | | |
| 2.200%, 07/21/2021 (1) | | | 15,654,000 | | | | 14,389,345 | | | | | |
| Time Warner Cable LLC: | | | | | | | | | | | | |
| 8.750%, 02/14/2019 | | | 4,395,000 | | | | 4,419,539 | | | | | |
| 8.250%, 04/01/2019 | | | 2,564,000 | | | | 2,592,774 | | | | | |
| 4.000%, 09/01/2021 | | | 9,700,000 | | | | 9,641,050 | | | | | |
| Total System Services, Inc., | | | | | | | | | | | | |
| 3.800%, 04/01/2021 | | | 7,960,000 | | | | 7,958,417 | | | | | |
| TransCanada PipeLines Ltd., | | | | | | | | | | | | |
| 3.125%, 01/15/2019 (1) | | | 6,800,000 | | | | 6,799,395 | | | | | |
| TTX Co.: | | | | | | | | | | | | |
| 2.250%, 02/01/2019 (2) | | | 7,450,000 | | | | 7,441,817 | | | | | |
| 4.400%, 05/01/2021 (2) | | | 2,100,000 | | | | 2,140,663 | | | | | |
| United Technologies Corp.: | | | | | | | | | | | | |
| 3.279%, 08/16/2021 (3 Month LIBOR USD + 0.650%) (3) | | | 5,800,000 | | | | 5,778,203 | | | | | |
| 3.350%, 08/16/2021 | | | 3,000,000 | | | | 2,991,882 | | | | | |
| Vale Overseas Ltd., | | | | | | | | | | | | |
| 4.375%, 01/11/2022 (1) | | | 1,968,000 | | | | 2,002,440 | | | | | |
| Verisk Analytics, Inc.: | | | | | | | | | | | | |
| 4.875%, 01/15/2019 | | | 19,150,000 | | | | 19,156,664 | | | | | |
| 5.800%, 05/01/2021 | | | 8,511,000 | | | | 8,947,221 | | | | | |
| Verizon Communications, Inc., | | | | | | | | | | | | |
| 2.946%, 03/15/2022 | | | 30,880,000 | | | | 30,554,666 | | | | | |
| Vodafone Group Plc: | | | | | | | | | | | | |
| 2.500%, 09/26/2022 (1) | | | 3,000,000 | | | | 2,879,443 | | | | | |
| 3.426%, 01/16/2024 (3 Month LIBOR USD + 0.990%) (1)(3) | | | 15,000,000 | | | | 14,632,375 | | | | | |
| Volkswagen Group of America Finance LLC: | | | | | | | | | | | | |
| 2.400%, 05/22/2020 (2) | | | 5,270,000 | | | | 5,188,069 | | | | | |
| 4.000%, 11/12/2021 (2) | | | 24,700,000 | | | | 24,684,660 | | | | | |
| Vulcan Materials Co.: | | | | | | | | | | | | |
| 3.388%, 06/15/2020 (3 Month LIBOR USD + 0.600%) (3) | | | 11,630,000 | | | | 11,556,795 | | | | | |
| 3.388%, 03/01/2021 (3 Month LIBOR USD + 0.650%) (3) | | | 16,000,000 | | | | 15,879,899 | | | | | |
| Walgreen Co., | | | | | | | | | | | | |
| 5.250%, 01/15/2019 | | | 2,330,000 | | | | 2,331,436 | | | | | |
| Williams Companies, Inc.: | | | | | | | | | | | | |
| 7.875%, 09/01/2021 | | | 3,000,000 | | | | 3,276,167 | | | | | |
| 3.700%, 01/15/2023 | | | 13,187,000 | | | | 12,864,054 | | | | | |
| Williams Partners LP, | | | | | | | | | | | | |
| 3.600%, 03/15/2022 | | | 4,750,000 | | | | 4,660,747 | | | | | |
| Yara International ASA, | | | | | | | | | | | | |
| 7.875%, 06/11/2019 (1)(2) | | | 500,000 | | | | 509,361 | | | | | |
| Zimmer Holdings, Inc.: | | | | | | | | | | | | |
| 2.700%, 04/01/2020 | | | 27,610,000 | | | | 27,346,513 | | | | | |
| 3.150%, 04/01/2022 | | | 2,190,000 | | | | 2,141,186 | | | | | |
| Zoetis, Inc., | | | | | | | | | | | | |
| 3.450%, 11/13/2020 | | | 7,932,000 | | | | 7,953,878 | | | | | |
| | | | | | | | 1,789,945,224 | | | | 30.9 | % |
| Utilities | | | | | | | | | |
| Dominion Resources, Inc., | | | | | | | | | |
| 2.962%, 07/01/2019 (7) | | | 4,000,000 | | | | 3,985,775 | | | | |
| EDP Finance BV: | | | | | | | | | | | |
| 4.125%, 01/15/2020 (1)(2) | | | 12,071,000 | | | | 12,083,554 | | | | |
| 5.250%, 01/14/2021 (1)(2) | | | 2,840,000 | | | | 2,886,269 | | | | |
| Enel Finance International NV, | | | | | | | | | | | |
| 2.875%, 05/25/2022 (1)(2) | | | 4,233,000 | | | | 3,988,361 | | | | |
| Exelon Corp.: | | | | | | | | | | | |
| 2.850%, 06/15/2020 | | | 2,425,000 | | | | 2,405,784 | | | | |
| 5.150%, 12/01/2020 | | | 7,775,000 | | | | 7,945,686 | | | | |
| 2.450%, 04/15/2021 | | | 800,000 | | | | 782,430 | | | | |
| Exelon Generation Co. LLC: | | | | | | | | | | | |
| 2.950%, 01/15/2020 | | | 7,500,000 | | | | 7,463,898 | | | | |
| 4.000%, 10/01/2020 | | | 8,300,000 | | | | 8,333,925 | | | | |
| Fortis, Inc., | | | | | | | | | | | |
| 2.100%, 10/04/2021 (1) | | | 2,100,000 | | | | 2,018,869 | | | | |
| Iberdrola Finance Ireland Ltd., | | | | | | | | | | | |
| 5.000%, 09/11/2019 (1)(2) | | | 2,400,000 | | | | 2,422,690 | | | | |
| Mississippi Power Co., | | | | | | | | | | | |
| 3.472%, 03/27/2020 (3 Month LIBOR USD + 0.650%) (3) | | | 5,475,000 | | | | 5,465,739 | | | | |
| NV Energy, Inc., | | | | | | | | | | | |
| 6.250%, 11/15/2020 | | | 1,668,000 | | | | 1,752,492 | | | | |
| Orange Cogen Funding Corp., | | | | | | | | | | | |
| 8.175%, 03/15/2022 (2) | | | 6,646,590 | | | | 7,257,376 | | | | |
| Sempra Energy: | | | | | | | | | | | |
| 9.800%, 02/15/2019 | | | 2,575,000 | | | | 2,592,169 | | | | |
| 2.936%, 01/15/2021 (3 Month LIBOR USD + 0.500%) (3) | | | 1,425,000 | | | | 1,401,068 | | | | |
| Southern Co., | | | | | | | | | | | |
| 2.750%, 06/15/2020 | | | 19,000,000 | | | | 18,789,485 | | | | |
| Southern Power Co., | | | | | | | | | | | |
| 1.950%, 12/15/2019 | | | 4,600,000 | | | | 4,530,595 | | | | |
| UIL Holdings Corp., | | | | | | | | | | | |
| 4.625%, 10/01/2020 | | | 1,750,000 | | | | 1,791,924 | | | | |
| | | | | | | | 97,898,089 | | | | 1.7 | % |
| Financials | | | | | | | | | | | | |
| ABN AMRO Bank NV: | | | | | | | | | | | | |
| 1.800%, 09/20/2019 (1)(2) | | | 4,750,000 | | | | 4,702,215 | | | | | |
| 3.400%, 08/27/2021 (1)(2) | | | 15,000,000 | | | | 14,969,760 | | | | | |
| Air Lease Corp.: | | | | | | | | | | | | |
| 3.875%, 04/01/2021 | | | 6,885,000 | | | | 6,893,767 | | | | | |
| 3.375%, 06/01/2021 | | | 3,000,000 | | | | 2,971,376 | | | | | |
| 3.500%, 01/15/2022 | | | 16,825,000 | | | | 16,557,366 | | | | | |
| 2.625%, 07/01/2022 | | | 1,239,000 | | | | 1,174,453 | | | | | |
| American International Group, Inc.: | | | | | | | | | | | | |
| 3.375%, 08/15/2020 | | | 2,000,000 | | | | 2,004,498 | | | | | |
| 6.400%, 12/15/2020 | | | 16,900,000 | | | | 17,846,228 | | | | | |
| Anthem, Inc., | | | | | | | | | | | | |
| 2.500%, 11/21/2020 | | | 14,325,000 | | | | 14,128,239 | | | | | |
| ANZ New Zealand (Int'l) Ltd.: | | | | | | | | | | | | |
| 2.600%, 09/23/2019 (1)(2) | | | 3,350,000 | | | | 3,339,004 | | | | | |
| 2.200%, 07/17/2020 (1)(2) | | | 10,000,000 | | | | 9,831,910 | | | | | |
| 2.850%, 08/06/2020 (1)(2) | | | 3,000,000 | | | | 2,976,331 | | | | | |
| 2.125%, 07/28/2021 (1)(2) | | | 2,013,000 | | | | 1,946,332 | | | | | |
| Assurant, Inc., | | | | | | | | | | | | |
| 4.072%, 03/26/2021 (3 Month LIBOR USD + 1.250%) (3) | | | 8,000,000 | | | | 7,997,159 | | | | | |
| Bank of America Corp.: | | | | | | | | | | | | |
| 2.600%, 01/15/2019 | | | 5,750,000 | | | | 5,748,880 | | | | | |
| 5.625%, 07/01/2020 | | | 2,000,000 | | | | 2,067,562 | | | | | |
| 5.875%, 01/05/2021 | | | 10,000,000 | | | | 10,524,271 | | | | | |
| 2.369%, 07/21/2021 (3 Month LIBOR USD + 0.660%) (3) | | | 10,000,000 | | | | 9,821,045 | | | | | |
| 2.328%, 10/01/2021 (3 Month LIBOR USD + 0.630%) (3) | | | 10,000,000 | | | | 9,804,808 | | | | | |
| 3.499%, 05/17/2022 (3 Month LIBOR USD + 0.630%) (3) | | | 5,000,000 | | | | 5,000,751 | | | | | |
| Bank of Montreal, | | | | | | | | | | | | |
| 3.100%, 04/13/2021 (1) | | | 15,000,000 | | | | 14,992,467 | | | | | |
| Bank of Nova Scotia, | | | | | | | | | | | | |
| 3.125%, 04/20/2021 (1) | | | 20,000,000 | | | | 19,968,464 | | | | | |
| Banque Federative du Credit Mutuel SA: | | | | | | | | | | | | |
| 2.000%, 04/12/2019 (1)(2) | | | 18,600,000 | | | | 18,538,853 | | | | | |
| 2.200%, 07/20/2020 (1)(2) | | | 5,000,000 | | | | 4,908,258 | | | | | |
| 2.750%, 10/15/2020 (1)(2) | | | 2,200,000 | | | | 2,177,914 | | | | | |
| 2.700%, 07/20/2022 (1)(2) | | | 2,800,000 | | | | 2,712,962 | | | | | |
| Barclays Bank PLC: | | | | | | | | | | | | |
| 5.140%, 10/14/2020 (1) | | | 5,506,000 | | | | 5,565,599 | | | | | |
| 10.179%, 06/12/2021 (1)(2) | | | 7,179,000 | | | | 8,070,259 | | | | | |
| Barclays PLC: | | | | | | | | | | | | |
| 2.875%, 06/08/2020 (1) | | | 3,000,000 | | | | 2,944,416 | | | | | |
| 3.250%, 01/12/2021 (1) | | | 15,175,000 | | | | 14,860,847 | | | | | |
| BNP Paribas SA: | | | | | | | | | | | | |
| 2.375%, 05/21/2020 (1) | | | 3,225,000 | | | | 3,189,791 | | | | | |
| 2.950%, 05/23/2022 (1)(2) | | | 13,475,000 | | | | 12,986,179 | | | | | |
| BNZ International Funding Ltd, | | | | | | | | | | | | |
| 2.900%, 02/21/2022 (1)(2) | | | 1,950,000 | | | | 1,911,865 | | | | | |
| BPCE SA: | | | | | | | | | | | | |
| 2.500%, 07/15/2019 (1) | | | 1,000,000 | | | | 996,161 | | | | | |
| 3.000%, 05/22/2022 (1)(2) | | | 17,380,000 | | | | 16,788,037 | | | | | |
| Capital One Financial Corp.: | | | | | | | | | | | | |
| 2.500%, 05/12/2020 | | | 10,400,000 | | | | 10,265,420 | | | | | |
| 3.450%, 04/30/2021 | | | 7,125,000 | | | | 7,121,651 | | | | | |
| Capital One NA: | | | | | | | | | | | | |
| 2.400%, 09/05/2019 | | | 9,300,000 | | | | 9,243,525 | | | | | |
| 1.850%, 09/13/2019 | | | 5,000,000 | | | | 4,945,259 | | | | | |
| Cigna Corp., | | | | | | | | | | | | |
| 3.400%, 09/17/2021 (2) | | | 3,000,000 | | | | 2,993,176 | | | | | |
| Citigroup, Inc.: | | | | | | | | | | | | |
| 2.450%, 01/10/2020 | | | 14,825,000 | | | | 14,705,951 | | | | | |
| 2.700%, 03/30/2021 | | | 10,000,000 | | | | 9,851,498 | | | | | |
| Citizens Bank NA: | | | | | | | | | | | | |
| 2.250%, 03/02/2020 | | | 5,000,000 | | | | 4,946,472 | | | | | |
| 2.200%, 05/26/2020 | | | 9,100,000 | | | | 8,969,615 | | | | | |
| CNA Financial Corp., | | | | | | | | | | | | |
| 5.750%, 08/15/2021 | | | 6,000,000 | | | | 6,332,044 | | | | | |
| Comerica Bank, | | | | | | | | | | | | |
| 2.500%, 06/02/2020 | | | 7,000,000 | | | | 6,913,052 | | | | | |
| Compass Bank: | | | | | | | | | | | | |
| 2.750%, 09/29/2019 | | | 9,906,000 | | | | 9,853,986 | | | | | |
| 5.500%, 04/01/2020 | | | 1,360,000 | | | | 1,390,247 | | | | | |
| 3.500%, 06/11/2021 | | | 16,200,000 | | | | 16,154,846 | | | | | |
| Credit Agricole SA, | | | | | | | | | | | | |
| 3.375%, 01/10/2022 (1)(2) | | | 10,000,000 | | | | 9,836,323 | | | | | |
| Credit Suisse: | | | | | | | | | | | | |
| 2.750%, 03/26/2020 (1) | | | 9,000,000 | | | | 8,902,901 | | | | | |
| 3.450%, 04/16/2021 (1) | | | 7,000,000 | | | | 6,974,846 | | | | | |
| Credit Suisse AG, | | | | | | | | | | | | |
| 5.400%, 01/14/2020 (1) | | | 8,084,000 | | | | 8,209,042 | | | | | |
| Deutsche Bank AG: | | | | | | | | | | | | |
| 3.895%, 01/18/2019 (3 Month LIBOR USD + 1.450%) (1)(3) | | | 4,000,000 | | | | 3,998,156 | | | | | |
| 2.500%, 02/13/2019 (1) | | | 8,000,000 | | | | 7,984,802 | | | | | |
| 2.950%, 08/20/2020 (1) | | | 4,400,000 | | | | 4,270,714 | | | | | |
| 3.125%, 01/13/2021 (1) | | | 5,515,000 | | | | 5,337,470 | | | | | |
| 3.150%, 01/22/2021 (1) | | | 3,000,000 | | | | 2,899,137 | | | | | |
| 4.250%, 10/14/2021 (1) | | | 5,000,000 | | | | 4,888,763 | | | | | |
| Discover Bank: | | | | | | | | | | | | |
| 8.700%, 11/18/2019 | | | 7,395,000 | | | | 7,712,727 | | | | | |
| 3.100%, 06/04/2020 | | | 8,735,000 | | | | 8,675,183 | | | | | |
| Discover Financial Services, | | | | | | | | | | | | |
| 5.200%, 04/27/2022 | | | 4,531,000 | | | | 4,700,612 | | | | | |
| DNB Bank ASA, | | | | | | | | | | | | |
| 2.125%, 10/02/2020 (1)(2) | | | 14,300,000 | | | | 14,018,266 | | | | | |
| First Horizon National Corp., | | | | | | | | | | | | |
| 3.500%, 12/15/2020 | | | 11,148,000 | | | | 11,147,323 | | | | | |
| First Niagara Financial Group, Inc., | | | | | | | | | | | | |
| 6.750%, 03/19/2020 | | | 3,850,000 | | | | 4,003,810 | | | | | |
| First Tennessee Bank NA, | | | | | | | | | | | | |
| 2.950%, 12/01/2019 | | | 15,286,000 | | | | 15,167,511 | | | | | |
| FMR LLC, | | | | | | | | | | | | |
| 7.490%, 06/15/2019 (2) | | | 1,000,000 | | | | 1,018,762 | | | | | |
| Goldman Sachs Group, Inc., | | | | | | | | | | | | |
| 2.876%, 10/31/2022 (3 Month LIBOR USD + 0.821%) (3) | | | 12,000,000 | | | | 11,654,502 | | | | | |
| 3.497%, 10/23/2019 (3 Month LIBOR USD + 1.020%) (3) | | | 2,751,000 | | | | 2,753,952 | | | | | |
| 3.000%, 04/26/2022 | | | 5,000,000 | | | | 4,842,216 | | | | | |
| Guardian Life Global Funding, | | | | | | | | | | | | |
| 2.000%, 04/26/2021 (2) | | | 7,825,000 | | | | 7,625,499 | | | | | |
| Hartford Financial Services Group, Inc.: | | | | | | | | | | | | |
| 6.000%, 01/15/2019 | | | 455,000 | | | | 455,347 | | | | | |
| 5.500%, 03/30/2020 | | | 1,947,000 | | | | 1,997,877 | | | | | |
| HSBC Bank USA NA, | | | | | | | | | | | | |
| 4.875%, 08/24/2020 | | | 10,000,000 | | | | 10,245,819 | | | | | |
| HSBC Holdings PLC, | | | | | | | | | | | | |
| 3.400%, 03/08/2021 (1) | | | 5,000,000 | | | | 4,987,024 | | | | | |
| HSBC USA, Inc.: | | | | | | | | | | | | |
| 3.228%, 11/13/2019 (3 Month LIBOR USD + 0.610%) (3) | | | 9,750,000 | | | | 9,759,005 | | | | | |
| 5.000%, 09/27/2020 | | | 4,805,000 | | | | 4,906,911 | | | | | |
| Humana, Inc., | | | | | | | | | | | | |
| 2.500%, 12/15/2020 | | | 9,625,000 | | | | 9,479,803 | | | | | |
| Huntington Bancshares, Inc., | | | | | | | | | | | | |
| 3.150%, 03/14/2021 | | | 1,335,000 | | | | 1,329,056 | | | | | |
| Huntington National Bank, | | | | | | | | | | | | |
| 3.250%, 05/14/2021 | | | 5,000,000 | | | | 4,987,565 | | | | | |
| ING Bank NV: | | | | | | | | | | | | |
| 1.650%, 08/15/2019 (1)(2) | | | 10,000,000 | | | | 9,905,146 | | | | | |
| 2.500%, 10/01/2019 (1)(2) | | | 8,961,000 | | | | 8,920,228 | | | | | |
| 5.000%, 06/09/2021 (1)(2) | | | 7,250,000 | | | | 7,508,454 | | | | | |
| Invesco Finance PLC, | | | | | | | | | | | | |
| 3.125%, 11/30/2022 (1) | | | 9,377,000 | | | | 9,190,737 | | | | | |
| Jackson National Life Global Funding, | | | | | | | | | | | | |
| 2.200%, 01/30/2020 (2) | | | 24,125,000 | | | | 23,897,963 | | | | | |
| Jefferies Group LLC: | | | | | | | | | | | | |
| 8.500%, 07/15/2019 | | | 1,500,000 | | | | 1,539,234 | | | | | |
| 6.875%, 04/15/2021 | | | 7,133,000 | | | | 7,590,478 | | | | | |
| JPMorgan Chase & Co.: | | | | | | | | | | | | |
| 2.250%, 01/23/2020 | | | 8,100,000 | | | | 8,019,323 | | | | | |
| 2.295%, 08/15/2021 | | | 10,550,000 | | | | 10,293,031 | | | | | |
| 3.514%, 06/18/2022 (3 Month LIBOR USD + 0.610%) (3) | | | 23,000,000 | | | | 23,052,040 | | | | | |
| KEB Hana Bank, | | | | | | | | | | | | |
| 1.750%, 10/18/2019 (1)(2) | | | 18,000,000 | | | | 17,813,880 | | | | | |
| KeyBank NA: | | | | | | | | | | | | |
| 2.350%, 03/08/2019 | | | 6,500,000 | | | | 6,491,623 | | | | | |
| 3.180%, 05/22/2022 | | | 9,972,000 | | | | 9,928,387 | | | | | |
| Kookmin Bank, | | | | | | | | | | | | |
| 1.625%, 08/01/2019 (1)(2) | | | 8,000,000 | | | | 7,913,320 | | | | | |
| Lloyds Bank PLC: | | | | | | | | | | | | |
| 2.050%, 01/22/2019 (1) | | | 4,000,000 | | | | 3,996,857 | | | | | |
| 6.500%, 09/14/2020 (1)(2) | | | 1,543,000 | | | | 1,600,263 | | | | | |
| Macquarie Bank Ltd., | | | | | | | | | | | | |
| 2.400%, 01/21/2020 (1)(2) | | | 13,000,000 | | | | 12,884,802 | | | | | |
| Macquarie Group Ltd, | | | | | | | | | | | | |
| 6.000%, 01/14/2020 (1)(2) | | | 15,475,000 | | | | 15,885,521 | | | | | |
| Manufacturers & Traders Trust Co., | | | | | | | | | | | | |
| 3.721%, 12/28/2020 (1 Month LIBOR USD + 1.215%) (3) | | | 282,000 | | | | 282,070 | | | | | |
| Marsh & McLennan Cos, Inc., | | | | | | | | | | | | |
| 2.750%, 01/30/2022 | | | 7,000,000 | | | | 6,860,960 | | | | | |
| Mitsubishi UFJ Financial Group, Inc., | | | | | | | | | | | | |
| 2.190%, 09/13/2021 (1) | | | 15,000,000 | | | | 14,480,158 | | | | | |
| Mitsubishi UFJ Trust & Banking Corp., | | | | | | | | | | | | |
| 2.650%, 10/19/2020 (1)(2) | | | 4,550,000 | | | | 4,500,145 | | | | | |
| Mizuho Bank Ltd., | | | | | | | | | | | | |
| 2.450%, 04/16/2019 (1)(2) | | | 2,400,000 | | | | 2,396,094 | | | | | |
| Mizuho Financial Group, Inc.: | | | | | | | | | | | | |
| 2.632%, 04/12/2021 (1)(2) | | | 12,350,000 | | | | 12,115,765 | | | | | |
| 3.905%, 04/12/2021 (3 Month LIBOR USD + 1.480%) (1)(2)(3) | | | 3,000,000 | | | | 3,035,316 | | | | | |
| 2.273%, 09/13/2021 (1) | | | 8,330,000 | | | | 8,065,465 | | | | | |
| 2.953%, 02/28/2022 (1) | | | 3,700,000 | | | | 3,627,360 | | | | | |
| Morgan Stanley: | | | | | | | | | | | | |
| 7.300%, 05/13/2019 | | | 15,125,000 | | | | 15,354,574 | | | | | |
| 3.649%, 01/27/2020 (3 Month LIBOR USD + 1.140%) (3) | | | 4,000,000 | | | | 4,016,433 | | | | | |
| 3.168%, 02/10/2021 (3 Month LIBOR USD + 0.550%) (3) | | | 9,850,000 | | | | 9,739,931 | | | | | |
| 3.399%, 07/22/2022 (3 Month LIBOR USD + 0.930%) (3) | | | 10,000,000 | | | | 9,859,642 | | | | | |
| National Australia Bank Ltd., | | | | | | | | | | | | |
| 2.250%, 01/10/2020 (1) | | | 24,600,000 | | | | 24,391,390 | | | | | |
| National Bank of Canada, | | | | | | | | | | | | |
| 2.150%, 06/12/2020 (1) | | | 23,525,000 | | | | 23,183,701 | | | | | |
| Nomura Holdings, Inc.: | | | | | | | | | | | | |
| 2.750%, 03/19/2019 (1) | | | 5,313,000 | | | | 5,308,448 | | | | | |
| 6.700%, 03/04/2020 (1) | | | 3,654,000 | | | | 3,795,069 | | | | | |
| Nordea Bank AB: | | | | | | | | | | | | |
| 4.875%, 05/13/2021 (1)(2) | | | 8,980,000 | | | | 9,133,459 | | | | | |
| 4.250%, 09/21/2022 (1)(2) | | | 5,385,000 | | | | 5,412,553 | | | | | |
| Pricoa Global Funding I, | | | | | | | | | | | | |
| 1.450%, 09/13/2019 (2) | | | 12,000,000 | | | | 11,870,665 | | | | | |
| Principal Life Global Funding II: | | | | | | | | | | | | |
| 1.500%, 04/18/2019 (2) | | | 3,000,000 | | | | 2,986,288 | | | | | |
| 2.150%, 01/10/2020 (2) | | | 19,100,000 | | | | 18,900,396 | | | | | |
| Protective Life Global Funding: | | | | | | | | | | | | |
| 1.555%, 09/13/2019 (2) | | | 18,000,000 | | | | 17,789,073 | | | | | |
| 2.161%, 09/25/2020 (2) | | | 10,000,000 | | | | 9,821,590 | | | | | |
| Prudential Financial, Inc., | | | | | | | | | | | | |
| 7.375%, 06/15/2019 | | | 7,000,000 | | | | 7,126,976 | | | | | |
| RBC USA Holdco Corp., | | | | | | | | | | | | |
| 5.250%, 09/15/2020 | | | 3,310,000 | | | | 3,411,585 | | | | | |
| Regions Bank, | | | | | | | | | | | | |
| 3.374%, 08/13/2021 (3 Month LIBOR USD + 0.500%) (3) | | | 14,000,000 | | | | 13,942,619 | | | | | |
| Regions Financial Corp., | | | | | | | | | | | | |
| 3.200%, 02/08/2021 | | | 16,500,000 | | | | 16,394,464 | | | | | |
| Reliance Standard Life Global Funding II, | | | | | | | | | | | | |
| 2.500%, 01/15/2020 (2) | | | 6,000,000 | | | | 5,942,643 | | | | | |
| Royal Bank of Scotland Group PLC, | | | | | | | | | | | | |
| 3.498%, 05/15/2023 (3 Month LIBOR USD + 1.480%) (1)(3) | | | 8,000,000 | | | | 7,692,939 | | | | | |
| 5.625%, 08/24/2020 (1) | | | 2,450,000 | | | | 2,529,785 | | | | | |
| 6.125%, 01/11/2021 (1) | | | 9,517,000 | | | | 9,911,251 | | | | | |
| Santander Holdings USA, Inc., | | | | | | | | | | | | |
| 4.450%, 12/03/2021 | | | 10,000,000 | | | | 10,173,256 | | | | | |
| Santander UK Group Holdings PLC: | | | | | | | | | | | | |
| 2.875%, 10/16/2020 (1) | | | 1,030,000 | | | | 1,012,031 | | | | | |
| 3.125%, 01/08/2021 (1) | | | 3,500,000 | | | | 3,436,013 | | | | | |
| 2.875%, 08/05/2021 (1) | | | 2,970,000 | | | | 2,865,022 | | | | | |
| Santander UK PLC, | | | | | | | | | | | | |
| 2.125%, 11/03/2020 (1) | | | 5,200,000 | | | | 5,078,735 | | | | | |
| Skandinaviska Enskilda Banken AB: | | | | | | | | | | | | |
| 2.375%, 03/25/2019 (1)(2) | | | 950,000 | | | | 948,248 | | | | | |
| 2.450%, 05/27/2020 (1)(2) | | | 4,700,000 | | | | 4,646,782 | | | | | |
| SMBC Aviation Capital Finance DAC, | | | | | | | | | | | | |
| 2.650%, 07/15/2021 (1)(2) | | | 1,300,000 | | | | 1,265,297 | | | | | |
| Standard Chartered PLC: | | | | | | | | | | | | |
| 2.100%, 08/19/2019 (1)(2) | | | 4,500,000 | | | | 4,460,484 | | | | | |
| 2.400%, 09/08/2019 (1)(2) | | | 4,225,000 | | | | 4,197,605 | | | | | |
| 2.250%, 04/17/2020 (1)(2) | | | 5,000,000 | | | | 4,900,640 | | | | | |
| 3.050%, 01/15/2021 (1)(2) | | | 17,271,000 | | | | 17,013,524 | | | | | |
| Stifel Financial Corp., | | | | | | | | | | | | |
| 3.500%, 12/01/2020 | | | 27,373,000 | | | | 27,370,166 | | | | | |
| Sumitomo Mitsui Banking Corp., | | | | | | | | | | | | |
| 2.450%, 01/16/2020 (1) | | | 4,500,000 | | | | 4,464,187 | | | | | |
| Sumitomo Mitsui Trust Bank Ltd., | | | | | | | | | | | | |
| 2.050%, 03/06/2019 (1)(2) | | | 22,400,000 | | | | 22,361,116 | | | | | |
| SunTrust Bank, | | | | | | | | | | | | |
| 3.525%, 10/26/2021 (3 Month LIBOR USD + 0.500%) (3) | | | 15,000,000 | | | | 15,017,931 | | | | | |
| Svenska Handelsbanken AB, | | | | | | | | | | | | |
| 3.727%, 10/01/2020 (3 Month LIBOR USD + 0.930%) (1)(3) | | | 10,000,000 | | | | 10,116,670 | | | | | |
| Synchrony Financial: | | | | | | | | | | | | |
| 2.600%, 01/15/2019 | | | 2,000,000 | | | | 1,999,318 | | | | | |
| 3.000%, 08/15/2019 | | | 13,350,000 | | | | 13,261,880 | | | | | |
| 2.700%, 02/03/2020 | | | 6,600,000 | | | | 6,487,884 | | | | | |
| 3.750%, 08/15/2021 | | | 8,489,000 | | | | 8,261,465 | | | | | |
| Trinity Acquisition PLC, | | | | | | | | | | | | |
| 3.500%, 09/15/2021 (1) | | | 12,885,000 | | | | 12,759,809 | | | | | |
| UBS Group Funding Jersey Ltd., | | | | | | | | | | | | |
| 3.000%, 04/15/2021 (1)(2) | | | 3,000,000 | | | | 2,976,798 | | | | | |
| UBS Group Funding Switzerland AG: | | | | | | | | | | | | |
| 2.950%, 09/24/2020 (1)(2) | | | 11,600,000 | | | | 11,477,355 | | | | | |
| 4.264%, 09/24/2020 (3 Month LIBOR USD + 1.440%) (1)(2)(3) | | | 2,000,000 | | | | 2,026,526 | | | | | |
| 2.650%, 02/01/2022 (1)(2) | | | 9,471,000 | | | | 9,166,751 | | | | | |
| WEA Finance LLC / Westfield UK & Europe Finance PLC: | | | | | | | | | | | | |
| 2.700%, 09/17/2019 (2) | | | 8,000,000 | | | | 7,964,577 | | | | | |
| 3.250%, 10/05/2020 (2) | | | 6,000,000 | | | | 5,991,668 | | | | | |
| Wells Fargo & Co.: | | | | | | | | | | | | |
| 3.200%, 01/30/2020 (3 Month LIBOR USD + 0.680%) (3) | | | 1,975,000 | | | | 1,978,940 | | | | | |
| 2.500%, 03/04/2021 | | | 3,900,000 | | | | 3,835,934 | | | | | |
| Wells Fargo Bank NA, | | | | | | | | | | | | |
| 3.325%, 07/23/2021 (3 Month LIBOR USD + 0.490%) (3) | | | 15,000,000 | | | | 14,985,381 | | | | | |
| Willis Towers Watson PLC, | | | | | | | | | | | | |
| 5.750%, 03/15/2021 (1) | | | 13,085,000 | | | | 13,684,356 | | | | | |
| Zions Bancorp NA, | | | | | | | | | | | | |
| 3.500%, 08/27/2021 | | | 11,700,000 | | | | 11,663,725 | | | | | |
| | | | | | | | 1,347,535,861 | | | | 23.5 | % |
| Total Corporate Bonds | | | | | | | 3,235,379,174 | | | | 56.1 | % |
| Municipal Bonds | | | | | | | | | |
| City of Pittsburg CA, | | | | | | | | | |
| 5.864%, 07/01/2021 | | | 1,515,000 | | | | 1,574,812 | | | | |
| City of Williston ND, | | | | | | | | | | | |
| 3.100%, 07/15/2025 (Callable 01/14/2019) | | | 630,000 | | | | 630,044 | | | | |
| County of Sonoma CA, | | | | | | | | | | | |
| 5.070%, 12/01/2022 | | | 16,840,000 | | | | 17,613,124 | | | | |
| Fresno Joint Powers Financing Authority, | | | | | | | | | | | |
| 2.880%, 04/01/2021 | | | 1,685,000 | | | | 1,662,606 | | | | |
| Illinois Housing Development Authority, | | | | | | | | | | | |
| 4.000%, 02/01/2034 (Callable 08/01/2025) | | | 6,860,000 | | | | 6,920,780 | | | | |
| Iowa Tobacco Settlement Authority, | | | | | | | | | | | |
| 6.500%, 06/01/2023 (Callable 01/31/2019) | | | 170,000 | | | | 172,438 | | | | |
| Memphis-Shelby County Industrial Development Board, | | | | | | | | | | | |
| 2.222%, 11/01/2020 | | | 5,990,000 | | | | 5,903,564 | | | | |
| New Hampshire Housing Finance Authority, | | | | | | | | | | | |
| 4.000%, 07/01/2036 (Callable 07/10/2024) | | | 6,595,000 | | | | 6,653,564 | | | | |
| New Jersey Economic Development Authority, | | | | | | | | | | | |
| –%, 02/15/2021 | | | 1,440,000 | | | | 1,333,872 | | | | |
| New Jersey Sports & Exposition Authority: | | | | | | | | | | | |
| 6.076%, 03/01/2023 | | | 2,195,000 | | | | 2,346,235 | | | | |
| 5.976%, 03/01/2024 | | | 7,305,000 | | | | 7,608,231 | | | | |
| Rhode Island Housing & Mortgage Finance Corp., | | | | | | | | | | | |
| 3.000%, 10/01/2034 (Callable 10/01/2022) | | | 4,045,000 | | | | 4,004,510 | | | | |
| State of Hawaii Department of Business Economic Development & Tourism, | | | | | | | | | | | |
| 1.467%, 07/01/2022 | | | 6,748,364 | | | | 6,683,917 | | | | |
| | | | | | | | 63,107,697 | | | | 1.1 | % |
| Residential Mortgage-Backed Securities | | | | | | | | | | | | |
| Non-U.S. Government Agency Issues | | | | | | | | | | | | |
| ACE Securities Corp. Home Equity Loan Trust, | | | | | | | | | | | | |
| Series 2006-OP1, Class A2C, 2.656%, 04/25/2036 (1 Month LIBOR USD + 0.150%) (3) | | | 2,102,641 | | | | 2,091,094 | | | | | |
| Aegis Asset Backed Securities Trust, | | | | | | | | | | | | |
| Series 2005-4, Class M1, 2.956%, 10/25/2035 (1 Month LIBOR USD + 0.450%) (3) | | | 11,981,651 | | | | 11,992,109 | | | | | |
| Alternative Loan Trust: | | | | | | | | | | | | |
| Series 2004-12CB, Class 1A1, 5.000%, 07/25/2019 | | | 84,219 | | | | 84,784 | | | | | |
| Series 2005-50CB, Class 4A1, 5.000%, 11/25/2020 (6) | | | 57,416 | | | | 57,038 | | | | | |
| Series 2004-J2, Class 3A3, 5.500%, 04/25/2034 | | | 109,987 | | | | 110,538 | | | | | |
| Series 2004-8CB, Class A, 2.776%, 06/25/2034 (1 Month LIBOR USD + 0.270%) (3) | | | 2,952,191 | | | | 2,931,511 | | | | | |
| Series 2005-73CB, Class 1A7, 5.500%, 01/25/2036 (6) | | | 68,099 | | | | 67,045 | | | | | |
| Series 2006-28CB, Class A17, 6.000%, 10/25/2036 (6) | | | 627,032 | | | | 489,064 | | | | | |
| Argent Securities Inc. Asset-Backed Pass-Through Certificates, | | | | | | | | | | | | |
| Series 2005-W3, Class A2D, 2.846%, 11/25/2035 (1 Month LIBOR USD + 0.340%) (3) | | | 4,620,513 | | | | 4,609,400 | | | | | |
| Asset Backed Securities Corp. Home Equity Loan Trust, | | | | | | | | | | | | |
| Series 2006-HE1, Class A1, 2.721%, 01/25/2036 (1 Month LIBOR USD + 0.215%) (3) | | | 6,513,274 | | | | 6,479,485 | | | | | |
| Banc of America Mortgage Trust, | | | | | | | | | | | | |
| Series 2004-B, Class 2A2, 3.928%, 03/25/2034 (4) | | | 1,081,608 | | | | 1,097,470 | | | | | |
| Carrington Mortgage Loan Trust: | | | | | | | | | | | | |
| Series 2006-NC1, Class A3, 2.716%, 01/25/2036 (1 Month LIBOR USD + 0.210%) (3) | | | 1,288,004 | | | | 1,287,467 | | | | | |
| Series 2006-OPT1, Class A3, 2.686%, 02/25/2036 (1 Month LIBOR USD + 0.180%) (3) | | | 875,505 | | | | 874,161 | | | | | |
| Series 2007-HE1, Class A2, 2.656%, 06/25/2037 (1 Month LIBOR USD + 0.150%) (3) | | | 7,768,764 | | | | 7,702,284 | | | | | |
| Countrywide Asset-Backed Certificates: | | | | | | | | | | | | |
| Series 2006-2, Class 2A3, 2.806%, 06/25/2036 (1 Month LIBOR USD + 0.300%) (3) | | | 8,351,365 | | | | 8,318,726 | | | | | |
| Series 2006-13, Class 1AF3, 5.944%, 01/25/2037 (4) | | | 319,711 | | | | 318,581 | | | | | |
| Series 2006-9, Class 1AF3, 5.859%, 10/25/2046 (4)(6) | | | 602,098 | | | | 555,416 | | | | | |
| CWABS Asset-Backed Certificates Trust, | | | | | | | | | | | | |
| Series 2005-16, Class 3AV, 2.736%, 05/25/2036 (1 Month LIBOR USD + 0.230%) (3) | | | 904,353 | | | | 903,816 | | | | | |
| GSAA Trust: | | | | | | | | | | | | |
| Series 2005-8, Class A4, 2.776%, 06/25/2035 (1 Month LIBOR USD + 0.270%) (3) | | | 2,235,010 | | | | 2,227,289 | | | | | |
| Series 2005-6, Class A3, 2.876%, 06/25/2035 (1 Month LIBOR USD + 0.370%) (3) | | | 651,981 | | | | 647,770 | | | | | |
| GSAMP Trust, | | | | | | | | | | | | |
| Series 2006-HE7, Class A2D, 2.736%, 10/25/2046 (1 Month LIBOR USD + 0.230%) (3) | | | 9,466,803 | | | | 9,373,522 | | | | | |
| J.P. Morgan Mortgage Acquisition Trust, | | | | | | | | | | | | |
| Series 2006-CH1, Class A1, 2.636%, 07/25/2036 (1 Month LIBOR USD + 0.130%) (3) | | | 2,004,858 | | | | 1,997,690 | | | | | |
| J.P. Morgan Mortgage Trust, | | | | | | | | | | | | |
| Series 2005-A4, Class 1A1, 4.314%, 07/25/2035 (4) | | | 621,210 | | | | 622,693 | | | | | |
| MASTR Alternative Loan Trust: | | | | | | | | | | | | |
| Series 2003-5, Class 7A1, 5.000%, 10/1/2031 | | | 45,889 | | | | 44,088 | | | | | |
| Series 2003-9, Class 3A1, 4.750%, 01/25/2019 | | | 87 | | | | 87 | | | | | |
| Series 2003-5, Class 4A1, 5.500%, 07/25/2033 | | | 3,314,582 | | | | 3,467,636 | | | | | |
| Mill City Mortgage Loan Trust, | | | | | | | | | | | | |
| Series 2018-2, Class A1, 3.500%, 05/25/2058 (2)(4) | | | 1,090,330 | | | | 1,081,729 | | | | | |
| New Century Home Equity Loan Trust, | | | | | | | | | | | | |
| Series 2005-C, Class A1, 2.736%, 12/25/2035 (1 Month LIBOR USD + 0.230%) (3) | | | 3,079,345 | | | | 3,066,546 | | | | | |
| Nomura Home Equity Loan, Inc., | | | | | | | | | | | | |
| Series 2006-HE2, Class A3, 2.676%, 03/25/2036 (1 Month LIBOR USD + 0.170%) (3) | | | 585,919 | | | | 585,339 | | | | | |
| Park Place Securities, Inc., | | | | | | | | | | | | |
| Series 2005-WCW1, Class M1, 2.956%, 09/25/2035 (1 Month LIBOR USD + 0.450%) (3) | | | 532,728 | | | | 532,855 | | | | | |
| Popular ABS Mortgage Pass-Through Trust, | | | | | | | | | | | | |
| Series 2005-B, Class M2, 3.166%, 08/25/2035 (1 Month LIBOR USD + 0.660%) (3) | | | 1,154,128 | | | | 1,155,490 | | | | | |
| RASC Series Trust: | | | | | | | | | | | | |
| Series 2005-AHL2, Class A3, 2.856%, 10/25/2035 (1 Month LIBOR USD + 0.350%) (3) | | | 956,031 | | | | 955,749 | | | | | |
| Series 2005-KS11, Class M1, 2.906%, 12/25/2035 (1 Month LIBOR USD + 0.400%) (3) | | | 7,874,603 | | | | 7,884,584 | | | | | |
| Renaissance Home Equity Loan Trust, | | | | | | | | | | | | |
| Series 2007-2, Class AF2, 5.675%, 06/25/2037 (7) | | | 1,914,212 | | | | 827,977 | | | | | |
| Saxon Asset Securities Trust, | | | | | | | | | | | | |
| Series 2006-2, Class A3C, 2.656%, 09/25/2036 (1 Month LIBOR USD + 0.150%) (3) | | | 776,240 | | | | 771,995 | | | | | |
| Soundview Home Loan Trust, | | | | | | | | | | | | |
| Series 2006-OPT2, Class A3, 2.686%, 05/25/2036 (1 Month LIBOR USD + 0.180%) (3) | | | 2,796,855 | | | | 2,786,572 | | | | | |
| Structured Asset Investment Loan Trust, | | | | | | | | | | | | |
| Series 2004-9, Class A5, 3.506%, 10/25/2034 (1 Month LIBOR USD + 1.000%) (3) | | | 4,510,131 | | | | 4,503,951 | | | | | |
| Structured Asset Securities Corp., | | | | | | | | | | | | |
| Series 2004-4XS, Class 1A6, 5.050%, 02/25/2034 (7) | | | 83,138 | | | | 84,056 | | | | | |
| Thornburg Mortgage Securities Trust, | | | | | | | | | | | | |
| Series 2003-5, Class 3A, 4.337%, 10/25/2043 (4) | | | 5,815,597 | | | | 5,889,450 | | | | | |
| Towd Point Mortgage Trust: | | | | | | | | | | | | |
| Series 2015-4, Class A1B, 2.750%, 04/25/2055 (2)(4) | | | 1,562,669 | | | | 1,540,897 | | | | | |
| Series 2015-4, Class A1, 3.500%, 04/25/2055 (2)(4) | | | 3,365,154 | | | | 3,352,607 | | | | | |
| Series 2016-5, Class A1, 2.500%, 10/25/2056 (2)(4) | | | 9,384,502 | | | | 9,097,922 | | | | | |
| Series 2017-1, Class A1, 2.750%, 10/25/2056 (2)(4) | | | 17,684,152 | | | | 17,298,712 | | | | | |
| Series 2017-5, Class A1, 2.915%, 02/25/2057 (1 Month LIBOR USD + 0.600%) (2)(3) | | | 12,876,463 | | | | 12,806,156 | | | | | |
| Series 2017-2, Class A1, 2.750%, 04/25/2057 (2)(4) | | | 4,939,239 | | | | 4,830,384 | | | | | |
| Series 2017-3, Class A1, 2.750%, 07/25/2057 (2)(4) | | | 15,484,201 | | | | 15,075,471 | | | | | |
| Series 2018-6, Class A1A, 3.750%, 03/25/2058 (2)(4) | | | 13,862,740 | | | | 13,870,362 | | | | | |
| WaMu Mortgage Pass-Through Certificates Trust: | | | | | | | | | | | | |
| Series 2004-CB4, Class 21A, 5.500%, 12/25/2019 | | | 10,620 | | | | 10,653 | | | | | |
| Series 2004-CB4, Class 22A, 6.000%, 12/25/2019 | | | 22,425 | | | | 22,548 | | | | | |
| Series 2004-AR3, Class A1, 3.958%, 06/25/2034 (4) | | | 4,410,982 | | | | 4,479,444 | | | | | |
| | | | | | | | 180,862,213 | | | | 3.2 | % |
| Commercial Mortgage-Backed Securities | | | | | | | | | | | | |
| U.S. Government Agency Issues | | | | | | | | | | | | |
| Freddie Mac Multifamily Structured Pass Through Certificates: | | | | | | | | | | | | |
| Series K008, Class A2, 3.531%, 06/25/2020 | | | 27,325,000 | | | | 27,466,380 | | | | | |
| Series K010, Class A2, 4.333%, 10/25/2020 (4) | | | 14,775,000 | | | | 15,109,107 | | | | | |
| Series K014, Class A2, 3.871%, 04/25/2021 | | | 10,045,999 | | | | 10,223,692 | | | | | |
| | | | | | | | 52,799,179 | | | | 0.9 | % |
| Non-U.S. Government Agency Issues | | | | | | | | | | | | |
| COMM Mortgage Trust, | | | | | | | | | | | | |
| Series 2012-CR1, Class ASB, 3.053%, 05/15/2045 | | | 18,071,843 | | | | 18,047,574 | | | | | |
| GS Mortgage Securities Trust, | | | | | | | | | | | | |
| Series 2011-GC5, Class A4, 3.707%, 08/10/2044 | | | 8,112,000 | | | | 8,215,734 | | | | | |
| J.P. Morgan Chase Commercial Mortgage Securities Trust: | | | | | | | | | | | | |
| Series 2012-C8, Class ASB, 2.379%, 10/15/2045 | | | 12,825,197 | | | | 12,616,373 | | | | | |
| Series 2011-C5, Class ASB, 3.678%, 08/15/2046 | | | 2,593,440 | | | | 2,610,719 | | | | | |
| JPMBB Commercial Mortgage Securities Trust, | | | | | | | | | | | | |
| Series 2013-C14, Class ASB, 3.761%, 08/15/2046 (4) | | | 17,077,881 | | | | 17,236,154 | | | | | |
| Morgan Stanley Bank of America Merrill Lynch Trust: | | | | | | | | | | | | |
| Series 2013-C9, Class AAB, 2.657%, 05/15/2046 | | | 17,785,673 | | | | 17,541,827 | | | | | |
| Series 2013-C8, Class ASB, 2.699%, 12/15/2048 | | | 12,240,796 | | | | 12,119,790 | | | | | |
| WFRBS Commercial Mortgage Trust, | | | | | | | | | | | | |
| Series 2012-C6, Class A4, 3.440%, 04/15/2045 | | | 7,050,000 | | | | 7,085,881 | | | �� | | |
| | | | | | | | 95,474,052 | | | | 1.7 | % |
| Total Commercial Mortgage-Backed Securities | | | | | | | 148,273,231 | | | | 2.6 | % |
| | | | | | | | | | | | | |
| Asset Backed Securities | | | | | | | | | | | | |
| Ally Auto Receivables Trust, | | | | | | | | | | | | |
| Series 2018-3, Class A3, 3.000%, 01/17/2023 | | | 8,000,000 | | | | 7,993,435 | | | | | |
| American Express Credit Account Master Trust, | | | | | | | | | | | | |
| Series 2017-6, Class A, 2.040%, 05/15/2023 | | | 11,600,000 | | | | 11,421,130 | | | | | |
| BA Credit Card Trust, | | | | | | | | | | | | |
| Series 2018-A2, Class A2, 3.000%, 09/15/2023 | | | 29,775,000 | | | | 29,859,135 | | | | | |
| Bank of The West Auto Trust: | | | | | | | | | | | | |
| Series 2018-1, Class A3, 3.430%, 12/15/2022 (2) | | | 17,550,000 | | | | 17,660,103 | | | | | |
| Series 2017-1, Class A3, 2.110%, 01/15/2023 (2) | | | 7,500,000 | | | | 7,408,540 | | | | | |
| Barclays Dryrock Issuance Trust, | | | | | | | | | | | | |
| Series 2015-1, Class A, 2.200%, 12/15/2022 | | | 6,750,000 | | | | 6,685,650 | | | | | |
| Capital One Multi-Asset Execution Trust, | | | | | | | | | | | | |
| Series 2017-A4, Class A4, 1.990%, 07/17/2023 | | | 42,500,000 | | | | 41,840,183 | | | | | |
| Carmax Auto Owner Trust, | | | | | | | | | | | | |
| Series 2018-4, Class A3, 3.360%, 09/15/2023 | | | 11,300,000 | | | | 11,377,402 | | | | | |
| Chesapeake Funding II LLC, | | | | | | | | | | | | |
| Series 2018-1A, Class A1, 3.040%, 04/15/2030 (2) | | | 11,352,293 | | | | 11,344,403 | | | | | |
| Citibank Credit Card Issuance Trust, | | | | | | | | | | | | |
| Series 2018-A1, Class A1, 2.490%, 01/20/2023 | | | 11,440,000 | | | | 11,347,749 | | | | | |
| Conseco Financial Corp.: | | | | | | | | | | | | |
| Series 1998-2, Class A5, 6.240%, 12/01/2028 | | | 3,928 | | | | 3,983 | | | | | |
| Series 1998-3, Class A5, 6.220%, 03/01/2030 | | | 89,859 | | | | 93,731 | | | | | |
| Dell Equipment Finance Trust, | | | | | | | | | | | | |
| Series 2017-2, Class A3, 2.190%, 10/24/2022 (2) | | | 10,000,000 | | | | 9,928,164 | | | | | |
| Ford Credit Auto Owner Trust: | | | | | | | | | | | | |
| Series 2015-1, Class A, 2.120%, 07/15/2026 (2) | | | 21,170,000 | | | | 20,953,414 | | | | | |
| Series 2016-2, Class A, 2.030%, 12/15/2027 (2) | | | 18,225,000 | | | | 17,778,202 | | | | | |
| GM Financial Automobile Leasing Trust, | | | | | | | | | | | | |
| Series 2018-1, Class A3, 2.610%, 01/20/2021 | | | 9,875,000 | | | | 9,827,745 | | | | | |
| Kookmin Bank, | | | | | | | | | | | | |
| 2.125%, 10/21/2020 (1)(2) | | | 3,400,000 | | | | 3,325,370 | | | | | |
| Master Credit Card Trust II, | | | | | | | | | | | | |
| Series 2017-1A, Class A, 2.260%, 07/21/2021 (1)(2) | | | 35,475,000 | | | | 35,165,626 | | | | | |
| MMAF Equipment Finance LLC, | | | | | | | | | | | | |
| Series 2017-AA, Class A3, 2.040%, 02/16/2022 (2) | | | 11,625,000 | | | | 11,515,887 | | | | | |
| PFS Financing Corp.: | | | | | | | | | | | | |
| Series 2016-BA, Class A, 1.870%, 10/15/2021 (2) | | | 15,734,000 | | | | 15,576,106 | | | | | |
| Series 2018-B, Class A, 2.890%, 02/15/2023 (2) | | | 11,600,000 | | | | 11,504,755 | | | | | |
| Series 2018-F, Class A, 3.520%, 10/16/2023 (2) | | | 5,700,000 | | | | 5,755,708 | | | | | |
| Santander Retail Auto Lease Trust, | | | | | | | | | | | | |
| Series 2017-A, Class A4, 2.370%, 01/20/2022 (2) | | | 3,148,000 | | | | 3,115,294 | | | | | |
| SoFi Consumer Loan Program, | | | | | | | | | | | | |
| Series 2017-3, Class A, 2.770%, 05/25/2026 (2) | | | 5,076,896 | | | | 5,031,720 | | | | | |
| SoFi Consumer Loan Program LLC, | | | | | | | | | | | | |
| Series 2017-4, Class A, 2.500%, 05/26/2026 (2) | | | 3,018,541 | | | | 2,983,589 | | | | | |
| Synchrony Card Issuance Trust, | | | | | | | | | | | | |
| Series 2018-A1, Class A, 3.380%, 09/15/2024 | | | 33,645,000 | | | | 33,950,705 | | | | | |
| TCF Auto Receivables Owner Trust, | | | | | | | | | | | | |
| Series 2016-1A, Class A4, 2.030%, 02/15/2022 (2) | | | 14,404,000 | | | | 14,286,268 | | | | | |
| Tesla Auto Lease Trust, | | | | | | | | | | | | |
| Series 2018-B, Class A, 3.710%, 08/20/2021 (2) | | | 7,275,000 | | | | 7,292,395 | | | | | |
| Verizon Owner Trust: | | | | | | | | | | | | |
| Series 2017-1A, Class A, 2.060%, 09/20/2021 (2) | | | 5,670,000 | | | | 5,627,718 | | | | | |
| Series 2018-1A, Class A1A, 2.820%, 09/20/2022 (2) | | | 28,600,000 | | | | 28,517,680 | | | | | |
| Volvo Financial Equipment LLC, | | | | | | | | | | | | |
| Series 2018-1A, Class A3, 2.540%, 02/15/2022 (2) | | | 12,800,000 | | | | 12,702,709 | | | | | |
| World Financial Network Credit Card Master Trust: | | | | | | | | | | | | |
| Series 2017-C, Class A, 2.310%, 08/15/2024 | | | 19,279,000 | | | | 19,009,728 | | | | | |
| Series 2016-A, Class A, 2.030%, 04/15/2025 | | | 13,000,000 | | | | 12,660,343 | | | | | |
| | | | | | | | 443,544,570 | | | | 7.7 | % |
| Total Long-Term Investments (Cost $5,709,298,324) | | | | | | | 5,675,707,442 | | | | 98.8 | % |
| | | | | | | | | | | | | |
| SHORT-TERM INVESTMENT | | Shares | | | | | | | | | |
| Money Market Mutual Fund | | | | | | | | | | | | |
| Fidelity Institutional Money Market Fund - Government Portfolio, Institutional Class, 2.29% (5) | | | 95,794,117 | | | | 95,794,117 | | | | | |
| Total Short-Term Investment (Cost $95,794,117) | | | | | | | 95,794,117 | | | | 1.7 | % |
| Total Investments (Cost $5,805,092,441) | | | | | | | 5,771,501,559 | | | | 100.5 | % |
| Liabilities in Excess of Other Assets | | | | | | | (30,264,800 | ) | | | (0.5 | )% |
| TOTAL NET ASSETS | | | | | | $ | 5,741,236,759 | | | | 100.0 | % |
Notes to Schedule of Investments | | | | | | |
| (1) | | Foreign security. | | | | | | |
| (2) | | Security issued under Rule 144A under the Securities Act of 1933 and determined to be liquid. Purchased in a private placement transaction; resale to the public may require registration or may extend only to qualified institutional buyers. At December 31, 2018, the value of these securities total $1,458,367,499, which represents 25.40% of total net assets. |
| (3) | | Variable rate security based on a reference index and spread. The rate reported is the rate in effect as of December 31, 2018. | | | |
| (4) | | Variable rate security. The coupon is based on an underlying pool of loans. The rate reported is the rate in effect as of December 31, 2018. | | |
| (5) | | Seven-day yield. | | | | | | |
| (6) | | Security that, on the last payment date, missed a partial principal or interest payment. | | | | |
| (7) | | Step-up bond; the interest rate shown is the rate in effect as of December 31, 2018. | | | | |
| Baird Short-Term Bond Fund | | | | | | | | |
| Schedule of Investments, December 31, 2018 | | | | | | | |
| Summary of Fair Value Exposure at December 31, 2018 | | | | | | |
| | | | | | | | | |
The Fund has adopted authoritative fair valuation accounting standards which establish a definition of fair value and set out a hierarchy for measuring fair value. These standards require additional disclosures about the various inputs and valuation techniques used to develop the measurements of fair value and a discussion on changes in valuation techniques and related inputs during the period. These standards define fair value as the price that would be received to sell an asset or paid to transfer a liability in an orderly transaction between market participants at the measurement date. |
| | | | | | | | | |
| The fair value hierarchy is organized into three levels based upon the assumptions (referred to as "inputs") used in pricing the asset or liability. These standards state that "observable inputs" reflect the assumptions market participants would use in pricing the asset or liability based on market data obtained from independent sources and "unobservable inputs" reflect an entity's own assumptions about the assumptions market participants would use in pricing the asset or liability. These inputs are summarized into three broad levels and described below: |
| | Level 1 - | Unadjusted quoted prices in active markets for identical unrestricted securities. | |
| | Level 2 - | Other significant observable inputs (including quoted prices for similar securities, quoted prices in inactive markets, dealer indications, interest rates, yield curves, prepayment speeds, credit risk, default rates, inputs corroborated by observable market data, etc.). | |
| | Level 3 - | Significant unobservable inputs (including the Fund's own assumptions about the factors that market participants would use in valuing the security) based on the best information available. | |
| The inputs or methodology used for valuing securities are not necessarily an indication of the risk associated with investing in those securities. |
| | | | | | | | | |
| The following is a summary of the inputs used to value the Fund's investments as of December 31, 2018: | | | | |
| | | Level 1 | | | Level 2 | | | Level 3 | | | Total | |
| Long-Term Investments | | | | | | | | | | | | |
| U.S. Treasury Securities | | $ | – | | | $ | 1,502,918,463 | | | $ | – | | | $ | 1,502,918,463 | |
| Other Government Related Securities | | | – | | | | 101,622,094 | | | | – | | | | 101,622,094 | |
| Corporate Bonds | | | – | | | | 3,235,379,174 | | | | – | | | | 3,235,379,174 | |
| Municipal Bonds | | | – | | | | 63,107,697 | | | | – | | | | 63,107,697 | |
| Residential Mortgage-Backed Securities - Non-U.S. Government Agency Issues | | | – | | | | 180,862,213 | | | | – | | | | 180,862,213 | |
| Commercial Mortgage-Backed Securities - U.S. Government Agency Issues | | | – | | | | 52,799,179 | | | | – | | | | 52,799,179 | |
| Commercial Mortgage-Backed Securities - Non-U.S. Government Agency Issues | | | – | | | | 95,474,052 | | | | – | | | | 95,474,052 | |
| Asset Backed Securities | | | – | | | | 443,544,570 | | | | – | | | | 443,544,570 | |
| Total Long-Term Investments | | | – | | | | 5,675,707,442 | | | | – | | | | 5,675,707,442 | |
| Short-Term Investment | | | | | | | | | | | | | | | | |
| Money Market Mutual Fund | | | 95,794,117 | | | | – | | | | – | | | | 95,794,117 | |
| Total Short-Term Investment | | | 95,794,117 | | | | – | | | | – | | | | 95,794,117 | |
| Total Investments | | $ | 95,794,117 | | | $ | 5,675,707,442 | | | $ | – | | | $ | 5,771,501,559 | |
| | | | | | | | | | | | | | | | | |
| Changes in valuation techniques may result in transfers into or out of assigned levels within the fair value hierarchy. There were no transfers into or out of Level 3 during the reporting period, as compared to the security classifications from the prior year's annual report. |
| | | | | | | | | |
| Baird Intermediate Bond Fund | | | | | | | | | |
| Schedule of Investments | | | | | | | | | |
| December 31, 2018 | | | | | | | | | |
| | | | | | | | | | |
| | | Principal | | | | | | % of | |
| | | Amount | | | Value | | | Net Assets | |
| LONG-TERM INVESTMENTS | | | | | | | | | |
| U.S. Treasury Securities | | | | | | | | | |
| U.S. Treasury Bonds: | | | | | | | | | |
| 1.375%, 08/31/2020 | | $ | 157,725,000 | | | $ | 154,749,173 | | | | |
| 1.750%, 03/31/2022 | | | 239,300,000 | | | | 233,934,444 | | | | |
| 1.875%, 03/31/2022 | | | 295,550,000 | | | | 290,008,438 | | | | |
| 2.500%, 05/15/2024 | | | 282,800,000 | | | | 282,280,796 | | | | |
| 2.250%, 11/15/2025 | | | 152,875,000 | | | | 149,501,001 | | | | |
| 2.000%, 11/15/2026 | | | 109,975,000 | | | | 104,978,870 | | | | |
| 2.250%, 11/15/2027 | | | 133,225,000 | | | | 128,692,227 | | | | |
| | | | | | | | 1,344,144,949 | | | | 40.6 | % |
| Other Government Related Securities | | | | | | | | | | | | |
| CDP Financial, Inc., | | | | | | | | | | | | |
| 4.400%, 11/25/2019 (1)(2) | | | 1,000,000 | | | | 1,014,323 | | | | | |
| Centrais Eletricas Brasileiras SA, | | | | | | | | | | | | |
| 5.750%, 10/27/2021 (1)(2) | | | 1,150,000 | | | | 1,157,199 | | | | | |
| CNOOC Finance (2013) Ltd., | | | | | | | | | | | | |
| 3.000%, 05/09/2023 (1) | | | 2,000,000 | | | | 1,930,340 | | | | | |
| CNOOC Nexen Finance (2014) ULC, | | | | | | | | | | | | |
| 4.250%, 04/30/2024 (1) | | | 5,150,000 | | | | 5,220,900 | | | | | |
| Electricite de France SA, | | | | | | | | | | | | |
| 2.350%, 10/13/2020 (1)(2) | | | 8,875,000 | | | | 8,748,015 | | | | | |
| Export-Import Bank of Korea, | | | | | | | | | | | | |
| 2.250%, 01/21/2020 (1) | | | 3,200,000 | | | | 3,171,859 | | | | | |
| KFW, | | | | | | | | | | | | |
| 4.875%, 06/17/2019 (1) | | | 3,250,000 | | | | 3,284,622 | | | | | |
| Petroleos Mexicanos, | | | | | | | | | | | | |
| 5.500%, 01/21/2021 (1) | | | 2,000,000 | | | | 1,991,940 | | | | | |
| Sinopec Group Overseas Development [2015] Ltd., | | | | | | | | | | | | |
| 2.500%, 04/28/2020 (1)(2) | | | 3,000,000 | | | | 2,963,136 | | | | | |
| Sinopec Group Overseas Development [2016] Ltd.: | | | | | | | | | | | | |
| 1.750%, 09/29/2019 (1)(2) | | | 3,000,000 | | | | 2,968,473 | | | | | |
| 2.750%, 05/03/2021 (1)(2) | | | 5,300,000 | | | | 5,206,455 | | | | | |
| | | | | | | | 37,657,262 | | | | 1.1 | % |
| Corporate Bonds | | | | | | | | | | | | |
| Industrials | | | | | | | | | | | | |
| Abbott Laboratories, | | | | | | | | | | | | |
| 3.400%, 11/30/2023 | | | 4,600,000 | | | | 4,585,971 | | | | | |
| Agilent Technologies, Inc., | | | | | | | | | | | | |
| 3.050%, 09/22/2026 | | | 1,450,000 | | | | 1,341,800 | | | | | |
| Alimentation Couche-Tard, Inc., | | | | | | | | | | | | |
| 2.700%, 07/26/2022 (1)(2) | | | 7,400,000 | | | | 7,140,842 | | | | | |
| Anadarko Holding Co., | | | | | | | | | | | | |
| 7.500%, 10/15/2026 | | | 1,288,000 | | | | 1,451,240 | | | | | |
| Anadarko Petroleum Corp., | | | | | | | | | | | | |
| 6.950%, 06/15/2019 | | | 1,000,000 | | | | 1,013,947 | | | | | |
| Anheuser-Busch InBev Finance, Inc., | | | | | | | | | | | | |
| 3.300%, 02/01/2023 | | | 4,455,000 | | | | 4,331,813 | | | | | |
| Anheuser-Busch InBev Worldwide, Inc., | | | | | | | | | | | | |
| 3.650%, 02/01/2026 (2) | | | 3,775,000 | | | | 3,569,445 | | | | | |
| AT&T, Inc.: | | | | | | | | | | | | |
| 3.950%, 01/15/2025 | | | 8,000,000 | | | | 7,822,844 | | | | | |
| 4.300%, 02/15/2030 | | | 9,367,000 | | | | 8,851,681 | | | | | |
| Boardwalk Pipelines LP, | | | | | | | | | | | | |
| 5.950%, 06/01/2026 | | | 1,360,000 | | | | 1,405,046 | | | | | |
| Boston Scientific Corp., | | | | | | | | | | | | |
| 4.125%, 10/01/2023 | | | 3,000,000 | | | | 3,042,397 | | | | | |
| BP Capital Markets PLC: | | | | | | | | | | | | |
| 4.750%, 03/10/2019 (1) | | | 2,500,000 | | | | 2,507,603 | | | | | |
| 2.521%, 01/15/2020 (1) | | | 2,650,000 | | | | 2,641,651 | | | | | |
| Broadcom Corp. / Broadcom Cayman Finance Ltd.: | | | | | | | | | | | | |
| 2.375%, 01/15/2020 | | | 1,500,000 | | | | 1,481,267 | | | | | |
| 3.000%, 01/15/2022 | | | 5,275,000 | | | | 5,072,985 | | | | | |
| Bunge Limited Finance Corp.: | | | | | | | | | | | | |
| 3.500%, 11/24/2020 | | | 2,500,000 | | | | 2,493,954 | | | | | |
| 3.750%, 09/25/2027 | | | 5,000,000 | | | | 4,446,489 | | | | | |
| Campbell Soup Co., | | | | | | | | | | | | |
| 3.950%, 03/15/2025 | | | 8,000,000 | | | | 7,664,405 | | | | | |
| Cenovus Energy, Inc., | | | | | | | | | | | | |
| 5.700%, 10/15/2019 (1) | | | 1,153,846 | | | | 1,174,501 | | | | | |
| CH Robinson Worldwide, Inc., | | | | | | | | | | | | |
| 4.200%, 04/15/2028 | | | 12,300,000 | | | | 12,334,519 | | | | | |
| Charter Communications Operating LLC: | | | | | | | | | | | | |
| 4.464%, 07/23/2022 | | | 7,425,000 | | | | 7,496,321 | | | | | |
| 3.750%, 02/15/2028 | | | 3,765,000 | | | | 3,405,881 | | | | | |
| 4.200%, 03/15/2028 | | | 2,000,000 | | | | 1,884,002 | | | | | |
| Chevron Phillips Chemical Co. LLC / Chevron Phillips Chemical Co. LP, | | | | | | | | | | | | |
| 2.450%, 05/01/2020 (2) | | | 4,125,000 | | | | 4,087,335 | | | | | |
| CNH Industrial Capital LLC, | | | | | | | | | | | | |
| 3.875%, 10/15/2021 | | | 3,000,000 | | | | 2,979,900 | | | | | |
| Columbia Pipeline Group, Inc., | | | | | | | | | | | | |
| 4.500%, 06/01/2025 | | | 630,000 | | | | 634,537 | | | | | |
| Comcast Corp., | | | | | | | | | | | | |
| 2.750%, 03/01/2023 | | | 1,475,000 | | | | 1,435,577 | | | | | |
| Constellation Brands, Inc.: | | | | | | | | | | | | |
| 2.700%, 05/09/2022 | | | 2,975,000 | | | | 2,873,496 | | | | | |
| 3.500%, 05/09/2027 | | | 3,475,000 | | | | 3,217,726 | | | | | |
| Cox Communications, Inc.: | | | | | | | | | | | | |
| 3.250%, 12/15/2022 (2) | | | 3,600,000 | | | | 3,516,883 | | | | | |
| 3.850%, 02/01/2025 (2) | | | 2,800,000 | | | | 2,758,499 | | | | | |
| 3.350%, 09/15/2026 (2) | | | 1,700,000 | | | | 1,568,422 | | | | | |
| CVS Health Corp.: | | | | | | | | | | | | |
| 2.250%, 08/12/2019 | | | 3,375,000 | | | | 3,358,467 | | | | | |
| 4.000%, 12/05/2023 | | | 4,425,000 | | | | 4,437,644 | | | | | |
| 4.100%, 03/25/2025 | | | 3,225,000 | | | | 3,192,822 | | | | | |
| Daimler Finance North America LLC: | | | | | | | | | | | | |
| 2.250%, 07/31/2019 (2) | | | 2,300,000 | | | | 2,283,107 | | | | | |
| 2.200%, 05/05/2020 (2) | | | 5,000,000 | | | | 4,918,062 | | | | | |
| 3.750%, 11/05/2021 (2) | | | 6,800,000 | | | | 6,823,184 | | | | | |
| Deutsche Telekom International Finance BV, | | | | | | | | | | | | |
| 6.000%, 07/08/2019 (1) | | | 1,700,000 | | | | 1,723,175 | | | | | |
| Diamond 1 Finance Corp. / Diamond 2 Finance Corp.: | | | | | | | | | | | | |
| 3.480%, 06/01/2019 (2) | | | 10,900,000 | | | | 10,867,788 | | | | | |
| 4.420%, 06/15/2021 (2) | | | 4,000,000 | | | | 3,993,401 | | | | | |
| Dollar Tree, Inc., | | | | | | | | | | | | |
| 3.700%, 05/15/2023 | | | 5,050,000 | | | | 4,965,839 | | | | | |
| Dow Chemical Co., | | | | | | | | | | | | |
| 4.550%, 11/30/2025 (2) | | | 2,500,000 | | | | 2,543,299 | | | | | |
| DowDuPont, Inc., | | | | | | | | | | | | |
| 4.493%, 11/15/2025 | | | 4,000,000 | | | | 4,118,304 | | | | | |
| DXC Technology Co.: | | | | | | | | | | | | |
| 4.450%, 09/18/2022 | | | 14,000,000 | | | | 14,285,683 | | | | | |
| 4.250%, 04/15/2024 | | | 1,700,000 | | | | 1,672,759 | | | | | |
| Energy Transfer Partners LP: | | | | | | | | | | | | |
| 9.700%, 03/15/2019 | | | 2,457,000 | | | | 2,486,191 | | | | | |
| 4.750%, 01/15/2026 | | | 10,206,000 | | | | 9,916,765 | | | | | |
| EnLink Midstream Partners LP, | | | | | | | | | | | | |
| 4.400%, 04/01/2024 | | | 10,000,000 | | | | 9,423,832 | | | | | |
| Enterprise Products Operating LLC, | | | | | | | | | | | | |
| 2.550%, 10/15/2019 | | | 3,000,000 | | | | 2,984,098 | | | | | |
| EQT Midstream Partners LP, | | | | | | | | | | | | |
| 4.125%, 12/01/2026 | | | 5,000,000 | | | | 4,538,849 | | | | | |
| ERAC USA Finance LLC: | | | | | | | | | | | | |
| 2.350%, 10/15/2019 (2) | | | 6,650,000 | | | | 6,605,031 | | | | | |
| 2.600%, 12/01/2021 (2) | | | 4,825,000 | | | | 4,694,627 | | | | | |
| Express Scripts Holding Co., | | | | | | | | | | | | |
| 3.000%, 07/15/2023 | | | 5,655,000 | | | | 5,442,809 | | | | | |
| Federal Express Corp. Pass Through Trust, | | | | | | | | | | | | |
| 6.845%, 01/15/2019 | | | 285,706 | | | | 286,022 | | | | | |
| Ferguson Finance PLC, | | | | | | | | | | | | |
| 4.500%, 10/24/2028 (1)(2) | | | 5,000,000 | | | | 4,994,983 | | | | | |
| Fidelity National Information Services, Inc.: | | | | | | | | | | | | |
| 3.500%, 04/15/2023 | | | 2,319,000 | | | | 2,292,326 | | | | | |
| 3.875%, 06/05/2024 | | | 1,192,000 | | | | 1,190,677 | | | | | |
| 3.000%, 08/15/2026 | | | 2,000,000 | | | | 1,839,933 | | | | | |
| 4.250%, 05/15/2028 | | | 8,675,000 | | | | 8,617,891 | | | | | |
| Fiserv, Inc.: | | | | | | | | | | | | |
| 4.750%, 06/15/2021 | | | 1,728,000 | | | | 1,779,838 | | | | | |
| 3.500%, 10/01/2022 | | | 2,900,000 | | | | 2,880,011 | | | | | |
| 4.200%, 10/01/2028 | | | 1,000,000 | | | | 997,996 | | | | | |
| FMC Corp., | | | | | | | | | | | | |
| 4.100%, 02/01/2024 | | | 2,000,000 | | | | 1,998,932 | | | | | |
| Ford Motor Credit Co. LLC: | | | | | | | | | | | | |
| 5.750%, 02/01/2021 | | | 2,000,000 | | | | 2,039,795 | | | | | |
| 3.336%, 03/18/2021 | | | 1,800,000 | | | | 1,746,563 | | | | | |
| 3.339%, 03/28/2022 | | | 2,000,000 | | | | 1,887,823 | | | | | |
| 2.979%, 08/03/2022 | | | 7,000,000 | | | | 6,469,516 | | | | | |
| 4.250%, 09/20/2022 | | | 1,295,000 | | | | 1,241,448 | | | | | |
| Fortune Brands Home & Security, Inc., | | | | | | | | | | | | |
| 4.000%, 09/21/2023 | | | 5,775,000 | | | | 5,713,783 | | | | | |
| Freeport-McMoRan, Inc.: | | | | | | | | | | | | |
| 3.550%, 03/01/2022 | | | 2,000,000 | | | | 1,892,500 | | | | | |
| 3.875%, 03/15/2023 | | | 1,100,000 | | | | 1,017,500 | | | | | |
| General Electric Co.: | | | | | | | | | | | | |
| 6.000%, 08/07/2019 | | | 774,000 | | | | 782,337 | | | | | |
| 5.500%, 01/08/2020 | | | 731,000 | | | �� | 739,611 | | | | | |
| 5.550%, 05/04/2020 | | | 816,000 | | | | 829,985 | | | | | |
| 3.150%, 09/07/2022 | | | 3,125,000 | | | | 2,953,374 | | | | | |
| General Motors Financial Co., Inc.: | | | | | | | | | | | | |
| 2.350%, 10/04/2019 | | | 5,500,000 | | | | 5,452,084 | | | | | |
| 4.375%, 09/25/2021 | | | 5,325,000 | | | | 5,335,304 | | | | | |
| 3.450%, 01/14/2022 | | | 1,475,000 | | | | 1,429,321 | | | | | |
| 3.150%, 06/30/2022 | | | 1,000,000 | | | | 955,158 | | | | | |
| 4.150%, 06/19/2023 | | | 1,325,000 | | | | 1,291,015 | | | | | |
| Georgia-Pacific LLC, | | | | | | | | | | | | |
| 5.400%, 11/01/2020 (2) | | | 6,797,000 | | | | 7,042,876 | | | | | |
| Glencore Funding LLC: | | | | | | | | | | | | |
| 2.500%, 01/15/2019 (2) | | | 4,400,000 | | | | 4,398,152 | | | | | |
| 4.125%, 05/30/2023 (2) | | | 1,750,000 | | | | 1,718,478 | | | | | |
| 4.625%, 04/29/2024 (2) | | | 1,000,000 | | | | 991,240 | | | | | |
| 4.000%, 03/27/2027 (2) | | | 4,725,000 | | | | 4,304,370 | | | | | |
| 3.875%, 10/27/2027 (2) | | | 1,150,000 | | | | 1,028,077 | | | | | |
| Grupo Bimbo SAB de CV: | | | | | | | | | | | | |
| 4.875%, 06/30/2020 (1)(2) | | | 3,504,000 | | | | 3,574,072 | | | | | |
| 3.875%, 06/27/2024 (1)(2) | | | 3,000,000 | | | | 2,946,449 | | | | | |
| Hutchison Whampoa International Ltd.: | | | | | | | | | | | | |
| 7.625%, 04/09/2019 (1)(2) | | | 5,400,000 | | | | 5,462,235 | | | | | |
| 4.625%, 01/13/2022 (1)(2) | | | 7,000,000 | | | | 7,222,439 | | | | | |
| Hyundai Capital America: | | | | | | | | | | | | |
| 2.500%, 03/18/2019 (2) | | | 1,300,000 | | | | 1,297,837 | | | | | |
| 2.000%, 07/01/2019 (2) | | | 2,500,000 | | | | 2,483,930 | | | | | |
| 1.750%, 09/27/2019 (2) | | | 3,000,000 | | | | 2,960,770 | | | | | |
| 3.450%, 03/12/2021 (2) | | | 9,000,000 | | | | 8,903,227 | | | | | |
| Ingersoll-Rand Co., | | | | | | | | | | | | |
| 6.391%, 11/15/2027 (1) | | | 1,195,000 | | | | 1,343,055 | | | | | |
| Johnson Controls International PLC, | | | | | | | | | | | | |
| 4.250%, 03/01/2021 (1) | | | 2,000,000 | | | | 2,038,364 | | | | | |
| Keysight Technologies, Inc., | | | | | | | | | | | | |
| 3.300%, 10/30/2019 | | | 4,690,000 | | | | 4,675,792 | | | | | |
| Kinder Morgan, Inc.: | | | | | | | | | | | | |
| 5.625%, 11/15/2023 (2) | | | 1,000,000 | | | | 1,057,142 | | | | | |
| 4.300%, 03/01/2028 | | | 5,000,000 | | | | 4,893,686 | | | | | |
| 7.800%, 08/01/2031 | | | 7,000,000 | | | | 8,386,197 | | | | | |
| Kraft Heinz Foods Co.: | | | | | | | | | | | | |
| 3.500%, 06/06/2022 | | | 2,000,000 | | | | 1,979,829 | | | | | |
| 6.375%, 07/15/2028 | | | 7,629,000 | | | | 8,234,231 | | | | | |
| Laboratory Corp. of America Holdings, | | | | | | | | | | | | |
| 4.625%, 11/15/2020 | | | 468,000 | | | | 477,762 | | | | | |
| LyondellBasell Industries NV, | | | | | | | | | | | | |
| 6.000%, 11/15/2021 (1) | | | 1,100,000 | | | | 1,162,721 | | | | | |
| Mead Johnson Nutrition Co., | | | | | | | | | | | | |
| 3.000%, 11/15/2020 | | | 5,400,000 | | | | 5,384,206 | | | | | |
| Microchip Technology, Inc., | | | | | | | | | | | | |
| 3.922%, 06/01/2021 (2) | | | 7,000,000 | | | | 6,943,914 | | | | | |
| Midcontinent Express Pipeline LLC, | | | | | | | | | | | | |
| 6.700%, 09/15/2019 (2) | | | 1,000,000 | | | | 1,009,377 | | | | | |
| Mosaic Co., | | | | | | | | | | | | |
| 4.250%, 11/15/2023 | | | 8,606,000 | | | | 8,650,125 | | | | | |
| MPLX LP: | | | | | | | | | | | | |
| 4.875%, 06/01/2025 | | | 10,192,000 | | | | 10,285,385 | | | | | |
| 4.800%, 02/15/2029 | | | 3,475,000 | | | | 3,466,440 | | | | | |
| Nissan Motor Acceptance Corp., | | | | | | | | | | | | |
| 3.650%, 09/21/2021 (2) | | | 7,200,000 | | | | 7,165,503 | | | | | |
| Noble Energy, Inc., | | | | | | | | | | | | |
| 4.150%, 12/15/2021 | | | 450,000 | | | | 452,113 | | | | | |
| Nutrien Ltd., | | | | | | | | | | | | |
| 3.150%, 10/01/2022 (1) | | | 1,306,000 | | | | 1,260,669 | | | | | |
| Nvent Finance Sarl, | | | | | | | | | | | | |
| 3.950%, 04/15/2023 (1) | | | 15,800,000 | | | | 15,686,976 | | | | | |
| NXP BV / NXP Funding LLC, | | | | | | | | | | | | |
| 4.875%, 03/01/2024 (1)(2) | | | 5,775,000 | | | | 5,800,352 | | | | | |
| ONEOK Partners LP, | | | | | | | | | | | | |
| 5.000%, 09/15/2023 | | | 3,300,000 | | | | 3,400,283 | | | | | |
| ONEOK, Inc., | | | | | | | | | | | | |
| 7.500%, 09/01/2023 | | | 7,470,000 | | | | 8,488,014 | | | | | |
| Penske Truck Leasing Co. LP / PTL Finance Corp., | | | | | | | | | | | | |
| 3.950%, 03/10/2025 (2) | | | 12,000,000 | | | | 11,755,479 | | | | | |
| Phillips 66 Partners LP, | | | | | | | | | | | | |
| 3.605%, 02/15/2025 | | | 2,000,000 | | | | 1,921,471 | | | | | |
| POSCO: | | | | | | | | | | | | |
| 5.250%, 04/14/2021 (1)(2) | | | 3,000,000 | | | | 3,117,812 | | | | | |
| 4.000%, 08/01/2023 (1)(2) | | | 5,000,000 | | | | 5,043,608 | | | | | |
| Regency Energy Partners LP / Regency Energy Finance Corp., | | | | | | | | | | | | |
| 4.500%, 11/01/2023 | | | 1,100,000 | | | | 1,100,357 | | | | | |
| Rockies Express Pipeline LLC, | | | | | | | | | | | | |
| 5.625%, 04/15/2020 (2) | | | 1,000,000 | | | | 1,000,000 | | | | | |
| Roper Technologies, Inc., | | | | | | | | | | | | |
| 3.800%, 12/15/2026 | | | 1,450,000 | | | | 1,413,840 | | | | | |
| Sabine Pass Liquefaction LLC, | | | | | | | | | | | | |
| 5.875%, 06/30/2026 | | | 9,730,000 | | | | 10,302,164 | | | | | |
| Samarco Mineracao SA, | | | | | | | | | | | | |
| 5.375%, 09/26/2024 (1)(2)(8) | | | 1,675,000 | | | | 1,310,704 | | | | | |
| Schneider Electric SE, | | | | | | | | | | | | |
| 2.950%, 09/27/2022 (1)(2) | | | 2,000,000 | | | | 1,965,150 | | | | | |
| Smithfield Foods, Inc.: | | | | | | | | | | | | |
| 2.700%, 01/31/2020 (2) | | | 7,118,000 | | | | 7,021,629 | | | | | |
| 2.650%, 10/03/2021 (2) | | | 8,000,000 | | | | 7,645,630 | | | | | |
| Solvay Finance America LLC: | | | | | | | | | | | | |
| 3.400%, 12/03/2020 (2) | | | 4,375,000 | | | | 4,372,634 | | | | | |
| 4.450%, 12/03/2025 (2) | | | 5,600,000 | | | | 5,553,064 | | | | | |
| Sysco Corp.: | | | | | | | | | | | | |
| 2.600%, 10/01/2020 | | | 7,600,000 | | | | 7,518,087 | | | | | |
| 2.500%, 07/15/2021 | | | 2,000,000 | | | | 1,959,561 | | | | | |
| 2.600%, 06/12/2022 | | | 150,000 | | | | 144,649 | | | | | |
| TC PipeLines LP: | | | | | | | | | | | | |
| 4.375%, 03/13/2025 | | | 5,500,000 | | | | 5,485,755 | | | | | |
| 3.900%, 05/25/2027 | | | 8,025,000 | | | | 7,660,641 | | | | | |
| Telefonica Emisiones SAU, | | | | | | | | | | | | |
| 5.462%, 02/16/2021 (1) | | | 400,000 | | | | 414,540 | | | | | |
| Time Warner, Inc.: | | | | | | | | | | | | |
| 4.700%, 01/15/2021 | | | 1,325,000 | | | | 1,358,695 | | | | | |
| 4.750%, 03/29/2021 | | | 2,000,000 | | | | 2,050,436 | | | | | |
| 3.600%, 07/15/2025 | | | 4,000,000 | | | | 3,788,488 | | | | | |
| TransCanada PipeLines Ltd., | | | | | | | | | | | | |
| 9.875%, 01/01/2021 (1) | | | 556,000 | | | | 620,107 | | | | | |
| Vale Overseas Ltd.: | | | | | | | | | | | | |
| 4.375%, 01/11/2022 (1) | | | 1,093,000 | | | | 1,112,128 | | | | | |
| 6.250%, 08/10/2026 (1) | | | 3,460,000 | | | | 3,736,800 | | | | | |
| Valero Energy Corp., | | | | | | | | | | | | |
| 3.400%, 09/15/2026 | | | 4,500,000 | | | | 4,128,018 | | | | | |
| Verizon Communications, Inc.: | | | | | | | | | | | | |
| 3.376%, 02/15/2025 | | | 6,424,000 | | | | 6,233,907 | | | | | |
| 4.125%, 03/16/2027 | | | 3,000,000 | | | | 3,002,315 | | | | | |
| 4.329%, 09/21/2028 | | | 2,051,000 | | | | 2,059,429 | | | | | |
| Volkswagen Group of America Finance LLC: | | | | | | | | | | | | |
| 3.558%, 11/12/2021 (3 Month LIBOR USD + 0.940%) (2)(3) | | | 1,800,000 | | | | 1,782,387 | | | | | |
| 4.000%, 11/12/2021 (2) | | | 8,000,000 | | | | 7,995,032 | | | | | |
| Wabtec Corp.: | | | | | | | | | | | | |
| 4.375%, 08/15/2023 | | | 7,850,000 | | | | 7,842,134 | | | | | |
| 3.450%, 11/15/2026 | | | 5,000,000 | | | | 4,494,093 | | | | | |
| Walgreen Co., | | | | | | | | | | | | |
| 5.250%, 01/15/2019 | | | 605,000 | | | | 605,373 | | | | | |
| Western Gas Partners LP, | | | | | | | | | | | | |
| 4.500%, 03/01/2028 | | | 7,000,000 | | | | 6,543,070 | | | | | |
| WestRock MWV LLC, | | | | | | | | | | | | |
| 7.375%, 09/01/2019 | | | 2,033,000 | | | | 2,079,733 | | | | | |
| Williams Partners LP: | | | | | | | | | | | | |
| 5.250%, 03/15/2020 | | | 1,000,000 | | | | 1,019,881 | | | | | |
| 4.125%, 11/15/2020 | | | 1,625,000 | | | | 1,637,904 | | | | | |
| 4.300%, 03/04/2024 | | | 2,500,000 | | | | 2,491,285 | | | | | |
| Yara International ASA, | | | | | | | | | | | | |
| 3.800%, 06/06/2026 (1)(2) | | | 300,000 | | | | 282,474 | | | | | |
| Zimmer Biomet Holdings, Inc., | | | | | | | | | | | | |
| 3.700%, 03/19/2023 | | | 10,000,000 | | | | 9,893,268 | | | | | |
| Zoetis, Inc.: | | | | | | | | | | | | |
| 3.250%, 02/01/2023 | | | 7,150,000 | | | | 7,041,989 | | | | | |
| 4.500%, 11/13/2025 | | | 2,000,000 | | | | 2,052,681 | | | | | |
| | | | | | | | 641,299,131 | | | | 19.4 | % |
| Utilities | | | | | | | | | |
| Ausgrid Finance Pty Ltd., | | | | | | | | | |
| 3.850%, 05/01/2023 (1)(2) | | | 6,200,000 | | | | 6,186,230 | | | | |
| Edison International: | | | | | | | | | | | |
| 2.950%, 03/15/2023 | | | 2,650,000 | | | | 2,503,266 | | | | |
| 4.125%, 03/15/2028 | | | 13,600,000 | | | | 12,871,869 | | | | |
| EDP Finance BV, | | | | | | | | | | | |
| 4.125%, 01/15/2020 (1)(2) | | | 15,000,000 | | | | 15,015,600 | | | | |
| Enel Finance International NV: | | | | | | | | | | | |
| 3.625%, 05/25/2027 (1)(2) | | | 1,550,000 | | | | 1,367,326 | | | | |
| 3.500%, 04/06/2028 (1)(2) | | | 13,550,000 | | | | 11,616,149 | | | | |
| Fortis, Inc., | | | | | | | | | | | |
| 2.100%, 10/04/2021 (1) | | | 5,000,000 | | | | 4,806,831 | | | | |
| Mississippi Power Co., | | | | | | | | | | | |
| 3.472%, 03/27/2020 (3 Month LIBOR USD + 0.650%) (3) | | | 7,000,000 | | | | 6,988,159 | | | | |
| National Rural Utilities Cooperative Finance Corp., | | | | | | | | | | | |
| 2.000%, 01/27/2020 | | | 3,000,000 | | | | 2,971,618 | | | | |
| PPL Capital Funding, Inc., | | | | | | | | | | | |
| 3.400%, 06/01/2023 | | | 2,475,000 | | | | 2,448,671 | | | | |
| PSEG Power LLC, | | | | | | | | | | | |
| 5.125%, 04/15/2020 | | | 220,000 | | | | 225,815 | | | | |
| RGS I&M Funding Corp., | | | | | | | | | | | |
| 9.820%, 06/07/2022 | | | 411,732 | | | | 467,106 | | | | |
| Southern Co., | | | | | | | | | | | |
| 2.750%, 06/15/2020 | | | 3,200,000 | | | | 3,164,545 | | | | |
| Talent Yield Investments Ltd., | | | | | | | | | | | |
| 4.500%, 04/25/2022 (1)(2) | | | 3,800,000 | | | | 3,837,502 | | | | |
| | | | | | | | 74,470,687 | | | | 2.2 | % |
| Financials | | | | | | | | | | | | |
| ABN AMRO Bank NV, | | | | | | | | | | | | |
| 2.450%, 06/04/2020 (1)(2) | | | 2,650,000 | | | | 2,615,789 | | | | | |
| Aetna, Inc., | | | | | | | | | | | | |
| 2.800%, 06/15/2023 | | | 4,000,000 | | | | 3,804,032 | | | | | |
| AIA Group Ltd., | | | | | | | | | | | | |
| 3.200%, 03/11/2025 (1)(2) | | | 3,000,000 | | | | 2,889,407 | | | | | |
| American International Group, Inc.: | | | | | | | | | | | | |
| 4.875%, 06/01/2022 | | | 6,000,000 | | | | 6,225,160 | | | | | |
| 4.125%, 02/15/2024 | | | 1,000,000 | | | | 1,004,094 | | | | | |
| AmSouth Bancorporation, | | | | | | | | | | | | |
| 6.750%, 11/01/2025 | | | 630,000 | | | | 716,640 | | | | | |
| Anthem, Inc., | | | | | | | | | | | | |
| 3.350%, 12/01/2024 | | | 10,000,000 | | | | 9,741,953 | | | | | |
| ANZ New Zealand (Int'l) Ltd.: | | | | | | | | | | | | |
| 2.600%, 09/23/2019 (1)(2) | | | 4,140,000 | | | | 4,126,410 | | | | | |
| 2.850%, 08/06/2020 (1)(2) | | | 4,000,000 | | | | 3,968,441 | | | | | |
| 2.125%, 07/28/2021 (1)(2) | | | 1,200,000 | | | | 1,160,258 | | | | | |
| Banco Santander SA, | | | | | | | | | | | | |
| 3.500%, 04/11/2022 (1) | | | 4,400,000 | | | | 4,317,897 | | | | | |
| Bank of America Corp.: | | | | | | | | | | | | |
| 2.369%, 07/21/2021 (3 Month LIBOR USD + 0.660%) (3) | | | 11,000,000 | | | | 10,803,150 | | | | | |
| 3.300%, 01/11/2023 | | | 3,350,000 | | | | 3,299,278 | | | | | |
| 4.000%, 04/01/2024 | | | 1,487,000 | | | | 1,495,242 | | | | | |
| 3.093%, 10/01/2025 (3 Month LIBOR USD + 1.090%) (3) | | | 3,000,000 | | | | 2,844,573 | | | | | |
| 3.705%, 04/24/2028 (3 Month LIBOR USD + 1.512%) (3) | | | 5,000,000 | | | | 4,796,341 | | | | | |
| 3.419%, 12/20/2028 (3 Month LIBOR USD + 1.040%) (3) | | | 1,338,000 | | | | 1,249,892 | | | | | |
| Bank of Nova Scotia, | | | | | | | | | | | | |
| 4.500%, 12/16/2025 (1) | | | 7,000,000 | | | | 6,970,036 | | | | | |
| Bank of Tokyo-Mitsubishi UFJ Ltd.: | | | | | | | | | | | | |
| 2.300%, 03/10/2019 (1)(2) | | | 1,125,000 | | | | 1,123,307 | | | | | |
| 2.300%, 03/05/2020 (1)(2) | | | 3,000,000 | | | | 2,971,560 | | | | | |
| Banque Federative du Credit Mutuel SA, | | | | | | | | | | | | |
| 3.750%, 07/20/2023 (1)(2) | | | 8,000,000 | | | | 7,985,420 | | | | | |
| Barclays Bank PLC, | | | | | | | | | | | | |
| 10.179%, 06/12/2021 (1)(2) | | | 5,000,000 | | | | 5,620,741 | | | | | |
| Barclays PLC: | | | | | | | | | | | | |
| 3.250%, 01/12/2021 (1) | | | 2,000,000 | | | | 1,958,596 | | | | | |
| 3.684%, 01/10/2023 (1) | | | 7,000,000 | | | | 6,725,993 | | | | | |
| 4.337%, 01/10/2028 (1) | | | 2,275,000 | | | | 2,105,146 | | | | | |
| BNP Paribas SA, | | | | | | | | | | | | |
| 3.500%, 03/01/2023 (1)(2) | | | 10,000,000 | | | | 9,695,124 | | | | | |
| BNZ International Funding Ltd.: | | | | | | | | | | | | |
| 2.350%, 03/04/2019 (1)(2) | | | 3,300,000 | | | | 3,296,291 | | | | | |
| 2.100%, 09/14/2021 (1)(2) | | | 10,000,000 | | | | 9,649,212 | | | | | |
| 3.375%, 03/01/2023 (1)(2) | | | 2,000,000 | | | | 1,975,546 | | | | | |
| Boston Properties LP, | | | | | | | | | | | | |
| 3.200%, 01/15/2025 | | | 12,175,000 | | | | 11,625,591 | | | | | |
| BPCE SA: | | | | | | | | | | | | |
| 5.700%, 10/22/2023 (1)(2) | | | 3,950,000 | | | | 4,089,925 | | | | | |
| 4.000%, 04/15/2024 (1) | | | 3,500,000 | | | | 3,513,706 | | | | | |
| 4.625%, 07/11/2024 (1)(2) | | | 10,000,000 | | | | 9,833,252 | | | | | |
| Capital One NA: | | | | | | | | | | | | |
| 2.250%, 02/13/2019 | | | 3,500,000 | | | | 3,499,065 | | | | | |
| 2.650%, 08/08/2022 | | | 12,150,000 | | | | 11,667,698 | | | | | |
| Citigroup, Inc.: | | | | | | | | | | | | |
| 2.876%, 07/24/2023 (3 Month LIBOR USD + 0.950%) (3) | | | 2,000,000 | | | | 1,935,457 | | | | | |
| 3.750%, 06/16/2024 | | | 500,000 | | | | 496,494 | | | | | |
| 3.887%, 01/10/2028 (3 Month LIBOR USD + 1.563%) (3) | | | 9,000,000 | | | | 8,684,179 | | | | | |
| Citizens Bank NA: | | | | | | | | | | | | |
| 2.450%, 12/04/2019 | | | 8,500,000 | | | | 8,439,742 | | | | | |
| 2.550%, 05/13/2021 | | | 2,000,000 | | | | 1,956,158 | | | | | |
| CNA Financial Corp.: | | | | | | | | | | | | |
| 5.750%, 08/15/2021 | | | 1,385,000 | | | | 1,461,647 | | | | | |
| 4.500%, 03/01/2026 | | | 5,000,000 | | | | 5,040,843 | | | | | |
| Comerica Bank, | | | | | | | | | | | | |
| 2.500%, 06/02/2020 | | | 3,375,000 | | | | 3,333,079 | | | | | |
| Commonwealth Bank of Australia, | | | | | | | | | | | | |
| 5.000%, 10/15/2019 (1)(2) | | | 4,335,000 | | | | 4,397,734 | | | | | |
| Compass Bank: | | | | | | | | | | | | |
| 2.750%, 09/29/2019 | | | 8,000,000 | | | | 7,957,994 | | | | | |
| 2.875%, 06/29/2022 | | | 3,125,000 | | | | 2,994,445 | | | | | |
| 3.875%, 04/10/2025 | | | 4,200,000 | | | | 4,026,223 | | | | | |
| Cooperatieve Rabobank UA: | | | | | | | | | | | | |
| 2.500%, 01/19/2021 (1) | | | 8,175,000 | | | | 8,033,189 | | | | | |
| 4.625%, 12/01/2023 (1) | | | 3,400,000 | | | | 3,447,363 | | | | | |
| Credit Agricole SA: | | | | | | | | | | | | |
| 2.750%, 06/10/2020 (1)(2) | | | 3,000,000 | | | | 2,966,064 | | | | | |
| 3.375%, 01/10/2022 (1)(2) | | | 7,400,000 | | | | 7,278,879 | | | | | |
| Credit Suisse AG, | | | | | | | | | | | | |
| 5.300%, 08/13/2019 (1) | | | 3,220,000 | | | | 3,260,551 | | | | | |
| Credit Suisse Group AG: | | | | | | | | | | | | |
| 3.574%, 01/09/2023 (1)(2) | | | 1,000,000 | | | | 975,531 | | | | | |
| 4.207%, 06/12/2024 (3 Month LIBOR USD + 1.240%) (1)(2)(3) | | | 4,000,000 | | | | 3,989,647 | | | | | |
| Credit Suisse Group Funding Guernsey Ltd., | | | | | | | | | | | | |
| 3.800%, 06/09/2023 (1) | | | 8,700,000 | | | | 8,537,196 | | | | | |
| Deutsche Bank AG: | | | | | | | | | | | | |
| 2.950%, 08/20/2020 (1) | | | 3,000,000 | | | | 2,911,850 | | | | | |
| 4.250%, 10/14/2021 (1) | | | 7,000,000 | | | | 6,844,269 | | | | | |
| 3.300%, 11/16/2022 (1) | | | 5,175,000 | | | | 4,795,932 | | | | | |
| Discover Financial Services, | | | | | | | | | | | | |
| 4.100%, 02/09/2027 | | | 9,000,000 | | | | 8,402,118 | | | | | |
| First Horizon National Corp., | | | | | | | | | | | | |
| 3.500%, 12/15/2020 | | | 13,196,000 | | | | 13,195,198 | | | | | |
| First Niagara Financial Group, Inc., | | | | | | | | | | | | |
| 6.750%, 03/19/2020 | | | 1,618,000 | | | | 1,682,640 | | | | | |
| First Tennessee Bank NA, | | | | | | | | | | | | |
| 2.950%, 12/01/2019 | | | 500,000 | | | | 496,124 | | | | | |
| Goldman Sachs Group, Inc.: | | | | | | | | | | | | |
| 2.550%, 10/23/2019 | | | 2,000,000 | | | | 1,987,366 | | | | | |
| 2.350%, 11/15/2021 | | | 2,825,000 | | | | 2,723,897 | | | | | |
| 3.000%, 04/26/2022 | | | 5,000,000 | | | | 4,842,216 | | | | | |
| 3.500%, 01/23/2025 | | | 2,000,000 | | | | 1,895,822 | | | | | |
| 3.272%, 09/29/2025 (3 Month LIBOR USD + 1.201%) (3) | | | 3,500,000 | | | | 3,280,804 | | | | | |
| 3.691%, 06/05/2028 (3 Month LIBOR USD + 1.510%) (3) | | | 4,000,000 | | | | 3,717,482 | | | | | |
| 4.223%, 05/01/2029 (3 Month LIBOR USD + 1.301%) (3) | | | 3,000,000 | | | | 2,887,165 | | | | | |
| Guardian Life Global Funding: | | | | | | | | | | | | |
| 2.000%, 04/26/2021 (2) | | | 4,000,000 | | | | 3,898,019 | | | | | |
| 3.400%, 04/25/2023 (2) | | | 9,000,000 | | | | 8,966,223 | | | | | |
| Hartford Financial Services Group, Inc., | | | | | | | | | | | | |
| 5.125%, 04/15/2022 | | | 500,000 | | | | 524,137 | | | | | |
| High Street Funding Trust I, | | | | | | | | | | | | |
| 4.111%, 02/15/2028 (2) | | | 5,000,000 | | | | 4,910,200 | | | | | |
| Highmark, Inc., | | | | | | | | | | | | |
| 4.750%, 05/15/2021 (2) | | | 2,000,000 | | | | 2,041,806 | | | | | |
| HSBC Holdings PLC: | | | | | | | | | | | | |
| 3.262%, 03/13/2023 (3 Month LIBOR USD + 1.055%) (1)(3) | | | 10,140,000 | | | | 9,923,587 | | | | | |
| 3.600%, 05/25/2023 (1) | | | 2,500,000 | | | | 2,485,725 | | | | | |
| HSBC USA, Inc., | | | | | | | | | | | | |
| 2.350%, 03/05/2020 | | | 3,500,000 | | | | 3,464,662 | | | | | |
| Humana, Inc., | | | | | | | | | | | | |
| 2.900%, 12/15/2022 | | | 6,275,000 | | | | 6,100,309 | | | | | |
| Huntington Bancshares, Inc.: | | | | | | | | | | | | |
| 3.150%, 03/14/2021 | | | 1,500,000 | | | | 1,493,322 | | | | | |
| 2.300%, 01/14/2022 | | | 1,300,000 | | | | 1,255,163 | | | | | |
| Huntington National Bank, | | | | | | | | | | | | |
| 2.875%, 08/20/2020 | | | 3,500,000 | | | | 3,477,251 | | | | | |
| ING Bank NV: | | | | | | | | | | | | |
| 2.500%, 10/01/2019 (1)(2) | | | 2,475,000 | | | | 2,463,739 | | | | | |
| 5.000%, 06/09/2021 (1)(2) | | | 2,000,000 | | | | 2,071,298 | | | | | |
| 5.800%, 09/25/2023 (1)(2) | | | 8,865,000 | | | | 9,259,747 | | | | | |
| Invesco Finance PLC, | | | | | | | | | | | | |
| 3.125%, 11/30/2022 (1) | | | 4,500,000 | | | | 4,410,613 | | | | | |
| Jackson National Life Global Funding, | | | | | | | | | | | | |
| 3.250%, 01/30/2024 (2) | | | 10,000,000 | | | | 9,805,200 | | | | | |
| Jefferies Group LLC: | | | | | | | | | | | | |
| 8.500%, 07/15/2019 | | | 3,325,000 | | | | 3,411,968 | | | | | |
| 6.875%, 04/15/2021 | | | 2,000,000 | | | | 2,128,271 | | | | | |
| Jefferies Group LLC / Jefferies Group Capital Finance, Inc., | | | | | | | | | | | | |
| 4.850%, 01/15/2027 | | | 1,425,000 | | | | 1,361,714 | | | | | |
| John Hancock Life Insurance Co., | | | | | | | | | | | | |
| 7.375%, 02/15/2024 (2) | | | 11,325,000 | | | | 13,106,562 | | | | | |
| JPMorgan Chase & Co.: | | | | | | | | | | | | |
| 2.250%, 01/23/2020 | | | 7,875,000 | | | | 7,796,564 | | | | | |
| 2.295%, 08/15/2021 | | | 2,500,000 | | | | 2,439,107 | | | | | |
| 4.500%, 01/24/2022 | | | 3,000,000 | | | | 3,091,156 | | | | | |
| 3.717%, 10/24/2023 (3 Month LIBOR USD + 1.230%) (3) | | | 5,000,000 | | | | 4,998,738 | | | | | |
| KeyBank NA: | | | | | | | | | | | | |
| 3.180%, 05/22/2022 | | | 2,750,000 | | | | 2,737,973 | | | | | |
| 3.400%, 05/20/2026 | | | 2,200,000 | | | | 2,110,248 | | | | | |
| Liberty Mutual Group, Inc., | | | | | | | | | | | | |
| 4.250%, 06/15/2023 (2) | | | 2,000,000 | | | | 2,016,433 | | | | | |
| Life Storage LP, | | | | | | | | | | | | |
| 3.875%, 12/15/2027 | | | 8,000,000 | | | | 7,613,166 | | | | | |
| Lloyds Bank PLC: | | | | | | | | | | | | |
| 2.050%, 01/22/2019 (1) | | | 3,000,000 | | | | 2,997,642 | | | | | |
| 5.800%, 01/13/2020 (1)(2) | | | 2,900,000 | | | | 2,968,503 | | | | | |
| 3.000%, 01/11/2022 (1) | | | 7,000,000 | | | | 6,771,644 | | | | | |
| 4.050%, 08/16/2023 (1) | | | 4,000,000 | | | | 3,951,697 | | | | | |
| Macquarie Bank Ltd.: | | | | | | | | | | | | |
| 2.400%, 01/21/2020 (1)(2) | | | 1,000,000 | | | | 991,139 | | | | | |
| 6.625%, 04/07/2021 (1)(2) | | | 5,482,000 | | | | 5,799,247 | | | | | |
| Macquarie Group Ltd.: | | | | | | | | | | | | |
| 3.189%, 11/28/2023 (3 Month LIBOR USD + 1.023%) (1)(2)(3) | | | 5,000,000 | | | | 4,805,715 | | | | | |
| 4.150%, 03/27/2024 (3 Month LIBOR USD + 1.330%) (1)(2)(3) | | | 4,000,000 | | | | 4,000,457 | | | | | |
| Manulife Financial Corp., | | | | | | | | | | | | |
| 4.900%, 09/17/2020 (1) | | | 2,375,000 | | | | 2,436,890 | | | | | |
| Massachusetts Mutual Life Insurance Co., | | | | | | | | | | | | |
| 7.625%, 11/15/2023 (2) | | | 9,906,000 | | | | 11,250,469 | | | | | |
| MBIA Insurance Corp., | | | | | | | | | | | | |
| 13.696%, 01/15/2033 (3 Month LIBOR USD + 11.260%) (2)(8) | | | 500,000 | | | | 305,000 | | | | | |
| Metropolitan Life Global Funding I, | | | | | | | | | | | | |
| 3.000%, 01/10/2023 (2) | | | 1,300,000 | | | | 1,279,816 | | | | | |
| Mitsubishi UFJ Financial Group, Inc.: | | | | | | | | | | | | |
| 2.190%, 09/13/2021 (1) | | | 3,000,000 | | | | 2,896,031 | | | | | |
| 2.998%, 02/22/2022 (1) | | | 2,575,000 | | | | 2,538,945 | | | | | |
| 3.455%, 03/02/2023 (1) | | | 2,000,000 | | | | 1,987,722 | | | | | |
| Mizuho Bank Ltd., | | | | | | | | | | | | |
| 2.450%, 04/16/2019 (1)(2) | | | 500,000 | | | | 499,186 | | | | | |
| Mizuho Financial Group, Inc.: | | | | | | | | | | | | |
| 2.601%, 09/11/2022 (1) | | | 5,000,000 | | | | 4,836,118 | | | | | |
| 3.922%, 09/11/2024 (3 Month LIBOR USD + 1.000%) (1)(3) | | | 3,000,000 | | | | 3,031,721 | | | | | |
| Morgan Stanley: | | | | | | | | | | | | |
| 7.300%, 05/13/2019 | | | 3,150,000 | | | | 3,197,812 | | | | | |
| 2.375%, 07/23/2019 | | | 1,000,000 | | | | 995,654 | | | | | |
| 3.887%, 10/24/2023 (3 Month LIBOR USD + 1.400%) (3) | | | 7,000,000 | | | | 6,965,966 | | | | | |
| 3.125%, 07/27/2026 | | | 4,525,000 | | | | 4,183,969 | | | | | |
| MUFG Americas Holdings Corp., | | | | | | | | | | | | |
| 3.500%, 06/18/2022 | | | 225,000 | | | | 225,537 | | | | | |
| Nationwide Building Society: | | | | | | | | | | | | |
| 3.766%, 03/08/2024 (3 Month LIBOR USD + 1.064%) (1)(2)(3) | | | 5,000,000 | | | | 4,812,169 | | | | | |
| 4.000%, 09/14/2026 (1)(2) | | | 10,000,000 | | | | 9,102,228 | | | | | |
| Nationwide Financial Services, Inc., | | | | | | | | | | | | |
| 5.375%, 03/25/2021 (2) | | | 1,303,000 | | | | 1,350,145 | | | | | |
| Nationwide Mutual Insurance Co., | | | | | | | | | | | | |
| 8.250%, 12/01/2031 (2) | | | 2,195,000 | | | | 3,030,513 | | | | | |
| Nomura Holdings, Inc., | | | | | | | | | | | | |
| 6.700%, 03/04/2020 (1) | | | 1,000,000 | | | | 1,038,607 | | | | | |
| Nordea Bank AB, | | | | | | | | | | | | |
| 4.250%, 09/21/2022 (1)(2) | | | 10,000,000 | | | | 10,051,166 | | | | | |
| Peachtree Corners Funding Trust, | | | | | | | | | | | | |
| 3.976%, 02/15/2025 (2) | | | 6,000,000 | | | | 5,820,097 | | | | | |
| People's United Bank NA, | | | | | | | | | | | | |
| 4.000%, 07/15/2024 | | | 5,000,000 | | | | 5,013,327 | | | | | |
| Principal Life Global Funding II: | | | | | | | | | | | | |
| 2.200%, 04/08/2020 (2) | | | 2,000,000 | | | | 1,977,137 | | | | | |
| 3.000%, 04/18/2026 (2) | | | 7,000,000 | | | | 6,718,701 | | | | | |
| Protective Life Corp.: | | | | | | | | | | | | |
| 7.375%, 10/15/2019 | | | 2,500,000 | | | | 2,569,885 | | | | | |
| 4.300%, 09/30/2028 (2) | | | 1,400,000 | | | | 1,387,750 | | | | | |
| Protective Life Global Funding, | | | | | | | | | | | | |
| 2.700%, 11/25/2020 (2) | | | 3,000,000 | | | | 2,964,481 | | | | | |
| Prudential Financial, Inc., | | | | | | | | | | | | |
| 7.375%, 06/15/2019 | | | 850,000 | | | | 865,419 | | | | | |
| Prudential Insurance Co. of America, | | | | | | | | | | | | |
| 8.300%, 07/01/2025 (2) | | | 8,300,000 | | | | 10,244,379 | | | | | |
| Regions Bank, | | | | | | | | | | | | |
| 3.374%, 08/13/2021 (3 Month LIBOR USD + 0.500%) (3) | | | 3,425,000 | | | | 3,410,962 | | | | | |
| Regions Financial Corp., | | | | | | | | | | | | |
| 2.750%, 08/14/2022 | | | 4,725,000 | | | | 4,558,587 | | | | | |
| Reliance Standard Life Global Funding II, | | | | | | | | | | | | |
| 3.050%, 01/20/2021 (2) | | | 5,000,000 | | | | 4,954,309 | | | | | |
| Royal Bank of Scotland Group PLC, | | | | | | | | | | | | |
| 5.076%, 01/27/2030 (3 Month LIBOR USD + 1.905%) (1)(3) | | | 4,700,000 | | | | 4,532,049 | | | | | |
| Santander UK Group Holdings PLC: | | | | | | | | | | | | |
| 3.125%, 01/08/2021 (1) | | | 2,325,000 | | | | 2,282,494 | | | | | |
| 4.796%, 11/15/2024 (3 Month LIBOR USD + 1.570%) (1)(3) | | | 5,000,000 | | | | 4,964,708 | | | | | |
| Santander UK PLC: | | | | | | | | | | | | |
| 2.125%, 11/03/2020 (1) | | | 4,500,000 | | | | 4,395,059 | | | | | |
| 5.000%, 11/07/2023 (1)(2) | | | 1,475,000 | | | | 1,440,323 | | | | | |
| Skandinaviska Enskilda Banken AB, | | | | | | | | | | | | |
| 2.450%, 05/27/2020 (1)(2) | | | 8,500,000 | | | | 8,403,755 | | | | | |
| SMBC Aviation Capital Finance DAC, | | | | | | | | | | | | |
| 3.000%, 07/15/2022 (1)(2) | | | 4,000,000 | | | | 3,880,417 | | | | | |
| Societe Generale SA: | | | | | | | | | | | | |
| 2.500%, 04/08/2021 (1)(2) | | | 2,150,000 | | | | 2,101,242 | | | | | |
| 5.200%, 04/15/2021 (1)(2) | | | 1,250,000 | | | | 1,301,906 | | | | | |
| 4.250%, 09/14/2023 (1)(2) | | | 5,000,000 | | | | 4,965,681 | | | | | |
| 5.000%, 01/17/2024 (1)(2) | | | 3,150,000 | | | | 3,175,937 | | | | | |
| Standard Chartered PLC: | | | | | | | | | | | | |
| 2.100%, 08/19/2019 (1)(2) | | | 3,200,000 | | | | 3,171,900 | | | | | |
| 3.050%, 01/15/2021 (1)(2) | | | 10,000,000 | | | | 9,850,920 | | | | | |
| Stifel Financial Corp., | | | | | | | | | | | | |
| 4.250%, 07/18/2024 | | | 4,156,000 | | | | 4,202,871 | | | | | |
| Sumitomo Mitsui Banking Corp., | | | | | | | | | | | | |
| 2.250%, 07/11/2019 (1) | | | 2,000,000 | | | | 1,990,318 | | | | | |
| Sumitomo Mitsui Financial Group, Inc., | | | | | | | | | | | | |
| 2.442%, 10/19/2021 (1) | | | 6,200,000 | | | | 6,045,334 | | | | | |
| Sumitomo Mitsui Trust Bank Ltd., | | | | | | | | | | | | |
| 2.050%, 03/06/2019 (1)(2) | | | 12,000,000 | | | | 11,979,169 | | | | | |
| Svenska Handelsbanken AB, | | | | | | | | | | | | |
| 2.400%, 10/01/2020 (1) | | | 5,000,000 | | | | 4,923,046 | | | | | |
| Swedbank AB: | | | | | | | | | | | | |
| 2.375%, 02/27/2019 (1)(2) | | | 2,600,000 | | | | 2,597,569 | | | | | |
| 2.650%, 03/10/2021 (1)(2) | | | 3,800,000 | | | | 3,745,592 | | | | | |
| Synchrony Financial: | | | | | | | | | | | | |
| 3.750%, 08/15/2021 | | | 5,000,000 | | | | 4,865,982 | | | | | |
| 4.250%, 08/15/2024 | | | 5,275,000 | | | | 4,853,387 | | | | | |
| 3.700%, 08/04/2026 | | | 3,000,000 | | | | 2,544,726 | | | | | |
| Trinity Acquisition PLC, | | | | | | | | | | | | |
| 4.400%, 03/15/2026 (1) | | | 1,125,000 | | | | 1,117,930 | | | | | |
| UBS Group Funding Switzerland AG: | | | | | | | | | | | | |
| 2.950%, 09/24/2020 (1)(2) | | | 6,225,000 | | | | 6,159,184 | | | | | |
| 2.650%, 02/01/2022 (1)(2) | | | 5,000,000 | | | | 4,839,379 | | | | | |
| 3.491%, 05/23/2023 (1)(2) | | | 3,050,000 | | | | 2,974,456 | | | | | |
| Voya Financial, Inc.: | | | | | | | | | | | | |
| 3.125%, 07/15/2024 | | | 3,000,000 | | | | 2,828,846 | | | | | |
| 3.650%, 06/15/2026 | | | 2,000,000 | | | | 1,890,668 | | | | | |
| WEA Finance LLC / Westfield UK & Europe Finance PLC: | | | | | | | | | | | | |
| 2.700%, 09/17/2019 (2) | | | 200,000 | | | | 199,115 | | | | | |
| 3.250%, 10/05/2020 (2) | | | 7,500,000 | | | | 7,489,585 | | | | | |
| Wells Fargo & Co.: | | | | | | | | | | | | |
| 2.150%, 01/30/2020 | | | 7,000,000 | | | | 6,923,878 | | | | | |
| 3.757%, 10/31/2023 (3 Month LIBOR USD + 1.230%) (3) | | | 5,000,000 | | | | 4,984,536 | | | | | |
| Westpac Banking Corp.: | | | | | | | | | | | | |
| 4.875%, 11/19/2019 (1) | | | 2,775,000 | | | | 2,818,032 | | | | | |
| 2.100%, 05/13/2021 (1) | | | 5,000,000 | | | | 4,872,271 | | | | | |
| Willis North America, Inc.: | | | | | | | | | | | | |
| 3.600%, 05/15/2024 | | | 8,070,000 | | | | 7,879,226 | | | | | |
| 4.500%, 09/15/2028 | | | 4,600,000 | | | | 4,563,941 | | | | | |
| Willis Towers Watson PLC, | | | | | | | | | | | | |
| 5.750%, 03/15/2021 (1) | | | 3,250,000 | | | | 3,398,866 | | | | | |
| | | | | | | | 771,544,005 | | | | 23.3 | % |
| Total Corporate Bonds | | | | | | | 1,487,313,823 | | | | 44.9 | % |
| Municipal Bonds | | | | | | | | | |
| Alabama Economic Settlement Authority, | | | | | | | | | |
| 3.163%, 09/15/2025 | | | 4,495,000 | | | | 4,459,085 | | | | |
| Alaska Municipal Bond Bank Authority, | | | | | | | | | | | |
| 4.459%, 08/01/2019 | | | 1,340,000 | | | | 1,351,980 | | | | |
| California Qualified School Bond Joint Powers Authority, | | | | | | | | | | | |
| 5.955%, 03/01/2019 | | | 3,375,000 | | | | 3,389,377 | | | | |
| California School Finance Authority, | | | | | | | | | | | |
| 4.426%, 07/01/2020 | | | 2,500,000 | | | | 2,550,075 | | | | |
| Central Valley Support Joint Powers Agency, | | | | | | | | | | | |
| 5.326%, 09/01/2022 | | | 2,000,000 | | | | 2,155,200 | | | | |
| City of Berwyn IL, | | | | | | | | | | | |
| 5.790%, 12/01/2022 | | | 4,500,000 | | | | 4,508,955 | | | | |
| County of Cook IL, | | | | | | | | | | | |
| 5.240%, 11/15/2025 (Callable 11/15/2021) | | | 2,345,000 | | | | 2,466,190 | | | | |
| Dallas Independent School District, | | | | | | | | | | | |
| 4.950%, 02/15/2022 (Callable 02/15/2021) | | | 1,965,000 | | | | 2,052,442 | | | | |
| Davie Florida Water & Sewer Revenue, | | | | | | | | | | | |
| 6.062%, 10/01/2025 (Callable 10/01/2020) | | | 1,000,000 | | | | 1,059,710 | | | | |
| Iowa Tobacco Settlement Authority, | | | | | | | | | | | |
| 6.500%, 06/01/2023 (Callable 01/31/2019) | | | 625,000 | | | | 633,963 | | | | |
| New Hampshire Housing Finance Authority, | | | | | | | | | | | |
| 2.600%, 01/01/2020 | | | 1,420,000 | | | | 1,410,529 | | | | |
| New Jersey Economic Development Authority: | | | | | | | | | | | |
| –%, 02/15/2019 | | | 4,450,000 | | | | 4,431,354 | | | | |
| –%, 02/15/2021 | | | 3,000,000 | | | | 2,778,900 | | | | |
| –%, 02/15/2022 | | | 2,000,000 | | | | 1,783,540 | | | | |
| North Carolina Housing Finance Agency: | | | | | | | | | | | |
| 4.000%, 01/01/2030 (Callable 07/01/2021) | | | 220,000 | | | | 222,312 | | | | |
| 3.000%, 01/01/2033 (Callable 01/01/2025) | | | 3,495,000 | | | | 3,454,528 | | | | |
| North East Texas Independent School District, | | | | | | | | | | | |
| 5.240%, 08/01/2027 | | | 2,100,000 | | | | 2,411,052 | | | | |
| Public Finance Authority, | | | | | | | | | | | |
| 2.820%, 03/01/2020 (Callable 01/22/2019) | | | 2,000,000 | | | | 1,993,400 | | | | |
| South Dakota Housing Development Authority, | | | | | | | | | | | |
| 2.700%, 11/01/2036 (Callable 11/01/2025) | | | 1,480,000 | | | | 1,444,983 | | | | |
| Winnebago & Boone Counties School District No. 205: | | | | | | | | | | | |
| 3.800%, 12/01/2026 (Callable 12/01/2025) | | | 2,200,000 | | | | 2,206,160 | | | | |
| 3.950%, 12/01/2027 (Callable 12/01/2025) | | | 1,700,000 | | | | 1,707,225 | | | | |
| | | | | | | | 48,470,960 | | | | 1.5 | % |
| Residential Mortgage-Backed Securities | | | | | | | | | | | | |
| U.S. Government Agency Issues | | | | | | | | | | | | |
| Fannie Mae REMIC Trust: | | | | | | | | | | | | |
| Series 1989-2, Class D, 8.800%, 01/25/2019 | | | 3 | | | | 3 | | | | | |
| Series 1990-108, Class G, 7.000%, 09/25/2020 | | | 865 | | | | 880 | | | | | |
| Series G-29, Class O, 8.500%, 09/25/2021 | | | 147 | | | | 153 | | | | | |
| Series 1991-137, Class H, 7.000%, 10/25/2021 | | | 9,243 | | | | 9,476 | | | | | |
| Series 1993-32, Class H, 6.000%, 03/25/2023 | | | 7,201 | | | | 7,478 | | | | | |
| Federal Gold Loan Mortgage Corp. (FGLMC): | | | | | | | | | | | | |
| 6.000%, 06/01/2021 | | | 27,542 | | | | 28,144 | | | | | |
| 6.000%, 07/01/2028 | | | 3,902 | | | | 4,258 | | | | | |
| Federal Home Loan Mortgage Corp. (FHLMC): | | | | | | | | | | | | |
| Series 74, Class F, 6.000%, 10/15/2020 | | | 47 | | | | 48 | | | | | |
| Series 1395, Class G, 6.000%, 10/15/2022 | | | 3,300 | | | | 3,410 | | | | | |
| | | | | | | | 53,850 | | | | 0.0 | % |
| Non-U.S. Government Agency Issues | | | | | | | | | | | | |
| Alternative Loan Trust: | | | | | | | | | | | | |
| Series 2005-50CB, Class 4A1, 5.000%, 11/25/2020 (6) | | | 66,029 | | | | 65,594 | | | | | |
| Series 2005-85CB, Class 3A1, 5.250%, 02/25/2021 (2)(6) | | | 68,619 | | | | 66,858 | | | | | |
| Series 2006-7CB, Class 3A1, 5.250%, 05/25/2021 (6) | | | 154,119 | | | | 150,454 | | | | | |
| Series 2004-8CB, Class A, 2.776%, 06/25/2034 (1 Month LIBOR USD + 0.270%) (3) | | | 1,813,488 | | | | 1,800,785 | | | | | |
| Series 2005-11CB, Class 2A1, 5.500%, 06/25/2035 (6) | | | 35,852 | | | | 35,608 | | | | | |
| AMRESCO Residential Securities Corp. Mortgage Loan Trust, | | | | | | | | | | | | |
| Series 1998-1, Class A6, 6.510%, 08/25/2027 (4) | | | 1,452 | | | | 1,499 | | | | | |
| Argent Securities Inc. Asset-Backed Pass-Through Certificates: | | | | | | | | | | | | |
| Series 2005-W3, Class A2D, 2.846%, 11/25/2035 (1 Month LIBOR USD + 0.340%) (3) | | | 886,429 | | | | 884,297 | | | | | |
| Series 2005-W5, Class A1, 2.741%, 01/25/2036 (1 Month LIBOR USD + 0.235%) (3) | | | 6,900,221 | | | | 6,808,695 | | | | | |
| Banc of America Alternative Loan Trust: | | | | | | | | | | | | |
| Series 2004-11, Class 4A1, 5.500%, 12/25/2019 | | | 30,522 | | | | 30,538 | | | | | |
| Series 2005-6, Class 7A1, 5.500%, 07/25/2020 (6) | | | 3,137 | | | | 2,865 | | | | | |
| Series 2006-2, Class 7A1, 6.000%, 03/25/2021 (6) | | | 75,266 | | | | 67,749 | | | | | |
| Banc of America Funding Trust, | | | | | | | | | | | | |
| Series 2004-2, Class 1CB1, 5.750%, 09/20/2034 | | | 2,521,252 | | | | 2,648,125 | | | | | |
| Bear Stearns ARM Trust, | | | | | | | | | | | | |
| Series 2004-5, Class 2A, 4.378%, 07/25/2034 (4) | | | 1,011,087 | | | | 1,002,784 | | | | | |
| Citigroup Global Markets Mortgage Securities VII, Inc., | | | | | | | | | | | | |
| Series 2003-UP2, Class A2, 7.000%, 06/25/2033 (7) | | | 47,709 | | | | 47,681 | | | | | |
| Cityscape Home Equity Loan Trust, | | | | | | | | | | | | |
| Series 1997-C, Class A4, 7.500%, 07/25/2028 (7) | | | 3,921 | | | | 1,959 | | | | | |
| Countrywide Asset-Backed Certificates: | | | | | | | | | | | | |
| Series 2004-12, Class AF6, 4.634%, 03/25/2035 (4) | | | 857 | | | | 872 | | | | | |
| Series 2005-1, Class AF6, 5.030%, 07/25/2035 (4) | | | 70,358 | | | | 71,357 | | | | | |
| Series 2006-13, Class 1AF3, 5.944%, 01/25/2037 (4) | | | 48,053 | | | | 47,883 | | | | | |
| Series 2006-9, Class 1AF3, 5.859%, 10/25/2046 (4)(6) | | | 553,930 | | | | 510,983 | | | | | |
| Delta Funding Home Equity Loan Trust: | | | | | | | | | | | | |
| Series 1997-2, Class A6, 7.040%, 06/25/2027 | | | 736 | | | | 683 | | | | | |
| Series 1999-2, Class A7F, 7.030%, 08/15/2030 | | | 219,980 | | | | 220,036 | | | | | |
| GSAMP Trust, | | | | | | | | | | | | |
| Series 2005-WMC2, Class A1B, 3.126%, 11/25/2035 (1 Month LIBOR USD + 0.620%) (3) | | | 1,205,217 | | | | 1,204,476 | | | | | |
| IMC Home Equity Loan Trust, | | | | | | | | | | | | |
| Series 1998-1, Class A6, 7.020%, 06/20/2029 (7) | | | 748 | | | | 747 | | | | | |
| J.P. Morgan Alternative Loan Trust: | | | | | | | | | | | | |
| Series 2005-S1, Class 3A1, 5.500%, 10/25/2020 (6) | | | 72,347 | | | | 80,928 | | | | | |
| Series 2006-A1, Class 2A1, 3.867%, 03/25/2036 (4)(6) | | | 329,042 | | | | 303,827 | | | | | |
| J.P. Morgan Mortgage Acquisition Trust, | | | | | | | | | | | | |
| Series 2006-CH1, Class A1, 2.636%, 07/25/2036 (1 Month LIBOR USD + 0.130%) (3) | | | 962,332 | | | | 958,891 | | | | | |
| MASTR Alternative Loan Trust, | | | | | | | | | | | | |
| Series 2005-3, Class 4A1, 5.500%, 03/25/2020 | | | 6,705 | | | | 6,707 | | | | | |
| MortgageIT Trust, | | | | | | | | | | | | |
| Series 2005-3, Class A1, 3.106%, 08/25/2035 (1 Month LIBOR USD + 0.600%) (3) | | | 4,370,623 | | | | 4,254,726 | | | | | |
| New Century Home Equity Loan Trust: | | | | | | | | | | | | |
| Series 2005-C, Class A1, 2.736%, 12/25/2035 (1 Month LIBOR USD + 0.230%) (3) | | | 1,539,673 | | | | 1,533,273 | | | | | |
| Series 2005-C, Class A2C, 2.756%, 12/25/2035 (1 Month LIBOR USD + 0.250%) (3) | | | 322,704 | | | | 322,495 | | | | | |
| New Residential Mortgage Loan Trust, | | | | | | | | | | | | |
| Series 2017-2A, Class A3, 4.000%, 03/25/2057 (2)(4) | | | 3,854,638 | | | | 3,890,212 | | | | | |
| Nomura Home Equity Loan, Inc., | | | | | | | | | | | | |
| Series 2006-HE2, Class A3, 2.676%, 03/25/2036 (1 Month LIBOR USD + 0.170%) (3) | | | 781,225 | | | | 780,452 | | | | | |
| RALI Series Trust, | | | | | | | | | | | | |
| Series 2004-QS6, Class A1, 5.000%, 05/25/2019 (6) | | | 2,449 | | | | 2,435 | | | | | |
| RAMP Series Trust, | | | | | | | | | | | | |
| Series 2005-RS1, Class AI6, 4.713%, 11/25/2034 | | | 4,850 | | | | 4,850 | | | | | |
| Soundview Home Loan Trust, | | | | | | | | | | | | |
| Series 2003-2, Class A2, 3.806%, 11/25/2033 (1 Month LIBOR USD + 1.300%) (3) | | | 1,484,816 | | | | 1,522,214 | | | | | |
| Specialty Underwriting & Residential Finance Trust, | | | | | | | | | | | | |
| Series 2004-BC4, Class A1A, 3.176%, 10/25/2035 (1 Month LIBOR USD + 0.670%) (3) | | | 1,521,727 | | | | 1,510,065 | | | | | |
| Structured Asset Investment Loan Trust, | | | | | | | | | | | | |
| Series 2004-9, Class A5, 3.506%, 10/25/2034 (1 Month LIBOR USD + 1.000%) (3) | | | 2,101,645 | | | | 2,098,766 | | | | | |
| Thornburg Mortgage Securities Trust, | | | | | | | | | | | | |
| Series 2003-5, Class 3A, 4.337%, 10/25/2043 (4) | | | 3,489,358 | | | | 3,533,670 | | | | | |
| Towd Point Mortgage Trust: | | | | | | | | | | | | |
| Series 2015-5, Class A1B, 2.750%, 05/25/2055 (2)(4) | | | 2,267,665 | | | | 2,233,407 | | | | | |
| Series 2016-2, Class A1, 3.000%, 08/25/2055 (2)(4) | | | 2,164,836 | | | | 2,132,025 | | | | | |
| Series 2017-1, Class A1, 2.750%, 10/25/2056 (2)(4) | | | 10,021,647 | | | | 9,803,217 | | | | | |
| Series 2017-5, Class A1, 2.915%, 02/25/2057 (1 Month LIBOR USD + 0.600%) (2)(3) | | | 6,026,185 | | | | 5,993,281 | | | | | |
| WaMu Mortgage Pass-Through Certificates Trust: | | | | | | | | | | | | |
| Series 2004-CB1, Class 5A, 5.000%, 06/25/2019 | | | 27,891 | | | | 27,832 | | | | | |
| Series 2004-CB3, Class 3A, 5.500%, 10/25/2019 | | | 26,526 | | | | 26,482 | | | | | |
| Series 2004-CB3, Class 4A, 6.000%, 10/25/2019 | | | 17,601 | | | | 17,764 | | | | | |
| Series 2004-CB4, Class 21A, 5.500%, 12/25/2019 | | | 25,488 | | | | 25,568 | | | | | |
| Series 2004-CB4, Class 22A, 6.000%, 12/25/2019 | | | 15,333 | | | | 15,417 | | | | | |
| Series 2004-AR3, Class A1, 3.958%, 06/25/2034 (4) | | | 2,670,115 | | | | 2,711,557 | | | | | |
| Series 2004-CB2, Class 3A, 6.000%, 08/25/2034 | | | 2,478,447 | | | | 2,621,756 | | | | | |
| Wells Fargo Home Equity Asset-Backed Securities Trust, | | | | | | | | | | | | |
| Series 2004-2, Class A33, 3.506%, 10/25/2034 (1 Month LIBOR USD + 1.000%) (3) | | | 2,750,180 | | | | 2,742,653 | | | | | |
| Wells Fargo Mortgage Backed Securities Trust, | | | | | | | | | | | | |
| Series 2005-AR10, Class 2A17, 4.513%, 06/25/2035 (4) | | | 3,370,989 | | | | 3,462,155 | | | | | |
| | | | | | | | 68,289,153 | | | | 2.1 | % |
| Total Residential Mortgage-Backed Securities | | | | | | | 68,343,003 | | | | 2.1 | % |
| | | | | | | | | | | | | |
| Commercial Mortgage-Backed Securities | | | | | | | | | | | | |
| U.S. Government Agency Issues | | | | | | | | | | | | |
| Freddie Mac Multifamily Structured Pass Through Certificates: | | | | | | | | | | | | |
| Series K720, Class A2, 2.716%, 06/25/2022 | | | 15,850,000 | | | | 15,748,904 | | | | | |
| Series K028, Class A2, 3.111%, 02/25/2023 | | | 13,850,000 | | | | 13,945,175 | | | | | |
| Series K727, Class A2, 2.946%, 07/25/2024 | | | 5,400,000 | | | | 5,391,255 | | | | | |
| Series K041, Class A2, 3.171%, 10/25/2024 | | | 3,845,000 | | | | 3,868,609 | | | | | |
| Series K050, Class A2, 3.334%, 08/25/2025 (4) | | | 12,150,000 | | | | 12,310,528 | | | | | |
| Series K071, Class A2, 3.286%, 11/25/2027 | | | 7,075,000 | | | | 7,051,708 | | | | | |
| Series K073, Class A2, 3.350%, 01/25/2028 | | | 8,925,000 | | | | 8,936,894 | | | | | |
| | | | | | | | 67,253,073 | | | | 2.1 | % |
| Non-U.S. Government Agency Issues | | | | | | | | | | | | |
| Citigroup Commercial Mortgage Trust: | | | | | | | | | | | | |
| Series 2013-GC11, Class A4, 3.093%, 04/10/2046 | | | 11,100,000 | | | | 11,020,058 | | | | | |
| Series 2015-GC27, Class A5, 3.137%, 02/10/2048 | | | 11,675,000 | | | | 11,475,341 | | | | | |
| COMM Mortgage Trust, | | | | | | | | | | | | |
| Series 2013-CR11, Class A4, 4.258%, 08/10/2050 | | | 10,000,000 | | | | 10,413,191 | | | | | |
| JPMBB Commercial Mortgage Securities Trust, | | | | | | | | | | | | |
| Series 2013-C12, Class A5, 3.664%, 07/15/2045 | | | 3,373,000 | | | | 3,413,792 | | | | | |
| Morgan Stanley Bank of America Merrill Lynch Trust: | | | | | | | | | | | | |
| Series 2013-C7, Class A4, 2.918%, 02/15/2046 | | | 9,540,000 | | | | 9,405,436 | | | | | |
| Series 2014-C16, Class A4, 3.600%, 06/15/2047 | | | 12,975,000 | | | | 13,090,533 | | | | | |
| Series 2016-C29, Class ASB, 3.140%, 05/15/2049 | | | 5,000,000 | | | | 4,992,553 | | | | | |
| Wells Fargo Commercial Mortgage Trust: | | | | | | | | | | | | |
| Series 2014-LC18, Class ASB, 3.244%, 12/15/2047 | | | 16,400,000 | | | | 16,462,488 | | | | | |
| Series 2015-P2, Class ASB, 3.656%, 12/15/2048 | | | 11,175,000 | | | | 11,316,263 | | | | | |
| Series 2015-P2, Class A4, 3.809%, 12/15/2048 | | | 9,041,144 | | | | 9,233,470 | | | | | |
| WFRBS Commercial Mortgage Trust: | | | | | | | | | | | | |
| Series 2012-C6, Class A4, 3.440%, 04/15/2045 | | | 8,875,000 | | | | 8,920,169 | | | | | |
| Series 2014-C24, Class ASB, 3.324%, 11/15/2047 | | | 9,852,000 | | | | 9,937,100 | | | | | |
| Series 2013-C12, Class ASB, 2.838%, 03/15/2048 | | | 7,608,407 | | | | 7,554,751 | | | | | |
| | | | | | | | 127,235,145 | | | | 3.7 | % |
| Total Commercial Mortgage-Backed Securities | | | | | | | 194,488,218 | | | | 5.8 | % |
| | | | | | | | | | | | | |
| Asset Backed Securities | | | | | | | | | | | | |
| Capital One Multi-Asset Execution Trust, | | | | | | | | | | | | |
| Series 2017-A4, Class A4, 1.990%, 07/17/2023 | | | 20,275,000 | | | | 19,960,228 | | | | | |
| Conseco Financial Corp.: | | | | | | | | | | | | |
| Series 1998-2, Class A5, 6.240%, 12/01/2028 | | | 61,168 | | | | 62,032 | | | | | |
| Series 1998-3, Class A5, 6.220%, 03/01/2030 | | | 164,143 | | | | 171,215 | | | | | |
| Series 1998-4, Class A5, 6.180%, 04/01/2030 | | | 71,865 | | | | 74,473 | | | | | |
| Series 1998-7, Class A1, 6.320%, 07/01/2030 | | | 1,429,247 | | | | 1,475,617 | | | | | |
| Dell Equipment Finance Trust, | | | | | | | | | | | | |
| Series 2018-1, Class A3, 3.180%, 06/22/2023 (2) | | | 15,935,000 | | | | 15,940,141 | | | | | |
| Ford Credit Auto Owner Trust, | | | | | | | | | | | | |
| Series 2016-1, Class A, 2.310%, 08/15/2027 (2) | | | 5,633,000 | | | | 5,556,222 | | | | | |
| MMAF Equipment Finance LLC, | | | | | | | | | | | | |
| Series 2017-AA, Class A3, 2.040%, 02/16/2022 (2) | | | 6,250,000 | | | | 6,191,337 | | | | | |
| Oakwood Mortgage Investors, Inc., | | | | | | | | | | | | |
| Series 1999-B, Class A3, 6.450%, 12/15/2023 | | | 38,565 | | | | 39,000 | | | | | |
| PFS Financing Corp., | | | | | | | | | | | | |
| Series 2017-D, Class A, 2.400%, 10/17/2022 (2) | | | 14,555,000 | | | | 14,356,853 | | | | | |
| SoFi Consumer Loan Program, | | | | | | | | | | | | |
| Series 2017-3, Class A, 2.770%, 05/25/2026 (2) | | | 2,686,429 | | | | 2,662,524 | | | | | |
| Verizon Owner Trust: | | | | | | | | | | | | |
| Series 2017-3A, Class A1A, 2.060%, 04/20/2022 (2) | | | 12,250,000 | | | | 12,102,699 | | | | | |
| Series 2018-1A, Class A1A, 2.820%, 09/20/2022 (2) | | | 4,350,000 | | | | 4,337,479 | | | | | |
| World Financial Network Credit Card Master Trust, | | | | | | | | | | | | |
| Series 2017-C, Class A, 2.310%, 08/15/2024 | | | 5,850,000 | | | | 5,768,292 | | | | | |
| | | | | | | | 88,698,112 | | | | 2.7 | % |
| Total Long-Term Investments (Cost $3,304,421,532) | | | | | | | 3,269,116,327 | | | | 98.7 | % |
| | | | | | | | | | | | | |
| SHORT-TERM INVESTMENT | | Shares | | | | | | | | | |
| Money Market Mutual Fund | | | | | | | | | | | | |
| Fidelity Institutional Money Market Fund - Government Portfolio, Institutional Class, 2.29% (5) | | | 48,868,118 | | | | 48,868,118 | | | | | |
| Total Short-Term Investment (Cost $48,868,118) | | | | | | | 48,868,118 | | | | 1.5 | % |
| Total Investments (Cost $3,353,289,650) | | | | | | | 3,317,984,445 | | | | 100.2 | % |
| Liabilities in Excess of Other Assets | | | | | | | (5,777,768 | ) | | | (0.2 | )% |
| TOTAL NET ASSETS | | | | | | $ | 3,312,206,677 | | | | 100.0 | % |
Notes to Schedule of Investments | | | | | | |
| (1) | | Foreign security. | | | | | | |
| (2) | | Security issued under Rule 144A under the Securities Act of 1933 and determined to be liquid. Purchased in a private placement transaction; resale to the public may require registration or may extend only to qualified institutional buyers. At December 31, 2018, the value of these securities total $672,604,116, which represents 20.31% of total net assets. |
| (3) | | Variable rate security based on a reference index and spread. The rate reported is the rate in effect as of December 31, 2018. | | |
| (4) | | Variable rate security. The coupon is based on an underlying pool of loans. The rate reported is the rate in effect as of December 31, 2018. |
| (5) | | Seven-day yield. | | | | | | |
| (6) | | Security that, on the last payment date, missed a partial principal or interest payment. | | |
| (7) | | Step-up bond; the interest rate shown is the rate in effect as of December 31, 2018. | | | |
| (8) | | Security in default. | | | |
| Baird Intermediate Bond Fund | | | | | | | | |
| Schedule of Investments, December 31, 2018 | | | | | | | | |
| Summary of Fair Value Exposure at December 31, 2018 | | | | | | |
| | | | | | | | | |
The Fund has adopted authoritative fair valuation accounting standards which establish a definition of fair value and set out a hierarchy for measuring fair value. These standards require additional disclosures about the various inputs and valuation techniques used to develop the measurements of fair value and a discussion on changes in valuation techniques and related inputs during the period. These standards define fair value as the price that would be received to sell an asset or paid to transfer a liability in an orderly transaction between market participants at the measurement date. |
| | | | | | | | | |
| The fair value hierarchy is organized into three levels based upon the assumptions (referred to as "inputs") used in pricing the asset or liability. These standards state that "observable inputs" reflect the assumptions market participants would use in pricing the asset or liability based on market data obtained from independent sources and "unobservable inputs" reflect an entity's own assumptions about the assumptions market participants would use in pricing the asset or liability. These inputs are summarized into three broad levels and described below: |
| | Level 1 - | Unadjusted quoted prices in active markets for identical unrestricted securities. | |
| | Level 2 - | Other significant observable inputs (including quoted prices for similar securities, quoted prices in inactive markets, dealer indications, interest rates, yield curves, prepayment speeds, credit risk, default rates, inputs corroborated by observable market data, etc.). | |
| | Level 3 - | Significant unobservable inputs (including the Fund's own assumptions about the factors that market participants would use in valuing the security) based on the best information available. | |
| The inputs or methodology used for valuing securities are not necessarily an indication of the risk associated with investing in those securities. |
| | | | | | | | | |
| The following is a summary of the inputs used to value the Fund's investments as of December 31, 2018: | | | | |
| | | Level 1 | | | Level 2 | | | Level 3 | | | Total | |
| Long-Term Investments | | | | | | | | | | | | |
| U.S. Treasury Securities | | $ | – | | | $ | 1,344,144,949 | | | $ | – | | | $ | 1,344,144,949 | |
| Other Government Related Securities | | | – | | | | 37,657,262 | | | | – | | | | 37,657,262 | |
| Corporate Bonds | | | – | | | | 1,487,313,823 | | | | – | | | | 1,487,313,823 | |
| Municipal Bonds | | | – | | | | 48,470,960 | | | | – | | | | 48,470,960 | |
| Residential Mortgage-Backed Securities - U.S. Government Agency Issues | | | – | | | | 53,850 | | | | – | | | | 53,850 | |
| Residential Mortgage-Backed Securities - Non-U.S. Government Agency Issues | | | – | | | | 68,289,153 | | | | – | | | | 68,289,153 | |
| Commercial Mortgage-Backed Securities - U.S. Government Agency Issues | | | – | | | | 67,253,073 | | | | – | | | | 67,253,073 | |
| Commercial Mortgage-Backed Securities - Non-U.S. Government Agency Issues | | | – | | | | 127,235,145 | | | | – | | | | 127,235,145 | |
| Asset Backed Securities | | | – | | | | 88,698,112 | | | | – | | | | 88,698,112 | |
| Total Long-Term Investments | | | – | | | | 3,269,116,327 | | | | – | | | | 3,269,116,327 | |
| Short-Term Investment | | | | | | | | | | | | | | | | |
| Money Market Mutual Fund | | | 48,868,118 | | | | – | | | | – | | | | 48,868,118 | |
| Total Short-Term Investment | | | 48,868,118 | | | | – | | | | – | | | | 48,868,118 | |
| Total Investments | | $ | 48,868,118 | | | $ | 3,269,116,327 | | | $ | – | | | $ | 3,317,984,445 | |
| Changes in valuation techniques may result in transfers into or out of assigned levels within the fair value hierarchy. There were no transfers into or out of Level 3 during the reporting period, as compared to the security classifications from the prior year's annual report. |
| | | | | | | | | |
| Baird Aggregate Bond Fund | | | | | | | | | |
| Schedule of Investments | | | | | | | | | |
| December 31, 2018 | | | | | | | | | |
| | | | | | | | | | |
| | | Principal | | | | | | % of | |
| | | Amount | | | Value | | | Net Assets | |
| LONG-TERM INVESTMENTS | | | | | | | | | |
| U.S. Treasury Securities | | | | | | | | | |
| U.S. Treasury Bonds: | | | | | | | | | |
| 1.750%, 03/31/2022 | | $ | 310,830,000 | | | $ | 303,860,607 | | | | |
| 1.875%, 03/31/2022 | | | 376,950,000 | | | | 369,882,188 | | | | |
| 2.500%, 05/15/2024 | | | 542,225,000 | | | | 541,229,507 | | | | |
| 2.250%, 11/15/2025 | | | 405,625,000 | | | | 396,672,731 | | | | |
| 2.000%, 11/15/2026 | | | 319,050,000 | | | | 304,555,657 | | | | |
| 2.250%, 11/15/2027 | | | 159,725,000 | | | | 154,290,606 | | | | |
| 3.500%, 02/15/2039 | | | 487,880,900 | | | | 533,638,791 | | | | |
| 2.875%, 05/15/2043 | | | 663,750,000 | | | | 647,960,011 | | | | |
| 2.500%, 02/15/2045 | | | 125,800,000 | | | | 114,006,250 | | | | |
| | | | | | | | 3,366,096,348 | | | | 21.5 | % |
| Other Government Related Securities | | | | | | | | | | | | |
| CNOOC Finance (2015) Australia Pty Ltd., | | | | | | | | | | | | |
| 2.625%, 05/05/2020 (1) | | | 14,500,000 | | | | 14,356,841 | | | | | |
| CNPC General Capital Ltd., | | | | | | | | | | | | |
| 2.750%, 05/14/2019 (1)(2) | | | 2,000,000 | | | | 1,997,500 | | | | | |
| Comision Federal de Electricidad, | | | | | | | | | | | | |
| 4.875%, 01/15/2024 (1)(2) | | | 2,678,000 | | | | 2,611,050 | | | | | |
| Corp Andina de Fomento, | | | | | | | | | | | | |
| 4.375%, 06/15/2022 (1) | | | 6,107,000 | | | | 6,320,440 | | | | | |
| Export-Import Bank of Korea, | | | | | | | | | | | | |
| 2.250%, 01/21/2020 (1) | | | 11,000,000 | | | | 10,903,266 | | | | | |
| Industrial Bank of Korea, | | | | | | | | | | | | |
| 2.000%, 04/23/2020 (1)(2) | | | 7,000,000 | | | | 6,909,038 | | | | | |
| Korea Development Bank, | | | | | | | | | | | | |
| 2.250%, 05/18/2020 (1) | | | 2,000,000 | | | | 1,978,051 | | | | | |
| Korea Gas Corp., | | | | | | | | | | | | |
| 4.250%, 11/02/2020 (1)(2) | | | 2,321,000 | | | | 2,357,718 | | | | | |
| Nexen Energy ULC, | | | | | | | | | | | | |
| 6.400%, 05/15/2037 (1) | | | 7,567,000 | | | | 9,209,728 | | | | | |
| Petroleos Mexicanos: | | | | | | | | | | | | |
| 8.000%, 05/03/2019 (1) | | | 5,911,000 | | | | 5,976,021 | | | | | |
| 5.500%, 01/21/2021 (1) | | | 5,600,000 | | | | 5,577,432 | | | | | |
| 4.875%, 01/24/2022 (1) | | | 4,000,000 | | | | 3,894,000 | | | | | |
| 4.500%, 01/23/2026 (1) | | | 2,500,000 | | | | 2,155,000 | | | | | |
| 6.625%, 06/15/2035 | | | 893,000 | | | | 779,589 | | | | | |
| 6.350%, 02/12/2048 (1) | | | 8,500,000 | | | | 6,800,000 | | | | | |
| Sinopec Group Overseas Development [2014] Ltd., | | | | | | | | | | | | |
| 4.375%, 04/10/2024 (1)(2) | | | 1,500,000 | | | | 1,531,442 | | | | | |
| Sinopec Group Overseas Development [2015] Ltd.: | | | | | | | | | | | | |
| 2.500%, 04/28/2020 (1)(2) | | | 15,000,000 | | | | 14,815,680 | | | | | |
| 3.250%, 04/28/2025 (1)(2) | | | 10,000,000 | | | | 9,562,482 | | | | | |
| Sinopec Group Overseas Development [2016] Ltd., | | | | | | | | | | | | |
| 3.500%, 05/03/2026 (1)(2) | | | 13,450,000 | | | | 12,926,405 | | | | | |
| Sinopec Group Overseas Development [2017] Ltd: | | | | | | | | | | | | |
| 2.250%, 09/13/2020 (1)(2) | | | 9,125,000 | | | | 8,958,451 | | | | | |
| 3.000%, 04/12/2022 (1)(2) | | | 15,000,000 | | | | 14,682,570 | | | | | |
| Syngenta Finance NV, | | | | | | | | | | | | |
| 4.441%, 04/24/2023 (1)(2) | | | 10,000,000 | | | | 9,637,263 | | | | | |
| | | | | | | | 153,939,967 | | | | 1.0 | % |
| Corporate Bonds | | | | | | | | | | | | |
| Industrials | | | | | | | | | | | | |
| 21st Century Fox America, Inc.: | | | | | | | | | | | | |
| 7.300%, 04/30/2028 | | | 6,350,000 | | | | 7,996,070 | | | | | |
| 6.150%, 03/01/2037 | | | 2,570,000 | | | | 3,152,332 | | | | | |
| 6.750%, 01/09/2038 | | | 5,650,000 | | | | 7,508,266 | | | | | |
| Abbott Laboratories: | | | | | | | | | | | | |
| 4.750%, 11/30/2036 | | | 33,949,000 | | | | 35,440,585 | | | | | |
| 4.900%, 11/30/2046 | | | 4,700,000 | | | | 4,933,704 | | | | | |
| AbbVie, Inc.: | | | | | | | | | | | | |
| 2.500%, 05/14/2020 | | | 9,500,000 | | | | 9,409,836 | | | | | |
| 4.500%, 05/14/2035 | | | 9,000,000 | | | | 8,325,962 | | | | | |
| 4.300%, 05/14/2036 | | | 6,000,000 | | | | 5,353,037 | | | | | |
| Actavis Funding SCS: | | | | | | | | | | | | |
| 3.850%, 06/15/2024 (1) | | | 12,067,000 | | | | 11,901,628 | | | | | |
| 3.800%, 03/15/2025 (1) | | | 12,000,000 | | | | 11,714,682 | | | | | |
| 4.550%, 03/15/2035 (1) | | | 8,000,000 | | | | 7,588,782 | | | | | |
| Acuity Brands Lighting, Inc., | | | | | | | | | | | | |
| 6.000%, 12/15/2019 | | | 3,749,000 | | | | 3,833,402 | | | | | |
| Allegion US Holding Co., Inc., | | | | | | | | | | | | |
| 3.200%, 10/01/2024 | | | 7,000,000 | | | | 6,602,580 | | | | | |
| Amgen, Inc., | | | | | | | | | | | | |
| 4.400%, 05/01/2045 | | | 12,300,000 | | | | 11,502,813 | | | | | |
| Anadarko Finance Co., | | | | | | | | | | | | |
| 7.500%, 05/01/2031 (1) | | | 7,170,000 | | | | 8,478,858 | | | | | |
| Anadarko Petroleum Corp., | | | | | | | | | | | | |
| 8.700%, 03/15/2019 | | | 2,432,000 | | | | 2,457,046 | | | | | |
| Analog Devices, Inc., | | | | | | | | | | | | |
| 3.125%, 12/05/2023 | | | 10,000,000 | | | | 9,713,457 | | | | | |
| Andeavor Logistics LP / Tesoro Logistics Finance Corp., | | | | | | | | | | | | |
| 5.250%, 01/15/2025 | | | 4,276,000 | | | | 4,352,823 | | | | | |
| Anheuser-Busch InBev Finance, Inc.: | | | | | | | | | | | | |
| 2.650%, 02/01/2021 | | | 3,077,000 | | | | 3,025,910 | | | | | |
| 4.375%, 04/15/2038 | | | 7,000,000 | | | | 6,245,382 | | | | | |
| Apple, Inc., | | | | | | | | | | | | |
| 2.400%, 05/03/2023 | | | 2,678,000 | | | | 2,589,441 | | | | | |
| ArcelorMittal, | | | | | | | | | | | | |
| 6.250%, 02/25/2022 (1) | | | 19,100,000 | | | | 20,188,700 | | | | | |
| AT&T, Inc.: | | | | | | | | | | | | |
| 3.950%, 01/15/2025 | | | 5,000,000 | | | | 4,889,278 | | | | | |
| 3.400%, 05/15/2025 | | | 23,200,000 | | | | 21,846,346 | | | | | |
| 4.125%, 02/17/2026 | | | 7,650,000 | | | | 7,475,595 | | | | | |
| 5.250%, 03/01/2037 | | | 10,000,000 | | | | 9,822,275 | | | | | |
| 4.900%, 08/15/2037 | | | 10,000,000 | | | | 9,323,894 | | | | | |
| 4.800%, 06/15/2044 | | | 1,375,000 | | | | 1,232,432 | | | | | |
| 4.750%, 05/15/2046 | | | 5,000,000 | | | | 4,439,470 | | | | | |
| 5.150%, 11/15/2046 | | | 10,599,000 | | | | 9,849,485 | | | | | |
| 5.150%, 02/15/2050 | | | 27,500,000 | | | | 25,476,255 | | | | | |
| Baxalta, Inc., | | | | | | | | | | | | |
| 2.875%, 06/23/2020 | | | 1,489,000 | | | | 1,475,697 | | | | | |
| Bayer US Finance II LLC, | | | | | | | | | | | | |
| 4.250%, 12/15/2025 (2) | | | 13,975,000 | | | | 13,601,320 | | | | | |
| Bayer US Finance LLC, | | | | | | | | | | | | |
| 2.375%, 10/08/2019 (2) | | | 10,000,000 | | | | 9,920,065 | | | | | |
| Becton Dickinson and Co.: | | | | | | | | | | | | |
| 2.675%, 12/15/2019 | | | 4,007,000 | | | | 3,968,897 | | | | | |
| 3.250%, 11/12/2020 | | | 7,000,000 | | | | 6,957,669 | | | | | |
| 3.363%, 06/06/2024 | | | 6,300,000 | | | | 6,051,005 | | | | | |
| 3.734%, 12/15/2024 | | | 4,000,000 | | | | 3,863,983 | | | | | |
| 4.875%, 05/15/2044 | | | 10,815,000 | | | | 10,237,824 | | | | | |
| Bell Canada, Inc., | | | | | | | | | | | | |
| 4.464%, 04/01/2048 (1) | | | 1,225,000 | | | | 1,184,158 | | | | | |
| Boardwalk Pipelines LP: | | | | | | | | | | | | |
| 5.950%, 06/01/2026 | | | 22,721,000 | | | | 23,473,565 | | | | | |
| 4.450%, 07/15/2027 | | | 7,000,000 | | | | 6,463,135 | | | | | |
| Boral Finance Pty Ltd., | | | | | | | | | | | | |
| 3.000%, 11/01/2022 (1)(2) | | | 6,000,000 | | | | 5,796,757 | | | | | |
| Boston Scientific Corp., | | | | | | | | | | | | |
| 2.850%, 05/15/2020 | | | 7,000,000 | | | | 6,954,395 | | | | | |
| Broadcom Corp. / Broadcom Cayman Finance Ltd., | | | | | | | | | | | | |
| 3.125%, 01/15/2025 | | | 12,000,000 | | | | 10,833,127 | | | | | |
| Bunge Limited Finance Corp.: | | | | | | | | | | | | |
| 3.500%, 11/24/2020 | | | 12,235,000 | | | | 12,205,410 | | | | | |
| 3.000%, 09/25/2022 | | | 15,000,000 | | | | 14,336,140 | | | | | |
| 3.250%, 08/15/2026 | | | 11,550,000 | | | | 10,119,774 | | | | | |
| Burlington Northern Santa Fe LLC, | | | | | | | | | | | | |
| 4.150%, 04/01/2045 | | | 3,000,000 | | | | 2,908,570 | | | | | |
| Campbell Soup Co.: | | | | | | | | | | | | |
| 3.950%, 03/15/2025 | | | 10,325,000 | | | | 9,891,873 | | | | | |
| 4.800%, 03/15/2048 | | | 7,000,000 | | | | 6,003,146 | | | | | |
| Canadian Natural Resources Ltd., | | | | | | | | | | | | |
| 6.500%, 02/15/2037 (1) | | | 982,000 | | | | 1,111,085 | | | | | |
| Carlisle Cos, Inc., | | | | | | | | | | | | |
| 3.500%, 12/01/2024 | | | 5,000,000 | | | | 4,787,633 | | | | | |
| Celgene Corp.: | | | | | | | | | | | | |
| 3.550%, 08/15/2022 | | | 6,450,000 | | | | 6,379,155 | | | | | |
| 3.250%, 02/20/2023 | | | 6,175,000 | | | | 6,029,594 | | | | | |
| 4.000%, 08/15/2023 | | | 2,477,000 | | | | 2,488,273 | | | | | |
| Celulosa Arauco y Constitucion SA, | | | | | | | | | | | | |
| 3.875%, 11/02/2027 (1) | | | 12,000,000 | | | | 10,974,120 | | | | | |
| CF Industries, Inc.: | | | | | | | | | | | | |
| 3.450%, 06/01/2023 | | | 21,000,000 | | | | 19,530,000 | | | | | |
| 5.150%, 03/15/2034 | | | 3,000,000 | | | | 2,520,000 | | | | | |
| Charter Communications Operating LLC: | | | | | | | | | | | | |
| 4.464%, 07/23/2022 | | | 13,773,000 | | | | 13,905,298 | | | | | |
| 6.384%, 10/23/2035 | | | 5,800,000 | | | | 5,953,393 | | | | | |
| Chevron Phillips Chemical Co. LLC / Chevron Phillips Chemical Co. LP, | | | | | | | | | | | | |
| 3.291%, 05/01/2020 (3 Month LIBOR USD + 0.750%) (2)(3) | | | 25,000,000 | | | | 25,050,653 | | | | | |
| CK Hutchison International Ltd., | | | | | | | | | | | | |
| 2.875%, 04/05/2022 (1)(2) | | | 8,000,000 | | | | 7,851,120 | | | | | |
| Columbia Pipeline Group, Inc.: | | | | | | | | | | | | |
| 3.300%, 06/01/2020 | | | 14,575,000 | | | | 14,524,877 | | | | | |
| 4.500%, 06/01/2025 | | | 2,819,000 | | | | 2,839,302 | | | | | |
| 5.800%, 06/01/2045 | | | 4,700,000 | | | | 5,039,776 | | | | | |
| Comcast Corp.: | | | | | | | | | | | | |
| 4.250%, 01/15/2033 | | | 5,712,000 | | | | 5,673,018 | | | | | |
| 3.200%, 07/15/2036 | | | 6,000,000 | | | | 5,161,237 | | | | | |
| 3.969%, 11/01/2047 | | | 8,622,000 | | | | 7,706,802 | | | | | |
| 4.950%, 10/15/2058 | | | 10,000,000 | | | | 10,166,512 | | | | | |
| Conagra Brands, Inc.: | | | | | | | | | | | | |
| 4.950%, 08/15/2020 | | | 332,000 | | | | 339,414 | | | | | |
| 9.750%, 03/01/2021 | | | 4,548,000 | | | | 5,102,321 | | | | | |
| 7.125%, 10/01/2026 | | | 6,441,000 | | | | 7,305,947 | | | | | |
| 7.000%, 10/01/2028 | | | 4,300,000 | | | | 4,879,599 | | | | | |
| 5.300%, 11/01/2038 | | | 5,000,000 | | | | 4,724,700 | | | | | |
| ConocoPhillips Co., | | | | | | | | | | | | |
| 3.516%, 05/15/2022 (3 Month LIBOR USD + 0.900%) (3) | | | 8,425,000 | | | | 8,510,122 | | | | | |
| Corning, Inc., | | | | | | | | | | | | |
| 4.375%, 11/15/2057 | | | 9,000,000 | | | | 7,553,705 | | | | | |
| Cox Communications, Inc.: | | | | | | | | | | | | |
| 3.850%, 02/01/2025 (2) | | | 4,725,000 | | | | 4,654,966 | | | | | |
| 3.350%, 09/15/2026 (2) | | | 2,800,000 | | | | 2,583,283 | | | | | |
| 4.800%, 02/01/2035 (2) | | | 14,000,000 | | | | 12,764,078 | | | | | |
| 8.375%, 03/01/2039 (2) | | | 19,011,000 | | | | 23,694,019 | | | | | |
| CSX Corp., | | | | | | | | | | | | |
| 4.650%, 03/01/2068 | | | 9,000,000 | | | | 8,132,168 | | | | | |
| CVS Health Corp.: | | | | | | | | | | | | |
| 3.500%, 07/20/2022 | | | 7,000,000 | | | | 6,951,970 | | | | | |
| 4.780%, 03/25/2038 | | | 23,000,000 | | | | 22,039,878 | | | | | |
| 5.050%, 03/25/2048 | | | 19,300,000 | | | | 18,771,370 | | | | | |
| Daimler Finance North America LLC, | | | | | | | | | | | | |
| 1.500%, 07/05/2019 (2) | | | 10,700,000 | | | | 10,594,614 | | | | | |
| Danone SA, | | | | | | | | | | | | |
| 2.589%, 11/02/2023 (1)(2) | | | 19,600,000 | | | | 18,633,524 | | | | | |
| Deutsche Telekom International Finance BV, | | | | | | | | | | | | |
| 8.750%, 06/15/2030 (1) | | | 1,661,000 | | | | 2,166,405 | | | | | |
| Diamond 1 Finance Corp. / Diamond 2 Finance Corp.: | | | | | | | | | | | | |
| 3.480%, 06/01/2019 (2) | | | 8,947,000 | | | | 8,920,559 | | | | | |
| 4.420%, 06/15/2021 (2) | | | 50,575,000 | | | | 50,491,566 | | | | | |
| 5.450%, 06/15/2023 (2) | | | 10,000,000 | | | | 10,176,403 | | | | | |
| Dominion Gas Holdings LLC, | | | | | | | | | | | | |
| 2.800%, 11/15/2020 | | | 7,275,000 | | | | 7,167,029 | | | | | |
| DowDuPont, Inc.: | | | | | | | | | | | | |
| 4.493%, 11/15/2025 | | | 10,000,000 | | | | 10,295,760 | | | | | |
| 5.319%, 11/15/2038 | | | 14,000,000 | | | | 14,415,570 | | | | | |
| DXC Technology Co.: | | | | | | | | | | | | |
| 3.688%, 03/01/2021 (3 Month LIBOR USD + 0.950%) (3) | | | 6,153,000 | | | | 6,146,160 | | | | | |
| 4.250%, 04/15/2024 | | | 34,725,000 | | | | 34,168,574 | | | | | |
| 4.750%, 04/15/2027 | | | 12,815,000 | | | | 12,860,094 | | | | | |
| Elanco Animal Health, Inc., | | | | | | | | | | | | |
| 4.272%, 08/28/2023 (2) | | | 10,000,000 | | | | 9,991,540 | | | | | |
| Enable Midstream Partners LP, | | | | | | | | | | | | |
| 3.900%, 05/15/2024 | | | 5,000,000 | | | | 4,796,181 | | | | | |
| Enbridge Energy Partners LP: | | | | | | | | | | | | |
| 7.500%, 04/15/2038 | | | 4,500,000 | | | | 5,673,059 | | | | | |
| 7.375%, 10/15/2045 | | | 20,000,000 | | | | 24,771,822 | | | | | |
| Energy Transfer Partners LP: | | | | | | | | | | | | |
| 9.700%, 03/15/2019 | | | 893,000 | | | | 903,610 | | | | | |
| 4.150%, 10/01/2020 | | | 10,000,000 | | | | 10,060,351 | | | | | |
| 4.050%, 03/15/2025 | | | 26,585,000 | | | | 24,951,449 | | | | | |
| 6.500%, 02/01/2042 | | | 5,621,000 | | | | 5,609,897 | | | | | |
| Ensco PLC, | | | | | | | | | | | | |
| 5.200%, 03/15/2025 (1) | | | 4,000,000 | | | | 2,660,000 | | | | | |
| Enterprise Products Operating LLC: | | | | | | | | | | | | |
| 3.700%, 02/15/2026 | | | 8,350,000 | | | | 8,227,198 | | | | | |
| 5.750%, 03/01/2035 | | | 4,930,000 | | | | 5,208,676 | | | | | |
| EQT Midstream Partners LP: | | | | | | | | | | | | |
| 4.750%, 07/15/2023 | | | 10,000,000 | | | | 9,978,498 | | | | | |
| 4.000%, 08/01/2024 | | | 3,000,000 | | | | 2,870,359 | | | | | |
| 4.125%, 12/01/2026 | | | 10,000,000 | | | | 9,077,699 | | | | | |
| ERAC USA Finance LLC: | | | | | | | | | | | | |
| 2.350%, 10/15/2019 (2) | | | 4,000,000 | | | | 3,972,951 | | | | | |
| 3.300%, 12/01/2026 (2) | | | 20,225,000 | | | | 19,009,129 | | | | | |
| Express Scripts Holding Co.: | | | | | | | | | | | | |
| 3.300%, 02/25/2021 | | | 2,350,000 | | | | 2,341,373 | | | | | |
| 4.750%, 11/15/2021 | | | 5,000,000 | | | | 5,143,139 | | | | | |
| 3.900%, 02/15/2022 | | | 10,000,000 | | | | 10,046,096 | | | | | |
| 3.050%, 11/30/2022 | | | 10,000,000 | | | | 9,678,006 | | | | | |
| 3.000%, 07/15/2023 | | | 5,512,000 | | | | 5,305,175 | | | | | |
| 3.500%, 06/15/2024 | | | 9,000,000 | | | | 8,740,070 | | | | | |
| Federal Express Corp. Pass Through Trust, | | | | | | | | | | | | |
| 6.845%, 01/15/2019 | | | 275,241 | | | | 275,545 | | | | | |
| FedEx Corp., | | | | | | | | | | | | |
| 4.950%, 10/17/2048 | | | 15,000,000 | | | | 14,495,588 | | | | | |
| Ferguson Finance PLC, | | | | | | | | | | | | |
| 4.500%, 10/24/2028 (1)(2) | | | 11,000,000 | | | | 10,988,963 | | | | | |
| Fidelity National Information Services, Inc.: | | | | | | | | | | | | |
| 3.625%, 10/15/2020 | | | 5,577,000 | | | | 5,602,352 | | | | | |
| 3.500%, 04/15/2023 | | | 12,188,000 | | | | 12,047,808 | | | | | |
| 3.875%, 06/05/2024 | | | 582,000 | | | | 581,354 | | | | | |
| 4.500%, 08/15/2046 | | | 17,040,000 | | | | 15,496,901 | | | | | |
| 4.750%, 05/15/2048 | | | 15,000,000 | | | | 13,943,333 | | | | | |
| Fiserv, Inc.: | | | | | | | | | | | | |
| 2.700%, 06/01/2020 | | | 10,000,000 | | | | 9,925,671 | | | | | |
| 3.500%, 10/01/2022 | | | 5,410,000 | | | | 5,372,711 | | | | | |
| FMC Corp., | | | | | | | | | | | | |
| 4.100%, 02/01/2024 | | | 6,400,000 | | | | 6,396,582 | | | | | |
| Fomento Economico Mexicano SAB de CV: | | | | | | | | | | | | |
| 2.875%, 05/10/2023 (1) | | | 5,000,000 | | | | 4,769,154 | | | | | |
| 4.375%, 05/10/2043 (1) | | | 1,874,000 | | | | 1,792,579 | | | | | |
| Ford Motor Credit Co. LLC: | | | | | | | | | | | | |
| 2.375%, 03/12/2019 | | | 6,806,000 | | | | 6,794,704 | | | | | |
| 2.597%, 11/04/2019 | | | 10,000,000 | | | | 9,889,636 | | | | | |
| 3.200%, 01/15/2021 | | | 25,000,000 | | | | 24,243,866 | | | | | |
| 3.336%, 03/18/2021 | | | 7,500,000 | | | | 7,277,344 | | | | | |
| 3.339%, 03/28/2022 | | | 5,000,000 | | | | 4,719,558 | | | | | |
| 2.979%, 08/03/2022 | | | 13,000,000 | | | | 12,014,817 | | | | | |
| Forest Laboratories, Inc., | | | | | | | | | | | | |
| 5.000%, 12/15/2021 (2) | | | 24,000,000 | | | | 24,693,578 | | | | | |
| Fortive Corp., | | | | | | | | | | | | |
| 2.350%, 06/15/2021 | | | 5,125,000 | | | | 4,997,209 | | | | | |
| Fresenius Medical Care US Finance II, Inc., | | | | | | | | | | | | |
| 4.750%, 10/15/2024 (2) | | | 14,530,000 | | | | 14,795,899 | | | | | |
| General Electric Co.: | | | | | | | | | | | | |
| 2.200%, 01/09/2020 | | | 1,432,000 | | | | 1,411,148 | | | | | |
| 5.550%, 05/04/2020 | | | 1,585,000 | | | | 1,612,165 | | | | | |
| 4.650%, 10/17/2021 | | | 1,534,000 | | | | 1,538,601 | | | | | |
| 3.150%, 09/07/2022 | | | 11,538,000 | | | | 10,904,328 | | | | | |
| 3.100%, 01/09/2023 | | | 2,850,000 | | | | 2,659,356 | | | | | |
| General Motors Financial Co., Inc.: | | | | | | | | | | | | |
| 2.400%, 05/09/2019 | | | 9,000,000 | | | | 8,966,175 | | | | | |
| 2.350%, 10/04/2019 | | | 6,800,000 | | | | 6,740,759 | | | | | |
| 2.650%, 04/13/2020 | | | 3,500,000 | | | | 3,441,561 | | | | | |
| 2.450%, 11/06/2020 | | | 9,000,000 | | | | 8,741,451 | | | | | |
| 4.200%, 03/01/2021 | | | 30,000,000 | | | | 29,983,883 | | | | | |
| 4.375%, 09/25/2021 | | | 2,675,000 | | | | 2,680,176 | | | | | |
| 3.450%, 01/14/2022 | | | 5,000,000 | | | | 4,845,156 | | | | | |
| 3.150%, 06/30/2022 | | | 6,000,000 | | | | 5,730,946 | | | | | |
| Georgia-Pacific LLC, | | | | | | | | | | | | |
| 2.539%, 11/15/2019 (2) | | | 19,125,000 | | | | 18,980,176 | | | | | |
| Gilead Sciences, Inc., | | | | | | | | | | | | |
| 4.600%, 09/01/2035 | | | 4,600,000 | | | | 4,644,359 | | | | | |
| Glencore Funding LLC: | | | | | | | | | | | | |
| 2.500%, 01/15/2019 (2) | | | 4,463,000 | | | | 4,461,125 | | | | | |
| 4.125%, 05/30/2023 (2) | | | 13,691,000 | | | | 13,444,391 | | | | | |
| 4.625%, 04/29/2024 (2) | | | 30,620,000 | | | | 30,351,769 | | | | | |
| 4.000%, 04/16/2025 (2) | | | 4,450,000 | | | | 4,189,276 | | | | | |
| 4.000%, 03/27/2027 (2) | | | 17,550,000 | | | | 15,987,661 | | | | | |
| 3.875%, 10/27/2027 (2) | | | 2,000,000 | | | | 1,787,960 | | | | | |
| Grupo Bimbo SAB de CV: | | | | | | | | | | | | |
| 4.500%, 01/25/2022 (1)(2) | | | 13,157,000 | | | | 13,400,424 | | | | | |
| 3.875%, 06/27/2024 (1)(2) | | | 18,220,000 | | | | 17,894,771 | | | | | |
| 4.875%, 06/27/2044 (1)(2) | | | 7,400,000 | | | | 6,821,946 | | | | | |
| 4.700%, 11/10/2047 (1)(2) | | | 25,000,000 | | | | 22,489,000 | | | | | |
| Gulf South Pipeline Co. LP, | | | | | | | | | | | | |
| 4.000%, 06/15/2022 | | | 3,633,000 | | | | 3,599,975 | | | | | |
| Gulfstream Natural Gas System LLC, | | | | | | | | | | | | |
| 4.600%, 09/15/2025 (2) | | | 5,000,000 | | | | 5,156,915 | | | | | |
| Halliburton Co., | | | | | | | | | | | | |
| 3.800%, 11/15/2025 | | | 9,000,000 | | | | 8,720,899 | | | | | |
| Harris Corp.: | | | | | | | | | | | | |
| 2.700%, 04/27/2020 | | | 4,000,000 | | | | 3,965,935 | | | | | |
| 3.832%, 04/27/2025 | | | 5,000,000 | | | | 4,904,459 | | | | | |
| Hewlett Packard Enterprise Co.: | | | | | | | | | | | | |
| 2.100%, 10/04/2019 (2) | | | 11,000,000 | | | | 10,876,051 | | | | | |
| 3.600%, 10/15/2020 | | | 10,000,000 | | | | 10,025,893 | | | | | |
| 4.400%, 10/15/2022 | | | 15,150,000 | | | | 15,382,643 | | | | | |
| Holcim US Finance Sarl & Cie SCS, | | | | | | | | | | | | |
| 6.000%, 12/30/2019 (1)(2) | | | 1,232,000 | | | | 1,261,727 | | | | | |
| Hubbell, Inc., | | | | | | | | | | | | |
| 3.150%, 08/15/2027 | | | 11,700,000 | | | | 10,626,988 | | | | | |
| Hutchison Whampoa International Ltd.: | | | | | | | | | | | | |
| 7.625%, 04/09/2019 (1)(2) | | | 8,288,000 | | | | 8,383,519 | | | | | |
| 5.750%, 09/11/2019 (1)(2) | | | 9,150,000 | | | | 9,317,436 | | | | | |
| 3.625%, 10/31/2024 (1)(2) | | | 7,850,000 | | | | 7,772,999 | | | | | |
| Hyundai Capital America: | | | | | | | | | | | | |
| 2.500%, 03/18/2019 (2) | | | 4,275,000 | | | | 4,267,888 | | | | | |
| 2.000%, 07/01/2019 (2) | | | 8,600,000 | | | | 8,544,719 | | | | | |
| 2.750%, 09/18/2020 (2) | | | 6,000,000 | | | | 5,907,492 | | | | | |
| 3.000%, 03/18/2021 (2) | | | 15,000,000 | | | | 14,768,338 | | | | | |
| 3.750%, 07/08/2021 (2) | | | 12,950,000 | | | | 12,911,681 | | | | | |
| 3.100%, 04/05/2022 (2) | | | 21,255,000 | | | | 20,747,182 | | | | | |
| Hyundai Capital Services, Inc., | | | | | | | | | | | | |
| 2.625%, 09/29/2020 (1)(2) | | | 5,150,000 | | | | 5,060,877 | | | | | |
| Ingersoll-Rand Luxembourg Finance SA, | | | | | | | | | | | | |
| 2.625%, 05/01/2020 (1) | | | 2,650,000 | | | | 2,624,053 | | | | | |
| JM Smucker Co., | | | | | | | | | | | | |
| 3.500%, 03/15/2025 | | | 5,000,000 | | | | 4,800,735 | | | | | |
| Johnson Controls International PLC: | | | | | | | | | | | | |
| 6.000%, 01/15/2036 (1) | | | 1,168,000 | | | | 1,304,782 | | | | | |
| 4.500%, 02/15/2047 (1) | | | 4,400,000 | | | | 4,070,875 | | | | | |
| 4.950%, 07/02/2064 (1)(8) | | | 2,400,000 | | | | 2,230,632 | | | | | |
| Kansas City Southern, | | | | | | | | | | | | |
| 4.700%, 05/01/2048 | | | 10,075,000 | | | | 9,838,815 | | | | | |
| Keysight Technologies, Inc.: | | | | | | | | | | | | |
| 3.300%, 10/30/2019 | | | 16,500,000 | | | | 16,450,014 | | | | | |
| 4.600%, 04/06/2027 | | | 32,450,000 | | | | 32,574,124 | | | | | |
| Kinder Morgan Energy Partners LP: | | | | | | | | | | | | |
| 9.000%, 02/01/2019 | | | 893,000 | | | | 896,852 | | | | | |
| 4.300%, 05/01/2024 | | | 10,000,000 | | | | 9,985,056 | | | | | |
| 6.950%, 01/15/2038 | | | 6,008,000 | | | | 6,701,014 | | | | | |
| 6.500%, 09/01/2039 | | | 893,000 | | | | 952,399 | | | | | |
| 7.500%, 11/15/2040 | | | 6,617,000 | | | | 7,633,501 | | | | | |
| Kinder Morgan, Inc.: | | | | | | | | | | | | |
| 5.000%, 02/15/2021 (2) | | | 4,155,000 | | | | 4,256,858 | | | | | |
| 5.625%, 11/15/2023 (2) | | | 5,017,000 | | | | 5,303,682 | | | | | |
| 7.800%, 08/01/2031 | | | 14,995,000 | | | | 17,964,431 | | | | | |
| 7.750%, 01/15/2032 | | | 19,102,000 | | | | 22,865,267 | | | | | |
| Kraft Heinz Foods Co.: | | | | | | | | | | | | |
| 2.800%, 07/02/2020 | | | 4,000,000 | | | | 3,970,925 | | | | | |
| 3.000%, 06/01/2026 | | | 10,000,000 | | | | 8,920,830 | | | | | |
| 5.000%, 07/15/2035 | | | 14,740,000 | | | | 13,833,163 | | | | | |
| Laboratory Corp. of America Holdings, | | | | | | | | | | | | |
| 3.200%, 02/01/2022 | | | 2,400,000 | | | | 2,381,835 | | | | | |
| Lafarge SA, | | | | | | | | | | | | |
| 7.125%, 07/15/2036 (1) | | | 893,000 | | | | 1,053,036 | | | | | |
| Lockheed Martin Corp., | | | | | | | | | | | | |
| 3.100%, 01/15/2023 | | | 5,000,000 | | | | 4,955,768 | | | | | |
| Magellan Midstream Partners LP, | | | | | | | | | | | | |
| 3.200%, 03/15/2025 | | | 5,000,000 | | | | 4,720,927 | | | | | |
| Marathon Petroleum Corp.: | | | | | | | | | | | | |
| 3.400%, 12/15/2020 | | | 10,825,000 | | | | 10,821,714 | | | | | |
| 3.625%, 09/15/2024 | | | 1,600,000 | | | | 1,556,871 | | | | | |
| 4.750%, 09/15/2044 | | | 1,500,000 | | | | 1,322,784 | | | | | |
| Martin Marietta Materials, Inc., | | | | | | | | | | | | |
| 6.250%, 05/01/2037 | | | 893,000 | | | | 994,224 | | | | | |
| Medtronic, Inc., | | | | | | | | | | | | |
| 3.150%, 03/15/2022 | | | 3,975,000 | | | | 3,964,027 | | | | | |
| Microchip Technology, Inc.: | | | | | | | | | | | | |
| 3.922%, 06/01/2021 (2) | | | 19,981,000 | | | | 19,820,906 | | | | | |
| 4.333%, 06/01/2023 (2) | | | 5,000,000 | | | | 4,877,075 | | | | | |
| Microsoft Corp.: | | | | | | | | | | | | |
| 4.450%, 11/03/2045 | | | 10,000,000 | | | | 10,606,405 | | | | | |
| 3.950%, 08/08/2056 | | | 12,000,000 | | | | 11,708,100 | | | | | |
| Molex Electronic Technologies LLC, | | | | | | | | | | | | |
| 2.878%, 04/15/2020 (2) | | | 23,093,000 | | | | 22,870,084 | | | | | |
| Mosaic Co.: | | | | | | | | | | | | |
| 4.250%, 11/15/2023 | | | 5,000,000 | | | | 5,025,636 | | | | | |
| 5.450%, 11/15/2033 | | | 2,000,000 | | | | 2,055,706 | | | | | |
| 4.875%, 11/15/2041 | | | 5,000,000 | | | | 4,554,492 | | | | | |
| MPLX LP: | | | | | | | | | | | | |
| 4.500%, 07/15/2023 | | | 22,405,000 | | | | 22,629,305 | | | | | |
| 4.875%, 12/01/2024 | | | 12,165,000 | | | | 12,383,129 | | | | | |
| 4.875%, 06/01/2025 | | | 12,500,000 | | | | 12,614,533 | | | | | |
| 4.125%, 03/01/2027 | | | 7,275,000 | | | | 6,926,628 | | | | | |
| 4.500%, 04/15/2038 | | | 5,725,000 | | | | 4,999,912 | | | | | |
| Mylan NV: | | | | | | | | | | | | |
| 3.150%, 06/15/2021 (1) | | | 5,000,000 | | | | 4,889,818 | | | | | |
| 3.950%, 06/15/2026 (1) | | | 28,925,000 | | | | 26,362,612 | | | | | |
| Mylan, Inc., | | | | | | | | | | | | |
| 4.550%, 04/15/2028 (2) | | | 10,000,000 | | | | 9,320,263 | | | | | |
| Newell Brands, Inc., | | | | | | | | | | | | |
| 3.850%, 04/01/2023 | | | 15,000,000 | | | | 14,780,181 | | | | | |
| Nutrien Ltd.: | | | | | | | | | | | | |
| 6.500%, 05/15/2019 (1) | | | 5,000,000 | | | | 5,057,224 | | | | | |
| 3.375%, 03/15/2025 (1) | | | 2,625,000 | | | | 2,466,188 | | | | | |
| Nvent Finance Sarl, | | | | | | | | | | | | |
| 4.550%, 04/15/2028 (1) | | | 15,525,000 | | | | 15,210,816 | | | | | |
| ONEOK Partners LP: | | | | | | | | | | | | |
| 8.625%, 03/01/2019 | | | 7,627,000 | | | | 7,681,013 | | | | | |
| 5.000%, 09/15/2023 | | | 1,200,000 | | | | 1,236,467 | | | | | |
| ONEOK, Inc., | | | | | | | | | | | | |
| 7.500%, 09/01/2023 | | | 5,000,000 | | | | 5,681,401 | | | | | |
| Orange SA, | | | | | | | | | | | | |
| 9.000%, 03/01/2031 (1) | | | 19,783,000 | | | | 27,333,728 | | | | | |
| Pactiv LLC, | | | | | | | | | | | | |
| 7.950%, 12/15/2025 | | | 286,000 | | | | 280,818 | | | | | |
| Pernod Ricard SA: | | | | | | | | | | | | |
| 4.450%, 01/15/2022 (1)(2) | | | 331,000 | | | | 337,604 | | | | | |
| 4.250%, 07/15/2022 (1)(2) | | | 20,527,000 | | | | 20,823,341 | | | | | |
| Perrigo Finance Unlimited Co., | | | | | | | | | | | | |
| 4.375%, 03/15/2026 (1) | | | 4,875,000 | | | | 4,424,236 | | | | | |
| Pfizer, Inc., | | | | | | | | | | | | |
| 5.800%, 08/12/2023 | | | 3,938,000 | | | | 4,371,327 | | | | | |
| Phillips 66: | | | | | | | | | | | | |
| 4.300%, 04/01/2022 | | | 10,000,000 | | | | 10,266,295 | | | | | |
| 5.875%, 05/01/2042 | | | 6,000,000 | | | | 6,550,260 | | | | | |
| 4.875%, 11/15/2044 | | | 21,130,000 | | | | 20,619,041 | | | | | |
| Phillips 66 Partners LP: | | | | | | | | | | | | |
| 3.605%, 02/15/2025 | | | 3,000,000 | | | | 2,882,206 | | | | | |
| 3.550%, 10/01/2026 | | | 7,000,000 | | | | 6,542,662 | | | | | |
| POSCO, | | | | | | | | | | | | |
| 4.250%, 10/28/2020 (1)(2) | | | 975,000 | | | | 988,163 | | | | | |
| Qualcomm, Inc., | | | | | | | | | | | | |
| 2.250%, 05/20/2020 | | | 3,600,000 | | | | 3,549,959 | | | | | |
| Regency Energy Partners LP / Regency Energy Finance Corp., | | | | | | | | | | | | |
| 5.875%, 03/01/2022 | | | 8,955,000 | | | | 9,317,450 | | | | | |
| Republic Services, Inc., | | | | | | | | | | | | |
| 5.500%, 09/15/2019 | | | 7,400,000 | | | | 7,514,644 | | | | | |
| Rio Tinto Alcan, Inc., | | | | | | | | | | | | |
| 5.750%, 06/01/2035 (1) | | | 446,000 | | | | 512,338 | | | | | |
| Rockies Express Pipeline LLC, | | | | | | | | | | | | |
| 5.625%, 04/15/2020 (2) | | | 1,785,000 | | | | 1,785,000 | | | | | |
| Rockwell Collins, Inc., | | | | | | | | | | | | |
| 4.350%, 04/15/2047 | | | 9,175,000 | | | | 8,440,459 | | | | | |
| Sabine Pass Liquefaction LLC: | | | | | | | | | | | | |
| 5.625%, 03/01/2025 | | | 17,500,000 | | | | 18,173,043 | | | | | |
| 5.875%, 06/30/2026 | | | 38,000,000 | | | | 40,234,558 | | | | | |
| Samarco Mineracao SA, | | | | | | | | | | | | |
| 5.750%, 10/24/2023 (1)(2)(7) | | | 4,463,000 | | | | 3,503,455 | | | | | |
| Seagate HDD Cayman, | | | | | | | | | | | | |
| 4.750%, 06/01/2023 (1) | | | 7,500,000 | | | | 7,012,736 | | | | | |
| Shell International Finance BV: | | | | | | | | | | | | |
| 3.250%, 05/11/2025 (1) | | | 5,725,000 | | | | 5,645,075 | | | | | |
| 4.125%, 05/11/2035 (1) | | | 10,000,000 | | | | 9,924,567 | | | | | |
| Sherwin-Williams Co., | | | | | | | | | | | | |
| 4.500%, 06/01/2047 | | | 4,000,000 | | | | 3,607,058 | | | | | |
| Shire Acquisitions Investments Ireland DAC, | | | | | | | | | | | | |
| 2.875%, 09/23/2023 (1) | | | 25,000,000 | | | | 23,632,926 | | | | | |
| SK Telecom Co. Ltd., | | | | | | | | | | | | |
| 6.625%, 07/20/2027 (1)(2) | | | 1,339,000 | | | | 1,603,158 | | | | | |
| Smithfield Foods, Inc.: | | | | | | | | | | | | |
| 2.650%, 10/03/2021 (2) | | | 6,000,000 | | | | 5,734,222 | | | | | |
| 3.350%, 02/01/2022 (2) | | | 20,062,000 | | | | 19,185,772 | | | | | |
| Solvay Finance America LLC: | | | | | | | | | | | | |
| 3.400%, 12/03/2020 (2) | | | 15,088,000 | | | | 15,079,839 | | | | | |
| 4.450%, 12/03/2025 (2) | | | 43,329,000 | | | | 42,965,844 | | | | | |
| Spectra Energy Partners LP, | | | | | | | | | | | | |
| 4.500%, 03/15/2045 | | | 7,000,000 | | | | 6,329,585 | | | | | |
| Sprint Capital Corp., | | | | | | | | | | | | |
| 6.900%, 05/01/2019 | | | 2,499,000 | | | | 2,511,495 | | | | | |
| Stryker Corp., | | | | | | | | | | | | |
| 2.625%, 03/15/2021 | | | 6,225,000 | | | | 6,141,002 | | | | | |
| Sunoco Logistics Partners Operations LP: | | | | | | | | | | | | |
| 3.900%, 07/15/2026 | | | 12,000,000 | | | | 11,082,189 | | | | | |
| 5.400%, 10/01/2047 | | | 7,425,000 | | | | 6,728,581 | | | | | |
| Sysco Corp., | | | | | | | | | | | | |
| 3.300%, 07/15/2026 | | | 11,550,000 | | | | 10,991,661 | | | | | |
| TC PipeLines LP: | | | | | | | | | | | | |
| 4.375%, 03/13/2025 | | | 31,115,000 | | | | 31,034,413 | | | | | |
| 3.900%, 05/25/2027 | | | 10,327,000 | | | | 9,858,123 | | | | | |
| Telecom Italia Capital SA: | | | | | | | | | | | | |
| 7.175%, 06/18/2019 (1) | | | 1,785,000 | | | | 1,797,388 | | | | | |
| 7.200%, 07/18/2036 (1) | | | 5,475,000 | | | | 5,228,625 | | | | | |
| Telefonica Emisiones SAU: | | | | | | | | | | | | |
| 5.462%, 02/16/2021 (1) | | | 8,830,000 | | | | 9,150,961 | | | | | |
| 5.213%, 03/08/2047 (1) | | | 7,225,000 | | | | 6,613,751 | | | | | |
| 4.895%, 03/06/2048 (1) | | | 12,550,000 | | | | 11,076,863 | | | | | |
| Teva Pharmaceutical Finance Netherlands III BV: | | | | | | | | | | | | |
| 2.800%, 07/21/2023 (1) | | | 25,000,000 | | | | 21,531,138 | | | | | |
| 3.150%, 10/01/2026 (1) | | | 15,000,000 | | | | 11,448,219 | | | | | |
| Thermo Fisher Scientific, Inc., | | | | | | | | | | | | |
| 3.000%, 04/15/2023 | | | 7,975,000 | | | | 7,758,783 | | | | | |
| Time Warner Cable LLC: | | | | | | | | | | | | |
| 6.550%, 05/01/2037 | | | 893,000 | | | | 916,432 | | | | | |
| 6.750%, 06/15/2039 | | | 2,767,000 | | | | 2,811,620 | | | | | |
| Time Warner, Inc.: | | | | | | | | | | | | |
| 3.600%, 07/15/2025 | | | 2,200,000 | | | | 2,083,668 | | | | | |
| 3.875%, 01/15/2026 | | | 7,000,000 | | | | 6,685,677 | | | | | |
| 2.950%, 07/15/2026 | | | 6,250,000 | | | | 5,587,713 | | | | | |
| 3.800%, 02/15/2027 | | | 6,300,000 | | | | 5,911,311 | | | | | |
| Timken Co.: | | | | | | | | | | | | |
| 3.875%, 09/01/2024 | | | 2,000,000 | | | | 1,994,377 | | | | | |
| 4.500%, 12/15/2028 | | | 6,550,000 | | | | 6,448,301 | | | | | |
| Transcontinental Gas Pipe Line Co. LLC: | | | | | | | | | | | | |
| 7.250%, 12/01/2026 | | | 3,500,000 | | | | 4,151,897 | | | | | |
| 4.600%, 03/15/2048 | | | 5,150,000 | | | | 4,815,340 | | | | | |
| TTX Co.: | | | | | | | | | | | | |
| 3.600%, 01/15/2025 (2) | | | 5,000,000 | | | | 4,975,219 | | | | | |
| 3.900%, 02/01/2045 (2) | | | 10,250,000 | | | | 9,423,242 | | | | | |
| Vale Overseas Ltd.: | | | | | | | | | | | | |
| 6.250%, 08/10/2026 (1) | | | 7,000,000 | | | | 7,560,000 | | | | | |
| 8.250%, 01/17/2034 (1) | | | 8,526,000 | | | | 10,540,267 | | | | | |
| 6.875%, 11/21/2036 (1) | | | 3,483,000 | | | | 3,982,811 | | | | | |
| 6.875%, 11/10/2039 (1) | | | 16,643,000 | | | | 19,222,665 | | | | | |
| Valero Energy Corp., | | | | | | | | | | | | |
| 6.625%, 06/15/2037 | | | 2,100,000 | | | | 2,300,837 | | | | | |
| Valero Energy Partners LP, | | | | | | | | | | | | |
| 4.375%, 12/15/2026 | | | 10,000,000 | | | | 9,833,560 | | | | | |
| Verisk Analytics, Inc., | | | | | | | | | | | | |
| 5.800%, 05/01/2021 | | | 8,325,000 | | | | 8,751,687 | | | | | |
| Verizon Communications, Inc.: | | | | | | | | | | | | |
| 4.329%, 09/21/2028 | | | 3,077,000 | | | | 3,089,646 | | | | | |
| 4.500%, 08/10/2033 | | | 16,325,000 | | | | 16,114,174 | | | | | |
| 4.272%, 01/15/2036 | | | 8,148,000 | | | | 7,609,199 | | | | | |
| 5.250%, 03/16/2037 | | | 18,000,000 | | | | 18,749,997 | | | | | |
| 4.812%, 03/15/2039 | | | 36,839,000 | | | | 36,075,986 | | | | | |
| Vodafone Group PLC: | | | | | | | | | | | | |
| 7.875%, 02/15/2030 (1) | | | 3,100,000 | | | | 3,862,033 | | | | | |
| 5.000%, 05/30/2038 (1) | | | 6,800,000 | | | | 6,371,684 | | | | | |
| 4.375%, 02/19/2043 (1) | | | 15,554,000 | | | | 13,235,772 | | | | | |
| Volkswagen Group of America Finance LLC: | | | | | | | | | | | | |
| 4.000%, 11/12/2021 (2) | | | 8,000,000 | | | | 7,995,032 | | | | | |
| 4.250%, 11/13/2023 (2) | | | 17,350,000 | | | | 17,207,829 | | | | | |
| Vulcan Materials Co., | | | | | | | | | | | | |
| 4.700%, 03/01/2048 | | | 3,446,000 | | | | 2,991,854 | | | | | |
| Wabtec Corp.: | | | | | | | | | | | | |
| 4.375%, 08/15/2023 | | | 2,678,000 | | | | 2,675,317 | | | | | |
| 3.450%, 11/15/2026 | | | 19,315,000 | | | | 17,360,679 | | | | | |
| Walgreens Boots Alliance, Inc.: | | | | | | | | | | | | |
| 3.300%, 11/18/2021 | | | 6,383,000 | | | | 6,353,645 | | | | | |
| 3.800%, 11/18/2024 | | | 5,934,000 | | | | 5,843,761 | | | | | |
| 4.500%, 11/18/2034 | | | 4,750,000 | | | | 4,555,550 | | | | | |
| Western Gas Partners LP: | | | | | | | | | | | | |
| 5.375%, 06/01/2021 | | | 3,353,000 | | | | 3,453,509 | | | | | |
| 4.000%, 07/01/2022 | | | 7,110,000 | | | | 7,049,113 | | | | | |
| 3.950%, 06/01/2025 | | | 8,000,000 | | | | 7,536,980 | | | | | |
| WestRock MWV LLC: | | | | | | | | | | | | |
| 9.750%, 06/15/2020 | | | 143,000 | | | | 154,263 | | | | | |
| 8.200%, 01/15/2030 | | | 7,963,000 | | | | 10,109,747 | | | | | |
| Williams Companies, Inc., | | | | | | | | | | | | |
| 4.550%, 06/24/2024 | | | 5,000,000 | | | | 5,048,549 | | | | | |
| Williams Partners LP: | | | | | | | | | | | | |
| 3.600%, 03/15/2022 | | | 10,176,000 | | | | 9,984,792 | | | | | |
| 6.300%, 04/15/2040 | | | 2,767,000 | | | | 2,943,488 | | | | | |
| 4.850%, 03/01/2048 | | | 7,000,000 | | | | 6,351,827 | | | | | |
| Woodside Finance Ltd., | | | | | | | | | | | | |
| 3.650%, 03/05/2025 (1)(2) | | | 12,300,000 | | | | 11,682,916 | | | | | |
| WRKCo, Inc., | | | | | | | | | | | | |
| 3.000%, 09/15/2024 (2) | | | 10,000,000 | | | | 9,420,545 | | | | | |
| Yara International ASA, | | | | | | | | | | | | |
| 3.800%, 06/06/2026 (1)(2) | | | 13,965,000 | | | | 13,149,144 | | | | | |
| Zimmer Holdings, Inc., | | | | | | | | | | | | |
| 3.150%, 04/01/2022 | | | 9,500,000 | | | | 9,288,251 | | | | | |
| Zoetis, Inc.: | | | | | | | | | | | | |
| 3.450%, 11/13/2020 | | | 5,145,000 | | | | 5,159,191 | | | | | |
| 3.250%, 02/01/2023 | | | 34,200,000 | | | | 33,683,358 | | | | | |
| 4.700%, 02/01/2043 | | | 3,568,000 | | | | 3,617,740 | | | | | |
| | | | | | | | 3,112,249,935 | | | | 19.9 | % |
| Utilities | | | | | | | | | |
| Ameren Corp., | | | | | | | | | |
| 2.700%, 11/15/2020 | | | 10,000,000 | | | | 9,866,317 | | | | |
| Arizona Public Service Co., | | | | | | | | | | | |
| 8.750%, 03/01/2019 | | | 759,000 | | | | 765,805 | | | | |
| Ausgrid Finance Pty Ltd., | | | | | | | | | | | |
| 3.850%, 05/01/2023 (1)(2) | | | 5,000,000 | | | | 4,988,895 | | | | |
| Berkshire Hathaway Energy Co., | | | | | | | | | | | |
| 2.400%, 02/01/2020 | | | 5,000,000 | | | | 4,967,353 | | | | |
| Duke Energy Corp., | | | | | | | | | | | |
| 2.650%, 09/01/2026 | | | 10,000,000 | | | | 9,091,354 | | | | |
| Edison International, | | | | | | | | | | | |
| 2.950%, 03/15/2023 | | | 5,000,000 | | | | 4,723,143 | | | | |
| EDP Finance BV, | | | | | | | | | | | |
| 3.625%, 07/15/2024 (1)(2) | | | 19,175,000 | | | | 17,930,178 | | | | |
| Enel Finance International NV: | | | | | | | | | | | |
| 2.875%, 05/25/2022 (1)(2) | | | 7,000,000 | | | | 6,595,446 | | | | |
| 3.625%, 05/25/2027 (1)(2) | | | 22,790,000 | | | | 20,104,103 | | | | |
| 3.500%, 04/06/2028 (1)(2) | | | 8,000,000 | | | | 6,858,243 | | | | |
| 6.800%, 09/15/2037 (1)(2) | | | 4,565,000 | | | | 4,899,584 | | | | |
| 4.750%, 05/25/2047 (1)(2) | | | 34,392,000 | | | | 29,200,852 | | | | |
| Entergy Corp., | | | | | | | | | | | |
| 2.950%, 09/01/2026 | | | 13,075,000 | | | | 12,062,712 | | | | |
| Exelon Corp., | | | | | | | | | | | |
| 4.950%, 06/15/2035 | | | 3,500,000 | | | | 3,524,147 | | | | |
| Mega Advance Investments Ltd., | | | | | | | | | | | |
| 5.000%, 05/12/2021 (1)(2) | | | 4,909,000 | | | | 5,021,274 | | | | |
| National Rural Utilities Cooperative Finance Corp.: | | | | | | | | | | | |
| 2.000%, 01/27/2020 | | | 2,000,000 | | | | 1,981,079 | | | | |
| 8.000%, 03/01/2032 | | | 4,659,000 | | | | 6,411,588 | | | | |
| NiSource, Inc., | | | | | | | | | | | |
| 3.950%, 03/30/2048 | | | 11,750,000 | | | | 10,448,327 | | | | |
| PSEG Power LLC, | | | | | | | | | | | |
| 5.125%, 04/15/2020 | | | 3,575,000 | | | | 3,669,502 | | | | |
| RGS I&M Funding Corp., | | | | | | | | | | | |
| 9.820%, 06/07/2022 | | | 713,509 | | | | 809,469 | | | | |
| South Carolina Electric & Gas Co., | | | | | | | | | | | |
| 4.100%, 06/15/2046 | | | 10,000,000 | | | | 9,336,817 | | | | |
| Southern Co., | | | | | | | | | | | |
| 4.250%, 07/01/2036 | | | 5,525,000 | | | | 5,214,789 | | | | |
| Talent Yield Investments Ltd., | | | | | | | | | | | |
| 4.500%, 04/25/2022 (1)(2) | | | 1,785,000 | | | | 1,802,616 | | | | |
| | | | | | | | 180,273,593 | | | | 1.1 | % |
| Financials | | | | | | | | | | | | |
| ABN AMRO Bank NV: | | | | | | | | | | | | |
| 2.450%, 06/04/2020 (1)(2) | | | 9,000,000 | | | | 8,883,810 | | | | | |
| 7.750%, 05/15/2023 (1)(2) | | | 7,200,000 | | | | 8,029,591 | | | | | |
| 4.750%, 07/28/2025 (1)(2) | | | 18,414,000 | | | | 18,320,862 | | | | | |
| 4.800%, 04/18/2026 (1)(2) | | | 9,000,000 | | | | 8,984,790 | | | | | |
| AIA Group Ltd., | | | | | | | | | | | | |
| 3.200%, 03/11/2025 (1)(2) | | | 6,000,000 | | | | 5,778,813 | | | | | |
| American International Group, Inc.: | | | | | | | | | | | | |
| 6.400%, 12/15/2020 | | | 10,830,000 | | | | 11,436,369 | | | | | |
| 4.875%, 06/01/2022 | | | 17,698,000 | | | | 18,362,147 | | | | | |
| 4.125%, 02/15/2024 | | | 893,000 | | | | 896,656 | | | | | |
| 3.875%, 01/15/2035 | | | 4,875,000 | | | | 4,186,982 | | | | | |
| 8.175%, 05/15/2058 (3 Month LIBOR USD + 4.195%) (3) | | | 893,000 | | | | 1,018,020 | | | | | |
| Ameriprise Financial, Inc., | | | | | | | | | | | | |
| 7.300%, 06/28/2019 | | | 1,785,000 | | | | 1,820,883 | | | | | |
| AmSouth Bancorporation, | | | | | | | | | | | | |
| 6.750%, 11/01/2025 | | | 223,000 | | | | 253,668 | | | | | |
| Anthem, Inc.: | | | | | | | | | | | | |
| 5.100%, 01/15/2044 | | | 1,584,000 | | | | 1,607,331 | | | | | |
| 4.375%, 12/01/2047 | | | 8,650,000 | | | | 8,044,875 | | | | | |
| ANZ New Zealand (Int'l) Ltd.: | | | | | | | | | | | | |
| 2.850%, 08/06/2020 (1)(2) | | | 15,350,000 | | | | 15,228,894 | | | | | |
| 2.750%, 02/03/2021 (1)(2) | | | 3,000,000 | | | | 2,959,164 | | | | | |
| Aon PLC: | | | | | | | | | | | | |
| 4.000%, 11/27/2023 (1) | | | 6,150,000 | | | | 6,223,982 | | | | | |
| 3.875%, 12/15/2025 (1) | | | 9,126,000 | | | | 9,005,611 | | | | | |
| 4.450%, 05/24/2043 (1) | | | 1,274,000 | | | | 1,155,129 | | | | | |
| Australia & New Zealand Banking Group Ltd., | | | | | | | | | | | | |
| 4.500%, 03/19/2024 (1)(2) | | | 44,423,000 | | | | 44,394,871 | | | | | |
| Banco Santander SA: | | | | | | | | | | | | |
| 3.500%, 04/11/2022 (1) | | | 13,000,000 | | | | 12,757,423 | | | | | |
| 5.179%, 11/19/2025 (1) | | | 14,000,000 | | | | 13,930,702 | | | | | |
| 4.379%, 04/12/2028 (1) | | | 13,400,000 | | | | 12,511,922 | | | | | |
| Bank of America Corp.: | | | | | | | | | | | | |
| 2.369%, 07/21/2021 (3 Month LIBOR USD + 0.660%) (3) | | | 29,000,000 | | | | 28,481,032 | | | | | |
| 3.300%, 01/11/2023 | | | 7,000,000 | | | | 6,894,013 | | | | | |
| 4.125%, 01/22/2024 | | | 15,000,000 | | | | 15,204,410 | | | | | |
| 3.093%, 10/01/2025 (3 Month LIBOR USD + 1.090%) (3) | | | 15,000,000 | | | | 14,222,866 | | | | | |
| 3.500%, 04/19/2026 | | | 9,000,000 | | | | 8,661,027 | | | | | |
| 3.248%, 10/21/2027 | | | 6,000,000 | | | | 5,553,872 | | | | | |
| 7.750%, 05/14/2038 | | | 1,138,000 | | | | 1,471,753 | | | | | |
| Bank of Montreal, | | | | | | | | | | | | |
| 3.100%, 04/13/2021 (1) | | | 12,500,000 | | | | 12,493,722 | | | | | |
| Bank of Nova Scotia: | | | | | | | | | | | | |
| 2.450%, 09/19/2022 (1) | | | 10,000,000 | | | | 9,655,179 | | | | | |
| 4.500%, 12/16/2025 (1) | | | 5,500,000 | | | | 5,476,457 | | | | | |
| Bank of Tokyo-Mitsubishi UFJ Ltd.: | | | | | | | | | | | | |
| 4.100%, 09/09/2023 (1)(2) | | | 2,911,000 | | | | 2,961,352 | | | | | |
| 3.750%, 03/10/2024 (1)(2) | | | 2,800,000 | | | | 2,813,858 | | | | | |
| Barclays Bank PLC, | | | | | | | | | | | | |
| 10.179%, 06/12/2021 (1)(2) | | | 12,770,000 | | | | 14,355,371 | | | | | |
| Barclays PLC: | | | | | | | | | | | | |
| 3.250%, 01/12/2021 (1) | | | 12,175,000 | | | | 11,922,953 | | | | | |
| 3.684%, 01/10/2023 (1) | | | 24,625,000 | | | | 23,661,084 | | | | | |
| 4.610%, 02/15/2023 (3 Month LIBOR USD + 1.400%) (1)(3) | | | 10,000,000 | | | | 9,915,612 | | | | | |
| 4.338%, 05/16/2024 (3 Month LIBOR USD + 1.356%) (1)(3) | | | 5,000,000 | | | | 4,861,233 | | | | | |
| 3.650%, 03/16/2025 (1) | | | 8,100,000 | | | | 7,466,086 | | | | | |
| BB&T Corp., | | | | | | | | | | | | |
| 2.625%, 06/29/2020 | | | 5,000,000 | | | | 4,955,240 | | | | | |
| Berkshire Hathaway, Inc., | | | | | | | | | | | | |
| 2.750%, 03/15/2023 | | | 14,675,000 | | | | 14,406,079 | | | | | |
| BNP Paribas SA: | | | | | | | | | | | | |
| 2.375%, 05/21/2020 (1) | | | 10,000,000 | | | | 9,890,823 | | | | | |
| 3.500%, 03/01/2023 (1)(2) | | | 5,000,000 | | | | 4,847,562 | | | | | |
| 3.250%, 03/03/2023 (1) | | | 3,570,000 | | | | 3,508,100 | | | | | |
| 3.375%, 01/09/2025 (1)(2) | | | 8,350,000 | | | | 7,857,994 | | | | | |
| BNZ International Funding Ltd.: | | | | | | | | | | | | |
| 2.400%, 02/21/2020 (1)(2) | | | 7,000,000 | | | | 6,931,404 | | | | | |
| 2.750%, 03/02/2021 (1)(2) | | | 14,000,000 | | | | 13,798,211 | | | | | |
| 2.650%, 11/03/2022 (1)(2) | | | 20,350,000 | | | | 19,622,698 | | | | | |
| 3.375%, 03/01/2023 (1)(2) | | | 20,000,000 | | | | 19,755,461 | | | | | |
| BPCE SA: | | | | | | | | | | | | |
| 2.500%, 07/15/2019 (1) | | | 7,925,000 | | | | 7,894,576 | | | | | |
| 5.700%, 10/22/2023 (1)(2) | | | 21,395,000 | | | | 22,152,897 | | | | | |
| 4.000%, 04/15/2024 (1) | | | 2,500,000 | | | | 2,509,790 | | | | | |
| 5.150%, 07/21/2024 (1)(2) | | | 31,285,000 | | | | 31,414,649 | | | | | |
| 4.500%, 03/15/2025 (1)(2) | | | 10,000,000 | | | | 9,677,507 | | | | | |
| Capital One Financial Corp.: | | | | | | | | | | | | |
| 3.050%, 03/09/2022 | | | 4,000,000 | | | | 3,901,325 | | | | | |
| 3.200%, 01/30/2023 | | | 6,550,000 | | | | 6,373,943 | | | | | |
| Capital One NA: | | | | | | | | | | | | |
| 2.400%, 09/05/2019 | | | 12,000,000 | | | | 11,927,129 | | | | | |
| 1.850%, 09/13/2019 | | | 5,000,000 | | | | 4,945,259 | | | | | |
| 3.375%, 02/15/2023 | | | 41,962,000 | | | | 40,517,190 | | | | | |
| Cigna Corp., | | | | | | | | | | | | |
| 4.125%, 11/15/2025 (2) | | | 13,000,000 | | | | 12,981,692 | | | | | |
| Citigroup, Inc.: | | | | | | | | | | | | |
| 2.350%, 08/02/2021 | | | 9,000,000 | | | | 8,743,155 | | | | | |
| 2.750%, 04/25/2022 | | | 8,675,000 | | | | 8,426,670 | | | | | |
| 3.142%, 01/24/2023 (3 Month LIBOR USD + 0.722%) (3) | | | 12,200,000 | | | | 11,983,461 | | | | | |
| 2.876%, 07/24/2023 (3 Month LIBOR USD + 0.950%) (3) | | | 20,350,000 | | | | 19,693,276 | | | | | |
| 4.168%, 09/01/2023 (3 Month LIBOR USD + 1.430%) (3) | | | 7,000,000 | | | | 7,003,871 | | | | | |
| 3.750%, 06/16/2024 | | | 1,000,000 | | | | 992,988 | | | | | |
| 3.700%, 01/12/2026 | | | 4,500,000 | | | | 4,326,588 | | | | | |
| 3.887%, 01/10/2028 (3 Month LIBOR USD + 1.563%) (3) | | | 7,600,000 | | | | 7,333,307 | | | | | |
| Citizens Bank NA: | | | | | | | | | | | | |
| 2.450%, 12/04/2019 | | | 19,300,000 | | | | 19,163,178 | | | | | |
| 2.250%, 03/02/2020 | | | 4,750,000 | | | | 4,699,149 | | | | | |
| CNA Financial Corp.: | | | | | | | | | | | | |
| 5.750%, 08/15/2021 | | | 7,199,000 | | | | 7,597,398 | | | | | |
| 7.250%, 11/15/2023 | | | 4,000,000 | | | | 4,536,922 | | | | | |
| 4.500%, 03/01/2026 | | | 14,000,000 | | | | 14,114,360 | | | | | |
| 3.450%, 08/15/2027 | | | 9,550,000 | | | | 8,885,327 | | | | | |
| Comerica Bank: | | | | | | | | | | | | |
| 2.500%, 06/02/2020 | | | 29,000,000 | | | | 28,639,786 | | | | | |
| 4.000%, 07/27/2025 | | | 10,000,000 | | | | 9,935,769 | | | | | |
| Compass Bank: | | | | | | | | | | | | |
| 2.750%, 09/29/2019 | | | 31,216,000 | | | | 31,052,092 | | | | | |
| 2.875%, 06/29/2022 | | | 8,000,000 | | | | 7,665,780 | | | | | |
| 3.875%, 04/10/2025 | | | 24,985,000 | | | | 23,951,230 | | | | | |
| Cooperatieve Rabobank UA: | | | | | | | | | | | | |
| 4.625%, 12/01/2023 (1) | | | 14,630,000 | | | | 14,833,798 | | | | | |
| 3.750%, 07/21/2026 (1) | | | 12,000,000 | | | | 11,245,638 | | | | | |
| Credit Agricole SA: | | | | | | | | | | | | |
| 3.375%, 01/10/2022 (1)(2) | | | 10,180,000 | | | | 10,013,377 | | | | | |
| 3.750%, 04/24/2023 (1)(2) | | | 5,000,000 | | | | 4,892,701 | | | | | |
| 4.375%, 03/17/2025 (1)(2) | | | 3,000,000 | | | | 2,904,333 | | | | | |
| 4.000%, 01/10/2033 (5 Year Swap Rate USD + 1.644%) (1)(2)(3) | | | 8,000,000 | | | | 7,325,957 | | | | | |
| Credit Suisse AG: | | | | | | | | | | | | |
| 5.300%, 08/13/2019 (1) | | | 1,406,000 | | | | 1,423,706 | | | | | |
| 5.400%, 01/14/2020 (1) | | | 5,000,000 | | | | 5,077,340 | | | | | |
| 3.625%, 09/09/2024 (1) | | | 4,325,000 | | | | 4,243,646 | | | | | |
| Credit Suisse Group AG: | | | | | | | | | | | | |
| 3.574%, 01/09/2023 (1)(2) | | | 17,000,000 | | | | 16,584,033 | | | | | |
| 4.207%, 06/12/2024 (3 Month LIBOR USD + 1.240%) (1)(2)(3) | | | 8,325,000 | | | | 8,303,452 | | | | | |
| 4.282%, 01/09/2028 (1)(2) | | | 8,900,000 | | | | 8,585,875 | | | | | |
| 3.869%, 01/12/2029 (3 Month LIBOR USD + 1.410%) (1)(2)(3) | | | 11,000,000 | | | | 10,233,418 | | | | | |
| Credit Suisse Group Funding Guernsey Ltd.: | | | | | | | | | | | | |
| 3.800%, 06/09/2023 (1) | | | 14,550,000 | | | | 14,277,725 | | | | | |
| 4.550%, 04/17/2026 (1) | | | 2,000,000 | | | | 1,980,171 | | | | | |
| Credit Suisse USA, Inc., | | | | | | | | | | | | |
| 7.125%, 07/15/2032 | | | 5,063,000 | | | | 6,368,257 | | | | | |
| Daiwa Securities Group, Inc., | | | | | | | | | | | | |
| 3.129%, 04/19/2022 (1)(2) | | | 12,000,000 | | | | 11,807,621 | | | | | |
| Deutsche Bank AG: | | | | | | | | | | | | |
| 2.700%, 07/13/2020 (1) | | | 5,300,000 | | | | 5,154,978 | | | | | |
| 2.950%, 08/20/2020 (1) | | | 575,000 | | | | 558,105 | | | | | |
| 3.125%, 01/13/2021 (1) | | | 1,625,000 | | | | 1,572,691 | | | | | |
| 3.150%, 01/22/2021 (1) | | | 3,000,000 | | | | 2,899,137 | | | | | |
| 4.250%, 10/14/2021 (1) | | | 36,125,000 | | | | 35,321,315 | | | | | |
| 3.300%, 11/16/2022 (1) | | | 22,175,000 | | | | 20,550,685 | | | | | |
| 3.700%, 05/30/2024 (1) | | | 10,000,000 | | | | 9,083,804 | | | | | |
| Discover Bank: | | | | | | | | | | | | |
| 3.350%, 02/06/2023 | | | 8,600,000 | | | | 8,370,891 | | | | | |
| 4.200%, 08/08/2023 | | | 20,000,000 | | | | 20,004,601 | | | | | |
| 3.450%, 07/27/2026 | | | 12,000,000 | | | | 11,003,958 | | | | | |
| Discover Financial Services: | | | | | | | | | | | | |
| 3.950%, 11/06/2024 | | | 10,000,000 | | | | 9,866,974 | | | | | |
| 4.100%, 02/09/2027 | | | 9,150,000 | | | | 8,542,153 | | | | | |
| Fifth Third Bancorp, | | | | | | | | | | | | |
| 2.875%, 07/27/2020 | | | 6,000,000 | | | | 5,965,395 | | | | | |
| First Horizon National Corp., | | | | | | | | | | | | |
| 3.500%, 12/15/2020 | | | 29,078,000 | | | | 29,076,233 | | | | | |
| First Tennessee Bank NA, | | | | | | | | | | | | |
| 2.950%, 12/01/2019 | | | 5,612,000 | | | | 5,568,499 | | | | | |
| FirstMerit Bank NA, | | | | | | | | | | | | |
| 4.270%, 11/25/2026 | | | 4,600,000 | | | | 4,489,563 | | | | | |
| FMR LLC, | | | | | | | | | | | | |
| 4.950%, 02/01/2033 (2) | | | 1,750,000 | | | | 1,899,599 | | | | | |
| GE Capital International Funding Co. Unlimited Co., | | | | | | | | | | | | |
| 2.342%, 11/15/2020 (1) | | | 12,638,000 | | | | 12,196,369 | | | | | |
| Goldman Sachs Group, Inc.: | | | | | | | | | | | | |
| 2.550%, 10/23/2019 | | | 2,700,000 | | | | 2,682,944 | | | | | |
| 2.350%, 11/15/2021 | | | 6,175,000 | | | | 5,954,004 | | | | | |
| 3.000%, 04/26/2022 | | | 20,000,000 | | | | 19,368,865 | | | | | |
| 2.905%, 07/24/2023 (3 Month LIBOR USD + 0.990%) (3) | | | 8,000,000 | | | | 7,620,610 | | | | | |
| 4.306%, 11/29/2023 (3 Month LIBOR USD + 1.600%) (3) | | | 5,000,000 | | | | 4,955,072 | | | | | |
| 3.850%, 07/08/2024 | | | 3,000,000 | | | | 2,932,700 | | | | | |
| 3.500%, 01/23/2025 | | | 3,000,000 | | | | 2,843,734 | | | | | |
| 3.750%, 05/22/2025 | | | 5,000,000 | | | | 4,783,861 | | | | | |
| 3.272%, 09/29/2025 (3 Month LIBOR USD + 1.201%) (3) | | | 15,000,000 | | | | 14,060,588 | | | | | |
| 4.259%, 10/28/2027 (3 Month LIBOR USD + 1.750%) (3) | | | 10,000,000 | | | | 9,606,580 | | | | | |
| 3.691%, 06/05/2028 (3 Month LIBOR USD + 1.510%) (3) | | | 6,775,000 | | | | 6,296,485 | | | | | |
| 4.223%, 05/01/2029 (3 Month LIBOR USD + 1.301%) (3) | | | 10,000,000 | | | | 9,623,883 | | | | | |
| 6.345%, 02/15/2034 | | | 1,053,000 | | | | 1,175,236 | | | | | |
| Guardian Life Global Funding, | | | | | | | | | | | | |
| 3.400%, 04/25/2023 (2) | | | 6,950,000 | | | | 6,923,917 | | | | | |
| Guardian Life Insurance Co. of America: | | | | | | | | | | | | |
| 4.875%, 06/19/2064 (2) | | | 2,000,000 | | | | 2,007,573 | | | | | |
| 4.850%, 01/24/2077 (2) | | | 22,227,000 | | | | 21,873,400 | | | | | |
| Hartford Financial Services Group, Inc., | | | | | | | | | | | | |
| 5.125%, 04/15/2022 | | | 1,538,000 | | | | 1,612,245 | | | | | |
| Highmark, Inc., | | | | | | | | | | | | |
| 4.750%, 05/15/2021 (2) | | | 4,378,000 | | | | 4,469,512 | | | | | |
| HSBC Bank PLC, | | | | | | | | | | | | |
| 7.650%, 05/01/2025 (1) | | | 2,525,000 | | | | 2,910,173 | | | | | |
| HSBC Bank USA NA, | | | | | | | | | | | | |
| 7.000%, 01/15/2039 | | | 4,200,000 | | | | 5,271,192 | | | | | |
| HSBC Holdings PLC: | | | | | | | | | | | | |
| 2.650%, 01/05/2022 (1) | | | 4,000,000 | | | | 3,880,514 | | | | | |
| 3.262%, 03/13/2023 (3 Month LIBOR USD + 1.055%) (1)(3) | | | 15,600,000 | | | | 15,267,057 | | | | | |
| 3.600%, 05/25/2023 (1) | | | 2,275,000 | | | | 2,262,010 | | | | | |
| 3.950%, 05/18/2024 (3 Month LIBOR USD + 0.987%) (1)(3) | | | 6,000,000 | | | | 5,967,600 | | | | | |
| 4.292%, 09/12/2026 (3 Month LIBOR USD + 1.348%) (1)(3) | | | 7,450,000 | | | | 7,338,080 | | | | | |
| 4.375%, 11/23/2026 (1) | | | 10,000,000 | | | | 9,681,200 | | | | | |
| HSBC USA, Inc.: | | | | | | | | | | | | |
| 2.350%, 03/05/2020 | | | 3,000,000 | | | | 2,969,711 | | | | | |
| 5.000%, 09/27/2020 | | | 3,716,000 | | | | 3,794,814 | | | | | |
| 9.125%, 05/15/2021 | | | 625,000 | | | | 691,215 | | | | | |
| Huntington Bancshares, Inc.: | | | | | | | | | | | | |
| 3.150%, 03/14/2021 | | | 7,600,000 | | | | 7,566,164 | | | | | |
| 2.300%, 01/14/2022 | | | 26,450,000 | | | | 25,537,740 | | | | | |
| ING Bank NV: | | | | | | | | | | | | |
| 2.500%, 10/01/2019 (1)(2) | | | 3,500,000 | | | | 3,484,075 | | | | | |
| 2.450%, 03/16/2020 (1)(2) | | | 9,225,000 | | | | 9,136,822 | | | | | |
| 5.800%, 09/25/2023 (1)(2) | | | 43,525,000 | | | | 45,463,112 | | | | | |
| Invesco Finance PLC: | | | | | | | | | | | | |
| 3.125%, 11/30/2022 (1) | | | 5,902,000 | | | | 5,784,764 | | | | | |
| 3.750%, 01/15/2026 (1) | | | 4,900,000 | | | | 4,777,878 | | | | | |
| Jackson National Life Global Funding, | | | | | | | | | | | | |
| 3.250%, 01/30/2024 (2) | | | 23,475,000 | | | | 23,017,707 | | | | | |
| Jefferies Group LLC: | | | | | | | | | | | | |
| 6.875%, 04/15/2021 | | | 3,570,000 | | | | 3,798,964 | | | | | |
| 6.250%, 01/15/2036 | | | 1,390,000 | | | | 1,393,747 | | | | | |
| Jefferies Group LLC / Jefferies Group Capital Finance, Inc.: | | | | | | | | | | | | |
| 4.850%, 01/15/2027 | | | 4,600,000 | | | | 4,395,708 | | | | | |
| 4.150%, 01/23/2030 | | | 10,000,000 | | | | 8,575,112 | | | | | |
| John Hancock Life Insurance Co., | | | | | | | | | | | | |
| 7.375%, 02/15/2024 (2) | | | 13,339,000 | | | | 15,437,389 | | | | | |
| JPMorgan Chase & Co.: | | | | | | | | | | | | |
| 2.250%, 01/23/2020 | | | 3,675,000 | | | | 3,638,396 | | | | | |
| 4.250%, 10/15/2020 | | | 886,000 | | | | 901,965 | | | | | |
| 2.550%, 03/01/2021 | | | 7,000,000 | | | | 6,901,298 | | | | | |
| 2.295%, 08/15/2021 | | | 18,000,000 | | | | 17,561,570 | | | | | |
| 3.717%, 10/24/2023 (3 Month LIBOR USD + 1.230%) (3) | | | 15,000,000 | | | | 14,996,213 | | | | | |
| 3.559%, 04/23/2024 (3 Month LIBOR USD + 0.730%) (3) | | | 15,000,000 | | | | 14,886,555 | | | | | |
| 3.125%, 01/23/2025 | | | 14,000,000 | | | | 13,337,885 | | | | | |
| 5.600%, 07/15/2041 | | | 4,106,000 | | | | 4,625,902 | | | | | |
| KEB Hana Bank, | | | | | | | | | | | | |
| 1.750%, 10/18/2019 (1)(2) | | | 20,000,000 | | | | 19,793,200 | | | | | |
| KeyBank NA: | | | | | | | | | | | | |
| 2.250%, 03/16/2020 | | | 5,000,000 | | | | 4,946,873 | | | | | |
| 3.400%, 05/20/2026 | | | 18,965,000 | | | | 18,191,300 | | | | | |
| Kookmin Bank, | | | | | | | | | | | | |
| 1.625%, 08/01/2019 (1)(2) | | | 7,000,000 | | | | 6,924,155 | | | | | |
| LeasePlan Corp. NV, | | | | | | | | | | | | |
| 2.875%, 01/22/2019 (1)(2) | | | 11,000,000 | | | | 10,995,898 | | | | | |
| Liberty Mutual Group, Inc.: | | | | | | | | | | | | |
| 4.250%, 06/15/2023 (2) | | | 2,678,000 | | | | 2,700,003 | | | | | |
| 10.750%, 06/15/2058 (3 Month LIBOR USD + 7.120%) (2)(3) | | | 2,231,000 | | | | 3,190,330 | | | | | |
| Liberty Mutual Insurance Co., | | | | | | | | | | | | |
| 7.697%, 10/15/2097 (2) | | | 465,000 | | | | 627,611 | | | | | |
| Lincoln National Corp., | | | | | | | | | | | | |
| 4.509%, 04/20/2067 (3 Month LIBOR USD + 2.040%) (3) | | | 1,004,000 | | | | 782,618 | | | | | |
| Lloyds Bank PLC, | | | | | | | | | | | | |
| 5.800%, 01/13/2020 (1)(2) | | | 1,428,000 | | | | 1,461,732 | | | | | |
| Lloyds Banking Group PLC: | | | | | | | | | | | | |
| 2.907%, 11/07/2023 (3 Month LIBOR USD + 0.810%) (1)(3) | | | 18,669,000 | | | | 17,678,296 | | | | | |
| 3.574%, 11/07/2028 (3 Month LIBOR USD + 1.205%) (1)(3) | | | 10,000,000 | | | | 8,895,234 | | | | | |
| Macquarie Bank Ltd.: | | | | | | | | | | | | |
| 2.400%, 01/21/2020 (1)(2) | | | 17,000,000 | | | | 16,849,356 | | | | | |
| 4.875%, 06/10/2025 (1)(2) | | | 7,600,000 | | | | 7,551,229 | | | | | |
| Macquarie Group Ltd.: | | | | | | | | | | | | |
| 7.625%, 08/13/2019 (1)(2) | | | 3,944,000 | | | | 4,046,104 | | | | | |
| 3.189%, 11/28/2023 (3 Month LIBOR USD + 1.023%) (1)(2)(3) | | | 19,000,000 | | | | 18,261,717 | | | | | |
| 4.150%, 03/27/2024 (3 Month LIBOR USD + 1.330%) (1)(2)(3) | | | 24,000,000 | | | | 24,002,742 | | | | | |
| Manufacturers & Traders Trust Co., | | | | | | | | | | | | |
| 2.100%, 02/06/2020 | | | 10,850,000 | | | | 10,733,474 | | | | | |
| Manulife Financial Corp.: | | | | | | | | | | | | |
| 4.150%, 03/04/2026 (1) | | | 10,000,000 | | | | 10,099,881 | | | | | |
| 5.375%, 03/04/2046 (1) | | | 5,150,000 | | | | 5,535,793 | | | | | |
| Marsh & McLennan Companies, Inc.: | | | | | | | | | | | | |
| 5.875%, 08/01/2033 | | | 4,700,000 | | | | 5,491,411 | | | | | |
| 4.350%, 01/30/2047 | | | 3,450,000 | | | | 3,217,307 | | | | | |
| Massachusetts Mutual Life Insurance Co.: | | | | | | | | | | | | |
| 8.875%, 06/01/2039 (2) | | | 8,124,000 | | | | 12,177,350 | | | | | |
| 4.500%, 04/15/2065 (2) | | | 3,000,000 | | | | 2,796,521 | | | | | |
| 4.900%, 04/01/2077 (2) | | | 11,175,000 | | | | 11,143,864 | | | | | |
| MBIA Insurance Corp., | | | | | | | | | | | | |
| 13.696%, 01/15/2033 (3 Month LIBOR USD + 11.260%) (2)(7) | | | 714,000 | | | | 435,540 | | | | | |
| MetLife, Inc.: | | | | | | | | | | | | |
| 6.500%, 12/15/2032 | | | 466,000 | | | | 570,635 | | | | | |
| 4.875%, 11/13/2043 | | | 3,375,000 | | | | 3,521,604 | | | | | |
| 4.050%, 03/01/2045 | | | 12,375,000 | | | | 11,535,074 | | | | | |
| Mitsubishi UFJ Financial Group, Inc.: | | | | | | | | | | | | |
| 2.950%, 03/01/2021 (1) | | | 8,738,000 | | | | 8,650,212 | | | | | |
| 2.190%, 09/13/2021 (1) | | | 12,400,000 | | | | 11,970,264 | | | | | |
| 2.665%, 07/25/2022 (1) | | | 9,000,000 | | | | 8,746,494 | | | | | |
| 3.455%, 03/02/2023 (1) | | | 10,650,000 | | | | 10,584,620 | | | | | |
| Mizuho Financial Group, Inc.: | | | | | | | | | | | | |
| 2.632%, 04/12/2021 (1)(2) | | | 13,000,000 | | | | 12,753,437 | | | | | |
| 2.953%, 02/28/2022 (1) | | | 12,575,000 | | | | 12,328,121 | | | | | |
| 2.601%, 09/11/2022 (1) | | | 13,000,000 | | | | 12,573,907 | | | | | |
| 3.922%, 09/11/2024 (3 Month LIBOR USD + 1.000%) (1)(3) | | | 5,000,000 | | | | 5,052,868 | | | | | |
| Morgan Stanley: | | | | | | | | | | | | |
| 7.300%, 05/13/2019 | | | 15,110,000 | | | | 15,339,346 | | | | | |
| 2.375%, 07/23/2019 | | | 1,000,000 | | | | 995,654 | | | | | |
| 5.625%, 09/23/2019 | | | 1,941,000 | | | | 1,969,725 | | | | | |
| 2.650%, 01/27/2020 | | | 4,200,000 | | | | 4,168,475 | | | | | |
| 2.800%, 06/16/2020 | | | 5,000,000 | | | | 4,967,522 | | | | | |
| 2.500%, 04/21/2021 | | | 8,000,000 | | | | 7,830,364 | | | | | |
| 2.750%, 05/19/2022 | | | 20,000,000 | | | | 19,457,611 | | | | | |
| 3.887%, 10/24/2023 (3 Month LIBOR USD + 1.400%) (3) | | | 8,000,000 | | | | 7,961,104 | | | | | |
| 3.875%, 04/29/2024 | | | 1,650,000 | | | | 1,642,114 | | | | | |
| 3.700%, 10/23/2024 | | | 4,000,000 | | | | 3,933,562 | | | | | |
| 3.591%, 07/22/2028 (3 Month LIBOR USD + 1.340%) (3) | | | 12,000,000 | | | | 11,346,045 | | | | | |
| 3.772%, 01/24/2029 (3 Month LIBOR USD + 1.140%) (3) | | | 1,000,000 | | | | 956,775 | | | | | |
| National Australia Bank Ltd., | | | | | | | | | | | | |
| 2.500%, 07/12/2026 (1) | | | 7,875,000 | | | | 7,177,096 | | | | | |
| Nationwide Building Society: | | | | | | | | | | | | |
| 3.766%, 03/08/2024 (3 Month LIBOR USD + 1.064%) (1)(2)(3) | | | 20,000,000 | | | | 19,248,676 | | | | | |
| 4.000%, 09/14/2026 (1)(2) | | | 30,507,000 | | | | 27,768,167 | | | | | |
| 4.302%, 03/08/2029 (3 Month LIBOR USD + 1.452%) (1)(2)(3) | | | 20,000,000 | | | | 18,793,002 | | | | | |
| 4.125%, 10/18/2032 (5 Year Mid Swap Rate USD + 1.849%) (1)(2)(3) | | | 7,000,000 | | | | 6,194,854 | | | | | |
| Nationwide Financial Services, Inc., | | | | | | | | | | | | |
| 5.375%, 03/25/2021 (2) | | | 16,905,000 | | | | 17,516,658 | | | | | |
| New York Life Insurance Co., | | | | | | | | | | | | |
| 6.750%, 11/15/2039 (2) | | | 12,026,000 | | | | 15,774,593 | | | | | |
| Nomura Holdings, Inc., | | | | | | | | | | | | |
| 6.700%, 03/04/2020 (1) | | | 1,667,000 | | | | 1,731,358 | | | | | |
| Nordea Bank AB, | | | | | | | | | | | | |
| 4.250%, 09/21/2022 (1)(2) | | | 15,793,000 | | | | 15,873,807 | | | | | |
| Peachtree Corners Funding Trust, | | | | | | | | | | | | |
| 3.976%, 02/15/2025 (2) | | | 8,000,000 | | | | 7,760,130 | | | | | |
| People's United Bank NA, | | | | | | | | | | | | |
| 4.000%, 07/15/2024 | | | 11,400,000 | | | | 11,430,386 | | | | | |
| PNC Bank NA, | | | | | | | | | | | | |
| 4.200%, 11/01/2025 | | | 2,678,000 | | | | 2,741,269 | | | | | |
| Pricoa Global Funding I, | | | | | | | | | | | | |
| 2.550%, 11/24/2020 (2) | | | 14,000,000 | | | | 13,804,826 | | | | | |
| Principal Financial Group, Inc.: | | | | | | | | | | | | |
| 3.300%, 09/15/2022 | | | 1,860,000 | | | | 1,847,529 | | | | | |
| 3.125%, 05/15/2023 | | | 4,667,000 | | | | 4,606,826 | | | | | |
| 3.400%, 05/15/2025 | | | 16,000,000 | | | | 15,558,051 | | | | | |
| 4.300%, 11/15/2046 | | | 2,325,000 | | | | 2,139,184 | | | | | |
| Principal Life Global Funding II: | | | | | | | | | | | | |
| 2.200%, 04/08/2020 (2) | | | 4,000,000 | | | | 3,954,274 | | | | | |
| 3.000%, 04/18/2026 (2) | | | 13,400,000 | | | | 12,861,514 | | | | | |
| Protective Life Corp.: | | | | | | | | | | | | |
| 7.375%, 10/15/2019 | | | 7,096,000 | | | | 7,294,361 | | | | | |
| 4.300%, 09/30/2028 (2) | | | 10,000,000 | | | | 9,912,499 | | | | | |
| 8.450%, 10/15/2039 | | | 1,400,000 | | | | 1,898,097 | | | | | |
| Protective Life Global Funding, | | | | | | | | | | | | |
| 2.700%, 11/25/2020 (2) | | | 8,000,000 | | | | 7,905,284 | | | | | |
| Prudential Financial, Inc.: | | | | | | | | | | | | |
| 3.878%, 03/27/2028 | | | 11,000,000 | | | | 11,054,482 | | | | | |
| 6.625%, 12/01/2037 | | | 5,000,000 | | | | 6,040,665 | | | | | |
| 3.935%, 12/07/2049 | | | 11,426,000 | | | | 10,214,600 | | | | | |
| RBC USA Holdco Corp., | | | | | | | | | | | | |
| 5.250%, 09/15/2020 | | | 2,025,000 | | | | 2,087,148 | | | | | |
| Regions Financial Corp.: | | | | | | | | | | | | |
| 3.200%, 02/08/2021 | | | 25,000,000 | | | | 24,840,097 | | | | | |
| 2.750%, 08/14/2022 | | | 8,800,000 | | | | 8,490,066 | | | | | |
| Reliance Standard Life Global Funding II: | | | | | | | | | | | | |
| 2.500%, 01/15/2020 (2) | | | 6,940,000 | | | | 6,873,656 | | | | | |
| 2.375%, 05/04/2020 (2) | | | 30,000,000 | | | | 29,612,793 | | | | | |
| Royal Bank of Canada, | | | | | | | | | | | | |
| 4.650%, 01/27/2026 (1) | | | 7,773,000 | | | | 8,001,586 | | | | | |
| Royal Bank of Scotland Group PLC: | | | | | | | | | | | | |
| 3.498%, 05/15/2023 (3 Month LIBOR USD + 1.480%) (1)(3) | | | 10,000,000 | | | | 9,616,174 | | | | | |
| 3.875%, 09/12/2023 (1) | | | 10,000,000 | | | | 9,586,874 | | | | | |
| 4.892%, 05/18/2029 (3 Month LIBOR USD + 1.754%) (1)(3) | | | 10,000,000 | | | | 9,545,468 | | | | | |
| 5.076%, 01/27/2030 (3 Month LIBOR USD + 1.905%) (1)(3) | | | 7,000,000 | | | | 6,749,860 | | | | | |
| Santander Holdings USA, Inc., | | | | | | | | | | | | |
| 2.650%, 04/17/2020 | | | 2,000,000 | | | | 1,974,123 | | | | | |
| Santander UK Group Holdings PLC: | | | | | | | | | | | | |
| 2.875%, 10/16/2020 (1) | | | 4,866,000 | | | | 4,781,108 | | | | | |
| 3.125%, 01/08/2021 (1) | | | 2,600,000 | | | | 2,552,467 | | | | | |
| 3.571%, 01/10/2023 (1) | | | 5,000,000 | | | | 4,785,936 | | | | | |
| 4.796%, 11/15/2024 (3 Month LIBOR USD + 1.570%) (1)(3) | | | 5,050,000 | | | | 5,014,355 | | | | | |
| 3.823%, 11/03/2028 (3 Month LIBOR USD + 1.400%) (1)(3) | | | 6,000,000 | | | | 5,423,425 | | | | | |
| Santander UK PLC, | | | | | | | | | | | | |
| 5.000%, 11/07/2023 (1)(2) | | | 15,880,000 | | | | 15,506,661 | | | | | |
| Skandinaviska Enskilda Banken AB, | | | | | | | | | | | | |
| 2.450%, 05/27/2020 (1)(2) | | | 15,000,000 | | | | 14,830,155 | | | | | |
| SMBC Aviation Capital Finance DAC, | | | | | | | | | | | | |
| 3.000%, 07/15/2022 (1)(2) | | | 8,000,000 | | | | 7,760,835 | | | | | |
| Societe Generale SA: | | | | | | | | | | | | |
| 2.500%, 04/08/2021 (1)(2) | | | 10,225,000 | | | | 9,993,117 | | | | | |
| 3.250%, 01/12/2022 (1)(2) | | | 8,000,000 | | | | 7,832,256 | | | | | |
| 4.250%, 09/14/2023 (1)(2) | | | 8,000,000 | | | | 7,945,090 | | | | | |
| 5.000%, 01/17/2024 (1)(2) | | | 10,000,000 | | | | 10,082,339 | | | | | |
| 4.250%, 04/14/2025 (1)(2) | | | 16,157,000 | | | | 15,464,589 | | | | | |
| Standard Chartered PLC: | | | | | | | | | | | | |
| 2.100%, 08/19/2019 (1)(2) | | | 14,000,000 | | | | 13,877,062 | | | | | |
| 2.250%, 04/17/2020 (1)(2) | | | 8,000,000 | | | | 7,841,024 | | | | | |
| 3.050%, 01/15/2021 (1)(2) | | | 4,500,000 | | | | 4,432,914 | | | | | |
| 5.700%, 03/26/2044 (1)(2) | | | 6,000,000 | | | | 6,004,061 | | | | | |
| Stifel Financial Corp., | | | | | | | | | | | | |
| 4.250%, 07/18/2024 | | | 7,850,000 | | | | 7,938,532 | | | | | |
| Sumitomo Mitsui Banking Corp.: | | | | | | | | | | | | |
| 2.450%, 01/16/2020 (1) | | | 20,500,000 | | | | 20,336,853 | | | | | |
| 3.950%, 07/19/2023 (1) | | | 1,850,000 | | | | 1,881,292 | | | | | |
| Sumitomo Mitsui Financial Group, Inc.: | | | | | | | | | | | | |
| 2.934%, 03/09/2021 (1) | | | 5,950,000 | | | | 5,887,370 | | | | | |
| 2.442%, 10/19/2021 (1) | | | 15,775,000 | | | | 15,381,474 | | | | | |
| 2.784%, 07/12/2022 (1) | | | 10,000,000 | | | | 9,744,084 | | | | | |
| 3.102%, 01/17/2023 (1) | | | 12,000,000 | | | | 11,771,338 | | | | | |
| SunTrust Banks, Inc.: | | | | | | | | | | | | |
| 2.900%, 03/03/2021 | | | 14,150,000 | | | | 14,027,595 | | | | | |
| 2.700%, 01/27/2022 | | | 12,800,000 | | | | 12,483,691 | | | | | |
| 3.300%, 05/15/2026 | | | 3,925,000 | | | | 3,719,233 | | | | | |
| Svenska Handelsbanken AB, | | | | | | | | | | | | |
| 2.400%, 10/01/2020 (1) | | | 5,200,000 | | | | 5,119,968 | | | | | |
| Swedbank AB, | | | | | | | | | | | | |
| 2.200%, 03/04/2020 (1)(2) | | | 6,468,000 | | | | 6,393,707 | | | | | |
| Synchrony Financial: | | | | | | | | | | | | |
| 3.000%, 08/15/2019 | | | 2,000,000 | | | | 1,986,798 | | | | | |
| 3.750%, 08/15/2021 | | | 10,225,000 | | | | 9,950,934 | | | | | |
| 4.250%, 08/15/2024 | | | 26,864,000 | | | | 24,716,852 | | | | | |
| 4.500%, 07/23/2025 | | | 23,127,000 | | | | 21,089,192 | | | | | |
| 3.950%, 12/01/2027 | | | 7,000,000 | | | | 5,895,949 | | | | | |
| TD Ameritrade Holding Corp.: | | | | | | | | | | | | |
| 2.950%, 04/01/2022 | | | 4,625,000 | | | | 4,575,385 | | | | | |
| 3.625%, 04/01/2025 | | | 7,000,000 | | | | 6,935,168 | | | | | |
| Torchmark Corp.: | | | | | | | | | | | | |
| 3.800%, 09/15/2022 | | | 12,475,000 | | | | 12,563,330 | | | | | |
| 4.550%, 09/15/2028 | | | 5,000,000 | | | | 5,080,225 | | | | | |
| Trinity Acquisition PLC: | | | | | | | | | | | | |
| 4.400%, 03/15/2026 (1) | | | 27,305,000 | | | | 27,133,406 | | | | | |
| 6.125%, 08/15/2043 (1) | | | 15,671,000 | | | | 17,380,430 | | | | | |
| UBS AG, | | | | | | | | | | | | |
| 3.588%, 06/01/2020 (3 Month LIBOR USD + 0.850%) (1)(3) | | | 4,710,000 | | | | 4,730,313 | | | | | |
| UBS Group Funding Switzerland AG: | | | | | | | | | | | | |
| 2.650%, 02/01/2022 (1)(2) | | | 14,150,000 | | | | 13,695,441 | | | | | |
| 3.491%, 05/23/2023 (1)(2) | | | 4,825,000 | | | | 4,705,492 | | | | | |
| 2.859%, 08/15/2023 (3 Month LIBOR USD + 0.954%) (1)(2)(3) | | | 21,550,000 | | | | 20,726,480 | | | | | |
| 4.253%, 03/23/2028 (1)(2) | | | 17,150,000 | | | | 16,910,573 | | | | | |
| Voya Financial, Inc.: | | | | | | | | | | | | |
| 3.125%, 07/15/2024 | | | 14,375,000 | | | | 13,554,885 | | | | | |
| 3.650%, 06/15/2026 | | | 5,800,000 | | | | 5,482,938 | | | | | |
| WEA Finance LLC / Westfield UK & Europe Finance PLC: | | | | | | | | | | | | |
| 2.700%, 09/17/2019 (2) | | | 5,985,000 | | | | 5,958,499 | | | | | |
| 3.250%, 10/05/2020 (2) | | | 8,000,000 | | | | 7,988,891 | | | | | |
| Wells Fargo & Co.: | | | | | | | | | | | | |
| 2.150%, 01/30/2020 | | | 2,750,000 | | | | 2,720,095 | | | | | |
| 2.500%, 03/04/2021 | | | 5,000,000 | | | | 4,917,864 | | | | | |
| 3.069%, 01/24/2023 | | | 10,000,000 | | | | 9,739,240 | | | | | |
| 3.757%, 10/31/2023 (3 Month LIBOR USD + 1.230%) (3) | | | 5,000,000 | | | | 4,984,536 | | | | | |
| 3.000%, 02/19/2025 | | | 5,000,000 | | | | 4,712,136 | | | | | |
| 3.000%, 04/22/2026 | | | 8,000,000 | | | | 7,454,711 | | | | | |
| 3.900%, 05/01/2045 | | | 5,000,000 | | | | 4,587,874 | | | | | |
| Wells Fargo Bank NA, | | | | | | | | | | | | |
| 5.850%, 02/01/2037 | | | 10,000,000 | | | | 11,292,650 | | | | | |
| Westpac Banking Corp., | | | | | | | | | | | | |
| 4.322%, 11/23/2031 (5 Year Mid Swap Rate USD + 2.236%) (1)(3) | | | 8,350,000 | | | | 7,925,635 | | | | | |
| Willis North America, Inc.: | | | | | | | | | | | | |
| 7.000%, 09/29/2019 | | | 5,463,000 | | | | 5,588,369 | | | | | |
| 3.600%, 05/15/2024 | | | 9,000,000 | | | | 8,787,241 | | | | | |
| 5.050%, 09/15/2048 | | | 2,500,000 | | | | 2,401,683 | | | | | |
| Willis Towers Watson PLC, | | | | | | | | | | | | |
| 5.750%, 03/15/2021 (1) | | | 13,879,000 | | | | 14,514,725 | | | | | |
| | | | | | | | 3,012,113,526 | | | | 19.3 | % |
| Total Corporate Bonds | | | | | | | 6,304,637,054 | | | | 40.3 | % |
| Municipal Bonds | | | | | | | | | |
| Atlanta Independent School System, | | | | | | | | | |
| 5.557%, 03/01/2026 | | | 4,465,000 | | | | 5,119,837 | | | | |
| California Housing Finance Agency: | | | | | | | | | | | |
| 3.656%, 02/01/2029 (Callable 08/01/2025) | | | 19,650,000 | | | | 19,500,070 | | | | |
| 2.794%, 08/01/2036 (Callable 08/01/2025) | | | 10,345,000 | | | | 10,073,651 | | | | |
| California Qualified School Bond Joint Powers Authority, | | | | | | | | | | | |
| 7.155%, 03/01/2027 | | | 6,695,000 | | | | 7,936,789 | | | | |
| California School Finance Authority, | | | | | | | | | | | |
| 5.041%, 07/01/2020 | | | 2,230,000 | | | | 2,294,559 | | | | |
| City of Berwyn IL, | | | | | | | | | | | |
| 5.790%, 12/01/2022 | | | 8,835,000 | | | | 8,852,582 | | | | |
| City of Vernon CA, | | | | | | | | | | | |
| 4.500%, 08/01/2022 | | | 7,265,000 | | | | 7,590,181 | | | | |
| County of Cuyahoga OH, | | | | | | | | | | | |
| 9.125%, 10/01/2023 | | | 895,000 | | | | 1,012,728 | | | | |
| Eaton Community City School District, | | | | | | | | | | | |
| 5.390%, 08/25/2027 (Callable 06/01/2020) | | | 2,305,000 | | | | 2,340,220 | | | | |
| Iowa Tobacco Settlement Authority, | | | | | | | | | | | |
| 6.500%, 06/01/2023 (Callable 01/31/2019) | | | 3,290,000 | | | | 3,337,179 | | | | |
| Kentucky Housing Corp., | | | | | | | | | | | |
| 3.500%, 01/01/2040 (Callable 07/01/2025) | | | 4,340,000 | | | | 4,322,380 | | | | |
| Louisiana Housing Corp., | | | | | | | | | | | |
| 2.100%, 12/01/2038 (Callable 09/01/2024) | | | 4,187,723 | | | | 3,869,791 | | | | |
| Maryland Community Development Administration Housing Revenue, | | | | | | | | | | | |
| 3.160%, 09/01/2041 (Callable 09/01/2025) | | | 15,590,000 | | | | 15,299,714 | | | | |
| New Hampshire Housing Finance Authority: | | | | | | | | | | | |
| 3.050%, 01/01/2021 | | | 750,000 | | | | 747,930 | | | | |
| 3.750%, 07/01/2034 (Callable 07/01/2023) | | | 1,120,000 | | | | 1,123,562 | | | | |
| 4.000%, 07/01/2036 (Callable 07/01/2025) | | | 6,290,000 | | | | 6,345,729 | | | | |
| North Carolina Housing Finance Agency, | | | | | | | | | | | |
| 2.812%, 07/01/2035 (Callable 01/01/2024) | | | 2,500,000 | | | | 2,435,550 | | | | |
| North Texas Tollway Authority, | | | | | | | | | | | |
| 8.910%, 02/01/2030 (Callable 02/01/2020) | | | 18,785,000 | | | | 19,870,773 | | | | |
| State of California, | | | | | | | | | | | |
| 7.950%, 03/01/2036 (Callable 03/01/2020) | | | 10,125,000 | | | | 10,689,570 | | | | |
| State Public School Building Authority, | | | | | | | | | | | |
| 5.000%, 09/15/2027 | | | 4,458,000 | | | | 4,885,522 | | | | |
| Three Rivers Local School District, | | | | | | | | | | | |
| 5.209%, 09/15/2027 (Callable 12/01/2020) | | | 2,365,000 | | | | 2,454,941 | | | | |
| West Contra Costa Unified School District, | | | | | | | | | | | |
| 6.250%, 08/01/2030 | | | 1,785,000 | | | | 2,246,476 | | | | |
| Westlake City School District, | | | | | | | | | | | |
| 5.227%, 12/01/2026 (Callable 12/01/2020) | | | 3,570,000 | | | | 3,735,505 | | | | |
| | | | | | | | 146,085,239 | | | | 0.9 | % |
| Residential Mortgage-Backed Securities | | | | | | | | | | | | |
| U.S. Government Agency Issues | | | | | | | | | | | | |
| Fannie Mae REMIC Trust: | | | | | | | | | | | | |
| Series 1989-37, Class G, 8.000%, 07/25/2019 | | | 2,682 | | | | 2,701 | | | | | |
| Series 1989-94, Class G, 7.500%, 12/25/2019 | | | 2,932 | | | | 2,959 | | | | | |
| Series 1990-58, Class J, 7.000%, 05/25/2020 | | | 416 | | | | 425 | | | | | |
| Series 1990-76, Class G, 7.000%, 07/25/2020 | | | 3,735 | | | | 3,786 | | | | | |
| Series 1990-105, Class J, 6.500%, 09/25/2020 | | | 3,093 | | | | 3,144 | | | | | |
| Series 1990-108, Class G, 7.000%, 09/25/2020 | | | 998 | | | | 1,015 | | | | | |
| Series 1991-1, Class G, 7.000%, 01/25/2021 | | | 1,363 | | | | 1,388 | | | | | |
| Series 1991-86, Class Z, 6.500%, 07/25/2021 | | | 4,568 | | | | 4,699 | | | | | |
| Series 1993-58, Class H, 5.500%, 04/25/2023 | | | 56,088 | | | | 57,704 | | | | | |
| Series 1998-66, Class C, 6.000%, 12/25/2028 | | | 40,477 | | | | 42,475 | | | | | |
| Federal Gold Loan Mortgage Corp. (FGLMC): | | | | | | | | | | | | |
| 6.000%, 06/01/2020 | | | 10,347 | | | | 10,410 | | | | | |
| 3.500%, 11/01/2025 | | | 2,539,392 | | | | 2,572,141 | | | | | |
| 3.000%, 12/01/2026 | | | 920,138 | | | | 923,646 | | | | | |
| 2.500%, 04/01/2028 | | | 2,789,679 | | | | 2,758,593 | | | | | |
| 6.500%, 06/01/2029 | | | 123,582 | | | | 135,692 | | | | | |
| 3.000%, 04/01/2031 | | | 8,100,865 | | | | 8,073,738 | | | | | |
| 3.000%, 02/01/2032 | | | 74,319,443 | | | | 74,070,571 | | | | | |
| 3.500%, 05/01/2032 | | | 20,751,320 | | | | 21,129,057 | | | | | |
| 3.500%, 07/01/2032 | | | 25,713,933 | | | | 26,182,073 | | | | | |
| 5.000%, 08/01/2033 | | | 5,054,511 | | | | 5,365,623 | | | | | |
| 3.500%, 01/01/2034 | | | 20,776,065 | | | | 21,154,286 | | | | | |
| 5.000%, 09/01/2035 | | | 10,624,461 | | | | 11,281,434 | | | | | |
| 5.500%, 01/01/2036 | | | 175,780 | | | | 189,520 | | | | | |
| 5.000%, 03/01/2036 | | | 4,534,255 | | | | 4,815,243 | | | | | |
| 6.000%, 12/01/2036 | | | 159,294 | | | | 173,972 | | | | | |
| 5.000%, 02/01/2038 | | | 2,525,036 | | | | 2,680,973 | | | | | |
| 5.500%, 05/01/2038 | | | 533,787 | | | | 569,938 | | | | | |
| 5.500%, 01/01/2039 | | | 11,188,686 | | | | 12,066,193 | | | | | |
| 4.500%, 11/01/2039 | | | 4,062,489 | | | | 4,252,722 | | | | | |
| 4.500%, 11/01/2039 | | | 4,732,253 | | | | 4,950,898 | | | | | |
| 4.500%, 12/01/2039 | | | 24,721,432 | | | | 25,884,891 | | | | | |
| 5.000%, 03/01/2040 | | | 1,002,038 | | | | 1,061,040 | | | | | |
| 4.500%, 08/01/2040 | | | 885,866 | | | | 927,552 | | | | | |
| 4.500%, 09/01/2040 | | | 3,276,553 | | | | 3,430,748 | | | | | |
| 4.000%, 01/01/2041 | | | 32,004,783 | | | | 32,930,976 | | | | | |
| 4.000%, 01/01/2041 | | | 16,343,563 | | | | 16,816,270 | | | | | |
| 4.500%, 03/01/2041 | | | 2,463,414 | | | | 2,579,335 | | | | | |
| 3.500%, 10/01/2041 | | | 10,242,060 | | | | 10,318,010 | | | | | |
| 4.000%, 03/01/2042 | | | 7,529,799 | | | | 7,747,678 | | | | | |
| 3.500%, 06/01/2042 | | | 5,157,973 | | | | 5,196,234 | | | | | |
| 3.500%, 07/01/2042 | | | 13,721,547 | | | | 13,823,334 | | | | | |
| 3.000%, 08/01/2042 | | | 17,972,884 | | | | 17,680,509 | | | | | |
| 3.000%, 10/01/2042 | | | 6,943,056 | | | | 6,826,876 | | | | | |
| 3.000%, 11/01/2042 | | | 38,200,619 | | | | 37,574,267 | | | | | |
| 3.500%, 12/01/2042 | | | 14,599,304 | | | | 14,707,575 | | | | | |
| 3.000%, 01/01/2043 | | | 13,605,770 | | | | 13,309,058 | | | | | |
| 3.000%, 01/01/2043 | | | 29,220,580 | | | | 28,718,029 | | | | | |
| 3.500%, 01/01/2043 | | | 22,784,686 | | | | 22,953,303 | | | | | |
| 3.000%, 02/01/2043 | | | 3,787,833 | | | | 3,722,690 | | | | | |
| 3.000%, 04/01/2043 | | | 9,510,489 | | | | 9,344,713 | | | | | |
| 3.000%, 04/01/2043 | | | 16,604,633 | | | | 16,321,057 | | | | | |
| 3.000%, 04/01/2043 | | | 6,016,730 | | | | 5,914,162 | | | | | |
| 3.500%, 04/01/2043 | | | 66,877,732 | | | | 67,312,123 | | | | | |
| 4.000%, 04/01/2043 | | | 20,874,860 | | | | 21,526,663 | | | | | |
| 3.500%, 05/01/2043 | | | 13,772,127 | | | | 13,874,203 | | | | | |
| 3.000%, 06/01/2043 | | | 19,568,747 | | | | 19,207,930 | | | | | |
| 3.000%, 08/01/2043 | | | 6,091,409 | | | | 5,984,282 | | | | | |
| 3.500%, 11/01/2043 | | | 10,581,581 | | | | 10,660,049 | | | | | |
| 3.500%, 01/01/2044 | | | 11,991,206 | | | | 12,080,146 | | | | | |
| 3.500%, 02/01/2044 | | | 43,060,771 | | | | 43,381,853 | | | | | |
| 4.000%, 03/01/2044 | | | 6,635,047 | | | | 6,783,950 | | | | | |
| 3.500%, 05/01/2044 | | | 43,614,393 | | | | 43,937,778 | | | | | |
| 4.000%, 05/01/2044 | | | 23,863,084 | | | | 24,553,410 | | | | | |
| 4.000%, 07/01/2044 | | | 5,590,958 | | | | 5,714,707 | | | | | |
| 3.500%, 10/01/2044 | | | 11,261,765 | | | | 11,319,140 | | | | | |
| 4.000%, 10/01/2044 | | | 13,199,109 | | | | 13,532,683 | | | | | |
| 3.500%, 01/01/2045 | | | 30,609,462 | | | | 30,836,555 | | | | | |
| 3.500%, 06/01/2045 | | | 22,434,994 | | | | 22,531,968 | | | | | |
| 3.000%, 10/01/2045 | | | 43,648,888 | | | | 42,883,149 | | | | | |
| 4.000%, 10/01/2045 | | | 9,117,205 | | | | 9,309,594 | | | | | |
| 4.000%, 11/01/2045 | | | 18,281,547 | | | | 18,665,436 | | | | | |
| 3.500%, 01/01/2046 | | | 41,886,570 | | | | 42,028,693 | | | | | |
| 4.000%, 02/01/2046 | | | 20,263,009 | | | | 20,686,491 | | | | | |
| 4.000%, 04/01/2046 | | | 12,682,013 | | | | 13,002,556 | | | | | |
| 3.500%, 05/01/2046 | | | 12,052,324 | | | | 12,087,001 | | | | | |
| 3.000%, 08/01/2046 | | | 5,570,138 | | | | 5,435,471 | | | | | |
| 3.500%, 08/01/2046 | | | 37,456,957 | | | | 37,665,363 | | | | | |
| 3.000%, 10/01/2046 | | | 15,372,441 | | | | 15,022,249 | | | | | |
| 3.000%, 10/01/2046 | | | 73,457,266 | | | | 71,715,462 | | | | | |
| 3.000%, 05/01/2047 | | | 71,697,025 | | | | 69,996,188 | | | | | |
| 4.000%, 08/01/2048 | | | 53,840,903 | | | | 55,091,188 | | | | | |
| Federal Home Loan Mortgage Corp. (FHLMC): | | | | | | | | | | | | |
| Series 141, Class D, 5.000%, 05/15/2021 | | | 1,163 | | | | 1,163 | | | | | |
| Series 1081, Class K, 7.000%, 05/15/2021 | | | 16,179 | | | | 16,552 | | | | | |
| Series 163, Class F, 6.000%, 07/15/2021 (4) | | | 2,721 | | | | 2,761 | | | | | |
| Series 188, Class H, 7.000%, 09/15/2021 | | | 6,106 | | | | 6,192 | | | | | |
| Federal National Mortgage Association (FNMA): | | | | | | | | | | | | |
| 5.000%, 11/01/2021 | | | 106,760 | | | | 108,621 | | | | | |
| 3.000%, 04/01/2027 | | | 7,330,112 | | | | 7,352,931 | | | | | |
| 3.500%, 07/01/2027 | | | 35,140,188 | | | | 35,628,315 | | | | | |
| 2.500%, 12/01/2027 | | | 9,479,539 | | | | 9,352,524 | | | | | |
| 2.500%, 05/01/2028 | | | 12,753,103 | | | | 12,582,177 | | | | | |
| 5.000%, 05/01/2028 | | | 184,184 | | | | 192,939 | | | | | |
| 3.000%, 11/01/2028 | | | 24,830,961 | | | | 24,908,387 | | | | | |
| 4.500%, 08/01/2029 | | | 1,447,822 | | | | 1,503,402 | | | | | |
| 4.500%, 09/01/2029 | | | 1,666,731 | | | | 1,730,696 | | | | | |
| 2.500%, 04/01/2030 | | | 4,654,324 | | | | 4,557,408 | | | | | |
| 2.500%, 05/01/2030 | | | 14,848,195 | | | | 14,539,007 | | | | | |
| 3.000%, 12/01/2030 | | | 23,771,073 | | | | 23,728,377 | | | | | |
| 3.000%, 12/01/2030 | | | 14,924,072 | | | | 14,934,070 | | | | | |
| 3.500%, 01/01/2032 | | | 51,071,777 | | | | 52,021,153 | | | | | |
| 2.500%, 02/01/2032 | | | 8,297,109 | | | | 8,106,124 | | | | | |
| 3.000%, 09/01/2032 | | | 3,369,351 | | | | 3,375,482 | | | | | |
| 6.000%, 03/01/2033 | | | 44,345 | | | | 48,358 | | | | | |
| 3.500%, 10/01/2033 | | | 24,120,832 | | | | 24,569,022 | | | | | |
| 4.500%, 10/01/2033 | | | 17,102,696 | | | | 17,802,780 | | | | | |
| 5.000%, 10/01/2033 | | | 18,587,842 | | | | 19,737,228 | | | | | |
| 5.000%, 11/01/2033 | | | 51,497 | | | | 54,681 | | | | | |
| 4.000%, 01/01/2034 | | | 7,626,349 | | | | 7,911,960 | | | | | |
| 5.500%, 04/01/2034 | | | 6,209,558 | | | | 6,687,200 | | | | | |
| 4.000%, 06/01/2034 | | | 10,207,222 | | | | 10,589,501 | | | | | |
| 4.000%, 09/01/2034 | | | 12,112,058 | | | | 12,565,713 | | | | | |
| 5.500%, 09/01/2034 | | | 164,367 | | | | 176,839 | | | | | |
| 6.000%, 11/01/2034 | | | 44,424 | | | | 48,454 | | | | | |
| 5.500%, 02/01/2035 | | | 558,905 | | | | 601,862 | | | | | |
| 5.000%, 07/01/2035 | | | 4,818,924 | | | | 5,116,226 | | | | | |
| 5.000%, 10/01/2035 | | | 2,381,623 | | | | 2,529,174 | | | | | |
| 5.000%, 02/01/2036 | | | 3,403,170 | | | | 3,613,848 | | | | | |
| 5.500%, 11/01/2036 | | | 218,346 | | | | 235,112 | | | | | |
| 2.500%, 12/01/2036 | | | 32,669,100 | | | | 31,393,505 | | | | | |
| 5.500%, 04/01/2037 | | | 1,397,636 | | | | 1,496,723 | | | | | |
| 4.000%, 05/01/2037 | | | 54,551,796 | | | | 56,215,407 | | | | | |
| 4.000%, 04/01/2039 | | | 13,182,558 | | | | 13,570,398 | | | | | |
| 5.000%, 06/01/2039 | | | 11,345,920 | | | | 12,044,802 | | | | | |
| 5.000%, 06/01/2039 | | | 16,584,454 | | | | 17,494,405 | | | | | |
| 4.500%, 11/01/2039 | | | 231,381 | | | | 242,299 | | | | | |
| 4.000%, 08/01/2040 | | | 1,671,507 | | | | 1,718,728 | | | | | |
| 3.500%, 12/01/2040 | | | 10,323,760 | | | | 10,404,303 | | | | | |
| 4.000%, 12/01/2040 | | | 10,083,723 | | | | 10,368,609 | | | | | |
| 3.500%, 02/01/2041 | | | 16,106,694 | | | | 16,232,420 | | | | | |
| 4.000%, 02/01/2041 | | | 23,816,216 | | | | 24,503,964 | | | | | |
| 3.500%, 03/01/2041 | | | 23,282,678 | | | | 23,464,418 | | | | | |
| 4.500%, 05/01/2041 | | | 8,591,018 | | | | 8,998,549 | | | | | |
| 4.000%, 06/01/2041 | | | 19,403,426 | | | | 19,950,842 | | | | | |
| 4.500%, 07/01/2041 | | | 8,849,835 | | | | 9,269,303 | | | | | |
| 5.000%, 07/01/2041 | | | 12,639,983 | | | | 13,418,496 | | | | | |
| 3.500%, 09/01/2041 | | | 23,573,713 | | | | 23,757,730 | | | | | |
| 4.000%, 09/01/2041 | | | 2,636,593 | | | | 2,711,095 | | | | | |
| 4.000%, 10/01/2041 | | �� | 7,140,523 | | | | 7,342,300 | | | | | |
| 3.500%, 11/01/2041 | | | 9,324,234 | | | | 9,396,317 | | | | | |
| 3.500%, 12/01/2041 | | | 40,795,258 | | | | 41,113,401 | | | | | |
| 4.000%, 12/01/2041 | | | 9,718,249 | | | | 9,992,865 | | | | | |
| 4.000%, 01/01/2042 | | | 12,837,809 | | | | 13,200,320 | | | | | |
| 4.500%, 01/01/2042 | | | 12,665,300 | | | | 13,265,696 | | | | | |
| 4.000%, 02/01/2042 | | | 48,603,077 | | | | 49,976,179 | | | | | |
| 3.000%, 05/01/2042 | | | 9,074,095 | | | | 8,925,792 | | | | | |
| 3.500%, 07/01/2042 | | | 105,620,411 | | | | 106,444,739 | | | | | |
| 3.500%, 08/01/2042 | | | 9,414,184 | | | | 9,487,672 | | | | | |
| 4.000%, 08/01/2042 | | | 17,614,149 | | | | 18,111,760 | | | | | |
| 3.000%, 10/01/2042 | | | 20,992,837 | | | | 20,653,847 | | | | | |
| 3.000%, 03/01/2043 | | | 38,017,035 | | | | 37,355,447 | | | | | |
| 3.000%, 03/01/2043 | | | 6,637,923 | | | | 6,526,947 | | | | | |
| 3.000%, 05/01/2043 | | | 36,973,862 | | | | 36,377,086 | | | | | |
| 3.000%, 05/01/2043 | | | 22,141,588 | | | | 21,760,793 | | | | | |
| 3.000%, 06/01/2043 | | | 9,286,961 | | | | 9,126,165 | | | | | |
| 3.000%, 07/01/2043 | | | 3,553,791 | | | | 3,491,888 | | | | | |
| 4.000%, 07/01/2043 | | | 32,954,425 | | | | 33,884,870 | | | | | |
| 3.000%, 08/01/2043 | | | 5,848,247 | | | | 5,746,911 | | | | | |
| 3.500%, 09/01/2043 | | | 57,261,546 | | | | 57,792,892 | | | | | |
| 4.500%, 09/01/2043 | | | 13,708,703 | | | | 14,358,469 | | | | | |
| 3.500%, 10/01/2043 | | | 63,333,302 | | | | 63,827,571 | | | | | |
| 3.000%, 11/01/2043 | | | 29,825,730 | | | | 29,333,734 | | | | | |
| 4.000%, 01/01/2045 | | | 9,251,484 | | | | 9,477,396 | | | | | |
| 3.500%, 02/01/2045 | | | 44,623,299 | | | | 44,971,488 | | | | | |
| 4.000%, 02/01/2045 | | | 22,764,671 | | | | 23,407,440 | | | | | |
| 3.500%, 04/01/2045 | | | 33,176,375 | | | | 33,301,821 | | | | | |
| 4.000%, 10/01/2045 | | | 10,059,759 | | | | 10,303,965 | | | | | |
| 4.000%, 11/01/2045 | | | 40,272,433 | | | | 41,098,429 | | | | | |
| 3.500%, 12/01/2045 | | | 38,481,059 | | | | 38,568,969 | | | | | |
| 4.500%, 02/01/2046 | | | 37,339,020 | | | | 39,106,809 | | | | | |
| 3.000%, 05/01/2046 | | | 17,012,430 | | | | 16,628,859 | | | | | |
| 3.500%, 05/01/2046 | | | 66,350,551 | | | | 66,543,208 | | | | | |
| 3.000%, 07/01/2046 | | | 10,731,221 | | | | 10,489,262 | | | | | |
| 4.500%, 08/01/2046 | | | 33,235,411 | | | | 34,600,460 | | | | | |
| 3.000%, 11/01/2046 | | | 28,504,735 | | | | 27,929,848 | | | | | |
| 3.500%, 11/01/2046 | | | 58,734,619 | | | | 58,941,499 | | | | | |
| 4.000%, 11/01/2047 | | | 33,538,201 | | | | 34,195,457 | | | | | |
| 4.000%, 07/01/2048 | | | 36,835,361 | | | | 37,849,729 | | | | | |
| Government National Mortgage Association (GNMA): | | | | | | | | | | | | |
| 6.000%, 11/20/2033 | | | 42,704 | | | | 46,296 | | | | | |
| 5.000%, 07/20/2040 | | | 1,972,382 | | | | 2,104,156 | | | | | |
| 3.500%, 10/20/2041 | | | 8,948,816 | | | | 9,061,674 | | | | | |
| 3.500%, 01/15/2042 | | | 15,281,834 | | | | 15,463,957 | | | | | |
| 4.000%, 06/20/2042 | | | 10,154,833 | | | | 10,486,230 | | | | | |
| 3.500%, 09/20/2042 | | | 3,894,259 | | | | 3,938,632 | | | | | |
| 3.500%, 01/20/2043 | | | 25,320,022 | | | | 25,608,470 | | | | | |
| 3.500%, 03/20/2045 | | | 19,228,761 | | | | 19,369,198 | | | | | |
| 3.000%, 04/20/2045 | | | 31,055,303 | | | | 30,691,587 | | | | | |
| 3.500%, 04/20/2045 | | | 27,105,818 | | | | 27,330,939 | | | | | |
| 4.000%, 08/20/2045 | | | 12,772,025 | | | | 13,143,124 | | | | | |
| 4.500%, 01/20/2046 | | | 17,985,233 | | | | 18,859,632 | | | | | |
| 4.000%, 04/20/2046 | | | 13,732,932 | | | | 14,089,810 | | | | | |
| 4.000%, 05/20/2046 | | | 34,206,667 | | | | 35,158,738 | | | | | |
| 3.000%, 06/20/2046 | | | 21,909,099 | | | | 21,607,384 | | | | | |
| 3.000%, 08/20/2046 | | | 44,638,463 | | | | 44,023,620 | | | | | |
| 4.500%, 06/20/2047 | | | 64,507,059 | | | | 66,792,275 | | | | | |
| 4.500%, 07/20/2047 | | | 15,954,945 | | | | 16,520,163 | | | | | |
| | | | | | | | 3,421,488,027 | | | | 21.9 | % |
| Non-U.S. Government Agency Issues | | | | | | | | | |
| Alternative Loan Trust: | | | | | | | | | |
| Series 2005-50CB, Class 4A1, 5.000%, 11/25/2020 (6) | | | 64,048 | | | | 63,626 | | | | |
| Series 2006-7CB, Class 3A1, 5.250%, 05/25/2021 (6) | | | 439,594 | | | | 429,143 | | | | |
| Series 2006-J5, Class 3A1, 4.455%, 07/25/2021 (4) | | | 99,238 | | | | 94,521 | | | | |
| Series 2006-43CB, Class 2A1, 6.000%, 02/25/2022 (6) | | | 80,473 | | | | 80,139 | | | | |
| Series 2004-8CB, Class A, 2.776%, 06/25/2034 (1 Month LIBOR USD + 0.270%) (3) | | | 7,928,740 | | | | 7,873,200 | | | | |
| Series 2006-28CB, Class A17, 6.000%, 10/25/2036 (6) | | | 629,621 | | | | 491,083 | | | | |
| Argent Securities Inc. Asset-Backed Pass-Through Certificates: | | | | | | | | | | | |
| Series 2005-W3, Class A2D, 2.846%, 11/25/2035 (1 Month LIBOR USD + 0.340%) (3) | | | 2,792,252 | | | | 2,785,537 | | | | |
| Series 2005-W5, Class A1, 2.741%, 01/25/2036 (1 Month LIBOR USD + 0.235%) (3) | | | 31,522,657 | | | | 31,104,534 | | | | |
| Asset Backed Securities Corp. Home Equity Loan Trust: | | | | | | | | | | | |
| Series 2006-HE1, Class A3, 2.706%, 01/25/2036 (1 Month LIBOR USD + 0.200%) (3) | | | 5,937,044 | | | | 5,892,040 | | | | |
| Series 2006-HE1, Class A1, 2.721%, 01/25/2036 (1 Month LIBOR USD + 0.215%) (3) | | | 2,187,064 | | | | 2,175,719 | | | | |
| Series 2006-HE3, Class A2, 2.671%, 03/25/2036 (1 Month LIBOR USD + 0.165%) (3) | | | 11,887,519 | | | | 11,689,855 | | | | |
| Series 2006-HE6, Class A1, 2.651%, 11/25/2036 (1 Month LIBOR USD + 0.145%) (3) | | | 25,918,919 | | | | 25,052,273 | | | | |
| Banc of America Alternative Loan Trust: | | | | | | | | | | | |
| Series 2004-11, Class 4A1, 5.500%, 12/25/2019 | | | 9,653 | | | | 9,658 | | | | |
| Series 2005-2, Class 4A1, 5.500%, 03/25/2020 | | | 33,619 | | | | 32,633 | | | | |
| Series 2005-4, Class 3A1, 5.500%, 05/25/2020 | | | 146,213 | | | | 142,084 | | | | |
| Series 2005-10, Class 5A1, 5.250%, 11/25/2020 | | | 54,649 | | | | 54,507 | | | | |
| Series 2007-1, Class 1A1, 5.550%, 04/25/2022 (4)(6) | | | 297,026 | | | | 290,095 | | | | |
| Series 2005-2, Class 1CB2, 5.500%, 03/25/2035 (6) | | | 66,959 | | | | 65,703 | | | | |
| Series 2005-9, Class 1CB3, 5.500%, 10/25/2035 (6) | | | 152,593 | | | | 150,255 | | | | |
| Series 2005-11, Class 1CB4, 5.500%, 12/25/2035 (6) | | | 92,432 | | | | 88,263 | | | | |
| Series 2006-5, Class CB7, 6.000%, 06/25/2046 (6) | | | 338,619 | | | | 306,501 | | | | |
| Bayview Financial Trust: | | | | | | | | | | | |
| Series 2007-A, Class 1A2, 6.205%, 05/28/2037 (8) | | | 761,830 | | | | 771,896 | | | | |
| Series 2007-B, Class 1A2, 6.831%, 08/28/2047 (8) | | | 1,603,132 | | | | 1,507,731 | | | | |
| Bear Stearns ALT-A Trust: | | | | | | | | | | | |
| Series 2004-4, Class A1, 3.106%, 06/25/2034 (1 Month LIBOR USD + 0.600%) (3) | | | 1,787,377 | | | | 1,770,667 | | | | |
| Series 2005-4, Class 1A1, 2.946%, 04/25/2035 (1 Month LIBOR USD + 0.440%) (3) | | | 4,152,786 | | | | 4,113,178 | | | | |
| Series 2005-7, Class 12A1, 3.046%, 08/25/2035 (1 Month LIBOR USD + 0.540%) (3) | | | 7,200,135 | | | | 7,155,771 | | | | |
| Bear Stearns Asset Backed Securities I Trust, | | | | | | | | | | | |
| Series 2004-AC2, Class 2A, 5.000%, 05/25/2034 | | | 218,025 | | | | 215,773 | | | | |
| Chase Mortgage Finance Trust, | | | | | | | | | | | |
| Series 2006-A1, Class 2A3, 4.294%, 09/25/2036 (4) | | | 1,253,690 | | | | 1,186,827 | | | | |
| Citigroup Global Markets Mortgage Securities VII, Inc., | | | | | | | | | | | |
| Series 2003-UP2, Class A2, 7.000%, 06/25/2033 (8) | | | 171,753 | | | | 171,652 | | | | |
| Citigroup Mortgage Loan Trust, Inc., | | | | | | | | | | | |
| Series 2005-9, Class 2A2, 5.500%, 11/25/2035 (6) | | | 48,211 | | | | 48,044 | | | | |
| Countrywide Asset-Backed Certificates: | | | | | | | | | | | |
| Series 2005-13, Class AF3, 5.430%, 02/25/2033 (4) | | | 484,894 | | | | 453,886 | | | | |
| Series 2004-S1, Class A3, 5.115%, 02/25/2035 (8) | | | 273,627 | | | | 274,607 | | | | |
| Series 2005-1, Class AF6, 5.030%, 07/25/2035 (4) | | | 151,339 | | | | 153,490 | | | | |
| Series 2005-10, Class AF6, 4.437%, 02/25/2036 (4) | | | 134,616 | | | | 137,098 | | | | |
| Series 2006-10, Class 1AF3, 5.971%, 09/25/2046 (4)(6) | | | 632,378 | | | | 567,776 | | | | |
| Credit Suisse First Boston Mortgage Securities Corp., | | | | | | | | | | | |
| Series 2003-AR26, Class 8A1, 4.484%, 11/25/2033 (4) | | | 6,709,994 | | | | 6,825,980 | | | | |
| CWABS Asset-Backed Certificates Trust: | | | | | | | | | | | |
| Series 2004-15, Class AF6, 4.613%, 04/25/2035 (4) | | | 37,568 | | | | 37,669 | | | | |
| Series 2005-16, Class 3AV, 2.736%, 05/25/2036 (1 Month LIBOR USD + 0.230%) (3) | | | 2,355,453 | | | | 2,354,054 | | | | |
| Series 2005-17, Class 1AF5, 5.564%, 05/25/2036 (4) | | | 205,010 | | | | 204,190 | | | | |
| CWHEQ Home Equity Loan Trust, | | | | | | | | | | | |
| Series 2007-S1, Class A6, 5.693%, 11/25/2036 (4) | | | 34,630 | | | | 35,229 | | | | |
| Deutsche Mortgage Securities, Inc. Mortgage Loan Trust, | | | | | | | | | | | |
| Series 2004-4, Class 1A6, 6.150%, 04/25/2034 (8) | | | 2,252 | | | | 2,272 | | | | |
| First Franklin Mortgage Loan Trust: | | | | | | | | | | | |
| Series 2006-FFH1, Class A4, 2.806%, 01/25/2036 (1 Month LIBOR USD + 0.300%) (3) | | | 1,209,016 | | | | 1,208,887 | | | | |
| Series 2006-FF1, Class 2A4, 2.846%, 01/25/2036 (1 Month LIBOR USD + 0.340%) (3) | | | 7,328,943 | | | | 7,335,694 | | | | |
| Series 2005-FF12, Class A2C, 2.836%, 11/25/2036 (1 Month LIBOR USD + 0.330%) (3) | | | 709,646 | | | | 709,759 | | | | |
| First Horizon Alternative Mortgage Securities Trust: | | | | | | | | | | | |
| Series 2005-FA7, Class 2A1, 5.000%, 09/25/2020 | | | 30,045 | | | | 29,940 | | | | |
| Series 2006-FA6, Class 3A1, 5.750%, 11/25/2021 (6) | | | 71,285 | | | | 68,619 | | | | |
| Series 2006-FA8, Class 2A1, 5.750%, 02/25/2037 (6) | | | 280,903 | | | | 236,837 | | | | |
| Fremont Home Loan Trust, | | | | | | | | | | | |
| Series 2006-A, Class 1A1, 2.651%, 05/25/2036 (1 Month LIBOR USD + 0.145%) (3)(6) | | | 23,170,000 | | | | 22,313,315 | | | | |
| GE Capital Mortgage Services, Inc. Trust, | | | | | | | | | | | |
| Series 1999-HE1, Class A7, 6.265%, 04/25/2029 | | | 275 | | | | 279 | | | | |
| GE Mortgage Services LLC, | | | | | | | | | | | |
| Series 1997-HE4, Class A7, 6.735%, 12/25/2028 | | | 29 | | | | 25 | | | | |
| GMACM Mortgage Loan Trust, | | | | | | | | | | | |
| Series 2004-GH1, Class A6, 4.810%, 07/25/2035 (8) | | | 496 | | | | 497 | | | | |
| GSAA Home Equity Trust, | | | | | | | | | | | |
| Series 2004-6, Class A1, 3.306%, 06/25/2034 (1 Month LIBOR USD + 0.800%) (3) | | | 1,069,128 | | | | 1,049,161 | | | | |
| GSAMP Trust: | | | | | | | | | | | |
| Series 2005-WMC2, Class A1B, 3.126%, 11/25/2035 (1 Month LIBOR USD + 0.620%) (3) | | | 5,834,239 | | | | 5,830,652 | | | | |
| Series 2005-WMC2, Class A2C, 3.206%, 11/25/2035 (1 Month LIBOR USD + 0.700%) (3) | | | 5,523,571 | | | | 5,522,148 | | | | |
| HomeBanc Mortgage Trust, | | | | | | | | | | | |
| Series 2005-3, Class A1, 2.746%, 07/25/2035 (1 Month LIBOR USD + 0.240%) (3) | | | 2,753,610 | | | | 2,717,997 | | | | |
| IMC Home Equity Loan Trust, | | | | | | | | | | | |
| Series 1997-5, Class A10, 6.880%, 11/20/2028 | | | 623 | | | | 620 | | | | |
| Impac CMB Trust: | | | | | | | | | | | |
| Series 2004-4, Class 2A2, 4.671%, 09/25/2034 (8) | | | 75,873 | | | | 78,172 | | | | |
| Series 2004-5, Class 1A2, 3.206%, 10/25/2034 (1 Month LIBOR USD + 0.700%) (3) | | | 3,972,062 | | | | 3,947,969 | | | | |
| Series 2004-6, Class 1A1, 3.306%, 10/25/2034 (1 Month LIBOR USD + 0.800%) (3) | | | 3,287,037 | | | | 3,198,152 | | | | |
| J.P. Morgan Alternative Loan Trust, | | | | | | | | | | | |
| Series 2006-A1, Class 2A1, 3.867%, 03/25/2036 (4)(6) | | | 293,689 | | | | 271,184 | | | | |
| J.P. Morgan Mortgage Acquisition Trust, | | | | | | | | | | | |
| Series 2006-CH1, Class A1, 2.636%, 07/25/2036 (1 Month LIBOR USD + 0.130%) (3) | | | 1,841,462 | | | | 1,834,879 | | | | |
| J.P. Morgan Mortgage Trust: | | | | | | | | | | | |
| Series 2005-A4, Class 1A1, 4.314%, 07/25/2035 (4) | | | 1,121,235 | | | | 1,123,911 | | | | |
| Series 2007-A1, Class 5A2, 4.327%, 07/25/2035 (4) | | | 2,935,014 | | | | 3,014,984 | | | | |
| Series 2007-A1, Class 5A5, 4.327%, 07/25/2035 (4) | | | 4,444,086 | | | | 4,582,032 | | | | |
| Series 2006-A7, Class 2A2, 4.216%, 01/25/2037 (4) | | | 142,625 | | | | 135,958 | | | | |
| Series 2006-A7, Class 2A4R, 4.216%, 01/25/2037 (4) | | | 609,357 | | | | 580,873 | | | | |
| Series 2007-A2, Class 2A3, 4.130%, 04/25/2037 (4) | | | 1,641,590 | | | | 1,542,902 | | | | |
| MASTR Alternative Loan Trust, | | | | | | | | | | | |
| Series 2004-2, Class 4A1, 5.000%, 02/25/2019 | | | 995 | | | | 992 | | | | |
| MASTR Asset Backed Securities Trust, | | | | | | | | | | | |
| Series 2006-NC1, Class A4, 3.106%, 01/25/2036 (1 Month LIBOR USD + 0.600%) (3) | | | 4,758,486 | | | | 4,757,932 | | | | |
| Merrill Lynch Mortgage Investors Trust: | | | | | | | | | | | |
| Series 2004-F, Class A1A, 3.854%, 12/25/2029 (4)(6) | | | 5,758,363 | | | | 5,754,995 | | | | |
| Series 2005-A10, Class A, 2.716%, 02/25/2036 (1 Month LIBOR USD + 0.210%) (3) | | | 15,876,888 | | | | 15,170,130 | | | | |
| Morgan Stanley Mortgage Loan Trust, | | | | | | | | | | | |
| Series 2004-7AR, Class 2A1, 4.353%, 09/25/2034 (4) | | | 2,553,356 | | | | 2,607,465 | | | | |
| MortgageIT Trust: | | | | | | | | | | | |
| Series 2005-2, Class 1A1, 3.026%, 05/25/2035 (1 Month LIBOR USD + 0.520%) (3) | | | 1,498,381 | | | | 1,492,890 | | | | |
| Series 2005-3, Class A1, 3.106%, 08/25/2035 (1 Month LIBOR USD + 0.600%) (3) | | | 3,549,243 | | | | 3,455,127 | | | | |
| New Century Home Equity Loan Trust, | | | | | | | | | | | |
| Series 2005-C, Class A1, 2.736%, 12/25/2035 (1 Month LIBOR USD + 0.230%) (3) | | | 7,698,363 | | | | 7,666,364 | | | | |
| New Residential Mortgage Loan Trust: | | | | | | | | | | | |
| Series 2017-2A, Class A3, 4.000%, 03/25/2057 (2)(4) | | | 13,775,858 | | | | 13,902,994 | | | | |
| Series 2017-3A, Class A1, 4.000%, 04/25/2057 (2)(4) | | | 14,931,021 | | | | 15,021,089 | | | | |
| Series 2017-4A, Class A1, 4.000%, 05/25/2057 (2)(4) | | | 26,651,097 | | | | 26,888,596 | | | | |
| Series 2018-1A, Class A1A, 4.000%, 12/25/2057 (2)(4) | | | 14,499,593 | | | | 14,573,203 | | | | |
| Park Place Securities, Inc., | | | | | | | | | | | |
| Series 2005-WCW1, Class M1, 2.956%, 09/25/2035 (1 Month LIBOR USD + 0.450%) (3) | | | 542,495 | | | | 542,624 | | | | |
| Popular ABS Mortgage Pass-Through Trust, | | | | | | | | | | | |
| Series 2006-E, Class A2, 2.656%, 01/25/2037 (1 Month LIBOR USD + 0.150%) (3) | | | 2,067,213 | | | | 2,059,417 | | | | |
| RALI Series Trust, | | | | | | | | | | | |
| Series 2004-QS6, Class A1, 5.000%, 05/25/2019 (6) | | | 12,727 | | | | 12,655 | | | | |
| RAMP Series Trust, | | | | | | | | | | | |
| Series 2005-RS1, Class AI6, 4.713%, 11/25/2034 | | | 7,569 | | | | 7,569 | | | | |
| RASC Series Trust, | | | | | | | | | | | |
| Series 2006-KS4, Class A4, 2.746%, 06/25/2036 (1 Month LIBOR USD + 0.240%) (3) | | | 6,743,908 | | | | 6,712,650 | | | | |
| Renaissance Home Equity Loan Trust, | | | | | | | | | | | |
| Series 2007-1, Class AF3, 5.612%, 04/25/2037 (8) | | | 2,489,630 | | | | 1,108,385 | | | | |
| Specialty Underwriting & Residential Finance Trust, | | | | | | | | | | | |
| Series 2004-BC4, Class A1A, 3.176%, 10/25/2035 (1 Month LIBOR USD + 0.670%) (3) | | | 1,606,244 | | | | 1,593,934 | | | | |
| Structured Adjustable Rate Mortgage Loan Trust, | | | | | | | | | | | |
| Series 2004-12, Class 3A1, 4.329%, 09/25/2034 (4) | | | 3,688,542 | | | | 3,662,425 | | | | |
| Structured Asset Securities Corp.: | | | | | | | | | | | |
| Series 2005-WF1, Class A3, 3.166%, 02/25/2035 (1 Month LIBOR USD + 0.660%) (3) | | | 3,935,407 | | | | 3,936,928 | | | | |
| Series 2005-7XS, Class 1A4B, 5.440%, 04/25/2035 (8) | | | 21,804 | | | | 22,176 | | | | |
| Structured Asset Securities Corp. Mortgage Loan Trust, | | | | | | | | | | | |
| Series 2006-OPT1, Class A6, 2.656%, 04/25/2036 (1 Month LIBOR USD + 0.150%) (3) | | | 11,811,916 | | | | 11,620,639 | | | | |
| Thornburg Mortgage Securities Trust, | | | | | | | | | | | |
| Series 2003-5, Class 3A, 4.337%, 10/25/2043 (4) | | | 13,523,083 | | | | 13,694,814 | | | | |
| Towd Point Mortgage Trust: | | | | | | | | | | | |
| Series 2015-3, Class A1A, 3.500%, 03/25/2054 (2)(4) | | | 5,271,732 | | | | 5,244,554 | | | | |
| Series 2015-5, Class A1, 3.500%, 05/25/2055 (2)(4) | | | 3,043,846 | | | | 3,032,934 | | | | |
| Series 2016-2, Class A1, 3.000%, 08/25/2055 (2)(4) | | | 8,938,248 | | | | 8,802,777 | | | | |
| Series 2016-3, Class A1, 2.250%, 04/25/2056 (2)(4) | | | 1,663,169 | | | | 1,624,987 | | | | |
| Series 2016-5, Class A1, 2.500%, 10/25/2056 (2)(4) | | | 8,094,536 | | | | 7,847,349 | | | | |
| Series 2017-1, Class A1, 2.750%, 10/25/2056 (2)(4) | | | 38,943,016 | | | | 38,094,222 | | | | |
| Series 2017-6, Class A1, 2.750%, 10/25/2057 (2)(4) | | | 41,221,564 | | | | 40,262,738 | | | | |
| Series 2018-6, Class A1A, 3.750%, 03/25/2058 (2)(4) | | | 37,940,132 | | | | 37,960,991 | | | | |
| WaMu Mortgage Pass-Through Certificates Trust: | | | | | | | | | | | |
| Series 2004-CB1, Class 5A, 5.000%, 06/25/2019 | | | 27,227 | | | | 27,170 | | | | |
| Series 2004-CB2, Class 7A, 5.500%, 08/25/2019 | | | 29,229 | | | | 29,176 | | | | |
| Series 2004-CB3, Class 3A, 5.500%, 10/25/2019 | | | 2,805 | | | | 2,800 | | | | |
| Series 2004-CB3, Class 4A, 6.000%, 10/25/2019 | | | 16,023 | | | | 16,171 | | | | |
| Series 2004-CB4, Class 21A, 5.500%, 12/25/2019 | | | 19,091 | | | | 19,151 | | | | |
| Series 2004-CB2, Class 3A, 6.000%, 08/25/2034 | | | 6,127,893 | | | | 6,482,221 | | | | |
| Series 2004-CB3, Class 2A, 6.500%, 10/25/2034 | | | 3,215,579 | | | | 3,419,877 | | | | |
| Series 2004-AR14, Class A1, 4.314%, 01/25/2035 (4) | | | 8,705,158 | | | | 8,879,800 | | | | |
| Wells Fargo Mortgage Backed Securities Trust, | | | | | | | | | | | |
| Series 2005-AR10, Class 2A17, 4.513%, 06/25/2035 (4) | | | 12,571,834 | | | | 12,911,832 | | | | |
| | | | | | | | 515,119,348 | | | | 3.3 | % |
| Total Residential Mortgage-Backed Securities | | | | | | | 3,936,607,375 | | | | 25.2 | % |
| | | | | | | | | | | | | |
| Commercial Mortgage-Backed Securities | | | | | | | | | | | | |
| U.S. Government Agency Issues | | | | | | | | | | | | |
| Fannie Mae REMIC Trust, | | | | | | | | | | | | |
| Series 2014-M2, Class A2, 3.513%, 12/25/2023 (4) | | | 10,864,029 | | | | 11,120,820 | | | | | |
| Freddie Mac Multifamily Structured Pass Through Certificates: | | | | | | | | | | | | |
| Series K720, Class A2, 2.716%, 06/25/2022 | | | 17,950,000 | | | | 17,835,510 | | | | | |
| Series K721, Class A2, 3.090%, 08/25/2022 (4) | | | 25,545,000 | | | | 25,670,050 | | | | | |
| Series K028, Class A2, 3.111%, 02/25/2023 | | | 47,010,000 | | | | 47,333,043 | | | | | |
| Series K029, Class A2, 3.320%, 02/25/2023 (4) | | | 27,398,000 | | | | 27,794,318 | | | | | |
| Series K037, Class A2, 3.490%, 01/25/2024 | | | 68,125,000 | | | | 69,665,913 | | | | | |
| Series K050, Class A2, 3.334%, 08/25/2025 (4) | | | 72,374,000 | | | | 73,330,220 | | | | | |
| Series K058, Class A2, 2.653%, 08/25/2026 | | | 19,865,000 | | | | 19,119,790 | | | | | |
| Series K063, Class A2, 3.430%, 01/25/2027 (4) | | | 49,560,000 | | | | 50,167,298 | | | | | |
| Series K064, Class A2, 3.224%, 03/25/2027 | | | 33,820,000 | | | | 33,741,889 | | | | | |
| Series K065, Class A2, 3.243%, 04/25/2027 | | | 28,200,000 | | | | 28,142,683 | | | | | |
| Series K066, Class A2, 3.117%, 06/25/2027 | | | 11,100,000 | | | | 10,973,396 | | | | | |
| Series K068, Class A2, 3.244%, 08/25/2027 | | | 9,000,000 | | | | 8,961,696 | | | | | |
| Series K069, Class A2, 3.187%, 09/25/2027 (4) | | | 23,130,000 | | | | 22,907,487 | | | | | |
| Series K071, Class A2, 3.286%, 11/25/2027 | | | 23,025,000 | | | | 22,949,199 | | | | | |
| Series K077, Class A2, 3.850%, 05/25/2028 (4) | | | 16,475,000 | | | | 17,124,962 | | | | | |
| Series K156, Class A3, 3.700%, 06/25/2033 (4) | | | 11,088,000 | | | | 11,103,038 | | | | | |
| | | | | | | | 497,941,312 | | | | 3.2 | % |
| Non-U.S. Government Agency Issues | | | | | | | | | | | | |
| BANK: | | | | | | | | | | | | |
| Series 2017-BNK4, Class A4, 3.625%, 05/15/2050 | | | 26,535,000 | | | | 26,444,808 | | | | | |
| Series 2017-BNK9, Class A4, 3.538%, 11/15/2054 | | | 44,971,000 | | | | 44,641,214 | | | | | |
| Series 2017-BNK5, Class A5, 3.390%, 06/15/2060 | | | 12,750,000 | | | | 12,475,939 | | | | | |
| CD Mortgage Trust, | | | | | | | | | | | | |
| Series 2016-CD1, Class A4, 2.724%, 08/10/2049 | | | 37,060,000 | | | | 34,941,532 | | | | | |
| Citigroup Commercial Mortgage Trust: | | | | | | | | | | | | |
| Series 2013-GC11, Class A4, 3.093%, 04/10/2046 | | | 34,503,388 | | | | 34,254,895 | | | | | |
| Series 2014-GC19, Class A3, 3.753%, 03/10/2047 | | | 7,102,477 | | | | 7,216,701 | | | | | |
| Series 2014-GC25, Class A4, 3.635%, 10/10/2047 | | | 10,340,590 | | | | 10,462,939 | | | | | |
| Series 2015-GC27, Class A5, 3.137%, 02/10/2048 | | | 24,587,000 | | | | 24,166,528 | | | | | |
| COMM Mortgage Trust: | | | | | | | | | | | | |
| Series 2012-CR1, Class A3, 3.391%, 05/15/2045 | | | 7,488,584 | | | | 7,500,964 | | | | | |
| Series 2013-CR9, Class A3, 4.022%, 07/10/2045 | | | 22,854,922 | | | | 23,583,466 | | | | | |
| Series 2012-CR2, Class A4, 3.147%, 08/15/2045 | | | 19,660,536 | | | | 19,593,486 | | | | | |
| Series 2013-CR10, Class A3, 3.923%, 08/10/2046 | | | 23,175,000 | | | | 23,802,085 | | | | | |
| DBJPM Mortgage Trust, | | | | | | | | | | | | |
| Series 2016-C3, Class ASB, 2.756%, 08/10/2049 | | | 10,360,000 | | | | 10,037,553 | | | | | |
| GS Mortgage Securities Trust: | | | | | | | | | | | | |
| Series 2012-GCJ9, Class A3, 2.773%, 11/10/2045 | | | 36,918,489 | | | | 36,412,380 | | | | | |
| Series 2013-GC14, Class A5, 4.243%, 08/10/2046 | | | 25,000,000 | | | | 25,976,420 | | | | | |
| J.P. Morgan Chase Commercial Mortgage Securities Trust: | | | | | | | | | | | | |
| Series 2013-LC11, Class A5, 2.960%, 04/15/2046 | | | 17,452,913 | | | | 17,184,806 | | | | | |
| Series 2013-C10, Class ASB, 2.702%, 12/15/2047 | | | 8,015,203 | | | | 7,913,161 | | | | | |
| Series 2012-LC9, Class A5, 2.840%, 12/15/2047 | | | 14,450,059 | | | | 14,198,559 | | | | | |
| JPMBB Commercial Mortgage Securities Trust: | | | | | | | | | | | | |
| Series 2013-C12, Class ASB, 3.157%, 07/15/2045 | | | 3,889,176 | | | | 3,874,691 | | | | | |
| Series 2013-C12, Class A5, 3.664%, 07/15/2045 | | | 6,835,000 | | | | 6,917,660 | | | | | |
| Series 2013-C15, Class A4, 4.096%, 11/15/2045 | | | 2,130,000 | | | | 2,193,836 | | | | | |
| Series 2013-C17, Class A3, 3.928%, 01/15/2047 | | | 3,107,071 | | | | 3,174,028 | | | | | |
| Series 2013-C17, Class A4, 4.199%, 01/15/2047 | | | 10,000,000 | | | | 10,359,362 | | | | | |
| Series 2014-C24, Class ASB, 3.368%, 11/15/2047 | | | 10,000,000 | | | | 10,007,639 | | | | | |
| Series 2014-C25, Class ASB, 3.407%, 11/15/2047 | | | 9,008,000 | | | | 9,024,605 | | | | | |
| Morgan Stanley Bank of America Merrill Lynch Trust: | | | | | | | | | | | | |
| Series 2012-C5, Class A4, 3.176%, 08/15/2045 | | | 37,550,000 | | | | 37,384,776 | | | | | |
| Series 2012-C6, Class A4, 2.858%, 11/15/2045 | | | 23,907,780 | | | | 23,566,339 | | | | | |
| Series 2013-C10, Class A3, 3.967%, 07/15/2046 (4) | | | 6,630,160 | | | | 6,823,560 | | | | | |
| Series 2013-C12, Class A3, 3.973%, 10/15/2046 | | | 17,280,595 | | | | 17,741,873 | | | | | |
| Series 2016-C29, Class ASB, 3.140%, 05/15/2049 | | | 12,250,000 | | | | 12,231,754 | | | | | |
| Wells Fargo Commercial Mortgage Trust: | | | | | | | | | | | | |
| Series 2015-C27, Class ASB, 3.278%, 02/15/2048 | | | 18,000,000 | | | | 18,092,171 | | | | | |
| Series 2015-SG1, Class ASB, 3.556%, 09/15/2048 | | | 18,900,000 | | | | 19,140,602 | | | | | |
| Series 2015-P2, Class A3, 3.541%, 12/15/2048 | | | 44,050,000 | | | | 44,322,749 | | | | | |
| WFRBS Commercial Mortgage Trust: | | | | | | | | | | | | |
| Series 2012-C6, Class A4, 3.440%, 04/15/2045 | | | 26,735,220 | | | | 26,871,289 | | | | | |
| Series 2013-C13, Class ASB, 2.654%, 05/15/2045 | | | 6,516,286 | | | | 6,471,017 | | | | | |
| Series 2013-C18, Class A4, 3.896%, 12/15/2046 | | | 12,900,000 | | | | 13,232,812 | | | | | |
| Series 2014-C21, Class A5, 3.678%, 08/15/2047 | | | 31,319,000 | | | | 31,782,089 | | | | | |
| Series 2014-C24, Class A4, 3.343%, 11/15/2047 | | | 10,330,000 | | | | 10,280,981 | | | | | |
| Series 2014-C23, Class ASB, 3.636%, 10/15/2057 | | | 6,920,000 | | | | 7,042,421 | | | | | |
| | | | | | | | 701,343,690 | | | | 4.5 | % |
| Total Commercial Mortgage-Backed Securities | | | | | | | 1,199,285,002 | | | | 7.7 | % |
| | | | | | | | | | |
| Asset Backed Securities | | | | | | | | | |
| Citibank Credit Card Issuance Trust, | | | | | | | | | |
| Series 2007-A3, Class A3, 6.150%, 06/15/2039 | | | 8,166,000 | | | | 10,436,216 | | | | |
| Conseco Financial Corp.: | | | | | | | | | | | |
| Series 1998-2, Class A5, 6.240%, 12/01/2028 | | | 122,275 | | | | 124,001 | | | | |
| Series 1998-3, Class A5, 6.220%, 03/01/2030 | | | 221,084 | | | | 230,609 | | | | |
| Series 1998-4, Class A5, 6.180%, 04/01/2030 | | | 1,343,500 | | | | 1,392,260 | | | | |
| Series 1998-7, Class A1, 6.320%, 07/01/2030 | | | 10,938,208 | | | | 11,293,080 | | | | |
| Ford Credit Auto Owner Trust: | | | | | | | | | | | |
| Series 2016-1, Class A, 2.310%, 08/15/2027 (2) | | | 28,860,000 | | | | 28,466,638 | | | | |
| Series 2016-2, Class A, 2.030%, 12/15/2027 (2) | | | 43,505,000 | | | | 42,438,445 | | | | |
| Series 2018-1, Class A, 3.190%, 07/15/2031 (2) | | | 40,550,000 | | | | 40,226,415 | | | | |
| MMAF Equipment Finance LLC, | | | | | | | | | | | |
| Series 2016-AA, Class A5, 2.210%, 12/15/2032 (2) | | | 14,100,000 | | | | 13,729,890 | | | | |
| Oakwood Mortgage Investors, Inc., | | | | | | | | | | | |
| Series 1999-B, Class A3, 6.450%, 12/15/2023 | | | 17,211 | | | | 17,405 | | | | |
| PFS Financing Corp., | | | | | | | | | | | |
| Series 2017-D, Class A, 2.400%, 10/17/2022 (2) | | | 20,380,000 | | | | 20,102,553 | | | | |
| Sofi Consumer Loan Program: | | | | | | | | | | | |
| Series 2017-6, Class A2, 2.820%, 11/25/2026 (2) | | | 10,000,000 | | | | 9,917,546 | | | | |
| Series 2018-3, Class A2, 3.670%, 08/25/2027 (2) | | | 20,000,000 | | | | 20,158,722 | | | | |
| Synchrony Credit Card Master Note Trust, | | | | | | | | | | | |
| Series 2016-2, Class A, 2.210%, 05/15/2024 | | | 8,900,000 | | | | 8,734,282 | | | | |
| | | | | | | | 207,268,062 | | | | 1.4 | % |
| Total Long-Term Investments (Cost $15,588,298,146) | | | | | | | 15,313,919,047 | | | | 98.0 | % |
| | | | | | | | | | | | | |
| SHORT-TERM INVESTMENT | | Shares | | | | | | | | | |
| Money Market Mutual Fund | | | | | | | | | | | | |
| Fidelity Institutional Money Market Fund - Government Portfolio, Institutional Class, 2.29% (5) | | | 259,568,092 | | | | 259,568,092 | | | | | |
| Total Short-Term Investment (Cost $259,568,092) | | | | | | | 259,568,092 | | | | 1.7 | % |
| Total Investments (Cost $15,847,866,238) | | | | | | | 15,573,487,139 | | | | 99.7 | % |
| Other Assets in Excess of Liabilities | | | | | | | 42,195,218 | | | | 0.3 | % |
| TOTAL NET ASSETS | | | | | | $ | 15,615,682,357 | | | | 100.0 | % |
Notes to Schedule of Investments | | | | | | |
| (1) | | Foreign security. | | | | | | |
| (2) | | Security issued under Rule 144A under the Securities Act of 1933 and determined to be liquid. Purchased in a private placement transaction; resale to the public may require registration or may extend only to qualified institutional buyers. At December 31, 2018, the value of these securities total $2,440,596,968, which represents 15.63% of total net assets. |
| (3) | | Variable rate security based on a reference index and spread. The rate reported is the rate in effect as of December 31, 2018. | | |
| (4) | | Variable rate security. The coupon is based on an underlying pool of loans. The rate reported is the rate in effect as of December 31, 2018. |
| (5) | | Seven-day yield. | | | | | | |
| (6) | | Security that, on the last payment date, missed a partial principal or interest payment. | | |
| (7) | | Security in default. | | | | | | |
| (8) | | Step-up bond; the interest rate shown is the rate in effect as of December 31, 2018. | | | |
| Baird Aggregate Bond Fund | | | | | | | | |
| Schedule of Investments, December 31, 2018 | | | | | | | | |
| Summary of Fair Value Exposure at December 31, 2018 | | | | | | |
| | | | | | | | | |
The Fund has adopted authoritative fair valuation accounting standards which establish a definition of fair value and set out a hierarchy for measuring fair value. These standards require additional disclosures about the various inputs and valuation techniques used to develop the measurements of fair value and a discussion on changes in valuation techniques and related inputs during the period. These standards define fair value as the price that would be received to sell an asset or paid to transfer a liability in an orderly transaction between market participants at the measurement date. |
| | | | | | | | | |
| The fair value hierarchy is organized into three levels based upon the assumptions (referred to as "inputs") used in pricing the asset or liability. These standards state that "observable inputs" reflect the assumptions market participants would use in pricing the asset or liability based on market data obtained from independent sources and "unobservable inputs" reflect an entity's own assumptions about the assumptions market participants would use in pricing the asset or liability. These inputs are summarized into three broad levels and described below: |
| | Level 1 - | Unadjusted quoted prices in active markets for identical unrestricted securities. | |
| | Level 2 - | Other significant observable inputs (including quoted prices for similar securities, quoted prices in inactive markets, dealer indications, interest rates, yield curves, prepayment speeds, credit risk, default rates, inputs corroborated by observable market data, etc.). | |
| | Level 3 - | Significant unobservable inputs (including the Fund's own assumptions about the factors that market participants would use in valuing the security) based on the best information available. | |
| The inputs or methodology used for valuing securities are not necessarily an indication of the risk associated with investing in those securities. |
| | | | | | | | | |
| The following is a summary of the inputs used to value the Fund's investments as of December 31, 2018: | | | | |
| | | | | | | | | |
| | | Level 1 | | | Level 2 | | | Level 3 | | | Total | |
| Long-Term Investments | | | | | | | | | | | | |
| U.S. Treasury Securities | | $ | – | | | $ | 3,366,096,348 | | | $ | – | | | $ | 3,366,096,348 | |
| Other Government Related Securities | | | – | | | | 153,939,967 | | | | – | | | | 153,939,967 | |
| Corporate Bonds | | | – | | | | 6,304,637,054 | | | | – | | | | 6,304,637,054 | |
| Municipal Bonds | | | – | | | | 146,085,239 | | | | – | | | | 146,085,239 | |
| Residential Mortgage-Backed Securities - U.S. Government Agency Issues | | | – | | | | 3,421,488,027 | | | | – | | | | 3,421,488,027 | |
| Residential Mortgage-Backed Securities - Non-U.S. Government Agency Issues | | | – | | | | 515,119,348 | | | | – | | | | 515,119,348 | |
| Commercial Mortgage-Backed Securities - U.S. Government Agency Issues | | | – | | | | 497,941,312 | | | | – | | | | 497,941,312 | |
| Commercial Mortgage-Backed Securities - Non-U.S. Government Agency Issues | | | – | | | | 701,343,690 | | | | – | | | | 701,343,690 | |
| Asset Backed Securities | | | – | | | | 207,268,062 | | | | – | | | | 207,268,062 | |
| Total Long-Term Investments | | | – | | | | 15,313,919,047 | | | | – | | | | 15,313,919,047 | |
| Short-Term Investment | | | | | | | | | | | | | | | | |
| Money Market Mutual Fund | | | 259,568,092 | | | | – | | | | – | | | | 259,568,092 | |
| Total Short-Term Investment | | | 259,568,092 | | | | – | | | | – | | | | 259,568,092 | |
| Total Investments | | $ | 259,568,092 | | | $ | 15,313,919,047 | | | $ | – | | | $ | 15,573,487,139 | |
| Changes in valuation techniques may result in transfers into or out of assigned levels within the fair value hierarchy. There were no transfers into or out of Level 3 during the reporting period, as compared to the security classifications from the prior year's annual report. |
| | | | | | | | | |
| Baird Core Plus Bond Fund | | | | | | | | | |
| Schedule of Investments | | | | | | | | | |
| December 31, 2018 | | | | | | | | | |
| | | | | | | | | | |
| | | Principal | | | | | | % of | |
| | | Amount | | | Value | | | Net Assets | |
| LONG-TERM INVESTMENTS | | | | | | | | | |
| U.S. Treasury Securities | | | | | | | | | |
| U.S. Treasury Bonds: | | | | | | | | | |
| 1.750%, 03/31/2022 | | $ | 185,175,000 | | | $ | 181,023,028 | | | | |
| 1.875%, 03/31/2022 | | | 318,025,000 | | | | 312,062,031 | | | | |
| 2.500%, 05/15/2024 | | | 99,425,000 | | | | 99,242,462 | | | | |
| 2.250%, 11/15/2025 | | | 214,425,000 | | | | 209,692,574 | | | | |
| 2.000%, 11/15/2026 | | | 202,025,000 | | | | 192,847,067 | | | | |
| 2.250%, 11/15/2027 | | | 253,525,000 | | | | 244,899,207 | | | | |
| 3.500%, 02/15/2039 | | | 364,345,000 | | | | 398,516,575 | | | | |
| 2.875%, 05/15/2043 | | | 654,400,000 | | | | 638,832,439 | | | | |
| 2.500%, 02/15/2045 | | | 228,175,000 | | | | 206,783,594 | | | | |
| | | | | | | | 2,483,898,977 | | | | 14.1 | % |
| Other Government Related Securities | | | | | | | | | | | | |
| Centrais Eletricas Brasileiras SA: | | | | | | | | | | | | |
| 6.875%, 07/30/2019 (1)(2) | | | 3,000,000 | | | | 3,040,530 | | | | | |
| 5.750%, 10/27/2021 (1)(2) | | | 4,000,000 | | | | 4,025,040 | | | | | |
| CNOOC Curtis Funding No. 1 Pty Ltd., | | | | | | | | | | | | |
| 4.500%, 10/03/2023 (1)(2) | | | 5,000,000 | | | | 5,109,875 | | | | | |
| CNOOC Finance (2013) Ltd., | | | | | | | | | | | | |
| 3.000%, 05/09/2023 (1) | | | 2,415,000 | | | | 2,330,885 | | | | | |
| CNOOC Finance (2015) USA LLC, | | | | | | | | | | | | |
| 3.500%, 05/05/2025 | | | 21,200,000 | | | | 20,532,815 | | | | | |
| CNOOC Nexen Finance (2014) ULC, | | | | | | | | | | | | |
| 4.250%, 04/30/2024 (1) | | | 4,750,000 | | | | 4,815,393 | | | | | |
| CNPC General Capital Ltd., | | | | | | | | | | | | |
| 2.750%, 05/14/2019 (1)(2) | | | 2,000,000 | | | | 1,997,500 | | | | | |
| Comision Federal de Electricidad, | | | | | | | | | | | | |
| 5.750%, 02/14/2042 (1)(2) | | | 5,200,000 | | | | 4,784,000 | | | | | |
| Corp Andina de Fomento, | | | | | | | | | | | | |
| 4.375%, 06/15/2022 (1) | | | 4,265,000 | | | | 4,414,062 | | | | | |
| Electricite de France SA, | | | | | | | | | | | | |
| 4.750%, 10/13/2035 (1)(2) | | | 10,000,000 | | | | 9,420,349 | | | | | |
| Export-Import Bank of Korea: | | | | | | | | | | | | |
| 2.250%, 01/21/2020 (1) | | | 14,000,000 | | | | 13,876,884 | | | | | |
| 4.000%, 01/29/2021 (1) | | | 2,400,000 | | | | 2,437,255 | | | | | |
| Korea Development Bank: | | | | | | | | | | | | |
| 2.250%, 05/18/2020 (1) | | | 7,200,000 | | | | 7,120,985 | | | | | |
| 3.000%, 09/14/2022 (1) | | | 4,400,000 | | | | 4,355,912 | | | | | |
| Nexen Energy ULC, | | | | | | | | | | | | |
| 6.400%, 05/15/2037 (1) | | | 6,249,000 | | | | 7,605,602 | | | | | |
| Petrobras Global Finance BV: | | | | | | | | | | | | |
| 5.299%, 01/27/2025 (1) | | | 3,400,000 | | | | 3,247,000 | | | | | |
| 7.375%, 01/17/2027 (1) | | | 9,300,000 | | | | 9,555,750 | | | | | |
| Petroleos Mexicanos: | | | | | | | | | | | | |
| 4.875%, 01/24/2022 (1) | | | 6,500,000 | | | | 6,327,750 | | | | | |
| 4.250%, 01/15/2025 (1) | | | 15,000,000 | | | | 13,110,000 | | | | | |
| 4.500%, 01/23/2026 (1) | | | 4,500,000 | | | | 3,879,000 | | | | | |
| 6.500%, 06/02/2041 (1) | | | 4,000,000 | | | | 3,312,000 | | | | | |
| Sinopec Group Overseas Development [2014] Ltd., | | | | | | | | | | | | |
| 4.375%, 04/10/2024 (1)(2) | | | 1,500,000 | | | | 1,531,441 | | | | | |
| Sinopec Group Overseas Development [2015] Ltd.: | | | | | | | | | | | | |
| 2.500%, 04/28/2020 (1)(2) | | | 20,000,000 | | | | 19,754,239 | | | | | |
| 3.250%, 04/28/2025 (1)(2) | | | 20,000,000 | | | | 19,124,965 | | | | | |
| Sinopec Group Overseas Development [2016] Ltd.: | | | | | | | | | | | | |
| 1.750%, 09/29/2019 (1)(2) | | | 8,000,000 | | | | 7,915,928 | | | | | |
| 3.500%, 05/03/2026 (1)(2) | | | 10,000,000 | | | | 9,610,710 | | | | | |
| Sinopec Group Overseas Development [2017] Ltd, | | | | | | | | | | | | |
| 3.000%, 04/12/2022 (1)(2) | | | 6,950,000 | | | | 6,802,924 | | | | | |
| Syngenta Finance NV: | | | | | | | | | | | | |
| 3.125%, 03/28/2022 (1) | | | 5,000,000 | | | | 4,790,783 | | | | | |
| 4.441%, 04/24/2023 (1)(2) | | | 5,000,000 | | | | 4,818,632 | | | | | |
| 4.892%, 04/24/2025 (1)(2) | | | 10,000,000 | | | | 9,455,491 | | | | | |
| | | | | | | | 219,103,700 | | | | 1.2 | % |
| Corporate Bonds | | | | | | | | | | | | |
| Industrials | | | | | | | | | | | | |
| 21st Century Fox America, Inc.: | | | | | | | | | | | | |
| 6.900%, 03/01/2019 | | | 6,659,000 | | | | 6,697,206 | | | | | |
| 3.700%, 09/15/2024 | | | 4,025,000 | | | | 4,062,056 | | | | | |
| 7.430%, 10/01/2026 | | | 3,300,000 | | | | 4,086,327 | | | | | |
| 6.150%, 03/01/2037 | | | 9,000,000 | | | | 11,039,294 | | | | | |
| 5.400%, 10/01/2043 | | | 5,000,000 | | | | 5,770,308 | | | | | |
| 4.750%, 09/15/2044 | | | 1,950,000 | | | | 2,076,574 | | | | | |
| A.P. Meoller - Maersk A/S, | | | | | | | | | | | | |
| 3.750%, 09/22/2024 (1)(2) | | | 4,475,000 | | | | 4,345,619 | | | | | |
| Abbott Laboratories: | | | | | | | | | | | | |
| 3.400%, 11/30/2023 | | | 4,583,000 | | | | 4,569,023 | | | | | |
| 4.750%, 11/30/2036 | | | 38,500,000 | | | | 40,191,539 | | | | | |
| AbbVie, Inc.: | | | | | | | | | | | | |
| 3.200%, 11/06/2022 | | | 3,000,000 | | | | 2,955,209 | | | | | |
| 3.600%, 05/14/2025 | | | 2,500,000 | | | | 2,397,962 | | | | | |
| 4.300%, 05/14/2036 | | | 3,825,000 | | | | 3,412,561 | | | | | |
| Actavis Funding SCS: | | | | | | | | | | | | |
| 3.850%, 06/15/2024 (1) | | | 10,125,000 | | | | 9,986,242 | | | | | |
| 3.800%, 03/15/2025 (1) | | | 10,200,000 | | | | 9,957,480 | | | | | |
| 4.550%, 03/15/2035 (1) | | | 14,098,000 | | | | 13,373,331 | | | | | |
| Acuity Brands Lighting, Inc., | | | | | | | | | | | | |
| 6.000%, 12/15/2019 | | | 700,000 | | | | 715,759 | | | | | |
| ADT Corp., | | | | | | | | | | | | |
| 3.500%, 07/15/2022 | | | 6,900,000 | | | | 6,382,500 | | | | | |
| Agilent Technologies, Inc., | | | | | | | | | | | | |
| 3.875%, 07/15/2023 | | | 5,325,000 | | | | 5,375,739 | | | | | |
| Alibaba Group Holding Ltd., | | | | | | | | | | | | |
| 3.125%, 11/28/2021 (1) | | | 10,000,000 | | | | 9,895,114 | | | | | |
| Allegion US Holding Co., Inc., | | | | | | | | | | | | |
| 3.200%, 10/01/2024 | | | 22,750,000 | | | | 21,458,385 | | | | | |
| Amgen, Inc., | | | | | | | | | | | | |
| 4.400%, 05/01/2045 | | | 8,000,000 | | | | 7,481,504 | | | | | |
| Anadarko Petroleum Corp.: | | | | | | | | | | | | |
| 8.700%, 03/15/2019 | | | 4,380,000 | | | | 4,425,107 | | | | | |
| 6.450%, 09/15/2036 | | | 4,025,000 | | | | 4,346,983 | | | | | |
| Andeavor Logistics LP, | | | | | | | | | | | | |
| 3.500%, 12/01/2022 | | | 8,600,000 | | | | 8,365,336 | | | | | |
| Anglo American Capital PLC: | | | | | | | | | | | | |
| 3.750%, 04/10/2022 (1)(2) | | | 7,000,000 | | | | 6,833,610 | | | | | |
| 4.125%, 09/27/2022 (1)(2) | | | 5,385,000 | | | | 5,288,806 | | | | | |
| 3.625%, 09/11/2024 (1)(2) | | | 4,325,000 | | | | 4,088,206 | | | | | |
| Anheuser-Busch InBev Finance, Inc., | | | | | | | | | | | | |
| 3.300%, 02/01/2023 | | | 20,350,000 | | | | 19,787,294 | | | | | |
| Anheuser-Busch InBev Worldwide, Inc., | | | | | | | | | | | | |
| 4.900%, 02/01/2046 (2) | | | 1,400,000 | | | | 1,298,340 | | | | | |
| ANR Pipeline Co., | | | | | | | | | | | | |
| 9.625%, 11/01/2021 | | | 9,150,000 | | | | 10,603,362 | | | | | |
| Aramark Services, Inc., | | | | | | | | | | | | |
| 5.000%, 02/01/2028 (2) | | | 1,000,000 | | | | 932,500 | | | | | |
| ArcelorMittal: | | | | | | | | | | | | |
| 5.500%, 03/01/2021 (1) | | | 7,950,000 | | | | 8,176,483 | | | | | |
| 6.250%, 02/25/2022 (1) | | | 19,760,000 | | | | 20,886,320 | | | | | |
| Arrow Electronics, Inc., | | | | | | | | | | | | |
| 3.250%, 09/08/2024 | | | 15,000,000 | | | | 13,966,649 | | | | | |
| AT&T, Inc.: | | | | | | | | | | | | |
| 3.950%, 01/15/2025 | | | 4,425,000 | | | | 4,327,011 | | | | | |
| 3.400%, 05/15/2025 | | | 20,225,000 | | | | 19,044,929 | | | | | |
| 4.125%, 02/17/2026 | | | 8,925,000 | | | | 8,721,528 | | | | | |
| 4.300%, 02/15/2030 | | | 10,980,000 | | | | 10,375,943 | | | | | |
| 5.250%, 03/01/2037 | | | 7,125,000 | | | | 6,998,371 | | | | | |
| 4.900%, 08/15/2037 | | | 10,000,000 | | | | 9,323,894 | | | | | |
| 5.150%, 11/15/2046 | | | 10,321,000 | | | | 9,591,144 | | | | | |
| 4.500%, 03/09/2048 | | | 15,264,000 | | | | 13,061,511 | | | | | |
| 5.150%, 02/15/2050 | | | 23,650,000 | | | | 21,909,579 | | | | | |
| Avnet, Inc., | | | | | | | | | | | | |
| 3.750%, 12/01/2021 | | | 5,000,000 | | | | 5,029,107 | | | | | |
| Ball Corp.: | | | | | | | | | | | | |
| 5.250%, 07/01/2025 | | | 25,000,000 | | | | 24,937,500 | | | | | |
| 4.875%, 03/15/2026 | | | 7,000,000 | | | | 6,807,500 | | | | | |
| Bayer US Finance II LLC: | | | | | | | | | | | | |
| 4.250%, 12/15/2025 (2) | | | 25,000,000 | | | | 24,331,521 | | | | | |
| 4.625%, 06/25/2038 (2) | | | 12,000,000 | | | | 10,897,690 | | | | | |
| 4.875%, 06/25/2048 (2) | | | 5,125,000 | | | | 4,606,054 | | | | | |
| Bayer US Finance LLC, | | | | | | | | | | | | |
| 2.375%, 10/08/2019 (2) | | | 14,725,000 | | | | 14,607,296 | | | | | |
| Beam Suntory, Inc.: | | | | | | | | | | | | |
| 3.250%, 05/15/2022 | | | 7,000,000 | | | | 6,938,249 | | | | | |
| 3.250%, 06/15/2023 | | | 10,960,000 | | | | 10,630,383 | | | | | |
| Becton Dickinson and Co.: | | | | | | | | | | | | |
| 3.250%, 11/12/2020 | | | 13,000,000 | | | | 12,921,385 | | | | | |
| 3.363%, 06/06/2024 | | | 10,000,000 | | | | 9,604,770 | | | | | |
| 3.734%, 12/15/2024 | | | 9,250,000 | | | | 8,935,459 | | | | | |
| 4.875%, 05/15/2044 | | | 5,455,000 | | | | 5,163,877 | | | | | |
| Bemis Co., Inc., | | | | | | | | | | | | |
| 4.500%, 10/15/2021 | | | 1,000,000 | | | | 1,022,329 | | | | | |
| Boardwalk Pipelines LP: | | | | | | | | | | | | |
| 4.950%, 12/15/2024 | | | 15,475,000 | | | | 15,692,703 | | | | | |
| 5.950%, 06/01/2026 | | | 26,406,000 | | | | 27,280,620 | | | | | |
| Boral Finance Pty Ltd.: | | | | | | | | | | | | |
| 3.000%, 11/01/2022 (1)(2) | | | 8,650,000 | | | | 8,356,992 | | | | | |
| 3.750%, 05/01/2028 (1)(2) | | | 5,550,000 | | | | 5,158,752 | | | | | |
| Broadcom Corp. / Broadcom Cayman Finance Ltd.: | | | | | | | | | | | | |
| 3.000%, 01/15/2022 | | | 25,000,000 | | | | 24,042,585 | | | | | |
| 3.125%, 01/15/2025 | | | 13,250,000 | | | | 11,961,578 | | | | | |
| Broadridge Financial Solutions, Inc., | | | | | | | | | | | | |
| 3.400%, 06/27/2026 | | | 18,286,000 | | | | 17,397,560 | | | | | |
| Browning-Ferris Industries, Inc., | | | | | | | | | | | | |
| 9.250%, 05/01/2021 | | | 1,600,000 | | | | 1,783,012 | | | | | |
| Bunge Limited Finance Corp.: | | | | | | | | | | | | |
| 3.250%, 08/15/2026 | | | 13,188,000 | | | | 11,554,943 | | | | | |
| 3.750%, 09/25/2027 | | | 22,800,000 | | | | 20,275,992 | | | | | |
| Burlington Northern Santa Fe LLC, | | | | | | | | | | | | |
| 4.150%, 04/01/2045 | | | 3,100,000 | | | | 3,005,523 | | | | | |
| Campbell Soup Co.: | | | | | | | | | | | | |
| 3.950%, 03/15/2025 | | | 11,000,000 | | | | 10,538,557 | | | | | |
| 4.800%, 03/15/2048 | | | 7,325,000 | | | | 6,281,864 | | | | | |
| Carlisle Cos, Inc., | | | | | | | | | | | | |
| 3.750%, 12/01/2027 | | | 4,600,000 | | | | 4,357,893 | | | | | |
| Celgene Corp.: | | | | | | | | | | | | |
| 3.550%, 08/15/2022 | | | 5,730,000 | | | | 5,667,064 | | | | | |
| 3.250%, 02/20/2023 | | | 10,000,000 | | | | 9,764,525 | | | | | |
| CF Industries, Inc.: | | | | | | | | | | | | |
| 3.450%, 06/01/2023 | | | 24,874,000 | | | | 23,132,820 | | | | | |
| 5.375%, 03/15/2044 | | | 10,922,000 | | | | 8,846,820 | | | | | |
| Charter Communications Operating LLC: | | | | | | | | | | | | |
| 4.464%, 07/23/2022 | | | 33,748,000 | | | | 34,072,169 | | | | | |
| 6.384%, 10/23/2035 | | | 6,000,000 | | | | 6,158,683 | | | | | |
| CK Hutchison International Ltd.: | | | | | | | | | | | | |
| 2.250%, 09/29/2020 (1)(2) | | | 17,600,000 | | | | 17,306,846 | | | | | |
| 2.875%, 04/05/2022 (1)(2) | | | 7,475,000 | | | | 7,335,890 | | | | | |
| CNH Industrial Capital LLC, | | | | | | | | | | | | |
| 4.200%, 01/15/2024 | | | 15,000,000 | | | | 14,823,889 | | | | | |
| CNH Industrial NV, | | | | | | | | | | | | |
| 4.500%, 08/15/2023 (1) | | | 6,168,000 | | | | 6,198,223 | | | | | |
| Columbia Pipeline Group, Inc.: | | | | | | | | | | | | |
| 3.300%, 06/01/2020 | | | 9,943,000 | | | | 9,908,806 | | | | | |
| 4.500%, 06/01/2025 | | | 14,135,000 | | | | 14,236,795 | | | | | |
| 5.800%, 06/01/2045 | | | 2,223,000 | | | | 2,383,707 | | | | | |
| Comcast Cable Communications Holdings, Inc., | | | | | | | | | | | | |
| 9.455%, 11/15/2022 | | | 2,030,000 | | | | 2,466,336 | | | | | |
| Comcast Corp.: | | | | | | | | | | | | |
| 4.250%, 01/15/2033 | | | 6,500,000 | | | | 6,455,640 | | | | | |
| 4.400%, 08/15/2035 | | | 13,575,000 | | | | 13,132,395 | | | | | |
| 3.200%, 07/15/2036 | | | 15,000,000 | | | | 12,903,092 | | | | | |
| 4.600%, 10/15/2038 | | | 12,350,000 | | | | 12,470,763 | | | | | |
| 4.650%, 07/15/2042 | | | 2,000,000 | | | | 1,979,032 | | | | | |
| 4.950%, 10/15/2058 | | | 7,500,000 | | | | 7,624,884 | | | | | |
| Conagra Brands, Inc., | | | | | | | | | | | | |
| 5.300%, 11/01/2038 | | | 6,625,000 | | | | 6,260,227 | | | | | |
| ConocoPhillips Canada Funding Co. I, | | | | | | | | | | | | |
| 5.950%, 10/15/2036 (1) | | | 845,000 | | | | 1,007,528 | | | | | |
| Constellation Brands, Inc., | | | | | | | | | | | | |
| 4.750%, 12/01/2025 | | | 1,000,000 | | | | 1,021,280 | | | | | |
| Corning, Inc., | | | | | | | | | | | | |
| 4.375%, 11/15/2057 | | | 10,000,000 | | | | 8,393,005 | | | | | |
| Cox Communications, Inc.: | | | | | | | | | | | | |
| 2.950%, 06/30/2023 (2) | | | 5,475,000 | | | | 5,268,227 | | | | | |
| 3.850%, 02/01/2025 (2) | | | 2,875,000 | | | | 2,832,387 | | | | | |
| 3.350%, 09/15/2026 (2) | | | 16,750,000 | | | | 15,453,568 | | | | | |
| 4.800%, 02/01/2035 (2) | | | 4,450,000 | | | | 4,057,153 | | | | | |
| 6.450%, 12/01/2036 (2) | | | 5,550,000 | | | | 5,844,984 | | | | | |
| 8.375%, 03/01/2039 (2) | | | 11,639,000 | | | | 14,506,059 | | | | | |
| 4.700%, 12/15/2042 (2) | | | 5,000,000 | | | | 4,402,340 | | | | | |
| CSX Corp.: | | | | | | | | | | | | |
| 6.220%, 04/30/2040 | | | 475,000 | | | | 563,239 | | | | | |
| 4.650%, 03/01/2068 | | | 9,000,000 | | | | 8,132,168 | | | | | |
| CVS Health Corp.: | | | | | | | | | | | | |
| 3.875%, 07/20/2025 | | | 2,302,000 | | | | 2,243,299 | | | | | |
| 4.780%, 03/25/2038 | | | 30,075,000 | | | | 28,819,537 | | | | | |
| 5.050%, 03/25/2048 | | | 19,600,000 | | | | 19,063,153 | | | | | |
| Danone SA: | | | | | | | | | | | | |
| 3.000%, 06/15/2022 (1)(2) | | | 3,500,000 | | | | 3,437,409 | | | | | |
| 2.589%, 11/02/2023 (1)(2) | | | 10,000,000 | | | | 9,506,900 | | | | | |
| DCP Midstream LLC, | | | | | | | | | | | | |
| 4.750%, 09/30/2021 (2) | | | 2,245,000 | | | | 2,216,938 | | | | | |
| Deutsche Telekom International Finance BV, | | | | | | | | | | | | |
| 8.750%, 06/15/2030 (1) | | | 18,415,000 | | | | 24,018,272 | | | | | |
| Diamond 1 Finance Corp. / Diamond 2 Finance Corp.: | | | | | | | | | | | | |
| 3.480%, 06/01/2019 (2) | | | 13,810,000 | | | | 13,769,188 | | | | | |
| 4.420%, 06/15/2021 (2) | | | 39,125,000 | | | | 39,060,454 | | | | | |
| 5.450%, 06/15/2023 (2) | | | 37,680,000 | | | | 38,344,686 | | | | | |
| DISH DBS Corp., | | | | | | | | | | | | |
| 5.000%, 03/15/2023 | | | 2,500,000 | | | | 2,081,250 | | | | | |
| Dominion Gas Holdings LLC, | | | | | | | | | | | | |
| 3.600%, 12/15/2024 | | | 6,100,000 | | | | 6,056,918 | | | | | |
| Dow Chemical Co., | | | | | | | | | | | | |
| 4.125%, 11/15/2021 | | | 835,000 | | | | 849,691 | | | | | |
| DowDuPont, Inc.: | | | | | | | | | | | | |
| 4.493%, 11/15/2025 | | | 9,275,000 | | | | 9,549,318 | | | | | |
| 5.319%, 11/15/2038 | | | 17,350,000 | | | | 17,865,010 | | | | | |
| DXC Technology Co.: | | | | | | | | | | | | |
| 3.688%, 03/01/2021 (3 Month LIBOR USD + 0.950%) (3) | | | 9,228,000 | | | | 9,217,742 | | | | | |
| 4.450%, 09/18/2022 | | | 2,000,000 | | | | 2,040,812 | | | | | |
| 4.250%, 04/15/2024 | | | 38,039,000 | | | | 37,429,471 | | | | | |
| 4.750%, 04/15/2027 | | | 25,650,000 | | | | 25,740,259 | | | | | |
| Eaton Corp.: | | | | | | | | | | | | |
| 2.750%, 11/02/2022 | | | 2,625,000 | | | | 2,553,057 | | | | | |
| 4.000%, 11/02/2032 | | | 3,660,000 | | | | 3,614,667 | | | | | |
| Ecolab, Inc., | | | | | | | | | | | | |
| 3.250%, 01/14/2023 | | | 6,325,000 | | | | 6,300,504 | | | | | |
| EMC Corp., | | | | | | | | | | | | |
| 2.650%, 06/01/2020 | | | 200,000 | | | | 192,084 | | | | | |
| Enable Midstream Partners LP, | | | | | | | | | | | | |
| 4.400%, 03/15/2027 | | | 15,000,000 | | | | 14,006,097 | | | | | |
| Enable Oklahoma Intrastate Transmission LLC, | | | | | | | | | | | | |
| 6.250%, 03/15/2020 (2) | | | 3,300,000 | | | | 3,394,679 | | | | | |
| Enbridge Energy Partners LP: | | | | | | | | | | | | |
| 7.500%, 04/15/2038 | | | 4,500,000 | | | | 5,673,060 | | | | | |
| 7.375%, 10/15/2045 | | | 23,298,000 | | | | 28,856,695 | | | | | |
| Encana Corp., | | | | | | | | | | | | |
| 6.500%, 05/15/2019 (1) | | | 610,000 | | | | 616,271 | | | | | |
| Energy Transfer Equity LP: | | | | | | | | | | | | |
| 4.250%, 03/15/2023 | | | 10,000,000 | | | | 9,625,000 | | | | | |
| 5.875%, 01/15/2024 | | | 15,000,000 | | | | 15,262,500 | | | | | |
| Energy Transfer Partners LP: | | | | | | | | | | | | |
| 9.700%, 03/15/2019 | | | 1,189,000 | | | | 1,203,126 | | | | | |
| 4.150%, 10/01/2020 | | | 13,475,000 | | | | 13,556,323 | | | | | |
| 5.200%, 02/01/2022 | | | 1,000,000 | | | | 1,026,961 | | | | | |
| 3.600%, 02/01/2023 | | | 5,000,000 | | | | 4,817,131 | | | | | |
| 4.050%, 03/15/2025 | | | 6,204,000 | | | | 5,822,787 | | | | | |
| 4.200%, 04/15/2027 | | | 8,650,000 | | | | 8,061,207 | | | | | |
| 6.500%, 02/01/2042 | | | 16,625,000 | | | | 16,592,163 | | | | | |
| 5.150%, 03/15/2045 | | | 5,000,000 | | | | 4,325,503 | | | | | |
| EnLink Midstream Partners LP, | | | | | | | | | | | | |
| 4.400%, 04/01/2024 | | | 23,605,000 | | | | 22,244,956 | | | | | |
| Ensco PLC, | | | | | | | | | | | | |
| 5.200%, 03/15/2025 (1) | | | 6,000,000 | | | | 3,990,000 | | | | | |
| Enterprise Products Operating LLC: | | | | | | | | | | | | |
| 2.850%, 04/15/2021 | | | 10,000,000 | | | | 9,900,225 | | | | | |
| 3.350%, 03/15/2023 | | | 10,000,000 | | | | 9,863,401 | | | | | |
| 3.750%, 02/15/2025 | | | 7,000,000 | | | | 6,926,199 | | | | | |
| EQT Midstream Partners LP: | | | | | | | | | | | | |
| 4.750%, 07/15/2023 | | | 22,000,000 | | | | 21,952,695 | | | | | |
| 4.125%, 12/01/2026 | | | 14,750,000 | | | | 13,389,605 | | | | | |
| ERAC USA Finance LLC: | | | | | | | | | | | | |
| 2.350%, 10/15/2019 (2) | | | 5,385,000 | | | | 5,348,585 | | | | | |
| 2.600%, 12/01/2021 (2) | | | 10,400,000 | | | | 10,118,989 | | | | | |
| Express Scripts Holding Co.: | | | | | | | | | | | | |
| 4.750%, 11/15/2021 | | | 14,700,000 | | | | 15,120,830 | | | | | |
| 3.050%, 11/30/2022 | | | 15,000,000 | | | | 14,517,009 | | | | | |
| 3.500%, 06/15/2024 | | | 7,800,000 | | | | 7,574,727 | | | | | |
| FedEx Corp.: | | | | | | | | | | | | |
| 3.900%, 02/01/2035 | | | 7,000,000 | | | | 6,337,533 | | | | | |
| 4.950%, 10/17/2048 | | | 13,500,000 | | | | 13,046,029 | | | | | |
| Ferguson Finance PLC, | | | | | | | | | | | | |
| 4.500%, 10/24/2028 (1)(2) | | | 5,700,000 | | | | 5,694,281 | | | | | |
| Fidelity National Information Services, Inc.: | | | | | | | | | | | | |
| 3.625%, 10/15/2020 | | | 2,789,000 | | | | 2,801,678 | | | | | |
| 4.500%, 10/15/2022 | | | 1,529,000 | | | | 1,574,808 | | | | | |
| 3.500%, 04/15/2023 | | | 3,268,000 | | | | 3,230,410 | | | | | |
| 3.875%, 06/05/2024 | | | 6,367,000 | | | | 6,359,934 | | | | | |
| 3.000%, 08/15/2026 | | | 9,300,000 | | | | 8,555,690 | | | | | |
| 4.500%, 08/15/2046 | | | 6,700,000 | | | | 6,093,265 | | | | | |
| 4.750%, 05/15/2048 | | | 15,000,000 | | | | 13,943,333 | | | | | |
| Fiserv, Inc.: | | | | | | | | | | | | |
| 3.500%, 10/01/2022 | | | 11,625,000 | | | | 11,544,873 | | | | | |
| 3.850%, 06/01/2025 | | | 11,720,000 | | | | 11,615,616 | | | | | |
| Florida Gas Transmission Co. LLC, | | | | | | | | | | | | |
| 3.875%, 07/15/2022 (2) | | | 3,000,000 | | | | 3,019,434 | | | | | |
| Fomento Economico Mexicano SAB de CV: | | | | | | | | | | | | |
| 2.875%, 05/10/2023 (1) | | | 11,700,000 | | | | 11,159,821 | | | | | |
| 4.375%, 05/10/2043 (1) | | | 2,000,000 | | | | 1,913,104 | | | | | |
| Ford Motor Credit Co. LLC: | | | | | | | | | | | | |
| 2.681%, 01/09/2020 | | | 5,000,000 | | | | 4,917,171 | | | | | |
| 3.200%, 01/15/2021 | | | 11,250,000 | | | | 10,909,740 | | | | | |
| 5.750%, 02/01/2021 | | | 13,000,000 | | | | 13,258,666 | | | | | |
| 3.336%, 03/18/2021 | | | 5,500,000 | | | | 5,336,719 | | | | | |
| 5.875%, 08/02/2021 | | | 8,975,000 | | | | 9,204,480 | | | | | |
| 2.979%, 08/03/2022 | | | 10,000,000 | | | | 9,242,167 | | | | | |
| 4.250%, 09/20/2022 | | | 4,459,000 | | | | 4,274,609 | | | | | |
| Forest Laboratories, Inc., | | | | | | | | | | | | |
| 5.000%, 12/15/2021 (2) | | | 41,397,000 | | | | 42,593,336 | | | | | |
| Freeport-McMoRan, Inc.: | | | | | | | | | | | | |
| 3.100%, 03/15/2020 | | | 3,775,000 | | | | 3,690,062 | | | | | |
| 3.550%, 03/01/2022 | | | 6,275,000 | | | | 5,937,719 | | | | | |
| 3.875%, 03/15/2023 | | | 27,816,000 | | | | 25,729,800 | | | | | |
| Fresenius Medical Care US Finance II, Inc., | | | | | | | | | | | | |
| 4.750%, 10/15/2024 (2) | | | 8,075,000 | | | | 8,222,773 | | | | | |
| Fresenius US Finance II, Inc., | | | | | | | | | | | | |
| 4.500%, 01/15/2023 (2) | | | 33,385,000 | | | | 33,734,669 | | | | | |
| General Electric Co.: | | | | | | | | | | | | |
| 2.200%, 01/09/2020 | | | 2,864,000 | | | | 2,822,295 | | | | | |
| 5.550%, 05/04/2020 | | | 1,199,000 | | | | 1,219,549 | | | | | |
| 4.375%, 09/16/2020 | | | 838,000 | | | | 836,807 | | | | | |
| 5.300%, 02/11/2021 | | | 859,000 | | | | 860,065 | | | | | |
| 4.650%, 10/17/2021 | | | 2,420,000 | | | | 2,427,259 | | | | | |
| 3.150%, 09/07/2022 | | | 6,500,000 | | | | 6,143,017 | | | | | |
| General Mills, Inc.: | | | | | | | | | | | | |
| 2.200%, 10/21/2019 | | | 12,000,000 | | | | 11,908,758 | | | | | |
| 3.700%, 10/17/2023 | | | 20,000,000 | | | | 19,883,303 | | | | | |
| 4.000%, 04/17/2025 | | | 3,175,000 | | | | 3,124,659 | | | | | |
| General Motors Financial Co., Inc.: | | | | | | | | | | | | |
| 2.400%, 05/09/2019 | | | 6,500,000 | | | | 6,475,571 | | | | | |
| 2.350%, 10/04/2019 | | | 2,700,000 | | | | 2,676,478 | | | | | |
| 2.450%, 11/06/2020 | | | 9,000,000 | | | | 8,741,451 | | | | | |
| 3.700%, 11/24/2020 | | | 1,509,000 | | | | 1,502,899 | | | | | |
| 4.200%, 03/01/2021 | | | 21,283,000 | | | | 21,271,566 | | | | | |
| 3.200%, 07/06/2021 | | | 25,600,000 | | | | 25,006,240 | | | | | |
| 4.375%, 09/25/2021 | | | 4,875,000 | | | | 4,884,433 | | | | | |
| 3.450%, 01/14/2022 | | | 5,200,000 | | | | 5,038,963 | | | | | |
| 3.150%, 06/30/2022 | | | 6,325,000 | | | | 6,041,372 | | | | | |
| 4.150%, 06/19/2023 | | | 3,375,000 | | | | 3,288,435 | | | | | |
| Genpact Luxembourg Sarl, | | | | | | | | | | | | |
| 3.700%, 04/01/2022 (1) | | | 43,005,000 | | | | 42,677,971 | | | | | |
| Georgia-Pacific LLC: | | | | | | | | | | | | |
| 5.400%, 11/01/2020 (2) | | | 11,000,000 | | | | 11,397,917 | | | | | |
| 3.163%, 11/15/2021 (2) | | | 20,000,000 | | | | 19,819,311 | | | | | |
| Glencore Finance (Canada) Ltd.: | | | | | | | | | | | | |
| 4.950%, 11/15/2021 (1)(2) | | | 2,000,000 | | | | 2,042,727 | | | | | |
| 4.250%, 10/25/2022 (1)(2) | | | 7,000,000 | | | | 6,977,849 | | | | | |
| 6.000%, 11/15/2041 (1)(2) | | | 9,400,000 | | | | 9,059,899 | | | | | |
| Glencore Funding LLC: | | | | | | | | | | | | |
| 4.125%, 05/30/2023 (2) | | | 16,940,000 | | | | 16,634,868 | | | | | |
| 4.625%, 04/29/2024 (2) | | | 26,730,000 | | | | 26,495,845 | | | | | |
| 4.000%, 03/27/2027 (2) | | | 17,000,000 | | | | 15,486,623 | | | | | |
| Grupo Bimbo SAB de CV: | | | | | | | | | | | | |
| 3.875%, 06/27/2024 (1)(2) | | | 26,633,000 | | | | 26,157,597 | | | | | |
| 4.875%, 06/27/2044 (1)(2) | | | 9,575,000 | | | | 8,827,046 | | | | | |
| 4.700%, 11/10/2047 (1)(2) | | | 22,671,000 | | | | 20,393,925 | | | | | |
| Gulf South Pipeline Co. LP, | | | | | | | | | | | | |
| 4.000%, 06/15/2022 | | | 3,000,000 | | | | 2,972,729 | | | | | |
| Gulfstream Natural Gas System LLC, | | | | | | | | | | | | |
| 4.600%, 09/15/2025 (2) | | | 10,000,000 | | | | 10,313,829 | | | | | |
| HB Fuller Co., | | | | | | | | | | | | |
| 4.000%, 02/15/2027 | | | 6,725,000 | | | | 5,649,000 | | | | | |
| HCA, Inc.: | | | | | | | | | | | | |
| 4.250%, 10/15/2019 | | | 10,900,000 | | | | 10,872,750 | | | | | |
| 6.500%, 02/15/2020 | | | 5,000,000 | | | | 5,125,000 | | | | | |
| 5.000%, 03/15/2024 | | | 10,366,000 | | | | 10,262,340 | | | | | |
| 5.375%, 02/01/2025 | | | 25,300,000 | | | | 24,667,500 | | | | | |
| 5.250%, 04/15/2025 | | | 4,200,000 | | | | 4,179,000 | | | | | |
| 5.375%, 09/01/2026 | | | 1,000,000 | | | | 972,500 | | | | | |
| Hewlett Packard Enterprise Co.: | | | | | | | | | | | | |
| 2.100%, 10/04/2019 (2) | | | 9,000,000 | | | | 8,898,587 | | | | | |
| 3.600%, 10/15/2020 | | | 7,550,000 | | | | 7,569,549 | | | | | |
| Hexcel Corp., | | | | | | | | | | | | |
| 3.950%, 02/15/2027 | | | 19,000,000 | | | | 18,583,112 | | | | | |
| Husky Energy, Inc., | | | | | | | | | | | | |
| 4.000%, 04/15/2024 (1) | | | 7,380,000 | | | | 7,303,539 | | | | | |
| Hutchison Whampoa International Ltd.: | | | | | | | | | | | | |
| 7.625%, 04/09/2019 (1)(2) | | | 2,500,000 | | | | 2,528,812 | | | | | |
| 3.250%, 11/08/2022 (1)(2) | | | 4,625,000 | | | | 4,586,243 | | | | | |
| 3.625%, 10/31/2024 (1)(2) | | | 15,000,000 | | | | 14,852,865 | | | | | |
| Hyundai Capital America: | | | | | | | | | | | | |
| 2.500%, 03/18/2019 (2) | | | 24,750,000 | | | | 24,708,825 | | | | | |
| 1.750%, 09/27/2019 (2) | | | 10,000,000 | | | | 9,869,234 | | | | | |
| 3.450%, 03/12/2021 (2) | | | 20,950,000 | | | | 20,724,732 | | | | | |
| 3.000%, 03/18/2021 (2) | | | 10,000,000 | | | | 9,845,559 | | | | | |
| 3.750%, 07/08/2021 (2) | | | 10,150,000 | | | | 10,119,966 | | | | | |
| 3.100%, 04/05/2022 (2) | | | 2,000,000 | | | | 1,952,217 | | | | | |
| Hyundai Capital Services, Inc., | | | | | | | | | | | | |
| 2.625%, 09/29/2020 (1)(2) | | | 9,225,000 | | | | 9,065,356 | | | | | |
| Ingersoll-Rand Global Holding Co. Ltd, | | | | | | | | | | | | |
| 5.750%, 06/15/2043 | | | 4,126,000 | | | | 4,734,621 | | | | | |
| Ingersoll-Rand Luxembourg Finance SA, | | | | | | | | | | | | |
| 4.650%, 11/01/2044 (1) | | | 1,300,000 | | | | 1,268,563 | | | | | |
| International Flavors & Fragrances, Inc., | | | | | | | | | | | | |
| 5.000%, 09/26/2048 | | | 10,000,000 | | | | 9,960,408 | | | | | |
| Johnson Controls International PLC: | | | | | | | | | | | | |
| 3.900%, 02/14/2026 (1) | | | 10,000,000 | | | | 9,807,086 | | | | | |
| 5.250%, 12/01/2041 (1) | | | 1,150,000 | | | | 1,110,607 | | | | | |
| Kansas City Southern, | | | | | | | | | | | | |
| 4.700%, 05/01/2048 | | | 12,000,000 | | | | 11,718,688 | | | | | |
| Kerr-McGee Corp., | | | | | | | | | | | | |
| 7.875%, 09/15/2031 | | | 12,790,000 | | | | 15,316,658 | | | | | |
| Keurig Dr Pepper, Inc., | | | | | | | | | | | | |
| 4.417%, 05/25/2025 (2) | | | 7,000,000 | | | | 6,967,608 | | | | | |
| Keysight Technologies, Inc.: | | | | | | | | | | | | |
| 3.300%, 10/30/2019 | | | 13,300,000 | | | | 13,259,708 | | | | | |
| 4.550%, 10/30/2024 | | | 7,283,000 | | | | 7,428,956 | | | | | |
| 4.600%, 04/06/2027 | | | 31,321,000 | | | | 31,440,805 | | | | | |
| Kinder Morgan Energy Partners LP: | | | | | | | | | | | | |
| 9.000%, 02/01/2019 | | | 8,828,000 | | | | 8,866,083 | | | | | |
| 6.850%, 02/15/2020 | | | 4,645,000 | | | | 4,809,510 | | | | | |
| 6.500%, 02/01/2037 | | | 400,000 | | | | 430,918 | | | | | |
| 6.950%, 01/15/2038 | | | 5,130,000 | | | | 5,721,738 | | | | | |
| 7.500%, 11/15/2040 | | | 8,041,000 | | | | 9,276,255 | | | | | |
| Kinder Morgan, Inc.: | | | | | | | | | | | | |
| 3.050%, 12/01/2019 | | | 7,000,000 | | | | 6,959,647 | | | | | |
| 5.000%, 02/15/2021 (2) | | | 10,008,000 | | | | 10,253,342 | | | | | |
| 8.050%, 10/15/2030 | | | 15,009,000 | | | | 17,581,182 | | | | | |
| 7.800%, 08/01/2031 | | | 16,174,000 | | | | 19,376,906 | | | | | |
| 5.200%, 03/01/2048 | | | 8,025,000 | | | | 7,660,753 | | | | | |
| Kinross Gold Corp., | | | | | | | | | | | | |
| 6.875%, 09/01/2041 (1) | | | 5,500,000 | | | | 5,252,500 | | | | | |
| Kraft Heinz Foods Co.: | | | | | | | | | | | | |
| 4.000%, 06/15/2023 | | | 17,000,000 | | | | 16,955,448 | | | | | |
| 6.750%, 03/15/2032 | | | 10,000,000 | | | | 11,391,690 | | | | | |
| 5.000%, 07/15/2035 | | | 7,375,000 | | | | 6,921,274 | | | | | |
| 5.000%, 06/04/2042 | | | 5,000,000 | | | | 4,471,366 | | | | | |
| Lafarge SA, | | | | | | | | | | | | |
| 7.125%, 07/15/2036 (1) | | | 1,500,000 | | | | 1,768,818 | | | | | |
| LafargeHolcim Finance US LLC, | | | | | | | | | | | | |
| 3.500%, 09/22/2026 (2) | | | 12,565,000 | | | | 11,413,030 | | | | | |
| Lear Corp., | | | | | | | | | | | | |
| 5.250%, 01/15/2025 | | | 21,600,000 | | | | 22,188,621 | | | | | |
| Lennox International, Inc., | | | | | | | | | | | | |
| 3.000%, 11/15/2023 | | | 10,000,000 | | | | 9,410,102 | | | | | |
| Magellan Midstream Partners LP: | | | | | | | | | | | | |
| 5.000%, 03/01/2026 | | | 10,000,000 | | | | 10,452,809 | | | | | |
| 4.200%, 03/15/2045 | | | 8,770,000 | | | | 7,722,865 | | | | | |
| 4.250%, 09/15/2046 | | | 1,230,000 | | | | 1,119,153 | | | | | |
| Marathon Oil Corp., | | | | | | | | | | | | |
| 2.800%, 11/01/2022 | | | 10,175,000 | | | | 9,556,707 | | | | | |
| Marathon Petroleum Corp.: | | | | | | | | | | | | |
| 3.400%, 12/15/2020 | | | 20,000,000 | | | | 19,993,929 | | | | | |
| 3.625%, 09/15/2024 | | | 2,500,000 | | | | 2,432,611 | | | | | |
| 4.750%, 09/15/2044 | | | 3,985,000 | | | | 3,514,195 | | | | | |
| Martin Marietta Materials, Inc., | | | | | | | | | | | | |
| 6.250%, 05/01/2037 | | | 450,000 | | | | 501,008 | | | | | |
| Masco Corp.: | | | | | | | | | | | | |
| 7.125%, 03/15/2020 | | | 232,000 | | | | 242,353 | | | | | |
| 6.500%, 08/15/2032 | | | 13,934,000 | | | | 15,403,333 | | | | | |
| McDonald's Corp., | | | | | | | | | | | | |
| 3.700%, 01/30/2026 | | | 7,250,000 | | | | 7,107,106 | | | | | |
| Microchip Technology, Inc.: | | | | | | | | | | | | |
| 3.922%, 06/01/2021 (2) | | | 12,845,000 | | | | 12,742,082 | | | | | |
| 4.333%, 06/01/2023 (2) | | | 9,000,000 | | | | 8,778,735 | | | | | |
| Microsoft Corp., | | | | | | | | | | | | |
| 4.200%, 11/03/2035 | | | 5,650,000 | | | | 5,857,135 | | | | | |
| Molex Electronic Technologies LLC: | | | | | | | | | | | | |
| 2.878%, 04/15/2020 (2) | | | 26,313,000 | | | | 26,059,002 | | | | | |
| 3.900%, 04/15/2025 (2) | | | 4,500,000 | | | | 4,476,931 | | | | | |
| Mosaic Co., | | | | | | | | | | | | |
| 5.450%, 11/15/2033 | | | 16,101,000 | | | | 16,549,460 | | | | | |
| MPLX LP: | | | | | | | | | | | | |
| 4.500%, 07/15/2023 | | | 275,000 | | | | 277,753 | | | | | |
| 4.875%, 12/01/2024 | | | 9,650,000 | | | | 9,823,033 | | | | | |
| 4.000%, 02/15/2025 | | | 8,125,000 | | | | 7,891,019 | | | | | |
| 4.875%, 06/01/2025 | | | 14,500,000 | | | | 14,632,858 | | | | | |
| 5.500%, 02/15/2049 | | | 8,825,000 | | | | 8,584,195 | | | | | |
| 4.900%, 04/15/2058 | | | 5,000,000 | | | | 4,176,541 | | | | | |
| Murphy Oil Corp., | | | | | | | | | | | | |
| 4.450%, 12/01/2022 | | | 12,600,000 | | | | 11,863,148 | | | | | |
| Mylan NV: | | | | | | | | | | | | |
| 3.750%, 12/15/2020 (1) | | | 5,875,000 | | | | 5,872,265 | | | | | |
| 3.150%, 06/15/2021 (1) | | | 8,100,000 | | | | 7,921,505 | | | | | |
| Mylan, Inc.: | | | | | | | | | | | | |
| 3.125%, 01/15/2023 (2) | | | 11,800,000 | | | | 11,065,218 | | | | | |
| 4.200%, 11/29/2023 | | | 4,525,000 | | | | 4,414,210 | | | | | |
| 4.550%, 04/15/2028 (2) | | | 5,000,000 | | | | 4,660,131 | | | | | |
| Newell Brands, Inc., | | | | | | | | | | | | |
| 3.850%, 04/01/2023 | | | 20,000,000 | | | | 19,706,908 | | | | | |
| Noble Energy, Inc.: | | | | | | | | | | | | |
| 3.900%, 11/15/2024 | | | 3,000,000 | | | | 2,906,036 | | | | | |
| 5.050%, 11/15/2044 | | | 3,000,000 | | | | 2,584,101 | | | | | |
| NuStar Logistics LP: | | | | | | | | | | | | |
| 4.800%, 09/01/2020 | | | 4,275,000 | | | | 4,189,500 | | | | | |
| 6.750%, 02/01/2021 | | | 3,000,000 | | | | 3,022,500 | | | | | |
| Nutrien Ltd.: | | | | | | | | | | | | |
| 4.000%, 12/15/2026 (1) | | | 10,000,000 | | | | 9,749,781 | | | | | |
| 4.125%, 03/15/2035 (1) | | | 6,550,000 | | | | 5,962,962 | | | | | |
| Nvent Finance Sarl: | | | | | | | | | | | | |
| 3.950%, 04/15/2023 (1) | | | 11,055,000 | | | | 10,975,919 | | | | | |
| 4.550%, 04/15/2028 (1) | | | 10,000,000 | | | | 9,797,627 | | | | | |
| ONEOK Partners LP: | | | | | | | | | | | | |
| 3.375%, 10/01/2022 | | | 4,007,000 | | | | 3,934,300 | | | | | |
| 5.000%, 09/15/2023 | | | 8,300,000 | | | | 8,552,228 | | | | | |
| ONEOK, Inc.: | | | | | | | | | | | | |
| 4.250%, 02/01/2022 | | | 6,450,000 | | | | 6,510,839 | | | | | |
| 7.500%, 09/01/2023 | | | 22,959,000 | | | | 26,087,859 | | | | | |
| Oracle Corp.: | | | | | | | | | | | | |
| 3.400%, 07/08/2024 | | | 8,850,000 | | | | 8,832,409 | | | | | |
| 3.900%, 05/15/2035 | | | 7,425,000 | | | | 7,107,387 | | | | | |
| Orange SA, | | | | | | | | | | | | |
| 9.000%, 03/01/2031 (1) | | | 22,353,000 | | | | 30,884,639 | | | | | |
| Owens Corning: | | | | | | | | | | | | |
| 4.200%, 12/01/2024 | | | 10,000,000 | | | | 9,920,481 | | | | | |
| 3.400%, 08/15/2026 | | | 5,000,000 | | | | 4,565,959 | | | | | |
| Packaging Corp. of America, | | | | | | | | | | | | |
| 4.500%, 11/01/2023 | | | 4,700,000 | | | | 4,817,823 | | | | | |
| Pactiv LLC, | | | | | | | | | | | | |
| 7.950%, 12/15/2025 | | | 1,338,000 | | | | 1,313,755 | | | | | |
| Pentair Finance SA, | | | | | | | | | | | | |
| 2.650%, 12/01/2019 (1) | | | 5,000,000 | | | | 4,961,857 | | | | | |
| Pernod Ricard SA, | | | | | | | | | | | | |
| 4.250%, 07/15/2022 (1)(2) | | | 26,700,000 | | | | 27,085,458 | | | | | |
| Perrigo Finance Unlimited Co., | | | | | | | | | | | | |
| 3.900%, 12/15/2024 (1) | | | 31,500,000 | | | | 29,149,405 | | | | | |
| Phillips 66: | | | | | | | | | | | | |
| 4.300%, 04/01/2022 | | | 6,168,000 | | | | 6,332,251 | | | | | |
| 4.650%, 11/15/2034 | | | 13,000,000 | | | | 12,662,159 | | | | | |
| 5.875%, 05/01/2042 | | | 5,000,000 | | | | 5,458,550 | | | | | |
| 4.875%, 11/15/2044 | | | 15,000,000 | | | | 14,637,275 | | | | | |
| Phillips 66 Partners LP: | | | | | | | | | | | | |
| 3.605%, 02/15/2025 | | | 2,000,000 | | | | 1,921,471 | | | | | |
| 4.680%, 02/15/2045 | | | 2,000,000 | | | | 1,801,042 | | | | | |
| Plum Creek Timberlands LP: | | | | | | | | | | | | |
| 4.700%, 03/15/2021 | | | 1,200,000 | | | | 1,229,764 | | | | | |
| 3.250%, 03/15/2023 | | | 8,375,000 | | | | 8,231,293 | | | | | |
| POSCO: | | | | | | | | | | | | |
| 4.250%, 10/28/2020 (1)(2) | | | 2,300,000 | | | | 2,331,050 | | | | | |
| 4.000%, 08/01/2023 (1)(2) | | | 13,000,000 | | | | 13,113,379 | | | | | |
| Qwest Capital Funding, Inc., | | | | | | | | | | | | |
| 7.625%, 08/03/2021 | | | 200,000 | | | | 202,416 | | | | | |
| Regency Energy Partners LP / Regency Energy Finance Corp., | | | | | | | | | | | | |
| 4.500%, 11/01/2023 | | | 11,850,000 | | | | 11,853,846 | | | | | |
| Reliance Holding USA, Inc.: | | | | | | | | | | | | |
| 4.500%, 10/19/2020 (2) | | | 2,000,000 | | | | 2,023,036 | | | | | |
| 5.400%, 02/14/2022 (2) | | | 3,500,000 | | | | 3,624,516 | | | | | |
| Republic Services, Inc.: | | | | | | | | | | | | |
| 5.500%, 09/15/2019 | | | 8,000,000 | | | | 8,123,939 | | | | | |
| 4.750%, 05/15/2023 | | | 13,459,000 | | | | 14,087,977 | | | | | |
| 2.900%, 07/01/2026 | | | 15,000,000 | | | | 14,148,479 | | | | | |
| Rockies Express Pipeline LLC, | | | | | | | | | | | | |
| 5.625%, 04/15/2020 (2) | | | 2,695,000 | | | | 2,695,000 | | | | | |
| Sabine Pass Liquefaction LLC: | | | | | | | | | | | | |
| 5.625%, 03/01/2025 | | | 14,500,000 | | | | 15,057,664 | | | | | |
| 5.875%, 06/30/2026 | | | 50,315,000 | | | | 53,273,731 | | | | | |
| Samarco Mineracao SA: | | | | | | | | | | | | |
| 5.750%, 10/24/2023 (1)(2)(8) | | | 5,475,000 | | | | 4,297,875 | | | | | |
| 5.375%, 09/26/2024 (1)(2)(8) | | | 5,125,000 | | | | 4,010,364 | | | | | |
| Schlumberger Holdings Corp., | | | | | | | | | | | | |
| 3.000%, 12/21/2020 (2) | | | 11,000,000 | | | | 10,904,657 | | | | | |
| Schneider Electric SE, | | | | | | | | | | | | |
| 2.950%, 09/27/2022 (1)(2) | | | 5,000,000 | | | | 4,912,876 | | | | | |
| Seagate HDD Cayman, | | | | | | | | | | | | |
| 4.250%, 03/01/2022 (1) | | | 52,944,000 | | | | 50,597,621 | | | | | |
| Sherwin-Williams Co., | | | | | | | | | | | | |
| 4.500%, 06/01/2047 | | | 10,550,000 | | | | 9,513,615 | | | | | |
| Shire Acquisitions Investments Ireland DAC, | | | | | | | | | | | | |
| 2.875%, 09/23/2023 (1) | | | 54,946,000 | | | | 51,941,390 | | | | | |
| Silgan Holdings, Inc., | | | | | | | | | | | | |
| 4.750%, 03/15/2025 | | | 1,000,000 | | | | 932,500 | | | | | |
| SK Telecom Co. Ltd., | | | | | | | | | | | | |
| 6.625%, 07/20/2027 (1)(2) | | | 960,000 | | | | 1,149,389 | | | | | |
| Smithfield Foods, Inc.: | | | | | | | | | | | | |
| 2.650%, 10/03/2021 (2) | | | 10,200,000 | | | | 9,748,178 | | | | | |
| 3.350%, 02/01/2022 (2) | | | 26,032,000 | | | | 24,895,026 | | | | | |
| Solvay Finance America LLC: | | | | | | | | | | | | |
| 3.400%, 12/03/2020 (2) | | | 39,226,000 | | | | 39,204,782 | | | | | |
| 4.450%, 12/03/2025 (2) | | | 24,426,000 | | | | 24,221,277 | | | | | |
| Sonoco Products Co., | | | | | | | | | | | | |
| 4.375%, 11/01/2021 | | | 1,000,000 | | | | 1,017,065 | | | | | |
| Spectra Energy Partners LP: | | | | | | | | | | | | |
| 3.500%, 03/15/2025 | | | 15,150,000 | | | | 14,462,412 | | | | | |
| 4.500%, 03/15/2045 | | | 5,000,000 | | | | 4,521,132 | | | | | |
| Sprint Capital Corp., | | | | | | | | | | | | |
| 6.900%, 05/01/2019 | | | 975,000 | | | | 979,875 | | | | | |
| Standard Industries, Inc.: | | | | | | | | | | | | |
| 6.000%, 10/15/2025 (2) | | | 8,511,000 | | | | 8,162,900 | | | | | |
| 4.750%, 01/15/2028 (2) | | | 21,000,000 | | | | 17,640,000 | | | | | |
| Stanley Black & Decker, Inc., | | | | | | | | | | | | |
| 4.850%, 11/15/2048 | | | 4,175,000 | | | | 4,303,616 | | | | | |
| Sunoco Finance Corp., | | | | | | | | | | | | |
| 4.875%, 01/15/2023 | | | 2,000,000 | | | | 1,950,000 | | | | | |
| Sunoco Logistics Partners Operations LP: | | | | | | | | | | | | |
| 3.450%, 01/15/2023 | | | 2,000,000 | | | | 1,934,025 | | | | | |
| 6.100%, 02/15/2042 | | | 1,000,000 | | | | 966,081 | | | | | |
| Tallgrass Energy Finance Corp., | | | | | | | | | | | | |
| 4.750%, 10/01/2023 (2) | | | 7,000,000 | | | | 6,755,000 | | | | | |
| Targa Resources Partners LP: | | | | | | | | | | | | |
| 4.125%, 11/15/2019 | | | 12,000,000 | | | | 11,895,000 | | | | | |
| 5.000%, 01/15/2028 | | | 28,000,000 | | | | 25,340,000 | | | | | |
| TC PipeLines LP: | | | | | | | | | | | | |
| 4.375%, 03/13/2025 | | | 26,205,000 | | | | 26,137,130 | | | | | |
| 3.900%, 05/25/2027 | | | 5,885,000 | | | | 5,617,803 | | | | | |
| Tech Data Corp., | | | | | | | | | | | | |
| 3.700%, 02/15/2022 | | | 7,000,000 | | | | 6,867,807 | | | | | |
| Telecom Italia Capital SA: | | | | | | | | | | | | |
| 7.175%, 06/18/2019 (1) | | | 900,000 | | | | 906,246 | | | | | |
| 5.303%, 05/30/2024 (1)(2) | | | 21,500,000 | | | | 20,425,000 | | | | | |
| 7.200%, 07/18/2036 (1) | | | 3,175,000 | | | | 3,032,125 | | | | | |
| Telefonica Emisiones SAU: | | | | | | | | | | | | |
| 5.462%, 02/16/2021 (1) | | | 2,402,000 | | | | 2,489,310 | | | | | |
| 4.570%, 04/27/2023 (1) | | | 1,000,000 | | | | 1,027,165 | | | | | |
| 4.103%, 03/08/2027 (1) | | | 8,125,000 | | | | 7,804,884 | | | | | |
| 7.045%, 06/20/2036 (1) | | | 4,925,000 | | | | 5,612,044 | | | | | |
| 5.213%, 03/08/2047 (1) | | | 5,000,000 | | | | 4,576,991 | | | | | |
| 4.895%, 03/06/2048 (1) | | | 9,475,000 | | | | 8,362,811 | | | | | |
| TELUS Corp., | | | | | | | | | | | | |
| 2.800%, 02/16/2027 (1) | | | 13,100,000 | | | | 12,068,622 | | | | | |
| Tenet Healthcare Corp., | | | | | | | | | | | | |
| 6.750%, 06/15/2023 | | | 1,000,000 | | | | 938,750 | | | | | |
| Teva Pharmaceutical Finance Netherlands III BV: | | | | | | | | | | | | |
| 2.800%, 07/21/2023 (1) | | | 24,275,000 | | | | 20,906,735 | | | | | |
| 3.150%, 10/01/2026 (1) | | | 36,000,000 | | | | 27,475,725 | | | | | |
| Thermo Fisher Scientific, Inc., | | | | | | | | | | | | |
| 3.300%, 02/15/2022 | | | 7,000,000 | | | | 6,970,183 | | | | | |
| Time Warner Cable LLC, | | | | | | | | | | | | |
| 8.250%, 04/01/2019 | | | 35,000 | | | | 35,393 | | | | | |
| Time Warner, Inc.: | | | | | | | | | | | | |
| 3.800%, 02/15/2027 | | | 3,500,000 | | | | 3,284,062 | | | | | |
| 4.850%, 07/15/2045 | | | 12,000,000 | | | | 10,767,239 | | | | | |
| Timken Co.: | | | | | | | | | | | | |
| 3.875%, 09/01/2024 | | | 18,500,000 | | | | 18,447,985 | | | | | |
| 4.500%, 12/15/2028 | | | 6,025,000 | | | | 5,931,452 | | | | | |
| T-Mobile USA, Inc., | | | | | | | | | | | | |
| 4.750%, 02/01/2028 | | | 17,250,000 | | | | 15,611,250 | | | | | |
| Total System Services, Inc.: | | | | | | | | | | | | |
| 3.800%, 04/01/2021 | | | 2,199,000 | | | | 2,198,563 | | | | | |
| 4.000%, 06/01/2023 | | | 10,775,000 | | | | 10,757,537 | | | | | |
| TransCanada PipeLines Ltd., | | | | | | | | | | | | |
| 4.750%, 05/15/2038 (1) | | | 10,000,000 | | | | 9,638,476 | | | | | |
| Transcontinental Gas Pipe Line Co. LLC, | | | | | | | | | | | | |
| 4.450%, 08/01/2042 | | | 2,600,000 | | | | 2,393,578 | | | | | |
| Transocean, Inc.: | | | | | | | | | | | | |
| 8.375%, 12/15/2021 (1) | | | 5,500,000 | | | | 5,458,750 | | | | | |
| 5.800%, 10/15/2022 (1) | | | 5,000,000 | | | | 4,400,000 | | | | | |
| TTX Co.: | | | | | | | | | | | | |
| 4.650%, 06/15/2044 (2) | | | 7,710,000 | | | | 7,971,049 | | | | | |
| 3.900%, 02/01/2045 (2) | | | 25,325,000 | | | | 23,282,303 | | | | | |
| Tyco Electronics Group SA, | | | | | | | | | | | | |
| 7.125%, 10/01/2037 (1) | | | 500,000 | | | | 640,833 | | | | | |
| United Rentals North America, Inc.: | | | | | | | | | | | | |
| 4.625%, 10/15/2025 | | | 15,540,000 | | | | 13,869,450 | | | | | |
| 5.875%, 09/15/2026 | | | 13,000,000 | | | | 12,252,500 | | | | | |
| 6.500%, 12/15/2026 | | | 5,000,000 | | | | 4,925,000 | | | | | |
| Vale Overseas Ltd.: | | | | | | | | | | | | |
| 4.375%, 01/11/2022 (1) | | | 1,063,000 | | | | 1,081,603 | | | | | |
| 6.250%, 08/10/2026 (1) | | | 22,000,000 | | | | 23,760,000 | | | | | |
| 8.250%, 01/17/2034 (1) | | | 425,000 | | | | 525,406 | | | | | |
| 6.875%, 11/21/2036 (1) | | | 10,475,000 | | | | 11,978,162 | | | | | |
| 6.875%, 11/10/2039 (1) | | | 15,850,000 | | | | 18,306,750 | | | | | |
| Valeant Pharmaceuticals International, Inc., | | | | | | | | | | | | |
| 5.875%, 05/15/2023 (1)(2) | | | 5,000,000 | | | | 4,625,000 | | | | | |
| Valero Energy Corp.: | | | | | | | | | | | | |
| 3.400%, 09/15/2026 | | | 17,500,000 | | | | 16,053,402 | | | | | |
| 6.625%, 06/15/2037 | | | 5,000,000 | | | | 5,478,184 | | | | | |
| Valero Energy Partners LP, | | | | | | | | | | | | |
| 4.500%, 03/15/2028 | | | 20,000,000 | | | | 19,583,215 | | | | | |
| Verisk Analytics, Inc.: | | | | | | | | | | | | |
| 5.800%, 05/01/2021 | | | 2,585,000 | | | | 2,717,491 | | | | | |
| 4.000%, 06/15/2025 | | | 10,000,000 | | | | 10,039,327 | | | | | |
| Verizon Communications, Inc.: | | | | | | | | | �� | | | |
| 4.500%, 08/10/2033 | | | 15,710,000 | | | | 15,507,117 | | | | | |
| 4.400%, 11/01/2034 | | | 790,000 | | | | 761,395 | | | | | |
| 4.272%, 01/15/2036 | | | 19,793,000 | | | | 18,484,153 | | | | | |
| 5.250%, 03/16/2037 | | | 18,225,000 | | | | 18,984,372 | | | | | |
| 4.812%, 03/15/2039 | | | 38,575,000 | | | | 37,776,029 | | | | | |
| Viterra, Inc., | | | | | | | | | | | | |
| 5.950%, 08/01/2020 (1)(2) | | | 7,000,000 | | | | 7,211,855 | | | | | |
| Vodafone Group PLC: | | | | | | | | | | | | |
| 7.875%, 02/15/2030 (1) | | | 9,793,000 | | | | 12,200,288 | | | | | |
| 6.150%, 02/27/2037 (1) | | | 11,825,000 | | | | 12,394,022 | | | | | |
| 4.375%, 02/19/2043 (1) | | | 5,054,000 | | | | 4,300,732 | | | | | |
| Volkswagen Group of America Finance LLC: | | | | | | | | | | | | |
| 4.000%, 11/12/2021 (2) | | | 9,000,000 | | | | 8,994,411 | | | | | |
| 4.250%, 11/13/2023 (2) | | | 18,000,000 | | | | 17,852,503 | | | | | |
| Vulcan Materials Co.: | | | | | | | | | | | | |
| 4.500%, 04/01/2025 | | | 3,000,000 | | | | 2,980,123 | | | | | |
| 4.700%, 03/01/2048 | | | 500,000 | | | | 434,105 | | | | | |
| Wabtec Corp.: | | | | | | | | | | | | |
| 4.375%, 08/15/2023 | | | 9,750,000 | | | | 9,740,230 | | | | | |
| 3.450%, 11/15/2026 | | | 27,225,000 | | | | 24,470,334 | | | | | |
| Walgreen Co., | | | | | | | | | | | | |
| 5.250%, 01/15/2019 | | | 2,482,000 | | | | 2,483,530 | | | | | |
| Walgreens Boots Alliance, Inc.: | | | | | | | | | | | | |
| 3.300%, 11/18/2021 | | | 8,060,000 | | | | 8,022,933 | | | | | |
| 3.800%, 11/18/2024 | | | 10,000,000 | | | | 9,847,928 | | | | | |
| 3.450%, 06/01/2026 | | | 7,000,000 | | | | 6,586,214 | | | | | |
| Walmart, Inc., | | | | | | | | | | | | |
| 4.050%, 06/29/2048 | | | 11,975,000 | | | | 11,915,349 | | | | | |
| Waste Management, Inc., | | | | | | | | | | | | |
| 3.900%, 03/01/2035 | | | 5,000,000 | | | | 4,852,976 | | | | | |
| Weatherford International Ltd., | | | | | | | | | | | | |
| 4.500%, 04/15/2022 (1) | | | 5,020,000 | | | | 2,936,700 | | | | | |
| Western Digital Corp., | | | | | | | | | | | | |
| 4.750%, 02/15/2026 | | | 57,075,000 | | | | 49,512,563 | | | | | |
| Western Gas Partners LP: | | | | | | | | | | | | |
| 5.375%, 06/01/2021 | | | 10,750,000 | | | | 11,072,242 | | | | | |
| 4.000%, 07/01/2022 | | | 7,095,000 | | | | 7,034,241 | | | | | |
| WestRock MWV LLC: | | | | | | | | | | | | |
| 7.375%, 09/01/2019 | | | 6,650,000 | | | | 6,802,865 | | | | | |
| 9.750%, 06/15/2020 | | | 1,160,000 | | | | 1,251,366 | | | | | |
| 8.200%, 01/15/2030 | | | 3,012,000 | | | | 3,824,006 | | | | | |
| Weyerhaeuser Co., | | | | | | | | | | | | |
| 7.375%, 10/01/2019 | | | 11,865,000 | | | | 12,191,599 | | | | | |
| Williams Companies, Inc.: | | | | | | | | | | | | |
| 7.875%, 09/01/2021 | | | 5,065,000 | | | | 5,531,262 | | | | | |
| 3.700%, 01/15/2023 | | | 44,375,000 | | | | 43,288,269 | | | | | |
| 4.550%, 06/24/2024 | | | 7,629,000 | | | | 7,703,076 | | | | | |
| 7.500%, 01/15/2031 | | | 120,000 | | | | 143,246 | | | | | |
| 7.750%, 06/15/2031 | | | 3,500,000 | | | | 4,227,865 | | | | | |
| 5.750%, 06/24/2044 | | | 2,500,000 | | | | 2,512,573 | | | | | |
| Williams Partners LP: | | | | | | | | | | | | |
| 5.250%, 03/15/2020 | | | 2,390,000 | | | | 2,437,517 | | | | | |
| 6.300%, 04/15/2040 | | | 1,590,000 | | | | 1,691,415 | | | | | |
| Woodside Finance Ltd., | | | | | | | | | | | | |
| 3.650%, 03/05/2025 (1)(2) | | | 15,575,000 | | | | 14,793,611 | | | | | |
| WPX Energy, Inc., | | | | | | | | | | | | |
| 6.000%, 01/15/2022 | | | 4,000,000 | | | | 3,890,000 | | | | | |
| Wynn Las Vegas LLC / Wynn Las Vegas Capital Corp., | | | | | | | | | | | | |
| 4.250%, 05/30/2023 (2) | | | 4,000,000 | | | | 3,760,000 | | | | | |
| Xerox Corp., | | | | | | | | | | | | |
| 3.625%, 03/15/2023 | | | 35,175,000 | | | | 31,645,239 | | | | | |
| Yara International ASA: | | | | | | | | | | | | |
| 7.875%, 06/11/2019 (1)(2) | | | 5,880,000 | | | | 5,990,083 | | | | | |
| 3.800%, 06/06/2026 (1)(2) | | | 20,250,000 | | | | 19,066,966 | | | | | |
| Zimmer Biomet Holdings, Inc., | | | | | | | | | | | | |
| 3.550%, 04/01/2025 | | | 5,000,000 | | | | 4,752,268 | | | | | |
| Zoetis, Inc.: | | | | | | | | | | | | |
| 3.450%, 11/13/2020 | | | 11,885,000 | | | | 11,917,782 | | | | | |
| 3.250%, 02/01/2023 | | | 24,701,000 | | | | 24,327,854 | | | | | |
| 4.500%, 11/13/2025 | | | 16,275,000 | | | | 16,703,695 | | | | | |
| | | | | | | | 4,695,903,482 | | | | 26.3 | % |
| Utilities | | | | | | | | | |
| Appalachian Power Co., | | | | | | | | | |
| 6.700%, 08/15/2037 | | | 1,400,000 | | | | 1,711,391 | | | | |
| Arizona Public Service Co., | | | | | | | | | | | |
| 8.750%, 03/01/2019 | | | 1,150,000 | | | | 1,160,310 | | | | |
| Berkshire Hathaway Energy Co., | | | | | | | | | | | |
| 3.500%, 02/01/2025 | | | 7,000,000 | | | | 6,940,963 | | | | |
| CMS Energy Corp., | | | | | | | | | | | |
| 5.050%, 03/15/2022 | | | 1,000,000 | | | | 1,043,635 | | | | |
| Consolidated Edison Co. of New York, Inc., | | | | | | | | | | | |
| 4.625%, 12/01/2054 | | | 7,600,000 | | | | 7,430,870 | | | | |
| Dominion Resources, Inc., | | | | | | | | | | | |
| 5.950%, 06/15/2035 | | | 1,880,000 | | | | 2,098,548 | | | | |
| Edison International, | | | | | | | | | | | |
| 2.950%, 03/15/2023 | | | 5,000,000 | | | | 4,723,143 | | | | |
| EDP Finance BV: | | | | | | | | | | | |
| 4.125%, 01/15/2020 (1)(2) | | | 8,816,000 | | | | 8,825,169 | | | | |
| 3.625%, 07/15/2024 (1)(2) | | | 27,200,000 | | | | 25,434,203 | | | | |
| Enel Finance International NV: | | | | | | | | | | | |
| 2.875%, 05/25/2022 (1)(2) | | | 7,500,000 | | | | 7,066,550 | | | | |
| 3.625%, 05/25/2027 (1)(2) | | | 27,500,000 | | | | 24,259,010 | | | | |
| 3.500%, 04/06/2028 (1)(2) | | | 7,000,000 | | | | 6,000,963 | | | | |
| 6.800%, 09/15/2037 (1)(2) | | | 3,875,000 | | | | 4,159,011 | | | | |
| 6.000%, 10/07/2039 (1)(2) | | | 631,000 | | | | 625,530 | | | | |
| 4.750%, 05/25/2047 (1)(2) | | | 42,584,000 | | | | 36,156,346 | | | | |
| Exelon Corp.: | | | | | | | | | | | |
| 3.950%, 06/15/2025 | | | 15,775,000 | | | | 15,570,221 | | | | |
| 5.100%, 06/15/2045 | | | 5,875,000 | | | | 6,047,647 | | | | |
| Exelon Generation Co. LLC, | | | | | | | | | | | |
| 5.600%, 06/15/2042 | | | 6,100,000 | | | | 5,938,544 | | | | |
| Fortis Inc., | | | | | | | | | | | |
| 3.055%, 10/04/2026 (1) | | | 14,150,000 | | | | 12,917,401 | | | | |
| Infraestructura Energetica Nova SAB de CV, | | | | | | | | | | | |
| 3.750%, 01/14/2028 (1)(2) | | | 5,000,000 | | | | 4,343,750 | | | | |
| KeySpan Corp., | | | | | | | | | | | |
| 8.000%, 11/15/2030 | | | 1,875,000 | | | | 2,451,672 | | | | |
| Mega Advance Investments Ltd., | | | | | | | | | | | |
| 5.000%, 05/12/2021 (1)(2) | | | 2,800,000 | | | | 2,864,039 | | | | |
| NiSource, Inc., | | | | | | | | | | | |
| 3.950%, 03/30/2048 | | | 11,775,000 | | | | 10,470,558 | | | | |
| PSEG Power LLC, | | | | | | | | | | | |
| 3.000%, 06/15/2021 | | | 25,027,000 | | | | 24,614,265 | | | | |
| RGS I&M Funding Corp., | | | | | | | | | | | |
| 9.820%, 06/07/2022 | | | 363,293 | | | | 412,153 | | | | |
| South Carolina Electric & Gas Co., | | | | | | | | | | | |
| 4.100%, 06/15/2046 | | | 7,325,000 | | | | 6,839,218 | | | | |
| Southern Co., | | | | | | | | | | | |
| 2.950%, 07/01/2023 | | | 17,400,000 | | | | 16,803,097 | | | | |
| Talent Yield Investments Ltd., | | | | | | | | | | | |
| 4.500%, 04/25/2022 (1)(2) | | | 6,000,000 | | | | 6,059,214 | | | | |
| | | | | | | | 252,967,421 | | | | 1.4 | % |
| Financials | | | | | | | | | | | | |
| ABN AMRO Bank NV: | | | | | | | | | | | | |
| 2.450%, 06/04/2020 (1)(2) | | | 13,000,000 | | | | 12,832,170 | | | | | |
| 7.750%, 05/15/2023 (1)(2) | | | 8,000,000 | | | | 8,921,768 | | | | | |
| 4.750%, 07/28/2025 (1)(2) | | | 28,175,000 | | | | 28,032,491 | | | | | |
| 4.800%, 04/18/2026 (1)(2) | | | 18,925,000 | | | | 18,893,016 | | | | | |
| AIA Group Ltd., | | | | | | | | | | | | |
| 3.200%, 03/11/2025 (1)(2) | | | 9,000,000 | | | | 8,668,220 | | | | | |
| AIG SunAmerica Global Financing X, | | | | | | | | | | | | |
| 6.900%, 03/15/2032 (2) | | | 2,000,000 | | | | 2,542,582 | | | | | |
| Ally Financial, Inc.: | | | | | | | | | | | | |
| 3.750%, 11/18/2019 | | | 18,200,000 | | | | 18,131,750 | | | | | |
| 4.125%, 03/30/2020 | | | 10,000,000 | | | | 9,887,500 | | | | | |
| 5.125%, 09/30/2024 | | | 3,000,000 | | | | 2,977,500 | | | | | |
| American International Group, Inc.: | | | | | | | | | | | | |
| 6.400%, 12/15/2020 | | | 3,500,000 | | | | 3,695,964 | | | | | |
| 4.875%, 06/01/2022 | | | 25,951,000 | | | | 26,924,855 | | | | | |
| 3.750%, 07/10/2025 | | | 11,400,000 | | | | 10,914,918 | | | | | |
| 3.875%, 01/15/2035 | | | 15,000,000 | | | | 12,883,021 | | | | | |
| 6.820%, 11/15/2037 | | | 4,173,000 | | | | 4,735,181 | | | | | |
| AmSouth Bancorporation, | | | | | | | | | | | | |
| 6.750%, 11/01/2025 | | | 1,110,000 | | | | 1,262,652 | | | | | |
| Anthem, Inc., | | | | | | | | | | | | |
| 3.350%, 12/01/2024 | | | 7,050,000 | | | | 6,868,077 | | | | | |
| ANZ New Zealand (Int'l) Ltd.: | | | | | | | | | | | | |
| 2.750%, 02/03/2021 (1)(2) | | | 10,000,000 | | | | 9,863,880 | | | | | |
| 2.125%, 07/28/2021 (1)(2) | | | 17,175,000 | | | | 16,606,185 | | | | | |
| Aon Corp., | | | | | | | | | | | | |
| 5.000%, 09/30/2020 | | | 150,000 | | | | 154,376 | | | | | |
| Aon PLC, | | | | | | | | | | | | |
| 3.875%, 12/15/2025 (1) | | | 14,490,000 | | | | 14,298,851 | | | | | |
| Assurant, Inc., | | | | | | | | | | | | |
| 4.072%, 03/26/2021 (3 Month LIBOR USD + 1.250%) (3) | | | 12,000,000 | | | | 11,995,738 | | | | | |
| Australia & New Zealand Banking Group Ltd., | | | | | | | | | | | | |
| 4.500%, 03/19/2024 (1)(2) | | | 32,000,000 | | | | 31,979,737 | | | | | |
| Banco Santander SA: | | | | | | | | | | | | |
| 3.500%, 04/11/2022 (1) | | | 12,000,000 | | | | 11,776,083 | | | | | |
| 3.848%, 04/12/2023 (1) | | | 16,700,000 | | | | 16,226,783 | | | | | |
| 5.179%, 11/19/2025 (1) | | | 11,150,000 | | | | 11,094,809 | | | | | |
| Bank of America Corp.: | | | | | | | | | | | | |
| 2.625%, 04/19/2021 | | | 17,500,000 | | | | 17,261,983 | | | | | |
| 2.369%, 07/21/2021 (3 Month LIBOR USD + 0.660%) (3) | | | 4,500,000 | | | | 4,419,470 | | | | | |
| 3.300%, 01/11/2023 | | | 22,650,000 | | | | 22,307,057 | | | | | |
| 3.004%, 12/20/2023 (3 Month LIBOR USD + 0.790%) (3) | | | 8,352,000 | | | | 8,118,214 | | | | | |
| 3.864%, 07/23/2024 (3 Month LIBOR USD + 0.940%) (3) | | | 12,575,000 | | | | 12,545,047 | | | | | |
| 3.093%, 10/01/2025 (3 Month LIBOR USD + 1.090%) (3) | | | 12,000,000 | | | | 11,378,293 | | | | | |
| 3.248%, 10/21/2027 | | | 6,000,000 | | | | 5,553,872 | | | | | |
| 7.750%, 05/14/2038 | | | 725,000 | | | | 937,628 | | | | | |
| Bank of Montreal: | | | | | | | | | | | | |
| 1.900%, 08/27/2021 (1) | | | 26,450,000 | | | | 25,546,412 | | | | | |
| 3.803%, 12/15/2032 (5 Year Swap Rate USD + 1.432%) (1)(3) | | | 5,000,000 | | | | 4,630,000 | | | | | |
| Bank of Nova Scotia: | | | | | | | | | | | | |
| 2.450%, 09/19/2022 (1) | | | 8,225,000 | | | | 7,941,385 | | | | | |
| 4.500%, 12/16/2025 (1) | | | 8,048,000 | | | | 8,013,550 | | | | | |
| Bank of Tokyo-Mitsubishi UFJ Ltd., | | | | | | | | | | | | |
| 2.300%, 03/05/2020 (1)(2) | | | 8,075,000 | | | | 7,998,450 | | | | | |
| Banque Federative du Credit Mutuel SA, | | | | | | | | | | | | |
| 3.750%, 07/20/2023 (1)(2) | | | 12,475,000 | | | | 12,452,264 | | | | | |
| Barclays PLC: | | | | | | | | | | | | |
| 2.750%, 11/08/2019 (1) | | | 7,000,000 | | | | 6,949,068 | | | | | |
| 3.250%, 01/12/2021 (1) | | | 25,000,000 | | | | 24,482,450 | | | | | |
| 3.684%, 01/10/2023 (1) | | | 22,500,000 | | | | 21,619,264 | | | | | |
| 4.610%, 02/15/2023 (3 Month LIBOR USD + 1.400%) (1)(3) | | | 10,000,000 | | | | 9,915,612 | | | | | |
| 4.338%, 05/16/2024 (3 Month LIBOR USD + 1.356%) (1)(3) | | | 5,000,000 | | | | 4,861,233 | | | | | |
| 3.650%, 03/16/2025 (1) | | | 17,350,000 | | | | 15,992,172 | | | | | |
| 4.337%, 01/10/2028 (1) | | | 10,000,000 | | | | 9,253,386 | | | | | |
| BB&T Corp.: | | | | | | | | | | | | |
| 2.450%, 01/15/2020 | | | 15,000,000 | | | | 14,895,317 | | | | | |
| 2.625%, 06/29/2020 | | | 13,000,000 | | | | 12,883,624 | | | | | |
| Berkshire Hathaway Finance Corp., | | | | | | | | | | | | |
| 4.400%, 05/15/2042 | | | 3,500,000 | | | | 3,569,833 | | | | | |
| BNP Paribas SA: | | | | | | | | | | | | |
| 5.000%, 01/15/2021 (1) | | | 5,000,000 | | | | 5,173,865 | | | | | |
| 3.250%, 03/03/2023 (1) | | | 4,000,000 | | | | 3,930,644 | | | | | |
| 3.375%, 01/09/2025 (1)(2) | | | 8,000,000 | | | | 7,528,617 | | | | | |
| BNZ International Funding Ltd.: | | | | | | | | | | | | |
| 2.350%, 03/04/2019 (1)(2) | | | 6,689,000 | | | | 6,681,481 | | | | | |
| 2.400%, 02/21/2020 (1)(2) | | | 8,000,000 | | | | 7,921,604 | | | | | |
| 2.750%, 03/02/2021 (1)(2) | | | 18,750,000 | | | | 18,479,747 | | | | | |
| 3.375%, 03/01/2023 (1)(2) | | | 24,750,000 | | | | 24,447,384 | | | | | |
| BPCE SA: | | | | | | | | | | | | |
| 5.700%, 10/22/2023 (1)(2) | | | 31,200,000 | | | | 32,305,229 | | | | | |
| 4.625%, 07/11/2024 (1)(2) | | | 3,185,000 | | | | 3,131,891 | | | | | |
| 5.150%, 07/21/2024 (1)(2) | | | 37,902,000 | | | | 38,059,071 | | | | | |
| 4.500%, 03/15/2025 (1)(2) | | | 10,475,000 | | | | 10,137,189 | | | | | |
| Brighthouse Financial, Inc., | | | | | | | | | | | | |
| 4.700%, 06/22/2047 | | | 7,000,000 | | | | 5,212,535 | | | | | |
| Capital One Financial Corp.: | | | | | | | | | | | | |
| 2.450%, 04/24/2019 | | | 3,975,000 | | | | 3,968,600 | | | | | |
| 3.050%, 03/09/2022 | | | 10,000,000 | | | | 9,753,313 | | | | | |
| 3.200%, 01/30/2023 | | | 5,000,000 | | | | 4,865,605 | | | | | |
| 3.750%, 07/28/2026 | | | 11,960,000 | | | | 10,954,659 | | | | | |
| Capital One NA: | | | | | | | | | | | | |
| 1.850%, 09/13/2019 | | | 5,000,000 | | | | 4,945,260 | | | | | |
| 3.375%, 02/15/2023 | | | 42,388,000 | | | | 40,928,522 | | | | | |
| Cigna Corp.: | | | | | | | | | | | | |
| 4.125%, 11/15/2025 (2) | | | 5,725,000 | | | | 5,716,937 | | | | | |
| 4.800%, 08/15/2038 (2) | | | 7,600,000 | | | | 7,464,071 | | | | | |
| CIT Group, Inc.: | | | | | | | | | | | | |
| 4.125%, 03/09/2021 | | | 100,000 | | | | 98,500 | | | | | |
| 5.000%, 08/01/2023 | | | 5,000,000 | | | | 4,900,000 | | | | | |
| 4.750%, 02/16/2024 | | | 13,000,000 | | | | 12,512,500 | | | | | |
| 5.250%, 03/07/2025 | | | 100,000 | | | | 97,750 | | | | | |
| Citigroup, Inc.: | | | | | | | | | | | | |
| 2.400%, 02/18/2020 | | | 8,000,000 | | | | 7,927,354 | | | | | |
| 2.350%, 08/02/2021 | | | 8,125,000 | | | | 7,893,126 | | | | | |
| 3.142%, 01/24/2023 (3 Month LIBOR USD + 0.722%) (3) | | | 10,000,000 | | | | 9,822,509 | | | | | |
| 2.876%, 07/24/2023 (3 Month LIBOR USD + 0.950%) (3) | | | 12,450,000 | | | | 12,048,220 | | | | | |
| 4.168%, 09/01/2023 (3 Month LIBOR USD + 1.430%) (3) | | | 8,000,000 | | | | 8,004,424 | | | | | |
| 3.700%, 01/12/2026 | | | 4,700,000 | | | | 4,518,881 | | | | | |
| 3.887%, 01/10/2028 (3 Month LIBOR USD + 1.563%) (3) | | | 30,000,000 | | | | 28,947,264 | | | | | |
| Citizens Bank NA: | | | | | | | | | | | | |
| 2.450%, 12/04/2019 | | | 36,000,000 | | | | 35,744,788 | | | | | |
| 2.550%, 05/13/2021 | | | 6,175,000 | | | | 6,039,639 | | | | | |
| CNA Financial Corp.: | | | | | | | | | | | | |
| 5.875%, 08/15/2020 | | | 6,839,000 | | | | 7,094,716 | | | | | |
| 5.750%, 08/15/2021 | | | 9,752,000 | | | | 10,291,683 | | | | | |
| 7.250%, 11/15/2023 | | | 12,400,000 | | | | 14,064,458 | | | | | |
| 4.500%, 03/01/2026 | | | 21,125,000 | | | | 21,297,561 | | | | | |
| 3.450%, 08/15/2027 | | | 9,000,000 | | | | 8,373,607 | | | | | |
| CNO Financial Group, Inc.: | | | | | | | | | | | | |
| 4.500%, 05/30/2020 | | | 5,000,000 | | | | 4,937,500 | | | | | |
| 5.250%, 05/30/2025 | | | 18,640,000 | | | | 17,754,600 | | | | | |
| Comerica Bank, | | | | | | | | | | | | |
| 4.000%, 07/27/2025 | | | 21,425,000 | | | | 21,287,385 | | | | | |
| Commonwealth Bank of Australia, | | | | | | | | | | | | |
| 4.500%, 12/09/2025 (1)(2) | | | 19,000,000 | | | | 18,613,295 | | | | | |
| Compass Bank: | | | | | | | | | | | | |
| 2.750%, 09/29/2019 | | | 38,994,000 | | | | 38,789,252 | | | | | |
| 2.875%, 06/29/2022 | | | 15,700,000 | | | | 15,044,093 | | | | | |
| 3.875%, 04/10/2025 | | | 31,180,000 | | | | 29,889,908 | | | | | |
| Cooperatieve Rabobank UA: | | | | | | | | | | | | |
| 3.875%, 02/08/2022 (1) | | | 4,150,000 | | | | 4,195,856 | | | | | |
| 4.625%, 12/01/2023 (1) | | | 7,229,000 | | | | 7,329,701 | | | | | |
| 3.750%, 07/21/2026 (1) | | | 23,000,000 | | | | 21,554,139 | | | | | |
| Credit Agricole SA: | | | | | | | | | | | | |
| 3.375%, 01/10/2022 (1)(2) | | | 23,225,000 | | | | 22,844,861 | | | | | |
| 3.750%, 04/24/2023 (1)(2) | | | 8,375,000 | | | | 8,195,274 | | | | | |
| 3.250%, 10/04/2024 (1)(2) | | | 8,575,000 | | | | 8,017,485 | | | | | |
| 4.375%, 03/17/2025 (1)(2) | | | 23,403,000 | | | | 22,656,702 | | | | | |
| Credit Suisse AG, | | | | | | | | | | | | |
| 5.300%, 08/13/2019 (1) | | | 7,166,000 | | | | 7,256,245 | | | | | |
| Credit Suisse Group AG: | | | | | | | | | | | | |
| 3.574%, 01/09/2023 (1)(2) | | | 9,000,000 | | | | 8,779,782 | | | | | |
| 4.207%, 06/12/2024 (3 Month LIBOR USD + 1.240%) (1)(2)(3) | | | 6,000,000 | | | | 5,984,470 | | | | | |
| 4.282%, 01/09/2028 (1)(2) | | | 15,000,000 | | | | 14,470,576 | | | | | |
| 3.869%, 01/12/2029 (3 Month LIBOR USD + 1.410%) (1)(2)(3) | | | 10,850,000 | | | | 10,093,871 | | | | | |
| Credit Suisse Group Funding Guernsey Ltd.: | | | | | | | | | | | | |
| 3.800%, 06/09/2023 (1) | | | 21,400,000 | | | | 20,999,541 | | | | | |
| 3.750%, 03/26/2025 (1) | | | 15,000,000 | | | | 14,303,355 | | | | | |
| 4.550%, 04/17/2026 (1) | | | 5,000,000 | | | | 4,950,427 | | | | | |
| Daiwa Securities Group, Inc., | | | | | | | | | | | | |
| 3.129%, 04/19/2022 (1)(2) | | | 14,175,000 | | | | 13,947,752 | | | | | |
| Deutsche Bank AG: | | | | | | | | | | | | |
| 2.950%, 08/20/2020 (1) | | | 8,625,000 | | | | 8,371,570 | | | | | |
| 3.150%, 01/22/2021 (1) | | | 16,954,000 | | | | 16,383,989 | | | | | |
| 3.375%, 05/12/2021 (1) | | | 5,450,000 | | | | 5,259,502 | | | | | |
| 4.250%, 10/14/2021 (1) | | | 29,900,000 | | | | 29,234,804 | | | | | |
| 3.300%, 11/16/2022 (1) | | | 17,625,000 | | | | 16,333,972 | | | | | |
| 3.950%, 02/27/2023 (1) | | | 3,325,000 | | | | 3,130,724 | | | | | |
| Digital Realty Trust LP, | | | | | | | | | | | | |
| 4.450%, 07/15/2028 | | | 7,000,000 | | | | 6,969,924 | | | | | |
| Discover Bank: | | | | | | | | | | | | |
| 8.700%, 11/18/2019 | | | 3,237,000 | | | | 3,376,078 | | | | | |
| 3.100%, 06/04/2020 | | | 12,000,000 | | | | 11,917,825 | | | | | |
| 3.350%, 02/06/2023 | | | 7,000,000 | | | | 6,813,516 | | | | | |
| 4.650%, 09/13/2028 | | | 8,225,000 | | | | 8,071,282 | | | | | |
| Discover Financial Services: | | | | | | | | | | | | |
| 3.950%, 11/06/2024 | | | 25,000,000 | | | | 24,667,434 | | | | | |
| 4.100%, 02/09/2027 | | | 4,600,000 | | | | 4,294,416 | | | | | |
| Fifth Third Bancorp, | | | | | | | | | | | | |
| 2.875%, 07/27/2020 | | | 9,825,000 | | | | 9,768,334 | | | | | |
| First Horizon National Corp., | | | | | | | | | | | | |
| 3.500%, 12/15/2020 | | | 29,022,000 | | | | 29,020,237 | | | | | |
| First Republic Bank, | | | | | | | | | | | | |
| 4.625%, 02/13/2047 | | | 1,850,000 | | | | 1,781,767 | | | | | |
| First Tennessee Bank NA, | | | | | | | | | | | | |
| 2.950%, 12/01/2019 | | | 12,000,000 | | | | 11,906,983 | | | | | |
| FMR LLC: | | | | | | | | | | | | |
| 4.950%, 02/01/2033 (2) | | | 4,235,000 | | | | 4,597,030 | | | | | |
| 6.500%, 12/14/2040 (2) | | | 1,820,000 | | | | 2,272,979 | | | | | |
| GE Capital International Funding Co. Unlimited Co., | | | | | | | | | | | | |
| 2.342%, 11/15/2020 (1) | | | 24,200,000 | | | | 23,354,339 | | | | | |
| Goldman Sachs Group, Inc.: | | | | | | | | | | | | |
| 2.550%, 10/23/2019 | | | 4,000,000 | | | | 3,974,732 | | | | | |
| 2.300%, 12/13/2019 | | | 12,450,000 | | | | 12,323,348 | | | | | |
| 5.250%, 07/27/2021 | | | 1,100,000 | | | | 1,141,902 | | | | | |
| 2.350%, 11/15/2021 | | | 10,000,000 | | | | 9,642,112 | | | | | |
| 5.750%, 01/24/2022 | | | 15,100,000 | | | | 15,810,219 | | | | | |
| 4.306%, 11/29/2023 (3 Month LIBOR USD + 1.600%) (3) | | | 10,000,000 | | | | 9,910,143 | | | | | |
| 3.500%, 01/23/2025 | | | 9,400,000 | | | | 8,910,365 | | | | | |
| 3.272%, 09/29/2025 (3 Month LIBOR USD + 1.201%) (3) | | | 24,000,000 | | | | 22,496,942 | | | | | |
| 3.814%, 04/23/2029 (3 Month LIBOR USD + 1.158%) (3) | | | 17,875,000 | | | | 16,688,551 | | | | | |
| 4.223%, 05/01/2029 (3 Month LIBOR USD + 1.301%) (3) | | | 15,050,000 | | | | 14,483,944 | | | | | |
| 6.345%, 02/15/2034 | | | 125,000 | | | | 139,510 | | | | | |
| 6.750%, 10/01/2037 | | | 300,000 | | | | 338,785 | | | | | |
| Guardian Life Insurance Co. of America: | | | | | | | | | | | | |
| 4.875%, 06/19/2064 (2) | | | 11,215,000 | | | | 11,257,464 | | | | | |
| 4.850%, 01/24/2077 (2) | | | 10,546,000 | | | | 10,378,228 | | | | | |
| Hartford Financial Services Group, Inc., | | | | | | | | | | | | |
| 5.125%, 04/15/2022 | | | 6,097,000 | | | | 6,391,325 | | | | | |
| High Street Funding Trust I, | | | | | | | | | | | | |
| 4.111%, 02/15/2028 (2) | | | 9,000,000 | | | | 8,838,360 | | | | | |
| High Street Funding Trust II, | | | | | | | | | | | | |
| 4.682%, 02/15/2048 (2) | | | 7,000,000 | | | | 6,629,000 | | | | | |
| Highmark, Inc., | | | | | | | | | | | | |
| 4.750%, 05/15/2021 (2) | | | 7,800,000 | | | | 7,963,041 | | | | | |
| HSBC Holdings PLC: | | | | | | | | | | | | |
| 3.400%, 03/08/2021 (1) | | | 9,100,000 | | | | 9,076,384 | | | | | |
| 2.650%, 01/05/2022 (1) | | | 4,000,000 | | | | 3,880,513 | | | | | |
| 3.262%, 03/13/2023 (3 Month LIBOR USD + 1.055%) (1)(3) | | | 30,996,000 | | | | 30,334,469 | | | | | |
| 3.600%, 05/25/2023 (1) | | | 6,000,000 | | | | 5,965,740 | | | | | |
| 3.950%, 05/18/2024 (3 Month LIBOR USD + 0.987%) (1)(3) | | | 9,000,000 | | | | 8,951,400 | | | | | |
| 4.583%, 06/19/2029 (3 Month LIBOR USD + 1.535%) (1)(3) | | | 17,125,000 | | | | 16,974,954 | | | | | |
| HSBC USA, Inc., | | | | | | | | | | | | |
| 2.350%, 03/05/2020 | | | 2,750,000 | | | | 2,722,235 | | | | | |
| Humana, Inc., | | | | | | | | | | | | |
| 8.150%, 06/15/2038 | | | 8,983,000 | | | | 12,170,886 | | | | | |
| Huntington Bancshares, Inc.: | | | | | | | | | | | | |
| 3.150%, 03/14/2021 | | | 17,225,000 | | | | 17,148,312 | | | | | |
| 2.300%, 01/14/2022 | | | 15,225,000 | | | | 14,699,890 | | | | | |
| Huntington National Bank, | | | | | | | | | | | | |
| 2.875%, 08/20/2020 | | | 12,275,000 | | | | 12,195,214 | | | | | |
| ING Bank NV: | | | | | | | | | | | | |
| 2.450%, 03/16/2020 (1)(2) | | | 9,500,000 | | | | 9,409,193 | | | | | |
| 2.750%, 03/22/2021 (1)(2) | | | 9,175,000 | | | | 9,050,715 | | | | | |
| 5.800%, 09/25/2023 (1)(2) | | | 39,680,000 | | | | 41,446,899 | | | | | |
| ING Groep NV, | | | | | | | | | | | | |
| 3.150%, 03/29/2022 (1) | | | 4,000,000 | | | | 3,932,959 | | | | | |
| Invesco Finance PLC, | | | | | | | | | | | | |
| 3.125%, 11/30/2022 (1) | | | 5,500,000 | | | | 5,390,749 | | | | | |
| Jackson National Life Global Funding, | | | | | | | | | | | | |
| 3.250%, 01/30/2024 (2) | | | 10,000,000 | | | | 9,805,200 | | | | | |
| Jefferies Group LLC, | | | | | | | | | | | | |
| 6.450%, 06/08/2027 | | | 1,300,000 | | | | 1,359,318 | | | | | |
| Jefferies Group LLC / Jefferies Group Capital Finance, Inc.: | | | | | | | | | | | | |
| 4.850%, 01/15/2027 | | | 15,750,000 | | | | 15,050,522 | | | | | |
| 4.150%, 01/23/2030 | | | 30,200,000 | | | | 25,896,837 | | | | | |
| John Hancock Life Insurance Co., | | | | | | | | | | | | |
| 7.375%, 02/15/2024 (2) | | | 17,615,000 | | | | 20,386,057 | | | | | |
| JPMorgan Chase & Co.: | | | | | | | | | | | | |
| 2.250%, 01/23/2020 | | | 3,650,000 | | | | 3,613,645 | | | | | |
| 4.250%, 10/15/2020 | | | 8,900,000 | | | | 9,060,373 | | | | | |
| 2.295%, 08/15/2021 | | | 22,000,000 | | | | 21,464,141 | | | | | |
| 4.350%, 08/15/2021 | | | 2,400,000 | | | | 2,455,983 | | | | | |
| 4.500%, 01/24/2022 | | | 4,400,000 | | | | 4,533,696 | | | | | |
| 3.200%, 01/25/2023 | | | 5,350,000 | | | | 5,272,054 | | | | | |
| 3.717%, 10/24/2023 (3 Month LIBOR USD + 1.230%) (3) | | | 10,000,000 | | | | 9,997,475 | | | | | |
| 3.559%, 04/23/2024 (3 Month LIBOR USD + 0.730%) (3) | | | 15,575,000 | | | | 15,457,207 | | | | | |
| 3.125%, 01/23/2025 | | | 21,850,000 | | | | 20,816,627 | | | | | |
| KEB Hana Bank, | | | | | | | | | | | | |
| 1.750%, 10/18/2019 (1)(2) | | | 16,750,000 | | | | 16,576,805 | | | | | |
| KeyBank NA: | | | | | | | | | | | | |
| 2.250%, 03/16/2020 | | | 9,425,000 | | | | 9,324,855 | | | | | |
| 3.400%, 05/20/2026 | | | 21,575,000 | | | | 20,694,822 | | | | | |
| KeyCorp, | | | | | | | | | | | | |
| 2.900%, 09/15/2020 | | | 17,200,000 | | | | 17,070,170 | | | | | |
| LeasePlan Corp. NV, | | | | | | | | | | | | |
| 2.875%, 01/22/2019 (1)(2) | | | 6,000,000 | | | | 5,997,763 | | | | | |
| Liberty Mutual Group, Inc.: | | | | | | | | | | | | |
| 6.500%, 03/15/2035 (2) | | | 750,000 | | | | 873,853 | | | | | |
| 10.750%, 06/15/2058 (3 Month LIBOR USD + 7.120%) (2)(3) | | | 900,000 | | | | 1,287,000 | | | | | |
| Liberty Mutual Insurance Co., | | | | | | | | | | | | |
| 7.697%, 10/15/2097 (2) | | | 375,000 | | | | 506,138 | | | | | |
| Life Storage LP, | | | | | | | | | | | | |
| 3.875%, 12/15/2027 | | | 2,575,000 | | | | 2,450,488 | | | | | |
| Lincoln National Corp., | | | | | | | | | | | | |
| 4.509%, 04/20/2067 (3 Month LIBOR USD + 2.040%) (3) | | | 930,000 | | | | 724,935 | | | | | |
| Lloyds Bank PLC: | | | | | | | | | | | | |
| 5.800%, 01/13/2020 (1)(2) | | | 6,350,000 | | | | 6,499,998 | | | | | |
| 4.050%, 08/16/2023 (1) | | | 6,575,000 | | | | 6,495,602 | | | | | |
| Lloyds Banking Group PLC: | | | | | | | | | | | | |
| 2.907%, 11/07/2023 (3 Month LIBOR USD + 0.810%) (1)(3) | | | 9,400,000 | | | | 8,901,172 | | | | | |
| 3.750%, 01/11/2027 (1) | | | 7,800,000 | | | | 7,165,840 | | | | | |
| 4.375%, 03/22/2028 (1) | | | 15,000,000 | | | | 14,230,320 | | | | | |
| 3.574%, 11/07/2028 (3 Month LIBOR USD + 1.205%) (1)(3) | | | 21,550,000 | | | | 19,169,228 | | | | | |
| Macquarie Bank Ltd.: | | | | | | | | | | | | |
| 2.400%, 01/21/2020 (1)(2) | | | 17,750,000 | | | | 17,592,710 | | | | | |
| 6.625%, 04/07/2021 (1)(2) | | | 275,000 | | | | 290,914 | | | | | |
| 4.875%, 06/10/2025 (1)(2) | | | 7,800,000 | | | | 7,749,946 | | | | | |
| Macquarie Group Ltd.: | | | | | | | | | | | | |
| 7.625%, 08/13/2019 (1)(2) | | | 2,467,000 | | | | 2,530,867 | | | | | |
| 3.189%, 11/28/2023 (3 Month LIBOR USD + 1.023%) (1)(2)(3) | | | 35,850,000 | | | | 34,456,977 | | | | | |
| 4.150%, 03/27/2024 (3 Month LIBOR USD + 1.330%) (1)(2)(3) | | | 21,000,000 | | | | 21,002,399 | | | | | |
| Manufacturers & Traders Trust Co.: | | | | | | | | | | | | |
| 2.100%, 02/06/2020 | | | 8,000,000 | | | | 7,914,082 | | | | | |
| 3.721%, 12/28/2020 (1 Month LIBOR USD + 1.215%) (3) | | | 9,483,000 | | | | 9,485,361 | | | | | |
| Manulife Financial Corp.: | | | | | | | | | | | | |
| 4.900%, 09/17/2020 (1) | | | 3,234,000 | | | | 3,318,275 | | | | | |
| 4.150%, 03/04/2026 (1) | | | 16,375,000 | | | | 16,538,554 | | | | | |
| Marsh & McLennan Companies, Inc.: | | | | | | | | | | | | |
| 4.800%, 07/15/2021 | | | 1,000,000 | | | | 1,030,573 | | | | | |
| 3.300%, 03/14/2023 | | | 6,875,000 | | | | 6,797,865 | | | | | |
| 3.750%, 03/14/2026 | | | 9,225,000 | | | | 9,116,123 | | | | | |
| 5.875%, 08/01/2033 | | | 3,729,000 | | | | 4,356,909 | | | | | |
| Massachusetts Mutual Life Insurance Co.: | | | | | | | | | | | | |
| 7.625%, 11/15/2023 (2) | | | 3,184,000 | | | | 3,616,141 | | | | | |
| 8.875%, 06/01/2039 (2) | | | 11,942,000 | | | | 17,900,285 | | | | | |
| 4.900%, 04/01/2077 (2) | | | 8,000,000 | | | | 7,977,710 | | | | | |
| MBIA Insurance Corp., | | | | | | | | | | | | |
| 13.696%, 01/15/2033 (3 Month LIBOR USD + 11.260%) (2)(3)(8) | | | 700,000 | | | | 427,000 | | | | | |
| MetLife Capital Trust IV, | | | | | | | | | | | | |
| 7.875%, 12/15/2037 (2) | | | 900,000 | | | | 1,019,250 | | | | | |
| MetLife, Inc.: | | | | | | | | | | | | |
| 4.875%, 11/13/2043 | | | 3,375,000 | | | | 3,521,605 | | | | | |
| 4.050%, 03/01/2045 | | | 9,025,000 | | | | 8,412,448 | | | | | |
| Mitsubishi UFJ Financial Group, Inc.: | | | | | | | | | | | | |
| 2.950%, 03/01/2021 (1) | | | 5,749,000 | | | | 5,691,242 | | | | | |
| 2.190%, 09/13/2021 (1) | | | 20,000,000 | | | | 19,306,877 | | | | | |
| 3.455%, 03/02/2023 (1) | | | 15,000,000 | | | | 14,907,915 | | | | | |
| Mitsubishi UFJ Trust & Banking Corp., | | | | | | | | | | | | |
| 2.450%, 10/16/2019 (1)(2) | | | 10,000,000 | | | | 9,942,988 | | | | | |
| Mizuho Bank Ltd.: | | | | | | | | | | | | |
| 2.650%, 09/25/2019 (1)(2) | | | 5,000,000 | | | | 4,982,425 | | | | | |
| 2.400%, 03/26/2020 (1)(2) | | | 20,225,000 | | | | 20,027,399 | | | | | |
| Mizuho Financial Group, Inc.: | | | | | | | | | | | | |
| 2.953%, 02/28/2022 (1) | | | 9,750,000 | | | | 9,558,583 | | | | | |
| 2.601%, 09/11/2022 (1) | | | 5,000,000 | | | | 4,836,118 | | | | | |
| 3.922%, 09/11/2024 (3 Month LIBOR USD + 1.000%) (1)(3) | | | 9,000,000 | | | | 9,095,162 | | | | | |
| 3.170%, 09/11/2027 (1) | | | 24,650,000 | | | | 23,221,782 | | | | | |
| Morgan Stanley: | | | | | | | | | | | | |
| 7.300%, 05/13/2019 | | | 4,675,000 | | | | 4,745,959 | | | | | |
| 2.375%, 07/23/2019 | | | 2,000,000 | | | | 1,991,308 | | | | | |
| 5.625%, 09/23/2019 | | | 10,225,000 | | | | 10,376,318 | | | | | |
| 2.650%, 01/27/2020 | | | 7,000,000 | | | | 6,947,458 | | | | | |
| 3.125%, 01/23/2023 | | | 15,000,000 | | | | 14,654,167 | | | | | |
| 3.750%, 02/25/2023 | | | 1,000,000 | | | | 998,237 | | | | | |
| 3.887%, 10/24/2023 (3 Month LIBOR USD + 1.400%) (3) | | | 10,000,000 | | | | 9,951,380 | | | | | |
| 3.700%, 10/23/2024 | | | 5,000,000 | | | | 4,916,952 | | | | | |
| 4.000%, 07/23/2025 | | | 2,500,000 | | | | 2,466,375 | | | | | |
| 3.875%, 01/27/2026 | | | 7,000,000 | | | | 6,827,598 | | | | | |
| 3.125%, 07/27/2026 | | | 13,175,000 | | | | 12,182,054 | | | | | |
| 3.591%, 07/22/2028 (3 Month LIBOR USD + 1.340%) (3) | | | 15,350,000 | | | | 14,513,482 | | | | | |
| MUFG Americas Holdings Corp., | | | | | | | | | | | | |
| 3.500%, 06/18/2022 | | | 1,150,000 | | | | 1,152,746 | | | | | |
| Nationwide Building Society: | | | | | | | | | | | | |
| 3.766%, 03/08/2024 (3 Month LIBOR USD + 1.064%) (1)(2)(3) | | | 14,500,000 | | | | 13,955,290 | | | | | |
| 3.900%, 07/21/2025 (1)(2) | | | 8,100,000 | | | | 7,875,039 | | | | | |
| 4.000%, 09/14/2026 (1)(2) | | | 53,541,000 | | | | 48,734,239 | | | | | |
| 4.302%, 03/08/2029 (3 Month LIBOR USD + 1.452%) (1)(2)(3) | | | 1,425,000 | | | | 1,339,001 | | | | | |
| 4.125%, 10/18/2032 (5 Year Mid Swap Rate USD + 1.849%) (1)(2)(3) | | | 8,000,000 | | | | 7,079,833 | | | | | |
| Nationwide Financial Services, Inc., | | | | | | | | | | | | |
| 5.375%, 03/25/2021 (2) | | | 15,088,000 | | | | 15,633,915 | | | | | |
| Nationwide Mutual Insurance Co.: | | | | | | | | | | | | |
| 7.875%, 04/01/2033 (2) | | | 5,600,000 | | | | 7,520,011 | | | | | |
| 9.375%, 08/15/2039 (2) | | | 20,434,000 | | | | 30,956,828 | | | | | |
| New England Mutual Life Insurance Co., | | | | | | | | | | | | |
| 7.875%, 02/15/2024 (2) | | | 3,200,000 | | | | 3,773,736 | | | | | |
| New York Life Insurance Co., | | | | | | | | | | | | |
| 6.750%, 11/15/2039 (2) | | | 25,105,000 | | | | 32,930,414 | | | | | |
| Nippon Life Insurance Co., | | | | | | | | | | | | |
| 5.000%, 10/18/2042 (3 Month LIBOR USD + 4.240%) (1)(2)(3) | | | 2,000,000 | | | | 2,045,000 | | | | | |
| Nomura Holdings, Inc.: | | | | | | | | | | | | |
| 2.750%, 03/19/2019 (1) | | | 618,000 | | | | 617,470 | | | | | |
| 6.700%, 03/04/2020 (1) | | | 3,050,000 | | | | 3,167,751 | | | | | |
| Peachtree Corners Funding Trust, | | | | | | | | | | | | |
| 3.976%, 02/15/2025 (2) | | | 16,000,000 | | | | 15,520,260 | | | | | |
| Principal Financial Group, Inc.: | | | | | | | | | | | | |
| 3.300%, 09/15/2022 | | | 1,215,000 | | | | 1,206,854 | | | | | |
| 3.125%, 05/15/2023 | | | 3,675,000 | | | | 3,627,616 | | | | | |
| Principal Life Global Funding II, | | | | | | | | | | | | |
| 2.200%, 04/08/2020 (2) | | | 8,000,000 | | | | 7,908,548 | | | | | |
| Protective Life Corp., | | | | | | | | | | | | |
| 7.375%, 10/15/2019 | | | 5,360,000 | | | | 5,509,833 | | | | | |
| Protective Life Global Funding, | | | | | | | | | | | | |
| 2.700%, 11/25/2020 (2) | | | 10,725,000 | | | | 10,598,021 | | | | | |
| Prudential Financial, Inc., | | | | | | | | | | | | |
| 3.878%, 03/27/2028 | | | 11,275,000 | | | | 11,330,844 | | | | | |
| Prudential Insurance Co. of America, | | | | | | | | | | | | |
| 8.300%, 07/01/2025 (2) | | | 21,011,000 | | | | 25,933,091 | | | | | |
| Raymond James Financial, Inc.: | | | | | | | | | | | | |
| 3.625%, 09/15/2026 | | | 425,000 | | | | 400,511 | | | | | |
| 4.950%, 07/15/2046 | | | 15,000,000 | | | | 14,411,285 | | | | | |
| Realty Income Corp., | | | | | | | | | | | | |
| 3.875%, 04/15/2025 | | | 10,000,000 | | | | 9,981,236 | | | | | |
| Regions Financial Corp.: | | | | | | | | | | | | |
| 3.200%, 02/08/2021 | | | 30,725,000 | | | | 30,528,479 | | | | | |
| 2.750%, 08/14/2022 | | | 14,900,000 | | | | 14,375,225 | | | | | |
| Reliance Standard Life Global Funding II: | | | | | | | | | | | | |
| 2.500%, 01/15/2020 (2) | | | 14,000,000 | | | | 13,866,166 | | | | | |
| 2.375%, 05/04/2020 (2) | | | 23,750,000 | | | | 23,443,461 | | | | | |
| 3.050%, 01/20/2021 (2) | | | 10,954,000 | | | | 10,853,900 | | | | | |
| Royal Bank of Canada, | | | | | | | | | | | | |
| 4.650%, 01/27/2026 (1) | | | 29,930,000 | | | | 30,810,173 | | | | | |
| Royal Bank of Scotland Group PLC: | | | | | | | | | | | | |
| 3.498%, 05/15/2023 (3 Month LIBOR USD + 1.480%) (1)(3) | | | 62,335,000 | | | | 59,942,419 | | | | | |
| 4.519%, 06/25/2024 (3 Month LIBOR USD + 1.550%) (1)(3) | | | 17,475,000 | | | | 17,146,995 | | | | | |
| 4.892%, 05/18/2029 (3 Month LIBOR USD + 1.754%) (1)(3) | | | 4,250,000 | | | | 4,056,824 | | | | | |
| Santander Holdings USA, Inc., | | | | | | | | | | | | |
| 3.400%, 01/18/2023 | | | 5,750,000 | | | | 5,517,984 | | | | | |
| Santander UK Group Holdings PLC: | | | | | | | | | | | | |
| 2.875%, 08/05/2021 (1) | | | 9,375,000 | | | | 9,043,631 | | | | | |
| 3.823%, 11/03/2028 (3 Month LIBOR USD + 1.400%) (1)(3) | | | 6,000,000 | | | | 5,423,425 | | | | | |
| Santander UK PLC: | | | | | | | | | | | | |
| 5.000%, 11/07/2023 (1)(2) | | | 28,625,000 | | | | 27,952,026 | | | | | |
| 4.000%, 03/13/2024 (1) | | | 7,700,000 | | | | 7,763,069 | | | | | |
| Societe Generale SA: | | | | | | | | | | | | |
| 5.200%, 04/15/2021 (1)(2) | | | 10,100,000 | | | | 10,519,402 | | | | | |
| 3.250%, 01/12/2022 (1)(2) | | | 20,000,000 | | | | 19,580,639 | | | | | |
| 4.250%, 09/14/2023 (1)(2) | | | 9,725,000 | | | | 9,658,250 | | | | | |
| 5.000%, 01/17/2024 (1)(2) | | | 13,000,000 | | | | 13,107,040 | | | | | |
| 4.250%, 04/14/2025 (1)(2) | | | 17,100,000 | | | | 16,367,177 | | | | | |
| Standard Chartered PLC: | | | | | | | | | | | | |
| 2.100%, 08/19/2019 (1)(2) | | | 18,685,000 | | | | 18,520,922 | | | | | |
| 2.250%, 04/17/2020 (1)(2) | | | 7,000,000 | | | | 6,860,896 | | | | | |
| 3.050%, 01/15/2021 (1)(2) | | | 14,000,000 | | | | 13,791,288 | | | | | |
| 3.885%, 03/15/2024 (3 Month LIBOR USD + 1.080%) (1)(2)(3) | | | 9,800,000 | | | | 9,486,338 | | | | | |
| 5.700%, 03/26/2044 (1)(2) | | | 14,000,000 | | | | 14,009,475 | | | | | |
| Stifel Financial Corp.: | | | | | | | | | | | | |
| 3.500%, 12/01/2020 | | | 5,000,000 | | | | 4,999,482 | | | | | |
| 4.250%, 07/18/2024 | | | 19,615,000 | | | | 19,836,218 | | | | | |
| Sumitomo Mitsui Banking Corp.: | | | | | | | | | | | | |
| 2.450%, 01/16/2020 (1) | | | 13,025,000 | | | | 12,921,342 | | | | | |
| 3.000%, 01/18/2023 (1) | | | 2,500,000 | | | | 2,444,688 | | | | | |
| Sumitomo Mitsui Financial Group, Inc.: | | | | | | | | | | | | |
| 2.784%, 07/12/2022 (1) | | | 13,325,000 | | | | 12,983,992 | | | | | |
| 3.102%, 01/17/2023 (1) | | | 16,125,000 | | | | 15,817,736 | | | | | |
| SunTrust Banks, Inc.: | | | | | | | | | | | | |
| 2.900%, 03/03/2021 | | | 15,125,000 | | | | 14,994,161 | | | | | |
| 3.689%, 08/02/2024 (3 Month LIBOR USD + 0.735%) (3) | | | 6,345,000 | | | | 6,319,420 | | | | | |
| 3.300%, 05/15/2026 | | | 28,734,000 | | | | 27,227,628 | | | | | |
| Swedbank AB, | | | | | | | | | | | | |
| 2.650%, 03/10/2021 (1)(2) | | | 7,025,000 | | | | 6,924,416 | | | | | |
| Synchrony Financial: | | | | | | | | | | | | |
| 3.750%, 08/15/2021 | | | 16,825,000 | | | | 16,374,030 | | | | | |
| 4.250%, 08/15/2024 | | | 33,325,000 | | | | 30,661,447 | | | | | |
| 4.500%, 07/23/2025 | | | 12,795,000 | | | | 11,667,584 | | | | | |
| 3.700%, 08/04/2026 | | | 5,388,000 | | | | 4,570,327 | | | | | |
| 3.950%, 12/01/2027 | | | 18,000,000 | | | | 15,161,012 | | | | | |
| Synovus Financial Corp., | | | | | | | | | | | | |
| 3.125%, 11/01/2022 | | | 19,588,000 | | | | 18,485,979 | | | | | |
| Torchmark Corp.: | | | | | | | | | | | | |
| 3.800%, 09/15/2022 | | | 1,275,000 | | | | 1,284,028 | | | | | |
| 4.550%, 09/15/2028 | | | 9,350,000 | | | | 9,500,020 | | | | | |
| Trinity Acquisition PLC: | | | | | | | | | | | | |
| 4.400%, 03/15/2026 (1) | | | 15,776,000 | | | | 15,676,858 | | | | | |
| 6.125%, 08/15/2043 (1) | | | 17,442,000 | | | | 19,344,615 | | | | | |
| UBS Group Funding Switzerland AG: | | | | | | | | | | | | |
| 4.264%, 09/24/2020 (3 Month LIBOR USD + 1.440%) (1)(2)(3) | | | 26,350,000 | | | | 26,699,482 | | | | | |
| 2.650%, 02/01/2022 (1)(2) | | | 10,000,000 | | | | 9,678,757 | | | | | |
| 3.491%, 05/23/2023 (1)(2) | | | 24,075,000 | | | | 23,478,699 | | | | | |
| 2.859%, 08/15/2023 (3 Month LIBOR USD + 0.954%) (1)(2)(3) | | | 17,700,000 | | | | 17,023,605 | | | | | |
| UnitedHealth Group, Inc., | | | | | | | | | | | | |
| 4.625%, 07/15/2035 | | | 12,175,000 | | | | 12,905,415 | | | | | |
| Voya Financial, Inc., | | | | | | | | | | | | |
| 3.650%, 06/15/2026 | | | 7,102,000 | | | | 6,713,763 | | | | | |
| Wells Fargo & Co.: | | | | | | | | | | | | |
| 2.150%, 01/30/2020 | | | 7,000,000 | | | | 6,923,878 | | | | | |
| 2.500%, 03/04/2021 | | | 15,950,000 | | | | 15,687,987 | | | | | |
| 3.069%, 01/24/2023 | | | 12,000,000 | | | | 11,687,088 | | | | | |
| 3.757%, 10/31/2023 (3 Month LIBOR USD + 1.230%) (3) | | | 10,000,000 | | | | 9,969,071 | | | | | |
| 3.000%, 02/19/2025 | | | 5,225,000 | | | | 4,924,182 | | | | | |
| 3.000%, 04/22/2026 | | | 4,000,000 | | | | 3,727,356 | | | | | |
| Westpac Banking Corp.: | | | | | | | | | | | | |
| 2.100%, 05/13/2021 (1) | | | 13,300,000 | | | | 12,960,241 | | | | | |
| 4.322%, 11/23/2031 (5 Year Mid Swap Rate USD + 2.236%) (1)(3) | | | 10,000,000 | | | | 9,491,779 | | | | | |
| Willis North America, Inc.: | | | | | | | | | | | | |
| 7.000%, 09/29/2019 | | | 16,003,000 | | | | 16,370,247 | | | | | |
| 5.050%, 09/15/2048 | | | 15,000,000 | | | | 14,410,101 | | | | | |
| Willis Towers Watson PLC, | | | | | | | | | | | | |
| 5.750%, 03/15/2021 (1) | | | 20,329,000 | | | | 21,260,166 | | | | | |
| | | | | | | | 3,834,345,426 | | | | 21.5 | % |
| Total Corporate Bonds | | | | | | | 8,783,216,329 | | | | 49.2 | % |
| Municipal Bonds | | | | | | | | | |
| Bellevue Union School District, | | | | | | | | | |
| 5.000%, 08/01/2028 | | | 625,000 | | | | 678,375 | | | | |
| California Housing Finance Agency, | | | | | | | | | | | |
| 2.794%, 08/01/2036 (Callable 08/01/2025) | | | 14,200,000 | | | | 13,827,534 | | | | |
| California Qualified School Bond Joint Powers Authority: | | | | | | | | | | | |
| 6.739%, 09/01/2026 | | | 2,415,000 | | | | 2,825,043 | | | | |
| 7.155%, 03/01/2027 | | | 1,700,000 | | | | 2,015,316 | | | | |
| California School Finance Authority, | | | | | | | | | | | |
| 5.041%, 07/01/2020 | | | 1,500,000 | | | | 1,543,425 | | | | |
| Camden County Improvement Authority, | | | | | | | | | | | |
| 7.747%, 07/01/2034 (Callable 07/01/2020) | | | 1,100,000 | | | | 1,170,609 | | | | |
| Central Valley Support Joint Powers Agency, | | | | | | | | | | | |
| 5.676%, 09/01/2024 | | | 1,500,000 | | | | 1,686,240 | | | | |
| City of Vernon CA, | | | | | | | | | | | |
| 4.500%, 08/01/2022 | | | 7,500,000 | | | | 7,835,700 | | | | |
| City of Williston ND, | | | | | | | | | | | |
| 3.100%, 07/15/2025 (Callable 01/14/2019) | | | 950,000 | | | | 950,067 | | | | |
| Colton Joint Unified School District, | | | | | | | | | | | |
| 6.008%, 08/01/2026 | | | 1,250,000 | | | | 1,459,700 | | | | |
| Hillsborough City School District: | | | | | | | | | | | |
| –%, 09/01/2036 (Callable 09/01/2021) | | | 10,000,000 | | | | 4,658,000 | | | | |
| –%, 09/01/2042 (Callable 09/01/2021) | | | 10,000,000 | | | | 3,468,300 | | | | |
| Iowa Tobacco Settlement Authority, | | | | | | | | | | | |
| 6.500%, 06/01/2023 (Callable 01/31/2019) | | | 1,815,000 | | | | 1,841,027 | | | | |
| New Hampshire Housing Finance Authority: | | | | | | | | | | | |
| 3.100%, 07/01/2021 | | | 1,395,000 | | | | 1,394,051 | | | | |
| 3.750%, 07/01/2034 (Callable 07/01/2023) | | | 3,300,000 | | | | 3,310,494 | | | | |
| North Carolina Housing Finance Agency: | | | | | | | | | | | |
| 2.870%, 07/01/2032 (Callable 01/01/2024) | | | 3,490,000 | | | | 3,399,714 | | | | |
| 2.812%, 07/01/2035 (Callable 01/01/2024) | | | 4,425,000 | | | | 4,310,923 | | | | |
| North East Texas Independent School District, | | | | | | | | | | | |
| 5.240%, 08/01/2027 | | | 3,000,000 | | | | 3,444,360 | | | | |
| Rhode Island Housing & Mortgage Finance Corp., | | | | | | | | | | | |
| 2.913%, 10/01/2039 (Callable 10/01/2023) | | | 2,320,000 | | | | 2,287,427 | | | | |
| State of Illinois, | | | | | | | | | | | |
| 6.200%, 07/01/2021 | | | 11,932,500 | | | | 12,361,593 | | | | |
| State Public School Building Authority, | | | | | | | | | | | |
| 5.000%, 09/15/2027 | | | 1,998,000 | | | | 2,189,608 | | | | |
| Three Rivers Local School District, | | | | | | | | | | | |
| 5.209%, 09/15/2027 (Callable 12/01/2020) | | | 1,350,000 | | | | 1,401,340 | | | | |
| Town of Davie FL, | | | | | | | | | | | |
| 6.599%, 10/01/2030 (Callable 10/01/2020) | | | 1,000,000 | | | | 1,063,530 | | | | |
| West Allis West Milwaukee School District, | | | | | | | | | | | |
| 4.000%, 04/01/2020 (Callable 01/31/2019) | | | 15,885,000 | | | | 15,890,719 | | | | |
| West Contra Costa Unified School District, | | | | | | | | | | | |
| 6.250%, 08/01/2030 | | | 4,320,000 | | | | 5,436,850 | | | | |
| Westlake City School District, | | | | | | | | | | | |
| 5.227%, 12/01/2026 (Callable 12/01/2020) | | | 1,160,000 | | | | 1,213,778 | | | | |
| | | | | | | | 101,663,723 | | | | 0.6 | % |
| Residential Mortgage-Backed Securities | | | | | | | | | | | | |
| U.S. Government Agency Issues | | | | | | | | | | | | |
| Fannie Mae REMIC Trust: | | | | | | | | | | | | |
| Series 1989-94, Class G, 7.500%, 12/25/2019 | | | 421 | | | | 425 | | | | | |
| Series 1991-21, Class J, 7.000%, 03/25/2021 | | | 394 | | | | 401 | | | | | |
| Series 1991-43, Class J, 7.000%, 05/25/2021 | | | 13,732 | | | | 14,023 | | | | | |
| Series 1991-65, Class Z, 6.500%, 06/25/2021 | | | 8,573 | | | | 8,765 | | | | | |
| Series 1992-129, Class L, 6.000%, 07/25/2022 | | | 26,687 | | | | 27,713 | | | | | |
| Series 1993-32, Class H, 6.000%, 03/25/2023 | | | 8,326 | | | | 8,646 | | | | | |
| Series 1993-58, Class H, 5.500%, 04/25/2023 | | | 35,499 | | | | 36,521 | | | | | |
| Federal Gold Loan Mortgage Corp. (FGLMC): | | | | | | | | | | | | |
| 5.000%, 12/01/2020 | | | 8,926 | | | | 9,036 | | | | | |
| 5.000%, 05/01/2021 | | | 15,347 | | | | 15,469 | | | | | |
| 6.000%, 06/01/2021 | | | 4,237 | | | | 4,330 | | | | | |
| 3.000%, 05/01/2027 | | | 5,082,567 | | | | 5,102,573 | | | | | |
| 6.500%, 12/01/2028 | | | 14,082 | | | | 15,498 | | | | | |
| 6.500%, 06/01/2029 | | | 6,112 | | | | 6,711 | | | | | |
| 3.000%, 10/01/2030 | | | 36,830,938 | | | | 36,760,840 | | | | | |
| 3.000%, 02/01/2032 | | | 54,645,686 | | | | 54,462,695 | | | | | |
| 3.500%, 05/01/2032 | | | 26,716,915 | | | | 27,203,244 | | | | | |
| 3.500%, 01/01/2034 | | | 26,437,298 | | | | 26,918,579 | | | | | |
| 5.000%, 03/01/2036 | | | 5,007,339 | | | | 5,317,645 | | | | | |
| 5.500%, 04/01/2037 | | | 109,215 | | | | 117,702 | | | | | |
| 5.500%, 04/01/2038 | | | 67,717 | | | | 72,976 | | | | | |
| 5.500%, 05/01/2038 | | | 110,977 | | | | 118,493 | | | | | |
| 5.500%, 01/01/2039 | | | 17,989,837 | | | | 19,400,744 | | | | | |
| 4.500%, 11/01/2039 | | | 686,883 | | | | 718,619 | | | | | |
| 4.500%, 11/01/2039 | | | 2,357,372 | | | | 2,467,760 | | | | | |
| 4.500%, 08/01/2040 | | | 2,310,126 | | | | 2,418,833 | | | | | |
| 4.500%, 08/01/2040 | | | 3,475,853 | | | | 3,639,416 | | | | | |
| 4.000%, 10/01/2040 | | | 22,994,472 | | | | 23,659,683 | | | | | |
| 4.000%, 01/01/2041 | | | 16,247,639 | | | | 16,717,832 | | | | | |
| 3.500%, 06/01/2042 | | | 4,471,855 | | | | 4,505,026 | | | | | |
| 3.500%, 06/01/2042 | | | 6,711,763 | | | | 6,761,549 | | | | | |
| 3.500%, 07/01/2042 | | | 26,046,808 | | | | 26,240,023 | | | | | |
| 3.500%, 07/01/2042 | | | 38,819,692 | | | | 39,107,623 | | | | | |
| 3.000%, 08/01/2042 | | | 21,435,651 | | | | 21,086,944 | | | | | |
| 3.500%, 09/01/2042 | | | 14,796,495 | | | | 14,906,082 | | | | | |
| 3.000%, 11/01/2042 | | | 51,207,578 | | | | 50,367,959 | | | | | |
| 3.500%, 12/01/2042 | | | 23,096,005 | | | | 23,267,289 | | | | | |
| 3.000%, 01/01/2043 | | | 38,102,216 | | | | 37,446,914 | | | | | |
| 3.000%, 02/01/2043 | | | 7,072,983 | | | | 6,951,341 | | | | | |
| 3.500%, 02/01/2043 | | | 14,966,652 | | | | 15,077,634 | | | | | |
| 3.000%, 03/01/2043 | | | 16,840,875 | | | | 16,549,292 | | | | | |
| 3.000%, 04/01/2043 | | | 12,776,804 | | | | 12,558,994 | | | | | |
| 3.000%, 04/01/2043 | | | 14,724,771 | | | | 14,468,105 | | | | | |
| 3.000%, 06/01/2043 | | | 11,816,799 | | | | 11,598,916 | | | | | |
| 3.000%, 08/01/2043 | | | 26,986,720 | | | | 26,512,113 | | | | | |
| 3.500%, 05/01/2044 | | | 14,259,266 | | | | 14,364,994 | | | | | |
| 3.500%, 08/01/2044 | | | 32,668,811 | | | | 32,899,328 | | | | | |
| 3.500%, 08/01/2044 | | | 27,209,756 | | | | 27,363,824 | | | | | |
| 4.000%, 09/01/2044 | | | 14,597,223 | | | | 14,920,321 | | | | | |
| 4.000%, 10/01/2044 | | | 21,882,632 | | | | 22,435,660 | | | | | |
| 3.500%, 01/01/2045 | | | 24,439,376 | | | | 24,620,692 | | | | | |
| 4.000%, 02/01/2045 | | | 15,387,278 | | | | 15,724,651 | | | | | |
| 3.500%, 06/01/2045 | | | 28,054,415 | | | | 28,175,679 | | | | | |
| 3.000%, 10/01/2045 | | | 36,294,009 | | | | 35,657,298 | | | | | |
| 4.000%, 10/01/2045 | | | 23,276,286 | | | | 23,764,512 | | | | | |
| 3.500%, 12/01/2045 | | | 28,818,827 | | | | 28,916,635 | | | | | |
| 4.000%, 12/01/2045 | | | 9,522,101 | | | | 9,721,080 | | | | | |
| 3.500%, 01/01/2046 | | | 57,675,844 | | | | 57,871,541 | | | | | |
| 4.000%, 02/01/2046 | | | 12,917,548 | | | | 13,187,515 | | | | | |
| 3.500%, 03/01/2046 | | | 7,328,339 | | | | 7,360,013 | | | | | |
| 3.500%, 08/01/2046 | | | 86,480,930 | | | | 86,962,100 | | | | | |
| 4.000%, 08/01/2046 | | | 14,360,926 | | | | 14,723,905 | | | | | |
| 3.000%, 10/01/2046 | | | 42,789,689 | | | | 41,814,920 | | | | | |
| 3.000%, 10/01/2046 | | | 75,119,752 | | | | 73,338,528 | | | | | |
| 4.000%, 01/01/2047 | | | 38,158,669 | | | | 39,228,825 | | | | | |
| 3.000%, 05/01/2047 | | | 82,980,874 | | | | 81,012,355 | | | | | |
| 3.500%, 08/01/2047 | | | 26,902,270 | | | | 26,993,638 | | | | | |
| 4.000%, 08/01/2048 | | | 44,051,648 | | | | 45,074,608 | | | | | |
| Federal Home Loan Mortgage Corp. (FHLMC): | | | | | | | | | | | | |
| Series 1053, Class G, 7.000%, 03/15/2021 | | | 889 | | | | 913 | | | | | |
| Series 136, Class E, 6.000%, 04/15/2021 | | | 839 | | | | 846 | | | | | |
| Series 1122, Class G, 7.000%, 08/15/2021 | | | 2,333 | | | | 2,408 | | | | | |
| Series 1186, Class I, 7.000%, 12/15/2021 | | | 5,067 | | | | 5,264 | | | | | |
| Federal National Mortgage Association (FNMA): | | | | | | | | | | | | |
| 5.000%, 11/01/2021 | | | 17,325 | | | | 17,627 | | | | | |
| 3.000%, 04/01/2027 | | | 9,376,216 | | | | 9,405,404 | | | | | |
| 3.500%, 07/01/2027 | | | 33,030,368 | | | | 33,489,188 | | | | | |
| 2.500%, 12/01/2027 | | | 14,342,819 | | | | 14,150,641 | | | | | |
| 5.000%, 05/01/2028 | | | 37,278 | | | | 39,050 | | | | | |
| 3.500%, 07/01/2028 | | | 24,126,663 | | | | 24,421,507 | | | | | |
| 6.500%, 09/01/2028 | | | 9,704 | | | | 10,736 | | | | | |
| 6.500%, 02/01/2029 | | | 23,032 | | | | 25,545 | | | | | |
| 4.500%, 07/01/2030 | | | 4,280,022 | | | | 4,474,408 | | | | | |
| 3.000%, 08/01/2030 | | | 28,822,955 | | | | 28,842,267 | | | | | |
| 4.000%, 11/01/2031 | | | 19,157,440 | | | | 19,673,521 | | | | | |
| 3.500%, 01/01/2032 | | | 46,531,180 | | | | 47,396,151 | | | | | |
| 5.500%, 01/01/2032 | | | 10,060 | | | | 10,745 | | | | | |
| 2.500%, 07/01/2032 | | | 29,433,850 | | | | 28,775,727 | | | | | |
| 5.000%, 09/01/2033 | | | 13,202,598 | | | | 14,020,321 | | | | | |
| 4.500%, 10/01/2033 | | | 23,776,298 | | | | 24,749,560 | | | | | |
| 4.000%, 01/01/2034 | | | 13,235,118 | | | | 13,730,781 | | | | | |
| 5.500%, 04/01/2034 | | | 735,228 | | | | 791,778 | | | | | |
| Series 2004-90, Class LH, 5.000%, 04/25/2034 | | | 80,107 | | | | 80,112 | | | | | |
| 4.000%, 09/01/2034 | | | 19,578,058 | | | | 20,311,350 | | | | | |
| 5.500%, 09/01/2034 | | | 32,735 | | | | 35,219 | | | | | |
| 5.000%, 02/01/2035 | | | 18,208,225 | | | | 19,332,912 | | | | | |
| 5.000%, 02/01/2035 | | | 12,060,745 | | | | 12,806,420 | | | | | |
| 5.500%, 02/01/2035 | | | 28,844 | | | | 31,061 | | | | | |
| 5.000%, 04/01/2035 | | | 1,309,410 | | | | 1,390,232 | | | | | |
| 5.000%, 07/01/2035 | | | 3,768,398 | | | | 4,000,889 | | | | | |
| 5.000%, 02/01/2036 | | | 2,308,872 | | | | 2,451,806 | | | | | |
| 5.000%, 03/01/2036 | | | 1,053,307 | | | | 1,118,614 | | | | | |
| 5.500%, 04/01/2036 | | | 3,453,648 | | | | 3,718,413 | | | | | |
| 4.000%, 05/01/2037 | | | 72,101,972 | | | | 74,300,793 | | | | | |
| 3.500%, 08/01/2037 | | | 45,999,903 | | | | 46,418,532 | | | | | |
| 6.000%, 05/01/2038 | | | 5,477,967 | | | | 5,931,662 | | | | | |
| 4.000%, 06/01/2039 | | | 12,217,670 | | | | 12,554,924 | | | | | |
| 5.000%, 06/01/2039 | | | 16,363,891 | | | | 17,261,739 | | | | | |
| 4.500%, 01/01/2040 | | | 8,440,921 | | | | 8,838,085 | | | | | |
| 4.500%, 01/01/2040 | | | 3,654,734 | | | | 3,806,238 | | | | | |
| 5.000%, 06/01/2040 | | | 13,819,458 | | | | 14,669,562 | | | | | |
| 4.000%, 08/01/2040 | | | 1,107,549 | | | | 1,138,838 | | | | | |
| 4.500%, 08/01/2040 | | | 4,913,619 | | | | 5,146,699 | | | | | |
| 4.500%, 08/01/2040 | | | 13,209,682 | | | | 13,836,287 | | | | | |
| 4.000%, 10/01/2040 | | | 1,974,292 | | | | 2,030,071 | | | | | |
| 4.000%, 11/01/2040 | | | 20,613,181 | | | | 21,195,548 | | | | | |
| 4.000%, 12/01/2040 | | | 4,162,076 | | | | 4,290,539 | | | | | |
| 3.500%, 01/01/2041 | | | 2,152,331 | | | | 2,169,124 | | | | | |
| 4.000%, 01/01/2041 | | | 4,261,228 | | | | 4,381,624 | | | | | |
| 3.500%, 02/01/2041 | | | 2,494,834 | | | | 2,514,308 | | | | | |
| 4.000%, 02/01/2041 | | | 421,183 | | | | 433,346 | | | | | |
| 3.500%, 03/01/2041 | | | 16,987,772 | | | | 17,120,375 | | | | | |
| 4.000%, 03/01/2041 | | | 7,602,429 | | | | 7,817,001 | | | | | |
| 4.500%, 07/01/2041 | | | 5,643,285 | | | | 5,910,768 | | | | | |
| 3.500%, 09/01/2041 | | | 35,138,416 | | | | 35,412,707 | | | | | |
| 4.000%, 09/01/2041 | | | 3,445,777 | | | | 3,543,144 | | | | | |
| 3.500%, 11/01/2041 | | | 18,641,602 | | | | 18,785,716 | | | | | |
| 3.500%, 12/01/2041 | | | 3,327,747 | | | | 3,353,728 | | | | | |
| 4.000%, 12/01/2041 | | | 15,449,101 | | | | 15,885,657 | | | | | |
| 4.000%, 01/01/2042 | | | 28,980,361 | | | | 29,798,702 | | | | | |
| 4.500%, 01/01/2042 | | | 11,562,225 | | | | 12,110,331 | | | | | |
| 4.000%, 02/01/2042 | | | 25,869,562 | | | | 26,600,412 | | | | | |
| 3.000%, 05/01/2042 | | | 3,874,971 | | | | 3,811,640 | | | | | |
| 3.500%, 05/01/2042 | | | 18,849,953 | | | | 19,006,764 | | | | | |
| 3.500%, 06/01/2042 | | | 7,316,290 | | | | 7,373,398 | | | | | |
| 3.500%, 07/01/2042 | | | 123,270,571 | | | | 124,232,651 | | | | | |
| 3.500%, 08/01/2042 | | | 11,862,141 | | | | 11,954,737 | | | | | |
| 3.500%, 09/01/2042 | | | 19,062,048 | | | | 19,210,668 | | | | | |
| 3.000%, 10/01/2042 | | | 19,419,635 | | | | 19,106,049 | | | | | |
| 3.000%, 03/01/2043 | | | 7,272,780 | | | | 7,148,550 | | | | | |
| 3.000%, 04/01/2043 | | | 2,456,449 | | | | 2,414,205 | | | | | |
| 3.000%, 05/01/2043 | | | 28,843,502 | | | | 28,347,447 | | | | | |
| 3.000%, 05/01/2043 | | | 8,502,578 | | | | 8,358,328 | | | | | |
| 3.500%, 05/01/2043 | | | 18,489,336 | | | | 18,627,444 | | | | | |
| 3.000%, 06/01/2043 | | | 30,927,591 | | | | 30,392,105 | | | | | |
| 3.000%, 07/01/2043 | | | 24,035,205 | | | | 23,628,818 | | | | | |
| 4.000%, 07/01/2043 | | | 33,268,030 | | | | 34,207,330 | | | | | |
| 3.000%, 08/01/2043 | | | 8,772,371 | | | | 8,620,367 | | | | | |
| 3.500%, 09/01/2043 | | | 41,169,397 | | | | 41,551,420 | | | | | |
| 4.500%, 09/01/2043 | | | 8,053,818 | | | | 8,435,553 | | | | | |
| 4.000%, 01/01/2045 | | | 15,784,726 | | | | 16,170,172 | | | | | |
| 3.500%, 02/01/2045 | | | 55,380,293 | | | | 55,812,419 | | | | | |
| 4.000%, 02/01/2045 | | | 22,973,592 | | | | 23,527,701 | | | | | |
| 4.000%, 02/01/2045 | | | 8,350,445 | | | | 8,586,223 | | | | | |
| 4.000%, 02/01/2045 | | | 16,670,817 | | | | 17,141,573 | | | | | |
| 4.000%, 02/01/2045 | | | 5,020,226 | | | | 5,128,649 | | | | | |
| 4.000%, 03/01/2045 | | | 12,037,339 | | | | 12,352,985 | | | | | |
| 4.000%, 11/01/2045 | | | 55,519,317 | | | | 56,658,031 | | | | | |
| 3.500%, 12/01/2045 | | | 43,983,305 | | | | 44,083,785 | | | | | |
| 4.500%, 02/01/2046 | | | 34,317,069 | | | | 35,941,786 | | | | | |
| 4.500%, 08/01/2046 | | | 36,520,973 | | | | 38,020,967 | | | | | |
| 3.000%, 10/01/2046 | | | 30,323,564 | | | | 29,630,297 | | | | | |
| 3.500%, 11/01/2046 | | | 36,050,657 | | | | 36,177,638 | | | | | |
| 4.000%, 11/01/2047 | | | 20,570,630 | | | | 20,973,757 | | | | | |
| Government National Mortgage Association (GNMA): | | | | | | | | | | | | |
| 6.000%, 12/20/2028 | | | 17,598 | | | | 18,915 | | | | | |
| 6.500%, 01/20/2029 | | | 9,436 | | | | 10,627 | | | | | |
| 6.000%, 11/20/2033 | | | 12,759 | | | | 13,832 | | | | | |
| 5.000%, 07/20/2040 | | | 678,216 | | | | 723,527 | | | | | |
| 4.000%, 08/20/2041 | | | 6,161,925 | | | | 6,364,555 | | | | | |
| 3.500%, 10/20/2041 | | | 11,133,068 | | | | 11,273,473 | | | | | |
| 4.000%, 12/20/2041 | | | 8,046,601 | | | | 8,310,866 | | | | | |
| 4.000%, 02/20/2042 | | | 15,580,619 | | | | 16,091,291 | | | | | |
| 4.000%, 06/20/2042 | | | 13,240,724 | | | | 13,672,828 | | | | | |
| 3.500%, 09/20/2042 | | | 8,720,327 | | | | 8,819,690 | | | | | |
| 3.000%, 04/20/2045 | | | 18,163,816 | | | | 17,951,084 | | | | | |
| 3.500%, 04/20/2045 | | | 25,317,969 | | | | 25,528,241 | | | | | |
| 4.000%, 05/20/2045 | | | 19,687,064 | | | | 20,307,905 | | | | | |
| 3.500%, 06/20/2045 | | | 23,986,168 | | | | 24,185,383 | | | | | |
| 3.500%, 10/20/2045 | | | 80,078,299 | | | | 80,743,418 | | | | | |
| 4.500%, 01/20/2046 | | | 19,000,537 | | | | 19,924,298 | | | | | |
| 3.000%, 06/20/2046 | | | 14,606,066 | | | | 14,404,923 | | | | | |
| 3.000%, 08/20/2046 | | | 52,956,665 | | | | 52,227,249 | | | | | |
| 4.500%, 06/20/2047 | | | 36,422,139 | | | | 37,712,423 | | | | | |
| 4.500%, 07/20/2047 | | | 25,116,531 | | | | 26,006,305 | | | | | |
| | | | | | | | 3,266,275,764 | | | | 18.3 | % |
| Non-U.S. Government Agency Issues | | | | | | | | | | | | |
| ABFC Trust, | | | | | | | | | | | | |
| Series 2006-OPT1, Class A3C2, 2.656%, 09/25/2036 (1 Month LIBOR USD + 0.150%) (3) | | | 7,161,390 | | | | 6,952,476 | | | | | |
| Accredited Mortgage Loan Trust: | | | | | | | | | | | | |
| Series 2005-4, Class A2D, 2.826%, 12/25/2035 (1 Month LIBOR USD + 0.320%) (3) | | | 5,869,631 | | | | 5,838,088 | | | | | |
| Series 2007-1, Class A3, 2.636%, 02/25/2037 (1 Month LIBOR USD + 0.130%) (3) | | | 1,721,822 | | | | 1,718,487 | | | | | |
| ACE Securities Corp. Home Equity Loan Trust, | | | | | | | | | | | | |
| Series 2006-OP1, Class A2C, 2.656%, 04/25/2036 (1 Month LIBOR USD + 0.150%) (3) | | | 5,210,931 | | | | 5,182,313 | | | | | |
| Alternative Loan Trust: | | | | | | | | | | | | |
| Series 2005-3CB, Class 2A1, 5.000%, 03/25/2020 (6) | | | 376,295 | | | | 371,450 | | | | | |
| Series 2005-50CB, Class 4A1, 5.000%, 11/25/2020 (6) | | | 112,679 | | | | 111,937 | | | | | |
| Series 2005-85CB, Class 3A1, 5.250%, 02/25/2021 (2)(6) | | | 32,291 | | | | 31,463 | | | | | |
| Series 2006-7CB, Class 3A1, 5.250%, 05/25/2021 (6) | | | 255,428 | | | | 249,355 | | | | | |
| Series 2006-J5, Class 3A1, 4.455%, 07/25/2021 (4) | | | 24,460 | | | | 23,298 | | | | | |
| Series 2006-43CB, Class 2A1, 6.000%, 02/25/2022 (6) | | | 117,448 | | | | 116,961 | | | | | |
| Series 2005-11CB, Class 2A6, 5.500%, 06/25/2025 (6) | | | 6,289,642 | | | | 6,246,915 | | | | | |
| Series 2004-18CB, Class 1A1, 6.000%, 09/25/2034 | | | 4,757,120 | | | | 4,905,450 | | | | | |
| Series 2005-6CB, Class 1A4, 5.500%, 04/25/2035 (6) | | | 15,594,290 | | | | 15,087,564 | | | | | |
| Series 2005-29CB, Class A1, 5.500%, 07/25/2035 (6) | | | 3,052,390 | | | | 2,686,854 | | | | | |
| Series 2005-49CB, Class A5, 5.500%, 11/25/2035 (6) | | | 2,937,146 | | | | 2,666,245 | | | | | |
| Series 2005-73CB, Class 1A7, 5.500%, 01/25/2036 (6) | | | 410,231 | | | | 403,877 | | | | | |
| Series 2005-85CB, Class 2A2, 5.500%, 02/25/2036 (6) | | | 3,628,035 | | | | 3,286,367 | | | | | |
| Series 2006-28CB, Class A17, 6.000%, 10/25/2036 (6) | | | 536,896 | | | | 418,761 | | | | | |
| AMRESCO Residential Securities Corp. Mortgage Loan Trust, | | | | | | | | | | | | |
| Series 1998-2, Class A6, 6.405%, 12/25/2027 | | | 750 | | | | 750 | | | | | |
| Argent Securities Inc. Asset-Backed Pass-Through Certificates, | | | | | | | | | | | | |
| Series 2005-W5, Class A1, 2.741%, 01/25/2036 (1 Month LIBOR USD + 0.235%) (3) | | | 38,900,343 | | | | 38,384,361 | | | | | |
| Arroyo Mortgage Trust, | | | | | | | | | | | | |
| Series 2018-1, Class A1, 3.763%, 04/25/2048 (2)(4) | | | 6,169,435 | | | | 6,157,047 | | | | | |
| Asset Backed Securities Corp. Home Equity Loan Trust: | | | | | | | | | | | | |
| Series 2006-HE3, Class A4, 2.676%, 03/25/2036 (1 Month LIBOR USD + 0.170%) (3) | | | 664,688 | | | | 659,802 | | | | | |
| Series 2006-HE2, Class A1, 2.696%, 03/25/2036 (1 Month LIBOR USD + 0.190%) (3) | | | 17,635,428 | | | | 17,529,171 | | | | | |
| Series 2006-HE6, Class A4, 2.666%, 11/25/2036 (1 Month LIBOR USD + 0.160%) (3) | | | 680,368 | | | | 669,429 | | | | | |
| Banc of America Alternative Loan Trust: | | | | | | | | | | | | |
| Series 2004-6, Class 4A1, 5.000%, 07/25/2019 | | | 516,681 | | | | 517,403 | | | | | |
| Series 2004-11, Class 4A1, 5.500%, 12/25/2019 | | | 9,133 | | | | 9,137 | | | | | |
| Series 2005-2, Class 4A1, 5.500%, 03/25/2020 | | | 155,093 | | | | 150,546 | | | | | |
| Series 2005-4, Class 3A1, 5.500%, 05/25/2020 | | | 124,376 | | | | 120,864 | | | | | |
| Series 2005-8, Class 5A1, 5.500%, 09/25/2020 (6) | | | 55,604 | | | | 53,537 | | | | | |
| Series 2007-1, Class 1A1, 5.550%, 04/25/2022 (4)(6) | | | 309,485 | | | | 302,264 | | | | | |
| Series 2003-8, Class 1CB1, 5.500%, 10/25/2033 | | | 2,372,660 | | | | 2,421,001 | | | | | |
| Series 2004-10, Class 1CB1, 6.000%, 11/25/2034 | | | 10,950,886 | | | | 11,498,611 | | | | | |
| Series 2004-11, Class 1CB1, 6.000%, 12/25/2034 | | | 11,894,621 | | | | 12,334,106 | | | | | |
| Series 2005-2, Class 1CB2, 5.500%, 03/25/2035 (6) | | | 862,725 | | | | 846,545 | | | | | |
| Series 2005-6, Class CB7, 5.250%, 07/25/2035 (6) | | | 2,933,854 | | | | 2,879,187 | | | | | |
| Series 2005-9, Class 1CB3, 5.500%, 10/25/2035 (6) | | | 40,366 | | | | 39,747 | | | | | |
| Series 2005-9, Class 2CB1, 6.000%, 10/25/2035 (6) | | | 6,203,581 | | | | 5,982,372 | | | | | |
| Series 2006-5, Class CB7, 6.000%, 06/25/2046 | | | 233,951 | | | | 211,761 | | | | | |
| Banc of America Funding Trust: | | | | | | | | | | | | |
| Series 2005-C, Class A1, 2.710%, 05/20/2035 (1 Month LIBOR USD + 0.240%) (3) | | | 6,396,050 | | | | 6,282,071 | | | | | |
| Series 2007-C, Class 1A3, 4.173%, 05/20/2036 (4)(6) | | | 2,611,439 | | | | 2,501,478 | | | | | |
| Series 2006-G, Class 1A1, 2.660%, 07/20/2036 (1 Month LIBOR USD + 0.190%) (3) | | | 33,880,902 | | | | 33,162,248 | | | | | |
| Series 2007-C, Class 7A5, 2.770%, 05/20/2047 (1 Month LIBOR USD + 0.300%) (3)(6) | | | 3,006,958 | | | | 2,739,882 | | | | | |
| Bayview Financial Trust: | | | | | | | | | | | | |
| Series 2007-A, Class 1A2, 6.205%, 05/28/2037 (7) | | | 172,881 | | | | 175,166 | | | | | |
| Series 2007-B, Class 1A2, 6.831%, 08/28/2047 (7) | | | 107,766 | | | | 101,353 | | | | | |
| Bear Stearns ARM Trust, | | | | | | | | | | | | |
| Series 2005-9, Class A1, 4.730%, 10/25/2035 (1 Year CMT Rate + 2.300%) (3) | | | 836,034 | | | | 842,346 | | | | | |
| Bear Stearns Asset Backed Securities I Trust: | | | | | | | | | | | | |
| Series 2005-HE4, Class M2, 3.466%, 04/25/2035 (1 Month LIBOR USD + 0.960%) (3) | | | 4,590,619 | | | | 4,590,108 | | | | | |
| Series 2006-HE8, Class 21A2, 2.676%, 10/25/2036 (1 Month LIBOR USD + 0.170%) (3) | | | 5,697,385 | | | | 5,682,197 | | | | | |
| Series 2007-HE5, Class 1A2, 2.686%, 06/25/2047 (1 Month LIBOR USD + 0.180%) (3) | | | 3,925,856 | | | | 3,922,931 | | | | | |
| Bear Stearns Asset Backed Securities Trust, | | | | | | | | | | | | |
| Series 2007-2, Class A2, 2.826%, 01/25/2047 (1 Month LIBOR USD + 0.320%) (3) | | | 6,586,202 | | | | 6,566,939 | | | | | |
| Carrington Mortgage Loan Trust: | | | | | | | | | | | | |
| Series 2005-NC1, Class M2, 3.286%, 02/25/2035 (1 Month LIBOR USD + 0.780%) (3) | | | 3,487,518 | | | | 3,484,718 | | | | | |
| Series 2005-FRE1, Class A6, 2.886%, 12/25/2035 (1 Month LIBOR USD + 0.380%) (3) | | | 2,090,675 | | | | 2,088,763 | | | | | |
| Series 2006-NC1, Class A3, 2.716%, 01/25/2036 (1 Month LIBOR USD + 0.210%) (3) | | | 310,636 | | | | 310,507 | | | | | |
| Series 2006-OPT1, Class A3, 2.686%, 02/25/2036 (1 Month LIBOR USD + 0.180%) (3) | | | 1,650,429 | | | | 1,647,895 | | | | | |
| Series 2007-HE1, Class A2, 2.656%, 06/25/2037 (1 Month LIBOR USD + 0.150%) (3) | | | 1,322,568 | | | | 1,311,250 | | | | | |
| Chase Mortgage Finance Trust: | | | | | | | | | | | | |
| Series 2005-A2, Class 1A5, 4.032%, 01/25/2036 (4) | | | 993,664 | | | | 931,279 | | | | | |
| Series 2006-A1, Class 2A3, 4.294%, 09/25/2036 (4) | | | 725,759 | | | | 687,052 | | | | | |
| Series 2007-A1, Class 3A1, 4.137%, 02/25/2037 (4) | | | 3,637,544 | | | | 3,632,121 | | | | | |
| Series 2007-A1, Class 2A3, 4.454%, 02/25/2037 (4) | | | 1,893,110 | | | | 1,914,678 | | | | | |
| CHL Mortgage Pass-Through Trust, | | | | | | | | | | | | |
| Series 2005-6, Class 2A1, 5.500%, 04/25/2035 | | | 556,280 | | | | 525,355 | | | | | |
| Citicorp Mortgage Securities Trust: | | | | | | | | | | | | |
| Series 2006-3, Class 1A4, 6.000%, 06/25/2036 | | | 5,188,143 | | | | 5,225,418 | | | | | |
| Series 2007-2, Class 1A3, 6.000%, 02/25/2037 | | | 1,259,640 | | | | 1,220,418 | | | | | |
| Citicorp Residential Mortgage Trust: | | | | | | | | | | | | |
| Series 2006-3, Class A4, 5.276%, 11/25/2036 (7) | | | 518,791 | | | | 519,782 | | | | | |
| Series 2007-1, Class A6, 5.362%, 03/25/2037 (7) | | | 38,494 | | | | 39,679 | | | | | |
| Series 2007-2, Class A4, 5.127%, 06/25/2037 (7) | | | 18,589,449 | | | | 18,694,972 | | | | | |
| Citigroup Mortgage Loan Trust, | | | | | | | | | | | | |
| Series 2018-RP2, Class A1, 3.500%, 02/25/2058 (2)(4) | | | 22,518,631 | | | | 22,577,179 | | | | | |
| Citigroup Mortgage Loan Trust, Inc.: | | | | | | | | | | | | |
| Series 2006-AR1, Class 1A1, 4.280%, 10/25/2035 (1 Year CMT Rate + 2.400%) (3) | | | 13,535,623 | | | | 13,642,808 | | | | | |
| Series 2005-9, Class 2A2, 5.500%, 11/25/2035 (6) | | | 152,768 | | | | 152,237 | | | | | |
| Series 2005-9, Class 22A2, 6.000%, 11/25/2035 (6) | | | 3,857,891 | | | | 3,869,967 | | | | | |
| Series 2007-AMC4, Class A2C, 2.676%, 05/25/2037 (1 Month LIBOR USD + 0.170%) (3) | | | 2,193,686 | | | | 2,176,440 | | | | | |
| Cityscape Home Equity Loan Trust, | | | | | | | | | | | | |
| Series 1997-C, Class A4, 7.500%, 07/25/2028 (7) | | | 18,820 | | | | 9,403 | | | | | |
| Countrywide Asset-Backed Certificates: | | | | | | | | | | | | |
| Series 2005-13, Class AF3, 5.430%, 02/25/2033 (4) | | | 316,498 | | | | 296,259 | | | | | |
| Series 2006-22, Class 2A3, 2.666%, 01/25/2034 (1 Month LIBOR USD + 0.160%) (3) | | | 9,645,000 | | | | 9,554,081 | | | | | |
| Series 2004-12, Class AF6, 4.634%, 03/25/2035 (4) | | | 15,417 | | | | 15,702 | | | | | |
| Series 2005-10, Class AF6, 4.437%, 02/25/2036 (4) | | | 220,215 | | | | 224,275 | | | | | |
| Series 2006-13, Class 3AV2, 2.656%, 01/25/2037 (1 Month LIBOR USD + 0.150%) (3) | | | 4,486,505 | | | | 4,468,117 | | | | | |
| Series 2006-13, Class 1AF3, 5.944%, 01/25/2037 (4) | | | 32,035 | | | | 31,922 | | | | | |
| Series 2006-23, Class 2A3, 2.676%, 05/25/2037 (1 Month LIBOR USD + 0.170%) (3) | | | 3,541,972 | | | | 3,517,207 | | | | | |
| Series 2006-10, Class 1AF3, 5.971%, 09/25/2046 (4)(6) | | | 614,033 | | | | 551,305 | | | | | |
| Series 2006-9, Class 1AF3, 5.859%, 10/25/2046 (4)(6) | | | 247,261 | | | | 228,091 | | | | | |
| Series 2007-9, Class 2A3, 2.686%, 06/25/2047 (1 Month LIBOR USD + 0.180%) (3) | | | 27,732,050 | | | | 27,405,400 | | | | | |
| Series 2007-11, Class 2A3, 2.696%, 06/25/2047 (1 Month LIBOR USD + 0.190%) (3) | | | 7,746,310 | | | | 7,620,814 | | | | | |
| Credit Suisse First Boston Mortgage Securities Corp., | | | | | | | | | | | | |
| Series 2005-7, Class 3A1, 5.000%, 08/25/2020 (6) | | | 83,114 | | | | 78,369 | | | | | |
| Credit-Based Asset Servicing & Securitization LLC, | | | | | | | | | | | | |
| Series 2007-CB4, Class A1A, 2.405%, 04/25/2037 (1 Month LIBOR USD + 0.090%) (3) | | | 3,898,491 | | | | 3,780,425 | | | | | |
| CWABS Asset-Backed Certificates Trust: | | | | | | | | | | | | |
| Series 2004-15, Class AF6, 4.613%, 04/25/2035 (4) | | | 10,918 | | | | 10,947 | | | | | |
| Series 2005-7, Class AF6, 4.693%, 10/25/2035 (4) | | | 59,841 | | | | 60,940 | | | | | |
| Series 2006-14, Class 2A2, 2.656%, 02/25/2037 (1 Month LIBOR USD + 0.150%) (3) | | | 2,327,033 | | | | 2,320,176 | | | | | |
| Series 2006-18, Class 2A2, 2.666%, 03/25/2037 (1 Month LIBOR USD + 0.160%) (3) | | | 4,846,761 | | | | 4,785,972 | | | | | |
| CWHEQ Home Equity Loan Trust, | | | | | | | | | | | | |
| Series 2007-S1, Class A6, 5.693%, 11/25/2036 (4) | | | 3,755 | | | | 3,820 | | | | | |
| Deutsche Alt-A Securities, Inc. Mortgage Loan Trust: | | | | | | | | | | | | |
| Series 2005-1, Class 1A1, 3.006%, 02/25/2035 (1 Month LIBOR USD + 0.500%) (3) | | | 7,155,869 | | | | 7,046,836 | | | | | |
| Series 2005-2, Class 1A7, 5.452%, 04/25/2035 (4) | | | 9,660,950 | | | | 9,790,021 | | | | | |
| First Franklin Mortgage Loan Trust: | | | | | | | | | | | | |
| Series 2006-FF3, Class A2B, 2.706%, 02/25/2036 (1 Month LIBOR USD + 0.200%) (3) | | | 8,812,419 | | | | 8,763,309 | | | | | |
| Series 2006-FF4, Class A2, 2.695%, 03/25/2036 (1 Month LIBOR USD + 0.190%) (3) | | | 4,236,708 | | | | 4,227,456 | | | | | |
| Series 2006-FF6, Class A4, 2.756%, 04/25/2036 (1 Month LIBOR USD + 0.250%) (3) | | | 27,597,401 | | | | 27,060,734 | | | | | |
| First Horizon Alternative Mortgage Securities Trust: | | | | | | | | | | | | |
| Series 2006-FA6, Class 3A1, 5.750%, 11/25/2021 (6) | | | 61,564 | | | | 59,262 | | | | | |
| Series 2004-AA1, Class A1, 4.290%, 06/25/2034 (4) | | | 4,705,051 | | | | 4,646,909 | | | | | |
| Series 2005-AA2, Class 2A1, 4.027%, 04/25/2035 (4) | | | 2,171,890 | | | | 2,160,031 | | | | | |
| Series 2006-FA8, Class 2A1, 5.750%, 02/25/2037 (6) | | | 198,501 | | | | 167,361 | | | | | |
| Fremont Home Loan Trust, | | | | | | | | | | | | |
| Series 2005-B, Class M4, 3.211%, 04/25/2035 (1 Month LIBOR USD + 0.705%) (3) | | | 1,949,915 | | | | 1,948,696 | | | | | |
| GE Capital Mortgage Services, Inc. Trust, | | | | | | | | | | | | |
| Series 1999-HE1, Class A7, 6.265%, 04/25/2029 | | | 166 | | | | 168 | | | | | |
| GS Mortgage Securities Trust, | | | | | | | | | | | | |
| Series 2018-RPL1, Class A1A, 3.750%, 10/25/2057 (2) | | | 51,035,041 | | | | 51,219,037 | | | | | |
| GSAA Home Equity Trust: | | | | | | | | | | | | |
| Series 2004-6, Class A1, 3.306%, 06/25/2034 (1 Month LIBOR USD + 0.800%) (3) | | | 1,569,285 | | | | 1,539,977 | | | | | |
| Series 2005-14, Class 1A1, 2.756%, 12/25/2035 (1 Month LIBOR USD + 0.250%) (3) | | | 17,932,287 | | | | 17,408,799 | | | | | |
| Series 2007-8, Class A3, 2.956%, 08/25/2037 (1 Month LIBOR USD + 0.450%) (3) | | | 6,584,668 | | | | 6,147,380 | | | | | |
| GSAMP Trust: | | | | | | | | | | | | |
| Series 2005-AHL2, Class A2C, 2.746%, 12/25/2035 (1 Month LIBOR USD + 0.240%) (3) | | �� | 4,447,628 | | | | 4,428,118 | | | | | |
| Series 2006-HE7, Class A2D, 2.736%, 10/25/2046 (1 Month LIBOR USD + 0.230%) (3) | | | 1,364,482 | | | | 1,351,037 | | | | | |
| GSR Mortgage Loan Trust: | | | | | | | | | | | | |
| Series 2004-15F, Class 5A1, 5.500%, 01/25/2020 | | | 91,905 | | | | 77,716 | | | | | |
| Series 2005-3F, Class 2A4, 6.000%, 03/25/2035 | | | 2,644,202 | | | | 2,650,936 | | | | | |
| Series 2005-AR2, Class 2A1, 3.941%, 04/25/2035 (4) | | | 3,121,156 | | | | 3,139,022 | | | | | |
| Home Equity Asset Trust: | | | | | | | | | | | | |
| Series 2004-7, Class A1, 3.226%, 01/25/2035 (1 Month LIBOR USD + 0.720%) (3) | | | 10,084,238 | | | | 10,040,471 | | | | | |
| Series 2007-2, Class 2A2, 2.691%, 07/25/2037 (1 Month LIBOR USD + 0.185%) (3) | | | 836,102 | | | | 834,568 | | | | | |
| HomeBanc Mortgage Trust, | | | | | | | | | | | | |
| Series 2005-4, Class A1, 2.776%, 10/25/2035 (1 Month LIBOR USD + 0.270%) (3) | | | 5,816,987 | | | | 5,794,930 | | | | | |
| HSI Asset Securitization Corp. Trust: | | | | | | | | | | | | |
| Series 2006-OPT4, Class 2A3, 2.666%, 03/25/2036 (1 Month LIBOR USD + 0.160%) (3) | | | 3,229,664 | | | | 3,200,899 | | | | | |
| Series 2007-WF1, Class 2A3, 2.676%, 05/25/2037 (1 Month LIBOR USD + 0.170%) (3) | | | 1,243,797 | | | | 1,243,442 | | | | | |
| J.P. Morgan Alternative Loan Trust: | | | | | | | | | | | | |
| Series 2005-S1, Class 3A1, 5.500%, 10/25/2020 (6) | | | 266,069 | | | | 297,625 | | | | | |
| Series 2006-A1, Class 2A1, 3.867%, 03/25/2036 (4)(6) | | | 90,486 | | | | 83,553 | | | | | |
| Series 2006-S3, Class A3A, 6.000%, 08/25/2036 (7) | | | 92,619 | | | | 92,049 | | | | | |
| Series 2007-S1, Class A1, 2.786%, 04/25/2047 (1 Month LIBOR USD + 0.280%) (3) | | | 6,850,606 | | | | 6,664,914 | | | | | |
| J.P. Morgan Mortgage Trust: | | | | | | | | | | | | |
| Series 2006-S3, Class 2A3, 5.000%, 08/25/2021 (6) | | | 28,116 | | | | 28,066 | | | | | |
| Series 2005-A8, Class 2A3, 4.220%, 11/25/2035 (4)(6) | | | 6,364,731 | | | | 6,205,760 | | | | | |
| Series 2006-A2, Class 2A1, 3.722%, 04/25/2036 (4) | | | 1,640,240 | | | | 1,550,947 | | | | | |
| Series 2006-A2, Class 3A3, 3.899%, 04/25/2036 (4) | | | 1,915,083 | | | | 1,739,803 | | | | | |
| Series 2006-A7, Class 2A2, 4.216%, 01/25/2037 (4) | | | 2,435,243 | | | | 2,321,410 | | | | | |
| Series 2006-A7, Class 2A4R, 4.216%, 01/25/2037 (4) | | | 2,490,780 | | | | 2,374,351 | | | | | |
| Series 2007-A2, Class 2A3, 4.130%, 04/25/2037 (4) | | | 5,139,194 | | | | 4,830,238 | | | | | |
| Series 2007-A4, Class 2A3, 4.054%, 06/25/2037 (4)(6) | | | 6,109,843 | | | | 5,700,747 | | | | | |
| Luminent Mortgage Trust, | | | | | | | | | | | | |
| Series 2005-1, Class A1, 2.766%, 11/25/2035 (1 Month LIBOR USD + 0.260%) (3) | | | 9,635,696 | | | | 9,323,577 | | | | | |
| MASTR Alternative Loan Trust: | | | | | | | | | | | | |
| Series 2004-5, Class 4A1, 5.500%, 07/25/2019 | | | 7,689 | | | | 7,682 | | | | | |
| Series 2005-3, Class 4A1, 5.500%, 03/25/2020 | | | 64,235 | | | | 64,260 | | | | | |
| Series 2004-2, Class 2A1, 6.000%, 02/25/2034 | | | 2,738,885 | | | | 2,863,500 | | | | | |
| Series 2004-8, Class 2A1, 6.000%, 09/25/2034 | | | 2,309,721 | | | | 2,459,906 | | | | | |
| Series 2005-6, Class 1A5, 5.500%, 12/25/2035 (6) | | | 2,632,390 | | | | 2,460,153 | | | | | |
| MASTR Asset Backed Securities Trust, | | | | | | | | | | | | |
| Series 2006-NC1, Class A4, 3.106%, 01/25/2036 (1 Month LIBOR USD + 0.600%) (3) | | | 2,626,318 | | | | 2,626,013 | | | | | |
| Merrill Lynch Mortgage Investors Trust: | | | | | | | | | | | | |
| Series 2004-F, Class A1B, 3.126%, 12/25/2029 (1 Month LIBOR USD + 0.620%) (3) | | | 7,428,203 | | | | 7,147,417 | | | | | |
| Series 2005-A5, Class A3, 3.977%, 06/25/2035 (4) | | | 2,573,223 | | | | 2,556,593 | | | | | |
| Mill City Mortgage Loan Trust, | | | | | | | | | | | | |
| Series 2018-2, Class A1, 3.500%, 05/25/2058 (2)(4) | | | 29,984,083 | | | | 29,747,538 | | | | | |
| Morgan Stanley Capital I, Inc. Trust, | | | | | | | | | | | | |
| Series 2006-HE2, Class A1, 2.676%, 03/25/2036 (1 Month LIBOR USD + 0.170%) (3) | | | 7,226,387 | | | | 7,075,441 | | | | | |
| MortgageIT Trust: | | | | | | | | | | | | |
| Series 2005-4, Class A1, 2.786%, 10/25/2035 (1 Month LIBOR USD + 0.280%) (3) | | | 4,816,381 | | | | 4,724,211 | | | | | |
| Series 2005-5, Class A1, 2.766%, 12/25/2035 (1 Month LIBOR USD + 0.260%) (3) | | | 4,796,434 | | | | 4,748,980 | | | | | |
| New Century Home Equity Loan Trust, | | | | | | | | | | | | |
| Series 2005-C, Class A1, 2.736%, 12/25/2035 (1 Month LIBOR USD + 0.230%) (3) | | | 4,604,668 | | | | 4,585,529 | | | | | |
| New Residential Mortgage Loan Trust: | | | | | | | | | | | | |
| Series 2016-1A, Class A1, 3.750%, 03/25/2056 (2)(4) | | | 15,282,806 | | | | 15,237,923 | | | | | |
| Series 2017-1A, Class A1, 4.000%, 02/25/2057 (2)(4) | | | 23,601,651 | | | | 23,748,309 | | | | | |
| Series 2017-3A, Class A1, 4.000%, 04/25/2057 (2)(4) | | | 27,336,890 | | | | 27,501,794 | | | | | |
| Series 2017-6A, Class A1, 4.000%, 08/27/2057 (2)(4) | | | 30,192,163 | | | | 30,348,326 | | | | | |
| Series 2018-1A, Class A1A, 4.000%, 12/25/2057 (2)(4) | | | 16,181,274 | | | | 16,263,422 | | | | | |
| Nomura Asset Acceptance Corp. Alternative Loan Trust, | | | | | | | | | | | | |
| Series 2005-WF1, Class 2A3, 5.100%, 03/25/2035 | | | 1,555,835 | | | | 1,569,450 | | | | | |
| RALI Series Trust: | | | | | | | | | | | | |
| Series 2004-QS3, Class CB, 5.000%, 03/25/2019 | | | 56,888 | | | | 56,690 | | | | | |
| Series 2004-QS13, Class CB, 5.000%, 09/25/2019 | | | 125,479 | | | | 126,240 | | | | | |
| Series 2005-QS5, Class A1, 2.906%, 04/25/2035 (1 Month LIBOR USD + 0.400%) (3)(6) | | | 2,559,839 | | | | 2,040,903 | | | | | |
| Series 2005-QS9, Class A2, 3.006%, 06/25/2035 (1 Month LIBOR USD + 0.500%) (3)(6) | | | 1,038,687 | | | | 879,819 | | | | | |
| Series 2005-QS11, Class A2, 3.006%, 07/25/2035 (1 Month LIBOR USD + 0.500%) (3) | | | 4,597,586 | | | | 3,876,112 | | | | | |
| Series 2005-QA7, Class A22, 4.425%, 07/25/2035 (4)(6) | | | 2,459,410 | | | | 2,294,726 | | | | | |
| RAMP Series Trust, | | | | | | | | | | | | |
| Series 2002-RS3, Class AI5, 5.572%, 06/25/2032 (4) | | | 1,513,114 | | | | 1,516,048 | | | | | |
| RASC Series Trust: | | | | | | | | | | | | |
| Series 2006-EMX2, Class A3, 2.806%, 02/25/2036 (1 Month LIBOR USD + 0.300%) (3) | | | 5,706,848 | | | | 5,707,333 | | | | | |
| Series 2007-KS1, Class A3, 2.656%, 01/25/2037 (1 Month LIBOR USD + 0.150%) (3) | | | 2,104,302 | | | | 2,078,295 | | | | | |
| Renaissance Home Equity Loan Trust: | | | | | | | | | | | | |
| Series 2005-1, Class AF6, 4.970%, 05/25/2035 (7) | | | 21,398 | | | | 21,882 | | | | | |
| Series 2005-2, Class AF6, 4.781%, 08/25/2035 (7) | | | 1,154,934 | | | | 1,185,892 | | | | | |
| Series 2006-2, Class AF3, 5.797%, 08/25/2036 (7) | | | 15,384,265 | | | | 8,912,260 | | | | | |
| Series 2006-3, Class AF2, 5.580%, 11/25/2036 (7) | | | 10,293,694 | | | | 5,518,718 | | | | | |
| Series 2007-1, Class AF3, 5.612%, 04/25/2037 (7) | | | 278,932 | | | | 124,181 | | | | | |
| Series 2007-2, Class AF2, 5.675%, 06/25/2037 (7) | | | 1,435,659 | | | | 620,983 | | | | | |
| Soundview Home Loan Trust: | | | | | | | | | | | | |
| Series 2006-OPT4, Class 2A3, 2.656%, 06/25/2036 (1 Month LIBOR USD + 0.150%) (3) | | | 2,425,175 | | | | 2,413,691 | | | | | |
| Series 2006-EQ1, Class A3, 2.666%, 10/25/2036 (1 Month LIBOR USD + 0.160%) (3) | | | 12,898,497 | | | | 12,777,998 | | | | | |
| Specialty Underwriting & Residential Finance Trust, | | | | | | | | | | | | |
| Series 2004-BC4, Class A1A, 3.176%, 10/25/2035 (1 Month LIBOR USD + 0.670%) (3) | | | 1,799,594 | | | | 1,785,803 | | | | | |
| Structured Asset Securities Corp.: | | | | | | | | | | | | |
| Series 2003-31A, Class 2A7, 4.279%, 10/25/2033 (4) | | | 1,492,016 | | | | 1,515,134 | | | | | |
| Series 2005-7XS, Class 1A4B, 5.440%, 04/25/2035 (7) | | | 38,294 | | | | 38,946 | | | | | |
| Towd Point Mortgage Trust: | | | | | | | | | | | | |
| Series 2015-3, Class A1A, 3.500%, 03/25/2054 (2)(4) | | | 6,774,533 | | | | 6,739,608 | | | | | |
| Series 2016-2, Class A1, 3.000%, 08/25/2055 (2)(4) | | | 11,634,332 | | | | 11,457,998 | | | | | |
| Series 2016-3, Class A1, 2.250%, 04/25/2056 (2)(4) | | | 100,191 | | | | 97,891 | | | | | |
| Series 2016-4, Class A1, 2.250%, 07/25/2056 (2)(4) | | | 14,329,537 | | | | 13,915,638 | | | | | |
| Series 2017-1, Class A1, 2.750%, 10/25/2056 (2)(4) | | | 4,167,578 | | | | 4,076,742 | | | | | |
| Series 2017-6, Class A1, 2.750%, 10/25/2057 (2)(4) | | | 32,794,322 | | | | 32,031,516 | | | | | |
| Series 2018-6, Class A1A, 3.750%, 03/25/2058 (2)(4) | | | 30,230,502 | | | | 30,247,123 | | | | | |
| Series 2018-4, 3.000%, 06/25/2058 (2)(4) | | | 42,144,889 | | | | 40,974,045 | | | | | |
| WaMu Mortgage Pass-Through Certificates Trust: | | | | | | | | | | | | |
| Series 2004-CB1, Class 5A, 5.000%, 06/25/2019 | | | 16,045 | | | | 16,012 | | | | | |
| Series 2004-CB2, Class 5A, 5.000%, 07/25/2019 | | | 1,756 | | | | 1,751 | | | | | |
| Series 2004-CB2, Class 7A, 5.500%, 08/25/2019 | | | 4,593 | | | | 4,584 | | | | | |
| Series 2004-CB3, Class 3A, 5.500%, 10/25/2019 | | | 2,047 | | | | 2,044 | | | | | |
| Series 2004-CB3, Class 4A, 6.000%, 10/25/2019 | | | 7,005 | | | | 7,070 | | | | | |
| Series 2004-CB4, Class 22A, 6.000%, 12/25/2019 | | | 33,733 | | | | 33,918 | | | | | |
| Series 2004-CB3, Class 1A, 6.000%, 10/25/2034 | | | 3,007,160 | | | | 3,126,420 | | | | | |
| Series 2004-CB3, Class 2A, 6.500%, 10/25/2034 | | | 3,707,006 | | | | 3,942,527 | | | | | |
| Series 2005-3, Class 1CB3, 2.956%, 05/25/2035 (1 Month LIBOR USD + 0.450%) (3)(6) | | | 6,136,522 | | | | 5,153,126 | | | | | |
| Series 2005-6, Class 2A4, 5.500%, 08/25/2035 (6) | | | 7,323,891 | | | | 6,948,711 | | | | | |
| Series 2006-AR10, Class 1A1, 3.880%, 09/25/2036 (4)(6) | | | 1,095,651 | | | | 1,025,348 | | | | | |
| Series 2007-HY3, Class 4A1, 3.849%, 03/25/2037 (4)(6) | | | 16,291,081 | | | | 16,172,224 | | | | | |
| Wells Fargo Alternative Loan Trust, | | | | | | | | | | | | |
| Series 2007-PA1, Class A4, 6.000%, 03/25/2037 (6) | | | 49,870 | | | | 45,934 | | | | | |
| Wells Fargo Mortgage Backed Securities Trust: | | | | | | | | | | | | |
| Series 2005-AR16, Class 4A2, 4.501%, 10/25/2035 (4) | | | 457,629 | | | | 455,445 | | | | | |
| Series 2005-16, Class A18, 6.000%, 12/25/2035 (6) | | | 1,238,500 | | | | 1,230,844 | | | | | |
| Series 2006-AR10, Class 5A5, 4.434%, 07/25/2036 (4)(6) | | | 5,130,255 | | | | 5,115,452 | | | | | |
| Series 2006-AR14, Class 2A3, 4.754%, 10/25/2036 (4)(6) | | | 2,410,187 | | | | 2,369,304 | | | | | |
| Series 2006-15, Class A1, 6.000%, 11/25/2036 (6) | | | 4,123,969 | | | | 4,056,826 | | | | | |
| Series 2007-4, Class A15, 6.000%, 04/25/2037 (6) | | | 4,323,759 | | | | 4,288,517 | | | | | |
| Series 2007-7, Class A49, 6.000%, 06/25/2037 (6) | | | 4,034,504 | | | | 3,980,379 | | | | | |
| Series 2007-8, Class 2A8, 6.000%, 07/25/2037 (6) | | | 4,038,401 | | | | 3,958,734 | | | | | |
| | | | | | | | 1,030,111,951 | | | | 5.8 | % |
| Total Residential Mortgage-Backed Securities | | | | | | | 4,296,387,715 | | | | 24.2 | % |
| | | | | | | | | | |
| Commercial Mortgage-Backed Securities | | | | | | | | | |
| U.S. Government Agency Issues | | | | | | | | | |
| Fannie Mae REMIC Trust, | | | | | | | | | |
| Series 2017-M4, Class A2, 2.597%, 12/25/2026 (4) | | | 30,550,000 | | | | 29,061,032 | | | | |
| Freddie Mac Multifamily Structured Pass Through Certificates: | | | | | | | | | | | |
| Series K029, Class A2, 3.320%, 02/25/2023 (4) | | | 64,407,000 | | | | 65,338,660 | | | | |
| Series K037, Class A2, 3.490%, 01/25/2024 | | | 66,950,000 | | | | 68,464,335 | | | | |
| Series K048, Class A2, 3.284%, 06/25/2025 (4) | | | 53,680,000 | | | | 54,261,376 | | | | |
| Series K050, Class A2, 3.334%, 08/25/2025 (4) | | | 82,951,000 | | | | 84,046,965 | | | | |
| Series K061, Class A2, 3.347%, 11/25/2026 (4) | | | 57,140,000 | | | | 57,518,210 | | | | |
| Series K065, Class A2, 3.243%, 04/25/2027 | | | 16,658,000 | | | | 16,624,143 | | | | |
| Series K077, Class A2, 3.850%, 05/25/2028 (4) | | | 18,449,000 | | | | 19,176,839 | | | | |
| Series K158, Class A3, 3.900%, 10/25/2033 (4) | | | 18,777,000 | | | | 19,215,088 | | | | |
| | | | | | | | 413,706,648 | | | | 2.4 | % |
| Non-U.S. Government Agency Issues | | | | | | | | | | | | |
| BANK: | | | | | | | | | | | | |
| Series 2017-BNK4, Class A4, 3.625%, 05/15/2050 | | | 28,652,000 | | | | 28,554,612 | | | | | |
| Series 2017-BNK8, Class A4, 3.488%, 11/15/2050 | | | 50,056,751 | | | | 49,514,992 | | | | | |
| Series 2017-BNK9, Class A4, 3.538%, 11/15/2054 | | | 11,858,000 | | | | 11,771,041 | | | | | |
| Citigroup Commercial Mortgage Trust: | | | | | | | | | | | | |
| Series 2014-GC19, Class A3, 3.753%, 03/10/2047 | | | 3,003,162 | | | | 3,051,459 | | | | | |
| Series 2015-GC27, Class A5, 3.137%, 02/10/2048 | | | 49,189,111 | | | | 48,347,909 | | | | | |
| Series 2015-GC29, Class A4, 3.192%, 04/10/2048 | | | 24,580,000 | | | | 24,141,832 | | | | | |
| COMM Mortgage Trust: | | | | | | | | | | | | |
| Series 2012-CR1, Class A3, 3.391%, 05/15/2045 | | | 24,224,935 | | | | 24,264,984 | | | | | |
| Series 2013-CR9, Class A3, 4.022%, 07/10/2045 | | | 31,335,009 | | | | 32,333,872 | | | | | |
| Series 2012-CR2, Class A4, 3.147%, 08/15/2045 | | | 35,088,000 | | | | 34,968,336 | | | | | |
| Series 2013-CR6, Class A4, 3.101%, 03/10/2046 | | | 13,725,000 | | | | 13,647,970 | | | | | |
| Series 2013-CR10, Class A4, 4.210%, 08/10/2046 (4) | | | 11,500,000 | | | | 11,946,609 | | | | | |
| Series 2014-CR18, Class A4, 3.550%, 07/15/2047 | | | 5,450,000 | | | | 5,483,853 | | | | | |
| Series 2014-CR19, Class A5, 3.796%, 08/10/2047 | | | 33,800,000 | | | | 34,470,203 | | | | | |
| Series 2014-CR20, Class ASB, 3.305%, 11/10/2047 | | | 25,550,000 | | | | 25,801,123 | | | | | |
| DBUBS Mortgage Trust, | | | | | | | | | | | | |
| Series 2011-LC3A, Class A4, 4.551%, 08/10/2044 | | | 1,967,511 | | | | 2,011,651 | | | | | |
| GS Mortgage Securities Trust: | | | | | | | | | | | | |
| Series 2011-GC5, Class A4, 3.707%, 08/10/2044 | | | 17,924,873 | | | | 18,154,091 | | | | | |
| Series 2012-GCJ9, Class A3, 2.773%, 11/10/2045 | | | 41,375,651 | | | | 40,808,441 | | | | | |
| Series 2014-GC20, Class AAB, 3.655%, 04/10/2047 | | | 23,004,000 | | | | 23,324,220 | | | | | |
| J.P. Morgan Chase Commercial Mortgage Securities Trust: | | | | | | | | | | | | |
| Series 2013-LC11, Class A4, 2.694%, 04/15/2046 | | | 4,659,412 | | | | 4,550,992 | | | | | |
| Series 2013-LC11, Class A5, 2.960%, 04/15/2046 | | | 31,025,000 | | | | 30,548,403 | | | | | |
| Series 2012-LC9, Class ASB, 2.437%, 12/15/2047 | | | 2,924,075 | | | | 2,873,792 | | | | | |
| Series 2013-C10, Class ASB, 2.702%, 12/15/2047 | | | 16,431,165 | | | | 16,221,980 | | | | | |
| JPMBB Commercial Mortgage Securities Trust: | | | | | | | | | | | | |
| Series 2013-C15, Class A4, 4.096%, 11/15/2045 | | | 10,000,000 | | | | 10,299,698 | | | | | |
| Series 2013-C17, Class A3, 3.928%, 01/15/2047 | | | 8,714,507 | | | | 8,902,304 | | | | | |
| Series 2014-C24, Class ASB, 3.368%, 11/15/2047 | | | 12,425,000 | | | | 12,434,492 | | | | | |
| Series 2014-C25, Class A5, 3.672%, 11/15/2047 | | | 36,997,000 | | | | 37,375,494 | | | | | |
| Series 2015-C30, Class A5, 3.822%, 07/15/2048 | | | 10,955,000 | | | | 11,158,618 | | | | | |
| Morgan Stanley Bank of America Merrill Lynch Trust: | | | | | | | | | | | | |
| Series 2012-C5, Class A4, 3.176%, 08/15/2045 | | | 41,590,000 | | | | 41,407,000 | | | | | |
| Series 2012-C6, Class A4, 2.858%, 11/15/2045 | | | 30,745,116 | | | | 30,306,026 | | | | | |
| Series 2013-C10, Class A3, 3.967%, 07/15/2046 (4) | | | 43,057,040 | | | | 44,313,001 | | | | | |
| Series 2013-C12, Class A3, 3.973%, 10/15/2046 | | | 14,633,677 | | | | 15,024,300 | | | | | |
| Series 2014-C16, Class A5, 3.892%, 06/15/2047 | | | 30,860,000 | | | | 31,543,351 | | | | | |
| Series 2015-C25, Class ASB, 3.383%, 10/15/2048 | | | 29,047,000 | | | | 29,244,157 | | | | | |
| Wells Fargo Commercial Mortgage Trust: | | | | | | | | | | | | |
| Series 2015-C26, Class ASB, 2.991%, 02/15/2048 | | | 15,049,000 | | | | 14,915,547 | | | | | |
| Series 2016-C35, Class ASB, 2.788%, 07/15/2048 | | | 11,425,000 | | | | 11,210,819 | | | | | |
| WFRBS Commercial Mortgage Trust: | | | | | | | | | | | | |
| Series 2013-C11, Class A5, 3.071%, 03/15/2045 | | | 13,100,000 | | | | 13,002,130 | | | | | |
| Series 2012-C6, Class A4, 3.440%, 04/15/2045 | | | 19,291,000 | | | | 19,389,182 | | | | | |
| Series 2013-C18, Class A4, 3.896%, 12/15/2046 | | | 21,950,000 | | | | 22,516,297 | | | | | |
| Series 2014-C21, Class ASB, 3.393%, 08/15/2047 | | | 12,655,000 | | | | 12,772,675 | | | | | |
| Series 2014-C24, Class A5, 3.607%, 11/15/2047 | | | 32,306,000 | | | | 32,560,384 | | | | | |
| Series 2014-C23, Class ASB, 3.636%, 10/15/2057 | | | 10,500,000 | | | | 10,685,754 | | | | | |
| | | | | | | | 895,853,594 | | | | 5.0 | % |
| Total Commercial Mortgage-Backed Securities | | | | | | | 1,309,560,242 | | | | 7.3 | % |
| | | | | | | | | | | | | |
| Asset Backed Securities | | | | | | | | | | | | |
| Citibank Credit Card Issuance Trust, | | | | | | | | | | | | |
| Series 2007-A3, Class A3, 6.150%, 06/15/2039 | | | 6,100,000 | | | | 7,795,851 | | | | | |
| Conseco Financial Corp.: | | | | | | | | | | | | |
| Series 1998-3, Class A5, 6.220%, 03/01/2030 | | | 127,361 | | | | 132,848 | | | | | |
| Series 1998-4, Class A5, 6.180%, 04/01/2030 | | | 61,983 | | | | 64,233 | | | | | |
| Ford Credit Auto Owner Trust: | | | | | | | | | | | | |
| Series 2016-1, Class A, 2.310%, 08/15/2027 (2) | | | 37,625,000 | | | | 37,112,171 | | | | | |
| Series 2016-2, Class A, 2.030%, 12/15/2027 (2) | | | 74,240,000 | | | | 72,419,954 | | | | | |
| Series 2018-1, Class A, 3.190%, 07/15/2031 (2) | | | 28,641,000 | | | | 28,412,448 | | | | | |
| Oakwood Mortgage Investors, Inc., | | | | | | | | | | | | |
| Series 1999-B, Class A3, 6.450%, 12/15/2023 | | | 11,019 | | | | 11,143 | | | | | |
| PFS Financing Corp.: | | | | | | | | | | | | |
| Series 2016-BA, Class A, 1.870%, 10/15/2021 (2) | | | 40,200,000 | | | | 39,796,585 | | | | | |
| Series 2018-D, Class A, 3.190%, 04/17/2023 (2) | | | 32,300,000 | | | | 32,256,472 | | | | | |
| Santander Retail Auto Lease Trust, | | | | | | | | | | | | |
| Series 2018-A, Class A3, 2.930%, 05/20/2021 (2) | | | 26,825,000 | | | | 26,791,206 | | | | | |
| SoFi Consumer Loan Program LLC: | | | | | | | | | | | | |
| Series 2017-4, Class A, 2.500%, 05/26/2026 (2) | | | 9,055,622 | | | | 8,950,767 | | | | | |
| Series 2017-5, Class A2, 2.780%, 09/25/2026 (2) | | | 30,110,000 | | | | 29,836,071 | | | | | |
| Sofi Consumer Loan Program Trust, | | | | | | | | | | | | |
| Series 2018-2, Class A1, 2.930%, 04/26/2027 (2) | | | 5,893,225 | | | | 5,878,288 | | | | | |
| | | | | | | | 289,458,037 | | | | 1.6 | % |
| Total Long-Term Investments (Cost $17,835,179,349) | | | | | | | 17,483,288,723 | | | | 98.2 | % |
| | | | | | | | | | | | | |
| SHORT-TERM INVESTMENT | | Shares | | | | | | | | | |
| Money Market Mutual Fund | | | | | | | | | | | | |
| Fidelity Institutional Money Market Fund - Government Portfolio, Institutional Class, 2.29% (5) | | | 283,206,904 | | | | 283,206,904 | | | | | |
| Total Short-Term Investment (Cost $283,206,904) | | | | | | | 283,206,904 | | | | 1.6 | % |
| Total Investments (Cost $18,118,386,253) | | | | | | | 17,766,495,627 | | | | 99.8 | % |
| Other Assets in Excess of Liabilities | | | | | | | 39,825,039 | | | | 0.2 | % |
| TOTAL NET ASSETS | | | | | | $ | 17,806,320,666 | | | | 100.0 | % |
Notes to Schedule of Investments | | | | | | |
| (1) | | Foreign security. | | | | | | |
| (2) | | Security issued under Rule 144A under the Securities Act of 1933 and determined to be liquid. Purchased in a private placement transaction; resale to the public may require registration or may extend only to qualified institutional buyers. At December 31, 2018, the value of these securities total $3,292,336,537, which represents 18.49% of total net assets. |
| (3) | | Variable rate security based on a reference index and spread. The rate reported is the rate in effect as of December 31, 2018. | | | | |
| (4) | | Variable rate security. The coupon is based on an underlying pool of loans. The rate reported is the rate in effect as of December 31, 2018. | | | |
| (5) | | Seven-day yield. | | | | | | |
| (6) | | Security that, on the last payment date, missed a partial principal or interest payment. | | | | | | |
| (7) | | Step-up bond; the interest rate shown is the rate in effect as of December 31, 2018. | | | | | | |
| (8) | | Security in default. | | | | | | |
| Baird Core Plus Bond Fund | | | | | | | | |
| Schedule of Investments, December 31, 2018 | | | | | | | | |
| Summary of Fair Value Exposure at December 31, 2018 | | | | | | |
| | | | | | | | | |
The Fund has adopted authoritative fair valuation accounting standards which establish a definition of fair value and set out a hierarchy for measuring fair value. These standards require additional disclosures about the various inputs and valuation techniques used to develop the measurements of fair value and a discussion on changes in valuation techniques and related inputs during the period. These standards define fair value as the price that would be received to sell an asset or paid to transfer a liability in an orderly transaction between market participants at the measurement date. |
| | | | | | | | | |
| The fair value hierarchy is organized into three levels based upon the assumptions (referred to as "inputs") used in pricing the asset or liability. These standards state that "observable inputs" reflect the assumptions market participants would use in pricing the asset or liability based on market data obtained from independent sources and "unobservable inputs" reflect an entity's own assumptions about the assumptions market participants would use in pricing the asset or liability. These inputs are summarized into three broad levels and described below: |
| | Level 1 - | Unadjusted quoted prices in active markets for identical unrestricted securities. | |
| | Level 2 - | Other significant observable inputs (including quoted prices for similar securities, quoted prices in inactive markets, dealer indications, interest rates, yield curves, prepayment speeds, credit risk, default rates, inputs corroborated by observable market data, etc.). | |
| | Level 3 - | Significant unobservable inputs (including the Fund's own assumptions about the factors that market participants would use in valuing the security) based on the best information available. | |
| The inputs or methodology used for valuing securities are not necessarily an indication of the risk associated with investing in those securities. |
| | | | | | | | | |
| The following is a summary of the inputs used to value the Fund's investments as of December 31, 2018: | | | | |
| | | Level 1 | | | Level 2 | | | Level 3 | | | Total | |
| Long-Term Investments | | | | | | | | | | | | |
| U.S. Treasury Securities | | $ | – | | | $ | 2,483,898,977 | | | $ | – | | | $ | 2,483,898,977 | |
| Other Government Related Securities | | | – | | | | 219,103,700 | | | | – | | | | 219,103,700 | |
| Corporate Bonds | | | – | | | | 8,783,216,329 | | | | – | | | | 8,783,216,329 | |
| Municipal Bonds | | | – | | | | 101,663,723 | | | | – | | | | 101,663,723 | |
| Residential Mortgage-Backed Securities - U.S. Government Agency Issues | | | – | | | | 3,266,275,764 | | | | – | | | | 3,266,275,764 | |
| Residential Mortgage-Backed Securities - Non-U.S. Government Agency Issues | | | – | | | | 1,030,111,951 | | | | – | | | | 1,030,111,951 | |
| Commercial Mortgage-Backed Securities - U.S. Government Agency Issues | | | – | | | | 413,706,648 | | | | – | | | | 413,706,648 | |
| Commercial Mortgage-Backed Securities - Non-U.S. Government Agency Issues | | | – | | | | 895,853,594 | | | | – | | | | 895,853,594 | |
| Asset Backed Securities | | | – | | | | 289,458,037 | | | | – | | | | 289,458,037 | |
| Total Long-Term Investments | | | – | | | | 17,483,288,723 | | | | – | | | | 17,483,288,723 | |
| Short-Term Investment | | | | | | | | | | | | | | | | |
| Money Market Mutual Fund | | | 283,206,904 | | | | – | | | | – | | | | 283,206,904 | |
| Total Short-Term Investment | | | 283,206,904 | | | | – | | | | – | | | | 283,206,904 | |
| Total Investments | | $ | 283,206,904 | | | $ | 17,483,288,723 | | | $ | – | | | $ | 17,766,495,627 | |
| Changes in valuation techniques may result in transfers into or out of assigned levels within the fair value hierarchy. There were no transfers into or out of Level 3 during the reporting period, as compared to the security classifications from the prior year's annual report. |
| | | | | | | | | |
| Baird Short-Term Municipal Bond Fund | | | | | | | | | |
| Schedule of Investments | | | | | | | | | |
| December 31, 2018 | | | | | | | | | |
| | | | | | | | | | |
| | | Principal | | | | | | % of | |
| | | Amount | | | Value | | | Net Assets | |
| LONG-TERM INVESTMENTS | | | | | | | | | |
| Municipal Bonds | | | | | | | | | |
| Alabama | | | | | | | | | |
| Alabama Special Care Facilities Financing Authority, | | | | | | | | | |
| 1.850%, 11/15/2046(Mandatory Tender Date 11/01/2022)(1) | | $ | 65,000 | | | $ | 63,676 | | | | |
| Anniston Public Building Authority, | | | | | | | | | | | |
| 3.250%, 03/01/2019(Insured by AGM) | | | 50,000 | | | | 50,100 | | | | |
| Autauga County Board of Education, | | | | | | | | | | | |
| 4.000%, 04/01/2019 | | | 150,000 | | | | 150,819 | | | | |
| Black Belt Energy Gas District: | | | | | | | | | | | |
| 4.000%, 07/01/2046(Callable 03/01/2021)(Mandatory Tender Date 06/01/2021)(1) | | | 570,000 | | | | 587,716 | | | | |
| 4.000%, 08/01/2047(Callable 04/01/2022)(Mandatory Tender Date 07/01/2022)(1) | | | 695,000 | | | | 723,050 | | | | |
| City of Troy AL, | | | | | | | | | | | |
| 3.000%, 07/01/2019(Insured by BAM) | | | 75,000 | | | | 75,426 | | | | |
| County of Jefferson AL, | | | | | | | | | | | |
| 0.000%, 10/01/2025(Callable 10/01/2023)(Insured by AGM) | | | 750,000 | | | | 609,945 | | | | |
| County of Talladega AL, | | | | | | | | | | | |
| 2.000%, 01/01/2019 | | | 200,000 | | | | 200,000 | | | | |
| Decatur City Board of Education, | | | | | | | | | | | |
| 4.000%, 02/01/2019 | | | 85,000 | | | | 85,150 | | | | |
| Jasper Water Works & Sewer Board, Inc., | | | | | | | | | | | |
| 5.000%, 06/01/2024(Callable 06/01/2021) | | | 100,000 | | | | 106,223 | | | | |
| Montgomery Medical Clinic Board, | | | | | | | | | | | |
| 5.000%, 03/01/2019 | | | 265,000 | | | | 265,975 | | | | |
| Montgomery Waterworks & Sanitation, | | | | | | | | | | | |
| 5.000%, 03/01/2025 | | | 150,000 | | | | 163,233 | | | | |
| Shelby County Board of Education, | | | | | | | | | | | |
| 3.000%, 02/01/2019 | | | 100,000 | | | | 100,098 | | | | |
| | | | | | | | 3,181,411 | | | | 0.9 | % |
| Alaska | | | | | | | | | | | | |
| Alaska Housing Finance Corp., | | | | | | | | | | | | |
| 4.000%, 12/01/2048(Callable 06/01/2027) | | | 1,485,000 | | | | 1,568,472 | | | | | |
| Alaska Industrial Development & Export Authority, | | | | | | | | | | | | |
| 3.500%, 12/01/2020(Callable 12/01/2019) | | | 750,000 | | | | 755,625 | | | | | |
| | | | | | | | 2,324,097 | | | | 0.7 | % |
| Arizona | | | | | | | | | | | | |
| Arizona Health Facilities Authority: | | | | | | | | | | | | |
| 4.625%, 07/01/2019 | | | 30,000 | | | | 30,415 | | | | | |
3.560%, 02/01/2048 (SIFMA Municipal Swap Index + 1.850%) (Callable 08/05/2022)(Mandatory Tender Date 02/01/2023)(2) | | | 100,000 | | | | 104,255 | | | | | |
| Arizona Industrial Development Authority: | | | | | | | | | | | | |
| 4.000%, 07/01/2019(Insured by SD CRED PROG) | | | 30,000 | | | | 30,257 | | | | | |
| 4.000%, 07/01/2020(Insured by SD CRED PROG) | | | 160,000 | | | | 163,806 | | | | | |
| 3.375%, 07/01/2021 | | | 270,000 | | | | 267,419 | | | | | |
| 4.000%, 07/01/2021(Insured by SD CRED PROG) | | | 165,000 | | | | 170,867 | | | | | |
| 4.000%, 05/01/2022 | | | 300,000 | | | | 312,714 | | | | | |
| 3.000%, 07/01/2022 | | | 150,000 | | | | 147,117 | | | | | |
| 4.000%, 08/01/2023 | | | 705,000 | | | | 701,482 | | | | | |
| 5.000%, 05/01/2025 | | | 405,000 | | | | 449,380 | | | | | |
| 4.625%, 08/01/2028 | | | 375,000 | | | | 370,560 | | | | | |
| Arizona State University, | | | | | | | | | | | | |
| 5.000%, 07/01/2032(Pre-refunded to 07/01/2022) | | | 885,000 | | | | 974,491 | | | | | |
| BluePath TE Trust, | | | | | | | | | | | | |
| 2.750%, 09/01/2026(Callable 08/27/2021)(3) | | | 219,359 | | | | 219,364 | | | | | |
| City of El Mirage AZ, | | | | | | | | | | | | |
| 5.000%, 07/01/2026(Callable 07/01/2020) | | | 50,000 | | | | 52,130 | | | | | |
| City of Winslow AZ, | | | | | | | | | | | | |
| 2.000%, 07/01/2019(Insured by AGM) | | | 25,000 | | | | 25,020 | | | | | |
| Glendale Industrial Development Authority, | | | | | | | | | | | | |
| 4.000%, 05/15/2019 | | | 120,000 | | | | 120,675 | | | | | |
| Industrial Development Authority of the City of Phoenix, | | | | | | | | | | | | |
| 1.620%, 11/15/2052(Optional Put Date 01/02/2019)(1) | | | 1,000,000 | | | | 1,000,000 | | | | | |
| Maricopa County Industrial Development Authority, | | | | | | | | | | | | |
| 2.625%, 07/01/2021 | | | 65,000 | | | | 63,471 | | | | | |
| Vistancia Community Facilities District, | | | | | | | | | | | | |
| 5.000%, 07/15/2021(Callable 07/15/2020) | | | 165,000 | | | | 172,283 | | | | | |
| | | | | | | | 5,375,706 | | | | 1.6 | % |
| Arkansas | | | | | | | | | | | | |
| Arkansas Technical University, | | | | | | | | | | | | |
| 4.000%, 06/01/2026(Callable 06/01/2023) | | | 200,000 | | | | 213,662 | | | | | |
| City of Bentonville AR, | | | | | | | | | | | | |
| 2.625%, 11/01/2027(Callable 11/01/2025) | | | 195,000 | | | | 199,725 | | | | | |
| City of Conway AR, | | | | | | | | | | | | |
| 4.000%, 12/01/2023(Callable 06/01/2022) | | | 35,000 | | | | 37,082 | | | | | |
| City of Fayetteville AR, | | | | | | | | | | | | |
| 3.050%, 01/01/2047(Callable 01/01/2027) | | | 700,000 | | | | 682,206 | | | | | |
| City of Hot Springs AR, | | | | | | | | | | | | |
| 4.000%, 12/01/2027(Callable 12/01/2023)(Insured by BAM) | | | 255,000 | | | | 272,692 | | | | | |
| City of Jacksonville AR, | | | | | | | | | | | | |
| 4.000%, 12/01/2025(Callable 06/01/2021) | | | 110,000 | | | | 114,914 | | | | | |
| City of Little Rock AR: | | | | | | | | | | | | |
| 3.000%, 10/01/2021 | | | 100,000 | | | | 102,198 | | | | | |
| 2.375%, 04/01/2028(Callable 10/01/2022) | | | 1,390,000 | | | | 1,408,695 | | | | | |
| 2.000%, 03/01/2038(Callable 03/01/2021) | | | 70,000 | | | | 69,987 | | | | | |
| City of Lonoke AR, | | | | | | | | | | | | |
| 5.000%, 06/01/2023 | | | 160,000 | | | | 178,875 | | | | | |
| City of Magnolia AR, | | | | | | | | | | | | |
| 2.600%, 08/01/2036(Callable 08/01/2024)(Insured by BAM) | | | 565,000 | | | | 551,191 | | | | | |
| City of Marion AR, | | | | | | | | | | | | |
| 2.900%, 09/01/2047(Callable 09/01/2027) | | | 330,000 | | | | 327,980 | | | | | |
| City of Maumelle AR, | | | | | | | | | | | | |
| 2.875%, 08/01/2038(Callable 08/01/2025) | | | 540,000 | | | | 532,802 | | | | | |
| City of Pine Bluff AR, | | | | | | | | | | | | |
| 3.000%, 02/01/2047(Callable 08/01/2027)(Insured by BAM) | | | 600,000 | | | | 575,340 | | | | | |
| City of Rogers AR: | | | | | | | | | | | | |
| 2.125%, 11/01/2029(Pre-refunded to 11/01/2021) | | | 75,000 | | | | 75,017 | | | | | |
| 3.250%, 11/01/2043(Callable 11/01/2026) | | | 2,000,000 | | | | 2,022,260 | | | | | |
| City of Sherwood AR, | | | | | | | | | | | | |
| 3.050%, 12/01/2043(Callable 12/01/2026) | | | 500,000 | | | | 505,975 | | | | | |
| City of Springdale AR: | | | | | | | | | | | | |
| 5.000%, 11/01/2025(Callable 11/01/2022) | | | 150,000 | | | | 165,507 | | | | | |
| 3.000%, 04/01/2043(Callable 04/01/2024)(Insured by BAM) | | | 955,000 | | | | 958,266 | | | | | |
| Little Rock Metrocentere Improvement District No. 1, | | | | | | | | | | | | |
| 1.760%, 12/01/2025(Optional Put Date 01/02/2019)(1) | | | 1,000,000 | | | | 1,000,000 | | | | | |
| Lonoke County School District No. 4, | | | | | | | | | | | | |
| 3.000%, 02/01/2020(Callable 01/31/2019)(Insured by ST) | | | 110,000 | | | | 110,102 | | | | | |
| Northwest Arkansas Conservation Authority, | | | | | | | | | | | | |
| 4.000%, 03/01/2024(Callable 09/01/2022)(Insured by BAM) | | | 325,000 | | | | 349,499 | | | | | |
| | | | | | | | 10,453,975 | | | | 3.0 | % |
| California | | | | | | | | | | | | |
| Allan Hancock Joint Community College District, | | | | | | | | | | | | |
| 0.000%, 08/01/2036(Pre-refunded to 08/01/2022) | | | 225,000 | | | | 97,382 | | | | | |
| Bay Area Toll Authority: | | | | | | | | | | | | |
2.310%, 04/01/2034 (SIFMA Municipal Swap Index + 0.600%) (Callable 10/01/2019)(Mandatory Tender Date 04/01/2020)(2) | | | 500,000 | | | | 500,585 | | | | | |
2.410%, 04/01/2047 (SIFMA Municipal Swap Index + 0.700%) (Callable 04/01/2019)(Mandatory Tender Date 10/01/2019)(2) | | | 225,000 | | | | 225,169 | | | | | |
| California Health Facilities Financing Authority: | | | | | | | | | | | | |
| 5.000%, 04/01/2020 | | | 65,000 | | | | 67,236 | | | | | |
| 3.533%, 07/01/2022(Insured by NATL)(1)(5) | | | 100,000 | | | | 100,000 | | | | | |
| 1.000%, 08/15/2053 | | | 2,000,000 | | | | 1,985,980 | | | | | |
| California State Public Works Board, | | | | | | | | | | | | |
| 5.000%, 12/01/2019(Insured by AMBAC) | | | 120,000 | | | | 123,662 | | | | | |
| California State University, | | | | | | | | | | | | |
| 4.000%, 11/01/2049(Callable 05/01/2021)(Mandatory Tender Date 11/01/2021)(1) | | | 75,000 | | | | 78,254 | | | | | |
| California Statewide Communities Development Authority: | | | | | | | | | | | | |
| 6.000%, 01/01/2021(ETM) | | | 100,000 | | | | 103,662 | | | | | |
| 3.500%, 11/01/2021(Callable 11/01/2019)(Insured by CA MTG) | | | 200,000 | | | | 202,580 | | | | | |
| 3.000%, 07/01/2026(Callable 01/01/2021)(Insured by CA MTG) | | | 625,000 | | | | 631,406 | | | | | |
| 6.250%, 04/01/2028(Insured by NATL)(1)(5) | | | 400,000 | | | | 400,000 | | | | | |
| Centinela Valley Union High School District, | | | | | | | | | | | | |
| 0.000%, 08/01/2037(Callable 08/01/2022)(Insured by AGM) | | | 180,000 | | | | 69,212 | | | | | |
| Central School District: | | | | | | | | | | | | |
| 6.250%, 08/01/2040(Callable 08/01/2021) | �� | | 225,000 | | | | 248,546 | | | | | |
| 0.000%, 08/01/2051(Callable 08/01/2022) | | | 400,000 | | | | 62,980 | | | | | |
| Ceres Unified School District, | | | | | | | | | | | | |
| 0.000%, 08/01/2034(Pre-refunded to 08/01/2020) | | | 300,000 | | | | 108,699 | | | | | |
| City of Redding CA, | | | | | | | | | | | | |
| 4.038%, 07/01/2022(ETM)(Insured by NATL)(1)(5) | | | 195,000 | | | | 191,547 | | | | | |
| Commerce Community Development Commission Successor Agency, | | | | | | | | | | | | |
| 0.000%, 08/01/2021(ETM) | | | 165,000 | | | | 147,175 | | | | | |
| Corona-Norca Unified School District, | | | | | | | | | | | | |
| 0.000%, 08/01/2026 | | | 120,000 | | | | 126,478 | | | | | |
| Eastern Municipal Water District, | | | | | | | | | | | | |
| 1.944%, 07/01/2030 (1 Month LIBOR USD + 0.300%)(Callable 04/01/2021)(Mandatory Tender Date 10/01/2021)(2) | | | 1,015,000 | | | | 1,010,910 | | | | | |
| Escondido Union High School District, | | | | | | | | | | | | |
| 0.000%, 11/01/2019 | | | 100,000 | | | | 98,544 | | | | | |
| Fresno Unified School District: | | | | | | | | | | | | |
| 0.000%, 08/01/2028(Callable 08/01/2021) | | | 95,000 | | | | 57,003 | | | | | |
| 0.000%, 08/01/2030(Callable 08/01/2021) | | | 65,000 | | | | 33,715 | | | | | |
| 0.000%, 08/01/2031(Callable 08/01/2023)(Insured by BAM) | | | 25,000 | | | | 13,621 | | | | | |
| 0.000%, 08/01/2033(Callable 08/01/2021) | | | 310,000 | | | | 128,889 | | | | | |
| 0.000%, 08/01/2033(Callable 08/01/2023)(Insured by BAM) | | | 585,000 | | | | 278,027 | | | | | |
| 0.000%, 08/01/2034(Callable 08/01/2021) | | | 65,000 | | | | 25,148 | | | | | |
| 0.000%, 08/01/2034(Callable 08/01/2023)(Insured by BAM) | | | 400,000 | | | | 177,496 | | | | | |
| 0.000%, 08/01/2035(Callable 08/01/2023)(Insured by BAM) | | | 150,000 | | | | 62,086 | | | | | |
| 0.000%, 08/01/2036(Callable 08/01/2023)(Insured by BAM) | | | 45,000 | | | | 17,379 | | | | | |
| 0.000%, 08/01/2039(Callable 08/01/2023)(Insured by BAM) | | | 650,000 | | | | 203,288 | | | | | |
| 0.000%, 08/01/2040(Callable 08/01/2023)(Insured by BAM) | | | 445,000 | | | | 129,682 | | | | | |
| 0.000%, 08/01/2041(Callable 08/01/2021) | | | 175,000 | | | | 41,669 | | | | | |
| 0.000%, 08/01/2041(Callable 08/01/2023)(Insured by BAM) | | | 1,000,000 | | | | 270,910 | | | | | |
| 0.000%, 08/01/2044(Callable 08/01/2023) | | | 1,000,000 | | | | 215,330 | | | | | |
| Glendale Unified School District: | | | | | | | | | | | | |
| 0.000%, 09/01/2030(Callable 09/01/2021) | | | 350,000 | | | | 186,231 | | | | | |
| 0.000%, 09/01/2041(Callable 09/01/2021) | | | 500,000 | | | | 119,395 | | | | | |
| Golden State Tobacco Securitization Corp.: | | | | | | | | | | | | |
| 5.000%, 06/01/2022 | | | 135,000 | | | | 146,613 | | | | | |
| 5.000%, 06/01/2023 | | | 590,000 | | | | 649,932 | | | | | |
| Healdsburg Unified School District, | | | | | | | | | | | | |
| 0.000%, 08/01/2032(Callable 08/01/2022) | | | 90,000 | | | | 49,932 | | | | | |
| Mendocino-Lake Community College District, | | | | | | | | | | | | |
| 0.000%, 08/01/2035(Pre-refunded to 08/01/2021)(Insured by AGM) | | | 65,000 | | | | 22,541 | | | | | |
| Morongo Unified School District, | | | | | | | | | | | | |
| 0.000%, 08/01/2039(Pre-refunded to 08/01/2022) | | | 100,000 | | | | 33,507 | | | | | |
| Northern California Gas Authority, | | | | | | | | | | | | |
| 2.235%, 07/01/2019 (3 Month LIBOR USD + 0.630%)(2) | | | 270,000 | | | | 270,084 | | | | | |
| Pittsburg Unified School District Financing Authority, | | | | | | | | | | | | |
| 0.000%, 09/01/2035(Pre-refunded to 09/01/2021)(Insured by AGM) | | | 200,000 | | | | 66,664 | | | | | |
| Ripon Unified School District, | | | | | | | | | | | | |
| 0.000%, 08/01/2035(Callable 08/01/2023)(Insured by BAM) | | | 50,000 | | | | 23,212 | | | | | |
| Roseville Finance Authority, | | | | | | | | | | | | |
| 4.000%, 09/01/2019 | | | 50,000 | | | | 50,805 | | | | | |
| State of California: | | | | | | | | | | | | |
| 5.000%, 09/01/2022 | | | 165,000 | | | | 183,561 | | | | | |
| 2.343%, 12/01/2028 (1 Month LIBOR USD + 0.700%)(Callable 06/01/2020)(Mandatory Tender Date 12/01/2020)(2) | | | 100,000 | | | | 100,479 | | | | | |
| Twin Rivers Unified School District, | | | | | | | | | | | | |
| 0.000%, 08/01/2035(Pre-refunded to 02/01/2024)(Insured by BAM) | | | 200,000 | | | | 87,830 | | | | | |
| University of California, | | | | | | | | | | | | |
| 1.400%, 05/15/2046(Callable 11/15/2020)(Mandatory Tender Date 05/15/2021)(1) | | | 330,000 | | | | 325,294 | | | | | |
| Victor Valley Union High School District, | | | | | | | | | | | | |
| 0.000%, 08/01/2044(Pre-refunded to 08/01/2023) | | | 1,000,000 | | | | 277,290 | | | | | |
| Westminster School District: | | | | | | | | | | | | |
| 0.000%, 08/01/2036(Callable 08/01/2023)(Insured by BAM) | | | 190,000 | | | | 74,286 | | | | | |
| 0.000%, 08/01/2038(Callable 08/01/2023)(Insured by BAM) | | | 165,000 | | | | 56,174 | | | | | |
| 0.000%, 08/01/2048(Callable 08/01/2023)(Insured by BAM) | | | 1,000,000 | | | | 159,590 | | | | | |
| 0.000%, 08/01/2053(Callable 08/01/2023)(Insured by BAM) | | | 255,000 | | | | 27,622 | | | | | |
| | | | | | | | 11,145,292 | | | | 3.3 | % |
| Colorado | | | | | | | | | | | | |
| Adams County Housing Authority, | | | | | | | | | | | | |
| 1.500%, 11/01/2020(Callable 05/01/2019)(Mandatory Tender Date 11/01/2019)(1) | | | 1,000,000 | | | | 995,660 | | | | | |
| Bromley Park Metropolitan District No. 2: | | | | | | | | | | | | |
| 5.000%, 12/01/2024(Insured by BAM) | | | 200,000 | | | | 226,490 | | | | | |
| 5.000%, 12/01/2025(Insured by BAM) | | | 315,000 | | | | 360,391 | | | | | |
| Colorado Educational & Cultural Facilities Authority: | | | | | | | | | | | | |
| 4.000%, 12/01/2019 | | | 275,000 | | | | 280,137 | | | | | |
| 5.000%, 12/01/2019 | | | 380,000 | | | | 389,295 | | | | | |
| 4.000%, 06/01/2020 | | | 100,000 | | | | 102,444 | | | | | |
| 4.000%, 10/01/2020 | | | 125,000 | | | | 128,394 | | | | | |
| 5.000%, 10/01/2020 | | | 435,000 | | | | 453,662 | | | | | |
| 5.000%, 12/01/2020 | | | 300,000 | | | | 314,652 | | | | | |
| 4.000%, 11/01/2021 | | | 50,000 | | | | 52,089 | | | | | |
| 5.000%, 12/01/2021 | | | 80,000 | | | | 85,650 | | | | | |
| 4.000%, 03/01/2022 | | | 45,000 | | | | 46,912 | | | | | |
| 5.000%, 12/01/2022 | | | 200,000 | | | | 217,970 | | | | | |
| 4.000%, 04/01/2023 | | | 130,000 | | | | 136,311 | | | | | |
| 5.250%, 03/01/2025(Insured by NATL) | | | 540,000 | | | | 620,541 | | | | | |
| 4.000%, 12/15/2025 | | | 800,000 | | | | 818,392 | | | | | |
| Colorado Health Facilities Authority: | | | | | | | | | | | | |
| 5.000%, 05/15/2019 | | | 250,000 | | | | 252,073 | | | | | |
| 5.000%, 05/15/2020 | | | 130,000 | | | | 133,592 | | | | | |
| 5.000%, 11/15/2036(Mandatory Tender Date 11/15/2023)(1) | | | 145,000 | | | | 163,780 | | | | | |
| 2.800%, 05/15/2042(Callable 11/15/2022)(Mandatory Tender Date 05/15/2023)(1) | | | 800,000 | | | | 807,600 | | | | | |
| Colorado Housing & Finance Authority: | | | | | | | | | | | | |
| 2.150%, 01/01/2038(Mandatory Tender Date 01/01/2020)(1) | | | 465,000 | | | | 464,907 | | | | | |
| 4.000%, 05/01/2048(Callable 11/01/2026)(Insured by GNMA) | | | 460,000 | | | | 481,781 | | | | | |
| E-470 Public Highway Authority: | | | | | | | | | | | | |
| 0.000%, 09/01/2020(Insured by NATL) | | | 125,000 | | | | 120,203 | | | | | |
| 0.000%, 09/01/2028(Callable 09/01/2020)(Insured by NATL) | | | 200,000 | | | | 121,656 | | | | | |
| 2.729%, 09/01/2039 (1 Month LIBOR USD + 1.050%)(Callable 03/01/2021)(Mandatory Tender Date 09/01/2021)(2) | | | 400,000 | | | | 402,780 | | | | | |
| High Plains Metropolitan District, | | | | | | | | | | | | |
| 4.000%, 12/01/2022(Insured by NATL) | | | 420,000 | | | | 443,486 | | | | | |
| Lincoln Park Metropolitan District, | | | | | | | | | | | | |
| 4.000%, 12/01/2023(Insured by AGM) | | | 150,000 | | | | 161,342 | | | | | |
| Lyons Regional Library District, | | | | | | | | | | | | |
| 3.000%, 12/01/2020 | | | 30,000 | | | | 30,492 | | | | | |
| Regional Transportation District, | | | | | | | | | | | | |
| 5.000%, 06/01/2025(Pre-refunded to 06/01/2020) | | | 100,000 | | | | 104,380 | | | | | |
| SBC Metropolitan District, | | | | | | | | | | | | |
| 4.000%, 12/01/2019(Insured by AGM) | | | 265,000 | | | | 269,879 | | | | | |
| Southlands Metropolitan District No. 1: | | | | | | | | | | | | |
| 3.000%, 12/01/2022 | | | 238,000 | | | | 235,653 | | | | | |
| 3.000%, 12/01/2022 | | | 100,000 | | | | 99,014 | | | | | |
| Sterling Hills West Metropolitan District: | | | | | | | | | | | | |
| 5.000%, 12/01/2019 | | | 100,000 | | | | 102,318 | | | | | |
| 5.000%, 12/01/2020 | | | 125,000 | | | | 130,626 | | | | | |
| Vista Ridge Metropolitan District, | | | | | | | | | | | | |
| 4.500%, 12/01/2024(Insured by BAM) | | | 200,000 | | | | 219,314 | | | | | |
| | | | | | | | 9,973,866 | | | | 2.9 | % |
| Connecticut | | | | | | | | | | | | |
| City of Hartford CT, | | | | | | | | | | | | |
| 5.000%, 04/01/2020(ETM)(Insured by ST) | | | 200,000 | | | | 207,106 | | | | | |
| City of New Haven CT: | | | | | | | | | | | | |
| 3.000%, 04/03/2019 | | | 1,000,000 | | | | 1,002,220 | | | | | |
| 5.000%, 08/15/2022(ETM)(Insured by AGM) | | | 520,000 | | | | 575,115 | | | | | |
| Connecticut Housing Finance Authority: | | | | | | | | | | | | |
| 4.000%, 11/15/2044(Callable 11/15/2023) | | | 120,000 | | | | 123,928 | | | | | |
| 4.000%, 11/15/2045(Callable 11/15/2027) | | | 170,000 | | | | 179,272 | | | | | |
| 2.600%, 11/15/2058(Callable 11/15/2019)(Mandatory Tender Date 11/15/2021)(1) | | | 750,000 | | | | 752,617 | | | | | |
| Connecticut State Health & Educational Facilities Authority: | | | | | | | | | | | | |
| 4.000%, 11/01/2021 | | | 100,000 | | | | 104,906 | | | | | |
| 5.000%, 11/01/2026(Callable 11/01/2022) | | | 445,000 | | | | 480,284 | | | | | |
| 5.000%, 07/01/2037(Mandatory Tender Date 07/01/2020)(1) | | | 35,000 | | | | 36,613 | | | | | |
| Southeastern Connecticut Water Authority, | | | | | | | | | | | | |
| 4.000%, 09/01/2022(Callable 01/31/2019)(Insured by ST) | | | 355,000 | | | | 355,614 | | | | | |
| State of Connecticut: | | | | | | | | | | | | |
| 4.000%, 11/01/2020 | | | 225,000 | | | | 232,580 | | | | | |
| 5.000%, 11/01/2020 | | | 150,000 | | | | 157,728 | | | | | |
| 5.000%, 10/01/2027(Callable 10/01/2023) | | | 1,000,000 | | | | 1,101,270 | | | | | |
| Town of Hamden CT: | | | | | | | | | | | | |
| 4.000%, 08/15/2021(Insured by BAM) | | | 415,000 | | | | 432,484 | | | | | |
| 5.000%, 08/15/2021(ETM) | | | 1,080,000 | | | | 1,163,894 | | | | | |
| Town of Plymouth CT, | | | | | | | | | | | | |
| 4.000%, 07/15/2019 | | | 25,000 | | | | 25,208 | | | | | |
| | | | | | | | 6,930,839 | | | | 2.0 | % |
| District of Columbia | | | | | | | | | | | | |
| District of Columbia: | | | | | | | | | | | | |
| 5.000%, 12/01/2026(Callable 12/01/2022) | | | 310,000 | | | | 343,214 | | | | | |
| 4.000%, 12/01/2028 | | | 300,000 | | | | 318,159 | | | | | |
| 1.700%, 08/15/2038(Optional Put Date 01/02/2019)(1) | | | 875,000 | | | | 875,000 | | | | | |
| District of Columbia Housing Finance Agency: | | | | | | | | | | | | |
| 2.000%, 09/01/2021(Mandatory Tender Date 09/01/2020)(1) | | | 150,000 | | | | 149,682 | | | | | |
| 3.500%, 06/15/2023 | | | 170,000 | | | | 173,738 | | | | | |
| 2.550%, 09/01/2023(Mandatory Tender Date 03/01/2022)(Insured by FHA)(1) | | | 900,000 | | | | 907,083 | | | | | |
| | | | | | | | 2,766,876 | | | | 0.8 | % |
| Florida | | | | | | | | | | | | |
| City of Boynton Beach FL, | | | | | | | | | | | | |
| 4.500%, 11/01/2022(Callable 11/01/2021)(Insured by AGM) | | | 130,000 | | | | 138,408 | | | | | |
| City of Jacksonville FL: | | | | | | | | | | | | |
| 5.000%, 11/01/2022 | | | 65,000 | | | | 71,393 | | | | | |
| 5.000%, 10/01/2025(Callable 10/01/2022) | | | 675,000 | | | | 743,067 | | | | | |
| City of Port St. Lucie FL: | | | | | | | | | | | | |
| 5.000%, 09/01/2021 | | | 55,000 | | | | 58,928 | | | | | |
| 5.250%, 09/01/2022(Insured by NATL) | | | 100,000 | | | | 110,669 | | | | | |
| City of Tallahassee FL, | | | | | | | | | | | | |
| 5.000%, 12/01/2019 | | | 190,000 | | | | 194,647 | | | | | |
| City of Tampa FL, | | | | | | | | | | | | |
| 5.250%, 11/15/2024(Pre-refunded to 05/15/2020) | | | 395,000 | | | | 413,087 | | | | | |
| County of Collier FL, | | | | | | | | | | | | |
| 5.000%, 06/01/2020 | | | 120,000 | | | | 125,034 | | | | | |
| County of Escambia FL: | | | | | | | | | | | | |
| 2.100%, 07/01/2022(Mandatory Tender Date 04/11/2019)(1) | | | 60,000 | | | | 59,962 | | | | | |
| 1.810%, 04/01/2039(Optional Put Date 01/02/2019)(1) | | | 1,000,000 | | | | 1,000,000 | | | | | |
| County of Miami-Dade FL, | | | | | | | | | | | | |
| 0.000%, 10/01/2023(ETM)(Insured by NATL) | | | 50,000 | | | | 44,901 | | | | | |
| Escambia County Health Facilities Authority, | | | | | | | | | | | | |
| 1.770%, 11/15/2029(Optional Put Date 01/02/2019)(Insured by AGC)(1) | | | 1,110,000 | | | | 1,110,000 | | | | | |
| Florida Gulf Coast University Financing Corp., | | | | | | | | | | | | |
| 4.100%, 02/01/2025(Callable 02/01/2020) | | | 100,000 | | | | 101,625 | | | | | |
| Florida Higher Educational Facilities Financial Authority, | | | | | | | | | | | | |
| 5.000%, 11/01/2019 | | | 195,000 | | | | 199,643 | | | | | |
| Florida Housing Finance Corp.: | | | | | | | | | | | | |
| 3.700%, 07/01/2021(Callable 01/01/2021)(Insured by GNMA) | | | 600,000 | | | | 612,276 | | | | | |
| 4.350%, 01/01/2046(Callable 01/01/2024) | | | 390,000 | | | | 393,213 | | | | | |
| 4.000%, 07/01/2047(Callable 07/01/2025)(Insured by GNMA) | | | 140,000 | | | | 145,515 | | | | | |
| Florida Municipal Loan Council: | | | | | | | | | | | | |
| 0.000%, 04/01/2023(Insured by NATL) | | | 75,000 | | | | 65,930 | | | | | |
| 0.000%, 04/01/2024(Insured by NATL) | | | 55,000 | | | | 46,757 | | | | | |
| Florida Municipal Power Agency, | | | | | | | | | | | | |
| 5.000%, 10/01/2025(Callable 10/01/2021) | | | 585,000 | | | | 628,700 | | | | | |
| Florida State Municipal Loan Council, | | | | | | | | | | | | |
| 3.000%, 10/01/2020(Insured by NATL) | | | 540,000 | | | | 546,048 | | | | | |
| Heritage Bay Community Development District: | | | | | | | | | | | | |
| 2.125%, 05/01/2020 | | | 125,000 | | | | 124,827 | | | | | |
| 2.250%, 05/01/2021 | | | 125,000 | | | | 124,689 | | | | | |
| Highlands County Health Facilities Authority: | | | | | | | | | | | | |
| 1.710%, 11/15/2035(Callable 01/02/2019)(Optional Put Date 01/07/2019)(1) | | | 400,000 | | | | 400,000 | | | | | |
| 1.710%, 11/15/2037(Callable 01/02/2019)(Optional Put Date 01/07/2019)(1) | | | 2,000,000 | | | | 2,000,000 | | | | | |
| Jacksonville Housing Finance Authority: | | | | | | | | | | | | |
| 1.900%, 01/01/2021(Mandatory Tender Date 01/01/2020)(1) | | | 125,000 | | | | 124,926 | | | | | |
| 2.250%, 12/01/2021(Mandatory Tender Date 12/01/2020)(1) | | | 1,500,000 | | | | 1,499,430 | | | | | |
| JEA Water & Sewer System Revenue: | | | | | | | | | | | | |
| 5.000%, 10/01/2023 | | | 150,000 | | | | 167,600 | | | | | |
| 5.000%, 10/01/2023 | | | 160,000 | | | | 178,696 | | | | | |
| 5.000%, 10/01/2026(Callable 04/01/2021) | | | 245,000 | | | | 260,878 | | | | | |
| Lee County School Board, | | | | | | | | | | | | |
| 5.000%, 08/01/2023 | | | 190,000 | | | | 213,927 | | | | | |
| Martin County Health Facilities Authority, | | | | | | | | | | | | |
| 3.750%, 11/15/2020 | | | 125,000 | | | | 128,523 | | | | | |
| Miami Health Facilities Authority, | | | | | | | | | | | | |
| 5.000%, 07/01/2020 | | | 300,000 | | | | 310,755 | | | | | |
| Miami-Dade County Educational Facilities Authority: | | | | | | | | | | | | |
| 5.000%, 04/01/2022 | | | 150,000 | | | | 163,619 | | | | | |
| 5.000%, 04/01/2023 | | | 150,000 | | | | 167,055 | | | | | |
| Miami-Dade County Industrial Development Authority: | | | | | | | | | | | | |
| 5.000%, 01/15/2019 | | | 100,000 | | | | 100,071 | | | | | |
| 5.000%, 01/15/2022 | | | 385,000 | | | | 404,650 | | | | | |
| 1.750%, 09/01/2027(Mandatory Tender Date 11/01/2019)(1) | | | 695,000 | | | | 691,991 | | | | | |
| Orange County Health Facilities Authority, | | | | | | | | | | | | |
| 6.250%, 10/01/2021(ETM)(Insured by NATL) | | | 110,000 | | | | 117,970 | | | | | |
| Orange County Housing Finance Authority: | | | | | | | | | | | | |
| 4.375%, 03/01/2031(Callable 03/01/2021)(Insured by GNMA) | | | 570,000 | | | | 580,898 | | | | | |
| 4.000%, 09/01/2040(Callable 09/01/2024)(Insured by GNMA) | | | 505,000 | | | | 521,620 | | | | | |
| Palm Beach County Health Facilities Authority, | | | | | | | | | | | | |
| 5.000%, 11/15/2022 | | | 220,000 | | | | 238,033 | | | | | |
| Pinellas County Housing Finance Authority: | | | | | | | | | | | | |
| 4.375%, 09/01/2027(Callable 09/01/2021)(Insured by GNMA) | | | 225,000 | | | | 230,022 | | | | | |
| 3.500%, 03/01/2046(Callable 09/01/2025)(Insured by GNMA) | | | 555,000 | | | | 569,314 | | | | | |
| School Board of Miami-Dade County, | | | | | | | | | | | | |
| 5.000%, 05/01/2031(Mandatory Tender Date 05/01/2024)(1) | | | 455,000 | | | | 513,090 | | | | | |
| St. Lucie County School Board, | | | | | | | | | | | | |
| 5.000%, 07/01/2027(Callable 07/01/2023) | | | 1,150,000 | | | | 1,266,357 | | | | | |
| University of North Florida Financing Corp., | | | | | | | | | | | | |
| 5.000%, 11/01/2023(Insured by AGM) | | | 300,000 | | | | 334,911 | | | | | |
| | | | | | | | 18,243,655 | | | | 5.3 | % |
| Georgia | | | | | | | | | |
| Burke County Development Authority: | | | | | | | | | |
| 2.200%, 10/01/2032(Mandatory Tender Date 04/02/2019)(1) | | | 50,000 | | | | 49,977 | | | | |
| 1.850%, 12/01/2049(Mandatory Tender Date 08/22/2019)(1) | | | 100,000 | | | | 99,704 | | | | |
| 1.850%, 12/01/2049(Mandatory Tender Date 08/22/2019)(1) | | | 70,000 | | | | 69,793 | | | | |
| City of Atlanta GA: | | | | | | | | | | | |
| 5.000%, 01/01/2023(Callable 01/01/2020) | | | 450,000 | | | | 462,776 | | | | |
| 5.000%, 01/01/2024(Callable 01/01/2020) | | | 515,000 | | | | 529,157 | | | | |
| Colquitt County Development Authority, | | | | | | | | | | | |
| 0.000%, 12/01/2021(ETM) | | | 35,000 | | | | 32,897 | | | | |
| County of Columbia GA, | | | | | | | | | | | |
| 6.000%, 06/01/2020(Insured by NATL) | | | 215,000 | | | | 222,822 | | | | |
| Forsyth County Hospital Authority, | | | | | | | | | | | |
| 6.375%, 10/01/2028(ETM) | | | 800,000 | | | | 970,768 | | | | |
| Gainesville & Hall County Hospital Authority, | | | | | | | | | | | |
2.660%, 08/15/2035 (SIFMA Municipal Swap Index + 0.950%) (Callable 08/22/2019)(Mandatory Tender Date 02/18/2020)(2) | | | 1,225,000 | | | | 1,226,053 | | | | |
| Macon-Bibb County Hospital Authority, | | | | | | | | | | | |
| 5.000%, 08/01/2022(Pre-refunded to 08/01/2019) | | | 50,000 | | | | 50,915 | | | | |
| Main Street Natural Gas, Inc.: | | | | | | | | | | | |
| 5.000%, 03/15/2019 | | | 275,000 | | | | 276,606 | | | | |
| 5.000%, 03/15/2022 | | | 155,000 | | | | 167,039 | | | | |
| Monroe County Development Authority: | | | | | | | | | | | |
| 2.000%, 07/01/2025(Mandatory Tender Date 06/13/2019)(1) | | | 405,000 | | | | 404,425 | | | | |
| 2.050%, 07/01/2049(Mandatory Tender Date 11/19/2021)(1) | | | 250,000 | | | | 243,832 | | | | |
| Morgan County Hospital Authority, | | | | | | | | | | | |
| 2.750%, 09/01/2019(Callable 03/01/2019) | | | 250,000 | | | | 250,223 | | | | |
| Private Colleges & Universities Authority: | | | | | | | | | | | |
| 3.750%, 10/01/2021 | | | 25,000 | | | | 25,676 | | | | |
| 5.000%, 10/01/2021 | | | 75,000 | | | | 79,694 | | | | |
| Richmond County Development Authority, | | | | | | | | | | | |
| 0.000%, 12/01/2021(ETM) | | | 30,000 | | | | 28,197 | | | | |
| Washington Wilkes Payroll Development Authority, | | | | | | | | | | | |
| 0.000%, 12/01/2021 | | | 400,000 | | | | 375,964 | | | | |
| | | | | | | | 5,566,518 | | | | 1.6 | % |
| Idaho | | | | | | | | | | | | |
| University of Idaho, | | | | | | | | | | | | |
| 5.250%, 04/01/2041(Mandatory Tender Date 04/01/2021)(1) | | | 1,475,000 | | | | 1,569,931 | | | | 0.5 | % |
| | | | | | | | | | | | | |
| Illinois | | | | | | | | | | | | |
| Bureau County Township High School District No. 502: | | | | | | | | | | | | |
| 3.000%, 12/01/2021(Insured by BAM) | | | 30,000 | | | | 30,477 | | | | | |
| 6.625%, 10/01/2043(Pre-refunded to 12/01/2023)(Insured by BAM) | | | 145,000 | | | | 175,916 | | | | | |
| Carroll & Whiteside Counties Cmnty Unit Sch Dist No. 399, | | | | | | | | | | | | |
| 4.000%, 12/01/2024(Insured by AGM)(6) | | | 410,000 | | | | 436,880 | | | | | |
| Chicago Board of Education: | | | | | | | | | | | | |
| 5.000%, 12/01/2022(Insured by AGM) | | | 295,000 | | | | 318,084 | | | | | |
| 5.000%, 12/01/2023(Insured by AGM) | | | 500,000 | | | | 546,290 | | | | | |
| Chicago O'Hare International Airport, | | | | | | | | | | | | |
| 5.000%, 01/01/2020 | | | 60,000 | | | | 61,829 | | | | | |
| Chicago Park District: | | | | | | | | | | | | |
| 5.000%, 01/01/2020 | | | 325,000 | | | | 332,865 | | | | | |
| 5.000%, 01/01/2024 | | | 1,305,000 | | | | 1,423,964 | | | | | |
| City of Berwyn IL, | | | | | | | | | | | | |
| 4.000%, 12/01/2019 | | | 125,000 | | | | 126,732 | | | | | |
| City of Burbank IL, | | | | | | | | | | | | |
| 4.000%, 12/01/2021(Insured by BAM) | | | 1,500,000 | | | | 1,543,980 | | | | | |
| City of Chicago IL: | | | | | | | | | | | | |
| 5.000%, 01/01/2019 | | | 100,000 | | | | 100,000 | | | | | |
| 5.000%, 11/01/2019 | | | 100,000 | | | | 102,340 | | | | | |
| 5.000%, 01/01/2020 | | | 300,000 | | | | 305,361 | | | | | |
| 5.000%, 01/01/2020 | | | 50,000 | | | | 51,405 | | | | | |
| 5.000%, 11/01/2020 | | | 850,000 | | | | 891,761 | | | | | |
| 5.000%, 01/01/2023(Callable 01/31/2019)(Partially Pre-refunded) | | | 50,000 | | | | 50,076 | | | | | |
| 5.000%, 01/01/2023(Callable 01/01/2020)(Partially Pre-refunded) | | | 25,000 | | | | 25,417 | | | | | |
| 5.000%, 01/01/2024(Callable 01/31/2019)(Partially Pre-refunded) | | | 100,000 | | | | 100,146 | | | | | |
| 5.250%, 01/01/2038(Pre-refunded to 01/01/2022) | | | 380,000 | | | | 416,301 | | | | | |
| City of Decatur IL, | | | | | | | | | | | | |
| 4.000%, 03/01/2022 | | | 65,000 | | | | 67,703 | | | | | |
| City of Springfield IL: | | | | | | | | | | | | |
| 5.000%, 03/01/2019 | | | 100,000 | | | | 100,463 | | | | | |
| 4.000%, 12/01/2019 | | | 95,000 | | | | 96,576 | | | | | |
| 5.000%, 12/01/2023 | | | 155,000 | | | | 171,291 | | | | | |
| City of Waukegan IL, | | | | | | | | | | | | |
| 5.000%, 12/30/2020 | | | 75,000 | | | | 79,175 | | | | | |
| Cook County Community College District No. 510, | | | | | | | | | | | | |
| 0.000%, 12/01/2019(Insured by AGM) | | | 500,000 | | | | 490,085 | | | | | |
| Cook County Community High School District No. 219, | | | | | | | | | | | | |
| 0.000%, 12/01/2020(Insured by NATL) | | | 55,000 | | | | 51,977 | | | | | |
| Cook county Illinois School District No. 163, | | | | | | | | | | | | |
| 6.000%, 12/15/2024(Insured by BAM) | | | 795,000 | | | | 932,567 | | | | | |
| Cook County School District No. 111, | | | | | | | | | | | | |
| 0.000%, 12/01/2020(ETM)(Insured by AGM) | | | 70,000 | | | | 67,426 | | | | | |
| Cook County School District No. 130, | | | | | | | | | | | | |
| 5.000%, 12/01/2025(Insured by AGM) | | | 1,320,000 | | | | 1,491,560 | | | | | |
| Cook County School District No. 154, | | | | | | | | | | | | |
| 3.500%, 12/01/2024(Insured by BAM) | | | 214,000 | | | | 220,865 | | | | | |
| Cook County School District No. 63, | | | | | | | | | | | | |
| 2.375%, 12/01/2028(Callable 12/01/2023)(1) | | | 500,000 | | | | 510,835 | | | | | |
| Cook County Township High School District No. 201: | | | | | | | | | | | | |
| 0.000%, 12/01/2020(Insured by AMBAC) | | | 210,000 | | | | 199,658 | | | | | |
| 0.000%, 12/01/2025(Insured by AGM) | | | 140,000 | | | | 112,725 | | | | | |
| County of Cook IL, | | | | | | | | | | | | |
| 5.000%, 11/15/2021(Callable 11/15/2019) | | | 340,000 | | | | 347,881 | | | | | |
| County of Jefferson IL, | | | | | | | | | | | | |
| 2.000%, 01/15/2020(Insured by AGM) | | | 100,000 | | | | 100,091 | | | | | |
| County of Washington IL, | | | | | | | | | | | | |
| 4.000%, 12/15/2024(Insured by AGM) | | | 250,000 | | | | 269,890 | | | | | |
| Danville Public Building Commission, | | | | | | | | | | | | |
| 4.000%, 12/01/2019 | | | 115,000 | | | | 117,012 | | | | | |
| DuPage County School District No. 34, | | | | | | | | | | | | |
| 0.000%, 01/01/2020(Insured by NATL) | | | 460,000 | | | | 449,480 | | | | | |
| Fulton, Mason, Knox, Schuyler, Etc. Counties Community College District No. 534: | | | | | | | | | | | | |
| 3.250%, 12/01/2020(Insured by BAM) | | | 210,000 | | | | 212,802 | | | | | |
| 4.000%, 12/01/2027(Callable 12/01/2022)(Insured by BAM) | | | 90,000 | | | | 93,776 | | | | | |
| Governors State University, | | | | | | | | | | | | |
| 5.000%, 07/01/2021(Insured by BAM) | | | 295,000 | | | | 311,116 | | | | | |
| Illinois Development Finance Authority: | | | | | | | | | | | | |
| 0.000%, 01/01/2020(Insured by AGM) | | | 75,000 | | | | 73,313 | | | | | |
| 1.720%, 05/01/2031(Optional Put Date 01/02/2019)(1) | | | 600,000 | | | | 600,000 | | | | | |
| Illinois Educational Facilities Authority, | | | | | | | | | | | | |
| 1.800%, 07/01/2036(Mandatory Tender Date 02/13/2020)(1) | | | 200,000 | | | | 199,540 | | | | | |
| Illinois Finance Authority: | | | | | | | | | | | | |
| 5.000%, 10/01/2019 | | | 75,000 | | | | 75,937 | | | | | |
| 4.000%, 11/01/2019 | | | 145,000 | | | | 147,053 | | | | | |
| 5.000%, 02/15/2020 | | | 100,000 | | | | 103,002 | | | | | |
| 5.000%, 10/01/2020 | | | 105,000 | | | | 107,871 | | | | | |
| 5.000%, 01/01/2021 | | | 125,000 | | | | 130,969 | | | | | |
| 4.000%, 09/01/2021 | | | 75,000 | | | | 77,740 | | | | | |
| 5.000%, 11/01/2021 | | | 60,000 | | | | 64,085 | | | | | |
| 5.000%, 02/15/2022 | | | 225,000 | | | | 244,579 | | | | | |
| 6.250%, 05/01/2022(Pre-refunded to 05/01/2020) | | | 145,000 | | | | 153,246 | | | | | |
| 5.000%, 05/15/2022 | | | 130,000 | | | | 137,920 | | | | | |
| 5.000%, 10/01/2022 | | | 50,000 | | | | 52,393 | | | | | |
| 5.000%, 05/15/2023 | | | 120,000 | | | | 133,385 | | | | | |
| 2.994%, 05/01/2036 (1 Month LIBOR USD + 1.350%)(Callable 11/01/2020)(Mandatory Tender Date 05/01/2021)(2) | | | 135,000 | | | | 135,432 | | | | | |
| 1.750%, 07/01/2042(Mandatory Tender Date 05/06/2020)(1) | | | 1,205,000 | | | | 1,196,119 | | | | | |
2.460%, 01/01/2046 (SIFMA Municipal Swap Index + 0.750%) (Callable 07/01/2022)(Mandatory Tender Date 07/01/2023)(2) | | | 50,000 | | | | 50,000 | | | | | |
| Illinois Health Facilities Authority, | | | | | | | | | | | | |
| 3.172%, 06/01/2019(Insured by NATL)(1)(5) | | | 50,000 | | | | 50,000 | | | | | |
| Illinois Housing Development Authority, | | | | | | | | | | | | |
| 2.450%, 06/01/2043(Callable 01/01/2023)(Insured by GNMA) | | | 413,050 | | | | 380,254 | | | | | |
| Illinois State University, | | | | | | | | | | | | |
| 5.000%, 04/01/2023(Callable 04/01/2021)(Insured by BAM) | | | 100,000 | | | | 104,305 | | | | | |
| Jefferson County Township High School District No. 201, | | | | | | | | | | | | |
| 6.500%, 12/30/2020(Insured by BAM) | | | 195,000 | | | | 210,657 | | | | | |
| Joliet Park District: | | | | | | | | | | | | |
| 5.000%, 03/01/2022(Callable 03/01/2021) | | | 170,000 | | | | 175,006 | | | | | |
| 4.000%, 02/01/2023(Insured by BAM) | | | 150,000 | | | | 156,170 | | | | | |
| Kankakee, Iroquois, Ford, Etc. Counties Community Unit School District No. 2, | | | | | | | | | | | | |
| 4.000%, 12/01/2023(Insured by AGM) | | | 445,000 | | | | 473,168 | | | | | |
| Knox & Warren Counties Community Unit School District No. 205, | | | | | | | | | | | | |
| 6.000%, 01/01/2030(Callable 01/01/2021) | | | 500,000 | | | | 533,335 | | | | | |
| Lake County Community High School District No. 117, | | | | | | | | | | | | |
| 0.000%, 12/01/2019(Insured by NATL) | | | 235,000 | | | | 229,534 | | | | | |
| Lake County Community High School District No. 127, | | | | | | | | | | | | |
| 0.000%, 02/01/2020(Insured by NATL) | | | 150,000 | | | | 146,691 | | | | | |
| Lake County Community Unit School District No. 116, | | | | | | | | | | | | |
| 5.000%, 01/15/2025(Callable 01/15/2023) | | | 220,000 | | | | 243,291 | | | | | |
| Lake County Elementary School District No. 6: | | | | | | | | | | | | |
| 0.000%, 12/01/2019(Insured by AMBAC) | | | 80,000 | | | | 77,712 | | | | | |
| 0.000%, 12/01/2021(Insured by AMBAC) | | | 115,000 | | | | 103,654 | | | | | |
| 0.000%, 12/01/2022(Insured by AMBAC) | | | 100,000 | | | | 86,476 | | | | | |
| 0.000%, 12/01/2024(Insured by AMBAC) | | | 70,000 | | | | 55,133 | | | | | |
| Lake County Forest Preserve District, | | | | | | | | | | | | |
| 2.348%, 12/15/2020 (3 Month LIBOR USD + 0.480%)(2) | | | 585,000 | | | | 585,281 | | | | | |
| Lake County School District No. 1, | | | | | | | | | | | | |
| 3.000%, 02/01/2019 | | | 85,000 | | | | 85,065 | | | | | |
| McDonough County Community Unit School District No. 185, | | | | | | | | | | | | |
| 3.000%, 12/01/2019 | | | 205,000 | | | | 206,691 | | | | | |
| Menard Cass & Sangamon Counties Community Unit School District No. 202, | | | | | | | | | | | | |
| 4.000%, 12/01/2022(Insured by AGM) | | | 300,000 | | | | 316,842 | | | | | |
| Metropolitan Pier & Exposition Authority: | | | | | | | | | | | | |
| 0.000%, 06/15/2019(ETM)(Insured by NATL) | | | 25,000 | | | | 24,792 | | | | | |
| 0.000%, 06/15/2019(Insured by NATL) | | | 130,000 | | | | 128,371 | | | | | |
| 0.000%, 06/15/2019(ETM) | | | 5,000 | | | | 4,958 | | | | | |
| 0.000%, 06/15/2019 | | | 45,000 | | | | 44,436 | | | | | |
| 5.650%, 06/15/2022(Insured by NATL) | | | 95,000 | | | | 103,582 | | | | | |
| 5.500%, 12/15/2023(Insured by NATL) | | | 225,000 | | | | 245,108 | | | | | |
| 0.000%, 06/15/2024(Insured by NATL) | | | 35,000 | | | | 28,692 | | | | | |
| 5.700%, 06/15/2025(Pre-refunded to 06/15/2022)(Insured by NATL) | | | 25,000 | | | | 28,320 | | | | | |
| 5.700%, 06/15/2025(Callable 06/15/2022)(Insured by NATL) | | | 35,000 | | | | 38,379 | | | | | |
| 5.000%, 12/15/2026(Callable 06/15/2022)(Insured by ST) | | | 215,000 | | | | 223,546 | | | | | |
| Monroe & St Clair Counties Community Unit School District No. 5, | | | | | | | | | | | | |
| 5.000%, 04/15/2020(Insured by BAM) | | | 270,000 | | | | 279,890 | | | | | |
| Ogle & Winnebago Counties Community Unit School District, | | | | | | | | | | | | |
| 5.000%, 12/01/2021(Insured by BAM) | | | 150,000 | | | | 161,293 | | | | | |
| Peoria Public Building Commission: | | | | | | | | | | | | |
| 0.000%, 12/01/2020(Callable 12/01/2019)(Insured by AGC) | | | 300,000 | | | | 277,746 | | | | | |
| 5.000%, 12/01/2020(Insured by BAM) | | | 185,000 | | | | 194,035 | | | | | |
| 0.000%, 12/01/2026(Callable 12/01/2019)(Insured by AGC) | | | 250,000 | | | | 152,528 | | | | | |
| Plano Special Service Areas No. 3 & 4, | | | | | | | | | | | | |
| 4.000%, 03/01/2030(Callable 03/01/2025) | | | 335,000 | | | | 350,058 | | | | | |
| Prospect Heights Park District, | | | | | | | | | | | | |
| 4.000%, 12/01/2020(Insured by BAM) | | | 120,000 | | | | 124,224 | | | | | |
| Public Building Commission of Chicago, | | | | | | | | | | | | |
| 5.000%, 03/01/2020(Callable 01/31/2019)(Insured by AMBAC) | | | 100,000 | | | | 101,803 | | | | | |
| Railsplitter Tobacco Settlement Authority, | | | | | | | | | | | | |
| 5.250%, 06/01/2020 | | | 75,000 | | | | 78,085 | | | | | |
| Regional Transportation Authority: | | | | | | | | | | | | |
| 6.250%, 07/01/2021(Insured by AGM) | | | 600,000 | | | | 660,204 | | | | | |
| 5.750%, 06/01/2023(Insured by AGM) | | | 175,000 | | | | 196,457 | | | | | |
| Rock Island County School District No. 37, | | | | | | | | | | | | |
| 4.000%, 02/01/2019(Insured by BAM) | | | 135,000 | | | | 135,202 | | | | | |
| Sales Tax Securitization Corp., | | | | | | | | | | | | |
| 5.000%, 01/01/2024 | | | 200,000 | | | | 219,592 | | | | | |
| Sangamon County Water Reclamation District, | | | | | | | | | | | | |
| 5.000%, 01/01/2021 | | | 205,000 | | | | 214,748 | | | | | |
| Shelby Christian Macon Counties Community School District No. 21: | | | | | | | | | | | | |
| 4.000%, 12/01/2025(Callable 12/01/2023)(Insured by AGM) | | | 400,000 | | | | 425,464 | | | | | |
| 4.000%, 12/01/2026(Callable 12/01/2023)(Insured by AGM) | | | 435,000 | | | | 460,239 | | | | | |
| Southern Illinois University, | | | | | | | | | | | | |
| 5.250%, 04/01/2019(Insured by NATL) | | | 1,390,000 | | | | 1,398,729 | | | | | |
| Southwestern Illinois Development Authority, | | | | | | | | | | | | |
| 7.125%, 11/01/2030(Pre-refunded to 11/01/2023) | | | 150,000 | | | | 184,274 | | | | | |
| St. Clair County Community Consolidated School District, | | | | | | | | | | | | |
| 0.000%, 12/01/2021 | | | 510,000 | | | | 471,561 | | | | | |
| St. Clair County School District No. 119: | | | | | | | | | | | | |
| 5.000%, 04/01/2022(Insured by AGM) | | | 350,000 | | | | 380,055 | | | | | |
| 5.000%, 04/01/2023(Insured by AGM) | | | 300,000 | | | | 332,952 | | | | | |
| 0.000%, 04/01/2033(Pre-refunded to 04/01/2019)(Insured by AGC) | | | 675,000 | | | | 279,315 | | | | | |
| St. Clair County Township High School District No. 203, | | | | | | | | | | | | |
| 4.000%, 12/01/2022 | | | 400,000 | | | | 420,164 | | | | | |
| State of Illinois: | | | | | | | | | | | | |
| 0.000%, 08/01/2019 | | | 100,000 | | | | 98,378 | | | | | |
| 5.000%, 12/01/2019 | | | 1,000,000 | | | | 1,022,630 | | | | | |
| 5.000%, 04/01/2020 | | | 40,000 | | | | 41,003 | | | | | |
| 5.000%, 06/15/2020 | | | 300,000 | | | | 309,786 | | | | | |
| 4.000%, 06/15/2021 | | | 35,000 | | | | 35,929 | | | | | |
| 5.000%, 01/01/2022(Callable 01/01/2020) | | | 105,000 | | | | 106,856 | | | | | |
| 6.500%, 06/15/2022 | | | 340,000 | | | | 355,263 | | | | | |
| 5.000%, 08/01/2024(Callable 08/01/2022) | | | 100,000 | | | | 104,316 | | | | | |
| 4.500%, 09/01/2024(Callable 01/31/2019) | | | 175,000 | | | | 175,164 | | | | | |
| 5.000%, 10/01/2024 | | | 500,000 | | | | 533,335 | | | | | |
| University of Illinois: | | | | | | | | | | | | |
| 4.000%, 10/01/2019 | | | 100,000 | | | | 101,476 | | | | | |
| 5.000%, 08/15/2020 | | | 260,000 | | | | 272,215 | | | | | |
| 5.000%, 10/01/2021 | | | 300,000 | | | | 322,077 | | | | | |
| 5.000%, 03/15/2022 | | | 50,000 | | | | 54,204 | | | | | |
| Upper Illinois River Valley Development Authority: | | | | | | | | | | | | |
| 5.000%, 12/01/2022 | | | 530,000 | | | | 574,743 | | | | | |
| 5.000%, 12/01/2023 | | | 400,000 | | | | 439,528 | | | | | |
| Village of Bolingbrook IL, | | | | | | | | | | | | |
| 0.000%, 01/01/2019(Insured by NATL) | | | 235,000 | | | | 235,000 | | | | | |
| Village of Cary IL, | | | | | | | | | | | | |
| 1.500%, 03/01/2019(Insured by BAM) | | | 96,000 | | | | 95,840 | | | | | |
| Village of Crestwood IL: | | | | | | | | | | | | |
| 4.000%, 12/15/2021(Insured by BAM) | | | 250,000 | | | | 261,615 | | | | | |
| 4.500%, 12/15/2025(Callable 12/15/2022)(Insured by BAM) | | | 60,000 | | | | 64,603 | | | | | |
| Village of Lansing IL, | | | | | | | | | | | | |
| 5.000%, 03/01/2022(Insured by AGM) | | | 340,000 | | | | 364,755 | | | | | |
| Village of Lyons IL, | | | | | | | | | | | | |
| 5.000%, 12/01/2025(Callable 12/01/2022)(Insured by BAM) | | | 25,000 | | | | 27,154 | | | | | |
| Village of Matteson IL, | | | | | | | | | | | | |
| 8.000%, 12/01/2029(Pre-refunded to 06/01/2022) | | | 335,000 | | | | 377,743 | | | | | |
| Village of Montgomery IL, | | | | | | | | | | | | |
| 2.100%, 03/01/2020(Insured by BAM) | | | 195,000 | | | | 195,400 | | | | | |
| Village of Oak Park IL: | | | | | | | | | | | | |
| 5.000%, 11/01/2020 | | | 235,000 | | | | 247,194 | | | | | |
| 4.000%, 11/01/2021 | | | 245,000 | | | | 256,951 | | | | | |
| Village of Orland Hills IL: | | | | | | | | | | | | |
| 4.000%, 12/01/2022(Insured by BAM) | | | 145,000 | | | | 152,697 | | | | | |
| 4.000%, 12/01/2023(Insured by BAM) | | | 130,000 | | | | 138,290 | | | | | |
| Village of Richton Park IL: | | | | | | | | | | | | |
| 3.000%, 12/01/2019(Insured by BAM) | | | 65,000 | | | | 65,290 | | | | | |
| 4.000%, 12/01/2022(Insured by BAM) | | | 80,000 | | | | 83,397 | | | | | |
| Village of River Grove IL: | | | | | | | | | | | | |
| 3.000%, 12/15/2020(Insured by BAM) | | | 75,000 | | | | 75,952 | | | | | |
| 3.000%, 12/15/2021(Insured by BAM) | | | 120,000 | | | | 121,991 | | | | | |
| Village of Tremont IL: | | | | | | | | | | | | |
| 3.000%, 01/01/2019(Insured by BAM) | | | 60,000 | | | | 60,000 | | | | | |
| 3.000%, 07/01/2019(Insured by BAM) | | | 50,000 | | | | 50,218 | | | | | |
| 3.000%, 01/01/2020(Insured by BAM) | | | 70,000 | | | | 70,568 | | | | | |
| 3.000%, 07/01/2020(Insured by BAM) | | | 95,000 | | | | 96,294 | | | | | |
| Western Illinois University: | | | | | | | | | | | | |
| 4.000%, 04/01/2019(Insured by BAM) | | | 50,000 | | | | 50,187 | | | | | |
| 5.000%, 04/01/2020(Insured by BAM) | | | 250,000 | | | | 257,570 | | | | | |
| White County Community Unit School District No. 5, | | | | | | | | | | | | |
| 4.300%, 12/01/2021(Insured by AGM) | | | 100,000 | | | | 106,264 | | | | | |
| Will County Community Consolidated School District No. 70-C: | | | | | | | | | | | | |
| 4.000%, 12/01/2019(Insured by AGM) | | | 155,000 | | | | 157,627 | | | | | |
| 4.000%, 12/01/2020(Insured by AGM) | | | 130,000 | | | | 134,477 | | | | | |
| 4.000%, 12/01/2022(Insured by AGM) | | | 270,000 | | | | 287,383 | | | | | |
| Will County Community High School District No. 210: | | | | | | | | | | | | |
| 5.000%, 01/01/2021(Callable 01/31/2019) | | | 125,000 | | | | 125,118 | | | | | |
| 0.000%, 01/01/2022(ETM)(Insured by AGM) | | | 145,000 | | | | 136,087 | | | | | |
| 0.000%, 01/01/2023(ETM)(Insured by AGM) | | | 335,000 | | | | 304,190 | | | | | |
| 0.000%, 01/01/2023(Insured by AGM) | | | 160,000 | | | | 141,333 | | | | | |
| 0.000%, 01/01/2024(ETM)(Insured by AGM) | | | 500,000 | | | | 442,525 | | | | | |
| 0.000%, 01/01/2024(Insured by AGM) | | | 275,000 | | | | 233,871 | | | | | |
| Will County Community Unit School District No. 201-U, | | | | | | | | | | | | |
| 0.000%, 11/01/2021(Insured by NATL) | | | 215,000 | | | | 199,855 | | | | | |
| Will County Elementary School District No. 122, | | | | | | | | | | | | |
| 0.000%, 11/01/2021(ETM)(Insured by AGM) | | | 50,000 | | | | 47,079 | | | | | |
| Will County IL School District No. 365, | | | | | | | | | | | | |
| 0.000%, 11/01/2021(Insured by AGM) | | | 200,000 | | | | 187,004 | | | | | |
| Will County School District No. 114: | | | | | | | | | | | | |
| 0.000%, 12/01/2019(ETM)(Insured by NATL) | | | 25,000 | | | | 24,573 | | | | | |
| 0.000%, 12/01/2019(Insured by NATL) | | | 25,000 | | | | 24,401 | | | | | |
| Will County School District No. 88, | | | | | | | | | | | | |
| 5.250%, 01/01/2022 | | | 860,000 | | | | 920,940 | | | | | |
| Williamson County Community Unit School District No. 5, | | | | | | | | | | | | |
| 0.000%, 01/01/2031(Pre-refunded to 01/01/2019)(Insured by AGC) | | | 500,000 | | | | 244,540 | | | | | |
| Winnebago & Boone Counties School District No. 205, | | | | | | | | | | | | |
| 0.000%, 02/01/2022 | | | 95,000 | | | | 87,340 | | | | | |
| | | | | | | | 41,505,648 | | | | 11.9 | % |
| Indiana | | | | | | | | | |
| Anderson Redevelopment District: | | | | | | | | | |
| 5.000%, 02/01/2019 | | | 980,000 | | | | 982,156 | | | | |
| 5.000%, 02/01/2020 | | | 535,000 | | | | 550,686 | | | | |
| Center Grove Community School Corp.: | | | | | | | | | | | |
| 2.000%, 07/01/2019(Insured by ST) | | | 160,000 | | | | 159,837 | | | | |
| 2.000%, 01/01/2020(Insured by ST) | | | 655,000 | | | | 652,602 | | | | |
| City of Goshen IN, | | | | | | | | | | | |
| 4.100%, 01/01/2021(Callable 01/31/2019)(Insured by AGM) | | | 470,000 | | | | 470,926 | | | | |
| City of Lawrence IN: | | | | | | | | | | | |
| 3.000%, 01/01/2020(Insured by BAM) | | | 175,000 | | | | 176,456 | | | | |
| 4.000%, 01/01/2021(Insured by BAM) | | | 200,000 | | | | 207,106 | | | | |
| 4.000%, 01/01/2022(Insured by BAM) | | | 400,000 | | | | 420,516 | | | | |
| City of Mishawaka IN, | | | | | | | | | | | |
| 5.000%, 03/01/2025(Insured by AGM) | | | 100,000 | | | | 115,176 | | | | |
| City of Valparaiso IN, | | | | | | | | | | | |
| 4.000%, 08/01/2026(Callable 08/01/2023) | | | 375,000 | | | | 399,851 | | | | |
| City of Whiting IN, | | | | | | | | | | | |
| 1.850%, 06/01/2044(Mandatory Tender Date 10/01/2019)(1) | | | 640,000 | | | | 638,816 | | | | |
| County of Lake IN, | | | | | | | | | | | |
| 4.000%, 07/15/2021(Insured by AGM) | | | 100,000 | | | | 104,865 | | | | |
| Hammond Local Public Improvement Bond Bank, | | | | | | | | | | | |
| 3.000%, 06/30/2019 | | | 1,000,000 | | | | 1,001,840 | | | | |
| Hammond Multi-School Building Corp., | | | | | | | | | | | |
| 5.000%, 01/15/2025(Insured by ST) | | | 525,000 | | | | 593,371 | | | | |
| Hammond Sanitary District, | | | | | | | | | | | |
| 5.000%, 01/15/2021(Insured by BAM) | | | 445,000 | | | | 472,292 | | | | |
| Indiana Bond Bank: | | | | | | | | | | | |
| 5.250%, 10/15/2019 | | | 80,000 | | | | 81,938 | | | | |
| 2.602%, 10/15/2022 (3 Month LIBOR USD + 0.970%)(2) | | | 1,075,000 | | | | 1,075,108 | | | | |
| Indiana Finance Authority: | | | | | | | | | | | |
| 5.000%, 10/01/2022 | | | 175,000 | | | | 191,392 | | | | |
| 5.250%, 10/01/2022(Callable 10/01/2021) | | | 800,000 | | | | 870,416 | | | | |
| 5.750%, 05/01/2031(Pre-refunded to 05/01/2019) | | | 80,000 | | | | 81,009 | | | | |
| Indiana Health & Educational Facilities Financing Authority, | | | | | | | | | | | |
| 1.750%, 11/15/2031(Mandatory Tender Date 11/02/2021)(1) | | | 335,000 | | | | 329,975 | | | | |
| Indiana Housing & Community Development Authority: | | | | | | | | | | | |
| 4.000%, 12/01/2027(Callable 06/01/2021)(Insured by GNMA) | | | 410,000 | | | | 418,257 | | | | |
| 1.950%, 07/01/2047(Optional Put Date 01/02/2019)(Insured by GNMA)(1) | | | 600,000 | | | | 600,000 | | | | |
| Indianapolis Local Public Improvement Bond Bank, | | | | | | | | | | | |
| 5.000%, 06/01/2020 | | | 125,000 | | | | 130,244 | | | | |
| Kankakee Valley Middle School Building Corp., | | | | | | | | | | | |
| 5.000%, 07/15/2022(Insured by ST) | | | 215,000 | | | | 234,666 | | | | |
| Michigan City School Building Corp., | | | | | | | | | | | |
| 5.000%, 07/15/2023(Insured by ST) | | | 350,000 | | | | 391,080 | | | | |
| Munster School Building Corp., | | | | | | | | | | | |
| 4.000%, 07/15/2023(Insured by ST) | | | 160,000 | | | | 171,218 | | | | |
| Salem Middle School Building Corp., | | | | | | | | | | | |
| 4.000%, 01/15/2024(Insured by ST) | | | 195,000 | | | | 209,375 | | | | |
| Town of Rossville IN, | | | | | | | | | | | |
| 3.500%, 07/01/2023 | | | 115,000 | | | | 118,627 | | | | |
| Vinton-Tecumseh School Building Corp.: | | | | | | | | | | | |
| 4.000%, 01/15/2020(Insured by ST) | | | 275,000 | | | | 280,767 | | | | |
| 4.000%, 07/15/2020(Insured by ST) | | | 255,000 | | | | 262,780 | | | | |
| 4.000%, 01/15/2021(Insured by ST) | | | 265,000 | | | | 275,560 | | | | |
| 4.000%, 07/15/2021(Insured by ST) | | | 220,000 | | | | 230,760 | | | | |
| 4.000%, 07/15/2022(Insured by ST) | | | 385,000 | | | | 409,648 | | | | |
| 5.000%, 01/15/2023(Insured by ST) | | | 145,000 | | | | 161,060 | | | | |
| Westfield High School Building Corp., | | | | | | | | | | | |
| 5.000%, 01/15/2024(Insured by ST) | | | 200,000 | | | | 223,910 | | | | |
| | | | | | | | 13,694,286 | | | | 4.0 | % |
| Iowa | | | | | | | | | | | | |
| Bondurant-Farrar Community School District, | | | | | | | | | | | | |
| 3.000%, 06/01/2023(Insured by MAC) | | | 110,000 | | | | 113,227 | | | | | |
| City of Cedar Rapids IA, | | | | | | | | | | | | |
| 2.975%, 08/15/2029(Insured by AMBAC)(1)(5) | | | 770,000 | | | | 770,000 | | | | | |
| City of Coralville IA, | | | | | | | | | | | | |
| 4.000%, 06/01/2019 | | | 100,000 | | | | 100,088 | | | | | |
| Iowa Finance Authority: | | | | | | | | | | | | |
| 3.500%, 07/01/2046(Callable 01/01/2026)(Insured by GNMA) | | | 225,000 | | | | 231,287 | | | | | |
| 1.670%, 07/01/2047 | | | 1,000,000 | | | | 1,000,000 | | | | | |
2.010%, 07/01/2047 (SIFMA Municipal Swap Index + 0.300%) (Callable 11/02/2020)(Mandatory Tender Date 05/03/2021)(Insured by GNMA)(2) | | | 1,000,000 | | | | 1,001,490 | | | | | |
| 4.000%, 07/01/2047(Callable 07/01/2027)(Insured by GNMA) | | | 1,000,000 | | | | 1,053,350 | | | | | |
| Iowa Western Community College, | | | | | | | | | | | | |
| 3.000%, 06/01/2021 | | | 500,000 | | | | 510,995 | | | | | |
| | | | | | | | 4,780,437 | | | | 1.4 | % |
| Kansas | | | | | | | | | | | | |
| City of Wichita KS, | | | | | | | | | | | | |
| 3.000%, 09/01/2023(Callable 09/01/2022) | | | 685,000 | | | | 683,212 | | | | | |
| Kansas Municipal Energy Agency, | | | | | | | | | | | | |
| 5.000%, 04/01/2022(Insured by BAM) | | | 515,000 | | | | 561,757 | | | | | |
| Public Building Commission of Johnson County, | | | | | | | | | | | | |
| 5.000%, 09/01/2023 | | | 1,310,000 | | | | 1,484,034 | | | | | |
| State of Kansas Department of Transportation, | | | | | | | | | | | | |
| 1.974%, 09/01/2019 (1 Month LIBOR USD + 0.400%)(2) | | | 205,000 | | | | 205,231 | | | | | |
| | | | | | | | 2,934,234 | | | | 0.8 | % |
| Kentucky | | | | | | | | | | | | |
| City of Owensboro KY, | | | | | | | | | | | | |
| 0.000%, 01/01/2020(Insured by AMBAC) | | | 95,000 | | | | 92,800 | | | | | |
| County of Carroll KY, | | | | | | | | | | | | |
| 1.050%, 09/01/2042(Mandatory Tender Date 09/01/2019)(1) | | | 250,000 | | | | 248,252 | | | | | |
| Kentucky Economic Development Finance Authority: | | | | | | | | | | | | |
| 6.000%, 06/01/2030(Pre-refunded to 06/01/2020) | | | 190,000 | | | | 200,819 | | | | | |
| 6.375%, 06/01/2040(Pre-refunded to 06/01/2020) | | | 340,000 | | | | 361,128 | | | | | |
| 6.500%, 03/01/2045(Pre-refunded to 06/01/2020) | | | 950,000 | | | | 1,010,543 | | | | | |
| Kentucky Housing Corp., | | | | | | | | | | | | |
| 2.000%, 09/01/2021(Mandatory Tender Date 09/01/2020)(1) | | | 150,000 | | | | 149,901 | | | | | |
| Kentucky Infrastructure Authority, | | | | | | | | | | | | |
| 5.000%, 02/01/2022 | | | 500,000 | | | | 546,430 | | | | | |
| Kentucky Public Energy Authority: | | | | | | | | | | | | |
| 4.000%, 04/01/2048(Callable 01/02/2024)(Mandatory Tender Date 04/01/2024)(1) | | | 610,000 | | | | 637,566 | | | | | |
| 4.000%, 01/01/2049(Callable 10/01/2024)(Mandatory Tender Date 01/01/2025)(1) | | | 175,000 | | | | 184,998 | | | | | |
| Kentucky Rural Water Finance Corp., | | | | | | | | | | | | |
| 2.250%, 03/01/2020(Callable 09/01/2019) | | | 250,000 | | | | 250,275 | | | | | |
| Louisville/Jefferson County Metropolitan Government, | | | | | | | | | | | | |
| 1.500%, 10/01/2033(Mandatory Tender Date 04/01/2019)(1) | | | 750,000 | | | | 748,800 | | | | | |
| | | | | | | | 4,431,512 | | | | 1.3 | % |
| Louisiana | | | | | | | | | | | | |
| Calcasieu Parish Fire Protection District No. 1: | | | | | | | | | | | | |
| 3.000%, 03/01/2020(Insured by BAM) | | | 110,000 | | | | 111,254 | | | | | |
| 3.500%, 03/01/2022(Insured by BAM) | | | 145,000 | | | | 150,294 | | | | | |
| 4.000%, 03/01/2024(Insured by BAM) | | | 155,000 | | | | 166,459 | | | | | |
| Calcasieu Parish School Board, | | | | | | | | | | | | |
| 5.000%, 02/01/2025(Callable 02/01/2022) | | | 115,000 | | | | 124,352 | | | | | |
| City of Shreveport LA, | | | | | | | | | | | | |
| 5.000%, 08/01/2023(Insured by BAM) | | | 150,000 | | | | 167,292 | | | | | |
| Jefferson Sales Tax District, | | | | | | | | | | | | |
| 4.500%, 12/01/2022 | | | 140,000 | | | | 143,373 | | | | | |
| Louisiana Local Government Environmental Facilities & Community Development Authority: | | | | | | | | | | | | |
| 5.500%, 10/01/2025(Pre-refunded to 10/01/2020) | | | 1,050,000 | | | | 1,114,522 | | | | | |
| 5.625%, 10/01/2030(Pre-refunded to 10/01/2020) | | | 80,000 | | | | 85,087 | | | | | |
| 5.750%, 09/01/2035(Pre-refunded to 09/01/2023) | | | 75,000 | | | | 87,201 | | | | | |
| 6.000%, 10/01/2044(Pre-refunded to 10/01/2020) | | | 145,000 | | | | 155,149 | | | | | |
| Louisiana Public Facilities Authority: | | | | | | | | | | | | |
| 0.000%, 02/01/2020(ETM) | | | 200,000 | | | | 195,588 | | | | | |
| 5.000%, 10/01/2023 | | | 255,000 | | | | 280,227 | | | | | |
| 5.500%, 05/15/2027(Pre-refunded to 05/15/2026) | | | 2,000,000 | | | | 2,376,940 | | | | | |
| New Orleans Aviation Board, | | | | | | | | | | | | |
| 5.000%, 10/01/2025(Insured by AGM) | | | 200,000 | | | | 230,044 | | | | | |
| Regional Transit Authority, | | | | | | | | | | | | |
| 0.000%, 12/01/2021(Insured by NATL) | | | 85,000 | | | | 74,561 | | | | | |
| State of Louisiana, | | | | | | | | | | | | |
| 5.000%, 05/01/2024(Pre-refunded to 05/01/2022) | | | 345,000 | | | | 379,086 | | | | | |
| West Baton Rouge Parish School District No. 3, | | | | | | | | | | | | |
| 5.000%, 03/01/2026(Insured by BAM) | | | 495,000 | | | | 577,076 | | | | | |
| | | | | | | | 6,418,505 | | | | 1.8 | % |
| Maine | | | | | | | | | | | | |
| Maine State Housing Authority: | | | | | | | | | | | | |
| 3.500%, 11/15/2045(Callable 05/15/2025) | | | 35,000 | | | | 35,859 | | | | | |
| 4.000%, 11/15/2045(Callable 11/15/2025) | | | 475,000 | | | | 492,874 | | | | | |
| | | | | | | | 528,733 | | | | 0.2 | % |
| Maryland | | | | | | | | | | | | |
| Maryland Community Development Administration, | | | | | | | | | | | | |
| 3.750%, 09/01/2019 | | | 30,000 | | | | 30,342 | | | | | |
| Maryland Health & Higher Educational Facilities Authority, | | | | | | | | | | | | |
| 5.000%, 07/01/2027(ETM)(Insured by AMBAC) | | | 2,300,000 | | | | 2,604,313 | | | | | |
| Montgomery County Housing Opportunites Commission, | | | | | | | | | | | | |
| 4.000%, 07/01/2048(Callable 07/01/2026) | | | 465,000 | | | | 486,246 | | | | | |
| | | | | | | | 3,120,901 | | | | 0.9 | % |
| Massachusetts | | | | | | | | | | | | |
| Commonwealth of Massachusetts: | | | | | | | | | | | | |
| 2.162%, 11/01/2020 (3 Month LIBOR USD + 0.460%)(Callable 01/31/2019)(2) | | | 75,000 | | | | 75,025 | | | | | |
| 1.050%, 08/01/2043(Mandatory Tender Date 07/01/2020)(1) | | | 515,000 | | | | 507,162 | | | | | |
| Massachusetts Development Finance Agency, | | | | | | | | | | | | |
| 5.000%, 07/01/2025 | | | 240,000 | | | | 272,069 | | | | | |
| Massachusetts Housing Finance Agency: | | | | | | | | | | | | |
| 2.400%, 12/01/2023(Mandatory Tender Date 12/01/2021)(1) | | | 1,745,000 | | | | 1,748,403 | | | | | |
| 4.000%, 12/01/2044(Callable 06/01/2025) | | | 140,000 | | | | 145,248 | | | | | |
| 4.000%, 12/01/2048(Callable 06/01/2027)(Insured by GNMA) | | | 1,000,000 | | | | 1,053,850 | | | | | |
| 4.000%, 12/01/2048(Callable 06/01/2027)(Insured by GNMA) | | | 700,000 | | | | 734,300 | | | | | |
| Town of Ashburnham MA, | | | | | | | | | | | | |
| 4.250%, 07/01/2021(Callable 01/31/2019)(Insured by AGC) | | | 250,000 | | | | 250,413 | | | | | |
| | | | | | | | 4,786,470 | | | | 1.4 | % |
| Michigan | | | | | | | | | | | | |
| Battle Creek Tax Increment Finance Authority, | | | | | | | | | | | | |
| 4.300%, 12/01/2028(Callable 01/31/2019) | | | 500,000 | | | | 501,000 | | | | | |
| Carman-Ainsworth Community School District, | | | | | | | | | | | | |
| 5.000%, 05/01/2019(Insured by BAM) | | | 200,000 | | | | 202,042 | | | | | |
| City of Detroit MI: | | | | | | | | | | | | |
| 5.000%, 07/01/2020 | | | 265,000 | | | | 275,968 | | | | | |
| 7.000%, 07/01/2027(Pre-refunded to 07/01/2019)(Insured by AGM) | | | 50,000 | | | | 51,264 | | | | | |
| City of Ferndale MI, | | | | | | | | | | | | |
| 4.000%, 05/01/2021(Callable 01/09/2019)(Insured by AGM) | | | 565,000 | | | | 565,949 | | | | | |
| City of Kalamazoo MI, | | | | | | | | | | | | |
| 5.000%, 10/01/2023 | | | 50,000 | | | | 56,465 | | | | | |
| Davison Community Schools, | | | | | | | | | | | | |
| 3.000%, 05/01/2022 | | | 190,000 | | | | 194,271 | | | | | |
| Essexville-Hampton Public Schools, | | | | | | | | | | | | |
| 4.000%, 05/01/2022(Insured by Q-SBLF) | | | 325,000 | | | | 344,805 | | | | | |
| Fruitport Community Schools: | | | | | | | | | | | | |
| 4.000%, 05/01/2020(Insured by Q-SBLF) | | | 65,000 | | | | 66,771 | | | | | |
| 4.000%, 05/01/2021(Insured by Q-SBLF) | | | 100,000 | | | | 104,501 | | | | | |
| 4.000%, 05/01/2023(Insured by Q-SBLF) | | | 135,000 | | | | 145,266 | | | | | |
| Ingham County Brownfield Redevelopment Authority, | | | | | | | | | | | | |
| 4.125%, 08/01/2024(Callable 01/31/2019)(Insured by AGM) | | | 215,000 | | | | 215,389 | | | | | |
| Jenison Public Schools, | | | | | | | | | | | | |
| 3.500%, 05/01/2021(Callable 05/01/2020) | | | 250,000 | | | | 254,380 | | | | | |
| Karegnondi Water Authority: | | | | | | | | | | | | |
| 4.000%, 11/01/2019 | | | 200,000 | | | | 203,412 | | | | | |
| 5.000%, 11/01/2020 | | | 100,000 | | | | 105,134 | | | | | |
| Michigan Finance Authority: | | | | | | | | | | | | |
| 3.400%, 10/01/2020 | | | 100,000 | | | | 101,097 | | | | | |
| 5.000%, 11/01/2022 | | | 100,000 | | | | 110,338 | | | | | |
| 5.000%, 07/01/2025(Callable 07/01/2024)(Insured by AGM) | | | 1,475,000 | | | | 1,672,930 | | | | | |
| 4.000%, 05/01/2026 | | | 60,000 | | | | 64,987 | | | | | |
| 5.500%, 12/01/2026(Callable 06/01/2025) | | | 335,000 | | | | 395,055 | | | | | |
| 2.454%, 10/15/2038 (1 Month LIBOR USD + 0.750%)(Callable 04/15/2020)(Mandatory Tender Date 10/15/2020)(2) | | | 350,000 | | | | 351,194 | | | | | |
| 2.219%, 12/01/2039 (1 Month LIBOR USD + 0.540%)(Callable 06/01/2020)(Mandatory Tender Date 12/01/2020)(2) | | | 100,000 | | | | 100,030 | | | | | |
| 1.100%, 11/15/2046(Mandatory Tender Date 08/15/2019)(1) | | | 350,000 | | | | 347,802 | | | | | |
| Michigan State Hospital Finance Authority: | | | | | | | | | | | | |
| 1.625%, 11/01/2027(Mandatory Tender Date 11/01/2019)(1) | | | 135,000 | | | | 134,387 | | | | | |
| 1.900%, 11/15/2047(Mandatory Tender Date 04/01/2021)(1) | | | 290,000 | | | | 287,660 | | | | | |
| Michigan State Housing Development Authority, | | | | | | | | | | | | |
| 4.000%, 06/01/2046(Callable 12/01/2024) | | | 1,060,000 | | | | 1,100,354 | | | | | |
| Pinckney Community Schools, | | | | | | | | | | | | |
| 5.000%, 05/01/2021(Insured by Q-SBLF) | | | 100,000 | | | | 106,835 | | | | | |
| Royal Oak Hospital Finance Authority, | | | | | | | | | | | | |
| 5.000%, 09/01/2019 | | | 50,000 | | | | 51,016 | | | | | |
| South Lake Schools: | | | | | | | | | | | | |
| 4.000%, 11/01/2021(Insured by Q-SBLF) | | | 425,000 | | | | 444,898 | | | | | |
| 4.000%, 05/01/2022(Insured by Q-SBLF) | | | 290,000 | | | | 304,938 | | | | | |
| Western Michigan University, | | | | | | | | | | | | |
| 5.000%, 11/15/2025(Callable 11/15/2021) | | | 75,000 | | | | 81,193 | | | | | |
| White Cloud Public Schools, | | | | | | | | | | | | |
| 4.000%, 05/01/2019(Insured by Q-SBLF) | | | 30,000 | | | | 30,199 | | | | | |
| Ypsilanti School District, | | | | | | | | | | | | |
| 4.000%, 05/01/2020(Insured by Q-SBLF) | | | 50,000 | | | | 51,310 | | | | | |
| | | | | | | | 9,022,840 | | | | 2.6 | % |
| Minnesota | | | | | | | | | | | | |
| City of Maple Grove MN, | | | | | | | | | | | | |
| 4.000%, 05/01/2022 | | | 605,000 | | | | 637,755 | | | | | |
| City of Marshall MN, | | | | | | | | | | | | |
| 2.000%, 07/01/2019 | | | 160,000 | | | | 160,024 | | | | | |
| City of Minneapolis MN/St. Paul Housing & Redevelopment Authority: | | | | | | | | | | | | |
| 3.587%, 08/01/2027(Insured by NATL)(1)(5) | | | 25,000 | | | | 25,000 | | | | | |
| 3.542%, 08/01/2028(Insured by NATL)(1)(5) | | | 175,000 | | | | 175,000 | | | | | |
| 1.750%, 11/15/2035(Optional Put Date 01/02/2019)(1) | | | 650,000 | | | | 650,000 | | | | | |
| City of Minneapolis MN/St. Paul Metropolitan Airports Commission: | | | | | | | | | | | | |
| 5.000%, 01/01/2022 | | | 1,000,000 | | | | 1,088,300 | | | | | |
| 5.000%, 01/01/2025 | | | 125,000 | | | | 144,936 | | | | | |
| City of Plato MN, | | | | | | | | | | | | |
| 4.000%, 04/01/2022 | | | 265,000 | | | | 277,307 | | | | | |
| City of Rochester MN, | | | | | | | | | | | | |
| 1.700%, 12/01/2020(Mandatory Tender Date 12/01/2019)(1) | | | 150,000 | | | | 149,313 | | | | | |
| City of Shoreview MN, | | | | | | | | | | | | |
| 4.150%, 02/01/2021(Callable 02/01/2019) | | | 190,000 | | | | 190,363 | | | | | |
| County of Kanabec MN, | | | | | | | | | | | | |
| 2.750%, 12/01/2019(Callable 01/31/2019) | | | 400,000 | | | | 399,960 | | | | | |
| Housing & Redevelopment Authority of The City of St. Paul, | | | | | | | | | | | | |
| 2.200%, 09/01/2021(Callable 03/01/2020)(Mandatory Tender Date 09/01/2020)(1) | | | 750,000 | | | | 750,075 | | | | | |
| Jordan Independent School District No. 717, | | | | | | | | | | | | |
| 5.000%, 02/01/2035(Callable 02/01/2023)(Insured by SD CRED PROG) | | | 1,000,000 | | | | 1,107,380 | | | | | |
| Minnesota Higher Education Facilities Authority, | | | | | | | | | | | | |
| 5.000%, 04/01/2023 | | | 100,000 | | | | 111,714 | | | | | |
| Minnesota Housing Finance Agency: | | | | | | | | | | | | |
| 2.900%, 01/01/2025(Insured by GNMA) | | | 60,000 | | | | 61,127 | | | | | |
| 3.900%, 07/01/2030(Callable 01/01/2022)(Insured by GNMA) | | | 210,000 | | | | 213,385 | | | | | |
| 1.680%, 04/01/2035 | | | 1,000,000 | | | | 1,000,000 | | | | | |
| 4.000%, 01/01/2038(Callable 01/01/2024) | | | 1,045,000 | | | | 1,085,055 | | | | | |
| 4.000%, 01/01/2047(Callable 01/01/2026)(Insured by GNMA) | | | 395,000 | | | | 410,599 | | | | | |
| 4.000%, 07/01/2047(Callable 01/01/2027)(Insured by GNMA) | | | 675,000 | | | | 704,794 | | | | | |
| Northern Municipal Power Agency, | | | | | | | | | | | | |
| 5.000%, 01/01/2027(Callable 01/01/2023) | | | 220,000 | | | | 240,433 | | | | | |
| Plymouth Intermediate District No. 287: | | | | | | | | | | | | |
| 4.000%, 05/01/2020 | | | 25,000 | | | | 25,665 | | | | | |
| 5.000%, 05/01/2022 | | | 105,000 | | | | 114,205 | | | | | |
| Shakopee Independent School District No. 720, | | | | | | | | | | | | |
| 5.000%, 02/01/2023(Insured by SD CRED PROG) | | | 675,000 | | | | 746,651 | | | | | |
| University of Minnesota, | | | | | | | | | | | | |
| 5.500%, 07/01/2021(ETM) | | | 310,000 | | | | 326,182 | | | | | |
| | | | | | | | 10,795,223 | | | | 3.1 | % |
| Mississippi | | | | | | | | | | | | |
| Marshall County School District, | | | | | | | | | | | | |
| 3.500%, 02/01/2019 | | | 600,000 | | | | 600,546 | | | | | |
| Mississippi Development Bank: | | | | | | | | | | | | |
| 3.000%, 07/01/2021(Insured by ST) | | | 730,000 | | | | 723,335 | | | | | |
| 5.000%, 03/01/2024(Insured by AGM) | | | 50,000 | | | | 56,016 | | | | | |
| 5.000%, 11/01/2025(Insured by BAM) | | | 215,000 | | | | 246,504 | | | | | |
| Mississippi Home Corp.: | | | | | | | | | | | | |
| 3.050%, 06/01/2019(Insured by GNMA) | | | 130,000 | | | | 130,356 | | | | | |
| 2.400%, 02/01/2022(Mandatory Tender Date 08/01/2021)(1) | | | 2,500,000 | | | | 2,498,725 | | | | | |
| Southwest Mississippi Regional Medical Center, | | | | | | | | | | | | |
| 2.100%, 06/01/2019(Callable 01/31/2019) | | | 150,000 | | | | 149,746 | | | | | |
| State of Mississippi, | | | | | | | | | | | | |
| 1.904%, 09/01/2027 (1 Month LIBOR USD + 0.330%)(Callable 03/01/2020)(Mandatory Tender Date 09/01/2020)(2) | | | 320,000 | | | | 319,923 | | | | | |
| | | | | | | | 4,725,151 | | | | 1.3 | % |
| Missouri | | | | | | | | | | | | |
| City of St. Louis MO, | | | | | | | | | | | | |
| 5.000%, 07/01/2023(Insured by AGM) | | | 415,000 | | | | 466,360 | | | | | |
| Industrial Development Authority of the City of St. Louis, | | | | | | | | | | | | |
| 3.875%, 11/15/2029(Callable 11/15/2026) | | | 470,000 | | | | 478,446 | | | | | |
| Kirkwood Industrial Development Authority, | | | | | | | | | | | | |
| 8.000%, 05/15/2021(Pre-refunded to 05/15/2020) | | | 425,000 | | | | 450,407 | | | | | |
| Missouri Association of Rural Education, | | | | | | | | | | | | |
| 3.000%, 04/15/2022(Callable 01/31/2019) | | | 300,000 | | | | 300,078 | | | | | |
| Missouri Development Finance Board, | | | | | | | | | | | | |
| 1.750%, 12/01/2033(Optional Put Date 01/02/2019)(1) | | | 570,000 | | | | 570,000 | | | | | |
| Missouri Housing Development Commission, | | | | | | | | | | | | |
| 4.000%, 05/01/2042(Callable 11/01/2026)(Insured by GNMA) | | | 665,000 | | | | 697,159 | | | | | |
| Move Rolla Transportation Development District, | | | | | | | | | | | | |
| 3.750%, 06/01/2029(Callable 06/01/2026) | | | 410,000 | | | | 417,704 | | | | | |
| State of Missouri Environmental Improvement & Energy Resources Authority, | | | | | | | | | | | | |
| 2.650%, 12/01/2022(Insured by NATL)(1)(5) | | | 275,000 | | | | 275,000 | | | | | |
| State of Missouri Health & Educational Facilities Authority: | | | | | | | | | | | | |
| 4.000%, 02/01/2019 | | | 260,000 | | | | 260,289 | | | | | |
| 3.172%, 06/01/2020(Insured by AMBAC)(1)(5) | | | 50,000 | | | | 50,000 | | | | | |
| 5.000%, 02/01/2022 | | | 215,000 | | | | 226,704 | | | | | |
| 5.000%, 05/15/2022 | | | 80,000 | | | | 87,147 | | | | | |
| 5.000%, 06/01/2036(Callable 12/01/2022)(Mandatory Tender Date 06/01/2023)(1) | | | 75,000 | | | | 81,856 | | | | | |
| | | | | | | | 4,361,150 | | | | 1.3 | % |
| Montana | | | | | | | | | | | | |
| Montana Board of Housing: | | | | | | | | | | | | |
| 4.000%, 12/01/2043(Callable 12/01/2027) | | | 1,110,000 | | | | 1,165,400 | | | | | |
| 4.000%, 06/01/2049(Callable 12/01/2027)(Insured by FHA) | | | 1,270,000 | | | | 1,335,011 | | | | | |
| Montana Facility Finance Authority, | | | | | | | | | | | | |
| 5.000%, 07/01/2025 | | | 110,000 | | | | 128,256 | | | | | |
| | | | | | | | 2,628,667 | | | | 0.7 | % |
| Nebraska | | | | | | | | | | | | |
| Central Plains Energy Project: | | | | | | | | | | | | |
| 5.000%, 09/01/2042(Callable 09/01/2022) | | | 1,035,000 | | | | 1,105,856 | | | | | |
| 5.000%, 03/01/2050(Callable 10/01/2023)(Mandatory Tender Date 01/01/2024)(1) | | | 1,000,000 | | | | 1,090,160 | | | | | |
| Douglas County Hospital Authority No. 2, | | | | | | | | | | | | |
| 5.000%, 05/15/2019 | | | 1,030,000 | | | | 1,039,445 | | | | | |
| Gering School District, | | | | | | | | | | | | |
| 5.000%, 12/01/2026(Callable 05/30/2022) | | | 115,000 | | | | 125,436 | | | | | |
| | | | | | | | 3,360,897 | | | | 1.0 | % |
| Nevada | | | | | | | | | | | | |
| Clark County School District: | | | | | | | | | | | | |
| 5.000%, 06/15/2019 | | | 125,000 | | | | 126,800 | | | | | |
| 5.000%, 06/15/2023 | | | 560,000 | | | | 623,101 | | | | | |
| Las Vegas Redevelopment Agency: | | | | | | | | | | | | |
| 3.000%, 06/15/2020 | | | 125,000 | | | | 126,687 | | | | | |
| 5.000%, 06/15/2023 | | | 250,000 | | | | 277,275 | | | | | |
| Nevada Housing Division, | | | | | | | | | | | | |
| 4.400%, 04/01/2029(Callable 10/01/2021)(Insured by GNMA) | | | 80,000 | | | | 81,750 | | | | | |
| | | | | | | | 1,235,613 | | | | 0.4 | % |
| New Jersey | | | | | | | | | | | | |
| Cape May County Industrial Pollution Control Financing Authority, | | | | | | | | | | | | |
| 6.800%, 03/01/2021(Insured by NATL) | | | 85,000 | | | | 92,115 | | | | | |
| City of Atlantic City NJ, | | | | | | | | | | | | |
| 5.000%, 03/01/2022(Insured by BAM) | | | 100,000 | | | | 107,708 | | | | | |
| City of Bayonne NJ, | | | | | | | | | | | | |
| 5.000%, 07/15/2022(Insured by AGM) | | | 475,000 | | | | 520,310 | | | | | |
| City of Trenton NJ: | | | | | | | | | | | | |
| 4.000%, 07/15/2022(Insured by AGM) | | | 500,000 | | | | 530,780 | | | | | |
| 4.000%, 07/15/2023(Insured by AGM) | | | 200,000 | | | | 215,182 | | | | | |
| New Jersey Economic Development Authority: | | | | | | | | | | | | |
| 5.250%, 09/01/2019 | | | 250,000 | | | | 254,902 | | | | | |
| 0.000%, 01/01/2020(Insured by AMBAC) | | | 70,000 | | | | 68,386 | | | | | |
| 5.000%, 03/01/2020 | | | 135,000 | | | | 139,101 | | | | | |
| 0.000%, 01/01/2021(Insured by AMBAC) | | | 130,000 | | | | 123,642 | | | | | |
| 3.250%, 01/01/2021 | | | 230,000 | | | | 231,994 | | | | | |
| 5.000%, 07/15/2021 | | | 100,000 | | | | 104,818 | | | | | |
| 4.000%, 01/01/2022 | | | 660,000 | | | | 679,721 | | | | | |
| 5.000%, 07/15/2022 | | | 240,000 | | | | 254,818 | | | | | |
| 4.000%, 01/01/2023 | | | 50,000 | | | | 51,735 | | | | | |
| 0.000%, 07/01/2024(ETM)(Insured by NATL) | | | 115,000 | | | | 100,326 | | | | | |
| 3.125%, 07/01/2029(Callable 07/01/2027) | | | 315,000 | | | | 315,022 | | | | | |
| New Jersey Educational Facilities Authority, | | | | | | | | | | | | |
| 5.000%, 07/01/2022 | | | 150,000 | | | | 164,477 | | | | | |
| New Jersey Health Care Facilities Financing Authority: | | | | | | | | | | | | |
| 4.000%, 07/01/2019(ETM) | | | 105,000 | | | | 106,111 | | | | | |
| 4.250%, 11/15/2021(Callable 11/15/2020) | | | 70,000 | | | | 72,923 | | | | | |
| 5.250%, 07/01/2024(Pre-refunded to 07/01/2019) | | | 75,000 | | | | 76,272 | | | | | |
| 5.000%, 07/01/2025(Insured by AGM) | | | 50,000 | | | | 56,617 | | | | | |
| New Jersey Housing & Mortgage Finance Agency: | | | | | | | | | | | | |
| 1.350%, 02/01/2020(Mandatory Tender Date 02/01/2019)(1) | | | 100,000 | | | | 99,953 | | | | | |
| 2.020%, 08/01/2021(Mandatory Tender Date 08/01/2020)(1) | | | 350,000 | | | | 350,213 | | | | | |
| 4.500%, 10/01/2048(Callable 10/01/2027) | | | 985,000 | | | | 1,057,565 | | | | | |
| New Jersey Transportation Trust Fund Authority: | | | | | | | | | | | | |
| 5.000%, 06/15/2019 | | | 620,000 | | | | 627,942 | | | | | |
| 5.250%, 12/15/2019 | | | 35,000 | | | | 35,954 | | | | | |
| 5.000%, 12/15/2023 | | | 250,000 | | | | 274,163 | | | | | |
| 5.000%, 06/15/2024 | | | 750,000 | | | | 831,652 | | | | | |
| North Hudson Sewerage Authority, | | | | | | | | | | | | |
| 0.000%, 08/01/2021(ETM)(Insured by NATL) | | | 60,000 | | | | 56,884 | | | | | |
| Town of West New York NJ, | | | | | | | | | | | | |
| 4.000%, 04/15/2019(Insured by MAC) | | | 200,000 | | | | 201,272 | | | | | |
| Washington Township Municipal Utilities Authority, | | | | | | | | | | | | |
| 0.000%, 12/15/2023(Insured by NATL) | | | 25,000 | | | | 21,775 | | | | | |
| | | | | | | | 7,824,333 | | | | 2.3 | % |
| New Mexico | | | | | | | | | | | | |
| Las Cruces School District No. 2, | | | | | | | | | | | | |
| 5.000%, 08/01/2026(Callable 08/01/2020)(Insured by ST) | | | 150,000 | | | | 157,168 | | | | | |
| New Mexico Educational Assistance Foundation, | | | | | | | | | | | | |
| 4.000%, 09/01/2020 | | | 105,000 | | | | 108,604 | | | | | |
| New Mexico Hospital Equipment Loan Council, | | | | | | | | | | | | |
| 4.750%, 07/01/2022 | | | 325,000 | | | | 336,563 | | | | | |
| New Mexico Mortgage Finance Authority: | | | | | | | | | | | | |
| 5.300%, 09/01/2040(Callable 09/01/2019)(Insured by GNMA) | | | 45,000 | | | | 46,218 | | | | | |
| 3.500%, 03/01/2045(Callable 03/01/2026) | | | 35,000 | | | | 36,058 | | | | | |
| 3.750%, 03/01/2048(Callable 03/01/2027)(Insured by GNMA) | | | 315,000 | | | | 328,419 | | | | | |
| 4.250%, 07/01/2049(Callable 01/01/2028) | | | 75,000 | | | | 80,234 | | | | | |
| New Mexico Municipal Energy Acquisition Authority, | | | | | | | | | | | | |
| 2.324%, 11/01/2039 (1 Month LIBOR USD + 0.750%)(Callable 02/01/2019)(Mandatory Tender Date 08/01/2019)(2) | | | 1,360,000 | | | | 1,360,231 | | | | | |
| | | | | | | | 2,453,495 | | | | 0.7 | % |
| New York | | | | | | | | | | | | |
| City of Long Beach NY, | | | | | | | | | | | | |
| 4.000%, 08/15/2025(Callable 08/15/2022)(Insured by BAM) | | | 75,000 | | | | 79,158 | | | | | |
| City of New York NY, | | | | | | | | | | | | |
| 5.000%, 08/01/2022 | | | 160,000 | | | | 176,782 | | | | | |
| County of Rockland NY, | | | | | | | | | | | | |
| 5.000%, 03/01/2023(Insured by AGM) | | | 415,000 | | | | 462,879 | | | | | |
| County of Suffolk NY, | | | | | | | | | | | | |
| 5.000%, 09/26/2019 | | | 500,000 | | | | 510,150 | | | | | |
| Metropolitan Transportation Authority: | | | | | | | | | | | | |
| 2.301%, 11/01/2032 (1 Month LIBOR USD + 0.680%)(Mandatory Tender Date 04/06/2021)(Insured by AGM)(2) | | | 100,000 | | | | 100,453 | | | | | |
2.160%, 11/01/2034 (SIFMA Municipal Swap Index + 0.450%) (Callable 05/01/2019)(Mandatory Tender Date 11/01/2019)(2) | | | 50,000 | | | | 49,946 | | | | | |
| 4.000%, 11/15/2034(Callable 08/15/2019)(Mandatory Tender Date 11/15/2019)(1) | | | 540,000 | | | | 546,642 | | | | | |
| Monroe County Industrial Development Corp.: | | | | | | | | | | | | |
| 5.000%, 10/01/2019 | | | 145,000 | | | | 148,074 | | | | | |
| 5.000%, 10/01/2020 | | | 100,000 | | | | 104,693 | | | | | |
| MTA Hudson Rail Yards Trust Obligations, | | | | | | | | | | | | |
| 5.000%, 11/15/2046(Callable 11/15/2019) | | | 1,000,000 | | | | 1,019,110 | | | | | |
| New York City Transitional Finance Authority: | | | | | | | | | | | | |
| 1.790%, 11/01/2022(Optional Put Date 01/02/2019)(1) | | | 600,000 | | | | 600,000 | | | | | |
| 1.770%, 08/01/2031(Optional Put Date 01/02/2019)(1) | | | 950,000 | | | | 950,000 | | | | | |
| New York State Dormitory Authority, | | | | | | | | | | | | |
| 5.000%, 12/15/2021 | | | 45,000 | | | | 49,037 | | | | | |
| State of New York Mortgage Agency: | | | | | | | | | | | | |
| 3.500%, 10/01/2043(Callable 04/01/2023) | | | 305,000 | | | | 311,875 | | | | | |
| 4.000%, 10/01/2046(Callable 04/01/2025) | | | 460,000 | | | | 477,954 | | | | | |
| Town of Oyster Bay NY, | | | | | | | | | | | | |
| 3.000%, 03/01/2020(Insured by AGM) | | | 200,000 | | | | 201,728 | | | | | |
| Triborough Bridge & Tunnel Authority: | | | | | | | | | | | | |
| 2.074%, 11/15/2027 (1 Month LIBOR USD + 0.500%)(Callable 05/15/2021)(Mandatory Tender Date 11/15/2021)(2) | | | 525,000 | | | | 523,042 | | | | | |
| 1.924%, 01/01/2033 (1 Month LIBOR USD + 0.350%)(Callable 06/03/2019)(Mandatory Tender Date 12/03/2019)(2) | | | 30,000 | | | | 29,986 | | | | | |
| Utility Debt Securitization Authority, | | | | | | | | | | | | |
| 5.000%, 12/15/2025(Callable 12/15/2023) | | | 210,000 | | | | 239,335 | | | | | |
| Yonkers Industrial Development Agency, | | | | | | | | | | | | |
| 5.000%, 06/01/2019(ETM) | | | 275,000 | | | | 278,674 | | | | | |
| | | | | | | | 6,859,518 | | | | 2.0 | % |
| North Carolina | | | | | | | | | | | | |
| Durham Housing Authority, | | | | | | | | | | | | |
| 1.800%, 01/01/2021(Mandatory Tender Date 01/01/2020)(1) | | | 110,000 | | | | 109,710 | | | | | |
| North Carolina Capital Facilities Finance Agency, | | | | | | | | | | | | |
| 5.000%, 06/01/2022(Insured by AGC) | | | 100,000 | | | | 108,945 | | | | | |
| North Carolina Eastern Municipal Power Agency: | | | | | | | | | | | | |
| 5.000%, 01/01/2021(ETM) | | | 675,000 | | | | 715,763 | | | | | |
| 5.000%, 01/01/2021(ETM) | | | 760,000 | | | | 807,432 | | | | | |
| 6.000%, 01/01/2022(ETM) | | | 105,000 | | | | 117,506 | | | | | |
| North Carolina Housing Finance Agency, | | | | | | | | | | | | |
| 4.000%, 07/01/2048(Callable 07/01/2027)(Insured by GNMA) | | | 425,000 | | | | 448,184 | | | | | |
| North Carolina Medical Care Commission, | | | | | | | | | | | | |
| 5.750%, 01/01/2035(Pre-refunded to 01/01/2021) | | | 130,000 | | | | 139,750 | | | | | |
| North Carolina Municipal Power Agency, | | | | | | | | | | | | |
| 5.000%, 01/01/2020(ETM) | | | 1,000,000 | | | | 1,014,690 | | | | | |
| State of North Carolina: | | | | | | | | | | | | |
| 5.000%, 03/01/2020 | | | 300,000 | | | | 310,833 | | | | | |
| 5.000%, 05/01/2024(Callable 05/01/2023) | | | 1,250,000 | | | | 1,403,587 | | | | | |
| | | | | | | | 5,176,400 | | | | 1.5 | % |
| North Dakota | | | | | | | | | |
| City of Mandan ND, | | | | | | | | | |
| 2.750%, 09/01/2041(Callable 01/31/2019) | | | 505,000 | | | | 496,163 | | | | |
| City of West Fargo ND, | | | | | | | | | | | |
| 5.000%, 05/01/2022 | | | 200,000 | | | | 218,206 | | | | |
| City of Williston ND: | | | | | | | | | | | |
| 4.250%, 07/15/2025(Callable 07/15/2022) | | | 775,000 | | | | 802,761 | | | | |
| 4.500%, 11/01/2026(Callable 11/01/2023) | | | 2,150,000 | | | | 2,291,878 | | | | |
| County of Burleigh ND: | | | | | | | | | | | |
| 4.000%, 11/01/2021 | | | 1,000,000 | | | | 1,033,600 | | | | |
| 4.000%, 11/01/2029(Callable 11/01/2022)(Insured by AGM) | | | 400,000 | | | | 418,928 | | | | |
| 4.500%, 07/01/2032(Pre-refunded to 07/01/2022) | | | 345,000 | | | | 372,879 | | | | |
| County of Ward ND, | | | | | | | | | | | |
| 4.000%, 04/01/2024(Callable 04/01/2023)(Insured by AGM) | | | 500,000 | | | | 528,975 | | | | |
| Jamestown Park District, | | | | | | | | | | | |
| 2.900%, 07/01/2035(Callable 01/16/2019) | | | 930,000 | | | | 916,422 | | | | |
| North Dakota Housing Finance Agency, | | | | | | | | | | | |
| 4.000%, 07/01/2048(Callable 01/01/2027) | | | 260,000 | | | | 273,328 | | | | |
| | | | | | | | 7,353,140 | | | | 2.1 | % |
| Ohio | | | | | | | | | | | | |
| Adams County/Ohio Valley Local School District, | | | | | | | | | | | | |
| 4.000%, 12/01/2020 | | | 750,000 | | | | 771,705 | | | | | |
| American Municipal Power, Inc., | | | | | | | | | | | | |
| 2.250%, 02/15/2048(Callable 02/15/2021)(Mandatory Tender Date 08/15/2021)(1) | | | 250,000 | | | | 249,935 | | | | | |
| City of Bowling Green OH: | | | | | | | | | | | | |
| 4.500%, 06/01/2019(ETM) | | | 35,000 | | | | 35,387 | | | | | |
| 5.000%, 06/01/2020(ETM) | | | 100,000 | | | | 104,380 | | | | | |
| City of Hamilton OH, | | | | | | | | | | | | |
| 4.000%, 10/15/2023(Pre-refunded to 10/15/2019)(Insured by AGC) | | | 25,000 | | | | 25,427 | | | | | |
| City of Lorain OH, | | | | | | | | | | | | |
| 3.500%, 07/17/2019 | | | 1,000,000 | | | | 1,007,330 | | | | | |
| County of Franklin OH, | | | | | | | | | | | | |
2.140%, 05/15/2050 (SIFMA Municipal Swap Index + 0.430%) (Callable 05/15/2021)(Mandatory Tender Date 11/15/2021)(2) | | | 500,000 | | | | 500,205 | | | | | |
| County of Holmes OH, | | | | | | | | | | | | |
| 3.000%, 12/01/2022(Callable 01/31/2019)(Insured by AGM) | | | 250,000 | | | | 251,215 | | | | | |
| County of Licking OH, | | | | | | | | | �� | | | |
| 3.000%, 05/09/2019 | | | 600,000 | | | | 601,872 | | | | | |
| County of Lorain OH, | | | | | | | | | | | | |
| 4.000%, 12/01/2020 | | | 140,000 | | | | 145,732 | | | | | |
| County of Richland OH, | | | | | | | | | | | | |
| 3.250%, 02/01/2019 | | | 150,000 | | | | 150,139 | | | | | |
| County of Trumbull OH, | | | | | | | | | | | | |
| 3.125%, 08/29/2019 | | | 575,000 | | | | 578,709 | | | | | |
| Greater Cleveland Regional Transit Authority, | | | | | | | | | | | | |
| 5.000%, 12/01/2023 | | | 145,000 | | | | 164,885 | | | | | |
| Groveport-Madison Local School District, | | | | | | | | | | | | |
| 4.000%, 12/01/2024(Callable 12/01/2022)(Insured by BAM) | | | 50,000 | | | | 52,911 | | | | | |
| Lancaster Port Authority, | | | | | | | | | | | | |
| 2.194%, 08/01/2019 (1 Month LIBOR USD + 0.620%)(Callable 02/01/2019)(2) | | | 70,000 | | | | 69,991 | | | | | |
| Miami University, | | | | | | | | | | | | |
| 4.000%, 09/01/2027(Callable 09/01/2022) | | | 160,000 | | | | 168,285 | | | | | |
| Ohio Higher Educational Facility Commission: | | | | | | | | | | | | |
| 5.000%, 12/01/2020 | | | 35,000 | | | | 37,006 | | | | | |
| 1.600%, 01/01/2039 | | | 1,250,000 | | | | 1,250,000 | | | | | |
| Ohio Housing Finance Agency, | | | | | | | | | | | | |
| 4.000%, 03/01/2047(Callable 09/01/2025)(Insured by GNMA) | | | 175,000 | | | | 182,289 | | | | | |
| Ohio Turnpike & Infrastructure Commission, | | | | | | | | | | | | |
| 5.500%, 02/15/2024 | | | 1,185,000 | | | | 1,342,878 | | | | | |
| Oregon City School District, | | | | | | | | | | | | |
| 0.000%, 12/01/2021 | | | 245,000 | | | | 229,683 | | | | | |
| Port of Greater Cincinnati Development Authority, | | | | | | | | | | | | |
| 3.125%, 11/15/2023 | | | 360,000 | | | | 362,653 | | | | | |
| Shawnee State University, | | | | | | | | | | | | |
| 2.000%, 06/01/2019(Insured by BAM) | | | 250,000 | | | | 249,985 | | | | | |
| State of Ohio, | | | | | | | | | | | | |
| 5.000%, 04/01/2029(Callable 04/01/2023) | | | 25,000 | | | | 27,853 | | | | | |
| Summit County Development Finance Authority, | | | | | | | | | | | | |
| 2.000%, 11/15/2019 | | | 30,000 | | | | 29,964 | | | | | |
| Village of Bratenahl OH, | | | | | | | | | | | | |
| 3.000%, 08/14/2019 | | | 1,000,000 | | | | 1,004,490 | | | | | |
| Wauseon Exempted Village School District, | | | | | | | | | | | | |
| 0.000%, 12/01/2021(Insured by SD CRED PROG) | | | 400,000 | | | | 375,316 | | | | | |
| | | | | | | | 9,970,225 | | | | 2.9 | % |
| Oklahoma | | | | | | | | | | | | |
| Catoosa Industrial Authority, | | | | | | | | | | | | |
| 4.000%, 10/01/2028(Callable 10/01/2026) | | | 325,000 | | | | 322,910 | | | | | |
| Cleveland County Justice Authority, | | | | | | | | | | | | |
| 4.000%, 03/01/2020(Callable 03/01/2019) | | | 125,000 | | | | 125,406 | | | | | |
| Logan County Independent School District, | | | | | | | | | | | | |
| 4.000%, 08/01/2020 | | | 25,000 | | | | 25,769 | | | | | |
| Norman Regional Hospital Authority, | | | | | | | | | | | | |
| 5.000%, 09/01/2020 | | | 50,000 | | | | 52,237 | | | | | |
| Oklahoma County Finance Authority, | | | | | | | | | | | | |
| 5.000%, 09/01/2024 | | | 350,000 | | | | 397,691 | | | | | |
| Oklahoma Housing Finance Agency, | | | | | | | | | | | | |
| 2.050%, 04/01/2021(Mandatory Tender Date 04/01/2020)(1) | | | 725,000 | | | | 725,007 | | | | | |
| Oklahoma Municipal Power Authority, | | | | | | | | | | | | |
| 2.100%, 01/01/2023 (SIFMA Municipal Swap Index + 0.390%)(2) | | | 325,000 | | | | 325,016 | | | | | |
| Oklahoma Water Resources Board, | | | | | | | | | | | | |
| 5.000%, 04/01/2023 | | | 750,000 | | | | 842,400 | | | | | |
| Texas County Development Authority, | | | | | | | | | | | | |
| 4.000%, 12/01/2023 | | | 675,000 | | | | 724,741 | | | | | |
| | | | | | | | 3,541,177 | | | | 1.0 | % |
| Oregon | | | | | | | | | | | | |
| Oregon State Facilities Authority: | | | | | | | | | | | | |
| 4.750%, 03/15/2024(Callable 03/15/2020) | | | 15,000 | | | | 15,459 | | | | | |
| 6.375%, 09/01/2040(Pre-refunded to 09/01/2020) | | | 1,000,000 | | | | 1,071,950 | | | | | |
| Port of Morrow OR, | | | | | | | | | | | | |
| 4.000%, 06/01/2026(Callable 06/01/2019) | | | 220,000 | | | | 220,942 | | | | | |
| State of Oregon: | | | | | | | | | | | | |
| 4.000%, 05/01/2023 | | | 500,000 | | | | 542,980 | | | | | |
| 4.000%, 12/01/2048(Callable 12/01/2026) | | | 990,000 | | | | 1,039,866 | | | | | |
| State of Oregon Housing & Community Services Department: | | | | | | | | | | | | |
| 2.200%, 12/01/2021(Mandatory Tender Date 12/01/2020)(1) | | | 2,450,000 | | | | 2,449,069 | | | | | |
| 3.500%, 07/01/2036(Callable 01/01/2025) | | | 150,000 | | | | 153,726 | | | | | |
| 4.500%, 01/01/2049(Callable 07/01/2027) | | | 1,480,000 | | | | 1,589,683 | | | | | |
| 4.500%, 07/01/2049(Callable 07/01/2027) | | | 450,000 | | | | 484,794 | | | | | |
| | | | | | | | 7,568,469 | | | | 2.2 | % |
| Pennsylvania | | | | | | | | | | | | |
| Allegheny County Hospital Development Authority, | | | | | | | | | | | | |
| 4.125%, 10/15/2026(Callable 10/15/2021) | | | 55,000 | | | | 57,326 | | | | | |
| Bethlehem Area School District: | | | | | | | | | | | | |
2.244%, 01/01/2030 (1 Month LIBOR USD + 0.490%) (Callable 05/01/2021)(Mandatory Tender Date 11/01/2021)(Insured by ST)(2) | | | 495,000 | | | | 493,797 | | | | | |
2.234%, 07/01/2031 (1 Month LIBOR USD + 0.480%) (Callable 11/02/2020)(Mandatory Tender Date 11/01/2021)(Insured by ST)(2) | | | 500,000 | | | | 498,655 | | | | | |
| Centennial School District Bucks County, | | | | | | | | | | | | |
| 5.000%, 12/15/2022(Insured by ST) | | | 50,000 | | | | 55,589 | | | | | |
| Central Bucks School District, | | | | | | | | | | | | |
| 4.000%, 05/15/2022(Pre-refunded to 05/15/2021)(Insured by ST) | | | 50,000 | | | | 52,335 | | | | | |
| Chester County Health & Education Facilities Authority: | | | | | | | | | | | | |
| 5.000%, 11/01/2019 | | | 225,000 | | | | 230,058 | | | | | |
| 5.000%, 05/15/2031(Pre-refunded to 05/15/2020) | | | 65,000 | | | | 67,713 | | | | | |
| 5.000%, 05/15/2040(Pre-refunded to 05/15/2020) | | | 70,000 | | | | 72,922 | | | | | |
| Coatesville School District, | | | | | | | | | | | | |
| 5.000%, 08/01/2023(Insured by AGM) | | | 150,000 | | | | 164,827 | | | | | |
| Commonwealth Financing Authority: | | | | | | | | | | | | |
| 5.000%, 06/01/2022 | | | 265,000 | | | | 288,248 | | | | | |
| 5.000%, 06/01/2023 | | | 225,000 | | | | 249,442 | | | | | |
| Commonwealth of Pennsylvania, | | | | | | | | | | | | |
| 3.750%, 10/01/2021(Callable 10/01/2019) | | | 175,000 | | | | 176,948 | | | | | |
| County of Allegheny PA, | | | | | | | | | | | | |
| 2.253%, 11/01/2026 (3 Month LIBOR USD + 0.550%)(Callable 01/31/2019)(Insured by AGM)(2) | | | 155,000 | | | | 153,951 | | | | | |
| Crawford Central School District, | | | | | | | | | | | | |
| 5.000%, 02/01/2019(Callable 01/31/2019)(Insured by ST) | | | 100,000 | | | | 100,784 | | | | | |
| Delaware County Authority: | | | | | | | | | | | | |
| 3.000%, 06/01/2019 | | | 170,000 | | | | 170,236 | | | | | |
| 4.000%, 06/01/2020 | | | 390,000 | | | | 396,314 | | | | | |
| East Allegheny School District, | | | | | | | | | | | | |
| 0.000%, 11/15/2021(Insured by AGM) | | | 480,000 | | | | 448,018 | | | | | |
| Erie City Water Authority, | | | | | | | | | | | | |
| 4.000%, 12/01/2025(Callable 12/01/2022)(Insured by AGM) | | | 380,000 | | | | 402,561 | | | | | |
| Lancaster Higher Education Authority, | | | | | | | | | | | | |
| 5.000%, 10/01/2022(Insured by BAM) | | | 35,000 | | | | 38,516 | | | | | |
| Lancaster Industrial Development Authority, | | | | | | | | | | | | |
| 5.000%, 05/01/2022 | | | 45,000 | | | | 47,858 | | | | | |
| Northampton County General Purpose Authority, | | | | | | | | | | | | |
| 2.684%, 08/15/2048 (1 Month LIBOR USD + 1.040%)(Callable 02/15/2023)(Mandatory Tender Date 08/15/2024)(2) | | | 75,000 | | | | 74,981 | | | | | |
| Pennsylvania Economic Development Financing Authority: | | | | | | | | | | | | |
| 5.000%, 03/01/2019 | | | 130,000 | | | | 130,624 | | | | | |
| 0.450%, 12/01/2030 | | | 2,000,000 | | | | 2,000,000 | | | | | |
| Pennsylvania Higher Educational Facilities Authority: | | | | | | | | | | | | |
| 5.000%, 08/15/2024(Pre-refunded to 08/15/2021) | | | 185,000 | | | | 199,617 | | | | | |
| 2.850%, 05/01/2034(Mandatory Tender Date 05/01/2021)(1) | | | 500,000 | | | | 502,460 | | | | | |
| Pennsylvania Housing Finance Agency: | | | | | | | | | | | | |
| 2.450%, 07/01/2022(Mandatory Tender Date 07/01/2021)(1) | | | 2,500,000 | | | | 2,503,600 | | | | | |
| 3.700%, 10/01/2042(Callable 10/01/2021) | | | 165,000 | | | | 161,164 | | | | | |
| 4.000%, 10/01/2046(Callable 04/01/2026) | | | 205,000 | | | | 213,880 | | | | | |
| Pennsylvania Turnpike Commission: | | | | | | | | | | | | |
| 2.590%, 12/01/2020 (SIFMA Municipal Swap Index + 0.880%)(Callable 06/01/2020)(2) | | | 345,000 | | | | 346,963 | | | | | |
| 2.690%, 12/01/2021 (SIFMA Municipal Swap Index + 0.980%)(Callable 06/01/2021)(2) | | | 855,000 | | | | 864,072 | | | | | |
| 5.000%, 12/01/2022 | | | 50,000 | | | | 55,040 | | | | | |
| 0.000%, 12/01/2023 | | | 50,000 | | | | 43,936 | | | | | |
| 5.450%, 12/01/2035(Pre-refunded to 12/01/2020)(Insured by AGM) | | | 40,000 | | | | 42,730 | | | | | |
| Pittsburgh Water & Sewer Authority, | | | | | | | | | | | | |
2.328%, 09/01/2040 (1 Month LIBOR USD + 0.640%) (Callable 06/01/2020)(Mandatory Tender Date 12/01/2020)(Insured by AGM)(2) | | | 50,000 | | | | 50,013 | | | | | |
| Sayre Health Care Facilities Authority, | | | | | | | | | | | | |
| 2.615%, 12/01/2024 (3 Month LIBOR USD + 0.780%)(Callable 01/31/2019)(2) | | | 60,000 | | | | 60,323 | | | | | |
| School District of Philadelphia: | | | | | | | | | | | | |
| 5.000%, 09/01/2019(Insured by ST) | | | 500,000 | | | | 509,290 | | | | | |
| 5.000%, 06/01/2024 | | | 270,000 | | | | 297,270 | | | | | |
| School District of Reading, | | | | | | | | | | | | |
| 5.000%, 03/01/2024(Insured by AGM) | | | 100,000 | | | | 112,237 | | | | | |
| Scranton School District: | | | | | | | | | | | | |
| 5.000%, 06/01/2019(Insured by ST) | | | 100,000 | | | | 101,025 | | | | | |
2.447%, 04/01/2031 (1 Month LIBOR USD + 0.850%) (Callable 10/01/2020)(Mandatory Tender Date 04/01/2021)(Insured by ST)(2) | | | 290,000 | | | | 290,368 | | | | | |
| Somerset County General Authority, | | | | | | | | | | | | |
| 2.000%, 10/01/2019(Insured by BAM) | | | 155,000 | | | | 155,124 | | | | | |
| Urban Redevelopment Authority of Pittsburgh, | | | | | | | | | | | | |
| 2.250%, 12/01/2020(Callable 12/01/2019)(Mandatory Tender Date 06/01/2020)(1) | | | 575,000 | | | | 575,357 | | | | | |
| Washington County Industrial Development Authority, | | | | | | | | | | | | |
| 4.000%, 11/01/2020(Pre-refunded to 05/01/2020) | | | 80,000 | | | | 82,308 | | | | | |
| West Mifflin Sanitary Sewer Municipal Authority, | | | | | | | | | | | | |
| 4.000%, 08/01/2020(Insured by BAM) | | | 200,000 | | | | 206,496 | | | | | |
| Wilkinsburg School District, | | | | | | | | | | | | |
| 3.000%, 05/15/2020(Insured by AGM) | | | 110,000 | | | | 111,653 | | | | | |
| | | | | | | | 13,856,629 | | | | 4.0 | % |
| Puerto Rico | | | | | | | | | | | | |
| Commonwealth of Puerto Rico, | | | | | | | | | | | | |
| 0.000%, 07/01/2019(Insured by NATL)(7) | | | 50,000 | | | | 49,030 | | | | | |
| Puerto Rico Highway & Transportation Authority, | | | | | | | | | | | | |
| 4.600%, 07/01/2022(ETM)(Insured by NATL) | | | 25,000 | | | | 27,175 | | | | | |
| Puerto Rico Public Finance Corp.: | | | | | | | | | | | | |
| 5.375%, 06/01/2019(Insured by AMBAC) | | | 340,000 | | | | 345,049 | | | | | |
| 5.125%, 06/01/2024(Insured by AMBAC) | | | 150,000 | | | | 163,566 | | | | | |
| 6.000%, 08/01/2026(ETM)(Insured by AGC) | | | 325,000 | | | | 404,342 | | | | | |
| | | | | | | | 989,162 | | | | 0.3 | % |
| Rhode Island | | | | | | | | | | | | |
| Providence Public Buildings Authority, | | | | | | | | | | | | |
| 5.125%, 06/15/2021(Insured by AGM) | | | 395,000 | | | | 407,786 | | | | | |
| Rhode Island Commerce Corp., | | | | | | | | | | | | |
| 3.000%, 06/15/2019 | | | 670,000 | | | | 673,102 | | | | | |
| Rhode Island Housing & Mortgage Finance Corp., | | | | | | | | | | | | |
| 3.500%, 10/01/2046(Callable 04/01/2025) | | | 55,000 | | | | 56,121 | | | | | |
| | | | | | | | 1,137,009 | | | | 0.3 | % |
| South Carolina | | | | | | | | | | | | |
| City of Myrtle Beach SC, | | | | | | | | | | | | |
| 5.000%, 10/01/2020 | | | 100,000 | | | | 105,115 | | | | | |
| City of Walhalla SC, | | | | | | | | | | | | |
| 5.000%, 06/01/2023(Insured by BAM) | | | 320,000 | | | | 356,608 | | | | | |
| Greenville Health System, | | | | | | | | | | | | |
| 5.000%, 05/01/2026(Callable 05/01/2022) | | | 1,020,000 | | | | 1,100,223 | | | | | |
| Greenwood Fifty School Facilities, Inc., | | | | | | | | | | | | |
| 5.000%, 12/01/2027 | | | 1,000,000 | | | | 1,154,980 | | | | | |
| Patriots Energy Group Financing Agency, | | | | | | | | | | | | |
| 4.000%, 10/01/2048(Callable 11/01/2023)(Mandatory Tender Date 02/01/2024)(1) | | | 805,000 | | | | 850,410 | | | | | |
| Piedmont Municipal Power Agency, | | | | | | | | | | | | |
| 5.375%, 01/01/2025(ETM)(Insured by NATL) | | | 195,000 | | | | 227,388 | | | | | |
| Scago Educational Facilities Corp. for Marro School District, | | | | | | | | | | | | |
| 4.250%, 12/01/2029(Callable 12/01/2020)(Insured by AGM) | | | 100,000 | | | | 102,625 | | | | | |
| South Carolina Jobs-Economic Development Authority: | | | | | | | | | | | | |
| 5.125%, 08/01/2020(Pre-refunded to 08/01/2019) | | | 500,000 | | | | 509,505 | | | | | |
| 5.250%, 08/01/2030(Pre-refunded to 08/01/2023) | | | 110,000 | | | | 125,201 | | | | | |
| 6.000%, 08/01/2031(Pre-refunded to 08/01/2021)(Insured by AGM) | | | 125,000 | | | | 137,864 | | | | | |
| 6.500%, 08/01/2039(Pre-refunded to 08/01/2021)(Insured by AGM) | | | 1,550,000 | | | | 1,728,513 | | | | | |
| 2.030%, 05/01/2048(Callable 01/02/2019)(Optional Put Date 01/07/2019)(1) | | | 1,000,000 | | | | 1,000,000 | | | | | |
| South Carolina State Housing Finance & Development Authority: | | | | | | | | | | | | |
| 4.000%, 07/01/2036(Callable 07/01/2025)(Insured by GNMA) | | | 260,000 | | | | 271,552 | | | | | |
| 4.500%, 07/01/2048(Callable 07/01/2027) | | | 550,000 | | | | 591,200 | | | | | |
| | | | | | | | 8,261,184 | | | | 2.4 | % |
| Tennessee | | | | | | | | | | | | |
| Clarksville Natural Gas Acquisition Corp.: | | | | | | | | | | | | |
| 5.000%, 12/15/2020 | | | 75,000 | | | | 79,031 | | | | | |
| 5.000%, 12/15/2021 | | | 185,000 | | | | 198,562 | | | | | |
| Knox County Health Educational & Housing Facility Board, | | | | | | | | | | | | |
| 4.000%, 04/01/2019 | | | 270,000 | | | | 270,961 | | | | | |
| Memphis Health Educational & Housing Facility Board, | | | | | | | | | | | | |
| 6.750%, 12/01/2046(Pre-refunded to 06/01/2021) | | | 825,000 | | | | 911,542 | | | | | |
| Montgomery County Health Educational & Housing Facilities Board, | | | | | | | | | | | | |
| 1.750%, 12/01/2020(Mandatory Tender Date 12/01/2019)(Insured by HUD)(1) | | | 380,000 | | | | 378,499 | | | | | |
| Nashville & Davidson County Metropolitan Government: | | | | | | | | | | | | |
| 2.050%, 04/01/2021(Mandatory Tender Date 04/01/2020)(1) | | | 150,000 | | | | 150,366 | | | | | |
| 2.100%, 04/01/2021(Mandatory Tender Date 10/01/2020)(1) | | | 250,000 | | | | 250,168 | | | | | |
| 1.550%, 11/15/2030(Mandatory Tender Date 11/03/2020)(1) | | | 860,000 | | | | 848,476 | | | | | |
| Tennessee Energy Acquisition Corp., | | | | | | | | | | | | |
| 5.250%, 09/01/2019 | | | 250,000 | | | | 254,470 | | | | | |
| Tennessee Housing Development Agency: | | | | | | | | | | | | |
| 4.700%, 07/01/2027(Callable 01/01/2019) | | | 585,000 | | | | 585,000 | | | | | |
| 4.200%, 07/01/2042(Callable 01/01/2022) | | | 380,000 | | | | 388,816 | | | | | |
| 4.000%, 01/01/2043(Callable 07/01/2027) | | | 905,000 | | | | 953,508 | | | | | |
| 3.800%, 07/01/2043(Callable 01/01/2022) | | | 210,000 | | | | 214,872 | | | | | |
| 4.000%, 01/01/2046(Callable 01/01/2025) | | | 55,000 | | | | 57,279 | | | | | |
| | | | | | | | 5,541,550 | | | | 1.6 | % |
| Texas | | | | | | | | | | | | |
| Arlington Higher Education Finance Corp., | | | | | | | | | | | | |
| 5.000%, 08/15/2024(PSF Guaranteed) | | | 535,000 | | | | 608,573 | | | | | |
| Beaumont Independent School District, | | | | | | | | | | | | |
| 5.000%, 02/15/2025 | | | 100,000 | | | | 116,251 | | | | | |
| Bexar County Health Facilities Development Corp., | | | | | | | | | | | | |
| 4.000%, 07/15/2019 | | | 75,000 | | | | 75,425 | | | | | |
| Brazoria County Municipal Utility District No. 17, | | | | | | | | | | | | |
| 4.000%, 09/01/2024(Callable 09/01/2023)(Insured by MAC) | | | 175,000 | | | | 187,143 | | | | | |
| Carrollton-Farmers Branch Independent School District: | | | | | | | | | | | | |
| 5.000%, 02/15/2020(PSF Guaranteed) | | | 90,000 | | | | 93,168 | | | | | |
| 5.000%, 02/15/2020(ETM)(PSF Guaranteed) | | | 35,000 | | | | 36,189 | | | | | |
| Central Texas Regional Mobility Authority, | | | | | | | | | | | | |
| 5.000%, 01/01/2022 | | | 350,000 | | | | 375,511 | | | | | |
| Central Texas Turnpike System, | | | | | | | | | | | | |
| 5.000%, 08/15/2042(Mandatory Tender Date 04/01/2020)(1) | | | 285,000 | | | | 295,018 | | | | | |
| City of Bullard TX, | | | | | | | | | | | | |
| 3.000%, 09/01/2020(Insured by BAM) | | | 135,000 | | | | 137,415 | | | | | |
| City of Dallas TX, | | | | | | | | | | | | |
| 5.000%, 02/15/2027(Callable 02/15/2024) | | | 500,000 | | | | 561,975 | | | | | |
| City of Houston TX: | | | | | | | | | | | | |
| 3.353%, 09/01/2033(Insured by AMBAC)(1)(5) | | | 600,000 | | | | 600,000 | | | | | |
| 2.114%, 05/15/2034 (1 Month LIBOR USD + 0.360%)(Callable 02/01/2021)(Mandatory Tender Date 08/01/2021)(2) | | | 975,000 | | | | 969,179 | | | | | |
| City of Round Rock TX: | | | | | | | | | | | | |
| 4.000%, 12/01/2023 | | | 30,000 | | | | 32,211 | | | | | |
| 4.000%, 12/01/2024 | | | 250,000 | | | | 270,770 | | | | | |
| City of San Antonio TX: | | | | | | | | | | | | |
| 3.000%, 12/01/2045(Mandatory Tender Date 12/01/2019)(1) | | | 120,000 | | | | 121,076 | | | | | |
| 2.750%, 02/01/2048(Mandatory Tender Date 12/01/2022)(1) | | | 1,000,000 | | | | 1,014,100 | | | | | |
| City of Sanger TX, | | | | | | | | | | | | |
| 2.500%, 08/01/2019 | | | 125,000 | | | | 125,370 | | | | | |
| City of Victoria TX, | | | | | | | | | | | | |
| 4.000%, 08/15/2023(Callable 08/15/2020) | | | 410,000 | | | | 422,341 | | | | | |
| Clear Creek Independent School District: | | | | | | | | | | | | |
| 5.000%, 02/15/2024 | | | 100,000 | | | | 113,997 | | | | | |
| 1.450%, 02/15/2035(Mandatory Tender Date 08/14/2020)(PSF Guaranteed)(1) | | | 300,000 | | | | 297,060 | | | | | |
| Clyde Education Facilities Corp., | | | | | | | | | | | | |
| 4.000%, 08/15/2021(PSF Guaranteed) | | | 140,000 | | | | 146,146 | | | | | |
| Corpus Christi Independent School District, | | | | | | | | | | | | |
| 2.000%, 08/15/2047(Mandatory Tender Date 08/15/2019)(PSF Guaranteed)(1) | | | 250,000 | | | | 250,090 | | | | | |
| Cotulla Independent School District, | | | | | | | | | | | | |
| 5.000%, 02/15/2023 | | | 100,000 | | | | 111,923 | | | | | |
| County of Archer TX, | | | | | | | | | | | | |
| 4.000%, 02/15/2024(6) | | | 350,000 | | | | 376,775 | | | | | |
| County of McLennan TX, | | | | | | | | | | | | |
| 5.000%, 06/01/2025(Insured by AGM) | | | 240,000 | | | | 273,048 | | | | | |
| Cypress-Fairbanks Independent School District, | | | | | | | | | | | | |
| 3.000%, 02/15/2036(Mandatory Tender Date 08/15/2019)(PSF Guaranteed)(1) | | | 490,000 | | | | 492,984 | | | | | |
| Dallas Independent School District: | | | | | | | | | | | | |
| 5.000%, 02/15/2036(Mandatory Tender Date 02/15/2020)(PSF Guaranteed)(1) | | | 200,000 | | | | 206,566 | | | | | |
| 5.000%, 02/15/2036(PSF Guaranteed)(1) | | | 5,000 | | | | 5,458 | | | | | |
| 5.000%, 02/15/2036(Mandatory Tender Date 02/15/2022)(PSF Guaranteed)(1) | | | 1,560,000 | | | | 1,695,751 | | | | | |
| Dawson Independent School District, | | | | | | | | | | | | |
| 0.000%, 02/16/2019(PSF Guaranteed) | | | 245,000 | | | | 244,392 | | | | | |
| Decatur Hospital Authority, | | | | | | | | | | | | |
| 5.750%, 09/01/2029(ETM) | | | 1,610,000 | | | | 1,927,025 | | | | | |
| Denton County Fresh Water Supply District No. 6: | | | | | | | | | | | | |
| 4.000%, 02/15/2019(Insured by BAM) | | | 150,000 | | | | 150,350 | | | | | |
| 4.000%, 02/15/2020(Insured by BAM) | | | 175,000 | | | | 178,941 | | | | | |
| Everman Independent School District, | | | | | | | | | | | | |
| 5.000%, 02/15/2025 | | | 125,000 | | | | 145,391 | | | | | |
| Fort Bend County Municipal Utility District No. 134B, | | | | | | | | | | | | |
| 4.625%, 09/01/2024(Insured by AGM) | | | 320,000 | | | | 355,501 | | | | | |
| Fort Bend Independent School District: | | | | | | | | | | | | |
| 1.350%, 08/01/2040(Callable 01/31/2019)(Mandatory Tender Date 08/01/2019)(PSF Guaranteed)(1) | | | 605,000 | | | | 602,750 | | | | | |
| 1.500%, 08/01/2042(Mandatory Tender Date 08/01/2021)(PSF Guaranteed)(1) | | | 365,000 | | | | 358,448 | | | | | |
| Garland Independent School District, | | | | | | | | | | | | |
| 5.000%, 02/15/2022(Callable 02/15/2020)(PSF Guaranteed) | | | 200,000 | | | | 207,266 | | | | | |
| Grand Parkway Transportation Corp.: | | | | | | | | | | | | |
| 5.000%, 02/01/2023 | | | 565,000 | | | | 624,274 | | | | | |
| 5.000%, 10/01/2052(Mandatory Tender Date 10/01/2023)(1) | | | 535,000 | | | | 599,559 | | | | | |
| Harris County Cultural Education Facilities Finance Corp.: | | | | | | | | | | | | |
2.290%, 12/01/2042 (SIFMA Municipal Swap Index + 0.580%) (Callable 06/01/2019)(Mandatory Tender Date 12/01/2019)(2) | | | 50,000 | | | | 50,036 | | | | | |
| 2.554%, 10/01/2045 (1 Month LIBOR USD + 0.850%)(Callable 12/01/2019)(Mandatory Tender Date 06/01/2020)(2) | | | 300,000 | | | | 301,671 | | | | | |
| Harris County Health Facilities Development Corp., | | | | | | | | | | | | |
| 5.750%, 07/01/2027(ETM) | | | 10,000 | | | | 11,897 | | | | | |
| Harris County Municipal Utility District No. 153, | | | | | | | | | | | | |
| 4.000%, 09/01/2023(Callable 09/01/2022)(Insured by BAM) | | | 100,000 | | | | 105,728 | | | | | |
| Harris County Municipal Utility District No. 500, | | | | | | | | | | | | |
| 5.000%, 12/01/2021(Insured by AGM) | | | 85,000 | | | | 91,799 | | | | | |
| Hitchcock Independent School District, | | | | | | | | | | | | |
| 5.000%, 02/15/2023 | | | 100,000 | | | | 111,234 | | | | | |
| Houston Independent School District, | | | | | | | | | | | | |
| 1.375%, 06/01/2037(Mandatory Tender Date 06/01/2019)(PSF Guaranteed)(1) | | | 105,000 | | | | 104,706 | | | | | |
| Ingleside Independent School District, | | | | | | | | | | | | |
| 5.000%, 08/15/2024 | | | 120,000 | | | | 138,275 | | | | | |
| Katy Independent School District, | | | | | | | | | | | | |
2.195%, 08/15/2036 (1 Month LIBOR USD + 0.550%) (Callable 02/15/2019)(Mandatory Tender Date 08/15/2019)(PSF Guaranteed)(2) | | | 1,050,000 | | | | 1,050,158 | | | | | |
| Lake Travis Independent School District, | | | | | | | | | | | | |
| 2.625%, 02/15/2048(Mandatory Tender Date 02/15/2022)(PSF Guaranteed)(1) | | | 970,000 | | | | 982,338 | | | | | |
| Lamar Consolidated Independent School District, | | | | | | | | | | | | |
| 1.950%, 08/15/2047(Mandatory Tender Date 08/17/2020)(PSF Guaranteed)(1) | | | 500,000 | | | | 499,045 | | | | | |
| Leander Independent School District: | | | | | | | | | | | | |
| 0.000%, 08/15/2023(Pre-refunded to 08/15/2020)(PSF Guaranteed) | | | 40,000 | | | | 33,507 | | | | | |
| 0.000%, 08/15/2036(Pre-refunded to 08/15/2024)(PSF Guaranteed) | | | 100,000 | | | | 47,486 | | | | | |
| 0.000%, 08/15/2041(Pre-refunded to 08/15/2024)(PSF Guaranteed) | | | 300,000 | | | | 107,055 | | | | | |
| 0.000%, 08/15/2041(Pre-refunded to 08/15/2024)(PSF Guaranteed) | | | 505,000 | | | | 194,268 | | | | | |
| 0.000%, 08/15/2042(Pre-refunded to 08/15/2024)(PSF Guaranteed) | | | 130,000 | | | | 47,709 | | | | | |
| 0.000%, 08/15/2045(Pre-refunded to 08/15/2024)(PSF Guaranteed) | | | 1,000,000 | | | | 283,170 | | | | | |
| 0.000%, 08/15/2046(Pre-refunded to 08/15/2024)(PSF Guaranteed) | | | 700,000 | | | | 186,263 | | | | | |
| Lewisville Independent School District, | | | | | | | | | | | | |
| 5.000%, 08/15/2024 | | | 420,000 | | | | 483,004 | | | | | |
| Longview Independent School District, | | | | | | | | | | | | |
| 5.000%, 02/15/2024(PSF Guaranteed) | | | 125,000 | | | | 142,561 | | | | | |
| Lower Colorado River Authority, | | | | | | | | | | | | |
| 5.000%, 05/15/2024(Callable 05/15/2022) | | | 125,000 | | | | 136,465 | | | | | |
| Manor Independent School District, | | | | | | | | | | | | |
| 5.000%, 08/01/2026 | | | 100,000 | | | | 118,753 | | | | | |
| Mansfield Independent School District, | | | | | | | | | | | | |
| 2.500%, 08/01/2042(Mandatory Tender Date 08/01/2021)(PSF Guaranteed)(1) | | | 1,515,000 | | | | 1,525,560 | | | | | |
| Montgomery County Municipal Utility District No. 119: | | | | | | | | | | | | |
| 4.000%, 04/01/2020(Insured by BAM) | | | 350,000 | | | | 357,987 | | | | | |
| 4.000%, 04/01/2021(Insured by BAM) | | | 175,000 | | | | 181,662 | | | | | |
| Montgomery Independent School District, | | | | | | | | | | | | |
| 5.000%, 02/15/2024(PSF Guaranteed) | | | 150,000 | | | | 171,231 | | | | | |
| New Caney Independent School District, | | | | | | | | | | | | |
| 5.000%, 02/15/2025 | | | 100,000 | | | | 115,754 | | | | | |
| New Hope Cultural Education Facilities Finance Corp.: | | | | | | | | | | | | |
| 4.000%, 04/01/2020 | | | 50,000 | | | | 50,264 | | | | | |
| 3.000%, 07/01/2021 | | | 120,000 | | | | 122,142 | | | | | |
| 3.625%, 08/15/2022(Callable 08/15/2021) | | | 100,000 | | | | 98,779 | | | | | |
| 4.000%, 06/15/2024 | | | 50,000 | | | | 53,878 | | | | | |
| North East Independent School District, | | | | | | | | | | | | |
| 2.000%, 08/01/2044(Mandatory Tender Date 08/01/2019)(PSF Guaranteed)(1) | | | 50,000 | | | | 50,000 | | | | | |
| North Texas Higher Education Authority, Inc., | | | | | | | | | | | | |
| 3.300%, 07/01/2030 (3 Month LIBOR USD + 0.900%)(2) | | | 515,000 | | | | 515,278 | | | | | |
| North Texas Tollway Authority: | | | | | | | | | | | | |
| 5.000%, 01/01/2022 | | | 25,000 | | | | 27,116 | | | | | |
| 1.950%, 01/01/2038(1) | | | 400,000 | | | | 400,000 | | | | | |
| Northside Independent School District: | | | | | | | | | | | | |
| 5.000%, 08/15/2022(PSF Guaranteed) | | | 100,000 | | | | 110,378 | | | | | |
| 1.750%, 06/01/2032(Callable 01/22/2019)(Mandatory Tender Date 06/01/2022)(PSF Guaranteed)(1) | | | 805,000 | | | | 791,846 | | | | | |
| 2.125%, 08/01/2040(Callable 02/01/2019)(Mandatory Tender Date 08/01/2020)(PSF Guaranteed)(1) | | | 485,000 | | | | 485,150 | | | | | |
| 2.000%, 08/01/2044(Mandatory Tender Date 08/01/2019)(PSF Guaranteed)(1) | | | 500,000 | | | | 499,995 | | | | | |
| 2.000%, 06/01/2046(Mandatory Tender Date 06/01/2021)(PSF Guaranteed)(1) | | | 640,000 | | | | 636,557 | | | | | |
| Northwest Harris County Municipal Utility District No. 16, | | | | | | | | | | | | |
| 5.500%, 10/01/2021(Insured by BAM) | | | 25,000 | | | | 27,059 | | | | | |
| Olmos Park Higher Education Facilities Corp., | | | | | | | | | | | | |
| 5.000%, 12/01/2021 | | | 210,000 | | | | 226,057 | | | | | |
| Palestine Independent School District, | | | | | | | | | | | | |
| 5.000%, 02/15/2024 | | | 135,000 | | | | 153,615 | | | | | |
| Plains Independent School District, | | | | | | | | | | | | |
| 4.000%, 08/15/2023(Callable 08/15/2020)(PSF Guaranteed) | | | 340,000 | | | | 349,731 | | | | | |
| Port Neches-Groves Independent School District, | | | | | | | | | | | | |
| 5.000%, 02/15/2026 | �� | | 715,000 | | | | 841,562 | | | | | |
| Prosper Independent School District, | | | | | | | | | | | | |
| 5.000%, 02/15/2024 | | | 100,000 | | | | 113,997 | | | | | |
| Round Rock Independent School District, | | | | | | | | | | | | |
| 1.500%, 08/01/2040(Callable 02/01/2019)(Mandatory Tender Date 08/01/2021)(PSF Guaranteed)(1) | | | 375,000 | | | | 368,546 | | | | | |
| SA Energy Acquisition Public Facility Corp., | | | | | | | | | | | | |
| 5.500%, 08/01/2021 | | | 25,000 | | | | 26,815 | | | | | |
| San Antonio Water System, | | | | | | | | | | | | |
| 2.000%, 05/01/2043(Mandatory Tender Date 11/01/2021)(1) | | | 100,000 | | | | 99,372 | | | | | |
| San Jacinto College District, | | | | | | | | | | | | |
| 5.000%, 02/15/2034(Pre-refunded to 02/15/2019) | | | 25,000 | | | | 25,099 | | | | | |
| San Juan Higher Education Finance Authority, | | | | | | | | | | | | |
| 5.125%, 08/15/2020 | | | 205,000 | | | | 209,996 | | | | | |
| South Shore Harbor Municipal Utility District No. 7, | | | | | | | | | | | | |
| 4.000%, 09/01/2023(Insured by BAM) | | | 370,000 | | | | 393,477 | | | | | |
| Southwest Texas Junior College District, | | | | | | | | | | | | |
| 4.000%, 10/01/2023(Insured by BAM) | | | 100,000 | | | | 105,521 | | | | | |
| State of Texas: | | | | | | | | | | | | |
| 5.000%, 08/01/2020 | | | 375,000 | | | | 393,518 | | | | | |
| 2.000%, 08/01/2025(Callable 01/31/2019)(Mandatory Tender Date 08/01/2019)(1) | | | 85,000 | | | | 84,965 | | | | | |
| Tarrant County Cultural Education Facilities, | | | | | | | | | | | | |
| 5.000%, 11/15/2024 | | | 75,000 | | | | 82,799 | | | | | |
| Texas City Industrial Development Corp., | | | | | | | | | | | | |
| 7.375%, 10/01/2020 | | | 200,000 | | | | 217,320 | | | | | |
| Texas Department of Housing & Community Affairs: | | | | | | | | | | | | |
| 4.050%, 07/01/2026(Callable 01/01/2021)(Insured by GNMA) | | | 470,000 | | | | 481,501 | | | | | |
| 4.750%, 03/01/2049(Callable 09/01/2027)(Insured by GNMA) | | | 710,000 | | | | 772,231 | | | | | |
| Texas Municipal Gas Acquisition & Supply Corp. I, | | | | | | | | | | | | |
| 5.250%, 12/15/2021 | | | 120,000 | | | | 129,647 | | | | | |
| Texas Municipal Gas Acquisition & Supply Corp. III: | | | | | | | | | | | | |
| 5.000%, 12/15/2021 | | | 140,000 | | | | 150,802 | | | | | |
| 5.000%, 12/15/2022 | | | 150,000 | | | | 165,029 | | | | | |
| 5.000%, 12/15/2023(Callable 12/15/2022) | | | 180,000 | | | | 197,820 | | | | | |
| Texas State Public Finance Authority Charter School Finance Corp.: | | | | | | | | | | | | |
| 6.000%, 08/15/2026(Pre-refunded to 02/15/2020) | | | 250,000 | | | | 261,238 | | | | | |
| 7.250%, 08/15/2041(Pre-refunded to 08/15/2021)(1) | | | 450,000 | | | | 508,815 | | | | | |
| Texas Transportation Commission State Highway Fund, | | | | | | | | | | | | |
| 4.000%, 04/01/2026(Mandatory Tender Date 10/01/2021)(1) | | | 530,000 | | | | 557,141 | | | | | |
| Town of Providence Village TX, | | | | | | | | | | | | |
| 4.000%, 03/01/2024(Insured by BAM) | | | 275,000 | | | | 297,272 | | | | | |
| Travis County Health Facilities Development Corp., | | | | | | | | | | | | |
| 7.125%, 01/01/2046(Pre-refunded to 01/01/2021) | | | 385,000 | | | | 423,388 | | | | | |
| Travis County Housing Finance Corp., | | | | | | | | | | | | |
| 2.000%, 04/01/2021(Mandatory Tender Date 04/01/2020)(1) | | | 570,000 | | | | 569,715 | | | | | |
| Tyler Health Facilities Development Corp., | | | | | | | | | | | | |
| 5.500%, 07/01/2027(Pre-refunded to 07/01/2021) | | | 55,000 | | | | 59,549 | | | | | |
| Viridian Municipal Management District: | | | | | | | | | | | | |
| 6.000%, 12/01/2023(Insured by BAM) | | | 50,000 | | | | 58,165 | | | | | |
| 4.000%, 12/01/2026(Callable 12/01/2023)(Insured by AGM) | | | 340,000 | | | | 359,234 | | | | | |
| West Ranch Management District, | | | | | | | | | | | | |
| 3.000%, 09/01/2019(Insured by MAC) | | | 50,000 | | | | 50,362 | | | | | |
| Wink-Loving Independent School District: | | | | | | | | | | | | |
| 5.000%, 02/15/2026(Callable 02/15/2023)(PSF Guaranteed) | | | 1,970,000 | | | | 2,193,319 | | | | | |
| 5.000%, 02/15/2027(Callable 02/15/2023)(PSF Guaranteed) | | | 2,350,000 | | | | 2,613,435 | | | | | |
| | | | | | | | 40,394,227 | | | | 11.7 | % |
| Utah | | | | | | | | | |
| County of Utah UT, | | | | | | | | | |
| 5.000%, 05/15/2057(Callable 02/01/2024)(Mandatory Tender Date 08/01/2024)(1) | | | 250,000 | | | | 280,260 | | | | |
| Utah Charter School Finance Authority, | | | | | | | | | | | |
| 4.000%, 04/15/2022(Insured by UT CSCE) | | | 250,000 | | | | 262,227 | | | | |
| Utah Housing Corp.: | | | | | | | | | | | |
| 2.000%, 07/01/2021(Mandatory Tender Date 01/01/2021)(Insured by GNMA)(1) | | | 250,000 | | | | 249,223 | | | | |
| 4.000%, 01/01/2045(Callable 01/01/2026)(Insured by FHA) | | | 80,000 | | | | 83,219 | | | | |
| | | | | | | | 874,929 | | | | 0.3 | % |
| Vermont | | | | | | | | | | | | |
| City of Burlington VT, | | | | | | | | | | | | |
| 5.000%, 07/01/2023(Pre-refunded to 07/01/2021) | | | 25,000 | | | | 26,860 | | | | | |
| Vermont Economic Development Authority, | | | | | | | | | | | | |
| 2.000%, 07/01/2020(Callable 07/01/2019) | | | 350,000 | | | | 343,900 | | | | | |
| Vermont Educational & Health Buildings Financing Agency, | | | | | | | | | | | | |
| 1.670%, 07/01/2039(Optional Put Date 01/02/2019)(1) | | | 500,000 | | | | 500,000 | | | | | |
| Vermont Housing Finance Agency: | | | | | | | | | | | | |
| 4.000%, 11/01/2044(Callable 11/01/2023) | | | 100,000 | | | | 104,133 | | | | | |
| 4.000%, 11/01/2048(Callable 05/01/2027) | | | 1,500,000 | | | | 1,577,670 | | | | | |
| Vermont Public Power Supply Authority, | | | | | | | | | | | | |
| 5.000%, 07/01/2022 | | | 380,000 | | | | 411,202 | | | | | |
| | | | | | | | 2,963,765 | | | | 0.9 | % |
| Virgin Islands | | | | | | | | | | | | |
| Virgin Islands Public Finance Authority, | | | | | | | | | | | | |
| 5.000%, 09/01/2020 | | | 100,000 | | | | 103,263 | | | | 0.0 | % |
| | | | | | | | | | | | | |
| Virginia | | | | | | | | | | | | |
| City of Petersburg VA, | | | | | | | | | | | | |
| 4.000%, 11/01/2025(Callable 11/01/2022)(Insured by ST) | | | 285,000 | | | | 300,553 | | | | | |
| Colonial Heights Economic Development Authority, | | | | | | | | | | | | |
| 1.800%, 01/01/2020(Mandatory Tender Date 07/01/2019)(1) | | | 380,000 | | | | 379,498 | | | | | |
| Stafford County & Staunton Industrial Development Authority, | | | | | | | | | | | | |
| 5.500%, 02/01/2041(Pre-refunded to 02/01/2021)(Insured by ST) | | | 30,000 | | | | 32,164 | | | | | |
| Virginia Commonwealth University Health System Authority, | | | | | | | | | | | | |
| 4.750%, 07/01/2041(Pre-refunded to 07/01/2021) | | | 90,000 | | | | 96,288 | | | | | |
| Virginia Resources Authority, | | | | | | | | | | | | |
| 4.250%, 11/01/2040(Pre-refunded to 11/01/2020) | | | 45,000 | | | | 46,857 | | | | | |
| Wise County Industrial Development Authority, | | | | | | | | | | | | |
| 2.150%, 10/01/2040(Mandatory Tender Date 09/01/2020)(1) | | | 125,000 | | | | 124,674 | | | | | |
| | | | | | | | 980,034 | | | | 0.3 | % |
| Washington | | | | | | | | | | | | |
| Central Puget Sound Regional Transit Authority, | | | | | | | | | | | | |
2.160%, 11/01/2045 (SIFMA Municipal Swap Index + 0.450%) (Callable 11/01/2022)(Mandatory Tender Date 11/01/2023)(2) | | | 100,000 | | | | 100,030 | | | | | |
| Central Washington University, | | | | | | | | | | | | |
| 4.000%, 05/01/2024(Callable 05/01/2023) | | | 230,000 | | | | 245,720 | | | | | |
| City of Everett WA, | | | | | | | | | | | | |
2.110%, 12/01/2034 (SIFMA Municipal Swap Index + 0.400%) (Callable 06/01/2019)(Mandatory Tender Date 12/01/2019)(Partially Pre-refunded)(2) | | | 55,000 | | | | 55,002 | | | | | |
| City of Port Angeles WA, | | | | | | | | | | | | |
| 4.000%, 11/01/2024(Callable 11/01/2019)(Insured by AGC) | | | 105,000 | | | | 106,687 | | | | | |
| Grays Harbor County Public Hospital District No. 1, | | | | | | | | | | | | |
| 3.000%, 08/01/2019(Callable 01/22/2019) | | | 500,000 | | | | 499,025 | | | | | |
| King County Housing Authority: | | | | | | | | | | | | |
| 3.500%, 05/01/2021 | | | 300,000 | | | | 308,658 | | | | | |
| 3.500%, 05/01/2022 | | | 335,000 | | | | 347,037 | | | | | |
| Spokane Public Facilities District, | | | | | | | | | | | | |
| 5.000%, 12/01/2028(Callable 06/01/2023) | | | 450,000 | | | | 496,899 | | | | | |
| Washington Health Care Facilities Authority, | | | | | | | | | | | | |
| 5.000%, 10/01/2042(Mandatory Tender Date 10/01/2021)(1) | | | 85,000 | | | | 91,633 | | | | | |
| | | | | | | | 2,250,691 | | | | 0.7 | % |
| West Virginia | | | | | | | | | | | | |
| West Virginia Hospital Finance Authority, | | | | | | | | | | | | |
| 5.125%, 09/01/2021(Callable 09/01/2019) | | | 120,000 | | | | 122,105 | | | | 0.0 | % |
| | | | | | | | | | | | | |
| Wisconsin | | | | | | | | | | | | |
| Campbellsport School District, | | | | | | | | | | | | |
| 5.000%, 03/01/2022 | | | 540,000 | | | | 588,848 | | | | | |
| City of Kenosha WI, | | | | | | | | | | | | |
| 5.000%, 06/01/2021 | | | 200,000 | | | | 214,198 | | | | | |
| City of Ladysmith WI, | | | | | | | | | | | | |
| 4.000%, 06/01/2022(Callable 01/31/2019) | | | 150,000 | | | | 150,259 | | | | | |
| County of Kenosha WI, | | | | | | | | | | | | |
| 2.500%, 08/01/2019(Callable 01/31/2019) | | | 25,000 | | | | 25,012 | | | | | |
| County of Manitowoc WI, | | | | | | | | | | | | |
| 4.000%, 11/01/2021 | | | 90,000 | | | | 93,974 | | | | | |
| Ladysmith School District, | | | | | | | | | | | | |
| 2.000%, 04/01/2021 | | | 150,000 | | | | 149,451 | | | | | |
| Milwaukee Redevelopment Authority, | | | | | | | | | | | | |
| 4.500%, 08/01/2023(Callable 08/01/2019) | | | 110,000 | | | | 111,290 | | | | | |
| Oconto Falls Public School District, | | | | | | | | | | | | |
| 2.000%, 03/01/2019(Callable 01/31/2019) | | | 155,000 | | | | 154,916 | | | | | |
| Public Finance Authority: | | | | | | | | | | | | |
| 4.000%, 01/01/2020 | | | 415,000 | | | | 418,631 | | | | | |
| 4.000%, 10/01/2020 | | | 200,000 | | | | 202,720 | | | | | |
| 4.000%, 12/01/2020 | | | 350,000 | | | | 351,848 | | | | | |
| 4.000%, 10/01/2021 | | | 200,000 | | | | 203,584 | | | | | |
| 3.000%, 11/15/2022(Callable 01/31/2019) | | | 250,000 | | | | 250,017 | | | | | |
| 8.375%, 06/01/2037(Pre-refunded to 06/01/2022) | | | 1,075,000 | | | | 1,276,337 | | | | | |
| 8.625%, 06/01/2047(Pre-refunded to 06/01/2022) | | | 1,250,000 | | | | 1,500,363 | | | | | |
| Rib Lake School District, | | | | | | | | | | | | |
| 3.000%, 10/22/2019 | | | 250,000 | | | | 251,983 | | | | | |
| Southeast Wisconsin Professional Baseball Park District, | | | | | | | | | | | | |
| 0.000%, 12/15/2021(ETM)(Insured by NATL) | | | 30,000 | | | | 28,256 | | | | | |
| State of Wisconsin: | | | | | | | | | | | | |
| 5.000%, 05/01/2025(Callable 05/01/2023) | | | 695,000 | | | | 781,319 | | | | | |
| 5.000%, 05/01/2026(Callable 05/01/2023) | | | 60,000 | | | | 67,452 | | | | | |
| 5.000%, 05/01/2029(Pre-refunded to 05/01/2022) | | | 145,000 | | | | 159,326 | | | | | |
| Town of Grand Chute WI, | | | | | | | | | | | | |
| 3.000%, 11/01/2020(Callable 01/31/2019) | | | 235,000 | | | | 235,193 | | | | | |
| Village of DeForest WI, | | | | | | | | | | | | |
| 3.375%, 05/01/2023(Callable 05/01/2021) | | | 100,000 | | | | 102,558 | | | | | |
| Village of Sussex WI, | | | | | | | | | | | | |
| 3.000%, 06/01/2023(Callable 06/01/2022) | | | 1,155,000 | | | | 1,179,209 | | | | | |
| West Allis West Milwaukee School District, | | | | | | | | | | | | |
| 3.000%, 04/01/2019 | | | 150,000 | | | | 149,889 | | | | | |
| Western Technical College District, | | | | | | | | | | | | |
| 2.000%, 04/01/2019(Callable 01/31/2019) | | | 125,000 | | | | 125,021 | | | | | |
| Wisconsin Center District: | | | | | | | | | | | | |
| 5.000%, 12/15/2020 | | | 100,000 | | | | 105,985 | | | | | |
| 5.000%, 12/15/2022 | | | 715,000 | | | | 791,763 | | | | | |
| 5.000%, 12/15/2025 | | | 75,000 | | | | 86,893 | | | | | |
| 5.250%, 12/15/2027(Insured by AGM) | | | 65,000 | | | | 75,009 | | | | | |
| Wisconsin Health & Educational Facilities Authority: | | | | | | | | | | | | |
| 5.500%, 02/15/2019(Insured by AMBAC) | | | 65,000 | | | | 65,270 | | | | | |
| 3.000%, 12/01/2019 | | | 575,000 | | | | 579,796 | | | | | |
| 5.000%, 08/15/2020(ETM) | | | 55,000 | | | | 57,746 | | | | | |
| 2.650%, 11/01/2020(Callable 11/01/2019) | | | 1,000,000 | | | | 998,390 | | | | | |
| 5.000%, 07/01/2022 | | | 160,000 | | | | 172,138 | | | | | |
| 4.000%, 09/15/2022 | | | 200,000 | | | | 205,534 | | | | | |
| 5.000%, 06/01/2023(Callable 06/01/2022) | | | 105,000 | | | | 113,637 | | | | | |
| 5.250%, 08/15/2023(Pre-refunded to 08/15/2020) | | | 420,000 | | | | 442,285 | | | | | |
| 4.000%, 09/15/2023(Callable 09/15/2022) | | | 150,000 | | | | 153,570 | | | | | |
| 4.000%, 09/15/2024(Callable 09/15/2023) | | | 360,000 | | | | 368,665 | | | | | |
| 4.500%, 06/01/2025(Pre-refunded to 06/01/2020) | | | 500,000 | | | | 518,080 | | | | | |
| 5.000%, 07/01/2025(Callable 07/01/2024) | | | 660,000 | | | | 730,283 | | | | | |
| 4.000%, 09/15/2025(Callable 09/15/2023) | | | 300,000 | | | | 306,045 | | | | | |
| 4.000%, 09/15/2025(Callable 09/15/2022) | | | 200,000 | | | | 203,226 | | | | | |
| 3.000%, 02/15/2035(Pre-refunded to 08/15/2025) | | | 110,000 | | | | 114,424 | | | | | |
| 5.250%, 04/15/2035(Pre-refunded to 04/15/2023) | | | 50,000 | | | | 56,660 | | | | | |
| 4.000%, 02/15/2038(Pre-refunded to 08/15/2025) | | | 330,000 | | | | 364,030 | | | | | |
| 5.000%, 11/15/2043(Mandatory Tender Date 06/01/2020)(1) | | | 100,000 | | | | 103,797 | | | | | |
| Wisconsin Housing & Economic Development Authority: | | | | | | | | | | | | |
| 3.500%, 09/01/2046(Callable 09/01/2025)(Insured by FNMA) | | | 420,000 | | | | 431,533 | | | | | |
| 4.000%, 03/01/2048(Callable 03/01/2027)(Insured by FNMA) | | | 475,000 | | | | 497,054 | | | | | |
| | | | | | | | 16,313,467 | | | | 4.7 | % |
| Wyoming | | | | | | | | | | | | |
| Wyoming Community Development Authority, | | | | | | | | | | | | |
| 4.000%, 12/01/2043(Callable 06/01/2027) | | | 1,500,000 | | | | 1,565,805 | | | | 0.5 | % |
| | | | | | | | | | | | | |
| Total Municipal Bonds (Cost $341,695,212) | | | | | | | 341,963,010 | | | | 99.1 | % |
| | | | | | | | | | | | | |
| | | | | | | | | | | | | |
| SHORT-TERM INVESTMENT | | Shares | | | | | | | | | |
| Money Market Mutual Fund | | | | | | | | | | | | |
| Fidelity Institutional Money Market Fund - Government Portfolio, Institutional Class, 2.29%(4) | | | 1,826,316 | | | | 1,826,316 | | | | | |
| Total Short-Term Investment (Cost $1,826,316) | | | | | | | 1,826,316 | | | | 0.5 | % |
| Total Investments (Cost $343,521,528) | | | | | | | 343,789,326 | | | | 99.6 | % |
| Other Assets in Excess of Liabilities | | | | | | | 1,389,076 | | | | 0.4 | % |
| TOTAL NET ASSETS | | | | | | $ | 345,178,402 | | | | 100.0 | % |
Notes to Schedule of Investments |
| | |
| AGC | Assured Guaranty Corp. |
| AGM | Assured Guaranty Municipal |
| AMBAC | Ambac Assurance Corp. |
| BAM | Build America Mutual Assurance Co. |
| CA MTG | CA Mortgage Insurance |
| FHA | Federal Housing Administration |
| FNMA | Fannie Mae |
| GNMA | Ginnie Mae |
| HUD | US Department of Housing and Development |
| MAC | Municipal Assurance Corp. |
| NATL | National Public Finance Guarantee Corp. |
| Q-SBLF | Qualified School Building Loan Fund |
| SD CRED PROG | State Credit Enhancement Program |
| ST | State Aid Intercept/Withholding |
| UT CSCE | Utah Charter School Finance Authority |
| (1) | | Variable rate security. The rate reported is the rate in effect as of December 31, 2018. | | | | | | |
| (2) | | Variable rate security based on a reference index and spread. The rate reported is the rate in effect as of December 31, 2018. |
| (3) | | Security issued under Rule 144A under the Securities Act of 1933 and determined to be liquid. Purchased in a private placement transaction; resale to the public may require registration or may extend only to qualified institutional buyers. At December 31, 2018, the value of these securities total $219,364, which represents 0.06% of total net assets. |
| (4) | | 7-Day Yield. | | | | | | |
| (5) | | Auction Rate Security. An Auction Rate Security is a debt instrument with a long nominal maturity for which the interest rate is regularly reset through a Dutch auction. The rate presented is either the rate set through the auction or the maximum interest rate provided for in the security issuance provision. |
| (6) | | Security or a portion of the security purchased on a when-issued or delayed delivery basis. | | | | | |
| (7) | | Security in default. | | | | | | |
| Baird Short-Term Municipal Bond Fund | | | | | | | | |
| Schedule of Investments, December 31, 2018 | | | | | | | | |
| Summary of Fair Value Exposure at December 31, 2018 | | | | | | |
| | | | | | | | | |
The Fund has adopted authoritative fair valuation accounting standards which establish a definition of fair value and set out a hierarchy for measuring fair value. These standards require additional disclosures about the various inputs and valuation techniques used to develop the measurements of fair value and a discussion on changes in valuation techniques and related inputs during the period. These standards define fair value as the price that would be received to sell an asset or paid to transfer a liability in an orderly transaction between market participants at the measurement date. |
| | | | | | | | | |
| The fair value hierarchy is organized into three levels based upon the assumptions (referred to as "inputs") used in pricing the asset or liability. These standards state that "observable inputs" reflect the assumptions market participants would use in pricing the asset or liability based on market data obtained from independent sources and "unobservable inputs" reflect an entity's own assumptions about the assumptions market participants would use in pricing the asset or liability. These inputs are summarized into three broad levels and described below: |
| | Level 1 - | Unadjusted quoted prices in active markets for identical unrestricted securities. | |
| | Level 2 - | Other significant observable inputs (including quoted prices for similar securities, quoted prices in inactive markets, dealer indications, interest rates, yield curves, prepayment speeds, credit risk, default rates, inputs corroborated by observable market data, etc.). | |
| | Level 3 - | Significant unobservable inputs (including the Fund's own assumptions about the factors that market participants would use in valuing the security) based on the best information available. | |
| The inputs or methodology used for valuing securities are not necessarily an indication of the risk associated with investing in those securities. |
| | | | | | | | | |
| The following is a summary of the inputs used to value the Fund's investments as of December 31, 2018: | | | | |
| | | Level 1 | | | Level 2 | | | Level 3 | | | Total | |
| Long-Term Investments | | | | | | | | | | | | |
| Municipal Bonds | | $ | – | | | $ | 341,963,010 | | | $ | – | | | $ | 341,963,010 | |
| Total Long-Term Investments | | | – | | | | 341,963,010 | | | | – | | | | 341,963,010 | |
| Short-Term Investment | | | | | | | | | | | | | | | | |
| Money Market Mutual Fund | | | 1,826,316 | | | | – | | | | – | | | | 1,826,316 | |
| Total Short-Term Investment | | | 1,826,316 | | | | – | | | | – | | | | 1,826,316 | |
| Total Investments | | $ | 1,826,316 | | | $ | 341,963,010 | | | $ | – | | | $ | 343,789,326 | |
| Changes in valuation techniques may result in transfers into or out of assigned levels within the fair value hierarchy. There were no transfers into or out of Level 3 during the reporting period, as compared to the security classifications from the prior year's annual report. |
| | | | | | | | | |
| Baird Quality Intermediate Municipal Bond Fund | | | | | | | | | |
| Schedule of Investments | | | | | | | | | |
| December 31, 2018 | | | | | | | | | |
| | | | | | | | | | |
| | | Principal | | | | | | % of | |
| | | Amount | | | Value | | | Net Assets | |
| LONG-TERM INVESTMENTS | | | | | | | | | |
| Municipal Bonds | | | | | | | | | |
| Alaska | | | | | | | | | |
| Alaska Housing Finance Corp., | | | | | | | | | |
| 4.000%, 12/01/2048(Callable 06/01/2027) | | $ | 1,285,000 | | | $ | 1,357,230 | | | | |
| City of Valdez AK, | | | | | | | | | | | |
| 5.000%, 06/30/2029(Callable 06/30/2022) | | | 1,225,000 | | | | 1,441,715 | | | | |
| | | | | | | | 2,798,945 | | | | 0.2 | % |
| Arizona | | | | | | | | | | | | |
| Arizona State University, | | | | | | | | | | | | |
| 5.000%, 07/01/2032(Pre-refunded to 07/01/2022) | | | 715,000 | | | | 788,573 | | | | | |
| City of Tucson AZ, | | | | | | | | | | | | |
| 5.000%, 07/01/2028(Callable 07/01/2025) | | | 750,000 | | | | 871,020 | | | | | |
| | | | | | | | 1,659,593 | | | | 0.1 | % |
| Arkansas | | | | | | | | | | | | |
| City of Little Rock AR: | | | | | | | | | | | | |
| 2.375%, 04/01/2028(Callable 10/01/2022) | | | 500,000 | | | | 506,725 | | | | | |
| 5.000%, 10/01/2034(Callable 04/01/2025) | | | 5,000,000 | | | | 5,610,750 | | | | | |
| City of Pine Bluff AR, | | | | | | | | | | | | |
| 3.000%, 02/01/2047(Callable 08/01/2027)(Insured by BAM) | | | 2,350,000 | | | | 2,253,415 | | | | | |
| City of Rogers AR: | | | | | | | | | | | | |
| 4.000%, 11/01/2025(Callable 05/01/2024) | | | 570,000 | | | | 615,640 | | | | | |
| 4.000%, 11/01/2027(Callable 05/01/2024) | | | 460,000 | | | | 493,493 | | | | | |
| 4.000%, 11/01/2028(Callable 05/01/2024) | | | 125,000 | | | | 133,266 | | | | | |
| | | | | | | | 9,613,289 | | | | 0.9 | % |
| California | | | | | | | | | | | | |
| Aromas-San Juan Unified School District, | | | | | | | | | | | | |
| 0.000%, 08/01/2050(Pre-refunded to 08/01/2021)(Insured by AGM) | | | 875,000 | | | | 74,637 | | | | | |
| Brea Redevelopment Agency: | | | | | | | | | | | | |
| 0.000%, 08/01/2033(Callable 08/01/2027) | | | 1,500,000 | | | | 1,404,540 | | | | | |
| 0.000%, 08/01/2034(Callable 08/01/2027) | | | 1,750,000 | | | | 1,629,320 | | | | | |
| Citrus Community College District, | | | | | | | | | | | | |
| 0.000%, 08/01/2034(Callable 02/01/2024) | | | 885,000 | | | | 800,730 | | | | | |
| City of Bakersfield CA, | | | | | | | | | | | | |
| 0.000%, 04/15/2021(ETM) | | | 12,380,000 | | | | 11,864,868 | | | | | |
| City of Pasadena CA, | | | | | | | | | | | | |
| 4.250%, 06/01/2034(Callable 06/01/2023) | | | 500,000 | | | | 526,265 | | | | | |
| Commerce Community Development Commission Successor Agency, | | | | | | | | | | | | |
| 0.000%, 08/01/2021(ETM) | | | 300,000 | | | | 267,591 | | | | | |
| Contra Costa Transportation Authority, | | | | | | | | | | | | |
| 5.000%, 03/01/2028(Callable 03/01/2025) | | | 1,535,000 | | | | 1,789,027 | | | | | |
| El Rancho Unified School District, | | | | | | | | | | | | |
| 0.000%, 08/01/2035(Pre-refunded to 08/01/2023)(Insured by BAM) | | | 300,000 | | | | 133,050 | | | | | |
| Los Angeles Department of Water & Power, | | | | | | | | | | | | |
| 1.460%, 07/01/2035(Optional Put Date 01/02/2019)(1) | | | 1,150,000 | | | | 1,150,000 | | | | | |
| Mendocino-Lake Community College District: | | | | | | | | | | | | |
| 0.000%, 08/01/2046(Pre-refunded to 08/01/2021)(Insured by AGM) | | | 100,000 | | | | 14,523 | | | | | |
| 0.000%, 08/01/2051(Pre-refunded to 08/01/2021)(Insured by AGM) | | | 1,285,000 | | | | 121,021 | | | | | |
| Metropolitan Water District of Southern California, | | | | | | | | | | | | |
| 5.000%, 07/01/2032(Callable 01/01/2026) | | | 4,555,000 | | | | 5,322,973 | | | | | |
| Mount San Antonio Community College District, | | | | | | | | | | | | |
| 0.000%, 08/01/2028(Callable 02/01/2028) | | | 550,000 | | | | 544,505 | | | | | |
| Northern California Power Agency, | | | | | | | | | | | | |
| 7.500%, 07/01/2023(Pre-refunded to 07/01/2021)(Insured by AMBAC) | | | 440,000 | | | | 483,868 | | | | | |
| Pajaro Valley Unified School District: | | | | | | | | | | | | |
| 5.000%, 08/01/2030(Callable 08/01/2019)(Insured by BAM)(3) | | | 235,000 | | | | 238,619 | | | | | |
| 5.000%, 08/01/2031(Callable 08/01/2019)(Insured by BAM)(3) | | | 275,000 | | | | 279,158 | | | | | |
| Pittsburg Unified School District Financing Authority, | | | | | | | | | | | | |
| 0.000%, 09/01/2040(Pre-refunded to 09/01/2021)(Insured by AGM) | | | 815,000 | | | | 184,443 | | | | | |
| Rio Hondo Community College District, | | | | | | | | | | | | |
| 0.000%, 08/01/2042(Callable 08/01/2034) | | | 6,445,000 | | | | 6,748,044 | | | | | |
| Roseville Joint Union School District, | | | | | | | | | | | | |
| 0.000%, 08/01/2039(Pre-refunded to 08/01/2021)(Insured by AGM) | | | 105,000 | | | | 25,030 | | | | | |
| San Diego Unified School District: | | | | | | | | | | | | |
| 0.000%, 07/01/2033(Pre-refunded to 07/01/2024) | | | 350,000 | | | | 410,210 | | | | | |
| 4.000%, 07/01/2034(Callable 07/01/2027) | | | 1,000,000 | | | | 1,068,300 | | | | | |
| San Joaquin Hills Transportation Corridor Agency: | | | | | | | | | | | | |
| 0.000%, 01/01/2020(ETM) | | | 6,865,000 | | | | 6,750,423 | | | | | |
| 0.000%, 01/01/2023(ETM) | | | 14,005,000 | | | | 12,975,773 | | | | | |
| 0.000%, 01/01/2027(ETM) | | | 1,380,000 | | | | 1,143,082 | | | | | |
| 0.000%, 01/01/2028(ETM) | | | 770,000 | | | | 614,706 | | | | | |
| San Marcos Public Facilities Authority, | | | | | | | | | | | | |
| 0.000%, 09/01/2019(ETM) | | | 17,495,000 | | | | 17,290,134 | | | | | |
| San Mateo Union High School District: | | | | | | | | | | | | |
| 5.000%, 09/01/2033(Callable 09/01/2023) | | | 190,000 | | | | 212,456 | | | | | |
| 5.000%, 09/01/2041(Callable 09/01/2023) | | | 2,105,000 | | | | 2,353,790 | | | | | |
| 0.000%, 12/15/2043(Pre-refunded to 12/15/2024)(Insured by AMBAC) | | | 1,375,000 | | | | 1,530,953 | | | | | |
| San Ysidro School District: | | | | | | | | | | | | |
| 0.000%, 08/01/2042(Pre-refunded to 08/01/2021)(Insured by AGM) | | | 375,000 | | | | 75,090 | | | | | |
| 0.000%, 08/01/2043(Pre-refunded to 08/01/2021)(Insured by AGM) | | | 290,000 | | | | 53,746 | | | | | |
| 0.000%, 08/01/2044(Pre-refunded to 08/01/2021)(Insured by AGM) | | | 150,000 | | | | 25,723 | | | | | |
| 0.000%, 08/01/2050(Pre-refunded to 08/01/2021)(Insured by AGM) | | | 525,000 | | | | 56,301 | | | | | |
| State of California, | | | | | | | | | | | | |
| 5.000%, 08/01/2031(Callable 02/01/2025) | | | 1,000,000 | | | | 1,136,510 | | | | | |
| Sutter Union High School District: | | | | | | | | | | | | |
| 0.000%, 08/01/2036(Pre-refunded to 08/01/2025) | | | 50,000 | | | | 19,849 | | | | | |
| 0.000%, 08/01/2037(Pre-refunded to 08/01/2025) | | | 50,000 | | | | 18,482 | | | | | |
| 0.000%, 08/01/2041(Pre-refunded to 08/01/2025) | | | 50,000 | | | | 13,842 | | | | | |
| 0.000%, 08/01/2043(Pre-refunded to 08/01/2025) | | | 200,000 | | | | 47,720 | | | | | |
| 0.000%, 08/01/2044(Pre-refunded to 08/01/2025) | | | 345,000 | | | | 76,376 | | | | | |
| 0.000%, 06/01/2050(Pre-refunded to 08/01/2025) | | | 700,000 | | | | 99,043 | | | | | |
| Tustin Unified School District, | | | | | | | | | | | | |
| 0.000%, 08/01/2028(Callable 08/01/2021) | | | 930,000 | | | | 996,030 | | | | | |
| Victor Valley Union High School District: | | | | | | | | | | | | |
| 0.000%, 08/01/2036(Pre-refunded to 08/01/2023)(Insured by AGM) | | | 510,000 | | | | 230,117 | | | | | |
| 0.000%, 08/01/2038(Pre-refunded to 08/01/2023)(Insured by AGM) | | | 460,000 | | | | 183,085 | | | | | |
| 0.000%, 08/01/2041(Pre-refunded to 08/01/2023) | | | 545,000 | | | | 181,610 | | | | | |
| 0.000%, 08/01/2042(Pre-refunded to 08/01/2023) | | | 2,000,000 | | | | 626,800 | | | | | |
| 0.000%, 08/01/2046(Pre-refunded to 08/01/2023) | | | 200,000 | | | | 49,082 | | | | | |
| 0.000%, 08/01/2052(Pre-refunded to 08/01/2023) | | | 790,000 | | | | 133,155 | | | | | |
| Westminster School District, | | | | | | | | | | | | |
| 0.000%, 08/01/2048(Callable 08/01/2023)(Insured by BAM) | | | 5,020,000 | | | | 801,142 | | | | | |
| | | | | | | | 82,775,742 | | | | 7.5 | % |
| Colorado | | | | | | | | | | | | |
| Brush School District No. RE-2J: | | | | | | | | | | | | |
| 5.000%, 12/01/2030(Callable 12/01/2027)(Insured by BAM) | | | 160,000 | | | | 188,138 | | | | | |
| 5.000%, 12/01/2031(Callable 12/01/2027)(Insured by BAM) | | | 380,000 | | | | 444,862 | | | | | |
| 5.000%, 12/01/2032(Callable 12/01/2027)(Insured by BAM) | | | 395,000 | | | | 461,407 | | | | | |
| 5.000%, 12/01/2035(Callable 12/01/2027)(Insured by BAM) | | | 460,000 | | | | 531,461 | | | | | |
| City of Fort Lupton CO, | | | | | | | | | | | | |
| 4.000%, 12/01/2042(Callable 12/01/2027)(Insured by AGM) | | | 850,000 | | | | 875,049 | | | | | |
| Colorado Health Facilities Authority, | | | | | | | | | | | | |
| 0.000%, 07/15/2022(ETM) | | | 6,505,000 | | | | 6,016,865 | | | | | |
| Colorado School of Mines, | | | | | | | | | | | | |
| 5.000%, 12/01/2027(Insured by ST) | | | 175,000 | | | | 209,134 | | | | | |
| Dawson Ridge Metropolitan District No. 1: | | | | | | | | | | | | |
| 0.000%, 10/01/2022(ETM) | | | 38,235,000 | | | | 35,318,817 | | | | | |
| 0.000%, 10/01/2022(ETM) | | | 23,665,000 | | | | 21,860,070 | | | | | |
| Mesa County Valley School District No. 51, | | | | | | | | | | | | |
| 5.500%, 12/01/2037(Callable 12/01/2027)(Insured by ST) | | | 1,000,000 | | | | 1,201,990 | | | | | |
| Regional Transportation District, | | | | | | | | | | | | |
| 4.375%, 06/01/2039(Callable 06/01/2023) | | | 5,725,000 | | | | 5,999,571 | | | | | |
| | | | | | | | 73,107,364 | | | | 6.5 | % |
| Connecticut | | | | | | | | | | | | |
| Connecticut Housing Finance Authority, | | | | | | | | | | | | |
| 4.000%, 11/15/2047(Callable 11/15/2026) | | | 1,710,000 | | | | 1,788,181 | | | | | |
| Harbor Point Infrastructure Improvement District, | | | | | | | | | | | | |
| 7.875%, 04/01/2039(Pre-refunded to 04/01/2020) | | | 100,000 | | | | 107,322 | | | | | |
| University of Connecticut, | | | | | | | | | | | | |
| 5.000%, 01/15/2031(Callable 01/15/2027)(Insured by AGM) | | | 1,250,000 | | | | 1,425,363 | | | | | |
| | | | | | | | 3,320,866 | | | | 0.3 | % |
| District of Columbia | | | | | | | | | | | | |
| District of Columbia, | | | | | | | | | | | | |
| 5.000%, 06/01/2035(Callable 06/01/2024) | | | 915,000 | | | | 1,019,777 | | | | 0.1 | % |
| | | | | | | | | | | | | |
| Florida | | | | | | | | | | | | |
| City of Fort Myers FL, | | | | | | | | | | | | |
| 4.000%, 12/01/2037(Callable 12/01/2025) | | | 480,000 | | | | 491,645 | | | | | |
| City of Miami Beach FL, | | | | | | | | | | | | |
| 6.250%, 10/01/2022(ETM)(Insured by AMBAC) | | | 1,035,000 | | | | 1,127,736 | | | | | |
| City of Miramar FL: | | | | | | | | | | | | |
| 5.000%, 10/01/2029(Callable 10/01/2027) | | | 1,025,000 | | | | 1,219,801 | | | | | |
| 5.000%, 10/01/2030(Callable 10/01/2027) | | | 1,000,000 | | | | 1,184,020 | | | | | |
| 5.000%, 10/01/2034(Callable 10/01/2027) | | | 1,000,000 | | | | 1,167,860 | | | | | |
| 5.000%, 10/01/2035(Callable 10/01/2027) | | | 1,030,000 | | | | 1,199,425 | | | | | |
| City of Orlando FL, | | | | | | | | | | | | |
| 5.000%, 11/01/2034(Callable 11/01/2027)(Insured by AGM) | | | 1,000,000 | | | | 1,134,140 | | | | | |
| City of Tallahassee FL: | | | | | | | | | | | | |
| 5.000%, 10/01/2033(Callable 10/01/2024) | | | 255,000 | | | | 288,469 | | | | | |
| 5.000%, 10/01/2034(Callable 10/01/2024) | | | 1,000,000 | | | | 1,129,540 | | | | | |
| 5.000%, 10/01/2035(Callable 10/01/2024) | | | 825,000 | | | | 929,519 | | | | | |
| County of Miami-Dade FL: | | | | | | | | | | | | |
| 4.500%, 10/01/2020 | | | 7,100,000 | | | | 7,416,305 | | | | | |
| 5.250%, 10/01/2022(Insured by AGM) | | | 1,140,000 | | | | 1,272,992 | | | | | |
| 5.250%, 10/01/2030(ETM)(Insured by NATL) | | | 1,960,000 | | | | 2,410,702 | | | | | |
| County of Seminole FL, | | | | | | | | | | | | |
| 6.000%, 10/01/2019(ETM)(Insured by NATL) | | | 1,280,000 | | | | 1,320,115 | | | | | |
| Escambia County Housing Finance Authority, | | | | | | | | | | | | |
| 2.050%, 05/01/2021(Mandatory Tender Date 05/01/2020)(1) | | | 1,500,000 | | | | 1,500,180 | | | | | |
| Florida Department of Management Services, | | | | | | | | | | | | |
| 5.000%, 11/01/2029 | | | 2,485,000 | | | | 3,065,745 | | | | | |
| JEA Water & Sewer System Revenue, | | | | | | | | | | | | |
| 5.000%, 10/01/2028(Pre-refunded to 04/01/2024) | | | 705,000 | | | | 806,379 | | | | | |
| Lee County School Board, | | | | | | | | | | | | |
| 5.000%, 08/01/2032(Callable 08/01/2026) | | | 1,000,000 | | | | 1,139,000 | | | | | |
| Miami-Dade County Health Facilities Authority, | | | | | | | | | | | | |
| 5.750%, 05/01/2021(ETM)(Insured by NATL) | | | 750,000 | | | | 785,940 | | | | | |
| Mid-Bay Bridge Authority: | | | | | | | | | | | | |
| 6.875%, 10/01/2022(ETM) | | | 3,895,000 | | | | 4,284,228 | | | | | |
| 6.875%, 10/01/2022(ETM)(Insured by AMBAC) | | | 2,670,000 | | | | 2,956,197 | | | | | |
| Orange County School Board, | | | | | | | | | | | | |
| 5.000%, 08/01/2029(Pre-refunded to 08/01/2024) | | | 165,000 | | | | 190,717 | | | | | |
| Pinellas County Housing Finance Authority, | | | | | | | | | | | | |
| 4.250%, 03/01/2027(Callable 09/01/2019)(Insured by GNMA) | | | 345,000 | | | | 349,288 | | | | | |
| Reedy Creek Improvement District: | | | | | | | | | | | | |
| 5.000%, 10/01/2030(Callable 10/01/2028) | | | 130,000 | | | | 154,359 | | | | | |
| 5.000%, 10/01/2031(Callable 10/01/2028) | | | 310,000 | | | | 365,769 | | | | | |
| School Board of Miami-Dade County, | | | | | | | | | | | | |
| 5.000%, 03/15/2039(Callable 03/15/2024) | | | 2,000,000 | | | | 2,227,860 | | | | | |
| School District of Broward County: | | | | | | | | | | | | |
| 5.250%, 07/01/2022(Pre-refunded to 07/01/2021) | | | 8,445,000 | | | | 9,146,104 | | | | | |
| 5.250%, 07/01/2023(Pre-refunded to 07/01/2021) | | | 4,915,000 | | | | 5,323,043 | | | | | |
| Seminole County School Board, | | | | | | | | | | | | |
| 5.000%, 07/01/2035(Callable 07/01/2026) | | | 145,000 | | | | 164,543 | | | | | |
| State of Florida, | | | | | | | | | | | | |
| 5.000%, 06/01/2022(Callable 06/01/2019) | | | 13,800,000 | | | | 13,976,364 | | | | | |
| Tampa Bay Water, | | | | | | | | | | | | |
| 5.000%, 10/01/2019(ETM) | | | 1,760,000 | | | | 1,800,885 | | | | | |
| | | | | | | | 70,528,870 | | | | 6.3 | % |
| Georgia | | | | | | | | | | | | |
| Atlanta Development Authority: | | | | | | | | | | | | |
| 5.000%, 09/01/2023(ETM) | | | 2,450,000 | | | | 2,761,517 | | | | | |
| 5.000%, 09/01/2024(Pre-refunded to 09/01/2023) | | | 810,000 | | | | 912,992 | | | | | |
| 5.000%, 09/01/2032(Pre-refunded to 09/01/2023) | | | 1,315,000 | | | | 1,482,202 | | | | | |
| Forsyth County Hospital Authority, | | | | | | | | | | | | |
| 6.375%, 10/01/2028(ETM) | | | 8,050,000 | | | | 9,768,353 | | | | | |
| Georgia Housing & Finance Authority, | | | | | | | | | | | | |
| 3.500%, 12/01/2046(Callable 12/01/2025) | | | 1,070,000 | | | | 1,097,189 | | | | | |
| Richmond County Development Authority: | | | | | | | | | | | | |
| 0.000%, 12/01/2021(ETM) | | | 1,835,000 | | | | 1,724,735 | | | | | |
| 0.000%, 12/01/2021(ETM) | | | 4,025,000 | | | | 3,783,138 | | | | | |
| | | | | | | | 21,530,126 | | | | 1.9 | % |
| Illinois | | | | | | | | | | | | |
| Boone & Winnebago Counties Community Unit School District No. 200, | | | | | | | | | | | | |
| 0.000%, 01/01/2024(ETM)(Insured by AGM) | | | 385,000 | | | | 343,274 | | | | | |
| City of Chicago IL, | | | | | | | | | | | | |
| 5.000%, 01/01/2034(Pre-refunded to 01/01/2025) | | | 2,170,000 | | | | 2,516,093 | | | | | |
| Cook County Community High School District No. 233, | | | | | | | | | | | | |
| 4.000%, 12/01/2026(Callable 06/01/2022) | | | 2,695,000 | | | | 2,829,939 | | | | | |
| Cook County Illinois School District No. 159: | | | | | | | | | | | | |
| 0.000%, 12/01/2022(ETM) | | | 2,000,000 | | | | 1,836,680 | | | | | |
| 0.000%, 12/01/2025(ETM) | | | 275,000 | | | | 231,929 | | | | | |
| 0.000%, 12/01/2028(ETM) | | | 165,000 | | | | 126,486 | | | | | |
| Cook County Illinois School District No. 163: | | | | | | | | | | | | |
| 6.000%, 12/15/2026(Insured by BAM) | | | 1,165,000 | | | | 1,404,885 | | | | | |
| 5.000%, 12/15/2028(Insured by BAM) | | | 1,305,000 | | | | 1,499,902 | | | | | |
| Cook County School District No. 130, | | | | | | | | | | | | |
| 5.000%, 12/01/2026(Callable 12/01/2025)(Insured by AGM) | | | 1,140,000 | | | | 1,282,090 | | | | | |
| Cook County School District No. 144, | | | | | | | | | | | | |
| 4.500%, 12/01/2025(ETM)(Insured by AGM) | | | 105,000 | | | | 115,057 | | | | | |
| County of Cook IL: | | | | | | | | | | | | |
| 5.000%, 11/15/2033(Callable 11/15/2027) | | | 3,000,000 | | | | 3,413,880 | | | | | |
| 5.000%, 11/15/2034(Callable 11/15/2027) | | | 4,325,000 | | | | 4,900,268 | | | | | |
| County of Du Page IL, | | | | | | | | | | | | |
| 5.600%, 01/01/2021 | | | 520,000 | | | | 539,698 | | | | | |
| Illinois Development Finance Authority: | | | | | | | | | | | | |
| 0.000%, 07/15/2023(ETM) | | | 26,755,000 | | | | 24,087,794 | | | | | |
| 0.000%, 07/15/2025(ETM) | | | 45,085,000 | | | | 38,404,305 | | | | | |
| Illinois Finance Authority: | | | | | | | | | | | | |
| 6.250%, 05/01/2022(Pre-refunded to 05/01/2020) | | | 2,550,000 | | | | 2,695,019 | | | | | |
| 5.000%, 12/01/2030(Pre-refunded to 12/01/2021) | | | 6,825,000 | | | | 7,403,146 | | | | | |
| 5.000%, 07/01/2031(Callable 01/01/2026) | | | 1,200,000 | | | | 1,369,920 | | | | | |
| 6.625%, 11/01/2039(Pre-refunded to 05/01/2019) | | | 395,000 | | | | 401,288 | | | | | |
| Illinois Housing Development Authority: | | | | | | | | | | | | |
| 3.100%, 02/01/2035(Callable 02/01/2026) | | | 2,715,000 | | | | 2,579,060 | | | | | |
| 3.500%, 08/01/2046(Callable 02/01/2026) | | | 790,000 | | | | 809,418 | | | | | |
| 4.000%, 08/01/2048(Callable 08/01/2027)(Insured by GNMA) | | | 885,000 | | | | 930,967 | | | | | |
| Kane County Community Unit School District No. 304: | | | | | | | | | | | | |
| 9.000%, 01/01/2023(ETM)(Insured by AGM) | | | 805,000 | | | | 1,015,339 | | | | | |
| 9.000%, 01/01/2023(Insured by AGM) | | | 2,720,000 | | | | 3,411,723 | | | | | |
| Kane McHenry Cook & De Kalb Counties Unit School District No. 300, | | | | | | | | | | | | |
| 5.000%, 01/01/2032(Callable 01/01/2027) | | | 2,060,000 | | | | 2,304,316 | | | | | |
| Kendall Kane & Will Counties Community Unit School District No. 308, | | | | | | | | | | | | |
| 0.000%, 02/01/2021(Insured by AGM) | | | 13,625,000 | | | | 12,974,134 | | | | | |
| Lake County Community Consolidated School District No. 50: | | | | | | | | | | | | |
| 5.000%, 01/01/2021(ETM) | | | 910,000 | | | | 964,955 | | | | | |
| 5.000%, 01/01/2021 | | | 465,000 | | | | 491,300 | | | | | |
| Metropolitan Pier & Exposition Authority, | | | | | | | | | | | | |
| 5.500%, 12/15/2023(ETM) | | | 2,310,000 | | | | 2,501,961 | | | | | |
| Metropolitan Water Reclamation District of Greater Chicago: | | | | | | | | | | | | |
| 5.000%, 12/01/2031(Callable 12/01/2021) | | | 4,800,000 | | | | 5,122,272 | | | | | |
| 5.000%, 12/01/2034(Callable 12/01/2026) | | | 295,000 | | | | 329,659 | | | | | |
| Public Building Commission of Chicago, | | | | | | | | | | | | |
| 7.000%, 01/01/2020(ETM)(Insured by NATL) | | | 1,555,000 | | | | 1,593,890 | | | | | |
| Regional Transportation Authority: | | | | | | | | | | | | |
| 7.750%, 06/01/2020(Insured by NATL) | | | 385,000 | | | | 405,101 | | | | | |
| 6.700%, 11/01/2021(Insured by NATL) | | | 585,000 | | | | 634,584 | | | | | |
| 6.000%, 07/01/2022(Insured by NATL) | | | 3,705,000 | | | | 4,181,389 | | | | | |
| 6.000%, 07/01/2027(Insured by AGM) | | | 1,000,000 | | | | 1,242,990 | | | | | |
| Sales Tax Securitization Corp., | | | | | | | | | | | | |
| 5.000%, 01/01/2029 | | | 1,000,000 | | | | 1,144,640 | | | | | |
| Southwestern Illinois Development Authority, | | | | | | | | | | | | |
| 7.625%, 11/01/2048(Pre-refunded to 11/01/2023) | | | 6,085,000 | | | | 7,614,221 | | | | | |
| State of Illinois: | | | | | | | | | | | | |
| 6.500%, 06/15/2022 | | | 145,000 | | | | 151,509 | | | | | |
| 4.000%, 06/15/2038(Callable 06/15/2028)(Insured by BAM) | | | 1,850,000 | | | | 1,810,762 | | | | | |
| Village of Oak Park IL, | | | | | | | | | | | | |
| 2.000%, 11/01/2019 | | | 650,000 | | | | 649,577 | | | | | |
| Village of Schaumburg IL, | | | | | | | | | | | | |
| 4.000%, 12/01/2024(Callable 12/01/2022) | | | 5,750,000 | | | | 6,140,195 | | | | | |
| Will County Community High School District No. 210: | | | | | | | | | | | | |
| 0.000%, 01/01/2024(ETM)(Insured by AGM) | | | 1,350,000 | | | | 1,194,818 | | | | | |
| 0.000%, 01/01/2025(ETM)(Insured by AGM) | | | 25,000 | | | | 21,515 | | | | | |
| Will County Community Unit School District No. 201-U, | | | | | | | | | | | | |
| 0.000%, 11/01/2024(ETM)(Insured by NATL) | | | 705,000 | | | | 609,613 | | | | | |
| | | | | | | | 156,231,561 | | | | 14.0 | % |
| Indiana | | | | | | | | | | | | |
| Carmel Redevelopment Authority, | | | | | | | | | | | | |
| 4.000%, 08/01/2033(Callable 08/01/2022) | | | 1,000,000 | | | | 1,041,600 | | | | | |
| Columbus Multi-High School Building Corp.: | | | | | | | | | | | | |
| 5.000%, 01/15/2026(Insured by ST) | | | 1,125,000 | | | | 1,313,258 | | | | | |
| 5.000%, 01/15/2027(Insured by ST) | | | 1,265,000 | | | | 1,492,864 | | | | | |
| 5.000%, 07/15/2028(Insured by ST) | | | 1,000,000 | | | | 1,194,960 | | | | | |
| Fort Wayne Redevelopment Authority, | | | | | | | | | | | | |
| 5.000%, 02/01/2025(Callable 02/01/2024)(Insured by ST) | | | 335,000 | | | | 378,278 | | | | | |
| Franklin Community Multi-School Building Corp., | | | | | | | | | | | | |
| 5.000%, 07/15/2020(Insured by NATL) | | | 1,990,000 | | | | 2,084,943 | | | | | |
| Kankakee Valley Middle School Building Corp.: | | | | | | | | | | | | |
| 5.000%, 01/15/2029(Insured by ST) | | | 475,000 | | | | 562,201 | | | | | |
| 5.000%, 07/15/2029(Insured by ST) | | | 1,180,000 | | | | 1,401,167 | | | | | |
| | | | | | | | 9,469,271 | | | | 0.8 | % |
| Iowa | | | | | | | | | | | | |
| Iowa Finance Authority, | | | | | | | | | | | | |
| 4.000%, 07/01/2047(Callable 07/01/2027)(Insured by GNMA) | | | 850,000 | | | | 895,348 | | | | | |
| Iowa Higher Education Loan Authority: | | | | | | | | | | | | |
| 4.500%, 10/01/2033(Pre-refunded to 10/01/2021) | | | 2,100,000 | | | | 2,242,947 | | | | | |
| 5.000%, 10/01/2038(Pre-refunded to 10/01/2021) | | | 2,090,000 | | | | 2,260,063 | | | | | |
| | | | | | | | 5,398,358 | | | | 0.5 | % |
| Kansas | | | | | | | | | | | | |
| City of Wichita KS: | | | | | | | | | | | | |
| 5.000%, 11/15/2020(ETM) | | | 1,120,000 | | | | 1,183,358 | | | | | |
| 5.000%, 11/15/2029(Pre-refunded to 11/15/2021) | | | 40,000 | | | | 43,338 | | | | | |
| | | | | | | | 1,226,696 | | | | 0.1 | % |
| Kentucky | | | | | | | | | | | | |
| Kentucky Infrastructure Authority: | | | | | | | | | | | | |
| 5.000%, 02/01/2023(Pre-refunded to 02/01/2022) | | | 70,000 | | | | 76,544 | | | | | |
| 5.000%, 02/01/2025(Pre-refunded to 02/01/2022) | | | 70,000 | | | | 76,544 | | | | | |
| 5.000%, 02/01/2026(Pre-refunded to 02/01/2022) | | | 75,000 | | | | 82,012 | | | | | |
| | | | | | | | 235,100 | | | | 0.0 | % |
| Louisiana | | | | | | | | | | | | |
| Jefferson Parish Hospital Service District, | | | | | | | | | | | | |
| 6.000%, 01/01/2039(Pre-refunded to 01/01/2021) | | | 1,080,000 | | | | 1,164,057 | | | | | |
| Louisiana Public Facilities Authority: | | | | | | | | | | | | |
| 5.500%, 05/15/2027(Pre-refunded to 05/15/2026) | | | 26,690,000 | | | | 31,720,264 | | | | | |
| 5.500%, 05/15/2032(Pre-refunded to 05/15/2026) | | | 22,180,000 | | | | 27,014,131 | | | | | |
| State of Louisiana, | | | | | | | | | | | | |
| 5.000%, 05/01/2027(Pre-refunded to 05/01/2022) | | | 1,390,000 | | | | 1,527,332 | | | | | |
| | | | | | | | 61,425,784 | | | | 5.4 | % |
| Maryland | | | | | | | | | | | | |
| City of Baltimore MD, | | | | | | | | | | | | |
| 5.000%, 07/01/2024(ETM) | | | 1,220,000 | | | | 1,360,373 | | | | | |
| Maryland Health & Higher Educational Facilities Authority, | | | | | | | | | | | | |
| 5.000%, 07/01/2027(ETM)(Insured by AMBAC) | | | 1,675,000 | | | | 1,896,619 | | | | | |
| State of Maryland: | | | | | | | | | | | | |
| 4.000%, 06/01/2030(Callable 06/01/2024) | | | 5,790,000 | | | | 6,199,643 | | | | | |
| 5.000%, 08/01/2031(Callable 08/01/2028) | | | 9,835,000 | | | | 11,898,875 | | | | | |
| | | | | | | | 21,355,510 | | | | 1.9 | % |
| Massachusetts | | | | | | | | | | | | |
| Commonwealth of Massachusetts, | | | | | | | | | | | | |
| 4.000%, 12/01/2022(Pre-refunded to 12/01/2019) | | | 15,000,000 | | | | 15,295,350 | | | | | |
| Massachusetts Department of Transportation, | | | | | | | | | | | | |
| 5.000%, 01/01/2020(ETM) | | | 815,000 | | | | 826,345 | | | | | |
| Massachusetts Development Finance Agency, | | | | | | | | | | | | |
| 5.000%, 07/15/2033(Callable 07/15/2026) | | | 625,000 | | | | 735,900 | | | | | |
| Massachusetts Housing Finance Agency: | | | | | | | | | | | | |
| 4.000%, 12/01/2044(Callable 06/01/2025) | | | 1,420,000 | | | | 1,473,236 | | | | | |
| 4.000%, 12/01/2048(Callable 06/01/2027)(Insured by GNMA) | | | 1,615,000 | | | | 1,701,967 | | | | | |
| Massachusetts Water Resources Authority, | | | | | | | | | | | | |
| 6.500%, 07/15/2019(ETM) | | | 220,000 | | | | 225,522 | | | | | |
| | | | | | | | 20,258,320 | | | | 1.8 | % |
| Michigan | | | | | | | | | | | | |
| Algonac Community Schools: | | | | | | | | | | | | |
| 4.000%, 05/01/2028(Callable 05/01/2027)(Insured by Q-SBLF) | | | 175,000 | | | | 187,124 | | | | | |
| 4.000%, 05/01/2029(Callable 05/01/2027)(Insured by Q-SBLF) | | | 370,000 | | | | 393,887 | | | | | |
| 4.000%, 05/01/2030(Callable 05/01/2027)(Insured by Q-SBLF) | | | 470,000 | | | | 498,012 | | | | | |
| Brighton Area School District, | | | | | | | | | | | | |
| 5.000%, 05/01/2021(Insured by Q-SBLF) | | | 500,000 | | | | 533,345 | | | | | |
| Ecorse Public School District, | | | | | | | | | | | | |
| 5.000%, 05/01/2027(Insured by Q-SBLF) | | | 515,000 | | | | 608,267 | | | | | |
| Fraser Public School District, | | | | | | | | | | | | |
| 5.000%, 05/01/2024(Insured by Q-SBLF) | | | 1,000,000 | | | | 1,136,780 | | | | | |
| Michigan Finance Authority, | | | | | | | | | | | | |
| 5.000%, 06/01/2027(Pre-refunded to 06/01/2022) | | | 1,315,000 | | | | 1,445,343 | | | | | |
| Michigan State Housing Development Authority, | | | | | | | | | | | | |
| 4.000%, 06/01/2046(Callable 12/01/2025) | | | 3,140,000 | | | | 3,268,049 | | | | | |
| Pinckney Community Schools: | | | | | | | | | | | | |
| 5.000%, 05/01/2022(Insured by Q-SBLF) | | | 1,935,000 | | | | 2,114,394 | | | | | |
| 5.000%, 05/01/2023(Insured by Q-SBLF) | | | 2,200,000 | | | | 2,454,826 | | | | | |
| State of Michigan, | | | | | | | | | | | | |
| 0.000%, 06/01/2022(ETM)(Insured by AMBAC) | | | 2,000,000 | | | | 1,861,820 | | | | | |
| Warren Consolidated Schools: | | | | | | | | | | | | |
| 5.000%, 05/01/2033(Callable 05/01/2026)(Insured by Q-SBLF) | | | 2,595,000 | | | | 2,917,688 | | | | | |
| 5.000%, 05/01/2033(Callable 05/01/2026)(Insured by Q-SBLF) | | | 4,660,000 | | | | 5,239,471 | | | | | |
| 5.000%, 05/01/2035(Callable 05/01/2026)(Insured by Q-SBLF) | | | 925,000 | | | | 1,031,671 | | | | | |
| | | | | | | | 23,690,677 | | | | 2.1 | % |
| Minnesota | | | | | | | | | | | | |
| County of Hennepin MN, | | | | | | | | | | | | |
| 4.000%, 12/01/2025(Callable 12/01/2022) | | | 3,000,000 | | | | 3,212,910 | | | | | |
| Minneapolis-Saint Paul Metropolitan Airports Commission, | | | | | | | | | | | | |
| 5.000%, 01/01/2032(Callable 01/01/2027) | | | 505,000 | | | | 589,199 | | | | | |
| Minnesota Housing Finance Agency: | | | | | | | | | | | | |
| 4.250%, 07/01/2028(Callable 01/01/2020)(Insured by GNMA) | | | 85,000 | | | | 85,944 | | | | | |
| 4.500%, 07/01/2034(Callable 07/01/2021)(Insured by GNMA) | | | 355,000 | | | | 366,012 | | | | | |
| 4.000%, 07/01/2047(Callable 01/01/2027)(Insured by GNMA) | | | 510,000 | | | | 532,512 | | | | | |
| University of Minnesota, | | | | | | | | | | | | |
| 5.500%, 07/01/2021(ETM) | | | 11,260,000 | | | | 11,847,772 | | | | | |
| | | | | | | | 16,634,349 | | | | 1.5 | % |
| Mississippi | | | | | | | | | | | | |
| Mississippi Development Bank: | | | | | | | | | | | | |
| 5.000%, 03/01/2029(Callable 03/01/2027) | | | 825,000 | | | | 955,267 | | | | | |
| 5.250%, 03/01/2035(Callable 03/01/2028) | | | 495,000 | | | | 571,181 | | | | | |
| Mississippi Home Corp., | | | | | | | | | | | | |
| 2.400%, 02/01/2022(Mandatory Tender Date 08/01/2021)(1) | | | 2,000,000 | | | | 1,998,980 | | | | | |
| Oxford School District, | | | | | | | | | | | | |
| 4.000%, 05/01/2027 | | | 500,000 | | | | 551,310 | | | | | |
| State of Mississippi, | | | | | | | | | | | | |
| 5.000%, 10/01/2028(Callable 10/01/2027) | | | 1,050,000 | | | | 1,260,473 | | | | | |
| West Rankin Utility Authority, | | | | | | | | | | | | |
| 5.000%, 01/01/2038(Callable 01/01/2025)(Insured by AGM) | | | 500,000 | | | | 554,780 | | | | | |
| | | | | | | | 5,891,991 | | | | 0.5 | % |
| Missouri | | | | | | | | | |
| Jackson County School District No. R-IV, | | | | | | | | | |
| 5.500%, 03/01/2037(Callable 03/01/2029)(Insured by ST) | | | 1,000,000 | | | | 1,227,360 | | | | |
| Missouri Housing Development Commission: | | | | | | | | | | | |
| 3.950%, 11/01/2040(Callable 05/01/2025)(Insured by GNMA) | | | 2,425,000 | | | | 2,477,113 | | | | |
| 4.000%, 05/01/2042(Callable 11/01/2026)(Insured by GNMA) | | | 1,260,000 | | | | 1,320,934 | | | | |
| St. Charles County School District No. R-IV, | | | | | | | | | | | |
| 4.000%, 03/01/2029(Callable 03/01/2026)(Insured by ST) | | | 600,000 | | | | 653,316 | | | | |
| Webster Groves School District: | | | | | | | | | | | |
| 4.000%, 03/01/2028(Callable 03/01/2026) | | | 910,000 | | | | 1,000,845 | | | | |
| 4.000%, 03/01/2029(Callable 03/01/2026) | | | 1,370,000 | | | | 1,502,054 | | | | |
| | | | | | | | 8,181,622 | | | | 0.7 | % |
| Montana | | | | | | | | | | | | |
| Flathead County School District No. 44, | | | | | | | | | | | | |
| 4.000%, 07/01/2036(Callable 07/01/2028) | | | 210,000 | | | | 222,602 | | | | | |
| Montana Facility Finance Authority: | | | | | | | | | | | | |
| 5.000%, 07/01/2028(Callable 07/01/2027) | | | 430,000 | | | | 511,812 | | | | | |
| 5.000%, 07/01/2029(Callable 07/01/2027) | | | 535,000 | | | | 633,643 | | | | | |
| | | | | | | | 1,368,057 | | | | 0.1 | % |
| Nebraska | | | | | | | | | | | | |
| Village of Boys Town NE, | | | | | | | | | | | | |
| 3.000%, 09/01/2028 | | | 4,500,000 | | | | 4,514,940 | | | | 0.4 | % |
| | | | | | | | | | | | | |
| Nevada | | | | | | | | | | | | |
| County of Clark NV, | | | | | | | | | | | | |
| 5.000%, 07/01/2033(Callable 07/01/2024) | | | 1,925,000 | | | | 2,148,627 | | | | 0.2 | % |
| | | | | | | | | | | | | |
| New Hampshire | | | | | | | | | | | | |
| New Hampshire Housing Finance Authority, | | | | | | | | | | | | |
| 5.250%, 07/01/2028(Callable 01/01/2021) | | | 775,000 | | | | 799,110 | | | | | |
| State of New Hampshire, | | | | | | | | | | | | |
| 5.000%, 07/01/2021(Callable 07/01/2020) | | | 1,000,000 | | | | 1,045,610 | | | | | |
| | | | | | | | 1,844,720 | | | | 0.2 | % |
| New Jersey | | | | | | | | | | | | |
| New Jersey Building Authority, | | | | | | | | | | | | |
| 5.000%, 06/15/2024(ETM) | | | 1,410,000 | | | | 1,618,737 | | | | | |
| New Jersey Economic Development Authority, | | | | | | | | | | | | |
| 0.000%, 07/01/2025(ETM)(Insured by NATL) | | | 100,000 | | | | 84,718 | | | | | |
| New Jersey Health Care Facilities Financing Authority, | | | | | | | | | | | | |
| 0.000%, 07/01/2023(ETM)(Insured by NATL) | | | 180,000 | | | | 162,563 | | | | | |
| New Jersey Housing & Mortgage Finance Agency, | | | | | | | | | | | | |
| 4.500%, 10/01/2048(Callable 10/01/2027) | | | 1,655,000 | | | | 1,776,924 | | | | | |
| New Jersey Transportation Trust Fund Authority, | | | | | | | | | | | | |
| 5.250%, 12/15/2020 | | | 5,000,000 | | | | 5,272,750 | | | | | |
| | | | | | | | 8,915,692 | | | | 0.8 | % |
| New Mexico | | | | | | | | | | | | |
| New Mexico Finance Authority, | | | | | | | | | | | | |
| 4.000%, 06/01/2029(Callable 06/01/2026) | | | 2,615,000 | | | | 2,858,456 | | | | | |
| New Mexico Mortgage Financial Authority: | | | | | | | | | | | | |
| 4.625%, 09/01/2025(Callable 03/01/2020)(Insured by GNMA) | | | 515,000 | | | | 522,164 | | | | | |
| 4.500%, 09/01/2028(Callable 03/01/2020)(Insured by GNMA) | | | 145,000 | | | | 146,776 | | | | | |
| 3.550%, 09/01/2037(Callable 03/01/2027)(Insured by GNMA) | | | 1,160,000 | | | | 1,138,192 | | | | | |
| | | | | | | | 4,665,588 | | | | 0.4 | % |
| New York | | | | | | | | | | | | |
| City of New York NY, | | | | | | | | | | | | |
| 5.000%, 08/01/2022 | | | 5,000,000 | | | | 5,524,450 | | | | | |
| Metropolitan Transportation Authority: | | | | | | | | | | | | |
| 6.000%, 04/01/2020(ETM)(Insured by NATL) | | | 7,225,000 | | | | 7,428,601 | | | | | |
| 5.000%, 11/15/2028(Pre-refunded to 11/15/2023) | | | 210,000 | | | | 240,435 | | | | | |
| New York City Transitional Finance Authority: | | | | | | | | | | | | |
| 5.000%, 08/01/2029(Callable 08/01/2026) | | | 1,525,000 | | | | 1,777,509 | | | | | |
| 5.000%, 08/01/2033(Callable 08/01/2026) | | | 2,835,000 | | | | 3,251,887 | | | | | |
| New York City Water & Sewer System, | | | | | | | | | | | | |
| 5.000%, 06/15/2032(Callable 12/15/2025) | | | 6,500,000 | | | | 7,499,375 | | | | | |
| New York State Dormitory Authority: | | | | | | | | | | | | |
| 5.000%, 02/15/2030(Callable 08/15/2026) | | | 700,000 | | | | 815,388 | | | | | |
| 5.000%, 03/15/2030(Callable 03/15/2024) | | | 6,685,000 | | | | 7,554,117 | | | | | |
| 5.000%, 03/15/2033(Callable 03/15/2025) | | | 5,000,000 | | | | 5,646,200 | | | | | |
| New York State Urban Development Corp.: | | | | | | | | | | | | |
| 5.000%, 03/15/2022 | | | 2,015,000 | | | | 2,209,971 | | | | | |
| 5.000%, 03/15/2032(Callable 03/15/2024) | | | 6,000,000 | | | | 6,745,620 | | | | | |
| | | | | | | | 48,693,553 | | | | 4.5 | % |
| North Carolina | | | | | | | | | | | | |
| North Carolina Eastern Municipal Power Agency: | | | | | | | | | | | | |
| 5.000%, 01/01/2021(Callable 01/31/2019)(ETM) | | | 10,385,000 | | | | 10,855,441 | | | | | |
| 6.400%, 01/01/2021(ETM) | | | 2,592,000 | | | | 2,703,715 | | | | | |
| 4.500%, 01/01/2024(Pre-refunded to 01/01/2022) | | | 12,170,000 | | | | 12,833,873 | | | | | |
| North Carolina Medical Care Commission, | | | | | | | | | | | | |
| 5.750%, 01/01/2035(Pre-refunded to 01/01/2021) | | | 525,000 | | | | 564,375 | | | | | |
| State of North Carolina, | | | | | | | | | | | | |
| 5.000%, 05/01/2024(Callable 05/01/2023) | | | 1,000,000 | | | | 1,122,870 | | | | | |
| | | | | | | | 28,080,274 | | | | 2.5 | % |
| North Dakota | | | | | | | | | | | | |
| County of Burleigh ND: | | | | | | | | | | | | |
| 5.000%, 07/01/2025(Pre-refunded to 07/01/2021) | | | 1,500,000 | | | | 1,609,725 | | | | | |
| 5.000%, 07/01/2029(Pre-refunded to 07/01/2021) | | | 470,000 | | | | 504,381 | | | | | |
| 4.000%, 11/01/2029(Callable 11/01/2022)(Insured by AGM) | | | 425,000 | | | | 445,111 | | | | | |
| North Dakota Housing Finance Agency: | | | | | | | | | | | | |
| 3.450%, 07/01/2037(Callable 07/01/2026)(Insured by FHA) | | | 3,050,000 | | | | 2,972,499 | | | | | |
| 3.500%, 07/01/2046(Callable 01/01/2026) | | | 1,340,000 | | | | 1,379,517 | | | | | |
| | | | | | | | 6,911,233 | | | | 0.6 | % |
| Ohio | | | | | | | | | | | | |
| Akron Bath Copley Joint Township Hospital District, | | | | | | | | | | | | |
| 3.800%, 01/01/2027(Pre-refunded to 01/01/2022) | | | 920,000 | | | | 948,134 | | | | | |
| City of Bowling Green OH, | | | | | | | | | | | | |
| 5.750%, 06/01/2031(Pre-refunded to 06/01/2020) | | | 750,000 | | | | 790,650 | | | | | |
| Cleveland Municipal School District, | | | | | | | | | | | | |
| 5.000%, 12/01/2020(Insured by SD CRED PROG) | | | 2,015,000 | | | | 2,129,714 | | | | | |
| County of Montgomery OH, | | | | | | | | | | | | |
| 5.250%, 05/01/2029(Pre-refunded to 11/12/2023) | | | 1,050,000 | | | | 1,187,959 | | | | | |
| Lucas-Plaza Housing Development Corp., | | | | | | | | | | | | |
| 0.000%, 06/01/2024(ETM)(Insured by FHA) | | | 1,200,000 | | | | 1,052,412 | | | | | |
| Ohio Housing Finance Agency: | | | | | | | | | | | | |
| 5.000%, 11/01/2028(Callable 05/01/2020)(Insured by GNMA) | | | 260,000 | | | | 263,957 | | | | | |
| 3.500%, 09/01/2046(Callable 09/01/2025)(Insured by GNMA) | | | 1,375,000 | | | | 1,415,178 | | | | | |
| State of Ohio, | | | | | | | | | | | | |
| 5.000%, 06/15/2021 | | | 6,740,000 | | | | 7,247,859 | | | | | |
| University of Akron, | | | | | | | | | | | | |
| 5.000%, 01/01/2033(Callable 07/01/2026) | | | 335,000 | | | | 379,910 | | | | | |
| | | | | | | | 15,415,773 | | | | 1.3 | % |
| Oklahoma | | | | | | | | | | | | |
| Oklahoma Housing Finance Agency, | | | | | | | | | | | | |
| 1.900%, 03/01/2021(Mandatory Tender Date 03/01/2020)(1) | | | 885,000 | | | | 883,982 | | | | 0.1 | % |
| | | | | | | | | | | | | |
| Oregon | | | | | | | | | | | | |
| County of Multnomah OR, | | | | | | | | | | | | |
| 4.000%, 06/01/2030(Callable 06/01/2022) | | | 1,565,000 | | | | 1,638,665 | | | | | |
| State of Oregon: | | | | | | | | | | | | |
| 4.000%, 12/01/2045(Callable 06/01/2025) | | | 3,480,000 | | | | 3,628,526 | | | | | |
| 4.000%, 12/01/2048(Callable 12/01/2026) | | | 3,205,000 | | | | 3,366,436 | | | | | |
| State of Oregon Housing & Community Services Department: | | | | | | | | | | | | |
| 2.200%, 12/01/2021(Mandatory Tender Date 12/01/2020)(1) | | | 400,000 | | | | 399,848 | | | | | |
| 4.000%, 01/01/2047(Callable 07/01/2025) | | | 1,600,000 | | | | 1,666,976 | | | | | |
| Washington County School District No. 1, | | | | | | | | | | | | |
| 5.000%, 06/15/2035(Callable 06/15/2027)(Insured by SCH BD GTY) | | | 600,000 | | | | 696,258 | | | | | |
| | | | | | | | 11,396,709 | | | | 1.0 | % |
| Pennsylvania | | | | | | | | | | | | |
| Commonwealth Financing Authority, | | | | | | | | | | | | |
| 4.000%, 06/01/2039(Callable 06/01/2028)(Insured by AGM) | | | 1,500,000 | | | | 1,518,765 | | | | | |
| Erie Sewer Authority, | | | | | | | | | | | | |
| 5.125%, 06/01/2020(ETM)(Insured by AMBAC) | | | 930,000 | | | | 953,520 | | | | | |
| Latrobe Municipal Authority: | | | | | | | | | | | | |
| 1.250%, 04/01/2019(Insured by BAM) | | | 120,000 | | | | 119,771 | | | | | |
| 3.000%, 04/01/2020(Insured by BAM) | | | 325,000 | | | | 329,651 | | | | | |
| Pennsylvania Higher Educational Facilities Authority, | | | | | | | | | | | | |
| 5.750%, 08/15/2041(Pre-refunded to 08/15/2021) | | | 500,000 | | | | 549,035 | | | | | |
| Pennsylvania Housing Finance Agency: | | | | | | | | | | | | |
| 2.450%, 07/01/2022(Mandatory Tender Date 07/01/2021)(1) | | | 5,325,000 | | | | 5,332,668 | | | | | |
| 3.500%, 10/01/2046(Callable 10/01/2025) | | | 1,415,000 | | | | 1,449,993 | | | | | |
| 3.700%, 10/01/2047(Callable 04/01/2027) | | | 4,000,000 | | | | 3,862,280 | | | | | |
| Pennsylvania Turnpike Commission, | | | | | | | | | | | | |
| 6.000%, 12/01/2030(Callable 12/01/2027)(Insured by AGM) | | | 1,360,000 | | | | 1,703,509 | | | | | |
| Philadelphia Gas Works Co., | | | | | | | | | | | | |
| 7.000%, 05/15/2020(ETM)(Insured by NATL) | | | 815,000 | | | | 848,570 | | | | | |
| Philadelphia Hospitals & Higher Education Facilities Authority: | | | | | | | | | | | | |
| 5.000%, 05/15/2020(ETM) | | | 1,575,000 | | | | 1,640,740 | | | | | |
| 5.250%, 05/15/2023(Pre-refunded to 05/15/2020) | | | 2,790,000 | | | | 2,915,829 | | | | | |
| South Fork Municipal Authority: | | | | | | | | | | | | |
| 5.500%, 07/01/2029(Pre-refunded to 07/01/2020) | | | 2,450,000 | | | | 2,577,498 | | | | | |
| 5.375%, 07/01/2035(Pre-refunded to 07/01/2020)(Insured by AGC) | | | 1,290,000 | | | | 1,353,790 | | | | | |
| | | | | | | | 25,155,619 | | | | 2.2 | % |
| Puerto Rico | | | | | | | | | | | | |
| Puerto Rico Highways & Transportation Authority, | | | | | | | | | | | | |
| 5.250%, 07/01/2022(ETM)(Insured by AGM) | | | 1,150,000 | | | | 1,275,131 | | | | | |
| Puerto Rico Public Finance Corp.: | | | | | | | | | | | | |
| 5.125%, 06/01/2024(Insured by AMBAC) | | | 5,490,000 | | | | 5,986,516 | | | | | |
| 6.000%, 08/01/2026(ETM) | | | 1,800,000 | | | | 2,239,434 | | | | | |
| 6.000%, 08/01/2026(ETM)(Insured by AGC) | | | 1,155,000 | | | | 1,436,970 | | | | | |
| 6.000%, 08/01/2026(ETM)(Insured by AGC) | | | 1,585,000 | | | | 1,971,946 | | | | | |
| 6.000%, 08/01/2026(ETM)(Insured by AGC) | | | 955,000 | | | | 1,188,144 | | | | | |
| 5.500%, 08/01/2027(ETM)(Insured by AMBAC) | | | 6,500,000 | | | | 7,985,705 | | | | | |
| | | | | | | | 22,083,846 | | | | 1.9 | % |
| Rhode Island | | | | | | | | | | | | |
| State of Rhode Island, | | | | | | | | | | | | |
| 5.000%, 08/01/2024 | | | 5,000,000 | | | | 5,750,850 | | | | 0.5 | % |
| | | | | | | | | | | | | |
| South Carolina | | | | | | | | | | | | |
| Charleston Educational Excellence Finance Corp., | | | | | | | | | | | | |
| 5.000%, 12/01/2026(Callable 12/01/2023) | | | 4,625,000 | | | | 5,206,270 | | | | | |
| City of Columbia SC, | | | | | | | | | | | | |
| 5.000%, 02/01/2029(Callable 02/01/2028) | | | 120,000 | | | | 144,877 | | | | | |
| Piedmont Municipal Power Agency: | | | | | | | | | | | | |
| 6.750%, 01/01/2020(ETM) | | | 6,450,000 | | | | 6,758,697 | | | | | |
| 5.375%, 01/01/2025(ETM)(Insured by NATL) | | | 5,645,000 | | | | 6,582,578 | | | | | |
| South Carolina Jobs-Economic Development Authority, | | | | | | | | | | | | |
| 6.500%, 04/01/2042(Pre-refunded to 04/01/2020) | | | 115,000 | | | | 121,471 | | | | | |
| | | | | | | | 18,813,893 | | | | 1.7 | % |
| South Dakota | | | | | | | | | | | | |
| Harrisburg School District No. 41-2, | | | | | | | | | | | | |
| 2.375%, 08/01/2026(Insured by ST) | | | 415,000 | | | | 414,282 | | | | | |
| Sioux Falls School District No. 49-5, | | | | | | | | | | | | |
| 1.375%, 08/01/2021(Insured by ST) | | | 150,000 | | | | 146,972 | | | | | |
| South Dakota Housing Development Authority, | | | | | | | | | | | | |
| 3.375%, 05/01/2033(Callable 05/01/2022) | | | 340,000 | | | | 337,504 | | | | | |
| | | | | | | | 898,758 | | | | 0.1 | % |
| Tennessee | | | | | | | | | | | | |
| Metropolitan Government Nashville & Davidson County Health & Educational Facs Bd: | | | | | | | | | | | | |
| 0.000%, 06/01/2021(ETM) | | | 1,315,000 | | | | 1,250,999 | | | | | |
| 4.875%, 11/01/2028(ETM)(Insured by NATL) | | | 1,025,000 | | | | 1,157,450 | | | | | |
| Rutherford County Health & Educational Facilities Board, | | | | | | | | | | | | |
| 2.500%, 11/01/2021(Mandatory Tender Date 11/01/2020)(1) | | | 1,850,000 | | | | 1,861,525 | | | | | |
| Shelby County Health Educational & Housing Facilities Board, | | | | | | | | | | | | |
| 5.500%, 08/15/2019(ETM)(Insured by NATL) | | | 835,000 | | | | 854,105 | | | | | |
| Tennessee Housing Development Agency: | | | | | | | | | | | | |
| 4.500%, 07/01/2028(Callable 01/01/2020) | | | 480,000 | | | | 481,138 | | | | | |
| 3.900%, 07/01/2042(Callable 07/01/2027) | | | 400,000 | | | | 400,572 | | | | | |
| 4.000%, 01/01/2043(Callable 07/01/2027) | | | 1,295,000 | | | | 1,364,412 | | | | | |
| 3.650%, 07/01/2047(Callable 01/01/2027) | | | 1,155,000 | | | | 1,105,589 | | | | | |
| | | | | | | | 8,475,790 | | | | 0.8 | % |
| Texas | | | | | | | | | | | | |
| Amarillo Independent School District, | | | | | | | | | | | | |
| 5.000%, 02/01/2026(Callable 02/01/2024)(PSF Guaranteed) | | | 1,370,000 | | | | 1,564,650 | | | | | |
| Anna Independent School District, | | | | | | | | | | | | |
| 5.000%, 08/15/2035(Callable 08/15/2026)(PSF Guaranteed) | | | 910,000 | | | | 1,041,067 | | | | | |
| Arlington Higher Education Finance Corp.: | | | | | | | | | | | | |
| 4.000%, 08/15/2024(PSF Guaranteed) | | | 1,025,000 | | | | 1,110,116 | | | | | |
| 5.000%, 08/15/2024(PSF Guaranteed) | | | 1,010,000 | | | | 1,148,895 | | | | | |
| 5.000%, 08/15/2026(PSF Guaranteed) | | | 500,000 | | | | 573,120 | | | | | |
| 4.000%, 08/15/2027(Callable 08/15/2026)(PSF Guaranteed) | | | 865,000 | | | | 950,678 | | | | | |
| 5.000%, 02/15/2028(Callable 02/15/2025)(PSF Guaranteed) | | | 1,675,000 | | | | 1,915,195 | | | | | |
| 4.000%, 08/15/2028(Callable 08/15/2026)(PSF Guaranteed) | | | 850,000 | | | | 923,763 | | | | | |
| 5.000%, 08/15/2028(Callable 08/15/2024)(PSF Guaranteed) | | | 555,000 | | | | 622,943 | | | | | |
| 5.000%, 08/15/2033(Callable 08/15/2024)(PSF Guaranteed) | | | 1,460,000 | | | | 1,615,417 | | | | | |
| Austin Community College District Public Facility Corp., | | | | | | | | | | | | |
| 5.000%, 08/01/2033(Callable 08/01/2025) | | | 750,000 | | | | 852,337 | | | | | |
| Burleson Independent School District, | | | | | | | | | | | | |
| 5.000%, 08/01/2025(PSF Guaranteed) | | | 1,240,000 | | | | 1,448,221 | | | | | |
| City of Austin TX, | | | | | | | | | | | | |
| 5.000%, 11/15/2024(Callable 11/15/2022) | | | 3,000,000 | | | | 3,326,130 | | | | | |
| City of El Paso TX, | | | | | | | | | | | | |
| 4.000%, 03/01/2028(Callable 03/01/2026) | | | 1,000,000 | | | | 1,091,590 | | | | | |
| City of Houston TX: | | | | | | | | | | | | |
| 0.000%, 12/01/2019(ETM)(Insured by AGM) | | | 13,355,000 | | | | 13,124,493 | | | | | |
| 5.500%, 12/01/2024(ETM)(Insured by NATL) | | | 1,835,000 | | | | 2,121,241 | | | | | |
| 5.500%, 12/01/2029(ETM)(Insured by NATL) | | | 16,050,000 | | | | 19,562,703 | | | | | |
| 5.750%, 12/01/2032(ETM)(Insured by AGM) | | | 6,715,000 | | | | 9,011,933 | | | | | |
| Conroe Independent School District: | | | | | | | | | | | | |
| 5.000%, 02/15/2023(Pre-refunded to 02/15/2021)(PSF Guaranteed) | | | 1,745,000 | | | | 1,860,432 | | | | | |
| 5.000%, 02/15/2023(Callable 02/15/2021)(PSF Guaranteed) | | | 935,000 | | | | 995,036 | | | | | |
| County of Bexar TX: | | | | | | | | | | | | |
| 4.000%, 06/15/2030(Callable 06/15/2026) | | | 150,000 | | | | 161,712 | | | | | |
| 5.000%, 06/15/2036(Callable 06/15/2026) | | | 2,120,000 | | | | 2,408,723 | | | | | |
| County of Harris TX, | | | | | | | | | | | | |
| 5.000%, 10/01/2026(Callable 10/01/2025) | | | 4,170,000 | | | | 4,861,011 | | | | | |
| County of Montgomery TX, | | | | | | | | | | | | |
| 5.000%, 03/01/2027(Pre-refunded to 03/01/2022) | | | 665,000 | | | | 725,588 | | | | | |
| Crowley Independent School District, | | | | | | | | | | | | |
| 5.000%, 08/01/2036(Callable 08/01/2025)(PSF Guaranteed) | | | 2,000,000 | | | | 2,254,940 | | | | | |
| Dallas Independent School District, | | | | | | | | | | | | |
| 5.000%, 02/15/2036(Mandatory Tender Date 02/15/2022)(PSF Guaranteed)(1) | | | 1,740,000 | | | | 1,891,415 | | | | | |
| Decatur Hospital Authority, | | | | | | | | | | | | |
| 5.750%, 09/01/2029(ETM) | | | 530,000 | | | | 634,362 | | | | | |
| DeSoto Independent School District, | | | | | | | | | | | | |
| 5.000%, 08/15/2032(Callable 08/15/2025)(Insured by BAM) | | | 1,080,000 | | | | 1,222,571 | | | | | |
| Ennis Independent School District, | | | | | | | | | | | | |
| 5.000%, 08/15/2025(PSF Guaranteed) | | | 1,145,000 | | | | 1,342,158 | | | | | |
| Fort Bend Independent School District, | | | | | | | | | | | | |
| 5.000%, 08/15/2024(PSF Guaranteed) | | | 1,655,000 | | | | 1,906,097 | | | | | |
| Godley Independent School District, | | | | | | | | | | | | |
| 5.000%, 02/15/2023(PSF Guaranteed) | | | 1,445,000 | | | | 1,611,825 | | | | | |
| Harlingen Consolidated Independent School District: | | | | | | | | | | | | |
| 5.000%, 08/15/2024(PSF Guaranteed) | | | 2,810,000 | | | | 3,236,333 | | | | | |
| 5.000%, 08/15/2025(PSF Guaranteed) | | | 1,445,000 | | | | 1,689,928 | | | | | |
| Harris County Cultural Education Facilities Finance Corp., | | | | | | | | | | | | |
| 7.000%, 01/01/2048(Pre-refunded to 01/01/2023) | | | 3,800,000 | | | | 4,506,648 | | | | | |
| Harris County Health Facilities Development Corp.: | | | | | | | | | | | | |
| 5.500%, 10/01/2019(ETM) | | | 1,540,000 | | | | 1,581,780 | | | | | |
| 5.750%, 07/01/2027(ETM) | | | 4,850,000 | | | | 5,769,900 | | | | | |
| Harris County Toll Road Authority, | | | | | | | | | | | | |
| 5.000%, 08/15/2028(Callable 02/15/2028) | | | 680,000 | | | | 814,130 | | | | | |
| Houston Higher Education Finance Corp.: | | | | | | | | | | | | |
| 5.000%, 02/15/2026(Callable 02/15/2024)(PSF Guaranteed) | | | 1,030,000 | | | | 1,153,981 | | | | | |
| 5.000%, 02/15/2034(Callable 02/15/2024)(PSF Guaranteed) | | | 1,795,000 | | | | 1,967,625 | | | | | |
| Humble Independent School District, | | | | | | | | | | | | |
| 5.000%, 02/15/2021(PSF Guaranteed) | | | 1,500,000 | | | | 1,596,645 | | | | | |
| Irving Independent School District, | | | | | | | | | | | | |
| 5.000%, 02/15/2025(Callable 08/15/2024)(PSF Guaranteed) | | | 1,250,000 | | | | 1,438,937 | | | | | |
| Kenedy Independent School District: | | | | | | | | | | | | |
| 4.000%, 08/15/2031(Callable 08/15/2023)(PSF Guaranteed) | | | 100,000 | | | | 105,161 | | | | | |
| 4.000%, 08/15/2035(Callable 08/15/2021)(PSF Guaranteed) | | | 100,000 | | | | 101,763 | | | | | |
| 4.000%, 08/15/2036(Callable 08/15/2021)(PSF Guaranteed) | | | 150,000 | | | | 152,457 | | | | | |
| 4.000%, 08/15/2037(Callable 08/15/2021)(PSF Guaranteed) | | | 100,000 | | | | 101,512 | | | | | |
| 4.000%, 08/15/2038(Callable 08/15/2021)(PSF Guaranteed) | | | 100,000 | | | | 101,412 | | | | | |
| Killeen Independent School District, | | | | | | | | | | | | |
| 4.000%, 02/15/2024(Callable 02/15/2021)(PSF Guaranteed) | | | 1,145,000 | | | | 1,195,117 | | | | | |
| La Porte Independent School District, | | | | | | | | | | | | |
| 5.000%, 02/15/2025(PSF Guaranteed) | | | 1,080,000 | | | | 1,254,161 | | | | | |
| Leander Independent School District: | | | | | | | | | | | | |
| 0.000%, 08/15/2035(Pre-refunded to 08/15/2024)(PSF Guaranteed) | | | 70,000 | | | | 35,314 | | | | | |
| 0.000%, 08/15/2037(Pre-refunded to 08/15/2024)(PSF Guaranteed) | | | 680,000 | | | | 321,239 | | | | | |
| 0.000%, 08/15/2041(Pre-refunded to 08/15/2024)(PSF Guaranteed) | | | 8,915,000 | | | | 3,181,318 | | | | | |
| 0.000%, 08/15/2042(Pre-refunded to 08/15/2024)(PSF Guaranteed) | | | 1,500,000 | | | | 506,010 | | | | | |
| 0.000%, 08/15/2047(Pre-refunded to 08/15/2024)(PSF Guaranteed) | | | 500,000 | | | | 124,920 | | | | | |
| 0.000%, 08/15/2048(Pre-refunded to 08/15/2024)(PSF Guaranteed) | | | 625,000 | | | | 146,837 | | | | | |
| Lower Colorado River Authority, | | | | | | | | | | | | |
| 4.750%, 01/01/2028(ETM)(Insured by AGM) | | | 2,200,000 | | | | 2,449,040 | | | | | |
| Lubbock Housing Finance Corp., | | | | | | | | | | | | |
| 8.000%, 10/01/2021(ETM) | | | 1,980,000 | | | | 2,297,572 | | | | | |
| Mansfield Independent School District, | | | | | | | | | | | | |
| 5.000%, 02/15/2024(PSF Guaranteed) | | | 1,905,000 | | | | 2,173,624 | | | | | |
| Melissa Independent School District, | | | | | | | | | | | | |
| 5.000%, 08/01/2036(Callable 08/01/2026)(PSF Guaranteed) | | | 1,020,000 | | | | 1,161,780 | | | | | |
| Mesquite Independent School District: | | | | | | | | | | | | |
| 5.000%, 08/15/2024(PSF Guaranteed) | | | 1,425,000 | | | | 1,641,201 | | | | | |
| 5.000%, 08/15/2025(PSF Guaranteed) | | | 2,615,000 | | | | 3,063,499 | | | | | |
| 5.000%, 08/15/2025(PSF Guaranteed) | | | 1,500,000 | | | | 1,757,265 | | | | | |
| Montgomery County Health Facilities Development Corp., | | | | | | | | | | | | |
| 0.000%, 07/15/2023(ETM) | | | 200,000 | | | | 180,466 | | | | | |
| New Caney Independent School District: | | | | | | | | | | | | |
| 5.000%, 02/15/2023(PSF Guaranteed) | | | 1,000,000 | | | | 1,115,870 | | | | | |
| 5.000%, 02/15/2024(PSF Guaranteed) | | | 1,030,000 | | | | 1,172,027 | | | | | |
| Newark Higher Education Finance Corp.: | | | | | | | | | | | | |
| 4.000%, 08/15/2020(PSF Guaranteed) | | | 355,000 | | | | 366,577 | | | | | |
| 4.000%, 08/15/2022(PSF Guaranteed) | | | 215,000 | | | | 228,534 | | | | | |
| 5.000%, 08/15/2024(PSF Guaranteed) | | | 135,000 | | | | 153,947 | | | | | |
| North East Independent School District, | | | | | | | | | | | | |
| 5.000%, 02/01/2024(PSF Guaranteed) | | | 2,930,000 | | | | 3,337,182 | | | | | |
| North Texas Tollway Authority: | | | | | | | | | | | | |
| 0.000%, 09/01/2037(Pre-refunded to 09/01/2031) | | | 2,180,000 | | | | 968,160 | | | | | |
| 0.000%, 09/01/2043(Pre-refunded to 09/01/2031) | | | 4,425,000 | | | | 1,252,496 | | | | | |
| 0.000%, 09/01/2043(Pre-refunded to 09/01/2031) | | | 2,085,000 | | | | 2,348,273 | | | | | |
| 0.000%, 09/01/2045(Pre-refunded to 09/01/2031) | | | 770,000 | | | | 948,124 | | | | | |
| Northside Independent School District, | | | | | | | | | | | | |
| 5.000%, 08/15/2025(PSF Guaranteed) | | | 1,000,000 | | | | 1,169,500 | | | | | |
| Pasadena Independent School District, | | | | | | | | | | | | |
| 5.000%, 02/15/2022(Callable 02/15/2021)(PSF Guaranteed) | | | 1,115,000 | | | | 1,185,635 | | | | | |
| Pflugerville Independent School District, | | | | | | | | | | | | |
| 5.000%, 02/15/2025(Callable 02/15/2024)(PSF Guaranteed) | | | 1,020,000 | | | | 1,159,057 | | | | | |
| Port Arthur Independent School District, | | | | | | | | | | | | |
| 5.000%, 02/15/2024(PSF Guaranteed) | | | 1,700,000 | | | | 1,939,717 | | | | | |
| Prosper Independent School District, | | | | | | | | | | | | |
| 5.000%, 02/15/2031(Callable 02/15/2028)(PSF Guaranteed) | | | 1,020,000 | | | | 1,210,250 | | | | | |
| Rockwall Independent School District, | | | | | | | | | | | | |
| 5.000%, 02/15/2038(Callable 08/15/2020)(PSF Guaranteed) | | | 745,000 | | | | 776,849 | | | | | |
| San Angelo Independent School District, | | | | | | | | | | | | |
| 5.000%, 02/15/2029(Callable 02/15/2024)(PSF Guaranteed) | | | 1,500,000 | | | | 1,691,310 | | | | | |
| San Jacinto College District, | | | | | | | | | | | | |
| 5.000%, 02/15/2026(Pre-refunded to 02/15/2021) | | | 700,000 | | | | 744,044 | | | | | |
| Sherman Independent School District, | | | | | | | | | | | | |
| 5.000%, 02/15/2026(Callable 02/15/2024)(PSF Guaranteed) | | | 1,775,000 | | | | 2,026,233 | | | | | |
| Socorro Independent School District, | | | | | | | | | | | | |
| 4.000%, 08/15/2033(Callable 02/15/2027)(PSF Guaranteed) | | | 900,000 | | | | 959,040 | | | | | |
| Tarrant County Health Facilities Development Corp., | | | | | | | | | | | | |
| 6.000%, 09/01/2024(ETM) | | | 5,340,000 | | | | 6,006,913 | | | | | |
| Texas Department of Housing & Community Affairs, | | | | | | | | | | | | |
| 3.350%, 09/01/2033(Callable 09/01/2027)(Insured by GNMA) | | | 1,415,000 | | | | 1,410,783 | | | | | |
| Texas State Public Finance Authority, | | | | | | | | | | | | |
| 6.200%, 02/15/2040(Pre-refunded to 02/15/2020) | | | 395,000 | | | | 413,624 | | | | | |
| Texas Water Development Board: | | | | | | | | | | | | |
| 4.000%, 10/15/2034(Callable 04/15/2028) | | | 2,000,000 | | | | 2,125,900 | | | | | |
| 4.000%, 10/15/2034(Callable 10/15/2028) | | | 975,000 | | | | 1,039,194 | | | | | |
| Town of Flower Mound TX, | | | | | | | | | | | | |
| 5.000%, 03/01/2031(Callable 03/01/2024) | | | 505,000 | | | | 572,034 | | | | | |
| Travis County Health Facilities Development Corp., | | | | | | | | | | | | |
| 7.125%, 01/01/2046(Pre-refunded to 01/01/2021) | | | 15,000 | | | | 16,496 | | | | | |
| Tyler Health Facilities Development Corp., | | | | | | | | | | | | |
| 5.500%, 07/01/2027(Pre-refunded to 07/01/2021) | | | 600,000 | | | | 649,626 | | | | | |
| The University of Texas System, | | | | | | | | | | | | |
| 5.000%, 08/15/2022 | | | 8,595,000 | | | | 9,515,524 | | | | | |
| Wichita Falls Independent School District, | | | | | | | | | | | | |
| 5.000%, 02/01/2024(PSF Guaranteed) | | | 1,670,000 | | | | 1,899,491 | | | | | |
| Wylie Independent School District, | | | | | | | | | | | | |
| 6.750%, 08/15/2023(PSF Guaranteed) | | | 1,010,000 | | | | 1,217,565 | | | | | |
| Ysleta Independent School District: | | | | | | | | | | | | |
| 5.000%, 08/15/2023(Callable 08/15/2021)(PSF Guaranteed) | | | 1,020,000 | | | | 1,097,612 | | | | | |
| 5.000%, 08/15/2025(Callable 08/15/2024)(PSF Guaranteed) | | | 1,545,000 | | | | 1,775,885 | | | | | |
| | | | | | | | 182,181,409 | | | | 16.2 | % |
| Utah | | | | | | | | | | | | |
| Granite School District Board of Education: | | | | | | | | | | | | |
| 5.000%, 06/01/2022(Pre-refunded to 06/01/2021)(Insured by SCH BD GTY) | | | 3,900,000 | | | | 4,190,238 | | | | | |
| 5.000%, 06/01/2023(Pre-refunded to 06/01/2021)(Insured by SCH BD GTY) | | | 1,750,000 | | | | 1,880,235 | | | | | |
| Timpanogos Special Service District: | | | | | | | | | | | | |
| 4.000%, 06/01/2025(Callable 06/01/2024) | | | 100,000 | | | | 108,867 | | | | | |
| 4.000%, 06/01/2027(Callable 06/01/2024) | | | 375,000 | | | | 403,886 | | | | | |
| 4.000%, 06/01/2028(Callable 06/01/2024) | | | 425,000 | | | | 454,623 | | | | | |
| Utah Charter School Finance Authority: | | | | | | | | | | | | |
| 5.000%, 04/15/2024(Insured by UT CSCE) | | | 235,000 | | | | 263,035 | | | | | |
| 5.000%, 04/15/2037(Callable 04/15/2026)(Insured by UT CSCE) | | | 500,000 | | | | 550,865 | | | | | |
| Utah Housing Corp., | | | | | | | | | | | | |
| 4.000%, 01/01/2045(Callable 01/01/2026)(Insured by FHA) | | | 1,900,000 | | | | 1,976,456 | | | | | |
| | | | | | | | 9,828,205 | | | | 0.9 | % |
| Vermont | | | | | | | | | | | | |
| Vermont Housing Finance Agency: | | | | | | | | | | | | |
| 3.600%, 11/01/2036(Callable 11/01/2025) | | | 1,590,000 | | | | 1,579,586 | | | | | |
| 4.000%, 05/01/2048(Callable 11/01/2026)(Insured by GNMA) | | | 1,160,000 | | | | 1,212,954 | | | | | |
| 4.000%, 11/01/2048(Callable 05/01/2027) | | | 695,000 | | | | 730,987 | | | | | |
| | | | | | | | 3,523,527 | | | | 0.3 | % |
| Virginia | | | | | | | | | |
| Danville Industrial Development Authority, | | | | | | | | | |
| 5.250%, 10/01/2028(ETM)(Insured by AMBAC) | | | 1,500,000 | | | | 1,672,185 | | | | |
| Virginia Housing Development Authority, | | | | | | | | | | | |
| 3.700%, 03/01/2023(Callable 03/01/2021) | | | 75,000 | | | | 77,731 | | | | |
| | | | | | | | 1,749,916 | | | | 0.2 | % |
| Washington | | | | | | | | | | | | |
| Central Puget Sound Regional Transit Authority, | | | | | | | | | | | | |
| 5.000%, 11/01/2032(Callable 11/01/2025) | | | 2,725,000 | | | | 3,129,799 | | | | | |
| County of King WA, | | | | | | | | | | | | |
| 5.000%, 07/01/2034(Callable 01/01/2025) | | | 705,000 | | | | 793,358 | | | | | |
| Energy Northwest, | | | | | | | | | | | | |
| 5.000%, 07/01/2034(Callable 07/01/2027) | | | 1,090,000 | | | | 1,265,697 | | | | | |
| Snohomish County Public Utility District No. 1, | | | | | | | | | | | | |
| 6.800%, 01/01/2020(Callable 01/31/2019)(ETM)(Insured by NATL) | | | 1,980,000 | | | | 2,032,351 | | | | | |
| Snohomish County School District No. 201, | | | | | | | | | | | | |
| 4.000%, 12/01/2021(Callable 12/01/2020)(Insured by SCH BD GTY) | | | 4,500,000 | | | | 4,681,665 | | | | | |
| State of Washington: | | | | | | | | | | | | |
| 5.500%, 07/01/2023 | | | 5,040,000 | | | | 5,643,893 | | | | | |
| 5.000%, 08/01/2029(Callable 08/01/2026) | | | 2,120,000 | | | | 2,485,361 | | | | | |
| 5.000%, 07/01/2032(Callable 01/01/2025) | | | 6,005,000 | | | | 6,782,407 | | | | | |
| 5.000%, 08/01/2034(Callable 08/01/2023) | | | 2,755,000 | | | | 3,053,642 | | | | | |
| 5.000%, 08/01/2038(Callable 08/01/2026) | | | 975,000 | | | | 1,105,572 | | | | | |
| Thurston & Pierce Counties Community Schools, | | | | | | | | | | | | |
| 4.250%, 12/01/2021(Callable 12/01/2020)(Insured by SCH BD GTY) | | | 2,755,000 | | | | 2,879,609 | | | | | |
| Washington Health Care Facilities Authority: | | | | | | | | | | | | |
| 6.125%, 11/15/2031(Pre-refunded to 05/15/2021) | | | 620,000 | | | | 680,022 | | | | | |
| 6.250%, 11/15/2041(Pre-refunded to 05/15/2021) | | | 4,845,000 | | | | 5,327,998 | | | | | |
| Washington State Housing Finance Commission, | | | | | | | | | | | | |
| 2.550%, 07/01/2022(Mandatory Tender Date 07/01/2021)(1) | | | 6,250,000 | | | | 6,260,500 | | | | | |
| | | | | | | | 46,121,874 | | | | 4.2 | % |
| Wisconsin | | | | | | | | | | | | |
| City of Oshkosh WI, | | | | | | | | | | | | |
| 4.000%, 05/01/2029(Callable 05/01/2023) | | | 1,280,000 | | | | 1,339,494 | | | | | |
| Public Finance Authority, | | | | | | | | | | | | |
| 5.000%, 03/01/2025 | | | 525,000 | | | | 601,755 | | | | | |
| Southeast Wisconsin Professional Baseball Park District: | | | | | | | | | | | | |
| 5.500%, 12/15/2026(Insured by NATL) | | | 805,000 | | | | 956,195 | | | | | |
| 0.000%, 12/15/2027(ETM)(Insured by NATL) | | | 135,000 | | | | 107,418 | | | | | |
| 0.000%, 12/15/2029(ETM)(Insured by NATL) | | | 230,000 | | | | 170,916 | | | | | |
| State of Wisconsin: | | | | | | | | | | | | |
| 5.000%, 05/01/2024(Callable 05/01/2023) | | | 2,150,000 | | | | 2,417,030 | | | | | |
| 5.000%, 05/01/2032(Callable 05/01/2023) | | | 5,000,000 | | | | 5,539,900 | | | | | |
| State of Wisconsin Clean Water Fund Leveraged Loan Portfolio: | | | | | | | | | | | | |
| 5.000%, 06/01/2028(Pre-refunded to 06/01/2024) | | | 5,305,000 | | | | 6,084,994 | | | | | |
| 5.000%, 06/01/2030(Pre-refunded to 06/01/2024) | | | 10,500,000 | | | | 12,043,815 | | | | | |
| 5.000%, 06/01/2031(Pre-refunded to 06/01/2024) | | | 7,975,000 | | | | 9,147,564 | | | | | |
| University of Wisconsin Hospitals & Clinics, | | | | | | | | | | | | |
| 5.000%, 04/01/2038(Callable 04/01/2023) | | | 2,295,000 | | | | 2,470,843 | | | | | |
| Village of Mount Pleasant WI: | | | | | | | | | | | | |
| 5.000%, 04/01/2036(Callable 04/01/2028) | | | 275,000 | | | | 310,571 | | | | | |
| 4.000%, 04/01/2037(Callable 04/01/2028) | | | 2,400,000 | | | | 2,450,160 | | | | | |
| Wisconsin Center District: | | | | | | | | | | | | |
| 4.000%, 12/15/2029(Callable 06/15/2026) | | | 1,435,000 | | | | 1,546,040 | | | | | |
| 5.000%, 12/15/2030(Callable 06/15/2026) | | | 775,000 | | | | 886,120 | | | | | |
| Wisconsin Health & Educational Facilities Authority: | | | | | | | | | | | | |
| 4.000%, 02/15/2033(Pre-refunded to 08/15/2025) | | | 100,000 | | | | 110,312 | | | | | |
| 4.000%, 02/15/2038(Pre-refunded to 08/15/2025) | | | 250,000 | | | | 275,780 | | | | | |
| Wisconsin Housing & Economic Development Authority: | | | | | | | | | | | | |
| 3.500%, 09/01/2046(Callable 09/01/2025)(Insured by FNMA) | | | 1,645,000 | | | | 1,690,172 | | | | | |
| 4.000%, 03/01/2048(Callable 03/01/2027)(Insured by FNMA) | | | 1,765,000 | | | | 1,846,949 | | | | | |
| | | | | | | | 49,996,028 | | | | 4.4 | % |
| Wyoming | | | | | | | | | | | | |
| Wyoming Community Development Authority, | | | | | | | | | | | | |
| 4.000%, 12/01/2043(Callable 06/01/2027) | | | 700,000 | | | | 730,709 | | | | 0.1 | % |
| | | | | | | | | | | | | |
| Total Municipal Bonds (Cost $1,094,157,766) | | | | | | | 1,106,503,383 | | | | 98.7 | % |
| | | | | | | | | | | | | |
| | | | | | | | | | | | | |
| SHORT-TERM INVESTMENT | | Shares | | | | | | | | | |
| Money Market Mutual Fund | | | | | | | | | | | | |
| Fidelity Institutional Money Market Fund - Government Portfolio, Institutional Class, 2.29%(2) | | | 571,064 | | | | 571,064 | | | | | |
| Total Short-Term Investment (Cost $571,064) | | | | | | | 571,064 | | | | 0.1 | % |
| Total Investments (Cost $1,094,728,830) | | | | | | | 1,107,074,447 | | | | 98.8 | % |
| Other Assets in Excess of Liabilities | | | | | | | 12,930,737 | | | | 1.2 | % |
| TOTAL NET ASSETS | | | | | | $ | 1,120,005,184 | | | | 100.0 | % |
Notes to Schedule of Investments |
| | |
| AGC | Assured Guaranty Corp. |
| AGM | Assured Guaranty Municipal |
| AMBAC | Ambac Assurance Corp. |
| BAM | Build America Mutual Assurance Co. |
| FHA | Federal Housing Administration |
| FNMA | Fannie Mae |
| GNMA | Ginnie Mae |
| NATL | National Public Finance Guarantee Corp. |
| Q-SBLF | Qualified School Building Loan Fund |
| SCH BD GTY | School Board Guaranty |
| SD CRED PROG | State Credit Enhancement Program |
| ST | State Aid Intercept/Withholding |
| UT CSCE | Utah Charter School Finance Authority |
| (1) | | Variable rate security. The rate reported is the rate in effect as of December 31, 2018. |
| (2) | | 7-Day Yield. |
| (3) | | Security or a portion of the security purchased on a when-issued or delayed delivery basis. |
| Baird Quality Intermediate Municipal Bond Fund | | | | | | | |
| Schedule of Investments, December 31, 2018 | | | | | | | | |
| Summary of Fair Value Exposure at December 31, 2018 | | | | | | |
| | | | | | | | | |
The Fund has adopted authoritative fair valuation accounting standards which establish a definition of fair value and set out a hierarchy for measuring fair value. These standards require additional disclosures about the various inputs and valuation techniques used to develop the measurements of fair value and a discussion on changes in valuation techniques and related inputs during the period. These standards define fair value as the price that would be received to sell an asset or paid to transfer a liability in an orderly transaction between market participants at the measurement date. |
| | | | | | | | | |
| The fair value hierarchy is organized into three levels based upon the assumptions (referred to as "inputs") used in pricing the asset or liability. These standards state that "observable inputs" reflect the assumptions market participants would use in pricing the asset or liability based on market data obtained from independent sources and "unobservable inputs" reflect an entity's own assumptions about the assumptions market participants would use in pricing the asset or liability. These inputs are summarized into three broad levels and described below: |
| | Level 1 - | Unadjusted quoted prices in active markets for identical unrestricted securities. | |
| | Level 2 - | Other significant observable inputs (including quoted prices for similar securities, quoted prices in inactive markets, dealer indications, interest rates, yield curves, prepayment speeds, credit risk, default rates, inputs corroborated by observable market data, etc.). | |
| | Level 3 - | Significant unobservable inputs (including the Fund's own assumptions about the factors that market participants would use in valuing the security) based on the best information available. | |
| The inputs or methodology used for valuing securities are not necessarily an indication of the risk associated with investing in those securities. |
| | | | | | | | | |
| The following is a summary of the inputs used to value the Fund's investments as of December 31, 2018: | | | | |
| | | Level 1 | | | Level 2 | | | Level 3 | | | Total | |
| Long-Term Investments | | | | | | | | | | | | |
| Municipal Bonds | | $ | – | | | $ | 1,106,503,383 | | | $ | – | | | $ | 1,106,503,383 | |
| Total Long-Term Investments | | | – | | | | 1,106,503,383 | | | | – | | | | 1,106,503,383 | |
| Short-Term Investment | | | | | | | | | | | | | | | | |
| Money Market Mutual Fund | | | 571,064 | | | | – | | | | – | | | | 571,064 | |
| Total Short-Term Investment | | | 571,064 | | | | – | | | | – | | | | 571,064 | |
| Total Investments | | $ | 571,064 | | | $ | 1,106,503,383 | | | $ | – | | | $ | 1,107,074,447 | |
| Changes in valuation techniques may result in transfers into or out of assigned levels within the fair value hierarchy. There were no transfers into or out of Level 3 during the reporting period, as compared to the security classifications from the prior year's annual report. |
| | | | | | | | | |
| Baird Core Intermediate Municipal Bond Fund | | | | | | | | | |
| Schedule of Investments | | | | | | | | | |
| December 31, 2018 | | | | | | | | | |
| | | | | | | | | | |
| | | Principal | | | | | | % of | |
| | | Amount | | | Value | | | Net Assets | |
| LONG-TERM INVESTMENTS | | | | | | | | | |
| Municipal Bonds | | | | | | | | | |
| Alabama | | | | | | | | | |
| Alabama Community College System, | | | | | | | | | |
| 5.000%, 10/01/2028(Callable 10/01/2026)(Insured by AGM) | | $ | 310,000 | | | $ | 359,749 | | | | |
| Black Belt Energy Gas District, | | | | | | | | | | | |
| 4.000%, 08/01/2047(Callable 04/01/2022)(Mandatory Tender Date 07/01/2022)(1) | | | 1,000,000 | | | | 1,040,360 | | | | |
| City of Birmingham AL: | | | | | | | | | | | |
| 5.000%, 03/01/2037(Callable 03/01/2023) | | | 30,000 | | | | 32,611 | | | | |
| 0.000%, 03/01/2040(Callable 09/01/2025) | | | 185,000 | | | | 200,225 | | | | |
| 5.000%, 03/01/2043(Callable 03/01/2023) | | | 285,000 | | | | 308,641 | | | | |
| 0.000%, 03/01/2045(Callable 09/01/2025) | | | 1,175,000 | | | | 1,266,615 | | | | |
| City of Pell City AL Special Care Facilities Financing Authority, | | | | | | | | | | | |
| 5.000%, 12/01/2031(Callable 12/01/2021) | | | 1,000,000 | | | | 1,070,040 | | | | |
| County of Jefferson AL: | | | | | | | | | | | |
| 0.000%, 10/01/2025(Callable 10/01/2023)(Insured by AGM) | | | 1,000,000 | | | | 813,260 | | | | |
| 5.000%, 09/15/2029 | | | 570,000 | | | | 659,929 | | | | |
| Jasper Water Works & Sewer Board, Inc., | | | | | | | | | | | |
| 5.000%, 06/01/2024(Callable 06/01/2021) | | | 200,000 | | | | 212,446 | | | | |
| | | | | | | | 5,963,876 | | | | 1.5 | % |
| Alaska | | | | | | | | | | | | |
| Alaska Housing Finance Corp., | | | | | | | | | | | | |
| 5.000%, 12/01/2029(Callable 06/01/2024) | | | 225,000 | | | | 251,728 | | | | | |
| Alaska Industrial Development & Export Authority, | | | | | | | | | | | | |
| 3.500%, 12/01/2020(Callable 12/01/2019) | | | 1,250,000 | | | | 1,259,375 | | | | | |
| Alaska Municipal Bond Bank Authority, | | | | | | | | | | | | |
| 5.000%, 08/01/2027(Callable 08/01/2023) | | | 500,000 | | | | 554,200 | | | | | |
| City of Valdez AK: | | | | | | | | | | | | |
| 5.000%, 01/01/2021 | | | 435,000 | | | | 458,377 | | | | | |
| 5.000%, 06/30/2029(Callable 06/30/2022) | | | 1,000,000 | | | | 1,176,910 | | | | | |
| | | | | | | | 3,700,590 | | | | 0.9 | % |
| Arizona | | | | | | | | | | | | |
| Arizona Health Facilities Authority, | | | | | | | | | | | | |
3.560%, 02/01/2048 (SIFMA Municipal Swap Index + 1.850%) (Callable 08/09/2019)(Mandatory Tender Date 02/05/2020)(2) | | | 115,000 | | | | 116,003 | | | | | |
| Arizona Industrial Development Authority: | | | | | | | | | | | | |
| 3.375%, 07/01/2021 | | | 530,000 | | | | 524,933 | | | | | |
| 4.000%, 07/01/2023(Insured by SD CRED PROG) | | | 115,000 | | | | 120,889 | | | | | |
| 4.000%, 07/01/2023(Insured by SD CRED PROG) | | | 100,000 | | | | 105,337 | | | | | |
| 4.000%, 07/01/2024(Insured by SD CRED PROG) | | | 200,000 | | | | 210,684 | | | | | |
| 4.000%, 07/01/2025(Insured by SD CRED PROG) | | | 100,000 | | | | 106,286 | | | | | |
| 4.000%, 07/01/2026(Insured by SD CRED PROG) | | | 100,000 | | | | 106,253 | | | | | |
| 5.000%, 05/01/2028 | | | 270,000 | | | | 304,962 | | | | | |
| 4.625%, 08/01/2028 | | | 1,160,000 | | | | 1,146,266 | | | | | |
| Arizona State University, | | | | | | | | | | | | |
| 5.000%, 07/01/2029(Callable 07/01/2024) | | | 150,000 | | | | 170,875 | | | | | |
| BluePath TE Trust, | | | | | | | | | | | | |
| 2.750%, 09/01/2026(Callable 08/27/2021)(3) | | | 423,872 | | | | 423,882 | | | | | |
| City of El Mirage AZ, | | | | | | | | | | | | |
| 5.000%, 07/01/2026(Callable 07/01/2020) | | | 400,000 | | | | 417,040 | | | | | |
| City of Tucson AZ, | | | | | | | | | | | | |
| 5.000%, 07/01/2032(Callable 07/01/2025) | | | 500,000 | | | | 574,505 | | | | | |
| Greater Arizona Development Authority, | | | | | | | | | | | | |
| 5.000%, 08/01/2029(Callable 08/01/2019) | | | 710,000 | | | | 721,750 | | | | | |
| Industrial Development Authority of the City of Phoenix, | | | | | | | | | | | | |
| 1.620%, 11/15/2052(Optional Put Date 01/02/2019)(1) | | | 1,000,000 | | | | 1,000,000 | | | | | |
| Maricopa County Industrial Development Authority, | | | | | | | | | | | | |
| 2.625%, 07/01/2021 | | | 165,000 | | | | 161,118 | | | | | |
| Maricopa County Unified School District No. 95, | | | | | | | | | | | | |
| 5.000%, 07/01/2028(Callable 07/01/2025) | | | 700,000 | | | | 818,524 | | | | | |
| Town of Marana AZ: | | | | | | | | | | | | |
| 4.000%, 07/01/2036(Callable 07/01/2027) | | | 350,000 | | | | 369,082 | | | | | |
| 4.000%, 07/01/2037(Callable 07/01/2027) | | | 500,000 | | | | 525,745 | | | | | |
| | | | | | | | 7,924,134 | | | | 2.1 | % |
| Arkansas | | | | | | | | | | | | |
| Arkansas Technical University, | | | | | | | | | | | | |
| 4.000%, 06/01/2028(Callable 06/01/2023) | | | 1,025,000 | | | | 1,086,182 | | | | | |
| City of Conway AR, | | | | | | | | | | | | |
| 5.000%, 10/01/2035(Callable 04/01/2024) | | | 185,000 | | | | 207,207 | | | | | |
| City of Fayetteville AR, | | | | | | | | | | | | |
| 3.050%, 01/01/2047(Callable 01/01/2027) | | | 1,035,000 | | | | 1,008,690 | | | | | |
| City of Hot Springs AR, | | | | | | | | | | | | |
| 4.000%, 12/01/2030(Callable 12/01/2023)(Insured by BAM) | | | 540,000 | | | | 573,097 | | | | | |
| City of Little Rock AR: | | | | | | | | | | | | |
| 2.375%, 04/01/2028(Callable 10/01/2022) | | | 2,000,000 | | | | 2,026,900 | | | | | |
| 4.000%, 10/01/2031(Callable 10/01/2025) | | | 105,000 | | | | 111,827 | | | | | |
| 4.000%, 10/01/2033(Callable 10/01/2025) | | | 210,000 | | | | 222,333 | | | | | |
| 2.000%, 03/01/2038(Callable 03/01/2021) | | | 190,000 | | | | 189,964 | | | | | |
| City of Lonoke AR: | | | | | | | | | | | | |
| 5.000%, 06/01/2025 | | | 210,000 | | | | 241,588 | | | | | |
| 4.000%, 06/01/2028(Callable 06/01/2025) | | | 50,000 | | | | 53,650 | | | | | |
| City of Magnolia AR, | | | | | | | | | | | | |
| 3.200%, 08/01/2033(Callable 08/01/2024)(Insured by BAM) | | | 1,085,000 | | | | 1,072,295 | | | | | |
| City of Marion AR, | | | | | | | | | | | | |
| 2.900%, 09/01/2047(Callable 09/01/2027) | | | 375,000 | | | | 372,705 | | | | | |
| City of Maumelle AR: | | | | | | | | | | | | |
| 4.000%, 08/01/2028(Callable 08/01/2025) | | | 290,000 | | | | 312,759 | | | | | |
| 4.000%, 08/01/2029(Callable 08/01/2025) | | | 700,000 | | | | 752,311 | | | | | |
| 4.000%, 08/01/2030(Callable 08/01/2025) | | | 325,000 | | | | 347,669 | | | | | |
| City of Pine Bluff AR, | | | | | | | | | | | | |
| 3.000%, 02/01/2047(Callable 08/01/2027)(Insured by BAM) | | | 955,000 | | | | 915,749 | | | | | |
| City of Rogers AR, | | | | | | | | | | | | |
| 3.250%, 11/01/2043(Callable 11/01/2026) | | | 2,000,000 | | | | 2,022,260 | | | | | |
| City of Russellville AR, | | | | | | | | | | | | |
| 4.000%, 07/01/2028(Callable 07/01/2025)(Insured by AGM) | | | 325,000 | | | | 349,411 | | | | | |
| City of Sherwood AR, | | | | | | | | | | | | |
| 3.050%, 12/01/2043(Callable 12/01/2026) | | | 750,000 | | | | 758,963 | | | | | |
| City of Springdale AR, | | | | | | | | | | | | |
| 3.000%, 04/01/2043(Callable 04/01/2024)(Insured by BAM) | | | 1,415,000 | | | | 1,419,839 | | | | | |
| Conway Health Facilities Board, | | | | | | | | | | | | |
| 4.000%, 08/01/2038(Callable 08/01/2026) | | | 500,000 | | | | 491,980 | | | | | |
| Northwest Arkansas Conservation Authority, | | | | | | | | | | | | |
| 4.000%, 03/01/2027(Callable 09/01/2022)(Insured by BAM) | | | 365,000 | | | | 389,973 | | | | | |
| University of Central Arkansas: | | | | | | | | | | | | |
| 4.000%, 11/01/2027(Callable 11/01/2025)(Insured by BAM) | | | 340,000 | | | | 366,942 | | | | | |
| 4.000%, 11/01/2028(Callable 11/01/2025)(Insured by BAM) | | | 250,000 | | | | 267,715 | | | | | |
| 4.000%, 11/01/2031(Callable 11/01/2025)(Insured by BAM) | | | 885,000 | | | | 933,091 | | | | | |
| | | | | | | | 16,495,100 | | | | 4.3 | % |
| California | | | | | | | | | | | | |
| Acalanes Union High School District, | | | | | | | | | | | | |
| 0.000%, 08/01/2039(Callable 08/01/2029) | | | 100,000 | | | | 94,010 | | | | | |
| Bay Area Toll Authority: | | | | | | | | | | | | |
2.810%, 04/01/2045 (SIFMA Municipal Swap Index + 1.100%) (Callable 10/01/2023)(Mandatory Tender Date 04/01/2024)(2) | | | 650,000 | | | | 663,806 | | | | | |
2.410%, 04/01/2047 (SIFMA Municipal Swap Index + 0.700%) (Callable 04/01/2019)(Mandatory Tender Date 10/01/2019)(2) | | | 250,000 | | | | 250,187 | | | | | |
| Beaumont Unified School District, | | | | | | | | | | | | |
| 0.000%, 08/01/2041(Pre-refunded to 08/01/2026)(Insured by AGM) | | | 25,000 | | | | 28,658 | | | | | |
| California Health Facilities Financing Authority: | | | | | | | | | | | | |
| 5.000%, 04/01/2020 | | | 300,000 | | | | 310,320 | | | | | |
| 3.533%, 07/01/2022(Insured by NATL)(1)(5) | | | 200,000 | | | | 200,000 | | | | | |
| 1.000%, 08/15/2053 | | | 1,970,000 | | | | 1,956,190 | | | | | |
| California Municipal Finance Authority, | | | | | | | | | | | | |
| 5.000%, 10/01/2026 | | | 300,000 | | | | 347,463 | | | | | |
| California Public Finance Authority: | | | | | | | | | | | | |
| 5.000%, 10/15/2020 | | | 180,000 | | | | 186,898 | | | | | |
| 5.000%, 10/15/2021 | | | 200,000 | | | | 211,640 | | | | | |
| California State Public Works Board, | | | | | | | | | | | | |
| 5.000%, 12/01/2019(Insured by AMBAC) | | | 115,000 | | | | 118,510 | | | | | |
| California Statewide Communities Development Authority, | | | | | | | | | | | | |
| 6.250%, 04/01/2028(Insured by NATL)(1)(5) | | | 700,000 | | | | 700,000 | | | | | |
| Chawanakee Unified School District: | | | | | | | | | | | | |
| 0.000%, 08/01/2026(Insured by BAM) | | | 110,000 | | | | 116,063 | | | | | |
| 0.000%, 08/01/2027(Callable 08/01/2026)(Insured by BAM) | | | 100,000 | | | | 105,230 | | | | | |
| 0.000%, 08/01/2028(Callable 08/01/2026)(Insured by BAM) | | | 75,000 | | | | 78,292 | | | | | |
| 0.000%, 08/01/2029(Callable 08/01/2026)(Insured by BAM) | | | 80,000 | | | | 83,011 | | | | | |
| City of Marysville CA, | | | | | | | | | | | | |
| 5.250%, 01/01/2042(Pre-refunded to 01/01/2021) | | | 95,000 | | | | 101,760 | | | | | |
| City of Redding CA, | | | | | | | | | | | | |
| 4.038%, 07/01/2022(ETM)(Insured by NATL)(1)(5) | | | 85,000 | | | | 83,495 | | | | | |
| College of the Sequoias Tulare Area Improvement District No. 3, | | | | | | | | | | | | |
| 0.000%, 08/01/2041(Callable 08/01/2026)(Insured by AGM) | | | 100,000 | | | | 108,148 | | | | | |
| Colton Joint Unified School District, | | | | | | | | | | | | |
| 0.000%, 08/01/2035(Callable 08/01/2026)(Insured by AGM) | | | 250,000 | | | | 252,888 | | | | | |
| Corona-Norca Unified School District, | | | | | | | | | | | | |
| 6.800%, 08/01/2039(Callable 08/01/2027)(Insured by AGM) | | | 890,000 | | | | 1,162,936 | | | | | |
| Covina-Valley Unified School District, | | | | | | | | | | | | |
| 0.000%, 08/01/2032(Callable 08/01/2019)(Insured by AGM) | | | 180,000 | | | | 90,563 | | | | | |
| Denair Unified School District, | | | | | | | | | | | | |
| 0.000%, 08/01/2031(Insured by AGM) | | | 30,000 | | | | 33,239 | | | | | |
| Desert Hot Springs Redevelopment Agency Successor Agency, | | | | | | | | | | | | |
| 5.000%, 09/01/2029(Callable 09/01/2027)(Insured by BAM) | | | 300,000 | | | | 353,469 | | | | | |
| East Bay Municipal Utility District, | | | | | | | | | | | | |
| 5.000%, 06/01/2033(Callable 06/01/2024) | | | 475,000 | | | | 538,085 | | | | | |
| Eastern Municipal Water District, | | | | | | | | | | | | |
| 1.944%, 07/01/2030 (1 Month LIBOR USD + 0.300%)(Callable 04/01/2021)(Mandatory Tender Date 10/01/2021)(2) | | | 500,000 | | | | 497,985 | | | | | |
| El Rancho Unified School District, | | | | | | | | | | | | |
| 0.000%, 08/01/2034(Callable 08/01/2028)(Insured by AGM) | | | 245,000 | | | | 246,223 | | | | | |
| Enterprise Elementary School District, | | | | | | | | | | | | |
| 0.000%, 08/01/2035(Callable 08/01/2031) | | | 30,000 | | | | 33,569 | | | | | |
| Escondido Union High School District, | | | | | | | | | | | | |
| 0.000%, 08/01/2034(Insured by AGC) | | | 105,000 | | | | 141,997 | | | | | |
| Fresno Joint Powers Financing Authority: | | | | | | | | | | | | |
| 5.000%, 04/01/2020 | | | 250,000 | | | | 259,165 | | | | | |
| 5.000%, 04/01/2027(Insured by AGM) | | | 305,000 | | | | 360,980 | | | | | |
| Golden State Tobacco Securitization Corp., | | | | | | | | | | | | |
| 5.000%, 06/01/2022 | | | 365,000 | | | | 396,397 | | | | | |
| Imperial Community College District, | | | | | | | | | | | | |
| 0.000%, 08/01/2040(Callable 08/01/2030)(Insured by AGM) | | | 140,000 | | | | 171,713 | | | | | |
| Lake Elsinore Redevelopment Agency Successor Agency, | | | | | | | | | | | | |
| 5.000%, 09/01/2027(Callable 09/01/2025)(Insured by BAM) | | | 275,000 | | | | 317,119 | | | | | |
| Lake Elsinore School Financing Authority: | | | | | | | | | | | | |
| 5.000%, 09/01/2028(Callable 09/01/2027)(Insured by BAM) | | | 150,000 | | | | 178,521 | | | | | |
| 5.000%, 09/01/2029(Callable 09/01/2027)(Insured by BAM) | | | 240,000 | | | | 283,793 | | | | | |
| 5.000%, 09/01/2030(Callable 09/01/2027)(Insured by BAM) | | | 250,000 | | | | 292,870 | | | | | |
| Long Beach Bond Finance Authority: | | | | | | | | | | | | |
| 5.250%, 11/15/2023 | | | 90,000 | | | | 101,053 | | | | | |
| 5.000%, 11/15/2029 | | | 50,000 | | | | 58,555 | | | | | |
| Northern California Gas Authority, | | | | | | | | | | | | |
| 2.235%, 07/01/2019 (3 Month LIBOR USD + 0.630%)(2) | | | 295,000 | | | | 295,091 | | | | | |
| Norwalk-La Mirada Unified School District, | | | | | | | | | | | | |
| 0.000%, 08/01/2029(Insured by AGC) | | | 210,000 | | | | 223,259 | | | | | |
| Oak Park Unified School District, | | | | | | | | | | | | |
| 0.000%, 08/01/2038(Callable 08/01/2031)(Insured by AGM) | | | 110,000 | | | | 130,921 | | | | | |
| Oceanside Unified School District, | | | | | | | | | | | | |
| 0.000%, 08/01/2051(Pre-refunded to 08/01/2022) | | | 1,000,000 | | | | 148,330 | | | | | |
| Pajaro Valley Unified School District: | | | | | | | | | | | | |
| 5.000%, 08/01/2032(Callable 08/01/2019)(Insured by BAM)(6) | | | 300,000 | | | | 304,452 | | | | | |
| 5.000%, 08/01/2033(Callable 08/01/2019)(Insured by BAM)(6) | | | 300,000 | | | | 304,350 | | | | | |
| 5.000%, 08/01/2034(Callable 08/01/2019)(Insured by BAM)(6) | | | 640,000 | | | | 649,062 | | | | | |
| Redondo Beach Unified School District: | | | | | | | | | | | | |
| 0.000%, 08/01/2031 | | | 20,000 | | | | 21,808 | | | | | |
| 6.375%, 08/01/2034(Callable 08/01/2026) | | | 590,000 | | | | 747,854 | | | | | |
| Richmond Joint Powers Financing Authority, | | | | | | | | | | | | |
| 5.500%, 11/01/2029(Callable 11/01/2025) | | | 300,000 | | | | 346,983 | | | | | |
| Rio Hondo Community College District: | | | | | | | | | | | | |
| 0.000%, 08/01/2042(Callable 08/01/2034) | | | 125,000 | | | | 128,949 | | | | | |
| 0.000%, 08/01/2042(Callable 08/01/2034) | | | 285,000 | | | | 298,400 | | | | | |
| Riverside County Public Financing Authority, | | | | | | | | | | | | |
| 5.000%, 10/01/2026(Callable 10/01/2025)(Insured by AGM) | | | 250,000 | | | | 292,790 | | | | | |
| San Bernardino City Unified School District, | | | | | | | | | | | | |
| 5.000%, 08/01/2027(Callable 08/01/2023)(Insured by AGM) | | | 450,000 | | | | 506,669 | | | | | |
| San Diego Unified School District, | | | | | | | | | | | | |
| 4.000%, 07/01/2032(Callable 07/01/2026) | | | 300,000 | | | | 321,459 | | | | | |
| San Mateo Foster City School District, | | | | | | | | | | | | |
| 0.000%, 08/01/2026 | | | 75,000 | | | | 72,416 | | | | | |
| Santa Paula Union High School District, | | | | | | | | | | | | |
| 0.000%, 08/01/2037(Callable 08/01/2027) | | | 80,000 | | | | 75,565 | | | | | |
| School District of Belmont-Redwood Shores CA, | | | | | | | | | | | | |
| 0.000%, 08/01/2031(Callable 08/01/2026) | | | 100,000 | | | | 105,871 | | | | | |
| Silicon Valley Clean Water, | | | | | | | | | | | | |
| 5.000%, 02/01/2039(Callable 02/01/2024) | | | 290,000 | | | | 323,341 | | | | | |
| Solano County Community College District: | | | | | | | | | | | | |
| 0.000%, 08/01/2027(Callable 08/01/2025) | | | 90,000 | | | | 83,250 | | | | | |
| 0.000%, 08/01/2041(Callable 08/01/2028) | | | 325,000 | | | | 295,129 | | | | | |
| State of California, | | | | | | | | | | | | |
| 5.000%, 08/01/2031(Callable 02/01/2025) | | | 450,000 | | | | 511,429 | | | | | |
| Summerville Union High School District, | | | | | | | | | | | | |
| 0.000%, 08/01/2033(Callable 08/01/2028)(Insured by BAM) | | | 25,000 | | | | 22,545 | | | | | |
| Temecula Valley Unified School District, | | | | | | | | | | | | |
| 0.000%, 08/01/2035(Callable 08/01/2024)(Insured by BAM) | | | 200,000 | | | | 205,778 | | | | | |
| Upland Unified School District, | | | | | | | | | | | | |
| 0.000%, 08/01/2041(Callable 08/01/2025) | | | 745,000 | | | | 882,967 | | | | | |
| West Hills Community College District, | | | | | | | | | | | | |
| 0.000%, 08/01/2035(Callable 08/01/2027)(Insured by AGM) | | | 50,000 | | | | 48,137 | | | | | |
| Westside Union School District, | | | | | | | | | | | | |
| 0.000%, 08/01/2028 | | | 160,000 | | | | 121,096 | | | | | |
| Wiseburn School District, | | | | | | | | | | | | |
| 0.000%, 08/01/2036(Callable 08/01/2031)(Insured by AGM) | | | 50,000 | | | | 45,034 | | | | | |
| | | | | | | | 19,027,736 | | | | 5.0 | % |
| Colorado | | | | | | | | | | | | |
| Board of Governors of Colorado State University System, | | | | | | | | | | | | |
| 5.000%, 03/01/2032(Callable 03/01/2027) | | | 125,000 | | | | 143,656 | | | | | |
| Bromley Park Metropolitan District, | | | | | | | | | | | | |
| 5.000%, 12/01/2023(Insured by BAM) | | | 225,000 | | | | 251,833 | | | | | |
| Canterberry Crossing Metropolitan District II: | | | | | | | | | | | | |
| 5.000%, 12/01/2030(Callable 12/01/2028)(Insured by AGM) | | | 235,000 | | | | 277,018 | | | | | |
| 5.000%, 12/01/2031(Callable 12/01/2028)(Insured by AGM) | | | 250,000 | | | | 293,290 | | | | | |
| 5.000%, 12/01/2032(Callable 12/01/2028)(Insured by AGM) | | | 530,000 | | | | 620,286 | | | | | |
| City & County of Denver Co.: | | | | | | | | | | | | |
| 0.000%, 08/01/2030(Callable 08/01/2026) | | | 500,000 | | | | 329,875 | | | | | |
| 0.000%, 08/01/2031(Callable 08/01/2026) | | | 150,000 | | | | 94,435 | | | | | |
| 0.000%, 08/01/2032(Callable 08/01/2026) | | | 335,000 | | | | 201,449 | | | | | |
| City of Commerce City CO: | | | | | | | | | | | | |
| 5.000%, 12/15/2028(Callable 12/15/2027)(Insured by AGM) | | | 100,000 | | | | 118,003 | | | | | |
| 5.000%, 12/15/2029(Callable 12/15/2027)(Insured by AGM) | | | 310,000 | | | | 362,588 | | | | | |
| 5.000%, 12/15/2030(Callable 12/15/2027)(Insured by AGM) | | | 500,000 | | | | 579,250 | | | | | |
| City of Fort Lupton CO: | | | | | | | | | | | | |
| 5.000%, 12/01/2027(Insured by AGM) | | | 75,000 | | | | 89,497 | | | | | |
| 5.000%, 12/01/2028(Callable 12/01/2027)(Insured by AGM) | | | 210,000 | | | | 248,936 | | | | | |
| 5.000%, 12/01/2029(Callable 12/01/2027)(Insured by AGM) | | | 250,000 | | | | 295,265 | | | | | |
| 5.000%, 12/01/2030(Callable 12/01/2027)(Insured by AGM) | | | 350,000 | | | | 411,551 | | | | | |
| City of Sheridan CO, | | | | | | | | | | | | |
| 5.000%, 12/01/2042(Callable 12/01/2025) | | | 1,130,000 | | | | 1,279,883 | | | | | |
| Colorado Educational & Cultural Facilities Authority: | | | | | | | | | | | | |
| 5.000%, 10/01/2020 | | | 400,000 | | | | 417,160 | | | | | |
| 4.000%, 11/15/2021 | | | 475,000 | | | | 492,043 | | | | | |
| 4.000%, 11/15/2022 | | | 445,000 | | | | 465,096 | | | | | |
| 4.000%, 12/15/2025 | | | 1,340,000 | | | | 1,370,807 | | | | | |
| 4.000%, 04/01/2028 | | | 540,000 | | | | 581,115 | | | | | |
| 5.000%, 08/15/2030(Callable 08/15/2024) | | | 500,000 | | | | 544,840 | | | | | |
| Colorado Health Facilities Authority: | | | | | | | | | | | | |
| 5.000%, 12/01/2023 | | | 50,000 | | | | 55,425 | | | | | |
| 5.000%, 02/01/2025(Callable 02/01/2021) | | | 100,000 | | | | 105,279 | | | | | |
| 5.000%, 06/01/2027 | | | 750,000 | | | | 847,665 | | | | | |
| 5.500%, 07/01/2034(Callable 07/01/2019) | | | 75,000 | | | | 76,281 | | | | | |
| 1.875%, 07/01/2039(Mandatory Tender Date 11/06/2019)(1) | | | 350,000 | | | | 348,649 | | | | | |
| Colorado Housing & Finance Authority: | | | | | | | | | | | | |
| 1.850%, 04/01/2020(Mandatory Tender Date 10/01/2019)(1) | | | 1,500,000 | | | | 1,495,800 | | | | | |
| 4.000%, 05/01/2048(Callable 11/01/2026)(Insured by GNMA) | | | 460,000 | | | | 481,781 | | | | | |
| Colorado School of Mines, | | | | | | | | | | | | |
| 5.000%, 12/01/2029(Callable 12/01/2027)(Insured by ST) | | | 125,000 | | | | 147,199 | | | | | |
| Denver City & County School District No. 1: | | | | | | | | | | | | |
| 5.000%, 12/01/2029(Callable 03/01/2021) | | | 500,000 | | | | 528,615 | | | | | |
| 5.000%, 12/01/2030(Callable 03/01/2021) | | | 395,000 | | | | 417,349 | | | | | |
| 5.000%, 12/01/2031(Callable 03/01/2021) | | | 595,000 | | | | 628,148 | | | | | |
| Denver Health & Hospital Authority: | | | | | | | | | | | | |
| 5.000%, 12/01/2025 | | | 400,000 | | | | 452,788 | | | | | |
| 5.000%, 12/01/2027 | | | 340,000 | | | | 388,246 | | | | | |
| E-470 Public Highway Authority, | | | | | | | | | | | | |
| 2.729%, 09/01/2039 (1 Month LIBOR USD + 1.050%)(Callable 03/01/2021)(Mandatory Tender Date 09/01/2021)(2) | | | 500,000 | | | | 503,475 | | | | | |
| El Paso County School District No. 3, | | | | | | | | | | | | |
| 5.000%, 12/01/2030(Callable 12/01/2022)(Insured by ST) | | | 250,000 | | | | 275,893 | | | | | |
| Glen Metropolitan District No. 1, | | | | | | | | | | | | |
| 2.500%, 12/01/2025(Insured by BAM) | | | 130,000 | | | | 129,588 | | | | | |
| Grand River Hospital District: | | | | | | | | | | | | |
| 5.250%, 12/01/2030(Callable 12/01/2028)(Insured by AGM) | | | 350,000 | | | | 415,093 | | | | | |
| 5.250%, 12/01/2031(Callable 12/01/2028)(Insured by AGM) | | | 1,190,000 | | | | 1,399,083 | | | | | |
| Regional Transportation District, | | | | | | | | | | | | |
| 5.000%, 11/01/2033(Callable 11/01/2027) | | | 500,000 | | | | 587,625 | | | | | |
| Southlands Metropolitan District No. 1, | | | | | | | | | | | | |
| 3.000%, 12/01/2022 | | | 238,000 | | | | 235,653 | | | | | |
| State of Colorado, | | | | | | | | | | | | |
| 4.000%, 03/15/2030(Callable 03/15/2022) | | | 175,000 | | | | 182,361 | | | | | |
| Sterling Hills West Metropolitan District, | | | | | | | | | | | | |
| 5.000%, 12/01/2027 | | | 230,000 | | | | 261,108 | | | | | |
| Vista Ridge Metropolitan District: | | | | | | | | | | | | |
| 5.000%, 12/01/2025(Insured by BAM) | | | 600,000 | | | | 680,388 | | | | | |
| 5.000%, 12/01/2026(Insured by BAM) | | | 460,000 | | | | 527,491 | | | | | |
| Woodmen Road Metropolitan District, | | | | | | | | | | | | |
| 3.000%, 12/01/2027(Insured by BAM) | | | 1,605,000 | | | | 1,640,037 | | | | | |
| | | | | | | | 22,278,896 | | | | 5.9 | % |
| Connecticut | | | | | | | | | | | | |
| City of Hartford CT: | | | | | | | | | | | | |
| 5.000%, 04/01/2027(Callable 04/01/2023)(Insured by BAM) | | | 550,000 | | | | 599,461 | | | | | |
| 5.000%, 10/01/2034(Pre-refunded to 10/01/2024) | | | 250,000 | | | | 287,863 | | | | | |
| City of New Haven CT, | | | | | | | | | | | | |
| 3.000%, 04/03/2019 | | | 2,000,000 | | | | 2,004,440 | | | | | |
| Connecticut Housing Finance Authority, | | | | | | | | | | | | |
| 4.000%, 11/15/2047(Callable 11/15/2026) | | | 220,000 | | | | 230,058 | | | | | |
| Connecticut State Health & Educational Facilities Authority: | | | | | | | | | | | | |
| 5.000%, 11/01/2026(Callable 11/01/2022) | | | 135,000 | | | | 145,704 | | | | | |
| 4.000%, 07/01/2036(Callable 07/01/2028) | | | 1,000,000 | | | | 1,043,380 | | | | | |
| State of Connecticut: | | | | | | | | | | | | |
| 5.000%, 04/15/2024 | | | 175,000 | | | | 194,960 | | | | | |
| 5.000%, 09/01/2027(Callable 09/01/2026) | | | 1,000,000 | | | | 1,149,220 | | | | | |
| 5.000%, 10/01/2027(Callable 10/01/2023) | | | 685,000 | | | | 754,370 | | | | | |
| 5.000%, 07/15/2030(Callable 07/15/2023) | | | 225,000 | | | | 241,864 | | | | | |
| 5.000%, 09/01/2033(Callable 09/01/2026) | | | 300,000 | | | | 334,263 | | | | | |
| Town of Hamden CT, | | | | | | | | | | | | |
| 4.000%, 08/15/2019(Insured by BAM) | | | 250,000 | | | | 252,813 | | | | | |
| University of Connecticut: | | | | | | | | | | | | |
| 5.000%, 01/15/2031(Callable 01/15/2027)(Insured by AGM) | | | 1,000,000 | | | | 1,140,290 | | | | | |
| 5.000%, 02/15/2031(Callable 02/15/2021) | | | 100,000 | | | | 104,867 | | | | | |
| | | | | | | | 8,483,553 | | | | 2.2 | % |
| District of Columbia | | | | | | | | | | | | |
| District of Columbia, | | | | | | | | | | | | |
| 5.000%, 06/01/2035(Callable 06/01/2024) | | | 2,000,000 | | | | 2,229,020 | | | | | |
| District of Columbia Housing Finance Agency: | | | | | | | | | | | | |
| 2.000%, 09/01/2021(Mandatory Tender Date 09/01/2020)(1) | | | 825,000 | | | | 823,251 | | | | | |
| 3.500%, 06/15/2023 | | | 370,000 | | | | 378,136 | | | | | |
| District of Columbia Water & Sewer Authority, | | | | | | | | | | | | |
| 5.000%, 10/01/2037(Callable 04/01/2026) | | | 275,000 | | | | 309,227 | | | | | |
| Metropolitan Washington Airports Authority: | | | | | | | | | | | | |
| 0.000%, 10/01/2029(Insured by AGC) | | | 90,000 | | | | 61,406 | | | | | |
| 5.000%, 10/01/2033(Callable 10/01/2025) | | | 250,000 | | | | 284,568 | | | | | |
| 6.500%, 10/01/2041(Callable 10/01/2026)(Insured by AGC) | | | 305,000 | | | | 379,698 | | | | | |
| 6.500%, 10/01/2044(Callable 10/01/2028) | | | 590,000 | | | | 735,588 | | | | | |
| 6.500%, 10/01/2044(Callable 10/01/2028)(Insured by AGM) | | | 850,000 | | | | 1,073,405 | | | | | |
| | | | | | | | 6,274,299 | | | | 1.7 | % |
| Florida | | | | | | | | | | | | |
| City of Fort Myers FL: | | | | | | | | | | | | |
| 5.000%, 12/01/2029(Callable 12/01/2025) | | | 475,000 | | | | 545,058 | | | | | |
| 4.000%, 12/01/2037(Callable 12/01/2025) | | | 1,000,000 | | | | 1,024,260 | | | | | |
| 4.000%, 12/01/2038(Callable 12/01/2025) | | | 500,000 | | | | 510,590 | | | | | |
| City of Orlando FL: | | | | | | | | | | | | |
| 5.000%, 10/01/2027(Pre-refunded to 10/01/2020) | | | 100,000 | | | | 105,380 | | | | | |
| 5.000%, 11/01/2034(Callable 11/01/2027)(Insured by AGM) | | | 775,000 | | | | 878,959 | | | | | |
| City of Tallahassee FL: | | | | | | | | | | | | |
| 5.000%, 12/01/2029(Callable 12/01/2025) | | | 560,000 | | | | 625,722 | | | | | |
| 5.000%, 10/01/2033(Callable 10/01/2025) | | | 1,250,000 | | | | 1,431,950 | | | | | |
| 5.000%, 10/01/2034(Callable 10/01/2023) | | | 1,225,000 | | | | 1,360,007 | | | | | |
| 5.000%, 10/01/2034(Callable 10/01/2024) | | | 500,000 | | | | 564,770 | | | | | |
| County of Miami-Dade FL: | | | | | | | | | | | | |
| 5.000%, 04/01/2027(Callable 04/01/2026) | | | 120,000 | | | | 141,065 | | | | | |
| 5.000%, 10/01/2032(Callable 10/01/2026) | | | 35,000 | | | | 40,116 | | | | | |
| 0.000%, 10/01/2034(Callable 10/01/2029)(Insured by AGC) | | | 165,000 | | | | 214,343 | | | | | |
| 0.000%, 10/01/2039(Callable 10/01/2029)(Insured by AGC) | | | 235,000 | | | | 302,633 | | | | | |
| Escambia County Health Facilities Authority, | | | | | | | | | | | | |
| 1.770%, 11/15/2029(Optional Put Date 01/02/2019)(Insured by AGC)(1) | | | 830,000 | | | | 830,000 | | | | | |
| Florida Department of Management Services, | | | | | | | | | | | | |
| 5.000%, 11/01/2029 | | | 2,000,000 | | | | 2,467,400 | | | | | |
| Florida Housing Finance Corp.: | | | | | | | | | | | | |
| 4.350%, 01/01/2046(Callable 01/01/2024) | | | 550,000 | | | | 554,532 | | | | | |
| 4.000%, 07/01/2047(Callable 07/01/2025)(Insured by GNMA) | | | 315,000 | | | | 327,408 | | | | | |
| Florida Municipal Loan Council: | | | | | | | | | | | | |
| 5.000%, 10/01/2024 | | | 115,000 | | | | 131,283 | | | | | |
| 5.000%, 10/01/2025 | | | 110,000 | | | | 127,410 | | | | | |
| 5.000%, 10/01/2026 | | | 90,000 | | | | 105,611 | | | | | |
| Florida Municipal Power Agency, | | | | | | | | | | | | |
| 4.000%, 10/01/2030(Callable 10/01/2027) | | | 500,000 | | | | 544,615 | | | | | |
| Heritage Bay Community Development District, | | | | | | | | | | | | |
| 2.000%, 05/01/2019 | | | 225,000 | | | | 224,928 | | | | | |
| Highlands County Health Facilities Authority, | | | | | | | | | | | | |
| 1.710%, 11/15/2037(Callable 01/02/2019)(Optional Put Date 01/07/2019)(1) | | | 2,350,000 | | | | 2,350,000 | | | | | |
| Hillsborough County Aviation Authority, | | | | | | | | | | | | |
| 5.000%, 10/01/2035(Callable 10/01/2024) | | | 500,000 | | | | 551,000 | | | | | |
| JEA Water & Sewer System Revenue: | | | | | | | | | | | | |
| 5.000%, 10/01/2028(Callable 10/01/2027) | | | 600,000 | | | | 702,234 | | | | | |
| 5.000%, 10/01/2032(Callable 10/01/2027) | | | 660,000 | | | | 759,191 | | | | | |
| Manatee County School District, | | | | | | | | | | | | |
| 5.000%, 10/01/2020(Insured by AGM) | | | 100,000 | | | | 105,451 | | | | | |
| Martin County Health Facilities Authority: | | | | | | | | | | | | |
| 3.370%, 11/15/2021 | | | 295,000 | | | | 303,785 | | | | | |
| 5.000%, 11/15/2023 | | | 260,000 | | | | 289,476 | | | | | |
| Miami Health Facilities Authority: | | | | | | | | | | | | |
| 5.000%, 07/01/2020 | | | 140,000 | | | | 145,019 | | | | | |
| 5.000%, 07/01/2021 | | | 250,000 | | | | 263,842 | | | | | |
| Miami-Dade County Industrial Development Authority: | | | | | | | | | | | | |
| 5.000%, 01/15/2020 | | | 350,000 | | | | 357,210 | | | | | |
| 5.000%, 01/15/2021 | | | 365,000 | | | | 378,633 | | | | | |
| Monroe County School District, | | | | | | | | | | | | |
| 5.000%, 10/01/2025(Insured by AGM) | | | 200,000 | | | | 232,600 | | | | | |
| Orange County Convention Center, | | | | | | | | | | | | |
| 5.000%, 10/01/2032(Callable 10/01/2026) | | | 1,000,000 | | | | 1,149,170 | | | | | |
| Orange County School Board: | | | | | | | | | | | | |
| 5.000%, 08/01/2031(Callable 08/01/2025) | | | 990,000 | | | | 1,122,541 | | | | | |
| 5.000%, 08/01/2033(Callable 08/01/2026) | | | 150,000 | | | | 171,288 | | | | | |
| Palm Beach County Health Facilities Authority, | | | | | | | | | | | | |
| 4.750%, 07/01/2025(Pre-refunded to 07/01/2020)(Insured by AGM) | | | 130,000 | | | | 135,532 | | | | | |
| Pinellas County Health Facilities Authority, | | | | | | | | | | | | |
| 3.629%, 11/15/2023(Insured by NATL)(1)(5) | | | 225,000 | | | | 225,000 | | | | | |
| Pinellas County School Board, | | | | | | | | | | | | |
| 5.000%, 07/01/2033(Callable 07/01/2027) | | | 515,000 | | | | 592,564 | | | | | |
| Reedy Creek Improvement District, | | | | | | | | | | | | |
| 4.000%, 06/01/2035(Callable 06/01/2027) | | | 1,000,000 | | | | 1,051,020 | | | | | |
| School Board of Miami-Dade County, | | | | | | | | | | | | |
| 5.000%, 11/01/2030(Callable 11/01/2024) | | | 185,000 | | | | 208,221 | | | | | |
| Village Community Development District No. 7, | | | | | | | | | | | | |
| 4.000%, 05/01/2021 | | | 230,000 | | | | 237,855 | | | | | |
| | | | | | | | 24,389,672 | | | | 6.4 | % |
| Georgia | | | | | | | | | | | | |
| Barnesville-Lamar County Industrial Development Authority, | | | | | | | | | | | | |
| 5.000%, 06/01/2028 | | | 175,000 | | | | 207,930 | | | | | |
| Burke County Development Authority: | | | | | | | | | | | | |
| 2.350%, 10/01/2032(Mandatory Tender Date 12/11/2020)(1) | | | 100,000 | | | | 99,717 | | | | | |
| 1.850%, 12/01/2049(Mandatory Tender Date 08/22/2019)(1) | | | 140,000 | | | | 139,586 | | | | | |
| Chatham County Hospital Authority, | | | | | | | | | | | | |
| 5.000%, 01/01/2031(Pre-refunded to 01/01/2022) | | | 150,000 | | | | 163,245 | | | | | |
| City of Atlanta GA: | | | | | | | | | | | | |
| 5.000%, 01/01/2025(Callable 01/01/2020) | | | 225,000 | | | | 231,095 | | | | | |
| 5.500%, 11/01/2027(Insured by AGM) | | | 145,000 | | | | 174,021 | | | | | |
| 5.000%, 01/01/2028(Callable 01/01/2020) | | | 1,000,000 | | | | 1,026,690 | | | | | |
| City of Dahlonega GA, | | | | | | | | | | | | |
| 4.000%, 09/01/2021(Insured by AGM) | | | 150,000 | | | | 156,898 | | | | | |
| Gainesville & Hall County Hospital Authority, | | | | | | | | | | | | |
| 5.000%, 02/15/2029(Callable 02/15/2027) | | | 475,000 | | | | 544,445 | | | | | |
| Monroe County Development Authority, | | | | | | | | | | | | |
| 2.050%, 07/01/2049(Mandatory Tender Date 11/19/2021)(1) | | | 750,000 | | | | 731,497 | | | | | |
| Morgan County Hospital Authority, | | | | | | | | | | | | |
| 2.750%, 09/01/2019(Callable 03/01/2019) | | | 750,000 | | | | 750,667 | | | | | |
| | | | | | | | 4,225,791 | | | | 1.1 | % |
| Illinois | | | | | | | | | | | | |
| Bourbonnais Township Park District: | | | | | | | | | | | | |
| 4.000%, 12/15/2023(Insured by BAM) | | | 100,000 | | | | 103,220 | | | | | |
| 4.000%, 12/15/2024(Insured by BAM) | | | 125,000 | | | | 129,210 | | | | | |
| 4.000%, 12/15/2025(Insured by BAM) | | | 130,000 | | | | 134,196 | | | | | |
| 4.000%, 12/15/2026(Callable 12/15/2025)(Insured by BAM) | | | 135,000 | | | | 138,610 | | | | | |
| Bureau County Township High School District No. 502: | | | | | | | | | | | | |
| 4.000%, 12/01/2031(Callable 12/01/2027)(Insured by BAM) | | | 1,330,000 | | | | 1,412,965 | | | | | |
| 6.625%, 10/01/2043(Pre-refunded to 12/01/2023)(Insured by BAM) | | | 290,000 | | | | 351,831 | | | | | |
| Chicago Board of Education, | | | | | | | | | | | | |
| 5.000%, 12/01/2023(Insured by AGM) | | | 1,000,000 | | | | 1,092,580 | | | | | |
| Chicago Park District, | | | | | | | | | | | | |
| 5.000%, 01/01/2024 | | | 580,000 | | | | 632,873 | | | | | |
| City of Berwyn IL, | | | | | | | | | | | | |
| 4.000%, 12/01/2020 | | | 100,000 | | | | 102,272 | | | | | |
| City of Chicago IL: | | | | | | | | | | | | |
| 4.000%, 01/01/2019 | | | 210,000 | | | | 210,000 | | | | | |
| 4.250%, 01/01/2019(ETM) | | | 175,000 | | | | 175,000 | | | | | |
| 5.000%, 01/01/2021(Callable 01/01/2020)(Partially Pre-refunded) | | | 115,000 | | | | 117,044 | | | | | |
| 5.000%, 01/01/2023(Callable 01/01/2020)(Partially Pre-refunded) | | | 125,000 | | | | 127,086 | | | | | |
| 5.000%, 01/01/2023 | | | 170,000 | | | | 185,587 | | | | | |
| 5.000%, 01/01/2024 | | | 250,000 | | | | 264,697 | | | | | |
| 5.000%, 01/01/2025(Callable 01/01/2024)(Insured by AGM) | | | 110,000 | | | | 122,891 | | | | | |
| 5.000%, 01/01/2026(Callable 01/01/2024) | | | 250,000 | | | | 262,140 | | | | | |
| 0.000%, 01/01/2027(Insured by NATL) | | | 300,000 | | | | 229,122 | | | | | |
| 5.000%, 11/01/2027(Callable 11/01/2024) | | | 175,000 | | | | 194,171 | | | | | |
| 5.000%, 11/01/2028(Callable 11/01/2027)(Insured by AGM) | | | 625,000 | | | | 719,719 | | | | | |
| 5.625%, 01/01/2031(Callable 01/01/2027) | | | 250,000 | | | | 275,765 | | | | | |
| 5.000%, 11/01/2033(Callable 11/01/2027)(Insured by AGM) | | | 375,000 | | | | 420,105 | | | | | |
| City of Country Club Hills IL, | | | | | | | | | | | | |
| 4.000%, 12/01/2019(Insured by BAM) | | | 195,000 | | | | 197,968 | | | | | |
| City of Decatur IL, | | | | | | | | | | | | |
| 4.250%, 03/01/2030 | | | 250,000 | | | | 262,510 | | | | | |
| City of Kankakee IL, | | | | | | | | | | | | |
| 4.500%, 05/01/2031(Callable 05/01/2025)(Insured by AGM) | | | 135,000 | | | | 143,608 | | | | | |
| City of Rockford IL, | | | | | | | | | | | | |
| 3.000%, 12/15/2022(Insured by AGM) | | | 150,000 | | | | 152,011 | | | | | |
| Cook & Will Counties Community College District No. 515, | | | | | | | | | | | | |
| 4.000%, 12/01/2021(Callable 06/01/2020)(Insured by AGM) | | | 690,000 | | | | 703,759 | | | | | |
| Cook & Will Counties School District No. 194: | | | | | | | | | | | | |
| 4.000%, 12/01/2025(Callable 12/01/2024)(Insured by BAM) | | | 160,000 | | | | 171,200 | | | | | |
| 4.000%, 12/01/2026(Callable 12/01/2024)(Insured by BAM) | | | 130,000 | | | | 138,011 | | | | | |
| Cook County Community Consolidated School District No. 65, | | | | | | | | | | | | |
| 0.000%, 12/01/2023 | | | 200,000 | | | | 175,830 | | | | | |
| Cook County School District No. 104, | | | | | | | | | | | | |
| 0.000%, 12/01/2022(ETM) | | | 500,000 | | | | 459,170 | | | | | |
| Cook County School District No. 130: | | | | | | | | | | | | |
| 5.000%, 12/01/2027(Callable 12/01/2025)(Insured by AGM) | | | 1,195,000 | | | | 1,336,034 | | | | | |
| 5.000%, 12/01/2028(Callable 12/01/2025)(Insured by AGM) | | | 1,000,000 | | | | 1,111,440 | | | | | |
| Cook County School District No. 144, | | | | | | | | | | | | |
| 0.000%, 12/01/2021(Insured by AGM) | | | 65,000 | | | | 60,170 | | | | | |
| Cook County School District No. 163: | | | | | | | | | | | | |
| 6.000%, 12/15/2025(Insured by BAM) | | | 430,000 | | | | 512,366 | | | | | |
| 6.000%, 12/15/2027(Insured by BAM) | | | 1,150,000 | | | | 1,404,783 | | | | | |
| Cook County School District No. 63, | | | | | | | | | | | | |
| 2.375%, 12/01/2028(Callable 12/01/2023)(1) | | | 1,500,000 | | | | 1,532,505 | | | | | |
| Cook County School District No. 83, | | | | | | | | | | | | |
| 5.625%, 06/01/2033 | | | 775,000 | | | | 896,791 | | | | | |
| Darien Park District, | | | | | | | | | | | | |
| 4.150%, 12/15/2026(Callable 12/15/2019) | | | 200,000 | | | | 203,484 | | | | | |
| Decatur Park District, | | | | | | | | | | | | |
| 4.000%, 03/01/2019(Callable 01/31/2019) | | | 525,000 | | | | 525,819 | | | | | |
| DeKalb County Community Unit School District No. 428, | | | | | | | | | | | | |
| 0.000%, 01/01/2030(Callable 07/01/2020) | | | 300,000 | | | | 164,703 | | | | | |
| DuPage County High School District No. 87, | | | | | | | | | | | | |
| 5.000%, 01/01/2029(Callable 01/01/2025) | | | 315,000 | | | | 353,367 | | | | | |
| Ford, Champaign Counties Community Unit School District No. 10, | | | | | | | | | | | | |
| 5.000%, 12/01/2027(Callable 12/01/2026)(Insured by AGM) | | | 600,000 | | | | 695,382 | | | | | |
| Governors State University: | | | | | | | | | | | | |
| 5.000%, 07/01/2019(Insured by BAM) | | | 250,000 | | | | 253,052 | | | | | |
| 5.000%, 07/01/2020(Insured by BAM) | | | 190,000 | | | | 196,557 | | | | | |
| Illinois Development Finance Authority, | | | | | | | | | | | | |
| 1.720%, 05/01/2031(Optional Put Date 01/02/2019)(1) | | | 525,000 | | | | 525,000 | | | | | |
| Illinois Finance Authority: | | | | | | | | | | | | |
| 5.000%, 10/01/2019 | | | 525,000 | | | | 531,562 | | | | | |
| 5.000%, 02/15/2021 | | | 100,000 | | | | 106,271 | | | | | |
| 5.000%, 10/01/2021 | | | 170,000 | | | | 176,564 | | | | | |
| 5.000%, 10/01/2023 | | | 205,000 | | | | 216,123 | | | | | |
| 4.375%, 12/01/2028(Callable 12/01/2023)(7) | | | 300,000 | | | | 228,573 | | | | | |
| 5.000%, 01/01/2029(Callable 01/01/2027) | | | 465,000 | | | | 528,194 | | | | | |
| 5.000%, 01/01/2030(Callable 01/01/2027) | | | 90,000 | | | | 101,618 | | | | | |
| 5.250%, 02/15/2030(Pre-refunded to 02/15/2020) | | | 245,000 | | | | 254,131 | | | | | |
| 5.000%, 08/01/2030(Callable 08/01/2024) | | | 1,065,000 | | | | 1,191,032 | | | | | |
| 6.250%, 10/01/2033(Callable 10/01/2020) | | | 150,000 | | | | 151,856 | | | | | |
| 4.000%, 05/15/2034(Callable 05/15/2026) | | | 200,000 | | | | 204,220 | | | | | |
| 2.994%, 05/01/2036 (1 Month LIBOR USD + 1.350%)(Callable 11/01/2020)(Mandatory Tender Date 05/01/2021)(2) | | | 300,000 | | | | 300,960 | | | | | |
| 6.625%, 11/01/2039(Pre-refunded to 05/01/2019) | | | 50,000 | | | | 50,796 | | | | | |
| 4.000%, 12/01/2040(Callable 12/01/2027) | | | 270,000 | | | | 274,247 | | | | | |
| 4.000%, 12/01/2042(Callable 12/01/2027) | | | 275,000 | | | | 278,286 | | | | | |
| 1.720%, 08/01/2043(Optional Put Date 01/02/2019)(1) | | | 950,000 | | | | 950,000 | | | | | |
| 5.100%, 12/01/2043(Callable 12/01/2023)(7) | | | 1,000,000 | | | | 665,230 | | | | | |
| Illinois Housing Development Authority: | | | | | | | | | | | | |
| 3.100%, 02/01/2035(Callable 02/01/2026) | | | 1,200,000 | | | | 1,139,916 | | | | | |
| 2.450%, 06/01/2043(Callable 01/01/2023)(Insured by GNMA) | | | 688,416 | | | | 633,756 | | | | | |
| Illinois State University: | | | | | | | | | | | | |
| 3.500%, 04/01/2020 | | | 320,000 | | | | 321,811 | | | | | |
| 5.000%, 04/01/2023(Callable 04/01/2021)(Insured by BAM) | | | 440,000 | | | | 458,942 | | | | | |
| 5.000%, 04/01/2031(Callable 04/01/2028)(Insured by AGM) | | | 500,000 | | | | 562,980 | | | | | |
| Knox & Warren Counties Community Unit School District No. 205: | | | | | | | | | | | | |
| 6.000%, 01/01/2030(Callable 01/01/2021) | | | 285,000 | | | | 304,001 | | | | | |
| 6.125%, 01/01/2036(Callable 01/01/2021) | | | 1,400,000 | | | | 1,495,032 | | | | | |
| Lake County Community Consolidated School District No. 34, | | | | | | | | | | | | |
| 3.000%, 01/01/2019 | | | 100,000 | | | | 100,000 | | | | | |
| Macoupin, Sangaman & Montgomery Government Bonds, | | | | | | | | | | | | |
| 4.250%, 12/01/2032(Callable 12/01/2023)(Insured by AGM) | | | 685,000 | | | | 711,270 | | | | | |
| Metropolitan Pier & Exposition Authority: | | | | | | | | | | | | |
| 0.000%, 06/15/2019(Insured by NATL) | | | 375,000 | | | | 370,301 | | | | | |
| 0.000%, 06/15/2020(Insured by NATL) | | | 140,000 | | | | 133,969 | | | | | |
| 5.500%, 12/15/2023(Insured by NATL) | | | 150,000 | | | | 163,405 | | | | | |
| 5.700%, 06/15/2025(Pre-refunded to 06/15/2022)(Insured by NATL) | | | 15,000 | | | | 16,992 | | | | | |
| 5.700%, 06/15/2025(Callable 06/15/2022)(Insured by NATL) | | | 50,000 | | | | 54,827 | | | | | |
| Metropolitan Water Reclamation District of Greater Chicago: | | | | | | | | | | | | |
| 5.000%, 12/01/2031(Callable 12/01/2021) | | | 1,010,000 | | | | 1,077,811 | | | | | |
| 5.000%, 12/01/2034(Callable 12/01/2026) | | | 1,500,000 | | | | 1,676,235 | | | | | |
| Monroe & St. Clair Counties Community Unit School District No. 5, | | | | | | | | | | | | |
| 5.000%, 04/15/2021(Insured by BAM) | | | 100,000 | | | | 106,337 | | | | | |
| Ogle & Winnebago Counties Community Unit School District: | | | | | | | | | | | | |
| 5.000%, 12/01/2023(Insured by BAM) | | | 415,000 | | | | 461,849 | | | | | |
| 5.000%, 12/01/2024(Insured by BAM) | | | 100,000 | | | | 112,544 | | | | | |
| Peoria City School District No. 150, | | | | | | | | | | | | |
| 5.000%, 01/01/2026(Insured by BAM) | | | 330,000 | | | | 373,141 | | | | | |
| Peoria Public Building Commission, | | | | | | | | | | | | |
| 0.000%, 12/01/2021(Callable 12/01/2019)(Insured by AGC) | | | 440,000 | | | | 383,244 | | | | | |
| Railsplitter Tobacco Settlement Authority, | | | | | | | | | | | | |
| 5.250%, 06/01/2020 | | | 135,000 | | | | 140,553 | | | | | |
| Sales Tax Securitization Corp.: | | | | | | | | | | | | |
| 5.000%, 01/01/2028 | | | 1,500,000 | | | | 1,705,815 | | | | | |
| 5.000%, 01/01/2029 | | | 2,500,000 | | | | 2,861,600 | | | | | |
| Sangamon County Water Reclamation District, | | | | | | | | | | | | |
| 5.000%, 01/01/2021 | | | 80,000 | | | | 83,804 | | | | | |
| Shelby Christian Macon Counties Community School District, | | | | | | | | | | | | |
| 4.000%, 12/01/2027(Callable 12/01/2023)(Insured by AGM) | | | 155,000 | | | | 163,127 | | | | | |
| Southwestern Illinois Development Authority, | | | | | | | | | | | | |
| 5.100%, 02/01/2029(Callable 02/01/2019)(Partially Pre-refunded)(Insured by AGC) | | | 100,000 | | | | 100,226 | | | | | |
| St. Clair County Community Consolidated School District, | | | | | | | | | | | | |
| 0.000%, 12/01/2021 | | | 200,000 | | | | 184,926 | | | | | |
| State of Illinois: | | | | | | | | | | | | |
| 0.000%, 08/01/2019 | | | 150,000 | | | | 147,567 | | | | | |
| 0.000%, 08/01/2019 | | | 110,000 | | | | 108,216 | | | | | |
| 5.000%, 12/01/2019 | | | 500,000 | | | | 511,315 | | | | | |
| 5.000%, 01/01/2022(Callable 01/01/2020) | | | 220,000 | | | | 223,890 | | | | | |
| 6.000%, 06/15/2024(Insured by NATL) | | | 100,000 | | | | 113,418 | | | | | |
| 5.000%, 08/01/2024(Callable 08/01/2022) | | | 665,000 | | | | 693,701 | | | | | |
| 5.000%, 10/01/2026 | | | 1,000,000 | | | | 1,072,170 | | | | | |
| 5.000%, 05/01/2027(Callable 05/01/2024) | | | 150,000 | | | | 157,346 | | | | | |
| 5.000%, 06/15/2027(Callable 06/15/2021) | | | 1,500,000 | | | | 1,558,800 | | | | | |
| 5.250%, 07/01/2028(Callable 07/01/2023) | | | 175,000 | | | | 184,432 | | | | | |
| 5.500%, 07/01/2033(Callable 07/01/2023) | | | 410,000 | | | | 433,341 | | | | | |
| 4.000%, 06/15/2038(Callable 06/15/2028)(Insured by BAM) | | | 2,500,000 | | | | 2,446,975 | | | | | |
| Town of Cicero IL: | | | | | | | | | | | | |
| 5.000%, 01/01/2019(Insured by AGM) | | | 400,000 | | | | 400,000 | | | | | |
| 5.000%, 01/01/2019(Insured by BAM) | | | 205,000 | | | | 205,000 | | | | | |
| University of Illinois, | | | | | | | | | | | | |
| 5.000%, 10/01/2021 | | | 700,000 | | | | 751,513 | | | | | |
| Upper Illinois River Valley Development Authority: | | | | | | | | | | | | |
| 5.000%, 12/01/2023 | | | 600,000 | | | | 659,292 | | | | | |
| 5.000%, 12/01/2024 | | | 485,000 | | | | 538,559 | | | | | |
| Village of Cary IL, | | | | | | | | | | | | |
| 1.500%, 03/01/2019(Insured by BAM) | | | 127,000 | | | | 126,788 | | | | | |
| Village of Coal City IL, | | | | | | | | | | | | |
| 4.100%, 12/01/2023(Pre-refunded to 12/01/2019)(Insured by AGC) | | | 520,000 | | | | 529,994 | | | | | |
| Village of Crestwood IL: | | | | | | | | | | | | |
| 4.000%, 12/15/2021(Insured by BAM) | | | 250,000 | | | | 261,615 | | | | | |
| 4.500%, 12/15/2026(Callable 12/15/2022)(Insured by BAM) | | | 200,000 | | | | 214,954 | | | | | |
| Village of Franklin Park IL, | | | | | | | | | | | | |
| 5.000%, 04/01/2023(Insured by BAM) | | | 460,000 | | | | 502,141 | | | | | |
| Village of Lansing IL, | | | | | | | | | | | | |
| 5.000%, 03/01/2020(Insured by AGM) | | | 455,000 | | | | 470,047 | | | | | |
| Village of River Grove IL: | | | | | | | | | | | | |
| 4.000%, 12/15/2027(Callable 12/15/2026)(Insured by BAM) | | | 135,000 | | | | 140,784 | | | | | |
| 4.000%, 12/15/2028(Callable 12/15/2026)(Insured by BAM) | | | 205,000 | | | | 212,597 | | | | | |
| Will County Community High School District No. 210: | | | | | | | | | | | | |
| 4.000%, 01/01/2022(Callable 01/31/2019) | | | 85,000 | | | | 85,009 | | | | | |
| 0.000%, 01/01/2023(Insured by AGM) | | | 140,000 | | | | 123,666 | | | | | |
| 0.000%, 01/01/2026(Insured by AGM) | | | 195,000 | | | | 152,141 | | | | | |
| 0.000%, 01/01/2027 | | | 660,000 | | | | 476,381 | | | | | |
| 0.000%, 01/01/2027(Insured by AGM) | | | 115,000 | | | | 86,190 | | | | | |
| 0.000%, 01/01/2028 | | | 465,000 | | | | 319,395 | | | | | |
| 0.000%, 01/01/2028(Insured by AGM) | | | 180,000 | | | | 128,527 | | | | | |
| 0.000%, 01/01/2029 | | | 40,000 | | | | 26,145 | | | | | |
| 0.000%, 01/01/2033 | | | 175,000 | | | | 91,471 | | | | | |
| 3.375%, 01/01/2033(Callable 01/01/2023) | | | 80,000 | | | | 64,574 | | | | | |
| Will County Community Unit School District No. 201, | | | | | | | | | | | | |
| 0.000%, 11/01/2019(Insured by NATL) | | | 905,000 | | | | 887,452 | | | | | |
| Will County IL School District No. 365, | | | | | | | | | | | | |
| 0.000%, 11/01/2021(Insured by AGM) | | | 505,000 | | | | 472,185 | | | | | |
| Will County Township High School District No. 204: | | | | | | | | | | | | |
| 5.000%, 01/01/2025 | | | 125,000 | | | | 141,924 | | | | | |
| 6.250%, 01/01/2031(Callable 01/01/2021) | | | 300,000 | | | | 322,848 | | | | | |
| | | | | | | | 57,727,044 | | | | 15.2 | % |
| Indiana | | | | | | | | | |
| Blue River Valley School Building Corp., | | | | | | | | | |
| 2.250%, 07/15/2019(Insured by ST) | | | 235,000 | | | | 235,197 | | | | |
| Carmel Redevelopment Authority, | | | | | | | | | | | |
| 4.000%, 08/01/2033(Callable 08/01/2022) | | | 250,000 | | | | 260,400 | | | | |
| City of Jeffersonville IN, | | | | | | | | | | | |
| 5.000%, 01/01/2030(Callable 01/01/2028)(Insured by BAM) | | | 325,000 | | | | 378,693 | | | | |
| City of Lawrence IN, | | | | | | | | | | | |
| 5.000%, 01/01/2027(Insured by BAM) | | | 385,000 | | | | 448,891 | | | | |
| City of Whiting IN, | | | | | | | | | | | |
| 1.850%, 06/01/2044(Mandatory Tender Date 10/01/2019)(1) | | | 450,000 | | | | 449,168 | | | | |
| East Allen Multi School Building Corp., | | | | | | | | | | | |
| 5.000%, 07/15/2026(Callable 01/15/2023)(Insured by ST) | | | 165,000 | | | | 182,803 | | | | |
| Franklin Township Community School Corp., | | | | | | | | | | | |
| 5.000%, 01/15/2035(Callable 01/15/2023)(Insured by ST) | | | 775,000 | | | | 841,131 | | | | |
| Hammond Multi-School Building Corp., | | | | | | | | | | | |
| 4.500%, 07/15/2026(Callable 01/15/2024)(Insured by ST) | | | 625,000 | | | | 685,013 | | | | |
| Hammond Sanitary District: | | | | | | | | | | | |
| 5.000%, 01/15/2022(Insured by BAM) | | | 285,000 | | | | 310,656 | | | | |
| 5.000%, 07/15/2026(Insured by BAM) | | | 610,000 | | | | 711,382 | | | | |
| 5.000%, 01/15/2028(Callable 07/15/2027)(Insured by BAM) | | | 295,000 | | | | 343,713 | | | | |
| Indiana Bond Bank: | | | | | | | | | | | |
| 2.370%, 10/15/2022 (SIFMA Municipal Swap Index + 0.660%)(2) | | | 125,000 | | | | 124,581 | | | | |
| 2.602%, 10/15/2022 (3 Month LIBOR USD + 0.970%)(2) | | | 510,000 | | | | 510,051 | | | | |
| Indiana Finance Authority: | | | | | | | | | | | |
| 5.000%, 10/01/2023 | | | 180,000 | | | | 200,178 | | | | |
| 5.500%, 08/15/2045(Callable 08/15/2020) | | | 165,000 | | | | 171,217 | | | | |
| Indiana Health & Educational Facilities Financing Authority, | | | | | | | | | | | |
| 1.750%, 11/15/2031(Mandatory Tender Date 11/02/2021)(1) | | | 500,000 | | | | 492,500 | | | | |
| Indiana Municipal Power Agency, | | | | | | | | | | | |
| 5.000%, 01/01/2032(Callable 01/01/2025) | | | 1,000,000 | | | | 1,121,210 | | | | |
| IPS Multi-School Building Corp., | | | | | | | | | | | |
| 5.000%, 07/15/2026(Callable 01/15/2025)(Insured by ST) | | | 925,000 | | | | 1,057,654 | | | | |
| Kankakee Valley Middle School Building Corp., | | | | | | | | | | | |
| 5.000%, 01/15/2029(Insured by ST) | | | 1,000,000 | | | | 1,183,580 | | | | |
| Loogootee School Building Corp., | | | | | | | | | | | |
| 4.000%, 07/15/2026(Insured by ST) | | | 135,000 | | | | 147,822 | | | | |
| Middlebury Community Schools, | | | | | | | | | | | |
| 3.000%, 07/15/2019(Insured by ST) | | | 400,000 | | | | 401,432 | | | | |
| Munster School Building Corp., | | | | | | | | | | | |
| 4.000%, 07/15/2024(Insured by ST) | | | 170,000 | | | | 183,374 | | | | |
| North Montgomery High School Building Corp., | | | | | | | | | | | |
| 5.000%, 07/15/2033(Callable 07/15/2026)(Insured by ST) | | | 165,000 | | | | 188,176 | | | | |
| Shelbyville Central Renovation School Building Corp., | | | | | | | | | | | |
| 5.000%, 01/15/2029(Callable 07/15/2026)(Insured by ST) | | | 220,000 | | | | 255,583 | | | | |
| Tipton County Jail Building Corp., | | | | | | | | | | | |
| 5.000%, 01/15/2027(Insured by ST) | | | 245,000 | | | | 284,298 | | | | |
| Westfield High School Building Corp.: | | | | | | | | | | | |
| 5.000%, 01/15/2029(Callable 01/15/2026)(Insured by ST) | | | 250,000 | | | | 283,013 | | | | |
| 5.000%, 01/15/2030(Callable 01/15/2026)(Insured by ST) | | | 300,000 | | | | 337,383 | | | | |
| 5.000%, 07/15/2031(Callable 01/15/2026)(Insured by ST) | | | 150,000 | | | | 167,784 | | | | |
| | | | | | | | 11,956,883 | | | | 3.1 | % |
| Iowa | | | | | | | | | | | | |
| City of Coralville IA: | | | | | | | | | | | | |
| 4.000%, 06/01/2019 | | | 100,000 | | | | 100,088 | | | | | |
| 4.000%, 05/01/2022 | | | 100,000 | | | | 101,052 | | | | | |
| | | | | | | | 201,140 | | | | 0.1 | % |
| Kansas | | | | | | | | | | | | |
| City of Hutchinson KS: | | | | | | | | | | | | |
| 4.000%, 12/01/2020 | | | 330,000 | | | | 335,524 | | | | | |
| 4.000%, 12/01/2021 | | | 360,000 | | | | 368,442 | | | | | |
| 5.000%, 12/01/2022 | | | 140,000 | | | | 149,085 | | | | | |
| City of Wichita KS, | | | | | | | | | | | | |
| 3.000%, 09/01/2023(Callable 09/01/2022) | | | 1,155,000 | | | | 1,151,985 | | | | | |
| Kansas Development Finance Authority, | | | | | | | | | | | | |
| 5.000%, 12/01/2019(Insured by BAM) | | | 250,000 | | | | 255,818 | | | | | |
| State of Kansas Department of Transportation, | | | | | | | | | | | | |
| 1.974%, 09/01/2019 (1 Month LIBOR USD + 0.400%)(2) | | | 115,000 | | | | 115,130 | | | | | |
| | | | | | | | 2,375,984 | | | | 0.6 | % |
| Kentucky | | | | | | | | | | | | |
| Kentucky Public Energy Authority, | | | | | | | | | | | | |
| 4.000%, 04/01/2048(Callable 01/02/2024)(Mandatory Tender Date 04/01/2024)(1) | | | 550,000 | | | | 574,855 | | | | | |
| Louisville & Jefferson County Metropolitan Government, | | | | | | | | | | | | |
| 5.000%, 10/01/2019 | | | 325,000 | | | | 332,036 | | | | | |
| Paducah Electric Plant Board, | | | | | | | | | | | | |
| 5.000%, 10/01/2032(Callable 10/01/2026)(Insured by AGM) | | | 1,000,000 | | | | 1,111,680 | | | | | |
| | | | | | | | 2,018,571 | | | | 0.5 | % |
| Louisiana | | | | | | | | | | | | |
| City of Shreveport LA, | | | | | | | | | | | | |
| 5.000%, 08/01/2023(Insured by BAM) | | | 350,000 | | | | 390,348 | | | | | |
| Louisiana Public Facilities Authority, | | | | | | | | | | | | |
| 5.000%, 10/01/2023 | | | 1,000,000 | | | | 1,098,930 | | | | | |
| St. Tammany Parish Wide School District No. 12: | | | | | | | | | | | | |
| 4.000%, 03/01/2035(Callable 03/01/2027) | | | 100,000 | | | | 105,262 | | | | | |
| 4.000%, 03/01/2036(Callable 03/01/2027) | | | 115,000 | | | | 120,546 | | | | | |
| Terrebonne Parish Consolidated Government, | | | | | | | | | | | | |
| 0.000%, 04/01/2034(Insured by AGM) | | | 715,000 | | | | 414,414 | | | | | |
| | | | | | | | 2,129,500 | | | | 0.6 | % |
| Maine | | | | | | | | | | | | |
| Maine State Housing Authority: | | | | | | | | | | | | |
| 3.500%, 11/15/2045(Callable 05/15/2025) | | | 225,000 | | | | 230,522 | | | | | |
| 4.000%, 11/15/2045(Callable 11/15/2025) | | | 505,000 | | | | 524,003 | | | | | |
| 3.500%, 11/15/2046(Callable 11/15/2025) | | | 60,000 | | | | 61,380 | | | | | |
| | | | | | | | 815,905 | | | | 0.2 | % |
| Massachusetts | | | | | | | | | | | | |
| Massachusetts Housing Finance Agency: | | | | | | | | | | | | |
| 4.000%, 12/01/2028(Callable 06/01/2023) | | | 1,000,000 | | | | 1,041,430 | | | | | |
| 4.500%, 12/01/2048(Callable 12/01/2027) | | | 2,000,000 | | | | 2,148,420 | | | | | |
| Town of Ashburnham MA, | | | | | | | | | | | | |
| 4.250%, 07/01/2021(Callable 01/31/2019)(Insured by AGC) | | | 700,000 | | | | 701,155 | | | | | |
| University of Massachusetts Building Authority, | | | | | | | | | | | | |
| 5.000%, 11/01/2039(Callable 11/01/2024) | | | 325,000 | | | | 362,079 | | | | | |
| | | | | | | | 4,253,084 | | | | 1.2 | % |
| Michigan | | | | | | | | | | | | |
| City of Detroit MI: | | | | | | | | | | | | |
| 5.250%, 07/01/2019(Insured by AGM) | | | 1,000,000 | | | | 1,015,310 | | | | | |
| 5.000%, 07/01/2039(Callable 07/01/2022)(Insured by AGM) | | | 185,000 | | | | 197,062 | | | | | |
| 5.250%, 07/01/2041(Callable 07/01/2021) | | | 50,000 | | | | 53,180 | | | | | |
| City of Wyandotte MI, | | | | | | | | | | | | |
| 5.000%, 10/01/2023(Insured by BAM) | | | 25,000 | | | | 27,625 | | | | | |
| Detroit Michigan School District, | | | | | | | | | | | | |
| 5.000%, 05/01/2033(Callable 05/01/2022)(Insured by Q-SBLF) | | | 1,000,000 | | | | 1,075,010 | | | | | |
| Flushing Community Schools, | | | | | | | | | | | | |
| 4.000%, 05/01/2029(Callable 05/01/2028)(Insured by Q-SBLF) | | | 220,000 | | | | 244,330 | | | | | |
| Lake Orion Community School District, | | | | | | | | | | | | |
| 5.000%, 05/01/2025(Insured by Q-SBLF) | | | 1,635,000 | | | | 1,895,619 | | | | | |
| Michigan Finance Authority: | | | | | | | | | | | | |
| 5.000%, 07/01/2034(Callable 07/01/2025) | | | 250,000 | | | | 276,045 | | | | | |
| 1.100%, 11/15/2046(Mandatory Tender Date 08/15/2019)(1) | | | 565,000 | | | | 561,452 | | | | | |
| Romeo Community School District, | | | | | | | | | | | | |
| 5.000%, 05/01/2029(Callable 05/01/2026)(Insured by Q-SBLF) | | | 1,000,000 | | | | 1,151,230 | | | | | |
| Roseville Community Schools, | | | | | | | | | | | | |
| 5.000%, 05/01/2026(Insured by Q-SBLF) | | | 400,000 | | | | 469,196 | | | | | |
| Trenton Public Schools School District: | | | | | | | | | | | | |
| 5.000%, 05/01/2029(Callable 05/01/2028)(Insured by Q-SBLF) | | | 135,000 | | | | 160,816 | | | | | |
| 5.000%, 05/01/2030(Callable 05/01/2028)(Insured by Q-SBLF) | | | 300,000 | | | | 354,921 | | | | | |
| Warren Consolidated Schools: | | | | | | | | | | | | |
| 5.000%, 05/01/2019(Insured by BAM) | | | 130,000 | | | | 131,305 | | | | | |
| 5.000%, 05/01/2025(Insured by BAM) | | | 300,000 | | | | 346,482 | | | | | |
| Wayne County Airport Authority, | | | | | | | | | | | | |
| 5.000%, 12/01/2031(Callable 12/01/2027) | | | 375,000 | | | | 432,622 | | | | | |
| Western Michigan University, | | | | | | | | | | | | |
| 5.000%, 11/15/2029(Callable 05/15/2025) | | | 250,000 | | | | 283,890 | | | | | |
| Ypsilanti School District, | | | | | | | | | | | | |
| 4.000%, 05/01/2020(Insured by Q-SBLF) | | | 50,000 | | | | 51,310 | | | | | |
| | | | | | | | 8,727,405 | | | | 2.3 | % |
| Minnesota | | | | | | | | | | | | |
| City of Maple Grove MN: | | | | | | | | | | | | |
| 5.000%, 05/01/2027 | | | 200,000 | | | | 233,770 | | | | | |
| 5.000%, 05/01/2031(Callable 05/01/2027) | | | 220,000 | | | | 249,944 | | | | | |
| City of Plato MN, | | | | | | | | | | | | |
| 4.000%, 04/01/2021 | | | 280,000 | | | | 289,663 | | | | | |
| County of Kanabec MN, | | | | | | | | | | | | |
| 2.750%, 12/01/2019(Callable 01/31/2019) | | | 600,000 | | | | 599,940 | | | | | |
| Minnesota Housing Finance Agency: | | | | | | | | | | | | |
| 4.375%, 07/01/2026(Callable 07/01/2021)(Insured by GNMA) | | | 130,000 | | | | 132,309 | | | | | |
| 3.300%, 07/01/2029(Callable 07/01/2025) | | | 640,000 | | | | 645,971 | | | | | |
| 1.680%, 04/01/2035 | | | 1,000,000 | | | | 1,000,000 | | | | | |
| 4.000%, 01/01/2038(Callable 01/01/2024) | | | 925,000 | | | | 960,455 | | | | | |
| 4.000%, 01/01/2047(Callable 01/01/2026)(Insured by GNMA) | | | 885,000 | | | | 919,949 | | | | | |
| Plymouth Intermediate District No. 287: | | | | | | | | | | | | |
| 4.000%, 02/01/2027 | | | 200,000 | | | | 220,892 | | | | | |
| 4.000%, 02/01/2028(Callable 02/01/2027) | | | 350,000 | | | | 382,021 | | | | | |
| 4.000%, 02/01/2037(Callable 02/01/2027) | | | 250,000 | | | | 260,333 | | | | | |
| | | | | | | | 5,895,247 | | | | 1.6 | % |
| Mississippi | | | | | | | | | | | | |
| Biloxi Public School District, | | | | | | | | | | | | |
| 5.000%, 04/01/2026(Insured by BAM) | | | 500,000 | | | | 575,190 | | | | | |
| City of Gulfport MS, | | | | | | | | | | | | |
| 5.000%, 07/01/2027(Callable 07/01/2026) | | | 500,000 | | | | 556,030 | | | | | |
| Mississippi Development Bank: | | | | | | | | | | | | |
| 4.375%, 03/01/2023(Callable 07/01/2019)(Insured by AGC) | | | 150,000 | | | | 151,388 | | | | | |
| 5.250%, 03/01/2034(Callable 03/01/2028) | | | 490,000 | | | | 568,772 | | | | | |
| Mississippi Home Corp., | | | | | | | | | | | | |
| 2.400%, 02/01/2022(Mandatory Tender Date 08/01/2021)(1) | | | 500,000 | | | | 499,745 | | | | | |
| Southwest Mississippi Regional Medical Center, | | | | | | | | | | | | |
| 2.100%, 06/01/2019(Callable 01/31/2019) | | | 350,000 | | | | 349,408 | | | | | |
| State of Mississippi: | | | | | | | | | | | | |
| 5.000%, 10/01/2032(Callable 10/01/2027) | | | 215,000 | | | | 252,545 | | | | | |
| 5.000%, 10/15/2034(Callable 10/15/2025) | | | 1,000,000 | | | | 1,108,290 | | | | | |
| West Rankin Utility Authority: | | | | | | | | | | | | |
| 5.000%, 01/01/2028(Callable 01/01/2025)(Insured by AGM) | | | 110,000 | | | | 124,959 | | | | | |
| 5.000%, 01/01/2029(Callable 01/01/2025)(Insured by AGM) | | | 275,000 | | | | 311,905 | | | | | |
| 5.000%, 01/01/2030(Callable 01/01/2025)(Insured by AGM) | | | 590,000 | | | | 667,426 | | | | | |
| | | | | | | | 5,165,658 | | | | 1.4 | % |
| Missouri | | | | | | | | | | | | |
| County of Boone MO, | | | | | | | | | | | | |
| 4.000%, 08/01/2019 | | | 250,000 | | | | 252,135 | | | | | |
| Industrial Development Authority of the City of St. Louis MO, | | | | | | | | | | | | |
| 4.750%, 11/15/2047(Callable 11/15/2026) | | | 500,000 | | | | 504,875 | | | | | |
| Missouri Housing Development Commission: | | | | | | | | | | | | |
| 3.700%, 11/01/2035(Callable 05/01/2025)(Insured by GNMA) | | | 150,000 | | | | 151,005 | | | | | |
| 3.950%, 11/01/2040(Callable 05/01/2025)(Insured by GNMA) | | | 940,000 | | | | 960,201 | | | | | |
| 4.000%, 05/01/2042(Callable 11/01/2026)(Insured by GNMA) | | | 1,100,000 | | | | 1,153,196 | | | | | |
| Move Rolla Transportation Development District, | | | | | | | | | | | | |
| 3.750%, 06/01/2029(Callable 06/01/2026) | | | 405,000 | | | | 412,610 | | | | | |
| St. Louis Municipal Finance Corp., | | | | | | | | | | | | |
| 3.000%, 06/01/2020(Insured by AGM) | | | 130,000 | | | | 131,745 | | | | | |
| St. Louis Regional Convention & Sports Complex Authority, | | | | | | | | | | | | |
| 5.250%, 08/15/2019(Insured by AMBAC) | | | 70,000 | | | | 71,203 | | | | | |
| State of Missouri Environmental Improvement & Energy Resources Authority, | | | | | | | | | | | | |
| 2.650%, 12/01/2022(Insured by NATL)(1)(5) | | | 600,000 | | | | 600,000 | | | | | |
| State of Missouri Health & Educational Facilities Authority, | | | | | | | | | | | | |
| 4.000%, 08/01/2019 | | | 150,000 | | | | 151,426 | | | | | |
| | | | | | | | 4,388,396 | | | | 1.2 | % |
| Montana | | | | | | | | | | | | |
| City of Billings MT, | | | | | | | | | | | | |
| 5.000%, 07/01/2028(Callable 07/01/2027) | | | 300,000 | | | | 359,616 | | | | | |
| Montana Board of Housing: | | | | | | | | | | | | |
| 3.600%, 12/01/2030(Callable 06/01/2022) | | | 410,000 | | | | 413,928 | | | | | |
| 3.750%, 12/01/2038(Callable 12/01/2027)(Insured by FHA) | | | 495,000 | | | | 496,480 | | | | | |
| Yellowstone County School District No. 8, | | | | | | | | | | | | |
| 5.000%, 07/01/2027 | | | 225,000 | | | | 266,485 | | | | | |
| | | | | | | | 1,536,509 | | | | 0.4 | % |
| Nebraska | | | | | | | | | | | | |
| Central Plains Energy Project: | | | | | | | | | | | | |
| 5.000%, 09/01/2027(Callable 09/01/2022) | | | 290,000 | | | | 309,853 | | | | | |
| 5.000%, 09/01/2042(Callable 09/01/2022) | | | 575,000 | | | | 614,365 | | | | | |
| 5.000%, 03/01/2050(Callable 10/01/2023)(Mandatory Tender Date 01/01/2024)(1) | | | 500,000 | | | | 545,080 | | | | | |
| County of Buffalo NE: | | | | | | | | | | | | |
| 4.000%, 12/15/2029(Callable 09/13/2021) | | | 200,000 | | | | 210,598 | | | | | |
| 4.000%, 12/15/2031(Callable 09/13/2021) | | | 300,000 | | | | 314,850 | | | | | |
| Douglas County Hospital Authority No. 2, | | | | | | | | | | | | |
| 5.000%, 05/15/2019 | | | 150,000 | | | | 151,375 | | | | | |
| Gering School District: | | | | | | | | | | | | |
| 5.000%, 12/01/2031(Callable 05/30/2022) | | | 25,000 | | | | 27,174 | | | | | |
| 5.000%, 12/01/2033(Callable 05/30/2022) | | | 430,000 | | | | 465,931 | | | | | |
| 5.000%, 12/01/2034(Callable 05/30/2022) | | | 300,000 | | | | 324,555 | | | | | |
| Nebraska Investment Finance Authority: | | | | | | | | | | | | |
| 3.500%, 09/01/2036(Callable 03/01/2025) | | | 395,000 | | | | 387,321 | | | | | |
| 3.500%, 09/01/2046(Callable 03/01/2025) | | | 170,000 | | | | 174,456 | | | | | |
| Papio-Missouri River Natural Resource District: | | | | | | | | | | | | |
| 4.000%, 12/15/2027(Callable 06/15/2022) | | | 150,000 | | | | 158,052 | | | | | |
| 4.000%, 12/15/2028(Callable 06/15/2022) | | | 210,000 | | | | 220,349 | | | | | |
| Village of Boys Town NE, | | | | | | | | | | | | |
| 3.000%, 09/01/2028 | | | 1,675,000 | | | | 1,680,561 | | | | | |
| | | | | | | | 5,584,520 | | | | 1.5 | % |
| Nevada | | | | | | | | | | | | |
| Clark County School District, | | | | | | | | | | | | |
| 5.000%, 06/15/2032(Callable 06/15/2027)(Insured by BAM) | | | 450,000 | | | | 513,126 | | | | | |
| Las Vegas Convention & Visitors Authority, | | | | | | | | | | | | |
| 5.000%, 07/01/2026 | | | 1,010,000 | | | | 1,185,356 | | | | | |
| Las Vegas Valley Water District, | | | | | | | | | | | | |
| 5.250%, 06/01/2027(Callable 06/01/2021) | | | 1,065,000 | | | | 1,143,970 | | | | | |
| Nevada Housing Division: | | | | | | | | | | | | |
| 4.400%, 04/01/2029(Callable 10/01/2021)(Insured by GNMA) | | | 585,000 | | | | 597,794 | | | | | |
| 5.375%, 10/01/2039(Callable 04/01/2019)(Insured by GNMA) | | | 115,000 | | | | 115,438 | | | | | |
| State of Nevada, | | | | | | | | | | | | |
| 5.000%, 06/01/2033(Callable 12/01/2023) | | | 300,000 | | | | 331,821 | | | | | |
| Washoe County School District, | | | | | | | | | | | | |
| 5.000%, 05/01/2030(Callable 05/01/2027) | | | 525,000 | | | | 610,670 | | | | | |
| | | | | | | | 4,498,175 | | | | 1.2 | % |
| New Jersey | | | | | | | | | | | | |
| City of Atlantic City NJ: | | | | | | | | | | | | |
| 4.000%, 03/01/2019(Insured by AGM) | | | 200,000 | | | | 200,582 | | | | | |
| 5.000%, 03/01/2020(Insured by AGM) | | | 200,000 | | | | 206,310 | | | | | |
| 5.000%, 03/01/2021(Insured by BAM) | | | 100,000 | | | | 105,462 | | | | | |
| City of Trenton NJ, | | | | | | | | | | | | |
| 4.000%, 07/15/2023(Insured by AGM) | | | 400,000 | | | | 430,364 | | | | | |
| City of Union City NJ, | | | | | | | | | | | | |
| 5.000%, 11/01/2023(Insured by ST) | | | 440,000 | | | | 484,458 | | | | | |
| Jackson Township School District, | | | | | | | | | | | | |
| 5.250%, 06/15/2019 | | | 720,000 | | | | 729,929 | | | | | |
| Landis Sewage Authority, | | | | | | | | | | | | |
| 5.433%, 09/19/2019(Insured by NATL)(1)(5) | | | 50,000 | | | | 50,000 | | | | | |
| New Jersey Economic Development Authority: | | | | | | | | | | | | |
| 5.000%, 07/15/2019 | | | 130,000 | | | | 131,551 | | | | | |
| 5.000%, 07/15/2020 | | | 100,000 | | | | 103,157 | | | | | |
| 5.000%, 06/15/2023(Insured by BAM) | | | 295,000 | | | | 324,698 | | | | | |
| 5.000%, 03/01/2024(Callable 03/01/2023) | | | 150,000 | | | | 162,136 | | | | | |
| 3.125%, 07/01/2029(Callable 07/01/2027) | | | 200,000 | | | | 200,014 | | | | | |
| New Jersey Health Care Facilities Financing Authority: | | | | | | | | | | | | |
| 5.000%, 07/01/2025(Insured by AGM) | | | 200,000 | | | | 226,470 | | | | | |
| 4.500%, 11/15/2025(Callable 11/15/2020) | | | 150,000 | | | | 157,173 | | | | | |
| 4.000%, 07/01/2026(Callable 07/01/2022) | | | 1,000,000 | | | | 1,053,320 | | | | | |
| 5.000%, 07/01/2026(Callable 07/01/2025)(Insured by AGM) | | | 175,000 | | | | 200,625 | | | | | |
| New Jersey Housing & Mortgage Finance Agency: | | | | | | | | | | | | |
| 1.350%, 02/01/2020(Mandatory Tender Date 02/01/2019)(1) | | | 710,000 | | | | 709,666 | | | | | |
| 4.500%, 10/01/2048(Callable 10/01/2027) | | | 1,660,000 | | | | 1,782,292 | | | | | |
| New Jersey Transportation Trust Fund Authority: | | | | | | | | | | | | |
| 5.000%, 06/15/2019 | | | 250,000 | | | | 253,102 | | | | | |
| 5.250%, 12/15/2019 | | | 345,000 | | | | 354,405 | | | | | |
| 0.000%, 12/15/2024(Insured by BHAC) | | | 555,000 | | | | 470,646 | | | | | |
| 4.000%, 12/15/2037(Callable 12/15/2028)(Insured by BAM) | | | 500,000 | | | | 505,730 | | | | | |
| New Jersey Turnpike Authority: | | | | | | | | | | | | |
| 5.000%, 01/01/2026(Callable 01/01/2023) | | | 500,000 | | | | 550,640 | | | | | |
| 5.000%, 01/01/2029(Callable 01/01/2028) | | | 50,000 | | | | 59,436 | | | | | |
| 2.394%, 01/01/2030 (1 Month LIBOR USD + 0.750%)(Callable 07/01/2022)(Mandatory Tender Date 01/01/2023)(2) | | | 650,000 | | | | 653,601 | | | | | |
| Passaic Valley Sewerage Commission, | | | | | | | | | | | | |
| 5.750%, 12/01/2022 | | | 500,000 | | | | 562,360 | | | | | |
| | | | | | | | 10,668,127 | | | | 2.8 | % |
| New Mexico | | | | | | | | | | | | |
| New Mexico Hospital Equipment Loan Council, | | | | | | | | | | | | |
| 4.750%, 07/01/2022 | | | 520,000 | | | | 538,502 | | | | | |
| New Mexico Municipal Energy Acquisition Authority, | | | | | | | | | | | | |
| 2.324%, 11/01/2039 (1 Month LIBOR USD + 0.750%)(Callable 02/01/2019)(Mandatory Tender Date 08/01/2019)(2) | | | 315,000 | | | | 315,053 | | | | | |
| | | | | | | | 853,555 | | | | 0.2 | % |
| New York | | | | | | | | | | | | |
| City of New York NY, | | | | | | | | | | | | |
| 5.250%, 07/01/2029(Callable 07/01/2023) | | | 250,000 | | | | 276,477 | | | | | |
| County of Suffolk NY: | | | | | | | | | | | | |
| 5.000%, 09/26/2019 | | | 1,000,000 | | | | 1,020,300 | | | | | |
| 3.500%, 10/15/2025(Callable 10/15/2019) | | | 50,000 | | | | 50,427 | | | | | |
| Metropolitan Transportation Authority, | | | | | | | | | | | | |
| 5.000%, 11/15/2038(Callable 11/15/2023) | | | 500,000 | | | | 537,910 | | | | | |
| MTA Hudson Rail Yards Trust Obligations, | | | | | | | | | | | | |
| 5.000%, 11/15/2046(Callable 11/15/2019) | | | 1,250,000 | | | | 1,273,887 | | | | | |
| New York City Transitional Finance Authority: | | | | | | | | | | | | |
| 1.790%, 11/01/2022(Optional Put Date 01/02/2019)(1) | | | 1,600,000 | | | | 1,600,000 | | | | | |
| 5.000%, 08/01/2031(Callable 08/01/2028) | | | 50,000 | | | | 59,554 | | | | | |
| 5.000%, 08/01/2034(Callable 08/01/2026) | | | 650,000 | | | | 742,722 | | | | | |
| 5.000%, 08/01/2038(Callable 08/01/2028) | | | 1,295,000 | | | | 1,496,360 | | | | | |
| 5.000%, 08/01/2039(Callable 08/01/2024) | | | 105,000 | | | | 116,107 | | | | | |
| New York City Water & Sewer System: | | | | | | | | | | | | |
| 5.000%, 06/15/2036(Callable 06/15/2024) | | | 1,000,000 | | | | 1,115,820 | | | | | |
| 5.000%, 06/15/2036(Callable 06/15/2024) | | | 1,000,000 | | | | 1,115,820 | | | | | |
| New York State Dormitory Authority, | | | | | | | | | | | | |
| 5.000%, 07/01/2023(Insured by ST) | | | 150,000 | | | | 169,251 | | | | | |
| New York State Thruway Authority, | | | | | | | | | | | | |
| 5.000%, 03/15/2029(Callable 09/15/2021) | | | 1,275,000 | | | | 1,369,784 | | | | | |
| Niskayuna Central School District, | | | | | | | | | | | | |
| 1.630%, 03/15/2019(Insured by ST) | | | 165,000 | | | | 164,629 | | | | | |
| Port Authority of New York & New Jersey, | | | | | | | | | | | | |
| 5.000%, 09/01/2031(Callable 09/01/2024) | | | 270,000 | | | | 305,114 | | | | | |
| State of New York Mortgage Agency, | | | | | | | | | | | | |
| 3.500%, 10/01/2043(Callable 04/01/2023) | | | 325,000 | | | | 332,326 | | | | | |
| | | | | | | | 11,746,488 | | | | 3.0 | % |
| North Carolina | | | | | | | | | | | | |
| North Carolina Capital Facilities Finance Agency, | | | | | | | | | | | | |
| 5.000%, 06/01/2022(Insured by AGC) | | | 150,000 | | | | 163,417 | | | | | |
| North Carolina Housing Finance Agency, | | | | | | | | | | | | |
| 4.000%, 07/01/2047(Callable 01/01/2027) | | | 620,000 | | | | 649,506 | | | | | |
| North Carolina Medical Care Commission, | | | | | | | | | | | | |
| 5.000%, 06/01/2025(Callable 06/01/2022) | | | 385,000 | | | | 420,632 | | | | | |
| North Carolina Turnpike Authority, | | | | | | | | | | | | |
| 4.000%, 01/01/2041(Callable 01/01/2029)(Insured by AGM) | | | 2,000,000 | | | | 1,997,100 | | | | | |
| Wilmington Housing Authority, | | | | | | | | | | | | |
| 1.500%, 10/01/2020(Mandatory Tender Date 10/01/2019)(1) | | | 1,000,000 | | | | 995,800 | | | | | |
| | | | | | | | 4,226,455 | | | | 1.1 | % |
| North Dakota | | | | | | | | | | | | |
| City of Mandan ND, | | | | | | | | | | | | |
| 2.750%, 09/01/2041(Callable 01/31/2019) | | | 1,050,000 | | | | 1,031,625 | | | | | |
| City of Williston ND: | | | | | | | | | | | | |
| 4.250%, 07/15/2025(Callable 07/15/2022) | | | 1,750,000 | | | | 1,812,685 | | | | | |
| 5.000%, 05/01/2028(Callable 05/01/2023) | | | 480,000 | | | | 518,875 | | | | | |
| County of Burleigh ND: | | | | | | | | | | | | |
| 4.000%, 11/01/2021 | | | 525,000 | | | | 542,640 | | | | | |
| 4.000%, 11/01/2029(Callable 11/01/2022)(Insured by AGM) | | | 850,000 | | | | 890,222 | | | | | |
| County of Ward ND, | | | | | | | | | | | | |
| 4.000%, 04/01/2026(Callable 04/01/2023)(Insured by AGM) | | | 1,030,000 | | | | 1,080,367 | | | | | |
| Jamestown Park District, | | | | | | | | | | | | |
| 2.900%, 07/01/2035(Callable 01/16/2019) | | | 1,435,000 | | | | 1,414,049 | | | | | |
| North Dakota Housing Finance Agency, | | | | | | | | | | | | |
| 3.500%, 07/01/2046(Callable 01/01/2026) | | | 385,000 | | | | 396,354 | | | | | |
| | | | | | | | 7,686,817 | | | | 2.1 | % |
| Ohio | | | | | | | | | | | | |
| American Municipal Power, Inc., | | | | | | | | | | | | |
| 5.250%, 02/15/2027(Pre-refunded to 02/15/2022) | | | 285,000 | | | | 313,209 | | | | | |
| City of Avon OH, | | | | | | | | | | | | |
| 3.000%, 09/05/2019 | | | 800,000 | | | | 805,864 | | | | | |
| City of Bowling Green OH, | | | | | | | | | | | | |
| 4.500%, 06/01/2019(ETM) | | | 80,000 | | | | 80,886 | | | | | |
| City of Cleveland OH, | | | | | | | | | | | | |
| 5.000%, 10/01/2023 | | | 430,000 | | | | 486,640 | | | | | |
| Clermont County Port Authority, | | | | | | | | | | | | |
| 5.000%, 12/01/2023(Insured by BAM) | | | 310,000 | | | | 348,654 | | | | | |
| Columbus-Franklin County Finance Authority: | | | | | | | | | | | | |
| 3.820%, 11/15/2036(Callable 11/15/2021) | | | 500,000 | | | | 500,655 | | | | | |
| 4.000%, 11/15/2038(Callable 05/15/2022) | | | 345,000 | | | | 345,204 | | | | | |
| County of Franklin OH, | | | | | | | | | | | | |
2.140%, 05/15/2050 (SIFMA Municipal Swap Index + 0.430%) (Callable 05/15/2021)(Mandatory Tender Date 11/15/2021)(2) | | | 1,000,000 | | | | 1,000,410 | | | | | |
| County of Licking OH: | | | | | | | | | | | | |
| 4.000%, 12/01/2026(Callable 12/01/2021) | | | 105,000 | | | | 110,421 | | | | | |
| 4.000%, 12/01/2028(Callable 12/01/2021) | | | 250,000 | | | | 261,610 | | | | | |
| County of Lorain OH: | | | | | | | | | | | | |
| 2.500%, 04/11/2019 | | | 150,000 | | | | 150,291 | | | | | |
| 4.000%, 12/01/2028(Callable 12/01/2023) | | | 180,000 | | | | 192,058 | | | | | |
| 5.000%, 12/01/2031(Callable 12/01/2023) | | | 480,000 | | | | 536,775 | | | | | |
| County of Trumbull OH, | | | | | | | | | | | | |
| 3.125%, 08/29/2019 | | | 400,000 | | | | 402,580 | | | | | |
| Lancaster Port Authority, | | | | | | | | | | | | |
| 2.194%, 08/01/2019 (1 Month LIBOR USD + 0.620%)(Callable 02/01/2019)(2) | | | 200,000 | | | | 199,974 | | | | | |
| Little Miami Local School District, | | | | | | | | | | | | |
| 5.000%, 11/01/2036(Callable 11/01/2025)(Insured by SD CRED PROG) | | | 1,845,000 | | | | 2,071,215 | | | | | |
| New Riegel Local School District, | | | | | | | | | | | | |
| 4.000%, 12/01/2033(Callable 12/01/2020)(Insured by BAM) | | | 215,000 | | | | 220,768 | | | | | |
| Ohio Higher Educational Facility Commission, | | | | | | | | | | | | |
| 1.600%, 01/01/2039 | | | 1,250,000 | | | | 1,250,000 | | | | | |
| Ohio Housing Finance Agency: | | | | | | | | | | | | |
| 3.200%, 09/01/2036(Callable 09/01/2025)(Insured by GNMA) | | | 940,000 | | | | 891,148 | | | | | |
| 4.000%, 03/01/2047(Callable 09/01/2025)(Insured by GNMA) | | | 345,000 | | | | 359,369 | | | | | |
| Ohio Turnpike & Infrastructure Commission: | | | | | | | | | | | | |
| 0.000%, 02/15/2034(Callable 02/15/2031) | | | 1,130,000 | | | | 1,130,034 | | | | | |
| 0.000%, 02/15/2036(Callable 02/15/2031) | | | 335,000 | | | | 333,482 | | | | | |
| State of Ohio, | | | | | | | | | | | | |
| 5.000%, 11/15/2028(Callable 05/15/2023) | | | 225,000 | | | | 250,097 | | | | | |
| Village of Bratenahl OH, | | | | | | | | | | | | |
| 3.000%, 08/14/2019 | | | 775,000 | | | | 778,480 | | | | | |
| | | | | | | | 13,019,824 | | | | 3.4 | % |
| Oklahoma | | | | | | | | | | | | |
| Catoosa Industrial Authority, | | | | | | | | | | | | |
| 4.000%, 10/01/2028(Callable 10/01/2026) | | | 350,000 | | | | 347,750 | | | | | |
| Oklahoma Housing Finance Agency, | | | | | | | | | | | | |
| 3.300%, 03/01/2031(Callable 03/01/2022)(Insured by GNMA) | | | 420,000 | | | | 421,289 | | | | | |
| Oklahoma Water Resources Board, | | | | | | | | | | | | |
| 5.000%, 10/01/2028(Callable 10/01/2024) | | | 180,000 | | | | 206,948 | | | | | |
| | | | | | | | 975,987 | | | | 0.3 | % |
| Oregon | | | | | | | | | | | | |
| Clackamas Community College District, | | | | | | | | | | | | |
| 0.000%, 06/15/2040(Callable 06/15/2027) | | | 425,000 | | | | 445,417 | | | | | |
| Port of Portland OR, | | | | | | | | | | | | |
| 3.000%, 07/01/2019 | | | 100,000 | | | | 100,583 | | | | | |
| Salem Hospital Facility Authority, | | | | | | | | | | | | |
| 5.000%, 05/15/2035(Callable 05/15/2026) | | | 500,000 | | | | 558,980 | | | | | |
| State of Oregon Department of Transportation, | | | | | | | | | | | | |
| 5.000%, 11/15/2038(Callable 11/15/2023) | | | 300,000 | | | | 332,271 | | | | | |
| State of Oregon Housing & Community Services Department, | | | | | | | | | | | | |
| 2.200%, 12/01/2021(Mandatory Tender Date 12/01/2020)(1) | | | 2,000,000 | | | | 1,999,240 | | | | | |
| Umatilla County School District, | | | | | | | | | | | | |
| 0.000%, 06/15/2030(Callable 06/15/2027)(Insured by SCH BD GTY) | | | 100,000 | | | | 92,724 | | | | | |
| Umatilla County School District No. 6R: | | | | | | | | | | | | |
| 0.000%, 06/15/2028(Callable 06/15/2027)(Insured by SCH BD GTY) | | | 100,000 | | | | 93,770 | | | | | |
| 0.000%, 06/15/2035(Callable 06/15/2027)(Insured by SCH BD GTY) | | | 415,000 | | | | 376,878 | | | | | |
| | | | | | | | 3,999,863 | | | | 1.0 | % |
| Pennsylvania | | | | | | | | | | | | |
| Bloomsburg PA Area School District, | | | | | | | | | | | | |
| 4.000%, 09/01/2030(6) | | | 250,000 | | | | 263,780 | | | | | |
| Commonwealth Financing Authority: | | | | | | | | | | | | |
| 5.000%, 06/01/2022 | | | 750,000 | | | | 815,797 | | | | | |
| 4.000%, 06/01/2039(Callable 06/01/2028)(Insured by AGM) | | | 1,500,000 | | | | 1,518,765 | | | | | |
| Deer Lakes School District, | | | | | | | | | | | | |
| 5.000%, 10/01/2020(Insured by AGM) | | | 100,000 | | | | 105,221 | | | | | |
| Delaware County Authority, | | | | | | | | | | | | |
| 3.000%, 06/01/2019 | | | 200,000 | | | | 200,278 | | | | | |
| Greater Latrobe School Authority, | | | | | | | | | | | | |
| 2.250%, 04/15/2019(Callable 01/31/2019)(Insured by AGM) | | | 670,000 | | | | 670,610 | | | | | |
| Northampton County General Purpose Authority, | | | | | | | | | | | | |
3.110%, 08/15/2043 (SIFMA Municipal Swap Index + 1.400%) (Callable 02/15/2020)(Mandatory Tender Date 08/15/2020)(2) | | | 225,000 | | | | 226,912 | | | | | |
| Pennsylvania Higher Educational Facilities Authority: | | | | | | | | | | | | |
| 5.250%, 07/01/2019 | | | 275,000 | | | | 278,245 | | | | | |
| 2.230%, 05/01/2030(Mandatory Tender Date 05/01/2019)(1) | | | 1,000,000 | | | | 999,740 | | | | | |
| 6.000%, 07/01/2043(Pre-refunded to 07/01/2020) | | | 1,000,000 | | | | 1,058,600 | | | | | |
| Pennsylvania Housing Finance Agency, | | | | | | | | | | | | |
| 3.500%, 10/01/2046(Callable 10/01/2025) | | | 400,000 | | | | 409,892 | | | | | |
| Pennsylvania Turnpike Commission: | | | | | | | | | | | | |
| 5.000%, 06/01/2019 | | | 25,000 | | | | 25,323 | | | | | |
| 5.000%, 06/01/2020 | | | 50,000 | | | | 52,162 | | | | | |
| 5.000%, 12/01/2023(Pre-refunded to 12/01/2019) | | | 200,000 | | | | 205,552 | | | | | |
| 5.000%, 12/01/2028 | | | 305,000 | | | | 356,670 | | | | | |
| 5.000%, 06/01/2030(Callable 12/01/2025) | | | 280,000 | | | | 311,203 | | | | | |
| 6.000%, 12/01/2030(Callable 12/01/2027)(Insured by BAM) | | | 205,000 | | | | 255,863 | | | | | |
| 6.000%, 12/01/2030(Callable 12/01/2027)(Insured by AGM) | | | 50,000 | | | | 62,629 | | | | | |
| 5.000%, 12/01/2038(Callable 12/01/2028) | | | 605,000 | | | | 665,524 | | | | | |
| 6.375%, 12/01/2038(Callable 12/01/2027) | | | 745,000 | | | | 916,708 | | | | | |
| Reading School District, | | | | | | | | | | | | |
| 5.000%, 02/01/2023(Insured by AGM) | | | 230,000 | | | | 253,283 | | | | | |
| School District of Philadelphia, | | | | | | | | | | | | |
| 5.000%, 09/01/2023(Insured by ST) | | | 55,000 | | | | 60,936 | | | | | |
| Sports & Exhibition Authority of Pittsburgh and Allegheny County, | | | | | | | | | | | | |
| 5.000%, 12/15/2028(Callable 12/15/2027)(Insured by BAM) | | | 500,000 | | | | 579,675 | | | | | |
| Upper Moreland Township School District, | | | | | | | | | | | | |
| 5.000%, 10/01/2030(Callable 04/01/2025)(Insured by ST) | | | 250,000 | | | | 284,832 | | | | | |
| Washington County Industrial Development Authority, | | | | | | | | | | | | |
| 5.000%, 11/01/2019 | | | 285,000 | | | | 291,384 | | | | | |
| West Mifflin Sanitary Sewer Municipal Authority, | | | | | | | | | | | | |
| 4.000%, 08/01/2020(Insured by BAM) | | | 125,000 | | | | 129,060 | | | | | |
| Westmoreland County Municipal Authority, | | | | | | | | | | | | |
| 5.000%, 08/15/2028(Callable 08/15/2027)(Insured by BAM) | | | 1,540,000 | | | | 1,800,322 | | | | | |
| | | | | | | | 12,798,966 | | | | 3.4 | % |
| Rhode Island | | | | | | | | | | | | |
| Providence Public Buildings Authority, | | | | | | | | | | | | |
| 5.125%, 06/15/2021(Insured by AGM) | | | 60,000 | | | | 61,942 | | | | | |
| Rhode Island Commerce Corp., | | | | | | | | | | | | |
| 5.000%, 07/01/2033(Callable 07/01/2028)(Insured by BAM) | | | 950,000 | | | | 1,080,720 | | | | | |
| Rhode Island Housing & Mortgage Finance Corp., | | | | | | | | | | | | |
| 3.500%, 10/01/2046(Callable 04/01/2025) | | | 110,000 | | | | 112,241 | | | | | |
| | | | | | | | 1,254,903 | | | | 0.3 | % |
| South Carolina | | | | | | | | | | | | |
| City of Greenville SC, | | | | | | | | | | | | |
| 5.000%, 02/01/2025(Callable 02/01/2022) | | | 325,000 | | | | 356,099 | | | | | |
| City of Walhalla SC, | | | | | | | | | | | | |
| 5.000%, 06/01/2025(Insured by BAM) | | | 185,000 | | | | 213,422 | | | | | |
| County of Florence SC, | | | | | | | | | | | | |
| 5.000%, 11/01/2033(Callable 11/01/2024) | | | 250,000 | | | | 278,665 | | | | | |
| Scago Educational Facilities Corp. for Union School District, | | | | | | | | | | | | |
| 5.000%, 12/01/2023(Insured by BAM) | | | 500,000 | | | | 558,650 | | | | | |
| South Carolina Jobs-Economic Development Authority, | | | | | | | | | | | | |
| 5.000%, 05/01/2029(Callable 05/01/2028) | | | 955,000 | | | | 1,096,798 | | | | | |
| Sumter Two School Facilities, Inc., | | | | | | | | | | | | |
| 5.000%, 12/01/2023(Insured by BAM) | | | 200,000 | | | | 222,090 | | | | | |
| University of South Carolina, | | | | | | | | | | | | |
| 5.000%, 05/01/2023 | | | 150,000 | | | | 168,365 | | | | | |
| | | | | | | | 2,894,089 | | | | 0.8 | % |
| South Dakota | | | | | | | | | | | | |
| South Dakota Health & Educational Facilities Authority, | | | | | | | | | | | | |
| 5.000%, 09/01/2028(Pre-refunded to 09/01/2020) | | | 330,000 | | | | 346,919 | | | | | |
| South Dakota Housing Development Authority, | | | | | | | | | | | | |
| 3.375%, 05/01/2033(Callable 05/01/2022) | | | 350,000 | | | | 347,431 | | | | | |
| | | | | | | | 694,350 | | | | 0.2 | % |
| Tennessee | | | | | | | | | | | | |
| Knox County Health Educational & Housing Facility Board: | | | | | | | | | | | | |
| 5.000%, 04/01/2022 | | | 200,000 | | | | 213,868 | | | | | |
| 5.000%, 01/01/2026(Callable 01/01/2023) | | | 145,000 | | | | 159,918 | | | | | |
| Nashville & Davidson County Metropolitan Government, | | | | | | | | | | | | |
| 1.550%, 11/15/2030(Mandatory Tender Date 11/03/2020)(1) | | | 255,000 | | | | 251,583 | | | | | |
| Tennessee Energy Acquisition Corp., | | | | | | | | | | | | |
| 5.625%, 09/01/2026 | | | 50,000 | | | | 57,482 | | | | | |
| Tennessee Housing Development Agency: | | | | | | | | | | | | |
| 3.600%, 01/01/2031(Callable 01/01/2023) | | | 315,000 | | | | 318,959 | | | | | |
| 4.000%, 01/01/2042(Callable 07/01/2026) | | | 275,000 | | | | 288,024 | | | | | |
| 3.800%, 07/01/2043(Callable 01/01/2022) | | | 240,000 | | | | 245,568 | | | | | |
| 4.000%, 07/01/2043(Callable 01/01/2023) | | | 45,000 | | | | 45,385 | | | | | |
| 4.000%, 07/01/2045(Callable 01/01/2025) | | | 180,000 | | | | 187,058 | | | | | |
| 4.500%, 07/01/2049(Callable 01/01/2028) | | | 1,000,000 | | | | 1,079,650 | | | | | |
| | | | | | | | 2,847,495 | | | | 0.7 | % |
| Texas | | | | | | | | | |
| Allen Independent School District, | | | | | | | | | |
| 5.000%, 02/15/2023(PSF Guaranteed) | | | 350,000 | | | | 390,995 | | | | |
| Arlington Higher Education Finance Corp.: | | | | | | | | | | | |
| 5.000%, 02/15/2025(PSF Guaranteed) | | | 875,000 | | | | 1,005,830 | | | | |
| 4.000%, 08/15/2028(Callable 08/15/2026)(PSF Guaranteed) | | | 250,000 | | | | 271,695 | | | | |
| 5.000%, 02/15/2038(Callable 02/15/2025)(PSF Guaranteed) | | | 295,000 | | | | 325,482 | | | | |
| Bexar County Health Facilities Development Corp.: | | | | | | | | | | | |
| 5.000%, 07/15/2021 | | | 145,000 | | | | 151,336 | | | | |
| 5.000%, 07/15/2021 | | | 250,000 | | | | 260,988 | | | | |
| 5.000%, 07/15/2022 | | | 235,000 | | | | 248,299 | | | | |
| Brazoria-Fort Bend County Municipal Utility, | | | | | | | | | | | |
| 2.000%, 09/01/2019(Insured by MAC) | | | 180,000 | | | | 179,924 | | | | |
| Bullard Independent School District, | | | | | | | | | | | |
| 4.000%, 02/15/2029(Callable 02/15/2024)(PSF Guaranteed) | | | 350,000 | | | | 377,457 | | | | |
| Burleson Independent School District, | | | | | | | | | | | |
| 2.500%, 02/01/2047(Mandatory Tender Date 08/01/2022)(PSF Guaranteed)(1) | | | 675,000 | | | | 679,603 | | | | |
| Central Texas Regional Mobility Authority, | | | | | | | | | | | |
| 5.000%, 01/01/2019 | | | 200,000 | | | | 200,000 | | | | |
| Central Texas Turnpike System, | | | | | | | | | | | |
| 5.000%, 08/15/2042(Mandatory Tender Date 04/01/2020)(1) | | | 200,000 | | | | 207,030 | | | | |
| Chambers County Improvement District No. 1, | | | | | | | | �� | | | |
| 3.000%, 09/01/2019 | | | 900,000 | | | | 903,915 | | | | |
| City of Amarillo TX, | | | | | | | | | | | |
| 5.000%, 04/01/2027 | | | 175,000 | | | | 208,124 | | | | |
| City of Brownsville TX, | | | | | | | | | | | |
| 4.000%, 09/01/2029 | | | 170,000 | | | | 182,638 | | | | |
| City of Bryan TX, | | | | | | | | | | | |
| 5.000%, 07/01/2030(Callable 07/01/2027)(Insured by AGM) | | | 530,000 | | | | 619,347 | | | | |
| City of Dallas TX, | | | | | | | | | | | |
| 5.000%, 02/15/2021 | | | 580,000 | | | | 616,372 | | | | |
| City of Houston TX: | | | | | | | | | | | |
| 5.500%, 12/01/2029(ETM)(Insured by NATL) | | | 500,000 | | | | 609,430 | | | | |
| 3.353%, 09/01/2033(Insured by AMBAC)(1)(5) | | | 750,000 | | | | 750,000 | | | | |
| City of Round Rock TX, | | | | | | | | | | | |
| 4.000%, 12/01/2024 | | | 205,000 | | | | 222,031 | | | | |
| City of San Antonio TX, | | | | | | | | | | | |
| 2.750%, 02/01/2048(Mandatory Tender Date 12/01/2022)(1) | | | 1,500,000 | | | | 1,521,150 | | | | |
| City of Tyler Texas, | | | | | | | | | | | |
| 5.000%, 09/01/2029 | | | 150,000 | | | | 174,173 | | | | |
| Corpus Christi Independent School District, | | | | | | | | | | | |
| 2.000%, 08/15/2047(Mandatory Tender Date 08/15/2019)(PSF Guaranteed)(1) | | | 1,035,000 | | | | 1,035,373 | | | | |
| County of Harris TX, | | | | | | | | | | | |
| 5.000%, 08/15/2029(Callable 08/15/2022) | | | 150,000 | | | | 163,376 | | | | |
| County of Williamson TX, | | | | | | | | | | | |
| 5.000%, 02/15/2028(Callable 02/15/2025) | | | 90,000 | | | | 103,236 | | | | |
| Crane County Water District, | | | | | | | | | | | |
| 5.000%, 02/15/2023 | | | 250,000 | | | | 277,400 | | | | |
| Dallas Independent School District, | | | | | | | | | | | |
| 5.000%, 02/15/2036(Mandatory Tender Date 02/15/2022)(PSF Guaranteed)(1) | | | 2,000,000 | | | | 2,174,040 | | | | |
| Danbury Higher Education Authority, Inc.: | | | | | | | | | | | |
| 4.000%, 02/15/2027(PSF Guaranteed) | | | 200,000 | | | | 217,616 | | | | |
| 4.000%, 02/15/2028(Callable 02/15/2027)(PSF Guaranteed) | | | 200,000 | | | | 216,858 | | | | |
| 4.000%, 02/15/2030(Callable 02/15/2027)(PSF Guaranteed) | | | 200,000 | | | | 213,714 | | | | |
| 4.000%, 02/15/2031(Callable 02/15/2027)(PSF Guaranteed) | | | 200,000 | | | | 212,676 | | | | |
| 5.000%, 02/15/2047(Callable 02/15/2022)(PSF Guaranteed) | | | 500,000 | | | | 533,675 | | | | |
| Dickinson Independent School District, | | | | | | | | | | | |
| 1.350%, 08/01/2037(Mandatory Tender Date 08/01/2019)(PSF Guaranteed)(1) | | | 750,000 | | | | 747,210 | | | | |
| Ferris Independent School District, | | | | | | | | | | | |
| 5.000%, 08/15/2029(Callable 08/15/2026)(PSF Guaranteed) | | | 560,000 | | | | 652,310 | | | | |
| Fort Bend Independent School District: | | | | | | | | | | | |
| 5.000%, 08/15/2030 | | | 100,000 | | | | 116,860 | | | | |
| 1.350%, 08/01/2042(Mandatory Tender Date 08/01/2020)(PSF Guaranteed)(1) | | | 975,000 | | | | 964,158 | | | | |
| Grand Parkway Transportation Corp.: | | | | | | | | | | | |
| 0.000%, 10/01/2034(Callable 10/01/2028) | | | 40,000 | | | | 38,794 | | | | |
| 0.000%, 10/01/2047(Callable 10/01/2028) | | | 235,000 | | | | 222,247 | | | | |
| 0.000%, 10/01/2048(Callable 10/01/2028) | | | 270,000 | | | | 255,347 | | | | |
| Harris County Cultural Education Facilities Finance Corp.: | | | | | | | | | | | |
| 5.000%, 12/01/2026(Callable 12/01/2024) | | | 100,000 | | | | 113,598 | | | | |
| 5.000%, 12/01/2035(Callable 12/01/2022) | | | 495,000 | | | | 534,872 | | | | |
| Harris County Municipal Utility District No. 390, | | | | | | | | | | | |
| 2.000%, 04/01/2019(Insured by BAM) | | | 375,000 | | | | 374,978 | | | | |
| Harris County Municipal Utility District No. 500, | | | | | | | | | | | |
| 3.000%, 12/01/2022(Insured by AGM) | | | 175,000 | | | | 178,108 | | | | |
| Harris County Municipal Utility District No. 71, | | | | | | | | | | | |
| 4.000%, 09/01/2028(Callable 09/01/2023)(Insured by BAM) | | | 250,000 | | | | 260,018 | | | | |
| Harris County Municipal Utility District No. 81, | | | | | | | | | | | |
| 4.000%, 09/01/2030(Callable 09/01/2019)(Insured by AGM) | | | 200,000 | | | | 201,830 | | | | |
| Harris County-Houston Sports Authority, | | | | | | | | | | | |
| 5.000%, 11/15/2026(Callable 11/15/2024)(Insured by AGM) | | | 135,000 | | | | 152,677 | | | | |
| Lake Travis Independent School District, | | | | | | | | | | | |
| 2.625%, 02/15/2048(Mandatory Tender Date 02/15/2022)(PSF Guaranteed)(1) | | | 225,000 | | | | 227,862 | | | | |
| Laredo Community College District: | | | | | | | | | | | |
| 5.000%, 08/01/2028(Callable 08/01/2027)(Insured by BAM) | | | 250,000 | | | | 293,550 | | | | |
| 5.000%, 08/01/2030(Callable 08/01/2027)(Insured by BAM) | | | 500,000 | | | | 578,810 | | | | |
| Leander Independent School District, | | | | | | | | | | | |
| 0.000%, 08/15/2047(Pre-refunded to 08/15/2024)(PSF Guaranteed) | | | 1,010,000 | | | | 252,338 | | | | |
| Mansfield Independent School District: | | | | | | | | | | | |
| 2.500%, 08/01/2042(Mandatory Tender Date 08/01/2021)(PSF Guaranteed)(1) | | | 500,000 | | | | 503,485 | | | | |
| 5.000%, 02/15/2047(Callable 02/15/2020)(PSF Guaranteed) | | | 1,400,000 | | | | 1,442,658 | | | | |
| Mesquite Independent School District, | | | | | | | | | | | |
| 5.000%, 08/15/2029(Callable 08/15/2025)(PSF Guaranteed) | | | 500,000 | | | | 575,125 | | | | |
| Mission Economic Development Corp., | | | | | | | | | | | |
| 0.500%, 01/01/2020 | | | 1,000,000 | | | | 1,000,000 | | | | |
| Montgomery County Municipal Utility District No. 119: | | | | | | | | | | | |
| 4.000%, 04/01/2023(Insured by BAM) | | | 200,000 | | | | 211,920 | | | | |
| 4.000%, 04/01/2024(Insured by BAM) | | | 200,000 | | | | 212,930 | | | | |
| New Caney Independent School District: | | | | | | | | | | | |
| 4.000%, 02/15/2029(Callable 02/15/2025)(PSF Guaranteed) | | | 1,450,000 | | | | 1,558,982 | | | | |
| 3.000%, 02/15/2050(Mandatory Tender Date 08/15/2021)(PSF Guaranteed)(1) | | | 575,000 | | | | 586,920 | | | | |
| New Hope Cultural Education Facilities Finance Corp.: | | | | | | | | | | | |
| 3.000%, 07/01/2019 | | | 125,000 | | | | 125,262 | | | | |
| 4.000%, 04/01/2020 | | | 175,000 | | | | 175,922 | | | | |
| 4.000%, 07/01/2022 | | | 120,000 | | | | 125,537 | | | | |
| 3.625%, 08/15/2022(Callable 08/15/2021) | | | 230,000 | | | | 227,192 | | | | |
| North East Independent School District, | | | | | | | | | | | |
| 2.000%, 08/01/2044(Mandatory Tender Date 08/01/2019)(PSF Guaranteed)(1) | | | 190,000 | | | | 189,998 | | | | |
| North Hays County Municipal Utility District No 1, | | | | | | | | | | | |
| 4.000%, 08/15/2019(Insured by BAM) | | | 225,000 | | | | 227,531 | | | | |
| North Texas Tollway Authority: | | | | | | | | | | | |
| 5.000%, 01/01/2024 | | | 100,000 | | | | 113,124 | | | | |
| 5.000%, 01/01/2033(Callable 01/01/2026) | | | 675,000 | | | | 762,784 | | | | |
| 0.000%, 09/01/2037(Pre-refunded to 09/01/2031) | | | 2,000,000 | | | | 888,220 | | | | |
| 5.500%, 09/01/2041(Pre-refunded to 09/01/2021) | | | 255,000 | | | | 278,427 | | | | |
| 0.000%, 09/01/2043(Pre-refunded to 09/01/2031) | | | 360,000 | | | | 405,457 | | | | |
| Northside Independent School District, | | | | | | | | | | | |
| 2.125%, 08/01/2040(Callable 02/01/2019)(Mandatory Tender Date 08/01/2020)(PSF Guaranteed)(1) | | | 490,000 | | | | 490,152 | | | | |
| Rio Vista Independent School District, | | | | | | | | | | | |
| 4.000%, 08/15/2028(Callable 08/15/2025)(Insured by BAM) | | | 125,000 | | | | 132,756 | | | | |
| Rosebud-Lott Independent School District: | | | | | | | | | | | |
| 5.500%, 02/15/2030(Callable 02/15/2025)(PSF Guaranteed) | | | 100,000 | | | | 117,411 | | | | |
| 5.500%, 02/15/2031(Callable 02/15/2025)(PSF Guaranteed) | | | 100,000 | | | | 117,225 | | | | |
| Round Rock Independent School District, | | | | | | | | | | | |
| 1.500%, 08/01/2040(Callable 02/01/2019)(Mandatory Tender Date 08/01/2021)(PSF Guaranteed)(1) | | | 425,000 | | | | 417,686 | | | | |
| Royse City Independent School District, | | | | | | | | | | | |
| 5.000%, 02/15/2038(Callable 08/15/2020)(PSF Guaranteed) | | | 200,000 | | | | 208,810 | | | | |
| SA Energy Acquisition Public Facility Corp., | | | | | | | | | | | |
| 5.500%, 08/01/2022 | | | 160,000 | | | | 175,637 | | | | |
| San Angelo Independent School District, | | | | | | | | | | | |
| 5.000%, 02/15/2029(Callable 02/15/2024)(PSF Guaranteed) | | | 1,250,000 | | | | 1,409,425 | | | | |
| San Juan Higher Education Finance Authority, | | | | | | | | | | | |
| 5.125%, 08/15/2020 | | | 375,000 | | | | 384,139 | | | | |
| Texas Municipal Gas Acquisition & Supply Corp. I: | | | | | | | | | | | |
| 5.250%, 12/15/2019 | | | 40,000 | | | | 41,228 | | | | |
| 6.250%, 12/15/2026 | | | 320,000 | | | | 365,642 | | | | |
| Texas Municipal Gas Acquisition & Supply Corp. III: | | | | | | | | | | | |
| 5.000%, 12/15/2026(Callable 12/15/2022) | | | 190,000 | | | | 207,459 | | | | |
| 5.000%, 12/15/2028(Callable 12/15/2022) | | | 575,000 | | | | 623,553 | | | | |
| 5.000%, 12/15/2029(Callable 12/15/2022) | | | 250,000 | | | | 270,525 | | | | |
| Texas Municipal Power Agency, | | | | | | | | | | | |
| 5.000%, 09/01/2047(Callable 09/01/2020) | | | 500,000 | | | | 517,220 | | | | |
| Town of Providence Village TX, | | | | | | | | | | | |
| 4.000%, 03/01/2025(Insured by BAM) | | | 105,000 | | | | 114,718 | | | | |
| Travis County Municipal Utility District No. 4, | | | | | | | | | | | |
| 4.000%, 09/01/2035(Callable 09/01/2022)(Insured by AGM) | | | 615,000 | | | | 636,156 | | | | |
| Viridian Municipal Management District: | | | | | | | | | | | |
| 4.000%, 12/01/2027(Callable 12/01/2023)(Insured by AGM) | | | 315,000 | | | | 331,635 | | | | |
| 4.000%, 12/01/2028(Callable 12/01/2023)(Insured by AGM) | | | 470,000 | | | | 492,837 | | | | |
| 6.000%, 12/01/2035(Callable 12/01/2024)(Insured by BAM) | | | 90,000 | | | | 107,590 | | | | |
| Washington County Junior College District, | | | | | | | | | | | |
| 5.000%, 10/01/2028(Callable 04/01/2026)(Insured by BAM) | | | 500,000 | | | | 575,190 | | | | |
| Wimberley Independent School District, | | | | | | | | | | | |
| 4.000%, 08/15/2031(Callable 08/15/2027)(PSF Guaranteed) | | | 330,000 | | | | 355,925 | | | | |
| | | | | | | | 39,123,743 | | | | 10.4 | % |
| Utah | | | | | | | | | | | | |
| Salt Lake City Corp., | | | | | | | | | | | | |
| 5.000%, 07/01/2030(Callable 07/01/2027) | | | 155,000 | | | | 181,130 | | | | | |
| Timpanogos Special Service District, | | | | | | | | | | | | |
| 4.000%, 06/01/2029(Callable 06/01/2024) | | | 40,000 | | | | 42,684 | | | | | |
| Utah Charter School Finance Authority: | | | | | | | | | | | | |
| 4.000%, 04/15/2019(Insured by UT CSCE) | | | 205,000 | | | | 206,105 | | | | | |
| 5.000%, 04/15/2027(Callable 04/15/2026)(Insured by UT CSCE) | | | 365,000 | | | | 417,301 | | | | | |
| 5.000%, 04/15/2028(Callable 04/15/2026)(Insured by UT CSCE) | | | 720,000 | | | | 818,597 | | | | | |
| 5.000%, 04/15/2037(Callable 04/15/2026)(Insured by UT CSCE) | | | 520,000 | | | | 572,899 | | | | | |
| Utah Housing Corp.: | | | | | | | | | | | | |
| 2.000%, 07/01/2021(Mandatory Tender Date 01/01/2021)(Insured by GNMA)(1) | | | 400,000 | | | | 398,756 | | | | | |
| 4.000%, 01/01/2045(Callable 01/01/2026)(Insured by FHA) | | | 375,000 | | | | 390,090 | | | | | |
| Utah Infrastructure Agency: | | | | | | | | | | | | |
| 5.000%, 10/15/2026 | | | 140,000 | | | | 163,211 | | | | | |
| 5.000%, 10/15/2027 | | | 125,000 | | | | 147,129 | | | | | |
| Utah Transit Authority, | | | | | | | | | | | | |
| 5.000%, 12/15/2029(Callable 06/15/2028) | | | 75,000 | | | | 88,343 | | | | | |
| | | | | | | | 3,426,245 | | | | 0.9 | % |
| Vermont | | | | | | | | | | | | |
| City of Burlington VT, | | | | | | | | | | | | |
| 5.000%, 07/01/2028(Callable 07/01/2027) | | | 275,000 | | | | 317,531 | | | | | |
| Vermont Economic Development Authority, | | | | | | | | | | | | |
| 2.000%, 07/01/2020(Callable 07/01/2019) | | | 650,000 | | | | 638,671 | | | | | |
| Vermont Housing Finance Agency, | | | | | | | | | | | | |
| 3.650%, 11/01/2032(Callable 11/01/2024) | | | 120,000 | | | | 121,380 | | | | | |
| Vermont Public Power Supply Authority, | | | | | | | | | | | | |
| 4.000%, 07/01/2020 | | | 335,000 | | | | 343,268 | | | | | |
| | | | | | | | 1,420,850 | | | | 0.4 | % |
| Virgin Islands | | | | | | | | | | | | |
| Virgin Islands Public Finance Authority, | | | | | | | | | | | | |
| 5.000%, 09/01/2020 | | | 400,000 | | | | 413,052 | | | | 0.1 | % |
| | | | | | | | | | | | | |
| Virginia | | | | | | | | | | | | |
| City of Petersburg VA, | | | | | | | | | | | | |
| 4.000%, 11/01/2025(Callable 11/01/2022)(Insured by ST) | | | 390,000 | | | | 411,282 | | | | 0.1 | % |
| | | | | | | | | | | | | |
| Washington | | | | | | | | | | | | |
| Energy Northwest, | | | | | | | | | | | | |
| 5.000%, 07/01/2030(Callable 07/01/2028) | | | 600,000 | | | | 722,142 | | | | | |
| Grays Harbor County Public Hospital District No. 1, | | | | | | | | | | | | |
| 3.000%, 08/01/2019(Callable 01/22/2019) | | | 1,000,000 | | | | 998,050 | | | | | |
| King County Public Hospital District No. 1, | | | | | | | | | | | | |
| 5.000%, 12/01/2029(Callable 12/01/2028) | | | 680,000 | | | | 786,991 | | | | | |
| Lewis County School District No. 302, | | | | | | | | | | | | |
| 5.000%, 12/01/2031(Callable 06/01/2025)(Insured by SCH BD GTY) | | | 235,000 | | | | 271,103 | | | | | |
| Mason & Kitsap Counties School District No. 403, | | | | | | | | | | | | |
| 5.000%, 12/01/2037(Callable 12/01/2023)(Insured by SCH BD GTY) | | | 1,430,000 | | | | 1,594,922 | | | | | |
| Pacific County School District No. 118, | | | | | | | | | | | | |
| 4.000%, 12/01/2025(Insured by SCH BD GTY) | | | 215,000 | | | | 235,919 | | | | | |
| State of Washington: | | | | | | | | | | | | |
| 5.000%, 02/01/2029(Callable 02/01/2022) | | | 160,000 | | | | 173,061 | | | | | |
| 5.000%, 02/01/2038(Callable 02/01/2024) | | | 645,000 | | | | 714,615 | | | | | |
| Washington Biomedical Research Properties 3.2, | | | | | | | | | | | | |
| 5.000%, 01/01/2037(Callable 07/01/2025) | | | 100,000 | | | | 112,413 | | | | | |
| Washington Health Care Facilities Authority, | | | | | | | | | | | | |
| 6.375%, 10/01/2036(Callable 01/31/2019) | | | 45,000 | | | | 45,148 | | | | | |
| Washington State Housing Finance Commission: | | | | | | | | | | | | |
| 3.700%, 12/01/2033(Callable 06/01/2024) | | | 85,000 | | | | 85,097 | | | | | |
| 3.700%, 12/01/2034(Callable 06/01/2025) | | | 165,000 | | | | 166,498 | | | | | |
| | | | | | | | 5,905,959 | | | | 1.5 | % |
| West Virginia | | | | | | | | | | | | |
| Morgantown Building Commission, | | | | | | | | | | | | |
| 2.400%, 10/01/2019(Callable 01/31/2019) | | | 255,000 | | | | 254,748 | | | | 0.1 | % |
| | | | | | | | | | | | | |
| Wisconsin | | | | | | | | | | | | |
| Public Finance Authority: | | | | | | | | | | | | |
| 3.000%, 01/01/2019 | | | 370,000 | | | | 370,000 | | | | | |
| 4.000%, 12/01/2020 | | | 650,000 | | | | 653,432 | | | | | |
| 4.000%, 01/01/2021 | | | 435,000 | | | | 441,586 | | | | | |
| 3.000%, 11/15/2022(Callable 01/31/2019) | | | 750,000 | | | | 750,053 | | | | | |
| Southeast Wisconsin Professional Baseball Park District, | | | | | | | | | | | | |
| 0.000%, 12/15/2023(ETM)(Insured by NATL) | | | 25,000 | | | | 22,401 | | | | | |
| University of Wisconsin Hospitals & Clinics, | | | | | | | | | | | | |
| 5.000%, 04/01/2038(Callable 04/01/2023) | | | 830,000 | | | | 893,595 | | | | | |
| Village of Mount Pleasant WI: | | | | | | | | | | | | |
| 5.000%, 04/01/2036(Callable 04/01/2028) | | | 1,000,000 | | | | 1,129,350 | | | | | |
| 4.000%, 04/01/2037(Callable 04/01/2028) | | | 1,000,000 | | | | 1,020,900 | | | | | |
| Village of Sussex WI, | | | | | | | | | | | | |
| 3.000%, 06/01/2023(Callable 06/01/2022) | | | 590,000 | | | | 602,366 | | | | | |
| West Allis West Milwaukee School District, | | | | | | | | | | | | |
| 3.000%, 04/01/2019 | | | 130,000 | | | | 129,904 | | | | | |
| Wisconsin Center District: | | | | | | | | | | | | |
| 5.250%, 12/15/2023(Insured by AGM) | | | 195,000 | | | | 214,305 | | | | | |
| 0.000%, 12/15/2027(Insured by NATL) | | | 220,000 | | | | 169,127 | | | | | |
| 5.250%, 12/15/2027(Insured by AGM) | | | 145,000 | | | | 167,329 | | | | | |
| 5.000%, 12/15/2028(Callable 06/15/2026) | | | 185,000 | | | | 213,270 | | | | | |
| 5.000%, 12/15/2030(Callable 12/15/2022) | | | 395,000 | | | | 429,744 | | | | | |
| Wisconsin Health & Educational Facilities Authority: | | | | | | | | | | | | |
| 4.000%, 09/15/2019 | | | 165,000 | | | | 166,426 | | | | | |
| 3.000%, 12/01/2019 | | | 750,000 | | | | 756,255 | | | | | |
| 2.650%, 11/01/2020(Callable 11/01/2019) | | | 1,625,000 | | | | 1,622,384 | | | | | |
| 5.000%, 07/01/2023 | | | 165,000 | | | | 180,376 | | | | | |
| 5.000%, 07/01/2024 | | | 250,000 | | | | 277,157 | | | | | |
| 4.000%, 09/15/2025(Callable 09/15/2023) | | | 200,000 | | | | 204,030 | | | | | |
| 5.000%, 07/01/2026(Callable 07/01/2024) | | | 50,000 | | | | 55,084 | | | | | |
| 5.000%, 02/15/2027(Pre-refunded to 08/15/2025) | | | 100,000 | | | | 116,415 | | | | | |
| 4.000%, 07/15/2028(Pre-refunded to 07/15/2021) | | | 185,000 | | | | 194,657 | | | | | |
| 5.000%, 08/15/2028(Callable 08/15/2023) | | | 1,000,000 | | | | 1,106,960 | | | | | |
| 5.000%, 12/01/2028(Callable 11/01/2026) | | | 45,000 | | | | 51,983 | | | | | |
| 5.000%, 08/15/2029(Callable 08/15/2027) | | | 170,000 | | | | 198,737 | | | | | |
| 5.000%, 12/15/2030(Callable 12/15/2024) | | | 380,000 | | | | 420,470 | | | | | |
| 5.125%, 04/15/2031(Pre-refunded to 04/15/2023) | | | 530,000 | | | | 597,882 | | | | | |
| 5.000%, 02/15/2032(Callable 02/15/2022) | | | 50,000 | | | | 53,075 | | | | | |
| 5.000%, 04/01/2032(Callable 10/01/2022) | | | 290,000 | | | | 313,269 | | | | | |
| 1.375%, 11/15/2038(Mandatory Tender Date 12/03/2019)(1) | | | 185,000 | | | | 183,655 | | | | | |
| 5.250%, 10/15/2039(Callable 10/15/2021) | | | 460,000 | | | | 489,445 | | | | | |
| Wisconsin Housing & Economic Development Authority, | | | | | | | | | | | | |
| 4.000%, 03/01/2048(Callable 03/01/2027)(Insured by FNMA) | | | 480,000 | | | | 502,286 | | | | | |
| | | | | | | | 14,697,908 | | | | 3.8 | % |
| Total Municipal Bonds (Cost $373,523,429) | | | | | | | 375,358,374 | | | | 98.8 | % |
| | | | | | | | | | | | | |
| | | | | | | | | | | | | |
| SHORT-TERM INVESTMENT | | Shares | | | | | | | | | |
| Money Market Mutual Fund | | | | | | | | | | | | |
| Fidelity Institutional Money Market Fund - Government Portfolio, Institutional Class, 2.29%(4) | | | 826,495 | | | | 826,495 | | | | | |
| Total Short-Term Investment (Cost $826,495) | | | | | | | 826,495 | | | | 0.2 | % |
| Total Investments (Cost $374,349,924) | | | | | | | 376,184,869 | | | | 99.0 | % |
| Other Assets in Excess of Liabilities | | | | | | | 3,871,646 | | | | 1.0 | % |
| TOTAL NET ASSETS | | | | | | $ | 380,056,515 | | | | 100.0 | % |
Notes to Schedule of Investments |
| | |
| AGC | Assured Guaranty Corp. |
| AGM | Assured Guaranty Municipal |
| AMBAC | Ambac Assurance Corp. |
| BAM | Build America Mutual Assurance Co. |
| BHAC | Berkshire Hathaway Assurance Corp. |
| FHA | Federal Housing Administration |
| FNMA | Fannie Mae |
| GNMA | Ginnie Mae |
| MAC | Municipal Assurance Corp. |
| NATL | National Public Finance Guarantee Corp. |
| PSF-GTD | Texas Permanent School Fund |
| Q-SBLF | Qualified School Building Loan Fund |
| SCH BD GTY | School Board Guaranty |
| SD CRED PROG | State Credit Enhancement Program |
| ST | State Aid Intercept/Withholding |
| UT CSCE | Utah Charter School Finance Authority |
| (1) | | Variable rate security. The rate reported is the rate in effect as of December 31, 2018. | | | | | |
| (2) | | Variable rate security based on a reference index and spread. The rate reported is the rate in effect as of December 31, 2018. |
| (3) | | Security issued under Rule 144A under the Securities Act of 1933 and determined to be liquid. Purchased in a private placement transaction; resale to the public may require registration or may extend only to qualified institutional buyers. At December 31, 2018, the value of these securities total $423,882, which represents 0.11% of total net assets. |
| (4) | | 7-Day Yield. | | | | | | |
| (5) | | Auction Rate Security. An Auction Rate Security is a debt instrument with a long nominal maturity for which the interest rate is regularly reset through a Dutch auction. The rate presented is either the rate set through the auction or the maximum interest rate provided for in the security issuance provision. |
| (6) | | Security or a portion of the security purchased on a when-issued or delayed delivery basis. | | | | |
| (7) | | Security in default. | | | | |
| Baird Core Intermediate Municipal Bond Fund | | | | | | | | |
| Schedule of Investments, December 31, 2018 | | | | | | | | |
| Summary of Fair Value Exposure at December 31, 2018 | | | | | | |
| | | | | | | | | |
The Fund has adopted authoritative fair valuation accounting standards which establish a definition of fair value and set out a hierarchy for measuring fair value. These standards require additional disclosures about the various inputs and valuation techniques used to develop the measurements of fair value and a discussion on changes in valuation techniques and related inputs during the period. These standards define fair value as the price that would be received to sell an asset or paid to transfer a liability in an orderly transaction between market participants at the measurement date. |
| | | | | | | | | |
| The fair value hierarchy is organized into three levels based upon the assumptions (referred to as "inputs") used in pricing the asset or liability. These standards state that "observable inputs" reflect the assumptions market participants would use in pricing the asset or liability based on market data obtained from independent sources and "unobservable inputs" reflect an entity's own assumptions about the assumptions market participants would use in pricing the asset or liability. These inputs are summarized into three broad levels and described below: |
| | Level 1 - | Unadjusted quoted prices in active markets for identical unrestricted securities. | |
| | Level 2 - | Other significant observable inputs (including quoted prices for similar securities, quoted prices in inactive markets, dealer indications, interest rates, yield curves, prepayment speeds, credit risk, default rates, inputs corroborated by observable market data, etc.). | |
| | Level 3 - | Significant unobservable inputs (including the Fund's own assumptions about the factors that market participants would use in valuing the security) based on the best information available. | |
| The inputs or methodology used for valuing securities are not necessarily an indication of the risk associated with investing in those securities. |
| | | | | | | | | |
| The following is a summary of the inputs used to value the Fund's investments as of December 31, 2018: | | | | |
| | | Level 1 | | | Level 2 | | | Level 3 | | | Total | |
| Long-Term Investments | | | | | | | | | | | | |
| Municipal Bonds | | $ | – | | | $ | 375,358,374 | | | $ | – | | | $ | 375,358,374 | |
| Total Long-Term Investments | | | – | | | | 375,358,374 | | | | – | | | | 375,358,374 | |
| Short-Term Investment | | | | | | | | | | | | | | | | |
| Money Market Mutual Fund | | | 826,495 | | | | – | | | | – | | | | 826,495 | |
| Total Short-Term Investment | | | 826,495 | | | | – | | | | – | | | | 826,495 | |
| Total Investments | | $ | 826,495 | | | $ | 375,358,374 | | | $ | – | | | $ | 376,184,869 | |
| Changes in valuation techniques may result in transfers into or out of assigned levels within the fair value hierarchy. There were no transfers into or out of Level 3 during the reporting period, as compared to the security classifications from the prior year's annual report. |
| | | | | | | | | |
REPORT OF INDEPENDENT REGISTERED PUBLIC ACCOUNTING FIRM
To the Shareholders and Board of Directors of
Baird Funds, Inc.
Opinion on the Financial Statements
We have audited the accompanying statements of assets and liabilities, including the summary schedules of investments, of Baird Ultra Short Bond Fund, Baird Short-Term Bond Fund, Baird Intermediate Bond Fund, Baird Aggregate Bond Fund, Baird Core Plus Bond Fund, Baird Short-Term Municipal Bond Fund, Baird Quality Intermediate Municipal Bond Fund, and Baird Core Intermediate Municipal Bond Fund (the “Funds”), each a series of Baird Funds, Inc., as of December 31, 2018, the related statements of operations for the year then ended, the statements of changes in net assets, including the related notes, and the financial highlights for each of the two years in the period then ended (included in Item 1 of this Form N-CSR) and the schedules of investments as of December 31, 2018 (included in Item 6 of this Form N-CSR), (collectively referred to as the “financial statements”). In our opinion, the financial statements present fairly, in all material respects, the financial position of the each of the Funds as of December 31, 2018, the results of their operations for the year then ended, and the changes in their net assets and the financial highlights for each of the two years in the period then ended, in conformity with accounting principles generally accepted in the United States of America.
The Funds’ financial highlights for the periods ended December 31, 2016 and prior, were audited by other auditors whose report dated February 27, 2017, expressed an unqualified opinion on those financial highlights.
Basis for Opinion
These financial statements are the responsibility of the Funds’ management. Our responsibility is to express an opinion on the Funds’ financial statements based on our audits. We are a public accounting firm registered with the Public Company Accounting Oversight Board (United States) (“PCAOB”) and are required to be independent with respect to the Funds in accordance with the U.S. federal securities laws and the applicable rules and regulations of the Securities and Exchange Commission and the PCAOB.
We conducted our audits in accordance with the standards of the PCAOB. Those standards require that we plan and perform the audit to obtain reasonable assurance about whether the financial statements are free of material misstatement, whether due to error or fraud.
Our audits included performing procedures to assess the risks of material misstatement of the financial statements, whether due to error or fraud, and performing procedures that respond to those risks. Such procedures included examining, on a test basis, evidence regarding the amounts and disclosures in the financial statements. Our procedures included confirmation of securities owned as of December 31, 2018, by correspondence with the custodian and brokers. Our audits also included evaluating the accounting principles used and significant estimates made by management, as well as evaluating the overall presentation of the financial statements. We believe that our audits provide a reasonable basis for our opinion.
We have served as the Funds’ auditor since 2017.
COHEN & COMPANY, LTD.
Milwaukee, Wisconsin
March 1, 2019
(b) Not Applicable.
Item 7. Disclosure of Proxy Voting Policies and Procedures for Closed-End Management Investment Companies.
Not applicable because the Registrant is not a closed-end management investment company.
Item 8. Portfolio Managers of Closed-End Management Investment Companies.
Not applicable because the Registrant is not a closed-end management investment company.
Item 9. Purchases of Equity Securities by Closed-End Management Investment Company and Affiliated Purchasers.
Not applicable because the Registrant is not a closed-end management investment company.
Item 10. Submission of Matters to a Vote of Security Holders.
There have been no material changes to the procedures by which shareholders may recommend nominees to the Registrant’s board of directors.
Item 11. Controls and Procedures.
| (a) | The Registrant’s management, with the participation of its principal executive and principal financial officers, has evaluated the effectiveness of the Registrant's disclosure controls and procedures (as defined in Rule 30a-3(c) under the Investment Company Act of 1940 (the “Act”)), as of a date within 90 days prior to the filing date of this Form N-CSR, as required by Rule 30a-3(b) under the Act and Rules 13a-15(b) or 15d-15(b) under the Securities Exchange Act of 1934. Based on such evaluation, the Registrant's principal executive and principal financial officers have concluded that the design and operation of the Registrant's disclosure controls and procedures are effective in providing reasonable assurance that the information required to be disclosed on Form N-CSR is recorded, processed, summarized and reported within the applicable time periods. |
| (b) | There were no changes in the Registrant's internal control over financial reporting (as defined in Rule 30a-3(d) under the Act) that occurred during the second fiscal quarter of the period covered by this report that have materially affected, or are reasonably likely to materially affect, the Registrant's internal control over financial reporting. |
Item 12. Disclosure of Securities Lending Activities for Closed-End Management Investment Companies
Not applicable because the Registrant is not a closed-end management investment company.
Item 13. Exhibits.
Incorporated by reference to the Registrant’s Form N-CSR filed on March 9, 2018.
(2) A separate certification for each principal executive and principal financial officer pursuant to Section 302 of the Sarbanes-Oxley Act of 2002. Filed herewith.
(3) Any written solicitation to purchase securities under Rule 23c-1 under the Act sent or given during the period covered by the report by or on behalf of the Registrant to 10 or more persons. Not applicable because the Registrant is not a closed-end management investment company.
(4) Changes in the Registrant’s independent public accountant.
There was no change in the Registrant’s independent public accountant for the period covered by the report.
| (b) | Certifications pursuant to Section 906 of the Sarbanes-Oxley Act of 2002. Furnished herewith. |
SIGNATURES
Pursuant to the requirements of the Securities Exchange Act of 1934 and the Investment Company Act of 1940, the Registrant has duly caused this report to be signed on its behalf by the undersigned, thereunto duly authorized.
(Registrant) BAIRD FUNDS, INC.
By (Signature and Title) /s/Mary Ellen Stanek
Mary Ellen Stanek, President
Date March 6, 2019
Pursuant to the requirements of the Securities Exchange Act of 1934 and the Investment Company Act of 1940, this report has been signed below by the following persons on behalf of the Registrant and in the capacities and on the dates indicated.
By (Signature and Title) /s/Mary Ellen Stanek
Mary Ellen Stanek, President
Date March 6, 2019
By (Signature and Title) /s/Heidi Schneider
Heidi Schneider, Treasurer
Date March 6, 2019