UNITED STATES
SECURITIES AND EXCHANGE COMMISSION
Washington, D.C. 20549
FORM N-CSR
CERTIFIED SHAREHOLDER REPORT OF REGISTERED
MANAGEMENT INVESTMENT COMPANIES
Investment Company Act file number: 811-09997
Baird Funds, Inc.
(Exact name of Registrant as specified in charter)
777 East Wisconsin Avenue
Milwaukee, WI 53202
(Address of principal executive offices) (Zip code)
Andrew D. Ketter
Robert W. Baird & Co. Incorporated
777 East Wisconsin Avenue
Milwaukee, WI 53202
(Name and address of agent for service)
1-866-442-2473
Registrant's telephone number, including area code
Date of fiscal year end: December 31, 2016
Date of reporting period: December 31, 2016
Item 1. Reports to Stockholders.
Annual Report –
Baird Funds
December 31, 2016
Taxable Bond Funds
Baird Ultra Short Bond Fund
Baird Short-Term Bond Fund
Baird Intermediate Bond Fund
Baird Aggregate Bond Fund
Baird Core Plus Bond Fund
Municipal Bond Funds
Baird Short-Term Municipal Bond Fund
Baird Quality Intermediate Municipal Bond Fund
Baird Core Intermediate Municipal Bond Fund
| Go Green. |  | Go Paperless. |
Sign up to receive your Baird Funds’ prospectuses and reports online.
Table of Contents
| Letter to Shareholders | 1 |
| 2016 Bond Market Overview | 2 |
| Baird Ultra Short Bond Fund | 7 |
| Baird Short-Term Bond Fund | 17 |
| Baird Intermediate Bond Fund | 27 |
| Baird Aggregate Bond Fund | 37 |
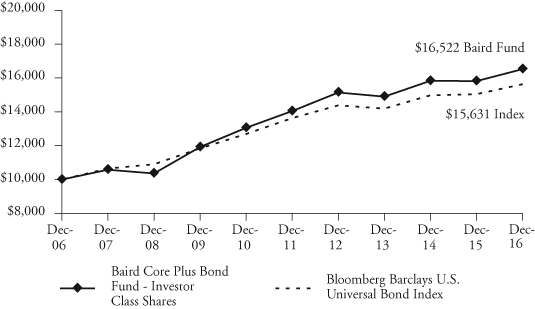
| Baird Core Plus Bond Fund | 46 |
| 2016 Municipal Bond Market Overview | 56 |
| Baird Short-Term Municipal Bond Fund | 61 |
| Baird Quality Intermediate Municipal Bond Fund | 74 |
| Baird Core Intermediate Municipal Bond Fund | 86 |
| Additional Information on Fund Expenses | 99 |
| Statements of Assets and Liabilities | 101 |
| Statements of Operations | 104 |
| Statements of Changes in Net Assets | 107 |
| Financial Highlights | 115 |
| Notes to the Financial Statements | 131 |
| Report of Independent Registered Public Accounting Firm | 145 |
| Directors and Officers | 146 |
| Disclosure Regarding the Board of Directors’ Approval | |
| of the Investment Advisory Agreement for Baird Bond Funds | 149 |
| Additional Information | 152 |
| Privacy Notice | A-1 |
This report has been prepared for shareholders and may be distributed to others only if preceded or accompanied by a current prospectus.
Cautionary Note on Analyses, Opinions and Outlooks: In this report we offer analyses and opinions on the performance of individual securities, companies, industries, sectors, markets, interest rates and governmental policies, including predictions, forecasts and outlooks regarding possible future events. These can generally be identified as such because the context of the statements may include such words as “believe,” “should,” “will,” “expects,” “anticipates,” “hopes” and words of similar effect. These statements reflect the portfolio managers’ good faith beliefs and judgments and involve risks and uncertainties, including the risk that the portfolio managers’ analyses, opinions and outlooks are or will prove to be inaccurate. It is inherently difficult to correctly assess and explain the performance of particular securities, sectors, markets, interest rate movements, governmental actions or general economic trends and conditions, and many unforeseen factors contribute to the performance of Baird Funds. Investors are, therefore, cautioned not to place undue reliance on subjective judgments contained in this report.

Baird Funds
1-866-442-2473
www.bairdfunds.com
February 27, 2017
Dear Shareholder,
2016 proved to be a year of significant volatility driven by changing U.S. and global growth expectations, shifting global central bank policies, and political surprises both in the U.S and abroad. Through this volatility, the Baird Bond Funds generated consistent and attractive results for the year. Our all-weather strategy produced these results for our Fund investors in a year with a lot of weather, reinforcing our belief that our bottom-up investment approach, focused on risk control, remains a prudent path.
Baird Advisors is a strategically sized investment manager possessing a unique combination of experience and expertise which gives us distinctive competitive advantages within the industry. These include:
| | • | A seasoned, knowledgeable and stable investment team with uncommon longevity together |
| | • | Our consistency of approach and exacting adherence to a duration neutral, risk-controlled investment philosophy |
| | • | A firm ownership structure and team-based, collaborative culture focused on generating competitive returns for our investors |
| | • | A high-touch service approach lead by the senior investment team |
| | • | Competitive expense ratios |
Our commitment to these long-term principles combined with strong alignment with the interests of our investors, helped drive assets under management in the Baird Bond Funds to $31.2 billion at year end.
We are mindful that we continue to operate in an elevated risk environment and are committed to judicious management of your assets. We never lose sight of the fact that our success rests on the trust you have placed in us to be effective stewards of your assets and we want to thank you for your continued investment in the Baird Bond Funds.
Sincerely,
Mary Ellen Stanek, CFA
President
Baird Funds
2016 Bond Market Overview
Treasury Yields Fall in 1H, Rise in 2H on Shifting Economic Data, Central Bank, Political Landscape
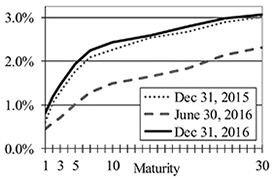
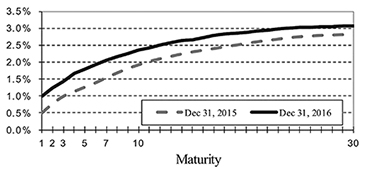
The Treasury market experienced significant volatility in 2016, driven by changing U.S. and global growth expectations, shifting global central bank policies, and political surprises both in the U.S and abroad. After a sharp dip in the 1st half and rebound in the 2nd half, the Treasury yield curve ended 2016 higher – the 10yr traded in a 123 bps range throughout the year before ending the year 17 bps higher at 2.44%. Early in 2016 global growth concerns focused on China shook global equity and credit markets as oil prices hit the lowest levels since 2003. By the end of March, however, volatility subsided and markets rebounded as global central banks took actions to abate market concerns – the European Central Bank announced an expanded bond-buying program, the Bank of Japan set a 0% target for its 10yr sovereign debt, and the Fed signaled it too would keep rates lower for longer as Fed Chair Janet Yellen noted “caution was especially warranted” in removing monetary stimulus. The Fed had started 2016 with a much more optimistic forecast than the market, projecting four rate hikes in the year, but ultimately only made one 25 bps hike at its December meeting, setting the Fed funds target range at 0.50%-0.75%. Britain’s unexpected “Brexit” vote on June 23rd to leave the European Union triggered a drop in global bond yields and the 10yr and 30yr U.S. Treasury yields hit all-time lows. Treasury yields began moving higher two weeks after the surprise “Brexit” vote as the market’s negative reaction was short-lived, allowing investors to focus on the policy shift that was taking place globally that would emphasize fiscal stimulus and move away from a sole reliance on central bank monetary stimulus. The U.S. economy also showed signs of improving growth in the second half of the year as annualized 3Q GDP rose +3.5%, bouncing back from a weak first half of +1.1% annualized growth. Treasury yields rose sharply in response to the surprising U.S. election results in November as Donald Trump won the presidency while the Republican Party held on to a majority of seats in the House and Senate. The 10yr Treasury rose from 1.86% on Election Day to 2.44% on 12/31/2016 in anticipation of higher growth and inflation if President Trump delivers on his promises of fiscal stimulus through tax cuts and infrastructure spending.
Treasury Yields
| | | | | 3 Mo | 1 Year |
Maturity | 12/31/15 | 9/30/16 | 12/31/16 | Change | Change |
| 1 | 0.60% | 0.58% | 0.81% | 0.23% | 0.21% |
| 2 | 1.05% | 0.76% | 1.19% | 0.43% | 0.14% |
| 3 | 1.31% | 0.87% | 1.45% | 0.58% | 0.14% |
| 5 | 1.76% | 1.15% | 1.93% | 0.78% | 0.17% |
| 7 | 2.09% | 1.43% | 2.25% | 0.82% | 0.16% |
| 10 | 2.27% | 1.60% | 2.44% | 0.84% | 0.17% |
| 30 | 3.02% | 2.33% | 3.07% | 0.74% | 0.05% |
Volatile Credit Spreads End 2016 Tighter as Heavy Issuance Absorbed by Strong Global Demand and Fund Inflows
Spreads experienced significant volatility in 2016 – after hitting a wide of 214 bps on 2/11/16, investment grade corporate spreads ended the year 42 bps tighter at 123 bps. While corporate leverage increased in 2016, the increase in debt levels has been concentrated in higher quality issuers such as Apple and Microsoft that have cash-rich balance sheets. Foreign net buying of corporate bonds, which had been close to zero and even negative from 2010-2012, grew as foreign direct net purchases of U.S. corporates was on pace to exceed $290 billion for
2016 Bond Market Overview
2016 (see graph below). In addition to strong demand from foreign direct buying, robust net flows into fixed-income mutual funds and ETFs ended the year just under $190 billion according to ICI estimates. High Yield corporates also benefitted from flows, tightening an impressive 251 bps to end the year at 409 bps.
Option-Adjusted Spreads (in bps)
| | | | | 3 Mo | 12 Mo |
| | 12/31/15 | 9/30/16 | 12/31/16 | Chg | Chg |
| U.S. Aggregate Index | 56 | 47 | 43 | -4 | -13 |
| U.S. Agency (non-mortgage) | 21 | 21 | 21 | 0 | 0 |
| Mortgage and ABS Sectors | | | | | |
| U.S. Agency Pass-throughs 24 | 14 | 15 | 1 | -9 | |
| Asset-Backed Securities | 72 | 55 | 59 | 4 | -13 |
| CMBS | 121 | 84 | 75 | -9 | -46 |
| Corporate Sectors | | | | | |
| U.S. Investment Grade | 165 | 138 | 123 | -15 | -42 |
| Industrial | 183 | 140 | 125 | -15 | -58 |
| Utility | 150 | 132 | 117 | -15 | -33 |
| Financial Institutions | 134 | 137 | 120 | -17 | -14 |
| U.S. High Yield | 660 | 480 | 409 | -71 | -251 |
Sources: Bloomberg Barclays Indices
Credit:Gross/Net Supply, Foreign Demand
| | *2016 Foreign Net Buying is YTD annualized rate through 3Q16 | |
| | Sources: Federal Reserve, Barclays | |
Volatile Interest Rate Moves Create Bumpy Ride for Agency Mortgage-Backed Securities
The volatile interest rate moves of 2016 had a profound impact on Agency Mortgage-Backed Securities (“MBS”). Record low Treasury yields midyear helped push 30-year mortgage rates down nearly 60bps to a 3.32% low, spurring borrowers to pay off their existing mortgages by refinancing into new mortgages with lower rates. As shown in the table (right), heightened prepayments shortened the duration of the MBS index from 4.49 yrs at the end of 2015 to 2.45 yrs by the end of June. However with the sharp rise in rates post-election, the refinancing opportunity quickly receded. As refinancing activity slowed, the MBS Index duration extended all the way to 4.61 yrs by year end and pushed the duration of the Aggregate index (of which 28% is MBS) to 5.89 yrs. This adverse duration drift (i.e. negative convexity) made MBS one of the worst performing index sectors in 2016 as tight spreads weren’t enough to compensate investors for this risk.
| Mortgage – Adverse Duration Drift |
| | 12/31/2015 | 6/30/2016 | 12/31/2016 |
| 30yr Mortgage | | | |
| Rate (Bankrate) | 3.90% | 3.53% | 4.06% |
| U.S. MBS | | | |
| Index Duration | 4.49 | 2.45 | 4.61 |
| U.S. Aggregate | | | |
| Index Duration | 5.68 | 5.47 | 5.89 |
| Source: Bankrate, Bloomberg Barclays Indices | | | |
2016 Bond Market Overview
Investment-Grade Returns Negative in 4Q, Positive for the Year
Rising Treasury yields led to negative returns for the 4th quarter, although returns stayed positive for the year. Treasuries and Tax-exempt municipal bonds were particularly hard-hit (-3.84% and -3.62%, respectively) due to the post-election rise in yields and the prospect of lower marginal tax rates in 2017. For the year, strong demand for yield drove outperformance for non-government sectors. Investment grade corporates posted strong annual returns (+6.11%) buoyed by tighter spreads. High yield corporates posted equity-like returns for the year (+17.13%) after dropping early in 2016 as fundamentals became worrisome in commodity-sensitive sectors. The sector recovered sharply as growth concerns abated, commodities recovered, and demand from yield-starved investors remained strong. MBS returns (+1.39%) lagged due to rate volatility and heightened prepayment concerns. In contrast, high quality mortgage and asset-backed sectors with more cashflow timing certainty such as CMBS and ABS outperformed for the year (+3.32% and +2.03%, respectively).
Total Returns of Selected Barclays Indices and Subsectors
Barclays Index/Sector | December | 4th Quarter | 2016 |
| U.S. Aggregate Index | 0.14% | -2.98% | 2.65% |
| U.S. Gov’t/Credit Index | 0.21% | -3.39% | 3.05% |
| U.S. Intermediate Gov’t/Credit Index | 0.07% | -2.07% | 2.08% |
| U.S. 1-3 Yr. Gov’t/Credit Index | 0.06% | -0.39% | 1.28% |
| U.S. Treasury | -0.11% | -3.84% | 1.04% |
| U.S. Agency | -0.13% | -1.96% | 1.39% |
| MBS (Mortgage Backed Securities) | 0.00% | -1.97% | 1.67% |
| CMBS (Commercial Mortgage Backed Securities) | -0.41% | -3.03% | 3.32% |
| ABS (Asset Backed Securities) | -0.15% | -0.70% | 2.03% |
| U.S. Corporate – Investment Grade | 0.67% | -2.83% | 6.11% |
| Corporate High Yield | 1.85% | 1.75% | 17.13% |
| Municipal Bond Index | 1.17% | -3.62% | 0.25% |
| TIPS (Treasury Inflation Protected Securities) | -0.10% | -2.41% | 4.68% |
Outlook
We expect the U.S. economy to continue to grow at a moderate pace in 2017 with better near-term prospects post-election given Trump’s pro-growth agenda, though headwinds remain. Consumer inflation is likely to move modestly higher and reach the Fed’s 2% target with wage inflation continuing its slow uptick. That being our base-case forecast, we believe the range of possible outcomes over the next 1-2 years is as wide as we have ever seen for a couple reasons. First, a global policy shift is underway from exhausted unconventional central bank easing toward fiscal stimulus that clearly presents “execution risk”. Second, while the immediate implications of a growing trend toward populism point to the potential for anti-free trade and anti-immigration policies, the ramifications of a broader resurgence of nationalism and less global cooperation remain to be seen. We believe these uncertainties should keep the risk environment quite elevated for some time. The pace of additional Fed moves will likely accelerate but be limited by the lower potential growth rate for the U.S. economy which continues to be impacted by secular trends including aging populations and stubbornly low productivity growth. Additionally, low interest rates abroad will continue to hold down yields in the U.S. as foreign capital flows into U.S. markets; however, the magnitude of such flows may be smaller than in previous years. We see potential for modest additional spread tightening in 2017 and anticipate non-government sectors, including investment grade corporates, will outperform modestly by earning their yield advantage over time. We remain cautious on agency MBS as the Fed will likely discontinue MBS reinvestment once policy normalization is “well underway” and anticipate wider spreads may be required in this sector to absorb any material increase in supply. We see better relative value in the mortgage and asset-backed sectors in securities with more certain cashflow timing, including senior CMBS structures with superior credit enhancement and select short-duration asset-backed sectors (e.g., cards, autos, equipment). Non-agency RMBS continue to offer attractive relative value as new issuance is very limited and housing fundamentals
2016 Bond Market Overview
continue to improve. We remain cautious of high yield corporates, finding value only selectively as spreads have compressed significantly. Municipal market valuations have become more compelling this year and will likely continue to offer select pockets of opportunity from both taxable and tax-free issuers.
Disclosures
This is not a complete analysis of every material fact regarding any company, industry or security. The information has been obtained from sources we consider to be reliable, but we cannot guarantee the accuracy.
Fixed income is generally considered to be a more conservative investment than stocks, but bonds and other fixed income investments still carry a variety of risks such as interest rate risk, credit risk, inflation risk, and liquidity risk. In a rising interest rate environment, the value of fixed-income securities generally decline and conversely, in a falling interest rate environment, the value of fixed-income securities generally increase. High yield securities may be subject to heightened market, interest rate or credit risk and should not be purchased solely because of the stated yield.
Indices are unmanaged, and are not available for direct investment. Past performance is not a guarantee of future results.
The Bloomberg Barclays Aggregate Bond Index is an index comprised of approximately 6000 publicly traded bonds including U.S. Government, mortgage-backed, corporate, and Yankee bonds with an average maturity of approximately 10 years.
The Bloomberg Barclays Government/Credit Index is a combination of the Government Index which measures government-bond general and Treasury funds, and the Credit Bond Index, which is a market value-weighted index which tracks the returns of all publicly issued, fixed-rate, nonconvertible, dollar-denominated, SEC registered, investment grade Corporate Debt.
The Bloomberg Barclays Intermediate Government/Credit Index is a combination of the Government Index which measures government-bond general and Treasury funds, and the Credit Bond Index, which is a market value-weighted index which tracks the returns of all publicly issued, fixed-rate, nonconvertible, dollar-denominated, SEC registered, investment grade Corporate Debt with maturities between one and ten years.
The Bloomberg Barclays Government/Credit Intermediate Index (1 – 3 yr.) is a combination of the Government Index which measures government-bond general and Treasury funds, and the Credit Bond Index, which is a market value-weighted index which tracks the returns of all publicly issued, fixed-rate, nonconvertible, dollar-denominated, SEC registered, investment grade Corporate Debt with maturities between zero and three years.
The Bloomberg Barclays U.S. Treasury Index includes public obligations of the U.S. Treasury. Treasury bills are excluded by the maturity constraint of at least one year but are part of a separate Short Treasury Index. In addition, certain special issues, such as state and local government series bonds (SLGs), as well as U.S. Treasury TIPS, are excluded. STRIPS are excluded from the index because their inclusion would result in double-counting. Securities in the Index roll up to the U.S. Aggregate, U.S. Universal, and Global Aggregate Indices. The U.S. Treasury Index was launched on January 1, 1973.
U.S. Agency: This index is the U.S. Agency component of the U.S. Government/Credit index. Publicly issued debt of U.S. Government agencies, quasi-federal corporations, and corporate or foreign debt guaranteed by the U.S. Government (such as USAID securities). The largest issues are Fannie Mae, Freddie Mac, and the Federal Home Loan Bank System (FHLB). The index includes both callable and non-callable agency securities.
U.S Corporate – Investment Grade: This index is the Corporate component of the U.S. Credit index. It includes publicly issued U.S. corporate and specified foreign debentures and secured notes that meet the specified maturity, liquidity, and quality requirements. To qualify, bonds must be SEC-registered.
CMBS (Commercial Mortgage-Backed Securities): This index is the CMBS component of the U.S. Aggregate index. The Bloomberg Barclays CMBS ERISA-Eligible Index is the ERISA-eligible component of the Bloomberg Barclays CMBS Index. This index, which includes investment grade securities that are ERISA eligible under the underwriter’s exemption, is the only CMBS sector that is included in the U.S. Aggregate Index.
MBS (Mortgage-Backed Securities): This index is the U.S. MBS component of the U.S. Aggregate index. The MBS Index covers the mortgage-backed pass-through securities of Ginnie Mae (GNMA), Fannie Mae (FNMA), and
2016 Bond Market Overview
Freddie Mac (FHLMC). The MBS Index is formed by grouping the universe of over 600,000 individual fixed rate MBS pools into approximately 3,500 generic aggregates.
ABS (Asset-Backed Securities): This index is the ABS component of the U.S. Aggregate index. The ABS index has three subsectors: credit and charge cards, autos, and utility. The index includes pass-through, bullet, and controlled amortization structures. The ABS Index includes only the senior class of each ABS issue and the ERISA-eligible B and C tranche. The Manufactured Housing sector was removed as of January 1, 2008, and the Home Equity Loan sector was removed as of October 1, 2009.
Corporate High Yield: The Bloomberg Barclays U.S. High Yield Index covers the universe of fixed rate, non-investment grade debt. Eurobonds and debt issues from countries designated as emerging markets (sovereign rating of Baa1/BBB+/BBB+ and below using the middle of Moody’s, S&P, and Fitch) are excluded, but Canadian and global bonds (SEC registered) of issuers in non-EMG countries are included. Original issue zeroes, step-up coupon structures, 144-As and pay-in-kind bonds (PIKs, as of October 1, 2009) are also included.
The Bloomberg Barclays Municipal Bond Index is a broad-based, total-return index. The bonds are all investment-grade, tax-exempt, and fixed-rate securities with long-term maturities (greater than 2 years). They are selected from issues larger than $50 million.
The Bloomberg Barclays TIPS Index consists of Treasury Inflation Protected Securities (TIPS). TIPS are securities whose principal is tied to the Consumer Price Index. TIPS pay interest semi-annually, based on the fixed rate applied to the adjusted principal.
Ratings are measured on a scale that ranges from AAA or Aaa (highest) to D or C (lowest). Investment grade investments are those rated from highest down to BBB- or Baa3.
Baird Ultra Short Bond Fund
December 31, 2016
The Baird Ultra Short Bond Fund seeks current income consistent with preservation of capital. The Fund’s primary benchmark index against which it measures performance is the Bloomberg Barclays U.S. Short-Term Government/Corporate Index. The Bloomberg Barclays U.S. Short-Term Government/Corporate Index is an unmanaged, market value weighted index of investment grade fixed debt, including government and corporate securities, with maturities of less than one year.
During a very volatile 2016, the Fund generated strong absolute returns and outperformed its benchmark. The year can be considered a tale of two halves with the bond market experiencing significant volatility, driven by changing U.S. and global growth expectations, shifting global central bank policies, and political surprises both in the U.S and abroad. Our long-term commitment and strict adherence to a risk-controlled, duration neutral approach overseen by a seasoned team of investment professionals with uncommon longevity working together through multiple market cycles once again proved to be a prudent strategy during this period of heightened volatility.
The primary factors contributing to the Fund’s strong absolute and relative performance in 2016 are described below.
Positive contributors to the Fund’s performance during the year:
| | • | Overweight to investment grade credit |
| | | º | Overweight to BBB-rated credit |
| | | º | Exposure to commodity sensitive industrial sectors (energy and metals and mining) as spreads were significantly tighter in the year |
| | • | Security selection particularly within the Credit sector |
| | • | Exposure to high-quality Non Agency Residential Mortgage Backed Securities (RMBS) and other Asset Backed Securities (ABS) |
Our base case outlook for 2017 is a continuation of moderate economic growth and inflation with better near-term economic growth prospects post-election given President Trump’s pro-growth agenda—though headwinds remain. However, we also acknowledge that a wide range of possible outcomes exists. If policy measures are passed that provide fiscal stimulus to the economy, they are likely to be met by tighter monetary policy from the Fed, limiting improvement in near-term economic growth. Additionally, low interest rates abroad will likely continue to limit the upside for U.S. interest rates. As a reminder, the Fund only purchases U.S. dollar denominated securities in the cash bond market (no derivatives). We believe the Fund is well positioned to add value relative to its benchmark.
Baird Ultra Short Bond Fund
December 31, 2016 (Unaudited)
Portfolio Characteristics
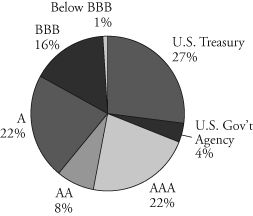
Quality Distribution(1)(2)
| | | | | | |
 | | Net Assets | $392,504,874 | | |
| | | | | |
| | SEC 30-Day | | | |
| | Yield(3) | | | |
| | Institutional Class | | | |
| | (Subsidized) | 1.15% | | |
| | Institutional Class | | | |
| | (Unsubsidized) | 1.00% | | |
| | Investor Class | | | |
| | (Subsidized) | 0.90% | | |
| | Investor Class | | | |
| | (Unsubsidized) | 0.75% | | |
| | | | | |
| | Average | | | |
| | Effective | | | |
| | Duration | 0.46 years | | |
| | | | | | |
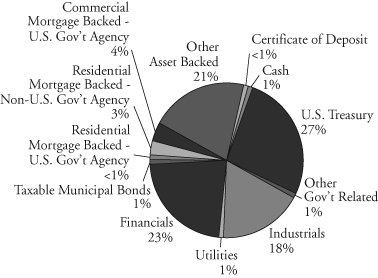
Sector Weightings(1) | | Average | | | |
| | | Effective | | | |
 | | Maturity | 0.47 years | | |
| | | | | |
| | Annualized | | | |
| | Expense Ratio(4) | | | |
| | Gross | | | |
| | Institutional Class | 0.30% | | |
| | Investor Class | 0.55% | (5) | |
| | | | | |
| | Net | | | |
| | Institutional Class | 0.15% | | |
| | Investor Class | 0.40% | (5) | |
| | | | | |
| | Portfolio | | | |
| | Turnover Rate | 96.9% | | |
| | | | | |
| | Number of | | | |
| | Holdings | 249 | | |
| | | | | |
| | | | | |
| | | | | |
| | | | | | |
(1) | Percentages shown are based on the Fund’s total investments. |
(2) | The quality profile is calculated on a market value-weighted basis using the highest credit quality rating for each security held by the Fund given by S&P, Moody’s or Fitch, each of which is a Nationally Recognized Statistical Rating Organization (NRSRO). NRSROs rate the credit quality of securities using a scale that generally ranges from AAA (highest) to D (lowest). |
(3) | SEC yields are based on SEC guidelines and are calculated for the 30 days ended December 31, 2016. |
(4) | Reflects expense ratios as stated in the Fund’s current prospectus. The Advisor has contractually agreed to waive management fees in an amount equal to an annual rate of 0.15% of average daily net assets for the Fund, at least through April 30, 2018. The agreement may only be terminated prior to the end of this term by or with the consent of the Board of Directors of Baird Funds, Inc. |
(5) | Includes 0.25% 12b-1 fee. |
Baird Ultra Short Bond Fund
December 31, 2016 (Unaudited)
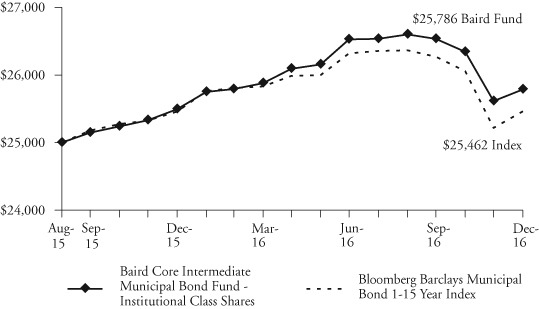
Institutional Class
Value of a $25,000 Investment
Growth of a hypothetical investment of $25,000 made on the Fund’s inception date (12/31/13), assuming reinvestment of all distributions.
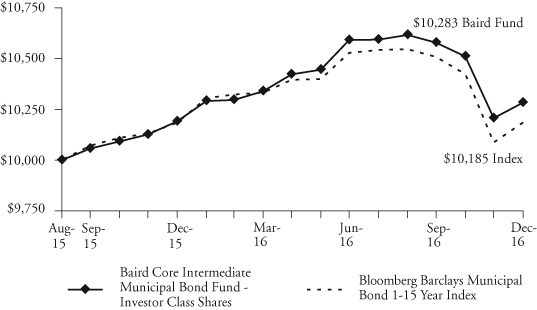
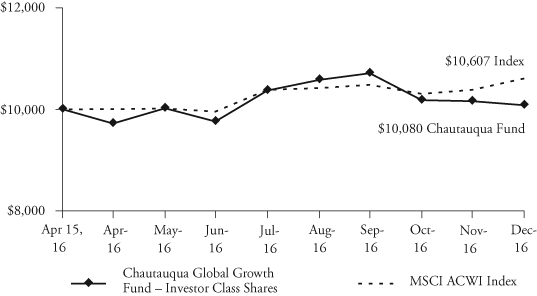
Investor Class
Value of a $10,000 Investment
Growth of a hypothetical investment of $10,000 made on the Fund’s inception date (12/31/13), assuming reinvestment of all distributions.
Baird Ultra Short Bond Fund
December 31, 2016 (Unaudited)
Total Returns
| | | Average Annual |
| | One | Three | Since |
| For the Periods Ended December 31, 2016 | Year | Years | Inception(1) |
| Institutional Class Shares | 1.56% | 1.02% | 1.02% |
| Investor Class Shares | 1.32% | 0.78% | 0.78% |
| Bloomberg Barclays U.S. Short-Term | | | |
Government/Corporate Index(2) | 0.80% | 0.41% | 0.41% |
| (1) | For the period from December 31, 2013 (inception date) through December 31, 2016. |
| (2) | The Bloomberg Barclays U.S. Short-Term Government/Corporate Index is an unmanaged, market value weighted index of investment grade, fixed debt including government and corporate securities with maturities less than one year. This Index does not reflect any deduction for fees, expenses or taxes. A direct investment in an index is not possible. |
The line graph on the previous page and the returns shown in the table above reflect reinvestment of dividends and/or capital gains distributions in additional shares. The returns do not reflect the deduction of taxes that a shareholder would pay on Fund distributions or the redemption of Fund shares. The returns reflect the actual performance for each period and do not include the impact of trades executed on the last business day of the period that were recorded on the first business day of the next period.
The Fund’s gross expense ratio for each Class, as reflected in the Fund’s current prospectus, is set forth under “Portfolio Characteristics”.
The Fund may invest up to 10% of its net assets in non-investment grade debt securities (commonly referred to as “high yield” bonds). While these types of securities typically offer higher yields than investment grade securities, they also include greater risks including increased credit risk and the increased risk of default or bankruptcy. The Fund may also invest in U.S. dollar denominated foreign securities which involve additional risks such as political and economic instability, and different and sometimes less strict financial reporting standards and regulation. The Fund may also invest in mortgage- and asset-backed securities, which include interest rate and prepayment risks more pronounced than those of other fixed income securities.
Past performance does not guarantee future results. Investment return and principal value will fluctuate so that an investor’s shares, when redeemed, may be worth more or less than their original cost.
For information about the performance of the Fund as of the most recent month-end, please call 1-866-44BAIRD or visit www.bairdfunds.com. Mutual fund performance changes over time and current performance may be lower or higher than that stated.
Baird Ultra Short Bond Fund
Summary Schedule of Investments, December 31, 2016
This schedule summarizes the Fund’s holdings by asset type. Details are reported for each of the Fund’s 50 largest individual holdings and for investments that, in total for any issuer, represent more than 1% of the Fund’s net assets. The total value of smaller holdings is reported as a single amount within each category.
The Fund reports a complete list of its holdings in regulatory filings four times in each fiscal year, at the quarter end. For the second and fourth fiscal quarters, the complete listing of the Fund’s holdings is available electronically in the Fund’s Form N-CSR at http://www.bairdassetmanagement.com/baird-funds/funds-and-performance#Literature and on the Securities and Exchange Commission’s website (www.sec.gov) or you can have it mailed to you without charge by calling 1-866-44BAIRD. For the first and third fiscal quarters, the Fund files the lists with the SEC on Form N-Q. Shareholders can look up the Fund’s Forms N-CSR and N-Q on the SEC’s website (www.sec.gov).
Long-Term Investments
| | | Principal | | | % of | | | | |
| | | Amount | | | Value | | | Net Assets | |
| U.S. Treasury Securities | | | | | | | | | |
| U.S. Treasury Notes: | | | | | | | | | |
| 2.375%, 07/31/2017 | | $ | 45,700,000 | | | $ | 46,139,132 | | | | 11.8 | % |
| 1.000%, 09/15/2017 | | | 46,100,000 | | | | 46,172,008 | | | | 11.8 | % |
| 0.875%, 01/15/2018 | | | 12,000,000 | | | | 11,994,372 | | | | 3.0 | % |
| Total U.S. Treasury Securities | | | | | | | | | | | | |
| (Cost $104,315,597) | | | | | | | 104,305,512 | | | | 26.6 | % |
| Other Government Related Securities | | | | | | | | | | | | |
Other Government Related Securities#~ | | | | | | | 3,267,226 | | | | 0.8 | % |
| Total Other Government Related Securities | | | | | | | | | | | | |
| (Cost $3,268,774) | | | | | | | 3,267,226 | | | | 0.8 | % |
| Corporate Bonds | | | | | | | | | | | | |
| Industrials | | | | | | | | | | | | |
| Bunge Limited Finance Corp., | | | | | | | | | | | | |
| 3.200%, 06/15/2017 | | | 2,000,000 | | | | 2,015,058 | | | | 0.5 | % |
| Enterprise Products Operating LLC, | | | | | | | | | | | | |
| Class L, 6.300%, 09/15/2017 | | | 2,000,000 | | | | 2,062,718 | | | | 0.5 | % |
| General Motors Financial Co., Inc., | | | | | | | | | | | | |
2.337%, 05/09/2019∞ | | | 2,000,000 | | | | 2,019,734 | | | | 0.5 | % |
| Hyundai Capital Services, Inc., | | | | | | | | | | | | |
| 1.793%, 03/18/2017 (Acquired 01/13/2015 through | | | | | | | | | | | | |
08/24/2016, Cost $2,450,546)∞ * f | | | 2,450,000 | | | | 2,450,691 | | | | 0.6 | % |
| Ingredion, Inc., | | | | | | | | | | | | |
| 1.800%, 09/25/2017 | | | 2,500,000 | | | | 2,503,162 | | | | 0.6 | % |
| Pentair Finance SA, | | | | | | | | | | | | |
1.875%, 09/15/2017 f | | | 2,000,000 | | | | 2,002,984 | | | | 0.5 | % |
| Pernod Ricard SA, | | | | | | | | | | | | |
| 2.950%, 01/15/2017 (Acquired 08/18/2016, | | | | | | | | | | | �� | |
Cost $2,001,394)* f | | | 2,000,000 | | | | 2,001,078 | | | | 0.5 | % |
| Rohm and Haas Co., | | | | | | | | | | | | |
| 6.000%, 09/15/2017 | | | 2,095,000 | | | | 2,160,364 | | | | 0.5 | % |
The accompanying notes are an integral part of these financial statements.
Baird Ultra Short Bond Fund
Summary Schedule of Investments, December 31, 2016
Long-Term Investments (cont.)
| | | Principal | | | | | | % of | |
| | | Amount | | | Value | | | Net Assets | |
| Time Warner Cable LLC, | | | | | | | | | |
| 5.850%, 05/01/2017 | | $ | 2,000,000 | | | $ | 2,028,382 | | | | 0.5 | % |
Other Industrials#~ | | | | | | | 49,483,088 | | | | 12.8 | % |
| Total Industrials | | | | | | | | | | | | |
| (Cost $68,663,289) | | | | | | | 68,727,259 | | | | 17.5 | % |
| Utilities | | | | | | | | | | | | |
| NextEra Energy Capital Holdings, Inc., | | | | | | | | | | | | |
| Class F, 2.056%, 09/01/2017 | | | 2,500,000 | | | | 2,511,012 | | | | 0.6 | % |
Other Utilities#~ | | | | | | | 1,803,237 | | | | 0.5 | % |
| Total Utilities | | | | | | | | | | | | |
| (Cost $4,320,251) | | | | | | | 4,314,249 | | | | 1.1 | % |
| Financials | | | | | | | | | | | | |
| ABN AMRO Bank NV, | | | | | | | | | | | | |
| 4.250%, 02/02/2017 (Acquired 11/16/2015 through | | | | | | | | | | | | |
08/16/2016, Cost $2,203,859)* f | | | 2,198,000 | | | | 2,202,743 | | | | 0.6 | % |
| Aetna, Inc., | | | | | | | | | | | | |
1.601%, 12/08/2017∞ | | | 2,000,000 | | | | 2,006,896 | | | | 0.5 | % |
| American Express Bank FSB, | | | | | | | | | | | | |
| 6.000%, 09/13/2017 | | | 2,000,000 | | | | 2,061,828 | | | | 0.5 | % |
| Bank of America NA, | | | | | | | | | | | | |
| 5.300%, 03/15/2017 | | | 2,000,000 | | | | 2,015,490 | | | | 0.5 | % |
| Capital One NA/Mclean VA, | | | | | | | | | | | | |
| 1.500%, 09/05/2017 | | | 2,000,000 | | | | 1,997,514 | | | | 0.5 | % |
| Compass Bank, | | | | | | | | | | | | |
| 1.850%, 09/29/2017 | | | 3,015,000 | | | | 3,008,156 | | | | 0.8 | % |
| Royal Bank of Canada, | | | | | | | | | | | | |
1.138%, 10/13/2017∞ f | | | 3,000,000 | | | | 2,998,983 | | | | 0.8 | % |
| SunTrust Banks, Inc., | | | | | | | | | | | | |
| 6.000%, 09/11/2017 | | | 2,143,000 | | | | 2,207,149 | | | | 0.6 | % |
| Swedbank AB, | | | | | | | | | | | | |
| 2.125%, 09/29/2017 | | | | | | | | | | | | |
(Acquired 08/30/2016, Cost $2,012,656)* f | | | 2,000,000 | | | | 2,009,596 | | | | 0.5 | % |
Other Financials#~ | | | | | | | 66,718,051 | | | | 16.9 | % |
| Total Financials | | | | | | | | | | | | |
| (Cost $87,204,081) | | | | | | | 87,226,406 | | | | 22.2 | % |
| Total Corporate Bonds | | | | | | | | | | | | |
| (Cost $160,187,621) | | | | | | | 160,267,914 | | | | 40.8 | % |
| Taxable Municipal Bonds | | | | | | | | | | | | |
| Montana Board of Investments, | | | | | | | | | | | | |
0.520%, 03/01/2032 (Callable 03/01/2017)∞ | | | 2,000,000 | | | | 1,997,760 | | | | 0.5 | % |
| Other Taxable Municipal Bonds# | | | | | | | 3,742,770 | | | | 1.0 | % |
| Total Taxable Municipal Bonds | | | | | | | | | | | | |
| (Cost $5,737,622) | | | | | | | 5,740,530 | | | | 1.5 | % |
The accompanying notes are an integral part of these financial statements.
Baird Ultra Short Bond Fund
Summary Schedule of Investments, December 31, 2016
Long-Term Investments (cont.)
| | | Principal | | | | | | % of | |
| | | Amount | | | Value | | | Net Assets | |
| Residential Mortgage-Backed Securities | | | | | | | | | |
| U.S. Government Agency Issues | | | | | | | | | |
| Other U.S. Government Agency Issues# | | | | | $ | 1,630,178 | | | | 0.4 | % |
| Total U.S. Government Agency Issues | | | | | | | | | | | |
| (Cost $1,619,227) | | | | | | 1,630,178 | | | | 0.4 | % |
| Non-U.S. Government Agency Issues | | | | | | | | | | | |
| Other Non-U.S. Government Agency Issues# | | | | | | 11,839,521 | | | | 3.0 | % |
| Total Non-U.S. Government Agency Issues | | | | | | | | | | | |
| (Cost $11,783,697) | | | | | | 11,839,521 | | | | 3.0 | % |
| Commercial Mortgage-Backed Securities | | | | | | | | | | | |
| U.S. Government Agency Issues | | | | | | | | | | | |
| Fannie Mae REMIC Trust: | | | | | | | | | | | |
| Series 2012-M9, Class ASQ2, 1.513%, 12/25/2017 | | $ | 2,991,716 | | | | 2,996,029 | | | | 0.8 | % |
| Series 2015-M1, Class ASQ2, 1.626%, 02/25/2018 | | | 1,539,018 | | | | 1,542,675 | | | | 0.4 | % |
| Freddie Mac Multifamily | | | | | | | | | | | | |
| Structured Pass Through Certificates: | | | | | | | | | | | | |
Series K701, Class A2, 3.882%, 11/25/2017∞ | | | 2,045,000 | | | | 2,080,145 | | | | 0.5 | % |
| Series K702, Class A2, 3.154%, 02/25/2018 | | | 2,031,037 | | | | 2,061,234 | | | | 0.5 | % |
| Series K008, Class A1, 2.746%, 12/25/2019 | | | 1,986,201 | | | | 2,006,315 | | | | 0.5 | % |
| Series K009, Class A1, 2.757%, 05/25/2020 | | | 2,132,019 | | | | 2,150,930 | | | | 0.6 | % |
| 1.426%-2.699%, 08/25/2017-05/25/2018 | | | 1,542,694 | | | | 1,558,116 | | | | 0.4 | % |
| Total U.S. Government Agency Issues | | | | | | | | | | | | |
| (Cost $14,387,453) | | | | | | | 14,395,444 | | | | 3.7 | % |
| Other Asset Backed Securities | | | | | | | | | | | | |
| Ally Auto Receivables Trust, | | | | | | | | | | | | |
| Series 2014-2, Class A3, 1.250%, 04/15/2019 | | | 2,034,304 | | | | 2,035,101 | | | | 0.5 | % |
| American Express Credit Account Master Trust, | | | | | | | | | | | | |
| Series 2014-2, Class A, 1.260%, 01/15/2020 | | | 4,630,000 | | | | 4,632,929 | | | | 1.2 | % |
| BMW Vehicle Lease Trust, | | | | | | | | | | | | |
| Series 2015-1, Class A4, 1.340%, 06/20/2018 | | | 1,925,000 | | | | 1,926,631 | | | | 0.5 | % |
| California Republic Auto Receivables Trust, | | | | | | | | | | | | |
| Series 2015-3, Class A3, 1.620%, 11/15/2019 | | | 3,160,000 | | | | 3,165,254 | | | | 0.8 | % |
| Capital One Multi-Asset Execution Trust: | | | | | | | | | | | | |
| Series 2014-A2, Class A2, 1.260%, 01/15/2020 | | | 3,280,000 | | | | 3,281,822 | | | | 0.8 | % |
| Series 2007-A7, Class A7, 5.750%, 07/15/2020 | | | 3,000,000 | | | | 3,096,200 | | | | 0.8 | % |
| Carmax Auto Owner Trust, | | | | | | | | | | | | |
| Series 2014-3, 1.160%, 06/17/2019 | | | 2,007,432 | | | | 2,006,454 | | | | 0.5 | % |
| Chase Issuance Trust: | | | | | | | | | | | | |
| Series 2014-A1, Class A1, 1.150%, 01/15/2019 | | | 2,593,000 | | | | 2,593,008 | | | | 0.7 | % |
| Series 2014-A6, Class A6, 1.260%, 07/15/2019 | | | 2,100,000 | | | | 2,101,287 | | | | 0.5 | % |
| Citibank Credit Card Issuance Trust: | | | | | | | | | | | | |
| Series 2014-A2, Class A2, 1.020%, 02/22/2019 | | | 2,984,000 | | | | 2,983,885 | | | | 0.8 | % |
| Series 2014-A4, Class A4, 1.230%, 04/24/2019 | | | 2,000,000 | | | | 2,000,800 | | | | 0.5 | % |
The accompanying notes are an integral part of these financial statements.
Baird Ultra Short Bond Fund
Summary Schedule of Investments, December 31, 2016
Long-Term Investments (cont.)
| | | Principal | | | | | | % of | |
| | | Amount | | | Value | | | Net Assets | |
| Discover Card Execution Note Trust, | | | | | | | | | |
| Series 2014-A3, Class A3, 1.220%, 10/15/2019 | | $ | 3,000,000 | | | $ | 3,001,010 | | | | 0.8 | % |
| Enterprise Fleet Financing LLC, | | | | | | | | | | | | |
| Series 2015-2, Class A2, 1.590%, 2/22/2021 | | | | | | | | | | | | |
| (Acquired 08/23/2016 through 12/19/2016, | | | | | | | | | | | | |
| Cost $2,802,871)* | | | 2,802,274 | | | | 2,800,718 | | | | 0.7 | % |
| Ford Credit Auto Lease Trust, | | | | | | | | | | | | |
| Series 2015-A, Class A4, 1.310%, 08/15/2018 | | | 2,450,000 | | | | 2,451,068 | | | | 0.6 | % |
| Ford Credit Floorplan Master Owner Trust | | | | | | | | | | | | |
| Series 2014-1, Class A1, 1.200%, 02/15/2019 | | | 2,500,000 | | | | 2,500,118 | | | | 0.6 | % |
| Golden Credit Card Trust, | | | | | | | | | | | | |
| Series 2012-2A, Class A1, 1.770%, 01/15/2019 | | | | | | | | | | | | |
| (Acquired 09/26/2016 through 09/30/2016, | | | | | | | | | | | | |
| Cost $4,001,306)* | | | 4,000,000 | | | | 4,001,128 | | | | 1.0 | % |
| Hyundai Auto Lease Securitization Trust, | | | | | | | | | | | | |
| Series 2015-A, Class A3, 1.420%, 09/17/2018 | | | | | | | | | | | | |
| (Acquired 09/26/2016 through 11/04/2016, | | | | | | | | | | | | |
| Cost $2,046,396)* | | | 2,043,137 | | | | 2,045,940 | | | | 0.5 | % |
| Mercedes Benz Auto Lease Trust, | | | | | | | | | | | | |
| Series 2015-A, Class A4, 1.210%, 10/15/2020 | | | 2,000,000 | | | | 2,000,129 | | | | 0.5 | % |
| MMAF Equipment Finance LLC: | | | | | | | | | | | | |
| Series 2016-AA, Class A2, 1.390%, 12/17/2018 | | | | | | | | | | | | |
| (Acquired 10/26/2016 through 11/14/2016, | | | | | | | | | | | | |
| Cost $3,302,311)* | | | 3,300,000 | | | | 3,301,181 | | | | 0.9 | % |
| Series 2011-AA, Class A5, 3.040%, 08/15/2028 | | | | | | | | | | | | |
| (Acquired 09/22/2016 through 12/30/2016, | | | | | | | | | | | | |
| Cost $2,446,093)* | | | 2,429,077 | | | | 2,443,641 | | | | 0.6 | % |
| Synchrony Credit Card Master Note Trust: | | | | | | | | | | | | |
| Series 2012-6, Class A, 1.360%, 08/17/2020 | | | 3,150,000 | | | | 3,151,757 | | | | 0.8 | % |
Series 2012-3, Class A, 1.154%, 03/15/2020∞ | | | 1,025,000 | | | | 1,025,278 | | | | 0.3 | % |
| Toyota Auto Receivables Owner Trust, | | | | | | | | | | | | |
| Series 2016-B, Class A2A, 1.020%, 10/15/2018 | | | 2,000,000 | | | | 1,998,825 | | | | 0.5 | % |
| Other Asset Backed Securities#~ | | | | | | | 19,210,029 | | | | 4.9 | % |
| Total Other Asset Backed Securities | | | | | | | | | | | | |
| (Cost $79,769,642) | | | | | | | 79,754,193 | | | | 20.3 | % |
| Total Long-Term Investments | | | | | | | | | | | | |
| (Cost $381,069,633) | | | | | | | 381,200,518 | | | | 97.1 | % |
The accompanying notes are an integral part of these financial statements.
Baird Ultra Short Bond Fund
Summary Schedule of Investments, December 31, 2016
Short-Term Investments
| | | Principal | | | | | | % of | |
| | | Amount | | | Value | | | Net Assets | |
| Certificate of Deposit | | | | | | | | | |
| Federal Home Loan Bank Discount Notes | | $ | 845,000 | | | $ | 844,390 | | | | 0.2 | % |
| Total Certificate of Deposit | | | | | | | | | | | | |
| (Cost $845,000) | | | | | | | 844,390 | | | | 0.2 | % |
| | | Shares | | | | | | | | | |
| Money Market Mutual Fund | | | | | | | | | | | | |
| Fidelity Institutional Money Market Fund – | | | | | | | | | | | | |
| Government Portfolio, Institutional Class, 0.43%« | | | 4,876,398 | | | | 4,876,398 | | | | 1.3 | % |
| Total Short-Term Investments | | | | | | | | | | | | |
| (Cost $5,720,775) | | | | | | | 5,720,788 | | | | 1.5 | % |
| Total Investments | | | | | | | | | | | | |
| (Cost $386,790,408) | | | | | | | 386,921,306 | | | | 98.6 | % |
| Other Assets in Excess of Liabilities | | | | | | | 5,583,568 | | | | 1.4 | % |
| TOTAL NET ASSETS | | | | | | $ | 392,504,874 | | | | 100.0 | % |
Notes to Summary Schedule of Investments
| ∞ | Variable or floating rate security. Floating rate securities are securities whose yields vary with a designated index rate. These securities’ rates are as of December 31, 2016. |
| * | Restricted security as defined in Rule 144(a) under the Securities Act of 1933 and determined to be liquid. Purchased in a private placement transaction; resale to the public may require registration or may extend only to qualified institutional buyers. At December 31, 2016, the value of these securities total $23,256,716, which represents 5.93% of total net assets. |
| f | Foreign Security |
| # | Represents the aggregate value, by category, of securities that are not among the 50 largest holdings and, in total for any issuer, represent 1% or less of net assets. |
| ~ | Groupings contain, in aggregate, restricted securities totaling $36,318,368, representing 9.25% of net assets. |
| « | 7-Day Yield |
Summary of Fair Value Exposure at December 31, 2016
The Fund has adopted authoritative fair valuation accounting standards which establish a definition of fair value and set out a hierarchy for measuring fair value. These standards require additional disclosures about the various inputs and valuation techniques used to develop the measurements of fair value and a discussion on changes in valuation techniques and related inputs during the period. These standards define fair value as the price that would be received to sell an asset or paid to transfer a liability in an orderly transaction between market participants at the measurement date.
The fair value hierarchy is organized into three levels based upon the assumptions (referred to as “inputs”) used in pricing the asset or liability. These standards state that “observable inputs” reflect the assumptions market participants would use in pricing the asset or liability based on market data obtained from independent sources and “unobservable inputs” reflect an entity’s own assumptions about the assumptions market participants would use in pricing the asset or liability. These inputs are summarized into three broad levels and described below:
The accompanying notes are an integral part of these financial statements.
Baird Ultra Short Bond Fund
Summary Schedule of Investments, December 31, 2016
Summary of Fair Value Exposure at December 31, 2016 (cont.)
Level 1 – | Unadjusted quoted prices in active markets for identical unrestricted securities. |
Level 2 – | Other significant observable inputs (including quoted prices for similar securities, quoted prices in inactive markets, dealer indications, interest rates, yield curves, prepayment speeds, credit risk, default rates, inputs corroborated by observable market data, etc.). |
Level 3 – | Significant unobservable inputs (including the Fund’s own assumptions about the factors that market participants would use in valuing the security) based on the best information available. |
The inputs or methodology used for valuing securities are not necessarily an indication of the risk associated with investing in those securities.
The following is a summary of the inputs used to value the Fund’s investments as of December 31, 2016:
| | | Level 1 | | | Level 2 | | | Level 3 | | | Total | |
| Long-Term Investments | | | | | | | | | | | | |
| U.S. Treasury Securities | | $ | — | | | $ | 104,305,512 | | | $ | — | | | $ | 104,305,512 | |
| Other Government Related Securities | | | — | | | | 3,267,226 | | | | — | | | | 3,267,226 | |
| Corporate Bonds | | | — | | | | 160,267,914 | | | | — | | | | 160,267,914 | |
| Taxable Municipal Bonds | | | — | | | | 5,740,530 | | | | — | | | | 5,740,530 | |
| Residential Mortgage-Backed Securities – | | | | | | | | | | | | | | | | |
| U.S. Government Agency Issues | | | — | | | | 1,630,178 | | | | — | | | | 1,630,178 | |
| Residential Mortgage-Backed Securities – | | | | | | | | | | | | | | | | |
| Non-U.S. Government Agency Issues | | | — | | | | 11,839,521 | | | | — | | | | 11,839,521 | |
| Commercial Mortgage-Backed Securities – | | | | | | | | | | | | | | | | |
| U.S. Government Agency Issues | | | — | | | | 14,395,444 | | | | — | | | | 14,395,444 | |
| Other Asset Backed Securities | | | — | | | | 79,754,193 | | | | — | | | | 79,754,193 | |
| Total Long-Term Investments | | | — | | | | 381,200,518 | | | | — | | | | 381,200,518 | |
| Short-Term Investments | | | | | | | | | | | | | | | | |
| Certificate of Deposit | | | — | | | | 844,390 | | | | — | | | | 844,390 | |
| Money Market Mutual Fund | | | 4,876,398 | | | | — | | | | — | | | | 4,876,398 | |
| Total Short-Term Investments | | | 4,876,398 | | | | 844,390 | | | | — | | | | 5,720,788 | |
| Total Investments | | $ | 4,876,398 | | | $ | 382,044,908 | | | $ | — | | | $ | 386,921,306 | |
Changes in valuation techniques may result in transfers into or out of assigned levels within the fair value hierarchy. There were no transfers between Level 1, Level 2 and Level 3 fair value measurements during the reporting period. See the Fund’s valuation policy in Note 2a to the financial statements.
The accompanying notes are an integral part of these financial statements.
Baird Short-Term Bond Fund
December 31, 2016
The Baird Short-Term Bond Fund seeks an annual rate of total return, before Fund expenses, greater than the annual rate of total return of the Bloomberg Barclays 1-3 Year U.S. Government/Credit Bond Index. The Bloomberg Barclays 1-3 Year U.S. Government/Credit Bond Index is an unmanaged, market value weighted index of investment grade, fixed rate debt issues, including government and credit securities, with maturities between one and three years.
During a very volatile 2016, the Fund generated strong absolute returns and outperformed its benchmark. The year can be considered a tale of two halves with the bond market experiencing significant volatility, driven by changing U.S. and global growth expectations, shifting global central bank policies, and political surprises both in the U.S and abroad. Our long-term commitment and strict adherence to a risk-controlled, duration neutral approach overseen by a seasoned team of investment professionals with uncommon longevity working together through multiple market cycles once again proved to be a prudent strategy during this period of heightened volatility.
The primary factors contributing to the Fund’s strong absolute and relative performance in 2016 are described below.
Positive contributors to the Fund’s performance during the year:
| | • | Overweight to investment grade credit |
| | | º | Overweight to BBB-rated credit |
| | | º | Exposure to commodity sensitive industrial sectors (energy and metals and mining) as spreads were significantly tighter in the year |
| | • | Security selection particularly within the Credit sector |
| | • | Exposure to high-quality Commercial Mortgage Backed Securities (CMBS), Non Agency Residential Mortgage Backed Securities (RMBS) and other Asset Backed Securities (ABS) |
Our base case outlook for 2017 is a continuation of moderate economic growth and inflation with better near-term economic growth prospects post-election given President Trump’s pro-growth agenda—though headwinds remain. However, we also acknowledge that a wide range of possible outcomes exists. If policy measures are passed that provide fiscal stimulus to the economy, they are likely to be met by tighter monetary policy from the Fed, limiting improvement in near-term economic growth. Additionally, low interest rates abroad will likely continue to limit the upside for U.S. interest rates. As a reminder, the Fund only purchases investment grade, U.S. dollar denominated securities in the cash bond market (no derivatives). The Fund remains duration neutral to its benchmark and we believe it is well positioned to add value relative to its benchmark.
Baird Short-Term Bond Fund
December 31, 2016 (Unaudited)
Portfolio Characteristics
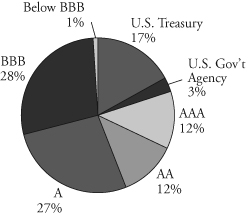
Quality Distribution(1)(2)
| | | | | | |
| | | Net Assets | $3,874,189,461 | | |
 | | | | | |
| | SEC 30-Day | | | |
| | Yield(3) | | | |
| | Institutional Class | 1.71% | | |
| | Investor Class | 1.47% | | |
| | | | | |
| | Average | | | |
| | Effective | | | |
| | Duration | 1.92 years | | |
| | | | | |
| | Average | | | |
| | Effective | | | |
| | Maturity | 2.00 years | | |
| | | | | |
| | Annualized | | | |
| | | Expense | | | |
Sector Weightings(1) | | Ratio(4) | | | |
| | | Institutional Class | 0.30% | | |
 | | Investor Class | 0.55% | (5) | |
| | | | | |
| | Portfolio | | | |
| | Turnover Rate | 44.0% | | |
| | | | | |
| | Number of | | | |
| | Holdings | 586 | | |
| | | | | |
| | | | | |
| | | | | |
| | | | | |
| | | | | |
| | | | | |
| | | | | |
| | | | | |
| | | | | |
| | | | | |
| | | | | |
| | | | | |
| | | | | |
| | | | | |
| | | | | |
| | | | | |
| | | | | | |
(1) | Percentages shown are based on the Fund’s total investments. |
(2) | The quality profile is calculated on a market value-weighted basis using the highest credit quality rating for each security held by the Fund given by S&P, Moody’s or Fitch, each of which is a Nationally Recognized Statistical Rating Organization (NRSRO). NRSROs rate the credit quality of securities using a scale that generally ranges from AAA (highest) to D (lowest). |
(3) | SEC yields are based on SEC guidelines and are calculated for the 30 days ended December 31, 2016. |
(4) | Reflects expense ratios as stated in the Fund’s current prospectus. |
(5) | Includes 0.25% 12b-1 fee. |
Baird Short-Term Bond Fund
December 31, 2016 (Unaudited)
Institutional Class
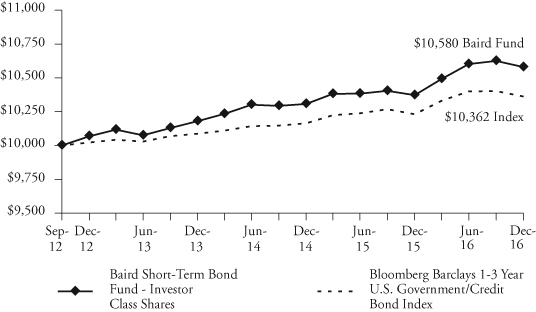
Value of a $25,000 Investment
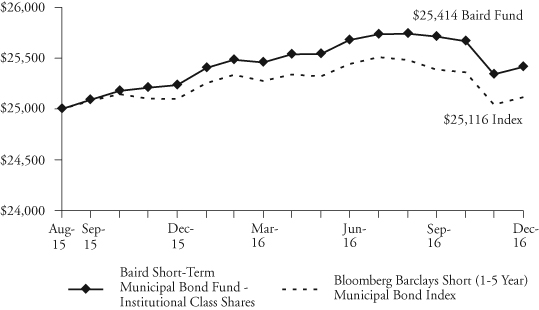
Growth of a hypothetical investment of $25,000 made on 12/31/06, assuming reinvestment of all distributions.
Investor Class
Value of a $10,000 Investment
Growth of a hypothetical investment of $10,000 made on 12/31/06, assuming reinvestment of all distributions.
Baird Short-Term Bond Fund
December 31, 2016 (Unaudited)
Total Returns
| | | Average Annual |
| | | | | Since | Since |
| | One | Five | Ten | Inception | Inception |
| For the Periods Ended December 31, 2016 | Year | Years | Years | (8/31/04) | (9/19/12) |
| Institutional Class Shares | 2.25% | 2.02% | 2.87% | 2.86% | N/A |
| Investor Class Shares | 2.00% | N/A | N/A | N/A | 1.33% |
| Bloomberg Barclays 1-3 Year U.S. | | | | | |
Government/Credit Bond Index(1) | 1.28% | 0.92% | 2.44% | 2.47% | 0.83% |
| (1) | The Bloomberg Barclays 1-3 Year U.S. Government/Credit Bond Index is an unmanaged, market value weighted index of investment grade, fixed-rate debt issues, including government and corporate securities, with maturities between one and three years. This Index does not reflect any deduction for fees, expenses or taxes. A direct investment in an index is not possible. |
The line graph on the previous page and the returns shown in the table above reflect reinvestment of dividends and/or capital gains distributions in additional shares. Returns do not reflect the deduction of taxes that a shareholder would pay on Fund distributions or the redemption of Fund shares. The returns reflect the actual performance for each period and do not include the impact of trades executed on the last business day of the period that were recorded on the first business day of the next period.
The Fund’s gross expense ratio for each Class, as reflected in the Fund’s current prospectus, is set forth under “Portfolio Characteristics”.
The Fund may invest in U.S. dollar denominated foreign securities which involve additional risks such as political and economic instability, and different and sometimes less strict financial reporting standards and regulation. The Fund may also invest in mortgage- and asset-backed securities, which include interest rate and prepayment risks more pronounced than those of other fixed income securities.
Past performance does not guarantee future results. Investment returns and principal value will fluctuate so that an investor’s shares, when redeemed, may be worth more or less than their original cost.
For information about the performance of the Fund as of the most recent month-end, please call 1-866-44BAIRD or visit www.bairdfunds.com. Mutual fund performance changes over time and current performance may be lower or higher than that stated.
Baird Short-Term Bond Fund
Summary Schedule of Investments, December 31, 2016
This schedule summarizes the Fund’s holdings by asset type. Details are reported for each of the Fund’s 50 largest individual holdings and for investments that, in total for any issuer, represent more than 1% of the Fund’s net assets. The total value of smaller holdings is reported as a single amount within each category.
The Fund reports a complete list of its holdings in regulatory filings four times in each fiscal year, at the quarter end. For the second and fourth fiscal quarters, the complete listing of the Fund’s holdings is available electronically in the Fund’s Form N-CSR at http://www.bairdassetmanagement.com/baird-funds/funds-and-performance#Literature and on the Securities and Exchange Commission’s website (www.sec.gov) or you can have it mailed to you without charge by calling 1-866-44BAIRD. For the first and third fiscal quarters, the Fund files the lists with the SEC on Form N-Q. Shareholders can look up the Fund’s Forms N-CSR and N-Q on the SEC’s website (www.sec.gov).
Long-Term Investments
| | | Principal | | | | | | % of | |
| | | Amount | | | Value | | | Net Assets | |
| U.S. Treasury Securities | | | | | | | | | |
| U.S. Treasury Bonds: | | | | | | | | | |
| 2.625%, 08/15/2020 | | $ | 258,775,000 | | | $ | 267,569,210 | | | | 6.9 | % |
| 1.375%, 08/31/2020 | | | 330,000,000 | | | | 326,570,970 | | | | 8.4 | % |
| 2.000%, 08/31/2021 | | | 67,000,000 | | | | 67,266,928 | | | | 1.8 | % |
| Total U.S. Treasury Securities | | | | | | | | | | | | |
| (Cost $669,144,141) | | | | | | | 661,407,108 | | | | 17.1 | % |
| Other Government Related Securities | | | | | | | | | | | | |
| Other Government Related Securities#~ | | | | | | | 72,690,299 | | | | 1.9 | % |
| Total Other Government Related Securities | | | | | | | | | | | | |
| (Cost $72,557,753) | | | | | | | 72,690,299 | | | | 1.9 | % |
| Corporate Bonds | | | | | | | | | | | | |
| Industrials | | | | | | | | | | | | |
| Abbott Laboratories, | | | | | | | | | | | | |
| 2.350%, 11/22/2019 | | | 14,125,000 | | | | 14,141,653 | | | | 0.4 | % |
| Boardwalk Pipelines LP, | | | | | | | | | | | | |
| 5.500%, 02/01/2017 | | | 17,884,000 | | | | 17,931,643 | | | | 0.5 | % |
| CF Industries, Inc., | | | | | | | | | | | | |
| 6.875%, 05/01/2018 | | | 19,412,000 | | | | 20,433,848 | | | | 0.5 | % |
| Diamond 1 Finance Corp. / Diamond 2 Finance Corp., | | | | | | | | | | | | |
| 3.480%, 06/01/2019 (Acquired 05/17/2016 | | | | | | | | | | | | |
| through 10/07/2016, Cost $18,556,894)* | | | 18,535,000 | | | | 18,920,639 | | | | 0.5 | % |
| Dollar General Corp., | | | | | | | | | | | | |
| 4.125%, 07/15/2017 | | | 17,321,000 | | | | 17,572,328 | | | | 0.5 | % |
| Ecolab, Inc., | | | | | | | | | | | | |
| 2.000%, 01/14/2019 | | | 14,250,000 | | | | 14,260,944 | | | | 0.4 | % |
| ERAC USA Finance LLC, | | | | | | | | | | | | |
| 2.350%, 10/15/2019 (Acquired 01/21/2015 | | | | | | | | | | | | |
| through 10/26/2016, Cost $19,143,622)* | | | 19,000,000 | | | | 18,983,128 | | | | 0.5 | % |
| Keysight Technologies, Inc., | | | | | | | | | | | | |
| 3.300%, 10/30/2019 | | | 18,125,000 | | | | 18,405,140 | | | | 0.5 | % |
The accompanying notes are an integral part of these financial statements.
Baird Short-Term Bond Fund
Summary Schedule of Investments, December 31, 2016
Long-Term Investments (cont.)
| | | Principal | | | | | | % of | |
| | | Amount | | | Value | | | Net Assets | |
| Marathon Petroleum Corp., | | | | | | | | | |
| 2.700%, 12/14/2018 | | $ | 14,100,000 | | | $ | 14,287,713 | | | | 0.4 | % |
| Mylan NV, | | | | | | | | | | | | |
| 3.000%, 12/15/2018 (Acquired 08/18/2016 | | | | | | | | | | | | |
through 10/31/2016, Cost $14,431,764)* f | | | 14,095,000 | | | | 14,196,935 | | | | 0.4 | % |
| Pentair Finance SA, | | | | | | | | | | | | |
2.900%, 09/15/2018 f | | | 13,075,000 | | | | 13,226,108 | | | | 0.3 | % |
| Potash Corp of Saskatchewan, Inc., | | | | | | | | | | | | |
6.500%, 05/15/2019 f | | | 11,500,000 | | | | 12,561,462 | | | | 0.3 | % |
| The Dow Chemical Co., | | | | | | | | | | | | |
| 8.550%, 05/15/2019 | | | 14,777,000 | | | | 16,935,639 | | | | 0.4 | % |
| Thermo Fisher Scientific, Inc., | | | | | | | | | | | | |
| 1.850%, 01/15/2018 | | | 13,000,000 | | | | 13,018,603 | | | | 0.3 | % |
| TSMC Global Ltd., | | | | | | | | | | | | |
| 1.625%, 04/03/2018 (Acquired 08/05/2014 | | | | | | | | | | | | |
through 06/07/2016, Cost $15,840,544)* f | | | 15,919,000 | | | | 15,858,126 | | | | 0.4 | % |
| Verizon Communications, Inc., | | | | | | | | | | | | |
| 3.650%, 09/14/2018 | | | 14,000,000 | | | | 14,462,238 | | | | 0.4 | % |
| Other Industrials#~ | | | | | | | 935,907,155 | | | | 24.0 | % |
| Total Industrials | | | | | | | | | | | | |
| (Cost $1,188,927,398) | | | | | | | 1,191,103,302 | | | | 30.7 | % |
| Utilities | | | | | | | | | | | | |
| Other Utilities#~ | | | | | | | 85,441,646 | | | | 2.2 | % |
| Total Utilities | | | | | | | | | | | | |
| (Cost $85,347,613) | | | | | | | 85,441,646 | | | | 2.2 | % |
| Financials | | | | | | | | | | | | |
| Banque Federative du Credit Mutuel SA, | | | | | | | | | | | | |
| 2.000%, 04/12/2019 (Acquired 04/06/2016 | | | | | | | | | | | | |
through 10/21/2016, Cost $18,599,065)* f | | | 18,600,000 | | | | 18,524,186 | | | | 0.5 | % |
| Branch Banking & Trust Co., | | | | | | | | | | | | |
1.220%, 05/23/2017∞ | | | 12,895,000 | | | | 12,894,033 | | | | 0.3 | % |
| Canadian Imperial Bank of Commerce/Canada, | | | | | | | | | | | | |
1.600%, 09/06/2019 f | | | 20,000,000 | | | | 19,809,640 | | | | 0.5 | % |
| Citizens Bank NA/Providence RI, | | | | | | | | | | | | |
| 1.600%, 12/04/2017 | | | 14,300,000 | | | | 14,284,985 | | | | 0.3 | % |
| CNA Financial Corp., | | | | | | | | | | | | |
| 7.350%, 11/15/2019 | | | 14,915,000 | | | | 16,915,445 | | | | 0.4 | % |
| Commonwealth Bank of Australia/New York NY, | | | | | | | | | | | | |
1.750%, 11/02/2018 f | | | 15,000,000 | | | | 14,962,860 | | | | 0.4 | % |
| First Tennessee Bank NA, | | | | | | | | | | | | |
| 2.950%, 12/01/2019 | | | 15,286,000 | | | | 15,323,909 | | | | 0.4 | % |
| KEB Hana Bank, | | | | | | | | | | | | |
| 1.750%, 10/18/2019 (Acquired 10/11/2016, | | | | | | | | | | | | |
Cost $17,942,040)* f | | | 18,000,000 | | | | 17,797,338 | | | | 0.5 | % |
The accompanying notes are an integral part of these financial statements.
Baird Short-Term Bond Fund
Summary Schedule of Investments, December 31, 2016
Long-Term Investments (cont.)
| | | Principal | | | | | | % of | |
| | | Amount | | | Value | | | Net Assets | |
| LeasePlan Corp. NV, | | | | | | | | | |
| 2.500%, 05/16/2018 (Acquired 05/07/2013 | | | | | | | | | |
through 02/25/2016, Cost $16,360,141)* f | | $ | 16,435,000 | | | $ | 16,458,896 | | | | 0.4 | % |
| Protective Life Global Funding, | | | | | | | | | | | | |
| 1.555%, 09/13/2019 (Acquired 09/07/2016, | | | | | | | | | | | | |
| Cost $18,000,000)* | | | 18,000,000 | | | | 17,725,050 | | | | 0.5 | % |
| Reliance Standard Life Global Funding II, | | | | | | | | | | | | |
| 2.150%, 10/15/2018 (Acquired 10/13/2015 | | | | | | | | | | | | |
| through 06/09/2016, Cost $13,020,388)* | | | 13,000,000 | | | | 13,064,584 | | | | 0.3 | % |
| Synchrony Financial, | | | | | | | | | | | | |
| 3.000%, 08/15/2019 | | | 13,350,000 | | | | 13,523,002 | | | | 0.3 | % |
| The Huntington National Bank, | | | | | | | | | | | | |
| 2.000%, 06/30/2018 | | | 12,990,000 | | | | 12,995,612 | | | | 0.3 | % |
| Voya Financial, Inc., | | | | | | | | | | | | |
| 2.900%, 02/15/2018 | | | 17,494,000 | | | | 17,710,681 | | | | 0.5 | % |
| Other Financials#~ | | | | | | | 761,889,686 | | | | 19.8 | % |
| Total Financials | | | | | | | | | | | | |
| (Cost $984,946,330) | | | | | | | 983,879,907 | | | | 25.4 | % |
| Total Corporate Bonds | | | | | | | | | | | | |
| (Cost $2,259,221,341) | | | | | | | 2,260,424,855 | | | | 58.3 | % |
| Taxable Municipal Bonds | | | | | | | | | | | | |
| Other Taxable Municipal Bonds# | | | | | | | 113,213,350 | | | | 2.9 | % |
| Total Taxable Municipal Bonds | | | | | | | | | | | | |
| (Cost $113,697,097) | | | | | | | 113,213,350 | | | | 2.9 | % |
| Residential Mortgage-Backed Securities | | | | | | | | | | | | |
| U.S. Government Agency Issues | | | | | | | | | | | | |
| Other U.S. Government Agency Issues# | | | | | | | 8,582 | | | | 0.0 | % |
| Total U.S. Government Agency Issues | | | | | | | | | | | | |
| (Cost $8,447) | | | | | | | 8,582 | | | | 0.0 | % |
| Non-U.S. Government Agency Issues | | | | | | | | | | | | |
| Other Non-U.S. Government Agency Issues#~ | | | | | | | 227,514,434 | | | | 5.9 | % |
| Total Non-U.S. Government Agency Issues | | | | | | | | | | | | |
| (Cost $227,308,316) | | | | | | | 227,514,434 | | | | 5.9 | % |
| Commercial Mortgage-Backed Securities | | | | | | | | | | | | |
| U.S. Government Agency Issues | | | | | | | | | | | | |
| Fannie Mae REMIC Trust: | | | | | | | | | | | | |
| Series 2012-M9, Class ASQ2, 1.513%, 12/25/2017 | | | 24,270,826 | | | | 24,305,813 | | | | 0.6 | % |
| Series 2015-M1, Class ASQ2, 1.626%, 02/25/2018 | | | 24,170,737 | | | | 24,228,161 | | | | 0.6 | % |
| Series 2016-M6, Class ASQ2, 1.785%, 06/25/2019 | | | 13,650,000 | | | | 13,681,435 | | | | 0.4 | % |
The accompanying notes are an integral part of these financial statements.
Baird Short-Term Bond Fund
Summary Schedule of Investments, December 31, 2016
Long-Term Investments (cont.)
| | | Principal | | | | | | % of | |
| | | Amount | | | Value | | | Net Assets | |
| Freddie Mac Multifamily | | | | | | | | | |
| Structured Pass Through Certificates: | | | | | | | | | |
| Series K006, Class A2, 4.251%, 01/25/2020 | | $ | 15,000,000 | | | $ | 15,878,226 | | | | 0.4 | % |
1.426%-3.882%, 08/25/2017-09/25/2018∞ | | | 26,243,388 | | | | 26,522,193 | | | | 0.7 | % |
| Total U.S. Government Agency Issues | | | | | | | | | | | | |
| (Cost $104,739,546) | | | | | | | 104,615,828 | | | | 2.7 | % |
| Non-U.S. Government Agency Issues | | | | | | | | | | | | |
| J.P. Morgan Chase Commercial Mortgage Securities Trust, | | | | | | | | | | | | |
| Series 2012-C8, Class ASB, 2.379%, 10/15/2045 | | | 16,100,000 | | | | 16,174,965 | | | | 0.4 | % |
| Other Non-U.S. Government Agency Issues# | | | | | | | 13,691,953 | | | | 0.4 | % |
| Total Non-U.S. Government Agency Issues | | | | | | | | | | | | |
| (Cost $30,074,294) | | | | | | | 29,866,918 | | | | 0.8 | % |
| Other Asset Backed Securities | | | | | | | | | | | | |
| California Republic Auto Receivables Trust, | | | | | | | | | | | | |
| Series 2015-3, Class A3, 1.620%, 11/15/2019 | | | 20,500,000 | | | | 20,534,083 | | | | 0.5 | % |
| Chase Issuance Trust, | | | | | | | | | | | | |
| Series 2015-A5, Class A5, 1.360%, 04/15/2020 | | | 13,750,000 | | | | 13,741,914 | | | | 0.4 | % |
| Discover Card Execution Note Trust, | | | | | | | | | | | | |
| Series 2016-A4, Class A4, 1.390%, 03/15/2022 | | | 19,075,000 | | | | 18,857,270 | | | | 0.5 | % |
| Ford Credit Auto Owner Trust: | | | | | | | | | | | | |
| Series 2014-1, Class A, 2.260%, 11/15/2025 | | | | | | | | | | | | |
| (Acquired 05/06/2014 through 11/18/2014, | | | | | | | | | | | | |
| Cost $17,933,705)* | | | 17,894,000 | | | | 18,046,743 | | | | 0.5 | % |
| Series 2014-2, Class A, 2.310%, 04/15/2026 | | | | | | | | | | | | |
| (Acquired 01/06/2016 through 09/02/2016, | | | | | | | | | | | | |
| Cost $15,050,289)* | | | 14,892,000 | | | | 15,016,546 | | | | 0.4 | % |
| Series 2015-1, Class A, 2.120%, 07/15/2026 | | | | | | | | | | | | |
| (Acquired 01/13/2015 through 03/14/2016, | | | | | | | | | | | | |
| Cost $12,566,749)* | | | 12,592,000 | | | | 12,616,795 | | | | 0.3 | % |
| GMF Floorplan Owner Revolving Trust, | | | | | | | | | | | | |
| Series 2015-1, Class A1, 1.650%, 05/15/2020 | | | | | | | | | | | | |
| (Acquired 05/13/2015, Cost $14,699,441)* | | | 14,700,000 | | | | 14,688,346 | | | | 0.4 | % |
| Honda Auto Receivables Owner Trust, | | | | | | | | | | | | |
| Series 2016-1, Class A3, 1.220%, 12/18/2019 | | | 13,000,000 | | | | 12,970,031 | | | | 0.3 | % |
| Kubota Credit Owner Trust, | | | | | | | | | | | | |
| Series 2015-1A, Class A3, 1.540%, 03/15/2019 | | | | | | | | | | | | |
| (Acquired 01/22/2015 through 07/21/2016, | | | | | | | | | | | | |
| Cost $20,226,877)* | | | 20,225,000 | | | | 20,252,002 | | | | 0.5 | % |
| Mercedes-Benz Auto Lease Trust, | | | | | | | | | | | | |
| Series 2016-B, Class A3, 1.350%, 08/15/2019 | | | 18,800,000 | | | | 18,748,845 | | | | 0.5 | % |
| Verizon Owner Trust: | | | | | | | | | | | | |
| Series 2016-1A, Class A, 1.420%, 01/20/2021 | | | | | | | | | | | | |
| (Acquired 07/12/2016, Cost $16,247,263)* | | | 16,250,000 | | | | 16,136,908 | | | | 0.4 | % |
The accompanying notes are an integral part of these financial statements.
Baird Short-Term Bond Fund
Summary Schedule of Investments, December 31, 2016
Long-Term Investments (cont.)
| | | Principal | | | | | | % of | |
| | | Amount | | | Value | | | Net Assets | |
| Series 2016-2A, Class A, 1.680%, 05/20/2021 | | | | | | | | | |
| (Acquired 11/16/2016, Cost $12,748,678)* | | $ | 12,750,000 | | | $ | 12,698,634 | | | | 0.3 | % |
| Other Asset Backed Securities#~ | | | | | | | 119,436,680 | | | | 3.1 | % |
| Total Other Asset Backed Securities | | | | | | | | | | | | |
| (Cost $314,028,455) | | | | | | | 313,744,797 | | | | 8.1 | % |
| Total Long-Term Investments | | | | | | | | | | | | |
| (Cost $3,790,779,390) | | | | | | | 3,783,486,171 | | | | 97.7 | % |
| Short-Term Investment | | | | | | | | | | | | |
| | | Shares | | | | | | | | | |
| Money Market Mutual Fund | | | | | | | | | | | | |
| Fidelity Institutional Money Market Fund – | | | | | | | | | | | | |
| Government Portfolio, Institutional Class, 0.43%« | | | 116,128,236 | | | | 116,128,236 | | | | 3.0 | % |
| Total Short-Term Investment | | | | | | | | | | | | |
| (Cost $116,128,236) | | | | | | | 116,128,236 | | | | 3.0 | % |
| Total Investments | | | | | | | | | | | | |
| (Cost $3,906,907,626) | | | | | | | 3,899,614,407 | | | | 100.7 | % |
| Liabilities in Excess of Other Assets | | | | | | | (25,424,946 | ) | | | (0.7 | )% |
| TOTAL NET ASSETS | | | | | | $ | 3,874,189,461 | | | | 100.0 | % |
Notes to Summary Schedule of Investments
| ∞ | Variable or Floating rate security. Floating rate securities are securities whose yields vary with a designated index rate. These securities’ rates are as of December 31, 2016. |
| * | Restricted security as defined in Rule 144(a) under the Securities Act of 1933 and determined to be liquid. Purchased in a private placement transaction; resale to the public may require registration or may extend only to qualified institutional buyers. At December 31, 2016, the value of these securities total $260,984,856, which represents 6.74% of total net assets. |
| f | Foreign Security |
| # | Represents the aggregate value, by category, of securities that are not among the 50 largest holdings and, in total for any issuer, represent 1% or less of net assets. |
| ~ | Groupings contain, in aggregate, restricted securities totaling $552,150,012, representing 14.25% of net assets. |
| « | 7-Day Yield |
Summary of Fair Value Exposure at December 31, 2016
The Fund has adopted authoritative fair valuation accounting standards which establish a definition of fair value and set out a hierarchy for measuring fair value. These standards require additional disclosures about the various inputs and valuation techniques used to develop the measurements of fair value and a discussion on changes in valuation techniques and related inputs during the period. These standards define fair value as the price that would be received to sell an asset or paid to transfer a liability in an orderly transaction between market participants at the measurement date.
The accompanying notes are an integral part of these financial statements.
Baird Short-Term Bond Fund
Summary Schedule of Investments, December 31, 2016
Summary of Fair Value Exposure at December 31, 2016 (cont.)
The fair value hierarchy is organized into three levels based upon the assumptions (referred to as “inputs”) used in pricing the asset or liability. These standards state that “observable inputs” reflect the assumptions market participants would use in pricing the asset or liability based on market data obtained from independent sources and “unobservable inputs” reflect an entity’s own assumptions about the assumptions market participants would use in pricing the asset or liability. These inputs are summarized into three broad levels and described below:
Level 1 – | Unadjusted quoted prices in active markets for identical unrestricted securities. |
Level 2 – | Other significant observable inputs (including quoted prices for similar securities, quoted prices in inactive markets, dealer indications, interest rates, yield curves, prepayment speeds, credit risk, default rates, inputs corroborated by observable market data, etc.). |
Level 3 – | Significant unobservable inputs (including the Fund’s own assumptions about the factors that market participants would use in valuing the security) based on the best information available. |
The inputs or methodology used for valuing securities are not necessarily an indication of the risk associated with investing in those securities.
The following is a summary of the inputs used to value the Fund’s investments as of December 31, 2016:
| | | Level 1 | | | Level 2 | | | Level 3 | | | Total | |
| Long-Term Investments | | | | | | | | | | | | |
| U.S. Treasury Securities | | $ | — | | | $ | 661,407,108 | | | $ | — | | | $ | 661,407,108 | |
| Other Government Related Securities | | | — | | | | 72,690,299 | | | | — | | | | 72,690,299 | |
| Corporate Bonds | | | — | | | | 2,260,424,855 | | | | — | | | | 2,260,424,855 | |
| Taxable Municipal Bonds | | | — | | | | 113,213,350 | | | | — | | | | 113,213,350 | |
| Residential Mortgage-Backed Securities – | | | | | | | | | | | | | | | | |
| U.S. Government Agency Issues | | | — | | | | 8,582 | | | | — | | | | 8,582 | |
| Residential Mortgage-Backed Securities – | | | | | | | | | | | | | | | | |
| Non-U.S. Government Agency Issues | | | — | | | | 227,514,434 | | | | — | | | | 227,514,434 | |
| Commercial Mortgage-Backed Securities – | | | | | | | | | | | | | | | | |
| U.S. Government Agency Issues | | | — | | | | 104,615,828 | | | | — | | | | 104,615,828 | |
| Commercial Mortgage-Backed Securities – | | | | | | | | | | | | | | | | |
| Non-U.S. Government Agency Issues | | | — | | | | 29,866,918 | | | | — | | | | 29,866,918 | |
| Other Asset Backed Securities | | | — | | | | 313,744,797 | | | | — | | | | 313,744,797 | |
| Total Long-Term Investments | | | — | | | | 3,783,486,171 | | | | — | | | | 3,783,486,171 | |
| Short-Term Investment | | | | | | | | | | | | | | | | |
| Money Market Mutual Fund | | | 116,128,236 | | | | — | | | | — | | | | 116,128,236 | |
| Total Short-Term Investment | | | 116,128,236 | | | | — | | | | — | | | | 116,128,236 | |
| Total Investments | | $ | 116,128,236 | | | $ | 3,783,486,171 | | | $ | — | | | $ | 3,899,614,407 | |
Changes in valuation techniques may result in transfers into or out of assigned levels within the fair value hierarchy. There were no transfers between Level 1, Level 2 and Level 3 fair value measurements during the reporting period, as compared to their classification from the prior year’s annual report. See the Fund’s valuation policy in Note 2a to the financial statements.
The accompanying notes are an integral part of these financial statements.
Baird Intermediate Bond Fund
December 31, 2016
The Baird Intermediate Bond Fund seeks an annual rate of total return, before Fund expenses, greater than the annual rate of total return of the Bloomberg Barclays Intermediate U.S. Government/Credit Bond Index. The Bloomberg Barclays Intermediate U.S. Government/Credit Bond Index is an unmanaged, market value weighted index of investment grade, fixed-rate debt issues, including government and credit securities, with maturities between one and ten years.
During a very volatile 2016, the Fund generated strong absolute returns and outperformed its benchmark. The year can be considered a tale of two halves with the bond market experiencing significant volatility, driven by changing U.S. and global growth expectations, shifting global central bank policies, and political surprises both in the U.S and abroad. Our long-term commitment and strict adherence to a risk-controlled, duration neutral approach overseen by a seasoned team of investment professionals with uncommon longevity working together through multiple market cycles once again proved to be a prudent strategy during this period of heightened volatility.
The primary factors contributing to the Fund’s strong absolute and relative performance in 2016 are described below.
Positive contributors to the Fund’s performance during the year:
| | • | Overweight to investment grade credit |
| | | º | Overweight to BBB-rated credit |
| | | º | Exposure to commodity sensitive industrial sectors (energy and metals and mining) as spreads were significantly tighter in the year |
| | • | Security selection particularly within the Credit sector |
| | • | Exposure to high-quality Commercial Mortgage Backed Securities (CMBS), Non Agency Residential Mortgage Backed Securities (RMBS) and other Asset Backed Securities (ABS) |
Detractors from the Fund’s relative performance during the year:
| | • | Favoring credit exposure shorter than the benchmark |
Our base case outlook for 2017 is a continuation of moderate economic growth and inflation with better near-term economic growth prospects post-election given President Trump’s pro-growth agenda—though headwinds remain. However, we also acknowledge that a wide range of possible outcomes exists. If policy measures are passed that provide fiscal stimulus to the economy, they are likely to be met by tighter monetary policy from the Fed, limiting improvement in near-term economic growth. Additionally, low interest rates abroad will likely continue to limit the upside for U.S. interest rates. As a reminder, the Fund only purchases investment grade, U.S. dollar denominated securities in the cash bond market (no derivatives). The Fund remains duration neutral to its benchmark and we believe it is well positioned to add value relative to its benchmark.
Baird Intermediate Bond Fund
December 31, 2016 (Unaudited)
Portfolio Characteristics
Quality Distribution(1)(2)
| | | | | | |
 | | Net Assets | $2,307,166,235 | | |
| | | | | |
| | SEC 30-Day | | | |
| | Yield(3) | | | |
| | Institutional Class | 2.23% | | |
| | Investor Class | 1.98% | | |
| | | | | |
| | Average | | | |
| | Effective | | | |
| | Duration | 4.05 years | | |
| | | | | |
| | Average | | | |
| | Effective | | | |
| | Maturity | 4.45 years | | |
| | | | | |
| | Annualized | | | |
| | | Expense | | | |
Sector Weightings(1) | | Ratio(4) | | | |
| | | Institutional Class | 0.30% | | |
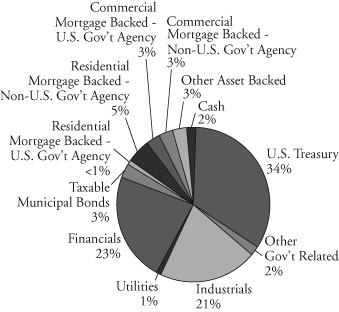 | | Investor Class | 0.55% | (5) | |
| | | | | |
| | Portfolio | | | |
| | Turnover Rate | 30.1% | | |
| | | | | |
| | Number of | | | |
| | Holdings | 478 | | |
| | | | | |
| | | | | |
| | | | | |
| | | | | |
| | | | | |
| | | | | |
| | | | | |
| | | | | |
| | | | | |
| | | | | |
| | | | | |
| | | | | |
| | | | | |
| | | | | |
| | | | | |
| | | | | | |
(1) | Percentages shown are based on the Fund’s total investments. |
(2) | The quality profile is calculated on a market value-weighted basis using the highest credit quality rating for each security held by the Fund given by S&P, Moody’s or Fitch, each of which is a Nationally Recognized Statistical Rating Organization (NRSRO). NRSROs rate the credit quality of securities using a scale that generally ranges from AAA (highest) to D (lowest). |
(3) | SEC yields are based on SEC guidelines and are calculated for the 30 days ended December 31, 2016. |
(4) | Reflects expense ratios as stated in the Fund’s current prospectus. |
(5) | Includes 0.25% 12b-1 fee. |
Baird Intermediate Bond Fund
December 31, 2016 (Unaudited)
Institutional Class
Value of a $25,000 Investment
Growth of a hypothetical investment of $25,000 made on 12/31/06, assuming reinvestment of all distributions.
Investor Class
Value of a $10,000 Investment
Growth of a hypothetical investment of $10,000 made on 12/31/06, assuming reinvestment of all distributions.
Baird Intermediate Bond Fund
December 31, 2016 (Unaudited)
Total Returns
| | | Average Annual |
| | One | Five | Ten | Since |
| For the Periods Ended December 31, 2016 | Year | Years | Years | Inception(1) |
| Institutional Class Shares | 2.83% | 2.71% | 4.38% | 5.01% |
| Investor Class Shares | 2.55% | 2.46% | 4.10% | 4.74% |
| Bloomberg Barclays Intermediate | | | | |
U.S. Government/Credit Bond Index(2) | 2.08% | 1.85% | 3.84% | 4.53% |
| (1) | For the period from September 29, 2000 (inception date) through December 31, 2016. |
| (2) | The Bloomberg Barclays Intermediate U.S. Government/Credit Bond Index is an unmanaged, market value weighted index of investment grade, fixed-rate debt issues, including government and corporate securities, with maturities between one and ten years. This Index does not reflect any deduction for fees, expenses or taxes. A direct investment in an index is not possible. |
The line graph on the previous page and the returns shown in the table above reflect reinvestment of dividends and/or capital gains distributions in additional shares. The returns do not reflect the deduction of taxes that a shareholder would pay on Fund distributions or the redemption of Fund shares. The returns reflect the actual performance for each period and do not include the impact of trades executed on the last business day of the period that were recorded on the first business day of the next period.
The Fund’s gross expense ratio for each Class, as reflected in the Fund’s current prospectus, is set forth under “Portfolio Characteristics”.
The Fund may invest in U.S. dollar denominated foreign securities which involve additional risks such as political and economic instability, and different and sometimes less strict financial reporting standards and regulation. The Fund may also invest in mortgage- and asset-backed securities, which include interest rate and prepayment risks more pronounced than those of other fixed income securities.
Past performance does not guarantee future results. Investment return and principal value will fluctuate so that an investor’s shares, when redeemed, may be worth more or less than their original cost.
For information about the performance of the Fund as of the most recent month-end, please call 1-866-44BAIRD or visit www.bairdfunds.com. Mutual fund performance changes over time and current performance may be lower or higher than that stated.
Baird Intermediate Bond Fund
Summary Schedule of Investments, December 31, 2016
This schedule summarizes the Fund’s holdings by asset type. Details are reported for each of the Fund’s 50 largest individual holdings and for investments that, in total for any issuer, represent more than 1% of the Fund’s net assets. The total value of smaller holdings is reported as a single amount within each category.
The Fund reports a complete list of its holdings in regulatory filings four times in each fiscal year, at the quarter end. For the second and fourth fiscal quarters, the complete listing of the Fund’s holdings is available electronically in the Fund’s Form N-CSR at http://www.bairdassetmanagement.com/baird-funds/funds-and-performance#Literature on the Securities and Exchange Commission’s website (www.sec.gov) or you can have it mailed to you without charge by calling 1-866-44BAIRD. For the first and third fiscal quarters, the Fund files the lists with the SEC on Form N-Q. Shareholders can look up the Fund’s Forms N-CSR and N-Q on the SEC’s website (www.sec.gov).
Long-Term Investments
| | | Principal | | | | | | % of | |
| | | Amount | | | Value | | | Net Assets | |
| U.S. Treasury Securities | | | | | | | | | |
| U.S. Treasury Bonds: | | | | | | | | | |
| 2.625%, 08/15/2020 | | $ | 115,700,000 | | | $ | 119,631,949 | | | | 5.2 | % |
| 1.375%, 08/31/2020 | | | 109,750,000 | | | | 108,609,588 | | | | 4.7 | % |
| 1.750%, 03/31/2022 | | | 280,000,000 | | | | 276,270,400 | | | | 12.0 | % |
| 2.500%, 05/15/2024 | | | 161,150,000 | | | | 163,560,965 | | | | 7.1 | % |
| 2.250%, 11/15/2025 | | | 122,700,000 | | | | 121,127,967 | | | | 5.2 | % |
| Total U.S. Treasury Securities | | | | | | | | | | | | |
| (Cost $806,123,453) | | | | | | | 789,200,869 | | | | 34.2 | % |
| Other Government Related Security# | | | | | | | | | | | | |
| Electricite de France SA, | | | | | | | | | | | | |
| 2.350%, 10/13/2020 (Acquired 10/07/2015, | | | | | | | | | | | | |
Cost $8,800,006)* f | | | 8,875,000 | | | | 8,790,137 | | | | 0.4 | % |
| Other Government Related Security#~ | | | | | | | 38,087,504 | | | | 1.6 | % |
| Total Other Government Related Securities | | | | | | | | | | | | |
| (Cost $46,279,793) | | | | | | | 46,877,641 | | | | 2.0 | % |
| Corporate Bonds | | | | | | | | | | | | |
| Industrials | | | | | | | | | | | | |
| Abbott Laboratories, | | | | | | | | | | | | |
| 3.400%, 11/30/2023 | | | 10,000,000 | | | | 9,962,410 | | | | 0.4 | % |
| Anheuser-Busch InBev Finance, Inc., | | | | | | | | | | | | |
| 3.300%, 02/01/2023 | | | 9,300,000 | | | | 9,464,908 | | | | 0.4 | % |
| AT&T, Inc., | | | | | | | | | | | | |
| 3.600%, 02/17/2023 | | | 9,000,000 | | | | 9,076,680 | | | | 0.4 | % |
| Charter Communications Operating LLC / | | | | | | | | | | | | |
| Charter Communications Operating Capital, | | | | | | | | | | | | |
| 4.464%, 07/23/2022 | | | 7,150,000 | | | | 7,471,972 | | | | 0.3 | % |
| Diamond 1 Finance Corp. / Diamond 2 Finance Corp., | | | | | | | | | | | | |
| 3.480%, 06/01/2019 (Acquired 05/17/2016 | | | | | | | | | | | | |
| through 10/07/2016, Cost $11,006,541)* | | | 10,900,000 | | | | 11,126,785 | | | | 0.5 | % |
| Georgia-Pacific LLC, | | | | | | | | | | | | |
| 5.400%, 11/01/2020 (Acquired 06/09/2016, | | | | | | | | | | | | |
| Cost $7,548,029)* | | | 6,797,000 | | | | 7,472,479 | | | | 0.3 | % |
The accompanying notes are an integral part of these financial statements.
Baird Intermediate Bond Fund
Summary Schedule of Investments, December 31, 2016
Long-Term Investments (cont.)
| | | Principal | | | | | | % of | |
| | | Amount | | | Value | | | Net Assets | |
| Sysco Corp., | | | | | | | | | |
| 2.600%, 10/01/2020 | | $ | 7,600,000 | | | $ | 7,665,633 | | | | 0.3 | % |
| The Dow Chemical Co., | | | | | | | | | | | | |
| 8.550%, 05/15/2019 | | | 8,800,000 | | | | 10,085,513 | | | | 0.5 | % |
| The Mosaic Co., | | | | | | | | | | | | |
| 4.250%, 11/15/2023 | | | 8,606,000 | | | | 8,677,783 | | | | 0.4 | % |
| Zoetis, Inc., | | | | | | | | | | | | |
| 3.250%, 02/01/2023 | | | 7,150,000 | | | | 7,134,370 | | | | 0.3 | % |
| Other Industrials#~ | | | | | | | 391,809,336 | | | | 17.0 | % |
| Total Industrials | | | | | | | | | | | | |
| (Cost $477,348,978) | | | | | | | 479,947,869 | | | | 20.8 | % |
| Utilities | | | | | | | | | | | | |
| Other Utilities#~ | | | | | | | 24,728,144 | | | | 1.1 | % |
| Total Utilities | | | | | | | | | | | | |
| (Cost $24,483,341) | | | | | | | 24,728,144 | | | | 1.1 | % |
| Financials | | | | | | | | | | | | |
| BNZ International Funding Ltd./London, | | | | | | | | | | | | |
| 2.100%, 09/14/2021 (Acquired 09/06/2016, | | | | | | | | | | | | |
Cost $9,990,600)* f | | | 10,000,000 | | | | 9,710,050 | | | | 0.4 | % |
| Caisse Centrale Desjardins, | | | | | | | | | | | | |
| 1.552%, 01/29/2018 (Acquired 01/26/2015, | | | | | | | | | | | | |
Cost $8,000,000)∞ * f | | | 8,000,000 | | | | 7,991,848 | | | | 0.3 | % |
| Citizens Bank NA/Providence RI, | | | | | | | | | | | | |
| 2.450%, 12/04/2019 | | | 8,000,000 | | | | 8,026,904 | | | | 0.3 | % |
| Compass Bank, | | | | | | | | | | | | |
| 2.750%, 09/29/2019 | | | 8,000,000 | | | | 7,956,456 | | | | 0.4 | % |
| Cooperatieve Rabobank UA/NY, | | | | | | | | | | | | |
2.500%, 01/19/2021 f | | | 8,175,000 | | | | 8,173,692 | | | | 0.4 | % |
| Credit Suisse Group Funding Guernsey Ltd., | | | | | | | | | | | | |
| 3.800%, 06/09/2023 f | | | 8,700,000 | | | | 8,690,413 | | | | 0.4 | % |
| JPMorgan Chase & Co., | | | | | | | | | | | | |
| 2.250%, 01/23/2020 | | | 7,875,000 | | | | 7,856,462 | | | | 0.3 | % |
| KeyBank NA/Cleveland OH, | | | | | | | | | | | | |
1.451%, 06/01/2018∞ | | | 8,000,000 | | | | 8,009,968 | | | | 0.3 | % |
| Morgan Stanley, | | | | | | | | | | | | |
2.282%, 10/24/2023∞ | | | 7,000,000 | | | | 7,077,777 | | | | 0.3 | % |
| Skandinaviska Enskilda Banken AB, | | | | | | | | | | | | |
| 2.450%, 05/27/2020 (Acquired 05/19/2015, | | | | | | | | | | | | |
Cost $8,486,910)* f | | | 8,500,000 | | | | 8,466,136 | | | | 0.4 | % |
| Standard Chartered PLC, | | | | | | | | | | | | |
| 1.520%, 04/17/2018 (Acquired 04/13/2015, | | | | | | | | | | | | |
Cost $8,500,000)∞ * f | | | 8,500,000 | | | | 8,467,411 | | | | 0.4 | % |
| SunTrust Bank/Atlanta GA, | | | | | | | | | | | | |
| 3.300%, 05/15/2026 | | | 9,000,000 | | | | 8,686,755 | | | | 0.4 | % |
The accompanying notes are an integral part of these financial statements.
Baird Intermediate Bond Fund
Summary Schedule of Investments, December 31, 2016
Long-Term Investments (cont.)
| | | Principal | | | | | | % of | |
| | | Amount | | | Value | | | Net Assets | |
| The Bank of Nova Scotia, | | | | | | | | | |
| 4.500%, 12/16/2025 | | $ | 7,000,000 | | | $ | 7,191,009 | | | | 0.3 | % |
| WEA Finance LLC / Westfield UK & | | | | | | | | | | | | |
| Europe Finance PLC, | | | | | | | | | | | | |
| 3.250%, 10/05/2020 (Acquired 09/28/2015, | | | | | | | | | | | | |
| Cost $7,474,275)* | | | 7,500,000 | | | | 7,627,515 | | | | 0.3 | % |
| Other Financials#~ | | | | | | | 418,946,921 | | | | 18.2 | % |
| Total Financials | | | | | | | | | | | | |
| (Cost $531,131,999) | | | | | | | 532,879,317 | | | | 23.1 | % |
| Total Corporate Bonds | | | | | | | | | | | | |
| (Cost $1,032,964,318) | | | | | | | 1,037,555,330 | | | | 45.0 | % |
| Taxable Municipal Bonds | | | | | | | | | | | | |
| City of Bristol VA, | | | | | | | | | | | | |
| 3.668%, 10/01/2022 (Callable 10/01/2020) | | | 7,500,000 | | | | 7,526,925 | | | | 0.4 | % |
| Other Taxable Municipal Bonds# | | | | | | | 60,469,015 | | | | 2.6 | % |
| Total Taxable Municipal Bonds | | | | | | | | | | | | |
| (Cost $66,923,442) | | | | | | | 67,995,940 | | | | 3.0 | % |
| Residential Mortgage-Backed Securities | | | | | | | | | | | | |
| U.S. Government Agency Issues | | | | | | | | | | | | |
| Other U.S. Government Agency Issues# | | | | | | | 239,159 | | | | 0.0 | % |
| Total U.S. Government Agency Issues | | | | | | | | | | | | |
| (Cost $221,763) | | | | | | | 239,159 | | | | 0.0 | % |
| Non-U.S. Government Agency Issues | | | | | | | | | | | | |
| Argent Securities Inc. Asset-Backed Pass-Through Certificates, | | | | | | | | | | | | |
Series 2005-W5, Class A1, 0.991%, 01/25/2036∞ | | | 9,413,061 | | | | 8,979,975 | | | | 0.4 | % |
| MortgageIT Trust, | | | | | | | | | | | | |
Series 2005-3, Class A1, 1.056%, 08/25/2035∞ | | | 7,755,604 | | | | 7,300,152 | | | | 0.3 | % |
| Specialty Underwriting & Residential Finance Trust, | | | | | | | | | | | | |
Series 2006-BC1, Class A2D, 1.056%, 12/25/2036∞ | | | 7,409,331 | | | | 7,328,806 | | | | 0.3 | % |
| Other Non-U.S. Government Agency Issues#~ | | | | | | | 87,689,700 | | | | 3.8 | % |
| Total Non-U.S. Government Agency Issues | | | | | | | | | | | | |
| (Cost $110,685,604) | | | | | | | 111,298,633 | | | | 4.8 | % |
| Commercial Mortgage-Backed Securities | | | | | | | | | | | | |
| U.S. Government Agency Issues | | | | | | | | | | | | |
| Freddie Mac Multifamily Structured Pass Through Certificates: | | | | | | | | | | | | |
| Series K708, Class A2, 2.130%, 01/25/2019 | | | 8,440,437 | | | | 8,516,779 | | | | 0.4 | % |
| Series K003, Class A4, 5.053%, 01/25/2019 | | | 9,000,000 | | | | 9,488,444 | | | | 0.4 | % |
| Series K004, Class A2, 4.186%, 08/25/2019 | | | 8,095,000 | | | | 8,560,921 | | | | 0.4 | % |
| Series K720, Class A2, 2.716%, 06/25/2022 | | | 15,725,000 | | | | 15,992,152 | | | | 0.7 | % |
2.303%-4.317%, 09/25/2018-03/25/2020∞ | | | 18,168,000 | | | | 18,860,192 | | | | 0.8 | % |
| Total U.S. Government Agency Issues | | | | | | | | | | | | |
| (Cost $61,046,010) | | | | | | | 61,418,488 | | | | 2.7 | % |
The accompanying notes are an integral part of these financial statements.
Baird Intermediate Bond Fund
Summary Schedule of Investments, December 31, 2016
Long-Term Investments (cont.)
| | | Principal | | | | | | % of | |
| | | Amount | | | Value | | | Net Assets | |
| Non-U.S. Government Agency Issues | | | | | | | | | |
| J.P. Morgan Chase Commercial Mortgage Securities Trust, | | | | | | | | | |
| Series 2012-C8, Class ASB, 2.379%, 10/15/2045 | | $ | 8,129,000 | | | $ | 8,166,850 | | | | 0.3 | % |
| Wells Fargo Commercial Mortgage Trust: | | | | | | | | | | | | |
| Series 2014-LC18, Class ASB, 3.244%, 12/15/2047 | | | 16,400,000 | | | | 16,802,505 | | | | 0.7 | % |
| Series 2015-P2, Class ASB, 3.656%, 12/15/2048 | | | 10,600,000 | | | | 11,027,422 | | | | 0.5 | % |
| WFRBS Commercial Mortgage Trust: | | | | | | | | | | | | |
| Series 2012-C6, Class A4, 3.440%, 04/15/2045 | | | 8,375,000 | | | | 8,748,749 | | | | 0.4 | % |
| Series 2014-C24, Class ASB, 3.324%, 11/15/2047 | | | 8,652,000 | | | | 8,902,569 | | | | 0.4 | % |
| Series 2013-C12, Class ASB, 2.838%, 03/15/2048 | | | 8,750,000 | | | | 8,907,776 | | | | 0.4 | % |
| Other Non-U.S. Government Agency Issues#~ | | | | | | | 12,294,288 | | | | 0.5 | % |
| Total Non-U.S. Government Agency Issues | | | | | | | | | | | | |
| (Cost $75,071,701) | | | | | | | 74,850,159 | | | | 3.2 | % |
| Other Asset Backed Securities | | | | | | | | | | | | |
| Discover Card Execution Note Trust, | | | | | | | | | | | | |
| Series 2016-A4, Class A4, 1.390%, 03/15/2022 | | | 10,925,000 | | | | 10,800,298 | | | | 0.5 | % |
| Ford Credit Auto Owner Trust: | | | | | | | | | | | | |
| Series 2014-1, Class A, 2.260%, 11/15/2025 | | | | | | | | | | | | |
| (Acquired 10/07/2014 through 10/09/2014, | | | | | | | | | | | | |
| Cost $10,893,304)* | | | 10,859,000 | | | | 10,951,692 | | | | 0.5 | % |
| Series 2014-2, Class A, 2.310%, 04/15/2026 | | | | | | | | | | | | |
| (Acquired 10/07/2014, Cost $11,745,689)* | | | 11,750,000 | | | | 11,848,269 | | | | 0.5 | % |
| Kubota Credit Owner Trust, | | | | | | | | | | | | |
| Series 2015-1A, Class A3, 1.540%, 03/15/2019 | | | | | | | | | | | | |
| (Acquired 01/22/2015, Cost $10,048,597)* | | | 10,050,000 | | | | 10,063,418 | | | | 0.4 | % |
| Synchrony Credit Card Master Note Trust, | | | | | | | | | | | | |
| Series 2012-2, Class A, 2.220%, 01/15/2022 | | | 8,375,000 | | | | 8,438,686 | | | | 0.3 | % |
| TCF Auto Receivables Owner Trust, | | | | | | | | | | | | |
| Series 2014-1A, Class A4, 1.560%, 01/15/2020 | | | | | | | | | | | | |
| (Acquired 05/29/2015 through 06/12/2015, | | | | | | | | | | | | |
| Cost $13,557,479)* | | | 13,543,913 | | | | 13,564,735 | | | | 0.6 | % |
| Other Asset Backed Securities#~ | | | | | | | 11,498,576 | | | | 0.5 | % |
| Total Other Asset Backed Securities | | | | | | | | | | | | |
| (Cost $77,045,250) | | | | | | | 77,165,674 | | | | 3.3 | % |
| Total Long-Term Investments | | | | | | | | | | | | |
| (Cost $2,276,361,334) | | | | | | | 2,266,601,893 | | | | 98.2 | % |
The accompanying notes are an integral part of these financial statements.
Baird Intermediate Bond Fund
Summary Schedule of Investments, December 31, 2016
Short-Term Investment
| | | | | | | | | % of | |
| | | Shares | | | Value | | | Net Assets | |
| Money Market Mutual Fund | | | | | | | | | |
| Fidelity Institutional Money Market Fund – | | | | | | | | | |
| Government Portfolio, Institutional Class, 0.43%« | | | 50,036,538 | | | $ | 50,036,538 | | | | 2.2 | % |
| Total Short-Term Investment | | | | | | | | | | | | |
| (Cost $50,036,538) | | | | | | | 50,036,538 | | | | 2.2 | % |
| Total Investments | | | | | | | | | | | | |
| (Cost $2,326,397,872) | | | | | | | 2,316,638,431 | | | | 100.4 | % |
| Liabilities in Excess of Other Assets | | | | | | | (9,472,196 | ) | | | (0.4 | )% |
| TOTAL NET ASSETS | | | | | | $ | 2,307,166,235 | | | | 100.0 | % |
Notes to Summary Schedule of Investments
| ∞ | Variable or Floating rate security. Floating rate securities are securities whose yields vary with a designated index rate. These securities’ rates are as of December 31, 2016. |
| * | Restricted security as defined in Rule 144(a) under the Securities Act of 1933 and determined to be liquid. Purchased in a private placement transaction; resale to the public may require registration or may extend only to qualified institutional buyers. At December 31, 2016, the value of these securities total $116,080,475 which represents 5.03% of total net assets. |
| f | Foreign Security |
| # | Represents the aggregate value, by category, of securities that are not among the 50 largest holdings and, in total for any issuer, represent 1% or less of net assets. |
| ~ | Groupings contain, in aggregate, restricted securities totaling $298,937,341, representing 12.96% of net assets. |
| « | 7-Day Yield |
Summary of Fair Value Exposure at December 31, 2016
The Fund has adopted authoritative fair valuation accounting standards which establish a definition of fair value and set out a hierarchy for measuring fair value. These standards require additional disclosures about the various inputs and valuation techniques used to develop the measurements of fair value and a discussion on changes in valuation techniques and related inputs during the period. These standards define fair value as the price that would be received to sell an asset or paid to transfer a liability in an orderly transaction between market participants at the measurement date.
The fair value hierarchy is organized into three levels based upon the assumptions (referred to as “inputs”) used in pricing the asset or liability. These standards state that “observable inputs” reflect the assumptions market participants would use in pricing the asset or liability based on market data obtained from independent sources and “unobservable inputs” reflect an entity’s own assumptions about the assumptions market participants would use in pricing the asset or liability. These inputs are summarized into three broad levels and described below:
Level 1 – | Unadjusted quoted prices in active markets for identical unrestricted securities. |
Level 2 – | Other significant observable inputs (including quoted prices for similar securities, quoted prices in inactive markets, dealer indications, interest rates, yield curves, prepayment speeds, credit risk, default rates, inputs corroborated by observable market data, etc.). |
Level 3 – | Significant unobservable inputs (including the Fund’s own assumptions about the factors that market participants would use in valuing the security) based on the best information available. |
The accompanying notes are an integral part of these financial statements.
Baird Intermediate Bond Fund
Summary Schedule of Investments, December 31, 2016
Summary of Fair Value Exposure at December 31, 2016 (cont.)
The inputs or methodology used for valuing securities are not necessarily an indication of the risk associated with investing in those securities.
The following is a summary of the inputs used to value the Fund’s investments as of December 31, 2016:
| | | Level 1 | | | Level 2 | | | Level 3 | | | Total | |
| Long-Term Investments | | | | | | | | | | | | |
| U.S. Treasury Securities | | $ | — | | | $ | 789,200,869 | | | $ | — | | | $ | 789,200,869 | |
| Other Government Related Securities | | | — | | | | 46,877,641 | | | | — | | | | 46,877,641 | |
| Corporate Bonds | | | — | | | | 1,037,555,330 | | | | — | | | | 1,037,555,330 | |
| Taxable Municipal Bonds | | | — | | | | 67,995,940 | | | | — | | | | 67,995,940 | |
| Residential Mortgage-Backed Securities – | | | | | | | | | | | | | | | | |
| U.S. Government Agency Issues | | | — | | | | 239,159 | | | | — | | | | 239,159 | |
| Residential Mortgage-Backed Securities – | | | | | | | | | | | | | | | | |
| Non-U.S. Government Agency Issues | | | — | | | | 111,298,633 | | | | — | | | | 111,298,633 | |
| Commercial Mortgage-Backed Securities – | | | | | | | | | | | | | | | | |
| U.S. Government Agency Issues | | | — | | | | 61,418,488 | | | | — | | | | 61,418,488 | |
| Commercial Mortgage-Backed Securities – | | | | | | | | | | | | | | | | |
| Non-U.S. Government Agency Issues | | | — | | | | 74,850,159 | | | | — | | | | 74,850,159 | |
| Other Asset Backed Securities | | | — | | | | 77,165,674 | | | | — | | | | 77,165,674 | |
| Total Long-Term Investments | | | — | | | | 2,266,601,893 | | | | — | | | | 2,266,601,893 | |
| Short-Term Investment | | | | | | | | | | | | | | | | |
| Money Market Mutual Fund | | | 50,036,538 | | | | — | | | | — | | | | 50,036,538 | |
| Total Short-Term Investment | | | 50,036,538 | | | | — | | | | — | | | | 50,036,538 | |
| Total Investments | | $ | 50,036,538 | | | $ | 2,266,601,893 | | | $ | — | | | $ | 2,316,638,431 | |
Changes in valuation techniques may result in transfers into or out of assigned levels within the fair value hierarchy. There were no transfers between Level 1 and Level 2 fair value measurements during the reporting period, as compared to their classification from the prior year’s annual report. See the Fund’s valuation policy in Note 2a to the financial statements.
Level 3 Reconciliation Disclosure
Following is a reconciliation of Level 3 assets for which significant unobservable inputs were used to determine fair value.
Description | | Investments in Securities | |
| Balance as of December 31, 2015 | | $ | 17,673 | |
| Accrued discounts/premiums | | | — | |
| Realized gain (loss) | | | (61,400 | ) |
| Change in unrealized appreciation (depreciation) | | | 56,083 | |
| Purchases | | | — | |
| Sales | | | (12,356 | ) |
| Transfers in and/or out of Level 3* | | | — | |
| Balance as of December 31, 2016 | | $ | — | |
* Transfers between levels are recognized at the end of the reporting period.
The accompanying notes are an integral part of these financial statements.
Baird Aggregate Bond Fund
December 31, 2016
The Baird Aggregate Bond Fund seeks an annual rate of total return, before Fund expenses, greater than the annual rate of total return of the Bloomberg Barclays U.S. Aggregate Bond Index. The Bloomberg Barclays U.S. Aggregate Bond Index is an unmanaged, market value weighted index of investment grade, fixed-rate debt issues, including government, credit, asset-backed (ABS), mortgage-backed (MBS) and commercial mortgage-backed (CMBS) securities with maturities of at least one year.
During a very volatile 2016, the Fund generated strong absolute returns and outperformed its benchmark. The year can be considered a tale of two halves with the bond market experiencing significant volatility, driven by changing U.S. and global growth expectations, shifting global central bank policies, and political surprises both in the U.S and abroad. Our long-term commitment and strict adherence to a risk-controlled, duration neutral approach overseen by a seasoned team of investment professionals with uncommon longevity working together through multiple market cycles once again proved to be a prudent strategy during this period of heightened volatility.
The primary factors contributing to the Fund’s strong absolute and relative performance in 2016 are described below.
Positive contributors to the Fund’s performance during the year:
| | • | Overweight to investment grade credit |
| | | º | Overweight to BBB-rated credit |
| | | º | Exposure to commodity sensitive industrial sectors (energy and metals and mining) as spreads were significantly tighter in the year |
| | • | Security selection particularly within the Credit sector |
| | • | Overweight to high-quality Commercial Mortgage Backed Securities (CMBS), Non Agency Residential Mortgage Backed Securities (RMBS) and other Asset Backed Securities (ABS) |
| | | |
| | • | Underweight to U.S. Government Agency Mortgage Backed Securities |
Detractors from the Fund’s relative performance during the year include:
| | • | Favoring credit exposure shorter than the benchmark |
Our base case outlook for 2017 is a continuation of moderate economic growth and inflation with better near-term economic growth prospects post-election given President Trump’s pro-growth agenda—though headwinds remain. However, we also acknowledge that a wide range of possible outcomes exists. If policy measures are passed that provide fiscal stimulus to the economy, they are likely to be met by tighter monetary policy from the Fed, limiting improvement in near-term economic growth. Additionally, low interest rates abroad will likely continue to limit the upside for U.S. interest rates. As a reminder, the Fund only purchases investment grade, U.S. dollar denominated securities in the cash bond market (no derivatives). The Fund remains duration neutral to its benchmark and we believe it is well positioned to add value relative to its benchmark.
Baird Aggregate Bond Fund
December 31, 2016 (Unaudited)
Portfolio Characteristics
Quality Distribution(1)(2)
| | | | | | |
 | | Net Assets | $10,579,024,356 | | |
| | | | | |
| | SEC 30-Day | | | |
| | Yield(3) | | | |
| | Institutional Class | 2.55% | | |
| | Investor Class | 2.29% | | |
| | | | | |
| | Average | | | |
| | Effective | | | |
| | Duration | 5.89 years | | |
| | | | | |
| | Average | | | |
| | Effective | | | |
| | Maturity | 7.61 years | | |
| | | | | |
| | | Annualized | | | |
Sector Weightings(1) | | Expense | | | |
| | | Ratio(4) | | | |
 | | Institutional Class | 0.30% | | |
| | Investor Class | 0.55% | (5) | |
| | | | | |
| | Portfolio | | | |
| | Turnover Rate | 35.7% | | |
| | | | | |
| | Number of | | | |
| | Holdings | 985 | | |
| | | | | |
| | | | | |
| | | | | |
| | | | | |
| | | | | |
| | | | | |
| | | | | |
| | | | | |
| | | | | |
| | | | | |
| | | | | |
| | | | | |
| | | | | | |
(1) | Percentages shown are based on the Fund’s total investments. |
(2) | The quality profile is calculated on a market value-weighted basis using the highest credit quality rating for each security held by the Fund given by S&P, Moody’s or Fitch, each of which is a Nationally Recognized Statistical Rating Organization (NRSRO). NRSROs rate the credit quality of securities using a scale that generally ranges from AAA (highest) to D (lowest). |
(3) | SEC yields are based on SEC guidelines and are calculated for the 30 days ended December 31, 2016. |
(4) | Reflects expense ratios as stated in the Fund’s current prospectus. |
(5) | Includes 0.25% 12b-1 fee. |
Baird Aggregate Bond Fund
December 31, 2016 (Unaudited)
Institutional ClassValue of a $25,000 Investment
Growth of a hypothetical investment of $25,000 made on 12/31/06, assuming reinvestment of all distributions.
Investor Class
Value of a $10,000 Investment
Growth of a hypothetical investment of $10,000 made on 12/31/06, assuming reinvestment of all distributions.
Baird Aggregate Bond Fund
December 31, 2016 (Unaudited)
Total Returns
| | | Average Annual |
| | One | Five | Ten | Since |
| For the Periods Ended December 31, 2016 | Year | Years | Years | Inception(1) |
| Institutional Class Shares | 3.52% | 3.47% | 4.71% | 5.52% |
| Investor Class Shares | 3.34% | 3.23% | 4.46% | 5.27% |
Bloomberg Barclays U.S. Aggregate Bond Index(2) | 2.65% | 2.23% | 4.34% | 5.01% |
| (1) | For the period from September 29, 2000 (inception date) through December 31, 2016. |
| (2) | The Bloomberg Barclays U.S. Aggregate Bond Index is an unmanaged, market value weighted index of investment grade, fixed-rate debt issues, including government, corporate, asset-backed and mortgage-backed securities, with maturities of at least one year. This Index does not reflect any deduction for fees, expenses or taxes. A direct investment in an index is not possible. |
The line graph on the previous page and the returns shown in the table above reflect reinvestment of dividends and/or capital gains distributions in additional shares. The returns do not reflect the deduction of taxes that a shareholder would pay on Fund distributions or the redemption of Fund shares. The returns reflect the actual performance for each period and do not include the impact of trades executed on the last business day of the period that were recorded on the first business day of the next period.
The Fund’s gross expense ratio for each Class, as reflected in the Fund’s current prospectus, is set forth under “Portfolio Characteristics”.
The Fund maintains securities with longer maturities in order to provide a greater potential for return. Generally, the longer a bond’s maturity, the greater the interest rate risk. The Fund may also invest in U.S. dollar denominated foreign securities which involve additional risks such as political and economic instability, and different and sometimes less strict financial reporting standards and regulation. The Fund may also invest in mortgage- and asset-backed securities, which include interest rate and prepayment risks more pronounced than those of other fixed income securities.
Past performance does not guarantee future results. Investment return and principal value will fluctuate so that an investor’s shares, when redeemed, may be worth more or less than their original cost.
For information about the performance of the Fund as of the most recent month-end, please call 1-866-44BAIRD or visit www.bairdfunds.com. Mutual fund performance changes over time and current performance may be lower or higher than that stated.
Baird Aggregate Bond Fund
Summary Schedule of Investments, December 31, 2016
This schedule summarizes the Fund’s holdings by asset type. Details are reported for each of the Fund’s 50 largest individual holdings and for investments that, in total for any issuer, represent more than 1% of the Fund’s net assets. The total value of smaller holdings is reported as a single amount within each category.
The Fund reports a complete list of its holdings in regulatory filings four times in each fiscal year, at the quarter end. For the second and fourth fiscal quarters, the complete listing of the Fund’s holdings is available electronically in the Fund’s Form N-CSR at http://www.bairdassetmanagement.com/baird-funds/funds-and-performance#Literature and on the Securities and Exchange Commission’s website (www.sec.gov) or you can have it mailed to you without charge by calling 1-866-44BAIRD. For the first and third fiscal quarters, the Fund files the lists with the SEC on Form N-Q. Shareholders can look up the Fund’s Forms N-CSR and N-Q on the SEC’s website (www.sec.gov).
Long-Term Investments
| | | Principal | | | | | | % of | |
| | | Amount | | | Value | | | Net Assets | |
| U.S. Treasury Securities | | | | | | | | | |
| U.S. Treasury Bonds: | | | | | | | | | |
| 1.375%, 08/31/2020 | | $ | 146,500,000 | | | $ | 144,977,719 | | | | 1.4 | % |
| 1.750%, 03/31/2022 | | | 423,730,000 | | | | 418,085,916 | | | | 3.9 | % |
| 2.500%, 05/15/2024 | | | 166,250,000 | | | | 168,737,266 | | | | 1.6 | % |
| 2.250%, 11/15/2025 | | | 81,800,000 | | | | 80,751,978 | | | | 0.8 | % |
| 5.250%, 11/15/2028 | | | 92,576,500 | | | | 117,854,236 | | | | 1.1 | % |
| 3.500%, 02/15/2039 | | | 371,355,900 | | | | 406,112,584 | | | | 3.8 | % |
| 2.875%, 05/15/2043 | | | 520,600,000 | | | | 502,846,499 | | | | 4.8 | % |
| 2.500%, 02/15/2045 | | | 15,450,000 | | | | 13,761,964 | | | | 0.1 | % |
| Total U.S. Treasury Securities | | | | | | | | | | | | |
| (Cost $1,929,738,410) | | | | | | | 1,853,128,162 | | | | 17.5 | % |
| Other Government Related Securities | | | | | | | | | | | | |
| Other Government Related Securities#~ | | | | | | | 119,989,431 | | | | 1.1 | % |
| Total Other Government Related Securities | | | | | | | | | | | | |
| (Cost $120,038,274) | | | | | | | 119,989,431 | | | | 1.1 | % |
| Corporate Bonds | | | | | | | | | | | | |
| Industrials | | | | | | | | | | | | |
| General Motors Financial Co., Inc., | | | | | | | | | | | | |
| 4.200%, 03/01/2021 | | | 30,000,000 | | | | 30,952,410 | | | | 0.3 | % |
| The Dow Chemical Co., | | | | | | | | | | | | |
| 8.550%, 05/15/2019 | | | 26,000,000 | | | | 29,798,106 | | | | 0.3 | % |
| Verizon Communications, Inc., | | | | | | | | | | | | |
| 6.400%, 09/15/2033 | | | 34,140,000 | | | | 41,190,388 | | | | 0.4 | % |
| Zoetis, Inc., | | | | | | | | | | | | |
| 3.250%, 02/01/2023 | | | 34,200,000 | | | | 34,125,239 | | | | 0.3 | % |
| Other Industrials#~ | | | | | | | 1,956,860,114 | | | | 18.5 | % |
| Total Industrials | | | | | | | | | | | | |
| (Cost $2,093,680,283) | | | | | | | 2,092,926,257 | | | | 19.8 | % |
| Utilities | | | | | | | | | | | | |
| Other Utilities#~ | | | | | | | 90,566,810 | | | | 0.9 | % |
| Total Utilities | | | | | | | | | | | | |
| (Cost $91,039,030) | | | | | | | 90,566,810 | | | | 0.9 | % |
The accompanying notes are an integral part of these financial statements.
Baird Aggregate Bond Fund
Summary Schedule of Investments, December 31, 2016
Long-Term Investments (cont.)
| | | Principal | | | | | | % of | |
| | | Amount | | | Value | | | Net Assets | |
| Financials | | | | | | | | | |
| Comerica Bank, | | | | | | | | | |
| 2.500%, 06/02/2020 | | $ | 29,000,000 | | | $ | 28,989,357 | | | | 0.3 | % |
| Compass Bank, | | | | | | | | | | | | |
| 2.750%, 09/29/2019 | | | 31,216,000 | | | | 31,046,091 | | | | 0.3 | % |
| First Horizon National Corp., | | | | | | | | | | | | |
| 3.500%, 12/15/2020 | | | 29,078,000 | | | | 29,342,842 | | | | 0.3 | % |
| Massachusetts Mutual Life Insurance Co., | | | | | | | | | | | | |
| 8.875%, 06/01/2039 (Acquired 05/27/2009 | | | | | | | | | | | | |
| through 10/31/2016, Cost $40,486,801)* | | | 27,017,000 | | | | 40,556,813 | | | | 0.4 | % |
| Nationwide Building Society, | | | | | | | | | | | | |
| 2.450%, 07/27/2021 (Acquired 07/20/2016 | | | | | | | | | | | | |
through 08/01/2016, Cost $38,476,783)* f | | | 38,500,000 | | | | 37,988,258 | | | | 0.4 | % |
| Reliance Standard Life Global Funding II, | | | | | | | | | | | | |
| 2.375%, 05/04/2020 (Acquired 04/27/2015 | | | | | | | | | | | | |
| through 11/08/2016, Cost $29,990,080)* | | | 30,000,000 | | | | 29,661,930 | | | | 0.3 | % |
| Other Financials#~ | | | | | | | 2,072,001,034 | | | | 19.4 | % |
| Total Financials | | | | | | | | | | | | |
| (Cost $2,269,483,276) | | | | | | | 2,269,586,325 | | | | 21.4 | % |
| Total Corporate Bonds | | | | | | | | | | | | |
| (Cost $4,454,202,589) | | | | | | | 4,453,079,392 | | | | 42.1 | % |
| Taxable Municipal Bonds | | | | | | | | | | | | |
| Other Taxable Municipal Bonds# | | | | | | | 174,137,029 | | | | 1.6 | % |
| Total Taxable Municipal Bonds | | | | | | | | | | | | |
| (Cost $171,342,641) | | | | | | | 174,137,029 | | | | 1.6 | % |
| Residential Mortgage-Backed Securities | | | | | | | | | | | | |
| U.S. Government Agency Issues | | | | | | | | | | | | |
| Federal Gold Loan Mortgage Corp. (FGLMC): | | | | | | | | | | | | |
| 3.500%, 07/01/2032 | | | 35,963,003 | | | | 37,295,470 | | | | 0.4 | % |
| 3.000%, 11/01/2042 | | | 49,944,539 | | | | 49,924,190 | | | | 0.5 | % |
| 3.000%, 01/01/2043 | | | 57,666,616 | | | | 57,582,296 | | | | 0.6 | % |
| 3.000%, 04/01/2043 | | | 33,404,635 | | | | 33,391,023 | | | | 0.3 | % |
| 3.500%, 05/01/2044 | | | 57,164,823 | | | | 58,852,299 | | | | 0.6 | % |
| 3.000%, 10/01/2045 | | | 55,006,641 | | | | 54,961,493 | | | | 0.5 | % |
| 3.500%, 01/01/2046 | | | 49,644,652 | | | | 50,987,430 | | | | 0.5 | % |
| 2.500%-6.500%, 06/01/2020-04/01/2046 | | | 364,978,192 | | | | 380,827,708 | | | | 3.5 | % |
| Federal National Mortgage Association (FNMA): | | | | | | | | | | | | |
| 3.500%, 07/01/2027 | | | 58,793,007 | | | | 61,418,015 | | | | 0.6 | % |
| 3.000%, 12/01/2030 | | | 52,174,816 | | | | 53,629,813 | | | | 0.5 | % |
| 3.500%, 10/01/2033 | | | 33,314,296 | | | | 34,660,531 | | | | 0.3 | % |
| 5.000%, 10/01/2033 | | | 28,731,066 | | | | 31,466,508 | | | | 0.3 | % |
| 3.500%, 03/01/2041 | | | 31,054,138 | | | | 32,022,962 | | | | 0.3 | % |
| 3.500%, 12/01/2041 | | | 28,895,227 | | | | 29,795,823 | | | | 0.3 | % |
| 3.000%, 03/01/2043 | | | 48,093,973 | | | | 48,080,278 | | | | 0.5 | % |
The accompanying notes are an integral part of these financial statements.
Baird Aggregate Bond Fund
Summary Schedule of Investments, December 31, 2016
Long-Term Investments (cont.)
| | | Principal | | | | | | % of | |
| | | Amount | | | Value | | | Net Assets | |
| Federal National Mortgage Association (FNMA): (cont.) | | | | | | | | | |
| 4.000%, 07/01/2043 | | $ | 45,411,396 | | | $ | 47,964,233 | | | | 0.5 | % |
| 3.500%, 10/01/2043 | | | 87,920,123 | | | | 90,596,654 | | | | 0.9 | % |
| 3.500%, 02/01/2045 | | | 61,033,879 | | | | 62,933,763 | | | | 0.6 | % |
| 3.500%, 04/01/2045 | | | 45,351,636 | | | | 46,625,955 | | | | 0.4 | % |
| 2.500%-6.000%, 01/01/2020-10/01/2045 | | | 605,230,541 | | | | 635,347,230 | | | | 5.9 | % |
3.000%, 05/01/2046∞ | | | 20,261,069 | | | | 20,161,090 | | | | 0.2 | % |
| Government National Mortgage Association (GNMA): | | | | | | | | | | | | |
| 3.500%, 01/20/2043 | | | 34,807,035 | | | | 36,349,737 | | | | 0.3 | % |
| 3.000%, 04/20/2045 | | | 44,450,795 | | | | 45,071,705 | | | | 0.4 | % |
| 3.500%, 04/20/2045 | | | 42,762,916 | | | | 44,498,016 | | | | 0.4 | % |
| 3.000%, 06/20/2046 | | | 28,395,390 | | | | 28,792,030 | | | | 0.3 | % |
| 3.500%-6.000%, 11/20/2033-01/20/2046 | | | 84,825,318 | | | | 90,129,181 | | | | 0.9 | % |
| Other U.S. Government Agency Issues# | | | | | | | 434,238 | | | | 0.0 | % |
| Total U.S. Government Agency Issues | | | | | | | | | | | | |
| (Cost $2,174,042,086) | | | | | | | 2,163,799,671 | | | | 20.5 | % |
| Non-U.S. Government Agency Issues | | | | | | | | | | | | |
| Argent Securities Inc. Asset-Backed Pass-Through Certificates, | | | | | | | | | | | | |
Series 2005-W5, Class A1, 0.991%, 01/25/2036∞ | | | 43,002,204 | | | | 41,023,711 | | | | 0.4 | % |
| Asset Backed Securities Corp. Home Equity Loan Trust, | | | | | | | | | | | | |
Series 2006-HE6, Class A1, 0.901%, 11/25/2036∞ | | | 33,885,474 | | | | 31,763,766 | | | | 0.3 | % |
| Other Non-U.S. Government Agency Issues#~ | | | | | | | 561,644,843 | | | | 5.3 | % |
| Total Non-U.S. Government Agency Issues | | | | | | | | | | | | |
| (Cost $635,297,405) | | | | | | | 634,432,320 | | | | 6.0 | % |
| Commercial Mortgage-Backed Securities | | | | | | | | | | | | |
| U.S. Government Agency Issues | | | | | | | | | | | | |
| Freddie Mac Multifamily Structured Pass Through Certificates, | | | | | | | | | | | | |
Series K714, Class A2, 3.034%, 10/25/2020∞ | | | 34,345,000 | | | | 35,568,630 | | | | 0.3 | % |
| Other U.S. Government Agency Issues# | | | | | | | 92,596,026 | | | | 0.9 | % |
| Total U.S. Government Agency Issues | | | | | | | | | | | | |
| (Cost $128,558,691) | | | | | | | 128,164,656 | | | | 1.2 | % |
| Non-U.S. Government Agency Issues | | | | | | | | | | | | |
| CD Mortgage Trust, | | | | | | | | | | | | |
| Series 2016-CD1, Class A4, 2.724%, 08/10/2049 | | | 32,725,000 | | | | 31,446,719 | | | | 0.3 | % |
| GS Mortgage Securities Trust, | | | | | | | | | | | | |
| Series 2012-GCJ9, Class A3, 2.773%, 11/10/2045 | | | 36,997,320 | | | | 37,298,256 | | | | 0.4 | % |
| Morgan Stanley Bank of America Merrill Lynch Trust, | | | | | | | | | | | | |
| Series 2012-C5, Class A4, 3.176%, 08/15/2045 | | | 37,550,000 | | | | 38,633,179 | | | | 0.4 | % |
| Wells Fargo Commercial Mortgage Trust, | | | | | | | | | | | | |
| Series 2015-P2, Class A3, 3.541%, 12/15/2048 | | | 31,100,000 | | | | 31,874,773 | | | | 0.3 | % |
| Other Non-U.S. Government Agency Issues# | | | | | | | 382,852,392 | | | | 3.6 | % |
| Total Non-U.S. Government Agency Issues | | | | | | | | | | | | |
| (Cost $524,900,958) | | | | | | | 522,105,319 | | | | 5.0 | % |
The accompanying notes are an integral part of these financial statements.
Baird Aggregate Bond Fund
Summary Schedule of Investments, December 31, 2016
Long-Term Investments (cont.)
| | | Principal | | | | | | % of | |
| | | Amount | | | Value | | | Net Assets | |
| Other Asset Backed Securities | | | | | | | | | |
| Capital One Multi-Asset Execution Trust, | | | | | | | | | |
| Series 2016-A4, Class A4, 1.330%, 06/15/2022 | | $ | 47,425,000 | | | $ | 46,788,855 | | | | 0.4 | % |
| Chase Issuance Trust, | | �� | | | | | | | | | | |
| Series 2016-A5, Class A5, 1.270%, 07/15/2021 | | | 40,100,000 | | | | 39,565,263 | | | | 0.4 | % |
| Discover Card Execution Note Trust, | | | | | | | | | | | | |
| Series 2016-A4, Class A4, 1.390%, 03/15/2022 | | | 50,225,000 | | | | 49,651,712 | | | | 0.5 | % |
| Verizon Owner Trust, | | | | | | | | | | | | |
| Series 2016-2A, Class A, 1.680%, 05/20/2021 | | | | | | | | | | | | |
| (Acquired 11/16/2016, Cost $50,644,748)* | | | 50,650,000 | | | | 50,445,946 | | | | 0.5 | % |
| Other Asset Backed Securities#~ | | | | | | | 229,292,938 | | | | 2.1 | % |
| Total Other Asset Backed Securities | | | | | | | | | | | | |
| (Cost $417,662,091) | | | | | | | 415,744,714 | | | | 3.9 | % |
| Total Long-Term Investments | | | | | | | | | | | | |
| (Cost $10,555,783,145) | | | | | | | 10,464,580,694 | | | | 98.9 | % |
| Short-Term Investment | | | | | | | | | | | | |
| | | Shares | | | | | | | | | |
| Money Market Mutual Fund | | | | | | | | | | | | |
| Fidelity Institutional Money Market Fund – | | | | | | | | | | | | |
| Government Portfolio, Institutional Class, 0.43%« | | | 233,776,874 | | | | 233,776,874 | | | | 2.2 | % |
| Total Short-Term Investment | | | | | | | | | | | | |
| (Cost $233,776,874) | | | | | | | 233,776,874 | | | | 2.2 | % |
| Total Investments | | | | | | | | | | | | |
| (Cost $10,789,560,019) | | | | | | | 10,698,357,568 | | | | 101.1 | % |
| Liabilities in Excess of Other Assets | | | | | | | (119,333,212 | ) | | | (1.1 | )% |
| TOTAL NET ASSETS | | | | | | $ | 10,579,024,356 | | | | 100.0 | % |
Notes to Summary Schedule of Investments
| ∞ | Variable or Floating rate security. Floating rate securities are securities whose yields vary with a designated index rate. These securities’ rates are as of December 31, 2016. |
| * | Restricted security as defined in Rule 144(a) under the Securities Act of 1933 and determined to be liquid. Purchased in a private placement transaction; resale to the public may require registration or may extend only to qualified institutional buyers. At December 31, 2016, the value of these securities total $158,652,947, which represents 1.50% of total net assets. |
| f | Foreign Security |
| # | Represents the aggregate value, by category, of securities that are not among the 50 largest holdings and, in total for any issuer, represent 1% or less of net assets. |
| ~ | Groupings contain, in aggregate, restricted securities totaling $1,440,142,607, representing 13.61% of net assets. |
| « | 7-Day Yield |
The accompanying notes are an integral part of these financial statements.
Baird Aggregate Bond Fund
Summary Schedule of Investments, December 31, 2016
Summary of Fair Value Exposure at December 31, 2016
The Fund has adopted authoritative fair valuation accounting standards which establish a definition of fair value and set out a hierarchy for measuring fair value. These standards require additional disclosures about the various inputs and valuation techniques used to develop the measurements of fair value and a discussion on changes in valuation techniques and related inputs during the period. These standards define fair value as the price that would be received to sell an asset or paid to transfer a liability in an orderly transaction between market participants at the measurement date.
The fair value hierarchy is organized into three levels based upon the assumptions (referred to as “inputs”) used in pricing the asset or liability. These standards state that “observable inputs” reflect the assumptions market participants would use in pricing the asset or liability based on market data obtained from independent sources and “unobservable inputs” reflect an entity’s own assumptions about the assumptions market participants would use in pricing the asset or liability. These inputs are summarized into three broad levels and described below:
Level 1 – | Unadjusted quoted prices in active markets for identical unrestricted securities. |
Level 2 – | Other significant observable inputs (including quoted prices for similar securities, quoted prices in inactive markets, dealer indications, interest rates, yield curves, prepayment speeds, credit risk, default rates, inputs corroborated by observable market data, etc.). |
Level 3 – | Significant unobservable inputs (including the Fund’s own assumptions about the factors that market participants would use in valuing the security) based on the best information available. |
The inputs or methodology used for valuing securities are not necessarily an indication of the risk associated with investing in those securities.
The following is a summary of the inputs used to value the Fund’s investments as of December 31, 2016:
| | | Level 1 | | | Level 2 | | | Level 3 | | | Total | |
| Long-Term Investments | | | | | | | | | | | | |
| U.S. Treasury Securities | | $ | — | | | $ | 1,853,128,162 | | | $ | — | | | $ | 1,853,128,162 | |
| Other Government Related Securities | | | — | | | | 119,989,431 | | | | — | | | | 119,989,431 | |
| Corporate Bonds | | | — | | | | 4,453,079,392 | | | | — | | | | 4,453,079,392 | |
| Taxable Municipal Bonds | | | — | | | | 174,137,029 | | | | — | | | | 174,137,029 | |
| Residential Mortgage-Backed Securities – | | | | | | | | | | | | | | | | |
| U.S. Government Agency Issues | | | — | | | | 2,163,799,671 | | | | — | | | | 2,163,799,671 | |
| Residential Mortgage-Backed Securities – | | | | | | | | | | | | | | | | |
| Non-U.S. Government Agency Issues | | | — | | | | 634,432,320 | | | | — | | | | 634,432,320 | |
| Commercial Mortgage-Backed Securities – | | | | | | | | | | | | | | | | |
| U.S. Government Agency Issues | | | — | | | | 128,164,656 | | | | — | | | | 128,164,656 | |
| Commercial Mortgage-Backed Securities – | | | | | | | | | | | | | | | | |
| Non-U.S. Government Agency Issues | | | — | | | | 522,105,319 | | | | — | | | | 522,105,319 | |
| Other Asset Backed Securities | | | — | | | | 415,744,714 | | | | — | | | | 415,744,714 | |
| Total Long-Term Investments | | | — | | | | 10,464,580,694 | | | | — | | | | 10,464,580,694 | |
| Short-Term Investment | | | | | | | | | | | | | | | | |
| Money Market Mutual Fund | | | 233,776,874 | | | | — | | | | — | | | | 233,776,874 | |
| Total Short-Term Investment | | | 233,776,874 | | | | — | | | | — | | | | 233,776,874 | |
| Total Investments | | $ | 233,776,874 | | | $ | 10,464,580,694 | | | $ | — | | | $ | 10,698,357,568 | |
Changes in valuation techniques may result in transfers into or out of assigned levels within the fair value hierarchy. There were no transfers between Level 1, Level 2 and Level 3 fair value measurements during the reporting period, as compared to their classification from the prior year’s annual report. See the Fund’s valuation policy in Note 2a to the financial statements.
The accompanying notes are an integral part of these financial statements.
Baird Core Plus Bond Fund
December 31, 2016
The Baird Core Plus Bond Fund seeks an annual rate of total return, before Fund expenses, greater than the annual rate of total return of the Bloomberg Barclays U.S. Universal Bond Index. The Bloomberg Barclays U.S. Universal Bond Index is an unmanaged, market value weighted index of fixed income securities issued in U.S. dollars, including U.S. government, investment grade and non-investment grade credit, emerging market debt, asset-backed and mortgage-backed securities, Eurobonds, 144A securities and commercial mortgage-backed securities (CMBS) with maturities of at least one year.
During a very volatile 2016, the Fund generated strong absolute returns and outperformed its benchmark. The year can be considered a tale of two halves with the bond market experiencing significant volatility, driven by changing U.S. and global growth expectations, shifting global central bank policies, and political surprises both in the U.S and abroad. Our long-term commitment and strict adherence to a risk-controlled, duration neutral approach overseen by a seasoned team of investment professionals with uncommon longevity working together through multiple market cycles once again proved to be a prudent strategy during this period of heightened volatility.
The primary factors contributing to the Fund’s strong absolute and relative performance in 2016 are described below.
Positive contributors to the Fund’s performance during the year:
| | • | Overweight to investment grade credit |
| | | º | Overweight to BBB-rated credit |
| | | º | Exposure to commodity sensitive industrial sectors (energy and metals and mining) as spreads were significantly tighter in the year |
| | • | Security selection particularly within the Credit sector |
| | • | Overweight to high-quality Commercial Mortgage Backed Securities (CMBS), Non Agency Residential Mortgage Backed Securities (RMBS) and other Asset Backed Securities (ABS) |
| | • | Underweight to U.S. Government Agency Mortgage Backed Securities |
Detractors from the Fund’s relative performance during the year:
| | • | Underweight to high yield corporate credit and dollar-denominated emerging market (EM) debt |
| | • | Favoring credit exposure shorter than the benchmark |
Our base case outlook for 2017 is a continuation of moderate economic growth and inflation with better near-term economic growth prospects post-election given President Trump’s pro-growth agenda—though headwinds remain. However, we also acknowledge that a wide range of possible outcomes exists. If policy measures are passed that provide fiscal stimulus to the economy, they are likely to be met by tighter monetary policy from the Fed, limiting improvement in near-term economic growth. Additionally, low interest rates abroad will likely continue to limit the upside for U.S. interest rates. As a reminder, the Fund only purchases U.S. dollar denominated securities in the cash bond market (no derivatives). The Fund remains duration neutral to its benchmark and we believe it is well positioned to add value relative to its benchmark.
Baird Core Plus Bond Fund
December 31, 2016 (Unaudited)
Portfolio Characteristics
Quality Distribution(1)(2)
| | | | | | |
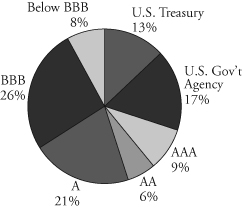 | | Net Assets | $12,905,445,044 | | |
| | | | | |
| | SEC 30-Day | | | |
| | Yield(3) | | | |
| | Institutional Class | 2.83% | | |
| | Investor Class | 2.59% | | |
| | | | | |
| | Average | | | |
| | Effective | | | |
| | Duration | 5.69 years | | |
| | | | | |
| | Average | | | |
| | Effective | | | |
| | Maturity | 7.39 years | | |
| | | | | |
| | | Annualized | | | |
Sector Weightings(1) | | Expense Ratio(4) | | | |
| | | Institutional Class | 0.30% | | |
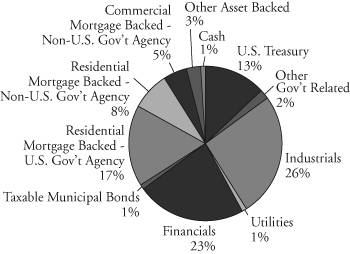 | | Investor Class | 0.55% | (5) | |
| | | | | |
| | Portfolio | | | |
| | Turnover Rate | 33.2% | | |
| | | | | |
| | Number of | | | |
| | Holdings | 1,180 | | |
| | | | | |
| | | | | |
| | | | | |
| | | | | |
| | | | | |
| | | | | |
| | | | | |
| | | | | |
| | | | | |
| | | | | |
| | | | | |
| | | | | | |
(1) | Percentages shown are based on the Fund’s total investments. |
(2) | The quality profile is calculated on a market value-weighted basis using the highest credit quality rating for each security held by the Fund given by S&P, Moody’s or Fitch, each of which is a Nationally Recognized Statistical Rating Organization (NRSRO). NRSROs rate the credit quality of securities using a scale that generally ranges from AAA (highest) to D (lowest). |
(3) | SEC yields are based on SEC guidelines and are calculated for the 30 days ended December 31, 2016. |
(4) | Reflects expense ratios as stated in the Fund’s current prospectus. |
(5) | Includes 0.25% 12b-1 fee. |
Baird Core Plus Bond Fund
December 31, 2016 (Unaudited)
Institutional ClassValue of a $25,000 Investment
Growth of a hypothetical investment of $25,000 made on 12/31/06, assuming reinvestment of all distributions.
Investor Class
Value of a $10,000 Investment
Growth of a hypothetical investment of $10,000 made on 12/31/06, assuming reinvestment of all distributions.
Baird Core Plus Bond Fund
December 31, 2016 (Unaudited)
Total Returns
| | | Average Annual |
| | One | Five | Ten | Since |
| For the Periods Ended December 31, 2016 | Year | Years | Years | Inception(1) |
| Institutional Class Shares | 4.73% | 3.55% | 5.41% | 6.02% |
| Investor Class Shares | 4.47% | 3.30% | 5.15% | 5.75% |
Bloomberg Barclays U.S. Universal Bond Index(2) | 3.91% | 2.78% | 4.57% | 5.27% |
| (1) | For the period from September 29, 2000 (inception date) through December 31, 2016. |
| (2) | The Bloomberg Barclays U.S. Universal Bond Index is an unmanaged, market value weighted index of fixed income securities issued in U.S. dollars, including U.S. government and investment grade debt, non-investment grade debt, asset-backed and mortgage-backed securities, Eurobonds, 144A securities and emerging market debt, with maturities of at least one year. This Index does not reflect any deduction for fees, expenses or taxes. A direct investment in an index is not possible. |
The line graph on the previous page and the returns shown in the table above reflect reinvestment of dividends and/or capital gains distributions in additional shares. The returns do not reflect the deduction of taxes that a shareholder would pay on Fund distributions or the redemption of Fund shares. The returns reflect the actual performance for each period and do not include the impact of trades executed on the last business day of the period that were recorded on the first business day of the next period.
The Fund’s gross expense ratio for each Class, as reflected in the Fund’s current prospectus, is set forth under “Portfolio Characteristics”.
The Fund may invest up to 20% of its net assets in non-investment grade debt securities (commonly referred to as “high yield” bonds). While these types of debt securities typically offer higher yields than investment grade securities, they also include greater risks including increased credit risk and the increased risk of default or bankruptcy. The Fund maintains securities with longer maturities in order to provide a greater potential for return. Generally, the longer a bond’s maturity, the greater the interest rate risk. The Fund may also invest in U.S. dollar denominated foreign securities which involve additional risks such as political and economic instability, and different and sometimes less strict financial reporting standards and regulation. The Fund may also invest in mortgage- and asset-backed securities, which include interest rate and prepayment risks more pronounced than those of other fixed income securities.
Past performance does not guarantee future results. Investment return and principal value will fluctuate so that an investor’s shares, when redeemed, may be worth more or less than their original cost.
For information about the performance of the Fund as of the most recent month-end, please call 1-866-44BAIRD or visit www.bairdfunds.com. Mutual fund performance changes over time and current performance may be lower or higher than that stated.
Baird Core Plus Bond Fund
Summary Schedule of Investments, December 31, 2016
This schedule summarizes the Fund’s holdings by asset type. Details are reported for each of the Fund’s 50 largest individual holdings and for investments that, in total for any issuer, represent more than 1% of the Fund’s net assets. The total value of smaller holdings is reported as a single amount within each category.
The Fund reports a complete list of its holdings in regulatory filings four times in each fiscal year, at the quarter end. For the second and fourth fiscal quarters, the complete listing of the Fund’s holdings is available electronically in the Fund’s Form N-CSR at http://www.bairdassetmanagement.com/baird-funds/funds-and-performance#Literature and on the Securities and Exchange Commission’s website (www.sec.gov) or you can have it mailed to you without charge by calling 1-866-44BAIRD. For the first and third fiscal quarters, the Fund files the lists with the SEC on Form N-Q. Shareholders can look up the Fund’s Forms N-CSR and N-Q on the SEC’s website (www.sec.gov).
Long-Term Investments
| | | Principal | | | | | | % of | |
| | | Amount | | | Value | | | Net Assets | |
| U.S. Treasury Securities | | | | | | | | | |
| U.S. Treasury Bonds: | | | | | | | | | |
| 2.625%, 08/15/2020 | | $ | 68,750,000 | | | $ | 71,086,400 | | | | 0.5 | % |
| 1.375%, 08/31/2020 | | | 302,575,000 | | | | 299,430,943 | | | | 2.3 | % |
| 1.750%, 03/31/2022 | | | 90,000,000 | | | | 88,801,200 | | | | 0.7 | % |
| 2.500%, 05/15/2024 | | | 135,000,000 | | | | 137,019,735 | | | | 1.1 | % |
| 2.250%, 11/15/2025 | | | 110,225,000 | | | | 108,812,798 | | | | 0.8 | % |
| 3.500%, 02/15/2039 | | | 377,695,000 | | | | 413,044,986 | | | | 3.2 | % |
| 2.875%, 05/15/2043 | | | 494,175,000 | | | | 477,322,644 | | | | 3.7 | % |
| 2.500%, 02/15/2045 | | | 36,550,000 | | | | 32,556,620 | | | | 0.3 | % |
| Total U.S. Treasury Securities | | | | | | | | | | | | |
| (Cost $1,700,385,538) | | | | | | | 1,628,075,326 | | | | 12.6 | % |
| Other Government Related Securities | | | | | | | | | | | | |
| Other Government Related Securities#~ | | | | | | | 218,605,828 | | | | 1.7 | % |
| Total Other Government Related Securities | | | | | | | | | | | | |
| (Cost $221,280,656) | | | | | | | 218,605,828 | | | | 1.7 | % |
| Corporate Bonds | | | | | | | | | | | | |
| Industrials | | | | | | | | | | | | |
| Forest Laboratories, Inc., | | | | | | | | | | | | |
| 5.000%, 12/15/2021 (Acquired 08/26/2014 | | | | | | | | | | | | |
| through 05/11/2016, Cost $44,268,632)* | | | 41,397,000 | | | | 44,757,733 | | | | 0.3 | % |
| Solvay Finance America LLC, | | | | | | | | | | | | |
| 3.400%, 12/03/2020 (Acquired 11/30/2015 | | | | | | | | | | | | |
| through 01/14/2016, Cost $39,203,146)* | | | 39,226,000 | | | | 39,912,180 | | | | 0.3 | % |
| The Dow Chemical Co., | | | | | | | | | | | | |
| 8.550%, 05/15/2019 | | | 32,150,000 | | | | 36,846,504 | | | | 0.3 | % |
| TSMC Global Ltd., | | | | | | | | | | | | |
| 1.625%, 04/03/2018 (Acquired 03/27/2013 | | | | | | | | | | | | |
through 03/14/2016, Cost $37,150,742)* f | | | 37,405,000 | | | | 37,261,963 | | | | 0.3 | % |
| Verizon Communications, Inc., | | | | | | | | | | | | |
| 6.400%, 09/15/2033 | | | 35,175,000 | | | | 42,439,130 | | | | 0.3 | % |
| Other Industrials#~ | | | | | | | 3,148,570,031 | | | | 24.4 | % |
| Total Industrials | | | | | | | | | | | | |
| (Cost $3,357,261,311) | | | | | | | 3,349,787,541 | | | | 25.9 | % |
The accompanying notes are an integral part of these financial statements.
Baird Core Plus Bond Fund
Summary Schedule of Investments, December 31, 2016
Long-Term Investments (cont.)
| | | Principal | | | | | | % of | |
| | | Amount | | | Value | | | Net Assets | |
| Utilities | | | | | | | | | |
| Other Utilities#~ | | | | | $ | 175,852,655 | | | | 1.4 | % |
| Total Utilities | | | | | | | | | | | |
| (Cost $175,314,582) | | | | | | 175,852,655 | | | | 1.4 | % |
| Financials | | | | | | | | | | | |
| Citizens Bank NA/Providence RI, | | | | | | | | | | | |
| 2.450%, 12/04/2019 | | $ | 36,000,000 | | | | 36,121,068 | | | | 0.3 | % |
| Compass Bank, | | | | | | | | | | | | |
| 2.750%, 09/29/2019 | | | 38,994,000 | | | | 38,781,755 | | | | 0.3 | % |
| HSBC Finance Corp., | | | | | | | | | | | | |
| 6.676%, 01/15/2021 | | | 32,693,000 | | | | 36,748,272 | | | | 0.3 | % |
| Massachusetts Mutual Life Insurance Co., | | | | | | | | | | | | |
| 8.875%, 06/01/2039 (Acquired 10/03/2012 | | | | | | | | | | | | |
| through 10/31/2016, Cost $52,325,279)* | | | 34,455,000 | | | | 51,722,433 | | | | 0.4 | % |
| Other Financials#~ | | | | | | | 2,778,547,023 | | | | 21.5 | % |
| Total Financials | | | | | | | | | | | | |
| (Cost $2,939,732,529) | | | | | | | 2,941,920,551 | | | | 22.8 | % |
| Total Corporate Bonds | | | | | | | | | | | | |
| (Cost $6,472,308,422) | | | | | | | 6,467,560,747 | | | | 50.1 | % |
| Taxable Municipal Bonds | | | | | | | | | | | | |
| Other Taxable Municipal Bonds# | | | | | | | 171,459,668 | | | | 1.3 | % |
| Total Taxable Municipal Bonds | | | | | | | | | | | | |
| (Cost $169,220,663) | | | | | | | 171,459,668 | | | | 1.3 | % |
| Residential Mortgage-Backed Securities | | | | | | | | | | | | |
| U.S. Government Agency Issues | | | | | | | | | | | | |
| Federal Gold Loan Mortgage Corp. (FGLMC): | | | | | | | | | | | | |
| 3.000%, 10/01/2030 | | | 50,230,441 | | | | 51,630,892 | | | | 0.4 | % |
| 3.500%, 05/01/2032 | | | 36,555,481 | | | | 37,911,769 | | | | 0.3 | % |
| 3.000%, 11/01/2042 | | | 66,831,036 | | | | 66,803,808 | | | | 0.5 | % |
| 3.000%, 01/01/2043 | | | 51,487,950 | | | | 51,466,983 | | | | 0.4 | % |
| 3.500%, 08/01/2044 | | | 36,484,246 | | | | 37,418,416 | | | | 0.3 | % |
| 3.500%, 06/01/2045 | | | 36,811,982 | | | | 37,853,861 | | | | 0.3 | % |
| 3.000%, 10/01/2045 | | | 45,737,970 | | | | 45,700,430 | | | | 0.4 | % |
| 3.500%, 01/01/2046 | | | 69,841,415 | | | | 71,730,471 | | | | 0.6 | % |
| 3.500%, 08/01/2046 | | | 54,630,728 | | | | 56,169,678 | | | | 0.4 | % |
| 3.000%-6.500%, 12/01/2020-02/01/2045 | | | 336,109,108 | | | | 347,699,770 | | | | 2.6 | % |
| Federal National Mortgage Association (FNMA): | | | | | | | | | | | | |
| 3.500%, 07/01/2027 | | | 54,916,919 | | | | 57,368,866 | | | | 0.4 | % |
| 3.500%, 07/01/2028 | | | 40,614,985 | | | | 42,364,759 | | | | 0.3 | % |
| 3.000%, 08/01/2030 | | | 40,002,709 | | | | 41,117,753 | | | | 0.3 | % |
| 4.500%, 10/01/2033 | | | 36,367,171 | | | | 39,245,166 | | | | 0.3 | % |
| 5.000%, 02/01/2035 | | | 50,308,007 | | | | 55,077,802 | | | | 0.4 | % |
| 3.500%, 09/01/2041 | | | 46,887,955 | | | | 48,351,560 | | | | 0.4 | % |
The accompanying notes are an integral part of these financial statements.
Baird Core Plus Bond Fund
Summary Schedule of Investments, December 31, 2016
Long-Term Investments (cont.)
| | | Principal | | | | | | % of | |
| | | Amount | | | Value | | | Net Assets | |
| Federal National Mortgage Association (FNMA): (cont.) | | | | | | | | | |
| 4.000%, 01/01/2042 | | $ | 40,342,207 | | | $ | 42,492,437 | | | | 0.3 | % |
| 3.000%, 05/01/2043 | | | 35,993,392 | | | | 35,983,120 | | | | 0.3 | % |
| 3.000%, 06/01/2043 | | | 37,702,712 | | | | 37,691,960 | | | | 0.3 | % |
| 4.000%, 07/01/2043 | | | 45,843,546 | | | | 48,420,677 | | | | 0.4 | % |
| 3.500%, 02/01/2045 | | | 75,107,508 | | | | 77,445,482 | | | | 0.6 | % |
| 4.000%, 02/01/2045 | | | 33,271,930 | | | | 35,150,667 | | | | 0.3 | % |
2.500%-6.500%, 11/01/2021-03/01/2045∞ | | | 578,585,470 | | | | 608,132,719 | | | | 4.8 | % |
| Government National Mortgage Association (GNMA): | | | | | | | | | | | | |
| 3.500%, 04/20/2045 | | | 39,854,952 | | | | 41,472,062 | | | | 0.3 | % |
| 3.500%, 06/20/2045 | | | 36,514,284 | | | | 37,997,994 | | | | 0.3 | % |
| 4.500%, 01/20/2046 | | | 33,898,593 | | | | 36,215,210 | | | | 0.3 | % |
| 3.000%-6.500%, 12/20/2028-06/20/2046 | | | 126,307,501 | | | | 131,745,755 | | | | 1.0 | % |
| Other U.S. Government Agency Issues# | | | | | | | 1,471,780 | | | | 0.0 | % |
| Total U.S. Government Agency Issues | | | | | | | | | | | | |
| (Cost $2,228,524,761) | | | | | | | 2,222,131,847 | | | | 17.2 | % |
| Non-U.S. Government Agency Issues | | | | | | | | | | | | |
| Argent Securities Inc. Asset-Backed Pass-Through Certificates, | | | | | | | | | | | | |
Series 2005-W5, Class A1, 0.991%, 01/25/2036∞ | | | 53,066,608 | | | | 50,625,061 | | | | 0.4 | % |
| Citicorp Residential Mortgage Trust, | | | | | | | | | | | | |
Series 2007-2, Class A4, 5.398%, 06/25/2037∞ | | | 43,000,195 | | | | 44,204,402 | | | | 0.4 | % |
| Countrywide Asset-Backed Certificates, | | | | | | | | | | | | |
Series 2007-9, Class 2A3, 0.936%, 06/25/2047∞ | | | 47,035,274 | | | | 44,930,413 | | | | 0.4 | % |
| Other Non-U.S. Government Agency Issues#~ | | | | | | | 890,136,534 | | | | 6.8 | % |
| Total Non-U.S. Government Agency Issues | | | | | | | | | | | | |
| (Cost $1,037,982,098) | | | | | | | 1,029,896,410 | | | | 8.0 | % |
| Commercial Mortgage-Backed Securities | | | | | | | | | | | | |
| Non-U.S. Government Agency Issues | | | | | | | | | | | | |
| GS Mortgage Securities Trust, | | | | | | | | | | | | |
| Series 2012-GCJ9, Class A3, 2.773%, 11/10/2045 | | | 41,464,000 | | | | 41,801,268 | | | | 0.3 | % |
| JPMBB Commercial Mortgage Securities Trust, | | | | | | | | | | | | |
| Series 2014-C25, Class A5, 3.672%, 11/15/2047 | | | 34,585,000 | | | | 36,001,211 | | | | 0.3 | % |
| Morgan Stanley Bank of America Merrill Lynch Trust: | | | | | | | | | | | | |
| Series 2012-C5, Class A4, 3.176%, 08/15/2045 | | | 40,030,000 | | | | 41,184,717 | | | | 0.3 | % |
Series 2013-C10, Class A3, 3.969%, 07/15/2046∞ | | | 44,160,000 | | | | 46,884,699 | | | | 0.4 | % |
| Other Non-U.S. Government Agency Issues# | | | | | | | 474,438,104 | | | | 3.6 | % |
| Total Non-U.S. Government Agency Issues | | | | | | | | | | | | |
| (Cost $640,633,805) | | | | | | | 640,309,999 | | | | 4.9 | % |
| Other Asset Backed Securities | | | | | | | | | | | | |
| Ford Credit Auto Owner Trust, | | | | | | | | | | | | |
| Series 2016-1, Class A, 2.310%, 08/15/2027 | | | | | | | | | | | | |
| (Acquired 02/23/2016 through 05/27/2016, | | | | | | | | | | | | |
| Cost $37,663,070)* | | | 37,625,000 | | | | 37,551,947 | | | | 0.3 | % |
The accompanying notes are an integral part of these financial statements.
Baird Core Plus Bond Fund
Summary Schedule of Investments, December 31, 2016
Long-Term Investments (cont.)
| | | Principal | | | | | | % of | |
| | | Amount | | | Value | | | Net Assets | |
| PFS Financing Corp., | | | | | | | | | |
| Series 2016-BA, Class A, 1.870%, 10/15/2021 | | | | | | | | | |
| (Acquired 10/18/2016 through 12/21/2016, | | | | | | | | | |
| Cost $40,196,331)* | | $ | 40,200,000 | | | $ | 39,798,000 | | | | 0.3 | % |
| TCF Auto Receivables Owner Trust, | | | | | | | | | | | | |
| Series 2016-1A, Class A3, 1.710%, 04/15/2021 | | | | | | | | | | | | |
| (Acquired 09/14/2016, Cost $38,993,592)* | | | 39,000,000 | | | | 38,783,936 | | | | 0.3 | % |
| Other Asset Backed Securities#~ | | | | | | | 229,567,121 | | | | 1.8 | % |
| Total Asset Backed Securities | | | | | | | | | | | | |
| (Cost $346,905,680) | | | | | | | 345,701,004 | | | | 2.7 | % |
| Total Long-Term Investments | | | | | | | | | | | | |
| (Cost $12,817,241,623) | | | | | | | 12,723,740,829 | | | | 98.5 | % |
| Short-Term Investment | | | | | | | | | | | | |
| | | Shares | | | | | | | | | |
| Money Market Mutual Fund | | | | | | | | | | | | |
| Fidelity Institutional Money Market Fund – | | | | | | | | | | | | |
| Government Portfolio, Institutional Class, 0.43%« | | | 200,414,435 | | | | 200,414,435 | | | | 1.6 | % |
| Total Short-Term Investment | | | | | | | | | | | | |
| (Cost $200,414,435) | | | | | | | 200,414,435 | | | | 1.6 | % |
| Total Investments | | | | | | | | | | | | |
| (Cost $13,017,656,058) | | | | | | | 12,924,155,264 | | | | 100.1 | % |
| Liabilities in Excess of Other Assets | | | | | | | (18,710,220 | ) | | | (0.1 | )% |
| TOTAL NET ASSETS | | | | | | $ | 12,905,445,044 | | | | 100.0 | % |
Notes to Summary Schedule of Investments
| ∞ | Variable or Floating rate security. Floating rate securities are securities whose yields vary with a designated index rate. These securities’ rates are as of December 31, 2016. |
| * | Restricted security as defined in Rule 144(a) under the Securities Act of 1933 and determined to be liquid. Purchased in a private placement transaction; resale to the public may require registration or may extend only to qualified institutional buyers. At December 31, 2016, the value of these securities total $289,788,192, which represents 2.25% of total net assets. |
| f | Foreign Security |
| # | Represents the aggregate value, by category, of securities that are not among the 50 largest holdings and, in total for any issuer, represent 1% or less of net assets. |
| ~ | Groupings contain, in aggregate, restricted securities totaling $2,009,503,663, representing 15.57% of net assets. |
| « | 7-Day Yield |
The accompanying notes are an integral part of these financial statements.
Baird Core Plus Bond Fund
Summary Schedule of Investments, December 31, 2016
Summary of Fair Value Exposure at December 31, 2016
The Fund has adopted authoritative fair valuation accounting standards which establish a definition of fair value and set out a hierarchy for measuring fair value. These standards require additional disclosures about the various inputs and valuation techniques used to develop the measurements of fair value and a discussion on changes in valuation techniques and related inputs during the period. These standards define fair value as the price that would be received to sell an asset or paid to transfer a liability in an orderly transaction between market participants at the measurement date.
The fair value hierarchy is organized into three levels based upon the assumptions (referred to as “inputs”) used in pricing the asset or liability. These standards state that “observable inputs” reflect the assumptions market participants would use in pricing the asset or liability based on market data obtained from independent sources and “unobservable inputs” reflect an entity’s own assumptions about the assumptions market participants would use in pricing the asset or liability. These inputs are summarized into three broad levels and described below:
Level 1 – | Unadjusted quoted prices in active markets for identical unrestricted securities. |
Level 2 – | Other significant observable inputs (including quoted prices for similar securities, quoted prices in inactive markets, dealer indications, interest rates, yield curves, prepayment speeds, credit risk, default rates, inputs corroborated by observable market data, etc.). |
Level 3 – | Significant unobservable inputs (including the Fund’s own assumptions about the factors that market participants would use in valuing the security) based on the best information available. |
The inputs or methodology used for valuing securities are not necessarily an indication of the risk associated with investing in those securities.
The following is a summary of the inputs used to value the Fund’s investments as of December 31, 2016:
| | | Level 1 | | | Level 2 | | | Level 3 | | | Total | |
| Long-Term Investments | | | | | | | | | | | | |
| U.S. Treasury Securities | | $ | — | | | $ | 1,628,075,326 | | | $ | — | | | $ | 1,628,075,326 | |
| Other Government Related Securities | | | — | | | | 218,605,828 | | | | — | | | | 218,605,828 | |
| Corporate Bonds | | | — | | | | 6,467,560,747 | | | | — | | | | 6,467,560,747 | |
| Taxable Municipal Bonds | | | — | | | | 171,459,668 | | | | — | | | | 171,459,668 | |
| Residential Mortgage-Backed Securities – | | | | | | | | | | | | | | | | |
| U.S. Government Agency Issues | | | — | | | | 2,222,131,847 | | | | — | | | | 2,222,131,847 | |
| Residential Mortgage-Backed Securities – | | | | | | | | | | | | | | | | |
| Non-U.S. Government Agency Issues | | | — | | | | 1,029,896,410 | | | | — | | | | 1,029,896,410 | |
| Commercial Mortgage-Backed Securities – | | | | | | | | | | | | | | | | |
| Non-U.S. Government Agency Issues | | | — | | | | 640,309,999 | | | | — | | | | 640,309,999 | |
| Asset Backed Securities | | | — | | | | 345,701,004 | | | | — | | | | 345,701,004 | |
| Total Long-Term Investments | | | — | | | | 12,723,740,829 | | | | — | | | | 12,723,740,829 | |
| Short-Term Investment | | | | | | | | | | | | | | | | |
| Money Market Mutual Fund | | | 200,414,435 | | | | — | | | | — | | | | 200,414,435 | |
| Total Short-Term Investment | | | 200,414,435 | | | | — | | | | — | | | | 200,414,435 | |
| Total Investments | | $ | 200,414,435 | | | $ | 12,723,740,829 | | | $ | — | | | $ | 12,924,155,264 | |
The accompanying notes are an integral part of these financial statements.
Baird Core Plus Bond Fund
Summary Schedule of Investments, December 31, 2016
Summary of Fair Value Exposure at December 31, 2016 (cont.)
Changes in valuation techniques may result in transfers into or out of assigned levels within the fair value hierarchy. There were no transfers between Level 1, Level 2 and Level 3 fair value measurements during the reporting period, as compared to their classification from the prior year’s annual report. See the Fund’s valuation policy in Note 2a to the financial statements.
Level 3 Reconciliation Disclosure
Following is a reconciliation of Level 3 assets for which significant unobservable inputs were used to determine fair value.
Description | | Investments in Securities | |
| Balance as of December 31, 2015 | | $ | 14,727 | |
| Accrued discounts/premiums | | | — | |
| Realized gain (loss) | | | (12,810 | ) |
| Change in unrealized appreciation (depreciation) | | | 8,379 | |
| Purchases | | | — | |
| Sales | | | (10,296 | ) |
| Transfers in and/or out of Level 3* | | | — | |
| Balance as of December 31, 2016 | | $ | — | |
* Transfers between levels are recognized at the end of the reporting period.
The accompanying notes are an integral part of these financial statements.
2016 Municipal Bond Market Overview
2016 – A Tale of Two Halves
Tax-free yields rose more than 50 bps year-over-year among intermediate maturities, but that analysis alone misses the volatility in rates this year. It is perhaps best to think of 2016 as a year of two phases, as there were two distinct phases of rate movements, fund flows, and credit spreads. In the first phase, 10-year tax-free rates fell by more than 60 bps as sluggish U.S. economic growth, which averaged just 1.1% through June, dovish Fed rhetoric, and global uncertainty following the Brexit vote, all contributed to the decline in yields. A favorable supply/demand backdrop strengthened the municipal market in the first phase as steady tax-free fund inflows more than offset a marginal increase in new supply relative to 2015’s pace. Long-term rates led the move lower in the first phase as 30-year yields fell 82 bps as 2-year yields fell 18 bps, resulting in a flatter curve.
AAA Municipal Yields
| | | | | | 1 Mo | 3 Mo | YTD |
Maturity | 12/31/15 | 9/30/16 | 11/30/16 | 12/31/16 | Change | Change | Change |
| 1 | 0.50% | 0.78% | 0.91% | 1.00% | 0.09% | 0.22% | 0.50% |
| 2 | 0.77% | 0.82% | 1.16% | 1.23% | 0.07% | 0.41% | 0.46% |
| 3 | 0.99% | 0.88% | 1.43% | 1.43% | 0.00% | 0.55% | 0.44% |
| 5 | 1.26% | 1.02% | 1.85% | 1.80% | -0.05% | 0.78% | 0.54% |
| 7 | 1.54% | 1.19% | 2.12% | 2.05% | -0.07% | 0.86% | 0.51% |
| 10 | 1.92% | 1.51% | 2.52% | 2.35% | -0.17% | 0.84% | 0.43% |
| 30 | 2.82% | 2.31% | 3.26% | 3.08% | -0.18% | 0.77% | 0.26% |
The second phase of the 2016 rate cycle began near mid-year as supply levels and economic data both improved as the curve resteepened. The supply boost came both from higher refunding volume and a higher level of new money financings. The pace of issuance accelerated through the fall, peaking in October at over $53B in total supply, the largest single month of issuance since 1985. Total supply in 2016 set a new record at $445B. Economic growth improved as 3Q GDP accelerated to a 3.5% pace and the Fed signaled a desire to hike the fed funds rate, which they did in December by 25 bps. It was the surprise election of Donald Trump, however, combined with the GOP maintaining majorities in both the House and Senate, that ultimately pushed tax-free rates up sharply as market sentiment shifted toward faster growth and higher inflation. With Republicans in full control of the agenda in Washington the probability of both corporate and personal tax reform increased, putting extra pressure on municipal prices following the election.

2016 Municipal Bond Market Overview
Demand shifted after a streak of 55 consecutive weekly municipal fund inflows ended in September and post-election outflows of at least $2B/week continued through year end (right graph). Investor selling was driven in part by concern over rising interest rates but was primarily due to the narrow window investors had to harvest tax losses before year end. The heavy selling also pushed municipal credit spreads wider. An example of this can be seen in the yield difference between 10-year, BBB and AAA rated tax-free yields (graph below right). The yield advantage for BBBs had narrowed to just +70 bps in August, before widening back to +156 bps at year end. While the trend for municipal credits from the end of the recession in 2009 through mid-2016 had been steadily narrower (see Baird’s “Managing Through a Municipal Credit Cycle”), the recent widening of spreads was primarily technical in nature, not driven by fundamental credit weakness. On the contrary, the fundamental credit outlook for the vast majority of municipalities remains strong and stable. In 2016 the upgrade-to-downgrade ratio for S&P-rated municipal bonds was over 3:1, the fourth consecutive year with a positive ratio. While overall state revenue growth likely slowed in 2016 relative to the prior year, local governments benefited from solid property tax growth thanks to rising real estate prices and assessed valuations. |
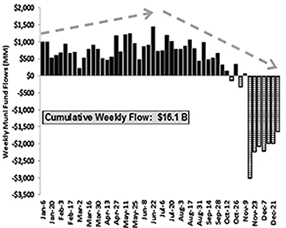 | | 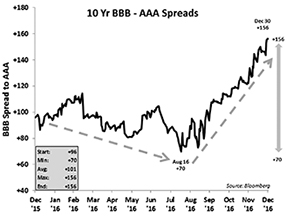 |
| | | |
2016 Key Municipal Credit Events
| | • | Puerto Rico opened 2016 with a default on public corporation debt and by mid-year had stopped payments on most other outstanding debt. In late June, President Obama signed the Puerto Rico Oversight, Management, and Economic Stability Act (PROMESA) which placed a temporary stay on all debt-related litigation and also established a federal oversight board. The board will attempt to work closely with new governor, Ricardo Rossello, who favors statehood for Puerto Rico, and expressed a willingness to work with the PROMESA board. Much work and significant hurdles remain before bondholders will know how they will fare relative to unfunded pension liabilities and other creditors. |
| | • | Illinois and Chicago struggled with persistent political, fiscal, and pension-related challenges. The Republican governor and Democratic Legislature went without a budget for all of FY2016 and operated with just a temporary spending bill through the first half of FY2017 as the two parties remain deeply divided. The Democrats lost their supermajority in the House in the recent elections but remain firmly in control of the legislative process. Chicago’s near-term outlook improved with the passage of a property tax hike and a new utility tax to help meet rising pension costs. So far, state courts have prevented pension reform attempts and long-term fiscal challenges remain for both the city and the state. |
| | • | Public pension-related news remained the other consistent credit topic in 2016. Pension investment returns lagged target assumptions for the second straight year, even as pension boards gradually lowered long-term return expectations. For example, the California Public Employees’ Retirement System (CalPERS) Board recently lowered the investment return assumption from 7.5% to 7.0%, phased in over the next three years. The gradual decline was requested by local municipal officials, allowing them time to adjust to the higher annual payments that will be required. |
2016 Municipal Bond Market Overview
Sharp Quarterly Declines
Although December returns were positive, municipal market returns were sharply negative in the fourth quarter, wiping out the full year gains for most segments of the market. In Q4, longer maturities underperformed the rest of the yield curve as the sharp steepening weighed on longer benchmarks more so than shorter maturities. The Pre-refunded sector, given its shorter average duration, outperformed other market sectors, and lower quality issues lagged higher quality for the quarter.
Total Returns of Selected Barclays Municipal Indices and Subsectors
| Bloomberg | | | | | Bloomberg | | | |
| Barclays | | | | | Barclays | | | |
Index/Sector | Dec | 4Q | 1 Yr | | Quality | Dec | 4Q | 1 Yr |
| Municipal Bond Index | 1.17% | -3.62% | 0.25% | | AAA | 1.16% | -3.32% | -0.17% |
| General Obligation bonds | 1.11% | -3.70% | -0.23% | | AA | 1.16% | -3.44% | 0.05% |
| Revenue bonds | 1.32% | -3.90% | 0.43% | | A | 1.21% | -3.96% | 0.85% |
| Prerefunded bonds | 0.26% | -0.96% | -0.01% | | BBB | 1.16% | -4.45% | 0.35% |
| Long maturities (22+ yrs.) | 1.58% | -4.95% | 0.88% | | High Yield | 1.38% | -5.84% | 2.99% |
| Intermediate | | | | | HY, ex- | | | |
| maturities (1 – 17 yrs.) | 0.97% | -3.08% | 0.01% | | Puerto Rico | 1.61% | -6.14% | 1.71% |
| Short maturities (1 – 5 yrs.) | 0.29% | -1.07% | 0.07% | | | | | |
2017 Outlook – More Questions Than Answers
The range of possible forecasts for 2017 is unusually wide. Although broad plans and themes have been discussed in the post-election period, until greater clarity and details are put forward by the Trump Administration and GOP-controlled Congress, there are perhaps more questions than answers as to what specific policy changes might actually occur, when they may occur, and, importantly, how much of the expected changes are already priced-in to the municipal market. Clearly, a significant shift in yield and valuation occurred in the tax-free market after the election. While tax reform is a goal of the Republican party, it is likely to occur through the reconciliation process which requires only a simple majority vote in the Senate to pass legislation rather than the filibuster proof 60 votes under normal procedures. Reconciliation rules do require, however, that the changes be scored as “revenue neutral” to the budget. How that will square with the Trump and House proposals, which would certainly increase future budget deficits, even when measured through the Republican-favored dynamic scoring process, will be important to monitor. Another significant uncertainty surrounds infrastructure spending plans. Most policy makers agree on the need for more spending on our nation’s roads, bridges, airports, ports, dams, and utilities, but how much to spend, over what time frame, and how to finance it remains very uncertain. The municipal market could (should) play a very integral role in the infrastructure financing plans, but if tax reform increases the cost of borrowing for municipalities then this would partially offset the fiscal stimulus benefit that is sought. The outcome of these two agenda items alone, tax reform and infrastructure spending, is likely to impact municipal market returns in 2017. Ironically, evidence suggests that tax rate changes have had little direct effect historically on tax-free valuations. More important to the relative appeal of municipal debt has been the level of market yields, the slope of the curve, and the trend for net supply. Viewed in this broader context, we are optimistic that the municipal market will remain an appealing, high quality, core fixed income sector for both individual and institutional investors alike. Rates have risen since the election, providing more incentive for investors. The yield curve resteepened in the fourth quarter, offering more potential reward from rolling along the curve, and supply is likely to decline from 2016’s record pace as refunding volume slips. Any increase in infrastructure borrowing will likely ramp up very gradually, if at all, in 2017. Market uncertainty often creates opportunity for investors, and 2017 may very well be another one of those situations for municipal investors.
2016 Municipal Bond Market Overview
Disclosures
This is not a complete analysis of every material fact regarding any company, industry or security. The information has been obtained from sources we consider to be reliable, but we cannot guarantee the accuracy.
Fixed income is generally considered to be a more conservative investment than stocks, but bonds and other fixed income investments still carry a variety of risks such as interest rate risk, credit risk, inflation risk, and liquidity risk. In a rising interest rate environment, the value of fixed-income securities generally decline and conversely, in a falling interest rate environment, the value of fixed-income securities generally increase. High yield securities may be subject to heightened market, interest rate or credit risk and should not be purchased solely because of the stated yield.
Indices are unmanaged, and are not available for direct investment. Past performance is not a guarantee of future results.
The Bloomberg Barclays Aggregate Bond Index is an index comprised of approximately 6000 publicly traded bonds including U.S. Government, mortgage-backed, corporate, and Yankee bonds with an average maturity of approximately 10 years.
The Bloomberg Barclays Government/Credit Index is a combination of the Government Index which measures government-bond general and Treasury funds, and the Credit Bond Index, which is a market value-weighted index which tracks the returns of all publicly issued, fixed-rate, nonconvertible, dollar-denominated, SEC registered, investment grade Corporate Debt.
The Bloomberg Barclays Intermediate Government/Credit Index is a combination of the Government Index which measures government-bond general and Treasury funds, and the Credit Bond Index, which is a market value-weighted index which tracks the returns of all publicly issued, fixed-rate, nonconvertible, dollar-denominated, SEC registered, investment grade Corporate Debt with maturities between one and ten years.
The Bloomberg Barclays Government/Credit Intermediate Index (1 – 3 yr.) is a combination of the Government Index which measures government-bond general and Treasury funds, and the Credit Bond Index, which is a market value-weighted index which tracks the returns of all publicly issued, fixed-rate, nonconvertible, dollar-denominated, SEC registered, investment grade Corporate Debt with maturities between zero and three years.
The Bloomberg Barclays U.S. Treasury Index includes public obligations of the U.S. Treasury. Treasury bills are excluded by the maturity constraint of at least one year but are part of a separate Short Treasury Index. In addition, certain special issues, such as state and local government series bonds (SLGs), as well as U.S. Treasury TIPS, are excluded. STRIPS are excluded from the index because their inclusion would result in double-counting. Securities in the Index roll up to the U.S. Aggregate, U.S. Universal, and Global Aggregate Indices. The U.S. Treasury Index was launched on January 1, 1973.
U.S. Agency: This index is the U.S. Agency component of the U.S. Government/Credit index. Publicly issued debt of U.S. Government agencies, quasi-federal corporations, and corporate or foreign debt guaranteed by the U.S. Government (such as USAID securities). The largest issues are Fannie Mae, Freddie Mac, and the Federal Home Loan Bank System (FHLB). The index includes both callable and non-callable agency securities.
U.S Corporate – Investment Grade: This index is the Corporate component of the U.S. Credit index. It includes publicly issued U.S. corporate and specified foreign debentures and secured notes that meet the specified maturity, liquidity, and quality requirements. To qualify, bonds must be SEC-registered.
CMBS (Commercial Mortgage-Backed Securities): This index is the CMBS component of the U.S. Aggregate index. The Bloomberg Barclays CMBS ERISA-Eligible Index is the ERISA-eligible component of the Bloomberg Barclays CMBS Index. This index, which includes investment grade securities that are ERISA eligible under the underwriter’s exemption, is the only CMBS sector that is included in the U.S. Aggregate Index.
MBS (Mortgage-Backed Securities): This index is the U.S. MBS component of the U.S. Aggregate index. The MBS Index covers the mortgage-backed pass-through securities of Ginnie Mae (GNMA), Fannie Mae (FNMA), and Freddie Mac (FHLMC). The MBS Index is formed by grouping the universe of over 600,000 individual fixed rate MBS pools into approximately 3,500 generic aggregates.
ABS (Asset-Backed Securities): This index is the ABS component of the U.S. Aggregate index. The ABS index has three subsectors: credit and charge cards, autos, and utility. The index includes pass-through, bullet, and controlled
2016 Municipal Bond Market Overview
amortization structures. The ABS Index includes only the senior class of each ABS issue and the ERISA-eligible B and C tranche. The Manufactured Housing sector was removed as of January 1, 2008, and the Home Equity Loan sector was removed as of October 1, 2009.
Corporate High Yield: The Bloomberg Barclays U.S. High Yield Index covers the universe of fixed rate, non-investment grade debt. Eurobonds and debt issues from countries designated as emerging markets (sovereign rating of Baa1/BBB+/BBB+ and below using the middle of Moody’s, S&P, and Fitch) are excluded, but Canadian and global bonds (SEC registered) of issuers in non-EMG countries are included. Original issue zeroes, step-up coupon structures, 144-As and pay-in-kind bonds (PIKs, as of October 1, 2009) are also included.
The Bloomberg Barclays Municipal Bond Index is a broad-based, total-return index. The bonds are all investment-grade, tax-exempt, and fixed-rate securities with long-term maturities (greater than 2 years). They are selected from issues larger than $50 million.
The Bloomberg Barclays TIPS Index consists of Treasury Inflation Protected Securities (TIPS). TIPS are securities whose principal is tied to the Consumer Price Index. TIPS pay interest semi-annually, based on the fixed rate applied to the adjusted principal.
Ratings are measured on a scale that ranges from AAA or Aaa (highest) to D or C (lowest). Investment grade investments are those rated from highest down to BBB- or Baa3.
Baird Short-Term Municipal Bond Fund
December 31, 2016
The Baird Short-Term Municipal Bond Fund seeks current income that is exempt from federal income tax and is consistent with the preservation of capital.
During a very volatile 2016, the Fund generated positive absolute performance and outperformed its benchmark.
It is perhaps best to think of 2016 as a year of two phases for the municipal bond market, as there were two distinct phases of rate movements, fund flows, and credit spreads. In the first phase, 10-year tax-free rates fell on sluggish U.S. economic growth, dovish Fed rhetoric, and global uncertainty following the Brexit vote. A favorable supply/demand backdrop strengthened the municipal market in the first phase as steady tax-free fund inflows more than offset a marginal increase in new supply relative to 2015’s pace. The second phase of the 2016 rate cycle began near mid-year as economic data improved and the Fed signaled a desire to hike the fed funds rate, which they did in December by 25 basis points (bps). Finally, it was the surprise election of Donald Trump, combined with the GOP maintaining majorities in both the U.S. House and Senate, that ultimately pushed tax-free rates up sharply as market sentiment shifted toward faster growth and higher inflation. With Republicans in full control of the agenda in Washington the probability of both corporate and personal tax reform increased, putting extra pressure on municipal prices following the election.
Positive contributors to the Fund’s relative performance include:
| | • | Security selection was an important factor in 2016 |
| | • | An overweight to the Revenue sector, particularly Housing and Healthcare issues |
| | • | A barbell curve allocation enhanced returns for the year |
Detractors from the Fund’s relative performance include:
| | • | A modest overweight to BBB-rated issues muted returns as credit spreads widened |
Our base case outlook for 2017 is for a continuation of moderate economic growth and inflation, while acknowledging that a wide range of range of possible outcomes certainly exists. If the Trump Administration’s policy measures are passed, providing fiscal stimulus to the economy, including tax reform, they are likely to be met by tighter monetary policy from the Fed, limiting the potential improvement in near-term economic growth. For the municipal market, although infrastructure borrowing may increase gradually in 2017, refunding volume is likely to decline with higher rates, leading to less overall supply in 2017 than last year. The backdrop for municipal credit remains positive, with ongoing economic expansion expected and wider credit spreads due to the post-election selling of municipal issues.
Baird Short-Term Municipal Bond Fund
December 31, 2016 (Unaudited)
Portfolio Characteristics
Quality Distribution(1)(2)
| | | | | | |
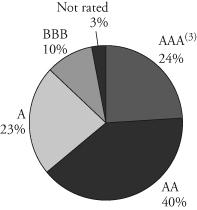 | | Net Assets | $58,693,890 | | |
| | | | | |
| | SEC 30-Day | | | |
| | Yield(4) | | | |
| | Institutional Class | 1.72% | | |
| | Investor Class | 1.49% | | |
| | | | | |
| | Average | | | |
| | Effective | | | |
| | Duration | 2.30 years | | |
| | | | | |
| | Average | | | |
| | Effective | | | |
| | Maturity | 2.57 years | | |
| | | | | |
| | | Annualized | | | |
Sector Weightings(1) | | Expense | | | |
| | | Ratio(5) | | | |
 | | Institutional Class | 0.30% | | |
| | Investor Class | 0.55% | (6) | |
| | | | | |
| | Portfolio | | | |
| | Turnover Rate | 38.3% | | |
| | | | | |
| | Number of | | | |
| | Holdings | 420 | | |
| | | | | |
| | | | | |
| | | | | |
| | | | | |
| | | | | |
| | | | | |
| | | | | | |
(1) | Percentages shown are based on the Fund’s total investments. |
(2) | The quality profile is calculated on a market value-weighted basis using the highest credit quality rating for each security held by the Fund given by S&P, Moody’s or Fitch, each of which is a Nationally Recognized Statistical Rating Organization (NRSRO). NRSROs rate the credit quality of securities using a scale that generally ranges from AAA (highest) to D (lowest). |
(3) | Includes pre-refunded and escrowed-to-maturity (ETM) bonds. |
(4) | SEC yields are based on SEC guidelines and are calculated for the 30 days ended December 31, 2016. |
(5) | Reflects expense ratios as stated in the Fund’s current prospectus. |
(6) | Includes 0.25% 12b-1 fee. |
Baird Short-Term Municipal Bond Fund
December 31, 2016 (Unaudited)
Institutional ClassValue of a $25,000 Investment
Growth of a hypothetical investment of $25,000 made on the Fund’s inception date (8/31/15), assuming reinvestment of all distributions.
Investor Class
Value of a $10,000 Investment
Growth of a hypothetical investment of $10,000 made on the Fund’s inception date (8/31/15), assuming reinvestment of all distributions.
Baird Short-Term Municipal Bond Fund
December 31, 2016 (Unaudited)
Total Returns
| | | Average |
| | | Annual |
| | One | Since |
| For the Periods Ended December 31, 2016 | Year | Inception(1) |
| Institutional Class Shares | 0.71% | 1.24% |
| Investor Class Shares | 0.40% | 0.94% |
Bloomberg Barclays Short (1-5 Year) Municipal Bond Index(2) | 0.07% | 0.35% |
| (1) | For the period from August 31, 2015 (inception date) through December 31, 2016. |
| (2) | The Bloomberg Barclays Short (1-5 Year) Municipal Bond Index is an unmanaged, market value weighted index that measures the performance of investment-grade, tax-exempt, and fixed-rated municipal securities with time to maturity of more than one year and less than five years. Securities must have an outstanding par value of at least $7 million and be issued as part of a transaction of at least $75 million. The bonds must be fixed rate, have a dated-date after December 31, 1990, and must be at least one year from their maturity date. This Index does not reflect any deduction for fees, expenses or taxes. A direct investment in an index is not possible. |
The line graph on the previous page and the returns shown in the table above reflect reinvestment of dividends and/or capital gains distributions in additional shares. The returns do not reflect the deduction of taxes that a shareholder would pay on Fund distributions or the redemption of Fund shares. The returns reflect the actual performance for each period and do not include the impact of trades executed on the last business day of the period that were recorded on the first business day of the next period.
The Fund’s gross expense ratio for each Class, as reflected in the Fund’s current prospectus, is set forth under “Portfolio Characteristics”.
The Fund may invest up to 10% of its net assets in non-investment grade debt securities (commonly referred to as “high yield” bonds). While these types of debt securities typically offer higher yields than investment grade securities, they also include greater risks including increased credit risk and the increased risk of default or bankruptcy. The Fund may invest up to 25% of its total assets in municipal obligations issued by persons in the same state. As a result, changes in economic, business or political conditions of a particular state may have a disproportionate impact on the Fund’s share price. Municipal securities investments are not appropriate for all investors, especially those taxed at lower rates.
Past performance does not guarantee future results. Investment return and principal value will fluctuate so that an investor’s shares, when redeemed, may be worth more or less than their original cost.
For information about the performance of the Fund as of the most recent month-end, please call 1-866-44BAIRD or visit www.bairdfunds.com. Mutual fund performance changes over time and current performance may be lower or higher than that stated.
Baird Short-Term Municipal Bond Fund
Summary Schedule of Investments, December 31, 2016
This schedule summarizes the Fund’s holdings by asset type. Details are reported for each of the Fund’s 50 largest individual holdings and for investments that, in total for any issuer, represent more than 1% of the Fund’s net assets. The total value of smaller holdings is reported as a single amount within each category.
The Fund reports a complete list of its holdings in regulatory filings four times in each fiscal year, at the quarter end. For the second and fourth fiscal quarters, the complete listing of the Fund’s holdings is available electronically in the Fund’s Form N-CSR at http://www.bairdassetmanagement.com/baird-funds/funds-and-performance#Literature and on the Securities and Exchange Commission’s website (www.sec.gov) or you can have it mailed to you without charge by calling 1-866-44BAIRD. For the first and third fiscal quarters, the Fund files the lists with the SEC on Form N-Q. Shareholders can look up the Fund’s Forms N-CSR and N-Q on the SEC’s website (www.sec.gov).
Long-Term Investments
| | | Principal | | | | | | % of | |
| | | Amount | | | Value | | | Net Assets | |
| Municipal Bonds | | | | | | | | | |
| Alabama | | | | | | | | | |
| Total Alabama | | | | | | | | | |
| (Cost $138,246)# | | | | | $ | 136,495 | | | | 0.2 | % |
| Alaska | | | | | | | | | | | |
| Total Alaska | | | | | | | | | | | |
| (Cost $41,044)# | | | | | | 40,740 | | | | 0.1 | % |
| Arizona | | | | | | | | | | | |
| Arizona State University | | | | | | | | | | | |
| 6.000%, 07/01/2026 (Pre-refunded to 07/01/2018) | | $ | 250,000 | | | | 267,655 | | | | 0.5 | % |
| Arizona Transportation Board | | | | | | | | | | | | |
| 5.000%, 07/01/2025 (Pre-refunded to 07/01/2019) | | | 250,000 | | | | 271,553 | | | | 0.5 | % |
| The Industrial Development | | | | | | | | | | | | |
| Authority of the City of Phoenix | | | | | | | | | | | | |
| 0.690%, 11/15/2052 | | | | | | | | | | | | |
(Optional Put Date 01/31/2017)(1) | | | 1,000,000 | | | | 1,000,000 | | | | 1.7 | % |
| The Industrial Development | | | | | | | | | | | | |
| Authority of the County of Pima | | | | | | | | | | | | |
| 4.950%, 10/01/2020 | | | 245,000 | | | | 262,035 | | | | 0.4 | % |
| Other Arizona# | | | | | | | 937,607 | | | | 1.6 | % |
| Total Arizona | | | | | | | | | | | | |
| (Cost $2,778,464) | | | | | | | 2,738,850 | | | | 4.7 | % |
| Arkansas | | | | | | | | | | | | |
| Total Arkansas | | | | | | | | | | | | |
| (Cost $581,923)# | | | | | | | 577,149 | | | | 1.0 | % |
| California | | | | | | | | | | | | |
| State of California | | | | | | | | | | | | |
| 5.250%, 10/01/2020 (Callable 10/01/2019) | | | 1,000,000 | | | | 1,096,840 | | | | 1.9 | % |
| 5.000%, 09/01/2022 | | | 165,000 | | | | 190,768 | | | | 0.3 | % |
| Other California# | | | | | | | 1,850,215 | | | | 3.1 | % |
| Total California | | | | | | | | | | | | |
| (Cost $3,164,323) | | | | | | | 3,137,823 | | | | 5.3 | % |
The accompanying notes are an integral part of these financial statements.
Baird Short-Term Municipal Bond Fund
Summary Schedule of Investments, December 31, 2016
Long-Term Investments (cont.)
| | | Principal | | | | | | % of | |
| | | Amount | | | Value | | | Net Assets | |
| Colorado | | | | | | | | | |
| Vista Ridge Metropolitan District | | | | | | | | | |
4.500%, 12/01/2024 (Insured by BAM)(3) | | $ | 250,000 | | | $ | 273,815 | | | | 0.5 | % |
| Other Colorado# | | | | | | | 1,292,260 | | | | 2.2 | % |
| Total Colorado | | | | | | | | | | | | |
| (Cost $1,583,527) | | | | | | | 1,566,075 | | | | 2.7 | % |
| Connecticut | | | | | | | | | | | | |
| Total Connecticut | | | | | | | | | | | | |
| (Cost $264,526)# | | | | | | | 262,080 | | | | 0.4 | % |
| District of Columbia | | | | | | | | | | | | |
| Total District of Columbia | | | | | | | | | | | | |
| (Cost $352,305)# | | | | | | | 344,309 | | | | 0.6 | % |
| Florida | | | | | | | | | | | | |
| City of Tampa FL | | | | | | | | | | | | |
| 5.250%, 11/15/2024 (Callable 05/15/2020) | | | 375,000 | | | | 415,061 | | | | 0.7 | % |
| Florida State Municipal Loan Council | | | | | | | | | | | | |
| 3.000%, 10/01/2020 | | | 500,000 | | | | 510,475 | | | | 0.9 | % |
| Osceola County Housing Finance Authority | | | | | | | | | | | | |
| 1.050%, 10/01/2019 (Callable 10/01/2017) | | | | | | | | | | | | |
| (Mandatory Tender Date 04/01/2018) | | | 500,000 | | | | 497,455 | | | | 0.8 | % |
| Other Florida# | | | | | | | 1,108,187 | | | | 1.9 | % |
| Total Florida | | | | | | | | | | | | |
| (Cost $2,555,921) | | | | | | | 2,531,178 | | | | 4.3 | % |
| Georgia | | | | | | | | | | | | |
| City of Atlanta GA | | | | | | | | | | | | |
5.000%, 01/01/2023 (Callable 01/01/2020)(3) | | | 450,000 | | | | 485,442 | | | | 0.9 | % |
5.000%, 01/01/2024 (Callable 01/01/2020)(3) | | | 500,000 | | | | 538,325 | | | | 0.9 | % |
| Other Georgia# | | | | | | | 650,989 | | | | 1.1 | % |
| Total Georgia | | | | | | | | | | | | |
| (Cost $1,680,769) | | | | | | | 1,674,756 | | | | 2.9 | % |
| Idaho | | | | | | | | | | | | |
| Total Idaho | | | | | | | | | | | | |
| (Cost $26,440)# | | | | | | | 26,363 | | | | 0.0 | % |
| Illinois | | | | | | | | | | | | |
| Cook County School District No. 99 Cicero | | | | | | | | | | | | |
1.500%, 12/01/2026 (Callable 01/09/2017)(3) | | | 300,000 | | | | 300,333 | | | | 0.5 | % |
| Illinois Finance Authority | | | | | | | | | | | | |
| 1.300%-6.250%, 08/15/2017-07/01/2042 | | | 595,000 | | | | 624,211 | | | | 1.1 | % |
| Other Illinois# | | | | | | | 3,703,729 | | | | 6.3 | % |
| Total Illinois | | | | | | | | | | | | |
| (Cost $4,677,965) | | | | | | | 4,628,273 | | | | 7.9 | % |
The accompanying notes are an integral part of these financial statements.
Baird Short-Term Municipal Bond Fund
Summary Schedule of Investments, December 31, 2016
Long-Term Investments (cont.)
| | | Principal | | | | | | % of | |
| | | Amount | | | Value | | | Net Assets | |
| Indiana | | | | | | | | | |
| City of Goshen IN Waterworks Revenue | | | | | | | | | |
| 4.100%, 01/01/2021 (Callable 01/30/2017) | | | | | | | | | |
| (Insured by AGM) | | $ | 470,000 | | | $ | 470,860 | | | | 0.8 | % |
| County of Tippecanoe IN | | | | | | | | | | | | |
| 0.770%, 11/01/2030 (Optional Pute Date | | | | | | | | | | | | |
01/06/2017)(Callable 01/31/2017)(1) | | | 300,000 | | | | 300,000 | | | | 0.5 | % |
| Other Indiana# | | | | | | | 696,648 | | | | 1.2 | % |
| Total Indiana | | | | | | | | | | | | |
| (Cost $1,468,114) | | | | | | | 1,467,508 | | | | 2.5 | % |
| Iowa | | | | | | | | | | | | |
| Iowa Finance Authority | | | | | | | | | | | | |
| 3.500%, 07/01/2046 (Callable 01/01/2026) | | | 250,000 | | | | 259,905 | | | | 0.4 | % |
| Iowa Higher Education Loan Authority | | | | | | | | | | | | |
| 2.000%, 12/01/2018 (Callable 06/01/2018) | | | 1,000,000 | | | | 998,690 | | | | 1.7 | % |
| Other Iowa# | | | | | | | 328,810 | | | | 0.6 | % |
| Total Iowa | | | | | | | | | | | | |
| (Cost $1,600,218) | | | | | | | 1,587,405 | | | | 2.7 | % |
| Kansas | | | | | | | | | | | | |
| Total Kansas | | | | | | | | | | | | |
| (Cost $617,144)# | | | | | | | 616,464 | | | | 1.1 | % |
| Kentucky | | | | | | | | | | | | |
| Total Kentucky | | | | | | | | | | | | |
| (Cost $50,021)# | | | | | | | 50,042 | | | | 0.1 | % |
| Louisiana | | | | | | | | | | | | |
| Total Louisiana | | | | | | | | | | | | |
| (Cost $71,532)# | | | | | | | 71,999 | | | | 0.1 | % |
| Maine | | | | | | | | | | | | |
| Total Maine | | | | | | | | | | | | |
| (Cost $315,336)# | | | | | | | 305,654 | | | | 0.5 | % |
| Maryland | | | | | | | | | | | | |
| Total Maryland | | | | | | | | | | | | |
| (Cost $56,444)# | | | | | | | 56,337 | | | | 0.1 | % |
| Massachusetts | | | | | | | | | | | | |
| Massachusetts Housing Finance Agency | | | | | | | | | | | | |
| 3.500%, 12/01/2046 (Callable 12/01/2025) | | | 1,000,000 | | | | 1,030,350 | | | | 1.7 | % |
| 4.000%, 12/01/2044 (Callable 06/01/2025) | | | 95,000 | | | | 100,281 | | | | 0.2 | % |
| Town of Ashburnham MA | | | | | | | | | | | | |
| 4.250%, 07/01/2021 (Callable 07/01/2018) | | | 250,000 | | | | 259,333 | | | | 0.4 | % |
| Other Massachusetts# | | | | | | | 100,013 | | | | 0.2 | % |
| Total Massachusetts | | | | | | | | | | | | |
| (Cost $1,492,181) | | | | | | | 1,489,977 | | | | 2.5 | % |
The accompanying notes are an integral part of these financial statements.
Baird Short-Term Municipal Bond Fund
Summary Schedule of Investments, December 31, 2016
Long-Term Investments (cont.)
| | | Principal | | | | | | % of | |
| | | Amount | | | Value | | | Net Assets | |
| Michigan | | | | | | | | | |
| Michigan Finance Authority | | | | | | | | | |
| 5.500%, 06/01/2021 (Pre-refunded to 06/01/2017) | | $ | 500,000 | | | $ | 524,040 | | | | 0.9 | % |
| 1.268%, 10/15/2038 (Callable 04/15/2020)(Mandatory | | | | | | | | | | | | |
Tender Date 10/15/2020)(1) | | | 350,000 | | | | 344,547 | | | | 0.6 | % |
| 3.400%, 10/01/2020 | | | 100,000 | | | | 102,184 | | | | 0.2 | % |
| Michigan State Housing Development Authority | | | | | | | | | | | | |
| 3.500%, 06/01/2047 (Callable 06/01/2026) | | | 700,000 | | | | 721,119 | | | | 1.2 | % |
| Other Michigan# | | | | | | | 662,843 | | | | 1.1 | % |
| Total Michigan | | | | | | | | | | | | |
| (Cost $2,380,745) | | | | | | | 2,354,733 | | | | 4.0 | % |
| Minnesota | | | | | | | | | | | | |
| Minnesota Housing Finance Agency | | | | | | | | | | | | |
4.000%, 01/01/2047 (Callable 01/01/2026)(3) | | | 500,000 | | | | 527,585 | | | | 0.9 | % |
| Other Minnesota# | | | | | | | 233,322 | | | | 0.4 | % |
| Total Minnesota | | | | | | | | | | | | |
| (Cost $773,613) | | | | | | | 760,907 | | | | 1.3 | % |
| Mississippi | | | | | | | | | | | | |
| Mississippi Business Finance Corp. | | | | | | | | | | | | |
| 0.740%, 11/01/2035 (Callable 01/03/2017) | | | | | | | | | | | | |
(Optional Put Date 01/31/2017)(1) | | | 400,000 | | | | 400,000 | | | | 0.7 | % |
| Other Mississippi# | | | | | | | 277,557 | | | | 0.5 | % |
| Total Mississippi | | | | | | | | | | | | |
| (Cost $678,736) | | | | | | | 677,557 | | | | 1.2 | % |
| Missouri | | | | | | | | | | | | |
| County of Boone MO | | | | | | | | | | | | |
| 5.750%, 08/01/2028 (Pre-refunded to 08/01/2018) | | | 630,000 | | | | 673,281 | | | | 1.1 | % |
| Other Missouri# | | | | | | | 964,226 | | | | 1.7 | % |
| Total Missouri | | | | | | | | | | | | |
| (Cost $1,656,245) | | | | | | | 1,637,507 | | | | 2.8 | % |
| Nebraska | | | | | | | | | | | | |
| Total Nebraska | | | | | | | | | | | | |
| (Cost $54,047)# | | | | | | | 53,238 | | | | 0.1 | % |
| Nevada | | | | | | | | | | | | |
| Total Nevada | | | | | | | | | | | | |
| (Cost $101,505)# | | | | | | | 100,522 | | | | 0.2 | % |
| New Jersey | | | | | | | | | | | | |
| New Jersey Economic Development Authority | | | | | | | | | | | | |
1.450%, 02/01/2017 (Callable 01/09/2017)(1) | | | 500,000 | | | | 500,000 | | | | 0.9 | % |
| 2.520%-5.000%, 06/15/2017-06/15/2023 | | | 250,000 | | | | 259,624 | | | | 0.4 | % |
| Other New Jersey# | | | | | | | 1,492,760 | | | | 2.5 | % |
| Total New Jersey | | | | | | | | | | | | |
| (Cost $2,256,965) | | | | | | | 2,252,384 | | | | 3.8 | % |
The accompanying notes are an integral part of these financial statements.
Baird Short-Term Municipal Bond Fund
Summary Schedule of Investments, December 31, 2016
Long-Term Investments (cont.)
| | | Principal | | | | | | % of | |
| | | Amount | | | Value | | | Net Assets | |
| New Mexico | | | | | | | | | |
| Total New Mexico | | | | | | | | | |
| (Cost $142,330)# | | | | | $ | 142,187 | | | | 0.2 | % |
| New York | | | | | | | | | | | |
| Metropolitan Transportation Authority | | | | | | | | | | | |
| 0.650%, 11/01/2035 | | $ | 300,000 | | | | 300,000 | | | | 0.5 | % |
| MTA Hudson Rail Yards Trust Obligations | | | | | | | | | | | | |
| 5.000%, 11/15/2046 (Callable 11/15/2019) | | | 500,000 | | | | 530,875 | | | | 0.9 | % |
| New York City Transitional Finance | | | | | | | | | | | | |
| Authority Future Tax Secured Revenue | | | | | | | | | | | | |
0.940%, 08/01/2022 (Optional Put Date 01/31/2017)(1) | | | 500,000 | | | | 500,000 | | | | 0.9 | % |
0.940%, 11/01/2022 (Optional Put Date 01/31/2017)(1) | | | 435,000 | | | | 435,000 | | | | 0.7 | % |
| 5.000%, 11/01/2018 | | | 50,000 | | | | 53,376 | | | | 0.1 | % |
| New York City Water & Sewer System | | | | | | | | | | | | |
| 1.070%, 06/15/2032 (Optional Put Date | | | | | | | | | | | | |
01/31/2017)(Callable 01/17/2017)(1) | | | 680,000 | | | | 680,000 | | | | 1.2 | % |
| New York State Dormitory Authority | | | | | | | | | | | | |
1.324%, 05/01/2018 (Callable 01/31/2017)(1) | | | 390,000 | | | | 389,754 | | | | 0.7 | % |
| Other New York# | | | | | | | 1,338,597 | | | | 2.2 | % |
| Total New York | | | | | | | | | | | | |
| (Cost $4,249,861) | | | | | | | 4,227,602 | | | | 7.2 | % |
| North Carolina | | | | | | | | | | | | |
| North Carolina Eastern Municipal Power Agency | | | | | | | | | | | | |
| 5.000%, 01/01/2021 (ETM) | | | 650,000 | | | | 732,654 | | | | 1.2 | % |
| 5.000%-6.000%, 01/01/2021-01/01/2022 | | | 285,000 | | | | 328,162 | | | | 0.6 | % |
| State of North Carolina | | | | | | | | | | | | |
| 5.000%, 05/01/2024 (Callable 05/01/2023) | | | 1,000,000 | | | | 1,160,550 | | | | 1.9 | % |
| Other North Carolina# | | | | | | | 387,698 | | | | 0.7 | % |
| Total North Carolina | | | | | | | | | | | | |
| (Cost $2,590,918) | | | | | | | 2,609,064 | | | | 4.4 | % |
| North Dakota | | | | | | | | | | | | |
| Jamestown Park District/ND | | | | | | | | | | | | |
| 2.900%, 07/01/2035 (Callable 01/17/2017) | | | 500,000 | | | | 460,540 | | | | 0.8 | % |
| Other North Dakota# | | | | | | | 302,365 | | | | 0.5 | % |
| Total North Dakota | | | | | | | | | | | | |
| (Cost $775,304) | | | | | | | 762,905 | | | | 1.3 | % |
| Ohio | | | | | | | | | | | | |
| Lake Local School District/Wood County OH | | | | | | | | | | | | |
| 2.000%, 12/01/2018 | | | 280,000 | | | | 283,041 | | | | 0.5 | % |
| Ohio Housing Finance Agency | | | | | | | | | | | | |
| 4.000%, 03/01/2047 (Callable 09/01/2025) | | | 250,000 | | | | 263,483 | | | | 0.4 | % |
| Other Ohio# | | | | | | | 1,334,887 | | | | 2.3 | % |
| Total Ohio | | | | | | | | | | | | |
| (Cost $1,891,719) | | | | | | | 1,881,411 | | | | 3.2 | % |
The accompanying notes are an integral part of these financial statements.
Baird Short-Term Municipal Bond Fund
Summary Schedule of Investments, December 31, 2016
Long-Term Investments (cont.)
| | | Principal | | | | | | % of | |
| | | Amount | | | Value | | | Net Assets | |
| Oklahoma | | | | | | | | | |
| Total Oklahoma | | | | | | | | | |
| (Cost $174,813)# | | | | | $ | 175,836 | | | | 0.3 | % |
| Oregon | | | | | | | | | | | |
| Total Oregon | | | | | | | | | | | |
| (Cost $41,823)# | | | | | | 41,934 | | | | 0.1 | % |
| Pennsylvania | | | | | | | | | | | |
| Allegheny County Higher Education Building Authority | | | | | | | | | | | |
4.000%, 10/15/2018(3) | | $ | 365,000 | | | | 378,330 | | | | 0.6 | % |
| Borough of Wilkinsburg PA | | | | | | | | | | | | |
| 1.020%, 07/15/2018 | | | 340,000 | | | | 337,042 | | | | 0.6 | % |
| 1.500%, 07/15/2019 | | | 315,000 | | | | 313,447 | | | | 0.5 | % |
| Other Pennsylvania# | | | | | | | 2,768,586 | | | | 4.8 | % |
| Total Pennsylvania | | | | | | | | | | | | |
| (Cost $3,843,398) | | | | | | | 3,797,405 | | | | 6.5 | % |
| Puerto Rico | | | | | | | | | | | | |
| Total Puerto Rico | | | | | | | | | | | | |
| (Cost $94,637)# | | | | | | | 97,755 | | | | 0.2 | % |
| Rhode Island | | | | | | | | | | | | |
| Total Rhode Island | | | | | | | | | | | | |
| (Cost $291,678)# | | | | | | | 288,152 | | | | 0.5 | % |
| South Carolina | | | | | | | | | | | | |
| South Carolina State Housing | | | | | | | | | | | | |
| Finance & Development Authority | | | | | | | | | | | | |
| 4.000%, 07/01/2036 (Callable 07/01/2025) | | | 340,000 | | | | 358,489 | | | | 0.6 | % |
| Other South Carolina# | | | | | | | 354,897 | | | | 0.6 | % |
| Total South Carolina | | | | | | | | | | | | |
| (Cost $725,690) | | | | | | | 713,386 | | | | 1.2 | % |
| Tennessee | | | | | | | | | | | | |
| Metropolitan Government Nashville | | | | | | | | | | | | |
| & Davidson County Revenue | | | | | | | | | | | | |
| 1.550%, 11/15/2030 | | | | | | | | | | | | |
| (Mandatory Tender Date 11/03/2020) | | | 500,000 | | | | 489,750 | | | | 0.8 | % |
| Other Tennessee# | | | | | | | 335,426 | | | | 0.6 | % |
| Total Tennessee | | | | | | | | | | | | |
| (Cost $837,959) | | | | | | | 825,176 | | | | 1.4 | % |
| Texas | | | | | | | | | | | | |
| City of Fort Worth TX | | | | | | | | | | | | |
| 5.000%, 03/01/2026 (Pre-refunded to 03/01/2019) | | | 500,000 | | | | 537,305 | | | | 0.9 | % |
| City of Round Rock TX | | | | | | | | | | | | |
| 4.000%, 12/01/2024 | | | 250,000 | | | | 272,435 | | | | 0.5 | % |
The accompanying notes are an integral part of these financial statements.
Baird Short-Term Municipal Bond Fund
Summary Schedule of Investments, December 31, 2016
Long-Term Investments (cont.)
| | | Principal | | | | | | % of | |
| | | Amount | | | Value | | | Net Assets | |
| City of San Antonio TX | | | | | | | | | |
| Electric & Gas Systems Revenue | | | | | | | | | |
| 2.250%, 02/01/2033 | | | | | | | | | |
| (Mandatory Tender Date 12/01/2019) | | $ | 1,000,000 | | | $ | 1,007,860 | | | | 1.7 | % |
| Dallas Independent School District | | | | | | | | | | | | |
| 5.000%, 02/15/2036 (Mandatory Tender Date | | | | | | | | | | | | |
| 02/15/2022)(PSF Guaranteed) | | | 340,000 | | | | 387,012 | | | | 0.6 | % |
| Fort Worth Independent School District | | | | | | | | | | | | |
| 5.000%, 02/15/2029 (Pre-refunded to 02/15/2019) | | | 300,000 | | | | 322,710 | | | | 0.6 | % |
| Humble Independent School District | | | | | | | | | | | | |
| 5.000%, 02/15/2025 (Pre-refunded to 02/15/2019) | | | 650,000 | | | | 698,503 | | | | 1.2 | % |
| Texas Transportation Commission State Highway Fund | | | | | | | | | | | | |
| 4.000%, 04/01/2026 | | | | | | | | | | | | |
(Mandatory Tender Date 10/01/2021)(3) | | | 400,000 | | | | 433,912 | | | | 0.7 | % |
| Other Texas# | | | | | | | 4,661,448 | | | | 8.0 | % |
| Total Texas | | | | | | | | | | | | |
| (Cost $8,394,853) | | | | | | | 8,321,185 | | | | 14.2 | % |
| Utah | | | | | | | | | | | | |
| Total Utah | | | | | | | | | | | | |
| (Cost $106,958)# | | | | | | | 105,150 | | | | 0.2 | % |
| Vermont | | | | | | | | | | | | |
| Total Vermont | | | | | | | | | | | | |
| (Cost $28,327)# | | | | | | | 27,129 | | | | 0.0 | % |
| Virgin Islands | | | | | | | | | | | | |
| Total Virgin Islands | | | | | | | | | | | | |
| (Cost $110,311)# | | | | | | | 107,597 | | | | 0.2 | % |
| Washington | | | | | | | | | | | | |
| Total Washington | | | | | | | | | | | | |
| (Cost $413,294)# | | | | | | | 412,628 | | | | 0.7 | % |
| Wisconsin | | | | | | | | | | | | |
| Wisconsin Housing & Economic Development Authority | | | | | | | | | | | | |
| 3.500%, 09/01/2046 (Callable 09/01/2025) | | | 500,000 | | | | 519,270 | | | | 0.9 | % |
| Other Wisconsin# | | | | | | | 1,383,007 | | | | 2.3 | % |
| Total Wisconsin | | | | | | | | | | | | |
| (Cost $1,927,738) | | | | | | | 1,902,277 | | | | 3.2 | % |
| Total Long-Term Investments | | | | | | | | | | | | |
| (Cost $58,059,910) | | | | | | | 57,585,104 | | | | 98.1 | % |
The accompanying notes are an integral part of these financial statements.
Baird Short-Term Municipal Bond Fund
Summary Schedule of Investments, December 31, 2016
Short-Term Investment
| | | | | | | | | % of | |
| | | Shares | | | Value | | | Net Assets | |
| Money Market Mutual Fund | | | | | | | | | |
| Fidelity Institutional Money Market Fund – | | | | | | | | | |
| Government Portfolio, Institutional Class, 0.43%« | | | 405,669 | | | $ | 405,669 | | | | 0.7 | % |
| Total Short-Term Investment | | | | | | | | | | | | |
| (Cost $405,669) | | | | | | | 405,669 | | | | 0.7 | % |
| Total Investments | | | | | | | | | | | | |
| (Cost $58,465,579) | | | | | | | 57,990,773 | | | | 98.8 | % |
| Other Assets in Excess of Liabilities | | | | | | | 703,117 | | | | 1.2 | % |
| TOTAL NET ASSETS | | | | | | $ | 58,693,890 | | | | 100.0 | % |
Notes to Summary Schedule of Investments
AGM – Assured Guaranty Municipal
BAM – Build America Mutual Assurance Co.
ETM – Escrowed to Maturity
PSF – Texas Permanent School Fund
| # | Represents the aggregate value, by category, of securities that are not among the 50 largest holdings and, in total for any issuer, represent 1% or less of net assets. |
| (1) | Variable or Floating rate security. Floating rate securities are securities whose yields vary with a designated index rate. These securities’ rates are as of December 31, 2016. |
| (2) | Auction Rate Security. An Auction Rate Security is a debt instrument with a long nominal maturity for which the interest rate is regularly reset through a Dutch auction. The rate presented is either the rate set through the auction or the maximum interest rate provided for in the security issuance provision. |
| (3) | Security or a portion of the security purchased on a when-issued or delayed delivery basis. |
| « | 7-Day Yield |
Summary of Fair Value Exposure at December 31, 2016
The Fund has adopted authoritative fair valuation accounting standards which establish a definition of fair value and set out a hierarchy for measuring fair value. These standards require additional disclosures about the various inputs and valuation techniques used to develop the measurements of fair value and a discussion on changes in valuation techniques and related inputs during the period. These standards define fair value as the price that would be received to sell an asset or paid to transfer a liability in an orderly transaction between market participants at the measurement date.
The fair value hierarchy is organized into three levels based upon the assumptions (referred to as “inputs”) used in pricing the asset or liability. These standards state that “observable inputs” reflect the assumptions market participants would use in pricing the asset or liability based on market data obtained from independent sources and “unobservable inputs” reflect an entity’s own assumptions about the assumptions market participants would use in pricing the asset or liability. These inputs are summarized into three broad levels and described below:
Level 1 – | Unadjusted quoted prices in active markets for identical unrestricted securities. |
Level 2 – | Other significant observable inputs (including quoted prices for similar securities, quoted prices in inactive markets, dealer indications, interest rates, yield curves, prepayment speeds, credit risk, default rates, inputs corroborated by observable market data, etc.). |
Level 3 – | Significant unobservable inputs (including the Fund’s own assumptions about the factors that market participants would use in valuing the security) based on the best information available. |
The accompanying notes are an integral part of these financial statements.
Baird Short-Term Municipal Bond Fund
Summary Schedule of Investments, December 31, 2016
Summary of Fair Value Exposure at December 31, 2016 (cont.)
The inputs or methodology used for valuing securities are not necessarily an indication of the risk associated with investing in those securities.
The following is a summary of the inputs used to value the Fund’s investments as of December 31, 2016:
| | | Level 1 | | | Level 2 | | | Level 3 | | | Total | |
| Municipal Bonds | | | | | | | | | | | | |
| Municipal Bonds | | $ | — | | | $ | 57,585,104 | | | $ | — | | | $ | 57,585,104 | |
| Total Municipal Bonds | | | — | | | | 57,585,104 | | | | — | | | | 57,585,104 | |
| Short-Term Investment | | | | | | | | | | | | | | | | |
| Money Market Mutual Fund | | | 405,669 | | | | — | | | | — | | | | 405,669 | |
| Total Short-Term Investment | | | 405,669 | | | | — | | | | — | | | | 405,669 | |
| Total Investments | | $ | 405,669 | | | $ | 57,585,104 | | | $ | — | | | $ | 57,990,773 | |
Changes in valuation techniques may result in transfers into or out of assigned levels within the fair value hierarchy. There were no transfers between Level 1, Level 2 and Level 3 fair value measurements during the reporting period, as compared to their classification from the prior year’s annual report. See the Fund’s valuation policy in Note 2a to the financial statements.
The accompanying notes are an integral part of these financial statements.
Baird Quality Intermediate Municipal Bond Fund
December 31, 2016
The Baird Quality Intermediate Municipal Bond Fund seeks current income that is exempt from federal income tax. As a reminder, the Fund maintains a quality focus, and there are several key strategies employed on an ongoing basis that differentiate it from others in the intermediate municipal fund space. These include, a consistent overweight among higher quality issues, with particular emphasis on AAA rated securities, a persistent overweight to U.S. government backed issues, and minimization of maturity extension risk.
It is perhaps best to think of 2016 as a year of two phases for the municipal bond market, as there were two distinct phases of rate movements, fund flows, and credit spreads. In the first phase, 10-year tax-free rates fell on sluggish U.S. economic growth, dovish Fed rhetoric, and global uncertainty following the Brexit vote. A favorable supply/demand backdrop strengthened the municipal market in the first phase as steady tax-free fund inflows more than offset a marginal increase in new supply relative to 2015’s pace. The second phase of the 2016 rate cycle began near mid-year as economic data improved and the Fed signaled a desire to hike the fed funds rate, which they did in December by 25 basis points (bps). Finally, it was the surprise election of Donald Trump, combined with the GOP maintaining majorities in both the U.S. House and Senate, that ultimately pushed tax-free rates up sharply as market sentiment shifted toward faster growth and higher inflation. With Republicans in full control of the agenda in Washington the probability of both corporate and personal tax reform increased, putting extra pressure on municipal prices following the election.
During a very volatile 2016, the Fund lagged its benchmark. Positive contributors to the Fund’s relative performance include:
| | • | An overweight to pre-refunded issues due to the shorter average duration relative to other sectors |
| | • | A barbell yield curve allocation provided a modest performance benefit |
Detractors from the Fund’s relative performance include:
| | • | The Fund’s quality allocation, with an underweight to A rated issues, was the primary performance drag |
Our base case outlook for 2017 is for a continuation of moderate economic growth and inflation, while acknowledging that a wide range of range of possible outcomes certainly exists. If the Trump Administration’s policy measures are passed, providing fiscal stimulus to the economy, including tax reform, they are likely to be met by tighter monetary policy from the Fed, limiting the potential improvement in near-term economic growth. For the municipal market, although infrastructure borrowing may increase gradually in 2017, refunding volume is likely to decline with higher rates, leading to less overall supply in 2017 than last year. The backdrop for municipal credit remains positive, with ongoing economic expansion expected and wider credit spreads due to the post-election selling of municipal issues.
Baird Quality Intermediate Municipal Bond Fund
December 31, 2016 (Unaudited)
Portfolio Characteristics
Quality Distribution(1)(2)
| | | | | | |
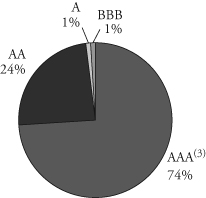 | | Net Assets | $1,072,284,144 | | |
| | | | | |
| | SEC 30-Day | | | |
| | Yield(4) | | | |
| | Institutional Class | 2.10% | | |
| | Investor Class | 1.85% | | |
| | | | | |
| | Average | | | |
| | Effective | | | |
| | Duration | 4.42 years | | |
| | | | | |
| | Average | | | |
| | Effective | | | |
| | Maturity | 4.88 years | | |
| | | | | | |
Sector Weightings(1) | | Annualized | | | |
| | | Expense | | | |
 | | Ratio(5) | | | |
| | Institutional Class | 0.30% | | |
| | Investor Class | 0.55% | (6) | |
| | | | | |
| | Portfolio | | | |
| | Turnover Rate | 22.0% | | |
| | | | | |
| | Number of | | | |
| | Holdings | 339 | | |
| | | | | |
| | | | | |
| | | | | |
| | | | | |
| | | | | |
| | | | | | |
(1) | Percentages shown are based on the Fund’s total investments. |
(2) | The quality profile is calculated on a market value-weighted basis using the highest credit quality rating for each security held by the Fund given by S&P, Moody’s or Fitch, each of which is a Nationally Recognized Statistical Rating Organization (NRSRO). NRSROs rate the credit quality of securities using a scale that generally ranges from AAA (highest) to D (lowest). |
(3) | Includes pre-refunded and escrowed-to-maturity (ETM) bonds. |
(4) | SEC yields are based on SEC guidelines and are calculated for the 30 days ended December 31, 2016. |
(5) | Reflects expense ratios as stated in the Fund’s current prospectus. |
(6) | Includes 0.25% 12b-1 fee. |
Baird Quality Intermediate Municipal Bond Fund
December 31, 2016 (Unaudited)
Institutional ClassValue of a $25,000 Investment
Growth of a hypothetical investment of $25,000 made on 12/31/06, assuming reinvestment of all distributions.
Investor Class
Value of a $10,000 Investment
Growth of a hypothetical investment of $10,000 made on 12/31/06, assuming reinvestment of all distributions.
Baird Quality Intermediate Municipal Bond Fund
December 31, 2016 (Unaudited)
Total Returns
| | | Average Annual |
| | One | Five | Ten | Since |
| For the Periods Ended December 31, 2016 | Year | Years | Years | Inception(1) |
| Institutional Class Shares | -0.46% | 1.62% | 3.63% | 4.09% |
| Investor Class Shares | -0.70% | 1.36% | 3.36% | 3.82% |
| Bloomberg Barclays Quality Intermediate | | | | |
Municipal Bond Index(2) | -0.19% | 2.20% | 3.93% | 4.08% |
| (1) | For the period from March 30, 2001 (inception date) through December 31, 2016. |
| (2) | The Bloomberg Barclays Quality Intermediate Municipal Bond Index is an unmanaged, market value weighted index consisting of tax-exempt, fixed-rate securities that are rated A3 or better, with maturities between 2 and 12 years. Securities must have an outstanding par value of at least $7 million and be issued as part of a transaction of at least $75 million. The bonds must be fixed rate, have a dated-date after December 31, 1990. This Index does not reflect any deduction for fees, expenses or taxes. A direct investment in an index is not possible. |
The line graph on the previous page and the returns shown in the table above reflect reinvestment of dividends and/or capital gains distributions in additional shares. The returns do not reflect the deduction of taxes that a shareholder would pay on Fund distributions or the redemption of Fund shares. The returns reflect the actual performance for each period and do not include the impact of trades executed on the last business day of the period that were recorded on the first business day of the next period.
The Fund’s gross expense ratio for each Class, as reflected in the Fund’s current prospectus, is set forth under “Portfolio Characteristics”.
The Fund may invest up to 25% of its total assets in municipal obligations issued by persons in the same state. As a result, changes in economic, business or political conditions of a particular state may have a disproportionate impact on the Fund’s share price. Municipal securities investments are not appropriate for all investors, especially those taxed at lower rates.
Past performance does not guarantee future results. Investment return and principal value will fluctuate so that an investor’s shares, when redeemed, may be worth more or less than their original cost.
For information about the performance of the Fund as of the most recent month-end, please call 1-866-44BAIRD or visit www.bairdfunds.com. Mutual fund performance changes over time and current performance may be lower or higher than that stated.
Baird Quality Intermediate Municipal Bond Fund
Summary Schedule of Investments, December 31, 2016
This schedule summarizes the Fund’s holdings by asset type. Details are reported for each of the Fund’s 50 largest individual holdings and for investments that, in total for any issuer, represent more than 1% of the Fund’s net assets. The total value of smaller holdings is reported as a single amount within each category.
The Fund reports a complete list of its holdings in regulatory filings four times in each fiscal year, at the quarter end. For the second and fourth fiscal quarters, the complete listing of the Fund’s holdings is available electronically in the Fund’s Form N-CSR at http://www.bairdassetmanagement.com/baird-funds/funds-and-performance#Literature and on the Securities and Exchange Commission’s website (www.sec.gov) or you can have it mailed to you without charge by calling 1-866-44BAIRD. For the first and third fiscal quarters, the Fund files the lists with the SEC on Form N-Q. Shareholders can look up the Fund’s Forms N-CSR and N-Q on the SEC’s website (www.sec.gov).
Long-Term Investments
| | | Principal | | | | | | % of | |
| | | Amount | | | Value | | | Net Assets | |
| Municipal Bonds | | | | | | | | | |
| Alabama | | | | | | | | | |
| Total Alabama | | | | | | | | | |
| (Cost $1,034,215)# | | | | | $ | 1,081,000 | | | | 0.1 | % |
| Arizona | | | | | | | | | | | |
| Total Arizona | | | | | | | | | | | |
| (Cost $1,003,270)# | | | | | | 1,020,870 | | | | 0.1 | % |
| Arkansas | | | | | | | | | | | |
| Total Arkansas | | | | | | | | | | | |
| (Cost $3,130,373)# | | | | | | 3,056,497 | | | | 0.3 | % |
| California | | | | | | | | | | | |
| City of Bakersfield CA | | | | | | | | | | | |
| 0.000%, 04/15/2021 (ETM) | | $ | 12,380,000 | | | | 11,422,778 | | | | 1.1 | % |
| San Joaquin Hills Transportation Corridor Agency | | | | | | | | | | | | |
| 0.000%, 01/01/2020 (ETM) | | | 6,865,000 | | | | 6,541,796 | | | | 0.6 | % |
| 0.000%, 01/01/2023 (ETM) | | | 14,000,000 | | | | 12,375,580 | | | | 1.2 | % |
| 0.000% – 0.000%, 01/01/2027-01/01/2028 | | | 1,650,000 | | | | 1,251,605 | | | | 0.1 | % |
| San Marcos Public Facilities Authority | | | | | | | | | | | | |
| 0.000%, 09/01/2019 (ETM) | | | 17,495,000 | | | | 16,682,007 | | | | 1.6 | % |
| Other California# | | | | | | | 4,842,317 | | | | 0.4 | % |
| Total California | | | | | | | | | | | | |
| (Cost $50,603,856) | | | | | | | 53,116,083 | | | | 5.0 | % |
| Colorado | | | | | | | | | | | | |
| Dawson Ridge Metropolitan District No. 1 | | | | | | | | | | | | |
| 0.000%, 10/01/2022 (ETM) | | | 36,045,000 | | | | 31,611,826 | | | | 3.0 | % |
| 0.000%, 10/01/2022 (ETM) | | | 22,540,000 | | | | 19,767,805 | | | | 1.8 | % |
| Other Colorado# | | | | | | | 13,771,388 | | | | 1.3 | % |
| Total Colorado | | | | | | | | | | | | |
| (Cost $64,334,140) | | | | | | | 65,151,019 | | | | 6.1 | % |
| Connecticut | | | | | | | | | | | | |
| Total Connecticut | | | | | | | | | | | | |
| (Cost $4,812,174)# | | | | | | | 4,843,180 | | | | 0.5 | % |
The accompanying notes are an integral part of these financial statements.
Baird Quality Intermediate Municipal Bond Fund
Summary Schedule of Investments, December 31, 2016
Long-Term Investments (cont.)
| | | Principal | | | | | | % of | |
| | | Amount | | | Value | | | Net Assets | |
| Delaware | | | | | | | | | |
| Total Delaware | | | | | | | | | |
| (Cost $2,227,811)# | | | | | $ | 2,214,260 | | | | 0.2 | % |
| District of Columbia | | | | | | | | | | | |
| Total District of Columbia | | | | | | | | | | | |
| (Cost $1,127,874)# | | | | | | 1,128,867 | | | | 0.1 | % |
| Florida | | | | | | | | | | | |
| County of Miami-Dade FL | | | | | | | | | | | |
| 4.500%, 10/01/2020 | | $ | 7,100,000 | | | | 7,795,374 | | | | 0.7 | % |
| School District of Broward County/FL | | | | | | | | | | | | |
| 5.250%, 07/01/2022 (Callable 07/01/2021) | | | 8,390,000 | | | | 9,539,598 | | | | 0.9 | % |
| 5.250%, 07/01/2023 (Callable 07/01/2021) | | | 4,915,000 | | | | 5,574,937 | | | | 0.5 | % |
| St. Lucie County FL Water & Sewer District | | | | | | | | | | | | |
| 6.000%, 10/01/2020 (ETM) | | | 6,520,000 | | | | 7,264,128 | | | | 0.7 | % |
| State of Florida | | | | | | | | | | | | |
| 5.000%, 06/01/2022 (Callable 06/01/2019) | | | 13,800,000 | | | | 14,899,308 | | | | 1.4 | % |
| Other Florida# | | | | | | | 44,203,867 | | | | 4.1 | % |
| Total Florida | | | | | | | | | | | | |
| (Cost $86,230,399) | | | | | | | 89,277,212 | | | | 8.3 | % |
| Georgia | | | | | | | | | | | | |
| Forsyth County Hospital Authority | | | | | | | | | | | | |
| 6.375%, 10/01/2028 (ETM) | | | 8,050,000 | | | | 10,088,099 | | | | 0.9 | % |
| Other Georgia# | | | | | | | 9,281,091 | | | | 0.9 | % |
| Total Georgia | | | | | | | | | | | | |
| (Cost $19,090,510) | | | | | | | 19,369,190 | | | | 1.8 | % |
| Illinois | | | | | | | | | | | | |
| Chicago Board of Education | | | | | | | | | | | | |
| 6.000%, 01/01/2020 | | | 12,745,000 | | | | 13,451,710 | | | | 1.3 | % |
| Illinois Finance Authority | | | | | | | | | | | | |
| 0.000%, 07/15/2023 (ETM) | | | 25,325,000 | | | | 21,630,842 | | | | 2.0 | % |
| 0.000%, 07/15/2025 (ETM) | | | 31,660,000 | | | | 25,145,005 | | | | 2.4 | % |
| 6.250%-6.625%, 05/01/2022-11/01/2039 | | | 2,945,000 | | | | 3,361,800 | | | | 0.3 | % |
| Kane McHenry Cook & De Kalb | | | | | | | | | | | | |
| Counties Unit School District No. 300/IL | | | | | | | | | | | | |
| 7.000%, 01/01/2018 (ETM)(Insured by AMBAC) | | | 5,775,000 | | | | 6,105,041 | | | | 0.6 | % |
| Kendall Kane & Will Counties | | | | | | | | | | | | |
| Community Unit School District No. 308 | | | | | | | | | | | | |
| 0.000%, 02/01/2021 (Insured by AGM) | | | 13,625,000 | | | | 12,205,548 | | | | 1.1 | % |
| Regional Transportation Authority | | | | | | | | | | | | |
| 6.000%, 07/01/2022 | | | 4,705,000 | | | | 5,584,506 | | | | 0.5 | % |
The accompanying notes are an integral part of these financial statements.
Baird Quality Intermediate Municipal Bond Fund
Summary Schedule of Investments, December 31, 2016
Long-Term Investments (cont.)
| | | Principal | | | | | | % of | |
| | | Amount | | | Value | | | Net Assets | |
| Village of Schaumburg IL | | | | | | | | | |
| 4.000%, 12/01/2024 (Callable 12/01/2022) | | $ | 5,750,000 | | | $ | 6,243,753 | | | | 0.6 | % |
| Other Illinois# | | | | | | | 36,481,632 | | | | 3.3 | % |
| Total Illinois | | | | | | | | | | | | |
| (Cost $129,107,316) | | | | | | | 130,209,837 | | | | 12.1 | % |
| Indiana | | | | | | | | | | | | |
| Total Indiana | | | | | | | | | | | | |
| (Cost $7,533,933)# | | | | | | | 7,648,031 | | | | 0.7 | % |
| Iowa | | | | | | | | | | | | |
| Iowa Higher Education Loan Authority | | | | | | | | | | | | |
| 5.000%, 09/01/2043 (Pre-refunded to 09/01/2023) | | | 5,050,000 | | | | 5,883,452 | | | | 0.6 | % |
| 2.000%-5.000%, 12/01/2018-10/01/2038 | | | 5,420,000 | | | | 5,920,511 | | | | 0.5 | % |
| Total Iowa | | | | | | | | | | | | |
| (Cost $12,112,965) | | | | | | | 11,803,963 | | | | 1.1 | % |
| Kansas | | | | | | | | | | | | |
| Total Kansas | | | | | | | | | | | | |
| (Cost $4,392,001)# | | | | | | | 4,449,260 | | | | 0.4 | % |
| Kentucky | | | | | | | | | | | | |
| Total Kentucky | | | | | | | | | | | | |
| (Cost $252,854)# | | | | | | | 246,856 | | | | 0.0 | % |
| Louisiana | | | | | | | | | | | | |
| Louisiana Public Facilities Authority | | | | | | | | | | | | |
| 5.500%, 05/15/2027 (Pre-refunded to 05/15/2026) | | | 11,470,000 | | | | 14,210,069 | | | | 1.3 | % |
| 5.500%, 05/15/2032 (Pre-refunded to 05/15/2026) | | | 22,075,000 | | | | 27,446,068 | | | | 2.6 | % |
| 6.750%, 07/01/2039 (Pre-refunded to 07/01/2019) | | | 6,655,000 | | | | 7,468,840 | | | | 0.7 | % |
| State of Louisiana | | | | | | | | | | | | |
| 5.000%, 11/15/2020 (Callable 05/15/2020) | | | 10,000,000 | | | | 11,032,000 | | | | 1.0 | % |
| Other Louisiana# | | | | | | | 3,999,550 | | | | 0.4 | % |
| Total Louisiana | | | | | | | | | | | | |
| (Cost $60,578,565) | | | | | | | 64,156,527 | | | | 6.0 | % |
| Maryland | | | | | | | | | | | | |
| Total Maryland | | | | | | | | | | | | |
| (Cost $3,642,892)# | | | | | | | 3,631,988 | | | | 0.3 | % |
| Massachusetts | | | | | | | | | | | | |
| Commonwealth of Massachusetts | | | | | | | | | | | | |
| 4.000%, 12/01/2022 (Callable 12/01/2019) | | | 15,000,000 | | | | 16,004,700 | | | | 1.5 | % |
| Other Massachusetts# | | | | | | | 6,156,878 | | | | 0.6 | % |
| Total Massachusetts | | | | | | | | | | | | |
| (Cost $21,962,087) | | | | | | | 22,161,578 | | | | 2.1 | % |
The accompanying notes are an integral part of these financial statements.
Baird Quality Intermediate Municipal Bond Fund
Summary Schedule of Investments, December 31, 2016
Long-Term Investments (cont.)
| | | Principal | | | | | | % of | |
| | | Amount | | | Value | | | Net Assets | |
| Michigan | | | | | | | | | |
| Michigan Finance Authority | | | | | | | | | |
| 5.000%, 01/01/2019 | | $ | 7,000,000 | | | $ | 7,509,740 | | | | 0.7 | % |
| Other Michigan# | | | | | | | 25,071,296 | | | | 2.3 | % |
| Total Michigan | | | | | | | | | | | | |
| (Cost $32,467,094) | | | | | | | 32,581,036 | | | | 3.0 | % |
| Minnesota | | | | | | | | | | | | |
| University of Minnesota | | | | | | | | | | | | |
| 5.500%, 07/01/2021 (ETM) | | | 10,380,000 | | | | 11,638,160 | | | | 1.1 | % |
| Other Minnesota# | | | | | | | 1,754,026 | | | | 0.2 | % |
| Total Minnesota | | | | | | | | | | | | |
| (Cost $13,435,867) | | | | | | | 13,392,186 | | | | 1.3 | % |
| Missouri | | | | | | | | | | | | |
| Total Missouri | | | | | | | | | | | | |
| (Cost $3,754,940)# | | | | | | | 3,653,722 | | | | 0.3 | % |
| Nebraska | | | | | | | | | | | | |
| Total Nebraska | | | | | | | | | | | | |
| (Cost $2,033,872)# | | | | | | | 2,037,917 | | | | 0.2 | % |
| New Hampshire | | | | | | | | | | | | |
| Total New Hampshire | | | | | | | | | | | | |
| (Cost $3,012,025)# | | | | | | | 3,052,342 | | | | 0.3 | % |
| New Jersey | | | | | | | | | | | | |
| Total New Jersey | | | | | | | | | | | | |
| (Cost $18,903,242)# | | | | | | | 19,013,621 | | | | 1.8 | % |
| New Mexico | | | | | | | | | | | | |
| Total New Mexico | | | | | | | | | | | | |
| (Cost $4,089,594)# | | | | | | | 3,970,273 | | | | 0.4 | % |
| New York | | | | | | | | | | | | |
| City of New York NY | | | | | | | | | | | | |
| 5.000%, 08/01/2022 | | | 5,000,000 | | | | 5,750,150 | | | | 0.5 | % |
| Metropolitan Transportation Authority | | | | | | | | | | | | |
| 6.000%, 04/01/2020 (ETM) | | | 13,615,000 | | | | 14,682,688 | | | | 1.4 | % |
| 5.000%, 11/15/2028 (Callable 05/15/2026) | | | 1,300,000 | | | | 1,513,096 | | | | 0.1 | % |
| New York State Dormitory Authority | | | | | | | | | | | | |
| 5.000%, 12/15/2023 (Callable 12/15/2022) | | | 11,685,000 | | | | 13,611,857 | | | | 1.3 | % |
| Other New York# | | | | | | | 10,800,350 | | | | 1.0 | % |
| Total New York | | | | | | | | | | | | |
| (Cost $45,839,900) | | | | | | | 46,358,141 | | | | 4.3 | % |
The accompanying notes are an integral part of these financial statements.
Baird Quality Intermediate Municipal Bond Fund
Summary Schedule of Investments, December 31, 2016
Long-Term Investments (cont.)
| | | Principal | | | | | | % of | |
| | | Amount | | | Value | | | Net Assets | |
| North Carolina | | | | | | | | | |
| North Carolina Eastern Municipal Power Agency | | | | | | | | | |
| 5.000%, 01/01/2021 (Callable 01/30/2017)(ETM) | | $ | 10,355,000 | | | $ | 11,464,228 | | | | 1.1 | % |
| 4.500%, 01/01/2024 (Pre-refunded to 01/01/2022) | | | 11,740,000 | | | | 12,969,882 | | | | 1.2 | % |
| 5.000%-6.400%, 01/01/2017-01/01/2021 | | | 5,522,000 | | | | 5,890,017 | | | | 0.5 | % |
| Other North Carolina# | | | | | | | 1,677,920 | | | | 0.2 | % |
| Total North Carolina | | | | | | | | | | | | |
| (Cost $31,957,607) | | | | | | | 32,002,047 | | | | 3.0 | % |
| North Dakota | | | | | | | | | | | | |
| Total North Dakota | | | | | | | | | | | | |
| (Cost $5,845,721)# | | | | | | | 5,624,470 | | | | 0.5 | % |
| Ohio | | | | | | | | | | | | |
| Ohio Housing Finance Agency | | | | | | | | | | | | |
| 4.000%, 03/01/2047 (Callable 09/01/2025) | | | 7,590,000 | | | | 7,999,329 | | | | 0.7 | % |
| State of Ohio | | | | | | | | | | | | |
| 5.000%, 06/15/2021 | | | 6,740,000 | | | | 7,641,745 | | | | 0.7 | % |
| Other Ohio# | | | | | | | 10,695,039 | | | | 1.1 | % |
| Total Ohio | | | | | | | | | | | | |
| (Cost $26,263,569) | | | | | | | 26,336,113 | | | | 2.5 | % |
| Oregon | | | | | | | | | | | | |
| Total Oregon | | | | | | | | | | | | |
| (Cost $7,204,901)# | | | | | | | 7,005,291 | | | | 0.7 | % |
| Pennsylvania | | | | | | | | | | | | |
| Pennsylvania Convention Center Authority | | | | | | | | | | | | |
| 6.000%, 09/01/2019 (ETM) | | | 14,055,000 | | | | 15,084,388 | | | | 1.4 | % |
| Other Pennsylvania# | | | | | | | 17,865,548 | | | | 1.7 | % |
| Total Pennsylvania | | | | | | | | | | | | |
| (Cost $33,219,339) | | | | | | | 32,949,936 | | | | 3.1 | % |
| Puerto Rico | | | | | | | | | | | | |
| Total Puerto Rico | | | | | | | | | | | | |
| (Cost $12,493,578)# | | | | | | | 12,123,567 | | | | 1.1 | % |
| Rhode Island | | | | | | | | | | | | |
| State of Rhode Island | | | | | | | | | | | | |
| 5.000%, 08/01/2024 | | | 5,000,000 | | | | 5,853,600 | | | | 0.5 | % |
| Total Rhode Island | | | | | | | | | | | | |
| (Cost $5,843,744) | | | | | | | 5,853,600 | | | | 0.5 | % |
| South Carolina | | | | | | | | | | | | |
| Piedmont Municipal Power Agency | | | | | | | | | | | | |
| 6.750%, 01/01/2020 (ETM) | | | 6,450,000 | | | | 7,391,249 | | | | 0.7 | % |
| Other South Carolina# | | | | | | | 5,396,203 | | | | 0.5 | % |
| Total South Carolina | | | | | | | | | | | | |
| (Cost $12,394,949) | | | | | | | 12,787,452 | | | | 1.2 | % |
The accompanying notes are an integral part of these financial statements.
Baird Quality Intermediate Municipal Bond Fund
Summary Schedule of Investments, December 31, 2016
Long-Term Investments (cont.)
| | | Principal | | | | | | % of | |
| | | Amount | | | Value | | | Net Assets | |
| South Dakota | | | | | | | | | |
| Total South Dakota | | | | | | | | | |
| (Cost $435,381)# | | | | | $ | 405,040 | | | | 0.0 | % |
| Tennessee | | | | | | | | | | | |
| Total Tennessee | | | | | | | | | | | |
| (Cost $7,395,209)# | | | | | | 7,530,588 | | | | 0.7 | % |
| Texas | | | | | | | | | | | |
| City of Houston TX Combined Utility System Revenue | | | | | | | | | | | |
| 0.000%, 12/01/2019 (ETM)(Insured by AGM) | | $ | 13,355,000 | | | | 12,677,501 | | | | 1.2 | % |
| 5.500%, 12/01/2029 (ETM) | | | 16,050,000 | | | | 20,689,092 | | | | 1.9 | % |
| 5.500%, 12/01/2024 (ETM) | | | 1,735,000 | | | | 2,093,451 | | | | 0.2 | % |
| City of San Antonio TX Electric & Gas Systems Revenue | | | | | | | | | | | | |
| 5.650%, 02/01/2019 (ETM) | | | 9,765,000 | | | | 10,297,778 | | | | 1.0 | % |
| County of Harris TX | | | | | | | | | | | | |
| 5.750%, 10/01/2028 (Pre-refunded to 10/01/2018) | | | 6,930,000 | | | | 7,470,886 | | | | 0.7 | % |
| 5.000%-5.750%, 10/01/2020-08/15/2027 | | | 7,810,000 | | | | 9,205,607 | | | | 0.9 | % |
| Harris County Health Facilities Development Corp. | | | | | | | | | | | | |
| 5.750%, 07/01/2027 (ETM) | | | 5,000,000 | | | | 6,090,700 | | | | 0.6 | % |
| Lamar Consolidated Independent School District | | | | | | | | | | | | |
| 5.000%, 02/15/2026 | | | | | | | | | | | | |
| (Callable 02/15/2025)(PSF Guaranteed) | | | 5,860,000 | | | | 6,934,079 | | | | 0.6 | % |
| North East Independent School District/TX | | | | | | | | | | | | |
| 5.000%, 08/01/2021 (PSF Guaranteed) | | | 6,095,000 | | | | 6,898,626 | | | | 0.7 | % |
| 5.000%, 08/01/2023 (PSF Guaranteed) | | | 5,805,000 | | | | 6,794,462 | | | | 0.6 | % |
| 5.000%, 02/01/2024 (PSF Guaranteed) | | | 2,930,000 | | | | 3,447,760 | | | | 0.3 | % |
| Tarrant County Health Facilities Development Corp. | | | | | | | | | | | | |
| 6.000%, 09/01/2024 (ETM) | | | 6,745,000 | | | | 7,795,062 | | | | 0.7 | % |
| The University of Texas System | | | | | | | | | | | | |
| 5.000%, 08/15/2022 | | | 9,530,000 | | | | 11,034,692 | | | | 1.0 | % |
| Tomball Independent School District | | | | | | | | | | | | |
| 5.000%, 02/15/2025 (PSF Guaranteed) | | | 5,865,000 | | | | 7,025,742 | | | | 0.7 | % |
| Other Texas# | | | | | | | 119,681,576 | | | | 11.1 | % |
| Total Texas | | | | | | | | | | | | |
| (Cost $235,512,755) | | | | | | | 238,137,014 | | | | 22.2 | % |
| Utah | | | | | | | | | | | | |
| Total Utah | | | | | | | | | | | | |
| (Cost $8,671,245)# | | | | | | | 8,972,641 | | | | 0.8 | % |
| Virginia | | | | | | | | | | | | |
| Total Virginia | | | | | | | | | | | | |
| (Cost $4,326,723)# | | | | | | | 4,287,847 | | | | 0.4 | % |
| Washington | | | | | | | | | | | | |
| State of Washington | | | | | | | | | | | | |
| 5.500%, 07/01/2023 | | | 5,040,000 | | | | 5,906,527 | | | | 0.6 | % |
The accompanying notes are an integral part of these financial statements.
Baird Quality Intermediate Municipal Bond Fund
Summary Schedule of Investments, December 31, 2016
Long-Term Investments (cont.)
| | | Principal | | | | | | % of | |
| | | Amount | | | Value | | | Net Assets | |
| Washington Health Care Facilities Authority | | | | | | | | | |
| 6.250%, 08/01/2036 (Pre-refunded to 08/01/2018) | | $ | 8,100,000 | | | $ | 8,725,887 | | | | 0.8 | % |
| 6.250%, 11/15/2041 (Pre-refunded to 05/15/2021) | | | 4,770,000 | | | | 5,632,178 | | | | 0.5 | % |
| 6.125%-6.250%, 08/01/2028-11/15/2031 | | | 1,965,000 | | | | 2,176,780 | | | | 0.2 | % |
| Other Washington# | | | | | | | 19,215,394 | | | | 1.8 | % |
| Total Washington | | | | | | | | | | | | |
| (Cost $41,569,593) | | | | | | | 41,656,766 | | | | 3.9 | % |
| West Virginia | | | | | | | | | | | | |
| Total West Virginia | | | | | | | | | | | | |
| (Cost $1,188,250)# | | | | | | | 1,193,099 | | | | 0.1 | % |
| Wisconsin | | | | | | | | | | | | |
| Total Wisconsin | | | | | | | | | | | | |
| (Cost $10,479,025)# | | | | | | | 10,070,633 | | | | 0.9 | % |
| Total Long-Term Investments | | | | | | | | | | | | |
| (Cost $1,041,515,358) | | | | | | | 1,055,561,560 | | | | 98.4 | % |
| Short-Term Investment | | | | | | | | | | | | |
| | | Shares | | | | | | | | | |
| Money Market Mutual Fund | | | | | | | | | | | | |
| Fidelity Institutional Money Market Fund – | | | | | | | | | | | | |
| Government Portfolio, Institutional Class, 0.43%« | | | 914,486 | | | | 914,486 | | | | 0.1 | % |
| Total Short-Term Investment | | | | | | | | | | | | |
| (Cost $914,486) | | | | | | | 914,486 | | | | 0.1 | % |
| Total Investments | | | | | | | | | | | | |
| (Cost $1,042,429,844) | | | | | | | 1,056,476,046 | | | | 98.5 | % |
| Other Assets in Excess of Liabilities | | | | | | | 15,808,098 | | | | 1.5 | % |
| TOTAL NET ASSETS | | | | | | $ | 1,072,284,144 | | | | 100.0 | % |
Notes to Summary Schedule of Investments
AGM – Assured Guaranty Municipal
AMBAC – Ambac Assurance Corporation
ETM – Escrowed to Maturity
PSF – Texas Permanent School Fund
| # | Represents the aggregate value, by category, of securities that are not among the 50 largest holdings and, in total for any issuer, represent 1% or less of net assets. |
| « | 7-Day Yield |
The accompanying notes are an integral part of these financial statements.
Baird Quality Intermediate Municipal Bond Fund
Summary Schedule of Investments, December 31, 2016
Summary of Fair Value Exposure at December 31, 2016
The Fund has adopted authoritative fair valuation accounting standards which establish a definition of fair value and set out a hierarchy for measuring fair value. These standards require additional disclosures about the various inputs and valuation techniques used to develop the measurements of fair value and a discussion on changes in valuation techniques and related inputs during the period. These standards define fair value as the price that would be received to sell an asset or paid to transfer a liability in an orderly transaction between market participants at the measurement date.
The fair value hierarchy is organized into three levels based upon the assumptions (referred to as “inputs”) used in pricing the asset or liability. These standards state that “observable inputs” reflect the assumptions market participants would use in pricing the asset or liability based on market data obtained from independent sources and “unobservable inputs” reflect an entity’s own assumptions about the assumptions market participants would use in pricing the asset or liability. These inputs are summarized into three broad levels and described below:
Level 1 – | Unadjusted quoted prices in active markets for identical unrestricted securities. |
Level 2 – | Other significant observable inputs (including quoted prices for similar securities, quoted prices in inactive markets, dealer indications, interest rates, yield curves, prepayment speeds, credit risk, default rates, inputs corroborated by observable market data, etc.). |
Level 3 – | Significant unobservable inputs (including the Fund’s own assumptions about the factors that market participants would use in valuing the security) based on the best information available. |
The inputs or methodology used for valuing securities are not necessarily an indication of the risk associated with investing in those securities.
The following is a summary of the inputs used to value the Fund’s investments as of December 31, 2016:
| | | Level 1 | | | Level 2 | | | Level 3 | | | Total | |
| Municipal Bonds | | | | | | | | | | | | |
| Municipal Bonds | | $ | — | | | $ | 1,055,561,560 | | | $ | — | | | $ | 1,055,561,560 | |
| Total Municipal Bonds | | | — | | | | 1,055,561,560 | | | | — | | | | 1,055,561,560 | |
| Short-Term Investment | | | | | | | | | | | | | | | | |
| Money Market Mutual Fund | | | 914,486 | | | | — | | | | — | | | | 914,486 | |
| Total Short-Term Investment | | | 914,486 | | | | — | | | | — | | | | 914,486 | |
| Total Investments | | $ | 914,486 | | | $ | 1,055,561,560 | | | $ | — | | | $ | 1,056,476,046 | |
Changes in valuation techniques may result in transfers into or out of assigned levels within the fair value hierarchy. There were no transfers between Level 1, Level 2 and Level 3 fair value measurements during the reporting period, as compared to their classification from the prior year’s annual report. See the Fund’s valuation policy in Note 2a to the financial statements.
The accompanying notes are an integral part of these financial statements.
Baird Core Intermediate Municipal Bond Fund
December 31, 2016
The Baird Core Intermediate Municipal Bond Fund seeks a high level of current income that is exempt from federal income tax and is consistent with preservation of capital.
During a very volatile 2016, the Fund generated positive absolute performance and outperformed its benchmark.
It is perhaps best to think of 2016 as a year of two phases for the municipal bond market, as there were two distinct phases of rate movements, fund flows, and credit spreads. In the first phase, 10-year tax-free rates fell on sluggish U.S. economic growth, dovish Fed rhetoric, and global uncertainty following the Brexit vote. A favorable supply/demand backdrop strengthened the municipal market in the first phase as steady tax-free fund inflows more than offset a marginal increase in new supply relative to 2015’s pace. The second phase of the 2016 rate cycle began near mid-year as economic data improved and the Fed signaled a desire to hike the fed funds rate, which they did in December by basis points (25) bps. Finally, it was the surprise election of Donald Trump, combined with the GOP maintaining majorities in both the U.S. House and Senate, that ultimately pushed tax-free rates up sharply as market sentiment shifted toward faster growth and higher inflation. With Republicans in full control of the agenda in Washington the probability of both corporate and personal tax reform increased, putting extra pressure on municipal prices following the election.
Positive contributors to the Fund’s relative performance include:
| | • | Security selection was the most significant factor in 2016 |
| | • | An overweight to the Revenue sector, particularly Housing and Healthcare issues |
| | • | A barbell curve allocation enhanced returns for the year |
Detractors from the Fund’s relative performance include:
| | • | A modest overweight to BBB-rated issues muted returns as credit spreads widened |
Our base case outlook for 2017 is for a continuation of moderate economic growth and inflation, while acknowledging that a wide range of range of possible outcomes certainly exists. If the Trump Administration’s policy measures are passed, providing fiscal stimulus to the economy, including tax reform, they are likely to be met by tighter monetary policy from the Fed, limiting the potential improvement in near-term economic growth. For the municipal market, although infrastructure borrowing may increase gradually in 2017, refunding volume is likely to decline with higher rates, leading to less overall supply in 2017 than last year. The backdrop for municipal credit remains positive, with ongoing economic expansion expected and wider credit spreads due to the post-election selling of municipal issues.
Baird Core Intermediate Municipal Bond Fund
December 31, 2016 (Unaudited)
Portfolio Characteristics
Quality Distribution(1)(2)
| | | | | | |
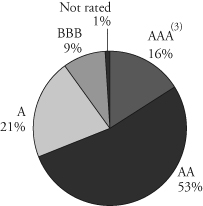 | | Net Assets | $97,704,494 | | |
| | | | | |
| | SEC 30-Day | | | |
| | Yield(4) | | | |
| | Institutional Class | 2.13% | | |
| | Investor Class | 1.87% | | |
| | | | | |
| | Average | | | |
| | Effective | | | |
| | Duration | 4.65 years | | |
| | | | | |
| | Average | | | |
| | Effective | | | |
| | Maturity | 4.92 years | | |
| | | | | |
| | | Annualized | | | |
Sector Weightings(1) | | Expense | | | |
| | | Ratio(5) | | | |
 | | Institutional Class | 0.30% | | |
| | Investor Class | 0.55% | (6) | |
| | | | | |
| | Portfolio | | | |
| | Turnover Rate | 94.8% | | |
| | | | | |
| | Number of | | | |
| | Holdings | 346 | | |
| | | | | |
| | | | | |
| | | | | |
| | | | | |
| | | | | |
| | | | | |
| | | | | |
| | | | | | |
(1) | Percentages shown are based on the Fund’s total investments. |
(2) | The quality profile is calculated on a market value-weighted basis using the highest credit quality rating for each security held by the Fund given by S&P, Moody’s or Fitch, each of which is a Nationally Recognized Statistical Rating Organization (NRSRO). NRSROs rate the credit quality of securities using a scale that generally ranges from AAA (highest) to D (lowest). |
(3) | Includes pre-refunded and escrowed-to-maturity (ETM) bonds. |
(4) | SEC yields are based on SEC guidelines and are calculated for the 30 days ended December 31, 2016. |
(5) | Reflects expense ratios as stated in the Fund’s current prospectus. |
(6) | Includes 0.25% 12b-1 fee. |
Baird Core Intermediate Municipal Bond Fund
December 31, 2016 (Unaudited)
Institutional ClassValue of a $25,000 Investment
Growth of a hypothetical investment of $25,000 made on the Fund’s inception date (8/31/15), assuming reinvestment of all distributions.
Investor Class
Value of a $10,000 Investment
Growth of a hypothetical investment of $10,000 made on the Fund’s inception date (8/31/15), assuming reinvestment of all distributions.
Baird Core Intermediate Municipal Bond Fund
December 31, 2016 (Unaudited)
Total Returns
| | | Average |
| | | Annual |
| | One | Since |
| For the Periods Ended December 31, 2016 | Year | Inception(1) |
| Institutional Class Shares | 1.14% | 2.35% |
| Investor Class Shares | 0.91% | 2.11% |
Bloomberg Barclays Municipal Bond (1-15 Year) Index(2) | 0.01% | 1.38% |
| (1) | For the period from August 31, 2015 (inception date) through December 31, 2016. |
| (2) | The Bloomberg Barclays Municipal Bond (1-15 Year) Index is an unmanaged, market value weighted index of investment-grade, tax-exempt, and fixed-rate securities with maturities between 1 and 17 years. Securities must have an outstanding par value of at least $7 million and be issued as part of a transaction of at least $75 million. The bonds must be fixed rate, have a dated-date after December 31, 1990, and must be at least one year from their maturity date. This Index does not reflect any deduction for fees, expenses or taxes. A direct investment in an index is not possible. |
The line graph on the previous page and the returns shown in the table above reflect reinvestment of dividends and/or capital gains distributions in additional shares. The returns do not reflect the deduction of taxes that a shareholder would pay on Fund distributions or the redemption of Fund shares. The returns reflect the actual performance for each period and do not include the impact of trades executed on the last business day of the period that were recorded on the first business day of the next period.
The Fund’s gross expense ratio for each Class, as reflected in the Fund’s current prospectus, is set forth under “Portfolio Characteristics”.
The Fund may invest up to 10% of its net assets in non-investment grade debt securities (commonly referred to as “high yield” bonds). While these types of debt securities typically offer higher yields than investment grade securities, they also include greater risks including increased credit risk and the increased risk of default or bankruptcy. The Fund may invest up to 25% of its total assets in municipal obligations issued by persons in the same state. As a result, changes in economic, business or political conditions of a particular state may have a disproportionate impact on the Fund’s share price. Municipal securities investments are not appropriate for all investors, especially those taxed at lower rates.
Past performance does not guarantee future results. Investment return and principal value will fluctuate so that an investor’s shares, when redeemed, may be worth more or less than their original cost.
For information about the performance of the Fund as of the most recent month-end, please call 1-866-44BAIRD or visit www.bairdfunds.com. Mutual fund performance changes over time and current performance may be lower or higher than that stated.
Baird Core Intermediate Municipal Bond Fund
Summary Schedule of Investments, December 31, 2016
This schedule summarizes the Fund’s holdings by asset type. Details are reported for each of the Fund’s 50 largest individual holdings and for investments that, in total for any issuer, represent more than 1% of the Fund’s net assets. The total value of smaller holdings is reported as a single amount within each category.
The Fund reports a complete list of its holdings in regulatory filings four times in each fiscal year, at the quarter end. For the second and fourth fiscal quarters, the complete listing of the Fund’s holdings is available electronically in the Fund’s Form N-CSR at http://www.bairdassetmanagement.com/baird-funds/funds-and-performance#Literature and on the Securities and Exchange Commission’s website (www.sec.gov) or you can have it mailed to you without charge by calling 1-866-44BAIRD. For the first and third fiscal quarters, the Fund files the lists with the SEC on Form N-Q. Shareholders can look up the Fund’s Forms N-CSR and N-Q on the SEC’s website (www.sec.gov).
Long-Term Investments
| | | Principal | | | | | | % of | |
| | | Amount | | | Value | | | Net Assets | |
| Municipal Bonds | | | | | | | | | |
| Alabama | | | | | | | | | |
| Special Care Facilities Financing | | | | | | | | | |
| Authority of the City of Pell City AL | | | | | | | | | |
| 5.000%, 12/01/2031 (Callable 12/01/2021) | | $ | 1,000,000 | | | $ | 1,059,180 | | | | 1.1 | % |
| Other Alabama# | | | | | | | 1,592,198 | | | | 1.6 | % |
| Total Alabama | | | | | | | | | | | | |
| (Cost $2,675,735) | | | | | | | 2,651,378 | | | | 2.7 | % |
| Alaska | | | | | | | | | | | | |
| Alaska Municipal Bond Bank Authority | | | | | | | | | | | | |
| 5.000%, 08/01/2027 (Callable 08/01/2023) | | | 500,000 | | | | 554,200 | | | | 0.6 | % |
| Other Alaska# | | | | | | | 792,800 | | | | 0.8 | % |
| Total Alaska | | | | | | | | | | | | |
| (Cost $1,375,362) | | | | | | | 1,347,000 | | | | 1.4 | % |
| Arizona | | | | | | | | | | | | |
| City of Tucson AZ Water System Revenue | | | | | | | | | | | | |
| 5.000%, 07/01/2032 (Callable 07/01/2025) | | | 500,000 | | | | 573,645 | | | | 0.6 | % |
| Other Arizona# | | | | | | | 1,989,690 | | | | 2.0 | % |
| Total Arizona | | | | | | | | | | | | |
| (Cost $2,610,311) | | | | | | | 2,563,335 | | | | 2.6 | % |
| Arkansas | | | | | | | | | | | | |
| Total Arkansas | | | | | | | | | | | | |
| (Cost $1,181,750)# | | | | | | | 1,178,012 | | | | 1.2 | % |
| California | | | | | | | | | | | | |
| Corona-Norca Unified School District | | | | | | | | | | | | |
| 0.000%, 08/01/2039 | | | | | | | | | | | | |
| (Callable 08/01/2027)(Insured by AGM) | | | 415,000 | | | | 533,113 | | | | 0.6 | % |
| East Bay Municipal Utility District Water System Revenue | | | | | | | | | | | | |
| 5.000%, 06/01/2033 (Callable 06/01/2024) | | | 475,000 | | | | 548,910 | | | | 0.6 | % |
| Los Angeles CA Department of Water & Power Systems | | | | | | | | | | | | |
| 0.540%, 07/01/2035 | | | 700,000 | | | | 700,000 | | | | 0.7 | % |
The accompanying notes are an integral part of these financial statements.
Baird Core Intermediate Municipal Bond Fund
Summary Schedule of Investments, December 31, 2016
Long-Term Investments (cont.)
| | | Principal | | | | | | % of | |
| | | Amount | | | Value | | | Net Assets | |
| Redondo Beach Unified School District | | | | | | | | | |
| 6.375%, 08/01/2034 (Callable 08/01/2026) | | $ | 455,000 | | | $ | 587,200 | | | | 0.6 | % |
| San Bernardino City Unified School District | | | | | | | | | | | | |
| 5.000%, 08/01/2027 | | | | | | | | | | | | |
| (Callable 08/01/2023)(Insured by AGM) | | | 450,000 | | | | 509,909 | | | | 0.5 | % |
| San Diego Unified School District/CA | | | | | | | | | | | | |
| 5.000%, 07/01/2030 (Callable 07/01/2026) | | | 570,000 | | | | 675,427 | | | | 0.7 | % |
| State of California | | | | | | | | | | | | |
| 5.250%, 10/01/2020 (Callable 10/01/2019) | | | 1,050,000 | | | | 1,151,682 | | | | 1.2 | % |
| 0.670%-5.000%, 10/01/2029-05/01/2034 | | | 800,000 | | | | 835,735 | | | | 0.8 | % |
| Westlands Water District | | | | | | | | | | | | |
| 5.000%, 09/01/2030 (Pre-refunded to | | | | | | | | | | | | |
| 09/01/2022)(Insured by AGM) | | | 500,000 | | | | 581,275 | | | | 0.6 | % |
| Other California# | | | | | | | 4,681,708 | | | | 4.8 | % |
| Total California | | | | | | | | | | | | |
| (Cost $10,820,916) | | | | | | | 10,804,959 | | | | 11.1 | % |
| Colorado | | | | | | | | | | | | |
| Colorado Educational & Cultural Facilities Authority | | | | | | | | | | | | |
| 5.000%, 08/15/2030 (Callable 08/15/2024) | | | 500,000 | | | | 541,030 | | | | 0.5 | % |
| Vista Ridge Metropolitan District | | | | | | | | | | | | |
| 5.000%, 12/01/2025 (Insured by BAM) | | | 600,000 | | | | 679,122 | | | | 0.7 | % |
| 5.000%, 12/01/2026 (Insured by BAM) | | | 460,000 | | | | 522,689 | | | | 0.5 | % |
| Weld County CO School District | | | | | | | | | | | | |
| 5.000%, 12/15/2029 (Callable 12/15/2026) | | | 1,150,000 | | | | 1,338,945 | | | | 1.4 | % |
| Other Colorado# | | | | | | | 1,240,564 | | | | 1.3 | % |
| Total Colorado | | | | | | | | | | | | |
| (Cost $4,321,782) | | | | | | | 4,322,350 | | | | 4.4 | % |
| District of Columbia | | | | | | | | | | | | |
| District of Columbia Housing Finance Agency | | | | | | | | | | | | |
| 3.500%, 06/15/2023 | | | 500,000 | | | | 508,095 | | | | 0.5 | % |
| Other District of Columbia# | | | | | | | 951,816 | | | | 1.0 | % |
| Total District of Columbia | | | | | | | | | | | | |
| (Cost $1,508,193) | | | | | | | 1,459,911 | | | | 1.5 | % |
| Florida | | | | | | | | | | | | |
| City of Orlando FL | | | | | | | | | | | | |
| 5.250%, 11/01/2026 (Pre-refunded to 05/01/2024) | | | 500,000 | | | | 603,350 | | | | 0.6 | % |
| 5.000%-5.250%, 10/01/2027-11/01/2029 | | | 380,000 | | | | 449,779 | | | | 0.5 | % |
| Other Florida# | | | | | | | 1,878,194 | | | | 1.9 | % |
| Total Florida | | | | | | | | | | | | |
| (Cost $2,932,992) | | | | | | | 2,931,323 | | | | 3.0 | % |
The accompanying notes are an integral part of these financial statements.
Baird Core Intermediate Municipal Bond Fund
Summary Schedule of Investments, December 31, 2016
Long-Term Investments (cont.)
| | | Principal | | | | | | % of | |
| | | Amount | | | Value | | | Net Assets | |
| Georgia | | | | | | | | | |
| City of Atlanta GA | | | | | | | | | |
| 5.000%, 01/01/2028 (Callable 01/01/2020) | | $ | 1,000,000 | | | $ | 1,071,270 | | | | 1.1 | % |
| 5.000%, 01/01/2025 (Callable 01/01/2020) | | | 225,000 | | | | 241,976 | | | | 0.2 | % |
| Other Georgia# | | | | | | | 1,154,175 | | | | 1.2 | % |
| Total Georgia | | | | | | | | | | | | |
| (Cost $2,471,999) | | | | | | | 2,467,421 | | | | 2.5 | % |
| Illinois | | | | | | | | | | | | |
| Chicago O’Hare International Airport | | | | | | | | | | | | |
| 5.500%, 01/01/2031 (Callable 01/01/2021) | | | 500,000 | | | | 558,625 | | | | 0.6 | % |
| Illinois Finance Authority | | | | | | | | | | | | |
| 1.782%-5.250%, 11/15/2017-05/01/2036 | | | 1,130,000 | | | | 1,184,802 | | | | 1.2 | % |
| Other Illinois# | | | | | | | 8,074,097 | | | | 8.2 | % |
| Total Illinois | | | | | | | | | | | | |
| (Cost $9,928,598) | | | | | | | 9,817,524 | | | | 10.0 | % |
| Indiana | | | | | | | | | | | | |
| Total Indiana | | | | | | | | | | | | |
| (Cost $1,356,530)# | | | | | | | 1,327,484 | | | | 1.4 | % |
| Iowa | | | | | | | | | | | | |
| Iowa Higher Education Loan Authority | | | | | | | | | | | | |
| 2.000%, 12/01/2018 (Callable 06/01/2018) | | | 1,000,000 | | | | 998,690 | | | | 1.0 | % |
| Other Iowa# | | | | | | | 203,676 | | | | 0.2 | % |
| Total Iowa | | | | | | | | | | | | |
| (Cost $1,205,598) | | | | | | | 1,202,366 | | | | 1.2 | % |
| Kansas | | | | | | | | | | | | |
| Total Kansas | | | | | | | | | | | | |
| (Cost $1,056,907)# | | | | | | | 1,053,677 | | | | 1.1 | % |
| Kentucky | | | | | | | | | | | | |
| Paducah Electric Plant Board | | | | | | | | | | | | |
| 5.000%, 10/01/2026 (Insured by AGM) | | | 450,000 | | | | 518,927 | | | | 0.5 | % |
| Other Kentucky# | | | | | | | 87,192 | | | | 0.1 | % |
| Total Kentucky | | | | | | | | | | | | |
| (Cost $628,798) | | | | | | | 606,119 | | | | 0.6 | % |
| Louisiana | | | | | | | | | | | | |
| Total Louisiana | | | | | | | | | | | | |
| (Cost $50,960)# | | | | | | | 50,951 | | | | 0.1 | % |
| Maine | | | | | | | | | | | | |
| Maine State Housing Authority | | | | | | | | | | | | |
| 4.000%, 11/15/2045 (Callable 11/15/2025) | | | 625,000 | | | | 660,731 | | | | 0.7 | % |
| Other Maine# | | | | | | | 305,800 | | | | 0.3 | % |
| Total Maine | | | | | | | | | | | | |
| (Cost $986,583) | | | | | | | 966,531 | | | | 1.0 | % |
The accompanying notes are an integral part of these financial statements.
Baird Core Intermediate Municipal Bond Fund
Summary Schedule of Investments, December 31, 2016
Long-Term Investments (cont.)
| | | Principal | | | | | | % of | |
| | | Amount | | | Value | | | Net Assets | |
| Massachusetts | | | | | | | | | |
| Town of Ashburnham MA | | | | | | | | | |
| 4.250%, 07/01/2021 (Callable 07/01/2018) | | $ | 700,000 | | | $ | 726,131 | | | | 0.7 | % |
| Other Massachusetts# | | | | | | | 495,007 | | | | 0.6 | % |
| Total Massachusetts | | | | | | | | | | | | |
| (Cost $1,220,843) | | | | | | | 1,221,138 | | | | 1.3 | % |
| Michigan | | | | | | | | | | | | |
| Lake Orion Community School District | | | | | | | | | | | | |
| 5.000%, 05/01/2025 (Insured By Q-SBLF) | | | 1,635,000 | | | | 1,914,879 | | | | 2.0 | % |
| Michigan Finance Authority | | | | | | | | | | | | |
| 5.500%, 06/01/2021 (Pre-refunded to 06/01/2017) | | | 500,000 | | | | 524,040 | | | | 0.5 | % |
| Other Michigan# | | | | | | | 1,373,999 | | | | 1.4 | % |
| Total Michigan | | | | | | | | | | | | |
| (Cost $3,801,302) | | | | | | | 3,812,918 | | | | 3.9 | % |
| Minnesota | | | | | | | | | | | | |
| Minnesota Housing Finance Agency | | | | | | | | | | | | |
| 4.000%, 01/01/2047 (Callable 01/01/2026) | | | 1,150,000 | | | | 1,213,446 | | | | 1.2 | % |
| Other Minnesota# | | | | | | | 157,441 | | | | 0.2 | % |
| Total Minnesota | | | | | | | | | | | | |
| (Cost $1,376,971) | | | | | | | 1,370,887 | | | | 1.4 | % |
| Mississippi | | | | | | | | | | | | |
| Mississippi Business Finance Corp. | | | | | | | | | | | | |
| 0.740%, 11/01/2035 (Callable 01/03/2017) | | | | | | | | | | | | |
(Optional Put Date 01/31/2017)(1) | | | 600,000 | | | | 600,000 | | | | 0.6 | % |
| Mississippi Development Bank | | | | | | | | | | | | |
| 5.500%, 10/01/2019 | | | 550,000 | | | | 592,938 | | | | 0.6 | % |
| Other Mississippi# | | | | | | | 384,651 | | | | 0.4 | % |
| Total Mississippi | | | | | | | | | | | | |
| (Cost $1,576,873) | | | | | | | 1,577,589 | | | | 1.6 | % |
| Missouri | | | | | | | | | | | | |
| Total Missouri | | | | | | | | | | | | |
| (Cost $1,622,503)# | | | | | | | 1,611,242 | | | | 1.6 | % |
| Montana | | | | | | | | | | | | |
| Montana Board of Housing | | | | | | | | | | | | |
| 3.600%, 12/01/2030 (Callable 06/01/2022) | | | 505,000 | | | | 499,536 | | | | 0.5 | % |
| Total Montana | | | | | | | | | | | | |
| (Cost $520,767) | | | | | | | 499,536 | | | | 0.5 | % |
| Nebraska | | | | | | | | | | | | |
| Total Nebraska | | | | | | | | | | | | |
| (Cost $987,311)# | | | | | | | 953,793 | | | | 1.0 | % |
The accompanying notes are an integral part of these financial statements.
Baird Core Intermediate Municipal Bond Fund
Summary Schedule of Investments, December 31, 2016
Long-Term Investments (cont.)
| | | Principal | | | | | | % of | |
| | | Amount | | | Value | | | Net Assets | |
| Nevada | | | | | | | | | |
| Total Nevada | | | | | | | | | |
| (Cost $755,681)# | | | | | $ | 742,312 | | | | 0.8 | % |
| New Jersey | | | | | | | | | | | |
| New Jersey Turnpike Authority | | | | | | | | | | | |
| 5.000%, 01/01/2026 (Callable 01/01/2023) | | $ | 500,000 | | | | 570,915 | | | | 0.6 | % |
| Other New Jersey# | | | | | | | 2,491,845 | | | | 2.5 | % |
| Total New Jersey | | | | | | | | | | | | |
| (Cost $3,054,160) | | | | | | | 3,062,760 | | | | 3.1 | % |
| New York | | | | | | | | | | | | |
| City of New York NY | | | | | | | | | | | | |
| 0.620%, 10/01/2039 | | | 600,000 | | | | 600,000 | | | | 0.6 | % |
0.720%, 10/01/2039 (Optional Put Date 01/31/2017)(1) | | | 600,000 | | | | 600,000 | | | | 0.6 | % |
| City of New York NY Transitional Revenue | | | | | | | | | | | | |
| 0.620%, 11/01/2022 | | | 600,000 | | | | 600,000 | | | | 0.6 | % |
| Metropolitan Transportation Authority | | | | | | | | | | | | |
| 5.000%, 11/15/2028 (Callable 05/15/2026) | | | 1,000,000 | | | | 1,163,920 | | | | 1.2 | % |
| 0.650%, 11/01/2035 | | | 700,000 | | | | 700,000 | | | | 0.7 | % |
| 5.000%, 11/15/2038 (Callable 11/15/2023) | | | 170,000 | | | | 188,158 | | | | 0.2 | % |
| MTA Hudson Rail Yards Trust Obligations | | | | | | | | | | | | |
| 5.000%, 11/15/2046 (Callable 11/15/2019) | | | 500,000 | | | | 530,875 | | | | 0.6 | % |
| Other New York# | | | | | | | 1,247,114 | | | | 1.3 | % |
| Total New York | | | | | | | | | | | | |
| (Cost $5,640,242) | | | | | | | 5,630,067 | | | | 5.8 | % |
| North Carolina | | | | | | | | | | | | |
| Total North Carolina | | | | | | | | | | | | |
| (Cost $524,003)# | | | | | | | 521,758 | | | | 0.5 | % |
| North Dakota | | | | | | | | | | | | |
| Jamestown Park District/ND | | | | | | | | | | | | |
| 2.900%, 07/01/2035 (Callable 01/17/2017) | | | 1,000,000 | | | | 921,080 | | | | 0.9 | % |
| North Dakota Housing Finance Agency | | | | | | | | | | | | |
| 3.500%, 07/01/2046 (Callable 01/01/2026) | | | 500,000 | | | | 516,850 | | | | 0.5 | % |
| Other North Dakota# | | | | | | | 848,865 | | | | 0.9 | % |
| Total North Dakota | | | | | | | | | | | | |
| (Cost $2,351,727) | | | | | | | 2,286,795 | | | | 2.3 | % |
| Ohio | | | | | | | | | | | | |
| City of Cleveland OH | | | | | | | | | | | | |
| 5.000%, 10/01/2023 | | | 430,000 | | | | 498,297 | | | | 0.5 | % |
| Montgomery County OH Hospital Revenue | | | | | | | | | | | | |
| 0.610%, 11/15/2039 | | | 800,000 | | | | 800,000 | | | | 0.8 | % |
The accompanying notes are an integral part of these financial statements.
Baird Core Intermediate Municipal Bond Fund
Summary Schedule of Investments, December 31, 2016
Long-Term Investments (cont.)
| | | Principal | | | | | | % of | |
| | | Amount | | | Value | | | Net Assets | |
| Ohio Housing Finance Agency | | | | | | | | | |
| 4.000%, 03/01/2047 (Callable 09/01/2025) | | $ | 495,000 | | | $ | 521,695 | | | | 0.5 | % |
| Other Ohio# | | | | | | | 3,421,978 | | | | 3.6 | % |
| Total Ohio | | | | | | | | | | | | |
| (Cost $5,316,706) | | | | | | | 5,241,970 | | | | 5.4 | % |
| Oklahoma | | | | | | | | | | | | |
| Total Oklahoma | | | | | | | | | | | | |
| (Cost $355,907)# | | | | | | | 361,096 | | | | 0.4 | % |
| Pennsylvania | | | | | | | | | | | | |
| Pennsylvania Housing Finance Agency | | | | | | | | | | | | |
| 3.500%, 10/01/2046 (Callable 10/01/2025) | | | 545,000 | | | | 564,702 | | | | 0.6 | % |
| Pennsylvania Turnpike Commission | | | | | | | | | | | | |
| 0.000%-5.000%, 12/01/2023-12/01/2038 | | | 1,003,850 | | | | 1,113,645 | | | | 1.1 | % |
| Other Pennsylvania# | | | | | | | 1,560,993 | | | | 1.6 | % |
| Total Pennsylvania | | | | | | | | | | | | |
| (Cost $3,268,772) | | | | | | | 3,239,340 | | | | 3.3 | % |
| Puerto Rico | | | | | | | | | | | | |
| Puerto Rico Public Finance Corp. | | | | | | | | | | | | |
| 5.500%, 08/01/2027 (ETM)(Insured by AMBAC) | | | 500,000 | | | | 615,065 | | | | 0.6 | % |
| Other Puerto Rico# | | | | | | | 341,954 | | | | 0.4 | % |
| Total Puerto Rico | | | | | | | | | | | | |
| (Cost $985,424) | | | | | | | 957,019 | | | | 1.0 | % |
| Rhode Island | | | | | | | | | | | | |
| Total Rhode Island | | | | | | | | | | | | |
| (Cost $474,642)# | | | | | | | 469,533 | | | | 0.5 | % |
| South Carolina | | | | | | | | | | | | |
| Scago Educational Facilities Corp. for Union School District | | | | | | | | | | | | |
| 5.000%, 12/01/2023 (Insured by BAM) | | | 500,000 | | | | 570,305 | | | | 0.6 | % |
| Other South Carolina# | | | | | | | 814,705 | | | | 0.8 | % |
| Total South Carolina | | | | | | | | | | | | |
| (Cost $1,385,437) | | | | | | | 1,385,010 | | | | 1.4 | % |
| South Dakota | | | | | | | | | | | | |
| Total South Dakota | | | | | | | | | | | | |
| (Cost $355,045)# | | | | | | | 356,187 | | | | 0.4 | % |
| Tennessee | | | | | | | | | | | | |
| Total Tennessee | | | | | | | | | | | | |
| (Cost $776,800)# | | | | | | | 765,433 | | | | 0.8 | % |
| Texas | | | | | | | | | | | | |
| Mesquite Independent School District | | | | | | | | | | | | |
| 5.000%, 08/15/2029 | | | | | | | | | | | | |
| (Callable 08/15/2025)(PSF Guaranteed) | | | 500,000 | | | | 584,055 | | | | 0.6 | % |
The accompanying notes are an integral part of these financial statements.
Baird Core Intermediate Municipal Bond Fund
Summary Schedule of Investments, December 31, 2016
Long-Term Investments (cont.)
| | | Principal | | | | | | % of | |
| | | Amount | | | Value | | | Net Assets | |
| North Texas Tollway Authority | | | | | | | | | |
| 5.000%, 01/01/2033 | | $ | 675,000 | | | $ | 767,563 | | | | 0.8 | % |
| 0.000%-5.000%, 01/01/2024-09/01/2043 | | | 375,000 | | | | 390,515 | | | | 0.4 | % |
| Washington County Junior College District | | | | | | | | | | | | |
| 5.000%, 10/01/2028 | | | | | | | | | | | | |
| (Callable 04/01/2026)(Insured by BAM) | | | 500,000 | | | | 582,780 | | | | 0.6 | % |
| Other Texas# | | | | | | | 6,397,232 | | | | 6.5 | % |
| Total Texas | | | | | | | | | | | | |
| (Cost $8,827,443) | | | | | | | 8,722,145 | | | | 8.9 | % |
| Utah | | | | | | | | | | | | |
| Utah Housing Corp. | | | | | | | | | | | | |
| 4.000%, 01/01/2045 (Callable 01/01/2026) | | | 485,000 | | | | 509,977 | | | | 0.5 | % |
| Other Utah# | | | | | | | 188,966 | | | | 0.2 | % |
| Total Utah | | | | | | | | | | | | |
| (Cost $707,810) | | | | | | | 698,943 | | | | 0.7 | % |
| Virgin Islands | | | | | | | | | | | | |
| Total Virgin Islands | | | | | | | | | | | | |
| (Cost $441,244)# | | | | | | | 430,388 | | | | 0.4 | % |
| Washington | | | | | | | | | | | | |
| State of Washington | | | | | | | | | | | | |
| 5.000%, 02/01/2038 (Callable 02/01/2024) | | | 645,000 | | | | 724,890 | | | | 0.7 | % |
| Other Washington# | | | | | | | 724,533 | | | | 0.8 | % |
| Total Washington | | | | | | | | | | | | |
| (Cost $1,480,121) | | | | | | | 1,449,423 | | | | 1.5 | % |
| Wisconsin | | | | | | | | | | | | |
| Wisconsin Health & Educational Facilities Authority | | | | | | | | | | | | |
| 5.000%-5.250%, 09/01/2018-10/15/2039 | | $ | 1,500,000 | | | | 1,637,783 | | | | 1.7 | % |
| Other Wisconsin# | | | | | | | 1,826,043 | | | | 1.8 | % |
| Total Wisconsin | | | | | | | | | | | | |
| (Cost $3,518,906) | | | | | | | 3,463,826 | | | | 3.5 | % |
| Total Long-Term Investments | | | | | | | | | | | | |
| (Cost $96,439,654) | | | | | | | 95,581,449 | | | | 97.8 | % |
The accompanying notes are an integral part of these financial statements.
Baird Core Intermediate Municipal Bond Fund
Summary Schedule of Investments, December 31, 2016
Short-Term Investment
| | | | | | | | | % of | |
| | | Shares | | | Value | | | Net Assets | |
| Money Market Mutual Fund | | | | | | | | | |
| Fidelity Institutional Money Market Fund – | | | | | | | | | |
| Government Portfolio, Institutional Class, 0.43%« | | | 1,459,565 | | | $ | 1,459,565 | | | | 1.5 | % |
| Total Short-Term Investment | | | | | | | | | | | | |
| (Cost $1,459,565) | | | | | | | 1,459,565 | | | | 1.5 | % |
| Total Investments | | | | | | | | | | | | |
| (Cost $97,899,219) | | | | | | | 97,041,014 | | | | 99.3 | % |
| Other Assets in Excess of Liabilities | | | | | | | 663,480 | | | | 0.7 | % |
| TOTAL NET ASSETS | | | | | | $ | 97,704,494 | | | | 100.0 | % |
Notes to Summary Schedule of Investments
AGM – Assured Guaranty Municipal
AMBAC – Ambac Assurance Corp.
BAM – Build America Mutual Assurance Co.
ETM – Escrowed to Maturity
PSF – Texas Permanent School Fund
Q-SBLF – Qualified School Building Loan Fund
| (1) | Variable or Floating rate security. Floating rate securities are securities whose yields vary with a designated index rate. These securities’ rates are as of December 31, 2016. |
| (2) | Security or a portion of the security purchased on a when-issued or delayed delivery basis. |
| # | Represents the aggregate value, by category, of securities that are not among the 50 largest holdings and, in total for any issuer, represent 1% or less of net assets. |
| « | 7-Day Yield |
Summary of Fair Value Exposure at December 31, 2016
The Fund has adopted authoritative fair valuation accounting standards which establish a definition of fair value and set out a hierarchy for measuring fair value. These standards require additional disclosures about the various inputs and valuation techniques used to develop the measurements of fair value and a discussion on changes in valuation techniques and related inputs during the period. These standards define fair value as the price that would be received to sell an asset or paid to transfer a liability in an orderly transaction between market participants at the measurement date.
The fair value hierarchy is organized into three levels based upon the assumptions (referred to as “inputs”) used in pricing the asset or liability. These standards state that “observable inputs” reflect the assumptions market participants would use in pricing the asset or liability based on market data obtained from independent sources and “unobservable inputs” reflect an entity’s own assumptions about the assumptions market participants would use in pricing the asset or liability. These inputs are summarized into three broad levels and described below:
Level 1 – | Unadjusted quoted prices in active markets for identical unrestricted securities. |
Level 2 – | Other significant observable inputs (including quoted prices for similar securities, quoted prices in inactive markets, dealer indications, interest rates, yield curves, prepayment speeds, credit risk, default rates, inputs corroborated by observable market data, etc.). |
Level 3 – | Significant unobservable inputs (including the Fund’s own assumptions about the factors that market participants would use in valuing the security) based on the best information available. |
The accompanying notes are an integral part of these financial statements.
Baird Core Intermediate Municipal Bond Fund
Summary Schedule of Investments, December 31, 2016
Summary of Fair Value Exposure at December 31, 2016 (cont.)
The inputs or methodology used for valuing securities are not necessarily an indication of the risk associated with investing in those securities.
The following is a summary of the inputs used to value the Fund’s investments as of December 31, 2016:
| | | Level 1 | | | Level 2 | | | Level 3 | | | Total | |
| Municipal Bonds | | | | | | | | | | | | |
| Municipal Bonds | | $ | — | | | $ | 95,581,449 | | | $ | — | | | $ | 95,581,449 | |
| Total Municipal Bonds | | | — | | | | 95,581,449 | | | | — | | | | 95,581,449 | |
| Short-Term Investment | | | | | | | | | | | | | | | | |
| Money Market Mutual Fund | | | 1,459,565 | | | | — | | | | — | | | | 1,459,565 | |
| Total Short-Term Investment | | | 1,459,565 | | | | — | | | | — | | | | 1,459,565 | |
| Total Investments | | $ | 1,459,565 | | | $ | 95,581,449 | | | $ | — | | | $ | 97,041,014 | |
Changes in valuation techniques may result in transfers into or out of assigned levels within the fair value hierarchy. There were no transfers between Level 1, Level 2 and Level 3 fair value measurements during the reporting period, as compared to their classification from the prior year’s annual report. See the Fund’s valuation policy in Note 2a to the financial statements.
The accompanying notes are an integral part of these financial statements.
Additional Information on Fund Expenses
December 31, 2016 (Unaudited)
As a shareholder of a mutual fund, you incur two types of costs: (1) transaction costs, which may include sales charges (loads) on purchase payments, reinvested dividends, or other distributions; redemption fees; and exchange fees; and (2) ongoing costs, such as management fees; distribution and/or service (12b-1) fees; and other fund expenses. Although the Funds do not charge any sales loads, redemption fees, or other transaction fees, you will be assessed fees for outgoing wire transfers, returned checks and stop payment orders at prevailing rates charged by U.S. Bancorp Fund Services, LLC, the Funds’ transfer agent. If you request that a redemption be made by wire transfer, currently the Funds’ transfer agent charges a $15.00 fee.
This Example is intended to help you understand your ongoing costs (in dollars) of investing in each Fund and to compare these costs with the ongoing costs of investing in other mutual funds. The Example is based on an investment of $1,000 invested at the beginning of the period and held for the entire period (7/1/16 – 12/31/16).
Actual Expenses
The third and fourth columns of the following table provide information about account values based on actual returns and actual expenses. You may use the information in these columns, together with the amount you invested, to estimate the expenses that you paid over the period. Simply divide your account value by $1,000 (for example, an $8,600 account value divided by $1,000 = 8.6), then multiply the result by the number in the fourth column entitled “Expenses Paid During Period’’ to estimate the expenses you paid on your account during this period.
Hypothetical Example for Comparison Purposes
The fifth and sixth columns of the following table provide information about hypothetical account values and hypothetical expenses based on the Funds’ actual expense ratios and an assumed rate of return of 5% per year before expenses, which is not the Funds’ actual return. The hypothetical account values and expenses may not be used to estimate the actual ending account balance or expenses you paid for the period. You may use this information to compare the ongoing costs of investing in the Funds and other mutual funds. To do so, compare this 5% hypothetical example with the 5% hypothetical examples that appear in the shareholder reports of the other mutual funds. Please note that the expenses shown in the table are meant to highlight your ongoing costs only and do not reflect any transactional costs. Therefore, the sixth column of the table (entitled “Expenses Paid During Period”) is useful in comparing ongoing costs only, and will not help you determine the relative total costs of owning different mutual funds. In addition, if these transactional costs were included, your costs could have been higher.
Additional Information on Fund Expenses
December 31, 2016 (Unaudited)
Actual vs. Hypothetical Returns
| | | | | | Hypothetical |
| | | | | | (5% return |
| | | | Actual | before expenses) |
| | Fund’s | Beginning | Ending | Expenses | Ending | Expenses |
| | Annualized | Account | Account | Paid | Account | Paid |
| | Expense | Value | Value | During | Value | During |
| | Ratio(1) | 7/1/16 | 12/31/16 | Period(1) | 12/31/16 | Period(1) |
| Baird Ultra Short | | | | | | |
| Bond Fund | | | | | | |
| Institutional Class | 0.15% | $1,000.00 | $1,006.30 | $0.76 | $1,024.38 | $0.76 |
| Investor Class | 0.40% | $1,000.00 | $1,005.10 | $2.02 | $1,023.13 | $2.03 |
| | | | | | | |
| Baird Short-Term | | | | | | |
| Bond Fund | | | | | | |
| Institutional Class | 0.30% | $1,000.00 | $ 999.20 | $1.51 | $1,023.63 | $1.53 |
| Investor Class | 0.55% | $1,000.00 | $ 997.90 | $2.76 | $1,022.37 | $2.80 |
| | | | | | | |
| Baird Intermediate | | | | | | |
| Bond Fund | | | | | | |
| Institutional Class | 0.30% | $1,000.00 | $ 984.00 | $1.50 | $1,023.63 | $1.53 |
| Investor Class | 0.55% | $1,000.00 | $ 983.30 | $2.74 | $1,022.37 | $2.80 |
| | | | | | | |
| Baird Aggregate | | | | | | |
| Bond Fund | | | | | | |
| Institutional Class | 0.30% | $1,000.00 | $ 979.70 | $1.49 | $1,023.63 | $1.53 |
| Investor Class | 0.55% | $1,000.00 | $ 978.20 | $2.73 | $1,022.37 | $2.80 |
| | | | | | | |
| Baird Core Plus | | | | | | |
| Bond Fund | | | | | | |
| Institutional Class | 0.30% | $1,000.00 | $ 987.00 | $1.50 | $1,023.63 | $1.53 |
| Investor Class | 0.55% | $1,000.00 | $ 985.40 | $2.74 | $1,022.37 | $2.80 |
| | | | | | | |
| Baird Short-Term | | | | | | |
| Municipal Bond Fund | | | | | | |
| Institutional Class | 0.30% | $1,000.00 | $ 989.70 | $1.50 | $1,023.63 | $1.53 |
| Investor Class | 0.55% | $1,000.00 | $ 988.60 | $2.75 | $1,022.37 | $2.80 |
| | | | | | | |
| Baird Quality Intermediate | | | | | | |
| Municipal Bond Fund | | | | | | |
| Institutional Class | 0.30% | $1,000.00 | $ 970.70 | $1.49 | $1,023.63 | $1.53 |
| Investor Class | 0.55% | $1,000.00 | $ 969.20 | $2.72 | $1,022.37 | $2.80 |
| | | | | | | |
| Baird Core Intermediate | | | | | | |
| Municipal Bond Fund | | | | | | |
| Institutional Class | 0.30% | $1,000.00 | $ 972.10 | $1.49 | $1,023.63 | $1.53 |
| Investor Class | 0.55% | $1,000.00 | $ 970.90 | $2.72 | $1,022.37 | $2.80 |
| (1) | Expenses are equal to the Fund’s annualized net expense ratio multiplied by the average account value over the period, 184 days and divided by 366 to reflect the one-half year period. |
Statements of Assets and Liabilities
December 31, 2016
| | | Baird | | | Baird | | | Baird | |
| | | Ultra Short | | | Short-Term | | | Intermediate | |
| | | Bond Fund | | | Bond Fund | | | Bond Fund | |
| ASSETS: | | | | | | | | | |
| Investments, at value | | | | | | | | | |
| (cost $386,790,408, $3,906,907,626, | | | | | | | | | |
| $2,326,397,872, respectively) | | $ | 386,921,306 | | | $ | 3,899,614,407 | | | $ | 2,316,638,431 | |
| Interest receivable | | | 1,853,138 | | | | 24,651,434 | | | | 14,885,668 | |
| Receivable for investments sold | | | 9,962,731 | | | | — | | | | 20 | |
| Receivable for Fund shares sold | | | 1,810,015 | | | | 66,523,028 | | | | 4,304,318 | |
| Uninvested cash | | | — | | | | — | | | | 2,621 | |
| Receivable for Securities Lending | | | — | | | | — | | | | 2,283 | |
| Prepaid expenses and other assets | | | 19 | | | | 68,902 | | | | 256,633 | |
| Total assets | | | 400,547,209 | | | | 3,990,857,771 | | | | 2,336,089,974 | |
| LIABILITIES: | | | | | | | | | | | | |
| Payable for securities purchased | | | 7,990,843 | | | | 112,243,337 | | | | 28,126,190 | |
| Payable for Fund shares repurchased | | | — | | | | 2,048,482 | | | | 173,716 | |
| Payable to Advisor and Distributor, net | | | 50,765 | | | | 1,007,568 | | | | 623,632 | |
| Other liabilities | | | 727 | | | | 1,368,923 | | | | 201 | |
| Total liabilities | | | 8,042,335 | | | | 116,668,310 | | | | 28,923,739 | |
| NET ASSETS | | $ | 392,504,874 | | | $ | 3,874,189,461 | | | $ | 2,307,166,235 | |
| NET ASSETS CONSIST OF: | | | | | | | | | | | | |
| Capital stock | | $ | 392,588,925 | | | $ | 3,880,725,321 | | | $ | 2,316,811,372 | |
| Distributions in excess of | | | | | | | | | | | | |
| net investment income | | | 17,622 | | | | 183,869 | | | | 142,642 | |
| Accumulated net realized | | | | | | | | | | | | |
| gain (loss) on investments sold | | | (232,571 | ) | | | 573,490 | | | | (28,338 | ) |
| Net unrealized appreciation/depreciation | | | | | | | | | | | | |
| on investments | | | 130,898 | | | | (7,293,219 | ) | | | (9,759,441 | ) |
| NET ASSETS | | $ | 392,504,874 | | | $ | 3,874,189,461 | | | $ | 2,307,166,235 | |
| INSTITUTIONAL CLASS SHARES | | | | | | | | | | | | |
| Net Assets | | $ | 387,267,820 | | | $ | 3,769,333,921 | | | $ | 2,209,066,034 | |
| Shares outstanding ($0.01 par value, | | | | | | | | | | | | |
| unlimited shares authorized) | | | 38,605,813 | | | | 390,057,414 | | | | 201,285,688 | |
| Net asset value, offering and | | | | | | | | | | | | |
| redemption price per share | | $ | 10.03 | | | $ | 9.66 | | | $ | 10.97 | |
| INVESTOR CLASS SHARES | | | | | | | | | | | | |
| Net Assets | | $ | 5,237,054 | | | $ | 104,855,540 | | | $ | 98,100,201 | |
| Shares outstanding ($0.01 par value, | | | | | | | | | | | | |
| unlimited shares authorized) | | | 522,193 | | | | 10,851,747 | | | | 8,572,608 | |
| Net asset value, offering and | | | | | | | | | | | | |
| redemption price per share | | $ | 10.03 | | | $ | 9.66 | | | $ | 11.44 | |
The accompanying notes are an integral part of these financial statements.
Statements of Assets and Liabilities
December 31, 2016
| | | Baird | | | Baird | |
| | | Aggregate | | | Core Plus | |
| | | Bond Fund | | | Bond Fund | |
| ASSETS: | | | | | | |
| Investments, at value | | | | | | |
| (cost $10,789,560,019 and | | | | | | |
| $13,017,656,058, respectively) | | $ | 10,698,357,568 | | | $ | 12,924,155,264 | |
| Interest receivable | | | 65,218,482 | | | | 91,235,001 | |
| Receivable for investments sold | | | 1,953 | | | | 124 | |
| Receivable for Fund shares sold | | | 83,099,429 | | | | 152,183,124 | |
| Uninvested cash | | | 79,447 | | | | 1,386,220 | |
| Prepaid expenses and other assets | | | 458,186 | | | | 40,836 | |
| Total assets | | | 10,847,215,065 | | | | 13,169,000,569 | |
| LIABILITIES: | | | | | | | | |
| Payable for securities purchased | | | 256,872,757 | | | | 236,428,029 | |
| Payable for Fund shares repurchased | | | 8,330,009 | | | | 22,584,279 | |
| Payable to Advisor and Distributor, net | | | 2,987,921 | | | | 4,542,400 | |
| Other liabilities | | | 22 | | | | 817 | |
| Total liabilities | | | 268,190,709 | | | | 263,555,525 | |
| NET ASSETS | | $ | 10,579,024,356 | | | $ | 12,905,445,044 | |
| NET ASSETS CONSIST OF: | | | | | | | | |
| Capital stock | | $ | 10,678,193,610 | | | $ | 13,004,316,575 | |
| Distributions in excess of net investment income | | | 547,786 | | | | 835,411 | |
| Accumulated net realized gain on investments sold | | | (8,514,589 | ) | | | (6,206,148 | ) |
| Net unrealized depreciation on investments | | | (91,202,451 | ) | | | (93,500,794 | ) |
| NET ASSETS | | $ | 10,579,024,356 | | | $ | 12,905,445,044 | |
| INSTITUTIONAL CLASS SHARES | | | | | | | | |
| Net Assets | | $ | 9,769,933,336 | | | $ | 10,023,607,537 | |
| Shares outstanding ($0.01 par value, | | | | | | | | |
| unlimited shares authorized) | | | 913,156,998 | | | | 909,048,912 | |
| Net asset value, offering and | | | | | | | | |
| redemption price per share | | $ | 10.70 | | | $ | 11.03 | |
| INVESTOR CLASS SHARES | | | | | | | | |
| Net Assets | | $ | 809,091,020 | | | $ | 2,881,837,507 | |
| Shares outstanding ($0.01 par value, | | | | | | | | |
| unlimited shares authorized) | | | 73,241,436 | | | | 251,464,110 | |
| Net asset value, offering and | | | | | | | | |
| redemption price per share | | $ | 11.05 | | | $ | 11.46 | |
The accompanying notes are an integral part of these financial statements.
Statements of Assets and Liabilities
December 31, 2016
| | | | | | Baird | | | Baird | |
| | | Baird | | | Quality | | | Core | |
| | | Short-Term | | | Intermediate | | | Intermediate | |
| | | Municipal | | | Municipal | | | Municipal | |
| | | Bond Fund | | | Bond Fund | | | Bond Fund | |
| ASSETS: | | | | | | | | | |
| Investments, at value | | | | | | | | | |
| (cost $58,465,579, $1,042,429,844, and | | | | | | | | | |
| $97,899,219, respectively) | | $ | 57,990,773 | | | $ | 1,056,476,046 | | | $ | 97,041,014 | |
| Interest receivable | | | 451,759 | | | | 11,938,357 | | | | 818,963 | |
| Receivable for investments sold | | | — | | | | 10,433,195 | | | | 7,916,435 | |
| Receivable for Fund shares sold | | | 1,013,117 | | | | 5,074,764 | | | | — | |
| Prepaid expenses and other assets | | | — | | | | 8 | | | | — | |
| Total assets | | | 59,455,649 | | | | 1,083,922,370 | | | | 105,776,412 | |
| LIABILITIES: | | | | | | | | | | | | |
| Payable for securities purchased | | | 720,528 | | | | 4,840,905 | | | | 7,861,265 | |
| Payable for Fund shares repurchased | | | 24,878 | | | | 6,416,331 | | | | 103,935 | |
| Payable to Advisor and Distributor, net | | | 16,102 | | | | 380,990 | | | | 22,172 | |
| Accrued expenses and other liabilities | | | 251 | | | | — | | | | 84,546 | |
| Total liabilities | | | 761,759 | | | | 11,638,226 | | | | 8,071,918 | |
| NET ASSETS | | $ | 58,693,890 | | | $ | 1,072,284,144 | | | $ | 97,704,494 | |
| NET ASSETS CONSIST OF: | | | | | | | | | | | | |
| Capital stock | | $ | 59,193,323 | | | $ | 1,064,335,478 | | | $ | 98,866,533 | |
| Accumulated undistributed | | | | | | | | | | | | |
| net investment income | | | | | | | | | | | | |
| (distributions in excess of) | | | 947 | | | | — | | | | 3,148 | |
| Accumulated net realized loss on | | | | | | | | | | | | |
| investments sold | | | (25,574 | ) | | | (6,097,536 | ) | | | (306,982 | ) |
| Net unrealized appreciation/depreciation | | | | | | | | | | | | |
| on investments | | | (474,806 | ) | | | 14,046,202 | | | | (858,205 | ) |
| NET ASSETS | | $ | 58,693,890 | | | $ | 1,072,284,144 | | | $ | 97,704,494 | |
| INSTITUTIONAL CLASS SHARES | | | | | | | | | | | | |
| Net Assets | | $ | 52,363,212 | | | $ | 936,195,743 | | | $ | 96,349,940 | |
| Shares outstanding ($0.01 par value, | | | | | | | | | | | | |
| unlimited shares authorized) | | | 5,250,648 | | | | 81,938,844 | | | | 9,629,893 | |
| Net asset value, offering and | | | | | | | | | | | | |
| redemption price per share | | $ | 9.97 | | | $ | 11.43 | | | $ | 10.01 | |
| INVESTOR CLASS SHARES | | | | | | | | | | | | |
| Net Assets | | $ | 6,330,678 | | | $ | 136,088,401 | | | $ | 1,354,554 | |
| Shares outstanding ($0.01 par value, | | | | | | | | | | | | |
| unlimited shares authorized) | | | 635,537 | | | | 11,641,240 | | | | 135,434 | |
| Net asset value, offering and | | | | | | | | | | | | |
| redemption price per share | | $ | 9.96 | | | $ | 11.69 | | | $ | 10.00 | |
The accompanying notes are an integral part of these financial statements.
Statement of Operations
Year Ended December 31, 2016
| | | Baird | | | Baird | | | Baird | |
| | | Ultra Short | | | Short-Term | | | Intermediate | |
| | | Bond Fund | | | Bond Fund | | | Bond Fund | |
| INVESTMENT INCOME: | | | | | | | | | |
| Interest income, net of paydowns | | $ | 3,014,395 | | | $ | 66,069,273 | | | $ | 52,330,147 | |
| Income from securities lending (Note 6) | | | 1,102 | | | | 124,367 | | | | 115,159 | |
| Other income | | | 593 | | | | 26,490 | | | | 40,603 | |
| Total investment income | | | 3,016,090 | | | | 66,220,130 | | | | 52,485,909 | |
| EXPENSES: | | | | | | | | | | | | |
| Investment advisory fees | | | 627,831 | | | | 8,861,483 | | | | 5,224,454 | |
| Administration fees | | | 125,566 | | | | 1,772,296 | | | | 1,044,891 | |
| Interest Expense (Note 7) | | | 144 | | | | — | | | | — | |
| Distribution expense – | | | | | | | | | | | | |
| Investor Class Shares (Note 8) | | | 6,592 | | | | 175,294 | | | | 258,062 | |
| Total expenses | | | 760,133 | | | | 10,809,073 | | | | 6,527,407 | |
| Fee waiver by Advisor (Note 5) | | | (376,698 | ) | | | — | | | | — | |
| Net expenses | | | 383,435 | | | | 10,809,073 | | | | 6,527,407 | |
| NET INVESTMENT INCOME | | | 2,632,655 | | | | 55,411,057 | | | | 45,958,502 | |
| | | | | | | | | | | | | |
| REALIZED AND UNREALIZED | | | | | | | | | | | | |
| GAIN (LOSS) ON INVESTMENTS: | | | | | | | | | | | | |
| Net realized gain (loss) on investments | | | (78,925 | ) | | | 5,195,831 | | | | 5,900,423 | |
| Change in unrealized | | | | | | | | | | | | |
| appreciation/depreciation on investments | | | 1,107,222 | | | | 15,426,285 | | | | (1,122,437 | ) |
| Net realized and unrealized | | | | | | | | | | | | |
| gain on investments | | | 1,028,297 | | | | 20,622,116 | | | | 4,777,986 | |
| NET INCREASE IN NET ASSETS | | | | | | | | | | | | |
| RESULTING FROM OPERATIONS | | $ | 3,660,952 | | | $ | 76,033,173 | | | $ | 50,736,488 | |
The accompanying notes are an integral part of these financial statements.
Statement of Operations
Year Ended December 31, 2016
| | | Baird | | | Baird | |
| | | Aggregate | | | Core Plus | |
| | | Bond Fund | | | Bond Fund | |
| INVESTMENT INCOME: | | | | | | |
| Interest income, net of paydowns | | $ | 223,879,970 | | | $ | 325,958,961 | |
| Income from securities lending (Note 6) | | | 235,973 | | | | 529,588 | |
| Other income | | | 94,611 | | | | 101,596 | |
| Total investment income | | | 224,210,554 | | | | 326,590,145 | |
| EXPENSES: | | | | | | | | |
| Investment advisory fees | | | 21,945,447 | | | | 28,094,917 | |
| Administration fees | | | 4,389,089 | | | | 5,618,984 | |
| Distribution expense – | | | | | | | | |
| Investor Class Shares (Note 8) | | | 1,498,734 | | | | 6,387,804 | |
| Total expenses | | | 27,833,270 | | | | 40,101,705 | |
| NET INVESTMENT INCOME | | | 196,377,284 | | | | 286,488,440 | |
| | | | | | | | | |
| REALIZED AND UNREALIZED | | | | | | | | |
| GAIN (LOSS) ON INVESTMENTS: | | | | | | | | |
| Net realized gain on investments | | | 32,403,391 | | | | 43,549,062 | |
| Change in unrealized | | | | | | | | |
| appreciation/depreciation on investments | | | (16,871,849 | ) | | | 90,818,651 | |
| Net realized and unrealized gain on investments | | | 15,531,542 | | | | 134,367,713 | |
| NET INCREASE IN NET ASSETS | | | | | | | | |
| RESULTING FROM OPERATIONS | | $ | 211,908,826 | | | $ | 420,856,153 | |
The accompanying notes are an integral part of these financial statements.
Statement of Operations
Year Ended December 31, 2016
| | | | | | Baird | | | Baird | |
| | | Baird | | | Quality | | | Core | |
| | | Short-Term | | | Intermediate | | | Intermediate | |
| | | Municipal | | | Municipal | | | Municipal | |
| | | Bond Fund | | | Bond Fund | | | Bond Fund | |
| INVESTMENT INCOME: | | | | | | | | | |
| Interest income, net of paydowns | | $ | 501,761 | | | $ | 30,020,372 | | | $ | 1,473,180 | |
| Other income | | | 681 | | | | — | | | | 6,921 | |
| Total investment income | | | 502,442 | | | | 30,020,372 | | | | 1,480,101 | |
| EXPENSES: | | | | | | | | | | | | |
| Investment advisory fees | | | 72,028 | | | | 3,013,842 | | | | 176,925 | |
| Administration fees | | | 14,406 | | | | 602,768 | | | | 35,385 | |
| Interest Expense (Note 7) | | | — | | | | — | | | | 1,038 | |
| Distribution expense – | | | | | | | | | | | | |
| Investor Class Shares (Note 8) | | | 2,672 | | | | 390,171 | | | | 1,637 | |
| Total expenses | | | 89,106 | | | | 4,006,781 | | | | 214,985 | |
| NET INVESTMENT INCOME | | | 413,336 | | | | 26,013,591 | | | | 1,265,116 | |
| | | | | | | | | | | | | |
| REALIZED AND UNREALIZED | | | | | | | | | | | | |
| GAIN (LOSS) ON INVESTMENTS: | | | | | | | | | | | | |
| Net realized gain (loss) on investments | | | (14,434 | ) | | | (4,831,770 | ) | | | 117,545 | |
| Change in unrealized | | | | | | | | | | | | |
| depreciation on investments | | | (511,890 | ) | | | (27,953,071 | ) | | | (1,332,991 | ) |
| Net realized and unrealized | | | | | | | | | | | | |
| loss on investments | | | (526,324 | ) | | | (32,784,841 | ) | | | (1,215,446 | ) |
| NET INCREASE (DECREASE) IN NET ASSETS | | | | | | | | | | | | |
| RESULTING FROM OPERATIONS | | $ | (112,988 | ) | | $ | (6,771,250 | ) | | $ | 49,670 | |
The accompanying notes are an integral part of these financial statements.
Statement of Changes in Net Assets
Baird Ultra Short Bond Fund
| | | Year Ended | | | Year Ended | |
| | | December 31, 2016 | | | December 31, 2015 | |
| OPERATIONS: | | | | | | |
| Net investment income | | $ | 2,632,655 | | | $ | 1,199,495 | |
| Net realized gain (loss) on investments | | | (78,925 | ) | | | 20,975 | |
| Change in unrealized appreciation/depreciation | | | | | | | | |
| on investments | | | 1,107,222 | | | | (791,398 | ) |
| Net increase in net assets resulting from operations | | | 3,660,952 | | | | 429,072 | |
| | | | | | | | | |
| CAPITAL SHARE TRANSACTIONS: | | | | | | | | |
| Proceeds from shares sold | | | 414,868,100 | | | | 184,101,859 | |
| Shares issued to holders in | | | | | | | | |
| reinvestment of distributions | | | 2,609,293 | | | | 1,160,831 | |
| Cost of shares redeemed | | | (216,466,024 | ) | | | (79,248,259 | ) |
| Net increase in net assets resulting | | | | | | | | |
| from capital share transactions | | | 201,011,369 | | | | 106,014,431 | |
| | | | | | | | | |
| DISTRIBUTIONS TO | | | | | | | | |
| INSTITUTIONAL CLASS SHAREHOLDERS: | | | | | | | | |
| From net investment income | | | (2,667,617 | ) | | | (1,283,032 | ) |
| Total Distributions | | | (2,667,617 | ) | | | (1,283,032 | ) |
| | | | | | | | | |
| DISTRIBUTIONS TO | | | | | | | | |
| INVESTOR CLASS SHAREHOLDERS: | | | | | | | | |
| From net investment income | | | (23,258 | ) | | | (5,607 | ) |
| Total Distributions | | | (23,258 | ) | | | (5,607 | ) |
| | | | | | | | | |
| TOTAL INCREASE IN NET ASSETS | | | 201,981,446 | | | | 105,154,864 | |
| | | | | | | | | |
| NET ASSETS: | | | | | | | | |
| Beginning of year | | | 190,523,428 | | | | 85,368,564 | |
| End of year (including accumulated | | | | | | | | |
| undistributed net investment income | | | | | | | | |
| of $17,622 and $17,379, respectively) | | $ | 392,504,874 | | | $ | 190,523,428 | |
The accompanying notes are an integral part of these financial statements.
Statement of Changes in Net Assets
Baird Short-Term Bond Fund
| | | Year Ended | | | Year Ended | |
| | | December 31, 2016 | | | December 31, 2015 | |
| OPERATIONS: | | | | | | |
| Net investment income | | $ | 55,411,057 | | | $ | 37,079,091 | |
| Net realized gain on investments | | | 5,195,831 | | | | 4,894,794 | |
| Change in unrealized appreciation/depreciation | | | | | | | | |
| on investments | | | 15,426,285 | | | | (17,981,848 | ) |
| Net increase in net assets resulting from operations | | | 76,033,173 | | | | 23,992,037 | |
| | | | | | | | | |
| CAPITAL SHARE TRANSACTIONS: | | | | | | | | |
| Proceeds from shares sold | | | 2,123,359,734 | | | | 1,344,761,825 | |
| Shares issued to holders in | | | | | | | | |
| reinvestment of distributions | | | 51,203,187 | | | | 39,526,909 | |
| Cost of shares redeemed | | | (1,336,016,853 | ) | | | (1,022,131,532 | ) |
| Net increase in net assets resulting | | | | | | | | |
| from capital share transactions | | | 838,546,068 | | | | 362,157,202 | |
| | | | | | | | | |
| DISTRIBUTIONS TO | | | | | | | | |
| INSTITUTIONAL CLASS SHAREHOLDERS: | | | | | | | | |
| From net investment income | | | (55,717,798 | ) | | | (44,451,797 | ) |
| From net realized gains | | | (282,221 | ) | | | (1,279,663 | ) |
| Total Distributions | | | (56,000,019 | ) | | | (45,731,460 | ) |
| | | | | | | | | |
| DISTRIBUTIONS TO | | | | | | | | |
| INVESTOR CLASS SHAREHOLDERS: | | | | | | | | |
| From net investment income | | | (990,914 | ) | | | (499,196 | ) |
| From net realized gains | | | (8,002 | ) | | | (17,313 | ) |
| Total Distributions | | | (998,916 | ) | | | (516,509 | ) |
| | | | | | | | | |
| TOTAL INCREASE IN NET ASSETS | | | 857,580,306 | | | | 339,901,270 | |
| | | | | | | | | |
| NET ASSETS: | | | | | | | | |
| Beginning of year | | | 3,016,609,155 | | | | 2,676,707,885 | |
| End of year (including accumulated | | | | | | | | |
| undistributed net investment income | | | | | | | | |
| of $183,869 and $202,243, respectively) | | $ | 3,874,189,461 | | | $ | 3,016,609,155 | |
The accompanying notes are an integral part of these financial statements.
Statement of Changes in Net Assets
Baird Intermediate Bond Fund
| | | Year Ended | | | Year Ended | |
| | | December 31, 2016 | | | December 31, 2015 | |
| OPERATIONS: | | | | | | |
| Net investment income | | $ | 45,958,502 | | | $ | 37,098,867 | |
| Net realized gain on investments | | | 5,900,423 | | | | 6,368,705 | |
| Change in unrealized depreciation | | | | | | | | |
| on investments | | | (1,122,437 | ) | | | (29,926,270 | ) |
| Net increase in net assets resulting from operations | | | 50,736,488 | | | | 13,541,302 | |
| | | | | | | | | |
| CAPITAL SHARE TRANSACTIONS: | | | | | | | | |
| Proceeds from shares sold | | | 737,295,663 | | | | 579,672,473 | |
| Shares issued to holders in | | | | | | | | |
| reinvestment of distributions | | | 44,018,187 | | | | 38,528,099 | |
| Cost of shares redeemed | | | (364,012,750 | ) | | | (280,699,940 | ) |
| Net increase in net assets resulting | | | | | | | | |
| from capital share transactions | | | 417,301,100 | | | | 337,500,632 | |
| | | | | | | | | |
| DISTRIBUTIONS TO | | | | | | | | |
| INSTITUTIONAL CLASS SHAREHOLDERS: | | | | | | | | |
| From net investment income | | | (44,572,517 | ) | | | (36,711,858 | ) |
| From net realized gains | | | (4,500,976 | ) | | | (5,444,825 | ) |
| Total Distributions | | | (49,073,493 | ) | | | (42,156,683 | ) |
| | | | | | | | | |
| DISTRIBUTIONS TO | | | | | | | | |
| INVESTOR CLASS SHAREHOLDERS: | | | | | | | | |
| From net investment income | | | (1,932,745 | ) | | | (2,032,634 | ) |
| From net realized gains | | | (192,882 | ) | | | (303,761 | ) |
| Total Distributions | | | (2,125,627 | ) | | | (2,336,395 | ) |
| | | | | | | | | |
| TOTAL INCREASE IN NET ASSETS | | | 416,838,468 | | | | 306,548,856 | |
| | | | | | | | | |
| NET ASSETS: | | | | | | | | |
| Beginning of year | | | 1,890,327,767 | | | | 1,583,778,911 | |
| End of year (including accumulated | | | | | | | | |
| undistributed net investment income | | | | | | | | |
| of $142,642 and $155,059, respectively) | | $ | 2,307,166,235 | | | $ | 1,890,327,767 | |
The accompanying notes are an integral part of these financial statements.
Statement of Changes in Net Assets
Baird Aggregate Bond Fund
| | | Year Ended | | | Year Ended | |
| | | December 31, 2016 | | | December 31, 2015 | |
| OPERATIONS: | | | | | | |
| Net investment income | | $ | 196,377,284 | | | $ | 121,685,194 | |
| Net realized gain on investments | | | 32,403,391 | | | | 21,969,042 | |
| Change in unrealized depreciation on investments | | | (16,871,849 | ) | | | (152,187,244 | ) |
| Net increase (decrease) in net assets | | | | | | | | |
| resulting from operations | | | 211,908,826 | | | | (8,533,008 | ) |
| | | | | | | | | |
| CAPITAL SHARE TRANSACTIONS: | | | | | | | | |
| Proceeds from shares sold | | | 5,417,337,933 | | | | 4,245,682,244 | |
| Shares issued to holders in | | | | | | | | |
| reinvestment of distributions | | | 202,259,552 | | | | 111,982,131 | |
| Cost of shares redeemed | | | (1,765,728,702 | ) | | | (1,155,475,332 | ) |
| Net increase in net assets resulting | | | | | | | | |
| from capital share transactions | | | 3,853,868,783 | | | | 3,202,189,043 | |
| | | | | | | | | |
| DISTRIBUTIONS TO | | | | | | | | |
| INSTITUTIONAL CLASS SHAREHOLDERS: | | | | | | | | |
| From net investment income | | | (201,214,756 | ) | | | (125,932,125 | ) |
| From net realized gains | | | (19,044,575 | ) | | | — | |
| Total Distributions | | | (220,259,331 | ) | | | (125,932,125 | ) |
| | | | | | | | | |
| DISTRIBUTIONS TO | | | | | | | | |
| INVESTOR CLASS SHAREHOLDERS: | | | | | | | | |
| From net investment income | | | (13,013,723 | ) | | | (9,901,008 | ) |
| From net realized gains | | | (1,543,019 | ) | | | — | |
| Total Distributions | | | (14,556,742 | ) | | | (9,901,008 | ) |
| | | | | | | | | |
| TOTAL INCREASE IN NET ASSETS | | | 3,830,961,536 | | | | 3,057,822,902 | |
| | | | | | | | | |
| NET ASSETS: | | | | | | | | |
| Beginning of year | | | 6,748,062,820 | | | | 3,690,239,918 | |
| End of year (including accumulated | | | | | | | | |
| undistributed net investment income | | | | | | | | |
| of $547,786 and $206,498, respectively) | | $ | 10,579,024,356 | | | $ | 6,748,062,820 | |
The accompanying notes are an integral part of these financial statements.
Statement of Changes in Net Assets
Baird Core Plus Bond Fund
| | | Year Ended | | | Year Ended | |
| | | December 31, 2016 | | | December 31, 2015 | |
| OPERATIONS: | | | | | | |
| Net investment income | | $ | 286,488,440 | | | $ | 208,299,299 | |
| Net realized gain on investments | | | 43,549,062 | | | | 33,091,952 | |
| Change in unrealized appreciation/depreciation | | | | | | | | |
| on investments | | | 90,818,651 | | | | (263,684,236 | ) |
| Net increase (decrease) in net assets | | | | | | | | |
| resulting from operations | | | 420,856,153 | | | | (22,292,985 | ) |
| | | | | | | | | |
| CAPITAL SHARE TRANSACTIONS: | | | | | | | | |
| Proceeds from shares sold | | | 5,478,976,936 | | | | 4,831,257,948 | |
| Shares issued to holders in | | | | | | | | |
| reinvestment of distributions | | | 311,703,965 | | | | 220,307,283 | |
| Cost of shares redeemed | | | (2,357,448,098 | ) | | | (2,128,911,254 | ) |
| Net increase in net assets resulting | | | | | | | | |
| from capital share transactions | | | 3,433,232,803 | | | | 2,922,653,977 | |
| | | | | | | | | |
| DISTRIBUTIONS TO | | | | | | | | |
| INSTITUTIONAL CLASS SHAREHOLDERS: | | | | | | | | |
| From net investment income | | | (244,902,899 | ) | | | (177,376,139 | ) |
| From net realized gains | | | (19,110,766 | ) | | | — | |
| Total Distributions | | | (264,013,665 | ) | | | (177,376,139 | ) |
| | | | | | | | | |
| DISTRIBUTIONS TO | | | | | | | | |
| INVESTOR CLASS SHAREHOLDERS: | | | | | | | | |
| From net investment income | | | (62,615,650 | ) | | | (56,262,268 | ) |
| From net realized gains | | | (5,344,093 | ) | | | — | |
| Total Distributions | | | (67,959,743 | ) | | | (56,262,268 | ) |
| | | | | | | | | |
| TOTAL INCREASE IN NET ASSETS | | | 3,522,115,548 | | | | 2,666,722,585 | |
| | | | | | | | | |
| NET ASSETS: | | | | | | | | |
| Beginning of year | | | 9,383,329,496 | | | | 6,716,606,911 | |
| End of year (including accumulated | | | | | | | | |
| undistributed net investment income | | | | | | | | |
| of $835,411 and $396,055, respectively) | | $ | 12,905,445,044 | | | $ | 9,383,329,496 | |
The accompanying notes are an integral part of these financial statements.
Statement of Changes in Net Assets
Baird Short-Term Municipal Bond Fund
| | | | | | August 31, 2015^ | |
| | | Year Ended | | | through | |
| | | December 31, 2016 | | | December 31, 2015 | |
| OPERATIONS: | | | | | | |
| Net investment income | | $ | 413,336 | | | $ | 45,049 | |
| Net realized gain (loss) on investments | | | (14,434 | ) | | | 13,112 | |
| Change in unrealized appreciation/depreciation | | | | | | | | |
| on investments | | | (511,890 | ) | | | 37,084 | |
| Net increase (decrease) in net assets | | | | | | | | |
| resulting from operations | | | (112,988 | ) | | | 95,245 | |
| | | | | | | | | |
| CAPITAL SHARE TRANSACTIONS: | | | | | | | | |
| Proceeds from shares sold | | | 59,918,064 | | | | 12,347,906 | |
| Shares issued to holders in | | | | | | | | |
| reinvestment of distributions | | | 310,787 | | | | 32,065 | |
| Cost of shares redeemed | | | (13,385,694 | ) | | | (13,607 | ) |
| Net increase in net assets resulting | | | | | | | | |
| from capital share transactions | | | 46,843,157 | | | | 12,366,364 | |
| | | | | | | | | |
| DISTRIBUTIONS TO | | | | | | | | |
| INSTITUTIONAL CLASS SHAREHOLDERS: | | | | | | | | |
| From net investment income | | | (404,698 | ) | | | (44,658 | ) |
| From net realized gains | | | (20,120 | ) | | | (10,100 | ) |
| Total Distributions | | | (424,818 | ) | | | (54,758 | ) |
| | | | | | | | | |
| DISTRIBUTIONS TO | | | | | | | | |
| INVESTOR CLASS SHAREHOLDERS: | | | | | | | | |
| From net investment income | | | (15,654 | ) | | | (190 | ) |
| From net realized gains | | | (2,421 | ) | | | (47 | ) |
| Total Distributions | | | (18,075 | ) | | | (237 | ) |
| | | | | | | | | |
| TOTAL INCREASE IN NET ASSETS | | | 46,287,276 | | | | 12,406,614 | |
| | | | | | | | | |
| NET ASSETS: | | | | | | | | |
| Beginning of year | | | 12,406,614 | | | | — | |
| End of year (including accumulated undistributed | | | | | | | | |
| net investment income of $947 and $8,605, respectively) | | $ | 58,693,890 | | | $ | 12,406,614 | |
^ Inception was the close of business on August 31, 2015.
The accompanying notes are an integral part of these financial statements.
Statement of Changes in Net Assets
Baird Quality Intermediate Municipal Bond Fund
| | | Year Ended | | | Year Ended | |
| | | December 31, 2016 | | | December 31, 2015 | |
| OPERATIONS: | | | | | | |
| Net investment income | | $ | 26,013,591 | | | $ | 27,130,248 | |
| Net realized loss on investments | | | (4,831,770 | ) | | | (364,295 | ) |
| Change in unrealized depreciation on investments | | | (27,953,071 | ) | | | (2,897,788 | ) |
| Net increase (decrease) in net assets | | | | | | | | |
| resulting from operations | | | (6,771,250 | ) | | | 23,868,165 | |
| | | | | | | | | |
| CAPITAL SHARE TRANSACTIONS: | | | | | | | | |
| Proceeds from shares sold | | | 393,025,806 | | | | 350,569,939 | |
| Shares issued to holders in | | | | | | | | |
| reinvestment of distributions | | | 23,259,485 | | | | 23,964,903 | |
| Cost of shares redeemed | | | (459,954,332 | ) | | | (328,099,203 | ) |
| Net increase (decrease) in net assets resulting | | | | | | | | |
| from capital share transactions | | | (43,669,041 | ) | | | 46,435,639 | |
| | | | | | | | | |
| DISTRIBUTIONS TO | | | | | | | | |
| INSTITUTIONAL CLASS SHAREHOLDERS: | | | | | | | | |
| From net investment income | | | (23,096,808 | ) | | | (23,455,666 | ) |
| Total Distributions | | | (23,096,808 | ) | | | (23,455,666 | ) |
| | | | | | | | | |
| DISTRIBUTIONS TO | | | | | | | | |
| INVESTOR CLASS SHAREHOLDERS: | | | | | | | | |
| From net investment income | | | (2,962,261 | ) | | | (3,677,285 | ) |
| Total Distributions | | | (2,962,261 | ) | | | (3,677,285 | ) |
| | | | | | | | | |
| TOTAL INCREASE (DECREASE) IN NET ASSETS | | | (76,499,360 | ) | | | 43,170,853 | |
| | | | | | | | | |
| NET ASSETS: | | | | | | | | |
| Beginning of year | | | 1,148,783,504 | | | | 1,105,612,651 | |
| End of year (including accumulated undistributed | | | | | | | | |
| net investment income of $0 and $22,182, respectively) | | $ | 1,072,284,144 | | | $ | 1,148,783,504 | |
The accompanying notes are an integral part of these financial statements.
Statement of Changes in Net Assets
Baird Core Intermediate Municipal Bond Fund
| | | | | | August 31, 2015^ | |
| | | Year Ended | | | through | |
| | | December 31, 2016 | | | December 31, 2015 | |
| OPERATIONS: | | | | | | |
| Net investment income | | $ | 1,265,116 | | | $ | 259,616 | |
| Net realized gain on investments | | | 117,545 | | | | 153,970 | |
| Change in unrealized appreciation/depreciation | | | | | | | | |
| on investments | | | (1,332,991 | ) | | | 474,786 | |
| Net increase in net assets resulting from operations | | | 49,670 | | | | 888,372 | |
| | | | | | | | | |
| CAPITAL SHARE TRANSACTIONS: | | | | | | | | |
| Proceeds from shares sold | | | 66,349,805 | | | | 52,495,493 | |
| Shares issued to holders in | | | | | | | | |
| reinvestment of distributions | | | 808,907 | | | | 126,064 | |
| Cost of shares redeemed | | | (18,776,047 | ) | | | (2,137,689 | ) |
| Net increase in net assets resulting | | | | | | | | |
| from capital share transactions | | | 48,382,665 | | | | 50,483,868 | |
| | | | | | | | | |
| DISTRIBUTIONS TO | | | | | | | | |
| INSTITUTIONAL CLASS SHAREHOLDERS: | | | | | | | | |
| From net investment income | | | (1,251,033 | ) | | | (262,655 | ) |
| From net realized gains | | | (519,478 | ) | | | (46,564 | ) |
| Total Distributions | | | (1,770,511 | ) | | | (309,219 | ) |
| | | | | | | | | |
| DISTRIBUTIONS TO | | | | | | | | |
| INVESTOR CLASS SHAREHOLDERS: | | | | | | | | |
| From net investment income | | | (10,871 | ) | | | (450 | ) |
| From net realized gains | | | (8,868 | ) | | | (162 | ) |
| Total Distributions | | | (19,739 | ) | | | (612 | ) |
| | | | | | | | | |
| TOTAL INCREASE IN NET ASSETS | | | 46,642,085 | | | | 51,062,409 | |
| | | | | | | | | |
| NET ASSETS: | | | | | | | | |
| Beginning of year | | | 51,062,409 | | | | — | |
| End of year (including accumulated undistributed | | | | | | | | |
| net investment income of $3,148 and $0, respectively) | | $ | 97,704,494 | | | $ | 51,062,409 | |
^ Inception was the close of business on August 31, 2015.
The accompanying notes are an integral part of these financial statements.
Financial Highlights
Baird Ultra Short Bond Fund – Institutional Class
| | | Year Ended December 31, | |
| | | 2016 | | | 2015 | | | 2014 | |
| Per Share Data: | | | | | | | | | |
| Net asset value, beginning of year | | $ | 9.98 | | | $ | 10.03 | | | $ | 10.00 | |
| Income from investment operations: | | | | | | | | | | | | |
| Net investment income | | | 0.11 | (1) | | | 0.08 | (1) | | | 0.09 | |
| Net realized and unrealized | | | | | | | | | | | | |
| gains (losses) on investments | | | 0.04 | | | | (0.05 | ) | | | 0.03 | (2) |
| Total from investment operations | | | 0.15 | | | | 0.03 | | | | 0.12 | |
| Less distributions: | | | | | | | | | | | | |
| Distributions from net investment income | | | (0.10 | ) | | | (0.08 | ) | | | (0.09 | ) |
| Total distributions | | | (0.10 | ) | | | (0.08 | ) | | | (0.09 | ) |
| Net asset value, end of year | | $ | 10.03 | | | $ | 9.98 | | | $ | 10.03 | |
| | | | | | | | | | | | | |
| Total return | | | 1.56 | % | | | 0.30 | % | | | 1.21 | % |
| | | | | | | | | | | | | |
| Supplemental data and ratios: | | | | | | | | | | | | |
| Net assets, end of year (millions) | | $ | 387.3 | | | $ | 189.3 | | | $ | 84.5 | |
| Ratio of expenses to average net assets | | | 0.15 | % | | | 0.15 | % | | | 0.15 | % |
| Ratio of expenses to average net assets (before waivers) | | | 0.30 | % | | | 0.30 | % | | | 0.30 | % |
| Ratio of net investment income to average net assets | | | 1.05 | % | | | 0.78 | % | | | 0.93 | % |
| Ratio of net investment income to | | | | | | | | | | | | |
| average net assets (before waivers) | | | 0.90 | % | | | 0.63 | % | | | 0.78 | % |
Portfolio turnover rate(3) | | | 96.9 | % | | | 65.5 | % | | | 57.6 | % |
| (1) | Calculated using average shares outstanding during the year. |
| (2) | Due to timing of capital share transactions, the per share amount of net realized and unrealized gain (loss) on investments varies from the amounts shown in the statement of operations. |
| (3) | Portfolio turnover is calculated on the basis of the Fund as a whole without distinguishing between the classes of shares issued. |
The accompanying notes are an integral part of these financial statements.
Financial Highlights
Baird Ultra Short Bond Fund – Investor Class
| | | Year Ended December 31, | |
| | | 2016 | | | 2015 | | | 2014 | |
| Per Share Data: | | | | | | | | | |
| Net asset value, beginning of year | | $ | 9.98 | | | $ | 10.02 | | | $ | 10.00 | |
| Income from investment operations: | | | | | | | | | | | | |
| Net investment income | | | 0.08 | (1) | | | 0.05 | (1) | | | 0.07 | |
| Net realized and unrealized | | | | | | | | | | | | |
| gains (losses) on investments | | | 0.05 | | | | (0.03 | ) | | | 0.02 | (2) |
| Total from investment operations | | | 0.13 | | | | 0.02 | | | | 0.09 | |
| Less distributions: | | | | | | | | | | | | |
| Distributions from net investment income | | | (0.08 | ) | | | (0.06 | ) | | | (0.07 | ) |
| Total distributions | | | (0.08 | ) | | | (0.06 | ) | | | (0.07 | ) |
| Net asset value, end of year | | $ | 10.03 | | | $ | 9.98 | | | $ | 10.02 | |
| | | | | | | | | | | | | |
| Total return | | | 1.32 | % | | | 0.16 | % | | | 0.88 | % |
| | | | | | | | | | | | | |
| Supplemental data and ratios: | | | | | | | | | | | | |
| Net assets, end of year (millions) | | $ | 5.2 | | | $ | 1.2 | | | $ | 0.9 | |
| Ratio of expenses to average net assets | | | 0.40 | % | | | 0.40 | % | | | 0.40 | % |
| Ratio of expenses to average net assets (before waivers) | | | 0.55 | % | | | 0.55 | % | | | 0.55 | % |
| Ratio of net investment income to average net assets | | | 0.80 | % | | | 0.53 | % | | | 0.68 | % |
| Ratio of net investment income to | | | | | | | | | | | | |
| average net assets (before waivers) | | | 0.65 | % | | | 0.38 | % | | | 0.53 | % |
Portfolio turnover rate(3) | | | 96.9 | % | | | 65.5 | % | | | 57.6 | % |
| (1) | Calculated using average shares outstanding during the year. |
| (2) | Due to timing of capital share transactions, the per share amount of net realized and unrealized gain (loss) on investments varies from the amounts shown in the statement of operations. |
| (3) | Portfolio turnover is calculated on the basis of the Fund as a whole without distinguishing between the classes of shares issued. |
The accompanying notes are an integral part of these financial statements.
Financial Highlights
Baird Short-Term Bond Fund – Institutional Class
| | | Year Ended December 31, | |
| | | 2016 | | | 2015 | | | 2014 | | | 2013 | | | 2012 | |
| Per Share Data: | | | | | | | | | | | | | | | |
| Net asset value, beginning of year | | $ | 9.60 | | | $ | 9.67 | | | $ | 9.69 | | | $ | 9.75 | | | $ | 9.59 | |
| Income from investment operations: | | | | | | | | | | | | | | | | | | | | |
| Net investment income | | | 0.15 | (1) | | | 0.13 | (1) | | | 0.16 | | | | 0.17 | (1) | | | 0.22 | |
| Net realized and unrealized | | | | | | | | | | | | | | | | | | | | |
| gains (losses) on investments | | | 0.06 | | | | (0.05 | ) | | | (0.01 | ) | | | (0.04 | ) | | | 0.17 | |
| Total from investment operations | | | 0.21 | | | | 0.08 | | | | 0.15 | | | | 0.13 | | | | 0.39 | |
| Less distributions: | | | | | | | | | | | | | | | | | | | | |
| Distributions from | | | | | | | | | | | | | | | | | | | | |
| net investment income | | | (0.15 | ) | | | (0.15 | ) | | | (0.16 | ) | | | (0.17 | ) | | | (0.22 | ) |
| Distributions from net realized gains | | | (0.00 | )(2) | | | (0.00 | )(2) | | | (0.01 | ) | | | (0.02 | ) | | | (0.01 | ) |
| Total distributions | | | (0.15 | ) | | | (0.15 | ) | | | (0.17 | ) | | | (0.19 | ) | | | (0.23 | ) |
| Net asset value, end of year | | $ | 9.66 | | | $ | 9.60 | | | $ | 9.67 | | | $ | 9.69 | | | $ | 9.75 | |
| | | | | | | | | | | | | | | | | | | | | |
| Total return | | | 2.25 | % | | | 0.89 | % | | | 1.49 | % | | | 1.33 | % | | | 4.16 | % |
| | | | | | | | | | | | | | | | | | | | | |
| Supplemental data and ratios: | | | | | | | | | | | | | | | | | | | | |
| Net assets, end of year (millions) | | $ | 3,769.3 | | | $ | 2,976.0 | | | $ | 2,640.9 | | | $ | 1,985.0 | | | $ | 1,295.7 | |
| Ratio of expenses to average net assets | | | 0.30 | % | | | 0.30 | % | | | 0.30 | % | | | 0.30 | % | | | 0.30 | % |
| Ratio of net investment income | | | | | | | | | | | | | | | | | | | | |
| to average net assets | | | 1.57 | % | | | 1.30 | % | | | 1.56 | % | | | 1.71 | % | | | 2.23 | % |
Portfolio turnover rate(3) | | | 44.0 | % | | | 37.8 | % | | | 51.2 | % | | | 45.1 | % | | | 40.1 | % |
| (1) | Calculated using average shares outstanding during the year. |
| (2) | Amount is less than $0.005. |
| (3) | Portfolio turnover is calculated on the basis of the Fund as a whole without distinguishing between the classes of shares issued. |
The accompanying notes are an integral part of these financial statements.
Financial Highlights
Baird Short-Term Bond Fund – Investor Class
| | | | | | | | | | | | | | | September 19, | |
| | | | | | | | | | | | | | | 2012^ | |
| | | | | | | | | | | | | | | through | |
| | | Year Ended December 31, | | | December 31, | |
| | | 2016 | | | 2015 | | | 2014 | | | 2013 | | | 2012 | |
| Per Share Data: | | | | | | | | | | | | | | | |
| Net asset value, beginning of period | | $ | 9.60 | | | $ | 9.67 | | | $ | 9.69 | | | $ | 9.75 | | | $ | 9.77 | |
| Income from investment operations: | | | | | | | | | | | | | | | | | | | | |
| Net investment income | | | 0.13 | (1) | | | 0.10 | (1) | | | 0.14 | | | | 0.15 | (1) | | | 0.06 | |
| Net realized and unrealized | | | | | | | | | | | | | | | | | | | | |
| gains (losses) on investments | | | 0.06 | | | | (0.04 | ) | | | (0.02 | ) | | | (0.04 | ) | | | 0.00 | (2) |
| Total from investment operations | | | 0.19 | | | | 0.06 | | | | 0.12 | | | | 0.11 | | | | 0.06 | |
| Less distributions: | | | | | | | | | | | | | | | | | | | | |
| Distributions from net | | | | | | | | | | | | | | | | | | | | |
| investment income | | | (0.13 | ) | | | (0.13 | ) | | | (0.13 | ) | | | (0.15 | ) | | | (0.07 | ) |
| Distributions from net realized gains | | | (0.00 | )(2) | | | (0.00 | )(2) | | | (0.01 | ) | | | (0.02 | ) | | | (0.01 | ) |
| Total distributions | | | (0.13 | ) | | | (0.13 | ) | | | (0.14 | ) | | | (0.17 | ) | | | (0.08 | ) |
| Net asset value, end of period | | $ | 9.66 | | | $ | 9.60 | | | $ | 9.67 | | | $ | 9.69 | | | $ | 9.75 | |
| | | | | | | | | | | | | | | | | | | | | |
| Total return | | | 2.00 | % | | | 0.64 | % | | | 1.25 | % | | | 1.11 | % | | | 0.68 | %(3) |
| | | | | | | | | | | | | | | | | | | | | |
| Supplemental data and ratios: | | | | | | | | | | | | | | | | | | | | |
| Net assets, end of period (millions) | | $ | 104.9 | | | $ | 40.6 | | | $ | 35.8 | | | $ | 2.5 | | | $ | 1.5 | |
| Ratio of expenses to average net assets | | | 0.55 | % | | | 0.55 | % | | | 0.55 | % | | | 0.55 | % | | | 0.55 | %(4) |
| Ratio of net investment income | | | | | | | | | | | | | | | | | | | | |
| to average net assets | | | 1.32 | % | | | 1.05 | % | | | 1.31 | % | | | 1.46 | % | | | 1.98 | %(4) |
Portfolio turnover rate(5) | | | 44.0 | % | | | 37.8 | % | | | 51.2 | % | | | 45.1 | % | | | 40.1 | %(3) |
| ^ | Inception date. |
| (1) | Calculated using average shares outstanding during the period. |
| (2) | Amount is less than $0.005. |
| (3) | Not annualized. |
| (4) | Annualized. |
| (5) | Portfolio turnover is calculated on the basis of the Fund as a whole without distinguishing between the classes of shares issued. |
The accompanying notes are an integral part of these financial statements.
Financial Highlights
Baird Intermediate Bond Fund – Institutional Class
| | | Year Ended December 31, | |
| | | 2016 | | | 2015 | | | 2014 | | | 2013 | | | 2012 | |
| Per Share Data: | | | | | | | | | | | | | | | |
| Net asset value, beginning of year | | $ | 10.93 | | | $ | 11.10 | | | $ | 11.00 | | | $ | 11.31 | | | $ | 11.06 | |
| Income from investment operations: | | | | | | | | | | | | | | | | | | | | |
| Net investment income | | | 0.25 | (1) | | | 0.24 | (1) | | | 0.26 | (1) | | | 0.27 | | | | 0.33 | (1) |
| Net realized and unrealized | | | | | | | | | | | | | | | | | | | | |
| gains (losses) on investments | | | 0.06 | | | | (0.13 | ) | | | 0.13 | | | | (0.29 | ) | | | 0.38 | |
| Total from investment operations | | | 0.31 | | | | 0.11 | | | | 0.39 | | | | (0.02 | ) | | | 0.71 | |
| Less distributions: | | | | | | | | | | | | | | | | | | | | |
| Distributions from | | | | | | | | | | | | | | | | | | | | �� |
| net investment income | | | (0.25 | ) | | | (0.25 | ) | | | (0.27 | ) | | | (0.27 | ) | | | (0.33 | ) |
| Distributions from net realized gains | | | (0.02 | ) | | | (0.03 | ) | | | (0.02 | ) | | | (0.02 | ) | | | (0.13 | ) |
| Total distributions | | | (0.27 | ) | | | (0.28 | ) | | | (0.29 | ) | | | (0.29 | ) | | | (0.46 | ) |
| Net asset value, end of year | | $ | 10.97 | | | $ | 10.93 | | | $ | 11.10 | | | $ | 11.00 | | | $ | 11.31 | |
| | | | | | | | | | | | | | | | | | | | | |
| Total return | | | 2.83 | % | | | 0.99 | % | | | 3.50 | % | | | (0.17 | )% | | | 6.52 | % |
| | | | | | | | | | | | | | | | | | | | | |
| Supplemental data and ratios: | | | | | | | | | | | | | | | | | | | | |
| Net assets, end of year (millions) | | $ | 2,209.1 | | | $ | 1,787.0 | | | $ | 1,468.2 | | | $ | 1,113.7 | | | $ | 867.5 | |
| Ratio of expenses to average net assets | | | 0.30 | % | | | 0.30 | % | | | 0.30 | % | | | 0.30 | % | | | 0.30 | % |
| Ratio of net investment income | | | | | | | | | | | | | | | | | | | | |
| to average net assets | | | 2.21 | % | | | 2.14 | % | | | 2.37 | % | | | 2.45 | % | | | 2.95 | % |
Portfolio turnover rate(2) | | | 30.1 | % | | | 39.0 | % | | | 29.2 | % | | | 45.1 | % | | | 45.1 | % |
| (1) | Calculated using average shares outstanding during the year. |
| (2) | Portfolio turnover is calculated on the basis of the Fund as a whole without distinguishing between the classes of shares issued. |
The accompanying notes are an integral part of these financial statements.
Financial Highlights
Baird Intermediate Bond Fund – Investor Class
| | | Year Ended December 31, | |
| | | 2016 | | | 2015 | | | 2014 | | | 2013 | | | 2012 | |
| Per Share Data: | | | | | | | | | | | | | | | |
| Net asset value, beginning of year | | $ | 11.39 | | | $ | 11.56 | | | $ | 11.43 | | | $ | 11.74 | | | $ | 11.47 | |
| Income from investment operations: | | | | | | | | | | | | | | | | | | | | |
| Net investment income | | | 0.23 | (1) | | | 0.22 | (1) | | | 0.25 | (1) | | | 0.25 | | | | 0.32 | (1) |
| Net realized and unrealized | | | | | | | | | | | | | | | | | | | | |
| gains (losses) on investments | | | 0.06 | | | | (0.14 | ) | | | 0.14 | | | | (0.29 | ) | | | 0.39 | |
| Total from investment operations | | | 0.29 | | | | 0.08 | | | | 0.39 | | | | (0.04 | ) | | | 0.71 | |
| Less distributions: | | | | | | | | | | | | | | | | | | | | |
| Distributions from | | | | | | | | | | | | | | | | | | | | |
| net investment income | | | (0.22 | ) | | | (0.22 | ) | | | (0.24 | ) | | | (0.25 | ) | | | (0.31 | ) |
| Distributions from net realized gains | | | (0.02 | ) | | | (0.03 | ) | | | (0.02 | ) | | | (0.02 | ) | | | (0.13 | ) |
| Total distributions | | | (0.24 | ) | | | (0.25 | ) | | | (0.26 | ) | | | (0.27 | ) | | | (0.44 | ) |
| Net asset value, end of year | | $ | 11.44 | | | $ | 11.39 | | | $ | 11.56 | | | $ | 11.43 | | | $ | 11.74 | |
| | | | | | | | | | | | | | | | | | | | | |
| Total return | | | 2.55 | % | | | 0.79 | % | | | 3.29 | % | | | (0.41 | )% | | | 6.20 | % |
| | | | | | | | | | | | | | | | | | | | | |
| Supplemental data and ratios: | | | | | | | | | | | | | | | | | | | | |
| Net assets, end of year (millions) | | $ | 98.1 | | | $ | 103.4 | | | $ | 115.6 | | | $ | 42.1 | | | $ | 26.7 | |
| Ratio of expenses to average net assets | | | 0.55 | % | | | 0.55 | % | | | 0.55 | % | | | 0.55 | % | | | 0.55 | % |
| Ratio of net investment income | | | | | | | | | | | | | | | | | | | | |
| to average net assets | | | 1.96 | % | | | 1.89 | % | | | 2.12 | % | | | 2.20 | % | | | 2.70 | % |
Portfolio turnover rate(2) | | | 30.1 | % | | | 39.0 | % | | | 29.2 | % | | | 45.1 | % | | | 45.1 | % |
| (1) | Calculated using average shares outstanding during the year. |
| (2) | Portfolio turnover is calculated on the basis of the Fund as a whole without distinguishing between the classes of shares issued. |
The accompanying notes are an integral part of these financial statements.
Financial Highlights
Baird Aggregate Bond Fund – Institutional Class
| | | Year Ended December 31, | |
| | | 2016 | | | 2015 | | | 2014 | | | 2013 | | | 2012 | |
| Per Share Data: | | | | | | | | | | | | | | | |
| Net asset value, beginning of year | | $ | 10.61 | | | $ | 10.81 | | | $ | 10.41 | | | $ | 10.89 | | | $ | 10.65 | |
| Income from investment operations: | | | | | | | | | | | | | | | | | | | | |
| Net investment income | | | 0.25 | (1) | | | 0.24 | (1) | | | 0.30 | (2) | | | 0.32 | (1) | | | 0.38 | (1) |
| Net realized and unrealized | | | | | | | | | | | | | | | | | | | | |
| gains (losses) on investments | | | 0.12 | | | | (0.18 | ) | | | 0.41 | | | | (0.45 | ) | | | 0.45 | |
| Total from investment operations | | | 0.37 | | | | 0.06 | | | | 0.71 | | | | (0.13 | ) | | | 0.83 | |
| Less distributions: | | | | | | | | | | | | | | | | | | | | |
| Distributions from net investment income | | | (0.26 | ) | | | (0.26 | ) | | | (0.31 | ) | | | (0.35 | ) | | | (0.43 | ) |
| Distributions from net realized gains | | | (0.02 | ) | | | — | | | | — | | | | — | | | | (0.16 | ) |
| Total distributions | | | (0.28 | ) | | | (0.26 | ) | | | (0.31 | ) | | | (0.35 | ) | | | (0.59 | ) |
| Net asset value, end of year | | $ | 10.70 | | | $ | 10.61 | | | $ | 10.81 | | | $ | 10.41 | | | $ | 10.89 | |
| | | | | | | | | | | | | | | | | | | | | |
| Total return | | | 3.52 | % | | | 0.55 | % | | | 6.89 | % | | | (1.25 | )% | | | 7.92 | % |
| | | | | | | | | | | | | | | | | | | | | |
| Supplemental data and ratios: | | | | | | | | | | | | | | | | | | | | |
| Net assets, end of year (millions) | | $ | 9,769.9 | | | $ | 6,318.4 | | | $ | 3,448.6 | | | $ | 1,665.0 | | | $ | 1,495.4 | |
| Ratio of expenses to average net assets | | | 0.30 | % | | | 0.30 | % | | | 0.30 | % | | | 0.30 | % | | | 0.30 | % |
| Ratio of net investment income | | | | | | | | | | | | | | | | | | | | |
| to average net assets | | | 2.25 | % | | | 2.24 | % | | | 2.81 | % | | | 3.01 | % | | | 3.51 | % |
Portfolio turnover rate(3) | | | 35.7 | % | | | 39.6 | % | | | 32.1 | % | | | 28.4 | % | | | 64.4 | % |
| (1) | Calculated using average shares outstanding during the year. |
| (2) | Net investment income per share is calculated using ending balance prior to consideration of adjustments for permanent book and tax differences. |
| (3) | Portfolio turnover is calculated on the basis of the Fund as a whole without distinguishing between the classes of shares issued. |
The accompanying notes are an integral part of these financial statements.
Financial Highlights
Baird Aggregate Bond Fund – Investor Class
| | | Year Ended December 31, | |
| | | 2016 | | | 2015 | | | 2014 | | | 2013 | | | 2012 | |
| Per Share Data: | | | | | | | | | | | | | | | |
| Net asset value, beginning of year | | $ | 10.94 | | | $ | 11.15 | | | $ | 10.72 | | | $ | 11.21 | | | $ | 10.94 | |
| Income from investment operations: | | | | | | | | | | | | | | | | | | | | |
| Net investment income | | | 0.23 | (1) | | | 0.22 | (1) | | | 0.28 | (2) | | | 0.29 | (1) | | | 0.37 | (1) |
| Net realized and unrealized | | | | | | | | | | | | | | | | | | | | |
| gains (losses) on investments | | | 0.14 | | | | (0.20 | ) | | | 0.43 | | | | (0.46 | ) | | | 0.46 | |
| Total from investment operations | | | 0.37 | | | | 0.02 | | | | 0.71 | | | | (0.17 | ) | | | 0.83 | |
| Less distributions: | | | | | | | | | | | | | | | | | | | | |
| Distributions from net investment income | | | (0.24 | ) | | | (0.23 | ) | | | (0.28 | ) | | | (0.32 | ) | | | (0.40 | ) |
| Distributions from net realized gains | | | (0.02 | ) | | | — | | | | — | | | | — | | | | (0.16 | ) |
| Total distributions | | | (0.26 | ) | | | (0.23 | ) | | | (0.28 | ) | | | (0.32 | ) | | | (0.56 | ) |
| Net asset value, end of year | | $ | 11.05 | | | $ | 10.94 | | | $ | 11.15 | | | $ | 10.72 | | | $ | 11.21 | |
| | | | | | | | | | | | | | | | | | | | | |
| Total return | | | 3.34 | % | | | 0.21 | % | | | 6.71 | % | | | (1.54 | )% | | | 7.72 | % |
| | | | | | | | | | | | | | | | | | | | | |
| Supplemental data and ratios: | | | | | | | | | | | | | | | | | | | | |
| Net assets, end of year (millions) | | $ | 809.1 | | | $ | 429.6 | | | $ | 241.7 | | | $ | 141.9 | | | $ | 49.4 | |
| Ratio of expenses to average net assets | | | 0.55 | % | | | 0.55 | % | | | 0.55 | % | | | 0.55 | % | | | 0.55 | % |
| Ratio of net investment income | | | | | | | | | | | | | | | | | | | | |
| to average net assets | | | 2.00 | % | | | 1.99 | % | | | 2.56 | % | | | 2.76 | % | | | 3.26 | % |
Portfolio turnover rate(3) | | | 35.7 | % | | | 39.6 | % | | | 32.1 | % | | | 28.4 | % | | | 64.4 | % |
| (1) | Calculated using average shares outstanding during the year. |
| (2) | Net investment income per share is calculated using ending balance prior to consideration of adjustments for permanent book and tax differences. |
| (3) | Portfolio turnover is calculated on the basis of the Fund as a whole without distinguishing between the classes of shares issued. |
The accompanying notes are an integral part of these financial statements.
Financial Highlights
Baird Core Plus Bond Fund – Institutional Class
| | | Year Ended December 31, | |
| | | 2016 | | | 2015 | | | 2014 | | | 2013 | | | 2012 | |
| Per Share Data: | | | | | | | | | | | | | | | |
| Net asset value, beginning of year | | $ | 10.85 | | | $ | 11.14 | | | $ | 10.77 | | | $ | 11.27 | | | $ | 10.82 | |
| Income from investment operations: | | | | | | | | | | | | | | | | | | | | |
| Net investment income | | | 0.29 | (1) | | | 0.28 | (1) | | | 0.32 | (2) | | | 0.31 | (2) | | | 0.35 | (1) |
| Net realized and unrealized | | | | | | | | | | | | | | | | | | | | |
| gains (losses) on investments | | | 0.22 | | | | (0.26 | ) | | | 0.38 | | | | (0.46 | ) | | | 0.50 | |
| Total from investment operations | | | 0.51 | | | | 0.02 | | | | 0.70 | | | | (0.15 | ) | | | 0.85 | |
| Less distributions: | | | | | | | | | | | | | | | | | | | | |
| Distributions from net investment income | | | (0.31 | ) | | | (0.31 | ) | | | (0.33 | ) | | | (0.34 | ) | | | (0.38 | ) |
| Distributions from net realized gains | | | (0.02 | ) | | | — | | | | — | | | | (0.01 | ) | | | (0.02 | ) |
| Total distributions | | | (0.33 | ) | | | (0.31 | ) | | | (0.33 | ) | | | (0.35 | ) | | | (0.40 | ) |
| Net asset value, end of year | | $ | 11.03 | | | $ | 10.85 | | | $ | 11.14 | | | $ | 10.77 | | | $ | 11.27 | |
| | | | | | | | | | | | | | | | | | | | | |
| Total return | | | 4.73 | % | | | 0.14 | % | | | 6.59 | % | | | (1.32 | )% | | | 7.95 | % |
| | | | | | | | | | | | | | | | | | | | | |
| Supplemental data and ratios: | | | | | | | | | | | | | | | | | | | | |
| Net assets, end of year (millions) | | $ | 10,023.6 | | | $ | 7,199.8 | | | $ | 4,520.9 | | | $ | 1,789.7 | | | $ | 1,573.4 | |
| Ratio of expenses to average net assets | | | 0.30 | % | | | 0.30 | % | | | 0.30 | % | | | 0.30 | % | | | 0.30 | % |
| Ratio of net investment income | | | | | | | | | | | | | | | | | | | | |
| to average net assets | | | 2.61 | % | | | 2.50 | % | | | 2.89 | % | | | 2.83 | % | | | 3.12 | % |
Portfolio turnover rate(3) | | | 33.2 | % | | | 34.2 | % | | | 35.0 | % | | | 35.5 | % | | | 36.7 | % |
| (1) | Calculated using average shares outstanding during the year. |
| (2) | Net investment income per share is calculated using ending balance prior to consideration of adjustments for permanent book and tax differences. |
| (3) | Portfolio turnover is calculated on the basis of the Fund as a whole without distinguishing between the classes of shares issued. |
The accompanying notes are an integral part of these financial statements.
Financial Highlights
Baird Core Plus Bond Fund – Investor Class
| | | Year Ended December 31, | |
| | | 2016 | | | 2015 | | | 2014 | | | 2013 | | | 2012 | |
| Per Share Data: | | | | | | | | | | | | | | | |
| Net asset value, beginning of year | | $ | 11.26 | | | $ | 11.55 | | | $ | 11.16 | | | $ | 11.67 | | | $ | 11.18 | |
| Income from investment operations: | | | | | | | | | | | | | | | | | | | | |
| Net investment income | | | 0.27 | (1) | | | 0.26 | (1) | | | 0.29 | (2) | | | 0.29 | (2) | | | 0.33 | (1) |
| Net realized and unrealized | | | | | | | | | | | | | | | | | | | | |
| gains (losses) on investments | | | 0.23 | | | | (0.27 | ) | | | 0.40 | | | | (0.48 | ) | | | 0.53 | |
| Total from investment operations | | | 0.50 | | | | (0.01 | ) | | | 0.69 | | | | (0.19 | ) | | | 0.86 | |
| Less distributions: | | | | | | | | | | | | | | | | | | | | |
| Distributions from net investment income | | | (0.28 | ) | | | (0.28 | ) | | | (0.30 | ) | | | (0.31 | ) | | | (0.35 | ) |
| Distributions from net realized gains | | | (0.02 | ) | | | — | | | | — | | | | (0.01 | ) | | | (0.02 | ) |
| Total distributions | | | (0.30 | ) | | | (0.28 | ) | | | (0.30 | ) | | | (0.32 | ) | | | (0.37 | ) |
| Net asset value, end of year | | $ | 11.46 | | | $ | 11.26 | | | $ | 11.55 | | | $ | 11.16 | | | $ | 11.67 | |
| | | | | | | | | | | | | | | | | | | | | |
| Total return | | | 4.47 | % | | | (0.11 | )% | | | 6.27 | % | | | (1.61 | )% | | | 7.80 | % |
| | | | | | | | | | | | | | | | | | | | | |
| Supplemental data and ratios: | | | | | | | | | | | | | | | | | | | | |
| Net assets, end of year (millions) | | $ | 2,881.8 | | | $ | 2,183.5 | | | $ | 2,195.7 | | | $ | 1,044.1 | | | $ | 1,036.0 | |
| Ratio of expenses to average net assets | | | 0.55 | % | | | 0.55 | % | | | 0.55 | % | | | 0.55 | % | | | 0.55 | % |
| Ratio of net investment income | | | | | | | | | | | | | | | | | | | | |
| to average net assets | | | 2.36 | % | | | 2.25 | % | | | 2.64 | % | | | 2.58 | % | | | 2.87 | % |
Portfolio turnover rate(3) | | | 33.2 | % | | | 34.2 | % | | | 35.0 | % | | | 35.5 | % | | | 36.7 | % |
| (1) | Calculated using average shares outstanding during the year. |
| (2) | Net investment income per share is calculated using ending balance prior to consideration of adjustments for permanent book and tax differences. |
| (3) | Portfolio turnover is calculated on the basis of the Fund as a whole without distinguishing between the classes of shares issued. |
The accompanying notes are an integral part of these financial statements.
Financial Highlights
Baird Short-Term Municipal Bond Fund – Institutional Class
| | | Year Ended | | | Period Ended | |
| | | December 31, 2016 | | | December 31, 2015^ | |
| Per Share Data: | | | | | | |
| Net asset value, beginning of period | | $ | 10.04 | | | $ | 10.00 | |
| Income from investment operations: | | | | | | | | |
| Net investment income | | | 0.15 | (1) | | | 0.05 | (1) |
| Net realized and unrealized gains (losses) on investments | | | (0.08 | ) | | | 0.04 | |
| Total from investment operations | | | 0.07 | | | | 0.09 | |
| Less distributions: | | | | | | | | |
| Distributions from net investment income | | | (0.14 | ) | | | (0.04 | ) |
| Distributions from net realized gains | | | (0.00 | )(2) | | | (0.01 | ) |
| Total distributions | | | (0.14 | ) | | | (0.05 | ) |
| Net asset value, end of period | | $ | 9.97 | | | $ | 10.04 | |
| Total return | | | 0.71 | % | | | 0.94 | %(3) |
| Supplemental data and ratios: | | | | | | | | |
| Net assets, end of period (millions) | | $ | 52.4 | | | $ | 12.3 | |
| Ratio of expenses to average net assets | | | 0.30 | % | | | 0.30 | %(4) |
| Ratio of net investment income to average net assets | | | 1.44 | % | | | 1.42 | %(4) |
Portfolio turnover rate(5) | | | 38.3 | % | | | 41.40 | %(3) |
| ^ | Inception was close of business on August 31, 2015. |
| (1) | Calculated using average shares outstanding during the period. |
| (2) | Amount is less then $0.005. |
| (3) | Not annualized. |
| (4) | Annualized. |
| (5) | Portfolio turnover is calculated on the basis of the Fund as a whole without distinguishing between the classes of shares issued. |
The accompanying notes are an integral part of these financial statements.
Financial Highlights
Baird Short-Term Municipal Bond Fund – Investor Class
| | | Year Ended | | | Period Ended | |
| | | December 31, 2016 | | | December 31, 2015^ | |
| Per Share Data: | | | | | | |
| Net asset value, beginning of period | | $ | 10.04 | | | $ | 10.00 | |
| Income from investment operations: | | | | | | | | |
| Net investment income | | | 0.12 | (1) | | | 0.04 | (1) |
| Net realized and unrealized gains (losses) on investments | | | (0.08 | ) | | | 0.05 | |
| Total from investment operations | | | 0.04 | | | | 0.09 | |
| Less distributions: | | | | | | | | |
| Distributions from net investment income | | | (0.12 | ) | | | (0.04 | ) |
| Distributions from net realized gains | | | (0.00 | )(2) | | | (0.01 | ) |
| Total distributions | | | (0.12 | ) | | | (0.05 | ) |
| Net asset value, end of period | | $ | 9.96 | | | $ | 10.04 | |
| Total return | | | 0.40 | % | | | 0.86 | %(3) |
| Supplemental data and ratios: | | | | | | | | |
| Net assets, end of period (millions) | | $ | 6.3 | | | $ | 0.1 | |
| Ratio of expenses to average net assets | | | 0.55 | % | | | 0.55 | %(4) |
| Ratio of net investment income to average net assets | | | 1.19 | % | | | 1.17 | %(4) |
Portfolio turnover rate(5) | | | 38.3 | % | | | 41.40 | %(3) |
| ^ | Inception was close of business on August 31, 2015. |
| (1) | Calculated using average shares outstanding during the period. |
| (2) | Amount is less then $0.005. |
| (3) | Not annualized. |
| (4) | Annualized. |
| (5) | Portfolio turnover is calculated on the basis of the Fund as a whole without distinguishing between the classes of shares issued. |
The accompanying notes are an integral part of these financial statements.
Financial Highlights
Baird Quality Intermediate Municipal Bond Fund – Institutional Class
| | | Year Ended December 31, | |
| | | 2016 | | | 2015 | | | 2014 | | | 2013 | | | 2012 | |
| Per Share Data: | | | | | | | | | | | | | | | |
| Net asset value, beginning of year | | $ | 11.74 | | | $ | 11.77 | | | $ | 11.55 | | | $ | 12.01 | | | $ | 11.94 | |
| Income from investment operations: | | | | | | | | | | | | | | | | | | | | |
| Net investment income | | | 0.26 | (1) | | | 0.28 | (1) | | | 0.30 | | | | 0.32 | (1) | | | 0.30 | |
| Net realized and unrealized | | | | | | | | | | | | | | | | | | | | |
| gains (losses) on investments | | | (0.31 | ) | | | (0.03 | ) | | | 0.22 | | | | (0.46 | ) | | | 0.07 | |
| Total from investment operations | | | (0.05 | ) | | | 0.25 | | | | 0.52 | | | | (0.14 | ) | | | 0.37 | |
| Less distributions: | | | | | | | | | | | | | | | | | | | | |
| Distributions from | | | | | | | | | | | | | | | | | | | | |
| net investment income | | | (0.26 | ) | | | (0.28 | ) | | | (0.30 | ) | | | (0.32 | ) | | | (0.30 | ) |
| Total distributions | | | (0.26 | ) | | | (0.28 | ) | | | (0.30 | ) | | | (0.32 | ) | | | (0.30 | ) |
| Net asset value, end of year | | $ | 11.43 | | | $ | 11.74 | | | $ | 11.77 | | | $ | 11.55 | | | $ | 12.01 | |
| | | | | | | | | | | | | | | | | | | | | |
| Total return | | | (0.46 | )% | | | 2.19 | % | | | 4.54 | % | | | (1.19 | )% | | | 3.12 | % |
| | | | | | | | | | | | | | | | | | | | | |
| Supplemental data and ratios: | | | | | | | | | | | | | | | | | | | | |
| Net assets, end of year (millions) | | $ | 936.2 | | | $ | 988.4 | | | $ | 918.9 | | | $ | 801.4 | | | $ | 963.1 | |
| Ratio of expenses to average net assets | | | 0.30 | % | | | 0.30 | % | | | 0.30 | % | | | 0.30 | % | | | 0.30 | % |
| Ratio of net investment income | | | | | | | | | | | | | | | | | | | | |
| to average net assets | | | 2.19 | % | | | 2.42 | % | | | 2.56 | % | | | 2.65 | % | | | 2.48 | % |
Portfolio turnover rate(2) | | | 22.0 | % | | | 9.3 | % | | | 4.7 | % | | | 9.0 | % | | | 5.1 | % |
| (1) | Calculated using average shares outstanding during the year. |
| (2) | Portfolio turnover is calculated on the basis of the Fund as a whole without distinguishing between the classes of shares issued. |
The accompanying notes are an integral part of these financial statements.
Financial Highlights
Baird Quality Intermediate Municipal Bond Fund – Investor Class
| | | Year Ended December 31, | |
| | | 2016 | | | 2015 | | | 2014 | | | 2013 | | | 2012 | |
| Per Share Data: | | | | | | | | | | | | | | | |
| Net asset value, beginning of year | | $ | 12.00 | | | $ | 12.03 | | | $ | 11.80 | | | $ | 12.26 | | | $ | 12.18 | |
| Income from investment operations: | | | | | | | | | | | | | | | | | | | | |
| Net investment income | | | 0.23 | (1) | | | 0.26 | (1) | | | 0.28 | | | | 0.29 | (1) | | | 0.27 | |
| Net realized and unrealized | | | | | | | | | | | | | | | | | | | | |
| gains (losses) on investments | | | (0.31 | ) | | | (0.04 | ) | | | 0.22 | | | | (0.46 | ) | | | 0.08 | |
| Total from investment operations | | | (0.08 | ) | | | 0.22 | | | | 0.50 | | | | (0.17 | ) | | | 0.35 | |
| Less distributions: | | | | | | | | | | | | | | | | | | | | |
| Distributions from | | | | | | | | | | | | | | | | | | | | |
| net investment income | | | (0.23 | ) | | | (0.25 | ) | | | (0.27 | ) | | | (0.29 | ) | | | (0.27 | ) |
| Total distributions | | | (0.23 | ) | | | (0.25 | ) | | | (0.27 | ) | | | (0.29 | ) | | | (0.27 | ) |
| Net asset value, end of year | | $ | 11.69 | | | $ | 12.00 | | | $ | 12.03 | | | $ | 11.80 | | | $ | 12.26 | |
| Total return | | | (0.70 | )% | | | 1.89 | % | | | 4.27 | % | | | (1.42 | )% | | | 2.88 | % |
| Supplemental data and ratios: | | | | | | | | | | | | | | | | | | | | |
| Net assets, end of year (millions) | | $ | 136.1 | | | $ | 160.3 | | | $ | 186.7 | | | $ | 205.6 | | | $ | 258.5 | |
| Ratio of expenses to average net assets | | | 0.55 | % | | | 0.55 | % | | | 0.55 | % | | | 0.55 | % | | | 0.55 | % |
| Ratio of net investment income | | | | | | | | | | | | | | | | | | | | |
| to average net assets | | | 1.94 | % | | | 2.17 | % | | | 2.31 | % | | | 2.40 | % | | | 2.23 | % |
Portfolio turnover rate(2) | | | 22.0 | % | | | 9.3 | % | | | 4.7 | % | | | 9.0 | % | | | 5.1 | % |
| (1) | Calculated using average shares outstanding during the year. |
| (2) | Portfolio turnover is calculated on the basis of the Fund as a whole without distinguishing between the classes of shares issued. |
The accompanying notes are an integral part of these financial statements.
Financial Highlights
Baird Core Intermediate Municipal Bond Fund – Institutional Class
| | | Year Ended | | | Period Ended | |
| | | December 31, 2016 | | | December 31, 2015^ | |
| Per Share Data: | | | | | | |
| Net asset value, beginning of period | | $ | 10.13 | | | $ | 10.00 | |
| Income from investment operations: | | | | | | | | |
| Net investment income | | | 0.18 | (1) | | | 0.06 | (1) |
| Net realized and unrealized gains (losses) on investments | | | (0.05 | ) | | | 0.14 | |
| Total from investment operations | | | 0.13 | | | | 0.20 | |
| Less distributions: | | | | | | | | |
| Distributions from net investment income | | | (0.18 | ) | | | (0.06 | ) |
| Distributions from net realized gains | | | (0.07 | ) | | | (0.01 | ) |
| Total distributions | | | (0.25 | ) | | | (0.07 | ) |
| Net asset value, end of period | | $ | 10.01 | | | $ | 10.13 | |
| Total return | | | 1.14 | % | | | 1.98 | %(2) |
| Supplemental data and ratios: | | | | | | | | |
| Net assets, end of period (millions) | | $ | 96.3 | | | $ | 50.8 | |
| Ratio of expenses to average net assets | | | 0.30 | % | | | 0.30 | %(3) |
| Ratio of net investment income to average net assets | | | 1.79 | % | | | 1.75 | %(3) |
Portfolio turnover rate(4) | | | 94.8 | % | | | 108.3 | %(2) |
| ^ | Inception was close of business on August 31, 2015. |
| (1) | Calculated using average shares outstanding during the period. |
| (2) | Not annualized. |
| (3) | Annualized. |
| (4) | Portfolio turnover is calculated on the basis of the Fund as a whole without distinguishing between the classes of shares issued. |
The accompanying notes are an integral part of these financial statements.
Financial Highlights
Baird Core Intermediate Municipal Bond Fund – Investor Class
| | | Year Ended | | | Period Ended | |
| | | December 31, 2016 | | | December 31, 2015^ | |
| Per Share Data: | | | | | | |
| Net asset value, beginning of period | | $ | 10.13 | | | $ | 10.00 | |
| Income from investment operations: | | | | | | | | |
| Net investment income | | | 0.16 | (1) | | | 0.05 | (1) |
| Net realized and unrealized gains (losses) on investments | | | (0.06 | ) | | | 0.14 | |
| Total from investment operations | | | 0.10 | | | | 0.19 | |
| Less distributions: | | | | | | | | |
| Distributions from net investment income | | | (0.16 | ) | | | (0.05 | ) |
| Distributions from net realized gains | | | (0.07 | ) | | | (0.01 | ) |
| Total distributions | | | (0.23 | ) | | | (0.06 | ) |
| Net asset value, end of period | | $ | 10.00 | | | $ | 10.13 | |
| | | | | | | | | |
| Total return | | | 0.91 | % | | | 1.91 | %(2) |
| | | | | | | | | |
| Supplemental data and ratios: | | | | | | | | |
| Net assets, end of period (millions) | | $ | 1.4 | | | $ | 0.2 | |
| Ratio of expenses to average net assets | | | 0.55 | % | | | 0.55 | %(3) |
| Ratio of net investment income to average net assets | | | 1.54 | % | | | 1.50 | %(3) |
Portfolio turnover rate(4) | | | 94.8 | % | | | 108.3 | %(2) |
| ^ | Inception was close of business on August 31, 2015. |
| (1) | Calculated using average shares outstanding during the period. |
| (2) | Not annualized. |
| (3) | Annualized. |
| (4) | Portfolio turnover is calculated on the basis of the Fund as a whole without distinguishing between the classes of shares issued. |
The accompanying notes are an integral part of these financial statements.
Notes to the Financial Statements
December 31, 2016
1. Organization
Baird Funds, Inc. (the “Corporation”) was incorporated on June 9, 2000 as a Wisconsin corporation and is registered as an open-end investment management company under the Investment Company Act of 1940, as amended (the “1940 Act”). The accompanying financial statements include the Baird Ultra Short Bond Fund, Baird Short-Term Bond Fund, Baird Intermediate Bond Fund, Baird Aggregate Bond Fund, Baird Core Plus Bond Fund, Baird Short-Term Municipal Bond Fund, Baird Quality Intermediate Municipal Bond Fund and Baird Core Intermediate Municipal Bond Fund (each, a “Fund” and collectively, the “Funds”), eight of the fifteen series comprising the Corporation, each of which is diversified within the meaning of the 1940 Act. Robert W. Baird & Co. Incorporated (“Baird” or the “Advisor”) serves as investment advisor to the Funds.
The Baird Ultra Short Bond Fund commenced with the sale of both Institutional and Investor Class shares on December 31, 2013. The Baird Short-Term Bond Fund commenced with the sale of Institutional Class shares on August 31, 2004 while the Investor Class shares commenced on September 19, 2012. The Baird Intermediate Bond Fund, Baird Aggregate Bond Fund and Baird Core Plus Bond Fund commenced with the sale of both Institutional and Investor Class shares on September 29, 2000. The Baird Short-Term Municipal Bond Fund and Core Intermediate Municipal Bond Fund commenced with the sale of both Institutional and Investor Class shares on August 31, 2015. The Baird Quality Intermediate Municipal Bond Fund commenced with the sale of both Institutional and Investor Class shares on March 30, 2001. Institutional Class shares are not subject to a distribution and service (12b-1) fee, while Investor Class shares are subject to a distribution and service (12b-1) fee of 0.25%. See Note 8.
The investment objective of the Baird Ultra Short Bond Fund is to seek current income consistent with preservation of capital. The Fund’s benchmark index, the Bloomberg Barclays U.S. Short-Term Government/Corporate Index, is an unmanaged, market value weighted index of investment grade, fixed debt including government and corporate securities with maturities less than one year.
The investment objective of the Baird Short-Term Bond Fund is to seek an annual rate of total return, before Fund expenses, greater than the annual rate of total return of the Bloomberg Barclays 1-3 Year U.S. Government/Credit Bond Index. The Bloomberg Barclays 1-3 Year U.S. Government/Credit Bond Index is an unmanaged, market value weighted index of investment grade, fixed-rate debt including government and corporate securities with maturities between one and three years.
The investment objective of the Baird Intermediate Bond Fund is to seek an annual rate of total return, before Fund expenses, greater than the annual rate of total return of the Bloomberg Barclays Intermediate U.S. Government/Credit Bond Index. The Bloomberg Barclays Intermediate U.S. Government/Credit Bond Index is an unmanaged, market value weighted index of investment grade, fixed-rate debt issues, including government and corporate securities, with maturities between one and ten years.
The investment objective of the Baird Aggregate Bond Fund is to seek an annual rate of total return, before Fund expenses, greater than the annual rate of total return of the Bloomberg Barclays U.S. Aggregate Bond Index. The Bloomberg Barclays U.S. Aggregate Bond Index is an unmanaged, market value weighted index of investment grade, fixed-rate debt issues, including government, corporate, asset-backed and mortgage-backed securities, with maturities of at least one year.
The investment objective of the Baird Core Plus Bond Fund is to seek an annual rate of total return, before Fund expenses, greater than the annual rate of total return of the Bloomberg Barclays U.S. Universal Bond Index. The Bloomberg Barclays U.S. Universal Bond Index is an unmanaged, market value weighted index of fixed income securities issued in U.S. dollars, including U.S. government and investment grade debt, non-investment grade debt, asset-backed and mortgage-backed securities, Eurobonds, 144A securities and emerging market debt, with maturities of at least one year.
The investment objective of the Baird Short-Term Municipal Bond Fund is to seek current income that is exempt from federal income tax and is consistent with the preservation of capital.
Notes to the Financial Statements
December 31, 2016
1. Organization (cont.)
The primary investment objective of the Baird Quality Intermediate Municipal Bond Fund is to seek current income that is substantially exempt from federal income tax. A secondary objective is to seek total return with relatively low volatility of principal.
The investment objective of the Baird Core Intermediate Municipal Bond Fund is to seek a high level of current income that is exempt from federal income tax and is consistent with preservation of capital.
2. Significant Accounting Policies
The following is a summary of significant accounting policies consistently followed by the Funds in the preparation of their financial statements. These policies are in conformity with accounting principles generally accepted in the United States of America.
| a) | Investment Valuation – Section 2(a)(41) of the 1940 Act, together with the rules and interpretations of the Securities and Exchange Commission, require the Funds, in computing net asset value, to value their portfolio securities using market quotations when they are “readily available.” When market quotations are not readily available (e.g., because there is no regular market quotation for such securities, the market for such security is limited, the validity of quotations is questionable or the Funds’ independent pricing service does not provide a price), the Board of Directors of the Corporation must value the securities at “fair value determined in good faith.” The Board has delegated such responsibility to the Advisor pursuant to pricing policies and procedures that the Board has adopted and regularly reviews. In general, the “fair value” of a security means the price that would be received to sell a security in an orderly transaction between market participants at the measurement date. |
| | The Funds determine the fair value of their investments and compute their net asset value per share as of the close of regular trading of the New York Stock Exchange (4:00 p.m. EST). |
| | Consistent with Section 2(a)(41) of the 1940 Act, the Funds price their securities as follows: debt securities are valued at their evaluated bid prices as provided by an independent pricing service using valuation methods that are designed to represent fair value, such as matrix pricing and other analytical pricing models, market transactions and dealer quotations. Debt securities purchased with maturities of 60 days or less are valued as described above unless an evaluated price is not available, in which case such security is valued at acquisition cost, plus or minus any amortized discount or premium (“amortized cost”), or, if the Advisor does not believe amortized cost is reflective of the value of the security, the security is priced at fair value as described below. Investments in mutual funds are valued at their stated net asset value. Common stocks that are listed on a securities exchange (other than NASDAQ) are valued at the last quoted sales price. Securities traded on Nasdaq are valued at the Nasdaq Official Closing Price. Price information on listed stocks is taken from the exchange where the security is primarily traded. Securities that were not traded on the valuation date, as well as stocks that are not listed on an exchange, including NASDAQ, are valued at the average of the current bid and asked price. Other assets and securities for which market quotations are not readily available are valued at fair value as determined in good faith by the Advisor in accordance with procedures approved by the Corporation’s Board of Directors. In accordance with such procedures, the Advisor may use broker quotes or prices obtained from alternative independent pricing services or, if broker quotes or prices from alternative pricing services are unavailable or deemed to be unreliable, fair value will be determined by a valuation committee of the Advisor. In determining fair value, the valuation committee takes into account all relevant factors and available information. Consequently, the price of the security used by a Fund to calculate its NAV may differ from quoted or published prices for the same security. Fair value pricing involves subjective judgments and there is no single standard for determining a security’s fair value. As a result, different mutual funds could reasonably arrive at a different fair value for the same security. It is possible that the fair value determined for a security is materially different from the value that could be realized upon the sale of that security or from the values that other mutual funds may determine. In addition, given the |
Notes to the Financial Statements
December 31, 2016
| 2. | Significant Accounting Policies (cont.) |
| | volatility and periodic illiquidity experienced in recent years, the prices determined for any individual security on any given day may vary significantly from the amount that can be obtained in an actual sale of that security, and the Funds’ NAVs may fluctuate significantly from day to day or from period to period. |
| b) | Unregistered Securities – Five of the Funds own certain investment securities which are unregistered and thus restricted with respect to resale. The value of such securities for the Baird Ultra Short Bond, Baird Short-Term Bond, Baird Intermediate Bond, Baird Aggregate Bond and Baird Core Plus Bond Funds were $59,575,084 (15.18% of net assets), $813,134,868 (20.99% of net assets), $415,017,816 (17.99% of net assets), $1,598,795,554 (15.11% of net assets), and $2,299,291,855 (17.82% of net assets), respectively, at December 31, 2016. Restricted securities may be deemed to be liquid as determined by the Advisor based on several factors. All of the restricted securities held by the Funds as of December 31, 2016 consist of securities issued pursuant to Rule 144A under the Securities Act of 1933 and all have been deemed to be liquid. |
| c) | Foreign Securities – Foreign securities are defined as securities of issuers that are organized outside the United States. The Funds may invest in U.S. dollar-denominated debt obligations of foreign companies and foreign governments. Investing in securities of foreign companies and foreign governments involves special risks and considerations not typically associated with investing in U.S. companies and the U.S. government. These risks include foreign currency fluctuations, political and economic instability and differences in financial reporting standards and less strict regulation of securities markets. Moreover, securities of many foreign companies and foreign governments and their markets may be less liquid and their prices more volatile than those of securities of comparable U.S. companies and the U.S. government. Occasionally, events that affect these values and exchange rates may occur after the close of the exchange on which such securities are traded. If such events materially affect the value of a Fund’s securities, these securities may be valued at their fair value pursuant to procedures adopted by the Board of Directors. |
| d) | Income Tax Status – The Funds intend to continue to qualify as regulated investment companies as provided in subchapter M of the Internal Revenue Code and to distribute substantially all of their taxable income to their shareholders in a manner which results in no tax expense to the Funds. Therefore, no federal income or excise tax provision is recorded. |
| | There is no tax liability resulting from unrecognized tax benefits relating to uncertain income tax positions taken or expected to be taken on the tax return for the fiscal year ended December 31, 2016, or for any other tax years which are open for exam. As of December 31, 2016, open tax years include the tax years ended December 31, 2013 through 2016. The Funds are not aware of any tax positions for which it is reasonably possible that the total amounts of unrecognized tax benefits will significantly change in the next 12 months. The Funds recognize interest and penalties, if any, related to unrecognized tax benefits as interest and other expense, respectively, in the Statement of Operations. During the period, the Funds did not incur any interest or penalties. |
| e) | Allocation of Income and Expenses – Each Fund is charged for those expenses directly attributable to it. Expenses directly attributable to a class of shares, such as Rule 12b-1 distribution fees, are charged to that class of shares. Income, expenses and realized and unrealized gains and losses are allocated to the classes based on their respective net assets. Expenses that are not directly attributable to a Fund are allocated among the Funds in the series in proportion to their assets or are divided equally amongst the Funds. |
| f) | Distributions to Shareholders – Dividends from net investment income are declared and paid monthly. Distributions of net realized capital gains, if any, are declared and paid at least annually. The book basis character of distributions may differ from their ultimate characterization for Federal income tax purposes. |
| g) | Use of Estimates – The preparation of financial statements in conformity with accounting principles generally accepted in the United States of America requires management to make estimates and assumptions that affect the reported amounts of assets and liabilities and disclosure of contingent assets |
Notes to the Financial Statements
December 31, 2016
| 2. | Significant Accounting Policies (cont.) |
| | and liabilities at the date of the financial statements and the reported amounts of revenues and expenses during the reporting period. Actual results could differ from those estimates. |
| h) | Securities Transactions and Investment Income – Investment and shareholder transactions are recorded on the trade date. The Funds determine the gain or loss realized from investment transactions by comparing the original cost of the security lot sold with the net sales proceeds. Dividend income is recognized on the ex-dividend date and interest income is recognized on an accrual basis. Premiums and discounts on the purchase of securities are amortized/accreted using the effective interest method. Paydown gains and losses are netted and recorded as interest income on the Statements of Operations for financial reporting purposes. Accounting principles generally accepted in the United States of America require that permanent financial reporting and tax differences be reclassified in the capital accounts. |
| i) | Guarantees and Indemnifications – In the normal course of business, the Funds enter into contracts with service providers that contain general indemnification clauses. The Funds’ maximum exposure under these arrangements is unknown and would involve future claims against the Funds that have not yet occurred. Based on experience, the Funds would expect the risk of loss to be remote. |
| j) | Recent Accounting Pronouncement – In October 2016, the U.S. Securities and Exchange Commission adopted new rules and amended existing rules (together, “final rules”) intended to modernize the reporting and disclosure of information by registered investment companies. In part, the final rules amend Regulation S-X and require standardized, enhanced disclosure about derivatives in investment company financial statements, as well as other amendments. The compliance date for the amendments to Regulation S-X is August 1, 2017. Management is currently evaluating the impact that the adoption of the amendments to Regulation S-X will have on the financial statements and related disclosures. |
| 3. | Capital Share Transactions |
The following table summarizes the capital share transactions of each Fund for the past two fiscal periods:
| Baird Ultra Short Bond Fund | | | | | | | | | | | | | | |
| Institutional Class Shares | | | | | | | | Investor Class Shares | | | | | | |
| | | Year Ended | | | | | Year Ended | |
| | | December 31, 2016 | | | | | December 31, 2016 | |
| | | Shares | | | Amount | | | | | Shares | | | Amount | |
| Shares sold | | | 40,894,406 | | | $ | 409,656,486 | | | Shares sold | | | 519,828 | | | $ | 5,211,614 | |
| Shares issued to | | | | | | | | | | Shares issued to | | | | | | | | |
| shareholders in | | | | | | | | | | shareholders in | | | | | | | | |
| reinvestment of | | | | | | | | | | reinvestment of | | | | | | | | |
| dividends | | | 260,009 | | | | 2,604,619 | | | dividends | | | 466 | | | | 4,674 | |
| Shares redeemed | | | (21,510,785 | ) | | | (215,281,434 | ) | | Shares redeemed | | | (118,196 | ) | | | (1,184,590 | ) |
| Net increase | | | 19,643,630 | | | $ | 196,979,671 | | | Net increase | | | 402,098 | | | $ | 4,031,698 | |
| Shares Outstanding: | | | | | | | | | | Shares Outstanding: | | | | | | | | |
| Beginning of year | | | 18,962,183 | | | | | | | Beginning of year | | | 120,095 | | | | | |
| End of year | | | 38,605,813 | | | | | | | End of year | | | 522,193 | | | | | |
Notes to the Financial Statements
December 31, 2016
3. Capital Share Transactions (cont.)
| Baird Ultra Short Bond Fund (cont.) | | | | | | | | | | | | | | |
| Institutional Class Shares | | | | | | | | Investor Class Shares | | | | | | |
| | | Year Ended | | | | | Year Ended | |
| | | December 31, 2015 | | | | | December 31, 2015 | |
| | | Shares | | | Amount | | | | | Shares | | | Amount | |
| Shares sold | | | 18,194,582 | | | $ | 182,496,800 | | | Shares sold | | | 160,110 | | | $ | 1,605,059 | |
| Shares issued to | | | | | | | | | | Shares issued to | | | | | | | | |
| shareholders in | | | | | | | | | | shareholders in | | | | | | | | |
| reinvestment of | | | | | | | | | | reinvestment of | | | | | | | | |
| dividends | | | 115,607 | | | | 1,158,204 | | | dividends | | | 262 | | | | 2,627 | |
| Shares redeemed | | | (7,772,290 | ) | | | (77,953,294 | ) | | Shares redeemed | | | (129,177 | ) | | | (1,294,965 | ) |
| Net increase | | | 10,537,899 | | | $ | 105,701,710 | | | Net increase | | | 31,195 | | | $ | 312,721 | |
| Shares Outstanding: | | | | | | | | | | Shares Outstanding: | | | | | | | | |
| Beginning of year | | | 8,424,284 | | | | | | | Beginning of year | | | 88,900 | | | | | |
| End of year | | | 18,962,183 | | | | | | | End of year | | | 120,095 | | | | | |
| | | | | | | | | | | | | | | | | | | |
| Baird Short-Term Bond Fund | | | | | | | | | | | | | | | | | | |
| Institutional Class Shares | | | | | | | | | | Investor Class Shares | | | | | | | | |
| | | Year Ended | | | | | Year Ended | |
| | | December 31, 2016 | | | | | December 31, 2016 | |
| | | Shares | | | Amount | | | | | Shares | | | Amount | |
| Shares sold | | | 208,721,216 | | | $ | 2,022,991,247 | | | Shares sold | | | 10,339,785 | | | $ | 100,368,487 | |
| Shares issued to | | | | | | | | | | Shares issued to | | | | | | | | |
| shareholders in | | | | | | | | | | shareholders in | | | | | | | | |
| reinvestment of | | | | | | | | | | reinvestment of | | | | | | | | |
| dividends | | | 5,191,423 | | | | 50,301,475 | | | dividends | | | 93,050 | | | | 901,712 | |
| Shares redeemed | | | (133,931,700 | ) | | | (1,299,046,819 | ) | | Shares redeemed | | | (3,813,267 | ) | | | (36,970,034 | ) |
| Net increase | | | 79,980,939 | | | $ | 774,245,903 | | | Net increase | | | 6,619,568 | | | $ | 64,300,165 | |
| Shares Outstanding: | | | | | | | | | | Shares Outstanding: | | | | | | | | |
| Beginning of year | | | 310,076,475 | | | | | | | Beginning of year | | | 4,232,180 | | | | | |
| End of year | | | 390,057,414 | | | | | | | End of year | | | 10,851,748 | | | | | |
| | | | | | | | | | | | | | | | | | | |
| Institutional Class Shares | | | | | | | | | | Investor Class Shares | | | | | | | | |
| | | Year Ended | | | | | Year Ended | |
| | | December 31, 2015 | | | | | December 31, 2015 | |
| | | Shares | | | Amount | | | | | Shares | | | Amount | |
| Shares sold | | | 135,569,368 | | | $ | 1,312,782,673 | | | Shares sold | | | 3,300,557 | | | $ | 31,979,152 | |
| Shares issued to | | | | | | | | | | Shares issued to | | | | | | | | |
| shareholders in | | | | | | | | | | shareholders in | | | | | | | | |
| reinvestment of | | | | | | | | | | reinvestment of | | | | | | | | |
| dividends | | | 4,045,771 | | | | 39,128,874 | | | dividends | | | 41,160 | | | | 398,035 | |
| Shares redeemed | | | (102,702,980 | ) | | | (994,845,046 | ) | | Shares redeemed | | | (2,814,301 | ) | | | (27,286,486 | ) |
| Net increase | | | 36,912,159 | | | $ | 357,066,501 | | | Net increase | | | 527,416 | | | $ | 5,090,701 | |
| Shares Outstanding: | | | | | | | | | | Shares Outstanding: | | | | | | | | |
| Beginning of year | | | 273,164,316 | | | | | | | Beginning of year | | | 3,704,764 | | | | | |
| End of year | | | 310,076,475 | | | | | | | End of year | | | 4,232,180 | | | | | |
Notes to the Financial Statements
December 31, 2016
3. Capital Share Transactions (cont.)
| Baird Intermediate Bond Fund | | | | | | | | | | | | | | |
| Institutional Class Shares | | | | | | | | Investor Class Shares | | | | | | |
| | | Year Ended | | | | | Year Ended | |
| | | December 31, 2016 | | | | | December 31, 2016 | |
| | | Shares | | | Amount | | | | | Shares | | | Amount | |
Shares sold(1) | | | 64,350,690 | | | $ | 719,411,019 | | | Shares sold | | | 1,543,535 | | | $ | 17,884,644 | |
| Shares issued to | | | | | | | | | | Shares issued to | | | | | | | | |
| shareholders in | | | | | | | | | | shareholders in | | | | | | | | |
| reinvestment of | | | | | | | | | | reinvestment of | | | | | | | | |
| dividends | | | 3,770,295 | | | | 41,921,480 | | | dividends | | | 180,930 | | | | 2,096,707 | |
| Shares redeemed | | | (30,325,724 | ) | | | (338,066,847 | ) | | Shares redeemed | | | (2,231,792 | ) | | | (25,945,903 | ) |
| Net increase | | | 37,795,261 | | | $ | 423,265,652 | | | Net decrease | | | (507,327 | ) | | $ | (5,964,552 | ) |
| Shares Outstanding: | | | | | | | | | | Shares Outstanding: | | | | | | | | |
| Beginning of year | | | 163,490,427 | | | | | | | Beginning of year | | | 9,079,935 | | | | | |
| End of year | | | 201,285,688 | | | | | | | End of year | | | 8,572,608 | | | | | |
(1) | In the fourth quarter of 2016, the Baird Intermediate Bond Fund satisfied a transfer in kind request made by a large Shareholder by transferring cash and securities into the Fund in the amount of $25,203,041 in exchange for 2,248,264 shares of the Fund. The transfer was effected in accordance with policies and procedures approved by the Board of Directors of the Funds. |
| Institutional Class Shares | | | | | | | | Investor Class Shares | | | | | | |
| | | Year Ended | | | | | Year Ended | |
| | | December 31, 2015 | | | | | December 31, 2015 | |
| | | Shares | | | Amount | | | | | Shares | | | Amount | |
| Shares sold | | | 50,507,223 | | | $ | 562,212,364 | | | Shares sold | | | 1,510,863 | | | $ | 17,460,109 | |
| Shares issued to | | | | | | | | | | Shares issued to | | | | | | | | |
| shareholders in | | | | | | | | | | shareholders in | | | | | | | | |
| reinvestment of | | | | | | | | | | reinvestment of | | | | | | | | |
| dividends | | | 3,265,821 | | | | 36,214,342 | | | dividends | | | 200,312 | | | | 2,313,757 | |
| Shares redeemed | | | (22,506,173 | ) | | | (250,191,862 | ) | | Shares redeemed | | | (2,632,587 | ) | | | (30,508,078 | ) |
| Net increase | | | 31,266,871 | | | $ | 348,234,844 | | | Net decrease | | | (921,412 | ) | | $ | (10,734,212 | ) |
| Shares Outstanding: | | | | | | | | | | Shares Outstanding: | | | | | | | | |
| Beginning of year | | | 132,223,556 | | | | | | | Beginning of year | | | 10,001,347 | | | | | |
| End of year | | | 163,490,427 | | | | | | | End of year | | | 9,079,935 | | | | | |
| | | | | | | | | | | | | | | | | | | |
| Baird Aggregate Bond Fund | | | | | | | | | | | | | | | | | | |
| Institutional Class Shares | | | | | | | | | | Investor Class Shares | | | | | | | | |
| | | Year Ended | | | | | Year Ended | |
| | | December 31, 2016 | | | | | December 31, 2016 | |
| | | Shares | | | Amount | | | | | Shares | | | Amount | |
| Shares sold | | | 446,191,460 | | | $ | 4,872,184,789 | | | Shares sold | | | 48,411,135 | | | $ | 545,153,144 | |
| Shares issued to | | | | | | | | | | Shares issued to | | | | | | | | |
| shareholders in | | | | | | | | | | shareholders in | | | | | | | | |
| reinvestment of | | | | | | | | | | reinvestment of | | | | | | | | |
| dividends | | | 17,343,130 | | | | 188,475,045 | | | dividends | | | 1,229,171 | | | | 13,784,507 | |
| Shares redeemed | | | (146,109,105 | ) | | | (1,589,759,877 | ) | | Shares redeemed | | | (15,658,884 | ) | | | (175,968,825 | ) |
| Net increase | | | 317,425,485 | | | $ | 3,470,899,957 | | | Net increase | | | 33,981,422 | | | $ | 382,968,826 | |
| Shares Outstanding: | | | | | | | | | | Shares Outstanding: | | | | | | | | |
| Beginning of year | | | 595,731,513 | | | | | | | Beginning of year | | | 39,260,014 | | | | | |
| End of year | | | 913,156,998 | | | | | | | End of year | | | 73,241,436 | | | | | |
Notes to the Financial Statements
December 31, 2016
3. Capital Share Transactions (cont.)
Baird Aggregate Bond Fund (cont.)
| Institutional Class Shares | | | | | | | | Investor Class Shares | | | | | | |
| | | Year Ended | | | | | Year Ended | |
| | | December 31, 2015 | | | | | December 31, 2015 | |
| | | Shares | | | Amount | | | | | Shares | | | Amount | |
| Shares sold | | | 356,830,993 | | | $ | 3,865,220,032 | | | Shares sold | | | 33,925,649 | | | $ | 380,462,212 | |
| Shares issued to | | | | | | | | | | Shares issued to | | | | | | | | |
| shareholders in | | | | | | | | | | shareholders in | | | | | | | | |
| reinvestment of | | | | | | | | | | reinvestment of | | | | | | | | |
| dividends | | | 9,544,951 | | | | 102,735,825 | | | dividends | | | 832,114 | | | | 9,246,306 | |
| Shares redeemed | | | (89,632,870 | ) | | | (965,571,353 | ) | | Shares redeemed | | | (17,180,037 | ) | | | (189,903,979 | ) |
| Net increase | | | 276,743,074 | | | $ | 3,002,384,504 | | | Net increase | | | 17,577,726 | | | $ | 199,804,539 | |
| Shares Outstanding: | | | | | | | | | | Shares Outstanding: | | | | | | | | |
| Beginning of year | | | 318,988,439 | | | | | | | Beginning of year | | | 21,682,288 | | | | | |
| End of year | | | 595,731,513 | | | | | | | End of year | | | 39,260,014 | | | | | |
| | | | | | | | | | | | | | | | | | | |
| Baird Core Plus Bond Fund | | | | | | | | | | | | | | | | | | |
| Institutional Class Shares | | | | | | | | | | Investor Class Shares | | | | | | | | |
| | | Year Ended | | | | | Year Ended | |
| | | December 31, 2016 | | | | | December 31, 2016 | |
| | | Shares | | | Amount | | | | | Shares | | | Amount | |
| Shares sold | | | 367,562,136 | | | $ | 4,121,093,117 | | | Shares sold | | | 116,052,805 | | | $ | 1,357,883,819 | |
| Shares issued to | | | | | | | | | | Shares issued to | | | | | | | | |
| shareholders in | | | | | | | | | | shareholders in | | | | | | | | |
| reinvestment of | | | | | | | | | | reinvestment of | | | | | | | | |
| dividends | | | 21,905,632 | | | | 244,377,395 | | | dividends | | | 5,809,669 | | | | 67,326,570 | |
| Shares redeemed | | | (144,024,634 | ) | | | (1,612,812,024 | ) | | Shares redeemed | | | (64,248,597 | ) | | | (744,636,074 | ) |
| Net increase | | | 245,443,134 | | | $ | 2,752,658,488 | | | Net increase | | | 57,613,877 | | | $ | 680,574,315 | |
| Shares Outstanding: | | | | | | | | | | Shares Outstanding: | | | | | | | | |
| Beginning of year | | | 663,605,778 | | | | | | | Beginning of year | | | 193,850,233 | | | | | |
| End of year | | | 909,048,912 | | | | | | | End of year | | | 251,464,110 | | | | | |
| | | | | | | | | | | | | | | | | | | |
| Institutional Class Shares | | | | | | | | | | Investor Class Shares | | | | | | | | |
| | | Year Ended | | | | | Year Ended | |
| | | December 31, 2015 | | | | | December 31, 2015 | |
| | | Shares | | | Amount | | | | | Shares | | | Amount | |
| Shares sold | | | 338,402,581 | | | $ | 3,765,813,087 | | | Shares sold | | | 92,075,541 | | | $ | 1,065,444,861 | |
| Shares issued to | | | | | | | | | | Shares issued to | | | | | | | | |
| shareholders in | | | | | | | | | | shareholders in | | | | | | | | |
| reinvestment of | | | | | | | | | | reinvestment of | | | | | | | | |
| dividends | | | 14,978,062 | | | | 165,809,786 | | | dividends | | | 4,736,958 | | | | 54,497,497 | |
| Shares redeemed | | | (95,670,704 | ) | | | (1,059,277,984 | ) | | Shares redeemed | | | (93,017,178 | ) | | | (1,069,633,270 | ) |
| Net increase | | | 257,709,939 | | | $ | 2,872,344,889 | | | Net increase | | | 3,795,321 | | | $ | 50,309,088 | |
| Shares Outstanding: | | | | | | | | | | Shares Outstanding: | | | | | | | | |
| Beginning of year | | | 405,895,839 | | | | | | | Beginning of year | | | 190,054,912 | | | | | |
| End of year | | | 663,605,778 | | | | | | | End of year | | | 193,850,233 | | | | | |
Notes to the Financial Statements
December 31, 2016
3. Capital Share Transactions (cont.)
Baird Short-Term Municipal Bond Fund
| Institutional Class Shares | | | | | | | | Investor Class Shares | | | | | | |
| | | Year Ended | | | | | Year Ended | |
| | | December 31, 2016 | | | | | December 31, 2016 | |
| | | Shares | | | Amount | | | | | Shares | | | Amount | |
| Shares sold | | | 5,168,209 | | | $ | 52,089,868 | | | Shares sold | | | 783,100 | | | $ | 7,828,196 | |
| Shares issued to | | | | | | | | | | Shares issued to | | | | | | | | |
| shareholders in | | | | | | | | | | shareholders in | | | | | | | | |
| reinvestment of | | | | | | | | | | reinvestment of | | | | | | | | |
| dividends | | | 29,158 | | | | 293,778 | | | dividends | | | 1,702 | | | | 17,009 | |
| Shares redeemed | | | (1,169,212 | ) | | | (11,765,314 | ) | | Shares redeemed | | | (162,007 | ) | | | (1,620,380 | ) |
| Net increase | | | 4,028,155 | | | $ | 40,618,332 | | | Net increase | | | 622,795 | | | $ | 6,224,825 | |
| Shares Outstanding: | | | | | | | | | | Shares Outstanding: | | | | | | | | |
| Beginning of year | | | 1,222,493 | | | | | | | Beginning of year | | | 12,742 | | | | | |
| End of year | | | 5,250,648 | | | | | | | End of year | | | 635,537 | | | | | |
| | | | | | | | | | | | | | | | | | | |
| Institutional Class Shares | | | | | | | | | | Investor Class Shares | | | | | | | | |
| | | Year Ended | | | | | Year Ended | |
| | | December 31, 2015^ | | | | | December 31, 2015^ | |
| | | Shares | | | Amount | | | | | Shares | | | Amount | |
| Shares sold | | | 1,220,676 | | | $ | 12,220,406 | | | Shares sold | | | 12,719 | | | $ | 127,500 | |
| Shares issued to | | | | | | | | | | Shares issued to | | | | | | | | |
| shareholders in | | | | | | | | | | shareholders in | | | | | | | | |
| reinvestment of | | | | | | | | | | reinvestment of | | | | | | | | |
| dividends | | | 3,170 | | | | 31,828 | | | dividends | | | 24 | | | | 237 | |
| Shares redeemed | | | (1,353 | ) | | | (13,600 | ) | | Shares redeemed | | | (1 | ) | | | (7 | ) |
| Net increase | | | 1,222,493 | | | $ | 12,238,634 | | | Net increase | | | 12,742 | | | $ | 127,730 | |
| Shares Outstanding: | | | | | | | | | | Shares Outstanding: | | | | | | | | |
| Beginning of period | | | — | | | | | | | Beginning of period | | | — | | | | | |
| End of period | | | 1,222,493 | | | | | | | End of period | | | 12,742 | | | | | |
| | | | | | | | | | | | | | | | | | | |
| ^ Inception was the close of business on August 31, 2015. | | | | | | | | |
| | | | | | | | | | | | |
| Baird Quality Intermediate Municipal Bond Fund | | | | | | | | | | | |
| Institutional Class Shares | | | | | | | | | | Investor Class Shares | | | | | | | | |
| | | Year Ended | | | | | Year Ended | |
| | | December 31, 2016 | | | | | December 31, 2016 | |
| | | Shares | | | Amount | | | | | Shares | | | Amount | |
| Shares sold | | | 29,580,986 | | | $ | 348,058,765 | | | Shares sold | | | 3,740,560 | | | $ | 44,967,041 | |
| Shares issued to | | | | | | | | | | Shares issued to | | | | | | | | |
| shareholders in | | | | | | | | | | shareholders in | | | | | | | | |
| reinvestment of | | | | | | | | | | reinvestment of | | | | | | | | |
| dividends | | | 1,732,099 | | | | 20,373,781 | | | dividends | | | 239,819 | | | | 2,885,704 | |
| Shares redeemed | | | (33,599,539 | ) | | | (391,653,840 | ) | | Shares redeemed | | | (5,700,686 | ) | | | (68,300,492 | ) |
| Net decrease | | | (2,286,454 | ) | | $ | (23,221,294 | ) | | Net decrease | | | (1,720,307 | ) | | $ | (20,447,747 | ) |
| Shares Outstanding: | | | | | | | | | | Shares Outstanding: | | | | | | | | |
| Beginning of year | | | 84,225,298 | | | | | | | Beginning of year | | | 13,361,547 | | | | | |
| End of year | | | 81,938,844 | | | | | | | End of year | | | 11,641,240 | | | | | |
Notes to the Financial Statements
December 31, 2016
3. Capital Share Transactions (cont.)
Baird Quality Intermediate Municipal Bond Fund (cont.)
| Institutional Class Shares | | | | | | | | Investor Class Shares | | | | | | |
| | | Year Ended | | | | | Year Ended | |
| | | December 31, 2015 | | | | | December 31, 2015 | |
| | | Shares | | | Amount | | | | | Shares | | | Amount | |
| Shares sold | | | 26,646,569 | | | $ | 312,714,221 | | | Shares sold | | | 3,150,812 | | | $ | 37,855,718 | |
| Shares issued to | | | | | | | | | | Shares issued to | | | | | | | | |
| shareholders in | | | | | | | | | | shareholders in | | | | | | | | |
| reinvestment of | | | | | | | | | | reinvestment of | | | | | | | | |
| dividends | | | 1,741,307 | | | | 20,418,954 | | | dividends | | | 295,661 | | | | 3,545,949 | |
| Shares redeemed | | | (22,266,810 | ) | | | (260,976,248 | ) | | Shares redeemed | | | (5,607,213 | ) | | | (67,122,955 | ) |
| Net increase | | | 6,121,066 | | | $ | 72,156,927 | | | Net decrease | | | (2,160,740 | ) | | $ | (25,721,288 | ) |
| Shares Outstanding: | | | | | | | | | | Shares Outstanding: | | | | | | | | |
| Beginning of year | | | 78,104,232 | | | | | | | Beginning of year | | | 15,522,287 | | | | | |
| End of year | | | 84,225,298 | | | | | | | End of year | | | 13,361,547 | | | | | |
| | | | | | | | | | | | | | | | | | | |
| Baird Core Intermediate Municipal Bond Fund | | | | | | | | | | | | | | | | |
| Institutional Class Shares | | | | | | | | | | Investor Class Shares | | | | | | | | |
| | | Year Ended | | | | | Year Ended | |
| | | December 31, 2016 | | | | | December 31, 2016 | |
| | | Shares | | | Amount | | | | | Shares | | | Amount | |
| Shares sold | | | 6,375,410 | | | $ | 65,179,152 | | | Shares sold | | | 114,091 | | | $ | 1,170,653 | |
| Shares issued to | | | | | | | | | | Shares issued to | | | | | | | | |
| shareholders in | | | | | | | | | | shareholders in | | | | | | | | |
| reinvestment of | | | | | | | | | | reinvestment of | | | | | | | | |
| dividends | | | 77,830 | | | | 791,320 | | | dividends | | | 1,737 | | | | 17,587 | |
| Shares redeemed | | | (1,839,627 | ) | | | (18,748,846 | ) | | Shares redeemed | | | (2,653 | ) | | | (27,201 | ) |
| Net increase | | | 4,613,613 | | | $ | 47,221,626 | | | Net increase | | | 113,175 | | | $ | 1,161,039 | |
| Shares Outstanding: | | | | | | | | | | Shares Outstanding: | | | | | | | | |
| Beginning of year | | | 5,016,280 | | | | | | | Beginning of year | | | 22,259 | | | | | |
| End of year | | | 9,629,893 | | | | | | | End of year | | | 135,434 | | | | | |
| | | | | | | | | | | | | | | | | | | |
| Institutional Class Shares | | | | | | | | | | Investor Class Shares | | | | | | | | |
| | | Year Ended | | | | | Year Ended | |
| | | December 31, 2015^ | | | | | December 31, 2015^ | |
| | | Shares | | | Amount | | | | | Shares | | | Amount | |
| Shares sold | | | 5,216,078 | | | $ | 52,271,310 | | | Shares sold | | | 22,221 | | | $ | 224,183 | |
| Shares issued to | | | | | | | | | | Shares issued to | | | | | | | | |
| shareholders in | | | | | | | | | | shareholders in | | | | | | | | |
| reinvestment of | | | | | | | | | | reinvestment of | | | | | | | | |
| dividends | | | 12,426 | | | | 125,453 | | | dividends | | | 60 | | | | 611 | |
| Shares redeemed | | | (212,224 | ) | | | (2,137,467 | ) | | Shares redeemed | | | (22 | ) | | | (222 | ) |
| Net increase | | | 5,016,280 | | | $ | 50,259,296 | | | Net increase | | | 22,259 | | | $ | 224,572 | |
| Shares Outstanding: | | | | | | | | | | Shares Outstanding: | | | | | | | | |
| Beginning of period | | | — | | | | | | | Beginning of period | | | — | | | | | |
| End of period | | | 5,016,280 | | | | | | | End of period | | | 22,259 | | | | | |
^ Inception was the close of business on August 31, 2015.
Notes to the Financial Statements
December 31, 2016
4. Investment Transactions and Income Tax Information
During the year ended December 31, 2016, purchases and sales of investment securities (excluding short-term investments) were as follows:
| | | Baird | | | Baird | | | Baird | |
| | | Ultra Short | | | Short-Term | | | Intermediate | |
| Purchases: | | Bond Fund | | | Bond Fund | | | Bond Fund | |
| U.S. Government | | $ | — | | | $ | — | | | $ | — | |
| Other | | $ | 282,512,118 | | | $ | 2,275,690,539 | | | $ | 1,015,955,836 | |
| | | | | | | | | | | | | |
| Sales: | | | | | | | | | | | | |
| U.S. Government | | $ | — | | | $ | — | | | $ | — | |
| Other | | $ | 182,297,803 | | | $ | 1,494,126,253 | | | $ | 610,761,262 | |
| | | | | | | | | | | Baird | |
| | | | | | | | | | |
| | | Baird | | | Baird | | | Short-Term | |
| | | Aggregate | | | Core Plus | | | Municipal | |
| Purchases: | | Bond Fund | | | Bond Fund | | | Bond Fund | |
| U.S. Government | | $ | 126,209,225 | | | $ | 97,821,361 | | | $ | — | |
| Other | | $ | 6,745,743,686 | | | $ | 6,997,973,050 | | | $ | 50,202,857 | |
| | | | | | | | | | | | | |
| Sales: | | | | | | | | | | | | |
| U.S. Government | | $ | 58,336,891 | | | $ | 62,697,066 | | | $ | — | |
| Other | | $ | 2,992,942,024 | | | $ | 3,561,513,183 | | | $ | 9,859,413 | |
| | | | | | | | | | | |
| | | | | | | Baird Quality | | | Baird Core | |
| | | | | | | Intermediate | | | Intermediate | |
| | | | | | | Municipal | | | Municipal | |
| Purchases: | | | | | | Bond Fund | | | Bond Fund | |
| U.S. Government | | | | | | $ | — | | | $ | — | |
| Other | | | | | | $ | 257,845,049 | | | $ | 103,976,254 | |
| | | | | | | | | | | | | |
| Sales: | | | | | | | | | | | | |
| U.S. Government | | | | | | $ | — | | | $ | — | |
| Other | | | | | | $ | 283,497,850 | | | $ | 62,499,360 | |
At December 31, 2016, gross unrealized appreciation and depreciation of investments and distributable ordinary income and long-term capital gains for federal tax purposes were as follows:
| | | Baird | | | Baird | | | Baird | |
| | | Ultra Short | | | Short-Term | | | Intermediate | |
| | | Bond Fund | | | Bond Fund | | | Bond Fund | |
| Cost of Investments | | $ | 386,796,106 | | | $ | 3,907,255,324 | | | $ | 2,327,428,894 | |
| Gross unrealized appreciation | | | 340,605 | | | | 10,841,882 | | | | 18,272,507 | |
| Gross unrealized depreciation | | | (215,405 | ) | | | (18,482,799 | ) | | | (29,062,970 | ) |
| Net unrealized appreciation | | $ | 125,200 | | | $ | (7,640,917 | ) | | $ | (10,790,463 | ) |
| Undistributed ordinary income | | | 17,622 | | | | 1,105,057 | | | | 460,714 | |
| Undistributed long-term capital gain | | | — | | | | — | | | | 684,612 | |
| Undistributed tax-exempt income | | | — | | | | — | | | | — | |
| Total distributable earnings | | $ | 17,622 | | | $ | 1,105,057 | | | $ | 1,145,326 | |
| Other accumulated losses | | | (226,873 | ) | | | — | | | | — | |
| Total accumulated earnings | | $ | (84,051 | ) | | $ | (6,535,860 | ) | | $ | (9,645,137 | ) |
Notes to the Financial Statements
December 31, 2016
4. Investment Transactions and Income Tax Information (cont.)
| | | | | | | | | Baird | |
| | | Baird | | | Baird | | | Short-Term | |
| | | Aggregate | | | Core Plus | | | Municipal | |
| | | Bond Fund | | | Bond Fund | | | Bond Fund | |
| Cost of Investments | | $ | 10,792,712,712 | | | $ | 13,020,416,854 | | | $ | 58,456,047 | |
| Gross unrealized appreciation | | | 81,991,311 | | | | 113,263,030 | | | | 105,428 | |
| Gross unrealized depreciation | | | (176,346,455 | ) | | | (209,524,620 | ) | | | (570,702 | ) |
| Net unrealized appreciation | | $ | (94,355,144 | ) | | $ | (96,261,590 | ) | | $ | (465,274 | ) |
| Undistributed ordinary income | | | 547,786 | | | | 835,411 | | | | — | |
| Undistributed long-term capital gain | | | — | | | | — | | | | — | |
| Undistributed tax-exempt income | | | — | | | | — | | | | 1,316 | |
| Total distributable earnings | | $ | 547,786 | | | $ | 835,411 | | | $ | 1,316 | |
| Other accumulated losses | | | (5,361,896 | ) | | | (3,445,352 | ) | | | (35,475 | ) |
| Total accumulated earnings | | $ | (99,169,254 | ) | | $ | (98,871,531 | ) | | $ | (499,433 | ) |
| | | | | | | | | | | | | |
| | | | | | | Baird Quality | | | Baird Core | |
| | | | | | | Intermediate | | | Intermediate | |
| | | | | | | Municipal | | | Municipal | |
| | | | | | | Bond Fund | | | Bond Fund | |
| Cost of Investments | | | | | | $ | 1,042,486,736 | | | $ | 97,899,219 | |
| Gross unrealized appreciation | | | | | | | 23,236,022 | | | | 360,748 | |
| Gross unrealized depreciation | | | | | | | (9,246,712 | ) | | | (1,218,953 | ) |
| Net unrealized appreciation | | | | | | $ | 13,989,310 | | | $ | (858,205 | ) |
| Undistributed ordinary income | | | | | | | — | | | | — | |
| Undistributed long-term capital gain | | | | | | | — | | | | — | |
| Undistributed tax-exempt income | | | | | | | — | | | | 3,148 | |
| Total distributable earnings | | | | | | $ | — | | | $ | 3,148 | |
| Other accumulated losses | | | | | | | (6,040,644 | ) | | | (306,982 | ) |
| Total accumulated earnings | | | | | | $ | 7,948,666 | | | $ | (1,162,039 | ) |
Undistributed income or net realized gains for financial statement purposes may differ from amounts recognized for federal income tax purposes due to differences in the recognition and characterization of income, expense and capital gain items. The difference between book-basis and tax-basis unrealized appreciation is attributed primarily to the tax deferral of losses on wash sales.
Additionally, U.S. generally accepted accounting principles require that certain components of net assets relating to permanent differences be reclassified between financial and tax reporting. These reclassifications are primarily due to differing treatments for losses deferred due to wash sales and non-deductible expenses. These reclassifications have no effect on net assets or net asset value per share. For the year ended December 31, 2016, the following table shows the reclassifications made:
Notes to the Financial Statements
December 31, 2016
4. Investment Transactions and Income Tax Information (cont.)
| | | Undistributed Net | | | Accumulated Net | | | Paid In | |
| | | Investment Income (Loss) | | | Realized Gain (Loss) | | | Capital | |
| Baird Ultra Short Bond Fund | | $ | 58,463 | | | $ | (58,463 | ) | | $ | — | |
| Baird Short-Term Bond Fund | | | 1,279,285 | | | | (1,279,285 | ) | | | — | |
| Baird Intermediate Bond Fund | | | 534,343 | | | | (534,343 | ) | | | — | |
| Baird Aggregate Bond Fund | | | 18,192,482 | | | | (18,192,482 | ) | | | — | |
| Baird Core Plus Bond Fund | | | 21,469,465 | | | | (21,469,465 | ) | | | — | |
| Baird Short-Term Municipal Bond Fund | | | (642 | ) | | | 642 | | | | — | |
| Baird Quality Intermediate | | | | | | | | | | | | |
| Municipal Bond Fund | | | 23,296 | | | | — | | | | (23,296 | ) |
| Baird Core Intermediate | | | | | | | | | | | | |
| Municipal Bond Fund | | | (65 | ) | | | 65 | | | | — | |
The tax components of dividends paid during the periods shown below were as follows:
| | | Year Ended | | | Year Ended | |
| | | December 31, 2016 | | | December 31, 2015 | |
| | | Ordinary | | | Long-Term | | | Ordinary | | | Long-Term | |
| | | Income | | | Capital Gains | | | Income | | | Capital Gains | |
| | | Distributions | | | Distributions | | | Distributions | | | Distributions | |
| Baird Ultra Short Bond Fund | | $ | 2,690,875 | | | $ | — | | | $ | 1,288,639 | | | $ | — | |
| Baird Short-Term Bond Fund | | $ | 56,998,935 | | | $ | — | | | $ | 45,056,387 | | | $ | 1,191,582 | |
| Baird Intermediate Bond Fund | | $ | 46,505,262 | | | $ | 4,693,858 | | | $ | 40,089,420 | | | $ | 4,403,658 | |
| Baird Aggregate Bond Fund | | $ | 227,916,820 | | | $ | 6,899,253 | | | $ | 135,833,133 | | | $ | — | |
| Baird Core Plus Bond Fund | | $ | 328,622,238 | | | $ | 3,351,170 | | | $ | 233,638,407 | | | $ | — | |
| Baird Short-Term Municipal Bond Fund | | $ | 30,307 | | | $ | — | | | $ | 18,089 | | | $ | — | |
| Baird Quality Intermediate | | | | | | | | | | | | | | | | |
| Municipal Bond Fund | | $ | 189,012 | | | $ | — | | | $ | 216,080 | | | $ | — | |
| Baird Core Intermediate | | | | | | | | | | | | | | | | |
| Municipal Bond Fund | | $ | 546,276 | | | $ | 2,509 | | | $ | 75,435 | | | $ | — | |
For the year ended December 31, 2016, the Baird Short-Term Municipal Bond Fund, Baird Quality Intermediate Municipal Bond Fund, and Baird Core Intermediate Municipal Bond Fund made distributions of tax-exempt income of $412,586, $25,870,057, and $1,241,465, respectively. For the year ended December 31, 2015, the Baird Short-Term Municipal Bond Fund, Baird Quality Intermediate Municipal Bond Fund, and Baird Core Intermediate Municipal Bond Fund made distributions of tax-exempt income of $36,906, $26,916,871, and $234,396, respectively.
Under the current tax law, capital losses realized after October 31 may be deferred and treated as occurring on the first day of the following fiscal year. For the year ended December 31, 2016, the Baird Aggregate Bond Fund, Baird Core Plus Bond Fund, Baird Short-Term Municipal Bond Fund, and Baird Core Intermediate Municipal Bond Fund elected to defer capital losses occurring between November 1, 2016 and December 31, 2016 in the amount of $5,361,896, $3,445,352, $35,475 and $306,982, respectively.
Notes to the Financial Statements
December 31, 2016
4. Investment Transactions and Income Tax Information (cont.)
To the extent the Funds realize future net capital gains, those gains will be offset by any unused capital loss carryovers. At December 31, 2016, accumulated net realized capital loss carryovers, if any, and the year(s) in which the capital loss carryovers expire were:
| | | Capital Loss | | | Year of |
| | | Carryover | | Character | Expiration |
| Baird Ultra Short Bond Fund | | $ | 86,934 | | Short-Term | Indefinitely |
| | | | 139,939 | | Long-Term | Indefinitely |
| Baird Quality Intermediate Municipal Bond Fund | | | 3,863,605 | | Short-Term | Indefinitely |
| | | | 2,177,039 | | Long-Term | Indefinitely |
5. Investment Advisory and Other Agreements
The Funds have entered into an Investment Advisory Agreement with Baird for the provision of investment advisory services. Pursuant to the Investment Advisory Agreement, the Advisor is entitled to receive a fee, calculated daily and payable monthly, at the annual rate of 0.25% for the Funds as applied to the respective Fund’s average daily net assets. Certain officers of the Advisor are also officers of the Funds.
For the year ended December 31, 2016, the Advisor waived the following amount pursuant to the fee waiver agreement between the Advisor and the Corporation on behalf of the Baird Ultra Short Bond Fund:
Fund | Waived Amount |
| Baird Ultra Short Bond Fund | $376,698 |
The Funds have entered into an Administration Agreement with Baird. Under the Administration Agreement, the Advisor assumes and pays all expenses of the applicable Fund other than the investment advisory fees, fees under the 12b-1 plan, costs related to portfolio securities transactions and extraordinary or non-recurring expenses. Pursuant to the Administration Agreement, the Advisor is entitled to receive a fee, calculated daily and payable monthly, at the annual rate of 0.05% for the Funds as applied to the respective Fund’s average daily net assets.
U.S. Bancorp Fund Services, LLC (“USBFS”) serves as transfer agent, administrator, and accounting services agent for the Funds. U.S. Bank, N.A. (“U.S. Bank”) serves as custodian for the Funds.
Baird (the “Distributor”) is the distributor of the Funds pursuant to a distribution agreement.
6. Securities Lending
During the year ended December 31, 2016, each Fund (other than the Short-Term Municipal Bond Fund, Quality Intermediate Municipal Bond Fund and Core Intermediate Municipal Bond Fund) was permitted to lend up to one-third of its total assets (including such loans) to borrowers under terms of participation in a securities lending program administered by U.S. Bank, N.A., the Funds’ custodian and an affiliated person of the Funds, and an affiliate of USBFS, the Funds’ transfer agent and administrator and a second-tier affiliate of the Funds. The securities lending agreement required that loans be collateralized at all times in an amount equal to at least 102% of the market value of any loaned securities at the time of the loan, plus accrued interest.
The Funds received compensation in the form of fees and earned interest on the cash collateral. The amount of fees depended on a number of factors including the type of security and length of the loan.
The Funds received cash as collateral in return for securities lent as part of the securities lending program. The collateral was invested in the Mount Vernon Securities Lending Prime Portfolio (a securities lending trust subject to Rule 2a-7 under the 1940 Act).
Notes to the Financial Statements
December 31, 2016
6. Securities Lending (cont.)
The interest income earned by the Funds on investments of cash collateral received from borrowers for the securities loaned to them (“securities lending income”) is reflected in the Funds’ statements of operations. Interest income earned on collateral investments and recognized by the Funds during the year ended December 31, 2016 for the Baird Ultra Short Bond Fund, Baird Short-Term Bond Fund, Baird Intermediate Bond Fund, Baird Aggregate Bond Fund, and Baird Core Plus Bond Fund were $1,102, $124,367, $115,159, $235,973, and $529,588, respectively.
Effective September 1, 2016, the Funds ceased securities lending activities, although they may do so again in the future.
7. Line of Credit
The Corporation maintains an uncommitted, senior secured line of credit (“LOC”) with U.S. Bank, N.A. (the “Bank”) to provide the Funds a temporary liquidity source to meet unanticipated redemptions. Under the terms of the LOC, borrowings for each Fund are limited to one-third of the total assets (including the amount borrowed) of the respective Fund, or as otherwise indicated within the Funds’ agreement with the Bank. The Bank charges interest at the Bank’s Prime Rate less 2% (weighted average rate of 1.51% for 2016). For the year ended December 31, 2016, the Baird Ultra Short Bond Fund incurred $144 in interest charges, on an average daily loan balance of $9,443. The Baird Core Intermediate Municipal Bond Fund incurred $1,038 in interest charges, on an average daily loan balance of $58,320. The Baird Short-Term Bond Fund, Baird Intermediate Bond Fund, Baird Aggregate Bond Fund, Baird Core Plus Bond Fund, Baird Short-Term Municipal Bond Fund and Baird Quality Intermediate Municipal Bond Fund did not borrow from the LOC during the period.
8. Distribution and Shareholder Service Plan
The Funds have adopted a distribution and shareholder service plan (the “Plan”) pursuant to Rule 12b-1 under the 1940 Act. The Plan allows the Funds to compensate the Distributor for the costs incurred in distributing the Funds’ Investor Class Shares, including amounts paid to brokers or dealers, at an annual rate of 0.25% of the average daily net assets of the Funds’ Investor Class Shares. The Baird Ultra Short Bond, Baird Short-Term Bond, Baird Intermediate Bond, Baird Aggregate Bond, Baird Core Plus Bond, Baird Short-Term Municipal Bond Fund, Baird Quality Intermediate Municipal Bond and Baird Core Intermediate Municipal Bond Funds incurred $6,592, $175,294, $258,062, $1,498,734, $6,387,804, $2,672, $390,171 and $1,637, respectively, in fees pursuant to the Plan during the year ended December 31, 2016.
9. Subsequent Event
In preparing these financial statements, the Corporation has evaluated events after December 31, 2016. There were no subsequent events since December 31, 2016 through the date the financial statements were issued that would require adjustment to or additional disclosure in these financial statements.
Report of Independent Registered Public
Accounting Firm
Board of Directors and ShareholdersBaird Funds, Inc.
We have audited the accompanying statements of assets and liabilities of Baird Ultra Short Bond Fund, Baird Short-Term Bond Fund, Baird Intermediate Bond Fund, Baird Aggregate Bond Fund, Baird Core Plus Bond Fund, Baird Short-Term Municipal Bond Fund, Baird Quality Intermediate Municipal Bond Fund (formerly the Baird Intermediate Municipal Bond Fund) and Baird Core Intermediate Municipal Bond Fund (eight of the funds constituting Baird Funds, Inc.) (collectively, the Funds), including the schedules of investments, as of December 31, 2016, and the related statement of operations for the year then ended, the statements of changes in net assets for each of the two years in the period then ended, and the financial highlights for each of the three years in the period then ended for the Baird Ultra Short Bond Fund; the related statements of operations for the year then ended, the statements of changes in net assets for each of the two years in the period then ended, and the financial highlights for each of the five years in the period then ended for the Baird Short-Term Bond Fund, Baird Intermediate Bond Fund, Baird Aggregate Bond Fund, Baird Core Plus Bond Fund and Baird Quality Intermediate Municipal Bond Fund; the related statements of operations for the year then ended, the statements of changes in net assets and the financial highlights for the year then ended and the period from August 31, 2015 (date of inception) through December 31, 2015, for the Baird Short-Term Municipal Bond Fund and Baird Core Intermediate Municipal Bond Fund. These financial statements are the responsibility of the Funds’ management. Our responsibility is to express an opinion on these financial statements based on our audits.
We conducted our audits in accordance with the standards of the Public Company Accounting Oversight Board (United States). Those standards require that we plan and perform the audits to obtain reasonable assurance about whether the financial statements are free of material misstatement. We were not engaged to perform an audit of the Funds’ internal control over financial reporting. Our audits included consideration of internal control over financial reporting as a basis for designing audit procedures that are appropriate in the circumstances, but not for the purpose of expressing an opinion on the effectiveness of the Funds’ internal control over financial reporting. Accordingly, we express no such opinion. Our procedures included confirmation of securities owned as of December 31, 2016, by correspondence with the custodian or brokers. An audit also includes examining, on a test basis, evidence supporting the amounts and disclosures in the financial statements, assessing the accounting principles used and significant estimates made by management, as well as evaluating the overall financial statement presentation. We believe that our audits provide a reasonable basis for our opinion.
In our opinion, the financial statements referred to above present fairly, in all material respects, the financial position of the aforementioned Funds of Baird Funds, Inc. as of December 31, 2016, and the results of their operations, changes in their net assets, and the financial highlights for the periods indicated above, in conformity with accounting principles generally accepted in the United States of America.
Chicago, Illinois
February 27, 2017
Directors & Officers
As of December 31, 2016
Independent Directors
G. Frederick Kasten, Jr.
Independent Director and Chairman
Term of Office: Indefinite
Length of Time Served: Since September 2000
Age: 77
c/o Robert W. Baird & Co. Incorporated
777 East Wisconsin Avenue
Milwaukee, WI 53202
Principal Occupation(s) During the Past 5 Years: Retired; Chairman, the Advisor (January 2000-December 2005); Chairman and CEO, the Advisor (January 1998-January 2000); President, Chairman and CEO, the Advisor (June 1983-January 1998); President, the Advisor (January 1979-January 1983)
Number of Portfolios in Complex Overseen by Director: 14
Other Directorships Held by Director: Director of Regal-Beloit Corporation, a Manufacturing Company (1995-2011).
John W. Feldt
Independent Director
Term of Office: Indefinite
Length of Time Served: Since September 2000
Age: 74
c/o Robert W. Baird & Co. Incorporated
777 East Wisconsin Avenue
Milwaukee, WI 53202
Principal Occupation(s) During the Past 5 Years: Retired.
Number of Portfolios in Complex Overseen by Director: 14
Other Directorships Held by Director: Director of Thompson Plumb Funds, Inc., a mutual fund complex (3 portfolios)
Frederick P. Stratton, Jr.
Independent Director
Term of Office: Indefinite
Length of Time Served: Since May 2004
Age: 77
c/o Robert W. Baird & Co. Incorporated
777 East Wisconsin Avenue
Milwaukee, WI 53202
Principal Occupation(s) During the Past 5 Years: Retired; Chairman Emeritus, Briggs & Stratton Corporation, a manufacturing company, since 2003.
Number of Portfolios in Complex Overseen by Director: 14
Other Directorships Held by Director: Director of Weyco Group, Inc., a men’s footwear distributor; Director of Wisconsin Energy Corporation and its subsidiaries, Wisconsin Electric Power Company and Wisconsin Gas LLC (1987-2012).
Marlyn J. Spear, CFA
Independent Director
Term of Office: Indefinite
Length of Time Served: Since January 2008
Age: 63
c/o Robert W. Baird & Co. Incorporated
777 East Wisconsin Avenue
Milwaukee, WI 53202
Principal Occupation(s) During the Past 5 Years: Chief Investment Officer, Building Trades United Pension Trust Fund, (July 1989-December 2016)
Number of Portfolios in Complex Overseen by Director: 14
Other Directorships Held by Director: Management Trustee of AFL-CIO Housing Investment Trust, a mutual fund complex (1 portfolio), since 1995.
Directors & Officers
As of December 31, 2016
Interested Directors and Officers
Cory L. Nettles*
Interested Director
Term of Office: Indefinite
Length of Time Served: Since January 2008
Age: 46
c/o Generation Growth Capital, Inc.
411 East Wisconsin Avenue, Suite 1710
Milwaukee, WI 53202
Principal Occupation(s) During the Past 5 Years: Managing Director, Generation Growth Capital, Inc., a private equity fund, since March 2007; Of Counsel, Quarles & Brady LLP, a law firm, (January 2005-December 2016); Secretary, Wisconsin Department of Commerce (January 2003-January 2005)
Number of Portfolios in Complex Overseen by Director: 14
Other Directorships Held by Director: Director of Weyco Group, Inc., a men’s footwear distributor; Director of Associated Banc-Corp, since 2013
Mary Ellen Stanek
President
Term of Office: Re-elected by Board annually
Length of Time Served: Since September 2000
Age: 60
777 East Wisconsin Avenue
Milwaukee, WI 53202
Principal Occupation(s) During the Past 5 Years: Managing Director, the Advisor, and Chief Investment Officer, Baird Advisors, a department of the Advisor, since March 2000
Charles B. Groeschell
Vice President
Term of Office: Re-elected by Board annually
Length of Time Served: Since January 2010
Age: 63
777 East Wisconsin Avenue
Milwaukee, WI 53202
Principal Occupation(s) During the Past 5 Years: Managing Director, the Advisor, and Senior Portfolio Manager, Baird Advisors, a department of the Advisor, since February 2000
Angela Palmer
Chief Compliance Officer
and AML Compliance Officer
Term of Office: Re-elected by Board annually
Length of Time Served: Since March 2014
Age: 45
777 East Wisconsin Ave
Milwaukee, WI 53202
Principal Occupation(s) During the Past 5 Years: Chief Compliance Officer, the Advisor, since March 2014; Director, the Advisor, since July 2014; Senior Vice President, the Advisor (March 2014-June 2014); Chief Compliance Officer, RIAs US, BMO Financial Group (January 2013-March 2014); Chief Compliance Officer, Institutional RIAs, BMO Financial Group (March 2012-January 2013); Vice President, BMO Harris Bank, N.A. (July 2011-March 2014); Chief Compliance Officer, Taplin, Canida & Habacht, LLC (December 2008-March 2014); Chief Compliance Officer and Vice President, M&I Investment Management Corp. (June 2006-May 2012); Assistant Secretary, M&I Investment Management Corp. (April 2010-May 2012); Vice President, Marshall & Ilsley Trust Company N.A. (June 2006-August 2012).
Terrance P. Maxwell
Treasurer
Term of Office: Re-elected by Board annually
Length of Time Served: Since March 2015
Age: 56
777 East Wisconsin Ave
Milwaukee, WI 53202
Principal Occupation(s) During the Past 5 Years: Chief Financial Officer, the Advisor, since March 2015; Member of the Board of Managers, Greenhouse Funds, LP, an affiliate of the Advisor, since April 2014; Trustee, Investors Real Estate Trust, since November 2013; Director of Corporate Development and Strategic Investment, the Advisor (May 2014-March 2015); Lecturer at University of Wisconsin-Madison (August 2006-May 2010 and August 2011-May 2014); Co-CEO of The Art Commission, LLC, an online start-up company focused on commissioned art and design, from January 2012-September 2013 and Member of the Board from January 2012-July 2015; consultant and Director of Flatirons Solutions, a portfolio company of Baird Capital Partners (April 2011-June 2012).
Directors & Officers
As of December 31, 2016
Interested Directors and Officers
Charles M. Weber
Secretary
Term of Office: Re-elected by Board annually
Length of Time Served: Since September 2005
Age: 53
777 East Wisconsin Avenue
Milwaukee, WI 53202
Principal Occupation(s) During the Past 5 Years: Senior Associate General Counsel, the Advisor, since January 2013; Managing Director, the Advisor since January 2009; Chief Compliance Officer and Secretary, Baird Kailash Group, LLC since July 2013; Associate General Counsel, the Advisor (July 2005-December 2012)
Peter J. Hammond
Vice President
Term of Office: Re-elected by Board annually
Length of Time Served: Since August 2012
Age: 53
777 East Wisconsin Avenue
Milwaukee, WI 53202
Principal Occupation(s) During the Past 5 Years: Senior Vice President, the Advisor, since March 2012; Vice President, Baird Kailash Group, LLC since July 2013; Executive VP and Chief Administrative Officer, UMB Fund Services (September 1996 to March 2012)
Dustin J. Hutter
Assistant Treasurer
Term of Office: Re-elected by Board annually
Length of Time Served: Since February 2011
Age: 40
777 East Wisconsin Avenue
Milwaukee, WI 53202
Principal Occupation(s) During the Past 5 Years: Director of Finance Services, the Advisor, since August 2015; Director of Reporting and Analysis, Capital Markets Finance, the Advisor (February 2013-August 2015); Senior Vice President, the Advisor (January 2011-January 2013); Treasurer, Baird Kailash Group, LLC since July 2013; First Vice President, the Advisor (January 2008-December 2010); Vice President, the Advisor (January 2006-December 2007); Assistant Controller, the Advisor (January 2006-January 2013)
Andrew D. Ketter
Assistant Secretary
Term of Office: Re-elected by Board annually
Length of Time Served: Since February 2011
Age: 42
777 East Wisconsin Avenue
Milwaukee, WI 53202
Principal Occupation(s) During the Past 5 Years: Associate General Counsel, the Advisor, since September 2010; Director, the Advisor, since July 2014; Senior Vice President, the Advisor (January 2014-June 2014); First Vice President, the Advisor (September 2010 to December 2013); Associate, Quarles & Brady LLP, a law firm (September 2002-August 2010)
| * | Mr. Nettles is considered an “interested person” of the Corporation (as defined in the 1940 Act) because of his association with the law firm, Quarles & Brady LLP, which provides legal services to the Advisor. The legal services that Quarles & Brady LLP has provided to the Advisor include litigation, real estate, trademark and miscellaneous securities related matters that did not relate to the Corporation or the Funds. The Advisor has invested in and may in the future invest in private equity funds managed by Generation Growth Capital, Inc., a company of which Mr. Nettles is affiliated, through its division, Baird Capital. |
Additional information about the Funds’ directors is available in the Statement of Additional Information which may be obtained without charge, upon request, by calling 1-866-44BAIRD, or at www.bairdfunds.com.
Baird Funds, Inc.
Disclosure Regarding the Board of Directors’ Approval of the Investment Advisory Agreement for Baird Bond Funds
The Board of Directors (the “Board”) of Baird Funds, Inc. (the “Corporation”), including the directors who are not “interested persons” of the Corporation within the meaning of the Investment Company Act of 1940 (the “Independent Directors”), met on August 18 and August 25, 2016 to consider the annual renewal of the investment advisory agreement between Robert W. Baird & Co. Incorporated (“Baird” or the “Advisor”) and the Corporation on behalf of the Baird Ultra Short Bond, Short-Term Bond, Intermediate Bond, Aggregate Bond, Core Plus Bond and Quality Intermediate Municipal Bond Funds (collectively, the “Funds”). The Board, including the Independent Directors, approved the investment advisory agreement through a process that concluded at the August 25, 2016 meeting. In connection with its consideration of the investment advisory agreement, the Board reviewed and discussed various information that had been provided prior to the meeting, including the investment advisory agreement, a memorandum provided by legal counsel summarizing the guidelines relevant to the Board’s consideration of the renewal of the investment advisory agreement, a memorandum and other information provided in response to requests from the Board from the Advisor (including the Advisor’s Form ADV Part 1, brochure and brochure supplements, annual report and financial information), a profitability analysis, comparative information about the Funds’ performance for periods ended June 30, 2016, management fees and expense ratios, and other pertinent information.
The Board met in executive session with the Funds’ legal counsel to consider the investment advisory agreement. The Board discussed the Advisor’s 15(c) response at the August 18, 2016 meeting and discussed various questions and information with the President of the Funds at the August 18, 2016 meeting and during executive session earlier in the meeting. The Board also took into account information reviewed periodically throughout the year that was relevant to its consideration of the investment advisory agreement, including performance, management fee and other expense information and discussions with the Funds’ portfolio managers. Based on its evaluation of this information, the Board, including a majority of the Independent Directors, approved the continuation of the investment advisory agreement for an additional one-year period.
In considering the investment advisory agreement and reaching its conclusions, the Board reviewed and analyzed various factors that it determined were relevant, including the factors below. In deciding to approve the investment advisory agreement for each Fund, the Board did not identify any single factor as determinative but considered all factors together.
Nature, Extent and Quality of Services Provided to the Funds
The Board analyzed the nature, extent and quality of the services provided by the Advisor to the Funds. The Board noted the depth of the Advisor’s personnel, resources and commitment to the Funds and the experience and credentials of the portfolio management teams employed to manage the Funds’ investments. The Board considered the consistency and continuity of the portfolio management teams for the Funds and noted that the Advisor has added resources in support of the Funds, including portfolio management, business, legal and sales personnel, and has made enhancements to its technology, trading and research capabilities. The Board noted that the Funds provide an opportunity for smaller institutional and retail accounts to receive the same professional advice from the Advisor that it offers to its larger institutional clients. However, the Board noted that the provision of investment advisory services to the Funds requires more effort than it does for separately managed accounts due to daily sales and redemption activity and additional regulatory and compliance requirements.
The Board considered the Advisor’s disciplined investment decision making process used for the Funds. The Board also considered other services that the Advisor provides the Funds in its capacity as their investment advisor, such as making some of its key personnel available to serve as officers of the Funds, selecting broker dealers for execution of portfolio transactions, ensuring adherence to the Funds’ investment policies and restrictions, compliance, risk management services, valuation, providing support services to the Board and the committees of the Board and overseeing the Funds’ other service providers. The Board also considered the strength of the Advisor’s compliance department, including the Funds’ chief compliance officer, as well as the
Baird Funds, Inc.
Disclosure Regarding the Board of Directors’ Approval of the Investment Advisory Agreement for Baird Bond Funds (cont.)
Advisor’s risk management tools and process. The Board concluded that the nature, extent and quality of the services provided by the Advisor to the Funds were appropriate and that each Fund was likely to continue to benefit from services provided under the respective investment advisory agreement.
Investment Performance of the Advisor and the Funds
In considering the investment performance of each of the Funds, the Board reviewed information as of June 30, 2016 regarding the Fund’s performance in comparison to its benchmark index and its peer groups as determined by Lipper. The Board also considered composite investment performance of Baird Advisors with respect to accounts managed by the Advisor that are comparable to the Funds.
The Board determined that the Funds have maintained strong short term and long term returns, particularly in light of the asset growth experienced by the Funds in the last two years. The Board noted that the returns of the Ultra Short Bond Fund, the Short-Term Bond Fund, the Aggregate Bond Fund and the Core Plus Bond Funds have exceeded the Lipper peer group average, with the Institutional Class exceeding the returns of the respective benchmark index and the Investor Class returns close to or exceeding the benchmark. The Institutional Class of the Intermediate Bond Fund has exceeded its benchmark index for all time periods. Both classes of the Fund exceeded the Lipper peer group average for the ten year and since inception periods and were close to or slightly lagged the peer group average for the one ,three and five year periods. The Board noted that the Fund is classified in a peer group category with funds that generally have a longer duration, and considered the Advisor’s commentary in that regard. While the Quality Intermediate Municipal Bond Fund has generally trailed its benchmark index and Lipper peer group average, the Board noted the Advisor’s commentary that the Fund’s high quality bias and emphasis on intermediate maturity holdings have detracted from relative returns over recent years as interest rates remain near historical lows.
The Board also considered the Advisor’s quarterly portfolio commentaries and reviews explaining the Funds’ performance, the Advisor’s consistent and disciplined investment decision process and the investment strategies it employs for the Funds. After considering all of the information, the Board concluded that, although past performance is not a guarantee of future results, each Fund and its shareholders were likely to benefit from the continued management by the Advisor.
Costs of Services Provided and Profits Realized by the Advisor
The Board examined the fee and expense information for each of the Funds, including a comparison of such information to comparable mutual funds as determined by Morningstar. The Board noted that each Fund’s advisory fee and total expense ratio (for both its Investor Class and Institutional Class Shares) were significantly lower than the average and median advisory fees and expense ratios for all mutual funds in its Morningstar category. With respect to the Ultra Short Fund, the Board considered the Advisor’s contractual agreement to waive management fees of 0.15% until April 30, 2017. In addition, the Board considered that the Advisor provides administrative services to each of the Funds at an annual rate of 0.05% of each Fund’s average daily net assets, and is responsible for paying each Fund’s custody, transfer agency, accounting, printing, auditing, legal and director fees and other ordinary expenses (except for advisory and 12b-1 fees and certain other costs), which has the effect of capping the Funds’ expense ratios at 0.55% and 0.30% for Investor and Institutional Class Shares, respectively.
The Board also reviewed and considered investment management fees charged by the Advisor to other investment advisory clients and found that the fee paid by the Funds (0.25%) was less than the fee that the Advisor charges on the first $50 million (0.30%) of a separately managed account. The Board noted the extent of the significant additional services provided to the Funds that the Advisor did not provide in the other advisory relationships. Those services included contract administration, valuation services, oversight of the Funds’ other service providers, director support, preparation of regulatory filings, implementation of the
Baird Funds, Inc.
Disclosure Regarding the Board of Directors’ Approval of the Investment Advisory Agreement for Baird Bond Funds (cont.)
Funds’ compliance program and various other services. The Board noted that the Advisor maintains a subadvisory arrangement with an unaffiliated fixed income mutual fund but did not consider the subadvisory fee to be a material factor given that the subadvisory services were limited to asset management.
The Board considered the fees realized, and the costs incurred, by the Advisor in providing investment management services to the Funds and a profitability analysis with respect to each Fund. The Board noted the unique expense structure of the Funds whereby the Institutional Class shareholders were charged only a management fee and an administration fee, Investor Class shareholders incurred the same expenses as the Institutional Class shareholders plus a 0.25% 12b-1 fee, and the Advisor assumes almost all of the other expenses on behalf of each Fund. The Board noted that for the past fiscal year, the Advisor had incurred more in expenses under the Administration Agreement than it received in administrative fees and that historically, the amount of administrative fees paid by the Advisor has far exceeded the amount of the administration fee received by the Advisor.
The Board concluded that the profits realized by the Advisor from its relationship with the Funds were reasonable. The Board noted that the Advisor’s profitability information does not reflect certain internal resources provided by the Advisor to the Funds, such as legal, finance and compliance support. The Board reviewed and considered the general financial condition of the Advisor and determined it to be sound. The Board also noted that all marketing and distribution fees other than the Rule 12b-1 fee payable by the Investor Class shares of the Funds were paid by the Advisor from its profits. In light of all of the information that it received and considered, the Board concluded that the management fee and total expense ratio of each Fund were reasonable.
Economies of Scale and Fee Levels Reflecting Those Economies
The Board reviewed the extent to which economies of scale may be realized as the Funds increase in size, noting that the Funds have experienced strong growth in assets, particularly since 2014. The Board noted that the Funds’ advisory fee structure does not contain any breakpoint reductions as the Funds grow in size. However, the Board recognized that the Advisor bears almost all of the Funds’ expenses other than management, 12b-1 and administration fees. The Board also considered the Advisor’s analysis of Morningstar data demonstrating that the Funds already have extremely low management fees and expense ratios and that Fund shareholders benefit from a very favorable pricing structure, particularly with respect to the Institutional Class where most of the assets are invested, when compared to larger peer funds. The Board also recognized that the advisory fee rates paid by the Funds were designed to be lower than the fees otherwise charged by the Advisor to its separately managed account clients and to be comparable to the second or third breakpoint advisory fee levels paid by other comparable mutual funds. The directors concluded that the current fee structure of each Fund was reasonable.
Benefits Derived from the Relationship with the Funds
The Board considered other benefits to the Advisor from serving as advisor to the Funds (in addition to the advisory fee). The Board considered the administration fees received by the Advisor under the Administration Agreement, noting that historically the Advisor has paid more in Fund expenses under the agreement than it has received in administration fees. The Board also noted that the Distributor and its financial advisors receive 12b-1 payments for selling Investor Class shares of the Funds. The Board noted that the Advisor’s asset management business may experience indirect benefits from the Advisor’s association with the Funds. The Board concluded that the other benefits realized by the Advisor from its relationship with the Funds were appropriate.
Based on its evaluation of the above factors, as well as other factors relevant to their consideration of the investment advisory agreement, the directors, including all of the Independent Directors, concluded that the continuation of the investment advisory agreements was in the best interest of each Fund and its shareholders.
Additional Information
Proxy Voting
A description of the policies and procedures that the Funds use to determine how to vote proxies relating to portfolio securities is available without charge, upon request, by calling toll free, 1-866-44BAIRD, or by accessing the Funds’ website at www.bairdfunds.com; and by accessing the SEC’s website at www.sec.gov.
Each Fund’s proxy voting record for the most recent 12-month period ended June 30, if applicable, is available without charge, upon request, by calling toll free, 1-866-44BAIRD, or by accessing the Funds’ website at www.bairdfunds.com; and by accessing the SEC’s website at www.sec.gov. The Funds generally do not vote proxies because the securities held in their portfolios, consisting of bonds and other fixed-income securities, are not entitled to vote.
Portfolio Holdings Disclosure
The Funds file a complete schedule of portfolio holdings with the SEC for the first and third quarters of each fiscal year on Form N-Q. The Funds’ Forms N-Q are available on the SEC’s website at www.sec.gov and may be reviewed and copied at the SEC’s Public Reference Room in Washington, D.C. Information on the operation of the Public Reference Room may be obtained by calling 1-800-732-0330. The Funds’ Forms N-Q may also be obtained by calling toll-free 1-866-44BAIRD.
Tax Information
The percentage of taxable ordinary income distributions that are designated as short-term capital gain distributions under Internal Revenue Section 871(k)(2)(c) for the Baird Short-Term Bond Fund, Baird Aggregate Bond Fund, Baird Core Plus Bond Fund, Baird Short-Term Municipal Bond Fund and Baird Core Intermediate Municipal Bond Fund were 0.51%, 6.00%, 6.42%, 74.20% and 96.25%, respectively.
Baird Funds, Inc. Privacy Policy
Protecting the privacy of Fund shareholders is important to us. The following is a description of the practices and policies through which Baird Funds, Inc. protects the privacy and security of your non-public personal information.
What Information We Collect
We collect and maintain information about you so that we can open and maintain your account in the Funds and provide various services to you. We may collect and maintain the following personal information about you:
| | • | Information we receive from you or your financial advisor on account applications or other forms, correspondence, or conversations, such as your name, address, e-mail address, phone number, social security number, assets, income and date of birth; and |
| | • | Information about your transactions with us, our affiliates, or others, such as your account number and balance, positions, activity, history, cost basis information, and other financial information. |
What Information We Disclose
We do not sell any non-public personal information about our current or former shareholders to third parties. We do not disclose any non-public personal information about our current or former shareholders to anyone, except as permitted or required by law. We are permitted by law to share any of the information we collect, as described above, with our affiliates. In addition, we may share such information with nonaffiliated third parties to the extent necessary to effect, process, administer or enforce a transaction that the shareholder requests or authorizes, in connection with maintaining or servicing the shareholder’s account, as requested by regulatory authorities or as otherwise permitted or required by law. For example, we are permitted by law to disclose all of the information we collect, as described above, to our transfer agent to process your transactions. We may also provide your name and address to third party service providers who send account statements and other Fund-related material to you.
How We Protect Your Information
We restrict access to your non-public personal information to those persons who require such information to provide products or services to you. We maintain physical, electronic, and procedural safeguards that comply with federal standards to protect the confidentiality, integrity and security of your non-public personal information.
We will continue to adhere to the privacy policies and practices in this notice even after your account is closed or becomes inactive.
In the event that you hold shares of the Fund(s) through a financial intermediary, including, but not limited to, a broker-dealer, bank, or trust company, the privacy policy of your financial intermediary would govern how your non-public personal information would be shared with nonaffiliated third parties.-
Baird Funds, Inc.
c/o U.S. Bancorp Fund Services, LLC
P.O. Box 701
Milwaukee, WI 53201-0701
1-866-44BAIRD
Board of Directors
G. Frederick Kasten, Jr. (Chairman)
John W. Feldt
Cory L. Nettles
Marlyn J. Spear
Frederick P. Stratton, Jr.
Investment Advisor and Distributor
Robert W. Baird & Co. Incorporated
777 East Wisconsin Avenue
Milwaukee, WI 53202
Administrator and Transfer Agent
U.S. Bancorp Fund Services, LLC
P.O. Box 701
615 East Michigan Street
Milwaukee, WI 53202
Custodian
U.S. Bank, N.A.
1555 N. RiverCenter Drive, Suite 302
Milwaukee, WI 53212
Legal Counsel
Godfrey & Kahn, S.C.
833 East Michigan Street, Suite 1800
Milwaukee, WI 53202
Independent Registered Public
Accounting Firm
Grant Thornton LLP
Grant Thornton Tower
171 N. Clark Street, Suite 200
Chicago, IL 60601
Annual Report –
Baird Funds
December 31, 2016
Baird LargeCap Fund
Baird MidCap Fund
Baird Small/Mid Cap Value Fund
Baird SmallCap Value Fund
Chautauqua International Growth Fund
Chautauqua Global Growth Fund
| Go Green. | | Go Paperless. |
Sign up to receive your Baird Funds’ prospectuses and reports online.
Table of Contents
| Letter to Shareholders | 1 |
| Baird LargeCap Fund | 2 |
| Baird MidCap Fund | 16 |
| Baird Small/Mid Cap Value Fund | 25 |
| Baird SmallCap Value Fund | 34 |
| Chautauqua International Growth Fund | 43 |
| Chautauqua Global Growth Fund | 51 |
| Additional Information on Fund Expenses | 60 |
| Statements of Assets and Liabilities | 62 |
| Statements of Operations | 64 |
| Statements of Changes in Net Assets | 66 |
| Financial Highlights | 72 |
| Notes to the Financial Statements | 84 |
| Report of Independent Registered Public Accounting Firm | 96 |
| Directors and Officers | 97 |
| Disclosure Regarding the Board of Directors’ Approval of the Investment | |
| Advisory Agreements for Baird Equity Funds | 100 |
| Additional Information | 103 |
| Privacy Notice | A-1 |
This report has been prepared for shareholders and may be distributed to others only if preceded or accompanied by a current prospectus.
Cautionary Note on Analyses, Opinions and Outlooks: In this report we offer analyses and opinions on the performance of individual securities, companies, industries, sectors, markets, interest rates and governmental policies, including predictions, forecasts and outlooks regarding possible future events. These can generally be identified as such because the context of the statements may include such words as “believe,” “should,” “will,” “expects,” “anticipates,” “hopes” and words of similar effect. These statements reflect the portfolio managers’ good faith beliefs and judgments and involve risks and uncertainties, including the risk that the portfolio managers’ analyses, opinions and outlooks are or will prove to be inaccurate. It is inherently difficult to correctly assess and explain the performance of particular securities, sectors, markets, interest rate movements, governmental actions or general economic trends and conditions, and many unforeseen factors contribute to the performance of Baird Funds. Investors are, therefore, cautioned not to place undue reliance on subjective judgments contained in this report.
Baird Funds
1-866-442-2473
www.bairdfunds.com
February 27, 2017
Dear Shareholder,
Thank you for your continued support of the Baird Equity Funds. We are excited to now offer growth, value, core and international strategies to our clients. Each of our independent teams has disciplined investment philosophies and processes that focus on fundamental research that favors quality and seek to deliver long-term value-added returns. Our time-tested, risk-managed approaches have been honed over decades of managing portfolios in various market environments.
In 2016 we acquired Chautauqua Capital Management, led by Brian Beitner, to expand our equity management offerings. With their joining Baird, we introduced the Chautauqua Global Growth Fund and Chautauqua International Growth Fund. This strong addition to our team has added immediate value and we are excited to offer our investors these additional fund options.
On the following pages, we review the performance and composition of each of the Baird Equity Funds.
Continued low interest rates aided equity returns in 2016, particularly with lower quality companies, which proved challenging to our high-quality style of investing. We are also mindful that we continue to operate in an elevated risk environment and are committed to judicious management of your assets. We never lose sight of the fact that our success rests on the trust you have placed in us to be effective stewards of your assets and we want to thank you for your continued investment in the Baird Equity Funds.
Sincerely,
Mary Ellen Stanek, CFA
President
Baird Funds
Baird LargeCap Fund
December 31, 2016
Portfolio Managers’ Commentary
Market Commentary
For the year, the Baird LargeCap Fund (Institutional Class) posted a return of 12.94%, while the S&P 500 ended the year up 11.96%. The Fund also finished the year 2.57% ahead of the Morningstar Large Blend category placing us firmly in the top quintile of funds we compete with. While we at L2 Asset Management (the sub-advisor to the Fund) are pleased, in our view the strong full year results masked an unusually volatile year. In the first half of the year the Fund underperformed the index by 5.09% net of fees (4.77% gross of fees) and led us, as we surveyed the composition of our holdings, to come out with a passionate letter to shareholders at the end of Q2. http://content.rwbaird.com/RWB/Content/PDF/AssetManagement/Q2-2016-Large-Cap-Commentary.pdf. While painful in the moment, our view at the time was that the Fund was populated by a group of firms whose magnitude of mispricing we had only seen a couple of times in history and that, based on those observations, the timing was ripe for a reversal that would be highly beneficial to our existing and potential partners in the Fund. While moments like the one we experienced in Q2 often stimulate a natural human desire to “do something,” it is precisely at those moments that action often undermines investment results. As disciplined investors like us who focus on identifying mispriced cash flows, in both the growth and value universes, we chose to “act” by doing almost nothing to the portfolio. Instead we focused on communicating in a clear and transparent manner the reason for the conviction in our process.
While standing pat is difficult, in the back half of 2016 the Fund outperformed the benchmark by 6.55% net of fees (over 7% gross of fees). The conviction we brought to bear in Q2 proved prophetic as the stocks that drove our rapid recovery in the second half of the year were largely made up of those names that inflicted the most damage on us in the first half. More specifically, among the 25 biggest contributors to our 6.55% net of fees (7% gross of fees) outperformance in the back half of the year, 18 of them accounted for 3.5% of the 5.09% net of fees (4.77% gross of fees) underperformance in the first half. Simplistically, the single best decision we made in 2016 was to do nearly nothing.
While we are obviously satisfied with the results for the year we think the more important message is that the keys to success in investing, in addition to discipline and process, also require maintaining a steady hand in moments of discomfort. We would like to thank all of our partners for their faith in the value of the process we bring to the LargeCap Fund.
Investment Process
In contemplating the requirements for our year-end commentary we at L2 could not help but find intellectual resonance in the concept that “…the commentary must discuss the factors that materially affected the Fund’s performance.” Before we get to the conventional component of the commentary where we discuss how various over- or underweights affected outcomes, it occurs to us that the single most important factor that has affected and will affect our Fund’s performance are the core beliefs that we hold at L2. Our core beliefs are not simply based on qualitative or anecdotal inputs, but instead are based on the facts we have at our disposal. Should someone possess alternate information please know that we would like nothing more than to receive your data. An important part of our process is to eradicate confirmation bias by actively seeking out and examining data that points to conclusions that differ from our own.
Core Beliefs
Discipline is the Key to Investment Success: We at L2 believe that investors continue to underestimate the negative implications of behavioral errors on investment returns. Overwhelming research shows investors routinely rotate out of stocks, asset classes and money managers at near-perfectly sub-optimal moments due to performance chasing, herding, overconfidence, confirmation bias, self-attribution bias and loss aversion. Even as managers who employ a disciplined process predicated on fundamental factors with historically proven ex-ante predictive ability, we feel the emotional pull like all other investors. The difference is when the desire to flinch is strongest, as it was by the second quarter of 2016, we work relentlessly to study our portfolios,
Baird LargeCap Fund
December 31, 2016
understand what is going on, ensure we have not missed something and communicate with our partners in a transparent and honest fashion. In doing so, we hope to demonstrate the depth of our portfolio knowledge, the rationale for our conviction and the need to ignore the human predisposition to “act.”
R&D is Important in Every Industry, Including Active Management: Investors spend considerable time researching their portfolio companies’ competitive moats and we think that is a wise move as it represents one of the pillars of any company’s competitive position. At L2, we believe that R&D is a critical component to the success achieved since inception and to what success we believe lies ahead of us. With that said we are acutely aware of the unavoidable predisposition of human beings to associate positive outcomes with their decisions while attributing suboptimal outcomes to externalities beyond their control. Effectively our often in-depth commentaries which delve into the systematic market and idiosyncratic factors driving our returns every quarter is the manner in which we do our best to turn our human proclivities into a competitive advantage. It is not fun studying your mistakes and trying to figure out process driven ways to avoid them in the future – even for us!
Partnership: L2 does not believe in “customers.” In fact we actively avoid them and you will not hear the term in our offices should you choose to visit us. Rather, we prefer to think of people that do business with us as partners. The legendary Seth Klarman once said “At the worst possible moment, when your fund is down because cheap things have gotten cheaper, you need to have capital, to have clients who will actually love the phone call and – most of the time, if not all the time – add, rather than subtract capital.” Every individual at L2 gets up every morning fighting as a team for the right to earn exactly that type of relationship with our partners in our strategies.
In summary, we believe the core beliefs listed above, more than anything we will write below, are the factors that have and will continue to impact our performance over time.
Discussion of Fund’s Performance in 2016
For 2016, the Baird LargeCap Fund (Institutional Class) generated a total return of 12.94% compared to an 11.96% return for the S&P 500 Index, the Fund’s benchmark. Below we discuss sectors and companies that were key contributors and detractors from the Fund’s performance relative to the S&P 500.
Key Contributors To Relative Returns:
| o | Information Technology as a sector was the largest contributor to the Fund’s full-year returns. Overall it was a potent mix of inexpensively priced growth stocks like Nvidia combined with companies others had decided were doomed by obsolescence like Western Union that combined to drive substantial excess returns. One of the things we would like to emphasize is that while Information Technology did outperform the benchmark by a small amount, virtually all of the excess returns came from stock selection within the group. |
| o | Despite being the only sector in the benchmark to fall for the year, being neutral weighted Health Care, which was down 2.44%, was our second largest contributor to returns. When the partners at L2 began working together in 2010, numerous firms in the sector fetched mid-to-high single digit multiples and traded as if their R&D would never discover a useful drug again. In fact, the two senior partners of the firm remember looking at one such firm and thinking even if the analysts were right, the run-off cash flows from the generics portion of the business warranted a higher valuation than the stock was fetching. Fast forward to 2016 and the change in opinions (and prices!) has been remarkable. Much of our success in the space came from avoiding high-flying firms whose valuations we simply could not justify. Completely avoiding firms like Alexion, Regeneron, and Bristol Meyers all of which were among the 20% most expensive firms in our large cap universe and opting instead for more mundanely priced firms like Merck generated roughly 60% of the value in our stock selection within the sector. |
Baird LargeCap Fund
December 31, 2016
Key Detractors From Relative Returns:
| o | Energy was the single biggest detractor from performance for the year. We struggled in both allocation and selection. Over the course of the year we were roughly half-weighted the group (3.8% vs. 7.1% for the S&P 500). This proved unfortunate as investor sentiment drove even money-losing stocks within the space soaring and the sector nearly tripled the index’s performance. Compounding that issue was our admittedly prosaic preference for firms that actually earn money. In what we would characterize as stunning evidence of market inefficiency, we would highlight Exxon Mobil, a company we have chronically been underweight. Looking at Exxon’s financials for the four quarters ending June of 2014 when oil was at roughly $110 per barrel, through the last four quarters we have available in 20161 when oil closed below $55, the company has seen revenues fall 49%, net income fall 74% and free-cash flow fall 96% to roughly zero. One might see such a change in fundamentals and posit that the firm’s equity value should likely decline. Yet the stock is flat over that period and rose nearly 20% in calendar year 2016. We make no claims to being able to predict the price of oil but find Exxon’s $400 billion enterprise value sitting atop near-zero free-cash flows to impute a highly optimistic oil price indeed. While this puts us directly at odds with the world’s current obsession with indexing we believe that Exxon and many companies like it represent pent-up excess returns for our partners in the Fund. |
| o | Despite being overweight Financials which outperformed the market as a group by nearly 5%, stock selection dragged results down and made it our second largest detractor from returns.2 At the idiosyncratic level our preference for asset managers and card companies created a meaningful headwind for sector returns. Investors seem to be pricing in lower aggregate market values and are deeply concerned about the macroeconomic exposure typically associated with credit card companies. Our picks in SEI, American Express and Ameriprise Financial all took a toll on aggregate returns. |
Conclusion
We at L2 would like to thank every one of our partners in the Fund for your faith in us. To reiterate from our commentaries since inception: our money is invested alongside yours in the belief that it is not just common sense that a Fund manager “eat his/her own cooking” but that it also provides a healthy dose of professional alignment. While there are many products that attempt to time markets or sectors, we believe these behaviors are more destructive in the long term than finding the under-appreciated growth firms and inexpensive value opportunities that are a part of our strategy. By maintaining a balanced approach and systematic process to stock selection, we hope to minimize our own (and hopefully our investors’!) behavioral errors. We believe this is the key to compounding wealth at better than market rates.
Thank you for your support.
Sincerely,
L2 Asset Management (Sub-Advisor)
Matthew Malgari, Portfolio Manager
Sanjeev Bhojraj, Ph.D., Portfolio Manager
1 | Four quarters ending September 2016. |
2 | Please see our Q4 Investor Commentary for insight on how our risk management process improved on the reported underperformance figure for financials. |
Baird LargeCap Fund
December 31, 2016 (Unaudited)
Portfolio Characteristics
A December 31, 2016 summary of the Fund’s top 10 holdings and equity sector analysis compared to the S&P 500® Index is shown below.
| Top 10 Holdings* | | | Equity Sector Analysis** |
| | | |  |
| Microsoft Corp. | 3.3% | |
| Apple, Inc. | 3.3% | |
| NVIDIA Corp. | 2.4% | |
| Alphabet, Inc. – Class A | 2.3% | |
| The Boeing Co. | 2.2% | |
| Abbvie, Inc. | 2.1% | |
| PepsiCo, Inc. | 2.0% | |
| Vanguard Financials ETF | 2.0% | |
| Discover Financial Services | 2.0% | |
| Xilinx, Inc. | 1.9% | |
| | | |
| Net Assets: | $39,558,362 | |
| Portfolio Turnover Rate: | 85.0% | |
| Number of Equity Holdings: | 106 | |
| | | |
| Annualized Portfolio Expense Ratio:*** | | |
Gross | | |
| Institutional Class: | 1.11% | |
| Investor Class: | 1.36% | **** |
| | | |
Net | | |
| Institutional Class: | 0.75% | |
| Investor Class: | 1.00% | **** |
| | | |
| | | | |
| * | | The Fund’s portfolio composition is subject to change and there is no assurance that the Fund will continue to hold any particular security. Percentages shown relate to the Fund’s total net assets as of December 31, 2016. |
| ** | | Percentages shown in parentheses relate to the Fund’s total market value of investments as of December 31, 2016, and may not add up to 100% due to rounding. |
| *** | | Reflects expense ratios as stated in the Fund’s current prospectus. The Advisor has contractually agreed to limit the Fund’s total annual fund operating expenses to 0.75% of average daily net assets for the Institutional Class shares and 1.00% of average daily net assets for the Investor Class shares, at least through April 30, 2018. |
| **** | | Includes 0.25% 12b-1 fee. |
Baird LargeCap Fund
December 31, 2016 (Unaudited)
Institutional Class
Value of a $25,000 Investment
Growth of a hypothetical investment of $25,000 made on 12/31/06, assuming reinvestment of all distributions.
Investor Class
Value of a $10,000 Investment
Growth of a hypothetical investment of $10,000 made on 12/31/06, assuming reinvestment of all distributions.
Baird LargeCap Fund
December 31, 2016 (Unaudited)
Total Returns
| | | Average Annual |
| | | | | Since |
| For the Periods Ended December 31, 2016 | One Year | Five Years | Ten Years | Inception(1) |
| Institutional Class Shares | 12.94% | 13.49% | 6.90% | 3.35% |
| Investor Class Shares | 12.67% | 13.22% | 6.65% | 3.10% |
S&P 500® Index(2) | 11.96% | 14.66% | 6.95% | 4.81% |
| (1) | For the period from September 29, 2000 (inception date) through December 31, 2016. |
| (2) | The S&P 500® Index measures the performance of 500 common stocks chosen for market size, liquidity and industry group representation of U.S. equity performance. This Index does not reflect any deduction for fees, expenses or taxes. A direct investment in the Index is not possible. |
L2 Asset Management, LLC (“L2”) became the Fund’s subadvisor effective April 30, 2016. From December 23, 2013 to April 30, 2016, Baird Kailash Group, LLC (“BKG”), was the Fund’s subadvisor. Matthew J. Malgari has served as the Fund’s lead portfolio manager since December 23, 2013, first as an employee of BKG and currently as an employee of L2. The Fund was managed by the Fund’s Advisor from the Fund’s inception date until December 23, 2013.
The returns shown in the table above and line graphs on the previous page reflect reinvestment of dividends and/or capital gains distributions in additional shares. The returns do not reflect the deduction of taxes that a shareholder would pay on Fund distributions or the redemption of Fund shares. The returns reflect the actual performance for each period and do not include the impact of trades executed on the last business day of the period that were recorded on the first business day of the next period.
The gross expense ratio for each Class, as reflected in the Fund’s current prospectus, is set forth under “Portfolio Characteristics”.
The Fund’s subadviser makes investment decisions for the Fund primarily using quantitative investment models which rank securities based on fundamental measures of value, past performance and indicators of recent positive changes. The success of the quantitative investment methodologies and processes employed by the subadviser depends on the analyses and assessments that were used in developing such methodologies and processes, as well as on the accuracy and reliability of models and data provided by third parties. Incorrect analyses and assessments or inaccurate or incomplete models and data would adversely affect performance. Certain low-probability events or factors that are assigned little weight may occur or prove to be more likely or may have more relevance than expected, for short or extended periods of time. It is also possible that prices of securities may move in directions that were not predicted by the subadviser’s quantitative methodologies. The Fund may invest in stocks (or ADRs representing stocks) of foreign companies that are traded on U.S. exchanges. Foreign investments involve additional risk such as currency rate fluctuations, political and economic instability, and different and sometimes less strict financial reporting standards and regulation.
Past performance does not guarantee future results. Investment return and principal value will fluctuate so that an investor’s shares, when redeemed, may be worth more or less than their original cost.
For information about the performance of the Fund as of the most recent month-end, please call 1-866-44BAIRD or visit www.bairdfunds.com. Mutual fund performance changes over time and current performance may be lower or higher than that stated.
Baird LargeCap Fund
Schedule of Investments, December 31, 2016
Common Stocks
| | | | | | | | | % of | |
| | | Shares | | | Value | | | Net Assets | |
| Aerospace & Defense | | | | | | | | | |
| The Boeing Co. | | | 5,532 | | | $ | 861,222 | | | | 2.2 | % |
| Huntington Ingalls Industries, Inc. | | | 600 | | | | 110,514 | | | | 0.3 | % |
| | | | | | | | 971,736 | | | | 2.5 | % |
| Airlines | | | | | | | | | | | | |
| Alaska Air Group, Inc. | | | 2,509 | | | | 222,624 | | | | 0.6 | % |
| American Airlines Group, Inc. | | | 7,799 | | | | 364,135 | | | | 0.9 | % |
| United Continental Holdings, Inc.* | | | 3,551 | | | | 258,797 | | | | 0.6 | % |
| | | | | | | | 845,556 | | | | 2.1 | % |
| Auto Components | | | | | | | | | | | | |
| Lear Corp. | | | 5,313 | | | | 703,282 | | | | 1.8 | % |
| Automobiles | | | | | | | | | | | | |
| Ford Motor Co. | | | 43,217 | | | | 524,222 | | | | 1.3 | % |
| General Motors Co. | | | 2,403 | | | | 83,721 | | | | 0.2 | % |
| Harley-Davidson, Inc. | | | 7,945 | | | | 463,511 | | | | 1.2 | % |
| | | | | | | | 1,071,454 | | | | 2.7 | % |
| Banks | | | | | | | | | | | | |
| Fifth Third Bancorp | | | 13,199 | | | | 355,977 | | | | 0.9 | % |
| J.P. Morgan Chase & Co. | | | 8,653 | | | | 746,667 | | | | 1.9 | % |
| PNC Financial Services Group, Inc. | | | 3,531 | | | | 412,986 | | | | 1.0 | % |
| U.S. Bancorp | | | 4,531 | | | | 232,758 | | | | 0.6 | % |
| Wells Fargo & Co. | | | 3,247 | | | | 178,942 | | | | 0.4 | % |
| | | | | | | | 1,927,330 | | | | 4.8 | % |
| Beverages | | | | | | | | | | | | |
| The Coca-Cola Co. | | | 13,470 | | | | 558,466 | | | | 1.4 | % |
| Dr Pepper Snapple Group, Inc. | | | 659 | | | | 59,752 | | | | 0.2 | % |
| PepsiCo, Inc. | | | 7,719 | | | | 807,639 | | | | 2.0 | % |
| | | | | | | | 1,425,857 | | | | 3.6 | % |
| Biotechnology | | | | | | | | | | | | |
| AbbVie, Inc. | | | 13,541 | | | | 847,937 | | | | 2.1 | % |
| Amgen, Inc. | | | 4,724 | | | | 690,696 | | | | 1.8 | % |
| Biogen, Inc.* | | | 473 | | | | 134,133 | | | | 0.3 | % |
| Celgene Corp.* | | | 5,118 | | | | 592,409 | | | | 1.5 | % |
| United Therapeutics Corp.* | | | 432 | | | | 61,962 | | | | 0.2 | % |
| | | | | | | | 2,327,137 | | | | 5.9 | % |
| Capital Markets | | | | | | | | | | | | |
| Ameriprise Financial, Inc. | | | 6,251 | | | | 693,486 | | | | 1.8 | % |
| SEI Investments Co. | | | 1,880 | | | | 92,797 | | | | 0.2 | % |
| | | | | | | | 786,283 | | | | 2.0 | % |
The accompanying notes are an integral part of these financial statements.
Baird LargeCap Fund
Schedule of Investments, December 31, 2016
Common Stocks (cont.)
| | | | | | | | | % of | |
| | | Shares | | | Value | | | Net Assets | |
| Chemicals | | | | | | | | | |
LyondellBasell Industries NV – Class A f | | | 5,633 | | | $ | 483,199 | | | | 1.2 | % |
| Monsanto Co. | | | 564 | | | | 59,338 | | | | 0.2 | % |
| Westlake Chemical Corp. | | | 1,499 | | | | 83,929 | | | | 0.2 | % |
| | | | | | | | 626,466 | | | | 1.6 | % |
| Communications Equipment | | | | | | | | | | | | |
| Cisco Systems, Inc. | | | 17,176 | | | | 519,059 | | | | 1.3 | % |
| F5 Networks, Inc.* | | | 3,573 | | | | 517,084 | | | | 1.3 | % |
| | | | | | | | 1,036,143 | | | | 2.6 | % |
| Consumer Finance | | | | | | | | | | | | |
| Ally Financial, Inc. | | | 4,266 | | | | 81,139 | | | | 0.2 | % |
| American Express Co. | | | 7,990 | | | | 591,899 | | | | 1.5 | % |
| Discover Financial Services | | | 10,831 | | | | 780,807 | | | | 2.0 | % |
| Synchrony Financial | | | 14,535 | | | | 527,185 | | | | 1.3 | % |
| | | | | | | | 1,981,030 | | | | 5.0 | % |
| Containers & Packaging | | | | | | | | | | | | |
| International Paper Co. | | | 7,017 | | | | 372,322 | | | | 0.9 | % |
| Packaging Corp of America | | | 2,762 | | | | 234,273 | | | | 0.6 | % |
| Sealed Air Corp. | | | 1,757 | | | | 79,662 | | | | 0.2 | % |
| | | | | | | | 686,257 | | | | 1.7 | % |
| Diversified Consumer Services | | | | | | | | | | | | |
| H&R Block, Inc. | | | 6,754 | | | | 155,275 | | | | 0.4 | % |
| Diversified Financial Services | | | | | | | | | | | | |
| MSCI, Inc. | | | 7,574 | | | | 596,680 | | | | 1.5 | % |
| Diversified Telecommunication Services | | | | | | | | | | | | |
| AT&T, Inc. | | | 12,205 | | | | 519,079 | | | | 1.3 | % |
| Electrical Equipment | | | | | | | | | | | | |
| Emerson Electric Co. | | | 4,826 | | | | 269,049 | | | | 0.7 | % |
| Rockwell Automation, Inc. | | | 4,802 | | | | 645,389 | | | | 1.6 | % |
| | | | | | | | 914,438 | | | | 2.3 | % |
| Energy Equipment & Services | | | | | | | | | | | | |
| FMC Technologies, Inc.* | | | 4,972 | | | | 176,655 | | | | 0.5 | % |
| Food & Staples Retailing | | | | | | | | | | | | |
| The Kroger Co. | | | 7,146 | | | | 246,608 | | | | 0.6 | % |
| Sysco Corporation | | | 4,421 | | | | 244,791 | | | | 0.6 | % |
| Wal-Mart Stores, Inc. | | | 1,530 | | | | 105,754 | | | | 0.3 | % |
| | | | | | | | 597,153 | | | | 1.5 | % |
The accompanying notes are an integral part of these financial statements.
Baird LargeCap Fund
Schedule of Investments, December 31, 2016
Common Stocks (cont.)
| | | | | | | | | % of | |
| | | Shares | | | Value | | | Net Assets | |
| Food Products | | | | | | | | | |
| Archer-Daniels-Midland Co. | | | 1,416 | | | $ | 64,640 | | | | 0.2 | % |
| Campbell Soup Co. | | | 892 | | | | 53,939 | | | | 0.1 | % |
| Ingredion, Inc. | | | 2,337 | | | | 292,032 | | | | 0.7 | % |
| Mead Johnson Nutrition Co. | | | 983 | | | | 69,557 | | | | 0.2 | % |
| | | | | | | | 480,168 | | | | 1.2 | % |
| Gas Utilities | | | | | | | | | | | | |
| UGI Corp. | | | 15,448 | | | | 711,844 | | | | 1.8 | % |
| Health Care Equipment & Supplies | | | | | | | | | | | | |
| Hologic, Inc.* | | | 1,667 | | | | 66,880 | | | | 0.2 | % |
| ResMed, Inc. | | | 7,505 | | | | 465,685 | | | | 1.2 | % |
| Varian Medical Systems, Inc.* | | | 3,633 | | | | 326,171 | | | | 0.8 | % |
| | | | | | | | 858,736 | | | | 2.2 | % |
| Health Care Providers & Services | | | | | | | | | | | | |
| AmerisourceBergen Corporation | | | 655 | | | | 51,215 | | | | 0.1 | % |
| McKesson Corp. | | | 560 | | | | 78,652 | | | | 0.2 | % |
| | | | | | | | 129,867 | | | | 0.3 | % |
| Hotels, Restaurants & Leisure | | | | | | | | | | | | |
| McDonald’s Corp. | | | 916 | | | | 111,496 | | | | 0.3 | % |
| Wyndham Worldwide Corp. | | | 5,828 | | | | 445,084 | | | | 1.1 | % |
| | | | | | | | 556,580 | | | | 1.4 | % |
| Household Products | | | | | | | | | | | | |
| The Procter & Gamble Co. | | | 4,912 | | | | 413,001 | | | | 1.0 | % |
| Independent Power and Renewable Electricity Producers | | | | | | | | | | | | |
| The AES Corp. | | | 60,789 | | | | 706,368 | | | | 1.8 | % |
| Insurance | | | | | | | | | | | | |
| Aflac, Inc. | | | 2,945 | | | | 204,972 | | | | 0.5 | % |
| The Progressive Corp. | | | 5,363 | | | | 190,386 | | | | 0.5 | % |
| The Travelers Companies, Inc. | | | 514 | | | | 62,924 | | | | 0.2 | % |
| | | | | | | | 458,282 | | | | 1.2 | % |
| Internet Software & Services | | | | | | | | | | | | |
| Alphabet, Inc. – Class A* | | | 1,171 | | | | 927,959 | | | | 2.3 | % |
| eBay, Inc.* | | | 1,971 | | | | 58,519 | | | | 0.2 | % |
| | | | | | | | 986,478 | | | | 2.5 | % |
| IT Services | | | | | | | | | | | | |
| Global Payments, Inc. | | | 2,834 | | | | 196,708 | | | | 0.5 | % |
| International Business Machines Corp. | | | 2,610 | | | | 433,234 | | | | 1.1 | % |
| The Western Union Co. | | | 9,824 | | | | 213,377 | | | | 0.5 | % |
| | | | | | | | 843,319 | | | | 2.1 | % |
The accompanying notes are an integral part of these financial statements.
Baird LargeCap Fund
Schedule of Investments, December 31, 2016
Common Stocks (cont.)
| | | | | | | | | % of | |
| | | Shares | | | Value | | | Net Assets | |
| Life Sciences Tools & Services | | | | | | | | | |
| Waters Corp.* | | | 3,371 | | | $ | 453,029 | | | | 1.2 | % |
| Machinery | | | | | | | | | | | | |
| Caterpillar, Inc. | | | 3,626 | | | | 336,275 | | | | 0.8 | % |
| Cummins, Inc. | | | 2,339 | | | | 319,671 | | | | 0.8 | % |
| Deere & Co. | | | 2,634 | | | | 271,408 | | | | 0.7 | % |
| | | | | | | | 927,354 | | | | 2.3 | % |
| Media | | | | | | | | | | | | |
| Omnicom Group, Inc. | | | 4,704 | | | | 400,357 | | | | 1.0 | % |
| Multiline Retail | | | | | | | | | | | | |
| Macy’s, Inc. | | | 1,558 | | | | 55,792 | | | | 0.2 | % |
| Nordstrom, Inc. | | | 4,326 | | | | 207,345 | | | | 0.5 | % |
| | | | | | | | 263,137 | | | | 0.7 | % |
| Oil, Gas & Consumable Fuels | | | | | | | | | | | | |
| Marathon Petroleum Corp. | | | 3,539 | | | | 178,188 | | | | 0.4 | % |
| Tesoro Corp. | | | 2,957 | | | | 258,590 | | | | 0.7 | % |
| Valero Energy Corp. | | | 6,590 | | | | 450,229 | | | | 1.1 | % |
| | | | | | | | 887,007 | | | | 2.2 | % |
| Personal Products | | | | | | | | | | | | |
| Coty, Inc. – Class A | | | 5,983 | | | | 109,549 | | | | 0.3 | % |
| Pharmaceuticals | | | | | | | | | | | | |
Jazz Pharmaceuticals PLC* f | | | 2,860 | | | | 311,826 | | | | 0.8 | % |
| Johnson & Johnson | | | 4,471 | | | | 515,104 | | | | 1.3 | % |
| Merck & Co., Inc. | | | 7,873 | | | | 463,483 | | | | 1.2 | % |
| | | | | | | | 1,290,413 | | | | 3.3 | % |
| Semiconductors & Semiconductor Equipment | | | | | | | | | | | | |
| Intel Corp. | | | 13,008 | | | | 471,800 | | | | 1.2 | % |
| Micron Technology, Inc.* | | | 13,367 | | | | 293,004 | | | | 0.8 | % |
| NVIDIA Corp. | | | 8,859 | | | | 945,610 | | | | 2.4 | % |
| QUALCOMM Incorporated | | | 5,239 | | | | 341,583 | | | | 0.9 | % |
| Xilinx, Inc. | | | 12,589 | | | | 759,998 | | | | 1.9 | % |
| | | | | | | | 2,811,995 | | | | 7.2 | % |
| Software | | | | | | | | | | | | |
| Akamai Technologies, Inc.* | | | 4,310 | | | | 287,391 | | | | 0.7 | % |
| Cadence Design System, Inc.* | | | 18,531 | | | | 467,352 | | | | 1.2 | % |
| Citrix Systems, Inc.* | | | 2,957 | | | | 264,089 | | | | 0.7 | % |
| Intuit, Inc. | | | 2,070 | | | | 237,243 | | | | 0.6 | % |
| Microsoft Corp. | | | 21,129 | | | | 1,312,956 | | | | 3.3 | % |
The accompanying notes are an integral part of these financial statements.
Baird LargeCap Fund
Schedule of Investments, December 31, 2016
Common Stocks (cont.)
| | | | | | | | | % of | |
| | | Shares | | | Value | | | Net Assets | |
| Software (cont.) | | | | | | | | | |
| Oracle Corp. | | | 11,364 | | | $ | 436,946 | | | | 1.1 | % |
| VMware, Inc. – Class A* | | | 1,558 | | | | 122,661 | | | | 0.3 | % |
| | | | | | | | 3,128,638 | | | | 7.9 | % |
| Specialty Retail | | | | | | | | | | | | |
| Best Buy Co., Inc. | | | 10,525 | | | | 449,102 | | | | 1.1 | % |
| The Gap, Inc. | | | 8,140 | | | | 182,661 | | | | 0.5 | % |
| | | | | | | | 631,763 | | | | 1.6 | % |
| Technology Hardware, Storage & Peripherals | | | | | | | | | | | | |
| Apple, Inc. | | | 11,244 | | | | 1,302,280 | | | | 3.3 | % |
| NetApp, Inc. | | | 6,424 | | | | 226,574 | | | | 0.5 | % |
Seagate Technology PLC f | | | 14,264 | | | | 544,457 | | | | 1.4 | % |
| | | | | | | | 2,073,311 | | | | 5.2 | % |
| Wireless Telecommunication Services | | | | | | | | | | | | |
| Sprint Corp.* | | | 13,315 | | | | 112,112 | | | | 0.3 | % |
| T-Mobile US, Inc.* | | | 2,240 | | | | 128,823 | | | | 0.3 | % |
| | | | | | | | 240,935 | | | | 0.6 | % |
| Total Common Stocks | | | | | | | | | | | | |
| (Cost $31,911,080) | | | | | | | 36,709,942 | | | | 92.8 | % |
| Contingent Value Rights | | | | | | | | | | | | |
| Contingent Value Rights | | | | | | | | | | | | |
| Safeway CASA LEY CVR*^† | | | 2,216 | | | | 2,249 | | | | 0.0 | % |
| Safeway PDC LLC CVR*^† | | | 2,216 | | | | 108 | | | | 0.0 | % |
| Total Contingent Value Rights | | | | | | | | | | | | |
| (Cost $0) | | | | | | | 2,357 | | | | 0.0 | % |
| Exchange Traded Funds | | | | | | | | | | | | |
| Exchange Traded Funds | | | | | | | | | | | | |
| iShares Core S&P 500 ETF | | | 1,226 | | | | 275,838 | | | | 0.7 | % |
| SPDR S&P Oil & Gas Exploration & Production ETF | | | 7,925 | | | | 328,253 | | | | 0.8 | % |
| Vanguard Financials ETF | | | 13,202 | | | | 783,539 | | | | 2.0 | % |
| Vanguard S&P 500 ETF | | | 2,887 | | | | 592,730 | | | | 1.5 | % |
| Total Exchange Traded Funds | | | | | | | | | | | | |
| (Cost $1,794,839) | | | | | | | 1,980,360 | | | | 5.0 | % |
The accompanying notes are an integral part of these financial statements.
Baird LargeCap Fund
Schedule of Investments, December 31, 2016
Short-Term Investment
| | | | | | | | | % of | |
| | | Shares | | | Value | | | Net Assets | |
| Money Market Mutual Fund | | | | | | | | | |
| Fidelity Institutional Money Market Fund – | | | | | | | | | |
| Government Portfolio, Institutional Class, 0.43%« | | | 860,517 | | | $ | 860,517 | | | | 2.2 | % |
| Total Short-Term Investment | | | | | | | | | | | | |
| (Cost $860,517) | | | | | | | 860,517 | | | | 2.2 | % |
| Total Investments | | | | | | | | | | | | |
| (Cost $34,566,436) | | | | | | | 39,553,176 | | | | 100.0 | % |
| Other Assets in Excess of Liabilities | | | | | | | 5,186 | | | | (0.0 | )% |
| TOTAL NET ASSETS | | | | | | $ | 39,558,362 | | | | 100.0 | % |
Notes to Schedule of Investments
| * | Non-Income Producing |
| f | Foreign Security |
| ^ | Illiquid Security |
| † | Priced at Fair Value by the Valuation Committee as delegated by the Baird Funds’ Board of Directors. |
| « | 7-Day Yield |
Industry classifications shown in the Schedule of Investments are based on the Global Industry Classification Standard (GICS®). GICS was developed by and/or is the exclusive property of MSCI, Inc. and Standard & Poor Financial Services LLC (“S&P”). GICS is a service mark of MSCI and S&P and has been licensed for use by U.S. Bancorp Fund Services, LLC.
The accompanying notes are an integral part of these financial statements.
Baird LargeCap Fund
Schedule of Investments, December 31, 2016
Summary of Fair Value Exposure at December 31, 2016
The Fund has adopted authoritative fair valuation accounting standards which establish a definition of fair value and set out a hierarchy for measuring fair value. These standards require additional disclosures about the various inputs and valuation techniques used to develop the measurements of fair value and a discussion on changes in valuation techniques and related inputs during the period. These standards define fair value as the price that would be received to sell an asset or paid to transfer a liability in an orderly transaction between market participants at the measurement date. Management has determined that these standards have no material impact on the Fund’s financial statements. The fair value hierarchy is organized into three levels based upon the assumptions (referred to as “inputs”) used in pricing the asset or liability. These standards state that “observable inputs” reflect the assumptions market participants would use in pricing the asset or liability based on market data obtained from independent sources and “unobservable inputs” reflect an entity’s own assumptions about the assumptions market participants would use in pricing the asset or liability. These inputs are summarized into three broad levels and described below:
| Level 1 – | Unadjusted quoted prices in active markets for identical unrestricted securities. |
| Level 2 – | Other significant observable inputs (including quoted prices for similar securities, quoted prices in inactive markets, dealer indications, interest rates, yield curves, prepayment speeds, credit risk, default rates, inputs corroborated by observable market data, etc.). |
| Level 3 – | Significant unobservable inputs (including the Fund’s own assumptions about the factors that market participants would use in valuing the security) based on the best information available. |
The inputs or methodology used for valuing securities are not necessarily an indication of the risk associated with investing in those securities.
The following is a summary of the inputs used to value the Fund’s investments as of December 31, 2016:
| | | Level 1 | | | Level 2 | | | Level 3 | | | Total | |
| Equity | | | | | | | | | | | | |
| Common Stocks | | $ | 36,709,942 | | | $ | — | | | $ | — | | | $ | 36,709,942 | |
| Total Equity | | | 36,709,942 | | | | — | | | | — | | | | 36,709,942 | |
| Contingent Value Rights | | | | | | | | | | | | | | | | |
| Contingent Value Rights | | | — | | | | — | | | | 2,357 | | | | 2,357 | |
| Total Contingent Value Rights | | | — | | | | — | | | | 2,357 | | | | 2,357 | |
| Exchange Traded Funds | | | | | | | | | | | | | | | | |
| Exchange Traded Funds | | | 1,980,360 | | | | — | | | | — | | | | 1,980,360 | |
| Total Exchange Traded Funds | | | 1,980,360 | | | | — | | | | — | | | | 1,980,360 | |
| Short-Term Investment | | | | | | | | | | | | | | | | |
| Money Market Mutual Fund | | | 860,517 | | | | — | | | | — | | | | 860,517 | |
| Total Short-Term Investment | | | 860,517 | | | | — | | | | — | | | | 860,517 | |
| Total Investments* | | $ | 39,550,819 | | | $ | — | | | $ | 2,357 | | | $ | 39,553,176 | |
| * | Additional information regarding the industry classifications of these investments is disclosed in the Schedule of Investments. |
Changes in valuation techniques may result in transfers into or out of current assigned levels within the hierarchy. Two securities with a fair value of $2,357 are priced at fair value by the Valuation Committee instead of the Fund’s pricing vendor and are valued using level 3 inputs. There were no transfers between Level 1, Level 2 and Level 3 fair value measurements during the reporting period, as compared to their classification from the prior year’s annual report. See the Fund’s valuation policy in Note 2a to the financial statements.
The accompanying notes are an integral part of these financial statements.
Baird LargeCap Fund
Schedule of Investments, December 31, 2016
Summary of Fair Value Exposure at December 31, 2016 (cont.)
Level 3 Reconciliation Disclosure
Following is a reconciliation of Level 3 assets for which significant unobservable inputs were used to determine fair value.
Description | | Investments in Securities | |
| Balance as of December 31, 2015 | | $ | 2,357 | |
| Accrued discounts/premiums | | | — | |
| Realized gain (loss) | | | — | |
| Change in unrealized appreciation (depreciation) | | | — | |
| Purchases | | | — | |
| Sales | | | — | |
| Transfers in and/or out of Level 3* | | | — | |
| Balance as of December 31, 2016 | | $ | 2,357 | |
* Transfers between levels are recognized at the end of the reporting period.
The accompanying notes are an integral part of these financial statements.
Baird MidCap Fund
December 31, 2016
Portfolio Managers’ Commentary
For the year ended December 31, 2016, the Baird MidCap Fund Institutional Class posted a total return of 5.40% (5.08% for the Investor Class), as compared to a gain of 7.33% for the Russell MidCap® Growth Index, the MidCap Fund’s primary benchmark.
As we reflect on 2016, it’s apparent that volatility was a constant companion. Beginning with recession fears, a meaningful market correction and snap-back rotation in the first quarter, followed by the brief, but unsettling Brexit reaction mid-year, and then the November election, market moves were quick and severe. Economic data showed improvement as the year advanced, and stocks took the news well. The inflection in activity was broad based, with China, the U.S. and Europe leading the way, and the global economy appeared to exit the year in better economic condition than it started.
Overall, the Fund’s 2016 positioning rested on the economy and corporate earnings pacing at low single digit growth, the likelihood of modest Federal Reserve tightening and balanced sector weights. This structure served Fund shareholders well amid the sharp market decline in January as economic growth was questioned. Cyclical exposure was added to the Fund during the first half of the year amid signs the economy was firming and remained in place through the election, proving helpful when stock correlations declined in late fall and the market embraced a stronger growth outlook. However, sharp positive market reversals in February and following the Brexit vote in June, along with a challenging December, created enough of a performance gap, leaving the Fund up for the year, but trailing returns of the benchmark.
The consumer discretionary sector provided the strongest contribution to relative performance. Key strength came from holdings touching several industries including off-price retail, auto parts and auto-related electronics providers, restaurants, and toys and entertainment. While the backdrop for consumer spending has been favorable due to continued job growth, wage increases, and low energy costs, it has not translated to across-the-board health in discretionary sector stocks. As a result, we continue to look for areas with favorable spending profiles, working to maintain a good diversity of end market exposure and using price volatility to our advantage.
As a counter to strength in the consumer discretionary sector, the Fund’s technology holdings fell well short of benchmark returns and were the source of the largest sector underperformance. The Fund’s mix of semiconductor stocks exhibited some fundamental and execution shortcomings and failed to keep pace with very strong returns from benchmark companies in this industry. Stock picking across the software and services industry, which continued to represent the largest component of Fund technology holdings, helped performance, but not nearly enough to offset the headwind in semiconductors.
In the producer durables sector, Fund holdings lagged during the year. As economic data improved, many companies and particularly those operating in more economically sensitive industries, such as manufacturing or transportation, performed well. A price decline in two of the Fund’s longer term holdings in this sector, which operate less economically sensitive business models, proved difficult to overcome. There was little room for error amid the general price strength in the sector. Throughout the course of the year as better economic activity unfolded and volatility presented itself, we selectively added exposure to this sector.
Fund holdings in the basic materials sector were a modest drag on relative performance for the year. Much like the dynamic affecting the producer durables sector, performance across materials was on average strong and broad. For the most part, Fund exposure in the sector has historically been tied to construction and manufacturing activity rather than pure commodity-oriented business models. In a recovery scenario, or periods of accelerating GDP growth, the Fund’s mix profile can be challenged to keep up with commodity-driven businesses. However, long-term Fund holdings delivered strong fundamentals and generally kept pace.
Healthcare sector holdings made a positive contribution as several equipment and service providers performed well. A rather sharp pullback in biotech and specialty pharmaceutical companies also helped due to the Fund’s minimal exposure to these areas. Our overall strategy of investing to obtain exposure to multiple end markets
Baird MidCap Fund
December 31, 2016
and identifying companies down the market cap spectrum that provide long-term growth opportunities proved beneficial. In recent years, our focus on profitability limited the opportunity set in this sector as the strongest performance was often found in what we judged as higher risk biotech and pharmaceutical companies.
In the consumer staples sector, performance of the Fund’s holdings matched benchmark sector returns. For the first time in several years, overall returns in this sector lagged the broader market. There appears to have been some unwind in the perceived attractiveness of staples companies; not surprising with interest rates moving higher and leading to capital exiting a sector that provided yield and a reasonable measure of earnings stability in a low rate, low growth world, despite rather elevated valuations in our view.
The Fund’s financial services holdings were a drag on relative performance during the year. The volatile market environment kept interest rates low for much of the year and generally restrained revenues linked to market activity, which negatively impacted asset management holdings. In addition, concern over consumer credit trends negatively impacted Fund exposure in this area, which underperformed other financial and data processing industry group peers. Anticipated tightening by the Federal Reserve later in the year on the back of better economic data, lifted rates and provided a tailwind for bank stocks and a headwind for REITs, an industry that comprised approximately 25% of the financial services sector weight, but none in the Fund.
The Fund’s energy stocks added to relative performance. With a substantial improvement in oil prices during the year, the Fund’s exposure through a well-positioned oil and gas production company was rewarded. We would welcome a benchmark change to add more weight to the sector as we believe this would allow us to take advantage of our historical fundamental work on businesses in the sector.
The long-standing investment process underlying the Baird MidCap Fund remains focused on identifying high-quality companies that deliver attractive returns and above average growth relative to peers. Seeking to control risk at the sector and position level is also a priority of our process, with the goal of providing lower volatility of returns for the Fund compared to its benchmark index.
Portfolio Managers:
Charles F. Severson
Kenneth M. Hemauer
Baird MidCap Fund
December 31, 2016 (Unaudited)
Portfolio Characteristics
A December 31, 2016 summary of the Fund’s top 10 holdings and equity sector analysis compared to the Russell MidCap® Growth Index is shown below.
| Top 10 Holdings* | | | Equity Sector Analysis** |
| | | |  |
| Watsco, Inc. | 2.4% | |
| CDW Corp. | 2.4% | |
| East West Bancorp, Inc. | 2.3% | |
| Cable One, Inc. | 2.3% | |
| A.O. Smith Corp. | 2.3% | |
| Alliance Data Systems Corp. | 2.3% | |
| Euronet Worldwide, Inc. | 2.2% | |
| The Middleby Corp. | 2.2% | |
| O’Reilly Automotive, Inc. | 2.2% | |
| Intuitive Surgical, Inc. | 2.2% | |
| | | |
| Net Assets: | $1,242,227,909 | |
| Portfolio Turnover Rate: | 57.2% | |
| Number of Equity Holdings: | 57 | |
| | | |
| Annualized Portfolio Expense Ratio:*** | | |
Gross | | |
| Institutional Class: | 0.81% | |
| Investor Class: | 1.06% | **** |
| | | |
Net | | |
| Institutional Class: | 0.81% | | |
| Investor Class: | 1.06% | **** | |
| | | | |
| * | | The Fund’s portfolio composition is subject to change and there is no assurance that the Fund will continue to hold any particular security. Percentages shown relate to the Fund’s total net assets as of December 31, 2016. |
| ** | | Percentages shown in parentheses relate to the Fund’s total market value of investments as of December 31, 2016, and may not add up to 100% due to rounding. |
| *** | | Reflects expense ratios as stated in the Fund’s current prospectus. The Advisor has contractually agreed to limit the Fund’s total annual fund operating expenses to 0.85% of average daily net assets for the Institutional Class shares and 1.10% of average daily net assets for the Investor Class shares, at least through April 30, 2018. |
| **** | | Includes 0.25% 12b-1 fee. |
Baird MidCap Fund
December 31, 2016 (Unaudited)
Institutional Class
Value of a $25,000 Investment
Growth of a hypothetical investment of $25,000 made on 12/31/06, assuming reinvestment of all distributions.
Investor Class
Value of a $10,000 Investment
Growth of a hypothetical investment of $10,000 made on 12/31/06, assuming reinvestment of all distributions.
Baird MidCap Fund
December 31, 2016 (Unaudited)
Total Returns
| | | Average Annual |
| | | | | Since |
| For the Periods Ended December 31, 2016 | One Year | Five Years | Ten Years | Inception(1) |
| Institutional Class Shares | 5.40% | 10.53% | 8.19% | 6.24% |
| Investor Class Shares | 5.08% | 10.25% | 7.92% | 5.99% |
Russell MidCap® Growth Index(2) | 7.33% | 13.51% | 7.83% | 5.77% |
| (1) | For the period from December 29, 2000 (inception date) through December 31, 2016. |
| (2) | The Russell Midcap® Growth Index measures the performance of the mid-cap growth segment of the U.S. equity universe. It includes those Russell Midcap® Index companies with higher price-to-book ratios and higher forecasted growth values. This index does not reflect any deduction for fees, expenses or taxes. A direct investment in the index is not possible. |
The returns shown in the table above and the line graphs on the previous page reflect reinvestment of dividends and/or capital gains distributions in additional shares. The returns do not reflect the deduction of taxes that a shareholder would pay on Fund distributions or the redemption of Fund shares. The returns reflect the actual performance for each period and do not include the impact of trades executed on the last business day of the period that were recorded on the first business day of the next period.
The gross expense ratio for each Class, as reflected in the Fund’s current prospectus, is set forth under “Portfolio Characteristics”.
The Fund focuses on growth-style stocks and therefore the performance of the Fund will typically be more volatile than the performance of funds that focus on types of stocks that have a broader investment style. The Fund may invest up to 15% of its total assets in U.S. dollar denominated foreign securities and ADRs. Foreign investments involve additional risks such as currency rate fluctuations, political and economic instability, and different and sometimes less strict financial reporting standards and regulation. The Fund invests a substantial portion of its assets in the stocks of mid-capitalization companies. Mid-capitalization companies often are more volatile and face greater risks than larger, more established companies.
Past performance does not guarantee future results. Investment return and principal value will fluctuate so that an investor’s shares, when redeemed, may be worth more or less than their original cost.
For information about the performance of the Fund as of the most recent month-end, please call 1-866-44BAIRD or visit www.bairdfunds.com. Mutual fund performance changes over time and current performance may be lower or higher than that stated.
Baird MidCap Fund
Schedule of Investments, December 31, 2016
Common Stocks
| | | | | | | | | % of | |
| | | Shares | | | Value | | | Net Assets | |
| Banks | | | | | | | | | |
| East West Bancorp, Inc. | | | 570,604 | | | $ | 29,003,802 | | | | 2.3 | % |
| First Republic Bank/CA | | | 181,473 | | | | 16,720,922 | | | | 1.4 | % |
| | | | | | | | 45,724,724 | | | | 3.7 | % |
| Beverages | | | | | | | | | | | | |
| Dr Pepper Snapple Group, Inc. | | | 215,550 | | | | 19,543,918 | | | | 1.6 | % |
| Building Products | | | | | | | | | | | | |
| A.O. Smith Corp. | | | 608,622 | | | | 28,818,252 | | | | 2.3 | % |
| Fortune Brands Home & Security, Inc. | | | 381,992 | | | | 20,421,292 | | | | 1.7 | % |
| | | | | | | | 49,239,544 | | | | 4.0 | % |
| Capital Markets | | | | | | | | | | | | |
| Affiliated Managers Group, Inc.* | | | 146,344 | | | | 21,263,783 | | | | 1.7 | % |
| MarketAxess Holdings, Inc. | | | 60,365 | | | | 8,868,826 | | | | 0.7 | % |
| | | | | | | | 30,132,609 | | | | 2.4 | % |
| Distributors | | | | | | | | | | | | |
| LKQ Corp.* | | | 698,106 | | | | 21,396,949 | | | | 1.7 | % |
| Pool Corp. | | | 133,845 | | | | 13,965,387 | | | | 1.1 | % |
| | | | | | | | 35,362,336 | | | | 2.8 | % |
| Electrical Equipment | | | | | | | | | | | | |
| Acuity Brands, Inc. | | | 105,663 | | | | 24,393,360 | | | | 2.0 | % |
| Rockwell Automation, Inc. | | | 133,188 | | | | 17,900,467 | | | | 1.4 | % |
| | | | | | | | 42,293,827 | | | | 3.4 | % |
| Electronic Equipment, Instruments & Components | | | | | | | | | | | | |
| CDW Corp. | | | 558,290 | | | | 29,081,326 | | | | 2.4 | % |
| Trimble Navigation Ltd.* | | | 632,811 | | | | 19,079,252 | | | | 1.5 | % |
| | | | | | | | 48,160,578 | | | | 3.9 | % |
| Food & Staples Retailing | | | | | | | | | | | | |
| Casey’s General Stores, Inc. | | | 148,215 | | | | 17,619,799 | | | | 1.4 | % |
| Food Products | | | | | | | | | | | | |
| Mccormick & Co., Inc. | | | 240,347 | | | | 22,431,586 | | | | 1.8 | % |
| Health Care Equipment & Supplies | | | | | | | | | | | | |
| The Cooper Cos., Inc. | | | 127,604 | | | | 22,321,768 | | | | 1.8 | % |
| Edwards Lifesciences Corp.* | | | 269,578 | | | | 25,259,459 | | | | 2.0 | % |
| IDEXX Laboratories, Inc.* | | | 208,572 | | | | 24,459,238 | | | | 2.0 | % |
| Intuitive Surgical, Inc.* | | | 42,535 | | | | 26,974,421 | | | | 2.2 | % |
| | | | | | | | 99,014,886 | | | | 8.0 | % |
| Health Care Providers & Services | | | | | | | | | | | | |
| Acadia Healthcare Co., Inc.* | | | 439,142 | | | | 14,535,600 | | | | 1.2 | % |
| Laboratory Corp. of America Holdings* | | | 95,355 | | | | 12,241,675 | | | | 1.0 | % |
| | | | | | | | 26,777,275 | | | | 2.2 | % |
The accompanying notes are an integral part of these financial statements.
Baird MidCap Fund
Schedule of Investments, December 31, 2016
Common Stocks (cont.)
| | | | | | | | | % of | |
| | | Shares | | | Value | | | Net Assets | |
| Health Care Technology | | | | | | | | | |
| Veeva Systems, Inc. – Class A* | | | 573,563 | | | $ | 23,344,014 | | | | 1.9 | % |
| Hotels, Restaurants & Leisure | | | | | | | | | | | | |
| Dominos Pizza, Inc. | | | 104,791 | | | | 16,686,919 | | | | 1.3 | % |
| Panera Bread Company – Class A* | | | 89,420 | | | | 18,339,148 | | | | 1.5 | % |
| | | | | | | | 35,026,067 | | | | 2.8 | % |
| Household Products | | | | | | | | | | | | |
| Church & Dwight Co., Inc. | | | 408,270 | | | | 18,041,451 | | | | 1.4 | % |
| IT Services | | | | | | | | | | | | |
| Alliance Data Systems Corp. | | | 124,238 | | | | 28,388,383 | | | | 2.3 | % |
| Broadridge Financial Solutions, Inc. | | | 146,295 | | | | 9,699,359 | | | | 0.8 | % |
| Euronet Worldwide, Inc.* | | | 385,524 | | | | 27,923,503 | | | | 2.2 | % |
| Fiserv, Inc.* | | | 244,861 | | | | 26,023,827 | | | | 2.1 | % |
| Gartner, Inc.* | | | 240,673 | | | | 24,324,820 | | | | 2.0 | % |
| | | | | | | | 116,359,892 | | | | 9.4 | % |
| Leisure Products | | | | | | | | | | | | |
| Hasbro, Inc. | | | 345,370 | | | | 26,866,332 | | | | 2.2 | % |
| Machinery | | | | | | | | | | | | |
| Fortive Corp. | | | 425,759 | | | | 22,833,455 | | | | 1.9 | % |
| Graco, Inc. | | | 213,905 | | | | 17,773,367 | | | | 1.4 | % |
| The Middleby Corp.* | | | 213,741 | | | | 27,531,978 | | | | 2.2 | % |
| Oshkosh Truck Corporation | | | 259,720 | | | | 16,780,509 | | | | 1.4 | % |
| Snap-on, Inc. | | | 111,017 | | | | 19,013,882 | | | | 1.5 | % |
| WABCO Holdings, Inc.* | | | 214,316 | | | | 22,749,643 | | | | 1.8 | % |
| | | | | | | | 126,682,834 | | | | 10.2 | % |
| Media | | | | | | | | | | | | |
| Cable One, Inc. | | | 46,558 | | | | 28,946,505 | | | | 2.3 | % |
| Multiline Retail | | | | | | | | | | | | |
| Burlington Stores, Inc.* | | | 262,514 | | | | 22,248,061 | | | | 1.8 | % |
| Dollar General Corp. | | | 348,981 | | | | 25,849,023 | | | | 2.1 | % |
| Ollie’s Bargain Outlet Holdings, Inc.* | | | 710,749 | | | | 20,220,809 | | | | 1.6 | % |
| | | | | | | | 68,317,893 | | | | 5.5 | % |
| Oil, Gas & Consumable Fuels | | | | | | | | | | | | |
| Diamondback Energy, Inc.* | | | 227,634 | | | | 23,004,692 | | | | 1.8 | % |
| Professional Services | | | | | | | | | | | | |
| Verisk Analytics, Inc.* | | | 219,599 | | | | 17,824,851 | | | | 1.4 | % |
| Road & Rail | | | | | | | | | | | | |
| J.B. Hunt Transport Services, Inc. | | | 207,253 | | | | 20,118,049 | | | | 1.6 | % |
| Semiconductors & Semiconductor Equipment | | | | | | | | | | | | |
| Monolithic Power Systems, Inc. | | | 243,057 | | | | 19,913,660 | | | | 1.6 | % |
The accompanying notes are an integral part of these financial statements.
Baird MidCap Fund
Schedule of Investments, December 31, 2016
Common Stocks (cont.)
| | | | | | | | | % of | |
| | | Shares | | | Value | | | Net Assets | |
| Software | | | | | | | | | |
| Akamai Technologies, Inc.* | | | 323,116 | | | $ | 21,545,375 | | | | 1.7 | % |
| Blackbaud, Inc. | | | 190,091 | | | | 12,165,824 | | | | 1.0 | % |
Mobileye NV*f | | | 312,375 | | | | 11,907,735 | | | | 1.0 | % |
| ServiceNow, Inc.* | | | 254,961 | | | | 18,953,801 | | | | 1.5 | % |
| Synopsys, Inc.* | | | 321,312 | | | | 18,912,424 | | | | 1.5 | % |
| Tyler Technologies, Inc.* | | | 147,558 | | | | 21,066,856 | | | | 1.7 | % |
| The Ultimate Software Group, Inc.* | | | 123,006 | | | | 22,430,144 | | | | 1.8 | % |
| | | | | | | | 126,982,159 | | | | 10.2 | % |
| Specialty Retail | | | | | | | | | | | | |
| O’Reilly Automotive, Inc.* | | | 97,304 | | | | 27,090,407 | | | | 2.2 | % |
| Ulta Salon, Cosmetics & Fragrance, Inc.* | | | 86,862 | | | | 22,144,598 | | | | 1.8 | % |
| | | | | | | | 49,235,005 | | | | 4.0 | % |
| Textiles, Apparel & Luxury Goods | | | | | | | | | | | | |
| Lululemon Athletica, Inc.* | | | 325,796 | | | | 21,173,482 | | | | 1.7 | % |
| Trading Companies & Distributors | | | | | | | | | | | | |
| Fastenal Co. | | | 436,799 | | | | 20,520,817 | | | | 1.7 | % |
| Watsco, Inc. | | | 203,723 | | | | 30,175,451 | | | | 2.4 | % |
| | | | | | | | 50,696,268 | | | | 4.1 | % |
| Total Common Stocks | | | | | | | | | | | | |
| (Cost $1,016,619,289) | | | | | | | 1,208,834,236 | | | | 97.3 | % |
| Short-Term Investment | | | | | | | | | | | | |
| Money Market Mutual Fund | | | | | | | | | | | | |
| Fidelity Institutional Money Market Fund – | | | | | | | | | | | | |
| Government Portfolio, Institutional Class, 0.43%« | | | 39,238,652 | | | | 39,238,652 | | | | 3.2 | % |
| Total Short-Term Investment | | | | | | | | | | | | |
| (Cost $39,238,652) | | | | | | | 39,238,652 | | | | 3.2 | % |
| Total Investments | | | | | | | | | | | | |
| (Cost $1,055,857,941) | | | | | | | 1,248,072,888 | | | | 100.5 | % |
| Liabilities in Excess of Other Assets | | | | | | | (5,844,979 | ) | | | (0.5 | )% |
| TOTAL NET ASSETS | | | | | | $ | 1,242,227,909 | | | | 100.0 | % |
Notes to Schedule of Investments
| * | Non-Income Producing |
| f | Foreign Security |
| « | 7-Day Yield |
Industry classifications shown in the Schedule of Investments are based on the Global Industry Classification Standard (GICS®). GICS was developed by and/or is the exclusive property of MSCI, Inc. and Standard & Poor Financial Services LLC (“S&P”). GICS is a service mark of MSCI and S&P and has been licensed for use by U.S. Bancorp Fund Services, LLC.
The accompanying notes are an integral part of these financial statements.
Baird MidCap Fund
Schedule of Investments, December 31, 2016
Summary of Fair Value Exposure at December 31, 2016
The Fund has adopted authoritative fair valuation accounting standards which establish a definition of fair value and set out a hierarchy for measuring fair value. These standards require additional disclosures about the various inputs and valuation techniques used to develop the measurements of fair value and a discussion on changes in valuation techniques and related inputs during the period. These standards define fair value as the price that would be received to sell an asset or paid to transfer a liability in an orderly transaction between market participants at the measurement date. Management has determined that these standards have no material impact on the Fund’s financial statements. The fair value hierarchy is organized into three levels based upon the assumptions (referred to as “inputs”) used in pricing the asset or liability. These standards state that “observable inputs” reflect the assumptions market participants would use in pricing the asset or liability based on market data obtained from independent sources and “unobservable inputs” reflect an entity’s own assumptions about the assumptions market participants would use in pricing the asset or liability. These inputs are summarized into three broad levels and described below:
| Level 1 – | Unadjusted quoted prices in active markets for identical unrestricted securities. |
| Level 2 – | Other significant observable inputs (including quoted prices for similar securities, quoted prices in inactive markets, dealer indications, interest rates, yield curves, prepayment speeds, credit risk, default rates, inputs corroborated by observable market data, etc.). |
| Level 3 – | Significant unobservable inputs (including the Fund’s own assumptions about the factors that market participants would use in valuing the security) based on the best information available. |
The inputs or methodology used for valuing securities are not necessarily an indication of the risk associated with investing in those securities.
The following is a summary of the inputs used to value the Fund’s investments as of December 31, 2016:
| | | Level 1 | | | Level 2 | | | Level 3 | | | Total | |
| Equity | | | | | | | | | | | | |
| Common Stocks | | $ | 1,208,834,236 | | | $ | — | | | $ | — | | | $ | 1,208,834,236 | |
| Total Equity | | | 1,208,834,236 | | | | — | | | | — | | | | 1,208,834,236 | |
| Short-Term Investment | | | | | | | | | | | | | | | | |
| Money Market Mutual Fund | | | 39,238,652 | | | | — | | | | — | | | | 39,238,652 | |
| Total Short-Term Investment | | | 39,238,652 | | | | — | | | | — | | | | 39,238,652 | |
| Total Investments* | | $ | 1,248,072,888 | | | $ | — | | | $ | — | | | $ | 1,248,072,888 | |
| * | Additional information regarding the industry classifications of these investments is disclosed in the Schedule of Investments. |
Changes in valuation techniques may result in transfers into or out of assigned levels within the fair value hierarchy. There were no transfers between Level 1, Level 2 and Level 3 fair value measurements during the reporting period, as compared to their classification from the prior year’s annual report. See the Fund’s valuation policy in Note 2a to the financial statements.
The accompanying notes are an integral part of these financial statements.
Baird Small/Mid Cap Value Fund
December 31, 2016
Portfolio Manager’s Commentary
Our investment process focuses on identifying companies with unrecognized growth prospects and the potential for earnings surprise at discounted valuations. We believe this is more important than ever during periods of falling corporate profits for the broader market. Earnings for the Baird Small/Mid Cap Value Fund were up approximately 16% for the calendar year 2016 versus -2% for the benchmark Russell 2500 Value Index. In fact, during 2016:
| 1. | Expectations for global economic growth were widely revised downward driven by lower growth expectations for Europe, China and the U.S. |
| 2. | The U.S. dollar resumed its upward trajectory as other currencies such as the British Pound Sterling and Chinese Yuan weakened considerably. |
| 3. | Corporate earnings estimates continued to be revised lower throughout the year, witnessing six consecutive quarterly earnings declines for the S&P 500 Index. |
Despite the aforementioned trends, during the second half of the year, stocks of companies with the slowest revenue and earnings growth outperformed. While this is certainly counterintuitive, particularly in an economy which is decelerating, it is not unheard of. The surprise Trump victory coupled with a Republican-controlled Congress sent the markets meaningfully higher in to year-end. Post-election, the Russell 2500 Value rallied 12.4%, the best November in the history of the benchmark and the largest margin of victory for small caps over large caps, with the S&P 500 up 5.0% over the same period.
Over the past 17 years, we have experienced only three other similar speculative markets when low quality stocks outperformed by such a wide margin in a short period of time. Although quality posted solid positive returns in these environments, it also tended to trail the overall benchmark meaningfully. Post these short-lived, intense periods of speculation, stocks with high earnings quality have tended to outperform for multi-year periods and also on a cumulative basis. Leading the post-election charge were sectors heretofore unloved, but now expected to benefit asymmetrically from the new political environment. Materials, Industrials and Energy stocks clocked multi-year gains in a matter of weeks, and many companies in these sectors posted triple-digit returns. Smaller regional banks, the largest industry in our benchmark, levitated more than 40% on average.
We believe such swift moves in such a brief time period are indicative of speculation versus fundamental investing. As such, we feel it is prudent to stay disciplined to our investment style which has outperformed over the long-run with lower commensurate risk.
In 2016, the Baird Small/Mid Cap Value Fund Institutional Class generated a total return of 8.91% compared to a 25.20% return for the Russell 2500 Value, the Fund’s benchmark. During a year of great dispersion of returns among economic sectors, allocation played an important role for portfolio managers in 2016. Following is a discussion of key contributors and detractors for the Fund’s performance relative to its benchmark.
Key Detractors from Relative Returns:
| • | Broadly speaking, the Fund’s exposure to less cyclical, more stable businesses detracted from relative performance post the election as lower quality stocks popped on the prospects of economic opportunity from the new Administration. The Fund’s overweight to Utilities and Health Care were meaningful detractors, as well as the Fund’s underweight to Materials and Energy. |
| • | The Fund’s holdings in Information Technology lagged stocks in the Russell 2500 Value. Despite strong earnings growth, Verisign and J2 Global were among the underperformers. Integrated Device Technology fell 11% on disappointing sales to Samsung due to their product recall. |
Baird Small/Mid Cap Value Fund
December 31, 2016
| • | Despite posting a solid absolute return in Real Estate (+11%), our stocks lagged the benchmark and our overweight created a significant detraction from relative returns for the year. Healthcare related REITs, Omega Healthcare Investors and Healthcare Trust of America, trailed due to the defensive nature of their lease profiles. |
Key Contributors to Relative Returns:
| • | The Fund enjoyed very strong security selection in Financials which allowed us to keep pace with the sector despite being underweight. Meta Financial Group, Renasant Corporation and American Financial Group were among the leaders. |
| • | Outperformance in Telecommunications led by Boingo Wireless, a beneficiary of burgeoning demand for mobile data, added to relative returns. |
| • | The Fund’s security selection in Consumer Staples was superior, with the Fund’s holdings returning 21% for the period. Strength was led by B&G Foods and Pinnacle Foods. |
Looking Forward
We concur with consensus that the prospects for tax reform, fiscal stimulus, and relaxed regulation under the new Administration should serve to benefit corporate earnings over the coming years. However, what policies become realities, which companies stand to benefit and by what magnitude is, to say the least, difficult to predict at this stage. In addition, the potential negative ramifications outside our borders of changes to our trade policy and a stronger currency must be considered, as well. Consistent with our disciplined investment style, we continue to analyze each investment prospect on its merits, factoring in the aforementioned tailwinds where we have conviction they will likely impact profitability.
Portfolio Manager:
Michelle Stevens
Baird Small/Mid Cap Value Fund
December 31, 2016 (Unaudited)
Portfolio Characteristics
A December 31, 2016 summary of the Fund’s top 10 holdings and equity sector analysis compared to the Russell 2500® Value Index is shown below.
| Top 10 Holdings* | | | Equity Sector Analysis** |
| | | |  |
| Meta Financial Group, Inc. | 5.6% | |
| Boingo Wireless, Inc. | 3.7% | |
| Mid-America Apartment | | |
| Communities, Inc. | 3.5% | |
| B&G Foods, Inc. | 3.4% | |
| LTC Properties, Inc. | 3.3% | |
| American Financial Group, Inc. | 3.3% | |
| j2 Global, Inc. | 3.1% | |
| Quanta Services, Inc. | 3.0% | |
| Pinnacle West Cap Corp. | 3.0% | |
| Physicians Realty Trust | 3.0% | |
| | | |
| Net Assets: | $11,966,978 | |
| Portfolio Turnover Rate: | 38.3% | |
| Number of Equity Holdings: | 38 | |
| | | |
| Annualized Portfolio Expense Ratio:*** | | |
Gross | | |
| Institutional Class: | 6.88% | |
| Investor Class: | 7.13% | **** |
| | | |
Net | | |
| Institutional Class: | 0.95% | | |
| Investor Class: | 1.20% | **** | |
| * | | The Fund’s portfolio composition is subject to change and there is no assurance that the Fund will continue to hold any particular security. Percentages shown relate to the Fund’s total net assets as of December 31, 2016. |
| ** | | Percentages shown in parentheses relate to the Fund’s total market value of investments as of December 31, 2016, and may not add up to 100% due to rounding. |
| *** | | Reflects expense ratios as stated in the Fund’s current prospectus. The Advisor has contractually agreed to limit the Fund’s total annual fund operating expenses to 0.95% of average daily net assets for the Institutional Class shares and 1.20% of average daily net assets for the Investor Class shares, at least through April 30, 2018. |
| **** | | Includes 0.25% 12b-1 fee. |
Baird Small/Mid Cap Value Fund
December 31, 2016 (Unaudited)
Institutional Class
Value of a $25,000 Investment
Growth of a hypothetical investment of $25,000 made on the Fund’s inception date (11/30/15), assuming reinvestment of all distributions.
Investor Class
Value of a $10,000 Investment
Growth of a hypothetical investment of $10,000 made on the Fund’s inception date (11/30/15), assuming reinvestment of all distributions.
Baird Small/Mid Cap Value Fund
December 31, 2016 (Unaudited)
Total Returns
| | | Since |
| For the Periods Ended December 31, 2016 | One Year | Inception(1) |
| Institutional Class Shares | 8.91% | 3.53% |
| Investor Class Shares | 8.64% | 3.28% |
Russell 2500® Value Index(2) | 25.20% | 17.81% |
| (1) | For the period from November 30, 2015 (inception date) through December 31, 2016. |
| (2) | The Russell 2500® Value Index measures the performance of the small cap value segment of the U.S. equity universe. It includes those Russell 2500® Index companies with lower price-to-book ratios and lower forecasted growth values. This index does not reflect any deduction for fees, expenses or taxes. A direct investment in the index is not possible. |
The returns shown in the table above and the line graphs on the previous page reflect reinvestment of dividends and/or capital gains distributions in additional shares. The returns do not reflect the deduction of taxes that a shareholder would pay on Fund distributions or the redemption of Fund shares. The returns reflect the actual performance for each period and do not include the impact of trades executed on the last business day of the period that were recorded on the first business day of the next period.
The gross expense ratio for each Class, as reflected in the Fund’s current prospectus, is set forth under “Portfolio Characteristics”.
The Fund focuses on small to mid cap value style stocks and therefore the performance of the Fund may be more volatile than the performance of funds that focus on types of stocks that have a broader investment style. The Fund may invest up to 15% of its total assets in U.S. dollar denominated foreign securities and ADRs. Foreign investments involve additional risks such as currency rate fluctuations and the potential for political and economic instability, and different and sometimes less strict financial reporting standards and regulation.
Past performance does not guarantee future results. Investment return and principal value will fluctuate so that an investor’s shares, when redeemed, may be worth more or less than their original cost.
For information about the performance of the Fund as of the most recent month-end, please call 1-866-44BAIRD or visit www.bairdfunds.com. Mutual fund performance changes over time and current performance may be lower or higher than that stated.
Baird Small/Mid Cap Value Fund
Schedule of Investments, December 31, 2016
Common Stocks
| | | | | | | | | % of | |
| | | Shares | | | Value | | | Net Assets | |
| Aerospace & Defense | | | | | | | | | |
| Hexcel Corp. | | | 5,934 | | | $ | 305,245 | | | | 2.6 | % |
| Orbital ATK, Inc. | | | 2,789 | | | | 244,679 | | | | 2.0 | % |
| | | | | | | | 549,924 | | | | 4.6 | % |
| Air Freight & Logistics | | | | | | | | | | | | |
| Air Transport Services Group, Inc.* | | | 14,623 | | | | 233,383 | | | | 2.0 | % |
| Auto Components | | | | | | | | | | | | |
| Motorcar Parts of America, Inc.* | | | 9,890 | | | | 266,239 | | | | 2.2 | % |
| Banks | | | | | | | | | | | | |
| Hilltop Holdings, Inc. | | | 9,334 | | | | 278,153 | | | | 2.3 | % |
| Renasant Corp. | | | 8,216 | | | | 346,880 | | | | 2.9 | % |
| | | | | | | | 625,033 | | | | 5.2 | % |
| Capital Markets | | | | | | | | | | | | |
| Diamond Hill Investment Group, Inc. | | | 1,151 | | | | 242,147 | | | | 2.0 | % |
| Commercial Services & Supplies | | | | | | | | | | | | |
| Deluxe Corp. | | | 3,585 | | | | 256,722 | | | | 2.1 | % |
| Construction & Engineering | | | | | | | | | | | | |
| Quanta Services, Inc.* | | | 10,393 | | | | 362,196 | | | | 3.0 | % |
| Distributors | | | | | | | | | | | | |
| LKQ Corp.* | | | 7,974 | | | | 244,403 | | | | 2.0 | % |
| Electric Utilities | | | | | | | | | | | | |
| Avangrid, Inc. | | | 7,356 | | | | 278,645 | | | | 2.4 | % |
| Pinnacle West Capital Corp. | | | 4,636 | | | | 361,748 | | | | 3.0 | % |
| | | | | | | | 640,393 | | | | 5.4 | % |
| Food Products | | | | | | | | | | | | |
| B & G Foods, Inc. | | | 9,272 | | | | 406,114 | | | | 3.4 | % |
| Lamb Weston Holdings, Inc.* | | | 7,071 | | | | 267,637 | | | | 2.2 | % |
| | | | | | | | 673,751 | | | | 5.6 | % |
| Health Care Equipment & Supplies | | | | | | | | | | | | |
| ICU Medical, Inc.* | | | 2,349 | | | | 346,125 | | | | 2.9 | % |
| Health Care Providers & Services | | | | | | | | | | | | |
| Laboratory Corp. of America Holdings* | | | 2,163 | | | | 277,686 | | | | 2.3 | % |
| Mednax, Inc.* | | | 3,832 | | | | 255,441 | | | | 2.2 | % |
| | | | | | | | 533,127 | | | | 4.5 | % |
| Household Durables | | | | | | | | | | | | |
| ZAGG, Inc.* | | | 33,811 | | | | 240,058 | | | | 2.0 | % |
| Household Products | | | | | | | | | | | | |
| Orchids Paper Products Co. | | | 8,654 | | | | 226,562 | | | | 1.9 | % |
The accompanying notes are an integral part of these financial statements.
Baird Small/Mid Cap Value Fund
Schedule of Investments, December 31, 2016
Common Stocks (cont.)
| | | | | | | | | % of | |
| | | Shares | | | Value | | | Net Assets | |
| Insurance | | | | | | | | | |
| American Financial Group, Inc. | | | 4,450 | | | $ | 392,134 | | | | 3.3 | % |
Atlas Financial Holdings, Inc.* f | | | 15,453 | | | | 278,927 | | | | 2.3 | % |
| | | | | | | | 671,061 | | | | 5.6 | % |
| Internet Software & Services | | | | | | | | | | | | |
| j2 Global, Inc. | | | 4,512 | | | | 369,081 | | | | 3.1 | % |
| Stamps.com, Inc.* | | | 2,411 | | | | 276,421 | | | | 2.3 | % |
| VeriSign, Inc.* | | | 4,450 | | | | 338,512 | | | | 2.8 | % |
| | | | | | | | 984,014 | | | | 8.2 | % |
| Multiline Retail | | | | | | | | | | | | |
| Dollar Tree, Inc.* | | | 2,658 | | | | 205,144 | | | | 1.7 | % |
| Multi-Utilities | | | | | | | | | | | | |
| Alliant Energy Corp. | | | 6,446 | | | | 244,239 | | | | 2.1 | % |
| CMS Energy Corp. | | | 5,815 | | | | 242,020 | | | | 2.0 | % |
| | | | | | | | 486,259 | | | | 4.1 | % |
| Real Estate Investment Trusts (REITs) | | | | | | | | | | | | |
| Agree Realty Corp. | | | 7,108 | | | | 327,323 | | | | 2.7 | % |
| Blackstone Mortgage Trust, Inc. – Class A | | | 11,002 | | | | 330,830 | | | | 2.8 | % |
| Healthcare Trust of America, Inc. – Class A | | | 11,126 | | | | 323,878 | | | | 2.7 | % |
| LTC Properties, Inc. | | | 8,468 | | | | 397,827 | | | | 3.3 | % |
| Mid-America Apartment Communities, Inc. | | | 4,265 | | | | 417,629 | | | | 3.5 | % |
| Physicians Realty Trust | | | 18,853 | | | | 357,453 | | | | 3.0 | % |
| | | | | | | | 2,154,940 | | | | 18.0 | % |
| Semiconductors & Semiconductor Equipment | | | | | | | | | | | | |
| Cypress Semiconductor Corp. | | | 20,583 | | | | 235,470 | | | | 2.0 | % |
Silicon Motion Technology Corp. – ADR f | | | 8,345 | | | | 354,495 | | | | 2.9 | % |
| | | | | | | | 589,965 | | | | 4.9 | % |
| Thrifts & Mortgage Finance | | | | | | | | | | | | |
| Bofi Holding, Inc.* | | | 7,417 | | | | 211,755 | | | | 1.8 | % |
| Meta Financial Group, Inc. | | | 6,502 | | | | 669,056 | | | | 5.6 | % |
| | | | | | | | 880,811 | | | | 7.4 | % |
| Wireless Telecommunication Services | | | | | | | | | | | | |
| Boingo Wireless, Inc.* | | | 36,160 | | | | 440,790 | | | | 3.7 | % |
| Total Common Stocks | | | | | | | | | | | | |
| (Cost $10,843,179) | | | | | | | 11,853,047 | | | | 99.0 | % |
The accompanying notes are an integral part of these financial statements.
Baird Small/Mid Cap Value Fund
Schedule of Investments, December 31, 2016
Short-Term Investment
| | | | | | | | | % of | |
| | | Shares | | | Value | | | Net Assets | |
| Money Market Mutual Fund | | | | | | | | | |
| Fidelity Institutional Money Market Fund – | | | | | | | | | |
| Government Portfolio, Institutional Class, 0.43%« | | | 114,568 | | | $ | 114,568 | | | | 1.0 | % |
| Total Short-Term Investment | | | | | | | | | | | | |
| (Cost $114,568) | | | | | | | 114,568 | | | | 1.0 | % |
| Total Investments | | | | | | | | | | | | |
| (Cost $10,957,747) | | | | | | | 11,967,615 | | | | 100.0 | % |
| Liabilities in Excess of Other Assets | | | | | | | (637 | ) | | | 0.0 | % |
| TOTAL NET ASSETS | | | | | | $ | 11,966,978 | | | | 100.0 | % |
Notes to Schedule of Investments
| * | Non-Income Producing |
| f | Foreign Security |
| « | 7-Day Yield |
ADR – American Depositary Receipt
Industry classifications shown in the Schedule of Investments are based on the Global Industry Classification Standard (GICS®). GICS was developed by and/or is the exclusive property of MSCI, Inc. and Standard & Poor Financial Services LLC (“S&P”). GICS is a service mark of MSCI and S&P and has been licensed for use by U.S. Bancorp Fund Services, LLC.
The accompanying notes are an integral part of these financial statements.
Baird Small/Mid Cap Value Fund
Schedule of Investments, December 31, 2016
Summary of Fair Value Exposure at December 31, 2016
The Fund has adopted authoritative fair valuation accounting standards which establish a definition of fair value and set out a hierarchy for measuring fair value. These standards require additional disclosures about the various inputs and valuation techniques used to develop the measurements of fair value and a discussion on changes in valuation techniques and related inputs during the period. These standards define fair value as the price that would be received to sell an asset or paid to transfer a liability in an orderly transaction between market participants at the measurement date. Management has determined that these standards have no material impact on the Fund’s financial statements. The fair value hierarchy is organized into three levels based upon the assumptions (referred to as “inputs”) used in pricing the asset or liability. These standards state that “observable inputs” reflect the assumptions market participants would use in pricing the asset or liability based on market data obtained from independent sources and “unobservable inputs” reflect an entity’s own assumptions about the assumptions market participants would use in pricing the asset or liability. These inputs are summarized into three broad levels and described below:
| Level 1 – | Unadjusted quoted prices in active markets for identical unrestricted securities. |
| Level 2 – | Other significant observable inputs (including quoted prices for similar securities, quoted prices in inactive markets, dealer indications, interest rates, yield curves, prepayment speeds, credit risk, default rates, inputs corroborated by observable market data, etc.). |
| Level 3 – | Significant unobservable inputs (including the Fund’s own assumptions about the factors that market participants would use in valuing the security) based on the best information available. |
The inputs or methodology used for valuing securities are not necessarily an indication of the risk associated with investing in those securities.
The following is a summary of the inputs used to value the Fund’s investments as of December 31, 2016:
| | | Level 1 | | | Level 2 | | | Level 3 | | | Total | |
| Equity | | | | | | | | | | | | |
| Common Stocks | | $ | 11,853,047 | | | $ | — | | | $ | — | | | $ | 11,853,047 | |
| Total Equity | | | 11,853,047 | | | | — | | | | — | | | | 11,853,047 | |
| Short-Term Investment | | | | | | | | | | | | | | | | |
| Money Market Mutual Fund | | | 114,568 | | | | — | | | | — | | | | 114,568 | |
| Total Short-Term Investment | | | 114,568 | | | | — | | | | — | | | | 114,568 | |
| Total Investments* | | $ | 11,967,615 | | | $ | — | | | $ | — | | | $ | 11,967,615 | |
| * | Additional information regarding the industry classifications of these investments is disclosed in the Schedule of Investments. |
Changes in valuation techniques may result in transfers into or out of assigned levels within the fair value hierarchy. There were no transfers between Level 1, Level 2 and Level 3 fair value measurements during the reporting period, as compared to their classification from the prior year’s annual report. See the Fund’s valuation policy in Note 2a to the financial statements.
The accompanying notes are an integral part of these financial statements.
Baird SmallCap Value Fund
December 31, 2016
Portfolio Manager’s Commentary
Our investment process focuses on identifying companies with unrecognized growth prospects and the potential for earnings surprise at discounted valuations. We believe this is more important than ever during periods of falling corporate profits for the broader market. Earnings for the Baird SmallCap Value Fund were up approximately 16% for the calendar year 2016 versus -10% for the benchmark Russell 2000 Value Index. In fact, during 2016:
| 1. | Expectations for global economic growth were widely revised downward driven by lower growth expectations for Europe, China and the U.S. |
| 2. | The U.S. dollar resumed its upward trajectory as other currencies such as the British Pound Sterling and Chinese Yuan weakened considerably. |
| 3. | Corporate earnings estimates continued to be revised lower throughout the year, witnessing six consecutive quarterly earnings declines for the S&P 500 Index. |
Despite the aforementioned trends, during the second half of the year, stocks of companies with the slowest revenue and earnings growth outperformed. While this is certainly counterintuitive, particularly in an economy which is decelerating, it is not unheard of. The surprise Trump victory coupled with a Republican-controlled Congress sent the markets meaningfully higher in to year-end. Post-election, the Russell 2000 Value rallied 17.4%, the best November in the history of the benchmark and the largest margin of victory for small caps over large caps, with the S&P 500 up 5.0% over the same period.
Over the past 17 years, we have experienced only three other similar speculative markets when low quality stocks outperformed by such a wide margin in a short period of time. Although quality posted solid positive returns in these environments, it also tended to trail the overall benchmark meaningfully. Post these short-lived, intense periods of speculation, stocks with high earnings quality have tended to outperform for multi-year periods and also on a cumulative basis. Leading the post-election charge were sectors heretofore unloved, but now expected to benefit asymmetrically from the new political environment. Materials, Industrials and Energy stocks clocked multi-year gains in a matter of weeks, and many companies in these sectors posting triple-digit returns. Small regional banks, the largest industry in our benchmark, levitated more than 40% on average.
We believe such swift moves in such a brief time period are indicative of speculation versus fundamental investing. As such, we feel it is prudent to stay disciplined to our investment style which has outperformed over the long-run with lower commensurate risk.
In 2016, the Baird SmallCap Value Fund Institutional Class generated a total return of 15.11% compared to a 31.74% return for the Russell 2000 Value, the Fund’s benchmark. During a year of great dispersion of returns among economic sectors, allocation played an important role for portfolio managers in 2016. Following is a discussion of key contributors and detractors for the Fund’s performance relative to its benchmark.
Key Detractors from Relative Returns:
| • | Broadly speaking, the Fund’s exposure to less cyclical, more stable businesses detracted from relative performance post the election as lower quality stocks popped on the prospects of economic opportunities arising from the new Administration. The Fund’s overweight to Utilities and Health Care were meaningful detractors, as well as the Fund’s underweight to Materials and Energy. Additionally, Aceto Corp, a generic pharmaceutical company, disappointed on lowered earnings guidance from pricing competition. |
| • | The Fund’s holdings in Information Technology lagged those stocks in the Russell 2000 Value. Despite strong earnings growth, J2 Global and Silicon Motion Technology were among the underperformers. Integrated Device Technology fell 11% on disappointing sales to Samsung due to a product recall. |
Baird SmallCap Value Fund
December 31, 2016
| • | Despite posting competitive returns in Financials (+33%), our underweight created a significant detraction from relative returns for the year. Banks within the Russell 2000 gained over 40% during the year, mostly after the election in November. Meta Financial and Bofi Holdings kept pace, but Atlas Financial and Private Bancorp lagged. Real Estate Investment Trusts, while posting double-digit returns, detracted from relative performance. |
Key Contributors to Relative Returns:
| • | The Fund enjoyed very strong security selection in Industrials despite being underweight the group. Patrick Industries and Drew Industries, suppliers to the manufactured housing market, both appreciated more than 75% during the year. |
| • | Outperformance in Telecommunications led by Boingo Wireless, a beneficiary of burgeoning demand for mobile data, added to relative returns. |
| • | The Fund’s security selection in Utilities was superior, with the Fund’s holdings returning 31% for the 12-month period. |
Looking Forward
We concur with consensus that the prospects for tax reform, fiscal stimulus, and relaxed regulation under the new Administration should serve to benefit corporate earnings over the coming years. However, what policies become realities, which companies stand to benefit and by what magnitude is, to say the least, difficult to predict at this stage. In addition, the potential negative ramifications outside our borders of changes to our trade policy and a stronger currency must be considered, as well. Consistent with our disciplined investment style, we continue to analyze each investment prospect on its merits, factoring in the aforementioned tailwinds where we have conviction that they will likely impact profitability.
Portfolio Manager:
Michelle Stevens
Baird SmallCap Value Fund
December 31, 2016 (Unaudited)
Portfolio Characteristics
A December 31, 2016 summary of the Fund’s top 10 holdings and equity sector analysis compared to the Russell 2000® Value Index is shown below.
| Top 10 Holdings* | | | Equity Sector Analysis** |
| | | |  �� �� |
| Meta Financial Group, Inc. | 5.4% | |
| ICU Medical, Inc. | 3.7% | |
| Boingo Wireless, Inc. | 3.6% | |
| LTC Properties, Inc. | 3.3% | |
| B&G Foods, Inc. | 3.3% | |
| Alliant Energy Corp. | 3.2% | |
| j2 Global, Inc. | 3.2% | |
| Renasant Corp. | 3.1% | |
| Atlas Financial Holdings, Inc. | 3.1% | |
| Agree Realty Corp. | 3.0% | |
| | | |
| Net Assets: | $30,848,895 | |
| Portfolio Turnover Rate: | 48.9% | |
| Number of Equity Holdings: | 36 | |
| | | |
| Annualized Portfolio Expense Ratio:*** | | |
Gross | | |
| Institutional Class: | 1.52% | |
| Investor Class: | 1.77% | **** |
| | | |
Net | | |
| Institutional Class: | 1.00% | | |
| Investor Class: | 1.25% | **** | |
| * | | The Fund’s portfolio composition is subject to change and there is no assurance that the Fund will continue to hold any particular security. Percentages shown relate to the Fund’s total net assets as of December 31, 2016. |
| ** | | Percentages shown in parentheses relate to the Fund’s total market value of investments as of December 31, 2016, and may not add up to 100% due to rounding. |
| *** | | Reflects expense ratios as stated in the Fund’s current prospectus. The Advisor has contractually agreed to limit the Fund’s total annual fund operating expenses to 1.00% of average daily net assets for the Institutional Class shares and 1.25% of average daily net assets for the Investor Class shares, at least through April 30, 2018. |
| **** | | Includes 0.25% 12b-1 fee. |
Baird SmallCap Value Fund
December 31, 2016 (Unaudited)
Institutional Class
Value of a $25,000 Investment
Growth of a hypothetical investment of $25,000 made on the Fund’s inception date (5/1/12), assuming reinvestment of all distributions.
Investor Class
Value of a $10,000 Investment
Growth of a hypothetical investment of $10,000 made on the Fund’s inception date (5/1/12), assuming reinvestment of all distributions.
Baird SmallCap Value Fund
December 31, 2016 (Unaudited)
Total Returns
| | | Average Annual |
| | | | Since |
| For the Periods Ended December 31, 2016 | One Year | Three Year | Inception(1) |
| Institutional Class Shares | 15.11% | 3.13% | 10.41% |
| Investor Class Shares | 14.84% | 2.86% | 10.13% |
Russell 2000® Value Index(2) | 31.74% | 8.31% | 13.87% |
| (1) | For the period from May 1, 2012 (inception date) through December 31, 2016. |
| (2) | The Russell 2000® Value Index measures the performance of the small-cap value segment of the U.S. equity universe. It includes those Russell 2000® Index companies with lower price-to-book ratios and lower forecasted growth values. This index does not reflect any deduction for fees, expenses or taxes. A direct investment in the index is not possible. |
The returns shown in the table above and the line graphs on the previous page reflect reinvestment of dividends and/or capital gains distributions in additional shares. The returns do not reflect the deduction of taxes that a shareholder would pay on Fund distributions or the redemption of Fund shares. The returns reflect the actual performance for each period and do not include the impact of trades executed on the last business day of the period that were recorded on the first business day of the next period.
The gross expense ratio for each Class, as reflected in the Fund’s current prospectus, is set forth under “Portfolio Characteristics”.
The Fund focuses on small cap value style stocks and therefore the performance of the Fund may be more volatile than the performance of funds that focus on types of stocks that have a broader investment style. The Fund may invest up to 15% of its total assets in U.S. dollar denominated foreign securities and ADRs. Foreign investments involve additional risks such as currency rate fluctuations and the potential for political and economic instability, and different and sometimes less strict financial reporting standards and regulation.
Past performance does not guarantee future results. Investment return and principal value will fluctuate so that an investor’s shares, when redeemed, may be worth more or less than their original cost.
For information about the performance of the Fund as of the most recent month-end, please call 1-866-44BAIRD or visit www.bairdfunds.com. Mutual fund performance changes over time and current performance may be lower or higher than that stated.
Baird SmallCap Value Fund
Schedule of Investments, December 31, 2016
Common Stocks
| | | | | | | | | % of | |
| | | Shares | | | Value | | | Net Assets | |
| Aerospace & Defense | | | | | | | | | |
| Hexcel Corp. | | | 13,209 | | | $ | 679,471 | | | | 2.2 | % |
| Orbital ATK, Inc. | | | 7,175 | | | | 629,463 | | | | 2.0 | % |
| | | | | | | | 1,308,934 | | | | 4.2 | % |
| Air Freight & Logistics | | | | | | | | | | | | |
| Air Transport Services Group, Inc.* | | | 37,396 | | | | 596,840 | | | | 1.9 | % |
| Auto Components | | | | | | | | | | | | |
| Drew Industries, Inc. | | | 7,012 | | | | 755,543 | | | | 2.5 | % |
| Motorcar Parts of America, Inc.* | | | 30,005 | | | | 807,735 | | | | 2.6 | % |
| | | | | | | | 1,563,278 | | | | 5.1 | % |
| Banks | | | | | | | | | | | | |
| Hilltop Holdings, Inc. | | | 23,482 | | | | 699,764 | | | | 2.3 | % |
| Renasant Corp. | | | 22,993 | | | | 970,764 | | | | 3.1 | % |
| | | | | | | | 1,670,528 | | | | 5.4 | % |
| Biotechnology | | | | | | | | | | | | |
| Eagle Pharmaceuticals, Inc./DE* | | | 8,173 | | | | 648,446 | | | | 2.1 | % |
| Building Products | | | | | | | | | | | | |
| Patrick Industries, Inc.* | | | 11,007 | | | | 839,834 | | | | 2.7 | % |
| Capital Markets | | | | | | | | | | | | |
| Diamond Hill Investment Group, Inc. | | | 2,955 | | | | 621,673 | | | | 2.0 | % |
| Commercial Services & Supplies | | | | | | | | | | | | |
| Deluxe Corp. | | | 10,437 | | | | 747,394 | | | | 2.4 | % |
| Construction & Engineering | | | | | | | | | | | | |
| Quanta Services, Inc.* | | | 26,578 | | | | 926,243 | | | | 3.0 | % |
| Food Products | | | | | | | | | | | | |
| B & G Foods, Inc. | | | 22,830 | | | | 999,954 | | | | 3.3 | % |
| Lamb Weston Holdings, Inc.* | | | 18,101 | | | | 685,123 | | | | 2.2 | % |
| | | | | | | | 1,685,077 | | | | 5.5 | % |
| Gas Utilities | | | | | | | | | | | | |
| South Jersey Industries, Inc. | | | 18,037 | | | | 607,666 | | | | 2.0 | % |
| Health Care Equipment & Supplies | | | | | | | | | | | | |
| ICU Medical, Inc.* | | | 7,664 | | | | 1,129,290 | | | | 3.7 | % |
| Household Durables | | | | | | | | | | | | |
| ZAGG, Inc.* | | | 120,510 | | | | 855,621 | | | | 2.8 | % |
| Household Products | | | | | | | | | | | | |
| Orchids Paper Products Co. | | | 31,147 | | | | 815,428 | | | | 2.6 | % |
| Insurance | | | | | | | | | | | | |
Atlas Financial Holdings, Inc.* f | | | 52,998 | | | | 956,614 | | | | 3.1 | % |
The accompanying notes are an integral part of these financial statements.
Baird SmallCap Value Fund
Schedule of Investments, December 31, 2016
Common Stocks (cont.)
| | | | | | | | | % of | |
| | | Shares | | | Value | | | Net Assets | |
| Internet Software & Services | | | | | | | | | |
| j2 Global, Inc. | | | 12,067 | | | $ | 987,081 | | | | 3.2 | % |
| Stamps.com, Inc.* | | | 6,034 | | | | 691,798 | | | | 2.2 | % |
| | | | | | | | 1,678,879 | | | | 5.4 | % |
| Multi-Utilities | | | | | | | | | | | | |
| Alliant Energy Corp. | | | 26,092 | | | | 988,626 | | | | 3.2 | % |
| Real Estate Investment Trusts (REITs) | | | | | | | | | | | | |
| Agree Realty Corp. | | | 20,384 | | | | 938,683 | | | | 3.0 | % |
| Blackstone Mortgage Trust, Inc. – Class A | | | 24,461 | | | | 735,542 | | | | 2.4 | % |
| Capstead Mortgage Corp. | | | 85,613 | | | | 872,397 | | | | 2.8 | % |
| Healthcare Trust of America, Inc. – Class A | | | 22,830 | | | | 664,581 | | | | 2.2 | % |
| LTC Properties, Inc. | | | 21,689 | | | | 1,018,949 | | | | 3.3 | % |
| Omega Healthcare Investors, Inc. | | | 25,095 | | | | 784,470 | | | | 2.6 | % |
| Physicians Realty Trust | | | 45,660 | | | | 865,714 | | | | 2.8 | % |
| | | | | | | | 5,880,336 | | | | 19.1 | % |
| Semiconductors & Semiconductor Equipment | | | | | | | | | | | | |
| Cypress Semiconductor Corp. | | | 52,604 | | | | 601,790 | | | | 2.0 | % |
Silicon Motion Technology Corp. – ADR f | | | 20,384 | | | | 865,912 | | | | 2.8 | % |
| | | | | | | | 1,467,702 | | | | 4.8 | % |
| Thrifts & Mortgage Finance | | | | | | | | | | | | |
| Bofi Holding, Inc.* | | | 32,614 | | | | 931,130 | | | | 3.0 | % |
| Capitol Federal Financial, Inc. | | | 21,852 | | | | 359,684 | | | | 1.2 | % |
| Meta Financial Group, Inc. | | | 16,307 | | | | 1,677,990 | | | | 5.4 | % |
| | | | | | | | 2,968,804 | | | | 9.6 | % |
| Water Utilities | | | | | | | | | | | | |
| Connecticut Water Service, Inc. | | | 12,230 | | | | 683,045 | | | | 2.2 | % |
| Wireless Telecommunication Services | | | | | | | | | | | | |
| Boingo Wireless, Inc.* | | | 90,994 | | | | 1,109,217 | | | | 3.6 | % |
| Total Common Stocks | | | | | | | | | | | | |
| (Cost $23,425,679) | | | | | | | 29,749,475 | | | | 96.4 | % |
The accompanying notes are an integral part of these financial statements.
Baird SmallCap Value Fund
Schedule of Investments, December 31, 2016
Short-Term Investment
| | | | | | | | | % of | |
| | | Shares | | | Value | | | Net Assets | |
| Money Market Mutual Fund | | | | | | | | | |
| Fidelity Institutional Money Market Fund – | | | | | | | | | |
| Government Portfolio, Institutional Class, 0.43%« | | | 1,096,298 | | | $ | 1,096,298 | | | | 3.6 | % |
| Total Short-Term Investment | | | | | | | | | | | | |
| (Cost $1,096,298) | | | | | | | 1,096,298 | | | | 3.6 | % |
| Total Investments | | | | | | | | | | | | |
| (Cost $24,521,977) | | | | | | | 30,845,773 | | | | 100.0 | % |
| Other Assets in Excess of Liabilities | | | | | | | 3,122 | | | | 0.0 | % |
| TOTAL NET ASSETS | | | | | | $ | 30,848,895 | | | | 100.0 | % |
Notes to Schedule of Investments
| * | Non-Income Producing |
| f | Foreign Security |
| « | 7-Day Yield |
ADR – American Depositary Receipt
Industry classifications shown in the Schedule of Investments are based off of the Global Industry Classification Standard (GICS®). GICS was developed by and/or is the exclusive property of MSCI, Inc. and Standard & Poor Financial Services LLC (“S&P”). GICS is a service mark of MSCI and S&P and has been licensed for use by U.S. Bancorp Fund Services, LLC.
The accompanying notes are an integral part of these financial statements.
Baird SmallCap Value Fund
Schedule of Investments, December 31, 2016
Summary of Fair Value Exposure at December 31, 2016
The Fund has adopted authoritative fair valuation accounting standards which establish a definition of fair value and set out a hierarchy for measuring fair value. These standards require additional disclosures about the various inputs and valuation techniques used to develop the measurements of fair value and a discussion on changes in valuation techniques and related inputs during the period. These standards define fair value as the price that would be received to sell an asset or paid to transfer a liability in an orderly transaction between market participants at the measurement date. Management has determined that these standards have no material impact on the Fund’s financial statements. The fair value hierarchy is organized into three levels based upon the assumptions (referred to as “inputs”) used in pricing the asset or liability. These standards state that “observable inputs” reflect the assumptions market participants would use in pricing the asset or liability based on market data obtained from independent sources and “unobservable inputs” reflect an entity’s own assumptions about the assumptions market participants would use in pricing the asset or liability. These inputs are summarized into three broad levels and described below:
| Level 1 – | Unadjusted quoted prices in active markets for identical unrestricted securities. |
| Level 2 – | Other significant observable inputs (including quoted prices for similar securities, quoted prices in inactive markets, dealer indications, interest rates, yield curves, prepayment speeds, credit risk, default rates, inputs corroborated by observable market data, etc.). |
| Level 3 – | Significant unobservable inputs (including the Fund’s own assumptions about the factors that market participants would use in valuing the security) based on the best information available. |
The inputs or methodology used for valuing securities are not necessarily an indication of the risk associated with investing in those securities.
The following is a summary of the inputs used to value the Fund’s investments as of December 31, 2016:
| | | Level 1 | | | Level 2 | | | Level 3 | | | Total | |
| Equity | | | | | | | | | | | | |
| Common Stocks | | $ | 29,749,475 | | | $ | — | | | $ | — | | | $ | 29,749,475 | |
| Total Equity | | | 29,749,475 | | | | — | | | | — | | | | 29,749,475 | |
| Short-Term Investment | | | | | | | | | | | | | | | | |
| Money Market Mutual Fund | | | 1,096,298 | | | | — | | | | — | | | | 1,096,298 | |
| Total Short-Term Investment | | | 1,096,298 | | | | — | | | | — | | | | 1,096,298 | |
| Total Investments* | | $ | 30,845,773 | | | $ | — | | | $ | — | | | $ | 30,845,773 | |
| * | Additional information regarding the industry classifications of these investments is disclosed in the Schedule of Investments. |
Changes in valuation techniques may result in transfers into or out of assigned levels within the fair value hierarchy. There were no transfers between Level 1, Level 2 and Level 3 fair value measurements during the reporting period, as compared to their classification from the prior year’s annual report. See the Fund’s valuation policy in Note 2a to the financial statements.
The accompanying notes are an integral part of these financial statements.
Chautauqua International Growth Fund
December 31, 2016
Portfolio Manager’s Commentary
On April 15, 2016, the Chautauqua International Growth Fund was established. The Chautauqua International Growth Fund delivered relative outperformance through the end of the third quarter, and then encountered significant countervailing market trends in the final quarter of 2016 that caused underperformance for our disciplined, high-quality growth investment approach.
For example, the fourth quarter began with a shift in the markets from a growth style outperformance in the third quarter, to a value style outperformance. At first, this appeared to be a short-term reversal, which has been typical in the “risk on, risk off” markets of the past 8 years. Then, in early November, despite most polls predicting up to 24 hours prior the opposite, Donald Trump became the surprise winner of the U.S. Presidency. The subsequent market rally, based upon the expectation of U.S. fiscal stimulus, widespread deregulation, and improved corporate profits – due to lower tax rates assured by a unified Republican federal government, combined with U.S. Federal Reserve interest rate hikes – took off, leaving large capitalization, quality growth investors, like us, behind.
In this environment and from the Fund’s April 15, 2016 inception through the end of 2016, the Chautauqua International Growth Fund’s Institutional Class declined 4.30%, underperforming the MSCI ACWI ex-U.S. Index® – ND, which advanced 3.02%.
Review
The following review and portfolio highlights account for the time period between the Chautauqua International Growth Fund’s inception on April 15, 2016 through the end of the year. For the MSCI ACWI ex-U.S. Index®, value style outperformed growth style. Within emerging markets, growth style outperformed value style. Small capitalization stocks outperformed large capitalization stocks in all but the emerging market portion of the Index.
Performance by country in which the Fund was invested had wide dispersions, as did sector returns. The best performing sectors were energy, 17.06%; materials, 13.85%; and information technology, 11.00%. The worst performing sectors were health care, -10.69%; telecomm, -10.27%; and consumer staples, -6.74%.
Chautauqua Capital’s investment approach focuses on companies that are faster growing, more profitable, and higher quality than the Fund’s benchmark index averages. However, the performance gap between growth and value style stocks in the past quarter was enormous, and so it is cold comfort that our underperformance was not alone among large capitalization growth investors.
Portfolio Highlights
During the roughly three quarters since the Fund was launched, the global markets have grappled with significant geopolitical events. The rise of Nationalist/Populist election outcomes began on June 23 when the United Kingdom (U.K.) held a referendum to decide whether the country should Leave or Remain in the European Union (E.U.). Leave won 52% of the vote, marking the first-ever departure from the E.U. Chautauqua Capital’s careful diversification and long-term focus prevented a significant performance dislocation during this time period, and the steps we took to safeguard against what we deemed to be a low probability but high negative impact event, such as a “Brexit Leave” outcome, were helpful. The Fund entered the U.K. referendum vote with an elevated cash position and an underweight to the financials sector, which was the most vulnerable sector to a political or economic shock. Additionally, prior to the vote, we made adjustments that were either neutral to or would benefit from depreciation of the pound sterling.
Immediately after the U.K. referendum, nearly all equity markets worldwide experienced significant downside volatility. We took advantage of what we deemed to be overreactions and pared back holdings that traded at higher valuations, and we added to existing positions and initiated new positions where we saw opportunity. Markets then advanced on further monetary stimulus.
Brent crude oil bottomed at $27 per barrel in January 2016 and ended the year at $57 per barrel. This move had a material impact on returns within the energy sector holdings of the Fund. The paradigm shift to limit oil production announced by the Organization of Petroleum Exporting Countries (OPEC) helped reduce the oversupply and led to higher oil prices. Our thesis was that the low oil price environment was unsustainable, especially for countries such as Saudi Arabia, which require higher oil prices to pay for their social programs,
Chautauqua International Growth Fund
December 31, 2016
and so price risk for the commodity was tilted to the upside. Earlier in the year, we reduced our weightings in oil services businesses and repositioned our energy exposure to exploration and production-oriented oil companies with attractive, low-cost assets and strong balance sheets in anticipation of higher oil prices.
Chautauqua Capital’s distinctive method of diversification through sector groups benefited the Fund’s portfolio. The allocation amongst correlated sector groupings (defensive, economically sensitive, energy and financials) worked to reduce volatility without sacrificing our best ideas. Within the defensive sectors, we avoided utilities and consumer staples due to their overall low growth rates and high valuations. Our intentional underweights to utilities and consumer staples stocks hurt performance throughout the year, as investors paid premium prices for stocks with high dividend yields. However, the Fund’s underweights to utilities and consumer staples stocks became additive to the Fund’s performance by year-end. Importantly, the Fund’s overweight to leading health care companies was a significant detractor to performance, given the health care sector’s 10.69% decline in the period. However, we are committed to the Fund’s health care positions and are finding advantaged companies with pricing power that are curing diseases and providing valuable services through proprietary technologies. We believe the strength of these companies, combined with our disciplined valuation work, provides for some of our best investment ideas within the Fund’s portfolio’s defensive sectors.
The Fund’s overweight to the information technology sector, along with strong stock selection, was a source of positive returns during the period. Our portfolio companies in the information technology sector benefit from strong secular trends – such as cloud computing, artificial intelligence, data analytics, and internet security – and possess what we believe are sustainable competitive advantages that will allow them to gain market share relative to their competitors. Moreover, we continue to evaluate advantaged companies within information technology, health care and consumer-related sectors either for investment, or for our watch list, to monitor for attractive valuation entry or exit points.
The year ended with the aforementioned surprise victory of U.S. President Donald Trump. In the immediate aftermath of the U.S. Election, and given President Trump’s campaign statements, Fund portfolio exposures to emerging markets positions were reduced, and the proceeds were redeployed to existing positions in the energy and financial sectors. This helped mitigate some of the Fund’s relative underperformance.
Outlook
As we enter the early stages of Trump’s Presidency, we are diligently assessing the impacts of the new administration’s policy decisions. We are watchful for potential changes in trade policy and will make adjustments accordingly. In general, however, the recent underperformance by large capitalization quality growth stocks has created one of those occasional opportunities to acquire positions in advantaged companies that benefit from secular growth trends at relatively attractive prices.
In terms of positioning, the investment trends we have identified remain intact and continue into 2017. For example, demographic demand of aging populations for medical solutions and financial services remain fruitful. Labor shortages should appear in some markets owing to low birth rates and the fact that the unemployment rate in places like the U.S. and Japan is already below its long-term average. Proposed infrastructure projects will compete for labor at a time when immigrant labor will likely be turned away. In these markets, rising labor costs could become inflationary. Therefore, we expect companies to continue to automate, and we are invested in this trend through portfolio companies such as Keyence and Dassault Systemes. Separately, we also envision a continued adoption of web-based services and activity, such as e-commerce, infrastructure-as-a-service, and software-as-a-service.
Being able to maneuver in a turbulent geopolitical world will be key to our investment success in 2017. Having a cohesive and collaborative team of six veteran investment professionals will be in our favor. Managing a concentrated, conviction-weighted portfolio of approximately 30 securities in the Fund enables us to be more nimble. First and foremost however, we benefit from owning companies which themselves can navigate challenging times. These well-capitalized businesses, which enjoy pricing power and the ability to focus their business in the most opportune places in the world, tend to maintain their margins and grow their market share as lesser competitors grapple to adapt.
Portfolio Manager:
Brian Beitner
Chautauqua International Growth Fund
December 31, 2016 (Unaudited)
Portfolio Characteristics
A December 31, 2016 summary of the Fund’s top 10 holdings and equity sector analysis compared to the MSCI ACWI ex USA Index is shown below.
| Top 10 Holdings* | | | | | |
| | | | | | |
| ASML Holding NV | 5.3% | | Net Assets: | $15,157,302 | |
| Eni SpA | 4.7% | | Portfolio Turnover Rate: | 72.6% | † |
| Wirecard AG | 4.5% | | Number of Equity Holdings: | 31 | |
| Alibaba Group Holding Ltd. | 4.3% | | | | |
| Sinopharm Group Co. Ltd. | 4.2% | | Annualized Portfolio Expense Ratio:*** | | |
| Julius Baer Group Ltd. | 4.1% | | Gross | | |
| Hargreaves Lansdown PLC | 4.0% | | Institutional Class: | 2.36% | |
| Core Laboratories NV | 4.0% | | Investor Class: | 2.61% | **** |
| Lululemon Athletica, Inc. | 4.0% | | | | |
| Olympus Corp. | 3.9% | | Net | | |
| | | | Institutional Class: | 0.95% | |
| | | | Investor Class: | 1.20% | **** |
| | | | | | |
| Equity Sector Analysis** | | | Country Allocation** | | |
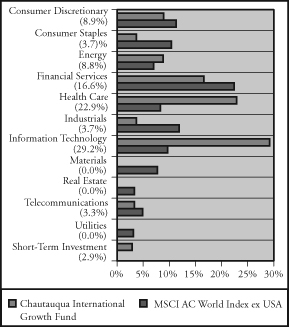 | | | 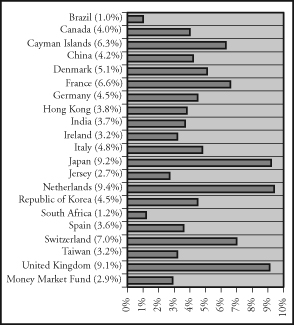 | | |
| * | | The Fund’s portfolio composition is subject to change and there is no assurance that the Fund will continue to hold any particular security. Percentages shown relate to the Fund’s total net assets as of December 31, 2016. |
| ** | | Percentages shown in parentheses relate to the Fund’s total market value of investments as of December 31, 2016, and may not add up to 100% due to rounding. |
| *** | | Reflects expense ratios as stated in the Fund’s current prospectus. The Advisor has contractually agreed to limit the Fund’s total annual fund operating expenses to 0.95% of average daily net assets for the Institutional Class shares and 1.20% of average daily net assets for the Investor Class shares, at least through April 30, 2018. |
| **** | | Includes 0.25% 12b-1 fee. |
| † | | Not annualized. |
Chautauqua International Growth Fund
December 31, 2016 (Unaudited)
Institutional Class
Value of a $25,000 Investment
Growth of a hypothetical investment of $25,000 made on the Fund’s inception date (04/15/16), assuming reinvestment of all distributions.
Investor Class
Value of a $10,000 Investment
Growth of a hypothetical investment of $10,000 made on the Fund’s inception date (04/15/16), assuming reinvestment of all distributions.
Chautauqua International Growth Fund
December 31, 2016 (Unaudited)
Total Returns
| | Six | Since |
| For the Periods Ended December 31, 2016 | Months | Inception(1) |
| Institutional Class Shares | -2.74% | -4.30% |
| Investor Class Shares | -2.75% | -4.40% |
| MSCI ACWI ex USA Index | 5.57% | 3.02% |
| (1) | For the period from April 15, 2016 (inception date) through December 31, 2016. |
| (2) | The MSCI ACWI ex USA Index is a market-capitalization-weighted index maintained by MSCI, Inc. and designed to provide a broad measure of stock performance throughout the world, with the exception of U.S.-based companies. The MSCI ACWI ex USA Index includes both developed and emerging markets. This index does not reflect any deduction for fees, expenses or taxes. A direct investment in the index is not possible. |
The returns shown in the table above and the line graphs on the previous page reflect reinvestment of dividends and/or capital gains distributions in additional shares. The returns do not reflect the deduction of taxes that a shareholder would pay on Fund distributions or the redemption of Fund shares. The returns reflect the actual performance for each period and do not include the impact of trades executed on the last business day of the period that were recorded on the first business day of the next period.
The gross expense ratio for each Class, as reflected in the Fund’s current prospectus, is set forth under “Portfolio Characteristics”.
The Fund focuses on both U.S. and non-U.S. stocks with medium to large market capitalizations and therefore the performance of the Fund may be more volatile than the performance of funds that focus on types of stocks that have a broader investment style. Under normal market conditions, the Fund will invest at least 65% of its total assets in non-U.S. companies. Foreign investments involve additional risks such as currency rate fluctuations and the potential for political and economic instability, and different and sometimes less strict financial reporting standards and regulation. In June 2016, the United Kingdom (UK) voted to leave the European Union (EU) following a referendum referred to as “Brexit.” It is expected that the UK will exit the EU within two years; however, the exact timeframe for the UK’s exit is unknown. There is significant market uncertainty regarding Brexit’s ramifications, and the range of possible political, regulatory, economic, and market outcomes are difficult to predict. The negative impact could be significant, potentially resulting in increased volatility and illiquidity and lower economic growth for companies that rely significantly on Europe for their business activities and revenues. Geopolitical events, including those in Ukraine and the Middle East, may cause market disruptions. The portfolio manager for the Fund has over 30 years of experience investing in the global markets and will attempt to minimize the negative impact of these events. However, it is possible that these or other geopolitical events could have an adverse effect on the value of the Fund’s investments.
Past performance does not guarantee future results. Investment return and principal value will fluctuate so that an investor’s shares, when redeemed, may be worth more or less than their original cost.
For information about the performance of the Fund as of the most recent month-end, please call 1-866-44BAIRD or visit www.bairdfunds.com. Mutual fund performance changes over time and current performance may be lower or higher than that stated.
Chautauqua International Growth Fund
Schedule of Investments, December 31, 2016
Common Stocks
| | | | | | | | | % of | |
| | | Shares | | | Value | | | Net Assets | |
| Alternative Carriers | | | | | | | | | |
| Iliad SA (France)^ | | | 2,596 | | | $ | 498,557 | | | | 3.3 | % |
| Apparel, Accessories & Luxury Goods | | | | | | | | | | | | |
| Lululemon Athletica, Inc. (Canada)* | | | 9,262 | | | | 601,937 | | | | 4.0 | % |
| Application Software | | | | | | | | | | | | |
| Dassault Systemes (France)^ | | | 6,379 | | | | 485,546 | | | | 3.2 | % |
| Asset Management & Custody Banks | | | | | | | | | | | | |
| Hargreaves Lansdown PLC (United Kingdom)^ | | | 40,776 | | | | 606,766 | | | | 4.0 | % |
| Julius Baer Group Ltd. (Switzerland)^ | | | 13,884 | | | | 615,085 | | | | 4.1 | % |
| | | | | | | | 1,221,851 | | | | 8.1 | % |
| Auto Parts & Equipment | | | | | | | | | | | | |
| Delphi Automotive PLC (United Kingdom) | | | 6,041 | | | | 406,861 | | | | 2.7 | % |
| Banks | | | | | | | | | | | | |
| HDFC Bank Ltd – ADR (India) | | | 9,289 | | | | 563,656 | | | | 3.7 | % |
| Biotechnology | | | | | | | | | | | | |
| Genmab A/S (Denmark)*^ | | | 1,545 | | | | 255,933 | | | | 1.7 | % |
| Cable & Satellite | | | | | | | | | | | | |
| Naspers Ltd. (South Africa)^ | | | 1,262 | | | | 184,241 | | | | 1.2 | % |
| Data Processing & Outsourced Services | | | | | | | | | | | | |
| Wirecard AG (Germany)^ | | | 15,908 | | | | 682,575 | | | | 4.5 | % |
| Electronic Equipment & Instruments | | | | | | | | | | | | |
| Keyence Corp. (Japan)^ | | | 842 | | | | 576,138 | | | | 3.8 | % |
| Health Care Equipment | | | | | | | | | | | | |
| Olympus Corp. (Japan)^ | | | 16,922 | | | | 583,044 | | | | 3.9 | % |
| Household Products | | | | | | | | | | | | |
| Reckitt Benckiser Group PLC (United Kingdom)^ | | | 2,544 | | | | 215,498 | | | | 1.4 | % |
| Insurance Brokers | | | | | | | | | | | | |
| BB Seguridade Participacoes SA (Brazil)^ | | | 17,652 | | | | 153,204 | | | | 1.0 | % |
| Internet Retail | | | | | | | | | | | | |
| Ctrip.com International Ltd. – ADR (Cayman Islands)* | | | 3,533 | | | | 141,320 | | | | 0.9 | % |
| Internet Software & Services | | | | | | | | | | | | |
| LINE Corp. (Japan)^ | | | 6,614 | | | | 225,793 | | | | 1.5 | % |
| NAVER Corp. (Republic of Korea)^ | | | 524 | | | | 335,558 | | | | 2.2 | % |
| Tencent Holdings Ltd. (Cayman Islands)^ | | | 5,897 | | | | 142,985 | | | | 1.0 | % |
| | | | | | | | 704,336 | | | | 4.7 | % |
| IT Consulting & Other Services | | | | | | | | | | | | |
| Alibaba Group Holding Ltd. – ADR (Cayman Islands)* | | | 7,502 | | | | 658,751 | | | | 4.3 | % |
The accompanying notes are an integral part of these financial statements.
Chautauqua International Growth Fund
Schedule of Investments, December 31, 2016
Common Stocks (cont.)
| | | | | | | | | % of | |
| | | Shares | | | Value | | | Net Assets | |
| Life & Health Insurance | | | | | | | | | |
| AIA Group Ltd. (Hong Kong)^ | | | 100,692 | | | $ | 564,061 | | | | 3.7 | % |
| Oil & Gas Equipment & Services | | | | | | | | | | | | |
| Core Laboratories NV (Netherlands) | | | 5,030 | | | | 603,801 | | | | 4.0 | % |
| Oil & Gas Exploration & Production | | | | | | | | | | | | |
| Eni SpA (Italy)^ | | | 44,337 | | | | 718,753 | | | | 4.7 | % |
| Personal Products | | | | | | | | | | | | |
| Amorepacific Corp. (Republic of Korea)^ | | | 1,293 | | | | 343,660 | | | | 2.3 | % |
| Pharmaceuticals | | | | | | | | | | | | |
| Allergan PLC (Ireland)* | | | 2,298 | | | | 482,603 | | | | 3.2 | % |
| Grifols SA – ADR (Spain) | | | 33,978 | | | | 546,026 | | | | 3.6 | % |
| Novo Nordisk A/S – ADR (Denmark) | | | 14,144 | | | | 507,204 | | | | 3.3 | % |
| Roche Holding AG (Switzerland)^ | | | 1,915 | | | | 436,529 | | | | 2.9 | % |
| Sinopharm Group Co. Ltd. (China)^ | | | 154,489 | | | | 633,149 | | | | 4.2 | % |
| | | | | | | | 2,605,511 | | | | 17.2 | % |
| Research & Consulting Services | | | | | | | | | | | | |
| Nielsen Holdings PLC (United Kingdom) | | | 13,099 | | | | 549,503 | | | | 3.6 | % |
| Semiconductor Equipment | | | | | | | | | | | | |
| ASML Holding NV (Netherlands) | | | 7,195 | | | | 807,280 | | | | 5.3 | % |
| Semiconductors | | | | | | | | | | | | |
| Taiwan Semiconductor Manufacturing Co. Ltd. – ADR (Taiwan) | | | 16,660 | | | | 478,975 | | | | 3.2 | % |
| Total Common Stocks | | | | | | | | | | | | |
| (Cost $14,956,436) | | | | | | | 14,604,992 | | | | 96.4 | % |
| Short-Term Investment | | | | | | | | | | | | |
| Money Market Mutual Fund | | | | | | | | | | | | |
| Fidelity Institutional Money Market Fund – | | | | | | | | | | | | |
| Government Portfolio, Institutional Class, 0.43%« | | | 430,762 | | | | 430,762 | | | | 2.8 | % |
| Total Short-Term Investment | | | | | | | | | | | | |
| (Cost $430,762) | | | | | | | 430,762 | | | | 2.8 | % |
| Total Investments | | | | | | | | | | | | |
| (Cost $15,387,198) | | | | | | | 15,035,754 | | | | 99.2 | % |
| Other Assets in Excess of Liabilities | | | | | | | 121,548 | | | | 0.8 | % |
| TOTAL NET ASSETS | | | | | | $ | 15,157,302 | | | | 100.0 | % |
Notes to Schedule of Investments
| * | Non-Income Producing |
| ^ | Fair Valued Security – See Note 2a to Financial Statements |
| « | 7-Day Yield |
ADR – American Depositary Receipt
Industry classifications shown in the Schedule of Investments are based on the Global Industry Classification Standard (GICS®). GICS was developed by and/or is the exclusive property of MSCI, Inc. and Standard & Poor Financial Services LLC (“S&P”). GICS is a service mark of MSCI and S&P and has been licensed for use by U.S. Bancorp Fund Services, LLC.
The accompanying notes are an integral part of these financial statements.
Chautauqua International Growth Fund
Schedule of Investments, December 31, 2016
Summary of Fair Value Exposure at December 31, 2016
The Fund has adopted authoritative fair valuation accounting standards which establish a definition of fair value and set out a hierarchy for measuring fair value. These standards require additional disclosures about the various inputs and valuation techniques used to develop the measurements of fair value and a discussion on changes in valuation techniques and related inputs during the period. These standards define fair value as the price that would be received to sell an asset or paid to transfer a liability in an orderly transaction between market participants at the measurement date. Management has determined that these standards have no material impact on the Fund’s financial statements. The fair value hierarchy is organized into three levels based upon the assumptions (referred to as “inputs”) used in pricing the asset or liability. These standards state that “observable inputs” reflect the assumptions market participants would use in pricing the asset or liability based on market data obtained from independent sources and “unobservable inputs” reflect an entity’s own assumptions about the assumptions market participants would use in pricing the asset or liability. These inputs are summarized into three broad levels and described below:
| Level 1 – | Unadjusted quoted prices in active markets for identical unrestricted securities. |
| Level 2 – | Other significant observable inputs (including quoted prices for similar securities, quoted prices in inactive markets, dealer indications, interest rates, yield curves, prepayment speeds, credit risk, default rates, inputs corroborated by observable market data, etc.). |
| Level 3 – | Significant unobservable inputs (including the Fund’s own assumptions about the factors that market participants would use in valuing the security) based on the best information available. |
The inputs or methodology used for valuing securities are not necessarily an indication of the risk associated with investing in those securities.
The following is a summary of the inputs used to value the Fund’s investments as of December 31, 2016:
| | | Level 1 | | | Level 2 | | | Level 3 | | | Total | |
| Equity | | | | | | | | | | | | |
| Common Stocks | | $ | 6,347,917 | | | $ | 8,257,075 | | | $ | — | | | $ | 14,604,992 | |
| Total Equity | | | 6,347,917 | | | | 8,257,075 | | | | — | | | | 14,604,992 | |
| Short-Term Investment | | | | | | | | | | | | | | | | |
| Money Market Mutual Fund | | | 430,762 | | | | — | | | | — | | | | 430,762 | |
| Total Short-Term Investment | | | 430,762 | | | | — | | | | — | | | | 430,762 | |
| Total Investments* | | $ | 6,778,679 | | | $ | 8,257,075 | | | $ | — | | | $ | 15,035,754 | |
| * | Additional information regarding the industry classifications of these investments is disclosed in the Schedule of Investments. |
Changes in valuation techniques may result in transfers into or out of assigned levels within the fair value hierarchy. There were no transfers between Level 1, Level 2 and Level 3 fair value measurements during the reporting period. See the Fund’s valuation policy in Note 2a to the financial statements.
The accompanying notes are an integral part of these financial statements.
Chautauqua Global Growth Fund
December 31, 2016
Portfolio Manager’s Commentary
On April 15, 2016, the Chautauqua Global Growth Fund was established. The Chautauqua Global Growth Fund delivered relative outperformance through the end of the third quarter, and then encountered significant countervailing market trends in the final quarter of 2016 that caused underperformance for our disciplined, high-quality growth investment approach.
For example, the fourth quarter began with a shift in the markets from a growth style outperformance in the third quarter, to a value style outperformance. At first, this appeared to be a short-term reversal, which has been typical in the “risk on, risk off” markets of the past 8 years. Then, in early November, despite most polls predicting up to 24 hours prior the opposite, Donald Trump became the surprise winner of the U.S. Presidency. The subsequent market rally, based upon the expectation of U.S. fiscal stimulus, widespread deregulation, and improved corporate profits – due to lower tax rates assured by a unified Republican federal government, combined with U.S. Federal Reserve interest rate hikes – took off, leaving large capitalization, quality growth investors, like us, behind.
In this environment and from the Fund’s April 15, 2016 inception through the end of 2016, the Chautauqua Global Growth Fund’s Institutional Class advanced 0.90%, underperforming the MSCI ACWI Index® – ND, which advanced 6.07%.
Review
The following review and portfolio highlights account for the time period between the Chautauqua Global Growth Fund’s inception on April 15, 2016 through the end of the year. For the MSCI ACWI Index®, value style outperformed growth style, and small capitalization stocks outperformed large capitalization stocks. Within emerging markets, growth style outperformed value style, and large capitalization stocks outperformed small capitalization stocks.
Performance by country in which the Fund was invested had wide dispersions, as did sector returns. The best performing sectors were energy, 17.06%; materials, 13.85%; and information technology, 11.00%. The worst performing sectors were health care, -10.69%; telecomm, -10.27%; and consumer staples, -6.74%.
Chautauqua Capital’s investment approach focuses on companies that are faster growing, more profitable, and higher quality than the Fund’s benchmark index averages. However, the performance gap between growth and value style stocks in the past quarter was enormous, and so it is cold comfort that our underperformance was not alone among large capitalization growth investors.
Portfolio Highlights
During the roughly three quarters since the Fund was launched, the global markets have grappled with significant geopolitical events. The rise of Nationalist/Populist election outcomes began on June 23 when the United Kingdom (U.K.) held a referendum to decide whether the country should Leave or Remain in the European Union (E.U.). Leave won 52% of the vote, marking the first-ever departure from the E.U. Chautauqua Capital’s careful diversification and long-term focus prevented a significant performance dislocation during this time period, and the steps we took to safeguard against what we deemed to be a low probability but high negative impact event, such as a “Brexit Leave” outcome, were helpful. The Fund entered the U.K. referendum vote with an elevated cash position and an underweight to the financials sector, which was the most vulnerable sector to a political or economic shock. Additionally, prior to the vote, we made adjustments that were either neutral to or would benefit from depreciation of the pound sterling.
Immediately after the U.K. referendum, nearly all equity markets worldwide experienced significant downside volatility. We took advantage of what we deemed to be overreactions and pared back holdings that traded at higher valuations, and we added to existing positions and initiated new positions where we saw opportunity. Markets then advanced on further monetary stimulus.
Brent crude oil bottomed at $27 per barrel in January 2016 and ended the year at $57 per barrel. This move had a material impact on returns within the energy sector holdings of the Fund. The paradigm shift to limit oil production announced by the Organization of Petroleum Exporting Countries (OPEC) helped reduce the oversupply and led to higher oil prices. Our thesis was that the low oil price environment was unsustainable, especially for countries such as Saudi Arabia, which require higher oil prices to pay for their social programs,
Chautauqua Global Growth Fund
December 31, 2016
and so price risk for the commodity was tilted to the upside. Earlier in the year, we reduced our weightings in oil services businesses and repositioned our energy exposure to exploration and production-oriented oil companies with attractive, low-cost assets and strong balance sheets in anticipation of higher oil prices.
Chautauqua Capital’s distinctive method of diversification through sector groups benefited the Fund’s portfolio. The allocation amongst correlated sector groupings (defensive, economically sensitive, energy and financials) worked to reduce volatility without sacrificing our best ideas. Within the defensive sectors, we avoided utilities and consumer staples due to their overall low growth rates and high valuations. Our intentional underweights to utilities and consumer staples stocks hurt performance throughout the year, as investors paid premium prices for stocks with high dividend yields. However, the Fund’s underweights to utilities and consumer staples stocks became additive to the Fund’s performance by year-end. Importantly, the Fund’s overweight to leading health care companies was a significant detractor to performance, given the health care sector’s 10.69% decline in the period. However, we are committed to the Fund’s health care positions and are finding advantaged companies with pricing power that are curing diseases and providing valuable services through proprietary technologies. We believe the strength of these companies, combined with our disciplined valuation work, provides for some of our best investment ideas within the Fund’s portfolio’s defensive sectors.
The Fund’s overweight to the information technology sector, along with strong stock selection, was a source of positive returns during the period. Our portfolio companies in the information technology sector benefit from strong secular trends – such as cloud computing, artificial intelligence, data analytics, and internet security – and possess what we believe are sustainable competitive advantages that will allow them to gain market share relative to their competitors. Moreover, we continue to evaluate advantaged companies within information technology, health care and consumer-related sectors either for investment, or for our watch list, to monitor for attractive valuation entry or exit points.
The year ended with the aforementioned surprise victory of U.S. President Donald Trump. In the immediate aftermath of the U.S. Election, and given President Trump’s campaign statements, portfolio exposures to emerging markets positions were reduced, and the proceeds were redeployed to existing positions in the energy and financial sectors. This helped mitigate some of the Fund’s relative underperformance.
Outlook
As we enter the early stages of Trump’s Presidency, we are diligently assessing the impacts of the new administration’s policy decisions. We are watchful for potential changes in trade policy and will make adjustments accordingly. In general, however, the recent underperformance by large capitalization quality growth stocks has created one of those occasional opportunities to acquire positions in advantaged companies that benefit from secular growth trends at relatively attractive prices.
In terms of positioning, the investment trends we have identified remain intact and continue into 2017. For example, demographic demand of aging populations for medical solutions and financial services remain fruitful. Labor shortages should appear in some markets owing to low birth rates and the fact that the unemployment rate in places like the U.S. and Japan is already below its long-term average. Proposed infrastructure projects will compete for labor at a time when immigrant labor will likely be turned away. In these markets, rising labor costs could become inflationary. Therefore, we expect companies to continue to automate, and we are invested in this trend through portfolio companies such as Keyence and Dassault Systemes. Separately, we also envision a continued adoption of web-based services and activity, such as e-commerce, infrastructure-as-a-service, and software-as-a-service.
Being able to maneuver in a turbulent geopolitical world will be key to our investment success in 2017. Having a cohesive and collaborative team of six veteran investment professionals will be in our favor. Managing a concentrated, conviction-weighted portfolio of approximately 40 securities in the Fund enables us to be more nimble. First and foremost, however, we benefit from owning companies which themselves can navigate challenging times. These well-capitalized businesses, which enjoy pricing power and the ability to focus their business in the most opportune places in the world, tend to maintain their margins and grow their market share as lesser competitors grapple to adapt.
Portfolio Manager:
Brian Beitner
Chautauqua Global Growth Fund
December 31, 2016 (Unaudited)
Portfolio Characteristics
A December 31, 2016 summary of the Fund’s top 10 holdings and equity sector analysis compared to the MSCI ACWI Index is shown below.
| Top 10 Holdings* | | | | | |
| | | | | | |
| Amazon.com, Inc. | 4.6% | | Net Assets: | $7,848,811 | |
| Illumina, Inc. | 4.5% | | Portfolio Turnover Rate: | 69.4% | † |
| Pioneer Natural Resources Co. | 4.3% | | Number of Equity Holdings: | 45 | |
| Palo Alto Networks, Inc. | 3.9% | | | | |
| MasterCard, Inc. – Class A | 3.9% | | Annualized Portfolio Expense Ratio:*** | | |
| Priceline.com, Inc. | 3.7% | | Gross | | |
| Lululemon Athletica, Inc. | 3.5% | | Institutional Class: | 2.36% | |
| Wirecard AG | 3.3% | | Investor Class: | 2.61% | **** |
| Julius Baer Group Ltd. | 3.3% | | | | |
| The Charles Schwab Corp. | 3.3% | | Net | | |
| | | | Institutional Class: | 0.95% | |
| | | | Investor Class: | 1.20% | **** |
| | | | | | |
| Equity Sector Analysis** | | | Country Allocation** | | |
 | | | 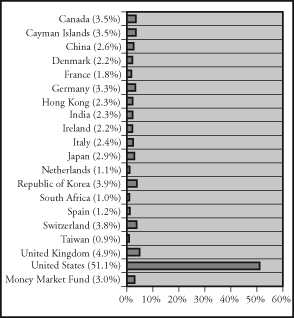 | | |
| | | | | | |
| * | | The Fund’s portfolio composition is subject to change and there is no assurance that the Fund will continue to hold any particular security. Percentages shown relate to the Fund’s total net assets as of December 31, 2016. |
| ** | | Percentages shown in parentheses relate to the Fund’s total market value of investments as of December 31, 2016, and may not add up to 100% due to rounding. |
| *** | | Reflects expense ratios as stated in the Fund’s current prospectus. The Advisor has contractually agreed to limit the Fund’s total annual fund operating expenses to 0.95% of average daily net assets for the Institutional Class shares and 1.20% of average daily net assets for the Investor Class shares, at least through April 30, 2018. |
| **** | | Includes 0.25% 12b-1 fee. |
| † | | Not annualized. |
Chautauqua Global Growth Fund
December 31, 2016 (Unaudited)
Institutional Class
Value of a $25,000 Investment
Growth of a hypothetical investment of $25,000 made on the Fund’s inception date (04/15/16), assuming reinvestment of all distributions.
Investor Class
Value of a $10,000 Investment
Growth of a hypothetical investment of $10,000 made on the Fund’s inception date (04/15/16), assuming reinvestment of all distributions.
Chautauqua Global Growth Fund
December 31, 2016 (Unaudited)
Total Returns
| | Six | Since |
| For the Periods Ended December 31, 2016 | Months | Inception(1) |
| Institutional Class Shares | 3.28% | 0.90% |
| Investor Class Shares | 3.28% | 0.80% |
| MSCI ACWI Index | 6.55% | 6.07% |
| (1) | For the period from April 15, 2016 (inception date) through December 31, 2016. |
| (2) | The MSCI ACWI Index is a market-capitalization-weighted index maintained by MSCI, Inc. and designed to provide a broad measure of stock performance throughout the world. The MSCI ACWI Index includes both developed and emerging markets. This index does not reflect any deduction for fees, expenses or taxes. A direct investment in the index is not possible. |
The returns shown in the table above and the line graphs on the previous page reflect reinvestment of dividends and/or capital gains distributions in additional shares. The returns do not reflect the deduction of taxes that a shareholder would pay on Fund distributions or the redemption of Fund shares. The returns reflect the actual performance for each period and do not include the impact of trades executed on the last business day of the period that were recorded on the first business day of the next period.
The gross expense ratio for each Class, as reflected in the Fund’s current prospectus, is set forth under “Portfolio Characteristics”.
The Fund focuses on both U.S. and non-U.S. stocks with medium to large market capitalizations and therefore the performance of the Fund may be more volatile than the performance of funds that focus on types of stocks that have a broader investment style. Under normal market conditions, the Fund will invest at least 40% of its total assets in non-U.S. companies. Foreign investments involve additional risks such as currency rate fluctuations and the potential for political and economic instability, and different and sometimes less strict financial reporting standards and regulation. In June 2016, the United Kingdom (UK) voted to leave the European Union (EU) following a referendum referred to as “Brexit.” It is expected that the UK will exit the EU within two years; however, the exact timeframe for the UK’s exit is unknown. There is significant market uncertainty regarding Brexit’s ramifications, and the range of possible political, regulatory, economic, and market outcomes are difficult to predict. The negative impact could be significant, potentially resulting in increased volatility and illiquidity and lower economic growth for companies that rely significantly on Europe for their business activities and revenues. Geopolitical events, including those in Ukraine and the Middle East, may cause market disruptions. The portfolio manager for the Fund has over 30 years of experience investing in the global markets and will attempt to minimize the negative impact of these events. However, it is possible that these or other geopolitical events could have an adverse effect on the value of the Fund’s investments.
Past performance does not guarantee future results. Investment return and principal value will fluctuate so that an investor’s shares, when redeemed, may be worth more or less than their original cost.
For information about the performance of the Fund as of the most recent month-end, please call 1-866-44BAIRD or visit www.bairdfunds.com. Mutual fund performance changes over time and current performance may be lower or higher than that stated.
Chautauqua Global Growth Fund
Schedule of Investments, December 31, 2016
Common Stocks
| | | | | | | | | % of | |
| | | Shares | | | Value | | | Net Assets | |
| Alternative Carriers | | | | | | | | | |
| Iliad SA (France)^ | | | 333 | | | $ | 63,952 | | | | 0.8 | % |
| Apparel, Accessories & Luxury Goods | | | | | | | | | | | | |
| Lululemon Athletica, Inc. (Canada)* | | | 4,290 | | | | 278,807 | | | | 3.5 | % |
| Application Software | | | | | | | | | | | | |
| Dassault Systemes (France)^ | | | 999 | | | | 76,040 | | | | 1.0 | % |
| Asset Management & Custody Banks | | | | | | | | | | | | |
| Hargreaves Lansdown PLC (United Kingdom)^ | | | 14,650 | | | | 217,999 | | | | 2.8 | % |
| Julius Baer Group Ltd. (Switzerland)^ | | | 5,820 | | | | 257,836 | | | | 3.3 | % |
| | | | | | | | 475,835 | | | | 6.1 | % |
| Biotechnology | | | | | | | | | | | | |
| Genmab A/S (Denmark)*^ | | | 463 | | | | 76,697 | | | | 1.0 | % |
| Regeneron Pharmaceuticals, Inc. (United States)* | | | 639 | | | | 234,570 | | | | 3.0 | % |
| | | | | | | | 311,267 | | | | 4.0 | % |
| Cable & Satellite | | | | | | | | | | | | |
| Naspers Ltd. (South Africa)^ | | | 566 | | | | 82,631 | | | | 1.1 | % |
| Communications Equipment | | | | | | | | | | | | |
| Palo Alto Networks, Inc. (United States)* | | | 2,460 | | | | 307,623 | | | | 3.9 | % |
| Computer Hardware | | | | | | | | | | | | |
| Apple, Inc. (United States) | | | 880 | | | | 101,922 | | | | 1.3 | % |
| Data Processing & Outsourced Services | | | | | | | | | | | | |
| Wirecard AG (Germany)^ | | | 6,048 | | | | 259,505 | | | | 3.3 | % |
| Electronic Equipment & Instruments | | | | | | | | | | | | |
| Keyence Corp. (Japan)^ | | | 122 | | | | 83,479 | | | | 1.1 | % |
| Health Care Equipment | | | | | | | | | | | | |
| Athenahealth, Inc. (United States)* | | | 1,434 | | | | 150,813 | | | | 1.9 | % |
| Olympus Corp. (Japan)^ | | | 4,265 | | | | 146,950 | | | | 1.9 | % |
| | | | | | | | 297,763 | | | | 3.8 | % |
| Health Care Services | | | | | | | | | | | | |
| Celgene Corp. (United States)* | | | 1,685 | | | | 195,039 | | | | 2.5 | % |
| Household Products | | | | | | | | | | | | |
| Reckitt Benckiser Group PLC (United Kingdom)^ | | | 885 | | | | 74,967 | | | | 1.0 | % |
| Internet Retail | | | | | | | | | | | | |
| Amazon.com, Inc. (United States)* | | | 481 | | | | 360,688 | | | | 4.6 | % |
| Ctrip.com International Ltd. – ADR (Cayman Islands)* | | | 1,812 | | | | 72,480 | | | | 0.9 | % |
| Priceline.com, Inc. (United States)* | | | 197 | | | | 288,814 | | | | 3.7 | % |
| | | | | | | | 721,982 | | | | 9.2 | % |
The accompanying notes are an integral part of these financial statements.
Chautauqua Global Growth Fund
Schedule of Investments, December 31, 2016
Common Stocks (cont.)
| | | | | | | | | % of | |
| | | Shares | | | Value | | | Net Assets | |
| Internet Software & Services | | | | | | | | | |
| Alphabet, Inc. – Class A (United States)* | | | 261 | | | $ | 206,829 | | | | 2.6 | % |
| NAVER Corp. (Republic of Korea)^ | | | 254 | | | | 162,656 | | | | 2.1 | % |
| Salesforce.com, Inc. (United States)* | | | 2,618 | | | | 179,228 | | | | 2.3 | % |
| Tencent Holdings Ltd. (Cayman Islands)^ | | | 3,022 | | | | 73,275 | | | | 0.9 | % |
| | | | | | | | 621,988 | | | | 7.9 | % |
| IT Consulting & Other Services | | | | | | | | | | | | |
| Alibaba Group Holding Ltd. – ADR (Cayman Islands)* | | | 1,461 | | | | 128,290 | | | | 1.6 | % |
| MasterCard, Inc. – Class A (United States) | | | 2,971 | | | | 306,756 | | | | 3.9 | % |
| | | | | | | | 435,046 | | | | 5.5 | % |
| Life & Health Insurance | | | | | | | | | | | | |
| AIA Group Ltd. (Hong Kong)^ | | | 31,985 | | | | 179,175 | | | | 2.3 | % |
| Life Sciences Tools & Services | | | | | | | | | | | | |
| Illumina, Inc. (United States)* | | | 2,762 | | | | 353,646 | | | | 4.5 | % |
| Oil & Gas Exploration & Production | | | | | | | | | | | | |
| Antero Resources Corp. (United States)* | | | 8,012 | | | | 189,484 | | | | 2.4 | % |
| Eni SpA (Italy)^ | | | 11,791 | | | | 191,145 | | | | 2.4 | % |
| Pioneer Natural Resources Co. (United States) | | | 1,848 | | | | 332,770 | | | | 4.3 | % |
| | | | | | | | 713,399 | | | | 9.1 | % |
| Other Diversified Financial Services | | | | | | | | | | | | |
| The Charles Schwab Corp. (United States) | | | 6,503 | | | | 256,673 | | | | 3.3 | % |
| Personal Products | | | | | | | | | | | | |
| Amorepacific Corp. (Republic of Korea)^ | | | 558 | | | | 148,308 | | | | 1.9 | % |
| Pharmaceuticals | | | | | | | | | | | | |
| Allergan PLC (Ireland)* | | | 822 | | | | 172,628 | | | | 2.2 | % |
| Grifols SA – ADR (Spain) | | | 6,036 | | | | 96,999 | | | | 1.2 | % |
| Novo Nordisk A/S – ADR (Denmark) | | | 2,612 | | | | 93,666 | | | | 1.2 | % |
| Roche Holding AG (Switzerland)^ | | | 204 | | | | 46,502 | | | | 0.6 | % |
| Sinopharm Group Co. Ltd. (China)^ | | | 51,385 | | | | 210,594 | | | | 2.7 | % |
| | | | | | | | 620,389 | | | | 7.9 | % |
| Regional Banks | | | | | | | | | | | | |
| HDFC Bank Ltd – ADR (India) | | | 2,973 | | | | 180,402 | | | | 2.3 | % |
| SVB Financial Group (United States)* | | | 823 | | | | 141,276 | | | | 1.8 | % |
| | | | | | | | 321,678 | | | | 4.1 | % |
| Research & Consulting Services | | | | | | | | | | | | |
| Nielsen Holdings PLC (United Kingdom) | | | 2,269 | | | | 95,185 | | | | 1.2 | % |
| Semiconductor Equipment | | | | | | | | | | | | |
| ASML Holding NV (Netherlands) | | | 767 | | | | 86,057 | | | | 1.1 | % |
| NVIDIA Corp. (United States) | | | 1,180 | | | | 125,954 | | | | 1.6 | % |
| | | | | | | | 212,011 | | | | 2.7 | % |
The accompanying notes are an integral part of these financial statements.
Chautauqua Global Growth Fund
Schedule of Investments, December 31, 2016
Common Stocks (cont.)
| | | | | | | | | % of | |
| | | Shares | | | Value | | | Net Assets | |
| Semiconductors | | | | | | | | | |
| Taiwan Semiconductor Manufacturing Co. Ltd. – ADR (Taiwan) | | | 2,579 | | | $ | 74,146 | | | | 0.9 | % |
| Specialty Chemicals | | | | | | | | | | | | |
| The Sherwin-Williams Co. (United States) | | | 264 | | | | 70,947 | | | | 0.9 | % |
| Systems Software | | | | | | | | | | | | |
| Adobe Systems, Inc. (United States)* | | | 2,248 | | | | 231,432 | | | | 2.9 | % |
| Total Common Stocks | | | | | | | | | | | | |
| (Cost $7,481,097) | | | | | | | 7,664,835 | | | | 97.7 | % |
| Short-Term Investment | | | | | | | | | | | | |
| Money Market Mutual Fund | | | | | | | | | | | | |
| Fidelity Institutional Money Market Fund – | | | | | | | | | | | | |
| Government Portfolio, Institutional Class, 0.43%« | | | 236,788 | | | | 236,788 | | | | 3.0 | % |
| Total Short-Term Investment | | | | | | | | | | | | |
| (Cost $236,788) | | | | | | | 236,788 | | | | 3.0 | % |
| Total Investments | | | | | | | | | | | | |
| (Cost $7,717,885) | | | | | | | 7,901,623 | | | | 100.7 | % |
| Liabilities in Excess of Other Assets | | | | | | | (52,812 | ) | | | (0.7 | )% |
| TOTAL NET ASSETS | | | | | | $ | 7,848,811 | | | | 100.0 | % |
Notes to Schedule of Investments
| * | Non-Income Producing |
| ^ | Fair Valued Security – See Note 2a to Financial Statements |
| « | 7-Day Yield |
ADR – American Depositary Receipt
Industry classifications shown in the Schedule of Investments are based on the Global Industry Classification Standard (GICS®). GICS was developed by and/or is the exclusive property of MSCI, Inc. and Standard & Poor Financial Services LLC (“S&P”). GICS is a service mark of MSCI and S&P and has been licensed for use by U.S. Bancorp Fund Services, LLC.
The accompanying notes are an integral part of these financial statements.
Chautauqua Global Growth Fund
Schedule of Investments, December 31, 2016
Summary of Fair Value Exposure at December 31, 2016
The Fund has adopted authoritative fair valuation accounting standards which establish a definition of fair value and set out a hierarchy for measuring fair value. These standards require additional disclosures about the various inputs and valuation techniques used to develop the measurements of fair value and a discussion on changes in valuation techniques and related inputs during the period. These standards define fair value as the price that would be received to sell an asset or paid to transfer a liability in an orderly transaction between market participants at the measurement date. Management has determined that these standards have no material impact on the Fund’s financial statements. The fair value hierarchy is organized into three levels based upon the assumptions (referred to as “inputs”) used in pricing the asset or liability. These standards state that “observable inputs” reflect the assumptions market participants would use in pricing the asset or liability based on market data obtained from independent sources and “unobservable inputs” reflect an entity’s own assumptions about the assumptions market participants would use in pricing the asset or liability. These inputs are summarized into three broad levels and described below:
| Level 1 – | Unadjusted quoted prices in active markets for identical unrestricted securities. |
| Level 2 – | Other significant observable inputs (including quoted prices for similar securities, quoted prices in inactive markets, dealer indications, interest rates, yield curves, prepayment speeds, credit risk, default rates, inputs corroborated by observable market data, etc.). |
| Level 3 – | Significant unobservable inputs (including the Fund’s own assumptions about the factors that market participants would use in valuing the security) based on the best information available. |
The inputs or methodology used for valuing securities are not necessarily an indication of the risk associated with investing in those securities.
The following is a summary of the inputs used to value the Fund’s investments as of December 31, 2016:
| | | Level 1 | | | Level 2 | | | Level 3 | | | Total | |
| Equity | | | | | | | | | | | | |
| Common Stocks | | $ | 5,313,124 | | | $ | 2,351,711 | | | $ | — | | | $ | 7,664,835 | |
| Total Equity | | | 5,313,124 | | | | 2,351,711 | | | | — | | | | 7,664,835 | |
| Short-Term Investment | | | | | | | | | | | | | | | | |
| Money Market Mutual Fund | | | 236,788 | | | | — | | | | — | | | | 236,788 | |
| Total Short-Term Investment | | | 236,788 | | | | — | | | | — | | | | 236,788 | |
| Total Investments* | | $ | 5,549,912 | | | $ | 2,351,711 | | | $ | — | | | $ | 7,901,623 | |
| * | Additional information regarding the industry classifications of these investments is disclosed in the Schedule of Investments. |
Changes in valuation techniques may result in transfers into or out of assigned levels within the fair value hierarchy. There were no transfers between Level 1, Level 2 and Level 3 fair value measurements during the reporting period. See the Fund’s valuation policy in Note 2a to the financial statements.
The accompanying notes are an integral part of these financial statements.
Additional Information on Fund Expenses
December 31, 2016 (Unaudited)
Example
As a shareholder of a mutual fund, you incur two types of costs: (1) transaction costs, which may include sales charges (loads) on purchase payments, reinvested dividends, or other distributions; redemption fees; and exchange fees; and (2) ongoing costs, such as management fees; distribution and/or service (12b-1) fees; and other fund expenses. Although the Funds do not charge any sales loads, redemption fees, or other transaction fees, you will be assessed fees for outgoing wire transfers, returned checks and stop payment orders at prevailing rates charged by U.S. Bancorp Fund Services, LLC, the Fund’s transfer agent. If you request that a redemption be made by wire transfer, currently the Fund’s transfer agent charges a $15.00 fee.
This Example is intended to help you understand your ongoing costs (in dollars) of investing in each Fund and to compare these costs with the ongoing costs of investing in other mutual funds. The Example is based on an investment of $1,000 invested at the beginning of the period and held for the entire period (7/1/16 – 12/31/16).
Actual Expenses
The third and fourth columns of the following table provide information about account values based on actual returns and actual expenses. You may use the information in these columns, together with the amount you invested, to estimate the expenses that you paid over the period. Simply divide your account value by $1,000 (for example, an $8,600 account value divided by $1,000 = 8.6), then multiply the result by the number in the fourth column entitled “Expenses Paid During Period” to estimate the expenses you paid on your account during this period.
Hypothetical Example for Comparison Purposes
The fifth and sixth columns of the following table provide information about hypothetical account values and hypothetical expenses based on the Funds’ actual expense ratios and an assumed rate of return of 5% per year before expenses, which is not the Funds’ actual return. The hypothetical account values and expenses may not be used to estimate the actual ending account balance or expenses you paid for the period. You may use this information to compare the ongoing costs of investing in the Funds and other mutual funds. To do so, compare this 5% hypothetical example with the 5% hypothetical examples that appear in the shareholder reports of the other mutual funds. Please note that the expenses shown in the table are meant to highlight your ongoing costs only and do not reflect any transactional costs. Therefore, the sixth column of the table (entitled “Expenses Paid During Period”) is useful in comparing ongoing costs only, and will not help you determine the relative total costs of owning different mutual funds. In addition, if these transactional costs were included, your costs could have been higher.
Additional Information on Fund Expenses
December 31, 2016 (Unaudited)
Actual vs. Hypothetical Returns
For the Six Months Ended December 31, 2016
| | | | | | Hypothetical |
| | | | | | (5% return |
| | | | Actual | before expenses) |
| | Fund’s | Beginning | Ending | Expenses | Ending | Expenses |
| | Annualized | Account | Account | Paid | Account | Paid |
| | Expense | Value | Value | During | Value | During |
| | Ratio(1) | 7/1/16 | 12/31/16 | Period(1) | 12/31/16 | Period(1) |
| Baird LargeCap Fund | | | | | | |
| Institutional Class | 0.75% | $1,000.00 | $1,144.30 | $4.04 | $1,021.37 | $3.81 |
| Investor Class | 1.00% | $1,000.00 | $1,142.90 | $5.39 | $1,020.11 | $5.08 |
| | | | | | | |
| Baird MidCap Fund | | | | | | |
| Institutional Class | 0.82% | $1,000.00 | $1,027.30 | $4.18 | $1,021.01 | $4.17 |
| Investor Class | 1.07% | $1,000.00 | $1,025.80 | $5.45 | $1,019.76 | $5.43 |
| | | | | | | |
| Baird Small/Mid | | | | | | |
| Cap Value Fund | | | | | | |
| Institutional Class | 0.95% | $1,000.00 | $1,046.20 | $4.89 | $1,020.36 | $4.82 |
| Investor Class | 1.20% | $1,000.00 | $1,044.70 | $6.17 | $1,019.10 | $6.09 |
| | | | | | | |
| Baird SmallCap Value Fund | | | | | | |
| Institutional Class | 1.00% | $1,000.00 | $1,085.30 | $5.24 | $1,020.11 | $5.08 |
| Investor Class | 1.25% | $1,000.00 | $1,084.10 | $6.55 | $1,018.85 | $6.34 |
| | | | | | | |
| Chautauqua International | | | | | | |
| Growth Fund | | | | | | |
| Institutional Class | 0.95% | $1,000.00 | $ 972.60 | $4.71 | $1,020.36 | $4.82 |
| Investor Class | 1.20% | $1,000.00 | $ 972.50 | $5.95 | $1,019.10 | $6.09 |
| | | | | | | |
| Chautauqua Global | | | | | | |
| Growth Fund | | | | | | |
| Institutional Class | 0.95% | $1,000.00 | $1,032.80 | $4.85 | $1,020.36 | $4.82 |
| Investor Class | 1.20% | $1,000.00 | $1,032.80 | $6.13 | $1,019.10 | $6.09 |
| (1) | Expenses are equal to the Fund’s annualized net expense ratio multiplied by the average account value over the period, multiplied by 184 days and divided by 366 to reflect the one-half year period. |
Statements of Assets and Liabilities
December 31, 2016
| | | | | | | | | Baird | |
| | | Baird | | | Baird | | | Small/Mid | |
| | | LargeCap | | | MidCap | | | Cap Value | |
| | | Fund | | | Fund | | | Fund | |
| ASSETS: | | | | | | | | | |
| Investments, at value (cost $34,566,436, | | | | | | | | | |
| $1,055,857,941 and $10,957,747, respectively) | | $ | 39,553,176 | | | $ | 1,248,072,888 | | | $ | 11,967,615 | |
| Dividends receivable | | | 38,506 | | | | 366,061 | | | | 25,755 | |
| Interest receivable | | | 438 | | | | 10,785 | | | | 110 | |
| Receivable for Fund shares sold | | | 8,692 | | | | 2,654,540 | | | | — | |
| Receivable from Advisor and Distributor | | | — | | | | — | | | | 3,965 | |
| Prepaid expenses and other assets | | | 8,620 | | | | 6,775 | | | | 1,380 | |
| Total assets | | | 39,609,432 | | | | 1,251,111,049 | | | | 11,998,825 | |
| LIABILITIES: | | | | | | | | | | | | |
| Payable for securities purchased | | | — | | | | 5,497,872 | | | | — | |
| Payable for Fund shares repurchased | | | — | | | | 2,329,793 | | | | 2,693 | |
| Payable to Advisor and Distributor | | | 9,892 | | | | 863,957 | | | | — | |
| Payable to directors | | | 1,418 | | | | 252 | | | | 3,341 | |
| Accrued expenses and other liabilities | | | 39,760 | | | | 191,266 | | | | 25,813 | |
| Total liabilities | | | 51,070 | | | | 8,883,140 | | | | 31,847 | |
| NET ASSETS | | $ | 39,558,362 | | | $ | 1,242,227,909 | | | $ | 11,966,978 | |
| NET ASSETS CONSIST OF: | | | | | | | | | | | | |
| Capital stock | | $ | 35,209,188 | | | $ | 1,113,872,603 | | | $ | 11,395,210 | |
| Accumulated undistributed | | | | | | | | | | | | |
| net investment income | | | 1,961 | | | | — | | | | 2,542 | |
| Accumulated net realized loss on investments | | | | | | | | | | | �� | |
| sold and foreign currency translations | | | (639,527 | ) | | | (63,859,641 | ) | | | (440,642 | ) |
| Net unrealized appreciation on Investments | | | 4,986,740 | | | | 192,214,947 | | | | 1,009,868 | |
| NET ASSETS | | $ | 39,558,362 | | | $ | 1,242,227,909 | | | $ | 11,966,978 | |
| INSTITUTIONAL CLASS SHARES | | | | | | | | | | | | |
| Net Assets | | $ | 38,824,525 | | | $ | 1,105,051,533 | | | $ | 11,913,771 | |
| Shares outstanding ($0.01 par value, | | | | | | | | | | | | |
| unlimited shares authorized) | | | 4,353,587 | | | | 69,960,995 | | | | 1,157,769 | |
| Net asset value, offering and | | | | | | | | | | | | |
| redemption price per share | | $ | 8.92 | | | $ | 15.80 | | | $ | 10.29 | |
| INVESTOR CLASS SHARES | | | | | | | | | | | | |
| Net Assets | | $ | 733,837 | | | $ | 137,176,376 | | | $ | 53,207 | |
| Shares outstanding ($0.01 par value, | | | | | | | | | | | | |
| unlimited shares authorized) | | | 82,406 | | | | 9,085,850 | | | | 5,176 | |
| Net asset value, offering and | | | | | | | | | | | | |
| redemption price per share | | $ | 8.91 | | | $ | 15.10 | | | $ | 10.28 | |
The accompanying notes are an integral part of these financial statements.
Statements of Assets and Liabilities
December 31, 2016
| | | Baird | | | Chautauqua | | | Chautauqua | |
| | | SmallCap | | | International | | | Global | |
| | | Value Fund | | | Growth Fund | | | Growth Fund | |
| ASSETS: | | | | | | | | | |
| Investments, at value (cost $24,521,977, | | | | | | | | | |
| $15,387,198 and $7,717,885, respectively) | | $ | 30,845,773 | | | $ | 15,035,754 | | | $ | 7,901,623 | |
| Foreign Currency, at value (Cost $0, $17,881 | | | | | | | | | | | | |
| and $6,466, respectively) | | | — | | | | 17,881 | | | | 6,461 | |
| Dividends receivable | | | 81,639 | | | | 2,613 | | | | 1,086 | |
| Interest receivable | | | 470 | | | | 220 | | | | 88 | |
| Receivable for investments sold | | | — | | | | 205,229 | | | | 25,488 | |
| Receivable for Fund shares sold | | | 375 | | | | 17,519 | | | | 14,000 | |
| Receivable from Advisor and Distributor | | | — | | | | — | | | | 5,719 | |
| Prepaid expenses and other assets | | | 5,847 | | | | 14,918 | | | | 14,433 | |
| Total assets | | | 30,934,104 | | | | 15,294,134 | | | | 7,968,898 | |
| LIABILITIES: | | | | | | | | | | | | |
| Payable for securities purchased | | | — | | | | 111,625 | | | | 95,161 | |
| Payable for Fund shares repurchased | | | 39,504 | | | | — | | | | — | |
| Payable to Advisor and Distributor | | | 13,952 | | | | 501 | | | | — | |
| Payable to directors | | | 226 | | | | 40 | | | | 80 | |
| Accrued expenses and other liabilities | | | 31,527 | | | | 24,666 | | | | 24,846 | |
| Total liabilities | | | 85,209 | | | | 136,832 | | | | 120,087 | |
| NET ASSETS | | $ | 30,848,895 | | | $ | 15,157,302 | | | $ | 7,848,811 | |
| NET ASSETS CONSIST OF: | | | | | | | | | | | | |
| Capital stock | | $ | 24,865,456 | | | $ | 15,696,193 | | | $ | 7,784,095 | |
| Accumulated undistributed | | | | | | | | | | | | |
| net investment income (loss) | | | 4,079 | | | | (3,823 | ) | | | (1,827 | ) |
| Accumulated net realized loss on investments | | | | | | | | | | | | |
| sold and foreign currency translations | | | (344,436 | ) | | | (183,509 | ) | | | (117,306 | ) |
| Net unrealized appreciation/depreciation on: | | | | | | | | | | | | |
| Investments | | | 6,323,796 | | | | (351,444 | ) | | | 183,738 | |
| Foreign currency and other assets | | | | | | | | | | | | |
| denominated in foreign currency | | | — | | | | (115 | ) | | | 111 | |
| NET ASSETS | | $ | 30,848,895 | | | $ | 15,157,302 | | | $ | 7,848,811 | |
| INSTITUTIONAL CLASS SHARES | | | | | | | | | | | | |
| Net Assets | | $ | 28,224,772 | | | $ | 14,846,274 | | | $ | 7,647,384 | |
| Shares outstanding ($0.01 par value, | | | | | | | | | | | | |
| unlimited shares authorized) | | | 1,903,267 | | | | 1,551,673 | | | | 757,695 | |
| Net asset value, offering and | | | | | | | | | | | | |
| redemption price per share | | $ | 14.83 | | | $ | 9.57 | | | $ | 10.09 | |
| INVESTOR CLASS SHARES | | | | | | | | | | | | |
| Net Assets | | $ | 2,624,123 | | | $ | 311,028 | | | $ | 201,427 | |
| Shares outstanding ($0.01 par value, | | | | | | | | | | | | |
| unlimited shares authorized) | | | 177,163 | | | | 32,548 | | | | 19,989 | |
| Net asset value, offering and | | | | | | | | | | | | |
| redemption price per share | | $ | 14.81 | | | $ | 9.56 | | | $ | 10.08 | |
The accompanying notes are an integral part of these financial statements.
Statements of Operations
Year Ended December 31, 2016
| | | | | | | | | Baird | |
| | | Baird | | | Baird | | | Small/Mid | |
| | | LargeCap | | | MidCap | | | Cap Value | |
| | | Fund | | | Fund | | | Fund | |
| INVESTMENT INCOME: | | | | | | | | | |
| Dividends (net of foreign taxes withheld of | | | | | | | | | |
| $0, $14,938 and $0, respectively) | | $ | 819,558 | | | $ | 8,383,983 | | | $ | 171,280 | |
| Interest | | | 4,920 | | | | 162,568 | | | | 1,852 | |
| Other income | | | 270 | | | | 9,633 | | | | 71 | |
| Total investment income | | | 824,748 | | | | 8,556,184 | | | | 173,203 | |
| EXPENSES: | | | | | | | | | | | | |
| Investment advisory fees | | | 237,238 | | | | 9,422,877 | | | | 65,277 | |
| Administration fees | | | 7,372 | | | | 88,987 | | | | 6,612 | |
| Shareholder servicing fees | | | 16,740 | | | | 555,062 | | | | 6,812 | |
| Fund accounting fees | | | 13,301 | | | | 57,265 | | | | 14,302 | |
| Professional fees | | | 35,191 | | | | 33,466 | | | | 31,685 | |
| Federal and state registration | | | 43,080 | | | | 65,221 | | | | 52,111 | |
| Directors fees | | | 47,987 | | | | 47,712 | | | | 46,104 | |
| Custody fees | | | 6,451 | | | | 23,219 | | | | 5,856 | |
| Reports to shareholders | | | 4,117 | | | | 54,124 | | | | 4,574 | |
| Miscellaneous expenses | | | 508 | | | | 2,456 | | | | 508 | |
| Distribution expense – Investor Class Shares (Note 8) | | | 1,520 | | | | 352,484 | | | | 73 | |
| Total expenses | | | 413,505 | | | | 10,702,873 | | | | 233,914 | |
| Fee waiver by Advisor (Note 5) | | | (138,150 | ) | | | — | | | | (156,332 | ) |
| Net expenses | | | 275,355 | | | | 10,702,873 | | | | 77,582 | |
| NET INVESTMENT INCOME (LOSS) | | | 549,393 | | | | (2,146,689 | ) | | | 95,621 | |
| | | | | | | | | | | | | |
| REALIZED AND UNREALIZED | | | | | | | | | | | | |
| GAIN (LOSS) ON INVESTMENTS: | | | | | | | | | | | | |
| Net realized gain (loss) on investments | | | 12,664 | | | | (20,374,537 | ) | | | (404,287 | ) |
| Net realized loss on foreign currency translations | | | (6 | ) | | | — | | | | — | |
| Change in unrealized appreciation on investments | | | 4,113,578 | | | | 85,885,944 | | | | 1,204,570 | |
| Net realized and unrealized gain on investments | | | 4,126,236 | | | | 65,511,407 | | | | 800,283 | |
| NET INCREASE IN NET ASSETS | | | | | | | | | | | | |
| RESULTING FROM OPERATIONS | | $ | 4,675,629 | | | $ | 63,364,718 | | | $ | 895,904 | |
The accompanying notes are an integral part of these financial statements.
Statements of Operations
Year Ended December 31, 2016
| | | Baird | | | Chautauqua | | | Chautauqua | |
| | | SmallCap | | | International | | | Global | |
| | | Value Fund | | | Growth Fund^ | | | Growth Fund^ | |
| INVESTMENT INCOME: | | | | | | | | | |
| Dividends (of foreign taxes withheld | | | | | | | | | |
| of $0, $5,359 and $1,888, respectively) | | $ | 610,302 | | | $ | 68,607 | | | $ | 29,092 | |
| Interest | | | 7,618 | | | | 1,643 | | | | 705 | |
| Other income | | | 1,112 | | | | 92 | | | | 20 | |
| Total investment income | | | 619,032 | | | | 70,342 | | | | 29,817 | |
| EXPENSES: | | | | | | | | | | | | |
| Investment advisory fees | | | 227,641 | | | | 55,799 | | | | 30,276 | |
| Administration fees | | | 4,762 | | | | 1,906 | | | | 1,864 | |
| Shareholder servicing fees | | | 15,656 | | | | 11,305 | | | | 10,469 | |
| Fund accounting fees | | | 13,469 | | | | 9,850 | | | | 9,758 | |
| Professional fees | | | 28,957 | | | | 15,304 | | | | 15,204 | |
| Federal and state registration | | | 38,854 | | | | 29,402 | | | | 30,467 | |
| Directors fees | | | 47,614 | | | | 23,304 | | | | 23,344 | |
| Custody fees | | | 4,672 | | | | 13,900 | | | | 15,038 | |
| Reports to shareholders | | | 2,050 | | | | 580 | | | | 1,180 | |
| Miscellaneous expenses | | | 447 | | | | 361 | | | | 469 | |
| Interest Expense (Note 7) | | | — | | | | — | | | | 38 | |
| Distribution expense – Investor Class Shares (Note 8) | | | 5,430 | | | | 211 | | | | 269 | |
| Total expenses | | | 389,552 | | | | 161,922 | | | | 138,376 | |
| Fee waiver by Advisor (Note 5) | | | (116,311 | ) | | | (95,476 | ) | | | (102,142 | ) |
| Net expenses | | | 273,241 | | | | 66,446 | | | | 36,234 | |
| NET INVESTMENT INCOME (LOSS) | | | 345,791 | | | | 3,896 | | | | (6,417 | ) |
| | | | | | | | | | | | | |
| REALIZED AND UNREALIZED | | | | | | | | | | | | |
| GAIN (LOSS) ON INVESTMENTS: | | | | | | | | | | | | |
| Net realized gain (loss) on investments | | | 406,537 | | | | (206,808 | ) | | | (126,573 | ) |
| Net realized gain on foreign currency translations | | | — | | | | 333 | | | | 47 | |
| Change in unrealized appreciation/depreciation | | | | | | | | | | | | |
| on investments | | | 3,244,223 | | | | (351,559 | ) | | | 183,849 | |
| Net realized and unrealized gain (loss) on investments | | | 3,650,760 | | | | (558,034 | ) | | | 57,323 | |
| NET INCREASE (DECREASE) IN NET | | | | | | | | | | | | |
| ASSETS RESULTING FROM OPERATIONS | | $ | 3,996,551 | | | $ | (554,138 | ) | | $ | 50,906 | |
| ^ | Inception of the Chautauqua International Growth Fund and the Chautauqua Global Growth Fund was the close of business on April 15, 2016. |
The accompanying notes are an integral part of these financial statements.
Statement of Changes in Net Assets
Baird LargeCap Fund
| | | Year Ended | | | Year Ended | |
| | | December 31, 2016 | | | December 31, 2015 | |
| OPERATIONS: | | | | | | |
| Net investment income | | $ | 549,393 | | | $ | 467,691 | |
| Net realized gain on investments | | | 12,664 | | | | 1,215,765 | |
| Net realized loss on foreign currency translations | | | (6 | ) | | | — | |
| Change in unrealized appreciation/depreciation | | | | | | | | |
| on investments | | | 4,113,578 | | | | (3,284,296 | ) |
| Net increase (decrease) in net | | | | | | | | |
| assets resulting from operations | | | 4,675,629 | | | | (1,600,840 | ) |
| | | | | | | | | |
| CAPITAL SHARE TRANSACTIONS: | | | | | | | | |
| Proceeds from shares sold | | | 4,634,043 | | | | 7,717,424 | |
| Shares issued to holders in reinvestment of distributions | | | 560,003 | | | | 2,431,224 | |
| Cost of shares redeemed | | | (6,000,917 | ) | | | (10,040,992 | ) |
| Net increase (decrease) in net assets resulting | | | | | | | | |
| from capital share transactions | | | (806,871 | ) | | | 107,656 | |
| | | | | | | | | |
| DISTRIBUTIONS TO | | | | | | | | |
| INSTITUTIONAL CLASS SHAREHOLDERS: | | | | | | | | |
| From net investment income | | | (555,559 | ) | | | (469,154 | ) |
| From net realized gains | | | — | | | | (1,918,299 | ) |
| Total Distributions | | | (555,559 | ) | | | (2,387,453 | ) |
| | | | | | | | | |
| DISTRIBUTIONS TO | | | | | | | | |
| INVESTOR CLASS SHAREHOLDERS: | | | | | | | | |
| From net investment income | | | (5,808 | ) | | | (6,047 | ) |
| From net realized gains | | | — | | | | (37,847 | ) |
| Total Distributions | | | (5,808 | ) | | | (43,894 | ) |
| | | | | | | | | |
| TOTAL INCREASE (DECREASE) IN NET ASSETS | | | 3,307,391 | | | | (3,924,531 | ) |
| | | | | | | | | |
| NET ASSETS: | | | | | | | | |
| Beginning of year | | | 36,250,971 | | | | 40,175,502 | |
| End of year (including distributions in excess of net | | | | | | | | |
| investment income of $1,961 and $0, respectively) | | $ | 39,558,362 | | | $ | 36,250,971 | |
The accompanying notes are an integral part of these financial statements.
Statement of Changes in Net Assets
Baird MidCap Fund
| | | Year Ended | | | Year Ended | |
| | | December 31, 2016 | | | December 31, 2015 | |
| OPERATIONS: | | | | | | |
| Net investment loss | | $ | (2,146,689 | ) | | $ | (2,768,264 | ) |
| Net realized loss on investments | | | (20,374,537 | ) | | | (27,744,335 | ) |
| Change in unrealized appreciation/depreciation | | | | | | | | |
| on investments | | | 85,885,944 | | | | (22,515,811 | ) |
| Net increase (decrease) in net | | | | | | | | |
| assets resulting from operations | | | 63,364,718 | | | | (53,028,410 | ) |
| | | | | | | | | |
| CAPITAL SHARE TRANSACTIONS: | | | | | | | | |
| Proceeds from shares sold | | | 439,643,509 | | | | 449,697,294 | |
| Shares issued to holders in reinvestment of distributions | | | — | | | | 1,614,082 | |
| Cost of shares redeemed | | | (479,905,649 | ) | | | (293,658,295 | ) |
| Net increase (decrease) in net assets resulting | | | | | | | | |
| from capital share transactions | | | (40,262,140 | ) | | | 157,653,081 | |
| | | | | | | | | |
| DISTRIBUTIONS TO | | | | | | | | |
| INSTITUTIONAL CLASS SHAREHOLDERS: | | | | | | | | |
| From net realized gains | | | — | | | | (1,484,630 | ) |
| Total Distributions | | | — | | | | (1,484,630 | ) |
| | | | | | | | | |
| DISTRIBUTIONS TO | | | | | | | | |
| INVESTOR CLASS SHAREHOLDERS: | | | | | | | | |
| From net realized gains | | | — | | | | (278,941 | ) |
| Total Distributions | | | — | | | | (278,941 | ) |
| | | | | | | | | |
| TOTAL INCREASE IN NET ASSETS | | | 23,102,578 | | | | 102,861,100 | |
| | | | | | | | | |
| NET ASSETS: | | | | | | | | |
| Beginning of year | | | 1,219,125,331 | | | | 1,116,264,231 | |
| End of year | | $ | 1,242,227,909 | | | $ | 1,219,125,331 | |
The accompanying notes are an integral part of these financial statements.
Statement of Changes in Net Assets
Baird Small/Mid Cap Value Fund
| | | | | | November 30, 2015^ | |
| | | Year Ended | | | through | |
| | | December 31, 2016 | | | December 31, 2015 | |
| OPERATIONS: | | | | | | |
| Net investment income | | $ | 95,621 | | | $ | 7,703 | |
| Net realized loss on investments | | | (404,287 | ) | | | (39,584 | ) |
| Change in unrealized appreciation/depreciation | | | | | | | | |
| on investments | | | 1,204,570 | | | | (194,702 | ) |
| Net increase (decrease) in net | | | | | | | | |
| assets resulting from operations | | | 895,904 | | | | (226,583 | ) |
| | | | | | | | | |
| CAPITAL SHARE TRANSACTIONS: | | | | | | | | |
| Proceeds from shares sold | | | 6,833,697 | | | | 4,960,000 | |
| Shares issued to holders in reinvestment of distributions | | | 79,329 | | | | 7,184 | |
| Cost of shares redeemed | | | (485,000 | ) | | | — | |
| Net increase in net assets resulting | | | | | | | | |
| from capital share transactions | | | 6,428,026 | | | | 4,967,184 | |
| | | | | | | | | |
| DISTRIBUTIONS TO | | | | | | | | |
| INSTITUTIONAL CLASS SHAREHOLDERS: | | | | | | | | |
| From net investment income | | | (90,044 | ) | | | (7,158 | ) |
| Total Distributions | | | (90,044 | ) | | | (7,158 | ) |
| | | | | | | | | |
| DISTRIBUTIONS TO | | | | | | | | |
| INVESTOR CLASS SHAREHOLDERS: | | | | | | | | |
| From net investment income | | | (325 | ) | | | (26 | ) |
| Total Distributions | | | (325 | ) | | | (26 | ) |
| | | | | | | | | |
| TOTAL INCREASE IN NET ASSETS | | | 7,233,561 | | | | 4,733,417 | |
| | | | | | | | | |
| NET ASSETS: | | | | | | | | |
| Beginning of period | | | 4,733,417 | | | | — | |
| End of period (including accumulated undistributed net | | | | | | | | |
| investment income of $2,542 and $289, respectively) | | $ | 11,966,978 | | | $ | 4,733,417 | |
| ^ | Inception was the close of business on November 30, 2015. |
The accompanying notes are an integral part of these financial statements.
Statement of Changes in Net Assets
Baird SmallCap Value Fund
| | | Year Ended | | | Year Ended | |
| | | December 31, 2016 | | | December 31, 2015 | |
| OPERATIONS: | | | | | | |
| Net investment income | | $ | 345,791 | | | $ | 186,109 | |
| Net realized gain (loss) on investments | | | 406,537 | | | | (676,064 | ) |
| Change in unrealized appreciation/depreciation | | | | | | | | |
| on investments | | | 3,244,223 | | | | (826,483 | ) |
| Net increase (decrease) in net | | | | | | | | |
| assets resulting from operations | | | 3,996,551 | | | | (1,316,438 | ) |
| | | | | | | | | |
| CAPITAL SHARE TRANSACTIONS: | | | | | | | | |
| Proceeds from shares sold | | | 5,035,886 | | | | 5,084,558 | |
| Shares issued to holders in reinvestment of distributions | | | 287,392 | | | | 133,162 | |
| Cost of shares redeemed | | | (3,257,446 | ) | | | (4,171,336 | ) |
| Net increase in net assets resulting | | | | | | | | |
| from capital share transactions | | | 2,065,832 | | | | 1,046,384 | |
| | | | | | | | | |
| DISTRIBUTIONS TO | | | | | | | | |
| INSTITUTIONAL CLASS SHAREHOLDERS: | | | | | | | | |
| From net investment income | | | (321,015 | ) | | | (148,738 | ) |
| Total Distributions | | | (321,015 | ) | | | (148,738 | ) |
| | | | | | | | | |
| DISTRIBUTIONS TO | | | | | | | | |
| INVESTOR CLASS SHAREHOLDERS: | | | | | | | | |
| From net investment income | | | (19,041 | ) | | | (8,071 | ) |
| Total Distributions | | | (19,041 | ) | | | (8,071 | ) |
| | | | | | | | | |
| TOTAL INCREASE (DECREASE) IN NET ASSETS | | | 5,722,327 | | | | (426,863 | ) |
| | | | | | | | | |
| NET ASSETS: | | | | | | | | |
| Beginning of year | | | 25,126,568 | | | | 25,553,431 | |
| End of year (including accumulated undistributed net | | | | | | | | |
| investment income of $4,079 and $7,487, respectively) | | $ | 30,848,895 | | | $ | 25,126,568 | |
The accompanying notes are an integral part of these financial statements.
Statement of Changes in Net Assets
Chautauqua International Growth Fund
| | | April 15, 2016^ | |
| | | through | |
| | | December 31, 2016 | |
| OPERATIONS: | | | |
| Net investment income | | $ | 3,896 | |
| Net realized loss on investments | | | (206,808 | ) |
| Net realized gain on foreign currency translations | | | 333 | |
| Change in unrealized depreciation on investments | | | | |
| and foreign currency translations | | | (351,559 | ) |
| Net decrease in net assets resulting from operations | | | (554,138 | ) |
| | | | | |
| CAPITAL SHARE TRANSACTIONS: | | | | |
| Proceeds from shares sold | | | 16,146,048 | |
| Cost of shares redeemed | | | (436,323 | ) |
| Redemption Fees | | | 1,715 | |
| Net increase in net assets resulting from capital share transactions | | | 15,711,440 | |
| | | | | |
| TOTAL INCREASE IN NET ASSETS | | | 15,157,302 | |
| | | | | |
| NET ASSETS: | | | | |
| Beginning of period | | | — | |
| End of period (including accumulated net investment loss of $(3,823)) | | $ | 15,157,302 | |
| ^ | Inception was the close of business on April 15, 2016. |
The accompanying notes are an integral part of these financial statements.
Statement of Changes in Net Assets
Chautauqua Global Growth Fund
| | | April 15, 2016^ | |
| | | through | |
| | | December 31, 2016 | |
| OPERATIONS: | | | |
| Net investment loss | | $ | (6,417 | ) |
| Net realized loss on investments | | | (126,573 | ) |
| Net realized gain on foreign currency translations | | | 47 | |
| Change in unrealized depreciation on investments | | | | |
| and foreign currency translations | | | 183,849 | |
| Net increase in net assets resulting from operations | | | 50,906 | |
| | | | | |
| CAPITAL SHARE TRANSACTIONS: | | | | |
| Proceeds from shares sold | | | 8,917,355 | |
| Cost of shares redeemed | | | (1,119,965 | ) |
| Redemption Fees | | | 515 | |
| Net increase in net assets resulting from capital share transactions | | | 7,797,905 | |
| | | | | |
| TOTAL INCREASE IN NET ASSETS | | | 7,848,811 | |
| | | | | |
| NET ASSETS: | | | | |
| Beginning of period | | | — | |
| End of period (including accumulated net investment loss of $(1,827)) | | $ | 7,848,811 | |
| ^ | Inception was the close of business on April 15, 2016. |
The accompanying notes are an integral part of these financial statements.
Financial Highlights
Baird LargeCap Fund – Institutional Class
| | | Year Ended December 31, | |
| | | 2016(1) | | | 2015 | | | 2014 | | | 2013(1) | | | 2012 | |
| Per Share Data: | | | | | | | | | | | | | | | |
| Net asset value, beginning of year | | $ | 8.01 | | | $ | 8.93 | | | $ | 7.92 | | | $ | 9.86 | | | $ | 8.71 | |
| Income from | | | | | | | | | | | | | | | | | | | | |
| investment operations: | | | | | | | | | | | | | | | | | | | | |
Net investment income(2) | | | 0.12 | | | | 0.10 | | | | 0.09 | | | | 0.03 | | | | 0.04 | |
| Net realized and unrealized | | | | | | | | | | | | | | | | | | | | |
| gains (losses) on investments | | | 0.92 | | | | (0.45 | ) | | | 1.10 | | | | 3.16 | | | | 1.15 | |
| Total from investment operations | | | 1.04 | | | | (0.35 | ) | | | 1.19 | | | | 3.19 | | | | 1.19 | |
| Less distributions: | | | | | | | | | | | | | | | | | | | | |
| Distributions from | | | | | | | | | | | | | | | | | | | | |
| net investment income | | | (0.13 | ) | | | (0.11 | ) | | | (0.08 | ) | | | (0.04 | ) | | | (0.04 | ) |
| Distributions from | | | | | | | | | | | | | | | | | | | | |
| net realized gains | | | — | | | | (0.46 | ) | | | (0.10 | ) | | | (5.09 | ) | | | — | |
| Total distributions | | | (0.13 | ) | | | (0.57 | ) | | | (0.18 | ) | | | (5.13 | ) | | | (0.04 | ) |
| Net asset value, end of year | | $ | 8.92 | | | $ | 8.01 | | | $ | 8.93 | | | $ | 7.92 | | | $ | 9.86 | |
| | | | | | | | | | | | | | | | | | | | | |
| Total return | | | 12.94 | % | | | (3.94 | )% | | | 15.09 | % | | | 32.68 | % | | | 13.62 | % |
| | | | | | | | | | | | | | | | | | | | | |
| Supplemental data and ratios: | | | | | | | | | | | | | | | | | | | | |
| Net assets, end of year (millions) | | $ | 38.8 | | | $ | 35.6 | | | $ | 39.0 | | | $ | 28.0 | | | $ | 24.0 | |
| Ratio of expenses to average net assets | | | 0.75 | % | | | 0.75 | % | | | 0.75 | % | | | 0.75 | % | | | 0.75 | % |
| Ratio of expenses to average | | | | | | | | | | | | | | | | | | | | |
| net assets (before waivers) | | | 1.13 | % | | | 1.11 | % | | | 1.17 | % | | | 1.24 | % | | | 1.34 | % |
| Ratio of net investment income | | | | | | | | | | | | | | | | | | | | |
| to average net assets | | | 1.51 | % | | | 1.18 | % | | | 1.08 | % | | | 0.28 | % | | | 0.37 | % |
| Ratio of net investment income (loss) | | | | | | | | | | | | | | | | | | | | |
| to average net assets (before waivers) | | | 1.13 | % | | | 0.82 | % | | | 0.66 | % | | | (0.21 | )% | | | (0.22 | )% |
Portfolio turnover rate(3) | | | 85.0 | % | | | 86.5 | % | | | 88.2 | % | | | 127.7 | % | | | 39.2 | % |
| (1) | Effective April 30, 2016, L2 Asset Management, LLC (“L2”) became the Fund’s subadvisor. L2 replaced Baird Kailash Group, LLC, which was the Fund’s subadvisor from December 23, 2013 until April 30, 2016. The Fund was managed by the Fund’s Advisor from the Fund’s inception date until December 23, 2013. |
| (2) | Calculated using average shares outstanding during the year. |
| (3) | Portfolio turnover is calculated on the basis of the Fund as a whole without distinguishing between the classes of shares issued. The Baird LargeCap Fund’s portfolio turnover rate in 2013 was higher than previous years primarily due to the implementation of a new investment strategy for the Fund by Baird Kailash Group, LLC, the Fund’s then-existing subadviser. |
The accompanying notes are an integral part of these financial statements.
Financial Highlights
Baird LargeCap Fund – Investor Class
| | | Year Ended December 31, | |
| | | 2016(1) | | | 2015 | | | 2014 | | | 2013(1) | | | 2012 | |
| Per Share Data: | | | | | | | | | | | | | | | |
| Net asset value, beginning of year | | $ | 7.97 | | | $ | 8.87 | | | $ | 7.87 | | | $ | 9.82 | | | $ | 8.68 | |
| Income from | | | | | | | | | | | | | | | | | | | | |
| investment operations: | | | | | | | | | | | | | | | | | | | | |
Net investment income(2) | | | 0.10 | | | | 0.08 | | | | 0.05 | | | | 0.00 | (3) | | | 0.01 | |
| Net realized and unrealized | | | | | | | | | | | | | | | | | | | | |
| gains (losses) on investments | | | 0.91 | | | | (0.45 | ) | | | 1.12 | | | | 3.14 | | | | 1.15 | |
| Total from investment operations | | | 1.01 | | | | (0.37 | ) | | | 1.17 | | | | 3.14 | | | | 1.16 | |
| Less distributions: | | | | | | | | | | | | | | | | | | | | |
| Distributions from | | | | | | | | | | | | | | | | | | | | |
| net investment income | | | (0.07 | ) | | | (0.07 | ) | | | (0.07 | ) | | | — | | | | (0.02 | ) |
| Distributions from | | | | | | | | | | | | | | | | | | | | |
| net realized gains | | | — | | | | (0.46 | ) | | | (0.10 | ) | | | (5.09 | ) | | | — | |
| Total distributions | | | (0.07 | ) | | | (0.53 | ) | | | (0.17 | ) | | | (5.09 | ) | | | (0.02 | ) |
| Net asset value, end of year | | $ | 8.91 | | | $ | 7.97 | | | $ | 8.87 | | | $ | 7.87 | | | $ | 9.82 | |
| | | | | | | | | | | | | | | | | | | | | |
| Total return | | | 12.67 | % | | | (4.18 | )% | | | 14.89 | % | | | 32.34 | % | | | 13.32 | % |
| | | | | | | | | | | | | | | | | | | | | |
| Supplemental data and ratios: | | | | | | | | | | | | | | | | | | | | |
| Net assets, end of year (millions) | | $ | 0.7 | | | $ | 0.6 | | | $ | 1.2 | | | $ | 0.2 | | | $ | 0.4 | |
| Ratio of expenses to average net assets | | | 1.00 | % | | | 1.00 | % | | | 1.00 | % | | | 1.00 | % | | | 1.00 | % |
| Ratio of expenses to average | | | | | | | | | | | | | | | | | | | | |
| net assets (before waivers) | | | 1.38 | % | | | 1.36 | % | | | 1.42 | % | | | 1.49 | % | | | 1.59 | % |
| Ratio of net investment income | | | | | | | | | | | | | | | | | | | | |
| to average net assets | | | 1.26 | % | | | 0.93 | % | | | 0.83 | % | | | 0.03 | % | | | 0.12 | % |
| Ratio of net investment income (loss) | | | | | | | | | | | | | | | | | | | | |
| to average net assets (before waivers) | | | 0.88 | % | | | 0.57 | % | | | 0.41 | % | | | (0.46 | )% | | | (0.47 | )% |
Portfolio turnover rate(4) | | | 85.0 | % | | | 86.5 | % | | | 88.2 | % | | | 127.7 | % | | | 39.2 | % |
| (1) | Effective April 30, 2016, L2 Asset Management, LLC (“L2”) became the Fund’s subadvisor. L2 replaced Baird Kailash Group, LLC, which was the Fund’s subadvisor from December 23, 2013 until April 30, 2016. The Fund was managed by the Fund’s Advisor from the Fund’s inception date until December 23, 2013. |
| (2) | Calculated using average shares outstanding during the year. |
| (3) | Amount is less than $0.005. |
| (4) | Portfolio turnover is calculated on the basis of the Fund as a whole without distinguishing between the classes of shares issued. The Baird LargeCap Fund’s portfolio turnover rate in 2013 was higher than previous years primarily due to the implementation of a new investment strategy for the Fund by Baird Kailash Group, LLC, the Fund’s then-existing subadviser. |
The accompanying notes are an integral part of these financial statements.
Financial Highlights
Baird MidCap Fund – Institutional Class
| | | Year Ended December 31, | |
| | | 2016 | | | 2015 | | | 2014 | | | 2013 | | | 2012 | |
| Per Share Data: | | | | | | | | | | | | | | | |
| Net asset value, beginning of year | | $ | 14.99 | | | $ | 15.57 | | | $ | 15.00 | | | $ | 11.52 | | | $ | 9.98 | |
| Income from | | | | | | | | | | | | | | | | | | | | |
| investment operations: | | | | | | | | | | | | | | | | | | | | |
| Net investment income (loss) | | | (0.02 | )(1) | | | (0.03 | )(1) | | | (0.03 | )(1) | | | (0.01 | ) | | | 0.07 | (1) |
| Net realized and unrealized | | | | | | | | | | | | | | | | | | | | |
| gains (losses) on investments | | | 0.83 | | | | (0.53 | ) | | | 0.76 | | | | 3.80 | | | | 1.57 | |
| Total from investment operations | | | 0.81 | | | | (0.56 | ) | | | 0.73 | | | | 3.79 | | | | 1.64 | |
| Less distributions: | | | | | | | | | | | | | | | | | | | | |
| Distributions from | | | | | | | | | | | | | | | | | | | | |
| net investment income | | | — | | | | — | | | | — | | | | — | | | | (0.04 | ) |
| Distributions from | | | | | | | | | | | | | | | | | | | | |
| net realized gains | | | — | | | | (0.02 | ) | | | (0.16 | ) | | | (0.31 | ) | | | (0.06 | ) |
| Total distributions | | | — | | | | (0.02 | ) | | | (0.16 | ) | | | (0.31 | ) | | | (0.10 | ) |
| Net asset value, end of year | | $ | 15.80 | | | $ | 14.99 | | | $ | 15.57 | | | $ | 15.00 | | | $ | 11.52 | |
| | | | | | | | | | | | | | | | | | | | | |
| Total return | | | 5.40 | % | | | (3.59 | )% | | | 4.85 | % | | | 32.90 | % | | | 16.49 | % |
| | | | | | | | | | | | | | | | | | | | | |
| Supplemental data and ratios: | | | | | | | | | | | | | | | | | | | | |
| Net assets, end of year (millions) | | $ | 1,105.1 | | | $ | 1,035.0 | | | $ | 910.9 | | | $ | 286.1 | | | $ | 137.2 | |
| Ratio of expenses to | | | | | | | | | | | | | | | | | | | | |
| average net assets | | | 0.82 | % | | | 0.80 | % | | | 0.85 | % | | | 0.85 | % | | | 0.85 | % |
| Ratio of expenses to average | | | | | | | | | | | | | | | | | | | | |
| net assets (before waivers) | | | 0.82 | % | | | 0.80 | % | | | 0.87 | % | | | 0.87 | % | | | 0.97 | % |
| Ratio of net investment income (loss) | | | | | | | | | | | | | | | | | | | | |
| to average net assets | | | (0.14 | )% | | | (0.18 | )% | | | (0.17 | )% | | | (0.04 | )% | | | 0.65 | % |
| Ratio of net investment income (loss) | | | | | | | | | | | | | | | | | | | | |
| to average net assets (before waivers) | | | (0.14 | )% | | | (0.18 | )% | | | (0.19 | )% | | | (0.06 | )% | | | 0.53 | % |
Portfolio turnover rate(2) | | | 57.2 | % | | | 52.8 | % | | | 37.3 | % | | | 36.3 | % | | | 29.5 | % |
| (1) | Calculated using average shares outstanding during the year. |
| (2) | Portfolio turnover is calculated on the basis of the Fund as a whole without distinguishing between the classes of shares issued. |
The accompanying notes are an integral part of these financial statements.
Financial Highlights
Baird MidCap Fund ��� Investor Class
| | | Year Ended December 31, | |
| | | 2016 | | | 2015 | | | 2014 | | | 2013 | | | 2012 | |
| Per Share Data: | | | | | | | | | | | | | | | |
| Net asset value, beginning of year | | $ | 14.36 | | | $ | 14.96 | | | $ | 14.45 | | | $ | 11.13 | | | $ | 9.66 | |
| Income from | | | | | | | | | | | | | | | | | | | | |
| investment operations: | | | | | | | | | | | | | | | | | | | | |
| Net investment income (loss) | | | (0.06 | )(1) | | | (0.06 | )(1) | | | (0.06 | )(1) | | | (0.03 | ) | | | 0.04 | (1) |
| Net realized and unrealized | | | | | | | | | | | | | | | | | | | | |
| gains (losses) on investments | | | 0.80 | | | | (0.52 | ) | | | 0.73 | | | | 3.66 | | | | 1.52 | |
| Total from investment operations | | | 0.74 | | | | (0.58 | ) | | | 0.67 | | | | 3.63 | | | | 1.56 | |
| Less distributions: | | | | | | | | | | | | | | | | | | | | |
| Distributions from | | | | | | | | | | | | | | | | | | | | |
| net investment income | | | — | | | | — | | | | — | | | | — | | | | (0.03 | ) |
| Distributions from | | | | | | | | | | | | | | | | | | | | |
| net realized gains | | | — | | | | (0.02 | ) | | | (0.16 | ) | | | (0.31 | ) | | | (0.06 | ) |
| Total distributions | | | — | | | | (0.02 | ) | | | (0.16 | ) | | | (0.31 | ) | | | (0.09 | ) |
| Net asset value, end of year | | $ | 15.10 | | | $ | 14.36 | | | $ | 14.96 | | | $ | 14.45 | | | $ | 11.13 | |
| | | | | | | | | | | | | | | | | | | | | |
| Total return | | | 5.08 | % | | | (3.80 | )% | | | 4.62 | % | | | 32.62 | % | | | 16.16 | % |
| | | | | | | | | | | | | | | | | | | | | |
| Supplemental data and ratios: | | | | | | | | | | | | | | | | | | | | |
| Net assets, end of year (millions) | | $ | 137.2 | | | $ | 184.1 | | | $ | 205.4 | | | $ | 143.1 | | | $ | 84.1 | |
| Ratio of expenses to average net assets | | | 1.07 | % | | | 1.05 | % | | | 1.10 | % | | | 1.10 | % | | | 1.10 | % |
| Ratio of expenses to average | | | | | | | | | | | | | | | | | | | | |
| net assets (before waivers) | | | 1.07 | % | | | 1.05 | % | | | 1.12 | % | | | 1.12 | % | | | 1.22 | % |
| Ratio of net investment income (loss) | | | | | | | | | | | | | | | | | | | | |
| to average net assets | | | (0.39 | )% | | | (0.43 | )% | | | (0.42 | )% | | | (0.29 | )% | | | 0.40 | % |
| Ratio of net investment income (loss) | | | | | | | | | | | | | | | | | | | | |
| to average net assets (before waivers) | | | (0.39 | )% | | | (0.43 | )% | | | (0.44 | )% | | | (0.31 | )% | | | 0.28 | % |
Portfolio turnover rate(2) | | | 57.2 | % | | | 52.8 | % | | | 37.3 | % | | | 36.3 | % | | | 29.5 | % |
| (1) | Calculated using average shares outstanding during the year. |
| (2) | Portfolio turnover is calculated on the basis of the Fund as a whole without distinguishing between the classes of shares issued. |
The accompanying notes are an integral part of these financial statements.
Financial Highlights
Baird Small/Mid Cap Value Fund – Institutional Class
| | | | | | November 30, 2015^ | |
| | | Year Ended | | | through | |
| | | December 31, 2016 | | | December 31, 2015 | |
| Per Share Data: | | | | | | |
| Net asset value, beginning of period | | $ | 9.52 | | | $ | 10.00 | |
| Income from investment operations: | | | | | | | | |
Net investment income(1) | | | 0.13 | | | | 0.02 | |
| Net realized and unrealized gains (losses) on investments | | | 0.72 | | | | (0.49 | ) |
| Total from investment operations | | | 0.85 | | | | (0.47 | ) |
| Less distributions: | | | | | | | | |
| Distributions from net investment income | | | (0.08 | ) | | | (0.01 | ) |
| Total distributions | | | (0.08 | ) | | | (0.01 | ) |
| Net asset value, end of period | | $ | 10.29 | | | $ | 9.52 | |
| | | | | | | | | |
| Total return | | | 8.91 | % | | | (4.66 | )%(2) |
| | | | | | | | | |
| Supplemental data and ratios: | | | | | | | | |
| Net assets, end of period (millions) | | $ | 11.9 | | | $ | 4.7 | |
| Ratio of expenses to average net assets | | | 0.95 | % | | | 0.95 | %(3) |
| Ratio of expenses to average net assets (before waivers) | | | 2.86 | % | | | 6.88 | %(3) |
| Ratio of net investment income to average net assets | | | 1.35 | % | | | 1.96 | %(3) |
| Ratio of net investment loss | | | | | | | | |
| to average net assets (before waivers) | | | (0.56 | )% | | | (3.97 | )%(3) |
Portfolio turnover rate(4) | | | 38.3 | % | | | 14.7 | %(2) |
| ^ | Inception date. |
| (1) | Calculated using average shares outstanding during the period. |
| (2) | Not annualized. |
| (3) | Annualized. |
| (4) | Portfolio turnover is calculated on the basis of the Fund as a whole without distinguishing between the classes of shares issued. |
The accompanying notes are an integral part of these financial statements.
Financial Highlights
Baird Small/Mid Cap Value Fund – Investor Class
| | | | | | November 30, 2015^ | |
| | | Year Ended | | | through | |
| | | December 31, 2016 | | | December 31, 2015 | |
| Per Share Data: | | | | | | |
| Net asset value, beginning of period | | $ | 9.52 | | | $ | 10.00 | |
| Income from investment operations: | | | | | | | | |
Net investment income(1) | | | 0.11 | | | | 0.01 | |
| Net realized and unrealized gains (losses) on investments | | | 0.71 | | | | (0.48 | ) |
| Total from investment operations | | | 0.82 | | | | (0.47 | ) |
| Less distributions: | | | | | | | | |
| Distributions from net investment income | | | (0.06 | ) | | | (0.01 | ) |
| Total distributions | | | (0.06 | ) | | | (0.01 | ) |
| Net asset value, end of period | | $ | 10.28 | | | $ | 9.52 | |
| | | | | | | | | |
| Total return | | | 8.64 | % | | | (4.67 | )%(2) |
| | | | | | | | | |
| Supplemental data and ratios: | | | | | | | | |
| Net assets, end of period (thousands) | | $ | 53.2 | | | $ | 19.0 | |
| Ratio of expenses to average net assets | | | 1.20 | % | | | 1.20 | %(3) |
| Ratio of expenses to average net assets (before waivers) | | | 3.11 | % | | | 7.13 | %(3) |
| Ratio of net investment income to average net assets | | | 1.10 | % | | | 1.71 | %(3) |
| Ratio of net investment loss | | | | | | | | |
| to average net assets (before waivers) | | | (0.81 | )% | | | (4.22 | )%(3) |
Portfolio turnover rate(4) | | | 38.3 | % | | | 14.7 | %(2) |
| ^ | Inception date. |
| (1) | Calculated using average shares outstanding during the period. |
| (2) | Not annualized. |
| (3) | Annualized. |
| (4) | Portfolio turnover is calculated on the basis of the Fund as a whole without distinguishing between the classes of shares issued. |
The accompanying notes are an integral part of these financial statements.
Financial Highlights
Baird SmallCap Value Fund – Institutional Class
| | | | | | | | | | | | | | | May 1, 2012^ | |
| | | | | | | | | | | | | | | through | |
| | | Year Ended December 31, | | | December 31, | |
| | | 2016 | | | 2015 | | | 2014 | | | 2013 | | | 2012 | |
| Per Share Data: | | | | | | | | | | | | | | | |
| Net asset value, beginning of period | | $ | 13.03 | | | $ | 13.82 | | | $ | 14.01 | | | $ | 10.20 | | | $ | 10.00 | |
| Income from investment operations: | | | | | | | | | | | | | | | | | | | | |
Net investment income(1) | | | 0.21 | | | | 0.11 | | | | 0.05 | | | | 0.07 | | | | 0.15 | |
| Net realized and unrealized | | | | | | | | | | | | | | | | | | | | |
| gains (losses) on investments | | | 1.76 | | | | (0.82 | ) | | | 0.01 | | | | 3.99 | | | | 0.20 | |
| Total from investment operations | | | 1.97 | | | | (0.71 | ) | | | 0.06 | | | | 4.06 | | | | 0.35 | |
| Less distributions: | | | | | | | | | | | | | | | | | | | | |
| Distributions from | | | | | | | | | | | | | | | | | | | | |
| net investment income | | | (0.17 | ) | | | (0.08 | ) | | | (0.05 | ) | | | (0.05 | ) | | | (0.12 | ) |
| Distributions from net realized gains | | | — | | | | — | | | | (0.20 | ) | | | (0.20 | ) | | | (0.03 | ) |
| Total distributions | | | (0.17 | ) | | | (0.08 | ) | | | (0.25 | ) | | | (0.25 | ) | | | (0.15 | ) |
| Net asset value, end of period | | $ | 14.83 | | | $ | 13.03 | | | $ | 13.82 | | | $ | 14.01 | | | $ | 10.20 | |
| | | | | | | | | | | | | | | | | | | | | |
| Total return | | | 15.11 | % | | | (5.11 | )% | | | 0.42 | % | | | 39.85 | % | | | 3.52 | %(2) |
| | | | | | | | | | | | | | | | | | | | | |
| Supplemental data and ratios: | | | | | | | | | | | | | | | | | | | | |
| Net assets, end of period (millions) | | $ | 28.2 | | | $ | 23.1 | | | $ | 23.5 | | | $ | 19.0 | | | $ | 8.1 | |
| Ratio of expenses to average net assets | | | 1.00 | % | | | 1.00 | % | | | 1.00 | % | | | 1.00 | % | | | 1.00 | %(3) |
| Ratio of expenses to average | | | | | | | | | | | | | | | | | | | | |
| net assets (before waivers) | | | 1.43 | % | | | 1.51 | % | | | 1.55 | % | | | 2.02 | % | | | 3.06 | %(3) |
| Ratio of net investment income | | | | | | | | | | | | | | | | | | | | |
| to average net assets | | | 1.58 | % | | | 0.79 | % | | | 0.36 | % | | | 0.71 | % | | | 2.32 | %(3) |
| Ratio of net investment income (loss) | | | | | | | | | | | | | | | | | | | | |
| to average net assets (before waivers) | | | 1.15 | % | | | 0.28 | % | | | (0.19 | )% | | | (0.31 | )% | | | 0.26 | %(3) |
Portfolio turnover rate(4) | | | 48.9 | % | | | 42.1 | % | | | 41.9 | % | | | 36.9 | % | | | 24.6 | %(2) |
| ^ | Inception date. |
| (1) | Calculated using average shares outstanding during the period. |
| (2) | Not annualized. |
| (3) | Annualized. |
| (4) | Portfolio turnover is calculated on the basis of the Fund as a whole without distinguishing between the classes of shares issued. |
The accompanying notes are an integral part of these financial statements.
Financial Highlights
Baird SmallCap Value Fund – Investor Class
| | | | | | | | | | | | | | | May 1, 2012^ | |
| | | | | | | | | | | | | | | through | |
| | | Year Ended December 31, | | | December 31, | |
| | | 2016 | | | 2015 | | | 2014 | | | 2013 | | | 2012 | |
| Per Share Data: | | | | | | | | | | | | | | | |
| Net asset value, beginning of period | | $ | 12.99 | | | $ | 13.78 | | | $ | 13.98 | | | $ | 10.19 | | | $ | 10.00 | |
| Income from investment operations: | | | | | | | | | | | | | | | | | | | | |
Net investment income(1) | | | 0.18 | | | | 0.07 | | | | 0.02 | | | | 0.04 | | | | 0.14 | |
| Net realized and unrealized | | | | | | | | | | | | | | | | | | | | |
| gains (losses) on investments | | | 1.75 | | | | (0.81 | ) | | | 0.00 | (2) | | | 3.99 | | | | 0.19 | |
| Total from investment operations | | | 1.93 | | | | (0.74 | ) | | | 0.02 | | | | 4.03 | | | | 0.33 | |
| Less distributions: | | | | | | | | | | | | | | | | | | | | |
| Distributions from | | | | | | | | | | | | | | | | | | | | |
| net investment income | | | (0.11 | ) | | | (0.05 | ) | | | (0.02 | ) | | | (0.04 | ) | | | (0.11 | ) |
| Distributions from net realized gains | | | — | | | | — | | | | (0.20 | ) | | | (0.20 | ) | | | (0.03 | ) |
| Total distributions | | | (0.11 | ) | | | (0.05 | ) | | | (0.22 | ) | | | (0.24 | ) | | | (0.14 | ) |
| Net asset value, end of period | | $ | 14.81 | | | $ | 12.99 | | | $ | 13.78 | | | $ | 13.98 | | | $ | 10.19 | |
| | | | | | | | | | | | | | | | | | | | | |
| Total return | | | 14.84 | % | | | (5.37 | )% | | | 0.13 | % | | | 39.58 | % | | | 3.32 | %(3) |
| | | | | | | | | | | | | | | | | | | | | |
| Supplemental data and ratios: | | | | | | | | | | | | | | | | | | | | |
| Net assets, end of period (millions) | | $ | 2.6 | | | $ | 2.0 | | | $ | 2.1 | | | $ | 1.1 | | | $ | 0.2 | |
| Ratio of expenses to average net assets | | | 1.25 | % | | | 1.25 | % | | | 1.25 | % | | | 1.25 | % | | | 1.25 | %(4) |
| Ratio of expenses to average | | | | | | | | | | | | | | | | | | | | |
| net assets (before waivers) | | | 1.68 | % | | | 1.76 | % | | | 1.80 | % | | | 2.27 | % | | | 3.31 | %(4) |
| Ratio of net investment income | | | | | | | | | | | | | | | | | | | | |
| to average net assets | | | 1.33 | % | | | 0.54 | % | | | 0.11 | % | | | 0.46 | % | | | 2.07 | %(4) |
| Ratio of net investment income (loss) | | | | | | | | | | | | | | | | | | | | |
| to average net assets (before waivers) | | | 0.90 | % | | | 0.03 | % | | | (0.44 | )% | | | (0.56 | )% | | | 0.01 | %(4) |
Portfolio turnover rate(5) | | | 48.9 | % | | | 42.1 | % | | | 41.9 | % | | | 36.9 | % | | | 24.6 | %(3) |
| ^ | Inception date. |
| (1) | Calculated using average shares outstanding during the period. |
| (2) | Amount is less than $0.005. |
| (3) | Not annualized. |
| (4) | Annualized. |
| (5) | Portfolio turnover is calculated on the basis of the Fund as a whole without distinguishing between the classes of shares issued. |
The accompanying notes are an integral part of these financial statements.
Financial Highlights
Chautauqua International Growth Fund – Institutional Class
| | | April 15, 2016^ | |
| | | through | |
| | | December 31, 2016 | |
| Per Share Data: | | | |
| Net asset value, beginning of period | | $ | 10.00 | |
| Income from investment operations: | | | | |
| Net investment income | | | 0.00 | (1)(2) |
| Net realized and unrealized loss on investments | | | (0.43 | ) |
| Total from investment operations | | | (0.43 | ) |
| Net asset value, end of period | | $ | 9.57 | |
| | | | | |
| Total return | | | (4.30 | )%(3) |
| | | | | |
| Supplemental data and ratios: | | | | |
| Net assets, end of period (millions) | | $ | 14.8 | |
| Ratio of expenses to average net assets | | | 0.95 | %(4) |
| Ratio of expenses to average net assets (before waivers) | | | 2.32 | %(4) |
| Ratio of net investment income to average net assets | | | 0.06 | %(4) |
| Ratio of net investment loss to average net assets (before waivers) | | | (1.31 | )%(4) |
| Portfolio turnover rate | | | 72.6 | %(3)(5) |
| ^ | Inception date. |
| (1) | Calculated using average shares outstanding during the period. |
| (2) | Amount is less than $0.005. |
| (3) | Not annualized. |
| (4) | Annualized. |
| (5) | Portfolio turnover is calculated on the basis of the Fund as a whole without distinguishing between the classes of shares issued. |
The accompanying notes are an integral part of these financial statements.
Financial Highlights
Chautauqua International Growth Fund – Investor Class
| | | April 15, 2016^ | |
| | | through | |
| | | December 31, 2016 | |
| Per Share Data: | | | |
| Net asset value, beginning of period | | $ | 10.00 | |
| Income from investment operations: | | | | |
| Net investment loss | | | (0.01 | )(1) |
| Net realized and unrealized loss on investments | | | | |
| and foreign currency translations | | | (0.44 | ) |
| Total from investment operations | | | (0.45 | ) |
| Paid in capital from redemption fees | | | 0.01 | |
| Net asset value, end of period | | $ | 9.56 | |
| | | | | |
| Total return | | | (4.40 | )%(2) |
| | | | | |
| Supplemental data and ratios: | | | | |
| Net assets, end of period (millions) | | $ | 0.3 | |
| Ratio of expenses to average net assets | | | 1.20 | %(3) |
| Ratio of expenses to average net assets (before waivers) | | | 2.58 | %(3) |
| Ratio of net investment loss to average net assets | | | (0.19 | )%(3) |
| Ratio of net investment loss to average net assets (before waivers) | | | (1.57 | )%(3) |
| Portfolio turnover rate | | | 72.6 | %(2)(4) |
| ^ | Inception date. |
| (1) | Calculated using average shares outstanding during the period. |
| (2) | Not annualized. |
| (3) | Annualized. |
| (4) | Portfolio turnover is calculated on the basis of the Fund as a whole without distinguishing between the classes of shares issued. |
The accompanying notes are an integral part of these financial statements.
Financial Highlights
Chautauqua Global Growth Fund – Institutional Class
| | | April 15, 2016^ | |
| | | through | |
| | | December 31, 2016 | |
| Per Share Data: | | | |
| Net asset value, beginning of period | | $ | 10.00 | |
| Income from investment operations: | | | | |
| Net investment loss | | | (0.01 | )(1) |
| Net realized and unrealized gain on investments | | | 0.10 | |
| Total from investment operations | | | 0.09 | |
| Net asset value, end of period | | $ | 10.09 | |
| | | | | |
| Total return | | | 0.90 | %(2) |
| | | | | |
| Supplemental data and ratios: | | | | |
| Net assets, end of period (millions) | | $ | 7.6 | |
| Ratio of expenses to average net assets | | | 0.95 | %(3) |
| Ratio of expenses to average net assets (before waivers) | | | 3.65 | %(3) |
| Ratio of net investment loss to average net assets | | | (0.16 | )%(3) |
| Ratio of net investment loss to average net assets (before waivers) | | | (2.86 | )%(3) |
| Portfolio turnover rate | | | 69.4 | %(2)(4) |
| ^ | Inception date. |
| (1) | Calculated using average shares outstanding during the period. |
| (2) | Not annualized. |
| (3) | Annualized. |
| (4) | Portfolio turnover is calculated on the basis of the Fund as a whole without distinguishing between the classes of shares issued. |
The accompanying notes are an integral part of these financial statements.
Financial Highlights
Chautauqua Global Growth Fund – Investor Class
| | | April 15, 2016^ | |
| | | through | |
| | | December 31, 2016 | |
| Per Share Data: | | | |
| Net asset value, beginning of period | | $ | 10.00 | |
| Income from investment operations: | | | | |
| Net investment loss | | | (0.03 | )(1) |
| Net realized and unrealized gain on investments | | | 0.11 | |
| Total from investment operations | | | 0.08 | |
| Net asset value, end of period | | $ | 10.08 | |
| | | | | |
| Total return | | | 0.80 | %(2) |
| | | | | |
| Supplemental data and ratios: | | | | |
| Net assets, end of period (millions) | | $ | 0.2 | |
| Ratio of expenses to average net assets | | | 1.20 | %(3) |
| Ratio of expenses to average net assets (before waivers) | | | 3.90 | %(3) |
| Ratio of net investment loss to average net assets | | | (0.41 | )%(3) |
| Ratio of net investment loss to average net assets (before waivers) | | | (3.11 | )%(3) |
| Portfolio turnover rate | | | 69.4 | %(2)(4) |
| ^ | Inception date. |
| (1) | Calculated using average shares outstanding during the period. |
| (2) | Not annualized. |
| (3) | Annualized. |
| (4) | Portfolio turnover is calculated on the basis of the Fund as a whole without distinguishing between the classes of shares issued. |
The accompanying notes are an integral part of these financial statements.
Notes to the Financial Statements
December 31, 2016
1. Organization
Baird Funds, Inc. (the “Corporation”) was incorporated on June 9, 2000 as a Wisconsin corporation and is registered as an open-end management investment company under the Investment Company Act of 1940, as amended (the “1940 Act”). The accompanying financial statements include the Baird LargeCap Fund, the Baird MidCap Fund, the Baird Small/Mid Cap Value Fund, the Baird SmallCap Value Fund, the Chautauqua International Growth Fund and the Chautauqua Global Growth Fund (each a “Fund” and collectively the “Funds”), six of the fifteen series comprising the Corporation. Pursuant to the 1940 Act, the Funds are “diversified” series of the Corporation. The investment advisor to the Funds is Robert W. Baird & Co. Incorporated (“Baird” or the “Advisor”).
The Baird LargeCap Fund commenced with the sale of both Institutional and Investor Class Shares on September 29, 2000. The Baird MidCap Fund commenced with the sale of both Institutional and Investor Class Shares on December 29, 2000. The Baird Small/Mid Cap Value Fund commenced with the sale of both Institutional and Investor Class Shares on November 30, 2015. The Baird SmallCap Value Fund commenced with the sale of both Institutional and Investor Class Shares to the public on May 1, 2012. The Chautauqua International Growth Fund and the Chautauqua Global Growth Fund commenced with the sale of both Institutional and Investor Class Shares to the public on April 18, 2016. Institutional Class shares are not subject to a distribution and service (12b-1) fee, while Investor Class shares are subject to a distribution and service (12b-1) fee up to 0.25%. See Note 8.
The Baird LargeCap Fund seeks long-term growth of capital through investments in equity securities of large-capitalization companies.
The Baird MidCap Fund seeks long-term growth of capital through investments in equity securities of mid-capitalization companies.
The Baird Small/Mid Cap Value Fund seeks long-term capital appreciation through investments in equity securities of small- to mid-capitalization companies.
The Baird SmallCap Value Fund seeks long-term capital appreciation through investments in equity securities of small-capitalization companies.
The Chautauqua International Growth Fund seeks to provide long-term capital appreciation through investment in equity securities of both U.S. and non-U.S. companies with medium to large market capitalization.
The Chautauqua Global Growth Fund seeks to provide long-term capital appreciation through investment in equity securities of both U.S. and non-U.S. companies with medium to large market capitalization.
On December 31, 2016, shareholders affiliated with the Advisor held 91% of the Institutional Class shares of the Baird LargeCap Fund, 3% of the Institutional Class shares of the Baird MidCap Fund, 53% of the Institutional Class shares of the Baird Small/Mid Cap Value Fund, 53% of the Institutional Class shares of the Baird SmallCap Value Fund, 26% of the Institutional Class shares of the Chautauqua International Growth Fund and 28% of the Institutional Class shares of the Chautauqua Global Growth Fund. These shareholders included the Advisor’s participant-directed retirement and deferred compensation plans and the Baird Foundation.
2. Significant Accounting Policies
The following is a summary of significant accounting policies consistently followed by the Funds in the preparation of their financial statements. These policies are in conformity with accounting principles generally accepted in the United States of America.
| a) | Investment Valuation – Section 2(a)(41) of the 1940 Act, together with the rules and interpretations of the SEC, require the Funds, in computing net asset value, to value their portfolio securities using market quotations when they are “readily available.” When market quotations are not readily available (e.g., because there is no regular market quotation for such securities, the market for such security is limited, the validity of quotations is questionable or, for debt securities, the Funds’ independent pricing service, |
Notes to the Financial Statements
December 31, 2016
| 2. | Significant Accounting Policies (cont.) |
| | does not provide a price), the Board of Directors of the Corporation must value the securities at “fair value determined in good faith.” The Board has delegated such responsibility to the Advisor pursuant to pricing policies and procedures that the Board has adopted and regularly reviews. In general, the “fair value” of a security means the price that would be received to sell a security in an orderly transaction between market participants at the measurement date. |
| | The Funds determine the fair value of their investments and compute their net asset value per share as of the close of regular trading of the New York Stock Exchange (4:00 p.m. EST). |
| | Consistent with Section 2(a)(41) of the 1940 Act, the Funds price their securities as follows: common stocks that are listed on a securities exchange (other than NASDAQ) are valued at the last quoted sale price. Securities traded on NASDAQ are valued at the NASDAQ Official Closing Price. Price information on listed stocks is taken from the exchange where the security is primarily traded. Securities that were not traded on the valuation date, as well as stocks that are not listed on an exchange, including NASDAQ, are valued at the average of the current bid and asked price. Debt securities are valued at their evaluated bid prices as provided by an independent pricing service using valuation methods that are designed to represent fair value, such as matrix pricing and other analytical pricing models, market transactions and dealer quotations. Debt securities purchased with maturities of 60 days or less are valued as described above unless an evaluated price is not available, in which case such security is valued at acquisition cost, plus or minus any amortized discount or premium (“amortized cost”), or, if the Advisor does not believe amortized cost is reflective of the value of the security, the security is priced at fair value as described below. Investments in mutual funds are valued at their stated net asset value. Other assets and securities for which market quotations are not readily available are valued at fair value as determined in good faith by the Advisor in accordance with procedures approved by the Corporation’s Board of Directors. In accordance with such procedures, the Advisor may use broker quotes or prices obtained from alternative independent pricing services or, if broker quotes or prices from alternative pricing services are unavailable or deemed to be unreliable, fair value will be determined by a valuation committee of the Advisor. In determining fair value, the valuation committee takes into account all relevant factors and available information. Consequently, the price of the security used by a Fund to calculate its NAV may differ from quoted or published prices for the same security. Fair value pricing involves subjective judgments and there is no single standard for determining a security’s fair value. As a result, different mutual funds could reasonably arrive at a different fair value for the same security. It is possible that the fair value determined for a security is materially different from the value that could be realized upon the sale of that security or from the values that other mutual funds may determine. In addition, given the volatility and periodic illiquidity experienced in recent years, the prices determined for any individual security on any given day may vary significantly from the amount that can be obtained in an actual sale of that security, and the Funds’ NAV may fluctuate significantly from day to day or from period to period. |
| | The Chautauqua International Growth and Chautauqua Global Growth Funds have retained an independent fair value pricing service to assist in valuing foreign securities in order to adjust for possible changes in value that may occur between the close of the foreign exchange and the time at which the Fund calculates its NAV. The fair value pricing service uses statistical data based on historical performance of securities and markets, and other data in developing factors used to estimate fair value for that day. |
| b) | Foreign Securities – For purposes of these financial statements, foreign securities are defined as securities issued by companies that are organized outside the United States. Investing in securities of foreign companies and foreign governments involves special risks and considerations not typically associated with investing in U.S. companies and the U.S. government. These risks include foreign currency fluctuations and adverse political and economic developments. Moreover, securities of many foreign companies and foreign governments and their markets may be less liquid and their prices more volatile than those of securities of comparable U.S. companies and the U.S. government. Occasionally, events |
Notes to the Financial Statements
December 31, 2016
| 2. | Significant Accounting Policies (cont.) |
| | that affect these values and exchange rates may occur after the close of the exchange on which such securities are traded. If such events materially affect the value of a Fund’s securities, these securities may be valued at their fair value pursuant to procedures adopted by the Board of Directors. |
| c.) | Foreign Currency Translation – Portfolio securities and other assets and liabilities denominated in foreign currencies are translated into U.S. dollar amounts at date of valuation. Purchases and sales of portfolio securities and income items denominated in foreign currencies are translated into U.S. dollar amounts on the respective dates of such transactions. When a Fund purchases or sells a foreign security, it will customarily enter into a foreign exchange contract to minimize foreign exchange risk from the trade date to the settlement date of such transaction. The Chautauqua Funds do not isolate the portion of the results of operations resulting from changes in foreign exchange rates on investments from the fluctuations arising from changes in market prices of securities held. Such fluctuations are included with the net realized and unrealized gain or loss from investments. Net realized gain (loss) on investments and foreign currency translations include those gains and losses arising from the sale of foreign currencies, currency gains or losses realized between the trade and settlement dates on securities transactions, the differences between the amounts of dividends, and foreign withholding taxes recorded on a Fund’s books, and the U.S. dollar equivalent of the amounts actually received or paid. Net unrealized appreciation (depreciation) on investments and foreign currency translation includes changes in the value of assets and liabilities resulting from exchange rates. |
| d) | Income Tax Status – The Funds intend to continue to qualify as regulated investment companies as provided in subchapter M of the Internal Revenue Code and to distribute substantially all of their taxable income to their shareholders in a manner which results in no tax expense to the Funds. Therefore, no federal income or excise tax provision is recorded. |
| | There is no tax liability resulting from unrecognized tax benefits relating to uncertain income tax positions taken or expected to be taken on the tax return for the fiscal year ended December 31, 2016, or for any other tax years which are open for exam. As of December 31, 2016, open tax years include the tax years ended December 31, 2013 through 2016. The Funds are not aware of any tax positions for which it is reasonably possible that the total amounts of unrecognized tax benefits will significantly change in the next 12 months. The Funds recognize interest and penalties, if any, related to unrecognized tax benefits as interest expense and other expense, respectively, in the Statement of Operations. During the period, the Funds did not incur any interest or penalties. |
| e) | Distributions to Shareholders – Dividends from net investment income, if any, are declared and paid annually. Distributions of net realized capital gains, if any, are declared and paid at least annually. The book basis character of distributions may differ from their ultimate characterization for Federal income tax purposes. |
| f) | Allocation of Income and Expenses – Each Fund is charged for those expenses directly attributable to it. Expenses directly attributable to a class of shares, such as Rule 12b-1 distribution fees, are charged to that class of shares. Income, expenses and realized and unrealized gains and losses are allocated to the classes based on their respective net assets. Expenses that are not directly attributable to a Fund are allocated among the Funds in the series in proportion to their assets or are divided equally amongst the Funds. |
| g) | Use of Estimates – The preparation of financial statements in conformity with accounting principles generally accepted in the United States requires management to make estimates and assumptions that affect the reported amounts of assets and liabilities and disclosure of contingent assets and liabilities at the date of the financial statements and the reported amounts of revenues and expenses during the reporting period. Actual results could differ from those estimates. |
| h) | Securities Transactions and Investment Income – Investment and shareholder transactions are recorded on trade date. The Funds determine the gain or loss realized from investment transactions by comparing |
Notes to the Financial Statements
December 31, 2016
| 2. | Significant Accounting Policies (cont.) |
| | the original cost of the security lot sold with the net sales proceeds. Dividend income is recognized on the ex-dividend date net of withholding taxes, if any, and interest income is recognized on an accrual basis. |
| i) | Guarantees and Indemnifications – In the normal course of business, the Funds enter into contracts with service providers that contain general indemnification clauses. The Funds’ maximum exposure under these arrangements is unknown and would involve future claims against the Funds that have not yet occurred. Based on experience, the Funds would expect the risk of loss to be remote. |
| j) | Recent Accounting Pronouncements – In October 2016, the U.S. Securities and Exchange Commission adopted new rules and amended existing rules (together, “final rules”) intended to modernize the reporting and disclosure of information by registered investment companies. In part, the final rules amend Regulation S-X and require standardized, enhanced disclosure about derivatives in investment company financial statements, as well as other amendments. The compliance date for the amendments to Regulation S-X is August 1, 2017. Management is currently evaluating the impact that the adoption of the amendments to Regulation S-X will have on the financial statements and related disclosures. |
| 3. | Capital Share Transactions |
The following table summarizes the capital share transactions of each Fund for the past two fiscal periods:
Baird LargeCap Fund
| Institutional Class Shares | | | | | | | | Investor Class Shares | | | | | | |
| | | Year Ended | | | | | Year Ended | |
| | | December 31, 2016 | | | | | December 31, 2016 | |
| | | Shares | | | Amount | | | | | Shares | | | Amount | |
| Shares sold | | | 561,393 | | | $ | 4,394,392 | | | Shares sold | | | 29,776 | | | $ | 239,651 | |
| Shares issued to | | | | | | | | | | Shares issued to | | | | | | | | |
| shareholders in | | | | | | | | | | shareholders in | | | | | | | | |
| reinvestment | | | | | | | | | | reinvestment | | | | | | | | |
| of dividends | | | 61,211 | | | | 555,182 | | | of dividends | | | 533 | | | | 4,821 | |
| Shares redeemed | | | (718,353 | ) | | | (5,812,429 | ) | | Shares redeemed | | | (23,384 | ) | | | (188,488 | ) |
| Net decrease | | | (95,749 | ) | | $ | (862,855 | ) | | Net increase | | | 6,925 | | | $ | 55,984 | |
| Shares Outstanding: | | | | | | | | | | Shares Outstanding: | | | | | | | | |
| Beginning of year | | | 4,449,336 | | | | | | | Beginning of year | | | 75,481 | | | | | |
| End of year | | | 4,353,587 | | | | | | | End of year | | | 82,406 | | | | | |
| | | | | | | | | | | | | | | | | | | |
| Institutional Class Shares | | | | | | | | | | Investor Class Shares | | | | | | | | |
| | | Year Ended | | | | | Year Ended | |
| | | December 31, 2015 | | | | | December 31, 2015 | |
| | | Shares | | | Amount | | | | | Shares | | | Amount | |
| Shares sold | | | 741,344 | | | $ | 6,555,160 | | | Shares sold | | | 129,900 | | | $ | 1,162,264 | |
| Shares issued to | | | | | | | | | | Shares issued to | | | | | | | | |
| shareholders in | | | | | | | | | | shareholders in | | | | | | | | |
| reinvestment | | | | | | | | | | reinvestment | | | | | | | | |
| of dividends | | | 295,843 | | | | 2,387,452 | | | of dividends | | | 5,451 | | | | 43,772 | |
| Shares redeemed | | | (949,026 | ) | | | (8,371,963 | ) | | Shares redeemed | | | (196,702 | ) | | | (1,669,029 | ) |
| Net increase | | | 88,161 | | | $ | 570,649 | | | Net decrease | | | (61,351 | ) | | $ | (462,993 | ) |
| Shares Outstanding: | | | | | | | | | | Shares Outstanding: | | | | | | | | |
| Beginning of year | | | 4,361,175 | | | | | | | Beginning of year | | | 136,832 | | | | | |
| End of year | | | 4,449,336 | | | | | | | End of year | | | 75,481 | | | | | |
Notes to the Financial Statements
December 31, 2016
3. Capital Share Transactions (cont.)
Baird MidCap Fund
| Institutional Class Shares | | | | | | | | Investor Class Shares | | | | | | |
| | | Year Ended | | | | | Year Ended | |
| | | December 31, 2016 | | | | | December 31, 2016 | |
| | | Shares | | | Amount | | | | | Shares | | | Amount | |
| Shares sold | | | 26,778,042 | | | $ | 402,275,627 | | | Shares sold | | | 2,530,062 | | | $ | 37,367,882 | |
Shares redeemed(1) | | | (25,858,100 | ) | | | (391,750,978 | ) | | Shares redeemed | | | (6,261,572 | ) | | | (88,154,671 | ) |
| Net increase | | | 919,942 | | | $ | 10,524,649 | | | Net decrease | | | (3,731,510 | ) | | $ | (50,786,789 | ) |
| Shares Outstanding: | | | | | | | | | | Shares Outstanding: | | | | | | | | |
| Beginning of year | | | 69,041,053 | | | | | | | Beginning of year | | | 12,817,360 | | | | | |
| End of year | | | 69,960,995 | | | | | | | End of year | | | 9,085,850 | | | | | |
(1) | In the third quarter of 2016, the Baird MidCap Fund satisfied a redemption request made by a large shareholder in the amount of $93,349,181 by distributing the Fund’s portfolio securities in kind to the redeeming shareholder. The realized gain associated with this transaction was $14,618,108. The redemption was effected in accordance with policies and procedures approved by the Board of Directors of the Funds. |
| Institutional Class Shares | | | | | | | | Investor Class Shares | | | | | | |
| | | Year Ended | | | | | Year Ended | |
| | | December 31, 2015 | | | | | December 31, 2015 | |
| | | Shares | | | Amount | | | | | Shares | | | Amount | |
| Shares sold | | | 24,895,673 | | | $ | 397,319,033 | | | Shares sold | | | 3,431,190 | | | $ | 52,378,261 | |
| Shares issued to | | | | | | | | | | Shares issued to | | | | | | | | |
| shareholders in | | | | | | | | | | shareholders in | | | | | | | | |
| reinvestment | | | | | | | | | | reinvestment | | | | | | | | |
| of dividends | | | 88,675 | | | | 1,340,418 | | | of dividends | | | 18,891 | | | | 273,664 | |
| Shares redeemed | | | (14,443,816 | ) | | | (227,556,679 | ) | | Shares redeemed | | | (4,362,243 | ) | | | (66,101,616 | ) |
| Net increase | | | 10,540,532 | | | $ | 171,102,772 | | | Net decrease | | | (912,162 | ) | | $ | (13,449,691 | ) |
| Shares Outstanding: | | | | | | | | | | Shares Outstanding: | | | | | | | | |
| Beginning of year | | | 58,500,521 | | | | | | | Beginning of year | | | 13,729,522 | | | | | |
| End of year | | | 69,041,053 | | | | | | | End of year | | | 12,817,360 | | | | | |
| | | | | | | | | | | | | | | | | | | |
| Baird Small/Mid Cap Value Fund | | | | | | | | | | | | | | | | | | |
| Institutional Class Shares | | | | | | | | | | Investor Class Shares | | | | | | | | |
| | | Year Ended | | | | | Year Ended | |
| | | December 31, 2016 | | | | | December 31, 2016 | |
| | | Shares | | | Amount | | | | | Shares | | | Amount | |
| Shares sold | | | 703,038 | | | $ | 6,800,150 | | | Shares sold | | | 3,475 | | | $ | 33,547 | |
| Shares issued to | | | | | | | | | | Shares issued to | | | | | | | | |
| shareholders in | | | | | | | | | | shareholders in | | | | | | | | |
| reinvestment | | | | | | | | | | reinvestment | | | | | | | | |
| of dividends | | | 7,655 | | | | 79,070 | | | of dividends | | | 25 | | | | 259 | |
| Shares redeemed | | | (48,230 | ) | | | (481,696 | ) | | Shares redeemed | | | (327 | ) | | | (3,304 | ) |
| Net increase | | | 662,463 | | | $ | 6,397,524 | | | Net increase | | | 3,173 | | | $ | 30,502 | |
| Shares Outstanding: | | | | | | | | | | Shares Outstanding: | | | | | | | | |
| Beginning of year | | | 495,306 | | | | | | | Beginning of year | | | 2,003 | | | | | |
| End of year | | | 1,157,769 | | | | | | | End of year | | | 5,176 | | | | | |
Notes to the Financial Statements
December 31, 2016
3. Capital Share Transactions (cont.)
Baird Small/Mid Cap Value Fund (cont.)
| Institutional Class Shares | | | | | | | | Investor Class Shares | | | | | | |
| | | Period Ended | | | | | Period Ended | |
| | | December 31, 2015^ | | | | | December 31, 2015^ | |
| | | Shares | | | Amount | | | | | Shares | | | Amount | |
| Shares sold | | | 494,559 | | | $ | 4,940,000 | | | Shares sold | | | 2,000 | | | $ | 20,000 | |
| Shares issued to | | | | | | | | | | Shares issued to | | | | | | | | |
| shareholders in | | | | | | | | | | shareholders in | | | | | | | | |
| reinvestment | | | | | | | | | | reinvestment | | | | | | | | |
| of dividends | | | 747 | | | | 7,158 | | | of dividends | | | 3 | | | | 26 | |
| Net increase | | | 495,306 | | | $ | 4,947,158 | | | Net increase | | | 2,003 | | | $ | 20,026 | |
| Shares Outstanding: | | | | | | | | | | Shares Outstanding: | | | | | | | | |
| Beginning of period | | | — | | | | | | | Beginning of period | | | — | | | | | |
| End of period | | | 495,306 | | | | | | | End of period | | | 2,003 | | | | | |
| | | | | | | | | | | | | | | | | | | |
| ^ Inception was the close of business on November 30, 2015. | | | | | | | | | | | |
| | | | | | | | | | | | |
| Baird SmallCap Value Fund | | | | | | | | | | | | | | | | | | |
| Institutional Class Shares | | | | | | | | | | Investor Class Shares | | | | | | | | |
| | | Year Ended | | | | | Year Ended | |
| | | December 31, 2016 | | | | | December 31, 2016 | |
| | | Shares | | | Amount | | | | | Shares | | | Amount | |
| Shares sold | | | 343,811 | | | $ | 4,541,684 | | | Shares sold | | | 35,989 | | | $ | 494,202 | |
| Shares issued to | | | | | | | | | | Shares issued to | | | | | | | | |
| shareholders in | | | | | | | | | | shareholders in | | | | | | | | |
| reinvestment | | | | | | | | | | reinvestment | | | | | | | | |
| of dividends | | | 18,682 | | | | 278,550 | | | of dividends | | | 594 | | | | 8,842 | |
| Shares redeemed | | | (234,905 | ) | | | (3,089,099 | ) | | Shares redeemed | | | (12,322 | ) | | | (168,347 | ) |
| Net increase | | | 127,588 | | | $ | 1,731,135 | | | Net increase | | | 24,261 | | | $ | 334,697 | |
| Shares Outstanding: | | | | | | | | | | Shares Outstanding: | | | | | | | | |
| Beginning of year | | | 1,775,679 | | | | | | | Beginning of year | | | 152,902 | | | | | |
| End of year | | | 1,903,267 | | | | | | | End of year | | | 177,163 | | | | | |
| | | | | | | | | | | | | | | | | | | |
| Institutional Class Shares | | | | | | | | | | Investor Class Shares | | | | | | | | |
| | | Year Ended | | | | | Year Ended | |
| | | December 31, 2015 | | | | | December 31, 2015 | |
| | | Shares | | | Amount | | | | | Shares | | | Amount | |
| Shares sold | | | 340,633 | | | $ | 4,606,208 | | | Shares sold | | | 35,000 | | | $ | 478,350 | |
| Shares issued to | | | | | | | | | | Shares issued to | | | | | | | | |
| shareholders in | | | | | | | | | | shareholders in | | | | | | | | |
| reinvestment | | | | | | | | | | reinvestment | | | | | | | | |
| of dividends | | | 9,857 | | | | 129,529 | | | of dividends | | | 277 | | | | 3,633 | |
| Shares redeemed | | | (272,018 | ) | | | (3,706,223 | ) | | Shares redeemed | | | (34,792 | ) | | | (465,113 | ) |
| Net increase | | | 78,472 | | | $ | 1,029,514 | | | Net decrease | | | 485 | | | $ | 16,870 | |
| Shares Outstanding: | | | | | | | | | | Shares Outstanding: | | | | | | | | |
| Beginning of year | | | 1,697,207 | | | | | | | Beginning of year | | | 152,417 | | | | | |
| End of year | | | 1,775,679 | | | | | | | End of year | | | 152,902 | | | | | |
Notes to the Financial Statements
December 31, 2016
3. Capital Share Transactions (cont.)
Chautauqua International Growth Fund^
| Institutional Class Shares | | | | | | | | Investor Class Shares | | | | | | |
| | | Period Ended | | | | | Period Ended | |
| | | December 31, 2016 | | | | | December 31, 2016 | |
| | | Shares | | | Amount | | | | | Shares | | | Amount | |
| Shares sold | | | 1,592,858 | | | $ | 15,788,874 | | | Shares sold | | | 35,224 | | | $ | 357,174 | |
| Shares redeemed | | | (41,185 | ) | | | (410,212 | ) | | Shares redeemed | | | (2,676 | ) | | | (26,111 | ) |
| Redemption fees | | | — | | | | 1,548 | | | Redemption fees | | | — | | | | 167 | |
| Net increase | | | 1,551,673 | | | $ | 15,380,210 | | | Net increase | | | 32,548 | | | $ | 331,230 | |
| Shares Outstanding: | | | | | | | | | | Shares Outstanding: | | | | | | | | |
| Beginning of period | | | — | | | | | | | Beginning of period | | | — | | | | | |
| End of period | | | 1,551,673 | | | | | | | End of period | | | 32,548 | | | | | |
| | | | | | | | | | | | | | | | | | | |
| ^ Inception was the close of business on April 15, 2016. | | | | | | | | | | | |
| | | | | | | | | | | | | | | | | | | |
| Chautauqua Global Growth Fund^ | | | | | | | | | | | | | | | | | | |
| Institutional Class Shares | | | | | | | | | | Investor Class Shares | | | | | | | | |
| | | Period Ended | | | | | Period Ended | |
| | | December 31, 2016 | | | | | December 31, 2016 | |
| | | Shares | | | Amount | | | | | Shares | | | Amount | |
| Shares sold | | | 867,491 | | | $ | 8,702,754 | | | Shares sold | | | 21,505 | | | $ | 214,601 | |
| Shares redeemed | | | (109,796 | ) | | | (1,104,703 | ) | | Shares redeemed | | | (1,516 | ) | | | (15,262 | ) |
| Redemption fees | | | — | | | | 515 | | | Redemption fees | | | — | | | | — | |
| Net increase | | | 757,695 | | | $ | 7,598,566 | | | Net increase | | | 19,989 | | | $ | 199,339 | |
| Shares Outstanding: | | | | | | | | | | Shares Outstanding: | | | | | | | | |
| Beginning of period | | | — | | | | | | | Beginning of period | | | — | | | | | |
| End of period | | | 757,695 | | | | | | | End of period | | | 19,989 | | | | | |
^ Inception was the close of business on April 15, 2016.
4. Investment Transactions and Income Tax Information
During the year ended December 31, 2016, purchases and sales of investment securities (excluding short-term investments) were as follows:
| | | Baird | | | Baird | | | Baird | |
| | | LargeCap | | | MidCap | | | Small/Mid Cap | |
| | | Fund | | | Fund | | | Value Fund | |
| Purchases: | | $ | 30,101,808 | | | $ | 749,347,295 | | | $ | 9,358,920 | |
| Sales: | | $ | 31,510,072 | | | $ | 695,618,070 | | | $ | 2,945,486 | |
| | | | | | | | | | | | | |
| | | Baird | | | Chautauqua | | | Chautauqua | |
| | | SmallCap | | | International | | | Global | |
| | | Value Fund | | | Growth Fund | | | Growth Fund | |
| Purchases: | | $ | 15,076,204 | | | $ | 21,777,906 | | | $ | 11,265,017 | |
| Sales: | | $ | 12,205,004 | | | $ | 7,335,941 | | | $ | 3,910,679 | |
Notes to the Financial Statements
December 31, 2016
4. Investment Transactions and Income Tax Information (cont.)
The Baird LargeCap Fund, Baird MidCap Fund, Baird Small/Mid Cap Value Fund, and Baird SmallCap Value Fund did not purchase or sell U.S. Government securities during the year ended December 31, 2016. The Chautauqua International Growth Fund and Chautauqua Global Growth Fund did not purchase or sell U.S. Government securities during the period April 15, 2016 through December 31, 2016.
At December 31, 2016, accumulated earnings/losses on a tax basis were as follows:
| | | Baird | | | Baird | | | Baird | |
| | | LargeCap | | | MidCap | | | Small/Mid Cap | |
| | | Fund | | | Fund | | | Value Fund | |
| Cost of Investments | | $ | 34,936,191 | | | $ | 1,058,088,437 | | | $ | 10,959,367 | |
| Gross unrealized appreciation | | | 5,434,156 | | | | 218,483,638 | | | | 1,297,429 | |
| Gross unrealized depreciation | | | (817,171 | ) | | | (28,499,187 | ) | | | (289,181 | ) |
| Net unrealized appreciation | | $ | 4,616,985 | | | $ | 189,984,451 | | | $ | 1,008,248 | |
| Undistributed ordinary income | | | 1,961 | | | | — | | | | 2,542 | |
| Undistributed long-term capital gain | | | — | | | | — | | | | — | |
| Total distributable earnings | | $ | 1,961 | | | $ | — | | | $ | 2,542 | |
| Other accumulated losses | | | (269,772 | ) | | | (61,629,145 | ) | | | (439,022 | ) |
| Total accumulated earnings | | $ | 4,349,174 | | | $ | 128,355,306 | | | $ | 571,768 | |
| | | | | | | | | | | | | |
| | | Baird | | | Chautauqua | | | Chautauqua | |
| | | SmallCap | | | International | | | Global | |
| | | Value Fund | | | Growth Fund | | | Growth Fund | |
| Cost of Investments | | $ | 24,560,685 | | | $ | 15,459,231 | | | $ | 7,819,691 | |
| Gross unrealized appreciation | | | 6,609,941 | | | | 397,006 | | | | 458,706 | |
| Gross unrealized depreciation | | | (324,853 | ) | | | (820,483 | ) | | | (376,774 | ) |
| Net unrealized appreciation (depreciation) | | $ | 6,285,088 | | | $ | (423,477 | ) | | $ | 81,932 | |
| Undistributed ordinary income | | | 4,079 | | | | — | | | | — | |
| Undistributed long-term capital gain | | | — | | | | — | | | | — | |
| Total distributable earnings | | $ | 4,079 | | | $ | — | | | $ | — | |
| Other accumulated losses | | | (305,728 | ) | | | (115,414 | ) | | | (17,216 | ) |
| Total accumulated earnings (losses) | | $ | 5,983,439 | | | $ | (538,891 | ) | | $ | 64,716 | |
Undistributed income or net realized gains for financial statement purposes may differ from amounts recognized for federal income tax purposes due to differences in the recognition and characterization of income, expense and capital gain items. The difference between book-basis and tax-basis unrealized appreciation is attributable primarily to the tax deferral of losses on wash sales.
Additionally, U.S. generally accepted accounting principles require that certain components of net assets relating to permanent differences be reclassified between financial and tax reporting. These reclassifications are primarily due to differing treatments for losses deferred due to wash sales, equalization accounting for tax purposes, and non-deductible expenses. These reclassifications have no effect on net assets or net asset value per share. For the year ended December 31, 2016, the following table shows the reclassifications made:
Notes to the Financial Statements
December 31, 2016
4. Investment Transactions and Income Tax Information (cont.)
| | | Undistributed Net | | | Accumulated Net | | | | |
| | | Investment Income/(Loss) | | | Realized Gain/(Loss) | | | Paid In Capital | |
| Baird LargeCap Fund | | $ | 13,935 | | | $ | (14,048 | ) | | $ | 113 | |
| Baird MidCap Fund | | | 2,146,689 | | | | (14,618,108 | ) | | | 12,471,419 | |
| Baird Small/Mid Cap Value Fund | | | (2,999 | ) | | | 2,999 | | | | — | |
| Baird SmallCap Value Fund | | | (9,143 | ) | | | 9,142 | | | | 1 | |
| Chautauqua International | | | | | | | | | | | | |
| Growth Fund | | | (7,719 | ) | | | 22,966 | | | | (15,247 | ) |
| Chautauqua Global Growth Fund | | | 4,590 | | | | 9,220 | | | | (13,810 | ) |
Under the current tax law, capital losses realized after October 31 may be deferred and treated as occurring on the first day of the following fiscal year. For the year ended December 31, 2016, the Chautauqua International Growth and Chautauqua Global Growth Funds elected to defer capital losses occurring between November 1, 2016 and December 31, 2016 in the amount of $3,823 and $1,827, respectively.
To the extent the Funds realize future net capital gains, those gains will be offset by any unused capital loss carryovers. At December 31, 2016, accumulated net realized capital loss carryovers, if any, and the year(s) in which the capital loss carryovers expire were:
| | | Capital Loss | | | Year of |
| | | Carryover | | Character | Expiration |
| Baird LargeCap Fund | | $ | 269,772 | | Short-Term | Indefinitely |
| Baird MidCap Fund | | | 61,629,145 | | Short-Term | Indefinitely |
| Baird Small/Mid Cap Value Fund | | | 439,022 | | Short-Term | Indefinitely |
| Baird SmallCap Value Fund | | | 305,728 | | Short-Term | Indefinitely |
| Chautauqua International Growth Fund | | | 115,414 | | Short-Term | Indefinitely |
| Chautauqua Global Growth Fund | | | 17,216 | | Short-Term | Indefinitely |
During the year ended December 31, 2016, the Funds paid the following distributions:
| | Ordinary Income Dividends | |
| Baird Large Cap Fund | | $ | 561,367 | | |
| Baird Small/ Mid Cap Value Fund | | | 90,369 | | |
| Baird SmallCap Value Fund | | | 340,056 | | |
For the year ended December 31, 2016 the Baird MidCap Fund, Chautauqua International Growth Fund and Chautauqua Global Growth Fund did not pay any distributions.
During the year ended December 31, 2015, the Funds paid the following distributions:
| | Ordinary Income Dividends | | Long – Term Capital Gain |
| Baird LargeCap Fund | | $ | 1,286,082 | | | | $ | 1,145,265 | |
| Baird MidCap Fund | | | 1,763,571 | | | | | — | |
| Baird Small/Mid Cap Value Fund | | | 7,184 | | | | | — | |
| Baird SmallCap Value Fund | | | 156,809 | | | | | — | |
The Funds designated as long-term capital gain dividend, pursuant to Internal Revenue Code Section 852(b)(3), the amount necessary to reduce the earnings and profits of the Funds related to net capital gain to zero for the tax year ended December 31, 2015. To the extent necessary to fully distribute such capital gains, the Baird LargeCap Fund designated earnings and profits distributed to shareholders on the redemption of shares.
Notes to the Financial Statements
December 31, 2016
5. Investment Advisory and Other Agreements
The Funds have entered into Investment Advisory Agreements with Baird for the provision of investment advisory services. Pursuant to the Investment Advisory Agreements, the Advisor is entitled to receive a fee, calculated daily and payable monthly, at the annual rate of 0.65% for the Baird LargeCap Fund, 0.75% for the Baird MidCap Fund, 0.80% for the Baird Small/Mid Cap Value Fund, 0.85% for the Baird SmallCap Value Fund, 0.80% for the Chautauqua International Growth Fund and 0.80% for the Chautauqua Global Growth Fund as applied to the respective Fund’s average daily net assets. Certain officers of the Advisor are also officers of the Funds.
Baird has entered into a Sub-Advisory Agreement with L2 Asset Management, LLC (“L2”), pursuant to which L2 acts as subadvisor to the Baird LargeCap Fund (the “Sub-Advisory Agreement”). Baird is responsible for paying L2 a sub-advisory fee equivalent to a percentage of the net advisory fee received by the Advisor from the Fund which is calculated daily at the annual rate of 0.65% of the average daily net assets of the Fund and paid monthly after giving effect for the expense cap/reimbursement agreement between the Advisor and the Company on behalf of the LargeCap Fund.
The percentage of sub-advisory fee is subject to increase based on the assets managed by the Subadvisor on behalf of the Advisor as follows:
| | Market Value of |
% Net Advisory Fee | Assets Managed by L2 |
| 50% | Less than $3 billion |
| 60% | Between $3 billion and $5 billion |
| 70% | Greater than $5 billion |
For the year ended December 31, 2016 and through April 30, 2018 for the Baird LargeCap Fund, Baird MidCap Fund, Baird Small/Mid Cap Value Fund, Baird SmallCap Value Fund, Chautauqua International Growth Fund and Chautauqua Global Growth Fund, the Advisor has contractually agreed to waive its investment advisory fee and/or reimburse the Funds’ operating expenses (exclusive of brokerage, taxes, and extraordinary expenses) to the extent necessary to ensure that each Fund’s annual operating expenses do not exceed the following percentages of average daily net assets:
| | Institutional Class Shares | Investor Class Shares |
| Baird LargeCap Fund | 0.75% | 1.00% |
| Baird MidCap Fund | 0.85% | 1.10% |
| Baird Small/Mid Cap Value Fund | 0.95% | 1.20% |
| Baird SmallCap Value Fund | 1.00% | 1.25% |
| Chautauqua International Growth Fund | 0.95% | 1.20% |
| Chautauqua Global Growth Fund | 0.95% | 1.20% |
To the extent that the Advisor reimburses or absorbs fees and expenses, it may seek payment of such amounts for three years after the year in which expenses were reimbursed or absorbed. A Fund will make no such payment, however, if its total annual operating expenses exceed the expense limits in effect at the time the expenses were reimbursed or at the time these payments are proposed.
| | | Fiscal Year Ended December 31, | |
| | | 2016 | | | 2015 | | | 2014 | |
| Reimbursed/Absorbed Expenses Subject | | | | | | | | | |
| to be Recovered by Advisor Until: | | 2019 | | | 2018 | | | 2017 | |
| Baird LargeCap Fund | | $ | 138,150 | | | $ | 143,538 | | | $ | 140,955 | |
| Baird Small/MidCap Value Fund | | $ | 156,332 | | | $ | 23,659 | | | | N/A | |
| Baird SmallCap Value Fund | | $ | 116,311 | | | $ | 131,370 | | | $ | 131,933 | |
| Chautauqua International Growth Fund | | $ | 95,476 | | | | N/A | | | | N/A | |
| Chautauqua Global Growth Fund | | $ | 102,142 | | | | N/A | | | | N/A | |
U.S. Bancorp Fund Services, LLC (“USBFS”) serves as transfer agent, administrator, and accounting services agent for the Funds. U.S. Bank, N.A. (“U.S. Bank”) serves as custodian for the Funds.
Notes to the Financial Statements
December 31, 2016
5. Investment Advisory and Other Agreements (cont.)
Robert W. Baird & Co. Incorporated (the “Distributor”) is the sole distributor of the Funds pursuant to a distribution agreement.
No commissions were earned by the Distributor for services rendered as a registered broker-dealer in securities transactions for the year ended December 31, 2016 for the Baird LargeCap Fund, Baird MidCap Fund and Baird SmallCap Value Fund and for the period April 15, 2016 through December 31, 2016 for the Chautauqua International Growth Fund and Chautauqua Global Growth Fund.
6. Securities Lending
Each Fund may lend up to one-third of its total assets (including such loans) to borrowers under terms of participation in a securities lending program administered by U.S. Bank N.A., the Funds’ custodian and an affiliate of USBFS, the Funds’ transfer agent and administrator. The securities lending agreement requires that loans are collateralized at all times in an amount equal to at least 102% of the market value of any loaned securities at the time of the loan, plus accrued interest.
The Funds receive compensation in the form of fees and earn interest on the cash collateral. The amount of fees depends on a number of factors including the type of security and length of the loan. Each Fund continues to receive interest payments or dividends on the securities loaned during the borrowing period. Each Fund has the right under the terms of the securities lending agreement to recall the securities from the borrower on demand.
As of December 31, 2016, none of the Funds had securities on loan. When a Fund engages in securities lending, loaned securities are collateralized by cash equivalents. The cash collateral is invested by the custodian in accordance with approved investment guidelines. Those guidelines require the cash collateral to be invested in readily marketable, high quality, short-term obligations; however, such investments are subject to risk of payment delays or default on the part of the issuer or counterparty or otherwise may not generate sufficient interest to support the costs associated with securities lending. A Fund could also experience delays in recovering its securities and possible loss of income or value if the borrower fails to return the borrowed securities, although the Funds are indemnified from this risk by contract with the securities lending agent.
The interest income earned by the Funds, if any, on investments of cash collateral received from borrowers for the securities loaned to them (“securities lending income”) is reflected in the Funds’ statements of operations. The Funds did not participate in the securities lending program during the year ended December 31, 2016.
Effective September 1, 2016, the Funds ceased securities lending activities, although they may do so again in the future.
7. Line of Credit
The Corporation maintains an uncommitted, senior secured and unsecured line of credit (“LOC”) with U.S. Bank, N.A. (the “Bank”) to provide the Funds a temporary liquidity source to meet unanticipated redemptions. The unsecured line of credit is available to the Funds for any period during which U.S. Bank is an affiliate of the Funds. Under the terms of the LOC, borrowings for each Fund are limited to one-third of the total assets (including the amount borrowed) of the respective Fund, or as otherwise indicated within the Funds’ agreement with the Bank. The Bank charges interest at the Bank’s Prime Rate less 2% (weighted average rate of 1.51% for 2016). For the year ended December 31, 2016, the Chautauqua Global Growth Fund incurred $38 in interest charges, on an average daily loan balance of $2,516. The Baird LargeCap Fund, Baird MidCap Fund, Baird Small/Mid Cap Value Fund, Baird SmallCap Value Fund and Chautauqua International Growth Fund did not borrow from the LOC during the period.
Notes to the Financial Statements
December 31, 2016
8. Distribution and Shareholder Service Plan
The Funds have adopted a distribution and shareholder service plan (the “Plan”) pursuant to Rule 12b-1 under the 1940 Act. The Plan allows the Funds to compensate the Distributor for the costs incurred in distributing the Funds’ Investor Class Shares, including amounts paid to brokers or dealers, at an annual rate of 0.25% of the average daily net assets of the Funds’ Investor Class Shares. The Baird LargeCap Fund, Baird MidCap Fund, Baird Small/Mid Cap Value Fund, Baird SmallCap Value Fund, Chautauqua International Growth Fund and Chautauqua Global Growth Fund incurred $1,520, $352,484, $73, $5,430, $211 and $269, respectively, in fees pursuant to the Plan during the year ended December 31, 2016.
9. Redemption Fees
A redemption fee of 2.00% will be assessed on Institutional and Investor Class shares of the Chautauqua International Growth Fund and Chautauqua Global Growth Fund if redeemed (including in connection with an exchange) 90 days or less from their date of purchase, determined on a first-in, first-out (“FIFO”) basis. The redemption fee is paid directly to the Funds and is designed to offset brokerage commissions, market impact and other costs associated with fluctuations in Fund asset levels and cash flow caused by short-term shareholder trading. For the year ended December 31, 2016, the Chautauqua International Growth Fund and Chautauqua Global Growth Fund charged redemption fees of $1,715 and $515, respectively. The Baird LargeCap Fund, Baird MidCap Fund, Baird Small/Mid Cap Value Fund and Baird SmallCap Value Fund do not charge redemption fees.
10. Subsequent Event
In preparing these financial statements, the Corporation has evaluated subsequent events after December 31, 2016 through the date the financial statements were issued. There were no subsequent events since December 31, 2016 that would require adjustment to or additional disclosure in these financial statements.
Report of Independent Registered Public
Accounting Firm
Board of Directors and ShareholdersBaird Funds, Inc.
We have audited the accompanying statements of assets and liabilities of Baird LargeCap Fund, Baird MidCap Fund, Baird Small/Mid Cap Value Fund, Baird SmallCap Value Fund, Chautauqua International Growth Fund and Chautauqua Global Growth Fund (six of the funds constituting Baird Funds, Inc.) (collectively, the Funds), including the schedules of investments, as of December 31, 2016, and the related statements of operations for the year then ended, the statements of changes in net assets for each of the two years in the period then ended, and the financial highlights for each of the five years in the period then ended for the Baird LargeCap Fund and the Baird MidCap Fund; the related statement of operations for the year then ended, the statements of changes in net assets and the financial highlights for the year then ended and for the period from November 30, 2015 (date of inception) through December 31, 2015, for the Baird Small/Mid Cap Value Fund; the related statement of operations for the year then ended, the statements of changes in net assets for each of the two years in the period then ended, and the financial highlights for each of the four years in the period then ended and for the period from May 1, 2012 (date of inception) through December 31, 2012, for the Baird SmallCap Value Fund; the related statements of operations, the statements of changes in net assets and the financial highlights for the period from April 15, 2016 (date of inception) through December 31, 2016, for the Chautauqua International Growth Fund and the Chautauqua Global Growth Fund. These financial statements are the responsibility of the Funds’ management. Our responsibility is to express an opinion on these financial statements based on our audits.
We conducted our audits in accordance with the standards of the Public Company Accounting Oversight Board (United States). Those standards require that we plan and perform the audits to obtain reasonable assurance about whether the financial statements are free of material misstatement. We were not engaged to perform an audit of the Funds’ internal control over financial reporting. Our audits included consideration of internal control over financial reporting as a basis for designing audit procedures that are appropriate in the circumstances, but not for the purpose of expressing an opinion on the effectiveness of the Funds’ internal control over financial reporting. Accordingly, we express no such opinion. Our procedures included confirmation of securities owned as of December 31, 2016, by correspondence with the custodian or brokers. An audit also includes examining, on a test basis, evidence supporting the amounts and disclosures in the financial statements, assessing the accounting principles used and significant estimates made by management, as well as evaluating the overall financial statement presentation. We believe that our audits provide a reasonable basis for our opinion.
In our opinion, the financial statements referred to above present fairly, in all material respects, the financial position of the aforementioned Funds of Baird Funds, Inc. as of December 31, 2016, and the results of their operations, changes in their net assets, and the financial highlights for the periods indicated above, in conformity with accounting principles generally accepted in the United States of America.
Chicago, Illinois
February 27, 2017
Directors & Officers
As of December 31, 2016
Independent Directors
G. Frederick Kasten, Jr.
Independent Director and Chairman
Term of Office: Indefinite
Length of Time Served: Since September 2000
Age: 77
c/o Robert W. Baird & Co. Incorporated
777 East Wisconsin Avenue
Milwaukee, WI 53202
Principal Occupation(s) During the Past 5 Years: Retired; Chairman, the Advisor (January 2000-December 2005); Chairman and CEO, the Advisor (January 1998-January 2000); President, Chairman and CEO, the Advisor (June 1983-January 1998); President, the Advisor (January 1979-January 1983)
Number of Portfolios in Complex Overseen by Director: 14
Other Directorships Held by Director: Director of Regal-Beloit Corporation, a Manufacturing Company (1995-2011)
John W. Feldt
Independent Director
Term of Office: Indefinite
Length of Time Served: Since September 2000
Age: 74
c/o Robert W. Baird & Co. Incorporated
777 East Wisconsin Avenue
Milwaukee, WI 53202
Principal Occupation(s) During the Past 5 Years: Retired.
Number of Portfolios in Complex Overseen by Director: 14
Other Directorships Held by Director: Director of Thompson Plumb Funds, Inc., a mutual fund complex (3 portfolios)
Frederick P. Stratton, Jr.
Independent Director
Term of Office: Indefinite
Length of Time Served: Since May 2004
Age: 77
c/o Robert W. Baird & Co. Incorporated
777 East Wisconsin Avenue
Milwaukee, WI 53202
Principal Occupation(s) During the Past 5 Years: Retired; Chairman Emeritus, Briggs & Stratton Corporation, a manufacturing company, since 2003.
Number of Portfolios in Complex Overseen by Director: 14
Other Directorships Held by Director: Director of Weyco Group, Inc., a men’s footwear distributor; Director of Wisconsin Energy Corporation and its subsidiaries, Wisconsin Electric Power Company and Wisconsin Gas LLC (1987-2012).
Marlyn J. Spear, CFA
Independent Director
Term of Office: Indefinite
Length of Time Served: Since January 2008
Age: 63
c/o Robert W. Baird & Co. Incorporated
777 East Wisconsin Avenue
Milwaukee, WI 53202
Principal Occupation(s) During the Past 5 Years: Chief Investment Officer, Building Trades United Pension Trust Fund, (July 1989-December 2016)
Number of Portfolios in Complex Overseen by Director: 14
Other Directorships Held by Director: Management Trustee of AFL-CIO Housing Investment Trust, a mutual fund complex (1 portfolio), since 1995.
Directors & Officers
As of December 31, 2016
Interested Directors and Officers
Cory L. Nettles*
Interested Director
Term of Office: Indefinite
Length of Time Served: Since January 2008
Age: 46
c/o Generation Growth Capital, Inc.
411 East Wisconsin Avenue, Suite 1710
Milwaukee, WI 53202
Principal Occupation(s) During the Past 5 Years: Managing Director, Generation Growth Capital, Inc., a private equity fund, since March 2007; Of Counsel, Quarles & Brady LLP, a law firm, (January 2005-December 2016))
Number of Portfolios in Complex Overseen by Director: 14
Other Directorships Held by Director: Director of Weyco Group, Inc., a men’s footwear distributor; Director of Associated Banc-Corp, since 2013
Mary Ellen Stanek
President
Term of Office: Re-elected by Board annually
Length of Time Served: Since September 2000
Age: 60
777 East Wisconsin Avenue
Milwaukee, WI 53202
Principal Occupation(s) During the Past 5 Years: Managing Director, the Advisor, and Chief Investment Officer, Baird Advisors, a department of the Advisor, since March 2000
Charles B. Groeschell
Vice President
Term of Office: Re-elected by Board annually
Length of Time Served: Since January 2010
Age: 63
777 East Wisconsin Avenue
Milwaukee, WI 53202
Principal Occupation(s) During the Past 5 Years: Managing Director, the Advisor, and Senior Portfolio Manager, Baird Advisors, a department of the Advisor, since February 2000
Angela M. Palmer
Chief Compliance Officer and
AML Compliance Officer
Term of Office: Re-elected by Board annually
Length of Time Served: Since March 2014
Age: 45
777 East Wisconsin Ave
Milwaukee, WI 53202
Chief Compliance Officer, the Advisor, since March 2014; Director, the Advisor, since July 2014; Senior Vice President, the Advisor (March 2014-June 2014); Chief Compliance Officer, RIAs US, BMO Financial Group (January 2013-March 2014); Chief Compliance Officer, Institutional RIAs, BMO Financial Group (March 2012-January 2013); Vice President, BMO Harris Bank, N.A. (July 2011-March 2014); Chief Compliance Officer, Taplin, Canida & Habacht, LLC (December 2008-March 2014); Chief Compliance Officer and Vice President, M&I Investment Management Corp. (June 2006-May 2012); Assistant Secretary, M&I Investment Management Corp. (April 2010-May 2012); Vice President, Marshall & Ilsley Trust Company N.A. (June 2006-August 2012).
Terrance P. Maxwell
Treasurer
Term of Office: Re-elected by Board annually
Length of Time Served: Since March 2015
Age: 56
777 East Wisconsin Ave
Milwaukee, WI 53202
Principal Occupation(s) During the Past 5 Years: Chief Financial Officer, the Advisor, since March 2015; Member of the Board of Managers, Greenhouse Funds, LP, an affiliate of the Advisor, since April 2014; Trustee, Investors Real Estate Trust, since November 2013; Director of Corporate Development and Strategic Investment, the Advisor (May 2014-March 2015); Lecturer at University of Wisconsin – Madison (August 2006-May 2010 and August 2011-May 2014); Co-CEO of The Art Commission, LLC, an online start-up company focused on commissioned art and design from January 2012-September 2013 and Member of the Board from January 2012-July 2015; consultant and Director of Flatirons Solutions, a portfolio company of Baird Capital Partners (April 2011-June 2012).
Directors & Officers
As of December 31, 2016
Interested Directors and Officers
Charles M. Weber
Secretary
Term of Office: Re-elected by Board annually
Length of Time Served: Since September 2005
Age: 53
777 East Wisconsin Avenue
Milwaukee, WI 53202
Principal Occupation(s) During the Past 5 Years: Senior Associate General Counsel, the Advisor, since January 2013; Managing Director, the Advisor since January 2009; Chief Compliance Officer and Secretary, Baird Kailash Group, LLC, since July 2013; Associate General Counsel, the Advisor (July 2005-December 2012)
Peter J. Hammond
Vice President
Term of Office: Re-elected by Board annually
Length of Time Served: Since August 2012
Age: 53
777 East Wisconsin Avenue
Milwaukee, WI 53202
Principal Occupation(s) During the Past 5 Years: Senior Vice President, the Advisor, since March 2012; Vice President, Baird Kailash Group, LLC since July 2013; Executive VP and Chief Administrative Officer, UMB Fund Services (September 1996-March 2012)
Dustin J. Hutter
Assistant Treasurer
Term of Office: Re-elected by Board annually
Length of Time Served: Since February 2011
Age: 40
777 East Wisconsin Avenue
Milwaukee, WI 53202
Principal Occupation(s) During the Past 5 Years: Director of Finance Services, the Advisor, since August 2015; Director of Reporting and Analysis, Capital Markets Finance, the Advisor (February 2013-August 2015); Senior Vice President, the Advisor (January 2011-January 2013); Treasurer, Baird Kailash Group, LLC since July 2013; First Vice President, the Advisor (January 2008-December 2010); Vice President, the Advisor (January 2006-December 2007); Assistant Controller, the Advisor (January 2006-January 2013)
Andrew D. Ketter
Assistant Secretary
Term of Office: Re-elected by Board annually
Length of Time Served: Since February 2011
Age: 42
777 East Wisconsin Avenue
Milwaukee, WI 53202
Principal Occupation(s) During the Past 5 Years: Associate General Counsel, the Advisor, since September 2010; Director, the Advisor, since July 2014; Senior Vice President, the Advisor, (January 2014-June 2014); First Vice President, the Advisor September 2010 to December 2013; Associate, Quarles & Brady LLP, a law firm (September 2002-August 2010)
| * | Mr. Nettles is considered an “interested person” of the Corporation (as defined in the 1940 Act) because of his association with the law firm, Quarles & Brady LLP, which provides legal services to the Advisor. The legal services that Quarles & Brady LLP has provided to the Advisor include litigation, real estate, trademark and miscellaneous securities related matters that did not relate to the Corporation or the Funds. The Advisor has invested in and may in the future invest in private equity funds managed by Generation Growth Capital, Inc., a company of which Mr. Nettles is affiliated, through its division, Baird Capital. |
Additional information about the Funds’ directors is available in the Statement of Additional Information which may be obtained without charge, upon request, by calling 1-866-44BAIRD, or at www.bairdfunds.com.
Baird Funds, Inc.
Disclosure Regarding the Board of Directors’ Approval of the Investment Advisory Agreements for Baird Equity Funds
The Board of Directors (the “Board”) of Baird Funds, Inc. (the “Corporation”), including the directors who are not “interested persons” of the Corporation within the meaning of the Investment Company Act of 1940 (the “Independent Directors”), met on August 18 and August 25, 2016 to consider the annual renewal of the investment advisory agreements between Robert W. Baird & Co. Incorporated (“Baird” or the “Advisor”) and the Corporation on behalf of the Baird LargeCap, MidCap and SmallCap Value Funds (the “Funds”). The Board, including the Independent Directors, approved the investment advisory agreements through a process that concluded at the August 25, 2016 meeting. In connection with its consideration of the investment advisory agreements, the Board reviewed and discussed various information that had been provided prior to the meeting, including the investment advisory agreements, a memorandum provided by legal counsel summarizing the guidelines relevant to the Board’s consideration of the renewal of the investment advisory agreements, a memorandum and other information provided in response to requests from the Board from the Advisor (including the Advisor’s Form ADV Part 1, brochure and brochure supplements, annual report and financial information), a profitability analysis, comparative information about the Funds’ performance for periods ended June 30, 2016, management fees and expense ratios, and other pertinent information.
The Board met in executive session with the Funds’ legal counsel to consider the investment advisory agreements. The Board discussed the Advisor’s 15(c) response at the August 18, 2016 special meeting and discussed various questions and information with the President of the Funds at the August 18, 2016 meeting and during executive session earlier in the meeting. The Board also took into account information reviewed periodically throughout the year that was relevant to its consideration of the investment advisory agreements, including performance, management fee and other expense information and discussions with the Funds’ portfolio managers. Based on its evaluation of this information, the Board, including a majority of the Independent Directors, approved the continuation of the investment advisory agreements for an additional one-year period.
In considering the investment advisory agreements and reaching its conclusions, the Board reviewed and analyzed various factors that it determined were relevant, including the factors below. In deciding to approve the investment advisory agreements for each Fund, the Board did not identify any single factor as determinative but considered all factors together.
Nature, Extent and Quality of Services Provided to the Funds
The Board analyzed the nature, extent and quality of the services provided by the Advisor to the Funds. The Board noted the depth of the Advisor’s personnel, resources and commitment to the Funds and the experience and credentials of the portfolio management teams employed to manage the Funds’ investments. The Board considered the consistency and continuity of the portfolio management teams for the Funds and noted that the Advisor has added resources in support of the Funds, including portfolio management, business, legal and sales personnel, and has made enhancements to its technology, trading and research capabilities. The Board noted that the Funds provide an opportunity for smaller institutional and retail accounts to receive the same professional advice from the Advisor that it offers to its larger institutional clients. However, the Board noted that the provision of investment advisory services to the Funds requires more effort than it does for separately managed accounts due to daily sales and redemption activity and additional regulatory and compliance requirements.
The Board considered the Advisor’s disciplined investment decision making process used for the Funds. The Board also considered other services that the Advisor provides the Funds in its capacity as their investment advisor, such as making some of its key personnel available to serve as officers of the Funds, selecting broker dealers for execution of portfolio transactions, ensuring adherence to the Funds’ investment policies and restrictions, compliance, risk management services, valuation, providing support services to the Board and the committees of the Board and overseeing the Funds’ other service providers. The Board also considered the strength of the Advisor’s compliance department, including the Funds’ chief compliance officer, as well as the Advisor’s risk management tools and process. With respect to the LargeCap Fund, the Board considered the
Baird Funds, Inc.
Disclosure Regarding the Board of Directors’ Approval of the Investment Advisory Agreements for Baird Equity Funds (cont.)
Advisor’s oversight responsibilities as it relates to the Fund’s subadviser, L2 Asset Management, LLC (“L2”). The Board concluded that the nature, extent and quality of the services provided by the Advisor to the Funds were appropriate and that each Fund was likely to continue to benefit from services provided under the respective investment advisory agreement.
Investment Performance of the Advisor and the Funds
In considering the investment performance of each of the Funds, the Board reviewed information as of June 30, 2016 regarding the Fund’s performance in comparison to its benchmark index and its peer groups as determined by Lipper. The Board also considered composite investment performance of Baird Equity Asset Management with respect to accounts managed by the Advisor that are comparable to the Funds.
The Board noted that the LargeCap Fund’s returns exceeded the peer group average for the three year period, but trailed the average for all other periods and trailed the applicable benchmark returns for all periods. The Board noted that L2 has been the Fund’s subadviser since April 30, 2016 and prior to that, Baird Kailash Group, LLC served as the subadviser from December 23, 2013. The Board considered L2’s and the Advisor’s commentary regarding the Fund’s performance challenges in recent years. The Board noted that the performance of the Baird MidCap Fund exceeded the Lipper peer group average for most periods. The Fund’s performance exceeded the benchmark index for the since inception period but lagged the index for the other periods. The Board considered the reasons for the Fund’s underperformance as discussed by the Advisor. The Board noted that the SmallCap Value Fund had outperformed its Lipper peer group average and benchmark index for most periods.
The Board also considered the Advisor’s quarterly portfolio commentaries and reviews explaining the Funds’ performance, the Advisor’s consistent and disciplined investment decision process and the investment strategies it employs for the Funds. With respect to the LargeCap Fund, the Board considered that the investment decisions are made by L2 and that performance is monitored by the Advisor. After considering all of the information, the Board concluded that, although past performance is not a guarantee of future results, each Fund and its shareholders were likely to benefit from the continued management by the Advisor.
Costs of Services Provided and Profits Realized by the Advisor
The Board examined the fee and expense information for each of the Funds, including a comparison of such information to other similarly situated mutual funds as determined by Morningstar. The Board noted that the advisory fee for the LargeCap Fund and the MidCap Fund was the same as or close to the average and median for all mutual funds in its Morningstar category while the advisory fee for the SmallCap Value Fund was slightly above the average and median for all funds in the Morningstar category. The Board also reviewed and considered management fees charged by the Advisor to other investment advisory clients and noted that the investment management fee paid by the MidCap Fund was 10 basis points (or 0.10%) less than what the Advisor charges on the first $10 million of a separately managed account. With respect to the SmallCap Value Fund, the Fund’s investment management fee was 15 basis points (or 0.15%) less than what the Advisor charges on the first $20 million of a separately managed account. The Board noted that the Advisor does not currently advise separate accounts using a strategy similar to the LargeCap Fund. The Board considered the extent of the significant additional services provided to the Funds that the Advisor did not provide in the other advisory relationships. Those services included contract administration, valuation services, oversight of the Funds’ other service providers, director support, preparation of regulatory filings, implementation of the Funds’ compliance program and various other services. With respect to the LargeCap Fund, those services include oversight of the Fund’s subadvisor. The Board noted that the Advisor maintains a subadvisory arrangement with an unaffiliated equity mutual fund but did not consider the subadvisory fee to be a material factor given that the subadvisory services were limited to asset management.
Baird Funds, Inc.
Disclosure Regarding the Board of Directors’ Approval of the Investment Advisory Agreements for Baird Equity Funds (cont.)
The Board also examined the total expense ratio of each Fund relative to all other mutual funds in its Morningstar category. The Board noted that the total expense ratio for each of the LargeCap Fund and MidCap Fund (for both Institutional and Investor Class shares), after fee waivers and expense reimbursements by the Advisor, was lower than the average and median expense ratios for all funds in its Morningstar category and in the lowest or second lowest quartile. With respect to the SmallCap Value Fund, the total expense ratio for both the Institutional and Investor Class shares, after fee waivers and expense reimbursements by the Advisor, was lower than the average and median expense ratios for all funds in the Fund’s Morningstar category.
The Board considered the fees realized, and the costs incurred, by the Advisor in providing investment management services to the Funds and the profitability to the Advisor of having a relationship with the Funds. The Board noted that the Advisor has waived fees for each of the Funds under the expense cap agreement and that, with respect to the LargeCap Fund, the Advisor pays the subadvisory fee to L2.
The Board concluded that the profits realized by the Advisor from its relationship with the Funds were reasonable. The Board noted that the Advisor’s profitability information does not reflect certain internal resources provided by the Advisor to the Funds, such as legal, finance and compliance support. The Board reviewed and considered the general financial condition of the Advisor and determined it to be sound. The Board also noted that all marketing and distribution fees other than the Rule 12b-1 fee payable by the Investor Class shares of the Funds were paid by the Advisor from its profits. In light of all of the information that it received and considered, the Board concluded that the management fee and total expense ratio of each Fund were reasonable.
Economies of Scale and Fee Levels Reflecting Those Economies
The Board reviewed the extent to which economies of scale may be realized as the Funds increase in size. The Board noted that the Funds’ advisory fee structure does not contain any breakpoint reductions as the Funds grow in size. However, the Board recognized that the advisory fee rates paid by the Funds were designed to be lower than the fees otherwise charged by the Advisor to its separately managed account clients and to be comparable to the second or third breakpoint advisory fee levels paid by other comparable mutual funds. The Board also recognized that the Advisor has committed to waive fees and/or reimburse expenses for the Funds pursuant to the expense cap agreement. With respect to the LargeCap Fund and SmallCap Value Fund, the Board did not consider economies of scale to be a material factor due to the current asset size of each Fund. Considering its current level of assets, the directors concluded that the absence of breakpoints in the management fee for the MidCap Fund is reasonable at this time. The directors concluded that the current fee structure of each Fund was reasonable.
Benefits Derived from the Relationship with the Funds
The Board considered other benefits to the Advisor from serving as advisor to the Funds (in addition to the advisory fee). The Board noted that the Advisor derives ancillary benefits from its association with the SmallCap Value and MidCap Funds in the form of research products and services received from unaffiliated broker dealers who execute portfolio trades for the Funds. However, the Board determined such products and services have been used for legitimate purposes relating to the Funds by providing assistance in the investment decision making process. The Board also noted that the Distributor and its financial advisors receive 12b-1 payments for selling Investor Class shares of the Funds. The Board noted that the Advisor’s asset management business may experience indirect benefits from the Advisor’s association with the Funds. The Board concluded that the other benefits realized by the Advisor from its relationship with the Funds were appropriate.
Based on its evaluation of the above factors, as well as other factors relevant to their consideration of the investment advisory agreement, the directors, including all of the Independent Directors, concluded that the continuation of the investment advisory agreements was in the best interest of each Fund and its shareholders.
Additional Information
Proxy Voting
A description of the policies and procedures that the Funds use to determine how to vote proxies relating to portfolio securities is available without charge, upon request, by calling toll free, 1-866-44BAIRD, or by accessing the Funds’ website at www.bairdfunds.com; and by accessing the SEC’s website at www.sec.gov.
Each Fund’s proxy voting record for the most recent 12-month period ended June 30 is available without charge, upon request, by calling toll free, 1-866-44BAIRD, or by accessing the Funds’ website at www.bairdfunds.com; and by accessing the SEC’s website at www.sec.gov.
Portfolio Holdings Disclosure
The Funds file a complete schedule of portfolio holdings with the SEC for the first and third quarters of each fiscal year on Form N-Q. The Funds’ Forms N-Q are available on the SEC’s website at www.sec.gov and may be reviewed and copied at the SEC’s Public Reference Room in Washington, D.C. Information on the operation of the Public Reference Room may be obtained by calling 1-800-732-0330. The Funds’ Forms N-Q may also be obtained by calling toll-free 1-866-44BAIRD.
Qualified Dividend Income/Dividends Received Deduction
For the fiscal year ended December 31, 2016, certain dividends paid by the Funds may be subject to a maximum tax rate of 15%, as provided for by the Jobs and Growth Tax Relief Reconciliation Act of 2003. The percentage of dividends declared from ordinary income designated as qualified dividend income was as follows:
| Baird LargeCap Fund | 100.00% | |
| Baird Small/Mid Cap Value Fund | 100.00% | |
| Baird SmallCap Value Fund | 100.00% | |
For corporate shareholders, the percent of ordinary income distributions qualifying for the corporate dividends received deduction for the fiscal year ended December 31, 2016 was as follows:
| Baird LargeCap Fund | 100.00% | |
| Baird Small/Mid Cap Value Fund | 100.00% | |
| Baird SmallCap Value Fund | 100.00% | |
(This Page Intentionally Left Blank.)
Baird Funds, Inc. Privacy Policy
Protecting the privacy of Fund shareholders is important to us. The following is a description of the practices and policies through which Baird Funds, Inc. protects the privacy and security of your non-public personal information.
What Information We Collect
We collect and maintain information about you so that we can open and maintain your account in the Funds and provide various services to you. We may collect and maintain the following personal information about you:
| | • | Information we receive from you or your financial advisor on account applications or other forms, correspondence, or conversations, such as your name, address, e-mail address, phone number, social security number, assets, income and date of birth; and |
| | • | Information about your transactions with us, our affiliates, or others, such as your account number and balance, positions, activity, history, cost basis information, and other financial information. |
What Information We Disclose
We do not sell any non-public personal information about our current or former shareholders to third parties. We do not disclose any non-public personal information about our current or former shareholders to anyone, except as permitted or required by law. We are permitted by law to share any of the information we collect, as described above, with our affiliates. In addition, we may share such information with nonaffiliated third parties to the extent necessary to effect, process, administer or enforce a transaction that the shareholder requests or authorizes, in connection with maintaining or servicing the shareholder’s account, as requested by regulatory authorities or as otherwise permitted or required by law. For example, we are permitted by law to disclose all of the information we collect, as described above, to our transfer agent to process your transactions. We may also provide your name and address to third party service providers who send account statements and other Fund-related material to you.
How We Protect Your Information
We restrict access to your non-public personal information to those persons who require such information to provide products or services to you. We maintain physical, electronic, and procedural safeguards that comply with federal standards to protect the confidentiality, integrity and security of your non-public personal information.
We will continue to adhere to the privacy policies and practices in this notice even after your account is closed or becomes inactive.
In the event that you hold shares of the Fund(s) through a financial intermediary, including, but not limited to, a broker-dealer, bank, or trust company, the privacy policy of your financial intermediary would govern how your non-public personal information would be shared with nonaffiliated third parties.
Baird Funds, Inc.
c/o U.S. Bancorp Fund Services, LLC
P.O. Box 701
Milwaukee, WI 53201-0701
1-866-44BAIRD
Board of Directors
G. Frederick Kasten, Jr. (Chairman)
John W. Feldt
Cory L. Nettles
Marlyn J. Spear
Frederick P. Stratton, Jr.
Investment Advisor and Distributor
Robert W. Baird & Co. Incorporated
777 East Wisconsin Avenue
Milwaukee, WI 53202
Administrator and Transfer Agent
U.S. Bancorp Fund Services, LLC
P.O. Box 701
615 East Michigan Street
Milwaukee, WI 53202
Custodian
U.S. Bank, N.A.
1555 N. RiverCenter Drive, Suite 302
Milwaukee, WI 53212
Legal Counsel
Godfrey & Kahn, S.C.
833 East Michigan Street, Suite 1800
Milwaukee, WI 53202
Independent Registered Public
Accounting Firm
Grant Thornton LLP
Grant Thornton Tower
171 N. Clark Street, Suite 200
Chicago, IL 60601
Item 2. Code of Ethics.
As of the end of the period covered by this report, the Registrant has adopted a code of ethics that applies to the President, Treasurer and Assistant Treasurer of the Registrant. The Registrant has not made any amendments to its code of ethics during the period covered by this report. The Registrant has not granted any waivers from any provisions of the code of ethics during the period covered by this report.
Item 3. Audit Committee Financial Expert.
The Registrant’s board of directors has determined that John W. Feldt, Frederick P. Stratton, Jr., and Marlyn J. Spear, members of the audit committee, each qualify as an “audit committee financial expert” as such term is defined in paragraph (b) of Item 3 of Form N-CSR. Mr. Feldt, Mr. Stratton, and Ms. Spear are each “independent” as such term is defined in paragraph (a)(2) of Item 3 of Form N‑CSR.
Item 4. Principal Accountant Fees and Services.
Fees Billed by Grant Thornton LLP. The aggregate fees billed for professional services by Grant Thornton LLP (“GT”) during the last two fiscal years were as follows:
| | FYE 12/31/2016 | FYE 12/31/2015 |
| Audit Fees | $178,068 | $145,464 |
| Audit-Related Fees | | |
| Tax Fees | $63,536 | $53,922 |
| All Other Fees | | |
In the above table, “audit fees” are fees billed for professional services for the audit of the Registrant’s annual financial statements or for services that are normally provided by the accountant in connection with statutory and regulatory filings or engagements. “Tax fees” are fees billed for professional services rendered for tax compliance, tax advice and tax planning, and specifically relate to GT’s review of the Registrant’s federal and state tax returns.
The audit committee has adopted pre-approval policies and procedures that require the audit committee to pre‑approve all audit and non‑audit services rendered to the Registrant, as well as all non-audit services provided to the Registrant’s investment adviser and any entity affiliated with the Registrant’s investment adviser with respect to any engagement that relates directly to the operations and financial reporting of the Registrant. In accordance with its policies and procedures, the audit committee pre-approved all audit and tax services provided by GT to the Registrant during fiscal 2016. During the past two fiscal years, the Registrant did not receive any non-audit services from GT pursuant to any waivers of the pre-approval requirement under paragraph (c)(7)(i)(C) of Rule 2-01 of Regulation S-X. All of GT’s hours spent on auditing the Registrant’s financial statements were attributed to work performed by full-time permanent employees of GT.
During the last two fiscal years, GT has served as the auditor to Robert W. Baird & Co. Incorporated (“RWB”), the Registrant’s investment adviser, and has rendered non-audit services to RWB. The non-audit services that GT provided to RWB in 2016 and 2015 consisted of a review of state and federal tax returns, tax and general consulting services and tax services for RWB associates working overseas. GT charged the following amounts for such non-audit services to RWB: $334,533 for 2016 and $371,694 for 2015. None of the non-audit services provided by GT to RWB directly related to the operations or financial reporting of the Registrant. During the last two fiscal years, GT has also provided audit and non-audit services to affiliates of RWB, but those affiliates do not provide ongoing services to the Registrant. The Audit Committee has concluded that the provision of these audit and non-audit services to RWB and RWB affiliates is compatible with GT’s independence.
Item 5. Audit Committee of Listed Registrants.
Not applicable because the Registrant is not a “listed issuer” within the meaning of Rule 10A-3 under the Securities Exchange Act of 1934.
Item 6. Schedule of Investments.
| (a) | The complete Schedules of Investments in securities of unaffiliated issuers as of the close of the reporting period for the Baird LargeCap Fund, Baird MidCap Fund, Baird Small/Mid Cap Value Fund, Baird SmallCap Value Fund, Chautauqua International Growth Fund and Chautauqua Global Growth Fund are included as part of the report to shareholders filed under Item 1. The Summary Schedules of Investments in securities of unaffiliated issuers as of the close of the reporting period for the Baird Ultra Short Bond Fund, Baird Short-Term Bond Fund, Baird Intermediate Bond Fund, Baird Aggregate Bond Fund, Baird Core Plus Bond, Baird Short-Term Municipal Bond Fund, Baird Quality Intermediate Municipal Bond Fund and Baird Core Intermediate Municipal Bond Fund are included as part of the report to shareholders filed under Item 1. The complete Schedule of Investments in securities of unaffiliated issuers as of the close of the reporting period for Baird Ultra Short Bond Fund, Baird Short-Term Bond Fund, Baird Intermediate Bond Fund, Baird Aggregate Bond Fund, Baird Core Plus Bond, Baird Short-Term Municipal Bond Fund, Baird Quality Intermediate Municipal Bond Fund and Baird Core Intermediate Municipal Bond Fund are listed below. |
| Baird Ultra Short Bond Fund | | | | | | | | | |
| Schedule of Investments | | | | | | | | | |
| December 31, 2016 | | | | | | | | | |
| | | | | | | | | | |
| | | Principal | | | | | | % of | |
| | | Amount | | | Value | | | Net Assets | |
| LONG-TERM INVESTMENTS | | | | | | | | | |
| U.S. Treasury Securities | | | | | | | | | |
| U.S. Treasury Notes: | | | | | | | | | |
| 2.375%, 07/31/2017 | | $ | 45,700,000 | | | $ | 46,139,132 | | | | |
| 1.000%, 09/15/2017 | | | 46,100,000 | | | | 46,172,008 | | | | |
| 0.875%, 01/15/2018 | | | 12,000,000 | | | | 11,994,372 | | | | |
| | | | | | | | 104,305,512 | | | | 26.6 | % |
| Other Government Related Securities | | | | | | | | | | | | |
| CNPC General Capital Ltd., | | | | | | | | | | | | |
| 1.802%, 05/14/2017 (Acquired 05/07/2014, Cost $250,000) ∞ * f | | | 250,000 | | | | 250,130 | | | | | |
| Electricite de France SA: | | | | | | | | | | | | |
| 1.150%, 01/20/2017 (Acquired 08/18/2016, Cost $1,000,039) * f | | | 1,000,000 | | | | 999,970 | | | | | |
| 1.341%, 01/20/2017 (Acquired 01/13/2014, Cost $250,000) ∞ * f | | | 250,000 | | | | 250,020 | | | | | |
| Export-Import Bank of Korea, | | | | | | | | | | | | |
| 1.631%, 01/14/2017 ∞ f | | | 250,000 | | | | 250,027 | | | | | |
| Statoil ASA, | | | | | | | | | | | | |
| 3.125%, 08/17/2017 f | | | 1,500,000 | | | | 1,517,079 | | | | | |
| | | | | | | | 3,267,226 | | | | 0.8 | % |
| Corporate Bonds | | | | | | | | | | | | |
| Industrials | | | | | | | | | | | | |
| Actavis Funding SCS, | | | | | | | | | | | | |
| 2.208%, 03/12/2020 ∞ f | | | 1,500,000 | | | | 1,528,720 | | | | | |
| Alibaba Group Holding Ltd., | | | | | | | | | | | | |
| 1.457%, 11/28/2017 ∞ f | | | 500,000 | | | | 499,293 | | | | | |
| American Honda Finance Corp., | | | | | | | | | | | | |
| 1.741%, 02/22/2019 ∞ | | | 200,000 | | | | 201,919 | | | | | |
| Amgen, Inc.: | | | | | | | | | | | | |
| 2.125%, 05/15/2017 | | | 1,500,000 | | | | 1,504,893 | | | | | |
| 1.296%, 05/22/2017 ∞ | | | 250,000 | | | | 250,263 | | | | | |
| Anheuser-Busch InBev Finance, Inc., | | | | | | | | | | | | |
| 1.286%, 02/01/2019 ∞ | | | 1,165,000 | | | | 1,166,291 | | | | | |
| AT&T, Inc.: | | | | | | | | | | | | |
| 1.847%, 11/27/2018 ∞ | | | 400,000 | | | | 402,848 | | | | | |
| 1.928%, 06/30/2020 ∞ | | | 1,000,000 | | | | 1,005,424 | | | | | |
| Baxalta, Inc., | | | | | | | | | | | | |
| 1.776%, 06/22/2018 ∞ | | | 1,500,000 | | | | 1,500,370 | | | | | |
| BellSouth LLC, | | | | | | | | | | | | |
| 4.400%, 04/26/2017 (Acquired 06/15/2016, Cost $1,009,504) * | | | 1,000,000 | | | | 1,010,250 | | | | | |
| Boardwalk Pipelines LP, | | | | | | | | | | | | |
| 5.500%, 02/01/2017 | | | 1,000,000 | | | | 1,002,664 | | | | | |
| Boston Scientific Corp., | | | | | | | | | | | | |
| 5.125%, 01/12/2017 | | | 1,500,000 | | | | 1,501,140 | | | | | |
| Bunge Limited Finance Corp., | | | | | | | | | | | | |
| 3.200%, 06/15/2017 | | | 2,000,000 | | | | 2,015,058 | | | | | |
| Bunge NA Finance LP, | | | | | | | | | | | | |
| 5.900%, 04/01/2017 | | | 720,000 | | | | 726,195 | | | | | |
| Cardinal Health, Inc., | | | | | | | | | | | | |
| 1.900%, 06/15/2017 | | | 1,730,000 | | | | 1,734,742 | | | | | |
| Chevron Phillips Chemical Co. LLC / Chevron Phillips Chemical Co. LP, | | | | | | | | | | | | |
| 1.636%, 05/01/2020 (Acquired 05/07/2015, Cost $1,500,000) ∞ * | | | 1,500,000 | | | | 1,485,483 | | | | | |
| Constellation Brands, Inc., | | | | | | | | | | | | |
| 7.250%, 05/15/2017 | | | 1,000,000 | | | | 1,020,000 | | | | | |
| Daimler Finance North America LLC: | | | | | | | | | | | | |
| 1.226%, 08/01/2017 (Acquired 01/13/2015, Cost $498,615) ∞ * | | | 500,000 | | | | 500,372 | | | | | |
| 1.375%, 08/01/2017 (Acquired 11/01/2016, Cost $750,711) * | | | 750,000 | | | | 750,011 | | | | | |
| 1.591%, 08/03/2017 (Acquired 07/28/2015, Cost $1,050,000) ∞ * | | | 1,050,000 | | | | 1,052,747 | | | | | |
| Dollar General Corp., | | | | | | | | | | | | |
| 4.125%, 07/15/2017 | | | 1,500,000 | | | | 1,521,765 | | | | | |
| Enbridge, Inc., | | | | | | | | | | | | |
| 1.384%, 06/02/2017 ∞ f | | | 450,000 | | | | 450,042 | | | | | |
| Enterprise Products Operating LLC, | | | | | | | | | | | | |
| Class L, 6.300%, 09/15/2017 | | | 2,000,000 | | | | 2,062,718 | | | | | |
| ERAC USA Finance LLC, | | | | | | | | | | | | |
| 2.750%, 03/15/2017 (Acquired 06/01/2016, Cost $260,749) * | | | 260,000 | | | | 260,697 | | | | | |
| Federal Express Corp. 2012 Pass Through Trust, | | | | | | | | | | | | |
| 2.625%, 01/15/2018 (Acquired 08/19/2015, Cost $234,003) * | | | 232,773 | | | | 233,532 | | | | | |
| Fidelity National Information Services, Inc., | | | | | | | | | | | | |
| 1.450%, 06/05/2017 | | | 1,823,000 | | | | 1,823,722 | | | | | |
| Ford Motor Credit Co. LLC: | | | | | | | | | | | | |
| 1.461%, 03/27/2017 | | | 1,200,000 | | | | 1,200,192 | | | | | |
| 3.000%, 06/12/2017 | | | 1,000,000 | | | | 1,005,821 | | | | | |
| General Motors Financial Co., Inc., | | | | | | | | | | | | |
| 2.337%, 05/09/2019 ∞ | | | 2,000,000 | | | | 2,019,734 | | | | | |
| Glencore Canada Corp., | | | | | | | | | | | | |
| 5.500%, 06/15/2017 f | | | 1,500,000 | | | | 1,524,057 | | | | | |
| Hewlett Packard Enterprise Co., | | | | | | | | | | | | |
| 2.929%, 10/05/2018 (Acquired 09/30/2015, Cost $1,000,000) * ∞ | | | 1,000,000 | | | | 1,022,087 | | | | | |
| HP, Inc., | | | | | | | | | | | | |
| 1.821%, 01/14/2019 ∞ | | | 737,000 | | | | 739,406 | | | | | |
| Hutchison Whampoa International (11) Ltd., | | | | | | | | | | | | |
| 3.500%, 01/13/2017 (Acquired 08/24/2016, Cost $1,000,793) * f | | | 1,000,000 | | | | 1,000,489 | | | | | |
| Hyundai Capital Services, Inc., | | | | | | | | | | | | |
| 1.793%, 03/18/2017 (Acquired 01/13/2015 through 08/24/2016, Cost $2,450,546) ∞ * f | | | 2,450,000 | | | | 2,450,691 | | | | | |
| Ingredion, Inc., | | | | | | | | | | | | |
| 1.800%, 09/25/2017 | | | 2,500,000 | | | | 2,503,162 | | | | | |
| Kinder Morgan Energy Partners LP, | | | | | | | | | | | | |
| 6.000%, 02/01/2017 | | | 1,500,000 | | | | 1,504,543 | | | | | |
| Kraft Heinz Foods Co., | | | | | | | | | | | | |
| 1.600%, 06/30/2017 | | | 724,000 | | | | 724,581 | | | | | |
| Medtronic, Inc., | | | | | | | | | | | | |
| 1.763%, 03/15/2020 ∞ f | | | 750,000 | | | | 757,401 | | | | | |
| Mondelez International, Inc., | | | | | | | | | | | | |
| 1.406%, 02/01/2019 ∞ | | | 500,000 | | | | 499,972 | | | | | |
| National Oilwell Varco, Inc., | | | | | | | | | | | | |
| 1.350%, 12/01/2017 | | | 1,800,000 | | | | 1,792,984 | | | | | |
| Pentair Finance SA, | | | | | | | | | | | | |
| 1.875%, 09/15/2017 f | | | 2,000,000 | | | | 2,002,984 | | | | | |
| Pernod Ricard SA, | | | | | | | | | | | | |
| 2.950%, 01/15/2017 (Acquired 08/18/2016, Cost $2,001,394) * f | | | 2,000,000 | | | | 2,001,078 | | | | | |
| Phillips 66, | | | | | | | | | | | | |
| 2.950%, 05/01/2017 | | | 1,500,000 | | | | 1,508,367 | | | | | |
| Qualcomm, Inc., | | | | | | | | | | | | |
| 1.461%, 05/20/2020 ∞ | | | 1,500,000 | | | | 1,500,390 | | | | | |
| Rohm and Haas Co., | | | | | | | | | | | | |
| 6.000%, 09/15/2017 | | | 2,095,000 | | | | 2,160,364 | | | | | |
| Telefonica Emisiones SAU, | | | | | | | | | | | | |
| 1.648%, 06/23/2017 ∞ f | | | 1,000,000 | | | | 1,001,569 | | | | | |
| Time Warner Cable LLC, | | | | | | | | | | | | |
| 5.850%, 05/01/2017 | | | 2,000,000 | | | | 2,028,382 | | | | | |
| Total Capital International SA, | | | | | | | | | | | | |
| 1.343%, 06/19/2019 ∞ f | | | 250,000 | | | | 248,999 | | | | | |
| Toyota Motor Credit Corp., | | | | | | | | | | | | |
| Class 2547, 1.194%, 01/12/2018 ∞ | | | 900,000 | | | | 901,249 | | | | | |
| TransCanada PipeLines Ltd., | | | | | | | | | | | | |
| 1.664%, 01/12/2018 ∞ f | | | 1,000,000 | | | | 1,003,896 | | | | | |
| Verizon Communications, Inc., | | | | | | | | | | | | |
| 2.709%, 09/14/2018 ∞ | | | 1,563,000 | | | | 1,597,889 | | | | | |
| Viacom, Inc., | | | | | | | | | | | | |
| 6.125%, 10/05/2017 | | | 830,000 | | | | 853,746 | | | | | |
| Vodafone Group PLC: | | | | | | | | | | | | |
| 5.625%, 02/27/2017 f | | | 1,000,000 | | | | 1,005,751 | | | | | |
| 1.250%, 09/26/2017 f | | | 1,400,000 | | | | 1,397,403 | | | | | |
| Volkswagen Group of America Finance LLC: | | | | | | | | | | | | |
| 1.290%, 05/23/2017 (Acquired 05/15/2014, Cost $250,000) ∞ * | | | 250,000 | | | | 249,735 | | | | | |
| 1.351%, 11/20/2017 (Acquired 11/12/2014, Cost $500,000) ∞ * | | | 500,000 | | | | 498,712 | | | | | |
| Williams Partners LP / Williams Partners Finance Corp., | | | | | | | | | | | | |
| 7.250%, 02/01/2017 | | | 1,200,000 | | | | 1,204,687 | | | | | |
| Xerox Corp., | | | | | | | | | | | | |
| 6.750%, 02/01/2017 | | | 1,600,000 | | | | 1,605,779 | | | | | |
| | | | | | | | 68,727,259 | | | | 17.5 | % |
| Utilities | | | | | | | | | | | | |
| Exelon Corp., | | | | | | | | | | | | |
| 1.550%, 06/09/2017 | | | 1,700,000 | | | | 1,696,906 | | | | | |
| NextEra Energy Capital Holdings, Inc., | | | | | | | | | | | | |
| Class F, 2.056%, 09/01/2017 | | | 2,500,000 | | | | 2,511,012 | | | | | |
| Tri-State Pass Through Trust, | | | | | | | | | | | | |
| 6.040%, 01/31/2018 (Acquired 09/18/2014, Cost $75,907) * | | | 74,640 | | | | 75,495 | | | | | |
| W3A Funding Corp., | | | | | | | | | | | | |
| 8.090%, 01/02/2017 | | | 30,836 | | | | 30,836 | | | | | |
| | | | | | | | 4,314,249 | | | | 1.1 | % |
| Financials | | | | | | | | | | | | |
| ABN AMRO Bank NV, | | | | | | | | | | | | |
| 4.250%, 02/02/2017 (Acquired 11/16/2015 through 08/16/2016, Cost $2,203,859) * f | | | 2,198,000 | | | | 2,202,743 | | | | | |
| Aetna, Inc., | | | | | | | | | | | | |
| 1.601%, 12/08/2017 ∞ | | | 2,000,000 | | | | 2,006,896 | | | | | |
| American Express Bank FSB, | | | | | | | | | | | | |
| 6.000%, 09/13/2017 | | | 2,000,000 | | | | 2,061,828 | | | | | |
| Australia and New Zealand Banking Group Ltd., | | | | | | | | | | | | |
| 1.320%, 01/16/2018 (Acquired 01/12/2015, Cost $1,000,000) ∞ * f | | | 1,000,000 | | | | 1,000,899 | | | | | |
| Banco Santander (Chile), | | | | | | | | | | | | |
| 1.776%, 04/11/2017 (Acquired 04/08/2014, Cost $200,000) ∞ * f | | | 200,000 | | | | 199,760 | | | | | |
| Bank of America NA, | | | | | | | | | | | | |
| 5.300%, 03/15/2017 | | | 2,000,000 | | | | 2,015,490 | | | | | |
| Bank of Montreal, | | | | | | | | | | | | |
| 1.476%, 04/09/2018 ∞ f | | | 1,095,000 | | | | 1,099,214 | | | | | |
| Barclays PLC, | | | | | | | | | | | | |
| 2.000%, 03/16/2018 f | | | 1,100,000 | | | | 1,097,713 | | | | | |
| BB&T Corp., | | | | | | | | | | | | |
| 1.546%, 02/01/2019 ∞ | | | 880,000 | | | | 883,765 | | | | | |
| BNP Paribas SA: | | | | | | | | | | | | |
| 1.341%, 05/07/2017 ∞ f | | | 1,000,000 | | | | 1,000,717 | | | | | |
| 2.375%, 09/14/2017 f | | | 1,000,000 | | | | 1,006,677 | | | | | |
| BPCE SA, | | | | | | | | | | | | |
| 1.732%, 02/10/2017 ∞ f | | | 500,000 | | | | 500,419 | | | | | |
| Branch Banking & Trust Co., | | | | | | | | | | | | |
| 1.220%, 05/23/2017 ∞ | | | 1,000,000 | | | | 999,925 | | | | | |
| Caisse Centrale Desjardins: | | | | | | | | | | | | |
| 1.303%, 09/12/2017 (Acquired 05/26/2016, Cost $99,795) ∞ * f | | | 100,000 | | | | 99,933 | | | | | |
| 1.550%, 09/12/2017 (Acquired 08/23/2016 through 09/23/2016, Cost $951,610) * f | | | 950,000 | | | | 950,407 | | | | | |
| 1.552%, 01/29/2018 (Acquired 01/26/2015, Cost $1,000,000) ∞ * f | | | 1,000,000 | | | | 998,981 | | | | | |
| Capital One NA/Mclean VA: | | | | | | | | | | | | |
| 1.500%, 09/05/2017 | | | 2,000,000 | | | | 1,997,514 | | | | | |
| 1.561%, 02/05/2018 ∞ | | | 500,000 | | | | 500,987 | | | | | |
| Citigroup, Inc.: | | | | | | | | | | | | |
| 1.493%, 03/10/2017 ∞ | | | 1,500,000 | | | | 1,500,931 | | | | | |
| 1.850%, 11/24/2017 | | | 1,200,000 | | | | 1,202,268 | | | | | |
| Citizens Bank NA/Providence RI, | | | | | | | | | | | | |
| 1.600%, 12/04/2017 | | | 1,890,000 | | | | 1,888,015 | | | | | |
| Comerica Bank, | | | | | | | | | | | | |
| 5.200%, 08/22/2017 | | | 110,000 | | | | 112,471 | | | | | |
| Commonwealth Bank of Australia, | | | | | | | | | | | | |
| 1.353%, 03/12/2018 (Acquired 11/09/2016, Cost $1,000,633) ∞ * f | | | 1,000,000 | | | | 999,265 | | | | | |
| Commonwealth Bank of Australia/New York NY, | | | | | | | | | | | | |
| 1.125%, 03/13/2017 f | | | 1,500,000 | | | | 1,500,120 | | | | | |
| Compass Bank, | | | | | | | | | | | | |
| 1.850%, 09/29/2017 | | | 3,015,000 | | | | 3,008,156 | | | | | |
| Cooperatieve Rabobank UA, | | | | | | | | | | | | |
| 3.375%, 01/19/2017 f | | | 1,120,000 | | | | 1,121,021 | | | | | |
| Credit Agricole SA/London, | | | | | | | | | | | | |
| 1.923%, 06/10/2020 (Acquired 06/03/2015, Cost $1,000,000) ∞ * f | | | 1,000,000 | | | | 1,003,416 | | | | | |
| Credit Suisse AG/New York NY: | | | | | | | | | | | | |
| 1.427%, 05/26/2017 ∞ f | | | 500,000 | | | | 500,384 | | | | | |
| 1.566%, 04/27/2018 ∞ f | | | 1,000,000 | | | | 999,577 | | | | | |
| Deutsche Bank AG/London: | | | | | | | | | | | | |
| 1.512%, 02/13/2017 ∞ f | | | 850,000 | | | | 849,798 | | | | | |
| 1.582%, 02/13/2018 ∞ f | | | 1,000,000 | | | | 993,736 | | | | | |
| HSBC USA, Inc.: | | | | | | | | | | | | |
| 1.651%, 08/07/2018 ∞ | | | 1,000,000 | | | | 999,168 | | | | | |
| 1.512%, 11/13/2019 ∞ | | | 250,000 | | | | 249,180 | | | | | |
| ING Bank NV: | | | | | | | | | | | | |
| 3.750%, 03/07/2017 (Acquired 08/19/2016, Cost $1,004,674) * f | | | 1,000,000 | | | | 1,004,229 | | | | | |
| 2.126%, 03/22/2019 (Acquired 05/26/2016, Cost $804,825) ∞ * f | | | 800,000 | | | | 810,119 | | | | | |
| JPMorgan Chase & Co.: | | | | | | | | | | | | |
| 2.000%, 08/15/2017 | | | 1,000,000 | | | | 1,003,706 | | | | | |
| Class 1, 1.520%, 01/28/2019 ∞ | | | 250,000 | | | | 250,803 | | | | | |
| 1.837%, 01/23/2020 ∞ | | | 1,000,000 | | | | 1,011,018 | | | | | |
| Kookmin Bank: | | | | | | | | | | | | |
| 1.761%, 01/27/2017 (Acquired 01/21/2014, Cost $250,000) ∞ * f | | | 250,000 | | | | 250,063 | | | | | |
| 1.625%, 07/14/2017 (Acquired 08/12/2016, Cost $1,503,184) * f | | | 1,500,000 | | | | 1,497,926 | | | | | |
| Macquarie Bank Ltd., | | | | | | | | | | | | |
| 1.787%, 03/24/2017 (Acquired 03/18/2014 through 09/17/2015, Cost $1,200,237) ∞ * f | | | 1,200,000 | | | | 1,201,319 | | | | | |
| Manufacturers & Traders Trust Co., | | | | | | | | | | | | |
| 6.625%, 12/04/2017 | | | 810,000 | | | | 845,605 | | | | | |
| MetLife, Inc., | | | | | | | | | | | | |
| Class A, 6.817%, 08/15/2018 | | | 105,000 | | | | 113,200 | | | | | |
| Mizuho Bank Ltd.: | | | | | | | | | | | | |
| 1.310%, 04/16/2017 (Acquired 04/09/2014, Cost $200,000) ∞ * f | | | 200,000 | | | | 200,101 | | | | | |
| 1.447%, 09/25/2017 (Acquired 09/18/2014 through 01/14/2015, Cost $799,361) ∞ * f | | | 800,000 | | | | 799,488 | | | | | |
| 1.637%, 03/26/2018 (Acquired 03/19/2015 through 03/14/2016, Cost $1,345,089) ∞ * f | | | 1,350,000 | | | | 1,350,167 | | | | | |
| 2.071%, 10/20/2018 (Acquired 10/13/2015, Cost $500,000) ∞ * f | | | 500,000 | | | | 502,541 | | | | | |
| Morgan Stanley: | | | | | | | | | | | | |
| 1.738%, 01/05/2018 ∞ | | | 500,000 | | | | 501,930 | | | | | |
| 1.732%, 01/24/2019 ∞ | | | 250,000 | | | | 251,560 | | | | | |
| 2.026%, 01/27/2020 ∞ | | | 500,000 | | | | 504,424 | | | | | |
| Nordea Bank AB, | | | | | | | | | | | | |
| 1.618%, 09/30/2019 (Acquired 09/22/2016, Cost $1,500,000) ∞ * f | | | 1,500,000 | | | | 1,500,411 | | | | | |
| Principal Life Global Funding II, | | | | | | | | | | | | |
| 1.125%, 02/24/2017 (Acquired 05/26/2016, Cost $1,000,230) * | | | 1,000,000 | | | | 999,952 | | | | | |
| Royal Bank of Canada, | | | | | | | | | | | | |
| 1.138%, 10/13/2017 ∞ f | | | 3,000,000 | | | | 2,998,983 | | | | | |
| Santander Bank NA, | | | | | | | | | | | | |
| 1.804%, 01/12/2018 ∞ | | | 1,400,000 | | | | 1,400,875 | | | | | |
| Santander UK PLC, | | | | | | | | | | | | |
| 1.375%, 03/13/2017 f | | | 500,000 | | | | 500,135 | | | | | |
| Societe Generale SA, | | | | | | | | | | | | |
| 2.078%, 10/01/2018 ∞ f | | | 1,500,000 | | | | 1,512,786 | | | | | |
| Standard Chartered PLC, | | | | | | | | | | | | |
| 1.520%, 04/17/2018 (Acquired 04/13/2015, Cost $1,200,000) ∞ * f | | | 1,200,000 | | | | 1,195,399 | | | | | |
| Sumitomo Mitsui Banking Corp.: | | | | | | | | | | | | |
| 1.460%, 01/16/2018 ∞ f | | | 300,000 | | | | 300,376 | | | | | |
| 1.622%, 07/23/2018 ∞ f | | | 1,350,000 | | | | 1,354,651 | | | | | |
| 1.548%, 10/19/2018 ∞ f | | | 1,000,000 | | | | 1,003,321 | | | | | |
| SunTrust Banks, Inc., | | | | | | | | | | | | |
| 6.000%, 09/11/2017 | | | 2,143,000 | | | | 2,207,149 | | | | | |
| Svenska Handelsbanken AB, | | | | | | | | | | | | |
| 1.483%, 06/17/2019 ∞ f | | | 850,000 | | | | 850,621 | | | | | |
| Swedbank AB, | | | | | | | | | | | | |
| 2.125%, 09/29/2017 (Acquired 08/30/2016, Cost $2,012,656) * f | | | 2,000,000 | | | | 2,009,596 | | | | | |
| Synchrony Financial: | | | | | | | | | | | | |
| 2.287%, 11/09/2017 ∞ | | | 1,000,000 | | | | 1,006,548 | | | | | |
| 2.111%, 02/03/2020 ∞ | | | 1,000,000 | | | | 988,684 | | | | | |
| The Bank of New York Mellon Corp., | | | | | | | | | | | | |
| 1.446%, 08/01/2018 ∞ | | | 1,000,000 | | | | 1,003,212 | | | | | |
| The Bank of Tokyo-Mitsubishi UFJ Ltd., | | | | | | | | | | | | |
| 1.363%, 03/10/2017 (Acquired 06/01/2016, Cost $500,044) ∞ * f | | | 500,000 | | | | 500,128 | | | | | |
| 1.261%, 09/08/2017 (Acquired 09/30/2014, Cost $998,890) ∞ * f | | | 1,000,000 | | | | 999,020 | | | | | |
| The Bear Stearns Companies LLC, | | | | | | | | | | | | |
| 6.400%, 10/02/2017 | | | 500,000 | | | | 517,973 | | | | | |
| The Goldman Sachs Group, Inc.: | | | | | | | | | | | | |
| 6.150%, 04/01/2018 | | | 1,000,000 | | | | 1,051,915 | | | | | |
| 2.006%, 11/15/2018 ∞ | | | 1,285,000 | | | | 1,297,215 | | | | | |
| The Hartford Financial Services Group, Inc., | | | | | | | | | | | | |
| 5.375%, 03/15/2017 | | | 1,750,000 | | | | 1,764,172 | | | | | |
| The Toronto-Dominion Bank, | | | | | | | | | | | | |
| 1.441%, 11/05/2019 ∞ f | | | 1,200,000 | | | | 1,201,472 | | | | | |
| UBS AG/Stamford CT: | | | | | | | | | | | | |
| 1.697%, 03/26/2018 ∞ f | | | 1,000,000 | | | | 1,003,326 | | | | | |
| 1.800%, 03/26/2018 f | | | 1,300,000 | | | | 1,300,898 | | | | | |
| UBS Group Funding Jersey Ltd., | | | | | | | | | | | | |
| 2.437%, 09/24/2020 (Acquired 09/21/2015, Cost $500,000) ∞ * f | | | 500,000 | | | | 505,791 | | | | | |
| Voya Financial, Inc., | | | | | | | | | | | | |
| 2.900%, 02/15/2018 | | | 1,000,000 | | | | 1,012,386 | | | | | |
| WEA Finance LLC / Westfield UK & Europe Finance PLC, | | | | | | | | | | | | |
| 1.750%, 09/15/2017 (Acquired 08/10/2016, Cost $1,403,829) * | | | 1,400,000 | | | | 1,400,871 | | | | | |
| Wells Fargo & Co.: | | | | | | | | | | | | |
| 5.625%, 12/11/2017 | | | 500,000 | | | | 518,380 | | | | | |
| Class N, 1.567%, 01/30/2020 ∞ | | | 1,000,000 | | | | 999,509 | | | | | |
| Westpac Banking Corp.: | | | | | | | | | | | | |
| 2.000%, 08/14/2017 f | | | 1,165,000 | | | | 1,170,098 | | | | | |
| 1.360%, 05/25/2018 ∞ f | | | 1,500,000 | | | | 1,500,980 | | | | | |
| | | | | | | | 87,226,406 | | | | 22.2 | % |
| Total Corporate Bonds | | | | | | | 160,267,914 | | | | 40.8 | % |
| Taxable Municipal Bonds | | | | | | | | | |
| City of Los Angeles Department of Airports, | | | | | | | | | |
| 5.175%, 05/15/2017 | | | 65,000 | | | | 65,733 | | | | |
| Kentucky Asset Liability Commission, | | | | | | | | | | | |
| 4.372%, 04/01/2017 | | | 1,200,000 | | | | 1,209,540 | | | | |
| Madison County Community Unit School District No. 12 Madison, | | | | | | | | | | | |
| 1.950%, 01/01/2017 | | | 200,000 | | | | 200,000 | | | | |
| Metropolitan Government Nashville & Davidson County Health & Educational Facilities, | | | | | | | | | | | |
| 1.750%, 07/01/2046 (Callable 1/31/2017) ∞ | | | 1,000,000 | | | | 1,000,000 | | | | |
| Montana Board of Investments, | | | | | | | | | | | |
| 0.520%, 03/01/2032 (Callable 03/01/2017) ∞ | | | 2,000,000 | | | | 1,997,760 | | | | |
| State of Illinois, | | | | | | | | | | | |
| 5.365%, 03/01/2017 | | | 1,260,000 | | | | 1,267,497 | | | | |
| | | | | | | | 5,740,530 | | | | 1.5 | % |
| Residential Mortgage-Backed Securities | | | | | | | | | | | | |
| U.S. Government Agency Issues | | | | | | | | | | | | |
| Federal Gold Loan Mortgage Corp. (FGLMC), | | | | | | | | | | | | |
| 5.000%, 12/01/2017 | | | 26,152 | | | | 26,793 | | | | | |
| Federal National Mortgage Association (FNMA): | | | | | | | | | | | | |
| 5.000%, 10/01/2017 | | | 19,556 | | | | 20,014 | | | | | |
| 5.000%, 11/01/2017 | | | 17,487 | | | | 17,896 | | | | | |
| 5.500%, 11/01/2017 | | | 37,860 | | | | 38,244 | | | | | |
| 5.000%, 12/01/2017 | | | 16,993 | | | | 17,390 | | | | | |
| 5.000%, 12/01/2019 | | | 301,906 | | | | 309,723 | | | | | |
| 4.500%, 04/01/2020 | | | 578,881 | | | | 595,784 | | | | | |
| 5.000%, 04/01/2020 | | | 588,101 | | | | 604,334 | | | | | |
| | | | | | | | 1,630,178 | | | | 0.4 | % |
| Non-U.S. Government Agency Issues | | | | | | | | | | | | |
| Aames Mortgage Investment Trust, | | | | | | | | | | | | |
| Series 2006-1, Class A3, 1.076%, 04/25/2036 ∞ | | | 503,118 | | | | 495,092 | | | | | |
| Accredited Mortgage Loan Trust: | | | | | | | | | | | | |
| Series 2005-4, Class A2D, 1.076%, 12/25/2035 ∞ | | | 658,749 | | | | 638,321 | | | | | |
| Series 2006-2, Class A3, 0.906%, 09/25/2036 ∞ | | | 376,877 | | | | 375,322 | | | | | |
| ACE Securities Corp. Home Equity Loan Trust: | | | | | | | | | | | | |
| Series 2006-HE1, Class A1B1, 0.946%, 02/25/2036 ∞ | | | 324,395 | | | | 321,276 | | | | | |
| Series 2006-HE1, Class A1A, 0.956%, 02/25/2036 ∞ | | | 122,496 | | | | 121,952 | | | | | |
| Banc of America Alternative Loan Trust, | | | | | | | | | | | | |
| Series 2004-1, Class 5A2, 5.500%, 02/25/2019 | | | 22,796 | | | | 23,071 | | | | | |
| Carrington Mortgage Loan Trust Series 2006-RFC1, | | | | | | | | | | | | |
| Series 2006-RFC1, Class A3, 0.906%, 05/25/2036 ∞ | | | 1,442,221 | | | | 1,421,441 | | | | | |
| CWABS Asset-Backed Certificates Trust, | | | | | | | | | | | | |
| Series 2006-14, Class 2A2, 0.906%, 02/25/2037 ∞ | | | 1,352,742 | | | | 1,327,836 | | | | | |
| HSI Asset Securitization Corp. Trust, | | | | | | | | | | | | |
| Series 2007-WF1, Class 2A3, 0.926%, 05/25/2037 ∞ | | | 371,591 | | | | 358,254 | | | | | |
| J.P. Morgan Mortgage Acquisition Trust: | | | | | | | | | | | | |
| Series 2006-NC1, Class A4, 0.754%, 04/25/2036 ∞ | | | 663,174 | | | | 653,719 | | | | | |
| Series 2007-CH3, Class A3, 0.906%, 03/25/2037 ∞ | | | 414,052 | | | | 412,555 | | | | | |
| Long Beach Mortgage Loan Trust: | | | | | | | | | | | | |
| Series 2005-WL2, Class M1, 1.461%, 08/25/2035 ∞ | | | 769,394 | | | | 765,253 | | | | | |
| Series 2006-WL2, Class 2A3, 0.956%, 01/25/2036 ∞ | | | 24,104 | | | | 23,828 | | | | | |
| MASTR Alternative Loan Trust, | | | | | | | | | | | | |
| Series 2004-13, Class 8A1, 5.500%, 01/25/2025 | | | 75,214 | | | | 75,127 | | | | | |
| MASTR Asset Backed Securities Trust, | | | | | | | | | | | | |
| Series 2006-AB1, Class A2, 0.986%, 02/25/2036 ∞ | | | 360,801 | | | | 359,511 | | | | | |
| Merrill Lynch Mortgage Investors Trust, | | | | | | | | | | | | |
| Series 2006-FF1, Class A1, 0.861%, 08/25/2036 ∞ | | | 153,486 | | | | 153,416 | | | | | |
| Morgan Stanley ABS Capital I, Inc. Trust, | | | | | | | | | | | | |
| Series 2006-HE3, Class A2C, 0.916%, 04/25/2036 ∞ | | | 1,452,115 | | | | 1,447,126 | | | | | |
| Nationstar Home Equity Loan Trust, | | | | | | | | | | | | |
| Series 2007-C, Class 2AV2, 0.886%, 06/25/2037 ∞ | | | 17,846 | | | | 17,751 | | | | | |
| Park Place Securities, Inc., | | | | | | | | | | | | |
| Series 2005-WCW1, Class M1, 1.206%, 09/25/2035 ∞ | | | 497,280 | | | | 494,188 | | | | | |
| RASC Series Trust: | | | | | | | | | | | | |
| Series 2003-KS2, Class AI6, 3.990%, 04/25/2033 ∞ | | | 20,514 | | | | 20,491 | | | | | |
| Series 2006-EMX2, Class A2, 0.956%, 02/25/2036 ∞ | | | 59,659 | | | | 59,596 | | | | | |
| Series 2006-KS1, Class A4, 1.056%, 02/25/2036 ∞ | | | 196,461 | | | | 194,656 | | | | | |
| Saxon Asset Securities Trust, | | | | | | | | | | | | |
| Series 2006-1, Class A2C, 1.076%, 03/25/2036 ∞ | | | 697,541 | | | | 688,525 | | | | | |
| Soundview Home Loan Trust: | | | | | | | | | | | | |
| Series 2005-OPT4, Class 2A3, 1.016%, 12/25/2035 ∞ | | | 831,096 | | | | 822,250 | | | | | |
| Series 2006-2, Class A4, 1.026%, 03/25/2036 ∞ | | | 213,530 | | | | 212,216 | | | | | |
| Series 2006-WF2, Class A2C, 0.896%, 12/25/2036 ∞ | | | 357,288 | | | | 356,748 | | | | | |
| | | | | | | | 11,839,521 | | | | 3.0 | % |
| Commercial Mortgage-Backed Securities | | | | | | | | | | | | |
| U.S. Government Agency Issues | | | | | | | | | | | | |
| Fannie Mae REMIC Trust: | | | | | | | | | | | | |
| Series 2012-M9, Class ASQ2, 1.513%, 12/25/2017 | | | 2,991,716 | | | | 2,996,029 | | | | | |
| Series 2015-M1, Class ASQ2, 1.626%, 02/25/2018 | | | 1,539,018 | | | | 1,542,675 | | | | | |
| Freddie Mac Multifamily Structured Pass Through Certificates: | | | | | | | | | | | | |
| Series K502, Class A2, 1.426%, 08/25/2017 | | | 458,060 | | | | 458,373 | | | | | |
| Series K701, Class A2, 3.882%, 11/25/2017 ∞ | | | 2,045,000 | | | | 2,080,145 | | | | | |
| Series K702, Class A2, 3.154%, 02/25/2018 | | | 2,031,037 | | | | 2,061,234 | | | | | |
| Series K703, Class A2, 2.699%, 05/25/2018 | | | 1,084,634 | | | | 1,099,743 | | | | | |
| Series K008, Class A1, 2.746%, 12/25/2019 | | | 1,986,201 | | | | 2,006,315 | | | | | |
| Series K009, Class A1, 2.757%, 05/25/2020 | | | 2,132,019 | | | | 2,150,930 | | | | | |
| | | | | | | | 14,395,444 | | | | 3.7 | % |
| Other Asset Backed Securities | | | | | | | | | | | | |
| Ally Auto Receivables Trust, | | | | | | | | | | | | |
| Series 2014-2, Class A3, 1.250%, 04/15/2019 | | | 2,034,304 | | | | 2,035,101 | | | | | |
| American Express Credit Account Master Trust, | | | | | | | | | | | | |
| Series 2014-2, Class A, 1.260%, 01/15/2020 | | | 4,630,000 | | | | 4,632,929 | | | | | |
| BMW Vehicle Lease Trust, | | | | | | | | | | | | |
| Series 2015-1, Class A4, 1.340%, 06/20/2018 | | | 1,925,000 | | | | 1,926,631 | | | | | |
| California Republic Auto Receivables Trust: | | | | | | | | | | | | |
| Series 2014-3, Class A3, 1.090%, 11/15/2018 | | | 204,403 | | | | 204,396 | | | | | |
| Series 2015-3, Class A3, 1.620%, 11/15/2019 | | | 3,160,000 | | | | 3,165,254 | | | | | |
| Capital Auto Receivables Asset Trust: | | | | | | | | | | | | |
| Series 2015-3, Class A1A, 1.390%, 02/20/2018 (Acquired 06/02/2016, cost $339,390) * | | | 339,270 | | | | 339,394 | | | | | |
| Series 2014-1, Class A3, 1.320%, 06/20/2018 | | | 415,805 | | | | 415,830 | | | | | |
| Series 2016-3, Class A2A, 1.360%, 04/22/2019 | | | 1,000,000 | | | | 1,000,455 | | | | | |
| Capital One Multi-Asset Execution Trust: | | | | | | | | | | | | |
| Series 2014-A2, Class A2, 1.260%, 01/15/2020 | | | 3,280,000 | | | | 3,281,822 | | | | | |
| Series 2007-A7, Class A7, 5.750%, 07/15/2020 | | | 3,000,000 | | | | 3,096,200 | | | | | |
| Carmax Auto Owner Trust: | | | | | | | | | | | | |
| Series 2013-2, Class A4, 0.840%, 11/15/2018 | | | 1,104,949 | | | | 1,103,553 | | | | | |
| Series 2014-3, 1.160%, 06/17/2019 | | | 2,007,432 | | | | 2,006,454 | | | | | |
| Series 2014-4, Class A3, 1.250%, 11/15/2019 | | | 1,026,043 | | | | 1,025,695 | | | | | |
| Chase Issuance Trust: | | | | | | | | | | | | |
| Series 2014-A1, Class A1, 1.150%, 01/15/2019 | | | 2,593,000 | | | | 2,593,008 | | | | | |
| Series 2014-A6, Class A6, 1.260%, 07/15/2019 | | | 2,100,000 | | | | 2,101,287 | | | | | |
| Citibank Credit Card Issuance Trust: | | | | | | | | | | | | |
| Series 2014-A2, Class A2, 1.020%, 02/22/2019 | | | 2,984,000 | | | | 2,983,885 | | | | | |
| Series 2014-A4, Class A4, 1.230%, 04/24/2019 | | | 2,000,000 | | | | 2,000,800 | | | | | |
| Conseco Financial Corp., | | | | | | | | | | | | |
| Series 1998-4, Class A6, 6.530%, 04/01/2030 ∞ | | | 541,069 | | | | 575,087 | | | | | |
| Dell Equipment Finance Trust: | | | | | | | | | | | | |
| Series 2015-1, Class A2, 1.010%, 07/24/2017 (Acquired 04/15/2015 through 10/26/2016, Cost $160,375) * | | | 160,387 | | | | 160,365 | | | | | |
| Series 2015-1, Class A3, 1.300%, 03/23/2020 (Acquired 07/06/2016, Cost $1,149,910) * | | | 1,150,000 | | | | 1,150,255 | | | | | |
| Discover Card Execution Note Trust, | | | | | | | | | | | | |
| Series 2014-A3, Class A3, 1.220%, 10/15/2019 | | | 3,000,000 | | | | 3,001,010 | | | | | |
| Enterprise Fleet Financing LLC, | | | | | | | | | | | | |
| Series 2015-2, Class A2, 1.590%, 02/22/2021 (Acquired 08/23/2016 through 12/19/2016, Cost $2,802,871) * | | | 2,802,274 | | | | 2,800,718 | | | | | |
| Ford Credit Auto Lease Trust, | | | | | | | | | | | | |
| Series 2015-A, Class A4, 1.310%, 08/15/2018 | | | 2,450,000 | | | | 2,451,068 | | | | | |
| Ford Credit Floorplan Master Owner Trust: | | | | | | | | | | | | |
| Series 2012-2, Class A, 1.920%, 01/15/2019 | | | 680,000 | | | | 680,181 | | | | | |
| Series 2014-1, Class A1, 1.200%, 02/15/2019 | | | 2,500,000 | | | | 2,500,118 | | | | | |
| GM Financial Automobile Leasing Trust: | | | | | | | | | | | | |
| Series 2014-2A, Class A3, 1.220%, 01/22/2018 (Acquired 04/05/2016, Cost $302,425) * | | | 302,392 | | | | 302,453 | | | | | |
| Series 2015-1, Class A3, 1.530%, 09/20/2018 | | | 905,000 | | | | 906,223 | | | | | |
| Golden Credit Card Trust, | | | | | | | | | | | | |
| Series 2012-2A, Class A1, 1.770%, 01/15/2019 (Acquired 09/26/2016 through 09/30/2016, Cost $4,001,306) * | | | 4,000,000 | | | | 4,001,128 | | | | | |
| Harley-Davidson Motorcycle Trust: | | | | | | | | | | | | |
| Series 2014-1, Class A3, 1.100%, 09/15/2019 | | | 1,265,222 | | | | 1,265,059 | | | | | |
| Series 2015-1, Class A3, 1.410%, 06/15/2020 | | | 1,750,000 | | | | 1,751,111 | | | | | |
| Honda Auto Receivables Owner Trust, | | | | | | | | | | | | |
| Series 2016-1, Class A2, 1.010%, 06/18/2018 | | | 1,575,162 | | | | 1,574,639 | | | | | |
| Hyundai Auto Lease Securitization Trust, | | | | | | | | | | | | |
| Series 2015-A, Class A3, 1.420%, 09/17/2018 (Acquired 09/26/2016 through 11/04/2016, Cost $2,046,396) * | | | 2,043,137 | | | | 2,045,940 | | | | | |
| Kubota Credit Owner Trust, | | | | | | | | | | | | |
| Series 2015-1A, Class A3, 1.540%, 03/15/2019 (Acquired 07/21/2016, Cost $1,101,798) * | | | 1,100,000 | | | | 1,101,469 | | | | | |
| Leaf Receivables Funding 10 LLC, | | | | | | | | | | | | |
| Series 2015-1, Class A3, 1.490%, 03/15/2018 (Acquired 04/23/2015, Cost $665,539) * | | | 665,661 | | | | 665,049 | | | | | |
| Master Credit Card Trust II, | | | | | | | | | | | | |
| Series 2016-1A, Class A, 1.494%, 09/23/2019 (Acquired 04/11/2016, Cost $1,050,000) ∞ * | | | 1,050,000 | | | | 1,054,119 | | | | | |
| Mercedes Benz Auto Lease Trust, | | | | | | | | | | | | |
| Series 2015-A, Class A4, 1.210%, 10/15/2020 | | | 2,000,000 | | | | 2,000,129 | | | | | |
| MMAF Equipment Finance LLC: | | | | | | | | | | | | |
| Series 2016-AA, Class A2, 1.390%, 12/17/2018 (Acquired 10/26/2016 through 11/14/2016, Cost $3,302,311) * | | | 3,300,000 | | | | 3,301,181 | | | | | |
| Series 2011-AA, Class A5, 3.040%, 08/15/2028 (Acquired 09/22/2016 through 12/30/2016, Cost $2,446,093) * | | | 2,429,077 | | | | 2,443,641 | | | | | |
| Nissan Auto Receivables Owner Trust, | | | | | | | | | | | | |
| Series 2013-A, Class A4, 0.750%, 07/15/2019 | | | 149,873 | | | | 149,782 | | | | | |
| OneMain Financial Issuance Trust, | | | | | | | | | | | | |
| Series 2014-2A, Class A, 2.470%, 09/18/2024 (Acquired 02/05/2016, Cost $423,800) * | | | 425,129 | | | | 425,304 | | | | | |
| Springleaf Funding Trust, | | | | | | | | | | | | |
| Series 2014-AA, Class A, 2.410%, 12/15/2022 (Acquired 05/13/2015 through 07/28/2015, Cost $384,711) * | | | 383,724 | | | | 383,865 | | | | | |
| Synchrony Credit Card Master Note Trust: | | | | | | | | | | | | |
| Series 2012-3, Class A, 1.154%, 03/15/2020 ∞ | | | 1,025,000 | | | | 1,025,278 | | | | | |
| Series 2012-6, Class A, 1.360%, 08/17/2020 | | | 3,150,000 | | | | 3,151,757 | | | | | |
| Toyota Auto Receivables Owner Trust: | | | | | | | | | | | | |
| Series 2016-B, Class A2A, 1.020%, 10/15/2018 | | | 2,000,000 | | | | 1,998,825 | | | | | |
| Series 2013-B, Class A4, 1.460%, 01/15/2019 | | | 1,046,843 | | | | 1,047,968 | | | | | |
| Series 2015-A, Class A3, 1.120%, 02/15/2019 | | | 802,025 | | | | 801,598 | | | | | |
| Wheels SPV 2 LLC, | | | | | | | | | | | | |
| Series 2014-1A, Class A2, 0.840%, 03/20/2023 (Acquired 07/28/2016 through 11/21/2016, Cost $1,125,593) * | | | 1,126,878 | | | | 1,126,179 | | | | | |
| | | | | | | | 79,754,193 | | | | 20.3 | % |
| Total Long-Term Investments (Cost $381,069,633) | | | | | | | 381,200,518 | | | | 97.1 | % |
| | | | | | | | | | | | | |
| SHORT-TERM INVESTMENTS | | | | | | | | | | | | |
| Certificate of Deposit | | | | | | | | | | | | |
| Federal Home Loan Bank Discount Notes | | | 845,000 | | | | 844,390 | | | | | |
| Total Certificate of Deposit (Cost $845,000) | | | | | | | 844,390 | | | | 0.2 | % |
| Money Market Mutual Fund | | Shares | | | | | | | | | |
| Fidelity Institutional Money Market Fund - Government Portfolio, Institutional Class, 0.43% « | | | 4,876,398 | | | | 4,876,398 | | | | | |
| Total Money Market Mutual Fund (Cost $4,876,398) | | | | | | | 4,876,398 | | | | 1.3 | % |
| Total Short-Term Investments (Cost $5,720,775) | | | | | | | 5,720,788 | | | | 1.5 | % |
| Total Investments (Cost $386,790,408) | | | | | | | 386,921,306 | | | | 98.6 | % |
| Other Assets in Excess of Liabilities | | | | | | | 5,583,568 | | | | 1.4 | % |
| TOTAL NET ASSETS | | | | | | $ | 392,504,874 | | | | 100.0 | % |
Notes to Schedule of Investments |
| ∞ | Variable or Floating rate security. Floating rate securities are securities whose yields vary with a designated index rate. These securities' rates are as of December 31, 2016. |
| * | Restricted security as defined in Rule 144(a) under the Securities Act of 1933 and determined to be liquid. Purchased in a private placement transaction; resale to the public may require registration or or may extend only to qualified institutional buyers. At December 31, 2016, the value of these securities total $59,575,084, which represents 15.18% of total net assets. |
| « | 7-Day Yield |
| f | Foreign Security |
| Baird Short-Term Bond Fund | | | | | | | | | |
| Schedule of Investments | | | | | | | | | |
| December 31, 2016 | | | | | | | | | |
| | | | | | | | | | |
| | | Principal | | | | | | % of | |
| | | Amount | | | Value | | | Net Assets | |
| LONG-TERM INVESTMENTS | | | | | | | | | |
| U.S. Treasury Securities | | | | | | | | | |
| U.S. Treasury Bonds: | | | | | | | | | |
| 2.625%, 08/15/2020 | | $ | 258,775,000 | | | $ | 267,569,210 | | | | |
| 1.375%, 08/31/2020 | | | 330,000,000 | | | | 326,570,970 | | | | |
| 2.000%, 08/31/2021 | | | 67,000,000 | | | | 67,266,928 | | | | |
| | | | | | | | 661,407,108 | | | | 17.1 | % |
| Other Government Related Securities | | | | | | | | | | | | |
| CNOOC Finance (2013) Ltd., | | | | | | | | | | | | |
| 1.750%, 05/09/2018 f | | | 1,000,000 | | | | 994,751 | | | | | |
| CNOOC Nexen Finance (2014) ULC, | | | | | | | | | | | | |
| 1.625%, 04/30/2017 f | | | 5,000,000 | | | | 4,995,300 | | | | | |
| CNPC General Capital Ltd., | | | | | | | | | | | | |
| 1.802%, 05/14/2017 (Acquired 05/07/2014, Cost $4,750,000) ∞ * f | | | 4,750,000 | | | | 4,752,479 | | | | | |
| Corp Andina de Fomento, | | | | | | | | | | | | |
| 5.750%, 01/12/2017 f | | | 250,000 | | | | 250,203 | | | | | |
| Electricite de France SA: | | | | | | | | | | | | |
| 1.341%, 01/20/2017 (Acquired 01/13/2014, Cost $9,750,000) ∞ * f | | | 9,750,000 | | | | 9,750,790 | | | | | |
| 4.600%, 01/27/2020 (Acquired 11/22/2016, Cost $3,122,331) * f | | | 2,926,000 | | | | 3,104,331 | | | | | |
| Export-Import Bank of Korea, | | | | | | | | | | | | |
| 1.631%, 01/17/2017 ∞ f | | | 1,570,000 | | | | 1,570,166 | | | | | |
| Korea Expressway Corp., | | | | | | | | | | | | |
| 1.625%, 04/28/2017 (Acquired 06/23/2014, Cost $3,989,480) * f | | | 4,000,000 | | | | 3,997,708 | | | | | |
| Korea Hydro & Nuclear Power Co. Ltd., | | | | | | | | | | | | |
| 2.875%, 10/02/2018 (Acquired 09/25/2013, Cost $2,982,150) * f | | | 3,000,000 | | | | 3,048,306 | | | | | |
| Nexen Energy ULC, | | | | | | | | | | | | |
| 6.200%, 07/30/2019 f | | | 2,065,000 | | | | 2,244,678 | | | | | |
| Petroleos Mexicanos: | | | | | | | | | | | | |
| 5.500%, 02/04/2019 (Acquired 01/28/2016, Cost $3,200,000) * f | | | 3,200,000 | | | | 3,314,848 | | | | | |
| 8.000%, 05/03/2019 f | | | 5,000,000 | | | | 5,487,500 | | | | | |
| Sinopec Group Overseas Development [2014] Ltd., | | | | | | | | | | | | |
| 1.750%, 04/10/2017 (Acquired 04/02/2014, Cost $6,984,110) * f | | | 7,000,000 | | | | 6,997,704 | | | | | |
| Sinopec Group Overseas Development [2015] Ltd., | | | | | | | | | | | | |
| 2.500%, 04/28/2020 (Acquired 04/21/2015, Cost $2,987,280) * f | | | 3,000,000 | | | | 2,980,113 | | | | | |
| Sinopec Group Overseas Development [2016] Ltd.: | | | | | | | | | | | | |
| 2.125%, 05/03/2019 (Acquired 04/25/2016, Cost $6,982,640) * f | | | 7,000,000 | | | | 6,972,980 | | | | | |
| 1.750%, 09/29/2019 (Acquired 09/22/2016, Cost $2,365,761) * f | | | 2,375,000 | | | | 2,336,140 | | | | | |
| The Korea Development Bank: | | | | | | | | | | | | |
| 1.507%, 01/23/2017 ∞ f | | | 5,000,000 | | | | 4,999,720 | | | | | |
| 3.875%, 05/04/2017 f | | | 2,350,000 | | | | 2,366,802 | | | | | |
| 3.000%, 03/17/2019 f | | | 2,475,000 | | | | 2,525,780 | | | | | |
| | | | | | | | 72,690,299 | | | | 1.9 | % |
| Corporate Bonds | | | | | | | | | | | | |
| Industrials | | | | | | | | | | | | |
| 21st Century Fox America, Inc., | | | | | | | | | | | | |
| 6.900%, 03/01/2019 | | | 9,225,000 | | | | 10,132,140 | | | | | |
| A.P. Meoller - Maersk A/S, | | | | | | | | | | | | |
| 2.550%, 09/22/2019 (Acquired 09/15/2014, Cost $4,540,672) * f | | | 4,550,000 | | | | 4,531,559 | | | | | |
| Abbott Laboratories, | | | | | | | | | | | | |
| 2.350%, 11/22/2019 | | | 14,125,000 | | | | 14,141,653 | | | | | |
| AbbVie, Inc., | | | | | | | | | | | | |
| 1.800%, 05/14/2018 | | | 9,450,000 | | | | 9,457,097 | | | | | |
| Actavis Funding SCS: | | | | | | | | | | | | |
| 2.450%, 06/15/2019 f | | | 3,000,000 | | | | 3,012,702 | | | | | |
| 2.208%, 03/12/2020 ∞ f | | | 1,000,000 | | | | 1,019,147 | | | | | |
| 3.000%, 03/12/2020 f | | | 3,900,000 | | | | 3,954,066 | | | | | |
| ACTAVIS, Inc., | | | | | | | | | | | | |
| 1.875%, 10/01/2017 | | | 1,392,000 | | | | 1,394,660 | | | | | |
| Agrium, Inc., | | | | | | | | | | | | |
| 7.700%, 02/01/2017 f | | | 5,000,000 | | | | 5,017,515 | | | | | |
| Alibaba Group Holding Ltd., | | | | | | | | | | | | |
| 1.457%, 11/28/2017 ∞ f | | | 2,500,000 | | | | 2,496,465 | | | | | |
| Altera Corp., | | | | | | | | | | | | |
| 2.500%, 11/15/2018 | | | 3,000,000 | | | | 3,051,807 | | | | | |
| Amgen, Inc.: | | | | | | | | | | | | |
| 1.296%, 05/22/2017 ∞ | | | 2,750,000 | | | | 2,752,890 | | | | | |
| 5.700%, 02/01/2019 | | | 10,000,000 | | | | 10,748,110 | | | | | |
| Anadarko Petroleum Corp., | | | | | | | | | | | | |
| 8.700%, 03/15/2019 | | | 2,970,000 | | | | 3,375,307 | | | | | |
| Anheuser-Busch InBev Finance, Inc., | | | | | | | | | | | | |
| 1.900%, 02/01/2019 | | | 11,425,000 | | | | 11,441,395 | | | | | |
| Anheuser-Busch InBev Worldwide, Inc.: | | | | | | | | | | | | |
| 1.576%, 08/01/2018 ∞ | | | 9,400,000 | | | | 9,457,725 | | | | | |
| 7.750%, 01/15/2019 | | | 6,000,000 | | | | 6,683,208 | | | | | |
| AT&T, Inc.: | | | | | | | | | | | | |
| 5.800%, 02/15/2019 | | | 3,000,000 | | | | 3,225,684 | | | | | |
| 2.300%, 03/11/2019 | | | 9,682,000 | | | | 9,719,121 | | | | | |
| 1.928%, 06/30/2020 ∞ | | | 4,000,000 | | | | 4,021,696 | | | | | |
| 2.800%, 02/17/2021 | | | 4,025,000 | | | | 3,993,029 | | | | | |
| Baxalta, Inc.: | | | | | | | | | | | | |
| 1.776%, 06/22/2018 ∞ | | | 3,500,000 | | | | 3,500,864 | | | | | |
| 2.000%, 06/22/2018 | | | 9,200,000 | | | | 9,200,488 | | | | | |
| Beam Suntory, Inc., | | | | | | | | | | | | |
| 1.875%, 05/15/2017 | | | 8,000,000 | | | | 8,011,448 | | | | | |
| Bemis Co., Inc., | | | | | | | | | | | | |
| 6.800%, 08/01/2019 | | | 9,075,000 | | | | 10,037,540 | | | | | |
| Boardwalk Pipelines LP, | | | | | | | | | | | | |
| 5.500%, 02/01/2017 | | | 17,884,000 | | | | 17,931,643 | | | | | |
| Boston Scientific Corp.: | | | | | | | | | | | | |
| 5.125%, 01/12/2017 | | | 3,500,000 | | | | 3,502,660 | | | | | |
| 2.650%, 10/01/2018 | | | 7,077,000 | | | | 7,154,613 | | | | | |
| BP Capital Markets PLC: | | | | | | | | | | | | |
| 1.392%, 05/10/2018 ∞ f | | | 1,575,000 | | | | 1,577,670 | | | | | |
| 1.627%, 09/26/2018 ∞ f | | | 7,085,000 | | | | 7,111,930 | | | | | |
| Bunge Limited Finance Corp.: | | | | | | | | | | | | |
| 3.200%, 06/15/2017 | | | 500,000 | | | | 503,764 | | | | | |
| 8.500%, 06/15/2019 | | | 10,255,000 | | | | 11,748,682 | | | | | |
| Bunge NA Finance LP, | | | | | | | | | | | | |
| 5.900%, 04/01/2017 | | | 5,635,000 | | | | 5,683,484 | | | | | |
| Celgene Corp., | | | | | | | | | | | | |
| 2.125%, 08/15/2018 | | | 6,500,000 | | | | 6,526,104 | | | | | |
| CF Industries, Inc., | | | | | | | | | | | | |
| 6.875%, 05/01/2018 | | | 19,412,000 | | | | 20,433,848 | | | | | |
| Charter Communications Operating LLC / Charter Communications Operating Capital, | | | | | | | | | | | | |
| 3.579%, 07/23/2020 | | | 3,000,000 | | | | 3,060,705 | | | | | |
| Chevron Phillips Chemical Co. LLC / Chevron Phillips Chemical Co. LP, | | | | | | | | | | | | |
| 1.636%, 05/01/2020 (Acquired 05/07/2015, Cost $5,050,000) ∞ * | | | 5,050,000 | | | | 5,001,126 | | | | | |
| Coca-Cola FEMSA SAB de CV, | | | | | | | | | | | | |
| 2.375%, 11/26/2018 f | | | 4,000,000 | | | | 4,027,780 | | | | | |
| Columbia Pipeline Group, Inc., | | | | | | | | | | | | |
| 2.450%, 06/01/2018 | | | 7,000,000 | | | | 7,034,209 | | | | | |
| Cox Communications, Inc.: | | | | | | | | | | | | |
| 6.250%, 06/01/2018 (Acquired 06/24/2015, Cost $9,496,805) * | | | 9,000,000 | | | | 9,496,089 | | | | | |
| 9.375%, 01/15/2019 (Acquired 02/10/2015 through 01/07/2016, Cost $1,011,335) * | | | 899,000 | | | | 1,015,619 | | | | | |
| Crane Co., | | | | | | | | | | | | |
| 2.750%, 12/15/2018 | | | 7,585,000 | | | | 7,679,812 | | | | | |
| CSX Corp., | | | | | | | | | | | | |
| 7.900%, 05/01/2017 | | | 2,221,000 | | | | 2,268,065 | | | | | |
| CVS Health Corp.: | | | | | | | | | | | | |
| 2.800%, 07/20/2020 | | | 6,725,000 | | | | 6,823,219 | | | | | |
| 2.125%, 06/01/2021 | | | 5,000,000 | | | | 4,902,720 | | | | | |
| Daimler Finance North America LLC: | | | | | | | | | | | | |
| 1.303%, 03/10/2017 (Acquired 03/03/2014, Cost $2,000,000) ∞ * | | | 2,000,000 | | | | 2,000,788 | | | | | |
| 1.226%, 08/01/2017 (Acquired 07/24/2014 through 11/10/2015, Cost $2,698,285) ∞ * | | | 2,700,000 | | | | 2,702,006 | | | | | |
| 1.591%, 08/03/2017 (Acquired 08/09/2016, Cost $6,009,331) ∞ * | | | 6,000,000 | | | | 6,015,696 | | | | | |
| 1.354%, 03/02/2018 (Acquired 08/05/2015, Cost $747,094) ∞ * | | | 750,000 | | | | 751,160 | | | | | |
| 1.746%, 08/01/2018 (Acquired 11/14/2014, Cost $2,010,520) ∞ * | | | 2,000,000 | | | | 2,012,436 | | | | | |
| 1.500%, 07/05/2019 (Acquired 09/30/2016, Cost $5,676,288) * | | | 5,700,000 | | | | 5,608,088 | | | | | |
| DCP Midstream Operating LP, | | | | | | | | | | | | |
| 2.500%, 12/01/2017 | | | 400,000 | | | | 398,000 | | | | | |
| Deutsche Telekom International Finance BV, | | | | | | | | | | | | |
| 6.750%, 08/20/2018 f | | | 3,900,000 | | | | 4,205,514 | | | | | |
| Diamond 1 Finance Corp. / Diamond 2 Finance Corp., | | | | | | | | | | | | |
| 3.480%, 06/01/2019 (Acquired 05/17/2016 through 10/07/2016, Cost $18,556,894) * | | | 18,535,000 | | | | 18,920,639 | | | | | |
| Dollar General Corp., | | | | | | | | | | | | |
| 4.125%, 07/15/2017 | | | 17,321,000 | | | | 17,572,328 | | | | | |
| Eaton Corp., | | | | | | | | | | | | |
| 1.500%, 11/02/2017 f | | | 5,000,000 | | | | 5,004,160 | | | | | |
| Ecolab, Inc., | | | | | | | | | | | | |
| 2.000%, 01/14/2019 | | | 14,250,000 | | | | 14,260,944 | | | | | |
| El Paso Natural Gas Co. LLC, | | | | | | | | | | | | |
| 5.950%, 04/15/2017 | | | 2,050,000 | | | | 2,073,044 | | | | | |
| Enable Midstream Partners LP, | | | | | | | | | | | | |
| 2.400%, 05/15/2019 | | | 3,000,000 | | | | 2,945,394 | | | | | |
| Enbridge, Inc., | | | | | | | | | | | | |
| 5.600%, 04/01/2017 f | | | 5,125,000 | | | | 5,177,649 | | | | | |
| Energy Transfer Partners LP: | | | | | | | | | | | | |
| 6.125%, 02/15/2017 | | | 645,000 | | | | 648,342 | | | | | |
| 2.500%, 06/15/2018 | | | 4,000,000 | | | | 4,014,660 | | | | | |
| 9.700%, 03/15/2019 | | | 6,994,000 | | | | 8,027,594 | | | | | |
| 4.150%, 10/01/2020 | | | 5,500,000 | | | | 5,695,476 | | | | | |
| Enterprise Products Operating LLC: | | | | | | | | | | | | |
| 6.650%, 04/15/2018 | | | 5,000,000 | | | | 5,301,895 | | | | | |
| 1.650%, 05/07/2018 | | | 2,000,000 | | | | 1,994,382 | | | | | |
| ERAC USA Finance LLC, | | | | | | | | | | | | |
| 2.350%, 10/15/2019 (Acquired 01/21/2015 through 10/26/2016, Cost $19,143,622) * | | | 19,000,000 | | | | 18,983,128 | | | | | |
| Express Scripts Holding Co., | | | | | | | | | | | | |
| 2.250%, 06/15/2019 | | | 2,157,000 | | | | 2,156,756 | | | | | |
| Exxon Mobil Corp., | | | | | | | | | | | | |
| 1.708%, 03/01/2019 | | | 8,000,000 | | | | 8,017,288 | | | | | |
| Federal Express Corp. 1998 Pass Through Trust, | | | | | | | | | | | | |
| Class 981B, 6.845%, 01/15/2019 | | | 2,262,717 | | | | 2,343,496 | | | | | |
| Federal Express Corp. 2012 Pass Through Trust, | | | | | | | | | | | | |
| 2.625%, 01/15/2018 (Acquired 01/20/2012 through 08/19/2015, Cost $658,620) * | | | 657,116 | | | | 659,259 | | | | | |
| FedEx Corp., | | | | | | | | | | | | |
| 2.300%, 02/01/2020 | | | 2,000,000 | | | | 2,002,352 | | | | | |
| Fidelity National Information Services, Inc.: | | | | | | | | | | | | |
| 1.450%, 06/05/2017 | | | 3,000,000 | | | | 3,001,188 | | | | | |
| 2.000%, 04/15/2018 | | | 2,295,000 | | | | 2,301,995 | | | | | |
| 2.850%, 10/15/2018 | | | 11,640,000 | | | | 11,842,455 | | | | | |
| 3.625%, 10/15/2020 | | | 3,000,000 | | | | 3,105,804 | | | | | |
| Fiserv, Inc., | | | | | | | | | | | | |
| 2.700%, 06/01/2020 | | | 3,500,000 | | | | 3,516,901 | | | | | |
| Ford Motor Credit Co. LLC: | | | | | | | | | | | | |
| 6.625%, 08/15/2017 | | | 9,100,000 | | | | 9,376,931 | | | | | |
| 1.724%, 12/06/2017 | | | 1,250,000 | | | | 1,249,055 | | | | | |
| 2.021%, 05/03/2019 | | | 7,000,000 | | | | 6,935,768 | | | | | |
| 1.897%, 08/12/2019 | | | 10,000,000 | | | | 9,838,980 | | | | | |
| Forest Laboratories, Inc., | | | | | | | | | | | | |
| 4.375%, 02/01/2019 (Acquired 08/13/2014 through 04/29/2015, Cost $10,013,548) * | | | 9,675,000 | | | | 10,053,660 | | | | | |
| Fortive Corp., | | | | | | | | | | | | |
| 1.800%, 06/15/2019 (Acquired 06/06/2016, Cost $4,645,025) * | | | 4,650,000 | | | | 4,621,082 | | | | | |
| Freeport-McMoRan, Inc.: | | | | | | | | | | | | |
| 2.150%, 03/01/2017 | | | 2,000,000 | | | | 1,987,500 | | | | | |
| 2.300%, 11/14/2017 | | | 11,469,000 | | | | 11,382,982 | | | | | |
| General Motors Financial Co., Inc.: | | | | | | | | | | | | |
| 2.625%, 07/10/2017 | | | 11,613,000 | | | | 11,675,803 | | | | | |
| 3.100%, 01/15/2019 | | | 2,825,000 | | | | 2,854,982 | | | | | |
| 2.400%, 05/09/2019 | | | 4,000,000 | | | | 3,989,404 | | | | | |
| Georgia-Pacific LLC: | | | | | | | | | | | | |
| 2.539%, 11/15/2019 (Acquired 02/23/2016, Cost $8,741,051) * | | | 8,750,000 | | | | 8,826,694 | | | | | |
| 5.400%, 11/01/2020 (Acquired 03/12/2015 through 11/08/2016, Cost $11,064,042) * | | | 9,968,000 | | | | 10,958,610 | | | | | |
| Gilead Sciences, Inc., | | | | | | | | | | | | |
| 2.550%, 09/01/2020 | | | 5,000,000 | | | | 5,052,695 | | | | | |
| Glencore Funding LLC: | | | | | | | | | | | | |
| 2.240%, 01/15/2019 (Acquired 06/17/2014 through 05/24/2016, Cost $5,210,120) ∞ * | | | 5,200,000 | | | | 5,211,284 | | | | | |
| 2.500%, 01/15/2019 (Acquired 05/22/2013, Cost $597,012) * | | | 600,000 | | | | 598,680 | | | | | |
| 3.125%, 04/29/2019 (Acquired 01/04/2016, Cost $4,513,736) * | | | 5,154,000 | | | | 5,173,327 | | | | | |
| GTE Corp., | | | | | | | | | | | | |
| 6.840%, 04/15/2018 | | | 140,000 | | | | 148,189 | | | | | |
| Harris Corp., | | | | | | | | | | | | |
| 1.999%, 04/27/2018 | | | 9,725,000 | | | | 9,730,923 | | | | | |
| Heineken NV, | | | | | | | | | | | | |
| 1.400%, 10/01/2017 (Acquired 10/02/2012, Cost $1,993,400) * f | | | 2,000,000 | | | | 2,000,806 | | | | | |
| Hewlett Packard Enterprise Co.: | | | | | | | | | | | | |
| 2.850%, 10/05/2018 | | | 7,000,000 | | | | 7,070,700 | | | | | |
| 2.929%, 10/05/2018 | | | 9,000,000 | | | | 9,198,783 | | | | | |
| HP, Inc., | | | | | | | | | | | | |
| 1.821%, 01/14/2019 ∞ | | | 5,700,000 | | | | 5,718,605 | | | | | |
| Husky Energy, Inc., | | | | | | | | | | | | |
| 6.200%, 09/15/2017 f | | | 1,000,000 | | | | 1,033,191 | | | | | |
| Hutchison Whampoa International (14) Ltd., | | | | | | | | | | | | |
| 1.625%, 10/31/2017 (Acquired 10/28/2014, Cost $4,988,500) * f | | | 5,000,000 | | | | 4,988,375 | | | | | |
| Hyundai Capital America: | | | | | | | | | | | | |
| 2.400%, 10/30/2018 (Acquired 10/27/2015, Cost $8,124,025) * | | | 8,125,000 | | | | 8,158,897 | | | | | |
| 2.500%, 03/18/2019 (Acquired 03/14/2016, Cost $2,997,930) * | | | 3,000,000 | | | | 3,008,022 | | | | | |
| 1.750%, 09/27/2019 (Acquired 09/22/2016, Cost $4,993,900) * | | | 5,000,000 | | | | 4,920,855 | | | | | |
| Hyundai Capital Services, Inc.: | | | | | | | | | | | | |
| 1.793%, 03/18/2017 (Acquired 04/04/2016, Cost $2,000,345) ∞ * f | | | 2,000,000 | | | | 2,000,564 | | | | | |
| 3.500%, 09/13/2017 (Acquired 06/04/2014 through 10/01/2015, Cost $5,106,679) * f | | | 5,050,000 | | | | 5,100,934 | | | | | |
| Ingersoll-Rand Global Holding Co. Ltd.: | | | | | | | | | | | | |
| 6.875%, 08/15/2018 | | | 7,751,000 | | | | 8,373,243 | | | | | |
| 2.875%, 01/15/2019 | | | 10,153,000 | | | | 10,334,789 | | | | | |
| Ingredion, Inc., | | | | | | | | | | | | |
| 1.800%, 09/25/2017 | | | 10,100,000 | | | | 10,112,777 | | | | | |
| Keysight Technologies, Inc., | | | | | | | | | | | | |
| 3.300%, 10/30/2019 | | | 18,125,000 | | | | 18,405,140 | | | | | |
| Kinder Morgan Energy Partners LP: | | | | | | | | | | | | |
| 6.000%, 02/01/2017 | | | 1,925,000 | | | | 1,930,831 | | | | | |
| 9.000%, 02/01/2019 | | | 2,692,000 | | | | 3,031,332 | | | | | |
| Kinder Morgan, Inc./DE: | | | | | | | | | | | | |
| 2.000%, 12/01/2017 | | | 3,000,000 | | | | 3,004,569 | | | | | |
| 7.250%, 06/01/2018 | | | 1,710,000 | | | | 1,822,292 | | | | | |
| Koninklijke Philips NV, | | | | | | | | | | | | |
| 5.750%, 03/11/2018 f | | | 1,000,000 | | | | 1,048,027 | | | | | |
| Kraft Heinz Foods Co., | | | | | | | | | | | | |
| 2.000%, 07/02/2018 | | | 10,000,000 | | | | 10,002,250 | | | | | |
| Laboratory Corp. of America Holdings: | | | | | | | | | | | | |
| 2.500%, 11/01/2018 | | | 2,050,000 | | | | 2,068,067 | | | | | |
| 2.625%, 02/01/2020 | | | 2,000,000 | | | | 1,998,038 | | | | | |
| LyondellBasell Industries NV, | | | | | | | | | | | | |
| 5.000%, 04/15/2019 f | | | 4,498,000 | | | | 4,752,821 | | | | | |
| Marathon Oil Corp., | | | | | | | | | | | | |
| 6.000%, 10/01/2017 | | | 7,805,000 | | | | 8,038,182 | | | | | |
| Marathon Petroleum Corp., | | | | | | | | | | | | |
| 2.700%, 12/14/2018 | | | 14,100,000 | | | | 14,287,713 | | | | | |
| Masco Corp., | | | | | | | | | | | | |
| 3.500%, 04/01/2021 | | | 1,000,000 | | | | 1,002,500 | | | | | |
| McDonald's Corp., | | | | | | | | | | | | |
| 2.100%, 12/07/2018 | | | 9,500,000 | | | | 9,556,421 | | | | | |
| Medtronic, Inc., | | | | | | | | | | | | |
| 1.763%, 03/15/2020 ∞ f | | | 2,250,000 | | | | 2,272,203 | | | | | |
| Merey Sweeny LP, | | | | | | | | | | | | |
| 8.850%, 12/18/2019 (Acquired 11/16/2015 through 05/26/2016, Cost $2,435,914) * | | | 2,226,057 | | | | 2,452,298 | | | | | |
| Molex Electronic Technologies LLC, | | | | | | | | | | | | |
| 2.878%, 04/15/2020 (Acquired 01/05/2016, Cost $2,258,985) * | | | 2,300,000 | | | | 2,294,811 | | | | | |
| Mondelez International Holdings Netherlands BV, | | | | | | | | | | | | |
| 1.625%, 10/28/2019 (Acquired 10/19/2016, Cost $9,728,940) * f | | | 9,750,000 | | | | 9,557,847 | | | | | |
| Mondelez International, Inc., | | | | | | | | | | | | |
| 1.406%, 02/01/2019 ∞ | | | 9,337,000 | | | | 9,336,477 | | | | | |
| Murphy Oil Corp., | | | | | | | | | | | | |
| 3.500%, 12/01/2017 | | | 9,756,000 | | | | 9,804,780 | | | | | |
| Mylan NV: | | | | | | | | | | | | |
| 3.000%, 12/15/2018 (Acquired 08/18/2016 through 10/31/2016, Cost $14,431,764) * f | | | 14,095,000 | | | | 14,196,935 | | | | | |
| 2.500%, 06/07/2019 (Acquired 05/31/2016, Cost $4,994,400) * f | | | 5,000,000 | | | | 4,972,940 | | | | | |
| Mylan, Inc., | | | | | | | | | | | | |
| 2.600%, 06/24/2018 | | | 1,150,000 | | | | 1,156,657 | | | | | |
| National Oilwell Varco, Inc., | | | | | | | | | | | | |
| 1.350%, 12/01/2017 | | | 5,600,000 | | | | 5,578,171 | | | | | |
| Newell Brands, Inc., | | | | | | | | | | | | |
| 2.600%, 03/29/2019 | | | 4,250,000 | | | | 4,296,635 | | | | | |
| Nissan Motor Acceptance Corp.: | | | | | | | | | | | | |
| 1.492%, 03/03/2017 (Acquired 02/25/2014, Cost $3,000,000) ∞ * | | | 3,000,000 | | | | 3,002,658 | | | | | |
| 2.650%, 09/26/2018 (Acquired 07/29/2014 through 10/08/2015, Cost $4,809,685) * | | | 4,760,000 | | | | 4,808,976 | | | | | |
| Noble Holding International Ltd.: | | | | | | | | | | | | |
| 2.500%, 03/15/2017 f | | | 5,510,000 | | | | 5,489,338 | | | | | |
| 5.250%, 03/16/2018 f | | | 1,848,000 | | | | 1,843,380 | | | | | |
| Norfolk Southern Railway Co., | | | | | | | | | | | | |
| 9.750%, 06/15/2020 | | | 2,000,000 | | | | 2,472,152 | | | | | |
| ONEOK Partners LP: | | | | | | | | | | | | |
| 2.000%, 10/01/2017 | | | 2,858,000 | | | | 2,865,897 | | | | | |
| 8.625%, 03/01/2019 | | | 1,500,000 | | | | 1,692,028 | | | | | |
| Pentair Finance SA: | | | | | | | | | | | | |
| 1.875%, 09/15/2017 f | | | 6,000,000 | | | | 6,008,952 | | | | | |
| 2.900%, 09/15/2018 f | | | 13,075,000 | | | | 13,226,108 | | | | | |
| Perrigo Co PLC, | | | | | | | | | | | | |
| 2.300%, 11/08/2018 f | | | 4,125,000 | | | | 4,119,522 | | | | | |
| Perrigo Finance Unlimited Co., | | | | | | | | | | | | |
| 3.500%, 03/15/2021 f | | | 4,500,000 | | | | 4,546,931 | | | | | |
| Petrofac Ltd., | | | | | | | | | | | | |
| 3.400%, 10/10/2018 (Acquired 10/03/2013 through 09/25/2015, Cost $12,146,802) * f | | | 12,050,000 | | | | 12,196,082 | | | | | |
| Phillips 66, | | | | | | | | | | | | |
| 2.950%, 05/01/2017 | | | 3,000,000 | | | | 3,016,734 | | | | | |
| Phillips 66 Partners LP, | | | | | | | | | | | | |
| 2.646%, 02/15/2020 | | | 2,000,000 | | | | 1,993,846 | | | | | |
| Pioneer Natural Resources Co.: | | | | | | | | | | | | |
| 6.650%, 03/15/2017 | | | 1,260,000 | | | | 1,272,853 | | | | | |
| 6.875%, 05/01/2018 | | | 1,000,000 | | | | 1,061,632 | | | | | |
| Potash Corp of Saskatchewan, Inc., | | | | | | | | | | | | |
| 6.500%, 05/15/2019 f | | | 11,500,000 | | | | 12,561,462 | | | | | |
| Republic Services, Inc.: | | | | | | | | | | | | |
| 3.800%, 05/15/2018 | | | 7,990,000 | | | | 8,212,170 | | | | | |
| 5.500%, 09/15/2019 | | | 6,446,000 | | | | 7,014,827 | | | | | |
| Rogers Communications, Inc., | | | | | | | | | | | | |
| 6.800%, 08/15/2018 f | | | 3,233,000 | | | | 3,485,973 | | | | | |
| Rohm and Haas Co., | | | | | | | | | | | | |
| 6.000%, 09/15/2017 | | | 1,871,000 | | | | 1,929,375 | | | | | |
| RPM International, Inc., | | | | | | | | | | | | |
| 6.500%, 02/15/2018 | | | 3,870,000 | | | | 4,055,923 | | | | | |
| Shire Acquisitions Investments Ireland DAC, | | | | | | | | | | | | |
| 1.900%, 09/23/2019 f | | | 9,775,000 | | | | 9,651,073 | | | | | |
| Solvay Finance America LLC, | | | | | | | | | | | | |
| 3.400%, 12/03/2020 (Acquired 05/04/2016, Cost $7,212,658) * | | | 7,000,000 | | | | 7,122,451 | | | | | |
| Stryker Corp., | | | | | | | | | | | | |
| 2.000%, 03/08/2019 | | | 6,250,000 | | | | 6,253,063 | | | | | |
| Sunoco, Inc., | | | | | | | | | | | | |
| 5.750%, 01/15/2017 | | | 600,000 | | | | 600,670 | | | | | |
| Telefonica Emisiones SAU, | | | | | | | | | | | | |
| 6.221%, 07/03/2017 f | | | 1,344,000 | | | | 1,374,162 | | | | | |
| Temple-Inland, Inc., | | | | | | | | | | | | |
| 6.625%, 01/15/2018 | | | 4,676,000 | | | | 4,885,896 | | | | | |
| Teva Pharmaceutical Finance Netherlands III BV, | | | | | | | | | | | | |
| 1.700%, 07/19/2019 f | | | 7,000,000 | | | | 6,877,696 | | | | | |
| Texas Eastern Transmission LP, | | | | | | | | | | | | |
| 6.000%, 09/15/2017 (Acquired 05/21/2015, Cost $3,817,380) * | | | 3,705,000 | | | | 3,814,431 | | | | | |
| The Dow Chemical Co., | | | | | | | | | | | | |
| 8.550%, 05/15/2019 | | | 14,777,000 | | | | 16,935,639 | | | | | |
| The JM Smucker Co.: | | | | | | | | | | | | |
| 1.750%, 03/15/2018 | | | 2,550,000 | | | | 2,553,325 | | | | | |
| 2.500%, 03/15/2020 | | | 2,725,000 | | | | 2,737,941 | | | | | |
| Thermo Fisher Scientific, Inc., | | | | | | | | | | | | |
| 1.850%, 01/15/2018 | | | 13,000,000 | | | | 13,018,603 | | | | | |
| Thomson Reuters Corp., | | | | | | | | | | | | |
| 1.650%, 09/29/2017 f | | | 7,000,000 | | | | 7,007,805 | | | | | |
| Time Warner Cable LLC: | | | | | | | | | | | | |
| 5.850%, 05/01/2017 | | | 2,355,000 | | | | 2,388,420 | | | | | |
| 6.750%, 07/01/2018 | | | 6,000,000 | | | | 6,405,720 | | | | | |
| 8.750%, 02/14/2019 | | | 4,395,000 | | | | 4,952,919 | | | | | |
| 8.250%, 04/01/2019 | | | 2,564,000 | | | | 2,881,166 | | | | | |
| Time Warner Co., Inc., | | | | | | | | | | | | |
| 7.250%, 10/15/2017 | | | 7,831,000 | | | | 8,182,072 | | | | | |
| Time Warner, Inc., | | | | | | | | | | | | |
| 4.875%, 03/15/2020 | | | 3,225,000 | | | | 3,442,581 | | | | | |
| Total Capital International SA: | | | | | | | | | | | | |
| 1.452%, 08/10/2018 ∞ f | | | 4,350,000 | | | | 4,361,410 | | | | | |
| 1.343%, 06/19/2019 ∞ f | | | 7,700,000 | | | | 7,669,185 | | | | | |
| TransCanada PipeLines Ltd.: | | | | | | | | | | | | |
| 1.875%, 01/12/2018 f | | | 4,000,000 | | | | 4,006,280 | | | | | |
| 3.125%, 01/15/2019 f | | | 6,800,000 | | | | 6,941,875 | | | | | |
| Transocean, Inc., | | | | | | | | | | | | |
| 4.250%, 10/15/2017 f | | | 7,400,000 | | | | 7,474,000 | | | | | |
| TSMC Global Ltd., | | | | | | | | | | | | |
| 1.625%, 04/03/2018 (Acquired 08/05/2014 through 06/07/2016, Cost $15,840,544) * f | | | 15,919,000 | | | | 15,858,126 | | | | | |
| TTX Co., | | | | | | | | | | | | |
| 2.250%, 02/01/2019 (Acquired 01/12/2016, Cost $7,440,390) * | | | 7,450,000 | | | | 7,445,716 | | | | | |
| Tyco Electronics Group SA, | | | | | | | | | | | | |
| 6.550%, 10/01/2017 f | | | 860,000 | | | | 892,035 | | | | | |
| Valero Energy Corp., | | | | | | | | | | | | |
| 9.375%, 03/15/2019 | | | 10,349,000 | | | | 11,917,908 | | | | | |
| Verisk Analytics, Inc., | | | | | | | | | | | | |
| 4.875%, 01/15/2019 | | | 9,900,000 | | | | 10,378,517 | | | | | |
| Verizon Communications, Inc., | | | | | | | | | | | | |
| 3.650%, 09/14/2018 | | | 14,000,000 | | | | 14,462,238 | | | | | |
| Viacom, Inc., | | | | | | | | | | | | |
| 2.500%, 09/01/2018 | | | 11,005,000 | | | | 11,037,993 | | | | | |
| Vodafone Group PLC: | | | | | | | | | | | | |
| 5.625%, 02/27/2017 f | | | 2,000,000 | | | | 2,011,502 | | | | | |
| 1.250%, 09/26/2017 f | | | 10,000,000 | | | | 9,981,450 | | | | | |
| Volkswagen Group of America Finance LLC: | | | | | | | | | | | | |
| 1.290%, 05/23/2017 (Acquired 05/15/2014, Cost $2,750,000) ∞ * | | | 2,750,000 | | | | 2,747,088 | | | | | |
| 1.351%, 11/20/2017 (Acquired 11/12/2014, Cost $4,500,000) ∞ * | | | 4,500,000 | | | | 4,488,403 | | | | | |
| Walgreen Co., | | | | | | | | | | | | |
| 5.250%, 01/15/2019 | | | 2,330,000 | | | | 2,465,930 | | | | | |
| Walgreens Boots Alliance, Inc.: | | | | | | | | | | | | |
| 1.750%, 11/17/2017 | | | 1,150,000 | | | | 1,152,870 | | | | | |
| 1.750%, 05/30/2018 | | | 2,750,000 | | | | 2,752,747 | | | | | |
| Williams Partners LP / Williams Partners Finance Corp., | | | | | | | | | | | | |
| 7.250%, 02/01/2017 | | | 3,085,000 | | | | 3,097,050 | | | | | |
| Xerox Corp.: | | | | | | | | | | | | |
| 6.750%, 02/01/2017 | | | 2,626,000 | | | | 2,635,485 | | | | | |
| 2.950%, 03/15/2017 | | | 5,245,000 | | | | 5,260,803 | | | | | |
| Yara International ASA, | | | | | | | | | | | | |
| 7.875%, 06/11/2019 (Acquired 10/02/2014, Cost $557,576) * f | | | 500,000 | | | | 559,039 | | | | | |
| Zimmer Holdings, Inc., | | | | | | | | | | | | |
| 2.700%, 04/01/2020 | | | 4,725,000 | | | | 4,725,236 | | | | | |
| Zoetis, Inc.: | | | | | | | | | | | | |
| 1.875%, 02/01/2018 | | | 11,000,000 | | | | 10,999,967 | | | | | |
| 3.450%, 11/13/2020 | | | 7,932,000 | | | | 8,141,095 | | | | | |
| | | | | | | | 1,191,103,302 | | | | 30.7 | % |
| Utilities | | | | | | | | | |
| Beaver Valley II Funding Corp., | | | | | | | | | |
| 9.000%, 06/01/2017 | | | 39,000 | | | | 39,004 | | | | |
| Commonwealth Edison Co., | | | | | | | | | | | |
| 6.150%, 09/15/2017 | | | 100,000 | | | | 103,286 | | | | |
| Dominion Resources, Inc./VA: | | | | | | | | | | | |
| 6.400%, 06/15/2018 | | | 3,550,000 | | | | 3,765,059 | | | | |
| 2.962%, 07/01/2019 | | | 4,000,000 | | | | 4,049,628 | | | | |
| 2.500%, 12/01/2019 | | | 9,500,000 | | | | 9,601,527 | | | | |
| Exelon Corp.: | | | | | | | | | | | |
| 1.550%, 06/09/2017 | | | 2,000,000 | | | | 1,996,360 | | | | |
| 2.850%, 06/15/2020 | | | 2,275,000 | | | | 2,299,286 | | | | |
| National Rural Utilities Cooperative Finance Corp., | | | | | | | | | | | |
| 10.375%, 11/01/2018 | | | 1,075,000 | | | | 1,239,719 | | | | |
| NextEra Energy Capital Holdings, Inc.: | | | | | | | | | | | |
| Class F, 2.056%, 09/01/2017 | | | 9,335,000 | | | | 9,376,121 | | | | |
| 1.649%, 09/01/2018 | | | 6,575,000 | | | | 6,554,361 | | | | |
| NiSource Finance Corp., | | | | | | | | | | | |
| 6.400%, 03/15/2018 | | | 199,000 | | | | 209,578 | | | | |
| Orange Cogen Funding Corp., | | | | | | | | | | | |
| 8.175%, 03/15/2022 (Acquired 02/10/2015 through 09/16/2015, Cost $10,756,678) * | | | 9,385,875 | | | | 10,750,478 | | | | |
| Pacific Gas & Electric Co., | | | | | | | | | | | |
| 8.250%, 10/15/2018 | | | 8,320,000 | | | | 9,236,290 | | | | |
| Public Service Co. of New Mexico, | | | | | | | | | | | |
| 7.950%, 05/15/2018 | | | 1,431,000 | | | | 1,544,839 | | | | |
| Sempra Energy: | | | | | | | | | | | |
| 2.300%, 04/01/2017 | | | 1,300,000 | | | | 1,302,548 | | | | |
| 9.800%, 02/15/2019 | | | 2,575,000 | | | | 2,982,571 | | | | |
| Southern Power Co., | | | | | | | | | | | |
| 1.950%, 12/15/2019 | | | 4,600,000 | | | | 4,561,438 | | | | |
| The Southern Co.: | | | | | | | | | | | |
| 1.850%, 07/01/2019 | | | 4,750,000 | | | | 4,735,294 | | | | |
| 2.750%, 06/15/2020 | | | 11,000,000 | | | | 11,094,259 | | | | |
| | | | | | | | 85,441,646 | | | | 2.2 | % |
| Financials | | | | | | | | | | | | |
| ABN AMRO Bank NV: | | | | | | | | | | | | |
| 4.250%, 02/02/2017 (Acquired 08/23/2013 through 08/16/2016, Cost $4,434,541) * f | | | 4,425,000 | | | | 4,434,549 | | | | | |
| 2.500%, 10/30/2018 (Acquired 03/04/2014 through 04/29/2015, Cost $1,155,438) * f | | | 1,150,000 | | | | 1,159,062 | | | | | |
| 1.800%, 09/20/2019 (Acquired 09/13/2016, Cost $4,743,635) * f | | | 4,750,000 | | | | 4,681,059 | | | | | |
| American Express Bank FSB, | | | | | | | | | | | | |
| 0.964%, 06/12/2017 ∞ | | | 750,000 | | | | 749,743 | | | | | |
| American Express Co.: | | | | | | | | | | | | |
| 7.000%, 03/19/2018 | | | 2,661,000 | | | | 2,827,823 | | | | | |
| 1.506%, 05/22/2018 ∞ | | | 5,528,000 | | | | 5,539,421 | | | | | |
| American Express Credit Corp., | | | | | | | | | | | | |
| 1.396%, 08/15/2019 ∞ | | | 2,000,000 | | | | 2,003,676 | | | | | |
| American International Group, Inc.: | | | | | | | | | | | | |
| 2.300%, 07/16/2019 | | | 1,400,000 | | | | 1,406,608 | | | | | |
| 3.375%, 08/15/2020 | | | 2,000,000 | | | | 2,057,600 | | | | | |
| ANZ New Zealand (Int'l) Ltd./London: | | | | | | | | | | | | |
| 2.600%, 09/23/2019 (Acquired 09/16/2014, Cost $3,347,823) * f | | | 3,350,000 | | | | 3,378,307 | | | | | |
| 2.850%, 08/06/2020 (Acquired 07/30/2015, Cost $2,997,510) * f | | | 3,000,000 | | | | 3,020,724 | | | | | |
| Australia & New Zealand Banking Group Ltd./New York NY: | | | | | | | | | | | | |
| 1.875%, 10/06/2017 f | | | 750,000 | | | | 752,996 | | | | | |
| 2.250%, 06/13/2019 f | | | 1,000,000 | | | | 1,003,237 | | | | | |
| Australia and New Zealand Banking Group Ltd., | | | | | | | | | | | | |
| 1.256%, 01/10/2017 (Acquired 01/06/2014, Cost $750,000) ∞ * f | | | 750,000 | | | | 750,061 | | | | | |
| Banco Santander (Chile), | | | | | | | | | | | | |
| 1.776%, 04/11/2017 (Acquired 04/08/2014, Cost $1,800,000) ∞ * f | | | 1,800,000 | | | | 1,797,840 | | | | | |
| Bank of America Corp.: | | | | | | | | | | | | |
| 5.750%, 12/01/2017 | | | 5,000,000 | | | | 5,179,245 | | | | | |
| Class L, 2.600%, 01/15/2019 | | | 5,750,000 | | | | 5,799,151 | | | | | |
| 5.625%, 07/01/2020 | | | 2,000,000 | | | | 2,199,106 | | | | | |
| 2.625%, 10/19/2020 | | | 10,000,000 | | | | 10,005,710 | | | | | |
| Bank of Montreal: | | | | | | | | | | | | |
| 1.476%, 04/09/2018 ∞ f | | | 1,325,000 | | | | 1,330,099 | | | | | |
| 1.800%, 07/31/2018 f | | | 5,000,000 | | | | 5,003,140 | | | | | |
| 1.900%, 08/27/2021 f | | | 10,000,000 | | | | 9,690,240 | | | | | |
| Banque Federative du Credit Mutuel SA, | | | | | | | | | | | | |
| 2.000%, 04/12/2019 (Acquired 04/06/2016 through 10/21/2016, Cost $18,599,065) * f | | | 18,600,000 | | | | 18,524,186 | | | | | |
| Barclays Bank PLC, | | | | | | | | | | | | |
| 1.486%, 02/17/2017 ∞ f | | | 4,000,000 | | | | 4,001,372 | | | | | |
| Barclays PLC: | | | | | | | | | | | | |
| 2.000%, 03/16/2018 f | | | 4,000,000 | | | | 3,991,684 | | | | | |
| 2.875%, 06/08/2020 f | | | 2,000,000 | | | | 1,983,106 | | | | | |
| 3.250%, 01/12/2021 f | | | 2,375,000 | | | | 2,377,313 | | | | | |
| BB&T Corp., | | | | | | | | | | | | |
| 1.823%, 06/15/2018 ∞ | | | 4,150,000 | | | | 4,173,037 | | | | | |
| BNP Paribas SA: | | | | | | | | | | | | |
| 2.375%, 09/14/2017 f | | | 3,000,000 | | | | 3,020,031 | | | | | |
| 2.400%, 12/12/2018 f | | | 1,600,000 | | | | 1,612,565 | | | | | |
| 2.375%, 05/21/2020 f | | | 3,225,000 | | | | 3,209,062 | | | | | |
| BNZ International Funding Ltd./London: | | | | | | | | | | | | |
| 1.900%, 02/26/2018 (Acquired 02/23/2015, Cost $1,702,050) * f | | | 1,700,000 | | | | 1,701,510 | | | | | |
| 2.350%, 03/04/2019 (Acquired 09/03/2014 through 11/13/2014, Cost $7,236,996) * f | | | 7,250,000 | | | | 7,275,882 | | | | | |
| BPCE SA, | | | | | | | | | | | | |
| 2.500%, 12/10/2018 f | | | 3,525,000 | | | | 3,555,928 | | | | | |
| Branch Banking & Trust Co., | | | | | | | | | | | | |
| 1.220%, 05/23/2017 ∞ | | | 12,895,000 | | | | 12,894,033 | | | | | |
| Caisse Centrale Desjardins: | | | | | | | | | | | | |
| 1.552%, 01/29/2018 (Acquired 01/26/2015, Cost $10,000,000) ∞ * f | | | 10,000,000 | | | | 9,989,810 | | | | | |
| 1.750%, 01/29/2018 (Acquired 04/06/2015, Cost $4,008,501) * f | | | 4,000,000 | | | | 3,991,984 | | | | | |
| Canadian Imperial Bank of Commerce/Canada, | | | | | | | | | | | | |
| 1.600%, 09/06/2019 f | | | 20,000,000 | | | | 19,809,640 | | | | | |
| Capital One Bank (USA) NA, | | | | | | | | | | | | |
| 2.250%, 02/13/2019 | | | 1,500,000 | | | | 1,506,697 | | | | | |
| Capital One Financial Corp., | | | | | | | | | | | | |
| 5.250%, 02/21/2017 | | | 1,100,000 | | | | 1,105,282 | | | | | |
| Capital One NA/Mclean VA: | | | | | | | | | | | | |
| 1.500%, 09/05/2017 | | | 5,000,000 | | | | 4,993,785 | | | | | |
| 1.561%, 02/05/2018 ∞ | | | 2,000,000 | | | | 2,003,950 | | | | | |
| 2.400%, 09/05/2019 | | | 5,300,000 | | | | 5,311,787 | | | | | |
| 1.850%, 09/13/2019 | | | 5,000,000 | | | | 4,943,165 | | | | | |
| Cigna Corp., | | | | | | | | | | | | |
| 5.375%, 03/15/2017 | | | 2,300,000 | | | | 2,317,537 | | | | | |
| Citigroup, Inc.: | | | | | | | | | | | | |
| 1.550%, 08/14/2017 | | | 2,400,000 | | | | 2,401,675 | | | | | |
| 1.700%, 04/27/2018 | | | 2,000,000 | | | | 1,995,592 | | | | | |
| 2.150%, 07/30/2018 | | | 3,975,000 | | | | 3,988,149 | | | | | |
| 2.050%, 12/07/2018 | | | 4,000,000 | | | | 3,999,552 | | | | | |
| Citizens Bank NA/Providence RI: | | | | | | | | | | | | |
| 1.600%, 12/04/2017 | | | 14,300,000 | | | | 14,284,985 | | | | | |
| 2.500%, 03/14/2019 | | | 2,700,000 | | | | 2,720,801 | | | | | |
| CNA Financial Corp., | | | | | | | | | | | | |
| 7.350%, 11/15/2019 | | | 14,915,000 | | | | 16,915,445 | | | | | |
| Comerica Bank: | | | | | | | | | | | | |
| 5.200%, 08/22/2017 | | | 6,825,000 | | | | 6,978,303 | | | | | |
| 2.500%, 06/02/2020 | | | 7,000,000 | | | | 6,997,431 | | | | | |
| Commonwealth Bank of Australia, | | | | | | | | | | | | |
| 1.353%, 03/12/2018 (Acquired 11/09/2016, Cost $2,501,583) ∞ * f | | | 2,500,000 | | | | 2,498,162 | | | | | |
| Commonwealth Bank of Australia/New York NY: | | | | | | | | | | | | |
| 1.750%, 11/02/2018 f | | | 15,000,000 | | | | 14,962,860 | | | | | |
| 2.050%, 03/15/2019 f | | | 1,500,000 | | | | 1,498,270 | | | | | |
| Compass Bank: | | | | | | | | | | | | |
| 1.850%, 09/29/2017 | | | 10,505,000 | | | | 10,481,153 | | | | | |
| 2.750%, 09/29/2019 | | | 8,337,000 | | | | 8,291,622 | | | | | |
| Credit Suisse AG/New York NY: | | | | | | | | | | | | |
| 1.427%, 05/26/2017 ∞ f | | | 2,000,000 | | | | 2,001,536 | | | | | |
| 6.000%, 02/15/2018 f | | | 8,440,000 | | | | 8,778,478 | | | | | |
| 1.700%, 04/27/2018 f | | | 2,500,000 | | | | 2,494,490 | | | | | |
| Deutsche Bank AG/London: | | | | | | | | | | | | |
| 1.512%, 02/13/2017 ∞ f | | | 5,450,000 | | | | 5,448,703 | | | | | |
| 1.405%, 05/30/2017 ∞ f | | | 2,640,000 | | | | 2,632,188 | | | | | |
| 6.000%, 09/01/2017 f | | | 3,467,000 | | | | 3,549,033 | | | | | |
| 1.875%, 02/13/2018 f | | | 3,000,000 | | | | 2,982,786 | | | | | |
| 2.500%, 02/13/2019 f | | | 3,000,000 | | | | 2,975,958 | | | | | |
| Discover Bank/Greenwood DE: | | | | | | | | | | | | |
| 2.000%, 02/21/2018 | | | 1,875,000 | | | | 1,874,659 | | | | | |
| 2.600%, 11/13/2018 | | | 8,000,000 | | | | 8,069,376 | | | | | |
| 8.700%, 11/18/2019 | | | 5,395,000 | | | | 6,125,494 | | | | | |
| Fifth Third Bancorp: | | | | | | | | | | | | |
| 5.450%, 01/15/2017 | | | 919,000 | | | | 920,262 | | | | | |
| 2.150%, 08/20/2018 | | | 2,000,000 | | | | 2,012,636 | | | | | |
| 2.875%, 07/27/2020 | | | 5,000,000 | | | | 5,055,000 | | | | | |
| First Horizon National Corp., | | | | | | | | | | | | |
| 3.500%, 12/15/2020 | | | 2,394,000 | | | | 2,415,805 | | | | | |
| First Niagara Financial Group, Inc., | | | | | | | | | | | | |
| 6.750%, 03/19/2020 | | | 3,850,000 | | | | 4,342,419 | | | | | |
| First Tennessee Bank NA, | | | | | | | | | | | | |
| 2.950%, 12/01/2019 | | | 15,286,000 | | | | 15,323,909 | | | | | |
| Guardian Life Global Funding, | | | | | | | | | | | | |
| 2.000%, 04/26/2021 (Acquired 04/19/2016, Cost $7,814,671) * | | | 7,825,000 | | | | 7,631,597 | | | | | |
| HSBC Bank USA NA/New York NY, | | | | | | | | | | | | |
| 6.000%, 08/09/2017 | | | 925,000 | | | | 949,567 | | | | | |
| HSBC Finance Corp., | | | | | | | | | | | | |
| 6.676%, 01/15/2021 | | | 221,000 | | | | 248,413 | | | | | |
| HSBC USA, Inc.: | | | | | | | | | | | | |
| 1.877%, 09/24/2018 ∞ | | | 1,000,000 | | | | 1,002,282 | | | | | |
| 1.512%, 11/13/2019 ∞ | | | 9,750,000 | | | | 9,718,001 | | | | | |
| Humana, Inc., | | | | | | | | | | | | |
| 7.200%, 06/15/2018 | | | 6,610,000 | | | | 7,105,307 | | | | | |
| Huntington Bancshares Inc./OH, | | | | | | | | | | | | |
| 2.600%, 08/02/2018 | | | 7,375,000 | | | | 7,446,840 | | | | | |
| ING Bank NV: | | | | | | | | | | | | |
| 3.750%, 03/07/2017 (Acquired 05/30/2013 through 01/13/2014, Cost $3,210,432) * f | | | 3,200,000 | | | | 3,213,533 | | | | | |
| 1.650%, 08/15/2019 (Acquired 08/08/2016, Cost $9,989,800) * f | | | 10,000,000 | | | | 9,864,740 | | | | | |
| 2.500%, 10/01/2019 (Acquired 04/18/2016, Cost $9,081,627) * f | | | 8,961,000 | | | | 9,018,709 | | | | | |
| JPMorgan Chase & Co.: | | | | | | | | | | | | |
| 1.432%, 04/25/2018 ∞ | | | 3,500,000 | | | | 3,509,863 | | | | | |
| Class 1, 1.520%, 01/28/2019 ∞ | | | 750,000 | | | | 752,408 | | | | | |
| 6.300%, 04/23/2019 | | | 5,000,000 | | | | 5,463,685 | | | | | |
| 2.250%, 01/23/2020 | | | 8,100,000 | | | | 8,080,933 | | | | | |
| KEB Hana Bank, | | | | | | | | | | | | |
| 1.750%, 10/18/2019 (Acquired 10/11/2016, Cost $17,942,040) * f | | | 18,000,000 | | | | 17,797,338 | | | | | |
| Kemper Corp., | | | | | | | | | | | | |
| 6.000%, 05/15/2017 | | | 4,565,000 | | | | 4,632,503 | | | | | |
| KeyBank NA/Cleveland OH: | | | | | | | | | | | | |
| 2.350%, 03/08/2019 | | | 6,500,000 | | | | 6,537,349 | | | | | |
| 1.600%, 08/22/2019 | | | 3,000,000 | | | | 2,958,918 | | | | | |
| 2.500%, 12/15/2019 | | | 5,325,000 | | | | 5,380,460 | | | | | |
| Kookmin Bank: | | | | | | | | | | | | |
| 1.761%, 01/27/2017 (Acquired 01/21/2014 through 02/20/2014, Cost $4,750,093) ∞ * f | | | 4,750,000 | | | | 4,751,207 | | | | | |
| 1.625%, 07/14/2017 (Acquired 07/07/2014, Cost $5,983,080) * f | | | 6,000,000 | | | | 5,991,702 | | | | | |
| 1.625%, 08/01/2019 (Acquired 07/25/2016, Cost $7,976,960) * f | | | 8,000,000 | | | | 7,879,920 | | | | | |
| LeasePlan Corp. NV, | | | | | | | | | | | | |
| 2.500%, 05/16/2018 (Acquired 05/07/2013 through 02/25/2016, Cost $16,360,141) * f | | | 16,435,000 | | | | 16,458,896 | | | | | |
| Lloyds Bank PLC: | | | | | | | | | | | | |
| 4.200%, 03/28/2017 f | | | 2,000,000 | | | | 2,013,704 | | | | | |
| 1.750%, 05/14/2018 f | | | 5,825,000 | | | | 5,817,241 | | | | | |
| 2.000%, 08/17/2018 f | | | 4,500,000 | | | | 4,506,930 | | | | | |
| 2.050%, 01/22/2019 f | | | 4,000,000 | | | | 3,996,168 | | | | | |
| M&I Marshall & Ilsley Bank, | | | | | | | | | | | | |
| 5.000%, 01/17/2017 | | | 2,488,000 | | | | 2,490,630 | | | | | |
| Macquarie Bank Ltd.: | | | | | | | | | | | | |
| 1.516%, 10/27/2017 (Acquired 10/22/2014, Cost $5,000,000) ∞ * f | | | 5,000,000 | | | | 5,005,545 | | | | | |
| 2.400%, 01/21/2020 (Acquired 11/22/2016, Cost $7,978,000) * f | | | 8,000,000 | | | | 7,927,840 | | | | | |
| Macquarie Group Ltd., | | | | | | | | | | | | |
| 4.875%, 08/10/2017 (Acquired 10/29/2014 through 11/25/2014, Cost $2,800,113) * f | | | 2,750,000 | | | | 2,798,312 | | | | | |
| Manufacturers & Traders Trust Co.: | | | | | | | | | | | | |
| 6.625%, 12/04/2017 | | | 1,000,000 | | | | 1,043,957 | | | | | |
| 1.971%, 12/28/2020 ∞ | | | 282,000 | | | | 280,250 | | | | | |
| Marsh & McLennan Companies, Inc., | | | | | | | | | | | | |
| 2.300%, 04/01/2017 | | | 1,297,000 | | | | 1,296,586 | | | | | |
| Metropolitan Life Global Funding I, | | | | | | | | | | | | |
| 1.256%, 04/10/2017 (Acquired 04/07/2014, Cost $8,500,000) ∞ * | | | 8,500,000 | | | | 8,507,268 | | | | | |
| Mizuho Bank Ltd.: | | | | | | | | | | | | |
| 2.550%, 03/17/2017 (Acquired 05/30/2013, Cost $6,911,207) * f | | | 6,900,000 | | | | 6,918,623 | | | | | |
| 1.310%, 04/16/2017 (Acquired 04/09/2014, Cost $2,800,000) ∞ * f | | | 2,800,000 | | | | 2,801,411 | | | | | |
| 1.447%, 09/25/2017 (Acquired 03/30/2016, Cost $2,992,046) ∞ * f | | | 3,000,000 | | | | 2,998,080 | | | | | |
| 1.637%, 03/26/2018 (Acquired 06/21/2016, Cost $1,248,700) ∞ * f | | | 1,250,000 | | | | 1,250,155 | | | | | |
| 2.071%, 10/20/2018 (Acquired 10/13/2015, Cost $2,500,000) ∞ * f | | | 2,500,000 | | | | 2,512,705 | | | | | |
| 2.450%, 04/16/2019 (Acquired 09/09/2016, Cost $2,430,815) * f | | | 2,400,000 | | | | 2,410,174 | | | | | |
| Morgan Stanley: | | | | | | | | | | | | |
| 5.450%, 01/09/2017 | | | 2,950,000 | | | | 2,951,451 | | | | | |
| 1.738%, 01/05/2018 ∞ | | | 1,500,000 | | | | 1,505,790 | | | | | |
| 6.625%, 04/01/2018 | | | 2,000,000 | | | | 2,115,056 | | | | | |
| 1.732%, 01/24/2019 ∞ | | | 4,750,000 | | | | 4,779,640 | | | | | |
| 7.300%, 05/13/2019 | | | 3,000,000 | | | | 3,342,834 | | | | | |
| 2.026%, 01/27/2020 ∞ | | | 4,000,000 | | | | 4,035,388 | | | | | |
| MUFG Union Bank NA, | | | | | | | | | | | | |
| 2.125%, 06/16/2017 | | | 3,500,000 | | | | 3,511,323 | | | | | |
| National Bank of Canada, | | | | | | | | | | | | |
| 1.799%, 12/14/2018 ∞ f | | | 1,000,000 | | | | 1,004,456 | | | | | |
| National City Bank/Cleveland OH, | | | | | | | | | | | | |
| 5.800%, 06/07/2017 | | | 8,695,000 | | | | 8,851,493 | | | | | |
| Nationwide Building Society, | | | | | | | | | | | | |
| 2.350%, 01/21/2020 (Acquired 01/12/2015, Cost $4,998,350) * f | | | 5,000,000 | | | | 4,988,100 | | | | | |
| New York Life Global Funding, | | | | | | | | | | | | |
| 1.550%, 11/02/2018 (Acquired 10/27/2015, Cost $9,486,415) * | | | 9,500,000 | | | | 9,472,830 | | | | | |
| Nomura Holdings, Inc., | | | | | | | | | | | | |
| 2.750%, 03/19/2019 f | | | 2,000,000 | | | | 2,018,928 | | | | | |
| Nordea Bank AB: | | | | | | | | | | | | |
| 3.125%, 03/20/2017 (Acquired 10/03/2012 through 08/21/2013, Cost $5,153,071) * f | | | 5,140,000 | | | | 5,163,336 | | | | | |
| 1.250%, 04/04/2017 (Acquired 03/31/2014, Cost $3,988,880) * f | | | 4,000,000 | | | | 4,001,084 | | | | | |
| 1.618%, 09/30/2019 (Acquired 09/22/2016, Cost $2,400,000) ∞ * f | | | 2,400,000 | | | | 2,400,657 | | | | | |
| Paine Webber Group, Inc., | | | | | | | | | | | | |
| 7.990%, 06/09/2017 | | | 300,000 | | | | 305,130 | | | | | |
| Pricoa Global Funding I, | | | | | | | | | | | | |
| 1.450%, 09/13/2019 (Acquired 09/06/2016, Cost $11,998,920) * | | | 12,000,000 | | | | 11,820,552 | | | | | |
| Principal Life Global Funding II, | | | | | | | | | | | | |
| 1.500%, 04/18/2019 (Acquired 04/11/2016, Cost $2,990,640) * | | | 3,000,000 | | | | 2,962,296 | | | | | |
| Protective Life Global Funding, | | | | | | | | | | | | |
| 1.555%, 09/13/2019 (Acquired 09/07/2016, Cost $18,000,000) * | | | 18,000,000 | | | | 17,725,050 | | | | | |
| Prudential Financial, Inc., | | | | | | | | | | | | |
| 7.375%, 06/15/2019 | | | 7,000,000 | | | | 7,879,949 | | | | | |
| Regions Bank/Birmingham AL, | | | | | | | | | | | | |
| 7.500%, 05/15/2018 | | | 7,733,000 | | | | 8,284,587 | | | | | |
| Reliance Standard Life Global Funding II: | | | | | | | | | | | | |
| 2.150%, 10/15/2018 (Acquired 10/13/2015 through 06/09/2016, Cost $13,020,388) * | | | 13,000,000 | | | | 13,064,584 | | | | | |
| 2.500%, 01/15/2020 (Acquired 01/07/2015, Cost $5,979,540) * | | | 6,000,000 | | | | 5,963,604 | | | | | |
| Royal Bank of Canada, | | | | | | | | | | | | |
| 1.400%, 10/13/2017 f | | | 8,450,000 | | | | 8,449,324 | | | | | |
| Santander Bank NA, | | | | | | | | | | | | |
| 8.750%, 05/30/2018 | | | 2,238,000 | | | | 2,408,728 | | | | | |
| Santander Holdings USA, Inc., | | | | | | | | | | | | |
| 2.700%, 05/24/2019 | | | 5,000,000 | | | | 4,996,195 | | | | | |
| Santander UK Group Holdings PLC, | | | | | | | | | | | | |
| 3.125%, 01/08/2021 f | | | 3,500,000 | | | | 3,491,824 | | | | | |
| Santander UK PLC, | | | | | | | | | | | | |
| 2.500%, 03/14/2019 f | | | 10,000,000 | | | | 10,058,400 | | | | | |
| Skandinaviska Enskilda Banken AB: | | | | | | | | | | | | |
| 2.375%, 11/20/2018 (Acquired 08/05/2015, Cost $5,028,797) * f | | | 5,000,000 | | | | 5,032,415 | | | | | |
| 2.375%, 03/25/2019 (Acquired 08/23/2016, Cost $966,296) * f | | | 950,000 | | | | 952,439 | | | | | |
| 2.450%, 05/27/2020 (Acquired 05/19/2015, Cost $4,692,762) * f | | | 4,700,000 | | | | 4,681,275 | | | | | |
| Societe Generale SA: | | | | | | | | | | | | |
| 2.078%, 10/01/2018 ∞ f | | | 6,000,000 | | | | 6,051,144 | | | | | |
| 2.625%, 10/01/2018 f | | | 1,000,000 | | | | 1,012,582 | | | | | |
| Standard Chartered PLC: | | | | | | | | | | | | |
| 1.291%, 09/08/2017 (Acquired 09/03/2014, Cost $10,000,000) ∞ * f | | | 10,000,000 | | | | 9,990,030 | | | | | |
| 1.520%, 04/17/2018 (Acquired 04/13/2015, Cost $2,000,000) ∞ * f | | | 2,000,000 | | | | 1,992,332 | | | | | |
| 2.100%, 08/19/2019 (Acquired 08/16/2016, Cost $4,492,080) * f | | | 4,500,000 | | | | 4,448,579 | | | | | |
| 2.400%, 09/08/2019 (Acquired 09/03/2014 through 10/12/2016, Cost $4,234,371) * f | | | 4,225,000 | | | | 4,199,189 | | | | | |
| Sumitomo Mitsui Banking Corp.: | | | | | | | | | | | | |
| 1.306%, 01/10/2017 ∞ f | | | 2,075,000 | | | | 2,075,104 | | | | | |
| 1.460%, 01/16/2018 ∞ f | | | 2,885,000 | | | | 2,888,618 | | | | | |
| 1.950%, 07/23/2018 f | | | 3,500,000 | | | | 3,497,515 | | | | | |
| 1.762%, 10/19/2018 f | | | 5,000,000 | | | | 4,979,130 | | | | | |
| 1.822%, 01/18/2019 ∞ f | | | 1,000,000 | | | | 1,005,317 | | | | | |
| 2.450%, 01/16/2020 f | | | 4,500,000 | | | | 4,481,383 | | | | | |
| SunTrust Bank/Atlanta GA, | | | | | | | | | | | | |
| 7.250%, 03/15/2018 | | | 154,000 | | | | 163,356 | | | | | |
| SunTrust Banks, Inc., | | | | | | | | | | | | |
| 6.000%, 09/11/2017 | | | 780,000 | | | | 803,349 | | | | | |
| Svenska Handelsbanken AB: | | | | | | | | | | | | |
| 1.625%, 03/21/2018 f | | | 1,100,000 | | | | 1,098,689 | | | | | |
| 1.483%, 06/17/2019 ∞ f | | | 2,000,000 | | | | 2,001,462 | | | | | |
| 1.928%, 10/01/2020 ∞ f | | | 10,000,000 | | | | 10,000,000 | | | | | |
| Swedbank AB, | | | | | | | | | | | | |
| 2.125%, 09/29/2017 (Acquired 08/30/2016, Cost $3,018,984) * f | | | 3,000,000 | | | | 3,014,394 | | | | | |
| Synchrony Financial: | | | | | | | | | | | | |
| 2.600%, 01/15/2019 | | | 2,000,000 | | | | 2,010,116 | | | | | |
| 3.000%, 08/15/2019 | | | 13,350,000 | | | | 13,523,002 | | | | | |
| 2.700%, 02/03/2020 | | | 3,250,000 | | | | 3,240,364 | | | | | |
| The Bank of New York Mellon Corp., | | | | | | | | | | | | |
| 1.446%, 08/01/2018 ∞ | | | 1,000,000 | | | | 1,003,212 | | | | | |
| The Bank of Nova Scotia, | | | | | | | | | | | | |
| 1.423%, 06/11/2018 ∞ f | | | 3,500,000 | | | | 3,506,611 | | | | | |
| The Bank of Tokyo-Mitsubishi UFJ Ltd.: | | | | | | | | | | | | |
| 1.363%, 03/10/2017 (Acquired 11/24/2014 through 06/01/2016, Cost $9,043,245) ∞ * f | | | 9,050,000 | | | | 9,052,317 | | | | | |
| 2.150%, 09/14/2018 (Acquired 09/08/2015, Cost $6,298,173) * f | | | 6,300,000 | | | | 6,305,197 | | | | | |
| The Bear Stearns Companies LLC: | | | | | | | | | | | | |
| 6.400%, 10/02/2017 | | | 7,700,000 | | | | 7,976,784 | | | | | |
| 7.250%, 02/01/2018 | | | 450,000 | | | | 476,207 | | | | | |
| The Goldman Sachs Group, Inc.: | | | | | | | | | | | | |
| 2.053%, 12/10/2017 ∞ | | | 1,000,000 | | | | 996,090 | | | | | |
| 5.950%, 01/18/2018 | | | 1,045,000 | | | | 1,088,621 | | | | | |
| 6.150%, 04/01/2018 | | | 4,775,000 | | | | 5,022,894 | | | | | |
| 2.900%, 07/19/2018 | | | 1,000,000 | | | | 1,013,810 | | | | | |
| 7.500%, 02/15/2019 | | | 3,000,000 | | | | 3,325,743 | | | | | |
| 1.902%, 10/23/2019 ∞ | | | 2,751,000 | | | | 2,773,258 | | | | | |
| 2.300%, 12/13/2019 | | | 12,000,000 | | | | 11,986,380 | | | | | |
| The Hartford Financial Services Group Inc., | | | | | | | | | | | | |
| 5.500%, 03/30/2020 | | | 1,947,000 | | | | 2,125,982 | | | | | |
| The Hartford Financial Services Group, Inc.: | | | | | | | | | | | | |
| 5.375%, 03/15/2017 | | | 3,145,000 | | | | 3,170,468 | | | | | |
| 6.300%, 03/15/2018 | | | 1,825,000 | | | | 1,914,872 | | | | | |
| 6.000%, 01/15/2019 | | | 455,000 | | | | 489,617 | | | | | |
| The Huntington National Bank, | | | | | | | | | | | | |
| 2.000%, 06/30/2018 | | | 12,990,000 | | | | 12,995,612 | | | | | |
| The Northern Trust Co., | | | | | | | | | | | | |
| 6.500%, 08/15/2018 | | | 4,075,000 | | | | 4,376,322 | | | | | |
| UBS AG/Stamford CT: | | | | | | | | | | | | |
| 1.800%, 03/26/2018 f | | | 8,825,000 | | | | 8,831,098 | | | | | |
| 5.750%, 04/25/2018 f | | | 3,351,000 | | | | 3,519,643 | | | | | |
| UBS Group Funding Jersey Ltd.: | | | | | | | | | | | | |
| 2.437%, 09/24/2020 (Acquired 09/21/2015, Cost $2,000,000) ∞ * f | | | 2,000,000 | | | | 2,023,162 | | | | | |
| 3.000%, 04/15/2021 (Acquired 03/29/2016, Cost $2,997,750) * f | | | 3,000,000 | | | | 3,001,581 | | | | | |
| UnitedHealth Group, Inc., | | | | | | | | | | | | |
| 6.000%, 02/15/2018 | | | 2,625,000 | | | | 2,752,341 | | | | | |
| Voya Financial, Inc., | | | | | | | | | | | | |
| 2.900%, 02/15/2018 | | | 17,494,000 | | | | 17,710,681 | | | | | |
| WEA Finance LLC / Westfield UK & Europe Finance PLC: | | | | | | | | | | | | |
| 2.700%, 09/17/2019 (Acquired 09/10/2014, Cost $6,986,000) * | | | 7,000,000 | | | | 7,080,129 | | | | | |
| 3.250%, 10/05/2020 (Acquired 09/28/2015, Cost $4,982,850) * | | | 5,000,000 | | | | 5,085,010 | | | | | |
| Wells Fargo & Co.: | | | | | | | | | | | | |
| Class N, 1.567%, 01/30/2020 ∞ | | | 1,975,000 | | | | 1,974,030 | | | | | |
| 2.600%, 07/22/2020 | | | 3,900,000 | | | | 3,922,542 | | | | | |
| Westpac Banking Corp.: | | | | | | | | | | | | |
| 2.000%, 08/14/2017 f | | | 8,000,000 | | | | 8,035,008 | | | | | |
| 1.650%, 05/13/2019 f | | | 4,650,000 | | | | 4,601,087 | | | | | |
| | | | | | | | 983,879,907 | | | | 25.4 | % |
| Total Corporate Bonds | | | | | | | 2,260,424,855 | | | | 58.3 | % |
| Taxable Municipal Bonds | | | | | | | | | |
| Chippewa Valley Schools, | | | | | | | | | |
| 1.180%, 05/01/2017 | | | 7,175,000 | | | | 7,183,825 | | | | |
| City of Bristol VA, | | | | | | | | | | | |
| 3.002%, 10/01/2020 | | | 8,210,000 | | | | 8,263,775 | | | | |
| City of Williston ND, | | | | | | | | | | | |
| 3.100%, 07/15/2025 (Callable 01/20/2017) | | | 5,630,000 | | | | 5,630,225 | | | | |
| Consolidated Municipalities Electric Power Systems Joint Powers Board, | | | | | | | | | | | |
| 1.550%, 06/01/2017 | | | 590,000 | | | | 590,501 | | | | |
| Cook County School District No. 144 Prairie Hills: | | | | | | | | | | | |
| 2.000%, 12/01/2017 | | | 810,000 | | | | 815,889 | | | | |
| 2.000%, 12/01/2017 | | | 120,000 | | | | 120,223 | | | | |
| 2.500%, 12/01/2018 | | | 745,000 | | | | 749,962 | | | | |
| Illinois Housing Development Authority, | | | | | | | | | | | |
| 4.000%, 02/01/2034 (Callable 08/01/2025) | | | 10,445,000 | | | | 10,695,471 | | | | |
| Indiana Bond Bank, | | | | | | | | | | | |
| 1.689%, 01/15/2017 | | | 1,000,000 | | | | 1,000,220 | | | | |
| Iowa Tobacco Settlement Authority, | | | | | | | | | | | |
| 6.500%, 06/01/2023 (Callable 01/30/2017) | | | 205,000 | | | | 201,417 | | | | |
| Kentucky Asset Liability Commission, | | | | | | | | | | | |
| 4.372%, 04/01/2017 | | | 2,400,000 | | | | 2,419,080 | | | | |
| Metropolitan Government Nashville & Davidson County Health & Educational Facilities, | | | | | | | | | | | |
| 1.750%, 07/01/2046 (Callable 12/30/2017) ∞ | | | 11,100,000 | | | | 11,100,000 | | | | |
| New Hampshire Housing Finance Authority: | | | | | | | | | | | |
| 1.500%, 01/01/2017 | | | 765,000 | | | | 765,000 | | | | |
| 1.650%, 07/01/2017 | | | 710,000 | | | | 710,518 | | | | |
| 4.000%, 07/01/2036 (Callable 07/10/2024) | | | 9,800,000 | | | | 10,033,142 | | | | |
| New Jersey Economic Development Authority: | | | | | | | | | | | |
| 1.802%, 06/15/2017 | | | 475,000 | | | | 476,662 | | | | |
| 1.802%, 06/15/2017 | | | 2,505,000 | | | | 2,508,257 | | | | |
| 3.375%, 06/15/2017 | | | 5,000,000 | | | | 5,050,250 | | | | |
| 2.421%, 06/15/2018 | | | 10,000,000 | | | | 9,993,200 | | | | |
| New Jersey Sports & Exposition Authority: | | | | | | | | | | | |
| 6.076%, 03/01/2023 | | | 2,705,000 | | | | 2,903,574 | | | | |
| 5.976%, 03/01/2024 | | | 5,000,000 | | | | 5,305,100 | | | | |
| Oakland Redevelopment Agency Successor Bonds, | | | | | | | | | | | |
| 2.271%, 09/01/2018 | | | 1,675,000 | | | | 1,679,858 | | | | |
| Public Finance Authority, | | | | | | | | | | | |
| 2.625%, 11/01/2019 (Callable 05/01/2018) | | | 4,500,000 | | | | 4,469,130 | | | | |
| Rhode Island Housing & Mortgage Finance Corp./RI: | | | | | | | | | | | |
| 1.930%, 04/01/2017 | | | 600,000 | | | | 600,936 | | | | |
| 3.000%, 10/01/2034 (Callable 10/01/2022) | | | 7,405,000 | | | | 7,441,285 | | | | |
| San Diego Metropolitan Transit System, | | | | | | | | | | | |
| 4.840%, 12/01/2018 | | | 3,485,000 | | | | 3,574,286 | | | | |
| Schenectady Metroplex Development Authority/NY, | | | | | | | | | | | |
| 2.232%, 08/01/2017 | | | 200,000 | | | | 200,664 | | | | |
| State of Hawaii Department of Business Economic Development & Tourism, | | | | | | | | | | | |
| 1.467%, 07/01/2022 | | | 5,050,000 | | | | 4,957,130 | | | | |
| State of Illinois: | | | | | | | | | | | |
| 5.090%, 04/01/2017 | | | 2,785,000 | | | | 2,807,753 | | | | |
| 4.350%, 06/01/2018 | | | 737,000 | | | | 748,188 | | | | |
| Tulsa Airports Improvement Trust: | | | | | | | | | | | |
| 2.592%, 06/01/2017 | | | 115,000 | | | | 115,867 | | | | |
| 3.042%, 06/01/2018 | | | 100,000 | | | | 101,962 | | | | |
| | | | | | | | 113,213,350 | | | | 2.9 | % |
| Residential Mortgage-Backed Securities | | | | | | | | | | | | |
| U.S. Government Agency Issues | | | | | | | | | | | | |
| Fannie Mae REMIC Trust, | | | | | | | | | | | | |
| Series 2004-W6, Class 1A6, 5.500%, 07/25/2034 | | | 7,953 | | | | 7,944 | | | | | |
| Federal Home Loan Mortgage Corp. (FHLMC), | | | | | | | | | | | | |
| Series 5, Class B, 1.404%, 05/15/2019 ∞ | | | 637 | | | | 638 | | | | | |
| | | | | | | | 8,582 | | | | 0.0 | % |
| Non-U.S. Government Agency Issues | | | | | | | | | | | | |
| Accredited Mortgage Loan Trust: | | | | | | | | | | | | |
| Series 2006-1, Class A3, 0.936%, 04/25/2036 ∞ | | | 1,864,439 | | | | 1,861,578 | | | | | |
| Series 2006-2, Class A3, 0.906%, 09/25/2036 ∞ | | | 5,192,718 | | | | 5,171,300 | | | | | |
| ACE Securities Corp. Home Equity Loan Trust: | | | | | | | | | | | | |
| Series 2006-HE1, Class A1B1, 0.946%, 02/25/2036 ∞ | | | 5,739,299 | | | | 5,684,118 | | | | | |
| Series 2006-OP1, Class A2C, 0.906%, 04/25/2036 ∞ | | | 4,823,280 | | | | 4,699,910 | | | | | |
| Aegis Asset Backed Securities Trust, | | | | | | | | | | | | |
| Series 2005-5, Class 1A3, 1.026%, 12/25/2035 ∞ | | | 2,561,427 | | | | 2,536,286 | | | | | |
| Alternative Loan Trust: | | | | | | | | | | | | |
| Series 2004-12CB, Class 1A1, 5.000%, 07/25/2019 | | | 605,751 | | | | 617,455 | | | | | |
| Series 2005-50CB, Class 4A1, 5.000%, 11/25/2020 § | | | 152,336 | | | | 152,185 | | | | | |
| Series 2004-J2, Class 3A3, 5.500%, 04/25/2034 | | | 181,263 | | | | 182,347 | | | | | |
| Series 2004-8CB, Class A, 1.026%, 06/25/2034 ∞ | | | 8,053,568 | | | | 7,955,738 | | | | | |
| Series 2005-73CB, Class 1A7, 5.500%, 01/25/2036 | | | 97,852 | | | | 95,172 | | | | | |
| Series 2006-28CB, Class A17, 6.000%, 10/25/2036 | | | 803,678 | | | | 642,241 | | | | | |
| Argent Securities Inc. Asset-Backed Pass-Through Certificates, | | | | | | | | | | | | |
| Series 2005-W3, Class A2D, 1.096%, 11/25/2035 ∞ | | | 9,282,312 | | | | 9,069,878 | | | | | |
| Banc of America Alternative Loan Trust, | | | | | | | | | | | | |
| Series 2004-2, Class 5A1, 5.500%, 03/25/2019 | | | 237,536 | | | | 238,410 | | | | | |
| Banc of America Mortgage Trust, | | | | | | | | | | | | |
| Series 2004-B, Class 2A2, 3.047%, 03/25/2034 ∞ | | | 2,216,474 | | | | 2,200,870 | | | | | |
| Carrington Mortgage Loan Trust: | | | | | | | | | | | | |
| Series 2006-NC1, Class A3, 0.966%, 01/25/2036 ∞ | | | 4,340,741 | | | | 4,297,865 | | | | | |
| Series 2006-OPT1, Class A3, 0.936%, 02/25/2036 ∞ | | | 3,502,134 | | | | 3,435,781 | | | | | |
| Countrywide Asset-Backed Certificates: | | | | | | | | | | | | |
| Series 2006-2, Class 2A3, 1.056%, 06/25/2036 ∞ | | | 9,835,292 | | | | 9,584,602 | | | | | |
| Series 2006-13, Class 1AF3, 4.577%, 01/25/2037 ∞ | | | 865,718 | | | | 1,338,191 | | | | | |
| Credit-Based Asset Servicing & Securitization LLC, | | | | | | | | | | | | |
| Series 2005-CB8, Class AF2, 3.986%, 12/25/2035 | | | 183,542 | | | | 181,849 | | | | | |
| CWABS Asset-Backed Certificates Trust: | | | | | | | | | | | | |
| Series 2005-16, Class 3AV, 0.814%, 05/25/2036 ∞ | | | 4,343,850 | | | | 4,294,181 | | | | | |
| Series 2006-9, Class 1AF3, 4.745%, 10/25/2046 ∞ § | | | 940,916 | | | | 843,626 | | | | | |
| First Franklin Mortgage Loan Trust, | | | | | | | | | | | | |
| Series 2005-FF12, Class A2B, 1.016%, 11/25/2036 ∞ | | | 2,487,615 | | | | 2,467,470 | | | | | |
| GE-WMC Asset-Backed Pass Through Certificates, | | | | | | | | | | | | |
| Series 2005-1, Class A2C, 1.476%, 10/25/2035 ∞ | | | 3,527,640 | | | | 3,496,791 | | | | | |
| GSAA Trust, | | | | | | | | | | | | |
| Series 2005-8, Class A4, 1.026%, 06/25/2035 ∞ | | | 10,921,170 | | | | 10,709,495 | | | | | |
| Home Equity Asset Trust, | | | | | | | | | | | | |
| Series 2006-4, Class 2A3, 0.926%, 08/25/2036 ∞ | | | 964,881 | | | | 959,185 | | | | | |
| J.P. Morgan Mortgage Acquisition Trust, | | | | | | | | | | | | |
| Series 2006-CH1, Class A1, 0.886%, 07/25/2036 ∞ | | | 6,494,954 | | | | 6,298,070 | | | | | |
| J.P. Morgan Mortgage Trust, | | | | | | | | | | | | |
| Series 2005-A4, Class 1A1, 3.086%, 07/25/2035 ∞ | | | 1,147,573 | | | | 1,140,399 | | | | | |
| Long Beach Mortgage Loan Trust, | | | | | | | | | | | | |
| Series 2005-WL2, Class M1, 1.461%, 08/25/2035 ∞ | | | 4,829,231 | | | | 4,803,236 | | | | | |
| MASTR Alternative Loan Trust: | | | | | | | | | | | | |
| Series 2003-5, Class 7A1, 5.000%, 07/25/2018 | | | 2,037,110 | | | | 2,037,487 | | | | | |
| Series 2003-9, Class 3A1, 4.750%, 11/25/2018 | | | 1,111,334 | | | | 1,114,148 | | | | | |
| Series 2003-5, Class 4A1, 5.500%, 07/25/2033 | | | 5,055,314 | | | | 5,277,334 | | | | | |
| MASTR Asset Backed Securities Trust, | | | | | | | | | | | | |
| Series 2006-AB1, Class A2, 0.986%, 02/25/2036 ∞ | | | 323,826 | | | | 322,668 | | | | | |
| Morgan Stanley ABS Capital I, Inc. Trust, | | | | | | | | | | | | |
| Series 2005-HE2, Class A3B, 1.196%, 01/25/2035 ∞ | | | 2,854,631 | | | | 2,846,775 | | | | | |
| New Century Home Equity Loan Trust, | | | | | | | | | | | | |
| Series 2005-C, Class A1, 0.986%, 12/25/2035 ∞ | | | 7,579,682 | | | | 7,439,529 | | | | | |
| Nomura Home Equity Loan, Inc. Home Equity Loan Trust, | | | | | | | | | | | | |
| Series 2006-HE2, Class A3, 0.926%, 03/25/2036 ∞ | | | 2,975,799 | | | | 2,914,052 | | | | | |
| Option One Mortgage Loan Trust Asset-Backed Certificates, | | | | | | | | | | | | |
| Series 2005-5, Class A3, 0.966%, 12/25/2035 ∞ | | | 4,512,291 | | | | 4,488,499 | | | | | |
| Park Place Securities, Inc., | | | | | | | | | | | | |
| Series 2005-WCW1, Class M1, 1.206%, 09/25/2035 ∞ | | | 7,241,937 | | | | 7,196,918 | | | | | |
| Popular ABS Mortgage Pass-Through Trust, | | | | | | | | | | | | |
| Series 2005-B, Class M2, 1.416%, 08/25/2035 ∞ | | | 3,192,862 | | | | 3,133,325 | | | | | |
| RAMP Series Trust: | | | | | | | | | | | | |
| Series 2003-RS11, Class AI7, 4.828%, 12/25/2033 ∞ | | | 141,198 | | | | 143,086 | | | | | |
| Series 2006-NC2, Class A2, 0.946%, 02/25/2036 ∞ | | | 2,579,914 | | | | 2,548,720 | | | | | |
| Series 2006-RZ4, Class A2, 0.936%, 10/25/2036 ∞ | | | 2,398,289 | | | | 2,381,412 | | | | | |
| RASC Series Trust: | | | | | | | | | | | | |
| Series 2005-AHL2, Class A3, 1.106%, 10/25/2035 ∞ | | | 7,818,649 | | | | 7,730,212 | | | | | |
| Series 2006-KS1, Class A4, 1.056%, 02/25/2036 ∞ | | | 3,525,939 | | | | 3,493,545 | | | | | |
| Renaissance Home Equity Loan Trust, | | | | | | | | | | | | |
| Series 2007-2, Class AF2, 5.675%, 06/25/2037 | | | 1,940,209 | | | | 898,717 | | | | | |
| Saxon Asset Securities Trust 2006-2, | | | | | | | | | | | | |
| Series 2006-2, Class A3C, 0.906%, 09/25/2036 ∞ | | | 1,637,966 | | | | 1,588,944 | | | | | |
| Securitized Asset Backed Receivables LLC Trust, | | | | | | | | | | | | |
| Series 2005-OP2, Class A1, 1.081%, 10/25/2035 (Acquired 03/13/2014, Cost $5,274,022) ∞ * | | | 5,339,092 | | | | 5,321,353 | | | | | |
| Soundview Home Loan Trust: | | | | | | | | | | | | |
| Series 2005-OPT4, Class 2A3, 1.016%, 12/25/2035 ∞ | | | 1,239,863 | | | | 1,226,666 | | | | | |
| Series 2006-2, Class A4, 1.026%, 03/25/2036 ∞ | | | 3,906,033 | | | | 3,881,997 | | | | | |
| Specialty Underwriting & Residential Finance Trust: | | | | | | | | | | | | |
| Series 2005-BC4, Class A2C, 1.106%, 09/25/2036 ∞ | | | 1,607,575 | | | | 1,605,877 | | | | | |
| Series 2006-BC1, Class A2D, 1.056%, 12/25/2036 ∞ | | | 9,580,345 | | | | 9,476,225 | | | | | |
| Structured Asset Investment Loan Trust, | | | | | | | | | | | | |
| Series 2004-9, Class A5, 1.756%, 10/25/2034 ∞ | | | 10,425,269 | | | | 10,348,023 | | | | | |
| Structured Asset Securities Corp., | | | | | | | | | | | | |
| Series 2004-4XS, Class 1A6, 5.050%, 02/25/2034 | | | 212,727 | | | | 215,606 | | | | | |
| Structured Asset Securities Corp. Mortgage Loan Trust, | | | | | | | | | | | | |
| Series 2007-BC3, Class 2A2, 0.896%, 05/25/2047 ∞ | | | 623,836 | | | | 613,658 | | | | | |
| Structured Asset Securities Corp. Mortgage Pass-Through Certificates, | | | | | | | | | | | | |
| Series 2004-22, Class A2, 5.033%, 01/25/2035 ∞ | | | 5,579,190 | | | | 5,771,007 | | | | | |
| Thornburg Mortgage Securities Trust, | | | | | | | | | | | | |
| Series 2003-5, Class 3A, 2.831%, 10/25/2043 ∞ | | | 9,720,181 | | | | 9,766,679 | | | | | |
| Towd Point Mortgage Trust: | | | | | | | | | | | | |
| Series 2015-4, Class A1B, 2.750%, 04/25/2055 (Acquired 09/28/2016, Cost $3,051,795) ∞ * | | | 3,003,396 | | | | 3,012,075 | | | | | |
| Series 2015-4, Class A1, 3.500%, 04/25/2055 (Acquired 06/09/2016, Cost $6,636,753) ∞ * | | | 6,467,709 | | | | 6,594,031 | | | | | |
| Series 2016-5, Class A1, 2.500%, 10/25/2056 (Acquired 12/07/2016, Cost $11,993,712) ∞ * | | | 12,000,000 | | | | 11,944,371 | | | | | |
| WaMu Mortgage Pass-Through Certificates Trust: | | | | | | | | | | | | |
| Series 2004-CB4, Class 21A, 5.500%, 12/25/2019 | | | 45,184 | | | | 45,956 | | | | | |
| Series 2004-CB4, Class 22A, 6.000%, 12/25/2019 | | | 112,059 | | | | 114,602 | | | | | |
| Series 2004-AR3, Class A1, 2.800%, 06/25/2034 ∞ | | | 7,041,255 | | | | 7,062,708 | | | | | |
| | | | | | | | 227,514,434 | | | | 5.9 | % |
| Commercial Mortgage-Backed Securities | | | | | | | | | | | | |
| U.S. Government Agency Issues | | | | | | | | | | | | |
| Fannie Mae REMIC Trust: | | | | | | | | | | | | |
| Series 2012-M9, Class ASQ2, 1.513%, 12/25/2017 | | | 24,270,826 | | | | 24,305,813 | | | | | |
| Series 2015-M1, Class ASQ2, 1.626%, 02/25/2018 | | | 24,170,737 | | | | 24,228,161 | | | | | |
| Series 2016-M6, Class ASQ2, 1.785%, 06/25/2019 | | | 13,650,000 | | | | 13,681,435 | | | | | |
| Freddie Mac Multifamily Structured Pass Through Certificates: | | | | | | | | | | | | |
| Series K502, Class A2, 1.426%, 08/25/2017 | | | 7,222,362 | | | | 7,227,294 | | | | | |
| Series K701, Class A2, 3.882%, 11/25/2017 ∞ | | | 7,335,000 | | | | 7,461,058 | | | | | |
| Series K703, Class A2, 2.699%, 05/25/2018 | | | 3,220,315 | | | | 3,265,175 | | | | | |
| Series K-704, Class A2, 2.412%, 08/25/2018 | | | 5,765,710 | | | | 5,837,613 | | | | | |
| Series K705, Class A2, 2.303%, 09/25/2018 | | | 2,700,000 | | | | 2,731,053 | | | | | |
| Series K006, Class A2, 4.251%, 01/25/2020 | | | 15,000,000 | | | | 15,878,226 | | | | | |
| | | | | | | | 104,615,828 | | | | 2.7 | % |
| Non-U.S. Government Agency Issues | | | | | | | | | | | | |
| J.P. Morgan Chase Commercial Mortgage Securities Trust: | | | | | | | | | | | | |
| Series 2012-C8, Class ASB, 2.379%, 10/15/2045 | | | 16,100,000 | | | | 16,174,965 | | | | | |
| Series 2011-C5, Class ASB, 3.678%, 08/15/2046 | | | 6,115,065 | | | | 6,327,335 | | | | | |
| WFRBS Commercial Mortgage Trust, | | | | | | | | | | | | |
| Series 2012-C6, Class A4, 3.440%, 04/15/2045 | | | 7,050,000 | | | | 7,364,618 | | | | | |
| | | | | | | | 29,866,918 | | | | 0.8 | % |
| Other Asset Backed Securities | | | | | | | | | | | | |
| American Express Credit Account Master Trust, | | | | | | | | | | | | |
| Series 2014-4, Class A, 1.430%, 06/15/2020 | | | 5,545,000 | | | | 5,554,187 | | | | | |
| Barclays Dryrock Issuance Trust, | | | | | | | | | | | | |
| Series 2015-1, Class A, 2.200%, 12/15/2022 | | | 6,750,000 | | | | 6,779,809 | | | | | |
| California Republic Auto Receivables Trust, | | | | | | | | | | | | |
| Series 2015-3, Class A3, 1.620%, 11/15/2019 | | | 20,500,000 | | | | 20,534,083 | | | | | |
| Capital Auto Receivables Asset Trust: | | | | | | | | | | | | |
| Series 2016-3, Class A2A, 1.360%, 04/22/2019 | | | 5,500,000 | | | | 5,502,502 | | | | | |
| Series 2015-4, Class A3, 1.830%, 03/20/2020 | | | 3,400,000 | | | | 3,405,435 | | | | | |
| Chase Issuance Trust, | | | | | | | | | | | | |
| Series 2015-A5, Class A5, 1.360%, 04/15/2020 | | | 13,750,000 | | | | 13,741,914 | | | | | |
| Chrysler Capital Auto Receivables Trust: | | | | | | | | | | | | |
| Series 2015-BA, Class A2, 1.460%, 12/17/2018 (Acquired 11/12/2015, Cost $1,613,939) * | | | 1,613,964 | | | | 1,614,808 | | | | | |
| Series 2013-BA, Class A4, 1.270%, 03/15/2019 (Acquired 11/12/2015 through 12/18/2015, Cost $2,227,815) * | | | 2,232,862 | | | | 2,232,223 | | | | | |
| Citibank Credit Card Issuance Trust, | | | | | | | | | | | | |
| Series 2008-A1, Class A1, 5.350%, 02/07/2020 | | | 2,325,000 | | | | 2,425,822 | | | | | |
| Conseco Financial Corp.: | | | | | | | | | | | | |
| Series 1998-2, Class A5, 6.240%, 12/01/2028 ∞ | | | 11,696 | | | | 12,137 | | | | | |
| Series 1998-3, Class A5, 6.220%, 03/01/2030 | | | 171,353 | | | | 181,438 | | | | | |
| Dell Equipment Finance Trust, | | | | | | | | | | | | |
| Series 2015-1, Class A2, 1.010%, 07/24/2017 (Acquired 04/15/2015 through 06/08/2016, Cost $886,214) * | | | 886,278 | | | | 886,153 | | | | | |
| Discover Card Execution Note Trust: | | | | | | | | | | | | |
| Series 2014-A5, Class A, 1.390%, 04/15/2020 | | | 7,399,000 | | | | 7,409,976 | | | | | |
| Series 2016-A4, Class A4, 1.390%, 03/15/2022 | | | 19,075,000 | | | | 18,857,270 | | | | | |
| Ford Credit Auto Owner Trust: | | | | | | | | | | | | |
| Series 2014-1, Class A, 2.260%, 11/15/2025 (Acquired 05/06/2014 through 11/18/2014, Cost $17,933,705) * | | | 17,894,000 | | | | 18,046,743 | | | | | |
| Series 2014-2, Class A, 2.310%, 04/15/2026 (Acquired 01/06/2016 through 09/02/2016, Cost $15,050,289) * | | | 14,892,000 | | | | 15,016,546 | | | | | |
| Series 2015-1, Class A, 2.120%, 07/15/2026 (Acquired 01/13/2015 through 03/14/2016, Cost $12,566,749) * | | | 12,592,000 | | | | 12,616,795 | | | | | |
| Ford Credit Floorplan Master Owner Trust A, | | | | | | | | | | | | |
| Series 2016-1, Class A1, 1.760%, 02/15/2021 | | | 11,425,000 | | | | 11,395,285 | | | | | |
| GM Financial Automobile Leasing Trust, | | | | | | | | | | | | |
| Series 2016-3, Class A3, 1.610%, 12/20/2019 | | | 12,000,000 | | | | 11,964,716 | | | | | |
| GMF Floorplan Owner Revolving Trust, | | | | | | | | | | | | |
| Series 2015-1, Class A1, 1.650%, 05/15/2020 (Acquired 05/13/2015, Cost $14,699,441) * | | | 14,700,000 | | | | 14,688,346 | | | | | |
| Honda Auto Receivables Owner Trust: | | | | | | | | | | | | |
| Series 2016-1, Class A2, 1.010%, 06/18/2018 | | | 2,362,742 | | | | 2,361,959 | | | | | |
| Series 2016-1, Class A3, 1.220%, 12/18/2019 | | | 13,000,000 | | | | 12,970,031 | | | | | |
| Kubota Credit Owner Trust, | | | | | | | | | | | | |
| Series 2015-1A, Class A3, 1.540%, 03/15/2019 (Acquired 01/22/2015 through 07/21/2016, Cost $20,226,877) * | 20,225,000 | | | | 20,252,002 | | | | | |
| Leaf Receivables Funding 10 LLC, | | | | | | | | | | | | |
| Series 2015-1, Class A3, 1.490%, 03/15/2018 (Acquired 04/23/2015, Cost $4,658,772) * | | | 4,659,628 | | | | 4,655,344 | | | | | |
| Leaf Receivables Funding 11 LLC, | | | | | | | | | | | | |
| Series 2016-1, Class A3, 2.050%, 06/15/2019 (Acquired 05/18/2016, Cost $9,999,075) * | | | 10,000,000 | | | | 9,977,589 | | | | | |
| Mercedes-Benz Auto Lease Trust, | | | | | | | | | | | | |
| Series 2016-B, Class A3, 1.350%, 08/15/2019 | | | 18,800,000 | | | | 18,748,845 | | | | | |
| OneMain Financial Issuance Trust, | | | | | | | | | | | | |
| Series 2014-2A, Class A, 2.470%, 09/18/2024 (Acquired 02/05/2016 through 05/04/2016, Cost $9,458,231) * | | | 9,486,444 | | | | 9,490,353 | | | | | |
| Springleaf Funding Trust, | | | | | | | | | | | | |
| Series 2014-AA, Class A, 2.410%, 12/15/2022 (Acquired 09/11/2015 through 06/20/2016, Cost $2,304,129) * | | | 2,302,342 | | | | 2,303,188 | | | | | |
| Synchrony Credit Card Master Note Trust: | | | | | | | | | | | | |
| Series 2012-2, Class A, 2.220%, 01/15/2022 | | | 9,243,000 | | | | 9,313,287 | | | | | |
| Series 2016-3, Class A, 1.580%, 09/15/2022 | | | 6,160,000 | | | | 6,082,635 | | | | | |
| TCF Auto Receivables Owner Trust, | | | | | | | | | | | | |
| Series 2014-1A, Class A4, 1.560%, 01/15/2020 (Acquired 10/21/2015, Cost $5,436,000) * | | | 5,434,957 | | | | 5,443,312 | | | | | |
| Toyota Auto Receivables Owner Trust: | | | | | | | | | | | | |
| Series 2016-B, Class A2A, 1.020%, 10/15/2018 | | | 3,469,000 | | | | 3,466,963 | | | | | |
| Series 2016-B, Class A3, 1.300%, 04/15/2020 | | | 7,000,000 | | | | 6,977,559 | | | | | |
| Verizon Owner Trust: | | | | | | | | | | | | |
| Series 2016-1A, Class A, 1.420%, 01/20/2021 (Acquired 07/12/2016, Cost $16,247,263) * | | | 16,250,000 | | | | 16,136,908 | | | | | |
| Series 2016-2A, Class A, 1.680%, 05/20/2021 (Acquired 11/16/2016, Cost $12,748,678) * | | | 12,750,000 | | | | 12,698,634 | | | | | |
| | | | | | | | 313,744,797 | | | | 8.1 | % |
| Total Long-Term Investments (Cost $3,790,779,390) | | | | | | | 3,783,486,171 | | | | 97.7 | % |
| SHORT-TERM INVESTMENT | | | | | | | | | |
| Money Market Mutual Fund | | Shares | | | | | | | |
| Fidelity Institutional Money Market Fund - Government Portfolio, Institutional Class, 0.43% « | | | 116,128,236 | | | | 116,128,236 | | | | |
| Total Short-Term Investment (Cost $116,128,236) | | | | | | | 116,128,236 | | | | 3.0 | % |
| Total Investments (Cost $3,906,907,626) | | | | | | | 3,899,614,407 | | | | 100.7 | % |
| Liabilities in Excess of Other Assets | | | | | | | (25,424,946 | ) | | | (0.7 | )% |
| TOTAL NET ASSETS | | | | | | $ | 3,874,189,461 | | | | 100.0 | % |
Notes to Schedule of Investments |
| ∞ | Variable or Floating rate security. Floating rate securities are securities whose yields vary with a designated index rate. These securities' rates are as of December 31, 2016. |
| * | Restricted security as defined in Rule 144(a) under the Securities Act of 1933 and determined to be liquid. Purchased in a private placement transaction; resale to the public may require registration or or may extend only to qualified institutional buyers. At December 31, 2016, the value of these securities total $813,134,868, which represents 20.99% of total net assets. |
| f | Foreign Security |
| § | Security in Default |
| « | 7-Day Yield |
| Baird Intermediate Bond Fund | | | | | | | | | |
| Schedule of Investments | | | | | | | | | |
| December 31, 2016 | | | | | | | | | |
| | | | | | | | | | |
| | | Principal | | | | | | % of | |
| | | Amount | | | Value | | | Net Assets | |
| LONG-TERM INVESTMENTS | | | | | | | | | |
| U.S. Treasury Securities | | | | | | | | | |
| U.S. Treasury Bonds: | | | | | | | | | |
| 2.625%, 08/15/2020 | | $ | 115,700,000 | | | $ | 119,631,949 | | | | |
| 1.375%, 08/31/2020 | | | 109,750,000 | | | | 108,609,588 | | | | |
| 1.750%, 03/31/2022 | | | 280,000,000 | | | | 276,270,400 | | | | |
| 2.500%, 05/15/2024 | | | 161,150,000 | | | | 163,560,965 | | | | |
| 2.250%, 11/15/2025 | | | 122,700,000 | | | | 121,127,967 | | | | |
| | | | | | | | 789,200,869 | | | | 34.2 | % |
| Other Government Related Securities | | | | | | | | | | | | |
| CDP Financial, Inc., | | | | | | | | | | | | |
| 4.400%, 11/25/2019 (Acquired 11/20/2009, Cost $997,520) * f | | | 1,000,000 | | | | 1,066,813 | | | | | |
| Centrais Eletricas Brasileiras SA, | | | | | | | | | | | | |
| 5.750%, 10/27/2021 (Acquired 10/20/2011 through 10/25/2011, Cost $1,151,372) * f | | | 1,150,000 | | | | 1,121,250 | | | | | |
| CNOOC Finance (2013) Ltd., | | | | | | | | | | | | |
| 3.000%, 05/09/2023 f | | | 2,000,000 | | | | 1,930,400 | | | | | |
| CNOOC Nexen Finance (2014) ULC, | | | | | | | | | | | | |
| 4.250%, 04/30/2024 f | | | 5,150,000 | | | | 5,268,950 | | | | | |
| Corp Andina de Fomento, | | | | | | | | | | | | |
| 4.375%, 06/15/2022 f | | | 680,000 | | | | 721,385 | | | | | |
| Electricite de France SA, | | | | | | | | | | | | |
| 2.350%, 10/13/2020 (Acquired 10/07/2015, Cost $8,800,006) * f | | | 8,875,000 | | | | 8,790,137 | | | | | |
| Export-Import Bank of Korea, | | | | | | | | | | | | |
| 2.250%, 01/21/2020 f | | | 3,200,000 | | | | 3,181,107 | | | | | |
| KFW, | | | | | | | | | | | | |
| 4.875%, 06/17/2019 f | | | 3,250,000 | | | | 3,503,572 | | | | | |
| Korea Electric Power Corp., | | | | | | | | | | | | |
| 6.750%, 08/01/2027 f | | | 300,000 | | | | 358,474 | | | | | |
| Korea Gas Corp., | | | | | | | | | | | | |
| 2.875%, 07/29/2018 (Acquired 07/22/2013, Cost $994,790) * f | | | 1,000,000 | | | | 1,015,619 | | | | | |
| Mexico Government International Bond, | | | | | | | | | | | | |
| 5.125%, 01/15/2020 f | | | 2,650,000 | | | | 2,844,775 | | | | | |
| Petroleos Mexicanos: | | | | | | | | | | | | |
| 3.125%, 01/23/2019 f | | | 2,000,000 | | | | 1,983,000 | | | | | |
| 5.500%, 01/21/2021 f | | | 2,000,000 | | | | 2,057,500 | | | | | |
| Sinopec Group Overseas Development [2015] Ltd., | | | | | | | | | | | | |
| 2.500%, 04/28/2020 (Acquired 04/21/2015, Cost $2,987,280) * f | | | 3,000,000 | | | | 2,980,113 | | | | | |
| Sinopec Group Overseas Development [2016] Ltd.: | | | | | | | | | | | | |
| 1.750%, 09/29/2019 (Acquired 09/22/2016, Cost $2,988,330) * f | | | 3,000,000 | | | | 2,950,914 | | | | | |
| 2.750%, 05/03/2021 (Acquired 04/25/2016, Cost $4,990,750) * f | | | 5,000,000 | | | | 4,938,260 | | | | | |
| The Korea Development Bank, | | | | | | | | | | | | |
| 3.875%, 05/04/2017 f | | | 2,150,000 | | | | 2,165,372 | | | | | |
| | | | | | | | 46,877,641 | | | | 2.0 | % |
| Corporate Bonds | | | | | | | | | | | | |
| Industrials | | | | | | | | | | | | |
| 21st Century Fox America, Inc., | | | | | | | | | | | | |
| 3.700%, 10/15/2025 | | | 2,825,000 | | | | 2,859,335 | | | | | |
| Abbott Laboratories, | | | | | | | | | | | | |
| 3.400%, 11/30/2023 | | | 10,000,000 | | | | 9,962,410 | | | | | |
| Agilent Technologies, Inc., | | | | | | | | | | | | |
| 3.050%, 09/22/2026 | | | 1,450,000 | | | | 1,385,349 | | | | | |
| Agrium, Inc., | | | | | | | | | | | | |
| 3.150%, 10/01/2022 f | | | 1,306,000 | | | | 1,298,410 | | | | | |
| Altera Corp., | | | | | | | | | | | | |
| 2.500%, 11/15/2018 | | | 2,000,000 | | | | 2,034,538 | | | | | |
| Ameritech Capital Funding Corp., | | | | | | | | | | | | |
| 6.450%, 01/15/2018 | | | 3,008,000 | | | | 3,144,413 | | | | | |
| Anadarko Petroleum Corp., | | | | | | | | | | | | |
| 6.950%, 06/15/2019 | | | 1,000,000 | | | | 1,109,449 | | | | | |
| Anglo American Capital PLC, | | | | | | | | | | | | |
| 9.375%, 04/08/2019 (Acquired 07/11/2012, Cost $2,247,130) * f | | | 2,000,000 | | | | 2,285,000 | | | | | |
| Anheuser-Busch InBev Finance, Inc., | | | | | | | | | | | | |
| 3.300%, 02/01/2023 | | | 9,300,000 | | | | 9,464,908 | | | | | |
| Anheuser-Busch InBev Worldwide, Inc., | | | | | | | | | | | | |
| 1.576%, 08/01/2018 ∞ | | | 3,980,000 | | | | 4,004,441 | | | | | |
| Apple, Inc., | | | | | | | | | | | | |
| 2.400%, 05/03/2023 | | | 2,000,000 | | | | 1,947,436 | | | | | |
| AT&T, Inc., | | | | | | | | | | | | |
| 3.600%, 02/17/2023 | | | 9,000,000 | | | | 9,076,680 | | | | | |
| Boardwalk Pipelines LP, | | | | | | | | | | | | |
| 5.200%, 06/01/2018 | | | 2,500,000 | | | | 2,588,368 | | | | | |
| Boston Scientific Corp., | | | | | | | | | | | | |
| 4.125%, 10/01/2023 | | | 3,000,000 | | | | 3,112,356 | | | | | |
| BP Capital Markets PLC: | | | | | | | | | | | | |
| 4.750%, 03/10/2019 f | | | 2,500,000 | | | | 2,650,165 | | | | | |
| 2.521%, 01/15/2020 f | | | 2,650,000 | | | | 2,665,383 | | | | | |
| 3.245%, 05/06/2022 f | | | 1,000,000 | | | | 1,021,133 | | | | | |
| British Telecommunications PLC, | | | | | | | | | | | | |
| 5.950%, 01/15/2018 f | | | 2,000,000 | | | | 2,084,404 | | | | | |
| Bunge Limited Finance Corp.: | | | | | | | | | | | | |
| 3.200%, 06/15/2017 | | | 1,300,000 | | | | 1,309,788 | | | | | |
| 3.500%, 11/24/2020 | | | 2,500,000 | | | | 2,544,562 | | | | | |
| Bunge NA Finance LP, | | | | | | | | | | | | |
| 5.900%, 04/01/2017 | | | 750,000 | | | | 756,453 | | | | | |
| Cardinal Health, Inc., | | | | | | | | | | | | |
| 1.950%, 06/15/2018 | | | 5,600,000 | | | | 5,612,174 | | | | | |
| Charter Communications Operating LLC / Charter Communications Operating Capital, | | | | | | | | | | | | |
| 4.464%, 07/23/2022 | | | 7,150,000 | | | | 7,471,972 | | | | | |
| Chevron Phillips Chemical Co. LLC / Chevron Phillips Chemical Co. LP, | | | | | | | | | | | | |
| 2.450%, 05/01/2020 (Acquired 05/07/2015, Cost $4,123,680) * | | | 4,125,000 | | | | 4,096,467 | | | | | |
| Coca-Cola FEMSA SAB de CV, | | | | | | | | | | | | |
| 2.375%, 11/26/2018 f | | | 3,550,000 | | | | 3,574,655 | | | | | |
| Comcast Corp.: | | | | | | | | | | | | |
| 2.750%, 03/01/2023 | | | 1,475,000 | | | | 1,464,455 | | | | | |
| 2.350%, 01/15/2027 | | | 4,175,000 | | | | 3,848,640 | | | | | |
| Cox Communications, Inc.: | | | | | | | | | | | | |
| 3.250%, 12/15/2022 (Acquired 11/26/2012, Cost $3,594,456) * | | | 3,600,000 | | | | 3,506,702 | | | | | |
| 3.850%, 02/01/2025 (Acquired 12/01/2014, Cost $4,492,215) * | | | 4,500,000 | | | | 4,413,375 | | | | | |
| CVS Health Corp.: | | | | | | | | | | | | |
| 2.250%, 08/12/2019 | | | 3,375,000 | | | | 3,393,526 | | | | | |
| 4.000%, 12/05/2023 | | | 4,425,000 | | | | 4,662,379 | | | | | |
| Daimler Finance North America LLC, | | | | | | | | | | | | |
| 2.250%, 07/31/2019 (Acquired 07/25/2012, Cost $2,285,234) * | | | 2,300,000 | | | | 2,303,036 | | | | | |
| DCP Midstream LLC, | | | | | | | | | | | | |
| 9.750%, 03/15/2019 (Acquired 10/15/2012, Cost $1,788,857) * | | | 1,600,000 | | | | 1,792,000 | | | | | |
| Deutsche Telekom International Finance BV: | | | | | | | | | | | | |
| 2.250%, 03/06/2017 (Acquired 03/24/2015, Cost $1,402,346) * f | | | 1,400,000 | | | | 1,401,987 | | | | | |
| 6.750%, 08/20/2018 f | | | 2,850,000 | | | | 3,073,260 | | | | | |
| 6.000%, 07/08/2019 f | | | 1,700,000 | | | | 1,859,441 | | | | | |
| Diamond 1 Finance Corp. / Diamond 2 Finance Corp., | | | | | | | | | | | | |
| 3.480%, 06/01/2019 (Acquired 05/17/2016 through 10/07/2016, Cost $11,006,541) * | | | 10,900,000 | | | | 11,126,785 | | | | | |
| Ecolab, Inc.: | | | | | | | | | | | | |
| 1.450%, 12/08/2017 | | | 4,000,000 | | | | 3,996,052 | | | | | |
| 3.250%, 01/14/2023 | | | 5,000,000 | | | | 5,091,320 | | | | | |
| Energy Transfer Partners LP, | | | | | | | | | | | | |
| 9.700%, 03/15/2019 | | | 2,457,000 | | | | 2,820,103 | | | | | |
| Enterprise Products Operating LLC, | | | | | | | | | | | | |
| 2.550%, 10/15/2019 | | | 3,000,000 | | | | 3,030,615 | | | | | |
| EQT Midstream Partners LP, | | | | | | | | | | | | |
| 4.125%, 12/01/2026 | | | 5,000,000 | | | | 4,873,735 | | | | | |
| ERAC USA Finance LLC: | | | | | | | | | | | | |
| 2.350%, 10/15/2019 (Acquired 06/30/2014 through 10/26/2016, Cost $6,669,203) * | | | 6,650,000 | | | | 6,644,095 | | | | | |
| 2.600%, 12/01/2021 (Acquired 05/23/2016, Cost $4,818,341) * | | | 4,825,000 | | | | 4,748,350 | | | | | |
| Express Scripts Holding Co., | | | | | | | | | | | | |
| 3.000%, 07/15/2023 | | | 5,655,000 | | | | 5,474,114 | | | | | |
| Federal Express Corp. 1998 Pass Through Trust, | | | | | | | | | | | | |
| Class 981B, 6.845%, 01/15/2019 | | | 1,405,874 | | | | 1,456,064 | | | | | |
| Fidelity National Information Services, Inc.: | | | | | | | | | | | | |
| 3.500%, 04/15/2023 | | | 4,400,000 | | | | 4,456,025 | | | | | |
| 3.875%, 06/05/2024 | | | 3,900,000 | | | | 3,979,014 | | | | | |
| 3.000%, 08/15/2026 | | | 2,000,000 | | | | 1,877,862 | | | | | |
| Fiserv, Inc.: | | | | | | | | | | | | |
| 4.750%, 06/15/2021 | | | 1,728,000 | | | | 1,859,559 | | | | | |
| 3.500%, 10/01/2022 | | | 2,900,000 | | | | 2,953,369 | | | | | |
| FMC Corp., | | | | | | | | | | | | |
| 4.100%, 02/01/2024 | | | 2,000,000 | | | | 2,007,856 | | | | | |
| Ford Motor Credit Co. LLC: | | | | | | | | | | | | |
| 1.724%, 12/06/2017 | | | 3,300,000 | | | | 3,297,505 | | | | | |
| 5.750%, 02/01/2021 | | | 2,000,000 | | | | 2,193,162 | | | | | |
| 3.336%, 03/18/2021 | | | 1,800,000 | | | | 1,812,490 | | | | | |
| Freeport-McMoRan, Inc.: | | | | | | | | | | | | |
| 6.750%, 02/01/2022 (Acquired 06/18/2014 through 09/22/2014, Cost $1,703,837) * | | | 1,649,000 | | | | 1,694,347 | | | | | |
| 3.550%, 03/01/2022 | | | 2,000,000 | | | | 1,860,000 | | | | | |
| 3.875%, 03/15/2023 | | | 1,100,000 | | | | 1,009,250 | | | | | |
| General Electric Co.: | | | | | | | | | | | | |
| 6.000%, 08/07/2019 | | | 774,000 | | | | 855,165 | | | | | |
| 5.500%, 01/08/2020 | | | 731,000 | | | | 800,954 | | | | | |
| 5.550%, 05/04/2020 | | | 816,000 | | | | 901,459 | | | | | |
| General Motors Financial Co., Inc.: | | | | | | | | | | | | |
| 2.350%, 10/04/2019 | | | 5,500,000 | | | | 5,435,364 | | | | | |
| 4.375%, 09/25/2021 | | | 5,325,000 | | | | 5,523,697 | | | | | |
| Georgia-Pacific LLC, | | | | | | | | | | | | |
| 5.400%, 11/01/2020 (Acquired 06/09/2016, Cost $7,548,029) * | | | 6,797,000 | | | | 7,472,479 | | | | | |
| Glencore Funding LLC: | | | | | | | | | | | | |
| 2.500%, 01/15/2019 (Acquired 05/22/2013 through 10/29/2013, Cost $4,350,557) * | | | 4,400,000 | | | | 4,390,320 | | | | | |
| 4.125%, 05/30/2023 (Acquired 04/03/2014, Cost $1,462,690) * | | | 1,500,000 | | | | 1,509,510 | | | | | |
| 4.625%, 04/29/2024 (Acquired 10/08/2014, Cost $1,023,744) * | | | 1,000,000 | | | | 1,022,500 | | | | | |
| Grupo Bimbo SAB de CV, | | | | | | | | | | | | |
| 3.875%, 06/27/2024 (Acquired 06/24/2014, Cost $2,987,700) * f | | | 3,000,000 | | | | 2,984,571 | | | | | |
| GTE Corp., | | | | | | | | | | �� | | |
| 8.750%, 11/01/2021 | | | 2,150,000 | | | | 2,619,855 | | | | | |
| Historic TW, Inc., | | | | | | | | | | | | |
| 6.875%, 06/15/2018 | | | 392,000 | | | | 419,253 | | | | | |
| Hutchison Whampoa International (09) Ltd., | | | | | | | | | | | | |
| 7.625%, 04/09/2019 (Acquired 10/16/2009 through 04/16/2014, Cost $5,804,943) * f | | | 5,400,000 | | | | 6,041,882 | | | | | |
| Hutchison Whampoa International (14) Ltd., | | | | | | | | | | | | |
| 1.625%, 10/31/2017 (Acquired 10/28/2014, Cost $1,995,400) * f | | | 2,000,000 | | | | 1,995,350 | | | | | |
| Hyundai Capital America: | | | | | | | | | | | | |
| 2.500%, 03/18/2019 (Acquired 03/14/2016, Cost $1,299,103) * | | | 1,300,000 | | | | 1,303,476 | | | | | |
| 2.000%, 07/01/2019 (Acquired 06/07/2016, Cost $2,498,225) * | | | 2,500,000 | | | | 2,480,668 | | | | | |
| 1.750%, 09/27/2019 (Acquired 09/22/2016, Cost $2,996,340) * | | | 3,000,000 | | | | 2,952,513 | | | | | |
| Hyundai Capital Services, Inc., | | | | | | | | | | | | |
| 3.500%, 09/13/2017 (Acquired 08/04/2014 through 09/30/2014, Cost $6,221,403) * f | | | 6,150,000 | | | | 6,212,029 | | | | | |
| Ingersoll-Rand Co., | | | | | | | | | | | | |
| 6.391%, 11/15/2027 f | | | 1,195,000 | | | | 1,414,040 | | | | | |
| Ingersoll-Rand Global Holding Co. Ltd., | | | | | | | | | | | | |
| 2.875%, 01/15/2019 | | | 5,000,000 | | | | 5,089,525 | | | | | |
| Ingredion, Inc.: | | | | | | | | | | | | |
| 1.800%, 09/25/2017 | | | 1,275,000 | | | | 1,276,613 | | | | | |
| 3.200%, 10/01/2026 | | | 3,100,000 | | | | 3,033,973 | | | | | |
| Johnson Controls International PLC, | | | | | | | | | | | | |
| 4.250%, 03/01/2021 f | | | 2,000,000 | | | | 2,112,160 | | | | | |
| Kinder Morgan, Inc./DE: | | | | | | | | | | | | |
| 5.625%, 11/15/2023 (Acquired 12/15/2016, Cost $1,086,076) * | | | 1,000,000 | | | | 1,097,611 | | | | | |
| 7.800%, 08/01/2031 | | | 5,000,000 | | | | 6,181,485 | | | | | |
| Kraft Heinz Foods Co., | | | | | | | | | | | | |
| 3.500%, 06/06/2022 | | | 2,000,000 | | | | 2,033,942 | | | | | |
| Laboratory Corp. of America Holdings, | | | | | | | | | | | | |
| 4.625%, 11/15/2020 | | | 468,000 | | | | 501,726 | | | | | |
| LyondellBasell Industries NV, | | | | | | | | | | | | |
| 6.000%, 11/15/2021 f | | | 1,100,000 | | | | 1,247,476 | | | | | |
| Martin Marietta Materials, Inc., | | | | | | | | | | | | |
| 6.600%, 04/15/2018 | | | 75,000 | | | | 79,192 | | | | | |
| Mead Johnson Nutrition Co., | | | | | | | | | | | | |
| 3.000%, 11/15/2020 | | | 5,400,000 | | | | 5,467,651 | | | | | |
| Merey Sweeny LP, | | | | | | | | | | | | |
| 8.850%, 12/18/2019 (Acquired 06/11/2013, Cost $1,031,992) * | | | 946,513 | | | | 1,042,710 | | | | | |
| Midcontinent Express Pipeline LLC, | | | | | | | | | | | | |
| 6.700%, 09/15/2019 (Acquired 09/30/2014, Cost $1,076,678) * | | | 1,000,000 | | | | 1,050,000 | | | | | |
| Nabors Industries, Inc., | | | | | | | | | | | | |
| 6.150%, 02/15/2018 | | | 875,000 | | | | 907,812 | | | | | |
| Noble Energy, Inc.: | | | | | | | | | | | | |
| 8.250%, 03/01/2019 | | | 1,000,000 | | | | 1,123,305 | | | | | |
| 4.150%, 12/15/2021 | | | 450,000 | | | | 468,309 | | | | | |
| ONEOK Partners LP, | | | | | | | | | | | | |
| 3.375%, 10/01/2022 | | | 6,100,000 | | | | 6,125,461 | | | | | |
| Pentair Finance SA: | | | | | | | | | | | | |
| 2.900%, 09/15/2018 f | | | 5,675,000 | | | | 5,740,586 | | | | | |
| 3.625%, 09/15/2020 f | | | 5,500,000 | | | | 5,595,980 | | | | | |
| Petrofac Ltd., | | | | | | | | | | | | |
| 3.400%, 10/10/2018 (Acquired 10/03/2013 through 09/19/2014, Cost $6,911,552) * f | | | 6,880,000 | | | | 6,963,406 | | | | | |
| Phillips 66 Partners LP, | | | | | | | | | | | | |
| 3.605%, 02/15/2025 | | | 2,000,000 | | | | 1,958,742 | | | | | |
| Pioneer Natural Resources Co., | | | | | | | | | | | | |
| 6.875%, 05/01/2018 | | | 1,225,000 | | | | 1,300,499 | | | | | |
| POSCO, | | | | | | | | | | | | |
| 5.250%, 04/14/2021 (Acquired 04/08/2011 through 09/22/2011, Cost $2,977,304) * f | | | 3,000,000 | | | | 3,267,552 | | | | | |
| R.R. Donnelley & Sons Co., | | | | | | | | | | | | |
| 7.625%, 06/15/2020 | | | 1,000,000 | | | | 1,040,000 | | | | | |
| Rio Tinto Finance (USA) Ltd., | | | | | | | | | | | | |
| 9.000%, 05/01/2019 f | | | 2,975,000 | | | | 3,430,336 | | | | | |
| Rockies Express Pipeline LLC, | | | | | | | | | | | | |
| 5.625%, 04/15/2020 (Acquired 03/17/2010, Cost $999,110) * | | | 1,000,000 | | | | 1,052,500 | | | | | |
| Rockwell Automation, Inc., | | | | | | | | | | | | |
| 2.875%, 03/01/2025 | | | 3,000,000 | | | | 2,938,704 | | | | | |
| Roper Technologies, Inc., | | | | | | | | | | | | |
| 3.800%, 12/15/2026 | | | 1,450,000 | | | | 1,461,177 | | | | | |
| Samarco Mineracao SA, | | | | | | | | | | | | |
| 5.375%, 09/26/2024 (Acquired 09/23/2014, Cost $1,670,511) * f | | | 1,675,000 | | | | 904,500 | | | | | |
| Schlumberger Holdings Corp., | | | | | | | | | | | | |
| 2.350%, 12/21/2018 (Acquired 12/10/2015, Cost $4,499,460) * | | | 4,500,000 | | | | 4,537,120 | | | | | |
| Schneider Electric SE, | | | | | | | | | | | | |
| 2.950%, 09/27/2022 (Acquired 09/20/2012, Cost $1,994,680) * f | | | 2,000,000 | | | | 1,997,556 | | | | | |
| Solvay Finance America LLC, | | | | | | | | | | | | |
| 3.400%, 12/03/2020 (Acquired 01/08/2016, Cost $3,996,160) * | | | 4,000,000 | | | | 4,069,972 | | | | | |
| Sunoco, Inc., | | | | | | | | | | | | |
| 5.750%, 01/15/2017 | | | 1,275,000 | | | | 1,276,423 | | | | | |
| Sysco Corp.: | | | | | | | | | | | | |
| 2.600%, 10/01/2020 | | | 7,600,000 | | | | 7,665,633 | | | | | |
| 2.500%, 07/15/2021 | | | 2,000,000 | | | | 1,978,656 | | | | | |
| 2.600%, 06/12/2022 | | | 150,000 | | | | 147,677 | | | | | |
| TC PipeLines LP, | | | | | | | | | | | | |
| 4.375%, 03/13/2025 | | | 4,500,000 | | | | 4,536,365 | | | | | |
| Telefonica Emisiones SAU: | | | | | | | | | | | | |
| 6.221%, 07/03/2017 f | | | 1,000,000 | | | | 1,022,442 | | | | | |
| 3.192%, 04/27/2018 f | | | 1,000,000 | | | | 1,014,381 | | | | | |
| Telstra Corp. Ltd., | | | | | | | | | | | | |
| 3.125%, 04/07/2025 (Acquired 03/30/2015, Cost $5,640,395) * f | | | 5,650,000 | | | | 5,581,132 | | | | | |
| Texas Eastern Transmission LP, | | | | | | | | | | | | |
| 6.000%, 09/15/2017 (Acquired 11/07/2013 through 11/14/2014, Cost $2,130,948) * | | | 2,073,000 | | | | 2,134,228 | | | | | |
| The Dow Chemical Co., | | | | | | | | | | | | |
| 8.550%, 05/15/2019 | | | 8,800,000 | | | | 10,085,513 | | | | | |
| The Mosaic Co., | | | | | | | | | | | | |
| 4.250%, 11/15/2023 | | | 8,606,000 | | | | 8,677,783 | | | | | |
| Time Warner Cable LLC: | | | | | | | | | | | | |
| 5.850%, 05/01/2017 | | | 1,000,000 | | | | 1,014,191 | | | | | |
| 6.750%, 07/01/2018 | | | 2,000,000 | | | | 2,135,240 | | | | | |
| Time Warner, Inc.: | | | | | | | | | | | | |
| 4.700%, 01/15/2021 | | | 1,325,000 | | | | 1,416,262 | | | | | |
| 4.750%, 03/29/2021 | | | 2,000,000 | | | | 2,142,602 | | | | | |
| 3.600%, 07/15/2025 | | | 4,000,000 | | | | 3,977,600 | | | | | |
| TransCanada PipeLines Ltd.: | | | | | | | | | | | | |
| 1.875%, 01/12/2018 f | | | 3,000,000 | | | | 3,004,710 | | | | | |
| 9.875%, 01/01/2021 f | | | 200,000 | | | | 251,846 | | | | | |
| 4.875%, 01/15/2026 f | | | 3,000,000 | | | | 3,333,432 | | | | | |
| TSMC Global Ltd., | | | | | | | | | | | | |
| 1.625%, 04/03/2018 (Acquired 03/27/2013, Cost $3,297,789) * f | | | 3,300,000 | | | | 3,287,381 | | | | | |
| Tyco Electronics Group SA, | | | | | | | | | | | | |
| 6.550%, 10/01/2017 f | | | 1,245,000 | | | | 1,291,376 | | | | | |
| Vale Overseas Ltd., | | | | | | | | | | | | |
| 4.375%, 01/11/2022 f | | | 2,500,000 | | | | 2,456,250 | | | | | |
| Valero Energy Corp.: | | | | | | | | | | | | |
| 9.375%, 03/15/2019 | | | 5,898,000 | | | | 6,792,137 | | | | | |
| 3.400%, 09/15/2026 | | | 4,500,000 | | | | 4,311,063 | | | | | |
| Verizon Communications, Inc.: | | | | | | | | | | | | |
| 5.150%, 09/15/2023 | | | 6,100,000 | | | | 6,745,032 | | | | | |
| 4.150%, 03/15/2024 | | | 2,000,000 | | | | 2,089,964 | | | | | |
| Vodafone Group PLC, | | | | | | | | | | | | |
| 1.250%, 09/26/2017 f | | | 6,925,000 | | | | 6,912,154 | | | | | |
| Vulcan Materials Co., | | | | | | | | | | | | |
| 7.000%, 06/15/2018 | | | 2,000,000 | | | | 2,135,000 | | | | | |
| Wabtec Corp./DE, | | | | | | | | | | | | |
| 4.375%, 08/15/2023 | | | 3,125,000 | | | | 3,264,547 | | | | | |
| 3.450%, 11/15/2026 (Acquired 10/31/2016, Cost $4,998,250) * | | | 5,000,000 | | | | 4,806,310 | | | | | |
| Walgreen Co., | | | | | | | | | | | | |
| 5.250%, 01/15/2019 | | | 605,000 | | | | 640,295 | | | | | |
| Waste Management, Inc.: | | | | | | | | | | | | |
| 2.400%, 05/15/2023 | | | 7,000,000 | | | | 6,787,522 | | | | | |
| 3.125%, 03/01/2025 | | | 1,975,000 | | | | 1,977,550 | | | | | |
| Wesfarmers Ltd., | | | | | | | | | | | | |
| 1.874%, 03/20/2018 (Acquired 03/13/2013, Cost $3,900,000) * f | | | 3,900,000 | | | | 3,895,496 | | | | | |
| WestRock MWV LLC, | | | | | | | | | | | | |
| 7.375%, 09/01/2019 | | | 2,033,000 | | | | 2,293,984 | | | | | |
| Williams Partners LP: | | | | | | | | | | | | |
| 5.250%, 03/15/2020 | | | 1,000,000 | | | | 1,068,419 | | | | | |
| 4.125%, 11/15/2020 | | | 1,625,000 | | | | 1,689,436 | | | | | |
| 4.300%, 03/04/2024 | | | 2,500,000 | | | | 2,524,528 | | | | | |
| Xylem, Inc./NY, | | | | | | | | | | | | |
| 3.250%, 11/01/2026 | | | 5,000,000 | | | | 4,855,255 | | | | | |
| Zoetis, Inc.: | | | | | | | | | | | | |
| 3.250%, 02/01/2023 | | | 7,150,000 | | | | 7,134,370 | | | | | |
| 4.500%, 11/13/2025 | | | 2,000,000 | | | | 2,120,296 | | | | | |
| | | | | | | | 479,947,869 | | | | 20.8 | % |
| Utilities | | | | | | | | | | | | |
| FORTIS, Inc., | | | | | | | | | | | | |
| 2.100%, 10/04/2021 (Acquired 09/29/2016, Cost $4,987,250) * f | | | 5,000,000 | | | | 4,832,575 | | | | | |
| National Rural Utilities Cooperative Finance Corp.: | | | | | | | | | | | | |
| 10.375%, 11/01/2018 | | | 3,694,000 | | | | 4,260,021 | | | | | |
| 2.000%, 01/27/2020 | | | 3,000,000 | | | | 2,978,322 | | | | | |
| PPL Capital Funding, Inc., | | | | | | | | | | | | |
| 3.400%, 06/01/2023 | | | 2,475,000 | | | | 2,491,865 | | | | | |
| PSEG Power LLC, | | | | | | | | | | | | |
| 5.125%, 04/15/2020 | | | 220,000 | | | | 235,646 | | | | | |
| Public Service Co. of New Mexico, | | | | | | | | | | | | |
| 7.950%, 05/15/2018 | | | 3,220,000 | | | | 3,476,158 | | | | | |
| RGS I&M Funding Corp., | | | | | | | | | | | | |
| Class F*, 9.820%, 06/07/2022 | | | 411,732 | | | | 417,609 | | | | | |
| Southern Power Co., | | | | | | | | | | | | |
| 1.850%, 12/01/2017 | | | 2,050,000 | | | | 2,055,418 | | | | | |
| Talent Yield Investments Ltd., | | | | | | | | | | | | |
| 4.500%, 04/25/2022 (Acquired 04/18/2012, Cost $3,774,008) * f | | | 3,800,000 | | | | 3,980,530 | | | | | |
| | | | | | | | 24,728,144 | | | | 1.1 | % |
| Financials | | | | | | | | | | | | |
| ABN AMRO Bank NV: | | | | | | | | | | | | |
| 4.250%, 02/02/2017 (Acquired 11/22/2013, Cost $4,510,182) * f | | | 4,500,000 | | | | 4,509,711 | | | | | |
| 2.500%, 10/30/2018 (Acquired 10/23/2013 through 04/17/2014, Cost $1,199,649) * f | | | 1,200,000 | | | | 1,209,456 | | | | | |
| 2.450%, 06/04/2020 (Acquired 05/28/2015, Cost $2,644,170) * f | | | 2,650,000 | | | | 2,635,308 | | | | | |
| Aetna, Inc., | | | | | | | | | | | | |
| 2.800%, 06/15/2023 | | | 4,000,000 | | | | 3,940,036 | | | | | |
| AIA Group Ltd., | | | | | | | | | | | | |
| 3.200%, 03/11/2025 (Acquired 03/04/2015, Cost $2,996,190) * f | | | 3,000,000 | | | | 2,895,483 | | | | | |
| Ally Financial, Inc., | | | | | | | | | | | | |
| 8.000%, 12/31/2018 | | | 96,000 | | | | 104,760 | | | | | |
| American International Group, Inc., | | | | | | | | | | | | |
| 4.875%, 06/01/2022 | | | 6,000,000 | | | | 6,556,650 | | | | | |
| AmSouth Bancorporation, | | | | | | | | | | | | |
| 6.750%, 11/01/2025 | | | 630,000 | | | | 723,135 | | | | | |
| ANZ New Zealand (Int'l) Ltd./London: | | | | | | | | | | | | |
| 2.600%, 09/23/2019 (Acquired 09/16/2014 through 03/19/2015, Cost $4,152,188) * f | | | 4,140,000 | | | | 4,174,983 | | | | | |
| 2.850%, 08/06/2020 (Acquired 07/30/2015, Cost $3,996,680) * f | | | 4,000,000 | | | | 4,027,632 | | | | | |
| 2.125%, 07/28/2021 (Acquired 07/21/2016, Cost $899,190) * f | | | 900,000 | | | | 875,648 | | | | | |
| Australia & New Zealand Banking Group Ltd./New York NY, | | | | | | | | | | | | |
| 3.700%, 11/16/2025 f | | | 1,000,000 | | | | 1,038,177 | | | | | |
| Bank of America Corp.: | | | | | | | | | | | | |
| 5.700%, 05/02/2017 | | | 1,100,000 | | | | 1,114,990 | | | | | |
| 6.875%, 04/25/2018 | | | 1,000,000 | | | | 1,062,910 | | | | | |
| 2.625%, 10/19/2020 | | | 5,000,000 | | | | 5,002,855 | | | | | |
| 3.300%, 01/11/2023 | | | 3,350,000 | | | | 3,361,189 | | | | | |
| 4.000%, 04/01/2024 | | | 2,750,000 | | | | 2,836,182 | | | | | |
| BanPonce Trust I, | | | | | | | | | | | | |
| Class A, 8.327%, 02/01/2027 | | | 2,500,000 | | | | 2,364,942 | | | | | |
| Barclays PLC: | | | | | | | | | | | | |
| 2.000%, 03/16/2018 f | | | 2,600,000 | | | | 2,594,595 | | | | | |
| 3.250%, 01/12/2021 f | | | 2,000,000 | | | | 2,001,948 | | | | | |
| BB&T Corp., | | | | | | | | | | | | |
| 6.850%, 04/30/2019 | | | 2,322,000 | | | | 2,573,507 | | | | | |
| BNZ International Funding Ltd./London: | | | | | | | | | | | | |
| 2.350%, 03/04/2019 (Acquired 09/03/2014, Cost $2,789,836) * f | | | 2,800,000 | | | | 2,809,996 | | | | | |
| 2.100%, 09/14/2021 (Acquired 09/06/2016, Cost $9,990,600) * f | | | 10,000,000 | | | | 9,710,050 | | | | | |
| BPCE SA: | | | | | | | | | | | | |
| 5.700%, 10/22/2023 (Acquired 11/10/2014, Cost $3,697,797) * f | | | 3,500,000 | | | | 3,679,491 | | | | | |
| 4.000%, 04/15/2024 f | | | 3,500,000 | | | | 3,633,045 | | | | | |
| Caisse Centrale Desjardins, | | | | | | | | | | | | |
| 1.552%, 01/29/2018 (Acquired 01/26/2015, Cost $8,000,000) ∞ * f | | | 8,000,000 | | | | 7,991,848 | | | | | |
| Capital One Bank (USA) NA, | | | | | | | | | | | | |
| 2.250%, 02/13/2019 | | | 3,500,000 | | | | 3,515,627 | | | | | |
| Capital One NA/Mclean VA, | | | | | | | | | | | | |
| 1.561%, 02/05/2018 ∞ | | | 2,000,000 | | | | 2,003,950 | | | | | |
| Citigroup, Inc.: | | | | | | | | | | | | |
| 1.550%, 08/14/2017 | | | 700,000 | | | | 700,489 | | | | | |
| 1.700%, 04/27/2018 | | | 1,500,000 | | | | 1,496,694 | | | | | |
| 2.050%, 12/07/2018 | | | 5,700,000 | | | | 5,699,362 | | | | | |
| 3.750%, 06/16/2024 | | | 500,000 | | | | 509,229 | | | | | |
| Citizens Bank NA/Providence RI: | | | | | | | | | | | | |
| 2.450%, 12/04/2019 | | | 8,000,000 | | | | 8,026,904 | | | | | |
| 2.550%, 05/13/2021 | | | 2,000,000 | | | | 1,987,722 | | | | | |
| CNA Financial Corp.: | | | | | | | | | | | | |
| 7.350%, 11/15/2019 | | | 2,395,000 | | | | 2,716,225 | | | | | |
| 5.750%, 08/15/2021 | | | 1,385,000 | | | | 1,547,179 | | | | | |
| 4.500%, 03/01/2026 | | | 5,000,000 | | | | 5,228,700 | | | | | |
| Comerica Bank: | | | | | | | | | | | | |
| 5.200%, 08/22/2017 | | | 5,695,000 | | | | 5,822,921 | | | | | |
| 2.500%, 06/02/2020 | | | 3,375,000 | | | | 3,373,761 | | | | | |
| Commonwealth Bank of Australia, | | | | | | | | | | | | |
| 5.000%, 10/15/2019 (Acquired 03/02/2012 through 10/03/2014, Cost $4,492,369) * f | | | 4,335,000 | | | | 4,657,125 | | | | | |
| Commonwealth Bank of Australia/New York NY, | | | | | | | | | | | | |
| 1.750%, 11/02/2018 f | | | 4,500,000 | | | | 4,488,858 | | | | | |
| Compass Bank: | | | | | | | | | | | | |
| 2.750%, 09/29/2019 | | | 8,000,000 | | | | 7,956,456 | | | | | |
| 3.875%, 04/10/2025 | | | 3,700,000 | | | | 3,521,072 | | | | | |
| Cooperatieve Rabobank UA/NY, | | | | | | | | | | | | |
| 2.500%, 01/19/2021 f | | | 8,175,000 | | | | 8,173,692 | | | | | |
| Credit Agricole SA/London, | | | | | | | | | | | | |
| 2.750%, 06/10/2020 (Acquired 06/03/2015, Cost $2,994,570) * f | | | 3,000,000 | | | | 3,007,050 | | | | | |
| Credit Suisse AG/New York NY, | | | | | | | | | | | | |
| 5.300%, 08/13/2019 f | | | 3,220,000 | | | | 3,474,486 | | | | | |
| Credit Suisse Group Funding Guernsey Ltd., | | | | | | | | | | | | |
| 3.800%, 06/09/2023 f | | | 8,700,000 | | | | 8,690,413 | | | | | |
| Deutsche Bank AG: | | | | | | | | | | | | |
| 2.950%, 08/20/2020 f | | | 3,000,000 | | | | 2,953,257 | | | | | |
| 3.125%, 01/13/2021 f | | | 2,175,000 | | | | 2,138,458 | | | | | |
| 3.375%, 05/12/2021 f | | | 5,000,000 | | | | 4,949,440 | | | | | |
| 4.250%, 10/14/2021 (Acquired 10/07/2016, Cost $1,999,380) * f | | | 2,000,000 | | | | 2,007,712 | | | | | |
| Discover Bank/Greenwood DE, | | | | | | | | | | | | |
| 2.600%, 11/13/2018 | | | 2,500,000 | | | | 2,521,680 | | | | | |
| First National Bank of Chicago Pass Through Trust, | | | | | | | | | | | | |
| Series 93-A, Class 93-A, 8.080%, 01/05/2018 | | | 100,002 | | | | 101,218 | | | | | |
| First Niagara Financial Group, Inc., | | | | | | | | | | | | |
| 6.750%, 03/19/2020 | | | 1,618,000 | | | | 1,824,944 | | | | | |
| GE Capital International Funding Co. Unlimited Co., | | | | | | | | | | | | |
| 2.342%, 11/15/2020 f | | | 6,730,000 | | | | 6,726,790 | | | | | |
| Genworth Holdings, Inc., | | | | | | | | | | | | |
| 4.900%, 08/15/2023 | | | 1,500,000 | | | | 1,237,500 | | | | | |
| Great-West Life & Annuity Insurance Capital LP II, | | | | | | | | | | | | |
| 3.449%, 05/16/2046 (Acquired 05/16/2006 through 11/08/2007, Cost $1,792,736) ∞ * | | | 1,800,000 | | | | 1,539,000 | | | | | |
| Guardian Life Global Funding, | | | | | | | | | | | | |
| 2.000%, 04/26/2021 (Acquired 04/19/2016, Cost $3,994,720) * | | | 4,000,000 | | | | 3,901,136 | | | | | |
| Highmark, Inc., | | | | | | | | | | | | |
| 4.750%, 05/15/2021 (Acquired 07/30/2014, Cost $2,010,731) * | | | 2,000,000 | | | | 2,030,446 | | | | | |
| HSBC Finance Corp., | | | | | | | | | | | | |
| 6.676%, 01/15/2021 | | | 4,709,000 | | | | 5,293,109 | | | | | |
| HSBC Holdings PLC, | | | | | | | | | | | | |
| 3.600%, 05/25/2023 f | | | 2,500,000 | | | | 2,514,495 | | | | | |
| HSBC USA, Inc., | | | | | | | | | | | | |
| 2.350%, 03/05/2020 | | | 3,500,000 | | | | 3,472,630 | | | | | |
| Humana, Inc., | | | | | | | | | | | | |
| 7.200%, 06/15/2018 | | | 2,000,000 | | | | 2,149,866 | | | | | |
| Huntington Bancshares Inc./OH: | | | | | | | | | | | | |
| 3.150%, 03/14/2021 | | | 1,500,000 | | | | 1,521,148 | | | | | |
| 2.300%, 01/14/2022 | | | 1,000,000 | | | | 969,885 | | | | | |
| ING Bank NV: | | | | | | | | | | | | |
| 2.500%, 10/01/2019 (Acquired 09/23/2014, Cost $2,461,635) * f | | | 2,475,000 | | | | 2,490,939 | | | | | |
| 5.000%, 06/09/2021 (Acquired 06/12/2013, Cost $2,114,452) * f | | | 2,000,000 | | | | 2,188,542 | | | | | |
| 5.800%, 09/25/2023 (Acquired 10/15/2015 through 09/21/2016, Cost $4,199,131) * f | | | 3,865,000 | | | | 4,246,819 | | | | | |
| Invesco Finance PLC, | | | | | | | | | | | | |
| 3.125%, 11/30/2022 f | | | 4,500,000 | | | | 4,533,188 | | | | | |
| iStar, Inc., | | | | | | | | | | | | |
| 5.850%, 03/15/2017 | | | 75,000 | | | | 75,338 | | | | | |
| Jefferies Group LLC, | | | | | | | | | | | | |
| 6.875%, 04/15/2021 | | | 2,000,000 | | | | 2,275,268 | | | | | |
| John Hancock Life Insurance Co., | | | | | | | | | | | | |
| 7.375%, 02/15/2024 (Acquired 04/10/2013 through 04/11/2013, Cost $2,816,323) * | | | 2,325,000 | | | | 2,747,671 | | | | | |
| JPMorgan Chase & Co.: | | | | | | | | | | | | |
| 2.250%, 01/23/2020 | | | 7,875,000 | | | | 7,856,462 | | | | | |
| 2.295%, 08/15/2021 | | | 2,500,000 | | | | 2,453,685 | | | | | |
| 4.500%, 01/24/2022 | | | 3,000,000 | | | | 3,235,293 | | | | | |
| 2.112%, 10/24/2023 ∞ | | | 5,000,000 | | | | 5,099,845 | | | | | |
| Kemper Corp., | | | | | | | | | | | | |
| 6.000%, 05/15/2017 | | | 600,000 | | | | 608,872 | | | | | |
| KeyBank NA/Cleveland OH: | | | | | | | | | | | | |
| 1.451%, 06/01/2018 ∞ | | | 8,000,000 | | | | 8,009,968 | | | | | |
| 3.400%, 05/20/2026 | | | 2,200,000 | | | | 2,136,356 | | | | | |
| Korea Housing Finance Corp., | | | | | | | | | | | | |
| 1.625%, 09/15/2018 (Acquired 02/26/2013 through 08/28/2014, Cost $1,042,714) * f | | | 1,050,000 | | | | 1,043,213 | | | | | |
| LeasePlan Corp. NV: | | | | | | | | | | | | |
| 3.000%, 10/23/2017 (Acquired 02/07/2013, Cost $4,010,370) * f | | | 4,000,000 | | | | 4,028,688 | | | | | |
| 2.500%, 05/16/2018 (Acquired 05/29/2013 through 10/20/2014, Cost $5,011,201) * f | | | 5,000,000 | | | | 5,007,270 | | | | | |
| Liberty Mutual Group, Inc., | | | | | | | | | | | | |
| 4.250%, 06/15/2023 (Acquired 06/13/2013, Cost $1,987,300) * | | | 2,000,000 | | | | 2,093,950 | | | | | |
| Lloyds Bank PLC: | | | | | | | | | | | | |
| 2.050%, 01/22/2019 f | | | 3,000,000 | | | | 2,997,126 | | | | | |
| 5.800%, 01/13/2020 (Acquired 02/09/2010 through 03/16/2012, Cost $2,902,495) * f | | | 2,900,000 | | | | 3,162,392 | | | | | |
| M&I Marshall & Ilsley Bank, | | | | | | | | | | | | |
| 5.000%, 01/17/2017 | | | 1,000,000 | | | | 1,001,057 | | | | | |
| Macquarie Bank Ltd, | | | | | | | | | | | | |
| 6.625%, 04/07/2021 (Acquired 10/05/2016, Cost $2,631,746) * f | | | 2,284,000 | | | | 2,567,616 | | | | | |
| 1.600%, 10/27/2017 (Acquired 10/22/2014, Cost $2,498,475) * f | | | 2,500,000 | | | | 2,499,840 | | | | | |
| 2.400%, 01/21/2020 (Acquired 01/14/2015, Cost $997,800) * f | | | 1,000,000 | | | | 990,980 | | | | | |
| Manulife Financial Corp., | | | | | | | | | | | | |
| 4.900%, 09/17/2020 f | | | 2,375,000 | | | | 2,547,765 | | | | | |
| Marsh & McLennan Companies, Inc., | | | | | | | | | | | | |
| 2.550%, 10/15/2018 | | | 1,000,000 | | | | 1,009,402 | | | | | |
| MassMutual Global Funding II, | | | | | | | | | | | | |
| 2.000%, 04/05/2017 (Acquired 03/29/2012, Cost $3,783,470) * | | | 3,800,000 | | | | 3,809,401 | | | | | |
| MBIA Insurance Corp., | | | | | | | | | | | | |
| 12.140%, 01/15/2033 (Acquired 01/11/2008, Cost $500,000) ∞ * | | | 500,000 | | | | 230,000 | | | | | |
| Metropolitan Life Global Funding I, | | | | | | | | | | | | |
| 3.000%, 01/10/2023 (Acquired 01/03/2013, Cost $1,299,337) * | | | 1,300,000 | | | | 1,305,659 | | | | | |
| Mitsubishi UFJ Financial Group, Inc., | | | | | | | | | | | | |
| 2.190%, 09/13/2021 f | | | 3,000,000 | | | | 2,917,386 | | | | | |
| Mizuho Bank Ltd., | | | | | | | | | | | | |
| 2.150%, 10/20/2018 (Acquired 10/13/2015, Cost $4,497,390) * f | | | 4,500,000 | | | | 4,504,253 | | | | | |
| Morgan Stanley: | | | | | | | | | | | | |
| 6.625%, 04/01/2018 | | | 1,700,000 | | | | 1,797,798 | | | | | |
| 7.300%, 05/13/2019 | | | 2,700,000 | | | | 3,008,551 | | | | | |
| 2.375%, 07/23/2019 | | | 1,000,000 | | | | 1,002,849 | | | | | |
| 2.282%, 10/24/2023 ∞ | | | 7,000,000 | | | | 7,077,777 | | | | | |
| 3.125%, 07/27/2026 | | | 4,525,000 | | | | 4,323,076 | | | | | |
| MUFG Americas Holdings Corp., | | | | | | | | | | | | |
| 3.500%, 06/18/2022 | | | 225,000 | | | | 230,046 | | | | | |
| MUFG Union Bank NA, | | | | | | | | | | | | |
| 2.125%, 06/16/2017 | | | 1,800,000 | | | | 1,805,823 | | | | | |
| Nationwide Building Society, | | | | | | | | | | | | |
| 2.350%, 01/21/2020 (Acquired 01/12/2015, Cost $2,999,010) * f | | | 3,000,000 | | | | 2,992,860 | | | | | |
| Nationwide Financial Services, Inc., | | | | | | | | | | | | |
| 5.375%, 03/25/2021 (Acquired 10/07/2013, Cost $868,229) * | | | 828,000 | | | | 904,376 | | | | | |
| Nomura Holdings, Inc., | | | | | | | | | | | | |
| 6.700%, 03/04/2020 f | | | 1,000,000 | | | | 1,117,645 | | | | | |
| NYSE Holdings LLC, | | | | | | | | | | | | |
| 2.000%, 10/05/2017 | | | 800,000 | | | | 804,253 | | | | | |
| Peachtree Corners Funding Trust, | | | | | | | | | | | | |
| 3.976%, 02/15/2025 (Acquired 03/10/2015, Cost $6,000,000) * | | | 6,000,000 | | | | 5,854,278 | | | | | |
| PNC Bank NA, | | | | | | | | | | | | |
| 2.950%, 01/30/2023 | | | 4,000,000 | | | | 3,942,180 | | | | | |
| Principal Life Global Funding II: | | | | | | | | | | | | |
| 2.200%, 04/08/2020 (Acquired 03/31/2015, Cost $1,997,360) * | | | 2,000,000 | | | | 1,985,026 | | | | | |
| 3.000%, 04/18/2026 (Acquired 04/11/2016, Cost $6,981,380) * | | | 7,000,000 | | | | 6,804,448 | | | | | |
| Protective Life Corp., | | | | | | | | | | | | |
| 7.375%, 10/15/2019 | | | 2,050,000 | | | | 2,321,883 | | | | | |
| Protective Life Global Funding, | | | | | | | | | | | | |
| 2.700%, 11/25/2020 (Acquired 11/19/2015, Cost $2,997,360) * | | | 3,000,000 | | | | 3,004,371 | | | | | |
| Prudential Financial, Inc., | | | | | | | | | | | | |
| 7.375%, 06/15/2019 | | | 850,000 | | | | 956,851 | | | | | |
| Regions Bank/Birmingham AL, | | | | | | | | | | | | |
| 7.500%, 05/15/2018 | | | 2,475,000 | | | | 2,651,539 | | | | | |
| Reliance Standard Life Global Funding II, | | | | | | | | | | | | |
| 3.050%, 01/20/2021 (Acquired 01/12/2016, Cost $4,994,250) * | | | 5,000,000 | | | | 5,039,805 | | | | | |
| Santander Bank NA, | | | | | | | | | | | | |
| 8.750%, 05/30/2018 | | | 4,415,000 | | | | 4,751,803 | | | | | |
| Santander Holdings USA, Inc., | | | | | | | | | | | | |
| 2.700%, 05/24/2019 | | | 2,000,000 | | | | 1,998,478 | | | | | |
| Santander UK Group Holdings PLC, | | | | | | | | | | | | |
| 3.125%, 01/08/2021 f | | | 2,325,000 | | | | 2,319,569 | | | | | |
| Santander UK PLC: | | | | | | | | | | | | |
| 3.050%, 08/23/2018 f | | | 1,175,000 | | | | 1,193,550 | | | | | |
| 5.000%, 11/07/2023 (Acquired 10/31/2013, Cost $996,810) * f | | | 1,000,000 | | | | 1,017,324 | | | | | |
| Skandinaviska Enskilda Banken AB, | | | | | | | | | | | | |
| 2.450%, 05/27/2020 (Acquired 05/19/2015, Cost $8,486,910) * f | | | 8,500,000 | | | | 8,466,136 | | | | | |
| Societe Generale SA: | | | | | | | | | | | | |
| 2.078%, 10/01/2018 ∞ f | | | 2,000,000 | | | | 2,017,048 | | | | | |
| 2.625%, 10/01/2018 f | | | 1,000,000 | | | | 1,012,582 | | | | | |
| 2.500%, 04/08/2021 (Acquired 04/04/2016, Cost $2,148,388) * f | | | 2,150,000 | | | | 2,129,889 | | | | | |
| 5.200%, 04/15/2021 (Acquired 01/28/2013, Cost $1,337,429) * f | | | 1,250,000 | | | | 1,372,281 | | | | | |
| 5.000%, 01/17/2024 (Acquired 01/14/2014 through 02/18/2014, Cost $3,127,444) * f | | | 3,150,000 | | | | 3,198,652 | | | | | |
| Standard Chartered PLC: | | | | | | | | | | | | |
| 1.520%, 04/17/2018 (Acquired 04/13/2015, Cost $8,500,000) ∞ * f | | | 8,500,000 | | | | 8,467,411 | | | | | |
| 2.100%, 08/19/2019 (Acquired 08/16/2016 through 11/17/2016, Cost $3,189,931) * f | | | 3,200,000 | | | | 3,163,434 | | | | | |
| Sumitomo Mitsui Banking Corp.: | | | | | | | | | | | | |
| 2.500%, 07/19/2018 f | | | 3,000,000 | | | | 3,024,171 | | | | | |
| 2.250%, 07/11/2019 f | | | 2,000,000 | | | | 1,997,672 | | | | | |
| Sumitomo Mitsui Financial Group, Inc., | | | | | | | | | | | | |
| 2.442%, 10/19/2021 f | | | 6,200,000 | | | | 6,099,343 | | | | | |
| SunTrust Bank/Atlanta GA: | | | | | | | | | | | | |
| 5.450%, 12/01/2017 | | | 500,000 | | | | 515,567 | | | | | |
| 7.250%, 03/15/2018 | | | 1,506,000 | | | | 1,597,499 | | | | | |
| 3.300%, 05/15/2026 | | | 9,000,000 | | | | 8,686,755 | | | | | |
| Svenska Handelsbanken AB: | | | | | | | | | | | | |
| 2.500%, 01/25/2019 f | | | 1,000,000 | | | | 1,010,574 | | | | | |
| 2.400%, 10/01/2020 f | | | 5,000,000 | | | | 4,989,405 | | | | | |
| Swedbank AB: | | | | | | | | | | | | |
| 1.750%, 03/12/2018 (Acquired 03/05/2013, Cost $3,236,382) * f | | | 3,250,000 | | | | 3,248,924 | | | | | |
| 2.375%, 02/27/2019 (Acquired 02/20/2014, Cost $2,595,606) * f | | | 2,600,000 | | | | 2,611,429 | | | | | |
| 2.650%, 03/10/2021 (Acquired 03/03/2016, Cost $3,795,592) * f | | | 3,800,000 | | | | 3,798,963 | | | | | |
| Synchrony Financial: | | | | | | | | | | | | |
| 3.750%, 08/15/2021 | | | 5,000,000 | | | | 5,139,085 | | | | | |
| 4.250%, 08/15/2024 | | | 4,800,000 | | | | 4,886,150 | | | | | |
| The Bank of Nova Scotia, | | | | | | | | | | | | |
| 4.500%, 12/16/2025 f | | | 7,000,000 | | | | 7,191,009 | | | | | |
| The Bank of Tokyo-Mitsubishi UFJ Ltd.: | | | | | | | | | | | | |
| 2.700%, 09/09/2018 (Acquired 09/03/2013, Cost $2,547,756) * f | | | 2,550,000 | | | | 2,575,885 | | | | | |
| 2.150%, 09/14/2018 (Acquired 09/08/2015, Cost $999,710) * f | | | 1,000,000 | | | | 1,000,825 | | | | | |
| 2.300%, 03/10/2019 (Acquired 03/04/2014 through 11/24/2015, Cost $1,123,462) * f | | | 1,125,000 | | | | 1,125,441 | | | | | |
| 2.300%, 03/05/2020 (Acquired 02/25/2015, Cost $2,998,020) * f | | | 3,000,000 | | | | 2,966,700 | | | | | |
| The Bear Stearns Companies LLC: | | | | | | | | | | | | |
| 6.400%, 10/02/2017 | | | 1,450,000 | | | | 1,502,122 | | | | | |
| 7.250%, 02/01/2018 | | | 2,275,000 | | | | 2,407,491 | | | | | |
| The Charles Schwab Corp., | | | | | | | | | | | | |
| 6.375%, 09/01/2017 | | | 325,000 | | | | 335,853 | | | | | |
| The Goldman Sachs Group, Inc.: | | | | | | | | | | | | |
| 6.150%, 04/01/2018 | | | 4,025,000 | | | | 4,233,958 | | | | | |
| 2.900%, 07/19/2018 | | | 1,000,000 | | | | 1,013,810 | | | | | |
| 7.500%, 02/15/2019 | | | 865,000 | | | | 958,922 | | | | | |
| 2.550%, 10/23/2019 | | | 2,000,000 | | | | 2,014,684 | | | | | |
| 2.350%, 11/15/2021 | | | 2,825,000 | | | | 2,744,657 | | | | | |
| 3.500%, 01/23/2025 | | | 2,000,000 | | | | 1,973,398 | | | | | |
| The Hartford Financial Services Group, Inc., | | | | | | | | | | | | |
| 5.125%, 04/15/2022 | | | 500,000 | | | | 554,592 | | | | | |
| The Huntington National Bank, | | | | | | | | | | | | |
| 2.875%, 08/20/2020 | | | 3,500,000 | | | | 3,531,178 | | | | | |
| Trinity Acquisition PLC, | | | | | | | | | | | | |
| 4.400%, 03/15/2026 f | | | 1,125,000 | | | | 1,138,786 | | | | | |
| UBS Group Funding Jersey Ltd, | | | | | | | | | | | | |
| 2.950%, 09/24/2020 (Acquired 09/21/2015, Cost $6,214,355) * f | | | 6,225,000 | | | | 6,227,745 | | | | | |
| UnitedHealth Group, Inc., | | | | | | | | | | | | |
| 3.350%, 07/15/2022 | | | 1,575,000 | | | | 1,622,732 | | | | | |
| Voya Financial, Inc., | | | | | | | | | | | | |
| 2.900%, 02/15/2018 | | | 1,525,000 | | | | 1,543,889 | | | | | |
| WEA Finance LLC / Westfield UK & Europe Finance PLC, | | | | | | | | | | | | |
| 3.250%, 10/05/2020 (Acquired 09/28/2015, Cost $7,474,275) * | | | 7,500,000 | | | | 7,627,515 | | | | | |
| Wells Fargo & Co.: | | | | | | | | | | | | |
| Class N, 2.150%, 01/30/2020 | | | 7,000,000 | | | | 6,966,925 | | | | | |
| 2.117%, 10/31/2023 ∞ | | | 5,000,000 | | | | 5,061,715 | | | | | |
| Westpac Banking Corp.: | | | | | | | | | | | | |
| 1.600%, 01/12/2018 f | | | 1,250,000 | | | | 1,249,024 | | | | | |
| 4.875%, 11/19/2019 f | | | 2,775,000 | | | | 2,977,794 | | | | | |
| 2.100%, 05/13/2021 f | | | 5,000,000 | | | | 4,888,775 | | | | | |
| Willis Towers Watson PLC, | | | | | | | | | | | | |
| 5.750%, 03/15/2021 f | | | 3,250,000 | | | | 3,551,363 | | | | | |
| | | | | | | | 532,879,317 | | | | 23.1 | % |
| Total Corporate Bonds | | | | | | | 1,037,555,330 | | | | 45.0 | % |
| Taxable Municipal Bonds | | | | | | | | | |
| Alabama Economic Settlement Authority, | | | | | | | | | |
| 3.163%, 09/15/2025 | | | 5,000,000 | | | | 5,043,250 | | | | |
| Alaska Municipal Bond Bank Authority: | | | | | | | | | | | |
| 4.309%, 08/01/2018 | | | 1,000,000 | | | | 1,041,210 | | | | |
| 4.459%, 08/01/2019 | | | 1,340,000 | | | | 1,422,826 | | | | |
| California Qualified School Bond Joint Powers Authority, | | | | | | | | | | | |
| 5.955%, 03/01/2019 | | | 3,375,000 | | | | 3,612,566 | | | | |
| California School Finance Authority, | | | | | | | | | | | |
| 4.426%, 07/01/2020 | | | 2,500,000 | | | | 2,666,375 | | | | |
| Central Valley Support Joint Powers Agency, | | | | | | | | | | | |
| 5.326%, 09/01/2022 | | | 2,000,000 | | | | 2,172,100 | | | | |
| City of Berwyn IL, | | | | | | | | | | | |
| 5.790%, 12/01/2022 | | | 5,095,000 | | | | 5,472,285 | | | | |
| City of Bristol VA, | | | | | | | | | | | |
| 3.668%, 10/01/2022 (Callable 10/01/2020) | | | 7,500,000 | | | | 7,526,925 | | | | |
| Cook County School District No. 104 Summit, | | | | | | | | | | | |
| 6.125%, 12/01/2027 (Callable 12/01/2017) | | | 1,535,000 | | | | 1,583,214 | | | | |
| County of Contra Costa CA, | | | | | | | | | | | |
| 5.140%, 06/01/2017 | | | 2,500,000 | | | | 2,529,975 | | | | |
| County of Cook IL, | | | | | | | | | | | |
| 5.240%, 11/15/2025 (Callable 11/15/2021) | | | 2,345,000 | | | | 2,523,783 | | | | |
| Dallas Independent School District, | | | | | | | | | | | |
| 4.950%, 02/15/2022 (Callable 02/15/2021) | | | 1,965,000 | | | | 2,219,586 | | | | |
| Davie Florida Water & Sewer Revenue, | | | | | | | | | | | |
| 6.062%, 10/01/2025 (Callable 10/01/2020) | | | 1,000,000 | | | | 1,128,620 | | | | |
| Iowa Tobacco Settlement Authority, | | | | | | | | | | | |
| 6.500%, 06/01/2023 (Callable 01/30/2017) | | | 760,000 | | | | 746,715 | | | | |
| New Hampshire Housing Finance Authority, | | | | | | | | | | | |
| 2.600%, 01/01/2020 | | | 1,630,000 | | | | 1,633,260 | | | | |
| New Jersey Economic Development Authority: | | | | | | | | | | | |
| 1.802%, 06/15/2017 | | | 785,000 | | | | 787,747 | | | | |
| 1.802%, 06/15/2017 | | | 4,215,000 | | | | 4,220,480 | | | | |
| 2.694%, 02/15/2019 <<<< | | | 4,450,000 | | | | 4,191,544 | | | | |
| North Carolina Housing Finance Agency: | | | | | | | | | | | |
| 4.000%, 01/01/2030 (Callable 07/01/2021) | | | 320,000 | | | | 326,995 | | | | |
| 3.000%, 01/01/2033 (Callable 01/01/2025) | | | 5,685,000 | | | | 5,675,108 | | | | |
| North East Independent School District/TX, | | | | | | | | | | | |
| 5.240%, 08/01/2027 | | | 2,100,000 | | | | 2,425,332 | | | | |
| Public Finance Authority, | | | | | | | | | | | |
| 2.625%, 11/01/2019 (Callable 05/01/2018) | | | 3,000,000 | | | | 2,979,420 | | | | |
| South Dakota Housing Development Authority, | | | | | | | | | | | |
| 2.700%, 11/01/2036 (Callable 11/01/2025) | | | 2,200,000 | | | | 2,169,266 | | | | |
| Winnebago & Boone Counties School District No. 205 Rockford: | | | | | | | | | | | |
| 3.800%, 12/01/2026 (Callable 12/01/2025) | | | 2,200,000 | | | | 2,219,866 | | | | |
| 3.950%, 12/01/2027 (Callable 12/01/2025) | | | 1,700,000 | | | | 1,677,492 | | | | |
| | | | | | | | 67,995,940 | | | | 3.0 | % |
| Residential Mortgage-Backed Securities | | | | | | | | | | | | |
| U.S. Government Agency Issues | | | | | | | | | | | | |
| Fannie Mae REMIC Trust: | | | | | | | | | | | | |
| Series 1989-2, Class D, 8.800%, 01/25/2019 | | | 1,904 | | | | 1,991 | | | | | |
| Series 1990-108, Class G, 7.000%, 09/25/2020 | | | 2,558 | | | | 2,713 | | | | | |
| Series G-29, Class O, 8.500%, 09/25/2021 | | | 351 | | | | 390 | | | | | |
| Series 1991-137, Class H, 7.000%, 10/25/2021 | | | 19,223 | | | | 20,715 | | | | | |
| Series 1993-32, Class H, 6.000%, 03/25/2023 | | | 13,102 | | | | 13,980 | | | | | |
| Series 2004-W6, Class 1A6, 5.500%, 07/25/2034 | | | 15,356 | | | | 15,339 | | | | | |
| Federal Gold Loan Mortgage Corp. (FGLMC): | | | | | | | | | | | | |
| 6.000%, 06/01/2021 | | | 75,535 | | | | 80,375 | | | | | |
| 6.000%, 07/01/2028 | | | 6,145 | | | | 7,043 | | | | | |
| Federal Home Loan Mortgage Corp. (FHLMC): | | | | | | | | | | | | |
| Series 74, Class F, 6.000%, 10/15/2020 | | | 700 | | | | 727 | | | | | |
| Series 1395, Class G, 6.000%, 10/15/2022 | | | 6,272 | | | | 6,738 | | | | | |
| Government National Mortgage Association (GNMA), | | | | | | | | | | | | |
| Series 1999-4, Class ZB, 6.000%, 02/20/2029 | | | 79,854 | | | | 89,148 | | | | | |
| | | | | | | | 239,159 | | | | 0.0 | % |
| Non-U.S. Government Agency Issues | | | | | | | | | | | | |
| Accredited Mortgage Loan Trust, | | | | | | | | | | | | |
| Series 2005-4, Class A1, 0.996%, 12/25/2035 ∞ | | | 3,804,348 | | | | 3,755,381 | | | | | |
| Alternative Loan Trust: | | | | | | | | | | | | |
| Series 2005-50CB, Class 4A1, 5.000%, 11/25/2020 | | | 175,186 | | | | 175,012 | | | | | |
| Series 2005-85CB, Class 3A1, 5.250%, 02/25/2021 (Acquired 09/26/2007 through 01/28/2009, Cost $169,031) * § | 170,259 | | | | 164,888 | | | | | |
| Series 2006-7CB, Class 3A1, 5.250%, 05/25/2021 § | | | 303,797 | | | | 294,055 | | | | | |
| Series 2004-8CB, Class A, 1.026%, 06/25/2034 ∞ | | | 4,947,192 | | | | 4,887,096 | | | | | |
| Series 2005-11CB, Class 2A1, 5.500%, 06/25/2035 § | | | 51,120 | | | | 49,129 | | | | | |
| AMRESCO Residential Securities Corp. Mortgage Loan Trust, | | | | | | | | | | | | |
| Series 1998-1, Class A6, 6.510%, 08/25/2027 | | | 6,825 | | | | 7,184 | | | | | |
| Argent Securities Inc. Asset-Backed Pass-Through Certificates: | | | | | | | | | | | | |
| Series 2005-W3, Class A2D, 1.096%, 11/25/2035 ∞ | | | 1,780,779 | | | | 1,740,024 | | | | | |
| Series 2005-W5, Class A1, 0.991%, 01/25/2036 ∞ | | | 9,413,061 | | | | 8,979,975 | | | | | |
| Banc of America Alternative Loan Trust: | | | | | | | | | | | | |
| Series 2003-11, Class 4A1, 4.750%, 01/25/2019 | | | 33,272 | | | | 33,368 | | | | | |
| Series 2004-2, Class 5A1, 5.500%, 03/25/2019 | | | 117,689 | | | | 118,122 | | | | | |
| Series 2004-11, Class 4A1, 5.500%, 12/25/2019 | | | 193,872 | | | | 196,250 | | | | | |
| Series 2005-6, Class 7A1, 5.500%, 07/25/2020 § | | | 8,826 | | | | 8,498 | | | | | |
| Series 2006-2, Class 7A1, 6.000%, 03/25/2021 § | | | 156,376 | | | | 147,869 | | | | | |
| Series 2006-4, Class 3CB4, 6.000%, 05/25/2046 § | | | 350,837 | | | | 290,843 | | | | | |
| Banc of America Funding Trust, | | | | | | | | | | | | |
| Series 2004-2, Class 1CB1, 5.750%, 09/20/2034 | | | 3,493,124 | | | | 3,613,162 | | | | | |
| Bear Stearns ARM Trust, | | | | | | | | | | | | |
| Series 2004-5, Class 2A, 3.515%, 07/25/2034 ∞ | | | 1,812,576 | | | | 1,802,478 | | | | | |
| Citigroup Global Markets Mortgage Securities VII, Inc., | | | | | | | | | | | | |
| Series 2003-UP2, Class A2, 7.000%, 06/25/2033 ∞ | | | 65,934 | | | | 66,780 | | | | | |
| Cityscape Home Equity Loan Trust, | | | | | | | | | | | | |
| Series 1997-C, Class A4, 7.000%, 07/25/2028 | | | 3,921 | | | | 3,608 | | | | | |
| Countrywide Asset-Backed Certificates: | | | | | | | | | | | | |
| Series 2004-12, Class AF6, 4.634%, 03/25/2035 ∞ | | | 5,570 | | | | 5,742 | | | | | |
| Series 2006-13, Class 1AF3, 4.577%, 01/25/2037 ∞ § | | | 130,118 | | | | 201,131 | | | | | |
| CWABS Asset-Backed Certificates Trust: | | | | | | | | | | | | |
| Series 2005-1, Class AF6, 5.030%, 07/25/2035 ∞ | | | 339,673 | | | | 346,836 | | | | | |
| Series 2006-9, Class 1AF3, 4.745%, 10/25/2046 ∞ § | | | 865,643 | | | | 776,136 | | | | | |
| Delta Funding Home Equity Loan Trust: | | | | | | | | | | | | |
| Series 1997-2, Class A6, 7.040%, 06/25/2027 ∞ | | | 2,104 | | | | 2,088 | | | | | |
| Series 1999-2, Class A7F, 7.030%, 08/15/2030 | | | 273,445 | | | | 311,436 | | | | | |
| GSAMP Trust, | | | | | | | | | | | | |
| Series 2005-WMC2, Class A1B, 1.066%, 11/25/2035 ∞ | | | 2,420,407 | | | | 2,365,761 | | | | | |
| IMC Home Equity Loan Trust, | | | | | | | | | | | | |
| Series 1998-1, Class A6, 7.020%, 06/20/2029 ∞ | | | 2,103 | | | | 2,102 | | | | | |
| J.P. Morgan Alternative Loan Trust: | | | | | | | | | | | | |
| Series 2005-S1, Class 3A1, 5.500%, 10/25/2020 | | | 293,066 | | | | 290,165 | | | | | |
| Series 2006-A1, Class 2A1, 2.972%, 03/25/2036 ∞ | | | 456,392 | | | | 382,188 | | | | | |
| J.P. Morgan Mortgage Acquisition Trust, | | | | | | | | | | | | |
| Series 2006-CH1, Class A1, 0.886%, 07/25/2036 ∞ | | | 3,117,578 | | | | 3,023,074 | | | | | |
| MASTR Alternative Loan Trust: | | | | | | | | | | | | |
| Series 2004-1, Class 1A1, 5.000%, 01/25/2019 | | | 135,295 | | | | 135,722 | | | | | |
| Series 2004-3, Class 1A1, 5.000%, 03/25/2019 | | | 32,182 | | | | 32,347 | | | | | |
| Series 2005-3, Class 4A1, 5.500%, 03/25/2020 | | | 39,177 | | | | 39,916 | | | | | |
| MortgageIT Trust, | | | | | | | | | | | | |
| Series 2005-3, Class A1, 1.056%, 08/25/2035 ∞ | | | 7,755,604 | | | | 7,300,152 | | | | | |
| New Century Home Equity Loan Trust: | | | | | | | | | | | | |
| Series 2005-C, Class A1, 0.986%, 12/25/2035 ∞ | | | 3,789,841 | | | | 3,719,765 | | | | | |
| Series 2005-C, Class A2C, 1.006%, 12/25/2035 ∞ | | | 2,101,730 | | | | 2,082,455 | | | | | |
| Nomura Home Equity Loan, Inc. Home Equity Loan Trust, | | | | | | | | | | | | |
| Series 2006-HE2, Class A3, 0.926%, 03/25/2036 ∞ | | | 3,967,732 | | | | 3,885,402 | | | | | |
| RAAC Series Trust, | | | | | | | | | | | | |
| Series 2004-SP1, Class AI4, 5.285%, 08/25/2027 ∞ | | | 2,326 | | | | 2,366 | | | | | |
| RALI Series Trust, | | | | | | | | | | | | |
| Series 2004-QS6, Class A1, 5.000%, 05/25/2019 | | | 13,318 | | | | 13,311 | | | | | |
| RAMP Series Trust, | | | | | | | | | | | | |
| Series 2005-RS1, Class AI6, 4.713%, 01/25/2035 | | | 27,917 | | | | 28,199 | | | | | |
| Saxon Asset Securities Trust, | | | | | | | | | | | | |
| Series 2005-4, Class A1B, 1.136%, 11/25/2037 ∞ | | | 4,205,803 | | | | 4,134,857 | | | | | |
| Securitized Asset Backed Receivables LLC Trust, | | | | | | | | | | | | |
| Series 2005-OP2, Class A1, 1.081%, 10/25/2035 (Acquired 03/13/2014, Cost $2,920,997) ∞ * | | | 2,957,036 | | | | 2,947,211 | | | | | |
| Soundview Home Loan Trust, | | | | | | | | | | | | |
| Series 2003-2, Class A2, 2.056%, 11/25/2033 ∞ | | | 2,401,463 | | | | 2,376,582 | | | | | |
| Specialty Underwriting & Residential Finance Trust: | | | | | | | | | | | | |
| Series 2004-BC4, Class A1A, 1.426%, 10/25/2035 ∞ | | | 2,568,013 | | | | 2,517,563 | | | | | |
| Series 2006-BC1, Class A2D, 1.056%, 12/25/2036 ∞ | | | 7,409,331 | | | | 7,328,806 | | | | | |
| Structured Asset Investment Loan Trust, | | | | | | | | | | | | |
| Series 2004-9, Class A5, 1.756%, 10/25/2034 ∞ | | | 4,858,001 | | | | 4,822,005 | | | | | |
| Structured Asset Securities Corp. Mortgage Pass-Through Certificates, | | | | | | | | | | | | |
| Series 2004-22, Class A2, 5.033%, 01/25/2035 ∞ | | | 3,719,460 | | | | 3,847,338 | | | | | |
| Thornburg Mortgage Securities Trust, | | | | | | | | | | | | |
| Series 2003-5, Class 3A, 2.831%, 10/25/2043 ∞ | | | 5,832,109 | | | | 5,860,007 | | | | | |
| Towd Point Mortgage Trust, | | | | | | | | | | | | |
| Series 2016-2, Class A1, 3.000%, 08/25/2055 (Acquired 05/20/2016, Cost $3,578,296) ∞ * | | | 3,551,859 | | | | 3,570,471 | | | | | |
| Towd Point Mortgage Trust 2015-5, | | | | | | | | | | | | |
| Series 2015-5, 2.750%, 05/25/2055 (Acquired 10/28/2016, Cost $4,102,055) ∞ * | | | 4,047,944 | | | | 4,057,760 | | | | | |
| WaMu Mortgage Pass-Through Certificates Trust: | | | | | | | | | | | | |
| Series 2004-CB1, Class 5A, 5.000%, 06/25/2019 | | | 191,302 | | | | 193,271 | | | | | |
| Series 2004-CB3, Class 3A, 5.500%, 10/25/2019 | | | 250,621 | | | | 254,111 | | | | | |
| Series 2004-CB3, Class 4A, 6.000%, 10/25/2019 | | | 128,102 | | | | 131,828 | | | | | |
| Series 2004-CB4, Class 21A, 5.500%, 12/25/2019 | | | 108,441 | | | | 110,295 | | | | | |
| Series 2004-CB4, Class 22A, 6.000%, 12/25/2019 | | | 76,622 | | | | 78,360 | | | | | |
| Series 2004-AR3, Class A1, 2.800%, 06/25/2034 ∞ | | | 4,262,307 | | | | 4,275,292 | | | | | |
| Series 2004-CB2, Class 3A, 6.000%, 08/25/2034 | | | 3,518,031 | | | | 3,717,204 | | | | | |
| Wells Fargo Home Equity Asset-Backed Securities Trust, | | | | | | | | | | | | |
| Series 2004-2, Class A33, 1.756%, 10/25/2034 ∞ | | | 3,423,470 | | | | 3,353,341 | | | | | |
| Wells Fargo Mortgage Backed Securities Trust, | | | | | | | | | | | | |
| Series 2005-AR10, Class 2A17, 3.010%, 06/25/2035 ∞ | | | 6,264,323 | | | | 6,442,315 | | | | | |
| | | | | | | | 111,298,633 | | | | 4.8 | % |
| Commercial Mortgage-Backed Securities | | | | | | | | | | | | |
| U.S. Government Agency Issues | | | | | | | | | | | | |
| Freddie Mac Multifamily Structured Pass Through Certificates: | | | | | | | | | | | | |
| Series K705, Class A2, 2.303%, 09/25/2018 ∞ | | | 4,250,000 | | | | 4,298,880 | | | | | |
| Series K708, Class A2, 2.130%, 01/25/2019 | | | 8,440,437 | | | | 8,516,779 | | | | | |
| Series K003, Class A4, 5.053%, 01/25/2019 | | | 9,000,000 | | | | 9,488,444 | | | | | |
| Series K004, Class A2, 4.186%, 08/25/2019 | | | 8,095,000 | | | | 8,560,921 | | | | | |
| Series K005, Class A2, 4.317%, 11/25/2019 | | | 6,475,000 | | | | 6,889,603 | | | | | |
| Series K006, Class A2, 4.251%, 01/25/2020 | | | 2,993,000 | | | | 3,168,235 | | | | | |
| Series K713, Class A2, 2.313%, 03/25/2020 | | | 4,450,000 | | | | 4,503,474 | | | | | |
| Series K720, Class A2, 2.716%, 06/25/2022 | | | 15,725,000 | | | | 15,992,152 | | | | | |
| | | | | | | | 61,418,488 | | | | 2.7 | % |
| Non-U.S. Government Agency Issues | | | | | | | | | | | | |
| J.P. Morgan Chase Commercial Mortgage Securities Trust: | | | | | | | | | | | | |
| Series 2012-C8, Class ASB, 2.379%, 10/15/2045 | | | 8,129,000 | | | | 8,166,850 | | | | | |
| Series 2011-C5, Class A3, 4.171%, 08/15/2046 | | | 4,441,787 | | | | 4,763,942 | | | | | |
| Morgan Stanley Bank of America Merrill Lynch Trust, | | | | | | | | | | | | |
| Series 2016-C29, Class ASB, 3.140%, 05/15/2049 | | | 5,000,000 | | | | 5,041,679 | | | | | |
| Wells Fargo Commercial Mortgage Trust: | | | | | | | | | | | | |
| Series 2014-LC18, Class ASB, 3.244%, 12/15/2047 | | | 16,400,000 | | | | 16,802,505 | | | | | |
| Series 2015-P2, Class ASB, 3.656%, 12/15/2048 | | | 10,600,000 | | | | 11,027,422 | | | | | |
| WFRBS Commercial Mortgage Trust: | | | | | | | | | | | | |
| Series 2012-C6, Class A4, 3.440%, 04/15/2045 | | | 8,375,000 | | | | 8,748,749 | | | | | |
| Series 2014-C21, Class A2, 2.917%, 08/15/2047 | | | 2,435,234 | | | | 2,488,667 | | | | | |
| Series 2014-C24, Class ASB, 3.324%, 11/15/2047 | | | 8,652,000 | | | | 8,902,569 | | | | | |
| Series 2013-C12, Class ASB, 2.838%, 03/15/2048 | | | 8,750,000 | | | | 8,907,776 | | | | | |
| | | | | | | | 74,850,159 | | | | 3.2 | % |
| Other Asset Backed Securities | | | | | | | | | | | | |
| Conseco Financial Corp.: | | | | | | | | | | | | |
| Series 1993-4, Class A5, 7.050%, 01/15/2019 | | | 1,300 | | | | 1,316 | | | | | |
| Series 1998-2, Class A5, 6.240%, 12/01/2028 ∞ | | | 182,142 | | | | 189,008 | | | | | |
| Series 1998-3, Class A5, 6.220%, 03/01/2030 | | | 313,005 | | | | 331,427 | | | | | |
| Series 1998-4, Class A5, 6.180%, 04/01/2030 | | | 130,858 | | | | 138,014 | | | | | |
| Series 1998-7, Class A1, 6.320%, 07/01/2030 | | | 2,682,767 | | | | 2,829,615 | | | | | |
| Dell Equipment Finance Trust, | | | | | | | | | | | | |
| Series 2015-1, Class A2, 1.010%, 07/24/2017 (Acquired 04/15/2015, Cost $497,736) * | | | 497,754 | | | | 497,683 | | | | | |
| Discover Card Execution Note Trust, | | | | | | | | | | | | |
| Series 2016-A4, Class A4, 1.390%, 03/15/2022 | | | 10,925,000 | | | | 10,800,298 | | | | | |
| Ford Credit Auto Owner Trust: | | | | | | | | | | | | |
| Series 2014-1, Class A, 2.260%, 11/15/2025 (Acquired 10/07/2014 through 10/09/2014, Cost $10,893,304) * | | | 10,859,000 | | | | 10,951,692 | | | | | |
| Series 2014-2, Class A, 2.310%, 04/15/2026 (Acquired 10/07/2014, Cost $11,745,689) * | | | 11,750,000 | | | | 11,848,269 | | | | | |
| Kubota Credit Owner Trust, | | | | | | | | | | | | |
| Series 2015-1A, Class A3, 1.540%, 03/15/2019 (Acquired 01/22/2015, Cost $10,048,597) * | | | 10,050,000 | | | | 10,063,418 | | | | | |
| Oakwood Mortgage Investors, Inc., | | | | | | | | | | | | |
| Series 1999-B, Class A3, 6.450%, 11/15/2017 | | | 63,152 | | | | 63,977 | | | | | |
| OneMain Financial Issuance Trust, | | | | | | | | | | | | |
| Series 2014-2A, Class A, 2.470%, 09/18/2024 (Acquired 07/30/2015 through 02/03/2016, Cost $4,082,456) * | | | 4,084,272 | | | | 4,085,955 | | | | | |
| Springleaf Funding Trust, | | | | | | | | | | | | |
| Series 2014-AA, Class A, 2.410%, 12/15/2022 (Acquired 10/26/2015, Cost $3,361,837) * | | | 3,360,346 | | | | 3,361,581 | | | | | |
| Synchrony Credit Card Master Note Trust, | | | | | | | | | | | | |
| Series 2012-2, Class A, 2.220%, 01/15/2022 | | | 8,375,000 | | | | 8,438,686 | | | | | |
| TCF Auto Receivables Owner Trust, | | | | | | | | | | | | |
| Series 2014-1A, Class A4, 1.560%, 01/15/2020 (Acquired 05/29/2015 through 06/12/2015, Cost $13,557,479) * | 13,543,913 | | | | 13,564,735 | | | | | |
| | | | | | | | 77,165,674 | | | | 3.3 | % |
| Total Long-Term Investments (Cost $2,276,361,334) | | | | | | | 2,266,601,893 | | | | 98.2 | % |
| | | | | | | | | | | | | |
| SHORT-TERM INVESTMENT | | | | | | | | | | | | |
| Money Market Mutual Fund | | Shares | | | | | | | | | |
| Fidelity Institutional Money Market Fund - Government Portfolio, Institutional Class, 0.43% « | | | 50,036,538 | | | | 50,036,538 | | | | | |
| Total Short-Term Investment (Cost $50,036,538) | | | | | | | 50,036,538 | | | | 2.2 | % |
| Total Investments (Cost $2,326,397,872) | | | | | | | 2,316,638,431 | | | | 100.4 | % |
| Liabilities in Excess of Other Assets | | | | | | | (9,472,196 | ) | | | (0.4 | )% |
| TOTAL NET ASSETS | | | | | | $ | 2,307,166,235 | | | | 100.0 | % |
Notes to Schedule of Investments |
| ∞ | Variable or Floating rate security. Floating rate securities are securities whose yields vary with a designated index rate. These securities' rates are as of December 31, 2016. |
| * | Restricted security as defined in Rule 144(a) under the Securities Act of 1933 and determined to be liquid. Purchased in a private placement transaction; resale to the public may require registration or or may extend only to qualified institutional buyers. At December 31, 2016, the value of these securities total $415,017,816, which represents 17.99% of total net assets. |
| f | Foreign Security |
| § | Security in Default |
| « | 7-Day Yield |
| <<<< | Effective yield as of December 31, 2016. |
| Baird Aggregate Bond Fund | | | | | | | | | |
| Schedule of Investments | | | | | | | | | |
| December 31, 2016 | | | | | | | | | |
| | | | | | | | | | |
| | | Principal | | | | | | % of | |
| | | Amount | | | Value | | | Net Assets | |
| LONG-TERM INVESTMENTS | | | | | | | | | |
| U.S. Treasury Securities | | | | | | | | | |
| U.S. Treasury Bonds: | | | | | | | | | |
| 1.375%, 08/31/2020 | | $ | 146,500,000 | | | $ | 144,977,719 | | | | |
| 1.750%, 03/31/2022 | | | 423,730,000 | | | | 418,085,916 | | | | |
| 2.500%, 05/15/2024 | | | 166,250,000 | | | | 168,737,266 | | | | |
| 2.250%, 11/15/2025 | | | 81,800,000 | | | | 80,751,978 | | | | |
| 5.250%, 11/15/2028 | | | 92,576,500 | | | | 117,854,236 | | | | |
| 3.500%, 02/15/2039 | | | 371,355,900 | | | | 406,112,584 | | | | |
| 2.875%, 05/15/2043 | | | 520,600,000 | | | | 502,846,499 | | | | |
| 2.500%, 02/15/2045 | | | 15,450,000 | | | | 13,761,964 | | | | |
| | | | | | | | 1,853,128,162 | | | | 17.5 | % |
| Other Government Related Securities | | | | | | | | | | | | |
| CNOOC Finance (2015) Australia Pty Ltd., | | | | | | | | | | | | |
| 2.625%, 05/05/2020 f | | | 14,500,000 | | | | 14,441,681 | | | | | |
| CNPC General Capital Ltd., | | | | | | | | | | | | |
| 2.750%, 05/14/2019 (Acquired 05/07/2014, Cost $1,983,740) * f | | | 2,000,000 | | | | 2,014,644 | | | | | |
| Comision Federal de Electricidad, | | | | | | | | | | | | |
| 4.875%, 01/15/2024 (Acquired 10/17/2013, Cost $2,662,655) * f | | | 2,678,000 | | | | 2,661,262 | | | | | |
| Corp Andina de Fomento, | | | | | | | | | | | | |
| 4.375%, 06/15/2022 f | | | 6,107,000 | | | | 6,478,672 | | | | | |
| Export-Import Bank of Korea: | | | | | | | | | | | | |
| 4.000%, 01/11/2017 f | | | 1,400,000 | | | | 1,400,560 | | | | | |
| 2.250%, 01/21/2020 f | | | 11,000,000 | | | | 10,935,056 | | | | | |
| Industrial Bank of Korea, | | | | | | | | | | | | |
| 2.000%, 04/23/2020 (Acquired 04/16/2015, Cost $6,972,210) * f | | | 7,000,000 | | | | 6,855,422 | | | | | |
| Korea Electric Power Corp., | | | | | | | | | | | | |
| 6.750%, 08/01/2027 f | | | 1,932,000 | | | | 2,308,574 | | | | | |
| Korea Gas Corp., | | | | | | | | | | | | |
| 4.250%, 11/02/2020 (Acquired 10/26/2010, Cost $2,309,418) * f | | | 2,321,000 | | | | 2,462,128 | | | | | |
| Nexen Energy ULC: | | | | | | | | | | | | |
| 6.400%, 05/15/2037 f | | | 3,392,000 | | | | 4,020,185 | | | | | |
| 7.500%, 07/30/2039 f | | | 4,175,000 | | | | 5,678,584 | | | | | |
| Pemex Finance Ltd., | | | | | | | | | | | | |
| Series 1999-2, 10.610%, 08/15/2017 f | | | 502,125 | | | | 517,584 | | | | | |
| Petroleos Mexicanos: | | | | | | | | | | | | |
| 5.750%, 03/01/2018 f | | | 2,499,000 | | | | 2,584,591 | | | | | |
| 8.000%, 05/03/2019 f | | | 1,500,000 | | | | 1,646,250 | | | | | |
| 5.500%, 01/21/2021 f | | | 5,600,000 | | | | 5,761,000 | | | | | |
| 4.875%, 01/24/2022 f | | | 4,000,000 | | | | 4,012,000 | | | | | |
| 4.500%, 01/23/2026 f | | | 2,500,000 | | | | 2,277,500 | | | | | |
| 6.625%, 06/15/2035 f | | | 893,000 | | | | 879,605 | | | | | |
| Sinopec Group Overseas Development [2014] Ltd., | | | | | | | | | | | | |
| 4.375%, 04/10/2024 (Acquired 04/02/2014, Cost $1,496,505) * f | | | 1,500,000 | | | | 1,558,737 | | | | | |
| Sinopec Group Overseas Development [2015] Ltd.: | | | | | | | | | | | | |
| 2.500%, 04/28/2020 (Acquired 04/21/2015, Cost $14,936,400) * f | | | 15,000,000 | | | | 14,900,565 | | | | | |
| 3.250%, 04/28/2025 (Acquired 04/21/2015, Cost $9,902,200) * f | | | 10,000,000 | | | | 9,587,650 | | | | | |
| Sinopec Group Overseas Development [2016] Ltd., | | | | | | | | | | | | |
| 3.500%, 05/03/2026 (Acquired 04/25/2016 through 04/28/2016, Cost $13,365,147) * f | | | 13,450,000 | | | | 13,029,513 | | | | | |
| The Korea Development Bank: | | | | | | | | | | | | |
| 1.507%, 01/23/2017 ∞ f | | | 2,000,000 | | | | 1,999,888 | | | | | |
| 2.250%, 05/18/2020 f | | | 2,000,000 | | | | 1,977,780 | | | | | |
| | | | | | | | 119,989,431 | | | | 1.1 | % |
| Corporate Bonds | | | | | | | | | | | | |
| Industrials | | | | | | | | | | | | |
| 21st Century Fox America, Inc.: | | | | | | | | | | | | |
| 6.150%, 03/01/2037 | | | 2,570,000 | | | | 3,007,579 | | | | | |
| 6.750%, 01/09/2038 | | | 5,650,000 | | | | 6,666,237 | | | | | |
| Abbott Laboratories: | | | | | | | | | | | | |
| 4.750%, 11/30/2036 | | | 15,500,000 | | | | 15,757,641 | | | | | |
| 4.900%, 11/30/2046 | | | 4,700,000 | | | | 4,823,774 | | | | | |
| AbbVie, Inc.: | | | | | | | | | | | | |
| 2.500%, 05/14/2020 | | | 9,500,000 | | | | 9,502,479 | | | | | |
| 4.300%, 05/14/2036 | | | 6,000,000 | | | | 5,717,460 | | | | | |
| Actavis Funding SCS, | | | | | | | | | | | | |
| 3.850%, 06/15/2024 f | | | 12,067,000 | | | | 12,174,601 | | | | | |
| Acuity Brands Lighting, Inc., | | | | | | | | | | | | |
| 6.000%, 12/15/2019 | | | 3,749,000 | | | | 4,123,368 | | | | | |
| Agrium, Inc., | | | | | | | | | | | | |
| 3.375%, 03/15/2025 f | | | 2,625,000 | | | | 2,542,690 | | | | | |
| Ameritech Capital Funding Corp., | | | | | | | | | | | | |
| 6.450%, 01/15/2018 | | | 2,668,000 | | | | 2,788,994 | | | | | |
| Amgen, Inc., | | | | | | | | | | | | |
| 4.400%, 05/01/2045 | | | 12,300,000 | | | | 11,790,116 | | | | | |
| Anadarko Finance Co., | | | | | | | | | | | | |
| Class B, 7.500%, 05/01/2031 f | | | 7,170,000 | | | | 9,124,879 | | | | | |
| Anadarko Petroleum Corp., | | | | | | | | | | | | |
| 8.700%, 03/15/2019 | | | 2,432,000 | | | | 2,763,888 | | | | | |
| Analog Devices, Inc., | | | | | | | | | | | | |
| 3.125%, 12/05/2023 | | | 10,000,000 | | | | 9,999,180 | | | | | |
| Anglo American Capital PLC, | | | | | | | | | | | | |
| 9.375%, 04/08/2019 (Acquired 04/02/2009, Cost $1,785,000) * f | | | 1,785,000 | | | | 2,039,362 | | | | | |
| Anheuser-Busch InBev Finance, Inc.: | | | | | | | | | | | | |
| 2.650%, 02/01/2021 | | | 6,300,000 | | | | 6,336,193 | | | | | |
| 3.300%, 02/01/2023 | | | 7,400,000 | | | | 7,531,217 | | | | | |
| 3.650%, 02/01/2026 | | | 9,000,000 | | | | 9,136,710 | | | | | |
| Anheuser-Busch InBev Worldwide, Inc., | | | | | | | | | | | | |
| 1.576%, 08/01/2018 ∞ | | | 10,000,000 | | | | 10,061,410 | | | | | |
| Apple, Inc., | | | | | | | | | | | | |
| 2.400%, 05/03/2023 | | | 2,678,000 | | | | 2,607,617 | | | | | |
| AT&T, Inc.: | | | | | | | | | | | | |
| 3.400%, 05/15/2025 | | | 28,200,000 | | | | 27,179,808 | | | | | |
| 4.125%, 02/17/2026 | | | 7,650,000 | | | | 7,746,130 | | | | | |
| 4.800%, 06/15/2044 | | | 1,375,000 | | | | 1,299,257 | | | | | |
| 4.750%, 05/15/2046 | | | 5,000,000 | | | | 4,737,095 | | | | | |
| 5.650%, 02/15/2047 | | | 4,200,000 | | | | 4,504,479 | | | | | |
| Baxalta, Inc., | | | | | | | | | | | | |
| 2.875%, 06/23/2020 | | | 5,000,000 | | | | 4,998,750 | | | | | |
| Bayer US Finance LLC, | | | | | | | | | | | | |
| 2.375%, 10/08/2019 (Acquired 10/01/2014, Cost $9,954,200) * | | | 10,000,000 | | | | 10,017,710 | | | | | |
| Beam Suntory, Inc., | | | | | | | | | | | | |
| 1.875%, 05/15/2017 | | | 2,000,000 | | | | 2,002,862 | | | | | |
| Becton Dickinson and Co.: | | | | | | | | | | | | |
| 2.675%, 12/15/2019 | | | 4,007,000 | | | | 4,065,546 | | | | | |
| 3.250%, 11/12/2020 | | | 7,000,000 | | | | 7,197,288 | | | | | |
| 3.734%, 12/15/2024 | | | 4,000,000 | | | | 4,090,488 | | | | | |
| Boston Scientific Corp.: | | | | | | | | | | | | |
| 2.650%, 10/01/2018 | | | 10,000,000 | | | | 10,109,670 | | | | | |
| 2.850%, 05/15/2020 | | | 7,000,000 | | | | 7,104,391 | | | | | |
| Bunge Limited Finance Corp.: | | | | | | | | | | | | |
| 8.500%, 06/15/2019 | | | 6,933,000 | | | | 7,942,819 | | | | | |
| 3.500%, 11/24/2020 | | | 12,235,000 | | | | 12,453,089 | | | | | |
| 3.250%, 08/15/2026 | | | 11,550,000 | | | | 11,091,176 | | | | | |
| Bunge NA Finance LP, | | | | | | | | | | | | |
| 5.900%, 04/01/2017 | | | 3,392,000 | | | | 3,421,185 | | | | | |
| Burlington Northern Santa Fe LLC, | | | | | | | | | | | | |
| 4.150%, 04/01/2045 | | | 3,000,000 | | | | 3,042,318 | | | | | |
| Canadian Natural Resources Ltd.: | | | | | | | | | | | | |
| 5.700%, 05/15/2017 f | | | 2,550,000 | | | | 2,587,962 | | | | | |
| 6.500%, 02/15/2037 f | | | 982,000 | | | | 1,123,660 | | | | | |
| Celgene Corp.: | | | | | | | | | | | | |
| 3.550%, 08/15/2022 | | | 6,450,000 | | | | 6,615,056 | | | | | |
| 4.000%, 08/15/2023 | | | 2,477,000 | | | | 2,582,661 | | | | | |
| CenturyLink, Inc., | | | | | | | | | | | | |
| Class R, 5.150%, 06/15/2017 | | | 2,678,000 | | | | 2,718,170 | | | | | |
| CF Industries, Inc.: | | | | | | | | | | | | |
| 3.450%, 06/01/2023 | | | 21,000,000 | | | | 18,879,000 | | | | | |
| 5.150%, 03/15/2034 | | | 3,000,000 | | | | 2,550,000 | | | | | |
| Charter Communications Operating LLC / Charter Communications Operating Capital: | | | | | | | | | | | | |
| 4.464%, 07/23/2022 | | | 8,773,000 | | | | 9,168,057 | | | | | |
| 6.384%, 10/23/2035 | | | 5,800,000 | | | | 6,622,626 | | | | | |
| Chevron Phillips Chemical Co. LLC / Chevron Phillips Chemical Co. LP, | | | | | | | | | | | | |
| 1.636%, 05/01/2020 (Acquired 05/07/2015, Cost $25,000,000) ∞ * | | | 25,000,000 | | | | 24,758,050 | | | | | |
| Columbia Pipeline Group, Inc.: | | | | | | | | | | | | |
| 2.450%, 06/01/2018 | | | 4,004,000 | | | | 4,023,567 | | | | | |
| 3.300%, 06/01/2020 | | | 14,575,000 | | | | 14,847,436 | | | | | |
| 4.500%, 06/01/2025 | | | 2,819,000 | | | | 2,961,557 | | | | | |
| Comcast Corp.: | | | | | | | | | | | | |
| 4.250%, 01/15/2033 | | | 5,712,000 | | | | 5,944,279 | | | | | |
| 3.200%, 07/15/2036 | | | 10,000,000 | | | | 8,994,730 | | | | | |
| 6.950%, 08/15/2037 | | | 1,953,000 | | | | 2,663,720 | | | | | |
| ConAgra Foods, Inc.: | | | | | | | | | | | | |
| 4.950%, 08/15/2020 | | | 332,000 | | | | 353,094 | | | | | |
| 9.750%, 03/01/2021 | | | 4,548,000 | | | | 5,567,016 | | | | | |
| 7.125%, 10/01/2026 | | | 2,070,000 | | | | 2,503,781 | | | | | |
| ConocoPhillips Co., | | | | | | | | | | | | |
| 1.806%, 05/15/2022 ∞ | | | 8,425,000 | | | | 8,338,475 | | | | | |
| Continental Airlines Pass Through Trust, | | | | | | | | | | | | |
| Series 1997-4, Class 974A, 6.900%, 01/02/2018 | | | 50,327 | | | | 50,734 | | | | | |
| Cox Communications, Inc.: | | | | | | | | | | | | |
| 3.850%, 02/01/2025 (Acquired 12/01/2014, Cost $4,991,350) * | | | 5,000,000 | | | | 4,903,750 | | | | | |
| 4.800%, 02/01/2035 (Acquired 12/01/2014, Cost $8,996,760) * | | | 9,000,000 | | | | 8,383,284 | | | | | |
| 8.375%, 03/01/2039 (Acquired 10/08/2014, Cost $2,843,349) * | | | 2,000,000 | | | | 2,494,178 | | | | | |
| Crane Co., | | | | | | | | | | | | |
| 2.750%, 12/15/2018 | | | 10,000,000 | | | | 10,125,000 | | | | | |
| CVS Health Corp., | | | | | | | | | | | | |
| 3.500%, 07/20/2022 | | | 7,000,000 | | | | 7,192,458 | | | | | |
| Daimler Finance North America LLC, | | | | | | | | | | | | |
| 1.500%, 07/05/2019 (Acquired 11/22/2016, Cost $10,533,764) * | | | 10,700,000 | | | | 10,527,462 | | | | | |
| Danone SA, | | | | | | | | | | | | |
| 2.589%, 11/02/2023 (Acquired 10/26/2016, Cost $19,600,000) * f | | | 19,600,000 | | | | 18,885,815 | | | | | |
| DCP Midstream LLC, | | | | | | | | | | | | |
| 9.750%, 03/15/2019 (Acquired 02/29/2012 through 10/15/2012, Cost $5,634,868) * | | | 5,065,000 | | | | 5,672,800 | | | | | |
| Deutsche Telekom International Finance BV, | | | | | | | | | | | | |
| 8.750%, 06/15/2030 ∞ f | | | 1,661,000 | | | | 2,441,861 | | | | | |
| Diamond 1 Finance Corp. / Diamond 2 Finance Corp.: | | | | | | | | | | | | |
| 3.480%, 06/01/2019 (Acquired 07/19/2016, Cost $9,155,438) * | | | 8,947,000 | | | | 9,133,152 | | | | | |
| 4.420%, 06/15/2021 (Acquired 05/17/2016 through 08/22/2016, Cost $15,091,977) * | | | 14,650,000 | | | | 15,159,014 | | | | | |
| Dominion Gas Holdings LLC, | | | | | | | | | | | | |
| 2.800%, 11/15/2020 | | | 7,275,000 | | | | 7,341,203 | | | | | |
| Enable Midstream Partners LP, | | | | | | | | | | | | |
| 3.900%, 05/15/2024 | | | 5,000,000 | | | | 4,742,750 | | | | | |
| Energy Transfer Partners LP: | | | | | | | | | | | | |
| 9.700%, 03/15/2019 | | | 893,000 | | | | 1,024,970 | | | | | |
| 4.150%, 10/01/2020 | | | 10,000,000 | | | | 10,355,410 | | | | | |
| 4.050%, 03/15/2025 | | | 16,585,000 | | | | 16,417,624 | | | | | |
| Ensco PLC, | | | | | | | | | | | | |
| 5.200%, 03/15/2025 f | | | 4,000,000 | | | | 3,454,680 | | | | | |
| Enterprise Products Operating LLC, | | | | | | | | | | | | |
| 3.700%, 02/15/2026 | | | 8,350,000 | | | | 8,380,277 | | | | | |
| EQT Midstream Partners LP: | | | | | | | | | | | | |
| 4.000%, 08/01/2024 | | | 3,000,000 | | | | 2,958,708 | | | | | |
| 4.125%, 12/01/2026 | | | 10,000,000 | | | | 9,747,470 | | | | | |
| ERAC USA Finance LLC: | | | | | | | | | | | | |
| 2.350%, 10/15/2019 (Acquired 10/26/2016, Cost $4,049,799) * | | | 4,000,000 | | | | 3,996,448 | | | | | |
| 3.300%, 12/01/2026 (Acquired 05/23/2016, Cost $13,156,968) * | | | 13,200,000 | | | | 12,665,638 | | | | | |
| Express Scripts Holding Co.: | | | | | | | | | | | | |
| 3.300%, 02/25/2021 | | | 2,350,000 | | | | 2,394,102 | | | | | |
| 4.750%, 11/15/2021 | | | 5,000,000 | | | | 5,370,365 | | | | | |
| 3.900%, 02/15/2022 | | | 10,000,000 | | | | 10,401,390 | | | | | |
| 3.000%, 07/15/2023 | | | 5,000,000 | | | | 4,840,065 | | | | | |
| 3.500%, 06/15/2024 | | | 9,000,000 | | | | 8,893,863 | | | | | |
| Federal Express Corp. 1998 Pass Through Trust, | | | | | | | | | | | | |
| Class 981B, 6.845%, 01/15/2019 | | | 1,354,375 | | | | 1,402,726 | | | | | |
| FedEx Corp., | | | | | | | | | | | | |
| 3.200%, 02/01/2025 | | | 6,000,000 | | | | 5,988,318 | | | | | |
| Fidelity National Information Services, Inc.: | | | | | | | | | | | | |
| 3.625%, 10/15/2020 | | | 10,000,000 | | | | 10,352,680 | | | | | |
| 3.500%, 04/15/2023 | | | 23,125,000 | | | | 23,419,451 | | | | | |
| 3.875%, 06/05/2024 | | | 2,150,000 | | | | 2,193,559 | | | | | |
| 4.500%, 08/15/2046 | | | 7,000,000 | | | | 6,664,364 | | | | | |
| Fiserv, Inc.: | | | | | | | | | | | | |
| 2.700%, 06/01/2020 | | | 10,000,000 | | | | 10,048,290 | | | | | |
| 4.625%, 10/01/2020 | | | 1,785,000 | | | | 1,906,443 | | | | | |
| 3.500%, 10/01/2022 | | | 5,410,000 | | | | 5,509,560 | | | | | |
| FMC Corp., | | | | | | | | | | | | |
| 4.100%, 02/01/2024 | | | 6,400,000 | | | | 6,425,139 | | | | | |
| Fomento Economico Mexicano SAB de CV: | | | | | | | | | | | | |
| 2.875%, 05/10/2023 f | | | 5,000,000 | | | | 4,767,000 | | | | | |
| 4.375%, 05/10/2043 f | | | 4,374,000 | | | | 4,140,739 | | | | | |
| Ford Motor Credit Co. LLC: | | | | | | | | | | | | |
| 2.145%, 01/09/2018 | | | 1,800,000 | | | | 1,802,606 | | | | | |
| 2.240%, 06/15/2018 | | | 6,250,000 | | | | 6,258,469 | | | | | |
| 2.375%, 03/12/2019 | | | 6,806,000 | | | | 6,801,964 | | | | | |
| 2.597%, 11/04/2019 | | | 10,000,000 | | | | 9,985,150 | | | | | |
| 3.200%, 01/15/2021 | | | 20,000,000 | | | | 20,029,180 | | | | | |
| 3.336%, 03/18/2021 | | | 7,500,000 | | | | 7,552,043 | | | | | |
| Forest Laboratories, Inc., | | | | | | | | | | | | |
| 5.000%, 12/15/2021 (Acquired 08/26/2014 through 04/24/2015, Cost $25,768,153) * | | | 24,000,000 | | | | 25,948,392 | | | | | |
| Fortive Corp., | | | | | | | | | | | | |
| 2.350%, 06/15/2021 (Acquired 06/06/2016, Cost $5,123,821) * | | | 5,125,000 | | | | 5,056,463 | | | | | |
| Freeport-McMoRan, Inc.: | | | | | | | | | | | | |
| 6.500%, 11/15/2020 (Acquired 05/29/2014 through 10/24/2014, Cost $3,307,258) * | | | 3,221,000 | | | | 3,309,577 | | | | | |
| 6.625%, 05/01/2021 (Acquired 10/24/2014, Cost $1,479,050) * | | | 1,447,000 | | | | 1,472,323 | | | | | |
| 6.750%, 02/01/2022 (Acquired 06/18/2014 through 09/22/2014, Cost $2,737,168) * | | | 2,649,000 | | | | 2,721,848 | | | | | |
| General Electric Co.: | | | | | | | | | | | | |
| 2.200%, 01/09/2020 | | | 1,432,000 | | | | 1,436,660 | | | | | |
| 5.550%, 05/04/2020 | | | 1,585,000 | | | | 1,750,995 | | | | | |
| 4.650%, 10/17/2021 | | | 1,534,000 | | | | 1,682,706 | | | | | |
| General Motors Financial Co., Inc.: | | | | | | | | | | | | |
| 2.400%, 05/09/2019 | | | 9,000,000 | | | | 8,976,159 | | | | | |
| 2.350%, 10/04/2019 | | | 6,800,000 | | | | 6,720,086 | | | | | |
| 4.200%, 03/01/2021 | | | 30,000,000 | | | | 30,952,410 | | | | | |
| 4.375%, 09/25/2021 | | | 2,675,000 | | | | 2,774,815 | | | | | |
| Georgia-Pacific LLC, | | | | | | | | | | | | |
| 2.539%, 11/15/2019 (Acquired 11/03/2014 through 02/25/2016, Cost $19,112,532) * | | | 19,125,000 | | | | 19,292,631 | | | | | |
| Gilead Sciences, Inc., | | | | | | | | | | | | |
| 4.600%, 09/01/2035 | | | 4,600,000 | | | | 4,771,074 | | | | | |
| Glencore Funding LLC: | | | | | | | | | | | | |
| 2.500%, 01/15/2019 (Acquired 05/22/2013, Cost $4,440,774) * | | | 4,463,000 | | | | 4,453,181 | | | | | |
| 4.125%, 05/30/2023 (Acquired 07/22/2013 through 04/20/2015, Cost $6,687,563) * | | | 6,746,000 | | | | 6,788,770 | | | | | |
| 4.625%, 04/29/2024 (Acquired 04/22/2014 through 03/24/2016, Cost $11,504,875) * | | | 12,620,000 | | | | 12,903,950 | | | | | |
| 4.000%, 04/16/2025 (Acquired 04/08/2015, Cost $4,411,285) * | | | 4,450,000 | | | | 4,361,000 | | | | | |
| Grupo Bimbo SAB de CV, | | | | | | | | | | | | |
| 4.500%, 01/25/2022 (Acquired 03/29/2016 through 04/07/2016, Cost $13,851,368) * f | | | 13,157,000 | | | | 13,711,962 | | | | | |
| GTE Corp., | | | | | | | | | | | | |
| 8.750%, 11/01/2021 | | | 89,000 | | | | 108,450 | | | | | |
| Gulf South Pipeline Co. LP, | | | | | | | | | | | | |
| 4.000%, 06/15/2022 | | | 3,633,000 | | | | 3,680,156 | | | | | |
| Gulfstream Natural Gas System LLC, | | | | | | | | | | | | |
| 4.600%, 09/15/2025 (Acquired 09/24/2015, Cost $5,037,043) * | | | 5,000,000 | | | | 5,180,290 | | | | | |
| Halliburton Co., | | | | | | | | | | | | |
| 3.800%, 11/15/2025 | | | 9,000,000 | | | | 9,143,073 | | | | | |
| Harris Corp.: | | | | | | | | | | | | |
| 2.700%, 04/27/2020 | | | 4,000,000 | | | | 3,995,600 | | | | | |
| 3.832%, 04/27/2025 | | | 5,000,000 | | | | 5,079,340 | | | | | |
| Hewlett Packard Enterprise Co.: | | | | | | | | | | | | |
| 3.600%, 10/15/2020 | | | 10,000,000 | | | | 10,181,900 | | | | | |
| 4.400%, 10/15/2022 | | | 15,150,000 | | | | 15,796,284 | | | | | |
| Historic TW, Inc., | | | | | | | | | | | | |
| 9.150%, 02/01/2023 | | | 5,535,000 | | | | 7,098,350 | | | | | |
| Holcim US Finance Sarl & Cie SCS, | | | | | | | | | | | | |
| 6.000%, 12/30/2019 (Acquired 09/24/2009 through 09/04/2013, Cost $1,237,914) * f | | | 1,232,000 | | | | 1,349,771 | | | | | |
| HP, Inc., | | | | | | | | | | | | |
| 4.650%, 12/09/2021 | | | 6,645,000 | | | | 7,092,846 | | | | | |
| Hutchison Whampoa International (09) Ltd., | | | | | | | | | | | | |
| 7.625%, 04/09/2019 (Acquired 10/22/2009 through 04/16/2014, Cost $8,816,014) * f | | | 8,288,000 | | | | 9,273,170 | | | | | |
| Hutchison Whampoa International (09/19) Ltd., | | | | | | | | | | | | |
| 5.750%, 09/11/2019 (Acquired 04/27/2015, Cost $9,992,336) * f | | | 9,150,000 | | | | 10,004,317 | | | | | |
| Hutchison Whampoa International (14) Ltd., | | | | | | | | | | | | |
| 3.625%, 10/31/2024 (Acquired 10/28/2014 through 07/22/2016, Cost $8,002,077) * f | | | 7,850,000 | | | | 7,842,864 | | | | | |
| Hyundai Capital America: | | | | | | | | | | | | |
| 2.500%, 03/18/2019 (Acquired 10/25/2016, Cost $4,335,130) * | | | 4,275,000 | | | | 4,286,432 | | | | | |
| 2.000%, 07/01/2019 (Acquired 06/07/2016, Cost $8,593,894) * | | | 8,600,000 | | | | 8,533,496 | | | | | |
| 3.000%, 03/18/2021 (Acquired 12/02/2016, Cost $15,016,786) * | | | 15,000,000 | | | | 14,984,025 | | | | | |
| Hyundai Capital Services, Inc.: | | | | | | | | | | | | |
| 3.500%, 09/13/2017 (Acquired 03/07/2012 through 08/21/2014, Cost $7,527,835) * f | | | 7,458,000 | | | | 7,533,221 | | | | | |
| 2.625%, 09/29/2020 (Acquired 03/23/2015, Cost $5,142,172) * f | | | 5,150,000 | | | | 5,099,510 | | | | | |
| Ingersoll-Rand Luxembourg Finance SA, | | | | | | | | | | | | |
| 2.625%, 05/01/2020 f | | | 2,650,000 | | | | 2,655,870 | | | | | |
| Johnson Controls International PLC: | | | | | | | | | | | | |
| 6.000%, 01/15/2036 f | | | 1,168,000 | | | | 1,347,560 | | | | | |
| 4.950%, 07/02/2064 f | | | 2,400,000 | | | | 2,238,144 | | | | | |
| Keysight Technologies, Inc., | | | | | | | | | | | | |
| 3.300%, 10/30/2019 | | | 8,500,000 | | | | 8,631,376 | | | | | |
| Kinder Morgan Energy Partners LP: | | | | | | | | | | | | |
| 9.000%, 02/01/2019 | | | 893,000 | | | | 1,005,564 | | | | | |
| 4.300%, 05/01/2024 | | | 10,000,000 | | | | 10,232,030 | | | | | |
| 6.950%, 01/15/2038 | | | 2,008,000 | | | | 2,329,218 | | | | | |
| 6.500%, 09/01/2039 | | | 893,000 | | | | 980,468 | | | | | |
| 7.500%, 11/15/2040 | | | 4,017,000 | | | | 4,803,344 | | | | | |
| Kinder Morgan, Inc./DE: | | | | | | | | | | | | |
| 5.000%, 02/15/2021 (Acquired 05/26/2015, Cost $4,378,894) * | | | 4,155,000 | | | | 4,425,806 | | | | | |
| 5.625%, 11/15/2023 (Acquired 06/14/2016, Cost $5,293,576) * | | | 5,017,000 | | | | 5,506,715 | | | | | |
| Kraft Heinz Foods Co.: | | | | | | | | | | | | |
| 2.800%, 07/02/2020 | | | 4,000,000 | | | | 4,038,008 | | | | | |
| 3.000%, 06/01/2026 | | | 10,000,000 | | | | 9,388,370 | | | | | |
| 5.000%, 07/15/2035 | | | 14,740,000 | | | | 15,463,719 | | | | | |
| Laboratory Corp. of America Holdings: | | | | | | | | | | | | |
| 2.500%, 11/01/2018 | | | 12,345,000 | | | | 12,453,796 | | | | | |
| 3.200%, 02/01/2022 | | | 2,400,000 | | | | 2,419,937 | | | | | |
| Lafarge SA, | | | | | | | | | | | | |
| 7.125%, 07/15/2036 f | | | 893,000 | | | | 1,080,846 | | | | | |
| Lockheed Martin Corp.: | | | | | | | | | | | | |
| 3.100%, 01/15/2023 | | | 5,000,000 | | | | 5,054,665 | | | | | |
| 4.700%, 05/15/2046 | | | 1,000,000 | | | | 1,087,726 | | | | | |
| Magellan Midstream Partners LP, | | | | | | | | | | | | |
| 3.200%, 03/15/2025 | | | 5,000,000 | | | | 4,861,140 | | | | | |
| Marathon Petroleum Corp.: | | | | | | | | | | | | |
| 3.400%, 12/15/2020 | | | 10,825,000 | | | | 11,070,987 | | | | | |
| 3.625%, 09/15/2024 | | | 1,600,000 | | | | 1,580,158 | | | | | |
| 4.750%, 09/15/2044 | | | 1,500,000 | | | | 1,329,761 | | | | | |
| Martin Marietta Materials, Inc., | | | | | | | | | | | | |
| 6.250%, 05/01/2037 | | | 893,000 | | | | 949,091 | | | | | |
| Medtronic, Inc.: | | | | | | | | | | | | |
| 3.150%, 03/15/2022 | | | 3,975,000 | | | | 4,071,282 | | | | | |
| 4.375%, 03/15/2035 | | | 2,808,000 | | | | 2,970,662 | | | | | |
| Microsoft Corp.: | | | | | | | | | | | | |
| 4.450%, 11/03/2045 | | | 10,000,000 | | | | 10,654,190 | | | | | |
| 3.950%, 08/08/2056 | | | 12,000,000 | | | | 11,333,784 | | | | | |
| Molex Electronic Technologies LLC, | | | | | | | | | | | | |
| 2.878%, 04/15/2020 (Acquired 10/23/2015 through 03/15/2016, Cost $22,851,007) * | | | 23,093,000 | | | | 23,040,902 | | | | | |
| MPLX LP, | | | | | | | | | | | | |
| 4.500%, 07/15/2023 | | | 21,505,000 | | | | 21,840,822 | | | | | |
| Mylan NV: | | | | | | | | | | | | |
| 3.150%, 06/15/2021 (Acquired 06/14/2016, Cost $5,008,572) * f | | | 5,000,000 | | | | 4,906,935 | | | | | |
| 3.950%, 06/15/2026 (Acquired 05/31/2016 through 06/28/2016, Cost $28,877,092) * f | | | 28,925,000 | | | | 27,069,403 | | | | | |
| Nabors Industries, Inc., | | | | | | | | | | | | |
| 6.150%, 02/15/2018 | | | 982,000 | | | | 1,018,825 | | | | | |
| New Cingular Wireless Services, Inc., | | | | | | | | | | | | |
| 8.750%, 03/01/2031 | | | 1,360,000 | | | | 1,945,171 | | | | | |
| Newell Brands, Inc., | | | | | | | | | | | | |
| 3.850%, 04/01/2023 | | | 15,000,000 | | | | 15,559,605 | | | | | |
| Nissan Motor Acceptance Corp., | | | | | | | | | | | | |
| 1.500%, 03/02/2018 (Acquired 02/24/2015, Cost $5,897,404) * | | | 5,900,000 | | | | 5,883,775 | | | | | |
| Noble Energy, Inc., | | | | | | | | | | | | |
| 8.250%, 03/01/2019 | | | 2,684,000 | | | | 3,014,951 | | | | | |
| Noble Holding International Ltd., | | | | | | | | | | | | |
| 5.250%, 03/16/2018 ∞ f | | | 4,000,000 | | | | 3,990,000 | | | | | |
| ONEOK Partners LP: | | | | | | | | | | | | |
| 8.625%, 03/01/2019 | | | 7,627,000 | | | | 8,603,401 | | | | | |
| 3.375%, 10/01/2022 | | | 1,130,000 | | | | 1,134,717 | | | | | |
| Oracle Corp.: | | | | | | | | | | | | |
| 3.400%, 07/08/2024 | | | 3,000,000 | | | | 3,056,718 | | | | | |
| 2.950%, 05/15/2025 | | | 6,025,000 | | | | 5,906,193 | | | | | |
| Pactiv LLC, | | | | | | | | | | | | |
| 7.950%, 12/15/2025 | | | 286,000 | | | | 303,160 | | | | | |
| Pentair Finance SA: | | | | | | | | | | | | |
| 1.875%, 09/15/2017 f | | | 7,620,000 | | | | 7,631,369 | | | | | |
| 3.625%, 09/15/2020 f | | | 26,620,000 | | | | 27,084,546 | | | | | |
| Pernod Ricard SA: | | | | | | | | | | | | |
| 4.450%, 01/15/2022 (Acquired 12/01/2016, Cost $351,009) * f | | | 331,000 | | | | 351,183 | | | | | |
| 4.250%, 07/15/2022 (Acquired 06/09/2016 through 09/08/2016, Cost $22,317,623) * f | | | 20,527,000 | | | | 21,478,570 | | | | | |
| Perrigo Co PLC, | | | | | | | | | | | | |
| 4.000%, 11/15/2023 f | | | 5,000,000 | | | | 4,956,585 | | | | | |
| Perrigo Finance Unlimited Co., | | | | | | | | | | | | |
| 4.375%, 03/15/2026 f | | | 4,875,000 | | | | 4,879,977 | | | | | |
| Petrofac Ltd., | | | | | | | | | | | | |
| 3.400%, 10/10/2018 (Acquired 10/03/2013 through 12/03/2014, Cost $15,542,758) * f | | | 15,546,000 | | | | 15,734,464 | | | | | |
| Pfizer, Inc., | | | | | | | | | | | | |
| 5.800%, 08/12/2023 | | | 6,000,000 | | | | 7,074,246 | | | | | |
| Phillips 66: | | | | | | | | | | | | |
| 4.300%, 04/01/2022 | | | 10,000,000 | | | | 10,737,170 | | | | | |
| 5.875%, 05/01/2042 | | | 6,000,000 | | | | 7,104,330 | | | | | |
| 4.875%, 11/15/2044 | | | 21,130,000 | | | | 22,314,653 | | | | | |
| Phillips 66 Partners LP, | | | | | | | | | | | | |
| 3.550%, 10/01/2026 | | | 7,000,000 | | | | 6,774,397 | | | | | |
| POSCO, | | | | | | | | | | | | |
| 4.250%, 10/28/2020 (Acquired 12/18/2014, Cost $1,020,954) * f | | | 975,000 | | | | 1,020,153 | | | | | |
| Potash Corp of Saskatchewan, Inc., | | | | | | | | | | | | |
| 6.500%, 05/15/2019 f | | | 5,000,000 | | | | 5,461,505 | | | | | |
| QEP Resources, Inc., | | | | | | | | | | | | |
| 6.800%, 03/01/2020 | | | 893,000 | | | | 928,720 | | | | | |
| Qualcomm, Inc.: | | | | | | | | | | | | |
| 1.461%, 05/20/2020 ∞ | | | 7,450,000 | | | | 7,451,937 | | | | | |
| 2.250%, 05/20/2020 | | | 3,600,000 | | | | 3,600,263 | | | | | |
| R.R. Donnelley & Sons Co., | | | | | | | | | | | | |
| 7.625%, 06/15/2020 | | | 893,000 | | | | 928,720 | | | | | |
| Republic Services, Inc.: | | | | | | | | | | | | |
| 5.500%, 09/15/2019 | | | 7,400,000 | | | | 8,053,013 | | | | | |
| 3.550%, 06/01/2022 | | | 3,000,000 | | | | 3,116,403 | | | | | |
| Rio Tinto Alcan, Inc., | | | | | | | | | | | | |
| 5.750%, 06/01/2035 f | | | 446,000 | | | | 476,422 | | | | | |
| Rio Tinto Finance (USA) Ltd., | | | | | | | | | | | | |
| 9.000%, 05/01/2019 f | | | 4,909,000 | | | | 5,660,342 | | | | | |
| Rockies Express Pipeline LLC, | | | | | | | | | | | | |
| 5.625%, 04/15/2020 (Acquired 03/17/2010, Cost $1,783,411) * | | | 1,785,000 | | | | 1,878,713 | | | | | |
| Samarco Mineracao SA, | | | | | | | | | | | | |
| 5.750%, 10/24/2023 (Acquired 10/22/2013, Cost $4,474,929) * f § | | | 4,463,000 | | | | 2,410,020 | | | | | |
| Schlumberger Holdings Corp., | | | | | | | | | | | | |
| 2.350%, 12/21/2018 (Acquired 12/10/2015, Cost $9,998,800) * | | | 10,000,000 | | | | 10,082,490 | | | | | |
| Shell International Finance BV: | | | | | | | | | | | | |
| 3.250%, 05/11/2025 f | | | 5,725,000 | | | | 5,720,306 | | | | | |
| 4.125%, 05/11/2035 f | | | 10,000,000 | | | | 10,210,610 | | | | | |
| Shire Acquisitions Investments Ireland DAC, | | | | | | | | | | | | |
| 2.875%, 09/23/2023 f | | | 10,000,000 | | | | 9,504,470 | | | | | |
| SK Telecom Co. Ltd., | | | | | | | | | | | | |
| 6.625%, 07/20/2027 (Acquired 07/13/2007, Cost $1,322,945) * f | | | 1,339,000 | | | | 1,681,704 | | | | | |
| Solvay Finance America LLC: | | | | | | | | | | | | |
| 3.400%, 12/03/2020 (Acquired 01/08/2016 through 02/23/2016, Cost $15,076,002) * | | | 15,088,000 | | | | 15,351,934 | | | | | |
| 4.450%, 12/03/2025 (Acquired 05/03/2016 through 11/17/2016, Cost $26,377,271) * | | | 25,329,000 | | | | 26,282,004 | | | | | |
| Southern Natural Gas Company LLC, | | | | | | | | | | | | |
| 5.900%, 04/01/2017 (Acquired 03/14/2007, Cost $1,247,925) * | | | 1,250,000 | | | | 1,263,018 | | | | | |
| Spectra Energy Partners LP, | | | | | | | | | | | | |
| 4.500%, 03/15/2045 | | | 7,000,000 | | | | 6,655,957 | | | | | |
| Sprint Capital Corp., | | | | | | | | | | | | |
| 6.900%, 05/01/2019 | | | 2,499,000 | | | | 2,645,816 | | | | | |
| Stryker Corp., | | | | | | | | | | | | |
| 2.625%, 03/15/2021 | | | 6,225,000 | | | | 6,249,041 | | | | | |
| Sunoco Logistics Partners Operations LP, | | | | | | | | | | | | |
| 3.900%, 07/15/2026 | | | 12,000,000 | | | | 11,615,268 | | | | | |
| Sysco Corp., | | | | | | | | | | | | |
| 3.300%, 07/15/2026 | | | 11,550,000 | | | | 11,334,373 | | | | | |
| TC PipeLines LP, | | | | | | | | | | | | |
| 4.375%, 03/13/2025 | | | 16,500,000 | | | | 16,633,337 | | | | | |
| Telecom Italia Capital SA: | | | | | | | | | | | | |
| 7.175%, 06/18/2019 f | | | 1,785,000 | | | | 1,976,887 | | | | | |
| 7.200%, 07/18/2036 f | | | 5,475,000 | | | | 5,396,927 | | | | | |
| Telefonica Emisiones SAU: | | | | | | | | | | | | |
| 6.221%, 07/03/2017 f | | | 4,530,000 | | | | 4,631,662 | | | | | |
| 5.462%, 02/16/2021 f | | | 8,830,000 | | | | 9,625,336 | | | | | |
| The Dow Chemical Co., | | | | | | | | | | | | |
| 8.550%, 05/15/2019 | | | 26,000,000 | | | | 29,798,106 | | | | | |
| The JM Smucker Co., | | | | | | | | | | | | |
| 3.500%, 03/15/2025 | | | 5,000,000 | | | | 5,041,700 | | | | | |
| The Mosaic Co.: | | | | | | | | | | | | |
| 4.250%, 11/15/2023 | | | 5,000,000 | | | | 5,041,705 | | | | | |
| 5.450%, 11/15/2033 | | | 2,000,000 | | | | 1,983,612 | | | | | |
| The Timken Co., | | | | | | | | | | | | |
| 3.875%, 09/01/2024 | | | 2,000,000 | | | | 1,959,812 | | | | | |
| The Williams Companies, Inc., | | | | | | | | | | | | |
| 4.550%, 06/24/2024 | | | 5,000,000 | | | | 4,962,500 | | | | | |
| Thermo Fisher Scientific, Inc.: | | | | | | | | | | | | |
| 1.850%, 01/15/2018 | | | 4,925,000 | | | | 4,932,048 | | | | | |
| 2.150%, 12/14/2018 | | | 4,000,000 | | | | 4,018,360 | | | | | |
| 3.000%, 04/15/2023 | | | 7,975,000 | | | | 7,838,364 | | | | | |
| Time Warner Cable LLC: | | | | | | | | | | | | |
| 6.550%, 05/01/2037 | | | 893,000 | | | | 1,010,922 | | | | | |
| 6.750%, 06/15/2039 | | | 2,767,000 | | | | 3,216,862 | | | | | |
| Time Warner, Inc.: | | | | | | | | | | | | |
| 3.600%, 07/15/2025 | | | 2,200,000 | | | | 2,187,680 | | | | | |
| 3.875%, 01/15/2026 | | | 7,000,000 | | | | 7,007,539 | | | | | |
| 2.950%, 07/15/2026 | | | 6,250,000 | | | | 5,822,013 | | | | | |
| 3.800%, 02/15/2027 | | | 6,300,000 | | | | 6,264,222 | | | | | |
| 7.625%, 04/15/2031 | | | 5,207,000 | | | | 7,061,707 | | | | | |
| 7.700%, 05/01/2032 | | | 12,018,000 | | | | 16,287,407 | | | | | |
| TransCanada PipeLines Ltd., | | | | | | | | | | | | |
| 4.875%, 01/15/2026 f | | | 12,000,000 | | | | 13,333,728 | | | | | |
| Transocean, Inc., | | | | | | | | | | | | |
| 6.500%, 11/15/2020 f | | | 4,000,000 | | | | 3,960,000 | | | | | |
| TSMC Global Ltd., | | | | | | | | | | | | |
| 1.625%, 04/03/2018 (Acquired 12/03/2013 through 04/29/2015, Cost $9,809,789) * f | | | 9,865,000 | | | | 9,827,276 | | | | | |
| TTX Co.: | | | | | | | | | | | | |
| 3.600%, 01/15/2025 (Acquired 11/13/2014, Cost $4,999,250) * | | | 5,000,000 | | | | 4,991,180 | | | | | |
| 3.900%, 02/01/2045 (Acquired 01/26/2015 through 04/29/2015, Cost $10,151,754) * | | | 10,250,000 | | | | 9,241,134 | | | | | |
| Tyco Electronics Group SA, | | | | | | | | | | | | |
| 6.550%, 10/01/2017 f | | | 6,248,000 | | | | 6,480,738 | | | | | |
| Union Pacific Corp., | | | | | | | | | | | | |
| 3.375%, 02/01/2035 | | | 3,000,000 | | | | 2,837,229 | | | | | |
| US Airways Pass Through Trust, | | | | | | | | | | | | |
| Series 1998-1, Class 981A, 6.850%, 01/30/2018 | | | 129,439 | | | | 132,027 | | | | | |
| Vale Overseas Ltd.: | | | | | | | | | | | | |
| 5.875%, 06/10/2021 f | | | 11,075,000 | | | | 11,601,063 | | | | | |
| 6.250%, 08/10/2026 f | | | 7,000,000 | | | | 7,280,000 | | | | | |
| 8.250%, 01/17/2034 f | | | 8,526,000 | | | | 9,399,915 | | | | | |
| 6.875%, 11/21/2036 f | | | 1,483,000 | | | | 1,460,755 | | | | | |
| 6.875%, 11/10/2039 f | | | 2,893,000 | | | | 2,813,442 | | | | | |
| Valero Energy Corp.: | | | | | | | | | | | | |
| 9.375%, 03/15/2019 | | | 15,578,000 | | | | 17,939,625 | | | | | |
| 6.625%, 06/15/2037 | | | 2,100,000 | | | | 2,457,764 | | | | | |
| Valero Energy Partners LP, | | | | | | | | | | | | |
| 4.375%, 12/15/2026 | | | 10,000,000 | | | | 10,089,610 | | | | | |
| Verizon Communications, Inc.: | | | | | | | | | | | | |
| 4.150%, 03/15/2024 | | | 3,000,000 | | | | 3,134,946 | | | | | |
| 6.400%, 09/15/2033 | | | 34,140,000 | | | | 41,190,388 | | | | | |
| 4.272%, 01/15/2036 | | | 8,148,000 | | | | 7,798,663 | | | | | |
| Viacom, Inc., | | | | | | | | | | | | |
| 2.500%, 09/01/2018 | | | 7,628,000 | | | | 7,650,869 | | | | | |
| Vodafone Group PLC, | | | | | | | | | | | | |
| 1.250%, 09/26/2017 f | | | 10,000,000 | | | | 9,981,450 | | | | | |
| Vulcan Materials Co.: | | | | | | | | | | | | |
| 7.000%, 06/15/2018 | | | 1,785,000 | | | | 1,905,488 | | | | | |
| 7.500%, 06/15/2021 | | | 4,000,000 | | | | 4,710,000 | | | | | |
| 7.150%, 11/30/2037 | | | 446,000 | | | | 532,970 | | | | | |
| Wabtec Corp./DE, | | | | | | | | | | | | |
| 4.375%, 08/15/2023 | | | 2,678,000 | | | | 2,797,586 | | | | | |
| 3.450%, 11/15/2026 (Acquired 10/31/2016, Cost $13,170,389) * | | | 13,175,000 | | | | 12,664,627 | | | | | |
| Walgreens Boots Alliance, Inc.: | | | | | | | | | | | | |
| 3.300%, 11/18/2021 | | | 6,383,000 | | | | 6,502,815 | | | | | |
| 3.100%, 06/01/2023 | | | 13,300,000 | | | | 13,212,100 | | | | | |
| 3.800%, 11/18/2024 | | | 5,934,000 | | | | 6,039,477 | | | | | |
| Western Gas Partners LP, | | | | | | | | | | | | |
| 5.375%, 06/01/2021 | | | 8,701,000 | | | | 9,358,413 | | | | | |
| WestRock MWV LLC: | | | | | | | | | | | | |
| 9.750%, 06/15/2020 | | | 143,000 | | | | 172,225 | | | | | |
| 8.200%, 01/15/2030 | | | 7,963,000 | | | | 10,395,505 | | | | | |
| Williams Partners LP, | | | | | | | | | | | | |
| 6.300%, 04/15/2040 | | | 2,767,000 | | | | 2,953,471 | | | | | |
| Woodside Finance Ltd., | | | | | | | | | | | | |
| 3.650%, 03/05/2025 (Acquired 02/26/2015 through 04/14/2015, Cost $12,292,106) * f | | | 12,300,000 | | | | 12,015,673 | | | | | |
| Yara International ASA, | | | | | | | | | | | | |
| 3.800%, 06/06/2026 (Acquired 06/01/2016 through 07/06/2016, Cost $14,103,211) * f | | | 13,965,000 | | | | 13,689,415 | | | | | |
| Zimmer Holdings, Inc., | | | | | | | | | | | | |
| 3.150%, 04/01/2022 | | | 9,500,000 | | | | 9,474,027 | | | | | |
| Zoetis, Inc.: | | | | | | | | | | | | |
| 3.450%, 11/13/2020 | | | 5,145,000 | | | | 5,280,627 | | | | | |
| 3.250%, 02/01/2023 | | | 34,200,000 | | | | 34,125,239 | | | | | |
| | | | | | | | 2,092,926,257 | | | | 19.8 | % |
| Utilities | | | | | | | | | |
| Ameren Corp., | | | | | | | | | |
| 2.700%, 11/15/2020 | | | 10,000,000 | | | | 10,053,680 | | | | |
| Arizona Public Service Co., | | | | | | | | | | | |
| 8.750%, 03/01/2019 | | | 759,000 | | | | 862,811 | | | | |
| Beaver Valley II Funding Corp., | | | | | | | | | | | |
| 9.000%, 06/01/2017 | | | 19,000 | | | | 19,002 | | | | |
| Berkshire Hathaway Energy Co., | | | | | | | | | | | |
| 2.400%, 02/01/2020 | | | 5,000,000 | | | | 5,013,615 | | | | |
| Duke Energy Corp., | | | | | | | | | | | |
| 2.650%, 09/01/2026 | | | 10,000,000 | | | | 9,333,280 | | | | |
| Edison International, | | | | | | | | | | | |
| 2.950%, 03/15/2023 | | | 5,000,000 | | | | 4,941,225 | | | | |
| ENEL Finance International NV: | | | | | | | | | | | |
| 5.125%, 10/07/2019 (Acquired 09/30/2009, Cost $2,199,280) * f | | | 2,209,000 | | | | 2,361,363 | | | | |
| 6.800%, 09/15/2037 (Acquired 09/13/2007, Cost $1,560,853) * f | | | 1,565,000 | | | | 1,902,569 | | | | |
| Entergy Corp., | | | | | | | | | | | |
| 2.950%, 09/01/2026 | | | 13,075,000 | | | | 12,230,904 | | | | |
| Exelon Corp., | | | | | | | | | | | |
| 4.950%, 06/15/2035 | | | 3,500,000 | | | | 3,713,178 | | | | |
| Exelon Generation Co. LLC, | | | | | | | | | | | |
| 6.200%, 10/01/2017 | | | 1,964,000 | | | | 2,029,955 | | | | |
| Mega Advance Investments Ltd., | | | | | | | | | | | |
| 5.000%, 05/12/2021 (Acquired 05/09/2011, Cost $4,858,830) * f | | | 4,909,000 | | | | 5,245,502 | | | | |
| National Rural Utilities Cooperative Finance Corp.: | | | | | | | | | | | |
| 2.000%, 01/27/2020 | | | 2,000,000 | | | | 1,985,548 | | | | |
| 8.000%, 03/01/2032 | | | 4,659,000 | | | | 6,606,122 | | | | |
| NextEra Energy Capital Holdings, Inc., | | | | | | | | | | | |
| Class D, 7.300%, 09/01/2067 ∞ | | | 2,455,000 | | | | 2,452,545 | | | | |
| PSEG Power LLC, | | | | | | | | | | | |
| 5.125%, 04/15/2020 | | | 3,575,000 | | | | 3,829,254 | | | | |
| RGS I&M Funding Corp., | | | | | | | | | | | |
| Class F*, 9.820%, 06/07/2022 | | | 713,509 | | | | 723,694 | | | | |
| South Carolina Electric & Gas Co., | | | | | | | | | | | |
| 4.100%, 06/15/2046 | | | 10,000,000 | | | | 9,898,270 | | | | |
| Talent Yield Investments Ltd., | | | | | | | | | | | |
| 4.500%, 04/25/2022 (Acquired 04/18/2012, Cost $1,772,791) * f | | | 1,785,000 | | | | 1,869,802 | | | | |
| The Southern Co., | | | | | | | | | | | |
| 4.250%, 07/01/2036 | | | 5,525,000 | | | | 5,494,491 | | | | |
| | | | | | | | 90,566,810 | | | | 0.9 | % |
| Financials | | | | | | | | | | | | |
| ABN AMRO Bank NV: | | | | | | | | | | | | |
| 2.500%, 10/30/2018 (Acquired 10/23/2013 through 01/13/2014, Cost $11,023,715) * f | | | 11,033,000 | | | | 11,119,940 | | | | | |
| 2.450%, 06/04/2020 (Acquired 05/28/2015, Cost $8,980,200) * f | | | 9,000,000 | | | | 8,950,104 | | | | | |
| 4.800%, 04/18/2026 (Acquired 04/11/2016, Cost $8,984,430) * f | | | 9,000,000 | | | | 9,177,111 | | | | | |
| Aetna, Inc., | | | | | | | | | | | | |
| 4.250%, 06/15/2036 | | | 4,575,000 | | | | 4,587,101 | | | | | |
| AIA Group Ltd., | | | | | | | | | | | | |
| 3.200%, 03/11/2025 (Acquired 03/04/2015, Cost $5,992,380) * f | | | 6,000,000 | | | | 5,790,966 | | | | | |
| Ally Financial, Inc., | | | | | | | | | | | | |
| 8.000%, 12/31/2018 | | | 360,000 | | | | 392,850 | | | | | |
| American International Group, Inc.: | | | | | | | | | | | | |
| 6.400%, 12/15/2020 | | | 10,830,000 | | | | 12,330,865 | | | | | |
| 4.875%, 06/01/2022 | | | 17,698,000 | | | | 19,339,932 | | | | | |
| 4.125%, 02/15/2024 | | | 893,000 | | | | 927,129 | | | | | |
| 3.875%, 01/15/2035 | | | 4,875,000 | | | | 4,579,253 | | | | | |
| 8.175%, 05/15/2058 ∞ | | | 893,000 | | | | 1,129,645 | | | | | |
| Ameriprise Financial, Inc., | | | | | | | | | | | | |
| 7.300%, 06/28/2019 | | | 1,785,000 | | | | 2,003,523 | | | | | |
| AmSouth Bancorporation, | | | | | | | | | | | | |
| 6.750%, 11/01/2025 | | | 223,000 | | | | 255,967 | | | | | |
| Anthem, Inc., | | | | | | | | | | | | |
| 5.100%, 01/15/2044 | | | 1,584,000 | | | | 1,687,833 | | | | | |
| ANZ New Zealand (Int'l) Ltd./London: | | | | | | | | | | | | |
| 1.750%, 03/29/2018 (Acquired 03/24/2015 through 06/15/2015, Cost $2,434,251) * f | | | 2,435,000 | | | | 2,430,975 | | | | | |
| 2.850%, 08/06/2020 (Acquired 07/30/2015, Cost $15,337,260) * f | | | 15,350,000 | | | | 15,456,038 | | | | | |
| 2.750%, 02/03/2021 (Acquired 01/27/2016, Cost $2,996,790) * f | | | 3,000,000 | | | | 3,002,847 | | | | | |
| Aon PLC: | | | | | | | | | | | | |
| 4.000%, 11/27/2023 f | | | 6,150,000 | | | | 6,380,914 | | | | | |
| 3.875%, 12/15/2025 f | | | 9,126,000 | | | | 9,301,995 | | | | | |
| Australia & New Zealand Banking Group Ltd./New York NY, | | | | | | | | | | | | |
| 3.700%, 11/16/2025 f | | | 6,500,000 | | | | 6,748,150 | | | | | |
| Australia and New Zealand Banking Group Ltd., | | | | | | | | | | | | |
| 4.500%, 03/19/2024 (Acquired 03/12/2014 through 02/23/2016, Cost $15,997,705) * f | | | 16,000,000 | | | | 16,383,312 | | | | | |
| BAC Capital Trust VI, | | | | | | | | | | | | |
| 5.625%, 03/08/2035 ^ | | | 357,000 | | | | 376,733 | | | | | |
| Bank of America Corp.: | | | | | | | | | | | | |
| 6.400%, 08/28/2017 | | | 893,000 | | | | 920,384 | | | | | |
| 6.875%, 04/25/2018 | | | 3,162,000 | | | | 3,360,921 | | | | | |
| 2.625%, 10/19/2020 | | | 5,000,000 | | | | 5,002,855 | | | | | |
| 3.300%, 01/11/2023 | | | 7,000,000 | | | | 7,023,380 | | | | | |
| 4.125%, 01/22/2024 | | | 15,000,000 | | | | 15,588,765 | | | | | |
| 3.500%, 04/19/2026 | | | 9,000,000 | | | | 8,880,048 | | | | | |
| 3.248%, 10/21/2027 | | | 6,000,000 | | | | 5,728,200 | | | | | |
| 7.750%, 05/14/2038 | | | 1,138,000 | | | | 1,566,803 | | | | | |
| Bank of Montreal, | | | | | | | | | | | | |
| 1.800%, 07/31/2018 f | | | 3,600,000 | | | | 3,602,261 | | | | | |
| BanPonce Trust I, | | | | | | | | | | | | |
| Class A, 8.327%, 02/01/2027 | | | 1,941,000 | | | | 1,836,141 | | | | | |
| Barclays Bank PLC, | | | | | | | | | | | | |
| 6.050%, 12/04/2017 (Acquired 05/27/2015, Cost $10,351,892) * f | | | 10,000,000 | | | | 10,330,870 | | | | | |
| Barclays PLC: | | | | | | | | | | | | |
| 2.875%, 06/08/2020 f | | | 5,000,000 | | | | 4,957,765 | | | | | |
| 3.250%, 01/12/2021 f | | | 12,175,000 | | | | 12,186,859 | | | | | |
| 3.650%, 03/16/2025 f | | | 8,100,000 | | | | 7,831,258 | | | | | |
| BB&T Corp., | | | | | | | | | | | | |
| 2.625%, 06/29/2020 | | | 5,000,000 | | | | 5,039,170 | | | | | |
| Berkshire Hathaway, Inc., | | | | | | | | | | | | |
| 2.750%, 03/15/2023 | | | 14,675,000 | | | | 14,619,910 | | | | | |
| BNP Paribas SA: | | | | | | | | | | | | |
| 2.375%, 05/21/2020 f | | | 10,000,000 | | | | 9,950,580 | | | | | |
| 3.250%, 03/03/2023 f | | | 3,570,000 | | | | 3,602,566 | | | | | |
| BNZ International Funding Ltd./London: | | | | | | | | | | | | |
| 2.350%, 03/04/2019 (Acquired 09/03/2014 through 04/17/2015, Cost $7,324,860) * f | | | 7,300,000 | | | | 7,326,061 | | | | | |
| 2.750%, 03/02/2021 (Acquired 02/23/2016, Cost $13,990,200) * f | | | 14,000,000 | | | | 14,025,298 | | | | | |
| BPCE SA: | | | | | | | | | | | | |
| 2.500%, 07/15/2019 f | | | 7,925,000 | | | | 7,966,329 | | | | | |
| 5.700%, 10/22/2023 (Acquired 10/15/2013 through 11/30/2016, Cost $22,215,043) * f | | | 21,395,000 | | | | 22,492,200 | | | | | |
| 4.000%, 04/15/2024 f | | | 2,500,000 | | | | 2,595,032 | | | | | |
| 5.150%, 07/21/2024 (Acquired 05/10/2016 through 08/16/2016, Cost $16,744,680) * f | | | 16,185,000 | | | | 16,453,768 | | | | | |
| Caisse Centrale Desjardins: | | | | | | | | | | | | |
| 1.550%, 09/12/2017 (Acquired 07/07/2015, Cost $4,002,337) * f | | | 4,000,000 | | | | 4,001,716 | | | | | |
| 1.552%, 01/29/2018 (Acquired 01/26/2015, Cost $19,000,000) ∞ * f | | | 19,000,000 | | | | 18,980,639 | | | | | |
| Capital One Bank (USA) NA, | | | | | | | | | | | | |
| 3.375%, 02/15/2023 | | | 22,650,000 | | | | 22,437,362 | | | | | |
| Capital One NA/Mclean VA: | | | | | | | | | | | | |
| 1.561%, 02/05/2018 ∞ | | | 3,625,000 | | | | 3,632,159 | | | | | |
| 2.400%, 09/05/2019 | | | 12,000,000 | | | | 12,026,688 | | | | | |
| 1.850%, 09/13/2019 | | | 5,000,000 | | | | 4,943,165 | | | | | |
| Chubb INA Holdings, Inc., | | | | | | | | | | | | |
| 2.875%, 11/03/2022 | | | 8,750,000 | | | | 8,821,592 | | | | | |
| Citigroup, Inc.: | | | | | | | | | | | | |
| 1.700%, 04/27/2018 | | | 13,000,000 | | | | 12,971,348 | | | | | |
| 2.050%, 12/07/2018 | | | 11,000,000 | | | | 10,998,768 | | | | | |
| 2.350%, 08/02/2021 | | | 9,000,000 | | | | 8,803,791 | | | | | |
| 2.361%, 09/01/2023 ∞ | | | 7,000,000 | | | | 7,139,181 | | | | | |
| 3.750%, 06/16/2024 | | | 1,000,000 | | | | 1,018,459 | | | | | |
| 3.700%, 01/12/2026 | | | 4,500,000 | | | | 4,476,834 | | | | | |
| Citizens Bank NA/Providence RI: | | | | | | | | | | | | |
| 2.300%, 12/03/2018 | | | 4,000,000 | | | | 4,020,496 | | | | | |
| 2.500%, 03/14/2019 | | | 7,800,000 | | | | 7,860,091 | | | | | |
| 2.450%, 12/04/2019 | | | 19,300,000 | | | | 19,364,906 | | | | | |
| CNA Financial Corp.: | | | | | | | | | | | | |
| 5.750%, 08/15/2021 | | | 7,199,000 | | | | 8,041,981 | | | | | |
| 7.250%, 11/15/2023 | | | 4,000,000 | | | | 4,728,532 | | | | | |
| 4.500%, 03/01/2026 | | | 14,000,000 | | | | 14,640,360 | | | | | |
| Comerica Bank: | | | | | | | | | | | | |
| 2.500%, 06/02/2020 | | | 29,000,000 | | | | 28,989,357 | | | | | |
| 4.000%, 07/27/2025 | | | 10,000,000 | | | | 10,011,450 | | | | | |
| Commonwealth Bank of Australia/New York NY, | | | | | | | | | | | | |
| 2.050%, 03/15/2019 f | | | 10,275,000 | | | | 10,263,153 | | | | | |
| Compass Bank: | | | | | | | | | | | | |
| 2.750%, 09/29/2019 | | | 31,216,000 | | | | 31,046,091 | | | | | |
| 3.875%, 04/10/2025 | | | 14,713,000 | | | | 14,001,494 | | | | | |
| Cooperatieve Rabobank UA, | | | | | | | | | | | | |
| 3.750%, 07/21/2026 f | | | 12,000,000 | | | | 11,762,976 | | | | | |
| Credit Agricole SA, | | | | | | | | | | | | |
| 6.637%, 05/31/2017 (Acquired 05/23/2007, Cost $893,000) ∞ * f | | | 893,000 | | | | 838,884 | | | | | |
| Credit Suisse AG/New York NY: | | | | | | | | | | | | |
| 1.700%, 04/27/2018 f | | | 6,000,000 | | | | 5,986,776 | | | | | |
| 5.300%, 08/13/2019 f | | | 1,406,000 | | | | 1,517,121 | | | | | |
| 5.400%, 01/14/2020 f | | | 5,000,000 | | | | 5,360,695 | | | | | |
| 3.000%, 10/29/2021 f | | | 7,000,000 | | | | 7,066,885 | | | | | |
| 3.625%, 09/09/2024 f | | | 4,325,000 | | | | 4,353,895 | | | | | |
| Credit Suisse Group Funding Guernsey Ltd.: | | | | | | | | | | | | |
| 3.800%, 09/15/2022 f | | | 3,000,000 | | | | 3,026,604 | | | | | |
| 3.800%, 06/09/2023 f | | | 4,550,000 | | | | 4,544,986 | | | | | |
| 4.550%, 04/17/2026 f | | | 2,000,000 | | | | 2,077,150 | | | | | |
| Credit Suisse USA, Inc., | | | | | | | | | | | | |
| 7.125%, 07/15/2032 | | | 5,063,000 | | | | 6,689,949 | | | | | |
| Deutsche Bank AG: | | | | | | | | | | | | |
| 2.950%, 08/20/2020 f | | | 4,500,000 | | | | 4,429,886 | | | | | |
| 3.125%, 01/13/2021 f | | | 10,800,000 | | | | 10,618,549 | | | | | |
| 4.250%, 10/14/2021 (Acquired 10/07/2016, Cost $17,994,420) * f | | | 18,000,000 | | | | 18,069,408 | | | | | |
| Deutsche Bank AG/London: | | | | | | | | | | | | |
| 1.512%, 02/13/2017 ∞ f | | | 9,000,000 | | | | 8,997,858 | | | | | |
| 3.700%, 05/30/2024 f | | | 10,000,000 | | | | 9,724,310 | | | | | |
| Discover Bank/Greenwood DE: | | | | | | | | | | | | |
| 2.600%, 11/13/2018 | | | 4,875,000 | | | | 4,917,276 | | | | | |
| 4.200%, 08/08/2023 | | | 20,000,000 | | | | 20,836,620 | | | | | |
| 3.450%, 07/27/2026 | | | 12,000,000 | | | | 11,587,332 | | | | | |
| Discover Financial Services, | | | | | | | | | | | | |
| 3.950%, 11/06/2024 | | | 5,000,000 | | | | 4,955,305 | | | | | |
| Fifth Third Bancorp, | | | | | | | | | | | | |
| 2.875%, 07/27/2020 | | | 6,000,000 | | | | 6,066,000 | | | | | |
| First Horizon National Corp., | | | | | | | | | | | | |
| 3.500%, 12/15/2020 | | | 29,078,000 | | | | 29,342,842 | | | | | |
| First Tennessee Bank NA, | | | | | | | | | | | | |
| 2.950%, 12/01/2019 | | | 5,612,000 | | | | 5,625,918 | | | | | |
| FMR LLC, | | | | | | | | | | | | |
| 4.950%, 02/01/2033 (Acquired 01/29/2013, Cost $1,747,795) * | | | 1,750,000 | | | | 1,812,459 | | | | | |
| GE Capital International Funding Co. Unlimited Co., | | | | | | | | | | | | |
| 2.342%, 11/15/2020 f | | | 12,638,000 | | | | 12,631,972 | | | | | |
| Genworth Holdings, Inc., | | | | | | | | | | | | |
| 4.900%, 08/15/2023 | | | 1,339,000 | | | | 1,104,675 | | | | | |
| Goldman Sachs Capital I, | | | | | | | | | | | | |
| 6.345%, 02/15/2034 | | | 1,053,000 | | | | 1,251,960 | | | | | |
| Great-West Life & Annuity Insurance Capital LP II, | | | | | | | | | | | | |
| 3.449%, 05/16/2046 (Acquired 05/16/2006 through 11/08/2007, Cost $2,482,656) ∞ * | | | 2,499,000 | | | | 2,136,645 | | | | | |
| Highmark, Inc., | | | | | | | | | | | | |
| 4.750%, 05/15/2021 (Acquired 05/03/2011 through 07/30/2014, Cost $4,376,303) * | | | 4,378,000 | | | | 4,444,646 | | | | | |
| HSBC Bank PLC, | | | | | | | | | | | | |
| 1.546%, 05/15/2018 (Acquired 12/17/2014, Cost $4,959,505) ∞ * f | | | 4,950,000 | | | | 4,951,673 | | | | | |
| HSBC Bank USA NA, | | | | | | | | | | | | |
| 7.000%, 01/15/2039 | | | 4,200,000 | | | | 5,549,750 | | | | | |
| HSBC Finance Corp., | | | | | | | | | | | | |
| 6.676%, 01/15/2021 | | | 15,925,000 | | | | 17,900,353 | | | | | |
| HSBC Holdings PLC: | | | | | | | | | | | | |
| 2.650%, 01/05/2022 f | | | 4,000,000 | | | | 3,905,044 | | | | | |
| 3.600%, 05/25/2023 f | | | 2,275,000 | | | | 2,288,190 | | | | | |
| 4.375%, 11/23/2026 f | | | 10,000,000 | | | | 10,074,240 | | | | | |
| HSBC USA, Inc.: | | | | | | | | | | | | |
| 2.350%, 03/05/2020 | | | 3,000,000 | | | | 2,976,540 | | | | | |
| 5.000%, 09/27/2020 | | | 3,716,000 | | | | 3,947,782 | | | | | |
| 9.125%, 05/15/2021 | | | 625,000 | | | | 768,567 | | | | | |
| Humana, Inc., | | | | | | | | | | | | |
| 7.200%, 06/15/2018 | | | 1,870,000 | | | | 2,010,125 | | | | | |
| Huntington Bancshares Inc./OH: | | | | | | | | | | | | |
| 3.150%, 03/14/2021 | | | 7,600,000 | | | | 7,707,153 | | | | | |
| 2.300%, 01/14/2022 | | | 26,450,000 | | | | 25,653,458 | | | | | |
| ING Bank NV: | | | | | | | | | | | | |
| 3.750%, 03/07/2017 (Acquired 03/28/2012, Cost $1,903,783) * f | | | 1,919,000 | | | | 1,927,116 | | | | | |
| 2.050%, 08/17/2018 (Acquired 08/10/2015, Cost $7,270,562) * f | | | 7,275,000 | | | | 7,281,009 | | | | | |
| 2.000%, 11/26/2018 (Acquired 11/17/2015, Cost $5,984,160) * f | | | 6,000,000 | | | | 5,997,606 | | | | | |
| 2.500%, 10/01/2019 (Acquired 09/23/2014, Cost $3,481,100) * f | | | 3,500,000 | | | | 3,522,540 | | | | | |
| 2.450%, 03/16/2020 (Acquired 03/10/2015 through 04/29/2015, Cost $9,209,983) * f | | | 9,225,000 | | | | 9,223,081 | | | | | |
| 5.800%, 09/25/2023 (Acquired 01/14/2014 through 04/29/2016, Cost $11,328,363) * f | | | 10,450,000 | | | | 11,482,345 | | | | | |
| Invesco Finance PLC: | | | | | | | | | | | | |
| 3.125%, 11/30/2022 f | | | 5,902,000 | | | | 5,945,527 | | | | | |
| 3.750%, 01/15/2026 f | | | 4,900,000 | | | | 4,965,577 | | | | | |
| Jefferies Group LLC: | | | | | | | | | | | | |
| 6.875%, 04/15/2021 | | | 3,570,000 | | | | 4,061,353 | | | | | |
| 6.250%, 01/15/2036 | | | 1,390,000 | | | | 1,417,604 | | | | | |
| John Hancock Life Insurance Co., | | | | | | | | | | | | |
| 7.375%, 02/15/2024 (Acquired 08/26/2010, Cost $6,583,866) * | | | 6,069,000 | | | | 7,172,308 | | | | | |
| JPMorgan Chase & Co.: | | | | | | | | | | | | |
| 2.250%, 01/23/2020 | | | 3,675,000 | | | | 3,666,349 | | | | | |
| 4.250%, 10/15/2020 | | | 886,000 | | | | 937,597 | | | | | |
| 2.550%, 03/01/2021 | | | 7,000,000 | | | | 6,977,999 | | | | | |
| 2.295%, 08/15/2021 | | | 18,000,000 | | | | 17,666,532 | | | | | |
| 2.112%, 10/24/2023 ∞ | | | 15,000,000 | | | | 15,299,535 | | | | | |
| 3.125%, 01/23/2025 | | | 14,000,000 | | | | 13,685,770 | | | | | |
| 5.600%, 07/15/2041 | | | 4,106,000 | | | | 4,909,951 | | | | | |
| JPMorgan Chase Bank NA, | | | | | | | | | | | | |
| 6.000%, 10/01/2017 | | | 500,000 | | | | 515,992 | | | | | |
| KEB Hana Bank, | | | | | | | | | | | | |
| 1.750%, 10/18/2019 (Acquired 10/11/2016, Cost $19,935,600) * f | | | 20,000,000 | | | | 19,774,820 | | | | | |
| KeyBank NA/Cleveland OH: | | | | | | | | | | | | |
| 1.451%, 06/01/2018 ∞ | | | 10,600,000 | | | | 10,613,207 | | | | | |
| 2.250%, 03/16/2020 | | | 5,000,000 | | | | 4,979,015 | | | | | |
| 3.400%, 05/20/2026 | | | 12,250,000 | | | | 11,895,620 | | | | | |
| Kookmin Bank: | | | | | | | | | | | | |
| 1.625%, 07/14/2017 (Acquired 07/07/2014, Cost $3,988,720) * f | | | 4,000,000 | | | | 3,994,468 | | | | | |
| 1.625%, 08/01/2019 (Acquired 07/25/2016, Cost $6,979,840) * f | | | 7,000,000 | | | | 6,894,930 | | | | | |
| LeasePlan Corp. NV: | | | | | | | | | | | | |
| 3.000%, 10/23/2017 (Acquired 12/03/2013 through 04/29/2015, Cost $955,709) * f | | | 950,000 | | | | 956,813 | | | | | |
| 2.500%, 05/16/2018 (Acquired 09/24/2013 through 04/27/2015, Cost $11,690,148) * f | | | 11,658,000 | | | | 11,674,951 | | | | | |
| 2.875%, 01/22/2019 (Acquired 10/14/2015, Cost $10,993,180) * f | | | 11,000,000 | | | | 10,996,524 | | | | | |
| Liberty Mutual Group, Inc.: | | | | | | | | | | | | |
| 4.250%, 06/15/2023 (Acquired 06/13/2013, Cost $2,660,995) * | | | 2,678,000 | | | | 2,803,799 | | | | | |
| 10.750%, 06/15/2058 (Acquired 05/21/2008, Cost $2,182,029) ∞ * | | | 2,231,000 | | | | 3,346,500 | | | | | |
| Liberty Mutual Insurance Co., | | | | | | | | | | | | |
| 7.697%, 10/15/2097 (Acquired 03/26/2003, Cost $297,832) * | | | 465,000 | | | | 570,757 | | | | | |
| Lincoln National Corp.: | | | | | | | | | | | | |
| 8.750%, 07/01/2019 | | | 1,601,000 | | | | 1,842,082 | | | | | |
| 6.050%, 04/20/2067 ∞ | | | 1,004,000 | | | | 773,080 | | | | | |
| Lloyds Bank PLC: | | | | | | | | | | | | |
| 1.750%, 05/14/2018 f | | | 7,775,000 | | | | 7,764,644 | | | | | |
| 5.800%, 01/13/2020 (Acquired 02/10/2010, Cost $1,412,255) * f | | | 1,428,000 | | | | 1,557,205 | | | | | |
| 2.400%, 03/17/2020 f | | | 20,000,000 | | | | 19,947,580 | | | | | |
| Macquarie Bank Ltd.: | | | | | | | | | | | | |
| 1.600%, 10/27/2017 (Acquired 10/22/2014, Cost $4,996,950) * f | | | 5,000,000 | | | | 4,999,680 | | | | | |
| 2.400%, 01/21/2020 (Acquired 01/14/2015 through 11/22/2016, Cost $11,969,750) * f | | | 12,000,000 | | | | 11,891,760 | | | | | |
| Macquarie Group Ltd.: | | | | | | | | | | | | |
| 3.000%, 12/03/2018 (Acquired 11/25/2013, Cost $8,490,900) * f | | | 8,525,000 | | | | 8,651,903 | | | | | |
| 7.625%, 08/13/2019 (Acquired 02/12/2014 through 05/18/2015, Cost $4,405,192) * f | | | 3,944,000 | | | | 4,423,520 | | | | | |
| Manufacturers & Traders Trust Co., | | | | | | | | | | | | |
| 2.100%, 02/06/2020 | | | 10,850,000 | | | | 10,819,631 | | | | | |
| Manulife Financial Corp.: | | | | | | | | | | | | |
| 4.150%, 03/04/2026 f | | | 10,000,000 | | | | 10,440,130 | | | | | |
| 5.375%, 03/04/2046 f | | | 5,150,000 | | | | 5,875,285 | | | | | |
| Marsh & McLennan Companies, Inc., | | | | | | | | | | | | |
| 2.300%, 04/01/2017 | | | 2,231,000 | | | | 2,230,288 | | | | | |
| Massachusetts Mutual Life Insurance Co.: | | | | | | | | | | | | |
| 8.875%, 06/01/2039 (Acquired 05/27/2009 through 10/31/2016, Cost $40,486,801) * | | | 27,017,000 | | | | 40,556,813 | | | | | |
| 4.500%, 04/15/2065 (Acquired 04/08/2015, Cost $2,945,520) * | | | 3,000,000 | | | | 2,751,609 | | | | | |
| MBIA Insurance Corp., | | | | | | | | | | | | |
| 12.140%, 01/15/2033 (Acquired 01/11/2008, Cost $714,000) ∞ * § | | | 714,000 | | | | 328,440 | | | | | |
| MetLife, Inc.: | | | | | | | | | | | | |
| 7.717%, 02/15/2019 | | | 982,000 | | | | 1,098,507 | | | | | |
| 6.500%, 12/15/2032 | | | 466,000 | | | | 585,255 | | | | | |
| 4.875%, 11/13/2043 | | | 3,375,000 | | | | 3,653,978 | | | | | |
| 4.050%, 03/01/2045 | | | 10,000,000 | | | | 9,589,490 | | | | | |
| 4.600%, 05/13/2046 | | | 2,375,000 | | | | 2,500,241 | | | | | |
| Metropolitan Life Global Funding I, | | | | | | | | | | | | |
| 3.000%, 01/10/2023 (Acquired 04/27/2015, Cost $2,038,336) * | | | 2,004,000 | | | | 2,012,723 | | | | | |
| Mitsubishi UFJ Financial Group, Inc.: | | | | | | | | | | | | |
| 2.950%, 03/01/2021 f | | | 15,200,000 | | | | 15,301,460 | | | | | |
| 2.190%, 09/13/2021 f | | | 12,400,000 | | | | 12,058,529 | | | | | |
| Mizuho Bank Ltd.: | | | | | | | | | | | | |
| 1.850%, 03/21/2018 (Acquired 03/14/2013 through 04/29/2015, Cost $3,345,077) * f | | | 3,349,000 | | | | 3,343,166 | | | | | |
| 1.800%, 03/26/2018 (Acquired 06/16/2016, Cost $24,344,927) * f | | | 24,275,000 | | | | 24,239,558 | | | | | |
| 2.450%, 04/16/2019 (Acquired 04/09/2014, Cost $2,096,262) * f | | | 2,100,000 | | | | 2,108,902 | | | | | |
| Mizuho Financial Group, Inc., | | | | | | | | | | | | |
| 2.632%, 04/12/2021 (Acquired 04/05/2016, Cost $13,000,000) * f | | | 13,000,000 | | | | 12,863,994 | | | | | |
| Morgan Stanley: | | | | | | | | | | | | |
| 7.300%, 05/13/2019 | | | 15,110,000 | | | | 16,836,741 | | | | | |
| 2.375%, 07/23/2019 | | | 1,000,000 | | | | 1,002,849 | | | | | |
| 5.625%, 09/23/2019 | | | 1,941,000 | | | | 2,103,966 | | | | | |
| 2.650%, 01/27/2020 | | | 4,200,000 | | | | 4,219,782 | | | | | |
| 2.800%, 06/16/2020 | | | 5,000,000 | | | | 5,040,920 | | | | | |
| 2.500%, 04/21/2021 | | | 8,000,000 | | | | 7,913,024 | | | | | |
| 2.282%, 10/24/2023 ∞ | | | 8,000,000 | | | | 8,088,888 | | | | | |
| Class F, 3.875%, 04/29/2024 | | | 1,650,000 | | | | 1,692,190 | | | | | |
| 3.700%, 10/23/2024 | | | 4,000,000 | | | | 4,047,648 | | | | | |
| MUFG Americas Holdings Corp., | | | | | | | | | | | | |
| 2.250%, 02/10/2020 | | | 5,000,000 | | | | 4,946,735 | | | | | |
| National Australia Bank Ltd./New York, | | | | | | | | | | | | |
| 2.500%, 07/12/2026 f | | | 20,875,000 | | | | 19,384,108 | | | | | |
| Nationwide Building Society, | | | | | | | | | | | | |
| 2.450%, 07/27/2021 (Acquired 07/20/2016 through 08/01/2016, Cost $38,476,783) * f | | | 38,500,000 | | | | 37,988,258 | | | | | |
| Nationwide Financial Services, Inc., | | | | | | | | | | | | |
| 5.375%, 03/25/2021 (Acquired 02/05/2015 through 05/08/2015, Cost $18,518,492) * | | | 16,905,000 | | | | 18,464,334 | | | | | |
| Navient Corp., | | | | | | | | | | | | |
| 5.625%, 08/01/2033 | | | 446,000 | | | | 367,950 | | | | | |
| New York Life Global Funding, | | | | | | | | | | | | |
| 2.350%, 07/14/2026 (Acquired 07/11/2016, Cost $7,895,102) * | | | 7,900,000 | | | | 7,362,413 | | | | | |
| New York Life Insurance Co., | | | | | | | | | | | | |
| 6.750%, 11/15/2039 (Acquired 05/04/2016, Cost $3,957,337) * | | | 3,000,000 | | | | 3,945,915 | | | | | |
| Nomura Holdings, Inc.: | | | | | | | | | | | | |
| 2.750%, 03/19/2019 f | | | 1,625,000 | | | | 1,640,379 | | | | | |
| 6.700%, 03/04/2020 f | | | 1,667,000 | | | | 1,863,114 | | | | | |
| Peachtree Corners Funding Trust, | | | | | | | | | | | | |
| 3.976%, 02/15/2025 (Acquired 03/10/2015 through 04/24/2015, Cost $8,112,753) * | | | 8,000,000 | | | | 7,805,704 | | | | | |
| PNC Bank NA, | | | | | | | | | | | | |
| 4.200%, 11/01/2025 | | | 2,678,000 | | | | 2,829,647 | | | | | |
| Pricoa Global Funding I, | | | | | | | | | | | | |
| 2.550%, 11/24/2020 (Acquired 11/17/2015, Cost $14,000,000) * | | | 14,000,000 | | | | 14,002,772 | | | | | |
| Principal Financial Group, Inc.: | | | | | | | | | | | | |
| 3.300%, 09/15/2022 | | | 1,860,000 | | | | 1,882,290 | | | | | |
| 3.125%, 05/15/2023 | | | 4,667,000 | | | | 4,641,523 | | | | | |
| 3.400%, 05/15/2025 | | | 16,000,000 | | | | 15,897,728 | | | | | |
| 4.300%, 11/15/2046 | | | 2,325,000 | | | | 2,277,970 | | | | | |
| Principal Life Global Funding II: | | | | | | | | | | | | |
| 2.200%, 04/08/2020 (Acquired 03/31/2015, Cost $3,994,720) * | | | 4,000,000 | | | | 3,970,052 | | | | | |
| 3.000%, 04/18/2026 (Acquired 04/11/2016, Cost $13,364,356) * | | | 13,400,000 | | | | 13,025,658 | | | | | |
| Protective Life Corp.: | | | | | | | | | | | | |
| 7.375%, 10/15/2019 | | | 7,096,000 | | | | 8,037,114 | | | | | |
| 8.450%, 10/15/2039 | | | 1,400,000 | | | | 1,854,635 | | | | | |
| Protective Life Global Funding, | | | | | | | | | | | | |
| 2.700%, 11/25/2020 (Acquired 11/19/2015, Cost $7,992,960) * | | | 8,000,000 | | | | 8,011,656 | | | | | |
| Prudential Financial, Inc., | | | | | | | | | | | | |
| 6.625%, 12/01/2037 | | | 5,000,000 | | | | 6,356,230 | | | | | |
| Raymond James Financial, Inc., | | | | | | | | | | | | |
| 8.600%, 08/15/2019 | | | 5,000,000 | | | | 5,736,140 | | | | | |
| RBC USA Holdco Corp., | | | | | | | | | | | | |
| 5.250%, 09/15/2020 | | | 2,025,000 | | | | 2,227,055 | | | | | |
| Regions Bank/Birmingham AL: | | | | | | | | | | | | |
| 7.500%, 05/15/2018 | | | 8,518,000 | | | | 9,125,580 | | | | | |
| 2.250%, 09/14/2018 | | | 5,000,000 | | | | 5,016,410 | | | | | |
| Regions Financial Corp., | | | | | | | | | | | | |
| 3.200%, 02/08/2021 | | | 25,000,000 | | | | 25,353,750 | | | | | |
| Reliance Standard Life Global Funding II: | | | | | | | | | | | | |
| 2.500%, 01/15/2020 (Acquired 04/14/2015, Cost $6,995,547) * | | | 6,940,000 | | | | 6,897,902 | | | | | |
| 2.375%, 05/04/2020 (Acquired 04/27/2015 through 11/08/2016, Cost $29,990,080) * | | | 30,000,000 | | | | 29,661,930 | | | | | |
| Santander Bank NA, | | | | | | | | | | | | |
| 8.750%, 05/30/2018 | | | 9,442,000 | | | | 10,162,292 | | | | | |
| Santander Holdings USA, Inc.: | | | | | | | | | | | | |
| 2.700%, 05/24/2019 | | | 5,000,000 | | | | 4,996,195 | | | | | |
| 2.650%, 04/17/2020 | | | 2,000,000 | | | | 1,982,262 | | | | | |
| Santander Issuances SAU, | | | | | | | | | | | | |
| 5.179%, 11/19/2025 f | | | 4,000,000 | | | | 4,037,612 | | | | | |
| Santander UK Group Holdings PLC: | | | | | | | | | | | | |
| 2.875%, 10/16/2020 f | | | 4,866,000 | | | | 4,822,162 | | | | | |
| 3.125%, 01/08/2021 f | | | 2,600,000 | | | | 2,593,927 | | | | | |
| 2.875%, 08/05/2021 f | | | 6,000,000 | | | | 5,867,130 | | | | | |
| Santander UK PLC, | | | | | | | | | | | | |
| 5.000%, 11/07/2023 (Acquired 10/31/2013 through 12/02/2014, Cost $10,232,333) * f | | | 9,880,000 | | | | 10,051,161 | | | | | |
| Skandinaviska Enskilda Banken AB: | | | | | | | | | | | | |
| 2.375%, 11/20/2018 (Acquired 11/13/2013 through 05/07/2015, Cost $6,846,539) * f | | | 6,835,000 | | | | 6,879,311 | | | | | |
| 2.375%, 03/25/2019 (Acquired 03/18/2014 through 04/29/2015, Cost $1,726,264) * f | | | 1,725,000 | | | | 1,729,428 | | | | | |
| 2.450%, 05/27/2020 (Acquired 05/19/2015, Cost $14,976,900) * f | | | 15,000,000 | | | | 14,940,240 | | | | | |
| Societe Generale SA: | | | | | | | | | | | | |
| 2.078%, 10/01/2018 ∞ f | | | 6,000,000 | | | | 6,051,144 | | | | | |
| 2.500%, 04/08/2021 (Acquired 04/04/2016, Cost $10,217,332) * f | | | 10,225,000 | | | | 10,129,355 | | | | | |
| 4.250%, 04/14/2025 (Acquired 04/08/2015, Cost $4,092,109) * f | | | 4,157,000 | | | | 4,032,702 | | | | | |
| 4.750%, 11/24/2025 (Acquired 11/17/2015, Cost $11,954,640) * f | | | 12,000,000 | | | | 12,071,256 | | | | | |
| SpareBank 1 Boligkreditt AS, | | | | | | | | | | | | |
| 1.750%, 11/15/2019 (Acquired 11/07/2012, Cost $4,428,322) * f | | | 4,463,000 | | | | 4,404,441 | | | | | |
| Springleaf Finance Corp., | | | | | | | | | | | | |
| 6.900%, 12/15/2017 | | | 400,000 | | | | 417,120 | | | | | |
| Standard Chartered PLC: | | | | | | | | | | | | |
| 1.520%, 04/17/2018 (Acquired 04/13/2015, Cost $3,000,000) ∞ * f | | | 3,000,000 | | | | 2,988,498 | | | | | |
| 1.700%, 04/17/2018 (Acquired 04/13/2015 through 04/24/2015, Cost $11,588,924) * f | | | 11,600,000 | | | | 11,516,480 | | | | | |
| 2.100%, 08/19/2019 (Acquired 11/17/2016, Cost $13,898,403) * f | | | 14,000,000 | | | | 13,840,022 | | | | | |
| 3.050%, 01/15/2021 (Acquired 01/12/2016, Cost $4,490,910) * f | | | 4,500,000 | | | | 4,494,591 | | | | | |
| 5.700%, 03/26/2044 (Acquired 03/21/2014, Cost $5,988,000) * f | | | 6,000,000 | | | | 5,992,458 | | | | | |
| Sumitomo Mitsui Banking Corp.: | | | | | | | | | | | | |
| 2.450%, 01/16/2020 f | | | 20,500,000 | | | | 20,415,191 | | | | | |
| 3.950%, 07/19/2023 f | | | 1,850,000 | | | | 1,929,728 | | | | | |
| Sumitomo Mitsui Financial Group, Inc.: | | | | | | | | | | | | |
| 2.934%, 03/09/2021 f | | | 5,950,000 | | | | 5,981,148 | | | | | |
| 2.442%, 10/19/2021 f | | | 15,775,000 | | | | 15,518,893 | | | | | |
| SunTrust Bank/Atlanta GA: | | | | | | | | | | | | |
| 7.250%, 03/15/2018 | | | 1,874,000 | | | | 1,987,857 | | | | | |
| 3.300%, 05/15/2026 | | | 3,925,000 | | | | 3,788,390 | | | | | |
| SunTrust Banks, Inc.: | | | | | | | | | | | | |
| 2.900%, 03/03/2021 | | | 14,150,000 | | | | 14,349,869 | | | | | |
| 2.700%, 01/27/2022 | | | 12,800,000 | | | | 12,805,440 | | | | | |
| Svenska Handelsbanken AB, | | | | | | | | | | | | |
| 2.400%, 10/01/2020 f | | | 5,200,000 | | | | 5,188,981 | | | | | |
| Swedbank AB: | | | | | | | | | | | | |
| 2.375%, 02/27/2019 (Acquired 02/20/2014, Cost $7,287,663) * f | | | 7,300,000 | | | | 7,332,091 | | | | | |
| 2.200%, 03/04/2020 (Acquired 02/25/2015 through 04/29/2015, Cost $6,464,444) * f | | | 6,468,000 | | | | 6,415,092 | | | | | |
| Synchrony Financial: | | | | | | | | | | | | |
| 3.000%, 08/15/2019 | | | 2,000,000 | | | | 2,025,918 | | | | | |
| 3.750%, 08/15/2021 | | | 10,225,000 | | | | 10,509,429 | | | | | |
| 4.250%, 08/15/2024 | | | 26,864,000 | | | | 27,346,155 | | | | | |
| 4.500%, 07/23/2025 | | | 5,140,000 | | | | 5,279,633 | | | | | |
| TD Ameritrade Holding Corp.: | | | | | | | | | | | | |
| 5.600%, 12/01/2019 | | | 2,945,000 | | | | 3,235,315 | | | | | |
| 2.950%, 04/01/2022 | | | 4,625,000 | | | | 4,682,577 | | | | | |
| 3.625%, 04/01/2025 | | | 7,000,000 | | | | 7,106,407 | | | | | |
| The Bank of Nova Scotia: | | | | | | | | | | | | |
| 1.700%, 06/11/2018 f | | | 15,000,000 | | | | 15,005,145 | | | | | |
| 4.500%, 12/16/2025 f | | | 5,500,000 | | | | 5,650,078 | | | | | |
| The Bank of Tokyo-Mitsubishi UFJ Ltd.: | | | | | | | | | | | | |
| 4.100%, 09/09/2023 (Acquired 09/03/2013 through 03/26/2014, Cost $2,932,813) * f | | | 2,911,000 | | | | 3,065,187 | | | | | |
| 3.750%, 03/10/2024 (Acquired 03/04/2014 through 04/29/2015, Cost $2,803,398) * f | | | 2,800,000 | | | | 2,897,138 | | | | | |
| The Bear Stearns Companies LLC, | | | | | | | | | | | | |
| 7.250%, 02/01/2018 | | | 5,547,000 | | | | 5,870,046 | | | | | |
| The Goldman Sachs Group, Inc.: | | | | | | | | | | | | |
| 6.150%, 04/01/2018 | | | 5,634,000 | | | | 5,926,489 | | | | | |
| 7.500%, 02/15/2019 | | | 1,964,000 | | | | 2,177,253 | | | | | |
| 2.550%, 10/23/2019 | | | 2,700,000 | | | | 2,719,824 | | | | | |
| 2.350%, 11/15/2021 | | | 6,175,000 | | | | 5,999,383 | | | | | |
| 2.537%, 11/29/2023 ∞ | | | 5,000,000 | | | | 5,155,035 | | | | | |
| 3.850%, 07/08/2024 | | | 3,000,000 | | | | 3,062,373 | | | | | |
| 3.500%, 01/23/2025 | | | 3,000,000 | | | | 2,960,097 | | | | | |
| 3.750%, 05/22/2025 | | | 5,000,000 | | | | 5,013,005 | | | | | |
| 2.640%, 10/28/2027 ∞ | | | 10,000,000 | | | | 10,193,950 | | | | | |
| The Guardian Life Insurance Co. of America: | | | | | | | | | | | | |
| 7.375%, 09/30/2039 (Acquired 05/04/2016 through 10/12/2016, Cost $12,346,148) * | | | 9,425,000 | | | | 12,565,646 | | | | | |
| 4.875%, 06/19/2064 (Acquired 06/16/2014, Cost $1,993,300) * | | | 2,000,000 | | | | 1,964,606 | | | | | |
| The Hartford Financial Services Group, Inc.: | | | | | | | | | | | | |
| 5.125%, 04/15/2022 | | | 1,538,000 | | | | 1,705,927 | | | | | |
| 8.125%, 06/15/2038 ∞ | | | 1,964,000 | | | | 2,103,444 | | | | | |
| The Huntington National Bank: | | | | | | | | | | | | |
| 2.000%, 06/30/2018 | | | 9,000,000 | | | | 9,003,888 | | | | | |
| 2.200%, 11/06/2018 | | | 4,825,000 | | | | 4,838,655 | | | | | |
| Torchmark Corp., | | | | | | | | | | | | |
| 3.800%, 09/15/2022 | | | 12,475,000 | | | | 12,748,801 | | | | | |
| Trinity Acquisition PLC, | | | | | | | | | | | | |
| 4.400%, 03/15/2026 f | | | 24,000,000 | | | | 24,294,096 | | | | | |
| UBS AG/Stamford CT: | | | | | | | | | | | | |
| 1.697%, 03/26/2018 ∞ f | | | 8,250,000 | | | | 8,277,440 | | | | | |
| 5.750%, 04/25/2018 f | | | 2,678,000 | | | | 2,812,773 | | | | | |
| 1.781%, 06/01/2020 ∞ f | | | 4,710,000 | | | | 4,713,537 | | | | | |
| UBS Group Funding Jersey Ltd., | | | | | | | | | | | | |
| 2.650%, 02/01/2022 (Acquired 08/19/2016 through 11/07/2016, Cost $14,135,790) * f | | | 14,150,000 | | | | 13,752,314 | | | | | |
| Voya Financial, Inc.: | | | | | | | | | | | | |
| 5.500%, 07/15/2022 | | | 23,802,000 | | | | 26,288,881 | | | | | |
| 3.650%, 06/15/2026 | | | 5,800,000 | | | | 5,671,095 | | | | | |
| WEA Finance LLC / Westfield UK & Europe Finance PLC: | | | | | | | | | | | | |
| 2.700%, 09/17/2019 (Acquired 04/06/2016 through 07/01/2016, Cost $6,047,755) * | | | 5,985,000 | | | | 6,053,510 | | | | | |
| 3.250%, 10/05/2020 (Acquired 09/28/2015, Cost $7,972,560) * | | | 8,000,000 | | | | 8,136,016 | | | | | |
| Wells Fargo & Co.: | | | | | | | | | | | | |
| Class N, 2.150%, 01/30/2020 | | | 2,750,000 | | | | 2,737,006 | | | | | |
| 2.500%, 03/04/2021 | | | 5,000,000 | | | | 4,962,950 | | | | | |
| 2.117%, 10/31/2023 ∞ | | | 5,000,000 | | | | 5,061,715 | | | | | |
| 3.000%, 02/19/2025 | | | 5,000,000 | | | | 4,803,195 | | | | | |
| 3.000%, 04/22/2026 | | | 8,000,000 | | | | 7,633,856 | | | | | |
| 3.900%, 05/01/2045 | | | 15,000,000 | | | | 14,227,605 | | | | | |
| Wells Fargo Bank NA, | | | | | | | | | | | | |
| 6.000%, 11/15/2017 | | | 3,789,000 | | | | 3,932,194 | | | | | |
| Westpac Banking Corp.: | | | | | | | | | | | | |
| 1.600%, 01/12/2018 f | | | 7,229,000 | | | | 7,223,354 | | | | | |
| 4.322%, 11/23/2031 ∞ f | | | 8,350,000 | | | | 8,376,595 | | | | | |
| Willis North America, Inc., | | | | | | | | | | | | |
| 7.000%, 09/29/2019 | | | 5,463,000 | | | | 6,078,079 | | | | | |
| Willis Towers Watson PLC, | | | | | | | | | | | | |
| 5.750%, 03/15/2021 f | | | 13,879,000 | | | | 15,165,958 | | | | | |
| | | | | | | | 2,269,586,325 | | | | 21.4 | % |
| Total Corporate Bonds | | | | | | | 4,453,079,392 | | | | 42.1 | % |
| Taxable Municipal Bonds | | | | | | | | | |
| Atlanta Independent School System, | | | | | | | | | |
| 5.557%, 03/01/2026 | | | 4,465,000 | | | | 5,031,921 | | | | |
| California Housing Finance Agency, | | | | | | | | | | | |
| 2.794%, 08/01/2036 (Callable 08/01/2025) | | | 15,000,000 | | | | 14,727,750 | | | | |
| California Qualified School Bond Joint Powers Authority, | | | | | | | | | | | |
| 7.155%, 03/01/2027 | | | 6,695,000 | | | | 7,747,052 | | | | |
| California School Finance Authority, | | | | | | | | | | | |
| 5.041%, 07/01/2020 | | | 2,230,000 | | | | 2,391,541 | | | | |
| City of Berwyn IL, | | | | | | | | | | | |
| 5.790%, 12/01/2022 | | | 10,000,000 | | | | 10,740,500 | | | | |
| City of Vernon CA Electric System Revenue, | | | | | | | | | | | |
| 4.500%, 08/01/2022 | | | 7,265,000 | | | | 7,590,617 | | | | |
| County of Contra Costa CA, | | | | | | | | | | | |
| 5.140%, 06/01/2017 | | | 5,335,000 | | | | 5,398,967 | | | | |
| County of Cuyahoga OH, | | | | | | | | | | | |
| 9.125%, 10/01/2023 | | | 895,000 | | | | 878,917 | | | | |
| Eaton Community City School District, | | | | | | | | | | | |
| 5.390%, 08/25/2027 (Callable 06/01/2020) | | | 2,305,000 | | | | 2,391,207 | | | | |
| Elgin Local School District, | | | | | | | | | | | |
| 5.499%, 08/31/2027 (Callable 12/01/2019) | | | 4,440,000 | | | | 4,630,787 | | | | |
| Iowa Tobacco Settlement Authority, | | | | | | | | | | | |
| 6.500%, 06/01/2023 (Callable 01/30/2017) | | | 4,005,000 | | | | 3,934,993 | | | | |
| Kentucky Housing Corp., | | | | | | | | | | | |
| 3.500%, 01/01/2040 (Callable 07/01/2025) | | | 6,500,000 | | | | 6,581,770 | | | | |
| Louisiana Housing Corp., | | | | | | | | | | | |
| 2.100%, 12/01/2038 (Callable 09/01/2024) | | | 6,652,208 | | | | 6,286,935 | | | | |
| Maryland Community Development Administration Housing Revenue, | | | | | | | | | | | |
| 3.160%, 09/01/2041 (Callable 09/01/2025) | | | 21,100,000 | | | | 20,982,895 | | | | |
| New Hampshire Housing Finance Authority: | | | | | | | | | | | |
| 3.050%, 01/01/2021 | | | 865,000 | | | | 869,368 | | | | |
| 3.750%, 07/01/2034 (Callable 07/01/2023) | | | 1,840,000 | | | | 1,869,146 | | | | |
| 4.000%, 07/01/2036 (Callable 07/01/2025) | | | 9,310,000 | | | | 9,594,141 | | | | |
| New Jersey Economic Development Authority: | | | | | | | | | | | |
| 3.375%, 06/15/2017 | | | 9,000,000 | | | | 9,090,450 | | | | |
| 2.421%, 06/15/2018 | | | 7,000,000 | | | | 6,995,240 | | | | |
| North Carolina Housing Finance Agency, | | | | | | | | | | | |
| 2.812%, 07/01/2035 (Callable 01/01/2024) | | | 3,545,000 | | | | 3,501,538 | | | | |
| North Texas Tollway Authority, | | | | | | | | | | | |
| 8.910%, 02/01/2030 (Callable 02/01/2020) | | | 9,735,000 | | | | 11,386,835 | | | | |
| San Dieguito Public Facilities Authority, | | | | | | | | | | | |
| 6.459%, 05/01/2027 | | | 5,675,000 | | | | 6,928,608 | | | | |
| State of California, | | | | | | | | | | | |
| 7.950%, 03/01/2036 (Callable 03/01/2020) | | | 10,125,000 | | | | 11,799,067 | | | | |
| State Public School Building Authority, | | | | | | | | | | | |
| 5.000%, 09/15/2027 | | | 4,458,000 | | | | 4,530,175 | | | | |
| Three Rivers Local School District, | | | | | | | | | | | |
| 5.209%, 09/15/2027 (Callable 12/01/2020) | | | 2,365,000 | | | | 2,449,951 | | | | |
| West Contra Costa Unified School District, | | | | | | | | | | | |
| 6.250%, 08/01/2030 | | | 1,785,000 | | | | 2,161,474 | | | | |
| Westlake City School District, | | | | | | | | | | | |
| 5.227%, 12/01/2026 (Callable 12/01/2020) | | | 3,570,000 | | | | 3,645,184 | | | | |
| | | | | | | | 174,137,029 | | | | 1.6 | % |
| Residential Mortgage-Backed Securities | | | | | | | | | | | | |
| U.S. Government Agency Issues | | | | | | | | | | | | |
| Fannie Mae REMIC Trust: | | | | | | | | | | | | |
| Series 1989-37, Class G, 8.000%, 07/25/2019 | | | 36,022 | | | | 37,920 | | | | | |
| Series 1989-94, Class G, 7.500%, 12/25/2019 | | | 16,008 | | | | 16,828 | | | | | |
| Series 1990-58, Class J, 7.000%, 05/25/2020 | | | 1,570 | | | | 1,682 | | | | | |
| Series 1990-76, Class G, 7.000%, 07/25/2020 | | | 15,533 | | | | 16,345 | | | | | |
| Series 1990-105, Class J, 6.500%, 09/25/2020 | | | 10,367 | | | | 10,864 | | | | | |
| Series 1990-108, Class G, 7.000%, 09/25/2020 | | | 2,950 | | | | 3,128 | | | | | |
| Series 1991-1, Class G, 7.000%, 01/25/2021 | | | 3,683 | | | | 3,894 | | | | | |
| Series 1991-86, Class Z, 6.500%, 07/25/2021 | | | 9,549 | | | | 10,096 | | | | | |
| Series 1993-58, Class H, 5.500%, 04/25/2023 | | | 107,049 | | | | 114,154 | | | | | |
| Series 1998-66, Class C, 6.000%, 12/25/2028 | | | 72,115 | | | | 78,783 | | | | | |
| Series 2004-W6, Class 1A6, 5.500%, 07/25/2034 | | | 29,051 | | | | 29,017 | | | | | |
| Federal Gold Loan Mortgage Corp. (FGLMC): | | | | | | | | | | | | |
| 6.000%, 06/01/2020 | | | 53,691 | | | | 55,929 | | | | | |
| 3.500%, 11/01/2025 | | | 4,391,989 | | | | 4,585,212 | | | | | |
| 2.500%, 04/01/2028 | | | 4,055,738 | | | | 4,066,674 | | | | | |
| 6.500%, 06/01/2029 | | | 195,669 | | | | 221,004 | | | | | |
| 3.000%, 04/01/2031 | | | 10,976,407 | | | | 11,281,432 | | | | | |
| 3.500%, 05/01/2032 | | | 11,869,033 | | | | 12,309,400 | | | | | |
| 3.500%, 07/01/2032 | | | 35,963,003 | | | | 37,295,470 | | | | | |
| 5.000%, 08/01/2033 | | | 7,771,793 | | | | 8,572,338 | | | | | |
| 5.000%, 09/01/2035 | | | 16,186,928 | | | | 17,723,173 | | | | | |
| 5.500%, 01/01/2036 | | | 308,508 | | | | 345,217 | | | | | |
| 5.000%, 03/01/2036 | | | 7,193,849 | | | | 7,857,828 | | | | | |
| 6.000%, 12/01/2036 | | | 253,664 | | | | 289,250 | | | | | |
| 5.500%, 05/01/2038 | | | 929,029 | | | | 1,032,786 | | | | | |
| 5.500%, 01/01/2039 | | | 17,468,168 | | | | 19,674,150 | | | | | |
| 4.500%, 11/01/2039 | | | 5,987,674 | | | | 6,442,097 | | | | | |
| 4.500%, 11/01/2039 | | | 7,278,348 | | | | 7,834,093 | | | | | |
| 5.000%, 03/01/2040 | | | 1,584,303 | | | | 1,726,451 | | | | | |
| 4.500%, 08/01/2040 | | | 1,300,340 | | | | 1,400,054 | | | | | |
| 4.500%, 09/01/2040 | | | 5,091,817 | | | | 5,482,506 | | | | | |
| 4.000%, 01/01/2041 | | | 22,386,760 | | | | 23,630,907 | | | | | |
| 4.500%, 03/01/2041 | | | 3,551,282 | | | | 3,818,613 | | | | | |
| 3.500%, 10/01/2041 | | | 13,373,671 | | | | 13,775,311 | | | | | |
| 4.000%, 03/01/2042 | | | 10,329,747 | | | | 10,907,067 | | | | | |
| 3.500%, 06/01/2042 | | | 6,805,085 | | | | 7,008,961 | | | | | |
| 3.500%, 07/01/2042 | | | 17,995,856 | | | | 18,533,669 | | | | | |
| 3.000%, 08/01/2042 | | | 22,767,732 | | | | 22,758,455 | | | | | |
| 3.000%, 10/01/2042 | | | 8,633,525 | | | | 8,630,007 | | | | | |
| 3.000%, 11/01/2042 | | | 49,944,539 | | | | 49,924,190 | | | | | |
| 3.000%, 01/01/2043 | | | 39,486,097 | | | | 39,470,017 | | | | | |
| 3.000%, 01/01/2043 | | | 18,180,520 | | | | 18,112,279 | | | | | |
| 3.000%, 02/01/2043 | | | 4,737,903 | | | | 4,735,972 | | | | | |
| 3.000%, 04/01/2043 | | | 7,838,715 | | | | 7,835,521 | | | | | |
| 3.000%, 04/01/2043 | | | 13,632,121 | | | | 13,626,566 | | | | | |
| 3.000%, 04/01/2043 | | | 11,933,799 | | | | 11,928,936 | | | | | |
| 3.500%, 05/01/2043 | | | 18,382,218 | | | | 18,835,231 | | | | | |
| 3.000%, 06/01/2043 | | | 24,503,956 | | | | 24,463,626 | | | | | |
| 3.000%, 08/01/2043 | | | 7,597,544 | | | | 7,578,755 | | | | | |
| 3.500%, 11/01/2043 | | | 13,788,744 | | | | 14,203,511 | | | | | |
| 3.500%, 01/01/2044 | | | 15,556,402 | | | | 16,018,314 | | | | | |
| 4.000%, 03/01/2044 | | | 9,512,154 | | | | 9,992,125 | | | | | |
| 3.500%, 05/01/2044 | | | 57,164,823 | | | | 58,852,299 | | | | | |
| 4.000%, 07/01/2044 | | | 8,188,985 | | | | 8,602,830 | | | | | |
| 3.500%, 10/01/2044 | | | 15,244,009 | | | | 15,628,401 | | | | | |
| 4.000%, 10/01/2044 | | | 17,605,273 | | | | 18,594,189 | | | | | |
| 3.500%, 06/01/2045 | | | 3,586,671 | | | | 3,688,183 | | | | | |
| 3.000%, 10/01/2045 | | | 55,006,641 | | | | 54,961,493 | | | | | |
| 3.500%, 01/01/2046 | | | 49,644,652 | | | | 50,987,430 | | | | | |
| 4.000%, 04/01/2046 | | | 17,533,728 | | | | 18,523,987 | | | | | |
| Federal Home Loan Mortgage Corp. (FHLMC): | | | | | | | | | | | | |
| Series 206, Class E, 0.321%, 07/15/2019 <<<< | | | 1,455 | | | | 1,443 | | | | | |
| Series 141, Class D, 5.000%, 05/15/2021 | | | 8,599 | | | | 8,819 | | | | | |
| Series 1074, Class I, 6.750%, 05/15/2021 | | | 6,748 | | | | 7,048 | | | | | |
| Series 1081, Class K, 7.000%, 05/15/2021 | | | 52,409 | | | | 56,218 | | | | | |
| Series 163, Class F, 6.000%, 07/15/2021 ∞ | | | 8,324 | | | | 8,798 | | | | | |
| Series 188, Class H, 7.000%, 09/15/2021 | | | 21,178 | | | | 22,349 | | | | | |
| Series 1286, Class A, 6.000%, 05/15/2022 | | | 6,503 | | | | 6,852 | | | | | |
| Federal National Mortgage Association (FNMA): | | | | | | | | | | | | |
| 4.500%, 01/01/2020 | | | 14,957,671 | | | | 15,372,665 | | | | | |
| 5.000%, 11/01/2021 | | | 956,911 | | | | 985,268 | | | | | |
| 3.000%, 04/01/2027 | | | 11,340,518 | | | | 11,662,852 | | | | | |
| 3.500%, 07/01/2027 | | | 58,793,007 | | | | 61,418,015 | | | | | |
| 2.500%, 12/01/2027 | | | 14,400,244 | | | | 14,444,359 | | | | | |
| 2.500%, 05/01/2028 | | | 18,705,742 | | | | 18,763,253 | | | | | |
| 5.000%, 05/01/2028 | | | 292,370 | | | | 318,321 | | | | | |
| 4.500%, 08/01/2029 | | | 2,244,744 | | | | 2,414,331 | | | | | |
| 4.500%, 09/01/2029 | | | 2,637,460 | | | | 2,836,716 | | | | | |
| 2.500%, 05/01/2030 | | | 20,927,585 | | | | 20,988,234 | | | | | |
| 3.000%, 12/01/2030 | | | 19,907,176 | | | | 20,462,043 | | | | | |
| 3.000%, 12/01/2030 | | | 32,267,640 | | | | 33,167,770 | | | | | |
| 3.500%, 01/01/2032 | | | 17,532,413 | | | | 18,095,207 | | | | | |
| 6.000%, 03/01/2033 | | | 67,165 | | | | 77,168 | | | | | |
| 3.500%, 10/01/2033 | | | 33,314,296 | | | | 34,660,531 | | | | | |
| 4.500%, 10/01/2033 | | | 26,368,739 | | | | 28,455,486 | | | | | |
| 5.000%, 10/01/2033 | | | 28,731,066 | | | | 31,466,508 | | | | | |
| 5.000%, 11/01/2033 | | | 77,806 | | | | 85,225 | | | | | |
| 4.000%, 01/01/2034 | | | 11,054,196 | | | | 11,734,689 | | | | | |
| 5.500%, 04/01/2034 | | | 9,540,660 | | | | 10,696,679 | | | | | |
| 4.000%, 06/01/2034 | | | 14,555,998 | | | | 15,449,183 | | | | | |
| 4.000%, 09/01/2034 | | | 17,457,263 | | | | 18,529,858 | | | | | |
| 5.500%, 09/01/2034 | | | 254,687 | | | | 285,650 | | | | | |
| 6.000%, 11/01/2034 | | | 67,976 | | | | 77,788 | | | | | |
| 5.500%, 02/01/2035 | | | 877,751 | | | | 984,294 | | | | | |
| 5.000%, 07/01/2035 | | | 7,353,160 | | | | 8,068,455 | | | | | |
| 5.000%, 10/01/2035 | | | 3,814,072 | | | | 4,164,291 | | | | | |
| 5.000%, 02/01/2036 | | | 5,364,437 | | | | 5,858,426 | | | | | |
| 5.500%, 11/01/2036 | | | 366,077 | | | | 409,376 | | | | | |
| 5.500%, 04/01/2037 | | | 2,130,318 | | | | 2,388,821 | | | | | |
| 4.000%, 04/01/2039 | | | 18,969,978 | | | | 20,136,829 | | | | | |
| 5.000%, 06/01/2039 | | | 17,282,004 | | | | 18,907,667 | | | | | |
| 4.500%, 11/01/2039 | | | 344,488 | | | | 370,965 | | | | | |
| 4.000%, 08/01/2040 | | | 2,406,504 | | | | 2,537,357 | | | | | |
| 3.500%, 12/01/2040 | | | 13,732,054 | | | | 14,160,664 | | | | | |
| 4.000%, 12/01/2040 | | | 13,421,849 | | | | 14,162,956 | | | | | |
| 3.500%, 02/01/2041 | | | 21,255,761 | | | | 21,919,025 | | | | | |
| 4.000%, 02/01/2041 | | | 19,098,815 | | | | 20,169,239 | | | | | |
| 3.500%, 03/01/2041 | | | 31,054,138 | | | | 32,022,962 | | | | | |
| 4.500%, 05/01/2041 | | | 12,676,498 | | | | 13,674,754 | | | | | |
| 4.000%, 06/01/2041 | | | 26,907,521 | | | | 28,393,117 | | | | | |
| 4.500%, 07/01/2041 | | | 13,820,483 | | | | 14,864,601 | | | | | |
| 5.000%, 07/01/2041 | | | 19,719,679 | | | | 21,645,472 | | | | | |
| 4.000%, 09/01/2041 | | | 3,813,767 | | | | 4,009,959 | | | | | |
| 4.000%, 10/01/2041 | | | 9,491,926 | | | | 9,999,269 | | | | | |
| 3.500%, 11/01/2041 | | | 12,917,583 | | | | 13,320,420 | | | | | |
| 3.500%, 12/01/2041 | | | 28,895,227 | | | | 29,795,823 | | | | | |
| 4.000%, 12/01/2041 | | | 13,429,708 | | | | 14,150,452 | | | | | |
| 4.000%, 01/01/2042 | | | 17,870,914 | | | | 18,823,430 | | | | | |
| 4.500%, 01/01/2042 | | | 18,444,855 | | | | 19,892,486 | | | | | |
| 3.000%, 05/01/2042 | | | 6,922,120 | | | | 6,920,149 | | | | | |
| 3.500%, 08/01/2042 | | | 12,190,556 | | | | 12,570,343 | | | | | |
| 4.000%, 08/01/2042 | | | 25,134,670 | | | | 26,548,127 | | | | | |
| 3.000%, 03/01/2043 | | | 8,721,690 | | | | 8,719,208 | | | | | |
| 3.000%, 03/01/2043 | | | 48,093,973 | | | | 48,080,278 | | | | | |
| 3.000%, 05/01/2043 | | | 27,884,764 | | | | 27,876,806 | | | | | |
| 3.000%, 06/01/2043 | | | 11,782,157 | | | | 11,778,797 | | | | | |
| 4.000%, 07/01/2043 | | | 45,411,396 | | | | 47,964,233 | | | | | |
| 3.000%, 08/01/2043 | | | 7,217,303 | | | | 7,215,248 | | | | | |
| 4.500%, 09/01/2043 | | | 20,211,751 | | | | 21,780,506 | | | | | |
| 3.500%, 10/01/2043 | | | 87,920,123 | | | | 90,596,654 | | | | | |
| 4.000%, 01/01/2045 | | | 14,728,333 | | | | 15,534,966 | | | | | |
| 3.500%, 02/01/2045 | | | 61,033,879 | | | | 62,933,763 | | | | | |
| 3.500%, 04/01/2045 | | | 45,351,636 | | | | 46,625,955 | | | | | |
| 4.000%, 10/01/2045 | | | 11,486,847 | | | | 12,117,823 | | | | | |
| 3.000%, 05/01/2046 ∞ | | | 20,261,069 | | | | 20,161,090 | | | | | |
| Government National Mortgage Association (GNMA): | | | | | | | | | | | | |
| 6.000%, 11/20/2033 | | | 62,494 | | | | 72,555 | | | | | |
| 5.000%, 07/20/2040 | | | 3,133,711 | | | | 3,450,147 | | | | | |
| 3.500%, 10/20/2041 | | | 13,396,886 | | | | 13,965,821 | | | | | |
| 4.000%, 06/20/2042 | | | 15,321,172 | | | | 16,352,405 | | | | | |
| 3.500%, 09/20/2042 | | | 5,593,327 | | | | 5,841,225 | | | | | |
| 3.500%, 01/20/2043 | | | 34,807,035 | | | | 36,349,737 | | | | | |
| 3.000%, 04/20/2045 | | | 44,450,795 | | | | 45,071,705 | | | | | |
| 3.500%, 04/20/2045 | | | 42,762,916 | | | | 44,498,016 | | | | | |
| 4.000%, 08/20/2045 | | | 21,234,773 | | | | 22,581,573 | | | | | |
| 4.500%, 01/20/2046 | | | 26,082,955 | | | | 27,865,455 | | | | | |
| 3.000%, 06/20/2046 | | | 28,395,390 | | | | 28,792,030 | | | | | |
| | | | | | | | 2,163,799,671 | | | | 20.5 | % |
| Non-U.S. Government Agency Issues | | | | | | | | | | | | |
| Accredited Mortgage Loan Trust: | | | | | | | | | | | | |
| Series 2005-4, Class A1, 0.996%, 12/25/2035 ∞ | | | 9,691,652 | | | | 9,566,909 | | | | | |
| Series 2006-1, Class A3, 0.936%, 04/25/2036 ∞ | | | 2,659,505 | | | | 2,655,424 | | | | | |
| Series 2006-2, Class A3, 0.906%, 09/25/2036 ∞ | | | 6,787,016 | | | | 6,759,021 | | | | | |
| ACE Securities Corp. Home Equity Loan Trust, | | | | | | | | | | | | |
| Series 2006-HE1, Class A1B1, 0.946%, 02/25/2036 ∞ | | | 4,343,950 | | | | 4,302,185 | | | | | |
| Alternative Loan Trust: | | | | | | | | | | | | |
| Series 2005-50CB, Class 4A1, 5.000%, 11/25/2020 § | | | 169,931 | | | | 169,762 | | | | | |
| Series 2006-7CB, Class 3A1, 5.250%, 05/25/2021 § | | | 866,522 | | | | 838,735 | | | | | |
| Series 2006-J5, Class 3A1, 4.574%, 07/25/2021 ∞ | | | 165,439 | | | | 156,206 | | | | | |
| Series 2006-43CB, Class 2A1, 6.000%, 02/25/2022 § | | | 204,005 | | | | 205,599 | | | | | |
| Series 2002-11, Class A4, 6.250%, 10/25/2032 | | | 26,923 | | | | 27,384 | | | | | |
| Series 2003-20CB, Class 1A1, 5.500%, 10/25/2033 | | | 3,777,787 | | | | 3,802,130 | | | | | |
| Series 2004-8CB, Class A, 1.026%, 06/25/2034 ∞ | | | 21,629,583 | | | | 21,366,840 | | | | | |
| Series 2006-28CB, Class A17, 6.000%, 10/25/2036 | | | 806,997 | | | | 644,892 | | | | | |
| Argent Securities Inc. Asset-Backed Pass-Through Certificates: | | | | | | | | | | | | |
| Series 2005-W3, Class A2D, 1.096%, 11/25/2035 ∞ | | | 5,609,455 | | | | 5,481,078 | | | | | |
| Series 2005-W5, Class A1, 0.991%, 01/25/2036 ∞ | | | 43,002,204 | | | | 41,023,711 | | | | | |
| Asset Backed Securities Corp. Home Equity Loan Trust: | | | | | | | | | | | | |
| Series 2006-HE1, Class A3, 0.956%, 01/25/2036 ∞ | | | 12,293,189 | | | | 12,051,553 | | | | | |
| Series 2006-HE3, Class A2, 0.921%, 03/25/2036 ∞ | | | 16,744,226 | | | | 16,117,448 | | | | | |
| Series 2006-HE6, Class A1, 0.901%, 11/25/2036 ∞ | | | 33,885,474 | | | | 31,763,766 | | | | | |
| Banc of America Alternative Loan Trust: | | | | | | | | | | | | |
| Series 2003-11, Class 4A1, 4.750%, 01/25/2019 | | | 58,570 | | | | 58,738 | | | | | |
| Series 2004-11, Class 4A1, 5.500%, 12/25/2019 | | | 61,314 | | | | 62,066 | | | | | |
| Series 2005-2, Class 4A1, 5.500%, 03/25/2020 | | | 92,582 | | | | 93,581 | | | | | |
| Series 2005-4, Class 3A1, 5.500%, 05/25/2020 | | | 450,524 | | | | 446,779 | | | | | |
| Series 2007-1, Class 1A1, 5.779%, 04/25/2022 ∞ § | | | 560,328 | | | | 537,819 | | | | | |
| Series 2004-7, Class 1A1, 6.000%, 08/25/2034 | | | 23,063,074 | | | | 24,229,570 | | | | | |
| Series 2005-2, Class 1CB2, 5.500%, 03/25/2035 § | | | 95,092 | | | | 86,517 | | | | | |
| Series 2005-9, Class 1CB3, 5.500%, 10/25/2035 § | | | 236,195 | | | | 230,209 | | | | | |
| Series 2006-5, Class CB7, 6.000%, 06/25/2046 § | | | 518,477 | | | | 451,137 | | | | | |
| Bank of America Alternative Loan Trust: | | | | | | | | | | | | |
| Series 2004-7, Class 4A1, 5.000%, 08/25/2019 | | | 1,068,082 | | | | 1,079,911 | | | | | |
| Series 2005-10, Class 5A1, 5.250%, 11/25/2020 | | | 220,697 | | | | 222,391 | | | | | |
| Series 2003-11, Class 2A1, 6.000%, 01/25/2034 | | | 366,054 | | | | 375,341 | | | | | |
| Series 2005-11, Class 1CB4, 5.500%, 12/25/2035 § | | | 143,538 | | | | 131,376 | | | | | |
| Bayview Financial Acquisition Trust, | | | | | | | | | | | | |
| Series 2007-A, Class 1A2, 6.205%, 05/28/2037 | | | 81,701 | | | | 84,608 | | | | | |
| Bayview Financial Mortgage Pass-Through Trust, | | | | | | | | | | | | |
| Series 2007-B, Class 1A2, 6.831%, 08/28/2047 ∞ | | | 2,018,466 | | | | 1,713,521 | | | | | |
| Bear Stearns ALT-A Trust: | | | | | | | | | | | | |
| Series 2004-4, Class A1, 1.356%, 06/25/2034 ∞ | | | 3,014,480 | | | | 2,961,916 | | | | | |
| Series 2005-4, Class 1A1, 1.196%, 04/25/2035 ∞ | | | 7,792,315 | | | | 7,455,966 | | | | | |
| Series 2005-7, Class 12A1, 1.296%, 08/25/2035 ∞ | | | 23,265,835 | | | | 22,958,545 | | | | | |
| Bear Stearns Asset Backed Securities I Trust, | | | | | | | | | | | | |
| Series 2004-AC2, Class 2A, 5.000%, 05/25/2034 | | | 587,479 | | | | 583,253 | | | | | |
| Chase Mortgage Finance Trust, | | | | | | | | | | | | |
| Series 2006-A1, Class 2A3, 3.085%, 09/25/2036 ∞ | | | 1,992,601 | | | | 1,788,262 | | | | | |
| Citigroup Global Markets Mortgage Securities VII, Inc., | | | | | | | | | | | | |
| Series 2003-UP2, Class A2, 7.000%, 06/25/2033 ∞ | | | 237,363 | | | | 240,406 | | | | | |
| Citigroup Mortgage Loan Trust, Inc.: | | | | | | | | | | | | |
| Series 2005-HE4, Class A2D, 1.116%, 10/25/2035 ∞ | | | 3,036,238 | | | | 3,012,231 | | | | | |
| Series 2005-9, Class 2A2, 5.500%, 11/25/2035 | | | 142,984 | | | | 143,610 | | | | | |
| Countrywide Asset-Backed Certificates: | | | | | | | | | | | | |
| Series 2004-S1, Class A3, 5.115%, 02/25/2035 ∞ | | | 563,299 | | | | 571,007 | | | | | |
| Series 2005-10, Class AF6, 4.541%, 02/25/2036 ∞ | | | 482,987 | | | | 494,728 | | | | | |
| Series 2005-13, Class AF3, 4.787%, 04/25/2036 ∞ | | | 1,715,340 | | | | 1,496,752 | | | | | |
Series 2006-10, Class 1AF3, 4.661%, 09/25/2046 ∞ § | | | 978,522 | | | | 837,011 | | | | | |
| Credit Suisse First Boston Mortgage Securities Corp., | | | | | | | | | | | | |
| Series 2003-AR26, Class 8A1, 3.053%, 11/25/2033 ∞ | | | 11,359,116 | | | | 11,399,841 | | | | | |
| Credit-Based Asset Servicing & Securitization LLC, | | | | | | | | | | | | |
| Series 2005-CB8, Class AF2, 3.986%, 12/25/2035 ∞ | | | 174,744 | | | | 173,132 | | | | | |
| CWABS Asset-Backed Certificates Trust: | | | | | | | | | | | | |
| Series 2004-15, Class AF6, 4.613%, 04/25/2035 ∞ | | | 304,941 | | | | 306,704 | | | | | |
| Series 2005-1, Class AF6, 5.030%, 07/25/2035 ∞ | | | 730,636 | | | | 746,043 | | | | | |
| Series 2005-11, Class AF3, 4.724%, 02/25/2036 ∞ | | | 2,592,770 | | | | 2,629,940 | | | | | |
| Series 2005-16, Class 3AV, 0.814%, 05/25/2036 ∞ | | | 11,313,867 | | | | 11,184,502 | | | | | |
| Series 2005-17, Class 1AF5, 4.633%, 05/25/2036 ∞ | | | 409,111 | | | | 634,100 | | | | | |
| CWHEQ Home Equity Loan Trust, | | | | | | | | | | | | |
| Series 2007-S1, Class A6, 5.693%, 11/25/2036 ∞ | | | 183,452 | | | | 181,262 | | | | | |
| Deutsche Mortgage Securities, Inc. Mortgage Loan Trust, | | | | | | | | | | | | |
| Series 2004-4, Class 1A6, 6.150%, 04/25/2034 ∞ | | | 12,516 | | | | 12,742 | | | | | |
| First Franklin Mortgage Loan Trust: | | | | | | | | | | | | |
| Series 2006-FFH1, Class A4, 1.056%, 01/25/2036 ∞ | | | 3,094,202 | | | | 3,024,158 | | | | | |
| Series 2006-FF1, Class 2A4, 1.096%, 01/25/2036 ∞ | | | 9,600,000 | | | | 9,365,476 | | | | | |
| Series 2005-FF12, Class A2C, 1.086%, 11/25/2036 ∞ | | | 6,946,500 | | | | 6,800,335 | | | | | |
| First Horizon Alternative Mortgage Securities Trust: | | | | | | | | | | | | |
| Series 2005-FA7, Class 2A1, 5.000%, 09/25/2020 | | | 91,554 | | | | 92,014 | | | | | |
| Series 2006-FA6, Class 3A1, 5.750%, 11/25/2021 | | | 180,406 | | | | 178,902 | | | | | |
| Series 2006-FA8, Class 2A1, 5.750%, 02/25/2037 | | | 627,648 | | | | 553,778 | | | | | |
| GE Capital Mortgage Services, Inc. Trust, | | | | | | | | | | | | |
| Series 1999-HE1, Class A7, 6.265%, 04/25/2029 | | | 818 | | | | 820 | | | | | |
| GE Mortgage Services LLC, | | | | | | | | | | | | |
| Series 1997-HE4, Class A7, 6.735%, 12/25/2028 | | | 49 | | | | 42 | | | | | |
| GMACM Mortgage Loan Trust, | | | | | | | | | | | | |
| Series 2004-GH1, Class A6, 4.810%, 07/25/2035 ∞ | | | 3,224 | | | | 3,213 | | | | | |
| GSAA Home Equity Trust, | | | | | | | | | | | | |
| Series 2004-6, Class A1, 1.556%, 06/25/2034 ∞ | | | 2,827,389 | | | | 2,732,054 | | | | | |
| GSAMP Trust: | | | | | | | | | | | | |
| Series 2005-WMC2, Class A1B, 1.066%, 11/25/2035 ∞ | | | 11,716,752 | | | | 11,452,220 | | | | | |
| Series 2005-WMC2, Class A2C, 1.106%, 11/25/2035 ∞ | | | 11,612,078 | | | | 11,300,113 | | | | | |
| IMC Home Equity Loan Trust, | | | | | | | | | | | | |
| Series 1997-5, Class A10, 6.880%, 11/20/2028 | | | 1,757 | | | | 1,752 | | | | | |
| Impac CMB Trust: | | | | | | | | | | | | |
| Series 2004-4, Class 2A2, 4.785%, 09/25/2034 ∞ | | | 103,306 | | | | 99,637 | | | | | |
| Series 2004-5, Class 1A2, 1.456%, 10/25/2034 ∞ | | | 6,920,592 | | | | 6,635,056 | | | | | |
| Series 2004-6, Class 1A1, 1.556%, 10/25/2034 ∞ | | | 4,907,905 | | | | 4,639,440 | | | | | |
| J.P. Morgan Alternative Loan Trust, | | | | | | | | | | | | |
| Series 2006-A1, Class 2A1, 2.972%, 03/25/2036 ∞ | | | 407,357 | | | | 341,125 | | | | | |
| J.P. Morgan Mortgage Acquisition Trust, | | | | | | | | | | | | |
| Series 2006-CH1, Class A1, 0.886%, 07/25/2036 ∞ | | | 5,965,615 | | | | 5,784,777 | | | | | |
| J.P. Morgan Mortgage Trust: | | | | | | | | | | | | |
| Series 2005-A4, Class 1A1, 3.086%, 07/25/2035 ∞ | | | 2,071,278 | | | | 2,058,329 | | | | | |
| Series 2007-A1, Class 5A2, 3.178%, 07/25/2035 ∞ | | | 5,162,898 | | | | 5,226,605 | | | | | |
| Series 2007-A1, Class 5A5, 3.178%, 07/25/2035 ∞ | | | 7,817,463 | | | | 7,820,511 | | | | | |
| Series 2006-A7, Class 2A4R, 3.186%, 01/25/2037 ∞ | | | 1,001,080 | | | | 933,804 | | | | | |
| Series 2006-A7, Class 2A2, 3.186%, 01/25/2037 ∞ | | | 234,311 | | | | 209,804 | | | | | |
| Series 2007-A2, Class 2A3, 3.100%, 04/25/2037 ∞ | | | 2,778,167 | | | | 2,453,952 | | | | | |
| Long Beach Mortgage Loan Trust, | | | | | | | | | | | | |
| Series 2006-WL2, Class 2A3, 0.956%, 01/25/2036 ∞ | | | 3,317,057 | | | | 3,279,144 | | | | | |
| MASTR Alternative Loan Trust: | | | | | | | | | | | | |
| Series 2004-2, Class 6A1, 5.250%, 12/25/2018 | | | 1,093,017 | | | | 1,111,887 | | | | | |
| Series 2004-1, Class 1A1, 5.000%, 01/25/2019 | | | 169,062 | | | | 169,596 | | | | | |
| Series 2004-2, Class 4A1, 5.000%, 02/25/2019 | | | 8,993 | | | | 9,056 | | | | | |
| Series 2004-4, Class 4A1, 5.000%, 04/25/2019 | | | 143,928 | | | | 144,880 | | | | | |
| Series 2003-5, Class 6A1, 6.000%, 08/25/2033 | | | 304,543 | | | | 319,162 | | | | | |
| MASTR Asset Backed Securities Trust, | | | | | | | | | | | | |
| Series 2006-NC1, Class A4, 1.056%, 01/25/2036 ∞ | | | 10,916,322 | | | | 10,726,863 | | | | | |
| Merrill Lynch Mortgage Investors Trust: | | | | | | | | | | | | |
| Series 2004-F, Class A1A, 2.346%, 12/25/2029 ∞ | | | 8,810,947 | | | | 8,816,129 | | | | | |
| Series 2005-A10, Class A, 0.966%, 02/25/2036 ∞ | | | 24,564,150 | | | | 22,826,477 | | | | | |
| Morgan Stanley Mortgage Loan Trust, | | | | | | | | | | | | |
| Series 2004-7AR, Class 2A1, 2.992%, 09/25/2034 ∞ | | | 4,806,299 | | | | 4,867,588 | | | | | |
| MortgageIT Trust: | | | | | | | | | | | | |
| Series 2005-2, Class 1A1, 1.276%, 05/25/2035 ∞ | | | 2,880,308 | | | | 2,811,636 | | | | | |
| Series 2005-3, Class A1, 1.056%, 08/25/2035 ∞ | | | 6,298,078 | | | | 5,928,220 | | | | | |
| New Century Home Equity Loan Trust, | | | | | | | | | | | | |
| Series 2005-C, Class A1, 0.986%, 12/25/2035 ∞ | | | 18,949,206 | | | | 18,598,823 | | | | | |
| Park Place Securities, Inc., | | | | | | | | | | | | |
| Series 2005-WCW1, Class M1, 1.206%, 09/25/2035 ∞ | | | 7,374,706 | | | | 7,328,861 | | | | | |
| Popular ABS Mortgage Pass-Through Trust, | | | | | | | | | | | | |
| Series 2006-E, Class A2, 0.906%, 01/25/2037 ∞ | | | 6,965,897 | | | | 6,864,257 | | | | | |
| RAAC Series Trust, | | | | | | | | | | | | |
| Series 2004-SP1, Class AI4, 5.285%, 08/25/2027 ∞ | | | 6,539 | | | | 6,652 | | | | | |
| RALI Series Trust, | | | | | | | | | | | | |
| Series 2004-QS6, Class A1, 5.000%, 05/25/2019 | | | 69,224 | | | | 69,189 | | | | | |
| RAMP Series Trust: | | | | | | | | | | | | |
| Series 2003-RS10, Class AI7, 4.850%, 11/25/2033 ∞ | | | 2,243 | | | | 2,251 | | | | | |
| Series 2005-RS1, Class AI6, 4.713%, 01/25/2035 | | | 43,573 | | | | 44,014 | | | | | |
| RASC Series Trust: | | | | | | | | | | | | |
| Series 2003-KS2, Class AI6, 3.990%, 04/25/2033 ∞ | | | 193,778 | | | | 193,566 | | | | | |
| Series 2003-KS5, Class AI6, 3.620%, 07/25/2033 ∞ | | | 11,969 | | | | 11,712 | | | | | |
| Series 2004-KS2, Class AI6, 4.300%, 03/25/2034 ∞ | | | 21,812 | | | | 22,020 | | | | | |
| Series 2006-KS4, Class A4, 0.996%, 06/25/2036 ∞ | | | 19,223,834 | | | | 18,787,607 | | | | | |
| Renaissance Home Equity Loan Trust, | | | | | | | | | | | | |
| Series 2007-1, Class AF3, 5.612%, 04/25/2037 | | | 2,550,294 | | | | 1,197,952 | | | | | |
| Securitized Asset Backed Receivables LLC Trust, | | | | | | | | | | | | |
| Series 2005-OP2, Class A1, 1.081%, 10/25/2035 (Acquired 03/13/2014, Cost $1,120,543) ∞ * | | | 1,134,368 | | | | 1,130,599 | | | | | |
| Specialty Underwriting & Residential Finance Trust: | | | | | | | | | | | | |
| Series 2004-BC4, Class A1A, 1.426%, 10/25/2035 ∞ | | | 2,710,642 | | | | 2,657,389 | | | | | |
| Series 2005-AB3, Class A2C, 1.116%, 09/25/2036 ∞ | | | 4,559,012 | | | | 4,421,160 | | | | | |
| Series 2006-BC1, Class A2D, 1.056%, 12/25/2036 ∞ | | | 4,315,238 | | | | 4,268,340 | | | | | |
| Structured Adjustable Rate Mortgage Loan Trust: | | | | | | | | | | | | |
| Series 2004-12, Class 3A1, 3.204%, 09/25/2034 ∞ | | | 7,191,564 | | | | 7,138,080 | | | | | |
| Series 2004-16, Class 2A, 3.215%, 11/25/2034 ∞ | | | 8,353,653 | | | | 8,331,737 | | | | | |
| Series 2004-16, Class 1A2, 3.241%, 11/25/2034 ∞ | | | 10,612,205 | | | | 10,585,661 | | | | | |
| Structured Asset Securities Corp., | | | | | | | | | | | | |
| Series 2005-WF1, Class A3, 1.416%, 02/25/2035 ∞ | | | 13,497,779 | | | | 13,246,490 | | | | | |
| Structured Asset Securities Corp. Mortgage Loan Trust: | | | | | | | | | | | | |
| Series 2005-7XS, Class 1A4B, 5.440%, 04/25/2035 ∞ | | | 82,157 | | | | 85,730 | | | | | |
| Series 2006-OPT1, Class A6, 0.906%, 04/25/2036 ∞ | | | 16,704,420 | | | | 15,848,693 | | | | | |
| Thornburg Mortgage Securities Trust, | | | | | | | | | | | | |
| Series 2003-5, Class 3A, 2.831%, 10/25/2043 ∞ | | | 22,602,464 | | | | 22,710,585 | | | | | |
| Towd Point Mortgage Trust: | | | | | | | | | | | | |
| Series 2015-3, Class A1A, 3.500%, 03/25/2054 (Acquired 06/21/2016, Cost $11,150,893) ∞ * | | | 10,855,488 | | | | 11,050,539 | | | | | |
| Series 2015-5, Class A1, 3.500%, 05/25/2055 (Acquired 06/15/2016, Cost $5,590,701) ∞ * | | | 5,433,482 | | | | 5,541,260 | | | | | |
| Series 2016-3, Class A1, 2.250%, 08/25/2055 (Acquired 09/08/2016, Cost $2,942,064) ∞ * | | | 2,930,460 | | | | 2,906,890 | | | | | |
| Series 2016-2, Class A1, 3.000%, 08/25/2055 (Acquired 05/20/2016, Cost $14,774,193) ∞ * | | | 14,665,037 | | | | 14,741,884 | | | | | |
| Series 2016-5, Class A1, 2.500%, 10/25/2056 (Acquired 12/07/2016, Cost $7,546,044) ∞ * | | | 7,550,000 | | | | 7,515,000 | | | | | |
| WaMu Mortgage Pass-Through Certificates Trust: | | | | | | | | | | | | |
| Series 2004-CB1, Class 5A, 5.000%, 06/25/2019 | | | 186,748 | | | | 188,670 | | | | | |
| Series 2004-CB2, Class 7A, 5.500%, 08/25/2019 | | | 341,404 | | | | 345,630 | | | | | |
| Series 2004-CB3, Class 3A, 5.500%, 10/25/2019 | | | 26,500 | | | | 26,869 | | | | | |
| Series 2004-CB3, Class 4A, 6.000%, 10/25/2019 | | | 116,614 | | | | 120,006 | | | | | |
| Series 2004-CB4, Class 21A, 5.500%, 12/25/2019 | | | 81,226 | | | | 82,615 | | | | | |
| Series 2004-CB2, Class 3A, 6.000%, 08/25/2034 | | | 8,698,235 | | | | 9,190,685 | | | | | |
| Series 2004-CB3, Class 2A, 6.500%, 10/25/2034 | | | 5,020,212 | | | | 5,346,318 | | | | | |
| Series 2004-AR14, Class A1, 2.831%, 01/25/2035 ∞ | | | 10,537,775 | | | | 10,531,772 | | | | | |
| Wells Fargo Mortgage Backed Securities Trust, | | | | | | | | | | | | |
| Series 2005-AR10, Class 2A17, 3.010%, 06/25/2035 ∞ | | | 23,362,294 | | | | 24,026,099 | | | | | |
| | | | | | | | 634,432,320 | | | | 6.0 | % |
| Commercial Mortgage-Backed Securities | | | | | | | | | |
| U.S. Government Agency Issues | | | | | | | | | |
| Fannie Mae REMIC Trust, | | | | | | | | | |
| Series 2011-M4, Class A2, 3.726%, 06/25/2021 | | | 20,000,000 | | | | 21,072,120 | | | | |
| Freddie Mac Multifamily Structured Pass Through Certificates: | | | | | | | | | | | |
| Series K003, Class A4, 5.053%, 01/25/2019 | | | 27,000,000 | | | | 28,465,333 | | | | |
| Series K004, Class A2, 4.186%, 08/25/2019 | | | 6,200,000 | | | | 6,556,851 | | | | |
| Series K712, Class A2, 1.869%, 11/25/2019 | | | 18,225,000 | | | | 18,246,770 | | | | |
| Series K714, Class A2, 3.034%, 10/25/2020 ∞ | | | 34,345,000 | | | | 35,568,630 | | | | |
| Series K720, Class A2, 2.716%, 06/25/2022 | | | 17,950,000 | | | | 18,254,952 | | | | |
| | | | | | | | 128,164,656 | | | | 1.2 | % |
| Non-U.S. Government Agency Issues | | | | | | | | | | | | |
| CD Mortgage Trust, | | | | | | | | | | | | |
| Series 2016-CD1, Class A4, 2.724%, 08/10/2049 | | | 32,725,000 | | | | 31,446,719 | | | | | |
| Citigroup Commercial Mortgage Trust, | | | | | | | | | | | | |
| Series 2014-GC19, Class A3, 3.753%, 03/10/2047 | | | 11,025,000 | | | | 11,538,037 | | | | | |
| COMM Mortgage Trust: | | | | | | | | | | | | |
| Series 2012-CR1, Class A3, 3.391%, 05/15/2045 | | | 7,813,462 | | | | 8,149,432 | | | | | |
| Series 2013-CR9, Class A3, 4.022%, 07/10/2045 | | | 25,725,000 | | | | 27,460,938 | | | | | |
| Series 2012-CR2, Class A4, 3.147%, 08/15/2045 | | | 19,660,536 | | | | 20,279,399 | | | | | |
| Series 2013-CR10, Class A3, 3.923%, 08/10/2046 | | | 13,875,000 | | | | 14,738,465 | | | | | |
| DBJPM Mortgage Trust, | | | | | | | | | | | | |
| Series 2016-C3, Class ASB, 2.756%, 09/10/2049 | | | 9,500,000 | | | | 9,384,697 | | | | | |
| GS Mortgage Securities Trust, | | | | | | | | | | | | |
| Series 2012-GCJ9, Class A3, 2.773%, 11/10/2045 | | | 36,997,320 | | | | 37,298,256 | | | | | |
| J.P. Morgan Chase Commercial Mortgage Securities Corp., | | | | | | | | | | | | |
| Series 2012-LC9, Class A5, 2.840%, 12/15/2047 | | | 8,700,059 | | | | 8,806,985 | | | | | |
| J.P. Morgan Chase Commercial Mortgage Securities Trust: | | | | | | | | | | | | |
| Series 2012-C8, Class ASB, 2.379%, 10/15/2045 | | | 9,965,000 | | | | 10,011,399 | | | | | |
| Series 2013-LC11, Class A5, 2.960%, 04/15/2046 | | | 12,802,913 | | | | 12,951,523 | | | | | |
| Series 2013-C10, Class ASB, 2.702%, 12/15/2047 | | | 10,000,000 | | | | 10,128,339 | | | | | |
| JPMBB Commercial Mortgage Securities Trust: | | | | | | | | | | | | |
| Series 2013-C12, Class ASB, 3.157%, 07/15/2045 | | | 4,500,000 | | | | 4,625,829 | | | | | |
| Series 2013-C12, Class A5, 3.664%, 07/15/2045 | | | 6,835,000 | | | | 7,190,961 | | | | | |
| Series 2013-C17, Class A3, 3.928%, 01/15/2047 | | | 8,450,000 | | | | 8,928,836 | | | | | |
| Series 2014-C24, Class ASB, 3.368%, 11/15/2047 | | | 10,000,000 | | | | 10,339,771 | | | | | |
| Series 2014-C25, Class ASB, 3.407%, 11/15/2047 | | | 7,138,000 | | | | 7,381,272 | | | | | |
| Morgan Stanley Bank of America Merrill Lynch Trust: | | | | | | | | | | | | |
| Series 2012-C5, Class A4, 3.176%, 08/15/2045 | | | 37,550,000 | | | | 38,633,179 | | | | | |
| Series 2012-C6, Class A4, 2.858%, 11/15/2045 | | | 25,685,945 | | | | 26,094,747 | | | | | |
| Series 2013-C11, Class A3, 3.960%, 08/15/2046 | | | 12,100,000 | | | | 12,840,793 | | | | | |
| Series 2013-C12, Class A3, 3.973%, 10/15/2046 | | | 22,850,000 | | | | 24,256,676 | | | | | |
| Series 2016-C29, Class ASB, 3.140%, 05/15/2049 | | | 12,250,000 | | | | 12,352,113 | | | | | |
| Wells Fargo Commercial Mortgage Trust: | | | | | | | | | | | | |
| Series 2013-LC12, Class A3, 3.986%, 07/15/2046 | | | 18,700,000 | | | | 19,910,453 | | | | | |
| Series 2015-SG1, Class ASB, 3.556%, 12/15/2047 | | | 18,900,000 | | | | 19,537,962 | | | | | |
| Series 2015-C27, Class ASB, 3.278%, 02/15/2048 | | | 18,000,000 | | | | 18,461,428 | | | | | |
| Series 2015-P2, Class A3, 3.541%, 12/15/2048 | | | 31,100,000 | | | | 31,874,773 | | | | | |
| WFRBS Commercial Mortgage Trust: | | | | | | | | | | | | |
| Series 2012-C6, Class A4, 3.440%, 04/15/2045 | | | 24,764,220 | | | | 25,869,365 | | | | | |
| Series 2013-C13, Class ASB, 2.654%, 05/15/2045 | | | 6,450,000 | | | | 6,520,863 | | | | | |
| Series 2013-C18, Class A4, 3.896%, 12/15/2046 | | | 12,900,000 | | | | 13,635,441 | | | | | |
| Series 2014-C21, Class A5, 3.678%, 08/15/2047 | | | 13,254,000 | | | | 13,756,517 | | | | | |
| Series 2014-C24, Class A4, 3.343%, 11/15/2047 | | | 10,330,000 | | | | 10,472,134 | | | | | |
| Series 2014-C23, Class ASB, 3.636%, 10/15/2057 | | | 6,920,000 | | | | 7,228,017 | | | | | |
| | | | | | | | 522,105,319 | | | | 5.0 | % |
| Other Asset Backed Securities | | | | | | | | | | | | |
| Capital Auto Receivables Asset Trust, | | | | | | | | | | | | |
| Series 2014-1, Class A3, 1.320%, 06/20/2018 | | | 857,110 | | | | 857,161 | | | | | |
| Capital One Multi-Asset Execution Trust, | | | | | | | | | | | | |
| Series 2016-A4, Class A4, 1.330%, 06/15/2022 | | | 47,425,000 | | | | 46,788,855 | | | | | |
| Chase Issuance Trust, | | | | | | | | | | | | |
| Series 2016-A5, Class A5, 1.270%, 07/15/2021 | | | 40,100,000 | | | | 39,565,263 | | | | | |
| Citibank Credit Card Issuance Trust, | | | | | | | | | | | | |
| Series 2007-A3, Class A3, 6.150%, 06/15/2039 | | | 4,166,000 | | | | 5,481,040 | | | | | |
| Conseco Financial Corp.: | | | | | | | | | | | | |
| Series 1993-3, Class A7, 6.400%, 10/15/2018 | | | 21,718 | | | | 21,725 | | | | | |
| Series 1993-4, Class A5, 7.050%, 01/15/2019 | | | 6,202 | | | | 6,280 | | | | | |
| Series 1998-2, Class A5, 6.240%, 12/01/2028 ∞ | | | 364,100 | | | | 377,826 | | | | | |
| Series 1998-3, Class A5, 6.220%, 03/01/2030 | | | 421,586 | | | | 446,398 | | | | | |
| Series 1998-4, Class A5, 6.180%, 04/01/2030 | | | 2,446,364 | | | | 2,580,150 | | | | | |
| Series 1998-7, Class A1, 6.320%, 07/01/2030 | | | 20,531,550 | | | | 21,655,395 | | | | | |
| Discover Card Execution Note Trust, | | | | | | | | | | | | |
| Series 2016-A4, Class A4, 1.390%, 03/15/2022 | | | 50,225,000 | | | | 49,651,712 | | | | | |
| Ford Credit Auto Owner Trust: | | | | | | | | | | | | |
| Series 2014-2, Class A, 2.310%, 04/15/2026 (Acquired 02/20/2015 through 03/23/2016, Cost $27,188,227) * | | | 27,030,000 | | | | 27,256,060 | | | | | |
| Series 2015-1, Class A, 2.120%, 07/15/2026 (Acquired 03/14/2016 through 10/31/2016, Cost $9,529,348) * | | | 9,540,000 | | | | 9,558,785 | | | | | |
| Series 2016-1, Class A, 2.310%, 08/15/2027 (Acquired 02/23/2016 through 05/24/2016, Cost $28,345,935) * | | | 28,325,000 | | | | 28,270,004 | | | | | |
| Series 2016-2, Class A, 2.030%, 12/15/2027 (Acquired 06/20/2016, Cost $19,993,088) * | | | 20,000,000 | | | | 19,669,604 | | | | | |
| GM Financial Automobile Leasing Trust, | | | | | | | | | | | | |
| Series 2016-3, Class A3, 1.610%, 12/20/2019 | | | 10,500,000 | | | | 10,469,127 | | | | | |
| Hyundai Auto Lease Securitization Trust, | | | | | | | | | | | | |
| Series 2016-C, Class A3, 1.490%, 02/18/2020 (Acquired 08/09/2016, Cost $14,773,378) * | | | 14,775,000 | | | | 14,732,810 | | | | | |
| Kubota Credit Owner Trust, | | | | | | | | | | | | |
| Series 2016-1A, Class A3, 1.500%, 07/15/2020 (Acquired 07/26/2016, Cost $12,172,018) * | | | 12,175,000 | | | | 12,056,663 | | | | | |
| Leaf Receivables Funding 10 LLC, | | | | | | | | | | | | |
| Series 2015-1, Class A3, 1.490%, 03/15/2018 (Acquired 04/23/2015, Cost $12,423,391) * | | | 12,425,674 | | | | 12,414,251 | | | | | |
| MMAF Equipment Finance LLC, | | | | | | | | | | | | |
| Series 2016-AA, Class A5, 2.210%, 12/15/2032 (Acquired 05/03/2016, Cost $10,624,553) * | | | 10,625,000 | | | | 10,415,513 | | | | | |
| Oakwood Mortgage Investors, Inc., | | | | | | | | | | | | |
| Series 1999-B, Class A3, 6.450%, 11/15/2017 | | | 28,184 | | | | 28,552 | | | | | |
| OneMain Financial Issuance Trust, | | | | | | | | | | | | |
| Series 2014-2A, Class A, 2.470%, 09/18/2024 (Acquired 11/16/2015 through 01/29/2016, Cost $17,955,043) * | | | 18,011,489 | | | | 18,018,912 | | | | | |
| Springleaf Funding Trust, | | | | | | | | | | | | |
| Series 2014-AA, Class A, 2.410%, 12/15/2022 (Acquired 02/10/2015 through 04/18/2016, Cost $6,051,670) * | | | 6,046,096 | | | | 6,048,318 | | | | | |
| Synchrony Credit Card Master Note Trust: | | | | | | | | | | | | |
| Series 2015-1, Class A, 2.370%, 03/15/2023 | | | 12,841,000 | | | | 12,956,805 | | | | | |
| Series 2016-2, Class A, 2.210%, 05/15/2024 | | | 8,900,000 | | | | 8,851,687 | | | | | |
| TCF Auto Receivables Owner Trust, | | | | | | | | | | | | |
| Series 2015-2A, Class A2, 1.640%, 01/15/2019 (Acquired 11/18/2015, Cost $7,113,288) * | | | 7,113,313 | | | | 7,119,872 | | | | | |
| Verizon Owner Trust, | | | | | | | | | | | | |
| Series 2016-2A, Class A, 1.680%, 05/20/2021 (Acquired 11/16/2016, Cost $50,644,748) * | | | 50,650,000 | | | | 50,445,946 | | | | | |
| | | | | | | | 415,744,714 | | | | 3.9 | % |
| Total Long-Term Investments (Cost $10,555,783,145) | | | | | | | 10,464,580,694 | | | | 98.9 | % |
| | | | | | | | | | | | | |
| SHORT-TERM INVESTMENT | | | | | | | | | | | | |
| Money Market Mutual Fund | | Shares | | | | | | | | | |
| Fidelity Institutional Money Market Fund - Government Portfolio, Institutional Class, 0.43% « | | | 233,776,874 | | | | 233,776,874 | | | | | |
| Total Short-Term Investment (Cost $233,776,874) | | | | | | | 233,776,874 | | | | 2.2 | % |
| Total Investments (Cost $10,789,560,019) | | | | | | | 10,698,357,568 | | | | 101.1 | % |
| Liabilities in Excess of Other Assets | | | | | | | (119,333,212 | ) | | | (1.1 | )% |
| TOTAL NET ASSETS | | | | | | $ | 10,579,024,356 | | | | 100.0 | % |
Notes to Schedule of Investments |
| ∞ | Variable or Floating rate security. Floating rate securities are securities whose yields vary with a designated index rate. These securities' rates are as of December 31, 2016. |
| * | Restricted security as defined in Rule 144(a) under the Securities Act of 1933 and determined to be liquid. Purchased in a private placement transaction; resale to the public may require registration or or may extend only to qualified institutional buyers. At December 31, 2016, the value of these securities total $1,598,795,554, which represents 15.11% of total net assets. |
| f | Foreign Security |
| § | Security in Default |
| ^ | Non-Income Producing |
| « | 7-Day Yield |
| <<<< | Effective yield as of December 31, 2016 |
| Baird Core Plus Bond Fund | | | | | | | | | |
| Schedule of Investments | | | | | | | | | |
| December 31, 2016 | | | | | | | | | |
| | | | | | | | | | |
| | | Principal | | | | | | % of | |
| | | Amount | | | Value | | | Net Assets | |
| LONG-TERM INVESTMENTS | | | | | | | | | |
| U.S. Treasury Securities | | | | | | | | | |
| U.S. Treasury Bonds: | | | | | | | | | |
| 2.625%, 08/15/2020 | | $ | 68,750,000 | | | $ | 71,086,400 | | | | |
| 1.375%, 08/31/2020 | | | 302,575,000 | | | | 299,430,943 | | | | |
| 1.750%, 03/31/2022 | | | 90,000,000 | | | | 88,801,200 | | | | |
| 2.500%, 05/15/2024 | | | 135,000,000 | | | | 137,019,735 | | | | |
| 2.250%, 11/15/2025 | | | 110,225,000 | | | | 108,812,798 | | | | |
| 3.500%, 02/15/2039 | | | 377,695,000 | | | | 413,044,986 | | | | |
| 2.875%, 05/15/2043 | | | 494,175,000 | | | | 477,322,644 | | | | |
| 2.500%, 02/15/2045 | | | 36,550,000 | | | | 32,556,620 | | | | |
| | | | | | | | 1,628,075,326 | | | | 12.6 | % |
| Other Government Related Securities | | | | | | | | | | | | |
| Centrais Eletricas Brasileiras SA: | | | | | | | | | | | | |
| 6.875%, 07/30/2019 (Acquired 12/06/2012, Cost $3,214,598) * f | | | 3,000,000 | | | | 3,138,750 | | | | | |
| 5.750%, 10/27/2021 (Acquired 10/20/2011, Cost $4,000,000) * f | | | 4,000,000 | | | | 3,900,000 | | | | | |
| CNOOC Curtis Funding No. 1 Pty Ltd., | | | | | | | | | | | | |
| 4.500%, 10/03/2023 (Acquired 02/26/2014, Cost $5,031,518) * f | | | 5,000,000 | | | | 5,250,370 | | | | | |
| CNOOC Finance (2013) Ltd., | | | | | | | | | | | | |
| 3.000%, 05/09/2023 f | | | 2,415,000 | | | | 2,330,958 | | | | | |
| CNOOC Finance (2015) USA LLC, | | | | | | | | | | | | |
| 3.500%, 05/05/2025 | | | 21,075,000 | | | | 20,483,720 | | | | | |
| CNOOC Nexen Finance (2014) ULC, | | | | | | | | | | | | |
| 4.250%, 04/30/2024 f | | | 4,450,000 | | | | 4,552,782 | | | | | |
| CNPC General Capital Ltd., | | | | | | | | | | | | |
| 2.750%, 05/14/2019 (Acquired 05/07/2014, Cost $1,983,740) * f | | | 2,000,000 | | | | 2,014,644 | | | | | |
| Comision Federal de Electricidad, | | | | | | | | | | | | |
| 5.750%, 02/14/2042 (Acquired 02/08/2012, Cost $5,116,800) * f | | | 5,200,000 | | | | 4,823,000 | | | | | |
| Corp Andina de Fomento, | | | | | | | | | | | | |
| 4.375%, 06/15/2022 f | | | 3,956,000 | | | | 4,196,762 | | | | | |
| Electricite de France SA, | | | | | | | | | | | | |
| 4.750%, 10/13/2035 (Acquired 10/07/2015, Cost $9,790,200) * f | | | 10,000,000 | | | | 10,032,920 | | | | | |
| Export-Import Bank of Korea: | | | | | | | | | | | | |
| 2.250%, 01/21/2020 f | | | 14,000,000 | | | | 13,917,344 | | | | | |
| 4.000%, 01/29/2021 f | | | 2,400,000 | | | | 2,510,445 | | | | | |
| Korea Electric Power Corp., | | | | | | | | | | | | |
| 6.750%, 08/01/2027 f | | | 490,000 | | | | 585,508 | | | | | |
| Korea Expressway Corp., | | | | | | | | | | | | |
| 1.625%, 04/28/2017 (Acquired 04/22/2014 through 02/12/2015, Cost $2,942,070) * f | | | 2,950,000 | | | | 2,948,310 | | | | | |
| Korea National Oil Corp., | | | | | | | | | | | | |
| 3.125%, 04/03/2017 (Acquired 02/18/2015, Cost $8,127,326) * f | | | 8,100,000 | | | | 8,130,513 | | | | | |
| Nexen Energy ULC, | | | | | | | | | | | | |
| 7.500%, 07/30/2039 f | | | 6,175,000 | | | | 8,398,864 | | | | | |
| Petrobras Global Finance BV: | | | | | | | | | | | | |
| 3.000%, 01/15/2019 f | | | 3,000,000 | | | | 2,924,100 | | | | | |
| 7.875%, 03/15/2019 f | | | 5,000,000 | | | | 5,359,200 | | | | | |
| 5.375%, 01/27/2021 f | | | 3,200,000 | | | | 3,129,600 | | | | | |
| Petroleos Mexicanos: | | | | | | | | | | | | |
| 4.875%, 01/24/2022 f | | | 6,500,000 | | | | 6,519,500 | | | | | |
| 4.250%, 01/15/2025 f | | | 15,000,000 | | | | 13,791,000 | | | | | |
| 4.500%, 01/23/2026 f | | | 4,500,000 | | | | 4,099,500 | | | | | |
| 6.500%, 06/02/2041 f | | | 4,000,000 | | | | 3,746,200 | | | | | |
| PTT PCL, | | | | | | | | | | | | |
| 3.375%, 10/25/2022 (Acquired 10/19/2012, Cost $4,958,500) * f | | | 5,000,000 | | | | 5,025,920 | | | | | |
| Sinopec Group Overseas Development [2014] Ltd., | | | | | | | | | | | | |
| 4.375%, 04/10/2024 (Acquired 04/02/2014, Cost $1,496,505) * f | | | 1,500,000 | | | | 1,558,737 | | | | | |
| Sinopec Group Overseas Development [2015] Ltd.: | | | | | | | | | | | | |
| 2.500%, 04/28/2020 (Acquired 04/21/2015, Cost $19,915,200) * f | | | 20,000,000 | | | | 19,867,420 | | | | | |
| 3.250%, 04/28/2025 (Acquired 04/21/2015, Cost $19,804,400) * f | | | 20,000,000 | | | | 19,175,300 | | | | | |
| Sinopec Group Overseas Development [2016] Ltd.: | | | | | | | | | | | | |
| 1.750%, 09/29/2019 (Acquired 09/22/2016, Cost $7,968,880) * f | | | 8,000,000 | | | | 7,869,104 | | | | | |
| 3.500%, 05/03/2026 (Acquired 04/25/2016, Cost $9,916,600) * f | | | 10,000,000 | | | | 9,687,370 | | | | | |
| State Bank of India/London, | | | | | | | | | | | | |
| 4.125%, 08/01/2017 (Acquired 07/25/2012, Cost $6,939,800) * f | | | 7,000,000 | | | | 7,081,305 | | | | | |
| The Korea Development Bank: | | | | | | | | | | | | |
| 2.250%, 05/18/2020 f | | | 7,200,000 | | | | 7,120,008 | | | | | |
| 3.000%, 09/14/2022 f | | | 4,400,000 | | | | 4,436,674 | | | | | |
| | | | | | | | 218,605,828 | | | | 1.7 | % |
| Corporate Bonds | | | | | | | | | | | | |
| Industrials | | | | | | | | | | | | |
| 21st Century Fox America, Inc.: | | | | | | | | | | | | |
| 6.900%, 03/01/2019 | | | 6,659,000 | | | | 7,313,813 | | | | | |
| 3.700%, 09/15/2024 | | | 4,025,000 | | | | 4,075,530 | | | | | |
| 7.430%, 10/01/2026 | | | 3,300,000 | | | | 4,158,838 | | | | | |
| 6.150%, 03/01/2037 | | | 9,000,000 | | | | 10,532,376 | | | | | |
| 5.400%, 10/01/2043 | | | 5,000,000 | | | | 5,383,995 | | | | | |
| 4.750%, 09/15/2044 | | | 1,950,000 | | | | 1,949,171 | | | | | |
| A.P. Meoller - Maersk A/S: | | | | | | | | | | | | |
| 2.550%, 09/22/2019 (Acquired 11/24/2014, Cost $10,038,877) * f | | | 10,000,000 | | | | 9,959,470 | | | | | |
| 3.750%, 09/22/2024 (Acquired 09/15/2014, Cost $4,459,830) * f | | | 4,475,000 | | | | 4,316,370 | | | | | |
| Abbott Laboratories: | | | | | | | | | | | | |
| 3.400%, 11/30/2023 | | | 10,000,000 | | | | 9,962,410 | | | | | |
| 4.750%, 11/30/2036 | | | 18,725,000 | | | | 19,036,247 | | | | | |
| AbbVie, Inc.: | | | | | | | | | | | | |
| 2.000%, 11/06/2018 | | | 10,835,000 | | | | 10,841,652 | | | | | |
| 3.200%, 11/06/2022 | | | 3,000,000 | | | | 3,001,974 | | | | | |
| 3.600%, 05/14/2025 | | | 2,500,000 | | | | 2,476,220 | | | | | |
| 4.300%, 05/14/2036 | | | 3,825,000 | | | | 3,644,881 | | | | | |
| Acuity Brands Lighting, Inc., | | | | | | | | | | | | |
| 6.000%, 12/15/2019 | | | 700,000 | | | | 769,901 | | | | | |
| Agilent Technologies, Inc., | | | | | | | | | | | | |
| 3.875%, 07/15/2023 | | | 5,325,000 | | | | 5,478,589 | | | | | |
| Agrium, Inc., | | | | | | | | | | | | |
| 4.125%, 03/15/2035 f | | | 6,550,000 | | | | 6,005,649 | | | | | |
| Alibaba Group Holding Ltd., | | | | | | | | | | | | |
| 3.125%, 11/28/2021 f | | | 10,000,000 | | | | 9,992,960 | | | | | |
| Ameritech Capital Funding Corp., | | | | | | | | | | | | |
| 6.450%, 01/15/2018 | | | 3,175,000 | | | | 3,318,986 | | | | | |
| Amgen, Inc., | | | | | | | | | | | | |
| 4.400%, 05/01/2045 | | | 8,000,000 | | | | 7,668,368 | | | | | |
| Anadarko Petroleum Corp.: | | | | | | | | | | | | |
| 8.700%, 03/15/2019 | | | 4,380,000 | | | | 4,977,726 | | | | | |
| 6.450%, 09/15/2036 | | | 4,025,000 | | | | 4,790,418 | | | | | |
| Anglo American Capital PLC, | | | | | | | | | | | | |
| 9.375%, 04/08/2019 (Acquired 09/20/2011 through 12/29/2014, Cost $6,244,157) * f | | | 5,600,000 | | | | 6,398,000 | | | | | |
| Anheuser-Busch InBev Finance, Inc.: | | | | | | | | | | | | |
| 3.300%, 02/01/2023 | | | 20,350,000 | | | | 20,710,846 | | | | | |
| 3.650%, 02/01/2026 | | | 25,625,000 | | | | 26,014,244 | | | | | |
| Anheuser-Busch InBev Worldwide, Inc., | | | | | | | | | | | | |
| 1.576%, 08/01/2018 ∞ | | | 15,000,000 | | | | 15,092,115 | | | | | |
| ANR Pipeline Co., | | | | | | | | | | | | |
| 9.625%, 11/01/2021 | | | 9,150,000 | | | | 11,847,301 | | | | | |
| ArcelorMittal SA, | | | | | | | | | | | | |
| 7.250%, 02/25/2022 f | | | 2,000,000 | | | | 2,255,000 | | | | | |
| AT&T, Inc.: | | | | | | | | | | | | |
| 3.600%, 02/17/2023 | | | 10,550,000 | | | | 10,639,886 | | | | | |
| 3.400%, 05/15/2025 | | | 20,000,000 | | | | 19,276,460 | | | | | |
| 4.125%, 02/17/2026 | | | 8,925,000 | | | | 9,037,152 | | | | | |
| 5.650%, 02/15/2047 | | | 4,225,000 | | | | 4,531,291 | | | | | |
| 4.500%, 03/09/2048 | | | 15,264,000 | | | | 13,715,818 | | | | | |
| Avnet, Inc., | | | | | | | | | | | | |
| 3.750%, 12/01/2021 | | | 5,000,000 | | | | 5,030,895 | | | | | |
| Ball Corp., | | | | | | | | | | | | |
| 5.250%, 07/01/2025 | | | 25,000,000 | | | | 26,125,000 | | | | | |
| Baxter International, Inc., | | | | | | | | | | | | |
| 2.600%, 08/15/2026 | | | 6,175,000 | | | | 5,700,606 | | | | | |
| Bayer US Finance LLC, | | | | | | | | | | | | |
| 2.375%, 10/08/2019 (Acquired 10/01/2014, Cost $14,657,559) * | | | 14,725,000 | | | | 14,751,078 | | | | | |
| Beam Suntory, Inc.: | | | | | | | | | | | | |
| 3.250%, 05/15/2022 | | | 7,000,000 | | | | 7,016,513 | | | | | |
| 3.250%, 06/15/2023 | | | 10,960,000 | | | | 10,720,097 | | | | | |
| Becton Dickinson and Co.: | | | | | | | | | | | | |
| 3.250%, 11/12/2020 | | | 13,000,000 | | | | 13,366,392 | | | | | |
| 3.734%, 12/15/2024 | | | 9,250,000 | | | | 9,459,254 | | | | | |
| Bemis Co., Inc., | | | | | | | | | | | | |
| 4.500%, 10/15/2021 | | | 1,000,000 | | | | 1,063,443 | | | | | |
| Boardwalk Pipelines LP: | | | | | | | | | | | | |
| 5.500%, 02/01/2017 | | | 3,175,000 | | | | 3,183,458 | | | | | |
| 4.950%, 12/15/2024 | | | 13,875,000 | | | | 14,246,420 | | | | | |
| 5.950%, 06/01/2026 | | | 14,000,000 | | | | 15,207,304 | | | | | |
| Boston Scientific Corp., | | | | | | | | | | | | |
| 2.650%, 10/01/2018 | | | 10,000,000 | | | | 10,109,670 | | | | | |
| BP Capital Markets PLC: | | | | | | | | | | | | |
| 1.627%, 09/26/2018 ∞ f | | | 5,000,000 | | | | 5,019,005 | | | | | |
| 4.750%, 03/10/2019 f | | | 1,500,000 | | | | 1,590,099 | | | | | |
| Broadridge Financial Solutions, Inc., | | | | | | | | | | | | |
| 3.400%, 06/27/2026 | | | 18,286,000 | | | | 17,646,337 | | | | | |
| Browning-Ferris Industries, Inc., | | | | | | | | | | | | |
| 9.250%, 05/01/2021 | | | 1,600,000 | | | | 1,938,030 | | | | | |
| Bunge Limited Finance Corp.: | | | | | | | | | | | | |
| 8.500%, 06/15/2019 | | | 13,690,000 | | | | 15,684,003 | | | | | |
| 3.250%, 08/15/2026 | | | 13,188,000 | | | | 12,664,107 | | | | | |
| Bunge NA Finance LP, | | | | | | | | | | | | |
| 5.900%, 04/01/2017 | | | 4,024,000 | | | | 4,058,623 | | | | | |
| Burlington Northern Santa Fe LLC, | | | | | | | | | | | | |
| 4.150%, 04/01/2045 | | | 3,100,000 | | | | 3,143,729 | | | | | |
| Celgene Corp., | | | | | | | | | | | | |
| 3.550%, 08/15/2022 | | | 5,730,000 | | | | 5,876,631 | | | | | |
| CenturyLink, Inc., | | | | | | | | | | | | |
| Class R, 5.150%, 06/15/2017 | | | 2,000,000 | | | | 2,030,000 | | | | | |
| CF Industries, Inc.: | | | | | | | | | | | | |
| 6.875%, 05/01/2018 | | | 8,480,000 | | | | 8,926,387 | | | | | |
| 3.450%, 06/01/2023 | | | 24,624,000 | | | | 22,136,976 | | | | | |
| 5.375%, 03/15/2044 | | | 10,922,000 | | | | 9,014,036 | | | | | |
| Charter Communications Operating LLC / Charter Communications Operating Capital: | | | | | | | | | | | | |
| 4.464%, 07/23/2022 | | | 28,748,000 | | | | 30,042,551 | | | | | |
| 6.384%, 10/23/2035 | | | 5,800,000 | | | | 6,622,626 | | | | | |
| Columbia Pipeline Group, Inc.: | | | | | | | | | | | | |
| 3.300%, 06/01/2020 | | | 9,943,000 | | | | 10,128,854 | | | | | |
| 4.500%, 06/01/2025 | | | 13,735,000 | | | | 14,429,579 | | | | | |
| 5.800%, 06/01/2045 | | | 2,223,000 | | | | 2,556,377 | | | | | |
| Comcast Cable Communications Holdings Inc., | | | | | | | | | | | | |
| 9.455%, 11/15/2022 | | | 2,030,000 | | | | 2,747,611 | | | | | |
| Comcast Corp.: | | | | | | | | | | | | |
| 4.250%, 01/15/2033 | | | 5,900,000 | | | | 6,139,924 | | | | | |
| 4.400%, 08/15/2035 | | | 13,450,000 | | | | 14,070,556 | | | | | |
| 3.200%, 07/15/2036 | | | 15,000,000 | | | | 13,492,095 | | | | | |
| 4.650%, 07/15/2042 | | | 2,000,000 | | | | 2,082,240 | | | | | |
| Computer Sciences Corp., | | | | | | | | | | | | |
| 4.450%, 09/15/2022 | | | 2,000,000 | | | | 2,070,816 | | | | | |
| ConocoPhillips Canada Funding Co. I, | | | | | | | | | | | | |
| 5.950%, 10/15/2036 f | | | 845,000 | | | | 989,864 | | | | | |
| ConocoPhillips Co., | | | | | | | | | | | | |
| 6.000%, 01/15/2020 | | | 3,550,000 | | | | 3,920,400 | | | | | |
| Constellation Brands, Inc.: | | | | | | | | | | | | |
| 4.750%, 11/15/2024 | | | 100,000 | | | | 106,150 | | | | | |
| 4.750%, 12/01/2025 | | | 1,000,000 | | | | 1,060,000 | | | | | |
| Continental Airlines Pass Through Trust, | | | | | | | | | | | | |
| Series 1997-4, Class 974A, 6.900%, 01/02/2018 | | | 8,646 | | | | 8,716 | | | | | |
| Cox Communications, Inc.: | | | | | | | | | | | | |
| 9.375%, 01/15/2019 (Acquired 10/06/2014, Cost $8,723,187) * | | | 7,670,000 | | | | 8,664,960 | | | | | |
| 2.950%, 06/30/2023 (Acquired 04/24/2013 through 12/29/2014, Cost $5,442,614) * | | | 5,475,000 | | | | 5,152,435 | | | | | |
| 3.850%, 02/01/2025 (Acquired 12/01/2014, Cost $4,616,999) * | | | 4,625,000 | | | | 4,535,969 | | | | | |
| 3.350%, 09/15/2026 (Acquired 09/08/2016, Cost $14,974,650) * | | | 15,000,000 | | | | 14,324,070 | | | | | |
| 4.800%, 02/01/2035 (Acquired 12/01/2014, Cost $9,996,400) * | | | 10,000,000 | | | | 9,314,760 | | | | | |
| 4.700%, 12/15/2042 (Acquired 11/26/2012, Cost $4,999,050) * | | | 5,000,000 | | | | 4,347,730 | | | | | |
| CSX Corp., | | | | | | | | | | | | |
| 6.220%, 04/30/2040 | | | 175,000 | | | | 218,116 | | | | | |
| CVS Health Corp., | | | | | | | | | | | | |
| 3.875%, 07/20/2025 | | | 2,302,000 | | | | 2,374,743 | | | | | |
| D.R. Horton, Inc., | | | | | | | | | | | | |
| 4.750%, 05/15/2017 | | | 1,447,000 | | | | 1,459,661 | | | | | |
| Daimler Finance North America LLC, | | | | | | | | | | | | |
| 1.875%, 01/11/2018 (Acquired 01/07/2013, Cost $2,116,139) * | | | 2,125,000 | | | | 2,127,901 | | | | | |
| Danone SA: | | | | | | | | | | | | |
| 3.000%, 06/15/2022 (Acquired 05/29/2012, Cost $3,489,465) * f | | | 3,500,000 | | | | 3,525,421 | | | | | |
| 2.589%, 11/02/2023 (Acquired 10/26/2016, Cost $10,000,000) * f | | | 10,000,000 | | | | 9,635,620 | | | | | |
| DCP Midstream LLC: | | | | | | | | | | | | |
| 9.750%, 03/15/2019 (Acquired 02/29/2012 through 07/22/2016, Cost $11,644,676) * | | | 10,505,000 | | | | 11,765,600 | | | | | |
| 4.750%, 09/30/2021 (Acquired 09/14/2011 through 11/18/2011, Cost $2,248,767) * | | | 2,245,000 | | | | 2,273,063 | | | | | |
| Deutsche Telekom International Finance BV: | | | | | | | | | | | | |
| 6.750%, 08/20/2018 f | | | 1,250,000 | | | | 1,347,921 | | | | | |
| 8.750%, 06/15/2030 f | | | 825,000 | | | | 1,212,845 | | | | | |
| Devon Financing Corp. LLC, | | | | | | | | | | | | |
| 7.875%, 09/30/2031 | | | 5,000,000 | | | | 6,344,220 | | | | | |
| Diamond 1 Finance Corp. / Diamond 2 Finance Corp.: | | | | | | | | | | | | |
| 3.480%, 06/01/2019 (Acquired 08/16/2016, Cost $14,049,503) * | | | 13,685,000 | | | | 13,969,730 | | | | | |
| 5.450%, 06/15/2023 (Acquired 05/17/2016, Cost $7,996,560) * | | | 8,000,000 | | | | 8,485,912 | | | | | |
| DISH DBS Corp., | | | | | | | | | | | | |
| 5.000%, 03/15/2023 | | | 2,500,000 | | | | 2,487,500 | | | | | |
| Dollar General Corp.: | | | | | | | | | | | | |
| 4.125%, 07/15/2017 | | | 4,545,000 | | | | 4,610,948 | | | | | |
| 1.875%, 04/15/2018 | | | 2,100,000 | | | | 2,102,690 | | | | | |
| Dominion Gas Holdings LLC, | | | | | | | | | | | | |
| 3.600%, 12/15/2024 | | | 6,100,000 | | | | 6,174,914 | | | | | |
| Eaton Corp.: | | | | | | | | | | | | |
| 2.750%, 11/02/2022 f | | | 2,500,000 | | | | 2,476,085 | | | | | |
| 4.000%, 11/02/2032 f | | | 3,660,000 | | | | 3,608,160 | | | | | |
| Ecolab, Inc.: | | | | | | | | | | | | |
| 1.450%, 12/08/2017 | | | 5,200,000 | | | | 5,194,867 | | | | | |
| 3.250%, 01/14/2023 | | | 6,325,000 | | | | 6,440,520 | | | | | |
| Enable Oklahoma Intrastate Transmission LLC, | | | | | | | | | | | | |
| 6.250%, 03/15/2020 (Acquired 10/25/2012 through 05/10/2013, Cost $3,425,640) * | | | 3,190,000 | | | | 3,379,113 | | | | | |
| Enbridge, Inc., | | | | | | | | | | | | |
| 5.500%, 12/01/2046 f | | | 5,000,000 | | | | 5,350,100 | | | | | |
| Encana Corp., | | | | | | | | | | | | |
| 6.500%, 05/15/2019 f | | | 610,000 | | | | 656,503 | | | | | |
| Energy Transfer Partners LP: | | | | | | | | | | | | |
| 2.500%, 06/15/2018 | | | 5,700,000 | | | | 5,720,891 | | | | | |
| 9.700%, 03/15/2019 | | | 1,189,000 | | | | 1,364,714 | | | | | |
| 4.150%, 10/01/2020 | | | 13,475,000 | | | | 13,953,915 | | | | | |
| 5.200%, 02/01/2022 | | | 1,000,000 | | | | 1,070,735 | | | | | |
| 3.600%, 02/01/2023 | | | 5,000,000 | | | | 4,917,535 | | | | | |
| 4.050%, 03/15/2025 | | | 6,204,000 | | | | 6,141,389 | | | | | |
| 5.150%, 03/15/2045 | | | 5,000,000 | | | | 4,795,400 | | | | | |
| EnLink Midstream Partners LP, | | | | | | | | | | | | |
| 4.400%, 04/01/2024 | | | 7,000,000 | | | | 6,955,109 | | | | | |
| Ensco PLC, | | | | | | | | | | | | |
| 5.200%, 03/15/2025 f | | | 6,000,000 | | | | 5,182,020 | | | | | |
| Enterprise Products Operating LLC: | | | | | | | | | | | | |
| 2.850%, 04/15/2021 | | | 10,000,000 | | | | 10,076,070 | | | | | |
| 3.350%, 03/15/2023 | | | 10,000,000 | | | | 10,123,560 | | | | | |
| 3.750%, 02/15/2025 | | | 7,000,000 | | | | 7,112,434 | | | | | |
| EQT Midstream Partners LP, | | | | | | | | | | | | |
| 4.125%, 12/01/2026 | | | 14,750,000 | | | | 14,377,518 | | | | | |
| ERAC USA Finance LLC: | | | | | | | | | | | | |
| 2.350%, 10/15/2019 (Acquired 10/26/2016, Cost $5,452,042) * | | | 5,385,000 | | | | 5,380,218 | | | | | |
| 2.600%, 12/01/2021 (Acquired 05/23/2016, Cost $9,986,200) * | | | 10,000,000 | | | | 9,841,140 | | | | | |
| Express Scripts Holding Co.: | | | | | | | | | | | | |
| 4.750%, 11/15/2021 | | | 14,700,000 | | | | 15,788,873 | | | | | |
| 3.500%, 06/15/2024 | | | 7,500,000 | | | | 7,411,553 | | | | | |
| FedEx Corp.: | | | | | | | | | | | | |
| 8.000%, 01/15/2019 | | | 6,100,000 | | | | 6,827,736 | | | | | |
| 3.900%, 02/01/2035 | | | 7,000,000 | | | | 6,721,596 | | | | | |
| Fidelity National Information Services, Inc.: | | | | | | | | | | | | |
| 3.625%, 10/15/2020 | | | 5,000,000 | | | | 5,176,340 | | | | | |
| 5.000%, 03/15/2022 | | | 9,345,000 | | | | 9,603,044 | | | | | |
| 4.500%, 10/15/2022 | | | 3,100,000 | | | | 3,297,653 | | | | | |
| 3.500%, 04/15/2023 | | | 5,850,000 | | | | 5,924,488 | | | | | |
| 3.875%, 06/05/2024 | | | 23,522,000 | | | | 23,998,556 | | | | | |
| 3.000%, 08/15/2026 | | | 9,300,000 | | | | 8,732,058 | | | | | |
| Fiserv, Inc.: | | | | | | | | | | | | |
| 4.625%, 10/01/2020 | | | 3,000,000 | | | | 3,204,105 | | | | | |
| 3.500%, 10/01/2022 | | | 11,500,000 | | | | 11,711,634 | | | | | |
| 3.850%, 06/01/2025 | | | 11,720,000 | | | | 11,919,662 | | | | | |
| Florida Gas Transmission Co. LLC, | | | | | | | | | | | | |
| 3.875%, 07/15/2022 (Acquired 06/12/2012, Cost $2,996,190) * | | | 3,000,000 | | | | 3,070,161 | | | | | |
| Fomento Economico Mexicano SAB de CV: | | | | | | | | | | | | |
| 2.875%, 05/10/2023 f | | | 11,700,000 | | | | 11,154,780 | | | | | |
| 4.375%, 05/10/2043 f | | | 4,000,000 | | | | 3,786,684 | | | | | |
| Ford Motor Credit Co. LLC: | | | | | | | | | | | | |
| 3.000%, 06/12/2017 | | | 3,000,000 | | | | 3,017,463 | | | | | |
| 6.625%, 08/15/2017 | | | 1,063,000 | | | | 1,095,349 | | | | | |
| 2.145%, 01/09/2018 | | | 5,375,000 | | | | 5,382,783 | | | | | |
| 2.551%, 10/05/2018 | | | 8,500,000 | | | | 8,547,804 | | | | | |
| 3.200%, 01/15/2021 | | | 11,250,000 | | | | 11,266,414 | | | | | |
| 5.750%, 02/01/2021 | | | 13,000,000 | | | | 14,255,553 | | | | | |
| 3.336%, 03/18/2021 | | | 5,500,000 | | | | 5,538,164 | | | | | |
| 5.875%, 08/02/2021 | | | 8,975,000 | | | | 9,911,703 | | | | | |
| Forest Laboratories, Inc.: | | | | | | | | | | | | |
| 4.375%, 02/01/2019 (Acquired 10/20/2014, Cost $4,117,161) * | | | 4,000,000 | | | | 4,156,552 | | | | | |
| 5.000%, 12/15/2021 (Acquired 08/26/2014 through 05/11/2016, Cost $44,268,632) * | | | 41,397,000 | | | | 44,757,733 | | | | | |
| Freeport-McMoRan, Inc.: | | | | | | | | | | | | |
| 3.100%, 03/15/2020 | | | 3,775,000 | | | | 3,680,625 | | | | | |
| 6.500%, 11/15/2020 (Acquired 05/29/2014 through 10/24/2014, Cost $6,506,704) * | | | 6,337,000 | | | | 6,511,267 | | | | | |
| 6.625%, 05/01/2021 (Acquired 10/23/2014 through 10/24/2014, Cost $6,589,797) * | | | 6,447,000 | | | | 6,559,823 | | | | | |
| 6.750%, 02/01/2022 (Acquired 06/18/2014 through 09/22/2014, Cost $2,737,168) * | | | 2,649,000 | | | | 2,721,848 | | | | | |
| 3.550%, 03/01/2022 | | | 6,275,000 | | | | 5,835,750 | | | | | |
| 3.875%, 03/15/2023 | | | 8,000,000 | | | | 7,340,000 | | | | | |
| Fresenius US Finance II, Inc., | | | | | | | | | | | | |
| 4.500%, 01/15/2023 (Acquired 09/16/2015 through 02/24/2016, Cost $25,132,579) * | | | 25,000,000 | | | | 25,750,000 | | | | | |
| General Electric Co.: | | | | | | | | | | | | |
| 2.200%, 01/09/2020 | | | 2,864,000 | | | | 2,873,319 | | | | | |
| 5.550%, 05/04/2020 | | | 1,199,000 | | | | 1,324,570 | | | | | |
| 4.375%, 09/16/2020 | | | 838,000 | | | | 900,725 | | | | | |
| 5.300%, 02/11/2021 | | | 859,000 | | | | 952,681 | | | | | |
| 4.650%, 10/17/2021 | | | 2,420,000 | | | | 2,654,595 | | | | | |
| General Mills, Inc., | | | | | | | | | | | | |
| 2.200%, 10/21/2019 | | | 12,000,000 | | | | 12,058,404 | | | | | |
| General Motors Financial Co., Inc.: | | | | | | | | | | | | |
| 2.400%, 05/09/2019 | | | 6,500,000 | | | | 6,482,782 | | | | | |
| 2.350%, 10/04/2019 | | | 2,700,000 | | | | 2,668,270 | | | | | |
| 3.200%, 07/13/2020 | | | 10,000,000 | | | | 10,030,080 | | | | | |
| 3.700%, 11/24/2020 | | | 1,509,000 | | | | 1,535,030 | | | | | |
| 4.200%, 03/01/2021 | | | 20,908,000 | | | | 21,571,766 | | | | | |
| 3.200%, 07/06/2021 | | | 15,000,000 | | | | 14,874,855 | | | | | |
| 4.375%, 09/25/2021 | | | 4,450,000 | | | | 4,616,047 | | | | | |
| Georgia-Pacific LLC: | | | | | | | | | | | | |
| 5.400%, 11/01/2020 (Acquired 10/27/2010 through 06/09/2016, Cost $12,099,072) * | | | 11,000,000 | | | | 12,093,169 | | | | | |
| 3.163%, 11/15/2021 (Acquired 11/03/2014, Cost $19,999,800) * | | | 20,000,000 | | | | 20,238,180 | | | | | |
| Glencore Finance (Canada) Ltd.: | | | | | | | | | | | | |
| 4.950%, 11/15/2021 (Acquired 11/03/2011, Cost $1,997,480) * f | | | 2,000,000 | | | | 2,140,000 | | | | | |
| 4.250%, 10/25/2022 (Acquired 10/18/2012 through 05/22/2013, Cost $7,091,720) * f | | | 7,000,000 | | | | 7,157,500 | | | | | |
| 6.000%, 11/15/2041 (Acquired 04/14/2016 through 10/12/2016, Cost $6,550,817) * f | | | 7,400,000 | | | | 7,326,000 | | | | | |
| Glencore Funding LLC: | | | | | | | | | | | | |
| 4.125%, 05/30/2023 (Acquired 05/22/2013 through 09/16/2016, Cost $16,885,916) * | | | 16,940,000 | | | | 17,047,400 | | | | | |
| 4.625%, 04/29/2024 (Acquired 10/08/2014 through 11/09/2015, Cost $13,848,151) * | | | 15,484,000 | | | | 15,832,390 | | | | | |
| Grupo Bimbo SAB de CV, | | | | | | | | | | | | |
| 3.875%, 06/27/2024 (Acquired 06/27/2014 through 06/22/2016, Cost $20,565,232) * f | | | 20,178,000 | | | | 20,074,225 | | | | | |
| GTE Corp., | | | | | | | | | | | | |
| 8.750%, 11/01/2021 | | | 975,000 | | | | 1,188,074 | | | | | |
| Gulf South Pipeline Co. LP, | | | | | | | | | | | | |
| 4.000%, 06/15/2022 | | | 3,000,000 | | | | 3,038,940 | | | | | |
| Gulfstream Natural Gas System LLC, | | | | | | | | | | | | |
| 4.600%, 09/15/2025 (Acquired 09/21/2015, Cost $9,996,200) * | | | 10,000,000 | | | | 10,360,580 | | | | | |
| HCA, Inc.: | | | | | | | | | | | | |
| 4.250%, 10/15/2019 | | | 10,900,000 | | | | 11,336,000 | | | | | |
| 6.500%, 02/15/2020 | | | 5,000,000 | | | | 5,470,000 | | | | | |
| 5.000%, 03/15/2024 | | | 8,366,000 | | | | 8,606,523 | | | | | |
| 5.375%, 02/01/2025 | | | 24,950,000 | | | | 25,012,375 | | | | | |
| Hewlett Packard Enterprise Co., | | | | | | | | | | | | |
| 3.600%, 10/15/2020 | | | 7,275,000 | | | | 7,407,332 | | | | | |
| HP, Inc., | | | | | | | | | | | | |
| 4.650%, 12/09/2021 | | | 32,425,000 | | | | 34,610,315 | | | | | |
| Husky Energy, Inc., | | | | | | | | | | | | |
| 4.000%, 04/15/2024 f | | | 1,605,000 | | | | 1,634,165 | | | | | |
| Hutchison Whampoa International (09) Ltd., | | | | | | | | | | | | |
| 7.625%, 04/09/2019 (Acquired 01/20/2015, Cost $2,241,147) * f | | | 2,000,000 | | | | 2,237,734 | | | | | |
| Hutchison Whampoa International (12) (II) Ltd., | | | | | | | | | | | | |
| 3.250%, 11/08/2022 (Acquired 11/05/2012 through 12/18/2014, Cost $4,603,093) * f | | | 4,625,000 | | | | 4,667,569 | | | | | |
| Hutchison Whampoa International (14) Ltd., | | | | | | | | | | | | |
| 3.625%, 10/31/2024 (Acquired 10/28/2014, Cost $14,982,600) * f | | | 15,000,000 | | | | 14,986,365 | | | | | |
| Hyundai Capital America: | | | | | | | | | | | | |
| 2.500%, 03/18/2019 (Acquired 03/14/2016, Cost $24,583,026) * | | | 24,600,000 | | | | 24,665,780 | | | | | |
| 1.750%, 09/27/2019 (Acquired 09/22/2016, Cost $9,987,800) * | | | 10,000,000 | | | | 9,841,710 | | | | | |
| 3.000%, 03/18/2021 (Acquired 12/02/2016, Cost $10,011,191) * | | | 10,000,000 | | | | 9,989,350 | | | | | |
| Hyundai Capital Services, Inc.: | | | | | | | | | | | | |
| 1.793%, 03/18/2017 (Acquired 03/11/2014, Cost $2,400,000) ∞ * f | | | 2,400,000 | | | | 2,400,677 | | | | | |
| 3.500%, 09/13/2017 (Acquired 03/06/2012 through 12/30/2014, Cost $12,581,549) * f | | | 12,470,000 | | | | 12,595,772 | | | | | |
| 2.625%, 09/29/2020 (Acquired 03/23/2015, Cost $8,986,320) * f | | | 9,000,000 | | | | 8,911,764 | | | | | |
| Ingersoll-Rand Global Holding Co. Ltd, | | | | | | | | | | | | |
| 5.750%, 06/15/2043 | | | 4,126,000 | | | | 4,882,222 | | | | | |
| Ingersoll-Rand Luxembourg Finance SA: | | | | | | | | | | | | |
| 3.550%, 11/01/2024 f | | | 8,200,000 | | | | 8,320,745 | | | | | |
| 4.650%, 11/01/2044 f | | | 1,300,000 | | | | 1,326,304 | | | | | |
| Ingredion, Inc.: | | | | | | | | | | | | |
| 1.800%, 09/25/2017 | | | 13,020,000 | | | | 13,036,470 | | | | | |
| 3.200%, 10/01/2026 | | | 10,000,000 | | | | 9,787,010 | | | | | |
| Johnson Controls International PLC: | | | | | | | | | | | | |
| 3.900%, 02/14/2026 f | | | 10,000,000 | | | | 10,300,140 | | | | | |
| 5.250%, 12/01/2041 f | | | 1,150,000 | | | | 1,237,311 | | | | | |
| Kerr-McGee Corp., | | | | | | | | | | | | |
| 7.875%, 09/15/2031 | | | 12,790,000 | | | | 16,377,864 | | | | | |
| Keysight Technologies, Inc., | | | | | | | | | | | | |
| 3.300%, 10/30/2019 | | | 13,000,000 | | | | 13,200,928 | | | | | |
| Kinder Morgan Energy Partners LP: | | | | | | | | | | | | |
| 9.000%, 02/01/2019 | | | 8,828,000 | | | | 9,940,787 | | | | | |
| 6.850%, 02/15/2020 | | | 4,645,000 | | | | 5,178,097 | | | | | |
| 6.500%, 02/01/2037 | | | 400,000 | | | | 438,336 | | | | | |
| 6.950%, 01/15/2038 | | | 1,225,000 | | | | 1,420,962 | | | | | |
| 7.500%, 11/15/2040 | | | 2,500,000 | | | | 2,989,385 | | | | | |
| Kinder Morgan Finance Co. LLC, | | | | | | | | | | | | |
| 6.000%, 01/15/2018 (Acquired 12/06/2010, Cost $999,930) * | | | 1,000,000 | | | | 1,041,199 | | | | | |
| Kinder Morgan, Inc./DE: | | | | | | | | | | | | |
| 3.050%, 12/01/2019 | | | 7,000,000 | | | | 7,100,492 | | | | | |
| 5.000%, 02/15/2021 (Acquired 05/26/2015 through 04/22/2016, Cost $10,426,453) * | | | 10,008,000 | | | | 10,660,281 | | | | | |
| 7.800%, 08/01/2031 | | | 5,000,000 | | | | 6,181,485 | | | | | |
| Kinross Gold Corp., | | | | | | | | | | | | |
| 6.875%, 09/01/2041 f | | | 5,500,000 | | | | 5,080,625 | | | | | |
| Kraft Heinz Foods Co.: | | | | | | | | | | | | |
| 3.500%, 07/15/2022 | | | 17,000,000 | | | | 17,256,785 | | | | | |
| 6.750%, 03/15/2032 | | | 10,000,000 | | | | 12,119,110 | | | | | |
| 5.000%, 07/15/2035 | | | 6,800,000 | | | | 7,133,873 | | | | | |
| 5.000%, 06/04/2042 | | | 5,000,000 | | | | 5,119,680 | | | | | |
| Lafarge SA, | | | | | | | | | | | | |
| 7.125%, 07/15/2036 f | | | 1,425,000 | | | | 1,724,754 | | | | | |
| LafargeHolcim Finance US LLC, | | | | | | | | | | | | |
| 3.500%, 09/22/2026 (Acquired 09/15/2016, Cost $9,991,600) * | | | 10,000,000 | | | | 9,674,700 | | | | | |
| Lear Corp., | | | | | | | | | | | | |
| 5.250%, 01/15/2025 | | | 21,600,000 | | | | 22,707,000 | | | | | |
| Lennox International, Inc., | | | | | | | | | | | | |
| 3.000%, 11/15/2023 | | | 10,000,000 | | | | 9,708,970 | | | | | |
| Magellan Midstream Partners LP: | | | | | | | | | | | | |
| 5.000%, 03/01/2026 | | | 10,000,000 | | | | 10,965,670 | | | | | |
| 4.200%, 03/15/2045 | | | 8,770,000 | | | | 7,920,494 | | | | | |
| 4.250%, 09/15/2046 | | | 1,230,000 | | | | 1,155,669 | | | | | |
| Marathon Oil Corp., | | | | | | | | | | | | |
| 2.800%, 11/01/2022 | | | 10,175,000 | | | | 9,729,956 | | | | | |
| Marathon Petroleum Corp.: | | | | | | | | | | | | |
| 3.400%, 12/15/2020 | | | 20,000,000 | | | | 20,454,480 | | | | | |
| 3.625%, 09/15/2024 | | | 2,500,000 | | | | 2,468,998 | | | | | |
| 4.750%, 09/15/2044 | | | 3,985,000 | | | | 3,532,730 | | | | | |
| Martin Marietta Materials, Inc.: | | | | | | | | | | | | |
| 6.600%, 04/15/2018 | | | 475,000 | | | | 501,550 | | | | | |
| 6.250%, 05/01/2037 | | | 450,000 | | | | 478,266 | | | | | |
| Masco Corp., | | | | | | | | | | | | |
| 7.125%, 03/15/2020 | | | 1,800,000 | | | | 2,025,000 | | | | | |
| McDonald's Corp., | | | | | | | | | | | | |
| 3.700%, 01/30/2026 | | | 7,250,000 | | | | 7,381,203 | | | | | |
| Medtronic, Inc.: | | | | | | | | | | | | |
| 2.500%, 03/15/2020 f | | | 5,000,000 | | | | 5,055,955 | | | | | |
| 4.375%, 03/15/2035 f | | | 6,552,000 | | | | 6,931,544 | | | | | |
| Microsoft Corp.: | | | | | | | | | | | | |
| 4.200%, 11/03/2035 | | | 5,650,000 | | | | 5,945,523 | | | | | |
| 3.950%, 08/08/2056 | | | 17,000,000 | | | | 16,056,194 | | | | | |
| Molex Electronic Technologies LLC: | | | | | | | | | | | | |
| 2.878%, 04/15/2020 (Acquired 04/01/2015 through 09/28/2016, Cost $25,843,515) * | | | 26,038,000 | | | | 25,979,258 | | | | | |
| 3.900%, 04/15/2025 (Acquired 06/20/2016, Cost $4,471,290) * | | | 4,500,000 | | | | 4,426,659 | | | | | |
| MPLX LP: | | | | | | | | | | | | |
| 5.500%, 02/15/2023 | | | 1,900,000 | | | | 1,976,680 | | | | | |
| 4.875%, 12/01/2024 | | | 9,650,000 | | | | 9,936,547 | | | | | |
| 4.000%, 02/15/2025 | | | 8,000,000 | | | | 7,776,040 | | | | | |
| Murphy Oil Corp.: | | | | | | | | | | | | |
| 4.000%, 06/01/2022 | | | 6,600,000 | | | | 6,345,900 | | | | | |
| 4.700%, 12/01/2022 | | | 6,000,000 | | | | 5,803,140 | | | | | |
| Mylan NV: | | | | | | | | | | | | |
| 3.000%, 12/15/2018 (Acquired 12/04/2015, Cost $4,494,330) * f | | | 4,500,000 | | | | 4,532,544 | | | | | |
| 3.750%, 12/15/2020 (Acquired 12/04/2015, Cost $5,873,120) * f | | | 5,875,000 | | | | 5,932,451 | | | | | |
| 3.150%, 06/15/2021 (Acquired 05/31/2016, Cost $8,090,604) * f | | | 8,100,000 | | | | 7,949,235 | | | | | |
| Mylan, Inc.: | | | | | | | | | | | | |
| 3.125%, 01/15/2023 (Acquired 11/21/2016, Cost $11,221,382) * | | | 11,800,000 | | | | 11,141,737 | | | | | |
| 4.200%, 11/29/2023 | | | 4,525,000 | | | | 4,530,453 | | | | | |
| Nabors Industries, Inc., | | | | | | | | | | | | |
| 6.150%, 02/15/2018 | | | 250,000 | | | | 259,375 | | | | | |
| New Cingular Wireless Services, Inc., | | | | | | | | | | | | |
| 8.750%, 03/01/2031 | | | 3,300,000 | | | | 4,719,901 | | | | | |
| Newell Brands, Inc., | | | | | | | | | | | | |
| 3.850%, 04/01/2023 | | | 20,000,000 | | | | 20,746,140 | | | | | |
| Noble Energy, Inc.: | | | | | | | | | | | | |
| 3.900%, 11/15/2024 | | | 3,000,000 | | | | 3,022,863 | | | | | |
| 5.050%, 11/15/2044 | | | 3,000,000 | | | | 3,008,844 | | | | | |
| Noble Holding International Ltd., | | | | | | | | | | | | |
| 5.250%, 03/16/2018 f | | | 7,000,000 | | | | 6,982,500 | | | | | |
| Northern Tier Energy LLC / Northern Tier Finance Corp., | | | | | | | | | | | | |
| 7.125%, 11/15/2020 | | | 15,935,000 | | | | 16,552,481 | | | | | |
| NuStar Logistics LP: | | | | | | | | | | | | |
| 4.800%, 09/01/2020 | | | 4,275,000 | | | | 4,285,688 | | | | | |
| 6.750%, 02/01/2021 | | | 3,000,000 | | | | 3,240,000 | | | | | |
| Oi Brasil Holdings Cooperatief UA, | | | | | | | | | | | | |
| 5.750%, 02/10/2022 (Acquired 02/06/2012, Cost $3,000,000) * f | | | 3,000,000 | | | | 945,000 | | | | | |
| ONEOK Partners LP: | | | | | | | | | | | | |
| 3.375%, 10/01/2022 | | | 9,500,000 | | | | 9,539,653 | | | | | |
| 5.000%, 09/15/2023 | | | 5,800,000 | | | | 6,311,438 | | | | | |
| ONEOK, Inc., | | | | | | | | | | | | |
| 4.250%, 02/01/2022 | | | 6,150,000 | | | | 6,180,750 | | | | | |
| Oracle Corp.: | | | | | | | | | | | | |
| 3.400%, 07/08/2024 | | | 8,850,000 | | | | 9,017,318 | | | | | |
| 3.900%, 05/15/2035 | | | 7,425,000 | | | | 7,323,359 | | | | | |
| Owens Corning: | | | | | | | | | | | | |
| 4.200%, 12/01/2024 | | | 10,000,000 | | | | 10,243,800 | | | | | |
| 3.400%, 08/15/2026 | | | 5,000,000 | | | | 4,749,665 | | | | | |
| Packaging Corp. of America, | | | | | | | | | | | | |
| 4.500%, 11/01/2023 | | | 4,700,000 | | | | 4,978,376 | | | | | |
| Pactiv LLC, | | | | | | | | | | | | |
| 7.950%, 12/15/2025 | | | 1,338,000 | | | | 1,418,280 | | | | | |
| Pentair Finance SA: | | | | | | | | | | | | |
| 2.900%, 09/15/2018 f | | | 4,500,000 | | | | 4,552,007 | | | | | |
| 2.650%, 12/01/2019 f | | | 5,000,000 | | | | 4,986,030 | | | | | |
| 3.625%, 09/15/2020 f | | | 16,000,000 | | | | 16,279,216 | | | | | |
| 3.150%, 09/15/2022 f | | | 6,950,000 | | | | 6,806,350 | | | | | |
| PepsiCo, Inc., | | | | | | | | | | | | |
| 4.250%, 10/22/2044 | | | 2,850,000 | | | | 2,943,286 | | | | | |
| Pernod Ricard SA, | | | | | | | | | | | | |
| 4.250%, 07/15/2022 (Acquired 06/09/2016 through 11/02/2016, Cost $28,686,787) * f | | | 26,400,000 | | | | 27,623,825 | | | | | |
| Petrofac Ltd., | | | | | | | | | | | | |
| 3.400%, 10/10/2018 (Acquired 10/03/2013 through 04/17/2015, Cost $31,203,740) * f | | | 31,200,000 | | | | 31,578,238 | | | | | |
| Pfizer, Inc., | | | | | | | | | | | | |
| 5.800%, 08/12/2023 | | | 7,938,000 | | | | 9,359,227 | | | | | |
| Phillips 66: | | | | | | | | | | | | |
| 4.300%, 04/01/2022 | | | 6,168,000 | | | | 6,622,686 | | | | | |
| 4.650%, 11/15/2034 | | | 13,000,000 | | | | 13,531,947 | | | | | |
| 5.875%, 05/01/2042 | | | 5,000,000 | | | | 5,920,275 | | | | | |
| 4.875%, 11/15/2044 | | | 15,000,000 | | | | 15,840,975 | | | | | |
| Phillips 66 Partners LP, | | | | | | | | | | | | |
| 4.680%, 02/15/2045 | | | 2,000,000 | | | | 1,857,002 | | | | | |
| Pioneer Natural Resources Co., | | | | | | | | | | | | |
| 6.875%, 05/01/2018 | | | 14,075,000 | | | | 14,942,470 | | | | | |
| Plum Creek Timberlands LP: | | | | | | | | | | | | |
| 4.700%, 03/15/2021 | | | 1,200,000 | | | | 1,273,473 | | | | | |
| 3.250%, 03/15/2023 | | | 8,375,000 | | | | 7,951,769 | | | | | |
| POSCO, | | | | | | | | | | | | |
| 4.250%, 10/28/2020 (Acquired 10/21/2010, Cost $2,165,365) * f | | | 2,175,000 | | | | 2,275,726 | | | | | |
| Potash Corp of Saskatchewan, Inc., | | | | | | | | | | | | |
| 4.000%, 12/15/2026 f | | | 10,000,000 | | | | 10,063,290 | | | | | |
| Qwest Capital Funding, Inc., | | | | | | | | | | | | |
| 7.625%, 08/03/2021 | | | 200,000 | | | | 207,000 | | | | | |
| Reliance Holding USA, Inc.: | | | | | | | | | | | | |
| 4.500%, 10/19/2020 (Acquired 10/14/2010 through 10/18/2010, Cost $1,988,700) * | | | 2,000,000 | | | | 2,109,554 | | | | | |
| 5.400%, 02/14/2022 (Acquired 02/09/2012 through 02/23/2012, Cost $3,509,683) * | | | 3,500,000 | | | | 3,783,857 | | | | | |
| Republic Services, Inc.: | | | | | | | | | | | | |
| 5.500%, 09/15/2019 | | | 13,000,000 | | | | 14,147,185 | | | | | |
| 3.550%, 06/01/2022 | | | 4,000,000 | | | | 4,155,204 | | | | | |
| 4.750%, 05/15/2023 | | | 13,459,000 | | | | 14,699,408 | | | | | |
| 2.900%, 07/01/2026 | | | 20,000,000 | | | | 19,173,000 | | | | | |
| Rio Tinto Finance (USA) Ltd., | | | | | | | | | | | | |
| 9.000%, 05/01/2019 f | | | 11,000,000 | | | | 12,683,594 | | | | | |
| Rockies Express Pipeline LLC: | | | | | | | | | | | | |
| 6.850%, 07/15/2018 (Acquired 12/21/2011, Cost $2,011,160) * | | | 2,000,000 | | | | 2,112,500 | | | | | |
| 5.625%, 04/15/2020 (Acquired 12/10/2010 through 12/29/2011, Cost $2,698,461) * | | | 2,695,000 | | | | 2,836,488 | | | | | |
| Samarco Mineracao SA: | | | | | | | | | | | | |
| 5.750%, 10/24/2023 (Acquired 10/21/2013 through 12/09/2014, Cost $5,338,400) * f | | | 5,475,000 | | | | 2,956,500 | | | | | |
| 5.375%, 09/26/2024 (Acquired 09/23/2014 through 12/09/2014, Cost $4,873,256) * f | | | 5,125,000 | | | | 2,767,500 | | | | | |
| Schlumberger Holdings Corp., | | | | | | | | | | | | |
| 3.000%, 12/21/2020 (Acquired 12/10/2015, Cost $10,975,140) * | | | 11,000,000 | | | | 11,232,683 | | | | | |
| Schneider Electric SE, | | | | | | | | | | | | |
| 2.950%, 09/27/2022 (Acquired 09/20/2012, Cost $4,986,700) * f | | | 5,000,000 | | | | 4,993,890 | | | | | |
| Shire Acquisitions Investments Ireland DAC, | | | | | | | | | | | | |
| 2.875%, 09/23/2023 f | | | 32,600,000 | | | | 30,984,572 | | | | | |
| SK Telecom Co. Ltd., | | | | | | | | | | | | |
| 6.625%, 07/20/2027 (Acquired 07/13/2007 through 04/30/2013, Cost $989,316) * f | | | 960,000 | | | | 1,205,702 | | | | | |
| Solvay Finance America LLC: | | | | | | | | | | | | |
| 3.400%, 12/03/2020 (Acquired 11/30/2015 through 01/14/2016, Cost $39,203,146) * | | | 39,226,000 | | | | 39,912,180 | | | | | |
| 4.450%, 12/03/2025 (Acquired 05/04/2016 through 12/02/2016, Cost $23,472,210) * | | | 22,451,000 | | | | 23,295,719 | | | | | |
| Sonoco Products Co., | | | | | | | | | | | | |
| 4.375%, 11/01/2021 | | | 1,000,000 | | | | 1,054,130 | | | | | |
| Spectra Energy Partners LP, | | | | | | | | | | | | |
| 3.500%, 03/15/2025 | | | 15,000,000 | | | | 14,651,010 | | | | | |
| Sprint Capital Corp., | | | | | | | | | | | | |
| 6.900%, 05/01/2019 | | | 675,000 | | | | 714,656 | | | | | |
| Sunoco Logistics Partners Operations LP: | | | | | | | | | | | | |
| 3.450%, 01/15/2023 | | | 2,000,000 | | | | 1,953,752 | | | | | |
| 6.100%, 02/15/2042 | | | 1,000,000 | | | | 1,033,640 | | | | | |
| Sunoco, Inc., | | | | | | | | | | | | |
| 5.750%, 01/15/2017 | | | 701,000 | | | | 701,782 | | | | | |
| Targa Resources Partners LP / Targa Resources Partners Finance Corp., | | | | | | | | | | | | |
| 4.125%, 11/15/2019 | | | 7,000,000 | | | | 7,087,500 | | | | | |
| TC PipeLines LP, | | | | | | | | | | | | |
| 4.375%, 03/13/2025 | | | 20,830,000 | | | | 20,998,327 | | | | | |
| Telecom Italia Capital SA: | | | | | | | | | | | | |
| 7.175%, 06/18/2019 f | | | 500,000 | | | | 553,750 | | | | | |
| 7.200%, 07/18/2036 f | | | 3,050,000 | | | | 3,006,507 | | | | | |
| Telecom Italia SpA/Milano, | | | | | | | | | | | | |
| 5.303%, 05/30/2024 (Acquired 05/22/2014 through 09/23/2015, Cost $21,655,304) * f | | | 21,500,000 | | | | 21,016,250 | | | | | |
| Telefonica Emisiones SAU: | | | | | | | | | | | | |
| 6.221%, 07/03/2017 f | | | 8,942,000 | | | | 9,142,676 | | | | | |
| 5.462%, 02/16/2021 f | | | 2,402,000 | | | | 2,618,353 | | | | | |
| 4.570%, 04/27/2023 f | | | 1,000,000 | | | | 1,049,132 | | | | | |
| 7.045%, 06/20/2036 f | | | 4,925,000 | | | | 5,716,482 | | | | | |
| TELUS Corp., | | | | | | | | | | | | |
| 2.800%, 02/16/2027 f | | | 13,100,000 | | | | 12,267,050 | | | | | |
| Tenet Healthcare Corp., | | | | | | | | | | | | |
| 6.750%, 06/15/2023 | | | 1,000,000 | | | | 882,500 | | | | | |
| Teva Pharmaceutical Finance Netherlands III BV, | | | | | | | | | | | | |
| 2.800%, 07/21/2023 f | | | 14,275,000 | | | | 13,512,587 | | | | | |
| The ADT Corp., | | | | | | | | | | | | |
| 3.500%, 07/15/2022 | | | 6,900,000 | | | | 6,572,250 | | | | | |
| The Dow Chemical Co.: | | | | | | | | | | | | |
| 8.550%, 05/15/2019 | | | 32,150,000 | | | | 36,846,504 | | | | | |
| 4.125%, 11/15/2021 | | | 835,000 | | | | 882,285 | | | | | |
| The Mosaic Co., | | | | | | | | | | | | |
| 5.450%, 11/15/2033 | | | 5,397,000 | | | | 5,352,777 | | | | | |
| The Timken Co., | | | | | | | | | | | | |
| 3.875%, 09/01/2024 | | | 18,500,000 | | | | 18,128,261 | | | | | |
| The Williams Companies, Inc.: | | | | | | | | | | | | |
| 7.875%, 09/01/2021 | | | 1,335,000 | | | | 1,525,238 | | | | | |
| 3.700%, 01/15/2023 | | | 3,000,000 | | | | 2,895,000 | | | | | |
| Class A, 7.500%, 01/15/2031 | | | 120,000 | | | | 135,300 | | | | | |
| 7.750%, 06/15/2031 | | | 3,500,000 | | | | 3,990,000 | | | | | |
| 5.750%, 06/24/2044 | | | 2,500,000 | | | | 2,425,000 | | | | | |
| Thermo Fisher Scientific, Inc.: | | | | | | | | | | | | |
| 3.300%, 02/15/2022 | | | 7,000,000 | | | | 7,111,811 | | | | | |
| 2.950%, 09/19/2026 | | | 15,525,000 | | | | 14,659,481 | | | | | |
| Time Warner Cable LLC: | | | | | | | | | | | | |
| 6.750%, 07/01/2018 | | | 11,000,000 | | | | 11,743,820 | | | | | |
| 8.750%, 02/14/2019 | | | 1,132,000 | | | | 1,275,701 | | | | | |
| 8.250%, 04/01/2019 | | | 35,000 | | | | 39,329 | | | | | |
| Time Warner Co., Inc., | | | | | | | | | | | | |
| 7.250%, 10/15/2017 | | | 2,300,000 | | | | 2,403,111 | | | | | |
| Time Warner, Inc.: | | | | | | | | | | | | |
| 3.800%, 02/15/2027 | | | 3,500,000 | | | | 3,480,124 | | | | | |
| 7.625%, 04/15/2031 | | | 13,375,000 | | | | 18,139,108 | | | | | |
| 7.700%, 05/01/2032 | | | 19,233,000 | | | | 26,065,542 | | | | | |
| 4.850%, 07/15/2045 | | | 12,000,000 | | | | 12,013,068 | | | | | |
| Transcontinental Gas Pipe Line Co. LLC, | | | | | | | | | | | | |
| 4.450%, 08/01/2042 | | | 2,600,000 | | | | 2,374,432 | | | | | |
| Transocean, Inc.: | | | | | | | | | | | | |
| 6.500%, 11/15/2020 f | | | 9,500,000 | | | | 9,405,000 | | | | | |
| 8.125%, 12/15/2021 f | | | 5,500,000 | | | | 5,500,000 | | | | | |
| 5.550%, 10/15/2022 f | | | 5,000,000 | | | | 4,387,500 | | | | | |
| TSMC Global Ltd., | | | | | | | | | | | | |
| 1.625%, 04/03/2018 (Acquired 03/27/2013 through 03/14/2016, Cost $37,150,742) * f | | | 37,405,000 | | | | 37,261,963 | | | | | |
| TTX Co.: | | | | | | | | | | | | |
| 4.650%, 06/15/2044 (Acquired 11/07/2016, Cost $8,231,651) * | | | 7,710,000 | | | | 7,742,775 | | | | | |
| 3.900%, 02/01/2045 (Acquired 01/26/2015, Cost $25,121,134) * | | | 25,325,000 | | | | 22,832,362 | | | | | |
| Tyco Electronics Group SA, | | | | | | | | | | | | |
| 7.125%, 10/01/2037 f | | | 500,000 | | | | 651,140 | | | | | |
| Union Pacific Corp., | | | | | | | | | | | | |
| 3.375%, 02/01/2035 | | | 6,000,000 | | | | 5,674,458 | | | | | |
| US Airways Pass Through Trust, | | | | | | | | | | | | |
| Series 1998-1, Class 981B, 7.350%, 01/30/2018 § | | | 177,936 | | | | 183,718 | | | | | |
| Vale Overseas Ltd.: | | | | | | | | | | | | |
| 5.875%, 06/10/2021 f | | | 18,000,000 | | | | 18,855,000 | | | | | |
| 4.375%, 01/11/2022 f | | | 2,700,000 | | | | 2,652,750 | | | | | |
| 6.250%, 08/10/2026 f | | | 11,000,000 | | | | 11,440,000 | | | | | |
| 8.250%, 01/17/2034 f | | | 425,000 | | | | 468,562 | | | | | |
| 6.875%, 11/10/2039 f | | | 13,425,000 | | | | 13,055,813 | | | | | |
| Valeant Pharmaceuticals International, Inc., | | | | | | | | | | | | |
| 5.875%, 05/15/2023 (Acquired 05/12/2015, Cost $5,080,300) * f | | | 5,000,000 | | | | 3,775,000 | | | | | |
| Valero Energy Corp.: | | | | | | | | | | | | |
| 9.375%, 03/15/2019 | | | 19,606,000 | | | | 22,578,270 | | | | | |
| 3.400%, 09/15/2026 | | | 17,500,000 | | | | 16,765,245 | | | | | |
| 6.625%, 06/15/2037 | | | 5,000,000 | | | | 5,851,820 | | | | | |
| Verisk Analytics, Inc., | | | | | | | | | | | | |
| 4.000%, 06/15/2025 | | | 10,000,000 | | | | 10,140,390 | | | | | |
| Verizon Communications, Inc.: | | | | | | | | | | | | |
| 6.400%, 09/15/2033 | | | 35,175,000 | | | | 42,439,130 | | | | | |
| 4.272%, 01/15/2036 | | | 19,649,000 | | | | 18,806,569 | | | | | |
| Viacom, Inc., | | | | | | | | | | | | |
| 2.750%, 12/15/2019 | | | 10,000,000 | | | | 9,986,930 | | | | | |
| Viterra, Inc., | | | | | | | | | | | | |
| 5.950%, 08/01/2020 (Acquired 03/18/2015, Cost $7,531,627) * f | | | 7,000,000 | | | | 7,599,270 | | | | | |
| Vodafone Group PLC: | | | | | | | | | | | | |
| 1.250%, 09/26/2017 f | | | 15,000,000 | | | | 14,972,175 | | | | | |
| 6.150%, 02/27/2037 f | | | 3,000,000 | | | | 3,364,104 | | | | | |
| Vulcan Materials Co.: | | | | | | | | | | | | |
| 7.000%, 06/15/2018 | | | 2,435,000 | | | | 2,599,362 | | | | | |
| 7.500%, 06/15/2021 | | | 16,763,000 | | | | 19,738,433 | | | | | |
| 4.500%, 04/01/2025 | | | 3,000,000 | | | | 3,135,000 | | | | | |
| 7.150%, 11/30/2037 | | | 500,000 | | | | 597,500 | | | | | |
| Wabtec Corp/DE, | | | | | | | | | | | | |
| 3.450%, 11/15/2026 (Acquired 10/31/2016 through 11/07/2016, Cost $26,946,928) * | | | 26,925,000 | | | | 25,881,979 | | | | | |
| Walgreen Co., | | | | | | | | | | | | |
| 5.250%, 01/15/2019 | | | 2,482,000 | | | | 2,626,797 | | | | | |
| Walgreens Boots Alliance, Inc.: | | | | | | | | | | | | |
| 3.300%, 11/18/2021 | | | 8,060,000 | | | | 8,211,294 | | | | | |
| 3.100%, 06/01/2023 | | | 10,000,000 | | | | 9,933,910 | | | | | |
| 3.800%, 11/18/2024 | | | 10,000,000 | | | | 10,177,750 | | | | | |
| 3.450%, 06/01/2026 | | | 7,000,000 | | | | 6,871,207 | | | | | |
| Waste Management, Inc., | | | | | | | | | | | | |
| 3.900%, 03/01/2035 | | | 5,000,000 | | | | 4,970,990 | | | | | |
| Weatherford International Ltd., | | | | | | | | | | | | |
| 4.500%, 04/15/2022 f | | | 5,020,000 | | | | 4,354,850 | | | | | |
| Western Gas Partners LP, | | | | | | | | | | | | |
| 5.375%, 06/01/2021 | | | 18,000,000 | | | | 19,360,008 | | | | | |
| WestRock MWV LLC: | | | | | | | | | | | | |
| 7.375%, 09/01/2019 | | | 6,650,000 | | | | 7,503,687 | | | | | |
| 9.750%, 06/15/2020 | | | 1,060,000 | | | | 1,276,629 | | | | | |
| 8.200%, 01/15/2030 | | | 3,012,000 | | | | 3,932,094 | | | | | |
| Weyerhaeuser Co., | | | | | | | | | | | | |
| 7.375%, 10/01/2019 | | | 11,865,000 | | | | 13,319,483 | | | | | |
| Williams Partners LP: | | | | | | | | | | | | |
| 5.250%, 03/15/2020 | | | 2,000,000 | | | | 2,136,838 | | | | | |
| 6.300%, 04/15/2040 | | | 1,590,000 | | | | 1,697,152 | | | | | |
| Williams Partners LP / ACMP Finance Corp., | | | | | | | | | | | | |
| 6.125%, 07/15/2022 | | | 300,000 | | | | 309,430 | | | | | |
| Woodside Finance Ltd., | | | | | | | | | | | | |
| 3.650%, 03/05/2025 (Acquired 02/26/2015, Cost $14,991,300) * f | | | 15,000,000 | | | | 14,653,260 | | | | | |
| WPX Energy, Inc., | | | | | | | | | | | | |
| 6.000%, 01/15/2022 | | | 4,000,000 | | | | 4,100,000 | | | | | |
| Wynn Las Vegas LLC / Wynn Las Vegas Capital Corp., | | | | | | | | | | | | |
| 4.250%, 05/30/2023 (Acquired 05/15/2013, Cost $4,000,000) * | | | 4,000,000 | | | | 3,808,760 | | | | | |
| Xerox Corp., | | | | | | | | | | | | |
| 6.750%, 02/01/2017 | | | 10,517,000 | | | | 10,554,987 | | | | | |
| Yara International ASA: | | | | | | | | | | | | |
| 7.875%, 06/11/2019 (Acquired 12/03/2012 through 10/31/2013, Cost $6,571,069) * f | | | 5,880,000 | | | | 6,574,299 | | | | | |
| 3.800%, 06/06/2026 (Acquired 06/01/2016 through 07/13/2016, Cost $20,421,408) * f | | | 20,000,000 | | | | 19,605,320 | | | | | |
| Zoetis, Inc.: | | | | | | | | | | | | |
| 3.450%, 11/13/2020 | | | 11,885,000 | | | | 12,198,300 | | | | | |
| 3.250%, 02/01/2023 | | | 24,276,000 | | | | 24,222,933 | | | | | |
| 4.500%, 11/13/2025 | | | 16,000,000 | | | | 16,962,368 | | | | | |
| | | | | | | | 3,349,787,541 | | | | 25.9 | % |
| Utilities | | | | | | | | | |
| Appalachian Power Co., | | | | | | | | | |
| Class P, 6.700%, 08/15/2037 | | | 1,275,000 | | | | 1,633,833 | | | | |
| Arizona Public Service Co., | | | | | | | | | | | |
| 8.750%, 03/01/2019 | | | 1,150,000 | | | | 1,307,290 | | | | |
| Berkshire Hathaway Energy Co., | | | | | | | | | | | |
| 3.500%, 02/01/2025 | | | 7,000,000 | | | | 7,138,691 | | | | |
| CMS Energy Corp., | | | | | | | | | | | |
| 5.050%, 03/15/2022 | | | 1,000,000 | | | | 1,095,480 | | | | |
| Consolidated Edison Co. of New York, Inc., | | | | | | | | | | | |
| 4.625%, 12/01/2054 | | | 7,600,000 | | | | 7,972,871 | | | | |
| Dominion Resources, Inc./VA: | | | | | | | | | | | |
| 2.500%, 12/01/2019 | | | 5,225,000 | | | | 5,280,840 | | | | |
| Class B, 5.950%, 06/15/2035 | | | 1,880,000 | | | | 2,172,426 | | | | |
| Edison International, | | | | | | | | | | | |
| 2.950%, 03/15/2023 | | | 5,000,000 | | | | 4,941,225 | | | | |
| EDP Finance BV: | | | | | | | | | | | |
| 4.900%, 10/01/2019 (Acquired 02/04/2015, Cost $1,625,671) * f | | | 1,564,000 | | | | 1,638,890 | | | | |
| 4.125%, 01/15/2020 (Acquired 03/03/2015 through 03/04/2015, Cost $9,044,960) * f | | | 8,816,000 | | | | 9,009,247 | | | | |
| Enel Finance International NV, | | | | | | | | | | | |
| 6.000%, 10/07/2039 (Acquired 10/04/2016, Cost $761,901) * f | | | 631,000 | | | | 704,941 | | | | |
| Exelon Corp.: | | | | | | | | | | | |
| 3.950%, 06/15/2025 | | | 6,050,000 | | | | 6,219,624 | | | | |
| 3.400%, 04/15/2026 | | | 9,600,000 | | | | 9,419,308 | | | | |
| 5.100%, 06/15/2045 | | | 5,875,000 | | | | 6,245,131 | | | | |
| Exelon Generation Co. LLC: | | | | | | | | | | | |
| 6.200%, 10/01/2017 | | | 4,350,000 | | | | 4,496,082 | | | | |
| 5.600%, 06/15/2042 | | | 6,100,000 | | | | 5,647,709 | | | | |
| FORTIS, Inc., | | | | | | | | | | | |
| 3.055%, 10/04/2026 (Acquired 09/29/2016, Cost $14,150,000) * f | | | 14,150,000 | | | | 13,234,170 | | | | |
| IPALCO Enterprises, Inc., | | | | | | | | | | | |
| 5.000%, 05/01/2018 | | | 1,000,000 | | | | 1,032,500 | | | | |
| KeySpan Corp., | | | | | | | | | | | |
| 8.000%, 11/15/2030 | | | 1,875,000 | | | | 2,506,356 | | | | |
| Mega Advance Investments Ltd., | | | | | | | | | | | |
| 5.000%, 05/12/2021 (Acquired 05/09/2011 through 05/23/2012, Cost $2,804,445) * f | | | 2,800,000 | | | | 2,991,934 | | | | |
| National Rural Utilities Cooperative Finance Corp.: | | | | | | | | | | | |
| 2.300%, 11/15/2019 | | | 5,000,000 | | | | 5,035,315 | | | | |
| 2.850%, 01/27/2025 | | | 9,125,000 | | | | 8,967,238 | | | | |
| NextEra Energy Capital Holdings, Inc., | | | | | | | | | | | |
| Class D, 7.300%, 09/01/2067 ∞ | | | 2,600,000 | | | | 2,597,400 | | | | |
| PSEG Power LLC, | | | | | | | | | | | |
| 3.000%, 06/15/2021 | | | 26,550,000 | | | | 26,631,562 | | | | |
| Public Service Co. of New Mexico, | | | | | | | | | | | |
| 7.950%, 05/15/2018 | | | 6,553,000 | | | | 7,074,304 | | | | |
| RGS I&M Funding Corp., | | | | | | | | | | | |
| Class F*, 9.820%, 06/07/2022 | | | 145,317 | | | | 147,391 | | | | |
| South Carolina Electric & Gas Co., | | | | | | | | | | | |
| 4.100%, 06/15/2046 | | | 7,325,000 | | | | 7,250,483 | | | | |
| Talent Yield Investments Ltd., | | | | | | | | | | | |
| 4.500%, 04/25/2022 (Acquired 04/18/2012, Cost $5,958,960) * f | | | 6,000,000 | | | | 6,285,048 | | | | |
| The Southern Co., | | | | | | | | | | | |
| 2.950%, 07/01/2023 | | | 17,400,000 | | | | 17,175,366 | | | | |
| | | | | | | | 175,852,655 | | | | 1.4 | % |
| Financials | | | | | | | | | | | | |
| ABN AMRO Bank NV: | | | | | | | | | | | | |
| 2.500%, 10/30/2018 (Acquired 10/23/2013 through 10/24/2014, Cost $6,786,406) * f | | | 6,750,000 | | | | 6,803,190 | | | | | |
| 2.450%, 06/04/2020 (Acquired 05/28/2015, Cost $12,771,840) * f | | | 12,800,000 | | | | 12,729,037 | | | | | |
| 4.750%, 07/28/2025 (Acquired 07/21/2015 through 11/21/2016, Cost $18,607,011) * f | | | 18,500,000 | | | | 18,717,542 | | | | | |
| 4.800%, 04/18/2026 (Acquired 04/11/2016 through 11/30/2016, Cost $19,736,228) * f | | | 19,600,000 | | | | 19,985,708 | | | | | |
| AIA Group Ltd., | | | | | | | | | | | | |
| 3.200%, 03/11/2025 (Acquired 03/04/2015, Cost $8,988,570) * f | | | 9,000,000 | | | | 8,686,449 | | | | | |
| AIG SunAmerica Global Financing X, | | | | | | | | | | | | |
| 6.900%, 03/15/2032 (Acquired 11/10/2011, Cost $2,118,528) * | | | 2,000,000 | | | | 2,551,546 | | | | | |
| Ally Financial, Inc.: | | | | | | | | | | | | |
| 5.500%, 02/15/2017 | | | 7,275,000 | | | | 7,302,281 | | | | | |
| 3.600%, 05/21/2018 | | | 7,000,000 | | | | 7,052,500 | | | | | |
| 3.250%, 11/05/2018 | | | 8,000,000 | | | | 8,010,000 | | | | | |
| 8.000%, 12/31/2018 | | | 1,206,000 | | | | 1,316,048 | | | | | |
| 3.750%, 11/18/2019 | | | 18,200,000 | | | | 18,277,896 | | | | | |
| 5.125%, 09/30/2024 | | | 3,000,000 | | | | 3,052,500 | | | | | |
| American Express Credit Corp., | | | | | | | | | | | | |
| 1.396%, 08/15/2019 ∞ | | | 7,450,000 | | | | 7,463,693 | | | | | |
| American International Group, Inc.: | | | | | | | | | | | | |
| 6.400%, 12/15/2020 | | | 3,500,000 | | | | 3,985,044 | | | | | |
| 4.875%, 06/01/2022 | | | 25,351,000 | | | | 27,702,939 | | | | | |
| 3.750%, 07/10/2025 | | | 11,400,000 | | | | 11,473,576 | | | | | |
| 3.875%, 01/15/2035 | | | 5,000,000 | | | | 4,696,670 | | | | | |
| 6.820%, 11/15/2037 | | | 4,173,000 | | | | 5,251,007 | | | | | |
| AmSouth Bancorporation, | | | | | | | | | | | | |
| 6.750%, 11/01/2025 | | | 860,000 | | | | 987,137 | | | | | |
| ANZ New Zealand (Int'l) Ltd./London: | | | | | | | | | | | | |
| 1.750%, 03/29/2018 (Acquired 03/24/2015, Cost $6,149,262) * f | | | 6,150,000 | | | | 6,139,834 | | | | | |
| 2.750%, 02/03/2021 (Acquired 01/27/2016, Cost $9,989,300) * f | | | 10,000,000 | | | | 10,009,490 | | | | | |
| 2.125%, 07/28/2021 (Acquired 07/21/2016, Cost $16,485,150) * f | | | 16,500,000 | | | | 16,053,543 | | | | | |
| Aon PLC, | | | | | | | | | | | | |
| 3.875%, 12/15/2025 f | | | 14,490,000 | | | | 14,769,440 | | | | | |
| Australia & New Zealand Banking Group Ltd./New York NY: | | | | | | | | | | | | |
| 1.600%, 07/15/2019 f | | | 5,000,000 | | | | 4,935,790 | | | | | |
| 3.700%, 11/16/2025 f | | | 2,875,000 | | | | 2,984,759 | | | | | |
| Australia and New Zealand Banking Group Ltd., | | | | | | | | | | | | |
| 4.500%, 03/19/2024 (Acquired 03/12/2014, Cost $8,987,760) * f | | | 9,000,000 | | | | 9,215,613 | | | | | |
| Banco Santander (Brasil) SA/Cayman Islands, | | | | | | | | | | | | |
| 4.625%, 02/13/2017 (Acquired 02/06/2012, Cost $994,140) * f | | | 1,000,000 | | | | 1,002,070 | | | | | |
| Bank of America Corp.: | | | | | | | | | | | | |
| 6.875%, 04/25/2018 | | | 1,250,000 | | | | 1,328,638 | | | | | |
| 7.625%, 06/01/2019 | | | 7,735,000 | | | | 8,691,943 | | | | | |
| 2.625%, 10/19/2020 | | | 4,500,000 | | | | 4,502,569 | | | | | |
| 2.625%, 04/19/2021 | | | 17,500,000 | | | | 17,379,915 | | | | | |
| 3.300%, 01/11/2023 | | | 22,450,000 | | | | 22,524,983 | | | | | |
| 3.248%, 10/21/2027 | | | 6,000,000 | | | | 5,728,200 | | | | | |
| 7.750%, 05/14/2038 | | | 725,000 | | | | 998,183 | | | | | |
| Bank of Montreal, | | | | | | | | | | | | |
| 1.900%, 08/27/2021 f | | | 26,450,000 | | | | 25,630,685 | | | | | |
| BanPonce Trust I, | | | | | | | | | | | | |
| Class A, 8.327%, 02/01/2027 | | | 2,310,000 | | | | 2,185,207 | | | | | |
| Barclays PLC: | | | | | | | | | | | | |
| 2.750%, 11/08/2019 f | | | 7,000,000 | | | | 6,981,520 | | | | | |
| 2.875%, 06/08/2020 f | | | 6,000,000 | | | | 5,949,318 | | | | | |
| 3.250%, 01/12/2021 f | | | 25,000,000 | | | | 25,024,350 | | | | | |
| 3.200%, 08/10/2021 f | | | 10,000,000 | | | | 9,883,910 | | | | | |
| 3.650%, 03/16/2025 f | | | 8,000,000 | | | | 7,734,576 | | | | | |
| BB&T Corp.: | | | | | | | | | | | | |
| 2.450%, 01/15/2020 | | | 15,000,000 | | | | 15,117,555 | | | | | |
| 2.625%, 06/29/2020 | | | 13,000,000 | | | | 13,101,842 | | | | | |
| Berkshire Hathaway Finance Corp., | | | | | | | | | | | | |
| 4.400%, 05/15/2042 | | | 3,500,000 | | | | 3,684,639 | | | | | |
| BNP Paribas SA: | | | | | | | | | | | | |
| 5.000%, 01/15/2021 f | | | 5,000,000 | | | | 5,454,845 | | | | | |
| 3.250%, 03/03/2023 f | | | 4,000,000 | | | | 4,036,488 | | | | | |
| BNZ International Funding Ltd./London: | | | | | | | | | | | | |
| 2.350%, 03/04/2019 (Acquired 09/03/2014 through 11/03/2014, Cost $13,750,633) * f | | | 13,775,000 | | | | 13,824,177 | | | | | |
| 2.750%, 03/02/2021 (Acquired 02/23/2016, Cost $18,736,875) * f | | | 18,750,000 | | | | 18,783,881 | | | | | |
| BPCE SA: | | | | | | | | | | | | |
| 2.500%, 12/10/2018 f | | | 5,500,000 | | | | 5,548,257 | | | | | |
| 2.250%, 01/27/2020 f | | | 4,000,000 | | | | 3,968,616 | | | | | |
| 5.700%, 10/22/2023 (Acquired 10/21/2014 through 11/21/2016, Cost $32,922,773) * f | | | 31,200,000 | | | | 32,800,030 | | | | | |
| 5.150%, 07/21/2024 (Acquired 05/10/2016 through 12/14/2016, Cost $27,133,597) * f | | | 26,500,000 | | | | 26,940,059 | | | | | |
| Caisse Centrale Desjardins: | | | | | | | | | | | | |
| 1.550%, 09/12/2017 (Acquired 07/07/2015, Cost $6,003,506) * f | | | 6,000,000 | | | | 6,002,574 | | | | | |
| 1.552%, 01/29/2018 (Acquired 01/26/2015 through 03/08/2016, Cost $29,174,288) ∞ * f | | | 29,175,000 | | | | 29,145,271 | | | | | |
| Canadian Imperial Bank of Commerce/Canada, | | | | | | | | | | | | |
| 1.600%, 09/06/2019 f | | | 8,475,000 | | | | 8,394,335 | | | | | |
| Capital One Bank (USA) NA, | | | | | | | | | | | | |
| 3.375%, 02/15/2023 | | | 32,638,000 | | | | 32,331,594 | | | | | |
| Capital One Financial Corp., | | | | | | | | | | | | |
| 2.450%, 04/24/2019 | | | 3,975,000 | | | | 4,000,170 | | | | | |
| Capital One NA/Mclean VA: | | | | | | | | | | | | |
| 1.650%, 02/05/2018 | | | 8,400,000 | | | | 8,383,687 | | | | | |
| 1.850%, 09/13/2019 | | | 5,000,000 | | | | 4,943,165 | | | | | |
| CIT Group, Inc.: | | | | | | | | | | | | |
| 4.250%, 08/15/2017 | | | 1,000,000 | | | | 1,013,750 | | | | | |
| 5.500%, 02/15/2019 (Acquired 02/02/2012, Cost $500,000) * | | | 500,000 | | | | 527,500 | | | | | |
| 5.000%, 08/01/2023 | | | 5,000,000 | | | | 5,162,500 | | | | | |
| Citigroup, Inc.: | | | | | | | | | | | | |
| 1.700%, 04/27/2018 | | | 12,650,000 | | | | 12,622,120 | | | | | |
| 2.050%, 12/07/2018 | | | 12,550,000 | | | | 12,548,594 | | | | | |
| 2.400%, 02/18/2020 | | | 8,000,000 | | | | 7,983,768 | | | | | |
| 2.350%, 08/02/2021 | | | 8,125,000 | | | | 7,947,867 | | | | | |
| 2.361%, 09/01/2023 ∞ | | | 8,000,000 | | | | 8,159,064 | | | | | |
| 3.700%, 01/12/2026 | | | 4,700,000 | | | | 4,675,804 | | | | | |
| Citizens Bank NA/Providence RI: | | | | | | | | | | | | |
| 2.450%, 12/04/2019 | | | 36,000,000 | | | | 36,121,068 | | | | | |
| 2.550%, 05/13/2021 | | | 6,175,000 | | | | 6,137,092 | | | | | |
| CNA Financial Corp.: | | | | | | | | | | | | |
| 7.350%, 11/15/2019 | | | 1,175,000 | | | | 1,332,595 | | | | | |
| 5.875%, 08/15/2020 | | | 6,839,000 | | | | 7,554,982 | | | | | |
| 5.750%, 08/15/2021 | | | 9,177,000 | | | | 10,251,599 | | | | | |
| 7.250%, 11/15/2023 | | | 7,400,000 | | | | 8,747,784 | | | | | |
| 4.500%, 03/01/2026 | | | 20,750,000 | | | | 21,699,105 | | | | | |
| CNO Financial Group, Inc.: | | | | | | | | | | | | |
| 4.500%, 05/30/2020 | | | 5,000,000 | | | | 5,125,000 | | | | | |
| 5.250%, 05/30/2025 | | | 18,640,000 | | | | 18,616,700 | | | | | |
| Comerica Bank: | | | | | | | | | | | | |
| 5.200%, 08/22/2017 | | | 5,980,000 | | | | 6,114,323 | | | | | |
| 4.000%, 07/27/2025 | | | 21,425,000 | | | | 21,449,531 | | | | | |
| Commonwealth Bank of Australia, | | | | | | | | | | | | |
| 5.000%, 10/15/2019 (Acquired 03/02/2012 through 08/16/2012, Cost $6,113,532) * f | | | 5,900,000 | | | | 6,338,417 | | | | | |
| Compass Bank: | | | | | | | | | | | | |
| 2.750%, 09/29/2019 | | | 38,994,000 | | | | 38,781,755 | | | | | |
| 3.875%, 04/10/2025 | | | 18,725,000 | | | | 17,819,478 | | | | | |
| Cooperatieve Rabobank UA: | | | | | | | | | | | | |
| 3.875%, 02/08/2022 f | | | 4,150,000 | | | | 4,381,628 | | | | | |
| 3.750%, 07/21/2026 f | | | 23,000,000 | | | | 22,545,704 | | | | | |
| Cooperatieve Rabobank UA/NY, | | | | | | | | | | | | |
| 1.700%, 03/19/2018 f | | | 5,250,000 | | | | 5,250,462 | | | | | |
| Credit Mutuel - CIC Home Loan SFH, | | | | | | | | | | | | |
| 1.500%, 11/16/2017 (Acquired 11/08/2012, Cost $4,981,300) * f | | | 5,000,000 | | | | 4,991,205 | | | | | |
| Credit Suisse AG/New York NY: | | | | | | | | | | | | |
| 1.700%, 04/27/2018 f | | | 5,800,000 | | | | 5,787,217 | | | | | |
| 5.300%, 08/13/2019 f | | | 6,966,000 | | | | 7,516,544 | | | | | |
| 3.000%, 10/29/2021 f | | | 12,600,000 | | | | 12,720,393 | | | | | |
| Credit Suisse Group Funding Guernsey Ltd.: | | | | | | | | | | | | |
| 3.800%, 09/15/2022 f | | | 8,500,000 | | | | 8,575,378 | | | | | |
| 3.750%, 03/26/2025 f | | | 15,000,000 | | | | 14,772,030 | | | | | |
| 4.550%, 04/17/2026 f | | | 5,000,000 | | | | 5,192,875 | | | | | |
| Deutsche Bank AG: | | | | | | | | | | | | |
| 2.950%, 08/20/2020 f | | | 8,625,000 | | | | 8,490,614 | | | | | |
| 3.125%, 01/13/2021 f | | | 9,500,000 | | | | 9,340,391 | | | | | |
| 3.375%, 05/12/2021 f | | | 7,650,000 | | | | 7,572,643 | | | | | |
| 4.250%, 10/14/2021 (Acquired 10/07/2016, Cost $14,570,482) * f | | | 14,575,000 | | | | 14,631,201 | | | | | |
| Deutsche Bank AG/London: | | | | | | | | | | | | |
| 1.512%, 02/13/2017 ∞ f | | | 9,729,000 | | | | 9,726,685 | | | | | |
| 1.582%, 02/13/2018 ∞ f | | | 9,000,000 | | | | 8,943,624 | | | | | |
| 1.875%, 02/13/2018 f | | | 8,494,000 | | | | 8,445,261 | | | | | |
| Discover Bank/Greenwood DE: | | | | | | | | | | | | |
| 8.700%, 11/18/2019 | | | 3,237,000 | | | | 3,675,296 | | | | | |
| 3.100%, 06/04/2020 | | | 12,000,000 | | | | 12,143,832 | | | | | |
| Discover Financial Services, | | | | | | | | | | | | |
| 3.950%, 11/06/2024 | | | 25,000,000 | | | | 24,776,525 | | | | | |
| Fifth Third Bancorp: | | | | | | | | | | | | |
| 2.150%, 08/20/2018 | | | 7,200,000 | | | | 7,245,490 | | | | | |
| 2.875%, 07/27/2020 | | | 9,250,000 | | | | 9,351,750 | | | | | |
| First Horizon National Corp., | | | | | | | | | | | | |
| 3.500%, 12/15/2020 | | | 13,861,000 | | | | 13,987,246 | | | | | |
| First Tennessee Bank NA, | | | | | | | | | | | | |
| 2.950%, 12/01/2019 | | | 12,000,000 | | | | 12,029,760 | | | | | |
| FMR LLC: | | | | | | | | | | | | |
| 4.950%, 02/01/2033 (Acquired 01/29/2013 through 12/23/2014, Cost $4,391,844) * | | | 4,235,000 | | | | 4,386,151 | | | | | |
| 6.500%, 12/14/2040 (Acquired 04/04/2013 through 10/28/2013, Cost $2,259,712) * | | | 1,820,000 | | | | 2,241,827 | | | | | |
| GE Capital International Funding Co. Unlimited Co., | | | | | | | | | | | | |
| 2.342%, 11/15/2020 f | | | 24,096,000 | | | | 24,084,506 | | | | | |
| Genworth Holdings, Inc., | | | | | | | | | | | | |
| 7.625%, 09/24/2021 | | | 1,000,000 | | | | 922,500 | | | | | |
| Goldman Sachs Capital I, | | | | | | | | | | | | |
| 6.345%, 02/15/2034 | | | 125,000 | | | | 148,618 | | | | | |
| Highmark, Inc., | | | | | | | | | | | | |
| 4.750%, 05/15/2021 (Acquired 07/30/2014, Cost $7,841,853) * | | | 7,800,000 | | | | 7,918,739 | | | | | |
| HSBC Bank USA NA/New York NY, | | | | | | | | | | | | |
| 6.000%, 08/09/2017 | | | 2,720,000 | | | | 2,792,240 | | | | | |
| HSBC Finance Corp., | | | | | | | | | | | | |
| 6.676%, 01/15/2021 | | | 32,693,000 | | | | 36,748,272 | | | | | |
| HSBC Holdings PLC: | | | | | | | | | | | | |
| 3.400%, 03/08/2021 f | | | 9,100,000 | | | | 9,253,599 | | | | | |
| 2.650%, 01/05/2022 f | | | 4,000,000 | | | | 3,905,044 | | | | | |
| 3.600%, 05/25/2023 f | | | 6,000,000 | | | | 6,034,788 | | | | | |
| HSBC USA, Inc., | | | | | | | | | | | | |
| 2.350%, 03/05/2020 | | | 2,750,000 | | | | 2,728,495 | | | | | |
| Humana, Inc., | | | | | | | | | | | | |
| 7.200%, 06/15/2018 | | | 800,000 | | | | 859,946 | | | | | |
| Huntington Bancshares Inc./OH: | | | | | | | | | | | | |
| 3.150%, 03/14/2021 | | | 17,100,000 | | | | 17,341,093 | | | | | |
| 2.300%, 01/14/2022 | | | 15,225,000 | | | | 14,766,499 | | | | | |
| ING Bank NV: | | | | | | | | | | | | |
| 2.050%, 08/17/2018 (Acquired 08/10/2015, Cost $4,122,484) * f | | | 4,125,000 | | | | 4,128,407 | | | | | |
| 2.450%, 03/16/2020 (Acquired 03/10/2015, Cost $9,257,656) * f | | | 9,275,000 | | | | 9,273,071 | | | | | |
| 2.750%, 03/22/2021 (Acquired 03/15/2016, Cost $9,166,100) * f | | | 9,175,000 | | | | 9,214,333 | | | | | |
| 5.000%, 06/09/2021 (Acquired 10/12/2011, Cost $2,468,800) * f | | | 2,500,000 | | | | 2,735,678 | | | | | |
| 5.800%, 09/25/2023 (Acquired 01/14/2014 through 04/29/2016, Cost $20,817,628) * f | | | 19,180,000 | | | | 21,074,773 | | | | | |
| Invesco Finance PLC, | | | | | | | | | | | | |
| 3.125%, 11/30/2022 f | | | 5,500,000 | | | | 5,540,563 | | | | | |
| iStar, Inc., | | | | | | | | | | | | |
| 5.850%, 03/15/2017 | | | 675,000 | | | | 678,038 | | | | | |
| Jefferies Group LLC, | | | | | | | | | | | | |
| 6.450%, 06/08/2027 | | | 1,000,000 | | | | 1,096,717 | | | | | |
| John Hancock Life Insurance Co., | | | | | | | | | | | | |
| 7.375%, 02/15/2024 (Acquired 08/26/2010 through 07/13/2016, Cost $20,441,013) * | | | 17,115,000 | | | | 20,226,404 | | | | | |
| JPMorgan Chase & Co.: | | | | | | | | | | | | |
| 2.250%, 01/23/2020 | | | 3,500,000 | | | | 3,491,761 | | | | | |
| 4.250%, 10/15/2020 | | | 8,100,000 | | | | 8,571,712 | | | | | |
| 2.295%, 08/15/2021 | | | 22,000,000 | | | | 21,592,428 | | | | | |
| 4.350%, 08/15/2021 | | | 2,400,000 | | | | 2,567,508 | | | | | |
| 4.500%, 01/24/2022 | | | 4,400,000 | | | | 4,745,096 | | | | | |
| 3.200%, 01/25/2023 | | | 5,350,000 | | | | 5,409,545 | | | | | |
| 2.112%, 10/24/2023 ∞ | | | 10,000,000 | | | | 10,199,690 | | | | | |
| 3.125%, 01/23/2025 | | | 21,850,000 | | | | 21,359,577 | | | | | |
| KEB Hana Bank, | | | | | | | | | | | | |
| 1.750%, 10/18/2019 (Acquired 10/12/2016, Cost $16,696,065) * f | | | 16,750,000 | | | | 16,561,412 | | | | | |
| Kemper Corp., | | | | | | | | | | | | |
| 6.000%, 05/15/2017 | | | 1,000,000 | | | | 1,014,787 | | | | | |
| KeyBank NA/Cleveland OH: | | | | | | | | | | | | |
| 4.625%, 06/15/2018 | | | 2,670,000 | | | | 2,743,689 | | | | | |
| 2.250%, 03/16/2020 | | | 9,425,000 | | | | 9,385,443 | | | | | |
| 3.400%, 05/20/2026 | | | 21,575,000 | | | | 20,950,857 | | | | | |
| KeyCorp, | | | | | | | | | | | | |
| 2.900%, 09/15/2020 | | | 17,200,000 | | | | 17,403,872 | | | | | |
| Kookmin Bank, | | | | | | | | | | | | |
| 1.625%, 07/14/2017 (Acquired 07/07/2014, Cost $4,985,900) * f | | | 5,000,000 | | | | 4,993,085 | | | | | |
| LeasePlan Corp. NV: | | | | | | | | | | | | |
| 3.000%, 10/23/2017 (Acquired 10/15/2012 through 02/07/2013, Cost $10,009,712) * f | | | 10,000,000 | | | | 10,071,720 | | | | | |
| 2.500%, 05/16/2018 (Acquired 09/24/2014 through 08/27/2015, Cost $27,294,366) * f | | | 27,204,000 | | | | 27,243,555 | | | | | |
| 2.875%, 01/22/2019 (Acquired 10/14/2015, Cost $4,996,900) * f | | | 5,000,000 | | | | 4,998,420 | | | | | |
| Liberty Mutual Group, Inc.: | | | | | | | | | | | | |
| 6.500%, 03/15/2035 (Acquired 09/29/2008 through 04/16/2013, Cost $699,672) * | | | 700,000 | | | | 836,382 | | | | | |
| 10.750%, 06/15/2058 (Acquired 05/21/2008 through 05/06/2009, Cost $751,629) ∞ * | | | 900,000 | | | | 1,350,000 | | | | | |
| Liberty Mutual Insurance Co., | | | | | | | | | | | | |
| 7.697%, 10/15/2097 (Acquired 03/26/2003, Cost $240,187) * | | | 375,000 | | | | 460,288 | | | | | |
| Lincoln National Corp.: | | | | | | | | | | | | |
| 8.750%, 07/01/2019 | | | 3,490,000 | | | | 4,015,531 | | | | | |
| 6.050%, 04/20/2067 ∞ | | | 930,000 | | | | 716,100 | | | | | |
| Lloyds Bank PLC: | | | | | | | | | | | | |
| 5.800%, 01/13/2020 (Acquired 01/05/2010 through 01/19/2012, Cost $6,379,553) * f | | | 6,350,000 | | | | 6,924,548 | | | | | |
| 2.400%, 03/17/2020 f | | | 6,700,000 | | | | 6,682,439 | | | | | |
| Macquarie Bank Ltd.: | | | | | | | | | | | | |
| 1.516%, 10/27/2017 (Acquired 10/22/2014, Cost $8,000,000) ∞ * f | | | 8,000,000 | | | | 8,008,872 | | | | | |
| 1.600%, 10/27/2017 (Acquired 10/22/2014, Cost $7,595,364) * f | | | 7,600,000 | | | | 7,599,514 | | | | | |
| 2.400%, 01/21/2020 (Acquired 01/14/2015, Cost $12,971,400) * f | | | 13,000,000 | | | | 12,882,740 | | | | | |
| Macquarie Group Ltd.: | | | | | | | | | | | | |
| 4.875%, 08/10/2017 (Acquired 10/30/2014, Cost $1,017,923) * f | | | 1,000,000 | | | | 1,017,568 | | | | | |
| 7.625%, 08/13/2019 (Acquired 12/15/2014, Cost $2,761,892) * f | | | 2,467,000 | | | | 2,766,943 | | | | | |
| Manufacturers & Traders Trust Co.: | | | | | | | | | | | | |
| 6.625%, 12/04/2017 | | | 1,120,000 | | | | 1,169,232 | | | | | |
| 2.100%, 02/06/2020 | | | 8,000,000 | | | | 7,977,608 | | | | | |
| 1.971%, 12/28/2020 ∞ | | | 9,483,000 | | | | 9,424,139 | | | | | |
| Manulife Financial Corp.: | | | | | | | | | | | | |
| 4.900%, 09/17/2020 f | | | 2,784,000 | | | | 2,986,517 | | | | | |
| 4.150%, 03/04/2026 f | | | 23,875,000 | | | | 24,925,810 | | | | | |
| Marsh & McLennan Companies, Inc.: | | | | | | | | | | | | |
| 4.800%, 07/15/2021 | | | 1,000,000 | | | | 1,086,986 | | | | | |
| 3.300%, 03/14/2023 | | | 6,875,000 | | | | 6,986,884 | | | | | |
| 3.750%, 03/14/2026 | | | 9,225,000 | | | | 9,397,987 | | | | | |
| Massachusetts Mutual Life Insurance Co.: | | | | | | | | | | | | |
| 7.625%, 11/15/2023 (Acquired 10/10/2012, Cost $3,963,100) * | | | 3,184,000 | | | | 3,781,042 | | | | | |
| 8.875%, 06/01/2039 (Acquired 10/03/2012 through 10/31/2016, Cost $52,325,279) * | | | 34,455,000 | | | | 51,722,433 | | | | | |
| MBIA Insurance Corp., | | | | | | | | | | | | |
| 12.140%, 01/15/2033 (Acquired 01/11/2008, Cost $700,000) * | | | 700,000 | | | | 322,000 | | | | | |
| MetLife Capital Trust IV, | | | | | | | | | | | | |
| 7.875%, 12/15/2037 (Acquired 03/26/2012 through 04/05/2013, Cost $1,040,722) * | | | 900,000 | | | | 1,084,950 | | | | | |
| MetLife, Inc.: | | | | | | | | | | | | |
| 7.717%, 02/15/2019 | | | 1,157,000 | | | | 1,294,270 | | | | | |
| 4.875%, 11/13/2043 | | | 3,375,000 | | | | 3,653,977 | | | | | |
| 4.050%, 03/01/2045 | | | 6,400,000 | | | | 6,137,274 | | | | | |
| 4.600%, 05/13/2046 | | | 2,625,000 | | | | 2,763,424 | | | | | |
| Metropolitan Life Global Funding I, | | | | | | | | | | | | |
| 3.875%, 04/11/2022 (Acquired 12/18/2012, Cost $1,578,268) * | | | 1,500,000 | | | | 1,585,058 | | | | | |
| Mitsubishi UFJ Financial Group, Inc.: | | | | | | | | | | | | |
| 2.950%, 03/01/2021 f | | | 10,000,000 | | | | 10,066,750 | | | | | |
| 2.190%, 09/13/2021 f | | | 20,000,000 | | | | 19,449,240 | | | | | |
| Mitsubishi UFJ Trust & Banking Corp., | | | | | | | | | | | | |
| 2.450%, 10/16/2019 (Acquired 07/12/2016, Cost $10,173,539) * f | | | 10,000,000 | | | | 10,011,400 | | | | | |
| Mizuho Bank Ltd.: | | | | | | | | | | | | |
| 1.850%, 03/21/2018 (Acquired 03/14/2013, Cost $1,847,447) * f | | | 1,850,000 | | | | 1,846,777 | | | | | |
| 2.650%, 09/25/2019 (Acquired 09/18/2014, Cost $4,991,400) * f | | | 5,000,000 | | | | 5,034,270 | | | | | |
| 2.400%, 03/26/2020 (Acquired 03/19/2015, Cost $19,974,800) * f | | | 20,000,000 | | | | 19,854,360 | | | | | |
| Morgan Stanley: | | | | | | | | | | | | |
| 6.625%, 04/01/2018 | | | 1,275,000 | | | | 1,348,348 | | | | | |
| 7.300%, 05/13/2019 | | | 4,675,000 | | | | 5,209,250 | | | | | |
| 2.375%, 07/23/2019 | | | 2,000,000 | | | | 2,005,698 | | | | | |
| 5.625%, 09/23/2019 | | | 10,100,000 | | | | 10,947,996 | | | | | |
| 2.650%, 01/27/2020 | | | 7,000,000 | | | | 7,032,970 | | | | | |
| 3.750%, 02/25/2023 | | | 1,000,000 | | | | 1,027,144 | | | | | |
| 2.282%, 10/24/2023 ∞ | | | 10,000,000 | | | | 10,111,110 | | | | | |
| 3.700%, 10/23/2024 | | | 5,000,000 | | | | 5,059,560 | | | | | |
| 4.000%, 07/23/2025 | | | 2,500,000 | | | | 2,562,542 | | | | | |
| 3.875%, 01/27/2026 | | | 7,000,000 | | | | 7,070,742 | | | | | |
| 3.125%, 07/27/2026 | | | 13,175,000 | | | | 12,587,079 | | | | | |
| MUFG Americas Holdings Corp.: | | | | | | | | | | | | |
| 2.250%, 02/10/2020 | | | 7,000,000 | | | | 6,925,429 | | | | | |
| 3.500%, 06/18/2022 | | | 1,150,000 | | | | 1,175,791 | | | | | |
| National Australia Bank Ltd./New York: | | | | | | | | | | | | |
| 1.875%, 07/23/2018 f | | | 6,000,000 | | | | 6,008,316 | | | | | |
| 2.500%, 07/12/2026 f | | | 17,000,000 | | | | 15,785,860 | | | | | |
| Nationwide Building Society: | | | | | | | | | | | | |
| 2.350%, 01/21/2020 (Acquired 01/12/2015, Cost $13,770,454) * | | | 13,775,000 | | | | 13,742,215 | | | | | |
| 3.900%, 07/21/2025 (Acquired 07/14/2015, Cost $8,069,463) * | | | 8,100,000 | | | | 8,335,135 | | | | | |
| Nationwide Financial Services, Inc., | | | | | | | | | | | | |
| 5.375%, 03/25/2021 (Acquired 02/05/2015 through 05/08/2015, Cost $16,198,366) * | | | 14,788,000 | | | | 16,152,060 | | | | | |
| Nationwide Mutual Insurance Co.: | | | | | | | | | | | | |
| 7.875%, 04/01/2033 (Acquired 10/13/2009, Cost $91,322) * | | | 100,000 | | | | 134,078 | | | | | |
| 9.375%, 08/15/2039 (Acquired 10/06/2015 through 08/26/2016, Cost $25,818,324) * | | | 16,803,000 | | | | 25,379,570 | | | | | |
| Navient Corp., | | | | | | | | | | | | |
| 5.625%, 08/01/2033 | | | 50,000 | | | | 41,250 | | | | | |
| New England Mutual Life Insurance Co., | | | | | | | | | | | | |
| 7.875%, 02/15/2024 (Acquired 11/07/2012, Cost $4,012,290) * | | | 3,200,000 | | | | 3,870,851 | | | | | |
| New York Life Insurance Co., | | | | | | | | | | | | |
| 6.750%, 11/15/2039 (Acquired 04/06/2016 through 10/12/2016, Cost $32,717,730) * | | | 24,227,000 | | | | 31,865,894 | | | | | |
| Nippon Life Insurance Co., | | | | | | | | | | | | |
| 5.000%, 10/18/2042 (Acquired 10/11/2012, Cost $2,000,000) ∞ * f | | | 2,000,000 | | | | 2,070,000 | | | | | |
| Nomura Holdings, Inc.: | | | | | | | | | | | | |
| 2.750%, 03/19/2019 f | | | 11,268,000 | | | | 11,374,640 | | | | | |
| 6.700%, 03/04/2020 f | | | 2,525,000 | | | | 2,822,054 | | | | | |
| Peachtree Corners Funding Trust, | | | | | | | | | | | | |
| 3.976%, 02/15/2025 (Acquired 03/10/2015, Cost $16,000,000) * | | | 16,000,000 | | | | 15,611,408 | | | | | |
| Principal Financial Group, Inc.: | | | | | | | | | | | | |
| 3.300%, 09/15/2022 | | | 1,000,000 | | | | 1,011,984 | | | | | |
| 3.125%, 05/15/2023 | | | 3,550,000 | | | | 3,530,621 | | | | | |
| Principal Life Global Funding II, | | | | | | | | | | | | |
| 2.200%, 04/08/2020 (Acquired 03/31/2015, Cost $7,989,440) * | | | 8,000,000 | | | | 7,940,104 | | | | | |
| Protective Life Corp., | | | | | | | | | | | | |
| 7.375%, 10/15/2019 | | | 5,360,000 | | | | 6,070,875 | | | | | |
| Protective Life Global Funding, | | | | | | | | | | | | |
| 2.700%, 11/25/2020 (Acquired 11/19/2015, Cost $10,715,562) * | | | 10,725,000 | | | | 10,740,626 | | | | | |
| Prudential Financial, Inc., | | | | | | | | | | | | |
| 6.000%, 12/01/2017 | | | 384,000 | | | | 398,957 | | | | | |
| Raymond James Financial, Inc.: | | | | | | | | | | | | |
| 8.600%, 08/15/2019 | | | 14,527,000 | | | | 16,665,781 | | | | | |
| 4.950%, 07/15/2046 | | | 15,000,000 | | | | 14,279,925 | | | | | |
| Regions Bank/Birmingham AL, | | | | | | | | | | | | |
| 7.500%, 05/15/2018 | | | 15,864,000 | | | | 16,995,563 | | | | | |
| Regions Financial Corp., | | | | | | | | | | | | |
| 3.200%, 02/08/2021 | | | 30,600,000 | | | | 31,032,990 | | | | | |
| Reliance Standard Life Global Funding II: | | | | | | | | | | | | |
| 2.500%, 01/15/2020 (Acquired 01/07/2015, Cost $13,952,260) * | | | 14,000,000 | | | | 13,915,076 | | | | | |
| 2.375%, 05/04/2020 (Acquired 04/27/2015 through 11/08/2016, Cost $23,762,240) * | | | 23,750,000 | | | | 23,482,361 | | | | | |
| 3.050%, 01/20/2021 (Acquired 01/12/2016, Cost $10,941,403) * | | | 10,954,000 | | | | 11,041,205 | | | | | |
| Royal Bank of Canada, | | | | | | | | | | | | |
| 1.138%, 10/13/2017 ∞ f | | | 7,000,000 | | | | 6,997,627 | | | | | |
| Santander Bank NA, | | | | | | | | | | | | |
| 8.750%, 05/30/2018 | | | 7,034,000 | | | | 7,570,596 | | | | | |
| Santander Issuances SAU, | | | | | | | | | | | | |
| 5.179%, 11/19/2025 f | | | 6,150,000 | | | | 6,207,828 | | | | | |
| Santander UK Group Holdings PLC, | | | | | | | | | | | | |
| 2.875%, 08/05/2021 f | | | 12,000,000 | | | | 11,734,260 | | | | | |
| Santander UK PLC: | | | | | | | | | | | | |
| 5.000%, 11/07/2023 (Acquired 10/31/2013 through 09/14/2016, Cost $26,893,427) * f | | | 25,575,000 | | | | 26,018,061 | | | | | |
| 4.000%, 03/13/2024 f | | | 7,700,000 | | | | 8,007,092 | | | | | |
| Simon Property Group LP, | | | | | | | | | | | | |
| 1.500%, 02/01/2018 (Acquired 12/10/2012, Cost $11,962,200) * | | | 12,000,000 | | | | 11,994,528 | | | | | |
| Societe Generale SA: | | | | | | | | | | | | |
| 5.200%, 04/15/2021 (Acquired 09/20/2011 through 02/13/2013, Cost $10,010,234) * f | | | 10,100,000 | | | | 11,088,033 | | | | | |
| 5.000%, 01/17/2024 (Acquired 01/14/2014, Cost $2,972,790) * f | | | 3,000,000 | | | | 3,046,335 | | | | | |
| 4.250%, 04/14/2025 (Acquired 04/08/2015, Cost $6,201,657) * f | | | 6,300,000 | | | | 6,111,624 | | | | | |
| 4.750%, 11/24/2025 (Acquired 11/17/2015, Cost $10,759,176) * f | | | 10,800,000 | | | | 10,864,130 | | | | | |
| SpareBank 1 Boligkreditt AS, | | | | | | | | | | | | |
| 1.750%, 11/15/2019 (Acquired 11/07/2012, Cost $4,961,150) * f | | | 5,000,000 | | | | 4,934,395 | | | | | |
| Springleaf Finance Corp., | | | | | | | | | | | | |
| 6.900%, 12/15/2017 | | | 1,000,000 | | | | 1,042,800 | | | | | |
| Standard Chartered PLC: | | | | | | | | | | | | |
| 1.700%, 04/17/2018 (Acquired 04/13/2015, Cost $9,988,900) * f | | | 10,000,000 | | | | 9,928,000 | | | | | |
| 2.100%, 08/19/2019 (Acquired 08/16/2016 through 11/17/2016, Cost $18,600,526) * f | | | 18,685,000 | | | | 18,471,487 | | | | | |
| 3.050%, 01/15/2021 (Acquired 01/12/2016, Cost $13,971,720) * f | | | 14,000,000 | | | | 13,983,172 | | | | | |
| 5.700%, 03/26/2044 (Acquired 03/21/2014 through 05/01/2014, Cost $14,101,282) * f | | | 14,000,000 | | | | 13,982,402 | | | | | |
| Stifel Financial Corp.: | | | | | | | | | | | | |
| 3.500%, 12/01/2020 | | | 5,000,000 | | | | 5,013,875 | | | | | |
| 4.250%, 07/18/2024 | | | 13,115,000 | | | | 13,024,926 | | | | | |
| Sumitomo Mitsui Banking Corp.: | | | | | | | | | | | | |
| 1.950%, 07/23/2018 f | | | 4,000,000 | | | | 3,997,160 | | | | | |
| 2.250%, 07/11/2019 f | | | 12,050,000 | | | | 12,035,974 | | | | | |
| 2.450%, 01/16/2020 f | | | 12,200,000 | | | | 12,149,528 | | | | | |
| 3.000%, 01/18/2023 f | | | 2,500,000 | | | | 2,474,860 | | | | | |
| SunTrust Bank/Atlanta GA: | | | | | | | | | | | | |
| 7.250%, 03/15/2018 | | | 5,682,000 | | | | 6,027,216 | | | | | |
| 3.300%, 05/15/2026 | | | 28,734,000 | | | | 27,733,913 | | | | | |
| SunTrust Banks, Inc., | | | | | | | | | | | | |
| 2.900%, 03/03/2021 | | | 15,000,000 | | | | 15,211,875 | | | | | |
| Swedbank AB, | | | | | | | | | | | | |
| 2.650%, 03/10/2021 (Acquired 03/03/2016, Cost $7,016,851) * f | | | 7,025,000 | | | | 7,023,082 | | | | | |
| Synchrony Financial: | | | | | | | | | | | | |
| 3.750%, 08/15/2021 | | | 16,650,000 | | | | 17,113,153 | | | | | |
| 4.250%, 08/15/2024 | | | 33,225,000 | | | | 33,821,322 | | | | | |
| 4.500%, 07/23/2025 | | | 4,600,000 | | | | 4,724,964 | | | | | |
| TD Ameritrade Holding Corp., | | | | | | | | | | | | |
| 5.600%, 12/01/2019 | | | 1,000,000 | | | | 1,098,579 | | | | | |
| The Bank of Nova Scotia: | | | | | | | | | | | | |
| 1.700%, 06/11/2018 f | | | 15,325,000 | | | | 15,330,256 | | | | | |
| 4.500%, 12/16/2025 f | | | 8,048,000 | | | | 8,267,606 | | | | | |
| The Bank of Tokyo-Mitsubishi UFJ Ltd.: | | | | | | | | | | | | |
| 2.350%, 02/23/2017 (Acquired 02/14/2012, Cost $5,996,640) * f | | | 6,000,000 | | | | 6,007,638 | | | | | |
| 2.300%, 03/05/2020 (Acquired 02/25/2015, Cost $7,844,819) * f | | | 7,850,000 | | | | 7,762,865 | | | | | |
| The Bear Stearns Companies LLC, | | | | | | | | | | | | |
| 7.250%, 02/01/2018 | | | 2,250,000 | | | | 2,381,036 | | | | | |
| The Chubb Corp., | | | | | | | | | | | | |
| 6.375%, 04/15/2037 ∞ | | | 1,320,000 | | | | 1,240,800 | | | | | |
| The Goldman Sachs Group, Inc.: | | | | | | | | | | | | |
| 5.950%, 01/18/2018 | | | 3,000,000 | | | | 3,125,226 | | | | | |
| 6.150%, 04/01/2018 | | | 6,500,000 | | | | 6,837,447 | | | | | |
| 7.500%, 02/15/2019 | | | 1,825,000 | | | | 2,023,160 | | | | | |
| 2.550%, 10/23/2019 | | | 4,000,000 | | | | 4,029,368 | | | | | |
| 2.300%, 12/13/2019 | | | 12,450,000 | | | | 12,435,869 | | | | | |
| 5.250%, 07/27/2021 | | | 1,000,000 | | | | 1,095,990 | | | | | |
| 2.350%, 11/15/2021 | | | 10,000,000 | | | | 9,715,600 | | | | | |
| 5.750%, 01/24/2022 | | | 15,100,000 | | | | 16,975,647 | | | | | |
| 2.537%, 11/29/2023 ∞ | | | 10,000,000 | | | | 10,310,070 | | | | | |
| 3.500%, 01/23/2025 | | | 9,250,000 | | | | 9,126,966 | | | | | |
| 6.750%, 10/01/2037 | | | 300,000 | | | | 370,454 | | | | | |
| The Guardian Life Insurance Co. of America: | | | | | | | | | | | | |
| 7.375%, 09/30/2039 (Acquired 08/27/2015, Cost $8,413,642) * | | | 6,507,000 | | | | 8,675,295 | | | | | |
| 4.875%, 06/19/2064 (Acquired 06/16/2014, Cost $2,989,950) * | | | 3,000,000 | | | | 2,946,909 | | | | | |
| The Hartford Financial Services Group, Inc.: | | | | | | | | | | | | |
| 5.375%, 03/15/2017 | | | 2,913,000 | | | | 2,936,589 | | | | | |
| 5.125%, 04/15/2022 | | | 6,097,000 | | | | 6,762,701 | | | | | |
| 8.125%, 06/15/2038 ∞ | | | 1,365,000 | | | | 1,461,915 | | | | | |
| The Huntington National Bank: | | | | | | | | | | | | |
| 2.000%, 06/30/2018 | | | 13,000,000 | | | | 13,005,616 | | | | | |
| 2.200%, 11/06/2018 | | | 5,000,000 | | | | 5,014,150 | | | | | |
| 2.875%, 08/20/2020 | | | 12,000,000 | | | | 12,106,896 | | | | | |
| The Toronto-Dominion Bank, | | | | | | | | | | | | |
| 3.625%, 09/15/2031 ∞ f | | | 21,928,000 | | | | 21,419,928 | | | | | |
| Torchmark Corp., | | | | | | | | | | | | |
| 3.800%, 09/15/2022 | | | 1,275,000 | | | | 1,302,984 | | | | | |
| Trinity Acquisition PLC, | | | | | | | | | | | | |
| 4.400%, 03/15/2026 f | | | 15,776,000 | | | | 15,969,319 | | | | | |
| UBS AG/Stamford CT, | | | | | | | | | | | | |
| 1.800%, 03/26/2018 f | | | 14,500,000 | | | | 14,510,020 | | | | | |
| UBS Group Funding Jersey Ltd.: | | | | | | | | | | | | |
| 2.437%, 09/24/2020 (Acquired 09/21/2015, Cost $26,350,000) ∞ * f | | | 26,350,000 | | | | 26,655,159 | | | | | |
| 2.650%, 02/01/2022 (Acquired 10/14/2016 through 11/07/2016, Cost $9,967,450) * f | | | 10,000,000 | | | | 9,718,950 | | | | | |
| UnitedHealth Group, Inc., | | | | | | | | | | | | |
| 4.625%, 07/15/2035 | | | 12,175,000 | | | | 13,271,225 | | | | | |
| Voya Financial, Inc.: | | | | | | | | | | | | |
| 5.500%, 07/15/2022 | | | 22,944,000 | | | | 25,341,235 | | | | | |
| 3.650%, 06/15/2026 | | | 7,102,000 | | | | 6,944,158 | | | | | |
| Wells Fargo & Co.: | | | | | | | | | | | | |
| Class N, 2.150%, 01/30/2020 | | | 7,000,000 | | | | 6,966,925 | | | | | |
| 2.600%, 07/22/2020 | | | 8,950,000 | | | | 9,001,731 | | | | | |
| 2.500%, 03/04/2021 | | | 10,000,000 | | | | 9,925,900 | | | | | |
| 2.117%, 10/31/2023 ∞ | | | 10,000,000 | | | | 10,123,430 | | | | | |
| 3.000%, 02/19/2025 | | | 5,000,000 | | | | 4,803,195 | | | | | |
| 3.000%, 04/22/2026 | | | 4,000,000 | | | | 3,816,928 | | | | | |
| Wells Fargo Bank NA, | | | | | | | | | | | | |
| 6.000%, 11/15/2017 | | | 8,322,000 | | | | 8,636,505 | | | | | |
| Westpac Banking Corp.: | | | | | | | | | | | | |
| 1.600%, 08/19/2019 f | | | 15,000,000 | | | | 14,821,335 | | | | | |
| 4.875%, 11/19/2019 f | | | 636,000 | | | | 682,478 | | | | | |
| 2.100%, 05/13/2021 f | | | 13,300,000 | | | | 13,004,142 | | | | | |
| 4.322%, 11/23/2031 ∞ f | | | 10,000,000 | | | | 10,031,850 | | | | | |
| Willis North America, Inc., | | | | | | | | | | | | |
| 7.000%, 09/29/2019 | | | 16,003,000 | | | | 17,804,778 | | | | | |
| Willis Towers Watson PLC, | | | | | | | | | | | | |
| 5.750%, 03/15/2021 f | | | 20,329,000 | | | | 22,214,047 | | | | | |
| | | | | | | | 2,941,920,551 | | | | 22.8 | % |
| Total Corporate Bonds | | | | | | | 6,467,560,747 | | | | 50.1 | % |
| Taxable Municipal Bonds | | | | | | | | | |
| Bellevue Union School District, | | | | | | | | | |
| 5.000%, 08/01/2028 | | | 625,000 | | | | 659,950 | | | | |
| California Housing Finance Agency, | | | | | | | | | | | |
| 2.794%, 08/01/2036 (Callable 08/01/2025) | | | 20,550,000 | | | | 20,177,017 | | | | |
| California Qualified School Bond Joint Powers Authority: | | | | | | | | | | | |
| 6.739%, 09/01/2026 | | | 2,415,000 | | | | 2,749,985 | | | | |
| 7.155%, 03/01/2027 | | | 1,700,000 | | | | 1,967,138 | | | | |
| California School Finance Authority, | | | | | | | | | | | |
| 5.041%, 07/01/2020 | | | 1,500,000 | | | | 1,608,660 | | | | |
| Camden County Improvement Authority, | | | | | | | | | | | |
| 7.747%, 07/01/2034 (Callable 07/01/2020) | | | 1,100,000 | | | | 1,258,554 | | | | |
| Central Valley Support Joint Powers Agency, | | | | | | | | | | | |
| 5.676%, 09/01/2024 | | | 1,500,000 | | | | 1,644,585 | | | | |
| City of Vernon CA Electric System Revenue, | | | | | | | | | | | |
| 4.500%, 08/01/2022 | | | 7,500,000 | | | | 7,836,150 | | | | |
| City of Weyauwega WI Sewerage System Revenue, | | | | | | | | | | | |
| 3.150%, 05/01/2017 (Callable 01/30/2017) | | | 5,700,000 | | | | 5,698,974 | | | | |
| City of Williston ND, | | | | | | | | | | | |
| 3.100%, 07/15/2025 (Callable 01/20/2017) | | | 8,430,000 | | | | 8,430,337 | | | | |
| Colton Joint Unified School District, | | | | | | | | | | | |
| 6.008%, 08/01/2026 | | | 1,250,000 | | | | 1,437,925 | | | | |
| County of Contra Costa CA, | | | | | | | | | | | |
| 5.140%, 06/01/2017 | | | 1,300,000 | | | | 1,315,587 | | | | |
| Elgin Local School District, | | | | | | | | | | | |
| 5.499%, 08/31/2027 (Callable 12/01/2019) | | | 1,000,000 | | | | 1,042,970 | | | | |
| Hillsborough City School District: | | | | | | | | | | | |
| –%, 09/01/2036 (Callable 09/01/2021) | | | 10,000,000 | | | | 3,910,600 | | | | |
| –%, 09/01/2042 (Callable 09/01/2021) | | | 10,000,000 | | | | 2,920,100 | | | | |
| Iowa Tobacco Settlement Authority, | | | | | | | | | | | |
| 6.500%, 06/01/2023 (Callable 01/30/2017) | | | 2,205,000 | | | | 2,166,457 | | | | |
| New Hampshire Housing Finance Authority: | | | | | | | | | | | |
| 3.100%, 07/01/2021 | | | 1,625,000 | | | | 1,626,690 | | | | |
| 3.750%, 07/01/2034 (Callable 07/01/2023) | | | 5,415,000 | | | | 5,500,774 | | | | |
| New Jersey Economic Development Authority: | | | | | | | | | | | |
| 1.802%, 06/15/2017 | | | 2,370,000 | | | | 2,378,295 | | | | |
| 1.802%, 06/15/2017 | | | 12,630,000 | | | | 12,646,419 | | | | |
| 3.375%, 06/15/2017 | | | 13,000,000 | | | | 13,130,650 | | | | |
| North Carolina Housing Finance Agency: | | | | | | | | | | | |
| 2.870%, 07/01/2032 (Callable 01/01/2024) | | | 4,725,000 | | | | 4,675,198 | | | | |
| 2.812%, 07/01/2035 (Callable 01/01/2024) | | | 6,340,000 | | | | 6,262,272 | | | | |
| North East Independent School District/TX, | | | | | | | | | | | |
| 5.240%, 08/01/2027 | | | 3,000,000 | | | | 3,464,760 | | | | |
| Port of Oakland, | | | | | | | | | | | |
| 5.000%, 11/01/2020 (Callable 11/01/2017) | | | 2,900,000 | | | | 2,985,724 | | | | |
| Rhode Island Housing & Mortgage Finance Corp./RI, | | | | | | | | | | | |
| 2.913%, 10/01/2039 (Callable 10/01/2023) | | | 3,695,000 | | | | 3,673,606 | | | | |
| San Dieguito Public Facilities Authority, | | | | | | | | | | | |
| 6.459%, 05/01/2027 | | | 1,825,000 | | | | 2,228,142 | | | | |
| State of Illinois: | | | | | | | | | | | |
| 5.163%, 02/01/2018 | | | 3,000,000 | | | | 3,070,110 | | | | |
| 6.200%, 07/01/2021 | | | 17,500,000 | | | | 18,389,000 | | | | |
| State Public School Building Authority, | | | | | | | | | | | |
| 5.000%, 09/15/2027 | | | 1,998,000 | | | | 2,030,348 | | | | |
| Three Rivers Local School District, | | | | | | | | | | | |
| 5.209%, 09/15/2027 (Callable 12/01/2020) | | | 1,350,000 | | | | 1,398,492 | | | | |
| Town of Davie FL Water & Sewer Revenue, | | | | | | | | | | | |
| 6.599%, 10/01/2030 (Callable 10/01/2020) | | | 1,000,000 | | | | 1,131,510 | | | | |
| West Allis West Milwaukee School District, | | | | | | | | | | | |
| 4.000%, 04/01/2020 (Callable 04/01/2018) | | | 15,550,000 | | | | 15,627,128 | | | | |
| West Contra Costa Unified School District, | | | | | | | | | | | |
| 6.250%, 08/01/2030 | | | 4,320,000 | | | | 5,231,131 | | | | |
| Westlake City School District, | | | | | | | | | | | |
| 5.227%, 12/01/2026 (Callable 12/01/2020) | | | 1,160,000 | | | | 1,184,430 | | | | |
| | | | | | | | 171,459,668 | | | | 1.3 | % |
| Residential Mortgage-Backed Securities | | | | | | | | | | | | |
| U.S. Government Agency Issues | | | | | | | | | | | | |
| Fannie Mae REMIC Trust: | | | | | | | | | | | | |
| Series 1989-94, Class G, 7.500%, 12/25/2019 | | | 2,299 | | | | 2,417 | | | | | |
| Series 1990-15, Class J, 7.000%, 02/25/2020 | | | 4,821 | | | | 4,973 | | | | | |
| Series 1991-21, Class J, 7.000%, 03/25/2021 | | | 1,615 | | | | 1,708 | | | | | |
| Series 1991-43, Class J, 7.000%, 05/25/2021 | | | 27,529 | | | | 29,571 | | | | | |
| Series 1991-65, Class Z, 6.500%, 06/25/2021 | | | 19,829 | | | | 20,820 | | | | | |
| Series 1992-129, Class L, 6.000%, 07/25/2022 | | | 59,218 | | | | 63,224 | | | | | |
| Series 1993-32, Class H, 6.000%, 03/25/2023 | | | 15,150 | | | | 16,165 | | | | | |
| Series 1993-58, Class H, 5.500%, 04/25/2023 | | | 67,752 | | | | 72,249 | | | | | |
| Series 2004-90, Class LH, 5.000%, 04/25/2034 | | | 1,094,222 | | | | 1,127,316 | | | | | |
| Series 2004-W6, Class 1A6, 5.500%, 07/25/2034 | | | 4,772 | | | | 4,766 | | | | | |
| Federal Gold Loan Mortgage Corp. (FGLMC): | | | | | | | | | | | | |
| 5.000%, 12/01/2020 | | | 29,237 | | | | 30,657 | | | | | |
| 5.000%, 05/01/2021 | | | 53,652 | | | | 56,227 | | | | | |
| 6.000%, 06/01/2021 | | | 11,621 | | | | 12,365 | | | | | |
| 3.000%, 05/01/2027 | | | 7,787,216 | | | | 7,996,504 | | | | | |
| 6.500%, 12/01/2028 | | | 22,232 | | | | 25,277 | | | | | |
| 6.500%, 06/01/2029 | | | 9,677 | | | | 10,930 | | | | | |
| 3.000%, 10/01/2030 | | | 50,230,441 | | | | 51,630,892 | | | | | |
| 3.500%, 05/01/2032 | | | 36,555,481 | | | | 37,911,769 | | | | | |
| 5.000%, 03/01/2036 | | | 5,566,930 | | | | 6,080,747 | | | | | |
| 5.500%, 04/01/2037 | | | 183,083 | | | | 204,030 | | | | | |
| 5.500%, 04/01/2038 | | | 96,385 | | | | 107,482 | | | | | |
| 5.500%, 05/01/2038 | | | 193,149 | | | | 214,721 | | | | | |
| 5.500%, 01/01/2039 | | | 28,086,361 | | | | 31,633,271 | | | | | |
| 4.500%, 11/01/2039 | | | 3,474,513 | | | | 3,738,205 | | | | | |
| 4.500%, 11/01/2039 | | | 1,056,447 | | | | 1,137,113 | | | | | |
| 4.500%, 08/01/2040 | | | 3,374,978 | | | | 3,631,980 | | | | | |
| 4.500%, 08/01/2040 | | | 5,005,652 | | | | 5,389,500 | | | | | |
| 3.500%, 06/01/2042 | | | 8,727,272 | | | | 8,988,736 | | | | | |
| 3.500%, 07/01/2042 | | | 31,549,123 | | | | 32,491,980 | | | | | |
| 3.000%, 08/01/2042 | | | 26,996,154 | | | | 26,985,154 | | | | | |
| 3.500%, 09/01/2042 | | | 19,839,527 | | | | 20,440,267 | | | | | |
| 3.000%, 11/01/2042 | | | 66,831,036 | | | | 66,803,808 | | | | | |
| 3.000%, 01/01/2043 | | | 51,487,950 | | | | 51,466,983 | | | | | |
| 3.000%, 02/01/2043 | | | 8,847,038 | | | | 8,843,433 | | | | | |
| 3.500%, 02/01/2043 | | | 19,242,513 | | | | 19,823,113 | | | | | |
| 3.000%, 03/01/2043 | | | 9,425,090 | | | | 9,421,250 | | | | | |
| 3.000%, 04/01/2043 | | | 16,860,291 | | | | 16,853,420 | | | | | |
| 3.000%, 04/01/2043 | | | 16,645,871 | | | | 16,639,089 | | | | | |
| 3.000%, 06/01/2043 | | | 14,796,978 | | | | 14,772,624 | | | | | |
| 3.000%, 08/01/2043 | | | 32,127,304 | | | | 32,047,850 | | | | | |
| 3.500%, 08/01/2044 | | | 36,484,246 | | | | 37,418,416 | | | | | |
| 4.000%, 09/01/2044 | | | 21,737,447 | | | | 22,835,820 | | | | | |
| 4.000%, 10/01/2044 | | | 30,628,497 | | | | 32,348,949 | | | | | |
| 4.000%, 02/01/2045 | | | 23,734,870 | | | | 24,939,076 | | | | | |
| 3.500%, 06/01/2045 | | | 36,811,982 | | | | 37,853,861 | | | | | |
| 3.000%, 10/01/2045 | | | 45,737,970 | | | | 45,700,430 | | | | | |
| 3.500%, 01/01/2046 | | | 69,841,415 | | | | 71,730,471 | | | | | |
| 3.500%, 08/01/2046 | | | 54,630,728 | | | | 56,169,678 | | | | | |
| Federal Home Loan Mortgage Corp. (FHLMC): | | | | | | | | | | | | |
| Series 1053, Class G, 7.000%, 03/15/2021 | | | 1,858 | | | | 2,044 | | | | | |
| Series 136, Class E, 6.000%, 04/15/2021 | | | 2,940 | | | | 3,041 | | | | | |
| Series 2804, Class VC, 5.000%, 07/15/2021 | | | 105,531 | | | | 107,621 | | | | | |
| Series 1122, Class G, 7.000%, 08/15/2021 | | | 5,153 | | | | 5,474 | | | | | |
| Series 1186, Class I, 7.000%, 12/15/2021 | | | 9,488 | | | | 10,391 | | | | | |
| Federal National Mortgage Association (FNMA): | | | | | | | | | | | | |
| 5.000%, 11/01/2021 | | | 155,288 | | | | 159,890 | | | | | |
| 3.000%, 04/01/2027 | | | 14,506,074 | | | | 14,918,382 | | | | | |
| 3.500%, 07/01/2027 | | | 54,916,919 | | | | 57,368,866 | | | | | |
| 2.500%, 12/01/2027 | | | 21,658,682 | | | | 21,725,035 | | | | | |
| 5.000%, 05/01/2028 | | | 59,175 | | | | 64,427 | | | | | |
| 3.500%, 07/01/2028 | | | 40,614,985 | | | | 42,364,759 | | | | | |
| 6.500%, 09/01/2028 | | | 16,284 | | | | 18,424 | | | | | |
| 6.500%, 02/01/2029 | | | 36,010 | | | | 40,770 | | | | | |
| 4.500%, 07/01/2030 | | | 6,616,747 | | | | 7,122,679 | | | | | |
| 3.000%, 08/01/2030 | | | 40,002,709 | | | | 41,117,753 | | | | | |
| 4.000%, 11/01/2031 | | | 28,191,115 | | | | 29,908,019 | | | | | |
| 5.500%, 01/01/2032 | | | 14,223 | | | | 15,948 | | | | | |
| 5.000%, 09/01/2033 | | | 19,954,791 | | | | 21,813,878 | | | | | |
| 4.500%, 10/01/2033 | | | 36,367,171 | | | | 39,245,166 | | | | | |
| 4.000%, 01/01/2034 | | | 19,183,962 | | | | 20,364,921 | | | | | |
| 5.500%, 04/01/2034 | | | 1,101,042 | | | | 1,235,034 | | | | | |
| 4.000%, 09/01/2034 | | | 28,218,104 | | | | 29,951,857 | | | | | |
| 5.500%, 09/01/2034 | | | 34,584 | | | | 38,789 | | | | | |
| 5.000%, 02/01/2035 | | | 27,752,210 | | | | 30,388,563 | | | | | |
| 5.000%, 02/01/2035 | | | 22,555,797 | | | | 24,689,239 | | | | | |
| 5.500%, 02/01/2035 | | | 16,825 | | | | 18,868 | | | | | |
| 5.000%, 04/01/2035 | | | 1,955,960 | | | | 2,138,957 | | | | | |
| 5.000%, 07/01/2035 | | | 5,706,052 | | | | 6,261,121 | | | | | |
| 5.000%, 02/01/2036 | | | 3,565,475 | | | | 3,893,805 | | | | | |
| 5.000%, 03/01/2036 | | | 1,602,489 | | | | 1,749,753 | | | | | |
| 5.500%, 04/01/2036 | | | 5,440,434 | | | | 6,085,452 | | | | | |
| 6.000%, 05/01/2038 | | | 9,163,986 | | | | 10,381,544 | | | | | |
| 4.000%, 06/01/2039 | | | 16,395,961 | | | | 17,384,516 | | | | | |
| 4.500%, 01/01/2040 | | | 12,011,377 | | | | 12,955,998 | | | | | |
| 5.000%, 06/01/2040 | | | 21,319,449 | | | | 23,254,884 | | | | | |
| 4.000%, 08/01/2040 | | | 1,507,702 | | | | 1,589,683 | | | | | |
| 4.500%, 08/01/2040 | | | 7,309,125 | | | | 7,875,723 | | | | | |
| 4.500%, 08/01/2040 | | | 19,358,022 | | | | 20,864,775 | | | | | |
| 4.000%, 10/01/2040 | | | 2,799,960 | | | | 2,945,868 | | | | | |
| 4.000%, 12/01/2040 | | | 5,009,055 | | | | 5,309,788 | | | | | |
| 3.500%, 01/01/2041 | | | 2,598,264 | | | | 2,665,067 | | | | | |
| 4.000%, 01/01/2041 | | | 5,916,465 | | | | 6,231,664 | | | | | |
| 3.500%, 02/01/2041 | | | 3,034,341 | | | | 3,129,025 | | | | | |
| 3.500%, 03/01/2041 | | | 22,658,073 | | | | 23,364,957 | | | | | |
| 4.000%, 03/01/2041 | | | 10,704,353 | | | | 11,299,497 | | | | | |
| 4.500%, 07/01/2041 | | | 8,812,925 | | | | 9,478,728 | | | | | |
| 3.500%, 09/01/2041 | | | 46,887,955 | | | | 48,351,560 | | | | | |
| 4.000%, 09/01/2041 | | | 4,821,506 | | | | 5,069,539 | | | | | |
| 3.500%, 11/01/2041 | | | 25,662,350 | | | | 26,462,633 | | | | | |
| 3.500%, 12/01/2041 | | | 4,374,593 | | | | 4,511,063 | | | | | |
| 4.000%, 12/01/2041 | | | 21,245,281 | | | | 22,385,472 | | | | | |
| 4.000%, 01/01/2042 | | | 40,342,207 | | | | 42,492,437 | | | | | |
| 4.500%, 01/01/2042 | | | 16,838,415 | | | | 18,159,965 | | | | | |
| 3.000%, 05/01/2042 | | | 4,517,841 | | | | 4,516,555 | | | | | |
| 3.500%, 05/01/2042 | | | 26,161,897 | | | | 26,985,161 | | | | | |
| 3.500%, 06/01/2042 | | | 9,689,748 | | | | 9,991,415 | | | | | |
| 3.500%, 08/01/2042 | | | 15,360,449 | | | | 15,838,991 | | | | | |
| 3.500%, 09/01/2042 | | | 25,133,373 | | | | 25,912,725 | | | | | |
| 3.000%, 03/01/2043 | | | 8,559,612 | | | | 8,557,167 | | | | | |
| 3.000%, 05/01/2043 | | | 35,993,392 | | | | 35,983,120 | | | | | |
| 3.500%, 05/01/2043 | | | 23,132,005 | | | | 23,845,602 | | | | | |
| 3.000%, 06/01/2043 | | | 37,702,712 | | | | 37,691,960 | | | | | |
| 3.000%, 07/01/2043 | | | 22,756,392 | | | | 22,749,902 | | | | | |
| 4.000%, 07/01/2043 | | | 45,843,546 | | | | 48,420,677 | | | | | |
| 3.000%, 08/01/2043 | | | 10,825,955 | | | | 10,822,874 | | | | | |
| 4.500%, 09/01/2043 | | | 11,743,262 | | | | 12,654,727 | | | | | |
| 4.000%, 01/01/2045 | | | 25,129,233 | | | | 26,505,497 | | | | | |
| 3.500%, 02/01/2045 | | | 75,107,508 | | | | 77,445,482 | | | | | |
| 4.000%, 02/01/2045 | | | 33,271,930 | | | | 35,150,667 | | | | | |
| 4.000%, 03/01/2045 | | | 16,001,183 | | | | 16,905,705 | | | | | |
| Government National Mortgage Association (GNMA): | | | | | | | | | | | | |
| 6.000%, 12/20/2028 | | | 26,064 | | | | 29,670 | | | | | |
| 6.500%, 01/20/2029 | | | 12,970 | | | | 14,932 | | | | | |
| 6.000%, 11/20/2033 | | | 18,671 | | | | 21,677 | | | | | |
| 5.000%, 07/20/2040 | | | 1,024,726 | | | | 1,128,200 | | | | | |
| 3.500%, 10/20/2041 | | | 16,666,836 | | | | 17,374,639 | | | | | |
| 4.000%, 06/20/2042 | | | 19,508,885 | | | | 20,821,984 | | | | | |
| 3.500%, 09/20/2042 | | | 12,171,483 | | | | 12,710,928 | | | | | |
| 3.000%, 04/20/2045 | | | 25,998,654 | | | | 26,361,816 | | | | | |
| 3.500%, 04/20/2045 | | | 39,854,952 | | | | 41,472,062 | | | | | |
| 4.000%, 05/20/2045 | | | 31,948,952 | | | | 34,087,222 | | | | | |
| 3.500%, 06/20/2045 | | | 36,514,284 | | | | 37,997,994 | | | | | |
| 4.500%, 01/20/2046 | | | 33,898,593 | | | | 36,215,210 | | | | | |
| 3.000%, 06/20/2046 | | | 18,930,260 | | | | 19,194,687 | | | | | |
| | | | | | | | 2,222,131,847 | | | | 17.2 | % |
| Non-U.S. Government Agency Issues | | | | | | | | | | | | |
| ABFC Trust, | | | | | | | | | | | | |
| Series 2006-OPT1, Class A3C2, 0.906%, 09/25/2036 ∞ | | | 10,143,432 | | | | 9,519,515 | | | | | |
| Accredited Mortgage Loan Trust: | | | | | | | | | | | | |
| Series 2005-4, Class A2D, 1.076%, 12/25/2035 ∞ | | | 11,911,520 | | | | 11,542,138 | | | | | |
| Series 2007-1, Class A3, 0.886%, 02/25/2037 ∞ | | | 6,530,477 | | | | 6,306,743 | | | | | |
| ACE Securities Corp. Home Equity Loan Trust, | | | | | | | | | | | | |
| Series 2006-OP1, Class A2C, 0.906%, 04/25/2036 ∞ | | | 11,953,432 | | | | 11,647,688 | | | | | |
| Alternative Loan Trust: | | | | | | | | | | | | |
| Series 2005-3CB, Class 2A1, 5.000%, 03/25/2020 | | | 1,163,934 | | | | 1,159,552 | | | | | |
| Series 2005-50CB, Class 4A1, 5.000%, 11/25/2020 § | | | 298,959 | | | | 298,662 | | | | | |
| Series 2005-85CB, Class 3A1, 5.250%, 02/25/2021 (Acquired 06/29/2015, Cost $13,160) * § | | | 13,354 | | | | 12,932 | | | | | |
| Series 2006-7CB, Class 3A1, 5.250%, 05/25/2021 § | | | 384,526 | | | | 372,195 | | | | | |
| Series 2006-J5, Class 3A1, 4.574%, 07/25/2021 ∞ | | | 18,535 | | | | 17,501 | | | | | |
| Series 2006-43CB, Class 2A1, 6.000%, 02/25/2022 § | | | 297,741 | | | | 300,066 | | | | | |
| Series 2004-18CB, Class 1A1, 6.000%, 09/25/2034 | | | 8,084,559 | | | | 8,352,152 | | | | | |
| Series 2005-11CB, Class 2A6, 5.500%, 06/25/2035 | | | 8,968,263 | | | | 8,618,861 | | | | | |
| Series 2005-29CB, Class A1, 5.500%, 07/25/2035 | | | 4,362,027 | | | | 4,049,637 | | | | | |
| Series 2005-49CB, Class A5, 5.500%, 11/25/2035 § | | | 4,191,145 | | | | 3,776,339 | | | | | |
| Series 2005-73CB, Class 1A7, 5.500%, 01/25/2036 | | | 589,458 | | | | 573,319 | | | | | |
| Series 2005-85CB, Class 2A2, 5.500%, 02/25/2036 § | | | 5,139,738 | | | | 4,769,358 | | | | | |
| Series 2006-28CB, Class A17, 6.000%, 10/25/2036 | | | 688,150 | | | | 549,918 | | | | | |
| AMRESCO Residential Securities Corp. Mortgage Loan Trust, | | | | | | | | | | | | |
| Series 1998-2, Class A6, 6.405%, 12/25/2027 | | | 2,445 | | | | 2,418 | | | | | |
| Argent Securities Inc. Asset-Backed Pass-Through Certificates, | | | | | | | | | | | | |
| Series 2005-W5, Class A1, 0.991%, 01/25/2036 ∞ | | | 53,066,608 | | | | 50,625,061 | | | | | |
| Asset Backed Securities Corp Home Equity Loan Trust Series OOMC 2006-HE3, | | | | | | | | | | | | |
| Series 2006-HE3, Class A1, 0.926%, 03/25/2036 ∞ | | | 1,349,549 | | | | 1,313,470 | | | | | |
| Asset Backed Securities Corp. Home Equity Loan Trust, | | | | | | | | | | | | |
| Series 2006-HE2, Class A1, 0.946%, 03/25/2036 ∞ | | | 27,115,824 | | | | 25,129,516 | | | | | |
| Banc of America Alternative Loan Trust: | | | | | | | | | | | | |
| Series 2003-11, Class 4A1, 4.750%, 01/25/2019 | | | 7,394 | | | | 7,415 | | | | | |
| Series 2004-1, Class 5A2, 5.500%, 02/25/2019 | | | 325,853 | | | | 329,771 | | | | | |
| Series 2004-2, Class 5A1, 5.500%, 03/25/2019 | | | 91,209 | | | | 91,545 | | | | | |
| Series 2004-6, Class 4A1, 5.000%, 07/25/2019 | | | 2,703,161 | | | | 2,724,318 | | | | | |
| Series 2004-8, Class 3A1, 5.500%, 09/25/2019 § | | | 461,285 | | | | 452,910 | | | | | |
| Series 2004-11, Class 4A1, 5.500%, 12/25/2019 | | | 4,580 | | | | 4,636 | | | | | |
| Series 2005-2, Class 4A1, 5.500%, 03/25/2020 | | | 411,856 | | | | 416,300 | | | | | |
| Series 2005-4, Class 3A1, 5.500%, 05/25/2020 | | | 304,723 | | | | 302,190 | | | | | |
| Series 2005-8, Class 5A1, 5.500%, 09/25/2020 § | | | 84,047 | | | | 81,806 | | | | | |
| Series 2007-1, Class 1A1, 5.779%, 04/25/2022 ∞ § | | | 408,055 | | | | 391,663 | | | | | |
| Series 2003-8, Class 1CB1, 5.500%, 10/25/2033 | | | 3,386,511 | | | | 3,452,130 | | | | | |
| Series 2003-11, Class 1A1, 6.000%, 01/25/2034 | | | 4,732,848 | | | | 4,845,360 | | | | | |
| Series 2004-2, Class 1A1, 6.000%, 03/25/2034 | | | 2,850,299 | | | | 2,984,626 | | | | | |
| Series 2004-5, Class 1A1, 6.000%, 06/25/2034 | | | 10,836,317 | | | | 11,280,059 | | | | | |
| Series 2004-6, Class 1A1, 6.000%, 07/25/2034 | | | 10,399,306 | | | | 10,840,027 | | | | | |
| Series 2004-10, Class 1CB1, 6.000%, 11/25/2034 | | | 18,113,128 | | | | 18,990,091 | | | | | |
| Series 2004-11, Class 1CB1, 6.000%, 12/25/2034 | | | 17,657,163 | | | | 18,462,333 | | | | | |
| Series 2005-2, Class 1CB2, 5.500%, 03/25/2035 § | | | 1,225,198 | | | | 1,114,712 | | | | | |
| Series 2005-9, Class 1CB3, 5.500%, 10/25/2035 § | | | 25,728 | | | | 25,076 | | | | | |
| Series 2005-9, Class 2CB1, 6.000%, 10/25/2035 § | | | 9,111,642 | | | | 8,866,733 | | | | | |
| Series 2006-4, Class 3CB4, 6.000%, 05/25/2046 § | | | 43,855 | | | | 36,356 | | | | | |
| Series 2006-5, Class CB7, 6.000%, 06/25/2046 § | | | 358,214 | | | | 311,689 | | | | | |
| Banc of America Funding Trust: | | | | | | | | | | | | |
| Series 2005-C, Class A1, 0.979%, 05/20/2035 ∞ | | | 12,724,717 | | | | 11,807,690 | | | | | |
| Series 2007-C, Class 1A3, 3.096%, 05/20/2036 ∞ § | | | 4,864,437 | | | | 4,363,574 | | | | | |
| Series 2007-C, Class 7A5, 1.039%, 05/20/2047 ∞ | | | 5,139,279 | | | | 4,209,532 | | | | | |
| Bayview Financial Acquisition Trust, | | | | | | | | | | | | |
| Series 2007-A, Class 1A2, 6.205%, 05/28/2037 | | | 490,206 | | | | 507,649 | | | | | |
| Bayview Financial Mortgage Pass-Through Trust, | | | | | | | | | | | | |
| Series 2007-B, Class 1A2, 6.831%, 08/28/2047 ∞ | | | 135,686 | | | | 115,187 | | | | | |
| Bear Stearns ARM Trust, | | | | | | | | | | | | |
| Series 2005-9, Class A1, 2.830%, 10/25/2035 ∞ | | | 1,562,201 | | | | 1,504,100 | | | | | |
| Bear Stearns Asset Backed Securities I Trust: | | | | | | | | | | | | |
| Series 2006-HE8, Class 21A2, 0.926%, 10/25/2036 ∞ | | | 9,823,590 | | | | 9,418,440 | | | | | |
| Series 2007-HE5, Class 1A2, 0.936%, 06/25/2047 ∞ | | | 11,143,377 | | | | 10,837,281 | | | | | |
| Bear Stearns Asset Backed Securities Trust, | | | | | | | | | | | | |
| Series 2007-2, Class A2, 1.076%, 01/25/2047 ∞ | | | 10,119,796 | | | | 9,790,842 | | | | | |
| Carrington Mortgage Loan Trust: | | | | | | | | | | | | |
| Series 2005-FRE1, Class A6, 1.136%, 12/25/2035 ∞ | | | 13,239,883 | | | | 12,928,617 | | | | | |
| Series 2006-NC1, Class A3, 0.966%, 01/25/2036 ∞ | | | 4,943,621 | | | | 4,894,790 | | | | | |
| Series 2006-OPT1, Class A3, 0.936%, 02/25/2036 ∞ | | | 6,601,928 | | | | 6,476,845 | | | | | |
| Chase Mortgage Finance Trust: | | | | | | | | | | | | |
| Series 2005-A2, Class 1A5, 2.966%, 01/25/2036 ∞ | | | 1,524,195 | | | | 1,430,961 | | | | | |
| Series 2006-A1, Class 2A3, 3.085%, 09/25/2036 ∞ | | | 1,153,513 | | | | 1,035,222 | | | | | |
| Series 2007-A1, Class 2A3, 3.084%, 02/25/2037 ∞ | | | 3,278,191 | | | | 3,273,259 | | | | | |
| Series 2007-A1, Class 3A1, 3.097%, 02/25/2037 ∞ | | | 6,163,841 | | | | 6,107,269 | | | | | |
| CHL Mortgage Pass-Through Trust, | | | | | | | | | | | | |
| Series 2005-6, Class 2A1, 5.500%, 04/25/2035 | | | 805,036 | | | | 784,170 | | | | | |
| Citicorp Mortgage Securities Trust: | | | | | | | | | | | | |
| Series 2006-3, Class 1A4, 6.000%, 06/25/2036 | | | 8,366,272 | | | | 8,256,734 | | | | | |
| Series 2007-2, Class 1A3, 6.000%, 02/25/2037 | | | 1,818,900 | | | | 1,717,473 | | | | | |
| Citicorp Residential Mortgage Trust: | | | | | | | | | | | | |
| Series 2006-2, Class A4, 5.752%, 09/25/2036 ∞ | | | 4,492,154 | | | | 4,585,666 | | | | | |
| Series 2006-3, Class A4, 5.703%, 11/25/2036 ∞ | | | 2,659,813 | | | | 2,734,118 | | | | | |
| Series 2007-1, Class A6, 5.702%, 03/25/2037 ∞ | | | 165,243 | | | | 171,278 | | | | | |
| Series 2007-2, Class A4, 5.398%, 06/25/2037 ∞ | | | 43,000,195 | | | | 44,204,402 | | | | | |
| Citigroup Mortgage Loan Trust, Inc.: | | | | | | | | | | | | |
| Series 2006-AR1, Class 1A1, 2.870%, 10/25/2035 ∞ | | | 24,687,716 | | | | 24,582,310 | | | | | |
| Series 2005-9, Class 2A2, 5.500%, 11/25/2035 | | | 453,079 | | | | 455,061 | | | | | |
| Series 2005-9, Class 22A2, 6.000%, 11/25/2035 | | | 5,747,532 | | | | 5,684,870 | | | | | |
| Cityscape Home Equity Loan Trust, | | | | | | | | | | | | |
| Series 1997-C, Class A4, 7.000%, 07/25/2028 § | | | 7,057 | | | | 6,495 | | | | | |
| Countrywide Asset-Backed Certificates: | | | | | | | | | | | | |
| Series 2004-12, Class AF6, 4.634%, 03/25/2035 ∞ | | | 100,257 | | | | 103,351 | | | | | |
| Series 2005-10, Class AF6, 4.541%, 02/25/2036 ∞ | | | 769,454 | | | | 788,159 | | | | | |
| Series 2005-13, Class AF3, 4.787%, 04/25/2036 ∞ | | | 1,119,631 | | | | 976,954 | | | | | |
| Series 2006-S9, Class A3, 5.728%, 08/25/2036 ∞ | | | 53,684 | | | | 53,621 | | | | | |
| Series 2006-13, Class 3AV2, 0.734%, 01/25/2037 ∞ | | | 11,390,510 | | | | 11,027,002 | | | | | |
| Series 2006-13, Class 1AF3, 4.577%, 01/25/2037 ∞ | | | 86,745 | | | | 134,087 | | | | | |
| Series 2006-10, Class 1AF3, 4.661%, 09/25/2046 ∞ § | | | 950,135 | | | | 812,730 | | | | | |
| Series 2007-9, Class 2A3, 0.936%, 06/25/2047 ∞ | | | 47,035,274 | | | | 44,930,413 | | | | | |
| Series 2007-11, 0.946%, 06/25/2047 ∞ | | | 12,463,729 | | | | 12,001,432 | | | | | |
| Credit Suisse First Boston Mortgage Securities Corp., | | | | | | | | | | | | |
| Series 2005-7, Class 3A1, 5.000%, 08/25/2020 | | | 271,421 | | | | 260,182 | | | | | |
| Credit-Based Asset Servicing & Securitization LLC: | | | | | | | | | | | | |
| Series 2005-CB8, Class AF2, 3.986%, 12/25/2035 ∞ | | | 947,762 | | | | 939,021 | | | | | |
| Series 2007-CB4, Class A1A, 0.674%, 04/25/2037 ∞ | | | 5,744,857 | | | | 5,247,901 | | | | | |
| CWABS Asset-Backed Certificates Trust: | | | | | | | | | | | | |
| Series 2004-15, Class AF6, 4.613%, 04/25/2035 ∞ | | | 76,731 | | | | 77,174 | | | | | |
| Series 2005-7, Class AF6, 4.693%, 10/25/2035 ∞ | | | 277,430 | | | | 284,594 | | | | | |
| Series 2005-11, Class AF3, 4.724%, 02/25/2036 ∞ | | | 8,760,159 | | | | 8,885,744 | | | | | |
| Series 2006-14, Class 2A2, 0.906%, 02/25/2037 ∞ | | | 8,702,637 | | | | 8,542,414 | | | | | |
| Series 2006-9, Class 1AF3, 4.745%, 10/25/2046 ∞ § | | | 386,403 | | | | 346,449 | | | | | |
| CWHEQ Home Equity Loan Trust, | | | | | | | | | | | | |
| Series 2007-S1, Class A6, 5.693%, 11/25/2036 ∞ | | | 19,891 | | | | 19,653 | | | | | |
| Deutsche Alt-A Securities, Inc. Mortgage Loan Trust: | | | | | | | | | | | | |
| Series 2005-1, Class 1A1, 1.256%, 02/25/2035 ∞ | | | 9,797,559 | | | | 9,143,643 | | | | | |
| Series 2005-3, Class 4A5, 5.250%, 06/25/2035 | | | 3,198,788 | | | | 3,223,924 | | | | | |
| First Franklin Mortgage Loan Trust: | | | | | | | | | | | | |
| Series 2006-FF3, Class A2B, 0.956%, 02/25/2036 ∞ | | | 14,827,128 | | | | 14,368,866 | | | | | |
| Series 2006-FF4, Class A2, 0.946%, 03/25/2036 ∞ | | | 4,202,586 | | | | 4,088,330 | | | | | |
| Series 2006-FF15, Class A5, 0.916%, 11/25/2036 ∞ | | | 22,164,781 | | | | 20,278,817 | | | | | |
| First Horizon Alternative Mortgage Securities Trust: | | | | | | | | | | | | |
| Series 2006-FA6, Class 3A1, 5.750%, 11/25/2021 | | | 131,204 | | | | 130,111 | | | | | |
| Series 2004-AA1, Class A1, 2.996%, 06/25/2034 ∞ | | | 7,449,739 | | | | 7,262,121 | | | | | |
| Series 2005-AA2, Class 2A1, 2.776%, 04/25/2035 ∞ | | | 3,992,531 | | | | 3,890,153 | | | | | |
| Series 2006-FA8, Class 2A1, 5.750%, 02/25/2037 | | | 443,529 | | | | 391,329 | | | | | |
| GE Capital Mortgage Services, Inc. Trust, | | | | | | | | | | | | |
| Series 1999-HE1, Class A7, 6.265%, 04/25/2029 | | | 494 | | | | 495 | | | | | |
| GSAA Home Equity Trust: | | | | | | | | | | | | |
| Series 2004-6, Class A1, 1.556%, 06/25/2034 ∞ | | | 4,150,090 | | | | 4,010,155 | | | | | |
| Series 2007-8, Class A3, 1.206%, 08/25/2037 ∞ | | | 10,923,508 | | | | 10,066,809 | | | | | |
| GSAMP Trust: | | | | | | | | | | | | |
| Series 2005-AHL2, Class A2C, 0.996%, 12/25/2035 ∞ | | | 9,116,665 | | | | 8,646,757 | | | | | |
| Series 2006-HE7, Class A2D, 0.986%, 10/25/2046 ∞ | | | 1,306,924 | | | | 1,237,912 | | | | | |
| GSR Mortgage Loan Trust: | | | | | | | | | | | | |
| Series 2004-15F, Class 5A1, 5.500%, 01/25/2020 | | | 511,731 | | | | 502,451 | | | | | |
| Series 2005-3F, Class 2A4, 6.000%, 03/25/2035 | | | 3,799,992 | | | | 3,967,064 | | | | | |
| Series 2005-AR2, Class 2A1, 3.132%, 04/25/2035 ∞ | | | 6,070,947 | | | | 6,055,848 | | | | | |
| Home Equity Asset Trust: | | | | | | | | | | | | |
| Series 2006-4, Class 2A3, 0.926%, 08/25/2036 ∞ | | | 241,418 | | | | 239,993 | | | | | |
| Series 2007-2, Class 2A2, 0.941%, 07/25/2037 ∞ | | | 1,781,423 | | | | 1,738,790 | | | | | |
| HomeBanc Mortgage Trust, | | | | | | | | | | | | |
| Series 2005-4, Class A1, 1.026%, 10/25/2035 ∞ | | | 11,679,586 | | | | 11,227,410 | | | | | |
| HSI Asset Securitization Corp. Trust: | | | | | | | | | | | | |
| Series 2006-OPT4, Class 2A3, 0.916%, 03/25/2036 ∞ | | | 5,266,396 | | | | 4,997,005 | | | | | |
| Series 2007-WF1, Class 2A3, 0.926%, 05/25/2037 ∞ | | | 14,576,382 | | | | 14,053,223 | | | | | |
| J.P. Morgan Alternative Loan Trust: | | | | | | | | | | | | |
| Series 2005-S1, Class 3A1, 5.500%, 10/25/2020 | | | 1,058,749 | | | | 1,048,271 | | | | | |
| Series 2006-A1, Class 2A1, 2.972%, 03/25/2036 ∞ | | | 125,508 | | | | 105,102 | | | | | |
| Series 2006-S3, Class A3A, 6.000%, 08/25/2036 ∞ § | | | 728,551 | | | | 730,683 | | | | | |
| Series 2007-S1, Class A1, 1.036%, 04/25/2047 ∞ | | | 10,629,321 | | | | 9,839,881 | | | | | |
| J.P. Morgan Mortgage Acquisition Trust: | | | | | | | | | | | | |
| Series 2007-CH1, Class AV5, 0.996%, 11/25/2036 ∞ | | | 7,613,610 | | | | 7,498,329 | | | | | |
| Series 2007-CH3, Class A3, 0.906%, 03/25/2037 ∞ | | | 5,497,729 | | | | 5,477,848 | | | | | |
| J.P. Morgan Mortgage Trust: | | | | | | | | | | | | |
| Series 2006-S3, Class 2A3, 5.000%, 08/25/2021 § | | | 105,058 | | | | 105,323 | | | | | |
| Series 2006-A2, Class 3A3, 2.884%, 04/25/2036 ∞ § | | | 3,014,426 | | | | 2,739,011 | | | | | |
| Series 2006-A2, Class 2A1, 2.912%, 04/25/2036 ∞ § | | | 2,517,932 | | | | 2,315,994 | | | | | |
| Series 2006-A7, Class 2A2, 3.186%, 01/25/2037 ∞ | | | 3,918,478 | | | | 3,508,646 | | | | | |
| Series 2006-A7, Class 2A4R, 3.186%, 01/25/2037 ∞ | | | 4,001,521 | | | | 3,732,607 | | | | | |
| Series 2007-A2, Class 2A3, 3.100%, 04/25/2037 ∞ | | | 8,059,558 | | | | 7,118,998 | | | | | |
| Series 2007-A4, Class 2A3, 3.135%, 06/25/2037 ∞ § | | | 9,375,846 | | | | 8,610,697 | | | | | |
| Long Beach Mortgage Loan Trust, | | | | | | | | | | | | |
| Series 2006-WL2, Class 2A3, 0.956%, 01/25/2036 ∞ | | | 1,371,492 | | | | 1,355,817 | | | | | |
| Luminent Mortgage Trust, | | | | | | | | | | | | |
| Series 2005-1, Class A1, 1.016%, 11/25/2035 ∞ | | | 13,788,529 | | | | 12,412,948 | | | | | |
| MASTR Alternative Loan Trust: | | | | | | | | | | | | |
| Series 2004-1, Class 1A1, 5.000%, 01/25/2019 | | | 54,118 | | | | 54,289 | | | | | |
| Series 2004-5, Class 4A1, 5.500%, 07/25/2019 | | | 142,693 | | | | 145,185 | | | | | |
| Series 2005-3, Class 4A1, 5.500%, 03/25/2020 | | | 375,344 | | | | 382,428 | | | | | |
| Series 2003-5, Class 6A1, 6.000%, 08/25/2033 | | | 46,204 | | | | 48,422 | | | | | |
| Series 2004-2, Class 2A1, 6.000%, 02/25/2034 | | | 4,233,644 | | | | 4,473,764 | | | | | |
| Series 2004-8, Class 2A1, 6.000%, 09/25/2034 | | | 3,324,110 | | | | 3,523,457 | | | | | |
| Series 2005-6, Class 1A5, 5.500%, 12/25/2035 | | | 3,929,077 | | | | 3,555,216 | | | | | |
| MASTR Asset Backed Securities Trust, | | | | | | | | | | | | |
| Series 2006-NC1, Class A4, 1.056%, 01/25/2036 ∞ | | | 6,024,970 | | | | 5,920,403 | | | | | |
| Merrill Lynch Mortgage Investors Trust: | | | | | | | | | | | | |
| Series 2004-F, Class A1B, 1.376%, 12/25/2029 ∞ | | | 11,365,991 | | | | 10,856,552 | | | | | |
| Series 2005-A5, Class A3, 2.830%, 06/25/2035 ∞ | | | 4,468,055 | | | | 4,360,367 | | | | | |
| Morgan Stanley ABS Capital I, Inc. Trust, | | | | | | | | | | | | |
| Series 2006-HE3, Class A2C, 0.916%, 04/25/2036 ∞ | | | 2,187,246 | | | | 2,179,731 | | | | | |
| Morgan Stanley Capital I, Inc. Trust, | | | | | | | | | | | | |
| Series 2006-HE2, Class A1, 0.926%, 03/25/2036 ∞ | | | 11,315,006 | | | | 10,578,306 | | | | | |
| MortgageIT Trust: | | | | | | | | | | | | |
| Series 2005-4, Class A1, 1.036%, 10/25/2035 ∞ | | | 8,889,581 | | | | 8,134,256 | | | | | |
| Series 2005-5, Class A1, 1.016%, 12/25/2035 ∞ | | | 7,921,034 | | | | 7,310,472 | | | | | |
| Nationstar Home Equity Loan Trust, | | | | | | | | | | | | |
| Series 2007-C, Class 2AV2, 0.886%, 06/25/2037 ∞ | | | 6,209,237 | | | | 6,176,012 | | | | | |
| New Century Home Equity Loan Trust, | | | | | | | | | | | | |
| Series 2005-C, Class A1, 0.986%, 12/25/2035 ∞ | | | 11,334,202 | | | | 11,124,626 | | | | | |
| Nomura Asset Acceptance Corp. Alternative Loan Trust, | | | | | | | | | | | | |
| Series 2005-WF1, Class 2A3, 5.100%, 03/25/2035 | | | 10,393,594 | | | | 10,641,829 | | | | | |
| Option One Mortgage Loan Trust Asset-Backed Certificates, | | | | | | | | | | | | |
| Series 2005-4, Class A3, 1.016%, 11/25/2035 ∞ | | | 86,415 | | | | 86,292 | | | | | |
| RALI Series Trust: | | | | | | | | | | | | |
| Series 2004-QS3, Class CB, 5.000%, 03/25/2019 | | | 599,194 | | | | 597,201 | | | | | |
| Series 2004-QS13, Class CB, 5.000%, 09/25/2019 | | | 605,537 | | | | 608,078 | | | | | |
| Series 2004-QS16, Class 1A1, 5.500%, 12/25/2034 | | | 125,961 | | | | 125,637 | | | | | |
| Series 2005-QS2, Class A1, 5.500%, 02/25/2035 | | | 311,765 | | | | 305,598 | | | | | |
| Series 2005-QS5, Class A1, 1.156%, 04/25/2035 ∞ § | | | 3,557,041 | | | | 2,702,562 | | | | | |
| Series 2005-QS9, Class A2, 1.256%, 06/25/2035 ∞ § | | | 1,464,868 | | | | 1,168,285 | | | | | |
| Series 2005-QS11, Class A2, 1.256%, 07/25/2035 ∞ | | | 6,214,001 | | | | 5,055,293 | | | | | |
| Series 2005-QA7, Class A22, 3.496%, 07/25/2035 ∞ | | | 4,166,665 | | | | 3,811,648 | | | | | |
| RAMP Series Trust: | | | | | | | | | | | | |
| Series 2002-RS3, Class AI5, 5.572%, 06/25/2032 ∞ | | | 2,251,547 | | | | 2,199,295 | | | | | |
| Series 2003-RS10, Class AI7, 4.850%, 11/25/2033 ∞ | | | 6,729 | | | | 6,754 | | | | | |
| Series 2006-NC2, Class A2, 0.946%, 02/25/2036 ∞ | | | 8,708,150 | | | | 8,602,860 | | | | | |
| Series 2006-RS4, Class A3, 0.926%, 07/25/2036 ∞ | | | 3,944,336 | | | | 3,912,653 | | | | | |
| RASC Series Trust: | | | | | | | | | | | | |
| Series 2003-KS5, Class AI6, 3.620%, 07/25/2033 ∞ | | | 17,242 | | | | 16,871 | | | | | |
| Series 2003-KS9, Class AI6, 4.710%, 11/25/2033 ∞ | | | 36,996 | | | | 35,879 | | | | | |
| Series 2006-EMX2, Class A2, 0.956%, 02/25/2036 ∞ | | | 355,840 | | | | 355,461 | | | | | |
| Series 2006-EMX2, Class A3, 1.056%, 02/25/2036 ∞ | | | 11,596,000 | | | | 11,290,534 | | | | | |
| Series 2007-KS1, Class A3, 0.906%, 01/25/2037 ∞ | | | 3,461,519 | | | | 3,214,466 | | | | | |
| Renaissance Home Equity Loan Trust: | | | | | | | | | | | | |
| Series 2005-1, Class AF6, 4.970%, 05/25/2035 | | | 55,641 | | | | 56,898 | | | | | |
| Series 2005-2, Class AF6, 4.781%, 08/25/2035 | | | 3,021,832 | | | | 3,091,251 | | | | | |
| Series 2005-3, Class AF3, 4.814%, 11/25/2035 ∞ | | | 1,036,615 | | | | 1,043,176 | | | | | |
| Series 2006-2, Class AF3, 5.797%, 08/25/2036 ∞ | | | 16,018,443 | | | | 9,658,848 | | | | | |
| Series 2006-3, Class AF2, 5.580%, 11/25/2036 ∞ | | | 10,626,261 | | | | 5,915,649 | | | | | |
| Series 2007-1, Class AF2, 5.512%, 04/25/2037 | | | 476,214 | | | | 219,709 | | | | | |
| Series 2007-1, Class AF3, 5.612%, 04/25/2037 | | | 285,728 | | | | 134,215 | | | | | |
| Series 2007-2, Class AF2, 5.675%, 06/25/2037 ∞ | | | 1,455,157 | | | | 674,038 | | | | | |
| Security National Mortgage Loan Trust, | | | | | | | | | | | | |
| Series 2005-1A, Class AF1, 4.670%, 02/25/2035 (Acquired 06/29/2015, Cost $489) ∞ * | | | 489 | | | | 488 | | | | | |
| SOUNDVIEW HM LN 2006-EQ1, | | | | | | | | | | | | |
| Series 2006-EQ1, Class A3, 0.916%, 10/25/2036 ∞ | | | 23,239,557 | | | | 22,201,357 | | | | | |
| Soundview Home Loan Trust: | | | | | | | | | | | | |
| Series 2005-OPT4, Class 2A3, 1.016%, 12/25/2035 ∞ | | | 5,503,302 | | | | 5,444,724 | | | | | |
| Series 2006-OPT4, Class 2A3, 0.906%, 06/25/2036 ∞ | | | 4,872,788 | | | | 4,536,076 | | | | | |
| Specialty Underwriting & Residential Finance Trust, | | | | | | | | | | | | |
| Series 2004-BC4, Class A1A, 1.426%, 10/25/2035 ∞ | | | 3,036,933 | | | | 2,977,270 | | | | | |
| Structured Asset Securities Corp., | | | | | | | | | | | | |
| Series 2003-31A, Class 2A7, 2.949%, 10/25/2033 ∞ | | | 2,459,456 | | | | 2,471,940 | | | | | |
| Structured Asset Securities Corp. Mortgage Loan Trust, | | | | | | | | | | | | |
| Series 2005-7XS, Class 1A4B, 5.440%, 04/25/2035 ∞ | | | 144,290 | | | | 150,563 | | | | | |
| Towd Point Mortgage Trust: | | | | | | | | | | | | |
| Series 2015-3, Class A1A, 3.500%, 03/25/2054 (Acquired 06/21/2016, Cost $14,329,654) ∞ * | | | 13,950,039 | | | | 14,200,693 | | | | | |
| Series 2016-2, Class A1, 3.000%, 08/25/2055 (Acquired 05/20/2016, Cost $19,230,599) ∞ * | | | 19,088,518 | | | | 19,188,544 | | | | | |
| Series 2016-4, Class A1, 2.250%, 07/25/2056 (Acquired 09/27/2016 through 12/06/2016, Cost $23,389,888) ∞ * | 23,318,627 | | | | 23,077,396 | | | | | |
| WaMu Mortgage Pass-Through Certificates Trust: | | | | | | | | | | | | |
| Series 2004-CB1, Class 5A, 5.000%, 06/25/2019 | | | 26,868 | | | | 27,145 | | | | | |
| Series 2004-CB2, Class 5A, 5.000%, 07/25/2019 | | | 24,080 | | | | 24,295 | | | | | |
| Series 2004-CB2, Class 7A, 5.500%, 08/25/2019 | | | 53,643 | | | | 54,307 | | | | | |
| Series 2004-CB3, Class 3A, 5.500%, 10/25/2019 | | | 4,835 | | | | 4,902 | | | | | |
| Series 2004-CB3, Class 4A, 6.000%, 10/25/2019 | | | 16,995 | | | | 17,490 | | | | | |
| Series 2004-CB4, Class 22A, 6.000%, 12/25/2019 | | | 76,622 | | | | 78,360 | | | | | |
| Series 2004-CB3, Class 1A, 6.000%, 10/25/2034 | | | 5,437,381 | | | | 5,706,566 | | | | | |
| Series 2004-CB3, Class 2A, 6.500%, 10/25/2034 | | | 5,624,410 | | | | 5,989,763 | | | | | |
| Series 2005-3, Class 1CB3, 1.206%, 05/25/2035 ∞ § | | | 8,616,249 | | | | 6,392,335 | | | | | |
| Series 2005-6, Class 2A4, 5.500%, 08/25/2035 § | | | 11,245,286 | | | | 10,323,426 | | | | | |
| Series 2006-AR10, Class 1A1, 2.837%, 09/25/2036 ∞ | | | 1,601,586 | | | | 1,473,558 | | | | | |
| Wells Fargo Alternative Loan Trust, | | | | | | | | | | | | |
| Series 2007-PA1, Class A4, 6.000%, 03/25/2037 § | | | 78,038 | | | | 68,939 | | | | | |
| Wells Fargo Mortgage Backed Securities Trust: | | | | | | | | | | | | |
| Series 2005-AR16, Class 4A2, 3.075%, 10/25/2035 ∞ | | | 3,587,482 | | | | 3,551,962 | | | | | |
| Series 2005-16, Class A18, 6.000%, 01/25/2036 § | | | 2,063,531 | | | | 2,041,432 | | | | | |
| Series 2006-AR10, Class 5A5, 3.080%, 07/25/2036 ∞ § | | | 10,034,893 | | | | 9,855,893 | | | | | |
| Series 2006-AR14, Class 2A3, 3.073%, 10/25/2036 ∞ § | | | 5,071,639 | | | | 4,719,474 | | | | | |
| Series 2006-15, Class A1, 6.000%, 11/25/2036 § | | | 7,199,954 | | | | 7,176,183 | | | | | |
| Series 2007-4, Class A15, 6.000%, 04/25/2037 § | | | 8,131,618 | | | | 7,983,807 | | | | | |
| Series 2007-8, Class 2A8, 6.000%, 07/25/2037 § | | | 7,441,899 | | | | 7,418,192 | | | | | |
| | | | | | | | 1,029,896,410 | | | | 8.0 | % |
| Commercial Mortgage-Backed Securities | | | | | | | | | |
| Non-U.S. Government Agency Issues | | | | | | | | | |
| Citigroup Commercial Mortgage Trust, | | | | | | | | | |
| Series 2014-GC19, Class A3, 3.753%, 03/10/2047 | | | 5,000,000 | | | | 5,232,670 | | | | |
| COMM Mortgage Trust: | | | | | | | | | | | |
| Series 2012-CR1, Class A3, 3.391%, 05/15/2045 | | | 25,842,000 | | | | 26,953,178 | | | | |
| Series 2013-CR9, Class A3, 4.022%, 07/10/2045 ∞ | | | 24,675,000 | | | | 26,340,084 | | | | |
| Series 2012-CR2, Class A4, 3.147%, 08/15/2045 | | | 30,063,000 | | | | 31,009,305 | | | | |
| Series 2014-CR18, Class A4, 3.550%, 07/15/2047 | | | 5,000,000 | | | | 5,164,165 | | | | |
| Series 2014-CR20, Class ASB, 3.305%, 11/10/2047 | | | 22,000,000 | | | | 22,839,403 | | | | |
| DBUBS Mortgage Trust, | | | | | | | | | | | |
| Series 2011-LC3A, Class A4, 4.551%, 08/10/2044 | | | 2,275,000 | | | | 2,457,517 | | | | |
| GS Mortgage Securities Trust: | | | | | | | | | | | |
| Series 2011-GC5, Class A4, 3.707%, 08/10/2044 | | | 17,924,873 | | | | 18,917,816 | | | | |
| Series 2012-GCJ9, Class A3, 2.773%, 11/10/2045 | | | 41,464,000 | | | | 41,801,268 | | | | |
| Series 2014-GC20, Class AAB, 3.655%, 04/10/2047 | | | 22,754,000 | | | | 23,891,154 | | | | |
| J.P. Morgan Chase Commercial Mortgage Securities Corp., | | | | | | | | | | | |
| Series 2012-LC9, Class ASB, 2.437%, 12/15/2047 | | | 3,450,000 | | | | 3,470,427 | | | | |
| J.P. Morgan Chase Commercial Mortgage Securities Trust: | | | | | | | | | | | |
| Series 2013-LC11, Class A4, 2.694%, 04/15/2046 | | | 10,150,000 | | | | 10,260,766 | | | | |
| Series 2013-LC11, Class A5, 2.960%, 04/15/2046 | | | 22,075,000 | | | | 22,331,236 | | | | |
| Series 2011-C5, Class A3, 4.171%, 08/15/2046 | | | 8,249,880 | | | | 8,848,228 | | | | |
| Series 2013-C10, Class ASB, 2.702%, 12/15/2047 | | | 19,950,000 | | | | 20,206,036 | | | | |
| JPMBB Commercial Mortgage Securities Trust: | | | | | | | | | | | |
| Series 2013-C17, Class A3, 3.928%, 01/15/2047 | | | 23,700,000 | | | | 25,043,008 | | | | |
| Series 2014-C25, Class A5, 3.672%, 11/15/2047 | | | 34,585,000 | | | | 36,001,211 | | | | |
| Morgan Stanley Bank of America Merrill Lynch Trust: | | | | | | | | | | | |
| Series 2012-C5, Class A4, 3.176%, 08/15/2045 | | | 40,030,000 | | | | 41,184,717 | | | | |
| Series 2012-C6, Class A4, 2.858%, 11/15/2045 ∞ | | | 33,435,000 | | | | 33,967,131 | | | | |
| Series 2013-C10, Class A3, 3.969%, 07/15/2046 ∞ | | | 44,160,000 | | | | 46,884,699 | | | | |
| Series 2013-C11, Class A3, 3.960%, 08/15/2046 | | | 19,100,000 | | | | 20,269,352 | | | | |
| Series 2013-C12, Class A3, 3.973%, 10/15/2046 | | | 19,050,000 | | | | 20,222,743 | | | | |
| Series 2015-C25, Class ASB, 3.383%, 10/15/2048 | | | 19,192,000 | | | | 19,572,188 | | | | |
| Wells Fargo Commercial Mortgage Trust: | | | | | | | | | | | |
| Series 2013-LC12, Class A3, 3.986%, 07/15/2046 | | | 13,600,000 | | | | 14,480,330 | | | | |
| Series 2015-C26, Class ASB, 2.991%, 02/15/2048 | | | 15,049,000 | | | | 15,222,474 | | | | |
| Series 2016-C35, Class ASB, 2.788%, 07/15/2048 | | | 11,000,000 | | | | 10,859,235 | | | | |
| WFRBS Commercial Mortgage Trust: | | | | | | | | | | | |
| Series 2013-C11, Class A5, 3.071%, 03/15/2045 | | | 12,000,000 | | | | 12,227,673 | | | | |
| Series 2012-C6, Class A4, 3.440%, 04/15/2045 | | | 19,016,000 | | | | 19,864,621 | | | | |
| Series 2013-C18, Class A4, 3.896%, 12/15/2046 | | | 21,950,000 | | | | 23,201,389 | | | | |
| Series 2014-C24, Class A5, 3.607%, 11/15/2047 | | | 20,000,000 | | | | 20,618,608 | | | | |
| Series 2014-C23, Class ASB, 3.636%, 10/15/2057 | | | 10,500,000 | | | | 10,967,367 | | | | |
| | | | | | | | 640,309,999 | | | | 4.9 | % |
| Other Asset Backed Securities | | | | | | | | | | | | |
| Citibank Credit Card Issuance Trust, | | | | | | | | | | | | |
| Series 2007-A3, Class A3, 6.150%, 06/15/2039 | | | 6,100,000 | | | | 8,025,527 | | | | | |
| Conseco Financial Corp.: | | | | | | | | | | | | |
| Series 1993-4, Class A5, 7.050%, 01/15/2019 | | | 700 | | | | 709 | | | | | |
| Series 1998-3, Class A5, 6.220%, 03/01/2030 | | | 242,865 | | | | 257,158 | | | | | |
| Series 1998-4, Class A5, 6.180%, 04/01/2030 | | | 112,865 | | | | 119,037 | | | | | |
| Dell Equipment Finance Trust, | | | | | | | | | | | | |
| Series 2016-1, Class A3, 1.650%, 07/22/2021 (Acquired 07/12/2016, Cost $11,999,688) * | | | 12,000,000 | | | | 11,991,719 | | | | | |
| Discover Card Execution Note Trust, | | | | | | | | | | | | |
| Series 2016-A4, Class A4, 1.390%, 03/15/2022 | | | 30,675,000 | | | | 30,324,863 | | | | | |
| Enterprise Fleet Financing LLC, | | | | | | | | | | | | |
| Series 2015-2, Class A2, 1.590%, 02/22/2021 (Acquired 07/22/2015 through 10/31/2016, Cost $12,302,973) * | | | 12,300,582 | | | | 12,293,750 | | | | | |
| Ford Credit Auto Owner Trust: | | | | | | | | | | | | |
| Series 2014-2, Class A, 2.310%, 04/15/2026 (Acquired 09/28/2016 through 10/20/2016, Cost $33,598,629) * | | | 32,858,000 | | | | 33,132,802 | | | | | |
| Series 2016-1, Class A, 2.310%, 08/15/2027 (Acquired 02/23/2016 through 05/27/2016, Cost $37,663,070) * | | | 37,625,000 | | | | 37,551,947 | | | | | |
| Series 2016-2, Class A, 2.030%, 12/15/2027 (Acquired 06/20/2016, Cost $29,264,882) * | | | 29,275,000 | | | | 28,791,383 | | | | | |
| Leaf Receivables Funding 11 LLC, | | | | | | | | | | | | |
| Series 2016-1, Class A3, 2.050%, 06/15/2019 (Acquired 05/18/2016 through 08/05/2016, Cost $18,006,296) * | | | 18,000,000 | | | | 17,959,660 | | | | | |
| Navistar Financial Dealer Note Master Owner Trust II, | | | | | | | | | | | | |
| Series 2015-1, Class A, 2.156%, 06/25/2020 (Acquired 07/22/2015 through 11/22/2016, Cost $34,193,175) ∞ * | | | 34,194,000 | | | | 34,233,552 | | | | | |
| Oakwood Mortgage Investors, Inc., | | | | | | | | | | | | |
| Series 1999-B, Class A3, 6.450%, 11/15/2017 | | | 18,043 | | | | 18,279 | | | | | |
| OneMain Financial Issuance Trust: | | | | | | | | | | | | |
| Series 2014-2A, Class A, 2.470%, 09/18/2024 (Acquired 02/05/2016 through 02/22/2016, Cost $7,022,718) * | | | 7,044,990 | | | | 7,047,893 | | | | | |
| Series 2015-2A, Class A, 2.570%, 07/18/2025 (Acquired 03/22/2016 through 10/19/2016, Cost $8,593,261) * | | | 8,620,000 | | | | 8,620,303 | | | | | |
| PFS Financing Corp., | | | | | | | | | | | | |
| Series 2016-BA, Class A, 1.870%, 10/15/2021 (Acquired 10/18/2016 through 12/21/2016, Cost $40,196,331) * | | | 40,200,000 | | | | 39,798,000 | | | | | |
| Springleaf Funding Trust, | | | | | | | | | | | | |
| Series 2014-AA, Class A, 2.410%, 12/15/2022 (Acquired 06/11/2015 through 12/03/2015, Cost $11,270,826) * | | | 11,252,736 | | | | 11,256,873 | | | | | |
| TCF Auto Receivables Owner Trust: | | | | | | | | | | | | |
| Series 2015-1A, Class A3, 1.490%, 12/16/2019 (Acquired 06/03/2015 through 07/28/2016, Cost $16,038,512) * | 16,037,957 | | | | 16,044,023 | | | | | |
| Series 2014-1A, Class A4, 1.560%, 01/15/2020 (Acquired 01/26/2016, Cost $9,392,702) * | | | 9,435,086 | | | | 9,449,590 | | | | | |
| Series 2016-1A, Class A3, 1.710%, 04/15/2021 (Acquired 09/14/2016, Cost $38,993,592) * | | | 39,000,000 | | | | 38,783,936 | | | | | |
| | | | | | | | 345,701,004 | | | | 2.7 | % |
| Total Long-Term Investments (Cost $12,817,241,623) | | | | | | | 12,723,740,829 | | | | 98.5 | % |
| | | | | | | | | | | | | |
| SHORT-TERM INVESTMENT | | | | | | | | | | | | |
| Money Market Mutual Fund | | Shares | | | | | | | | | |
| Fidelity Institutional Money Market Fund - Government Portfolio, Institutional Class, 0.43% « | | | 200,414,435 | | | | 200,414,435 | | | | | |
| Total Short-Term Investment (Cost $200,414,435) | | | | | | | 200,414,435 | | | | 1.6 | % |
| Total Investments (Cost $13,017,656,058) | | | | | | | 12,924,155,264 | | | | 100.1 | % |
| Liabilities in Excess of Other Assets | | | | | | | (18,710,220 | ) | | | (0.1 | )% |
| TOTAL NET ASSETS | | | | | | $ | 12,905,445,044 | | | | 100.0 | % |
Notes to Schedule of Investments |
| ∞ | Variable or Floating rate security. Floating rate securities are securities whose yields vary with a designated index rate. These securities' rates are as of December 31, 2016. |
| * | Restricted security as defined in Rule 144(a) under the Securities Act of 1933 and determined to be liquid. Purchased in a private placement transaction; resale to the public may require registration or or may extend only to qualified institutional buyers. At December 31, 2016, the value of these securities total $2,299,291,855, which represents 17.82% of total net assets. |
| f | Foreign Security |
| § | Security in Default |
| « | 7-Day Yield |
| Baird Short-Term Municipal Bond Fund | | | | | | | | | |
| Schedule of Investments | | | | | | | | | |
| December 31, 2016 | | | | | | | | | |
| | | | | | | | | | |
| | | Principal | | | | | | % of | |
| | | Amount | | | Value | | | Net Assets | |
| LONG-TERM INVESTMENTS | | | | | | | | | |
| Municipal Bonds | | | | | | | | | |
| Alabama | | | | | | | | | |
| Jasper Water Works & Sewer Board, Inc., | | | | | | | | | |
| 5.000%, 06/01/2024 (Callable 06/01/2021) | | $ | 100,000 | | | $ | 111,426 | | | | |
| State of Alabama Docks Department, | | | | | | | | | | | |
| 5.000%, 10/01/2022 (Callable 01/30/2017) | | | 25,000 | | | | 25,069 | | | | |
| | | | | | | | 136,495 | | | | 0.2 | % |
| Alaska | | | | | | | | | | | | |
| Alaska Housing Finance Corp., | | | | | | | | | | | | |
| 4.000%, 06/01/2040 (Callable 06/01/2021) | | | 40,000 | | | | 40,740 | | | | 0.1 | % |
| | | | | | | | | | | | | |
| Arizona | | | | | | | | | | | | |
| Arizona Health Facilities Authority, | | | | | | | | | | | | |
| 4.625%, 07/01/2019 | | | 30,000 | | | | 32,129 | | | | | |
| Arizona State University, | | | | | | | | | | | | |
| 6.000%, 07/01/2026 (Pre-refunded to 07/01/2018) | | | 250,000 | | | | 267,655 | | | | | |
| Arizona Transportation Board: | | | | | | | | | | | | |
| 5.000%, 07/01/2017 | | | 25,000 | | | | 25,502 | | | | | |
| 5.000%, 07/01/2025 (Pre-refunded to 07/01/2019) | | | 250,000 | | | | 271,553 | | | | | |
| BluePath 2016-1 TE Trust, | | | | | | | | | | | | |
| 2.750%, 09/01/2026 (Callable 08/27/2021) | | | 250,000 | | | | 230,790 | | | | | |
| City of El Mirage AZ, | | | | | | | | | | | | |
| 5.000%, 07/01/2026 (Callable 07/01/2020) | | | 50,000 | | | | 54,942 | | | | | |
| City of Winslow AZ Wastewater System Revenue, | | | | | | | | | | | | |
| 2.000%, 07/01/2019 (Insured by AGM) | | | 25,000 | | | | 25,067 | | | | | |
| Festival Ranch Community Facilities District, | | | | | | | | | | | | |
| 2.000%, 07/15/2018 (Insured by BAM) | | | 25,000 | | | | 25,143 | | | | | |
| Maricopa County Industrial Development Authority: | | | | | | | | | | | | |
| 2.550%, 07/01/2021 | | | 185,000 | | | | 180,689 | | | | | |
| 2.625%, 07/01/2021 | | | 100,000 | | | | 97,083 | | | | | |
| Scottsdale Mountain Community Facilities District, | | | | | | | | | | | | |
| 4.600%, 07/15/2017 (Callable 01/30/2017) | | | 100,000 | | | | 100,199 | | | | | |
| The Industrial Development Authority of the City of Phoenix, | | | | | | | | | | | | |
| 0.690%, 11/15/2052 (Optional Put Date 01/31/2017)(1) | | | 1,000,000 | | | | 1,000,000 | | | | | |
| The Industrial Development Authority of the County of Pima, | | | | | | | | | | | | |
| 4.950%, 10/01/2020 | | | 245,000 | | | | 262,035 | | | | | |
| Vistancia Community Facilities District, | | | | | | | | | | | | |
| 5.000%, 07/15/2021 (Callable 07/15/2020) | | | 150,000 | | | | 166,063 | | | | | |
| | | | | | | | 2,738,850 | | | | 4.7 | % |
| Arkansas | | | | | | | | | | | | |
| City of Jacksonville AR Wastewater Revenue, | | | | | | | | | | | | |
| 4.000%, 12/01/2025 (Callable 06/01/2021) | | | 110,000 | | | | 116,746 | | | | | |
| City of Little Rock AR, | | | | | | | | | | | | |
| 2.000%, 03/01/2038 (Callable 03/01/2021) | | | 150,000 | | | | 149,174 | | | | | |
| City of Rogers AR, | | | | | | | | | | | | |
| 2.125%, 11/01/2029 (Callable 11/01/2021) | | | 70,000 | | | | 69,603 | | | | | |
| City of Van Buren AR Water & Sewer Revenue, | | | | | | | | | | | | |
| 2.000%, 12/01/2019 (Insured by AGM) | | | 150,000 | | | | 150,675 | | | | | |
| Pulaski County Public Facilities Board, | | | | | | | | | | | | |
| 4.000%, 07/01/2017 | | | 50,000 | | | | 50,594 | | | | | |
| University of Central Arkansas, | | | | | | | | | | | | |
| 2.500%, 09/01/2017 (Insured by AGM) | | | 40,000 | | | | 40,357 | | | | | |
| | | | | | | | 577,149 | | | | 1.0 | % |
| California | | | | | | | | | | | | |
| California Health Facilities Financing Authority, | | | | | | | | | | | | |
| 5.000%, 04/01/2020 | | | 65,000 | | | | 68,940 | | | | | |
| California School Finance Authority: | | | | | | | | | | | | |
| 3.000%, 08/01/2017 | | | 50,000 | | | | 50,328 | | | | | |
| 3.000%, 08/01/2017 | | | 100,000 | | | | 100,656 | | | | | |
| California State Public Works Board, | | | | | | | | | | | | |
| 5.000%, 12/01/2019 (Insured by AMBAC) | | | 70,000 | | | | 74,991 | | | | | |
| California Statewide Communities Development Authority: | | | | | | | | | | | | |
| 6.000%, 01/01/2021 (ETM) | | | 100,000 | | | | 108,309 | | | | | |
| 3.500%, 11/01/2021 (Callable 11/01/2019) (3) | | | 200,000 | | | | 208,300 | | | | | |
| Central School District, | | | | | | | | | | | | |
| 6.250%, 08/01/2040 (Callable 08/01/2021) | | | 225,000 | | | | 258,561 | | | | | |
| City of Redding CA, | | | | | | | | | | | | |
| 1.435%, 07/01/2022 (ETM)(1)(2) | | | 50,000 | | | | 47,402 | | | | | |
| Commerce Community Development Commission Successor Agency, | | | | | | | | | | | | |
| 0.000%, 08/01/2021 (ETM) | | | 155,000 | | | | 125,206 | | | | | |
| Corona-Norca Unified School District, | | | | | | | | | | | | |
| 0.000%, 08/01/2026 | | | 20,000 | | | | 19,403 | | | | | |
| Fresno Unified School District, | | | | | | | | | | | | |
| 0.000%, 08/01/2033 (Callable 08/01/2021) | | | 100,000 | | | | 39,778 | | | | | |
| Jurupa Public Financing Authority, | | | | | | | | | | | | |
| 4.000%, 09/01/2018 | | | 25,000 | | | | 25,855 | | | | | |
| La Quinta Financing Authority, | | | | | | | | | | | | |
| 5.550%, 10/01/2018 | | | 40,000 | | | | 42,038 | | | | | |
| Menlo Park City School District, | | | | | | | | | | | | |
| 0.000%, 07/01/2025 (Callable 07/01/2018) | | | 100,000 | | | | 68,029 | | | | | |
| Northern California Gas Authority, | | | | | | | | | | | | |
| 1.197%, 07/01/2019 (1) | | | 100,000 | | | | 98,729 | | | | | |
| Palomar Health, | | | | | | | | | | | | |
| 3.000%, 11/01/2017 (3) | | | 100,000 | | | | 100,646 | | | | | |
| San Diego Community Facilities District No. 3, | | | | | | | | | | | | |
| 5.000%, 09/01/2018 | | | 25,000 | | | | 26,349 | | | | | |
| San Diego Redevelopment Agency Successor Agency, | | | | | | | | | | | | |
| 4.000%, 09/01/2018 | | | 50,000 | | | | 52,237 | | | | | |
| Soledad Unified School District: | | | | | | | | | | | | |
| 8.000%, 08/01/2020 (Insured by AGM) (3) | | | 60,000 | | | | 71,663 | | | | | |
| 8.000%, 08/01/2022 (Insured by AGM) (3) | | | 70,000 | | | | 89,238 | | | | | |
| State of California: | | | | | | | | | | | | |
| 5.250%, 10/01/2020 (Callable 10/01/2019) | | | 1,000,000 | | | | 1,096,840 | | | | | |
| 5.000%, 09/01/2022 | | | 165,000 | | | | 190,768 | | | | | |
| University of California, | | | | | | | | | | | | |
| 1.400%, 05/15/2046 (Callable 11/15/2020)(Mandatory Tender Date 05/15/2021) | | | 100,000 | | | | 96,690 | | | | | |
| Washington Township Health Care District, | | | | | | | | | | | | |
| 5.000%, 07/01/2017 | | | 50,000 | | | | 50,820 | | | | | |
| Yuba Community College District, | | | | | | | | | | | | |
| 0.000%, 08/01/2028 (Callable 08/01/2017)(Insured by AMBAC) | | | 45,000 | | | | 26,047 | | | | | |
| | | | | | | | 3,137,823 | | | | 5.3 | % |
| Colorado | | | | | | | | | | | | |
| Bromley Park Metropolitan District No. 2, | | | | | | | | | | | | |
| 4.250%, 12/01/2022 (Callable 12/01/2017) | | | 60,000 | | | | 60,210 | | | | | |
| Colorado Educational & Cultural Facilities Authority: | | | | | | | | | | | | |
| 4.000%, 07/01/2018 | | | 120,000 | | | | 124,382 | | | | | |
| 3.000%, 12/15/2018 | | | 75,000 | | | | 76,495 | | | | | |
| 4.000%, 06/01/2020 | | | 100,000 | | | | 105,671 | | | | | |
| 4.000%, 10/01/2020 | | | 125,000 | | | | 132,061 | | | | | |
| E-470 Public Highway Authority: | | | | | | | | | | | | |
| 0.000%, 09/01/2020 | | | 125,000 | | | | 113,164 | | | | | |
| 2.470%, 09/01/2039 (Callable 03/01/2017)(Mandatory Tender Date 09/01/2017)(1) | | | 75,000 | | | | 74,995 | | | | | |
| Fossil Ridge Metropolitan District No. 3, | | | | | | | | | | | | |
| 4.000%, 12/01/2020 | | | 50,000 | | | | 52,564 | | | | | |
| Park 70 Metropolitan District: | | | | | | | | | | | | |
| 5.000%, 12/01/2017 | | | 135,000 | | | | 138,590 | | | | | |
| 5.000%, 12/01/2018 | | | 160,000 | | | | 168,190 | | | | | |
| Regional Transportation District, | | | | | | | | | | | | |
| 5.000%, 06/01/2025 (Callable 06/01/2020) | | | 100,000 | | | | 109,171 | | | | | |
| VDW Metropolitan District No. 2, | | | | | | | | | | | | |
| 1.250%, 12/01/2018 (Insured by AGM) | | | 55,000 | | | | 54,750 | | | | | |
| Vista Ridge Metropolitan District: | | | | | | | | | | | | |
| 4.500%, 12/01/2023 (Insured by BAM) (3) | | | 75,000 | | | | 82,017 | | | | | |
| 4.500%, 12/01/2024 (Insured by BAM) (3) | | | 250,000 | | | | 273,815 | | | | | |
| | | | | | | | 1,566,075 | | | | 2.7 | % |
| Connecticut | | | | | | | | | | | | |
| Bristol Housing Authority, | | | | | | | | | | | | |
| 0.820%, 08/01/2018 (Mandatory Tender Date 08/01/2017)(1) | | | 50,000 | | | | 49,852 | | | | | |
| City of Hartford CT, | | | | | | | | | | | | |
| 5.000%, 04/01/2020 (ETM) | | | 100,000 | | | | 110,454 | | | | | |
| Regional School District No. 8, | | | | | | | | | | | | |
| 5.000%, 05/01/2019 (Callable 05/01/2017) | | | 75,000 | | | | 75,929 | | | | | |
| Town of Plymouth CT, | | | | | | | | | | | | |
| 4.000%, 07/15/2019 | | | 25,000 | | | | 25,845 | | | | | |
| | | | | | | | 262,080 | | | | 0.4 | % |
| District of Columbia | | | | | | | | | | | | |
| District of Columbia, | | | | | | | | | | | | |
| 5.450%, 07/15/2035 (Pre-refunded to 07/15/2018)(Insured by AGM) | | | 100,000 | | | | 105,504 | | | | | |
| District of Columbia Housing Finance Agency, | | | | | | | | | | | | |
| 3.500%, 06/15/2023 | | | 235,000 | | | | 238,805 | | | | | |
| | | | | | | | 344,309 | | | | 0.6 | % |
| Florida | | | | | | | | | | | | |
| City of Jacksonville FL, | | | | | | | | | | | | |
| 5.000%, 11/01/2022 | | | 50,000 | | | | 55,842 | | | | | |
| City of North Port FL, | | | | | | | | | | | | |
| 4.000%, 07/01/2018 (Insured by BAM) | | | 50,000 | | | | 51,924 | | | | | |
| City of Port St Lucie FL Utility System Revenue: | | | | | | | | | | | | |
| 5.000%, 09/01/2021 | | | 35,000 | | | | 39,545 | | | | | |
| 5.250%, 09/01/2022 | | | 100,000 | | | | 116,191 | | | | | |
| City of Tallahassee FL, | | | | | | | | | | | | |
| 5.000%, 12/01/2019 | | | 50,000 | | | | 53,758 | | | | | |
| City of Tampa FL, | | | | | | | | | | | | |
| 5.250%, 11/15/2024 (Callable 05/15/2020) | | | 375,000 | | | | 415,061 | | | | | |
| Florida Housing Finance Corp., | | | | | | | | | | | | |
| 4.000%, 07/01/2047 (Callable 07/01/2025) | | | 150,000 | | | | 159,285 | | | | | |
| Florida Municipal Power Agency: | | | | | | | | | | | | |
| 1.278%, 10/01/2021 (Callable 01/05/2017)(Insured by AMBAC)(1)(2) | | | 50,000 | | | | 47,998 | | | | | |
| 1.278%, 10/01/2027 (Callable 01/04/2017)(Insured by AMBAC)(1)(2) | | | 100,000 | | | | 90,729 | | | | | |
| Florida State Municipal Loan Council, | | | | | | | | | | | | |
| 3.000%, 10/01/2020 | | | 500,000 | | | | 510,475 | | | | | |
| Halifax Hospital Medical Center, | | | | | | | | | | | | |
| 3.000%, 06/01/2017 | | | 55,000 | | | | 55,423 | | | | | |
| Lee County School Board, | | | | | | | | | | | | |
| 5.000%, 08/01/2023 | | | 140,000 | | | | 162,653 | | | | | |
| Martin County Health Facilities Authority, | | | | | | | | | | | | |
| 3.750%, 11/15/2020 | | | 125,000 | | | | 130,620 | | | | | |
| Orange County Health Facilities Authority, | | | | | | | | | | | | |
| 6.250%, 10/01/2021 | | | 50,000 | | | | 55,462 | | | | | |
| Orange County School Board, | | | | | | | | | | | | |
| 4.500%, 08/01/2020 (Pre-refunded to 08/01/2017) | | | 35,000 | | | | 35,703 | | | | | |
| Osceola County Housing Finance Authority, | | | | | | | | | | | | |
| 1.050%, 10/01/2019 (Callable 10/01/2017)(Mandatory Tender Date 04/01/2018) | | | 500,000 | | | | 497,455 | | | | | |
| St. Lucie County School Board, | | | | | | | | | | | | |
| 5.000%, 10/01/2018 (Insured by AGM) | | | 50,000 | | | | 53,054 | | | | | |
| | | | | | | | 2,531,178 | | | | 4.3 | % |
| Georgia | | | | | | | | | | | | |
| Bartow County Development Authority, | | | | | | | | | | | | |
| 2.375%, 09/01/2029 (Mandatory Tender Date 08/10/2017) | | | 185,000 | | | | 185,869 | | | | | |
| City of Atlanta GA: | | | | | | | | | | | | |
| 5.000%, 01/01/2023 (Callable 01/01/2020) (3) | | | 450,000 | | | | 485,442 | | | | | |
| 5.000%, 01/01/2024 (Callable 01/01/2020) (3) | | | 500,000 | | | | 538,325 | | | | | |
| Georgia State Road & Tollway Authority, | | | | | | | | | | | | |
| 5.000%, 06/01/2017 (Callable 01/30/2017) | | | 30,000 | | | | 30,094 | | | | | |
| Main Street Natural Gas, Inc., | | | | | | | | | | | | |
| 5.000%, 03/15/2019 | | | 125,000 | | | | 132,234 | | | | | |
| Peach County GA Development Authority, | | | | | | | | | | | | |
| 1.200%, 10/01/2018 (Callable 04/01/2018) | | | 250,000 | | | | 248,545 | | | | | |
| Private Colleges & Universities Authority, | | | | | | | | | | | | |
| 5.000%, 10/01/2020 | | | 50,000 | | | | 54,247 | | | | | |
| | | | | | | | 1,674,756 | | | | 2.9 | % |
| Idaho | | | | | | | | | | | | |
| Idaho Housing & Finance Association, | | | | | | | | | | | | |
| 5.000%, 07/15/2018 | | | 25,000 | | | | 26,363 | | | | 0.0 | % |
| | | | | | | | | | | | | |
| Illinois | | | | | | | | | | | | |
| Chicago O'Hare International Airport: | | | | | | | | | | | | |
| 5.000%, 01/01/2020 (Callable 01/01/2017)(Insured by AGM) | | | 65,000 | | | | 65,000 | | | | | |
| 5.000%, 01/01/2020 | | | 50,000 | | | | 54,407 | | | | | |
| Chicago Transit Authority, | | | | | | | | | | | | |
| 5.250%, 12/01/2023 (Callable 12/01/2021) | | | 25,000 | | | | 27,801 | | | | | |
| City of Berwyn IL: | | | | | | | | | | | | |
| 3.000%, 12/01/2017 (3) | | | 50,000 | | | | 50,567 | | | | | |
| 4.000%, 12/01/2019 (3) | | | 125,000 | | | | 130,723 | | | | | |
| City of Chicago IL: | | | | | | | | | | | | |
| 5.000%, 01/01/2017 | | | 30,000 | | | | 30,000 | | | | | |
| 5.000%, 01/01/2018 (Callable 01/30/2017)(Insured by AGM) | | | 75,000 | | | | 75,781 | | | | | |
| City of Chicago IL Motor Fuel Tax Revenue, | | | | | | | | | | | | |
| 5.000%, 01/01/2019 | | | 100,000 | | | | 102,780 | | | | | |
| City of Chicago IL Wastewater Transmission Revenue, | | | | | | | | | | | | |
| 5.000%, 01/01/2020 | | | 50,000 | | | | 53,400 | | | | | |
| City of Rockford IL, | | | | | | | | | | | | |
| 4.700%, 12/15/2017 (Insured by AGM) | | | 25,000 | | | | 25,394 | | | | | |
| Cook County School District No. 99 Cicero, | | | | | | | | | | | | |
| 1.500%, 12/01/2026 (Callable 01/09/2017) (3) | | | 300,000 | | | | 300,333 | | | | | |
| Danville Public Building Commission, | | | | | | | | | | | | |
| 4.000%, 12/01/2019 | | | 115,000 | | | | 120,959 | | | | | |
| DuPage County Community High School District No. 100 Fenton, | | | | | | | | | | | | |
| 2.000%, 12/15/2018 | | | 70,000 | | | | 70,830 | | | | | |
| Governors State University, | | | | | | | | | | | | |
| 4.000%, 10/01/2020 (Callable 10/01/2017) | | | 50,000 | | | | 50,563 | | | | | |
| Homewood-Flossmoor Park District, | | | | | | | | | | | | |
| 3.000%, 12/01/2017 (Insured by AGM) | | | 50,000 | | | | 50,599 | | | | | |
| Illinois Finance Authority: | | | | | | | | | | | | |
| 5.000%, 08/15/2017 | | | 50,000 | | | | 50,930 | | | | | |
| 4.000%, 10/01/2017 | | | 75,000 | | | | 76,388 | | | | | |
| 5.000%, 02/15/2020 | | | 100,000 | | | | 105,682 | | | | | |
| 6.250%, 05/01/2022 (Pre-refunded to 05/01/2020) | | | 45,000 | | | | 51,538 | | | | | |
| 5.000%, 05/15/2023 | | | 100,000 | | | | 114,552 | | | | | |
| 1.782%, 05/01/2036 (Callable 11/01/2020)(Mandatory Tender Date 05/01/2021)(1) | | | 135,000 | | | | 135,192 | | | | | |
| 1.300%, 07/01/2042 (Mandatory Tender Date 05/08/2017) | | | 90,000 | | | | 89,929 | | | | | |
| Illinois Housing Development Authority, | | | | | | | | | | | | |
| 2.450%, 06/01/2043 (Callable 01/01/2023) | | | 199,191 | | | | 192,195 | | | | | |
| Illinois State University, | | | | | | | | | | | | |
| 5.000%, 04/01/2023 (Callable 04/01/2021) | | | 100,000 | | | | 108,315 | | | | | |
| Kane County Community Unit School District No. 304 Geneva, | | | | | | | | | | | | |
| 4.250%, 01/01/2025 (Callable 01/01/2018)(Insured by AGM) | | | 25,000 | | | | 25,603 | | | | | |
| Kankakee River Metropolitan Agency, | | | | | | | | | | | | |
| 2.000%, 05/01/2018 (Insured by AGM) | | | 100,000 | | | | 100,168 | | | | | |
| Lake County Community High School District No. 117 Antioch, | | | | | | | | | | | | |
| 0.000%, 12/01/2019 | | | 140,000 | | | | 129,765 | | | | | |
| Lake County Community High School District No. 127 Grayslake, | | | | | | | | | | | | |
| 0.000%, 02/01/2020 | | | 150,000 | | | | 139,866 | | | | | |
| Lake County School District No. 1 Winthrop Harbor, | | | | | | | | | | | | |
| 3.000%, 02/01/2019 | | | 85,000 | | | | 87,135 | | | | | |
| McHenry & Kane Counties Community Consolidated School District No. 158 Huntley, | | | | | | | | | | | | |
| 0.000%, 01/01/2017 | | | 25,000 | | | | 25,000 | | | | | |
| Metropolitan Pier & Exposition Authority: | | | | | | | | | | | | |
| 5.300%, 06/15/2018 (Callable 06/15/2017)(Insured by NPFGC) | | | 120,000 | | | | 123,224 | | | | | |
| 5.300%, 06/15/2018 (Pre-refunded to 06/15/2017)(Insured by NPFGC) | | | 50,000 | | | | 51,462 | | | | | |
| 0.000%, 06/15/2019 | | | 50,000 | | | | 46,546 | | | | | |
| 0.000%, 06/15/2019 | | | 135,000 | | | | 124,620 | | | | | |
| Ogle & Winnebago Counties Community Unit School District No 223 Meridian, | | | | | | | | | | | | |
| 0.000%, 12/01/2017 (ETM)(Insured by AGM) | | | 20,000 | | | | 19,795 | | | | | |
| Ogle & Winnebago Counties Community Unit School District No. 223 Meridian, | | | | | | | | | | | | |
| 5.000%, 12/01/2021 (Insured by BAM) | | | 150,000 | | | | 167,576 | | | | | |
| Public Building Commission of Chicago, | | | | | | | | | | | | |
| 5.000%, 03/01/2020 (Callable 03/01/2017)(Insured by AMBAC) | | | 100,000 | | | | 100,523 | | | | | |
| Southern Illinois University, | | | | | | | | | | | | |
| 2.050%, 04/01/2017 | | | 60,000 | | | | 59,822 | | | | | |
| St Clair County Community Consolidated School District No. 90 O'Fallon, | | | | | | | | | | | | |
| 0.000%, 12/01/2020 | | | 100,000 | | | | 90,963 | | | | | |
| State of Illinois: | | | | | | | | | | | | |
| 0.000%, 08/01/2017 | | | 20,000 | | | | 19,683 | | | | | |
| 5.000%, 06/01/2019 | | | 100,000 | | | | 103,429 | | | | | |
| 5.000%, 03/01/2020 | | | 90,000 | | | | 93,233 | | | | | |
| 5.000%, 04/01/2020 | | | 30,000 | | | | 31,095 | | | | | |
| 5.000%, 01/01/2022 (Callable 01/01/2020) | | | 100,000 | | | | 103,360 | | | | | |
| 6.500%, 06/15/2022 | | | 45,000 | | | | 50,410 | | | | | |
| The Illinois Sports Facilities Authority: | | | | | | | | | | | | |
| 0.000%, 06/15/2017 (Insured by AMBAC) | | | 50,000 | | | | 49,398 | | | | | |
| 0.000%, 06/15/2018 (Insured by AMBAC) | | | 50,000 | | | | 47,800 | | | | | |
| Village of Cary IL, | | | | | | | | | | | | |
| 1.500%, 03/01/2019 (Insured by BAM) | | | 97,000 | | | | 95,447 | | | | | |
| Village of Crestwood IL: | | | | | | | | | | | | |
| 2.000%, 12/15/2018 (Insured by BAM) | | | 150,000 | | | | 151,518 | | | | | |
| 4.500%, 12/15/2025 (Callable 12/15/2022)(Insured by BAM) | | | 60,000 | | | | 64,595 | | | | | |
| Village of Lyons IL, | | | | | | | | | | | | |
| 5.000%, 12/01/2025 (Callable 12/01/2022)(Insured by BAM) | | | 25,000 | | | | 28,133 | | | | | |
| Village of McCook IL, | | | | | | | | | | | | |
| 5.000%, 12/01/2020 (Callable 12/01/2018) | | | 50,000 | | | | 52,454 | | | | | |
| Western Illinois University, | | | | | | | | | | | | |
| 4.000%, 04/01/2019 | | | 50,000 | | | | 51,832 | | | | | |
| White County Community Unit School District No. 5 Carmi-White, | | | | | | | | | | | | |
| 4.300%, 12/01/2021 (Insured by AGM) | | | 100,000 | | | | 106,309 | | | | | |
| Will County IL School District No. 114 Manhattan, | | | | | | | | | | | | |
| 0.000%, 12/01/2019 | | | 50,000 | | | | 46,252 | | | | | |
| Will County IL School District No. 365 Valley View, | | | | | | | | | | | | |
| 0.000%, 11/01/2021 (Insured by AGM) | | | 100,000 | | | | 87,078 | | | | | |
| Wilmette Park District, | | | | | | | | | | | | |
| 3.000%, 12/01/2017 | | | 20,000 | | | | 20,321 | | | | | |
| | | | | | | | 4,628,273 | | | | 7.9 | % |
| Indiana | | | | | | | | | | | | |
| City of Goshen IN Waterworks Revenue, | | | | | | | | | | | | |
| 4.100%, 01/01/2021 (Callable 01/30/2017)(Insured by AGM) | | | 470,000 | | | | 470,860 | | | | | |
| County of Tippecanoe IN, | | | | | | | | | | | | |
| 0.770%, 11/01/2030 (Optional Pute Date 01/06/2017)(Callable 01/31/2017)(1) | | | 300,000 | | | | 300,000 | | | | | |
| East Porter County School Building Corp., | | | | | | | | | | | | |
| 4.000%, 01/15/2018 | | | 50,000 | | | | 51,451 | | | | | |
| Indiana Bond Bank, | | | | | | | | | | | | |
| 5.250%, 10/15/2019 | | | 55,000 | | | | 59,325 | | | | | |
| Indiana Finance Authority: | | | | | | | | | | | | |
| 4.000%, 12/01/2017 | | | 50,000 | | | | 51,293 | | | | | |
| 4.000%, 02/01/2018 | | | 50,000 | | | | 51,536 | | | | | |
| Indiana Health & Educational Facilities Financing Authority, | | | | | | | | | | | | |
| 1.750%, 11/15/2031 (Mandatory Tender Date 11/02/2021) | | | 250,000 | | | | 242,645 | | | | | |
| Indiana Health Facility Financing Authority: | | | | | | | | | | | | |
| 0.648%, 05/01/2020 (Callable 01/06/2017)(Insured by AMBAC)(1)(2) | | | 25,000 | | | | 23,578 | | | | | |
| 5.000%, 10/01/2027 (Mandatory Tender Date 06/01/2017) | | | 20,000 | | | | 20,326 | | | | | |
| Noblesville High School Building Corp., | | | | | | | | | | | | |
| 0.000%, 02/15/2018 | | | 20,000 | | | | 19,556 | | | | | |
| Pike Township Metropolitan School District, | | | | | | | | | | | | |
| 2.000%, 01/15/2017 | | | 25,000 | | | | 25,009 | | | | | |
| South Bend Community School Corp., | | | | | | | | | | | | |
| 5.000%, 07/15/2017 | | | 100,000 | | | | 101,022 | | | | | |
| Twin Lakes Regional Sewer District, | | | | | | | | | | | | |
| 3.000%, 01/01/2018 (Insured by AGM) | | | 50,000 | | | | 50,907 | | | | | |
| | | | | | | | 1,467,508 | | | | 2.5 | % |
| Iowa | | | | | | | | | | | | |
| City of Coralville IA, | | | | | | | | | | | | |
| 4.000%, 06/01/2019 | | | 100,000 | | | | 103,408 | | | | | |
| Iowa Finance Authority: | | | | | | | | | | | | |
| 3.500%, 09/01/2017 | | | 100,000 | | | | 100,268 | | | | | |
| 3.500%, 07/01/2046 (Callable 01/01/2026) | | | 250,000 | | | | 259,905 | | | | | |
| Iowa Higher Education Loan Authority, | | | | | | | | | | | | |
| 2.000%, 12/01/2018 (Callable 06/01/2018) (3) | | | 1,000,000 | | | | 998,690 | | | | | |
| Xenia Rural Water District, | | | | | | | | | | | | |
| 2.000%, 12/01/2017 | | | 125,000 | | | | 125,134 | | | | | |
| | | | | | | | 1,587,405 | | | | 2.7 | % |
| Kansas | | | | | | | | | | | | |
| City of Hutchinson KS: | | | | | | | | | | | | |
| 4.000%, 12/01/2017 (3) | | | 70,000 | | | | 71,122 | | | | | |
| 4.000%, 12/01/2018 (3) | | | 200,000 | | | | 205,582 | | | | | |
| 4.000%, 12/01/2019 (3) | | | 210,000 | | | | 215,679 | | | | | |
| State of Kansas Department of Transportation, | | | | | | | | | | | | |
| 0.813%, 09/01/2019 (1) | | | 125,000 | | | | 124,081 | | | | | |
| | | | | | | | 616,464 | | | | 1.1 | % |
| Kentucky | | | | | | | | | | | | |
| Kentucky Municipal Power Agency, | | | | | | | | | | | | |
| 2.120%, 09/01/2042 (Callable 03/01/2018)(Mandatory Tender Date 09/01/2018)(1) | | | 50,000 | | | | 50,042 | | | | 0.1 | % |
| | | | | | | | | | | | | |
| Louisiana | | | | | | | | | | | | |
| Regional Transit Authority, | | | | | | | | | | | | |
| 0.000%, 12/01/2021 | | | 90,000 | | | | 71,999 | | | | 0.1 | % |
| | | | | | | | | | | | | |
| Maine | | | | | | | | | | | | |
| Maine State Housing Authority: | | | | | | | | | | | | |
| 3.500%, 11/15/2045 (Callable 05/15/2025) | | | 45,000 | | | | 46,647 | | | | | |
| 4.000%, 11/15/2045 (Callable 11/15/2025) | | | 245,000 | | | | 259,007 | | | | | |
| | | | | | | | 305,654 | | | | 0.5 | % |
| Maryland | | | | | | | | | | | | |
| Maryland Health & Higher Educational Facilities Authority, | | | | | | | | | | | | |
| 5.000%, 07/01/2018 | | | 25,000 | | | | 26,155 | | | | | |
| Maryland State Transportation Authority, | | | | | | | | | | | | |
| 5.000%, 03/01/2018 (Callable 03/01/2017) | | | 30,000 | | | | 30,182 | | | | | |
| | | | | | | | 56,337 | | | | 0.1 | % |
| Massachusetts | | | | | | | | | | | | |
| Eaton Vance Municipal Bond Fund II, | | | | | | | | | | | | |
| 1.770%, 07/01/2019 (Callable 01/30/2017)(1) | | | 100,000 | | | | 100,013 | | | | | |
| Massachusetts Housing Finance Agency: | | | | | | | | | | | | |
| 4.000%, 12/01/2044 (Callable 06/01/2025) | | | 95,000 | | | | 100,281 | | | | | |
| 3.500%, 12/01/2046 (Callable 12/01/2025) | | | 1,000,000 | | | | 1,030,350 | | | | | |
| Town of Ashburnham MA, | | | | | | | | | | | | |
| 4.250%, 07/01/2021 (Callable 07/01/2018) | | | 250,000 | | | | 259,333 | | | | | |
| | | | | | | | 1,489,977 | | | | 2.5 | % |
| Michigan | | | | | | | | | | | | |
| City of Detroit MI Sewage Disposal System Revenue, | | | | | | | | | | | | |
| 7.000%, 07/01/2027 (Callable 07/01/2019)(Insured by AGM) | | | 50,000 | | | | 55,911 | | | | | |
| City of Detroit MI Water Supply System Revenue, | | | | | | | | | | | | |
| 4.250%, 07/01/2017 | | | 55,000 | | | | 55,794 | | | | | |
| City of Saginaw MI Water Supply System Revenue, | | | | | | | | | | | | |
| 4.000%, 07/01/2020 (Insured by AGM) (3) | | | 25,000 | | | | 26,572 | | | | | |
| Dexter Community Schools, | | | | | | | | | | | | |
| 5.100%, 05/01/2018 | | | 25,000 | | | | 25,735 | | | | | |
| Hudsonville Public Schools, | | | | | | | | | | | | |
| 4.000%, 05/01/2017 (Insured by Q-SBLF) | | | 75,000 | | | | 75,679 | | | | | |
| Lowell Area Schools, | | | | | | | | | | | | |
| 0.000%, 05/01/2019 | | | 100,000 | | | | 95,814 | | | | | |
| Michigan Finance Authority: | | | | | | | | | | | | |
| 3.400%, 10/01/2020 | | | 100,000 | | | | 102,184 | | | | | |
| 5.500%, 06/01/2021 (Pre-refunded to 06/01/2017) | | | 500,000 | | | | 524,040 | | | | | |
| 1.268%, 10/15/2038 (Callable 04/15/2020)(Mandatory Tender Date 10/15/2020)(1) | | | 350,000 | | | | 344,547 | | | | | |
| Michigan State Hospital Finance Authority, | | | | | | | | | | | | |
| 1.625%, 11/01/2027 (Mandatory Tender Date 11/01/2019) | | | 45,000 | | | | 44,636 | | | | | |
| Michigan State Housing Development Authority, | | | | | | | | | | | | |
| 3.500%, 06/01/2047 (Callable 06/01/2026) | | | 700,000 | | | | 721,119 | | | | | |
| Rudyard MI Area Schools, | | | | | | | | | | | | |
| 1.500%, 05/01/2019 | | | 25,000 | | | | 24,722 | | | | | |
| South Haven Public Schools, | | | | | | | | | | | | |
| 4.000%, 05/01/2020 (Insured by AGM) | | | 50,000 | | | | 53,098 | | | | | |
| Western Michigan University, | | | | | | | | | | | | |
| 5.000%, 11/15/2025 (Callable 11/15/2021) | | | 75,000 | | | | 84,114 | | | | | |
| White Cloud Public Schools: | | | | | | | | | | | | |
| 4.000%, 05/01/2018 (Insured by Q-SBLF) | | | 35,000 | | | | 36,150 | | | | | |
| 4.000%, 05/01/2019 (Insured by Q-SBLF) | | | 30,000 | | | | 31,635 | | | | | |
| Ypsilanti School District/MI, | | | | | | | | | | | | |
| 4.000%, 05/01/2020 (Insured by Q-SBLF) | | | 50,000 | | | | 52,983 | | | | | |
| | | | | | | | 2,354,733 | | | | 4.0 | % |
| Minnesota | | | | | | | | | | | | |
| Minneapolis-Saint Paul Metropolitan Airports Commission, | | | | | | | | | | | | |
| 5.000%, 01/01/2025 | | | 125,000 | | | | 147,900 | | | | | |
| Minnesota Housing Finance Agency: | | | | | | | | | | | | |
| 2.900%, 01/01/2025 | | | 85,000 | | | | 85,422 | | | | | |
| 4.000%, 01/01/2047 (Callable 01/01/2026) (3) | | | 500,000 | | | | 527,585 | | | | | |
| | | | | | | | 760,907 | | | | 1.3 | % |
| Mississippi | | | | | | | | | | | | |
| City of Jackson MS Water & Sewer System Revenue, | | | | | | | | | | | | |
| 4.000%, 09/01/2018 (Insured by BAM) | | | 135,000 | | | | 140,135 | | | | | |
| Mississippi Business Finance Corp., | | | | | | | | | | | | |
| 0.740%, 11/01/2035 (Callable 01/03/2017)(Optional Put Date 01/31/2017)(1) | | | 400,000 | | | | 400,000 | | | | | |
| Mississippi Development Bank: | | | | | | | | | | | | |
| 5.500%, 10/01/2019 | | | 75,000 | | | | 80,855 | | | | | |
| 5.000%, 03/01/2024 (Insured by AGM) | | | 50,000 | | | | 56,567 | | | | | |
| | | | | | | | 677,557 | | | | 1.2 | % |
| Missouri | | | | | | | | | | | | |
| County of Boone MO, | | | | | | | | | | | | |
| 5.750%, 08/01/2028 (Pre-refunded to 08/01/2018) | | | 630,000 | | | | 673,281 | | | | | |
| Health & Educational Facilities Authority of the State of Missouri: | | | | | | | | | | | | |
| 4.000%, 02/01/2019 | | | 250,000 | | | | 256,757 | | | | | |
| 5.000%, 05/15/2022 | | | 50,000 | | | | 56,181 | | | | | |
| Jasper County Reorganized School District No. R-9/MO, | | | | | | | | | | | | |
| 2.000%, 04/01/2018 | | | 150,000 | | | | 151,303 | | | | | |
| St Charles County School District No. R-IV Wentzville, | | | | | | | | | | | | |
| 0.000%, 03/01/2027 (Pre-refunded to 03/01/2019) | | | 65,000 | | | | 38,921 | | | | | |
| State of Missouri Environmental Improvement & Energy Resources Authority, | | | | | | | | | | | | |
| 1.278%, 12/01/2022 (Callable 12/30/2016)(1)(2) | | | 275,000 | | | | 252,692 | | | | | |
| State of Missouri Housing Development Commission, | | | | | | | | | | | | |
| 3.500%, 05/01/2041 (Callable 11/01/2025) | | | 200,000 | | | | 208,372 | | | | | |
| | | | | | | | 1,637,507 | | | | 2.8 | % |
| Nebraska | | | | | | | | | | | | |
| Douglas County Hospital Authority No. 2, | | | | | | | | | | | | |
| 5.000%, 05/15/2019 | | | 50,000 | | | | 53,238 | | | | 0.1 | % |
| | | | | | | | | | | | | |
| Nevada | | | | | | | | | | | | |
| City of North Las Vegas NV, | | | | | | | | | | | | |
| 2.000%, 12/01/2018 | | | 100,000 | | | | 100,522 | | | | 0.2 | % |
| | | | | | | | | | | | | |
| New Jersey | | | | | | | | | | | | |
| Landis Sewage Authority, | | | | | | | | | | | | |
| 2.544%, 09/19/2019 (1)(2) | | | 100,000 | | | | 95,777 | | | | | |
| New Jersey Economic Development Authority: | | | | | | | | | | | | |
| 1.450%, 02/01/2017 (Callable 01/09/2017)(1) | | | 500,000 | | | | 500,000 | | | | | |
| 4.000%, 06/15/2017 | | | 50,000 | | | | 50,479 | | | | | |
| 2.520%, 02/01/2018 (Callable 08/01/2017)(1) | | | 50,000 | | | | 50,313 | | | | | |
| 4.000%, 07/15/2018 | | | 100,000 | | | | 102,826 | | | | | |
| 5.000%, 06/15/2023 (Insured by BAM) | | | 50,000 | | | | 56,006 | | | | | |
| New Jersey Educational Facilities Authority, | | | | | | | | | | | | |
| 5.000%, 07/01/2022 | | | 150,000 | | | | 168,466 | | | | | |
| New Jersey Health Care Facilities Financing Authority: | | | | | | | | | | | | |
| 4.000%, 07/01/2019 (ETM) | | | 105,000 | | | | 111,231 | | | | | |
| 4.250%, 11/15/2021 (Callable 11/15/2020) | | | 65,000 | | | | 70,256 | | | | | |
| 5.000%, 07/01/2025 (Insured by AGM) | | | 50,000 | | | | 56,843 | | | | | |
| New Jersey Sports & Exposition Authority, | | | | | | | | | | | | |
| 4.500%, 09/01/2022 (Callable 09/01/2018) | | | 250,000 | | | | 252,650 | | | | | |
| New Jersey Transportation Trust Fund Authority: | | | | | | | | | | | | |
| 5.500%, 12/15/2017 (Insured by AGM) | | | 100,000 | | | | 103,248 | | | | | |
| 5.000%, 06/15/2021 (Callable 06/15/2018) (3) | | | 150,000 | | | | 155,372 | | | | | |
| New Jersey Turnpike Authority, | | | | | | | | | | | | |
| 1.278%, 01/01/2030 (Callable 01/05/2017)(1)(2) | | | 130,000 | | | | 117,919 | | | | | |
| Town of West New York NJ: | | | | | | | | | | | | |
| 3.000%, 04/15/2018 | | | 100,000 | | | | 102,056 | | | | | |
| 4.000%, 04/15/2019 | | | 200,000 | | | | 210,644 | | | | | |
| Township of Irvington NJ, | | | | | | | | | | | | |
| 0.000%, 07/15/2018 | | | 50,000 | | | | 48,298 | | | | | |
| | | | | | | | 2,252,384 | | | | 3.8 | % |
| New Mexico | | | | | | | | | | | | |
| Montecito Estates Public Improvement District, | | | | | | | | | | | | |
| 2.000%, 10/01/2018 (Insured by BAM) | | | 100,000 | | | | 101,389 | | | | | |
| State of New Mexico Severance Tax Permanent Fund, | | | | | | | | | | | | |
| 5.000%, 07/01/2017 | | | 40,000 | | | | 40,798 | | | | | |
| | | | | | | | 142,187 | | | | 0.2 | % |
| New York | | | | | | | | | | | | |
| Brooklyn Arena Local Development Corp., | | | | | | | | | | | | |
| 5.000%, 07/15/2020 | | | 100,000 | | | | 108,850 | | | | | |
| City of Yonkers NY, | | | | | | | | | | | | |
| 5.000%, 03/15/2024 (Callable 03/15/2021) | | | 50,000 | | | | 55,325 | | | | | |
| Metropolitan Transportation Authority: | | | | | | | | | | | | |
| 1.170%, 11/01/2034 (Callable 05/01/2019)(Mandatory Tender Date 11/01/2019)(1) | | | 50,000 | | | | 49,983 | | | | | |
| 0.650%, 11/01/2035 | | | 300,000 | | | | 300,000 | | | | | |
| MTA Hudson Rail Yards Trust Obligations, | | | | | | | | | | | | |
| 5.000%, 11/15/2046 (Callable 11/15/2019) | | | 500,000 | | | | 530,875 | | | | | |
| New York City Industrial Development Agency, | | | | | | | | | | | | |
| 0.000%, 03/01/2017 | | | 85,000 | | | | 84,828 | | | | | |
| New York City Transitional Finance Authority Future Tax Secured Revenue: | | | | | | | | | | | | |
| 5.000%, 11/01/2018 | | | 50,000 | | | | 53,376 | | | | | |
| 0.940%, 08/01/2022 (Optional Put Date 01/31/2017)(1) | | | 500,000 | | | | 500,000 | | | | | |
| 0.940%, 11/01/2022 (Optional Put Date 01/31/2017)(1) | | | 435,000 | | | | 435,000 | | | | | |
| New York City Water & Sewer System, | | | | | | | | | | | | |
| 1.070%, 06/15/2032 (Callable 01/17/2016)(Optional Put Date 01/31/2017)(1) | | | 680,000 | | | | 680,000 | | | | | |
| New York State Dormitory Authority: | | | | | | | | | | | | |
| 4.000%, 05/15/2017 | | | 25,000 | | | | 25,279 | | | | | |
| 5.000%, 07/01/2017 | | | 25,000 | | | | 25,492 | | | | | |
| 1.324%, 05/01/2018 (Callable 01/31/2017)(1) | | | 390,000 | | | | 389,754 | | | | | |
| 5.000%, 12/15/2021 | | | 45,000 | | | | 51,530 | | | | | |
| New York State Housing Finance Agency, | | | | | | | | | | | | |
| 1.250%, 11/01/2018 | | | 15,000 | | | | 14,925 | | | | | |
| New York State Thruway Authority Highway & Bridge Trust Fund, | | | | | | | | | | | | |
| 5.000%, 04/01/2019 (Pre-refunded to 10/01/2018) | | | 175,000 | | | | 186,188 | | | | | |
| Niskayuna Central School District, | | | | | | | | | | | | |
| 1.300%, 03/15/2018 | | | 160,000 | | | | 158,853 | | | | | |
| Oneida County Industrial Development Agency, | | | | | | | | | | | | |
| 0.000%, 07/01/2026 (Callable 07/01/2017) | | | 75,000 | | | | 49,587 | | | | | |
| Shenendehowa Central School District, | | | | | | | | | | | | |
| 1.550%, 08/01/2018 | | | 200,000 | | | | 198,690 | | | | | |
| State of New York, | | | | | | | | | | | | |
| 0.992%, 03/15/2021 (Callable 01/05/2017)(Insured by AGM)(1)(2) | | | 75,000 | | | | 73,237 | | | | | |
| Town of Oyster Bay NY, | | | | | | | | | | | | |
| 3.000%, 03/01/2020 (Insured by AGM) | | | 250,000 | | | | 255,830 | | | | | |
| | | | | | | | 4,227,602 | | | | 7.2 | % |
| North Carolina | | | | | | | | | | | | |
| North Carolina Capital Facilities Finance Agency, | | | | | | | | | | | | |
| 5.000%, 06/01/2022 | | | 100,000 | | | | 111,440 | | | | | |
| North Carolina Eastern Municipal Power Agency: | | | | | | | | | | | | |
| 5.000%, 01/01/2021 (ETM) | | | 185,000 | | | | 208,525 | | | | | |
| 5.000%, 01/01/2021 (ETM) | | | 650,000 | | | | 732,654 | | | | | |
| 6.000%, 01/01/2022 (ETM) | | | 100,000 | | | | 119,637 | | | | | |
| North Carolina Medical Care Commission: | | | | | | | | | | | | |
| 4.750%, 11/01/2017 | | | 50,000 | | | | 51,343 | | | | | |
| 5.000%, 11/01/2018 | | | 25,000 | | | | 26,427 | | | | | |
| 5.000%, 10/01/2019 (Callable 10/01/2017) | | | 55,000 | | | | 56,466 | | | | | |
| 5.750%, 01/01/2035 (Pre-refunded to 01/01/2021) | | | 80,000 | | | | 91,977 | | | | | |
| State of North Carolina, | | | | | | | | | | | | |
| 5.000%, 05/01/2024 (Callable 05/01/2023) | | | 1,000,000 | | | | 1,160,550 | | | | | |
| University of North Carolina at Chapel Hill, | | | | | | | | | | | | |
| 1.163%, 12/01/2041 (Callable 06/01/2017)(Mandatory Tender Date 12/01/2017)(1) | | | 50,000 | | | | 50,045 | | | | | |
| | | | | | | | 2,609,064 | | | | 4.4 | % |
| North Dakota | | | | | | | | | | | | |
| City of Hazen ND, | | | | | | | | | | | | |
| 2.500%, 07/01/2017 (Callable 01/23/2017) | | | 100,000 | | | | 100,082 | | | | | |
| City of Mandan ND, | | | | | | | | | | | | |
| 2.750%, 09/01/2041 (Callable 01/30/2017) | | | 145,000 | | | | 142,763 | | | | | |
| Jamestown Park District/ND, | | | | | | | | | | | | |
| 2.900%, 07/01/2035 (Callable 01/17/2017) | | | 500,000 | | | | 460,540 | | | | | |
| Williston Parks & Recreation District, | | | | | | | | | | | | |
| 3.250%, 03/01/2032 (Callable 01/17/2017) | | | 60,000 | | | | 59,520 | | | | | |
| | | | | | | | 762,905 | | | | 1.3 | % |
| Ohio | | | | | | | | | |
| City of Bowling Green OH, | | | | | | | | | |
| 4.500%, 06/01/2019 | | | 60,000 | | | | 62,395 | | | | |
| City of Toledo OH, | | | | | | | | | | | |
| 4.000%, 12/01/2017 (Insured by AGM) | | | 50,000 | | | | 51,271 | | | | |
| Clear Fork Valley Local School District, | | | | | | | | | | | |
| 2.000%, 12/01/2017 | | | 100,000 | | | | 100,781 | | | | |
| Cleveland-Cuyahoga County Port Authority, | | | | | | | | | | | |
| 3.000%, 05/15/2018 | | | 50,000 | | | | 50,775 | | | | |
| County of Crawford OH, | | | | | | | | | | | |
| 1.430%, 11/01/2017 (Callable 05/01/2017) | | | 100,000 | | | | 100,012 | | | | |
| County of Hamilton OH, | | | | | | | | | | | |
| 4.000%, 01/01/2018 | | | 100,000 | | | | 101,456 | | | | |
| County of Huron OH, | | | | | | | | | | | |
| 5.250%, 12/01/2017 (Callable 06/01/2017) | | | 50,000 | | | | 50,799 | | | | |
| County of Richland OH, | | | | | | | | | | | |
| 2.750%, 01/05/2017 | | | 240,000 | | | | 240,019 | | | | |
| Groveport-Madison Local School District, | | | | | | | | | | | |
| 4.000%, 12/01/2024 (Callable 12/01/2022)(Insured by BAM) | | | 50,000 | | | | 53,244 | | | | |
| Lake Local School District/Wood County OH, | | | | | | | | | | | |
| 2.000%, 12/01/2018 | | | 280,000 | | | | 283,041 | | | | |
| Lancaster Port Authority, | | | | | | | | | | | |
| 1.033%, 08/01/2019 (Callable 02/01/2019)(1) | | | 70,000 | | | | 69,225 | | | | |
| Ohio Higher Educational Facility Commission, | | | | | | | | | | | |
| 5.000%, 12/01/2020 | | | 35,000 | | | | 38,911 | | | | |
| Ohio Housing Finance Agency, | | | | | | | | | | | |
| 4.000%, 03/01/2047 (Callable 09/01/2025) | | | 250,000 | | | | 263,483 | | | | |
| Shawnee State University, | | | | | | | | | | | |
| 2.000%, 06/01/2019 (Insured by BAM) (3) | | | 250,000 | | | | 249,823 | | | | |
| Summit County Development Finance Authority: | | | | | | | | | | | |
| 3.000%, 05/15/2018 | | | 135,000 | | | | 136,637 | | | | |
| 2.000%, 11/15/2019 | | | 30,000 | | | | 29,539 | | | | |
| | | | | | | | 1,881,411 | | | | 3.2 | % |
| Oklahoma | | | | | | | | | | | | |
| Logan County Independent School District No. 1 Guthrie, | | | | | | | | | | | | |
| 4.000%, 08/01/2020 | | | 25,000 | | | | 26,520 | | | | | |
| Mayes County Independent School District No. 1 Pryor, | | | | | | | | | | | | |
| 0.850%, 06/01/2017 | | | 50,000 | | | | 49,941 | | | | | |
| Oklahoma City Industrial & Cultural Facilities Trust, | | | | | | | | | | | | |
| 1.103%, 06/01/2019 (Callable 01/31/2017)(1)(2) | | | 100,000 | | | | 99,375 | | | | | |
| | | | | | | | 175,836 | | | | 0.3 | % |
| Oregon | | | | | | | | | | | | |
| City of Portland OR, | | | | | | | | | | | | |
| 4.000%, 02/01/2018 | | | 25,000 | | | | 25,751 | | | | | |
| Oregon State Facilities Authority, | | | | | | | | | | | | |
| 4.750%, 03/15/2024 (Callable 03/15/2020) | | | 15,000 | | | | 16,183 | | | | | |
| | | | | | | | 41,934 | | | | 0.1 | % |
| Pennsylvania | | | | | | | | | | | | |
| Allegheny County Higher Education Building Authority, | | | | | | | | | | | | |
| 4.000%, 10/15/2018 (3) | | | 365,000 | | | | 378,330 | | | | | |
| Allegheny County Hospital Development Authority, | | | | | | | | | | | | |
| 4.125%, 10/15/2026 (Callable 10/15/2021) | | | 30,000 | | | | 31,518 | | | | | |
| Allentown City School District, | | | | | | | | | | | | |
| 4.000%, 03/15/2018 | | | 100,000 | | | | 103,164 | | | | | |
| Bethlehem Parking Authority, | | | | | | | | | | | | |
| 2.000%, 10/01/2018 | | | 100,000 | | | | 100,957 | | | | | |
| Borough of Wilkinsburg PA: | | | | | | | | | | | | |
| 1.020%, 07/15/2018 | | | 340,000 | | | | 337,042 | | | | | |
| 1.500%, 07/15/2019 | | | 315,000 | | | | 313,447 | | | | | |
| Chester County Health & Education Facilities Authority, | | | | | | | | | | | | |
| 5.000%, 11/01/2019 | | | 225,000 | | | | 242,334 | | | | | |
| City of Erie PA, | | | | | | | | | | | | |
| 0.000%, 11/15/2018 (ETM)(Insured by AGM) | | | 60,000 | | | | 58,441 | | | | | |
| Commonwealth Financing Authority, | | | | | | | | | | | | |
| 5.000%, 06/01/2023 | | | 225,000 | | | | 255,249 | | | | | |
| County of Westmoreland PA, | | | | | | | | | | | | |
| 0.000%, 08/01/2017 (ETM)(Insured by AMBAC) | | | 40,000 | | | | 39,745 | | | | | |
| Crawford Central School District, | | | | | | | | | | | | |
| 5.000%, 02/01/2019 (Callable 08/01/2018) | | | 100,000 | | | | 105,225 | | | | | |
| Erie Parking Authority, | | | | | | | | | | | | |
| 2.000%, 09/01/2019 | | | 105,000 | | | | 105,188 | | | | | |
| Hollidaysburg Sewer Authority: | | | | | | | | | | | | |
| 2.000%, 12/01/2018 (Insured by BAM) | | | 50,000 | | | | 50,458 | | | | | |
| 2.000%, 12/01/2019 (Insured by BAM) | | | 105,000 | | | | 105,502 | | | | | |
| Lancaster Industrial Development Authority, | | | | | | | | | | | | |
| 5.000%, 05/01/2022 | | | 45,000 | | | | 48,979 | | | | | |
| Montgomery County Industrial Development Authority/PA, | | | | | | | | | | | | |
| 5.000%, 01/15/2018 | | | 50,000 | | | | 51,430 | | | | | |
| Pennsylvania Economic Development Financing Authority: | | | | | | | | | | | | |
| 5.000%, 03/01/2019 | | | 130,000 | | | | 138,072 | | | | | |
| 1.550%, 12/01/2033 (Mandatory Tender Date 12/03/2018) | | | 180,000 | | | | 178,520 | | | | | |
| Pennsylvania Higher Educational Facilities Authority, | | | | | | | | | | | | |
| 5.000%, 08/15/2024 (Pre-refunded to 08/15/2021) | | | 100,000 | | | | 114,097 | | | | | |
| Pennsylvania Housing Finance Agency: | | | | | | | | | | | | |
| 3.700%, 10/01/2042 (Callable 10/01/2021) | | | 100,000 | | | | 101,510 | | | | | |
| 3.500%, 10/01/2046 (Callable 10/01/2025) | | | 245,000 | | | | 253,857 | | | | | |
| Pennsylvania Turnpike Commission, | | | | | | | | | | | | |
| 1.600%, 12/01/2020 (Callable 06/01/2020)(1) | | | 225,000 | | | | 225,443 | | | | | |
| Somerset County General Authority, | | | | | | | | | | | | |
| 2.000%, 10/01/2019 | | | 155,000 | | | | 155,781 | | | | | |
| Southern Columbia PA Area School District: | | | | | | | | | | | | |
| 0.800%, 04/01/2017 | | | 40,000 | | | | 39,979 | | | | | |
| 1.000%, 04/01/2018 | | | 50,000 | | | | 49,701 | | | | | |
| West Mifflin Sanitary Sewer Municipal Authority, | | | | | | | | | | | | |
| 4.000%, 08/01/2020 (Insured by BAM) | | | 200,000 | | | | 213,436 | | | | | |
| | | | | | | | 3,797,405 | | | | 6.5 | % |
| Puerto Rico | | | | | | | | | | | | |
| Commonwealth of Puerto Rico: | | | | | | | | | | | | |
| 5.500%, 07/01/2018 | | | 50,000 | | | | 52,059 | | | | | |
| 0.000%, 07/01/2019 | | | 50,000 | | | | 45,696 | | | | | |
| | | | | | | | 97,755 | | | | 0.2 | % |
| Rhode Island | | | | | | | | | | | | |
| Providence Public Buildings Authority, | | | | | | | | | | | | |
| 5.125%, 06/15/2021 (Insured by AGM) | | | 90,000 | | | | 95,995 | | | | | |
| Rhode Island Housing & Mortgage Finance Corp./RI: | | | | | | | | | | | | |
| 1.050%, 10/01/2044 (Callable 10/01/2017)(Mandatory Tender Date 04/01/2018) | | | 100,000 | | | | 99,334 | | | | | |
| 3.500%, 10/01/2046 (Callable 04/01/2025) | | | 90,000 | | | | 92,823 | | | | | |
| | | | | | | | 288,152 | | | | 0.5 | % |
| South Carolina | | | | | | | | | | | | |
| City of Charleston SC Waterworks & Sewer System Revenue, | | | | | | | | | | | | |
| 1.107%, 01/01/2028 (Callable 07/01/2017)(Mandatory Tender Date 01/01/2018)(1) | | | 50,000 | | | | 50,040 | | | | | |
| City of Myrtle Beach SC, | | | | | | | | | | | | |
| 5.000%, 10/01/2020 | | | 100,000 | | | | 110,335 | | | | | |
| Easley Combined Utility System, | | | | | | | | | | | | |
| 3.250%, 12/01/2017 | | | 50,000 | | | | 50,934 | | | | | |
| Scago Educational Facilities Corp. for Union School District, | | | | | | | | | | | | |
| 4.000%, 12/01/2017 | | | 100,000 | | | | 102,495 | | | | | |
| South Carolina Jobs-Economic Development Authority, | | | | | | | | | | | | |
| 4.500%, 11/01/2017 | | | 40,000 | | | | 41,093 | | | | | |
| South Carolina State Housing Finance & Development Authority, | | | | | | | | | | | | |
| 4.000%, 07/01/2036 (Callable 07/01/2025) | | | 340,000 | | | | 358,489 | | | | | |
| | | | | | | | 713,386 | | | | 1.2 | % |
| Tennessee | | | | | | | | | | | | |
| Clarksville Natural Gas Acquisition Corp., | | | | | | | | | | | | |
| 5.000%, 12/15/2020 | | | 75,000 | | | | 82,296 | | | | | |
| Knox County Health Educational & Housing Facility Board: | | | | | | | | | | | | |
| 0.000%, 01/01/2037 (Callable 01/01/2017) | | | 100,000 | | | | 37,026 | | | | | |
| 0.000%, 01/01/2038 (Callable 01/01/2017) | | | 100,000 | | | | 35,159 | | | | | |
| Metropolitan Government Nashville & Davidson County Health & Educational Facilities, | | | | | | | | | | | | |
| 0.900%, 04/01/2019 (Mandatory Tender Date 04/01/2018) | | | 150,000 | | | | 149,209 | | | | | |
| Metropolitan Government Nashville & Davidson County Revenue, | | | | | | | | | | | | |
| 1.550%, 11/15/2030 (Mandatory Tender Date 11/03/2020) | | | 500,000 | | | | 489,750 | | | | | |
| Tennessee Energy Acquisition Corp., | | | | | | | | | | | | |
| 5.250%, 09/01/2018 | | | 30,000 | | | | 31,736 | | | | | |
| | | | | | | | 825,176 | | | | 1.4 | % |
| Texas | | | | | | | | | | | | |
| Bexar County Health Facilities Development Corp.: | | | | | | | | | | | | |
| 4.000%, 07/15/2018 | | | 50,000 | | | | 51,208 | | | | | |
| 4.000%, 07/15/2019 | | | 75,000 | | | | 77,311 | | | | | |
| Central Texas Turnpike System, | | | | | | | | | | | | |
| 5.000%, 08/15/2042 (Mandatory Tender Date 04/01/2020) | | | 100,000 | | | | 109,096 | | | | | |
| City of Bullard TX, | | | | | | | | | | | | |
| 3.000%, 09/01/2020 (Insured by BAM) | | | 135,000 | | | | 138,771 | | | | | |
| City of Dallas TX, | | | | | | | | | | | | |
| 5.000%, 02/15/2021 | | | 100,000 | | | | 110,821 | | | | | |
| City of Fort Worth TX, | | | | | | | | | | | | |
| 5.000%, 03/01/2026 (Pre-refunded to 03/01/2019) | | | 500,000 | | | | 537,305 | | | | | |
| City of Round Rock TX: | | | | | | | | | | | | |
| 4.000%, 12/01/2023 | | | 30,000 | | | | 32,678 | | | | | |
| 4.000%, 12/01/2024 | | | 250,000 | | | | 272,435 | | | | | |
| City of San Antonio TX Electric & Gas Systems Revenue, | | | | | | | | | | | | |
| 2.250%, 02/01/2033 (Mandatory Tender Date 12/01/2019) | | | 1,000,000 | | | | 1,007,860 | | | | | |
| Clear Creek Independent School District, | | | | | | | | | | | | |
| 3.000%, 02/15/2035 (Mandatory Tender Date 08/14/2017)(PSF Guaranteed) | | | 225,000 | | | | 227,308 | | | | | |
| Clifton Higher Education Finance Corp., | | | | | | | | | | | | |
| 5.000%, 08/15/2018 | | | 100,000 | | | | 104,992 | | | | | |
| Coastal Water Authority, | | | | | | | | | | | | |
| 4.000%, 12/15/2017 | | | 25,000 | | | | 25,689 | | | | | |
| County of Denton TX, | | | | | | | | | | | | |
| 2.625%, 07/15/2017 | | | 25,000 | | | | 25,233 | | | | | |
| Crane County Water District, | | | | | | | | | | | | |
| 3.000%, 02/15/2017 | | | 50,000 | | | | 50,111 | | | | | |
| Cypress-Fairbanks Independent School District, | | | | | | | | | | | | |
| 3.000%, 02/15/2036 (Mandatory Tender Date 08/15/2019)(PSF Guaranteed) | | | 50,000 | | | | 51,609 | | | | | |
| Dallas Independent School District: | | | | | | | | | | | | |
| 5.000%, 02/15/2036 (Mandatory Tender Date 02/15/2020)(PSF Guaranteed) | | | 200,000 | | | | 218,070 | | | | | |
| 5.000%, 02/15/2036 (Mandatory Tender Date 02/15/2022)(PSF Guaranteed) | | | 340,000 | | | | 387,012 | | | | | |
| Dawson Independent School District, | | | | | | | | | | | | |
| 0.000%, 02/16/2019 (PSF Guaranteed) (3) | | | 245,000 | | | | 235,668 | | | | | |
| Fort Bend County Municipal Utility District No. 187, | | | | | | | | | | | | |
| 3.000%, 09/01/2017 | | | 20,000 | | | | 20,199 | | | | | |
| Fort Bend County Municipal Utility District No. 58, | | | | | | | | | | | | |
| 5.000%, 04/01/2019 (Insured by BAM) | | | 150,000 | | | | 160,038 | | | | | |
| Fort Bend Independent School District, | | | | | | | | | | | | |
| 0.900%, 08/01/2040 (Mandatory Tender Date 08/01/2018)(PSF Guaranteed) | | | 115,000 | | | | 113,807 | | | | | |
| Fort Worth Independent School District, | | | | | | | | | | | | |
| 5.000%, 02/15/2029 (Pre-refunded to 02/15/2019) | | | 300,000 | | | | 322,710 | | | | | |
| Generation Park Management District, | | | | | | | | | | | | |
| 3.000%, 09/01/2018 | | | 160,000 | | | | 161,936 | | | | | |
| Harlingen Consolidated Independent School District, | | | | | | | | | | | | |
| 5.000%, 08/15/2021 (PSF Guaranteed) | | | 100,000 | | | | 113,622 | | | | | |
| Harris County Cultural Education Facilities Finance Corp.: | | | | | | | | | | | | |
| 1.300%, 12/01/2042 (Callable 06/01/2019)(Mandatory Tender Date 12/01/2019)(1) | | | 50,000 | | | | 49,710 | | | | | |
| 1.374%, 10/01/2045 (Callable 12/01/2019)(Mandatory Tender Date 06/01/2020)(1) | | | 200,000 | | | | 198,978 | | | | | |
| Harris County Municipal Utility District No. 153, | | | | | | | | | | | | |
| 4.000%, 09/01/2023 (Callable 09/01/2022)(Insured by BAM) | | | 100,000 | | | | 108,467 | | | | | |
| Harris County Municipal Utility District No. 419: | | | | | | | | | | | | |
| 3.000%, 09/01/2017 (Insured by AGM) | | | 25,000 | | | | 25,309 | | | | | |
| 3.000%, 09/01/2017 (Insured by AGM) | | | 50,000 | | | | 50,596 | | | | | |
| Harris County-Houston Sports Authority, | | | | | | | | | | | | |
| 0.000%, 11/15/2017 | | | 25,000 | | | | 24,651 | | | | | |
| Horsepen Bayou Municipal Utility District, | | | | | | | | | | | | |
| 4.000%, 03/01/2017 | | | 85,000 | | | | 85,399 | | | | | |
| Humble Independent School District, | | | | | | | | | | | | |
| 5.000%, 02/15/2025 (Pre-refunded to 02/15/2019) | | | 650,000 | | | | 698,503 | | | | | |
| Laredo Independent School District, | | | | | | | | | | | | |
| 4.000%, 08/01/2017 | | | 25,000 | | | | 25,416 | | | | | |
| Lewisville Independent School District, | | | | | | | | | | | | |
| 4.500%, 08/15/2023 (Callable 08/15/2017)(PSF Guaranteed) | | | 25,000 | | | | 25,507 | | | | | |
| Medina Valley Independent School District, | | | | | | | | | | | | |
| 0.000%, 02/15/2027 (Pre-refunded to 02/15/2017)(PSF Guaranteed) | | | 50,000 | | | | 29,837 | | | | | |
| Metropolitan Transit Authority of Harris County, | | | | | | | | | | | | |
| 5.000%, 11/01/2017 | | | 25,000 | | | | 25,821 | | | | | |
| Mission Economic Development Corp., | | | | | | | | | | | | |
| 1.800%, 12/01/2018 | | | 100,000 | | | | 100,749 | | | | | |
| New Hope Cultural Education Facilities Finance Corp.: | | | | | | | | | | | | |
| 1.250%, 11/01/2018 | | | 100,000 | | | | 97,016 | | | | | |
| 3.000%, 07/01/2019 | | | 100,000 | | | | 100,741 | | | | | |
| 4.000%, 04/01/2020 | | | 50,000 | | | | 52,365 | | | | | |
| North Texas Health Facilities Development Corp., | | | | | | | | | | | | |
| 5.000%, 09/01/2020 (Callable 09/01/2017)(Insured by AGM) | | | 55,000 | | | | 56,202 | | | | | |
| North Texas Higher Education Authority, Inc., | | | | | | | | | | | | |
| 1.746%, 07/01/2030 (1) | | | 55,000 | | | | 54,359 | | | | | |
| North Texas Tollway Authority: | | | | | | | | | | | | |
| 5.000%, 01/01/2022 | | | 25,000 | | | | 28,290 | | | | | |
| 1.950%, 01/01/2038 (Mandatory Tender Date 01/01/2019) | | | 100,000 | | | | 99,845 | | | | | |
| Northside Independent School District, | | | | | | | | | | | | |
| 2.000%, 06/01/2046 (Mandatory Tender Date 06/01/2021)(PSF Guaranteed) | | | 200,000 | | | | 199,494 | | | | | |
| Round Rock Independent School District, | | | | | | | | | | | | |
| 1.500%, 08/01/2040 (Callable 02/01/2017)(Mandatory Tender Date 08/01/2021)(PSF Guaranteed) | | | 60,000 | | | | 57,776 | | | | | |
| SA Energy Acquisition Public Facility Corp., | | | | | | | | | | | | |
| 5.500%, 08/01/2022 | | | 200,000 | | | | 224,494 | | | | | |
| Sam Rayburn Municipal Power Agency, | | | | | | | | | | | | |
| 5.000%, 10/01/2020 | | | 150,000 | | | | 163,132 | | | | | |
| San Jacinto College District, | | | | | | | | | | | | |
| 5.000%, 02/15/2034 (Pre-refunded to 02/15/2019) | | | 25,000 | | | | 26,893 | | | | | |
| Seminole Hospital District, | | | | | | | | | | | | |
| 2.000%, 02/15/2017 | | | 50,000 | | | | 50,030 | | | | | |
| Siena Municipal Utility District No. 1, | | | | | | | | | | | | |
| 2.250%, 09/01/2018 (Insured by BAM) | | | 100,000 | | | | 101,616 | | | | | |
| Spring Meadows Municipal Utility District, | | | | | | | | | | | | |
| 2.000%, 09/01/2018 | | | 110,000 | | | | 111,202 | | | | | |
| Tarrant County Cultural Education Facilities Finance Corp., | | | | | | | | | | | | |
| 2.100%, 11/15/2017 | | | 50,000 | | | | 49,954 | | | | | |
| Texas Municipal Gas Acquisition & Supply Corp. I: | | | | | | | | | | | | |
| 5.250%, 12/15/2018 | | | 105,000 | | | | 111,083 | | | | | |
| 5.250%, 12/15/2021 | | | 50,000 | | | | 55,448 | | | | | |
| Texas Municipal Gas Acquisition & Supply Corp. II, | | | | | | | | | | | | |
| 1.346%, 09/15/2017 (1) | | | 30,000 | | | | 29,997 | | | | | |
| Texas Transportation Commission State Highway Fund, | | | | | | | | | | | | |
| 4.000%, 04/01/2026 (Mandatory Tender Date 10/01/2021) (3) | | | 400,000 | | | | 433,912 | | | | | |
| Trophy Club Public Improvement District No. 1, | | | | | | | | | | | | |
| 0.000%, 06/01/2017 (Insured by AGM) | | | 50,000 | | | | 49,784 | | | | | |
| Viridian Municipal Management District, | | | | | | | | | | | | |
| 6.000%, 12/01/2023 (Insured by BAM) | | | 50,000 | | | | 61,070 | | | | | |
| West Ranch Management District: | | | | | | | | | | | | |
| 2.000%, 09/01/2018 | | | 50,000 | | | | 50,383 | | | | | |
| 3.000%, 09/01/2019 | | | 50,000 | | | | 51,667 | | | | | |
| | | | | | | | 8,321,185 | | | | 14.2 | % |
| Utah | | | | | | | | | | | | |
| Utah Housing Corp., | | | | | | | | | | | | |
| 4.000%, 01/01/2045 (Callable 01/01/2026) | | | 100,000 | | | | 105,150 | | | | 0.2 | % |
| | | | | | | | | | | | | |
| Vermont | | | | | | | | | | | | |
| City of Burlington VT Electric System Revenue, | | | | | | | | | | | | |
| 5.000%, 07/01/2023 (Callable 07/01/2021) | | | 25,000 | | | | 27,129 | | | | 0.0 | % |
| | | | | | | | | | | | | |
| Virgin Islands | | | | | | | | | | | | |
| Virgin Islands Public Finance Authority, | | | | | | | | | | | | |
| 5.000%, 09/01/2020 | | | 100,000 | | | | 107,597 | | | | 0.2 | % |
| | | | | | | | | | | | | |
| Washington | | | | | | | | | | | | |
| Central Puget Sound Regional Transit Authority, | | | | | | | | | | | | |
| 1.420%, 11/01/2045 (Callable 05/01/2018)(Mandatory Tender Date 11/01/2018)(1) | | | 50,000 | | | | 50,007 | | | | | |
| Washington Economic Development Finance Authority, | | | | | | | | | | | | |
| 1.250%, 11/01/2017 | | | 250,000 | | | | 249,835 | | | | | |
| Washington Health Care Facilities Authority, | | | | | | | | | | | | |
| 4.000%, 01/01/2018 | | | 70,000 | | | | 71,893 | | | | | |
| Washington State University, | | | | | | | | | | | | |
| 4.000%, 10/01/2017 | | | 40,000 | | | | 40,893 | | | | | |
| | | | | | | | 412,628 | | | | 0.7 | % |
| Wisconsin | | | | | | | | | | | | |
| City of Two Rivers WI, | | | | | | | | | | | | |
| 4.000%, 04/01/2018 | | | 125,000 | | | | 127,392 | | | | | |
| Kaukauna Redevelopment Authority, | | | | | | | | | | | | |
| 4.000%, 06/01/2018 | | | 25,000 | | | | 25,898 | | | | | |
| Milwaukee Redevelopment Authority, | | | | | | | | | | | | |
| 1.800%, 12/01/2038 (Optional Put Date 01/06/2017)(Callable 01/31/2017)(1) | | | 140,000 | | | | 140,000 | | | | | |
| Village of Johnson Creek WI, | | | | | | | | | | | | |
| 2.700%, 03/01/2017 | | | 30,000 | | | | 30,032 | | | | | |
| Village of Somers WI, | | | | | | | | | | | | |
| 2.000%, 05/01/2017 | | | 25,000 | | | | 25,049 | | | | | |
| Waukesha Housing Authority, | | | | | | | | | | | | |
| 1.800%, 12/01/2042 (Optional Put Date 01/06/2017)(Callable 01/31/2017)(1) | | | 145,000 | | | | 145,000 | | | | | |
| West Allis West Milwaukee School District, | | | | | | | | | | | | |
| 3.000%, 04/01/2019 | | | 150,000 | | | | 149,448 | | | | | |
| Whitehall School District, | | | | | | | | | | | | |
| 1.500%, 10/25/2017 | | | 250,000 | | | | 250,658 | | | | | |
| Wisconsin Center District: | | | | | | | | | | | | |
| 0.000%, 12/15/2018 | | | 80,000 | | | | 77,083 | | | | | |
| 5.250%, 12/15/2023 | | | 70,000 | | | | 79,818 | | | | | |
| 5.250%, 12/15/2027 | | | 15,000 | | | | 17,584 | | | | | |
| Wisconsin Health & Educational Facilities Authority: | | | | | | | | | | | | |
| 3.000%, 07/01/2017 | | | 125,000 | | | | 126,143 | | | | | |
| 5.000%, 11/15/2018 | | | 15,000 | | | | 16,006 | | | | | |
| 5.000%, 08/15/2020 | | | 35,000 | | | | 38,294 | | | | | |
| 5.875%, 02/15/2022 | | | 25,000 | | | | 28,104 | | | | | |
| 4.000%, 09/15/2023 (Callable 09/15/2022) | | | 50,000 | | | | 51,670 | | | | | |
| 5.250%, 04/15/2024 (Callable 04/15/2020) | | | 50,000 | | | | 54,828 | | | | | |
| Wisconsin Housing & Economic Development Authority, | | | | | | | | | | | | |
| 3.500%, 09/01/2046 (Callable 09/01/2025) | | | 500,000 | | | | 519,270 | | | | | |
| | | | | | | | 1,902,277 | | | | 3.2 | % |
| Total Municipal Bonds (Cost $58,059,910) | | | | | | | 57,585,104 | | | | 98.1 | % |
| | | | | | | | | | | | | |
| SHORT-TERM INVESTMENT | | | | | | | | | | | | |
| Money Market Mutual Fund | | Shares | | | | | | | | | |
| Fidelity Institutional Money Market Fund - Government Portfolio, Institutional Class, 0.43% « | | | 405,669 | | | | 405,669 | | | | | |
| Total Short-Term Investment (Cost $405,669) | | | | | | | 405,669 | | | | 0.7 | % |
| Total Investments (Cost $58,465,579) | | | | | | | 57,990,773 | | | | 98.8 | % |
| Other Assets in Excess of Liabilities | | | | | | | 703,117 | | | | 1.2 | % |
| TOTAL NET ASSETS | | | | | | $ | 58,693,890 | | | | 100.0 | % |
Notes to Schedule of Investments |
| AGM | Assured Guaranty Municipal |
| AMBAC | Ambac Assurance Corp. |
| BAM | Build America Mutual Assurance Co. |
| CIFG | CIFG Assurance North America, Inc. |
| ETM | Escrowed to Maturity |
| NPFGC | National Public Finance Guarantee Corp. |
| PSF | Texas Permanent School Fund |
| Q-SBLF | Qualified School Building Loan Fund |
| (1) | Variable or Floating rate security. Floating rate securities are securities whose yields vary with a designated index rate. These securities' rates are as of December 31, 2016. |
| (2) | Auction Rate Security. An Auction Rate Security is a debt instrument with a long nominal maturity for which the interest rate is regularly reset through a Dutch auction. The rate presented is either the rate set through the auction or the maximum interest rate provided for in the security issuance provision. |
| (3) | Security or a portion of the security purchased on a when-issued or delayed delivery basis. |
| « | 7-Day Yield |
| Baird Quality Intermediate Municipal Bond Fund | | | | | | | | | |
| Schedule of Investments | | | | | | | | | |
| December 31, 2016 | | | | | | | | | |
| | | | | | | | | | |
| | | Principal | | | | | | % of | |
| | | Amount | | | Value | | | Net Assets | |
| LONG-TERM INVESTMENTS | | | | | | | | | |
| Municipal Bonds | | | | | | | | | |
| Alabama | | | | | | | | | |
| Alabama State Public School & College Authority, | | | | | | | | | |
| 5.000%, 05/01/2019 | | $ | 1,000,000 | | | $ | 1,081,000 | | | | 0.1 | % |
| | | | | | | | | | | | | |
| Arizona | | | | | | | | | | | | |
| Gila County Unified School District No. 10-Payson, | | | | | | | | | | | | |
| 5.250%, 07/01/2027 (Pre-refunded to 07/01/2017)(Insured by AMBAC) | | | 1,000,000 | | | | 1,020,870 | | | | 0.1 | % |
| | | | | | | | | | | | | |
| Arkansas | | | | | | | | | | | | |
| Arkansas Development Finance Authority, | | | | | | | | | | | | |
| 5.500%, 12/01/2018 (ETM) | | | 1,000,000 | | | | 1,052,330 | | | | | |
| City of Rogers AR Sewer Revenue: | | | | | | | | | | | | |
| 4.000%, 11/01/2025 (Callable 05/01/2024)(2) | | | 570,000 | | | | 626,470 | | | | | |
| 4.000%, 11/01/2026 (Callable 05/01/2024)(2) | | | 680,000 | | | | 742,607 | | | | | |
| 4.000%, 11/01/2027 (Callable 05/01/2024)(2) | | | 460,000 | | | | 499,795 | | | | | |
| 4.000%, 11/01/2028 (Callable 05/01/2024)(2) | | | 125,000 | | | | 135,295 | | | | | |
| | | | | | | | 3,056,497 | | | | 0.3 | % |
| California | | | | | | | | | | | | |
| Aromas-San Juan Unified School District, | | | | | | | | | | | | |
| 0.000%, 08/01/2050 (Pre-refunded to 08/01/2021)(Insured by AGM) | | | 700,000 | | | | 56,784 | | | | | |
| California Infrastructure & Economic Development Bank, | | | | | | | | | | | | |
| 5.000%, 07/01/2029 (Pre-refunded to 01/01/2028) | | | 150,000 | | | | 184,076 | | | | | |
| Centinela Valley Union High School District, | | | | | | | | | | | | |
| 5.000%, 08/01/2050 (Callable 08/01/2022)(Insured by AGM) | | | 385,000 | | | | 440,321 | | | | | |
| Citrus Community College District, | | | | | | | | | | | | |
| 0.000%, 08/01/2034 (Callable 02/01/2024) | | | 885,000 | | | | 726,337 | | | | | |
| City of Bakersfield CA, | | | | | | | | | | | | |
| 0.000%, 04/15/2021 (ETM) | | | 12,380,000 | | | | 11,422,778 | | | | | |
| Commerce Community Development Commission Successor Agency, | | | | | | | | | | | | |
| 0.000%, 08/01/2021 (ETM) | | | 535,000 | | | | 432,162 | | | | | |
| El Rancho Unified School District, | | | | | | | | | | | | |
| 0.000%, 08/01/2035 (Pre-refunded to 08/01/2023)(Insured by BAM) | | | 300,000 | | | | 126,414 | | | | | |
| Northern California Power Agency, | | | | | | | | | | | | |
| 7.500%, 07/01/2023 (Pre-refunded to 07/01/2021)(Insured by AMBAC) | | | 575,000 | | | | 673,250 | | | | | |
| Pittsburg Unified School District Financing Authority, | | | | | | | | | | | | |
| 0.000%, 09/01/2040 (Pre-refunded to 09/01/2021) | | | 675,000 | | | | 146,293 | | | | | |
| Roseville Joint Union School District GO, | | | | | | | | | | | | |
| 0.000%, 08/01/2039 (Pre-refunded to 08/01/2021)(Insured by AGM) | | | 105,000 | | | | 23,987 | | | | | |
| San Diego Unified School District/CA, | | | | | | | | | | | | |
| 0.000%, 07/01/2033 (Pre-refunded to 07/01/2024) | | | 250,000 | | | | 277,218 | | | | | |
| San Joaquin Hills Transportation Corridor Agency: | | | | | | | | | | | | |
| 0.000%, 01/01/2020 (ETM) | | | 6,865,000 | | | | 6,541,796 | | | | | |
| 0.000%, 01/01/2023 (ETM) | | | 14,000,000 | | | | 12,375,580 | | | | | |
| 0.000%, 01/01/2027 (ETM) | | | 1,030,000 | | | | 797,313 | | | | | |
| 0.000%, 01/01/2028 (ETM) | | | 620,000 | | | | 454,292 | | | | | |
| San Marcos Public Facilities Authority, | | | | | | | | | | | | |
| 0.000%, 09/01/2019 (ETM) | | | 17,495,000 | | | | 16,682,007 | | | | | |
| San Ysidro School District: | | | | | | | | | | | | |
| 0.000%, 08/01/2042 (Pre-refunded to 08/01/2021)(Insured by AGM) | | | 275,000 | | | | 52,838 | | | | | |
| 0.000%, 08/01/2043 (Pre-refunded to 08/01/2021)(Insured by AGM) | | | 290,000 | | | | 51,574 | | | | | |
| 0.000%, 08/01/2044 (Pre-refunded to 08/01/2021)(Insured by AGM) | | | 150,000 | | | | 24,684 | | | | | |
| 0.000%, 08/01/2050 (Pre-refunded to 08/01/2021)(Insured by AGM) | | | 525,000 | | | | 54,023 | | | | | |
| Sutter Union High School District: | | | | | | | | | | | | |
| 0.000%, 08/01/2036 (Pre-refunded to 08/01/2025) | | | 50,000 | | | | 18,221 | | | | | |
| 0.000%, 08/01/2037 (Pre-refunded to 08/01/2025) | | | 50,000 | | | | 16,965 | | | | | |
| 0.000%, 08/01/2041 (Pre-refunded to 08/01/2025) | | | 50,000 | | | | 12,706 | | | | | |
| 0.000%, 08/01/2043 (Pre-refunded to 08/01/2025) | | | 200,000 | | | | 43,804 | | | | | |
| 0.000%, 08/01/2044 (Pre-refunded to 08/01/2025) | | | 345,000 | | | | 70,111 | | | | | |
| 0.000%, 06/01/2050 (Pre-refunded to 08/01/2025) | | | 700,000 | | | | 90,916 | | | | | |
| Victor Valley Union High School District: | | | | | | | | | | | | |
| 0.000%, 08/01/2036 (Pre-refunded to 08/01/2023) | | | 510,000 | | | | 216,311 | | | | | |
| 0.000%, 08/01/2038 (Pre-refunded to 08/01/2023) | | | 460,000 | | | | 172,100 | | | | | |
| 0.000%, 08/01/2041 (Pre-refunded to 08/01/2023) | | | 545,000 | | | | 170,716 | | | | | |
| 0.000%, 08/01/2042 (Pre-refunded to 08/01/2023) | | | 2,000,000 | | | | 589,200 | | | | | |
| 0.000%, 08/01/2046 (Pre-refunded to 08/01/2023) | | | 200,000 | | | | 46,138 | | | | | |
| 0.000%, 08/01/2052 (Pre-refunded to 08/01/2023) | | | 790,000 | | | | 125,168 | | | | | |
| | | | | | | | 53,116,083 | | | | 5.0 | % |
| Colorado | | | | | | | | | | | | |
| City of Colorado Springs CO, | | | | | | | | | | | | |
| 5.000%, 12/15/2032 (Pre-refunded to 12/15/2018)(Insured by AGM) | | | 1,300,000 | | | | 1,391,013 | | | | | |
| Colorado Health Facilities Authority, | | | | | | | | | | | | |
| 0.000%, 07/15/2022 (ETM) | | | 4,990,000 | | | | 4,378,276 | | | | | |
| Colorado Housing & Finance Authority, | | | | | | | | | | | | |
| 1.050%, 08/01/2018 | | | 1,500,000 | | | | 1,491,495 | | | | | |
| Colorado Springs Colorado Utilities Revenue Bonds, | | | | | | | | | | | | |
| 5.875%, 11/15/2017 (ETM) | | | 1,665,000 | | | | 1,734,846 | | | | | |
| Dawson Ridge Metropolitan District No. 1: | | | | | | | | | | | | |
| 0.000%, 10/01/2022 (ETM) | | | 36,045,000 | | | | 31,611,826 | | | | | |
| 0.000%, 10/01/2022 (ETM) | | | 22,540,000 | | | | 19,767,805 | | | | | |
| Weld County School District: | | | | | | | | | | | | |
| 5.000%, 12/15/2027 (Callable 12/15/2026)(2) | | | 2,370,000 | | | | 2,792,761 | | | | | |
| 5.000%, 12/15/2028 (Callable 12/15/2026)(2) | | | 1,695,000 | | | | 1,982,997 | | | | | |
| | | | | | | | 65,151,019 | | | | 6.1 | % |
| Connecticut | | | | | | | | | | | | |
| State of Connecticut, | | | | | | | | | | | | |
| 5.000%, 10/15/2020 | | | 4,390,000 | | | | 4,843,180 | | | | 0.5 | % |
| | | | | | | | | | | | | |
| Delaware | | | | | | | | | | | | |
| State of Delaware, | | | | | | | | | | | | |
| 5.000%, 03/01/2020 | | | 2,000,000 | | | | 2,214,260 | | | | 0.2 | % |
| | | | | | | | | | | | | |
| District of Columbia | | | | | | | | | | | | |
| District of Columbia: | | | | | | | | | | | | |
| 5.000%, 06/01/2028 (Callable 12/01/2026)(2) | | | 800,000 | | | | 969,816 | | | | | |
| 5.250%, 07/15/2038 (Pre-refunded to 07/15/2018) | | | 150,000 | | | | 159,051 | | | | | |
| | | | | | | | 1,128,867 | | | | 0.1 | % |
| Florida | | | | | | | | | | | | |
| City of Miami Beach FL, | | | | | | | | | | | | |
| 6.250%, 10/01/2022 (ETM)(Insured by AMBAC) | | | 1,470,000 | | | | 1,657,851 | | | | | |
| City of Sunrise FL Utility System Revenue, | | | | | | | | | | | | |
| 5.500%, 10/01/2018 (ETM)(Insured by AMBAC) | | | 1,695,000 | | | | 1,773,885 | | | | | |
| County of Miami-Dade FL, | | | | | | | | | | | | |
| 4.500%, 10/01/2020 | | | 7,100,000 | | | | 7,795,374 | | | | | |
| County of Miami-Dade FL Water & Sewer System Revenue, | | | | | | | | | | | | |
| 5.250%, 10/01/2022 (Insured by AGM) | | | 1,125,000 | | | | 1,310,321 | | | | | |
| County of Palm Beach FL, | | | | | | | | | | | | |
| 5.000%, 11/01/2018 (Pre-refunded to 11/01/2017) | | | 1,000,000 | | | | 1,032,490 | | | | | |
| County of Seminole FL Water & Sewer Revenue, | | | | | | | | | | | | |
| 6.000%, 10/01/2019 (ETM) | | | 3,625,000 | | | | 3,891,401 | | | | | |
| Escambia County Housing Finance Authority, | | | | | | | | | | | | |
| 0.000%, 10/15/2018 (ETM) | | | 4,130,000 | | | | 4,007,546 | | | | | |
| Florida Housing Finance Corp., | | | | | | | | | | | | |
| 4.000%, 07/01/2047 (Callable 07/01/2025) | | | 5,000,000 | | | | 5,309,500 | | | | | |
| Florida Municipal Power Agency, | | | | | | | | | | | | |
| 5.000%, 10/01/2017 (Callable 01/30/2017)(ETM) | | | 1,590,000 | | | | 1,637,159 | | | | | |
| Gulf Environmental Services Inc., | | | | | | | | | | | | |
| 5.000%, 10/01/2018 (ETM) | | | 585,000 | | | | 609,213 | | | | | |
| Hillsborough County Industrial Development Authority: | | | | | | | | | | | | |
| 5.625%, 08/15/2029 (Pre-refunded to 08/15/2018) | | | 2,950,000 | | | | 3,154,199 | | | | | |
| 8.000%, 08/15/2032 (Pre-refunded to 08/15/2019) | | | 2,065,000 | | | | 2,422,575 | | | | | |
| Lee County School Board: | | | | | | | | | | | | |
| 5.000%, 08/01/2031 (Callable 08/01/2026) | | | 2,170,000 | | | | 2,518,936 | | | | | |
| 5.000%, 08/01/2032 (Callable 08/01/2026) | | | 1,000,000 | | | | 1,155,410 | | | | | |
| Miami-Dade County Health Facilities Authority, | | | | | | | | | | | | |
| 5.750%, 05/01/2021 (ETM) | | | 1,180,000 | | | | 1,282,507 | | | | | |
| Mid-Bay Bridge Authority: | | | | | | | | | | | | |
| 6.875%, 10/01/2022 (ETM) | | | 4,675,000 | | | | 5,451,424 | | | | | |
| 6.875%, 10/01/2022 (ETM) | | | 3,175,000 | | | | 3,702,304 | | | | | |
| Orlando Utilities Commission, | | | | | | | | | | | | |
| 6.750%, 10/01/2017 (ETM) | | | 580,000 | | | | 604,435 | | | | | |
| Pinellas County Housing Finance Authority, | | | | | | | | | | | | |
| 4.250%, 03/01/2027 (Callable 09/01/2019) | | | 810,000 | | | | 832,008 | | | | | |
| School District of Broward County/FL: | | | | | | | | | | | | |
| 5.250%, 07/01/2022 (Callable 07/01/2021) | | | 8,390,000 | | | | 9,539,598 | | | | | |
| 5.250%, 07/01/2023 (Callable 07/01/2021) | | | 4,915,000 | | | | 5,574,937 | | | | | |
| St. Lucie County FL Water & Sewer District, | | | | | | | | | | | | |
| 6.000%, 10/01/2020 (ETM) | | | 6,520,000 | | | | 7,264,128 | | | | | |
| State of Florida, | | | | | | | | | | | | |
| 5.000%, 06/01/2022 (Callable 06/01/2019) | | | 13,800,000 | | | | 14,899,308 | | | | | |
| Tampa Bay Water, | | | | | | | | | | | | |
| 5.000%, 10/01/2019 (ETM) | | | 1,695,000 | | | | 1,850,703 | | | | | |
| | | | | | | | 89,277,212 | | | | 8.3 | % |
| Georgia | | | | | | | | | | | | |
| Atlanta Development Authority, | | | | | | | | | | | | |
| 5.000%, 09/01/2023 (ETM) | | | 2,325,000 | | | | 2,740,129 | | | | | |
| Forsyth County Hospital Authority, | | | | | | | | | | | | |
| 6.375%, 10/01/2028 (ETM) | | | 8,050,000 | | | | 10,088,099 | | | | | |
| Georgia Housing & Finance Authority, | | | | | | | | | | | | |
| 3.500%, 12/01/2046 (Callable 12/01/2025) | | | 1,500,000 | | | | 1,561,695 | | | | | |
| Richmond County Development Authority: | | | | | | | | | | | | |
| 0.000%, 12/01/2021 (ETM) | | | 1,835,000 | | | | 1,652,252 | | | | | |
| 0.000%, 12/01/2021 (ETM) | | | 3,695,000 | | | | 3,327,015 | | | | | |
| | | | | | | | 19,369,190 | | | | 1.8 | % |
| Illinois | | | | | | | | | | | | |
| Chicago Board of Education, | | | | | | | | | | | | |
| 6.000%, 01/01/2020 | | | 12,745,000 | | | | 13,451,710 | | | | | |
| City of Chicago IL, | | | | | | | | | | | | |
| 5.000%, 01/01/2017 (Callable 10/31/2017)(Insured by AGM) | | | 395,000 | | | | 395,000 | | | | | |
| Cook County Community High School District No. 233, | | | | | | | | | | | | |
| 4.000%, 12/01/2026 (Callable 06/01/2022) | | | 3,695,000 | | | | 3,963,885 | | | | | |
| Cook County Illinois School District No. 159, | | | | | | | | | | | | |
| 0.000%, 12/01/2022 (ETM) | | | 2,000,000 | | | | 1,755,520 | | | | | |
| County of Du Page IL, | | | | | | | | | | | | |
| 5.600%, 01/01/2021 | | | 815,000 | | | | 880,811 | | | | | |
| Illinois Finance Authority: | | | | | | | | | | | | |
| 6.250%, 05/01/2022 (Pre-refunded to 05/01/2020) | | | 2,550,000 | | | | 2,920,490 | | | | | |
| 0.000%, 07/15/2023 (ETM) | | | 25,325,000 | | | | 21,630,842 | | | | | |
| 0.000%, 07/15/2025 (ETM) | | | 31,660,000 | | | | 25,145,005 | | | | | |
| 6.625%, 11/01/2039 (Pre-refunded to 05/01/2019) | | | 395,000 | | | | 441,310 | | | | | |
| Kane County Community Unit School District No. 304 Geneva, | | | | | | | | | | | | |
| 9.000%, 01/01/2023 (Insured by AGM) | | | 3,200,000 | | | | 4,324,768 | | | | | |
| Kane McHenry Cook & De Kalb Counties Unit School District No. 300/IL: | | | | | | | | | | | | |
| 7.000%, 01/01/2018 (ETM)(Insured by AMBAC) | | | 5,775,000 | | | | 6,105,041 | | | | | |
| 7.000%, 01/01/2018 (ETM)(Insured by AMBAC) | | | 365,000 | | | | 385,860 | | | | | |
| 7.000%, 01/01/2019 (ETM)(Insured by AMBAC) | | | 1,755,000 | | | | 1,947,839 | | | | | |
| Kendall Kane & Will Counties Community Unit School District No. 308, | | | | | | | | | | | | |
| 0.000%, 02/01/2021 (Insured by AGM) | | | 13,625,000 | | | | 12,205,548 | | | | | |
| Lake County Community Consolidated School District No. 50 Woodland, | | | | | | | | | | | | |
| 5.000%, 01/01/2021 | | | 1,375,000 | | | | 1,521,259 | | | | | |
| Lake County Illinois Community High School District No. 124 Grant, | | | | | | | | | | | | |
| 5.000%, 12/01/2017 | | | 1,050,000 | | | | 1,086,981 | | | | | |
| Metropolitan Pier & Exposition Authority, | | | | | | | | | | | | |
| 5.500%, 12/15/2023 (ETM) | | | 2,250,000 | | | | 2,570,535 | | | | | |
| Public Building Commission of Chicago, | | | | | | | | | | | | |
| 7.000%, 01/01/2020 (ETM) | | | 1,555,000 | | | | 1,751,054 | | | | | |
| Regional Transportation Authority: | | | | | | | | | | | | |
| 7.750%, 06/01/2020 | | | 720,000 | | | | 795,031 | | | | | |
| 6.700%, 11/01/2021 | | | 910,000 | | | | 1,019,500 | | | | | |
| 6.000%, 07/01/2022 | | | 4,705,000 | | | | 5,584,506 | | | | | |
| Southern Illinois University: | | | | | | | | | | | | |
| 5.250%, 04/01/2018 | | | 1,075,000 | | | | 1,116,839 | | | | | |
| 5.250%, 04/01/2019 | | | 1,390,000 | | | | 1,464,893 | | | | | |
| State of Illinois: | | | | | | | | | | | | |
| 5.000%, 01/01/2019 (Insured by AGM) | | | 1,000,000 | | | | 1,039,510 | | | | | |
| 4.000%, 09/01/2019 (Callable 09/01/2018) | | | 5,000,000 | | | | 5,065,450 | | | | | |
| 6.000%, 11/01/2026 | | | 3,000,000 | | | | 3,484,140 | | | | | |
| Village of Schaumburg IL, | | | | | | | | | | | | |
| 4.000%, 12/01/2024 (Callable 12/01/2022) | | | 5,750,000 | | | | 6,243,753 | | | | | |
| Will County Community Unit School District No. 201-U Crete-Monee, | | | | | | | | | | | | |
| 0.000%, 11/01/2024 (ETM) | | | 705,000 | | | | 583,627 | | | | | |
| Winnebago County School District No. 122 Harlem-Loves Park: | | | | | | | | | | | | |
| 0.000%, 01/01/2018 (ETM)(Insured by AGM) | | | 155,000 | | | | 153,146 | | | | | |
| 0.000%, 01/01/2018 (Insured by AGM) | | | 1,205,000 | | | | 1,175,984 | | | | | |
| | | | | | | | 130,209,837 | | | | 12.1 | % |
| Indiana | | | | | | | | | | | | |
| Franklin Community Multi-School Building Corp., | | | | | | | | | | | | |
| 5.000%, 07/15/2020 | | | 1,990,000 | | | | 2,190,930 | | | | | |
| Hammond Multi-School Building Corp.: | | | | | | | | | | | | |
| 6.000%, 01/15/2018 (ETM) | | | 435,000 | | | | 444,918 | | | | | |
| Indiana Health & Educational Facilities Financing Authority, | | | | | | | | | | | | |
| 1.750%, 11/15/2031 (Mandatory Tender Date 11/02/2021)(1) | | | 1,550,000 | | | | 1,504,399 | | | | | |
| Indianapolis Local Public Improvement Bond Bank, | | | | | | | | | | | | |
| 5.500%, 01/01/2019 | | | 1,155,000 | | | | 1,241,175 | | | | | |
| Pike County Multi-School Building Corp., | | | | | | | | | | | | |
| 5.000%, 07/15/2021 | | | 1,125,000 | | | | 1,256,389 | | | | | |
| South Bend Community School Corp., | | | | | | | | | | | | |
| 5.000%, 07/15/2017 | | | 1,000,000 | | | | 1,010,220 | | | | | |
| | | | | | | | 7,648,031 | | | | 0.7 | % |
| Iowa | | | | | | | | | | | | |
| Iowa Higher Education Loan Authority: | | | | | | | | | | | | |
| 2.000%, 12/01/2018 (Callable 06/01/2018)(2) | | | 1,230,000 | | | | 1,228,389 | | | | | |
| 4.500%, 10/01/2033 (Pre-refunded to 10/01/2021) | | | 2,100,000 | | | | 2,328,144 | | | | | |
| 5.000%, 10/01/2038 (Pre-refunded to 10/01/2021) | | | 2,090,000 | | | | 2,363,978 | | | | | |
| 5.000%, 09/01/2043 (Pre-refunded to 09/01/2023) | | | 5,050,000 | | | | 5,883,452 | | | | | |
| | | | | | | | 11,803,963 | | | | 1.1 | % |
| Kansas | | | | | | | | | | | | |
| City of Wichita KS: | | | | | | | | | | | | |
| 5.000%, 11/15/2020 (ETM) | | | 1,120,000 | | | | 1,252,194 | | | | | |
| 5.000%, 11/15/2029 (Pre-refunded to 11/15/2021) | | | 40,000 | | | | 45,551 | | | | | |
| 5.000%, 11/15/2034 (Pre-refunded to 11/15/2019) | | | 1,055,000 | | | | 1,153,969 | | | | | |
| Wyandotte County-Kansas City Unified Government Utility System Revenue, | | | | | | | | | | | | |
| 5.000%, 09/01/2019 (Callable 03/01/2019)(Insured by BHAC) | | | 1,865,000 | | | | 1,997,546 | | | | | |
| | | | | | | | 4,449,260 | | | | 0.4 | % |
| Kentucky | | | | | | | | | | | | |
| Kentucky Infrastructure Authority: | | | | | | | | | | | | |
| 5.000%, 02/01/2023 (Pre-refunded to 02/01/2022) | | | 70,000 | | | | 80,372 | | | | | |
| 5.000%, 02/01/2025 (Pre-refunded to 02/01/2022) | | | 70,000 | | | | 80,372 | | | | | |
| 5.000%, 02/01/2026 (Pre-refunded to 02/01/2022) | | | 75,000 | | | | 86,112 | | | | | |
| | | | | | | | 246,856 | | | | 0.0 | % |
| Louisiana | | | | | | | | | | | | |
| Jefferson Parish Hospital Service District No. 1: | | | | | | | | | | | | |
| 6.000%, 01/01/2039 (Pre-refunded to 01/01/2021)(Insured by AGM) | | | 2,370,000 | | | | 2,747,517 | | | | | |
| 6.000%, 01/01/2039 (Pre-refunded to 01/01/2021) | | | 1,080,000 | | | | 1,252,033 | | | | | |
| Louisiana Public Facilities Authority: | | | | | | | | | | | | |
| 5.500%, 05/15/2027 (Pre-refunded to 05/15/2026) | | | 11,470,000 | | | | 14,210,069 | | | | | |
| 5.500%, 05/15/2032 (Pre-refunded to 05/15/2026) | | | 22,075,000 | | | | 27,446,068 | | | | | |
| 6.750%, 07/01/2039 (Pre-refunded to 07/01/2019) | | | 6,655,000 | | | | 7,468,840 | | | | | |
| State of Louisiana, | | | | | | | | | | | | |
| 5.000%, 11/15/2020 (Callable 05/15/2020) | | | 10,000,000 | | | | 11,032,000 | | | | | |
| | | | | | | | 64,156,527 | | | | 6.0 | % |
| Maryland | | | | | | | | | | | | |
| City of Baltimore MD, | | | | | | | | | | | | |
| 5.000%, 07/01/2024 (ETM) | | | 1,195,000 | | | | 1,382,603 | | | | | |
| State of Maryland: | | | | | | | | | | | | |
| 5.000%, 03/15/2019 (Pre-refunded to 03/15/2017) | | | 1,135,000 | | | | 1,144,205 | | | | | |
| 5.000%, 03/01/2021 (Callable 03/01/2020) | | | 1,000,000 | | | | 1,105,180 | | | | | |
| | | | | | | | 3,631,988 | | | | 0.3 | % |
| Massachusetts | | | | | | | | | | | | |
| Commonwealth of Massachusetts, | | | | | | | | | | | | |
| 4.000%, 12/01/2022 (Callable 12/01/2019) | | | 15,000,000 | | | | 16,004,700 | | | | | |
| Massachusetts Department of Transportation, | | | | | | | | | | | | |
| 5.000%, 01/01/2020 (ETM) | | | 1,530,000 | | | | 1,605,689 | | | | | |
| Massachusetts Housing Finance Agency: | | | | | | | | | | | | |
| 4.000%, 12/01/2044 (Callable 06/01/2025) | | | 1,935,000 | | | | 2,042,567 | | | | | |
| 3.500%, 12/01/2046 (Callable 12/01/2025) | | | 1,020,000 | | | | 1,050,957 | | | | | |
| Massachusetts Water Resources Authority, | | | | | | | | | | | | |
| 6.500%, 07/15/2019 (ETM)(Insured by FGIC-TCRS) | | | 1,375,000 | | | | 1,457,665 | | | | | |
| | | | | | | | 22,161,578 | | | | 2.1 | % |
| Michigan | | | | | | | | | | | | |
| Brighton Area School District/MI: | | | | | | | | | | | | |
| 5.000%, 05/01/2020 (Insured by Q-SBLF) | | | 1,300,000 | | | | 1,416,402 | | | | | |
| 5.000%, 05/01/2021 (Insured by Q-SBLF) | | | 500,000 | | | | 554,140 | | | | | |
| Chippewa Valley Schools, | | | | | | | | | | | | |
| 5.000%, 05/01/2023 (Insured by Q-SBLF) | | | 4,505,000 | | | | 5,165,343 | | | | | |
| Fraser Public School District: | | | | | | | | | | | | |
| 5.000%, 05/01/2024 (Insured by Q-SBLF) | | | 1,000,000 | | | | 1,161,210 | | | | | |
| 5.000%, 05/01/2026 (Callable 05/01/2025)(Insured by Q-SBLF) | | | 1,140,000 | | | | 1,325,911 | | | | | |
| Garden City Hospital Finance Authority, | | | | | | | | | | | | |
| 4.875%, 08/15/2027 (Pre-refunded to 08/15/2017) | | | 1,000,000 | | | | 1,023,100 | | | | | |
| Michigan Finance Authority, | | | | | | | | | | | | |
| 5.000%, 01/01/2019 | | | 7,000,000 | | | | 7,509,740 | | | | | |
| Michigan State Housing Development Authority: | | | | | | | | | | | | |
| 4.000%, 06/01/2046 (Callable 12/01/2025) | | | 4,000,000 | | | | 4,221,360 | | | | | |
| 3.500%, 06/01/2047 (Callable 06/01/2026) | | | 1,500,000 | | | | 1,545,255 | | | | | |
| Pinckney Community Schools: | | | | | | | | | | | | |
| 5.000%, 05/01/2022 (Insured by Q-SBLF) | | | 1,935,000 | | | | 2,171,534 | | | | | |
| 5.000%, 05/01/2023 (Insured by Q-SBLF) | | | 2,200,000 | | | | 2,497,682 | | | | | |
| State of Michigan, | | | | | | | | | | | | |
| 0.000%, 06/01/2022 (ETM)(Insured by AMBAC) | | | 2,000,000 | | | | 1,784,520 | | | | | |
| Wayne-Westland Community Schools, | | | | | | | | | | | | |
| 5.000%, 05/01/2019 (Insured by Q-SBLF) | | | 2,060,000 | | | | 2,204,839 | | | | | |
| | | | | | | | 32,581,036 | | | | 3.0 | % |
| Minnesota | | | | | | | | | | | | |
| Minneapolis-Saint Paul Metropolitan Airports Commission, | | | | | | | | | | | | |
| 5.000%, 01/01/2032 (Callable 01/01/2027) | | | 500,000 | | | | 587,175 | | | | | |
| Minnesota Housing Finance Agency: | | | | | | | | | | | | |
| 4.250%, 07/01/2028 (Callable 01/01/2020) | | | 330,000 | | | | 339,187 | | | | | |
| 4.500%, 07/01/2034 (Callable 07/01/2021) | | | 770,000 | | | | 796,588 | | | | | |
| 3.500%, 07/01/2046 (Callable 07/01/2025) | | | 30,000 | | | | 31,076 | | | | | |
| University of Minnesota, | | | | | | | | | | | | |
| 5.500%, 07/01/2021 (ETM) | | | 10,380,000 | | | | 11,638,160 | | | | | |
| | | | | | | | 13,392,186 | | | | 1.3 | % |
| Missouri | | | | | | | | | | | | |
| Missouri State Environmental Improvement & Energy Resources Authority, | | | | | | | | | | | | |
| 5.000%, 01/01/2026 (Callable 07/01/2025) | | | 1,000,000 | | | | 1,210,560 | | | | | |
| State of Missouri Housing Development Commission, | | | | | | | | | | | | |
| 3.500%, 05/01/2041 (Callable 11/01/2025) | | | 2,345,000 | | | | 2,443,162 | | | | | |
| | | | | | | | 3,653,722 | | | | 0.3 | % |
| Nebraska | | | | | | | | | | | | |
| Omaha Public Power District, | | | | | | | | | | | | |
| 6.200%, 02/01/2017 (ETM) | | | 2,030,000 | | | | 2,037,917 | | | | 0.2 | % |
| | | | | | | | | | | | | |
| New Hampshire | | | | | | | | | | | | |
| New Hampshire Housing Finance Authority, | | | | | | | | | | | | |
| 5.250%, 07/01/2028 (Callable 01/01/2021) | | | 1,875,000 | | | | 1,940,662 | | | | | |
| State of New Hampshire, | | | | | | | | | | | | |
| 5.000%, 07/01/2021 (Callable 07/01/2020) | | | 1,000,000 | | | | 1,111,680 | | | | | |
| | | | | | | | 3,052,342 | | | | 0.3 | % |
| New Jersey | | | | | | | | | | | | |
| County of Hudson NJ, | | | | | | | | | | | | |
| 3.000%, 03/15/2021 | | | 1,140,000 | | | | 1,188,906 | | | | | |
| New Jersey Educational Facilities Authority, | | | | | | | | | | | | |
| 7.500%, 12/01/2032 (Pre-refunded to 06/01/2019) | | | 3,635,000 | | | | 4,139,974 | | | | | |
| New Jersey Health Care Facilities Financing Authority, | | | | | | | | | | | | |
| 5.750%, 07/01/2039 (Pre-refunded to 07/01/2019) | | | 2,230,000 | | | | 2,457,215 | | | | | |
| New Jersey State Housing & Mortgage Finance Agency Bonds, | | | | | | | | | | | | |
| 4.500%, 10/01/2029 (Callable 04/01/2021) | | | 2,260,000 | | | | 2,294,736 | | | | | |
| New Jersey Transportation Trust Fund Authority: | | | | | | | | | | | | |
| 5.250%, 12/15/2020 | | | 5,000,000 | | | | 5,350,100 | | | | | |
| 5.000%, 06/15/2021 (Callable 06/15/2018)(2) | | | 1,000,000 | | | | 1,035,810 | | | | | |
| New Jersey Turnpike Authority, | | | | | | | | | | | | |
| 5.500%, 01/01/2025 | | | 2,100,000 | | | | 2,546,880 | | | | | |
| | | | | | | | 19,013,621 | | | | 1.8 | % |
| New Mexico | | | | | | | | | | | | |
| New Mexico Finance Authority, | | | | | | | | | | | | |
| 4.000%, 06/01/2029 (Callable 06/01/2026) | | | 2,615,000 | | | | 2,845,748 | | | | | |
| New Mexico Mortgage Financial Authority: | | | | | | | | | | | | |
| 4.625%, 09/01/2025 (Callable 03/01/2020) | | | 705,000 | | | | 729,026 | | | | | |
| 4.500%, 09/01/2028 (Callable 03/01/2020) | | | 385,000 | | | | 395,499 | | | | | |
| | | | | | | | 3,970,273 | | | | 0.4 | % |
| New York | | | | | | | | | | | | |
| Churchville-Chili Central School District, | | | | | | | | | | | | |
| 3.000%, 06/15/2018 | | | 1,070,000 | | | | 1,097,338 | | | | | |
| City of New York NY: | | | | | | | | | | | | |
| 5.250%, 08/15/2021 (Callable 08/15/2018) | | | 1,125,000 | | | | 1,195,043 | | | | | |
| 5.000%, 08/01/2022 | | | 5,000,000 | | | | 5,750,150 | | | | | |
| Metropolitan Transportation Authority: | | | | | | | | | | | | |
| 6.000%, 04/01/2020 (ETM) | | | 13,615,000 | | | | 14,682,688 | | | | | |
| 5.000%, 11/15/2028 (Callable 05/15/2026) | | | 1,300,000 | | | | 1,513,096 | | | | | |
| New York State Dormitory Authority, | | | | | | | | | | | | |
| 5.000%, 12/15/2023 (Callable 12/15/2022) | | | 11,685,000 | | | | 13,611,857 | | | | | |
| New York State Thruway Authority, | | | | | | | | | | | | |
| 5.000%, 03/15/2022 (Callable 03/15/2019) | | | 4,040,000 | | | | 4,346,757 | | | | | |
| New York State Urban Development Corp., | | | | | | | | | | | | |
| 5.000%, 03/15/2022 | | | 2,000,000 | | | | 2,299,900 | | | | | |
| Suffolk County Water Authority, | | | | | | | | | | | | |
| 6.000%, 06/01/2017 (ETM) | | | 1,750,000 | | | | 1,786,313 | | | | | |
| TSASC, Inc./NY, | | | | | | | | | | | | |
| 4.750%, 06/01/2022 (Callable 01/17/2017) | | | 75,000 | | | | 74,999 | | | | | |
| | | | | | | | 46,358,141 | | | | 4.3 | % |
| North Carolina | | | | | | | | | | | | |
| North Carolina Eastern Municipal Power Agency: | | | | | | | | | | | | |
| 5.000%, 01/01/2017 (ETM) | | | 1,460,000 | | | | 1,460,000 | | | | | |
| 5.000%, 01/01/2021 (Callable 01/30/2017)(ETM) | | | 10,355,000 | | | | 11,464,228 | | | | | |
| 6.400%, 01/01/2021 (ETM) | | | 4,062,000 | | | | 4,430,017 | | | | | |
| 4.500%, 01/01/2024 (Pre-refunded to 01/01/2022) | | | 11,740,000 | | | | 12,969,882 | | | | | |
| North Carolina Medical Care Commission, | | | | | | | | | | | | |
| 5.750%, 01/01/2035 (Pre-refunded to 01/01/2021) | | | 450,000 | | | | 517,370 | | | | | |
| State of North Carolina, | | | | | | | | | | | | |
| 5.000%, 05/01/2024 (Callable 05/01/2023) | | | 1,000,000 | | | | 1,160,550 | | | | | |
| | | | | | | | 32,002,047 | | | | 3.0 | % |
| North Dakota | | | | | | | | | | | | |
| County of Burleigh ND, | | | | | | | | | | | | |
| 5.000%, 07/01/2025 (Pre-refunded to 07/01/2021) | | | 1,500,000 | | | | 1,696,410 | | | | | |
| North Dakota Housing Finance Agency, | | | | | | | | | | | | |
| 3.500%, 07/01/2046 (Callable 01/01/2026) | | | 3,800,000 | | | | 3,928,060 | | | | | |
| | | | | | | | 5,624,470 | | | | 0.5 | % |
| Ohio | | | | | | | | | | | | |
| Akron Bath Copley Joint Township Hospital District, | | | | | | | | | | | | |
| 3.800%, 01/01/2027 (Pre-refunded to 01/01/2022) | | | 1,000,000 | | | | 1,056,540 | | | | | |
| Cleveland Municipal School District: | | | | | | | | | | | | |
| 4.000%, 12/01/2019 | | | 1,940,000 | | | | 2,062,530 | | | | | |
| 5.000%, 12/01/2020 | | | 2,015,000 | | | | 2,252,246 | | | | | |
| Ohio Housing Finance Agency: | | | | | | | | | | | | |
| 5.000%, 11/01/2028 (Callable 05/01/2020) | | | 880,000 | | | | 910,791 | | | | | |
| 3.500%, 09/01/2046 (Callable 09/01/2025) | | | 1,710,000 | | | | 1,766,242 | | | | | |
| 4.000%, 03/01/2047 (Callable 09/01/2025) | | | 7,590,000 | | | | 7,999,329 | | | | | |
| State of Ohio: | | | | | | | | | | | | |
| 5.000%, 03/01/2019 | | | 1,220,000 | | | | 1,312,915 | | | | | |
| 5.500%, 02/01/2020 | | | 1,195,000 | | | | 1,333,775 | | | | | |
| 5.000%, 06/15/2021 | | | 6,740,000 | | | | 7,641,745 | | | | | |
| | | | | | | | 26,336,113 | | | | 2.5 | % |
| Oregon | | | | | | | | | | | | |
| State of Oregon, | | | | | | | | | | | | |
| 4.000%, 12/01/2045 (Callable 06/01/2025) | | | 4,710,000 | | | | 4,942,815 | | | | | |
| State of Oregon Housing & Community Services Department, | | | | | | | | | | | | |
| 4.000%, 01/01/2047 (Callable 07/01/2025) | | | 1,950,000 | | | | 2,062,476 | | | | | |
| | | | | | | | 7,005,291 | | | | 0.7 | % |
| Pennsylvania | | | | | | | | | | | | |
| Erie Sewer Authority, | | | | | | | | | | | | |
| 5.125%, 06/01/2020 (ETM)(Insured by AMBAC) | | | 1,410,000 | | | | 1,503,229 | | | | | |
| Lampeter Strasburg School District, | | | | | | | | | | | | |
| 4.000%, 06/01/2019 | | | 1,715,000 | | | | 1,808,399 | | | | | |
| Pennsylvania Convention Center Authority, | | | | | | | | | | | | |
| 6.000%, 09/01/2019 (ETM) | | | 14,055,000 | | | | 15,084,388 | | | | | |
| Pennsylvania Housing Finance Agency, | | | | | | | | | | | | |
| 3.500%, 10/01/2046 (Callable 10/01/2025) | | | 1,975,000 | | | | 2,046,396 | | | | | |
| Philadelphia Authority for Industrial Development, | | | | | | | | | | | | |
| 5.250%, 01/01/2027 (Pre-refunded to 01/01/2017) | | | 1,790,000 | | | | 1,790,000 | | | | | |
| Philadelphia Gas Works Co., | | | | | | | | | | | | |
| 7.000%, 05/15/2020 (ETM) | | | 1,510,000 | | | | 1,657,829 | | | | | |
| South Fork Municipal Authority: | | | | | | | | | | | | |
| 5.500%, 07/01/2029 (Pre-refunded to 07/01/2020) | | | 2,450,000 | | | | 2,763,184 | | | | | |
| 5.375%, 07/01/2035 (Pre-refunded to 07/01/2020) | | | 1,290,000 | | | | 1,444,813 | | | | | |
| The Hospitals & Higher Education Facilities Authority of Philadelphia: | | | | | | | | | | | | |
| 5.000%, 05/15/2020 (ETM) | | | 1,575,000 | | | | 1,742,438 | | | | | |
| 5.250%, 05/15/2023 (Pre-refunded to 05/15/2020) | | | 2,790,000 | | | | 3,109,260 | | | | | |
| | | | | | | | 32,949,936 | | | | 3.1 | % |
| Puerto Rico | | | | | | | | | | | | |
| Puerto Rico Electric Power Authority: | | | | | | | | | | | | |
| 0.000%, 07/01/2017 (ETM) | | | 1,555,000 | | | | 1,547,210 | | | | | |
| 0.000%, 07/01/2017 (Pre-refunded to various dates)(ETM) | | | 620,000 | | | | 616,894 | | | | | |
| Puerto Rico Highways & Transportation Authority, | | | | | | | | | | | | |
| 5.250%, 07/01/2022 (ETM)(Insured by AGM) | | | 890,000 | | | | 1,029,623 | | | | | |
| Puerto Rico Public Finance Corp.: | | | | | | | | | | | | |
| 6.000%, 08/01/2026 (ETM) | | | 1,675,000 | | | | 2,098,306 | | | | | |
| 6.000%, 08/01/2026 (ETM) | | | 200,000 | | | | 250,544 | | | | | |
| 6.000%, 08/01/2026 (ETM) | | | 1,080,000 | | | | 1,352,938 | | | | | |
| 5.500%, 08/01/2027 (ETM)(Insured by AMBAC) | | | 4,250,000 | | | | 5,228,052 | | | | | |
| | | | | | | | 12,123,567 | | | | 1.1 | % |
| Rhode Island | | | | | | | | | | | | |
| State of Rhode Island, | | | | | | | | | | | | |
| 5.000%, 08/01/2024 | | | 5,000,000 | | | | 5,853,600 | | | | 0.5 | % |
| | | | | | | | | | | | | |
| South Carolina | | | | | | | | | | | | |
| Charleston Educational Excellence Finance Corp., | | | | | | | | | | | | |
| 5.000%, 12/01/2026 (Callable 12/01/2023) | | | 4,580,000 | | | | 5,292,556 | | | | | |
| Piedmont Municipal Power Agency, | | | | | | | | | | | | |
| 6.750%, 01/01/2020 (ETM) | | | 6,450,000 | | | | 7,391,249 | | | | | |
| South Carolina Jobs-Economic Development Authority, | | | | | | | | | | | | |
| 6.500%, 04/01/2042 (Pre-refunded to 04/01/2020) | | | 90,000 | | | | 103,647 | | | | | |
| | | | | | | | 12,787,452 | | | | 1.2 | % |
| South Dakota | | | | | | | | | | | | |
| South Dakota Housing Development Authority, | | | | | | | | | | | | |
| 3.375%, 05/01/2033 (Callable 05/01/2022) | | | 415,000 | | | | 405,040 | | | | 0.0 | % |
| | | | | | | | | | | | | |
| Tennessee | | | | | | | | | | | | |
| County of Rutherford TN, | | | | | | | | | | | | |
| 5.000%, 04/01/2021 | | | 1,955,000 | | | | 2,212,591 | | | | | |
| Metropolitan Government Nashville & Davidson County Health & Educational Facilities, | | | | | | | | | | | | |
| 0.000%, 06/01/2021 (ETM) | | | 1,270,000 | | | | 1,161,872 | | | | | |
| Shelby County Health Educational & Housing Facilities Board, | | | | | | | | | | | | |
| 5.500%, 08/15/2019 (ETM) | | | 2,375,000 | | | | 2,520,540 | | | | | |
| Tennessee Housing Development Agency, | | | | | | | | | | | | |
| 4.500%, 07/01/2028 (Callable 01/01/2020) | | | 1,590,000 | | | | 1,635,585 | | | | | |
| | | | | | | | 7,530,588 | | | | 0.7 | % |
| Texas | | | | | | | | | | | | |
| Amarillo Independent School District, | | | | | | | | | | | | |
| 5.000%, 02/01/2026 (Callable 02/01/2024)(PSF Guaranteed) | | | 1,370,000 | | | | 1,604,284 | | | | | |
| Arlington Higher Education Finance Corp.: | | | | | | | | | | | | |
| 4.000%, 08/15/2024 (PSF Guaranteed) | | | 1,025,000 | | | | 1,119,792 | | | | | |
| 5.000%, 08/15/2024 (PSF Guaranteed) | | | 1,000,000 | | | | 1,158,750 | | | | | |
| 5.000%, 08/15/2026 (PSF Guaranteed) | | | 500,000 | | | | 592,580 | | | | | |
| 4.000%, 08/15/2027 (Callable 08/15/2026)(PSF Guaranteed) | | | 865,000 | | | | 939,001 | | | | | |
| 5.000%, 02/15/2028 (Callable 02/15/2025)(PSF Guaranteed) | | | 1,675,000 | | | | 1,945,948 | | | | | |
| 4.000%, 08/15/2028 (Callable 08/15/2026)(PSF Guaranteed) | | | 850,000 | | | | 914,608 | | | | | |
| 5.000%, 08/15/2033 (Callable 08/15/2024)(PSF Guaranteed) | | | 1,460,000 | | | | 1,656,268 | | | | | |
| Burleson Independent School District, | | | | | | | | | | | | |
| 5.000%, 08/01/2025 (PSF Guaranteed) | | | 1,240,000 | | | | 1,487,368 | | | | | |
| City of Austin TX Water & Wastewater System Revenue, | | | | | | | | | | | | |
| 5.000%, 11/15/2024 (Callable 11/15/2022) | | | 3,000,000 | | | | 3,480,960 | | | | | |
| City of El Paso TX Water & Sewer Revenue, | | | | | | | | | | | | |
| 4.000%, 03/01/2028 (Callable 03/01/2026)(2) | | | 1,000,000 | | | | 1,091,230 | | | | | |
| City of Houston TX Combined Utility System Revenue: | | | | | | | | | | | | |
| 0.000%, 12/01/2019 (ETM)(Insured by AGM) | | | 13,355,000 | | | | 12,677,501 | | | | | |
| 5.500%, 12/01/2024 (ETM) | | | 1,735,000 | | | | 2,093,451 | | | | | |
| 5.500%, 12/01/2029 (ETM) | | | 16,050,000 | | | | 20,689,092 | | | | | |
| City of Lubbock TX, | | | | | | | | | | | | |
| 5.000%, 02/15/2021 (Pre-refunded to 02/15/2018)(Insured by AGM) | | | 3,425,000 | | | | 3,570,528 | | | | | |
| City of San Antonio TX Electric & Gas Systems Revenue, | | | | | | | | | | | | |
| 5.650%, 02/01/2019 (ETM) | | | 9,765,000 | | | | 10,297,778 | | | | | |
| Conroe Independent School District: | | | | | | | | | | | | |
| 5.000%, 02/15/2022 (Callable 02/15/2021)(PSF Guaranteed) | | | 1,000,000 | | | | 1,124,550 | | | | | |
| 5.000%, 02/15/2023 (Callable 02/15/2021)(PSF Guaranteed) | | | 2,680,000 | | | | 3,009,265 | | | | | |
| County of Harris TX: | | | | | | | | | | | | |
| 5.750%, 10/01/2020 (Pre-refunded to 10/01/2018) | | | 175,000 | | | | 188,659 | | | | | |
| 5.000%, 10/01/2026 (Callable 10/01/2025) | | | 4,155,000 | | | | 4,980,183 | | | | | |
| 5.000%, 08/15/2027 (Callable 08/15/2022) | | | 3,480,000 | | | | 4,036,765 | | | | | |
| 5.750%, 10/01/2028 (Pre-refunded to 10/01/2018) | | | 6,930,000 | | | | 7,470,886 | | | | | |
| Dallas Independent School District, | | | | | | | | | | | | |
| 5.000%, 02/15/2020 (PSF Guaranteed) | | | 2,410,000 | | | | 2,649,964 | | | | | |
| DeSoto Independent School District, | | | | | | | | | | | | |
| 5.000%, 08/15/2032 (Callable 08/15/2025)(Insured by BAM) | | | 1,080,000 | | | | 1,229,634 | | | | | |
| Ennis Independent School District, | | | | | | | | | | | | |
| 5.000%, 08/15/2025 (PSF Guaranteed) | | | 1,145,000 | | | | 1,374,343 | | | | | |
| Fort Bend Independent School District, | | | | | | | | | | | | |
| 5.000%, 08/15/2024 (PSF Guaranteed) | | | 1,655,000 | | | | 1,969,135 | | | | | |
| Georgetown Independent School District, | | | | | | | | | | | | |
| 4.000%, 02/15/2020 (PSF Guaranteed) | | | 1,900,000 | | | | 2,040,828 | | | | | |
| Godley Independent School District, | | | | | | | | | | | | |
| 5.000%, 02/15/2023 (PSF Guaranteed) | | | 1,445,000 | | | | 1,677,833 | | | | | |
| Goose Creek Consolidated Independent School District, | | | | | | | | | | | | |
| 5.000%, 02/15/2021 (PSF Guaranteed) | | | 1,050,000 | | | | 1,179,885 | | | | | |
| Harlingen Consolidated Independent School District: | | | | | | | | | | | | |
| 5.000%, 08/15/2024 (PSF Guaranteed) | | | 2,810,000 | | | | 3,339,067 | | | | | |
| 5.000%, 08/15/2025 (PSF Guaranteed) | | | 1,430,000 | | | | 1,716,429 | | | | | |
| Harris County Health Facilities Development Corp.: | | | | | | | | | | | | |
| 5.500%, 10/01/2019 (ETM) | | | 4,370,000 | | | | 4,626,432 | | | | | |
| 5.750%, 07/01/2027 (ETM) | | | 5,000,000 | | | | 6,090,700 | | | | | |
| Houston Higher Education Finance Corp.: | | | | | | | | | | | | |
| 5.000%, 02/15/2020 (PSF Guaranteed) | | | 1,000,000 | | | | 1,094,470 | | | | | |
| 5.000%, 02/15/2026 (Callable 02/15/2024)(PSF Guaranteed) | | | 1,030,000 | | | | 1,185,911 | | | | | |
| Humble Independent School District, | | | | | | | | | | | | |
| 5.000%, 02/15/2021 (PSF Guaranteed) | | | 1,500,000 | | | | 1,685,550 | | | | | |
| Irving Independent School District, | | | | | | | | | | | | |
| 5.000%, 02/15/2025 (Callable 08/15/2024)(PSF Guaranteed) | | | 1,250,000 | | | | 1,489,200 | | | | | |
| Katy Independent School District, | | | | | | | | | | | | |
| 5.000%, 02/15/2020 (PSF Guaranteed) | | | 4,635,000 | | | | 5,105,406 | | | | | |
| Keller Independent School District/TX: | | | | | | | | | | | | |
| 5.000%, 02/15/2022 (PSF Guaranteed) | | | 1,370,000 | | | | 1,566,567 | | | | | |
| 5.000%, 02/15/2023 (PSF Guaranteed) | | | 3,340,000 | | | | 3,884,387 | | | | | |
| Killeen Independent School District, | | | | | | | | | | | | |
| 4.000%, 02/15/2024 (Callable 02/15/2021)(PSF Guaranteed) | | | 1,145,000 | | | | 1,228,367 | | | | | |
| La Porte Independent School District/TX, | | | | | | | | | | | | |
| 5.000%, 02/15/2025 (PSF Guaranteed) | | | 1,080,000 | | | | 1,291,972 | | | | | |
| Lamar Consolidated Independent School District: | | | | | | | | | | | | |
| 5.000%, 02/15/2026 (Callable 02/15/2025)(PSF Guaranteed) | | | 5,860,000 | | | | 6,934,079 | | | | | |
| 5.000%, 02/15/2027 (Callable 02/15/2025)(PSF Guaranteed) | | | 2,550,000 | | | | 3,005,099 | | | | | |
| Llano Independent School District, | | | | | | | | | | | | |
| 5.000%, 02/15/2024 (Callable 02/15/2023)(PSF Guaranteed) | | | 1,265,000 | | | | 1,467,261 | | | | | |
| Lower Colorado River Authority, | | | | | | | | | | | | |
| 4.750%, 01/01/2028 (ETM)(Insured by AGM) | | | 1,200,000 | | | | 1,377,864 | | | | | |
| Lubbock Independent School District, | | | | | | | | | | | | |
| 4.000%, 02/15/2022 (Callable 02/15/2020)(PSF Guaranteed) | | | 1,000,000 | | | | 1,063,440 | | | | | |
| Mansfield Independent School District: | | | | | | | | | | | | |
| 5.000%, 02/15/2023 (PSF Guaranteed) | | | 1,725,000 | | | | 2,007,245 | | | | | |
| 5.000%, 02/15/2024 (PSF Guaranteed) | | | 1,905,000 | | | | 2,248,814 | | | | | |
| Mesquite Independent School District: | | | | | | | | | | | | |
| 5.000%, 08/15/2024 (PSF Guaranteed) | | | 1,425,000 | | | | 1,685,647 | | | | | |
| 5.000%, 08/15/2025 (PSF Guaranteed) | | | 2,600,000 | | | | 3,105,154 | | | | | |
| 5.000%, 08/15/2025 (PSF Guaranteed) | | | 1,500,000 | | | | 1,791,435 | | | | | |
| Montgomery County Health Facilities Development Corp., | | | | | | | | | | | | |
| 0.000%, 07/15/2023 (ETM) | | | 200,000 | | | | 173,046 | | | | | |
| New Caney Independent School District: | | | | | | | | | | | | |
| 5.000%, 02/15/2023 (PSF Guaranteed) | | | 1,000,000 | | | | 1,163,620 | | | | | |
| 5.000%, 02/15/2024 (PSF Guaranteed) | | | 1,030,000 | | | | 1,216,636 | | | | | |
| North East Independent School District/TX: | | | | | | | | | | | | |
| 5.000%, 08/01/2021 (PSF Guaranteed) | | | 6,095,000 | | | | 6,898,626 | | | | | |
| 5.000%, 08/01/2023 (PSF Guaranteed) | | | 5,805,000 | | | | 6,794,462 | | | | | |
| 5.000%, 02/01/2024 (PSF Guaranteed) | | | 2,930,000 | | | | 3,447,760 | | | | | |
| North Texas Tollway Authority: | | | | | | | | | | | | |
| 5.125%, 01/01/2028 (Pre-refunded to 01/01/2018) | | | 70,000 | | | | 72,750 | | | | | |
| 0.000%, 09/01/2043 (Callable 09/01/2031) | | | 1,400,000 | | | | 1,395,002 | | | | | |
| Northside Independent School District: | | | | | | | | | | | | |
| 5.000%, 08/15/2025 (PSF Guaranteed) | | | 1,000,000 | | | | 1,207,210 | | | | | |
| 2.000%, 06/01/2046 (Mandatory Tender Date 06/01/2021)(PSF Guaranteed) (1) | | | 1,450,000 | | | | 1,446,331 | | | | | |
| Pasadena Independent School District, | | | | | | | | | | | | |
| 5.000%, 02/15/2022 (Callable 02/15/2021)(PSF Guaranteed) | | | 1,115,000 | | | | 1,253,405 | | | | | |
| Pflugerville Independent School District, | | | | | | | | | | | | |
| 5.000%, 02/15/2025 (Callable 02/15/2024)(PSF Guaranteed) | | | 1,000,000 | | | | 1,179,760 | | | | | |
| Port Arthur Independent School District, | | | | | | | | | | | | |
| 5.000%, 02/15/2024 (PSF Guaranteed) | | | 1,700,000 | | | | 2,009,264 | | | | | |
| Retama Development Corp., | | | | | | | | | | | | |
| 8.750%, 12/15/2018 (ETM) | | | 2,035,000 | | | | 2,308,646 | | | | | |
| Sherman Independent School District/TX, | | | | | | | | | | | | |
| 5.000%, 02/15/2026 (Callable 02/15/2024)(PSF Guaranteed) | | | 1,775,000 | | | | 2,076,271 | | | | | |
| Spring Independent School District, | | | | | | | | | | | | |
| 5.000%, 08/15/2019 (Pre-refunded to 08/15/2018)(PSF Guaranteed) | | | 1,020,000 | | | | 1,082,159 | | | | | |
| State of Texas: | | | | | | | | | | | | |
| 5.000%, 08/01/2021 | | | 1,205,000 | | | | 1,370,663 | | | | | |
| Tarrant County Health Facilities Development Corp., | | | | | | | | | | | | |
| 6.000%, 09/01/2024 (ETM) | | | 6,745,000 | | | | 7,795,062 | | | | | |
| Temple Independent School District/TX, | | | | | | | | | | | | |
| 4.000%, 02/01/2022 (Callable 02/01/2021)(PSF Guaranteed) | | | 1,120,000 | | | | 1,211,280 | | | | | |
| Texas State Public Finance Authority Charter School Finance Corp., | | | | | | | | | | | | |
| 6.200%, 02/15/2040 (Pre-refunded to 02/15/2020) | | | 380,000 | | | | 431,718 | | | | | |
| Texas Transportation Commission State Highway Fund, | | | | | | | | | | | | |
| 4.000%, 04/01/2026 (Mandatory Tender Date 10/01/2021) (1)(2) | | | 1,570,000 | | | | 1,703,105 | | | | | |
| The Lubbock Housing Finance Corp., | | | | | | | | | | | | |
| 8.000%, 10/01/2021 (ETM) | | | 1,980,000 | | | | 2,478,208 | | | | | |
| The University of Texas System, | | | | | | | | | | | | |
| 5.000%, 08/15/2022 | | | 9,530,000 | | | | 11,034,692 | | | | | |
| Tomball Independent School District, | | | | | | | | | | | | |
| 5.000%, 02/15/2025 (PSF Guaranteed) | | | 5,865,000 | | | | 7,025,742 | | | | | |
| Tyler Health Facilities Development Corp., | | | | | | | | | | | | |
| 5.500%, 07/01/2027 (Pre-refunded to 07/01/2021) | | | 600,000 | | | | 691,404 | | | | | |
| Waco Independent School District: | | | | | | | | | | | | |
| 5.000%, 08/15/2022 (PSF Guaranteed) | | | 3,085,000 | | | | 3,557,930 | | | | | |
| 5.000%, 08/15/2023 (PSF Guaranteed) | | | 3,090,000 | | | | 3,617,494 | | | | | |
| Wichita Falls Independent School District, | | | | | | | | | | | | |
| 5.000%, 02/01/2024 (PSF Guaranteed) | | | 1,670,000 | | | | 1,969,882 | | | | | |
| Wylie Independent School District/TX, | | | | | | | | | | | | |
| 6.750%, 08/15/2023 (PSF Guaranteed) | | | 1,010,000 | | | | 1,301,345 | | | | | |
| Ysleta Independent School District: | | | | | | | | | | | | |
| 5.000%, 08/15/2023 (Callable 08/15/2021)(PSF Guaranteed) | | | 1,020,000 | | | | 1,163,789 | | | | | |
| 5.000%, 08/15/2025 (Callable 08/15/2024)(PSF Guaranteed) | | | 1,545,000 | | | | 1,818,187 | | | | | |
| | | | | | | | 238,137,014 | | | | 22.2 | % |
| Utah | | | | | | | | | |
| Granite School District Board of Education: | | | | | | | | | |
| 5.000%, 06/01/2022 (Pre-refunded to 06/01/2021) | | | 3,900,000 | | | | 4,429,776 | | | | |
| 5.000%, 06/01/2023 (Pre-refunded to 06/01/2021) | | | 1,750,000 | | | | 1,987,720 | | | | |
| Utah Housing Corp., | | | | | | | | | | | |
| 4.000%, 01/01/2045 (Callable 01/01/2026) | | | 2,430,000 | | | | 2,555,145 | | | | |
| | | | | | | | 8,972,641 | | | | 0.8 | % |
| Virginia | | | | | | | | | | | | |
| City of Bristol VA, | | | | | | | | | | | | |
| 5.500%, 11/01/2018 (ETM)(Insured by AGM) | | | 1,095,000 | | | | 1,146,728 | | | | | |
| Danville Industrial Development Authority, | | | | | | | | | | | | |
| 5.250%, 10/01/2028 (ETM)(Insured by AMBAC) | | | 1,500,000 | | | | 1,736,550 | | | | | |
| Virginia Public School Authority, | | | | | | | | | | | | |
| 6.250%, 12/01/2028 (Pre-refunded to 12/01/2018) | | | 1,285,000 | | | | 1,404,569 | | | | | |
| | | | | | | | 4,287,847 | | | | 0.4 | % |
| Washington | | | | | | | | | | | | |
| Grant & Douglas Counties School District No. 144-101 Quincy, | | | | | | | | | | | | |
| 4.000%, 12/01/2027 (Callable 06/01/2026) | | | 2,200,000 | | | | 2,447,720 | | | | | |
| Pierce County School District No. 320 Sumner, | | | | | | | | | | | | |
| 4.000%, 12/01/2027 (Callable 06/01/2026) | | | 1,000,000 | | | | 1,099,470 | | | | | |
| Snohomish County Public Utility District No. 1, | | | | | | | | | | | | |
| 6.800%, 01/01/2020 (Callable 01/30/2017)(ETM) | | | 3,605,000 | | | | 3,874,618 | | | | | |
| Snohomish County School District No. 201 Snohomish, | | | | | | | | | | | | |
| 4.000%, 12/01/2021 (Callable 12/01/2020) | | | 4,500,000 | | | | 4,878,765 | | | | | |
| Spokane County School District No. 356 Central Valley, | | | | | | | | | | | | |
| 4.000%, 12/01/2027 (Callable 06/01/2026) | | | 1,250,000 | | | | 1,377,600 | | | | | |
| State of Washington: | | | | | | | | | | | | |
| 5.500%, 07/01/2023 | | | 5,040,000 | | | | 5,906,527 | | | | | |
| 5.000%, 08/01/2038 (Pre-refunded to 08/01/2026) | | | 975,000 | | | | 1,110,935 | | | | | |
| Thurston & Pierce Counties Community Schools, | | | | | | | | | | | | |
| 4.250%, 12/01/2021 (Callable 12/01/2020) | | | 2,755,000 | | | | 3,014,962 | | | | | |
| Walla Walla County WA School District No. 250 College Place, | | | | | | | | | | | | |
| 5.000%, 12/01/2019 | | | 1,290,000 | | | | 1,411,324 | | | | | |
| Washington Health Care Facilities Authority: | | | | | | | | | | | | |
| 6.250%, 08/01/2028 (Pre-refunded to 08/01/2018) | | | 1,355,000 | | | | 1,459,701 | | | | | |
| 6.125%, 11/15/2031 (Pre-refunded to 05/15/2021) | | | 610,000 | | | | 717,079 | | | | | |
| 6.250%, 08/01/2036 (Pre-refunded to 08/01/2018) | | | 8,100,000 | | | | 8,725,887 | | | | | |
| 6.250%, 11/15/2041 (Pre-refunded to 05/15/2021) | | | 4,770,000 | | | | 5,632,178 | | | | | |
| | | | | | | | 41,656,766 | | | | 3.9 | % |
| West Virginia | | | | | | | | | | | | |
| Ohio County Board of Education, | | | | | | | | | | | | |
| 5.250%, 06/01/2018 (ETM) | | | 1,130,000 | | | | 1,193,099 | | | | 0.1 | % |
| | | | | | | | | | | | | |
| Wisconsin | | | | | | | | | | | | |
| Southeast Wisconsin Professional Baseball Park District, | | | | | | | | | | | | |
| 0.000%, 12/15/2029 (ETM) | | | 50,000 | | | | 34,620 | | | | | |
| Wisconsin Center District: | | | | | | | | | | | | |
| 4.000%, 12/15/2029 (Callable 06/15/2026) | | | 1,410,000 | | | | 1,493,035 | | | | | |
| 5.000%, 12/15/2030 (Callable 06/15/2026) | | | 775,000 | | | | 896,125 | | | | | |
| 5.000%, 12/15/2031 (Callable 06/15/2026) | | | 2,530,000 | | | | 2,900,847 | | | | | |
| Wisconsin Health & Educational Facilities Authority, | | | | | | | | | | | | |
| 5.000%, 08/15/2027 (Pre-refunded to 08/15/2022) | | | 1,500,000 | | | | 1,734,240 | | | | | |
| Wisconsin Housing & Economic Development Authority, | | | | | | | | | | | | |
| 3.500%, 09/01/2046 (Callable 09/01/2025) | | | 2,900,000 | | | | 3,011,766 | | | | | |
| | | | | | | | 10,070,633 | | | | 0.9 | % |
| Total Municipal Bonds (Cost $1,041,515,358) | | | | | | | 1,055,561,560 | | | | 98.4 | % |
| | | | | | | | | | | | | |
| SHORT-TERM INVESTMENT | | | | | | | | | | | | |
| Money Market Mutual Fund | | Shares | | | | | | | | | |
| Fidelity Institutional Money Market Fund - Government Portfolio, Institutional Class, 0.43% « | | | 914,486 | | | | 914,486 | | | | | |
| Total Short-Term Investment (Cost $914,486) | | | | | | | 914,486 | | | | 0.1 | % |
| Total Investments (Cost $1,042,429,844) | | | | | | | 1,056,476,046 | | | | 98.5 | % |
| Other Assets in Excess of Liabilities | | | | | | | 15,808,098 | | | | 1.5 | % |
| TOTAL NET ASSETS | | | | | | $ | 1,072,284,144 | | | | 100.0 | % |
Notes to Schedule of Investments |
| AGM | Assured Guaranty Municipal |
| AMBAC | Ambac Assurance Corporation |
| BHAC | Berkshire Hathaway Assurance Corp. |
| ETM | Escrowed to Maturity |
| FGIC-TCRS | Financial Guaranty Insurance Company |
| PSF | Texas Permanent School Fund |
| Q-SBLF | Qualified School Building Loan Fund |
| (1) | Variable or floating rate security. Floating rate securities are securities whose yields vary with a designated index rate. These securities' rates are as of December 31, 2016. |
| (2) | Security or a portion of the security purchased on a when-issued or delayed delivery basis. |
| « | 7-Day Yield |
| Baird Core Intermediate Municipal Bond Fund | | | | | | | | | |
| Schedule of Investments | | | | | | | | | |
| December 31, 2016 | | | | | | | | | |
| | | | | | | | | | |
| | | Principal | | | | | | % of | |
| | | Amount | | | Value | | | Net Assets | |
| LONG-TERM INVESTMENTS | | | | | | | | | |
| Municipal Bonds | | | | | | | | | |
| Alabama | | | | | | | | | |
| Alabama Community College System, | | | | | | | | | |
| 5.000%, 10/01/2028 (Callable 10/01/2026)(Insured by AGM) | | $ | 310,000 | | | $ | 357,201 | | | | |
| City of Birmingham AL: | | | | | | | | | | | |
| 0.000%, 03/01/2037 (Callable 03/01/2023) | | | 30,000 | | | | 32,086 | | | | |
| 0.000%, 03/01/2043 (Callable 03/01/2023) | | | 275,000 | | | | 296,810 | | | | |
| County of Cullman AL Water Revenue, | | | | | | | | | | | |
| 3.000%, 05/01/2017 (Insured by BAM) | | | 280,000 | | | | 281,904 | | | | |
| County of Jefferson AL, | | | | | | | | | | | |
| 1.715%, 01/01/2027 (Callable 01/05/2017)(Insured by AMBAC)(1)(2) | | | 50,000 | | | | 45,886 | | | | |
| Industrial Development Board of the City of Mobile Alabama, | | | | | | | | | | | |
| 1.625%, 07/15/2034 (Mandatory Tender Date 10/02/2018) | | | 150,000 | | | | 149,961 | | | | |
| Jasper Water Works & Sewer Board, Inc., | | | | | | | | | | | |
| 5.000%, 06/01/2024 (Callable 06/01/2021) | | | 200,000 | | | | 222,852 | | | | |
| Special Care Facilities Financing Authority of the City of Pell City AL, | | | | | | | | | | | |
| 5.000%, 12/01/2031 (Callable 12/01/2021) | | | 1,000,000 | | | | 1,059,180 | | | | |
| Town of Mulga AL, | | | | | | | | | | | |
| 3.000%, 08/15/2018 (Insured by AGM) | | | 200,000 | | | | 205,498 | | | | |
| | | | | | | | 2,651,378 | | | | 2.7 | % |
| Alaska | | | | | | | | | | | | |
| Alaska Housing Finance Corp.: | | | | | | | | | | | | |
| 5.000%, 12/01/2029 (Callable 06/01/2024) | | | 225,000 | | | | 254,518 | | | | | |
| 4.000%, 06/01/2040 (Callable 06/01/2021) | | | 65,000 | | | | 66,202 | | | | | |
| Alaska Municipal Bond Bank Authority, | | | | | | | | | | | | |
| 5.000%, 08/01/2027 (Callable 08/01/2023) | | | 500,000 | | | | 554,200 | | | | | |
| City of Valdez AK, | | | | | | | | | | | | |
| 5.000%, 01/01/2021 | | | 435,000 | | | | 472,080 | | | | | |
| | | | | | | | 1,347,000 | | | | 1.4 | % |
| Arizona | | | | | | | | | | | | |
| Arizona Department of Transportation State Highway Fund Revenue, | | | | | | | | | | | | |
| 4.000%, 07/01/2030 (Callable 07/01/2022) | | | 15,000 | | | | 15,832 | | | | | |
| Arizona Health Facilities Authority, | | | | | | | | | | | | |
| 2.570%, 02/01/2048 (Callable 08/09/2019)(1) | | | 100,000 | | | | 101,986 | | | | | |
| Arizona Transportation Board, | | | | | | | | | | | | |
| 5.000%, 07/01/2025 (Pre-refunded to 07/01/2019) | | | 350,000 | | | | 380,173 | | | | | |
| BluePath 2016-1 TE Trust, | | | | | | | | | | | | |
| 2.750%, 09/01/2026 (Callable 08/27/2021) | | | 500,000 | | | | 461,580 | | | | | |
| City of El Mirage AZ, | | | | | | | | | | | | |
| 5.000%, 07/01/2026 (Callable 07/01/2020) | | | 400,000 | | | | 439,536 | | | | | |
| City of Tucson AZ Water System Revenue, | | | | | | | | | | | | |
| 5.000%, 07/01/2032 (Callable 07/01/2025) | | | 500,000 | | | | 573,645 | | | | | |
| Maricopa County Industrial Development Authority: | | | | | | | | | | | | |
| 2.625%, 07/01/2021 | | | 250,000 | | | | 242,708 | | | | | |
| 4.000%, 07/01/2026 | | | 125,000 | | | | 126,280 | | | | | |
| The Industrial Development Authority of the County of Yavapai, | | | | | | | | | | | | |
| 3.000%, 08/01/2017 | | | 220,000 | | | | 221,595 | | | | | |
| | | | | | | | 2,563,335 | | | | 2.6 | % |
| Arkansas | | | | | | | | | | | | |
| Arkansas Development Finance Authority, | | | | | | | | | | | | |
| 3.000%, 07/01/2018 | | | 100,000 | | | | 101,298 | | | | | |
| City of Conway AR Wasterwater Department, | | | | | | | | | | | | |
| 5.000%, 10/01/2035 (Callable 04/01/2024) | | | 185,000 | | | | 204,094 | | | | | |
| City of Little Rock AR, | | | | | | | | | | | | |
| 2.000%, 03/01/2038 (Callable 03/01/2021) | | | 390,000 | | | | 387,851 | | | | | |
| Forrest City School District No. 7, | | | | | | | | | | | | |
| 4.375%, 02/01/2039 (Callable 02/01/2017) | | | 100,000 | | | | 100,255 | | | | | |
| Pulaski County Public Facilities Board, | | | | | | | | | | | | |
| 4.000%, 07/01/2017 | | | 380,000 | | | | 384,514 | | | | | |
| | | | | | | | 1,178,012 | | | | 1.2 | % |
| California | | | | | | | | | | | | |
| Bay Area Toll Authority, | | | | | | | | | | | | |
| 1.420%, 04/01/2047 (Callable 04/01/2019)(Mandatory Tender Date 10/01/2019)(1) | | | 250,000 | | | | 250,767 | | | | | |
| Belmont-Redwood Shores CA School District, | | | | | | | | | | | | |
| 0.000%, 08/01/2031 (Callable 08/01/2026) | | | 75,000 | | | | 71,365 | | | | | |
| California Health Facilities Financing Authority, | | | | | | | | | | | | |
| 5.000%, 04/01/2020 | | | 300,000 | | | | 318,183 | | | | | |
| California School Finance Authority: | | | | | | | | | | | | |
| 3.000%, 08/01/2017 | | | 50,000 | | | | 50,328 | | | | | |
| 3.000%, 08/01/2017 | | | 300,000 | | | | 301,968 | | | | | |
| California Statewide Communities Development Authority: | | | | | | | | | | | | |
| 5.250%, 12/01/2027 (Pre-refunded to 12/01/2017) | | | 35,000 | | | | 36,337 | | | | | |
| 1.966%, 04/01/2028 (1)(2) | | | 200,000 | | | | 175,914 | | | | | |
| Chawanakee Unified School District: | | | | | | | | | | | | |
| 0.000%, 08/01/2026 (Insured by BAM) | | | 110,000 | | | | 105,510 | | | | | |
| 0.000%, 08/01/2027 (Callable 08/01/2026)(Insured by BAM) | | | 100,000 | | | | 94,036 | | | | | |
| 0.000%, 08/01/2028 (Callable 08/01/2026)(Insured by BAM) | | | 75,000 | | | | 70,224 | | | | | |
| 0.000%, 08/01/2029 (Callable 08/01/2026)(Insured by BAM) | | | 80,000 | | | | 74,201 | | | | | |
| 0.000%, 08/01/2030 (Callable 08/01/2026)(Insured by BAM) | | | 155,000 | | | | 141,923 | | | | | |
| 0.000%, 08/01/2031 (Callable 08/01/2026)(Insured by BAM) | | | 145,000 | | | | 132,083 | | | | | |
| 0.000%, 08/01/2032 (Callable 08/01/2026)(Insured by BAM) | | | 100,000 | | | | 90,625 | | | | | |
| 0.000%, 08/01/2033 (Callable 08/01/2026)(Insured by BAM) | | | 125,000 | | | | 112,596 | | | | | |
| City of Redding CA, | | | | | | | | | | | | |
| 1.435%, 07/01/2022 (ETM)(1)(2) | | | 150,000 | | | | 142,207 | | | | | |
| College of the Sequoias Tulare Area Improvement District No. 3, | | | | | | | | | | | | |
| 0.000%, 08/01/2041 (Callable 08/01/2026)(Insured by AGM) | | | 40,000 | | | | 40,238 | | | | | |
| Corona-Norca Unified School District, | | | | | | | | | | | | |
| 0.000%, 08/01/2039 (Callable 08/01/2027)(Insured by AGM) | | | 415,000 | | | | 533,113 | | | | | |
| Dinuba Redevelopment Agency, | | | | | | | | | | | | |
| 5.000%, 09/01/2028 (Callable 09/01/2024)(Insured by BAM) | | | 330,000 | | | | 377,259 | | | | | |
| East Bay Municipal Utility District Water System Revenue, | | | | | | | | | | | | |
| 5.000%, 06/01/2033 (Callable 06/01/2024) | | | 475,000 | | | | 548,910 | | | | | |
| Encinitas Union School District/CA, | | | | | | | | | | | | |
| 0.000%, 08/01/2030 (Callable 08/01/2025) | | | 130,000 | | | | 78,298 | | | | | |
| Imperial Community College District, | | | | | | | | | | | | |
| 0.000%, 08/01/2040 (Callable 08/01/2030)(Insured by AGM) | | | 140,000 | | | | 154,886 | | | | | |
| Lake Elsinore Redevelopment Agency Successor Agency, | | | | | | | | | | | | |
| 5.000%, 09/01/2027 (Callable 09/01/2025)(Insured by BAM) | | | 275,000 | | | | 317,097 | | | | | |
| Long Beach Bond Finance Authority: | | | | | | | | | | | | |
| 5.250%, 11/15/2023 | | | 50,000 | | | | 56,927 | | | | | |
| 5.000%, 11/15/2029 | | | 50,000 | | | | 56,438 | | | | | |
| Los Angeles CA Department of Water & Power Systems, | | | | | | | | | | | | |
| 0.540%, 07/01/2035 | | | 700,000 | | | | 700,000 | | | | | |
| Mount Diablo Unified School District/CA, | | | | | | | | | | | | |
| 0.000%, 08/01/2035 (Callable 08/01/2025)(Insured by AGM) | | | 380,000 | | | | 333,648 | | | | | |
| Mountain View Los Altos Union High School District/CA, | | | | | | | | | | | | |
| 0.000%, 08/01/2030 | | | 50,000 | | | | 48,458 | | | | | |
| Needles Unified School District, | | | | | | | | | | | | |
| 0.000%, 08/01/2034 (Insured by AGM) | | | 25,000 | | | | 21,545 | | | | | |
| Palomar Health, | | | | | | | | | | | | |
| 3.000%, 11/01/2017 | | | 150,000 | | | | 150,969 | | | | | |
| Redondo Beach Unified School District: | | | | | | | | | | | | |
| 0.000%, 08/01/2031 | | | 20,000 | | | | 19,199 | | | | | |
| 6.375%, 08/01/2034 (Callable 08/01/2026) | | | 455,000 | | | | 587,200 | | | | | |
| Rialto Unified School District, | | | | | | | | | | | | |
| 0.000%, 08/01/2041 (Callable 08/01/2036)(Insured by AGM) | | | 120,000 | | | | 106,410 | | | | | |
| Riverside County Public Financing Authority, | | | | | | | | | | | | |
| 5.000%, 10/01/2026 (Callable 10/01/2025)(Insured by AGM) | | | 250,000 | | | | 290,890 | | | | | |
| San Bernardino City Unified School District, | | | | | | | | | | | | |
| 5.000%, 08/01/2027 (Callable 08/01/2023)(Insured by AGM) | | | 450,000 | | | | 509,909 | | | | | |
| San Diego Unified School District/CA: | | | | | | | | | | | | |
| 5.000%, 07/01/2030 (Callable 07/01/2026) | | | 570,000 | | | | 675,427 | | | | | |
| 4.000%, 07/01/2032 (Callable 07/01/2026) | | | 300,000 | | | | 317,742 | | | | | |
| State of California: | | | | | | | | | | | | |
| 5.250%, 10/01/2020 (Callable 10/01/2019) | | | 1,050,000 | | | | 1,151,682 | | | | | |
| 5.000%, 10/01/2029 (Callable 10/01/2024) | | | 225,000 | | | | 260,744 | | | | | |
| 1.267%, 12/01/2029 (Callable 06/01/2018)(Mandatory Tender Date 12/03/2018)(1) | | | 125,000 | | | | 124,991 | | | | | |
| 0.670%, 05/01/2034 | | | 450,000 | | | | 450,000 | | | | | |
| Upland Unified School District, | | | | | | | | | | | | |
| 0.000%, 08/01/2041 (Callable 08/01/2025) | | | 60,000 | | | | 60,029 | | | | | |
| West Hills Community College District, | | | | | | | | | | | | |
| 0.000%, 08/01/2035 (Callable 08/01/2027)(Insured by AGM) | | | 50,000 | | | | 42,581 | | | | | |
| Westlands Water District, | | | | | | | | | | | | |
| 5.000%, 09/01/2030 (Pre-refunded to 09/01/2022)(Insured by AGM) | | | 500,000 | | | | 581,275 | | | | | |
| Wiseburn School District, | | | | | | | | | | | | |
| 0.000%, 08/01/2036 (Callable 08/01/2031)(Insured by AGM) | | | 50,000 | | | | 40,827 | | | | | |
| | | | | | | | 10,804,959 | | | | 11.1 | % |
| Colorado | | | | | | | | | | | | |
| Board of Governors of Colorado State University System, | | | | | | | | | | | | |
| 5.000%, 03/01/2032 (Callable 03/01/2027) | | | 125,000 | | | | 144,490 | | | | | |
| Bromley Park Metropolitan District No. 2, | | | | | | | | | | | | |
| 4.250%, 12/01/2022 (Callable 12/01/2017) | | | 300,000 | | | | 301,050 | | | | | |
| Cathedral Pines Metropolitan District, | | | | | | | | | | | | |
| 2.625%, 12/01/2021 | | | 225,000 | | | | 216,286 | | | | | |
| Colorado Educational & Cultural Facilities Authority, | | | | | | | | | | | | |
| 5.000%, 08/15/2030 (Callable 08/15/2024) | | | 500,000 | | | | 541,030 | | | | | |
| Denver Health & Hospital Authority, | | | | | | | | | | | | |
| 5.000%, 12/01/2017 (Callable 01/30/2017) | | | 250,000 | | | | 250,843 | | | | | |
| E-470 Public Highway Authority, | | | | | | | | | | | | |
| 2.470%, 09/01/2039 (Callable 03/01/2017)(Mandatory Tender Date 09/01/2017)(1) | | | 110,000 | | | | 109,993 | | | | | |
| Glen Metropolitan District No. 1, | | | | | | | | | | | | |
| 2.500%, 12/01/2025 (Insured by BAM) | | | 160,000 | | | | 153,198 | | | | | |
| VDW Metropolitan District No. 2, | | | | | | | | | | | | |
| 1.250%, 12/01/2018 (Insured by AGM) | | | 65,000 | | | | 64,704 | | | | | |
| Vista Ridge Metropolitan District: | | | | | | | | | | | | |
| 5.000%, 12/01/2025 (Insured by BAM) | | | 600,000 | | | | 679,122 | | | | | |
| 5.000%, 12/01/2026 (Insured by BAM) | | | 460,000 | | | | 522,689 | | | | | |
| Weld County CO School District, | | | | | | | | | | | | |
| 5.000%, 12/15/2029 (Callable 12/15/2026) | | | 1,150,000 | | | | 1,338,945 | | | | | |
| | | | | | | | 4,322,350 | | | | 4.4 | % |
| District of Columbia | | | | | | | | | | | | |
| District of Columbia, | | | | | | | | | | | | |
| 5.250%, 07/15/2045 (Pre-refunded to 07/15/2018)(Insured by AGM) | | | 100,000 | | | | 106,034 | | | | | |
| District of Columbia Housing Finance Agency, | | | | | | | | | | | | |
| 3.500%, 06/15/2023 | | | 500,000 | | | | 508,095 | | | | | |
| Metropolitan Washington Airports Authority, | | | | | | | | | | | | |
| 5.000%, 10/01/2033 (Callable 10/01/2025) | | | 250,000 | | | | 287,552 | | | | | |
| Metropolitan Washington Airports Authority Dulles Toll Road Revenue: | | | | | | | | | | | | |
| 6.500%, 10/01/2041 (Callable 10/01/2026) | | | 275,000 | | | | 351,997 | | | | | |
| 0.000%, 10/01/2044 (Callable 10/01/2028) | | | 140,000 | | | | 152,078 | | | | | |
| Washington Metropolitan Area Transit Authority, | | | | | | | | | | | | |
| 5.250%, 07/01/2024 (Callable 07/01/2019) | | | 50,000 | | | | 54,155 | | | | | |
| | | | | | | | 1,459,911 | | | | 1.5 | % |
| Florida | | | | | | | | | | | | |
| City of Fort Myers FL, | | | | | | | | | | | | |
| 4.000%, 12/01/2034 (Callable 12/01/2025) | | | 200,000 | | | | 205,276 | | | | | |
| City of Orlando FL: | | | | | | | | | | | | |
| 5.250%, 11/01/2026 (Pre-refunded to 05/01/2024) | | | 500,000 | | | | 603,350 | | | | | |
| 5.000%, 10/01/2027 (Pre-refunded to 10/01/2020) | | | 100,000 | | | | 111,903 | | | | | |
| 5.250%, 11/01/2029 (Pre-refunded to 05/01/2024) | | | 280,000 | | | | 337,876 | | | | | |
| County of Bay FL Water and Sewer System Revenue, | | | | | | | | | | | | |
| 4.000%, 09/01/2018 | | | 250,000 | | | | 260,345 | | | | | |
| County of Miami-Dade FL, | | | | | | | | | | | | |
| 5.000%, 04/01/2027 (Callable 04/01/2026) | | | 120,000 | | | | 142,429 | | | | | |
| Florida Housing Finance Corp., | | | | | | | | | | | | |
| 4.000%, 07/01/2047 (Callable 07/01/2025) | | | 350,000 | | | | 371,665 | | | | | |
| Hollywood Community Redevelopment Agency, | | | | | | | | | | | | |
| 5.000%, 03/01/2018 | | | 200,000 | | | | 208,244 | | | | | |
| Martin County Health Facilities Authority, | | | | | | | | | | | | |
| 5.000%, 11/15/2023 | | | 260,000 | | | | 291,336 | | | | | |
| Palm Beach County Health Facilities Authority, | | | | | | | | | | | | |
| 4.750%, 07/01/2025 (Callable 07/01/2020)(Insured by AGM) | | | 130,000 | | | | 140,483 | | | | | |
| Village Community Development District No. 7, | | | | | | | | | | | | |
| 4.000%, 05/01/2021 | | | 245,000 | | | | 258,416 | | | | | |
| | | | | | | | 2,931,323 | | | | 3.0 | % |
| Georgia | | | | | | | | | | | | |
| Bartow County Development Authority, | | | | | | | | | | | | |
| 2.375%, 09/01/2029 (Mandatory Tender Date 08/10/2017)(1) | | | 400,000 | | | | 401,880 | | | | | |
| Chatham County Hospital Authority, | | | | | | | | | | | | |
| 5.000%, 01/01/2031 (Callable 01/01/2022) | | | 150,000 | | | | 167,113 | | | | | |
| City of Atlanta GA: | | | | | | | | | | | | |
| 5.000%, 01/01/2025 (Callable 01/01/2020) | | | 225,000 | | | | 241,976 | | | | | |
| 5.000%, 01/01/2028 (Callable 01/01/2020) | | | 1,000,000 | | | | 1,071,270 | | | | | |
| City of Dahlonega GA Water & Sewer Revenue, | | | | | | | | | | | | |
| 4.000%, 09/01/2021 (Insured by AGM) | | | 200,000 | | | | 215,292 | | | | | |
| Murray County School District, | | | | | | | | | | | | |
| 4.000%, 10/01/2017 | | | 240,000 | | | | 245,122 | | | | | |
| Private Colleges & Universities Authority, | | | | | | | | | | | | |
| 5.000%, 10/01/2020 | | | 115,000 | | | | 124,768 | | | | | |
| | | | | | | | 2,467,421 | | | | 2.5 | % |
| Illinois | | | | | | | | | | | | |
| Bureau County Township High School District No. 502, | | | | | | | | | | | | |
| 6.625%, 10/01/2043 (Callable 12/01/2023)(Insured by BAM) | | | 110,000 | | | | 134,469 | | | | | |
| Champaign & Piatt Counties Community Unit School District No. 3, | | | | | | | | | | | | |
| 5.000%, 10/01/2017 (Insured by AGM) | | | 145,000 | | | | 148,668 | | | | | |
| Chicago O'Hare International Airport: | | | | | | | | | | | | |
| 5.000%, 01/01/2020 (Callable 01/01/2017)(Insured by AGM) | | | 100,000 | | | | 100,000 | | | | | |
| 5.500%, 01/01/2031 (Callable 01/01/2021) | | | 500,000 | | | | 558,625 | | | | | |
| City of Berwyn IL, | | | | | | | | | | | | |
| 4.000%, 12/01/2020 | | | 100,000 | | | | 104,938 | | | | | |
| City of Chicago IL: | | | | | | | | | | | | |
| 4.250%, 01/01/2019 | | | 175,000 | | | | 180,733 | | | | | |
| 5.000%, 01/01/2023 (Callable 01/01/2020) | | | 100,000 | | | | 100,027 | | | | | |
| 5.000%, 01/01/2024 | | | 250,000 | | | | 248,110 | | | | | |
| 5.000%, 01/01/2026 (Callable 01/30/2017)(Insured by AGM) | | | 60,000 | | | | 60,152 | | | | | |
| City of Chicago IL Motor Fuel Tax Revenue, | | | | | | | | | | | | |
| 5.000%, 01/01/2026 (Callable 01/01/2024) | | | 250,000 | | | | 257,122 | | | | | |
| City of Chicago IL Wastewater Transmission Revenue: | | | | | | | | | | | | |
| 5.000%, 01/01/2018 (Insured by BHAC) | | | 150,000 | | | | 154,848 | | | | | |
| 5.000%, 01/01/2023 | | | 170,000 | | | | 187,433 | | | | | |
| 5.000%, 01/01/2025 (Callable 01/01/2024) | | | 110,000 | | | | 123,483 | | | | | |
| City of Chicago IL Waterworks Revenue, | | | | | | | | | | | | |
| 5.000%, 11/01/2028 (Callable 11/01/2018)(Insured by AGM) | | | 450,000 | | | | 464,855 | | | | | |
| Coles Cumberland Moultrie Etc Counties Community Unit School District No. 2, | | | | | | | | | | | | |
| 4.000%, 12/01/2018 (Insured by BAM) | | | 250,000 | | | | 261,165 | | | | | |
| Cook County Community Consolidated School District No. 65 Evanston, | | | | | | | | | | | | |
| 0.000%, 12/01/2023 | | | 200,000 | | | | 161,614 | | | | | |
| Cook County School District No. 83 Mannheim, | | | | | | | | | | | | |
| 5.625%, 06/01/2033 | | | 245,000 | | | | 281,226 | | | | | |
| DeKalb County Community Unit School District No. 428 DeKalb, | | | | | | | | | | | | |
| 0.000%, 01/01/2030 (Callable 07/01/2020) | | | 300,000 | | | | 151,839 | | | | | |
| Illinois Finance Authority: | | | | | | | | | | | | |
| 4.000%, 11/15/2017 | | | 100,000 | | | | 102,303 | | | | | |
| 5.000%, 02/15/2021 | | | 100,000 | | | | 106,482 | | | | | |
| 5.250%, 02/15/2030 (Callable 02/15/2020) | | | 200,000 | | | | 217,298 | | | | | |
| 5.000%, 08/01/2030 (Callable 08/01/2024) | | | 250,000 | | | | 284,003 | | | | | |
| 4.000%, 05/15/2034 (Callable 05/15/2026) | | | 180,000 | | | | 174,290 | | | | | |
| 1.782%, 05/01/2036 (Callable 11/01/2020)(Mandatory Tender Date 05/01/2021)(1) | | | 300,000 | | | | 300,426 | | | | | |
| Illinois Housing Development Authority, | | | | | | | | | | | | |
| 2.450%, 06/01/2043 (Callable 01/01/2023) | | | 298,786 | | | | 288,293 | | | | | |
| Illinois State University, | | | | | | | | | | | | |
| 5.000%, 04/01/2023 (Callable 04/01/2021) | | | 440,000 | | | | 476,586 | | | | | |
| Kankakee River Metropolitan Agency, | | | | | | | | | | | | |
| 2.000%, 05/01/2017 (Insured by AGM) | | | 100,000 | | | | 100,194 | | | | | |
| Knox & Warren Counties Community Unit School District No. 205 Galesburg, | | | | | | | | | | | | |
| 6.125%, 01/01/2036 (Callable 01/01/2021) | | | 285,000 | | | | 316,550 | | | | | |
| Ogle & Winnebago Counties Community Unit School District No. 223 Meridian: | | | | | | | | | | | | |
| 5.000%, 12/01/2023 (Insured by BAM) | | | 400,000 | | | | 454,092 | | | | | |
| 5.000%, 12/01/2024 (Insured by BAM) | | | 100,000 | | | | 112,780 | | | | | |
| Southern Illinois University, | | | | | | | | | | | | |
| 2.050%, 04/01/2017 | | | 100,000 | | | | 99,704 | | | | | |
| St Clair County Community Consolidated School District No. 90 O'Fallon, | | | | | | | | | | | | |
| 0.000%, 12/01/2020 | | | 500,000 | | | | 454,815 | | | | | |
| State of Illinois: | | | | | | | | | | | | |
| 5.000%, 06/01/2019 | | | 400,000 | | | | 413,716 | | | | | |
| 5.000%, 01/01/2022 (Callable 01/01/2020) | | | 215,000 | | | | 222,224 | | | | | |
| Town of Cicero IL, | | | | | | | | | | | | |
| 5.000%, 01/01/2019 (Insured by AGM) | | | 400,000 | | | | 421,516 | | | | | |
| Village of Cary IL, | | | | | | | | | | | | |
| 1.500%, 03/01/2019 (Insured by BAM) | | | 130,000 | | | | 127,919 | | | | | |
| Village of Crestwood IL: | | | | | | | | | | | | |
| 2.000%, 12/15/2018 (Insured by BAM) | | | 225,000 | | | | 227,277 | | | | | |
| 4.500%, 12/15/2026 (Callable 12/15/2022)(Insured by BAM) | | | 200,000 | | | | 214,194 | | | | | |
| Village of Franklin Park IL, | | | | | | | | | | | | |
| 5.000%, 04/01/2023 (Insured by BAM) | | | 400,000 | | | | 452,728 | | | | | |
| Will County IL School District No. 204 Joliet, | | | | | | | | | | | | |
| 6.250%, 01/01/2031 (Callable 01/01/2021) | | | 300,000 | | | | 344,424 | | | | | |
| Will County IL School District No. 365 Valley View, | | | | | | | | | | | | |
| 0.000%, 11/01/2021 (Insured by AGM) | | | 260,000 | | | | 226,403 | | | | | |
| | | | | | | | 9,817,524 | | | | 10.0 | % |
| Indiana | | | | | | | | | | | | |
| City of Rockport IN, | | | | | | | | | | | | |
| 1.750%, 06/01/2025 (Mandatory Tender Date 06/01/2018) | | | 100,000 | | | | 99,696 | | | | | |
| Indiana Bond Bank, | | | | | | | | | | | | |
| 1.380%, 10/15/2022 (1) | | | 100,000 | | | | 95,794 | | | | | |
| Indiana Finance Authority, | | | | | | | | | | | | |
| 5.500%, 08/15/2045 (Callable 08/15/2020) | | | 165,000 | | | | 176,212 | | | | | |
| Indiana Health & Educational Facilities Financing Authority, | | | | | | | | | | | | |
| 1.750%, 11/15/2031 (Mandatory Tender Date 11/02/2021) | | | 500,000 | | | | 485,290 | | | | | |
| South Gibson School Building Corp., | | | | | | | | | | | | |
| 5.000%, 01/10/2028 (Callable 07/10/2026) | | | 400,000 | | | | 470,492 | | | | | |
| | | | | | | | 1,327,484 | | | | 1.4 | % |
| Iowa | | | | | | | | | | | | |
| City of Coralville IA, | | | | | | | | | | | | |
| 4.000%, 06/01/2019 | | | 100,000 | | | | 103,408 | | | | | |
| Iowa Finance Authority, | | | | | | | | | | | | |
| 3.500%, 09/01/2017 | | | 100,000 | | | | 100,268 | | | | | |
| Iowa Higher Education Loan Authority, | | | | | | | | | | | | |
| 2.000%, 12/01/2018 (Callable 06/01/2018) | | | 1,000,000 | | | | 998,690 | | | | | |
| | | | | | | | 1,202,366 | | | | 1.2 | % |
| Kansas | | | | | | | | | | | | |
| City of Hutchinson KS: | | | | | | | | | | | | |
| 4.000%, 12/01/2020 | | | 330,000 | | | | 338,880 | | | | | |
| 4.000%, 12/01/2021 | | | 440,000 | | | | 450,226 | | | | | |
| 5.000%, 12/01/2022 | | | 140,000 | | | | 150,416 | | | | | |
| State of Kansas Department of Transportation, | | | | | | | | | | | | |
| 0.813%, 09/01/2019 (1) | | | 115,000 | | | | 114,155 | | | | | |
| | | | | | | | 1,053,677 | | | | 1.1 | % |
| Kentucky | | | | | | | | | | | | |
| Kentucky Municipal Power Agency, | | | | | | | | | | | | |
| 5.000%, 09/01/2037 (Pre-refunded to 09/01/2017) | | | 85,000 | | | | 87,192 | | | | | |
| Paducah Electric Plant Board, | | | | | | | | | | | | |
| 5.000%, 10/01/2026 (Insured by AGM) | | | 450,000 | | | | 518,927 | | | | | |
| | | | | | | | 606,119 | | | | 0.6 | % |
| Louisiana | | | | | | | | | | | | |
| Louisiana Public Facilities Authority, | | | | | | | | | | | | |
| 5.000%, 07/01/2017 | | | 50,000 | | | | 50,951 | | | | 0.1 | % |
| | | | | | | | | | | | | |
| Maine | | | | | | | | | | | | |
| Maine State Housing Authority: | | | | | | | | | | | | |
| 3.500%, 11/15/2045 (Callable 05/15/2025) | | | 295,000 | | | | 305,800 | | | | | |
| 4.000%, 11/15/2045 (Callable 11/15/2025) | | | 625,000 | | | | 660,731 | | | | | |
| | | | | | | | 966,531 | | | | 1.0 | % |
| Massachusetts | | | | | | | | | | | | |
| Eaton Vance Municipal Bond Fund II, | | | | | | | | | | | | |
| 1.770%, 07/01/2019 (Callable 01/30/2017)(1) | | | 150,000 | | | | 150,019 | | | | | |
| Massachusetts Development Finance Agency, | | | | | | | | | | | | |
| 5.000%, 07/01/2017 | | | 340,000 | | | | 344,988 | | | | | |
| Town of Ashburnham MA, | | | | | | | | | | | | |
| 4.250%, 07/01/2021 (Callable 07/01/2018) | | | 700,000 | | | | 726,131 | | | | | |
| | | | | | | | 1,221,138 | | | | 1.3 | % |
| Michigan | | | | | | | | | | | | |
| City of Detroit MI Sewage Disposal System Revenue, | | | | | | | | | | | | |
| 5.000%, 07/01/2039 (Callable 07/01/2022)(Insured by AGM) | | | 155,000 | | | | 164,689 | | | | | |
| City of Detroit MI Water Supply System Revenue: | | | | | | | | | | | | |
| 4.250%, 07/01/2018 | | | 100,000 | | | | 104,004 | | | | | |
| 5.250%, 07/01/2041 (Callable 07/01/2021) | | | 50,000 | | | | 53,306 | | | | | |
| City of Wyandotte MI Electric System Revenue, | | | | | | | | | | | | |
| 5.000%, 10/01/2023 (Insured by BAM) | | | 25,000 | | | | 27,803 | | | | | |
| Hudsonville Public Schools, | | | | | | | | | | | | |
| 4.000%, 05/01/2018 (Insured by Q-SBLF) | | | 100,000 | | | | 103,339 | | | | | |
| Lake Orion Community School District, | | | | | | | | | | | | |
| 5.000%, 05/01/2025 (Insured By Q-SBLF) | | | 1,635,000 | | | | 1,914,879 | | | | | |
| Michigan Finance Authority: | | | | | | | | | | | | |
| 5.500%, 06/01/2021 (Pre-refunded to 06/01/2017) | | | 500,000 | | | | 524,040 | | | | | |
| 5.000%, 07/01/2034 (Callable 07/01/2025) | | | 250,000 | | | | 274,062 | | | | | |
| Saginaw City School District, | | | | | | | | | | | | |
| 5.000%, 05/01/2024 (Insured by Q-SBLF) | | | 210,000 | | | | 242,945 | | | | | |
| Warren Consolidated Schools, | | | | | | | | | | | | |
| 5.000%, 05/01/2025 (Insured by BAM) | | | 300,000 | | | | 350,868 | | | | | |
| Ypsilanti School District/MI, | | | | | | | | | | | | |
| 4.000%, 05/01/2020 (Insured by Q-SBLF) | | | 50,000 | | | | 52,983 | | | | | |
| | | | | | | | 3,812,918 | | | | 3.9 | % |
| Minnesota | | | | | | | | | | | | |
| Minnesota Housing Finance Agency, | | | | | | | | | | | | |
| 4.000%, 01/01/2047 (Callable 01/01/2026) | | | 1,150,000 | | | | 1,213,446 | | | | | |
| Western Minnesota Municipal Power Agency, | | | | | | | | | | | | |
| 5.000%, 01/01/2033 (Callable 01/01/2024) | | | 140,000 | | | | 157,441 | | | | | |
| | | | | | | | 1,370,887 | | | | 1.4 | % |
| Mississippi | | | | | | | | | | | | |
| City of Jackson MS Water & Sewer System Revenue, | | | | | | | | | | | | |
| 4.000%, 09/01/2018 (Insured by BAM) | | | 250,000 | | | | 259,510 | | | | | |
| Mississippi Business Finance Corp., | | | | | | | | | | | | |
| 0.740%, 11/01/2035 (Callable 01/03/2017)(Optional Put Date 01/31/2017)(1) | | | 600,000 | | | | 600,000 | | | | | |
| Mississippi Development Bank: | | | | | | | | | | | | |
| 5.500%, 10/01/2019 | | | 550,000 | | | | 592,938 | | | | | |
| 6.750%, 12/01/2033 (Callable 12/01/2023)(Insured by AGM) | | | 100,000 | | | | 125,141 | | | | | |
| | | | | | | | 1,577,589 | | | | 1.6 | % |
| Missouri | | | | | | | | | | | | |
| County of Boone MO, | | | | | | | | | | | | |
| 4.000%, 08/01/2019 | | | 250,000 | | | | 261,830 | | | | | |
| Health & Educational Facilities Authority of the State of Missouri: | | | | | | | | | | | | |
| 4.000%, 08/01/2018 | | | 100,000 | | | | 102,142 | | | | | |
| 4.000%, 08/01/2019 | | | 150,000 | | | | 153,984 | | | | | |
| Missouri Development Finance Board, | | | | | | | | | | | | |
| 2.000%, 04/01/2017 | | | 130,000 | | | | 130,196 | | | | | |
| Missouri Housing Development Commission, | | | | | | | | | | | | |
| 3.700%, 11/01/2035 (Callable 05/01/2025) | | | 245,000 | | | | 243,185 | | | | | |
| State of Missouri Environmental Improvement & Energy Resources Authority, | | | | | | | | | | | | |
| 1.278%, 12/01/2022 (Callable 01/31/2017)(1)(2) | | | 500,000 | | | | 459,440 | | | | | |
| State of Missouri Housing Development Commission, | | | | | | | | | | | | |
| 3.500%, 05/01/2041 (Callable 11/01/2025) | | | 250,000 | | | | 260,465 | | | | | |
| | | | | | | | 1,611,242 | | | | 1.6 | % |
| Montana | | | | | | | | | | | | |
| Montana Board of Housing, | | | | | | | | | | | | |
| 3.600%, 12/01/2030 (Callable 06/01/2022) | | | 505,000 | | | | 499,536 | | | | 0.5 | % |
| | | | | | | | | | | | | |
| Nebraska | | | | | | | | | | | | |
| County of Buffalo NE: | | | | | | | | | | | | |
| 4.000%, 12/15/2029 (Callable 09/13/2021) | | | 200,000 | | | | 212,552 | | | | | |
| 4.000%, 12/15/2030 (Callable 09/13/2021) | | | 250,000 | | | | 265,007 | | | | | |
| 4.000%, 12/15/2031 (Callable 09/13/2021) | | | 300,000 | | | | 316,518 | | | | | |
| Douglas County Hospital Authority No. 2, | | | | | | | | | | | | |
| 5.000%, 05/15/2019 | | | 150,000 | | | | 159,716 | | | | | |
| | | | | | | | 953,793 | | | | 1.0 | % |
| Nevada | | | | | | | | | | | | |
| City of North Las Vegas NV: | | | | | | | | | | | | |
| 2.000%, 12/01/2017 | | | 195,000 | | | | 196,084 | | | | | |
| 2.000%, 12/01/2018 | | | 195,000 | | | | 196,018 | | | | | |
| Nevada Housing Division, | | | | | | | | | | | | |
| 5.375%, 10/01/2039 (Callable 04/01/2019) | | | 345,000 | | | | 350,210 | | | | | |
| | | | | | | | 742,312 | | | | 0.8 | % |
| New Jersey | | | | | | | | | | | | |
| City of Newark NJ, | | | | | | | | | | | | |
| 5.000%, 09/01/2017 | | | 100,000 | | | | 102,319 | | | | | |
| Landis Sewage Authority, | | | | | | | | | | | | |
| 2.544%, 09/19/2019 (1)(2) | | | 150,000 | | | | 143,665 | | | | | |
| New Jersey Economic Development Authority: | | | | | | | | | | | | |
| 4.000%, 06/15/2017 | | | 375,000 | | | | 378,596 | | | | | |
| 5.000%, 06/15/2023 (Insured by BAM) | | | 275,000 | | | | 308,033 | | | | | |
| New Jersey Health Care Facilities Financing Authority: | | | | | | | | | | | | |
| 5.000%, 07/01/2025 (Insured by AGM) | | | 200,000 | | | | 227,372 | | | | | |
| 4.500%, 11/15/2025 (Callable 11/15/2020) | | | 150,000 | | | | 160,802 | | | | | |
| 5.000%, 07/01/2026 (Callable 07/01/2025)(Insured by AGM) | | | 225,000 | | | | 251,001 | | | | | |
| New Jersey Transportation Trust Fund Authority: | | | | | | | | | | | | |
| 5.500%, 12/15/2017 (Insured by AGM) | | | 185,000 | | | | 191,009 | | | | | |
| 5.250%, 12/15/2019 | | | 345,000 | | | | 366,514 | | | | | |
| 5.000%, 06/15/2021 (Callable 06/15/2018) | | | 350,000 | | | | 362,534 | | | | | |
| New Jersey Turnpike Authority, | | | | | | | | | | | | |
| 5.000%, 01/01/2026 (Callable 01/01/2023) | | | 500,000 | | | | 570,915 | | | | | |
| | | | | | | | 3,062,760 | | | | 3.1 | % |
| New York | | | | | | | | | | | | |
| Build NYC Resource Corp., | | | | | | | | | | | | |
| 5.000%, 08/01/2023 | | | 200,000 | | | | 227,270 | | | | | |
| City of New York NY: | | | | | | | | | | | | |
| 0.620%, 10/01/2039 | | | 600,000 | | | | 600,000 | | | | | |
| 0.720%, 10/01/2039 (Optional Put Date 01/31/2017)(1) | | | 600,000 | | | | 600,000 | | | | | |
| City of New York NY Transitional Revenue: | | | | | | | | | | | | |
| 0.620%, 11/01/2022 | | | 600,000 | | | | 600,000 | | | | | |
| 5.250%, 07/01/2029 (Callable 07/01/2023) | | | 250,000 | | | | 289,485 | | | | | |
| County of Nassau NY: | | | | | | | | | | | | |
| 5.000%, 07/01/2022 (Callable 07/01/2018)(Insured by AGM) | | | 95,000 | | | | 100,355 | | | | | |
| 5.000%, 07/01/2022 (Callable 07/01/2018)(Insured by AGM) | | | 5,000 | | | | 5,254 | | | | | |
| Metropolitan Transportation Authority: | | | | | | | | | | | | |
| 5.000%, 11/15/2028 (Callable 05/15/2026) | | | 1,000,000 | | | | 1,163,920 | | | | | |
| 0.650%, 11/01/2035 | | | 700,000 | | | | 700,000 | | | | | |
| 5.000%, 11/15/2038 (Callable 11/15/2023) | | | 170,000 | | | | 188,158 | | | | | |
| MTA Hudson Rail Yards Trust Obligations, | | | | | | | | | | | | |
| 5.000%, 11/15/2046 (Callable 11/15/2019) | | | 500,000 | | | | 530,875 | | | | | |
| New York State Dormitory Authority, | | | | | | | | | | | | |
| 5.000%, 07/01/2023 | | | 150,000 | | | | 172,818 | | | | | |
| Niskayuna Central School District, | | | | | | | | | | | | |
| 1.630%, 03/15/2019 | | | 165,000 | | | | 163,160 | | | | | |
| Port Authority of New York & New Jersey, | | | | | | | | | | | | |
| 5.000%, 09/01/2031 (Callable 09/01/2024) | | | 250,000 | | | | 288,772 | | | | | |
| | | | | | | | 5,630,067 | | | | 5.8 | % |
| North Carolina | | | | | | | | | | | | |
| City of Raleigh NC, | | | | | | | | | | | | |
| 5.000%, 02/01/2021 (Pre-refunded to 02/01/2017) | | | 200,000 | | | | 200,600 | | | | | |
| North Carolina Capital Facilities Finance Agency, | | | | | | | | | | | | |
| 5.000%, 06/01/2022 | | | 150,000 | | | | 167,160 | | | | | |
| North Carolina Medical Care Commission, | | | | | | | | | | | | |
| 5.000%, 10/01/2019 (Callable 10/01/2017) | | | 150,000 | | | | 153,998 | | | | | |
| | | | | | | | 521,758 | | | | 0.5 | % |
| North Dakota | | | | | | | | | | | | |
| City of Hazen ND, | | | | | | | | | | | | |
| 2.500%, 07/01/2017 (Callable 01/23/2017) | | | 400,000 | | | | 400,328 | | | | | |
| City of Mandan ND, | | | | | | | | | | | | |
| 2.750%, 09/01/2041 (Callable 01/30/2017) | | | 380,000 | | | | 374,136 | | | | | |
| Jamestown Park District/ND, | | | | | | | | | | | | |
| 2.900%, 07/01/2035 (Callable 01/17/2017) | | | 1,000,000 | | | | 921,080 | | | | | |
| North Dakota Housing Finance Agency, | | | | | | | | | | | | |
| 3.500%, 07/01/2046 (Callable 01/01/2026) | | | 500,000 | | | | 516,850 | | | | | |
| Williston Parks & Recreation District, | | | | | | | | | | | | |
| 3.250%, 03/01/2032 (Callable 01/17/2017) | | | 75,000 | | | | 74,401 | | | | | |
| | | | | | | | 2,286,795 | | | | 2.3 | % |
| Ohio | | | | | | | | | | | | |
| American Municipal Power, Inc., | | | | | | | | | | | | |
| 5.250%, 02/15/2027 (Callable 02/15/2022) | | | 245,000 | | | | 275,880 | | | | | |
| City of Bowling Green OH, | | | | | | | | | | | | |
| 4.500%, 06/01/2019 | | | 150,000 | | | | 155,988 | | | | | |
| City of Cleveland OH, | | | | | | | | | | | | |
| 5.000%, 10/01/2023 | | | 430,000 | | | | 498,297 | | | | | |
| City of Cleveland OH Airport System Revenue, | | | | | | | | | | | | |
| 5.000%, 01/01/2025 (Insured by AGM) | | | 100,000 | | | | 116,117 | | | | | |
| City of Toledo OH, | | | | | | | | | | | | |
| 4.000%, 12/01/2017 (Insured by AGM) | | | 200,000 | | | | 205,082 | | | | | |
| Clear Fork Valley Local School District, | | | | | | | | | | | | |
| 4.000%, 12/01/2028 (Callable 12/01/2023) | | | 200,000 | | | | 217,856 | | | | | |
| Clermont County Port Authority, | | | | | | | | | | | | |
| 5.000%, 12/01/2023 (Insured by BAM) | | | 300,000 | | | | 344,418 | | | | | |
| County of Crawford OH, | | | | | | | | | | | | |
| 1.430%, 11/01/2017 (Callable 05/01/2017) | | | 300,000 | | | | 300,036 | | | | | |
| County of Licking OH: | | | | | | | | | | | | |
| 4.000%, 12/01/2026 (Callable 12/01/2021) | | | 105,000 | | | | 113,538 | | | | | |
| 4.000%, 12/01/2027 (Callable 12/01/2021) | | | 60,000 | | | | 64,763 | | | | | |
| 4.000%, 12/01/2028 (Callable 12/01/2021) | | | 250,000 | | | | 269,485 | | | | | |
| 4.000%, 12/01/2030 (Callable 12/01/2021) | | | 290,000 | | | | 311,347 | | | | | |
| Lancaster Port Authority, | | | | | | | | | | | | |
| 1.033%, 08/01/2019 (Callable 02/01/2019)(1) | | | 200,000 | | | | 197,786 | | | | | |
| Montgomery County OH Hospital Revenue, | | | | | | | | | | | | |
| 0.610%, 11/15/2039 | | | 800,000 | | | | 800,000 | | | | | |
| Ohio Housing Finance Agency, | | | | | | | | | | | | |
| 4.000%, 03/01/2047 (Callable 09/01/2025) | | | 495,000 | | | | 521,695 | | | | | |
| Ohio Turnpike & Infrastructure Commission, | | | | | | | | | | | | |
| 0.000%, 02/15/2034 (Callable 02/15/2031) | | | 540,000 | | | | 490,304 | | | | | |
| State of Ohio, | | | | | | | | | | | | |
| 5.000%, 11/15/2028 (Callable 05/15/2023) | | | 225,000 | | | | 258,885 | | | | | |
| Summit County Development Finance Authority, | | | | | | | | | | | | |
| 3.000%, 05/15/2017 | | | 100,000 | | | | 100,493 | | | | | |
| | | | | | | | 5,241,970 | | | | 5.4 | % |
| Oklahoma | | | | | | | | | |
| Oklahoma City Industrial & Cultural Facilities Trust, | | | | | | | | | |
| 1.103%, 06/01/2019 (Callable 01/31/2017)(1)(2) | | | 150,000 | | | | 149,063 | | | | |
| Oklahoma Water Resources Board, | | | | | | | | | | | |
| 5.000%, 10/01/2028 (Callable 10/01/2024) | | | 180,000 | | | | 212,033 | | | | |
| | | | | | | | 361,096 | | | | 0.4 | % |
| Pennsylvania | | | | | | | | | | | | |
| Bethlehem Area School District, | | | | | | | | | | | | |
| 5.000%, 10/15/2017 | | | 115,000 | | | | 118,572 | | | | | |
| Bethlehem Parking Authority, | | | | | | | | | | | | |
| 2.000%, 10/01/2018 | | | 250,000 | | | | 252,392 | | | | | |
| New Castle Sanitation Authority, | | | | | | | | | | | | |
| 2.000%, 06/01/2017 (Insured by BAM) | | | 320,000 | | | | 321,421 | | | | | |
| Northampton County General Purpose Authority, | | | | | | | | | | | | |
| 2.120%, 08/15/2043 (Callable 02/15/2020)(Mandatory Tender Date 08/15/2020)(1) | | | 65,000 | | | | 65,317 | | | | | |
| Pennsylvania Housing Finance Agency, | | | | | | | | | | | | |
| 3.500%, 10/01/2046 (Callable 10/01/2025) | | | 545,000 | | | | 564,702 | | | | | |
| Pennsylvania Turnpike Commission: | | | | | | | | | | | | |
| 5.000%, 12/01/2023 (Pre-refunded to 12/01/2019) | | | 200,000 | | | | 219,526 | | | | | |
| 0.000%, 12/01/2028 | | | 275,000 | | | | 287,191 | | | | | |
| 0.000%, 12/01/2030 (Callable 12/01/2027) | | | 198,850 | | | | 239,409 | | | | | |
| 0.000%, 12/01/2030 (Callable 12/01/2027) | | | 205,000 | | | | 241,513 | | | | | |
| 0.000%, 12/01/2038 (Callable 12/01/2028) | | | 125,000 | | | | 126,006 | | | | | |
| Reading School District, | | | | | | | | | | | | |
| 5.000%, 02/01/2023 | | | 230,000 | | | | 261,094 | | | | | |
| The School District of Philadelphia: | | | | | | | | | | | | |
| 5.000%, 09/01/2017 | | | 100,000 | | | | 102,200 | | | | | |
| 5.000%, 09/01/2017 | | | 300,000 | | | | 306,600 | | | | | |
| West Mifflin Sanitary Sewer Municipal Authority, | | | | | | | | | | | | |
| 4.000%, 08/01/2020 (Insured by BAM) | | | 125,000 | | | | 133,397 | | | | | |
| | | | | | | | 3,239,340 | | | | 3.3 | % |
| Puerto Rico | | | | | | | | | | | | |
| Commonwealth of Puerto Rico: | | | | | | | | | | | | |
| 4.700%, 07/01/2017 | | | 25,000 | | | | 25,330 | | | | | |
| 4.750%, 07/01/2018 | | | 60,000 | | | | 61,545 | | | | | |
| 5.500%, 07/01/2018 | | | 200,000 | | | | 208,238 | | | | | |
| Puerto Rico Public Finance Corp., | | | | | | | | | | | | |
| 5.500%, 08/01/2027 (ETM)(Insured by AMBAC) | | | 500,000 | | | | 615,065 | | | | | |
| Puerto Rico Sales Tax Financing Corp. Sales Tax Revenue, | | | | | | | | | | | | |
| 0.000%, 08/01/2042 | | | 195,000 | | | | 46,841 | | | | | |
| | | | | | | | 957,019 | | | | 1.0 | % |
| Rhode Island | | | | | | | | | | | | |
| Providence Public Buildings Authority, | | | | | | | | | | | | |
| 5.125%, 06/15/2021 (Insured by AGM) | | | 95,000 | | | | 101,328 | | | | | |
| Rhode Island Housing & Mortgage Finance Corp./RI: | | | | | | | | | | | | |
| 0.800%, 04/01/2044 (Callable 04/01/2017)(Mandatory Tender Date 10/01/2017) | | | 75,000 | | | | 74,813 | | | | | |
| 1.050%, 10/01/2044 (Callable 10/01/2017)(Mandatory Tender Date 04/01/2018) | | | 150,000 | | | | 149,001 | | | | | |
| 3.500%, 10/01/2046 (Callable 04/01/2025) | | | 140,000 | | | | 144,391 | | | | | |
| | | | | | | | 469,533 | | | | 0.5 | % |
| South Carolina | | | | | | | | | | | | |
| County of Florence SC, | | | | | | | | | | | | |
| 5.000%, 11/01/2033 (Callable 11/01/2024) | | | 250,000 | | | | 277,440 | | | | | |
| Scago Educational Facilities Corp. for Spartanburg School District No. 1, | | | | | | | | | | | | |
| 2.000%, 06/01/2017 | | | 75,000 | | | | 75,275 | | | | | |
| Scago Educational Facilities Corp. for Union School District, | | | | | | | | | | | | |
| 5.000%, 12/01/2023 (Insured by BAM) | | | 500,000 | | | | 570,305 | | | | | |
| South Carolina Jobs-Economic Development Authority, | | | | | | | | | | | | |
| 6.500%, 08/01/2039 (Callable 08/01/2021)(Insured by AGM) | | | 60,000 | | | | 70,081 | | | | | |
| Sumter Two School Facilities, Inc., | | | | | | | | | | | | |
| 5.000%, 12/01/2023 (Insured by BAM) | | | 200,000 | | | | 229,342 | | | | | |
| University of South Carolina, | | | | | | | | | | | | |
| 5.000%, 05/01/2023 | | | 140,000 | | | | 162,567 | | | | | |
| | | | | | | | 1,385,010 | | | | 1.4 | % |
| South Dakota | | | | | | | | | | | | |
| South Dakota Health & Educational Facilities Authority, | | | | | | | | | | | | |
| 5.000%, 09/01/2028 (Callable 09/01/2020) | | | 325,000 | | | | 356,187 | | | | 0.4 | % |
| | | | | | | | | | | | | |
| Tennessee | | | | | | | | | | | | |
| Knox County Health Educational & Housing Facility Board, | | | | | | | | | | | | |
| 5.000%, 01/01/2026 (Callable 01/01/2023) | | | 145,000 | | | | 161,460 | | | | | |
| Metropolitan Government Nashville & Davidson County Revenue, | | | | | | | | | | | | |
| 1.550%, 11/15/2030 (Mandatory Tender Date 11/03/2020) | | | 250,000 | | | | 244,875 | | | | | |
| Tennessee Energy Acquisition Corp., | | | | | | | | | | | | |
| 5.625%, 09/01/2026 | | | 50,000 | | | | 55,773 | | | | | |
| Tennessee Housing Development Agency: | | | | | | | | | | | | |
| 4.000%, 07/01/2043 (Callable 01/01/2023) | | | 80,000 | | | | 82,701 | | | | | |
| 4.000%, 07/01/2045 (Callable 01/01/2025) | | | 210,000 | | | | 220,624 | | | | | |
| | | | | | | | 765,433 | | | | 0.8 | % |
| Texas | | | | | | | | | | | | |
| Allen Independent School District, | | | | | | | | | | | | |
| 5.000%, 02/15/2023 (PSF Guaranteed) | | | 350,000 | | | | 408,138 | | | | | |
| Arlington Higher Education Finance Corp.: | | | | | | | | | | | | |
| 4.000%, 08/15/2028 (Callable 08/15/2026)(PSF Guaranteed) | | | 250,000 | | | | 269,002 | | | | | |
| 4.000%, 08/15/2029 (Callable 08/15/2026)(PSF Guaranteed) | | | 200,000 | | | | 213,484 | | | | | |
| City of Round Rock TX: | | | | | | | | | | | | |
| 4.000%, 12/01/2022 | | | 280,000 | | | | 304,203 | | | | | |
| 4.000%, 12/01/2024 | | | 205,000 | | | | 223,397 | | | | | |
| Clifton Higher Education Finance Corp., | | | | | | | | | | | | |
| 5.000%, 08/15/2018 | | | 180,000 | | | | 188,986 | | | | | |
| Crane County Water District, | | | | | | | | | | | | |
| 5.000%, 02/15/2023 | | | 250,000 | | | | 286,582 | | | | | |
| Culberson County-Allamoore Independent School District, | | | | | | | | | | | | |
| 4.000%, 02/15/2036 (Callable 08/15/2022)(PSF Guaranteed) | | | 200,000 | | | | 206,802 | | | | | |
| Dallas County Flood Control District No. 1, | | | | | | | | | | | | |
| 5.000%, 04/01/2017 | | | 250,000 | | | | 251,490 | | | | | |
| Grand Parkway Transportation Corp., | | | | | | | | | | | | |
| 0.000%, 10/01/2048 (Callable 10/01/2028) | | | 50,000 | | | | 41,378 | | | | | |
| Harris County Cultural Education Facilities Finance Corp.: | | | | | | | | | | | | |
| 5.000%, 12/01/2026 (Callable 12/01/2024) | | | 100,000 | | | | 117,204 | | | | | |
| 5.000%, 12/01/2035 (Callable 12/01/2022) | | | 350,000 | | | | 382,266 | | | | | |
| Harris County Municipal Utility District No. 390: | | | | | | | | | | | | |
| 2.000%, 04/01/2018 (Insured by BAM) | | | 140,000 | | | | 140,872 | | | | | |
| 2.000%, 04/01/2019 (Insured by BAM) | | | 375,000 | | | | 373,365 | | | | | |
| Harris County Municipal Utility District No. 419, | | | | | | | | | | | | |
| 3.000%, 09/01/2017 (Insured by AGM) | | | 200,000 | | | | 202,474 | | | | | |
| Harris County Municipal Utility District No. 71, | | | | | | | | | | | | |
| 4.000%, 09/01/2028 (Callable 09/01/2023)(Insured by BAM) | | | 250,000 | | | | 263,275 | | | | | |
| Leander Independent School District, | | | | | | | | | | | | |
| 0.000%, 08/15/2046 (Pre-refunded to 08/15/2024)(PSF Guaranteed) | | | 125,000 | | | | 31,354 | | | | | |
| Lower Colorado River Authority, | | | | | | | | | | | | |
| 5.000%, 05/15/2023 | | | 200,000 | | | | 231,140 | | | | | |
| Mesquite Independent School District, | | | | | | | | | | | | |
| 5.000%, 08/15/2029 (Callable 08/15/2025)(PSF Guaranteed) | | | 500,000 | | | | 584,055 | | | | | |
| Millsap Independent School District, | | | | | | | | | | | | |
| 0.000%, 02/15/2018 (Callable 11/01/2025) | | | 125,000 | | | | 122,604 | | | | | |
| New Hope Cultural Education Facilities Finance Corp.: | | | | | | | | | | | | |
| 1.000%, 02/01/2018 (Callable 08/01/2017) | | | 200,000 | | | | 198,384 | | | | | |
| 3.000%, 07/01/2019 | | | 125,000 | | | | 125,927 | | | | | |
| 4.000%, 04/01/2020 | | | 175,000 | | | | 183,279 | | | | | |
| North Texas Tollway Authority: | | | | | | | | | | | | |
| 5.000%, 01/01/2024 | | | 100,000 | | | | 116,497 | | | | | |
| 5.000%, 01/01/2033 | | | 675,000 | | | | 767,563 | | | | | |
| 0.000%, 09/01/2043 (Callable 09/01/2031) | | | 275,000 | | | | 274,018 | | | | | |
| SA Energy Acquisition Public Facility Corp., | | | | | | | | | | | | |
| 5.500%, 08/01/2022 | | | 100,000 | | | | 112,247 | | | | | |
| Siena Municipal Utility District No. 1, | | | | | | | | | | | | |
| 2.250%, 09/01/2018 (Insured by BAM) | | | 75,000 | | | | 76,212 | | | | | |
| Spring Meadows Municipal Utility District, | | | | | | | | | | | | |
| 4.000%, 09/01/2028 (Callable 09/01/2023) | | | 290,000 | | | | 314,105 | | | | | |
| Tarrant County Cultural Education Facilities Finance Corp., | | | | | | | | | | | | |
| 2.100%, 11/15/2017 | | | 200,000 | | | | 199,814 | | | | | |
| Texas Municipal Gas Acquisition & Supply Corp. II, | | | | | | | | | | | | |
| 1.346%, 09/15/2017 (1) | | | 55,000 | | | | 54,995 | | | | | |
| Texas Municipal Gas Acquisition & Supply Corp. III, | | | | | | | | | | | | |
| 5.000%, 12/15/2026 (Callable 12/15/2022) | | | 190,000 | | | | 202,441 | | | | | |
| Trophy Club Public Improvement District No. 1, | | | | | | | | | | | | |
| 0.000%, 06/01/2017 (Insured by AGM) | | | 370,000 | | | | 368,402 | | | | | |
| Viridian Municipal Management District, | | | | | | | | | | | | |
| 6.000%, 12/01/2035 (Callable 12/01/2024)(Insured by BAM) | | | 250,000 | | | | 303,410 | | | | | |
| Washington County Junior College District, | | | | | | | | | | | | |
| 5.000%, 10/01/2028 (Callable 04/01/2026)(Insured by BAM) | | | 500,000 | | | | 582,780 | | | | | |
| | | | | | | | 8,722,145 | | | | 8.9 | % |
| Utah | | | | | | | | | | | | |
| Salt Lake County Housing Authority, | | | | | | | | | | | | |
| 1.100%, 02/01/2017 | | | 125,000 | | | | 124,999 | | | | | |
| Utah Housing Corp., | | | | | | | | | | | | |
| 4.000%, 01/01/2045 (Callable 01/01/2026) | | | 485,000 | | | | 509,977 | | | | | |
| Utah Transit Authority, | | | | | | | | | | | | |
| 0.000%, 06/15/2026 (Pre-refunded to 06/15/2017) | | | 100,000 | | | | 63,967 | | | | | |
| | | | | | | | 698,943 | | | | 0.7 | % |
| Virgin Islands | | | | | | | | | | | | |
| Virgin Islands Public Finance Authority, | | | | | | | | | | | | |
| 5.000%, 09/01/2020 | | | 400,000 | | | | 430,388 | | | | 0.4 | % |
| | | | | | | | | | | | | |
| Washington | | | | | | | | | | | | |
| Central Puget Sound Regional Transit Authority, | | | | | | | | | | | | |
| 1.420%, 11/01/2045 (Callable 05/01/2018)(Mandatory Tender Date 11/01/2018)(1) | | | 250,000 | | | | 250,037 | | | | | |
| City of Tacoma WA Solid Waste Utility Revenue, | | | | | | | | | | | | |
| 5.000%, 12/01/2027 (Callable 06/01/2026) | | | 400,000 | | | | 474,496 | | | | | |
| State of Washington, | | | | | | | | | | | | |
| 5.000%, 02/01/2038 (Callable 02/01/2024) | | | 645,000 | | | | 724,890 | | | | | |
| | | | | | | | 1,449,423 | | | | 1.5 | % |
| Wisconsin | | | | | | | | | | | | |
| State of Wisconsin, | | | | | | | | | | | | |
| 5.000%, 05/01/2029 (Callable 05/01/2024) | | | 350,000 | | | | 405,412 | | | | | |
| Waukesha Housing Authority, | | | | | | | | | | | | |
| 1.800%, 12/01/2042 (Callable 12/30/2016)(Optional Put Date 01/06/2017)(1) | | | 230,000 | | | | 230,000 | | | | | |
| West Allis West Milwaukee School District: | | | | | | | | | | | | |
| 3.000%, 04/01/2019 | | | 130,000 | | | | 129,521 | | | | | |
| 4.000%, 04/01/2024 (Insured by AGM) | | | 180,000 | | | | 187,929 | | | | | |
| Wisconsin Center District: | | | | | | | | | | | | |
| 5.000%, 12/15/2028 (Callable 06/15/2026) | | | 125,000 | | | | 145,874 | | | | | |
| 5.000%, 12/15/2030 (Callable 12/15/2022) | | | 395,000 | | | | 423,037 | | | | | |
| 4.000%, 12/15/2033 (Callable 06/15/2026) | | | 125,000 | | | | 128,366 | | | | | |
| Wisconsin Health & Educational Facilities Authority: | | | | | | | | | | | | |
| 5.000%, 09/01/2018 (Callable 09/01/2017) | | | 175,000 | | | | 178,489 | | | | | |
| 5.000%, 07/01/2023 | | | 165,000 | | | | 183,709 | | | | | |
| 5.000%, 07/01/2024 | | | 250,000 | | | | 281,173 | | | | | |
| 5.000%, 07/01/2026 (Callable 07/01/2024) | | | 50,000 | | | | 55,845 | | | | | |
| 5.000%, 12/15/2030 (Callable 12/15/2024) | | | 350,000 | | | | 396,767 | | | | | |
| 5.000%, 09/15/2037 (Callable 09/15/2022) | | | 250,000 | | | | 258,613 | | | | | |
| 5.250%, 10/15/2039 (Callable 10/15/2021) | | | 260,000 | | | | 283,187 | | | | | |
| Wisconsin State General Fund, | | | | | | | | | | | | |
| 6.000%, 05/01/2036 | | | 160,000 | | | | 175,904 | | | | | |
| | | | | | | | 3,463,826 | | | | 3.5 | % |
| Total Municipal Bonds (Cost $96,439,654) | | | | | | | 95,581,449 | | | | 97.8 | % |
| | | | | | | | | | | | | |
| SHORT-TERM INVESTMENT | | | | | | | | | | | | |
| Money Market Mutual Fund | | Shares | | | | | | | | | |
| Fidelity Institutional Money Market Fund - Government Portfolio, Institutional Class, 0.43% « | | | 1,459,565 | | | | 1,459,565 | | | | | |
| Total Short-Term Investment (Cost $1,459,565) | | | | | | | 1,459,565 | | | | 1.5 | % |
| Total Investments (Cost $97,899,219) | | | | | | | 97,041,014 | | | | 99.3 | % |
| Other Assets in Excess of Liabilities | | | | | | | 663,480 | | | | 0.7 | % |
| TOTAL NET ASSETS | | | | | | $ | 97,704,494 | | | | 100.0 | % |
Notes to Schedule of Investments |
| AGM | Assured Guaranty Municipal |
| AMBAC | Ambac Assurance Corp. |
| BAM | Build America Mutual Assurance Co. |
| CIFG | CIFG Assurance North America, Inc. |
| ETM | Escrowed to Maturity |
| NPFGC | National Public Finance Guarantee Corp. |
| PSF | Texas Permanent School Fund |
| Q-SBLF | Qualified School Building Loan Fund |
| (1) | Variable or Floating rate security. Floating rate securities are securities whose yields vary with a designated index rate. These securities' rates are as of December 31, 2016. |
| (2) | Auction Rate Security. An Auction Rate Security is a debt instrument with a long nominal maturity for which the interest rate is regularly reset through a Dutch auction. The rate presented is either the rate set through the auction or the maximum interest rate provided for in the security issuance provision. |
| (3) | Security or a portion of the security purchased on a when-issued or delayed delivery basis. |
| « | 7-Day Yield |
[LOGO OMITTED]
| REPORT OF INDEPENDENT REGISTERED PUBLIC ACCOUNTING FIRM |
Board of Directors and Shareholders
Baird Funds, Inc.
We have audited in accordance with the standards of the Public Company Accounting Oversight Board (United States) the financial statements of Baird Funds, Inc. (including the Baird LargeCap Fund, Baird MidCap Fund, Baird Small/Mid Cap Value Fund, Baird SmallCap Value Fund, Chautauqua International Growth Fund, Chautauqua Global Growth Fund, Baird Ultra Short Bond Fund, Baird Short-Term Bond Fund, Baird Intermediate Bond Fund, Baird Aggregate Bond Fund, Baird Core Plus Bond Fund, Baird Short-Term Municipal Bond Fund, Baird Quality Intermediate Municipal Bond Fund and Baird Core Intermediate Municipal Bond Fund) (the Funds) as of December 31, 2016 and for the year then ended and have issued our reports thereon dated February 27, 2017, which reports are included in Item 1 of this Certified Shareholder Report on Form N-CSR. Our audits included an audit of Baird Funds, Inc.’s schedules of investments in securities (the Schedules) as of December 31, 2016 appearing in Item 6 of this Form N-CSR. These Schedules are the responsibility of the Funds’ management. In our opinion, the Schedules referred to above, when considered in relation to the financial statements of the Funds referred to above, present fairly, in all material respects, the information set forth therein.
/s/ GRANT THORNTON LLP
Chicago, Illinois
March 9, 2017
Grant Thornton LLP
U.S. member firm of Grant Thornton International Ltd
(b) Not applicable
Item 7. Disclosure of Proxy Voting Policies and Procedures for Closed-End Management Investment Companies.
Not applicable because the Registrant is not a closed-end management investment company.
Item 8. Portfolio Managers of Closed-End Management Investment Companies.
Not applicable because the Registrant is not a closed-end management investment company.
Item 9. Purchases of Equity Securities by Closed‑End Management Investment Company and Affiliated Purchasers.
Not applicable because the Registrant is not a closed-end management investment company.
Item 10. Submission of Matters to a Vote of Security Holders.
There have been no material changes to the procedures by which shareholders may recommend nominees to the Registrant’s board of directors.
Item 11. Controls and Procedures.
| (a) | The Registrant’s management, with the participation of its principal executive and principal financial officers, has evaluated the effectiveness of the Registrant's disclosure controls and procedures (as defined in Rule 30a-3(c) under the Investment Company Act of 1940 (the “Act”)), as of a date within 90 days prior to the filing date of this Form N-CSR, as required by Rule 30a-3(b) under the Act and Rules 13a-15(b) or 15d-15(b) under the Securities Exchange Act of 1934. Based on such evaluation, the Registrant's principal executive and principal financial officers have concluded that the design and operation of the Registrant's disclosure controls and procedures are effective in providing reasonable assurance that the information required to be disclosed on Form N-CSR is recorded, processed, summarized and reported within the applicable time periods. |
| (b) | There were no changes in the Registrant's internal control over financial reporting (as defined in Rule 30a-3(d) under the Act) that occurred during the second fiscal quarter of the period covered by this report that have materially affected, or are reasonably likely to materially affect, the Registrant's internal control over financial reporting. |
Item 12. Exhibits.
Incorporated by reference to the Registrant’s Form N-CSR filed on March 9, 2004.
(2) Certifications pursuant to Section 302 of the Sarbanes-Oxley Act of 2002. Filed herewith.
(3) Any written solicitation to purchase securities under Rule 23c‑1 under the Act sent or given during the period covered by the report by or on behalf of the Registrant to 10 or more persons. Not applicable because the Registrant is not a closed-end management investment company.
(b) Certification pursuant to Section 906 of the Sarbanes‑Oxley Act of 2002. Furnished herewith.
SIGNATURES
Pursuant to the requirements of the Securities Exchange Act of 1934 and the Investment Company Act of 1940, the Registrant has duly caused this report to be signed on its behalf by the undersigned, thereunto duly authorized.
BAIRD FUNDS, INC.
By: /s/Mary Ellen Stanek
Mary Ellen Stanek, President
Date: March 9, 2017
Pursuant to the requirements of the Securities Exchange Act of 1934 and the Investment Company Act of 1940, this report has been signed below by the following persons on behalf of the Registrant and in the capacities and on the dates indicated.
By: /s/Mary Ellen Stanek
Mary Ellen Stanek, President
Date: March 9, 2017
By: /s/Terrance Maxwell
Terrance Maxwell, Treasurer
Date: March 9, 2017