UNITED STATES
SECURITIES AND EXCHANGE COMMISSION
Washington, D.C. 20549
FORM N-CSR
CERTIFIED SHAREHOLDER REPORT OF REGISTERED
MANAGEMENT INVESTMENT COMPANIES
Investment Company Act file number: 811-09997
Baird Funds, Inc.
(Exact name of registrant as specified in charter)
777 East Wisconsin Avenue
Milwaukee, WI 53202
(Address of principal executive offices) (Zip code)
Andrew D. Ketter
Robert W. Baird & Co. Incorporated
777 East Wisconsin Avenue
Milwaukee, WI 53202
(Name and address of agent for service)
1-866-442-2473
Registrant's telephone number, including area code
Date of fiscal year end: December 31, 2014
Date of reporting period: December 31, 2014
Item 1. Reports to Stockholders.
Annual Report –
Baird Funds
December 31, 2014
Baird Ultra Short Bond Fund
Baird Short-Term Bond Fund
Baird Intermediate Bond Fund
Baird Intermediate Municipal Bond Fund
Baird Aggregate Bond Fund
Baird Core Plus Bond Fund
| Go Green. |  | Go Paperless. |
Sign up to receive your Baird Funds’ prospectuses and reports online.
Table of Contents
| Letter to Shareholders | 1 |
| 2014 Bond Market Overview | 2 |
| Baird Ultra Short Bond Fund | 6 |
| Baird Short-Term Bond Fund | 16 |
| Baird Intermediate Bond Fund | 26 |
| Baird Intermediate Municipal Bond Fund | 36 |
| Baird Aggregate Bond Fund | 49 |
| Baird Core Plus Bond Fund | 58 |
| Additional Information on Fund Expenses | 68 |
| Statements of Assets and Liabilities | 70 |
| Statements of Operations | 72 |
| Statements of Changes in Net Assets | 74 |
| Financial Highlights | 80 |
| Notes to the Financial Statements | 92 |
| Report of Independent Registered Public Accounting Firm | 105 |
| Directors and Officers | 106 |
Disclosure Regarding the Board of Directors’ Approval of the Investment Advisory Agreement for Baird Bond Funds | 109 |
| Additional Information | 112 |
| Privacy Notice | A-1 |
This report has been prepared for shareholders and may be distributed to others only if preceded or accompanied by a current prospectus.
Cautionary Note on Analyses, Opinions and Outlooks: In this report we offer analyses and opinions on the performance of individual securities, companies, industries, sectors, markets, interest rates and governmental policies, including predictions, forecasts and outlooks regarding possible future events. These can generally be identified as such because the context of the statements may include such words as “believe,” “should,” “will,” “expects,” “anticipates,” “hopes” and words of similar effect. These statements reflect the portfolio managers’ good faith beliefs and judgments and involve risks and uncertainties, including the risk that the portfolio managers’ analyses, opinions and outlooks are or will prove to be inaccurate. It is inherently difficult to correctly assess and explain the performance of particular securities, sectors, markets, interest rate movements, governmental actions or general economic trends and conditions, and many unforeseen factors contribute to the performance of Baird Funds. Investors are, therefore, cautioned not to place undue reliance on subjective judgments contained in this report.
Baird Funds
1-866-442-2473
www.bairdfunds.com
February 26, 2015
Dear Shareholder,
The Baird Funds has a passion for delivering competitive, risk-adjusted returns and outstanding service. That deeply held commitment led to another year of strong asset growth during 2014 for our fixed income and equity funds. Consistency, continuity and collaboration are hallmarks of our approach to meeting your investing and servicing needs. Our senior portfolio management teams have worked through many market cycles and have developed disciplined, risk-controlled approaches of adding value over benchmark returns through proven, bottom-up strategies focused on identifying, researching and investing in quality investments that exhibit strong fundamentals and offer attractive relative value.
We understand that it is this consistency of approach and unwavering focus on risk control that our shareholders depend on to help them achieve their investment objectives through market cycles. Our commitment to these long-term principles combined with strong alignment with the interests of investors helped drive assets under management in the Baird Funds to $17 billion at year end.
Our success rests on the trust you have placed in us to be effective stewards of your assets and we want to thank you for your continued investment in the Baird Funds.
On the following pages, we review the bond market in 2014 and the performance and composition of each of the Baird Bond Funds.
We are privileged to provide you with fixed income investment management services and appreciate the confidence and trust you have placed in our experienced investment team.
Sincerely,

Mary Ellen Stanek, CFA
President
Baird Funds
Page 1
2014 Bond Market Overview
Curve Flattens: Fed Ends QE as U.S. Growth Accelerates, Global Growth Falters
The yield curve flattened significantly during the year as weak global growth outside the U.S. and declining energy prices pushed the 30-year bond yield down 122 bps to 2.75% while the yield on the 2-year Treasury rose 28 bps to 0.66%, reflecting the consensus expectation of a Fed Funds rate hike in 2015. The Fed concluded QE purchases in October, but continues to reinvest interest and principal payments on its $4.5 trillion portfolio of Treasuries, Agency Debentures, and Mortgage Backed Securities. U.S. economic data demonstrated substantial progress: 3Q GDP accelerated to a +5.0% annualized pace and unemployment declined to 5.8% through November (down from 7% one year prior). Nevertheless, the yield on the 30-year Treasury fell 122 bps over the year as inflation remained tepid (U.S. Nov. CPI +1.3% year over year) and global growth faltered.
Treasury Yields
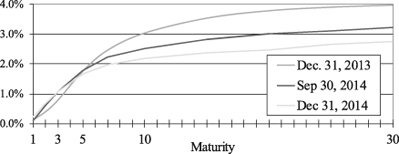
| 3 Mo. | 12 Mo. | ||||
| Maturity | 12/31/13 | 9/30/14 | 12/31/14 | Change | Change |
| 1 | 0.11% | 0.10% | 0.21% | 0.11% | 0.10% |
| 2 | 0.38% | 0.58% | 0.66% | 0.08% | 0.28% |
| 3 | 0.77% | 1.05% | 1.07% | 0.02% | 0.30% |
| 5 | 1.74% | 1.78% | 1.65% | -0.13% | -0.09% |
| 7 | 2.45% | 2.22% | 1.97% | -0.25% | -0.48% |
| 10 | 3.03% | 2.51% | 2.17% | -0.34% | -0.86% |
| 30 | 3.97% | 3.21% | 2.75% | -0.46% | -1.22% |
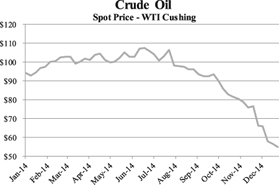
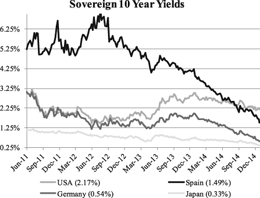
Oil Drops, Global Bond Yields Decline
Economic weakness across China, Europe, and Japan has contributed to a roughly 50% decline in oil prices since mid-year (see chart below left). Wrestling with weak growth and deflationary worries, foreign central banks have remained very accommodative, contributing to a precipitous decline in foreign sovereign bond yields. The yield on the 10-year German sovereign dropped from 1.93% at the start of the year to 0.54% (see graph below right). Remarkably low yields abroad have put downward pressure on U.S. Treasury yields, which look attractive in a global context.
 |  |
Page 2
2014 Bond Market Overview
Corporate Yield Spreads Widen on Heavy Supply, Securitized Sectors Stable
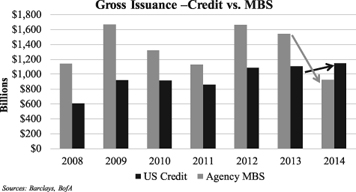
Corporate spreads were nearly unchanged through September but widened 19 bps in the 4th quarter (17 bps wider on the year, see chart below), pressured by heavy supply and weak global growth outside of the U.S. Industrials widened more than other corporate sectors during the year (+26 bps) as energy-related sectors were adversely impacted by falling oil prices. 2014 set an all-time record for gross issuance of investment grade corporate bonds, totaling over $1.1 trillion and pushing spreads wider. Conversely, spreads on securitized sectors (e.g. MBS) were stable for the quarter. MBS spreads tightened 7 bps in 2014, in spite of the Fed tapering QE purchases of MBS from $35 billion per month in January to zero by November. Declining supply was the predominant factor, as gross MBS issuance fell roughly 40% from 2013 to 2014 (see chart, next page right). Please note that the 1-year change in CMBS and Utility spreads are impacted by mid-year changes to Barclay’s index inclusion rules.
Option-Adjusted Spreads (in bps)
| 4th Qtr | 1 Year | ||||
| 12/31/13 | 9/30/14 | 12/31/14 | Change | Change | |
| U.S. Aggregate Index | 45 | 43 | 48 | 5 | 3 |
| U.S. Agency (non-mortgage) | 17 | 16 | 16 | 0 | -1 |
| Mortgage and ABS Sectors | |||||
| U.S. Agency Pass-throughs | 34 | 30 | 27 | -3 | -7 |
| Asset-Backed Securities | 55 | 56 | 58 | 2 | 3 |
| CMBS | 126 | 99 | 98 | -1 | -28 |
| Corporate Sectors | |||||
| U.S. Investment Grade | 114 | 112 | 131 | 19 | 17 |
| Industrial | 114 | 115 | 140 | 25 | 26 |
| Utility | 125 | 106 | 119 | 13 | -6 |
| Financial Institutions | 109 | 107 | 117 | 10 | 8 |
| U.S. High Yield | 382 | 424 | 483 | 59 | 101 |
Source: Barclays
Strong Year - Except for High Yield
For the 2014 calendar year, Municipals (+9.05%) finished on top, as scant supply and steady demand drove returns while Investment Grade Corporates (+7.46%) benefitted from declining yields and solid credit fundamentals to overcome record issuance. After a very strong start to the year, Corporate High Yield dropped to the back of the pack, returning just 2.45% for the year. Corporate High Yield returns for the fourth quarter (-1.00%) were dragged down by a 10% decline in the Energy sector (which comprises 15% of the HY sector) as falling oil prices raised fundamental credit concerns at leveraged high yield energy companies.
Page 3
2014 Bond Market Overview
Total Returns of Selected Barclays Indices and Subsectors
| Barclays Index/Sector | December | 4th Quarter | 2014 | ||||||||||
| U.S. Aggregate Index | 0.09 | % | 1.79 | % | 5.97 | % | |||||||
| U.S. Gov’t/Credit Index | 0.08 | % | 1.82 | % | 6.01 | % | |||||||
| U.S. Intermediate Gov’t/Credit Index | -0.32 | % | 0.89 | % | 3.13 | % | |||||||
| U.S. 1-3 Yr. Gov’t/Credit Index | -0.26 | % | 0.17 | % | 0.77 | % | |||||||
| U.S. Treasury | 0.14 | % | 1.93 | % | 5.05 | % | |||||||
| U.S. Agency | 0.01 | % | 1.16 | % | 3.58 | % | |||||||
| MBS (Mortgage Backed Securities) | 0.15 | % | 1.79 | % | 6.08 | % | |||||||
| CMBS (Commercial Mortgage Backed Securities) | -0.15 | % | 1.45 | % | 3.86 | % | |||||||
| ABS (Asset Backed Securities) | -0.22 | % | 0.55 | % | 1.88 | % | |||||||
| U.S. Corporate - Investment Grade | 0.06 | % | 1.77 | % | 7.46 | % | |||||||
| Corporate High Yield | -1.45 | % | -1.00 | % | 2.45 | % | |||||||
| Municipal Bond Index | 0.50 | % | 1.37 | % | 9.05 | % | |||||||
| TIPS (Treasury Inflation Protected Securities) | -1.13 | % | -0.03 | % | 3.64 | % | |||||||
Outlook
We expect the modest acceleration in U.S. economic growth will continue and inflation will stay contained in 2015, although many headwinds and uncertainties remain. Wage inflation remains benign and we expect the decline in oil prices will keep consumer inflation well below the Fed’s 2% target, while providing a net positive impact to growth. The first Fed Funds rate hike and eventual end of QE reinvestments will put upward pressure on rates; however, the magnitude will be limited as we expect the Fed will be “patient” and limit the pace of subsequent hikes. As other global central banks maintain accommodative policies, remarkably low interest rates abroad will continue to encourage capital flows into U.S. markets. We see limited return potential for Treasuries and Agencies, especially shorter maturities. Instead, we see good relative value in several non-government sectors. We expect Investment Grade Corporates to outperform, as strong credit fundamentals and attractive valuations will allow spreads to tighten modestly. We also see select relative value in senior CMBS structures with superior credit enhancement and conservative loan underwriting. We hold a cautious view on Agency MBS as the Fed is now only making reinvestment purchases in the sector and wider spreads may be required to absorb any material increase in supply. Non-Agency RMBS continues to offer attractive relative value as new issuance is very limited and fundamentals continue to improve. Even with the recent widening in Corporate High Yield spreads we remain cautious, finding very select value in the sector. In the municipal sector, state credit conditions have shown signs of improvement and some of the high-profile challenges (e.g. Detroit) have largely been resolved. Nevertheless investors will remain cautious of credit risk for municipals as high looming pension liabilities and infrastructure spending needs remain. Across tax-exempt markets, we caution investors against going too far out the yield curve or too far down in quality given the high level of uncertainty and broad range of potential outcomes.
This is not a complete analysis of every material fact regarding any company, industry or security. The information has been obtained from sources we consider to be reliable, but we cannot guarantee the accuracy.
Fixed income is generally considered to be a more conservative investment than stocks, but bonds and other fixed income investments still carry a variety of risks such as interest rate risk, credit risk, inflation risk, and liquidity risk. In a rising interest rate environment, the value of fixed-income securities generally decline and conversely, in a falling interest rate environment, the value of fixed-income securities generally increase. High yield securities may be subject to heightened market, interest rate or credit risk and should not be purchased solely because of the stated yield.
Indices are unmanaged, and are not available for direct investment. Past performance is not a guarantee of future results.
The Barclays Aggregate Bond Index is an index comprised of approximately 6000 publicly traded bonds including U.S. Government, mortgage backed, corporate, and Yankee bonds with an average maturity of approximately 10 years.
The Barclays Government/Credit Index is a combination of the Government Index which measures government-bond general and Treasury funds, and the Credit Bond Index, which is a market value-weighted index which tracks the
Page 4
2014 Bond Market Overview
returns of all publicly issued, fixed-rate, nonconvertible, dollar-denominated, SEC registered, investment grade Corporate Debt.
The Barclays Intermediate Government/Credit Index is a combination of the Government Index which measures government-bond general and Treasury funds, and the Credit Bond Index, which is a market value-weighted index which tracks the returns of all publicly issued, fixed-rate, nonconvertible, dollar-denominated, SEC registered, investment grade Corporate Debt with maturities between one and ten years.
The Barclays Government/Credit Intermediate Index (1 – 3 yr.) is a combination of the Government Index which measures government-bond general and Treasury funds, and the Credit Bond Index, which is a market value-weighted index which tracks the returns of all publicly issued, fixed-rate, nonconvertible, dollar-denominated, SEC registered, investment grade Corporate Debt with maturities between zero and three years.
The Barclays U.S. Treasury Index includes public obligations of the U.S. Treasury. Treasury bills are excluded by the maturity constraint of at least one year but are part of a separate Short Treasury Index. In addition, certain special issues, such as state and local government series bonds (SLGs), as well as U.S. Treasury TIPS, are excluded. STRIPS are excluded from the index because their inclusion would result in double-counting. Securities in the Index roll up to the U.S. Aggregate, U.S. Universal, and Global Aggregate Indices. The U.S. Treasury Index was launched on January 1, 1973.
U.S. Agency: This index is the U.S. Agency component of the U.S. Government/Credit index. Publicly issued debt of U.S. Government agencies, quasi-federal corporations, and corporate or foreign debt guaranteed by the U.S. Government (such as USAID securities). The largest issues are Fannie Mae, Freddie Mac, and the Federal Home Loan Bank System (FHLB). The index includes both callable and non-callable agency securities.
U.S. Corporate – Investment Grade: This index is the Corporate component of the U.S. Credit index. It includes publicly issued U.S. corporate and specified foreign debentures and secured notes that meet the specified maturity, liquidity, and quality requirements. To qualify, bonds must be SEC-registered.
CMBS (Commercial Mortgage Backed Securities): This index is the CMBS component of the U.S. Aggregate index. The Barclays CMBS ERISA-Eligible Index is the ERISA-eligible component of the Barclays CMBS Index. This index, which includes investment grade securities that are ERISA eligible under the underwriter’s exemption, is the only CMBS sector that is included in the U.S. Aggregate Index.
MBS (Mortgage Backed Securities): This index is the U.S. MBS component of the U.S. Aggregate index. The MBS Index covers the mortgage-backed pass-through securities of Ginnie Mae (GNMA), Fannie Mae (FNMA), and Freddie Mac (FHLMC). The MBS Index is formed by grouping the universe of over 600,000 individual fixed rate MBS pools into approximately 3,500 generic aggregates.
ABS (Asset Backed Securities): This index is the ABS component of the U.S. Aggregate index. The ABS index has three subsectors: credit and charge cards, autos, and utility. The index includes pass-through, bullet, and controlled amortization structures. The ABS Index includes only the senior class of each ABS issue and the ERISA-eligible B and C tranche. The Manufactured Housing sector was removed as of January 1, 2008, and the Home Equity Loan sector was removed as of October 1, 2009.
Corporate High Yield: The Barclays U.S. High Yield Index covers the universe of fixed rate, non-investment grade debt. Eurobonds and debt issues from countries designated as emerging markets (sovereign rating of Baa1/BBB+/BBB+ and below using the middle of Moody’s, S&P, and Fitch) are excluded, but Canadian and global bonds (SEC registered) of issuers in non-EMG countries are included. Original issue zeroes, step-up coupon structures, 144-As and pay-in-kind bonds (PIKs, as of October 1, 2009) are also included.
The Barclays Municipal Bond Index is a broad-based, total-return index. The bonds are all investment-grade, tax-exempt, and fixed-rate securities with long-term maturities (greater than 2 years). They are selected from issues larger than $50 million.
The Barclays TIPS Index consists of Treasury Inflation Protected Securities (TIPS). TIPS are securities whose principal is tied to the Consumer Price Index. TIPS pay interest semi-annually, based on the fixed rate applied to the adjusted principal.
Page 5
Baird Ultra Short Bond Fund
December 31, 2014
The Baird Ultra Short Bond Fund seeks current income consistent with preservation of capital. The Fund’s primary benchmark index against which it measures performance is the Barclays U.S. Short-Term Government/Corporate Index. The Barclays U.S. Short-Term Government/Corporate Index is an unmanaged, market value weighted index of investment grade fixed debt, including government and corporate securities, with maturities of less than one year.
The Fund had strong absolute and relative returns versus its benchmark index in 2014. Our long-term commitment to duration neutrality again proved to be a prudent strategy as the bond market saw a sharp drop in yields for longer maturities and continued flattening of the yield curve throughout the year. The movements in the bond market confounded the predictions of many market participants who expected rates to rise and proved again the difficulty of forecasting both the direction and timing of interest rate moves. The primary factors contributing to the Fund’s outperformance in 2014 are described below.
| • | Within the Credit sector, an overweight to the Financial sub-sector, which continued to outperform other credit sectors for the full year, aided the Fund’s performance as credit fundamentals remained solid. | |
| • | Exposure to non-agency residential mortgage-backed securities (RMBS) contributed to the Fund’s outperformance as limited supply and continued improvements in housing provided strong technical and fundamental support. | |
| • | An overweight position to commercial mortgage-backed securities (CMBS) primarily through seasoned, super-senior CMBS added to performance as the sector outperformed significantly for the year resulting from tight supply combined with growing demand for these high quality securities. | |
| • | Yield curve positioning benefitted the Fund’s performance, allowing it to achieve a rolldown advantage versus its benchmark. |
Looking forward, we believe select credits still offer good relative value despite an elevated risk environment, as company balance sheets and credit fundamentals remain solid. We also expect continued positive contribution from non-agency RMBS. Yield curve positioning should modestly benefit from continued flattening of the yield curve with attractive rolldown opportunities being captured on a more selective basis. The Fund remains duration neutral to its benchmark and we are optimistic that the Fund is well positioned to add value relative to its benchmark.
Page 6
Baird Ultra Short Bond Fund
December 31, 2014 (Unaudited)
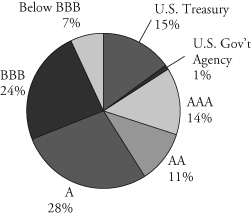
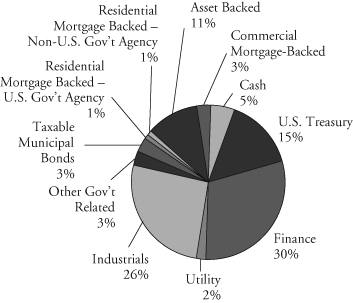
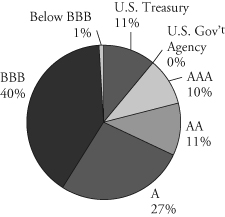
Portfolio Characteristics
Quality Distribution(1)(2)
 | Net Assets | $85,368,564 | ||
SEC 30-Day | ||||
Yield(3) | ||||
| Institutional Class | ||||
| (Subsidized) | 1.13% | |||
| Institutional Class | ||||
| (Unsubsidized) | 0.99% | |||
| Investor Class (Subsidized) | 0.90% | |||
| Investor Class | ||||
| (Unsubsidized) | 0.75% | |||
Average | ||||
| Effective | ||||
| Duration | 0.60 years | |||
Average | ||||
| Effective | ||||
| Maturity | 0.61 years | |||
| Sector Weightings(1) | Annualized | |||
| Portfolio | ||||
 | Expense Ratio(4) | |||
| Gross | ||||
| Institutional Class | 0.30% | |||
| Investor Class | 0.55%(5) | |||
Net | ||||
| Institutional Class | 0.15% | |||
| Investor Class | 0.40%(5) | |||
Portfolio | ||||
| Turnover | ||||
| Rate | 57.6%(6) | |||
Number of | ||||
| Holdings | 162 | |||
| (1) | Percentages shown are based on the Fund’s total investments. |
| (2) | The quality profile is calculated on a market value-weighted basis using the highest credit quality rating for each security held by the Fund given by S&P, Moody’s or Fitch, each of which is a Nationally Recognized Statistical Rating Organization (NRSRO). NRSROs rate the credit quality of securities using a scale that generally ranges from AAA (highest) to D (lowest). |
| (3) | SEC yields are based on SEC guidelines and are calculated for the 30 days ended December 31, 2014. |
| (4) | Reflects expense ratios as stated in the Fund’s current prospectus. The Advisor has contractually agreed to waive management fees in an amount equal to an annual rate of 0.15% of average daily net assets for the Fund, at least through April 30, 2016. The agreement may only be terminated prior to the end of this term by or with the consent of the Board of Directors of Baird Funds, Inc. |
| (5) | Includes 0.25% 12b-1 fee. |
| (6) | Not annualized. |
Page 7
Baird Ultra Short Bond Fund
December 31, 2014 (Unaudited)
Institutional Class
Value of a $25,000 Investment
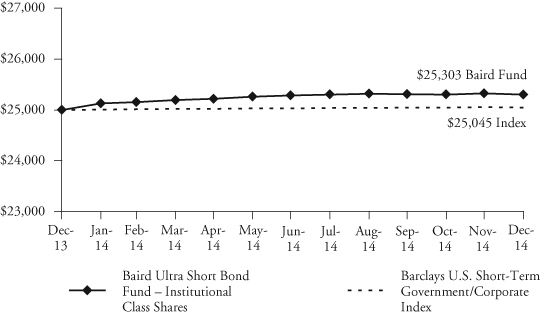
Growth of a hypothetical investment of $25,000 made on the Fund’s inception date (12/31/13), assuming reinvestment of all distributions.
Investor Class
Value of a $10,000 Investment
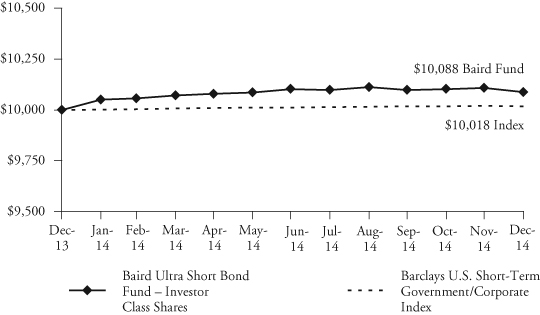
Growth of a hypothetical investment of $10,000 made on the Fund’s inception date (12/31/13), assuming reinvestment of all distributions.
Page 8
Baird Ultra Short Bond Fund
December 31, 2014 (Unaudited)
Total Returns
| One | Since | |
| For the Periods Ended December 31, 2014 | Year | Inception(1) |
| Institutional Class Shares | 1.21% | 1.21% |
| Investor Class Shares | 0.88% | 0.88% |
Barclays U.S. Short-Term Government/Corporate Index(2) | 0.18% | 0.18% |
| (1) | For the period from inception as of the close of business on December 31, 2013 through December 31, 2014. |
| (2) | The Barclays U.S. Short-Term Government/Corporate Credit Index is an unmanaged, market value weighted index of investment grade, fixed debt including government and corporate securities with maturities less than one year. This index does not reflect any deduction for fees, expenses or taxes. A direct investment in an index is not possible. |
The line graph on the previous page and the returns shown in the table above reflect reinvestment of dividends and/or capital gains distributions in additional shares. The returns do not reflect the deduction of taxes that a shareholder would pay on Fund distributions or the redemption of Fund shares. The returns reflect the actual performance for each period and do not include the impact of trades executed on the last business day of the period that were recorded on the first business day of the next period.
The Fund’s gross expense ratio for each Class, as reflected in the Fund’s current prospectus, is set forth under “Portfolio Characteristics”.
The Fund may invest up to 10% of its net assets in non-investment grade debt securities (commonly referred to as “high yield” bonds). While these types of securities typically offer higher yields than investment grade securities, they also include greater risks including increased credit risk and the increased risk of default or bankruptcy. The Fund may also invest in U.S. dollar denominated foreign securities which involve additional risks such as political and economic instability, and different and sometimes less strict financial reporting standards and regulation. The Fund may also invest in mortgage- and asset-backed securities, which include interest rate and prepayment risks more pronounced than those of other fixed income securities.
Past performance does not guarantee future results. Investment return and principal value will fluctuate so that an investor’s shares, when redeemed, may be worth more or less than their original cost.
For information about the performance of the Fund as of the most recent month-end, please call 1-866-44BAIRD or visit www.bairdfunds.com. Mutual fund performance changes over time and current performance may be lower or higher than that stated.
Page 9
Baird Ultra Short Bond Fund
Summary Schedule of Investments, December 31, 2014
This schedule summarizes the Fund’s holdings by asset type. Details are reported for each of the Fund’s 50 largest individual holdings and for investments that, in total for any issuer, represent more than 1% of the Fund’s net assets. The total value of smaller holdings is reported as a single amount within each category.
The Fund reports a complete list of its holdings in regulatory filings four times in each fiscal year, at the quarter end. For the second and fourth fiscal quarters, the complete listing of the Fund’s holdings is available electronically in the Fund’s Form N-CSR at http://www.bairdfunds.com/prospectuses-reports and on the Securities and Exchange Commission’s website (www.sec.gov) or you can have it mailed to you without charge by calling 1-866-44BAIRD. For the first and third fiscal quarters, the Fund files the lists with the SEC on Form N-Q. Shareholders can look up the Fund’s Forms N-CSR and N-Q on the SEC’s website (www.sec.gov).
Long-Term Investments
| Principal | % of | |||||||||||
| Amount | Value | Net Assets | ||||||||||
| U.S. Treasury Securities | ||||||||||||
| U.S. Treasury Bonds, | ||||||||||||
| 2.000%, 01/31/2016 | $ | 10,000,000 | $ | 10,178,120 | 11.9 | % | ||||||
| 2.375%, 03/31/2016 | 2,500,000 | 2,561,720 | 3.0 | % | ||||||||
| Total U.S. Treasury Securities | ||||||||||||
| (Cost $12,743,502) | 12,739,840 | 14.9 | % | |||||||||
| Corporate Bonds | ||||||||||||
| Finance | ||||||||||||
| BB&T Corporation: | ||||||||||||
| 5.200%, 12/23/2015 | 41,000 | 42,635 | 0.1 | % | ||||||||
| 0.892%, 02/01/2019 | 880,000 | 881,220 | 1.0 | % | ||||||||
| BNP Paribas SA, | ||||||||||||
0.692%, 05/07/2017 f | 1,000,000 | 998,574 | 1.2 | % | ||||||||
| BPCE, | ||||||||||||
1.082%, 02/10/2017 f | 500,000 | 503,311 | 0.6 | % | ||||||||
| Capital One Financial Corporation, | ||||||||||||
| 3.150%, 07/15/2016 | 1,015,000 | 1,043,874 | 1.2 | % | ||||||||
| Citigroup Inc., | ||||||||||||
| 0.506%, 06/09/2016 | 950,000 | 940,912 | 1.1 | % | ||||||||
| Fifth Third Bancorp, | ||||||||||||
| 0.667%, 12/20/2016 | 1,000,000 | 992,012 | 1.1 | % | ||||||||
| First Horizon National Corporation, | ||||||||||||
| 5.375%, 12/15/2015 | 550,000 | 569,416 | 0.6 | % | ||||||||
| General Electric Capital Corporation, | ||||||||||||
| 0.740%, 01/14/2019 | 1,000,000 | 1,000,392 | 1.2 | % | ||||||||
| ING Bank N.V., | ||||||||||||
| 4.000%, 03/15/2016 (Acquired 03/08/2011, | ||||||||||||
Cost $517,981)* f | 500,000 | 517,167 | 0.6 | % | ||||||||
| PNC Funding Corp, | ||||||||||||
| 5.250%, 11/15/2015 | 730,000 | 756,573 | 0.9 | % | ||||||||
| Royal Bank of Canada, | ||||||||||||
0.488%, 10/13/2017 f | 1,000,000 | 999,168 | 1.2 | % | ||||||||
The accompanying notes are an integral part of these financial statements.
Page 10
Baird Ultra Short Bond Fund
Summary Schedule of Investments, December 31, 2014
Long-Term Investments (cont.)
| Principal | % of | |||||||||||
| Amount | Value | Net Assets | ||||||||||
| Societe Generale, | ||||||||||||
1.335%, 10/01/2018 f | $ | 1,000,000 | $ | 1,017,644 | 1.2 | % | ||||||
| Symetra Financial Corporation, | ||||||||||||
| 6.125%, 04/01/2016 (Acquired 04/23/2014 | ||||||||||||
| through 11/24/2014, Cost $590,741)* | 560,000 | 587,513 | 0.7 | % | ||||||||
| The Bank of New York Mellon Corporation, | ||||||||||||
| 0.792%, 08/01/2018 | 1,000,000 | 1,002,100 | 1.2 | % | ||||||||
| The Bank of Tokyo-Mitsubishi UFJ, Ltd., | ||||||||||||
| 0.545%, 09/08/2017 (Acquired 09/30/2014, | ||||||||||||
Cost $998,890)* f | 1,000,000 | 989,930 | 1.1 | % | ||||||||
| The Goldman Sachs Group, Inc.: | ||||||||||||
| 5.350%, 01/15/2016 | 555,000 | 579,152 | 0.7 | % | ||||||||
| 1.332%, 11/15/2018 | 500,000 | 504,900 | 0.6 | % | ||||||||
| The Royal Bank of Scotland Group | ||||||||||||
| Public Limited Company, | ||||||||||||
2.550%, 09/18/2015 f | 800,000 | 808,010 | 0.9 | % | ||||||||
| Other Finance#~ | 10,195,288 | 12.0 | % | |||||||||
| Total Finance | ||||||||||||
| (Cost $24,982,112) | 24,929,791 | 29.2 | % | |||||||||
| Utility | ||||||||||||
| Exelon Corporation, | ||||||||||||
| 4.900%, 06/15/2015 | 503,000 | 511,995 | 0.6 | % | ||||||||
| PPL Energy Supply, LLC, | ||||||||||||
| Series A, 5.700%, 10/15/2015 | 600,000 | 613,066 | 0.7 | % | ||||||||
| Other Utility#~ | 592,759 | 0.7 | % | |||||||||
| Total Utility | ||||||||||||
| (Cost $1,719,425) | 1,717,820 | 2.0 | % | |||||||||
| Industrials | ||||||||||||
| Anglo American Capital PLC, | ||||||||||||
| 1.181%, 04/15/2016 (Acquired 04/08/2014 | ||||||||||||
through 11/13/2014, Cost $802,361)* f | 800,000 | 800,805 | 0.9 | % | ||||||||
| Becton, Dickinson and Company, | ||||||||||||
| 0.691%, 06/15/2016 | 1,000,000 | 1,000,238 | 1.2 | % | ||||||||
| Deutsche Telekom International Finance B.V., | ||||||||||||
| 3.125%, 04/11/2016 (Acquired 09/17/2014, | ||||||||||||
Cost $514,177)* f | 500,000 | 512,464 | 0.6 | % | ||||||||
| Enbridge Inc.: | ||||||||||||
0.905%, 10/01/2016 f | 750,000 | 749,612 | 0.9 | % | ||||||||
0.684%, 06/02/2017 f | 250,000 | 248,919 | 0.3 | % | ||||||||
| Ford Motor Credit Company LLC: | ||||||||||||
| 2.500%, 01/15/2016 | 200,000 | 202,237 | 0.2 | % | ||||||||
| 4.207%, 04/15/2016 | 750,000 | 776,284 | 0.9 | % | ||||||||
The accompanying notes are an integral part of these financial statements.
Page 11
Baird Ultra Short Bond Fund
Summary Schedule of Investments, December 31, 2014
Long-Term Investments (cont.)
| Principal | % of | |||||||||||
| Amount | Value | Net Assets | ||||||||||
| Gulf South Pipeline Company, LP, | ||||||||||||
| 5.050%, 02/01/2015 (Acquired 09/29/2014, | ||||||||||||
| Cost $501,798)* | $ | 500,000 | $ | 501,489 | 0.6 | % | ||||||
| Hanson Limited, | ||||||||||||
6.125%, 08/15/2016 f | 800,000 | 848,000 | 1.0 | % | ||||||||
| Kinder Morgan Finance Company LLC, | ||||||||||||
| 5.700%, 01/05/2016 | 650,000 | 674,778 | 0.8 | % | ||||||||
| Laboratory Corporation of America Holdings, | ||||||||||||
| 5.625%, 12/15/2015 | 1,000,000 | 1,040,268 | 1.2 | % | ||||||||
| Marathon Petroleum Corporation, | ||||||||||||
| 3.500%, 03/01/2016 | 1,000,000 | 1,024,744 | 1.2 | % | ||||||||
| Medtronic, Inc., | ||||||||||||
| 1.043%, 03/15/2020 (Acquired 12/01/2014, | ||||||||||||
| Cost $750,000)* | 750,000 | 749,209 | 0.9 | % | ||||||||
| Plum Creek Timberlands, L.P., | ||||||||||||
| 5.875%, 11/15/2015 | 725,000 | 753,151 | 0.9 | % | ||||||||
| Rockies Express Pipeline LLC, | ||||||||||||
| 3.900%, 04/15/2015 (Acquired 09/30/2014 | ||||||||||||
| through 10/08/2014, Cost $1,073,079)* | 1,072,000 | 1,066,640 | 1.3 | % | ||||||||
| Verizon Communications Inc., | ||||||||||||
| 1.991%, 09/14/2018 | 1,063,000 | 1,105,793 | 1.3 | % | ||||||||
| Xerox Corporation, | ||||||||||||
| 6.400%, 03/15/2016 | 843,000 | 894,307 | 1.0 | % | ||||||||
| Other Industrials#~ | 8,869,487 | 10.4 | % | |||||||||
| Total Industrials | ||||||||||||
| (Cost $21,861,577) | 21,818,425 | 25.6 | % | |||||||||
| Total Corporate Bonds | ||||||||||||
| (Cost $48,563,114) | 48,466,036 | 56.8 | % | |||||||||
| Other Government Related Securities | ||||||||||||
| Eksportfinans ASA, | ||||||||||||
2.000%, 09/15/2015 f | 540,000 | 540,632 | 0.6 | % | ||||||||
| Other Government Related Securities#~ | 2,033,694 | 2.4 | % | |||||||||
| Total Other Government Related Securities | ||||||||||||
| (Cost $2,647,306) | 2,574,326 | 3.0 | % | |||||||||
| Taxable Municipal Bonds | ||||||||||||
| University of Illinois, | ||||||||||||
| 1.308%, 02/15/2016 | 700,000 | 699,524 | 0.8 | % | ||||||||
| Other Taxable Municipal Bonds# | 2,183,543 | 2.6 | % | |||||||||
| Total Taxable Municipal Bonds | ||||||||||||
| (Cost $2,887,738) | 2,883,067 | 3.4 | % | |||||||||
The accompanying notes are an integral part of these financial statements.
Page 12
Baird Ultra Short Bond Fund
Summary Schedule of Investments, December 31, 2014
Long-Term Investments (cont.)
| Principal | % of | |||||||||||
| Amount | Value | Net Assets | ||||||||||
| Residential Mortgage-Backed Securities | ||||||||||||
| U.S. Government Agency Issues | ||||||||||||
| Other U.S. Government Agency Issues# | $ | 737,465 | 0.9 | % | ||||||||
| Total U.S. Government Agency Issues | ||||||||||||
| (Cost $721,764) | 737,465 | 0.9 | % | |||||||||
| Non-U.S. Government Agency Issues | ||||||||||||
| Other Non-U.S. Government Agency Issues# | 341,844 | 0.4 | % | |||||||||
| Total Non-U.S. Government Agency Issues | ||||||||||||
| (Cost $339,018) | 341,844 | 0.4 | % | |||||||||
| Asset Backed Securities | ||||||||||||
| Accredited Mortgage Loan Trust: | ||||||||||||
| Series 2005-3, Class A1, 0.400%, 09/25/2035 | $ | 186,271 | 185,565 | 0.2 | % | |||||||
| Series 2006-2, Class A3, 0.320%, 09/25/2036 | 1,022,933 | 1,010,298 | 1.2 | % | ||||||||
| Asset Backed Securities Corp Home Equity Loan Trust, | ||||||||||||
| Series 2004-HE6, Class A1, 0.720%, 09/25/2034 | 667,312 | 667,286 | 0.8 | % | ||||||||
| Capital Auto Receivables Asset Trust, | ||||||||||||
| Series 2014-1, Class A1B, 0.515%, 05/20/2016 | 590,000 | 590,159 | 0.7 | % | ||||||||
| HSI Asset Securitization Corp Trust, | ||||||||||||
| Series 2007-WF1, Class 2A3, 0.340%, 05/25/2037 | 668,363 | 646,410 | 0.8 | % | ||||||||
| Master Credit Card Trust II, | ||||||||||||
| Series 2012-2A, Class A, 0.780%, 04/21/2017 | ||||||||||||
(Acquired 10/24/2012, Cost $1,001,048)* f | 1,000,000 | 1,000,320 | 1.2 | % | ||||||||
| Specialty Underwriting & Residential Finance Trust, | ||||||||||||
| Series 2006-BC1, Class A2C, 0.370%, 12/25/2036 | 665,770 | 659,909 | 0.8 | % | ||||||||
| Springleaf Mortgage Loan Trust, | ||||||||||||
| Series 2012-2A, Class A, 2.220%, 10/25/2057 (Acquired | ||||||||||||
| 08/20/2014 through 10/22/2014, Cost $531,381)* | 525,962 | 533,015 | 0.6 | % | ||||||||
| Other Asset Backed Securities#~ | 4,039,638 | 4.6 | % | |||||||||
| Total Asset Backed Securities | ||||||||||||
| (Cost $9,329,059) | 9,332,600 | 10.9 | % | |||||||||
| Commercial Mortgage-Backed Securities | ||||||||||||
| Bear Stearns Commercial Mortgage Securities Trust, | ||||||||||||
| Series 2005-PWR9, Class A4A, 4.871%, 09/11/2042 | 982,681 | 996,832 | 1.2 | % | ||||||||
| COMM Mortgage Trust, | ||||||||||||
| Series 2005-C6, Class A5A, 5.116%, 06/10/2044 | 885,035 | 894,471 | 1.1 | % | ||||||||
| Wachovia Bank Commercial Mortgage Trust, | ||||||||||||
| Series 2005-C22, Class A4, 5.269%, 12/15/2044 | 871,172 | 889,771 | 1.0 | % | ||||||||
| Other Commercial Mortgage Backed Securities# | 20,207 | 0.0 | % | |||||||||
| Total Commercial Mortgage Backed Securities | ||||||||||||
| (Cost $2,829,884) | 2,801,281 | 3.3 | % | |||||||||
| Total Long-Term Investments | ||||||||||||
| (Cost $80,061,385) | 79,876,459 | 93.6 | % | |||||||||
The accompanying notes are an integral part of these financial statements.
Page 13
Baird Ultra Short Bond Fund
Summary Schedule of Investments, December 31, 2014
Short-Term Investments
| % of | ||||||||||||
| Shares | Value | Net Assets | ||||||||||
| Money Market Mutual Funds | ||||||||||||
| Dreyfus Cash Advantage Fund, 0.06%« | 3,882,770 | $ | 3,882,770 | 4.5 | % | |||||||
| Total Short-Term Investments | ||||||||||||
| (Cost $3,882,770) | 3,882,770 | 4.5 | % | |||||||||
| Total Investments | ||||||||||||
| (Cost $83,944,155) | 83,759,229 | 98.1 | % | |||||||||
| Other Assets in Excess of Liabilities | 1,609,335 | 1.9 | % | |||||||||
| TOTAL NET ASSETS | $ | 85,368,564 | 100.0 | % | ||||||||
Notes to Summary Schedule of Investments
| * | Restricted Security Deemed Liquid |
| f | Foreign Security |
| « | 7-Day Yield |
| # | Represents the aggregate value, by category, securities that are not among the 50 largest holdings and, in total for any issuer, represent 1% or less of net assets. |
| ~ | Groupings contain, in aggregate, restricted securities totaling $5,085,445 representing 5.96% of net assets. |
Summary of Fair Value Exposure at December 31, 2014
The Fund has adopted authoritative fair valuation accounting standards which establish a definition of fair value and set out a hierarchy for measuring fair value. These standards require additional disclosures about the various inputs and valuation techniques used to develop the measurements of fair value and a discussion on changes in valuation techniques and related inputs during the period. These standards define fair value as the price that would be received to sell an asset or paid to transfer a liability in an orderly transaction between market participants at the measurement date.
The fair value hierarchy is organized into three levels based upon the assumptions (referred to as “inputs”) used in pricing the asset or liability. These standards state that “observable inputs” reflect the assumptions market participants would use in pricing the asset or liability based on market data obtained from independent sources and “unobservable inputs” reflect an entity’s own assumptions about the assumptions market participants would use in pricing the asset or liability. These inputs are summarized into three broad levels and described below:
Level 1 – | Unadjusted quoted prices in active markets for identical unrestricted securities. |
Level 2 – | Other significant observable inputs (including quoted prices for similar securities, quoted prices in inactive markets, dealer indications, interest rates, yield curves, prepayment speeds, credit risk, default rates, inputs corroborated by observable market data, etc.). |
Level 3 – | Significant unobservable inputs (including the Fund’s own assumptions about the factors that market participants would use in valuing the security) based on the best information available. |
The inputs or methodology used for valuing securities are not necessarily an indication of the risk associated with investing in those securities.
The accompanying notes are an integral part of these financial statements.
Page 14
Baird Ultra Short Bond Fund
Summary Schedule of Investments, December 31, 2014
Summary of Fair Value Exposure at December 31, 2014 (cont.)
The following is a summary of the inputs used to value the Fund’s investments as of December 31, 2014:
| Level 1 | Level 2 | Level 3 | Total | |||||||||||||
| Fixed Income | ||||||||||||||||
| U.S. Treasury Securities | $ | — | $ | 12,739,840 | $ | — | $ | 12,739,840 | ||||||||
| Corporate Bonds | — | 48,466,036 | — | 48,466,036 | ||||||||||||
| Other Government Related Securities | — | 2,574,326 | — | 2,574,326 | ||||||||||||
| Taxable Municipal Bonds | — | 2,883,067 | — | 2,883,067 | ||||||||||||
| Residential Mortgage-Backed Securities – | ||||||||||||||||
| U.S. Government Agency Issues | — | 737,465 | — | 737,465 | ||||||||||||
| Residential Mortgage-Backed Securities – | �� | |||||||||||||||
| Non-U.S. Government Agency Issues | — | 341,844 | — | 341,844 | ||||||||||||
| Asset Backed Securities | — | 9,332,600 | — | 9,332,600 | ||||||||||||
| Commercial Mortgage-Backed Securities | — | 2,801,281 | — | 2,801,281 | ||||||||||||
| Total Fixed Income | — | 79,876,459 | — | 79,876,459 | ||||||||||||
| Short-Term Investment | ||||||||||||||||
| Money Market Mutual Fund | 3,882,770 | — | — | 3,882,770 | ||||||||||||
| Total Short-Term Investment | 3,882,770 | — | — | 3,882,770 | ||||||||||||
| Investments Purchased with Cash | ||||||||||||||||
| Proceeds from Securities Lending | ||||||||||||||||
| Investment Companies | — | — | — | — | ||||||||||||
| Total Investments Purchased with | ||||||||||||||||
| Cash Proceeds from Securities Lending | — | — | — | — | ||||||||||||
| Total Investments | $ | 3,882,770 | $ | 79,876,459 | $ | — | $ | 83,759,229 | ||||||||
Changes in valuation techniques may result in transfers into or out of assigned levels within the fair value hierarchy. There were no transfers between Level 1, Level 2 and Level 3 fair value measurements during the reporting period. See the Fund’s valuation policy in Note 2a to the financial statements.
The accompanying notes are an integral part of these financial statements.
Page 15
Baird Short-Term Bond Fund
December 31, 2014
The Baird Short-Term Bond Fund seeks an annual rate of total return, before Fund expenses, greater than the annual rate of total return of the Barclays 1-3 Year U.S. Government/Credit Bond Index. The Barclays 1-3 Year U.S. Government/Credit Bond Index is an unmanaged, market value weighted index of investment grade, fixed rate debt issues, including government and credit securities, with maturities between one and three years.
The Fund had strong absolute and relative returns versus its benchmark index in 2014. Our long-term commitment to duration neutrality again proved to be a prudent strategy as the bond market saw a sharp drop in yields for longer maturities and continued flattening of the yield curve throughout the year. The movements in the bond market confounded the predictions of many market participants who expected rates to rise and proved again the difficulty of forecasting both the direction and timing of interest rate moves. The primary factors contributing to the Fund’s outperformance in 2014 are described below.
| • | Within the Credit sector, an overweight to the Financial sub-sector, which continued to outperform other credit sectors for the full year, aided the Fund’s performance as credit fundamentals remained solid. | |
| • | Exposure to non-agency residential mortgage-backed securities (RMBS) contributed to the Fund’s outperformance as limited supply and continued improvements in housing provided strong technical and fundamental support. | |
| • | An overweight position to commercial mortgage-backed securities (CMBS) primarily through seasoned, super-senior CMBS added to performance as the sector outperformed significantly for the year resulting from tight supply combined with growing demand for these high quality securities. | |
| • | The Fund’s yield curve positioning where an underweight in 1-2 year maturities and a slight overweight in the 4 year part of the curve benefitted the Fund as the curve continued to flatten. |
Looking forward, we believe select credits still offer good relative value despite an elevated risk environment, as company balance sheets and credit fundamentals remain solid. We also expect continued positive contribution from non-agency RMBS. Yield curve positioning should modestly benefit from continued flattening of the yield curve with attractive rolldown opportunities being captured on a more selective basis. The Fund remains duration neutral to its benchmark and we are optimistic that the Fund is well positioned to add value relative to its benchmark.
Page 16
Baird Short-Term Bond Fund
December 31, 2014 (Unaudited)
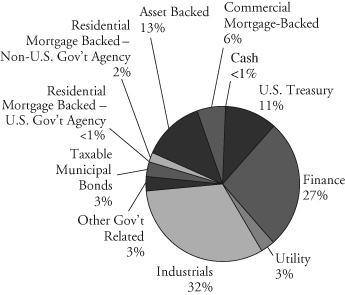
Portfolio Characteristics
Quality Distribution(1)(2)
 | Net Assets | $2,676,707,885 | ||
| SEC 30-Day | ||||
Yield(3) | ||||
| Institutional Class | 1.55% | |||
| Investor Class | 1.30% | |||
| Average | ||||
| Effective | ||||
| Duration | 1.93 years | |||
| Average | ||||
| Effective | ||||
| Maturity | 1.99 years | |||
| Annualized | ||||
Sector Weightings(1) | Expense | |||
| Ratio | ||||
 | Institutional Class | 0.30% | ||
| Investor Class | 0.55%(4) | |||
| Portfolio | ||||
| Turnover | ||||
| Rate | 51.2% | |||
| Number of | ||||
| Holdings | 532 | |||
| (1) | Percentages shown are based on the Fund’s total investments (less investments purchased with cash proceeds from securities lending). |
| (2) | The quality profile is calculated on a market value-weighted basis using the highest credit quality rating for each security held by the Fund given by S&P, Moody’s or Fitch, each of which is a Nationally Recognized Statistical Rating Organization (NRSRO). NRSROs rate the credit quality of securities using a scale that generally ranges from AAA (highest) to D (lowest). |
| (3) | SEC yields are based on SEC guidelines and are calculated for the 30 days ended December 31, 2014. |
| (4) | Includes 0.25% 12b-1 fee. |
Page 17
Baird Short-Term Bond Fund
December 31, 2014 (Unaudited)
Institutional Class
Value of a $25,000 Investment
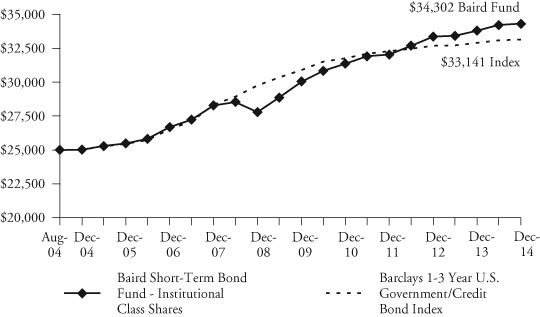
Growth of a hypothetical investment of $25,000 made on the Fund’s inception date (8/31/04), assuming reinvestment of all distributions.
Investor Class
Value of a $10,000 Investment
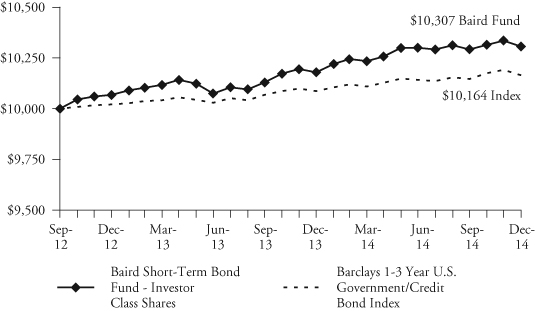
Growth of a hypothetical investment of $10,000 made on the Fund’s inception date (9/19/12), assuming reinvestment of all distributions.
Page 18
Baird Short-Term Bond Fund
December 31, 2014 (Unaudited)
Total Returns
| Average Annual | |||||
| Since | Since | ||||
| One | Five | Ten | Inception | Inception | |
| For the Periods Ended December 31, 2014 | Year | Years | Years | (8/31/04) | (9/19/12) |
| Institutional Class Shares | 1.49% | 2.68% | 3.20% | 3.11% | N/A |
| Investor Class Shares | 1.25% | N/A | N/A | N/A | 1.33% |
| Barclays 1-3 Year U.S. | |||||
Government/Credit Bond Index(1) | 0.77% | 1.41% | 2.85% | 2.77% | 0.72% |
| (1) | The Barclays 1-3 Year U.S. Government/Credit Bond Index is an unmanaged, market value weighted index of investment grade, fixed-rate debt issues, including government and corporate securities, with maturities between one and three years. This index does not reflect any deduction for fees, expenses or taxes. A direct investment in an index is not possible. |
The line graph on the previous page and the returns shown in the table above reflect reinvestment of dividends and/or capital gains distributions in additional shares. Returns do not reflect the deduction of taxes that a shareholder would pay on Fund distributions or the redemption of Fund shares. The returns reflect the actual performance for each period and do not include the impact of trades executed on the last business day of the period that were recorded on the first business day of the next period.
The Fund’s gross expense ratio for each Class, as reflected in the Fund’s current prospectus, is set forth under “Portfolio Characteristics”.
The Fund may invest in U.S. dollar denominated foreign securities which involve additional risks such as political and economic instability, and different and sometimes less strict financial reporting standards and regulation. The Fund may also invest in mortgage- and asset-backed securities, which include interest rate and prepayment risks more pronounced than those of other fixed income securities.
Past performance does not guarantee future results. Investment returns and principal value will fluctuate so that an investor’s shares, when redeemed, may be worth more or less than their original cost.
For information about the performance of the Fund as of the most recent month-end, please call 1-866-44BAIRD or visit www.bairdfunds.com. Mutual fund performance changes over time and current performance may be lower or higher than that stated.
Page 19
Baird Short-Term Bond Fund
Summary Schedule of Investments, December 31, 2014
This schedule summarizes the Fund’s holdings by asset type. Details are reported for each of the Fund’s 50 largest individual holdings and for investments that, in total for any issuer, represent more than 1% of the Fund’s net assets. The total value of smaller holdings is reported as a single amount within each category.
The Fund reports a complete list of its holdings in regulatory filings four times in each fiscal year, at the quarter end. For the second and fourth fiscal quarters, the complete listing of the Fund’s holdings is available electronically in the Fund’s Form N-CSR at http://www.bairdfunds.com/prospectuses-reports and on the Securities and Exchange Commission’s website (www.sec.gov) or you can have it mailed to you without charge by calling 1-866-44BAIRD. For the first and third fiscal quarters, the Fund files the lists with the SEC on Form N-Q. Shareholders can look up the Fund’s Forms N-CSR and N-Q on the SEC’s website (www.sec.gov).
Long-Term Investments
| Principal | % of | |||||||||||
| Amount | Value | Net Assets | ||||||||||
| U.S. Treasury Securities | ||||||||||||
| U.S. Treasury Bonds: | ||||||||||||
| 2.250%, 07/31/2018@ | $ | 130,950,000 | $ | 135,154,674 | 5.0 | % | ||||||
| 1.250%, 04/30/2019@ | 172,000,000 | 169,997,748 | 6.4 | % | ||||||||
| Total U.S. Treasury Securities | ||||||||||||
| (Cost $304,755,926) | 305,152,422 | 11.4 | % | |||||||||
| Corporate Bonds | ||||||||||||
| Finance | ||||||||||||
| ABN AMRO Bank N.V., | ||||||||||||
| 1.033%, 10/28/2016 (Acquired 10/23/2013 through | ||||||||||||
05/19/2014, Cost $11,058,523)* f | 11,050,000 | 11,128,886 | 0.4 | % | ||||||||
| Citizens Bank, National Association, | ||||||||||||
| 1.600%, 12/04/2017 | 12,500,000 | 12,444,875 | 0.5 | % | ||||||||
| CNA Financial Corporation, | ||||||||||||
| 7.350%, 11/15/2019 | 10,200,000 | 12,174,159 | 0.5 | % | ||||||||
| Dresdner Bank AG, | ||||||||||||
7.250%, 09/15/2015 f | 12,322,000 | 12,741,835 | 0.5 | % | ||||||||
| LeasePlan Corporation N.V., | ||||||||||||
| 2.500%, 05/16/2018 (Acquired 05/07/2013 through | ||||||||||||
10/20/2014, Cost $14,710,581)* f | 14,785,000 | 14,791,343 | 0.5 | % | ||||||||
| Nomura Holdings, Inc., | ||||||||||||
2.000%, 09/13/2016 f | 10,205,000 | 10,287,324 | 0.4 | % | ||||||||
| Synchrony Financial, | ||||||||||||
| 3.000%, 08/15/2019@ | 13,350,000 | 13,496,089 | 0.5 | % | ||||||||
| Voya Financial, Inc., | ||||||||||||
| 2.900%, 02/15/2018 | 14,708,000 | 15,057,359 | 0.6 | % | ||||||||
| Other Finance#~ | 611,155,586 | 22.8 | % | |||||||||
| Total Finance | ||||||||||||
| (Cost $710,774,596) | 713,277,456 | 26.7 | % | |||||||||
The accompanying notes are an integral part of these financial statements.
Page 20
Baird Short-Term Bond Fund
Summary Schedule of Investments, December 31, 2014
Long-Term Investments (cont.)
| Principal | % of | |||||||||||
| Amount | Value | Net Assets | ||||||||||
| Utility | ||||||||||||
| National Grid PLC | ||||||||||||
6.300%, 08/01/2016 f | $ | 9,531,000 | $ | 10,288,219 | 0.4 | % | ||||||
| Other Utility#~ | 73,544,435 | 2.7 | % | |||||||||
| Total Utility | ||||||||||||
| (Cost $83,674,285) | 83,832,654 | 3.1 | % | |||||||||
| Industrials | ||||||||||||
| Amgen Inc., | ||||||||||||
| 5.700%, 02/01/2019 | 10,000,000 | 11,248,780 | 0.4 | % | ||||||||
| Boardwalk Pipelines, LP, | ||||||||||||
| 5.500%, 02/01/2017 | 13,384,000 | 14,118,969 | 0.5 | % | ||||||||
| CF Industries, Inc., | ||||||||||||
| 6.875%, 05/01/2018 | 11,182,000 | 12,712,022 | 0.5 | % | ||||||||
| Dollar General Corporation, | ||||||||||||
| 4.125%, 07/15/2017 | 17,321,000 | 17,863,424 | 0.7 | % | ||||||||
| Hospira, Inc., | ||||||||||||
| 6.050%, 03/30/2017 | 9,654,000 | 10,408,605 | 0.4 | % | ||||||||
| Petrofac Limited, | ||||||||||||
| 3.400%, 10/10/2018 (Acquired 10/03/2013 through | ||||||||||||
09/19/2014, Cost $11,971,239)* f | 11,750,000 | 11,591,751 | 0.4 | % | ||||||||
| PetroLogistics LP / PetroLogistics Finance Corp., | ||||||||||||
| 6.250%, 04/01/2020 | 11,755,000 | 12,666,013 | 0.5 | % | ||||||||
| Pioneer Natural Resources Company, | ||||||||||||
| 5.875%, 07/15/2016 | 10,133,000 | 10,762,057 | 0.4 | % | ||||||||
| Seagate HDD Cayman, | ||||||||||||
6.875%, 05/01/2020 f | 10,653,000 | 11,185,650 | 0.4 | % | ||||||||
| Telecom Italia Capital, | ||||||||||||
5.250%, 10/01/2015 f | 10,960,000 | 11,179,200 | 0.4 | % | ||||||||
| The Dow Chemical Company, | ||||||||||||
| 8.550%, 05/15/2019 | 11,427,000 | 14,206,572 | 0.5 | % | ||||||||
| The Valspar Corporation, | ||||||||||||
| 5.100%, 08/01/2015 | 10,450,000 | 10,698,376 | 0.4 | % | ||||||||
| Valero Energy Corporation, | ||||||||||||
| 9.375%, 03/15/2019 | 10,349,000 | 12,906,559 | 0.5 | % | ||||||||
| Verizon Communications Inc., | ||||||||||||
| 3.650%, 09/14/2018 | 14,000,000 | 14,794,178 | 0.5 | % | ||||||||
| Walgreen Co., | ||||||||||||
| 5.250%, 01/15/2019 | 9,392,000 | 10,440,025 | 0.4 | % | ||||||||
| Other Industrials#~ | 669,215,310 | 25.1 | % | |||||||||
| Total Industrials | ||||||||||||
| (Cost $858,524,095) | 855,997,491 | 32.0 | % | |||||||||
| Total Corporate Bonds | ||||||||||||
| (Cost $1,652,972,976) | 1,653,107,601 | 61.8 | % | |||||||||
The accompanying notes are an integral part of these financial statements.
Page 21
Baird Short-Term Bond Fund
Summary Schedule of Investments, December 31, 2014
Long-Term Investments (cont.)
| Principal | % of | |||||||||||
| Amount | Value | Net Assets | ||||||||||
| Other Government Related Securities | ||||||||||||
| Other Government Related Securities#~ | $ | 74,963,835 | 2.8 | % | ||||||||
| Total Other Government Related Securities | ||||||||||||
| (Cost $75,485,344) | 74,963,835 | 2.8 | % | |||||||||
| Taxable Municipal Bonds | ||||||||||||
| Rhode Island Housing & Mortgage Finance Corp/RI, | ||||||||||||
| 3.000%, 10/01/2034 (Callable 10/01/2023) | $ | 11,760,000 | 12,039,653 | 0.5 | % | |||||||
| Other Taxable Municipal Bonds# | 55,720,525 | 2.0 | % | |||||||||
| Total Taxable Municipal Bonds | ||||||||||||
| (Cost $67,442,585) | 67,760,178 | 2.5 | % | |||||||||
| Residential Mortgage-Backed Securities | ||||||||||||
| U.S. Government Agency Issues | ||||||||||||
| Other U.S. Government Agency Issues# | 556,684 | 0.0 | % | |||||||||
| Total U.S. Government Agency Issues | ||||||||||||
| (Cost $530,947) | 556,684 | 0.0 | % | |||||||||
| Non-U.S. Government Agency Issues | ||||||||||||
| Structured Securities Corp | ||||||||||||
| Mortgage Pass-Through Certificates, | ||||||||||||
| Series 2004-22, Class A2, 5.133%, 01/25/2035 | 11,396,361 | 11,796,339 | 0.4 | % | ||||||||
| WaMu Mortgage Pass-Through Certificates, | ||||||||||||
| Series 2004-AR3, Class A1, 2.370%, 06/25/2034 | 11,157,219 | 11,259,452 | 0.4 | % | ||||||||
| Other Non-U.S. Government Agency Issues# | 39,326,014 | 1.5 | % | |||||||||
| Total Non-U.S. Government Agency Issues | ||||||||||||
| (Cost $62,269,082) | 62,381,805 | 2.3 | % | |||||||||
| Asset Backed Securities | ||||||||||||
| Accredited Mortgage Loan Trust, | ||||||||||||
| Series 2006-2, Class A3, 0.320%, 09/25/2036 | 17,591,177 | 17,373,891 | 0.7 | % | ||||||||
| Ally Auto Receivables Trust, | ||||||||||||
| Series 2014-SN2, Class A2B, 0.465%, 03/20/2017 | 13,000,000 | 13,000,559 | 0.5 | % | ||||||||
| Ameriquest Mortgage Securities Inc | ||||||||||||
| Asset-Backed Pass-Through Ctfs, | ||||||||||||
| Series 2005-R8, Class A2D, 0.530%, 10/25/2035 | 11,660,913 | 11,613,838 | 0.4 | % | ||||||||
| Argent Securities Inc Asset-Backed | ||||||||||||
| Pass-Through Certificates, | ||||||||||||
| Series 2005-W3, Class A2D, 0.510%, 11/25/2035 | 14,097,419 | 13,542,798 | 0.5 | % | ||||||||
| Capital Auto Receivables Asset Trust, | ||||||||||||
| Series 2014-3, Class A-2, 1.180%, 12/20/2017 | 25,515,000 | 25,515,230 | 1.0 | % | ||||||||
| Ford Credit Auto Owner Trust, | ||||||||||||
| Series 2014-1, Class A, 2.260%, 11/15/2025 | ||||||||||||
| (Acquired 05/06/2014 through 11/18/2014, | ||||||||||||
| Cost $17,958,650)* | 17,894,000 | 17,989,518 | 0.7 | % | ||||||||
The accompanying notes are an integral part of these financial statements.
Page 22
Baird Short-Term Bond Fund
Summary Schedule of Investments, December 31, 2014
Long-Term Investments (cont.)
| Principal | % of | |||||||||||
| Amount | Value | Net Assets | ||||||||||
| GSAA Trust, | ||||||||||||
| Series 2005-8, Class A4, 0.440%, 06/25/2035 | $ | 21,675,795 | $ | 21,045,268 | 0.8 | % | ||||||
| Nationstar Home Equity Loan Trust, | ||||||||||||
| Series 2006-B, Class AV3, 0.340%, 09/25/2036 | 20,309,304 | 20,267,406 | 0.8 | % | ||||||||
| RASC Series Trust, | ||||||||||||
| Series 2005-AHL2, Class A3, 0.520%, 10/25/2035 | 12,150,000 | 11,990,519 | 0.4 | % | ||||||||
| Securitized Asset Backed Receivables LLC Trust, | ||||||||||||
| Series 2005-OP2, Class A1, 0.495%, 10/25/2035 | ||||||||||||
| (Acquired 03/13/2014, Cost $13,669,278)* | 13,837,928 | 13,678,778 | 0.5 | % | ||||||||
| Springleaf Funding Trust, | ||||||||||||
| Series 2013-AA, Class A, 2.580%, 09/15/2021 (Acquired | ||||||||||||
| 01/09/2014 through 11/18/2014, Cost $23,206,842)* | 23,100,000 | 23,166,505 | 0.9 | % | ||||||||
| Structured Asset Investment Loan Trust, | ||||||||||||
| Series 2004-9, Class A5, 1.170%, 10/25/2034 | 16,953,015 | 16,921,940 | 0.6 | % | ||||||||
| Synchrony Credit Card Master Note Trust, | ||||||||||||
| Series 2014-1, Class A, 1.610%, 11/15/2020 | 11,700,000 | 11,657,307 | 0.4 | % | ||||||||
| Other Asset Backed Securities#~ | 120,271,442 | 4.4 | % | |||||||||
| Total Asset Backed Securities | ||||||||||||
| (Cost $337,392,381) | 338,034,999 | 12.6 | % | |||||||||
| Commercial Mortgage-Backed Securities | ||||||||||||
| Bear Stearns Commercial Mortgage Securities Trust, | ||||||||||||
| Series 2005-PWR9, Class A4A, 4.871%, 09/11/2042 | 24,181,820 | 24,530,038 | 0.9 | % | ||||||||
| CD Commercial Mortgage Trust, | ||||||||||||
| Series 2005-CD1, Class A4, 5.226%, 07/15/2044 | 18,872,614 | 19,177,558 | 0.7 | % | ||||||||
| COMM Mortgage Trust, | ||||||||||||
| Series 2005-C6, Class A5A, 5.116%, 06/10/2044 | 14,296,123 | 14,448,548 | 0.6 | % | ||||||||
| Credit Suisse First Boston Mortgage Securities Corp., | ||||||||||||
| Series 2005-C5, Class A4, 5.100%, 08/15/2038 | 13,878,629 | 14,062,854 | 0.5 | % | ||||||||
| DBUBS Mortgage Trust, | ||||||||||||
| Series 2011-LC3A, Class A2, 3.642%, 08/10/2044 | 18,450,000 | 19,047,614 | 0.7 | % | ||||||||
| J.P. Morgan Chase Commercial Mortgage Securities Trust, | ||||||||||||
| Series 2005-CB12, Class A4, 4.895%, 09/12/2037 | 19,435,000 | 19,636,638 | 0.7 | % | ||||||||
| Morgan Stanley Capital I Trust, | ||||||||||||
| Series 2005-HQ7, Class A4, 5.206%, 11/14/2042 | 12,256,304 | 12,449,549 | 0.5 | % | ||||||||
| Wachovia Bank Commercial Mortgage Trust, | ||||||||||||
| Series 2005-C22, Class A4, 5.269%, 12/15/2044 | 17,540,804 | 17,915,282 | 0.7 | % | ||||||||
| Other Commercial Mortgage Backed Securities# | 7,956,896 | 0.3 | % | |||||||||
| Total Commercial Mortgage Backed Securities | ||||||||||||
| (Cost $155,070,916) | 149,224,977 | 5.6 | % | |||||||||
| Total Long-Term Investments | ||||||||||||
| (Cost $2,655,920,157) | 2,651,182,501 | 99.0 | % | |||||||||
The accompanying notes are an integral part of these financial statements.
Page 23
Baird Short-Term Bond Fund
Summary Schedule of Investments, December 31, 2014
Short-Term Investments
| % of | ||||||||||||
| Shares | Value | Net Assets | ||||||||||
| Money Market Mutual Funds | ||||||||||||
| Short-Term Investments Trust – | ||||||||||||
| Liquid Assets Portfolio, 0.07%« | 9,270,655 | $ | 9,270,655 | 0.4 | % | |||||||
| Total Short-Term Investments | ||||||||||||
| (Cost $9,270,655) | 9,270,655 | 0.4 | % | |||||||||
| Investments Purchased with Cash | ||||||||||||
| Proceeds from Securities Lending | ||||||||||||
| Investment Companies | ||||||||||||
| Mount Vernon Securities Lending | ||||||||||||
| Trust Prime Portfolio, 0.29%« | 147,613,109 | 147,613,109 | 5.5 | % | ||||||||
| Total Investment Companies | ||||||||||||
| (Cost $147,613,109) | 147,613,109 | 5.5 | % | |||||||||
| Total Investments Purchased With Securities Lending | ||||||||||||
| (Cost $147,613,109) | 147,613,109 | 5.5 | % | |||||||||
| Total Investments | ||||||||||||
| (Cost $2,812,803,921) | 2,808,066,265 | 104.9 | % | |||||||||
| Liabilities in Excess of Other Assets | (131,358,380 | ) | (4.9 | )% | ||||||||
| TOTAL NET ASSETS | $ | 2,676,707,885 | 100.0 | % | ||||||||
Notes to Summary Schedule of Investments
| * | Restricted Security Deemed Liquid |
| @ | This security or portion of this security is out on loan at December 31, 2014. |
| f | Foreign Security |
| « | 7-Day Yield |
| ~ | Groupings contain, in aggregate, restricted securities totaling $369,690,728 representing 13.81% of net assets. |
| # | Represents the aggregate value, by category, securities that are not among the 50 largest holdings and, in total for any issuer, represent 1% or less of net assets. |
Summary of Fair Value Exposure at December 31, 2014
The Fund has adopted authoritative fair valuation accounting standards which establish a definition of fair value and set out a hierarchy for measuring fair value. These standards require additional disclosures about the various inputs and valuation techniques used to develop the measurements of fair value and a discussion on changes in valuation techniques and related inputs during the period. These standards define fair value as the price that would be received to sell an asset or paid to transfer a liability in an orderly transaction between market participants at the measurement date.
The fair value hierarchy is organized into three levels based upon the assumptions (referred to as “inputs”) used in pricing the asset or liability. These standards state that “observable inputs” reflect the assumptions market participants would use in pricing the asset or liability based on market data obtained from independent sources and “unobservable inputs” reflect an entity’s own assumptions about the assumptions market participants would use in pricing the asset or liability. These inputs are summarized into three broad levels and described below:
The accompanying notes are an integral part of these financial statements.
Page 24
Baird Short-Term Bond Fund
Summary Schedule of Investments, December 31, 2014
Summary of Fair Value Exposure at December 31, 2014 (cont.)
Level 1 – | Unadjusted quoted prices in active markets for identical unrestricted securities. |
Level 2 – | Other significant observable inputs (including quoted prices for similar securities, quoted prices in inactive markets, dealer indications, interest rates, yield curves, prepayment speeds, credit risk, default rates, inputs corroborated by observable market data, etc.). |
Level 3 – | Significant unobservable inputs (including the Fund’s own assumptions about the factors that market participants would use in valuing the security) based on the best information available. |
The inputs or methodology used for valuing securities are not necessarily an indication of the risk associated with investing in those securities.
The following is a summary of the inputs used to value the Fund’s investments as of December 31, 2014:
| Level 1 | Level 2 | Level 3 | Total | |||||||||||||
| Long-Term Investments | ||||||||||||||||
| U.S. Treasury Securities | $ | — | $ | 305,152,422 | $ | — | $ | 305,152,422 | ||||||||
| Corporate Bonds | — | 1,653,107,601 | — | 1,653,107,601 | ||||||||||||
| Other Government Related Securities | — | 74,963,835 | — | 74,963,835 | ||||||||||||
| Taxable Municipal Bonds | — | 67,760,178 | — | 67,760,178 | ||||||||||||
| Residential Mortgage- | ||||||||||||||||
| Backed Securities – | ||||||||||||||||
| U.S. Government Agency Issues | — | 556,684 | — | 556,684 | ||||||||||||
| Residential Mortgage- | ||||||||||||||||
| Backed Securities – | ||||||||||||||||
| Non-U.S. Government Agency Issues | — | 62,381,805 | — | 62,381,805 | ||||||||||||
| Asset Backed Securities | — | 338,034,999 | — | 338,034,999 | ||||||||||||
| Commercial Mortgage- | ||||||||||||||||
| Backed Securities | — | 149,224,977 | — | 149,224,977 | ||||||||||||
| Total Long-Term Investments | — | 2,651,182,501 | — | 2,651,182,501 | ||||||||||||
| Short-Term Investments | ||||||||||||||||
| Money Market Mutual Fund | 9,270,655 | — | — | 9,270,655 | ||||||||||||
| Total Short-Term Investments | 9,270,655 | — | — | 9,270,655 | ||||||||||||
| Investments Purchased with Cash | ||||||||||||||||
| Proceeds from Securities Lending | ||||||||||||||||
| Investment Companies | 147,613,109 | — | — | 147,613,109 | ||||||||||||
| Total Investments Purchased with | ||||||||||||||||
| Cash Proceeds from | ||||||||||||||||
| Securities Lending | 147,613,109 | — | — | 147,613,109 | ||||||||||||
| Total Investments | $ | 156,883,764 | $ | 2,651,182,501 | $ | — | $ | 2,808,066,265 | ||||||||
Changes in valuation techniques may result in transfers into or out of assigned levels within the fair value hierarchy. There were no transfers between Level 1, Level 2 and Level 3 fair value measurements during the reporting period, as compared to their classification from the prior year’s annual report. See the Fund’s valuation policy in Note 2a to the financial statements.
The accompanying notes are an integral part of these financial statements.
Page 25
Baird Intermediate Bond Fund
December 31, 2014
The Baird Intermediate Bond Fund seeks an annual rate of total return, before Fund expenses, greater than the annual rate of total return of the Barclays Intermediate U.S. Government/Credit Bond Index. The Barclays Intermediate U.S. Government/Credit Bond Index is an unmanaged, market value weighted index of investment grade, fixed-rate debt issues, including government and credit securities, with maturities between one and ten years.
The Fund had strong absolute and relative returns versus its benchmark index in 2014. Our long-term commitment to duration neutrality again proved to be a prudent strategy as the bond market saw a sharp drop in yields for longer maturities and continued flattening of the yield curve throughout the year. The movements in the bond market confounded the predictions of many market participants who expected rates to rise and proved again the difficulty of forecasting both the direction and timing of interest rate moves. The primary factors contributing to the Fund’s outperformance in 2014 are described below.
| • | Within the Credit sector, an overweight in short to intermediate maturities versus long maturity credit added value in the year as credit spreads widened less on intermediate maturities than long maturities. An overweight to Financials also added value as this sector outperformed other credit sectors for the full year due to continued solid credit fundamentals. | |
| • | Exposure to non-agency residential mortgage-backed securities (RMBS) contributed to the Fund’s outperformance as limited supply and continued improvements in housing provided strong technical and fundamental support. | |
| • | An overweight position to commercial mortgage-backed securities (CMBS) primarily through seasoned, super-senior CMBS added to performance as the sector outperformed significantly for the year resulting from tight supply combined with growing demand for these high quality securities. |
Looking forward, we believe select credits still offer good relative value despite an elevated risk environment, as company balance sheets and credit fundamentals remain solid. We also expect continued positive contribution from non-agency RMBS. Yield curve positioning should modestly benefit from continued flattening of the yield curve with attractive rolldown opportunities being captured on a more selective basis. The Fund remains duration neutral to its benchmark and we are optimistic that the Fund is well positioned to add value relative to its benchmark.
Page 26
Baird Intermediate Bond Fund
December 31, 2014 (Unaudited)
Portfolio Characteristics
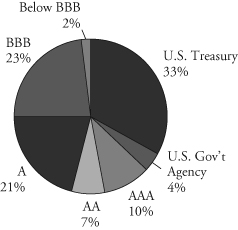
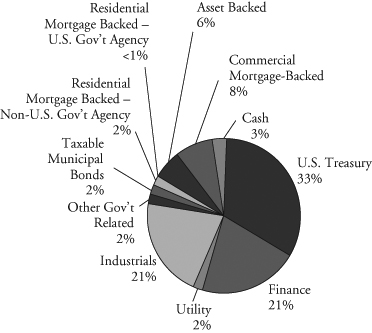
Quality Distribution(1)(2)
 | Net Assets | $1,583,778,911 | ||
| SEC 30-Day | ||||
Yield(3) | ||||
| Institutional Class | 1.97% | |||
| Investor Class | 1.73% | |||
| Average | ||||
| Effective | ||||
| Duration | 3.89 years | |||
| Average | ||||
| Effective | ||||
| Maturity | 4.35 years | |||
| Annualized | ||||
| Expense | ||||
Sector Weightings(1) | Ratio | |||
| Institutional Class | 0.30% | |||
 | Investor Class | 0.55%(4) | ||
| Portfolio | ||||
| Turnover | ||||
| Rate | 29.2% | |||
| Number of | ||||
| Holdings | 438 | |||
| (1) | Percentages shown are based on the Fund’s total investments (less investments purchased with cash proceeds from securities lending). |
| (2) | The quality profile is calculated on a market value-weighted basis using the highest credit quality rating for each security held by the Fund given by S&P, Moody’s or Fitch, each of which is a Nationally Recognized Statistical Rating Organization (NRSRO). NRSROs rate the credit quality of securities using a scale that generally ranges from AAA (highest) to D (lowest). |
| (3) | SEC yields are based on SEC guidelines and are calculated for the 30 days ended December 31, 2014. |
| (4) | Includes 0.25% 12b-1 fee. |
Page 27
Baird Intermediate Bond Fund
December 31, 2014 (Unaudited)
Institutional Class
Value of a $25,000 Investment

Growth of a hypothetical investment of $25,000 made on the Fund’s inception date (9/29/00), assuming reinvestment of all distributions.
Investor Class
Value of a $10,000 Investment
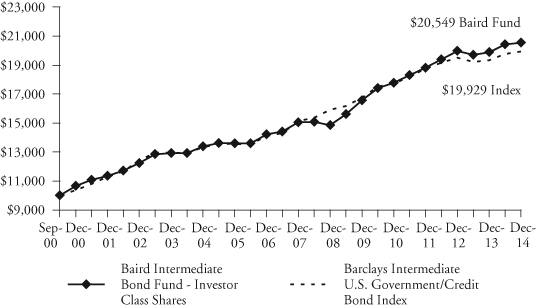
Growth of a hypothetical investment of $10,000 made on the Fund’s inception date (9/29/00), assuming reinvestment of all distributions.
Page 28
Baird Intermediate Bond Fund
December 31, 2014 (Unaudited)
Total Returns
| Average Annual | ||||
| One | Five | Ten | Since | |
| For the Periods Ended December 31, 2014 | Year | Years | Years | Inception(1) |
| Institutional Class Shares | 3.50% | 4.67% | 4.65% | 5.45% |
| Investor Class Shares | 3.29% | 4.41% | 4.37% | 5.18% |
| Barclays Intermediate | ||||
U.S. Government/Credit Bond Index(2) | 3.13% | 3.54% | 4.10% | 4.96% |
| (1) | For the period from September 29, 2000 (inception date) through December 31, 2014. |
| (2) | The Barclays Intermediate U.S. Government/Credit Bond Index is an unmanaged, market value weighted index of investment grade, fixed-rate debt issues, including government and corporate securities, with maturities between one and ten years. This index does not reflect any deduction for fees, expenses or taxes. A direct investment in an index is not possible. |
The line graph on the previous page and the returns shown in the table above reflect reinvestment of dividends and/or capital gains distributions in additional shares. The returns do not reflect the deduction of taxes that a shareholder would pay on Fund distributions or the redemption of Fund shares. The returns reflect the actual performance for each period and do not include the impact of trades executed on the last business day of the period that were recorded on the first business day of the next period.
The Fund’s gross expense ratio for each Class, as reflected in the Fund’s current prospectus, is set forth under “Portfolio Characteristics”.
The Fund may invest in U.S. dollar denominated foreign securities which involve additional risks such as political and economic instability, and different and sometimes less strict financial reporting standards and regulation. The Fund may also invest in mortgage- and asset-backed securities, which include interest rate and prepayment risks more pronounced than those of other fixed income securities.
Past performance does not guarantee future results. Investment return and principal value will fluctuate so that an investor’s shares, when redeemed, may be worth more or less than their original cost.
For information about the performance of the Fund as of the most recent month-end, please call 1-866-44BAIRD or visit www.bairdfunds.com. Mutual fund performance changes over time and current performance may be lower or higher than that stated.
Page 29
Baird Intermediate Bond Fund
Summary Schedule of Investments, December 31, 2014
This schedule summarizes the Fund’s holdings by asset type. Details are reported for each of the Fund’s 50 largest individual holdings and for investments that, in total for any issuer, represent more than 1% of the Fund’s net assets. The total value of smaller holdings is reported as a single amount within each category.
The Fund reports a complete list of its holdings in regulatory filings four times in each fiscal year, at the quarter end. For the second and fourth fiscal quarters, the complete listing of the Fund’s holdings is available electronically in the Fund’s Form N-CSR at http://www.bairdfunds.com/prospectuses-reports and on the Securities and Exchange Commission’s website (www.sec.gov) or you can have it mailed to you without charge by calling 1-866-44BAIRD. For the first and third fiscal quarters, the Fund files the lists with the SEC on Form N-Q. Shareholders can look up the Fund’s Forms N-CSR and N-Q on the SEC’s website (www.sec.gov).
Long-Term Investments
| Principal | % of | |||||||||||
| Amount | Value | Net Assets | ||||||||||
| U.S. Treasury Securities | ||||||||||||
| U.S. Treasury Bonds: | ||||||||||||
| 1.250%, 04/30/2019@ | $ | 143,300,000 | $ | 141,631,845 | 8.9 | % | ||||||
| 2.625%, 08/15/2020@ | 262,525,000 | 274,154,070 | 17.3 | % | ||||||||
| 7.875%, 02/15/2021@ | 67,000,000 | 90,518,072 | 5.7 | % | ||||||||
| 2.500%, 05/15/2024 | 13,000,000 | 13,393,042 | 0.9 | % | ||||||||
| Total U.S. Treasury Securities | ||||||||||||
| (Cost $515,610,298) | 519,697,029 | 32.8 | % | |||||||||
| Corporate Bonds | ||||||||||||
| Finance | ||||||||||||
| Citizens Bank, National Association, | ||||||||||||
| 2.450%, 12/04/2019 | 8,000,000 | 7,950,000 | 0.5 | % | ||||||||
| Comerica Bank, | ||||||||||||
| 5.200%, 08/22/2017 | 5,570,000 | 6,054,039 | 0.4 | % | ||||||||
| Commonwealth Bank of Australia, | ||||||||||||
| 5.000%, 10/15/2019 (Acquired 03/02/2012 | ||||||||||||
| through 10/03/2014, Cost $4,596,189)* f | 4,335,000 | 4,839,910 | 0.3 | % | ||||||||
| LeasePlan Corporation N.V., | ||||||||||||
| 2.500%, 05/16/2018 (Acquired 05/29/2013 | ||||||||||||
| through 10/20/2014, Cost $5,026,908)* f | 5,000,000 | 5,002,145 | 0.3 | % | ||||||||
| Macquarie Bank Limited, | ||||||||||||
| 2.000%, 08/15/2016 (Acquired 08/07/2013, | ||||||||||||
| Cost $4,998,250)* f | 5,000,000 | 5,060,895 | 0.3 | % | ||||||||
| Synchrony Financial, | ||||||||||||
| 3.750%, 08/15/2021 | 5,000,000 | 5,107,445 | 0.3 | % | ||||||||
| The Huntington National Bank, | ||||||||||||
| 1.300%, 11/20/2016 | 4,850,000 | 4,829,984 | 0.3 | % | ||||||||
| Other Finance#~ | 288,156,756 | 18.2 | % | |||||||||
| Total Finance | ||||||||||||
| (Cost $318,318,244) | 327,001,174 | 20.6 | % | |||||||||
The accompanying notes are an integral part of these financial statements.
Page 30
Baird Intermediate Bond Fund
Summary Schedule of Investments, December 31, 2014
Long-Term Investments (cont.)
| Principal | % of | |||||||||||
| Amount | Value | Net Assets | ||||||||||
| Utility | ||||||||||||
| Other Utility#~ | $ | 28,839,901 | 1.8 | % | ||||||||
| Total Utility | ||||||||||||
| (Cost $27,910,938) | 28,839,901 | 1.8 | % | |||||||||
| Industrials | ||||||||||||
| 21st CENTURY FOX AMERICA, INC., | ||||||||||||
| 8.000%, 10/17/2016 | $ | 5,575,000 | 6,225,485 | 0.4 | % | |||||||
| Hutchison Whampoa International (09) Limited, | ||||||||||||
| 7.625%, 04/09/2019 (Acquired 10/16/2009 | ||||||||||||
| through 04/16/2014, Cost $6,136,117)* f | 5,400,000 | 6,532,369 | 0.4 | % | ||||||||
| Hyundai Capital Services, Inc., | ||||||||||||
| 3.500%, 09/13/2017 (Acquired 08/04/2014 | ||||||||||||
| through 09/30/2014, Cost $6,422,012)* f | 6,150,000 | 6,362,034 | 0.4 | % | ||||||||
| ONEOK Partners, L.P., | ||||||||||||
| 3.375%, 10/01/2022 | 6,000,000 | 5,553,972 | 0.4 | % | ||||||||
| Pearson Funding Two plc, | ||||||||||||
| 4.000%, 05/17/2016 (Acquired 10/03/2014, | ||||||||||||
| Cost $6,230,596)* f | 6,000,000 | 6,236,658 | 0.4 | % | ||||||||
| Petrofac Limited, | ||||||||||||
| 3.400%, 10/10/2018 (Acquired 10/03/2013 | ||||||||||||
| through 09/19/2014, Cost $6,959,451)* f | 6,880,000 | 6,787,340 | 0.4 | % | ||||||||
| Seagate HDD Cayman, | ||||||||||||
| 6.875%, 05/01/2020 f | 5,000,000 | 5,250,000 | 0.3 | % | ||||||||
| Valero Energy Corporation, | ||||||||||||
| 9.375%, 03/15/2019 | 5,898,000 | 7,355,579 | 0.5 | % | ||||||||
| Verizon Communications Inc., | ||||||||||||
| 5.150%, 09/15/2023 | 6,100,000 | 6,735,821 | 0.4 | % | ||||||||
| Waste Management, Inc., | ||||||||||||
| 7.375%, 03/11/2019 | 5,000,000 | 6,042,715 | 0.4 | % | ||||||||
| Other Industrials#~ | 272,477,213 | 17.2 | % | |||||||||
| Total Industrials | ||||||||||||
| (Cost $330,552,397) | 335,559,186 | 21.2 | % | |||||||||
| Total Corporate Bonds | ||||||||||||
| (Cost $676,781,579) | 691,400,261 | 43.6 | % | |||||||||
| Other Government Related Securities | ||||||||||||
| CNOOC Nexen Finance (2014) ULC, | ||||||||||||
| 4.250%, 04/30/2024 f | 5,150,000 | 5,328,597 | 0.3 | % | ||||||||
| Federal Home Loan Mortgage Corporation (FHLMC), | ||||||||||||
| 1.375%, 05/01/2020@ | 10,000,000 | 9,751,660 | 0.6 | % | ||||||||
| Other Government Related Securities#~ | 27,081,569 | 1.8 | % | |||||||||
| Total Other Government Related Securities | ||||||||||||
| (Cost $40,870,072) | 42,161,826 | 2.7 | % | |||||||||
The accompanying notes are an integral part of these financial statements.
Page 31
Baird Intermediate Bond Fund
Summary Schedule of Investments, December 31, 2014
Long-Term Investments (cont.)
| Principal | % of | |||||||||||
| Amount | Value | Net Assets | ||||||||||
| Taxable Municipal Bonds | ||||||||||||
| New Jersey Economic Development Authority, | ||||||||||||
| 1.802%, 06/15/2017 | $ | 5,000,000 | $ | 4,964,950 | 0.3 | % | ||||||
| Other Taxable Municipal Bonds# | 26,363,925 | 1.7 | % | |||||||||
| Total Taxable Municipal Bonds | ||||||||||||
| (Cost $30,180,895) | 31,328,875 | 2.0 | % | |||||||||
| Residential Mortgage-Backed Securities | ||||||||||||
| U.S. Government Agency Issues | ||||||||||||
| Other U.S. Government Agency Issues# | 938,541 | 0.1 | % | |||||||||
| Total U.S. Government Agency Issues | ||||||||||||
| (Cost $887,801) | 938,541 | 0.1 | % | |||||||||
| Non-U.S. Government Agency Issues | ||||||||||||
| Banc of America Funding Trust, | ||||||||||||
| Series 2004-2, Class 1CB1, 5.750%, 09/20/2034 | 5,035,983 | 5,429,036 | 0.3 | % | ||||||||
| Structured Asset Securities Corp | ||||||||||||
| Mortgage Pass-Through Certificates, | ||||||||||||
| Series 2004-22, Class A2, 5.133%, 01/25/2035 | 7,597,574 | 7,864,226 | 0.5 | % | ||||||||
| WaMu Mortgage Pass-Through Certificates: | ||||||||||||
| Series 2004-AR3, Class A1, 2.370%, 06/25/2034 | 6,545,568 | 6,605,546 | 0.4 | % | ||||||||
| Series 2004-CB2, Class 3A, 6.000%, 08/25/2034 | 4,887,754 | 5,225,953 | 0.3 | % | ||||||||
| Other Non-U.S. Government Agency Issues#~ | 12,637,818 | 0.9 | % | |||||||||
| Total Non-U.S. Government Agency Issues | ||||||||||||
| (Cost $37,632,608) | 37,762,579 | 2.4 | % | |||||||||
| Asset Backed Securities | ||||||||||||
| Ford Credit Auto Owner Trust: | ||||||||||||
| Series 2014-1, Class A, 2.260%, 11/15/2025 (Acquired | ||||||||||||
| 10/07/2014 through 10/09/2014, Cost $10,913,561)* | 10,859,000 | 10,916,965 | 0.7 | % | ||||||||
| Series 2014-2, Class A, 2.310%, 04/15/2026 | ||||||||||||
| (Acquired 10/07/2014, Cost $11,745,689)* | 11,750,000 | 11,780,268 | 0.7 | % | ||||||||
| Nomura Holdings, Inc., | ||||||||||||
| Series 2006-HE2, Class A3, 0.340%, 03/25/2036 | 6,445,215 | 6,275,171 | 0.4 | % | ||||||||
| Securitized Asset Backed Receivables LLC Trust, | ||||||||||||
| Series 2005-OP2, Class A1, 0.495%, 10/25/2035 | ||||||||||||
| (Acquired 03/13/2014, Cost $7,570,677)* | 7,664,083 | 7,575,939 | 0.5 | % | ||||||||
| Specialty Underwriting & Residential Finance Trust, | ||||||||||||
| Series 2006-BC1, Class A2D, 0.470%, 12/25/2036 | 7,617,879 | 7,378,845 | 0.5 | % | ||||||||
| Springleaf Funding Trust, | ||||||||||||
| Series 2013-AA, Class A, 2.580%, 09/15/2021 | ||||||||||||
| (Acquired 02/14/2014, Cost $5,021,458)* | 5,000,000 | 5,014,395 | 0.3 | % | ||||||||
| Structured Asset Investment Loan Trust, | ||||||||||||
| Series 2004-9, Class A5, 1.170%, 10/25/2034 | 7,899,820 | 7,885,340 | 0.5 | % | ||||||||
| Other Asset Backed Securities#~ | 37,394,504 | 2.3 | % | |||||||||
| Total Asset Backed Securities | ||||||||||||
| (Cost $94,050,350) | 94,221,427 | 5.9 | % | |||||||||
The accompanying notes are an integral part of these financial statements.
Page 32
Baird Intermediate Bond Fund
Summary Schedule of Investments, December 31, 2014
Long-Term Investments (cont.)
| Principal | % of | |||||||||||
| Amount | Value | Net Assets | ||||||||||
| Commercial Mortgage Backed Securities | ||||||||||||
| Bear Stearns Commercial Mortgage Securities Trust, | ||||||||||||
| Series 2005-PWR9, Class A4A, 4.871%, 09/11/2042 | $ | 5,337,924 | $ | 5,414,790 | 0.3 | % | ||||||
| CD Commercial Mortgage Trust, | ||||||||||||
| Series 2005-CD1, Class A4, 5.226%, 07/15/2044 | 6,551,416 | 6,657,273 | 0.4 | % | ||||||||
| DBUBS Mortgage Trust, | ||||||||||||
| Series 2011-LC3A, Class A2, 3.642%, 08/10/2044 | 6,885,000 | 7,108,012 | 0.5 | % | ||||||||
| FHLMC Multifamily Structured Pass Through Certificates: | ||||||||||||
| Series K-708, Class A2, 2.130%, 01/25/2019 | 8,300,000 | 8,393,010 | 0.5 | % | ||||||||
| Series K-003, Class A4, 5.053%, 01/25/2019 | 9,000,000 | 10,054,692 | 0.6 | % | ||||||||
| Series K-004, Class A2, 4.186%, 08/25/2019 | 5,875,000 | 6,416,217 | 0.4 | % | ||||||||
| Series K-005, Class A2, 4.317%, 11/25/2019 | 4,975,000 | 5,472,321 | 0.4 | % | ||||||||
| Series K-F02, Class A3, 0.800%, 07/25/2020 | 6,441,042 | 6,477,054 | 0.4 | % | ||||||||
| 1.655%-4.251%, 11/25/2016-01/25/2020 | 8,083,000 | 8,400,633 | 0.6 | % | ||||||||
| J.P. Morgan Chase Commercial Mortgage Securities Trust, | ||||||||||||
| Series 2005-CB12, Class A4, 4.895%, 09/12/2037 | 5,000,000 | 5,051,875 | 0.3 | % | ||||||||
| Wachovia Bank Commercial Mortgage Trust, | ||||||||||||
| Series 2005-C22, Class A4, 5.269%, 12/15/2044 | 9,027,691 | 9,220,423 | 0.6 | % | ||||||||
| Wells Fargo Commercial Mortgage Trust, | ||||||||||||
| Series 2014-LC18, Class ASB, 3.244%, 12/15/2047 | 10,000,000 | 10,245,800 | 0.6 | % | ||||||||
| WFRBS Commercial Mortgage Trust: | ||||||||||||
| Series 2012-C6, Class A4, 3.440%, 04/15/2045 | 8,000,000 | 8,358,064 | 0.5 | % | ||||||||
| Series 2014-C24, Class ASB, 3.324%, 11/15/2047 | 8,275,000 | 8,539,742 | 0.5 | % | ||||||||
| Series 2014-C21, Class A2, 2.917%, 08/15/2047 | 2,435,234 | 2,500,304 | 0.2 | % | ||||||||
| Other Commercial Mortgage Backed Securities#~ | 14,364,440 | 0.9 | % | |||||||||
| Total Commercial Mortgage Backed Securities | ||||||||||||
| (Cost $122,882,319) | 122,674,650 | 7.7 | % | |||||||||
| Total Long-Term Investments | ||||||||||||
| (Cost $1,518,895,922) | 1,540,185,188 | 97.2 | % | |||||||||
| Short-Term Investments | ||||||||||||
| Shares | ||||||||||||
| Money Market Mutual Funds | ||||||||||||
| Dreyfus Cash Advantage Fund, 0.06%« | 12,590,051 | 12,590,051 | 0.8 | % | ||||||||
| Short-Term Investments Trust – | ||||||||||||
| Liquid Assets Portfolio, 0.07%« | 30,000,000 | 30,000,000 | 1.9 | % | ||||||||
| Total Short-Term Investments | ||||||||||||
| (Cost $42,590,051) | 42,590,051 | 2.7 | % | |||||||||
The accompanying notes are an integral part of these financial statements.
Page 33
Baird Intermediate Bond Fund
Summary Schedule of Investments, December 31, 2014
Investments Purchased with Cash
Proceeds from Securities Lending
| % of | ||||||||||||
| Shares | Value | Net Assets | ||||||||||
| Investment Companies | ||||||||||||
| Mount Vernon Securities Lending | ||||||||||||
| Trust Prime Portfolio, 0.29%« | 192,781,148 | $ | 192,781,148 | 12.2 | % | |||||||
| Total Investment Companies | ||||||||||||
| (Cost $192,781,148) | 192,781,148 | 12.2 | % | |||||||||
| Total Investments Purchased With | ||||||||||||
| Cash Proceeds From Securities Lending | ||||||||||||
| (Cost $192,781,148) | 192,781,148 | 12.2 | % | |||||||||
| Total Investments | ||||||||||||
| (Cost $1,754,267,121) | 1,775,556,387 | 112.1 | % | |||||||||
| Liabilities in Excess of Other Assets | (191,777,476 | ) | (12.1 | )% | ||||||||
| TOTAL NET ASSETS | $ | 1,583,778,911 | 100.0 | % | ||||||||
Notes to Summary Schedule of Investments
| * | Restricted Security Deemed Liquid |
| @ | This security or portion of this security is out on loan at December 31, 2014. |
| f | Foreign Security |
| « | 7-Day Yield |
| # | Represents the aggregate value, by category, securities that are not among the 50 largest holdings and, in total for any issuer, represent 1% or less of net assets. |
| ~ | Groupings contain, in aggregate, restricted securities totaling $161,203,712 representing 10.18% of net assets. |
Summary of Fair Value Exposure at December 31, 2014
The Fund has adopted authoritative fair valuation accounting standards which establish a definition of fair value and set out a hierarchy for measuring fair value. These standards require additional disclosures about the various inputs and valuation techniques used to develop the measurements of fair value and a discussion on changes in valuation techniques and related inputs during the period. These standards define fair value as the price that would be received to sell an asset or paid to transfer a liability in an orderly transaction between market participants at the measurement date.
The fair value hierarchy is organized into three levels based upon the assumptions (referred to as “inputs”) used in pricing the asset or liability. These standards state that “observable inputs” reflect the assumptions market participants would use in pricing the asset or liability based on market data obtained from independent sources and “unobservable inputs” reflect an entity’s own assumptions about the assumptions market participants would use in pricing the asset or liability. These inputs are summarized into three broad levels and described below:
Level 1 – | Unadjusted quoted prices in active markets for identical unrestricted securities. |
Level 2 – | Other significant observable inputs (including quoted prices for similar securities, quoted prices in inactive markets, dealer indications, interest rates, yield curves, prepayment speeds, credit risk, default rates, inputs corroborated by observable market data, etc.). |
Level 3 – | Significant unobservable inputs (including the Fund’s own assumptions about the factors that market participants would use in valuing the security) based on the best information available. |
The inputs or methodology used for valuing securities are not necessarily an indication of the risk associated with investing in those securities.
The accompanying notes are an integral part of these financial statements.
Page 34
Baird Intermediate Bond Fund
Summary Schedule of Investments, December 31, 2014
Summary of Fair Value Exposure at December 31, 2014 (cont.)
The following is a summary of the inputs used to value the Fund’s investments as of December 31, 2014:
| Level 1 | Level 2 | Level 3 | Total | |||||||||||||
| Long-Term Investments | ||||||||||||||||
| U.S. Treasury Securities | $ | — | $ | 519,697,029 | $ | — | $ | 519,697,029 | ||||||||
| Corporate Bonds | — | 691,379,750 | 20,511 | 691,400,261 | ||||||||||||
| Other Government Related Securities | — | 42,161,826 | — | 42,161,826 | ||||||||||||
| Taxable Municipal Bonds | — | 31,328,875 | — | 31,328,875 | ||||||||||||
| Residential Mortgage-Backed Securities – | ||||||||||||||||
| U.S. Government Agency Issues | — | 938,541 | — | 938,541 | ||||||||||||
| Residential Mortgage-Backed Securities – | ||||||||||||||||
| Non-U.S. Government Agency Issues | — | 37,762,579 | — | 37,762,579 | ||||||||||||
| Asset Backed Securities | — | 94,221,427 | — | 94,221,427 | ||||||||||||
| Commercial Mortgage-Backed Securities | — | 122,674,650 | — | 122,674,650 | ||||||||||||
| Total Long-Term Investments | — | 1,540,164,677 | 20,511 | 1,540,185,188 | ||||||||||||
| Short-Term Investments | ||||||||||||||||
| Money Market Mutual Funds | 42,590,051 | — | — | 42,590,051 | ||||||||||||
| Total Short-Term Investments | 42,590,051 | — | — | 42,590,051 | ||||||||||||
| Investments Purchased with Cash | ||||||||||||||||
| Proceeds from Securities Lending | ||||||||||||||||
| Investment Companies | 192,781,148 | — | — | 192,781,148 | ||||||||||||
| Total Investments Purchased with | ||||||||||||||||
| Cash Proceeds from Securities Lending | 192,781,148 | — | — | 192,781,148 | ||||||||||||
| Total Investments | $ | 235,371,199 | $ | 1,540,164,677 | $ | 20,511 | $ | 1,775,556,387 | ||||||||
Changes in valuation techniques may result in transfers into or out of assigned levels within the fair value hierarchy. There were no transfers between Level 1 and Level 2 fair value measurements during the reporting period, as compared to their classification from the prior year’s annual report. There were two transfers between Level 2 and Level 3 fair value measurements during the reporting period, as compared to their classification from the prior year’s annual report. One security that had been priced by the Valuation Committee using Level 3 inputs instead of the Fund’s pricing vendor transferred to Level 2 from Level 3 due to the Fund’s pricing vendor beginning to price the security. One security that had been priced by the Fund’s pricing vendor began to be priced by the Valuation Committee using Level 3 inputs and transferred from Level 2 to Level 3. See the Fund’s valuation policy in Note 2a to the financial statements.
Level 3 Reconciliation Disclosure
Following is a reconciliation of Level 3 assets for which significant unobservable inputs were used to determine fair value.
| Description | Investments in Securities | |||
| Balance as of December 31, 2013 | $ | 392 | ||
| Accrued discounts/premiums | — | |||
| Realized gain (loss) | — | |||
| Change in unrealized appreciation (depreciation) | 3,565 | |||
| Purchases | — | |||
| Sales | — | |||
| Transfers in and/or out of Level 3* | 16,554 | |||
| Balance as of December 31, 2014 | $ | 20,511 | ||
* Transfers between levels are recognized at the end of the reporting period.
The accompanying notes are an integral part of these financial statements.
Page 35
Baird Intermediate Municipal Bond Fund
December 31, 2014
The Baird Intermediate Municipal Bond Fund seeks current income that is substantially exempt from federal income tax. A secondary objective is to provide total return with relatively low volatility of principal. The Fund uses the Barclays 7-Year General Obligation Bond Index as its benchmark. The Barclays 7-Year General Obligation Bond Index is an unmanaged, market value weighted index consisting of investment grade state and local general obligation bonds that have been issued as part of an offering of at least $50 million; have a minimum amount outstanding of at least $5 million; have been issued within the last five years; and have a maturity of six to eight years.
The Fund had solid absolute returns in 2014 though it lagged its benchmark for the year as investor demand for additional yield continued to help lower quality issues outperform higher quality sectors of the market. The portfolio benefited from its yield curve positioning relative to its benchmark as the yield curve flattened, but its high quality bias limited its return. We believe the Fund’s focus on high quality intermediate maturities will serve our investors well in 2015 given the current level of interest rates near historic lows and the ongoing financial strain on many municipalities.
The Fund had a very broadly diversified portfolio at year end, with 53% of its investments in pre-refunded bonds. Pre-refunded municipal bonds are generally regarded as the safest municipal bonds available as their interest and principal payments are paid from an escrow account which holds U.S. Treasury and/or U.S. Agency securities. With its focus on high-quality holdings and intermediate duration, we believe the Fund is well-positioned for the uncertain environment for municipal bonds as we enter 2015.
Page 36
Baird Intermediate Municipal Bond Fund
December 31, 2014 (Unaudited)
Portfolio Characteristics
Quality Distribution(1)(2)
 | Net Assets | $1,105,612,651 | ||
| SEC 30-Day | ||||
Yield(4) | ||||
| Institutional Class | 1.65% | |||
| Investor Class | 1.40% | |||
| Average | ||||
| Effective | ||||
| Duration | 4.50 years | |||
| Average | ||||
| Effective | ||||
| Maturity | 5.40 years | |||
Sector Weightings(1) | Annualized | |||
| Expense | ||||
 | Ratio | |||
| Institutional Class | 0.30% | |||
| Investor Class | 0.55%(5) | |||
| Portfolio | ||||
| Turnover | ||||
| Rate | 4.7% | |||
| Number of | ||||
| Holdings | 299 | |||
| (1) | Percentages shown are based on the Fund’s total investments. |
| (2) | The quality profile is calculated on a market value-weighted basis using the highest credit quality rating for each security held by the Fund given by S&P, Moody’s or Fitch, each of which is a Nationally Recognized Statistical Rating Organization (NRSRO). NRSROs rate the credit quality of securities using a scale that generally ranges from AAA (highest) to D (lowest). |
| (3) | Includes pre-refunded and escrowed-to-maturity (ETM) bonds. |
| (4) | SEC yields are based on SEC guidelines and are calculated for the 30 days ended December 31, 2014. |
| (5) | Includes 0.25% 12b-1 fee. |
Page 37
Baird Intermediate Municipal Bond Fund
December 31, 2014 (Unaudited)
Institutional Class
Value of a $25,000 Investment
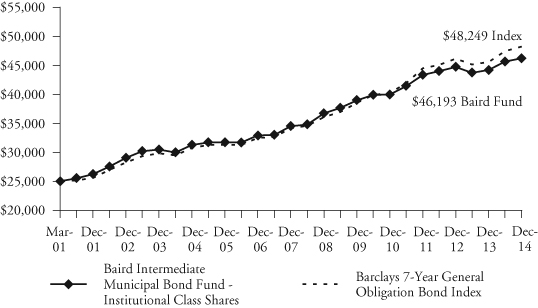
Growth of a hypothetical investment of $25,000 made on the Fund’s inception date (3/30/01), assuming reinvestment of all distributions.
Investor Class
Value of a $10,000 Investment
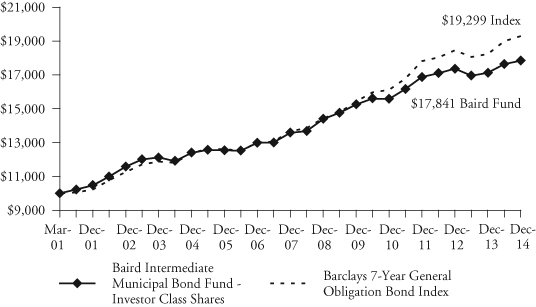
Growth of a hypothetical investment of $10,000 made on the Fund’s inception date (3/30/01), assuming reinvestment of all distributions.
Page 38
Baird Intermediate Municipal Bond Fund
December 31, 2014 (Unaudited)
Total Returns
| Average Annual | ||||
| One | Five | Ten | Since | |
| For the Periods Ended December 31, 2014 | Year | Years | Years | Inception(1) |
| Institutional Class Shares | 4.54% | 3.44% | 3.96% | 4.56% |
| Investor Class Shares | 4.27% | 3.18% | 3.70% | 4.30% |
Barclays 7-Year General Obligation Bond Index(2) | 5.81% | 4.58% | 4.61% | 4.90% |
| (1) | For the period from March 30, 2001 (inception date) through December 31, 2014. |
| (2) | The Barclays 7-Year General Obligation Bond Index is an unmanaged, market value weighted index comprised of investment grade state and local general obligation bonds that have been issued as part of an offering of at least $50 million, have a minimum amount outstanding of at least $5 million, have been issued within the last five years and have a maturity of six to eight years. This index does not reflect any deduction for fees, expenses or taxes. A direct investment in an index is not possible. |
The line graph on the previous page and the returns shown in the table above reflect reinvestment of dividends and/or capital gains distributions in additional shares. The returns do not reflect the deduction of taxes that a shareholder would pay on Fund distributions or the redemption of Fund shares. The returns reflect the actual performance for each period and do not include the impact of trades executed on the last business day of the period that were recorded on the first business day of the next period.
The Fund’s gross expense ratio for each Class, as reflected in the Fund’s current prospectus, is set forth under “Portfolio Characteristics”.
The Fund may invest up to 25% of its total assets in municipal obligations issued by persons in the same state. As a result, changes in economic, business or political conditions of a particular state may have a disproportionate impact on the Fund’s share price. Municipal securities investments are not appropriate for all investors, especially those taxed at lower rates.
Past performance does not guarantee future results. Investment return and principal value will fluctuate so that an investor’s shares, when redeemed, may be worth more or less than their original cost.
For information about the performance of the Fund as of the most recent month-end, please call 1-866-44BAIRD or visit www.bairdfunds.com. Mutual fund performance changes over time and current performance may be lower or higher than that stated.
Page 39
Baird Intermediate Municipal Bond Fund
Summary Schedule of Investments, December 31, 2014
This schedule summarizes the Fund’s holdings by asset type. Details are reported for each of the Fund’s 50 largest individual holdings and for investments that, in total for any issuer, represent more than 1% of the Fund’s net assets. The total value of smaller holdings is reported as a single amount within each category.
The Fund reports a complete list of its holdings in regulatory filings four times in each fiscal year, at the quarter end. For the second and fourth fiscal quarters, the complete listing of the Fund’s holdings is available electronically in the Fund’s Form N-CSR at http://www.bairdfunds.com/prospectuses-reports and on the Securities and Exchange Commission’s website (www.sec.gov) or you can have it mailed to you without charge by calling 1-866-44BAIRD. For the first and third fiscal quarters, the Fund files the lists with the SEC on Form N-Q. Shareholders can look up the Fund’s Forms N-CSR and N-Q on the SEC’s website (www.sec.gov).
Long-Term Investments
| Principal | % of | |||||||||||
| Amount | Value | Net Assets | ||||||||||
| Municipal Bonds | ||||||||||||
| Alabama | ||||||||||||
| Other Alabama# | $ | 2,366,049 | 0.2 | % | ||||||||
| Total Alabama | ||||||||||||
| (Cost $2,177,319) | 2,366,049 | 0.2 | % | |||||||||
| Alaska | ||||||||||||
| Other Alaska# | 1,019,270 | 0.1 | % | |||||||||
| Total Alaska | ||||||||||||
| (Cost $1,003,903) | 1,019,270 | 0.1 | % | |||||||||
| Arizona | ||||||||||||
| Other Arizona# | 3,070,223 | 0.3 | % | |||||||||
| Total Arizona | ||||||||||||
| (Cost $2,923,370) | 3,070,223 | 0.3 | % | |||||||||
| Arkansas | ||||||||||||
| Other Arkansas# | 1,129,880 | 0.1 | % | |||||||||
| Total Arkansas | ||||||||||||
| (Cost $1,137,808) | 1,129,880 | 0.1 | % | |||||||||
| California | ||||||||||||
| Bakersfield California Certificates Participation | ||||||||||||
| 0.000%, 04/15/2021 (ETM) | $ | 12,380,000 | 11,028,971 | 1.0 | % | |||||||
| San Joaquin Hills California Transportation | ||||||||||||
| Corridor Agency Toll Road Revenue | ||||||||||||
| 0.000%, 01/01/2020 (ETM) | 6,865,000 | 6,403,672 | 0.6 | % | ||||||||
| 0.000%, 01/01/2023 (ETM) | 14,000,000 | 11,858,140 | 1.0 | % | ||||||||
| San Marcos California Public | ||||||||||||
| Facilities Authority Revenue | ||||||||||||
| 0.000%, 09/01/2019 (ETM) | 17,295,000 | 16,192,963 | 1.5 | % | ||||||||
| Other California# | 10,425,987 | 1.0 | % | |||||||||
| Total California | ||||||||||||
| (Cost $51,084,577) | 55,909,733 | 5.1 | % | |||||||||
The accompanying notes are an integral part of these financial statements.
Page 40
Baird Intermediate Municipal Bond Fund
Summary Schedule of Investments, December 31, 2014
Long-Term Investments (cont.)
| Principal | % of | |||||||||||
| Amount | Value | Net Assets | ||||||||||
| Colorado | ||||||||||||
| Dawson Ridge Metropolitan District No. 1 Colorado | ||||||||||||
| 0.000%, 10/01/2022 (ETM) | $ | 17,540,000 | $ | 14,899,704 | 1.3 | % | ||||||
| 0.000%, 10/01/2022 (ETM) | 26,895,000 | 22,846,495 | 2.1 | % | ||||||||
| Regional Transportation District | ||||||||||||
| Colorado Sales Tax Revenue | ||||||||||||
| 5.000%, 11/01/2036 (Pre-refunded to 11/01/2016) | 6,785,000 | 7,328,207 | 0.7 | % | ||||||||
| Other Colorado# | 12,708,636 | 1.1 | % | |||||||||
| Total Colorado | ||||||||||||
| (Cost $55,235,906) | 57,783,042 | 5.2 | % | |||||||||
| Connecticut | ||||||||||||
| Other Connecticut# | 5,172,956 | 0.5 | % | |||||||||
| Total Connecticut | ||||||||||||
| (Cost $5,020,871) | 5,172,956 | 0.5 | % | |||||||||
| Delaware | ||||||||||||
| Other Delaware# | 2,357,780 | 0.2 | % | |||||||||
| Total Delaware | ||||||||||||
| (Cost $2,367,226) | 2,357,780 | 0.2 | % | |||||||||
| Florida | ||||||||||||
| Broward County Florida School Board | ||||||||||||
| 5.250%, 07/01/2022 (Callable 07/01/2021) | 8,390,000 | 9,962,370 | 0.9 | % | ||||||||
| 5.250%, 07/01/2023 (Callable 07/01/2021) | 4,915,000 | 5,748,486 | 0.5 | % | ||||||||
| County of St. Lucie Florida | ||||||||||||
| 6.000%, 10/01/2020 (ETM) | 6,420,000 | 7,725,122 | 0.7 | % | ||||||||
| Florida State Board of Education | ||||||||||||
| 5.000%, 06/01/2022 (Callable 06/01/2019) | 13,800,000 | 15,965,082 | 1.4 | % | ||||||||
| Miami-Dade County Florida | ||||||||||||
| 4.500%, 10/01/2020 | 7,100,000 | 8,098,544 | 0.7 | % | ||||||||
| Other Florida# | 54,608,006 | 5.0 | % | |||||||||
| Total Florida | ||||||||||||
| (Cost $95,070,015) | 102,107,610 | 9.2 | % | |||||||||
| Georgia | ||||||||||||
| Atlanta Georgia Water & Wastewater Revenue | ||||||||||||
| 5.500%, 11/01/2017 (Insured by AGM) | 8,445,000 | 9,516,417 | 0.9 | % | ||||||||
| Forsyth County Georgia Hospital Authority | ||||||||||||
| Revenue Anticipation Certificates | ||||||||||||
| 6.375%, 10/01/2028 (ETM) | 8,050,000 | 10,295,708 | 0.9 | % | ||||||||
| Gwinnett County Georgia School District | ||||||||||||
| 5.000%, 02/01/2026 (Pre-refunded to 02/01/2018) | 7,400,000 | 8,318,858 | 0.7 | % | ||||||||
The accompanying notes are an integral part of these financial statements.
Page 41
Baird Intermediate Municipal Bond Fund
Summary Schedule of Investments, December 31, 2014
Long-Term Investments (cont.)
| Principal | % of | |||||||||||
| Amount | Value | Net Assets | ||||||||||
| State of Georgia | ||||||||||||
| 5.000%, 07/01/2020 (Callable 07/01/2017) | $ | 12,570,000 | $ | 13,889,976 | 1.3 | % | ||||||
| Other Georgia# | 11,494,066 | 1.0 | % | |||||||||
| Total Georgia | ||||||||||||
| (Cost $52,116,384) | 53,515,025 | 4.8 | % | |||||||||
| Illinois | ||||||||||||
| Chicago Illinois Board of Education | ||||||||||||
| 6.000%, 01/01/2020 (Insured by NPFGC) | 14,745,000 | 16,501,572 | 1.5 | % | ||||||||
| 5.000%-5.000%, 12/01/2017-12/01/2017 | 6,445,000 | 6,921,363 | 0.6 | % | ||||||||
| Illinois Development Financial Authority | ||||||||||||
| 0.000%, 07/15/2023 (ETM) | 21,475,000 | 17,760,684 | 1.6 | % | ||||||||
| Illinois Finance Authority | ||||||||||||
| 0.000%, 07/15/2025 (ETM) | 12,625,000 | 9,760,514 | 0.9 | % | ||||||||
| Kane McHenry Cook & De Kalb | ||||||||||||
| Counties Illinois School District No. 300 | ||||||||||||
| 7.000%, 01/01/2018 (ETM) | 5,775,000 | 6,812,479 | 0.6 | % | ||||||||
| Kendall Kane & Will Counties | ||||||||||||
| Community Unit School District No. 308 | ||||||||||||
| 0.000%, 02/01/2021 | 13,625,000 | 11,710,824 | 1.1 | % | ||||||||
| Village of Schaumburg IL | ||||||||||||
| 4.000%, 12/01/2024 (Callable 12/01/2022) | 5,750,000 | 6,291,477 | 0.6 | % | ||||||||
| Other Illinois# | 60,066,239 | 5.4 | % | |||||||||
| Total Illinois | ||||||||||||
| (Cost $130,031,911) | 135,825,152 | 12.3 | % | |||||||||
| Indiana | ||||||||||||
| Other Indiana# | 15,073,300 | 1.4 | % | |||||||||
| Total Indiana | ||||||||||||
| (Cost $14,341,676) | 15,073,300 | 1.4 | % | |||||||||
| Kansas | ||||||||||||
| Other Kansas# | 3,302,857 | 0.3 | % | |||||||||
| Total Kansas | ||||||||||||
| (Cost $3,111,559) | 3,302,857 | 0.3 | % | |||||||||
| Kentucky | ||||||||||||
| Louisville & Jefferson County | ||||||||||||
| Metropolitan Government | ||||||||||||
| 6.125%, 02/01/2037 (Pre-refunded to 02/01/2018) | 13,665,000 | 15,826,256 | 1.4 | % | ||||||||
| Other Kentucky# | 3,732,851 | 0.4 | % | |||||||||
| Total Kentucky | ||||||||||||
| (Cost $19,372,369) | 19,559,107 | 1.8 | % | |||||||||
| Louisiana | ||||||||||||
| Louisiana Public Facilities Authority Revenue | ||||||||||||
| 5.500%, 05/15/2027 (Pre-refunded to 05/15/2026) | 9,885,000 | 12,708,749 | 1.2 | % | ||||||||
| 5.500%, 05/15/2032 (Pre-refunded to 05/15/2026) | 20,585,000 | 27,039,427 | 2.4 | % | ||||||||
The accompanying notes are an integral part of these financial statements.
Page 42
Baird Intermediate Municipal Bond Fund
Summary Schedule of Investments, December 31, 2014
Long-Term Investments (cont.)
| Principal | % of | |||||||||||
| Amount | Value | Net Assets | ||||||||||
| State of Louisiana | ||||||||||||
| 5.000%, 11/15/2020 (Callable 05/15/2020) | $ | 10,000,000 | $ | 11,750,300 | 1.0 | % | ||||||
| 5.000%, 11/15/2018 | 1,775,000 | 2,032,872 | 0.2 | % | ||||||||
| Total Louisiana | ||||||||||||
| (Cost $48,029,527) | 53,531,348 | 4.8 | % | |||||||||
| Maryland | ||||||||||||
| Other Maryland# | 3,878,293 | 0.4 | % | |||||||||
| Total Maryland | ||||||||||||
| (Cost $3,844,851) | 3,878,293 | 0.4 | % | |||||||||
| Massachusetts | ||||||||||||
| Massachusetts State | ||||||||||||
| 5.000%, 08/01/2020 (Pre-refunded to 08/01/2016) | 5,820,000 | 6,236,537 | 0.6 | % | ||||||||
| 4.000%, 12/01/2022 (Callable 12/01/2019) | 15,000,000 | 16,571,400 | 1.5 | % | ||||||||
| Other Massachusetts# | 8,410,309 | 0.7 | % | |||||||||
| Total Massachusetts | ||||||||||||
| (Cost $30,499,023) | 31,218,246 | 2.8 | % | |||||||||
| Michigan | ||||||||||||
| Michigan Finance Authority | ||||||||||||
| 5.000%, 01/01/2019 | 7,000,000 | 7,994,140 | 0.7 | % | ||||||||
| Other Michigan# | 31,011,458 | 2.8 | % | |||||||||
| Total Michigan | ||||||||||||
| (Cost $38,424,729) | 39,005,598 | 3.5 | % | |||||||||
| Minnesota | ||||||||||||
| University of Minnesota | ||||||||||||
| 5.500%, 07/01/2021 (ETM) | 9,980,000 | 11,964,922 | 1.1 | % | ||||||||
| Other Minnesota# | 2,870,682 | 0.2 | % | |||||||||
| Total Minnesota | ||||||||||||
| (Cost $14,527,370) | 14,835,604 | 1.3 | % | |||||||||
| Mississippi | ||||||||||||
| Other Mississippi# | 2,649,702 | 0.2 | % | |||||||||
| Total Mississippi | ||||||||||||
| (Cost $2,611,275) | 2,649,702 | 0.2 | % | |||||||||
| Missouri | ||||||||||||
| Other Missouri# | 1,107,360 | 0.1 | % | |||||||||
| Total Missouri | ||||||||||||
| (Cost $1,067,361) | 1,107,360 | 0.1 | % | |||||||||
| Nebraska | ||||||||||||
| Other Nebraska# | 5,960,762 | 0.5 | % | |||||||||
| Total Nebraska | ||||||||||||
| (Cost $5,887,144) | 5,960,762 | 0.5 | % | |||||||||
The accompanying notes are an integral part of these financial statements.
Page 43
Baird Intermediate Municipal Bond Fund
Summary Schedule of Investments, December 31, 2014
Long-Term Investments (cont.)
| Principal | % of | |||||||||||
| Amount | Value | Net Assets | ||||||||||
| Nevada | ||||||||||||
| Other Nevada# | $ | 2,232,110 | 0.2 | % | ||||||||
| Total Nevada | ||||||||||||
| (Cost $2,091,692) | 2,232,110 | 0.2 | % | |||||||||
| New Hampshire | ||||||||||||
| Other New Hampshire# | 3,681,238 | 0.3 | % | |||||||||
| Total New Hampshire | ||||||||||||
| (Cost $3,612,663) | 3,681,238 | 0.3 | % | |||||||||
| New Jersey | ||||||||||||
| New Jersey State Housing & | ||||||||||||
| Mortgage Finance Agency Bonds | ||||||||||||
| 4.500%, 10/01/2029 (Callable 04/01/2021) | $ | 7,305,000 | 7,630,292 | 0.7 | % | |||||||
| Other New Jersey# | 18,569,676 | 1.7 | % | |||||||||
| Total New Jersey | ||||||||||||
| (Cost $25,551,539) | 26,199,968 | 2.4 | % | |||||||||
| New Mexico | ||||||||||||
| Other New Mexico# | 2,808,636 | 0.3 | % | |||||||||
| Total New Mexico | ||||||||||||
| (Cost $2,839,203) | 2,808,636 | 0.3 | % | |||||||||
| New York | ||||||||||||
| Metropolitan Transit Authority New York | ||||||||||||
| 6.000%, 04/01/2020 (ETM) | 13,430,000 | 15,718,472 | 1.4 | % | ||||||||
| New York State Dormitory Authority | ||||||||||||
| 5.000%, 12/15/2023 (Callable 12/15/2022) | 11,685,000 | 14,142,122 | 1.3 | % | ||||||||
| Westchester Tobacco Asset | ||||||||||||
| Securitization Corp. New York | ||||||||||||
| 6.950%, 07/15/2039 (Pre-refunded to 07/15/2017) | 13,075,000 | 15,234,336 | 1.4 | % | ||||||||
| Other New York# | 30,148,665 | 2.7 | % | |||||||||
| Total New York | ||||||||||||
| (Cost $72,682,717) | 75,243,595 | 6.8 | % | |||||||||
| North Carolina | ||||||||||||
| North Carolina Eastern Municipal Power Agency | ||||||||||||
| 5.000%, 01/01/2021 (ETM) | 10,120,000 | 11,909,216 | 1.1 | % | ||||||||
| North Carolina Eastern Municipal | ||||||||||||
| Power Agency Power Systems Revenue | ||||||||||||
| 5.000%, 01/01/2017 (ETM) | 6,630,000 | 6,926,560 | 0.6 | % | ||||||||
| 4.500%, 01/01/2024 (Pre-refunded to 01/01/2022) | 7,665,000 | 9,028,067 | 0.8 | % | ||||||||
| 6.000%-6.400%, 01/01/2021-01/01/2026 | 7,647,000 | 9,147,535 | 0.9 | % | ||||||||
| Total North Carolina | ||||||||||||
| (Cost $36,163,663) | 37,011,378 | 3.4 | % | |||||||||
The accompanying notes are an integral part of these financial statements.
Page 44
Baird Intermediate Municipal Bond Fund
Summary Schedule of Investments, December 31, 2014
Long-Term Investments (cont.)
| Principal | % of | |||||||||||
| Amount | Value | Net Assets | ||||||||||
| Ohio | ||||||||||||
| State of Ohio | ||||||||||||
| 5.000%, 06/15/2021 | $ | 6,740,000 | $ | 8,091,572 | 0.8 | % | ||||||
| Other Ohio# | 15,184,313 | 1.3 | % | |||||||||
| Total Ohio | ||||||||||||
| (Cost $22,601,776) | 23,275,885 | 2.1 | % | |||||||||
| Pennsylvania | ||||||||||||
| Pennsylvania Convention Center | ||||||||||||
| Authority Revenue Bonds | ||||||||||||
| 6.000%, 09/01/2019 (ETM) | 11,125,000 | 12,999,118 | 1.2 | % | ||||||||
| Other Pennsylvania# | 22,199,417 | 2.0 | % | |||||||||
| Total Pennsylvania | ||||||||||||
| (Cost $34,162,782) | 35,198,535 | 3.2 | % | |||||||||
| Puerto Rico | ||||||||||||
| Other Puerto Rico# | 13,433,475 | 1.2 | % | |||||||||
| Total Puerto Rico | ||||||||||||
| (Cost $15,011,212) | 13,433,475 | 1.2 | % | |||||||||
| South Carolina | ||||||||||||
| Piedmont Municipal Power Agency | ||||||||||||
| South Carolina Electric Revenue | ||||||||||||
| 6.750%, 01/01/2020 (ETM) | 6,450,000 | 8,070,949 | 0.7 | % | ||||||||
| Other South Carolina# | 5,468,566 | 0.5 | % | |||||||||
| Total South Carolina | ||||||||||||
| (Cost $12,844,136) | 13,539,515 | 1.2 | % | |||||||||
| South Dakota | ||||||||||||
| Other South Dakota# | 469,537 | 0.1 | % | |||||||||
| Total South Dakota | ||||||||||||
| (Cost $467,290) | 469,537 | 0.1 | % | |||||||||
| Tennessee | ||||||||||||
| Other Tennessee# | 10,300,652 | 0.9 | % | |||||||||
| Total Tennessee | ||||||||||||
| (Cost $10,179,369) | 10,300,652 | 0.9 | % | |||||||||
| Texas | ||||||||||||
| City of Houston TX Combined Utility System Revenue | ||||||||||||
| 0.000%, 12/01/2019 (ETM) | 13,355,000 | 12,411,469 | 1.1 | % | ||||||||
| 5.500%, 12/01/2029 (ETM) | 16,050,000 | 21,784,183 | 2.0 | % | ||||||||
| 5.500%, 12/01/2024 (ETM) | 1,735,000 | 2,206,452 | 0.2 | % | ||||||||
| Harris County Texas | ||||||||||||
| 5.750%, 10/01/2028 (Pre-refunded to 10/01/2018) | 6,830,000 | 8,000,252 | 0.7 | % | ||||||||
| North East Independent School District/TX | ||||||||||||
| 5.000%, 08/01/2021 | 6,095,000 | 7,323,386 | 0.7 | % | ||||||||
The accompanying notes are an integral part of these financial statements.
Page 45
Baird Intermediate Municipal Bond Fund
Summary Schedule of Investments, December 31, 2014
Long-Term Investments (cont.)
| Principal | % of | |||||||||||
| Amount | Value | Net Assets | ||||||||||
| San Antonio Texas Electric & Gas Revenue | ||||||||||||
| 5.650%, 02/01/2019 (ETM) | $ | 11,665,000 | $ | 13,111,577 | 1.2 | % | ||||||
| Tarrant County Texas Health Facilities Revenue | ||||||||||||
| 6.000%, 09/01/2024 (ETM) | 7,990,000 | 9,603,820 | 0.9 | % | ||||||||
| Texas State | ||||||||||||
| 5.000%, 10/01/2018 | 6,285,000 | 7,182,184 | 0.7 | % | ||||||||
| 5.000%-5.000%, 04/01/2020-08/01/2021 | 5,170,000 | 5,654,026 | 0.5 | % | ||||||||
| University of Texas System/The | ||||||||||||
| 5.000%, 08/15/2022 | 9,530,000 | 11,628,506 | 1.1 | % | ||||||||
| Other Texas# | 87,141,538 | 7.7 | % | |||||||||
| Total Texas | ||||||||||||
| (Cost $179,186,786) | 186,047,393 | 16.8 | % | |||||||||
| Utah | ||||||||||||
| Other Utah# | 6,823,145 | 0.6 | % | |||||||||
| Total Utah | ||||||||||||
| (Cost $6,330,992) | 6,823,145 | 0.6 | % | |||||||||
| Virginia | ||||||||||||
| Other Virginia# | 7,243,089 | 0.7 | % | |||||||||
| Total Virginia | ||||||||||||
| (Cost $7,161,750) | 7,243,089 | 0.7 | % | |||||||||
| Washington | ||||||||||||
| Washington Health Care Facilities Authority | ||||||||||||
| 6.250%, 08/01/2036 (Pre-refunded to 08/01/2018) | 7,850,000 | 9,258,133 | 0.8 | % | ||||||||
| 6.125%-6.250%, 08/01/2028-11/15/2041 | 6,195,000 | 7,795,011 | 0.7 | % | ||||||||
| Washington State | ||||||||||||
| 5.000%, 01/01/2021 | 10,000,000 | 11,889,500 | 1.1 | % | ||||||||
| 5.500%, 07/01/2023 | 5,000,000 | 6,165,050 | 0.5 | % | ||||||||
| Other Washington# | 13,833,972 | 1.3 | % | |||||||||
| Total Washington | ||||||||||||
| (Cost $47,371,433) | 48,941,666 | 4.4 | % | |||||||||
| West Virginia | ||||||||||||
| Other West Virginia# | 1,287,816 | 0.1 | % | |||||||||
| Total West Virginia | ||||||||||||
| (Cost $1,268,525) | 1,287,816 | 0.1 | % | |||||||||
| Wisconsin | ||||||||||||
| Other Wisconsin# | 2,825,533 | 0.3 | % | |||||||||
| Total Wisconsin | ||||||||||||
| (Cost $2,631,300) | 2,825,533 | 0.3 | % | |||||||||
| Total Long-Term Investments | ||||||||||||
| (Cost $1,062,045,002) | 1,106,942,063 | 100.1 | % | |||||||||
The accompanying notes are an integral part of these financial statements.
Page 46
Baird Intermediate Municipal Bond Fund
Summary Schedule of Investments, December 31, 2014
Short-Term Investment
| % of | ||||||||||||
| Shares | Value | Net Assets | ||||||||||
| Money Market Mutual Fund | ||||||||||||
| Goldman Sachs Financial Square Funds, 0.01%« | 12,684,854 | $ | 12,684,854 | 1.2 | % | |||||||
| Total Short-Term Investments | ||||||||||||
| (Cost $12,684,854) | 12,684,854 | 1.2 | % | |||||||||
| Total Investments | ||||||||||||
| (Cost $1,074,729,856) | 1,119,626,917 | 101.3 | % | |||||||||
| Liabilities in Excess of Other Assets | (14,014,266 | ) | (1.3 | )% | ||||||||
| TOTAL NET ASSETS | $ | 1,105,612,651 | 100.0 | % | ||||||||
Notes to Summary Schedule of Investments
ETM – Escrowed to Maturity
AGM – Assured Guaranty Municipal
NPFGC – National Public Finance Guarantee Corp.
| « | 7-Day Yield |
| # | Represents the aggregate value, by category, securities that are not among the 50 largest holdings and, in total for any issuer, represent 1% or less of net assets. |
Summary of Fair Value Exposure at December 31, 2014
The Fund has adopted authoritative fair valuation accounting standards which establish a definition of fair value and set out a hierarchy for measuring fair value. These standards require additional disclosures about the various inputs and valuation techniques used to develop the measurements of fair value and a discussion on changes in valuation techniques and related inputs during the period. These standards define fair value as the price that would be received to sell an asset or paid to transfer a liability in an orderly transaction between market participants at the measurement date.
The fair value hierarchy is organized into three levels based upon the assumptions (referred to as “inputs”) used in pricing the asset or liability. These standards state that “observable inputs” reflect the assumptions market participants would use in pricing the asset or liability based on market data obtained from independent sources and “unobservable inputs” reflect an entity’s own assumptions about the assumptions market participants would use in pricing the asset or liability. These inputs are summarized into three broad levels and described below:
Level 1 – | Unadjusted quoted prices in active markets for identical unrestricted securities. |
Level 2 – | Other significant observable inputs (including quoted prices for similar securities, quoted prices in inactive markets, dealer indications, interest rates, yield curves, prepayment speeds, credit risk, default rates, inputs corroborated by observable market data, etc.). |
Level 3 – | Significant unobservable inputs (including the Fund’s own assumptions about the factors that market participants would use in valuing the security) based on the best information available. |
The inputs or methodology used for valuing securities are not necessarily an indication of the risk associated with investing in those securities.
The accompanying notes are an integral part of these financial statements.
Page 47
Baird Intermediate Municipal Bond Fund
Summary Schedule of Investments, December 31, 2014
Summary of Fair Value Exposure at December 31, 2014 (cont.)
The following is a summary of the inputs used to value the Fund’s investments as of December 31, 2014:
| Level 1 | Level 2 | Level 3 | Total | |||||||||||||
| Municipal Bonds | ||||||||||||||||
| Municipal Bonds | $ | — | $ | 1,106,942,063 | $ | — | $ | 1,106,942,063 | ||||||||
| Total Municipal Bonds | — | 1,106,942,063 | — | 1,106,942,063 | ||||||||||||
| Short-Term Investment | ||||||||||||||||
| Money Market Mutual Fund | 12,684,854 | — | — | 12,684,854 | ||||||||||||
| Total Short-Term Investment | 12,684,854 | — | — | 12,684,854 | ||||||||||||
| Total Investments | $ | 12,684,854 | $ | 1,106,942,063 | $ | — | $ | 1,119,626,917 | ||||||||
Changes in valuation techniques may result in transfers into or out of assigned levels within the fair value hierarchy. There were no transfers between Level 1, Level 2 and Level 3 fair value measurements during the reporting period, as compared to their classification from the prior year’s annual report. See the Fund’s valuation policy in Note 2a to the financial statements.
The accompanying notes are an integral part of these financial statements.
Page 48
Baird Aggregate Bond Fund
December 31, 2014
The Baird Aggregate Bond Fund seeks an annual rate of total return, before Fund expenses, greater than the annual rate of total return of the Barclays U.S. Aggregate Bond Index. The Barclays U.S. Aggregate Bond Index is an unmanaged, market value weighted index of investment grade, fixed-rate debt issues, including government, credit, asset-backed, mortgage-backed and commercial mortgage-backed securities (CMBS) with maturities of at least one year.
The Fund had strong absolute and relative returns versus its benchmark index in 2014. Our long-term commitment to duration neutrality again proved to be a prudent strategy as the bond market saw a sharp drop in yields for longer maturities and continued flattening of the yield curve throughout the year. The movements in the bond market confounded the predictions of many market participants who expected rates to rise and proved again the difficulty of forecasting both the direction and timing of interest rate moves. The primary factors contributing to the Fund’s outperformance in 2014 are described below.
| • | Within the Credit sector, an overweight in short to intermediate maturities versus long maturity credit added value in the year as credit spreads widened less on intermediate maturities than long maturities. An overweight to Financials also added value as this sector outperformed other credit sectors for the full year due to continued solid credit fundamentals. | |
| • | Exposure to non-agency residential mortgage-backed securities (RMBS) contributed to the Fund’s outperformance as limited supply and continued improvements in housing provided strong technical and fundamental support. | |
| • | An overweight position to commercial mortgage-backed securities (CMBS) primarily through seasoned, super-senior CMBS added to performance as the sector outperformed significantly for the year resulting from tight supply combined with growing demand for these high quality securities. | |
| • | Yield curve positioning aided the Fund’s performance as the Fund benefitted from the flattening of the curve over the year. |
Looking forward, we believe select credits still offer good relative value despite an elevated risk environment, as company balance sheets and credit fundamentals remain solid. We also expect continued positive contribution from non-agency RMBS. Yield curve positioning should modestly benefit from continued flattening of the yield curve with attractive rolldown opportunities being captured on a more selective basis. The Fund remains duration neutral to its benchmark and we are optimistic that the Fund is well positioned to add value relative to its benchmark.
Page 49
Baird Aggregate Bond Fund
December 31, 2014 (Unaudited)
Portfolio Characteristics
Quality Distribution(1)(2)
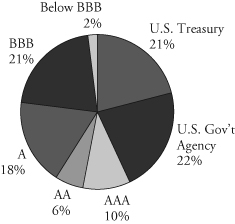 | Net Assets | $3,690,239,918 | ||
| SEC 30-Day | ||||
Yield(3) | ||||
| Institutional Class | 2.52% | |||
| Investor Class | 2.28% | |||
| Average | ||||
| Effective | ||||
| Duration | 5.55 years | |||
| Average | ||||
| Effective | ||||
| Maturity | 7.10 years | |||
| Annualized | ||||
| Expense | ||||
Sector Weightings(1) | Ratio | |||
| Institutional Class | 0.30% | |||
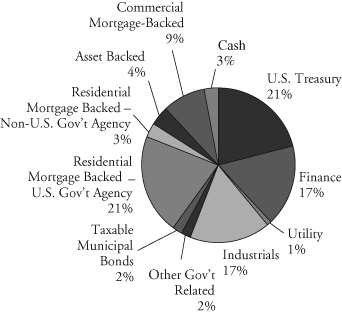 | Investor Class | 0.55%(4) | ||
| Portfolio | ||||
| Turnover | ||||
| Rate | 32.1% | |||
| Number of | ||||
| Holdings | 600 | |||
| (1) | Percentages shown are based on the Fund’s total investments (less investments purchased with cash proceeds from securities lending). |
| (2) | The quality profile is calculated on a market value-weighted basis using the highest credit quality rating for each security held by the Fund given by S&P, Moody’s or Fitch, each of which is a Nationally Recognized Statistical Rating Organization (NRSRO). NRSROs rate the credit quality of securities using a scale that generally ranges from AAA (highest) to D (lowest). |
| (3) | SEC yields are based on SEC guidelines and are calculated for the 30 days ended December 31, 2014. |
| (4) | Includes 0.25% 12b-1 fee. |
Page 50
Baird Aggregate Bond Fund
December 31, 2014 (Unaudited)
Institutional Class
Value of a $25,000 Investment

Growth of a hypothetical investment of $25,000 made on the Fund’s inception date (9/29/00), assuming reinvestment of all distributions.
Investor Class
Value of a $10,000 Investment
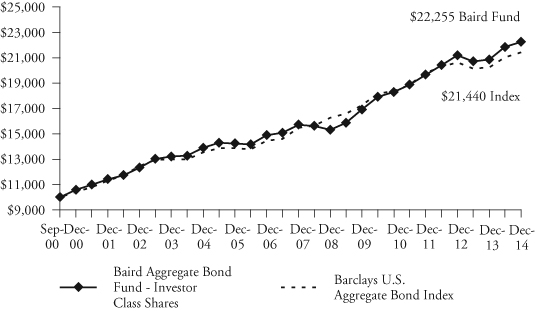
Growth of a hypothetical investment of $10,000 made on the Fund’s inception date (9/29/00), assuming reinvestment of all distributions.
Page 51
Baird Aggregate Bond Fund
December 31, 2014 (Unaudited)
Total Returns
| Average Annual | ||||
| One | Five | Ten | Since | |
| For the Periods Ended December 31, 2014 | Year | Years | Years | Inception(1) |
| Institutional Class Shares | 6.89% | 5.88% | 5.08% | 6.02% |
| Investor Class Shares | 6.71% | 5.64% | 4.82% | 5.77% |
Barclays U.S. Aggregate Bond Index(2) | 5.97% | 4.45% | 4.71% | 5.50% |
| (1) | For the period from September 29, 2000 (inception date) through December 31, 2014. |
| (2) | The Barclays U.S. Aggregate Bond Index is an unmanaged, market value weighted index of investment grade, fixed-rate debt issues, including government, corporate, asset-backed and mortgage-backed securities, with maturities of at least one year. This index does not reflect any deduction for fees, expenses or taxes. A direct investment in an index is not possible. |
The line graph on the previous page and the returns shown in the table above reflect reinvestment of dividends and/or capital gains distributions in additional shares. The returns do not reflect the deduction of taxes that a shareholder would pay on Fund distributions or the redemption of Fund shares. The returns reflect the actual performance for each period and do not include the impact of trades executed on the last business day of the period that were recorded on the first business day of the next period.
The Fund’s gross expense ratio for each Class, as reflected in the Fund’s current prospectus, is set forth under “Portfolio Characteristics”.
The Fund maintains securities with longer maturities in order to provide a greater potential for return. Generally, the longer a bond’s maturity, the greater the interest rate risk. The Fund may also invest in U.S. dollar denominated foreign securities which involve additional risks such as political and economic instability, and different and sometimes less strict financial reporting standards and regulation. The Fund may also invest in mortgage- and asset-backed securities, which include interest rate and prepayment risks more pronounced than those of other fixed income securities.
Past performance does not guarantee future results. Investment return and principal value will fluctuate so that an investor’s shares, when redeemed, may be worth more or less than their original cost.
For information about the performance of the Fund as of the most recent month-end, please call 1-866-44BAIRD or visit www.bairdfunds.com. Mutual fund performance changes over time and current performance may be lower or higher than that stated.
Page 52
Baird Aggregate Bond Fund
Summary Schedule of Investments, December 31, 2014
This schedule summarizes the Fund’s holdings by asset type. Details are reported for each of the Fund’s 50 largest individual holdings and for investments that, in total for any issuer, represent more than 1% of the Fund’s net assets. The total value of smaller holdings is reported as a single amount within each category.
The Fund reports a complete list of its holdings in regulatory filings four times in each fiscal year, at the quarter end. For the second and fourth fiscal quarters, the complete listing of the Fund’s holdings is available electronically in the Fund’s Form N-CSR at http://www.bairdfunds.com/prospectuses-reports and on the Securities and Exchange Commission’s website (www.sec.gov) or you can have it mailed to you without charge by calling 1-866-44BAIRD. For the first and third fiscal quarters, the Fund files the lists with the SEC on Form N-Q. Shareholders can look up the Fund’s Forms N-CSR and N-Q on the SEC’s website (www.sec.gov).
Long-Term Investments
| Principal | % of | |||||||||||
| Amount | Value | Net Assets | ||||||||||
| U.S. Treasury Securities | ||||||||||||
| U.S. Treasury Bonds: | ||||||||||||
| 2.625%, 08/15/2020@ | $ | 423,000,000 | $ | 441,737,631 | 12.0 | % | ||||||
| 6.250%, 08/15/2023@ | 23,600,000 | 31,423,022 | 0.8 | % | ||||||||
| 5.250%, 11/15/2028@ | 60,626,500 | 81,282,131 | 2.2 | % | ||||||||
| 3.500%, 02/15/2039@ | 196,330,900 | 225,489,180 | 6.1 | % | ||||||||
| 1.250%-4.375%, 04/30/2019-08/15/2044@ | 2,500,400 | 2,691,928 | 0.1 | % | ||||||||
| Total U.S. Treasury Securities | ||||||||||||
| (Cost $759,266,174) | 782,623,892 | 21.2 | % | |||||||||
| Corporate Bonds | ||||||||||||
| Finance | ||||||||||||
| Citizens Bank, National Association, | ||||||||||||
| 2.450%, 12/04/2019 | 18,000,000 | 17,887,500 | 0.5 | % | ||||||||
| LeasePlan Corporation N.V., | ||||||||||||
| 2.500%, 05/16/2018 (Acquired 08/02/2013 | ||||||||||||
through 10/20/2014, Cost $18,106,913)* f | 18,158,000 | 18,165,790 | 0.5 | % | ||||||||
| Massachusetts Mutual Life Insurance Company, | ||||||||||||
| 8.875%, 06/01/2039 (Acquired 05/27/2009 | ||||||||||||
| through 12/16/2014, Cost $19,421,722)*@ | 13,000,000 | 20,975,461 | 0.6 | % | ||||||||
| Voya Financial, Inc., | ||||||||||||
| 5.500%, 07/15/2022 | 17,350,000 | 19,598,838 | 0.5 | % | ||||||||
| Other Finance#~ | 562,131,281 | 15.2 | % | |||||||||
| Total Finance | ||||||||||||
| (Cost $619,724,496) | 638,758,870 | 17.3 | % | |||||||||
| Utility | ||||||||||||
| Other Utility#~ | 37,475,890 | 1.0 | % | |||||||||
| Total Utility | ||||||||||||
| (Cost $35,711,821) | 37,475,890 | 1.0 | % | |||||||||
The accompanying notes are an integral part of these financial statements.
Page 53
Baird Aggregate Bond Fund
Summary Schedule of Investments, December 31, 2014
Long-Term Investments (cont.)
| Principal | % of | |||||||||||
| Amount | Value | Net Assets | ||||||||||
| Industrials | ||||||||||||
| Petrofac Limited, | ||||||||||||
| 3.400%, 10/10/2018 (Acquired 10/03/2013 | ||||||||||||
through 12/03/2014, Cost $15,573,119)* f | $ | 15,546,000 | $ | 15,336,626 | 0.4 | % | ||||||
| Seagate HDD Cayman, | ||||||||||||
6.875%, 05/01/2020 f | 13,137,000 | 13,793,850 | 0.4 | % | ||||||||
| Valero Energy Corporation, | ||||||||||||
| 9.375%, 03/15/2019 | 15,578,000 | 19,427,807 | 0.5 | % | ||||||||
| Verizon Communications Inc., | ||||||||||||
| 6.400%, 09/15/2033 | 12,140,000 | 14,953,846 | 0.4 | % | ||||||||
| Other Industrials#~ | 583,497,742 | 15.8 | % | |||||||||
| Total Industrials | ||||||||||||
| (Cost $635,118,028) | 647,009,871 | 17.5 | % | |||||||||
| Total Corporate Bonds | ||||||||||||
| (Cost $1,290,554,345) | 1,323,244,631 | 35.8 | % | |||||||||
| Other Government Related Securities | ||||||||||||
| Other Government Related Securities#~ | 58,870,672 | 1.6 | % | |||||||||
| Total Other Government Related Securities | ||||||||||||
| (Cost $57,149,203) | 58,870,672 | 1.6 | % | |||||||||
| Taxable Municipal Bonds | ||||||||||||
| Other Taxable Municipal Bonds# | 71,891,692 | 2.0 | % | |||||||||
| Total Taxable Municipal Bonds | ||||||||||||
| (Cost $67,210,710) | 71,891,692 | 2.0 | % | |||||||||
| Residential Mortgage-Backed Securities | ||||||||||||
| U.S. Government Agency Issues | ||||||||||||
| Federal Gold Loan Mortgage Corporation (FGLMC): | ||||||||||||
| 5.000%, 03/01/2036 | 13,333,755 | 14,748,959 | 0.4 | % | ||||||||
| 3.500%, 07/01/2042 | 24,921,096 | 25,951,116 | 0.7 | % | ||||||||
| 3.000%, 08/01/2042 | 29,410,175 | 29,770,702 | 0.8 | % | ||||||||
| 3.000%, 06/01/2043 | 29,145,934 | 29,487,905 | 0.8 | % | ||||||||
| 4.000%, 03/01/2044 | 17,702,169 | 18,892,473 | 0.5 | % | ||||||||
| 3.500%, 07/01/2044 | 26,061,345 | 27,126,823 | 0.7 | % | ||||||||
| 4.000%, 07/01/2044 | 14,547,938 | 15,526,150 | 0.4 | % | ||||||||
| 3.500%, 10/01/2044 | 23,682,205 | 24,650,416 | 0.7 | % | ||||||||
| 4.000%, 10/01/2044 | 23,872,897 | 25,586,748 | 0.7 | % | ||||||||
| 2.500%-6.500%, 06/01/2020-08/01/2043 | 88,733,531 | 93,599,261 | 2.6 | % | ||||||||
| Federal National Mortgage Association (FNMA): | ||||||||||||
| 2.500%, 12/01/2027 | 18,187,506 | 18,567,324 | 0.5 | % | ||||||||
| 4.000%, 01/01/2034 | 16,199,105 | 17,443,542 | 0.5 | % | ||||||||
| 4.000%, 06/01/2034 | 21,561,020 | 23,182,479 | 0.6 | % | ||||||||
| 4.000%, 09/01/2034 | 23,074,170 | 24,826,579 | 0.7 | % | ||||||||
| 5.000%, 07/01/2035 | 12,460,325 | 13,796,908 | 0.4 | % | ||||||||
| 3.500%, 02/01/2041 | 30,108,654 | 31,440,201 | 0.9 | % | ||||||||
| 4.000%, 02/01/2041 | 20,919,408 | 22,352,703 | 0.6 | % | ||||||||
The accompanying notes are an integral part of these financial statements.
Page 54
Baird Aggregate Bond Fund
Summary Schedule of Investments, December 31, 2014
Long-Term Investments (cont.)
| Principal | % of | |||||||||||
| Amount | Value | Net Assets | ||||||||||
| Federal National Mortgage Association (FNMA): (cont.) | ||||||||||||
| 3.500%, 03/01/2041 | $ | 35,675,753 | $ | 37,253,964 | 1.0 | % | ||||||
| 4.500%, 07/01/2041 | 26,836,656 | 29,160,204 | 0.8 | % | ||||||||
| 3.500%, 11/01/2041 | 21,116,964 | 22,056,362 | 0.6 | % | ||||||||
| 4.000%, 12/01/2041 | 21,024,574 | 22,465,074 | 0.6 | % | ||||||||
| 4.500%, 01/01/2042 | 31,282,168 | 34,034,118 | 0.9 | % | ||||||||
| 3.000%, 05/01/2043 | 35,490,509 | 35,955,674 | 1.0 | % | ||||||||
| 3.000%, 06/01/2043 | 14,558,335 | 14,748,073 | 0.4 | % | ||||||||
| 3.000%-8.000%, 07/25/2019-05/01/2042 | 71,592,925 | 76,975,540 | 2.0 | % | ||||||||
| Government National Mortgage Association (GNMA): | ||||||||||||
| 4.500%, 01/20/2041 | 16,918,186 | 18,577,368 | 0.5 | % | ||||||||
| 4.000%, 06/20/2042 | 19,749,637 | 21,196,436 | 0.6 | % | ||||||||
| 4.500%, 04/20/2044 | 12,423,038 | 13,591,617 | 0.3 | % | ||||||||
| 3.500%-6.000%, 11/20/2033-09/20/2042 | 15,817,272 | 16,999,425 | 0.5 | % | ||||||||
| Other U.S. Government Agency Issues# | 255,064 | 0.0 | % | |||||||||
| Total U.S. Government Agency Issues | ||||||||||||
| (Cost $784,566,274) | 800,219,208 | 21.7 | % | |||||||||
| Non-U.S. Government Agency Issues | ||||||||||||
| Merrill Lynch Mortgage Investors Trust, | ||||||||||||
| Series 2004-F, 1.827%, 12/25/2029 | 15,596,039 | 15,709,687 | 0.4 | % | ||||||||
| Other Non-U.S. Government Agency Issues# | 84,337,304 | 2.3 | % | |||||||||
| Total Non-U.S. Government Agency Issues | ||||||||||||
| (Cost $100,472,034) | 100,046,991 | 2.7 | % | |||||||||
| Asset Backed Securities | ||||||||||||
| Accredited Mortgage Loan Trust, | ||||||||||||
| Series 2006-2, Class A3, 0.320%, 09/25/2036 | 13,514,993 | 13,348,056 | 0.4 | % | ||||||||
| Republic Services, Inc., | ||||||||||||
| Series 2006-KS4, Class A4, 0.410%, 06/25/2036 | 26,038,000 | 25,247,929 | 0.7 | % | ||||||||
| Other Asset Backed Securities#~ | 105,879,306 | 2.8 | % | |||||||||
| Total Asset Backed Securities | ||||||||||||
| (Cost $143,986,451) | 144,475,291 | 3.9 | % | |||||||||
| Commercial Mortgage-Backed Securities | ||||||||||||
| COMM Mortgage Trust: | ||||||||||||
| Series 2005-C6, Class A5A, 5.116%, 06/10/2044 | 24,213,710 | 24,471,876 | 0.7 | % | ||||||||
| Series 2012-CR2, Class A4, 3.147%, 08/15/2045 | 16,445,536 | 16,847,268 | 0.5 | % | ||||||||
| 3.391%-4.022%, 05/15/2045-08/10/2046 | 30,263,462 | 32,257,686 | 0.8 | % | ||||||||
| FHLMC Multifamily Structured | ||||||||||||
| Pass Through Certificates, | ||||||||||||
| Series K-003, Class A4, 5.053%, 01/25/2019 | 12,525,000 | 13,992,780 | 0.4 | % | ||||||||
| GS Mortgage Securities Corp II, | ||||||||||||
| Series 2012-GCJ9, Class A3, 2.773%, 11/10/2045 | 22,112,320 | 21,982,388 | 0.6 | % | ||||||||
| Morgan Stanley Bank of America Merrill Lynch Trust: | ||||||||||||
| Series 2012-C5, Class A4, 3.176%, 08/15/2045 | 20,835,000 | 21,331,727 | 0.6 | % | ||||||||
| Series 2012-C6, Class A4, 2.858%, 11/15/2045 | 20,460,945 | 20,490,859 | 0.5 | % | ||||||||
| 3.960%-3.973%, 08/15/2046-10/15/2046 | 21,100,000 | 22,624,916 | 0.6 | % | ||||||||
The accompanying notes are an integral part of these financial statements.
Page 55
Baird Aggregate Bond Fund
Summary Schedule of Investments, December 31, 2014
Long-Term Investments (cont.)
| Principal | % of | |||||||||||
| Amount | Value | Net Assets | ||||||||||
| WFRBS Commercial Mortgage Trust: | ||||||||||||
| Series 2012-C6, Class A4, 3.440%, 04/15/2045 | $ | 20,464,220 | $ | 21,380,158 | 0.6 | % | ||||||
| 3.636%-3.678%, 08/15/2047-10/15/2057 | 17,254,000 | 18,106,808 | 0.5 | % | ||||||||
| Other Commercial Mortgage Backed Securities# | 110,901,712 | 3.0 | % | |||||||||
| Total Commercial Mortgage Backed Securities | ||||||||||||
| (Cost $324,698,722) | 324,388,178 | 8.8 | % | |||||||||
| Total Long-Term Investments | ||||||||||||
| (Cost $3,527,903,913) | 3,605,760,555 | 97.7 | % | |||||||||
| Short-Term Investments | ||||||||||||
| Shares | ||||||||||||
| Money Market Mutual Funds | ||||||||||||
| Dreyfus Cash Advantage Fund, 0.06%« | 44,145,740 | 44,145,740 | 1.2 | % | ||||||||
| Short-Term Investments Trust – | ||||||||||||
| Liquid Assets Portfolio, 0.07%« | 70,000,000 | 70,000,000 | 1.9 | % | ||||||||
| Total Short-Term Investments | ||||||||||||
| (Cost $114,145,740) | 114,145,740 | 3.1 | % | |||||||||
| Investments Purchased with Cash | ||||||||||||
| Proceeds from Securities Lending | ||||||||||||
| Investment Companies | ||||||||||||
| Mount Vernon Securities Lending | ||||||||||||
| Trust Prime Portfolio, 0.29%« | 98,296,098 | 98,296,098 | 2.7 | % | ||||||||
| Total Investment Companies | ||||||||||||
| (Cost $98,296,098) | 98,296,098 | 2.7 | % | |||||||||
| Total Investments Purchased With | ||||||||||||
| Cash Proceeds From Securities Lending | ||||||||||||
| (Cost $98,296,098) | 98,296,098 | 2.7 | % | |||||||||
| Total Investments | ||||||||||||
| (Cost $3,740,345,751) | 3,818,202,393 | 103.5 | % | |||||||||
| Liabilities in Excess of Other Assets | (127,962,475 | ) | (3.5 | )% | ||||||||
| TOTAL NET ASSETS | $ | 3,690,239,918 | 100.0 | % | ||||||||
Notes to Summary Schedule of Investments
| # | Represents the aggregate value, by category, securities that are not among the 50 largest holdings and, in total for any issuer, represent 1% or less of net assets. |
| * | Restricted Security Deemed Liquid |
| @ | This security or portion of this security is out on loan at December 31, 2014. |
| f | Foreign Security |
| « | 7-Day Yield |
| ~ | Groupings contain, in aggregate, restricted securities totaling $344,699,002 representing 9.34% of net assets. |
The accompanying notes are an integral part of these financial statements.
Page 56
Baird Aggregate Bond Fund
Summary Schedule of Investments, December 31, 2014
Summary of Fair Value Exposure at December 31, 2014
The Fund has adopted authoritative fair valuation accounting standards which establish a definition of fair value and set out a hierarchy for measuring fair value. These standards require additional disclosures about the various inputs and valuation techniques used to develop the measurements of fair value and a discussion on changes in valuation techniques and related inputs during the period. These standards define fair value as the price that would be received to sell an asset or paid to transfer a liability in an orderly transaction between market participants at the measurement date.
The fair value hierarchy is organized into three levels based upon the assumptions (referred to as “inputs”) used in pricing the asset or liability. These standards state that “observable inputs” reflect the assumptions market participants would use in pricing the asset or liability based on market data obtained from independent sources and “unobservable inputs” reflect an entity’s own assumptions about the assumptions market participants would use in pricing the asset or liability. These inputs are summarized into three broad levels and described below:
Level 1 – | Unadjusted quoted prices in active markets for identical unrestricted securities. |
Level 2 – | Other significant observable inputs (including quoted prices for similar securities, quoted prices in inactive markets, dealer indications, interest rates, yield curves, prepayment speeds, credit risk, default rates, inputs corroborated by observable market data, etc.). |
Level 3 – | Significant unobservable inputs (including the Fund’s own assumptions about the factors that market participants would use in valuing the security) based on the best information available. |
The inputs or methodology used for valuing securities are not necessarily an indication of the risk associated with investing in those securities.
The following is a summary of the inputs used to value the Fund’s investments as of December 31, 2014:
| Level 1 | Level 2 | Level 3 | Total | |||||||||||||
| Long-Term Investments | ||||||||||||||||
| U.S. Treasury Securities | $ | — | $ | 782,623,892 | $ | — | $ | 782,623,892 | ||||||||
| Corporate Bonds | — | 1,323,244,631 | — | 1,323,244,631 | ||||||||||||
| Other Government Related Securities | — | 58,870,672 | — | 58,870,672 | ||||||||||||
| Taxable Municipal Bonds | — | 71,891,692 | — | 71,891,692 | ||||||||||||
| Residential Mortgage-Backed Securities – | ||||||||||||||||
| U.S. Government Agency Issues | — | 800,219,208 | — | 800,219,208 | ||||||||||||
| Residential Mortgage-Backed Securities – | ||||||||||||||||
| Non-U.S. Government Agency Issues | — | 100,046,991 | — | 100,046,991 | ||||||||||||
| Asset Backed Securities | — | 144,475,291 | — | 144,475,291 | ||||||||||||
| Commercial Mortgage Backed Securities | — | 324,388,178 | — | 324,388,178 | ||||||||||||
| Total Long-Term Investments | — | 3,605,760,555 | — | 3,605,760,555 | ||||||||||||
| Short-Term Investments | ||||||||||||||||
| Money Market Mutual Funds | 114,145,740 | — | — | 114,145,740 | ||||||||||||
| Total Short-Term Investment | 114,145,740 | — | — | 114,145,740 | ||||||||||||
| Investments Purchased with Cash | ||||||||||||||||
| Proceeds from Securities Lending | ||||||||||||||||
| Investment Companies | 98,296,098 | — | — | 98,296,098 | ||||||||||||
| Total Investments Purchased with | ||||||||||||||||
| Cash Proceeds from Securities Lending | 98,296,098 | — | — | 98,296,098 | ||||||||||||
| Total Investments | $ | 212,441,838 | $ | 3,605,760,555 | $ | — | $ | 3,818,202,393 | ||||||||
Changes in valuation techniques may result in transfers into or out of assigned levels within the fair value hierarchy. There were no transfers between Level 1, Level 2 and Level 3 fair value measurements during the reporting period, as compared to their classification from the prior year’s annual report. See the Fund’s valuation policy in Note 2a to the financial statements.
The accompanying notes are an integral part of these financial statements.
Page 57
Baird Core Plus Bond Fund
December 31, 2014
The Baird Core Plus Bond Fund seeks an annual rate of total return, before Fund expenses, greater than the annual rate of total return of the Barclays U.S. Universal Bond Index. The Barclays U.S. Universal Bond Index is an unmanaged, market value weighted index of fixed income securities issued in U.S. dollars, including U.S. government, investment grade and non-investment grade credit, emerging market debt, asset-backed and mortgage-backed securities, Eurobonds, 144A securities and commercial mortgage-backed securities (CMBS) with maturities of at least one year.
The Fund had strong absolute and relative returns versus its benchmark index in 2014. Our long-term commitment to duration neutrality again proved to be a prudent strategy as the bond market saw a sharp drop in yields for longer maturities and continued flattening of the yield curve throughout the year. The movements in the bond market confounded the predictions of many market participants who expected rates to rise and proved again the difficulty of forecasting both the direction and timing of interest rate moves. The primary factors contributing to the Fund’s outperformance in 2014 are described below.
| • | Within the Credit sector, an overweight in short to intermediate maturities versus long maturity credit added value in the year as credit spreads widened less on intermediate maturities than long maturities. An overweight to Financials also added value as this sector outperformed other credit sectors for the full year due to continued solid credit fundamentals. | |
| • | Exposure to non-agency residential mortgage-backed securities (RMBS) contributed to the Fund’s outperformance as limited supply and continued improvements in housing provided strong technical and fundamental support. | |
| • | An overweight position to commercial mortgage-backed securities (CMBS) primarily through seasoned, super-senior CMBS added to performance as the sector outperformed significantly for the year resulting from tight supply combined with growing demand for these high quality securities. | |
| • | Yield curve positioning aided the Fund’s performance as the Fund benefitted from the flattening of the curve over the year. | |
| • | An underweight to high yield corporates benefitted relative performance as high yield corporate spreads widened significantly for the year. |
Looking forward, we believe select credits still offer good relative value despite an elevated risk environment, as company balance sheets and credit fundamentals remain solid. We also expect continued positive contribution from non-agency RMBS. Yield curve positioning should modestly benefit from continued flattening of the yield curve with attractive rolldown opportunities being captured on a more selective basis. The Fund remains duration neutral to its benchmark and we are optimistic that the Fund is well positioned to add value relative to its benchmark.
Page 58
Baird Core Plus Bond Fund
December 31, 2014 (Unaudited)
Portfolio Characteristics
Quality Distribution(1)(2)
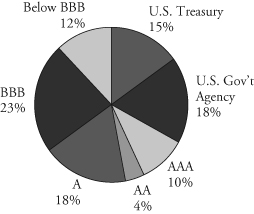 | Net Assets | $6,716,606,911 | ||
| SEC 30-Day | ||||
Yield(3) | ||||
| Institutional Class | 2.86% | |||
| Investor Class | 2.62% | |||
| Average | ||||
| Effective | ||||
| Duration | 5.42 years | |||
| Average | ||||
| Effective | ||||
| Maturity | 6.90 years | |||
| Annualized | ||||
Sector Weightings(1) | Expense | |||
| Ratio | ||||
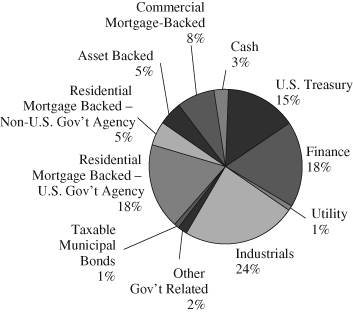 | Institutional Class | 0.30% | ||
| Investor Class | 0.55%(4) | |||
| Portfolio | ||||
| Turnover | ||||
| Rate | 35.0% | |||
| Number of | ||||
| Holdings | 867 | |||
| (1) | Percentages shown are based on the Fund’s total investments (less investments purchased with cash proceeds from securities lending). |
| (2) | The quality profile is calculated on a market value-weighted basis using the highest credit quality rating for each security held by the Fund given by S&P, Moody’s or Fitch, each of which is a Nationally Recognized Statistical Rating Organization (NRSRO). NRSROs rate the credit quality of securities using a scale that generally ranges from AAA (highest) to D (lowest). |
| (3) | SEC yields are based on SEC guidelines and are calculated for the 30 days ended December 31, 2014. |
| (4) | Includes 0.25% 12b-1 fee. |
Page 59
Baird Core Plus Bond Fund
December 31, 2014 (Unaudited)
Institutional Class
Value of a $25,000 Investment
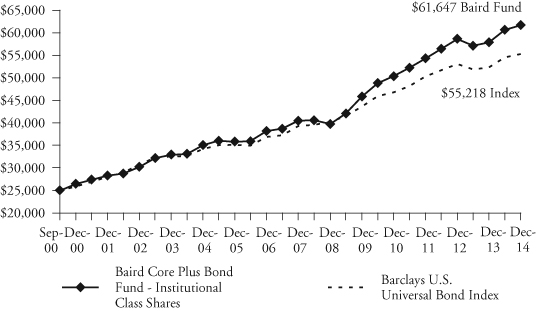
Growth of a hypothetical investment of $25,000 made on the Fund’s inception date (9/29/00), assuming reinvestment of all distributions.
Investor Class
Value of a $10,000 Investment
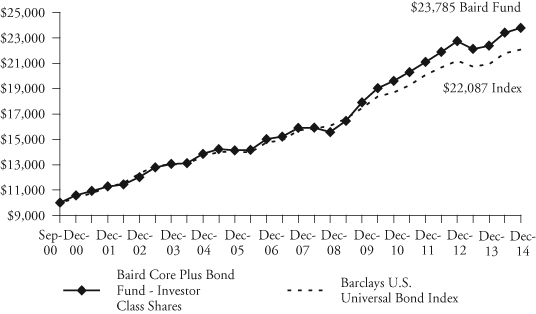
Growth of a hypothetical investment of $10,000 made on the Fund’s inception date (9/29/00), assuming reinvestment of all distributions.
Page 60
Baird Core Plus Bond Fund
December 31, 2014 (Unaudited)
Total Returns
| Average Annual | ||||
| One | Five | Ten | Since | |
| For the Periods Ended December 31, 2014 | Year | Years | Years | Inception(1) |
| Institutional Class Shares | 6.59% | 6.11% | 5.82% | 6.54% |
| Investor Class Shares | 6.27% | 5.84% | 5.55% | 6.27% |
Barclays U.S. Universal Bond Index(2) | 5.56% | 4.81% | 4.91% | 5.72% |
| (1) | For the period from September 29, 2000 (inception date) through December 31, 2014. |
| (2) | The Barclays U.S. Universal Bond Index is an unmanaged, market value weighted index of fixed income securities issued in U.S. dollars, including U.S. government and investment grade debt, non-investment grade debt, asset-backed and mortgage-backed securities, Eurobonds, 144A securities and emerging market debt, with maturities of at least one year. This index does not reflect any deduction for fees, expenses or taxes. A direct investment in an index is not possible. |
The line graph on the previous page and the returns shown in the table above reflect reinvestment of dividends and/or capital gains distributions in additional shares. The returns do not reflect the deduction of taxes that a shareholder would pay on Fund distributions or the redemption of Fund shares. The returns reflect the actual performance for each period and do not include the impact of trades executed on the last business day of the period that were recorded on the first business day of the next period.
The Fund’s gross expense ratio for each Class, as reflected in the Fund’s current prospectus, is set forth under “Portfolio Characteristics”.
The Fund may invest up to 20% of its net assets in non-investment grade debt securities (commonly referred to as “high yield” bonds). While these types of debt securities typically offer higher yields than investment grade securities, they also include greater risks including increased credit risk and the increased risk of default or bankruptcy. The Fund maintains securities with longer maturities in order to provide a greater potential for return. Generally, the longer a bond’s maturity, the greater the interest rate risk. The Fund may also invest in U.S. dollar denominated foreign securities which involve additional risks such as political and economic instability, and different and sometimes less strict financial reporting standards and regulation. The Fund may also invest in mortgage- and asset-backed securities, which include interest rate and prepayment risks more pronounced than those of other fixed income securities.
Past performance does not guarantee future results. Investment return and principal value will fluctuate so that an investor’s shares, when redeemed, may be worth more or less than their original cost.
For information about the performance of the Fund as of the most recent month-end, please call 1-866-44BAIRD or visit www.bairdfunds.com. Mutual fund performance changes over time and current performance may be lower or higher than that stated.
Page 61
Baird Core Plus Bond Fund
Summary Schedule of Investments, December 31, 2014
This schedule summarizes the Fund’s holdings by asset type. Details are reported for each of the Fund’s 50 largest individual holdings and for investments that, in total for any issuer, represent more than 1% of the Fund’s net assets. The total value of smaller holdings is reported as a single amount within each category.
The Fund reports a complete list of its holdings in regulatory filings four times in each fiscal year, at the quarter end. For the second and fourth fiscal quarters, the complete listing of the Fund’s holdings is available electronically in the Fund’s Form N-CSR at http://www.bairdfunds.com/prospectuses-reports and on the Securities and Exchange Commission’s website (www.sec.gov) or you can have it mailed to you without charge by calling 1-866-44BAIRD. For the first and third fiscal quarters, the Fund files the lists with the SEC on Form N-Q. Shareholders can look up the Fund’s Forms N-CSR and N-Q on the SEC’s website (www.sec.gov).
Long-Term Investments
| Principal | % of | |||||||||||
| Amount | Value | Net Assets | ||||||||||
| U.S. Treasury Securities | ||||||||||||
| U.S. Treasury Bonds: | ||||||||||||
| 2.625%, 08/15/2020 | $ | 441,300,000 | $ | 460,848,266 | 6.9 | % | ||||||
| 6.250%, 08/15/2023 | 40,000,000 | 53,259,360 | 0.8 | % | ||||||||
| 5.250%, 11/15/2028 | 118,325,000 | 158,638,682 | 2.3 | % | ||||||||
| 3.500%, 02/15/2039@ | 282,420,000 | 324,363,889 | 4.8 | % | ||||||||
| Total U.S. Treasury Securities | ||||||||||||
| (Cost $967,984,709) | 997,110,197 | 14.8 | % | |||||||||
| Corporate Bonds | ||||||||||||
| Finance | ||||||||||||
| BPCE, | ||||||||||||
| 5.700%, 10/22/2023 (Acquired 10/15/2013, | ||||||||||||
Cost $30,117,248)* f | 28,500,000 | 30,602,359 | 0.5 | % | ||||||||
| Citizens Bank, National Association, | ||||||||||||
| 2.450%, 12/04/2019 | 36,000,000 | 35,775,000 | 0.5 | % | ||||||||
| Compass Bank, | ||||||||||||
| 2.750%, 09/29/2019 | 30,470,000 | 30,501,140 | 0.4 | % | ||||||||
| Discover Financial Services, | ||||||||||||
| 3.950%, 11/06/2024 | 25,000,000 | 25,131,075 | 0.4 | % | ||||||||
| HSBC Finance Corporation, | ||||||||||||
| 6.676%, 01/15/2021 | 21,623,000 | 25,654,738 | 0.4 | % | ||||||||
| Massachusetts Mutual Life Insurance Company, | ||||||||||||
| 8.875%, 06/01/2039 (Acquired 10/03/2012 | ||||||||||||
| through 09/26/2014, Cost $30,206,377)* | 19,440,000 | 31,366,382 | 0.5 | % | ||||||||
| Voya Financial, Inc., | ||||||||||||
| 5.500%, 07/15/2022 | 25,634,000 | 28,956,577 | 0.4 | % | ||||||||
| Other Finance#~ | 1,000,004,426 | 14.9 | % | |||||||||
| Total Finance | ||||||||||||
| (Cost $1,180,667,059) | 1,207,991,697 | 18.0 | % | |||||||||
The accompanying notes are an integral part of these financial statements.
Page 62
Baird Core Plus Bond Fund
Summary Schedule of Investments, December 31, 2014
Long-Term Investments (cont.)
| Principal | % of | |||||||||||
| Amount | Value | Net Assets | ||||||||||
| Utility | ||||||||||||
| Other Utility#~ | $ | 100,034,916 | 1.5 | % | ||||||||
| Total Utility | ||||||||||||
| (Cost $95,996,939) | 100,034,916 | 1.5 | % | |||||||||
| Industrials | ||||||||||||
| Hospira, Inc., | ||||||||||||
| 6.050%, 03/30/2017 | $ | 25,000,000 | 26,954,125 | 0.4 | % | |||||||
| Petrofac Limited, | ||||||||||||
| 3.400%, 10/10/2018 (Acquired 10/03/2013 | ||||||||||||
through 09/19/2014, Cost $30,947,395)* f | 30,900,000 | 30,483,839 | 0.4 | % | ||||||||
| Rockwood Specialties Group Inc Sr Glbl Nt 20, | ||||||||||||
| 4.625%, 10/15/2020 | 26,454,000 | 27,313,755 | 0.4 | % | ||||||||
| Valero Energy Corporation, | ||||||||||||
| 9.375%, 03/15/2019 | 19,606,000 | 24,451,250 | 0.4 | % | ||||||||
| Verizon Communications Inc., | ||||||||||||
| 6.400%, 09/15/2033@ | 22,675,000 | 27,930,680 | 0.4 | % | ||||||||
| Other Industrials#~ | 1,516,327,234 | 22.6 | % | |||||||||
| Total Industrials | ||||||||||||
| (Cost $1,655,053,379) | 1,653,460,883 | 24.6 | % | |||||||||
| Total Corporate Bonds | ||||||||||||
| (Cost $2,931,717,377) | 2,961,487,496 | 44.1 | % | |||||||||
| Other Government Related Securities | ||||||||||||
| Other Government Related Securities#~ | 125,691,062 | 1.9 | % | |||||||||
| Total Other Government Related Securities | ||||||||||||
| (Cost $124,241,875) | 125,691,062 | 1.9 | % | |||||||||
| Taxable Municipal Bonds | ||||||||||||
| Other Taxable Municipal Bonds# | 90,246,582 | 1.3 | % | |||||||||
| Total Taxable Municipal Bonds | ||||||||||||
| (Cost $86,203,322) | 90,246,582 | 1.3 | % | |||||||||
| Residential Mortgage-Backed Securities | ||||||||||||
| U.S. Government Agency Issues | ||||||||||||
| Federal Gold Loan Mortgage Corporation (FGLMC): | ||||||||||||
| 3.500%, 07/01/2042 | 44,208,857 | 46,036,064 | 0.7 | % | ||||||||
| 3.000%, 08/01/2042 | 35,165,351 | 35,596,428 | 0.5 | % | ||||||||
| 3.000%, 08/01/2043 | 28,123,864 | 28,448,937 | 0.4 | % | ||||||||
| 3.500%, 07/01/2044 | 34,504,440 | 35,915,101 | 0.5 | % | ||||||||
| 3.500%, 08/01/2044 | 57,289,724 | 59,631,925 | 0.9 | % | ||||||||
| 4.000%, 09/01/2044 | 72,146,397 | 76,997,565 | 1.2 | % | ||||||||
| 4.000%, 10/01/2044 | 41,875,737 | 44,882,024 | 0.7 | % | ||||||||
| 3.000%-6.500%, 12/01/2020-06/01/2043 | 88,205,108 | 92,704,930 | 1.4 | % | ||||||||
The accompanying notes are an integral part of these financial statements.
Page 63
Baird Core Plus Bond Fund
Summary Schedule of Investments, December 31, 2014
Long-Term Investments (cont.)
| Principal | % of | |||||||||||
| Amount | Value | Net Assets | ||||||||||
| Federal National Mortgage Association (FNMA): | ||||||||||||
| 3.000%, 04/01/2027 | $ | 21,961,457 | $ | 22,886,552 | 0.3 | % | ||||||
| 2.500%, 12/01/2027 | 31,745,931 | 32,408,897 | 0.5 | % | ||||||||
| 4.000%, 01/01/2034 | 28,112,674 | 30,272,328 | 0.4 | % | ||||||||
| 4.000%, 09/01/2034 | 37,297,332 | 40,129,943 | 0.6 | % | ||||||||
| 5.000%, 06/01/2040 | 39,901,521 | 44,126,679 | 0.7 | % | ||||||||
| 3.500%, 03/01/2041 | 21,630,571 | 22,587,457 | 0.3 | % | ||||||||
| 3.500%, 11/01/2041 | 38,370,981 | 40,077,932 | 0.6 | % | ||||||||
| 4.000%, 12/01/2041 | 34,948,428 | 37,342,923 | 0.6 | % | ||||||||
| 4.500%, 01/01/2042 | 28,557,672 | 31,069,943 | 0.5 | % | ||||||||
| 3.000%, 05/01/2043 | 47,027,453 | 47,643,830 | 0.7 | % | ||||||||
| 3.000%, 06/01/2043 | 47,771,468 | 48,394,070 | 0.7 | % | ||||||||
| 3.000%-7.500%, 12/25/2019-06/01/2042 | 157,454,757 | 169,985,896 | 2.5 | % | ||||||||
| 3.000%-6.000%, 05/01/2038-03/01/2043 | 46,499,762 | 50,552,686 | 0.7 | % | ||||||||
| Government National Mortgage Association (GNMA): | ||||||||||||
| 4.500%, 07/20/2040 | 23,755,343 | 26,101,668 | 0.4 | % | ||||||||
| 4.000%, 06/20/2042 | 33,552,983 | 36,010,972 | 0.5 | % | ||||||||
| 4.000%, 09/20/2044 | 49,171,576 | 52,820,348 | 0.8 | % | ||||||||
| 3.500%-6.500%, 12/20/2028-09/20/2042 | 41,386,799 | 44,623,537 | 0.7 | % | ||||||||
| Other U.S. Government Agency Issues# | 193,456 | 0.0 | % | |||||||||
| Total U.S. Government Agency Issues | ||||||||||||
| (Cost $1,179,038,242) | 1,197,442,091 | 17.8 | % | |||||||||
| Non-U.S. Government Agency Issues | ||||||||||||
| COMM Mortgage Trust, | ||||||||||||
| Series 2014-CCRE18, Class A4, 3.550%, 07/15/2047 | 5,000,000 | 5,177,600 | 0.1 | % | ||||||||
| Other Non-U.S. Government Agency Issues# | 320,169,183 | 4.7 | % | |||||||||
| Total Non-U.S. Government Agency Issues | ||||||||||||
| (Cost $325,137,934) | 325,346,783 | 4.8 | % | |||||||||
| Asset Backed Securities | ||||||||||||
| Carrington Mortgage Loan Trust, | ||||||||||||
| Series 2007-FRE1, Class A2, 0.370%, 02/25/2037 | 45,098,518 | 41,230,328 | 0.6 | % | ||||||||
| Other Asset Backed Securities#~ | 318,786,365 | 4.8 | % | |||||||||
| Total Asset Backed Securities | ||||||||||||
| (Cost $359,548,871) | 360,016,693 | 5.4 | % | |||||||||
| Commercial Mortgage-Backed Securities | ||||||||||||
| COMM Mortgage Trust: | ||||||||||||
| Series 2012-CR1, Class A3, 3.391%, 05/15/2045 | 25,842,000 | 26,878,419 | 0.4 | % | ||||||||
| Series 2012-CR2, Class A4, 3.147%, 08/15/2045 | 29,950,000 | 30,681,619 | 0.5 | % | ||||||||
| 4.022%-5.116%, 06/10/2044-07/10/2045 | 36,581,545 | 38,262,723 | 0.6 | % | ||||||||
| GS Mortgage Securities Corp II, | ||||||||||||
| Series 2012-GCJ9, Class A3, 2.773%, 11/10/2045 | 37,485,000 | 37,264,738 | 0.5 | % | ||||||||
The accompanying notes are an integral part of these financial statements.
Page 64
Baird Core Plus Bond Fund
Summary Schedule of Investments, December 31, 2014
Long-Term Investments (cont.)
| Principal | % of | |||||||||||
| Amount | Value | Net Assets | ||||||||||
| J.P. Morgan Chase Commercial Mortgage Securities Trust: | ||||||||||||
| Series 2005-CB12, Class A4, 4.895%, 09/12/2037 | $ | 24,965,000 | $ | 25,224,012 | 0.4 | % | ||||||
| Series 2013-LC11, Class A5, 2.960%, 04/15/2046 | 22,075,000 | 22,164,624 | 0.3 | % | ||||||||
| JPMBB Commercial Mortgage Securities Trust, | ||||||||||||
| Series 2013-C17, Class A3, 3.928%, 01/15/2047 | 23,700,000 | 25,382,818 | 0.4 | % | ||||||||
| Series 2014-C25, Class A5, 3.672%, 11/15/2047 | 24,000,000 | 25,070,064 | 0.4 | % | ||||||||
| Morgan Stanley Bank of America Merrill Lynch Trust: | ||||||||||||
| Series 2012-C5, Class A4, 3.176%, 08/15/2045 | 27,800,000 | 28,462,780 | 0.4 | % | ||||||||
| Series 2012-C6, Class A4, 2.858%, 11/15/2045 | 30,160,000 | 30,204,094 | 0.5 | % | ||||||||
| Series 2013-C10, Class A3, 3.968%, 07/15/2046 | 31,290,000 | 33,726,896 | 0.5 | % | ||||||||
| Series 2013-C11, Class A3, 3.960%, 08/15/2046 | 19,100,000 | 20,445,595 | 0.3 | % | ||||||||
| Other Commercial Mortgage Backed Securities# | 170,819,878 | 2.5 | % | |||||||||
| Total Commercial Mortgage Backed Securities | ||||||||||||
| (Cost $518,692,043) | 514,588,260 | 7.7 | % | |||||||||
| Total Long-Term Investments | ||||||||||||
| (Cost $6,492,564,373) | 6,571,929,164 | 97.8 | % | |||||||||
| Short-Term Investments | ||||||||||||
| Shares | ||||||||||||
| Money Market Mutual Funds | ||||||||||||
| Dreyfus Cash Advantage Fund, 0.06%« | 67,643,075 | 67,643,075 | 1.0 | % | ||||||||
| Short-Term Investments Trust - | ||||||||||||
| Liquid Assets Portfolio, 0.07%« | 130,000,000 | 130,000,000 | 2.0 | % | ||||||||
| Total Short-Term Investments | ||||||||||||
| (Cost $197,643,075) | 197,643,075 | 3.0 | % | |||||||||
The accompanying notes are an integral part of these financial statements.
Page 65
Baird Core Plus Bond Fund
Summary Schedule of Investments, December 31, 2014
Investments Purchased with Cash
Proceeds from Securities Lending
| % of | ||||||||||||
| Shares | Value | Net Assets | ||||||||||
| Investment Companies | ||||||||||||
| Mount Vernon Securities Lending | ||||||||||||
| Trust Prime Portfolio, 0.29%« | 180,054,574 | $ | 180,054,574 | 2.7 | % | |||||||
| Total Investment Companies | ||||||||||||
| (Cost $180,054,574) | 180,054,574 | 2.7 | % | |||||||||
| Total Investments Purchased With | ||||||||||||
| Cash Proceeds From Securities Lending | ||||||||||||
| (Cost $180,054,574) | 180,054,574 | 2.7 | % | |||||||||
| Total Investments | ||||||||||||
| (Cost $6,870,262,022) | 6,949,626,813 | 103.5 | % | |||||||||
| Liabilities in Excess of Other Assets | (233,019,902 | ) | (3.5 | )% | ||||||||
| TOTAL NET ASSETS | $ | 6,716,606,911 | 100.0 | % | ||||||||
Notes to Summary Schedule of Investments
| # | Represents the aggregate value, by category, securities that are not among the 50 largest holdings and, in total for any issuer, represent 1% or less of net assets. |
| * | Restricted Security Deemed Liquid |
| @ | This security or portion of this security is out on loan at December 31, 2014. |
| f | Foreign Security |
| « | 7-Day Yield |
| ~ | Groupings contain, in aggregate, restricted securities totaling $713,432,972 representing 10.62% of net assets. |
Summary of Fair Value Exposure at December 31, 2014
The Fund has adopted authoritative fair valuation accounting standards which establish a definition of fair value and set out a hierarchy for measuring fair value. These standards require additional disclosures about the various inputs and valuation techniques used to develop the measurements of fair value and a discussion on changes in valuation techniques and related inputs during the period. These standards define fair value as the price that would be received to sell an asset or paid to transfer a liability in an orderly transaction between market participants at the measurement date.
The fair value hierarchy is organized into three levels based upon the assumptions (referred to as “inputs”) used in pricing the asset or liability. These standards state that “observable inputs” reflect the assumptions market participants would use in pricing the asset or liability based on market data obtained from independent sources and “unobservable inputs” reflect an entity’s own assumptions about the assumptions market participants would use in pricing the asset or liability. These inputs are summarized into three broad levels and described below:
Level 1 – | Unadjusted quoted prices in active markets for identical unrestricted securities. |
Level 2 – | Other significant observable inputs (including quoted prices for similar securities, quoted prices in inactive markets, dealer indications, interest rates, yield curves, prepayment speeds, credit risk, default rates, inputs corroborated by observable market data, etc.). |
Level 3 – | Significant unobservable inputs (including the Fund’s own assumptions about the factors that market participants would use in valuing the security) based on the best information available. |
The inputs or methodology used for valuing securities are not necessarily an indication of the risk associated with investing in those securities.
The accompanying notes are an integral part of these financial statements.
Page 66
Baird Core Plus Bond Fund
Summary Schedule of Investments, December 31, 2014
Summary of Fair Value Exposure at December 31, 2014 (cont.)
The following is a summary of the inputs used to value the Fund’s investments as of December 31, 2014:
| Level 1 | Level 2 | Level 3 | Total | |||||||||||||
| Fixed Income | ||||||||||||||||
| U.S. Treasury Securities | $ | — | $ | 997,110,197 | $ | — | $ | 997,110,197 | ||||||||
| Corporate Bonds | — | 2,961,470,404 | 17,092 | 2,961,487,496 | ||||||||||||
| Other Government Related Securities | — | 125,691,062 | — | 125,691,062 | ||||||||||||
| Taxable Municipal Bonds | — | 90,246,582 | — | 90,246,582 | ||||||||||||
| Residential Mortgage-Backed Securities – | ||||||||||||||||
| U.S. Government Agency Issues | — | 1,197,442,091 | — | 1,197,442,091 | ||||||||||||
| Residential Mortgage-Backed Securities – | ||||||||||||||||
| Non-U.S. Government Agency Issues | — | 325,346,783 | — | 325,346,783 | ||||||||||||
| Asset Backed Securities | — | 360,016,693 | — | 360,016,693 | ||||||||||||
| Commercial Mortgage-Backed Securities | — | 514,588,260 | — | 514,588,260 | ||||||||||||
| Total Fixed Income | — | 6,571,912,072 | 17,092 | 6,571,929,164 | ||||||||||||
| Short-Term Investments | ||||||||||||||||
| Money Market Mutual Fund | 197,643,075 | — | — | 197,643,075 | ||||||||||||
| Total Short-Term Investments | 197,643,075 | — | — | 197,643,075 | ||||||||||||
| Investments Purchased with Cash | ||||||||||||||||
| Proceeds from Securities Lending | ||||||||||||||||
| Investment Companies | 180,054,574 | — | — | 180,054,574 | ||||||||||||
| Total Investments Purchased with | ||||||||||||||||
| Cash Proceeds from Securities Lending | 180,054,574 | — | — | 180,054,574 | ||||||||||||
| Total Investments | $ | 377,697,649 | $ | 6,571,912,072 | $ | 17,092 | $ | 6,949,626,813 | ||||||||
Changes in valuation techniques may result in transfers into or out of assigned levels within the fair value hierarchy. There were no transfers between Level 1 and Level 2 fair value measurements during the reporting period, as compared to their classification from the prior year’s annual report. There was one transfer between Level 2 and Level 3 fair value measurements during the reporting period, as compared to their classification from the prior year’s annual report. One security that had been priced by the Fund’s pricing vendor began to be priced by the Valuation Committee using Level 3 inputs and transferred from Level 2 to Level 3. See the Fund’s valuation policy in Note 2a to the financial statements.
Level 3 Reconciliation Disclosure
Following is a reconciliation of Level 3 assets for which significant unobservable inputs were used to determine fair value.
| Description | Investments in Securities | |||
| Balance as of December 31, 2013 | $ | — | ||
| Accrued discounts/premiums | — | |||
| Realized gain (loss) | — | |||
| Change in unrealized appreciation (depreciation) | — | |||
| Purchases | — | |||
| Sales | — | |||
| Transfers in and/or out of Level 3* | 17,092 | |||
| Balance as of December 31, 2014 | $ | 17,092 | ||
* Transfers between levels are recognized at the end of the reporting period.
The accompanying notes are an integral part of these financial statements.
Page 67
Additional Information on Fund Expenses
December 31, 2014 (Unaudited)
As a shareholder of a mutual fund, you incur two types of costs: (1) transaction costs, which may include sales charges (loads) on purchase payments, reinvested dividends, or other distributions; redemption fees; and exchange fees; and (2) ongoing costs, such as management fees; distribution and/or service (12b-1) fees; and other fund expenses. Although the Funds do not charge any sales loads, redemption fees, or other transaction fees, you will be assessed fees for outgoing wire transfers, returned checks and stop payment orders at prevailing rates charged by U.S. Bancorp Fund Services, LLC, the Funds’ transfer agent. If you request that a redemption be made by wire transfer, currently the Funds’ transfer agent charges a $15.00 fee.
This Example is intended to help you understand your ongoing costs (in dollars) of investing in each Fund and to compare these costs with the ongoing costs of investing in other mutual funds. The Example is based on an investment of $1,000 invested at the beginning of the period and held for the entire period (7/1/14 – 12/31/14).
Actual Expenses
The third and fourth columns of the following table provide information about account values based on actual returns and actual expenses. You may use the information in these columns, together with the amount you invested, to estimate the expenses that you paid over the period. Simply divide your account value by $1,000 (for example, an $8,600 account value divided by $1,000 = 8.6), then multiply the result by the number in the fourth column entitled “Expenses Paid During Period’’ to estimate the expenses you paid on your account during this period.
Hypothetical Example for Comparison Purposes
The fifth and sixth columns of the following table provide information about hypothetical account values and hypothetical expenses based on the Funds’ actual expense ratios and an assumed rate of return of 5% per year before expenses, which is not the Funds’ actual return. The hypothetical account values and expenses may not be used to estimate the actual ending account balance or expenses you paid for the period. You may use this information to compare the ongoing costs of investing in the Funds and other mutual funds. To do so, compare this 5% hypothetical example with the 5% hypothetical examples that appear in the shareholder reports of the other mutual funds. Please note that the expenses shown in the table are meant to highlight your ongoing costs only and do not reflect any transactional costs. Therefore, the sixth column of the table (entitled “Expenses Paid During Period”) is useful in comparing ongoing costs only, and will not help you determine the relative total costs of owning different mutual funds. In addition, if these transactional costs were included, your costs could have been higher.
Page 68
Additional Information on Fund Expenses
December 31, 2014 (Unaudited)
Actual vs. Hypothetical Returns
| Hypothetical | ||||||
| (5% return | ||||||
| Actual | before expenses) | |||||
| Fund’s | Beginning | Ending | Expenses | Ending | Expenses | |
| Annualized | Account | Account | Paid | Account | Paid | |
| Expense | Value | Value | During | Value | During | |
Ratio(1) | 7/1/14 | 12/31/14 | Period(1) | 12/31/14 | Period(1) | |
| Baird Ultra Short | ||||||
| Bond Fund | ||||||
| Institutional Class | 0.15% | $1,000.00 | $1,000.70 | $0.76 | $1,024.45 | $0.77 |
| Investor Class | 0.40% | $1,000.00 | $ 998.50 | $2.01 | $1,023.19 | $2.04 |
| Baird Short-Term | ||||||
| Bond Fund | ||||||
| Institutional Class | 0.30% | $1,000.00 | $1,001.80 | $1.51 | $1,023.69 | $1.53 |
| Investor Class | 0.55% | $1,000.00 | $1,000.50 | $2.77 | $1,022.43 | $2.80 |
| Baird Intermediate | ||||||
| Bond Fund | ||||||
| Institutional Class | 0.30% | $1,000.00 | $1,007.20 | $1.52 | $1,023.69 | $1.53 |
| Investor Class | 0.55% | $1,000.00 | $1,005.60 | $2.78 | $1,022.43 | $2.80 |
| Baird Intermediate | ||||||
| Municipal Bond Fund | ||||||
| Institutional Class | 0.30% | $1,000.00 | $1,012.30 | $1.52 | $1,023.69 | $1.53 |
| Investor Class | 0.55% | $1,000.00 | $1,011.60 | $2.79 | $1,022.43 | $2.80 |
| Baird Aggregate | ||||||
| Bond Fund | ||||||
| Institutional Class | 0.30% | $1,000.00 | $1,020.10 | $1.53 | $1,023.69 | $1.53 |
| Investor Class | 0.55% | $1,000.00 | $1,019.10 | $2.80 | $1,022.43 | $2.80 |
| Baird Core Plus | ||||||
| Bond Fund | ||||||
| Institutional Class | 0.30% | $1,000.00 | $1,016.90 | $1.53 | $1,023.69 | $1.53 |
| Investor Class | 0.55% | $1,000.00 | $1,015.90 | $2.79 | $1,022.43 | $2.80 |
| (1) | Expenses are equal to the Fund’s annualized net expense ratio multiplied by the average account value over the period, multiplied by 184 days and divided by 365 to reflect the one-half year period. |
Page 69
Statements of Assets and Liabilities
December 31, 2014
| Baird | Baird | Baird | ||||||||||
| Ultra Short | Short-Term | Intermediate | ||||||||||
| Bond Fund | Bond Fund | Bond Fund | ||||||||||
| ASSETS: | ||||||||||||
| Investments, at value (cost $83,944,155, | ||||||||||||
| $2,812,803,921 and $1,754,267,121, respectively)* | $ | 83,759,229 | $ | 2,808,066,265 | $ | 1,775,556,387 | ||||||
| Interest receivable | 485,304 | 19,316,764 | 14,050,266 | |||||||||
| Receivable for investments sold | — | — | 25 | |||||||||
| Receivable for Fund shares sold | 13,870,158 | 7,909,865 | 1,564,230 | |||||||||
| Uninvested cash | — | 5,804 | — | |||||||||
| Receivable for securities lending | — | 9,308 | 11,777 | |||||||||
| Total assets | 98,114,691 | 2,835,308,006 | 1,791,182,685 | |||||||||
| LIABILITIES: | ||||||||||||
| Payable for collateral received | ||||||||||||
| for securities loaned (Note 6) | — | 147,613,109 | 192,781,148 | |||||||||
| Payable for securities purchased | 12,737,380 | 6,472,885 | 13,428,104 | |||||||||
| Payable for Fund shares repurchased | — | 3,818,186 | 622,123 | |||||||||
| Payable to Advisor and Distributor | 8,747 | 695,888 | 419,935 | |||||||||
| Other liabilities | — | 53 | 152,464 | |||||||||
| Total liabilities | 12,746,127 | 158,600,121 | 207,403,774 | |||||||||
| NET ASSETS | $ | 85,368,564 | $ | 2,676,707,885 | $ | 1,583,778,911 | ||||||
| NET ASSETS CONSIST OF: | ||||||||||||
| Capital stock | $ | 85,563,125 | $ | 2,680,022,051 | $ | 1,562,009,640 | ||||||
| Accumulated undistributed | ||||||||||||
| net investment income | 3,769 | 151,789 | 143,749 | |||||||||
| Accumulated net realized | ||||||||||||
| gain (loss) on investments sold | (13,404 | ) | 1,271,701 | 336,256 | ||||||||
| Net unrealized appreciation (depreciation) | ||||||||||||
| on investments | (184,926 | ) | (4,737,656 | ) | 21,289,266 | |||||||
| NET ASSETS | $ | 85,368,564 | $ | 2,676,707,885 | $ | 1,583,778,911 | ||||||
| INSTITUTIONAL CLASS SHARES | ||||||||||||
| Net Assets | $ | 84,477,492 | $ | 2,640,892,177 | $ | 1,468,212,932 | ||||||
| Shares outstanding ($0.01 par value, | ||||||||||||
| unlimited shares authorized) | 8,424,284 | 273,164,316 | 132,223,556 | |||||||||
| Net asset value, offering and | ||||||||||||
| redemption price per share | $ | 10.03 | $ | 9.67 | $ | 11.10 | ||||||
| INVESTOR CLASS SHARES | ||||||||||||
| Net Assets | $ | 891,072 | $ | 35,815,708 | $ | 115,565,979 | ||||||
| Shares outstanding ($0.01 par value, | ||||||||||||
| unlimited shares authorized) | 88,900 | 3,704,764 | 10,001,347 | |||||||||
| Net asset value, offering and | ||||||||||||
| redemption price per share | $ | 10.02 | $ | 9.67 | $ | 11.56 | ||||||
| * | Includes securities out on loan to brokers with a market value of $0, $144,409,191 and $188,657,283, respectively. |
The accompanying notes are an integral part of these financial statements.
Page 70
Statements of Assets and Liabilities
December 31, 2014
| Baird | ||||||||||||
| Intermediate | Baird | Baird | ||||||||||
| Municipal | Aggregate | Core Plus | ||||||||||
| Bond Fund | Bond Fund | Bond Fund | ||||||||||
| ASSETS: | ||||||||||||
| Investments, at value (cost $1,074,729,856, | ||||||||||||
| $3,740,345,751 and | ||||||||||||
| $6,870,262,022, respectively)* | $ | 1,119,626,917 | $ | 3,818,202,393 | $ | 6,949,626,813 | ||||||
| Interest receivable | 13,118,022 | 27,547,589 | 50,818,666 | |||||||||
| Receivable for investments sold | — | 27,179,805 | 111 | |||||||||
| Receivable for Fund shares sold | 3,564,972 | 16,632,483 | 28,792,054 | |||||||||
| Uninvested cash | 462 | — | — | |||||||||
| Receivable for securities lending | — | 16,264 | 53,636 | |||||||||
| Other assets | — | 4,376 | — | |||||||||
| Total assets | 1,136,310,373 | 3,889,582,910 | 7,029,291,280 | |||||||||
| LIABILITIES: | ||||||||||||
| Payable for collateral received | ||||||||||||
| for securities loaned (Note 6) | — | 98,296,098 | 180,054,574 | |||||||||
| Payable for securities purchased | 4,136,676 | 97,738,892 | 125,569,045 | |||||||||
| Payable for Fund shares repurchased | 26,208,023 | 2,047,132 | 3,968,572 | |||||||||
| Payable to Advisor and Distributor | 353,023 | 951,747 | 2,111,403 | |||||||||
| Other liabilities | — | 309,123 | 980,775 | |||||||||
| Total liabilities | 30,697,722 | 199,342,992 | 312,684,369 | |||||||||
| NET ASSETS | $ | 1,105,612,651 | $ | 3,690,239,918 | $ | 6,716,606,911 | ||||||
| NET ASSETS CONSIST OF: | ||||||||||||
| Capital stock | $ | 1,061,592,176 | $ | 3,622,135,784 | $ | 6,648,429,795 | ||||||
| Accumulated undistributed | ||||||||||||
| net investment income | 24,885 | 63,990 | 402,605 | |||||||||
| Accumulated net realized loss on | ||||||||||||
| investments sold | (901,471 | ) | (9,816,498 | ) | (11,590,280 | ) | ||||||
| Net unrealized appreciation on investments | 44,897,061 | 77,856,642 | 79,364,791 | |||||||||
| NET ASSETS | $ | 1,105,612,651 | $ | 3,690,239,918 | $ | 6,716,606,911 | ||||||
| INSTITUTIONAL CLASS SHARES | ||||||||||||
| Net Assets | $ | 918,944,572 | $ | 3,448,566,888 | $ | 4,520,948,037 | ||||||
| Shares outstanding ($0.01 par value, | ||||||||||||
| unlimited shares authorized) | 78,104,232 | 318,988,439 | 405,895,839 | |||||||||
| Net asset value, offering and | ||||||||||||
| redemption price per share | $ | 11.77 | $ | 10.81 | $ | 11.14 | ||||||
| INVESTOR CLASS SHARES | ||||||||||||
| Net Assets | $ | 186,668,079 | $ | 241,673,030 | $ | 2,195,658,874 | ||||||
| Shares outstanding ($0.01 par value, | ||||||||||||
| unlimited shares authorized) | 15,522,287 | 21,682,288 | 190,054,912 | |||||||||
| Net asset value, offering and | ||||||||||||
| redemption price per share | $ | 12.03 | $ | 11.15 | $ | 11.55 | ||||||
| * | Includes securities out on loan to brokers with a market value of $0, $96,025,717 and $175,957,815, respectively. |
The accompanying notes are an integral part of these financial statements.
Page 71
Statement of Operations
Year Ended December 31, 2014
| Baird | Baird | Baird | ||||||||||
| Ultra Short | Short-Term | Intermediate | ||||||||||
| Bond Fund | Bond Fund | Bond Fund | ||||||||||
| INVESTMENT INCOME: | ||||||||||||
| Interest income, net of paydowns | $ | 288,480 | $ | 42,323,282 | $ | 35,181,502 | ||||||
| Income from securities lending (Note 6) | — | 199,859 | 266,526 | |||||||||
| Other income | — | 77,115 | 8,989 | |||||||||
| Total investment income | 288,480 | 42,600,256 | 35,457,017 | |||||||||
| EXPENSES: | ||||||||||||
| Investment advisory fees | 66,373 | 5,717,200 | 3,317,947 | |||||||||
| Administration fees | 13,275 | 1,143,440 | 663,590 | |||||||||
| Distribution expense – | ||||||||||||
| Investor Class Shares (Note 8) | 501 | 72,753 | 163,945 | |||||||||
| Total expenses | 80,149 | 6,933,393 | 4,145,482 | |||||||||
| Fee waiver by Advisor (Note 5) | (39,803 | ) | — | — | ||||||||
| Net expenses | 40,346 | 6,933,393 | 4,145,482 | |||||||||
| NET INVESTMENT INCOME | 248,134 | 35,666,863 | 31,311,535 | |||||||||
| REALIZED AND UNREALIZED GAIN (LOSS) | ||||||||||||
| ON INVESTMENTS: | ||||||||||||
| Net realized gain on investments | 13,668 | 4,753,146 | 3,224,796 | |||||||||
| Change in unrealized appreciation/ | ||||||||||||
| depreciation on investments | (184,926 | ) | (9,498,528 | ) | 9,181,636 | |||||||
| Net realized and unrealized gain (loss) | ||||||||||||
| on investments | (171,258 | ) | (4,745,382 | ) | 12,406,432 | |||||||
| NET INCREASE IN NET ASSETS | ||||||||||||
| RESULTING FROM OPERATIONS | $ | 76,876 | $ | 30,921,481 | $ | 43,717,967 | ||||||
The accompanying notes are an integral part of these financial statements.
Page 72
Statement of Operations
Year Ended December 31, 2014
| Baird | ||||||||||||
| Intermediate | Baird | Baird | ||||||||||
| Municipal | Aggregate | Core Plus | ||||||||||
| Bond Fund | Bond Fund | Bond Fund | ||||||||||
| INVESTMENT INCOME: | ||||||||||||
| Interest income, net of paydowns | $ | 30,714,118 | $ | 74,343,857 | $ | 121,967,930 | ||||||
| Income from securities lending (Note 6) | — | 234,566 | 704,653 | |||||||||
| Other income | — | 27,543 | 26,647 | |||||||||
| Total investment income | 30,714,118 | 74,605,966 | 122,699,230 | |||||||||
| EXPENSES: | ||||||||||||
| Investment advisory fees | 2,684,440 | 6,003,443 | 9,618,223 | |||||||||
| Administration fees | 536,888 | 1,200,689 | 1,923,645 | |||||||||
| Distribution expense – | ||||||||||||
| Investor Class Shares (Note 8) | 520,135 | 476,674 | 3,367,885 | |||||||||
| Total expenses | 3,741,463 | 7,680,806 | 14,909,753 | |||||||||
| NET INVESTMENT INCOME | 26,972,655 | 66,925,160 | 107,789,477 | |||||||||
| REALIZED AND UNREALIZED GAIN (LOSS) | ||||||||||||
| ON INVESTMENTS: | ||||||||||||
| Net realized gain (loss) on investments | (530,835 | ) | 4,517,863 | 8,760,815 | ||||||||
| Change in unrealized appreciation/ | ||||||||||||
| depreciation on investments | 19,389,924 | 77,563,931 | 107,099,217 | |||||||||
| Net realized and unrealized gain | ||||||||||||
| on investments | 18,859,089 | 82,081,794 | 115,860,032 | |||||||||
| NET INCREASE IN NET ASSETS | ||||||||||||
| RESULTING FROM OPERATIONS | $ | 45,831,744 | $ | 149,006,954 | $ | 223,649,509 | ||||||
The accompanying notes are an integral part of these financial statements.
Page 73
Statement of Changes in Net Assets
Baird Ultra Short Bond Fund^
| Year Ended | ||||
| December 31, 2014 | ||||
| OPERATIONS: | ||||
| Net investment income | $ | 248,134 | ||
| Net realized gain on investments | 13,668 | |||
| Change in unrealized depreciation on investments | (184,926 | ) | ||
| Net increase in net assets resulting from operations | 76,876 | |||
| CAPITAL SHARE TRANSACTIONS: | ||||
| Proceeds from shares sold | 93,172,532 | |||
| Shares issued to holders in reinvestment of distributions | 226,670 | |||
| Cost of shares redeemed | (7,836,077 | ) | ||
| Net increase in net assets resulting from capital share transactions | 85,563,125 | |||
| DISTRIBUTIONS TO INSTITUTIONAL CLASS SHAREHOLDERS: | ||||
| From net investment income | (269,807 | ) | ||
| Total Distributions | (269,807 | ) | ||
| DISTRIBUTIONS TO INVESTOR CLASS SHAREHOLDERS: | ||||
| From net investment income | (1,630 | ) | ||
| Total Distributions | (1,630 | ) | ||
| TOTAL INCREASE IN NET ASSETS | 85,368,564 | |||
| NET ASSETS: | ||||
| Beginning of year | — | |||
| End of year (including accumulated undistributed net investment | ||||
| income of $3,769) | $ | 85,368,564 | ||
^ Inception was the close of business on December 31, 2013.
The accompanying notes are an integral part of these financial statements.
Page 74
Statement of Changes in Net Assets
Baird Short-Term Bond Fund
| Year Ended | Year Ended | ||||||||
| December 31, 2014 | December 31, 2013 | ||||||||
| OPERATIONS: | |||||||||
| Net investment income | $ | 35,666,863 | $ | 27,854,126 | |||||
| Net realized gain on investments | 4,753,146 | 4,483,161 | |||||||
| Change in unrealized depreciation on investments | (9,498,528 | ) | (9,991,149 | ) | |||||
| Net increase in net assets | |||||||||
| resulting from operations | 30,921,481 | 22,346,138 | |||||||
| CAPITAL SHARE TRANSACTIONS: | |||||||||
| Proceeds from shares sold | 1,376,961,950 | 1,321,429,969 | |||||||
| Shares issued to holders in reinvestment of distributions | 34,127,758 | 28,803,751 | |||||||
| Cost of shares redeemed | (734,856,529 | ) | (628,082,008 | ) | |||||
| Net increase in net assets resulting | |||||||||
| from capital share transactions | 676,233,179 | 722,151,712 | |||||||
| DISTRIBUTIONS TO | |||||||||
| INSTITUTIONAL CLASS SHAREHOLDERS: | |||||||||
| From net investment income | (37,504,235 | ) | (28,830,295 | ) | |||||
| From net realized gains | (1,473,635 | ) | (3,715,930 | ) | |||||
| Total Distributions | (38,977,870 | ) | (32,546,225 | ) | |||||
| DISTRIBUTIONS TO | |||||||||
| INVESTOR CLASS SHAREHOLDERS: | |||||||||
| From net investment income | (413,795 | ) | (101,725 | ) | |||||
| From net realized gains | (19,699 | ) | (43,827 | ) | |||||
| Total Distributions | (433,494 | ) | (145,552 | ) | |||||
| TOTAL INCREASE IN NET ASSETS | 667,743,296 | 711,806,073 | |||||||
| NET ASSETS: | |||||||||
| Beginning of year | 2,008,964,589 | 1,297,158,516 | |||||||
| End of year (including accumulated | |||||||||
| undistributed net investment income | |||||||||
| of $151,789 and $87,597) | $ | 2,676,707,885 | $ | 2,008,964,589 | |||||
The accompanying notes are an integral part of these financial statements.
Page 75
Statement of Changes in Net Assets
Baird Intermediate Bond Fund
| Year Ended | Year Ended | ||||||||
| December 31, 2014 | December 31, 2013 | ||||||||
| OPERATIONS: | |||||||||
| Net investment income | $ | 31,311,535 | $ | 24,284,984 | |||||
| Net realized gain on investments | 3,224,796 | 280,244 | |||||||
| Change in unrealized appreciation/depreciation | |||||||||
| on investments | 9,181,636 | (25,956,146 | ) | ||||||
| Net increase (decrease) in net assets | |||||||||
| resulting from operations | 43,717,967 | (1,390,918 | ) | ||||||
| CAPITAL SHARE TRANSACTIONS: | |||||||||
| Proceeds from shares sold | 579,006,584 | 446,423,832 | |||||||
| Shares issued to holders in reinvestment of distributions | 29,350,298 | 22,280,498 | |||||||
| Cost of shares redeemed | (189,933,013 | ) | (179,390,475 | ) | |||||
| Net increase in net assets resulting | |||||||||
| from capital share transactions | 418,423,869 | 289,313,855 | |||||||
| DISTRIBUTIONS TO | |||||||||
| INSTITUTIONAL CLASS SHAREHOLDERS: | |||||||||
| From net investment income | (30,366,524 | ) | (23,931,138 | ) | |||||
| From net realized gains | (2,154,632 | ) | (1,670,359 | ) | |||||
| Total Distributions | (32,521,156 | ) | (25,601,497 | ) | |||||
| DISTRIBUTIONS TO | |||||||||
| INVESTOR CLASS SHAREHOLDERS: | |||||||||
| From net investment income | (1,383,958 | ) | (763,548 | ) | |||||
| From net realized gains | (163,736 | ) | (60,340 | ) | |||||
| Total Distributions | (1,547,694 | ) | (823,888 | ) | |||||
| TOTAL INCREASE IN NET ASSETS | 428,072,986 | 261,497,552 | |||||||
| NET ASSETS: | |||||||||
| Beginning of year | 1,155,705,925 | 894,208,373 | |||||||
| End of year (including accumulated | |||||||||
| undistributed net investment income | |||||||||
| of $143,749 and $34,180) | $ | 1,583,778,911 | $ | 1,155,705,925 | |||||
The accompanying notes are an integral part of these financial statements.
Page 76
Statement of Changes in Net Assets
Baird Intermediate Municipal Bond Fund
| Year Ended | Year Ended | ||||||||
| December 31, 2014 | December 31, 2013 | ||||||||
| OPERATIONS: | |||||||||
| Net investment income | $ | 26,972,655 | $ | 29,327,292 | |||||
| Net realized gain (loss) on investments | (530,835 | ) | 393,206 | ||||||
| Change in unrealized appreciation/depreciation | |||||||||
| on investments | 19,389,924 | (45,857,361 | ) | ||||||
| Net increase (decrease) in net assets | |||||||||
| resulting from operations | 45,831,744 | (16,136,863 | ) | ||||||
| CAPITAL SHARE TRANSACTIONS: | |||||||||
| Proceeds from shares sold | 323,804,525 | 375,180,193 | |||||||
| Shares issued to holders in reinvestment of distributions | 23,414,513 | 24,773,117 | |||||||
| Cost of shares redeemed | (267,484,959 | ) | (569,130,806 | ) | |||||
| Net increase (decrease) in net assets | |||||||||
| resulting from capital share transactions | 79,734,079 | (169,177,496 | ) | ||||||
| DISTRIBUTIONS TO | |||||||||
| INSTITUTIONAL CLASS SHAREHOLDERS: | |||||||||
| From net investment income | (22,257,987 | ) | (23,787,845 | ) | |||||
| Total Distributions | (22,257,987 | ) | (23,787,845 | ) | |||||
| DISTRIBUTIONS TO | |||||||||
| INVESTOR CLASS SHAREHOLDERS: | |||||||||
| From net investment income | (4,689,783 | ) | (5,549,463 | ) | |||||
| Total Distributions | (4,689,783 | ) | (5,549,463 | ) | |||||
| TOTAL INCREASE (DECREASE) IN NET ASSETS | 98,618,053 | (214,651,667 | ) | ||||||
| NET ASSETS: | |||||||||
| Beginning of year | 1,006,994,598 | 1,221,646,265 | |||||||
| End of year (including accumulated undistributed | |||||||||
| net investment income of $24,885 and $0) | $ | 1,105,612,651 | $ | 1,006,994,598 | |||||
The accompanying notes are an integral part of these financial statements.
Page 77
Statement of Changes in Net Assets
Baird Aggregate Bond Fund
| Year Ended | Year Ended | ||||||||
| December 31, 2014 | December 31, 2013 | ||||||||
| OPERATIONS: | |||||||||
| Net investment income | $ | 66,925,160 | $ | 51,332,825 | |||||
| Net realized gain on investments | 4,517,863 | 378,075 | |||||||
| Change in unrealized appreciation/depreciation | |||||||||
| on investments | 77,563,931 | (72,138,203 | ) | ||||||
| Net increase (decrease) in net assets | |||||||||
| resulting from operations | 149,006,954 | (20,427,303 | ) | ||||||
| CAPITAL SHARE TRANSACTIONS: | |||||||||
| Proceeds from shares sold | 2,221,120,686 | 1,010,876,966 | |||||||
| Shares issued to holders in reinvestment of distributions | 60,169,930 | 44,941,674 | |||||||
| Cost of shares redeemed | (476,225,763 | ) | (717,490,386 | ) | |||||
| Net increase in net assets resulting | |||||||||
| from capital share transactions | 1,805,064,853 | 338,328,254 | |||||||
| DISTRIBUTIONS TO | |||||||||
| INSTITUTIONAL CLASS SHAREHOLDERS: | |||||||||
| From net investment income | (65,793,639 | ) | (52,544,503 | ) | |||||
| Total Distributions | (65,793,639 | ) | (52,544,503 | ) | |||||
| DISTRIBUTIONS TO | |||||||||
| INVESTOR CLASS SHAREHOLDERS: | |||||||||
| From net investment income | (4,963,419 | ) | (3,280,448 | ) | |||||
| Total Distributions | (4,963,419 | ) | (3,280,448 | ) | |||||
| TOTAL INCREASE IN NET ASSETS | 1,883,314,749 | 262,076,000 | |||||||
| NET ASSETS: | |||||||||
| Beginning of year | 1,806,925,169 | 1,544,849,169 | |||||||
| End of year (including accumulated | |||||||||
| undistributed net investment income | |||||||||
| of $63,990 and $63,323) | $ | 3,690,239,918 | $ | 1,806,925,169 | |||||
The accompanying notes are an integral part of these financial statements.
Page 78
Statement of Changes in Net Assets
Baird Core Plus Bond Fund
| Year Ended | Year Ended | ||||||||
| December 31, 2014 | December 31, 2013 | ||||||||
| OPERATIONS: | |||||||||
| Net investment income | $ | 107,789,477 | $ | 76,999,110 | |||||
| Net realized gain (loss) on investments | 8,760,815 | (5,595,901 | ) | ||||||
| Change in unrealized appreciation/depreciation | |||||||||
| on investments | 107,099,217 | (116,074,581 | ) | ||||||
| Net increase (decrease) in net assets | |||||||||
| resulting from operations | 223,649,509 | (44,671,372 | ) | ||||||
| CAPITAL SHARE TRANSACTIONS: | |||||||||
| Proceeds from shares sold | 4,327,319,011 | 1,377,196,811 | |||||||
| Shares issued to holders in reinvestment of distributions | 110,692,074 | 81,644,399 | |||||||
| Cost of shares redeemed | (664,302,496 | ) | (1,103,175,773 | ) | |||||
| Net increase in net assets resulting | |||||||||
| from capital share transactions | 3,773,708,589 | 355,665,437 | |||||||
| DISTRIBUTIONS TO | |||||||||
| INSTITUTIONAL CLASS SHAREHOLDERS: | |||||||||
| From net investment income | (78,483,997 | ) | (54,209,559 | ) | |||||
| From net realized gains | — | (1,221,572 | ) | ||||||
| Total Distributions | (78,483,997 | ) | (55,431,131 | ) | |||||
| DISTRIBUTIONS TO | |||||||||
| INVESTOR CLASS SHAREHOLDERS: | |||||||||
| From net investment income | (36,081,493 | ) | (30,443,741 | ) | |||||
| From net realized gains | — | (694,353 | ) | ||||||
| Total Distributions | (36,081,493 | ) | (31,138,094 | ) | |||||
| TOTAL INCREASE IN NET ASSETS | 3,882,792,608 | 224,424,840 | |||||||
| NET ASSETS: | |||||||||
| Beginning of year | 2,833,814,303 | 2,609,389,463 | |||||||
| End of year (including accumulated | |||||||||
| undistributed net investment income | |||||||||
| of $402,605 and $269,644) | $ | 6,716,606,911 | $ | 2,833,814,303 | |||||
The accompanying notes are an integral part of these financial statements.
Page 79
Financial Highlights
Baird Ultra Short Bond Fund – Institutional Class^
| Year Ended | ||||
| December 31, 2014 | ||||
| Per Share Data: | ||||
| Net asset value, beginning of year | $ | 10.00 | ||
| Income from investment operations: | ||||
| Net investment income | 0.09 | |||
| Net realized and unrealized gain on investments | 0.03 | (1) | ||
| Total from investment operations | 0.12 | |||
| Less distributions: | ||||
| Distributions from net investment income | (0.09 | ) | ||
| Total Distributions | (0.09 | ) | ||
| Net asset value, end of year | $ | 10.03 | ||
| Total return | 1.21 | % | ||
| Supplemental data and ratios: | ||||
| Net assets, end of year (millions) | $ | 84.5 | ||
| Ratio of expenses to average net assets | 0.15 | % | ||
| Ratio of expenses to average net assets (before waivers) | 0.30 | % | ||
| Ratio of net investment income to average net assets | 0.93 | % | ||
| Ratio of net investment income to average net assets (before waivers) | 0.78 | % | ||
Portfolio turnover rate(2) | 57.6 | % | ||
| ^ | Inception was the close of business on December 31, 2013. |
| (1) | Due to timing of capital share transactions, the per share amount of net realized and unrealized gain on investments varies from the amounts shown in the statement of operations. |
| (2) | Portfolio turnover is calculated on the basis of the Fund as a whole without distinguishing between the classes of shares issued. |
The accompanying notes are an integral part of these financial statements.
Page 80
Financial Highlights
Baird Ultra Short Bond Fund – Investor Class^
| Year Ended | ||||
| December 31, 2014 | ||||
| Per Share Data: | ||||
| Net asset value, beginning of year | $ | 10.00 | ||
| Income from investment operations: | ||||
| Net investment income | 0.07 | |||
| Net realized and unrealized gain on investments | 0.02 | (1) | ||
| Total from investment operations | 0.09 | |||
| Less distributions: | ||||
| Distributions from net investment income | (0.07 | ) | ||
| Total Distributions | (0.07 | ) | ||
| Net asset value, end of year | $ | 10.02 | ||
| Total return | 0.88 | % | ||
| Supplemental data and ratios: | ||||
| Net assets, end of year (millions) | $ | 0.9 | ||
| Ratio of expenses to average net assets | 0.40 | % | ||
| Ratio of expenses to average net assets (before waivers) | 0.55 | % | ||
| Ratio of net investment income to average net assets | 0.68 | % | ||
| Ratio of net investment income to average net assets (before waivers) | 0.53 | % | ||
Portfolio turnover rate(2) | 57.6 | % | ||
| ^ | Inception was the close of business on December 31, 2013. |
| (1) | Due to timing of capital share transactions, the per share amount of net realized and unrealized gain on investments varies from the amounts shown in the statement of operations. |
| (2) | Portfolio turnover is calculated on the basis of the Fund as a whole without distinguishing between the classes of shares issued. |
The accompanying notes are an integral part of these financial statements.
Page 81
Financial Highlights
Baird Short-Term Bond Fund – Institutional Class
| Year Ended December 31, | ||||||||||||||||||||
| 2014 | 2013 | 2012 | 2011 | 2010 | ||||||||||||||||
| Per Share Data: | ||||||||||||||||||||
| Net asset value, beginning of year | $ | 9.69 | $ | 9.75 | $ | 9.59 | $ | 9.68 | $ | 9.57 | ||||||||||
| Income from | ||||||||||||||||||||
| investment operations: | ||||||||||||||||||||
| Net investment income | 0.16 | 0.17 | (1) | 0.22 | 0.23 | 0.29 | ||||||||||||||
| Net realized and unrealized | ||||||||||||||||||||
| gains (losses) on investments | (0.01 | ) | (0.04 | ) | 0.17 | (0.03 | ) | 0.13 | ||||||||||||
| Total from investment operations | 0.15 | 0.13 | 0.39 | 0.20 | 0.42 | |||||||||||||||
| Less distributions: | ||||||||||||||||||||
| Distributions from | ||||||||||||||||||||
| net investment income | (0.16 | ) | (0.17 | ) | (0.22 | ) | (0.23 | ) | (0.29 | ) | ||||||||||
| Distributions from | ||||||||||||||||||||
| net realized gains | (0.01 | ) | (0.02 | ) | (0.01 | ) | (0.06 | ) | (0.02 | ) | ||||||||||
| Total distributions | (0.17 | ) | (0.19 | ) | (0.23 | ) | (0.29 | ) | (0.31 | ) | ||||||||||
| Net asset value, end of year | $ | 9.67 | $ | 9.69 | $ | 9.75 | $ | 9.59 | $ | 9.68 | ||||||||||
| Total return | 1.49 | % | 1.33 | % | 4.16 | % | 2.08 | % | 4.39 | % | ||||||||||
| Supplemental data and ratios: | ||||||||||||||||||||
| Net assets, end of year (millions) | $ | 2,640.9 | $ | 1,985.0 | $ | 1,295.7 | $ | 1,017.2 | $ | 919.0 | ||||||||||
| Ratio of expenses to average net assets | 0.30 | % | 0.30 | % | 0.30 | % | 0.30 | % | 0.30 | % | ||||||||||
| Ratio of net investment income | ||||||||||||||||||||
| to average net assets | 1.56 | % | 1.71 | % | 2.23 | % | 2.40 | % | 2.92 | % | ||||||||||
Portfolio turnover rate(2) | 51.2 | % | 45.1 | % | 40.1 | % | 61.1 | % | 58.7 | % | ||||||||||
| (1) | Calculated using average shares outstanding during the year. |
| (2) | Portfolio turnover is calculated on the basis of the Fund as a whole without distinguishing between the classes of shares issued. |
The accompanying notes are an integral part of these financial statements.
Page 82
Financial Highlights
Baird Short-Term Bond Fund – Investor Class
| September 19, 2012^ | ||||||||||||
| through | ||||||||||||
| Year Ended December 31, | December 31, | |||||||||||
| 2014 | 2013 | 2012 | ||||||||||
| Per Share Data: | ||||||||||||
| Net asset value, beginning of period | $ | 9.69 | $ | 9.75 | $ | 9.77 | ||||||
| Income from investment operations: | ||||||||||||
| Net investment income | 0.14 | 0.15 | (1) | 0.06 | ||||||||
| Net realized and unrealized gains (losses) | ||||||||||||
| on investments | (0.02 | ) | (0.04 | ) | 0.00 | (2) | ||||||
| Total from investment operations | 0.12 | 0.11 | 0.06 | |||||||||
| Less distributions: | ||||||||||||
| Distributions from net investment income | (0.13 | ) | (0.15 | ) | (0.07 | ) | ||||||
| Distributions from net realized gains | (0.01 | ) | (0.02 | ) | (0.01 | ) | ||||||
| Total distributions | (0.14 | ) | (0.17 | ) | (0.08 | ) | ||||||
| Net asset value, end of period | $ | 9.67 | $ | 9.69 | $ | 9.75 | ||||||
| Total return | 1.25 | % | 1.11 | % | 0.68 | %(3) | ||||||
| Supplemental data and ratios: | ||||||||||||
| Net assets, end of period (millions) | $ | 35.8 | $ | 2.5 | $ | 1.5 | ||||||
| Ratio of expenses to average net assets | 0.55 | % | 0.55 | % | 0.55 | %(4) | ||||||
| Ratio of net investment income | ||||||||||||
| to average net assets | 1.31 | % | 1.46 | % | 1.98 | %(4) | ||||||
Portfolio turnover rate(5) | 51.2 | % | 45.1 | % | 40.1 | %(3) | ||||||
| ^ | Inception date. |
| (1) | Calculated using average shares outstanding during the year. |
| (2) | Amount is less than $0.005. |
| (3) | Not annualized. |
| (4) | Annualized. |
| (5) | Portfolio turnover is calculated on the basis of the Fund as a whole without distinguishing between the classes of shares issued. |
The accompanying notes are an integral part of these financial statements.
Page 83
Financial Highlights
Baird Intermediate Bond Fund – Institutional Class
| Year Ended December 31, | ||||||||||||||||||||
| 2014 | 2013 | 2012 | 2011 | 2010 | ||||||||||||||||
| Per Share Data: | ||||||||||||||||||||
| Net asset value, beginning of year | $ | 11.00 | $ | 11.31 | $ | 11.06 | $ | 10.87 | $ | 10.61 | ||||||||||
| Income from | ||||||||||||||||||||
| investment operations: | ||||||||||||||||||||
| Net investment income | 0.26 | (1) | 0.27 | 0.33 | (1) | 0.39 | 0.44 | (1) | ||||||||||||
| Net realized and unrealized | ||||||||||||||||||||
| gains (losses) on investments | 0.13 | (0.29 | ) | 0.38 | 0.27 | 0.35 | ||||||||||||||
| Total from investment operations | 0.39 | (0.02 | ) | 0.71 | 0.66 | 0.79 | ||||||||||||||
| Less distributions: | ||||||||||||||||||||
| Distributions from | ||||||||||||||||||||
| net investment income | (0.27 | ) | (0.27 | ) | (0.33 | ) | (0.39 | ) | (0.44 | ) | ||||||||||
| Distributions from | ||||||||||||||||||||
| net realized gains | (0.02 | ) | (0.02 | ) | (0.13 | ) | (0.08 | ) | (0.09 | ) | ||||||||||
| Total distributions | (0.29 | ) | (0.29 | ) | (0.46 | ) | (0.47 | ) | (0.53 | ) | ||||||||||
| Net asset value, end of year | $ | 11.10 | $ | 11.00 | $ | 11.31 | $ | 11.06 | $ | 10.87 | ||||||||||
| Total return | 3.50 | % | (0.17 | )% | 6.52 | % | 6.14 | % | 7.54 | % | ||||||||||
| Supplemental data and ratios: | ||||||||||||||||||||
| Net assets, end of year (millions) | $ | 1,468.2 | $ | 1,113.7 | $ | 867.5 | $ | 703.2 | $ | 591.2 | ||||||||||
| Ratio of expenses to average net assets | 0.30 | % | 0.30 | % | 0.30 | % | 0.30 | % | 0.30 | % | ||||||||||
| Ratio of net investment income | ||||||||||||||||||||
| to average net assets | 2.37 | % | 2.45 | % | 2.95 | % | 3.49 | % | 4.05 | % | ||||||||||
Portfolio turnover rate(2) | 29.2 | % | 45.1 | % | 45.1 | % | 24.1 | % | 38.7 | % | ||||||||||
| (1) | Calculated using average shares outstanding during the year. |
| (2) | Portfolio turnover is calculated on the basis of the Fund as a whole without distinguishing between the classes of shares issued. |
The accompanying notes are an integral part of these financial statements.
Page 84
Financial Highlights
Baird Intermediate Bond Fund – Investor Class
| Year Ended December 31, | ||||||||||||||||||||
| 2014 | 2013 | 2012 | 2011 | 2010 | ||||||||||||||||
| Per Share Data: | ||||||||||||||||||||
| Net asset value, beginning of year | $ | 11.43 | $ | 11.74 | $ | 11.47 | $ | 11.26 | $ | 10.97 | ||||||||||
| Income from | ||||||||||||||||||||
| investment operations: | ||||||||||||||||||||
| Net investment income | 0.25 | (1) | 0.25 | 0.32 | (1) | 0.37 | 0.43 | (1) | ||||||||||||
| Net realized and unrealized | ||||||||||||||||||||
| gains (losses) on investments | 0.14 | (0.29 | ) | 0.39 | 0.28 | 0.36 | ||||||||||||||
| Total from investment operations | 0.39 | (0.04 | ) | 0.71 | 0.65 | 0.79 | ||||||||||||||
| Less distributions: | ||||||||||||||||||||
| Distributions from | ||||||||||||||||||||
| net investment income | (0.24 | ) | (0.25 | ) | (0.31 | ) | (0.36 | ) | (0.41 | ) | ||||||||||
| Distributions from | ||||||||||||||||||||
| net realized gains | (0.02 | ) | (0.02 | ) | (0.13 | ) | (0.08 | ) | (0.09 | ) | ||||||||||
| Total distributions | (0.26 | ) | (0.27 | ) | (0.44 | ) | (0.44 | ) | (0.50 | ) | ||||||||||
| Net asset value, end of year | $ | 11.56 | $ | 11.43 | $ | 11.74 | $ | 11.47 | $ | 11.26 | ||||||||||
| Total return | 3.29 | % | (0.41 | )% | 6.20 | % | 5.84 | % | 7.30 | % | ||||||||||
| Supplemental data and ratios: | ||||||||||||||||||||
| Net assets, end of year (millions) | $ | 115.6 | $ | 42.1 | $ | 26.7 | $ | 14.7 | $ | 12.7 | ||||||||||
| Ratio of expenses to average net assets | 0.55 | % | 0.55 | % | 0.55 | % | 0.55 | % | 0.55 | % | ||||||||||
| Ratio of net investment income | ||||||||||||||||||||
| to average net assets | 2.12 | % | 2.20 | % | 2.70 | % | 3.24 | % | 3.80 | % | ||||||||||
Portfolio turnover rate(2) | 29.2 | % | 45.1 | % | 45.1 | % | 24.1 | % | 38.7 | % | ||||||||||
| (1) | Calculated using average shares outstanding during the year. |
| (2) | Portfolio turnover is calculated on the basis of the Fund as a whole without distinguishing between the classes of shares issued. |
The accompanying notes are an integral part of these financial statements.
Page 85
Financial Highlights
Baird Intermediate Municipal Bond Fund – Institutional Class
| Year Ended December 31, | ||||||||||||||||||||
| 2014 | 2013 | 2012 | 2011 | 2010 | ||||||||||||||||
| Per Share Data: | ||||||||||||||||||||
| Net asset value, beginning of year | $ | 11.55 | $ | 12.01 | $ | 11.94 | $ | 11.31 | $ | 11.35 | ||||||||||
| Income from | ||||||||||||||||||||
| investment operations: | ||||||||||||||||||||
| Net investment income | 0.30 | 0.32 | (1) | 0.30 | 0.32 | 0.32 | ||||||||||||||
| Net realized and unrealized | ||||||||||||||||||||
| gains (losses) on investments | 0.22 | (0.46 | ) | 0.07 | 0.64 | (0.04 | ) | |||||||||||||
| Total from investment operations | 0.52 | (0.14 | ) | 0.37 | 0.96 | 0.28 | ||||||||||||||
| Less distributions: | ||||||||||||||||||||
| Distributions from | ||||||||||||||||||||
| net investment income | (0.30 | ) | (0.32 | ) | (0.30 | ) | (0.32 | ) | (0.32 | ) | ||||||||||
| Distributions from | ||||||||||||||||||||
| net realized gains | — | — | — | (0.01 | ) | — | ||||||||||||||
| Total distributions | (0.30 | ) | (0.32 | ) | (0.30 | ) | (0.33 | ) | (0.32 | ) | ||||||||||
| Net asset value, end of year | $ | 11.77 | $ | 11.55 | $ | 12.01 | $ | 11.94 | $ | 11.31 | ||||||||||
| Total return | 4.54 | % | (1.19 | )% | 3.12 | % | 8.55 | % | 2.42 | % | ||||||||||
| Supplemental data and ratios: | ||||||||||||||||||||
| Net assets, end of year (millions) | $ | 918.9 | $ | 801.4 | $ | 963.1 | $ | 836.1 | $ | 739.0 | ||||||||||
| Ratio of expenses to average net assets | 0.30 | % | 0.30 | % | 0.30 | % | 0.30 | % | 0.30 | % | ||||||||||
| Ratio of net investment income | ||||||||||||||||||||
| to average net assets | 2.56 | % | 2.65 | % | 2.48 | % | 2.74 | % | 2.74 | % | ||||||||||
Portfolio turnover rate(2) | 4.7 | % | 9.0 | % | 5.1 | % | 8.0 | % | 8.7 | % | ||||||||||
| (1) | Calculated using average shares outstanding during the year. |
| (2) | Portfolio turnover is calculated on the basis of the Fund as a whole without distinguishing between the classes of shares issued. |
The accompanying notes are an integral part of these financial statements.
Page 86
Financial Highlights
Baird Intermediate Municipal Bond Fund – Investor Class
| Year Ended December 31, | ||||||||||||||||||||
| 2014 | 2013 | 2012 | 2011 | 2010 | ||||||||||||||||
| Per Share Data: | ||||||||||||||||||||
| Net asset value, beginning of year | $ | 11.80 | $ | 12.26 | $ | 12.18 | $ | 11.53 | $ | 11.57 | ||||||||||
| Income from | ||||||||||||||||||||
| investment operations: | ||||||||||||||||||||
| Net investment income | 0.28 | 0.29 | (1) | 0.27 | 0.29 | 0.29 | ||||||||||||||
| Net realized and unrealized | ||||||||||||||||||||
| gains (losses) on investments | 0.22 | (0.46 | ) | 0.08 | 0.66 | (0.04 | ) | |||||||||||||
| Total from investment operations | 0.50 | (0.17 | ) | 0.35 | 0.95 | 0.25 | ||||||||||||||
| Less distributions: | ||||||||||||||||||||
| Distributions from | ||||||||||||||||||||
| net investment income | (0.27 | ) | (0.29 | ) | (0.27 | ) | (0.29 | ) | (0.29 | ) | ||||||||||
| Distributions from | ||||||||||||||||||||
| net realized gains | — | — | — | (0.01 | ) | — | ||||||||||||||
| Total distributions | (0.27 | ) | (0.29 | ) | (0.27 | ) | (0.30 | ) | (0.29 | ) | ||||||||||
| Net asset value, end of year | $ | 12.03 | $ | 11.80 | $ | 12.26 | $ | 12.18 | $ | 11.53 | ||||||||||
| Total return | 4.27 | % | (1.42 | )% | 2.88 | % | 8.30 | % | 2.11 | % | ||||||||||
| Supplemental data and ratios: | ||||||||||||||||||||
| Net assets, end of year (millions) | $ | 186.7 | $ | 205.6 | $ | 258.5 | $ | 257.9 | $ | 202.8 | ||||||||||
| Ratio of expenses to average net assets | 0.55 | % | 0.55 | % | 0.55 | % | 0.55 | % | 0.55 | % | ||||||||||
| Ratio of net investment income | ||||||||||||||||||||
| to average net assets | 2.31 | % | 2.40 | % | 2.23 | % | 2.49 | % | 2.49 | % | ||||||||||
Portfolio turnover rate(2) | 4.7 | % | 9.0 | % | 5.1 | % | 8.0 | % | 8.7 | % | ||||||||||
| (1) | Calculated using average shares outstanding during the year. |
| (2) | Portfolio turnover is calculated on the basis of the Fund as a whole without distinguishing between the classes of shares issued. |
The accompanying notes are an integral part of these financial statements.
Page 87
Financial Highlights
Baird Aggregate Bond Fund – Institutional Class
| Year Ended December 31, | ||||||||||||||||||||
| 2014 | 2013 | 2012 | 2011 | 2010 | ||||||||||||||||
| Per Share Data: | ||||||||||||||||||||
| Net asset value, beginning of year | $ | 10.41 | $ | 10.89 | $ | 10.65 | $ | 10.52 | $ | 10.23 | ||||||||||
| Income from | ||||||||||||||||||||
| investment operations: | ||||||||||||||||||||
| Net investment income | 0.30 | (1) | 0.32 | (2) | 0.38 | (2) | 0.44 | (2) | 0.47 | (1) | ||||||||||
| Net realized and unrealized | ||||||||||||||||||||
| gains (losses) on investments | 0.41 | (0.45 | ) | 0.45 | 0.36 | 0.37 | ||||||||||||||
| Total from investment operations | 0.71 | (0.13 | ) | 0.83 | 0.80 | 0.84 | ||||||||||||||
| Less distributions: | ||||||||||||||||||||
| Distributions from | ||||||||||||||||||||
| net investment income | (0.31 | ) | (0.35 | ) | (0.43 | ) | (0.46 | ) | (0.49 | ) | ||||||||||
| Distributions from | ||||||||||||||||||||
| net realized gains | — | — | (0.16 | ) | (0.21 | ) | (0.06 | ) | ||||||||||||
| Total distributions | (0.31 | ) | (0.35 | ) | (0.59 | ) | (0.67 | ) | (0.55 | ) | ||||||||||
| Net asset value, end of year | $ | 10.81 | $ | 10.41 | $ | 10.89 | $ | 10.65 | $ | 10.52 | ||||||||||
| Total return | 6.89 | % | (1.25 | )% | 7.92 | % | 7.85 | % | 8.34 | % | ||||||||||
| Supplemental data and ratios: | ||||||||||||||||||||
| Net assets, end of year (millions) | $ | 3,448.6 | $ | 1,665.0 | $ | 1,495.4 | $ | 1,480.3 | $ | 1,658.4 | ||||||||||
| Ratio of expenses to average net assets | 0.30 | % | 0.30 | % | 0.30 | % | 0.30 | % | 0.30 | % | ||||||||||
| Ratio of net investment income | ||||||||||||||||||||
| to average net assets | 2.81 | % | 3.01 | % | 3.51 | % | 4.10 | % | 4.44 | % | ||||||||||
Portfolio turnover rate(3) | 32.1 | % | 28.4 | % | 64.4 | % | 45.9 | % | 41.4 | % | ||||||||||
| (1) | Net investment income per share is calculated using ending balance prior to consideration of adjustments for permanent book and tax differences. |
| (2) | Calculated using average shares outstanding during the year. |
| (3) | Portfolio turnover is calculated on the basis of the Fund as a whole without distinguishing between the classes of shares issued. |
The accompanying notes are an integral part of these financial statements.
Page 88
Financial Highlights
Baird Aggregate Bond Fund – Investor Class
| Year Ended December 31, | ||||||||||||||||||||
| 2014 | 2013 | 2012 | 2011 | 2010 | ||||||||||||||||
| Per Share Data: | ||||||||||||||||||||
| Net asset value, beginning of year | $ | 10.72 | $ | 11.21 | $ | 10.94 | $ | 10.80 | $ | 10.48 | ||||||||||
| Income from | ||||||||||||||||||||
| investment operations: | ||||||||||||||||||||
| Net investment income | 0.28 | (1) | 0.29 | (2) | 0.37 | (2) | 0.42 | (2) | 0.46 | (1) | ||||||||||
| Net realized and unrealized | ||||||||||||||||||||
| gains (losses) on investments | 0.43 | (0.46 | ) | 0.46 | 0.37 | 0.38 | ||||||||||||||
| Total from investment operations | 0.71 | (0.17 | ) | 0.83 | 0.79 | 0.84 | ||||||||||||||
| Less distributions: | ||||||||||||||||||||
| Distributions from | ||||||||||||||||||||
| net investment income | (0.28 | ) | (0.32 | ) | (0.40 | ) | (0.44 | ) | (0.46 | ) | ||||||||||
| Distributions from | ||||||||||||||||||||
| net realized gains | — | — | (0.16 | ) | (0.21 | ) | (0.06 | ) | ||||||||||||
| Total distributions | (0.28 | ) | (0.32 | ) | (0.56 | ) | (0.65 | ) | (0.52 | ) | ||||||||||
| Net asset value, end of year | $ | 11.15 | $ | 10.72 | $ | 11.21 | $ | 10.94 | $ | 10.80 | ||||||||||
| Total return | 6.71 | % | (1.54 | )% | 7.72 | % | 7.46 | % | 8.16 | % | ||||||||||
| Supplemental data and ratios: | ||||||||||||||||||||
| Net assets, end of year (millions) | $ | 241.7 | $ | 141.9 | $ | 49.4 | $ | 26.1 | $ | 38.9 | ||||||||||
| Ratio of expenses to average net assets | 0.55 | % | 0.55 | % | 0.55 | % | 0.55 | % | 0.55 | % | ||||||||||
| Ratio of net investment income | ||||||||||||||||||||
| to average net assets | 2.56 | % | 2.76 | % | 3.26 | % | 3.85 | % | 4.19 | % | ||||||||||
Portfolio turnover rate(3) | 32.1 | % | 28.4 | % | 64.4 | % | 45.9 | % | 41.4 | % | ||||||||||
| (1) | Net investment income per share is calculated using ending balance prior to consideration of adjustments for permanent book and tax differences. |
| (2) | Calculated using average shares outstanding during the year. |
| (3) | Portfolio turnover is calculated on the basis of the Fund as a whole without distinguishing between the classes of shares issued. |
The accompanying notes are an integral part of these financial statements.
Page 89
Financial Highlights
Baird Core Plus Bond Fund – Institutional Class
| Year Ended December 31, | ||||||||||||||||||||
| 2014 | 2013 | 2012 | 2011 | 2010 | ||||||||||||||||
| Per Share Data: | ||||||||||||||||||||
| Net asset value, beginning of year | $ | 10.77 | $ | 11.27 | $ | 10.82 | $ | 10.51 | $ | 10.18 | ||||||||||
| Income from | ||||||||||||||||||||
| investment operations: | ||||||||||||||||||||
| Net investment income | 0.32 | (1) | 0.31 | (1) | 0.35 | (2) | 0.45 | (2) | 0.59 | (1) | ||||||||||
| Net realized and unrealized | ||||||||||||||||||||
| gains (losses) on investments | 0.38 | (0.46 | ) | 0.50 | 0.36 | 0.39 | ||||||||||||||
| Total from investment operations | 0.70 | (0.15 | ) | 0.85 | 0.81 | 0.98 | ||||||||||||||
| Less distributions: | ||||||||||||||||||||
| Distributions from | ||||||||||||||||||||
| net investment income | (0.33 | ) | (0.34 | ) | (0.38 | ) | (0.46 | ) | (0.60 | ) | ||||||||||
| Distributions from | ||||||||||||||||||||
| net realized gains | — | (0.01 | ) | (0.02 | ) | (0.04 | ) | (0.05 | ) | |||||||||||
| Total distributions | (0.33 | ) | (0.35 | ) | (0.40 | ) | (0.50 | ) | (0.65 | ) | ||||||||||
| Net asset value, end of year | $ | 11.14 | $ | 10.77 | $ | 11.27 | $ | 10.82 | $ | 10.51 | ||||||||||
| Total return | 6.59 | % | (1.32 | )% | 7.95 | % | 7.89 | % | 9.81 | % | ||||||||||
| Supplemental data and ratios: | ||||||||||||||||||||
| Net assets, end of year (millions) | $ | 4,520.9 | $ | 1,789.7 | $ | 1,573.4 | $ | 768.9 | $ | 452.4 | ||||||||||
| Ratio of expenses to average net assets | 0.30 | % | 0.30 | % | 0.30 | % | 0.30 | % | 0.30 | % | ||||||||||
| Ratio of net investment income | ||||||||||||||||||||
| to average net assets | 2.89 | % | 2.83 | % | 3.12 | % | 4.22 | % | 5.56 | % | ||||||||||
Portfolio turnover rate(3) | 35.0 | % | 35.5 | % | 36.7 | % | 34.6 | % | 61.5 | % | ||||||||||
| (1) | Net investment income per share is calculated using ending balance prior to consideration of adjustments for permanent book and tax differences. |
| (2) | Calculated using average shares outstanding during the year. |
| (3) | Portfolio turnover is calculated on the basis of the Fund as a whole without distinguishing between the classes of shares issued. |
The accompanying notes are an integral part of these financial statements.
Page 90
Financial Highlights
Baird Core Plus Bond Fund – Investor Class
| Year Ended December 31, | ||||||||||||||||||||
| 2014 | 2013 | 2012 | 2011 | 2010 | ||||||||||||||||
| Per Share Data: | ||||||||||||||||||||
| Net asset value, beginning of year | $ | 11.16 | $ | 11.67 | $ | 11.18 | $ | 10.85 | $ | 10.49 | ||||||||||
| Income from | ||||||||||||||||||||
| investment operations: | ||||||||||||||||||||
| Net investment income | 0.29 | (1) | 0.29 | (1) | 0.33 | (2) | 0.44 | (2) | 0.57 | (1) | ||||||||||
| Net realized and unrealized | ||||||||||||||||||||
| gains (losses) on investments | 0.40 | (0.48 | ) | 0.53 | 0.37 | 0.41 | ||||||||||||||
| Total from investment operations | 0.69 | (0.19 | ) | 0.86 | 0.81 | 0.98 | ||||||||||||||
| Less distributions: | ||||||||||||||||||||
| Distributions from | ||||||||||||||||||||
| net investment income | (0.30 | ) | (0.31 | ) | (0.35 | ) | (0.44 | ) | (0.57 | ) | ||||||||||
| Distributions from | ||||||||||||||||||||
| net realized gains | — | (0.01 | ) | (0.02 | ) | (0.04 | ) | (0.05 | ) | |||||||||||
| Total distributions | (0.30 | ) | (0.32 | ) | (0.37 | ) | (0.48 | ) | (0.62 | ) | ||||||||||
| Net asset value, end of year | $ | 11.55 | $ | 11.16 | $ | 11.67 | $ | 11.18 | $ | 10.85 | ||||||||||
| Total return | 6.27 | % | (1.61 | )% | 7.80 | % | 7.57 | % | 9.53 | % | ||||||||||
| �� | ||||||||||||||||||||
| Supplemental data and ratios: | ||||||||||||||||||||
| Net assets, end of year (millions) | $ | 2,195.7 | $ | 1,044.1 | $ | 1,036.0 | $ | 331.9 | $ | 58.4 | ||||||||||
| Ratio of expenses to average net assets | 0.55 | % | 0.55 | % | 0.55 | % | 0.55 | % | 0.55 | % | ||||||||||
| Ratio of net investment income | ||||||||||||||||||||
| to average net assets | 2.64 | % | 2.58 | % | 2.87 | % | 3.97 | % | 5.31 | % | ||||||||||
Portfolio turnover rate(3) | 35.0 | % | 35.5 | % | 36.7 | % | 34.6 | % | 61.5 | % | ||||||||||
| (1) | Net investment income per share is calculated using ending balance prior to consideration of adjustments for permanent book and tax differences. |
| (2) | Calculated using average shares outstanding during the year. |
| (3) | Portfolio turnover is calculated on the basis of the Fund as a whole without distinguishing between the classes of shares issued. |
The accompanying notes are an integral part of these financial statements.
Page 91
Notes to the Financial Statements
December 31, 2014
| 1. | Organization |
Baird Funds, Inc. (the “Corporation”) was incorporated on June 9, 2000 as a Wisconsin corporation and is registered as an open-end investment management company under the Investment Company Act of 1940, as amended (the “1940 Act”). The accompanying financial statements include the Baird Ultra Short Bond Fund, Baird Short-Term Bond Fund, Baird Intermediate Bond Fund, Baird Intermediate Municipal Bond Fund, Baird Aggregate Bond Fund and Baird Core Plus Bond Fund (each, a “Fund” and collectively, the “Funds”), six of the nine series comprising the Corporation, each of which is diversified within the meaning of the 1940 Act. Robert W. Baird & Co. Incorporated (“Baird” or the “Advisor”) serves as investment advisor to the Funds.
The Baird Ultra Short Bond Fund commenced with the sale of both Institutional and Investor Class shares on December 31, 2013. The Baird Short-Term Bond Fund commenced with the sale of Institutional Class shares on August 31, 2004 while the Investor Class shares commenced on September 19, 2012. The Baird Intermediate Municipal Bond Fund commenced with the sale of both Institutional and Investor Class shares on March 30, 2001. The Baird Intermediate Bond Fund, Baird Aggregate Bond Fund and Baird Core Plus Bond Fund commenced with the sale of both Institutional and Investor Class shares on September 29, 2000. The Institutional Class Shares are not subject to a distribution and service (12b-1) fee, while the Investor Class Shares are subject to a distribution and service (12b-1) fee of 0.25%. See Note 8.
The investment objective of the Baird Ultra Short Bond Fund is to seek current income consistent with preservation of capital. The Fund’s benchmark index, the Barclays U.S. Short-Term Government/Corporate Index, is an unmanaged, market value weighted index of investment grade, fixed debt including government and corporate securities with maturities less than one year.
The investment objective of the Baird Short-Term Bond Fund is to provide an annual rate of total return, before Fund expenses, greater than the annual rate of total return of the Barclays 1-3 Year U.S. Government/Credit Bond Index. The Barclays 1-3 Year U.S. Government/Credit Bond Index is an unmanaged, market value weighted index of investment grade, fixed-rate debt including government and corporate securities with maturities between one and three years.
The investment objective of the Baird Intermediate Bond Fund is to provide an annual rate of total return, before Fund expenses, greater than the annual rate of total return of the Barclays Intermediate U.S. Government/Credit Bond Index. The Barclays Intermediate U.S. Government/Credit Bond Index is an unmanaged, market value weighted index of investment grade, fixed-rate debt issues, including government and corporate securities, with maturities between one and ten years.
The primary investment objective of the Baird Intermediate Municipal Bond Fund is to provide current income that is substantially exempt from federal income tax. A secondary objective is to provide total return with relatively low volatility of principal.
The investment objective of the Baird Aggregate Bond Fund is to provide an annual rate of total return, before Fund expenses, greater than the annual rate of total return of the Barclays U.S. Aggregate Bond Index. The Barclays U.S. Aggregate Bond Index is an unmanaged, market value weighted index of investment grade, fixed-rate debt issues, including government, corporate, asset-backed and mortgage-backed securities, with maturities of at least one year.
The investment objective of the Baird Core Plus Bond Fund is to provide an annual rate of total return, before Fund expenses, greater than the annual rate of total return of the Barclays U.S. Universal Bond Index. The Barclays U.S. Universal Bond Index is an unmanaged, market value weighted index of fixed income securities issued in U.S. dollars, including U.S. government and investment grade debt, non-investment grade debt, asset-backed and mortgage-backed securities, Eurobonds, 144A securities and emerging market debt, with maturities of at least one year.
Page 92
Notes to the Financial Statements
December 31, 2014
| 2. | Significant Accounting Policies |
The following is a summary of significant accounting policies consistently followed by the Funds in the preparation of their financial statements. These policies are in conformity with accounting principles generally accepted in the United States of America.
| a) | Investment Valuation – Section 2(a)(41) of the 1940 Act, together with the rules and interpretations of the SEC, require the Funds, in computing net asset value, to value their portfolio securities using market quotations when they are “readily available.” When market quotations are not readily available (e.g., because there is no regular market quotation for such securities, the market for such security is limited, the validity of quotations is questionable or the Funds’ independent pricing service does not provide a price), the Board of Directors of the Corporation must value the securities at “fair value determined in good faith.” The Board has delegated such responsibility to the Advisor pursuant to pricing policies and procedures that the Board has adopted and regularly reviews. In general, the “fair value” of a security means the price that would be received to sell a security in an orderly transaction between market participants at the measurement date. |
The Funds determine the fair value of their investments and compute their net asset value per share as of the close of regular trading of the New York Stock Exchange (4:00 p.m. EST). | |
Consistent with Section 2(a)(41) of the 1940 Act, the Funds price their securities as follows: debt securities are valued at their evaluated bid prices as provided by an independent pricing service using valuation methods that are designed to represent fair value, such as matrix pricing and other analytical pricing models, market transactions and dealer quotations. Debt securities purchased with maturities of 60 days or less are valued as described above unless an evaluated price is not available, in which case such security is valued at acquisition cost, plus or minus any amortized discount or premium (“amortized cost”), or, if the Advisor does not believe amortized cost is reflective of the value of the security, the security is priced at fair value as described below. Investments in mutual funds are valued at their stated net asset value. Common stocks that are listed on a securities exchange (other than NASDAQ) are valued at the last quoted sales price. Securities traded on Nasdaq are valued at the Nasdaq Official Closing Price. Price information on listed stocks is taken from the exchange where the security is primarily traded. Securities that were not traded on the valuation date, as well as stocks that are not listed on an exchange, including NASDAQ, are valued at the average of the current bid and asked price. Other assets and securities for which market quotations are not readily available are valued at fair value as determined in good faith by the Advisor in accordance with procedures approved by the Corporation’s Board of Directors. In accordance with such procedures, the Advisor may use broker quotes or prices obtained from alternative independent pricing services or, if the broker quotes or prices from alternative pricing services are unavailable or deemed to be unreliable, fair value will be determined by a valuation committee of the Advisor. In determining fair value, the valuation committee takes into account all relevant factors and available information. Consequently, the price of the security used by a Fund to calculate its NAV may differ from quoted or published prices for the same security. Fair value pricing involves subjective judgments and there is no single standard for determining a security’s fair value. As a result, different mutual funds could reasonably arrive at a different fair value for the same security. It is possible that the fair value determined for a security is materially different from the value that could be realized upon the sale of that security or from the values that other mutual funds may determine. In addition, given the volatility and periodic illiquidity experienced in recent years, the prices determined for any individual security on any given day may vary significantly from the amount that can be obtained in an actual sale of that security, and the Funds’ NAVs may fluctuate significantly from day to day or from period to period. | |
| b) | Unregistered Securities – Five of the Funds own certain investment securities which are unregistered and thus restricted with respect to resale. The value of such securities for the Baird Ultra Short Bond, Baird Short-Term Bond, Baird Intermediate Bond, Baird Aggregate Bond and Baird Core Plus Bond Funds were $12,343,997 (14.46% of net assets), $462,037,510 (17.26% of net assets), $237,312,630 (14.98% |
Page 93
Notes to the Financial Statements
December 31, 2014
| 2. | Significant Accounting Policies (cont.) |
of net assets), $399,176,879 (10.82% of net assets), and $805,885,552 (12.00% of net assets), respectively, at December 31, 2014. Restricted securities may be deemed to be liquid as determined by the Advisor based on several factors. All of the restricted securities held by the Funds as of December 31, 2014 consist of securities issued pursuant to Rule 144A under the Securities Act of 1933 and all have been deemed to be liquid. | |
| c) | Foreign Securities – Foreign securities are defined as securities of issuers that are organized outside the United States. The Funds may invest in U.S. dollar-denominated debt obligations of foreign companies and foreign governments. Investing in securities of foreign companies and foreign governments involves special risks and considerations not typically associated with investing in U.S. companies and the U.S. government. These risks include foreign currency fluctuations, political and economic instability and differences in financial reporting standards and less strict regulation of securities markets. Moreover, securities of many foreign companies and foreign governments and their markets may be less liquid and their prices more volatile than those of securities of comparable U.S. companies and the U.S. government. Occasionally, events that affect these values and exchange rates may occur after the close of the exchange on which such securities are traded. If such events materially affect the value of a Fund’s securities, these securities may be valued at their fair value pursuant to procedures adopted by the Board of Directors. |
| d) | Income Tax Status – The Funds intend to continue to qualify as regulated investment companies as provided in subchapter M of the Internal Revenue Code and to distribute substantially all of their taxable income to their shareholders in a manner which results in no tax expense to the Funds. Therefore, no federal income or excise tax provision is recorded. |
There is no tax liability resulting from unrecognized tax benefits relating to uncertain income tax positions taken or expected to be taken on the tax return for the fiscal year ended December 31, 2014, or for any other tax years which are open for exam. As of December 31, 2014, open tax years include the tax years ended December 31, 2011 through 2014. The Funds are not aware of any tax positions for which it is reasonably possible that the total amounts of unrecognized tax benefits will significantly change in the next 12 months. The Funds recognize interest and penalties, if any, related to unrecognized tax benefits as interest and other expense, respectively, in the Statement of Operations. During the period, the Funds did not incur any interest or penalties. | |
| e) | Allocation of Income and Expenses – Each Fund is charged for those expenses directly attributable to it. Expenses directly attributable to a class of shares, such as Rule 12b-1 distribution fees, are charged to that class of shares. Income, expenses and realized and unrealized gains and losses are allocated to the classes based on their respective net assets. Expenses that are not directly attributable to a Fund are allocated among the Funds in the series in proportion to their assets or are divided equally amongst the Funds. |
| f) | Distributions to Shareholders – Dividends from net investment income are declared and paid monthly. Distributions of net realized capital gains, if any, are declared and paid at least annually. The book basis character of distributions may differ from their ultimate characterization for Federal income tax purposes. |
| g) | Use of Estimates – The preparation of financial statements in conformity with accounting principles generally accepted in the United States of America requires management to make estimates and assumptions that affect the reported amounts of assets and liabilities and disclosure of contingent assets and liabilities at the date of the financial statements and the reported amounts of revenues and expenses during the reporting period. Actual results could differ from those estimates. |
| h) | Securities Transactions and Investment Income – Investment and shareholder transactions are recorded on the trade date. The Funds determine the gain or loss realized from investment transactions by comparing the original cost of the security lot sold with the net sales proceeds. Dividend income is recognized on the ex-dividend date and interest income is recognized on an accrual basis. Premiums and |
Page 94
Notes to the Financial Statements
December 31, 2014
| 2. | Significant Accounting Policies (cont.) |
discounts on the purchase of securities are amortized/accreted using the effective interest method. Paydown gains and losses are netted and recorded as interest income on the Statements of Operations for financial reporting purposes. Accounting principles generally accepted in the United States of America require that permanent financial reporting and tax differences be reclassified in the capital accounts. | |
| i) | Guarantees and Indemnifications – In the normal course of business, the Funds enter into contracts with service providers that contain general indemnification clauses. The Funds’ maximum exposure under these arrangements is unknown and would involve future claims against the Funds that have not yet occurred. Based on experience, the Funds would expect the risk of loss to be remote. |
| j) | Recent Accounting Pronouncements – In June 2014, the FASB issued ASU No. 2014-11 “Repurchase-to-Maturity Transactions, Repurchase Financings, and Disclosures.” ASU No. 2014-11 makes limited changes to the accounting for repurchase agreements, clarifies when repurchase agreements and securities lending transactions should be accounted for as secured borrowings, and requires additional disclosures regarding these types of transactions. The effective date of this ASU is for fiscal years beginning on or after December 15, 2014, and for interim periods within those fiscal years. Management is currently evaluating the impact these changes will have on the Funds’ financial statement disclosures. |
| 3. | Capital Share Transactions |
The following table summarizes the capital share transactions of each Fund for the past two fiscal periods:
| Baird Ultra Short Bond Fund^ | ||||||||||||||||||
| Institutional Class Shares | Investor Class Shares | |||||||||||||||||
| Year Ended | Year Ended | |||||||||||||||||
| December 31, 2014 | December 31, 2014 | |||||||||||||||||
| Shares | Amount | Shares | Amount | |||||||||||||||
| Shares sold | 9,168,297 | $ | 92,148,532 | Shares sold | 101,927 | $ | 1,024,000 | |||||||||||
| Shares issued to | Shares issued to | |||||||||||||||||
| shareholders in | shareholders in | |||||||||||||||||
| reinvestment of | reinvestment of | |||||||||||||||||
| dividends | 22,471 | 225,826 | dividends | 84 | 844 | |||||||||||||
| Shares redeemed | (766,484 | ) | (7,704,577 | ) | Shares redeemed | (13,111 | ) | (131,500 | ) | |||||||||
| Net increase | 8,424,284 | $ | 84,669,781 | Net increase | 88,900 | $ | 893,344 | |||||||||||
| Shares Outstanding: | Shares Outstanding: | |||||||||||||||||
| Beginning of year | — | Beginning of year | — | |||||||||||||||
| End of year | 8,424,284 | End of year | 88,900 | |||||||||||||||
^ Inception was the close of business on December 31, 2013.
Page 95
Notes to the Financial Statements
December 31, 2014
| 3. | Capital Share Transactions (cont.) |
Baird Short-Term Bond Fund
| Institutional Class Shares | Investor Class Shares | |||||||||||||||||
| Year Ended | Year Ended | |||||||||||||||||
| December 31, 2014 | December 31, 2014 | |||||||||||||||||
| Shares | Amount | Shares | Amount | |||||||||||||||
| Shares sold | 138,260,639 | $ | 1,344,119,921 | Shares sold | 3,377,961 | $ | 32,842,029 | |||||||||||
| Shares issued to | Shares issued to | |||||||||||||||||
| shareholders in | shareholders in | |||||||||||||||||
| reinvestment of | reinvestment of | |||||||||||||||||
| dividends | 3,483,214 | 33,814,184 | dividends | 32,310 | 313,574 | |||||||||||||
| Shares redeemed | (73,412,100 | ) | (713,624,084 | ) | Shares redeemed | (2,183,840 | ) | (21,232,445 | ) | |||||||||
| Net increase | 68,331,753 | $ | 664,310,021 | Net increase | 1,226,431 | $ | 11,923,158 | |||||||||||
| Shares Outstanding: | Shares Outstanding: | |||||||||||||||||
| Beginning of year | 204,832,563 | Beginning of year | 2,478,333 | |||||||||||||||
| End of year | 273,164,316 | End of year | 3,704,764 | |||||||||||||||
| Institutional Class Shares | Investor Class Shares | |||||||||||||||||
| Year Ended | Year Ended | |||||||||||||||||
| December 31, 2013 | December 31, 2013 | |||||||||||||||||
| Shares | Amount | Shares | Amount | |||||||||||||||
| Shares sold | 133,023,716 | $ | 1,293,669,284 | Shares sold | 2,851,595 | $ | 27,760,685 | |||||||||||
| Shares issued to | Shares issued to | |||||||||||||||||
| shareholders in | shareholders in | |||||||||||||||||
| reinvestment of | reinvestment of | |||||||||||||||||
| dividends | 2,957,005 | 28,726,556 | dividends | 7,956 | 77,195 | |||||||||||||
| Shares redeemed | (63,981,180 | ) | (622,888,419 | ) | Shares redeemed | (533,574 | ) | (5,193,589 | ) | |||||||||
| Net increase | 71,999,541 | $ | 699,507,421 | Net increase | 2,325,977 | $ | 22,644,291 | |||||||||||
| Shares Outstanding: | Shares Outstanding: | |||||||||||||||||
| Beginning of year | 132,833,022 | Beginning of year | 152,356 | |||||||||||||||
| End of year | 204,832,563 | End of year | 2,478,333 | |||||||||||||||
| Baird Intermediate Bond Fund | ||||||||||||||||||
| Institutional Class Shares | Investor Class Shares | |||||||||||||||||
| Year Ended | Year Ended | |||||||||||||||||
| December 31, 2014 | December 31, 2014 | |||||||||||||||||
| Shares | Amount | Shares | Amount | |||||||||||||||
| Shares sold | 43,826,069 | $ | 488,521,243 | Shares sold | 7,818,912 | $ | 90,485,341 | |||||||||||
| Shares issued to | Shares issued to | |||||||||||||||||
| shareholders in | shareholders in | |||||||||||||||||
| reinvestment of | reinvestment of | |||||||||||||||||
| dividends | 2,502,026 | 27,818,191 | dividends | 132,487 | 1,532,107 | |||||||||||||
| Shares redeemed | (15,357,797 | ) | (171,067,958 | ) | Shares redeemed | (1,628,553 | ) | (18,865,055 | ) | |||||||||
| Net increase | 30,970,298 | $ | 345,271,476 | Net increase | 6,322,846 | $ | 73,152,393 | |||||||||||
| Shares Outstanding: | Shares Outstanding: | |||||||||||||||||
| Beginning of year | 101,253,258 | Beginning of year | 3,678,501 | |||||||||||||||
| End of year | 132,223,556 | End of year | 10,001,347 | |||||||||||||||
Page 96
Notes to the Financial Statements
December 31, 2014
| 3. | Capital Share Transactions (cont.) |
Baird Intermediate Bond Fund (cont.)
| Institutional Class Shares | Investor Class Shares | |||||||||||||||||
| Year Ended | Year Ended | |||||||||||||||||
| December 31, 2013 | December 31, 2013 | |||||||||||||||||
| Shares | Amount | Shares | Amount | |||||||||||||||
| Shares sold | 37,134,677 | $ | 412,939,370 | Shares sold | 2,881,540 | $ | 33,484,462 | |||||||||||
| Shares issued to | Shares issued to | |||||||||||||||||
| shareholders in | shareholders in | |||||||||||||||||
| reinvestment of | reinvestment of | |||||||||||||||||
| dividends | 1,931,633 | 21,480,431 | dividends | 69,261 | 800,067 | |||||||||||||
| Shares redeemed | (14,537,572 | ) | (161,463,957 | ) | Shares redeemed | (1,548,764 | ) | (17,926,518 | ) | |||||||||
| Net increase | 24,528,738 | $ | 272,955,844 | Net increase | 1,402,037 | $ | 16,358,011 | |||||||||||
| Shares Outstanding: | Shares Outstanding: | |||||||||||||||||
| Beginning of year | 76,724,520 | Beginning of year | 2,276,464 | |||||||||||||||
| End of year | 101,253,258 | End of year | 3,678,501 | |||||||||||||||
| Baird Intermediate Municipal Bond Fund | ||||||||||||||||||
| Institutional Class Shares | Investor Class Shares | |||||||||||||||||
| Year Ended | Year Ended | |||||||||||||||||
| December 31, 2014 | December 31, 2014 | |||||||||||||||||
| Shares | Amount | Shares | Amount | |||||||||||||||
| Shares sold | 23,703,150 | $ | 278,740,222 | Shares sold | 3,749,692 | $ | 45,064,303 | |||||||||||
| Shares issued to | Shares issued to | |||||||||||||||||
| shareholders in | shareholders in | |||||||||||||||||
| reinvestment of | reinvestment of | |||||||||||||||||
| dividends | 1,605,530 | 18,878,665 | dividends | 377,495 | 4,535,848 | |||||||||||||
| Shares redeemed | (16,597,639 | ) | (194,974,883 | ) | Shares redeemed | (6,035,550 | ) | (72,510,076 | ) | |||||||||
| Net increase | 8,711,041 | $ | 102,644,004 | Net decrease | (1,908,363 | ) | $ | (22,909,925 | ) | |||||||||
| Shares Outstanding: | Shares Outstanding: | |||||||||||||||||
| Beginning of year | 69,393,191 | Beginning of year | 17,430,650 | |||||||||||||||
| End of year | 78,104,232 | End of year | 15,522,287 | |||||||||||||||
| Institutional Class Shares | Investor Class Shares | |||||||||||||||||
| Year Ended | Year Ended | |||||||||||||||||
| December 31, 2013 | December 31, 2013 | |||||||||||||||||
| Shares | Amount | Shares | Amount | |||||||||||||||
| Shares sold | 26,493,640 | $ | 312,051,832 | Shares sold | 5,238,276 | $ | 63,128,361 | |||||||||||
| Shares issued to | Shares issued to | |||||||||||||||||
| shareholders in | shareholders in | |||||||||||||||||
| reinvestment of | reinvestment of | |||||||||||||||||
| dividends | 1,665,529 | 19,521,896 | dividends | 438,678 | 5,251,221 | |||||||||||||
| Shares redeemed | (38,953,053 | ) | (457,319,983 | ) | Shares redeemed | (9,327,884 | ) | (111,810,823 | ) | |||||||||
| Net decrease | (10,793,884 | ) | $ | (125,746,255 | ) | Net decrease | (3,650,930 | ) | $ | (43,431,241 | ) | |||||||
| Shares Outstanding: | Shares Outstanding: | |||||||||||||||||
| Beginning of year | 80,187,075 | Beginning of year | 21,081,580 | |||||||||||||||
| End of year | 69,393,191 | End of year | 17,430,650 | |||||||||||||||
Page 97
Notes to the Financial Statements
December 31, 2014
| 3. | Capital Share Transactions (cont.) |
Baird Aggregate Bond Fund
| Institutional Class Shares | Investor Class Shares | |||||||||||||||||
| Year Ended | Year Ended | |||||||||||||||||
| December 31, 2014 | December 31, 2014 | |||||||||||||||||
| Shares | Amount | Shares | Amount | |||||||||||||||
| Shares sold | 193,596,308 | $ | 2,082,229,816 | Shares sold | 12,606,839 | $ | 138,890,870 | |||||||||||
| Shares issued to | Shares issued to | |||||||||||||||||
| shareholders in | shareholders in | |||||||||||||||||
| reinvestment of | reinvestment of | |||||||||||||||||
| dividends | 5,162,943 | 55,308,532 | dividends | 440,709 | 4,861,398 | |||||||||||||
| Shares redeemed | (39,723,087 | ) | (425,549,216 | ) | Shares redeemed | (4,594,876 | ) | (50,676,547 | ) | |||||||||
| Net increase | 159,036,164 | $ | 1,711,989,132 | Net increase | 8,452,672 | $ | 93,075,721 | |||||||||||
| Shares Outstanding: | Shares Outstanding: | |||||||||||||||||
| Beginning of year | 159,952,275 | Beginning of year | 13,229,616 | |||||||||||||||
| End of year | 318,988,439 | End of year | 21,682,288 | |||||||||||||||
| Institutional Class Shares | Investor Class Shares | |||||||||||||||||
| Year Ended | Year Ended | |||||||||||||||||
| December 31, 2013 | December 31, 2013 | |||||||||||||||||
| Shares | Amount | Shares | Amount | |||||||||||||||
| Shares sold | 81,532,396 | $ | 864,177,608 | Shares sold | 13,314,778 | $ | 146,699,358 | |||||||||||
| Shares issued to | Shares issued to | |||||||||||||||||
| shareholders in | shareholders in | |||||||||||||||||
| reinvestment of | reinvestment of | |||||||||||||||||
| dividends | 3,939,511 | 41,769,235 | dividends | 291,300 | 3,172,439 | |||||||||||||
Shares redeemed(1) | (62,786,649 | ) | (665,296,456 | ) | Shares redeemed | (4,783,014 | ) | (52,193,930 | ) | |||||||||
| Net increase | 22,685,258 | $ | 240,650,387 | Net increase | 8,823,064 | $ | 97,677,867 | |||||||||||
| Shares Outstanding: | Shares Outstanding: | |||||||||||||||||
| Beginning of year | 137,267,017 | Beginning of year | 4,406,552 | |||||||||||||||
| End of year | 159,952,275 | End of year | 13,229,616 | |||||||||||||||
| (1) | In the fourth quarter of 2013, the Baird Aggregate Bond Fund satisfied a redemption request made by a large shareholder by distributing the Fund’s portfolio securities in kind to the redeeming shareholder. The redemption was effected in accordance with policies and procedures approved by the Board of Directors of the Funds. |
Page 98
Notes to the Financial Statements
December 31, 2014
| 3. | Capital Share Transactions (cont.) |
Baird Core Plus Bond Fund
| Institutional Class Shares | Investor Class Shares | |||||||||||||||||
| Year Ended | Year Ended | |||||||||||||||||
| December 31, 2014 | December 31, 2014 | |||||||||||||||||
| Shares | Amount | Shares | Amount | |||||||||||||||
| Shares sold | 266,303,664 | $ | 2,958,518,458 | Shares sold | 119,230,689 | $ | 1,368,800,553 | |||||||||||
| Shares issued to | Shares issued to | |||||||||||||||||
| shareholders in | shareholders in | |||||||||||||||||
| reinvestment of | reinvestment of | |||||||||||||||||
| dividends | 6,772,143 | 74,952,246 | dividends | 3,115,198 | 35,739,828 | |||||||||||||
| Shares redeemed | (33,346,604 | ) | (368,208,073 | ) | Shares redeemed | (25,852,541 | ) | (296,094,423 | ) | |||||||||
| Net increase | 239,729,203 | $ | 2,665,262,631 | Net increase | 96,493,346 | $ | 1,108,445,958 | |||||||||||
| Shares Outstanding: | Shares Outstanding: | |||||||||||||||||
| Beginning of year | 166,166,636 | Beginning of year | 93,561,566 | |||||||||||||||
| End of year | 405,895,839 | End of year | 190,054,912 | |||||||||||||||
| Institutional Class Shares | Investor Class Shares | |||||||||||||||||
| Year Ended | Year Ended | |||||||||||||||||
| December 31, 2013 | December 31, 2013 | |||||||||||||||||
| Shares | Amount | Shares | Amount | |||||||||||||||
| Shares sold | 74,068,429 | $ | 816,081,945 | Shares sold | 48,901,785 | $ | 561,114,866 | |||||||||||
| Shares issued to | Shares issued to | |||||||||||||||||
| shareholders in | shareholders in | |||||||||||||||||
| reinvestment of | reinvestment of | |||||||||||||||||
| dividends | 4,648,511 | 50,888,369 | dividends | 2,710,437 | 30,756,030 | |||||||||||||
| Shares redeemed | (52,145,086 | ) | (570,782,143 | ) | Shares redeemed | (46,866,443 | ) | (532,393,630 | ) | |||||||||
| Net increase | 26,571,854 | $ | 296,188,171 | Net increase | 4,745,779 | $ | 59,477,266 | |||||||||||
| Shares Outstanding: | Shares Outstanding: | |||||||||||||||||
| Beginning of year | 139,594,782 | Beginning of year | 88,815,787 | |||||||||||||||
| End of year | 166,166,636 | End of year | 93,561,566 | |||||||||||||||
| 4. | INVESTMENT TRANSACTIONS AND INCOME TAX INFORMATION |
During the year ended December 31, 2014, purchases and sales of investment securities (excluding short-term investments) were as follows:
| Baird | Baird | Baird | ||||||||||
| Ultra Short | Short-Term | Intermediate | ||||||||||
| Bond Fund | Bond Fund | Bond Fund | ||||||||||
| Purchases: | ||||||||||||
| U.S. Government | $ | — | $ | — | $ | — | ||||||
| Other | $ | 76,530,190 | $ | 1,893,000,813 | $ | 776,412,437 | ||||||
| Sales: | ||||||||||||
| U.S. Government | $ | — | $ | — | $ | 25,715 | ||||||
| Other | $ | 13,620,727 | $ | 1,144,323,727 | $ | 375,308,745 | ||||||
Page 99
Notes to the Financial Statements
December 31, 2014
4. Investment Transactions and Income Tax Information (cont.)
| Baird | ||||||||||||
| Intermediate | Baird | Baird | ||||||||||
| Municipal | Aggregate | Core Plus | ||||||||||
| Bond Fund | Bond Fund | Bond Fund | ||||||||||
| Purchases: | ||||||||||||
| U.S. Government | $ | — | $ | 20,376,483 | $ | 82,738,352 | ||||||
| Other | $ | 179,367,784 | $ | 2,329,070,432 | $ | 4,806,304,290 | ||||||
| Sales: | ||||||||||||
| U.S. Government | $ | — | $ | 10,739,389 | $ | 18,707,151 | ||||||
| Other | $ | 48,892,156 | $ | 739,941,677 | $ | 1,303,188,066 | ||||||
At December 31, 2014, gross unrealized appreciation and depreciation of investments and distributable ordinary income and long-term capital gains for federal tax purposes were as follows:
| Baird | Baird | Baird | ||||||||||
| Ultra Short | Short-Term | Intermediate | ||||||||||
| Bond Fund | Bond Fund | Bond Fund | ||||||||||
| Cost of Investments | $ | 83,944,155 | $ | 2,812,824,722 | $ | 1,754,360,432 | ||||||
| Gross unrealized appreciation | $ | 52,130 | $ | 10,864,328 | $ | 27,786,867 | ||||||
| Gross unrealized depreciation | (237,056 | ) | (15,622,785 | ) | (6,590,912 | ) | ||||||
| Net unrealized | ||||||||||||
| appreciation (depreciation) | $ | (184,926 | ) | $ | (4,758,457 | ) | $ | 21,195,955 | ||||
| Undistributed ordinary income | 3,769 | 252,709 | 213,371 | |||||||||
| Undistributed long-term capital gain | — | 1,191,582 | 359,945 | |||||||||
| Total distributable earnings | $ | 3,769 | $ | 1,444,291 | $ | 573,316 | ||||||
| Other accumulated losses | (13,404 | ) | — | — | ||||||||
| Total accumulated earnings/(losses) | $ | (194,561 | ) | $ | (3,314,166 | ) | $ | 21,769,271 | ||||
| Baird | ||||||||||||
| Intermediate | Baird | Baird | ||||||||||
| Municipal | Aggregate | Core Plus | ||||||||||
| Bond Fund | Bond Fund | Bond Fund | ||||||||||
| Cost of Investments | $ | 1,074,767,553 | $ | 3,740,392,274 | $ | 6,871,638,917 | ||||||
| Gross unrealized appreciation | $ | 47,832,843 | $ | 95,431,123 | $ | 124,743,476 | ||||||
| Gross unrealized depreciation | (2,973,479 | ) | (17,621,004 | ) | (46,755,580 | ) | ||||||
| Net unrealized appreciation | $ | 44,859,364 | $ | 77,810,119 | $ | 77,987,896 | ||||||
| Undistributed ordinary income | — | 63,990 | 402,605 | |||||||||
| Undistributed tax-exempt income | 24,885 | — | — | |||||||||
| Total distributable earnings | $ | 24,885 | $ | 63,990 | $ | 402,605 | ||||||
| Other accumulated losses | (863,774 | ) | (9,769,975 | ) | (10,213,385 | ) | ||||||
| Total accumulated earnings | $ | 44,020,475 | $ | 68,104,134 | $ | 68,177,116 | ||||||
Page 100
Notes to the Financial Statements
December 31, 2014
| 4. | Investment Transactions and Income Tax Information (cont.) |
Undistributed income or net realized gains for financial statement purposes may differ from amounts recognized for federal income tax purposes due to differences in the recognition and characterization of income, expense and capital gain items. The difference between book-basis and tax-basis unrealized appreciation is attributed primarily to the tax deferral of losses on wash sales.
Additionally, U.S. generally accepted accounting principles require that certain components of net assets relating to permanent differences be reclassified between financial and tax reporting. These reclassifications are primarily due to differing treatments for losses deferred due to wash sales, equalization accounting for tax purposes, and non-deductible expenses. These reclassifications have no effect on net assets or net asset value per share. For the year ended December 31, 2014, the following table shows the reclassifications made:
| Undistributed Net | Accumulated Net | Paid In | ||||||||||||
| Investment Income (Loss) | Realized Gain (Loss) | Capital | ||||||||||||
| Baird Ultra Short Bond Fund | $ | 27,072 | $ | (27,072 | ) | $ | — | |||||||
| Baird Short-Term Bond Fund | 2,315,359 | (2,315,359 | ) | — | ||||||||||
| Baird Intermediate Bond Fund | 548,516 | (548,516 | ) | — | ||||||||||
| Baird Intermediate Municipal Bond Fund | — | — | — | |||||||||||
| Baird Aggregate Bond Fund | 3,832,565 | (3,832,565 | ) | — | ||||||||||
| Baird Core Plus Bond Fund | 6,908,974 | (6,908,974 | ) | — | ||||||||||
The tax components of dividends paid during the periods shown below were as follows:
| Year Ended | Year Ended | |||||||||||||||
| December 31, 2014 | December 31, 2013 | |||||||||||||||
| Ordinary | Long-Term | Ordinary | Long-Term | |||||||||||||
| Income | Capital Gains | Income | Capital Gains | |||||||||||||
| Distributions | Distributions | Distributions | Distributions | |||||||||||||
| Baird Ultra Short Bond Fund | $ | 271,437 | $ | — | $ | — | $ | — | ||||||||
| Baird Short-Term Bond Fund | $ | 38,351,400 | $ | 1,059,964 | $ | 29,397,102 | $ | 3,294,675 | ||||||||
| Baird Intermediate Bond Fund | $ | 31,870,518 | $ | 2,198,332 | $ | 25,175,900 | $ | 1,249,485 | ||||||||
| Baird Intermediate Municipal Bond Fund | $ | 199,334 | $ | — | $ | 209,368 | $ | — | ||||||||
| Baird Aggregate Bond Fund | $ | 70,757,058 | $ | — | $ | 55,824,951 | $ | — | ||||||||
| Baird Core Plus Bond Fund | $ | 114,565,490 | $ | — | $ | 84,668,834 | $ | 1,900,391 | ||||||||
For the year ended December 31, 2014 and the year ended December 31, 2013, distributions of $26,748,436 and $29,127,940, respectively, from the Baird Intermediate Municipal Bond Fund were tax-exempt.
The Fund designated as long-term capital gain dividend, pursuant to Internal Revenue Code Section 852(b)(3), the amount necessary to reduce the earnings and profits of the Fund related to net capital gain to zero for the tax year ended December 31, 2014. To the extent necessary to fully distribute such capital gains, the Funds also designate earnings and profits distributed to shareholders on the redemption of shares.
Under the current tax law, capital losses realized after October 31 may be deferred and treated as occurring on the first day of the following fiscal year. For the year ended December 31, 2014, the Baird Funds did not defer any capital losses occurring between November 1, 2014 and December 31, 2014.
Page 101
Notes to the Financial Statements
December 31, 2014
| 4. | Investment Transactions and Income Tax Information (cont.) |
At December 31, 2014, accumulated net realized capital loss carryovers, if any, and the year(s) in which the capital loss carryovers expire were:
| Capital Loss | Year of | |||||
| Carryover | Character | Expiration | ||||
| Baird Ultra Short Bond Fund | $ | 13,404 | Short-Term | Indefinitely | ||
| Baird Intermediate Municipal Bond Fund | 365,127 | Short-Term | Indefinitely | |||
| 498,647 | Long-Term | Indefinitely | ||||
| Baird Aggregate Bond Fund | 4,058,488 | Short-Term | Indefinitely | |||
| 5,711,487 | Long-Term | Indefinitely | ||||
| Baird Core Plus Bond Fund | 10,213,385 | Long-Term | Indefinitely | |||
| 5. | Investment Advisory and Other Agreements |
The Funds have entered into an Investment Advisory Agreement with Baird for the provision of investment advisory services. Pursuant to the Investment Advisory Agreement, the Advisor is entitled to receive a fee, calculated daily and payable monthly, at the annual rate of 0.25% for the Funds as applied to the respective Fund’s average daily net assets. Certain officers of the Advisor are also officers of the Funds.
For the year ended December 31, 2014, the Advisor waived the following amount pursuant to the fee waiver agreement between the Advisor and the Corporation on behalf of the Baird Ultra Short Bond Fund:
| Fund | Waived Amount | |
| Baird Ultra Short Bond Fund | $39,803 |
The Funds have entered into an Administration Agreement with Baird. Under the Administration Agreement, the Advisor assumes and pays all expenses of the applicable Fund other than the investment advisory fees, fees under the 12b-1 plan, costs related to portfolio securities transactions and extraordinary or non-recurring expenses. Pursuant to the Administration Agreement, the Advisor is entitled to receive a fee, calculated daily and payable monthly, at the annual rate of 0.05% for the Funds as applied to the respective Fund’s average daily net assets.
U.S. Bancorp Fund Services, LLC (“USBFS”) serves as transfer agent, administrator, and accounting services agent for the Funds. U.S. Bank, N.A. (“U.S. Bank”) serves as custodian for the Funds. Effective June 20, 2014, U.S. Bank is considered an “affiliated person” of the Funds for purposes of the 1940 Act, as a result of U.S. Bank’s fiduciary accounts for which it has investment authority and/or voting authority collectively acquiring 5% or more of the shares of the Baird Aggregate Bond Fund, a separate series of the Company. As a result, USBFS is an affiliated person of an affiliated person (or a “second tier” affiliate) of the Funds.
Baird (the “Distributor”) is the distributor of the Funds pursuant to a distribution agreement.
| 6. | Securities Lending |
Each Fund (other than the Intermediate Municipal Bond Fund) may lend up to one-third of its total assets (including such loans) to borrowers under terms of participation in a securities lending program administered by U.S. Bank, N.A., the Funds’ custodian and an affiliated person of the Funds, and an affiliate of USBFS, the Funds’ transfer agent and administrator and a second-tier affiliate of the Funds. The securities lending agreement requires that loans are collateralized at all times in an amount equal to at least 102% of the market value of any loaned securities at the time of the loan, plus accrued interest.
Page 102
Notes to the Financial Statements
December 31, 2014
| 6. | Securities Lending (cont.) |
The Funds receive compensation in the form of fees and earn interest on the cash collateral. The amount of fees depends on a number of factors including the type of security and length of the loan. Each Fund continues to receive interest payments or dividends on the securities loaned during the borrowing period. Each Fund has the right under the terms of the securities lending agreement to recall the securities from the borrower on demand.
As of December 31, 2014, the Baird Short-Term Bond Fund, Baird Intermediate Bond Fund, Baird Aggregate Bond Fund and Baird Core Plus Bond Fund had loaned securities that were collateralized by cash equivalents. The cash collateral is invested by the custodian in accordance with approved investment guidelines. Those guidelines require the cash collateral to be invested in readily marketable, high quality, short-term obligations; however, such investments are subject to risk of payment delays or default on the part of the issuer or counterparty or otherwise may not generate sufficient interest to support the costs associated with securities lending. A Fund could also experience delays in recovering its securities and possible loss of income or value if the borrower fails to return the borrowed securities, although the Funds are indemnified from this risk by contract with the securities lending agent.
As of December 31, 2014, the market value of the securities on loan and payable on collateral due to broker were as follows:
| Market Value of | Payable on Collateral | ||||||||
| Securities on Loan | due to Broker | ||||||||
| Baird Short-Term Bond Fund | $ | 144,409,191 | $ | 147,613,109 | |||||
| Baird Intermediate Bond Fund | 188,657,283 | 192,781,148 | |||||||
| Baird Aggregate Bond Fund | 96,025,717 | 98,296,098 | |||||||
| Baird Core Plus Bond Fund | 175,957,815 | 180,054,574 | |||||||
The Funds receive cash as collateral in return for securities lent as part of the securities lending program. The collateral is invested in the Mount Vernon Securities Lending Prime Portfolio (a securities lending trust subject to Rule 2a-7 under the 1940 Act). The schedules of investments for the Funds include the particular cash collateral holdings as of December 31, 2014.
The interest income earned by the Funds on investments of cash collateral received from borrowers for the securities loaned to them (“securities lending income”) is reflected in the Funds’ statements of operations. Interest income earned on collateral investments and recognized by the Funds during the year ended December 31, 2014 for the Baird Short-Term Bond Fund, Baird Intermediate Bond Fund, Baird Aggregate Bond Fund, and Baird Core Plus Bond Fund were $199,859, $266,526, $234,566, and $704,653, respectively.
| 7. | Line of Credit |
The Corporation maintains an uncommitted, senior secured and unsecured line of credit (“LOC”) with U.S. Bank, N.A. (the “Bank”) to provide the Funds a temporary liquidity source to meet unanticipated redemptions. The unsecured line of credit is available to the Funds for any period during which U.S. Bank is an affiliate of the Funds. Under the terms of the LOC, borrowings for each Fund are limited to one-third of the total assets (including the amount borrowed) of the respective Fund, or as otherwise indicated within the Funds’ agreement with the Bank. The Bank charges interest at the Bank’s Prime Rate less 2% (weighted average rate of 1.25% for 2014). During the year ended December 31, 2014, the Funds did not have any borrowings.
Page 103
Notes to the Financial Statements
December 31, 2014
| 8. | Distribution and Shareholder Service Plan |
The Funds have adopted a distribution and shareholder service plan (the “Plan”) pursuant to Rule 12b-1 under the 1940 Act. The Plan allows the Funds to compensate the Distributor for the costs incurred in distributing the Funds’ Investor Class Shares, including amounts paid to brokers or dealers, at an annual rate of 0.25% of the average daily net assets of the Funds’ Investor Class Shares. The Baird Ultra Short Bond, Baird Short-Term Bond, Baird Intermediate Bond, Baird Intermediate Municipal Bond, Baird Aggregate Bond and Baird Core Plus Bond Funds incurred $501, $72,753, $163,945, $520,135, $476,674 and $3,367,885, respectively, in fees pursuant to the Plan during the year ended December 31, 2014.
| 9. | Subsequent Event |
In preparing these financial statements, the Corporation has evaluated events after December 31, 2014. There were no subsequent events since December 31, 2014 through the date the financial statements were issued that would require adjustment to or additional disclosure in these financial
Page 104
Report of Independent Registered Public
Accounting Firm
Board of Directors and Shareholders
Baird Funds, Inc.
We have audited the accompanying statements of assets and liabilities of Baird Ultra Short Bond Fund, Baird Short-Term Bond Fund, Baird Intermediate Bond Fund, Baird Intermediate Municipal Bond Fund, Baird Aggregate Bond Fund and Baird Core Plus Bond Fund (six of the nine funds constituting Baird Funds, Inc.) (collectively the “Funds”), including the summary schedules of investments, as of December 31, 2014, and the related statements of operations for the year then ended, the statements of changes in net assets for each of the two years in the period then ended, and the financial highlights for each of the five years in the period then ended for the Baird Short-Term Bond Fund, Baird Intermediate Bond Fund, Baird Intermediate Municipal Bond Fund, Baird Aggregate Bond Fund and Baird Core Plus Bond Fund, and the related statement of operations, statement of changes in net assets, and the financial highlights for the year ended December 31, 2014, for the Baird Ultra Short Bond Fund. These financial statements and financial highlights are the responsibility of the Funds’ management. Our responsibility is to express an opinion on these financial statements and financial highlights based on our audits.
We conducted our audits in accordance with the standards of the Public Company Accounting Oversight Board (United States). Those standards require that we plan and perform the audit to obtain reasonable assurance about whether the financial statements and financial highlights are free of material misstatement. We were not engaged to perform an audit of the Funds’ internal control over financial reporting. Our audits included consideration of internal control over financial reporting as a basis for designing audit procedures that are appropriate in the circumstances, but not for the purpose of expressing an opinion on the effectiveness of the Funds’ internal control over financial reporting. Accordingly, we express no such opinion. An audit includes examining, on a test basis, evidence supporting the amounts and disclosures in the financial statements. Our procedures included confirmation of securities owned as of December 31, 2014, by correspondence with the custodian and brokers. An audit also includes assessing the accounting principles used and significant estimates made by management, as well as evaluating the overall financial statement presentation. We believe that our audits provide a reasonable basis for our opinion.
In our opinion, the financial statements and financial highlights referred to above present fairly, in all material respects, the financial position of each of the aforementioned Funds of Baird Funds, Inc. as of December 31, 2014, and the results of their operations, the changes in their net assets, and the financial highlights for the periods indicated above, in conformity with accounting principles generally accepted in the United States of America.

Chicago, Illinois
February 26, 2015
Page 105
Directors & Officers
As of December 31, 2014
Independent Directors
G. Frederick Kasten, Jr.
Independent Director and Chairman
Term of Office: Indefinite
Length of Time Served: Since September 2000
Age: 75
c/o Robert W. Baird & Co. Incorporated
777 East Wisconsin Avenue
Milwaukee, WI 53202
Principal Occupation(s) During the Past 5 Years: Retired; Chairman, the Advisor (January 2000-December 2005); Chairman and CEO, the Advisor (January 1998-January 2000); President, Chairman and CEO, the Advisor (June 1983-January 1998); President, the Advisor (January 1979-January 1983)
Number of Portfolios in Complex Overseen by Director: 9
Other Directorships Held by Director: None
John W. Feldt
Independent Director
Term of Office: Indefinite
Length of Time Served: Since September 2000
Age: 72
c/o Robert W. Baird & Co. Incorporated
777 East Wisconsin Avenue
Milwaukee, WI 53202
Principal Occupation(s) During the Past 5 Years: Retired; Senior Vice President-Finance, University of Wisconsin Foundation (1985-2006); Vice President-Finance, University of Wisconsin Foundation (1980-1985); Associate Director, University of Wisconsin Foundation (1967-1980)
Number of Portfolios in Complex Overseen by Director: 9
Other Directorships Held by Director: Director of Thompson Plumb Funds, Inc., a mutual fund complex (3 portfolios)
Frederick P. Stratton, Jr.
Independent Director
Term of Office: Indefinite
Length of Time Served: Since May 2004
Age: 75
c/o Robert W. Baird & Co. Incorporated
777 East Wisconsin Avenue
Milwaukee, WI 53202
Principal Occupation(s) During the Past 5 Years: Retired; Chairman Emeritus, Briggs & Stratton Corporation, a manufacturing company, since 2003; Chairman of the Board, Briggs & Stratton Corporation (2001-2002); Chairman and CEO, Briggs & Stratton Corporation (1986-2001)
Number of Portfolios in Complex Overseen by Director: 9
Other Directorships Held by Director: Director of Weyco Group, Inc., a men’s footwear distributor
Marlyn J. Spear, CFA
Independent Director
Term of Office: Indefinite
Length of Time Served: Since January 2008
Age: 61
c/o Robert W. Baird & Co. Incorporated
777 East Wisconsin Avenue
Milwaukee, WI 53202
Principal Occupation(s) During the Past 5 Years: Chief Investment Officer, Building Trades United Pension Trust Fund, since July 1989; Investment Officer, Northwestern Mutual Financial Network (1988-1989); Assistant Vice-President, Firstar Trust Company (1978-1987); Financial Analyst, Harco Holdings, Inc. (1976-1978)
Number of Portfolios in Complex Overseen by Director: 9
Other Directorships Held by Director: Management Trustee of AFL-CIO Housing Investment Trust, a mutual fund complex (1 portfolio)
Page 106
Directors & Officers
As of December 31, 2014
Interested Directors and Officers
Cory L. Nettles*
Interested Director
Term of Office: Indefinite
Length of Time Served: Since January 2008
Age: 44
c/o Generation Growth Capital, Inc.
411 East Wisconsin Avenue, Suite 1710
Milwaukee, WI 53202
Principal Occupation(s) During the Past 5 Years: Managing Director, Generation Growth Capital, Inc., a private equity fund, since March 2007; Of Counsel, Quarles & Brady LLP, a law firm, since January 2005; Secretary, Wisconsin Department of Commerce (January 2003-January 2005)
Number of Portfolios in Complex Overseen by Director: 9
Other Directorships Held by Director: Director of Weyco Group, Inc., a men’s footwear distributor;
Director of Associated Banc-Corp
Mary Ellen Stanek
President
Term of Office: Re-elected by Board annually
Length of Time Served: Since September 2000
Age: 58
777 East Wisconsin Avenue
Milwaukee, WI 53202
Principal Occupation(s) During the Past 5 Years: Managing Director, the Advisor, and Chief Investment Officer, Baird Advisors, a department of the Advisor, since March 2000; Director, Baird Kailash Group, LLC since December 2013
Charles B. Groeschell
Vice President
Term of Office: Re-elected by Board annually
Length of Time Served: Since January 2010
Age: 61
777 East Wisconsin Avenue
Milwaukee, WI 53202
Principal Occupation(s) During the Past 5 Years: Managing Director, the Advisor, and Senior Portfolio Manager, Baird Advisors, a department of the Advisor, since February 2000
Angela Palmer
Chief Compliance Officer
Term of Office: Re-elected by Board annually
Length of Time Served: Since March 2014
Age: 43
777 East Wisconsin Ave
Milwaukee, WI 53202
Principal Occupation(s) During the Past 5 Years: Chief Compliance Officer, the Advisor, since March 2014; Director, the Advisor, since July 2014; Senior Vice President, the Advisor (March 2014-June 2014); Chief Compliance Officer, RIAs US, BMO Financial Group (January 2013-March 2014); Chief Compliance Officer, Institutional RIAs, BMO Financial Group (March 2012-January 2013); Vice President, BMO Harris Bank, N.A. (July 2011-March 2014); Chief Compliance Officer, Taplin, Canida & Habacht, LLC (December 2008-March 2014); Chief Compliance Officer and Vice President, M&I Investment Management Corp. (June 2006-May 2012); Assistant Secretary, M&I Investment Management Corp. (April 2010-May 2012); Vice President, Marshall & Ilsley Trust Company N.A. (June 2006-August 2012).
Dominick P. Zarcone
Treasurer
Term of Office: Re-elected by Board annually
Length of Time Served: Since March 2011
Age: 56
777 East Wisconsin Avenue
Milwaukee, WI 53202
Principal Occupation(s) During the Past 5 Years: Chief Financial Officer, the Advisor, since March 2011; Chief Financial Officer, Baird Financial Group, since October 2012; Chief Operating Officer-Investment Banking, the Advisor (June 2004-March 2011); Managing Director, the Advisor since February 1995
Page 107
Directors & Officers
As of December 31, 2014
Interested Directors and Officers
Charles M. Weber
Secretary
Term of Office: Re-elected by Board annually
Length of Time Served: Since September 2005
Age: 51
777 East Wisconsin Avenue
Milwaukee, WI 53202
Principal Occupation(s) During the Past 5 Years: Senior Associate General Counsel, the Advisor, since January 2013; Managing Director, the Advisor since January 2009; Chief Compliance Officer and Secretary, Baird Kailash Group, LLC since July 2013; Associate General Counsel, the Advisor (July 2005-December 2012)
Peter J. Hammond
Vice President
Term of Office: Re-elected by Board annually
Length of Time Served: Since August 2012
Age: 51
777 East Wisconsin Avenue
Milwaukee, WI 53202
Principal Occupation(s) During the Past 5 Years:
Senior Vice President, the Advisor, since March 2012; Vice President, Baird Kailash Group, LLC since July 2013; Executive VP and Chief Administrative Officer, UMB Fund Services (September 1996 to March 2012)
Dustin J. Hutter
Assistant Treasurer
Term of Office: Re-elected by Board annually
Length of Time Served: Since February 2011
Age: 38
777 East Wisconsin Avenue
Milwaukee, WI 53202
Principal Occupation(s) During the Past 5 Years: Director of Reporting and Analysis, Capital Markets Finance since February 2013; Senior Vice President, the Advisor, since January 2011; Treasurer, Baird Kailash Group, LLC since July 2013; First Vice President, the Advisor (January 2008-December 2010); Vice President, the Advisor (January 2006-December 2007); Assistant Controller, the Advisor (January 2006-January 2013)
Andrew D. Ketter
Assistant Secretary
Term of Office: Re-elected by Board annually
Length of Time Served: Since February 2011
Age: 40
777 East Wisconsin Avenue
Milwaukee, WI 53202
Principal Occupation(s) During the Past 5 Years: Associate General Counsel, the Advisor, since September 2010; Director, the Advisor, since July 2014; Senior Vice President, the Advisor (January 2014-June 2014); First Vice President, the Advisor (September 2010 to December 2013); Associate, Quarles & Brady LLP, a law firm (September 2002-August 2010)
Edgar L. Sturkey
AML Compliance Officer
Term of Office: Re-elected by Board annually
Length of Time Served: Since March 2014
Age: 30
777 East Wisconsin Ave
Milwaukee, WI 53202
Principal Occupation(s) During Past 5 Years: Senior Compliance Officer and Vice President, the Advisor, since January 2015; Compliance Officer and Vice President, the Advisor (January 2013-December 2014); Compliance Officer and Assistant Vice President, the Advisor (January 2011-December 2012); Compliance Analyst, the Advisor (November 2009-December 2010).
| * | Mr. Nettles is considered an “interested person” of the Corporation (as defined in the 1940 Act) because of his association with the law firm, Quarles & Brady LLP, which provides legal services to the Advisor. The legal services that Quarles & Brady LLP has provided to the Advisor include litigation, real estate, trademark and miscellaneous securities related matters that did not relate to the Corporation or the Funds. The Advisor has invested in and may in the future invest in private equity funds managed by Generation Growth Capital, Inc., a company of which Mr. Nettles is affiliated, through its division, Baird Capital. |
Additional information about the Funds’ directors is available in the Statement of Additional Information which may be obtained without charge, upon request, by calling 1-866-44BAIRD, or at www.bairdfunds.com.
Page 108
Baird Funds, Inc.
Disclosure Regarding the Board of Directors’ Approval of the Investment Advisory Agreement for Baird Bond Funds
The Board of Directors (the “Board”) of Baird Funds, Inc. (the “Corporation”), including the directors who are not “interested persons” of the Corporation within the meaning of the Investment Company Act of 1940 (the “Independent Directors”), met on August 13 and August 21, 2014 to consider the annual renewal of the investment advisory agreement between Robert W. Baird & Co. Incorporated (“Baird” or the “Advisor”) and the Corporation on behalf of the Baird Intermediate Bond, Aggregate Bond, Intermediate Municipal Bond, Core Plus Bond and Short-Term Bond Funds (collectively, the “Funds”). The Board, including the Independent Directors, approved the investment advisory agreement through a process that concluded at the August 21, 2014 meeting. In connection with its consideration of the investment advisory agreement, the Board reviewed and discussed various information that had been provided prior to the meeting, including the investment advisory agreement, a memorandum provided by legal counsel summarizing the guidelines relevant to the Board’s consideration of the renewal of the investment advisory agreement, a memorandum and other information provided in response to requests from the Board, from the Advisor (including the Advisor’s Form ADV brochure, annual report and financial statements), a profitability analysis, comparative information about the Funds’ performance for periods ended June 30, 2014, management fees and expense ratios, and other pertinent information. The Board also considered relevant case law.
The Independent Directors met separately in executive session with the Funds’ legal counsel to consider the investment advisory agreement. The Board discussed the Advisor’s 15(c) response at the August 13, 2014 special meeting and discussed various questions and information with the President of the Funds at the August 13, 2014 meeting and during executive session earlier in the meeting. The Board also took into account information reviewed periodically throughout the year that was relevant to its consideration of the investment advisory agreement, including performance, management fee and other expense information and discussions with the Funds’ portfolio managers. Based on its evaluation of this information, the Board, including a majority of the Independent Directors, approved the continuation of the investment advisory agreement for an additional one-year period.
In considering the investment advisory agreement and reaching its conclusions, the Board reviewed and analyzed various factors that it determined were relevant, including the factors below. In deciding to approve the investment advisory agreement for each Fund, the Board did not identify any single factor as determinative but considered all factors together.
Nature, Extent and Quality of Services Provided to the Funds
The Board analyzed the nature, extent and quality of the services provided by the Advisor to the Funds. The Board reviewed and considered the Advisor’s significant role in establishing the Funds and the construction of their investment objectives, principal strategies, investment limitations and fee structures. The Board noted the Advisor’s overall reputation and positive name recognition, the depth of the Advisor’s personnel, resources and commitment to the Funds, and the experience, credentials and continuity of the portfolio management teams employed to manage the Funds’ investments. The Board further noted that the Funds provide an opportunity for smaller institutional and retail accounts to receive the same professional advice from the Advisor that it offers to its larger institutional clients. However, the Board noted that the provision of investment advisory services to the Funds requires more effort than it does for separately managed accounts due to daily sales and redemption activity and additional regulatory and compliance requirements.
The Board considered the Advisor’s disciplined investment decision-making process used for the Funds. The Board also considered other services that the Advisor provides the Funds in its capacity as their investment advisor, such as making some of its key personnel available to serve as officers of the Funds, selecting broker-dealers for execution of portfolio transactions, ensuring adherence to the Funds’ investment policies and restrictions, compliance, risk management services, valuation, providing support services to the Board and the committees of the Board and overseeing the Funds’ other service providers. In addition, the Board considered
Page 109
Baird Funds, Inc.
Disclosure Regarding the Board of Directors’ Approval of the Investment Advisory Agreement for Baird Bond Funds (cont.)
that the Advisor provides administrative services to each of the Funds at an annual rate of 0.05% of each Fund’s average daily net assets, and is responsible for paying each Fund’s custody, transfer agency, accounting, printing, auditing, legal and director fees and other ordinary expenses (except for advisory and 12b-1 fees and certain other costs), which has the effect of capping the Funds’ expense ratios at 0.55% and 0.30% for Investor and Institutional Class Shares, respectively. The Board further noted that the Advisor, in its capacity as a registered broker-dealer, also serves as distributor and principal underwriter of shares of the Funds and spends time and effort marketing the Funds. The Board also considered the strength of the Advisor’s compliance department, including the Funds’ chief compliance officer, and the fact that the Advisor has not experienced any significant legal, compliance or regulatory difficulties since the Funds were launched. The Board reviewed a summary of the Advisor’s risk management tools and process. The Board concluded that the nature, extent and quality of the services provided by the Advisor to the Funds were appropriate and that each Fund was likely to continue to benefit from services provided under the investment advisory agreement.
Investment Performance of the Advisor and the Funds
In considering the investment performance of each of the Funds, the Board reviewed information as of June 30, 2014 regarding the Fund’s performance in comparison to its benchmark index and its peer groups as determined by Lipper. The Board concluded that the Funds had performed extremely well over most time periods and had achieved consistent performance results. While the Intermediate Municipal Bond Fund has trailed its benchmark index and Lipper peer group average over recent periods, the Board noted that the Fund’s high quality bias and emphasis on intermediate maturity holdings have detracted from relative returns and referred to the Advisor’s commentary in this regard. The Board noted that the Intermediate Bond Fund had exceeded the Lipper peer group average for the 10-year and since-inception periods but trailed the average for the one-year and five-year periods, and that the Fund’s performance exceeded its benchmark index for all respective time periods. The Board took into consideration that the Fund falls into the broadly defined intermediate bond fund category along with core and core plus strategies with longer duration, and longer duration funds tend to outperform in falling interest rate environments. The Board also noted that each of the other Funds (both Institutional and Investor Class shares) had outperformed its respective Lipper peer group average over most time periods.
The Board also considered the Advisor’s quarterly portfolio commentaries and reviews explaining the Funds’ performance, the Advisor’s consistent and disciplined investment decision process and the investment strategies it employs for the Funds. After considering all of the information, the Board concluded that, although past performance is not a guarantee of future results, each Fund and its shareholders were likely to benefit from the continued management by the Advisor.
Costs of Services Provided and Profits Realized by the Advisor
The Board examined the fee and expense information for each of the Funds, including a comparison of such information to other similarly situated mutual funds as determined by Morningstar. The Board noted that each Fund’s advisory fee and total expense ratio (for both its Investor Class and Institutional Class Shares) were significantly lower than the average and median advisory fees and expense ratios for all mutual funds in its Morningstar category.
The Board also reviewed and considered investment management fees charged by the Advisor to other investment advisory clients and found that the fee paid by the Funds (0.25%) was less than the fee that the Advisor charges on the first $25 million (0.30%) of a separately managed account and the same as the fee that the Advisor charges on the next $25 million. The Board noted the extent of the significant additional services provided to the Funds that the Advisor did not provide in the other advisory relationships. Those services included certain administrative services, oversight of the Funds’ other service providers, director support, risk management, regulatory compliance and various other services. The Board was informed of the subadvisory
Page 110
Baird Funds, Inc.
Disclosure Regarding the Board of Directors’ Approval of the Investment Advisory Agreement for Baird Bond Funds (cont.)
fees paid to the Advisor under two subadvisory arrangements with unaffiliated mutual funds. The Board noted that the subadvisory services were limited to asset management and that the Advisor provided numerous other services under the advisory agreement with the Funds.
The Board considered the fees realized, and the costs incurred, by the Advisor in providing investment management services to the Funds and a profitability analysis with respect to each Fund. The Board noted the unique expense structure of the Funds whereby the Institutional Class shareholders were charged only a management fee and an administration fee, Investor Class shareholders incurred the same expenses as the Institutional Class shareholders plus a 0.25% 12b-1 fee, and the Advisor assumes almost all of the other expenses on behalf of each Fund. The Board noted that for the past fiscal year, the Advisor had incurred more in expenses under the Administration Agreement than it received in administrative fees.
The Board concluded that the profits realized by the Advisor from its relationship with the Funds were appropriate. The Board noted that the Advisor’s profitability information does not reflect certain internal resources provided by the Advisor to the Funds, such as legal and compliance support. The Board reviewed and considered the general financial condition of the Advisor and determined it to be sound. The Board also discussed a report regarding payments to financial intermediaries, noting that all fees other than the Rule 12b-1 fee payable by the Investor Class shares of the Funds were paid by the Advisor and any payments by the Advisor for distribution were made from the Advisor’s profits. In light of all of the information that it received and considered, the Board concluded that the management fee and total expense ratio of each Fund were reasonable.
Economies of Scale and Fee Levels Reflecting Those Economies
The Board reviewed the extent to which economies of scale may be realized as the Funds increase in size, noting that the Funds have experienced strong growth in assets over recent years. The Board noted that the Funds’ advisory fee structure does not contain any breakpoint reductions as the Funds grow in size. However, the Board recognized that the Advisor bears almost all of the Funds’ expenses other than management, 12b-1 and administration fees. The Board also recognized that the advisory fee rates paid by the Funds were designed to be lower than the fees otherwise charged by the Advisor to its separately managed account clients and to be comparable to the second or third breakpoint advisory fee levels paid by other comparable mutual funds. The Board also considered the Advisor’s commitment to continue to evaluate advisory fee breakpoints in the future. The directors concluded that the current fee structure of each Fund was reasonable.
Benefits Derived from the Relationship with the Funds
The Board considered other benefits to the Advisor from serving as advisor to the Funds (in addition to the advisory fee). The Board considered the administration fees received by the Advisor under the Administration Agreement, noting that historically the Advisor has paid more in Fund expenses under the agreement than it has received in administration fees. The Board noted that the Advisor does not have any soft dollar arrangements in connection with its management of the Funds. The Board also noted that the Advisor’s financial advisors receive 12b-1 payments under the selling agreement with the Distributor. The Board noted that the Advisor’s asset management business may experience indirect benefits from the Advisor’s association with the Funds. The Board concluded that the other benefits realized by the Advisor from its relationship with the Funds were appropriate.
Based on its evaluation of the above factors, as well as other factors relevant to their consideration of the investment advisory agreement, the directors, including all of the Independent Directors, concluded that the continuation of the investment advisory agreement was in the best interest of each Fund and its shareholders.
Page 111
Additional Information
Proxy Voting
A description of the policies and procedures that the Funds use to determine how to vote proxies relating to portfolio securities is available without charge, upon request, by calling toll free, 1-866-44BAIRD, or by accessing the Funds’ website at www.bairdfunds.com; and by accessing the SEC’s website at www.sec.gov.
Each Fund’s proxy voting record for the most recent 12-month period ended June 30, if applicable, is available without charge, upon request, by calling toll free, 1-866-44BAIRD, or by accessing the Funds’ website at www.bairdfunds.com; and by accessing the SEC’s website at www.sec.gov. The Funds generally do not vote proxies because the securities held in their portfolios, consisting of bonds and other fixed-income securities, are not entitled to vote.
Portfolio Holdings Disclosure
The Funds file a complete schedule of portfolio holdings with the SEC for the first and third quarters of each fiscal year on Form N-Q. The Funds’ Forms N-Q are available on the SEC’s website at www.sec.gov and may be reviewed and copied at the SEC’s Public Reference Room in Washington, D.C. Information on the operation of the Public Reference Room may be obtained by calling 1-800-732-0330. The Funds’ Forms N-Q may also be obtained by calling toll-free 1-866-44BAIRD.
Tax Information
The percentage of taxable ordinary income distributions that are designated as short-term capital gain distributions under Internal Revenue Section 871(k)(2)(c) for the Baird Short-Term Bond Fund and Baird Intermediate Bond Fund were 1.13% and 0.38%, respectively.
Page 112
Baird Funds, Inc. Privacy Policy
Protecting the privacy of Fund shareholders is important to us. The following is a description of the practices and policies through which Baird Funds, Inc. protects the privacy and security of your non-public personal information.
What Information We Collect
We collect and maintain information about you so that we can open and maintain your account in the Funds and provide various services to you. We may collect and maintain the following personal information about you:
| • | Information we receive from you or your financial advisor on account applications or other forms, correspondence, or conversations, such as your name, address, e-mail address, phone number, social security number, assets, income and date of birth; and | |
| • | Information about your transactions with us, our affiliates, or others, such as your account number and balance, positions, activity, history, cost basis information, and other financial information. |
What Information We Disclose
We do not sell any non-public personal information about our current or former shareholders to third parties. We do not disclose any non-public personal information about our current or former shareholders to anyone, except as permitted or required by law. We are permitted by law to share any of the information we collect, as described above, with our affiliates. In addition, we may share such information with nonaffiliated third parties to the extent necessary to effect, process, administer or enforce a transaction that the shareholder requests or authorizes, in connection with maintaining or servicing the shareholder’s account, as requested by regulatory authorities or as otherwise permitted or required by law. For example, we are permitted by law to disclose all of the information we collect, as described above, to our transfer agent to process your transactions. We may also provide your name and address to third party service providers who send account statements and other Fund-related material to you.
How We Protect Your Information
We restrict access to your non-public personal information to those persons who require such information to provide products or services to you. We maintain physical, electronic, and procedural safeguards that comply with federal standards to protect the confidentiality, integrity and security of your non-public personal information.
We will continue to adhere to the privacy policies and practices in this notice even after your account is closed or becomes inactive.
In the event that you hold shares of the Fund(s) through a financial intermediary, including, but not limited to, a broker-dealer, bank, or trust company, the privacy policy of your financial intermediary would govern how your non-public personal information would be shared with nonaffiliated third parties.
Page A-1
Baird Funds, Inc.
c/o U.S. Bancorp Fund Services, LLC
P.O. Box 701
Milwaukee, WI 53201-0701
1-866-44BAIRD
Board of Directors
G. Frederick Kasten, Jr. (Chairman)
John W. Feldt
Cory L. Nettles
Marlyn J. Spear
Frederick P. Stratton, Jr.
Investment Advisor and Distributor
Robert W. Baird & Co. Incorporated
777 East Wisconsin Avenue
Milwaukee, WI 53202
Administrator and Transfer Agent
U.S. Bancorp Fund Services, LLC
P.O. Box 701
615 East Michigan Street
Milwaukee, WI 53202
Custodian
U.S. Bank, N.A.
1555 N. RiverCenter Drive, Suite 302
Milwaukee, WI 53212
Legal Counsel
Godfrey & Kahn, S.C.
780 North Water Street
Milwaukee, WI 53202
Independent Registered Public
Accounting Firm
Grant Thornton LLP
175 West Jackson Boulevard, 20th Floor
Chicago, IL 60604
Annual Report –
Baird Funds
December 31, 2014
Baird LargeCap Fund
Baird MidCap Fund
Baird SmallCap Value Fund
| Go Green. | | Go Paperless. |
Sign up to receive your Baird Funds’ prospectuses and reports online.
Table of Contents
| Letter to Shareholders | 1 |
| 2014 Economic and Stock Market Commentary | 2 |
| Baird LargeCap Fund | 4 |
| Baird MidCap Fund | 19 |
| Baird SmallCap Value Fund | 29 |
| Additional Information on Fund Expenses | 38 |
| Statements of Assets and Liabilities | 40 |
| Statements of Operations | 41 |
| Statements of Changes in Net Assets | 42 |
| Financial Highlights | 45 |
| Notes to the Financial Statements | 51 |
| Report of Independent Registered Public Accounting Firm | 61 |
| Directors and Officers | 62 |
Disclosure Regarding the Board of Directors’ Approval of the Investment Advisory Agreement for Baird Equity Funds | 65 |
| Additional Information | 68 |
| Privacy Notice | A-1 |
This report has been prepared for shareholders and may be distributed to others only if preceded or accompanied by a current prospectus.
Cautionary Note on Analyses, Opinions and Outlooks: In this report we offer analyses and opinions on the performance of individual securities, companies, industries, sectors, markets, interest rates and governmental policies, including predictions, forecasts and outlooks regarding possible future events. These can generally be identified as such because the context of the statements may include such words as “believe,” “should,” “will,” “expects,” “anticipates,” “hopes” and words of similar effect. These statements reflect the portfolio managers’ good faith beliefs and judgments and involve risks and uncertainties, including the risk that the portfolio managers’ analyses, opinions and outlooks are or will prove to be inaccurate. It is inherently difficult to correctly assess and explain the performance of particular securities, sectors, markets, interest rate movements, governmental actions or general economic trends and conditions, and many unforeseen factors contribute to the performance of Baird Funds. Investors are, therefore, cautioned not to place undue reliance on subjective judgments contained in this report.
Baird Funds
1-866-442-2473
www.bairdfunds.com
February 26, 2015
Dear Shareholder,
The Baird Funds has a passion for delivering competitive, risk-adjusted returns and outstanding service. That deeply held commitment led to another year of strong asset growth during 2014 for our fixed income and equity funds. Consistency, continuity and collaboration are hallmarks of our approach to meeting your investing and servicing needs. Our senior portfolio management teams have worked through many market cycles and have developed disciplined, risk-controlled approaches of adding value over benchmark returns through proven, bottom-up strategies focused on identifying, researching and investing in quality investments that exhibit strong fundamentals and offer attractive relative value.
We understand that it is this consistency of approach and unwavering focus on risk control that our shareholders depend on to help them achieve their investment objectives through market cycles. Our commitment to these long-term principles combined with strong alignment with the interests of investors helped drive assets under management in the Baird Funds to $17 billion at year end.
Our success rests on the trust you have placed in us to be effective stewards of your assets and we want to thank you for your continued investment in the Baird Funds.
On the following pages, we review the equity market in 2014 and the performance and composition of each of the Baird Equity Funds.
We are privileged to provide you with equity investment management services and appreciate the confidence and trust you have placed in our experienced investment team.
Sincerely,
Mary Ellen Stanek, CFA
President
Baird Funds
Page 1
2014 Economic and Stock Market Commentary
U.S. equity markets adjusted to the diverging growth path of global economies, with further strengthening on the domestic front contrasting the heightened concerns about activity in Europe and China. The broad-based S&P 500 Index rose 13.7% for the year, while Dow Jones Industrial Average advanced 10.0%. Market returns were influenced by size as larger companies tended to fare better. For the year, the Russell 1000® Growth Index advanced 13.0%, the Russell Midcap Growth® Index increased 11.9%, and the Russell 2000® Value Index increased 4.2%.
Sector performance within the broad S&P 500 index reflected an interesting mix, with typically more-defensive sectors such as healthcare, utilities, and staples, combining with technology and financials, to outperform the index. On the weaker side of the ledger were the energy, materials, consumer discretionary and industrial sectors.
As in most years, equity returns were not steady on a quarter-to-quarter basis. Market returns early in the year were muted as harsh winter weather throughout much of the country tempered domestic economic data. As the year progressed, improving domestic growth contrasted an uptick in geopolitical tensions, particularly in the Middle East and between Russia and Ukraine, along with weaker economic data globally. Notably, the global inflation picture remained benign as a sharp drop in commodity prices, led by oil, helped pull interest rates lower. A rather abrupt market pullback in October quickly reversed itself on the back of solid domestic economic data as well as anticipated benefits from declining energy costs. The favorable market push into year-end resulted in solid fourth quarter returns and moved the S&P 500 Index into positive double-digit territory for the fifth time out of the past six years.
Economic Outlook
The U.S. stock market, having delivered a string of positive returns, will continue to be influenced by the pace of domestic growth, which we believe to be improving. Economic data released during the final quarter of 2014 reflected solid economic activity in the U.S. – employment, inflation, and confidence measures to name a few, indicate good momentum as we turn the calendar. The consumer appears to be particularly well positioned given these factors, plus improving personal balance sheets and substantially lower fuel prices. We expect economic momentum to result in continued growth in profits, a key driver of stock prices. Offsetting that backdrop, however, is that multiples paid for earnings could be challenged by the prospects of rising short-term interest rates. The Federal Reserve has indicated a desire to raise short-term rates, possibly as early as the June meeting. History shows that stocks can rise alongside interest rates, but investors should expect volatility as we get closer to the eventual announcement. We are also mindful of the sharp decline in oil prices. Historically, the dislocation of an important asset price can lead to episodes of financial or political strain.
The growth (or lack thereof) in international economies will also remain a concern in 2015. Europe has delivered anemic growth for years, and the European Central Bank has taken a page out of the Fed’s playbook and commenced with a Quantitative Easing program. That program follows the very aggressive easing moves in Japan, which to date have shown modest success in reinvigorating growth. Additionally, China recently relaxed lending requirements in a hope to stimulate activity. The key is whether the strength in our economy helps pull the rest of the world along, or will the rest of the world drag U.S. growth down. As of today, we think the former is the correct answer, but the latter cannot be dismissed.
In closing, we are optimistic that the U.S. economy continues to grow at modest, but sustainable rates, a positive backdrop for stocks. Foreign central bank moves may help lift international markets, but the effectiveness of those actions to spur sustainable economic growth is uncertain. We will keep a close eye on changes both here and abroad and are prepared to make necessary adjustments. Thank you for your support of Baird Investment Management and Baird Kailash Group.
The S&P 500 Index is an unmanaged, market capitalization weighted index of 500 common stocks widely regarded to be representative of the U.S. market in general. Returns include reinvestment of dividends.
Page 2
2014 Economic and Stock Market Commentary
The Dow Jones Industrial Average is a price weighted average of 30 high quality stocks selected for total market value and broad public ownership. A price weighted benchmark results in the stocks with the highest prices contributing the most to the performance of the benchmark. The returns of this index do not include the reinvestment of dividend income.
The Russell 1000® Growth Index measures the performance of the large-cap growth segment of the U.S. equity universe. It includes those Russell 1000® companies with higher price-to-book ratios and higher forecasted growth values. This index does not reflect any deduction for fees, expenses or taxes.
The Russell Midcap® Growth Index measures the performance of the mid-cap growth segment of the U.S. equity universe. It includes those Russell Midcap® Index companies with higher price-to-book ratios and higher forecasted growth values. This index does not reflect any deduction for fees, expenses or taxes.
The Russell 2000® Value Index measures the performance of the small-cap value segment of the U.S. equity universe and includes Russell 2000® Index companies with lower price-to-book ratios and lower forecasted growth values. This index does not reflect any deduction for fees, expenses or taxes.
A direct investment in an index is not possible.
Page 3
Baird LargeCap Fund
December 31, 2014
Portfolio Managers’ Commentary
Rising over 13% in 2014, the S&P 500 built on the powerful 32% return from 2013. On a sector level Utilities, Health Care and IT all returned over 20% for the year while Materials, Telecoms and Energy stocks lagged with returns ranging from 10% to -8%. The market climbed as investor confidence rose, index products took in record amounts of assets and investor exposure to equities reached levels approximating those seen in 1999 and 2007. We are somewhat concerned about rising investor enthusiasm for equities this late in a bull market. This anxiety is exacerbated by a number of long-run valuation models that indicate equities may be expensive. With that said, we recognize that market timing is futile and that relative to many alternatives, equities may have significant long-term appeal.
We would encourage investors to read a recent cover article in The Economist that attempted to answer “Who buys negative-yield bonds?” Observing that “…government bonds…in as many as ten countries are selling at negative yields” the author went on to note that one “…would have to be quite depressed to conclude that no asset on the planet would make any money at all over the next decade.”1 We could not agree more and believe that a disciplined approach that seeks to source returns from both value and growth among large global franchises with strong balance sheets and durable economic moats helmed by capable managers represents one of the best risk-adjusted methods to compound wealth over long horizons.
While the Baird LargeCap Fund (Institutional Class) outperformed the S&P by 1.40% in 2014, we believe 2014 sends a powerful message about the benefits of using a balanced approach towards large-cap stock selection.
Investment Process
We believe there are meaningful advantages to both growth and value investing. While we understand the near religious affiliations some managers and investors have for one or the other, few would argue with the assertion that the performance pendulum can swing back and forth. There are times when value bests growth and others when growth outperforms value.
The field of behavioral finance does not shine a flattering light on fund managers’ or investors’ ability to astutely time their entry and exit points from various strategies. Human beings have shown a tendency to switch from disciplines right when they are bottoming and enter strategies when they should probably be departing. Taking a balanced approach that seeks to identify both the best value and growth opportunities may afford us a significant competitive advantage over indexing while reducing the odds we experience the large relative drawdowns that can afflict these strategies when run in isolation. Because we are convinced that trying to time growth vs. value is futile, managing money in a way that improves our ability (and hopefully yours!) to stick with our discipline is at the heart of what we believe will give us a significant competitive advantage over a full-market cycle.
Some Simple Evidence:
We ran a test to see if even the most naïve approach to balanced investing would have historically offered a meaningful advantage over just buying the index. For this purpose only, we simply built a hypothetical hybrid portfolio that contained both the 20% highest growth and the 20% deepest value names in the S&P 500 and compared the results to the broader index.2 The results were striking. In our hypothetical example, Fig. 1 below shows that even a simple combination of value and growth stocks would have doubled the value of the hypothetical investment compared to the index since 1990. Equally interesting, as shown in Fig. 2, the volatility of the monthly relative returns of this hypothetical hybrid strategy are significantly below those found in either the growth or value return streams.
| 1 | The Economist, January 24th-30th 2015, “Buttonwood: Accentuate the Negative, Why investors would opt to lose money”, p 62. |
| 2 | The hypothetical hybrid portfolio is used for illustrative purposes only and does not represent any accounts managed by Baird Kailash Group. |
Page 4
Baird LargeCap Fund
December 31, 2014
| Fig. 1: A hypothetical combination of Growth + | Fig. 2: …While significantly reducing the |
| Value has outperformed the broader S&P 500 | volatility of relative returns compared to Growth |
| index since 1990… | or Value alone |
 |  |
Sources: Kailash Capital LLC, Compustat
See note 2 above
Figure 3 below compares the performance of the S&P 500 index to the performance of a hypothetical portfolio consisting of 20% of the index’s deepest value and highest growth names in 2014.3 You can see that growth (blue line) outperformed the core index (dashed black line) while the value names (solid red line) ended the year just shy of the broader benchmark. Figure 4 shows us historically how often growth outperforms value depending on the market’s monthly return. The left-most bar shows that since 1990, when the market experiences its strongest upside, growth outperforms value nearly 70% of the time.4 The right-most bar shows that when the market suffers sharp reversals, growth only beats value 30% of the time. With the market up north of 13% last year we find nothing surprising about growth’s dominance in 2014.
| Fig. 3: In 2014, growth outperformed value | Fig. 4: History tells us growth tends to do better |
| in up markets | |
 |  |
Sources: Kailash Capital LLC, Compustat
See note 2 above
| 3 | We define “growth” as the 20% of firms in the S&P 500 with the highest price to earnings ratios and “value” as the 20% of firms in the S&P 500 with the lowest price to earnings ratios. |
| 4 | Hypothetical data since 1990. |
Page 5
Baird LargeCap Fund
December 31, 2014
No Fans of Forecasting:
The data above indicates that historically when the market is going to rise a lot, you are better off in growth strategies and when it falls sharply, value has historically been the better place to be. Unfortunately, like Warren Buffet who in 1961 told his investors “I am certainly not going to predict what general business or the stock market are going to do in the next year or two since I don’t have the faintest idea,” we don’t believe anyone can predict short-term market direction.5 Instead we use a balanced approach to large cap investing to avoid the pain that can emerge from dedicated growth or value strategies and the associated timing errors that even short term missteps can encourage.
Similarly, since we believe that history rhymes, we like to use large amounts of fundamental data to try and exploit the behavioral errors of other investors caught up in what we view as futile attempts to predict the future. We are in the “Moneyball” business, not the “crystal-ball” business. We would rather stick to our process of trying to find self-funded firms whose growth may be underestimated by other investors or find inexpensive firms with asymmetrically positive payoff structures.
Examples from 2014:
The following examples are not stock recommendations. One investment represents one of our largest contributors to the Fund’s performance and the other was one of our largest detractors to performance. These examples are merely intended to better explain our investment approach that seeks to identify companies that we believe are mispriced.
Capitalizing on a Favorable Environment for Growth: Health Care
In 2013 Edwards Lifesciences fell 27% while the S&P 500 rose over 32%. This apparently left its mark on investors who, by the start of 2014, saw the company’s relentlessly rising R&D spend, the movement of its U.S. end-market from a monopoly to a duopoly and emerging competitors in other geographies as credible reasons to avoid the stock. We cannot help but wonder if much of the antipathy towards Edwards at the start of 2014 stemmed from the less than spectacular price movement in the prior year rather than dispassionate analysis.
Devoid of emotions or biases, our models simply saw a firm that by year end 2013 had managed to grow revenues by 22% and profits by 65% over the prior three years trading at a mid-teens price to earnings ratio with a healthy return on equity and a management repurchasing shares after a bout of severe underperformance. Our fundamental review of the company found a firm whose products sought to mitigate the number-one cause of death in the world: cardiovascular disease. As the global leader in heart valve therapy, a world leader in hemodynamic monitoring systems (used to monitor a patient’s heart function in surgery and ICU settings) and with a rapidly growing franchise in transcatheter heart valves which allow the non-surgical replacement of heart valves, we believed the core products were unlikely to go away anytime soon. While other investors were frustrated as the company grew R&D spending from 14.7% of sales in 2011 to nearly 16% by 2013, we believed the money was being put to good use as evidenced by the firm’s 2,500 patents. At the start of 2014 we felt the negative view on the company was priced in, the firm’s economic moat defensible, the balance sheet robust, the management credible and that the firm’s prospects and growth were significantly mispriced. Without forecasting anything we were pleased to see this growth firm rise over 93% and become the largest contributor to the Fund’s 2014 returns.
Suffering at the Hands of an Inhospitable Value Environment: Industrials
Investor views about China are about as diverse and widely distributed as anything we can remember. There are China acolytes who believe the country’s economic ascent to displace America as the global hegemon is all but certain and others who believe the country is a Potemkin village built on a debt bubble. In late 2013, a prominent short-seller who believes in the bearish view targeted Caterpillar (CAT) as a likely casualty of what he felt were the inevitable problems facing China.
| 5 | We define “short-term” as any period less than three years. |
Page 6
Baird LargeCap Fund
December 31, 2014
Although we also worry a great deal about the “big picture,” investor anxiety is often the source of great opportunities. In early 2014, our models looked at CAT and found an inexpensive firm with robust cash flows and shareholder friendly management and indicated the timing was ripe to invest. Reviewing the fundamentals of the firm we noted that Caterpillar was the world’s leading manufacturer of heavy equipment, diesel and gas engines and provided a wide array of products used for residential and commercial construction, mining, paving, forestry, tunneling, power generation, rail and marine applications. To us it seemed that investors’ worries about China had already transpired as the company’s Resource division had seen revenues collapse from over $21 billion in 2012 to just over $10 billion by FYE 2013. In contrast, the firm’s Power and Construction divisions had remained essentially flat at around $20 billion each by the end of 2013. Despite being cast as a macro-dependent cyclical, it is worth mentioning that in the depths of the 2009 crash, CAT lost only a nominal amount of money in one quarter that year.
Caterpillar’s management was aggressive as they embraced cost reductions across the complex taking charges to set the firm up for robust profits despite the painful decrease in revenues. Looking at the situation, we felt this was an outstanding opportunity to buy a world-class global franchise at a very reasonable price. For much of 2014 this decision seemed to be the right one as the stock outperformed both the broad S&P 500 and the S&P 500 industrials index. Unfortunately for us however, as oil’s descent accelerated in the back-half of the year, it eventually took CAT down with it. With a meaningful and lucrative business selling well stimulation pumps, reciprocating engines and turbines to the energy space this would prove to be CAT’s undoing, the shares suffered and became one of the Fund’s largest detractors from returns as investors (rightly) worried that the firm’s profits would decline. While the shares have suffered, we continue to believe the Caterpillar franchise is healthy, intact and a good deal of pessimism is reflected in current valuations.
Discussion of Fund’s Performance in 2014
In 2014, the Baird LargeCap Fund (Institutional Class) generated a total return of 15.09%, compared to a 13.69% return for the S&P 500 index, the Fund’s benchmark. Below we discuss sectors and companies that were key contributors and detractors from the Fund’s performance relative to the S&P 500.
Key Contributors To Relative Returns:
| o | Industrials as a sector rose less than 10% compared to the broad S&P 500 index which was up nearly 14%. The Fund ran almost exactly at the sector weight but benefitted from very strong stock selection with its Industrial picks rising over 20% for the year. Significant overweights in low cost and legacy carriers Southwest and Delta added the most to the Fund’s relative returns as the industry continues to benefit from a more rational operating environment post significant capacity reductions. |
| o | Similar to Industrials, Consumer Discretionary was another sector that underperformed the benchmark (again up 10% vs. the broad S&P 500 being up nearly 14%), where the Fund carried an identical sector weight but strong stock selection contributed significantly to relative returns. The Fund’s holdings in the sector rose nearly 18% as a large weighting in DISH Networks and Delphi Automotive, among others, drove meaningful outperformance in the group. |
| o | The Fund was neutral the Health Care sector which meaningfully outperformed the broad benchmark, rising almost 25% for the year. With its Health Care holdings up 31% for the year, the Fund benefitted from strong stock selection in the space as we profited from both growth (Edwards Lifesciences) and value names (Abbvie). |
Key Detractors From Relative Returns:
| o | Despite representing only 3% of the S&P 500, the Utilities sector detracted from the Fund’s relative returns more than any other sector. The Fund held just shy of a 2% weighting in the sector and our largest weighting, AES, fell in absolute terms. Being underweight such a strong sector hampered us on allocation and due to the underperformance of our largest weighted stock, selection in the sector was also negative. |
Page 7
Baird LargeCap Fund
December 31, 2014
| o | Despite being overweight Financials which outperformed the broad benchmark, poor stock selection dragged results down as our holdings rose only 12.5% compared to the S&P 500 Financial sector being up 15%. Our positions in credit card companies (American Express and Capital One) combined with a weak showing out of some of our regional banks led to a negative effect from stock selection in the group. |
| o | Despite carrying less than 2% of the Fund’s assets in cash on average, our desire to keep even this small amount of “dry powder” on hand cost the Fund 25 bps. |
Conclusion
As the first year of managing the LargeCap Fund comes to a close we would like to thank every one of our investors for sticking with us. We understand that a new manager represents an unknown and are deeply grateful for your support. My money is invested along-side yours in the belief that it is not just common sense that a fund manager “eat his own cooking” but that it also provides a healthy dose of professional alignment. Over the course of the year nearly 80% of the Fund’s excess returns were sourced from stock selection and we believe that hews to the product’s core value proposition. While there are many products that attempt to time markets or sectors, we believe these behaviors are more difficult than finding the under-appreciated growth firms and inexpensive value opportunities we typically work in. By maintaining a balanced approach to stock selection we hope to minimize our own (and hopefully our investors’) behavioral errors in an effort to keep us all focused on the long-term, process-driven approach that we believe is the key to compounding wealth at better than market rates. We understand that track records are built over years and that even the best managers will experience unflattering moments. With that said, we would like to make it clear that in our view the investors in the Fund are not customers, rather they are partners. While long-term investment results are always the ultimate arbiters of a money manager’s success, we understand that aside from the portfolios we build, the shareholders we work with represent the LargeCap Fund’s greatest asset.
Portfolio Manager:
Matt Malgari
Page 8
Baird LargeCap Fund
December 31, 2014 (Unaudited)
A December 31, 2014 summary of the Fund’s top 10 holdings and equity sector analysis compared to the S&P 500® Index is shown below.
| Top 10 Holdings* | Equity Sector Analysis** | ||
| Intel Corporation | 2.8% | 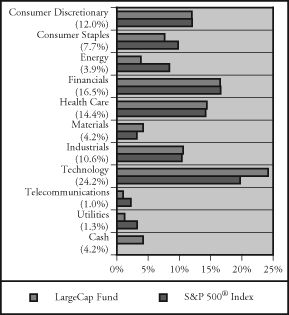 | |
| AbbVie Inc. | 2.7% | ||
| Oracle Corporation | 2.6% | ||
| Moody’s Corporation | 2.3% | ||
| SanDisk Corporation | 2.3% | ||
| Hewlett-Packard Company | 2.2% | ||
| C.R. Bard, Inc. | 2.2% | ||
| Expedia, Inc. | 2.1% | ||
| PepsiCo, Inc. | 2.0% | ||
| Medtronic, Inc. | 2.0% | ||
| Net Assets: | $40,175,502 | ||
| Portfolio Turnover Rate: | 88.2% | ||
| Number of Equity Holdings: | 115 | ||
| Annualized Portfolio Expense Ratio:*** | |||
| Gross | |||
| Institutional Class: | 1.24% | ||
| Investor Class: | 1.49% | **** | |
| Net | |||
| Institutional Class: | 0.75% | ||
| Investor Class: | 1.00% | **** |
| * | The Fund’s portfolio composition is subject to change and there is no assurance that the Fund will continue to hold any particular security. Percentages shown relate to the Fund’s total net assets as of December 31, 2014. | |
| ** | Percentages shown in parentheses relate to the Fund’s total market value of investments as of December 31, 2014, and may not add up to 100% due to rounding. | |
| *** | Reflects expense ratios as stated in the Fund’s current prospectus. The Advisor has contractually agreed to limit the Fund’s total annual fund operating expenses to 0.75% of average daily net assets for the Institutional Class shares and 1.00% of average daily net assets for the Investor Class shares, at least through April 30, 2016. | |
| **** | Includes 0.25% 12b-1 fee. |
Page 9
Baird LargeCap Fund
December 31, 2014 (Unaudited)
Institutional Class
Value of a $25,000 Investment
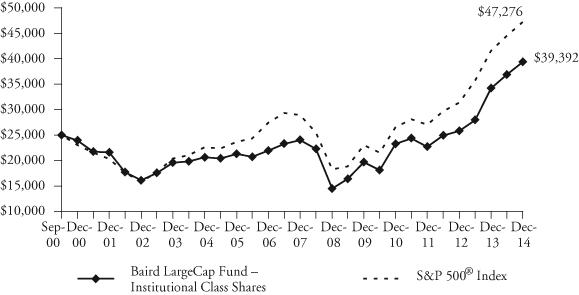
Growth of a hypothetical investment of $25,000 made on the Fund’s inception date (9/29/00), assuming reinvestment of all distributions.
Investor Class
Value of a $10,000 Investment

Growth of a hypothetical investment of $10,000 made on the Fund’s inception date (9/29/00), assuming reinvestment of all distributions.
Page 10
Baird LargeCap Fund
December 31, 2014 (Unaudited)
Average Annual Total Returns
| Since | ||||
| For the Periods Ended December 31, 2014 | One Year | Five Years | Ten Years | Inception(1) |
| Institutional Class Shares | 15.09% | 14.88% | 6.69% | 3.24% |
| Investor Class Shares | 14.89% | 14.62% | 6.44% | 2.99% |
S&P 500® Index(2) | 13.69% | 15.45% | 7.67% | 4.57% |
| (1) | For the period from September 29, 2000 (inception date) through December 31, 2014. |
| (2) | The S&P 500® Index measures the performance of 500 common stocks chosen for market size, liquidity and industry group representation of U.S. equity performance. This index does not reflect any deduction for fees, expenses or taxes. A direct investment in the index is not possible. |
Effective December 23, 2013, Baird Kailash Group, LLC became the Fund’s subadviser. The returns shown in the table above and line graphs on the previous page reflect reinvestment of dividends and/or capital gains distributions in additional shares. The returns do not reflect the deduction of taxes that a shareholder would pay on Fund distributions or the redemption of Fund shares. The returns reflect the actual performance for each period and do not include the impact of trades executed on the last business day of the period that were recorded on the first business day of the next period.
The gross expense ratio for each Class, as reflected in the Fund’s current prospectus, is set forth under “Portfolio Characteristics”.
The Fund’s subadviser makes investment decisions for the Fund primarily using quantitative investment models which rank securities based on fundamental measures of value, past performance and indicators of recent positive changes. The success of the quantitative investment methodologies and processes employed by the subadviser depends on the analyses and assessments that were used in developing such methodologies and processes, as well as on the accuracy and reliability of models and data provided by third parties. Incorrect analyses and assessments or inaccurate or incomplete models and data would adversely affect performance. Certain low-probability events or factors that are assigned little weight may occur or prove to be more likely or may have more relevance than expected, for short or extended periods of time. It is also possible that prices of securities may move in directions that were not predicted by the subadviser’s quantitative methodologies. The Fund may invest in stocks (or ADRs representing stocks) of foreign companies that are traded on U.S. exchanges. Foreign investments involve additional risk such as currency rate fluctuations, political and economic instability, and different and sometimes less strict financial reporting standards and regulation.
Past performance does not guarantee future results. Investment return and principal value will fluctuate so that an investor’s shares, when redeemed, may be worth more or less than their original cost.
For information about the performance of the Fund as of the most recent month-end, please call 1-866-44BAIRD or visit www.bairdfunds.com. Mutual fund performance changes over time and current performance may be lower or higher than that stated.
Page 11
Baird LargeCap Fund
Schedule of Investments, December 31, 2014
Common Stocks
| % of | ||||||||||||
| Shares | Value | Net Assets | ||||||||||
| Aerospace & Defense | ||||||||||||
| The Boeing Company | 1,601 | $ | 208,098 | 0.5 | % | |||||||
| General Dynamics Corporation | 1,821 | 250,606 | 0.6 | % | ||||||||
| Northrop Grumman Corporation | 2,498 | 368,180 | 0.9 | % | ||||||||
| Raytheon Company | 1,609 | 174,046 | 0.5 | % | ||||||||
| 1,000,930 | 2.5 | % | ||||||||||
| Airlines | ||||||||||||
| Alaska Air Group, Inc. | 1,421 | 84,919 | 0.2 | % | ||||||||
| Delta Air Lines, Inc. | 4,777 | 234,981 | 0.6 | % | ||||||||
| Southwest Airlines Co. | 13,232 | 559,978 | 1.4 | % | ||||||||
| United Continental Holdings, Inc.* | 2,901 | 194,048 | 0.5 | % | ||||||||
| 1,073,926 | 2.7 | % | ||||||||||
| Auto Components | ||||||||||||
| Autoliv, Inc. | 724 | 76,831 | 0.2 | % | ||||||||
| Automobiles | ||||||||||||
| Ford Motor Company | 39,411 | 610,870 | 1.5 | % | ||||||||
| General Motors Company | 1,850 | 64,584 | 0.2 | % | ||||||||
| Harley-Davidson, Inc. | 4,686 | 308,854 | 0.8 | % | ||||||||
| 984,308 | 2.5 | % | ||||||||||
| Banks | ||||||||||||
| Bank of America Corp. | 13,891 | 248,510 | 0.6 | % | ||||||||
| Fifth Third Bancorp | 10,434 | 212,592 | 0.5 | % | ||||||||
| Huntington Bancshares Incorporated | 41,567 | 437,285 | 1.1 | % | ||||||||
| U.S. Bancorp | 16,663 | 749,002 | 1.9 | % | ||||||||
| Wells Fargo & Company | 14,133 | 774,771 | 1.9 | % | ||||||||
| 2,422,160 | 6.0 | % | ||||||||||
| Beverages | ||||||||||||
| The Coca-Cola Company | 5,772 | 243,694 | 0.6 | % | ||||||||
| Dr Pepper Snapple Group, Inc. | 2,454 | 175,903 | 0.5 | % | ||||||||
| PepsiCo, Inc. | 8,668 | 819,646 | 2.0 | % | ||||||||
| 1,239,243 | 3.1 | % | ||||||||||
| Biotechnology | ||||||||||||
| Amgen Inc. | 2,149 | 342,314 | 0.9 | % | ||||||||
| Biogen Idec Inc.* | 514 | 174,477 | 0.4 | % | ||||||||
| Celgene Corporation* | 3,046 | 340,726 | 0.8 | % | ||||||||
| 857,517 | 2.1 | % | ||||||||||
| Building Products | ||||||||||||
| Masco Corporation | 17,382 | 438,026 | 1.1 | % | ||||||||
The accompanying notes are an integral part of these financial statements.
Page 12
Baird LargeCap Fund
Schedule of Investments, December 31, 2014
Common Stocks (cont.)
| % of | ||||||||||||
| Shares | Value | Net Assets | ||||||||||
| Capital Markets | ||||||||||||
| Ameriprise Financial, Inc. | 4,507 | $ | 596,051 | 1.5 | % | |||||||
| The Blackstone Group L.P. | 16,920 | 572,403 | 1.4 | % | ||||||||
| 1,168,454 | 2.9 | % | ||||||||||
| Chemicals | ||||||||||||
| Celanese Corporation | 2,734 | 163,931 | 0.4 | % | ||||||||
| CF Industries Holdings, Inc. | 1,223 | 333,316 | 0.8 | % | ||||||||
| The Dow Chemical Company | 5,891 | 268,689 | 0.7 | % | ||||||||
| International Flavors & Fragrances Inc. | 790 | 80,074 | 0.2 | % | ||||||||
LyondellBasell Industries N.V. – Class A f | 6,203 | 492,456 | 1.2 | % | ||||||||
| 1,338,466 | 3.3 | % | ||||||||||
| Communications Equipment | ||||||||||||
| Harris Corporation | 3,050 | 219,051 | 0.5 | % | ||||||||
| QUALCOMM Incorporated | 1,950 | 144,944 | 0.4 | % | ||||||||
| 363,995 | 0.9 | % | ||||||||||
| Consumer Finance | ||||||||||||
| American Express Company | 3,435 | 319,592 | 0.8 | % | ||||||||
| Capital One Financial Corporation | 4,805 | 396,653 | 1.0 | % | ||||||||
| Discover Financial Services | 8,844 | 579,194 | 1.4 | % | ||||||||
| 1,295,439 | 3.2 | % | ||||||||||
| Containers & Packaging | ||||||||||||
| Ball Corporation | 5,220 | 355,847 | 0.9 | % | ||||||||
| Diversified Financial Services | ||||||||||||
| Moody’s Corporation | 9,760 | 935,106 | 2.3 | % | ||||||||
| Diversified Telecommunication Services | ||||||||||||
| AT&T Inc. | 8,950 | 300,630 | 0.7 | % | ||||||||
| CenturyLink, Inc. | 2,058 | 81,456 | 0.2 | % | ||||||||
| 382,086 | 0.9 | % | ||||||||||
| Electrical Equipment | ||||||||||||
| Rockwell Automation, Inc. | 1,256 | 139,667 | 0.3 | % | ||||||||
| Electronic Equipment, Instruments & Components | ||||||||||||
| Corning Incorporated | 7,963 | 182,592 | 0.5 | % | ||||||||
| Energy Equipment & Services | ||||||||||||
| Halliburton Company | 4,620 | 181,705 | 0.4 | % | ||||||||
Schlumberger Limited f | 715 | 61,068 | 0.2 | % | ||||||||
Seadrill Ltd f | 2,902 | 34,650 | 0.1 | % | ||||||||
| 277,423 | 0.7 | % | ||||||||||
The accompanying notes are an integral part of these financial statements.
Page 13
Baird LargeCap Fund
Schedule of Investments, December 31, 2014
| % of | ||||||||||||
| Shares | Value | Net Assets | ||||||||||
| Food & Staples Retailing | ||||||||||||
| The Kroger Co. | 11,551 | $ | 741,690 | 1.8 | % | |||||||
| Safeway Inc. | 2,216 | 77,826 | 0.2 | % | ||||||||
| 819,516 | 2.0 | % | ||||||||||
| Food Products | ||||||||||||
| Archer-Daniels-Midland Company | 5,420 | 281,840 | 0.7 | % | ||||||||
Bunge Limited f | 1,840 | 167,274 | 0.4 | % | ||||||||
| General Mills, Inc. | 1,471 | 78,449 | 0.2 | % | ||||||||
| Tyson Foods, Inc. | 1,730 | 69,356 | 0.2 | % | ||||||||
| 596,919 | 1.5 | % | ||||||||||
| Health Care Equipment & Supplies | ||||||||||||
| Baxter International Inc. | 1,004 | 73,583 | 0.2 | % | ||||||||
| Becton, Dickson and Company | 4,620 | 642,919 | 1.6 | % | ||||||||
| C.R. Bard, Inc. | 5,338 | 889,418 | 2.2 | % | ||||||||
| Edwards Lifesciences Corporation* | 4,717 | 600,851 | 1.5 | % | ||||||||
| Medtronic, Inc. | 11,303 | 816,077 | 2.0 | % | ||||||||
| Varian Medical Systems, Inc.* | 894 | 77,340 | 0.2 | % | ||||||||
| 3,100,188 | 7.7 | % | ||||||||||
| Health Care Providers & Services | ||||||||||||
| Anthem, Inc. | 1,293 | 162,491 | 0.4 | % | ||||||||
| Hotels, Restaurants & Leisure | ||||||||||||
| Wyndham Worldwide Corporation | 9,105 | 780,845 | 1.9 | % | ||||||||
| Household Durables | ||||||||||||
| PulteGroup, Inc. | 18,191 | 390,379 | 1.0 | % | ||||||||
| Household Products | ||||||||||||
| Energizer Holdings, Inc. | 3,278 | 421,420 | 1.1 | % | ||||||||
| Independent Power Producers & Energy Traders | ||||||||||||
| The AES Corporation | 25,670 | 353,476 | 0.9 | % | ||||||||
| Insurance | ||||||||||||
| Aflac, Inc. | 3,383 | 206,667 | 0.5 | % | ||||||||
| The Progressive Corporation | 6,145 | 165,854 | 0.4 | % | ||||||||
| The Travelers Companies, Inc. | 1,606 | 169,995 | 0.4 | % | ||||||||
| 542,516 | 1.3 | % | ||||||||||
| Internet & Catalog Retail | ||||||||||||
| Expedia, Inc. | 9,676 | 825,943 | 2.1 | % | ||||||||
| Internet Software & Services | ||||||||||||
| Google Inc.* | 1,256 | 661,158 | 1.6 | % | ||||||||
| IT Services | ||||||||||||
| Alliance Data Systems Corporation* | 598 | 171,058 | 0.4 | % | ||||||||
The accompanying notes are an integral part of these financial statements.
Page 14
Baird LargeCap Fund
Schedule of Investments, December 31, 2014
Common Stocks (cont.)
| % of | ||||||||||||
| Shares | Value | Net Assets | ||||||||||
| IT Services (cont.) | ||||||||||||
| International Business Machines Corporation | 923 | $ | 148,086 | 0.4 | % | |||||||
| MasterCard Incorporated | 2,130 | 183,521 | 0.4 | % | ||||||||
| Visa Inc. | 1,065 | 279,243 | 0.7 | % | ||||||||
| The Western Union Company | 4,515 | 80,863 | 0.2 | % | ||||||||
| 862,771 | 2.1 | % | ||||||||||
| Leisure Equipment Products | ||||||||||||
| Hasbro, Inc. | 1,351 | 74,291 | 0.2 | % | ||||||||
| Life Sciences Tools & Services | ||||||||||||
| Agilent Technologies, Inc. | 1,732 | 70,908 | 0.2 | % | ||||||||
| Machinery | ||||||||||||
| Caterpillar Inc. | 7,529 | 689,129 | 1.7 | % | ||||||||
| Deere & Company | 6,025 | 533,032 | 1.4 | % | ||||||||
| Illinois Tool Works, Inc. | 921 | 87,219 | 0.2 | % | ||||||||
| 1,309,380 | 3.3 | % | ||||||||||
| Media | ||||||||||||
| DISH Network Corporation – Class A* | 10,277 | 749,090 | 1.9 | % | ||||||||
| Gannett Co., Inc. | 2,577 | 82,284 | 0.2 | % | ||||||||
| Omnicom Group Inc. | 2,039 | 157,961 | 0.4 | % | ||||||||
| 989,335 | 2.5 | % | ||||||||||
| Multiline Retail | ||||||||||||
| Kohl’s Corporation | 1,493 | 91,133 | 0.2 | % | ||||||||
| Macy’s, Inc. | 1,268 | 83,371 | 0.2 | % | ||||||||
| Nordstrom, Inc. | �� | 4,632 | 367,734 | 0.9 | % | |||||||
| 542,238 | 1.3 | % | ||||||||||
| Multi-Utilities | ||||||||||||
| CMS Energy Corporation | 5,021 | 174,480 | 0.4 | % | ||||||||
| Oil, Gas & Consumable Fuels | ||||||||||||
| Marathon Petroleum Corporation | 5,010 | 452,203 | 1.1 | % | ||||||||
| Phillips 66 | 5,388 | 386,320 | 1.0 | % | ||||||||
| Tesoro Corporation | 3,511 | 261,043 | 0.6 | % | ||||||||
| Valero Energy Corporation | 1,329 | 65,785 | 0.2 | % | ||||||||
| Whiting Petroleum Corporation* | 3,196 | 105,468 | 0.3 | % | ||||||||
| 1,270,819 | 3.2 | % | ||||||||||
| Pharmaceuticals | ||||||||||||
| AbbVie Inc. | 16,562 | 1,083,817 | 2.7 | % | ||||||||
| Eli Lilly and Company | 3,752 | 258,851 | 0.6 | % | ||||||||
| Johnson & Johnson | 2,281 | 238,524 | 0.6 | % | ||||||||
| Pfizer Inc. | 2,415 | 75,227 | 0.2 | % | ||||||||
| 1,656,419 | 4.1 | % | ||||||||||
The accompanying notes are an integral part of these financial statements.
Page 15
Baird LargeCap Fund
Schedule of Investments, December 31, 2014
Common Stocks (cont.)
| % of | ||||||||||||
| Shares | Value | Net Assets | ||||||||||
| Real Estate Investment Trusts (REITs) | ||||||||||||
| American Capital Agency Corp. | 6,930 | $ | 151,282 | 0.4 | % | |||||||
| Road & Rail | ||||||||||||
| Hertz Global Holdings, Inc.* | 2,721 | 67,862 | 0.2 | % | ||||||||
| Union Pacific Corporation | 1,937 | 230,755 | 0.6 | % | ||||||||
| 298,617 | 0.8 | % | ||||||||||
| Semiconductors & Semiconductor Equipment | ||||||||||||
| Intel Corporation | 31,001 | 1,125,026 | 2.8 | % | ||||||||
| Linear Technology Corporation | 1,643 | 74,921 | 0.2 | % | ||||||||
| Maxim Integrated Products, Inc. | 9,417 | 300,120 | 0.7 | % | ||||||||
| Microchip Technology Incorporated | 1,657 | 74,747 | 0.2 | % | ||||||||
| Micron Technology, Inc.* | 15,984 | 559,600 | 1.4 | % | ||||||||
NXP Semiconductors N.V.*f | 3,563 | 272,213 | 0.7 | % | ||||||||
| 2,406,627 | 6.0 | % | ||||||||||
| Software | ||||||||||||
Check Point Software Technologies Ltd.*f | 2,277 | 178,904 | 0.4 | % | ||||||||
| Citrix Systems, Inc.* | 3,510 | 223,938 | 0.6 | % | ||||||||
| Electronic Arts Inc.* | 1,910 | 89,799 | 0.2 | % | ||||||||
| Microsoft Corporation | 9,572 | 444,619 | 1.1 | % | ||||||||
| Oracle Corporation | 23,022 | 1,035,299 | 2.6 | % | ||||||||
| 1,972,559 | 4.9 | % | ||||||||||
| Specialty Retail | ||||||||||||
| Foot Locker, Inc. | 1,402 | 78,765 | 0.2 | % | ||||||||
| The Gap, Inc. | 2,138 | 90,031 | 0.2 | % | ||||||||
| 168,796 | 0.4 | % | ||||||||||
| Technology Hardware, Storage & Peripherals | ||||||||||||
| Apple Inc. | 4,928 | 543,953 | 1.4 | % | ||||||||
| Hewlett-Packard Company | 22,244 | 892,652 | 2.2 | % | ||||||||
| NetApp, Inc. | 3,860 | 159,997 | 0.4 | % | ||||||||
| SanDisk Corporation | 9,445 | 925,421 | 2.3 | % | ||||||||
Seagate Technology Public Limited Company f | 10,205 | 678,632 | 1.7 | % | ||||||||
| 3,200,655 | 8.0 | % | ||||||||||
| Thrifts & Mortgage Finance | ||||||||||||
| New York Community Bancorp, Inc. | 9,444 | 151,104 | 0.4 | % | ||||||||
| Total Common Stocks | ||||||||||||
| (Cost $34,329,690) | 38,487,148 | 95.8 | % | |||||||||
The accompanying notes are an integral part of these financial statements.
Page 16
Baird LargeCap Fund
Schedule of Investments, December 31, 2014
Short-Term Investments
| % of | ||||||||||||
| Shares | Value | Net Assets | ||||||||||
| Money Market Mutual Funds | ||||||||||||
| Dreyfus Cash Advantage Fund, 0.06%« | 952,402 | $ | 952,402 | 2.4 | % | |||||||
| Short-Term Investments Trust – | ||||||||||||
| Liquid Assets Portfolio, 0.07%« | 700,000 | 700,000 | 1.7 | % | ||||||||
| Total Short-Term Investments | ||||||||||||
| (Cost $1,652,402) | 1,652,402 | 4.1 | % | |||||||||
| Total Investments | ||||||||||||
| (Cost $35,982,092) | 40,139,550 | 99.9 | % | |||||||||
| Other Assets in Excess of Liabilities | 35,952 | 0.1 | % | |||||||||
| TOTAL NET ASSETS | $ | 40,175,502 | 100.0 | % | ||||||||
Notes to Schedule of Investments
| * | Non-Income Producing |
| f | Foreign Security |
| « | 7-Day Yield |
Industry classifications shown in the Schedule of Investments are based off of the Global Industry Classification Standard (GICS®). GICS was developed by and/or is the exclusive property of MSCI, Inc. and Standard & Poor Financial Services LLC (“S&P”). GICS is a service mark of MSCI and S&P and has been licensed for use by U.S. Bancorp Fund Services, LLC.
The accompanying notes are an integral part of these financial statements.
Page 17
Baird LargeCap Fund
Schedule of Investments, December 31, 2014
Summary of Fair Value Exposure at December 31, 2014
The Fund has adopted authoritative fair valuation accounting standards which establish a definition of fair value and set out a hierarchy for measuring fair value. These standards require additional disclosures about the various inputs and valuation techniques used to develop the measurements of fair value and a discussion on changes in valuation techniques and related inputs during the period. These standards define fair value as the price that would be received to sell an asset or paid to transfer a liability in an orderly transaction between market participants at the measurement date. The fair value hierarchy is organized into three levels based upon the assumptions (referred to as “inputs”) used in pricing the asset or liability. These standards state that “observable inputs” reflect the assumptions market participants would use in pricing the asset or liability based on market data obtained from independent sources and “unobservable inputs” reflect an entity’s own assumptions about the assumptions market participants would use in pricing the asset or liability. These inputs are summarized into three broad levels and described below:
Level 1 – | Unadjusted quoted prices in active markets for identical unrestricted securities. |
Level 2 – | Other significant observable inputs (including quoted prices for similar securities, quoted prices in inactive markets, dealer indications, interest rates, yield curves, prepayment speeds, credit risk, default rates, inputs corroborated by observable market data, etc.). |
Level 3 – | Significant unobservable inputs (including the Fund’s own assumptions about the factors that market participants would use in valuing the security) based on the best information available. |
The inputs or methodology used for valuing securities are not necessarily an indication of the risk associated with investing in those securities.
The following is a summary of the inputs used to value the Fund’s investments as of December 31, 2014:
| Level 1 | Level 2 | Level 3 | Total | |||||||||||||
| Equity | ||||||||||||||||
| Common Stocks | $ | 38,487,148 | $ | — | $ | — | $ | 38,487,148 | ||||||||
| Total Equity | 38,487,148 | — | — | 38,487,148 | ||||||||||||
| Short-Term Investments | ||||||||||||||||
| Money Market Mutual Funds | 1,652,402 | — | — | 1,652,402 | ||||||||||||
| Total Short-Term Investments | 1,652,402 | — | — | 1,652,402 | ||||||||||||
| Total Investments* | $ | 40,139,550 | $ | — | $ | — | $ | 40,139,550 | ||||||||
| * | Additional information regarding the industry classifications of these investments is disclosed in the Schedule of Investments. |
Changes in valuation techniques may result in transfers into or out of assigned levels within the fair value hierarchy. There were no transfers between Level 1, Level 2 and Level 3 fair value measurements during the reporting period, as compared to their classification from the prior year’s annual report. See the Fund’s valuation policy in Note 2a to the financial statements.
The accompanying notes are an integral part of these financial statements.
Page 18
Baird MidCap Fund
December 31, 2014
Portfolio Managers’ Commentary
For the year ended December 31, 2014, the Baird MidCap Fund Institutional Class posted a total return of 4.85% (4.62% for the Investor Class), as compared with a gain of 11.90% for the Russell MidCap® Growth Index, the MidCap Fund’s primary benchmark.
As we move further into the economic recovery, we are increasingly sensitive to the performance dynamics within the market. In recent quarters, we have been struck by the strong relative performance from companies that are unprofitable or carrying higher debt levels. In our long tenure of managing mid cap stocks, we have seen these types of low quality cycles before. We understand why it is happening, how abruptly it can change and the importance of staying true to the Fund’s high quality approach. In the interim, the Fund has felt the very real challenge of keeping pace in such an environment. Among several possibilities, Fed tightening may serve as a catalyst to return favor to businesses with strong profitability and conservative balance sheets, the type of companies on which we focus. We believe that focus is one of the primary reasons for the long-term success of the Fund.
The Fund’s sector weights remained relatively balanced compared to its benchmark during 2014, a continuation of our approach in recent years. We did maintain a modest pro-cyclical stance within economically-sensitive sectors. This positioning was based on continued U.S. economic growth, supported by the positive trend in U.S. employment, low inflation, and rising consumer and business confidence.
The Fund’s technology holdings provided the strongest relative performance. Our stock selection in the semiconductor industry was helped by strong product cycle participation. In addition, the software and services industry benefitted from exposure to security spending and merger activity. These two industry groups helped the Fund outpace broad strength in the technology sector overall.
Stocks in the basic materials sector also made a positive contribution to relative performance. Holding companies with end market exposure tilted toward construction activity proved beneficial as fundamentals improved. We tend to avoid pure commodity-oriented business models in this sector, as those earnings patterns are often more volatile.
Producer durable holdings fought several macro-related headwinds and failed to keep pace with benchmark returns. Thematically, an expectation for continued economic growth in the form of better corporate and consumer spending generally played out on the domestic front, but weakness emerged on a global basis, hurting businesses with a higher foreign revenue mix. A sharp drop in oil prices in the second half negatively impacted performance from industrial companies tied to energy activity. Also, a lack of exposure to the traditionally cyclical airline industry created a meaningful performance headwind.
The Fund’s healthcare stocks produced fairly broad strength, but relative performance was hurt by the Fund’s relatively light exposure to biotech and pharmaceutical companies, areas with significant price returns. The challenge of matching performance in the healthcare sector is underscored by the strong multi-year run in biotech. Many companies in that industry offer interesting growth prospects, but are not profitable. We will participate in that industry when we find companies that meet our fundamental criteria, but may struggle in periods when we do not.
The Fund’s energy stocks detracted from relative performance, reflecting a tale of two halves, with a positive first half more than offset by the impact of a dramatic decrease in the price of oil during the second half. We have often mentioned the potential for volatility in this sector due to performance correlation with oil and natural gas prices. We continue to like the long-term backdrop for many energy companies, recognizing the potential for continued commodity volatility as the global growth picture sorts itself out.
In the consumer staples sector, the performance of the Fund’s holdings fell short of corresponding benchmark sector returns. We were somewhat surprised all year that returns from the staples sector significantly outpaced the market advance. Notably, many companies within the sector displayed meaningful price-earnings multiple
Page 19
Baird MidCap Fund
December 31, 2014
expansion, which was due in part to increased merger activity in the beverage, tobacco, and food industries. The Fund’s holdings were underexposed to these industries relative to the benchmark.
The consumer discretionary sector lagged the overall market. While many of the Fund’s holdings, including retailers, restaurants, and apparel companies, delivered strong performance, the collective holdings in that sector trailed on a relative performance basis. The outlook for spending remains relatively favorable due to improving employment trends, higher confidence levels, and the potential benefit from low energy prices.
The Fund’s financial services holdings provided a drag on relative performance during the year. The Fund’s financial services sector holdings were based on our expectation that stronger U.S. economic growth would lead to higher rates during the year, which did not occur. The persistent decline in longer-term interest rates created a headwind as low yields proved very supportive of REIT performance. The REIT industry comprised approximately 20% of the financial services sector weight, but none in the Fund. We find the REIT business model, which requires the distribution of earnings and dependency on the capital markets for growth, difficult for our fundamental approach. We will continue to assess the appropriateness of REITs for the Fund, but don’t intend to blindly plug a benchmark hole. Asset managers, a key Fund holding, lagged overall sector performance despite what we viewed as solid fundamental performance.
The investment process underlying the MidCap Fund remains focused on identifying high-quality companies that deliver attractive returns and above average growth relative to peers. Seeking to control risk at the sector and position level is also a priority of our process, with the goal of providing lower volatility of returns for the Fund compared to its benchmark index.
Portfolio Managers:
Charles F. Severson
Kenneth M. Hemauer
Page 20
Baird MidCap Fund
December 31, 2014 (Unaudited)
A December 31, 2014 summary of the Fund’s top 10 holdings and equity sector analysis compared to the Russell MidCap® Growth Index is shown below.
| Top 10 Holdings* | Equity Sector Analysis** | ||
| O’Reilly Automotive, Inc. | 2.5% |  | |
| Integrated Device Technology, Inc. | 2.5% | ||
| Affiliated Managers Group, Inc. | 2.4% | ||
| Stericycle, Inc. | 2.4% | ||
| Mead Johnson Nutrition Company | 2.4% | ||
| Acuity Brands, Inc. | 2.3% | ||
| Fortinet, Inc. | 2.3% | ||
| Alliance Data Systems Corporation | 2.3% | ||
| Tractor Supply Company | 2.2% | ||
| Acadia Healthcare Company, Inc. | 2.2% | ||
| Net Assets: | $1,116,264,231 | ||
| Portfolio Turnover Rate: | 37.3% | ||
| Number of Equity Holdings: | 59 | ||
| Annualized Portfolio Expense Ratio:*** | |||
| Gross | |||
| Institutional Class: | 0.88% | ||
| Investor Class: | 1.13% | **** | |
| Net | |||
| Institutional Class: | 0.85% | ||
| Investor Class: | 1.10% | **** |
| * | The Fund’s portfolio composition is subject to change and there is no assurance that the Fund will continue to hold any particular security. Percentages shown relate to the Fund’s total net assets as of December 31, 2014. | |
| ** | Percentages shown in parentheses relate to the Fund’s total market value of investments as of December 31, 2014, and may not add up to 100% due to rounding. | |
| *** | Reflects expense ratios as stated in the Fund’s current prospectus. The Advisor has contractually agreed to limit the Fund’s total annual fund operating expenses to 0.85% of average daily net assets for the Institutional Class shares and 1.10% of average daily net assets for the Investor Class shares, at least through April 30, 2016. | |
| **** | Includes 0.25% 12b-1 fee. |
Page 21
Baird MidCap Fund
December 31, 2014 (Unaudited)
Institutional Class
Value of a $25,000 Investment
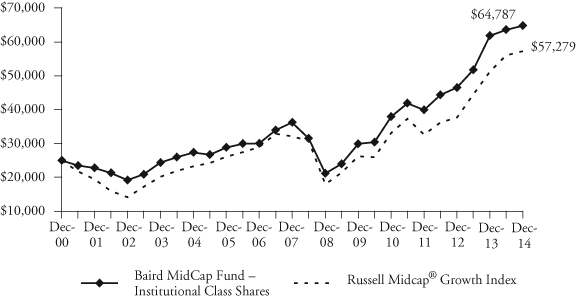
Growth of a hypothetical investment of $25,000 made on the Fund’s inception date (12/29/00), assuming reinvestment of all distributions.
Investor Class
Value of a $10,000 Investment

Growth of a hypothetical investment of $10,000 made on the Fund’s inception date (12/29/00), assuming reinvestment of all distributions.
Page 22
Baird MidCap Fund
December 31, 2014 (Unaudited)
Average Annual Total Returns
| Since | ||||
| For the Periods Ended December 31, 2014 | One Year | Five Years | Ten Years | Inception(1) |
| Institutional Class Shares | 4.85% | 16.76% | 9.02% | 7.04% |
| Investor Class Shares | 4.62% | 16.50% | 8.76% | 6.79% |
Russell Midcap® Growth Index(2) | 11.90% | 16.94% | 9.43% | 6.10% |
| (1) | For the period from December 29, 2000 (inception date) through December 31, 2014. |
| (2) | The Russell Midcap® Growth Index measures the performance of the mid-cap growth segment of the U.S. equity universe. It includes those Russell Midcap® index companies with higher price-to-book ratios and higher forecasted growth values. This index does not reflect any deduction for fees, expenses or taxes. A direct investment in the index is not possible. |
The returns shown in the table above and the line graphs on the previous page reflect reinvestment of dividends and/or capital gains distributions in additional shares. The returns do not reflect the deduction of taxes that a shareholder would pay on Fund distributions or the redemption of Fund shares. The returns reflect the actual performance for each period and do not include the impact of trades executed on the last business day of the period that were recorded on the first business day of the next period.
The gross expense ratio for each Class, as reflected in the Fund’s current prospectus, is set forth under “Portfolio Characteristics”.
The Fund focuses on growth-style stocks and therefore the performance of the Fund will typically be more volatile than the performance of funds that focus on types of stocks that have a broader investment style. The Fund may invest up to 15% of its total assets in U.S. dollar denominated foreign securities and ADRs. Foreign investments involve additional risks such as currency rate fluctuations, political and economic instability, and different and sometimes less strict financial reporting standards and regulation. The Fund invests a substantial portion of its assets in the stocks of mid-capitalization companies. Mid-capitalization companies often are more volatile and face greater risks than larger, more established companies.
Past performance does not guarantee future results. Investment return and principal value will fluctuate so that an investor’s shares, when redeemed, may be worth more or less than their original cost.
For information about the performance of the Fund as of the most recent month-end, please call 1-866-44BAIRD or visit www.bairdfunds.com. Mutual fund performance changes over time and current performance may be lower or higher than that stated.
Page 23
Baird MidCap Fund
Schedule of Investments, December 31, 2014
Common Stocks
| % of | ||||||||||||
| Shares | Value | Net Assets | ||||||||||
| Banks | ||||||||||||
| East West Bancorp, Inc. | 513,913 | $ | 19,893,572 | 1.8 | % | |||||||
| Building Products | ||||||||||||
| Fortune Brands Home & Security, Inc. | 506,251 | 22,917,983 | 2.1 | % | ||||||||
| Capital Markets | ||||||||||||
| Affiliated Managers Group, Inc.* | 128,312 | 27,232,939 | 2.4 | % | ||||||||
| Greenhill & Co., Inc. | 432,009 | 18,835,592 | 1.7 | % | ||||||||
Invesco Limited f | 242,119 | 9,568,543 | 0.9 | % | ||||||||
| 55,637,074 | 5.0 | % | ||||||||||
| Chemicals | ||||||||||||
| Airgas, Inc. | 154,768 | 17,826,178 | 1.6 | % | ||||||||
| Commercial Services & Supplies | ||||||||||||
| Stericycle, Inc.* | 205,019 | 26,873,891 | 2.4 | % | ||||||||
| Distributors | ||||||||||||
| LKQ Corporation* | 757,097 | 21,289,568 | 1.9 | % | ||||||||
| Electrical Equipment | ||||||||||||
| Acuity Brands, Inc. | 186,006 | 26,053,860 | 2.3 | % | ||||||||
| Regal-Beloit Corporation | 107,329 | 8,071,141 | 0.7 | % | ||||||||
| Rockwell Automation, Inc. | 100,759 | 11,204,401 | 1.1 | % | ||||||||
| 45,329,402 | 4.1 | % | ||||||||||
| Electronic Equipment, Instruments & Components | ||||||||||||
| Trimble Navigation Limited* | 600,570 | 15,939,128 | 1.4 | % | ||||||||
| Energy Equipment & Services | ||||||||||||
Core Laboratories N.V. f | 53,064 | 6,385,722 | 0.6 | % | ||||||||
| Oceaneering International, Inc. | 291,501 | 17,143,174 | 1.5 | % | ||||||||
| 23,528,896 | 2.1 | % | ||||||||||
| Food & Staples Retailing | ||||||||||||
| The Fresh Market, Inc.* | 385,581 | 15,885,937 | 1.4 | % | ||||||||
| Food Products | ||||||||||||
| McCormick & Co, Incorporated | 323,313 | 24,022,156 | 2.1 | % | ||||||||
| Mead Johnson Nutrition Company | 265,053 | 26,648,429 | 2.4 | % | ||||||||
| 50,670,585 | 4.5 | % | ||||||||||
| Health Care Equipment & Supplies | ||||||||||||
| Globus Medical, Inc.* | 442,375 | 10,515,254 | 1.0 | % | ||||||||
| Health Care Providers & Services | ||||||||||||
| Acadia Healthcare Company, Inc.* | 403,478 | 24,696,888 | 2.2 | % | ||||||||
| Envision Healthcare Holdings, Inc.* | 451,127 | 15,649,596 | 1.4 | % | ||||||||
| 40,346,484 | 3.6 | % | ||||||||||
The accompanying notes are an integral part of these financial statements.
Page 24
Baird MidCap Fund
Schedule of Investments, December 31, 2014
Common Stocks (cont.)
| % of | ||||||||||||
| Shares | Value | Net Assets | ||||||||||
| Health Care Technology | ||||||||||||
| Cerner Corporation* | 280,440 | $ | 18,133,250 | 1.6 | % | |||||||
| Hotels, Restaurants & Leisure | ||||||||||||
| Buffalo Wild Wings Inc.* | 121,032 | 21,831,752 | 2.0 | % | ||||||||
| Household Products | ||||||||||||
| Church & Dwight Co., Inc. | 287,670 | 22,671,273 | 2.0 | % | ||||||||
| Internet & Catalog Retail | ||||||||||||
| HomeAway, Inc.* | 600,532 | 17,883,843 | 1.6 | % | ||||||||
| Internet Software & Services | ||||||||||||
| Envestnet, Inc.* | 306,768 | 15,074,579 | 1.3 | % | ||||||||
| Pandora Media, Inc.* | 423,518 | 7,551,326 | 0.7 | % | ||||||||
| 22,625,905 | 2.0 | % | ||||||||||
| IT Services | ||||||||||||
| Alliance Data Systems Corporation* | 88,966 | 25,448,724 | 2.3 | % | ||||||||
| Fiserv, Inc.* | 156,930 | 11,137,322 | 1.0 | % | ||||||||
| Gartner, Inc.* | 216,879 | 18,263,381 | 1.6 | % | ||||||||
| 54,849,427 | 4.9 | % | ||||||||||
| Leisure Equipment Products | ||||||||||||
| Polaris Industries Inc. | 141,875 | 21,457,175 | 1.9 | % | ||||||||
| Life Sciences Tools & Services | ||||||||||||
ICON Public Limited Company*f | 251,908 | 12,844,789 | 1.1 | % | ||||||||
| Illumina, Inc.* | 77,103 | 14,231,672 | 1.3 | % | ||||||||
| 27,076,461 | 2.4 | % | ||||||||||
| Machinery | ||||||||||||
| The Middleby Corporation* | 230,949 | 22,887,046 | 2.1 | % | ||||||||
| Trinity Industries, Inc. | 395,509 | 11,078,207 | 1.0 | % | ||||||||
| WABCO Holdings Inc.* | 213,862 | 22,408,460 | 2.0 | % | ||||||||
| 56,373,713 | 5.1 | % | ||||||||||
| Multiline Retail | ||||||||||||
| Dollar Tree, Inc.* | 162,132 | 11,410,850 | 1.0 | % | ||||||||
| Oil, Gas & Consumable Fuels | ||||||||||||
| Concho Resources Inc.* | 96,547 | 9,630,563 | 0.9 | % | ||||||||
| Southwestern Energy Company* | 651,909 | 17,790,597 | 1.6 | % | ||||||||
| Whiting Petroleum Corporation* | 225,115 | 7,428,795 | 0.6 | % | ||||||||
| 34,849,955 | 3.1 | % | ||||||||||
| Pharmaceuticals | ||||||||||||
Perrigo Company PLC f | 145,700 | 24,355,212 | 2.2 | % | ||||||||
The accompanying notes are an integral part of these financial statements.
Page 25
Baird MidCap Fund
Schedule of Investments, December 31, 2014
Common Stocks (cont.)
| % of | ||||||||||||
| Shares | Value | Net Assets | ||||||||||
| Road & Rail | ||||||||||||
| J.B. Hunt Transport Services, Inc. | 275,800 | $ | 23,236,150 | 2.1 | % | |||||||
| Semiconductors & Semiconductor Equipment | ||||||||||||
| Integrated Device Technology, Inc.* | 1,395,296 | 27,347,801 | 2.5 | % | ||||||||
| Skyworks Solutions, Inc. | 222,059 | 16,145,910 | 1.4 | % | ||||||||
| 43,493,711 | 3.9 | % | ||||||||||
| Software | ||||||||||||
| ANSYS, Inc.* | 155,189 | 12,725,498 | 1.1 | % | ||||||||
| Fortinet, Inc.* | 837,896 | 25,689,891 | 2.3 | % | ||||||||
| ServiceNow, Inc.* | 180,664 | 12,258,053 | 1.1 | % | ||||||||
| The Ultimate Software Group, Inc.* | 127,541 | 18,724,932 | 1.7 | % | ||||||||
| 69,398,374 | 6.2 | % | ||||||||||
| Specialty Retail | ||||||||||||
| Dick’s Sporting Goods, Inc. | 373,405 | 18,539,558 | 1.7 | % | ||||||||
| O’Reilly Automotive, Inc.* | 146,847 | 28,285,669 | 2.5 | % | ||||||||
| Ross Stores, Inc. | 122,441 | 11,541,289 | 1.0 | % | ||||||||
| Tiffany & Co. | 230,451 | 24,625,994 | 2.2 | % | ||||||||
| Tractor Supply Company | 318,103 | 25,072,878 | 2.2 | % | ||||||||
| Urban Outfitters, Inc.* | 558,816 | 19,631,206 | 1.8 | % | ||||||||
| 127,696,594 | 11.4 | % | ||||||||||
| Technology Hardware, Storage & Peripherals | ||||||||||||
Stratasys Ltd.*f | 188,503 | 15,666,484 | 1.4 | % | ||||||||
| Textiles, Apparel & Luxury Goods | ||||||||||||
| PVH Corp. | 169,566 | 21,733,274 | 2.0 | % | ||||||||
| Under Armour, Inc. – Class A* | 230,025 | 15,618,698 | 1.4 | % | ||||||||
| 37,351,972 | 3.4 | % | ||||||||||
| Trading Companies & Distributors | ||||||||||||
| Fastenal Company | 392,498 | 18,667,205 | 1.7 | % | ||||||||
| United Rentals, Inc.* | 147,143 | 15,010,057 | 1.3 | % | ||||||||
| Watsco, Inc. | 185,285 | 19,825,495 | 1.8 | % | ||||||||
| 53,502,757 | 4.8 | % | ||||||||||
| Total Common Stocks | ||||||||||||
| (Cost $941,673,996) | 1,070,518,810 | 95.9 | % | |||||||||
The accompanying notes are an integral part of these financial statements.
Page 26
Baird MidCap Fund
Schedule of Investments, December 31, 2014
Short-Term Investments
| % of | ||||||||||||
| Shares | Value | Net Assets | ||||||||||
| Money Market Mutual Funds | ||||||||||||
| Dreyfus Institutional Cash Advantage Fund, 0.06%« | 23,324,166 | $ | 23,324,166 | 2.1 | % | |||||||
| Short-Term Investments Trust – | ||||||||||||
| Liquid Assets Portfolio, 0.07%« | 20,000,000 | 20,000,000 | 1.8 | % | ||||||||
| Total Short-Term Investments | ||||||||||||
| (Cost $43,324,166) | 43,324,166 | 3.9 | % | |||||||||
| Total Investments | ||||||||||||
| (Cost $984,998,162) | 1,113,842,976 | 99.8 | % | |||||||||
| Other Assets in Excess of Liabilities | 2,421,255 | 0.2 | % | |||||||||
| TOTAL NET ASSETS | $ | 1,116,264,231 | 100.0 | % | ||||||||
Notes to Schedule of Investments
| * | Non-Income Producing |
| f | Foreign Security |
| « | 7-Day Yield |
Industry classifications shown in the Schedule of Investments are based off of the Global Industry Classification Standard (GICS®). GICS was developed by and/or is the exclusive property of MSCI, Inc. and Standard & Poor Financial Services LLC (“S&P”). GICS is a service mark of MSCI and S&P and has been licensed for use by U.S. Bancorp Fund Services, LLC.
The accompanying notes are an integral part of these financial statements.
Page 27
Baird MidCap Fund
Schedule of Investments, December 31, 2014
Summary of Fair Value Exposure at December 31, 2014
The Fund has adopted authoritative fair valuation accounting standards which establish a definition of fair value and set out a hierarchy for measuring fair value. These standards require additional disclosures about the various inputs and valuation techniques used to develop the measurements of fair value and a discussion on changes in valuation techniques and related inputs during the period. These standards define fair value as the price that would be received to sell an asset or paid to transfer a liability in an orderly transaction between market participants at the measurement date. The fair value hierarchy is organized into three levels based upon the assumptions (referred to as “inputs”) used in pricing the asset or liability. These standards state that “observable inputs” reflect the assumptions market participants would use in pricing the asset or liability based on market data obtained from independent sources and “unobservable inputs” reflect an entity’s own assumptions about the assumptions market participants would use in pricing the asset or liability. These inputs are summarized into three broad levels and described below:
Level 1 – | Unadjusted quoted prices in active markets for identical unrestricted securities. |
Level 2 – | Other significant observable inputs (including quoted prices for similar securities, quoted prices in inactive markets, dealer indications, interest rates, yield curves, prepayment speeds, credit risk, default rates, inputs corroborated by observable market data, etc.). |
Level 3 – | Significant unobservable inputs (including the Fund’s own assumptions about the factors that market participants would use in valuing the security) based on the best information available. |
The inputs or methodology used for valuing securities are not necessarily an indication of the risk associated with investing in those securities.
The following is a summary of the inputs used to value the Fund’s investments as of December 31, 2014:
| Level 1 | Level 2 | Level 3 | Total | |||||||||||||
| Equity | ||||||||||||||||
| Common Stocks | $ | 1,070,518,810 | $ | — | $ | — | $ | 1,070,518,810 | ||||||||
| Total Equity | 1,070,518,810 | — | — | 1,070,518,810 | ||||||||||||
| Short-Term Investments | ||||||||||||||||
| Money Market Mutual Funds | 43,324,166 | — | — | 43,324,166 | ||||||||||||
| Total Short-Term Investments | 43,324,166 | — | — | 43,324,166 | ||||||||||||
| Total Investments* | $ | 1,113,842,976 | $ | — | $ | — | $ | 1,113,842,976 | ||||||||
| * | Additional information regarding the industry classifications of these investments is disclosed in the Schedule of Investments. |
Changes in valuation techniques may result in transfers into or out of assigned levels within the fair value hierarchy. There were no transfers between Level 1, Level 2 and Level 3 fair value measurements during the reporting period, as compared to their classification from the prior year’s annual report. See the Fund’s valuation policy in Note 2a to the financial statements.
The accompanying notes are an integral part of these financial statements.
Page 28
Baird SmallCap Value Fund
December 31, 2014
Portfolio Manager’s Commentary
For the year ended December 31, 2014, the Baird SmallCap Value Fund Institutional Class posted a total return of 0.42% (0.13% for the Investor Class), as compared to a gain of 4.22% for the Russell 2000 Value Index, the SmallCap Value Fund’s primary benchmark.
As we reflect on what worked last year, we note positive security selection across most economic sectors. We witnessed our investment theses bear out for many of the Fund’s individual holdings, which posted better than anticipated profits, leading to upwards earnings revisions and the ultimate reward of market revaluation. In general, defensive sectors in our benchmark fared better than cyclical industries for the year. The strongest absolute performance came from the Fund’s healthcare, consumer staples, consumer discretionary, and utilities sector holdings. On a relative contribution basis, the Fund’s overweight in the information technology sector added meaningfully to performance. Two information technology positions, Triquint Semiconductor and Integrated Device Technology Inc., moved sharply higher as earnings growth accelerated from both margin improvement and market share gains in mobile devices. Motorcar Parts of America and newly acquired Land’s End both performed well.
Throughout the year, the Fund held a meaningful overweight in consumer discretionary, energy, industrials and information technology stocks. Despite reducing our exposure in October, the substantial drop in the price of oil during the last quarter of the year punished our energy overweight despite strong security selection in the sector. It was this overweight to energy and energy-related industrials that was responsible for the Fund’s underperformance for the year. Pacific Drilling, Willbros and Mastec were the biggest detractors. While our overweight to energy was a drag on overall performance, our strategy of avoiding the highest risk securities in the sector, including exploration and production, as well as oil and gas servicing companies, in favor of infrastructure-related businesses proved correct. Earlier in the year we sold Mitcham Industries and Sandridge Energy and lightened up again in the Fall, selling our holdings in PDC Energy and Vantage Drilling. A number of our industrial holdings also traded lower on the energy selloff despite having large project backlogs or ancillary businesses without direct ties to the energy infrastructure space. During the year, we sold positions in Willbros Group and MasTec Incorporated.
While the Fed did complete its quantitative easing (QE) tapering process, global slowdowns outside the United States in emerging markets and Europe saw overseas investors flock to U.S. fixed income markets, pressuring interest rates even lower. Last year, we continued to rotate our financial exposure away from more defensive areas in favor of economically sensitive holdings that stand to benefit from a better lending and interest rate environment. Many of our holdings such as Real Estate Investment Trusts continue to benefit from a low interest rate environment but also offer the upside of improving revenues from sources such as rents.
We continue to find value in information technology, increasing the number of positions within the Fund, and ended the year with a substantial overweight versus the benchmark, a reflection of our belief in continued rollouts of smartphones with content and features consumers demand. In May, we initiated a position in Integrated Device Technology Inc. a semiconductor chip maker of random access memory and involved in wireless charging.
We began 2014 with a strategic focus on companies which operate primarily domestically to avoid the earnings disappointment experienced by firms with large foreign exposure, especially to emerging markets. Predicated on our weaker outlook for China and emerging markets, we maintained our aversion to materials stocks, with no exposure, a theme dating back to last year. The Fund benefited from this underweight in 2013 and once again in 2014.
As we look to 2015, we remain wary of economic growth prospects outside the U.S. We expect the strong U.S. dollar and decelerating global growth will be headwinds for large multinational companies but plays to the strength of domestic small companies with less than half the exposure to foreign revenue. We are most bullish on the U.S. consumer, which has made progress repairing personal balance sheets and should benefit
Page 29
Baird SmallCap Value Fund
December 31, 2014
from continued gains in employment, housing market strength and falling gas prices. While falling energy prices are ultimately good for the majority of industries and capital spending, our concern is that in the short-run, the benefit will not be able to offset a rapid decline in domestic oil-related capital expenditures. Consequently, we start the year with a somewhat defensive bias as the market digests these spending adjustments, and we will look to become more constructive on cyclical exposure as we see signs of stabilization outside the U.S. and within the energy complex. As always, we will seek to mitigate risk by maintaining a well-diversified portfolio of businesses, which we project can exceed growth expectations and which trade at compelling valuations. This strategy, we believe, when applied with discipline, yields attractive long-term returns for investors.
Portfolio Manager:
Michelle Stevens
Page 30
Baird SmallCap Value Fund
December 31, 2014 (Unaudited)
A December 31, 2014 summary of the Fund’s top 10 holdings and equity sector analysis compared to the Russell 2000® Value Index is shown below.
| Top 10 Holdings* | Equity Sector Analysis** | ||
| Lands’ End, Inc | 5.0% | 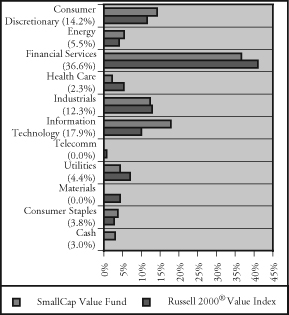 | |
| Integrated Device Technology, Inc. | 4.6% | ||
| Motorcar Parts of America, Inc. | 4.5% | ||
| TriQuint Semiconductor, Inc. | 3.9% | ||
| PRA Group, Inc. | 3.9% | ||
| Pinnacle Foods Inc. | 3.8% | ||
| LTC Properties, Inc. | 3.4% | ||
| Diamond Hill Investment Group, Inc. | 3.0% | ||
| Hilltop Holdings, Inc. | 3.0% | ||
| Universal Truckload Services, Inc. | 3.0% | ||
| Net Assets: | $25,553,431 | ||
| Portfolio Turnover Rate: | 41.9% | ||
| Number of Equity Holdings: | 40 | ||
| Annualized Portfolio Expense Ratio:*** | |||
| Gross | |||
| Institutional Class: | 2.03% | ||
| Investor Class: | 2.28% | **** | |
| Net | |||
| Institutional Class: | 1.00% | ||
| Investor Class: | 1.25% | **** |
| * | The Fund’s portfolio composition is subject to change and there is no assurance that the Fund will continue to hold any particular security. Percentages shown relate to the Fund’s total net assets as of December 31, 2014. | |
| ** | Percentages shown in parentheses relate to the Fund’s total market value of investments as of December 31, 2014, and may not add up to 100% due to rounding. | |
| *** | Reflects expense ratios as stated in the Fund’s current prospectus. The Advisor has contractually agreed to limit the Fund’s total annual fund operating expenses to 1.00% of average daily net assets for the Institutional Class shares and 1.25% of average daily net assets for the Investor Class shares, at least through April 30, 2016. | |
| **** | Includes 0.25% 12b-1 fee. |
Page 31
Baird SmallCap Value Fund
December 31, 2014 (Unaudited)
Institutional Class
Value of a $25,000 Investment

Growth of a hypothetical investment of $25,000 made on the Fund’s inception date (5/1/12), assuming reinvestment of all distributions.
Investor Class
Value of a $10,000 Investment
Growth of a hypothetical investment of $10,000 made on the Fund’s inception date (5/1/12), assuming reinvestment of all distributions.
Page 32
Baird SmallCap Value Fund
December 31, 2014 (Unaudited)
Average Annual Total Returns
| Since | ||
| For the Periods Ended December 31, 2014 | One Year | Inception(1) |
| Institutional Class Shares | 0.42% | 15.04% |
| Investor Class Shares | 0.13% | 14.75% |
Russell 2000® Value Index(2) | 4.22% | 16.53% |
| (1) | For the period from May 1, 2012 (inception date) through December 31, 2014. |
| (2) | The Russell 2000® Value Index measures the performance of the small-cap value segment of the U.S. equity universe. It includes those Russell 2000® Index companies with lower price-to-book ratios and lower forecasted growth values. This index does not reflect any deduction for fees, expenses or taxes. A direct investment in the index is not possible. |
The returns shown in the table above and the line graphs on the previous page reflect reinvestment of dividends and/or capital gains distributions in additional shares. The returns do not reflect the deduction of taxes that a shareholder would pay on Fund distributions or the redemption of Fund shares. The returns reflect the actual performance for each period and do not include the impact of trades executed on the last business day of the period that were recorded on the first business day of the next period.
The gross expense ratio for each Class, as reflected in the Fund’s current prospectus, is set forth under “Portfolio Characteristics”.
The Fund focuses on small cap value style stocks and therefore the performance of the Fund may be more volatile than the performance of funds that focus on types of stocks that have a broader investment style. The Fund may invest up to 15% of its total assets in U.S. dollar denominated foreign securities and ADRs. Foreign investments involve additional risks such as currency rate fluctuations and the potential for political and economic instability, and different and sometimes less strict financial reporting standards and regulation.
Past performance does not guarantee future results. Investment return and principal value will fluctuate so that an investor’s shares, when redeemed, may be worth more or less than their original cost.
For information about the performance of the Fund as of the most recent month-end, please call 1-866-44BAIRD or visit www.bairdfunds.com. Mutual fund performance changes over time and current performance may be lower or higher than that stated.
Page 33
Baird SmallCap Value Fund
Schedule of Investments, December 31, 2014
Common Stocks
| % of | ||||||||||||
| Shares | Value | Net Assets | ||||||||||
| Aerospace & Defense | ||||||||||||
| Hexcel Corporation* | 12,534 | $ | 520,036 | 2.0 | % | |||||||
| Auto Components | ||||||||||||
| Drew Industries Incorporated* | 5,112 | 261,070 | 1.0 | % | ||||||||
| Motorcar Parts of America, Inc.* | 36,840 | 1,145,356 | 4.5 | % | ||||||||
| 1,406,426 | 5.5 | % | ||||||||||
| Banks | ||||||||||||
| PrivateBancorp, Inc. | 20,276 | 677,219 | 2.6 | % | ||||||||
| Texas Capital Bancshares, Inc.* | 9,783 | 531,510 | 2.1 | % | ||||||||
| 1,208,729 | 4.7 | % | ||||||||||
| Capital Markets | ||||||||||||
| Diamond Hill Investment Group, Inc. | 5,555 | 766,812 | 3.0 | % | ||||||||
| Communications Equipment | ||||||||||||
| Applied Optoelectronics, Inc.* | 25,342 | 284,337 | 1.1 | % | ||||||||
| Construction & Engineering | ||||||||||||
| Quanta Services, Inc.* | 18,393 | 522,177 | 2.0 | % | ||||||||
| Consumer Finance | ||||||||||||
| Encore Capital Group, Inc.* | 15,777 | 700,499 | 2.7 | % | ||||||||
| PRA Group, Inc.* | 16,968 | 982,956 | 3.9 | % | ||||||||
| 1,683,455 | 6.6 | % | ||||||||||
| Diversified Consumer Services | ||||||||||||
Steiner Leisure Limited*f | 8,533 | 394,310 | 1.5 | % | ||||||||
| Electric Utilities | ||||||||||||
| UIL Holdings Corporation | 13,897 | 605,075 | 2.4 | % | ||||||||
| Electrical Equipment | ||||||||||||
| Generac Holdings Inc.* | 10,708 | 500,706 | 2.0 | % | ||||||||
| Electronic Equipment, Instruments & Components | ||||||||||||
| Methode Electronics, Inc. | 17,170 | 626,877 | 2.5 | % | ||||||||
| Energy Equipment & Services | ||||||||||||
Pacific Drilling SA*f | 55,304 | 256,611 | 1.0 | % | ||||||||
| Food Products | ||||||||||||
| Pinnacle Foods Inc. | 27,760 | 979,928 | 3.8 | % | ||||||||
| Gas Utilities | ||||||||||||
| South Jersey Industries, Inc. | 8,751 | 515,696 | 2.0 | % | ||||||||
| Health Care Equipment & Supplies | ||||||||||||
| ICU Medical, Inc.* | 7,267 | 595,167 | 2.3 | % | ||||||||
The accompanying notes are an integral part of these financial statements.
Page 34
Baird SmallCap Value Fund
Schedule of Investments, December 31, 2014
Common Stocks (cont.)
| % of | ||||||||||||
| Shares | Value | Net Assets | ||||||||||
| Insurance | ||||||||||||
| Hilltop Holdings, Inc.* | 38,304 | $ | 764,165 | 3.0 | % | |||||||
| Internet & Catalog Retail | ||||||||||||
| Lands’ End, Inc.* | 23,819 | 1,285,273 | 5.0 | % | ||||||||
| Internet Software & Services | ||||||||||||
| j2 Global, Inc. | 11,345 | 703,390 | 2.8 | % | ||||||||
| IT Services | ||||||||||||
| WEX Inc.* | 3,474 | 343,648 | 1.3 | % | ||||||||
| Oil, Gas & Consumable Fuels | ||||||||||||
Dorian LPG Limited*f | 28,280 | 392,809 | 1.5 | % | ||||||||
Navigator Holdings Limited*f | 21,357 | 449,778 | 1.8 | % | ||||||||
| Targa Resources Corp. | 7,016 | 744,047 | 2.9 | % | ||||||||
| 1,586,634 | 6.2 | % | ||||||||||
| Real Estate Investment Trusts (REITs) | ||||||||||||
| BioMed Realty Trust, Inc. | 23,184 | 499,383 | 2.0 | % | ||||||||
| Blackstone Mortgage Trust, Inc. | 22,882 | 666,782 | 2.6 | % | ||||||||
| Capstead Mortgage Corporation | 29,690 | 364,593 | 1.4 | % | ||||||||
| DiamondRock Hospitality Company | 44,075 | 655,395 | 2.6 | % | ||||||||
| Hatteras Financial Corp. | 20,012 | 368,821 | 1.4 | % | ||||||||
| Hersha Hospitality Trust | 71,799 | 504,747 | 2.0 | % | ||||||||
| LTC Properties, Inc. | 20,314 | 876,956 | 3.4 | % | ||||||||
| 3,936,677 | 15.4 | % | ||||||||||
| Road & Rail | ||||||||||||
| Quality Distribution, Inc.* | 35,517 | 377,901 | 1.5 | % | ||||||||
| Universal Truckload Services, Inc. | 26,589 | 758,052 | 3.0 | % | ||||||||
| 1,135,953 | 4.5 | % | ||||||||||
| Semiconductors & Semiconductor Equipment | ||||||||||||
| Integrated Device Technology, Inc.* | 59,862 | 1,173,295 | 4.6 | % | ||||||||
| Synaptics Incorporated* | 6,477 | 445,877 | 1.7 | % | ||||||||
| TriQuint Semiconductor, Inc.* | 35,942 | 990,202 | 3.9 | % | ||||||||
| 2,609,374 | 10.2 | % | ||||||||||
| Specialty Retail | ||||||||||||
| Lithia Motors, Inc. | 6,047 | 524,215 | 2.1 | % | ||||||||
| Thrifts & Mortgage Finance | ||||||||||||
| Bofi Holding, Inc.* | 9,368 | 728,924 | 2.9 | % | ||||||||
| Capitol Federal Financial, Inc. | 20,256 | 258,872 | 1.0 | % | ||||||||
| 987,796 | 3.9 | % | ||||||||||
| Total Common Stocks | ||||||||||||
| (Cost $20,837,411) | 24,743,467 | 96.8 | % | |||||||||
The accompanying notes are an integral part of these financial statements.
Page 35
Baird SmallCap Value Fund
Schedule of Investments, December 31, 2014
Short-Term Investments
| % of | ||||||||||||
| Shares | Value | Net Assets | ||||||||||
| Money Market Mutual Funds | ||||||||||||
| Dreyfus Cash Advantage Fund, 0.06%« | 260,804 | $ | 260,804 | 1.0 | % | |||||||
| Short-Term Investments Trust – | ||||||||||||
| Liquid Assets Portfolio, 0.07%« | 450,000 | 450,000 | 1.8 | % | ||||||||
| Total Short-Term Investments | ||||||||||||
| (Cost $710,804) | 710,804 | 2.8 | % | |||||||||
| Total Investments | ||||||||||||
| (Cost $21,548,215) | 25,454,271 | 99.6 | % | |||||||||
| Other Assets in Excess of Liabilities | 99,160 | 0.4 | % | |||||||||
| TOTAL NET ASSETS | $ | 25,553,431 | 100.0 | % | ||||||||
Notes to Schedule of Investments
| * | Non-Income Producing |
| f | Foreign Security |
| « | 7-Day Yield |
Industry classifications shown in the Schedule of Investments are based off of the Global Industry Classification Standard (GICS®). GICS was developed by and/or is the exclusive property of MSCI, Inc. and Standard & Poor Financial Services LLC (“S&P”). GICS is a service mark of MSCI and S&P and has been licensed for use by U.S. Bancorp Fund Services, LLC.
The accompanying notes are an integral part of these financial statements.
Page 36
Baird SmallCap Value Fund
Schedule of Investments, December 31, 2014
Summary of Fair Value Exposure at December 31, 2014
The Fund has adopted authoritative fair valuation accounting standards which establish a definition of fair value and set out a hierarchy for measuring fair value. These standards require additional disclosures about the various inputs and valuation techniques used to develop the measurements of fair value and a discussion on changes in valuation techniques and related inputs during the period. These standards define fair value as the price that would be received to sell an asset or paid to transfer a liability in an orderly transaction between market participants at the measurement date. The fair value hierarchy is organized into three levels based upon the assumptions (referred to as “inputs”) used in pricing the asset or liability. These standards state that “observable inputs” reflect the assumptions market participants would use in pricing the asset or liability based on market data obtained from independent sources and “unobservable inputs” reflect an entity’s own assumptions about the assumptions market participants would use in pricing the asset or liability. These inputs are summarized into three broad levels and described below:
Level 1 – | Unadjusted quoted prices in active markets for identical unrestricted securities. |
Level 2 – | Other significant observable inputs (including quoted prices for similar securities, quoted prices in inactive markets, dealer indications, interest rates, yield curves, prepayment speeds, credit risk, default rates, inputs corroborated by observable market data, etc.). |
Level 3 – | Significant unobservable inputs (including the Fund’s own assumptions about the factors that market participants would use in valuing the security) based on the best information available. |
The inputs or methodology used for valuing securities are not necessarily an indication of the risk associated with investing in those securities.
The following is a summary of the inputs used to value the Fund’s investments as of December 31, 2014:
| Level 1 | Level 2 | Level 3 | Total | |||||||||||||
| Equity | ||||||||||||||||
| Common Stocks | $ | 24,743,467 | $ | — | $ | — | $ | 24,743,467 | ||||||||
| Total Equity | 24,743,467 | — | — | 24,743,467 | ||||||||||||
| Short-Term Investments | ||||||||||||||||
| Money Market Mutual Funds | 710,804 | — | — | 710,804 | ||||||||||||
| Total Short-Term Investments | 710,804 | — | — | 710,804 | ||||||||||||
| Total Investments* | $ | 25,454,271 | $ | — | $ | — | $ | 25,454,271 | ||||||||
| * | Additional information regarding the industry classifications of these investments is disclosed in the Schedule of Investments. |
Changes in valuation techniques may result in transfers into or out of assigned levels within the fair value hierarchy. There were no transfers between Level 1, Level 2 and Level 3 fair value measurements during the reporting period, as compared to their classification from the prior year’s annual report. See the Fund’s valuation policy in Note 2a to the financial statements.
The accompanying notes are an integral part of these financial statements.
Page 37
Additional Information on Fund Expenses
December 31, 2014 (Unaudited)
Example
As a shareholder of a mutual fund, you incur two types of costs: (1) transaction costs, which may include sales charges (loads) on purchase payments, reinvested dividends, or other distributions; redemption fees; and exchange fees; and (2) ongoing costs, such as management fees; distribution and/or service (12b-1) fees; and other fund expenses. Although the Funds do not charge any sales loads, redemption fees, or other transaction fees, you will be assessed fees for outgoing wire transfers, returned checks and stop payment orders at prevailing rates charged by U.S. Bancorp Fund Services, LLC, the Fund’s transfer agent. If you request that a redemption be made by wire transfer, currently the Fund’s transfer agent charges a $15.00 fee.
This Example is intended to help you understand your ongoing costs (in dollars) of investing in each Fund and to compare these costs with the ongoing costs of investing in other mutual funds. The Example is based on an investment of $1,000 invested at the beginning of the period and held for the entire period (7/1/14 – 12/31/14).
Actual Expenses
The third and fourth columns of the following table provide information about account values based on actual returns and actual expenses. You may use the information in these columns, together with the amount you invested, to estimate the expenses that you paid over the period. Simply divide your account value by $1,000 (for example, an $8,600 account value divided by $1,000 = 8.6), then multiply the result by the number in the fourth column entitled “Expenses Paid During Period” to estimate the expenses you paid on your account during this period.
Hypothetical Example for Comparison Purposes
The fifth and sixth columns of the following table provide information about hypothetical account values and hypothetical expenses based on the Funds’ actual expense ratios and an assumed rate of return of 5% per year before expenses, which is not the Funds’ actual return. The hypothetical account values and expenses may not be used to estimate the actual ending account balance or expenses you paid for the period. You may use this information to compare the ongoing costs of investing in the Funds and other mutual funds. To do so, compare this 5% hypothetical example with the 5% hypothetical examples that appear in the shareholder reports of the other mutual funds. Please note that the expenses shown in the table are meant to highlight your ongoing costs only and do not reflect any transactional costs. Therefore, the sixth column of the table (entitled “Expenses Paid During Period”) is useful in comparing ongoing costs only, and will not help you determine the relative total costs of owning different mutual funds. In addition, if these transactional costs were included, your costs could have been higher.
Page 38
Additional Information on Fund Expenses
December 31, 2014 (Unaudited)
Actual vs. Hypothetical Returns
For the Six Months Ended December 31, 2014
| Hypothetical | ||||||
| (5% return | ||||||
| Actual | before expenses) | |||||
| Fund’s | Beginning | Ending | Expenses | Ending | Expenses | |
| Annualized | Account | Account | Paid | Account | Paid | |
| Expense | Value | Value | During | Value | During | |
Ratio(1) | 7/1/14 | 12/31/14 | Period(1) | 12/31/14 | Period(1) | |
| Baird LargeCap Fund | ||||||
| Institutional Class | 0.75% | $1,000.00 | $1,067.43 | $3.91 | $1,021.42 | $3.82 |
| Investor Class | 1.00% | $1,000.00 | $1,067.50 | $5.21 | $1,020.16 | $5.09 |
| Baird MidCap Fund | ||||||
| Institutional Class | 0.85% | $1,000.00 | $1,019.30 | $4.33 | $1,020.92 | $4.33 |
| Investor Class | 1.10% | $1,000.00 | $1,018.10 | $5.60 | $1,019.66 | $5.60 |
| Baird SmallCap Value Fund | ||||||
| Institutional Class | 1.00% | $1,000.00 | $ 974.30 | $4.98 | $1,020.16 | $5.09 |
| Investor Class | 1.25% | $1,000.00 | $ 972.80 | $6.22 | $1,018.90 | $6.36 |
| (1) | Expenses are equal to the Fund’s annualized net expense ratio multiplied by the average account value over the period, multiplied by 184 days and divided by 365 to reflect the one-half year period. |
Page 39
Statements of Assets and Liabilities
December 31, 2014
| Baird | Baird | Baird | ||||||||||
| LargeCap | MidCap | SmallCap | ||||||||||
| Fund | Fund | Value Fund | ||||||||||
| ASSETS: | ||||||||||||
| Investments, at value (cost $35,982,092, | ||||||||||||
| $984,998,162 and $21,548,215, respectively) | $ | 40,139,550 | $ | 1,113,842,976 | $ | 25,454,271 | ||||||
| Dividends receivable | 42,472 | 333,217 | 60,098 | |||||||||
| Interest receivable | 89 | 3,146 | 71 | |||||||||
| Receivable for Fund shares sold | 27,928 | 8,515,527 | 55,598 | |||||||||
| Uninvested cash | — | 109,233 | — | |||||||||
| Prepaid expenses and other assets | 8,536 | 19,387 | 8,381 | |||||||||
| Total assets | 40,218,575 | 1,122,823,486 | 25,578,419 | |||||||||
| LIABILITIES: | ||||||||||||
| Payable for Fund shares repurchased | — | 5,410,394 | 993 | |||||||||
| Payable to Advisor and Distributor | 12,954 | 813,342 | 4,244 | |||||||||
| Accrued expenses and other liabilities | 30,119 | 335,519 | 19,751 | |||||||||
| Total liabilities | 43,073 | 6,559,255 | 24,988 | |||||||||
| NET ASSETS | $ | 40,175,502 | $ | 1,116,264,231 | $ | 25,553,431 | ||||||
| NET ASSETS CONSIST OF: | ||||||||||||
| Capital stock | $ | 35,653,560 | $ | 986,778,852 | $ | 21,753,240 | ||||||
| Accumulated net realized gain (loss) on investments sold | 364,484 | 640,565 | (105,865 | ) | ||||||||
| Net unrealized appreciation on investments | 4,157,458 | 128,844,814 | 3,906,056 | |||||||||
| NET ASSETS | $ | 40,175,502 | $ | 1,116,264,231 | $ | 25,553,431 | ||||||
| INSTITUTIONAL CLASS SHARES | ||||||||||||
| Net Assets | $ | 38,961,436 | $ | 910,893,531 | $ | 23,453,239 | ||||||
| Shares outstanding ($0.01 par value, | ||||||||||||
| unlimited shares authorized) | 4,361,175 | 58,500,521 | 1,697,207 | |||||||||
| Net asset value, offering and | ||||||||||||
| redemption price per share | $ | 8.93 | $ | 15.57 | $ | 13.82 | ||||||
| INVESTOR CLASS SHARES | ||||||||||||
| Net Assets | $ | 1,214,066 | $ | 205,370,700 | $ | 2,100,192 | ||||||
| Shares outstanding ($0.01 par value, | ||||||||||||
| unlimited shares authorized) | 136,832 | 13,729,522 | 152,417 | |||||||||
| Net asset value, offering and | ||||||||||||
| redemption price per share | $ | 8.87 | $ | 14.96 | $ | 13.78 | ||||||
The accompanying notes are an integral part of these financial statements.
Page 40
Statements of Operations
Year Ended December 31, 2014
| Baird | Baird | Baird | ||||||||||
| LargeCap | MidCap | SmallCap | ||||||||||
| Fund | Fund | Value Fund | ||||||||||
| INVESTMENT INCOME: | ||||||||||||
| Dividends (net of foreign taxes withheld | ||||||||||||
| of $0, $12,090 and $0, respectively) | $ | 616,570 | $ | 5,895,509 | $ | 326,937 | ||||||
| Interest | 686 | 24,358 | 532 | |||||||||
| Other income | — | 2,428 | 91 | |||||||||
| Total investment income | 617,256 | 5,922,295 | 327,560 | |||||||||
| EXPENSES: | ||||||||||||
| Investment advisory fees | 218,066 | 6,537,585 | 204,070 | |||||||||
| Administration fees | 5,894 | 88,343 | 5,478 | |||||||||
| Shareholder servicing fees | 16,410 | 502,272 | 14,312 | |||||||||
| Fund accounting fees | 16,040 | 60,929 | 15,213 | |||||||||
| Professional fees | 38,913 | 38,891 | 30,831 | |||||||||
| Federal and state registration | 40,752 | 167,111 | 44,065 | |||||||||
| Directors fees | 50,161 | 50,130 | 50,161 | |||||||||
| Custody fees | 7,083 | 38,195 | 6,264 | |||||||||
| Reports to shareholders | 2,278 | 70,389 | 1,846 | |||||||||
| Distribution expense – Investor Class Shares (Note 8) | 1,770 | 569,959 | 4,509 | |||||||||
| Miscellaneous expenses | 132 | 1,947 | 73 | |||||||||
| Total expenses | 397,499 | 8,125,751 | 376,822 | |||||||||
| Expense reimbursement by Advisor (Note 5) | (141,765 | ) | (143,779 | ) | (132,231 | ) | ||||||
| Net expenses | 255,734 | 7,981,972 | 244,591 | |||||||||
| NET INVESTMENT INCOME (LOSS) | 361,522 | (2,059,677 | ) | 82,969 | ||||||||
| REALIZED AND UNREALIZED | ||||||||||||
| GAIN (LOSS) ON INVESTMENTS: | ||||||||||||
| Net realized gain on investments | 837,245 | 11,854,713 | 280,519 | |||||||||
| Change in unrealized appreciation/depreciation | ||||||||||||
| on investments | 3,634,313 | 31,922,782 | (211,518 | ) | ||||||||
| Net realized and unrealized gain on investments | 4,471,558 | 43,777,495 | 69,001 | |||||||||
| NET INCREASE IN NET ASSETS | ||||||||||||
| RESULTING FROM OPERATIONS | $ | 4,833,080 | $ | 41,717,818 | $ | 151,970 | ||||||
The accompanying notes are an integral part of these financial statements.
Page 41
Statements of Changes in Net Assets
Baird LargeCap Fund
| Year Ended | Year Ended | ||||||||
| December 31, 2014 | December 31, 2013 | ||||||||
| OPERATIONS: | |||||||||
| Net investment income | $ | 361,522 | $ | 76,503 | |||||
| Net realized gain on investments | 837,245 | 13,127,622 | |||||||
| Change in unrealized appreciation/depreciation | |||||||||
| on investments | 3,634,313 | (5,351,781 | ) | ||||||
| Net increase in net assets resulting from operations | 4,833,080 | 7,852,344 | |||||||
| CAPITAL SHARE TRANSACTIONS: | |||||||||
| Proceeds from shares sold | 13,065,266 | 4,465,469 | |||||||
| Shares issued to holders in reinvestment of distributions | 824,279 | 11,004,303 | |||||||
| Cost of shares redeemed | (5,923,052 | ) | (8,523,677 | ) | |||||
| Net increase in net assets resulting | |||||||||
| from capital share transactions | 7,966,493 | 6,946,095 | |||||||
| DISTRIBUTIONS TO | |||||||||
| INSTITUTIONAL CLASS SHAREHOLDERS: | |||||||||
| From net investment income | (354,933 | ) | (76,300 | ) | |||||
| From net realized gains | (446,433 | ) | (10,867,055 | ) | |||||
| Total Distributions | (801,366 | ) | (10,943,355 | ) | |||||
| DISTRIBUTIONS TO | |||||||||
| INVESTOR CLASS SHAREHOLDERS: | |||||||||
| From net investment income | (9,164 | ) | — | ||||||
| From net realized gains | (13,750 | ) | (60,948 | ) | |||||
| Total Distributions | (22,914 | ) | (60,948 | ) | |||||
| TOTAL INCREASE IN NET ASSETS | 11,975,293 | 3,794,136 | |||||||
| NET ASSETS: | |||||||||
| Beginning of year | 28,200,209 | 24,406,073 | |||||||
| End of year (including distributions in excess of net investment | |||||||||
| income (loss) of $0 and $297, respectively) | $ | 40,175,502 | $ | 28,200,209 | |||||
The accompanying notes are an integral part of these financial statements.
Page 42
Statements of Changes in Net Assets
Baird MidCap Fund
| Year Ended | Year Ended | ||||||||
| December 31, 2014 | December 31, 2013 | ||||||||
| OPERATIONS: | |||||||||
| Net investment loss | $ | (2,059,677 | ) | $ | (441,675 | ) | |||
| Net realized gain on investments | 11,854,713 | 12,919,158 | |||||||
| Change in unrealized appreciation/depreciation | |||||||||
| on investments | 31,922,782 | 78,465,897 | |||||||
| Net increase in net assets resulting from operations | 41,717,818 | 90,943,380 | |||||||
| CAPITAL SHARE TRANSACTIONS: | |||||||||
| Proceeds from shares sold | 963,929,395 | 184,044,271 | |||||||
| Shares issued to holders in reinvestment of distributions | 10,127,896 | 8,466,032 | |||||||
| Cost of shares redeemed | (317,272,798 | ) | (66,916,146 | ) | |||||
| Other capital contribution (Note 3) | — | 118 | |||||||
| Net increase in net assets resulting | |||||||||
| from capital share transactions | 656,784,493 | 125,594,275 | |||||||
| DISTRIBUTIONS TO | |||||||||
| INSTITUTIONAL CLASS SHAREHOLDERS: | |||||||||
| From net realized gains | (9,261,206 | ) | (5,756,644 | ) | |||||
| Total Distributions | (9,261,206 | ) | (5,756,644 | ) | |||||
| DISTRIBUTIONS TO | |||||||||
| INVESTOR CLASS SHAREHOLDERS: | |||||||||
| From net realized gains | (2,129,486 | ) | (2,987,660 | ) | |||||
| Total Distributions | (2,129,486 | ) | (2,987,660 | ) | |||||
| TOTAL INCREASE IN NET ASSETS | 687,111,619 | 207,793,351 | |||||||
| NET ASSETS: | |||||||||
| Beginning of year | 429,152,612 | 221,359,261 | |||||||
| End of year | $ | 1,116,264,231 | $ | 429,152,612 | |||||
The accompanying notes are an integral part of these financial statements.
Page 43
Statements of Changes in Net Assets
Baird SmallCap Value Fund
| Year Ended | Year Ended | ||||||||
| December 31, 2014 | December 31, 2013 | ||||||||
| OPERATIONS: | |||||||||
| Net investment income | $ | 82,969 | $ | 76,633 | |||||
| Net realized gain on investments | 280,519 | 345,941 | |||||||
| Change in unrealized appreciation/depreciation | |||||||||
| on investments | (211,518 | ) | 3,905,459 | ||||||
| Net increase in net assets resulting from operations | 151,970 | 4,328,033 | |||||||
| CAPITAL SHARE TRANSACTIONS: | |||||||||
| Proceeds from shares sold | 9,218,037 | 9,409,735 | |||||||
| Shares issued to holders in reinvestment of distributions | 399,253 | 325,192 | |||||||
| Cost of shares redeemed | (3,881,622 | ) | (1,934,888 | ) | |||||
| Net increase in net assets resulting | |||||||||
| from capital share transactions | 5,735,668 | 7,800,039 | |||||||
| DISTRIBUTIONS TO | |||||||||
| INSTITUTIONAL CLASS SHAREHOLDERS: | |||||||||
| From net investment income | (76,463 | ) | (70,596 | ) | |||||
| From net realized gains | (340,398 | ) | (265,202 | ) | |||||
| Total Distributions | (416,861 | ) | (335,798 | ) | |||||
| DISTRIBUTIONS TO | |||||||||
| INVESTOR CLASS SHAREHOLDERS: | |||||||||
| From net investment income | (2,430 | ) | (3,119 | ) | |||||
| From net realized gains | (30,893 | ) | (15,228 | ) | |||||
| Total Distributions | (33,323 | ) | (18,347 | ) | |||||
| TOTAL INCREASE IN NET ASSETS | 5,437,454 | 11,773,927 | |||||||
| NET ASSETS: | |||||||||
| Beginning of year | 20,115,977 | 8,342,050 | |||||||
| End of year | $ | 25,553,431 | $ | 20,115,977 | |||||
The accompanying notes are an integral part of these financial statements.
Page 44
Financial Highlights
Baird LargeCap Fund – Institutional Class
| Year Ended December 31, | ||||||||||||||||||||
| 2014 | 2013(1) | 2012 | 2011 | 2010 | ||||||||||||||||
| Per Share Data: | ||||||||||||||||||||
| Net asset value, beginning of year | $ | 7.92 | $ | 9.86 | $ | 8.71 | $ | 8.93 | $ | 7.57 | ||||||||||
| Income from | ||||||||||||||||||||
| investment operations: | ||||||||||||||||||||
| Net investment income | 0.09 | (2) | 0.03 | (2) | 0.04 | (2) | 0.01 | 0.01 | ||||||||||||
| Net realized and unrealized | ||||||||||||||||||||
| gains (losses) on investments | 1.10 | 3.16 | 1.15 | (0.22 | ) | 1.36 | ||||||||||||||
| Total from investment operations | 1.19 | 3.19 | 1.19 | (0.21 | ) | 1.37 | ||||||||||||||
| Less distributions: | ||||||||||||||||||||
| Distributions from | ||||||||||||||||||||
| net investment income | (0.08 | ) | (0.04 | ) | (0.04 | ) | (0.01 | ) | (0.01 | ) | ||||||||||
| Distributions from | ||||||||||||||||||||
| net realized gains | (0.10 | ) | (5.09 | ) | — | — | — | |||||||||||||
| Total distributions | (0.18 | ) | (5.13 | ) | (0.04 | ) | (0.01 | ) | (0.01 | ) | ||||||||||
| Net asset value, end of year | $ | 8.93 | $ | 7.92 | $ | 9.86 | $ | 8.71 | $ | 8.93 | ||||||||||
| Total return | 15.09 | % | 32.68 | % | 13.62 | % | (2.34 | )% | 18.06 | % | ||||||||||
| Supplemental data and ratios: | ||||||||||||||||||||
| Net assets, end of year (millions) | $ | 39.0 | $ | 28.0 | $ | 24.0 | $ | 20.5 | $ | 23.4 | ||||||||||
| Ratio of net expenses | ||||||||||||||||||||
| to average net assets | 0.75 | % | 0.75 | % | 0.75 | % | 0.75 | % | 0.75 | % | ||||||||||
| Ratio of expenses to average | ||||||||||||||||||||
| net assets (before waivers) | 1.17 | % | 1.24 | % | 1.34 | % | 1.35 | % | 1.40 | % | ||||||||||
| Ratio of net investment income | ||||||||||||||||||||
| to average net assets | 1.08 | % | 0.28 | % | 0.37 | % | 0.12 | % | 0.14 | % | ||||||||||
| Ratio of net investment income (loss) to | ||||||||||||||||||||
| average net assets (before waivers) | 0.66 | % | (0.21 | )% | (0.22 | )% | (0.48 | )% | (0.51 | )% | ||||||||||
Portfolio turnover rate(3) | 88.2 | % | 127.7 | % | 39.2 | % | 38.2 | % | 52.0 | % | ||||||||||
| (1) | Effective December 23, 2013, Baird Kailash Group, LLC became the Fund’s subadviser. |
| (2) | Calculated using average shares outstanding during the year. |
| (3) | Portfolio turnover is calculated on the basis of the Fund as a whole without distinguishing between the classes of shares issued. The Baird LargeCap Fund’s portfolio turnover rate in 2013 was higher than previous years primarily due to the implementation of a new investment strategy for the Fund by Baird Kailash Group, LLC, the Fund’s subadviser. |
The accompanying notes are an integral part of these financial statements.
Page 45
Financial Highlights
Baird LargeCap Fund – Investor Class
| Year Ended December 31, | ||||||||||||||||||||
| 2014 | 2013(1) | 2012 | 2011 | 2010 | ||||||||||||||||
| Per Share Data: | ||||||||||||||||||||
| Net asset value, beginning of year | $ | 7.87 | $ | 9.82 | $ | 8.68 | $ | 8.91 | $ | 7.56 | ||||||||||
| Income from | ||||||||||||||||||||
| investment operations: | ||||||||||||||||||||
| Net investment income (loss) | 0.05 | (2) | 0.00 | (2)(3) | 0.01 | (2) | (0.01 | ) | (0.02 | ) | ||||||||||
| Net realized and unrealized | ||||||||||||||||||||
| gains (losses) on investments | 1.12 | 3.14 | 1.15 | (0.22 | ) | 1.37 | ||||||||||||||
| Total from investment operations | 1.17 | 3.14 | 1.16 | (0.23 | ) | 1.35 | ||||||||||||||
| Less distributions: | ||||||||||||||||||||
| Distributions from | ||||||||||||||||||||
| net investment income | (0.07 | ) | — | (0.02 | ) | — | — | |||||||||||||
| Distributions from | ||||||||||||||||||||
| net realized gains | (0.10 | ) | (5.09 | ) | — | — | — | |||||||||||||
| Total distributions | (0.17 | ) | (5.09 | ) | (0.02 | ) | — | — | ||||||||||||
| Net asset value, end of year | $ | 8.87 | $ | 7.87 | $ | 9.82 | $ | 8.68 | $ | 8.91 | ||||||||||
| Total return | 14.89 | % | 32.34 | % | 13.32 | % | (2.58 | )% | 17.86 | % | ||||||||||
| Supplemental data and ratios: | ||||||||||||||||||||
| Net assets, end of year (millions) | $ | 1.2 | $ | 0.2 | $ | 0.4 | $ | 0.2 | $ | 0.1 | ||||||||||
| Ratio of net expenses | ||||||||||||||||||||
| to average net assets | 1.00 | % | 1.00 | % | 1.00 | % | 1.00 | % | 1.00 | % | ||||||||||
| Ratio of expenses to average | ||||||||||||||||||||
| net assets (before waivers) | 1.42 | % | 1.49 | % | 1.59 | % | 1.60 | % | 1.65 | % | ||||||||||
| Ratio of net investment income (loss) | ||||||||||||||||||||
| to average net assets | 0.83 | % | 0.03 | % | 0.12 | % | (0.13 | )% | (0.11 | )% | ||||||||||
| Ratio of net investment income (loss) | ||||||||||||||||||||
| to average net assets (before waivers) | 0.41 | % | (0.46 | )% | (0.47 | )% | (0.73 | )% | (0.76 | )% | ||||||||||
Portfolio turnover rate(4) | 88.2 | % | 127.7 | % | 39.2 | % | 38.2 | % | 52.0 | % | ||||||||||
| (1) | Effective December 23, 2013, Baird Kailash Group, LLC became the Fund’s subadviser. |
| (2) | Calculated using average shares outstanding during the period. |
| (3) | Amount is less than $0.005. |
| (4) | Portfolio turnover is calculated on the basis of the Fund as a whole without distinguishing between the classes of shares issued. The Baird LargeCap Fund’s portfolio turnover rate in 2013 was higher than previous years primarily due to the implementation of a new investment strategy for the Fund by Baird Kailash Group, LLC, the Fund’s subadviser. |
The accompanying notes are an integral part of these financial statements.
Page 46
Financial Highlights
Baird MidCap Fund – Institutional Class
| Year Ended December 31, | ||||||||||||||||||||
| 2014 | 2013 | 2012 | 2011 | 2010 | ||||||||||||||||
| Per Share Data: | ||||||||||||||||||||
| Net asset value, beginning of year | $ | 15.00 | $ | 11.52 | $ | 9.98 | $ | 10.04 | $ | 7.90 | ||||||||||
| Income from | ||||||||||||||||||||
| investment operations: | ||||||||||||||||||||
| Net investment income (loss) | (0.03 | )(1) | (0.01 | ) | 0.07 | (1) | (0.01 | )(1) | (0.01 | )(1) | ||||||||||
| Net realized and unrealized | ||||||||||||||||||||
| gain on investments | 0.76 | 3.80 | 1.57 | 0.54 | 2.15 | |||||||||||||||
| Total from investment operations | 0.73 | 3.79 | 1.64 | 0.53 | 2.14 | |||||||||||||||
| Less distributions: | ||||||||||||||||||||
| Distributions from | ||||||||||||||||||||
| net investment income | — | — | (0.04 | ) | — | — | ||||||||||||||
| Distributions from | ||||||||||||||||||||
| net realized gains | (0.16 | ) | (0.31 | ) | (0.06 | ) | (0.59 | ) | — | |||||||||||
| Total distributions | (0.16 | ) | (0.31 | ) | (0.10 | ) | (0.59 | ) | — | |||||||||||
| Net asset value, end of year | $ | 15.57 | $ | 15.00 | $ | 11.52 | $ | 9.98 | $ | 10.04 | ||||||||||
| Total return | 4.85 | % | 32.90 | % | 16.49 | % | 5.19 | % | 27.09 | % | ||||||||||
| Supplemental data and ratios: | ||||||||||||||||||||
| Net assets, end of year (millions) | $ | 910.9 | $ | 286.1 | $ | 137.2 | $ | 40.9 | $ | 33.4 | ||||||||||
| Ratio of net expenses | ||||||||||||||||||||
| to average net assets | 0.85 | % | 0.85 | % | 0.85 | % | 0.85 | % | 0.85 | % | ||||||||||
| Ratio of expenses to average | ||||||||||||||||||||
| net assets (before waivers) | 0.87 | % | 0.87 | % | 0.97 | % | 1.21 | % | 1.30 | % | ||||||||||
| Ratio of net investment income (loss) | ||||||||||||||||||||
| to average net assets | (0.17 | )% | (0.04 | )% | 0.65 | % | (0.10 | )% | (0.10 | )% | ||||||||||
| Ratio of net investment income (loss) | ||||||||||||||||||||
| to average net assets (before waivers) | (0.19 | )% | (0.06 | )% | 0.53 | % | (0.46 | )% | (0.55 | )% | ||||||||||
Portfolio turnover rate(2) | 37.3 | % | 36.3 | % | 29.5 | % | 44.8 | % | 62.7 | % | ||||||||||
| (1) | Calculated using average shares outstanding during the year. |
| (2) | Portfolio turnover is calculated on the basis of the Fund as a whole without distinguishing between the classes of shares issued. |
The accompanying notes are an integral part of these financial statements.
Page 47
Financial Highlights
Baird MidCap Fund – Investor Class
| Year Ended December 31, | ||||||||||||||||||||
| 2014 | 2013 | 2012 | 2011 | 2010 | ||||||||||||||||
| Per Share Data: | ||||||||||||||||||||
| Net asset value, beginning of year | $ | 14.45 | $ | 11.13 | $ | 9.66 | $ | 9.76 | $ | 7.69 | ||||||||||
| Income from | ||||||||||||||||||||
| investment operations: | ||||||||||||||||||||
| Net investment income (loss) | (0.06 | )(1) | (0.03 | ) | 0.04 | (1) | (0.03 | )(1) | (0.03 | )(1) | ||||||||||
| Net realized and unrealized gain | ||||||||||||||||||||
| on investments | 0.73 | 3.66 | 1.52 | 0.52 | 2.10 | |||||||||||||||
| Total from investment operations | 0.67 | 3.63 | 1.56 | 0.49 | 2.07 | |||||||||||||||
| Less distributions: | ||||||||||||||||||||
| Distributions from | ||||||||||||||||||||
| net investment income | — | — | (0.03 | ) | — | — | ||||||||||||||
| Distributions from | ||||||||||||||||||||
| net realized gains | (0.16 | ) | (0.31 | ) | (0.06 | ) | (0.59 | ) | — | |||||||||||
| Total distributions | (0.16 | ) | (0.31 | ) | (0.09 | ) | (0.59 | ) | — | |||||||||||
| Net asset value, end of year | $ | 14.96 | $ | 14.45 | $ | 11.13 | $ | 9.66 | $ | 9.76 | ||||||||||
| Total return | 4.62 | % | 32.62 | % | 16.16 | % | 4.93 | % | 26.92 | % | ||||||||||
| Supplemental data and ratios: | ||||||||||||||||||||
| Net assets, end of year (millions) | $ | 205.4 | $ | 143.1 | $ | 84.1 | $ | 2.6 | $ | 1.1 | ||||||||||
| Ratio of net expenses to | ||||||||||||||||||||
| average net assets | 1.10 | % | 1.10 | % | 1.10 | % | 1.10 | % | 1.10 | % | ||||||||||
| Ratio of expenses to average | ||||||||||||||||||||
| net assets (before waivers) | 1.12 | % | 1.12 | % | 1.22 | % | 1.46 | % | 1.55 | % | ||||||||||
| Ratio of net investment income (loss) | ||||||||||||||||||||
| to average net assets | (0.42 | )% | (0.29 | )% | 0.40 | % | (0.35 | )% | (0.35 | )% | ||||||||||
| Ratio of net investment income (loss) | ||||||||||||||||||||
| to average net assets (before waivers) | (0.44 | )% | (0.31 | )% | 0.28 | % | (0.71 | )% | (0.80 | )% | ||||||||||
Portfolio turnover rate(2) | 37.3 | % | 36.3 | % | 29.5 | % | 44.8 | % | 62.7 | % | ||||||||||
| (1) | Calculated using average shares outstanding during the year. |
| (2) | Portfolio turnover is calculated on the basis of the Fund as a whole without distinguishing between the classes of shares issued. |
The accompanying notes are an integral part of these financial statements.
Page 48
Financial Highlights
Baird SmallCap Value Fund – Institutional Class
| May 1, 2012^ | ||||||||||||
| through | ||||||||||||
| Year Ended December 31, | December 31, | |||||||||||
| 2014 | 2013 | 2012 | ||||||||||
| Per Share Data: | ||||||||||||
| Net asset value, beginning of period | $ | 14.01 | $ | 10.20 | $ | 10.00 | ||||||
| Income from investment operations: | ||||||||||||
Net investment income(1) | 0.05 | 0.07 | 0.15 | |||||||||
| Net realized and unrealized | ||||||||||||
| gain on investments | 0.01 | 3.99 | 0.20 | |||||||||
| Total from investment operations | 0.06 | 4.06 | 0.35 | |||||||||
| Less distributions: | ||||||||||||
| Distributions from net investment income | (0.05 | ) | (0.05 | ) | (0.12 | ) | ||||||
| Distributions from net realized gains | (0.20 | ) | (0.20 | ) | (0.03 | ) | ||||||
| Total distributions | (0.25 | ) | (0.25 | ) | (0.15 | ) | ||||||
| Net asset value, end of period | $ | 13.82 | $ | 14.01 | $ | 10.20 | ||||||
| Total return | 0.42 | % | 39.85 | % | 3.52 | %(2) | ||||||
| Supplemental data and ratios: | ||||||||||||
| Net assets, end of period (millions) | $ | 23.5 | $ | 19.0 | $ | 8.1 | ||||||
| Ratio of net expenses to average net assets | 1.00 | % | 1.00 | % | 1.00 | %(3) | ||||||
| Ratio of expenses to | ||||||||||||
| average net assets (before waivers) | 1.55 | % | 2.02 | % | 3.06 | %(3) | ||||||
| Ratio of net investment income to | ||||||||||||
| average net assets | 0.36 | % | 0.71 | % | 2.32 | %(3) | ||||||
| Ratio of net investment income (loss) to | ||||||||||||
| average net assets (before waivers) | (0.19 | )% | (0.31 | )% | 0.26 | %(3) | ||||||
Portfolio turnover rate(4) | 41.9 | % | 36.9 | % | 24.6 | %(2) | ||||||
| ^ | Inception date. |
| (1) | Calculated using average shares outstanding during the period. |
| (2) | Not annualized. |
| (3) | Annualized. |
| (4) | Portfolio turnover is calculated on the basis of the Fund as a whole without distinguishing between the classes of shares issued. |
The accompanying notes are an integral part of these financial statements.
Page 49
Financial Highlights
Baird SmallCap Value Fund – Investor Class
| May 1, 2012^ | ||||||||||||
| through | ||||||||||||
| Year Ended December 31, | December 31, | |||||||||||
| 2014 | 2013 | 2012 | ||||||||||
| Per Share Data: | ||||||||||||
| Net asset value, beginning of period | $ | 13.98 | $ | 10.19 | $ | 10.00 | ||||||
| Income from investment operations: | ||||||||||||
Net investment income(1) | 0.02 | 0.04 | 0.14 | |||||||||
| Net realized and unrealized | ||||||||||||
| gain on investments | 0.00 | (2) | 3.99 | 0.19 | ||||||||
| Total from investment operations | 0.02 | 4.03 | 0.33 | |||||||||
| Less distributions: | ||||||||||||
| Distributions from net investment income | (0.02 | ) | (0.04 | ) | (0.11 | ) | ||||||
| Distributions from net realized gains | (0.20 | ) | (0.20 | ) | (0.03 | ) | ||||||
| Total distributions | (0.22 | ) | (0.24 | ) | (0.14 | ) | ||||||
| Net asset value, end of period | $ | 13.78 | $ | 13.98 | $ | 10.19 | ||||||
| Total return | 0.13 | % | 39.58 | % | 3.32 | %(3) | ||||||
| Supplemental data and ratios: | ||||||||||||
| Net assets, end of period (millions) | $ | 2.1 | $ | 1.1 | $ | 0.2 | ||||||
| Ratio of net expenses to average net assets | 1.25 | % | 1.25 | % | 1.25 | %(4) | ||||||
| Ratio of expenses to | ||||||||||||
| average net assets (before waivers) | 1.80 | % | 2.27 | % | 3.31 | %(4) | ||||||
| Ratio of net investment income to | ||||||||||||
| average net assets | 0.11 | % | 0.46 | % | 2.07 | %(4) | ||||||
| Ratio of net investment income (loss) to | ||||||||||||
| average net assets (before waivers) | (0.44 | )% | (0.56 | )% | 0.01 | %(4) | ||||||
Portfolio turnover rate(5) | 41.9 | % | 36.9 | % | 24.6 | %(3) | ||||||
| ^ | Inception date. |
| (1) | Calculated using average shares outstanding during the period. |
| (2) | Amount is less than $0.005. |
| (3) | Not annualized. |
| (4) | Annualized. |
| (5) | Portfolio turnover is calculated on the basis of the Fund as a whole without distinguishing between the classes of shares issued. |
The accompanying notes are an integral part of these financial statements.
Page 50
Notes to the Financial Statements
December 31, 2014
| 1. | Organization |
Baird Funds, Inc. (the “Corporation”) was incorporated on June 9, 2000 as a Wisconsin corporation and is registered as an open-end management investment company under the Investment Company Act of 1940, as amended (the “1940 Act”). The accompanying financial statements include the Baird LargeCap Fund, the Baird MidCap Fund and the Baird SmallCap Value Fund (each a “Fund” and collectively the “Funds”), three of the nine series comprising the Corporation. Pursuant to the 1940 Act, the Funds are “diversified” series of the Corporation. The investment advisor to the Funds is Robert W. Baird & Co. Incorporated (“Baird” or the “Advisor”).
The Baird LargeCap Fund commenced with the sale of both Institutional and Investor Class Shares on September 29, 2000. The Baird MidCap Fund commenced with the sale of both Institutional and Investor Class Shares on December 29, 2000. The Baird SmallCap Value Fund commenced with the sale of both Institutional and Investor Class Shares on May 1, 2012. The Institutional Class Shares are not subject to a distribution and service (12b-1) fee, while the Investor Class Shares are subject to a distribution and service (12b-1) fee up to 0.25%. See Note 8.
The Baird LargeCap Fund seeks long-term growth of capital through investments in equity securities of large-capitalization companies.
The Baird MidCap Fund seeks long-term growth of capital through investments in equity securities of mid-capitalization companies.
The Baird SmallCap Value Fund seeks long-term growth of capital through investments in equity securities of small-capitalization companies.
On December 31, 2014, shareholders affiliated with the Advisor held 90% of the Institutional Class shares of the Baird LargeCap Fund and 51% of the Institutional Class shares of the Baird SmallCap Value Fund. These shareholders included the Advisor’s participant-directed retirement and deferred compensation plans and the Baird Foundation.
| 2. | Significant Accounting Policies |
The following is a summary of significant accounting policies consistently followed by the Funds in the preparation of their financial statements. These policies are in conformity with accounting principles generally accepted in the United States of America.
| a) | Investment Valuation – Section 2(a)(41) of the 1940 Act, together with the rules and interpretations of the SEC, require the Funds, in computing net asset value, to value their portfolio securities using market quotations when they are “readily available.” When market quotations are not readily available (e.g., because there is no regular market quotation for such securities, the market for such security is limited, the validity of quotations is questionable or, for debt securities, the Funds’ independent pricing service, does not provide a price), the Board of Directors of the Corporation must value the securities at “fair value determined in good faith.” The Board has delegated such responsibility to the Advisor pursuant to pricing policies and procedures that the Board has adopted and regularly reviews. In general, the “fair value” of a security means the price that would be received to sell a security in an orderly transaction between market participants at the measurement date. |
The Funds determine the fair value of their investments and compute their net asset value per share as of the close of regular trading of the New York Stock Exchange (4:00 p.m. EST). | |
| Consistent with Section 2(a)(41) of the 1940 Act, the Funds price their securities as follows: common stocks that are listed on a securities exchange (other than NASDAQ) are valued at the last quoted sale price. Securities traded on NASDAQ are valued at the NASDAQ Official Closing Price. Price information on listed stocks is taken from the exchange where the security is primarily traded. Securities that were not traded on the valuation date, as well as stocks that are not listed on an exchange, including |
Page 51
Notes to the Financial Statements
December 31, 2014
| 2. | Significant Accounting Policies (cont.) |
NASDAQ, are valued at the average of the current bid and asked price. Debt securities are valued at their evaluated bid prices as provided by an independent pricing service using valuation methods that are designed to represent fair value, such as matrix pricing and other analytical pricing models, market transactions and dealer quotations. Debt securities purchased with maturities of 60 days or less are valued as described above unless an evaluated price is not available, in which case such security is valued at acquisition cost, plus or minus any amortized discount or premium (“amortized cost”), or, if the Advisor does not believe amortized cost is reflective of the value of the security, the security is priced at fair value as described below. Investments in mutual funds are valued at their stated net asset value. Other assets and securities for which market quotations are not readily available are valued at fair value as determined in good faith by the Advisor in accordance with procedures approved by the Corporation’s Board of Directors. In accordance with such procedures, the Advisor may use broker quotes or prices obtained from alternative independent pricing services or, if the broker quotes or prices from alternative pricing services are unavailable or deemed to be unreliable, fair value will be determined by a valuation committee of the Advisor. In determining fair value, the valuation committee takes into account all relevant factors and available information. Consequently, the price of the security used by a Fund to calculate its NAV may differ from quoted or published prices for the same security. Fair value pricing involves subjective judgments and there is no single standard for determining a security’s fair value. As a result, different mutual funds could reasonably arrive at a different fair value for the same security. It is possible that the fair value determined for a security is materially different from the value that could be realized upon the sale of that security or from the values that other mutual funds may determine. In addition, given the volatility and periodic illiquidity experienced in recent years, the prices determined for any individual security on any given day may vary significantly from the amount that can be obtained in an actual sale of that security, and the Funds’ NAV may fluctuate significantly from day to day or from period to period. | |
| b) | Foreign Securities – Foreign securities are defined as securities issued by companies that are organized outside the United States. Investing in securities of foreign companies and foreign governments involves special risks and considerations not typically associated with investing in U.S. companies and the U.S. government. These risks include foreign currency fluctuations and adverse political and economic developments. Moreover, securities of many foreign companies and foreign governments and their markets may be less liquid and their prices more volatile than those of securities of comparable U.S. companies and the U.S. government. Occasionally, events that affect these values and exchange rates may occur after the close of the exchange on which such securities are traded. If such events materially affect the value of a Fund’s securities, these securities may be valued at their fair value pursuant to procedures adopted by the Board of Directors. All of the foreign securities owned by the Funds as of December 31, 2014 are traded directly on the New York Stock Exchange or NASDAQ or through an American Depository Receipt (ADR). |
| c) | Income Tax Status – The Funds intend to continue to qualify as regulated investment companies as provided in subchapter M of the Internal Revenue Code and to distribute substantially all of their taxable income to their shareholders in a manner which results in no tax expense to the Funds. Therefore, no federal income or excise tax provision is recorded. |
| There is no tax liability resulting from unrecognized tax benefits relating to uncertain income tax positions taken or expected to be taken on the tax return for the fiscal year ended December 31, 2014, or for any other tax years which are open for exam. As of December 31, 2014, open tax years include the tax years ended December 31, 2011 through 2014. The Funds are not aware of any tax positions for which it is reasonably possible that the total amounts of unrecognized tax benefits will significantly change in the next 12 months. The Funds recognize interest and penalties, if any, related to unrecognized tax benefits as interest expense and other expense, respectively, in the Statement of Operations. During the year, the Funds did not incur any interest or penalties. |
Page 52
Notes to the Financial Statements
December 31, 2014
| 2. | Significant Accounting Policies (cont.) |
| d) | Distributions to Shareholders – Dividends from net investment income, if any, are declared and paid annually. Distributions of net realized capital gains, if any, are declared and paid at least annually. The book basis character of distributions may differ from their ultimate characterization for Federal income tax purposes. |
| e) | Allocation of Income and Expenses – Each Fund is charged for those expenses directly attributable to it. Expenses directly attributable to a class of shares, such as Rule 12b-1 distribution fees, are charged to that class of shares. Income, expenses and realized and unrealized gains and losses are allocated to the classes based on their respective net assets. Expenses that are not directly attributable to a Fund are allocated among the Funds in the series of the Corporation in proportion to their assets. |
| f) | Use of Estimates – The preparation of financial statements in conformity with accounting principles generally accepted in the United States requires management to make estimates and assumptions that affect the reported amounts of assets and liabilities and disclosure of contingent assets and liabilities at the date of the financial statements and the reported amounts of revenues and expenses during the reporting period. Actual results could differ from those estimates. |
| g) | Securities Transactions and Investment Income – Investment and shareholder transactions are recorded on trade date. The Funds determine the gain or loss realized from investment transactions by comparing the original cost of the security lot sold with the net sales proceeds. Dividend income is recognized on the ex-dividend date net of withholding taxes, if any, and interest income is recognized on an accrual basis. |
| h) | Guarantees and Indemnifications – In the normal course of business, the Funds enter into contracts with service providers that contain general indemnification clauses. The Funds’ maximum exposure under these arrangements is unknown and would involve future claims against the Funds that have not yet occurred. Based on experience, the Funds would expect the risk of loss to be remote. |
| i) | Recent Accounting Pronouncement – In June 2014, the FASB issued ASU No. 2014-11 “Repurchase-to-Maturity Transactions, Repurchase Financings, and Disclosures.” ASU No. 2014-11 makes limited changes to the accounting for repurchase agreements, clarifies when repurchase agreements and securities lending transactions should be accounted for as secured borrowings, and requires additional disclosures regarding these types of transactions. The effective date of this ASU is for fiscal years beginning on or after December 15, 2014, and for interim periods within those fiscal years. Management is currently evaluating the impact these changes will have on the Fund’s financial statement disclosures. |
Page 53
Notes to the Financial Statements
December 31, 2014
| 3. | Capital Share Transactions |
The following table summarizes the capital share transactions of each Fund for the past two fiscal periods:
Baird LargeCap Fund
| Institutional Class Shares | Investor Class Shares | |||||||||||||||||
| Year Ended | Year Ended | |||||||||||||||||
| December 31, 2014 | December 31, 2014 | |||||||||||||||||
| Shares | Amount | Shares | Amount | |||||||||||||||
| Shares sold | 1,328,086 | $ | 11,158,768 | Shares sold | 227,284 | $ | 1,906,498 | |||||||||||
| Shares issued to | Shares issued to | |||||||||||||||||
| shareholders in | shareholders in | |||||||||||||||||
| reinvestment | reinvestment | |||||||||||||||||
| of dividends | 88,451 | 801,365 | of dividends | 2,546 | 22,914 | |||||||||||||
| Shares redeemed | (597,146 | ) | (4,981,546 | ) | Shares redeemed | (112,615 | ) | (941,506 | ) | |||||||||
| Net increase | 819,391 | $ | 6,978,587 | Net increase | 117,215 | $ | 987,906 | |||||||||||
| Shares Outstanding: | Shares Outstanding: | |||||||||||||||||
| Beginning of year | 3,541,784 | Beginning of year | 19,617 | |||||||||||||||
| End of year | 4,361,175 | End of year | 136,832 | |||||||||||||||
| Institutional Class Shares | Investor Class Shares | |||||||||||||||||
| Year Ended | Year Ended | |||||||||||||||||
| December 31, 2013 | December 31, 2013 | |||||||||||||||||
| Shares | Amount | Shares | Amount | |||||||||||||||
| Shares sold | 412,836 | $ | 4,388,931 | Shares sold | 7,175 | $ | 76,538 | |||||||||||
| Shares issued to | Shares issued to | |||||||||||||||||
| shareholders in | shareholders in | |||||||||||||||||
| reinvestment | reinvestment | |||||||||||||||||
| of dividends | 1,390,515 | 10,943,355 | of dividends | 7,794 | 60,948 | |||||||||||||
| Shares redeemed | (700,194 | ) | (8,160,107 | ) | Shares redeemed | (31,739 | ) | (363,570 | ) | |||||||||
| Net increase | 1,103,157 | $ | 7,172,179 | Net decrease | (16,770 | ) | $ | (226,084 | ) | |||||||||
| Shares Outstanding: | Shares Outstanding: | |||||||||||||||||
| Beginning of year | 2,438,627 | Beginning of year | 36,387 | |||||||||||||||
| End of year | 3,541,784 | End of year | 19,617 | |||||||||||||||
Page 54
Notes to the Financial Statements
December 31, 2014
| 3. | Capital Share Transactions (cont.) |
Baird MidCap Fund
| Institutional Class Shares | Investor Class Shares | |||||||||||||||||
| Year Ended | Year Ended | |||||||||||||||||
| December 31, 2014 | December 31, 2014 | |||||||||||||||||
| Shares | Amount | Shares | Amount | |||||||||||||||
| Shares sold | 47,418,737 | $ | 720,729,467 | Shares sold | 16,548,473 | $ | 243,199,928 | |||||||||||
| Shares issued to | Shares issued to | |||||||||||||||||
| shareholders in | shareholders in | |||||||||||||||||
| reinvestment | reinvestment | |||||||||||||||||
| of dividends | 515,098 | 8,107,643 | of dividends | 133,615 | 2,020,253 | |||||||||||||
| Shares redeemed | (8,506,966 | ) | (130,128,454 | ) | Shares redeemed | (12,855,423 | ) | (187,144,344 | ) | |||||||||
| Net increase | 39,426,869 | $ | 598,708,656 | Net increase | 3,826,665 | $ | 58,075,837 | |||||||||||
| Shares Outstanding: | Shares Outstanding: | |||||||||||||||||
| Beginning of year | 19,073,652 | Beginning of year | 9,902,857 | |||||||||||||||
| End of year | 58,500,521 | End of year | 13,729,522 | |||||||||||||||
| Institutional Class Shares | Investor Class Shares | |||||||||||||||||
| Year Ended | Year Ended | |||||||||||||||||
| December 31, 2013 | December 31, 2013 | |||||||||||||||||
| Shares | Amount | Shares | Amount | |||||||||||||||
| Shares sold | 9,558,656 | $ | 126,368,466 | Shares sold | 4,440,509 | $ | 57,675,805 | |||||||||||
| Shares issued to | Shares issued to | |||||||||||||||||
| shareholders in | shareholders in | |||||||||||||||||
| reinvestment | reinvestment | |||||||||||||||||
| of dividends | 374,122 | 5,585,636 | of dividends | 200,305 | 2,880,396 | |||||||||||||
| Shares redeemed | (2,772,115 | ) | (37,423,433 | ) | Shares redeemed | (2,295,565 | ) | (29,492,713 | ) | |||||||||
| Other capital | Other capital | |||||||||||||||||
contribution(1) | — | 75 | contribution(1) | — | 43 | |||||||||||||
| Net increase | 7,160,663 | $ | 94,530,744 | Net increase | 2,345,249 | $ | 31,063,531 | |||||||||||
| Shares Outstanding: | Shares Outstanding: | |||||||||||||||||
| Beginning of year | 11,912,989 | Beginning of year | 7,557,608 | |||||||||||||||
| End of year | 19,073,652 | End of year | 9,902,857 | |||||||||||||||
(1) Reimbursement from Advisor for trade error.
Page 55
Notes to the Financial Statements
December 31, 2014
| 3. | Capital Share Transactions (cont.) |
Baird SmallCap Value Fund
| Institutional Class Shares | Investor Class Shares | |||||||||||||||||
| Year Ended | Year Ended | |||||||||||||||||
| December 31, 2014 | December 31, 2014 | |||||||||||||||||
| Shares | Amount | Shares | Amount | |||||||||||||||
| Shares sold | 575,554 | $ | 7,984,672 | Shares sold | 89,753 | $ | 1,233,365 | |||||||||||
| Shares issued to | Shares issued to | |||||||||||||||||
| shareholders in | shareholders in | |||||||||||||||||
| reinvestment | reinvestment | |||||||||||||||||
| of dividends | 27,353 | 381,575 | of dividends | 1,270 | 17,678 | |||||||||||||
| Shares redeemed | (264,424 | ) | (3,666,171 | ) | Shares redeemed | (15,479 | ) | (215,451 | ) | |||||||||
| Net increase | 338,483 | $ | 4,700,076 | Net increase | 75,544 | $ | 1,035,592 | |||||||||||
| Shares Outstanding: | Shares Outstanding: | |||||||||||||||||
| Beginning of year | 1,358,724 | Beginning of year | 76,873 | |||||||||||||||
| End of year | 1,697,207 | End of year | 152,417 | |||||||||||||||
| Institutional Class Shares | Investor Class Shares | |||||||||||||||||
| Year Ended | Year Ended | |||||||||||||||||
| December 31, 2013 | December 31, 2013 | |||||||||||||||||
| Shares | Amount | Shares | Amount | |||||||||||||||
| Shares sold | 686,823 | $ | 8,629,742 | Shares sold | 58,124 | $ | 779,993 | |||||||||||
| Shares issued to | Shares issued to | |||||||||||||||||
| shareholders in | shareholders in | |||||||||||||||||
| reinvestment | reinvestment | |||||||||||||||||
| of dividends | 22,607 | 314,468 | of dividends | 773 | 10,724 | |||||||||||||
| Shares redeemed | (149,451 | ) | (1,918,409 | ) | Shares redeemed | (1,298 | ) | (16,479 | ) | |||||||||
| Net increase | 559,979 | $ | 7,025,801 | Net increase | 57,599 | $ | 774,238 | |||||||||||
| Shares Outstanding: | Shares Outstanding: | |||||||||||||||||
| Beginning of year | 798,745 | Beginning of year | 19,274 | |||||||||||||||
| End of year | 1,358,724 | End of year | 76,873 | |||||||||||||||
| 4. | Investment Transactions and Income Tax Information |
During the year ended December 31, 2014, purchases and sales of investment securities (excluding short-term investments) were as follows:
| Baird | Baird | Baird | |
| LargeCap Fund | MidCap Fund | SmallCap Value Fund | |
| Purchases: | $35,427,809 | $926,488,862 | $15,076,074 |
| Sales: | $28,596,613 | $309,742,990 | $ 9,690,701 |
The Baird LargeCap Fund, Baird MidCap Fund and Baird SmallCap Value Fund did not purchase or sell U.S. Government securities during the year ended December 31, 2014.
Page 56
Notes to the Financial Statements
December 31, 2014
| 4. | Investment Transactions and Income Tax Information (cont.) |
At December 31, 2014, accumulated earnings/losses on a tax basis were as follows:
| Baird | Baird | Baird | ||||||||||
| LargeCap | MidCap | SmallCap | ||||||||||
| Fund | Fund | Value Fund | ||||||||||
| Cost of Investments | $ | 36,021,682 | $ | 986,120,823 | $ | 21,558,762 | ||||||
| Gross unrealized appreciation | 4,847,959 | 174,862,351 | 5,066,368 | |||||||||
| Gross unrealized depreciation | (730,091 | ) | (47,140,198 | ) | (1,170,859 | ) | ||||||
| Net unrealized appreciation | $ | 4,117,868 | $ | 127,722,153 | $ | 3,895,509 | ||||||
| Undistributed ordinary income | 404,074 | — | — | |||||||||
| Undistributed long-term capital gain | — | 1,763,226 | — | |||||||||
| Total distributable earnings | $ | 404,074 | $ | 1,763,226 | $ | — | ||||||
| Other accumulated losses | — | — | (95,318 | ) | ||||||||
| Total accumulated earnings | $ | 4,521,942 | $ | 129,485,379 | $ | 3,800,191 | ||||||
Undistributed income or net realized gains for financial statement purposes may differ from amounts recognized for federal income tax purposes due to differences in the recognition and characterization of income, expense and capital gain items. The difference between book-basis and tax-basis unrealized appreciation is attributable primarily to the tax deferral of losses on wash sales.
Additionally, U.S. generally accepted accounting principles require that certain components of net assets relating to permanent differences be reclassified between financial and tax reporting. These reclassifications are primarily due to differing treatments for losses deferred due to wash sales, equalization accounting for tax purposes, and non-deductible expenses. These reclassifications have no effect on net assets or net asset value per share. For the year ended December 31, 2014, the following table shows the reclassifications made:
| Undistributed Net | Accumulated Net | |||||||||||||
| Investment Income/(Loss) | Realized Gain/(Loss) | Paid In Capital | ||||||||||||
| Baird LargeCap Fund | $ | 2,278 | $ | (2,278 | ) | $ | — | |||||||
| Baird MidCap Fund | 2,059,677 | (2,400,798 | ) | 341,121 | ||||||||||
| Baird SmallCap Value Fund | (4,076 | ) | (68,186 | ) | 72,262 | |||||||||
Under the current tax law, capital losses realized after October 31 may be deferred and treated as occurring on the first day of the following fiscal year. For the year ended, December 31, 2014, Baird SmallCap Fund elected to defer capital losses occurring between November 1, 2014 and December 31, 2014 in the amount of $95,318.
To the extent the Fund realizes future net capital gains, those gains will be offset by any unused capital loss carryovers. During the year ended December 31, 2014, the Baird LargeCap Fund, Baird MidCap Fund and Baird SmallCap Fund did not use any capital loss carryovers.
During the year ended December 31, 2014, the Funds paid the following dividends:
| Ordinary Income Dividends | Long-Term Capital Gain | ||||||||
| Baird LargeCap Fund | $ | 780,172 | $ | 44,108 | |||||
| Baird MidCap Fund | 990,315 | 10,400,377 | |||||||
| Baird SmallCap Value Fund | 107,742 | 342,442 | |||||||
Page 57
Notes to the Financial Statements
December 31, 2014
| 4. | Investment Transactions and Income Tax Information (cont.) |
During the year ended December 31, 2013, the Funds paid the following dividends:
| Ordinary Income Dividends | Long-Term Capital Gain | ||||||||
| Baird LargeCap Fund | $ | 76,300 | $ | 10,928,003 | |||||
| Baird MidCap Fund | 5,304,795 | 3,439,509 | |||||||
| Baird SmallCap Value Fund | 98,898 | 255,247 | |||||||
The Funds designated as long-term capital gain dividend, pursuant to Internal Revenue Code Section 852(b)(3), the amount necessary to reduce the earnings and profits of the Funds related to net capital gain to zero for the tax year ended December 31, 2014. To the extent necessary to fully distribute such capital gains, the Baird MidCap Fund and Baird SmallCap Value Fund also designated earnings and profits distributed to shareholders on the redemption of shares.
| 5. | Investment Advisory and Other Agreements |
The Funds have entered into Investment Advisory Agreements with Baird for the provision of investment advisory services. Pursuant to the Investment Advisory Agreements, the Advisor is entitled to receive a fee, calculated daily and payable monthly, at the annual rate of 0.65% for the Baird LargeCap Fund, 0.75% for the Baird MidCap Fund and 0.85% for the Baird SmallCap Value Fund as applied to the respective Fund’s average daily net assets. Certain officers of the Advisor are also officers of the Funds.
Baird has entered into a Sub-Advisory Agreement with Baird Kailash Group, LLC (“BKG”), pursuant to which BKG acts as subadvisor to the Baird LargeCap Fund (the “Sub-Advisory Agreement”). Baird is responsible for paying BKG a subadvisory fee, which is calculated daily and paid monthly at the annual rate of 0.45% of the average daily net assets of the Baird LargeCap Fund, out of the advisory fee that the Baird LargeCap Fund pays to Baird. Certain officers of BKG are also officers of the Funds.
For the year ended December 31, 2014 and through April 30, 2016, the Advisor has contractually agreed to waive its investment advisory fee and/or reimburse the Funds’ operating expenses (exclusive of brokerage, taxes, and extraordinary expenses) to the extent necessary to ensure that each Fund’s annual operating expenses do not exceed the following percentages of average daily net assets:
| Institutional Class Shares | Investor Class Shares | |
| Baird LargeCap Fund | 0.75% | 1.00% |
| Baird MidCap Fund | 0.85% | 1.10% |
| Baird SmallCap Value Fund | 1.00% | 1.25% |
To the extent that the Advisor reimburses or absorbs fees and expenses, it may seek payment of such amounts for three years after the year in which expenses were reimbursed or absorbed. A Fund will make no such payment, however, if its total annual operating expenses exceed the expense limits in effect at the time the expenses were reimbursed or at the time these payments are proposed.
| Fiscal Year Ended December 31, | ||||||||||||
| 2014 | 2013 | 2012 | ||||||||||
| Reimbursed/Absorbed Expenses Subject | ||||||||||||
| to Recovery by Advisor Until: | 2017 | 2016 | 2015 | |||||||||
| Baird LargeCap Fund | $ | 141,765 | $ | 136,777 | $ | 141,680 | ||||||
| Baird MidCap Fund | $ | 143,779 | $ | 73,919 | $ | 153,676 | ||||||
| Baird SmallCap Value Fund | $ | 132,231 | $ | 133,527 | $ | 91,176 | (1) | |||||
| (1) | Amount shown reflects expense reimbursements made by the Advisor from May 1, 2012 (inception date) through December 31, 2012. |
Page 58
Notes to the Financial Statements
December 31, 2014
U.S. Bancorp Fund Services, LLC (“USBFS”) serves as transfer agent, administrator, and accounting services agent for the Funds. U.S. Bank, N.A. (“U.S. Bank”) serves as custodian for the Funds. Effective June 20, 2014, U.S. Bank is considered an “affiliated person” of the Funds for purposes of the 1940 Act, as a result of U.S. Bank’s fiduciary accounts for which it has investment authority and/or voting authority collectively acquiring 5% or more of the shares of the Baird Aggregate Bond Fund, a separate series of the Company. As a result, USBFS is an affiliated person of an affiliated person (or a “second tier” affiliate) of the Funds.
Robert W. Baird & Co. Incorporated (the “Distributor”) is the sole distributor of the Funds pursuant to a distribution agreement.
No commissions were earned by the Distributor for services rendered as a registered broker-dealer in securities transactions for the Baird LargeCap Fund, Baird MidCap Fund and Baird SmallCap Value Fund for the year ended December 31, 2014.
| 6. | Securities Lending |
Each Fund may lend up to one-third of its total assets (including such loans) to borrowers under terms of participation in a securities lending program administered by U.S. Bank N.A., the Funds’ custodian and an affiliated person of the Funds, and an affiliate of USBFS, the Funds’ transfer agent and administrator, and a second-tier affiliate of the Funds. The securities lending agreement requires that loans are collateralized at all times in an amount equal to at least 102% of the market value of any loaned securities at the time of the loan, plus accrued interest.
The Funds receive compensation in the form of fees and earn interest on the cash collateral. The amount of fees depends on a number of factors including the type of security and length of the loan. Each Fund continues to receive interest payments or dividends on the securities loaned during the borrowing period. Each Fund has the right under the terms of the securities lending agreement to recall the securities from the borrower on demand.
As of December 31, 2014, none of the Funds had securities on loan. When a Fund engages in securities lending, loaned securities are collateralized by cash equivalents. The cash collateral is invested by the custodian in accordance with approved investment guidelines. Those guidelines require the cash collateral to be invested in readily marketable, high quality, short-term obligations; however, such investments are subject to risk of payment delays or default on the part of the issuer or counterparty or otherwise may not generate sufficient interest to support the costs associated with securities lending. A Fund could also experience delays in recovering its securities and possible loss of income or value if the borrower fails to return the borrowed securities, although the Funds are indemnified from this risk by contract with the securities lending agent.
The Funds receive cash as collateral in return for securities lent as part of a securities lending program. The collateral is invested in the Mount Vernon Securities Lending Prime Portfolio (a securities lending trust subject to Rule 2a-7 under the 1940 Act).
The interest income earned by the Funds, if any, on investments of cash collateral received from borrowers for the securities loaned to them (“securities lending income”) is reflected in the Funds’ statements of operations. The Funds did not participate in the securities lending program during the year ended December 31, 2014.
| 7. | Line of Credit |
The Corporation maintains an uncommitted, senior secured and unsecured line of credit (“LOC”) with U.S. Bank, N.A. (the “Bank”) to provide the Funds a temporary liquidity source to meet unanticipated redemptions. The unsecured line of credit is available to the Funds for any period during which U.S. Bank is an affiliate of the Funds. Under the terms of the LOC, borrowings for each Fund are limited to one-third of the total assets (including the amount borrowed) of the respective Fund, or as otherwise indicated within the Funds’ agreement with the Bank. The Bank charged interest at the Bank’s Prime Rate less 2% (weighted average rate of 1.25% during 2014). For the year ended December 31, 2014, the Funds did not borrow on the LOC.
Page 59
Notes to the Financial Statements
December 31, 2014
| 8. | Distribution and Shareholder Service Plan |
The Funds have adopted a distribution and shareholder service plan (the “Plan”) pursuant to Rule 12b-1 under the 1940 Act. The Plan allows the Funds to compensate the Distributor for the costs incurred in distributing the Funds’ Investor Class Shares, including amounts paid to brokers or dealers, at an annual rate of 0.25% of the average daily net assets of the Funds’ Investor Class Shares. The Baird LargeCap Fund, Baird MidCap Fund and Baird SmallCap Value Fund incurred $1,770, $569,959 and $4,509, respectively, in fees pursuant to the Plan during the year ended December 31, 2014.
| 9. | Subsequent Event |
In preparing these financial statements, the Corporation has evaluated subsequent events after December 31, 2014 through the date the financial statements were issued. There were no subsequent events since December 31, 2014 that would require adjustment to or additional disclosure in these financial statements.
Page 60
Report of Independent Registered Public
Accounting Firm
Board of Directors and Shareholders
Baird Funds, Inc.
We have audited the accompanying statements of assets and liabilities of Baird LargeCap Fund, Baird MidCap Fund and Baird SmallCap Value Fund (three of the nine funds constituting Baird Funds, Inc.) (collectively the “Funds”), including the schedules of investments, as of December 31, 2014, and the related statements of operations for the year then ended, the statements of changes in net assets for each of the two years in the period then ended, and the financial highlights for each of the five years in the period then ended for the Baird LargeCap Fund and Baird MidCap Fund, the statement of operations for the year then ended, and the statements of changes in net assets for each of the two years in the period then ended, and financial highlights for each of the two years in the period then ended and for the period from May 1, 2012 (inception) to December 31, 2012, for the Baird SmallCap Value Fund. These financial statements and financial highlights are the responsibility of the Funds’ management. Our responsibility is to express an opinion on these financial statements and financial highlights based on our audits.
We conducted our audits in accordance with the standards of the Public Company Accounting Oversight Board (United States). Those standards require that we plan and perform the audit to obtain reasonable assurance about whether the financial statements and financial highlights are free of material misstatement. We were not engaged to perform an audit of the Funds’ internal control over financial reporting. Our audits included consideration of internal control over financial reporting as a basis for designing audit procedures that are appropriate in the circumstances, but not for the purpose of expressing an opinion on the effectiveness of the Funds’ internal control over financial reporting. Accordingly, we express no such opinion. An audit includes examining, on a test basis, evidence supporting the amounts and disclosures in the financial statements. Our procedures included confirmation of securities owned as of December 31, 2014, by correspondence with the custodian and brokers. An audit also includes assessing the accounting principles used and significant estimates made by management, as well as evaluating the overall financial statement presentation. We believe that our audits provide a reasonable basis for our opinion.
In our opinion, the financial statements and financial highlights referred to above present fairly, in all material respects, the financial position of each of the aforementioned Funds of Baird Funds, Inc. as of December 31, 2014, and the results of their operations, the changes in their net assets, and the financial highlights for the periods indicated above, in conformity with accounting principles generally accepted in the United States of America.
Chicago, Illinois
February 26, 2015
Page 61
Directors & Officers
As of December 31, 2014
Independent Directors
G. Frederick Kasten, Jr.
Independent Director and Chairman
Term of Office: Indefinite
Length of Time Served: Since September 2000
Age: 75
c/o Robert W. Baird & Co. Incorporated
777 East Wisconsin Avenue
Milwaukee, WI 53202
Principal Occupation(s) During the Past 5 Years: Retired; Chairman, the Advisor (January 2000-December 2005); Chairman and CEO, the Advisor (January 1998-January 2000); President, Chairman and CEO, the Advisor (June 1983-January 1998); President, the Advisor (January 1979-January 1983)
Number of Portfolios in Complex Overseen by Director: 9
Other Directorships Held by Director: None
John W. Feldt
Independent Director
Term of Office: Indefinite
Length of Time Served: Since September 2000
Age: 72
c/o Robert W. Baird & Co. Incorporated
777 East Wisconsin Avenue
Milwaukee, WI 53202
Principal Occupation(s) During the Past 5 Years: Retired; Senior Vice President-Finance, University of Wisconsin Foundation (1985-2006); Vice President-Finance, University of Wisconsin Foundation (1980-1985); Associate Director, University of Wisconsin Foundation (1967-1980)
Number of Portfolios in Complex Overseen by Director: 9
Other Directorships Held by Director: Director of Thompson Plumb Funds, Inc., a mutual fund complex (3 portfolios)
Frederick P. Stratton, Jr.
Independent Director
Term of Office: Indefinite
Length of Time Served: Since May 2004
Age: 75
c/o Robert W. Baird & Co. Incorporated
777 East Wisconsin Avenue
Milwaukee, WI 53202
Principal Occupation(s) During the Past 5 Years: Retired; Chairman Emeritus, Briggs & Stratton Corporation, a manufacturing company, since 2003; Chairman of the Board, Briggs & Stratton Corporation (2001-2002); Chairman and CEO, Briggs & Stratton Corporation (1986-2001)
Number of Portfolios in Complex Overseen by Director: 9
Other Directorships Held by Director: Director of Weyco Group, Inc., a men’s footwear distributor.
Marlyn J. Spear, CFA
Independent Director
Term of Office: Indefinite
Length of Time Served: Since January 2008
Age: 61
c/o Robert W. Baird & Co. Incorporated
777 East Wisconsin Avenue
Milwaukee, WI 53202
Principal Occupation(s) During the Past 5 Years: Chief Investment Officer, Building Trades United Pension Trust Fund, since July 1989; Investment Officer, Northwestern Mutual Financial Network (1988-1989); Assistant Vice-President, Firstar Trust Company (1978-1987); Financial Analyst, Harco Holdings, Inc. (1976-1978)
Number of Portfolios in Complex Overseen by Director: 9
Other Directorships Held by Director: Management Trustee of AFL-CIO Housing Investment Trust, a mutual fund complex (1 portfolio)
Page 62
Directors & Officers
As of December 31, 2014
Interested Directors and Officers
Cory L. Nettles*
Interested Director
Term of Office: Indefinite
Length of Time Served: Since January 2008
Age: 44
c/o Generation Growth Capital, Inc.
411 East Wisconsin Avenue, Suite 1710
Milwaukee, WI 53202
Principal Occupation(s) During the Past 5 Years: Managing Director, Generation Growth Capital, Inc., a private equity fund, since March 2007; Of Counsel, Quarles & Brady LLP, a law firm, since January 2005; Secretary, Wisconsin Department of Commerce (January 2003-January 2005)
Number of Portfolios in Complex Overseen by Director: 9
Other Directorships Held by Director: Director of Weyco Group, Inc., a men’s footwear distributor;
Director of Associated Banc-Corp
Mary Ellen Stanek
President
Term of Office: Re-elected by Board annually
Length of Time Served: Since September 2000
Age: 58
777 East Wisconsin Avenue
Milwaukee, WI 53202
Principal Occupation(s) During the Past 5 Years: Managing Director, the Advisor, and Chief Investment Officer, Baird Advisors, a department of the Advisor, since March 2000; Director, Baird Kailash Group, LLC since December 2013
Charles B. Groeschell
Vice President
Term of Office: Re-elected by Board annually
Length of Time Served: Since January 2010
Age: 61
777 East Wisconsin Avenue
Milwaukee, WI 53202
Principal Occupation(s) During the Past 5 Years: Managing Director, the Advisor, and Senior Portfolio Manager, Baird Advisors, a department of the Advisor, since February 2000
Angela M. Palmer
Chief Compliance Officer
Term of Office: Re-elected by Board annually
Length of Time Served: Since March 2014
Age: 43
777 East Wisconsin Ave
Milwaukee, WI 53202
Chief Compliance Officer, the Advisor, since March 2014; Director, the Advisor, since July 2014; Senior Vice President, the Advisor (March 2014-June 2014); Chief Compliance Officer, RIAs US, BMO Financial Group (January 2013-March 2014); Chief Compliance Officer, Institutional RIAs, BMO Financial Group (March 2012-January 2013); Vice President, BMO Harris Bank, N.A. (July 2011-March 2014); Chief Compliance Officer, Taplin, Canida & Habacht, LLC (December 2008-March 2014); Chief Compliance Officer and Vice President, M&I Investment Management Corp. (June 2006-May 2012); Assistant Secretary, M&I Investment Management Corp. (April 2010-May 2012); Vice President, Marshall & Ilsley Trust Company N.A. (June 2006-August 2012).
Dominick P. Zarcone
Treasurer
Term of Office: Re-elected by Board annually
Length of Time Served: Since March 2011
Age: 56
777 East Wisconsin Avenue
Milwaukee, WI 53202
Principal Occupation(s) During the Past 5 Years: Chief Financial Officer, the Advisor, since March 2011; Chief Financial Officer, Baird Financial Group, since October 2012; Chief Operating Officer-Investment Banking, the Advisor (June 2004-March 2011); Managing Director, the Advisor, since February 1995
Page 63
Directors & Officers
As of December 31, 2014
Interested Directors and Officers
Charles M. Weber
Secretary
Term of Office: Re-elected by Board annually
Length of Time Served: Since September 2005
Age: 51
777 East Wisconsin Avenue
Milwaukee, WI 53202
Principal Occupation(s) During the Past 5 Years: Senior Associate General Counsel, the Advisor, since January 2013; Managing Director, the Advisor since January 2009; Chief Compliance Officer and Secretary, Baird Kailash Group, LLC, since July 2013; Associate General Counsel, the Advisor (July 2005-December 2012)
Peter J. Hammond
Vice President
Term of Office: Re-elected by Board annually
Length of Time Served: Since August 2012
Age: 51
777 East Wisconsin Avenue
Milwaukee, WI 53202
Principal Occupation(s) During the Past 5 Years:
Senior Vice President, the Advisor, since March 2012; Vice President, Baird Kailash Group, LLC since July 2013; Executive VP and Chief Administrative Officer, UMB Fund Services (September 1996-March 2012)
Dustin J. Hutter
Assistant Treasurer
Term of Office: Re-elected by Board annually
Length of Time Served: Since February 2011
Age: 38
777 East Wisconsin Avenue
Milwaukee, WI 53202
Principal Occupation(s) During the Past 5 Years: Director of Reporting and Analysis, Capital Markets Finance since February 2013; Senior Vice President, the Advisor, since January 2011; Treasurer, Baird Kailash Group, LLC since July 2013; First Vice President, the Advisor (January 2008-December 2010); Vice President, the Advisor (January 2006-December 2007); Assistant Controller, the Advisor (January 2006-January 2013)
Andrew D. Ketter
Assistant Secretary
Term of Office: Re-elected by Board annually
Length of Time Served: Since February 2011
Age: 40
777 East Wisconsin Avenue
Milwaukee, WI 53202
Principal Occupation(s) During the Past 5 Years: Associate General Counsel, the Advisor, since September 2010; Director, the Advisor, since July 2014; Senior Vice President, the Advisor, (January 2014-June 2014); First Vice President, the Advisor September 2010 to December 2013; Associate, Quarles & Brady LLP, a law firm (September 2002-August 2010)
Edgar L. Sturkey
AML Compliance Officer
Term of Office: Re-elected by Board annually
Length of Time Served: Since March 2014
Age: 30
777 East Wisconsin Ave
Milwaukee, WI 53202
Principal Occupation(s) During Past 5 Years:
Senior Compliance Officer and Vice President, the Advisor, since January 2015; Compliance Officer and Vice President, the Advisor (January 2013-December 2014); Compliance Officer and Assistant Vice President, the Advisor (January 2011-December 2012); Compliance Analyst, the Advisor (November 2009-December 2010).
| * | Mr. Nettles is considered an “interested person” of the Corporation (as defined in the 1940 Act) because of his association with the law firm, Quarles & Brady LLP, which provides legal services to the Advisor. The legal services that Quarles & Brady LLP has provided to the Advisor include litigation, real estate, trademark and miscellaneous securities related matters that did not relate to the Corporation or the Funds.. The Advisor has invested in and may in the future invest in private equity funds managed by Generation Growth Capital, Inc., a company of which Mr. Nettles is affiliated, through its division, Baird Capital. |
Additional information about the Funds’ directors is available in the Statement of Additional Information which may be obtained without charge, upon request, by calling 1-866-44BAIRD, or at www.bairdfunds.com.
Page 64
Baird Funds, Inc.
Disclosure Regarding the Board of Directors’ Approval of the Investment Advisory Agreement for Baird Equity Funds
The Board of Directors (the “Board”) of Baird Funds, Inc. (the “Corporation”), including the directors who are not “interested persons” of the Corporation within the meaning of the Investment Company Act of 1940 (the “Independent Directors”), met on August 13 and August 21, 2014 to consider the annual renewal of the investment advisory agreement between Robert W. Baird & Co. Incorporated (“Baird” or the “Advisor”) and the Corporation on behalf of the Baird MidCap and SmallCap Value Funds (the “Funds”). The Board, including the Independent Directors, approved the investment advisory agreement through a process that concluded at the August 21, 2014 meeting. In connection with its consideration of the investment advisory agreement, the Board reviewed and discussed various information that had been provided prior to the meeting, including the investment advisory agreement, a memorandum provided by legal counsel summarizing the guidelines relevant to the Board’s consideration of the renewal of the investment advisory agreement, a memorandum and other information provided in response to requests from the Board, from the Advisor (including the Advisor’s Form ADV brochure, annual report and financial statements), a profitability analysis, comparative information about the Funds’ performance for periods ended June 30, 2014, management fees and expense ratios, and other pertinent information. The Board also considered relevant case law.
The Independent Directors met separately in executive session with the Funds’ legal counsel to consider the investment advisory agreement. The Board discussed the Advisor’s 15(c) response at the August 13, 2014 special meeting and discussed various questions and information with the President of the Funds at the August 13, 2014 meeting and during executive session earlier in the meeting. The Board also took into account information reviewed periodically throughout the year that was relevant to its consideration of the investment advisory agreement, including performance, management fee and other expense information and discussions with the Funds’ portfolio managers. Based on its evaluation of this information, the Board, including a majority of the Independent Directors, approved the continuation of the investment advisory agreement for an additional one-year period.
In considering the investment advisory agreement and reaching its conclusions, the Board reviewed and analyzed various factors that it determined were relevant, including the factors below. In deciding to approve the investment advisory agreement for each Fund, the Board did not identify any single factor as determinative but considered all factors together.
Nature, Extent and Quality of Services Provided to the Funds
The Board analyzed the nature, extent and quality of the services provided by the Advisor to the Funds. The Board reviewed and considered the Advisor’s significant role in establishing the Funds and the construction of their investment objectives, principal strategies, investment limitations and fee structures. The Board noted the Advisor’s overall reputation and positive name recognition, the depth of the Advisor’s personnel, resources and commitment to the Funds, and the experience, credentials and continuity of the portfolio management teams employed to manage the Funds’ investments. The Board further noted that the Funds provide an opportunity for smaller institutional and retail accounts to receive the same professional advice from the Advisor that it offers to its larger institutional clients. However, the Board noted that the provision of investment advisory services to the Funds requires more effort than it does for separately managed accounts due to daily sales and redemption activity and additional regulatory and compliance requirements.
The Board considered the Advisor’s disciplined investment decision-making process used for the Funds. The Board also considered other services that the Advisor provides the Funds in its capacity as their investment advisor, such as making some of its key personnel available to serve as officers of the Funds, selecting broker-dealers for execution of portfolio transactions, ensuring adherence to the Funds’ investment policies and restrictions, compliance, risk management services, valuation, providing support services to the Board and the committees of the Board and overseeing the Funds’ other service providers. The Board further noted that the Advisor, in its capacity as a registered broker-dealer, also serves as distributor and principal underwriter of
Page 65
Baird Funds, Inc.
Disclosure Regarding the Board of Directors’ Approval of the Investment Advisory Agreement for Baird Equity Funds (cont.)
shares of the Funds and spends time and effort marketing the Funds. The Board also considered the strength of the Advisor’s compliance department, including the Funds’ chief compliance officer, and the fact that the Advisor has not experienced any significant legal, compliance or regulatory difficulties since the Funds were launched. The Board reviewed a summary of the Advisor’s risk management tools and process. The Board concluded that the nature, extent and quality of the services provided by the Advisor to the Funds were appropriate and that each Fund was likely to continue to benefit from services provided under the investment advisory agreement.
Investment Performance of the Advisor and the Funds
In considering the investment performance of each of the Funds, the Board reviewed information as of June 30, 2014 regarding the Fund’s performance in comparison to its benchmark index and its peer group as determined by Lipper. The Board noted that the performance of the Baird MidCap Fund had exceeded its Lipper peer group average for the five-year, ten-year and since inception periods but lagged the average for the one-year period. The Fund’s performance had exceeded the benchmark index for the five-year and since inception periods but lagged the index for the one-year and ten-year periods. With respect to the SmallCap Value Fund, the Board noted that the Fund had exceeded its Lipper peer group average and benchmark index for the one-year period and had slightly trailed the peer group average and benchmark index for the since inception period.
The Board also considered the Advisor’s quarterly portfolio commentaries and reviews explaining the Funds’ performance, the Advisor’s consistent and disciplined investment decision process and the investment strategies it employs for the Funds. After considering all of the information, the Board concluded that, although past performance is not a guarantee of future results, each Fund and its shareholders were likely to benefit from the continued management by the Advisor.
Costs of Services Provided and Profits Realized by the Advisor
The Board examined the fee and expense information for each of the Funds, including a comparison of such information to other similarly situated mutual funds as determined by Morningstar. The Board noted that each Fund’s advisory fee was comparable to the average and median for all mutual funds in its Morningstar category. The Board also reviewed and considered management fees charged by the Advisor to other investment advisory clients and found that the investment management fee paid by the MidCap Fund was 10 basis points (or 0.10%) less than what the Advisor charges on the first $10 million of a separately managed account. With respect to the SmallCap Value Fund, the Fund’s investment management fee was 15 basis points (or 0.15%) less than what the Advisor charges on the first $20 million of a separately managed account. The Board recognized the extent of the significant additional services provided to each Fund that the Advisor did not provide to its other clients, such as certain administrative services, oversight of the Fund’s other service providers, director support, risk management, regulatory compliance and various other services. The Board was informed of the subadvisory fee paid to the Advisor under a subadvisory arrangement with an unaffiliated mutual fund. The Board noted that the subadvisory services were limited to asset management and that the Advisor provided numerous other services under the advisory agreement with the Funds.
The Board also examined the total expense ratio of each Fund relative to all other mutual funds in its Morningstar category. The Board noted that each Fund’s total expense ratio (both for its Institutional and Investor Class shares), after fee waivers and expense reimbursements by the Advisor, was lower than the average and median expense ratios for all funds in its Morningstar category and also but in the lowest or second lowest quartile.
Page 66
Baird Funds, Inc.
Disclosure Regarding the Board of Directors’ Approval of the Investment Advisory Agreement for Baird Equity Funds (cont.)
The Board considered the fees realized, and the costs incurred, by the Advisor in providing investment management services to the Funds and the profitability to the Advisor of having a relationship with the Funds. The Board noted that the Advisor had waived significant fees and/or reimbursed expenses for the Funds since their respective inception dates, but that the Advisor had begun recouping previously waived management fees with respect to the MidCap Fund.
The Board concluded that the profits realized by the Advisor from its relationship with the Funds were appropriate. The Board noted that the Advisor’s profitability information does not reflect certain internal resources provided by the Advisor to the Funds, such as legal and compliance support. The Board reviewed and considered the general financial condition of the Advisor and determined it to be sound. The Board also discussed a report regarding payments to financial intermediaries, noting that all fees other than the Rule 12b-1 fee payable by the Investor Class shares of the Funds were paid by the Advisor and any payments by the Advisor for distribution were made from the Advisor’s profits. In light of all of the information that it received and considered, the Board concluded that the management fee and total expense ratio of each Fund were reasonable.
Economies of Scale and Fee Levels Reflecting Those Economies
The Board reviewed the extent to which economies of scale may be realized as the Funds increase in size. The Board noted that the Funds’ advisory fee structure does not contain any breakpoint reductions as the Funds grow in size. However, the Board recognized that the Advisor has committed to waive fees and/or reimburse expenses for the Funds pursuant to the expense cap agreement. The Board also recognized that the advisory fee rates paid by the Funds were designed to be lower than the fees otherwise charged by the Advisor to its separately managed account clients and to be comparable to the second or third breakpoint advisory fee levels paid by other comparable mutual funds. The directors concluded that the current fee structure of each Fund was reasonable.
Benefits Derived from the Relationship with the Funds
The Board considered other benefits to the Advisor from serving as advisor to the Funds (in addition to the advisory fee). The Board noted that the Advisor derives ancillary benefits from its association with the Funds in the form of research products and services received from unaffiliated broker dealers who execute portfolio trades for the Funds. However, the Board determined such products and services have been used for legitimate purposes relating to the Funds by providing assistance in the investment decision-making process. The Board also noted that the Advisor’s financial advisors receive 12b-1 payments under the selling agreement with the Distributor. The Board noted that the Advisor’s asset management business may experience indirect benefits from the Advisor’s association with the Funds. The Board concluded that the other benefits realized by the Advisor from its relationship with the Funds were appropriate.
Based on its evaluation of the above factors, as well as other factors relevant to their consideration of the investment advisory agreement, the directors, including all of the Independent Directors, concluded that the continuation of the investment advisory agreement was in the best interest of each Fund and its shareholders.
Page 67
Additional Information
Proxy Voting
A description of the policies and procedures that the Funds use to determine how to vote proxies relating to portfolio securities is available without charge, upon request, by calling toll free, 1-866-44BAIRD, or by accessing the Funds’ website at www.bairdfunds.com; and by accessing the SEC’s website at www.sec.gov.
Each Fund’s proxy voting record for the most recent 12-month period ended June 30 is available without charge, upon request, by calling toll free, 1-866-44BAIRD, or by accessing the Funds’ website at www.bairdfunds.com; and by accessing the SEC’s website at www.sec.gov.
Portfolio Holdings Disclosure
The Funds file a complete schedule of portfolio holdings with the SEC for the first and third quarters of each fiscal year on Form N-Q. The Funds’ Forms N-Q are available on the SEC’s website at www.sec.gov and may be reviewed and copied at the SEC’s Public Reference Room in Washington, D.C. Information on the operation of the Public Reference Room may be obtained by calling 1-800-732-0330. The Funds’ Forms N-Q may also be obtained by calling toll-free 1-866-44BAIRD.
Qualified Dividend Income/Dividends Received Deduction
For the fiscal year ended December 31, 2014, certain dividends paid by the Funds may be subject to a maximum tax rate of 15%, as provided for by the Jobs and Growth Tax Relief Reconciliation Act of 2003. The percentage of dividends declared from ordinary income designated as qualified dividend income was as follows:
| Baird LargeCap Fund | 74.19% | |
| Baird MidCap Fund | 43.44% | |
| Baird SmallCap Value Fund | 100.00% |
For corporate shareholders, the percent of ordinary income distributions qualifying for the corporate dividends received deduction for the fiscal year ended December 31, 2014 was as follows:
| Baird LargeCap Fund | 69.11% | |
| Baird MidCap Fund | 30.82% | |
| Baird SmallCap Value Fund | 100.00% |
Other Tax Information
For the fiscal year ended December 31, 2014, the percentage of taxable ordinary income distributions that are designated as short-term capital gain distributions under Internal Revenue Section 871(k)(2)(C) for each Fund were as follows:
| Baird LargeCap Fund | 53.63% | |
| Baird MidCap Fund | 100.00% | |
| Baird SmallCap Value Fund | 31.72% |
Page 68
Baird Funds, Inc. Privacy Policy
Protecting the privacy of Fund shareholders is important to us. The following is a description of the practices and policies through which Baird Funds, Inc. protects the privacy and security of your non-public personal information.
What Information We Collect
We collect and maintain information about you so that we can open and maintain your account in the Funds and provide various services to you. We may collect and maintain the following personal information about you:
| • | Information we receive from you or your financial advisor on account applications or other forms, correspondence, or conversations, such as your name, address, e-mail address, phone number, social security number, assets, income and date of birth; and | |
| • | Information about your transactions with us, our affiliates, or others, such as your account number and balance, positions, activity, history, cost basis information, and other financial information. |
What Information We Disclose
We do not sell any non-public personal information about our current or former shareholders to third parties. We do not disclose any non-public personal information about our current or former shareholders to anyone, except as permitted or required by law. We are permitted by law to share any of the information we collect, as described above, with our affiliates. In addition, we may share such information with nonaffiliated third parties to the extent necessary to effect, process, administer or enforce a transaction that the shareholder requests or authorizes, in connection with maintaining or servicing the shareholder’s account, as requested by regulatory authorities or as otherwise permitted or required by law. For example, we are permitted by law to disclose all of the information we collect, as described above, to our transfer agent to process your transactions. We may also provide your name and address to third party service providers who send account statements and other Fund-related material to you.
How We Protect Your Information
We restrict access to your non-public personal information to those persons who require such information to provide products or services to you. We maintain physical, electronic, and procedural safeguards that comply with federal standards to protect the confidentiality, integrity and security of your non-public personal information.
We will continue to adhere to the privacy policies and practices in this notice even after your account is closed or becomes inactive.
In the event that you hold shares of the Fund(s) through a financial intermediary, including, but not limited to, a broker-dealer, bank, or trust company, the privacy policy of your financial intermediary would govern how your non-public personal information would be shared with nonaffiliated third parties.
Page A-1
Baird Funds, Inc.
c/o U.S. Bancorp Fund Services, LLC
P.O. Box 701
Milwaukee, WI 53201-0701
1-866-44BAIRD
Board of Directors
G. Frederick Kasten, Jr. (Chairman)
John W. Feldt
Cory L. Nettles
Marlyn J. Spear
Frederick P. Stratton, Jr.
Investment Advisor and Distributor
Robert W. Baird & Co. Incorporated
777 East Wisconsin Avenue
Milwaukee, WI 53202
Administrator and Transfer Agent
U.S. Bancorp Fund Services, LLC
P.O. Box 701
615 East Michigan Street
Milwaukee, WI 53202
Custodian
U.S. Bank, N.A.
1555 N. RiverCenter Drive, Suite 302
Milwaukee, WI 53212
Legal Counsel
Godfrey & Kahn, S.C.
780 North Water Street
Milwaukee, WI 53202
Independent Registered Public
Accounting Firm
Grant Thornton LLP
175 West Jackson Boulevard, 20th Floor
Chicago, IL 60604
Item 2. Code of Ethics.
As of the end of the period covered by this report, the Registrant has adopted a code of ethics that applies to the President, Treasurer and Assistant Treasurer of the Registrant. The Registrant has not made any amendments to its code of ethics during the period covered by this report. The Registrant has not granted any waivers from any provisions of the code of ethics during the period covered by this report.
Item 3. Audit Committee Financial Expert.
The Registrant’s board of directors has determined that John W. Feldt, Frederick P. Stratton, Jr., and Marlyn J. Spear, members of the audit committee, each qualify as an “audit committee financial expert” as such term is defined in paragraph (b) of Item 3 of Form N-CSR. Mr. Feldt, Mr. Stratton, and Ms. Spear are each “independent” as such term is defined in paragraph (a)(2) of Item 3 of Form N-CSR.
Item 4. Principal Accountant Fees and Services.
Fees Billed by Grant Thornton LLP. The aggregate fees billed for professional services by Grant Thornton LLP (“GT”) during the last two fiscal years were as follows:
| FYE 12/31/2014 | FYE 12/31/2013 | |
| Audit Fees | $113,400 | $103,950 |
| Audit-Related Fees | - | - |
| Tax Fees | $39,690 | $31,920 |
| All Other Fees | - | - |
In the above table, “audit fees” are fees billed for professional services for the audit of the Registrant’s annual financial statements or for services that are normally provided by the accountant in connection with statutory and regulatory filings or engagements. “Tax fees” are fees billed for professional services rendered for tax compliance, tax advice and tax planning, and specifically relate to GT’s review of the Registrant’s federal and state tax returns.
The audit committee has adopted pre-approval policies and procedures that require the audit committee to pre-approve all audit and non-audit services rendered to the Registrant, as well as all non-audit services provided to the Registrant’s investment adviser and any entity affiliated with the Registrant’s investment adviser with respect to any engagement that relates directly to the operations and financial reporting of the Registrant. In accordance with its policies and procedures, the audit committee pre-approved all audit and tax services provided by GT to the Registrant during fiscal 2014. During the past two fiscal years, the Registrant did not receive any non-audit services from GT pursuant to any waivers of the pre-approval requirement under paragraph (c)(7)(i)(C) of Rule 2-01 of Regulation S-X. All of GT’s hours spent on auditing the Registrant’s financial statements were attributed to work performed by full-time permanent employees of GT.
During the last two fiscal years, GT has served as the auditor to Robert W. Baird & Co. Incorporated (“RWB”), the Registrant’s investment adviser, and has rendered non-audit services to RWB. The non-audit services that GT provided to RWB in 2014 and 2013 consisted of a review of state and federal tax returns, tax and general consulting services and tax services for RWB associates working overseas. GT charged the following amounts for such non-audit services to RWB: $333,572 for 2014 and $552,151 for 2013. None of the non-audit services provided by GT to RWB directly related to the operations or financial reporting of the Registrant. During the last two fiscal years, GT has also provided audit and non-audit services to affiliates of RWB, but those affiliates do not provide ongoing services to the Registrant. The Audit Committee has concluded that the provision of these audit and non-audit services to RWB and RWB affiliates is compatible with GT’s independence.
Item 5. Audit Committee of Listed Registrants.
Not applicable because the Registrant is not a “listed issuer” within the meaning of Rule 10A-3 under the Securities Exchange Act of 1934.
Item 6. Schedule of Investments.
| (a) | The complete Schedules of Investments in securities of unaffiliated issuers as of the close of the reporting period for the LargeCap Fund, MidCap Fund and SmallCap Value Fund are included as part of the report to shareholders filed under Item 1. The Summary Schedules of Investments in securities of unaffiliated issuers as of the close of the reporting period for the Baird Ultra Short Bond Fund, Baird Short-Term Bond Fund, Baird Intermediate Bond Fund, Baird Intermediate Municipal Bond Fund, Baird Aggregate Bond Fund and Baird Core Plus Bond Fund are included as part of the report to shareholders filed under Item 1. The complete Schedule of Investments in securities of unaffiliated issuers as of the close of the reporting period for Baird Ultra Short Bond Fund, Baird Short-Term Bond Fund, Baird Intermediate Bond Fund, Baird Intermediate Municipal Bond Fund, Baird Aggregate Bond Fund and Baird Core Plus Bond Fund are listed below. |
| Baird Ultra Short Bond Fund | ||||||||||||
| Schedule of Investments | ||||||||||||
| December 31, 2014 | ||||||||||||
| Principal | % of | |||||||||||
| Amount | Value | Net Assets | ||||||||||
| LONG-TERM INVESTMENTS | ||||||||||||
| U.S. Treasury Securities | ||||||||||||
| U.S. Treasury Bonds, | ||||||||||||
| 2.000%, 01/31/2016 | $ | 10,000,000 | $ | 10,178,120 | ||||||||
| 2.375%, 03/31/2016 | 2,500,000 | 2,561,720 | ||||||||||
| 12,739,840 | 14.9 | % | ||||||||||
| Corporate Bonds | ||||||||||||
| Finance | ||||||||||||
| ABN AMRO Bank N.V., | ||||||||||||
| 1.033%, 10/28/2016 (Acquired 01/03/2014 through 10/03/2014, Cost $326,099) * f | 325,000 | 327,320 | ||||||||||
| Ally Financial Inc., | ||||||||||||
| 3.125%, 01/15/2016 | 500,000 | 501,250 | ||||||||||
| American Express Company, | ||||||||||||
| 0.823%, 05/22/2018 | 500,000 | 499,984 | ||||||||||
| Ameriprise Financial, Inc., | ||||||||||||
| 5.650%, 11/15/2015 | 325,000 | 338,110 | ||||||||||
| AmSouth Bank, | ||||||||||||
| Class AI, 5.200%, 04/01/2015 | 400,000 | 404,000 | ||||||||||
| Banco Santander-Chile, | ||||||||||||
| 1.131%, 04/11/2017 (Acquired 04/08/2014, Cost $200,000) * f | 200,000 | 199,107 | ||||||||||
| Barclays Bank PLC, | ||||||||||||
| 2.500%, 01/30/2015 f | 500,000 | 500,207 | ||||||||||
| BB&T Corporation: | ||||||||||||
| 5.200%, 12/23/2015 | 41,000 | 42,635 | ||||||||||
| 0.892%, 02/01/2019 | 880,000 | 881,220 | ||||||||||
| BNP Paribas SA, | ||||||||||||
| 0.692%, 05/07/2017 f | 1,000,000 | 998,574 | ||||||||||
| BPCE, | ||||||||||||
| 1.082%, 02/10/2017 f | 500,000 | 503,311 | ||||||||||
| Capital One Financial Corporation, | ||||||||||||
| 3.150%, 07/15/2016 | 1,015,000 | 1,043,874 | ||||||||||
| Citigroup Inc., | ||||||||||||
| 0.506%, 06/09/2016 | 950,000 | 940,912 | ||||||||||
| Commonwealth Bank of Australia, | ||||||||||||
| 0.833%, 10/08/2015 (Acquired 01/03/2014, Cost $199,800) * f | 200,000 | 199,956 | ||||||||||
| Countrywide Financial Corporation, | ||||||||||||
| 6.250%, 05/15/2016 | 400,000 | 424,537 | ||||||||||
| Credit Agricole SA, | ||||||||||||
| 1.106%, 10/03/2016 (Acquired 01/03/2014, Cost $250,404) * f | 250,000 | 251,559 | ||||||||||
| Credit Suisse, | ||||||||||||
| 0.724%, 05/26/2017 f | 500,000 | 499,389 | ||||||||||
| Deutsche Bank Aktiengesellschaft, | ||||||||||||
| 0.843%, 02/13/2017 f | 150,000 | 150,215 | ||||||||||
| Dresdner Bank AG, | ||||||||||||
| 7.250%, 09/15/2015 f | 357,000 | 369,164 | ||||||||||
| Fifth Third Bancorp, | ||||||||||||
| 0.667%, 12/20/2016 | 1,000,000 | 992,012 | ||||||||||
| First Horizon National Corporation, | ||||||||||||
| 5.375%, 12/15/2015 | 550,000 | 569,416 | ||||||||||
| First Tennessee Bank National Association, | ||||||||||||
| 5.050%, 01/15/2015 | 250,000 | 250,321 | ||||||||||
| General Electric Capital Corporation, | ||||||||||||
| 0.740%, 01/14/2019 | 1,000,000 | 1,000,392 | ||||||||||
| HSBC Finance Corporation, | ||||||||||||
| 5.500%, 01/19/2016 | 300,000 | 313,652 | ||||||||||
| HSBC USA Inc., | ||||||||||||
| 0.843%, 11/13/2019 | 250,000 | 249,993 | ||||||||||
| ING Bank N.V., | ||||||||||||
| 4.000%, 03/15/2016 (Acquired 03/08/2011, Cost $517,981) * f | 500,000 | 517,167 | ||||||||||
| J.P. Morgan Chase & Co., | ||||||||||||
| Series 1, 0.863%, 01/28/2019 | 250,000 | 249,998 | ||||||||||
| Kookmin Bank, | ||||||||||||
| 1.109%, 01/27/2017 (Acquired 01/21/2014, Cost $250,000) * f | 250,000 | 251,658 | ||||||||||
| Macquarie Bank Limited, | ||||||||||||
| 1.045%, 03/24/2017 (Acquired 03/18/2014, Cost $200,000) * f | 200,000 | 200,868 | ||||||||||
| Mizuho Bank, Ltd.: | ||||||||||||
| 0.705%, 04/16/2017 (Acquired 04/09/2014, Cost $200,000) * f | 200,000 | 200,089 | ||||||||||
| 0.684%, 09/25/2017 (Acquired 09/18/2014, Cost $300,000) * f | 300,000 | 300,226 | ||||||||||
| Morgan Stanley: | ||||||||||||
| 1.007%, 01/05/2018 | 500,000 | 500,127 | ||||||||||
| 1.083%, 01/24/2019 | 250,000 | 250,493 | ||||||||||
| National Australia Bank Limited, | ||||||||||||
| 0.733%, 10/08/2015 (Acquired 01/03/2014, Cost $199,860) * f | 200,000 | 199,971 | ||||||||||
| Nomura Holdings, Inc., | ||||||||||||
| 5.000%, 03/04/2015 f | 250,000 | 251,786 | ||||||||||
| PNC Funding Corp, | ||||||||||||
| 5.250%, 11/15/2015 | 730,000 | 756,573 | ||||||||||
| Rabobank Nederland, | ||||||||||||
| 0.485%, 03/07/2016 (Acquired 01/03/2014, Cost $249,625) * f | 250,000 | 250,445 | ||||||||||
| Raymond James Financial, Inc., | ||||||||||||
| 4.250%, 04/15/2016 | 400,000 | 414,722 | ||||||||||
| Royal Bank of Canada, | ||||||||||||
| 0.488%, 10/13/2017 f | 1,000,000 | 999,168 | ||||||||||
| Societe Generale, | ||||||||||||
| 1.335%, 10/01/2018 f | 1,000,000 | 1,017,644 | ||||||||||
| Sumitomo Mitsui Banking Corporation, | ||||||||||||
| 0.900%, 01/18/2016 f | 400,000 | 399,645 | ||||||||||
| SunTrust Bank, | ||||||||||||
| 0.555%, 04/01/2015 | 450,000 | 449,667 | ||||||||||
| Symetra Financial Corporation, | ||||||||||||
| 6.125%, 04/01/2016 (Acquired 04/23/2014 through 11/24/2014, Cost $590,741) * | 560,000 | 587,513 | ||||||||||
| The Bank of New York Mellon Corporation, | ||||||||||||
| 0.792%, 08/01/2018 | 1,000,000 | 1,002,100 | ||||||||||
| The Bank of Tokyo-Mitsubishi UFJ, Ltd., | ||||||||||||
| 0.545%, 09/08/2017 (Acquired 09/30/2014, Cost $998,890) * f | 1,000,000 | 989,930 | ||||||||||
| The Bear Stearns Companies LLC, | ||||||||||||
| 5.300%, 10/30/2015 | 294,000 | 304,776 | ||||||||||
| The Goldman Sachs Group, Inc.: | ||||||||||||
| 5.350%, 01/15/2016 | 555,000 | 579,152 | ||||||||||
| 1.332%, 11/15/2018 | 500,000 | 504,900 | ||||||||||
| The Royal Bank of Scotland Group Public Limited Company, | ||||||||||||
| 2.550%, 09/18/2015 f | 800,000 | 808,010 | ||||||||||
| Wells Fargo Bank, National Association, | ||||||||||||
| 0.442%, 05/16/2016 | 250,000 | 249,314 | ||||||||||
| Willis North America, Inc., | ||||||||||||
| 5.625%, 07/15/2015 | 237,000 | 242,739 | ||||||||||
| 24,929,791 | 29.2 | % | ||||||||||
| Utility | ||||||||||||
| Exelon Corporation, | ||||||||||||
| 4.900%, 06/15/2015 | 503,000 | 511,995 | ||||||||||
| Orange and Rockland Utilities, Inc., | ||||||||||||
| 2.500%, 08/15/2015 (Acquired 03/19/2014, Cost $100,712) * | 100,000 | 100,655 | ||||||||||
| PPL Energy Supply, LLC, | ||||||||||||
| Series A, 5.700%, 10/15/2015 | 600,000 | 613,066 | ||||||||||
| TECO Finance Inc, | ||||||||||||
| 4.000%, 03/15/2016 | 100,000 | 103,505 | ||||||||||
| Trans-Allegheny Interstate Line Company, | ||||||||||||
| 4.000%, 01/15/2015 (Acquired 01/07/2014 through 06/16/2014, Cost $350,345) * | 350,000 | 350,275 | ||||||||||
| W3A Funding Corporation, | ||||||||||||
| 8.090%, 01/02/2017 | 38,329 | 38,324 | ||||||||||
| 1,717,820 | 2.0 | % | ||||||||||
| Industrials | ||||||||||||
| Alibaba Group Holding Limited, | ||||||||||||
| 0.756%, 11/28/2017 (Acquired 11/20/2014, Cost $500,000) * f | 500,000 | 500,983 | ||||||||||
| Amgen Inc., | ||||||||||||
| 0.613%, 05/22/2017 | 250,000 | 249,461 | ||||||||||
| Anglo American Capital PLC, | ||||||||||||
| 1.181%, 04/15/2016 (Acquired 04/08/2014 through 11/13/2014, Cost $802,361) * f | 800,000 | 800,805 | ||||||||||
| Becton, Dickinson and Company, | ||||||||||||
| 0.691%, 06/15/2016 | 1,000,000 | 1,000,238 | ||||||||||
| Bunge Limited Finance Corp.: | ||||||||||||
| 5.100%, 07/15/2015 | 405,000 | 413,795 | ||||||||||
| 4.100%, 03/15/2016 | 250,000 | 257,740 | ||||||||||
| Chesapeake Energy Corporation, | ||||||||||||
| 3.481%, 04/15/2019 | 500,000 | 490,000 | ||||||||||
| Computer Sciences Corporation, | ||||||||||||
| 2.500%, 09/15/2015 | 390,000 | 393,521 | ||||||||||
| ConAgra Foods, Inc., | ||||||||||||
| 0.601%, 07/21/2016 | 375,000 | 374,075 | ||||||||||
| CNPC General Capital Ltd, | ||||||||||||
| 1.133%, 05/14/2017 (Acquired 05/07/2014, Cost $250,000) * f | 250,000 | 250,397 | ||||||||||
| D.R. Horton, Inc., | ||||||||||||
| 6.500%, 04/15/2016 | 390,000 | 411,450 | ||||||||||
| Deutsche Telekom International Finance B.V., | ||||||||||||
| 3.125%, 04/11/2016 (Acquired 09/17/2014, Cost $514,177) * f | 500,000 | 512,464 | ||||||||||
| Enbridge Inc.: | ||||||||||||
| 0.905%, 10/01/2016 f | 750,000 | 749,612 | ||||||||||
| 0.684%, 06/02/2017 f | 250,000 | 248,919 | ||||||||||
| Energy Transfer Partners, L.P., | ||||||||||||
| 5.950%, 02/01/2015 | 299,000 | 299,987 | ||||||||||
| Fiserv, Inc.: | ||||||||||||
| 3.125%, 10/01/2015 | 75,000 | 76,292 | ||||||||||
| 3.125%, 06/15/2016 | 175,000 | 179,672 | ||||||||||
| Ford Motor Credit Company LLC: | ||||||||||||
| 2.500%, 01/15/2016 | 200,000 | 202,237 | ||||||||||
| 4.207%, 04/15/2016 | 750,000 | 776,284 | ||||||||||
| Glencore Canada Corporation: | ||||||||||||
| 5.375%, 06/01/2015 f | 200,000 | 203,384 | ||||||||||
| 6.000%, 10/15/2015 f | 200,000 | 206,751 | ||||||||||
| Gulf South Pipeline Company, LP, | ||||||||||||
| 5.050%, 02/01/2015 (Acquired 09/29/2014, Cost $501,798) * | 500,000 | 501,489 | ||||||||||
| Hanson Limited, | ||||||||||||
| 6.125%, 08/15/2016 f | 800,000 | 848,000 | ||||||||||
| Hewlett-Packard Company, | ||||||||||||
| 1.170%, 01/14/2019 | 461,000 | 453,112 | ||||||||||
| Hyundai Capital Services, Inc., | ||||||||||||
| 6.000%, 05/05/2015 (Acquired 01/09/2014 through 07/15/2014, Cost $320,387) * f | 315,000 | 320,259 | ||||||||||
| John Deere Capital Corporation, | ||||||||||||
| 0.461%, 12/15/2017 | 500,000 | 500,073 | ||||||||||
| Kinder Morgan Finance Company LLC, | ||||||||||||
| 5.700%, 01/05/2016 | 650,000 | 674,778 | ||||||||||
| Laboratory Corporation of America Holdings, | ||||||||||||
| 5.625%, 12/15/2015 | 1,000,000 | 1,040,268 | ||||||||||
| Lafarge S.A., | ||||||||||||
| 6.500%, 07/15/2016 f | 100,000 | 106,500 | ||||||||||
| Marathon Petroleum Corporation, | ||||||||||||
| 3.500%, 03/01/2016 | 1,000,000 | 1,024,744 | ||||||||||
| Masco Corporation, | ||||||||||||
| 6.125%, 10/03/2016 | 400,000 | 424,200 | ||||||||||
| McKesson Corporation, | ||||||||||||
| 0.638%, 09/10/2015 | 400,000 | 400,125 | ||||||||||
| Medtronic, Inc., | ||||||||||||
| 1.043%, 03/15/2020 (Acquired 12/01/2014, Cost $750,000) * | 750,000 | 749,209 | ||||||||||
| Mondelez International, Inc., | ||||||||||||
| 0.752%, 02/01/2019 | 500,000 | 494,421 | ||||||||||
| Plum Creek Timberlands, L.P., | ||||||||||||
| 5.875%, 11/15/2015 | 725,000 | 753,151 | ||||||||||
| Quest Diagnostics Inc, | ||||||||||||
| 5.450%, 11/01/2015 | 439,000 | 454,514 | ||||||||||
| Rockies Express Pipeline LLC, | ||||||||||||
| 3.900%, 04/15/2015 (Acquired 09/30/2014 through 10/08/2014, Cost $1,073,079) * | 1,072,000 | 1,066,640 | ||||||||||
| Total Capital International, | ||||||||||||
| 0.595%, 06/19/2019 f | 250,000 | 247,583 | ||||||||||
| Verizon Communications Inc., | ||||||||||||
| 1.991%, 09/14/2018 | 1,063,000 | 1,105,793 | ||||||||||
| Volkswagen Group of America Finance, LLC: | ||||||||||||
| 0.603%, 05/23/2017 (Acquired 05/15/2014, Cost $250,000) * | 250,000 | 249,280 | ||||||||||
| 0.672%, 11/20/2017 (Acquired 11/12/2014, Cost $500,000) * | 500,000 | 499,274 | ||||||||||
| Weatherford International Ltd, | ||||||||||||
| 5.500%, 02/15/2016 f | 400,000 | 412,638 | ||||||||||
| Xerox Corporation, | ||||||||||||
| 6.400%, 03/15/2016 | 843,000 | 894,307 | ||||||||||
| 21,818,425 | 25.6 | % | ||||||||||
| Total Corporate Bonds | 48,466,036 | 56.8 | % | |||||||||
| Other Government Related Securities | |||||||||||||
| CNOOC Finance 2013 Ltd, | |||||||||||||
| 1.125%, 05/09/2016 f | 500,000 | 498,228 | |||||||||||
| Corp Andina de Fomento, | |||||||||||||
| 3.750%, 01/15/2016 f | 375,000 | 384,390 | |||||||||||
| Eksportfinans ASA, | |||||||||||||
| 2.000%, 09/15/2015 f | 540,000 | 540,632 | |||||||||||
| Electricite de France Societe anonyme, | |||||||||||||
| 0.691%, 01/20/2017 (Acquired 01/13/2014, Cost $250,000) * f | 250,000 | 250,680 | |||||||||||
| Petrobras Global Finance B.V., | |||||||||||||
| 2.603%, 03/17/2017 f | 250,000 | 230,775 | |||||||||||
| Portigon AG, | |||||||||||||
| 4.796%, 07/15/2015 f | 411,000 | 418,920 | |||||||||||
| The Export-Import Bank of Korea, | |||||||||||||
| 0.980%, 01/14/2017 f | 250,000 | 250,701 | |||||||||||
| 2,574,326 | 3.0 | % | |||||||||||
| Taxable Municipal Bonds | |||||||||||||
| Board of Governors of Colorado State University System, | |||||||||||||
| 0.963%, 03/01/2015 | 105,000 | 105,043 | |||||||||||
| City of Passaic NJ, | |||||||||||||
| 1.630%, 02/01/2015 | 125,000 | 125,074 | |||||||||||
| City of Trenton NJ, | |||||||||||||
| 1.430%, 04/01/2015 | 440,000 | 440,497 | |||||||||||
| Consolidated Municipalities Electric Power Systems Joint Powers Board, | |||||||||||||
| 1.000%, 06/01/2016 | 300,000 | 298,794 | |||||||||||
| Cook County School District No 144 Prairie Hills: | |||||||||||||
| 1.000%, 12/01/2015 | 150,000 | 149,758 | |||||||||||
| 1.500%, 12/01/2016 | 250,000 | 248,928 | |||||||||||
| Madison County Community Unit School District No 12 Madison, | |||||||||||||
| 1.950%, 01/01/2017 | 200,000 | 199,322 | |||||||||||
| Plano Special Service Areas No 1 & 2, | |||||||||||||
| 2.000%, 03/01/2016 | 150,000 | 151,559 | |||||||||||
| State of Illinois, | |||||||||||||
| 4.961%, 03/01/2016 | 350,000 | 364,605 | |||||||||||
| Tulsa Airports Improvement Trust, | |||||||||||||
| 1.389%, 06/01/2015 | 100,000 | 99,963 | |||||||||||
| University of Illinois, | |||||||||||||
| 1.308%, 02/15/2016 | 700,000 | 699,524 | |||||||||||
| 2,883,067 | 3.4 | % | |||||||||||
| Residential Mortgage-Backed Securities | |||||||||||||
| U.S. Government Agency Issues | |||||||||||||
| Fannie Mae Pool, | |||||||||||||
| 5.500%, 11/01/2017 | 223,343 | 235,906 | |||||||||||
| Federal Gold Loan Mortgage Corporation (FGLMC), | |||||||||||||
| 5.000%, 12/01/2017 | 134,810 | 141,622 | |||||||||||
| Federal National Mortgage Association (FNMA): | |||||||||||||
| 5.000%, 10/01/2017 | 135,152 | 142,372 | |||||||||||
| 5.000%, 11/01/2017 | 110,156 | 116,049 | |||||||||||
| 5.000%, 12/01/2017 | 96,369 | 101,516 | |||||||||||
| 737,465 | 0.9 | % | |||||||||||
| Non-U.S. Government Agency Issues | |||||||||||||
| Banc of America Alternative Loan Trust: | |||||||||||||
| Series 2003-4, Class 2A1, 5.000%, 06/25/2018 | 83,810 | 85,891 | |||||||||||
| Series 2004-1, Class 5A2, 5.500%, 02/25/2019 | 66,241 | 68,404 | |||||||||||
| MASTR Alternative Loan Trust, | |||||||||||||
| Series 2004-13, Class 8A1, 5.500%, 01/25/2025 | 95,241 | 96,176 | |||||||||||
| Morgan Stanley Mortgage Loan Trust, | |||||||||||||
| Series 2004-4, Class 1A10, 5.000%, 08/25/2034 | 89,878 | 91,373 | |||||||||||
| 341,844 | 0.4 | % | |||||||||||
| Asset Backed Securities | |||||||||||||
| Accredited Mortgage Loan Trust: | |||||||||||||
| Series 2005-3, Class A1, 0.400%, 09/25/2035 | 186,271 | 185,565 | |||||||||||
| Series 2006-2, Class A3, 0.320%, 09/25/2036 | 1,022,933 | 1,010,298 | |||||||||||
| ACE Securities Corp Home Equity Loan Trust, | |||||||||||||
| Series 2006-HE1, Class A1A, 0.370%, 02/25/2036 | 320,590 | 317,776 | |||||||||||
| Asset Backed Securities Corp Home Equity Loan Trust, | |||||||||||||
| Series 2004-HE6, Class A1, 0.720%, 09/25/2034 | 667,312 | 667,286 | |||||||||||
| Capital Auto Receivables Asset Trust, | |||||||||||||
| Series 2014-1, Class A1B, 0.515%, 05/20/2016 | 590,000 | 590,159 | |||||||||||
| Carrington Mortgage Loan Trust, | |||||||||||||
| Series 2007-HE1, Class A1, 0.270%, 06/25/2037 | 47,641 | 47,187 | |||||||||||
| Countrywide Asset-Backed Certificates: | |||||||||||||
| Series 2005-1, Class AF4, 5.147%, 02/25/2033 | 248,710 | 250,334 | |||||||||||
| Series 2005-13, Class 3AV3, 0.405%, 04/25/2036 | 252,638 | 250,105 | |||||||||||
| First Franklin Mortgage Loan Trust, | |||||||||||||
| Series 2004-FF7, Class A1, 0.810%, 09/25/2034 | 174,386 | 174,024 | |||||||||||
| Ford Credit Floorplan Master Owner Trust, | |||||||||||||
| Series 2013-1, Class A2, 0.541%, 01/15/2018 | 400,000 | 400,147 | |||||||||||
| GSAMP Trust: | |||||||||||||
| Series 2005-HE5, Class A2D, 0.510%, 11/25/2035 | 286,802 | 285,784 | |||||||||||
| Series 2006-HE1, Class A2C, 0.380%, 01/25/2036 | 450,703 | 441,903 | |||||||||||
| HSI Asset Securitization Corp Trust, | |||||||||||||
| Series 2007-WF1, Class 2A3, 0.340%, 05/25/2037 | 668,363 | 646,410 | |||||||||||
| J.P. Morgan Mortgage Acquisition Trust: | |||||||||||||
| Series 2007-CH1, Class AV4, 0.285%, 11/25/2036 | 217,182 | 216,270 | |||||||||||
| Series 2007-CH3, Class A3, 0.320%, 03/25/2037 | 192,843 | 190,147 | |||||||||||
| Long Beach Mortgage Loan Trust, | |||||||||||||
| Series 2006-WL2, Class 2A3, 0.370%, 01/25/2036 | 48,408 | 46,965 | |||||||||||
| Louisiana Local Government Environmental Facilities & Community Development Auth., | |||||||||||||
| 1.520%, 02/01/2018 | 245,620 | 246,919 | |||||||||||
| Master Credit Card Trust II, | |||||||||||||
| Series 2012-2A, Class A, 0.780%, 04/21/2017 (Acquired 10/24/2012, Cost $1,001,048) * f | 1,000,000 | 1,000,320 | |||||||||||
| Morgan Stanley Capital I Inc. Trust, | |||||||||||||
| Series 2006-NC2, Class A2C, 0.350%, 02/25/2036 | 129,017 | 128,495 | |||||||||||
| Morgan Stanley Home Equity Loan Trust, | |||||||||||||
| Series 2006-2, Class A3, 0.340%, 02/25/2036 | 104,650 | 103,864 | |||||||||||
| Park Place Securities Inc Asset-Backed Pass-Through Certificates, | |||||||||||||
| Series 2005-WCW2, Class A2D, 0.540%, 07/25/2035 | 443,428 | 441,293 | |||||||||||
| RAMP Series Trust, | |||||||||||||
| Series 2003-RS7, Class AI6, 5.340%, 08/25/2033 | 94,473 | 94,756 | |||||||||||
| RASC Series Trust: | |||||||||||||
| Series 2003-KS2, Class AI6, 3.990%, 04/25/2033 | 56,858 | 56,800 | |||||||||||
| Series 2005-AHL2, Class A2, 0.430%, 10/25/2035 | 55,299 | 55,262 | |||||||||||
| Soundview Home Loan Trust, | |||||||||||||
| Series 2005-4, Class 2A4, 0.520%, 03/25/2036 | 109,286 | 109,164 | |||||||||||
| Specialty Underwriting & Residential Finance Trust, | |||||||||||||
| Series 2006-BC1, Class A2C, 0.370%, 12/25/2036 | 665,770 | 659,909 | |||||||||||
| Springleaf Mortgage Loan Trust, | |||||||||||||
| Series 2012-2A, Class A, 2.220%, 10/25/2057 (Acquired 08/20/2014 through 10/22/2014, Cost $531,381) * | 525,962 | 533,015 | |||||||||||
| Tri-State Pass Through Trust, | |||||||||||||
| 6.040%, 01/31/2018 (Acquired 09/18/2014, Cost $183,875) * | 175,745 | 182,443 | |||||||||||
| 9,332,600 | 10.9 | % | |||||||||||
| Commercial Mortgage Backed Securities | |||||||||||||
| Bear Stearns Commercial Mortgage Securities Trust, | |||||||||||||
| Series 2005-PWR9, Class A4A, 4.871%, 09/11/2042 | 982,681 | 996,832 | |||||||||||
| COMM Mortgage Trust, | |||||||||||||
| Series 2005-C6, Class A5A, 5.116%, 06/10/2044 | 885,035 | 894,471 | |||||||||||
| J.P. Morgan Chase Commercial Mortgage Securities Trust, | |||||||||||||
| Series 2005-CB12, Class A4, 4.895%, 09/12/2037 | 20,000 | 20,207 | |||||||||||
| Wachovia Bank Commercial Mortgage Trust, | |||||||||||||
| Series 2005-C22, Class A4, 5.269%, 12/15/2044 | 871,172 | 889,771 | |||||||||||
| 2,801,281 | 3.3 | % | |||||||||||
| Total Long-Term Investments (Cost $80,061,385) | 79,876,459 | 93.6 | % | ||||||||||
| Shares | |||||||||||||
| SHORT-TERM INVESTMENTS | |||||||||||||
| Money Market Mutual Fund | |||||||||||||
| Dreyfus Cash Advantage Fund, 0.06% « | 3,882,770 | 3,882,770 | |||||||||||
| Total Short-Term Investments (Cost $3,882,770) | 3,882,770 | 4.5 | % | ||||||||||
| Total Investments (Cost $83,944,155) | 83,759,229 | 98.1 | % | ||||||||||
| Other Assets in Excess of Liabilities | 1,609,335 | 1.9 | % | ||||||||||
| TOTAL NET ASSETS | $ | 85,368,564 | 100.0 | % | |||||||||
| Notes to Schedule of Investments | |||||||||||||
| * | Restricted security as defined in Rule 144(a) under the Securities Act of 1933 and determined to be liquid. Purchased in a private placement transaction; resale to the public may require registration or may extend only to qualified institutional buyers. At December 31, 2014, the value of these securities total $12,343,997, which represents 14.46% of total net assets. | ||||||||||||
| f | Foreign Security | ||||||||||||
| « | 7-Day Yield |
| Baird Short-Term Bond Fund | ||||||||||||
| Schedule of Investments | ||||||||||||
| December 31, 2014 | ||||||||||||
| Principal | % of | |||||||||||
| Amount | Value | Net Assets | ||||||||||
| LONG-TERM INVESTMENTS | ||||||||||||
| U.S. Treasury Securities | ||||||||||||
| U.S. Treasury Bonds: | ||||||||||||
| 2.250%, 07/31/2018 @ | $ | 130,950,000 | $ | 135,154,674 | ||||||||
| 1.250%, 04/30/2019 @ | 172,000,000 | 169,997,748 | ||||||||||
| 305,152,422 | 11.4 | % | ||||||||||
| Corporate Bonds | ||||||||||||
| Finance | ||||||||||||
| ABN AMRO Bank N.V.: | ||||||||||||
| 1.033%, 10/28/2016 (Acquired 10/23/2013 through 05/19/2014, Cost $11,058,523) * f | 11,050,000 | 11,128,886 | ||||||||||
| 4.250%, 02/02/2017 (Acquired 08/23/2013 through 11/21/2014, Cost $3,852,004) * f | 3,675,000 | 3,872,201 | ||||||||||
| 2.500%, 10/30/2018 (Acquired 03/04/2014, Cost $956,469) * f | 950,000 | 959,515 | ||||||||||
| American Express Bank, FSB, | ||||||||||||
| 0.461%, 06/12/2017 | 750,000 | 746,200 | ||||||||||
| American Express Company: | ||||||||||||
| 5.500%, 09/12/2016 | 1,213,000 | 1,299,805 | ||||||||||
| 7.000%, 03/19/2018 | 2,661,000 | 3,078,652 | ||||||||||
| 0.823%, 05/22/2018 | 1,155,000 | 1,154,964 | ||||||||||
| American Express Credit Corporation: | ||||||||||||
| 0.743%, 07/29/2016 | 5,000,000 | 5,018,725 | ||||||||||
| 0.722%, 08/15/2019 | 2,000,000 | 1,985,508 | ||||||||||
| American International Group, Inc.: | ||||||||||||
| 2.375%, 08/24/2015 | 1,100,000 | 1,108,904 | ||||||||||
| 5.600%, 10/18/2016 | 5,120,000 | 5,501,824 | ||||||||||
| 5.450%, 05/18/2017 | 3,575,000 | 3,900,675 | ||||||||||
| AmSouth Bank, | ||||||||||||
| Series AI, 5.200%, 04/01/2015 | 6,740,000 | 6,807,407 | ||||||||||
| ANZ New Zealand (Int'l) Limited: | ||||||||||||
| 1.125%, 03/24/2016 (Acquired 03/20/2013 through 01/16/2014, Cost $5,322,805) * f | 5,324,000 | 5,341,873 | ||||||||||
| 2.600%, 09/23/2019 (Acquired 09/16/2014, Cost $3,347,823) * f | 3,350,000 | 3,383,212 | ||||||||||
| Aon Corporation, | ||||||||||||
| 3.125%, 05/27/2016 f | 1,582,000 | 1,623,333 | ||||||||||
| Associates Corporation of North America, | ||||||||||||
| 6.950%, 11/01/2018 | 667,000 | 779,049 | ||||||||||
| Australia and New Zealand Banking Group Limited: | ||||||||||||
| 0.609%, 01/10/2017 (Acquired 01/06/2014, Cost $750,000) * f | 750,000 | 751,199 | ||||||||||
| 1.875%, 10/06/2017 (Acquired 07/17/2013 through 11/21/2013, Cost $749,522) * f | 750,000 | 756,797 | ||||||||||
| 2.250%, 06/13/2019 f | 1,000,000 | 1,004,791 | ||||||||||
| Banco Santander-Chile: | ||||||||||||
| 3.750%, 09/22/2015 (Acquired 11/21/2013 through 03/28/2014, Cost $1,599,633) * f | 1,575,000 | 1,598,537 | ||||||||||
| 1.130%, 04/11/2017 (Acquired 04/08/2014, Cost $1,800,000) * f | 1,800,000 | 1,791,965 | ||||||||||
| Bank of America Corporation: | ||||||||||||
| 10.200%, 07/15/2015 | 3,920,000 | 4,112,468 | ||||||||||
| 5.750%, 12/01/2017 | 5,000,000 | 5,524,485 | ||||||||||
| Bank of Montreal, | ||||||||||||
| 0.831%, 04/09/2018 f | 1,325,000 | 1,330,550 | ||||||||||
| Barclays Bank PLC: | ||||||||||||
| 2.500%, 01/30/2015 f | 500,000 | 500,207 | ||||||||||
| Series 1, 5.000%, 09/22/2016 f | 5,480,000 | 5,839,472 | ||||||||||
| 0.812%, 02/17/2017 f | 4,000,000 | 4,003,280 | ||||||||||
| BB&T Corporation, | ||||||||||||
| 1.101%, 06/15/2018 | 3,750,000 | 3,787,001 | ||||||||||
| BBVA U.S. Senior, S.A. Unipersonal, | ||||||||||||
| 4.664%, 10/09/2015 f | 2,800,000 | 2,874,936 | ||||||||||
| BNP Paribas: | ||||||||||||
| 0.830%, 12/12/2016 f | 4,540,000 | 4,548,676 | ||||||||||
| 2.375%, 09/14/2017 @ f | 3,000,000 | 3,051,312 | ||||||||||
| BNZ International Funding Limited, | ||||||||||||
| 2.350%, 03/04/2019 (Acquired 09/03/2014 through 11/13/2014, Cost $7,239,851) * f | 7,250,000 | 7,250,863 | ||||||||||
| BPCE: | ||||||||||||
| 1.082%, 02/10/2017 f | 9,650,000 | 9,713,912 | ||||||||||
| 2.500%, 12/10/2018 f | 3,275,000 | 3,319,648 | ||||||||||
| Branch Banking and Trust Company, | ||||||||||||
| 0.533%, 05/23/2017 | 9,370,000 | 9,312,075 | ||||||||||
| Canadian Imperial Bank of Commerce, | ||||||||||||
| 1.350%, 07/18/2016 @ f | 5,000,000 | 5,031,655 | ||||||||||
| Capital One Bank, (USA), National Association, | ||||||||||||
| 2.250%, 02/13/2019 | 1,500,000 | 1,489,137 | ||||||||||
| Capital One Financial Corporation: | ||||||||||||
| 6.150%, 09/01/2016 | 1,403,000 | 1,507,716 | ||||||||||
| 5.250%, 02/21/2017 | 1,100,000 | 1,184,714 | ||||||||||
| Capital One N.A.: | ||||||||||||
| 1.500%, 09/05/2017 | 5,000,000 | 4,959,715 | ||||||||||
| 2.400%, 09/05/2019 | 5,300,000 | 5,274,125 | ||||||||||
| CIGNA Corporation: | ||||||||||||
| 2.750%, 11/15/2016 | 5,331,000 | 5,474,239 | ||||||||||
| 5.375%, 03/15/2017 | 2,300,000 | 2,484,602 | ||||||||||
| Citigroup Inc.: | ||||||||||||
| 0.912%, 11/15/2016 | 2,000,000 | 2,000,628 | ||||||||||
| 1.550%, 08/14/2017 @ | 2,400,000 | 2,393,230 | ||||||||||
| 1.850%, 11/24/2017 | 5,000,000 | 4,994,255 | ||||||||||
| 6.125%, 05/15/2018 | 3,920,000 | 4,436,162 | ||||||||||
| Citizens Bank, National Association, | ||||||||||||
| 1.600%, 12/04/2017 | 12,500,000 | 12,444,875 | ||||||||||
| CNA Financial Corporation: | ||||||||||||
| 6.500%, 08/15/2016 | 4,995,000 | 5,402,767 | ||||||||||
| 7.350%, 11/15/2019 | 10,200,000 | 12,174,159 | ||||||||||
| Comerica Bank: | ||||||||||||
| 5.750%, 11/21/2016 | 1,425,000 | 1,543,109 | ||||||||||
| 5.200%, 08/22/2017 | 4,325,000 | 4,700,847 | ||||||||||
| Commonwealth Bank of Australia, | ||||||||||||
| 0.833%, 10/08/2015 (Acquired 12/05/2013, Cost $1,198,800) * f | 1,200,000 | 1,199,738 | ||||||||||
| Compass Bank: | ||||||||||||
| 1.850%, 09/29/2017 | 10,000,000 | 9,957,350 | ||||||||||
| 2.750%, 09/29/2019 | 3,400,000 | 3,403,475 | ||||||||||
| Countrywide Financial Corporation, | ||||||||||||
| 6.250%, 05/15/2016 | 4,150,000 | 4,404,569 | ||||||||||
| Credit Agricole SA, | ||||||||||||
| 1.106%, 10/03/2016 (Acquired 09/26/2013, Cost $10,000,000) * @ f | 10,000,000 | 10,062,340 | ||||||||||
| Credit Suisse: | ||||||||||||
| 0.724%, 05/26/2017 f | 2,000,000 | 1,997,556 | ||||||||||
| 6.000%, 02/15/2018 f | 8,440,000 | 9,388,555 | ||||||||||
| Deutsche Bank Aktiengesellschaft: | ||||||||||||
| 0.843%, 02/13/2017 f | 3,850,000 | 3,855,517 | ||||||||||
| Series 3FXD, 1.400%, 02/13/2017 f | 3,000,000 | 2,993,745 | ||||||||||
| 0.706%, 05/30/2017 f | 2,640,000 | 2,635,501 | ||||||||||
| 6.000%, 09/01/2017 f | 3,467,000 | 3,851,442 | ||||||||||
| Discover Bank, | ||||||||||||
| 8.700%, 11/18/2019 | 4,000,000 | 4,946,560 | ||||||||||
| Dresdner Bank AG, | ||||||||||||
| 7.250%, 09/15/2015 f | 12,322,000 | 12,741,835 | ||||||||||
| Fifth Third Bancorp: | ||||||||||||
| 3.625%, 01/25/2016 | 1,305,000 | 1,337,179 | ||||||||||
| 0.667%, 12/20/2016 | 6,135,000 | 6,085,993 | ||||||||||
| 5.450%, 01/15/2017 | 619,000 | 664,259 | ||||||||||
| First Hawaiian Capital I, | ||||||||||||
| Series B, 8.343%, 07/01/2027 | 1,500,000 | 1,520,053 | ||||||||||
| First Horizon National Corporation, | ||||||||||||
| 5.375%, 12/15/2015 | 3,079,000 | 3,187,692 | ||||||||||
| First Tennessee Bank National Association: | ||||||||||||
| 5.050%, 01/15/2015 | 1,000,000 | 1,001,282 | ||||||||||
| 5.650%, 04/01/2016 | 7,219,000 | 7,459,949 | ||||||||||
| General Electric Capital Corporation: | ||||||||||||
| 5.625%, 09/15/2017 | 9,080,000 | 10,079,290 | ||||||||||
| 5.625%, 05/01/2018 | 175,000 | 196,916 | ||||||||||
| 0.740%, 01/14/2019 | 1,750,000 | 1,750,686 | ||||||||||
| Genworth Holdings, Inc., | ||||||||||||
| 8.625%, 12/15/2016 | 1,000,000 | 1,058,038 | ||||||||||
| Hana Bank, | ||||||||||||
| 1.357%, 11/09/2016 (Acquired 11/05/2013, Cost $7,004,564) * f | 7,000,000 | 7,038,871 | ||||||||||
| HSBC Bank USA, National Association, | ||||||||||||
| 6.000%, 08/09/2017 | 925,000 | 1,022,589 | ||||||||||
| HSBC Finance Corporation: | ||||||||||||
| 5.500%, 01/19/2016 | 556,000 | 581,301 | ||||||||||
| 6.676%, 01/15/2021 | 221,000 | 262,207 | ||||||||||
| HSBC USA Capital Trust III, | ||||||||||||
| 8.380%, 05/15/2027 (Acquired 11/06/2007, Cost $1,514,977) * | 1,500,000 | 1,519,599 | ||||||||||
| HSBC USA Inc.: | ||||||||||||
| 1.135%, 09/24/2018 | 1,000,000 | 1,008,759 | ||||||||||
| 0.843%, 11/13/2019 | 4,750,000 | 4,749,872 | ||||||||||
| Huntington Bancshares Incorporated, | ||||||||||||
| 2.600%, 08/02/2018 | 3,250,000 | 3,289,507 | ||||||||||
| ING Bank N.V.: | ||||||||||||
| 4.000%, 03/15/2016 (Acquired 03/08/2012 through 07/15/2013, Cost $5,912,747) * f | 5,783,000 | 5,981,548 | ||||||||||
| 3.750%, 03/07/2017 (Acquired 05/30/2013 through 01/13/2014, Cost $3,324,735) * f | 3,200,000 | 3,348,806 | ||||||||||
| J.P. Morgan Chase & Co.: | ||||||||||||
| 0.784%, 04/25/2018 | 3,500,000 | 3,491,974 | ||||||||||
| Series 1, 0.863%, 01/28/2019 | 750,000 | 749,993 | ||||||||||
| Kemper Corporation: | ||||||||||||
| 6.000%, 11/30/2015 | 8,500,000 | 8,860,774 | ||||||||||
| 6.000%, 05/15/2017 | 4,565,000 | 4,931,711 | ||||||||||
| KeyBank National Association: | ||||||||||||
| 4.950%, 09/15/2015 | 920,000 | 946,203 | ||||||||||
| 2.500%, 12/15/2019 @ | 5,325,000 | 5,346,811 | ||||||||||
| Kookmin Bank: | ||||||||||||
| 1.109%, 01/27/2017 (Acquired 01/21/2014 through 02/20/2014, Cost $4,752,506) * f | 4,750,000 | 4,781,492 | ||||||||||
| 1.625%, 07/14/2017 (Acquired 07/07/2014, Cost $5,983,080) * f | 6,000,000 | 5,966,460 | ||||||||||
| LeasePlan Corporation N.V., | ||||||||||||
| 2.500%, 05/16/2018 (Acquired 05/07/2013 through 10/20/2014, Cost $14,710,581) * f | 14,785,000 | 14,791,343 | ||||||||||
| Lloyds Bank plc, | ||||||||||||
| 4.875%, 01/21/2016 f | 1,775,000 | 1,846,435 | ||||||||||
| M&I Marshall & Ilsley Bank: | ||||||||||||
| 4.850%, 06/16/2015 | 6,857,000 | 6,980,872 | ||||||||||
| 5.000%, 01/17/2017 | 2,488,000 | 2,640,464 | ||||||||||
| M&T Capital Trust I, | ||||||||||||
| 8.234%, 02/01/2027 | 1,000,000 | 1,009,336 | ||||||||||
| Macquarie Bank Limited: | ||||||||||||
| 2.000%, 08/15/2016 (Acquired 08/07/2013 through 09/27/2013, Cost $10,014,962) * f | 10,000,000 | 10,121,790 | ||||||||||
| 0.864%, 10/27/2017 (Acquired 10/22/2014, Cost $5,000,000) * f | 5,000,000 | 5,005,470 | ||||||||||
| Macquarie Group Limited, | ||||||||||||
| 4.875%, 08/10/2017 (Acquired 10/29/2014 through 11/25/2014, Cost $2,960,787) * f | 2,750,000 | 2,940,542 | ||||||||||
| Manufacturers And Traders Trust Company: | ||||||||||||
| 0.535%, 03/07/2016 | 8,150,000 | 8,146,406 | ||||||||||
| 0.534%, 07/25/2017 | 1,000,000 | 996,695 | ||||||||||
| 6.625%, 12/04/2017 | 1,000,000 | 1,131,327 | ||||||||||
| Marsh & McLennan Companies, Inc., | ||||||||||||
| 2.300%, 04/01/2017 | 1,297,000 | 1,313,075 | ||||||||||
| MassMutual Global Funding II, | ||||||||||||
| 3.125%, 04/14/2016 (Acquired 01/19/2012 through 08/26/2014, Cost $2,132,041) * | 2,100,000 | 2,162,641 | ||||||||||
| Metropolitan Life Global Funding I, | ||||||||||||
| 0.609%, 04/10/2017 (Acquired 04/07/2014, Cost $8,500,000) * | 8,500,000 | 8,522,916 | ||||||||||
| Mizuho Bank, Ltd.: | ||||||||||||
| 2.550%, 03/17/2017 (Acquired 05/30/2013 through 05/30/2013, Cost $7,017,702) * f | 6,900,000 | 7,034,847 | ||||||||||
| 0.659%, 04/16/2017 (Acquired 04/09/2014, Cost $2,800,000) * f | 2,800,000 | 2,801,246 | ||||||||||
| Morgan Stanley: | ||||||||||||
| 1.750%, 02/25/2016 | 2,000,000 | 2,010,848 | ||||||||||
| 5.450%, 01/09/2017 | 2,950,000 | 3,167,456 | ||||||||||
| 1.007%, 01/05/2018 | 1,500,000 | 1,500,381 | ||||||||||
| 6.625%, 04/01/2018 | 2,000,000 | 2,278,070 | ||||||||||
| 1.083%, 01/24/2019 | 4,750,000 | 4,759,372 | ||||||||||
| MUFG Union Bank, National Association: | ||||||||||||
| 3.000%, 06/06/2016 | 6,300,000 | 6,467,744 | ||||||||||
| 2.125%, 06/16/2017 | 3,500,000 | 3,538,937 | ||||||||||
| National Australia Bank Limited, | ||||||||||||
| 0.733%, 10/08/2015 (Acquired 03/26/2013 through 08/26/2014, Cost $1,198,889) * f | 1,200,000 | 1,199,827 | ||||||||||
| National City Bank, | ||||||||||||
| 5.800%, 06/07/2017 | 2,525,000 | 2,772,437 | ||||||||||
| Nomura Holdings, Inc.: | ||||||||||||
| 5.000%, 03/04/2015 f | 1,000,000 | 1,007,145 | ||||||||||
| 2.000%, 09/13/2016 f | 10,205,000 | 10,287,324 | ||||||||||
| Nordea Bank AB: | ||||||||||||
| 3.125%, 03/20/2017 (Acquired 10/03/2012 through 08/21/2013, Cost $5,272,324) * f | 5,140,000 | 5,324,911 | ||||||||||
| 1.250%, 04/04/2017 (Acquired 03/31/2014, Cost $3,988,880) * f | 4,000,000 | 3,979,664 | ||||||||||
| Paine Webber Group Inc., | ||||||||||||
| 7.990%, 06/09/2017 | 300,000 | 317,906 | ||||||||||
| Principal Financial Group, Inc., | ||||||||||||
| 1.850%, 11/15/2017 @ | 3,500,000 | 3,502,796 | ||||||||||
| Prudential Covered Trust 2012-1, | ||||||||||||
| 2.997%, 09/30/2015 (Acquired 10/16/2012 through 07/15/2013, Cost $2,445,237) * | 2,418,750 | 2,452,724 | ||||||||||
| Prudential Financial, Inc., | ||||||||||||
| 6.100%, 06/15/2017 | 4,720,000 | 5,211,772 | ||||||||||
| Rabobank Nederland, | ||||||||||||
| 3.375%, 01/19/2017 f | 1,092,000 | 1,139,159 | ||||||||||
| Raymond James Financial, Inc., | ||||||||||||
| 4.250%, 04/15/2016 | 5,600,000 | 5,806,114 | ||||||||||
| Regions Bank, | ||||||||||||
| 7.500%, 05/15/2018 | 4,670,000 | 5,421,380 | ||||||||||
| Regions Financial Corporation, | ||||||||||||
| 5.750%, 06/15/2015 @ | 3,549,000 | 3,622,709 | ||||||||||
| Royal Bank of Canada, | ||||||||||||
| 1.400%, 10/13/2017 f | 8,450,000 | 8,422,352 | ||||||||||
| Santander Bank, N.A., | ||||||||||||
| 8.750%, 05/30/2018 | 1,443,000 | 1,718,616 | ||||||||||
| Santander Holdings USA, Inc., | ||||||||||||
| 3.000%, 09/24/2015 | 2,975,000 | 3,010,658 | ||||||||||
| Societe Generale: | ||||||||||||
| 3.100%, 09/14/2015 (Acquired 02/06/2013 through 06/19/2013, Cost $3,514,671) * f | 3,475,000 | 3,527,399 | ||||||||||
| 5.750%, 04/20/2016 (Acquired 07/08/2014, Cost $1,995,217) * f | 1,890,000 | 1,979,023 | ||||||||||
| 1.335%, 10/01/2018 f | 6,000,000 | 6,105,864 | ||||||||||
| 2.625%, 10/01/2018 @ f | 1,000,000 | 1,015,637 | ||||||||||
| Standard Chartered PLC: | ||||||||||||
| 0.575%, 09/08/2017 (Acquired 09/03/2014, Cost $10,000,000) * f | 10,000,000 | 9,951,950 | ||||||||||
| 2.400%, 09/08/2019 (Acquired 09/03/2014, Cost $1,996,540) * @ f | 2,000,000 | 1,989,442 | ||||||||||
| Sumitomo Mitsui Banking Corporation: | ||||||||||||
| 1.450%, 07/19/2016 @ f | 4,000,000 | 4,014,892 | ||||||||||
| 0.659%, 01/10/2017 f | 2,075,000 | 2,072,510 | ||||||||||
| SunTrust Bank: | ||||||||||||
| 0.555%, 04/01/2015 | 7,755,000 | 7,749,269 | ||||||||||
| 0.523%, 08/24/2015 | 1,000,000 | 997,998 | ||||||||||
| 5.000%, 09/01/2015 | 2,396,000 | 2,461,572 | ||||||||||
| 7.250%, 03/15/2018 | 154,000 | 178,186 | ||||||||||
| SunTrust Banks, Inc., | ||||||||||||
| 6.000%, 09/11/2017 | 780,000 | 864,663 | ||||||||||
| SUSA Partnership, L.P., | ||||||||||||
| 8.200%, 06/01/2017 | 714,000 | 814,360 | ||||||||||
| Svenska Handelsbanken AB: | ||||||||||||
| 3.125%, 07/12/2016 f | 175,000 | 180,760 | ||||||||||
| 2.875%, 04/04/2017 f | 275,000 | 284,232 | ||||||||||
| 1.625%, 03/21/2018 f | 1,100,000 | 1,098,295 | ||||||||||
| 0.733%, 06/17/2019 f | 2,000,000 | 2,001,650 | ||||||||||
| Symetra Financial Corporation, | ||||||||||||
| 6.125%, 04/01/2016 (Acquired 11/24/2014, Cost $2,776,492) * | 2,630,000 | 2,759,215 | ||||||||||
| Synchrony Financial, | ||||||||||||
| 3.000%, 08/15/2019 @ | 13,350,000 | 13,496,089 | ||||||||||
| The Bank of New York Mellon Corporation, | ||||||||||||
| 0.792%, 08/01/2018 | 1,000,000 | 1,002,100 | ||||||||||
| The Bank of Tokyo-Mitsubishi UFJ, Ltd.: | ||||||||||||
| 0.611%, 07/15/2016 f | 5,000,000 | 4,998,435 | ||||||||||
| 0.648%, 03/10/2017 (Acquired 11/24/2014, Cost $3,296,337) * f | 3,300,000 | 3,283,536 | ||||||||||
| The Bear Stearns Companies LLC: | ||||||||||||
| 6.400%, 10/02/2017 | 7,700,000 | 8,623,307 | ||||||||||
| 7.250%, 02/01/2018 | 450,000 | 518,647 | ||||||||||
| The Goldman Sachs Group, Inc.: | ||||||||||||
| 6.250%, 09/01/2017 | 4,583,000 | 5,099,275 | ||||||||||
| 1.338%, 12/10/2017 | 1,000,000 | 995,679 | ||||||||||
| 5.950%, 01/18/2018 | 1,045,000 | 1,160,962 | ||||||||||
| 6.150%, 04/01/2018 | 4,550,000 | 5,107,006 | ||||||||||
| 2.900%, 07/19/2018 | 1,000,000 | 1,025,880 | ||||||||||
| 7.500%, 02/15/2019 @ | 3,000,000 | 3,568,383 | ||||||||||
| The Hartford Financial Services Group, Inc.: | ||||||||||||
| 5.500%, 10/15/2016 | 3,150,000 | 3,378,863 | ||||||||||
| 5.375%, 03/15/2017 | 3,145,000 | 3,397,239 | ||||||||||
| 6.300%, 03/15/2018 | 1,825,000 | 2,062,420 | ||||||||||
| 6.000%, 01/15/2019 | 455,000 | 516,017 | ||||||||||
| The Huntington National Bank, | ||||||||||||
| 1.350%, 08/02/2016 | 5,000,000 | 5,002,660 | ||||||||||
| The Royal Bank of Scotland Group Public Limited Company, | ||||||||||||
| 2.550%, 09/18/2015 f | 4,430,000 | 4,474,353 | ||||||||||
| UBS AG: | ||||||||||||
| 5.875%, 12/20/2017 f | 1,000,000 | 1,116,590 | ||||||||||
| 5.750%, 04/25/2018 f | 3,201,000 | 3,600,930 | ||||||||||
| Voya Financial, Inc., | ||||||||||||
| 2.900%, 02/15/2018 | 14,708,000 | 15,057,359 | ||||||||||
| WEA Finance LLC / Westfield UK & Europe Finance PLC, | ||||||||||||
| 2.700%, 09/17/2019 (Acquired 09/10/2014, Cost $6,986,000) * | 7,000,000 | 6,997,963 | ||||||||||
| Wells Fargo Bank, National Association: | ||||||||||||
| 0.442%, 05/16/2016 | 7,000,000 | 6,980,792 | ||||||||||
| 6.000%, 11/15/2017 | 610,000 | 683,757 | ||||||||||
| Westpac Banking Corporation: | ||||||||||||
| 2.000%, 08/14/2017 f | 2,000,000 | 2,026,428 | ||||||||||
| 0.604%, 12/01/2017 f | 10,000,000 | 9,962,280 | ||||||||||
| Willis North America, Inc., | ||||||||||||
| 5.625%, 07/15/2015 | 6,650,000 | 6,811,043 | ||||||||||
| 713,277,456 | 26.7 | % | ||||||||||
| Utility | ||||||||||||
| Beaver Valley II Funding Corporation, | ||||||||||||
| 9.000%, 06/01/2017 | 434,000 | 468,720 | ||||||||||
| Commonwealth Edison Company: | ||||||||||||
| Series 104, 5.950%, 08/15/2016 | 550,000 | 593,148 | ||||||||||
| 6.150%, 09/15/2017 | 100,000 | 112,181 | ||||||||||
| Constellation Energy Group, Inc., | ||||||||||||
| 4.550%, 06/15/2015 | 3,169,000 | 3,220,173 | ||||||||||
| Dominion Resources, Inc.: | ||||||||||||
| 6.400%, 06/15/2018 | 3,550,000 | 4,052,566 | ||||||||||
| 2.500%, 12/01/2019 | 9,500,000 | 9,527,740 | ||||||||||
| Entergy Corporation, | ||||||||||||
| 4.700%, 01/15/2017 | 8,750,000 | 9,214,573 | ||||||||||
| National Grid PLC, | ||||||||||||
| 6.300%, 08/01/2016 f | 9,531,000 | 10,288,219 | ||||||||||
| National Rural Utilities Cooperative Finance Corporation, | ||||||||||||
| 10.375%, 11/01/2018 | 550,000 | 716,502 | ||||||||||
| NextEra Energy Capital Holdings, Inc., | ||||||||||||
| 1.339%, 09/01/2015 | 5,100,000 | 5,115,371 | ||||||||||
| Pacific Gas and Electric Company, | ||||||||||||
| 8.250%, 10/15/2018 | 8,320,000 | 10,011,772 | ||||||||||
| Pepco Holdings, Inc., | ||||||||||||
| 2.700%, 10/01/2015 | 1,395,000 | 1,411,792 | ||||||||||
| PPL Energy Supply, LLC: | ||||||||||||
| Series A, 5.700%, 10/15/2015 | 6,127,000 | 6,260,422 | ||||||||||
| 6.200%, 05/15/2016 | 4,041,000 | 4,199,423 | ||||||||||
| PSEG Power LLC, | ||||||||||||
| 5.320%, 09/15/2016 | 4,905,000 | 5,240,389 | ||||||||||
| Public Service Company of New Mexico, | ||||||||||||
| 7.950%, 05/15/2018 | 623,000 | 733,184 | ||||||||||
| Sempra Energy: | ||||||||||||
| 2.300%, 04/01/2017 | 1,300,000 | 1,323,899 | ||||||||||
| 9.800%, 02/15/2019 | 1,325,000 | 1,701,430 | ||||||||||
| Southwestern Public Service Company, | ||||||||||||
| 5.600%, 10/01/2016 | 3,000,000 | 3,241,512 | ||||||||||
| Trans-Allegheny Interstate Line Company, | ||||||||||||
| 4.000%, 01/15/2015 (Acquired 01/19/2010 through 08/26/2014, Cost $5,883,867) * | 5,890,000 | 5,894,635 | ||||||||||
| Union Electric Company, | ||||||||||||
| 4.750%, 04/01/2015 | 500,000 | 505,003 | ||||||||||
| 83,832,654 | 3.1 | % | ||||||||||
| Industrials | ||||||||||||
| A.P. Meoller - Maersk A/S, | ||||||||||||
| 2.550%, 09/22/2019 (Acquired 09/15/2014, Cost $4,540,672) * f | 4,550,000 | 4,562,763 | ||||||||||
| AbbVie Inc., | ||||||||||||
| 1.750%, 11/06/2017 | 10,049,000 | 10,070,836 | ||||||||||
| Actavis Funding SCS, | ||||||||||||
| 2.450%, 06/15/2019 f | 3,000,000 | 2,948,841 | ||||||||||
| ACTAVIS, INC., | ||||||||||||
| 1.875%, 10/01/2017 | 1,392,000 | 1,386,605 | ||||||||||
| ADT Corp., | ||||||||||||
| 2.250%, 07/15/2017 | 6,700,000 | 6,482,250 | ||||||||||
| Agrium Inc., | ||||||||||||
| 7.700%, 02/01/2017 f | 5,000,000 | 5,580,145 | ||||||||||
| Alibaba Group Holding Limited, | ||||||||||||
| 0.756%, 11/28/2017 (Acquired 11/20/2014, Cost $2,500,000) * f | 2,500,000 | 2,504,917 | ||||||||||
| Altera Corporation, | ||||||||||||
| 2.500%, 11/15/2018 | 3,000,000 | 3,019,110 | ||||||||||
| America Movil, S.A.B. de C.V., | ||||||||||||
| 1.241%, 09/12/2016 f | 9,000,000 | 9,064,377 | ||||||||||
| Amgen Inc.: | ||||||||||||
| 0.613%, 05/22/2017 | 2,750,000 | 2,744,074 | ||||||||||
| 5.700%, 02/01/2019 | 10,000,000 | 11,248,780 | ||||||||||
| Anadarko Petroleum Corporation: | ||||||||||||
| 5.950%, 09/15/2016 | 5,705,000 | 6,100,813 | ||||||||||
| 6.375%, 09/15/2017 | 2,400,000 | 2,668,325 | ||||||||||
| 8.700%, 03/15/2019 | 2,970,000 | 3,638,104 | ||||||||||
| Anglo American Capital PLC, | ||||||||||||
| 1.181%, 04/15/2016 (Acquired 04/08/2014 through 11/13/2014, Cost $2,045,964) * f | 2,045,000 | 2,047,057 | ||||||||||
| ArcelorMittal S.A., | ||||||||||||
| 4.250%, 08/05/2015 f | 1,525,000 | 1,547,875 | ||||||||||
| Avon Products, Inc., | ||||||||||||
| 2.375%, 03/15/2016 | 2,000,000 | 1,980,000 | ||||||||||
| Beam Suntory Inc.: | ||||||||||||
| 5.375%, 01/15/2016 | 1,269,000 | 1,326,774 | ||||||||||
| 1.875%, 05/15/2017 | 8,000,000 | 8,032,440 | ||||||||||
| Boardwalk Pipelines, LP, | ||||||||||||
| 5.500%, 02/01/2017 | 13,384,000 | 14,118,969 | ||||||||||
| Boston Scientific Corporation: | ||||||||||||
| 5.125%, 01/12/2017 | 3,000,000 | 3,180,045 | ||||||||||
| 2.650%, 10/01/2018 | 7,077,000 | 7,085,330 | ||||||||||
| BP Capital Markets: | ||||||||||||
| 0.742%, 05/10/2018 f | 1,575,000 | 1,557,977 | ||||||||||
| 0.885%, 09/26/2018 f | 7,085,000 | 7,020,406 | ||||||||||
| Bunge Limited Finance Corp.: | ||||||||||||
| 5.100%, 07/15/2015 | 2,335,000 | 2,385,707 | ||||||||||
| 3.200%, 06/15/2017 @ | 500,000 | 514,122 | ||||||||||
| 8.500%, 06/15/2019 | 3,808,000 | 4,666,856 | ||||||||||
| Bunge N.A. Finance L.P., | ||||||||||||
| 5.900%, 04/01/2017 | 1,820,000 | 1,978,844 | ||||||||||
| CareFusion Corporation, | ||||||||||||
| 1.450%, 05/15/2017 | 5,315,000 | 5,277,386 | ||||||||||
| CF Industries, Inc., | ||||||||||||
| 6.875%, 05/01/2018 | 11,182,000 | 12,712,022 | ||||||||||
| Coca-Cola FEMSA, S.A.B. de C.V., | ||||||||||||
| 2.375%, 11/26/2018 f | 4,000,000 | 4,072,840 | ||||||||||
| Colorado Interstate Gas Company, L.L.C., | ||||||||||||
| 6.800%, 11/15/2015 | 2,000,000 | 2,092,016 | ||||||||||
| Computer Sciences Corporation, | ||||||||||||
| 2.500%, 09/15/2015 | 9,864,000 | 9,953,062 | ||||||||||
| ConAgra Foods, Inc.: | ||||||||||||
| 5.819%, 06/15/2017 | 6,234,000 | 6,824,952 | ||||||||||
| 1.900%, 01/25/2018 | 9,290,000 | 9,228,110 | ||||||||||
| Cox Communications, Inc.: | ||||||||||||
| 5.500%, 10/01/2015 | 200,000 | 206,769 | ||||||||||
| 7.250%, 11/15/2015 | 2,000,000 | 2,105,196 | ||||||||||
| 5.875%, 12/01/2016 (Acquired 02/26/2014, Cost $1,083,617) * | 1,000,000 | 1,080,922 | ||||||||||
| Crane Co., | ||||||||||||
| 2.750%, 12/15/2018 | 7,585,000 | 7,666,819 | ||||||||||
| CRH America, Inc., | ||||||||||||
| 6.000%, 09/30/2016 | 5,865,000 | 6,312,582 | ||||||||||
| CSX Corporation, | ||||||||||||
| 7.900%, 05/01/2017 | 2,221,000 | 2,535,367 | ||||||||||
| Daimler Finance North America LLC: | ||||||||||||
| 1.250%, 01/11/2016 (Acquired 01/07/2013, Cost $2,846,494) * | 2,850,000 | 2,857,752 | ||||||||||
| 0.912%, 08/01/2016 (Acquired 07/24/2013 through 08/26/2014, Cost $2,281,972) * | 2,280,000 | 2,292,146 | ||||||||||
| 0.588%, 03/10/2017 (Acquired 03/03/2014, Cost $2,000,000) * | 2,000,000 | 1,996,018 | ||||||||||
| 0.572%, 08/01/2017 (Acquired 07/24/2014, Cost $2,000,000) * | 2,000,000 | 1,994,360 | ||||||||||
| 1.092%, 08/01/2018 (Acquired 11/14/2014, Cost $2,023,734) * | 2,000,000 | 2,025,374 | ||||||||||
| DCP Midstream Operating, LP, | ||||||||||||
| 2.500%, 12/01/2017 | 250,000 | 249,713 | ||||||||||
| DCP Midstream, LLC, | ||||||||||||
| 5.375%, 10/15/2015 (Acquired 01/13/2012, Cost $1,745,587) * | 1,708,000 | 1,760,917 | ||||||||||
| Deutsche Telekom International Finance B.V.: | ||||||||||||
| 5.750%, 03/23/2016 f | 400,000 | 422,399 | ||||||||||
| 3.125%, 04/11/2016 (Acquired 03/14/2012 through 06/25/2013, Cost $5,848,404) * f | 5,775,000 | 5,918,953 | ||||||||||
| 6.750%, 08/20/2018 f | 3,900,000 | 4,525,814 | ||||||||||
| DIRECTV Holdings LLC / DIRECTV Financing Co., Inc., | ||||||||||||
| 3.500%, 03/01/2016 | 400,000 | 410,434 | ||||||||||
| Dollar General Corporation, | ||||||||||||
| 4.125%, 07/15/2017 | 17,321,000 | 17,863,424 | ||||||||||
| Eaton Corporation, | ||||||||||||
| 1.500%, 11/02/2017 | 5,000,000 | 4,971,035 | ||||||||||
| El Paso Natural Gas Company, L.L.C., | ||||||||||||
| 5.950%, 04/15/2017 | 2,050,000 | 2,203,865 | ||||||||||
| El Paso Pipeline Partners Operating Company, L.L.C., | ||||||||||||
| 4.100%, 11/15/2015 | 5,286,000 | 5,408,535 | ||||||||||
| Enable Midstream Partners, LP, | ||||||||||||
| 2.400%, 05/15/2019 (Acquired 05/19/2014, Cost $2,997,780) * | 3,000,000 | 2,917,806 | ||||||||||
| Enbridge Inc.: | ||||||||||||
| 0.905%, 10/01/2016 f | 2,100,000 | 2,098,914 | ||||||||||
| 5.600%, 04/01/2017 f | 5,125,000 | 5,563,839 | ||||||||||
| Encana Corporation, | ||||||||||||
| 5.900%, 12/01/2017 f | 1,500,000 | 1,636,138 | ||||||||||
| Energy Transfer Partners, L.P.: | ||||||||||||
| 5.950%, 02/01/2015 | 5,570,000 | 5,588,386 | ||||||||||
| 6.125%, 02/15/2017 | 645,000 | 698,517 | ||||||||||
| 9.700%, 03/15/2019 | 5,494,000 | 6,895,613 | ||||||||||
| Enterprise Products Operating LLC, | ||||||||||||
| 1.250%, 08/13/2015 | 3,000,000 | 3,007,926 | ||||||||||
| Express Scripts Holding Company: | ||||||||||||
| 3.125%, 05/15/2016 | 3,000,000 | 3,083,829 | ||||||||||
| 2.650%, 02/15/2017 | 200,000 | 204,499 | ||||||||||
| FBG Finance Pty Ltd, | ||||||||||||
| 5.125%, 06/15/2015 (Acquired 03/12/2012, Cost $522,949) * f | 515,000 | 525,198 | ||||||||||
| Federal Express Corp 1998 Pass Through Trust, | ||||||||||||
| Series 981B, 6.845%, 01/15/2019 | 3,429,592 | 3,777,996 | ||||||||||
| Federal Express Corp 2012 Pass Through Trust, | ||||||||||||
| 2.625%, 01/15/2018 (Acquired 01/20/2012 through 05/07/2012, Cost $1,471,681) * | 1,470,453 | 1,488,189 | ||||||||||
| Fidelity National Information Services, Inc., | ||||||||||||
| 1.450%, 06/05/2017 | 3,000,000 | 2,983,197 | ||||||||||
| Fiserv, Inc.: | ||||||||||||
| 3.125%, 10/01/2015 | 2,586,000 | 2,630,539 | ||||||||||
| 3.125%, 06/15/2016 | 3,295,000 | 3,382,963 | ||||||||||
| Florida Gas Transmission Company, LLC, | ||||||||||||
| 4.000%, 07/15/2015 (Acquired 09/12/2012 through 10/15/2013, Cost $3,499,486) * | 3,450,000 | 3,497,627 | ||||||||||
| Ford Motor Credit Company LLC: | ||||||||||||
| 2.500%, 01/15/2016 | 800,000 | 808,949 | ||||||||||
| 6.625%, 08/15/2017 @ | 9,100,000 | 10,144,289 | ||||||||||
| 1.724%, 12/06/2017 | 1,250,000 | 1,237,081 | ||||||||||
| Forest Laboratories, Inc., | ||||||||||||
| 4.375%, 02/01/2019 (Acquired 08/13/2014 through 09/29/2014, Cost $10,079,534) * | 9,450,000 | 9,982,697 | ||||||||||
| Freeport-McMoRan Inc., | ||||||||||||
| 2.150%, 03/01/2017 | 2,000,000 | 2,003,292 | ||||||||||
| Georgia-Pacific LLC, | ||||||||||||
| 7.700%, 06/15/2015 | 3,600,000 | 3,704,306 | ||||||||||
| Glencore Canada Corporation, | ||||||||||||
| 6.000%, 10/15/2015 f | 2,245,000 | 2,320,784 | ||||||||||
| Glencore Finance (Canada) Limited, | ||||||||||||
| 2.050%, 10/23/2015 (Acquired 10/18/2012, Cost $2,999,040) * f | 3,000,000 | 3,019,521 | ||||||||||
| Glencore Funding LLC: | ||||||||||||
| 1.700%, 05/27/2016 (Acquired 05/22/2013, Cost $2,998,770) * @ | 3,000,000 | 3,004,770 | ||||||||||
| 1.591%, 01/15/2019 (Acquired 06/17/2014, Cost $5,041,781) * | 5,000,000 | 5,084,445 | ||||||||||
| 2.500%, 01/15/2019 (Acquired 05/22/2013, Cost $597,012) * @ | 600,000 | 590,805 | ||||||||||
| GTE Corporation, | ||||||||||||
| 6.840%, 04/15/2018 | 140,000 | 161,528 | ||||||||||
| Gulfstream Natural Gas System, L.L.C., | ||||||||||||
| 6.950%, 06/01/2016 (Acquired 07/22/2013 through 08/27/2013, Cost $8,233,706) * | 7,646,000 | 8,200,847 | ||||||||||
| Heineken N.V., | ||||||||||||
| 1.400%, 10/01/2017 (Acquired 10/02/2012, Cost $1,993,400) * f | 2,000,000 | 1,988,476 | ||||||||||
| Hess Corporation, | ||||||||||||
| 8.125%, 02/15/2019 | 3,982,000 | 4,737,752 | ||||||||||
| Hewlett-Packard Company: | ||||||||||||
| 3.000%, 09/15/2016 | 550,000 | 564,727 | ||||||||||
| 1.170%, 01/14/2019 @ | 5,700,000 | 5,602,473 | ||||||||||
| 2.750%, 01/14/2019 | 1,119,000 | 1,120,430 | ||||||||||
| Hospira, Inc., | ||||||||||||
| 6.050%, 03/30/2017 | 9,654,000 | 10,408,605 | ||||||||||
| Husky Energy Inc., | ||||||||||||
| 6.200%, 09/15/2017 f | 1,000,000 | 1,099,777 | ||||||||||
| Husky Oil Limited, | ||||||||||||
| 7.550%, 11/15/2016 f | 2,500,000 | 2,749,428 | ||||||||||
| Hutchison Whampoa International (09/16) Limited, | ||||||||||||
| 4.625%, 09/11/2015 (Acquired 09/24/2012 through 06/25/2013, Cost $9,278,424) * f | 9,090,000 | 9,318,886 | ||||||||||
| Hutchison Whampoa International (14) Limited, | ||||||||||||
| 1.625%, 10/31/2017 (Acquired 10/28/2014, Cost $4,988,500) * f | 5,000,000 | 4,958,800 | ||||||||||
| Hyundai Capital Services, Inc.: | ||||||||||||
| 6.000%, 05/05/2015 (Acquired 11/01/2012 through 08/26/2014, Cost $7,898,354) * f | 7,774,000 | 7,903,795 | ||||||||||
| 4.375%, 07/27/2016 (Acquired 05/11/2012 through 12/05/2013, Cost $6,416,982) * f | 6,230,000 | 6,518,729 | ||||||||||
| 3.500%, 09/13/2017 (Acquired 06/04/2014, Cost $2,091,007) * f | 2,000,000 | 2,068,954 | ||||||||||
| Ingersoll-Rand Global Holding Company Limited, | ||||||||||||
| 6.875%, 08/15/2018 | 1,000,000 | 1,160,866 | ||||||||||
| Ingredion Incorporated, | ||||||||||||
| 1.800%, 09/25/2017 | 9,100,000 | 9,073,856 | ||||||||||
| John Deere Capital Corporation, | ||||||||||||
| 0.461%, 12/15/2017 | 500,000 | 500,073 | ||||||||||
| Johnson Controls, Inc., | ||||||||||||
| 5.500%, 01/15/2016 @ | 7,370,000 | 7,718,048 | ||||||||||
| Kia Motors Corporation, | ||||||||||||
| 3.625%, 06/14/2016 (Acquired 02/18/2014, Cost $1,441,542) * f | 1,400,000 | 1,443,456 | ||||||||||
| Kinder Morgan Energy Partners, L.P.: | ||||||||||||
| 6.000%, 02/01/2017 | 250,000 | 270,058 | ||||||||||
| 5.950%, 02/15/2018 | 1,710,000 | 1,887,845 | ||||||||||
| Kinder Morgan, Inc., | ||||||||||||
| 2.000%, 12/01/2017 | 3,000,000 | 2,981,439 | ||||||||||
| L-3 Communications Corporation, | ||||||||||||
| 1.500%, 05/28/2017 | 2,000,000 | 1,980,326 | ||||||||||
| Laboratory Corporation of America Holdings: | ||||||||||||
| 5.625%, 12/15/2015 | 2,491,000 | 2,591,308 | ||||||||||
| 3.125%, 05/15/2016 | 2,000,000 | 2,052,520 | ||||||||||
| Marathon Oil Corporation, | ||||||||||||
| 6.000%, 10/01/2017 | 7,805,000 | 8,603,202 | ||||||||||
| Marathon Petroleum Corporation, | ||||||||||||
| 3.500%, 03/01/2016 | 1,503,000 | 1,540,190 | ||||||||||
| Masco Corporation, | ||||||||||||
| 6.125%, 10/03/2016 | 9,654,000 | 10,238,067 | ||||||||||
| McKesson Corporation, | ||||||||||||
| 0.638%, 09/10/2015 | 435,000 | 435,136 | ||||||||||
| Medco Health Solutions, Inc., | ||||||||||||
| 2.750%, 09/15/2015 | 375,000 | 379,922 | ||||||||||
| Medtronic, Inc., | ||||||||||||
| 1.043%, 03/15/2020 (Acquired 12/01/2014, Cost $2,250,000) * | 2,250,000 | 2,247,626 | ||||||||||
| Mondelez International, Inc.: | ||||||||||||
| 6.125%, 02/01/2018 | 8,400,000 | 9,438,181 | ||||||||||
| 0.752%, 02/01/2019 @ | 9,337,000 | 9,232,818 | ||||||||||
| Murphy Oil Corporation, | ||||||||||||
| 2.500%, 12/01/2017 | 10,281,000 | 10,219,314 | ||||||||||
| Mylan Inc.: | ||||||||||||
| 1.800%, 06/24/2016 | 1,350,000 | 1,358,140 | ||||||||||
| 2.600%, 06/24/2018 | 1,150,000 | 1,165,025 | ||||||||||
| 7.875%, 07/15/2020 (Acquired 07/16/2013 through 09/16/2013, Cost $6,428,152) * | 6,000,000 | 6,391,170 | ||||||||||
| Nabors Industries, Inc., | ||||||||||||
| 2.350%, 09/15/2016 | 2,000,000 | 1,978,276 | ||||||||||
| National Oilwell Varco, Inc., | ||||||||||||
| Series B, 6.125%, 08/15/2015 | 4,700,000 | 4,702,237 | ||||||||||
| NBCUniversal Enterprise, Inc., | ||||||||||||
| 0.768%, 04/15/2016 (Acquired 07/03/2013 through 10/21/2013, Cost $2,264,120) * | 2,260,000 | 2,264,079 | ||||||||||
| NiSource Finance Corp.: | ||||||||||||
| 5.250%, 09/15/2017 | 5,400,000 | 5,904,997 | ||||||||||
| 6.400%, 03/15/2018 | 500,000 | 569,464 | ||||||||||
| Nissan Motor Acceptance Corporation: | ||||||||||||
| 0.955%, 09/26/2016 (Acquired 09/19/2013, Cost $5,000,000) * | 5,000,000 | 5,028,865 | ||||||||||
| 0.785%, 03/03/2017 (Acquired 02/25/2014, Cost $3,000,000) * | 3,000,000 | 3,009,543 | ||||||||||
| 2.650%, 09/26/2018 (Acquired 07/29/2014 through 11/05/2014, Cost $4,458,349) * | 4,365,000 | 4,444,779 | ||||||||||
| Noble Holding International Limited: | ||||||||||||
| 3.450%, 08/01/2015 f | 4,552,000 | 4,611,877 | ||||||||||
| 2.500%, 03/15/2017 f | 5,510,000 | 5,271,081 | ||||||||||
| ONEOK Partners, L.P.: | ||||||||||||
| 6.150%, 10/01/2016 | 5,289,000 | 5,678,694 | ||||||||||
| 2.000%, 10/01/2017 | 2,858,000 | 2,842,044 | ||||||||||
| 8.625%, 03/01/2019 | 1,500,000 | 1,812,484 | ||||||||||
| Pentair Finance S.A., | ||||||||||||
| 1.875%, 09/15/2017 f | 4,000,000 | 3,995,164 | ||||||||||
| Petrofac Limited, | ||||||||||||
| 3.400%, 10/10/2018 (Acquired 10/03/2013 through 09/19/2014, Cost $11,971,239) * f | 11,750,000 | 11,591,751 | ||||||||||
| PetroLogistics LP / PetroLogistics Finance Corp., | ||||||||||||
| 6.250%, 04/01/2020 | 11,755,000 | 12,666,013 | ||||||||||
| Phillips 66, | ||||||||||||
| 2.950%, 05/01/2017 | 3,000,000 | 3,098,349 | ||||||||||
| Pioneer Natural Resources Company: | ||||||||||||
| 5.875%, 07/15/2016 | 10,133,000 | 10,762,057 | ||||||||||
| 6.650%, 03/15/2017 | 1,260,000 | 1,380,390 | ||||||||||
| 6.875%, 05/01/2018 | 1,000,000 | 1,119,425 | ||||||||||
| Plum Creek Timberlands, L.P., | ||||||||||||
| 5.875%, 11/15/2015 | 9,700,000 | 10,076,641 | ||||||||||
| PPG Industries, Inc., | ||||||||||||
| 1.900%, 01/15/2016 | 1,552,000 | 1,568,518 | ||||||||||
| Quest Diagnostics Inc, | ||||||||||||
| 3.200%, 04/01/2016 | 5,050,000 | 5,174,154 | ||||||||||
| Republic Services, Inc., | ||||||||||||
| 5.500%, 09/15/2019 | 6,446,000 | 7,261,928 | ||||||||||
| Rockies Express Pipeline LLC, | ||||||||||||
| 3.900%, 04/15/2015 (Acquired 02/17/2011, Cost $2,000,023) * | 2,000,000 | 1,990,000 | ||||||||||
| Rohm and Haas Company, | ||||||||||||
| 6.000%, 09/15/2017 | 646,000 | 714,466 | ||||||||||
| RPM International Inc., | ||||||||||||
| 6.500%, 02/15/2018 | 3,870,000 | 4,324,384 | ||||||||||
| RPM United Kingdom G.P., | ||||||||||||
| 6.700%, 11/01/2015 (Acquired 03/04/2013 through 08/26/2014, Cost $8,030,186) * f | 7,700,000 | 7,999,569 | ||||||||||
| SABMiller Holdings Inc., | ||||||||||||
| 0.922%, 08/01/2018 (Acquired 08/06/2013 through 11/14/2014, Cost $7,207,139) * | 7,180,000 | 7,202,746 | ||||||||||
| Seagate HDD Cayman, | ||||||||||||
| 6.875%, 05/01/2020 f | 10,653,000 | 11,185,650 | ||||||||||
| Southwestern Bell Telephone, L.P., | ||||||||||||
| 7.000%, 07/01/2015 | 875,000 | 898,330 | ||||||||||
| Sunoco, Inc., | ||||||||||||
| 5.750%, 01/15/2017 | 600,000 | 648,684 | ||||||||||
| Talisman Energy Inc., | ||||||||||||
| 5.125%, 05/15/2015 f | 3,557,000 | 3,610,341 | ||||||||||
| Telecom Italia Capital, | ||||||||||||
| 5.250%, 10/01/2015 f | 10,960,000 | 11,179,200 | ||||||||||
| Telefonica Emisiones S.A.U.: | ||||||||||||
| 6.421%, 06/20/2016 f | 7,290,000 | 7,798,492 | ||||||||||
| 6.221%, 07/03/2017 f | 1,344,000 | 1,487,938 | ||||||||||
| Telefonica Moviles Chile S.A., | ||||||||||||
| 2.875%, 11/09/2015 (Acquired 11/03/2010 through 04/04/2012, Cost $1,017,018) * f | 1,020,000 | 1,031,294 | ||||||||||
| Temple-Inland Inc., | ||||||||||||
| 6.625%, 01/15/2018 | 4,676,000 | 5,221,189 | ||||||||||
| Tennessee Gas Pipeline Company, L.L.C., | ||||||||||||
| 8.000%, 02/01/2016 | 1,000,000 | 1,065,814 | ||||||||||
| The Dow Chemical Company, | ||||||||||||
| 8.550%, 05/15/2019 | 11,427,000 | 14,206,572 | ||||||||||
| The Valspar Corporation, | ||||||||||||
| 5.100%, 08/01/2015 | 10,450,000 | 10,698,376 | ||||||||||
| Thermo Fisher Scientific Inc., | ||||||||||||
| 1.850%, 01/15/2018 | 7,000,000 | 6,944,924 | ||||||||||
| Thomson Reuters Corporation: | ||||||||||||
| 0.875%, 05/23/2016 f | 4,650,000 | 4,625,904 | ||||||||||
| 1.650%, 09/29/2017 f | 7,000,000 | 6,957,104 | ||||||||||
| Time Warner Cable Inc.: | ||||||||||||
| 5.850%, 05/01/2017 | 2,355,000 | 2,570,598 | ||||||||||
| 8.250%, 04/01/2019 | 1,000,000 | 1,224,143 | ||||||||||
| Time Warner Companies, Inc., | ||||||||||||
| 7.250%, 10/15/2017 | 7,831,000 | 8,974,342 | ||||||||||
| Total Capital International: | ||||||||||||
| 0.802%, 08/10/2018 f | 4,350,000 | 4,373,233 | ||||||||||
| 0.595%, 06/19/2019 f | 7,700,000 | 7,625,564 | ||||||||||
| TransCanada PipeLines Ltd, | ||||||||||||
| 0.937%, 06/30/2016 f | 2,575,000 | 2,587,180 | ||||||||||
| Transocean Inc: | ||||||||||||
| 5.050%, 12/15/2016 f | 400,000 | 401,915 | ||||||||||
| 2.500%, 10/15/2017 f | 7,400,000 | 6,541,926 | ||||||||||
| TSMC Global Ltd: | ||||||||||||
| 0.950%, 04/03/2016 (Acquired 03/27/2013, Cost $1,999,760) * f | 2,000,000 | 1,990,656 | ||||||||||
| 1.625%, 04/03/2018 (Acquired 08/05/2014 through 08/14/2014, Cost $6,088,652) * f | 6,175,000 | 6,060,886 | ||||||||||
| Tyco Electronics Group S.A., | ||||||||||||
| 6.550%, 10/01/2017 f | 860,000 | 968,041 | ||||||||||
| Vale Overseas Limited, | ||||||||||||
| 6.250%, 01/23/2017 f | 915,000 | 975,948 | ||||||||||
| Valero Energy Corporation: | ||||||||||||
| 6.125%, 06/15/2017 | 1,120,000 | 1,230,222 | ||||||||||
| 9.375%, 03/15/2019 | 10,349,000 | 12,906,559 | ||||||||||
| Verizon Communications Inc.: | ||||||||||||
| 2.500%, 09/15/2016 | 2,057,000 | 2,102,614 | ||||||||||
| 3.650%, 09/14/2018 | 14,000,000 | 14,794,178 | ||||||||||
| Viacom Inc., | ||||||||||||
| 6.250%, 04/30/2016 | 2,255,000 | 2,409,021 | ||||||||||
| Vodafone Group Public Limited Company, | ||||||||||||
| 5.625%, 02/27/2017 f | 2,000,000 | 2,166,970 | ||||||||||
| Volkswagen Group of America Finance, LLC: | ||||||||||||
| 0.603%, 05/23/2017 (Acquired 05/15/2014, Cost $2,750,000) * | 2,750,000 | 2,742,083 | ||||||||||
| 0.672%, 11/20/2017 (Acquired 11/12/2014, Cost $4,500,000) * | 4,500,000 | 4,493,461 | ||||||||||
| Walgreen Co., | ||||||||||||
| 5.250%, 01/15/2019 | 9,392,000 | 10,440,025 | ||||||||||
| Walgreens Boots Alliance, Inc., | ||||||||||||
| 1.750%, 11/17/2017 | 1,150,000 | 1,152,847 | ||||||||||
| Weatherford International Ltd, | ||||||||||||
| 5.500%, 02/15/2016 f | 600,000 | 618,958 | ||||||||||
| Williams Partners L.P., | ||||||||||||
| 3.800%, 02/15/2015 | 9,000,000 | 9,025,713 | ||||||||||
| Williams Partners LP / Williams Partners Finance Corp., | ||||||||||||
| 7.250%, 02/01/2017 | 935,000 | 1,030,575 | ||||||||||
| Xerox Corporation, | ||||||||||||
| 6.400%, 03/15/2016 @ | 2,893,000 | 3,069,074 | ||||||||||
| Yara International ASA, | ||||||||||||
| 7.875%, 06/11/2019 (Acquired 10/02/2014, Cost $601,795) * f | 500,000 | 595,716 | ||||||||||
| Yum! Brands, Inc.: | ||||||||||||
| 4.250%, 09/15/2015 | 6,425,000 | 6,574,857 | ||||||||||
| 6.250%, 04/15/2016 | 2,000,000 | 2,122,260 | ||||||||||
| Zoetis Inc., | ||||||||||||
| 1.150%, 02/01/2016 | 1,000,000 | 999,107 | ||||||||||
| 855,997,491 | 32.0 | % | ||||||||||
| Total Corporate Bonds | 1,653,107,601 | 61.8 | % | |||||||||
| Other Government Related Securities | ||||||||||||
| Centrais Eletricas Brasileiras SA, | ||||||||||||
| 7.750%, 11/30/2015 (Acquired 12/06/2012 through 12/06/2012, Cost $3,152,358) * f | 3,000,000 | 3,076,500 | ||||||||||
| CNOOC Finance 2013 Ltd: | ||||||||||||
| 1.125%, 05/09/2016 f | 2,575,000 | 2,565,877 | ||||||||||
| 1.750%, 05/09/2018 f | 1,000,000 | 983,998 | ||||||||||
| CNOOC Nexen Finance (2014) ULC, | ||||||||||||
| 1.625%, 04/30/2017 f | 5,000,000 | 4,975,585 | ||||||||||
| CNPC General Capital Ltd, | ||||||||||||
| 1.133%, 05/14/2017 (Acquired 05/07/2014, Cost $4,750,000) * f | 4,750,000 | 4,757,548 | ||||||||||
| CNPC HK Overseas Capital Ltd, | ||||||||||||
| 3.125%, 04/28/2016 (Acquired 12/18/2012 through 07/23/2014, Cost $2,417,103) * f | 2,375,000 | 2,420,956 | ||||||||||
| Corp Andina de Fomento, | ||||||||||||
| 5.750%, 01/12/2017 f | 250,000 | 270,644 | ||||||||||
| Electricite de France Societe anonyme, | ||||||||||||
| 0.691%, 01/20/2017 (Acquired 01/13/2014, Cost $9,750,000) * f | 9,750,000 | 9,776,539 | ||||||||||
| Korea Expressway Corporation, | ||||||||||||
| 1.625%, 04/28/2017 (Acquired 06/23/2014, Cost $3,989,480) * f | 4,000,000 | 3,977,640 | ||||||||||
| Korea Hydro & Nuclear Power Co., Ltd., | ||||||||||||
| 2.875%, 10/02/2018 (Acquired 09/25/2013, Cost $2,982,150) * f | 3,000,000 | 3,059,643 | ||||||||||
| Petrobras Global Finance B.V., | ||||||||||||
| 2.603%, 03/17/2017 f | 4,000,000 | 3,692,400 | ||||||||||
| Petrobras International Finance Company S.A., | ||||||||||||
| 3.875%, 01/27/2016 f | 6,825,000 | 6,697,372 | ||||||||||
| Petroleos Mexicanos, | ||||||||||||
| 8.000%, 05/03/2019 f | 5,000,000 | 5,912,500 | ||||||||||
| Sinopec Capital (2013) Limited, | ||||||||||||
| 1.250%, 04/24/2016 (Acquired 01/10/2014, Cost $4,250,110) * f | 4,250,000 | 4,237,633 | ||||||||||
| Sinopec Group Overseas Development [2014] Ltd., | ||||||||||||
| 1.750%, 04/10/2017 (Acquired 04/02/2014, Cost $6,984,110) * f | 7,000,000 | 6,966,610 | ||||||||||
| The Export-Import Bank of Korea, | ||||||||||||
| 0.980%, 01/14/2017 f | 1,570,000 | 1,574,401 | ||||||||||
| The Korea Development Bank: | ||||||||||||
| 0.857%, 01/22/2017 f | 5,000,000 | 5,010,630 | ||||||||||
| 3.875%, 05/04/2017 f | 2,350,000 | 2,458,077 | ||||||||||
| 3.000%, 03/17/2019 f | 2,475,000 | 2,549,282 | ||||||||||
| 74,963,835 | 2.8 | % | ||||||||||
| Taxable Municipal Bonds | ||||||||||||
| City of Cuyahoga Falls OH, | ||||||||||||
| 1.000%, 08/13/2015 | 6,600,000 | 6,612,276 | ||||||||||
| City of Passaic NJ, | ||||||||||||
| 1.882%, 02/01/2016 | 1,020,000 | 1,022,111 | ||||||||||
| City of Trenton NJ, | ||||||||||||
| 1.722%, 04/01/2016 | 1,470,000 | 1,479,202 | ||||||||||
| Consolidated Municipalities Electric Power Systems Joint Powers Board, | ||||||||||||
| 1.550%, 06/01/2017 | 590,000 | 586,755 | ||||||||||
| Cook County School District No 144 Prairie Hills: | ||||||||||||
| 2.000%, 12/01/2017 | 930,000 | 925,955 | ||||||||||
| 2.500%, 12/01/2018 | 745,000 | 744,575 | ||||||||||
| County of Dauphin PA, | ||||||||||||
| 1.194%, 03/01/2016 | 1,200,000 | 1,194,252 | ||||||||||
| County of Miami-Dade FL Aviation Revenue, | ||||||||||||
| 5.000%, 10/01/2016 | 6,200,000 | 6,625,692 | ||||||||||
| Government Development Bank for Puerto Rico, | ||||||||||||
| 4.704%, 05/01/2016 | 725,000 | 618,788 | ||||||||||
| Indiana Bond Bank, | ||||||||||||
| 1.689%, 01/15/2017 | 1,000,000 | 1,005,350 | ||||||||||
| Iowa Tobacco Settlement Authority, | ||||||||||||
| 6.500%, 06/01/2023 (Callable 06/01/2015) | 265,000 | 264,992 | ||||||||||
| New Hampshire Housing Finance Authority: | ||||||||||||
| 1.250%, 07/01/2016 | 890,000 | 886,938 | ||||||||||
| 1.500%, 01/01/2017 | 855,000 | 856,505 | ||||||||||
| 1.650%, 07/01/2017 | 810,000 | 809,409 | ||||||||||
| New Jersey Economic Development Authority: | ||||||||||||
| 0.000%, 02/15/2016 ^ | 2,500,000 | 2,462,425 | ||||||||||
| 2.421%, 06/15/2018 | 10,000,000 | 10,043,000 | ||||||||||
| Ohio Air Quality Development Authority, | ||||||||||||
| 5.750%, 06/01/2033 | 3,000,000 | 3,183,210 | ||||||||||
| Rhode Island Housing & Mortgage Finance Corp/RI: | ||||||||||||
| 1.150%, 04/01/2016 | 1,175,000 | 1,171,052 | ||||||||||
| 1.930%, 04/01/2017 | 600,000 | 604,350 | ||||||||||
| 3.000%, 10/01/2034 (Callable 10/01/2023) | 11,760,000 | 12,039,653 | ||||||||||
| Schenectady Metroplex Development Authority/NY: | ||||||||||||
| 0.979%, 08/01/2015 | 375,000 | 374,760 | ||||||||||
| 2.232%, 08/01/2017 | 200,000 | 200,856 | ||||||||||
| South Carolina State Public Service Authority, | ||||||||||||
| 1.255%, 06/01/2016 (Callable 12/01/2015) | 6,800,000 | 6,816,932 | ||||||||||
| State of Illinois: | ||||||||||||
| 4.422%, 04/01/2015 | 2,210,000 | 2,228,166 | ||||||||||
| 4.961%, 03/01/2016 | 1,760,000 | 1,833,445 | ||||||||||
| 5.090%, 04/01/2017 | 2,785,000 | 2,954,077 | ||||||||||
| Tulsa Airports Improvement Trust: | ||||||||||||
| 2.592%, 06/01/2017 | 115,000 | 114,865 | ||||||||||
| 3.042%, 06/01/2018 | 100,000 | 100,587 | ||||||||||
| 67,760,178 | 2.5 | % | ||||||||||
| Residential Mortgage-Backed Securities | ||||||||||||
| U.S. Government Agency Issues | ||||||||||||
| Federal Home Loan Mortgage Corporation (FHLMC), | ||||||||||||
| Series 5, Class B, 0.861%, 05/15/2019 | 6,375 | 6,415 | ||||||||||
| Federal National Mortgage Association (FNMA): | ||||||||||||
| 5.500%, 07/01/2015 | 8,477 | 8,947 | ||||||||||
| Series 2004-W6, Class 1A4, 5.500%, 07/25/2034 | 246,922 | 248,048 | ||||||||||
| Series 2004-W6, Class 1A6, 5.500%, 07/25/2034 | 285,833 | 293,274 | ||||||||||
| 556,684 | 0.0 | % | ||||||||||
| Non-U.S. Government Agency Issues | ||||||||||||
| Alternative Loan Trust: | ||||||||||||
| Series 2005-50CB, Class 4A1, 5.000%, 11/25/2020 § | 302,948 | 302,695 | ||||||||||
| Series 2004-2CB, Class 1A8, 5.750%, 03/25/2034 | 3,136,711 | 3,139,390 | ||||||||||
| Series 2005-73CB, Class 1A7, 5.500%, 01/25/2036 § | 143,240 | 134,877 | ||||||||||
| Series 2006-28CB, Class A17, 6.000%, 10/25/2036 § | 1,086,152 | 900,716 | ||||||||||
| Banc of America Alternative Loan Trust: | ||||||||||||
| Series 2003-4, Class 2A1, 5.000%, 06/25/2018 | 128,509 | 131,701 | ||||||||||
| Series 2004-2, Class 5A1, 5.500%, 03/25/2019 | 600,435 | 612,964 | ||||||||||
| Series 2003-3, Class A1, 5.500%, 05/25/2033 | 1,587,739 | 1,655,420 | ||||||||||
| Series 2004-B, Class 2A2, 2.646%, 03/25/2034 | 3,674,393 | 3,699,588 | ||||||||||
| Banc of America Mortgage Trust, | ||||||||||||
| Series 2003-10, Class 3A1, 5.000%, 01/25/2019 | 904,597 | 932,962 | ||||||||||
| Countrywide Alternative Loan Trust: | ||||||||||||
| Series 2004-12CB, Class 1A1, 5.000%, 07/25/2019 | 1,494,439 | 1,553,155 | ||||||||||
| Series 2004-J2, Class 3A3, 5.500%, 04/25/2034 | 301,423 | 308,066 | ||||||||||
| HSI Asset Securitization Corp. Trust, | ||||||||||||
| Series 2005-NC1, Class 2A3, 0.530%, 07/25/2035 | 532,508 | 531,987 | ||||||||||
| J.P. Morgan Mortgage Trust, | ||||||||||||
| Series 2005-A4, Class 1A1, 5.238%, 07/25/2035 | 1,956,967 | 1,958,763 | ||||||||||
| MASTR Alternative Loan Trust: | ||||||||||||
| Series 2003-5, Class 7A1, 5.000%, 07/25/2018 | 8,190,682 | 8,470,517 | ||||||||||
| Series 2003-9, Class 3A1, 4.750%, 11/25/2018 | 4,019,338 | 4,099,729 | ||||||||||
| Series 2003-5, Class 4A1, 5.500%, 07/25/2033 | 7,758,988 | 8,249,100 | ||||||||||
| Morgan Stanley Mortgage Loan Trust, | ||||||||||||
| Series 2004-4, Class 1A10, 5.000%, 08/25/2034 | 1,611,805 | 1,638,615 | ||||||||||
| Structured Asset Securities Corp Mortgage Pass-Through Certificates, | ||||||||||||
| Series 2004-22, Class A2, 5.133%, 01/25/2035 | 11,396,361 | 11,796,339 | ||||||||||
| Structured Asset Securities Corp., | ||||||||||||
| Series 2004-4XS, Class 1A6, 4.550%, 02/25/2034 | 593,585 | 605,430 | ||||||||||
| WaMu Mortgage Pass-Through Certificates: | ||||||||||||
| Series 2004-CB4, Class 21A, 5.500%, 12/25/2019 | 120,117 | 124,427 | ||||||||||
| Series 2004-CB4, Class 22A, 6.000%, 12/25/2019 | 264,186 | 275,912 | ||||||||||
| Series 2004-AR3, Class A1, 2.370%, 06/25/2034 | 11,157,219 | 11,259,452 | ||||||||||
| 62,381,805 | 2.3 | % | ||||||||||
| Asset Backed Securities | ||||||||||||
| Accredited Mortgage Loan Trust: | ||||||||||||
| Series 2005-3, Class A1, 0.400%, 09/25/2035 | 176,026 | 175,359 | ||||||||||
| Series 2006-2, Class A3, 0.320%, 09/25/2036 | 17,591,177 | 17,373,891 | ||||||||||
| Aegis Asset Backed Securities Trust, | ||||||||||||
| Series 2005-5, Class 1A3, 0.440%, 12/25/2035 | 7,133,621 | 7,033,871 | ||||||||||
| Ally Auto Receivables Trust, | ||||||||||||
| Series 2014-SN2, Class A2B, 0.465%, 03/20/2017 | 13,000,000 | 13,000,559 | ||||||||||
| Ameriquest Mortgage Securities Inc Asset-Backed Pass-Through Ctfs, | ||||||||||||
| Series 2005-R8, Class A2D, 0.530%, 10/25/2035 | 11,660,913 | 11,613,838 | ||||||||||
| Argent Securities Inc Asset-Backed Pass-Through Certificates: | ||||||||||||
| Series 2005-W2, Class A2B1, 0.370%, 10/25/2035 | 753,964 | 752,192 | ||||||||||
| Series 2005-W3, Class A2D, 0.510%, 11/25/2035 | 14,097,419 | 13,542,798 | ||||||||||
| Barclays Dryrock Issuance Trust, | ||||||||||||
| Series 2014-4, Class A, 0.545%, 09/15/2020 | 3,925,000 | 3,925,612 | ||||||||||
| BCMSC Trust, | ||||||||||||
| Series 1998-A, Class A3, 6.230%, 04/15/2028 | 2,965 | 2,973 | ||||||||||
| Capital Auto Receivables Asset Trust: | ||||||||||||
| Series 2014-1, Class A1B, 0.515%, 05/20/2016 | 465,000 | 465,125 | ||||||||||
| Series 2014-3, Class A-2, 1.180%, 12/20/2017 | 25,515,000 | 25,515,230 | ||||||||||
| Carrington Mortgage Loan Trust, | ||||||||||||
| Series 2006-OPT1, Class A3, 0.350%, 02/25/2036 | 6,257,772 | 6,065,007 | ||||||||||
| Citigroup Mortgage Loan Trust. Inc., | ||||||||||||
| Series 2006-WFH3, Class A3, 0.320%, 10/25/2036 | 510,936 | 509,915 | ||||||||||
| Conseco Financial Corp.: | ||||||||||||
| Series 1998-2, Class A5, 6.240%, 12/01/2028 | 21,289 | 21,968 | ||||||||||
| Series 1997-5, Class A6, 6.820%, 05/15/2029 | 56,257 | 56,526 | ||||||||||
| Series 1998-3, Class A5, 6.220%, 03/01/2030 | 273,757 | 289,688 | ||||||||||
| Countrywide Asset-Backed Certificates: | ||||||||||||
| Series 2006-13, Class 1AF3, 4.896%, 01/25/2037 § | 1,509,089 | 1,826,645 | ||||||||||
| Series 2006-9, Class 1AF3, 5.297%, 10/25/2046 § | 1,268,947 | 989,913 | ||||||||||
| Credit-Based Asset Servicing and Securitization LLC, | ||||||||||||
| Series 2005-CB8, Class AF2, 4.184%, 12/25/2035 | 299,259 | 296,604 | ||||||||||
| First Franklin Mortgage Loan Trust, | ||||||||||||
| Series 2004-FF7, Class A1, 0.810%, 09/25/2034 | 7,659,414 | 7,643,536 | ||||||||||
| Ford Credit Auto Owner Trust, | ||||||||||||
| Series 2014-1, Class A, 2.260%, 11/15/2025 (Acquired 05/06/2014 through 11/18/2014, Cost $17,958,650) * | 17,894,000 | 17,989,518 | ||||||||||
| GE-WMC Asset-Backed Pass Through Certificates, | ||||||||||||
| Series 2005-1, Class A2C, 0.530%, 10/25/2035 | 4,707,986 | 4,679,889 | ||||||||||
| GSAA Trust, | ||||||||||||
| Series 2005-8, Class A4, 0.440%, 06/25/2035 | 21,675,795 | 21,045,268 | ||||||||||
| GSAMP Trust: | ||||||||||||
| Series 2005-HE5, Class A2D, 0.510%, 11/25/2035 | 590,197 | 588,101 | ||||||||||
| Series 2006-HE1, Class A2C, 0.380%, 01/25/2036 | 3,695,763 | 3,623,607 | ||||||||||
| Home Equity Asset Trust, | ||||||||||||
| Series 2006-4, Class 2A3, 0.340%, 08/25/2036 | 3,893,627 | 3,821,735 | ||||||||||
| J.P. Morgan Mortgage Acquisition Trust: | ||||||||||||
| Series 2006-CH1, Class A1, 0.285%, 07/25/2036 | 10,243,905 | 9,852,967 | ||||||||||
| Series 2007-CH1, Class AV4, 0.285%, 11/25/2036 | 5,755,327 | 5,731,155 | ||||||||||
| Master Credit Card Trust II: | ||||||||||||
| Series 2012-2A, Class A, 0.780%, 04/21/2017 (Acquired 10/08/2014, Cost $1,701,781) * f | 1,700,000 | 1,700,544 | ||||||||||
| Series 2013-3A, Class A, 0.595%, 01/22/2018 (Acquired 07/25/2013 through 11/05/2014, Cost $8,950,769) * f | 8,950,000 | 8,957,285 | ||||||||||
| MASTR Asset Backed Securities Trust, | ||||||||||||
| Series 2006-AB1, Class A2, 0.400%, 02/25/2036 | 1,161,741 | 1,154,028 | ||||||||||
| Morgan Stanley ABS Capital I Inc Trust, | ||||||||||||
| Series 2005-HE2, Class A3B, 0.610%, 01/25/2035 | 8,206,362 | 8,054,388 | ||||||||||
| Nationstar Home Equity Loan Trust, | ||||||||||||
| Series 2006-B, Class AV3, 0.340%, 09/25/2036 | 20,309,304 | 20,267,406 | ||||||||||
| Nomura Holdings, Inc., | ||||||||||||
| Series 2006-HE2, Class A3, 0.340%, 03/25/2036 | 6,445,215 | 6,275,171 | ||||||||||
| Option One Mortgage Loan Trust Asset-Backed Certificates, | ||||||||||||
| Series 2005-5, Class A3, 0.380%, 12/25/2035 | 8,020,815 | 7,967,340 | ||||||||||
| RAMP Series Trust: | ||||||||||||
| Series 2003-RS7, Class AI6, 5.340%, 08/25/2033 | 57,698 | 57,871 | ||||||||||
| Series 2003-RS11, Class AI7, 4.828%, 12/25/2033 | 400,650 | 407,291 | ||||||||||
| RASC Series Trust: | ||||||||||||
| Series 2005-AHL2, Class A3, 0.520%, 10/25/2035 | 12,150,000 | 11,990,519 | ||||||||||
| Series 2006-KS1, Class A4, 0.470%, 02/25/2036 | 4,938,990 | 4,891,907 | ||||||||||
| Renaissance Home Equity Loan Trust, | ||||||||||||
| Series 2007-2, Class AF2, 5.675%, 06/25/2037 | 1,965,282 | 1,022,456 | ||||||||||
| Securitized Asset Backed Receivables LLC Trust, | ||||||||||||
| Series 2005-OP2, Class A1, 0.495%, 10/25/2035 (Acquired 03/13/2014, Cost $13,669,278) * | 13,837,928 | 13,678,778 | ||||||||||
| Soundview Home Loan Trust, | ||||||||||||
| Series 2005-OPT4, Class 2A3, 0.690%, 12/25/2035 | 2,722,271 | 2,675,590 | ||||||||||
| Specialty Underwriting & Residential Finance Trust, | ||||||||||||
| Series 2006-BC1, Class A2C, 0.370%, 12/25/2036 | 3,837,023 | 3,803,245 | ||||||||||
| Springleaf Funding Trust, | ||||||||||||
| Series 2013-AA, Class A, 2.580%, 09/15/2021 (Acquired 01/09/2014 through 11/18/2014, Cost $23,206,842) * | 23,100,000 | 23,166,505 | ||||||||||
| Springleaf Mortgage Loan Trust: | ||||||||||||
| Series 2012-1A, Class A, 2.667%, 09/25/2057 (Acquired 04/11/2012 through 03/28/2014, Cost $2,693,482) * | 2,682,682 | 2,722,651 | ||||||||||
| Series 2012-2A, Class A, 2.220%, 10/25/2057 (Acquired 07/31/2012 through 08/20/2014, Cost $5,422,217) * | 5,383,581 | 5,455,769 | ||||||||||
| Structured Asset Investment Loan Trust, | ||||||||||||
| Series 2004-9, Class A5, 1.170%, 10/25/2034 | 16,953,015 | 16,921,940 | ||||||||||
| Structured Asset Securities Corp Mortgage Loan Trust, | ||||||||||||
| Series 2007-BC2, Class A3, 0.300%, 03/25/2037 | 6,805,620 | 6,773,518 | ||||||||||
| Synchrony Credit Card Master Note Trust, | ||||||||||||
| Series 2014-1, Class A, 1.610%, 11/15/2020 | 11,700,000 | 11,657,307 | ||||||||||
| 338,034,999 | 12.6 | % | ||||||||||
| Commercial Mortgage Backed Securities | ||||||||||||
| Bear Stearns Commercial Mortgage Securities Trust, | ||||||||||||
| Series 2005-PWR9, Class A4A, 4.871%, 09/11/2042 | 24,181,820 | 24,530,038 | ||||||||||
| CD Commercial Mortgage Trust, | ||||||||||||
| Series 2005-CD1, Class A4, 5.226%, 07/15/2044 | 18,872,614 | 19,177,558 | ||||||||||
| Citigroup Commercial Mortgage Trust, | ||||||||||||
| Series 2006-C4, Class A3, 5.771%, 03/15/2049 | 7,612,733 | 7,956,896 | ||||||||||
| COMM Mortgage Trust, | ||||||||||||
| Series 2005-C6, Class A5A, 5.116%, 06/10/2044 | 14,296,123 | 14,448,548 | ||||||||||
| Credit Suisse First Boston Mortgage Securities Corp., | ||||||||||||
| Series 2005-C5, Class A4, 5.100%, 08/15/2038 | 13,878,629 | 14,062,854 | ||||||||||
| DBUBS Mortgage Trust, | ||||||||||||
| Series 2011-LC3A, Class A2, 3.642%, 08/10/2044 | 18,450,000 | 19,047,614 | ||||||||||
| J.P. Morgan Chase Commercial Mortgage Securities Trust, | ||||||||||||
| Series 2005-CB12, Class A4, 4.895%, 09/12/2037 | 19,435,000 | 19,636,638 | ||||||||||
| Morgan Stanley Capital I Trust, | ||||||||||||
| Series 2005-HQ7, Class A4, 5.206%, 11/14/2042 | 12,256,304 | 12,449,549 | ||||||||||
| Wachovia Bank Commercial Mortgage Trust, | ||||||||||||
| Series 2005-C22, Class A4, 5.269%, 12/15/2044 | 17,540,804 | 17,915,282 | ||||||||||
| 149,224,977 | 5.6% | |||||||||||
| Total Long-Term Investments (Cost $2,655,920,157) | 2,651,182,501 | 99.0% | ||||||||||
| SHORT-TERM INVESTMENTS | ||||||||||||
| Money Market Mutual Funds | ||||||||||||
| Short-Term Investments Trust - Liquid Assets Portfolio, 0.07% « | 9,270,655 | 9,270,655 | ||||||||||
| Total Short-Term Investments (Cost $9,270,655) | 9,270,655 | 0.4 | % | |||||||||
| INVESTMENTS PURCHASED WITH CASH PROCEEDS FROM | ||||||||||||
| SECURITIES LENDING | ||||||||||||
| Investment Companies | ||||||||||||
| Mount Vernon Securities Lending Trust Prime Portfolio, 0.29% « | 147,613,109 | 147,613,109 | ||||||||||
| Total Investment Companies (Cost $147,613,109) | 147,613,109 | 5.5 | % | |||||||||
| Total Investments Purchased With Cash Proceeds From | ||||||||||||
| Securities Lending (Cost $147,613,109) | 147,613,109 | 5.5 | % | |||||||||
| Total Investments (Cost $2,812,803,921) | 2,808,066,265 | 104.9 | % | |||||||||
| Liabilities in Excess of Other Assets | (131,358,380 | ) | (4.9 | )% | ||||||||
| TOTAL NET ASSETS | $ | 2,676,707,885 | 100.0 | % | ||||||||
| Notes to Schedule of Investments | ||
| * | Restricted security as defined in Rule 144(a) under the Securities Act of 1933 and determined to be liquid. Purchased in a private placement transaction; resale to the public may require registration or may extend only to qualified institutional buyers. At December 31, 2014, the value of these securities total $462,037,510, which represents 17.26% of total net assets. | |
| @ | This security or portion of this security is out on loan at December 31, 2014. | |
| f | Foreign Security | |
| « | 7-Day Yield | |
| § | Security in Default | |
| ^ | Non-Income Producing | |
| Baird Intermediate Bond Fund | ||||||||||||
| Schedule of Investments | ||||||||||||
| December 31, 2014 | ||||||||||||
| Principal | % of | |||||||||||
| Amount | Value | Net Assets | ||||||||||
| LONG-TERM INVESTMENTS | ||||||||||||
| U.S. Treasury Securities | ||||||||||||
| U.S. Treasury Bonds: | ||||||||||||
| 1.250%, 04/30/2019 @ | $ | 143,300,000 | $ | 141,631,845 | ||||||||
| 2.625%, 08/15/2020 @ | 262,525,000 | 274,154,070 | ||||||||||
| 7.875%, 02/15/2021 @ | 67,000,000 | 90,518,072 | ||||||||||
| 2.500%, 05/15/2024 | 13,000,000 | 13,393,042 | ||||||||||
| 519,697,029 | 32.8 | % | ||||||||||
| Corporate Bonds | ||||||||||||
| Finance | ||||||||||||
| Abbey National Treasury Services plc, | ||||||||||||
| 3.050%, 08/23/2018 f | 1,050,000 | 1,087,085 | ||||||||||
| ABN AMRO Bank N.V.: | ||||||||||||
| 4.250%, 02/02/2017 (Acquired 11/22/2013, Cost $4,740,927) * f | 4,500,000 | 4,741,470 | ||||||||||
| 2.500%, 10/30/2018 (Acquired 10/23/2013 through 04/17/2014, Cost $1,200,606) * f | 1,200,000 | 1,212,019 | ||||||||||
| AgriBank, FCB, | ||||||||||||
| Series AI, 9.125%, 07/15/2019 (Acquired 02/24/2014, Cost $3,574,969) * | 2,850,000 | 3,638,595 | ||||||||||
| Ally Financial Inc., | ||||||||||||
| 8.000%, 12/31/2018 | 96,000 | 108,960 | ||||||||||
| American International Group, Inc., | ||||||||||||
| 4.875%, 06/01/2022 | 3,000,000 | 3,370,032 | ||||||||||
| AmSouth Bancorporation, | ||||||||||||
| 6.750%, 11/01/2025 | 630,000 | 751,281 | ||||||||||
| ANZ New Zealand (Int'l) Limited: | ||||||||||||
| 1.850%, 10/15/2015 (Acquired 08/29/2013, Cost $1,005,497) * f | 1,000,000 | 1,009,595 | ||||||||||
| 2.600%, 09/23/2019 (Acquired 09/16/2014, Cost $2,998,050) * f | 3,000,000 | 3,029,742 | ||||||||||
| Associates Corporation of North America, | ||||||||||||
| 6.950%, 11/01/2018 | 2,579,000 | 3,012,246 | ||||||||||
| Australia and New Zealand Banking Group Limited, | ||||||||||||
| 3.250%, 03/01/2016 (Acquired 02/22/2011, Cost $1,693,081) * f | 1,700,000 | 1,750,927 | ||||||||||
| Bank of America Corporation: | ||||||||||||
| 10.200%, 07/15/2015 | 1,035,000 | 1,085,817 | ||||||||||
| 5.700%, 05/02/2017 | 1,100,000 | 1,189,107 | ||||||||||
| 6.875%, 04/25/2018 | 1,000,000 | 1,148,580 | ||||||||||
| 3.300%, 01/11/2023 | 3,350,000 | 3,350,258 | ||||||||||
| 4.000%, 04/01/2024 | 2,750,000 | 2,863,369 | ||||||||||
| BanPonce Trust I, | ||||||||||||
| Series A, 8.327%, 02/01/2027 | 2,500,000 | 2,182,869 | ||||||||||
| Barclays Bank PLC: | ||||||||||||
| Series 1, 5.000%, 09/22/2016 f | 2,565,000 | 2,733,256 | ||||||||||
| 6.750%, 05/22/2019 f | 2,000,000 | 2,353,408 | ||||||||||
| BB&T Corporation, | ||||||||||||
| 6.850%, 04/30/2019 | 2,322,000 | 2,754,619 | ||||||||||
| Berkshire Hathaway Finance Corporation, | ||||||||||||
| 1.600%, 05/15/2017 | 3,800,000 | 3,832,486 | ||||||||||
| BNZ International Funding Limited, | ||||||||||||
| 2.350%, 03/04/2019 (Acquired 09/03/2014, Cost $2,789,836) * f | 2,800,000 | 2,800,333 | ||||||||||
| BPCE: | ||||||||||||
| 5.700%, 10/22/2023 (Acquired 11/10/2014, Cost $3,744,707) * f | 3,500,000 | 3,758,184 | ||||||||||
| 4.000%, 04/15/2024 @ f | 3,500,000 | 3,658,081 | ||||||||||
| Capital One Bank, (USA), National Association, | ||||||||||||
| 2.250%, 02/13/2019 | 3,500,000 | 3,474,653 | ||||||||||
| Capital One Financial Corporation, | ||||||||||||
| 3.150%, 07/15/2016 @ | 2,596,000 | 2,669,848 | ||||||||||
| Capital One N.A., | ||||||||||||
| 0.697%, 03/22/2016 | 2,100,000 | 2,102,650 | ||||||||||
| CIGNA Corporation, | ||||||||||||
| 2.750%, 11/15/2016 | 3,781,000 | 3,882,592 | ||||||||||
| Citigroup Inc.: | ||||||||||||
| 4.450%, 01/10/2017 | 1,800,000 | 1,902,750 | ||||||||||
| 1.550%, 08/14/2017 @ | 1,000,000 | 997,179 | ||||||||||
| 6.125%, 11/21/2017 | 635,000 | 708,078 | ||||||||||
| 3.750%, 06/16/2024 @ | 500,000 | 510,624 | ||||||||||
| Citizens Bank, National Association, | ||||||||||||
| 2.450%, 12/04/2019 | 8,000,000 | 7,950,000 | ||||||||||
| CNA Financial Corporation: | ||||||||||||
| 6.500%, 08/15/2016 | 2,000,000 | 2,163,270 | ||||||||||
| 7.350%, 11/15/2019 | 2,395,000 | 2,858,540 | ||||||||||
| 5.750%, 08/15/2021 | 1,260,000 | 1,435,973 | ||||||||||
| Comerica Bank, | ||||||||||||
| 5.200%, 08/22/2017 | 5,570,000 | 6,054,039 | ||||||||||
| Commonwealth Bank of Australia, | ||||||||||||
| 5.000%, 10/15/2019 (Acquired 03/02/2012 through 10/03/2014, Cost $4,596,189) * f | 4,335,000 | 4,839,910 | ||||||||||
| Countrywide Financial Corporation, | ||||||||||||
| 6.250%, 05/15/2016 | 2,200,000 | 2,334,952 | ||||||||||
| Credit Suisse: | ||||||||||||
| 2.300%, 05/28/2019 @ f | 2,450,000 | 2,445,794 | ||||||||||
| 5.300%, 08/13/2019 f | 3,220,000 | 3,611,906 | ||||||||||
| Deutsche Bank Aktiengesellschaft, | ||||||||||||
| 3.250%, 01/11/2016 f | 4,250,000 | 4,342,204 | ||||||||||
| Dresdner Bank AG, | ||||||||||||
| 7.250%, 09/15/2015 f | 2,652,000 | 2,742,359 | ||||||||||
| First Tennessee Bank National Association, | ||||||||||||
| 5.650%, 04/01/2016 | 4,263,000 | 4,405,286 | ||||||||||
| General Electric Capital Corporation: | ||||||||||||
| 6.000%, 08/07/2019 | 2,700,000 | 3,140,567 | ||||||||||
| 5.500%, 01/08/2020 | 2,550,000 | 2,918,669 | ||||||||||
| 5.550%, 05/04/2020 | 2,850,000 | 3,275,439 | ||||||||||
| Genworth Holdings, Inc., | �� | |||||||||||
| 4.900%, 08/15/2023 | 1,500,000 | 1,208,546 | ||||||||||
| Great-West Life & Annuity Insurance Capital LP II, | ||||||||||||
| 7.153%, 05/16/2046 (Acquired 05/16/2006 through 11/08/2007, Cost $1,792,736) * | 1,800,000 | 1,863,000 | ||||||||||
| Highmark Inc, | ||||||||||||
| 4.750%, 05/15/2021 (Acquired 07/30/2014, Cost $2,014,854) * | 2,000,000 | 2,065,636 | ||||||||||
| HSBC Finance Corporation, | ||||||||||||
| 6.676%, 01/15/2021 | 4,059,000 | 4,815,825 | ||||||||||
| Humana Inc., | ||||||||||||
| 7.200%, 06/15/2018 | 2,000,000 | 2,336,376 | ||||||||||
| ING Bank N.V.: | ||||||||||||
| 3.000%, 09/01/2015 (Acquired 08/17/2010 through 09/14/2012, Cost $2,306,381) * f | 2,300,000 | 2,332,108 | ||||||||||
| 2.500%, 10/01/2019 (Acquired 09/23/2014, Cost $2,461,635) * f | 2,475,000 | 2,490,830 | ||||||||||
| 5.000%, 06/09/2021 (Acquired 06/12/2013, Cost $2,160,417) * f | 2,000,000 | 2,262,692 | ||||||||||
| Invesco Finance PLC, | ||||||||||||
| 3.125%, 11/30/2022 f | 4,225,000 | 4,187,262 | ||||||||||
| iStar Financial Inc., | ||||||||||||
| 5.850%, 03/15/2017 | 75,000 | 76,875 | ||||||||||
| J.P. Morgan Chase & Co., | ||||||||||||
| 4.500%, 01/24/2022 | 3,000,000 | 3,275,256 | ||||||||||
| Jefferies Group LLC, | ||||||||||||
| 6.875%, 04/15/2021 | 2,000,000 | 2,273,520 | ||||||||||
| John Hancock Life Insurance Company, | ||||||||||||
| 7.375%, 02/15/2024 (Acquired 04/10/2013 through 04/11/2013, Cost $2,931,333) * | 2,325,000 | 2,902,311 | ||||||||||
| Kemper Corporation, | ||||||||||||
| 6.000%, 05/15/2017 | 600,000 | 648,199 | ||||||||||
| KeyBank National Association, | ||||||||||||
| 7.413%, 05/06/2015 | 4,000,000 | 4,090,128 | ||||||||||
| Korea Housing Finance Corporation, | ||||||||||||
| 1.625%, 09/15/2018 (Acquired 02/26/2013 through 08/28/2014, Cost $1,039,533) * f | 1,050,000 | 1,028,607 | ||||||||||
| LeasePlan Corporation N.V.: | ||||||||||||
| 3.000%, 10/23/2017 (Acquired 02/07/2013, Cost $4,035,045) * f | 4,000,000 | 4,096,972 | ||||||||||
| 2.500%, 05/16/2018 (Acquired 05/29/2013 through 10/20/2014, Cost $5,026,908) * f | 5,000,000 | 5,002,145 | ||||||||||
| Liberty Mutual Group Inc., | ||||||||||||
| 4.250%, 06/15/2023 (Acquired 06/13/2013, Cost $1,987,300) * | 2,000,000 | 2,060,958 | ||||||||||
| Lloyds Bank plc: | ||||||||||||
| 4.875%, 01/21/2016 f | 225,000 | 234,055 | ||||||||||
| 5.800%, 01/13/2020 (Acquired 02/09/2010 through 03/16/2012, Cost $2,904,036) * f | 2,900,000 | 3,351,081 | ||||||||||
| M&I Marshall & Ilsley Bank: | ||||||||||||
| 4.850%, 06/16/2015 | 3,075,000 | 3,130,550 | ||||||||||
| 5.000%, 01/17/2017 | 1,000,000 | 1,061,280 | ||||||||||
| Macquarie Bank Limited: | ||||||||||||
| 2.000%, 08/15/2016 (Acquired 08/07/2013, Cost $4,998,250) * f | 5,000,000 | 5,060,895 | ||||||||||
| 1.600%, 10/27/2017 (Acquired 10/22/2014, Cost $2,498,475) * f | 2,500,000 | 2,483,570 | ||||||||||
| Manulife Financial Corporation, | ||||||||||||
| 4.900%, 09/17/2020 @ f | 2,300,000 | 2,525,257 | ||||||||||
| Marsh & McLennan Companies, Inc., | ||||||||||||
| 2.550%, 10/15/2018 | 1,000,000 | 1,016,906 | ||||||||||
| MassMutual Global Funding II, | ||||||||||||
| 2.000%, 04/05/2017 (Acquired 03/29/2012, Cost $3,783,470) * @ | 3,800,000 | 3,853,538 | ||||||||||
| MBIA Insurance Corporation, | ||||||||||||
| 11.491%, 01/15/2033 (Acquired 01/11/2008, Cost $500,000) * | 500,000 | 300,000 | ||||||||||
| Metropolitan Life Global Funding I, | ||||||||||||
| 3.000%, 01/10/2023 (Acquired 01/03/2013, Cost $1,299,337) * | 1,300,000 | 1,293,226 | ||||||||||
| Metropolitan Life Insurance Company, | ||||||||||||
| 7.700%, 11/01/2015 (Acquired 11/21/2013, Cost $2,106,057) * | 2,000,000 | 2,108,824 | ||||||||||
| Morgan Stanley: | ||||||||||||
| 6.625%, 04/01/2018 | 1,600,000 | 1,822,456 | ||||||||||
| 7.300%, 05/13/2019 | 2,700,000 | 3,202,594 | ||||||||||
| 2.375%, 07/23/2019 @ | 1,000,000 | 996,312 | ||||||||||
| MUFG Americas Holdings Corporation, | ||||||||||||
| 3.500%, 06/18/2022 | 225,000 | 231,717 | ||||||||||
| MUFG Union Bank, National Association, | ||||||||||||
| 2.125%, 06/16/2017 | 1,800,000 | 1,820,025 | ||||||||||
| National Australia Bank Limited, | ||||||||||||
| 0.733%, 10/08/2015 (Acquired 02/19/2013, Cost $3,100,571) * f | 3,100,000 | 3,099,554 | ||||||||||
| Nationwide Financial Services, Inc., | ||||||||||||
| 5.375%, 03/25/2021 (Acquired 10/07/2013, Cost $884,948) * | 828,000 | 931,584 | ||||||||||
| Nomura Holdings, Inc.: | ||||||||||||
| 5.000%, 03/04/2015 f | 2,900,000 | 2,920,721 | ||||||||||
| 2.000%, 09/13/2016 f | 2,450,000 | 2,469,764 | ||||||||||
| 6.700%, 03/04/2020 f | 1,000,000 | 1,182,276 | ||||||||||
| NYSE Euronext, | ||||||||||||
| 2.000%, 10/05/2017 | 800,000 | 806,818 | ||||||||||
| PNC Bank, National Association, | ||||||||||||
| 2.950%, 01/30/2023 | 4,000,000 | 3,908,760 | ||||||||||
| Protective Life Corporation, | ||||||||||||
| 7.375%, 10/15/2019 | 1,925,000 | 2,316,535 | ||||||||||
| Prudential Covered Trust 2012-1, | ||||||||||||
| 2.997%, 09/30/2015 (Acquired 11/06/2012 through 07/23/2013, Cost $2,275,168) * | 2,250,000 | 2,281,604 | ||||||||||
| Prudential Financial, Inc., | ||||||||||||
| 7.375%, 06/15/2019 | 850,000 | 1,021,828 | ||||||||||
| Regions Bank, | ||||||||||||
| 7.500%, 05/15/2018 | 2,475,000 | 2,873,215 | ||||||||||
| Regions Financial Corporation: | ||||||||||||
| 5.750%, 06/15/2015 | 1,500,000 | 1,531,154 | ||||||||||
| 2.000%, 05/15/2018 | 2,000,000 | 1,980,378 | ||||||||||
| Santander Bank, N.A., | ||||||||||||
| 8.750%, 05/30/2018 | 3,080,000 | 3,668,286 | ||||||||||
| Santander UK PLC, | ||||||||||||
| 5.000%, 11/07/2023 (Acquired 10/31/2013, Cost $996,810) * f | 1,000,000 | 1,056,196 | ||||||||||
| Societe Generale: | ||||||||||||
| 1.335%, 10/01/2018 f | 2,000,000 | 2,035,288 | ||||||||||
| 2.625%, 10/01/2018 f | 1,000,000 | 1,015,637 | ||||||||||
| 5.200%, 04/15/2021 (Acquired 01/28/2013, Cost $1,374,058) * f | 1,250,000 | 1,414,978 | ||||||||||
| 5.000%, 01/17/2024 (Acquired 01/14/2014 through 02/18/2014, Cost $3,127,979) * @ f | 3,150,000 | 3,167,265 | ||||||||||
| Sumitomo Mitsui Banking Corporation: | ||||||||||||
| 2.500%, 07/19/2018 f | 3,000,000 | 3,032,991 | ||||||||||
| 2.250%, 07/11/2019 f | 2,000,000 | 1,980,990 | ||||||||||
| SunTrust Bank: | ||||||||||||
| 5.450%, 12/01/2017 | 500,000 | 546,463 | ||||||||||
| 7.250%, 03/15/2018 | 1,506,000 | 1,742,523 | ||||||||||
| SunTrust Banks, Inc., | ||||||||||||
| 3.600%, 04/15/2016 | 2,600,000 | 2,681,632 | ||||||||||
| SUSA Partnership, L.P., | ||||||||||||
| 8.200%, 06/01/2017 | 2,800,000 | 3,193,568 | ||||||||||
| Svenska Handelsbanken AB: | ||||||||||||
| 3.125%, 07/12/2016 f | 275,000 | 284,052 | ||||||||||
| 2.875%, 04/04/2017 f | 1,500,000 | 1,550,357 | ||||||||||
| 2.500%, 01/25/2019 @ f | 1,000,000 | 1,019,620 | ||||||||||
| Swedbank AB: | ||||||||||||
| 1.750%, 03/12/2018 (Acquired 03/05/2013, Cost $3,236,382) * f | 3,250,000 | 3,242,772 | ||||||||||
| 2.375%, 02/27/2019 (Acquired 02/20/2014, Cost $2,595,606) * f | 2,600,000 | 2,615,720 | ||||||||||
| Symetra Financial Corporation, | ||||||||||||
| 6.125%, 04/01/2016 (Acquired 08/12/2011 through 12/02/2013, Cost $1,303,518) * | 1,269,000 | 1,331,347 | ||||||||||
| Synchrony Financial: | ||||||||||||
| 3.750%, 08/15/2021 | 5,000,000 | 5,107,445 | ||||||||||
| 4.250%, 08/15/2024 | 4,000,000 | 4,104,516 | ||||||||||
| The Bank of Nova Scotia, | ||||||||||||
| 2.550%, 01/12/2017 f | 150,000 | 153,831 | ||||||||||
| The Bank of Tokyo-Mitsubishi UFJ, Ltd.: | ||||||||||||
| 2.700%, 09/09/2018 (Acquired 09/03/2013, Cost $2,547,756) * f | 2,550,000 | 2,594,184 | ||||||||||
| 2.300%, 03/10/2019 (Acquired 03/04/2014, Cost $998,400) * f | 1,000,000 | 994,604 | ||||||||||
| The Bear Stearns Companies LLC: | ||||||||||||
| 6.400%, 10/02/2017 | 1,450,000 | 1,623,870 | ||||||||||
| 7.250%, 02/01/2018 | 2,275,000 | 2,622,051 | ||||||||||
| The Charles Schwab Corporation, | ||||||||||||
| 6.375%, 09/01/2017 | 325,000 | 365,494 | ||||||||||
| The Goldman Sachs Group, Inc.: | ||||||||||||
| 6.150%, 04/01/2018 | 3,900,000 | 4,377,434 | ||||||||||
| 2.900%, 07/19/2018 | 1,000,000 | 1,025,880 | ||||||||||
| 7.500%, 02/15/2019 | 865,000 | 1,028,884 | ||||||||||
| 2.550%, 10/23/2019 | 2,000,000 | 1,992,696 | ||||||||||
| The Hartford Financial Services Group, Inc.: | ||||||||||||
| 5.500%, 10/15/2016 | 1,500,000 | 1,608,983 | ||||||||||
| 5.125%, 04/15/2022 | 500,000 | 562,044 | ||||||||||
| The Huntington National Bank, | ||||||||||||
| 1.300%, 11/20/2016 | 4,850,000 | 4,829,984 | ||||||||||
| The Royal Bank of Scotland Group Public Limited Company, | ||||||||||||
| 2.550%, 09/18/2015 f | 200,000 | 202,002 | ||||||||||
| The Royal Bank of Scotland Public Limited Company: | ||||||||||||
| 5.625%, 08/24/2020 f | 3,300,000 | 3,757,704 | ||||||||||
| 6.125%, 01/11/2021 f | 1,300,000 | 1,531,895 | ||||||||||
| UBS AG, | ||||||||||||
| 5.875%, 12/20/2017 f | 2,000,000 | 2,233,180 | ||||||||||
| Voya Financial, Inc., | ||||||||||||
| 2.900%, 02/15/2018 | 2,000,000 | 2,047,506 | ||||||||||
| Wells Fargo Bank, National Association, | ||||||||||||
| 6.000%, 11/15/2017 | 1,479,000 | 1,657,830 | ||||||||||
| Westpac Banking Corporation: | ||||||||||||
| 1.600%, 01/12/2018 f | 1,250,000 | 1,249,923 | ||||||||||
| 4.875%, 11/19/2019 f | 2,775,000 | 3,096,245 | ||||||||||
| Willis Group Holdings Public Limited Company, | ||||||||||||
| 5.750%, 03/15/2021 f | 3,250,000 | 3,629,980 | ||||||||||
| 327,001,174 | 20.6 | % | ||||||||||
| Utility | ||||||||||||
| Commonwealth Edison Company, | ||||||||||||
| Series 104, 5.950%, 08/15/2016 | 375,000 | 404,419 | ||||||||||
| National Grid PLC, | ||||||||||||
| 6.300%, 08/01/2016 f | 3,925,000 | 4,236,833 | ||||||||||
| National Rural Utilities Cooperative Finance Corporation, | ||||||||||||
| 10.375%, 11/01/2018 | 3,619,000 | 4,714,580 | ||||||||||
| PPL Capital Funding, Inc., | ||||||||||||
| 3.400%, 06/01/2023 @ | 2,475,000 | 2,479,648 | ||||||||||
| PPL Energy Supply, LLC, | ||||||||||||
| Series A, 5.700%, 10/15/2015 | 1,950,000 | 1,992,463 | ||||||||||
| PSEG Power LLC: | ||||||||||||
| 2.750%, 09/15/2016 | 75,000 | 76,862 | ||||||||||
| 5.320%, 09/15/2016 | 994,000 | 1,061,967 | ||||||||||
| 5.125%, 04/15/2020 | 220,000 | 244,406 | ||||||||||
| Public Service Company of New Mexico, | ||||||||||||
| 7.950%, 05/15/2018 | 2,820,000 | 3,318,748 | ||||||||||
| RGS I&M Funding Corp, | ||||||||||||
| Series F*, 9.820%, 06/07/2022 | 438,351 | 519,464 | ||||||||||
| Talent Yield Investments Ltd., | ||||||||||||
| 4.500%, 04/25/2022 (Acquired 04/18/2012, Cost $3,774,008) * @ f | 3,800,000 | 3,978,144 | ||||||||||
| Trans-Allegheny Interstate Line Company, | ||||||||||||
| 4.000%, 01/15/2015 (Acquired 01/19/2010 through 02/22/2013, Cost $3,664,883) * | 3,673,000 | 3,675,891 | ||||||||||
| West Penn Power Company, | ||||||||||||
| 5.875%, 08/15/2016 (Acquired 10/25/2010, Cost $2,086,952) * | 2,000,000 | 2,136,476 | ||||||||||
| 28,839,901 | 1.8 | % | ||||||||||
| Industrials | ||||||||||||
| 21st CENTURY FOX AMERICA, INC., | ||||||||||||
| 8.000%, 10/17/2016 | 5,575,000 | 6,225,485 | ||||||||||
| Agrium Inc., | ||||||||||||
| 3.150%, 10/01/2022 f | 1,306,000 | 1,274,877 | ||||||||||
| Altera Corporation, | ||||||||||||
| 2.500%, 11/15/2018 | 2,000,000 | 2,012,740 | ||||||||||
| America Movil, S.A.B. de C.V., | ||||||||||||
| 1.241%, 09/12/2016 f | 3,200,000 | 3,222,890 | ||||||||||
| Ameritech Capital Funding Corporation: | ||||||||||||
| 9.100%, 06/01/2016 | 476,700 | 515,759 | ||||||||||
| 6.450%, 01/15/2018 | 2,758,000 | 3,093,207 | ||||||||||
| Anadarko Petroleum Corporation: | ||||||||||||
| 5.950%, 09/15/2016 | 2,270,000 | 2,427,493 | ||||||||||
| 6.375%, 09/15/2017 | 2,000,000 | 2,223,604 | ||||||||||
| 6.950%, 06/15/2019 | 1,000,000 | 1,168,351 | ||||||||||
| Anglo American Capital PLC, | ||||||||||||
| 9.375%, 04/08/2019 (Acquired 07/11/2012, Cost $2,449,203) * f | 2,000,000 | 2,490,884 | ||||||||||
| Apple Inc., | ||||||||||||
| 2.400%, 05/03/2023 | 2,000,000 | 1,943,994 | ||||||||||
| Boston Scientific Corporation, | ||||||||||||
| 4.125%, 10/01/2023 | 3,000,000 | 3,064,908 | ||||||||||
| BP Capital Markets: | ||||||||||||
| 4.750%, 03/10/2019 @ f | 2,500,000 | 2,734,770 | ||||||||||
| 2.521%, 01/15/2020 @ f | 2,650,000 | 2,653,098 | ||||||||||
| 3.245%, 05/06/2022 f | 1,000,000 | 983,039 | ||||||||||
| British Telecommunications plc, | ||||||||||||
| 5.950%, 01/15/2018 f | 2,000,000 | 2,230,378 | ||||||||||
| Bunge Limited Finance Corp.: | ||||||||||||
| 4.100%, 03/15/2016 | 2,830,000 | 2,917,620 | ||||||||||
| 3.200%, 06/15/2017 | 1,300,000 | 1,336,716 | ||||||||||
| Bunge N.A. Finance L.P., | ||||||||||||
| 5.900%, 04/01/2017 | 575,000 | 625,184 | ||||||||||
| Celgene Corporation, | ||||||||||||
| 4.000%, 08/15/2023 | 2,000,000 | 2,105,058 | ||||||||||
| Coca-Cola FEMSA, S.A.B. de C.V., | ||||||||||||
| 2.375%, 11/26/2018 f | 3,425,000 | 3,487,369 | ||||||||||
| Comcast Cable Communications, LLC, | ||||||||||||
| 8.875%, 05/01/2017 | 550,000 | 643,612 | ||||||||||
| Comcast Corporation: | ||||||||||||
| 6.500%, 01/15/2017 | 175,000 | 193,236 | ||||||||||
| 2.850%, 01/15/2023 | 1,475,000 | 1,465,163 | ||||||||||
| Computer Sciences Corporation, | ||||||||||||
| 2.500%, 09/15/2015 | 4,500,000 | 4,540,630 | ||||||||||
| ConAgra Foods, Inc.: | ||||||||||||
| 0.601%, 07/21/2016 | 2,125,000 | 2,119,757 | ||||||||||
| 7.000%, 04/15/2019 | 1,583,000 | 1,843,904 | ||||||||||
| Cox Communications, Inc.: | ||||||||||||
| 3.250%, 12/15/2022 (Acquired 11/26/2012, Cost $3,594,456) * @ | 3,600,000 | 3,534,620 | ||||||||||
| 3.850%, 02/01/2025 (Acquired 12/01/2014, Cost $4,492,215) * | 4,500,000 | 4,542,377 | ||||||||||
| CVS Health Corporation: | ||||||||||||
| 2.250%, 08/12/2019 | 3,375,000 | 3,360,903 | ||||||||||
| 4.000%, 12/05/2023 | 4,425,000 | 4,682,853 | ||||||||||
| D.R. Horton, Inc., | ||||||||||||
| 6.500%, 04/15/2016 | 1,000,000 | 1,055,000 | ||||||||||
| Daimler Finance North America LLC, | ||||||||||||
| 2.250%, 07/31/2019 (Acquired 07/25/2012, Cost $2,285,234) * @ | 2,300,000 | 2,292,937 | ||||||||||
| DCP Midstream, LLC, | ||||||||||||
| 9.750%, 03/15/2019 (Acquired 10/15/2012, Cost $1,946,620) * | 1,600,000 | 2,001,290 | ||||||||||
| Deutsche Telekom International Finance B.V.: | ||||||||||||
| 6.750%, 08/20/2018 f | 2,850,000 | 3,307,325 | ||||||||||
| 6.000%, 07/08/2019 @ f | 1,700,000 | 1,972,160 | ||||||||||
| Devon Energy Corporation, | ||||||||||||
| 6.300%, 01/15/2019 | 910,000 | 1,038,664 | ||||||||||
| DIRECTV Holdings LLC / DIRECTV Financing Co., Inc., | ||||||||||||
| 3.500%, 03/01/2016 | 250,000 | 256,521 | ||||||||||
| Ecolab Inc., | ||||||||||||
| 1.450%, 12/08/2017 | 4,000,000 | 3,964,152 | ||||||||||
| El Paso Pipeline Partners Operating Company, L.L.C., | ||||||||||||
| 4.100%, 11/15/2015 | 3,000,000 | 3,069,543 | ||||||||||
| Energy Transfer Partners, L.P.: | ||||||||||||
| 5.950%, 02/01/2015 | 1,336,000 | 1,340,410 | ||||||||||
| 9.700%, 03/15/2019 | 2,457,000 | 3,083,823 | ||||||||||
| Enterprise Products Operating LLC, | ||||||||||||
| 2.550%, 10/15/2019 | 3,000,000 | 2,969,796 | ||||||||||
| ERAC USA Finance LLC, | ||||||||||||
| 2.350%, 10/15/2019 (Acquired 06/30/2014, Cost $3,594,744) * | 3,600,000 | 3,573,169 | ||||||||||
| Express Scripts Holding Company: | ||||||||||||
| 2.650%, 02/15/2017 | 2,000,000 | 2,044,988 | ||||||||||
| 7.250%, 06/15/2019 | 1,000,000 | 1,200,657 | ||||||||||
| Federal Express Corp 1998 Pass Through Trust, | ||||||||||||
| Series 981B, 6.845%, 01/15/2019 | 2,130,878 | 2,347,349 | ||||||||||
| Fidelity National Information Services, Inc., | ||||||||||||
| 3.875%, 06/05/2024 | 2,300,000 | 2,323,235 | ||||||||||
| Fiserv, Inc.: | ||||||||||||
| 4.750%, 06/15/2021 | 1,630,000 | 1,794,540 | ||||||||||
| 3.500%, 10/01/2022 | 2,300,000 | 2,322,835 | ||||||||||
| FMC Corporation, | ||||||||||||
| 4.100%, 02/01/2024 | 2,000,000 | 2,069,074 | ||||||||||
| Ford Motor Credit Company LLC: | ||||||||||||
| 2.500%, 01/15/2016 | 3,000,000 | 3,033,558 | ||||||||||
| 1.724%, 12/06/2017 | 3,300,000 | 3,265,894 | ||||||||||
| 5.750%, 02/01/2021 | 2,000,000 | 2,291,864 | ||||||||||
| Freeport-McMoRan Inc.: | ||||||||||||
| 3.100%, 03/15/2020 | 2,000,000 | 1,945,466 | ||||||||||
| 3.875%, 03/15/2023 @ | 1,100,000 | 1,037,120 | ||||||||||
| Freeport-McMoran Oil & Gas LLC / FCX Oil & Gas Inc., | ||||||||||||
| 6.750%, 02/01/2022 | 1,649,000 | 1,813,900 | ||||||||||
| Glencore Canada Corporation, | ||||||||||||
| 6.000%, 10/15/2015 f | 1,024,000 | 1,058,567 | ||||||||||
| Glencore Funding LLC: | ||||||||||||
| 2.500%, 01/15/2019 (Acquired 05/22/2013 through 10/29/2013, Cost $4,311,300) * @ | 4,400,000 | 4,332,570 | ||||||||||
| 4.125%, 05/30/2023 (Acquired 04/03/2014, Cost $1,452,965) * | 1,500,000 | 1,463,638 | ||||||||||
| 4.625%, 04/29/2024 (Acquired 10/08/2014, Cost $1,029,005) * | 1,000,000 | 1,004,800 | ||||||||||
| Grupo Bimbo, S.A.B. de C.V., | ||||||||||||
| 3.875%, 06/27/2024 (Acquired 06/24/2014, Cost $2,987,700) * f | 3,000,000 | 3,011,790 | ||||||||||
| GTE Corporation, | ||||||||||||
| 8.750%, 11/01/2021 | 2,150,000 | 2,804,026 | ||||||||||
| Hanson Limited, | ||||||||||||
| 6.125%, 08/15/2016 f | 650,000 | 689,000 | ||||||||||
| Hess Corporation, | ||||||||||||
| 8.125%, 02/15/2019 | 1,200,000 | 1,427,750 | ||||||||||
| Hewlett-Packard Company: | ||||||||||||
| 3.300%, 12/09/2016 | 3,500,000 | 3,614,537 | ||||||||||
| 2.750%, 01/14/2019 @ | 2,550,000 | 2,553,259 | ||||||||||
| Historic TW Inc., | ||||||||||||
| 6.875%, 06/15/2018 | 392,000 | 453,224 | ||||||||||
| Hutchison Whampoa International (09) Limited, | ||||||||||||
| 7.625%, 04/09/2019 (Acquired 10/16/2009 through 04/16/2014, Cost $6,136,117) * f | 5,400,000 | 6,532,369 | ||||||||||
| Hutchison Whampoa International (14) Limited, | ||||||||||||
| 1.625%, 10/31/2017 (Acquired 10/28/2014, Cost $1,995,400) * f | 2,000,000 | 1,983,520 | ||||||||||
| Hyundai Capital Services, Inc., | ||||||||||||
| 3.500%, 09/13/2017 (Acquired 08/04/2014 through 09/30/2014, Cost $6,422,012) * f | 6,150,000 | 6,362,034 | ||||||||||
| Ingersoll-Rand Company, | ||||||||||||
| 6.391%, 11/15/2027 f | 1,195,000 | 1,432,691 | ||||||||||
| Ingersoll-Rand Global Holding Company Limited, | ||||||||||||
| 2.875%, 01/15/2019 | 3,000,000 | 3,047,319 | ||||||||||
| Ingredion Incorporated, | ||||||||||||
| 1.800%, 09/25/2017 | 1,275,000 | 1,271,337 | ||||||||||
| Johnson Controls, Inc.: | ||||||||||||
| 5.500%, 01/15/2016 @ | 1,625,000 | 1,701,741 | ||||||||||
| 4.250%, 03/01/2021 | 2,000,000 | 2,161,762 | ||||||||||
| Kinder Morgan Finance Company LLC, | ||||||||||||
| 5.700%, 01/05/2016 | 2,500,000 | 2,595,300 | ||||||||||
| Kraft Foods Group, Inc., | ||||||||||||
| 3.500%, 06/06/2022 | 2,000,000 | 2,049,424 | ||||||||||
| Laboratory Corporation of America Holdings, | ||||||||||||
| 4.625%, 11/15/2020 | 400,000 | 431,186 | ||||||||||
| Lafarge S.A.: | ||||||||||||
| 6.200%, 07/09/2015 (Acquired 07/06/2010, Cost $999,140) * f | 1,000,000 | 1,022,900 | ||||||||||
| 6.500%, 07/15/2016 f | 625,000 | 665,625 | ||||||||||
| Martin Marietta Materials, Inc., | ||||||||||||
| 6.600%, 04/15/2018 | 75,000 | 85,023 | ||||||||||
| Masco Corporation, | ||||||||||||
| 6.125%, 10/03/2016 | 2,200,000 | 2,333,100 | ||||||||||
| MeadWestvaco Corporation, | ||||||||||||
| 7.375%, 09/01/2019 | 2,033,000 | 2,402,095 | ||||||||||
| Medco Health Solutions, Inc.: | ||||||||||||
| 2.750%, 09/15/2015 | 215,000 | 217,822 | ||||||||||
| 7.125%, 03/15/2018 | 1,850,000 | 2,135,931 | ||||||||||
| Merey Sweeny, L.P., | ||||||||||||
| 8.850%, 12/18/2019 (Acquired 06/11/2013, Cost $1,663,325) * | 1,454,448 | 1,679,339 | ||||||||||
| Midcontinent Express Pipeline LLC, | ||||||||||||
| 6.700%, 09/15/2019 (Acquired 09/30/2014, Cost $1,128,781) * | 1,000,000 | 1,095,000 | ||||||||||
| Murphy Oil Corporation, | ||||||||||||
| 3.700%, 12/01/2022 | 5,000,000 | 4,487,565 | ||||||||||
| Mylan Inc., | ||||||||||||
| 7.875%, 07/15/2020 (Acquired 07/22/2013, Cost $1,071,324) * | 1,000,000 | 1,065,195 | ||||||||||
| Nabors Industries, Inc., | ||||||||||||
| 6.150%, 02/15/2018 | 825,000 | 859,293 | ||||||||||
| NiSource Finance Corp., | ||||||||||||
| 4.450%, 12/01/2021 | 2,000,000 | 2,161,002 | ||||||||||
| Noble Energy, Inc.: | ||||||||||||
| 8.250%, 03/01/2019 | 1,000,000 | 1,198,901 | ||||||||||
| 4.150%, 12/15/2021 | 450,000 | 458,865 | ||||||||||
| ONEOK Partners, L.P., | ||||||||||||
| 3.375%, 10/01/2022 | 6,000,000 | 5,553,972 | ||||||||||
| Pearson Funding Two plc, | ||||||||||||
| 4.000%, 05/17/2016 (Acquired 10/03/2014, Cost $6,230,596) * f | 6,000,000 | 6,236,658 | ||||||||||
| Petrofac Limited, | ||||||||||||
| 3.400%, 10/10/2018 (Acquired 10/03/2013 through 09/19/2014, Cost $6,959,451) * f | 6,880,000 | 6,787,340 | ||||||||||
| Pioneer Natural Resources Company, | ||||||||||||
| 6.875%, 05/01/2018 | 1,225,000 | 1,371,296 | ||||||||||
| Plum Creek Timberlands, L.P., | ||||||||||||
| 5.875%, 11/15/2015 | 2,445,000 | 2,539,937 | ||||||||||
| POSCO, | ||||||||||||
| 5.250%, 04/14/2021 (Acquired 04/08/2011 through 09/22/2011, Cost $2,977,729) * f | 3,000,000 | 3,397,128 | ||||||||||
| R.R. Donnelley & Sons Company: | ||||||||||||
| 8.600%, 08/15/2016 | 1,000,000 | 1,095,000 | ||||||||||
| 6.125%, 01/15/2017 | 43,000 | 45,580 | ||||||||||
| 7.625%, 06/15/2020 @ | 1,000,000 | 1,097,500 | ||||||||||
| Rio Tinto Alcan Inc., | ||||||||||||
| 5.000%, 06/01/2015 f | 450,000 | 457,917 | ||||||||||
| Rio Tinto Finance (USA) Limited: | ||||||||||||
| 9.000%, 05/01/2019 f | 2,975,000 | 3,763,857 | ||||||||||
| 3.500%, 11/02/2020 f | 500,000 | 518,783 | ||||||||||
| Rockies Express Pipeline LLC: | ||||||||||||
| 3.900%, 04/15/2015 (Acquired 02/17/2011, Cost $3,000,034) * | 3,000,000 | 2,985,000 | ||||||||||
| 5.625%, 04/15/2020 (Acquired 03/17/2010, Cost $999,110) * | 1,000,000 | 982,500 | ||||||||||
| RPM United Kingdom G.P., | ||||||||||||
| 6.700%, 11/01/2015 (Acquired 03/06/2013, Cost $3,441,197) * f | 3,300,000 | 3,428,387 | ||||||||||
| SABMiller Holdings Inc., | ||||||||||||
| 0.922%, 08/01/2018 (Acquired 10/28/2014, Cost $3,998,590) * | 3,980,000 | 3,992,609 | ||||||||||
| Samarco Mineracao S.A., | ||||||||||||
| 5.375%, 09/26/2024 (Acquired 09/23/2014, Cost $1,670,511) * f | 1,675,000 | 1,552,725 | ||||||||||
| Schneider Electric SE, | ||||||||||||
| 2.950%, 09/27/2022 (Acquired 09/20/2012, Cost $1,994,680) * f | 2,000,000 | 2,010,466 | ||||||||||
| Seagate HDD Cayman, | ||||||||||||
| 6.875%, 05/01/2020 f | 5,000,000 | 5,250,000 | ||||||||||
| Southwestern Bell Telephone, L.P., | ||||||||||||
| 7.000%, 07/01/2015 | 125,000 | 128,333 | ||||||||||
| Sprint Communications, Inc., | ||||||||||||
| 6.000%, 12/01/2016 | 500,000 | 523,013 | ||||||||||
| Sunoco, Inc., | ||||||||||||
| 5.750%, 01/15/2017 | 1,275,000 | 1,378,454 | ||||||||||
| Sysco Corporation: | ||||||||||||
| 3.000%, 10/02/2021 | 2,550,000 | 2,588,686 | ||||||||||
| 2.600%, 06/12/2022 | 150,000 | 147,563 | ||||||||||
| Teck Resources Limited, | ||||||||||||
| 3.150%, 01/15/2017 f | 1,000,000 | 1,019,690 | ||||||||||
| Telecom Italia Capital, | ||||||||||||
| 5.250%, 10/01/2015 f | 4,425,000 | 4,513,500 | ||||||||||
| Telefonica Emisiones S.A.U.: | ||||||||||||
| 6.421%, 06/20/2016 f | 3,450,000 | 3,690,644 | ||||||||||
| 6.221%, 07/03/2017 f | 1,000,000 | 1,107,097 | ||||||||||
| 3.192%, 04/27/2018 f | 1,000,000 | 1,028,339 | ||||||||||
| Teva Pharmaceutical Finance IV, LLC, | ||||||||||||
| 2.250%, 03/18/2020 | 1,250,000 | 1,227,851 | ||||||||||
| Texas Eastern Transmission, LP, | ||||||||||||
| 6.000%, 09/15/2017 (Acquired 11/07/2013 through 11/14/2014, Cost $2,292,214) * | 2,073,000 | 2,283,664 | ||||||||||
| The Dow Chemical Company, | ||||||||||||
| 8.550%, 05/15/2019 | 2,800,000 | 3,481,089 | ||||||||||
| The Mosaic Company, | ||||||||||||
| 4.250%, 11/15/2023 | 2,000,000 | 2,110,390 | ||||||||||
| Time Warner Cable Inc., | ||||||||||||
| 5.850%, 05/01/2017 | 1,000,000 | 1,091,549 | ||||||||||
| Time Warner Inc.: | ||||||||||||
| 4.700%, 01/15/2021 | 1,325,000 | 1,450,301 | ||||||||||
| 4.750%, 03/29/2021 | 2,000,000 | 2,182,754 | ||||||||||
| TransCanada PipeLines Ltd, | ||||||||||||
| 9.875%, 01/01/2021 f | 150,000 | 204,114 | ||||||||||
| TSMC Global Ltd, | ||||||||||||
| 1.625%, 04/03/2018 (Acquired 03/27/2013, Cost $3,297,789) * f | 3,300,000 | 3,239,016 | ||||||||||
| Tyco Electronics Group S.A., | ||||||||||||
| 6.550%, 10/01/2017 f | 1,245,000 | 1,401,408 | ||||||||||
| United AirLines, Inc. Pass Through Trust, | ||||||||||||
| Series 91A2, 10.020%, 03/22/2014 ** § † | 85,600 | 20,511 | ||||||||||
| Vale Overseas Limited: | ||||||||||||
| 6.250%, 01/23/2017 f | 1,650,000 | 1,759,906 | ||||||||||
| 4.375%, 01/11/2022 @ f | 2,425,000 | 2,324,387 | ||||||||||
| Valero Energy Corporation, | ||||||||||||
| 9.375%, 03/15/2019 | 5,898,000 | 7,355,579 | ||||||||||
| Verizon Communications Inc.: | ||||||||||||
| 5.150%, 09/15/2023 | 6,100,000 | 6,735,821 | ||||||||||
| 4.150%, 03/15/2024 | 2,000,000 | 2,070,468 | ||||||||||
| Viacom Inc., | ||||||||||||
| 6.250%, 04/30/2016 | 500,000 | 534,151 | ||||||||||
| Vulcan Materials Company, | ||||||||||||
| 7.000%, 06/15/2018 | 2,000,000 | 2,200,000 | ||||||||||
| Wabtec Corporation, | ||||||||||||
| 4.375%, 08/15/2023 | 3,000,000 | 3,188,277 | ||||||||||
| Walgreen Co., | ||||||||||||
| 5.250%, 01/15/2019 | 637,000 | 708,081 | ||||||||||
| Waste Management, Inc., | ||||||||||||
| 7.375%, 03/11/2019 | 5,000,000 | 6,042,715 | ||||||||||
| Wesfarmers Limited, | ||||||||||||
| 1.874%, 03/20/2018 (Acquired 03/13/2013, Cost $3,900,000) * f | 3,900,000 | 3,886,424 | ||||||||||
| Williams Partners L.P.: | ||||||||||||
| 5.250%, 03/15/2020 | 1,000,000 | 1,085,528 | ||||||||||
| 4.125%, 11/15/2020 | 350,000 | 358,574 | ||||||||||
| 4.300%, 03/04/2024 | 2,500,000 | 2,495,405 | ||||||||||
| 335,559,186 | 21.2 | % | ||||||||||
| Total Corporate Bonds | 691,400,261 | 43.6 | % |
| Other Government Related Securities | ||||||||||||
| CDP Financial Inc., | ||||||||||||
| 4.400%, 11/25/2019 (Acquired 11/20/2009, Cost $997,520) * f | 1,000,000 | 1,101,126 | ||||||||||
| Centrais Eletricas Brasileiras SA, | ||||||||||||
| 5.750%, 10/27/2021 (Acquired 10/20/2011 through 10/25/2011, Cost $1,151,829) * @ f | 1,150,000 | 1,104,000 | ||||||||||
| CNOOC Finance 2013 Ltd, | ||||||||||||
| 3.000%, 05/09/2023 f | 2,000,000 | 1,892,814 | ||||||||||
| CNOOC Nexen Finance (2014) ULC, | ||||||||||||
| 4.250%, 04/30/2024 f | 5,150,000 | 5,328,597 | ||||||||||
| Corp Andina de Fomento, | ||||||||||||
| 4.375%, 06/15/2022 f | 680,000 | 730,903 | ||||||||||
| Federal Home Loan Mortgage Corporation (FHLMC): | ||||||||||||
| 1.375%, 05/01/2020 @ | 10,000,000 | 9,751,660 | ||||||||||
| 2.375%, 01/13/2022 | 300,000 | 303,088 | ||||||||||
| KfW, | ||||||||||||
| 4.875%, 06/17/2019 f | 3,250,000 | 3,694,567 | ||||||||||
| Korea Electric Power Corporation, | ||||||||||||
| 6.750%, 08/01/2027 f | 300,000 | 381,760 | ||||||||||
| Korea Gas Corporation, | ||||||||||||
| 2.875%, 07/29/2018 (Acquired 07/22/2013, Cost $994,790) * f | 1,000,000 | 1,020,714 | ||||||||||
| Mexico Government International Bond, | ||||||||||||
| 5.125%, 01/15/2020 f | 2,650,000 | 2,921,625 | ||||||||||
| Petrobras Global Finance B.V., | ||||||||||||
| 2.603%, 03/17/2017 f | 1,700,000 | 1,569,270 | ||||||||||
| Petrobras International Finance Company S.A., | ||||||||||||
| 3.875%, 01/27/2016 f | 4,175,000 | 4,096,928 | ||||||||||
| Petroleos Mexicanos: | ||||||||||||
| 3.125%, 01/23/2019 f | 2,000,000 | 2,005,000 | ||||||||||
| 5.500%, 01/21/2021 f | 2,000,000 | 2,165,000 | ||||||||||
| Portigon AG, | ||||||||||||
| 4.796%, 07/15/2015 f | 1,811,000 | 1,845,896 | ||||||||||
| The Korea Development Bank, | ||||||||||||
| 3.875%, 05/04/2017 f | 2,150,000 | 2,248,878 | ||||||||||
| 42,161,826 | 2.7 | % | ||||||||||
| Taxable Municipal Bonds | ||||||||||||
| Alaska Municipal Bond Bank Authority: | ||||||||||||
| 4.309%, 08/01/2018 | 1,000,000 | 1,076,820 | ||||||||||
| 4.459%, 08/01/2019 | 1,340,000 | 1,465,880 | ||||||||||
| California Qualified School Bond Joint Powers Authority, | ||||||||||||
| 5.955%, 03/01/2019 | 3,375,000 | 3,623,265 | ||||||||||
| California School Finance Authority, | ||||||||||||
| 4.426%, 07/01/2020 | 2,500,000 | 2,673,000 | ||||||||||
| Central Valley Support Joint Power Agency, | ||||||||||||
| 5.326%, 09/01/2022 | 2,000,000 | 2,138,980 | ||||||||||
| County of Contra Costa CA, | ||||||||||||
| 5.140%, 06/01/2017 | 2,500,000 | 2,647,525 | ||||||||||
| Dallas Independent School District, | ||||||||||||
| 4.950%, 02/15/2022 (Callable 02/15/2021) | 1,965,000 | 2,223,692 | ||||||||||
| Davie Florida Water & Sewer Revenue, | ||||||||||||
| 6.062%, 10/01/2025 (Callable 10/01/2020) | 1,000,000 | 1,167,810 | ||||||||||
| Government Development Bank for Puerto Rico, | ||||||||||||
| 4.704%, 05/01/2016 | 3,525,000 | 3,008,588 | ||||||||||
| Iowa Tobacco Settlement Authority, | ||||||||||||
| 6.500%, 06/01/2023 | 970,000 | 969,971 | ||||||||||
| New Hampshire Housing Finance Authority, | ||||||||||||
| 2.600%, 01/01/2020 | 1,880,000 | 1,909,215 | ||||||||||
| New Jersey Economic Development Authority, | ||||||||||||
| 1.802%, 06/15/2017 | 5,000,000 | 4,964,950 | ||||||||||
| North Carolina Housing Finance Agency, | ||||||||||||
| 4.000%, 01/01/2030 (Callable 07/01/2021) | 415,000 | 427,093 | ||||||||||
| North East Independent School District/TX, | ||||||||||||
| 5.240%, 08/01/2027 | 2,100,000 | 2,503,956 | ||||||||||
| State of California, | ||||||||||||
| 5.500%, 03/01/2016 | 500,000 | 528,130 | ||||||||||
| 31,328,875 | 2.0 | % | ||||||||||
| Residential Mortgage-Backed Securities | ||||||||||||
| U.S. Government Agency Issues | ||||||||||||
| Federal Gold Loan Mortgage Corporation (FGLMC): | ||||||||||||
| 6.000%, 06/01/2021 | 131,322 | 143,869 | ||||||||||
| 6.000%, 07/01/2028 | 9,463 | 10,831 | ||||||||||
| Federal Home Loan Mortgage Corporation (FHLMC): | ||||||||||||
| Series 74, Class F, 6.000%, 10/15/2020 | 1,414 | 1,503 | ||||||||||
| Series 1395, Class G, 6.000%, 10/15/2022 | 11,967 | 12,936 | ||||||||||
| Federal National Mortgage Association (FNMA): | ||||||||||||
| Series 1989-2, Class D, 8.800%, 01/25/2019 | 5,748 | 6,249 | ||||||||||
| Series 1990-108, Class G, 7.000%, 09/25/2020 | 5,698 | 6,231 | ||||||||||
| Series G-29, Class O, 8.500%, 09/25/2021 | 642 | 730 | ||||||||||
| Series 1991-137, Class H, 7.000%, 10/25/2021 | 32,791 | 36,290 | ||||||||||
| Series 1993-32, Class H, 6.000%, 03/25/2023 | 20,455 | 22,189 | ||||||||||
| Series 2004-W6, Class 1A6, 5.500%, 07/25/2034 | 551,877 | 566,244 | ||||||||||
| Government National Mortgage Association (GNMA), | ||||||||||||
| Series 1999-4, Class ZB, 6.000%, 02/20/2029 | 117,587 | 131,469 | ||||||||||
| 938,541 | 0.1 | % | ||||||||||
| Non-U.S. Government Agency Issues | ||||||||||||
| Alternative Loan Trust: | ||||||||||||
| Series 2005-50CB, Class 4A1, 5.000%, 11/25/2020 § | 348,390 | 348,099 | ||||||||||
| Series 2005-85CB, Class 3A1, 5.250%, 02/25/2021 (Acquired 09/26/2007 through 01/28/2009, Cost $286,667) *§ | 290,361 | 281,911 | ||||||||||
| Series 2006-7CB, Class 3A1, 5.250%, 05/25/2021 § | 518,348 | 502,696 | ||||||||||
| Series 2004-2CB, Class 1A8, 5.750%, 03/25/2034 | 1,801,167 | 1,802,705 | ||||||||||
| Series 2005-11CB, Class 2A1, 5.500%, 06/25/2035 § | 81,653 | 81,530 | ||||||||||
| Banc of America Alternative Loan Trust: | ||||||||||||
| Series 2003-11, Class 4A1, 4.750%, 01/25/2019 | 90,816 | 91,679 | ||||||||||
| Series 2004-2, Class 5A1, 5.500%, 03/25/2019 | 297,491 | 303,698 | ||||||||||
| Series 2004-11, Class 4A1, 5.500%, 12/25/2019 | 413,534 | 425,513 | ||||||||||
| Series 2005-6, Class 7A1, 5.500%, 07/25/2020 | 20,069 | 20,242 | ||||||||||
| Series 2006-2, Class 7A1, 6.000%, 03/25/2021 | 287,322 | 291,011 | ||||||||||
| Series 2003-9, Class 1CB2, 5.500%, 11/25/2033 | 399,715 | 402,900 | ||||||||||
| Series 2006-3, Class 6A1, 6.000%, 04/25/2036 | 342,339 | 351,993 | ||||||||||
| Series 2006-4, Class 3CB4, 6.000%, 05/25/2046 § | 467,324 | 388,379 | ||||||||||
| Banc of America Funding Trust, | ||||||||||||
| Series 2004-2, Class 1CB1, 5.750%, 09/20/2034 | 5,035,983 | 5,429,036 | ||||||||||
| Bear Stearns ARM Trust, | ||||||||||||
| Series 2004-5, Class 2A, 2.957%, 07/25/2034 | 3,035,277 | 3,039,141 | ||||||||||
| Credit Suisse First Boston Mortgage Securities Corp., | ||||||||||||
| Series 2005-3, Class 3A27, 5.500%, 07/25/2035 | 23,219 | 23,594 | ||||||||||
| J.P. Morgan Alternative Loan Trust: | ||||||||||||
| Series 2005-S1, Class 3A1, 5.500%, 10/25/2020 | 739,017 | 734,650 | ||||||||||
| Series 2006-A1, Class 2A1, 2.584%, 03/25/2036 § | 608,708 | 496,393 | ||||||||||
| Lehman Mortgage Trust, | ||||||||||||
| Series 2006-4, Class 3A1, 5.000%, 08/25/2021 | 128,371 | 125,652 | ||||||||||
| MASTR Alternative Loan Trust: | ||||||||||||
| Series 2004-1, Class 1A1, 5.000%, 01/25/2019 | 386,139 | 392,300 | ||||||||||
| Series 2004-3, Class 1A1, 5.000%, 03/25/2019 | 98,634 | 101,001 | ||||||||||
| Series 2005-3, Class 4A1, 5.500%, 03/25/2020 | 95,310 | 98,833 | ||||||||||
| RALI Series Trust, | ||||||||||||
| Series 2004-QS6, Class A1, 5.000%, 05/25/2019 | 36,946 | 37,479 | ||||||||||
| Salomon Brothers Mortgage Securities VII, Inc., | ||||||||||||
| Series 2003-UP2, Class A2, 7.000%, 06/25/2033 | 99,280 | 107,360 | ||||||||||
| Structured Asset Securities Corp Mortgage Pass-Through Certificates, | ||||||||||||
| Series 2004-22, Class A2, 5.133%, 01/25/2035 | 7,597,574 | 7,864,226 | ||||||||||
| WaMu Mortgage Pass-Through Certificates: | ||||||||||||
| Series 2004-CB1, Class 5A, 5.000%, 06/25/2019 | 489,143 | 501,823 | ||||||||||
| Series 2004-CB3, Class 3A, 5.500%, 10/25/2019 | 852,944 | 885,105 | ||||||||||
| Series 2004-CB3, Class 4A, 6.000%, 10/25/2019 | 277,476 | 291,267 | ||||||||||
| Series 2004-CB4, Class 21A, 5.500%, 12/25/2019 | 288,280 | 298,624 | ||||||||||
| Series 2004-CB4, Class 22A, 6.000%, 12/25/2019 | 203,220 | 212,240 | ||||||||||
| Series 2004-AR3, Class A1, 2.370%, 06/25/2034 | 6,545,568 | 6,605,546 | ||||||||||
| Series 2004-CB2, Class 3A, 6.000%, 08/25/2034 | 4,887,754 | 5,225,953 | ||||||||||
| 37,762,579 | 2.4 | % | ||||||||||
| Asset Backed Securities | ||||||||||||
| Amresco Residential Securities Mortgage Loan Trust, | ||||||||||||
| Series 1998-1, Class A6, 6.510%, 08/25/2027 | 16,721 | 17,931 | ||||||||||
| Argent Securities Inc Asset-Backed Pass-Through Certificates, | ||||||||||||
| Series 2005-W3, Class A2D, 0.510%, 11/25/2035 | 2,704,541 | 2,598,139 | ||||||||||
| Citigroup Mortgage Loan Trust. Inc., | ||||||||||||
| Series 2006-WFH3, Class A3, 0.320%, 10/25/2036 | 410,531 | 409,710 | ||||||||||
| Cityscape Home Equity Loan Trust, | ||||||||||||
| Series 1997-C, Class A4, 7.000%, 07/25/2028 § | 3,921 | 3,957 | ||||||||||
| Conseco Financial Corp.: | ||||||||||||
| Series 1993-4, Class A5, 7.050%, 01/15/2019 | 6,723 | 6,906 | ||||||||||
| Series 1998-2, Class A5, 6.240%, 12/01/2028 | 331,538 | 342,116 | ||||||||||
| Series 1998-3, Class A5, 6.220%, 03/01/2030 | 500,062 | 529,163 | ||||||||||
| Series 1998-4, Class A5, 6.180%, 04/01/2030 | 197,745 | 202,796 | ||||||||||
| Countrywide Asset-Backed Certificates: | ||||||||||||
| Series 2006-S3, Class A2, 6.085%, 06/25/2021 § | 285,887 | 284,706 | ||||||||||
| Series 2004-12, Class AF6, 4.634%, 03/25/2035 | 25,247 | 25,616 | ||||||||||
| Series 2005-1, Class AF6, 5.030%, 07/25/2035 | 1,231,822 | 1,253,999 | ||||||||||
| Series 2006-13, Class 1AF3, 4.896%, 01/25/2037 § | 226,817 | 274,546 | ||||||||||
| Series 2006-9, Class 1AF3, 5.297%, 10/25/2046 § | 1,167,431 | 910,720 | ||||||||||
| Delta Funding Home Equity Loan Trust: | ||||||||||||
| Series 1997-2, Class A6, 7.040%, 06/25/2027 | 4,561 | 4,647 | ||||||||||
| Series 1999-1, Class A6F, 6.340%, 12/15/2028 | 25 | 25 | ||||||||||
| Series 1999-2, Class A7F, 7.030%, 08/15/2030 | 421,665 | 439,109 | ||||||||||
| First Franklin Mortgage Loan Trust, | ||||||||||||
| Series 2004-FF7, Class A1, 0.810%, 09/25/2034 | 4,767,985 | 4,758,101 | ||||||||||
| Ford Credit Auto Owner Trust: | ||||||||||||
| Series 2014-1, Class A, 2.260%, 11/15/2025 (Acquired 10/07/2014 through 10/09/2014, Cost $10,913,561) * | 10,859,000 | 10,916,965 | ||||||||||
| Series 2014-2, Class A, 2.310%, 04/15/2026 (Acquired 10/07/2014, Cost $11,745,689) * | 11,750,000 | 11,780,268 | ||||||||||
| IMC Home Equity Loan Trust, | ||||||||||||
| Series 1998-1, Class A6, 7.020%, 06/20/2029 | 5,200 | 5,203 | ||||||||||
| J.P. Morgan Mortgage Acquisition Trust, | ||||||||||||
| Series 2006-CH1, Class A1, 0.285%, 07/25/2036 | 4,917,075 | 4,729,424 | ||||||||||
| Nomura Holdings, Inc., | ||||||||||||
| Series 2006-HE2, Class A3, 0.340%, 03/25/2036 | 6,445,215 | 6,275,171 | ||||||||||
| Oakwood Mortgage Investors, Inc., | ||||||||||||
| Series 1999-B, Class A3, 6.450%, 11/15/2017 | 89,091 | 91,323 | ||||||||||
| RAAC Series Trust, | ||||||||||||
| Series 2004-SP1, Class AI4, 5.285%, 08/25/2027 | 11,990 | 12,183 | ||||||||||
| RAMP Series Trust, | ||||||||||||
| Series 2005-RS1, Class AI6, 4.713%, 01/25/2035 | 119,944 | 121,374 | ||||||||||
| Saxon Asset Securities Trust, | ||||||||||||
| Series 2005-4, Class A1B, 0.550%, 11/25/2037 | 4,205,803 | 4,081,135 | ||||||||||
| Securitized Asset Backed Receivables LLC Trust, | ||||||||||||
| Series 2005-OP2, Class A1, 0.495%, 10/25/2035 (Acquired 03/13/2014, Cost $7,570,677) * | 7,664,083 | 7,575,939 | ||||||||||
| Soundview Home Loan Trust, | ||||||||||||
| Series 2003-2, Class A2, 1.470%, 11/25/2033 | 3,909,807 | 3,873,113 | ||||||||||
| Specialty Underwriting & Residential Finance Trust: | ||||||||||||
| Series 2004-BC4, Class A1A, 0.840%, 10/25/2035 | 3,585,643 | 3,488,386 | ||||||||||
| Series 2006-BC1, Class A2D, 0.470%, 12/25/2036 | 7,617,879 | 7,378,845 | ||||||||||
| Springleaf Funding Trust, | ||||||||||||
| Series 2013-AA, Class A, 2.580%, 09/15/2021 (Acquired 02/14/2014, Cost $5,021,458) * | 5,000,000 | 5,014,395 | ||||||||||
| Springleaf Mortgage Loan Trust, | ||||||||||||
| Series 2012-1A, Class A, 2.667%, 09/25/2057 (Acquired 04/11/2012, Cost $1,730,742) * | 1,730,762 | 1,756,549 | ||||||||||
| Structured Asset Investment Loan Trust, | ||||||||||||
| Series 2004-9, Class A5, 1.170%, 10/25/2034 | 7,899,820 | 7,885,340 | ||||||||||
| Synchrony Credit Card Master Note Trust, | ||||||||||||
| Series 2014-1, Class A, 1.610%, 11/15/2020 | 3,825,000 | 3,811,043 | ||||||||||
| Wells Fargo Home Equity Asset-Backed Securities, | ||||||||||||
| Series 2004-2, Class A33, 0.670%, 10/25/2034 | 3,473,159 | 3,362,584 | ||||||||||
| 94,221,427 | 5.9 | % | ||||||||||
| Commercial Mortgage Backed Securities | ||||||||||||
| Bear Stearns Commercial Mortgage Securities Trust, | ||||||||||||
| Series 2005-PWR9, Class A4A, 4.871%, 09/11/2042 | 5,337,924 | 5,414,790 | ||||||||||
| CD Commercial Mortgage Trust, | ||||||||||||
| Series 2005-CD1, Class A4, 5.226%, 07/15/2044 | 6,551,416 | 6,657,273 | ||||||||||
| Credit Suisse First Boston Mortgage Securities Corp., | ||||||||||||
| Series 2005-C5, Class A4, 5.100%, 08/15/2038 | 4,100,391 | 4,154,820 | ||||||||||
| DBUBS Mortgage Trust, | ||||||||||||
| Series 2011-LC3A, Class A2, 3.642%, 08/10/2044 | 6,885,000 | 7,108,012 | ||||||||||
| Federal National Mortgage Association (FNMA): | ||||||||||||
| Series 2013-M1, Class ASQ2, 1.074%, 11/25/2016 | 2,736,058 | 2,742,852 | ||||||||||
| Series 2012-M9, Class ASQ2, 1.513%, 12/25/2017 | 1,125,000 | 1,126,215 | ||||||||||
| FHLMC Multifamily Structured Pass Through Certificates: | ||||||||||||
| Series K-501, Class A2, 1.655%, 11/25/2016 | 2,345,000 | 2,369,723 | ||||||||||
| Series K-702, Class A2, 3.154%, 02/25/2018 | 275,000 | 288,215 | ||||||||||
| Series K-704, Class A2, 2.412%, 08/25/2018 | 300,000 | 307,275 | ||||||||||
| Series K-705, Class A2, 2.303%, 09/25/2018 | 3,000,000 | 3,059,496 | ||||||||||
| Series K-708, Class A2, 2.130%, 01/25/2019 | 8,300,000 | 8,393,010 | ||||||||||
| Series K-003, Class A4, 5.053%, 01/25/2019 | 9,000,000 | 10,054,692 | ||||||||||
| Series K-004, Class A2, 4.186%, 08/25/2019 | 5,875,000 | 6,416,217 | ||||||||||
| Series K-005, Class A2, 4.317%, 11/25/2019 | 4,975,000 | 5,472,321 | ||||||||||
| Series K-006, Class A2, 4.251%, 01/25/2020 | 2,163,000 | 2,375,924 | ||||||||||
| Series K-F02, Class A3, 0.800%, 07/25/2020 | 6,441,042 | 6,477,054 | ||||||||||
| J.P. Morgan Chase Commercial Mortgage Securities Trust: | ||||||||||||
| Series 2005-CB12, Class A4, 4.895%, 09/12/2037 | 5,000,000 | 5,051,875 | ||||||||||
| Series 2012-C8, Class ASB, 2.379%, 10/15/2045 (Acquired 11/21/2014, Cost $4,136,035) * | 4,129,000 | 4,132,927 | ||||||||||
| NCUA Guaranteed Notes Trust, | ||||||||||||
| Series 2010-C1, Class A2, 2.900%, 10/29/2020 | 2,150,000 | 2,207,626 | ||||||||||
| Wachovia Bank Commercial Mortgage Trust, | ||||||||||||
| Series 2005-C22, Class A4, 5.269%, 12/15/2044 | 9,027,691 | 9,220,423 | ||||||||||
| Wells Fargo Commercial Mortgage Trust, | ||||||||||||
| Series 2014-LC18, Class ASB, 3.244%, 12/15/2047 | 10,000,000 | 10,245,800 | ||||||||||
| WFRBS Commercial Mortgage Trust: | ||||||||||||
| Series 2012-C6, Class A4, 3.440%, 04/15/2045 | 8,000,000 | 8,358,064 | ||||||||||
| Series 2014-C21, Class A2, 2.917%, 08/15/2047 | 2,435,234 | 2,500,304 | ||||||||||
| Series 2014-C24, Class ASB, 3.324%, 11/15/2047 | 8,275,000 | 8,539,742 | ||||||||||
| 122,674,650 | 7.7 | % | ||||||||||
| Total Long-Term Investments (Cost $1,518,895,922) | 1,540,185,188 | 97.2 | % | |||||||||
| SHORT-TERM INVESTMENTS | ||||||||||||
| Money Market Mutual Funds | ||||||||||||
| Dreyfus Cash Advantage Fund, 0.06% « | 12,590,051 | 12,590,051 | ||||||||||
| Short-Term Investments Trust - Liquid Assets Portfolio, 0.07% « | 30,000,000 | 30,000,000 | ||||||||||
| Total Short-Term Investments (Cost $42,590,051) | 42,590,051 | 2.7 | % | |||||||||
| INVESTMENTS PURCHASED WITH CASH PROCEEDS FROM | ||||||||||||
| SECURITIES LENDING | ||||||||||||
| Investment Companies | ||||||||||||
| Mount Vernon Securities Lending Trust Prime Portfolio, 0.29% « | 192,781,148 | 192,781,148 | ||||||||||
| Total Investment Companies (Cost $192,781,148) | 192,781,148 | 12.2 | % | |||||||||
| Total Investments Purchased With Cash Proceeds From | ||||||||||||
| Securities Lending (Cost $192,781,148) | 192,781,148 | 12.2 | % | |||||||||
| Total Investments (Cost $1,754,267,121) | 1,775,556,387 | 112.1 | % | |||||||||
| Liabilities in Excess of Other Assets | (191,777,476 | ) | (12.1 | )% | ||||||||
| TOTAL NET ASSETS | $ | 1,583,778,911 | 100.0 | % | ||||||||
| Notes to Schedule of Investments | ||
| * | Restricted security as defined in Rule 144(a) under the Securities Act of 1933 and determined to be liquid. Purchased in a private placement transaction; resale to the public may require registration or may extend only to qualified institutional buyers. At December 31, 2014, the value of these securities total $237,312,630, which represents 14.98% of total net assets. | |
| ** | Illiquid Security | |
| @ | This security or portion of this security is out on loan at December 31, 2014. | |
| f | Foreign Security | |
| « | 7-Day Yield | |
| § | Security in Default | |
| † | Priced at Fair Value by the Valuation Committee as delegated by the Baird Funds' Board of Directors. | |
| Baird Intermediate Municipal Bond Fund | ||||||||||||
| Schedule of Investments | ||||||||||||
| December 31, 2014 | ||||||||||||
| Principal | % of | |||||||||||
| Amount | Value | Net Assets | ||||||||||
| Municipal Bonds | ||||||||||||
| Alabama | ||||||||||||
| Alabama State Public School & College Authority, | ||||||||||||
| 5.000%, 05/01/2019 | $ | 1,000,000 | $ | 1,153,090 | ||||||||
| Gulf Shores Alabama, | ||||||||||||
| 5.000%, 12/15/2018 (Callable 12/15/2017)(Insured by AGM) | 1,080,000 | 1,212,959 | ||||||||||
| 2,366,049 | 0.2 | % | ||||||||||
| Alaska | ||||||||||||
| Alaska State Housing Finance Corporation, | ||||||||||||
| 5.000%, 06/01/2017 (Callable 06/01/2015)(Insured by NPFGC) | 1,000,000 | 1,019,270 | 0.1 | % | ||||||||
| Arizona | ||||||||||||
| Gila County Arizona Unified School District Bonds, | ||||||||||||
| 5.250%, 07/01/2027 (Pre-refunded to 07/01/2017) | 1,000,000 | 1,111,680 | ||||||||||
| Maricopa County Arizona University School District No. 48 Scottsdale, | ||||||||||||
| 4.000%, 07/01/2026 (Pre-refunded to 07/01/2016) | 1,860,000 | 1,958,543 | ||||||||||
| 3,070,223 | 0.3 | % | ||||||||||
| Arkansas | ||||||||||||
| Arkansas Development Finance Authority, | ||||||||||||
| 5.500%, 12/01/2018 (ETM) | 1,000,000 | 1,129,880 | 0.1 | % | ||||||||
| California | ||||||||||||
| Bakersfield California Certificates Participation, | ||||||||||||
| 0.000%, 04/15/2021 (ETM) | 12,380,000 | 11,028,971 | ||||||||||
| Coalinga California Regional Medical Center, | ||||||||||||
| 5.125%, 03/01/2032 (Pre-refunded to 03/01/2015) | 2,370,000 | 2,435,507 | ||||||||||
| Commerce Community Development Commission, | ||||||||||||
| 0.000%, 08/01/2021 (ETM) | 815,000 | 582,635 | ||||||||||
| Pittsburg California Redevelopment Agency Residential Mortgage Revenue, | ||||||||||||
| 9.600%, 06/01/2016 (ETM) | 3,725,000 | 4,184,106 | ||||||||||
| Port Oakland California Revenue, | ||||||||||||
| 5.000%, 11/01/2017 (Insured by NPFGC) | 1,800,000 | 2,003,904 | ||||||||||
| San Joaquin Hills California Transportation Corridor Agency Toll Road Revenue: | ||||||||||||
| 0.000%, 01/01/2020 (ETM) | 6,865,000 | 6,403,672 | ||||||||||
| 0.000%, 01/01/2023 (ETM) | 14,000,000 | 11,858,140 | ||||||||||
| San Marcos California Public Facilities Authority Revenue, | ||||||||||||
| 0.000%, 09/01/2019 (ETM) | 17,295,000 | 16,192,963 | ||||||||||
| Woodside California Elementary School District Government School Bonds, | ||||||||||||
| 5.000%, 10/01/2023 (Pre-refunded to 10/01/2016) | 1,130,000 | 1,219,835 | ||||||||||
| 55,909,733 | 5.1 | % | ||||||||||
| Colorado | ||||||||||||
| Colorado Health Facilities Authority, | ||||||||||||
| 0.000%, 07/15/2022 (ETM) | 4,540,000 | 3,830,807 | ||||||||||
| Colorado Springs Colorado Hospital Revenue Bonds, | ||||||||||||
| 5.000%, 12/15/2032 (Pre-refunded to 12/15/2018) | 1,300,000 | 1,494,493 | ||||||||||
| Colorado Springs Colorado Utilities Revenue Bonds, | ||||||||||||
| 5.875%, 11/15/2017 (ETM) | 4,720,000 | 5,157,261 | ||||||||||
| County of El Paso Colorado Mortgage Revenue Bonds, | ||||||||||||
| 0.000%, 09/01/2015 (ETM) | 2,230,000 | 2,226,075 | ||||||||||
| Dawson Ridge Metropolitan District No. 1 Colorado: | ||||||||||||
| 0.000%, 10/01/2022 (ETM) | 17,540,000 | 14,899,704 | ||||||||||
| 0.000%, 10/01/2022 (ETM) | 26,895,000 | 22,846,495 | ||||||||||
| Regional Transportation District Colorado Sales Tax Revenue, | ||||||||||||
| 5.000%, 11/01/2036 (Pre-refunded to 11/01/2016) | 6,785,000 | 7,328,207 | ||||||||||
| 57,783,042 | 5.2 | % | ||||||||||
| Connecticut | ||||||||||||
| State of Connecticut, | ||||||||||||
| 5.000%, 10/15/2020 | 4,390,000 | 5,172,956 | 0.5 | % | ||||||||
| Delaware | ||||||||||||
| State of Delaware, | ||||||||||||
| 5.000%, 03/01/2020 | 2,000,000 | 2,357,780 | 0.2 | % | ||||||||
| Florida | ||||||||||||
| Brevard County Florida School Board, | ||||||||||||
| 5.000%, 07/01/2020 (Callable 07/01/2017)(Insured by AMBAC) | 1,925,000 | 2,102,658 | ||||||||||
| Broward County Florida School Board: | ||||||||||||
| 5.250%, 07/01/2022 (Callable 07/01/2021) | 8,390,000 | 9,962,370 | ||||||||||
| 5.250%, 07/01/2023 (Callable 07/01/2021) | 4,915,000 | 5,748,486 | ||||||||||
| County of St. Lucie Florida, | ||||||||||||
| 6.000%, 10/01/2020 (ETM) | 6,420,000 | 7,725,122 | ||||||||||
| Dade County Florida Health Facility Authority Hospital Revenue, | ||||||||||||
| 5.750%, 05/01/2021 (ETM) | 1,570,000 | 1,770,520 | ||||||||||
| Escambia County Florida Housing Finance Authority Multifamily Housing Revenue, | ||||||||||||
| 0.000%, 10/15/2018 (ETM) | 4,130,000 | 3,901,983 | ||||||||||
| Florida State Board of Education, | ||||||||||||
| 5.000%, 06/01/2022 (Callable 06/01/2019) | 13,800,000 | 15,965,082 | ||||||||||
| Florida State Department of Management Services, | ||||||||||||
| 5.000%, 08/01/2018 | 2,500,000 | 2,832,825 | ||||||||||
| Florida State Mid-Bay Bridge Authority Revenue: | ||||||||||||
| 6.875%, 10/01/2022 (ETM) | 4,675,000 | 5,890,920 | ||||||||||
| 6.875%, 10/01/2022 (ETM) | 3,175,000 | 4,000,786 | ||||||||||
| Florida State Municipal Power Agency Revenue, | ||||||||||||
| 5.000%, 10/01/2017 (Callable 03/13/2015)(ETM) | 1,590,000 | 1,774,488 | ||||||||||
| Gulf Environmental Services Inc. Florida Revenue Bonds, | ||||||||||||
| 5.000%, 10/01/2018 (ETM) | 1,065,000 | 1,166,335 | ||||||||||
| Hillsborough County Florida School Board Master Lease Program, | ||||||||||||
| 5.500%, 07/01/2018 (Insured by NPFGC) | 2,000,000 | 2,290,540 | ||||||||||
| Hillsborough County Industrial Development Authority: | ||||||||||||
| 5.625%, 08/15/2029 (Pre-refunded to 08/15/2018) | 2,285,000 | 2,657,706 | ||||||||||
| 8.000%, 08/15/2032 (Pre-refunded to 08/15/2019) | 1,940,000 | 2,525,609 | ||||||||||
| Miami Beach Florida Resort Tax Revenue, | ||||||||||||
| 6.250%, 10/01/2022 (ETM) | 1,470,000 | 1,779,905 | ||||||||||
| Miami Dade County Florida Entitlement Revenue Bonds, | ||||||||||||
| 5.000%, 08/01/2015 (Insured by NPFGC) | 3,000,000 | 3,081,030 | ||||||||||
| Miami-Dade County Florida, | ||||||||||||
| 4.500%, 10/01/2020 | 7,100,000 | 8,098,544 | ||||||||||
| Miami-Dade County Florida School Board, | ||||||||||||
| 5.000%, 05/01/2016 (Insured by NPFGC) | 3,000,000 | 3,174,840 | ||||||||||
| Miami-Dade County Florida Water & Sewer Revenue, | ||||||||||||
| 5.250%, 10/01/2022 | 1,125,000 | 1,363,365 | ||||||||||
| Orlando Florida Utilities Commission Water & Electric Revenue, | ||||||||||||
| 6.750%, 10/01/2017 (ETM) | 1,635,000 | 1,803,585 | ||||||||||
| Palm Beach County Florida Revenue, | ||||||||||||
| 5.000%, 11/01/2018 (Pre-refunded to 11/01/2017) | 1,000,000 | 1,119,530 | ||||||||||
| Pinellas County Housing Finance Authority, | ||||||||||||
| 4.250%, 03/01/2027 (Callable 09/01/2019) | 1,435,000 | 1,468,895 | ||||||||||
| Sarasota County Florida School Board, | ||||||||||||
| 5.000%, 07/01/2015 (Insured by NPFGC) | 1,000,000 | 1,023,310 | ||||||||||
| Seminole County Florida Water & Sewage Revenue, | ||||||||||||
| 6.000%, 10/01/2019 (ETM) | 5,200,000 | 5,838,144 | ||||||||||
| Sunrise Florida Utility System Revenue, | ||||||||||||
| 5.500%, 10/01/2018 (ETM) | 2,750,000 | 3,041,032 | ||||||||||
| 102,107,610 | 9.2 | % | ||||||||||
| Georgia | ||||||||||||
| Atlanta Georgia Water & Wastewater Revenue, | ||||||||||||
| 5.500%, 11/01/2017 (Insured by AGM) | 8,445,000 | 9,516,417 | ||||||||||
| Forsyth County Georgia Hospital Authority Revenue Anticipation Certificates, | ||||||||||||
| 6.375%, 10/01/2028 (ETM) | 8,050,000 | 10,295,708 | ||||||||||
| Georgia Municipal Electric Authority Power Revenue, | ||||||||||||
| 6.500%, 01/01/2017 (Insured by AGM) | 4,700,000 | 4,945,293 | ||||||||||
| Gwinnett County Georgia School District, | ||||||||||||
| 5.000%, 02/01/2026 (Pre-refunded to 02/01/2018) | 7,400,000 | 8,318,858 | ||||||||||
| Northwestern Gwinnett County Georgia Facilities Corporation I Certificate Participation, | ||||||||||||
| 5.750%, 06/15/2019 (Pre-refunded to 06/15/2015) | 1,735,000 | 1,785,992 | ||||||||||
| Richmond County Development Authority: | ||||||||||||
| 0.000%, 12/01/2021 (ETM) | 3,510,000 | 3,099,505 | ||||||||||
| 0.000%, 12/01/2021 (ETM) | 720,000 | 635,796 | ||||||||||
| State of Georgia, | ||||||||||||
| 5.000%, 07/01/2020 (Callable 07/01/2017) | 12,570,000 | 13,889,976 | ||||||||||
| Walton County School District, | ||||||||||||
| 5.000%, 08/01/2024 (Pre-refunded to 08/01/2015) | 1,000,000 | 1,027,480 | ||||||||||
| 53,515,025 | 4.8 | % | ||||||||||
| Illinois | ||||||||||||
| Chicago Illinois, | ||||||||||||
| 5.000%, 01/01/2017 (Callable 01/01/2016)(Insured by AGM) | 2,360,000 | 2,451,686 | ||||||||||
| Chicago Illinois Board of Education: | ||||||||||||
| 5.000%, 12/01/2017 (Callable 12/01/2016)(Insured by AGM) | 4,345,000 | 4,649,541 | ||||||||||
| 5.000%, 12/01/2017 (Insured by AMBAC) | 2,100,000 | 2,271,822 | ||||||||||
| 6.000%, 01/01/2020 (Insured by NPFGC) | 14,745,000 | 16,501,572 | ||||||||||
| Chicago Illinois Public Building Community Building Revenue: | ||||||||||||
| 7.000%, 01/01/2015 (ETM) | 1,025,000 | 1,025,000 | ||||||||||
| 7.000%, 01/01/2020 (ETM) | 1,555,000 | 1,915,013 | ||||||||||
| Cook County Community High School District No. 233, | ||||||||||||
| 4.000%, 12/01/2026 (Callable 06/01/2022) | 3,695,000 | 4,109,616 | ||||||||||
| Cook County Illinois School District No. 097, | ||||||||||||
| 9.000%, 12/01/2015 (Insured by NPFGC) | 2,605,000 | 2,806,419 | ||||||||||
| Cook County Illinois School District No. 100, | ||||||||||||
| 8.100%, 12/01/2016 (ETM) | 1,430,000 | 1,633,189 | ||||||||||
| Cook County Illinois School District No. 159, | ||||||||||||
| 0.000%, 12/01/2022 (ETM) | 2,000,000 | 1,666,720 | ||||||||||
| Dupage County Illinois Stormwater Project, | ||||||||||||
| 5.600%, 01/01/2021 | 980,000 | 1,113,349 | ||||||||||
| Illinois Development Financial Authority, | ||||||||||||
| 0.000%, 07/15/2023 (ETM) | 21,475,000 | 17,760,684 | ||||||||||
| Illinois Finance Authority, | ||||||||||||
| 0.000%, 07/15/2025 (ETM) | 12,625,000 | 9,760,514 | ||||||||||
| Illinois Municipal Electric Agency Power Supply Revenue Bonds, | ||||||||||||
| 5.250%, 02/01/2016 (Insured by NPFGC) | 1,000,000 | 1,050,490 | ||||||||||
| Illinois State: | ||||||||||||
| 5.000%, 01/01/2019 (Insured by AGM) | 1,000,000 | 1,116,420 | ||||||||||
| 4.000%, 09/01/2019 (Callable 09/01/2018)(Insured by AGM) | 5,000,000 | 5,276,250 | ||||||||||
| 6.000%, 11/01/2026 (Insured by NPFGC) | 3,000,000 | 3,692,940 | ||||||||||
| Illinois State Toll Highway Authority Priority Revenue Bonds, | ||||||||||||
| 5.500%, 01/01/2016 (Insured by AGM) | 2,100,000 | 2,207,016 | ||||||||||
| Illinois State Toll Highway Authority Revenue Bonds: | ||||||||||||
| 5.000%, 01/01/2026 (Pre-refunded to 07/01/2016) | 1,065,000 | 1,137,186 | ||||||||||
| 5.000%, 01/01/2031 (Pre-refunded to 07/01/2016) | 2,055,000 | 2,194,288 | ||||||||||
| Kane County Community Unit School District No 304 Geneva, | ||||||||||||
| 9.000%, 01/01/2023 (Insured by AGM) | 2,000,000 | 2,910,500 | ||||||||||
| Kane McHenry Cook & De Kalb Counties Illinois School District No. 300: | ||||||||||||
| 9.000%, 01/01/2015 (Insured by AMBAC) | 1,000,000 | 1,000,000 | ||||||||||
| 7.750%, 01/01/2017 (ETM) | 1,835,000 | 2,094,047 | ||||||||||
| 7.000%, 01/01/2018 (ETM) | 5,775,000 | 6,812,479 | ||||||||||
| 7.000%, 01/01/2018 (ETM) | 365,000 | 430,572 | ||||||||||
| Kendall Kane & Will Counties Community Unit School District No. 308, | ||||||||||||
| 0.000%, 02/01/2021 | 13,625,000 | 11,710,824 | ||||||||||
| Lake County Illinois Community High School District No. 124 Grant, | ||||||||||||
| 5.000%, 12/01/2017 | 1,050,000 | 1,161,573 | ||||||||||
| McHenry & Kane Counties Illinois Community School District No. 158: | ||||||||||||
| 0.000%, 01/01/2016 (ETM) | 1,245,000 | 1,240,842 | ||||||||||
| 0.000%, 01/01/2016 | 725,000 | 714,603 | ||||||||||
| Metropolitan Pier & Exposition Authority Illinois: | ||||||||||||
| 5.500%, 06/15/2016 (ETM) | 1,805,000 | 1,935,285 | ||||||||||
| 5.500%, 12/15/2023 (ETM) | 2,250,000 | 2,695,837 | ||||||||||
| Regional Transportation Authority Illinois: | ||||||||||||
| 7.750%, 06/01/2020 | 1,000,000 | 1,181,480 | ||||||||||
| 6.700%, 11/01/2021 | 1,200,000 | 1,405,272 | ||||||||||
| 6.000%, 07/01/2022 (Insured by NPFGC) | 4,705,000 | 5,888,543 | ||||||||||
| Southern Illinois University Revenue: | ||||||||||||
| 5.250%, 04/01/2018 (Insured by NPFGC) | 1,075,000 | 1,189,261 | ||||||||||
| 5.250%, 04/01/2019 (Insured by NPFGC) | 1,390,000 | 1,559,330 | ||||||||||
| Village of Schaumburg IL, | ||||||||||||
| 4.000%, 12/01/2024 (Callable 12/01/2022) | 5,750,000 | 6,291,477 | ||||||||||
| Winnebago County Illinois School District No. 122 Harlam-Loves Park: | ||||||||||||
| 0.000%, 01/01/2018 (ETM) | 155,000 | 150,273 | ||||||||||
| 0.000%, 01/01/2018 (Insured by AGM) | 1,205,000 | 1,113,239 | ||||||||||
| 135,825,152 | 12.3 | % | ||||||||||
| Indiana | ||||||||||||
| Franklin Community Multi-School Building Corp, | ||||||||||||
| 5.000%, 07/15/2020 | 1,990,000 | 2,215,885 | ||||||||||
| Hammond Indiana Multi-School Building Corporation Revenue Bonds: | ||||||||||||
| 6.000%, 01/15/2018 (ETM) | 825,000 | 890,629 | ||||||||||
| 5.000%, 07/15/2018 (Insured by NPFGC) | 1,330,000 | 1,487,778 | ||||||||||
| Indiana State Office Building Commissions Facilities Revenue Bonds, | ||||||||||||
| 5.250%, 07/01/2017 | 1,115,000 | 1,231,651 | ||||||||||
| Indiana Toll Road Commission, | ||||||||||||
| 9.000%, 01/01/2015 (ETM) | 255,000 | 255,000 | ||||||||||
| Indianapolis Local Public Improvement Bond Bank, | ||||||||||||
| 5.500%, 01/01/2019 (Insured by NPFGC) | 1,155,000 | 1,297,816 | ||||||||||
| Indianapolis Local Public Improvement Bond Waterworks Project, | ||||||||||||
| 5.500%, 07/01/2018 (Insured by NPFGC) | 3,460,000 | 3,893,192 | ||||||||||
| Perry Township Multi School Building Corporation, | ||||||||||||
| 5.000%, 07/10/2018 (Callable 07/10/2015) | 1,000,000 | 1,023,570 | ||||||||||
| Purdue University Indiana Revenue, | ||||||||||||
| 5.000%, 07/01/2015 | 1,650,000 | 1,689,039 | ||||||||||
| South Bend Indiana Community School Building Corporation, | ||||||||||||
| 5.000%, 07/15/2017 (Insured by NPFGC) | 1,000,000 | 1,088,740 | ||||||||||
| 15,073,300 | 1.4 | % | ||||||||||
| Kansas | ||||||||||||
| City of Wichita KS, | ||||||||||||
| 5.000%, 11/15/2034 (Pre-refunded to 11/15/2019) | 1,005,000 | 1,178,473 | ||||||||||
| Wyandotte County Kansas Revenue, | ||||||||||||
| 5.000%, 09/01/2019 (Callable 03/01/2019)(Insured by BHAC) | 1,865,000 | 2,124,384 | ||||||||||
| 3,302,857 | 0.3 | % | ||||||||||
| Kentucky | ||||||||||||
| Jefferson County Kentucky School District Financial School Building Revenue Bonds, | ||||||||||||
| 5.500%, 01/01/2018 (Insured by AGM) | 3,340,000 | 3,732,851 | ||||||||||
| Louisville & Jefferson County Metropolitan Government, | ||||||||||||
| 6.125%, 02/01/2037 (Pre-refunded to 02/01/2018) | 13,665,000 | 15,826,256 | ||||||||||
| 19,559,107 | 1.8 | % | ||||||||||
| Louisiana | ||||||||||||
| Louisiana Public Facilities Authority Revenue: | ||||||||||||
| 5.500%, 05/15/2027 (Pre-refunded to 05/15/2026) | 9,885,000 | 12,708,749 | ||||||||||
| 5.500%, 05/15/2032 (Pre-refunded to 05/15/2026) | 20,585,000 | 27,039,427 | ||||||||||
| State of Louisiana: | ||||||||||||
| 5.000%, 11/15/2018 | 1,775,000 | 2,032,872 | ||||||||||
| 5.000%, 11/15/2020 (Callable 05/15/2020) | 10,000,000 | 11,750,300 | ||||||||||
| 53,531,348 | 4.8 | % | ||||||||||
| Maryland | ||||||||||||
| City of Baltimore MD, | ||||||||||||
| 5.000%, 07/01/2024 (ETM) | 1,195,000 | 1,456,454 | ||||||||||
| State of Maryland: | ||||||||||||
| 5.000%, 03/15/2019 (Pre-refunded to 03/15/2017) | 1,135,000 | 1,245,129 | ||||||||||
| 5.000%, 03/01/2021 (Callable 03/01/2020) | 1,000,000 | 1,176,710 | ||||||||||
| 3,878,293 | 0.4 | % | ||||||||||
| Massachusetts | ||||||||||||
| Massachusetts Clean Water Trust/The, | ||||||||||||
| 5.000%, 08/01/2018 (Callable 08/01/2016)(Partially Pre-refunded) | 2,115,000 | 2,269,839 | ||||||||||
| Massachusetts Department of Transportation, | ||||||||||||
| 5.000%, 01/01/2020 (ETM) | 2,075,000 | 2,284,368 | ||||||||||
| Massachusetts State: | ||||||||||||
| 5.000%, 08/01/2020 (Pre-refunded to 08/01/2016) | 5,820,000 | 6,236,537 | ||||||||||
| 4.000%, 12/01/2022 (Callable 12/01/2019) | 15,000,000 | 16,571,400 | ||||||||||
| Massachusetts State Water Resources Authority: | ||||||||||||
| 5.250%, 12/01/2015 (ETM) | 1,115,000 | 1,165,655 | ||||||||||
| 6.500%, 07/15/2019 (ETM) | 2,395,000 | 2,690,447 | ||||||||||
| 31,218,246 | 2.8 | % | ||||||||||
| Michigan | ||||||||||||
| Brighton Area School District/MI: | ||||||||||||
| 5.000%, 05/01/2020 (Insured by Q-SBLF) | 1,300,000 | 1,485,952 | ||||||||||
| 5.000%, 05/01/2021 (Insured by Q-SBLF) | 500,000 | 575,155 | ||||||||||
| Detroit Michigan City School District, | ||||||||||||
| 5.000%, 05/01/2016 (Callable 05/01/2015)(Insured by AGM and Q-SBLF) | 1,000,000 | 1,014,700 | ||||||||||
| Fraser Public School District: | ||||||||||||
| 5.000%, 05/01/2024 (Insured by Q-SBLF) | 1,000,000 | 1,182,480 | ||||||||||
| 5.000%, 05/01/2026 (Callable 05/01/2025) (Insured by Q-SBLF) | 1,140,000 | 1,345,223 | ||||||||||
| Garden City Hospital Finance Authority, | ||||||||||||
| 4.875%, 08/15/2027 (Pre-refunded to 08/15/2017) | 1,000,000 | 1,106,070 | ||||||||||
| Harper Creek Michigan Community School District, | ||||||||||||
| 5.000%, 05/01/2016 (Callable 05/01/2015)(Insured by AGM) | 1,550,000 | 1,572,785 | ||||||||||
| Jenison Michigan Public Schools, | ||||||||||||
| 5.250%, 05/01/2015 (Insured by NPFGC) | 1,390,000 | 1,412,351 | ||||||||||
| Lakeview Public School District, | ||||||||||||
| 5.000%, 05/01/2017 (Insured by NPFGC and Q-SBLF) | 2,275,000 | 2,466,123 | ||||||||||
| Michigan Finance Authority, | ||||||||||||
| 5.000%, 01/01/2019 | 7,000,000 | 7,994,140 | ||||||||||
| Michigan State Housing Development Authority, | ||||||||||||
| 4.750%, 06/01/2016 | 4,000,000 | 4,117,080 | ||||||||||
| Pinckney Community Schools: | ||||||||||||
| 5.000%, 05/01/2022 (Insured by Q-SBLF) | 1,935,000 | 2,239,859 | ||||||||||
| 5.000%, 05/01/2023 (Insured by Q-SBLF) | 2,200,000 | 2,555,124 | ||||||||||
| St Johns Public Schools, | ||||||||||||
| 5.000%, 05/01/2021 (Insured by Q-SBLF) | 5,040,000 | 5,871,399 | ||||||||||
| State of Michigan, | ||||||||||||
| 0.000%, 06/01/2022 (ETM) | 2,000,000 | 1,729,840 | ||||||||||
| Wayne-Westland Community Schools, | ||||||||||||
| 5.000%, 05/01/2019 (Insured by Q-SBLF) | 2,060,000 | 2,337,317 | ||||||||||
| 39,005,598 | 3.5 | % | ||||||||||
| Minnesota | ||||||||||||
| Minnesota State Housing Finance Agency Homeownership Finance Bond: | ||||||||||||
| 4.250%, 07/01/2028 (Callable 01/01/2020) | 630,000 | 661,437 | ||||||||||
| 4.500%, 07/01/2034 (Callable 07/01/2021) | 1,305,000 | 1,365,891 | ||||||||||
| University of Minnesota, | ||||||||||||
| 5.500%, 07/01/2021 (ETM) | 9,980,000 | 11,964,922 | ||||||||||
| Western Minnesota Municipal Power Agency, | ||||||||||||
| 6.375%, 01/01/2016 (ETM) | 820,000 | 843,354 | ||||||||||
| 14,835,604 | 1.3 | % | ||||||||||
| Mississippi | ||||||||||||
| Mississippi Development Bank Special Obligations, | ||||||||||||
| 5.250%, 10/01/2030 (Pre-refunded to 10/01/2015) | 1,110,000 | 1,151,037 | ||||||||||
| Mississippi Housing Financial Corporation, | ||||||||||||
| 0.000%, 06/01/2015 (ETM) | 1,500,000 | 1,498,665 | ||||||||||
| 2,649,702 | 0.2 | % | ||||||||||
| Missouri | ||||||||||||
| St. Charles County Missouri Francis Howell School District, | ||||||||||||
| 4.500%, 03/01/2018 | 1,000,000 | 1,107,360 | 0.1 | % | ||||||||
| Nebraska | ||||||||||||
| Omaha Nebraska Public Electric Power District Revenue, | ||||||||||||
| 6.200%, 02/01/2017 (ETM) | 5,630,000 | 5,960,762 | 0.5 | % | ||||||||
| Nevada | ||||||||||||
| Las Vegas Clark County Nevada Library District, | ||||||||||||
| 5.000%, 01/01/2017 | 2,080,000 | 2,232,110 | 0.2 | % | ||||||||
| New Hampshire | ||||||||||||
| New Hampshire Housing Finance Authority Revenue Bonds, | ||||||||||||
| 5.250%, 07/01/2028 (Callable 01/01/2021) | 2,385,000 | 2,490,608 | ||||||||||
| State of New Hampshire, | ||||||||||||
| 5.000%, 07/01/2021 (Callable 07/01/2020) | 1,000,000 | 1,190,630 | ||||||||||
| 3,681,238 | 0.3 | % | ||||||||||
| New Jersey | ||||||||||||
| County of Hudson NJ, | ||||||||||||
| 3.000%, 03/15/2021 | 1,140,000 | 1,212,219 | ||||||||||
| New Jersey Educational Facilities Authority, | ||||||||||||
| 7.500%, 12/01/2032 (Pre-refunded to 06/01/2019) | 3,575,000 | 4,516,905 | ||||||||||
| New Jersey Health Care Facilities Financing Authority, | ||||||||||||
| 5.750%, 07/01/2039 (Pre-refunded to 07/01/2019) | 870,000 | 1,037,344 | ||||||||||
| New Jersey State Housing & Mortgage Finance Agency Bonds, | ||||||||||||
| 4.500%, 10/01/2029 (Callable 04/01/2021) | 7,305,000 | 7,630,292 | ||||||||||
| New Jersey State Transportation Trust Fund Authority: | ||||||||||||
| 5.500%, 12/15/2015 (Insured by AMBAC) | 2,595,000 | 2,719,768 | ||||||||||
| 5.250%, 12/15/2020 | 5,000,000 | 5,781,650 | ||||||||||
| New Jersey State Turnpike Authority: | ||||||||||||
| 6.500%, 01/01/2016 (ETM) | 585,000 | 591,944 | ||||||||||
| 6.500%, 01/01/2016 (ETM) | 45,000 | 45,534 | ||||||||||
| 5.500%, 01/01/2025 | 2,100,000 | 2,664,312 | ||||||||||
| 26,199,968 | 2.4 | % | ||||||||||
| New Mexico | ||||||||||||
| New Mexico Mortgage Financial Authority: | ||||||||||||
| 4.625%, 09/01/2025 (Callable 03/01/2020) | 970,000 | 1,009,877 | ||||||||||
| 4.500%, 09/01/2028 (Callable 03/01/2020) | 735,000 | 775,079 | ||||||||||
| New Mexico State Hospital Equipment Loan Council Hospital Revenue, | ||||||||||||
| 5.250%, 07/01/2025 (Pre-refunded to 07/01/2015) | 1,000,000 | 1,023,680 | ||||||||||
| 2,808,636 | 0.3 | % | ||||||||||
| New York | ||||||||||||
| Cattaraugus-Little Valley Central School District: | ||||||||||||
| 3.125%, 06/15/2016 (Insured by AGM) | 1,520,000 | 1,567,880 | ||||||||||
| 3.125%, 06/15/2017 (Insured by AGM) | 1,000,000 | 1,046,430 | ||||||||||
| Churchville-Chili Central School District: | ||||||||||||
| 3.000%, 06/15/2017 | 1,045,000 | 1,096,842 | ||||||||||
| 3.000%, 06/15/2018 | 1,070,000 | 1,134,746 | ||||||||||
| City of New York NY, | ||||||||||||
| 5.000%, 08/01/2022 | 5,000,000 | 6,002,050 | ||||||||||
| Long Island Power Authority and Electric System Revenue, | ||||||||||||
| 5.000%, 12/01/2017 (Callable 12/01/2016)(Insured by NPFGC) | 2,000,000 | 2,154,740 | ||||||||||
| Metropolitan Transit Authority New York, | ||||||||||||
| 6.000%, 04/01/2020 (ETM) | 13,430,000 | 15,718,472 | ||||||||||
| New York State Dormitory Authority, | ||||||||||||
| 5.000%, 12/15/2023 (Callable 12/15/2022) | 11,685,000 | 14,142,122 | ||||||||||
| New York State Thruway Authority, | ||||||||||||
| 5.000%, 03/15/2022 (Callable 03/15/2019) | 4,040,000 | 4,603,459 | ||||||||||
| New York State Urban Development Corp, | ||||||||||||
| 5.000%, 03/15/2022 | 2,000,000 | 2,408,900 | ||||||||||
| New York, New York: | ||||||||||||
| 5.000%, 03/01/2016 (Callable 03/01/2015)(Partially Pre-refunded)(Insured by FGIC-TCRS) | 1,000,000 | 1,007,330 | ||||||||||
| 5.250%, 08/15/2021 (Callable 08/15/2018) | 1,125,000 | 1,285,414 | ||||||||||
| Suffolk County Water Authority, | ||||||||||||
| 6.000%, 06/01/2017 (ETM) | 4,715,000 | 5,053,160 | ||||||||||
| Susquehanna Valley Central School District: | ||||||||||||
| 3.125%, 06/15/2017 (Insured by AGM) | 1,155,000 | 1,208,626 | ||||||||||
| 3.125%, 06/15/2019 (Insured by AGM) | 1,375,000 | 1,428,529 | ||||||||||
| TSASC Inc. New York, | ||||||||||||
| 4.750%, 06/01/2022 (Callable 06/01/2016) | 150,000 | 150,559 | ||||||||||
| Westchester Tobacco Asset Securitization Corp. New York, | ||||||||||||
| 6.950%, 07/15/2039 (Pre-refunded to 07/15/2017) | 13,075,000 | 15,234,336 | ||||||||||
| 75,243,595 | 6.8 | % | ||||||||||
| North Carolina | ||||||||||||
| North Carolina Eastern Municipal Power Agency, | ||||||||||||
| 5.000%, 01/01/2021 (ETM) | 10,120,000 | 11,909,216 | ||||||||||
| North Carolina Eastern Municipal Power Agency Power Systems Revenue: | ||||||||||||
| 5.000%, 01/01/2017 (ETM) | 6,630,000 | 6,926,560 | ||||||||||
| 6.400%, 01/01/2021 (ETM) | 5,362,000 | 6,212,681 | ||||||||||
| 4.500%, 01/01/2024 (Pre-refunded to 01/01/2022) | 7,665,000 | 9,028,067 | ||||||||||
| 6.000%, 01/01/2026 (Pre-refunded to 01/01/2022) | 2,285,000 | 2,934,854 | ||||||||||
| 37,011,378 | 3.4 | % | ||||||||||
| Ohio | ||||||||||||
| Cincinnati Ohio City School District, | ||||||||||||
| 5.000%, 12/01/2016 (Insured by AGM) | 2,000,000 | 2,169,820 | ||||||||||
| Cleveland Municipal School District: | ||||||||||||
| 4.000%, 12/01/2017 | 1,790,000 | 1,926,685 | ||||||||||
| 4.000%, 12/01/2018 | 1,865,000 | 2,022,611 | ||||||||||
| 4.000%, 12/01/2019 | 1,940,000 | 2,114,619 | ||||||||||
| 5.000%, 12/01/2020 | 2,015,000 | 2,323,275 | ||||||||||
| Miamisburg Ohio Water Revenue, | ||||||||||||
| 7.000%, 11/15/2016 (Callable 03/13/2015)(ETM) | 60,000 | 63,071 | ||||||||||
| Ohio Housing Finance Agency, | ||||||||||||
| 5.000%, 11/01/2028 (Callable 05/01/2020) | 1,630,000 | 1,731,321 | ||||||||||
| State of Ohio: | ||||||||||||
| 5.000%, 03/01/2019 | 1,220,000 | 1,403,488 | ||||||||||
| 5.500%, 02/01/2020 | 1,195,000 | 1,429,423 | ||||||||||
| 5.000%, 06/15/2021 | 6,740,000 | 8,091,572 | ||||||||||
| 23,275,885 | 2.1 | % | ||||||||||
| Pennsylvania | ||||||||||||
| Central Dauphin Pennsylvania School District, | ||||||||||||
| 6.750%, 02/01/2024 (Pre-refunded to 02/01/2016) | 1,275,000 | 1,363,600 | ||||||||||
| Erie Pennsylvania Sewer Authority Revenue, | ||||||||||||
| 5.125%, 06/01/2020 (ETM) | 1,380,000 | 1,559,662 | ||||||||||
| Lampeter Strasburg School District, | ||||||||||||
| 4.000%, 06/01/2019 | 1,715,000 | 1,852,818 | ||||||||||
| Pennsylvania Convention Center Authority Revenue Bonds, | ||||||||||||
| 6.000%, 09/01/2019 (ETM) | 11,125,000 | 12,999,118 | ||||||||||
| Pennsylvania Housing Finance Agency: | ||||||||||||
| 3.700%, 04/01/2018 | 2,130,000 | 2,250,430 | ||||||||||
| 3.750%, 10/01/2018 | 1,760,000 | 1,877,515 | ||||||||||
| 3.900%, 04/01/2019 | 1,025,000 | 1,102,398 | ||||||||||
| 3.900%, 10/01/2019 (Callable 04/01/2019) | 1,675,000 | 1,801,479 | ||||||||||
| Philadelphia Hospitals & Higher Education Facilities Authority: | ||||||||||||
| 5.000%, 05/15/2020 (ETM) | 1,525,000 | 1,794,498 | ||||||||||
| 5.250%, 05/15/2023 (Pre-refunded to 05/15/2020) | 2,675,000 | 3,181,966 | ||||||||||
| Philadelphia Pennsylvania Authority For Industrial Development Revenue, | ||||||||||||
| 5.250%, 01/01/2027 (Pre-refunded to 01/01/2017) | 1,790,000 | 1,950,724 | ||||||||||
| Philadelphia Pennsylvania Gas Works, | ||||||||||||
| 7.000%, 05/15/2020 (ETM) | 2,120,000 | 2,473,552 | ||||||||||
| South Fork Municipal Authority: | ||||||||||||
| 5.500%, 07/01/2029 (Pre-refunded to 07/01/2020) | 450,000 | 544,455 | ||||||||||
| 5.375%, 07/01/2035 (Pre-refunded to 07/01/2020) | 370,000 | 446,320 | ||||||||||
| 35,198,535 | 3.2 | % | ||||||||||
| Puerto Rico | ||||||||||||
| Commonwealth of Puerto Rico, | ||||||||||||
| 5.000%, 07/01/2021 | 6,000,000 | 4,736,760 | ||||||||||
| Puerto Rico Electric Power Authority: | ||||||||||||
| 0.000%, 07/01/2017 (ETM) | 5,010,000 | 4,583,649 | ||||||||||
| 0.000%, 07/01/2017 (Pre-refunded to various dates)(ETM) | 3,000,000 | 2,694,810 | ||||||||||
| Puerto Rico Public Finance Corp., | ||||||||||||
| 6.000%, 08/01/2026 (ETM) | 1,080,000 | 1,418,256 | ||||||||||
| 13,433,475 | 1.2 | % | ||||||||||
| South Carolina | ||||||||||||
| Charleston Educational Excellence Finance Corp, | ||||||||||||
| 5.000%, 12/01/2026 (Callable 12/01/2023) | 4,580,000 | 5,468,566 | ||||||||||
| Piedmont Municipal Power Agency South Carolina Electric Revenue, | ||||||||||||
| 6.750%, 01/01/2020 (ETM) | 6,450,000 | 8,070,949 | ||||||||||
| 13,539,515 | 1.2 | % | ||||||||||
| South Dakota | ||||||||||||
| Heartland Consumers Power District, | ||||||||||||
| 7.000%, 01/01/2016 (ETM) | 455,000 | 469,537 | 0.1 | % | ||||||||
| Tennessee | ||||||||||||
| County of Rutherford TN, | ||||||||||||
| 5.000%, 04/01/2021 | 1,955,000 | 2,341,543 | ||||||||||
| Metropolitan Government Nashville & Davidson County Tennessee H&E, | ||||||||||||
| 0.000%, 06/01/2021 (ETM) | 1,050,000 | 934,993 | ||||||||||
| Shelby County Tennessee Health Educational & Housing Facilities Revenue, | ||||||||||||
| 5.500%, 08/15/2019 (ETM) | 3,755,000 | 4,002,680 | ||||||||||
| Tennessee Housing Development Agency, | ||||||||||||
| 4.500%, 07/01/2028 (Callable 01/01/2020) | 2,935,000 | 3,021,436 | ||||||||||
| 10,300,652 | 0.9 | % | ||||||||||
| Texas | ||||||||||||
| Amarillo Independent School District, | ||||||||||||
| 5.000%, 02/01/2026 (Callable 02/01/2024)(PSF Guaranteed) | 1,370,000 | 1,676,250 | ||||||||||
| Arlington Higher Education Finance Corp, | ||||||||||||
| 5.000%, 08/15/2024 (PSF Guaranteed) | 1,000,000 | 1,229,610 | ||||||||||
| Barbers Hill Texas Independent School District General Obligation, | ||||||||||||
| 5.000%, 02/15/2017 (Pre-refunded to 02/15/2015)(PSF Guaranteed) | 2,125,000 | 2,136,305 | ||||||||||
| Capital Area Housing Finance Corporation Texas, | ||||||||||||
| 0.000%, 01/01/2016 (ETM) | 6,060,000 | 6,033,821 | ||||||||||
| Central Texas Housing Finance Corporation, | ||||||||||||
| 0.000%, 09/01/2016 (ETM) | 1,500,000 | 1,484,730 | ||||||||||
| City of Austin TX Water & Wastewater System Revenue, | ||||||||||||
| 5.000%, 11/15/2024 (Callable 11/15/2022) | 3,000,000 | 3,615,090 | ||||||||||
| City of Houston TX Combined Utility System Revenue: | ||||||||||||
| 0.000%, 12/01/2019 (ETM) | 13,355,000 | 12,411,469 | ||||||||||
| 5.500%, 12/01/2024 (ETM) | 1,735,000 | 2,206,452 | ||||||||||
| 5.500%, 12/01/2029 (ETM) | 16,050,000 | 21,784,183 | ||||||||||
| Conroe Independent School District: | ||||||||||||
| 5.000%, 02/15/2022 (Callable 02/15/2021)(PSF Guaranteed) | 1,000,000 | 1,198,380 | ||||||||||
| 5.000%, 02/15/2023 (Callable 02/15/2021)(PSF Guaranteed) | 2,680,000 | 3,197,883 | ||||||||||
| Cypress-Fairbanks Independent School District: | ||||||||||||
| 5.000%, 02/15/2017 (Pre-refunded to 02/15/2016) | 1,085,000 | 1,142,125 | ||||||||||
| 5.000%, 02/15/2017 (Callable 02/15/2016)(PSF Guaranteed) | 415,000 | 436,277 | ||||||||||
| Dallas Texas Independent School District, | ||||||||||||
| 5.000%, 02/15/2020 (PSF Guaranteed) | 2,410,000 | 2,831,051 | ||||||||||
| El Paso Texas, | ||||||||||||
| 5.000%, 08/15/2018 | 1,355,000 | 1,538,846 | ||||||||||
| Frisco Texas Independent School District, | ||||||||||||
| 6.000%, 08/15/2018 (Callable 08/15/2016)(PSF Guaranteed) | 1,625,000 | 1,771,006 | ||||||||||
| Georgetown Independent School District, | ||||||||||||
| 4.000%, 02/15/2020 (PSF Guaranteed) | 1,900,000 | 2,141,699 | ||||||||||
| Georgetown Texas Independent School District, | ||||||||||||
| 5.000%, 02/15/2016 (Callable 02/15/2015)(PSF Guaranteed) | 1,000,000 | 1,005,320 | ||||||||||
| Goose Creek Consolidated Independent School District, | ||||||||||||
| 5.000%, 02/15/2021 (PSF Guaranteed) | 1,050,000 | 1,253,574 | ||||||||||
| Harris County Texas: | ||||||||||||
| 5.000%, 10/01/2019 | 1,525,000 | 1,778,745 | ||||||||||
| 5.750%, 10/01/2020 (Pre-refunded to 10/01/2018) | 175,000 | 204,985 | ||||||||||
| 5.750%, 10/01/2028 (Pre-refunded to 10/01/2018) | 6,830,000 | 8,000,252 | ||||||||||
| Harris County Texas Health Facilities Development Corporation Hospital Revenue, | ||||||||||||
| 5.500%, 10/01/2019 (ETM) | 4,780,000 | 5,401,830 | ||||||||||
| Houston Higher Education Finance Corp: | ||||||||||||
| 5.000%, 02/15/2020 | 1,000,000 | 1,170,940 | ||||||||||
| 5.000%, 02/15/2026 (Callable 02/15/2024) | 1,030,000 | 1,237,638 | ||||||||||
| Humble Texas Independent School District, | ||||||||||||
| 5.000%, 02/15/2021 (PSF Guaranteed) | 1,500,000 | 1,793,700 | ||||||||||
| Irving Independent School District, | ||||||||||||
| 5.000%, 02/15/2025 (Callable 08/15/2024) | 1,250,000 | 1,539,438 | ||||||||||
| Killeen Independent School District, | ||||||||||||
| 4.000%, 02/15/2024 (Callable 02/15/2021)(PSF Guaranteed) | 1,145,000 | 1,258,057 | ||||||||||
| La Porte Independent School District/TX, | ||||||||||||
| 5.000%, 02/15/2018 (Pre-refunded to 02/15/2015)(Insured by NPFGC) | 85,000 | 85,447 | ||||||||||
| Llano Independent School District, | ||||||||||||
| 5.000%, 02/15/2024 (Callable 02/15/2023)(PSF Guaranteed) | 1,265,000 | 1,534,015 | ||||||||||
| Lower Colorado River Authority, | ||||||||||||
| 4.750%, 01/01/2028 (ETM) | 1,200,000 | 1,445,112 | ||||||||||
| Lubbock Texas, | ||||||||||||
| 5.000%, 02/15/2021 (Callable 02/15/2018)(Insured by AGM) | 3,425,000 | 3,815,313 | ||||||||||
| Lubbock Texas Housing Finance Corp., | ||||||||||||
| 8.000%, 10/01/2021 (ETM) | 1,780,000 | 2,433,687 | ||||||||||
| Lubbock Texas Independent School District, | ||||||||||||
| 4.000%, 02/15/2022 (Callable 02/15/2020)(PSF Guaranteed) | 1,000,000 | 1,097,160 | ||||||||||
| Magnolia Texas Independent School District, | ||||||||||||
| 5.000%, 08/15/2016 (PSF Guaranteed) | 1,475,000 | 1,582,174 | ||||||||||
| Mansfield Independent School District: | ||||||||||||
| 5.000%, 02/15/2023 (PSF Guaranteed) | 1,725,000 | 2,104,776 | ||||||||||
| 5.000%, 02/15/2024 (PSF Guaranteed) | 1,905,000 | 2,351,894 | ||||||||||
| Mission Consolidation Independent School District, | ||||||||||||
| 5.000%, 02/15/2019 (Pre-refunded to 02/17/2015)(PSF Guaranteed) | 1,265,000 | 1,272,071 | ||||||||||
| North East Independent School District/TX, | ||||||||||||
| 5.000%, 08/01/2021 (PSF Guaranteed) | 6,095,000 | 7,323,386 | ||||||||||
| Pasadena Independent School District, | ||||||||||||
| 5.000%, 02/15/2022 (Callable 02/15/2021)(PSF Guaranteed) | 1,115,000 | 1,312,734 | ||||||||||
| Pflugerville Independent School District, | ||||||||||||
| 5.000%, 02/15/2025 (Callable 02/15/2024)(PSF Guaranteed) | 1,000,000 | 1,226,240 | ||||||||||
| Retama Texas Development Corporation Special Facilities Revenue, | ||||||||||||
| 8.750%, 12/15/2018 (ETM) | 2,035,000 | 2,596,701 | ||||||||||
| San Antonio Texas Electric & Gas Revenue, | ||||||||||||
| 5.650%, 02/01/2019 (ETM) | 11,665,000 | 13,111,577 | ||||||||||
| San Antonio Texas Hotel Occupancy Tax Revenue Bonds, | ||||||||||||
| 0.000%, 08/15/2015 (ETM) | 2,100,000 | 2,095,926 | ||||||||||
| San Antonio Texas Independent School District, | ||||||||||||
| 5.000%, 08/15/2017 (Callable 08/15/2015)(PSF Guaranteed) | 2,000,000 | 2,058,840 | ||||||||||
| Sherman Independent School District/TX, | ||||||||||||
| 5.000%, 02/15/2026 (Callable 02/15/2024)(PSF Guaranteed) | 1,775,000 | 2,173,292 | ||||||||||
| Spring Texas Independent School District, | ||||||||||||
| 5.000%, 08/15/2019 (Callable 08/15/2018)(PSF Guaranteed) | 1,020,000 | 1,159,954 | ||||||||||
| Tarrant County Texas Health Facilities Revenue, | ||||||||||||
| 6.000%, 09/01/2024 (ETM) | 7,990,000 | 9,603,820 | ||||||||||
| Tarrant County Texas Housing Finance Corporation Revenue Bonds, | ||||||||||||
| 0.000%, 09/15/2016 (ETM) | 1,800,000 | 1,784,250 | ||||||||||
| Temple Independent School District, | ||||||||||||
| 4.000%, 02/01/2022 (Callable 02/01/2021)(PSF Guaranteed) | 1,120,000 | 1,249,450 | ||||||||||
| Texas State: | ||||||||||||
| 5.000%, 10/01/2018 | 6,285,000 | 7,182,184 | ||||||||||
| 5.000%, 04/01/2020 (Pre-refunded to 04/01/2016) | 3,965,000 | 4,200,362 | ||||||||||
| 5.000%, 08/01/2021 | 1,205,000 | 1,453,664 | ||||||||||
| Tomball Hospital Authority, | ||||||||||||
| 5.000%, 07/01/2020 (Pre-refunded to 07/01/2015) | 2,200,000 | 2,252,162 | ||||||||||
| University of Texas Revenue Bonds, | ||||||||||||
| 5.000%, 08/15/2018 (Pre-refunded to 08/15/2016) | 1,225,000 | 1,312,771 | ||||||||||
| University of Texas System/The, | ||||||||||||
| 5.000%, 08/15/2022 | 9,530,000 | 11,628,506 | ||||||||||
| Ysleta Independent School District: | ||||||||||||
| 5.000%, 08/15/2023 (Callable 08/15/2021)(PSF Guaranteed) | 1,020,000 | 1,208,517 | ||||||||||
| 5.000%, 08/15/2025 (Callable 08/15/2024)(PSF Guaranteed) | 1,545,000 | 1,911,752 | ||||||||||
| 186,047,393 | 16.8 | % | ||||||||||
| Utah | ||||||||||||
| Granite School District Board of Education: | ||||||||||||
| 5.000%, 06/01/2022 (Callable 06/01/2021) | 3,900,000 | 4,656,678 | ||||||||||
| 5.000%, 06/01/2023 (Callable 06/01/2021) | 1,750,000 | 2,079,052 | ||||||||||
| Salt Lake City Utah Hospital Revenue, | ||||||||||||
| 8.125%, 05/15/2015 (Callable 02/02/2015)(ETM) | 85,000 | 87,415 | ||||||||||
| 6,823,145 | 0.6 | % | ||||||||||
| Virginia | ||||||||||||
| Bristol Virginia Utility Systems General Obligations, | ||||||||||||
| 5.500%, 11/01/2018 (ETM) | 1,095,000 | 1,232,182 | ||||||||||
| County of Fairfax VA, | ||||||||||||
| 4.000%, 10/01/2016 | 2,500,000 | 2,651,500 | ||||||||||
| Danville Industrial Development Authority, | ||||||||||||
| 5.250%, 10/01/2028 (ETM) | 1,500,000 | 1,822,830 | ||||||||||
| Virginia Public School Authority, | ||||||||||||
| 6.250%, 12/01/2028 (Pre-refunded to 12/01/2018) | 1,285,000 | 1,536,577 | ||||||||||
| 7,243,089 | 0.7 | % | ||||||||||
| Washington | ||||||||||||
| Snohomish County School District No. 201, | ||||||||||||
| 4.000%, 12/01/2021 (Callable 12/01/2020) | 4,500,000 | 5,065,425 | ||||||||||
| Snohomish County Washington Public Utilities Revenue, | ||||||||||||
| 6.800%, 01/01/2020 (Callable 03/13/2015)(ETM) | 3,605,000 | 4,232,378 | ||||||||||
| Thurston & Pierce Counties Washington Community Schools, | ||||||||||||
| 4.250%, 12/01/2021 (Callable 12/01/2020) | 2,755,000 | 3,074,057 | ||||||||||
| Walla Walla County School District No 250 College Place, | ||||||||||||
| 5.000%, 12/01/2019 | 1,290,000 | 1,462,112 | ||||||||||
| Washington Health Care Facilities Authority: | ||||||||||||
| 6.250%, 08/01/2028 (Pre-refunded to 08/01/2018) | 1,305,000 | 1,539,091 | ||||||||||
| 6.125%, 11/15/2031 (Pre-refunded to 05/15/2021) | 455,000 | 578,987 | ||||||||||
| 6.250%, 08/01/2036 (Pre-refunded to 08/01/2018) | 7,850,000 | 9,258,133 | ||||||||||
| 6.250%, 11/15/2041 (Pre-refunded to 05/15/2021) | 4,435,000 | 5,676,933 | ||||||||||
| Washington State: | ||||||||||||
| 5.000%, 01/01/2021 | 10,000,000 | 11,889,500 | ||||||||||
| 5.500%, 07/01/2023 | 5,000,000 | 6,165,050 | ||||||||||
| 48,941,666 | 4.4 | % | ||||||||||
| West Virginia | ||||||||||||
| Ohio County Board of Education, | ||||||||||||
| 5.250%, 06/01/2018 (ETM) | 1,130,000 | 1,287,816 | 0.1 | % | ||||||||
| Wisconsin | ||||||||||||
| Ladysmith-Hawkins Wisconsin School District General Obligation, | ||||||||||||
| 5.200%, 04/01/2018 (Callable 04/01/2016)(Insured by NPFGC) | 2,685,000 | 2,825,533 | 0.3 | % | ||||||||
| Total Municipal Bonds (Cost $1,062,045,002) | 1,106,942,063 | 100.1 | % | |||||||||
| Shares | ||||||||||||
| SHORT-TERM INVESTMENT | ||||||||||||
| Money Market Mutual Fund | ||||||||||||
| Goldman Sachs Financial Square Funds, 0.01% « | 12,684,854 | 12,684,854 | ||||||||||
| Total Short-Term Investments (Cost $12,684,854) | 12,684,854 | 1.2 | % | |||||||||
| Total Investments (Cost $1,074,729,856) | 1,119,626,917 | 101.3 | % | |||||||||
| Liabilities in Excess of Other Assets | (14,014,266 | ) | (1.3 | )% | ||||||||
| TOTAL NET ASSETS | $ | 1,105,612,651 | 100.0 | % | ||||||||
| Notes to Schedule of Investments | |
| AGM - Assured Guaranty Municipal | |
| AMBAC - Ambac Assurance Corporation | |
| BHAC - Berkshire Hathaway Assurance Corp. | |
| FGIC-TCRS - Financial Guaranty Insurance Company | |
| NPFGC - National Public Finance Guarantee Corp. | |
| PSF - Texas Permanent School Fund | |
| ETM - Escrowed to Maturity | |
| Q-SBLF - Qualified School Building Loan Fund | |
| « 7-Day Yield |
| Baird Aggregate Bond Fund | ||||||||||||
| Schedule of Investments | ||||||||||||
| December 31, 2014 | ||||||||||||
| Principal | % of | |||||||||||
| Amount | Value | Net Assets | ||||||||||
| LONG-TERM INVESTMENTS | ||||||||||||
| U.S. Treasury Securities | ||||||||||||
| U.S. Treasury Bonds: | ||||||||||||
| 2.625%, 08/15/2020 @ | $ | 423,000,000 | $ | 441,737,631 | ||||||||
| 6.250%, 08/15/2023 | 23,600,000 | 31,423,022 | ||||||||||
| 5.250%, 11/15/2028 @ | 60,626,500 | 81,282,131 | ||||||||||
| 4.375%, 02/15/2038 | 400 | 523 | ||||||||||
| 3.500%, 02/15/2039 @ | 196,330,900 | 225,489,180 | ||||||||||
| 3.125%, 08/15/2044 @ | 2,500,000 | 2,691,405 | ||||||||||
| 782,623,892 | 21.2 | % | ||||||||||
| Corporate Bonds | ||||||||||||
| Finance | ||||||||||||
| ABN AMRO Bank N.V., | ||||||||||||
| 2.500%, 10/30/2018 (Acquired 10/23/2013 through 01/13/2014, Cost $11,027,299) * f | 11,033,000 | 11,143,506 | ||||||||||
| Ally Financial Inc., | ||||||||||||
| 8.000%, 12/31/2018 | 360,000 | 408,600 | ||||||||||
| American International Group, Inc.: | ||||||||||||
| 5.450%, 05/18/2017 | 2,678,000 | 2,921,961 | ||||||||||
| 6.400%, 12/15/2020 @ | 830,000 | 989,750 | ||||||||||
| 4.875%, 06/01/2022 | 3,700,000 | 4,156,373 | ||||||||||
| 4.125%, 02/15/2024 @ | 893,000 | 950,609 | ||||||||||
| 8.175%, 05/15/2058 | 893,000 | 1,210,015 | ||||||||||
| Ameriprise Financial, Inc., | ||||||||||||
| 7.300%, 06/28/2019 | 1,785,000 | 2,150,802 | ||||||||||
| AmSouth Bancorporation, | ||||||||||||
| 6.750%, 11/01/2025 | 223,000 | 265,930 | ||||||||||
| Associates Corporation of North America, | ||||||||||||
| 6.950%, 11/01/2018 | 4,764,000 | 5,564,304 | ||||||||||
| Australia and New Zealand Banking Group Limited, | ||||||||||||
| 4.500%, 03/19/2024 (Acquired 03/12/2014, Cost $5,991,840) * @ f | 6,000,000 | 6,124,926 | ||||||||||
| BAC Capital Trust VI, | ||||||||||||
| 5.625%, 03/08/2035 ^ | 357,000 | 370,883 | ||||||||||
| Bank of America Corporation: | ||||||||||||
| 10.200%, 07/15/2015 | 1,531,000 | 1,606,171 | ||||||||||
| 6.400%, 08/28/2017 | 893,000 | 994,950 | ||||||||||
| 6.875%, 04/25/2018 | 3,162,000 | 3,631,810 | ||||||||||
| 7.750%, 05/14/2038 | 1,138,000 | 1,607,202 | ||||||||||
| BanPonce Trust I, | ||||||||||||
| Series A, 8.327%, 02/01/2027 | 1,941,000 | 1,694,779 | ||||||||||
| Barclays Bank PLC: | ||||||||||||
| 2.500%, 02/20/2019 @ f | 2,000,000 | 2,026,572 | ||||||||||
| 6.750%, 05/22/2019 f | 3,570,000 | 4,200,833 | ||||||||||
| 3.750%, 05/15/2024 f | 1,450,000 | 1,494,589 | ||||||||||
| BNP Paribas, | ||||||||||||
| 3.250%, 03/03/2023 f | 3,570,000 | 3,639,561 | ||||||||||
| BNZ International Funding Limited, | ||||||||||||
| 2.350%, 03/04/2019 (Acquired 09/03/2014, Cost $3,288,021) * f | 3,300,000 | 3,300,393 | ||||||||||
| BPCE: | ||||||||||||
| 1.082%, 02/10/2017 f | 2,544,000 | 2,560,849 | ||||||||||
| 2.500%, 07/15/2019 @ f | 1,925,000 | 1,932,583 | ||||||||||
| 5.700%, 10/22/2023 (Acquired 10/15/2013 through 09/30/2014, Cost $8,230,913) * f | 8,055,000 | 8,649,193 | ||||||||||
| 4.000%, 04/15/2024 @ f | 2,500,000 | 2,612,915 | ||||||||||
| Capital One Bank, (USA), National Association, | ||||||||||||
| 3.375%, 02/15/2023 | 6,000,000 | 5,966,646 | ||||||||||
| Capital One N.A., | ||||||||||||
| 2.400%, 09/05/2019 | 12,000,000 | 11,941,416 | ||||||||||
| Citigroup Inc.: | ||||||||||||
| 4.450%, 01/10/2017 | 893,000 | 943,975 | ||||||||||
| 6.125%, 11/21/2017 | 2,477,000 | 2,762,063 | ||||||||||
| 1.850%, 11/24/2017 | 6,100,000 | 6,092,991 | ||||||||||
| 3.750%, 06/16/2024 @ | 1,000,000 | 1,021,248 | ||||||||||
| Citizens Bank, National Association, | ||||||||||||
| 2.450%, 12/04/2019 | 18,000,000 | 17,887,500 | ||||||||||
| CNA Financial Corporation: | ||||||||||||
| 6.500%, 08/15/2016 | 4,463,000 | 4,827,337 | ||||||||||
| 7.250%, 11/15/2023 | 4,000,000 | 4,987,668 | ||||||||||
| Commonwealth Bank of Australia, | ||||||||||||
| 0.833%, 10/08/2015 (Acquired 01/09/2013, Cost $4,263,757) * f | 4,263,000 | 4,262,071 | ||||||||||
| Compass Bank, | ||||||||||||
| 2.750%, 09/29/2019 | 8,650,000 | 8,658,840 | ||||||||||
| Countrywide Financial Corporation, | ||||||||||||
| 6.250%, 05/15/2016 | 4,757,000 | 5,048,804 | ||||||||||
| Credit Agricole SA: | ||||||||||||
| 1.106%, 10/03/2016 (Acquired 09/26/2013, Cost $1,500,000) * @ f | 1,500,000 | 1,509,351 | ||||||||||
| 6.637%, 05/29/2049 (Acquired 05/23/2007, Cost $893,000) * @ f | 893,000 | 934,013 | ||||||||||
| Credit Suisse: | ||||||||||||
| 5.300%, 08/13/2019 @ f | 1,406,000 | 1,577,124 | ||||||||||
| 5.400%, 01/14/2020 f | 5,000,000 | 5,591,435 | ||||||||||
| 3.625%, 09/09/2024 @ f | 4,325,000 | 4,399,559 | ||||||||||
| Deutsche Bank Aktiengesellschaft, | ||||||||||||
| 3.700%, 05/30/2024 @ f | 10,000,000 | 10,147,670 | ||||||||||
| Discover Financial Services, | ||||||||||||
| 3.950%, 11/06/2024 | 5,000,000 | 5,026,215 | ||||||||||
| Dresdner Bank AG, | ||||||||||||
| 7.250%, 09/15/2015 f | 5,475,000 | 5,661,544 | ||||||||||
| First Hawaiian Capital I, | ||||||||||||
| Series B, 8.343%, 07/01/2027 | 3,346,000 | 3,390,733 | ||||||||||
| First Horizon National Corporation, | ||||||||||||
| 5.375%, 12/15/2015 | 2,872,000 | 2,973,384 | ||||||||||
| First Tennessee Bank National Association: | ||||||||||||
| 5.050%, 01/15/2015 | 8,503,000 | 8,513,901 | ||||||||||
| 5.650%, 04/01/2016 | 500,000 | 516,689 | ||||||||||
| 2.950%, 12/01/2019 | 3,400,000 | 3,391,265 | ||||||||||
| FMR LLC, | ||||||||||||
| 4.950%, 02/01/2033 (Acquired 01/29/2013, Cost $1,747,795) * @ | 1,750,000 | 1,934,819 | ||||||||||
| General Electric Capital Corporation: | ||||||||||||
| 5.550%, 05/04/2020 @ | 5,534,000 | 6,360,099 | ||||||||||
| 4.650%, 10/17/2021 | 5,355,000 | 6,035,776 | ||||||||||
| Genworth Holdings, Inc., | ||||||||||||
| 4.900%, 08/15/2023 | 1,339,000 | 1,078,828 | ||||||||||
| Goldman Sachs Capital I, | ||||||||||||
| 6.345%, 02/15/2034 @ | 1,053,000 | 1,252,654 | ||||||||||
| Great-West Life & Annuity Insurance Capital LP II, | ||||||||||||
| 7.153%, 05/16/2046 (Acquired 05/16/2006 through 11/08/2007, Cost $2,482,656) * | 2,499,000 | 2,586,465 | ||||||||||
| Highmark Inc, | ||||||||||||
| 4.750%, 05/15/2021 (Acquired 05/03/2011 through 07/30/2014, Cost $4,379,807) * | 4,378,000 | 4,521,677 | ||||||||||
| HSBC Bank plc, | ||||||||||||
| 0.872%, 05/15/2018 (Acquired 12/17/2014, Cost $4,973,561) * f | 4,950,000 | 4,969,770 | ||||||||||
| HSBC Finance Corporation, | ||||||||||||
| 0.664%, 06/01/2016 | 5,000,000 | 4,989,085 | ||||||||||
| HSBC Holdings PLC, | ||||||||||||
| 6.500%, 09/15/2037 f | 1,874,000 | 2,407,876 | ||||||||||
| HSBC USA Capital Trust I, | ||||||||||||
| 7.808%, 12/15/2026 (Acquired 03/08/2007, Cost $302,289) * | 300,000 | 302,451 | ||||||||||
| HSBC USA Capital Trust III: | ||||||||||||
| 7.750%, 11/15/2026 | 893,000 | 900,101 | ||||||||||
| 8.380%, 05/15/2027 (Acquired 11/06/2007, Cost $450,453) * | 446,000 | 451,828 | ||||||||||
| HSBC USA Inc., | ||||||||||||
| 9.125%, 05/15/2021 | 625,000 | 829,109 | ||||||||||
| Humana Inc., | ||||||||||||
| 7.200%, 06/15/2018 | 1,870,000 | 2,184,512 | ||||||||||
| ING Bank N.V.: | ||||||||||||
| 4.000%, 03/15/2016 (Acquired 03/08/2011, Cost $3,256,241) * @ f | 3,258,000 | 3,369,857 | ||||||||||
| 3.750%, 03/07/2017 (Acquired 03/28/2012, Cost $1,903,782) * f | 1,919,000 | 2,008,237 | ||||||||||
| 2.500%, 10/01/2019 (Acquired 09/23/2014, Cost $3,481,100) * f | 3,500,000 | 3,522,386 | ||||||||||
| 5.800%, 09/25/2023 (Acquired 01/14/2014 through 04/07/2014, Cost $2,585,887) * f | 2,450,000 | 2,717,734 | ||||||||||
| Invesco Finance PLC, | ||||||||||||
| 3.125%, 11/30/2022 f | 5,902,000 | 5,849,283 | ||||||||||
| J.P. Morgan Chase & Co.: | ||||||||||||
| 2.200%, 10/22/2019 | 3,675,000 | 3,643,310 | ||||||||||
| 4.250%, 10/15/2020 | 636,000 | 683,764 | ||||||||||
| 5.600%, 07/15/2041 | 4,106,000 | 4,971,171 | ||||||||||
| J.P. Morgan Chase Bank, National Association, | ||||||||||||
| 6.000%, 10/01/2017 | 500,000 | 554,942 | ||||||||||
| Jefferies Group LLC: | ||||||||||||
| 6.875%, 04/15/2021 | 3,570,000 | 4,058,233 | ||||||||||
| 6.250%, 01/15/2036 | 1,290,000 | 1,267,779 | ||||||||||
| John Hancock Life Insurance Company, | ||||||||||||
| 7.375%, 02/15/2024 (Acquired 08/26/2010, Cost $6,693,506) * | 6,069,000 | 7,575,969 | ||||||||||
| Kookmin Bank, | ||||||||||||
| 1.625%, 07/14/2017 (Acquired 07/07/2014, Cost $3,988,720) * f | 4,000,000 | 3,977,640 | ||||||||||
| LeasePlan Corporation N.V.: | ||||||||||||
| 3.000%, 10/23/2017 (Acquired 12/03/2013 through 04/04/2014, Cost $763,883) * f | 750,000 | 768,182 | ||||||||||
| 2.500%, 05/16/2018 (Acquired 08/02/2013 through 10/20/2014, Cost $18,106,913) * f | 18,158,000 | 18,165,790 | ||||||||||
| Liberty Mutual Group Inc.: | ||||||||||||
| 4.250%, 06/15/2023 (Acquired 06/13/2013, Cost $2,660,995) * | 2,678,000 | 2,759,623 | ||||||||||
| 10.750%, 06/15/2058 (Acquired 05/21/2008, Cost $2,182,029) * | 2,231,000 | 3,443,809 | ||||||||||
| Liberty Mutual Insurance Company, | ||||||||||||
| 7.697%, 10/15/2097 (Acquired 03/26/2003, Cost $297,700) * | 465,000 | 587,397 | ||||||||||
| Lincoln National Corporation: | ||||||||||||
| 8.750%, 07/01/2019 | 5,218,000 | 6,520,048 | ||||||||||
| 6.050%, 04/20/2067 | 1,004,000 | 1,004,000 | ||||||||||
| Lloyds Bank plc, | ||||||||||||
| 5.800%, 01/13/2020 (Acquired 02/10/2010, Cost $1,403,280) * f | 1,428,000 | 1,650,118 | ||||||||||
| M&I Marshall & Ilsley Bank, | ||||||||||||
| 4.850%, 06/16/2015 | 5,355,000 | 5,451,738 | ||||||||||
| M&T Capital Trust I, | ||||||||||||
| 8.234%, 02/01/2027 | 2,798,000 | 2,824,122 | ||||||||||
| M&T Capital Trust II, | ||||||||||||
| 8.277%, 06/01/2027 | 1,406,000 | 1,431,215 | ||||||||||
| Macquarie Bank Limited, | ||||||||||||
| 1.600%, 10/27/2017 (Acquired 10/22/2014, Cost $4,996,950) * f | 5,000,000 | 4,967,140 | ||||||||||
| Macquarie Group Limited: | ||||||||||||
| 3.000%, 12/03/2018 (Acquired 11/25/2013, Cost $8,490,900) * @ f | 8,525,000 | 8,728,500 | ||||||||||
| 7.625%, 08/13/2019 (Acquired 02/12/2014 through 04/09/2014, Cost $1,926,933) * f | 1,630,000 | 1,954,299 | ||||||||||
| Marsh & McLennan Companies, Inc., | ||||||||||||
| 2.300%, 04/01/2017 | 2,231,000 | 2,258,651 | ||||||||||
| Massachusetts Mutual Life Insurance Company, | ||||||||||||
| 8.875%, 06/01/2039 (Acquired 05/27/2009 through 12/16/2014, Cost $19,421,722) * @ | 13,000,000 | 20,975,461 | ||||||||||
| MBIA Insurance Corporation, | ||||||||||||
| 11.491%, 01/15/2033 (Acquired 01/11/2008, Cost $714,000) * § | 714,000 | 428,400 | ||||||||||
| MetLife, Inc.: | ||||||||||||
| 7.717%, 02/15/2019 @ | 982,000 | 1,189,961 | ||||||||||
| 6.500%, 12/15/2032 | 466,000 | 621,616 | ||||||||||
| Mizuho Bank, Ltd.: | ||||||||||||
| 1.850%, 03/21/2018 (Acquired 03/14/2013, Cost $3,119,689) * f | 3,124,000 | 3,107,012 | ||||||||||
| 2.450%, 04/16/2019 (Acquired 04/09/2014, Cost $2,096,262) * f | 2,100,000 | 2,086,337 | ||||||||||
| Morgan Stanley: | ||||||||||||
| 7.300%, 05/13/2019 | 5,110,000 | 6,061,206 | ||||||||||
| 2.375%, 07/23/2019 @ | 1,000,000 | 996,312 | ||||||||||
| 5.625%, 09/23/2019 | 1,941,000 | 2,190,989 | ||||||||||
| Series F, 3.875%, 04/29/2024 | 1,650,000 | 1,692,960 | ||||||||||
| 3.700%, 10/23/2024 @ | 4,000,000 | 4,054,480 | ||||||||||
| National Australia Bank Limited, | ||||||||||||
| 0.733%, 10/08/2015 (Acquired 01/16/2013, Cost $8,703,094) * f | 8,700,000 | 8,698,747 | ||||||||||
| National City Bank, | ||||||||||||
| 5.800%, 06/07/2017 | 1,750,000 | 1,921,491 | ||||||||||
| Navient, LLC, | ||||||||||||
| 5.625%, 08/01/2033 | 446,000 | 336,730 | ||||||||||
| Nomura Holdings, Inc.: | ||||||||||||
| 2.000%, 09/13/2016 f | 6,248,000 | 6,298,403 | ||||||||||
| 2.750%, 03/19/2019 @ f | 1,400,000 | 1,415,334 | ||||||||||
| 6.700%, 03/04/2020 f | 1,667,000 | 1,970,854 | ||||||||||
| PNC Bank, National Association, | ||||||||||||
| 4.200%, 11/01/2025 | 2,678,000 | 2,832,488 | ||||||||||
| PNC Funding Corp, | ||||||||||||
| 5.250%, 11/15/2015 | 2,500,000 | 2,591,002 | ||||||||||
| Protective Life Corporation, | ||||||||||||
| 7.375%, 10/15/2019 | 7,096,000 | 8,539,291 | ||||||||||
| Prudential Covered Trust 2012-1, | ||||||||||||
| 2.997%, 09/30/2015 (Acquired 12/19/2012 through 07/23/2013, Cost $6,041,068) * | 5,974,500 | 6,058,418 | ||||||||||
| Rabobank Nederland, | ||||||||||||
| 0.485%, 03/07/2016 (Acquired 05/21/2013, Cost $8,648,260) * f | 8,676,000 | 8,691,435 | ||||||||||
| Raymond James Financial, Inc., | ||||||||||||
| 8.600%, 08/15/2019 | 5,000,000 | 6,207,845 | ||||||||||
| Regions Bank, | ||||||||||||
| 7.500%, 05/15/2018 @ | 7,108,000 | 8,251,642 | ||||||||||
| Regions Financial Corporation, | ||||||||||||
| 5.750%, 06/15/2015 | 1,785,000 | 1,822,073 | ||||||||||
| Santander Bank, N.A., | ||||||||||||
| 8.750%, 05/30/2018 | 8,802,000 | 10,483,200 | ||||||||||
| Santander UK PLC, | ||||||||||||
| 5.000%, 11/07/2023 (Acquired 10/31/2013 through 12/02/2014, Cost $10,318,530) * f | 9,880,000 | 10,435,216 | ||||||||||
| Skandinaviska Enskilda Banken AB: | ||||||||||||
| 2.375%, 11/20/2018 (Acquired 11/13/2013, Cost $4,995,550) * f | 5,000,000 | 5,056,920 | ||||||||||
| 2.375%, 03/25/2019 (Acquired 03/18/2014, Cost $1,498,875) * f | 1,500,000 | 1,509,720 | ||||||||||
| SpareBank 1 Boligkreditt AS, | ||||||||||||
| 1.750%, 11/15/2019 (Acquired 11/07/2012, Cost $4,428,322) * f | 4,463,000 | 4,368,594 | ||||||||||
| Springleaf Finance Corp, | ||||||||||||
| 6.900%, 12/15/2017 | 400,000 | 426,000 | ||||||||||
| Standard Chartered PLC, | ||||||||||||
| 5.700%, 03/26/2044 (Acquired 03/21/2014, Cost $5,988,000) * f | 6,000,000 | 6,241,158 | ||||||||||
| Sumitomo Mitsui Banking Corporation, | ||||||||||||
| 3.950%, 07/19/2023 f | 1,850,000 | 1,969,438 | ||||||||||
| SunTrust Bank, | ||||||||||||
| 7.250%, 03/15/2018 | 1,874,000 | 2,168,319 | ||||||||||
| SUSA Partnership, L.P., | ||||||||||||
| 8.200%, 06/01/2017 | 921,000 | 1,050,456 | ||||||||||
| Swedbank AB: | ||||||||||||
| 2.125%, 09/29/2017 (Acquired 09/24/2012, Cost $1,782,305) * f | 1,785,000 | 1,805,574 | ||||||||||
| 2.375%, 02/27/2019 (Acquired 02/20/2014, Cost $7,287,663) * f | 7,300,000 | 7,344,136 | ||||||||||
| Symetra Financial Corporation, | ||||||||||||
| 6.125%, 04/01/2016 (Acquired 03/23/2006, Cost $889,044) * | 893,000 | 936,874 | ||||||||||
| Synchrony Financial: | ||||||||||||
| 3.000%, 08/15/2019 | 2,000,000 | 2,021,886 | ||||||||||
| 3.750%, 08/15/2021 | 10,000,000 | 10,214,890 | ||||||||||
| 4.250%, 08/15/2024 | 8,000,000 | 8,209,032 | ||||||||||
| TD Ameritrade Holding Corporation: | ||||||||||||
| 5.600%, 12/01/2019 | 2,945,000 | 3,380,639 | ||||||||||
| 3.625%, 04/01/2025 | 7,000,000 | 7,094,591 | ||||||||||
| The Bank of Tokyo-Mitsubishi UFJ, Ltd.: | ||||||||||||
| 0.611%, 07/15/2016 f | 4,600,000 | 4,598,560 | ||||||||||
| 4.100%, 09/09/2023 (Acquired 09/03/2013 through 03/26/2014, Cost $2,940,356) * f | 2,911,000 | 3,134,548 | ||||||||||
| 3.750%, 03/10/2024 (Acquired 03/04/2014, Cost $2,594,410) * f | 2,600,000 | 2,693,176 | ||||||||||
| The Bear Stearns Companies LLC, | ||||||||||||
| 7.250%, 02/01/2018 | 5,547,000 | 6,393,195 | ||||||||||
| The Goldman Sachs Group, Inc.: | ||||||||||||
| 6.250%, 09/01/2017 | 893,000 | 993,596 | ||||||||||
| 6.150%, 04/01/2018 | 5,634,000 | 6,323,709 | ||||||||||
| 7.500%, 02/15/2019 @ | 1,964,000 | 2,336,101 | ||||||||||
| 2.550%, 10/23/2019 | 2,700,000 | 2,690,140 | ||||||||||
| 3.850%, 07/08/2024 | 3,000,000 | 3,076,794 | ||||||||||
| The Guardian Life Insurance Company of America, | ||||||||||||
| 4.875%, 06/19/2064 (Acquired 06/16/2014, Cost $1,993,300) * | 2,000,000 | 2,129,208 | ||||||||||
| The Hartford Financial Services Group, Inc.: | ||||||||||||
| 4.000%, 10/15/2017 | 4,463,000 | 4,745,182 | ||||||||||
| 8.125%, 06/15/2038 | 1,964,000 | 2,248,450 | ||||||||||
| The Royal Bank of Scotland Public Limited Company, | ||||||||||||
| 6.125%, 01/11/2021 f | 2,812,000 | 3,313,607 | ||||||||||
| UBS AG: | ||||||||||||
| 1.375%, 08/14/2017 f | 7,000,000 | 6,954,458 | ||||||||||
| 5.750%, 04/25/2018 f | 2,678,000 | 3,012,587 | ||||||||||
| Voya Financial, Inc., | ||||||||||||
| 5.500%, 07/15/2022 | 17,350,000 | 19,598,838 | ||||||||||
| WellPoint, Inc., | ||||||||||||
| 5.100%, 01/15/2044 | 1,584,000 | 1,780,018 | ||||||||||
| Wells Fargo Bank, National Association, | ||||||||||||
| 6.000%, 11/15/2017 | 3,789,000 | 4,247,139 | ||||||||||
| Westpac Banking Corporation, | ||||||||||||
| 1.600%, 01/12/2018 f | 7,079,000 | 7,078,561 | ||||||||||
| Willis North America, Inc.: | ||||||||||||
| 5.625%, 07/15/2015 | 669,000 | 685,201 | ||||||||||
| 7.000%, 09/29/2019 | 4,463,000 | 5,205,184 | ||||||||||
| 638,758,870 | 17.3 | % | ||||||||||
| Utility | ||||||||||||
| Arizona Public Service Company, | ||||||||||||
| 8.750%, 03/01/2019 | 759,000 | 954,681 | ||||||||||
| Beaver Valley II Funding Corporation, | ||||||||||||
| 9.000%, 06/01/2017 | 219,000 | 236,520 | ||||||||||
| ENEL Finance International N.V.: | ||||||||||||
| 5.125%, 10/07/2019 (Acquired 09/30/2009, Cost $2,199,280) * f | 2,209,000 | 2,440,834 | ||||||||||
| 6.800%, 09/15/2037 (Acquired 09/13/2007, Cost $1,691,506) * f | 1,696,000 | 2,168,421 | ||||||||||
| Exelon Generation Company, LLC, | ||||||||||||
| 6.200%, 10/01/2017 | 1,964,000 | 2,182,446 | ||||||||||
| Mega Advance Investments Ltd, | ||||||||||||
| 5.000%, 05/12/2021 (Acquired 05/09/2011, Cost $4,858,830) * f | 4,909,000 | 5,316,840 | ||||||||||
| MidAmerican Energy Holdings Company, | ||||||||||||
| 2.400%, 02/01/2020 (Acquired 12/01/2014, Cost $4,998,900) * | 5,000,000 | 4,978,230 | ||||||||||
| National Rural Utilities Cooperative Finance Corporation: | ||||||||||||
| 10.375%, 11/01/2018 | 547,000 | 712,593 | ||||||||||
| 8.000%, 03/01/2032 | 2,834,000 | 4,165,224 | ||||||||||
| NextEra Energy Capital Holdings, Inc., | ||||||||||||
| Series D, 7.300%, 09/01/2067 | 2,455,000 | 2,626,850 | ||||||||||
| PPL Energy Supply, LLC, | ||||||||||||
| Series A, 5.700%, 10/15/2015 | 1,839,000 | 1,879,046 | ||||||||||
| PSEG Power LLC: | ||||||||||||
| 5.320%, 09/15/2016 | 2,877,000 | 3,073,720 | ||||||||||
| 5.125%, 04/15/2020 | 3,575,000 | 3,971,600 | ||||||||||
| RGS I&M Funding Corp, | ||||||||||||
| Series F*, 9.820%, 06/07/2022 | 759,638 | 900,204 | ||||||||||
| Talent Yield Investments Ltd., | ||||||||||||
| 4.500%, 04/25/2022 (Acquired 04/18/2012, Cost $1,772,791) * @ f | 1,785,000 | 1,868,681 | ||||||||||
| 37,475,890 | 1.0 | % | ||||||||||
| Industrials | ||||||||||||
| Actavis Funding SCS, | ||||||||||||
| 3.850%, 06/15/2024 @ f | 3,000,000 | 3,015,327 | ||||||||||
| Acuity Brands Lighting, Inc., | ||||||||||||
| 6.000%, 12/15/2019 | 3,749,000 | 4,155,605 | ||||||||||
| Altera Corporation, | ||||||||||||
| 4.100%, 11/15/2023 | 2,000,000 | 2,070,000 | ||||||||||
| Ameritech Capital Funding Corporation: | ||||||||||||
| 9.100%, 06/01/2016 | 910,497 | 985,098 | ||||||||||
| 6.450%, 01/15/2018 | 2,668,000 | 2,992,269 | ||||||||||
| Anadarko Petroleum Corporation: | ||||||||||||
| 6.375%, 09/15/2017 @ | 5,355,000 | 5,953,699 | ||||||||||
| 8.700%, 03/15/2019 | 2,432,000 | 2,979,081 | ||||||||||
| Anglo American Capital PLC, | ||||||||||||
| 9.375%, 04/08/2019 (Acquired 04/02/2009, Cost $1,785,000) * f | 1,785,000 | 2,223,114 | ||||||||||
| Apple Inc., | ||||||||||||
| 2.400%, 05/03/2023 @ | 2,678,000 | 2,603,008 | ||||||||||
| Bayer US Finance LLC, | ||||||||||||
| 2.375%, 10/08/2019 (Acquired 10/01/2014, Cost $9,954,200) * | 10,000,000 | 10,039,680 | ||||||||||
| Beam Suntory Inc., | ||||||||||||
| 1.875%, 05/15/2017 | 2,000,000 | 2,008,110 | ||||||||||
| Becton, Dickinson and Company: | ||||||||||||
| 2.675%, 12/15/2019 | 4,600,000 | 4,660,495 | ||||||||||
| 3.250%, 11/12/2020 | 7,000,000 | 7,120,932 | ||||||||||
| Boston Scientific Corporation, | ||||||||||||
| 2.650%, 10/01/2018 | 10,000,000 | 10,011,770 | ||||||||||
| Bunge Limited Finance Corp., | ||||||||||||
| 8.500%, 06/15/2019 | 6,933,000 | 8,496,669 | ||||||||||
| Bunge N.A. Finance L.P., | ||||||||||||
| 5.900%, 04/01/2017 | 3,392,000 | 3,688,044 | ||||||||||
| Canadian Natural Resources Limited: | ||||||||||||
| 5.700%, 05/15/2017 f | 2,550,000 | 2,764,315 | ||||||||||
| 6.500%, 02/15/2037 f | 982,000 | 1,125,153 | ||||||||||
| Celgene Corporation, | ||||||||||||
| 4.000%, 08/15/2023 @ | 2,477,000 | 2,607,114 | ||||||||||
| CenturyLink, Inc., | ||||||||||||
| Series R, 5.150%, 06/15/2017 | 2,678,000 | 2,805,205 | ||||||||||
| CF Industries, Inc., | ||||||||||||
| 5.150%, 03/15/2034 | 3,000,000 | 3,137,997 | ||||||||||
| Comcast Corporation: | ||||||||||||
| 4.250%, 01/15/2033 | 5,712,000 | 6,048,591 | ||||||||||
| 6.950%, 08/15/2037 | 893,000 | 1,258,144 | ||||||||||
| Computer Sciences Corporation, | ||||||||||||
| 2.500%, 09/15/2015 | 4,986,000 | 5,031,019 | ||||||||||
| ConAgra Foods, Inc.: | ||||||||||||
| 0.601%, 07/21/2016 | 4,000,000 | 3,990,132 | ||||||||||
| 5.819%, 06/15/2017 | 1,506,000 | 1,648,761 | ||||||||||
| 1.900%, 01/25/2018 | 4,000,000 | 3,973,352 | ||||||||||
| 4.950%, 08/15/2020 | 1,785,000 | 1,960,594 | ||||||||||
| 9.750%, 03/01/2021 | 4,107,000 | 5,299,254 | ||||||||||
| Continental Airlines Pass Through Trust, | ||||||||||||
| Series 974A, 6.900%, 01/02/2018 | 185,556 | 194,834 | ||||||||||
| Cox Communications, Inc.: | ||||||||||||
| 3.850%, 02/01/2025 (Acquired 12/01/2014, Cost $4,991,350) * | 5,000,000 | 5,047,085 | ||||||||||
| 4.800%, 02/01/2035 (Acquired 12/01/2014, Cost $8,996,760) * | 9,000,000 | 9,376,857 | ||||||||||
| 8.375%, 03/01/2039 (Acquired 10/08/2014, Cost $2,882,138) * | 2,000,000 | 2,851,312 | ||||||||||
| Crane Co., | ||||||||||||
| 2.750%, 12/15/2018 | 10,000,000 | 10,107,870 | ||||||||||
| D.R. Horton, Inc., | ||||||||||||
| 6.500%, 04/15/2016 | 893,000 | 942,115 | ||||||||||
| DCP Midstream, LLC, | ||||||||||||
| 9.750%, 03/15/2019 (Acquired 02/29/2012 through 10/15/2012, Cost $6,108,505) * | 5,065,000 | 6,335,332 | ||||||||||
| Deutsche Telekom International Finance B.V., | ||||||||||||
| 8.750%, 06/15/2030 f | 411,000 | 607,112 | ||||||||||
| El Paso Pipeline Partners Operating Company, L.L.C., | ||||||||||||
| 7.500%, 11/15/2040 | 4,017,000 | 4,940,818 | ||||||||||
| Enable Midstream Partners, LP, | ||||||||||||
| 3.900%, 05/15/2024 (Acquired 05/19/2014, Cost $4,994,350) * | 5,000,000 | 4,819,430 | ||||||||||
| Energy Transfer Partners, L.P.: | ||||||||||||
| 5.950%, 02/01/2015 | 10,000,000 | 10,033,010 | ||||||||||
| 9.700%, 03/15/2019 | 893,000 | 1,120,819 | ||||||||||
| EQT Midstream Partners, LP, | ||||||||||||
| 4.000%, 08/01/2024 @ | 3,000,000 | 2,970,795 | ||||||||||
| Express Scripts Holding Company: | ||||||||||||
| 2.650%, 02/15/2017 | 2,678,000 | 2,738,239 | ||||||||||
| 4.750%, 11/15/2021 | 5,000,000 | 5,517,765 | ||||||||||
| 3.500%, 06/15/2024 | 9,000,000 | 8,968,428 | ||||||||||
| Federal Express Corp 1998 Pass Through Trust, | ||||||||||||
| Series 981B, 6.845%, 01/15/2019 | 2,052,822 | 2,261,363 | ||||||||||
| Fidelity National Information Services, Inc.: | ||||||||||||
| 3.500%, 04/15/2023 | 12,845,000 | 12,767,968 | ||||||||||
| 3.875%, 06/05/2024 | 2,000,000 | 2,020,204 | ||||||||||
| Fiserv, Inc.: | ||||||||||||
| 4.625%, 10/01/2020 | 1,785,000 | 1,939,079 | ||||||||||
| 3.500%, 10/01/2022 | 5,410,000 | 5,463,711 | ||||||||||
| FMC Corporation, | ||||||||||||
| 4.100%, 02/01/2024 @ | 3,000,000 | 3,103,611 | ||||||||||
| Fomento Economico Mexicano, S.A.B. de C.V.: | ||||||||||||
| 2.875%, 05/10/2023 f | 5,000,000 | 4,663,560 | ||||||||||
| 4.375%, 05/10/2043 @ f | 4,374,000 | 4,087,337 | ||||||||||
| Ford Motor Credit Company LLC: | ||||||||||||
| 2.375%, 03/12/2019 @ | 6,806,000 | 6,758,617 | ||||||||||
| 2.597%, 11/04/2019 | 10,000,000 | 9,946,210 | ||||||||||
| Forest Laboratories, Inc., | ||||||||||||
| 5.000%, 12/15/2021 (Acquired 08/26/2014, Cost $10,962,456) * | 10,000,000 | 10,828,260 | ||||||||||
| Freeport-McMoran Oil & Gas LLC / FCX Oil & Gas Inc.: | ||||||||||||
| 6.500%, 11/15/2020 | 3,221,000 | 3,486,636 | ||||||||||
| 6.625%, 05/01/2021 | 1,447,000 | 1,555,525 | ||||||||||
| 6.750%, 02/01/2022 | 2,649,000 | 2,913,900 | ||||||||||
| Georgia-Pacific LLC, | ||||||||||||
| 2.539%, 11/15/2019 (Acquired 11/03/2014, Cost $10,675,000) * @ | 10,675,000 | 10,671,306 | ||||||||||
| Glencore Finance (Canada) Limited, | ||||||||||||
| 5.800%, 11/15/2016 (Acquired 12/06/2011, Cost $636,421) * f | 616,000 | 658,960 | ||||||||||
| Glencore Funding LLC: | ||||||||||||
| 2.500%, 01/15/2019 (Acquired 05/22/2013, Cost $4,440,774) * @ | 4,463,000 | 4,394,605 | ||||||||||
| 4.125%, 05/30/2023 (Acquired 07/22/2013 through 04/03/2014, Cost $3,605,781) * | 3,746,000 | 3,655,193 | ||||||||||
| 4.625%, 04/29/2024 (Acquired 04/22/2014 through 10/08/2014, Cost $4,755,249) * @ | 4,675,000 | 4,697,440 | ||||||||||
| GTE Corporation, | ||||||||||||
| 8.750%, 11/01/2021 | 89,000 | 116,074 | ||||||||||
| Gulf South Pipeline Company, LP, | ||||||||||||
| 4.000%, 06/15/2022 | 3,633,000 | 3,581,455 | ||||||||||
| Hess Corporation, | ||||||||||||
| 8.125%, 02/15/2019 | 4,376,000 | 5,206,530 | ||||||||||
| Hewlett-Packard Company: | ||||||||||||
| 3.300%, 12/09/2016 | 5,219,000 | 5,389,792 | ||||||||||
| 4.650%, 12/09/2021 @ | 6,645,000 | 7,115,240 | ||||||||||
| Holcim US Finance S. a r.l. & Cie S.C.S., | ||||||||||||
| 6.000%, 12/30/2019 (Acquired 09/24/2009 through 09/04/2013, Cost $1,248,288) * f | 1,232,000 | 1,410,104 | ||||||||||
| Hospira, Inc., | ||||||||||||
| 6.050%, 03/30/2017 | 4,463,000 | 4,811,850 | ||||||||||
| Hutchison Whampoa International (09) Limited, | ||||||||||||
| 7.625%, 04/09/2019 (Acquired 10/22/2009 through 04/16/2014, Cost $9,244,613) * f | 8,288,000 | 10,025,977 | ||||||||||
| Hutchison Whampoa International (14) Limited, | ||||||||||||
| 3.625%, 10/31/2024 (Acquired 10/28/2014, Cost $4,994,200) * @ f | 5,000,000 | 5,022,895 | ||||||||||
| Hyundai Capital Services, Inc.: | ||||||||||||
| 6.000%, 05/05/2015 (Acquired 05/20/2013, Cost $35,543) * f | 35,000 | 35,584 | ||||||||||
| 4.375%, 07/27/2016 (Acquired 04/23/2013, Cost $2,086,786) * f | 2,008,000 | 2,101,061 | ||||||||||
| 1.043%, 03/18/2017 (Acquired 03/11/2014, Cost $2,000,000) * f | 2,000,000 | 1,995,988 | ||||||||||
| 3.500%, 09/13/2017 (Acquired 08/21/2014 through 12/03/2013, Cost $7,723,934) * f | 7,458,000 | 7,715,130 | ||||||||||
| Ingersoll-Rand Luxembourg Finance S.A., | ||||||||||||
| 2.625%, 05/01/2020 f | 2,650,000 | 2,632,847 | ||||||||||
| Johnson Controls, Inc.: | ||||||||||||
| 6.000%, 01/15/2036 | 893,000 | 1,081,350 | ||||||||||
| 4.950%, 07/02/2064 | 2,400,000 | 2,474,328 | ||||||||||
| Kinder Morgan Energy Partners, L.P.: | ||||||||||||
| 9.000%, 02/01/2019 | 893,000 | 1,082,544 | ||||||||||
| 6.950%, 01/15/2038 | 2,008,000 | 2,317,491 | ||||||||||
| 6.500%, 09/01/2039 | 893,000 | 993,812 | ||||||||||
| Kinder Morgan Finance Company LLC, | ||||||||||||
| 5.700%, 01/05/2016 | 803,000 | 833,610 | ||||||||||
| Lafarge S.A., | ||||||||||||
| 7.125%, 07/15/2036 f | 893,000 | 1,035,880 | ||||||||||
| Marathon Petroleum Corporation: | ||||||||||||
| 3.625%, 09/15/2024 | 1,600,000 | 1,568,005 | ||||||||||
| 4.750%, 09/15/2044 | 1,500,000 | 1,416,609 | ||||||||||
| Martin Marietta Materials, Inc., | ||||||||||||
| 6.250%, 05/01/2037 | 893,000 | 945,682 | ||||||||||
| Masco Corporation, | ||||||||||||
| 6.125%, 10/03/2016 | 1,450,000 | 1,537,725 | ||||||||||
| Medtronic, Inc.: | ||||||||||||
| 3.150%, 03/15/2022 (Acquired 12/01/2014, Cost $3,966,692) * @ | 3,975,000 | 4,025,387 | ||||||||||
| 4.375%, 03/15/2035 (Acquired 12/01/2014, Cost $2,973,510) * @ | 3,000,000 | 3,182,568 | ||||||||||
| Murphy Oil Corporation, | ||||||||||||
| 4.000%, 06/01/2022 | 4,463,000 | 4,102,631 | ||||||||||
| Mylan Inc., | ||||||||||||
| 7.875%, 07/15/2020 (Acquired 04/25/2014, Cost $3,227,885) * | 3,000,000 | 3,195,585 | ||||||||||
| Nabors Industries, Inc., | ||||||||||||
| 6.150%, 02/15/2018 | 982,000 | 1,022,819 | ||||||||||
| National Oilwell Varco, Inc., | ||||||||||||
| Series B, 6.125%, 08/15/2015 | 6,288,000 | 6,290,993 | ||||||||||
| New Cingular Wireless Services, Inc., | ||||||||||||
| 8.750%, 03/01/2031 | 1,260,000 | 1,951,880 | ||||||||||
| Noble Energy, Inc., | ||||||||||||
| 8.250%, 03/01/2019 | 2,684,000 | 3,217,850 | ||||||||||
| ONEOK Partners, L.P.: | ||||||||||||
| 6.150%, 10/01/2016 | 3,036,000 | 3,259,692 | ||||||||||
| 8.625%, 03/01/2019 | 7,627,000 | 9,215,880 | ||||||||||
| 3.375%, 10/01/2022 @ | 1,130,000 | 1,045,998 | ||||||||||
| Oracle Corporation, | ||||||||||||
| 3.400%, 07/08/2024 | 3,000,000 | 3,066,216 | ||||||||||
| Pactiv LLC, | ||||||||||||
| 7.950%, 12/15/2025 | 286,000 | 287,430 | ||||||||||
| Petrofac Limited, | ||||||||||||
| 3.400%, 10/10/2018 (Acquired 10/03/2013 through 12/03/2014, Cost $15,573,119) * f | 15,546,000 | 15,336,626 | ||||||||||
| PetroLogistics LP / PetroLogistics Finance Corp., | ||||||||||||
| 6.250%, 04/01/2020 | 7,041,000 | 7,586,677 | ||||||||||
| Plum Creek Timberlands, L.P., | ||||||||||||
| 5.875%, 11/15/2015 | 3,887,000 | 4,037,928 | ||||||||||
| POSCO, | ||||||||||||
| 4.250%, 10/28/2020 (Acquired 12/18/2014, Cost $1,043,034) * f | 975,000 | 1,041,535 | ||||||||||
| QEP Resources, Inc., | ||||||||||||
| 6.800%, 03/01/2020 | 893,000 | 924,255 | ||||||||||
| R.R. Donnelley & Sons Company: | ||||||||||||
| 8.600%, 08/15/2016 @ | 2,231,000 | 2,442,945 | ||||||||||
| 6.125%, 01/15/2017 | 88,000 | 93,280 | ||||||||||
| 7.625%, 06/15/2020 @ | 893,000 | 980,067 | ||||||||||
| Republic Services, Inc.: | ||||||||||||
| 5.500%, 09/15/2019 | 7,400,000 | 8,336,685 | ||||||||||
| 3.550%, 06/01/2022 | 3,000,000 | 3,079,851 | ||||||||||
| Rio Tinto Alcan Inc., | ||||||||||||
| 5.750%, 06/01/2035 f | 446,000 | 513,679 | ||||||||||
| Rio Tinto Finance (USA) Limited, | ||||||||||||
| 9.000%, 05/01/2019 @ f | 4,909,000 | 6,210,680 | ||||||||||
| Rockies Express Pipeline LLC, | ||||||||||||
| 5.625%, 04/15/2020 (Acquired 03/17/2010, Cost $1,783,411) * | 1,785,000 | 1,753,762 | ||||||||||
| SABMiller Holdings Inc., | ||||||||||||
| 0.922%, 08/01/2018 (Acquired 10/21/2014, Cost $10,050,452) * | 10,000,000 | 10,031,680 | ||||||||||
| Samarco Mineracao S.A., | ||||||||||||
| 5.750%, 10/24/2023 (Acquired 10/22/2013, Cost $4,477,199) * f | 4,463,000 | 4,262,165 | ||||||||||
| Seagate HDD Cayman, | ||||||||||||
| 6.875%, 05/01/2020 f | 13,137,000 | 13,793,850 | ||||||||||
| SK Telecom Co., Ltd., | ||||||||||||
| 6.625%, 07/20/2027 (Acquired 07/13/2007, Cost $1,322,945) * f | 1,339,000 | 1,706,194 | ||||||||||
| Southern Natural Gas Company, L.L.C., | ||||||||||||
| 5.900%, 04/01/2017 (Acquired 03/14/2007, Cost $1,247,925) * | 1,250,000 | 1,344,050 | ||||||||||
| Sprint Capital Corporation: | ||||||||||||
| 6.900%, 05/01/2019 | 2,499,000 | 2,548,980 | ||||||||||
| 8.750%, 03/15/2032 | 320,000 | 309,600 | ||||||||||
| Talisman Energy Inc., | ||||||||||||
| 7.750%, 06/01/2019 f | 1,071,000 | 1,233,652 | ||||||||||
| Telecom Italia Capital: | ||||||||||||
| 7.175%, 06/18/2019 f | 1,785,000 | 2,043,825 | ||||||||||
| 7.200%, 07/18/2036 f | 5,350,000 | 5,751,250 | ||||||||||
| Telefonica Emisiones S.A.U.: | ||||||||||||
| 6.421%, 06/20/2016 f | 1,930,000 | 2,064,621 | ||||||||||
| 6.221%, 07/03/2017 f | 4,530,000 | 5,015,150 | ||||||||||
| The Mosaic Company, | ||||||||||||
| 5.450%, 11/15/2033 | 2,000,000 | 2,262,814 | ||||||||||
| The Timken Company, | ||||||||||||
| 3.875%, 09/01/2024 (Acquired 08/13/2014, Cost $1,978,020) * | 2,000,000 | 1,996,898 | ||||||||||
| The Williams Companies, Inc., | ||||||||||||
| 4.550%, 06/24/2024 @ | 5,000,000 | 4,649,905 | ||||||||||
| Time Warner Cable Inc.: | ||||||||||||
| 6.550%, 05/01/2037 | 893,000 | 1,149,728 | ||||||||||
| 6.750%, 06/15/2039 | 2,767,000 | 3,617,246 | ||||||||||
| Time Warner Inc.: | ||||||||||||
| 7.625%, 04/15/2031 | 5,082,000 | 7,084,994 | ||||||||||
| 7.700%, 05/01/2032 @ | 5,918,000 | 8,361,181 | ||||||||||
| Transocean Inc, | ||||||||||||
| 6.500%, 11/15/2020 @ f | 4,000,000 | 3,771,872 | ||||||||||
| TSMC Global Ltd, | ||||||||||||
| 1.625%, 04/03/2018 (Acquired 12/03/2013, Cost $1,147,107) * f | 1,175,000 | 1,153,286 | ||||||||||
| TTX Company, | ||||||||||||
| 3.600%, 01/15/2025 (Acquired 11/13/2014, Cost $4,999,250) * | 5,000,000 | 5,095,065 | ||||||||||
| Tyco Electronics Group S.A., | ||||||||||||
| 6.550%, 10/01/2017 f | 6,248,000 | 7,032,930 | ||||||||||
| U.S. Airways Pass Through Trust, | ||||||||||||
| Series 981A, 6.850%, 01/30/2018 | 207,944 | 223,019 | ||||||||||
| Vale Overseas Limited: | ||||||||||||
| 8.250%, 01/17/2034 @ f | 8,526,000 | 10,203,405 | ||||||||||
| 6.875%, 11/21/2036 f | 1,383,000 | 1,457,945 | ||||||||||
| 6.875%, 11/10/2039 @ f | 893,000 | 951,099 | ||||||||||
| Valero Energy Corporation, | ||||||||||||
| 9.375%, 03/15/2019 | 15,578,000 | 19,427,807 | ||||||||||
| Verizon Communications Inc.: | ||||||||||||
| 5.150%, 09/15/2023 | 7,000,000 | 7,729,631 | ||||||||||
| 4.150%, 03/15/2024 | 3,000,000 | 3,105,702 | ||||||||||
| 6.400%, 09/15/2033 | 12,140,000 | 14,953,846 | ||||||||||
| Viacom Inc., | ||||||||||||
| 2.500%, 09/01/2018 @ | 3,153,000 | 3,180,879 | ||||||||||
| Vulcan Materials Company: | ||||||||||||
| 7.000%, 06/15/2018 | 1,785,000 | 1,963,500 | ||||||||||
| 7.150%, 11/30/2037 | 446,000 | 454,920 | ||||||||||
| Wabtec Corporation, | ||||||||||||
| 4.375%, 08/15/2023 | 2,678,000 | 2,846,069 | ||||||||||
| Walgreens Boots Alliance, Inc., | ||||||||||||
| 3.800%, 11/18/2024 | 5,934,000 | 6,052,087 | ||||||||||
| Weatherford International Ltd, | ||||||||||||
| 9.625%, 03/01/2019 f | 3,120,000 | 3,700,570 | ||||||||||
| Western Gas Partners, LP, | ||||||||||||
| 5.375%, 06/01/2021 | 8,701,000 | 9,546,198 | ||||||||||
| Westvaco Corporation: | ||||||||||||
| 9.750%, 06/15/2020 | 143,000 | 183,328 | ||||||||||
| 8.200%, 01/15/2030 | 4,463,000 | 5,905,267 | ||||||||||
| Williams Partners L.P., | ||||||||||||
| 6.300%, 04/15/2040 | 2,767,000 | 3,095,363 | ||||||||||
| 647,009,871 | 17.5 | % | ||||||||||
| Total Corporate Bonds | 1,323,244,631 | 35.8 | % | |||||||||
| Other Government Related Securities | ||||||||||||
| CNPC General Capital Ltd, | ||||||||||||
| 2.750%, 05/14/2019 (Acquired 05/07/2014, Cost $1,983,740) * f | 2,000,000 | 1,986,442 | ||||||||||
| Comision Federal de Electricidad, | ||||||||||||
| 4.875%, 01/15/2024 (Acquired 10/17/2013, Cost $2,662,655) * f | 2,678,000 | 2,798,510 | ||||||||||
| Corp Andina de Fomento, | ||||||||||||
| 4.375%, 06/15/2022 f | 6,107,000 | 6,564,152 | ||||||||||
| Korea Electric Power Corporation, | ||||||||||||
| 6.750%, 08/01/2027 f | 1,932,000 | 2,458,531 | ||||||||||
| Korea Gas Corporation, | ||||||||||||
| 4.250%, 11/02/2020 (Acquired 10/26/2010, Cost $2,309,418) * f | 2,321,000 | 2,521,061 | ||||||||||
| Nexen Energy ULC: | ||||||||||||
| 6.400%, 05/15/2037 f | 3,392,000 | 4,224,899 | ||||||||||
| 7.500%, 07/30/2039 f | 4,000,000 | 5,551,400 | ||||||||||
| Petrobras Global Finance B.V.: | ||||||||||||
| 2.603%, 03/17/2017 f | 3,000,000 | 2,769,300 | ||||||||||
| 4.375%, 05/20/2023 f | 1,785,000 | 1,535,243 | ||||||||||
| Petrobras International Finance Company S.A.: | ||||||||||||
| 3.500%, 02/06/2017 @ f | 4,463,000 | 4,261,763 | ||||||||||
| 5.750%, 01/20/2020 f | 893,000 | 862,379 | ||||||||||
| Petroleos Mexicanos: | ||||||||||||
| 5.750%, 03/01/2018 | 2,499,000 | 2,698,920 | ||||||||||
| 8.000%, 05/03/2019 f | 1,500,000 | 1,773,750 | ||||||||||
| 5.500%, 01/21/2021 f | 5,600,000 | 6,062,000 | ||||||||||
| 4.875%, 01/24/2022 f | 4,000,000 | 4,189,640 | ||||||||||
| 6.625%, 06/15/2035 @ | 893,000 | 1,031,415 | ||||||||||
| Portigon AG, | ||||||||||||
| 4.796%, 07/15/2015 f | 2,488,000 | 2,535,941 | ||||||||||
| Sinopec Group Overseas Development [2014] Ltd., | ||||||||||||
| 4.375%, 04/10/2024 (Acquired 04/02/2014, Cost $1,496,505) * f | 1,500,000 | 1,573,412 | ||||||||||
| The Export-Import Bank of Korea, | ||||||||||||
| 4.000%, 01/11/2017 f | 1,400,000 | 1,467,662 | ||||||||||
| The Korea Development Bank, | ||||||||||||
| 0.857%, 01/22/2017 f | 2,000,000 | 2,004,252 | ||||||||||
| 58,870,672 | 1.6 | % | ||||||||||
| Taxable Municipal Bonds | ||||||||||||
| Atlanta Independent School System, | ||||||||||||
| 5.557%, 03/01/2026 | 4,465,000 | 5,089,475 | ||||||||||
| California Qualified School Bond Joint Powers Authority, | ||||||||||||
| 7.155%, 03/01/2027 | 6,695,000 | 7,563,676 | ||||||||||
| California School Finance Authority: | ||||||||||||
| 5.041%, 07/01/2020 | 2,230,000 | 2,454,271 | ||||||||||
| 5.043%, 01/01/2021 (Callable 12/31/2015) | 1,785,000 | 1,813,953 | ||||||||||
| County of Contra Costa CA, | ||||||||||||
| 5.140%, 06/01/2017 | 5,335,000 | 5,649,818 | ||||||||||
| County of Cuyahoga OH, | ||||||||||||
| 9.125%, 10/01/2023 | 895,000 | 875,767 | ||||||||||
| Eaton Community City School District, | ||||||||||||
| 5.390%, 08/25/2027 (Callable 06/01/2020) | 2,305,000 | 2,459,781 | ||||||||||
| Elgin Local School District, | ||||||||||||
| 5.499%, 08/31/2027 (Callable 12/01/2019) | 4,440,000 | 4,798,796 | ||||||||||
| Iowa Tobacco Settlement Authority, | ||||||||||||
| 6.500%, 06/01/2023 (Callable 06/01/2015) | 5,105,000 | 5,104,847 | ||||||||||
| New Hampshire Housing Finance Authority: | ||||||||||||
| 3.050%, 01/01/2021 | 1,005,000 | 1,037,562 | ||||||||||
| 3.750%, 07/01/2034 (Callable 07/01/2023) | 2,705,000 | 2,870,167 | ||||||||||
| New Jersey Economic Development Authority, | ||||||||||||
| 2.421%, 06/15/2018 | 7,000,000 | 7,030,100 | ||||||||||
| North Carolina Housing Finance Agency, | ||||||||||||
| 2.812%, 07/01/2035 (Callable 01/01/2024) | 5,270,000 | 5,398,799 | ||||||||||
| San Dieguito Public Facilities Authority, | ||||||||||||
| 6.459%, 05/01/2027 | 5,675,000 | 6,519,667 | ||||||||||
| State Public School Building Authority, | ||||||||||||
| 5.000%, 09/15/2027 | 4,458,000 | 4,825,384 | ||||||||||
| Three Rivers Local School District, | ||||||||||||
| 5.209%, 09/15/2027 (Callable 12/01/2020) | 2,365,000 | 2,514,752 | ||||||||||
| West Contra Costa Unified School District, | ||||||||||||
| 6.250%, 08/01/2030 | 1,785,000 | 2,160,439 | ||||||||||
| Westlake City School District, | ||||||||||||
| 5.227%, 12/01/2026 (Callable 12/01/2020) | 3,570,000 | 3,724,438 | ||||||||||
| 71,891,692 | 2.0 | % | ||||||||||
| Residential Mortgage-Backed Securities | ||||||||||||
| U.S. Government Agency Issues | ||||||||||||
| Federal Gold Loan Mortgage Corporation (FGLMC): | ||||||||||||
| 6.000%, 06/01/2020 | 137,160 | 147,739 | ||||||||||
| 5.500%, 11/01/2022 | 85,757 | 95,646 | ||||||||||
| 5.000%, 06/01/2023 | 89,008 | 98,114 | ||||||||||
| 5.500%, 07/01/2023 | 101,911 | 113,702 | ||||||||||
| 3.500%, 11/01/2025 | 7,435,983 | 7,861,114 | ||||||||||
| 2.500%, 04/01/2028 | 5,255,240 | 5,356,227 | ||||||||||
| 6.500%, 06/01/2029 | 298,894 | 349,738 | ||||||||||
| 5.500%, 01/01/2036 | 540,052 | 604,012 | ||||||||||
| 5.000%, 03/01/2036 | 13,333,755 | 14,748,959 | ||||||||||
| 6.000%, 12/01/2036 | 425,796 | 483,919 | ||||||||||
| 5.000%, 03/01/2038 | 4,250,901 | 4,688,750 | ||||||||||
| 5.500%, 05/01/2038 | 1,825,509 | 2,043,439 | ||||||||||
| 4.500%, 11/01/2039 | 10,386,863 | 11,261,219 | ||||||||||
| 4.500%, 11/01/2039 | 5,996,437 | 6,500,617 | ||||||||||
| 4.500%, 08/01/2040 | 1,957,073 | 2,123,309 | ||||||||||
| 4.500%, 09/01/2040 | 8,241,518 | 8,942,448 | ||||||||||
| 4.500%, 03/01/2041 | 6,051,418 | 6,566,384 | ||||||||||
| 3.500%, 06/01/2042 | 9,562,286 | 9,958,350 | ||||||||||
| 3.500%, 07/01/2042 | 24,921,096 | 25,951,116 | ||||||||||
| 3.000%, 08/01/2042 | 29,410,175 | 29,770,702 | ||||||||||
| 3.000%, 10/01/2042 | 10,785,227 | 10,917,464 | ||||||||||
| 3.000%, 02/01/2043 | 5,978,750 | 6,051,506 | ||||||||||
| 3.000%, 06/01/2043 | 29,145,934 | 29,487,905 | ||||||||||
| 3.000%, 08/01/2043 | 9,327,748 | 9,435,564 | ||||||||||
| 4.000%, 03/01/2044 | 17,702,169 | 18,892,473 | ||||||||||
| 3.500%, 07/01/2044 | 26,061,345 | 27,126,823 | ||||||||||
| 4.000%, 07/01/2044 | 14,547,938 | 15,526,150 | ||||||||||
| 3.500%, 10/01/2044 | 23,682,205 | 24,650,416 | ||||||||||
| 4.000%, 10/01/2044 | 23,872,897 | 25,586,748 | ||||||||||
| Federal Home Loan Mortgage Corporation (FHLMC): | ||||||||||||
| Series 206, Class E, 0.000%, 07/15/2019 | 27,500 | 27,353 | ||||||||||
| Series 141, Class D, 5.000%, 05/15/2021 | 18,487 | 19,332 | ||||||||||
| Series 1074, Class I, 6.750%, 05/15/2021 | 16,456 | 17,625 | ||||||||||
| Series 1081, Class K, 7.000%, 05/15/2021 | 105,833 | 116,648 | ||||||||||
| Series 163, Class F, 6.000%, 07/15/2021 | 16,938 | 18,293 | ||||||||||
| Series 188, Class H, 7.000%, 09/15/2021 | 38,675 | 42,159 | ||||||||||
| Series 1286, Class A, 6.000%, 05/15/2022 | 12,770 | 13,654 | ||||||||||
| Federal National Mortgage Association (FNMA): | ||||||||||||
| Series 1989-37, Class G, 8.000%, 07/25/2019 | 92,304 | 100,275 | ||||||||||
| 5.000%, 12/01/2019 | 312,849 | 330,313 | ||||||||||
| Series 1989-94, Class G, 7.500%, 12/25/2019 | 30,369 | 32,930 | ||||||||||
| Series 1990-58, Class J, 7.000%, 05/25/2020 | 4,238 | 4,606 | ||||||||||
| Series 1990-76, Class G, 7.000%, 07/25/2020 | 34,035 | 37,031 | ||||||||||
| Series 1990-105, Class J, 6.500%, 09/25/2020 | 19,045 | 20,366 | ||||||||||
| Series 1990-108, Class G, 7.000%, 09/25/2020 | 6,570 | 7,186 | ||||||||||
| Series 1991-1, Class G, 7.000%, 01/25/2021 | 8,449 | 9,262 | ||||||||||
| Series 1991-86, Class Z, 6.500%, 07/25/2021 | 15,253 | 16,458 | ||||||||||
| 5.000%, 11/01/2021 | 2,701,931 | 2,901,751 | ||||||||||
| 5.500%, 01/01/2023 § | 4,400,223 | 4,916,940 | ||||||||||
| Series 1993-58, Class H, 5.500%, 04/25/2023 | 186,919 | 204,506 | ||||||||||
| 5.500%, 07/01/2023 | 358,450 | 400,557 | ||||||||||
| 5.000%, 11/01/2023 | 856,488 | 945,591 | ||||||||||
| 6.000%, 03/01/2026 | 344,090 | 389,575 | ||||||||||
| 6.000%, 05/01/2026 | 745,204 | 843,712 | ||||||||||
| 3.000%, 04/01/2027 | 11,543,340 | 12,029,586 | ||||||||||
| 2.500%, 12/01/2027 | 18,187,506 | 18,567,324 | ||||||||||
| 5.000%, 05/01/2028 | 527,112 | 581,949 | ||||||||||
| Series 1998-66, Class C, 6.000%, 12/25/2028 | 114,474 | 123,029 | ||||||||||
| 4.500%, 08/01/2029 | 4,000,888 | 4,341,780 | ||||||||||
| 4.500%, 09/01/2029 | 4,485,229 | 4,867,390 | ||||||||||
| 6.000%, 03/01/2033 | 105,610 | 120,923 | ||||||||||
| 5.000%, 11/01/2033 | 111,480 | 123,491 | ||||||||||
| 4.000%, 01/01/2034 | 16,199,105 | 17,443,542 | ||||||||||
| 5.500%, 04/01/2034 | 2,199,083 | 2,476,826 | ||||||||||
| 4.000%, 06/01/2034 | 21,561,020 | 23,182,479 | ||||||||||
| Series 2004-W6, Class 1A6, 5.500%, 07/25/2034 | 1,044,041 | 1,071,220 | ||||||||||
| Series 2004-W6, Class 1A4, 5.500%, 07/25/2034 | 169,702 | 170,476 | ||||||||||
| 4.000%, 09/01/2034 | 23,074,170 | 24,826,579 | ||||||||||
| 5.500%, 09/01/2034 | 419,981 | 472,582 | ||||||||||
| 6.000%, 11/01/2034 | 109,567 | 125,130 | ||||||||||
| 5.500%, 02/01/2035 | 1,469,854 | 1,651,432 | ||||||||||
| 5.000%, 07/01/2035 | 12,460,325 | 13,796,908 | ||||||||||
| 5.000%, 10/01/2035 | 6,626,025 | 7,338,609 | ||||||||||
| 5.000%, 11/01/2035 | 2,558,820 | 2,829,199 | ||||||||||
| 5.500%, 11/01/2036 | 661,080 | 740,020 | ||||||||||
| 5.500%, 04/01/2037 | 3,325,666 | 3,748,849 | ||||||||||
| 6.000%, 08/01/2037 | 118,886 | 130,290 | ||||||||||
| 4.500%, 11/01/2039 | 620,293 | 674,213 | ||||||||||
| 4.000%, 08/01/2040 | 4,100,061 | 4,383,811 | ||||||||||
| 3.500%, 12/01/2040 | 2,026,451 | 2,116,391 | ||||||||||
| 3.500%, 02/01/2041 | 30,108,654 | 31,440,201 | ||||||||||
| 4.000%, 02/01/2041 | 20,919,408 | 22,352,703 | ||||||||||
| 3.500%, 03/01/2041 | 35,675,753 | 37,253,964 | ||||||||||
| 4.500%, 07/01/2041 | 26,836,656 | 29,160,204 | ||||||||||
| 4.000%, 09/01/2041 | 6,411,384 | 6,850,661 | ||||||||||
| 3.500%, 11/01/2041 | 21,116,964 | 22,056,362 | ||||||||||
| 4.000%, 12/01/2041 | 21,024,574 | 22,465,074 | ||||||||||
| 4.500%, 01/01/2042 | 31,282,168 | 34,034,118 | ||||||||||
| 3.000%, 05/01/2042 | 8,727,485 | 8,846,624 | ||||||||||
| 3.000%, 05/01/2043 | 35,490,509 | 35,955,674 | ||||||||||
| 3.000%, 06/01/2043 | 14,558,335 | 14,748,073 | ||||||||||
| Government National Mortgage Association (GNMA): | ||||||||||||
| 6.000%, 11/20/2033 | 93,920 | 108,031 | ||||||||||
| 5.000%, 07/20/2040 | 5,569,850 | 6,216,266 | ||||||||||
| 4.500%, 01/20/2041 | 16,918,186 | 18,577,368 | ||||||||||
| 4.000%, 06/20/2042 | 19,749,637 | 21,196,436 | ||||||||||
| 3.500%, 09/20/2042 | 10,153,502 | 10,675,128 | ||||||||||
| 4.500%, 04/20/2044 | 12,423,038 | 13,591,617 | ||||||||||
| 800,219,208 | 21.7 | % |
| Non-U.S. Government Agency Issues | ||||||||||||
| Alternative Loan Trust: | ||||||||||||
| Series 2006-43CB, Class 2A1, 6.000%, 02/25/2022 | 355,084 | 380,591 | ||||||||||
| Series 2006-28CB, Class A17, 6.000%, 10/25/2036 § | 1,090,637 | 904,436 | ||||||||||
| Banc of America Alternative Loan Trust: | ||||||||||||
| Series 2003-4, Class 2A1, 5.000%, 06/25/2018 | 87,273 | 89,441 | ||||||||||
| Series 2003-11, Class 4A1, 4.750%, 01/25/2019 | 159,865 | 161,384 | ||||||||||
| Series 2004-11, Class 4A1, 5.500%, 12/25/2019 | 130,785 | 134,573 | ||||||||||
| Series 2005-2, Class 4A1, 5.500%, 03/25/2020 | 187,937 | 193,878 | ||||||||||
| Series 2005-4, Class 3A1, 5.500%, 05/25/2020 | 997,187 | 1,010,357 | ||||||||||
| Series 2007-1, Class 1A1, 5.875%, 04/25/2022 | 954,532 | 957,532 | ||||||||||
| Series 2005-2, Class 1CB2, 5.500%, 03/25/2035 § | 153,463 | 142,112 | ||||||||||
| Series 2006-5, Class CB7, 6.000%, 06/25/2046 § | 829,159 | 677,918 | ||||||||||
| Bank of America Alternative Loan Trust: | ||||||||||||
| Series 2003-5, Class 2A1, 5.000%, 07/25/2018 | 1,080,170 | 1,102,744 | ||||||||||
| Series 2004-7, Class 4A1, 5.000%, 08/25/2019 | 2,467,450 | 2,540,595 | ||||||||||
| Series 2005-10, Class 5A1, 5.250%, 11/25/2020 | 505,899 | 516,550 | ||||||||||
| Series 2003-11, Class 2A1, 6.000%, 01/25/2034 | 575,864 | 599,658 | ||||||||||
| Series 2005-9, Class 1CB3, 5.500%, 10/25/2035 § | 362,644 | 331,864 | ||||||||||
| Series 2005-11, Class 1CB4, 5.500%, 12/25/2035 § | 218,208 | 198,211 | ||||||||||
| Bear Stearns Asset Backed Securities I Trust, | ||||||||||||
| Series 2004-AC2, Class 2A, 5.000%, 05/25/2034 | 1,045,686 | 1,052,460 | ||||||||||
| Chase Mortgage Finance Trust, | ||||||||||||
| Series 2006-A1, Class 2A3, 2.515%, 09/25/2036 § | 2,941,725 | 2,602,029 | ||||||||||
| Citigroup Mortgage Loan Trust, Inc., | ||||||||||||
| Series 2005-9, Class 2A2, 5.500%, 11/25/2035 § | 307,628 | 305,246 | ||||||||||
| Countrywide Alternative Loan Trust: | ||||||||||||
| Series 2005-50CB, Class 4A1, 5.000%, 11/25/2020 § | 337,939 | 337,656 | ||||||||||
| Series 2006-7CB, Class 3A1, 5.250%, 05/25/2021 § | 1,478,487 | 1,433,842 | ||||||||||
| Series 2006-J5, Class 3A1, 5.149%, 07/25/2021 | 273,195 | 271,445 | ||||||||||
| Series 2002-11, Class A4, 6.250%, 10/25/2032 | 55,956 | 57,149 | ||||||||||
| Series 2003-20CB, Class 1A1, 5.500%, 10/25/2033 | 5,751,447 | 5,866,090 | ||||||||||
| Deutsche Alt-A Securities Mortgage Loan Trust, | ||||||||||||
| Series 2006-AR5, Class 21A, 6.000%, 10/25/2021 § | 497,917 | 432,806 | ||||||||||
| First Horizon Alternative Mortgage Securities Trust: | ||||||||||||
| Series 2005-FA7, Class 2A1, 5.000%, 09/25/2020 | 206,587 | 210,829 | ||||||||||
| Series 2006-FA6, Class 3A1, 5.750%, 11/25/2021 | 314,621 | 312,214 | ||||||||||
| Series 2006-FA8, Class 2A1, 5.750%, 02/25/2037 § | 1,205,329 | 1,045,600 | ||||||||||
| J.P. Morgan Alternative Loan Trust, | ||||||||||||
| Series 2006-A1, Class 2A1, 2.584%, 03/25/2036 § | 543,308 | 443,060 | ||||||||||
| J.P. Morgan Mortgage Trust: | ||||||||||||
| Series 2007-A1, Class 5A2, 2.576%, 07/25/2035 | 6,519,208 | 6,622,538 | ||||||||||
| Series 2005-A4, Class 1A1, 5.238%, 07/25/2035 | 3,532,170 | 3,535,412 | ||||||||||
| Series 2006-A7, Class 2A2, 2.695%, 01/25/2037 § | 325,925 | 297,552 | ||||||||||
| Series 2006-A7, Class 2A4R, 2.695%, 01/25/2037 § | 1,392,499 | 1,260,403 | ||||||||||
| Series 2007-A2, Class 2A3, 2.539%, 04/25/2037 | 3,699,482 | 3,313,319 | ||||||||||
| MASTR Alternative Loan Trust: | ||||||||||||
| Series 2004-2, Class 6A1, 5.250%, 12/25/2018 | 3,703,423 | 3,849,234 | ||||||||||
| Series 2004-1, Class 1A1, 5.000%, 01/25/2019 | 482,512 | 490,212 | ||||||||||
| Series 2004-2, Class 4A1, 5.000%, 02/25/2019 | 28,688 | 29,448 | ||||||||||
| Series 2004-4, Class 4A1, 5.000%, 04/25/2019 | 382,043 | 390,144 | ||||||||||
| Series 2003-5, Class 6A1, 6.000%, 08/25/2033 | 442,165 | 471,171 | ||||||||||
| Merrill Lynch Mortgage Investors Trust: | ||||||||||||
| Series 2004-F, 1.827%, 12/25/2029 | 15,596,039 | 15,709,687 | ||||||||||
| Series 2005-A10, Class A, 0.380%, 02/25/2036 | 12,367,665 | 11,329,795 | ||||||||||
| RALI Series Trust, | ||||||||||||
| Series 2004-QS6, Class A1, 5.000%, 05/25/2019 | 192,038 | 194,809 | ||||||||||
| RFMSI Series Trust, | ||||||||||||
| Series 2003-S11, Class A2, 4.000%, 06/25/2018 | 13,815 | 13,682 | ||||||||||
| Salomon Brothers Mortgage Securities VII, Inc., | ||||||||||||
| Series 2003-UP2, Class A2, 7.000%, 06/25/2033 | 357,407 | 386,494 | ||||||||||
| Structured Asset Securities Corp. Mortgage Loan Trust, | ||||||||||||
| Series 2005-7XS, Class 1A4B, 5.440%, 04/25/2035 | 327,055 | 344,517 | ||||||||||
| WaMu Mortgage Pass-Through Certificates: | ||||||||||||
| Series 2004-CB1, Class 5A, 5.000%, 06/25/2019 | 461,011 | 472,961 | ||||||||||
| Series 2004-CB2, Class 7A, 5.500%, 08/25/2019 | 903,714 | 930,149 | ||||||||||
| Series 2004-CB3, Class 3A, 5.500%, 10/25/2019 | 70,990 | 73,666 | ||||||||||
| Series 2004-CB3, Class 4A, 6.000%, 10/25/2019 | 283,110 | 297,181 | ||||||||||
| Series 2004-CB4, Class 21A, 5.500%, 12/25/2019 | 215,932 | 223,680 | ||||||||||
| Series 2004-CB2, Class 3A, 6.000%, 08/25/2034 § | 12,084,840 | 12,921,027 | ||||||||||
| Series 2004-CB3, Class 2A, 6.500%, 10/25/2034 | 6,995,813 | 7,640,331 | ||||||||||
| WaMu Mortgage Pass-Through Certificates Trust, | ||||||||||||
| Series 2004-AR14, Class A1, 2.395%, 01/25/2035 | 4,917,345 | 4,937,309 | ||||||||||
| 100,046,991 | 2.7 | % | ||||||||||
| Asset Backed Securities | ||||||||||||
| Accredited Mortgage Loan Trust, | ||||||||||||
| Series 2006-2, Class A3, 0.320%, 09/25/2036 | 13,514,993 | 13,348,056 | ||||||||||
| AMRESCO Residential Securities Corp Mortgage Loan Trust, | ||||||||||||
| Series 1997-3, Class A9, 6.960%, 03/25/2027 § | 0 | 0 | ||||||||||
| Bayview Financial Mortgage Pass-Through Trust: | ||||||||||||
| Series 2006-A, Class 1A2, 5.483%, 02/28/2041 | 319,298 | 326,882 | ||||||||||
| Series 2007-B, Class 1A2, 6.831%, 08/28/2047 | 2,231,398 | 1,840,163 | ||||||||||
| Bear Stearns ALT-A Trust, | ||||||||||||
| Series 2004-4, Class A1, 0.770%, 06/25/2034 | 4,175,892 | 3,999,097 | ||||||||||
| Citibank Credit Card Issuance Trust, | ||||||||||||
| Series 2007-A3, Class A3, 6.150%, 06/15/2039 | 4,166,000 | 5,583,444 | ||||||||||
| Citigroup Mortgage Loan Trust, Inc., | ||||||||||||
| Series 2005-HE4, Class A2D, 0.530%, 10/25/2035 | 12,711,444 | 12,564,182 | ||||||||||
| Conseco Financial Corp.: | ||||||||||||
| Series 1993-3, Class A7, 6.400%, 10/15/2018 | 63,491 | 65,019 | ||||||||||
| Series 1993-4, Class A5, 7.050%, 01/15/2019 | 32,083 | 32,955 | ||||||||||
| Series 1997-1, Class A5, 6.860%, 03/15/2028 | 902 | 904 | ||||||||||
| Series 1998-2, Class A5, 6.240%, 12/01/2028 | 662,741 | 683,887 | ||||||||||
| Series 1997-6, Class A8, 7.070%, 01/15/2029 | 8,373 | 8,522 | ||||||||||
| Series 1998-3, Class A5, 6.220%, 03/01/2030 | 673,533 | 712,728 | ||||||||||
| Series 1998-4, Class A5, 6.180%, 04/01/2030 | 397,566 | 407,722 | ||||||||||
| Contimortgage Home Equity Loan Trust, | ||||||||||||
| Series 1997-2, Class A9, 7.090%, 04/15/2028 | 18 | 18 | ||||||||||
| Countrywide Asset-Backed Certificates: | ||||||||||||
| Series 2004-13, Class AF4, 4.583%, 01/25/2033 | 953,507 | 959,742 | ||||||||||
| Series 2004-S1, Class A3, 5.115%, 02/25/2035 | 1,112,677 | 1,134,464 | ||||||||||
| Series 2004-15, Class AF6, 4.613%, 04/25/2035 | 1,646,223 | 1,655,913 | ||||||||||
| Series 2005-1, Class AF6, 5.030%, 07/25/2035 | 2,649,648 | 2,697,352 | ||||||||||
| Series 2005-11, Class AF3, 4.778%, 02/25/2036 | 6,629,802 | 6,733,578 | ||||||||||
| Series 2005-10, Class AF6, 4.835%, 02/25/2036 | 1,897,827 | 1,878,410 | ||||||||||
| Series 2005-13, Class AF3, 5.000%, 04/25/2036 | 3,000,935 | 2,530,488 | ||||||||||
| Series 2005-17, Class 1AF2, 4.981%, 05/25/2036 § | 283,901 | 353,749 | ||||||||||
| Series 2005-17, Class 1AF5, 4.981%, 05/25/2036 § | 828,260 | 956,032 | ||||||||||
| Series 2006-10, Class 1AF3, 4.933%, 09/25/2046 § | 1,290,940 | 988,666 | ||||||||||
| Credit-Based Asset Servicing and Securitization LLC, | ||||||||||||
| Series 2005-CB8, Class AF2, 4.184%, 12/25/2035 | 284,914 | 282,386 | ||||||||||
| CWHEQ Home Equity Loan Trust, | ||||||||||||
| Series 2007-S1, Class A6, 5.693%, 11/25/2036 | 664,263 | 639,449 | ||||||||||
| Deutsche Mortgage Securities Inc Mortgage Loan Trust, | ||||||||||||
| Series 2004-4, Class 1A6, 6.000%, 04/25/2034 | 44,934 | 46,020 | ||||||||||
| First Franklin Mortgage Loan Trust, | ||||||||||||
| Series 2006-FFH1, Class A4, 0.470%, 01/25/2036 | 5,000,000 | 4,842,590 | ||||||||||
| GE Capital Mortgage Services Inc. Trust, | ||||||||||||
| Series 1999-HE1, Class A7, 6.265%, 04/25/2029 | 2,554 | 2,575 | ||||||||||
| GE Mortgage Services LLC, | ||||||||||||
| Series 1997-HE4, Class A7, 6.735%, 12/25/2028 | 92 | 93 | ||||||||||
| GSAA Home Equity Trust, | ||||||||||||
| Series 2004-6, Class A1, 0.970%, 06/25/2034 | 3,775,908 | 3,682,469 | ||||||||||
| GSAMP Trust, | ||||||||||||
| Series 2005-WMC2, Class A2C, 0.520%, 11/25/2035 | 1,134,457 | 1,101,153 | ||||||||||
| Imc Home Equity Loan Trust, | ||||||||||||
| Series 1997-5, Class A10, 6.880%, 11/20/2028 | 5,525 | 5,514 | ||||||||||
| Impac CMB Trust, | ||||||||||||
| Series 2004-4, Class 2A2, 4.636%, 09/25/2034 | 148,147 | 150,282 | ||||||||||
| J.P. Morgan Mortgage Acquisition Trust: | ||||||||||||
| Series 2006-CH1, Class A1, 0.285%, 07/25/2036 | 9,409,027 | 9,049,950 | ||||||||||
| Series 2007-CH1, Class AV4, 0.285%, 11/25/2036 | 2,010,688 | 2,002,243 | ||||||||||
| MortgageIT Trust, | ||||||||||||
| Series 2005-2, Class 1A1, 0.430%, 05/25/2035 | 4,684,941 | 4,502,734 | ||||||||||
| Nationstar Home Equity Loan Trust, | ||||||||||||
| Series 2006-B, Class AV3, 0.340%, 09/25/2036 | 6,291,819 | 6,278,839 | ||||||||||
| Oakwood Mortgage Investors, Inc., | ||||||||||||
| Series 1999-B, Class A3, 6.450%, 11/15/2017 | 39,760 | 40,756 | ||||||||||
| Pemex Finance Ltd., | ||||||||||||
| 10.610%, 08/15/2017 f | 1,841,125 | 2,046,730 | ||||||||||
| RAAC Series Trust, | ||||||||||||
| Series 2004-SP1, Class AI4, 5.285%, 08/25/2027 | 33,709 | 34,253 | ||||||||||
| RAMP Series Trust: | ||||||||||||
| Series 2003-RS7, Class AI6, 5.340%, 08/25/2033 | 373,227 | 374,344 | ||||||||||
| Series 2005-RS1, Class AI6, 4.713%, 01/25/2035 | 152,939 | 154,763 | ||||||||||
| RASC Series Trust: | ||||||||||||
| Series 2003-KS2, Class AI6, 3.990%, 04/25/2033 | 537,097 | 536,552 | ||||||||||
| Series 2003-KS5, Class AI6, 3.620%, 07/25/2033 | 31,201 | 30,296 | ||||||||||
| Series 2004-KS2, Class AI6, 4.300%, 03/25/2034 | 61,950 | 62,626 | ||||||||||
| Renaissance Home Equity Loan Trust, | ||||||||||||
| Series 2007-1, Class AF3, 5.612%, 04/25/2037 | 2,603,261 | 1,394,288 | ||||||||||
| Republic Services, Inc., | ||||||||||||
| Series 2006-KS4, Class A4, 0.410%, 06/25/2036 | 26,038,000 | 25,247,929 | ||||||||||
| Securitized Asset Backed Receivables LLC Trust, | ||||||||||||
| Series 2005-OP2, Class A1, 0.495%, 10/25/2035 (Acquired 03/13/2014, Cost $2,904,238) * | 2,940,070 | 2,906,256 | ||||||||||
| Specialty Underwriting & Residential Finance Trust: | ||||||||||||
| Series 2004-BC4, Class A1A, 0.840%, 10/25/2035 | 3,784,791 | 3,682,132 | ||||||||||
| Series 2006-BC1, Class A2D, 0.470%, 12/25/2036 | 4,436,698 | 4,297,484 | ||||||||||
| Structured Asset Securities Corp., | ||||||||||||
| Series 2005-WF1, Class A3, 0.830%, 02/25/2035 | 11,677,079 | 11,618,612 | ||||||||||
| 144,475,291 | 3.9 | % | ||||||||||
| Commercial Mortgage Backed Securities | ||||||||||||
| Bear Stearns Commercial Mortgage Securities Trust, | ||||||||||||
| Series 2005-PWR9, Class A4A, 4.871%, 09/11/2042 | 8,823,130 | 8,950,183 | ||||||||||
| CD Commercial Mortgage Trust, | ||||||||||||
| Series 2005-CD1, Class A4, 5.226%, 07/15/2044 | 11,464,977 | 11,650,229 | ||||||||||
| Citigroup Commercial Mortgage Trust, | ||||||||||||
| Series 2014-GC19, Class A3, 3.753%, 03/10/2047 | 5,000,000 | 5,269,850 | ||||||||||
| COMM Mortgage Trust: | ||||||||||||
| Series 2005-C6, Class A5A, 5.116%, 06/10/2044 | 24,213,710 | 24,471,876 | ||||||||||
| Series 2012-CR1, Class A3, 3.391%, 05/15/2045 | 7,813,462 | 8,126,829 | ||||||||||
| Series 2013-CR9, Class A3, 4.022%, 07/10/2045 | 11,900,000 | 12,835,542 | ||||||||||
| Series 2012-CR2, Class A4, 3.147%, 08/15/2045 | 16,445,536 | 16,847,268 | ||||||||||
| Series 2013-CR10, Class A3, 3.923%, 08/10/2046 | 10,550,000 | 11,295,315 | ||||||||||
| Credit Suisse First Boston Mortgage Securities Corp., | ||||||||||||
| Series 2005-C5, Class A4, 5.100%, 08/15/2038 | 11,968,999 | 12,127,875 | ||||||||||
| FHLMC Multifamily Structured Pass Through Certificates, | ||||||||||||
| Series K-003, Class A4, 5.053%, 01/25/2019 | 12,525,000 | 13,992,780 | ||||||||||
| GE Capital Commercial Mortgage Corp., | ||||||||||||
| Series 2005-C4, Class A4, 5.312%, 11/10/2045 | 9,751,208 | 9,902,615 | ||||||||||
| GS Mortgage Securities Corp II, | ||||||||||||
| Series 2012-GCJ9, Class A3, 2.773%, 11/10/2045 | 22,112,320 | 21,982,388 | ||||||||||
| J.P. Morgan Chase Commercial Mortgage Securities Corp., | ||||||||||||
| Series 2012-LC9, Class A5, 2.840%, 12/15/2047 | 5,530,059 | 5,518,855 | ||||||||||
| J.P. Morgan Chase Commercial Mortgage Securities Trust: | ||||||||||||
| Series 2005-CB12, Class A4, 4.895%, 09/12/2037 | 10,399,264 | 10,507,156 | ||||||||||
| Series 2013-LC11, Class A5, 2.960%, 04/15/2046 | 11,652,913 | 11,700,224 | ||||||||||
| JPMBB Commercial Mortgage Securities Trust: | ||||||||||||
| Series 2013-C17, Class A3, 3.928%, 01/15/2047 | 8,300,000 | 8,889,342 | ||||||||||
| Series 2014-C25, Class ASB, 3.407%, 11/15/2047 | 5,388,000 | 5,599,075 | ||||||||||
| Morgan Stanley Bank of America Merrill Lynch Trust: | ||||||||||||
| Series 2012-C5, Class A4, 3.176%, 08/15/2045 | 20,835,000 | 21,331,727 | ||||||||||
| Series 2012-C6, Class A4, 2.858%, 11/15/2045 | 20,460,945 | 20,490,859 | ||||||||||
| Series 2013-C11, Class A3, 3.960%, 08/15/2046 | 12,100,000 | 12,952,445 | ||||||||||
| Series 2013-C12, Class A3, 3.973%, 10/15/2046 | 9,000,000 | 9,672,471 | ||||||||||
| Wachovia Bank Commercial Mortgage Trust, | ||||||||||||
| Series 2005-C22, Class A4, 5.269%, 12/15/2044 | 10,560,215 | 10,785,665 | ||||||||||
| Wells Fargo Commercial Mortgage Trust, | ||||||||||||
| Series 2013-LC12, Class A3, 3.986%, 07/15/2046 | 9,300,000 | 10,000,643 | ||||||||||
| WFRBS Commercial Mortgage Trust: | ||||||||||||
| Series 2012-C6, Class A4, 3.440%, 04/15/2045 | 20,464,220 | 21,380,158 | ||||||||||
| Series 2014-C21, Class A5, 3.678%, 08/15/2047 | 11,254,000 | 11,793,854 | ||||||||||
| Series 2014-C23, Class ASB, 3.636%, 10/15/2057 | 6,000,000 | 6,312,954 | ||||||||||
| 324,388,178 | 8.8 | % | ||||||||||
| Total Long-Term Investments (Cost $3,527,903,913) | 3,605,760,555 | 97.7 | % | |||||||||
| Shares | ||||||||||||
| SHORT-TERM INVESTMENTS | ||||||||||||
| Money Market Mutual Funds | ||||||||||||
| Dreyfus Cash Advantage Fund, 0.06% « | 44,145,740 | 44,145,740 | ||||||||||
| Short-Term Investments Trust - Liquid Assets Portfolio, 0.07% « | 70,000,000 | 70,000,000 | ||||||||||
| Total Short-Term Investments (Cost $114,145,740) | 114,145,740 | 3.1 | % | |||||||||
| INVESTMENTS PURCHASED WITH CASH PROCEEDS FROM | ||||||||||||
| SECURITIES LENDING | ||||||||||||
| Investment Companies | ||||||||||||
| Mount Vernon Securities Lending Trust Prime Portfolio, 0.29% « | 98,296,098 | 98,296,098 | ||||||||||
| Total Investment Companies (Cost $98,296,098) | 98,296,098 | 2.7 | % | |||||||||
| Total Investments Purchased With Cash Proceeds From | ||||||||||||
| Securities Lending (Cost $98,296,098) | 98,296,098 | 2.7 | % | |||||||||
| Total Investments (Cost $3,740,345,751) | 3,818,202,393 | 103.5 | % | |||||||||
| Liabilities in Excess of Other Assets | (127,962,475 | ) | (3.5 | )% | ||||||||
| TOTAL NET ASSETS | $ | 3,690,239,918 | 100.0 | % | ||||||||
| Notes to Schedule of Investments | ||
| * | Restricted security as defined in Rule 144(a) under the Securities Act of 1933 and determined to be liquid. Purchased in a private placement transaction; resale to the public may require registration or may extend only to qualified institutional buyers. At December 31, 2014, the value of these securities total $399,176,879, which represents 10.82% of total net assets. | |
| @ | This security or portion of this security is out on loan at December 31, 2014. | |
| f | Foreign Security | |
| ^ | Non-Income Producing | |
| « | 7-Day Yield | |
| § | Security in Default | |
| Baird Core Plus Bond Fund | |||||||||||||
| Schedule of Investments | |||||||||||||
| December 31, 2014 | |||||||||||||
| Principal | % of | ||||||||||||
| Amount | Value | Net Assets | |||||||||||
| LONG-TERM INVESTMENTS | |||||||||||||
| U.S. Treasury Securities | |||||||||||||
| U.S. Treasury Bonds: | |||||||||||||
| 2.625%, 08/15/2020 | $ | 441,300,000 | $ | 460,848,266 | |||||||||
| 6.250%, 08/15/2023 | 40,000,000 | 53,259,360 | |||||||||||
| 5.250%, 11/15/2028 | 118,325,000 | 158,638,682 | |||||||||||
| 3.500%, 02/15/2039 @ | 282,420,000 | 324,363,889 | |||||||||||
| 997,110,197 | 14.8 | % | |||||||||||
| Corporate Bonds | |||||||||||||
| Finance | |||||||||||||
| Abbey National Treasury Services plc, | |||||||||||||
| 4.000%, 03/13/2024 f | 7,700,000 | 8,015,993 | |||||||||||
| ABN AMRO Bank N.V.: | |||||||||||||
| 4.250%, 02/02/2017 (Acquired 01/30/2012, Cost $4,995,100) * f | 5,000,000 | 5,268,300 | |||||||||||
| 2.500%, 10/30/2018 (Acquired 10/23/2013, Cost $6,828,106) * f | 6,750,000 | 6,817,608 | |||||||||||
| AIG SunAmerica Global Financing X, | |||||||||||||
| 6.900%, 03/15/2032 (Acquired 11/10/2011, Cost $2,127,116) * | 2,000,000 | 2,753,854 | |||||||||||
| Ally Financial Inc.: | |||||||||||||
| 8.300%, 02/12/2015 | 1,065,000 | 1,070,325 | |||||||||||
| 4.625%, 06/26/2015 | 5,000,000 | 5,037,500 | |||||||||||
| 5.500%, 02/15/2017 | 7,275,000 | 7,638,750 | |||||||||||
| 8.000%, 12/31/2018 | 1,194,000 | 1,355,190 | |||||||||||
| 3.750%, 11/18/2019 | 17,000,000 | 16,745,000 | |||||||||||
| 5.125%, 09/30/2024 | 3,000,000 | 3,045,000 | |||||||||||
| American Express Credit Corporation, | |||||||||||||
| 0.722%, 08/15/2019 | 7,450,000 | 7,396,017 | |||||||||||
| American International Group, Inc.: | |||||||||||||
| 6.400%, 12/15/2020 @ | 3,500,000 | 4,173,645 | |||||||||||
| 4.875%, 06/01/2022 | 10,625,000 | 11,935,530 | |||||||||||
| AmSouth Bancorporation, | |||||||||||||
| 6.750%, 11/01/2025 | 710,000 | 846,682 | |||||||||||
| Associates Corporation of North America, | |||||||||||||
| 6.950%, 11/01/2018 | 12,038,000 | 14,060,264 | |||||||||||
| Australia and New Zealand Banking Group Limited, | |||||||||||||
| 4.500%, 03/19/2024 (Acquired 03/12/2014, Cost $8,987,760) * @ f | 9,000,000 | 9,187,389 | |||||||||||
| Banco Santander (Brasil) S.A., | |||||||||||||
| 4.625%, 02/13/2017 (Acquired 02/06/2012, Cost $994,140) * f | 1,000,000 | 1,036,300 | |||||||||||
| Bank of America Corporation: | |||||||||||||
| 10.200%, 07/15/2015 | 2,675,000 | 2,806,340 | |||||||||||
| 6.875%, 04/25/2018 | 1,250,000 | 1,435,725 | |||||||||||
| 7.625%, 06/01/2019 | 6,000,000 | 7,251,672 | |||||||||||
| 3.300%, 01/11/2023 | 9,450,000 | 9,450,728 | |||||||||||
| 7.750%, 05/14/2038 | 725,000 | 1,023,920 | |||||||||||
| BanPonce Trust I, | |||||||||||||
| Series A, 8.327%, 02/01/2027 | 2,185,000 | 1,907,827 | |||||||||||
| Barclays Bank PLC: | |||||||||||||
| 6.750%, 05/22/2019 f | 9,850,000 | 11,590,534 | |||||||||||
| 3.750%, 05/15/2024 @ f | 1,450,000 | 1,494,589 | |||||||||||
| Barclays PLC, | |||||||||||||
| 2.750%, 11/08/2019 f | 7,000,000 | 6,957,230 | |||||||||||
| BB&T Corporation, | |||||||||||||
| 2.450%, 01/15/2020 | 15,000,000 | 14,938,935 | |||||||||||
| Berkshire Hathaway Finance Corporation, | |||||||||||||
| 4.400%, 05/15/2042 | 3,500,000 | 3,764,555 | |||||||||||
| BNP Paribas: | |||||||||||||
| 0.692%, 05/07/2017 f | 6,500,000 | 6,490,731 | |||||||||||
| 2.375%, 09/14/2017 f | 3,000,000 | 3,051,312 | |||||||||||
| 5.000%, 01/15/2021 f | 5,000,000 | 5,655,115 | |||||||||||
| 3.250%, 03/03/2023 f | 4,000,000 | 4,077,940 | |||||||||||
| BNZ International Funding Limited, | |||||||||||||
| 2.350%, 03/04/2019 (Acquired 09/03/2014, Cost $13,754,587) * f | 13,775,000 | 13,776,639 | |||||||||||
| BOKF, National Association, | |||||||||||||
| 0.922%, 05/15/2017 | 3,000,000 | 2,992,080 | |||||||||||
| BPCE: | |||||||||||||
| 2.500%, 12/10/2018 f | 5,500,000 | 5,574,982 | |||||||||||
| 5.700%, 10/22/2023 (Acquired 10/15/2013, Cost $30,117,248) * f | 28,500,000 | 30,602,359 | |||||||||||
| Capital One Financial Corporation: | |||||||||||||
| 6.150%, 09/01/2016 | 4,425,000 | 4,755,269 | |||||||||||
| 2.450%, 04/24/2019 | 3,975,000 | 3,965,893 | |||||||||||
| CIT Group Inc.: | |||||||||||||
| 4.250%, 08/15/2017 @ | 1,000,000 | 1,020,000 | |||||||||||
| 5.500%, 02/15/2019 (Acquired 02/02/2012, Cost $500,000) * @ | 500,000 | 527,500 | |||||||||||
| 5.000%, 08/01/2023 @ | 5,000,000 | 5,137,500 | |||||||||||
| Citigroup Inc.: | |||||||||||||
| 4.450%, 01/10/2017 | 1,800,000 | 1,902,749 | |||||||||||
| 1.850%, 11/24/2017 | 11,500,000 | 11,486,787 | |||||||||||
| 8.500%, 05/22/2019 | 1,389,000 | 1,730,787 | |||||||||||
| Citizens Bank, National Association, | |||||||||||||
| 2.450%, 12/04/2019 | 36,000,000 | 35,775,000 | |||||||||||
| CNA Financial Corporation: | |||||||||||||
| 6.500%, 08/15/2016 | 1,000,000 | 1,081,635 | |||||||||||
| 7.350%, 11/15/2019 | 1,175,000 | 1,402,416 | |||||||||||
| 5.875%, 08/15/2020 @ | 6,839,000 | 7,806,965 | |||||||||||
| 5.750%, 08/15/2021 | 4,477,000 | 5,102,262 | |||||||||||
| 7.250%, 11/15/2023 | 5,300,000 | 6,608,660 | |||||||||||
| Comerica Bank: | |||||||||||||
| 5.750%, 11/21/2016 | 3,200,000 | 3,465,229 | |||||||||||
| 5.200%, 08/22/2017 | 2,855,000 | 3,103,102 | |||||||||||
| Commonwealth Bank of Australia, | |||||||||||||
| 5.000%, 10/15/2019 (Acquired 03/02/2012 through 08/16/2012, Cost $6,254,222) * f | 5,900,000 | 6,587,191 | |||||||||||
| Compass Bank, | |||||||||||||
| 2.750%, 09/29/2019 | 30,470,000 | 30,501,140 | |||||||||||
| Cooperatieve Centrale Raiffeisen-Boerenleenbank BA, | |||||||||||||
| 1.700%, 03/19/2018 @ f | 5,250,000 | 5,240,823 | |||||||||||
| Countrywide Financial Corporation, | |||||||||||||
| 6.250%, 05/15/2016 | 2,100,000 | 2,228,818 | |||||||||||
| Credit Mutuel-CIC Home Loan SFH, | |||||||||||||
| 1.500%, 11/16/2017 (Acquired 11/08/2012, Cost $4,981,300) * @ f | 5,000,000 | 5,016,745 | |||||||||||
| Credit Suisse: | |||||||||||||
| 0.553%, 08/24/2015 f | 5,000,000 | 5,000,780 | |||||||||||
| 5.300%, 08/13/2019 @ f | 6,966,000 | 7,813,832 | |||||||||||
| 3.000%, 10/29/2021 f | 12,600,000 | 12,541,183 | |||||||||||
| Deutsche Bank Aktiengesellschaft, | |||||||||||||
| 3.250%, 01/11/2016 f | 2,000,000 | 2,043,390 | |||||||||||
| Discover Bank, | |||||||||||||
| 8.700%, 11/18/2019 | 3,237,000 | 4,003,004 | |||||||||||
| Discover Financial Services, | |||||||||||||
| 3.950%, 11/06/2024 | 25,000,000 | 25,131,075 | |||||||||||
| Dresdner Bank AG, | |||||||||||||
| 7.250%, 09/15/2015 f | 10,425,000 | 10,780,201 | |||||||||||
| Fifth Third Bancorp, | |||||||||||||
| 0.667%, 12/20/2016 | 9,585,000 | 9,508,435 | |||||||||||
| First Horizon National Corporation, | |||||||||||||
| 5.375%, 12/15/2015 | 12,420,000 | 12,858,438 | |||||||||||
| First Tennessee Bank National Association: | |||||||||||||
| 5.050%, 01/15/2015 | 7,022,000 | 7,031,002 | |||||||||||
| 2.950%, 12/01/2019 | 9,000,000 | 8,976,879 | |||||||||||
| FMR LLC: | |||||||||||||
| 4.950%, 02/01/2033 (Acquired 01/29/2013, Cost $4,405,344) * | 4,235,000 | 4,682,262 | |||||||||||
| 6.500%, 12/14/2040 (Acquired 04/04/2013 through 10/28/2013, Cost $2,278,543) * | 1,820,000 | 2,426,406 | |||||||||||
| General Electric Capital Corporation: | |||||||||||||
| 5.500%, 01/08/2020 | 1,875,000 | 2,146,080 | |||||||||||
| 5.550%, 05/04/2020 | 4,185,000 | 4,809,724 | |||||||||||
| 4.375%, 09/16/2020 | 2,925,000 | 3,203,566 | |||||||||||
| 5.300%, 02/11/2021 | 3,000,000 | 3,425,961 | |||||||||||
| 4.650%, 10/17/2021 | 8,450,000 | 9,524,240 | |||||||||||
| Genworth Holdings, Inc., | |||||||||||||
| 7.625%, 09/24/2021 | 1,000,000 | 977,792 | |||||||||||
| Goldman Sachs Capital I, | |||||||||||||
| 6.345%, 02/15/2034 @ | 125,000 | 148,701 | |||||||||||
| Highmark Inc, | |||||||||||||
| 4.750%, 05/15/2021 (Acquired 07/30/2014, Cost $7,857,931) * | 7,800,000 | 8,055,980 | |||||||||||
| HSBC Bank USA, National Association, | |||||||||||||
| 6.000%, 08/09/2017 | 2,720,000 | 3,006,965 | |||||||||||
| HSBC Finance Corporation: | |||||||||||||
| 5.500%, 01/19/2016 | 2,420,000 | 2,530,125 | |||||||||||
| 6.676%, 01/15/2021 | 21,623,000 | 25,654,738 | |||||||||||
| Humana Inc., | |||||||||||||
| 7.200%, 06/15/2018 | 800,000 | 934,550 | |||||||||||
| ING Bank N.V.: | |||||||||||||
| 4.000%, 03/15/2016 (Acquired 03/08/2011 through 09/20/2011, Cost $1,599,838) * f | 1,600,000 | 1,654,933 | |||||||||||
| 3.750%, 03/07/2017 (Acquired 02/29/2012 through 04/24/2013, Cost $4,984,106) * f | 5,000,000 | 5,232,510 | |||||||||||
| 5.000%, 06/09/2021 (Acquired 10/12/2011, Cost $2,468,800) * f | 2,500,000 | 2,828,365 | |||||||||||
| 5.800%, 09/25/2023 (Acquired 01/14/2014, Cost $2,945,147) * f | 2,800,000 | 3,105,981 | |||||||||||
| Invesco Finance PLC, | |||||||||||||
| 3.125%, 11/30/2022 f | 5,500,000 | 5,450,874 | |||||||||||
| iStar Financial Inc., | |||||||||||||
| 5.850%, 03/15/2017 | 500,000 | 512,500 | |||||||||||
| J.P. Morgan Chase & Co.: | |||||||||||||
| 0.784%, 04/25/2018 | 2,300,000 | 2,294,726 | |||||||||||
| 2.200%, 10/22/2019 | 3,500,000 | 3,469,820 | |||||||||||
| 4.250%, 10/15/2020 | 8,100,000 | 8,708,310 | |||||||||||
| 4.350%, 08/15/2021 | 2,400,000 | 2,608,022 | |||||||||||
| 4.500%, 01/24/2022 | 4,400,000 | 4,803,709 | |||||||||||
| 3.200%, 01/25/2023 @ | 5,350,000 | 5,356,035 | |||||||||||
| Jefferies Group LLC, | |||||||||||||
| 6.450%, 06/08/2027 | 1,000,000 | 1,037,541 | |||||||||||
| John Hancock Life Insurance Company, | |||||||||||||
| 7.375%, 02/15/2024 (Acquired 08/26/2010 through 04/11/2013, Cost $11,929,136) * | 9,765,000 | 12,189,708 | |||||||||||
| Kemper Corporation: | |||||||||||||
| 6.000%, 11/30/2015 | 2,500,000 | 2,606,110 | |||||||||||
| 6.000%, 05/15/2017 | 1,000,000 | 1,080,331 | |||||||||||
| KeyBank National Association: | |||||||||||||
| 7.413%, 05/06/2015 | 5,100,000 | 5,214,913 | |||||||||||
| 5.450%, 03/03/2016 | 1,279,000 | 1,344,005 | |||||||||||
| 4.625%, 06/15/2018 | 2,670,000 | 2,792,564 | |||||||||||
| Kookmin Bank, | |||||||||||||
| 1.625%, 07/14/2017 (Acquired 07/07/2014, Cost $4,985,900) * f | 5,000,000 | 4,972,050 | |||||||||||
| LeasePlan Corporation N.V.: | |||||||||||||
| 3.000%, 10/23/2017 (Acquired 10/15/2012 through 02/07/2013, Cost $10,040,556) * f | 10,000,000 | 10,242,430 | |||||||||||
| 2.500%, 05/16/2018 (Acquired 05/07/2013 through 09/24/2014, Cost $20,076,061) * f | 19,960,000 | 19,968,563 | |||||||||||
| Liberty Mutual Group Inc.: | |||||||||||||
| 6.500%, 03/15/2035 (Acquired 09/29/2008 through 04/16/2013, Cost $700,157) * | 700,000 | 855,236 | |||||||||||
| 10.750%, 06/15/2058 (Acquired 05/21/2008 through 05/06/2009, Cost $751,178) * | 900,000 | 1,389,256 | |||||||||||
| Liberty Mutual Insurance Company, | |||||||||||||
| 7.697%, 10/15/2097 (Acquired 03/26/2003, Cost $240,081) * | 375,000 | 473,707 | |||||||||||
| Lincoln National Corporation: | |||||||||||||
| 8.750%, 07/01/2019 | 7,801,000 | 9,747,584 | |||||||||||
| 6.050%, 04/20/2067 | 930,000 | 930,000 | |||||||||||
| Lloyds Bank plc: | |||||||||||||
| 4.200%, 03/28/2017 f | 2,000,000 | 2,115,158 | |||||||||||
| 5.800%, 01/13/2020 (Acquired 01/05/2010 through 01/19/2012, Cost $6,398,137) * f | 6,350,000 | 7,337,711 | |||||||||||
| M&I Marshall & Ilsley Bank, | |||||||||||||
| 4.850%, 06/16/2015 | 2,189,000 | 2,228,544 | |||||||||||
| M&T Capital Trust I, | |||||||||||||
| 8.234%, 02/01/2027 | 500,000 | 504,668 | |||||||||||
| M&T Capital Trust II, | |||||||||||||
| 8.277%, 06/01/2027 | 2,300,000 | 2,341,248 | |||||||||||
| Macquarie Bank Limited: | |||||||||||||
| 2.000%, 08/15/2016 (Acquired 09/27/2013, Cost $3,511,699) * f | 3,500,000 | 3,542,626 | |||||||||||
| 0.864%, 10/27/2017 (Acquired 10/22/2014, Cost $8,000,000) * f | 8,000,000 | 8,008,752 | |||||||||||
| 1.600%, 10/27/2017 (Acquired 10/22/2014, Cost $7,595,364) * f | 7,600,000 | 7,550,053 | |||||||||||
| Macquarie Group Limited: | |||||||||||||
| 4.875%, 08/10/2017 (Acquired 10/30/2014, Cost $1,075,379) * f | 1,000,000 | 1,069,288 | |||||||||||
| 7.625%, 08/13/2019 (Acquired 12/15/2014, Cost $2,972,715) * f | 2,467,000 | 2,957,824 | |||||||||||
| Manufacturers And Traders Trust Company: | |||||||||||||
| 6.625%, 12/04/2017 | 1,120,000 | 1,267,086 | |||||||||||
| 5.585%, 12/28/2020 | 4,614,000 | 4,787,713 | |||||||||||
| Manulife Financial Corporation, | |||||||||||||
| 4.900%, 09/17/2020 f | 2,784,000 | 3,056,659 | |||||||||||
| Marsh & McLennan Companies, Inc., | |||||||||||||
| 4.800%, 07/15/2021 | 1,000,000 | 1,111,420 | |||||||||||
| Massachusetts Mutual Life Insurance Company: | |||||||||||||
| 7.625%, 11/15/2023 (Acquired 10/10/2012, Cost $4,156,492) * | 3,184,000 | 4,085,046 | |||||||||||
| 8.875%, 06/01/2039 (Acquired 10/03/2012 through 09/26/2014, Cost $30,206,377) * | 19,440,000 | 31,366,382 | |||||||||||
| MBIA Insurance Corporation, | |||||||||||||
| 11.491%, 01/15/2033 (Acquired 01/11/2008, Cost $700,000) * § | 700,000 | 420,000 | |||||||||||
| METLIFE CAPITAL TRUST IV, | |||||||||||||
| 7.875%, 12/15/2037 (Acquired 03/26/2012 through 04/05/2013, Cost $1,046,853) * | 900,000 | 1,149,750 | |||||||||||
| MetLife, Inc., | |||||||||||||
| 7.717%, 02/15/2019 @ | 1,157,000 | 1,402,021 | |||||||||||
| Metropolitan Life Global Funding I, | |||||||||||||
| 3.875%, 04/11/2022 (Acquired 12/18/2012, Cost $1,605,052) * | 1,500,000 | 1,585,661 | |||||||||||
| Mizuho Bank, Ltd.: | |||||||||||||
| 1.850%, 03/21/2018 (Acquired 03/14/2013, Cost $1,847,447) * f | 1,850,000 | 1,839,940 | |||||||||||
| 2.650%, 09/25/2019 (Acquired 09/18/2014, Cost $4,991,400) * f | 5,000,000 | 5,022,865 | |||||||||||
| Morgan Stanley: | |||||||||||||
| 5.450%, 01/09/2017 | 2,000,000 | 2,147,428 | |||||||||||
| 6.625%, 04/01/2018 | 1,275,000 | 1,452,270 | |||||||||||
| 7.300%, 05/13/2019 | 4,675,000 | 5,545,233 | |||||||||||
| 2.375%, 07/23/2019 @ | 2,000,000 | 1,992,624 | |||||||||||
| 5.625%, 09/23/2019 | 10,100,000 | 11,400,819 | |||||||||||
| 3.750%, 02/25/2023 | 1,000,000 | 1,025,821 | |||||||||||
| 3.700%, 10/23/2024 | 5,000,000 | 5,068,100 | |||||||||||
| MUFG Americas Holdings Corporation, | |||||||||||||
| 3.500%, 06/18/2022 | 1,150,000 | 1,184,331 | |||||||||||
| National Australia Bank Ltd/New York, | |||||||||||||
| 2.750%, 03/09/2017 f | 6,000,000 | 6,181,884 | |||||||||||
| National City Bank, | |||||||||||||
| 5.800%, 06/07/2017 | 6,170,000 | 6,774,629 | |||||||||||
| Nationwide Mutual Insurance Company, | |||||||||||||
| 7.875%, 04/01/2033 (Acquired 10/13/2009, Cost $90,823) * | 100,000 | 138,655 | |||||||||||
| Navient, LLC, | |||||||||||||
| 5.625%, 08/01/2033 | 50,000 | 37,750 | |||||||||||
| New England Mutual Life Insurance Company, | |||||||||||||
| 7.875%, 02/15/2024 (Acquired 11/07/2012, Cost $4,203,933) * | 3,200,000 | 4,103,216 | |||||||||||
| Nippon Life Insurance Company, | |||||||||||||
| 5.000%, 10/18/2042 (Acquired 10/11/2012, Cost $2,000,000) * f | 2,000,000 | 2,084,202 | |||||||||||
| Nomura Holdings, Inc.: | |||||||||||||
| 2.000%, 09/13/2016 f | 3,000,000 | 3,024,201 | |||||||||||
| 2.750%, 03/19/2019 f | 11,268,000 | 11,391,418 | |||||||||||
| 6.700%, 03/04/2020 f | 2,525,000 | 2,985,247 | |||||||||||
| Nordea Bank AB, | |||||||||||||
| 3.125%, 03/20/2017 (Acquired 03/14/2012 through 05/09/2012, Cost $8,022,880) * f | 8,000,000 | 8,287,800 | |||||||||||
| Principal Financial Group, Inc.: | |||||||||||||
| 3.300%, 09/15/2022 | 1,000,000 | 999,709 | |||||||||||
| 3.125%, 05/15/2023 | 3,550,000 | 3,494,936 | |||||||||||
| Prudential Financial, Inc., | |||||||||||||
| 6.000%, 12/01/2017 | 2,000,000 | 2,238,856 | |||||||||||
| Rabobank Nederland: | |||||||||||||
| 3.375%, 01/19/2017 f | 2,000,000 | 2,086,372 | |||||||||||
| 3.875%, 02/08/2022 f | 4,150,000 | 4,414,670 | |||||||||||
| Raymond James Financial, Inc., | |||||||||||||
| 8.600%, 08/15/2019 | 6,427,000 | 7,979,564 | |||||||||||
| Regions Bank, | |||||||||||||
| 7.500%, 05/15/2018 | 15,864,000 | 18,416,438 | |||||||||||
| Royal Bank of Canada, | |||||||||||||
| 0.488%, 10/13/2017 f | 9,000,000 | 8,992,512 | |||||||||||
| Santander Bank, N.A., | |||||||||||||
| 8.750%, 05/30/2018 | 7,034,000 | 8,377,508 | |||||||||||
| Santander Financial Issuances Limited, | |||||||||||||
| 7.250%, 11/01/2015 f | 300,000 | 314,096 | |||||||||||
| Santander UK PLC, | |||||||||||||
| 5.000%, 11/07/2023 (Acquired 10/31/2013, Cost $996,810) * f | 1,000,000 | 1,056,196 | |||||||||||
| Simon Property Group LP, | |||||||||||||
| 1.500%, 02/01/2018 (Acquired 12/10/2012, Cost $11,962,200) * | 12,000,000 | 11,923,920 | |||||||||||
| Societe Generale: | |||||||||||||
| 5.200%, 04/15/2021 (Acquired 09/20/2011 through 02/13/2013, Cost $9,990,291) * @ f | 10,100,000 | 11,433,018 | |||||||||||
| 5.000%, 01/17/2024 (Acquired 01/14/2014, Cost $2,972,790) * @ f | 3,000,000 | 3,016,443 | |||||||||||
| SpareBank 1 Boligkreditt AS, | |||||||||||||
| 1.750%, 11/15/2019 (Acquired 11/07/2012, Cost $4,961,150) * f | 5,000,000 | 4,894,235 | |||||||||||
| Springleaf Finance Corp, | |||||||||||||
| 6.900%, 12/15/2017 @ | 1,000,000 | 1,065,000 | |||||||||||
| Standard Chartered PLC, | |||||||||||||
| 5.700%, 03/26/2044 (Acquired 03/21/2014 through 05/01/2014, Cost $14,104,484) * f | 14,000,000 | 14,562,702 | |||||||||||
| Stifel Financial Corp., | |||||||||||||
| 4.250%, 07/18/2024 | 10,000,000 | 10,059,260 | |||||||||||
| Sumitomo Mitsui Banking Corporation: | |||||||||||||
| 2.250%, 07/11/2019 f | 12,050,000 | 11,935,465 | |||||||||||
| 3.000%, 01/18/2023 f | 2,500,000 | 2,483,417 | |||||||||||
| SunTrust Bank: | |||||||||||||
| 0.523%, 08/24/2015 | 10,000,000 | 9,979,980 | |||||||||||
| 7.250%, 03/15/2018 | 5,682,000 | 6,574,381 | |||||||||||
| SunTrust Banks, Inc., | |||||||||||||
| 3.500%, 01/20/2017 | 4,750,000 | 4,951,661 | |||||||||||
| SUSA Partnership, L.P., | |||||||||||||
| 8.200%, 06/01/2017 | 1,000,000 | 1,140,560 | |||||||||||
| Svenska Handelsbanken AB, | |||||||||||||
| 2.875%, 04/04/2017 f | 2,425,000 | 2,506,410 | |||||||||||
| Swedbank AB, | |||||||||||||
| 2.125%, 09/29/2017 (Acquired 09/24/2012, Cost $2,995,470) * f | 3,000,000 | 3,034,578 | |||||||||||
| Symetra Financial Corporation, | |||||||||||||
| 6.125%, 04/01/2016 (Acquired 10/12/2010 through 10/16/2012, Cost $7,377,493) * | 7,127,000 | 7,477,157 | |||||||||||
| Synchrony Financial: | |||||||||||||
| 3.750%, 08/15/2021 | 16,650,000 | 17,007,792 | |||||||||||
| 4.250%, 08/15/2024 @ | 18,000,000 | 18,470,322 | |||||||||||
| TD Ameritrade Holding Corporation, | |||||||||||||
| 5.600%, 12/01/2019 | 1,000,000 | 1,147,925 | |||||||||||
| The Bank of Tokyo-Mitsubishi UFJ, Ltd.: | |||||||||||||
| 0.684%, 02/26/2016 (Acquired 10/09/2014, Cost $3,347,197) * f | 3,340,000 | 3,343,153 | |||||||||||
| 0.611%, 07/15/2016 * f | 10,000,000 | 9,996,870 | |||||||||||
| 2.350%, 02/23/2017 (Acquired 02/14/2012, Cost $5,996,640) * f | 6,000,000 | 6,101,316 | |||||||||||
| 0.648%, 03/10/2017 (Acquired 10/08/2014 through 11/12/2014, Cost $7,259,985) * f | 7,250,000 | 7,213,830 | |||||||||||
| The Bear Stearns Companies LLC, | |||||||||||||
| 7.250%, 02/01/2018 | 2,250,000 | 2,593,238 | |||||||||||
| The Chubb Corporation, | |||||||||||||
| 6.375%, 03/29/2067 | 1,320,000 | 1,415,106 | |||||||||||
| The Goldman Sachs Group, Inc.: | |||||||||||||
| 5.950%, 01/18/2018 | 3,000,000 | 3,332,904 | |||||||||||
| 6.150%, 04/01/2018 | 6,500,000 | 7,295,724 | |||||||||||
| 7.500%, 02/15/2019 | 1,825,000 | 2,170,766 | |||||||||||
| 2.550%, 10/23/2019 @ | 4,000,000 | 3,985,392 | |||||||||||
| 5.250%, 07/27/2021 | 1,000,000 | 1,128,662 | |||||||||||
| 5.750%, 01/24/2022 | 8,100,000 | 9,369,975 | |||||||||||
| 6.750%, 10/01/2037 | 300,000 | 377,212 | |||||||||||
| The Guardian Life Insurance Company of America, | |||||||||||||
| 4.875%, 06/19/2064 (Acquired 06/16/2014, Cost $2,989,950) * | 3,000,000 | 3,193,812 | |||||||||||
| The Hartford Financial Services Group, Inc.: | |||||||||||||
| 5.375%, 03/15/2017 | 2,913,000 | 3,146,631 | |||||||||||
| 4.000%, 10/15/2017 | 3,000,000 | 3,189,681 | |||||||||||
| 5.125%, 04/15/2022 | 3,447,000 | 3,874,731 | |||||||||||
| 8.125%, 06/15/2038 | 1,365,000 | 1,562,696 | |||||||||||
| The Royal Bank of Scotland Group Public Limited Company: | |||||||||||||
| 5.050%, 01/08/2015 f | 1,528,000 | 1,528,305 | |||||||||||
| 2.550%, 09/18/2015 f | 4,225,000 | 4,267,301 | |||||||||||
| The Royal Bank of Scotland Public Limited Company, | |||||||||||||
| 6.125%, 01/11/2021 f | 7,850,000 | 9,250,291 | |||||||||||
| Torchmark Corporation, | |||||||||||||
| 3.800%, 09/15/2022 | 1,275,000 | 1,314,985 | |||||||||||
| UBS AG, | |||||||||||||
| 1.375%, 08/14/2017 f | 3,000,000 | 2,980,482 | |||||||||||
| UnitedHealth Group Incorporated, | |||||||||||||
| 6.000%, 02/15/2018 | 1,000,000 | 1,125,652 | |||||||||||
| Voya Financial, Inc., | |||||||||||||
| 5.500%, 07/15/2022 | 25,634,000 | 28,956,577 | |||||||||||
| Wells Fargo Bank, National Association, | |||||||||||||
| 6.000%, 11/15/2017 @ | 8,322,000 | 9,328,238 | |||||||||||
| Westpac Banking Corporation: | |||||||||||||
| 2.000%, 08/14/2017 f | 8,000,000 | 8,105,712 | |||||||||||
| 4.875%, 11/19/2019 f | 636,000 | 709,626 | |||||||||||
| Willis North America, Inc.: | |||||||||||||
| 5.625%, 07/15/2015 | 2,600,000 | 2,662,964 | |||||||||||
| 7.000%, 09/29/2019 | 7,803,000 | 9,100,616 | |||||||||||
| 1,207,991,697 | 18.0 | % | |||||||||||
| Utility | |||||||||||||
| Appalachian Power Company, | |||||||||||||
| Series P, 6.700%, 08/15/2037 | 1,150,000 | 1,537,267 | |||||||||||
| Arizona Public Service Company, | |||||||||||||
| 8.750%, 03/01/2019 | 1,150,000 | 1,446,487 | |||||||||||
| CMS Energy Corporation, | |||||||||||||
| 5.050%, 03/15/2022 | 1,000,000 | 1,121,111 | |||||||||||
| Consolidated Edison Company of New York, Inc., | |||||||||||||
| 4.625%, 12/01/2054 | 7,600,000 | 8,323,444 | |||||||||||
| Constellation Energy Group, Inc., | |||||||||||||
| 4.550%, 06/15/2015 | 750,000 | 762,111 | |||||||||||
| Dominion Resources, Inc.: | |||||||||||||
| 2.500%, 12/01/2019 | 5,225,000 | 5,240,257 | |||||||||||
| Series B, 5.950%, 06/15/2035 | 1,880,000 | 2,390,552 | |||||||||||
| ENEL Finance International N.V., | |||||||||||||
| 6.800%, 09/15/2037 (Acquired 09/13/2007 through 09/29/2008, Cost $498,897) * f | 500,000 | 639,275 | |||||||||||
| Exelon Corporation, | |||||||||||||
| 4.900%, 06/15/2015 | 775,000 | 788,859 | |||||||||||
| Exelon Generation Company, LLC: | |||||||||||||
| 6.200%, 10/01/2017 | 4,350,000 | 4,833,829 | |||||||||||
| 5.600%, 06/15/2042 | 6,100,000 | 6,824,235 | |||||||||||
| IPALCO Enterprises, Inc., | |||||||||||||
| 5.000%, 05/01/2018 | 1,000,000 | 1,055,000 | |||||||||||
| KeySpan Corporation, | |||||||||||||
| 8.000%, 11/15/2030 | 1,875,000 | 2,585,503 | |||||||||||
| Mega Advance Investments Ltd, | |||||||||||||
| 5.000%, 05/12/2021 (Acquired 05/09/2011 through 05/23/2012, Cost $2,812,201) * f | 2,800,000 | 3,032,624 | |||||||||||
| MidAmerican Energy Holdings Company, | |||||||||||||
| 3.500%, 02/01/2025 (Acquired 12/01/2014, Cost $6,998,390) * @ | 7,000,000 | 7,044,506 | |||||||||||
| National Grid PLC, | |||||||||||||
| 6.300%, 08/01/2016 f | 4,790,000 | 5,170,556 | |||||||||||
| National Rural Utilities Cooperative Finance Corporation: | |||||||||||||
| 10.375%, 11/01/2018 | 6,673,000 | 8,693,117 | |||||||||||
| 2.300%, 11/15/2019 | 5,000,000 | 4,993,950 | |||||||||||
| NextEra Energy Capital Holdings, Inc., | |||||||||||||
| Series D, 7.300%, 09/01/2067 | 2,600,000 | 2,782,000 | |||||||||||
| ONEOK, Inc., | |||||||||||||
| 4.250%, 02/01/2022 | 6,150,000 | 5,628,806 | |||||||||||
| PPL Energy Supply, LLC: | |||||||||||||
| Series A, 5.700%, 10/15/2015 | 1,600,000 | 1,634,842 | |||||||||||
| 6.200%, 05/15/2016 | 3,070,000 | 3,190,356 | |||||||||||
| PSEG Power LLC, | |||||||||||||
| 5.320%, 09/15/2016 | 3,077,000 | 3,287,396 | |||||||||||
| Public Service Company of New Mexico, | |||||||||||||
| 7.950%, 05/15/2018 | 6,553,000 | 7,711,970 | |||||||||||
| RGS I&M Funding Corp, | |||||||||||||
| Series F*, 9.820%, 06/07/2022 | 154,712 | 183,340 | |||||||||||
| Talent Yield Investments Ltd., | |||||||||||||
| 4.500%, 04/25/2022 (Acquired 04/18/2012, Cost $5,958,960) * f | 6,000,000 | 6,281,280 | |||||||||||
| Trans-Allegheny Interstate Line Company, | |||||||||||||
| 4.000%, 01/15/2015 (Acquired 08/03/2012, Cost $2,852,520) * | 2,850,000 | 2,852,243 | |||||||||||
| 100,034,916 | 1.5 | % | |||||||||||
| Industrials | |||||||||||||
| 21st CENTURY FOX AMERICA, INC.: | |||||||||||||
| 6.900%, 03/01/2019 | 6,659,000 | 7,851,973 | |||||||||||
| 3.700%, 09/15/2024 (Acquired 09/10/2014, Cost $4,023,350) * | 4,025,000 | 4,140,216 | |||||||||||
| 4.750%, 09/15/2044 (Acquired 09/10/2014, Cost $1,948,459) * | 1,950,000 | 2,130,899 | |||||||||||
| A.P. Meoller - Maersk A/S: | |||||||||||||
| 2.550%, 09/22/2019 (Acquired 11/24/2014, Cost $10,065,609) * f | 10,000,000 | 10,028,050 | |||||||||||
| 3.750%, 09/22/2024 (Acquired 09/15/2014, Cost $4,459,830) * @ f | 4,475,000 | 4,594,550 | |||||||||||
| AbbVie Inc.: | |||||||||||||
| 1.750%, 11/06/2017 | 7,450,000 | 7,466,189 | |||||||||||
| 2.000%, 11/06/2018 | 10,835,000 | 10,798,648 | |||||||||||
| Access Midstream Partners LP / ACMP Finance Corp, | |||||||||||||
| 6.125%, 07/15/2022 @ | 300,000 | 318,750 | |||||||||||
| Acuity Brands Lighting, Inc., | |||||||||||||
| 6.000%, 12/15/2019 | 700,000 | 775,920 | |||||||||||
| ADT Corp.: | |||||||||||||
| 2.250%, 07/15/2017 | 2,810,000 | 2,718,675 | |||||||||||
| 3.500%, 07/15/2022 | 1,200,000 | 1,023,000 | |||||||||||
| Alibaba Group Holding Limited, | |||||||||||||
| 3.125%, 11/28/2021 (Acquired 11/20/2014, Cost $9,955,800) * f | 10,000,000 | 9,879,770 | |||||||||||
| Altera Corporation, | |||||||||||||
| 4.100%, 11/15/2023 | 3,000,000 | 3,105,000 | |||||||||||
| Ameritech Capital Funding Corporation, | |||||||||||||
| 6.450%, 01/15/2018 | 3,175,000 | 3,560,889 | |||||||||||
| Anadarko Petroleum Corporation: | |||||||||||||
| 5.950%, 09/15/2016 | 2,792,000 | 2,985,709 | |||||||||||
| 6.375%, 09/15/2017 | 968,000 | 1,076,224 | |||||||||||
| 8.700%, 03/15/2019 | 4,380,000 | 5,365,286 | |||||||||||
| 6.450%, 09/15/2036 @ | 1,725,000 | 2,072,922 | |||||||||||
| Anglo American Capital PLC, | |||||||||||||
| 9.375%, 04/08/2019 (Acquired 09/20/2011 through 07/11/2012, Cost $6,767,133) * @ f | 5,600,000 | 6,974,475 | |||||||||||
| ArcelorMittal S.A.: | |||||||||||||
| 5.000%, 02/25/2017 f | 5,000,000 | 5,200,000 | |||||||||||
| 6.750%, 02/25/2022 @ f | 2,000,000 | 2,135,000 | |||||||||||
| AT&T Inc.: | |||||||||||||
| 6.300%, 01/15/2038 @ | 11,000,000 | 13,309,208 | |||||||||||
| 5.550%, 08/15/2041 | 1,000,000 | 1,114,300 | |||||||||||
| Atlas Air, Inc. Pass Through Trust, | |||||||||||||
| Series 00-1, 8.707%, 01/02/2019 | 132,635 | 137,609 | |||||||||||
| Ball Corporation, | |||||||||||||
| 6.750%, 09/15/2020 @ | 13,153,000 | 13,679,120 | |||||||||||
| Bayer US Finance LLC, | |||||||||||||
| 2.375%, 10/08/2019 (Acquired 10/01/2014, Cost $14,657,559) * | 14,725,000 | 14,783,429 | |||||||||||
| Beam Suntory Inc., | |||||||||||||
| 3.250%, 05/15/2022 | 2,000,000 | 2,002,216 | |||||||||||
| Becton, Dickinson and Company: | |||||||||||||
| 3.250%, 11/12/2020 | 13,000,000 | 13,224,588 | |||||||||||
| 3.734%, 12/15/2024 | 4,900,000 | 5,044,917 | |||||||||||
| Bemis Company, Inc., | |||||||||||||
| 4.500%, 10/15/2021 | 1,000,000 | 1,084,830 | |||||||||||
| Boston Scientific Corporation, | |||||||||||||
| 2.650%, 10/01/2018 | 10,000,000 | 10,011,770 | |||||||||||
| BP Capital Markets: | |||||||||||||
| 0.885%, 09/26/2018 f | 5,000,000 | 4,954,415 | |||||||||||
| 4.750%, 03/10/2019 @ f | 1,500,000 | 1,640,862 | |||||||||||
| Browning-Ferris Industries, Inc., | |||||||||||||
| 9.250%, 05/01/2021 | 1,600,000 | 2,040,934 | |||||||||||
| Bunge Limited Finance Corp., | |||||||||||||
| 8.500%, 06/15/2019 | 13,690,000 | 16,777,643 | |||||||||||
| Bunge N.A. Finance L.P., | |||||||||||||
| 5.900%, 04/01/2017 | 4,024,000 | 4,375,203 | |||||||||||
| CareFusion Corporation: | |||||||||||||
| 6.375%, 08/01/2019 | 5,000,000 | 5,784,990 | |||||||||||
| 3.875%, 05/15/2024 | 7,500,000 | 7,739,940 | |||||||||||
| CCOH Safari, LLC: | |||||||||||||
| 5.500%, 12/01/2022 | 2,000,000 | 2,030,000 | |||||||||||
| 5.750%, 12/01/2024 @ | 10,000,000 | 10,112,500 | |||||||||||
| CenturyLink, Inc., | |||||||||||||
| Series R, 5.150%, 06/15/2017 | 2,000,000 | 2,095,000 | |||||||||||
| CF Industries, Inc.: | |||||||||||||
| 6.875%, 05/01/2018 | 5,000,000 | 5,684,145 | |||||||||||
| 3.450%, 06/01/2023 | 8,745,000 | 8,548,631 | |||||||||||
| 5.375%, 03/15/2044 | 5,000,000 | 5,394,475 | |||||||||||
| Chesapeake Energy Corporation: | |||||||||||||
| 6.500%, 08/15/2017 | 3,544,000 | 3,774,360 | |||||||||||
| 3.481%, 04/15/2019 | 4,500,000 | 4,410,000 | |||||||||||
| Cliffs Natural Resources Inc., | |||||||||||||
| 5.700%, 01/15/2018 @ | 11,579,000 | 7,526,350 | |||||||||||
| Comcast Cable Communications Holdings, Inc., | |||||||||||||
| 9.455%, 11/15/2022 | 2,030,000 | 2,918,415 | |||||||||||
| Comcast Corporation: | |||||||||||||
| 4.250%, 01/15/2033 | 5,900,000 | 6,247,669 | |||||||||||
| 4.650%, 07/15/2042 | 2,000,000 | 2,189,024 | |||||||||||
| Computer Sciences Corporation, | |||||||||||||
| 4.450%, 09/15/2022 | 2,000,000 | 2,045,826 | |||||||||||
| ConAgra Foods, Inc., | |||||||||||||
| 1.900%, 01/25/2018 | 8,569,000 | 8,511,913 | |||||||||||
| ConocoPhillips Canada Funding Company I, | |||||||||||||
| 5.950%, 10/15/2036 f | 845,000 | 1,055,218 | |||||||||||
| Constellation Brands, Inc., | |||||||||||||
| 4.750%, 11/15/2024 @ | 100,000 | 101,250 | |||||||||||
| Continental Airlines Pass Through Trust, | |||||||||||||
| Series 974A, 6.900%, 01/02/2018 | 31,877 | 33,471 | |||||||||||
| Cox Communications, Inc.: | |||||||||||||
| 9.375%, 01/15/2019 (Acquired 10/06/2014 through 10/06/2014, Cost $9,708,015) * | 7,670,000 | 9,652,864 | |||||||||||
| 2.950%, 06/30/2023 (Acquired 04/24/2013, Cost $5,440,103) * @ | 5,475,000 | 5,250,207 | |||||||||||
| 3.850%, 02/01/2025 (Acquired 12/01/2014, Cost $4,616,999) * | 4,625,000 | 4,668,554 | |||||||||||
| 4.800%, 02/01/2035 (Acquired 12/01/2014, Cost $9,996,400) * | 10,000,000 | 10,418,730 | |||||||||||
| 4.700%, 12/15/2042 (Acquired 11/26/2012, Cost $4,999,050) * @ | 5,000,000 | 4,995,570 | |||||||||||
| CSX Corporation, | |||||||||||||
| 6.220%, 04/30/2040 | 175,000 | 227,952 | |||||||||||
| D.R. Horton, Inc., | |||||||||||||
| 4.750%, 05/15/2017 @ | 1,447,000 | 1,512,115 | |||||||||||
| Daimler Finance North America LLC, | |||||||||||||
| 1.875%, 01/11/2018 (Acquired 01/07/2013, Cost $2,116,139) * | 2,125,000 | 2,132,384 | |||||||||||
| Danone, | |||||||||||||
| 3.000%, 06/15/2022 (Acquired 05/29/2012, Cost $3,489,465) * f | 3,500,000 | 3,515,414 | |||||||||||
| DCP Midstream, LLC: | |||||||||||||
| 9.750%, 03/15/2019 (Acquired 02/29/2012 through 12/12/2012, Cost $11,004,099) * | 9,155,000 | 11,451,129 | |||||||||||
| 4.750%, 09/30/2021 (Acquired 09/14/2011 through 11/18/2011, Cost $2,250,486) * | 2,245,000 | 2,229,042 | |||||||||||
| Deutsche Telekom International Finance B.V.: | |||||||||||||
| 6.750%, 08/20/2018 f | 1,250,000 | 1,450,581 | |||||||||||
| 8.750%, 06/15/2030 f | 825,000 | 1,218,656 | |||||||||||
| Devon Energy Corporation, | |||||||||||||
| 6.300%, 01/15/2019 | 5,220,000 | 5,958,051 | |||||||||||
| Devon Financing Corporation, LLC | |||||||||||||
| 7.875%, 09/30/2031 | 5,000,000 | 6,820,735 | |||||||||||
| DISH DBS Corporation, | |||||||||||||
| 5.000%, 03/15/2023 @ | 2,500,000 | 2,418,750 | |||||||||||
| Dollar General Corporation: | |||||||||||||
| 4.125%, 07/15/2017 | 275,000 | 283,612 | |||||||||||
| 1.875%, 04/15/2018 | 2,100,000 | 2,029,211 | |||||||||||
| Dominion Gas Holdings, LLC, | |||||||||||||
| 3.600%, 12/15/2024 | 6,100,000 | 6,205,207 | |||||||||||
| Eaton Corporation: | |||||||||||||
| 2.750%, 11/02/2022 | 2,500,000 | 2,455,992 | |||||||||||
| 4.000%, 11/02/2032 | 3,660,000 | 3,722,802 | |||||||||||
| Ecolab Inc., | |||||||||||||
| 1.450%, 12/08/2017 | 5,200,000 | 5,153,398 | |||||||||||
| El Paso Pipeline Partners Operating Company, L.L.C., | |||||||||||||
| 7.500%, 11/15/2040 | 2,500,000 | 3,074,942 | |||||||||||
| Enbridge Inc., | |||||||||||||
| 0.905%, 10/01/2016 f | 1,250,000 | 1,249,354 | |||||||||||
| Encana Corporation, | |||||||||||||
| 6.500%, 05/15/2019 f | 500,000 | 567,558 | |||||||||||
| Energy Transfer Partners, L.P.: | |||||||||||||
| 9.700%, 03/15/2019 | 1,189,000 | 1,492,334 | |||||||||||
| 5.200%, 02/01/2022 | 1,000,000 | 1,069,556 | |||||||||||
| 3.600%, 02/01/2023 @ | 5,000,000 | 4,838,340 | |||||||||||
| EnLink Midstream Partners, LP, | |||||||||||||
| 4.400%, 04/01/2024 | 7,000,000 | 7,091,287 | |||||||||||
| Enogex LLC, | |||||||||||||
| 6.250%, 03/15/2020 (Acquired 10/25/2012 through 05/10/2013, Cost $3,559,188) * | 3,190,000 | 3,648,588 | |||||||||||
| Enterprise Products Operating LLC: | |||||||||||||
| 3.350%, 03/15/2023 @ | 10,000,000 | 9,890,920 | |||||||||||
| 3.750%, 02/15/2025 @ | 7,000,000 | 7,026,656 | |||||||||||
| Express Scripts Holding Company: | |||||||||||||
| 7.250%, 06/15/2019 | 4,600,000 | 5,523,022 | |||||||||||
| 4.750%, 11/15/2021 | 14,700,000 | 16,222,229 | |||||||||||
| 3.500%, 06/15/2024 | 7,500,000 | 7,473,690 | |||||||||||
| FedEx Corporation, | |||||||||||||
| 8.000%, 01/15/2019 | 6,100,000 | 7,425,945 | |||||||||||
| Fidelity National Information Services, Inc.: | |||||||||||||
| 5.000%, 03/15/2022 | 9,345,000 | 9,910,886 | |||||||||||
| 3.500%, 04/15/2023 | 4,100,000 | 4,075,412 | |||||||||||
| 3.875%, 06/05/2024 @ | 19,750,000 | 19,949,515 | |||||||||||
| Fiserv, Inc.: | |||||||||||||
| 3.125%, 06/15/2016 | 2,475,000 | 2,541,073 | |||||||||||
| 4.625%, 10/01/2020 | 3,000,000 | 3,258,957 | |||||||||||
| 3.500%, 10/01/2022 | 11,500,000 | 11,614,172 | |||||||||||
| Florida Gas Transmission Company, LLC, | |||||||||||||
| 3.875%, 07/15/2022 (Acquired 06/12/2012, Cost $2,996,190) * | 3,000,000 | 3,038,295 | |||||||||||
| Fomento Economico Mexicano, S.A.B. de C.V.: | |||||||||||||
| 2.875%, 05/10/2023 f | 11,700,000 | 10,912,730 | |||||||||||
| 4.375%, 05/10/2043 @ f | 4,000,000 | 3,737,848 | |||||||||||
| Ford Motor Credit Company LLC: | |||||||||||||
| 2.500%, 01/15/2016 | 2,000,000 | 2,022,372 | |||||||||||
| 4.207%, 04/15/2016 | 4,710,000 | 4,875,062 | |||||||||||
| 8.000%, 12/15/2016 | 2,000,000 | 2,238,304 | |||||||||||
| 3.000%, 06/12/2017 | 3,000,000 | 3,078,021 | |||||||||||
| 6.625%, 08/15/2017 | 1,063,000 | 1,184,987 | |||||||||||
| 5.750%, 02/01/2021 @ | 13,000,000 | 14,897,116 | |||||||||||
| Forest Laboratories, Inc.: | |||||||||||||
| 4.375%, 02/01/2019 (Acquired 10/20/2014, Cost $4,222,938) * | 4,000,000 | 4,225,480 | |||||||||||
| 5.000%, 12/15/2021 (Acquired 08/26/2014 through 09/29/2014, Cost $20,099,491) * | 18,608,000 | 20,149,226 | |||||||||||
| Freeport-McMoRan Inc.: | |||||||||||||
| 3.100%, 03/15/2020 @ | 3,800,000 | 3,696,385 | |||||||||||
| 3.550%, 03/01/2022 @ | 5,000,000 | 4,725,555 | |||||||||||
| Freeport-McMoran Oil & Gas LLC / FCX Oil & Gas Inc.: | |||||||||||||
| 6.500%, 11/15/2020 | 6,337,000 | 6,859,612 | |||||||||||
| 6.625%, 05/01/2021 | 6,447,000 | 6,930,525 | |||||||||||
| 6.750%, 02/01/2022 | 2,649,000 | 2,913,900 | |||||||||||
| General Mills, Inc., | |||||||||||||
| 2.200%, 10/21/2019 | 12,000,000 | 11,899,188 | |||||||||||
| Georgia-Pacific LLC: | |||||||||||||
| 5.400%, 11/01/2020 (Acquired 10/27/2010, Cost $994,130) * | 1,000,000 | 1,125,238 | |||||||||||
| 3.163%, 11/15/2021 (Acquired 11/03/2014, Cost $19,999,800) * | 20,000,000 | 20,119,520 | |||||||||||
| Glencore Canada Corporation, | |||||||||||||
| 5.375%, 06/01/2015 f | 2,000,000 | 2,033,840 | |||||||||||
| Glencore Finance (Canada) Limited: | |||||||||||||
| 4.950%, 11/15/2021 (Acquired 11/03/2011, Cost $1,997,480) * f | 2,000,000 | 2,109,958 | |||||||||||
| 4.250%, 10/25/2022 (Acquired 10/18/2012 through 05/22/2013, Cost $7,120,116) * f | 7,000,000 | 6,965,693 | |||||||||||
| Glencore Funding LLC: | |||||||||||||
| 4.125%, 05/30/2023 (Acquired 05/22/2013 through 04/03/2014, Cost $12,194,471) * | 12,300,000 | 12,001,836 | |||||||||||
| 4.625%, 04/29/2024 (Acquired 10/08/2014, Cost $5,145,026) * | 5,000,000 | 5,024,000 | |||||||||||
| Grupo Bimbo, S.A.B. de C.V., | |||||||||||||
| 3.875%, 06/27/2024 (Acquired 06/27/2014, Cost $7,011,037) * f | 7,000,000 | 7,027,510 | |||||||||||
| GTE Corporation, | |||||||||||||
| 8.750%, 11/01/2021 | 975,000 | 1,271,593 | |||||||||||
| Gulf South Pipeline Company, LP, | |||||||||||||
| 4.000%, 06/15/2022 | 3,000,000 | 2,957,436 | |||||||||||
| H. J. Heinz Company, | |||||||||||||
| 4.250%, 10/15/2020 @ | 20,000,000 | 20,200,000 | |||||||||||
| H. J. Heinz Finance Company, | |||||||||||||
| 6.750%, 03/15/2032 | 10,000,000 | 10,575,000 | |||||||||||
| Hanson Limited, | |||||||||||||
| 6.125%, 08/15/2016 f | 15,157,000 | 16,066,420 | |||||||||||
| HCA Inc.: | |||||||||||||
| 4.250%, 10/15/2019 | 10,900,000 | 11,063,500 | |||||||||||
| 5.000%, 03/15/2024 | 8,366,000 | 8,596,065 | |||||||||||
| Hess Corporation, | |||||||||||||
| 8.125%, 02/15/2019 | 1,262,000 | 1,501,517 | |||||||||||
| Hewlett-Packard Company: | |||||||||||||
| 4.375%, 09/15/2021 | 10,000,000 | 10,484,770 | |||||||||||
| 4.650%, 12/09/2021 @ | 15,500,000 | 16,596,873 | |||||||||||
| Hospira, Inc.: | |||||||||||||
| 6.050%, 03/30/2017 | 25,000,000 | 26,954,125 | |||||||||||
| 5.800%, 08/12/2023 | 6,465,000 | 7,235,175 | |||||||||||
| Husky Energy Inc., | |||||||||||||
| 4.000%, 04/15/2024 f | 1,605,000 | 1,576,373 | |||||||||||
| Hutchison Whampoa International (09/16) Limited, | |||||||||||||
| 4.625%, 09/11/2015 (Acquired 08/19/2010 through 12/28/2011, Cost $3,597,608) * f | 3,563,000 | 3,652,716 | |||||||||||
| Hutchison Whampoa International (11) Limited, | |||||||||||||
| 3.500%, 01/13/2017 (Acquired 01/10/2012, Cost $4,070,309) * f | 4,000,000 | 4,144,240 | |||||||||||
| Hutchison Whampoa International (12) (II) Limited, | |||||||||||||
| 3.250%, 11/08/2022 (Acquired 11/05/2012, Cost $4,603,093) * f | 4,625,000 | 4,598,244 | |||||||||||
| Hutchison Whampoa International (14) Limited, | |||||||||||||
| 3.625%, 10/31/2024 (Acquired 10/28/2014, Cost $14,982,600) * f | 15,000,000 | 15,068,685 | |||||||||||
| Hyundai Capital Services, Inc.: | |||||||||||||
| 4.375%, 07/27/2016 (Acquired 04/05/2013, Cost $1,145,127) * f | 1,100,000 | 1,150,979 | |||||||||||
| 1.043%, 03/18/2017 (Acquired 03/11/2014, Cost $2,400,000) * f | 2,400,000 | 2,395,186 | |||||||||||
| 3.500%, 09/13/2017 (Acquired 03/06/2012 through 08/29/2014, Cost $12,915,582) * f | 12,470,000 | 12,899,928 | |||||||||||
| Ingersoll-Rand Luxembourg Finance S.A.: | |||||||||||||
| 3.550%, 11/01/2024 f | 3,200,000 | 3,180,493 | |||||||||||
| 4.650%, 11/01/2044 f | 1,300,000 | 1,321,789 | |||||||||||
| Ingredion Incorporated, | |||||||||||||
| 1.800%, 09/25/2017 | 5,650,000 | 5,633,768 | |||||||||||
| Johnson Controls, Inc., | |||||||||||||
| 5.250%, 12/01/2041 | 1,150,000 | 1,297,131 | |||||||||||
| Keysight Technologies, Inc., | |||||||||||||
| 3.300%, 10/30/2019 (Acquired 10/06/2014, Cost $4,995,100) * | 5,000,000 | 4,967,545 | |||||||||||
| Kinder Morgan Energy Partners, L.P.: | |||||||||||||
| 9.000%, 02/01/2019 | 1,658,000 | 2,009,920 | |||||||||||
| 6.850%, 02/15/2020 | 4,645,000 | 5,335,359 | |||||||||||
| 6.500%, 02/01/2037 | 400,000 | 449,611 | |||||||||||
| 6.950%, 01/15/2038 | 350,000 | 403,945 | |||||||||||
| Kinder Morgan Finance Company LLC: | |||||||||||||
| 5.700%, 01/05/2016 | 2,536,000 | 2,632,672 | |||||||||||
| 6.000%, 01/15/2018 (Acquired 12/06/2010, Cost $999,930) * | 1,000,000 | 1,083,800 | |||||||||||
| Kinder Morgan, Inc., | |||||||||||||
| 3.050%, 12/01/2019 | 7,000,000 | 6,944,350 | |||||||||||
| Kinross Gold Corporation, | |||||||||||||
| 6.875%, 09/01/2041 f | 5,500,000 | 5,229,191 | |||||||||||
| Kraft Foods Group Inc, | |||||||||||||
| 5.000%, 06/04/2042 @ | 1,000,000 | 1,100,803 | |||||||||||
| Lafarge S.A.: | |||||||||||||
| 6.200%, 07/09/2015 (Acquired 10/01/2013, Cost $509,945) * f | 500,000 | 511,450 | |||||||||||
| 6.500%, 07/15/2016 f | 4,843,000 | 5,157,795 | |||||||||||
| 7.125%, 07/15/2036 f | 1,225,000 | 1,421,000 | |||||||||||
| Lear Corporation, | |||||||||||||
| 5.250%, 01/15/2025 | 20,000,000 | 20,250,000 | |||||||||||
| Marathon Oil Corporation, | |||||||||||||
| 2.800%, 11/01/2022 @ | 10,175,000 | 9,528,867 | |||||||||||
| Marathon Petroleum Corporation: | |||||||||||||
| 3.625%, 09/15/2024 | 2,500,000 | 2,450,008 | |||||||||||
| 4.750%, 09/15/2044 @ | 2,375,000 | 2,242,964 | |||||||||||
| Martin Marietta Materials, Inc.: | |||||||||||||
| 6.600%, 04/15/2018 | 475,000 | 538,478 | |||||||||||
| 6.250%, 05/01/2037 | 450,000 | 476,548 | |||||||||||
| Masco Corporation: | |||||||||||||
| 6.125%, 10/03/2016 | 2,150,000 | 2,280,075 | |||||||||||
| 7.125%, 03/15/2020 | 1,800,000 | 2,079,000 | |||||||||||
| MeadWestvaco Corporation, | |||||||||||||
| 7.375%, 09/01/2019 | 6,650,000 | 7,857,321 | |||||||||||
| Medtronic, Inc.: | |||||||||||||
| 2.500%, 03/15/2020 (Acquired 12/01/2014, Cost $4,994,950) * | 5,000,000 | 5,013,115 | |||||||||||
| 4.375%, 03/15/2035 (Acquired 12/01/2014, Cost $6,938,190) * @ | 7,000,000 | 7,425,992 | |||||||||||
| Murphy Oil Corporation, | |||||||||||||
| 4.000%, 06/01/2022 | 12,600,000 | 11,582,600 | |||||||||||
| Mylan Inc.: | |||||||||||||
| 7.875%, 07/15/2020 (Acquired 07/16/2013, Cost $5,355,348) * | 5,000,000 | 5,325,975 | |||||||||||
| 4.200%, 11/29/2023 @ | 4,525,000 | 4,689,846 | |||||||||||
| Nabors Industries, Inc., | |||||||||||||
| 6.150%, 02/15/2018 | 250,000 | 260,392 | |||||||||||
| National Oilwell Varco, Inc., | |||||||||||||
| Series B, 6.125%, 08/15/2015 | 2,655,000 | 2,656,264 | |||||||||||
| New Cingular Wireless Services, Inc., | |||||||||||||
| 8.750%, 03/01/2031 | 3,050,000 | 4,724,789 | |||||||||||
| Noble Energy, Inc.: | |||||||||||||
| 3.900%, 11/15/2024 @ | 3,000,000 | 2,965,044 | |||||||||||
| 5.050%, 11/15/2044 | 3,000,000 | 2,965,284 | |||||||||||
| Northern Tier Energy LLC / Northern Tier Finance Corp: | |||||||||||||
| 7.125%, 11/15/2020 | 5,000,000 | 5,050,000 | |||||||||||
| 7.125%, 11/15/2020 | 10,935,000 | 11,044,350 | |||||||||||
| NuStar Logistics, L.P.: | |||||||||||||
| 4.800%, 09/01/2020 | 4,275,000 | 4,018,500 | |||||||||||
| 6.750%, 02/01/2021 | 3,000,000 | 3,172,500 | |||||||||||
| Oi S.A., | |||||||||||||
| 5.750%, 02/10/2022 (Acquired 02/06/2012, Cost $3,000,000) * @ f | 3,000,000 | 2,745,000 | |||||||||||
| ONEOK Partners, L.P.: | |||||||||||||
| 3.375%, 10/01/2022 | 9,500,000 | 8,793,789 | |||||||||||
| 5.000%, 09/15/2023 @ | 5,800,000 | 6,059,886 | |||||||||||
| Oracle Corporation, | |||||||||||||
| 3.400%, 07/08/2024 | 8,850,000 | 9,045,337 | |||||||||||
| Orange, | |||||||||||||
| 2.750%, 09/14/2016 f | 1,050,000 | 1,073,002 | |||||||||||
| Owens Corning, | |||||||||||||
| 4.200%, 12/01/2024 @ | 10,000,000 | 9,868,660 | |||||||||||
| Packaging Corporation of America, | |||||||||||||
| 4.500%, 11/01/2023 | 4,700,000 | 4,923,302 | |||||||||||
| Pactiv LLC, | |||||||||||||
| 7.950%, 12/15/2025 | 1,338,000 | 1,344,690 | |||||||||||
| PCCW-HKT Capital No. 3 Limited, | |||||||||||||
| 5.250%, 07/20/2015 (Acquired 09/29/2008 through 12/20/2010, Cost $776,905) * f | 775,000 | 791,199 | |||||||||||
| Pearson Funding Two plc, | |||||||||||||
| 4.000%, 05/17/2016 (Acquired 07/17/2012, Cost $2,803,768) * f | 2,700,000 | 2,806,496 | |||||||||||
| Pentair Finance S.A., | |||||||||||||
| 2.650%, 12/01/2019 f | 5,000,000 | 4,948,540 | |||||||||||
| PepsiCo, Inc., | |||||||||||||
| 4.250%, 10/22/2044 | 2,850,000 | 2,974,397 | |||||||||||
| Petrofac Limited, | |||||||||||||
| 3.400%, 10/10/2018 (Acquired 10/03/2013 through 09/19/2014, Cost $30,947,395) * f | 30,900,000 | 30,483,839 | |||||||||||
| PetroLogistics LP / PetroLogistics Finance Corp., | |||||||||||||
| 6.250%, 04/01/2020 | 2,225,000 | 2,397,438 | |||||||||||
| Phillips 66: | |||||||||||||
| 4.300%, 04/01/2022 | 6,168,000 | 6,511,502 | |||||||||||
| 4.650%, 11/15/2034 | 13,000,000 | 13,324,974 | |||||||||||
| Pioneer Natural Resources Company, | |||||||||||||
| 6.875%, 05/01/2018 | 14,075,000 | 15,755,907 | |||||||||||
| Plum Creek Timberlands, L.P.: | |||||||||||||
| 5.875%, 11/15/2015 | 4,775,000 | 4,960,409 | |||||||||||
| 4.700%, 03/15/2021 | 1,200,000 | 1,301,460 | |||||||||||
| 3.250%, 03/15/2023 | 8,375,000 | 8,231,268 | |||||||||||
| POSCO, | |||||||||||||
| 4.250%, 10/28/2020 (Acquired 10/21/2010, Cost $2,165,365) * f | 2,175,000 | 2,323,424 | |||||||||||
| Qwest Capital Funding, Inc., | |||||||||||||
| 7.625%, 08/03/2021 | 200,000 | 215,500 | |||||||||||
| R.R. Donnelley & Sons Company: | |||||||||||||
| 8.600%, 08/15/2016 | 1,250,000 | 1,368,750 | |||||||||||
| 6.125%, 01/15/2017 | 76,000 | 80,560 | |||||||||||
| Reliance Holding USA, Inc.: | |||||||||||||
| 4.500%, 10/19/2020 (Acquired 10/14/2010 through 10/18/2010, Cost $1,988,700) * | 2,000,000 | 2,089,896 | |||||||||||
| 5.400%, 02/14/2022 (Acquired 02/09/2012 through 02/23/2012, Cost $3,514,333) * @ | 3,500,000 | 3,791,578 | |||||||||||
| Republic Services, Inc.: | |||||||||||||
| 5.500%, 09/15/2019 | 13,000,000 | 14,645,527 | |||||||||||
| 3.550%, 06/01/2022 | 4,000,000 | 4,106,468 | |||||||||||
| 4.750%, 05/15/2023 | 13,459,000 | 14,958,211 | |||||||||||
| Rio Tinto Finance (USA) Limited, | |||||||||||||
| 9.000%, 05/01/2019 @ f | 11,000,000 | 13,916,782 | |||||||||||
| Rockies Express Pipeline LLC: | |||||||||||||
| 3.900%, 04/15/2015 (Acquired 09/15/2011 through 01/08/2013, Cost $2,851,540) * | 2,850,000 | 2,835,750 | |||||||||||
| 6.850%, 07/15/2018 (Acquired 12/21/2011, Cost $2,024,067) * | 2,000,000 | 2,060,000 | |||||||||||
| 5.625%, 04/15/2020 (Acquired 12/10/2010 through 12/29/2011, Cost $2,700,128) * | 2,695,000 | 2,647,838 | |||||||||||
| Rockwood Specialties Group Inc Sr Glbl Nt 20, | |||||||||||||
| 4.625%, 10/15/2020 | 26,454,000 | 27,313,755 | |||||||||||
| SABMiller Holdings Inc., | |||||||||||||
| 0.922%, 08/01/2018 (Acquired 10/16/2014, Cost $15,075,759) * | 15,000,000 | 15,047,520 | |||||||||||
| Samarco Mineracao S.A.: | |||||||||||||
| 5.750%, 10/24/2023 (Acquired 10/21/2013, Cost $5,312,968) * f | 5,475,000 | 5,228,625 | |||||||||||
| 5.375%, 09/26/2024 (Acquired 09/23/2014, Cost $4,835,580) * @ f | 5,125,000 | 4,750,875 | |||||||||||
| Schneider Electric SE, | |||||||||||||
| 2.950%, 09/27/2022 (Acquired 09/20/2012, Cost $4,986,700) * f | 5,000,000 | 5,026,165 | |||||||||||
| Seagate HDD Cayman, | |||||||||||||
| 6.875%, 05/01/2020 f | 10,447,000 | 10,969,350 | |||||||||||
| Sealed Air Corporation, | |||||||||||||
| 8.375%, 09/15/2021 (Acquired 09/16/2011 through 09/19/2011, Cost $2,288,360) * | 2,250,000 | 2,514,375 | |||||||||||
| SK Telecom Co., Ltd., | |||||||||||||
| 6.625%, 07/20/2027 (Acquired 07/13/2007 through 04/30/2013, Cost $996,143) * f | 960,000 | 1,223,261 | |||||||||||
| Sonoco Products Company, | |||||||||||||
| 4.375%, 11/01/2021 | 1,000,000 | 1,065,017 | |||||||||||
| Sprint Capital Corporation: | |||||||||||||
| 6.900%, 05/01/2019 | 675,000 | 688,500 | |||||||||||
| 8.750%, 03/15/2032 | 300,000 | 290,250 | |||||||||||
| Sprint Communications, Inc., | |||||||||||||
| 6.000%, 12/01/2016 | 200,000 | 209,205 | |||||||||||
| Sunoco Logistics Partners Operations L.P.: | |||||||||||||
| 3.450%, 01/15/2023 | 2,000,000 | 1,917,954 | |||||||||||
| 6.100%, 02/15/2042 | 1,000,000 | 1,084,621 | |||||||||||
| Sunoco, Inc., | |||||||||||||
| 5.750%, 01/15/2017 | 701,000 | 757,879 | |||||||||||
| Targa Resources Partners LP, | |||||||||||||
| 4.125%, 11/15/2019 (Acquired 10/23/2014 through 10/27/2014, Cost $7,031,250) * | 7,000,000 | 6,737,500 | |||||||||||
| Telecom Italia Capital: | |||||||||||||
| 5.250%, 10/01/2015 f | 4,250,000 | 4,335,000 | |||||||||||
| 7.200%, 07/18/2036 f | 2,900,000 | 3,117,500 | |||||||||||
| Telecom Italia S.p.A., | |||||||||||||
| 5.303%, 05/30/2024 (Acquired 05/22/2014, Cost $17,142,728) * @ f | 17,000,000 | 17,212,500 | |||||||||||
| Telefonica Emisiones S.A.U.: | |||||||||||||
| 6.421%, 06/20/2016 f | 3,950,000 | 4,225,521 | |||||||||||
| 6.221%, 07/03/2017 f | 8,942,000 | 9,899,661 | |||||||||||
| 5.462%, 02/16/2021 f | 2,402,000 | 2,678,211 | |||||||||||
| 4.570%, 04/27/2023 @ f | 1,000,000 | 1,070,645 | |||||||||||
| 7.045%, 06/20/2036 f | 200,000 | 263,096 | |||||||||||
| The Dow Chemical Company: | |||||||||||||
| 8.550%, 05/15/2019 | 5,000,000 | 6,216,230 | |||||||||||
| 4.125%, 11/15/2021 | 835,000 | 882,267 | |||||||||||
| The Timken Company, | |||||||||||||
| 3.875%, 09/01/2024 (Acquired 08/13/2014, Cost $18,336,205) * | 18,500,000 | 18,471,307 | |||||||||||
| The Williams Companies, Inc.: | |||||||||||||
| 7.875%, 09/01/2021 | 1,335,000 | 1,542,157 | |||||||||||
| 3.700%, 01/15/2023 | 3,000,000 | 2,694,258 | |||||||||||
| Series A, 7.500%, 01/15/2031 | 120,000 | 127,326 | |||||||||||
| 7.750%, 06/15/2031 | 3,500,000 | 3,748,248 | |||||||||||
| 5.750%, 06/24/2044 @ | 2,500,000 | 2,174,643 | |||||||||||
| Thermo Fisher Scientific Inc., | |||||||||||||
| 3.300%, 02/15/2022 @ | 7,000,000 | 7,011,571 | |||||||||||
| Time Warner Cable Inc.: | |||||||||||||
| 8.750%, 02/14/2019 | 1,132,000 | 1,401,250 | |||||||||||
| 8.250%, 04/01/2019 | 35,000 | 42,845 | |||||||||||
| Time Warner Companies, Inc., | |||||||||||||
| 7.250%, 10/15/2017 | 2,300,000 | 2,635,805 | |||||||||||
| Time Warner Inc.: | |||||||||||||
| 7.625%, 04/15/2031 @ | 13,375,000 | 18,646,556 | |||||||||||
| 7.700%, 05/01/2032 | 408,000 | 576,438 | |||||||||||
| Transcontinental Gas Pipe Line Company, LLC, | |||||||||||||
| 4.450%, 08/01/2042 | 2,600,000 | 2,433,119 | |||||||||||
| Transocean Inc.: | |||||||||||||
| 6.500%, 11/15/2020 @ f | 9,500,000 | 8,958,196 | |||||||||||
| 6.375%, 12/15/2021 @ f | 5,500,000 | 5,073,470 | |||||||||||
| 3.800%, 10/15/2022 @ f | 5,000,000 | 4,051,625 | |||||||||||
| 6.800%, 03/15/2038 @ f | 878,000 | 752,364 | |||||||||||
| TSMC Global Ltd, | |||||||||||||
| 1.625%, 04/03/2018 (Acquired 03/27/2013, Cost $2,997,990) * f | 3,000,000 | 2,944,560 | |||||||||||
| Tyco Electronics Group S.A.: | |||||||||||||
| 6.550%, 10/01/2017 f | 5,243,000 | 5,901,673 | |||||||||||
| 7.125%, 10/01/2037 f | 500,000 | 681,566 | |||||||||||
| U.S. Airways Pass Through Trust, | |||||||||||||
| Series 981B, 7.350%, 01/30/2018 | 311,469 | 330,936 | |||||||||||
| United AirLines, Inc. Pass Through Trust, | |||||||||||||
| Series 91A2, 10.020%, 12/31/2014 § † ** | 60,931 | 17,092 | |||||||||||
| Ultramar Diamond Shamrock Corporation, | |||||||||||||
| 7.200%, 10/15/2017 | 7,100,000 | 7,982,594 | |||||||||||
| Vale Overseas Limited: | |||||||||||||
| 6.250%, 01/23/2017 f | 3,850,000 | 4,106,449 | |||||||||||
| 4.375%, 01/11/2022 @ f | 2,700,000 | 2,587,977 | |||||||||||
| 8.250%, 01/17/2034 @ f | 425,000 | 508,614 | |||||||||||
| 6.875%, 11/10/2039 f | 5,625,000 | 5,990,963 | |||||||||||
| Valero Energy Corporation: | |||||||||||||
| 9.375%, 03/15/2019 | 19,606,000 | 24,451,250 | |||||||||||
| 6.625%, 06/15/2037 | 5,000,000 | 5,903,295 | |||||||||||
| Verizon Communications Inc.: | |||||||||||||
| 5.150%, 09/15/2023 | 17,000,000 | 18,771,961 | |||||||||||
| 6.400%, 09/15/2033 @ | 22,675,000 | 27,930,680 | |||||||||||
| Viacom Inc., | |||||||||||||
| 2.750%, 12/15/2019 @ | 10,000,000 | 10,019,830 | |||||||||||
| Vodafone Group Public Limited Company, | |||||||||||||
| 6.150%, 02/27/2037 f | 500,000 | 603,315 | |||||||||||
| Vulcan Materials Company: | |||||||||||||
| 7.000%, 06/15/2018 | 2,435,000 | 2,678,500 | |||||||||||
| 7.150%, 11/30/2037 | 500,000 | 510,000 | |||||||||||
| Walgreen Co., | |||||||||||||
| 5.250%, 01/15/2019 | 10,000,000 | 11,115,870 | |||||||||||
| Walgreens Boots Alliance, Inc., | |||||||||||||
| 3.800%, 11/18/2024 | 10,000,000 | 10,199,000 | |||||||||||
| Wal-Mart Stores, Inc., | |||||||||||||
| 3.300%, 04/22/2024 | 12,000,000 | 12,390,180 | |||||||||||
| Weatherford International Ltd., | |||||||||||||
| 4.500%, 04/15/2022 f | 5,020,000 | 4,467,926 | |||||||||||
| 6.750%, 09/15/2040 f | 1,250,000 | 1,164,356 | |||||||||||
| Western Gas Partners, LP, | |||||||||||||
| 5.375%, 06/01/2021 | 18,000,000 | 19,748,484 | |||||||||||
| Westvaco Corporation: | |||||||||||||
| 9.750%, 06/15/2020 | 930,000 | 1,192,272 | |||||||||||
| 8.200%, 01/15/2030 | 2,790,000 | 3,691,619 | |||||||||||
| Weyerhaeuser Company, | |||||||||||||
| 7.375%, 10/01/2019 | 11,865,000 | 14,155,206 | |||||||||||
| Williams Partners L.P.: | |||||||||||||
| 5.250%, 03/15/2020 @ | 2,000,000 | 2,171,056 | |||||||||||
| 6.300%, 04/15/2040 | 1,590,000 | 1,778,687 | |||||||||||
| WPX Energy, Inc., | |||||||||||||
| 6.000%, 01/15/2022 | 4,000,000 | 3,850,000 | |||||||||||
| Wynn Las Vegas LLC / Wynn Las Vegas Capital Corp., | |||||||||||||
| 4.250%, 05/30/2023 (Acquired 05/15/2013, Cost $4,000,000) * @ | 4,000,000 | 3,800,000 | |||||||||||
| Yara International ASA, | |||||||||||||
| 7.875%, 06/11/2019 (Acquired 12/03/2012 through 10/31/2013, Cost $7,102,981) * f | 5,880,000 | 7,005,614 | |||||||||||
| 1,653,460,883 | 24.6 | % | |||||||||||
| Total Corporate Bonds | 2,961,487,496 | 44.1 | % | ||||||||||
| Other Government Related Securities | |||||||||||||
| Centrais Eletricas Brasileiras SA: | |||||||||||||
| 6.875%, 07/30/2019 (Acquired 12/06/2012, Cost $3,366,904) * f | 3,000,000 | 3,060,000 | |||||||||||
| 5.750%, 10/27/2021 (Acquired 10/20/2011, Cost $4,000,000) * @ f | 4,000,000 | 3,840,000 | |||||||||||
| CNOOC Curtis Funding No.1 Pty Ltd, | |||||||||||||
| 4.500%, 10/03/2023 (Acquired 02/26/2014, Cost $5,038,886) * f | 5,000,000 | 5,255,890 | |||||||||||
| CNOOC Finance 2013 Ltd, | |||||||||||||
| 3.000%, 05/09/2023 f | 2,415,000 | 2,285,573 | |||||||||||
| CNOOC Nexen Finance (2014) ULC, | |||||||||||||
| 4.250%, 04/30/2024 f | 4,450,000 | 4,604,322 | |||||||||||
| CNPC General Capital Ltd, | |||||||||||||
| 2.750%, 05/14/2019 (Acquired 05/07/2014, Cost $1,983,740) * f | 2,000,000 | 1,986,442 | |||||||||||
| CNPC HK Overseas Capital Ltd, | |||||||||||||
| 5.950%, 04/28/2041 (Acquired 04/20/2011, Cost $978,120) * f | 1,000,000 | 1,241,480 | |||||||||||
| Comision Federal de Electricidad, | |||||||||||||
| 5.750%, 02/14/2042 (Acquired 02/08/2012, Cost $5,116,800) * f | 5,200,000 | 5,548,400 | |||||||||||
| Corp Andina de Fomento, | |||||||||||||
| 4.375%, 06/15/2022 f | 3,956,000 | 4,252,134 | |||||||||||
| Eksportfinans ASA, | |||||||||||||
| 2.000%, 09/15/2015 f | 12,213,000 | 12,227,289 | |||||||||||
| Korea Electric Power Corporation, | |||||||||||||
| 6.750%, 08/01/2027 f | 490,000 | 623,541 | |||||||||||
| Korea Expressway Corporation, | |||||||||||||
| 1.625%, 04/28/2017 (Acquired 04/22/2014, Cost $2,643,057) * f | 2,650,000 | 2,635,186 | |||||||||||
| Korea Hydro & Nuclear Power Co., Ltd., | |||||||||||||
| 3.125%, 09/16/2015 (Acquired 09/09/2010, Cost $493,770) * f | 500,000 | 507,352 | |||||||||||
| Nexen Energy ULC, | |||||||||||||
| 7.500%, 07/30/2039 f | 6,175,000 | 8,569,974 | |||||||||||
| Petrobras Global Finance B.V., | |||||||||||||
| 3.000%, 01/15/2019 f | 3,000,000 | 2,652,210 | |||||||||||
| Petrobras International Finance Company S.A.: | |||||||||||||
| 3.875%, 01/27/2016 f | 5,800,000 | 5,691,540 | |||||||||||
| 7.875%, 03/15/2019 f | 5,000,000 | 5,261,850 | �� | ||||||||||
| 5.375%, 01/27/2021 f | 3,200,000 | 2,965,024 | |||||||||||
| Petroleos Mexicanos: | |||||||||||||
| 4.875%, 01/24/2022 f | 6,500,000 | 6,808,165 | |||||||||||
| 4.250%, 01/15/2025 (Acquired 10/06/2014 through 10/24/2014, Cost $15,000,829) * f | 15,000,000 | 14,902,500 | |||||||||||
| 6.500%, 06/02/2041 f | 4,000,000 | 4,590,000 | |||||||||||
| Portigon AG, | |||||||||||||
| 4.796%, 07/15/2015 f | 1,885,000 | 1,921,322 | |||||||||||
| PTT Public Company Limited, | |||||||||||||
| 3.375%, 10/25/2022 (Acquired 10/19/2012, Cost $4,958,500) * f | 5,000,000 | 4,932,630 | |||||||||||
| Sinopec Group Overseas Development [2014] Ltd., | |||||||||||||
| 4.375%, 04/10/2024 (Acquired 04/02/2014, Cost $1,496,505) * f | 1,500,000 | 1,573,412 | |||||||||||
| State Bank of India, | |||||||||||||
| 4.125%, 08/01/2017 (Acquired 07/25/2012, Cost $6,939,800) * f | 7,000,000 | 7,264,180 | |||||||||||
| The Export-Import Bank of Korea: | |||||||||||||
| 5.875%, 01/14/2015 f | 3,500,000 | 3,504,099 | |||||||||||
| 4.000%, 01/29/2021 f | 2,400,000 | 2,566,831 | |||||||||||
| The Korea Development Bank, | |||||||||||||
| 3.000%, 09/14/2022 f | 4,400,000 | 4,419,716 | |||||||||||
| 125,691,062 | 1.9 | % | |||||||||||
| Taxable Municipal Bonds | |||||||||||||
| Bellevue Union School District, | |||||||||||||
| 5.000%, 08/01/2028 | 625,000 | 643,956 | |||||||||||
| California Qualified School Bond Joint Powers Authority: | |||||||||||||
| 6.739%, 09/01/2026 | 2,415,000 | 2,670,338 | |||||||||||
| 7.155%, 03/01/2027 | 1,700,000 | 1,920,575 | |||||||||||
| California School Finance Authority, | |||||||||||||
| 5.041%, 07/01/2020 | 1,500,000 | 1,650,855 | |||||||||||
| Central Valley Support Joint Powers Agency, | |||||||||||||
| 5.676%, 09/01/2024 | 1,500,000 | 1,610,355 | |||||||||||
| Colton Joint Unified School District, | |||||||||||||
| 6.008%, 08/01/2026 | 1,250,000 | 1,431,875 | |||||||||||
| County of Contra Costa CA, | |||||||||||||
| 5.140%, 06/01/2017 | 1,300,000 | 1,376,713 | |||||||||||
| Elgin Local School District, | |||||||||||||
| 5.499%, 08/31/2027 (Callable 12/01/2019) | 1,000,000 | 1,080,810 | |||||||||||
| Government Development Bank for Puerto Rico, | |||||||||||||
| 4.704%, 05/01/2016 | 875,000 | 746,812 | |||||||||||
| Iowa Tobacco Settlement Authority, | |||||||||||||
| 6.500%, 06/01/2023 (Callable 06/01/2015) | 2,810,000 | 2,809,916 | |||||||||||
| New Hampshire Housing Finance Authority: | |||||||||||||
| 3.100%, 07/01/2021 | 1,880,000 | 1,938,788 | |||||||||||
| 3.750%, 07/01/2034 | 7,555,000 | 8,016,308 | |||||||||||
| New Jersey Economic Development Authority, | |||||||||||||
| 1.802%, 06/15/2017 | 15,000,000 | 14,894,850 | |||||||||||
| North Carolina Housing Finance Agency: | |||||||||||||
| 2.870%, 07/01/2032 (Callable 01/01/2024) | 7,000,000 | 7,170,940 | |||||||||||
| 2.812%, 07/01/2035 (Callable 01/01/2024) | 9,430,000 | 9,660,469 | |||||||||||
| North East Independent School District/TX, | |||||||||||||
| 5.240%, 08/01/2027 | 3,000,000 | 3,577,080 | |||||||||||
| Port of Oakland, | |||||||||||||
| 5.000%, 11/01/2020 (Callable 11/01/2017) | 2,900,000 | 3,199,454 | |||||||||||
| Rhode Island Housing & Mortgage Finance Corporation, | |||||||||||||
| 2.913%, 10/01/2039 (Callable 10/01/2023) | 3,500,000 | 3,529,610 | |||||||||||
| San Dieguito Public Facilities Authority, | |||||||||||||
| 6.459%, 05/01/2027 | 1,825,000 | 2,096,633 | |||||||||||
| State of California, | |||||||||||||
| 5.500%, 03/01/2016 | 2,000,000 | 2,112,520 | |||||||||||
| State of Illinois: | |||||||||||||
| 4.421%, 01/01/2015 | 1,600,000 | 1,600,000 | |||||||||||
| 4.961%, 03/01/2016 | 2,000,000 | 2,083,460 | |||||||||||
| 5.163%, 02/01/2018 | 3,000,000 | 3,213,270 | |||||||||||
| State Public School Building Authority, | |||||||||||||
| 5.000%, 09/15/2027 | 1,998,000 | 2,162,655 | |||||||||||
| Three Rivers Local School District, | |||||||||||||
| 5.209%, 09/15/2027 (Callable 12/01/2020) | 1,350,000 | 1,435,482 | |||||||||||
| Town of Davie FL Water & Sewer Revenue, | |||||||||||||
| 6.599%, 10/01/2030 (Callable 10/01/2020) | 1,000,000 | 1,174,050 | |||||||||||
| West Contra Costa Unified School District, | |||||||||||||
| 6.250%, 08/01/2030 | 4,320,000 | 5,228,626 | |||||||||||
| Westlake City School District, | |||||||||||||
| 5.227%, 12/01/2026 (Callable 12/01/2020) | 1,160,000 | 1,210,182 | |||||||||||
| 90,246,582 | 1.3 | % | |||||||||||
| Residential Mortgage-Backed Securities | |||||||||||||
| U.S. Government Agency Issues | |||||||||||||
| Federal Gold Loan Mortgage Corporation (FGLMC): | |||||||||||||
| 5.000%, 12/01/2020 | 63,436 | 67,585 | |||||||||||
| 5.000%, 05/01/2021 | 117,575 | 125,257 | |||||||||||
| 6.000%, 06/01/2021 | 22,839 | 25,021 | |||||||||||
| 3.000%, 05/01/2027 | 11,749,673 | 12,226,498 | |||||||||||
| 6.500%, 12/01/2028 | 35,075 | 40,624 | |||||||||||
| 6.500%, 06/01/2029 | 14,782 | 17,297 | |||||||||||
| 5.000%, 03/01/2036 | 10,318,270 | 11,413,420 | |||||||||||
| 5.500%, 04/01/2037 | 326,336 | 365,315 | |||||||||||
| 5.500%, 04/01/2038 | 187,093 | 209,300 | |||||||||||
| 5.500%, 05/01/2038 | 379,531 | 424,840 | |||||||||||
| 4.500%, 11/01/2039 | 6,027,265 | 6,534,634 | |||||||||||
| 4.500%, 11/01/2039 | 1,933,678 | 2,096,261 | |||||||||||
| 4.500%, 08/01/2040 | 6,101,891 | 6,619,837 | |||||||||||
| 4.500%, 08/01/2040 | 8,694,766 | 9,433,308 | |||||||||||
| 3.500%, 06/01/2042 | 12,545,971 | 13,065,618 | |||||||||||
| 3.500%, 07/01/2042 | 44,208,857 | 46,036,064 | |||||||||||
| 3.000%, 08/01/2042 | 35,165,351 | 35,596,428 | |||||||||||
| 3.000%, 02/01/2043 | 11,164,060 | 11,299,918 | |||||||||||
| 3.000%, 06/01/2043 | 18,522,868 | 18,740,197 | |||||||||||
| 3.000%, 08/01/2043 | 28,123,864 | 28,448,937 | |||||||||||
| 3.500%, 07/01/2044 | 34,504,440 | 35,915,101 | |||||||||||
| 3.500%, 08/01/2044 | 57,289,724 | 59,631,925 | |||||||||||
| 4.000%, 09/01/2044 | 72,146,397 | 76,997,565 | |||||||||||
| 4.000%, 10/01/2044 | 41,875,737 | 44,882,024 | |||||||||||
| Federal Home Loan Mortgage Corporation (FHLMC): | |||||||||||||
| Series 1053, Class G, 7.000%, 03/15/2021 | 3,609 | 4,105 | |||||||||||
| Series 136, Class E, 6.000%, 04/15/2021 | 7,226 | 7,685 | |||||||||||
| Series 2804, Class VC, 5.000%, 07/15/2021 | 145,333 | 153,215 | |||||||||||
| Series 1122, Class G, 7.000%, 08/15/2021 | 8,541 | 9,287 | |||||||||||
| Series 1186, Class I, 7.000%, 12/15/2021 | 17,079 | 19,164 | |||||||||||
| Federal National Mortgage Association (FNMA): | |||||||||||||
| Series 1989-94, Class G, 7.500%, 12/25/2019 | 4,362 | 4,730 | |||||||||||
| Series 1990-15, Class J, 7.000%, 02/25/2020 | 13,220 | 14,132 | |||||||||||
| Series 1991-21, Class J, 7.000%, 03/25/2021 | 2,970 | 3,252 | |||||||||||
| Series 1991-43, Class J, 7.000%, 05/25/2021 | 58,545 | 64,650 | |||||||||||
| Series 1991-65, Class Z, 6.500%, 06/25/2021 | 52,466 | 55,797 | |||||||||||
| 5.000%, 11/01/2021 | 438,470 | 470,897 | |||||||||||
| Series 1992-129, Class L, 6.000%, 07/25/2022 | 104,916 | 113,498 | |||||||||||
| 5.500%, 03/01/2023 | 252,211 | 281,828 | |||||||||||
| Series 1993-32, Class H, 6.000%, 03/25/2023 | 23,651 | 25,656 | |||||||||||
| Series 1993-58, Class H, 5.500%, 04/25/2023 | 118,302 | 129,433 | |||||||||||
| 5.500%, 07/01/2023 | 122,280 | 136,645 | |||||||||||
| 5.500%, 12/01/2023 | 177,034 | 197,933 | |||||||||||
| 6.000%, 03/01/2026 | 38,551 | 43,647 | |||||||||||
| 5.000%, 06/01/2026 | 9,352,732 | 10,139,422 | |||||||||||
| 3.000%, 04/01/2027 | 21,961,457 | 22,886,552 | |||||||||||
| 2.500%, 12/01/2027 | 31,745,931 | 32,408,897 | |||||||||||
| 5.000%, 05/01/2028 | 106,686 | 117,785 | |||||||||||
| 6.500%, 09/01/2028 | 27,899 | 32,402 | |||||||||||
| 6.500%, 02/01/2029 | 56,288 | 64,283 | |||||||||||
| 4.500%, 07/01/2030 | 11,481,362 | 12,536,692 | |||||||||||
| 4.000%, 11/01/2031 | 11,177,160 | 12,051,764 | |||||||||||
| 5.500%, 01/01/2032 | 23,516 | 26,490 | |||||||||||
| 4.000%, 01/01/2034 | 28,112,674 | 30,272,328 | |||||||||||
| 5.500%, 04/01/2034 | 1,754,666 | 1,976,279 | |||||||||||
| 5.500%, 04/01/2034 | 1,827,856 | 2,059,691 | |||||||||||
| Series 2004-90, Class LH, 5.000%, 04/25/2034 | 2,995,056 | 3,098,149 | |||||||||||
| Series 2004-W6, Class 1A6, 5.500%, 07/25/2034 | 171,500 | 175,964 | |||||||||||
| Series 2004-W6, Class 1A4, 5.500%, 07/25/2034 | 63,102 | 63,390 | |||||||||||
| 4.000%, 09/01/2034 | 37,297,332 | 40,129,943 | |||||||||||
| 5.500%, 09/01/2034 | 57,030 | 64,172 | |||||||||||
| 5.500%, 02/01/2035 | 28,175 | 31,656 | |||||||||||
| 5.000%, 04/01/2035 | 3,295,831 | 3,650,608 | |||||||||||
| 5.000%, 07/01/2035 | 9,669,212 | 10,706,400 | |||||||||||
| 5.000%, 02/01/2036 | 6,212,854 | 6,875,351 | |||||||||||
| 5.000%, 03/01/2036 | 2,023,368 | 2,236,573 | |||||||||||
| 5.500%, 04/01/2036 | 9,449,607 | 10,564,674 | |||||||||||
| 6.000%, 08/01/2037 | 133,197 | 145,973 | |||||||||||
| 6.000%, 05/01/2038 | 17,167,700 | 19,481,116 | |||||||||||
| 4.500%, 06/01/2039 | 18,178,677 | 19,769,166 | |||||||||||
| 5.000%, 06/01/2040 | 39,901,521 | 44,126,679 | |||||||||||
| 4.000%, 08/01/2040 | 2,618,036 | 2,799,221 | |||||||||||
| 4.500%, 08/01/2040 | 12,898,278 | 14,029,355 | |||||||||||
| 4.000%, 10/01/2040 | 1,781,732 | 1,903,988 | |||||||||||
| 4.000%, 12/01/2040 | 6,865,499 | 7,404,613 | |||||||||||
| 3.500%, 01/01/2041 | 4,048,050 | 4,229,046 | |||||||||||
| 4.000%, 01/01/2041 | 9,361,576 | 10,002,986 | |||||||||||
| 3.500%, 02/01/2041 | 4,409,004 | 4,603,991 | |||||||||||
| 3.500%, 03/01/2041 | 21,630,571 | 22,587,457 | |||||||||||
| 4.500%, 07/01/2041 | 17,112,963 | 18,594,623 | |||||||||||
| 4.000%, 09/01/2041 | 8,262,190 | 8,828,275 | |||||||||||
| 3.500%, 11/01/2041 | 38,370,981 | 40,077,932 | |||||||||||
| 4.000%, 12/01/2041 | 34,948,428 | 37,342,923 | |||||||||||
| 4.500%, 01/01/2042 | 28,557,672 | 31,069,943 | |||||||||||
| 3.000%, 05/01/2042 | 5,862,503 | 5,942,532 | |||||||||||
| 3.500%, 06/01/2042 | 12,920,850 | 13,487,450 | |||||||||||
| 3.000%, 03/01/2043 | 11,153,385 | 11,302,404 | |||||||||||
| 3.000%, 05/01/2043 | 47,027,453 | 47,643,830 | |||||||||||
| 3.000%, 06/01/2043 | 47,771,468 | 48,394,070 | |||||||||||
| Government National Mortgage Association (GNMA): | |||||||||||||
| 6.000%, 12/20/2028 | 37,104 | 41,958 | |||||||||||
| 6.500%, 01/20/2029 | 17,814 | 20,828 | |||||||||||
| 6.000%, 11/20/2033 | 28,060 | 32,276 | |||||||||||
| 4.500%, 05/20/2040 | 4,257,324 | 4,680,080 | |||||||||||
| 4.500%, 07/20/2040 | 23,755,343 | 26,101,668 | |||||||||||
| 5.000%, 07/20/2040 | 1,855,753 | 2,071,125 | |||||||||||
| 4.500%, 01/20/2041 | 16,674,297 | 18,309,560 | |||||||||||
| 4.000%, 06/20/2042 | 33,552,983 | 36,010,972 | |||||||||||
| 3.500%, 09/20/2042 | 18,516,447 | 19,467,710 | |||||||||||
| 4.000%, 09/20/2044 | 49,171,576 | 52,820,348 | |||||||||||
| 1,197,442,091 | 17.8 | % | |||||||||||
| Non-U.S. Government Agency Issues | |||||||||||||
| Alternative Loan Trust: | |||||||||||||
| Series 2005-3CB, Class 2A1, 5.000%, 03/25/2020 | 2,423,179 | 2,453,893 | |||||||||||
| Series 2005-50CB, Class 4A1, 5.000%, 11/25/2020 § | 594,536 | 594,038 | |||||||||||
| Series 2006-7CB, Class 3A1, 5.250%, 05/25/2021 § | 656,090 | 636,279 | |||||||||||
| Series 2006-43CB, Class 2A1, 6.000%, 02/25/2022 § | 253,018 | 271,193 | |||||||||||
| Series 2004-18CB, Class 1A1, 6.000%, 09/25/2034 | 13,588,132 | 14,288,097 | |||||||||||
| Series 2005-73CB, Class 1A7, 5.500%, 01/25/2036 § | 776,931 | 731,576 | |||||||||||
| Series 2006-28CB, Class A17, 6.000%, 10/25/2036 § | 930,018 | 771,239 | |||||||||||
| Banc of America Alternative Loan Trust: | |||||||||||||
| Series 2004-6, Class 4A1, 5.000%, 07/25/2019 | 6,434,321 | 6,625,298 | |||||||||||
| Series 2004-1, Class 5A2, 5.500%, 02/25/2019 | 946,863 | 977,771 | |||||||||||
| Series 2004-2, Class 5A1, 5.500%, 03/25/2019 | 205,764 | 210,058 | |||||||||||
| Series 2004-8, Class 3A1, 5.500%, 09/25/2019 | 1,247,539 | 1,299,332 | |||||||||||
| Series 2005-2, Class 4A1, 5.500%, 03/25/2020 | 817,468 | 843,310 | |||||||||||
| Series 2005-4, Class 3A1, 5.500%, 05/25/2020 | 674,471 | 683,379 | |||||||||||
| Series 2005-8, Class 5A1, 5.500%, 09/25/2020 | 170,191 | 172,086 | |||||||||||
| Series 2006-2, Class 6A1, 5.500%, 03/25/2021 | 167,490 | 172,038 | |||||||||||
| Series 2007-1, Class 1A1, 5.875%, 04/25/2022 | 695,131 | 697,316 | |||||||||||
| Series 2004-2, Class 1A1, 6.000%, 03/25/2034 | 4,277,123 | 4,473,396 | |||||||||||
| Series 2005-2, Class 1CB2, 5.500%, 03/25/2035 § | 1,977,258 | 1,831,020 | |||||||||||
| Series 2005-9, Class 2CB1, 6.000%, 10/25/2035 § | 13,534,342 | 13,022,013 | |||||||||||
| Series 2006-3, Class 6A1, 6.000%, 04/25/2036 | 241,349 | 248,155 | |||||||||||
| Series 2007-C, Class 1A3, 5.293%, 05/20/2036 | 7,683,255 | 7,409,116 | |||||||||||
| Series 2006-5, Class CB7, 6.000%, 06/25/2046 § | 418,036 | 341,785 | |||||||||||
| Banc of America Mortgage Trust, | |||||||||||||
| Series 2003-L, Class 2A1, 2.775%, 01/25/2034 | 5,244,365 | 5,253,469 | |||||||||||
| Chase Mortgage Finance Trust: | |||||||||||||
| Series 2006-A1, Class 2A3, 2.515%, 09/25/2036 § | 604,276 | 534,497 | |||||||||||
| Series 2007-A1, Class 2A3, 2.465%, 02/25/2037 | 5,147,179 | 5,146,973 | |||||||||||
| CHL Mortgage Pass-Through Trust, | |||||||||||||
| Series 2005-6, Class 2A1, 5.500%, 04/25/2035 | 1,228,175 | 1,153,963 | |||||||||||
| Citicorp Mortgage Securities Trust, | |||||||||||||
| Series 2007-2, Class 1A3, 6.000%, 02/25/2037 | 2,670,540 | 2,728,931 | |||||||||||
| Citicorp Residential Mortgage Trust, | |||||||||||||
| Series 2007-1, Class A6, 5.702%, 03/25/2037 | 520,953 | 540,609 | |||||||||||
| Citigroup Mortgage Loan Trust, Inc., | |||||||||||||
| Series 2005-9, Class 2A2, 5.500%, 11/25/2035 § | 160,144 | 158,904 | |||||||||||
| Citigroup Mortgage Loan Trust. Inc.: | |||||||||||||
| Series 2006-AR1, Class 1A1, 2.500%, 10/25/2035 | 13,789,570 | 13,673,724 | |||||||||||
| Series 2005-9, Class 22A2, 6.000%, 11/25/2035 | 8,100,117 | 7,694,188 | |||||||||||
| Credit Suisse First Boston Mortgage Securities Corp., | |||||||||||||
| Series 2005-7, Class 3A1, 5.000%, 08/25/2020 | 578,422 | 577,854 | |||||||||||
| Deutsche Alt-A Securities Inc Mortgage Loan Trust, | |||||||||||||
| Series 2005-3, Class 4A5, 5.250%, 06/25/2035 | 3,105,233 | 3,166,835 | |||||||||||
| Deutsche Alt-A Securities Mortgage Loan Trust, | |||||||||||||
| Series 2006-AR5, Class 21A, 6.000%, 10/25/2021 § | 459,826 | 399,696 | |||||||||||
| First Frankin Mortgage Loan Trust, | |||||||||||||
| Series 2006-FF3, Class A2B, 0.570%, 02/25/2036 | 21,582,632 | 20,745,247 | |||||||||||
| First Horizon Alternative Mortgage Securities Trust: | |||||||||||||
| Series 2006-FA6, Class 3A1, 5.750%, 11/25/2021 | 228,815 | 227,064 | |||||||||||
| Series 2005-AA2, Class 2A1, 2.248%, 04/25/2035 | 5,805,726 | 5,690,093 | |||||||||||
| Series 2006-FA8, Class 2A1, 5.750%, 02/25/2037 § | 851,749 | 738,877 | |||||||||||
| GSR Mortgage Loan Trust: | |||||||||||||
| Series 2004-15F, Class 5A1, 5.500%, 01/25/2020 | 1,410,979 | 1,446,769 | |||||||||||
| Series 2005-3F, Class 2A4, 6.000%, 03/25/2035 | 7,656,180 | 7,899,608 | |||||||||||
| J.P. Morgan Alternative Loan Trust: | |||||||||||||
| Series 2005-S1, Class 3A1, 5.500%, 10/25/2020 | 2,669,822 | 2,654,046 | |||||||||||
| Series 2006-A1, Class 2A1, 2.584%, 03/25/2036 § | 167,395 | 136,508 | |||||||||||
| Series 2006-S3, Class A3A, 6.000%, 08/25/2036 § | 200,225 | 189,841 | |||||||||||
| J.P. Morgan Mortgage Trust: | |||||||||||||
| Series 2006-S3, Class 2A3, 5.000%, 08/25/2021 § | 412,381 | 410,833 | |||||||||||
| Series 2006-A2, Class 2A1, 2.609%, 04/25/2036 § | 3,688,295 | 3,381,174 | |||||||||||
| Series 2006-A2, Class 3A3, 5.076%, 04/25/2036 § | 4,427,649 | 4,155,247 | |||||||||||
| Series 2006-A7, Class 2A2, 2.695%, 01/25/2037 § | 5,409,206 | 4,938,302 | |||||||||||
| Series 2006-A7, Class 2A4R, 2.695%, 01/25/2037 § | 4,018,566 | 3,637,357 | |||||||||||
| Series 2007-A2, Class 2A3, 2.539%, 04/25/2037 | 10,562,454 | 9,459,914 | |||||||||||
| Series 2007-A4, Class 2A3, 2.801%, 06/25/2037 § | 11,943,132 | 10,929,327 | |||||||||||
| MASTR Alternative Loan Trust: | |||||||||||||
| Series 2004-1, Class 1A1, 5.000%, 01/25/2019 | 154,455 | 156,920 | |||||||||||
| Series 2004-5, Class 4A1, 5.500%, 07/25/2019 | 454,858 | 473,183 | |||||||||||
| Series 2005-3, Class 4A1, 5.500%, 03/25/2020 | 913,143 | 946,901 | |||||||||||
| Series 2003-5, Class 6A1, 6.000%, 08/25/2033 | 67,084 | 71,485 | |||||||||||
| Series 2004-2, Class 2A1, 6.000%, 02/25/2034 | 6,141,370 | 6,703,109 | |||||||||||
| Series 2004-8, Class 2A1, 6.000%, 09/25/2034 | 5,290,371 | 5,416,213 | |||||||||||
| Series 2005-6, Class 1A5, 5.500%, 12/25/2035 | 6,121,743 | 5,465,082 | |||||||||||
| Merrill Lynch Mortgage Investors Trust, | |||||||||||||
| Series 2004-F, Class A1B, 0.790%, 12/25/2029 | 20,118,658 | 19,384,146 | |||||||||||
| RALI Trust: | |||||||||||||
| Series 2004-QS3, Class CB, 5.000%, 03/25/2019 | 1,681,893 | 1,724,509 | |||||||||||
| Series 2004-QS13, Class CB, 5.000%, 09/25/2019 | 1,454,192 | 1,484,972 | |||||||||||
| Series 2004-QS5, Class A5, 4.750%, 04/25/2034 | 7,330 | 7,507 | |||||||||||
| Series 2004-QS16, Class 1A1, 5.500%, 12/25/2034 | 4,537,480 | 4,630,807 | |||||||||||
| Series 2005-QS2, Class A1, 5.500%, 02/25/2035 | 510,132 | 504,788 | |||||||||||
| Series 2005-QS5, Class A1, 0.570%, 04/25/2035 § | 5,112,311 | 3,869,191 | |||||||||||
| Series 2005-QS9, Class A2, 0.670%, 06/25/2035 § | 2,551,762 | 2,056,080 | |||||||||||
| Series 2005-QS11, Class A2, 0.670%, 07/25/2035 | 9,049,223 | 7,655,516 | |||||||||||
| Sequoia Mortgage Trust, | |||||||||||||
| Series 2013-6, Class A2, 3.000%, 05/25/2043 | 18,334,620 | 17,950,730 | |||||||||||
| Structured Asset Securities Corp., | |||||||||||||
| Series 2003-31A, Class 2A7, 2.437%, 10/25/2033 | 3,802,443 | 3,743,718 | |||||||||||
| Structured Asset Securities Corp. Mortgage Loan Trust, | |||||||||||||
| Series 2005-7XS, Class 1A4B, 5.440%, 04/25/2035 | 534,781 | 563,334 | |||||||||||
| WaMu Mortgage Pass-Through Certificates: | |||||||||||||
| Series 2004-CB1, Class 5A, 5.000%, 06/25/2019 | 68,700 | 70,481 | |||||||||||
| Series 2004-CB2, Class 5A, 5.000%, 07/25/2019 | 62,583 | 63,918 | |||||||||||
| Series 2004-CB2, Class 7A, 5.500%, 08/25/2019 | 141,997 | 146,150 | |||||||||||
| Series 2004-CB3, Class 4A, 6.000%, 10/25/2019 | 41,260 | 43,311 | |||||||||||
| Series 2004-CB4, Class 22A, 6.000%, 12/25/2019 | 203,220 | 212,240 | |||||||||||
| Series 2004-CB3, Class 1A, 6.000%, 10/25/2034 | 10,152,690 | 10,810,300 | |||||||||||
| Series 2004-CB3, Class 2A, 6.500%, 10/25/2034 | 7,837,780 | 8,559,867 | |||||||||||
| Series 2005-3, Class 1CB3, 0.620%, 05/25/2035 | 12,275,863 | 9,826,878 | |||||||||||
| Wells Fargo Alternative Loan Trust, | |||||||||||||
| Series 2007-PA1, Class A4, 6.000%, 03/25/2037 § | 118,274 | 101,104 | |||||||||||
| Wells Fargo Mortgage Backed Securities: | |||||||||||||
| Series 2005-AR16, Class 4A2, 2.609%, 10/25/2035 | 8,437,707 | 8,466,639 | |||||||||||
| Series 2006-AR14, Class 2A3, 2.617%, 10/25/2036 § | 7,423,908 | 6,980,886 | |||||||||||
| Wfrbs Coml Mtg Tr 2014-c24, | |||||||||||||
| Series 2014-C24, Class A5, 3.607%, 11/15/2047 | 20,000,000 | 20,834,580 | |||||||||||
| 325,346,783 | 4.8 | % | |||||||||||
| Asset Backed Securities | |||||||||||||
| ABFC Trust, | |||||||||||||
| Series 2006-OPT1, Class A3C2, 0.320%, 09/25/2036 | 13,981,467 | 12,060,777 | |||||||||||
| Accredited Mortgage Loan Trust, | |||||||||||||
| Series 2005-4, Class A2D, 0.490%, 12/25/2035 | 16,015,065 | 15,227,700 | |||||||||||
| ACE Securities Corp Home Equity Loan Trust, | |||||||||||||
| Series 2006-OP1, Class A2C, 0.320%, 04/25/2036 | 18,915,809 | 17,855,748 | |||||||||||
| AMRESCO Residential Securities Corp Mortgage Loan Trust, | |||||||||||||
| Series 1998-2, Class A6, 6.405%, 12/25/2027 | 4,331 | 4,233 | |||||||||||
| Banc of America Funding Trust, | |||||||||||||
| Series 2005-C, Class A1, 0.405%, 05/20/2035 | 18,893,827 | 17,449,470 | |||||||||||
| Bayview Financial Acquisition Trust, | |||||||||||||
| Series 2007-A, Class 1A2, 6.205%, 05/28/2037 | 800,779 | 847,713 | |||||||||||
| Bayview Financial Mortgage Pass-Through Trust, | |||||||||||||
| Series 2007-B, Class 1A2, 6.831%, 08/28/2047 | 150,000 | 123,700 | |||||||||||
| Bear Stearns Asset Backed Securities I Trust, | |||||||||||||
| Series 2007-HE4, Class 1A1, 0.290%, 05/25/2037 § | 622,366 | 821,554 | |||||||||||
| Carrington Mortgage Loan Trust: | |||||||||||||
| Series 2006-NC1, Class A3, 0.380%, 01/25/2036 | 9,613,202 | 9,196,402 | |||||||||||
| Series 2006-OPT1, Class A3, 0.350%, 02/25/2036 | 12,263,663 | 11,885,894 | |||||||||||
| Series 2006-NC2, Class A2, 0.260%, 06/25/2036 | 6,552,942 | 6,447,702 | |||||||||||
| Series 2007-FRE1, Class A2, 0.370%, 02/25/2037 | 45,098,518 | 41,230,328 | |||||||||||
| Series 2007-HE1, Class A1, 0.270%, 06/25/2037 | 733,669 | 726,682 | |||||||||||
| Citibank Credit Card Issuance Trust, | |||||||||||||
| Series 2007-A3, Class A3, 6.150%, 06/15/2039 | 6,100,000 | 8,175,470 | |||||||||||
| Citicorp Residential Mortgage Trust, | |||||||||||||
| Series 2006-3, Class A4, 5.703%, 11/25/2036 | 4,681,871 | 4,901,067 | |||||||||||
| Citigroup Mortgage Loan Trust, Inc., | |||||||||||||
| Series 2007-WFH1, Class A3, 0.320%, 01/25/2037 | 6,861,363 | 6,735,875 | |||||||||||
| Citigroup Mortgage Loan Trust. Inc., | |||||||||||||
| Series 2006-WFH3, Class A3, 0.320%, 10/25/2036 | 752,100 | 750,596 | |||||||||||
| Conseco Financial Corp.: | |||||||||||||
| Series 1993-4, Class A5, 7.050%, 01/15/2019 | 3,620 | 3,718 | |||||||||||
| Series 1997-1, Class A5, 6.860%, 03/15/2028 | 405 | 406 | |||||||||||
| Series 1997-4, Class A5, 6.880%, 02/15/2029 | 10,968 | 11,242 | |||||||||||
| Series 1997-5, Class A6, 6.820%, 05/15/2029 | 36,969 | 37,145 | |||||||||||
| Series 1998-3, Class A5, 6.220%, 03/01/2030 | 388,004 | 410,584 | |||||||||||
| Series 1998-4, Class A5, 6.180%, 04/01/2030 | 170,555 | 174,912 | |||||||||||
| Countrywide Asset-Backed Certificates: | |||||||||||||
| Series 2005-1, Class AF4, 5.147%, 02/25/2033 | 649,410 | 653,651 | |||||||||||
| Series 2004-12, Class AF6, 4.634%, 03/25/2035 | 454,450 | 461,080 | |||||||||||
| Series 2004-15, Class AF6, 4.613%, 04/25/2035 | 414,230 | 416,668 | |||||||||||
| Series 2005-7, Class AF6, 4.693%, 10/25/2035 | 1,264,068 | 1,257,798 | |||||||||||
| Series 2005-11, Class AF3, 4.778%, 02/25/2036 | 1,361,262 | 1,382,570 | |||||||||||
| Series 2005-10, Class AF6, 4.835%, 02/25/2036 | 3,023,457 | 2,992,524 | |||||||||||
| Series 2005-13, Class 3AV3, 0.405%, 04/25/2036 | 3,452,713 | 3,418,097 | |||||||||||
| Series 2005-13, Class AF3, 5.000%, 04/25/2036 | 1,382,654 | 1,165,899 | |||||||||||
| Series 2006-S9, Class A3, 5.728%, 08/25/2036 | 145,278 | 143,051 | |||||||||||
| Series 2006-13, Class 1AF3, 4.896%, 01/25/2037 § | 151,211 | 183,031 | |||||||||||
| Series 2006-10, Class 1AF3, 4.933%, 09/25/2046 § | 1,253,490 | 959,985 | |||||||||||
| Series 2006-9, Class 1AF3, 5.297%, 10/25/2046 § | 521,114 | 406,524 | |||||||||||
| Series 2007-4, Class A3, 5.628%, 04/25/2047 § | 527,844 | 433,668 | |||||||||||
| Credit-Based Asset Servicing and Securitization LLC, | |||||||||||||
| Series 2005-CB8, Class AF2, 4.184%, 12/25/2035 | 1,545,296 | 1,531,585 | |||||||||||
| CWHEQ Home Equity Loan Trust, | |||||||||||||
| Series 2007-S1, Class A6, 5.693%, 11/25/2036 | 72,022 | 69,331 | |||||||||||
| GE Capital Mortgage Services Inc. Trust, | |||||||||||||
| Series 1999-HE1, Class A7, 6.265%, 04/25/2029 | 1,541 | 1,554 | |||||||||||
| GSAA Home Equity Trust, | |||||||||||||
| Series 2004-6, Class A1, 0.970%, 06/25/2034 | 5,542,342 | 5,405,192 | |||||||||||
| Home Equity Asset Trust, | |||||||||||||
| Series 2006-4, Class 2A3, 0.340%, 08/25/2036 | 974,207 | 956,219 | |||||||||||
| HSI Asset Securitization Corp Trust: | |||||||||||||
| Series 2006-OPT4, Class 2A3, 0.330%, 03/25/2036 | 6,912,392 | 6,368,601 | |||||||||||
| Series 2007-WF1, Class 2A3, 0.340%, 05/25/2037 | 6,113,521 | 5,912,716 | |||||||||||
| J.P. Morgan Mortgage Acquisition Trust: | |||||||||||||
| Series 2007-CH1, Class AV5, 0.395%, 11/25/2036 | 10,000,000 | 9,585,680 | |||||||||||
| Series 2007-CH3, Class A3, 0.320%, 03/25/2037 | 13,751,210 | 13,558,927 | |||||||||||
| Long Beach Mortgage Loan Trust, | |||||||||||||
| Series 2006-WL2, Class 2A3, 0.370%, 01/25/2036 | 2,754,381 | 2,672,271 | |||||||||||
| Luminent Mortgage Trust, | |||||||||||||
| Series 2005-1, Class A1, 0.430%, 11/25/2035 | 19,724,349 | 17,742,821 | |||||||||||
| MASTR Asset Backed Securities Trust, | |||||||||||||
| Series 2006-NC1, Class A4, 0.470%, 01/25/2036 | 7,175,000 | 6,877,324 | |||||||||||
| Morgan Stanley Capital I Inc. Trust: | |||||||||||||
| Series 2006-HE1, Class A3, 0.350%, 01/25/2036 | 2,930,527 | 2,911,637 | |||||||||||
| Series 2006-NC2, Class A2C, 0.350%, 02/25/2036 | 516,069 | 513,980 | |||||||||||
| Morgan Stanley Home Equity Loan Trust, | |||||||||||||
| Series 2006-2, Class A3, 0.340%, 02/25/2036 | 5,370,309 | 5,329,935 | |||||||||||
| MortgageIT Trust, | |||||||||||||
| Series 2005-5, Class A1, 0.430%, 12/25/2035 | 11,247,777 | 10,317,744 | |||||||||||
| Nationstar Home Equity Loan Trust: | |||||||||||||
| Series 2006-B, Class AV3, 0.340%, 09/25/2036 | 3,846,619 | 3,838,684 | |||||||||||
| Series 2007-C, Class 2AV2, 0.300%, 06/25/2037 | 20,882,054 | 20,013,862 | |||||||||||
| Oakwood Mortgage Investors, Inc., | |||||||||||||
| Series 1999-B, Class A3, 6.450%, 11/15/2017 | 25,455 | 26,092 | |||||||||||
| Option One Mortgage Loan Trust, | |||||||||||||
| Series 2005-4, Class A3, 0.430%, 11/25/2035 | 481,366 | 474,903 | |||||||||||
| RAMP Trust: | |||||||||||||
| Series 2002-RS3, Class AI5, 5.572%, 06/25/2032 | 2,910,447 | 2,885,682 | |||||||||||
| Series 2003-RS10, Class AI7, 4.850%, 11/25/2033 | 27,383 | 27,540 | |||||||||||
| Series 2004-RS4, Class AI6, 5.072%, 04/25/2034 | 1,974,649 | 2,019,147 | |||||||||||
| RASC Series Trust, | |||||||||||||
| Series 2006-EMX2, Class A2, 0.370%, 02/25/2036 | 8,492,271 | 8,366,075 | |||||||||||
| RASC Series Trust, | |||||||||||||
| Series 2003-KS5, Class AI6, 3.620%, 07/25/2033 | 44,944 | 43,640 | |||||||||||
| RASC Trust, | |||||||||||||
| Series 2003-KS9, Class AI6, 4.710%, 11/25/2033 | 80,562 | 77,679 | |||||||||||
| Renaissance Home Equity Loan Trust: | |||||||||||||
| Series 2005-1, Class AF6, 4.970%, 05/25/2035 | 122,578 | 124,366 | |||||||||||
| Series 2005-3, Class AF3, 4.814%, 11/25/2035 | 1,768,809 | 1,791,573 | |||||||||||
| Series 2006-2, Class AF3, 5.797%, 08/25/2036 | 16,479,123 | 10,562,722 | |||||||||||
| Series 2006-3, Class AF2, 5.580%, 11/25/2036 | 10,921,352 | 6,732,806 | |||||||||||
| Series 2007-1, Class AF2, 5.512%, 04/25/2037 | 486,104 | 255,700 | |||||||||||
| Series 2007-1, Class AF3, 5.612%, 04/25/2037 | 291,663 | 156,213 | |||||||||||
| Series 2007-2, Class AF2, 5.675%, 06/25/2037 | 1,473,962 | 766,842 | |||||||||||
| Soundview Home Loan Trust: | |||||||||||||
| Series 2005-OPT4, Class 2A3, 0.690%, 12/25/2035 | 12,083,175 | 11,875,973 | |||||||||||
| Series 2006-OPT4, Class 2A3, 0.320%, 06/25/2036 | 7,483,857 | 6,925,838 | |||||||||||
| Series 2006-OPT5, Class 2A3, 0.320%, 07/25/2036 | 20,123,219 | 17,436,065 | |||||||||||
| Specialty Underwriting & Residential Finance Trust, | |||||||||||||
| Series 2004-BC4, Class A1A, 0.840%, 10/25/2035 | 4,240,382 | 4,125,365 | |||||||||||
| Springleaf Mortgage Loan Trust, | |||||||||||||
| Series 2012-2A, Class A, 2.220%, 10/25/2057 (Acquired 07/31/2012, Cost $2,743,838) * | 2,744,149 | 2,780,945 | |||||||||||
| 360,016,693 | 5.4 | % | |||||||||||
| Commercial Mortgage Backed Securities | |||||||||||||
| Bear Stearns Commercial Mortgage Securities Trust, | |||||||||||||
| Series 2005-PWR9, Class A4A, 4.871%, 09/11/2042 | 15,593,186 | 15,817,727 | |||||||||||
| CD Commercial Mortgage Trust, | |||||||||||||
| Series 2005-CD1, Class A4, 5.226%, 07/15/2044 | 17,619,769 | 17,904,470 | |||||||||||
| Citigroup Commercial Mortgage Trust, | |||||||||||||
| Series 2014-GC19, Class A3, 3.753%, 03/10/2047 | 5,000,000 | 5,269,850 | |||||||||||
| COMM Mortgage Trust: | |||||||||||||
| Series 2005-C6, Class A5A, 5.116%, 06/10/2044 | 17,581,545 | 17,769,000 | |||||||||||
| Series 2012-CR1, Class A3, 3.391%, 05/15/2045 | 25,842,000 | 26,878,419 | |||||||||||
| Series 2013-CR9, Class A3, 4.022%, 07/10/2045 | 19,000,000 | 20,493,723 | |||||||||||
| Series 2012-CR2, Class A4, 3.147%, 08/15/2045 | 29,950,000 | 30,681,619 | |||||||||||
| Series 2014-CCRE18, Class A4, 3.550%, 07/15/2047 | 5,000,000 | 5,177,600 | |||||||||||
| Credit Suisse First Boston Mortgage Securities Corp., | |||||||||||||
| Series 2005-C5, Class A4, 5.100%, 08/15/2038 | 9,976,252 | 10,108,677 | |||||||||||
| DBUBS Mortgage Trust, | |||||||||||||
| Series 2011-LC3A, Class A4, 4.551%, 08/10/2044 | 2,000,000 | 2,219,458 | |||||||||||
| GE Capital Commercial Mortgage Corp., | |||||||||||||
| Series 2005-C4, Class A4, 5.312%, 11/10/2045 | 12,795,000 | 12,993,668 | |||||||||||
| GMAC Commercial Mortgage Securities Inc Trust, | |||||||||||||
| Series 2004-C2, Class A4, 5.301%, 08/10/2038 | 52,010 | 52,080 | |||||||||||
| GS Mortgage Securities Corp II, | |||||||||||||
| Series 2011-GC5, Class A4, 3.707%, 08/10/2044 | 6,256,873 | 6,619,653 | |||||||||||
| Series 2012-GCJ9, Class A3, 2.773%, 11/10/2045 | 37,485,000 | 37,264,738 | |||||||||||
| Series 2014-GC20, Class AAB, 3.655%, 04/10/2047 | 13,000,000 | 13,683,267 | |||||||||||
| J.P. Morgan Chase Commercial Mortgage Securities Trust: | |||||||||||||
| Series 2005-CB12, Class A4, 4.895%, 09/12/2037 | 24,965,000 | 25,224,012 | |||||||||||
| Series 2013-LC11, Class A5, 2.960%, 04/15/2046 | 22,075,000 | 22,164,624 | |||||||||||
| JPMBB Commercial Mortgage Securities Trust, | |||||||||||||
| Series 2013-C17, Class A3, 3.928%, 01/15/2047 | 23,700,000 | 25,382,818 | |||||||||||
| Series 2014-C25, Class A5, 3.672%, 11/15/2047 | 24,000,000 | 25,070,064 | |||||||||||
| Morgan Stanley Bank of America Merrill Lynch Trust: | |||||||||||||
| Series 2012-C5, Class A4, 3.176%, 08/15/2045 | 27,800,000 | 28,462,780 | |||||||||||
| Series 2012-C6, Class A4, 2.858%, 11/15/2045 | 30,160,000 | 30,204,094 | |||||||||||
| Series 2013-C10, Class A3, 3.968%, 07/15/2046 | 31,290,000 | 33,726,896 | |||||||||||
| Series 2013-C11, Class A3, 3.960%, 08/15/2046 | 19,100,000 | 20,445,595 | |||||||||||
| Morgan Stanley Capital I Trust, | |||||||||||||
| Series 2005-HQ7, Class A4, 5.206%, 11/14/2042 | 17,546,380 | 17,823,034 | |||||||||||
| Wachovia Bank Commercial Mortgage Trust, | |||||||||||||
| Series 2005-C22, Class A4, 5.269%, 12/15/2044 | 17,242,890 | 17,611,008 | |||||||||||
| Wells Fargo Commercial Mortgage Trust, | |||||||||||||
| Series 2013-LC12, Class A3, 3.986%, 07/15/2046 | 13,600,000 | 14,624,597 | |||||||||||
| WFRBS Commercial Mortgage Trust: | |||||||||||||
| Series 2012-C6, Class A4, 3.440%, 04/15/2045 | 19,016,000 | 19,867,118 | |||||||||||
| Series 2014-C23, Class ASB, 3.636%, 10/15/2057 | 10,500,000 | 11,047,671 | |||||||||||
| 514,588,260 | 7.7 | % | |||||||||||
| Total Long-Term Investments (Cost $6,492,564,373) | 6,571,929,164 | 97.8 | % | ||||||||||
| SHORT-TERM INVESTMENTS | Shares | ||||||||||||
| Money Market Mutual Funds | |||||||||||||
| Dreyfus Cash Advantage Fund, 0.06% « | 67,643,075 | 67,643,075 | |||||||||||
| Short-Term Investments Trust - Liquid Assets Portfolio, 0.07% « | 130,000,000 | 130,000,000 | |||||||||||
| Total Short-Term Investments (Cost $197,643,075) | 197,643,075 | 3.0 | % | ||||||||||
| INVESTMENTS PURCHASED WITH CASH PROCEEDS FROM | |||||||||||||
| SECURITIES LENDING | |||||||||||||
| Investment Companies | |||||||||||||
| Mount Vernon Securities Lending Trust Prime Portfolio, 0.29% « | 180,054,574 | 180,054,574 | |||||||||||
| Total Investment Companies (Cost $180,054,574) | 180,054,574 | 2.7 | % | ||||||||||
| Total Investments Purchased With Cash Proceeds From | |||||||||||||
| Securities Lending (Cost $180,054,574) | 180,054,574 | 2.7 | % | ||||||||||
| Total Investments (Cost $6,870,262,022) | 6,949,626,813 | 103.5 | % | ||||||||||
| Liabilities in Excess of Other Assets | (233,019,902 | ) | (3.5 | )% | |||||||||
| TOTAL NET ASSETS | $ | 6,716,606,911 | 100.0 | % | |||||||||
| Notes to Schedule of Investments | ||
| * | Restricted security as defined in Rule 144(a) under the Securities Act of 1933 and determined to be liquid. Purchased in a private placement transaction; resale to the public may require registration or may extend only to qualified institutional buyers. At December 31, 2014, the value of these securities total $805,885,552, which represents 12% of total net assets. | |
| ** | Illiquid Security | |
| @ | This security or portion of this security is out on loan at December 31, 2014. | |
| f | Foreign Security | |
| « | 7-Day Yield | |
| § | Security in Default | |
| † | Priced at Fair Value by the Valuation Committee as delegated by the Baird Funds' Board of Directors. | |
Report of Independent Registered Public
Accounting Firm
Board of Directors and Shareholders
Baird Funds, Inc.
We have audited the accompanying statements of assets and liabilities of Baird Ultra Short Bond Fund, Baird Short-Term Bond Fund, Baird Intermediate Bond Fund, Baird Intermediate Municipal Bond Fund, Baird Aggregate Bond Fund and Baird Core Plus Bond Fund (six of the nine funds constituting Baird Funds, Inc.) (collectively the “Funds”), including the summary schedules of investments, as of December 31, 2014, and the related statements of operations for the year then ended, the statements of changes in net assets for each of the two years in the period then ended (as to the Baird Ultra Short Bond Fund, for the year ended December 31, 2014) (collectively, the "financial statements"), the financial highlights for each of the five years in the period then ended (as to the Baird Ultra Short Bond Fund, for the year ended December 31, 2014) (the financial statements and financial highlights are included in Item 1 of this Form N-CSR), and the schedules of investments as of December 31, 2014 (included in Item 6 of this Form N-CSR). These financial statements, financial highlights, and schedules of investments are the responsibility of the Funds’ management. Our responsibility is to express an opinion on these financial statements, financial highlights, and schedules of investments based on our audits.
We conducted our audits in accordance with the standards of the Public Company Accounting Oversight Board (United States). Those standards require that we plan and perform the audit to obtain reasonable assurance about whether the financial statements, financial highlights, and schedules of investments are free of material misstatement. We were not engaged to perform an audit of the Funds’ internal control over financial reporting. Our audits included consideration of internal control over financial reporting as a basis for designing audit procedures that are appropriate in the circumstances, but not for the purpose of expressing an opinion on the effectiveness of the Funds’ internal control over financial reporting. Accordingly, we express no such opinion. An audit includes examining, on a test basis, evidence supporting the amounts and disclosures in the financial statements and schedules of investments. Our procedures included confirmation of securities owned as of December 31, 2014, by correspondence with the custodian and brokers. An audit also includes assessing the accounting principles used and significant estimates made by management, as well as evaluating the overall financial statement presentation. We believe that our audits provide a reasonable basis for our opinion.
In our opinion, the financial statements, financial highlights, and schedules of investments referred to above present fairly, in all material respects, the financial position of each of the aforementioned Funds of Baird Funds, Inc. as of December 31, 2014, and the results of their operations, the changes in their net assets, and the financial highlights for the periods indicated above, in conformity with accounting principles generally accepted in the United States of America.
Chicago, Illinois
February 26, 2015
| (b) | Not applicable |
Item 7. Disclosure of Proxy Voting Policies and Procedures for Closed-End Management Investment Companies.
Not applicable because the Registrant is not a closed-end management investment company.
Item 8. Portfolio Managers of Closed-End Management Investment Companies.
Not applicable because the Registrant is not a closed-end management investment company.
Item 9. Purchases of Equity Securities by Closed-End Management Investment Company and Affiliated Purchasers.
Not applicable because the Registrant is not a closed-end management investment company.
Item 10. Submission of Matters to a Vote of Security Holders.
There have been no material changes to the procedures by which shareholders may recommend nominees to the Registrant’s board of directors.
Item 11. Controls and Procedures.
| (a) | The Registrant’s management, with the participation of its principal executive and principal financial officers, has evaluated the effectiveness of the Registrant's disclosure controls and procedures (as defined in Rule 30a-3(c) under the Investment Company Act of 1940 (the “Act”)), as of a date within 90 days prior to the filing date of this Form N-CSR. Based on such evaluation, the Registrant's principal executive and principal financial officers have concluded that the design and operation of the Registrant's disclosure controls and procedures are effective in providing reasonable assurance that the information required to be disclosed on Form N-CSR is recorded, processed, summarized and reported within the applicable time periods. |
| (b) | There were no changes in the Registrant's internal control over financial reporting (as defined in Rule 30a-3(d) under the Act) that occurred during the second fiscal quarter of the period covered by this report that have materially affected, or are reasonably likely to materially affect, the Registrant's internal control over financial reporting. |
Item 12. Exhibits.
| (a) | (1) Code of ethics. |
Incorporated by reference to the Registrant’s Form N-CSR filed on March 9, 2004.
(2) Certifications pursuant to Section 302 of the Sarbanes-Oxley Act of 2002. Filed herewith.
(3) Any written solicitation to purchase securities under Rule 23c-1 under the Act sent or given during the period covered by the report by or on behalf of the registrant to 10 or more persons. Not applicable because the Registrant is not a closed-end management investment company.
(b) Certification pursuant to Section 906 of the Sarbanes-Oxley Act of 2002. Furnished herewith.
SIGNATURES
Pursuant to the requirements of the Securities Exchange Act of 1934 and the Investment Company Act of 1940, the registrant has duly caused this report to be signed on its behalf by the undersigned, thereunto duly authorized.
BAIRD FUNDS, INC.
By: /s/Mary Ellen Stanek
Mary Ellen Stanek, President
Date: March 9, 2015
Pursuant to the requirements of the Securities Exchange Act of 1934 and the Investment Company Act of 1940, this report has been signed below by the following persons on behalf of the registrant and in the capacities and on the dates indicated.
By: /s/Mary Ellen Stanek
Mary Ellen Stanek, President
Date: March 9, 2015
By: /s/Dominick Zarcone
Dominick Zarcone, Treasurer
Date: March 9, 2015