UNITED STATES
SECURITIES AND EXCHANGE COMMISSION
Washington, D.C. 20549
FORM N-CSR
CERTIFIED SHAREHOLDER REPORT OF REGISTERED
MANAGEMENT INVESTMENT COMPANIES
Investment Company Act file number: 811-09997
Baird Funds, Inc.
(Exact name of registrant as specified in charter)
777 East Wisconsin Avenue
Milwaukee, WI 53202
(Address of principal executive offices) (Zip code)
Andrew D. Ketter
Robert W. Baird & Co. Incorporated
777 East Wisconsin Avenue
Milwaukee, WI 53202
(Name and address of agent for service)
1-866-442-2473
Registrant's telephone number, including area code
Date of fiscal year end: December 31, 2012
Date of reporting period: December 31, 2012
Item 1. Reports to Stockholders.
Annual Report –
Baird Funds
December 31, 2012
Baird Short-Term Bond Fund
Baird Intermediate Bond Fund
Baird Intermediate Municipal Bond Fund
Baird Aggregate Bond Fund
Baird Core Plus Bond Fund
| Go Green. |  | Go Paperless. |
Sign up to receive your Baird Funds’ prospectuses and reports online.
Table of Contents
| Letter to Shareholders | 1 | |
| 2012 Bond Market Overview | 2 | |
| Baird Short-Term Bond Fund | 7 | |
| Baird Intermediate Bond Fund | 18 | |
| Baird Intermediate Municipal Bond Fund | 29 | |
| Baird Aggregate Bond Fund | 42 | |
| Baird Core Plus Bond Fund | 53 | |
| Additional Information on Fund Expenses | 64 | |
| Statements of Assets and Liabilities | 66 | |
| Statements of Operations | 68 | |
| Statements of Changes in Net Assets | 69 | |
| Financial Highlights | 74 | |
| Notes to the Financial Statements | 84 | |
| Report of Independent Registered Public Accounting Firm | 95 | |
| Directors and Officers | 96 | |
| Disclosure Regarding the Board of Directors’ Approval | ||
| of the Investment Advisory Agreement for Baird Bond Funds | 99 | |
| Additional Information | 102 | |
| Privacy Notice | A-1 |
This report has been prepared for shareholders and may be distributed to others only if preceded or accompanied by a current prospectus.
Cautionary Note on Analyses, Opinions and Outlooks: In this report we offer analyses and opinions on the performance of individual securities, companies, industries, sectors, markets, interest rates and governmental policies, including predictions, forecasts and outlooks regarding possible future events. These can generally be identified as such because the context of the statements may include such words as “believe,” “should,” “will,” “expects,” “anticipates,” “hopes” and words of similar effect. These statements reflect the portfolio managers’ good faith beliefs and judgments and involve risks and uncertainties, including the risk that the portfolio managers’ analyses, opinions and outlooks are or will prove to be inaccurate. It is inherently difficult to correctly assess and explain the performance of particular securities, sectors, markets, interest rate movements, governmental actions or general economic trends and conditions, and many unforeseen factors contribute to the performance of Baird Funds. Investors are, therefore, cautioned not to place undue reliance on subjective judgments contained in this report.
Baird Funds
1-866-442-2473
www.bairdfunds.com
February 27, 2013
Dear Shareholder,
Overall, 2012 was another good year for bond investors. The disciplined, duration neutral strategy we employ against benchmarks coupled with our opportunistic ability to add value through yield curve positioning, sector allocation, and individual security selection were critical elements to our success in 2012.
We thank you for your continued investment in Baird Funds. Steady inflows into the Baird Funds family have increased total net assets to $7.5 billion at the end of 2012. We’ve built our reputation on employing a risk controlled process in our approach to investment decision making and portfolio management. Our long-term success is a testament to this focus on risk control and providing excellent stewardship of shareholders’ assets.
On the following pages, we review the bond market in 2012 and the performance and composition of each of the Baird Bond Funds.
We appreciate the confidence and trust that you have placed in our experienced investment team to help you achieve your financial goals and we welcome the opportunity to continue to serve you.
Sincerely,

Mary Ellen Stanek, CFA
President
Baird Funds
Page 1
2012 Bond Market Overview
Treasury Yields End Volatile 2012 Nearly Unchanged as Fed Increases Bond Buying Stimulus
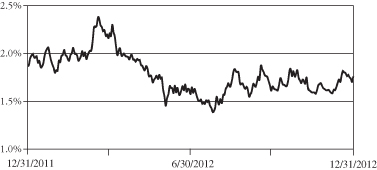
A tepid U.S. economy, geo-political uncertainties across the globe, a series of policy responses from the Fed, and the so-called “Fiscal Cliff” negotiations all made for volatile markets this year. Although U.S. Treasury yields ended the year nearly unchanged, the 10-year U.S. Treasury yield ranged from 1.39% to 2.38% in 2012. Treasury yields rose in the first quarter due to greater economic optimism, but then fell in the second when indications of a more robust economic recovery waned (see charts and table below). The Federal Reserve Board (the “Fed”) extended Operation Twist in June after the monthly nonfarm payrolls dropped below 100,000 for three months, then launched an open-ended round of quantitative easing (QE3) in September. In December, the Fed announced it would further increase the pace of bond-buying to keep economic conditions very accommodative when Operation Twist came to a close at year-end. Additionally, the Fed provided thresholds for unemployment (6.5%) and inflation (2.5%) that will steer its Federal Funds rate-setting policy in an attempt to increase transparency. Entering the new year, Congress brokered a deal on taxes, avoiding a complete Fiscal Cliff stalemate, but pushed spending decisions into 2013. Additionally, the European Central Bank provided liquidity to alleviate member nations’ short-term funding pressures, which continue to strive to reduce unsustainable levels of debt.
Treasury Yields (Source: Bloomberg)
| 1 Year | ||||
 | Maturity | 12/31/11 | 12/31/12 | Change |
| 1 | 0.10% | 0.14% | 0.04 | |
| 2 | 0.24% | 0.25% | 0.01 | |
| 3 | 0.35% | 0.35% | 0.00 | |
| 5 | 0.83% | 0.72% | -0.11 | |
| 7 | 1.34% | 1.18% | -0.16 | |
| 10 | 1.88% | 1.76% | -0.12 | |
| 30 | 2.89% | 2.95% | 0.06 |
| 10 Year Treasury Yield | |
 |
Flows into Bonds Show Strong Demand
The Fed’s zero interest rate policy has effectively pushed investors out of money markets and into other assets in the search for yield. As the charts below show, investment grade (IG) and high yield (HY) bond funds and ETFs benefitted from this trend as money markets and U.S. stocks saw net outflows. High yield received inflows in excess of $50 billion, the greatest on record, and Municipal net inflows were the second highest on record as well. The strong flows pushed valuations in these sectors.
Page 2
2012 Bond Market Overview
Mutual Fund/ETF – Net Flows
2010 – 2012 ($ Billions)
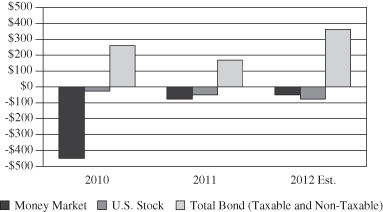
Bond Fund/ETF – Net Flows
2010 – 2012 ($ Billions)
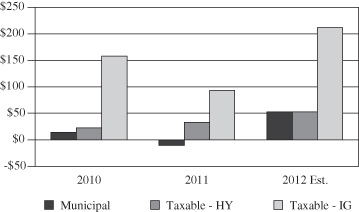
Source: Morningstar and ICI
Yield Spreads Tighten Dramatically in 2012
Strong investor demand coupled with solid fundamentals pushed spreads tighter. Ongoing extraordinary monetary stimulus from the Fed and modest improvements in economic data (such as rising home prices) eased recessionary concerns in the U.S., driving spreads on financials, commercial mortgage-backed securities (CMBS) and high-yield corporates all sharply tighter (see table on next page). Spreads for the financial sector moved dramatically lower (tightened 182 basis points (“bps”)) on improved balance sheets and negative net supply (see chart). For example, tier 1 common equity ratios for large banks rose on average from approximately 5% in 2008 to nearly 11% in 2012, and much higher than the 7% pre-crisis average. Strong earnings and balance sheets drove more modest spread tightening on industrials and utilities (51 bps and 42 bps, respectively) in spite of significant net issuance.
Page 3
2012 Bond Market Overview
Option-Adjusted Spreads (in bps)
| YTD | ||||||||||||||||||||
| 6/30/07 | 12/31/08 | 12/31/11 | 12/31/12 | Change | ||||||||||||||||
| U.S. Aggregate Index | 53 | 213 | 87 | 53 | -34 | |||||||||||||||
| U.S. Agency (non-mortgage) Sector | 34 | 93 | 33 | 13 | -20 | |||||||||||||||
| Mortgage and ABS Sectors | ||||||||||||||||||||
| U.S. Agency Pass-throughs | 65 | 145 | 75 | 50 | -25 | |||||||||||||||
| Asset-Backed Securities | 57 | 955 | 99 | 43 | -56 | |||||||||||||||
| CMBS | 82 | 1010 | 308 | 124 | -184 | |||||||||||||||
| Corporate Sectors | ||||||||||||||||||||
| U.S. Investment Grade | 97 | 555 | 234 | 141 | -93 | |||||||||||||||
| Industrial | 104 | 500 | 184 | 133 | -51 | |||||||||||||||
| Utility | 100 | 537 | 186 | 144 | -42 | |||||||||||||||
| Financial Institutions | 88 | 629 | 337 | 155 | -182 | |||||||||||||||
| U.S. High Yield | 292 | 1662 | 699 | 511 | -188 | |||||||||||||||
Source: Barclays
Financial and Non-Financial Net Supply (SB)
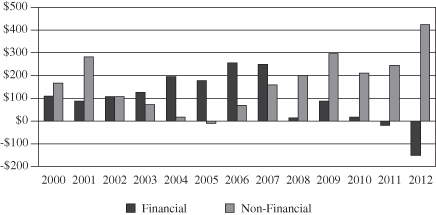
Source: JP Morgan
Spread Sectors Significantly Outperform Governments in 2012
Dramatic spread tightening in non-government “spread sectors” led to strong performance for the bond market overall in 2012, despite a challenging December and more modest fourth quarter. Accordingly, the returns for U.S. Treasuries (+1.99%), U.S. Agencies (+3.02%), and U.S. Agency mortgage-backed securities (MBS) (+2.59%) paled in comparison to spread sectors. Within investment grade bonds, financials (+14.65%) and CMBS (+9.66%) delivered some of the strongest returns. Fueled by investor demand (note record inflows above), high-yield corporates (+15.81%) offered returns in line with the stock market. Municipals again posted attractive returns in 2012 (+6.78%) despite a challenging December (-1.24%).
Page 4
2012 Bond Market Overview
Total Returns of Selected Barclays (BC) Sectors and Indices
| Barclays Index/Sector | December | 4th Quarter | 2012 | |
| U.S. Aggregate Index | -0.14% | 0.21% | 4.21% | |
| U.S. Gov’t/Credit Index | -0.28% | 0.37% | 4.82% | |
| U.S. Interm. Gov’t/Credit Index | -0.10% | 0.35% | 3.89% | |
| U.S. 1-3 Yr. Gov’t/Credit Index | 0.06% | 0.15% | 1.26% | |
| U.S. Treasury | -0.44% | -0.09% | 1.99% | |
| U.S. Agency | -0.14% | 0.22% | 3.02% | |
| U.S. Corporate – Investment Grade | -0.06% | 1.06% | 9.82% | |
| CMBS (Commercial Mortgage Backed Securities) | 0.34% | 1.22% | 9.66% | |
| MBS (Mortgage Backed Securities) | 0.14% | -0.20% | 2.59% | |
| ABS (Asset-Backed Securities) | -0.08% | 0.22% | 3.66% | |
| Corporate High Yield | 1.58% | 3.29% | 15.81% | |
| Municipal Bond Index | -1.24% | 0.67% | 6.78% | |
| TIPS (Treasury Inflation Protected Securities) | -0.65% | 0.69% | 6.98% |
Municipals: Stay Tuned in 2013
Anticipating higher tax rates, investors sought the tax-exempt benefit of municipals in 2012. Despite continued challenging credit dynamics, lower-quality issues outperformed higher-rated issues by significant margins (BBBs returned +9.80% vs. AAAs at +4.52%), generating attractive returns for the sector. While state revenues increased over the course of 2012, local revenues remained challenged. Municipal downgrades continue to outnumber upgrades approximately four to one. While the supply/demand technical of strong investor demand and limited net new supply were the key drivers of municipal performance in 2012, we caution that developing Chapter 9 bankruptcies, primarily in California, will likely set profound precedents and could make the market more attuned to credit fundamentals in 2013.
Outlook
We believe the Fed will hold their overnight policy rate at zero through 2013, and although longer yields could drift somewhat higher in 2013, modest economic growth and minimal wage inflation could keep rates lower longer than many market participants expect. We see limited return potential for U.S. Treasuries and Agencies in 2013 given their historically low yields. Although U.S. Agency MBS will benefit from additional Fed purchases, various policy proposals pose significant prepayment uncertainty and even a modest increase in long-term yields could lead to significant underperformance as prepayments slow and durations extend. While we don’t expect yield spreads to tighten as much as in the past year, spreads on non-Government sectors are still wide when compared to pre-crisis levels (mid-2007) and still look attractive in the context of today’s very low absolute level of interest rates. Given strong credit fundamentals, investment-grade corporates and select senior class CMBS structures offer attractive relative value. With yields in the High Yield sector near all-time lows, we are concerned about the sector as sluggish economic growth could present challenges for very leveraged issuers. In the context of today’s moderate growth and low interest rate environment that could persist, we still see good relative value in several non-government sectors of the bond market. However, we caution investors against going too far out on the yield curve or too far down in quality given the high level of global uncertainty and broad range of potential outcomes.
The Barclays U.S. Government/Credit Index is a combination of the Government Index which measures government-bond general and Treasury funds, and the Credit Bond Index, which is a market value-weighted index which tracks the returns of all publicly issued, fixed-rate, nonconvertible, dollar-denominated, SEC registered, investment grade Corporate Debt.
The Barclays U.S. Treasury Index includes public obligations of the U.S. Treasury. Treasury bills are excluded by the maturity constraint of at least one year but are part of a separate Short Treasury Index. In addition, certain special issues, such as state and local government series bonds (SLGs), as well as U.S. Treasury TIPS, are excluded. STRIPS are
Page 5
2012 Bond Market Overview
excluded from the index because their inclusion would result in double-counting. Securities in the Index roll up to the U.S. Aggregate, U.S. Universal, and Global Aggregate Indices. The U.S. Treasury Index was launched on January 1, 1973.
The Barclays U.S. Agency Bond Index measures the performance of the agency sector of the U.S. government bond market.
The Barclays U.S. Corporate Investment Grade Bond Index consists of publicly issued, fixed rate, nonconvertible, investment grade debt securities.
The Barclays Commercial Mortgage Backed Securities Index is the CMBS component of the U.S. Aggregate index. The Barclays CMBS ERISA-Eligible Index is the ERISA-eligible component of the Barclays CMBS Index. This index, which includes investment grade securities that are ERISA eligible under the underwriter’s exemption, is the only CMBS sector that is included in the U.S. Aggregate Index.
The Barclays Mortgage-Backed Securities Index is an unmanaged index comprising 15- and 30-year fixed-rate securities backed by mortgage pools of Ginnie Mae, Freddie Mac and Fannie Mae.
The Barclays Asset-Backed Securities Index is the ABS component of the Barclays Capital US Aggregate Index. The ABS Index has three subsectors: credit and charge cards, autos, and utility. The index includes pass-through, bullet, and controlled amortization structures. The ABS Index includes only the senior class of each ABS issue and the ERISA-eligible B and C tranche. The manufactured housing sector was removed as of January 1, 2008, and the home equity loan sector was removed as of October 1, 2009.
The Barclays U.S. Corporate High Yield Index is an unmanaged index that covers the universe of fixed-rate, noninvestment grade debt.
The Barclays Municipal Bond Index is a broad-based, total-return index. The bonds are all investment-grade, tax-exempt, and fixed-rate securities with long-term maturities (greater than 2 years). They are selected from issues larger than $50 million.
The Barclays TIPS Index consists of Treasury Inflation Protected Securities (TIPS). TIPS are securities whose principal is tied to the Consumer Price Index. TIPS pay interest semi-annually, based on the fixed rate applied to the adjusted principal.
A direct investment in an index is not possible.
Page 6
Baird Short-Term Bond Fund
December 31, 2012
The Baird Short-Term Bond Fund seeks an annual rate of total return, before Fund expenses, greater than the annual rate of total return of the Barclays 1-3 Year U.S. Government/Credit Bond Index. The Barclays 1-3 Year U.S. Government/Credit Bond Index is an unmanaged, market value weighted index of investment grade, fixed-rate debt issues, including government and corporate securities, with maturities between one and three years.
The Fund entered the year with a significant yield advantage over its benchmark and converted that advantage into strong absolute and relative returns versus its benchmark index in 2012. Our long-term commitment to duration neutrality was very important as well. The primary factors contributing to the Fund’s outperformance over its benchmark are described below.
| • | The Fund’s overweight position to the corporate credit sector relative to the Fund’s benchmark positively impacted the Fund’s performance. Corporate bonds generally experienced favorable price returns relative to U.S. Treasuries of comparable maturity due to a significant narrowing of corporate bond spreads (the additional yield that investors demand above U.S. Treasury bonds for owning corporate debt) during the year. The narrowing was driven by generally solid corporate credit fundamentals and very strong investor demand. |
| • | An overweight to the financial sub-sector in particular was an important contributor to the Fund’s relative outperformance as financials significantly outperformed other investment grade corporate bonds. The financial sub-sector’s performance was driven by both strong and improving credit fundamentals and negative net supply (gross supply or issuance less maturities and early redemptions by issuers). |
| • | The Fund’s underweight to U.S. Treasuries was a positive contributor to relative performance as non-government “spread sectors” such as corporate, mortgage-backed, and asset-backed securities outperformed equal-duration U.S. Treasuries for the year. |
| • | Modest exposure to commercial mortgage-backed securities (CMBS) had an overall positive impact on the Fund’s performance for the year. As part of the risk management for the Fund’s exposure to this sector, the Fund holds short maturity, select super-senior issues with significant credit enhancement. |
We are pleased with the Fund’s performance in 2012 and are confident in the individual issues and the overall structure of the Fund. The Fund’s current significant yield advantage over the benchmark is meaningful and we are optimistic regarding the Fund’s relative performance as we head into 2013.
Page 7
Baird Short-Term Bond Fund
December 31, 2012
Portfolio Characteristics
| Quality Distribution* | ||
 | Net Assets: | $1,297,158,516 |
| SEC 30-Day | ||
Yield:** | ||
| Institutional Class: | 1.41% | |
| Investor Class: | 1.12% | |
| Average | ||
| Effective | ||
| Duration: | 1.88 years | |
| Average | ||
| Effective | ||
| Maturity: | 2.06 years | |
| Annualized | ||
| Expense | ||
| Ratio: | ||
| Institutional Class: | 0.30% | |
| Sector Weightings* | Investor Class: | 0.55%*** |
 | Portfolio | |
| Turnover | ||
| Rate: | 40.1% | |
| Total | ||
| Number of | ||
| Holdings: | 403 | |
| * | Percentages shown are based on the Fund’s total investments (less investments purchased with cash proceeds from securities lending). | |
| ** | SEC yields are based on SEC guidelines and are calculated for the 30 days ended December 31, 2012. | |
| *** | Includes 0.25% 12b-1 fee. |
Page 8
Baird Short-Term Bond Fund
December 31, 2012
Institutional Class*
Value of a $25,000 Investment
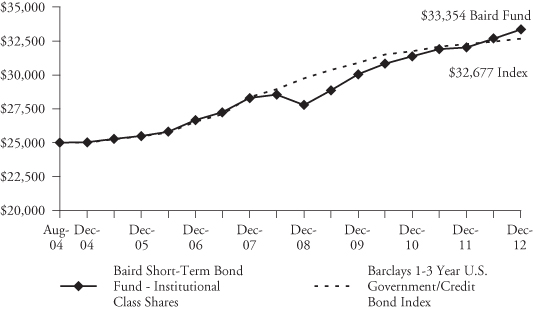
Growth of a hypothetical investment of $25,000 made on the Fund’s inception date (8/31/04), assuming reinvestment of all distributions.
*The Baird Short-Term Bond Fund first offered Investor Class shares on September 19, 2012.
Page 9
Baird Short-Term Bond Fund
December 31, 2012
Average Annual Total Returns
| One | Five | Since | ||
| For the Periods Ended December 31, 2012 | Year | Years | Inception(1) | |
| Institutional Class | 4.16% | 3.35% | 3.52% | |
Investor Class(2) | 3.93% | 3.10% | 3.27% | |
Barclays 1-3 Year U.S. Government/Credit Bond Index(3) | 1.26% | 2.88% | 3.27% |
| (1) | For the period from August 31, 2004 (commencement of operations) to December 31, 2012. | |
| (2) | Performance figures for the Investor Class shares, first offered on September 19, 2012, include the historical performance of the Institutional Class shares through September 18, 2012. Investor Class share results prior to the date of first sale are hypothetical based on Institutional Class share results and were calculated using an estimated total annual fund operating expense of 0.55%. | |
| (3) | The Barclays 1-3 Year U.S. Government/Credit Bond Index is an unmanaged, market value weighted index of investment grade, fixed-rate debt issues, including government and corporate securities, with maturities between one and three years. This index does not reflect any deduction for fees, expenses or taxes. A direct investment in an index is not possible. |
The returns shown in the table above and the line graph on the previous page reflect reinvestment of dividends and/or capital gains distributions in additional shares. Returns do not reflect the deduction of taxes that a shareholder would pay on Fund distributions or the redemption of Fund shares. The returns reflect the actual performance for each period and do not include the impact of trades executed on the last business day of the period that were recorded on the first business day of the next period.
The Fund’s gross expense ratio for each Class, as reflected in the Fund’s current prospectus, is set forth under “Portfolio Characteristics”.
The Fund may invest in U.S. dollar denominated foreign securities which involve additional risks such as currency rate fluctuations, political and economic instability, and different and sometimes less strict financial reporting standards and regulation. The Fund may also invest in mortgage- and asset-backed securities, which include interest rate and prepayment risks more pronounced than those of other fixed income securities.
Past performance does not guarantee future results. Investment returns and principal value will fluctuate so that an investor’s shares, when redeemed, may be worth more or less than their original cost.
For information about the performance of the Fund as of the most recent month-end, please call 1-866-44BAIRD or visit www.bairdfunds.com. Mutual fund performance changes over time and current performance may be lower or higher than that stated.
Page 10
Baird Short-Term Bond Fund
Summary Schedule of Investments, December 31, 2012
This schedule summarizes the Fund’s holdings by asset type. Details are reported for each of the Fund’s 50 largest individual holdings and for investments that, in total for any issuer, represent more than 1% of the Fund’s net assets. The total value of smaller holdings is reported as a single amount within each category.
The Fund reports a complete list of its holdings in regulatory filings four times in each fiscal year, at the quarter end. For the second and fourth fiscal quarters, the complete listing of the Fund’s holdings is available electronically in the Fund’s Form N-CSR at http://www.rwbaird.com/baird-funds/prospectus-applications/prospectus-applications.aspx and on the Securities and Exchange Commission’s website (www.sec.gov) or you can have it mailed to you without charge by calling 1-866-44BAIRD. For the first and third fiscal quarters, the Fund files the lists with the SEC on Form N-Q. Shareholders can look up the Fund’s Forms N-CSR and N-Q on the SEC’s website (www.sec.gov).
Long-Term Investments
| Principal | Market | % of | ||||||||||
| Amount | Value | Net Assets | ||||||||||
| U.S. Treasury Obligations | ||||||||||||
| U.S. Treasury Bonds | ||||||||||||
| 2.375%, 03/31/2016 @ | $ | 85,700,000 | $ | 91,109,813 | 7.0 | % | ||||||
| Total U.S. Treasury Obligations | ||||||||||||
| (Cost $90,660,005) | 91,109,813 | 7.0 | % | |||||||||
| Taxable Municipal Bonds | ||||||||||||
| County of Miami-Dade FL Aviation Revenue | ||||||||||||
| 5.000%, 10/01/2016 | 6,200,000 | 6,969,730 | 0.5 | % | ||||||||
| Government Development Bank for Puerto Rico | ||||||||||||
| 3.670%, 05/01/2014 | 6,450,000 | 6,428,264 | 0.5 | % | ||||||||
| Other Municipal Bonds# | 22,764,544 | 1.8 | % | |||||||||
| Total Municipal Bonds | ||||||||||||
| (Cost $35,987,246) | 36,162,538 | 2.8 | % | |||||||||
| Other Government Related Securities#~ | 21,322,024 | 1.6 | % | |||||||||
| Total Other Government Related Securities | ||||||||||||
| (Cost $21,075,876) | 21,322,024 | 1.6 | % | |||||||||
| Corporate Bonds | ||||||||||||
| Industrials | ||||||||||||
| Anglo American Capital PLC | ||||||||||||
| 2.150%, 09/27/2013 (Acquired 09/20/2010 | ||||||||||||
through 03/21/2012, Cost $6,902,572)* f | 6,900,000 | 6,948,928 | 0.5 | % | ||||||||
| Bunge Limited Finance Corporation | ||||||||||||
| 5.350%, 04/15/2014 | 6,550,000 | 6,892,342 | 0.5 | % | ||||||||
| Glencore Funding LLC | ||||||||||||
| 6.000%, 04/15/2014 (Acquired 01/12/2010 | ||||||||||||
| through 02/27/2012, Cost $7,288,960)* | 7,120,000 | 7,519,824 | 0.6 | % | ||||||||
| Hutchison Whampoa International Ltd. | ||||||||||||
| 4.625%, 09/11/2015 (Acquired 09/24/2012 | ||||||||||||
through 12/18/2012, Cost $8,310,025)* f | 7,690,000 | 8,310,045 | 0.6 | % | ||||||||
| Johnson Controls Inc. | ||||||||||||
| 5.500%, 01/15/2016 @ | 6,491,000 | 7,327,002 | 0.6 | % | ||||||||
| Pioneer Natural Resources Company | ||||||||||||
| 5.875%, 07/15/2016 | 10,000,000 | 11,338,900 | 0.9 | % | ||||||||
The accompanying notes are in integral part of these financial statements.
Page 11
Baird Short-Term Bond Fund
Summary Schedule of Investments, December 31, 2012
Long-Term Investments (cont.)
| Principal | Market | % of | ||||||||||
| Amount | Value | Net Assets | ||||||||||
| POSCO | ||||||||||||
| 8.750%, 03/26/2014 (Acquired 03/19/2009 | ||||||||||||
through 04/28/2011, Cost $7,670,146)* f | $ | 7,300,000 | $ | 7,936,881 | 0.6 | % | ||||||
| Staples, Inc. | ||||||||||||
| 9.750%, 01/15/2014 | 6,327,000 | 6,878,689 | 0.5 | % | ||||||||
| The ADT Corporation | ||||||||||||
| 2.250%, 07/15/2017 (Acquired 06/27/2012 | ||||||||||||
| through 12/14/2012, Cost $6,724,436)* | 6,700,000 | 6,646,789 | 0.5 | % | ||||||||
| Transocean Inc. | ||||||||||||
| 5.050%, 12/15/2016 f @ | 6,000,000 | 6,680,532 | 0.5 | % | ||||||||
| Union Pacific Railroad Co. 2004 Pass Through Trust | ||||||||||||
| 5.214%, 09/30/2014 (Acquired 10/22/2010 | ||||||||||||
| through 03/29/2012, Cost $6,227,290)* | 5,924,000 | 6,295,435 | 0.5 | % | ||||||||
| Wm. Wrigley Jr. Company | ||||||||||||
| 3.700%, 06/30/2014 (Acquired 03/15/2012 | ||||||||||||
| through 11/14/2012, Cost $6,688,548)*@ | 6,486,000 | 6,713,166 | 0.5 | % | ||||||||
| Xerox Corporation | ||||||||||||
| 8.250%, 05/15/2014 | 7,100,000 | 7,744,581 | 0.6 | % | ||||||||
| Yara International ASA | ||||||||||||
| 5.250%, 12/15/2014 (Acquired 09/25/2012 | ||||||||||||
through 10/02/2012, Cost $7,502,440)* f | 7,000,000 | 7,524,874 | 0.6 | % | ||||||||
| Other Industrials#~ | 259,014,535 | 20.0 | % | |||||||||
| Total Industrials | ||||||||||||
| (Cost $360,462,642) | 363,772,523 | 28.0 | % | |||||||||
| Utility | ||||||||||||
| Ameren Corporation | ||||||||||||
| 8.875%, 05/15/2014 | 6,239,000 | 6,827,462 | 0.5 | % | ||||||||
| Consolidated Natural Gas | ||||||||||||
| Series A, 5.000%, 03/01/2014 | 5,923,000 | 6,213,340 | 0.5 | % | ||||||||
| National Grid PLC | ||||||||||||
6.300%, 08/01/2016 f | 7,911,000 | 9,179,023 | 0.7 | % | ||||||||
| Nisource Finance Corp. | ||||||||||||
| 5.400%, 07/15/2014 | 5,775,000 | 6,154,169 | 0.5 | % | ||||||||
| Nustar Pipeline Operating Partnership L.P. | ||||||||||||
| 5.875%, 06/01/2013 | 6,562,000 | 6,634,923 | 0.5 | % | ||||||||
| Spectra Energy Capital LLC | ||||||||||||
| 5.668%, 08/15/2014 | 6,114,000 | 6,560,120 | 0.5 | % | ||||||||
| Williams Partners L.P. | ||||||||||||
| 3.800%, 02/15/2015 | 9,000,000 | 9,516,483 | 0.7 | % | ||||||||
| Other Utility#~ | 105,962,521 | 8.2 | % | |||||||||
| Total Utility | ||||||||||||
| (Cost $154,529,235) | 157,048,041 | 12.1 | % | |||||||||
The accompanying notes are in integral part of these financial statements.
Page 12
Baird Short-Term Bond Fund
Summary Schedule of Investments, December 31, 2012
Long-Term Investments (cont.)
| Principal | Market | % of | ||||||||||
| Amount | Value | Net Assets | ||||||||||
| Finance | ||||||||||||
| AEGON N.V. | ||||||||||||
4.750%, 06/01/2013 f | $ | 6,722,000 | $ | 6,825,606 | 0.5 | % | ||||||
| ANZ National (Int’l) LTD | ||||||||||||
| 6.200%, 07/19/2013 (Acquired 05/25/2010 | ||||||||||||
through 06/09/2011, Cost $7,839,040)* f | 7,678,000 | 7,877,329 | 0.6 | % | ||||||||
| Capital One Financial Corporation | ||||||||||||
| 7.375%, 05/23/2014 | 5,765,000 | 6,271,328 | 0.5 | % | ||||||||
| Citigroup, Inc. | ||||||||||||
| 6.010%, 01/15/2015 | 7,350,000 | 8,031,455 | 0.6 | % | ||||||||
| FMR LLC | ||||||||||||
| 4.750%, 03/01/2013 (Acquired 10/04/2010 | ||||||||||||
| through 05/30/2012, Cost $8,655,601)* | 8,615,000 | 8,673,280 | 0.7 | % | ||||||||
| General Electric Capital Corporation | ||||||||||||
| 2.300%-5.900%, 05/13/2014-05/01/2018@ | 15,725,000 | 16,798,778 | 1.4 | % | ||||||||
| Genworth Life Institutional Funding Trust | ||||||||||||
| 5.875%, 05/03/2013 (Acquired 04/07/2010 | ||||||||||||
| through 01/17/2012, Cost $6,032,946)* | 5,980,000 | 6,071,016 | 0.5 | % | ||||||||
| Irish Life & Permanent Group Holdings PLC | ||||||||||||
| 3.600%, 01/14/2013 (Acquired 01/07/2010 | ||||||||||||
through 02/28/2012, Cost $6,047,017)* f | 6,050,000 | 6,050,042 | 0.5 | % | ||||||||
| J.P. Morgan Chase & Co. | ||||||||||||
| 3.450%, 03/01/2016 | 5,700,000 | 6,053,463 | 0.5 | % | ||||||||
| Kemper Corporation | ||||||||||||
| 6.000%, 11/30/2015 | 8,500,000 | 9,167,684 | 0.7 | % | ||||||||
| M&I Marshall & Ilsley Bank | ||||||||||||
| 4.850%, 06/16/2015 | 6,357,000 | 6,835,854 | 0.5 | % | ||||||||
| Manulife Financial Corp. | ||||||||||||
3.400%, 09/17/2015 f @ | 6,195,000 | 6,514,117 | 0.5 | % | ||||||||
| SunTrust Bank | ||||||||||||
| 0.608%, 04/01/2015 | 6,880,000 | 6,713,703 | 0.5 | % | ||||||||
| UFJ Finance Aruba A.E.C. | ||||||||||||
6.750%, 07/15/2013 f | 7,850,000 | 8,097,927 | 0.6 | % | ||||||||
| WEA Finance LLC | ||||||||||||
| 7.500%, 06/02/2014 (Acquired 12/14/2011 | ||||||||||||
| through 09/13/2012, Cost $8,534,839)* | 8,005,000 | 8,709,688 | 0.7 | % | ||||||||
| Willis North America, Inc. | ||||||||||||
| 5.625%, 07/15/2015 | 6,650,000 | 7,265,378 | 0.6 | % | ||||||||
| Other Finance#~ | 314,706,626 | 24.1 | % | |||||||||
| Total Finance | ||||||||||||
| (Cost $431,881,040) | 440,663,274 | 34.0 | % | |||||||||
The accompanying notes are in integral part of these financial statements.
Page 13
Baird Short-Term Bond Fund
Summary Schedule of Investments, December 31, 2012
Long-Term Investments (cont.)
| Principal | Market | % of | ||||||||||
| Amount | Value | Net Assets | ||||||||||
| Residential Mortgage-Backed Securities | ||||||||||||
| U.S. Government Agency Issues | ||||||||||||
| Other U.S. Government Agency Issues# | $ | 2,002,895 | 0.2 | % | ||||||||
| Total U.S. Government Agency Issues | ||||||||||||
| (Cost $1,893,124) | 2,002,895 | 0.2 | % | |||||||||
| Non-U.S. Government Agency Issues | ||||||||||||
| Other Non-U.S. Government Agency Issues# | 12,848,217 | 1.0 | % | |||||||||
| Total Non-U.S. Government Agency Issues | ||||||||||||
| (Cost $13,109,131) | 12,848,217 | 1.0 | % | |||||||||
| Asset Backed Securities | ||||||||||||
| Carrington Mortgage Loan Trust | ||||||||||||
| Series 2006-OPT1, Class A3, 0.390%, 02/25/2036 | $ | 8,686,568 | 8,377,170 | 0.7 | % | |||||||
| Master Credit Card Trust | ||||||||||||
| Series 2012-2A, Class A, 0.780%, 04/21/2017 | ||||||||||||
(Acquired 10/24/2012, Cost $6,723,674)* f | 6,725,000 | 6,739,304 | 0.5 | % | ||||||||
| Specialty Underwriting & Residential Finance | ||||||||||||
| Series 2006-BC1, Class A2C, 0.410%, 12/25/2036 | 6,690,088 | 6,520,420 | 0.5 | % | ||||||||
| Other Asset Backed Securities#~ | 35,368,900 | 2.7 | % | |||||||||
| Total Asset Backed Securities | ||||||||||||
| (Cost $57,862,494) | 57,005,794 | 4.4 | % | |||||||||
| Commercial Mortgage-Backed Securities | ||||||||||||
| Bear Stearns Commercial Mortgage Securities | ||||||||||||
| Series 2005-PWR9, Class A4A, 4.871%, 09/11/2042 | 10,000,000 | 10,985,330 | 0.8 | % | ||||||||
| Commercial Mortgage Trust | ||||||||||||
| Series 2005-C6, Class A5A, 5.116%, 06/10/2044 | 9,413,000 | 10,387,528 | 0.8 | % | ||||||||
| Credit Suisse First Boston | ||||||||||||
| Mortgage Securities Corporation | ||||||||||||
| Series 2005-C5, Class A4, 5.100%, 08/15/2038 @ | 7,208,250 | 7,923,006 | 0.6 | % | ||||||||
| GE Capital Commercial Mortgage Corporation | ||||||||||||
| Series 2004-C3, Class A4, 5.189%, 07/10/2039 | 6,810,031 | 7,192,564 | 0.6 | % | ||||||||
| J.P. Morgan Chase Commercial | ||||||||||||
| Mortgage Securities Corp. | ||||||||||||
| Series 2003-CB7, Class A4, 4.879%, 01/12/2038 | 10,729,076 | 11,013,290 | 0.9 | % | ||||||||
| J.P. Morgan Chase Commercial Mortgage Trust | ||||||||||||
| Series 2005-CB12, Class A4, 4.895%, 09/12/2037 | 8,774,000 | 9,624,104 | 0.7 | % | ||||||||
| Morgan Stanley Capital I Trust | ||||||||||||
| Series 2005-HQ7, Class A4, 5.208%, 11/14/2042 | 9,650,000 | 10,658,666 | 0.8 | % | ||||||||
| Other Commercial Mortgage Backed Securities#~ | 2,387,118 | 0.2 | % | |||||||||
| Total Commercial Mortgage Backed Securities | ||||||||||||
| (Cost $69,893,911) | 70,171,606 | 5.4 | % | |||||||||
| Total Long-Term Investments | ||||||||||||
| (Cost $1,237,354,704) | 1,252,106,725 | 96.5 | % | |||||||||
The accompanying notes are in integral part of these financial statements.
Page 14
Baird Short-Term Bond Fund
Summary Schedule of Investments, December 31, 2012
Short-Term Investments
| Market | % of | |||||||||||
| Shares | Value | Net Assets | ||||||||||
| Money Market Mutual Funds | ||||||||||||
| Short-Term Investments Trust – | ||||||||||||
| Liquid Assets Portfolio, 0.15% « | 21,179,336 | $ | 21,179,336 | 1.7 | % | |||||||
| Total Short-Term Investments | ||||||||||||
| (Cost $21,179,336) | 21,179,336 | 1.7 | % | |||||||||
| Investments Purchased with Cash | ||||||||||||
| Proceeds from Securities Lending | ||||||||||||
| Principal | ||||||||||||
| Amount | ||||||||||||
| Commercial Paper | ||||||||||||
| Atlantic East Funding LLC, | ||||||||||||
| 0.562%, 03/25/2013†** | $ | 735,923 | 556,429 | 0.0 | % | |||||||
| Total Commercial Paper | ||||||||||||
| (Cost $735,923) | 556,429 | 0.0 | % | |||||||||
| Shares | ||||||||||||
| Investment Companies | ||||||||||||
| Mount Vernon Securities Lending | ||||||||||||
| Trust Prime Portfolio, 0.28%« | 83,738,364 | 83,738,364 | 6.5 | % | ||||||||
| Total Investment Companies | ||||||||||||
| (Cost $83,738,364) | 83,738,364 | 6.5 | % | |||||||||
| Total Investments Purchased With | ||||||||||||
| Cash Proceeds From Securities Lending | ||||||||||||
| (Cost $84,474,287) | 84,294,793 | 6.5 | % | |||||||||
| Total Investments | ||||||||||||
| (Cost $1,343,008,327) | 1,357,580,854 | 104.7 | % | |||||||||
| Asset Relating to Securities Lending Investments | ||||||||||||
Support Agreement**^a† | 179,494 | 0.0 | % | |||||||||
| Total | ||||||||||||
| (Cost $0) | 179,494 | 0.0 | % | |||||||||
| Liabilities in Excess of Other Assets | (60,601,832 | ) | (4.7 | %) | ||||||||
| TOTAL NET ASSETS | $ | 1,297,158,516 | 100.0 | % | ||||||||
The accompanying notes are in integral part of these financial statements.
Page 15
Baird Short-Term Bond Fund
Summary Schedule of Investments, December 31, 2012
Notes to Summary Schedule of Investments
| * | Restricted Security Deemed Liquid | |
| ** | Illiquid Security | |
| @ | This security or portion of this security is out on loan at December 31, 2012. | |
| f | Foreign Security | |
| ^ | Non-Income Producing | |
| « | 7-Day Yield | |
| † | Priced at Fair Value by the Valuation Committee as delegated by the Baird Funds’ Board of Directors. | |
| a | The Fund’s transfer agent and administrator and securities lending agent entered into a support agreement with the Fund to cover losses realized by the Fund on its investment in Atlantic East Funding, LLC (up to a certain amount), which investment was made by the Fund’s securities lending agent. | |
| # | Represents the aggregate value, by category, securities that are not among the 50 largest holdings and, in total for any issuer, represent 1% or less of net assets. | |
| ~ | Groupings contain, in aggregate, restricted securities totaling $236,301,164 representing 18.22% of net assets. |
Summary of Fair Value Exposure at December 31, 2012
The Fund has adopted authoritative fair valuation accounting standards which establish a definition of fair value and set out a hierarchy for measuring fair value. These standards require additional disclosures about the various inputs and valuation techniques used to develop the measurements of fair value and a discussion on changes in valuation techniques and related inputs during the period. These standards define fair value as the price that would be received to sell an asset or paid to transfer a liability in an orderly transaction between market participants at the measurement date.
The fair value hierarchy is organized into three levels based upon the assumptions (referred to as “inputs”) used in pricing the asset or liability. These standards state that “observable inputs” reflect the assumptions market participants would use in pricing the asset or liability based on market data obtained from independent sources and “unobservable inputs” reflect an entity’s own assumptions about the assumptions market participants would use in pricing the asset or liability. These inputs are summarized into three broad levels and described below:
Level 1 – | Unadjusted quoted prices in active markets for identical unrestricted securities. |
Level 2 – | Other significant observable inputs (including quoted prices for similar securities, quoted prices in inactive markets, dealer indications, interest rates, yield curves, prepayment speeds, credit risk, default rates, inputs corroborated by observable market data, etc.). |
Level 3 – | Significant unobservable inputs (including the Fund’s own assumptions about the factors that market participants would use in valuing the security) based on the best information available. |
The inputs or methodology used for valuing securities are not necessarily an indication of the risk associated with investing in those securities.
The accompanying notes are in integral part of these financial statements.
Page 16
Baird Short-Term Bond Fund
Summary Schedule of Investments, December 31, 2012
The following is a summary of the inputs used to value the Fund’s investments as of December 31, 2012:
| Level 1 | Level 2 | Level 3 | Total | |||||||||||||
| Fixed Income | ||||||||||||||||
| U.S. Treasury Securities | $ | — | $ | 91,109,813 | $ | — | $ | 91,109,813 | ||||||||
| Taxable Municipal Bonds | — | 36,162,538 | — | 36,162,538 | ||||||||||||
| Other Government Related Securities | — | 21,322,024 | — | 21,322,024 | ||||||||||||
| Corporate Debt Securities | — | 961,483,838 | — | 961,483,838 | ||||||||||||
| Residential Mortgage-Backed Securities – | ||||||||||||||||
| U.S. Government Agency Issues | — | 2,002,895 | — | 2,002,895 | ||||||||||||
| Residential Mortgage-Backed Securities – | ||||||||||||||||
| Non-U.S. Government Agency Issues | — | 12,848,217 | — | 12,848,217 | ||||||||||||
| Asset Backed Securities | — | 57,005,794 | — | 57,005,794 | ||||||||||||
| Commercial Mortgage-Backed Securities | — | 70,171,606 | — | 70,171,606 | ||||||||||||
| Total Fixed Income | — | 1,252,106,725 | — | 1,252,106,725 | ||||||||||||
| Short-Term Investments | ||||||||||||||||
| Money Market Mutual Funds | 21,179,336 | — | — | 21,179,336 | ||||||||||||
| Total Short-Term Investments | 21,179,336 | — | — | 21,179,336 | ||||||||||||
| Investments Purchased with Cash | ||||||||||||||||
| Proceeds from Securities Lending | ||||||||||||||||
| Commercial Paper | — | 556,429 | — | 556,429 | ||||||||||||
| Money Market Mutual Fund | 83,738,364 | — | — | 83,738,364 | ||||||||||||
| Total Investments Purchased with | ||||||||||||||||
| Cash Proceeds from Securities Lending | 83,738,364 | 556,429 | — | 84,294,793 | ||||||||||||
| Total Investments | $ | 104,917,700 | $ | 1,252,663,154 | $ | — | $ | 1,357,580,854 | ||||||||
| Asset Relating to | ||||||||||||||||
| Securities Lending Investments | $ | — | $ | 179,494 | $ | — | $ | 179,494 | ||||||||
Changes in valuation techniques may result in transfers into or out of current assigned levels within the hierarchy. There were no transfers between Level 1, Level 2 and Level 3 fair value measurements during the reporting period, as compared to their classification from the prior year’s annual report.
Page 17
Baird Intermediate Bond Fund
December 31, 2012
The Baird Intermediate Bond Fund seeks an annual rate of total return, before Fund expenses, greater than the annual rate of total return of the Barclays Intermediate U.S. Government/Credit Bond Index. The Barclays Intermediate U.S. Government/Credit Bond Index is an unmanaged, market value weighted index of investment grade, fixed-rate debt issues, including government and corporate securities, with maturities between one and ten years.
The Fund entered the year with a significant yield advantage over its benchmark and converted that advantage into strong absolute and relative returns versus its benchmark index in 2012. Our long-term commitment to duration neutrality was very important as well. The primary factors contributing to the Fund’s outperformance over its benchmark in 2012 are described below.
| • | The Fund’s overweight position to the corporate credit sector relative to the Fund’s benchmark positively impacted the Fund’s performance. Corporate bonds generally experienced favorable price returns relative to U.S. Treasuries of comparable maturity due to a significant narrowing of corporate bond spreads (the additional yield that investors demand above U.S. Treasury bonds for owning corporate debt) during the year. The narrowing was driven by generally solid corporate credit fundamentals and very strong investor demand. | |
| • | An overweight to the financial sub-sector in particular was an important contributor to the Fund’s relative outperformance, as financials significantly outperformed other investment grade corporate bonds. The financial sub-sector’s performance was driven by both strong and improving credit fundamentals and negative net supply (gross supply or issuance less maturities and early redemptions by issuers). | |
| • | The Fund’s underweight to U.S. Treasuries was a positive contributor to relative performance, as non-government “spread sectors” such as corporate, mortgage-backed, and asset-backed securities, outperformed equal-duration U.S. Treasuries for the year. | |
| • | Modest exposure to commercial mortgage-backed securities (CMBS) had an overall positive impact on the Fund’s performance for the year. As part of the risk management for the Fund’s exposure to this sector, the Fund holds short maturity, select super-senior issues with significant credit enhancement. | |
| • | The Fund’s modest exposure to non-U.S. Agency mortgage-backed securities was a positive contributor as prices for those securities generally rose during 2012. The Fund also benefited from relatively high coupon payments, an important consideration in the current low interest rate environment. |
We are pleased with the Fund’s performance in 2012 and are confident in the individual issues and the overall structure of the Fund. The Fund’s current yield advantage over the benchmark index is meaningful and we are optimistic regarding the Fund’s relative performance as we head into 2013.
Page 18
Baird Intermediate Bond Fund
December 31, 2012
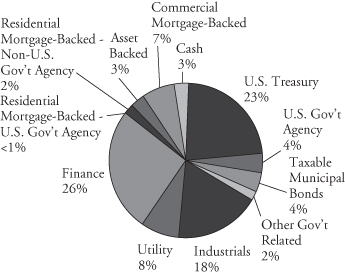
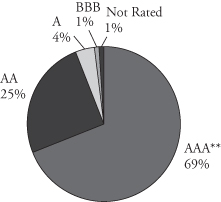
Portfolio Characteristics
| Quality Distribution* | ||
| Net Assets: | $894,208,373 | |
 | SEC 30-Day | |
Yield:** | ||
| Institutional Class: | 1.71% | |
| Investor Class: | 1.46% | |
| Average | ||
| Effective | ||
| Duration: | 3.89 years | |
| Average | ||
| Effective | ||
| Maturity: | 4.44 years | |
| Annualized | ||
| Expense | ||
| Sector Weightings* | Ratio: | |
| Institutional Class: | 0.30% | |
 | Investor Class: | 0.55%*** |
| Portfolio | ||
| Turnover | ||
| Rate: | 45.1% | |
| Total | ||
| Number of | ||
| Holdings: | 420 | |
| * | Percentages shown are based on the Fund’s total investments (less investments purchased with cash proceeds from securities lending). | |
| ** | SEC yields are based on SEC guidelines and are calculated for the 30 days ended December 31, 2012. | |
| *** | Includes 0.25% 12b-1 fee. |
Page 19
Baird Intermediate Bond Fund
Institutional Class
Value of a $25,000 Investment
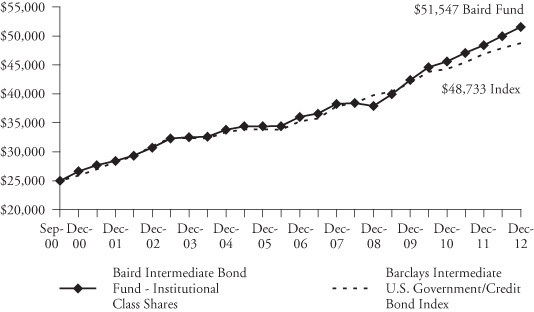
Growth of a hypothetical investment of $25,000 made on the Fund’s inception date (9/29/00), assuming reinvestment of all distributions.
Investor Class
Value of a $10,000 Investment
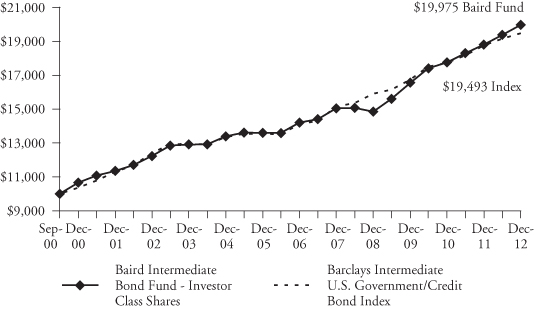
Growth of a hypothetical investment of $10,000 made on the Fund’s inception date (9/29/00), assuming reinvestment of all distributions.
Page 20
Baird Intermediate Bond Fund
December 31, 2012
Average Annual Total Returns
| One | Five | Ten | Since | |
| For the Periods Ended December 31, 2012 | Year | Years | Years | Inception(1) |
| Institutional Class Shares | 6.52% | 6.13% | 5.31% | 6.08% |
| Investor Class Shares | 6.20% | 5.83% | 5.02% | 5.81% |
| Barclays Intermediate | ||||
U.S. Government/Credit Bond Index(2) | 3.89% | 5.18% | 4.62% | 5.60% |
| (1) | For the period from September 29, 2000 (commencement of operations) through December 31, 2012. | |
| (2) | The Barclays Intermediate U.S. Government/Credit Bond Index is an unmanaged, market value weighted index of investment grade, fixed-rate debt issues, including government and corporate securities, with maturities between one and ten years. This index does not reflect any deduction for fees, expenses or taxes. A direct investment in an index is not possible. |
The returns shown in the table above and line graphs on the previous page reflect reinvestment of dividends and/or capital gains distributions in additional shares. The returns do not reflect the deduction of taxes that a shareholder would pay on Fund distributions or the redemption of Fund shares. The returns reflect the actual performance for each period and do not include the impact of trades executed on the last business day of the period that were recorded on the first business day of the next period.
The Fund’s gross expense ratio for each Class, as reflected in the Fund’s current prospectus, is set forth under “Portfolio Characteristics”.
The Fund may invest in U.S. dollar denominated foreign securities which involve additional risks such as currency rate fluctuations, political and economic instability, and different and sometimes less strict financial reporting standards and regulation. The Fund may also invest in mortgage- and asset-backed securities, which include interest rate and prepayment risks more pronounced than those of other fixed income securities.
Past performance does not guarantee future results. Investment return and principal value will fluctuate so that an investor’s shares, when redeemed, may be worth more or less than their original cost.
For information about the performance of the Fund as of the most recent month-end, please call 1-866-44BAIRD or visit www.bairdfunds.com. Mutual fund performance changes over time and current performance may be lower or higher than that stated.
Page 21
Baird Intermediate Bond Fund
Summary Schedule of Investments, December 31, 2012
This schedule summarizes the Fund’s holdings by asset type. Details are reported for each of the Fund’s 50 largest individual holdings and for investments that, in total for any issuer, represent more than 1% of the Fund’s net assets. The total value of smaller holdings is reported as a single amount within each category.
The Fund reports a complete list of its holdings in regulatory filings four times in each fiscal year, at the quarter end. For the second and fourth fiscal quarters, the complete listing of the Fund’s holdings is available electronically in the Fund’s Form N-CSR at http://www.rwbaird.com/baird-funds/prospectus-applications/prospectus-applications.aspx and on the Securities and Exchange Commission’s website (www.sec.gov) or you can have it mailed to you without charge by calling 1-866-44BAIRD. For the first and third fiscal quarters, the Fund files the lists with the SEC on Form N-Q. Shareholders can look up the Fund’s Forms N-CSR and N-Q on the SEC’s website (www.sec.gov).
Long-Term Investments
| Principal | Market | % of | ||||||||||
| Amount | Value | Net Assets | ||||||||||
| U.S. Treasury Securities | ||||||||||||
| U.S. Treasury Bonds | ||||||||||||
| 2.375%, 07/31/2017 | $ | 35,475,000 | $ | 38,254,786 | 4.3 | % | ||||||
| 3.875%, 05/15/2018@ | 11,200,000 | 13,015,621 | 1.5 | % | ||||||||
| 9.125%, 05/15/2018 | 13,950,000 | 20,079,281 | 2.2 | % | ||||||||
| 2.250%, 07/31/2018 | 97,800,000 | 105,341,260 | 11.8 | % | ||||||||
| 2.625%, 08/15/2020 | 6,050,000 | 6,643,656 | 0.7 | % | ||||||||
| 7.875%, 02/15/2021 | 10,000,000 | 15,050,000 | 1.7 | % | ||||||||
| 6.250%, 08/15/2023 | 7,500,000 | 10,753,125 | 1.2 | % | ||||||||
| Total U.S. Treasury Securities | ||||||||||||
| (Cost $202,906,402) | 209,137,729 | 23.4 | % | |||||||||
| U.S. Government Agency Securities | ||||||||||||
| Federal Home Loan Mortgage Corporation (FHLMC) | ||||||||||||
| 1.250%, 05/12/2017 | 5,050,000 | 5,166,998 | 0.6 | % | ||||||||
| 1.000%, 06/29/2017@ | 9,200,000 | 9,314,301 | 1.1 | % | ||||||||
| Series 1, 1.000%, 07/28/2017 | 5,500,000 | 5,555,258 | 0.6 | % | ||||||||
| Federal National Mortgage Association (FNMA) | ||||||||||||
| 1.375%, 11/15/2016@ | 6,700,000 | 6,902,273 | 0.8 | % | ||||||||
| 0.875%, 08/28/2017 | 4,625,000 | 4,638,343 | 0.5 | % | ||||||||
Other U.S. Government Agency Securities# | 2,168,502 | 0.2 | % | |||||||||
| Total U.S. Government Agency Securities | ||||||||||||
| (Cost $33,143,712) | 33,745,675 | 3.8 | % | |||||||||
| Taxable Municipal Bonds | ||||||||||||
| California Qualified School Construction Bonds | ||||||||||||
| 5.955%, 03/01/2019 | 3,375,000 | 3,812,906 | 0.4 | % | ||||||||
| State of Illinois | ||||||||||||
| 3.636%, 02/01/2014 | 5,150,000 | 5,266,287 | 0.6 | % | ||||||||
Other Municipal Bonds# | 26,402,839 | 2.9 | % | |||||||||
| Total Municipal Bonds | ||||||||||||
| (Cost $32,797,153) | 35,482,032 | 3.9 | % | |||||||||
| Other Government Related Securities | ||||||||||||
| KFW | ||||||||||||
4.875%, 06/17/2019 f | 3,250,000 | 3,956,225 | 0.4 | % | ||||||||
The accompanying notes are in integral part of these financial statements.
Page 22
Baird Intermediate Bond Fund
Summary Schedule of Investments, December 31, 2012
Long-Term Investments (cont.)
| Principal | Market | % of | ||||||||||
| Amount | Value | Net Assets | ||||||||||
| Petrobras International Finance Company | ||||||||||||
| 3.875%, 01/27/2016 | $ | 4,175,000 | $ | 4,404,638 | 0.5 | % | ||||||
Other Government Related Securities#~ | 9,322,264 | 1.1 | % | |||||||||
| Total Other Government Related Securities | ||||||||||||
| (Cost $15,752,870) | 17,683,127 | 2.0 | % | |||||||||
| Corporate Bonds | ||||||||||||
| Industrials | ||||||||||||
| Bunge Limited Finance Corporation | ||||||||||||
| 5.350%, 04/15/2014 | 3,562,000 | 3,748,172 | 0.4 | % | ||||||||
| ConAgra Foods, Inc. | ||||||||||||
| 5.875%, 04/15/2014 | 3,650,000 | 3,883,501 | 0.4 | % | ||||||||
| Cox Communications, Inc. | ||||||||||||
| 3.250%, 12/15/2022 | ||||||||||||
| (Acquired 11/26/2012, Cost $3,594,456)*@ | 3,600,000 | 3,712,529 | 0.4 | % | ||||||||
| Ecolab Inc. | ||||||||||||
| 1.450%, 12/08/2017 | 4,000,000 | 3,981,828 | 0.4 | % | ||||||||
| Glencore Funding LLC | ||||||||||||
| 6.000%, 04/15/2014 (Acquired 03/31/2004 | ||||||||||||
| through 02/02/2010, Cost $3,461,876)* | 3,456,000 | 3,650,072 | 0.4 | % | ||||||||
| Hutchison Whampoa International Ltd. | ||||||||||||
| 7.625%, 04/09/2019 (Acquired 10/16/2009 | ||||||||||||
through 09/19/2011, Cost $3,117,344)* f | 2,800,000 | 3,609,385 | 0.4 | % | ||||||||
| Petrohawk Energy Corporation | ||||||||||||
| 7.250%, 08/15/2018 | 4,000,000 | 4,515,788 | 0.5 | % | ||||||||
| TCI Communications, Inc. | ||||||||||||
| 8.750%, 08/01/2015 | 3,498,000 | 4,174,146 | 0.5 | % | ||||||||
Other Industrials#~ | 132,325,931 | 14.9 | % | |||||||||
| Total Industrials | ||||||||||||
| (Cost $154,568,174) | 163,601,352 | 18.3 | % | |||||||||
| Utility | ||||||||||||
| Ameren Corporation | ||||||||||||
| 8.875%, 05/15/2014 | 4,500,000 | 4,924,440 | 0.5 | % | ||||||||
| Enterprise Products Operating LLC | ||||||||||||
| Series O, 9.750%, 01/31/2014 | 3,824,000 | 4,183,835 | 0.5 | % | ||||||||
| National Grid PLC | ||||||||||||
6.300%, 08/01/2016 f | 3,925,000 | 4,554,123 | 0.5 | % | ||||||||
| Nustar Pipeline Operating Partnership L.P. | ||||||||||||
| 5.875%, 06/01/2013 | 4,000,000 | 4,044,452 | 0.4 | % | ||||||||
Other Utility#~ | 57,938,076 | 6.5 | % | |||||||||
| Total Utility | ||||||||||||
| (Cost $72,505,223) | 75,644,926 | 8.4 | % | |||||||||
The accompanying notes are in integral part of these financial statements.
Page 23
Baird Intermediate Bond Fund
Summary Schedule of Investments, December 31, 2012
Long-Term Investments (cont.)
| Principal | Market | % of | ||||||||||
| Amount | Value | Net Assets | ||||||||||
| Finance | ||||||||||||
| Berkshire Hathaway Finance Corporation | ||||||||||||
| 1.600%, 05/15/2017 | $ | 3,800,000 | $ | 3,873,260 | 0.4 | % | ||||||
| Commonwealth Bank of Australia | ||||||||||||
| 5.000%, 10/15/2019 | ||||||||||||
(Acquired 03/02/2012, Cost $4,304,778)* f | 4,000,000 | 4,648,404 | 0.5 | % | ||||||||
| Deutsche Bank Aktiengesellschaft | ||||||||||||
3.250%, 01/11/2016 f | 4,250,000 | 4,497,350 | 0.5 | % | ||||||||
| Invesco Finance PLC | ||||||||||||
3.125%, 11/30/2022 f | 4,225,000 | 4,267,634 | 0.5 | % | ||||||||
| Irish Life & Permanent Group Holdings PLC | ||||||||||||
| 3.600%, 01/14/2013 (Acquired 01/07/2010 | ||||||||||||
through 08/10/2012, Cost $4,072,768)* f | 4,075,000 | 4,075,029 | 0.5 | % | ||||||||
| MassMutual Global Funding II | ||||||||||||
| 2.000%, 04/05/2017 | ||||||||||||
| (Acquired 03/29/2012, Cost $3,783,470)* | 3,800,000 | 3,915,170 | 0.4 | % | ||||||||
| SLM Corporation | ||||||||||||
| 5.000%, 10/01/2013 | 4,000,000 | 4,095,000 | 0.5 | % | ||||||||
| Talent Yield Investments Ltd | ||||||||||||
| 4.500%, 04/25/2022 | ||||||||||||
(Acquired 04/18/2012, Cost $3,774,008)*@ f | 3,800,000 | 4,132,325 | 0.5 | % | ||||||||
| Willis Group Holdings Limited | ||||||||||||
5.750%, 03/15/2021 f | 3,250,000 | 3,698,607 | 0.4 | % | ||||||||
Other Finance#~ | 198,937,701 | 22.2 | % | |||||||||
| Total Finance | ||||||||||||
| (Cost $223,736,500) | 236,140,480 | 26.4 | % | |||||||||
| Residential Mortgage-Backed Securities | ||||||||||||
| U.S. Government Agency Issues | ||||||||||||
Other U.S. Government Agency Issues# | 3,327,156 | 0.4 | % | |||||||||
| Total U.S. Government Agency Issues | ||||||||||||
| (Cost $3,211,129) | 3,327,156 | 0.4 | % | |||||||||
| Non-U.S. Government Agency Issues | ||||||||||||
Other Non-U.S. Government Agency Issues#~ | 14,284,553 | 1.6 | % | |||||||||
| Total Non-U.S. Government Agency Issues | ||||||||||||
| (Cost $14,317,595) | 14,284,553 | 1.6 | % | |||||||||
| Asset Backed Securities | ||||||||||||
| Citigroup Mortgage Loan Trust, Inc. | ||||||||||||
| Series 2006-WFH3, Class A3, 0.360%, 10/25/2036 | 3,923,528 | 3,877,035 | 0.4 | % | ||||||||
| Master Credit Card Trust | ||||||||||||
| Series 2012-2A, Class A, 0.780%, 04/21/2017 | ||||||||||||
(Acquired 10/24/2012, Cost $5,998,817)* f | 6,000,000 | 6,012,762 | 0.7 | % | ||||||||
The accompanying notes are in integral part of these financial statements.
Page 24
Baird Intermediate Bond Fund
Summary Schedule of Investments, December 31, 2012
Long-Term Investments (cont.)
| Principal | Market | % of | ||||||||||
| Amount | Value | Net Assets | ||||||||||
| Springleaf Mortgage Loan Trust | ||||||||||||
| Series 2012-1A, Class A, 2.667%, 09/25/2057 | ||||||||||||
| (Acquired 04/11/2012, Cost $3,997,562)* | $ | 3,997,608 | $ | 4,044,724 | 0.5 | % | ||||||
Other Asset Backed Securities# | 10,973,398 | 1.2 | % | |||||||||
| Total Asset Backed Securities | ||||||||||||
| (Cost $24,909,800) | 24,907,919 | 2.8 | % | |||||||||
| Commercial Mortgage Backed Securities | ||||||||||||
| Bear Stearns Commercial Mortgage Securities | ||||||||||||
| Series 2005-PWR9, Class A4A, 4.871%, 09/11/2042 | 6,790,000 | 7,459,039 | 0.8 | % | ||||||||
| Citigroup Deutsche Bank | ||||||||||||
| Series 2005-CD1, Class A4, 5.219%, 07/15/2044 | 5,600,000 | 6,214,678 | 0.7 | % | ||||||||
| Credit Suisse First Boston | ||||||||||||
| Mortgage Securities Corporation | ||||||||||||
| Series 2005-C5, Class A4, 5.100%, 08/15/2038@ | 4,000,000 | 4,396,632 | 0.5 | % | ||||||||
| Federal Home Loan Mortgage Corporation (FHLMC) | ||||||||||||
| Multifamily Structured Pass Through Certificates | ||||||||||||
| Series K708, Class A2, 2.130%, 01/25/2019 | 8,300,000 | 8,648,907 | 1.0 | % | ||||||||
| Series K-710, Class A2, 1.883%, 05/25/2019 | 7,325,000 | 7,516,798 | 0.8 | % | ||||||||
| Series K-711, Class A2, 1.730%, 07/25/2019 | 4,950,000 | 5,027,022 | 0.6 | % | ||||||||
| Series K705-K706, Class A2, | ||||||||||||
| 2.303%-2.323%, 09/25/2018-10/25/2018 | 6,375,000 | 6,718,835 | 0.8 | % | ||||||||
| J.P. Morgan Chase Commercial Mortgage Trust | ||||||||||||
| Series 2005-CB12, Class A4, 4.895%, 09/12/2037 | 5,000,000 | 5,484,445 | 0.6 | % | ||||||||
| Wachovia Bank Commercial Mortgage Trust | ||||||||||||
| Series 2005-C22, Class A4, 5.293%, 12/15/2044 | 5,000,000 | 5,575,575 | 0.6 | % | ||||||||
Other Commercial Mortgage Backed Securities# | 3,477,801 | 0.4 | % | |||||||||
| Total Commercial Mortgage Backed Securities | ||||||||||||
| (Cost $58,562,347) | 60,519,732 | 6.8 | % | |||||||||
| Total Long-Term Investments | ||||||||||||
| (Cost $836,410,905) | 874,474,681 | 97.8 | % | |||||||||
| Short-Term Investments | ||||||||||||
| Shares | ||||||||||||
| Money Market Mutual Funds | ||||||||||||
| Dreyfus Institutional Cash Advantage Fund, 0.11%« | 8,092,000 | 8,092,000 | 0.9 | % | ||||||||
| Short-Term Investments Trust – | ||||||||||||
| Liquid Assets Portfolio, 0.15%« | 17,000,000 | 17,000,000 | 1.9 | % | ||||||||
| Total Short-Term Investments | ||||||||||||
| (Cost $25,092,000) | 25,092,000 | 2.8 | % | |||||||||
The accompanying notes are in integral part of these financial statements.
Page 25
Baird Intermediate Bond Fund
Summary Schedule of Investments, December 31, 2012
Investments Purchased with Cash
Proceeds from Securities Lending
| Principal | Market | % of | ||||||||||
| Amount | Value | Net Assets | ||||||||||
| Commercial Paper | ||||||||||||
| Atlantic East Funding LLC, 0.562%, 03/25/2013†** | $ | 1,859,566 | $ | 1,406,010 | 0.1 | % | ||||||
| Total Commercial Paper | ||||||||||||
| (Cost $1,859,566) | 1,406,010 | 0.1 | % | |||||||||
| Shares | ||||||||||||
| Investment Companies | ||||||||||||
| Mount Vernon Securities Lending | ||||||||||||
| Trust Prime Portfolio, 0.28%« | 78,452,055 | 78,452,055 | 8.8 | % | ||||||||
| Total Investment Companies | ||||||||||||
| (Cost $78,452,055) | 78,452,055 | 8.8 | % | |||||||||
| Total Investments Purchased With | ||||||||||||
| Cash Proceeds From Securities Lending | ||||||||||||
| (Cost $80,311,621) | 79,858,065 | 8.9 | % | |||||||||
| Total Investments | ||||||||||||
| (Cost $941,814,526) | 979,424,746 | 109.5 | % | |||||||||
| Asset Relating to Securities Lending Investments | ||||||||||||
Support Agreement**^a† | 453,556 | 0.1 | % | |||||||||
| Total | ||||||||||||
| (Cost $0) | 453,556 | 0.1 | % | |||||||||
| Liabilities in Excess of Other Assets | (85,669,929 | ) | (9.6 | %) | ||||||||
| TOTAL NET ASSETS | $ | 894,208,373 | 100.0 | % | ||||||||
Notes to Summary Schedule of Investments
| * | Restricted Security Deemed Liquid | |
| ** | Illiquid Security | |
| @ | This security or portion of this security is out on loan at December 31, 2012. | |
| f | Foreign Security | |
| ^ | Non-Income Producing | |
| « | 7-Day Yield | |
| † | Priced at Fair Value by the Valuation Committee as delegated by the Baird Funds’ Board of Directors. | |
| a | The Fund’s transfer agent and administrator and securities lending agent entered into a support agreement with the Fund to cover losses realized by the Fund on its investment in Atlantic East Funding, LLC (up to a certain amount), which investment was made by the Fund’s securities lending agent. | |
| # | Represents the aggregate value, by category, securities that are not among the 50 largest holdings and, in total for any issuer, represent 1% or less of net assets. | |
| ~ | Groupings contain, in aggregate, restricted securities totaling $84,566,616 representing 9.45% of net assets. |
The accompanying notes are in integral part of these financial statements.
Page 26
Baird Intermediate Bond Fund
Summary Schedule of Investments, December 31, 2012
Summary of Fair Value Exposure at December 31, 2012
The Fund has adopted authoritative fair valuation accounting standards which establish a definition of fair value and set out a hierarchy for measuring fair value. These standards require additional disclosures about the various inputs and valuation techniques used to develop the measurements of fair value and a discussion on changes in valuation techniques and related inputs during the period. These standards define fair value as the price that would be received to sell an asset or paid to transfer a liability in an orderly transaction between market participants at the measurement date.
The fair value hierarchy is organized into three levels based upon the assumptions (referred to as “inputs”) used in pricing the asset or liability. These standards state that “observable inputs” reflect the assumptions market participants would use in pricing the asset or liability based on market data obtained from independent sources and “unobservable inputs” reflect an entity’s own assumptions about the assumptions market participants would use in pricing the asset or liability. These inputs are summarized into three broad levels and described below:
Level 1 – | Uadjusted quoted prices in active markets for identical unrestricted securities. |
Level 2 – | Oher significant observable inputs (including quoted prices for similar securities, quoted prices in inactive markets, dealer indications, interest rates, yield curves, prepayment speeds, credit risk, default rates, inputs corroborated by observable market data, etc.). |
Level 3 – | Significant unobservable inputs (including the Fund’s own assumptions about the factors that market participants would use in valuing the security) based on the best information available. |
The inputs or methodology used for valuing securities are not necessarily an indication of the risk associated with investing in those securities.
The accompanying notes are in integral part of these financial statements.
Page 27
Baird Intermediate Bond Fund
Summary Schedule of Investments, December 31, 2012
The following is a summary of the inputs used to value the Fund’s investments as of December 31, 2012:
| Level 1 | Level 2 | Level 3 | Total | |||||||||||||
| Fixed Income | ||||||||||||||||
| U.S. Treasury Securities | $ | — | $ | 209,137,729 | $ | — | $ | 209,137,729 | ||||||||
| U.S. Government Agency Securities | — | 33,745,675 | — | 33,745,675 | ||||||||||||
| Taxable Municipal Bonds | — | 35,482,032 | — | 35,482,032 | ||||||||||||
| Other Government Related Securities | — | 17,683,127 | — | 17,683,127 | ||||||||||||
| Corporate Debt Securities | — | 475,385,297 | 1,461 | 475,386,758 | ||||||||||||
| Residential Mortgage-Backed Securities – | ||||||||||||||||
| U.S. Government Agency Issues | — | 3,327,156 | — | 3,327,156 | ||||||||||||
| Residential Mortgage-Backed Securities – | ||||||||||||||||
| Non-U.S. Government Agency Issues | — | 14,284,553 | — | 14,284,553 | ||||||||||||
| Asset Backed Securities | — | 24,907,919 | — | 24,907,919 | ||||||||||||
| Commercial Mortgage-Backed Securities | — | 60,519,732 | — | 60,519,732 | ||||||||||||
| Total Fixed Income | — | 874,473,220 | 1,461 | 874,474,681 | ||||||||||||
| Short-Term Investments | ||||||||||||||||
| Money Market Mutual Funds | 25,092,000 | — | — | 25,092,000 | ||||||||||||
| Total Short-Term Investments | 25,092,000 | — | — | 25,092,000 | ||||||||||||
| Investments Purchased with Cash | ||||||||||||||||
| Proceeds from Securities Lending | ||||||||||||||||
| Commercial Paper | — | 1,406,010 | — | 1,406,010 | ||||||||||||
| Money Market Mutual Fund | 78,452,055 | — | — | 78,452,055 | ||||||||||||
| Total Investments Purchased with | ||||||||||||||||
| Cash Proceeds from Securities Lending | 78,452,055 | 1,406,010 | — | 79,858,065 | ||||||||||||
| Total Investments | $ | 103,544,055 | $ | 875,879,230 | $ | 1,461 | $ | 979,424,746 | ||||||||
| Asset Relating to Securities | ||||||||||||||||
| Lending Investments | $ | — | $ | 453,556 | $ | — | $ | 453,556 | ||||||||
Changes in valuation techniques may result in transfers into or out of current assigned levels within the hierarchy. There were no transfers between Level 1, Level 2 and Level 3 fair value measurements during the reporting period, as compared to their classification from the prior year’s annual report. One security that is priced at fair value by the Valuation Committee instead of the Fund’s pricing vendor is valued using level 3 inputs.
Level 3 Reconciliation Disclosure
Following is a reconciliation of Level 3 assets for which significant unobservable inputs were used to determine fair value.
| Description | Investments in Securities | |||
| Balance as of December 31, 2011 | $ | 1,461 | ||
| Accrued discounts/premiums | — | |||
| Realized gain (loss) | — | |||
| Change in unrealized appreciation (depreciation) | — | |||
| Purchases | — | |||
| Sales | — | |||
| Transfers in and/or out of Level 3* | — | |||
| Balance as of December 31, 2012 | $ | 1,461 | ||
* Transfers between levels are recognized at the end of the reporting period.
The accompanying notes are in integral part of these financial statements.
Page 28
Baird Intermediate Municipal Bond Fund
December 31, 2012
The Baird Intermediate Municipal Bond Fund seeks current income that is substantially exempt from federal income tax. A secondary objective is to provide total return with relatively low volatility of principal. The Fund strives to achieve an annual rate of return, before Fund expenses, greater than the annual rate of the total return of the Barclays 7-Year General Obligation Bond Index. The Barclays 7-Year General Obligation Bond Index is an unmanaged, market value weighted index consisting of investment grade state and local general obligation bonds that have been issued as part of an offering of at least $50 million; have a minimum amount outstanding of at least $5 million; have been issued within the last five years; and have a maturity of six to eight years.
The Fund delivered solid positive returns in 2012, although its focus on high-quality, intermediate-maturity issues limited its participation in the broader market’s rally, which was driven by strong performance from longer- and lower-quality issues.
Even though rating downgrades outpaced upgrades approximately four to one in 2012, the strong performance of lower-quality and longer issues was the result of strong demand from investors searching for additional yield amidst very limited net new supply. We remain concerned that the persistent economic challenges currently faced by many municipalities could result in continued downgrades and associated price declines in 2013. We continue to emphasize high-quality, intermediate holdings.
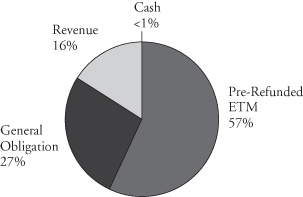
The Fund had a very broadly diversified portfolio at year end, with 57% of its investments in pre-refunded bonds. Pre-refunded municipal bonds are generally regarded as the safest municipal bonds available as their interest and principal payments are paid from an escrow account which holds U.S. Treasury and/or U.S. Agency securities.
With its focus on high-quality holdings and intermediate duration, we believe the Fund is well-positioned for the uncertain environment for municipal bonds as we enter 2013.
Page 29
Baird Intermediate Municipal Bond Fund
December 31, 2012
Portfolio Characteristics
| Quality Distribution* | Net Assets: | $1,221,646,265 |
| SEC 30-Day | ||
 | Yield:*** | |
| Institutional Class: | 1.42% | |
| Investor Class: | 1.17% | |
| Average | ||
| Effective | ||
| Duration: | 4.92 years | |
| Average | ||
| Effective | ||
| Maturity: | 5.54 years | |
| Annualized | ||
| Expense | ||
| Ratio: | ||
| Institutional Class: | 0.30% | |
| Sector Weightings* | Investor Class: | 0.55%**** |
 | Portfolio | |
| Turnover | ||
| Rate: | 5.1% | |
| Total | ||
| Number of | ||
| Holdings: | 315 | |
| * | Percentages shown are based on the Fund’s total investments. | |
| ** | Includes pre-refunded and escrowed-to-maturity (ETM) bonds. | |
| *** | SEC yields are based on SEC guidelines and are calculated for the 30 days ended December 31, 2012. | |
| **** | Includes 0.25% 12b-1 fee. |
Page 30
Baird Intermediate Municipal Bond Fund
Institutional Class
Value of a $25,000 Investment
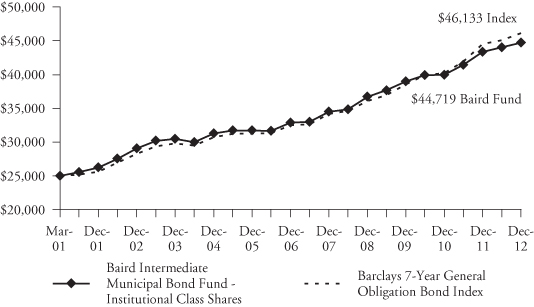
Growth of a hypothetical investment of $25,000 made on the Fund’s inception date (3/30/01), assuming reinvestment of all distributions.
Investor Class
Value of a $10,000 Investment
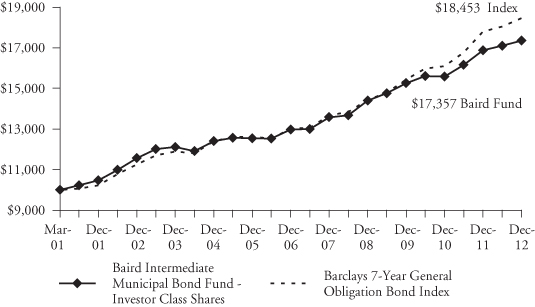
Growth of a hypothetical investment of $10,000 made on the Fund’s inception date (3/30/01), assuming reinvestment of all distributions.
Page 31
Baird Intermediate Municipal Bond Fund
December 31, 2012
Average Annual Total Returns
| One | Five | Ten | Since | |
| For the Periods Ended December 31, 2012 | Year | Years | Years | Inception(1) |
| Institutional Class Shares | 3.12% | 5.31% | 4.40% | 5.07% |
| Investor Class Shares | 2.88% | 5.03% | 4.14% | 4.80% |
Barclays 7-Year General Obligation Bond Index(2) | 3.66% | 6.14% | 5.07% | 5.35% |
| (1) | For the period from March 30, 2001 (commencement of operations) through December 31, 2012. |
| (2) | The Barclays 7-Year General Obligation Bond Index is an unmanaged, market value weighted index comprised of investment grade state and local general obligation bonds that have been issued as part of an offering of at least $50 million, have a minimum amount outstanding of at least $5 million, have been issued within the last five years and have a maturity of six to eight years. This index does not reflect any deduction for fees, expenses or taxes. A direct investment in an index is not possible. |
The returns shown in the table above and line graphs on the previous page reflect reinvestment of dividends and/or capital gains distributions in additional shares. The returns do not reflect the deduction of taxes that a shareholder would pay on Fund distributions or the redemption of Fund shares. The returns reflect the actual performance for each period and do not include the impact of trades executed on the last business day of the period that were recorded on the first business day of the next period.
The Fund’s gross expense ratio for each Class, as reflected in the Fund’s current prospectus, is set forth under “Portfolio Characteristics”.
The Fund may invest up to 25% of its total assets in municipal obligations issued by persons in the same state. As a result, changes in economic, business or political conditions of a particular state may have a disproportionate impact on the Fund’s share price. Municipal securities investments are not appropriate for all investors, especially those taxed at lower rates. The Fund may also invest in U.S. dollar denominated foreign securities which involve additional risks such as currency rate fluctuations, political and economic instability, and different and sometimes less strict financial reporting standards and regulation.
Past performance does not guarantee future results. Investment return and principal value will fluctuate so that an investor’s shares, when redeemed, may be worth more or less than their original cost.
For information about the performance of the Fund as of the most recent month-end, please call 1-866-44BAIRD or visit www.bairdfunds.com. Mutual fund performance changes over time and current performance may be lower or higher than that stated.
Page 32
Baird Intermediate Municipal Bond Fund
Summary Schedule of Investments, December 31, 2012
This schedule summarizes the Fund’s holdings by asset type. Details are reported for each of the Fund’s 50 largest individual holdings and for investments that, in total for any issuer, represent more than 1% of the Fund’s net assets. The total value of smaller holdings is reported as a single amount within each category.
The Fund reports a complete list of its holdings in regulatory filings four times in each fiscal year, at the quarter end. For the second and fourth fiscal quarters, the complete listing of the Fund’s holdings is available electronically in the Fund’s Form N-CSR at http://www.rwbaird.com/baird-funds/prospectus-applications/prospectus-applications.aspx and on the Securities and Exchange Commission’s website (www.sec.gov) or you can have it mailed to you without charge by calling 1-866-44BAIRD. For the first and third fiscal quarters, the Fund files the lists with the SEC on Form N-Q. Shareholders can look up the Fund’s Forms N-CSR and N-Q on the SEC’s website (www.sec.gov).
Long-Term Investments
| Principal | Market | % of | ||||||||||
| Amount | Value | Net Assets | ||||||||||
| Municipal Bonds | ||||||||||||
| Alabama | ||||||||||||
| Montgomery Alabama Special Care Facility Revenue | ||||||||||||
| 5.000%, 11/15/2021 (Pre-refunded to 11/15/2014) | $ | 11,385,000 | $ | 12,372,079 | 1.0 | % | ||||||
| 5.000%-5.250%, 11/15/2015-11/15/2029 | ||||||||||||
| (Pre-refunded to 11/15/2014) | 5,525,000 | 6,019,490 | 0.5 | % | ||||||||
Other Alabama# | 3,554,417 | 0.3 | % | |||||||||
| Total Alabama | ||||||||||||
| (Cost $21,139,591) | 21,945,986 | 1.8 | % | |||||||||
| Alaska | ||||||||||||
Other Alaska# | 1,078,520 | 0.1 | % | |||||||||
| Total Alaska | ||||||||||||
| (Cost $1,021,871) | 1,078,520 | 0.1 | % | |||||||||
| Arizona | ||||||||||||
Other Arizona# | 15,397,409 | 1.3 | % | |||||||||
| Total Arizona | ||||||||||||
| (Cost $14,871,588) | 15,397,409 | 1.3 | % | |||||||||
| California | ||||||||||||
| San Joaquin Hills California Transportation | ||||||||||||
| Corridor Agency Toll Road Revenue | ||||||||||||
| 0.000%, 01/01/2020 (ETM)^ | 6,865,000 | 6,192,505 | 0.5 | % | ||||||||
| 0.000%, 01/01/2023 (ETM)^ | 14,000,000 | 11,333,840 | 0.9 | % | ||||||||
| San Marcos California Public | ||||||||||||
| Facilities Authority Revenue | ||||||||||||
| 0.000%, 09/01/2019 (ETM)^ | 17,295,000 | 15,523,127 | 1.3 | % | ||||||||
Other California# | 26,905,028 | 2.2 | % | |||||||||
| Total California | ||||||||||||
| (Cost $53,693,641) | 59,954,500 | 4.9 | % | |||||||||
| Colorado | ||||||||||||
| Colorado Springs Colorado Utilities Revenue Bonds | ||||||||||||
| 5.875%, 11/15/2017 (ETM) | 7,410,000 | 8,300,534 | 0.7 | % | ||||||||
The accompanying notes are in integral part of these financial statements.
Page 33
Baird Intermediate Municipal Bond Fund
Summary Schedule of Investments, December 31, 2012
Long-Term Investments (cont.)
| Principal | Market | % of | ||||||||||
| Amount | Value | Net Assets | ||||||||||
| Dawson Ridge Metropolitan District No. 1 Colorado | ||||||||||||
| 0.000%, 10/01/2022 (ETM)^ | $ | 16,250,000 | $ | 13,117,975 | 1.1 | % | ||||||
| 0.000%, 10/01/2022 (ETM)^ | 15,795,000 | 12,750,672 | 1.0 | % | ||||||||
| Denver Colorado Health & | ||||||||||||
| Hospital Authority Healthcare Revenue | ||||||||||||
| 6.250%, 12/01/2033 (Pre-refunded to 12/01/2014) | 7,975,000 | 8,859,348 | 0.7 | % | ||||||||
| Regional Transportation District | ||||||||||||
| Colorado Sales Tax Revenue | ||||||||||||
| 5.000%, 11/01/2036 (Pre-refunded to 11/01/2016) | 6,785,000 | 7,900,997 | 0.6 | % | ||||||||
Other Colorado# | 15,701,103 | 1.3 | % | |||||||||
| Total Colorado | ||||||||||||
| (Cost $62,852,847) | 66,630,629 | 5.4 | % | |||||||||
| Delaware | ||||||||||||
Other Delaware# | 330,000 | 0.0 | % | |||||||||
| Total Delaware | ||||||||||||
| (Cost $330,000) | 330,000 | 0.0 | % | |||||||||
| Florida | ||||||||||||
| Broward County Florida School Board | ||||||||||||
| 5.250%, 07/01/2022 (Callable 07/01/2021) | 8,390,000 | 10,109,782 | 0.8 | % | ||||||||
| 5.250%, 07/01/2023 (Callable 07/01/2021) | 4,865,000 | 5,829,389 | 0.5 | % | ||||||||
| County of St. Lucie Florida | ||||||||||||
| 6.000%, 10/01/2020 (ETM) | 6,340,000 | 8,236,928 | 0.7 | % | ||||||||
| Florida State Board of Education | ||||||||||||
| 5.000%, 06/01/2022 (Callable 06/01/2019) | 13,800,000 | 16,581,528 | 1.4 | % | ||||||||
| Highlands County Florida Health Facilities Revenue | ||||||||||||
| 5.875%, 11/15/2029 (Pre-refunded to 11/15/2013) | 9,800,000 | 10,249,918 | 0.8 | % | ||||||||
| 5.375%, 11/15/2035 (Pre-refunded to 11/15/2013) | 5,010,000 | 5,218,466 | 0.4 | % | ||||||||
| Miami-Dade County Florida | ||||||||||||
| 4.500%, 10/01/2020 | 7,100,000 | 8,294,930 | 0.7 | % | ||||||||
Other Florida# | 73,234,313 | 6.0 | % | |||||||||
| Total Florida | ||||||||||||
| (Cost $127,300,747) | 137,755,254 | 11.3 | % | |||||||||
| Georgia | ||||||||||||
| Atlanta Georgia Water & Wastewater Revenue | ||||||||||||
| 5.500%, 11/01/2017 (Insured by AGM) | 8,445,000 | 10,098,446 | 0.8 | % | ||||||||
| Forsyth County Georgia Hospital | ||||||||||||
| Authority Revenue Anticipation Certificates | ||||||||||||
| 6.375%, 10/01/2028 (Callable 02/04/2013)(ETM) | 8,050,000 | 10,807,044 | 0.9 | % | ||||||||
| Georgia Municipal Electric Authority Power Revenue | ||||||||||||
| 6.500%, 01/01/2017 (Insured by AGM) | 7,350,000 | 8,229,133 | 0.7 | % | ||||||||
| Gwinnett County Georgia School District | ||||||||||||
| 5.000%, 02/01/2026 (Pre-refunded to 02/01/2018) | 7,400,000 | 8,848,920 | 0.7 | % | ||||||||
The accompanying notes are in integral part of these financial statements.
Page 34
Baird Intermediate Municipal Bond Fund
Summary Schedule of Investments, December 31, 2012
Long-Term Investments (cont.)
| Principal | Market | % of | ||||||||||
| Amount | Value | Net Assets | ||||||||||
| State of Georgia | ||||||||||||
| 5.000%, 07/01/2020 (Callable 07/01/2017) | $ | 12,570,000 | $ | 14,760,951 | 1.2 | % | ||||||
Other Georgia# | 6,147,247 | 0.5 | % | |||||||||
| Total Georgia | ||||||||||||
| (Cost $56,855,712) | 58,891,741 | 4.8 | % | |||||||||
| Illinois | ||||||||||||
| Illinois Development Financial Authority | ||||||||||||
| 0.000%, 07/15/2023 (ETM)^ | 16,610,000 | 12,746,514 | 1.0 | % | ||||||||
| Kane Cook & Dupage Counties Illinois | ||||||||||||
| Community United School District No. 303 | ||||||||||||
| 5.000%, 01/01/2014 (Insured by AGM) | 6,750,000 | 7,045,987 | 0.6 | % | ||||||||
| Kane McHenry Cook & De Kalb Counties | ||||||||||||
| Illinois School District No. 300 | ||||||||||||
| 7.000%, 01/01/2018 (Insured by AMBAC) | 6,140,000 | 7,483,800 | 0.6 | % | ||||||||
| Kendall Kane & Will Counties Community | ||||||||||||
| Unit School District No. 308 | ||||||||||||
| 0.000%, 02/01/2021^ | 13,625,000 | 10,712,929 | 0.9 | % | ||||||||
Other Illinois# | 86,628,981 | 7.1 | % | |||||||||
| Total Illinois | ||||||||||||
| (Cost $117,463,675) | 124,618,211 | 10.2 | % | |||||||||
| Indiana | ||||||||||||
Other Indiana# | 16,727,808 | 1.4 | % | |||||||||
| Total Indiana | ||||||||||||
| (Cost $15,339,266) | 16,727,808 | 1.4 | % | |||||||||
| Iowa | ||||||||||||
Other Iowa# | 1,166,660 | 0.1 | % | |||||||||
| Total Iowa | ||||||||||||
| (Cost $1,116,547) | 1,166,660 | 0.1 | % | |||||||||
| Kansas | ||||||||||||
Other Kansas# | 2,229,384 | 0.2 | % | |||||||||
| Total Kansas | ||||||||||||
| (Cost $2,000,776) | 2,229,384 | 0.2 | % | |||||||||
| Kentucky | ||||||||||||
| Louisville & Jefferson County Metropolitan Government | ||||||||||||
| 6.125%, 02/01/2037 (Pre-refunded to 02/01/2018) | 11,995,000 | 15,144,887 | 1.3 | % | ||||||||
Other Kentucky# | 5,077,605 | 0.4 | % | |||||||||
| Total Kentucky | ||||||||||||
| (Cost $19,852,692) | 20,222,492 | 1.7 | % | |||||||||
The accompanying notes are in integral part of these financial statements.
Page 35
Baird Intermediate Municipal Bond Fund
Summary Schedule of Investments, December 31, 2012
Long-Term Investments (cont.)
| Principal | Market | % of | ||||||||||
| Amount | Value | Net Assets | ||||||||||
| Louisiana | ||||||||||||
| Louisiana Public Facilities Authority Revenue | ||||||||||||
| 5.500%, 05/15/2032 (Pre-refunded to 05/15/2026) | $ | 14,985,000 | $ | 20,166,513 | 1.6 | % | ||||||
| 5.500%, 05/15/2027 (Pre-refunded to 05/15/2026) | 1,740,000 | 2,263,723 | 0.2 | % | ||||||||
| State of Louisiana | ||||||||||||
| 5.000%, 11/15/2020 (Callable 05/15/2020) | 10,000,000 | 12,510,400 | 1.0 | % | ||||||||
| 5.000%, 11/15/2018 | 1,775,000 | 2,163,672 | 0.2 | % | ||||||||
| Total Louisiana | ||||||||||||
| (Cost $31,003,042) | 37,104,308 | 3.0 | % | |||||||||
| Maine | ||||||||||||
Other Maine# | 4,827,599 | 0.4 | % | |||||||||
| Total Maine | ||||||||||||
| (Cost $4,636,207) | 4,827,599 | 0.4 | % | |||||||||
| Maryland | ||||||||||||
Other Maryland# | 1,476,680 | 0.1 | % | |||||||||
| Total Maryland | ||||||||||||
| (Cost $1,447,689) | 1,476,680 | 0.1 | % | |||||||||
| Massachusetts | ||||||||||||
| Massachusetts State | ||||||||||||
| 4.000%, 12/01/2022 (Callable 12/01/2019) | 15,000,000 | 17,050,950 | 1.4 | % | ||||||||
| 5.000%, 08/01/2020 (Pre-refunded to 08/01/2016) | 5,820,000 | 6,715,407 | 0.5 | % | ||||||||
Other Massachusetts# | 12,142,710 | 1.0 | % | |||||||||
| Total Massachusetts | ||||||||||||
| (Cost $34,586,659) | 35,909,067 | 2.9 | % | |||||||||
| Michigan | ||||||||||||
| Michigan Finance Authority | ||||||||||||
| 5.000%, 01/01/2019 | 7,000,000 | 8,524,320 | 0.7 | % | ||||||||
Other Michigan# | 22,799,076 | 1.9 | % | |||||||||
| Total Michigan | ||||||||||||
| (Cost $30,054,350) | 31,323,396 | 2.6 | % | |||||||||
| Minnesota | ||||||||||||
| University of Minnesota | ||||||||||||
| 5.500%, 07/01/2021 (ETM) | 8,455,000 | 10,490,541 | 0.9 | % | ||||||||
Other Minnesota# | 4,903,845 | 0.4 | % | |||||||||
| Total Minnesota | ||||||||||||
| (Cost $15,003,738) | 15,394,386 | 1.3 | % | |||||||||
| Mississippi | ||||||||||||
Other Mississippi# | 2,680,234 | 0.2 | % | |||||||||
| Total Mississippi | ||||||||||||
| (Cost $2,527,535) | 2,680,234 | 0.2 | % | |||||||||
The accompanying notes are in integral part of these financial statements.
Page 36
Baird Intermediate Municipal Bond Fund
Summary Schedule of Investments, December 31, 2012
Long-Term Investments (cont.)
| Principal | Market | % of | ||||||||||
| Amount | Value | Net Assets | ||||||||||
| Missouri | ||||||||||||
Other Missouri# | $ | 3,277,260 | 0.3 | % | ||||||||
| Total Missouri | ||||||||||||
| (Cost $3,150,603) | 3,277,260 | 0.3 | % | |||||||||
| Nebraska | ||||||||||||
| Omaha Nebraska Public Electric Power District Revenue | ||||||||||||
| 6.200%, 02/01/2017 (ETM) | $ | 9,150,000 | 10,110,110 | 0.8 | % | |||||||
Other Nebraska# | 1,781,958 | 0.2 | % | |||||||||
| Total Nebraska | ||||||||||||
| (Cost $11,615,768) | 11,892,068 | 1.0 | % | |||||||||
| Nevada | ||||||||||||
Other Nevada# | 2,372,323 | 0.2 | % | |||||||||
| Total Nevada | ||||||||||||
| (Cost $2,102,347) | 2,372,323 | 0.2 | % | |||||||||
| New Hampshire | ||||||||||||
Other New Hampshire# | 6,432,799 | 0.5 | % | |||||||||
| Total New Hampshire | ||||||||||||
| (Cost $6,212,570) | 6,432,799 | 0.5 | % | |||||||||
| New Jersey | ||||||||||||
| New Jersey State Housing & | ||||||||||||
| Mortgage Finance Agency Bonds | ||||||||||||
| 4.500%, 10/01/2029 (Callable 04/01/2021) | 8,795,000 | 9,160,520 | 0.8 | % | ||||||||
Other New Jersey# | 23,646,197 | 1.9 | % | |||||||||
| Total New Jersey | ||||||||||||
| (Cost $31,795,125) | 32,806,717 | 2.7 | % | |||||||||
| New Mexico | ||||||||||||
Other New Mexico# | 3,664,103 | 0.3 | % | |||||||||
| Total New Mexico | ||||||||||||
| (Cost $3,590,752) | 3,664,103 | 0.3 | % | |||||||||
| New York | ||||||||||||
| Metropolitan Transit Authority New York | ||||||||||||
| 6.000%, 04/01/2020 (ETM) | 13,330,000 | 16,878,713 | 1.4 | % | ||||||||
| Westchester Tobacco Asset | ||||||||||||
| Securitization Corp. New York | ||||||||||||
| 6.950%, 07/15/2039 (Pre-refunded to 07/15/2017) | 13,075,000 | 16,744,891 | 1.4 | % | ||||||||
Other New York# | 42,674,464 | 3.4 | % | |||||||||
| Total New York | ||||||||||||
| (Cost $71,257,854) | 76,298,068 | 6.2 | % | |||||||||
| North Carolina | ||||||||||||
| North Carolina Eastern Municipal Power Agency | ||||||||||||
| 5.000%, 01/01/2021 (ETM) | 6,725,000 | 8,480,897 | 0.7 | % | ||||||||
The accompanying notes are in integral part of these financial statements.
Page 37
Baird Intermediate Municipal Bond Fund
Summary Schedule of Investments, December 31, 2012
Long-Term Investments (cont.)
| Principal | Market | % of | ||||||||||
| Amount | Value | Net Assets | ||||||||||
| North Carolina Eastern Municipal | ||||||||||||
| Power Agency Power Systems Revenue | ||||||||||||
| 4.500%, 01/01/2024 (Pre-refunded to 01/01/2022) | $ | 6,425,000 | $ | 7,867,220 | 0.6 | % | ||||||
| 5.000%-6.400%, 01/01/2017-01/01/2026 | 12,145,000 | 14,640,611 | 1.2 | % | ||||||||
| North Carolina Medical Care | ||||||||||||
| Community Hospital Revenue | ||||||||||||
| 5.250%, 11/01/2029 (Pre-refunded to 11/01/2014) | 6,495,000 | 7,050,972 | 0.6 | % | ||||||||
| Total North Carolina | ||||||||||||
| (Cost $35,989,259) | 38,039,700 | 3.1 | % | |||||||||
| Ohio | ||||||||||||
Other Ohio# | 14,622,876 | 1.2 | % | |||||||||
| Total Ohio | ||||||||||||
| (Cost $14,269,299) | 14,622,876 | 1.2 | % | |||||||||
| Pennsylvania | ||||||||||||
| Pennsylvania Convention Center | ||||||||||||
| Authority Revenue Bonds | ||||||||||||
| 6.000%, 09/01/2019 (ETM) | 10,060,000 | 12,782,639 | 1.0 | % | ||||||||
Other Pennsylvania# | 25,900,408 | 2.2 | % | |||||||||
| Total Pennsylvania | ||||||||||||
| (Cost $36,447,525) | 38,683,047 | 3.2 | % | |||||||||
| Puerto Rico | ||||||||||||
Other Puerto Rico# | 16,463,654 | 1.3 | % | |||||||||
| Total Puerto Rico | ||||||||||||
| (Cost $16,418,078) | 16,463,654 | 1.3 | % | |||||||||
| South Carolina | ||||||||||||
| Piedmont Municipal Power Agency | ||||||||||||
| South Carolina Electric Revenue | ||||||||||||
| 6.750%, 01/01/2020 (ETM) | 6,375,000 | 8,654,254 | 0.7 | % | ||||||||
Other South Carolina# | 5,186,090 | 0.4 | % | |||||||||
| Total South Carolina | ||||||||||||
| (Cost $12,927,777) | 13,840,344 | 1.1 | % | |||||||||
| South Dakota | ||||||||||||
Other South Dakota# | 931,183 | 0.1 | % | |||||||||
| Total South Dakota | ||||||||||||
| (Cost $913,440) | 931,183 | 0.1 | % | |||||||||
| Tennessee | ||||||||||||
Other Tennessee# | 11,406,741 | 0.9 | % | |||||||||
| Total Tennessee | ||||||||||||
| (Cost $10,959,307) | 11,406,741 | 0.9 | % | |||||||||
The accompanying notes are in integral part of these financial statements.
Page 38
Baird Intermediate Municipal Bond Fund
Summary Schedule of Investments, December 31, 2012
Long-Term Investments (cont.)
| Principal | Market | % of | ||||||||||
| Amount | Value | Net Assets | ||||||||||
| Texas | ||||||||||||
| Harris County Texas | ||||||||||||
| 5.750%, 10/01/2028 (Pre-refunded to 10/01/2018) | $ | 5,605,000 | $ | 7,090,493 | 0.6 | % | ||||||
| Houston Texas Health Facilities | ||||||||||||
| Corporate Facilities Revenue | ||||||||||||
| 7.125%, 02/15/2034 (Pre-refunded to 02/15/2014) | 10,960,000 | 11,895,217 | 1.0 | % | ||||||||
| Houston Texas Water & Sewer System Revenue Bonds | ||||||||||||
| 0.000%, 12/01/2023 (ETM)^ | 1,500,000 | 1,152,570 | 0.1 | % | ||||||||
| 5.500%, 12/01/2029 (ETM) | 16,050,000 | 22,590,054 | 1.9 | % | ||||||||
| Lamar Consolidated Independent School District | ||||||||||||
| 5.000%, 02/15/2021 (PSF Guaranteed) | 6,760,000 | 8,519,898 | 0.7 | % | ||||||||
| San Antonio Texas Electric & Gas Revenue | ||||||||||||
| 5.650%, 02/01/2019 (ETM) | 11,665,000 | 14,135,064 | 1.2 | % | ||||||||
| Tarrant County Texas Health Facilities Revenue | ||||||||||||
| 6.000%, 09/01/2024 (ETM) | 7,990,000 | 10,319,165 | 0.8 | % | ||||||||
| Texas State | ||||||||||||
| 5.000%, 10/01/2018 | 6,285,000 | 7,672,539 | 0.6 | % | ||||||||
Other Texas# | 84,715,731 | 6.9 | % | |||||||||
| Total Texas | ||||||||||||
| (Cost $156,944,521) | 168,090,731 | 13.8 | % | |||||||||
| Utah | ||||||||||||
Other Utah# | 7,329,127 | 0.6 | % | |||||||||
| Total Utah | ||||||||||||
| (Cost $6,711,794) | 7,329,127 | 0.6 | % | |||||||||
| Virginia | ||||||||||||
| Tobacco Settlement Financing Corporation Revenue | ||||||||||||
| 5.625%, 06/01/2037 (Pre-refunded to 06/01/2015) | 7,775,000 | 8,725,649 | 0.7 | % | ||||||||
Other Virginia# | 3,245,276 | 0.3 | % | |||||||||
| Total Virginia | ||||||||||||
| (Cost $11,549,158) | 11,970,925 | 1.0 | % | |||||||||
| Washington | ||||||||||||
| King County Washington | ||||||||||||
| 5.000%, 12/01/2021 | 11,665,000 | 14,934,350 | 1.2 | % | ||||||||
| University of Washington | ||||||||||||
| 5.000%, 07/01/2022 | 6,505,000 | 8,229,475 | 0.7 | % | ||||||||
| Washington State | ||||||||||||
| 5.000%, 01/01/2021 | 10,000,000 | 12,541,100 | 1.0 | % | ||||||||
| 5.000%-5.500%, 07/01/2018-07/01/2023 | 6,260,000 | 7,718,559 | 0.6 | % | ||||||||
Other Washington# | 18,233,893 | 1.5 | % | |||||||||
| Total Washington | ||||||||||||
| (Cost $59,157,522) | 61,657,377 | 5.0 | % | |||||||||
The accompanying notes are in integral part of these financial statements.
Page 39
Baird Intermediate Municipal Bond Fund
Summary Schedule of Investments, December 31, 2012
Long-Term Investments (cont.)
| Principal | Market | % of | ||||||||||
| Amount | Value | Net Assets | ||||||||||
| West Virginia | ||||||||||||
| Berkeley Brooke Fayette Counties West Virginia | ||||||||||||
| Single Family Mortgage Revenue | ||||||||||||
| 0.000%, 12/01/2014 (ETM)^ | $ | 7,365,000 | $ | 7,286,857 | 0.6 | % | ||||||
Other West Virginia# | 1,382,883 | 0.1 | % | |||||||||
| Total West Virginia | ||||||||||||
| (Cost $8,363,931) | 8,669,740 | 0.7 | % | |||||||||
| Wisconsin | ||||||||||||
| State of Wisconsin | ||||||||||||
| 5.000%, 05/01/2022 | 10,000,000 | 12,598,500 | 1.0 | % | ||||||||
Other Wisconsin# | 6,760,273 | 0.6 | % | |||||||||
| Total Wisconsin | ||||||||||||
| (Cost $18,632,519) | 19,358,773 | 1.6 | % | |||||||||
| Total Long-Term Investments | ||||||||||||
| (Cost $1,132,107,322) | 1,203,471,820 | 98.5 | % | |||||||||
| Short-Term Investments | ||||||||||||
| Shares | ||||||||||||
| Money Market Mutual Fund | ||||||||||||
| Goldman Sachs Financial Square Funds, 0.01%« | 2,007,449 | 2,007,449 | 0.2 | % | ||||||||
| Total Short-Term Investments | ||||||||||||
| (Cost $2,007,449) | 2,007,449 | 0.2 | % | |||||||||
| Total Investments | ||||||||||||
| (Cost $1,134,114,771) | 1,205,479,269 | 98.7 | % | |||||||||
| Other Assets in Excess of Liabilities | 16,166,996 | 1.3 | % | |||||||||
| TOTAL NET ASSETS | $ | 1,221,646,265 | 100.0 | % | ||||||||
Notes to Summary Schedule of Investments
AGM – Assured Guaranty Municipal
AMBAC – Ambac Assurance Corporation. Ambac Assurance’s plan of rehabilitation transferring certain troubled insurance policies and assets (mostly relating to insurance coverage and credit default swaps on residential mortgage-backed securities) to a segregated account has obtained court approval but has not yet been implemented.
PSF – Texas Permanent School Fund
ETM – Escrowed to Maturity
| ^ | Non-Income Producing | |
| « | 7-Day Yield | |
| # | Represents the aggregate value, by category, securities that are not among the 50 largest holdings and, in total for any issuer, represent 1% or less of net assets. |
The accompanying notes are in integral part of these financial statements.
Page 40
Baird Intermediate Municipal Bond Fund
Summary Schedule of Investments, December 31, 2012
Summary of Fair Value Exposure at December 31, 2012
The Fund has adopted authoritative fair valuation accounting standards which establish a definition of fair value and set out a hierarchy for measuring fair value. These standards require additional disclosures about the various inputs and valuation techniques used to develop the measurements of fair value and a discussion on changes in valuation techniques and related inputs during the period. These standards define fair value as the price that would be received to sell an asset or paid to transfer a liability in an orderly transaction between market participants at the measurement date.
The fair value hierarchy is organized into three levels based upon the assumptions (referred to as “inputs”) used in pricing the asset or liability. These standards state that “observable inputs” reflect the assumptions market participants would use in pricing the asset or liability based on market data obtained from independent sources and “unobservable inputs” reflect an entity’s own assumptions about the assumptions market participants would use in pricing the asset or liability. These inputs are summarized into three broad levels and described below:
Level 1 – Unadjusted quoted prices in active markets for identical unrestricted securities.
Level 2 – Other significant observable inputs (including quoted prices for similar securities, quoted prices in inactive markets, dealer indications, interest rates, yield curves, prepayment speeds, credit risk, default rates, inputs corroborated by observable market data, etc.).
Level 3 – Significant unobservable inputs (including the Fund’s own assumptions about the factors that market participants would use in valuing the security) based on the best information available.
The inputs or methodology used for valuing securities are not necessarily an indication of the risk associated with investing in those securities.
The following is a summary of the inputs used to value the Fund’s investments as of December 31, 2012:
| Level 1 | Level 2 | Level 3 | Total | |||||||||||||
| Fixed Income | ||||||||||||||||
| Municipal Bonds | $ | — | $ | 1,203,471,820 | $ | — | $ | 1,203,471,820 | ||||||||
| Total Fixed Income | — | 1,203,471,820 | — | 1,203,471,820 | ||||||||||||
| Short-Term Investments | ||||||||||||||||
| Money Market Mutual Fund | 2,007,449 | — | — | 2,007,449 | ||||||||||||
| Total Short-Term Investments | 2,007,449 | — | — | 2,007,449 | ||||||||||||
| Total Investments | $ | 2,007,449 | $ | 1,203,471,820 | $ | — | $ | 1,205,479,269 | ||||||||
Changes in valuation techniques may result in transfers into or out of current assigned levels within the hierarchy. There were no transfers between Level 1, Level 2 and Level 3 fair value measurements during the reporting period, as compared to their classification from the prior year’s annual report.
The accompanying notes are in integral part of these financial statements.
Page 41
Baird Aggregate Bond Fund
December 31, 2012
The Baird Aggregate Bond Fund seeks an annual rate of total return, before Fund expenses, greater than the annual rate of total return of the Barclays U.S. Aggregate Bond Index. The Barclays U.S. Aggregate Bond Index is an unmanaged, market value weighted index of investment grade, fixed-rate debt issues, including government, corporate, asset-backed and mortgage-backed securities, with maturities of at least one year.
The Fund entered the year with a significant yield advantage over its benchmark and converted that advantage into strong absolute and relative returns versus its benchmark index in 2012. Our long-term commitment to duration neutrality was very important as well. The primary factors contributing to the Fund’s outperformance over its benchmark in 2012 are described below.
| • | The Fund’s overweight position to the corporate credit sector relative to the Fund’s benchmark positively impacted the Fund’s performance. Corporate bonds generally experienced favorable price returns relative to U.S. Treasuries of comparable maturity due to a significant narrowing of corporate bond spreads (the additional yield that investors demand above U.S. Treasury bonds for owning corporate debt) during the year. The narrowing was driven by generally solid corporate credit fundamentals and very strong investor demand. | |
| • | An overweight to the financial sub-sector in particular was an important contributor to the Fund’s relative outperformance as financials significantly outperformed other investment grade corporate bonds. The financial sub-sector’s performance was driven by both strong and improving credit fundamentals and negative net supply (gross supply or issuance less maturities and early redemptions by issuers). | |
| • | The Fund’s underweight to U.S. Treasuries was a positive contributor to relative performance as non-government “spread sectors” such as corporate, mortgage-backed, and asset-backed securities, outperformed equal-duration U.S. Treasuries for the year. | |
| • | An overweight position to commercial mortgage-backed securities (CMBS) through primarily seasoned, super-senior CMBS was a positive for the year as spreads tightened. | |
| • | The Fund’s modest exposure to non-U.S. Agency mortgage-backed securities was a positive contributor as prices for those securities generally rose during 2012. The Fund also benefited from relatively high coupon payments, an important consideration in the current low interest rate environment. |
We are pleased with the Fund’s performance in 2012 and are confident in the individual issues and the overall structure of the Fund. The Fund’s current significant yield advantage over the benchmark is meaningful and we are optimistic regarding the Fund’s relative performance as we head into 2013.
Page 42
Baird Aggregate Bond Fund
December 31, 2012
Portfolio Characteristics
| Quality Distribution* | ||
| Net Assets: | $1,544,849,169 | |
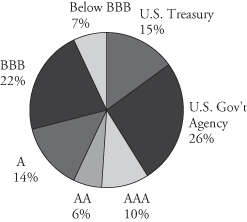 | SEC 30-Day | |
Yield:** | ||
| Institutional Class: | 2.79% | |
| Investor Class: | 2.51% | |
| Average | ||
| Effective | ||
| Duration: | 5.06 years | |
| Average | ||
| Effective | ||
| Maturity: | 6.82 years | |
| Annualized | ||
| Expense | ||
| Ratio: | ||
| Institutional Class: | 0.30% | |
| Sector Weightings* | Investor Class: | 0.55%*** |
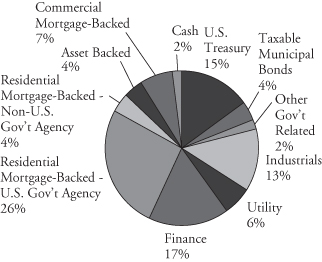 | Portfolio | |
| Turnover | ||
| Rate: | 64.4% | |
| Total | ||
| Number of | ||
| Holdings: | 397 | |
| * | Percentages shown are based on the Fund’s total investments (less investments purchased with cash proceeds from securities lending). | |
| ** | SEC yields are based on SEC guidelines and are calculated for the 30 days ended December 31, 2012. | |
| *** | Includes 0.25% 12b-1 fee. |
Page 43
Baird Aggregate Bond Fund
Institutional Class
Value of a $25,000 Investment
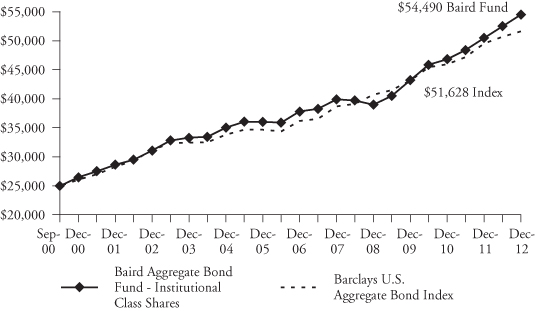
Growth of a hypothetical investment of $25,000 made on the Fund’s inception date (9/29/00), assuming reinvestment of all distributions.
Investor Class
Value of a $10,000 Investment
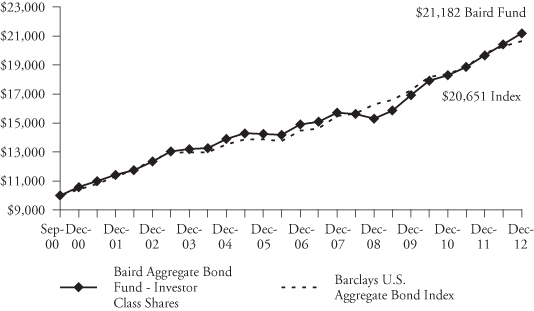
Growth of a hypothetical investment of $10,000 made on the Fund’s inception date (9/29/00), assuming reinvestment of all distributions.
Page 44
Baird Aggregate Bond Fund
December 31, 2012
Average Annual Total Returns
| One | Five | Ten | Since | |
| For the Periods Ended December 31, 2012 | Year | Year | Years | Years |
Inception(1) | ||||
| Institutional Class Shares | 7.92% | 6.42% | 5.79% | 6.56% |
| Investor Class Shares | 7.72% | 6.15% | 5.55% | 6.32% |
Barclays U.S. Aggregate Bond Index(2) | 4.21% | 5.95% | 5.18% | 6.10% |
| (1) | For the period from September 29, 2000 (commencement of operations) through December 31, 2012. | |
| (2) | The Barclays U.S. Aggregate Bond Index is an unmanaged, market value weighted index of investment grade, fixed-rate debt issues, including government, corporate, asset-backed and mortgage-backed securities, with maturities of at least one year. This index does not reflect any deduction for fees, expenses or taxes. A direct investment in an index is not possible. |
The returns shown in the table above and line graphs on the previous page reflect reinvestment of dividends and/or capital gains distributions in additional shares. The returns do not reflect the deduction of taxes that a shareholder would pay on Fund distributions or the redemption of Fund shares. The returns reflect the actual performance for each period and do not include the impact of trades executed on the last business day of the period that were recorded on the first business day of the next period.
The Fund’s gross expense ratio for each Class, as reflected in the Fund’s current prospectus, is set forth under “Portfolio Characteristics”.
The Fund maintains securities with longer maturities in order to provide a greater potential for return. Generally, the longer a bond’s maturity, the greater the interest rate risk. The Fund may also invest in U.S. dollar denominated foreign securities which involve additional risks such as currency rate fluctuations, political and economic instability, and different and sometimes less strict financial reporting standards and regulation. The Fund may also invest in mortgage- and asset-backed securities, which include interest rate and prepayment risks more pronounced than those of other fixed income securities.
Past performance does not guarantee future results. Investment return and principal value will fluctuate so that an investor’s shares, when redeemed, may be worth more or less than their original cost.
For information about the performance of the Fund as of the most recent month-end, please call 1-866-44BAIRD or visit www.bairdfunds.com. Mutual fund performance changes over time and current performance may be lower or higher than that stated.
Page 45
Baird Aggregate Bond Fund
Summary Schedule of Investments, December 31, 2012
This schedule summarizes the Fund’s holdings by asset type. Details are reported for each of the Fund’s 50 largest individual holdings and for investments that, in total for any issuer, represent more than 1% of the Fund’s net assets. The total value of smaller holdings is reported as a single amount within each category.
The Fund reports a complete list of its holdings in regulatory filings four times in each fiscal year, at the quarter end. For the second and fourth fiscal quarters, the complete listing of the Fund’s holdings is available electronically in the Fund’s Form N-CSR at http://www.rwbaird.com/baird-funds/prospectus-applications/prospectus-applications.aspx and on the Securities and Exchange Commission’s website (www.sec.gov) or you can have it mailed to you without charge by calling 1-866-44BAIRD. For the first and third fiscal quarters, the Fund files the lists with the SEC on Form N-Q. Shareholders can look up the Fund’s Forms N-CSR and N-Q on the SEC’s website (www.sec.gov).
Long-Term Investments
| Principal | Market | % of | ||||||||||
| Amount | Value | Net Assets | ||||||||||
| U.S. Treasury Securities | ||||||||||||
| U.S. Treasury Bonds | ||||||||||||
| 1.250%, 04/30/2019 | $ | 118,825,000 | $ | 120,616,643 | 7.8 | % | ||||||
| 5.250%, 11/15/2028 | 33,825,000 | 46,731,335 | 3.0 | % | ||||||||
| 4.375%, 02/15/2038 | 48,350,000 | 62,734,125 | 4.1 | % | ||||||||
| Total U.S. Treasury Securities | ||||||||||||
| (Cost $222,575,828) | 230,082,103 | 14.9 | % | |||||||||
| Taxable Municipal Bonds | ||||||||||||
| California Qualified School Construction Bonds | ||||||||||||
| 7.155%, 03/01/2027 | 7,500,000 | 8,755,725 | 0.6 | % | ||||||||
| San Dieguito California Public Facilities | ||||||||||||
| 6.459%, 05/01/2027 | 6,500,000 | 7,705,165 | 0.5 | % | ||||||||
Other Municipal Bonds# | 48,712,255 | 3.1 | % | |||||||||
| Total Municipal Bonds | ||||||||||||
| (Cost $58,129,777) | 65,173,145 | 4.2 | % | |||||||||
| Other Government Related Securities | ||||||||||||
Other Government Related Securities#~ | 32,473,128 | 2.1 | % | |||||||||
| Total Other Government Related Securities | ||||||||||||
| (Cost $29,003,064) | 32,473,128 | 2.1 | % | |||||||||
| Corporate Bonds | ||||||||||||
| Industrials | ||||||||||||
| Anadarko Petroleum Corporation | ||||||||||||
| 6.375%, 09/15/2017 | 6,000,000 | 7,166,970 | 0.5 | % | ||||||||
| Glencore Funding LLC | ||||||||||||
| 6.000%, 04/15/2014 (Acquired 03/31/2004 | ||||||||||||
| through 06/20/2011, Cost $8,127,975)* | 8,092,000 | 8,546,406 | 0.6 | % | ||||||||
| Hutchison Whampoa International Ltd. | ||||||||||||
| 7.625%, 04/09/2019 (Acquired 10/22/2009 | ||||||||||||
through 10/29/2009, Cost $6,230,430)* f | 5,700,000 | 7,347,676 | 0.5 | % | ||||||||
| Petrohawk Energy Corporation | ||||||||||||
| 7.250%, 08/15/2018 | 6,808,000 | 7,685,871 | 0.5 | % | ||||||||
The accompanying notes are in integral part of these financial statements.
Page 46
Baird Aggregate Bond Fund
Summary Schedule of Investments, December 31, 2012
Long-Term Investments (cont.)
| Principal | Market | % of | ||||||||||
| Amount | Value | Net Assets | ||||||||||
| Staples, Inc. | ||||||||||||
| 9.750%, 01/15/2014 | $ | 7,431,000 | $ | 8,078,954 | 0.5 | % | ||||||
Other Industrials#~ | 159,859,984 | 10.3 | % | |||||||||
| Total Industrials | ||||||||||||
| (Cost $182,911,940) | 198,685,861 | 12.9 | % | |||||||||
| Utility | ||||||||||||
| Ameren Corporation | ||||||||||||
| 8.875%, 05/15/2014 | 6,900,000 | 7,550,808 | 0.5 | % | ||||||||
| DCP Midstream, LLC | ||||||||||||
| 9.750%, 03/15/2019 (Acquired 02/29/2012 | ||||||||||||
| through 10/15/2012, Cost $7,325,716)* | 5,675,000 | 7,507,032 | 0.5 | % | ||||||||
Other Utility#~ | 79,759,759 | 5.1 | % | |||||||||
| Total Utility | ||||||||||||
| (Cost $87,884,949) | 94,817,599 | 6.1 | % | |||||||||
| Finance | ||||||||||||
| General Electric Capital Corporation | ||||||||||||
| 5.625%, 05/01/2018@ | 6,200,000 | 7,362,711 | 0.5 | % | ||||||||
| Irish Life & Permanent Group Holdings PLC | ||||||||||||
| 3.600%, 01/14/2013 (Acquired 01/07/2010 | ||||||||||||
through 03/09/2012, Cost $7,520,403)* f | 7,525,000 | 7,525,053 | 0.5 | % | ||||||||
| John Hancock Mutual Life Insurance Company | ||||||||||||
| 7.375%, 02/15/2024 | ||||||||||||
| (Acquired 08/26/2010, Cost $7,609,543)* | 6,800,000 | 8,634,783 | 0.6 | % | ||||||||
| Prudential Covered Trust 2012-1 | ||||||||||||
| 2.997%, 09/30/2015 | ||||||||||||
| (Acquired 12/19/2012, Cost $7,756,046)* | 7,457,500 | 7,733,517 | 0.5 | % | ||||||||
Other Finance#~ | 223,557,123 | 14.4 | % | |||||||||
| Total Finance | ||||||||||||
| (Cost $236,564,788) | 254,813,187 | 16.5 | % | |||||||||
| Residential Mortgage-Backed Securities | ||||||||||||
| U.S. Government Agency Issues | ||||||||||||
| Federal Gold Loan Mortgage Corporation (FGLMC) | ||||||||||||
| 5.000%, 03/01/2038 | 11,249,521 | 12,115,713 | 0.8 | % | ||||||||
| 4.500%, 11/01/2039 | 6,957,300 | 7,465,823 | 0.5 | % | ||||||||
| 4.500%, 11/01/2039 | 15,083,066 | 16,185,516 | 1.1 | % | ||||||||
| 3.500%, 06/01/2042 | 11,268,478 | 12,016,802 | 0.8 | % | ||||||||
| 3.500%, 07/01/2042 | 18,411,942 | 19,634,654 | 1.3 | % | ||||||||
| 3.000%, 08/01/2042 | 29,047,702 | 30,397,641 | 2.0 | % | ||||||||
| 3.000%, 10/01/2042 | 13,671,307 | 14,306,656 | 0.9 | % | ||||||||
| 5.000%-6.500%, 07/01/2014-12/01/2036 | 4,197,010 | 4,597,058 | 0.2 | % | ||||||||
| Federal Home Loan Mortgage Corporation (FHLMC) | ||||||||||||
| 4.500%, 09/01/2040 | 15,197,297 | 16,365,087 | 1.1 | % | ||||||||
| 0.000%-7.000%, 07/15/2019-05/01/2038 | 5,585,337 | 6,036,189 | 0.4 | % | ||||||||
The accompanying notes are in integral part of these financial statements.
Page 47
Baird Aggregate Bond Fund
Summary Schedule of Investments, December 31, 2012
Long-Term Investments (cont.)
| Principal | Market | % of | ||||||||||
| Amount | Value | Net Assets | ||||||||||
| Federal National Mortgage Association (FNMA) | ||||||||||||
| 5.000%, 11/01/2021 | $ | 6,560,929 | $ | 7,130,022 | 0.5 | % | ||||||
| 2.500%, 12/01/2027 | 18,007,030 | 18,843,607 | 1.2 | % | ||||||||
| 5.000%, 10/01/2035 | 16,005,034 | 17,334,341 | 1.1 | % | ||||||||
| 5.000%, 11/01/2035 | 7,309,929 | 7,936,741 | 0.5 | % | ||||||||
| 5.500%, 04/01/2037 | 7,743,428 | 8,510,254 | 0.6 | % | ||||||||
| 4.000%, 08/01/2040 | 7,846,488 | 8,419,743 | 0.5 | % | ||||||||
| 3.500%, 02/01/2041 | 27,227,492 | 29,051,585 | 1.9 | % | ||||||||
| 4.000%, 02/01/2041 | 35,293,119 | 37,871,589 | 2.5 | % | ||||||||
| 4.000%, 09/01/2041 | 11,750,435 | 12,612,579 | 0.8 | % | ||||||||
| 3.000%, 05/01/2042 | 11,406,756 | 11,964,266 | 0.8 | % | ||||||||
| 3.500%-8.000%, 09/25/2017-12/01/2040 | 30,963,545 | 33,408,056 | 2.1 | % | ||||||||
| Government National Mortgage Association (GNMA) | ||||||||||||
| 6.000%, 11/20/2033 | 178,955 | 201,509 | 0.0 | % | ||||||||
| 5.000%, 07/20/2040 | 10,296,577 | 11,410,024 | 0.7 | % | ||||||||
| 4.500%, 01/20/2041 | 29,322,732 | 32,347,889 | 2.1 | % | ||||||||
| 4.000%, 06/20/2042 | 24,709,077 | 26,920,610 | 1.7 | % | ||||||||
| Total U.S. Government Agency Issues | ||||||||||||
| (Cost $389,899,110) | 403,083,954 | 26.1 | % | |||||||||
| Non-U.S. Government Agency Issues | ||||||||||||
| Bank of America Alternative Loan Trust | ||||||||||||
| 4.750%-6.000%, 06/25/2018-06/25/2046 | 18,632,975 | 18,724,517 | 1.2 | % | ||||||||
| Countrywide Alternative Loan Trust | ||||||||||||
| Series 2003-20CB, Class 1A1, 5.500%, 10/25/2033 | 9,139,488 | 9,651,665 | 0.6 | % | ||||||||
| 5.000%-6.250%, 11/25/2020-10/25/2036 | 9,047,716 | 8,413,624 | 0.7 | % | ||||||||
Other Non-U.S. Government Agency Issues# | 27,188,957 | 1.7 | % | |||||||||
| Total Non-U.S. Government Agency Issues | �� | |||||||||||
| (Cost $66,123,193) | 63,978,763 | 4.2 | % | |||||||||
| Asset Backed Securities | ||||||||||||
| Countrywide Asset-Backed Certificates | ||||||||||||
| Series 2005-1, Class AF6, 5.030%, 07/25/2035 | 7,295,215 | 7,313,920 | 0.5 | % | ||||||||
| Series 2005-11, Class AF3, 4.778%, 02/25/2036 | 9,414,310 | 8,425,648 | 0.5 | % | ||||||||
| 4.583%-5.884%, 03/25/2030-09/25/2046 | 24,321,702 | 22,151,130 | 1.4 | % | ||||||||
Other Asset Backed Securities# | 14,767,623 | 1.0 | % | |||||||||
| Total Asset Backed Securities | ||||||||||||
| (Cost $54,977,195) | 52,658,321 | 3.4 | % | |||||||||
| Commercial Mortgage-Backed Securities | ||||||||||||
| Bear Stearns Commercial Mortgage Securities | ||||||||||||
| Series 2005-PWR9, Class A4A, 4.871%, 09/11/2042 | 11,139,000 | 12,236,559 | 0.8 | % | ||||||||
| Commercial Mortgage Trust | ||||||||||||
| Series 2005-C6, Class A5A, 5.116%, 06/10/2044 | 11,248,000 | 12,412,505 | 0.8 | % | ||||||||
| Series 2012-CR2, Class A4, 3.147%, 08/15/2045 | 11,650,000 | 12,293,954 | 0.8 | % | ||||||||
The accompanying notes are in integral part of these financial statements.
Page 48
Baird Aggregate Bond Fund
Summary Schedule of Investments, December 31, 2012
Long-Term Investments (cont.)
| Principal | Market | % of | ||||||||||
| Amount | Value | Net Assets | ||||||||||
| Credit Suisse First Boston | ||||||||||||
| Mortgage Securities Corporation | ||||||||||||
| Series 2005-C5, Class A4, 5.100%, 08/15/2038@ | $ | 10,149,000 | $ | 11,155,354 | 0.7 | % | ||||||
| GE Capital Commercial Mortgage Corporation | ||||||||||||
| Series 2005-C4, Class A4, 5.307%, 11/10/2045 | 10,750,000 | 12,022,424 | 0.8 | % | ||||||||
| J.P. Morgan Chase Commercial Mortgage Trust | ||||||||||||
| Series 2005-CB12, Class A4, 4.895%, 09/12/2037 | 11,355,000 | 12,455,175 | 0.8 | % | ||||||||
| Morgan Stanley Bank of America Merrill Lynch Trust | ||||||||||||
| Series 2012-C6, Class A4, 2.858%, 11/17/2045 | 14,000,000 | 14,471,311 | 0.9 | % | ||||||||
| Wachovia Bank Commercial Mortgage Trust | ||||||||||||
| Series 2005-C22, Class A4, 5.293%, 12/15/2044 | 10,000,000 | 11,151,150 | 0.7 | % | ||||||||
| WF-RBS Commercial Mortgage Trust | ||||||||||||
| Series 2012-C6, Class A4, 3.440%, 04/15/2045 | 12,000,000 | 13,029,396 | 0.9 | % | ||||||||
| Total Commercial Mortgage Backed Securities | ||||||||||||
| (Cost $106,493,130) | 111,227,828 | 7.2 | % | |||||||||
| Total Long-Term Investments | ||||||||||||
| (Cost $1,434,562,974) | 1,506,993,889 | 97.6 | % | |||||||||
| Short-Term Investments | ||||||||||||
| Money Market Mutual Funds | ||||||||||||
| Dreyfus Institutional Cash Advantage Fund, 0.11%« | 567,652 | 567,652 | 0 | % | ||||||||
| Short-Term Investments Trust – | ||||||||||||
| Liquid Assets Portfolio, 0.15%« | 30,000,000 | 30,000,000 | 2.0 | % | ||||||||
| Total Short-Term Investments | ||||||||||||
| (Cost $30,567,652) | 30,567,652 | 2.0 | % | |||||||||
| Investments Purchased with Cash | ||||||||||||
| Proceeds from Securities Lending | ||||||||||||
| Principal | ||||||||||||
| Amount | ||||||||||||
| Commercial Paper | ||||||||||||
| Atlantic East Funding LLC, 0.562%, 03/25/2013†** | $ | 2,553,134 | 1,930,414 | 0.1 | % | |||||||
| Total Commercial Paper | ||||||||||||
| (Cost $2,553,134) | 1,930,414 | 0.1 | % | |||||||||
The accompanying notes are in integral part of these financial statements.
Page 49
Baird Aggregate Bond Fund
Summary Schedule of Investments, December 31, 2012
Investments Purchased with Cash
Proceeds from Securities Lending (cont.)
| Market | % of | |||||||||||
| Shares | Value | Net Assets | ||||||||||
| Investment Companies | ||||||||||||
| Mount Vernon Securities Lending | ||||||||||||
| Trust Prime Portfolio, 0.28%« | 61,954,700 | $ | 61,954,700 | 4.0 | % | |||||||
| Total Investment Companies | ||||||||||||
| (Cost $61,954,700) | 61,954,700 | 4.0 | % | |||||||||
| Total Investments Purchased With | ||||||||||||
| Cash Proceeds From Securities Lending | ||||||||||||
| (Cost $64,507,834) | 63,885,114 | 4.1 | % | |||||||||
| Total Investments | ||||||||||||
| (Cost $1,529,638,460) | 1,601,446,655 | 103.7 | % | |||||||||
| Asset Relating to Securities Lending Investments | ||||||||||||
Support Agreement**^a† | 622,719 | 0.0 | % | |||||||||
| Total | ||||||||||||
| (Cost $0) | 622,719 | 0.0 | % | |||||||||
| Liabilities in Excess of Other Assets | (57,220,205 | ) | (3.7 | %) | ||||||||
| TOTAL NET ASSETS | $ | 1,544,849,169 | 100.0 | % | ||||||||
Notes to Summary Schedule of Investments
| # | Represents the aggregate value, by category, securities that are not among the 50 largest holdings and, in total for any issuer, represent 1% or less of net assets. | |
| * | Restricted Security Deemed Liquid | |
| ** | Illiquid Security | |
| @ | This security or portion of this security is out on loan at December 31, 2012. | |
| f | Foreign Security | |
| ^ | Non-Income Producing | |
| « | 7-Day Yield | |
| † | Priced at Fair Value by the Valuation Committee as delegated by the Baird Funds’ Board of Directors. | |
| a | The Fund’s transfer agent and administrator and securities lending agent entered into a support agreement with the Fund to cover losses realized by the Fund on its investment in Atlantic East Funding, LLC (up to a certain amount), which investment was made by the Fund’s securities lending agent. | |
| ~ | Groupings contain, in aggregate, restricted securities totaling $97,461,658 representing 6.31% of net assets. |
The accompanying notes are in integral part of these financial statements.
Page 50
Baird Aggregate Bond Fund
Summary Schedule of Investments, December 31, 2012
Summary of Fair Value Exposure at December 31, 2012
The Fund has adopted authoritative fair valuation accounting standards which establish a definition of fair value and set out a hierarchy for measuring fair value. These standards require additional disclosures about the various inputs and valuation techniques used to develop the measurements of fair value and a discussion on changes in valuation techniques and related inputs during the period. These standards define fair value as the price that would be received to sell an asset or paid to transfer a liability in an orderly transaction between market participants at the measurement date.
The fair value hierarchy is organized into three levels based upon the assumptions (referred to as “inputs”) used in pricing the asset or liability. These standards state that “observable inputs” reflect the assumptions market participants would use in pricing the asset or liability based on market data obtained from independent sources and “unobservable inputs” reflect an entity’s own assumptions about the assumptions market participants would use in pricing the asset or liability. These inputs are summarized into three broad levels and described below:
Level 1 – | Unadjusted quoted prices in active markets for identical unrestricted securities. |
Level 2 – | Other significant observable inputs (including quoted prices for similar securities, quoted prices in inactive markets, dealer indications, interest rates, yield curves, prepayment speeds, credit risk, default rates, inputs corroborated by observable market data, etc.). |
Level 3 – | Significant unobservable inputs (including the Fund’s own assumptions about the factors that market participants would use in valuing the security) based on the best information available. |
The inputs or methodology used for valuing securities are not necessarily an indication of the risk associated with investing in those securities.
The accompanying notes are in integral part of these financial statements.
Page 51
Baird Aggregate Bond Fund
Summary Schedule of Investments, December 31, 2012
The following is a summary of the inputs used to value the Fund’s investments as of December 31, 2012:
| Level 1 | Level 2 | Level 3 | Total | |||||||||||||
| Fixed Income | ||||||||||||||||
| U.S. Treasury Securities | $ | — | $ | 230,082,103 | $ | — | $ | 230,082,103 | ||||||||
| Taxable Municipal Bonds | — | 65,173,145 | — | 65,173,145 | ||||||||||||
| Other Government Related Securities | — | 32,473,128 | — | 32,473,128 | ||||||||||||
| Corporate Debt Securities | — | 548,315,040 | 1,607 | 548,316,647 | ||||||||||||
| Residential Mortgage-Backed Securities – | ||||||||||||||||
| U.S. Government Agency Issues | — | 403,083,954 | — | 403,083,954 | ||||||||||||
| Residential Mortgage-Backed Securities – | ||||||||||||||||
| Non-U.S. Government Agency Issues | — | 63,978,763 | — | 63,978,763 | ||||||||||||
| Asset Backed Securities | — | 52,658,321 | — | 52,658,321 | ||||||||||||
| Commercial Mortgage-Backed Securities | — | 111,227,828 | — | 111,227,828 | ||||||||||||
| Total Fixed Income | — | 1,506,992,282 | 1,607 | 1,506,993,889 | ||||||||||||
| Short-Term Investments | ||||||||||||||||
| Money Market Mutual Funds | 30,567,652 | — | — | 30,567,652 | ||||||||||||
| Total Short-Term Investments | 30,567,652 | — | — | 30,567,652 | ||||||||||||
| Investments Purchased with Cash | ||||||||||||||||
| Proceeds from Securities Lending | ||||||||||||||||
| Commercial Paper | — | 1,930,414 | — | 1,930,414 | ||||||||||||
| Money Market Mutual Fund | 61,954,700 | — | — | 61,954,700 | ||||||||||||
| Total Investments Purchased with | ||||||||||||||||
| Cash Proceeds from Securities Lending | 61,954,700 | 1,930,414 | — | 63,885,114 | ||||||||||||
| Total Investments | $ | 92,522,352 | $ | 1,508,922,696 | $ | 1,607 | $ | 1,601,446,655 | ||||||||
| Asset Relating to | ||||||||||||||||
| Securities Lending Investments | $ | — | $ | 622,719 | $ | — | $ | 622,719 | ||||||||
Changes in valuation techniques may result in transfers into or out of current assigned levels within the hierarchy. There were no transfers between Level 1, Level 2 and Level 3 fair value measurements during the reporting period, as compared to their classification from the prior year’s annual report. One security that is priced at fair value by the Valuation Committee instead of the Fund’s pricing vendor is valued using level 3 inputs.
Level 3 Reconciliation Disclosure
Following is a reconciliation of Level 3 assets for which significant unobservable inputs were used to determine fair value.
| Description | Investments in Securities | |||
| Balance as of December 31, 2011 | $ | 1,607 | ||
| Accrued discounts/premiums | — | |||
| Realized gain (loss) | — | |||
| Change in unrealized appreciation (depreciation) | — | |||
| Purchases | — | |||
| Sales | — | |||
| Transfers in and/or out of Level 3* | — | |||
| Balance as of December 31, 2012 | $ | 1,607 | ||
* Transfers between levels are recognized at the end of the reporting period.
The accompanying notes are in integral part of these financial statements.
Page 52
Baird Core Plus Bond Fund
December 31, 2012
The Baird Core Plus Bond Fund seeks an annual rate of total return, before Fund expenses, greater than the annual rate of total return of the Barclays U.S. Universal Bond Index. The Barclays U.S. Universal Bond Index is an unmanaged, market value weighted index of fixed income securities issued in U.S. dollars, including U.S. government and investment grade debt, non-investment grade debt, asset-backed and mortgage-backed securities, Eurobonds, 144A securities and emerging market debt, with maturities of at least one year.
The Fund entered the year with a significant yield advantage over its benchmark and converted that advantage into strong absolute and relative returns versus its benchmark index in 2012. Our long-term commitment to duration neutrality was very important as well. The primary factors contributing to the Fund’s outperformance over its benchmark in 2012 are described below.
| • | The Fund’s overweight position to the corporate credit sector relative to the Fund’s benchmark positively impacted the Fund’s performance. Corporate bonds generally experienced favorable price returns relative to U.S. Treasuries of comparable maturity due to a significant narrowing of corporate bond spreads (the additional yield that investors demand above U.S. Treasury bonds for owning corporate debt) during the year. The narrowing was driven by generally solid corporate credit fundamentals and very strong investor demand. | |
| • | An overweight to the financial sub-sector in particular was an important contributor to the Fund’s relative outperformance as financials significantly outperformed other investment grade corporate bonds. The financial sub-sector’s performance was driven by both strong and improving credit fundamentals and negative net supply (gross supply or issuance less maturities and early redemptions by issuers). | |
| • | The Fund’s underweight to U.S. Treasuries was a positive contributor to relative performance as non-government “spread sectors” such as corporate, mortgage-backed, and asset-backed securities, outperformed equal-duration U.S. Treasuries for the year. | |
| • | An overweight position to commercial mortgage-backed securities (CMBS) through primarily seasoned, super-senior CMBS was a positive for the year as spreads tightened. | |
| • | The Fund’s modest exposure to non-U.S. Agency mortgage-backed securities was a positive contributor as prices for those securities generally rose during 2012. The Fund also benefited from relatively high coupon payments, an important consideration in the current low interest rate environment. |
We are pleased with the Fund’s performance in 2012 and are confident in the individual issues and the overall structure of the Fund. The Fund’s current yield advantage over the benchmark is meaningful and we are optimistic regarding the Fund’s relative performance as we head into 2013.
Page 53
Baird Core Plus Bond Fund
December 31, 2012
Portfolio Characteristics
| Quality Distribution* | ||
| Net Assets: | $2,609,389,463 | |
 | SEC 30-Day | |
Yield:** | ||
| Institutional Class: | 2.46% | |
| Investor Class: | 2.21% | |
| Average | ||
| Effective | ||
| Duration: | 5.03 years | |
| Average | ||
| Effective | ||
| Maturity: | 6.59 years | |
| Annualized | ||
| Expense | ||
| Sector Weightings* | Ratio: | |
| Institutional Class: | 0.30% | |
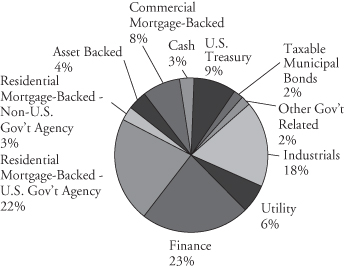 | Investor Class: | 0.55%*** |
| Portfolio | ||
| Turnover | ||
| Rate: | 36.7% | |
| Total | ||
| Number of | ||
| Holdings: | 665 | |
| * | Percentages shown are based on the Fund’s total investments (less investments purchased with cash proceeds from securities lending). | |
| ** | SEC yields are based on SEC guidelines and are calculated for the 30 days ended December 31, 2012. | |
| *** | Includes 0.25% 12b-1 fee. |
Page 54
Baird Core Plus Bond Fund
Institutional Class
Value of a $25,000 Investment
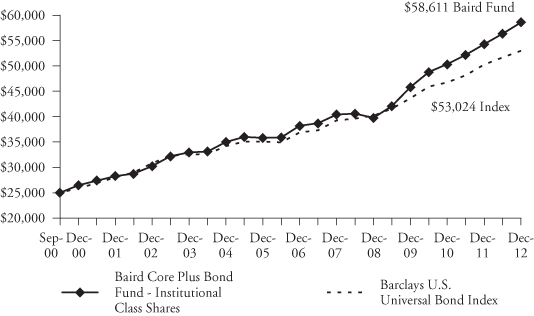
Growth of a hypothetical investment of $25,000 made on the Fund’s inception date (9/29/00), assuming reinvestment of all distributions.
Investor Class
Value of a $10,000 Investment
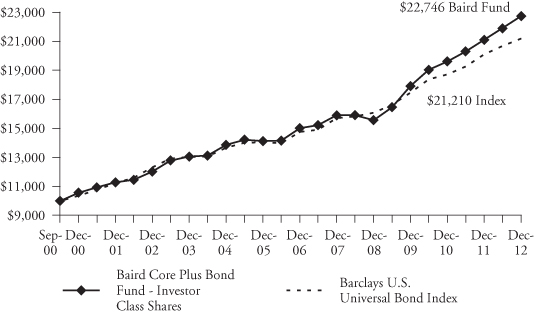
Growth of a hypothetical investment of $10,000 made on the Fund’s inception date (9/29/00), assuming reinvestment of all distributions.
Page 55
Baird Core Plus Bond Fund
December 31, 2012
Average Annual Total Returns
| One | Five | Ten | Since | |
| For the Periods Ended December 31, 2012 | Year | Years | Years | Inception(1) |
| Institutional Class Shares | 7.95% | 7.70% | 6.84% | 7.20% |
| Investor Class Shares | 7.80% | 7.43% | 6.58% | 6.94% |
Barclays U.S. Universal Bond Index(2) | 5.53% | 6.19% | 5.59% | 6.33% |
| (1) | For the period from September 29, 2000 (commencement of operations) through December 31, 2012. | |
| (2) | The Barclays U.S. Universal Bond Index is an unmanaged, market value weighted index of fixed income securities issued in U.S. dollars, including U.S. government and investment grade debt, non-investment grade debt, asset-backed and mortgage-backed securities, Eurobonds, 144A securities and emerging market debt, with maturities of at least one year. This index does not reflect any deduction for fees, expenses or taxes. A direct investment in an index is not possible. |
The returns shown in the table above and line graphs on the previous page reflect reinvestment of dividends and/or capital gains distributions in additional shares. The returns do not reflect the deduction of taxes that a shareholder would pay on Fund distributions or the redemption of Fund shares. The returns reflect the actual performance for each period and do not include the impact of trades executed on the last business day of the period that were recorded on the first business day of the next period.
The Fund’s gross expense ratio for each Class, as reflected in the Fund’s current prospectus, is set forth under “Portfolio Characteristics”.
The Fund may invest up to 20% of its net assets in non-investment grade debt securities (commonly referred to as junk bonds). While these types of debt securities typically offer higher yields than investment grade securities, they also include greater risks including increased credit risk and the increased risk of default or bankruptcy. The Fund maintains securities with longer maturities in order to provide a greater potential for return. Generally, the longer a bond’s maturity, the greater the interest rate risk. The Fund may also invest in U.S. dollar denominated foreign securities which involve additional risks such as currency rate fluctuations, political and economic instability, and different and sometimes less strict financial reporting standards and regulation. The Fund may also invest in mortgage- and asset-backed securities, which include interest rate and prepayment risks more pronounced than those of other fixed income securities.
Past performance does not guarantee future results. Investment return and principal value will fluctuate so that an investor’s shares, when redeemed, may be worth more or less than their original cost.
For information about the performance of the Fund as of the most recent month-end, please call 1-866-44BAIRD or visit www.bairdfunds.com. Mutual fund performance changes over time and current performance may be lower or higher than that stated.
Page 56
Baird Core Plus Bond Fund
Summary Schedule of Investments, December 31, 2012
This schedule summarizes the Fund’s holdings by asset type. Details are reported for each of the Fund’s 50 largest individual holdings and for investments that, in total for any issuer, represent more than 1% of the Fund’s net assets. The total value of smaller holdings is reported as a single amount within each category.
The Fund reports a complete list of its holdings in regulatory filings four times in each fiscal year, at the quarter end. For the second and fourth fiscal quarters, the complete listing of the Fund’s holdings is available electronically in the Fund’s Form N-CSR at http://www.rwbaird.com/baird-funds/prospectus-applications/prospectus-applications.aspx and on the Securities and Exchange Commission’s website (www.sec.gov) or you can have it mailed to you without charge by calling 1-866-44BAIRD. For the first and third fiscal quarters, the Fund files the lists with the SEC on Form N-Q. Shareholders can look up the Fund’s Forms N-CSR and N-Q on the SEC’s website (www.sec.gov).
Long-Term Investments
| Principal | Market | % of | ||||||||||
| Amount | Value | Net Assets | ||||||||||
| U.S. Treasury Securities | ||||||||||||
| U.S. Treasury Bonds | ||||||||||||
| 1.250%, 04/30/2019 | $ | 94,125,000 | $ | 95,544,217 | 3.7 | % | ||||||
| 5.250%, 11/15/2028 | 49,025,000 | 67,731,077 | 2.6 | % | ||||||||
| 4.375%, 02/15/2038 | 67,600,000 | 87,711,000 | 3.3 | % | ||||||||
| Total U.S. Treasury Securities | ||||||||||||
| (Cost $245,579,180) | 250,986,294 | 9.6 | % | |||||||||
| Taxable Municipal Bonds | ||||||||||||
Other Municipal Bonds# | 47,331,395 | 1.8 | % | |||||||||
| Total Municipal Bonds | ||||||||||||
| (Cost $43,052,935) | 47,331,395 | 1.8 | % | |||||||||
| Other Government Related Securities | ||||||||||||
Other Government Related Securities#~ | 56,297,518 | 2.2 | % | |||||||||
| Total Other Government Related Securities | ||||||||||||
| (Cost $52,798,539) | 56,297,518 | 2.2 | % | |||||||||
| Corporate Bonds | ||||||||||||
| Industrials | ||||||||||||
| Nabors Industries, Inc. | ||||||||||||
| 9.250%, 01/15/2019 | 10,123,000 | 13,383,102 | 0.5 | % | ||||||||
| Staples, Inc. | ||||||||||||
| 9.750%, 01/15/2014 | 10,325,000 | 11,225,299 | 0.4 | % | ||||||||
| The Interpublic Group of Companies, Inc. | ||||||||||||
| 10.000%, 07/15/2017 | 10,250,000 | 11,198,125 | 0.4 | % | ||||||||
| Walgreen Co. | ||||||||||||
| 5.250%, 01/15/2019@ | 10,000,000 | 11,729,180 | 0.5 | % | ||||||||
Other Industrials#~ | 420,409,519 | 16.1 | % | |||||||||
| Total Industrials | ||||||||||||
| (Cost $450,999,711) | 467,945,225 | 17.9 | % | |||||||||
The accompanying notes are in integral part of these financial statements.
Page 57
Baird Core Plus Bond Fund
Summary Schedule of Investments, December 31, 2012
Long-Term Investments (cont.)
| Principal | Market | % of | ||||||||||
| Amount | Value | Net Assets | ||||||||||
| Utility | ||||||||||||
| DCP Midstream, LLC | ||||||||||||
| 9.750%, 03/15/2019 (Acquired 02/29/2012 | ||||||||||||
| through 12/12/2012, Cost $11,772,198)* | $ | 9,155,000 | $ | 12,110,463 | 0.5 | % | ||||||
Other Utility#~ | 151,087,531 | 5.8 | % | |||||||||
| Total Utility | ||||||||||||
| (Cost $153,341,511) | 163,197,994 | 6.3 | % | |||||||||
| Finance | ||||||||||||
| Barclays Bank PLC | ||||||||||||
6.750%, 05/22/2019 f | 9,850,000 | 12,029,165 | 0.5 | % | ||||||||
| Dresdner Bank AG | ||||||||||||
7.250%, 09/15/2015 f | 9,850,000 | 10,593,074 | 0.4 | % | ||||||||
| Irish Life & Permanent Group Holdings PLC | ||||||||||||
| 3.600%, 01/14/2013 (Acquired 12/01/2010 | ||||||||||||
through 08/10/2012, Cost $11,375,461)* f | 11,400,000 | 11,400,080 | 0.4 | % | ||||||||
| Lincoln National Corporation | ||||||||||||
| 8.750%, 07/01/2019 | 7,801,000 | 10,432,246 | 0.4 | % | ||||||||
| Regions Bank | ||||||||||||
| 7.500%, 05/15/2018 | 9,575,000 | 11,549,844 | 0.4 | % | ||||||||
| Simon Property Group, L.P. | ||||||||||||
| 1.500%, 02/01/2018 | ||||||||||||
| (Acquired 12/10/2012, Cost $11,962,200)* | 12,000,000 | 11,932,260 | 0.5 | % | ||||||||
Other Finance#~ | 535,545,104 | 20.5 | % | |||||||||
| Total Finance | ||||||||||||
| (Cost $570,710,629) | 603,481,773 | 23.1 | % | |||||||||
| Residential Mortgage-Backed Securities | ||||||||||||
| U.S. Government Agency Issues | ||||||||||||
| Federal Gold Loan Mortgage Corporation (FGLMC) | ||||||||||||
| Pass-Through Certificates | ||||||||||||
| 3.000%, 05/01/2027 | 17,081,100 | 18,026,610 | 0.7 | % | ||||||||
| 4.500%, 11/01/2039 | 10,729,459 | 11,513,696 | 0.4 | % | ||||||||
| 4.500%, 08/01/2040 | 9,488,950 | 10,218,099 | 0.4 | % | ||||||||
| 4.500%, 08/01/2040 | 15,780,788 | 16,993,414 | 0.7 | % | ||||||||
| 3.500%, 06/01/2042 | 16,034,105 | 17,098,908 | 0.6 | % | ||||||||
| 3.500%, 07/01/2042 | 54,338,105 | 57,946,625 | 2.2 | % | ||||||||
| 3.000%, 08/01/2042 | 41,808,118 | 43,751,074 | 1.7 | % | ||||||||
| 3.000%, 10/01/2042 | 21,874,090 | 22,890,649 | 0.9 | % | ||||||||
| 4.500%-6.500%, 12/01/2020-11/01/2039 | 6,521,138 | 7,025,397 | 0.2 | % | ||||||||
The accompanying notes are in integral part of these financial statements.
Page 58
Baird Core Plus Bond Fund
Summary Schedule of Investments, December 31, 2012
Long-Term Investments (cont.)
| Principal | Market | % of | ||||||||||
| Amount | Value | Net Assets | ||||||||||
| Federal National Mortgage Association (FNMA) | ||||||||||||
| Pass-Through Certificates | ||||||||||||
| 2.500%, 12/01/2027 | $ | 29,721,548 | $ | 31,102,362 | 1.2 | % | ||||||
| 5.000%, 07/01/2035 | 20,555,827 | 22,363,240 | 0.9 | % | ||||||||
| 5.000%, 02/01/2036 | 11,546,771 | 12,557,947 | 0.5 | % | ||||||||
| 5.500%, 04/01/2036 | 11,903,076 | 13,007,435 | 0.5 | % | ||||||||
| 4.000%, 01/01/2041 | 14,064,251 | 15,091,767 | 0.6 | % | ||||||||
| 3.500%, 02/01/2041 | 16,279,577 | 17,370,220 | 0.7 | % | ||||||||
| 4.000%, 02/01/2041 | 27,353,947 | 29,352,391 | 1.1 | % | ||||||||
| 4.000%, 09/01/2041 | 13,692,752 | 14,697,406 | 0.6 | % | ||||||||
| 4.000%, 12/01/2041 | 11,287,859 | 12,116,063 | 0.5 | % | ||||||||
| 3.000%, 05/01/2042 | 17,396,249 | 18,246,498 | 0.7 | % | ||||||||
| 3.500%, 06/01/2042 | 16,760,945 | 17,920,501 | 0.7 | % | ||||||||
| 3.500%-7.500%, 12/25/2019-07/01/2041 | 66,157,214 | 71,538,664 | 2.7 | % | ||||||||
| Government National Mortgage Association (GNMA) | ||||||||||||
| Pass-Through Certificates | ||||||||||||
| 4.500%, 01/20/2041 | 18,263,488 | 20,147,689 | 0.8 | % | ||||||||
| 4.000%, 06/20/2042 | 51,602,091 | 56,220,627 | 2.1 | % | ||||||||
| 4.500%-6.500%, 12/20/2028-07/20/2040 | 10,268,594 | 11,335,212 | 0.4 | % | ||||||||
Other U.S. Government Agency Issues# | 1,970,879 | 0.1 | % | |||||||||
| Total U.S. Government Agency Issues | ||||||||||||
| (Cost $561,868,663) | 570,503,373 | 21.9 | % | |||||||||
| Non-U.S. Government Agency Issues | ||||||||||||
| GSR Mortgage Loan Trust | ||||||||||||
| Series 2005-3F, Class 2A4, 6.000%, 03/25/2035 | 13,988,348 | 14,435,696 | 0.5 | % | ||||||||
Other Non-U.S. Government Agency Issues# | 75,045,351 | 2.9 | % | |||||||||
| Total Non-U.S. Government Agency Issues | ||||||||||||
| (Cost $88,574,932) | 89,481,047 | 3.4 | % | |||||||||
| Asset Backed Securities | ||||||||||||
| Morgan Stanley ABS Capital I | ||||||||||||
| Series 2006-HE1, Class A3, 0.390%, 01/25/2036 | 10,631,544 | 10,425,685 | 0.4 | % | ||||||||
| Morgan Stanley Home Equity Loan Trust | ||||||||||||
| Series 2006-2, Class A3, 0.380%, 02/25/2036 | 19,899,647 | 19,519,345 | 0.8 | % | ||||||||
| Soundview Home Equity Loan Trust | ||||||||||||
| Series 2005-OPT4, Class 2A3, 0.470%, 12/25/2035 | 14,002,640 | 13,557,776 | 0.5 | % | ||||||||
Other Asset Backed Securities#~ | 60,651,268 | 2.3 | % | |||||||||
| Total Asset Backed Securities | ||||||||||||
| (Cost $102,035,411) | 104,154,074 | 4.0 | % | |||||||||
| Commercial Mortgage Backed Securities | ||||||||||||
| Bear Stearns Commercial Mortgage Securities | ||||||||||||
| Series 2005-PWR9, Class A4A, 4.871%, 09/11/2042 | 16,160,000 | 17,752,293 | 0.7 | % | ||||||||
| Citigroup Deutsche Bank | ||||||||||||
| Series 2005-CD1, Class A4, 5.219%, 07/15/2044 | 13,222,000 | 14,673,300 | 0.6 | % | ||||||||
The accompanying notes are in integral part of these financial statements.
Page 59
Baird Core Plus Bond Fund
Summary Schedule of Investments, December 31, 2012
Long-Term Investments (cont.)
| Principal | Market | % of | ||||||||||
| Amount | Value | Net Assets | ||||||||||
| Commercial Mortgage Trust | ||||||||||||
| Series 2012-CR1, Class A3, 3.391%, 05/15/2045 | $ | 18,198,000 | $ | 19,610,019 | 0.8 | % | ||||||
| Series 2012-CR2, Class A4, 3.147%, 08/15/2045 | 13,050,000 | 13,771,339 | 0.5 | % | ||||||||
| Credit Suisse First Boston | ||||||||||||
| Mortgage Securities Corporation | ||||||||||||
| Series 2005-C5, Class A4, 5.100%, 08/15/2038 | 16,925,000 | 18,603,249 | 0.7 | % | ||||||||
| GE Capital Commercial Mortgage Corporation | ||||||||||||
| Series 2005-C4, Class A4, 5.307%, 11/10/2045 | 12,795,000 | 14,309,480 | 0.5 | % | ||||||||
| J.P. Morgan Chase Commercial Mortgage Trust | ||||||||||||
| Series 2005-CB12, Class A4, 4.895%, 09/12/2037 | 15,505,000 | 17,007,264 | 0.7 | % | ||||||||
| Morgan Stanley Bank of America Merrill Lynch Trust | ||||||||||||
| Series 2012-C6, Class A4, 2.858%, 11/17/2045 | 23,100,000 | 23,877,662 | 0.9 | % | ||||||||
| Morgan Stanley Capital I Trust | ||||||||||||
| Series 2005-HQ7, Class A4, 5.208%, 11/14/2042 | 19,275,000 | 21,289,719 | 0.8 | % | ||||||||
| WF-RBS Commercial Mortgage Trust | ||||||||||||
| Series 2012-C6, Class A4, 3.440%, 04/15/2045 | 10,800,000 | 11,726,456 | 0.4 | % | ||||||||
Other Commercial Mortgage Backed Securities# | 28,093,182 | 1.1 | % | |||||||||
| Total Commercial Mortgage Backed Securities | ||||||||||||
| (Cost $196,790,990) | 200,713,963 | 7.7 | % | |||||||||
| Total Long-Term Investments | ||||||||||||
| (Cost $2,465,752,501) | 2,554,092,656 | 97.9 | % | |||||||||
| Short-Term Investments | ||||||||||||
| Shares | ||||||||||||
| Money Market Mutual Funds | ||||||||||||
| Dreyfus Institutional Cash Advantage Fund, 0.11%« | 6,562,598 | 6,562,598 | 0.2 | % | ||||||||
| Short-Term Investments Trust – | ||||||||||||
| Liquid Assets Portfolio, 0.15%« | 61,589,097 | 61,589,097 | 2.4 | % | ||||||||
| Total Short-Term Investments | ||||||||||||
| (Cost $68,151,695) | 68,151,695 | 2.6 | % | |||||||||
| Investments Purchased with Cash | ||||||||||||
| Proceeds from Securities Lending | ||||||||||||
| Principal | Market | % of | ||||||||||
| Amount | Value | Net Assets | ||||||||||
| Commercial Paper | ||||||||||||
| Atlantic East Funding LLC, 0.562%, 03/25/2013†** | $ | 232,082 | 175,476 | 0.0 | % | |||||||
| Total Commercial Paper | ||||||||||||
| (Cost $232,082) | 175,476 | 0.0 | % | |||||||||
The accompanying notes are in integral part of these financial statements.
Page 60
Baird Core Plus Bond Fund
Summary Schedule of Investments, December 31, 2012
Investments Purchased with Cash
Proceeds from Securities Lending
| Market | % of | |||||||||||
| Shares | Value | Net Assets | ||||||||||
| Investment Companies | ||||||||||||
| Mount Vernon Securities Lending | ||||||||||||
| Trust Prime Portfolio, 0.28%« | 111,038,991 | $ | 111,038,991 | 4.3 | % | |||||||
| Total Investment Companies | ||||||||||||
| (Cost $111,038,991) | 111,038,991 | 4.3 | % | |||||||||
| Total Investments Purchased With | ||||||||||||
| Cash Proceeds From Securities Lending | ||||||||||||
| (Cost $111,271,073) | 111,214,467 | 4.3 | % | |||||||||
| Total Investments | ||||||||||||
| (Cost $2,645,175,269) | 2,733,458,818 | 104.8 | % | |||||||||
| Asset Relating to Securities Lending Investments | ||||||||||||
Support Agreement**^a† | 56,606 | 0.0 | % | |||||||||
| Total | ||||||||||||
| (Cost $0) | 56,606 | 0.0 | % | |||||||||
| Liabilities in Excess of Other Assets | (124,125,961 | ) | (4.8 | %) | ||||||||
| TOTAL NET ASSETS | $ | 2,609,389,463 | 100.0 | % | ||||||||
Notes to Summary Schedule of Investments
| # | Represents the aggregate value, by category, securities that are not among the 50 largest holdings and, in total for any issuer, represent 1% or less of net assets. | |
| * | Restricted Security Deemed Liquid | |
| ** | Illiquid Security | |
| @ | This security or portion of this security is out on loan at December 31, 2012. | |
| f | Foreign Security | |
| ^ | Non-Income Producing | |
| « | 7-Day Yield | |
| † | Priced at Fair Value by the Valuation Committee as delegated by the Baird Funds’ Board of Directors. | |
| a | The Fund’s transfer agent and administrator and securities lending agent entered into a support agreement with the Fund to cover losses realized by the Fund on its investment in Atlantic East Funding, LLC (up to a certain amount), which investment was made by the Fund’s securities lending agent. | |
| ~ | Groupings contain, in aggregate, restricted securities totaling $347,099,151 representing 13.30% of net assets. |
The accompanying notes are in integral part of these financial statements.
Page 61
Baird Core Plus Bond Fund
Summary Schedule of Investments, December 31, 2012
Summary of Fair Value Exposure at December 31, 2012
The Fund has adopted authoritative fair valuation accounting standards which establish a definition of fair value and set out a hierarchy for measuring fair value. These standards require additional disclosures about the various inputs and valuation techniques used to develop the measurements of fair value and a discussion on changes in valuation techniques and related inputs during the period. These standards define fair value as the price that would be received to sell an asset or paid to transfer a liability in an orderly transaction between market participants at the measurement date.
The fair value hierarchy is organized into three levels based upon the assumptions (referred to as “inputs”) used in pricing the asset or liability. These standards state that “observable inputs” reflect the assumptions market participants would use in pricing the asset or liability based on market data obtained from independent sources and “unobservable inputs” reflect an entity’s own assumptions about the assumptions market participants would use in pricing the asset or liability. These inputs are summarized into three broad levels and described below:
Level 1 – | Unadjusted quoted prices in active markets for identical unrestricted securities. |
Level 2 – | Other significant observable inputs (including quoted prices for similar securities, quoted prices in inactive markets, dealer indications, interest rates, yield curves, prepayment speeds, credit risk, default rates, inputs corroborated by observable market data, etc.). |
Level 3 – | Significant unobservable inputs (including the Fund’s own assumptions about the factors that market participants would use in valuing the security) based on the best information available. |
The inputs or methodology used for valuing securities are not necessarily an indication of the risk associated with investing in those securities.
The accompanying notes are in integral part of these financial statements.
Page 62
Baird Core Plus Bond Fund
Summary Schedule of Investments, December 31, 2012
The following is a summary of the inputs used to value the Fund’s investments as of December 31, 2012:
| Level 1 | Level 2 | Level 3 | Total | |||||||||||||
| Fixed Income | ||||||||||||||||
| U.S. Treasury Securities | $ | — | $ | 250,986,294 | $ | — | $ | 250,986,294 | ||||||||
| Taxable Municipal Bonds | — | 47,331,395 | — | 47,331,395 | ||||||||||||
| Other Government Related Securities | — | 56,297,518 | — | 56,297,518 | ||||||||||||
| Corporate Bonds | — | 1,234,620,317 | 4,675 | 1,234,624,992 | ||||||||||||
| Residential Mortgage-Backed Securities – | ||||||||||||||||
| U.S. Government Agency Issues | — | 570,503,373 | — | 570,503,373 | ||||||||||||
| Residential Mortgage-Backed Securities – | ||||||||||||||||
| Non-U.S. Government Agency Issues | — | 89,481,047 | — | 89,481,047 | ||||||||||||
| Asset Backed Securities | — | 104,154,074 | — | 104,154,074 | ||||||||||||
| Commercial Mortgage-Backed Securities | — | 200,713,963 | — | 200,713,963 | ||||||||||||
| Total Fixed Income | — | 2,554,087,981 | 4,675 | 2,554,092,656 | ||||||||||||
| Short-Term Investments | ||||||||||||||||
| Money Market Mutual Funds | 68,151,695 | — | — | 68,151,695 | ||||||||||||
| Total Short-Term Investments | 68,151,695 | — | — | 68,151,695 | ||||||||||||
| Investments Purchased with Cash | ||||||||||||||||
| Proceeds from Securities Lending | ||||||||||||||||
| Commercial Paper | — | 175,476 | — | 175,476 | ||||||||||||
| Money Market Mutual Fund | 111,038,991 | — | — | 111,038,991 | ||||||||||||
| Total Investments Purchased with | ||||||||||||||||
| Cash Proceeds from Securities Lending | 111,038,991 | 175,476 | — | 111,214,467 | ||||||||||||
| Total Investments | $ | 179,190,686 | $ | 2,554,263,457 | $ | 4,675 | $ | 2,733,458,818 | ||||||||
| Asset Relating to | ||||||||||||||||
| Securities Lending Investments | $ | — | $ | 56,606 | $ | — | $ | 56,606 | ||||||||
Changes in valuation techniques may result in transfers into or out of current assigned levels within the hierarchy. There were no transfers between Level 1, Level 2 and Level 3 fair value measurements during the reporting period, as compared to their classification from the prior year’s annual report. One security that is priced at fair value by the Valuation Committee instead of the Fund’s pricing vendor is valued using level 3 inputs.
Level 3 Reconciliation Disclosure
Following is a reconciliation of Level 3 assets for which significant unobservable inputs were used to determine fair value.
| Description | Investments in Securities | |||
| Balance as of December 31, 2011 | $ | 4,675 | ||
| Accrued discounts/premiums | — | |||
| Realized gain (loss) | — | |||
| Change in unrealized appreciation (depreciation) | — | |||
| Purchases | — | |||
| Sales | — | |||
| Transfers in and/or out of Level 3* | — | |||
| Balance as of December 31, 2012 | $ | 4,675 | ||
* Transfers between levels are recognized at the end of the reporting period.
The accompanying notes are in integral part of these financial statements.
Page 63
Additional Information on Fund Expenses
December 31, 2012
As a shareholder of a mutual fund, you incur two types of costs: (1) transaction costs, which may include sales charges (loads) on purchase payments, reinvested dividends, or other distributions; redemption fees; and exchange fees; and (2) ongoing costs, such as management fees; distribution and/or service (12b-1) fees; and other fund expenses. Although the Funds do not charge any sales loads, redemption fees, or other transaction fees, you will be assessed fees for outgoing wire transfers, returned checks and stop payment orders at prevailing rates charged by U.S. Bancorp Fund Services, LLC, the Funds’ transfer agent. If you request that a redemption be made by wire transfer, currently the Funds’ transfer agent charges a $15.00 fee.
This Example is intended to help you understand your ongoing costs (in dollars) of investing in each Fund and to compare these costs with the ongoing costs of investing in other mutual funds. The Example is based on an investment of $1,000 invested at the beginning of the period and held for the entire period (7/1/12 – 12/31/12).
Actual Expenses
The third and fourth columns of the following table provide information about account values based on actual returns and actual expenses. You may use the information in these columns, together with the amount you invested, to estimate the expenses that you paid over the period. Simply divide your account value by $1,000 (for example, an $8,600 account value divided by $1,000 = 8.6), then multiply the result by the number in the fourth column entitled “Expenses Paid During Period’’ to estimate the expenses you paid on your account during this period.
Hypothetical Example for Comparison Purposes
The fifth and sixth columns of the following table provide information about hypothetical account values and hypothetical expenses based on the Funds’ actual expense ratios and an assumed rate of return of 5% per year before expenses, which is not the Funds’ actual return. The hypothetical account values and expenses may not be used to estimate the actual ending account balance or expenses you paid for the period. You may use this information to compare the ongoing costs of investing in the Funds and other mutual funds. To do so, compare this 5% hypothetical example with the 5% hypothetical examples that appear in the shareholder reports of the other mutual funds. Please note that the expenses shown in the table are meant to highlight your ongoing costs only and do not reflect any transactional costs. Therefore, the sixth column of the table (entitled “Expenses Paid During Period”) is useful in comparing ongoing costs only, and will not help you determine the relative total costs of owning different mutual funds. In addition, if these transactional costs were included, your costs could have been higher.
Page 64
Additional Information on Fund Expenses
December 31, 2012
Actual vs. Hypothetical Returns
| Hypothetical | ||||||||||||||||||||||||
| (5% return | ||||||||||||||||||||||||
| Actual | before expenses) | |||||||||||||||||||||||
| Fund's | Beginning | Ending | Expenses | Ending | Expenses | |||||||||||||||||||
| Annualized | Account | Account | Paid | Account | Paid | |||||||||||||||||||
| Expense | Value | Value | During | Value | During | |||||||||||||||||||
Ratio(1) | 7/1/12 | 12/31/12 | Period(1) | 12/31/12 | Period(1) | |||||||||||||||||||
| Baird Short-Term | ||||||||||||||||||||||||
| Bond Fund | ||||||||||||||||||||||||
| Institutional Class | 0.30 | % | $ | 1,000.00 | $ | 1,020.40 | $ | 1.52 | $ | 1,023.63 | $ | 1.53 | ||||||||||||
Investor Class(2) | 0.55 | % | $ | 1,000.00 | $ | 1,006.80 | $ | 1.57 | $ | 1,012.64 | $ | 1.57 | ||||||||||||
| Baird Intermediate | ||||||||||||||||||||||||
| Bond Fund | ||||||||||||||||||||||||
| Institutional Class | 0.30 | % | $ | 1,000.00 | $ | 1,031.70 | $ | 1.53 | $ | 1,023.63 | $ | 1.53 | ||||||||||||
| Investor Class | 0.55 | % | $ | 1,000.00 | $ | 1,030.10 | $ | 2.81 | $ | 1,022.37 | $ | 2.80 | ||||||||||||
| Baird Intermediate | ||||||||||||||||||||||||
| Municipal Bond Fund | ||||||||||||||||||||||||
| Institutional Class | 0.30 | % | $ | 1,000.00 | $ | 1,016.00 | $ | 1.52 | $ | 1,023.63 | $ | 1.53 | ||||||||||||
| Investor Class | 0.55 | % | $ | 1,000.00 | $ | 1,015.20 | $ | 2.79 | $ | 1,022.37 | $ | 2.80 | ||||||||||||
| Baird Aggregate | ||||||||||||||||||||||||
| Bond Fund | ||||||||||||||||||||||||
| Institutional Class | 0.30 | % | $ | 1,000.00 | $ | 1,037.90 | $ | 1.54 | $ | 1,023.63 | $ | 1.53 | ||||||||||||
| Investor Class | 0.55 | % | $ | 1,000.00 | $ | 1,037.30 | $ | 2.82 | $ | 1,022.37 | $ | 2.80 | ||||||||||||
| Baird Core Plus | ||||||||||||||||||||||||
| Bond Fund | ||||||||||||||||||||||||
| Institutional Class | 0.30 | % | $ | 1,000.00 | $ | 1,039.50 | $ | 1.54 | $ | 1,023.63 | $ | 1.53 | ||||||||||||
| Investor Class | 0.55 | % | $ | 1,000.00 | $ | 1,038.60 | $ | 2.82 | $ | 1,022.37 | $ | 2.80 | ||||||||||||
| (1) | Expenses are equal to the Fund's annualized net expense ratio multiplied by the average account value over the period, multiplied by 184 days and divided by 366 to reflect the one-half year period. | |
| (2) | Expenses are equal to the Baird Short-Term Bond Fund Investor Class's annualized net expense ratio multiplied by the average account value over the period, multiplied by 104 days and divided by 366 to reflect the period since the Class inception on September 19, 2012. |
Page 65
Statement of Assets and Liabilities
December 31, 2012
| Baird | ||||||||||||
| Baird | Baird | Intermediate | ||||||||||
| Short-Term | Intermediate | Municipal | ||||||||||
| Bond Fund | Bond Fund | Bond Fund | ||||||||||
| ASSETS: | ||||||||||||
| Investments, at value (cost $1,343,008,327; | ||||||||||||
| $941,814,526 & $1,134,114,771, respectively)* | $ | 1,357,580,854 | $ | 979,424,746 | $ | 1,205,479,269 | ||||||
| Support Agreement (Note 6) | 179,494 | 453,556 | — | |||||||||
| Interest receivable | 13,569,284 | 9,258,237 | 14,569,812 | |||||||||
| Receivable for investments sold or paid down | 228,308 | 17,615 | — | |||||||||
| Receivable for Fund shares sold | 11,204,389 | 3,674,469 | 5,049,190 | |||||||||
| Uninvested cash | 13,299 | 3,428 | — | |||||||||
| Total assets | 1,382,775,628 | 992,832,051 | 1,225,098,271 | |||||||||
| LIABILITIES: | ||||||||||||
| Payable for collateral received | ||||||||||||
| for securities loaned (Note 6) | 84,476,862 | 80,314,034 | — | |||||||||
| Payable for securities purchased | — | 16,304,790 | 276,892 | |||||||||
| Payable for Fund shares repurchased | 806,380 | 1,694,038 | 2,783,805 | |||||||||
| Payable to Advisor and Distributor | 322,895 | 232,914 | 391,272 | |||||||||
| Other liabilities | 10,975 | 77,902 | 37 | |||||||||
| Total liabilities | 85,617,112 | 98,623,678 | 3,452,006 | |||||||||
| NET ASSETS | $ | 1,297,158,516 | $ | 894,208,373 | $ | 1,221,646,265 | ||||||
| NET ASSETS CONSIST OF: | ||||||||||||
| Capital stock | $ | 1,281,637,160 | $ | 854,271,916 | $ | 1,151,045,609 | ||||||
| Undistributed net investment income | 48,525 | 143,175 | — | |||||||||
| Accumulated net realized gain (loss) | ||||||||||||
| on investments sold | 720,810 | 1,729,506 | (763,842 | ) | ||||||||
| Net unrealized appreciation on | ||||||||||||
| investments and support agreement | 14,752,021 | 38,063,776 | 71,364,498 | |||||||||
| NET ASSETS | $ | 1,297,158,516 | $ | 894,208,373 | $ | 1,221,646,265 | ||||||
| INSTITUTIONAL CLASS SHARES | ||||||||||||
| Net Assets | $ | 1,295,672,435 | $ | 867,477,943 | $ | 963,120,073 | ||||||
| Shares outstanding ($0.01 par value, | ||||||||||||
| unlimited shares authorized) | 132,833,022 | 76,724,520 | 80,187,075 | |||||||||
| Net asset value, offering and | ||||||||||||
| redemption price per share | $ | 9.75 | $ | 11.31 | $ | 12.01 | ||||||
| INVESTOR CLASS SHARES | ||||||||||||
| Net Assets | $ | 1,486,081 | $ | 26,730,430 | $ | 258,526,192 | ||||||
| Shares outstanding ($0.01 par value, | ||||||||||||
| unlimited shares authorized) | 152,356 | 2,276,464 | 21,081,580 | |||||||||
| Net asset value, offering and | ||||||||||||
| redemption price per share | $ | 9.75 | $ | 11.74 | $ | 12.26 | ||||||
*Includes securities out on loan to brokers with a market value of $82,723,692, $78,411,737 and $0, respectively.
The accompanying notes are in integral part of these financial statements.
Page 66
Statement of Assets and Liabilities
December 31, 2012
| Baird | Baird | |||||||
| Aggregate | Core Plus | |||||||
| Bond Fund | Bond Fund | |||||||
| ASSETS: | ||||||||
| Investments, at value (cost $1,529,638,460 | ||||||||
| & $2,645,175,269, respectively)* | $ | 1,601,446,655 | $ | 2,733,458,818 | ||||
| Support Agreement (Note 6) | 622,719 | 56,606 | ||||||
| Interest receivable | 11,970,036 | 21,926,208 | ||||||
| Receivable for investments sold or paid down | 37,864 | 3,897 | ||||||
| Receivable for Fund shares sold | 4,609,675 | 19,001,880 | ||||||
| Uninvested cash | 1,905 | 3,502 | ||||||
| Total assets | 1,618,688,854 | 2,774,450,911 | ||||||
| LIABILITIES: | ||||||||
| Payable for collateral received | ||||||||
| for securities loaned (Note 6) | 64,509,739 | 111,274,488 | ||||||
| Payable for securities purchased | 6,145,923 | 46,209,600 | ||||||
| Payable for Fund shares repurchased | 2,626,951 | 6,636,962 | ||||||
| Payable to Advisor and Distributor | 411,569 | 909,085 | ||||||
| Other liabilities | 145,503 | 31,313 | ||||||
| Total liabilities | 73,839,685 | 165,061,448 | ||||||
| NET ASSETS | $ | 1,544,849,169 | $ | 2,609,389,463 | ||||
| NET ASSETS CONSIST OF: | ||||||||
| Capital stock | $ | 1,473,164,727 | $ | 2,519,055,769 | ||||
| Undistributed net investment income | 96,715 | 212,042 | ||||||
| Accumulated net realized gain (loss) | ||||||||
| on investments sold | (843,187 | ) | 1,781,497 | |||||
| Net unrealized appreciation on | ||||||||
| investments and support agreement | 72,430,914 | 88,340,155 | ||||||
| NET ASSETS | $ | 1,544,849,169 | $ | 2,609,389,463 | ||||
| INSTITUTIONAL CLASS SHARES | ||||||||
| Net Assets | $ | 1,495,432,440 | $ | 1,573,352,073 | ||||
| Shares outstanding ($0.01 par value, | ||||||||
| unlimited shares authorized) | 137,267,017 | 139,594,782 | ||||||
| Net asset value, offering and | ||||||||
| redemption price per share | $ | 10.89 | $ | 11.27 | ||||
| INVESTOR CLASS SHARES | ||||||||
| Net Assets | $ | 49,416,729 | $ | 1,036,037,390 | ||||
| Shares outstanding ($0.01 par value, | ||||||||
| unlimited shares authorized) | 4,406,552 | 88,815,787 | ||||||
| Net asset value, offering and | ||||||||
| redemption price per share | $ | 11.21 | $ | 11.67 | ||||
| * | Includes securities out on loan to brokers with a market value of $62,894,298 and $108,574,628, respectively. |
The accompanying notes are in integral part of these financial statements.
Page 67
Statement of Operations
Year Ended December 31, 2012
| Baird | ||||||||||||||||||||
| Baird | Baird | Intermediate | Baird | Baird | ||||||||||||||||
| Short-Term | Intermediate | Municipal | Aggregate | Core Plus | ||||||||||||||||
| Bond Fund | Bond Fund | Bond Fund | Bond Fund | Bond Fund | ||||||||||||||||
| INVESTMENT INCOME: | ||||||||||||||||||||
| Interest income, | ||||||||||||||||||||
| net of paydowns | $ | 28,856,604 | $ | 25,438,697 | $ | 33,026,383 | $ | 56,207,634 | $ | 62,296,806 | ||||||||||
| Income from securities | ||||||||||||||||||||
| lending (Note 6) | 135,381 | 129,243 | — | 195,673 | 226,011 | |||||||||||||||
| Other income | 29 | 232 | — | — | 3,125 | |||||||||||||||
| Total investment income | 28,992,014 | 25,568,172 | 33,026,383 | 56,403,307 | 62,525,942 | |||||||||||||||
| EXPENSES: | ||||||||||||||||||||
| Investment advisory fee | 2,869,681 | 1,969,462 | 2,971,787 | 3,702,435 | 4,564,059 | |||||||||||||||
| Administration fee | 573,936 | 393,893 | 594,358 | 740,487 | 912,812 | |||||||||||||||
| Distribution expense – | ||||||||||||||||||||
| Investor Class Shares (Note 8) | 343 | ^ | 46,407 | 657,724 | 84,129 | 1,684,693 | ||||||||||||||
| Interest Expense (Note 7) | — | 72 | 37 | — | — | |||||||||||||||
| Total expenses | 3,443,960 | 2,409,834 | 4,223,906 | 4,527,051 | 7,161,564 | |||||||||||||||
| NET INVESTMENT | ||||||||||||||||||||
| INCOME | 25,548,054 | 23,158,338 | 28,802,477 | 51,876,256 | 55,364,378 | |||||||||||||||
| REALIZED AND | ||||||||||||||||||||
| UNREALIZED GAIN (LOSS) | ||||||||||||||||||||
| ON INVESTMENTS: | ||||||||||||||||||||
| Net realized gain (loss) | ||||||||||||||||||||
| on investments | 2,915,046 | 11,899,430 | (576,946 | ) | 35,762,825 | 12,662,520 | ||||||||||||||
| Change in unrealized | ||||||||||||||||||||
| appreciation/depreciation | ||||||||||||||||||||
| on investments | ||||||||||||||||||||
| and support agreement | 18,243,680 | 14,062,432 | 7,863,442 | 23,619,570 | 64,502,693 | |||||||||||||||
| Net realized and unrealized | ||||||||||||||||||||
| gain on investments | 21,158,726 | 25,961,862 | 7,286,496 | 59,382,395 | 77,165,213 | |||||||||||||||
| NET INCREASE IN | ||||||||||||||||||||
| NET ASSETS RESULTING | ||||||||||||||||||||
| FROM OPERATIONS | $ | 46,706,780 | $ | 49,120,200 | $ | 36,088,973 | $ | 111,258,651 | $ | 132,529,591 | ||||||||||
| ^ | The Baird Short-Term Bond Fund Investor Class commenced operations on September 19, 2012. |
The accompanying notes are in integral part of these financial statements.
Page 68
Statement of Changes in Net Assets
Baird Short-Term Bond Fund
| Year Ended | Year Ended | |||||||
| December 31, 2012 | December 31, 2011 | |||||||
| OPERATIONS: | ||||||||
| Net investment income | $ | 25,548,054 | $ | 24,101,938 | ||||
| Net realized gain on investments | 2,915,046 | 6,055,269 | ||||||
| Change in unrealized appreciation/depreciation | ||||||||
| on investments and support agreement | 18,243,680 | (9,257,746 | ) | |||||
| Net increase in net assets resulting from operations | 46,706,780 | 20,849,461 | ||||||
| CAPITAL SHARE TRANSACTIONS: | ||||||||
| Proceeds from shares sold | 638,547,205 | 514,984,905 | ||||||
| Shares issued to holders in reinvestment of dividends | 25,364,865 | 27,443,430 | ||||||
| Cost of shares redeemed | (402,443,066 | ) | (434,651,786 | ) | ||||
| Net increase in net assets resulting | ||||||||
| from capital share transactions | 261,469,004 | 107,776,549 | ||||||
| DISTRIBUTIONS TO | ||||||||
| INSTITUTIONAL CLASS SHAREHOLDERS: | ||||||||
| From net investment income | (26,295,016 | ) | (24,321,455 | ) | ||||
| From net realized gains | (1,945,462 | ) | (6,100,633 | ) | ||||
| Total Distributions | (28,240,478 | ) | (30,422,088 | ) | ||||
| DISTRIBUTIONS TO | ||||||||
| INVESTOR CLASS SHAREHOLDERS: | ||||||||
| From net investment income | (4,660 | ) | — | |||||
| From net realized gains | (2,217 | ) | — | |||||
| Total Distributions | (6,877 | ) | — | |||||
| TOTAL INCREASE IN NET ASSETS | 279,928,429 | 98,203,922 | ||||||
| �� | ||||||||
| NET ASSETS: | ||||||||
| Beginning of year | 1,017,230,087 | 919,026,165 | ||||||
| End of year (including undistributed net investment | ||||||||
| income of $48,525 and $12,570, respectively) | $ | 1,297,158,516 | $ | 1,017,230,087 | ||||
The accompanying notes are in integral part of these financial statements.
Page 69
Statement of Changes in Net Assets
Baird Intermediate Bond Fund
| Year Ended | Year Ended | |||||||
| December 31, 2012 | December 31, 2011 | |||||||
| OPERATIONS: | ||||||||
| Net investment income | $ | 23,158,338 | $ | 23,725,726 | ||||
| Net realized gain on investments | 11,899,430 | 3,633,559 | ||||||
| Change in unrealized appreciation/depreciation on | ||||||||
| investments and support agreement | 14,062,432 | 12,455,100 | ||||||
| Net increase in net assets resulting from operations | 49,120,200 | 39,814,385 | ||||||
| CAPITAL SHARE TRANSACTIONS: | ||||||||
| Proceeds from shares sold | 272,848,000 | 215,597,625 | ||||||
| Shares issued to holders in reinvestment of dividends | 27,351,259 | 24,186,576 | ||||||
| Cost of shares redeemed | (139,799,278 | ) | (136,560,126 | ) | ||||
| Net increase in net assets resulting | ||||||||
| from capital share transactions | 160,399,981 | 103,224,075 | ||||||
| DISTRIBUTIONS TO | ||||||||
| INSTITUTIONAL CLASS SHAREHOLDERS: | ||||||||
| From net investment income | (22,946,240 | ) | (23,416,880 | ) | ||||
| From net realized gains | (9,536,285 | ) | (5,067,500 | ) | ||||
| Total Distributions | (32,482,525 | ) | (28,484,380 | ) | ||||
| DISTRIBUTIONS TO | ||||||||
| INVESTOR CLASS SHAREHOLDERS: | ||||||||
| From net investment income | (496,752 | ) | (411,556 | ) | ||||
| From net realized gains | (277,674 | ) | (101,027 | ) | ||||
| Total Distributions | (774,426 | ) | (512,583 | ) | ||||
| TOTAL INCREASE IN NET ASSETS | 176,263,230 | 114,041,497 | ||||||
| NET ASSETS: | ||||||||
| Beginning of year | 717,945,143 | 603,903,646 | ||||||
| End of year (including undistributed net investment | ||||||||
| income of $143,175 and $130,830, respectively) | $ | 894,208,373 | $ | 717,945,143 | ||||
The accompanying notes are in integral part of these financial statements.
Page 70
Statement of Changes in Net Assets
Baird Intermediate Municipal Bond Fund
| Year Ended | Year Ended | |||||||
| December 31, 2012 | December 31, 2011 | |||||||
| OPERATIONS: | ||||||||
| Net investment income | $ | 28,802,477 | $ | 26,026,096 | ||||
| Net realized gain (loss) on investments | (576,946 | ) | 1,184,801 | |||||
| Change in unrealized appreciation/depreciation | ||||||||
| on investments | 7,863,442 | 51,360,206 | ||||||
| Net increase in net assets resulting from operations | 36,088,973 | 78,571,103 | ||||||
| CAPITAL SHARE TRANSACTIONS: | ||||||||
| Proceeds from shares sold | 466,665,428 | 434,046,253 | ||||||
| Shares issued to holders in reinvestment of dividends | 24,192,460 | 22,891,902 | ||||||
| Cost of shares redeemed | (370,530,966 | ) | (356,580,147 | ) | ||||
| Net increase in net assets resulting | ||||||||
| from capital share transactions | 120,326,922 | 100,358,008 | ||||||
| DISTRIBUTIONS TO | ||||||||
| INSTITUTIONAL CLASS SHAREHOLDERS: | ||||||||
| From net investment income | (23,091,313 | ) | (20,603,834 | ) | ||||
| From net realized gains | — | (467,874 | ) | |||||
| Total Distributions | (23,091,313 | ) | (21,071,708 | ) | ||||
| DISTRIBUTIONS TO | ||||||||
| INVESTOR CLASS SHAREHOLDERS: | ||||||||
| From net investment income | (5,746,219 | ) | (5,402,244 | ) | ||||
| From net realized gains | — | (141,151 | ) | |||||
| Total Distributions | (5,746,219 | ) | (5,543,395 | ) | ||||
| TOTAL INCREASE IN NET ASSETS | 127,578,363 | 152,314,008 | ||||||
| NET ASSETS: | ||||||||
| Beginning of year | 1,094,067,902 | 941,753,894 | ||||||
| End of year (including undistributed net investment | ||||||||
| income of $0 and $19,518, respectively) | $ | 1,221,646,265 | $ | 1,094,067,902 | ||||
The accompanying notes are in integral part of these financial statements.
Page 71
Statement of Changes in Net Assets
Baird Aggregate Bond Fund
| Year Ended | Year Ended | |||||||
| December 31, 2012 | December 31, 2011 | |||||||
| OPERATIONS: | ||||||||
| Net investment income | $ | 51,876,256 | $ | 66,027,410 | ||||
| Net realized gain on investments | 35,762,825 | 29,334,806 | ||||||
| Change in unrealized appreciation/depreciation on | ||||||||
| investments and support agreement | 23,619,570 | 27,081,217 | ||||||
| Net increase in net assets resulting from operations | 111,258,651 | 122,443,433 | ||||||
| CAPITAL SHARE TRANSACTIONS: | ||||||||
| Proceeds from shares sold | 640,965,634 | 605,032,019 | ||||||
| Shares issued to holders in reinvestment of dividends | 67,166,621 | 87,989,277 | ||||||
| Cost of shares redeemed | (700,577,380 | ) | (908,429,486 | ) | ||||
| Net increase (decrease) in net assets resulting | ||||||||
| from capital share transactions | 7,554,875 | (215,408,190 | ) | |||||
| DISTRIBUTIONS TO | ||||||||
| INSTITUTIONAL CLASS SHAREHOLDERS: | ||||||||
| From net investment income | (56,119,715 | ) | (67,922,305 | ) | ||||
| From net realized gains | (22,329,198 | ) | (28,455,915 | ) | ||||
| Total Distributions | (78,448,913 | ) | (96,378,220 | ) | ||||
| DISTRIBUTIONS TO | ||||||||
| INVESTOR CLASS SHAREHOLDERS: | ||||||||
| From net investment income | (1,226,159 | ) | (1,101,319 | ) | ||||
| From net realized gains | (682,825 | ) | (496,921 | ) | ||||
| Total Distributions | (1,908,984 | ) | (1,598,240 | ) | ||||
| TOTAL INCREASE (DECREASE) IN NET ASSETS | 38,455,629 | (190,941,217 | ) | |||||
| NET ASSETS: | ||||||||
| Beginning of year | 1,506,393,540 | 1,697,334,757 | ||||||
| End of year (including undistributed net investment | ||||||||
| income of $96,715 and $82,473, respectively) | $ | 1,544,849,169 | $ | 1,506,393,540 | ||||
The accompanying notes are in integral part of these financial statements.
Page 72
Statement of Changes in Net Assets
Baird Core Plus Bond Fund
| Year Ended | Year Ended | |||||||
| December 31, 2012 | December 31, 2011 | |||||||
| OPERATIONS: | ||||||||
| Net investment income | $ | 55,364,378 | $ | 28,180,121 | ||||
| Net realized gain on investments | 12,662,520 | 5,311,546 | ||||||
| Change in unrealized appreciation/depreciation on | ||||||||
| investments and support agreement | 64,502,693 | 15,339,832 | ||||||
| Net increase in net assets resulting from operations | 132,529,591 | 48,831,499 | ||||||
| CAPITAL SHARE TRANSACTIONS: | ||||||||
| Proceeds from shares sold | 1,745,509,776 | 687,143,111 | ||||||
| Shares issued to holders in reinvestment of dividends | 61,568,260 | 30,879,432 | ||||||
| Cost of shares redeemed | (365,015,424 | ) | (143,951,115 | ) | ||||
| Net increase in net assets resulting | ||||||||
| from capital share transactions | 1,442,062,612 | 574,071,428 | ||||||
| DISTRIBUTIONS TO | ||||||||
| INSTITUTIONAL CLASS SHAREHOLDERS: | ||||||||
| From net investment income | (39,973,418 | ) | (24,400,094 | ) | ||||
| From net realized gains | (2,922,050 | ) | (2,509,064 | ) | ||||
| Total Distributions | (42,895,468 | ) | (26,909,158 | ) | ||||
| DISTRIBUTIONS TO | ||||||||
| INVESTOR CLASS SHAREHOLDERS: | ||||||||
| From net investment income | (21,217,769 | ) | (4,960,208 | ) | ||||
| From net realized gains | (1,858,946 | ) | (1,035,923 | ) | ||||
| Total Distributions | (23,076,715 | ) | (5,996,131 | ) | ||||
| TOTAL INCREASE IN NET ASSETS | 1,508,620,020 | 589,997,638 | ||||||
| NET ASSETS: | ||||||||
| Beginning of year | 1,100,769,443 | 510,771,805 | ||||||
| End of year (including undistributed net investment | ||||||||
| income of $212,042 and $127,835, respectively) | $ | 2,609,389,463 | $ | 1,100,769,443 | ||||
The accompanying notes are in integral part of these financial statements.
Page 73
Financial Highlights
Baird Short-Term Bond Fund – Institutional Class
| Year Ended December 31, | ||||||||||||||||||||
| 2012 | 2011 | 2010 | 2009 | 2008 | ||||||||||||||||
| Per Share Data: | ||||||||||||||||||||
| Net asset value, | ||||||||||||||||||||
| beginning of year | $ | 9.59 | $ | 9.68 | $ | 9.57 | $ | 9.25 | $ | 9.91 | ||||||||||
| Income from | ||||||||||||||||||||
| investment operations: | ||||||||||||||||||||
| Net investment income | 0.22 | 0.23 | 0.29 | 0.41 | 0.52 | |||||||||||||||
| Net realized and unrealized | ||||||||||||||||||||
| gains (losses) on investments | 0.17 | (0.03 | ) | 0.13 | 0.32 | (0.67 | ) | |||||||||||||
| Total from | ||||||||||||||||||||
| investment operations | 0.39 | 0.20 | 0.42 | 0.73 | (0.15 | ) | ||||||||||||||
| Less distributions: | ||||||||||||||||||||
| Dividends from net | ||||||||||||||||||||
| investment income | (0.22 | ) | (0.23 | ) | (0.29 | ) | (0.41 | ) | (0.51 | ) | ||||||||||
| Distributions from | ||||||||||||||||||||
| net realized gains | (0.01 | ) | (0.06 | ) | (0.02 | ) | — | — | ||||||||||||
| Total distributions | (0.23 | ) | (0.29 | ) | (0.31 | ) | (0.41 | ) | (0.51 | ) | ||||||||||
| Net asset value, end of year | $ | 9.75 | $ | 9.59 | $ | 9.68 | $ | 9.57 | $ | 9.25 | ||||||||||
| Total return | 4.16 | % | 2.08 | % | 4.39 | % | 8.14 | % | (1.79 | )% | ||||||||||
| Supplemental data and ratios: | ||||||||||||||||||||
| Net assets, end of year (millions) | $ | 1,295.7 | $ | 1,017.2 | $ | 919.0 | $ | 606.2 | $ | 215.0 | ||||||||||
| Ratio of expenses to average net assets | 0.30 | % | 0.30 | % | 0.30 | % | 0.30 | % | 0.30 | % | ||||||||||
| Ratio of net investment income | ||||||||||||||||||||
| to average net assets | 2.23 | % | 2.40 | % | 2.92 | % | 4.28 | % | 5.01 | % | ||||||||||
Portfolio turnover rate(1) | 40.1 | % | 61.1 | % | 58.7 | % | 55.5 | % | 98.5 | % | ||||||||||
| (1) | Portfolio turnover is calculated on the basis of the Fund as a whole without distinguishing between the classes of shares issued. |
The accompanying notes are in integral part of these financial statements.
Page 74
Financial Highlights
Baird Short-Term Bond Fund – Investor Class
| September 19, 2012^ | ||||
| through | ||||
| December 31, 2012 | ||||
| Per Share Data: | ||||
| Net asset value, beginning of period | $ | 9.77 | ||
| Income from investment operations: | ||||
| Net investment income | 0.06 | |||
| Net realized and unrealized gains on investments | 0.00 | (1) | ||
| Total from investment operations | 0.06 | |||
| Less distributions: | ||||
| Distributions from net investment income | (0.07 | ) | ||
| Distributions from net realized gains | (0.01 | ) | ||
| Total distributions | (0.08 | ) | ||
| Net asset value, end of year | $ | 9.75 | ||
| Total return | 0.68 | %(2) | ||
| Supplemental data and ratios: | ||||
| Net assets, end of year (millions) | $ | 1.5 | ||
| Ratio of expenses to average net assets | 0.55 | %(3) | ||
| Ratio of net investment income to average net assets | 1.98 | %(3) | ||
Portfolio turnover rate(4) | 40.1 | %(2) | ||
| ^ | Commencement of Operations | |
| (1) | Amount is less than $0.005. | |
| (2) | Not annualized. | |
| (3) | Annualized. | |
| (4) | Portfolio turnover is calculated on the basis of the Fund as a whole without distinguishing between the classes of shares issued. |
The accompanying notes are in integral part of these financial statements.
Page 75
Financial Highlights
Baird Intermediate Bond Fund – Institutional Class
| Year Ended December 31, | ||||||||||||||||||||
| 2012 | 2011 | 2010 | 2009 | 2008 | ||||||||||||||||
| Per Share Data: | ||||||||||||||||||||
| Net asset value, | ||||||||||||||||||||
| beginning of year | $ | 11.06 | $ | 10.87 | $ | 10.61 | $ | 10.00 | $ | 10.62 | ||||||||||
| Income from | ||||||||||||||||||||
| investment operations: | ||||||||||||||||||||
| Net investment income | 0.33 | (1) | 0.39 | 0.44 | (1) | 0.51 | (1) | 0.55 | ||||||||||||
| Net realized and unrealized | ||||||||||||||||||||
| gains (losses) on investments | 0.38 | 0.27 | 0.35 | 0.63 | (0.64 | ) | ||||||||||||||
| Total from | ||||||||||||||||||||
| investment operations | 0.71 | 0.66 | 0.79 | 1.14 | (0.09 | ) | ||||||||||||||
| Less distributions: | ||||||||||||||||||||
| Distributions from net | ||||||||||||||||||||
| investment income | (0.33 | ) | (0.39 | ) | (0.44 | ) | (0.51 | ) | (0.53 | ) | ||||||||||
| Distributions from | ||||||||||||||||||||
| net realized gains | (0.13 | ) | (0.08 | ) | (0.09 | ) | (0.02 | ) | — | |||||||||||
| Total distributions | (0.46 | ) | (0.47 | ) | (0.53 | ) | (0.53 | ) | (0.53 | ) | ||||||||||
| Net asset value, end of year | $ | 11.31 | $ | 11.06 | $ | 10.87 | $ | 10.61 | $ | 10.00 | ||||||||||
| Total return | 6.52 | % | 6.14 | % | 7.54 | % | 11.76 | % | (0.91 | )% | ||||||||||
| Supplemental data and ratios: | ||||||||||||||||||||
| Net assets, end of year (millions) | $ | 867.5 | $ | 703.2 | $ | 591.2 | $ | 527.8 | $ | 401.9 | ||||||||||
| Ratio of expenses to average net assets | 0.30 | % | 0.30 | % | 0.30 | % | 0.30 | % | 0.30 | % | ||||||||||
| Ratio of net investment income | ||||||||||||||||||||
| to average net assets | 2.95 | % | 3.49 | % | 4.05 | % | 4.92 | % | 5.14 | % | ||||||||||
Portfolio turnover rate(2) | 45.1 | % | 24.1 | % | 38.7 | % | 38.6 | % | 32.9 | % | ||||||||||
| (1) | Calculated using average shares outstanding during the year. | |
| (2) | Portfolio turnover is calculated on the basis of the Fund as a whole without distinguishing between the classes of shares issued. |
The accompanying notes are in integral part of these financial statements.
Page 76
Financial Highlights
Baird Intermediate Bond Fund – Investor Class
| Year Ended December 31, | ||||||||||||||||||||
| 2012 | 2011 | 2010 | 2009 | 2008 | ||||||||||||||||
| Per Share Data: | ||||||||||||||||||||
| Net asset value, | ||||||||||||||||||||
| beginning of year | $ | 11.47 | $ | 11.26 | $ | 10.97 | $ | 10.32 | $ | 10.96 | ||||||||||
| Income from | ||||||||||||||||||||
| investment operations: | ||||||||||||||||||||
| Net investment income | 0.32 | (1) | 0.37 | 0.43 | (1) | 0.50 | (1) | 0.52 | ||||||||||||
| Net realized and unrealized | ||||||||||||||||||||
| gains (losses) on investments | 0.39 | 0.28 | 0.36 | 0.65 | (0.65 | ) | ||||||||||||||
| Total from | ||||||||||||||||||||
| investment operations | 0.71 | 0.65 | 0.79 | 1.15 | (0.13 | ) | ||||||||||||||
| Less distributions: | ||||||||||||||||||||
| Distributions from net | ||||||||||||||||||||
| investment income | (0.31 | ) | (0.36 | ) | (0.41 | ) | (0.48 | ) | (0.51 | ) | ||||||||||
| Distributions from | ||||||||||||||||||||
| net realized gains | (0.13 | ) | (0.08 | ) | (0.09 | ) | (0.02 | ) | — | |||||||||||
| Total distributions | (0.44 | ) | (0.44 | ) | (0.50 | ) | (0.50 | ) | (0.51 | ) | ||||||||||
| Net asset value, end of year | $ | 11.74 | $ | 11.47 | $ | 11.26 | $ | 10.97 | $ | 10.32 | ||||||||||
| Total return | 6.20 | % | 5.84 | % | 7.30 | % | 11.51 | % | (1.31 | )% | ||||||||||
| Supplemental data and ratios: | ||||||||||||||||||||
| Net assets, end of year (millions) | $ | 26.7 | $ | 14.7 | $ | 12.7 | $ | 6.7 | $ | 4.0 | ||||||||||
| Ratio of expenses to average net assets | 0.55 | % | 0.55 | % | 0.55 | % | 0.55 | % | 0.55 | % | ||||||||||
| Ratio of net investment income | ||||||||||||||||||||
| to average net assets | 2.70 | % | 3.24 | % | 3.80 | % | 4.67 | % | 4.89 | % | ||||||||||
Portfolio turnover rate(2) | 45.1 | % | 24.1 | % | 38.7 | % | 38.6 | % | 32.9 | % | ||||||||||
| (1) | Calculated using average shares outstanding during the year. | |
| (2) | Portfolio turnover is calculated on the basis of the Fund as a whole without distinguishing between the classes of shares issued. |
The accompanying notes are in integral part of these financial statements.
Page 77
Financial Highlights
Baird Intermediate Municipal Bond Fund – Institutional Class
| Year Ended December 31, | ||||||||||||||||||||
| 2012 | 2011 | 2010 | 2009 | 2008 | ||||||||||||||||
| Per Share Data: | ||||||||||||||||||||
| Net asset value, | ||||||||||||||||||||
| beginning of year | $ | 11.94 | $ | 11.31 | $ | 11.35 | $ | 10.98 | $ | 10.69 | ||||||||||
| Income from | ||||||||||||||||||||
| investment operations: | ||||||||||||||||||||
| Net investment income | 0.30 | 0.32 | 0.32 | 0.32 | (1) | 0.39 | (1) | |||||||||||||
| Net realized and unrealized | ||||||||||||||||||||
| gains (losses) on investments | 0.07 | 0.64 | (0.04 | ) | 0.36 | 0.28 | ||||||||||||||
| Total from | ||||||||||||||||||||
| investment operations | 0.37 | 0.96 | 0.28 | 0.68 | 0.67 | |||||||||||||||
| Less distributions: | ||||||||||||||||||||
| Distributions from net | ||||||||||||||||||||
| investment income | (0.30 | ) | (0.32 | ) | (0.32 | ) | (0.31 | ) | (0.38 | ) | ||||||||||
| Distributions from | ||||||||||||||||||||
| net realized gains | — | (0.01 | ) | — | — | — | ||||||||||||||
| Total distributions | (0.30 | ) | (0.33 | ) | (0.32 | ) | (0.31 | ) | (0.38 | ) | ||||||||||
| Net asset value, end of year | $ | 12.01 | $ | 11.94 | $ | 11.31 | $ | 11.35 | $ | 10.98 | ||||||||||
| Total return | 3.12 | % | 8.55 | % | 2.42 | % | 6.22 | % | 6.37 | % | ||||||||||
| Supplemental data and ratios: | ||||||||||||||||||||
| Net assets, end of year (millions) | $ | 963.1 | $ | 836.1 | $ | 739.0 | $ | 533.3 | $ | 226.1 | ||||||||||
| Ratio of expenses to average net assets | 0.30 | % | 0.30 | % | 0.30 | % | 0.30 | % | 0.30 | % | ||||||||||
| Ratio of net investment income | ||||||||||||||||||||
| to average net assets | 2.48 | % | 2.74 | % | 2.74 | % | 2.83 | % | 3.58 | % | ||||||||||
Portfolio turnover rate(2) | 5.1 | % | 8.0 | % | 8.7 | % | 0.7 | % | 0.9 | % | ||||||||||
| (1) | Calculated using average shares outstanding during the year. | |
| (2) | Portfolio turnover is calculated on the basis of the Fund as a whole without distinguishing between the classes of shares issued. |
The accompanying notes are in integral part of these financial statements.
Page 78
Financial Highlights
Baird Intermediate Municipal Bond Fund – Investor Class
| Year Ended December 31, | ||||||||||||||||||||
| 2012 | 2011 | 2010 | 2009 | 2008 | ||||||||||||||||
| Per Share Data: | ||||||||||||||||||||
| Net asset value, | ||||||||||||||||||||
| beginning of year | $ | 12.18 | $ | 11.53 | $ | 11.57 | $ | 11.19 | $ | 10.90 | ||||||||||
| Income from | ||||||||||||||||||||
| investment operations: | ||||||||||||||||||||
| Net investment income | 0.27 | 0.29 | 0.29 | 0.29 | (1) | 0.36 | (1) | |||||||||||||
| Net realized and unrealized | ||||||||||||||||||||
| gains (losses) on investments | 0.08 | 0.66 | (0.04 | ) | 0.37 | 0.28 | ||||||||||||||
| Total from | ||||||||||||||||||||
| investment operations | 0.35 | 0.95 | 0.25 | 0.66 | 0.64 | |||||||||||||||
| Less distributions: | ||||||||||||||||||||
| Distributions from net | ||||||||||||||||||||
| investment income | (0.27 | ) | (0.29 | ) | (0.29 | ) | (0.28 | ) | (0.35 | ) | ||||||||||
| Distributions from | ||||||||||||||||||||
| net realized gains | — | (0.01 | ) | — | — | — | ||||||||||||||
| Total distributions | (0.27 | ) | (0.30 | ) | (0.29 | ) | (0.28 | ) | (0.35 | ) | ||||||||||
| Net asset value, end of year | $ | 12.26 | $ | 12.18 | $ | 11.53 | $ | 11.57 | $ | 11.19 | ||||||||||
| Total return | 2.88 | % | 8.30 | % | 2.11 | % | 5.95 | % | 6.02 | % | ||||||||||
| Supplemental data and ratios: | ||||||||||||||||||||
| Net assets, end of year (millions) | $ | 258.5 | $ | 257.9 | $ | 202.8 | $ | 196.7 | $ | 17.4 | ||||||||||
| Ratio of expenses to average net assets | 0.55 | % | 0.55 | % | 0.55 | % | 0.55 | % | 0.55 | % | ||||||||||
| Ratio of net investment income | ||||||||||||||||||||
| to average net assets | 2.23 | % | 2.49 | % | 2.49 | % | 2.58 | % | 3.33 | % | ||||||||||
Portfolio turnover rate(2) | 5.1 | % | 8.0 | % | 8.7 | % | 0.7 | % | 0.9 | % | ||||||||||
| (1) | Calculated using average shares outstanding during the year. | |
| (2) | Portfolio turnover is calculated on the basis of the Fund as a whole without distinguishing between the classes of shares issued. | |
The accompanying notes are in integral part of these financial statements.
Page 79
Financial Highlights
Baird Aggregate Bond Fund – Institutional Class
| Year Ended December 31, | ||||||||||||||||||||
| 2012 | 2011 | 2010 | 2009 | 2008 | ||||||||||||||||
| Per Share Data: | ||||||||||||||||||||
| Net asset value, | ||||||||||||||||||||
| beginning of year | $ | 10.65 | $ | 10.52 | $ | 10.23 | $ | 9.74 | $ | 10.54 | ||||||||||
| Income from | ||||||||||||||||||||
| investment operations: | ||||||||||||||||||||
| Net investment income | 0.38 | (1) | 0.44 | (1) | 0.47 | (2) | 0.54 | 0.56 | ||||||||||||
| Net realized and unrealized | ||||||||||||||||||||
| gains (losses) on investments | 0.45 | 0.36 | 0.37 | 0.49 | (0.81 | ) | ||||||||||||||
| Total from | ||||||||||||||||||||
| investment operations | 0.83 | 0.80 | 0.84 | 1.03 | (0.25 | ) | ||||||||||||||
| Less distributions: | ||||||||||||||||||||
| Distributions from net | ||||||||||||||||||||
| investment income | (0.43 | ) | (0.46 | ) | (0.49 | ) | (0.54 | ) | (0.55 | ) | ||||||||||
| Distributions from | ||||||||||||||||||||
| net realized gains | (0.16 | ) | (0.21 | ) | (0.06 | ) | (0.00 | )(3) | — | |||||||||||
| Total distributions | (0.59 | ) | (0.67 | ) | (0.55 | ) | (0.54 | ) | (0.55 | ) | ||||||||||
| Net asset value, end of year | $ | 10.89 | $ | 10.65 | $ | 10.52 | $ | 10.23 | $ | 9.74 | ||||||||||
| Total return | 7.92 | % | 7.85 | % | 8.34 | % | 10.88 | % | (2.36 | )% | ||||||||||
| Supplemental data and ratios: | ||||||||||||||||||||
| Net assets, end of year (millions) | $ | 1,495.4 | $ | 1,480.3 | $ | 1,658.4 | $ | 1,362.2 | $ | 842.7 | ||||||||||
| Ratio of expenses to average net assets | 0.30 | % | 0.30 | % | 0.30 | % | 0.30 | % | 0.30 | % | ||||||||||
| Ratio of net investment income | ||||||||||||||||||||
| to average net assets | 3.51 | % | 4.10 | % | 4.44 | % | 5.37 | % | 5.46 | % | ||||||||||
Portfolio turnover rate(4) | 64.4 | % | 45.9 | % | 41.4 | % | 37.7 | % | 21.9 | % | ||||||||||
| (1) | Calculated using average shares outstanding during the year. | |
| (2) | Net investment income per share is calculated using ending balances prior to consideration of adjustments for permanent book and tax differences. | |
| (3) | Amount is less than ($0.005). | |
| (4) | Portfolio turnover is calculated on the basis of the Fund as a whole without distinguishing between the classes of shares issued. |
The accompanying notes are in integral part of these financial statements.
Page 80
Financial Highlights
Baird Aggregate Bond Fund – Investor Class
| Year Ended December 31, | ||||||||||||||||||||
| 2012 | 2011 | 2010 | 2009 | 2008 | ||||||||||||||||
| Per Share Data: | ||||||||||||||||||||
| Net asset value, | ||||||||||||||||||||
| beginning of year | $ | 10.94 | $ | 10.80 | $ | 10.48 | $ | 9.97 | $ | 10.78 | ||||||||||
| Income from | ||||||||||||||||||||
| investment operations: | ||||||||||||||||||||
| Net investment income | 0.37 | (1) | 0.42 | (1) | 0.46 | (2) | 0.52 | 0.52 | ||||||||||||
| Net realized and unrealized | ||||||||||||||||||||
| gains (losses) on investments | 0.46 | 0.37 | 0.38 | 0.50 | (0.81 | ) | ||||||||||||||
| Total from | ||||||||||||||||||||
| investment operations | 0.83 | 0.79 | 0.84 | 1.02 | (0.29 | ) | ||||||||||||||
| Less distributions: | ||||||||||||||||||||
| Distributions from net | ||||||||||||||||||||
| investment income | (0.40 | ) | (0.44 | ) | (0.46 | ) | (0.51 | ) | (0.52 | ) | ||||||||||
| Distributions from | ||||||||||||||||||||
| net realized gains | (0.16 | ) | (0.21 | ) | (0.06 | ) | (0.00 | )(3) | — | |||||||||||
| Total distributions | (0.56 | ) | (0.65 | ) | (0.52 | ) | (0.51 | ) | (0.52 | ) | ||||||||||
| Net asset value, end of year | $ | 11.21 | $ | 10.94 | $ | 10.80 | $ | 10.48 | $ | 9.97 | ||||||||||
| Total return | 7.72 | % | 7.46 | % | 8.16 | % | 10.55 | % | (2.63 | )% | ||||||||||
| Supplemental data and ratios: | ||||||||||||||||||||
| Net assets, end of year (millions) | $ | 49.4 | $ | 26.1 | $ | 38.9 | $ | 35.1 | $ | 29.1 | ||||||||||
| Ratio of expenses to average net assets | 0.55 | % | 0.55 | % | 0.55 | % | 0.55 | % | 0.55 | % | ||||||||||
| Ratio of net investment income | ||||||||||||||||||||
| to average net assets | 3.26 | % | 3.85 | % | 4.19 | % | 5.12 | % | 5.21 | % | ||||||||||
Portfolio turnover rate(4) | 64.4 | % | 45.9 | % | 41.4 | % | 37.7 | % | 21.9 | % | ||||||||||
| (1) | Calculated using average shares outstanding during the year. | |
| (2) | Net investment income per share is calculated using ending balances prior to consideration of adjustments for permanent book and tax differences. | |
| (3) | Amount is less than ($0.005). | |
| (4) | Portfolio turnover is calculated on the basis of the Fund as a whole without distinguishing between the classes of shares issued. |
The accompanying notes are in integral part of these financial statements.
Page 81
Financial Highlights
Baird Core Plus Bond Fund – Institutional Class
| Year Ended December 31, | ||||||||||||||||||||
| 2012 | 2011 | 2010 | 2009 | 2008 | ||||||||||||||||
| Per Share Data: | ||||||||||||||||||||
| Net asset value, | ||||||||||||||||||||
| beginning of year | $ | 10.82 | $ | 10.51 | $ | 10.18 | $ | 9.46 | $ | 10.22 | ||||||||||
| Income from | ||||||||||||||||||||
| investment operations: | ||||||||||||||||||||
| Net investment income | 0.35 | (1) | 0.45 | (1) | 0.59 | (2) | 0.65 | (1) | 0.56 | (1) | ||||||||||
| Net realized and unrealized | ||||||||||||||||||||
| gains (losses) on investments | 0.50 | 0.36 | 0.39 | 0.74 | (0.73 | ) | ||||||||||||||
| Total from | ||||||||||||||||||||
| investment operations | 0.85 | 0.81 | 0.98 | 1.39 | (0.17 | ) | ||||||||||||||
| Less distributions: | ||||||||||||||||||||
| Distributions from net | ||||||||||||||||||||
| investment income | (0.38 | ) | (0.46 | ) | (0.60 | ) | (0.65 | ) | (0.55 | ) | ||||||||||
| Distributions from | ||||||||||||||||||||
| net realized gains | (0.02 | ) | (0.04 | ) | (0.05 | ) | (0.02 | ) | (0.04 | ) | ||||||||||
| Total distributions | (0.40 | ) | (0.50 | ) | (0.65 | ) | (0.67 | ) | (0.59 | ) | ||||||||||
| Net asset value, end of year | $ | 11.27 | $ | 10.82 | $ | 10.51 | $ | 10.18 | $ | 9.46 | ||||||||||
| Total return | 7.95 | % | 7.89 | % | 9.81 | % | 15.36 | % | (1.79 | )% | ||||||||||
| Supplemental data and ratios: | ||||||||||||||||||||
| Net assets, end of year (millions) | $ | 1,573.4 | $ | 768.9 | $ | 452.4 | $ | 215.2 | $ | 159.0 | ||||||||||
| Ratio of expenses to average net assets | 0.30 | % | 0.30 | % | 0.30 | % | 0.30 | % | 0.30 | % | ||||||||||
| Ratio of net investment income | ||||||||||||||||||||
| to average net assets | 3.12 | % | 4.22 | % | 5.56 | % | 6.67 | % | 5.61 | % | ||||||||||
Portfolio turnover rate(3) | 36.7 | % | 34.6 | % | 61.5 | % | 33.2 | % | 27.7 | % | ||||||||||
| (1) | Calculated using average shares outstanding during the year. | |
| (2) | Net investment income per share is calculated using ending balances prior to consideration of adjustments for permanent book and tax differences. | |
| (3) | Portfolio turnover is calculated on the basis of the Fund as a whole without distinguishing between the classes of shares issued. |
The accompanying notes are in integral part of these financial statements.
Page 82
Financial Highlights
Baird Core Plus Bond Fund – Investor Class
| Year Ended December 31, | ||||||||||||||||||||
| 2012 | 2011 | 2010 | 2009 | 2008 | ||||||||||||||||
| Per Share Data: | ||||||||||||||||||||
| Net asset value, | ||||||||||||||||||||
| beginning of year | $ | 11.18 | $ | 10.85 | $ | 10.49 | $ | 9.72 | $ | 10.50 | ||||||||||
| Income from | ||||||||||||||||||||
| investment operations: | ||||||||||||||||||||
| Net investment income | 0.33 | (1) | 0.44 | (1) | 0.57 | (2) | 0.64 | (1) | 0.53 | (1) | ||||||||||
| Net realized and unrealized | ||||||||||||||||||||
| gains (losses) on investments | 0.53 | 0.37 | 0.41 | 0.78 | (0.74 | ) | ||||||||||||||
| Total from | ||||||||||||||||||||
| investment operations | 0.86 | 0.81 | 0.98 | 1.42 | (0.21 | ) | ||||||||||||||
| Less distributions: | ||||||||||||||||||||
| Distributions from net | ||||||||||||||||||||
| investment income | (0.35 | ) | (0.44 | ) | (0.57 | ) | (0.63 | ) | (0.53 | ) | ||||||||||
| Distributions from | ||||||||||||||||||||
| net realized gains | (0.02 | ) | (0.04 | ) | (0.05 | ) | (0.02 | ) | (0.04 | ) | ||||||||||
| Total distributions | (0.37 | ) | (0.48 | ) | (0.62 | ) | (0.65 | ) | (0.57 | ) | ||||||||||
| Net asset value, end of year | $ | 11.67 | $ | 11.18 | $ | 10.85 | $ | 10.49 | $ | 9.72 | ||||||||||
| Total return | 7.80 | % | 7.57 | % | 9.53 | % | 15.06 | % | (2.07 | )% | ||||||||||
| Supplemental data and ratios: | ||||||||||||||||||||
| Net assets, end of year (millions) | $ | 1,036.0 | $ | 331.9 | $ | 58.4 | $ | 45.5 | $ | 29.6 | ||||||||||
| Ratio of expenses to average net assets | 0.55 | % | 0.55 | % | 0.55 | % | 0.55 | % | 0.55 | % | ||||||||||
| Ratio of net investment income | ||||||||||||||||||||
| to average net assets | 2.87 | % | 3.97 | % | 5.31 | % | 6.42 | % | 5.36 | % | ||||||||||
Portfolio turnover rate(3) | 36.7 | % | 34.6 | % | 61.5 | % | 33.2 | % | 27.7 | % | ||||||||||
| (1) | Calculated using average shares outstanding during the year. | |
| (2) | Net investment income per share is calculated using ending balances prior to consideration of adjustments for permanent book and tax differences. | |
| (3) | Portfolio turnover is calculated on the basis of the Fund as a whole without distinguishing between the classes of shares issued. |
The accompanying notes are in integral part of these financial statements.
Page 83
Notes to the Financial Statements
December 31, 2012
1.Organization
Baird Funds, Inc. (the “Corporation”) was incorporated on June 9, 2000 as a Wisconsin corporation and is registered as an open-end investment management company under the Investment Company Act of 1940, as amended (the “1940 Act”). The accompanying financial statements include the Baird Short-Term Bond Fund, Baird Intermediate Bond Fund, Baird Intermediate Municipal Bond Fund, Baird Aggregate Bond Fund and Baird Core Plus Bond Fund (each, a “Fund” and collectively, the “Funds”), five of the eight series comprising the Corporation, each of which is diversified within the meaning of the 1940 Act. Robert W. Baird & Co. Incorporated (“Baird” or the “Advisor”) serves as investment advisor to the Funds.
The Baird Short-Term Bond Fund commenced operations with the sale of Institutional Class shares on August 31, 2004 while the Investor Class shares commenced operations on September 19, 2012. The Baird Intermediate Municipal Bond Fund commenced operations with the sale of both Institutional and Investor Class shares on March 30, 2001. The Baird Intermediate Bond Fund, Baird Aggregate Bond Fund and Baird Core Plus Bond Fund commenced operations with the sale of both Institutional and Investor Class shares on September 29, 2000. The Institutional Class Shares are not subject to a distribution and service (12b-1) fee, while the Investor Class Shares are subject to a distribution and service (12b-1) fee of 0.25%.
The investment objective of the Baird Short-Term Bond Fund is to provide an annual rate of total return, before Fund expenses, greater than the annual rate of total return of the Barclays 1-3 Year U.S. Government/Credit Bond Index. The Barclays 1-3 Year U.S. Government/Credit Bond Index is an unmanaged, market value weighted index of investment grade, fixed-rate debt including government and corporate securities with maturities between one and three years.
The investment objective of the Baird Intermediate Bond Fund is to provide an annual rate of total return, before Fund expenses, greater than the annual rate of total return of the Barclays Intermediate U.S. Government/Credit Bond Index. The Barclays Intermediate U.S. Government/Credit Bond Index is an unmanaged, market value weighted index of investment grade, fixed-rate debt issues, including government and corporate securities, with maturities between one and ten years.
The primary investment objective of the Baird Intermediate Municipal Bond Fund is to provide current income that is substantially exempt from federal income tax. A secondary objective is to provide total return with relatively low volatility of principal.
The investment objective of the Baird Aggregate Bond Fund is to provide an annual rate of total return, before Fund expenses, greater than the annual rate of total return of the Barclays U.S. Aggregate Bond Index. The Barclays U.S. Aggregate Bond Index is an unmanaged, market value weighted index of investment grade, fixed-rate debt issues, including government, corporate, asset-backed and mortgage-backed securities, with maturities of at least one year.
The investment objective of the Baird Core Plus Bond Fund is to provide an annual rate of total return, before Fund expenses, greater than the annual rate of total return of the Barclays U.S. Universal Bond Index. The Barclays U.S. Universal Bond Index is an unmanaged, market value weighted index of fixed income securities issued in U.S. dollars, including U.S. government and investment grade debt, non-investment grade debt, asset-backed and mortgage-backed securities, Eurobonds, 144A securities and emerging market debt, with maturities of at least one year.
2.Significant Accounting Policies
The following is a summary of significant accounting policies consistently followed by the Funds in the preparation of their financial statements. These policies are in conformity with accounting principles generally accepted in the United States of America.
| a) | Investment Valuation – Section 2(a)(41) of the 1940 Act, together with the rules and interpretations of the SEC, require the Funds, in computing net asset value, to value their portfolio securities using market |
Page 84
Notes to the Financial Statements
December 31, 2012
2.Significant Accounting Policies (cont.)
quotations when they are “readily available.” When market quotations are not readily available (e.g., because there is no regular market quotation for such securities, the market for such security is limited, the validity of quotations is questionable or, for debt securities, Interactive Data Corporation (IDC), the Funds’ independent pricing service, does not provide a price), the Board of Directors of the Corporation must value the securities at “fair value determined in good faith.” The Board has delegated such responsibility to the Advisor pursuant to pricing policies and procedures that the Board has adopted and regularly reviews. In general, the “fair value” of a security means the price that would be received to sell a security in an orderly transaction between market participants at the measurement date. | |
The Funds determine the fair value of their investments and compute their net asset value per share as of the close of regular trading of the New York Stock Exchange (4:00 p.m. EST). | |
Consistent with Section 2(a)(41) of the 1940 Act, the Funds price their securities as follows: debt securities are valued at their bid prices by an independent pricing service using valuation methods that are designed to represent fair value, such as matrix pricing and other analytical pricing models, market transactions and dealer quotations. Debt securities purchased with a remaining maturity of 60 days or less are valued at acquisition cost, plus or minus any amortized discount or premium which approximates fair value. Investments in mutual funds are valued at their stated net asset value. Common stocks that are listed on a securities exchange (other than NASDAQ) are valued at the last quoted sales price. Securities traded on Nasdaq are valued at the Nasdaq Official Closing Price. Price information on listed stocks is taken from the exchange where the security is primarily traded. Securities that were not traded on the valuation date, as well as stocks that are not listed on an exchange, including NASDAQ, are valued at the average of the current bid and asked price. Other assets and securities for which market quotations are not readily available are valued at fair value as determined in good faith by the Advisor in accordance with procedures approved by the Corporation’s Board of Directors. In accordance with such procedures, the Advisor may use broker quotes or prices obtained from alternative independent pricing services or, if the broker quotes or prices from alternative pricing services are unavailable or deemed to be unreliable, fair value will be determined by a valuation committee of the Advisor. In determining fair value, the valuation committee takes into account all relevant factors and available information. Consequently, the price of the security used by a Fund to calculate its NAV may differ from quoted or published prices for the same security. Fair value pricing involves subjective judgments and there is no single standard for determining a security’s fair value. As a result, different mutual funds could reasonably arrive at a different fair value for the same security. It is possible that the fair value determined for a security is materially different from the value that could be realized upon the sale of that security or from the values that other mutual funds may determine. In addition, given the volatility and periodic illiquidity experienced in recent years, the prices determined for any individual security on any given day may vary significantly from the amount that can be obtained in an actual sale of that security, and the Funds’ NAVs may fluctuate significantly from day to day or from period to period. | |
In May 2011, the FASB issued ASU No. 2011-04 “Amendments to Achieve Common Fair Value Measurement and Disclosure Requirements in GAAP and the International Financial Reporting Standards (“IFRS”)” (ASU 2011-04). ASU 2011-04 amends FASB ASC Topic 820, Fair Value Measurements and Disclosures, to establish common requirements for measuring fair value and for disclosing information about fair value measurements in accordance with GAAP and IFRS. ASU No. 2011-04 is effective for fiscal years beginning after December 15, 2011 and for interim periods within those fiscal years. The Funds have disclosed the applicable requirements of this accounting standard in their financial statements. | |
| b) | Unregistered Securities – Four of the Funds own certain investment securities which are unregistered and thus restricted with respect to resale. The value of such securities for the Baird Short-Term Bond, Baird Intermediate Bond, Baird Aggregate Bond and Baird Core Plus Bond Funds were $338,317,765 (26.08% of net assets), $122,367,016 (13.68% of net assets), $144,756,125 (9.37% of net assets), and $382,541,954 |
Page 85
Notes to the Financial Statements
December 31, 2012
2.Significant Accounting Policies (cont.)
(14.66% of net assets), respectively, at December 31, 2012. Restricted securities may be deemed to be liquid as determined by the Advisor based on several factors. All of the restricted securities held by the Funds as of December 31, 2012 consist of securities issued pursuant to Rule 144A under the Securities Act of 1933 and nearly all have been deemed to be liquid. | |
| c) | Foreign Securities – Foreign securities are defined as securities of issuers that are organized outside the United States.The Funds may invest in U.S. dollar-denominated debt obligations of foreign companies and foreign governments. Investing in securities of foreign companies and foreign governments involves special risks and considerations not typically associated with investing in U.S. companies and the U.S. government. These risks include foreign currency fluctuations, political and economic instability and differences in financial reporting standards and less strict regulation of securities markets. Moreover, securities of many foreign companies and foreign governments and their markets may be less liquid and their prices more volatile than those of securities of comparable U.S. companies and the U.S. government. Occasionally, events that affect these values and exchange rates may occur after the close of the exchange on which such securities are traded. If such events materially affect the value of a Fund’s securities, these securities may be valued at their fair value pursuant to procedures adopted by the Board of Directors. |
| d) | Income Tax Status – The Funds intend to continue to qualify as regulated investment companies as provided in subchapter M of the Internal Revenue Code and to distribute substantially all of their taxable income to their shareholders in a manner which results in no tax cost to the Funds. Therefore, no federal income or excise tax provision is recorded. |
There is no tax liability resulting from unrecognized tax benefits relating to uncertain income tax positions taken or expected to be taken on the tax return for the fiscal year ended December 31, 2012, or for any other tax years which are open for exam. As of December 31, 2012, open tax years include the tax years ended December 31, 2009 through 2012. The Funds are not aware of any tax positions for which it is reasonably possible that the total amounts of unrecognized tax benefits will significantly change in the next 12 months. The Funds recognize interest and penalties, if any, related to unrecognized tax benefits as income tax expense and other expense, respectively, in the Statement of Operations. During the year, the Funds did not incur any interest or penalties. | |
| e) | Allocation of Income and Expenses – Each Fund is charged for those expenses directly attributable to it. Expenses directly attributable to a class of shares, such as Rule 12b-1 distribution fees, are charged to that class of shares. Income, expenses and realized and unrealized gains and losses are allocated to the classes based on their respective net assets. Expenses that are not directly attributable to a Fund are allocated among the Funds in the series in proportion to their assets. |
| f) | Distributions to Shareholders – Dividends from net investment income are declared and paid monthly. Distributions of net realized capital gains, if any, are declared and paid at least annually. The book basis character of distributions may differ from their ultimate characterization for Federal income tax purposes. |
| g) | Use of Estimates – The preparation of financial statements in conformity with accounting principles generally accepted in the United States of America requires management to make estimates and assumptions that affect the reported amounts of assets and liabilities and disclosure of contingent assets and liabilities at the date of the financial statements and the reported amounts of revenues and expenses during the reporting period. Actual results could differ from those estimates. |
| h) | Securities Transactions and Investment Income – Investment and shareholder transactions are recorded on the trade date. The Funds determine the gain or loss realized from investment transactions by comparing the original cost of the security lot sold with the net sales proceeds. Dividend income is recognized on the ex-dividend date and interest income is recognized on an accrual basis. Premiums and discounts on the purchase of securities are amortized/accreted using the effective interest method. Paydown gains and losses |
Page 86
Notes to the Financial Statements
December 31, 2012
2.Significant Accounting Policies (cont.)
are netted and recorded as interest income on the Statement of Operations for financial reporting purposes. Accounting principles generally accepted in the United States of America require that permanent financial reporting and tax differences be reclassified in the capital accounts. | |
| i) | Guarantees and Indemnifications – In the normal course of business, the Funds enter into contracts with service providers that contain general indemnification clauses. The Funds’ maximum exposure under these arrangements is unknown and would involve future claims against the Funds that have not yet occurred. Based on experience, the Funds would expect the risk of loss to be remote. |
3.Capital Share Transactions
The following table summarizes the capital share transactions of each Fund for the past two fiscal periods:
Baird Short-Term Bond Fund
| Institutional Class | Investor Class Shares | |||||||||||||||||
| Year Ended | Year Ended | |||||||||||||||||
| December 31, 2012 | December 31, 2012 | |||||||||||||||||
| Shares | Amount | Shares | Amount | |||||||||||||||
| Shares sold | 65,489,880 | $ | 636,935,199 | Shares sold | 164,773 | $ | 1,612,006 | |||||||||||
| Shares issued to | Shares issued to | |||||||||||||||||
| shareholders in | shareholders in | |||||||||||||||||
| reinvestment | reinvestment | |||||||||||||||||
| of dividends | 2,609,918 | 25,358,257 | of dividends | 677 | 6,608 | |||||||||||||
| Shares redeemed | (41,364,636 | ) | (402,314,887 | ) | Shares redeemed | (13,094 | ) | (128,179 | ) | |||||||||
| Net increase | 26,735,162 | $ | 259,978,569 | Net increase | 152,356 | $ | 1,490,435 | |||||||||||
| Shares Outstanding: | Shares Outstanding: | |||||||||||||||||
| Beginning of year | 106,097,860 | Beginning of period | — | |||||||||||||||
| End of year | 132,833,022 | End of year | 152,356 | |||||||||||||||
| Institutional Class | |||||||||
| Year Ended | |||||||||
| December 31, 2011 | |||||||||
| Shares | Amount | ||||||||
| Shares sold | 53,122,196 | $ | 514,984,905 | ||||||
| Shares issued to | |||||||||
| shareholders in | |||||||||
| reinvestment | |||||||||
| of dividends | 2,841,238 | 27,443,430 | |||||||
| Shares redeemed | (44,833,884 | ) | (434,651,786 | ) | |||||
| Net increase | 11,129,550 | $ | 107,776,549 | ||||||
| Shares Outstanding: | |||||||||
| Beginning of year | 94,968,310 | ||||||||
| End of year | 106,097,860 | ||||||||
Page 87
Notes to the Financial Statements
December 31, 2012
3.Capital Share Transactions (cont.)
Baird Intermediate Bond Fund
| Institutional Class Shares | Investor Class Shares | ||||||||||||||||
| Year Ended | Year Ended | ||||||||||||||||
| December 31, 2012 | December 31, 2012 | ||||||||||||||||
| Shares | Amount | Shares | Amount | ||||||||||||||
| Shares sold | 22,685,511 | $ | 256,806,194 | Shares sold | 1,360,552 | $ | 16,041,806 | ||||||||||
| Shares issued to | Shares issued to | ||||||||||||||||
| shareholders in | shareholders in | ||||||||||||||||
| reinvestment | reinvestment | ||||||||||||||||
| of dividends | 2,358,925 | 26,615,614 | of dividends | 62,775 | 735,645 | ||||||||||||
| Shares redeemed | (11,927,363 | ) | (134,734,403 | ) | Shares redeemed | (430,341 | ) | (5,064,875 | ) | ||||||||
| Net increase | 13,117,073 | $ | 148,687,405 | Net increase | 992,986 | $ | 11,712,576 | ||||||||||
| Shares Outstanding: | Shares Outstanding: | ||||||||||||||||
| Beginning of year | 63,607,447 | Beginning of year | 1,283,478 | ||||||||||||||
| End of year | 76,724,520 | End of year | 2,276,464 | ||||||||||||||
| Institutional Class Shares | Investor Class Shares | ||||||||||||||||
| Year Ended | Year Ended | ||||||||||||||||
| December 31, 2011 | December 31, 2011 | ||||||||||||||||
| Shares | Amount | Shares | Amount | ||||||||||||||
| Shares sold | 18,638,168 | $ | 205,507,343 | Shares sold | 883,474 | $ | 10,090,282 | ||||||||||
| Shares issued to | Shares issued to | ||||||||||||||||
| shareholders in | shareholders in | ||||||||||||||||
| reinvestment | reinvestment | ||||||||||||||||
| of dividends | 2,149,990 | 23,704,272 | of dividends | 42,204 | 482,304 | ||||||||||||
| Shares redeemed | (11,543,624 | ) | (127,767,983 | ) | Shares redeemed | (773,902 | ) | (8,792,143 | ) | ||||||||
| Net increase | 9,244,534 | $ | 101,443,632 | Net increase | 151,776 | $ | 1,780,443 | ||||||||||
| Shares Outstanding: | Shares Outstanding: | ||||||||||||||||
| Beginning of year | 54,362,913 | Beginning of year | 1,131,702 | ||||||||||||||
| End of year | 63,607,447 | End of year | 1,283,478 | ||||||||||||||
| Baird Intermediate Municipal Bond Fund | |||||||||||||||||
| Institutional Class Shares | Investor Class Shares | ||||||||||||||||
| Year Ended | Year Ended | ||||||||||||||||
| December 31, 2012 | December 31, 2012 | ||||||||||||||||
| Shares | Amount | Shares | Amount | ||||||||||||||
| Shares sold | 32,138,671 | $ | 386,239,717 | Shares sold | 6,559,069 | $ | 80,425,711 | ||||||||||
| Shares issued to | Shares issued to | ||||||||||||||||
| shareholders in | shareholders in | ||||||||||||||||
| reinvestment | reinvestment | ||||||||||||||||
| of dividends | 1,565,719 | 18,794,190 | of dividends | 440,565 | 5,398,270 | ||||||||||||
| Shares redeemed | (23,574,458 | ) | (283,394,100 | ) | Shares redeemed | (7,095,704 | ) | (87,136,866 | ) | ||||||||
| Net increase | 10,129,932 | $ | 121,639,807 | Net decrease | (96,070 | ) | $ | (1,312,885 | ) | ||||||||
| Shares Outstanding: | Shares Outstanding: | ||||||||||||||||
| Beginning of year | 70,057,143 | Beginning of year | 21,177,650 | ||||||||||||||
| End of year | 80,187,075 | End of year | 21,081,580 | ||||||||||||||
Page 88
Notes to the Financial Statements
December 31, 2012
3.Capital Share Transactions (cont.)
Baird Intermediate Municipal Bond Fund (cont.)
| Institutional Class Shares | Investor Class Shares | ||||||||||||||||
| Year Ended | Year Ended | ||||||||||||||||
| December 31, 2011 | December 31, 2011 | ||||||||||||||||
| Shares | Amount | Shares | Amount | ||||||||||||||
| Shares sold | 28,247,024 | $ | 327,854,380 | Shares sold | 8,949,573 | $ | 106,191,873 | ||||||||||
| Shares issued to | Shares issued to | ||||||||||||||||
| shareholders in | shareholders in | ||||||||||||||||
| reinvestment | reinvestment | ||||||||||||||||
| of dividends | 1,511,354 | 17,575,486 | of dividends | 447,538 | 5,316,416 | ||||||||||||
| Shares redeemed | (25,043,108 | ) | (288,447,567 | ) | Shares redeemed | (5,800,868 | ) | (68,132,580 | ) | ||||||||
| Net increase | 4,715,270 | $ | 56,982,299 | Net increase | 3,596,243 | $ | 43,375,709 | ||||||||||
| Shares Outstanding: | Shares Outstanding: | ||||||||||||||||
| Beginning of year | 65,341,873 | Beginning of year | 17,581,407 | ||||||||||||||
| End of year | 70,057,143 | End of year | 21,177,650 | ||||||||||||||
| Baird Aggregate Bond Fund | |||||||||||||||||
| Institutional Class Shares | Investor Class Shares | ||||||||||||||||
| Year Ended | Year Ended | ||||||||||||||||
| December 31, 2012 | December 31, 2012 | ||||||||||||||||
| Shares | Amount | Shares | Amount | ||||||||||||||
| Shares sold | 55,801,073 | $ | 610,473,223 | Shares sold | 2,703,995 | $ | 30,492,411 | ||||||||||
| Shares issued to | Shares issued to | ||||||||||||||||
| shareholders in | shareholders in | ||||||||||||||||
| reinvestment | reinvestment | ||||||||||||||||
| of dividends | 6,013,523 | 65,390,126 | of dividends | 158,565 | 1,776,495 | ||||||||||||
| Shares redeemed | (63,578,566 | ) | (691,076,338 | ) | Shares redeemed | (842,629 | ) | (9,501,042 | ) | ||||||||
| Net decrease | (1,763,970 | ) | $ | (15,212,989 | ) | Net increase | 2,019,931 | $ | 22,767,864 | ||||||||
| Shares Outstanding: | Shares Outstanding: | ||||||||||||||||
| Beginning of year | 139,030,987 | Beginning of year | 2,386,621 | ||||||||||||||
| End of year | 137,267,017 | End of year | 4,406,552 | ||||||||||||||
| Institutional Class Shares | Investor Class Shares | ||||||||||||||||
| Year Ended | Year Ended | ||||||||||||||||
| December 31, 2011 | December 31, 2011 | ||||||||||||||||
| Shares | Amount | Shares | Amount | ||||||||||||||
| Shares sold | 55,839,863 | $ | 597,699,924 | Shares sold | 667,679 | $ | 7,332,095 | ||||||||||
| Shares issued to | Shares issued to | ||||||||||||||||
| shareholders in | shareholders in | ||||||||||||||||
| reinvestment | reinvestment | ||||||||||||||||
| of dividends | 8,120,694 | 86,467,957 | of dividends | 139,163 | 1,521,320 | ||||||||||||
| Shares redeemed | (82,507,416 | ) | (886,351,800 | ) | Shares redeemed | (2,025,333 | ) | (22,077,686 | ) | ||||||||
| Net decrease | (18,546,859 | ) | $ | (202,183,919 | ) | Net decrease | (1,218,491 | ) | $ | (13,224,271 | ) | ||||||
| Shares Outstanding: | Shares Outstanding: | ||||||||||||||||
| Beginning of year | 157,577,846 | Beginning of year | 3,605,112 | ||||||||||||||
| End of year | 139,030,987 | End of year | 2,386,621 | ||||||||||||||
Page 89
Notes to the Financial Statements
December 31, 2012
3.Capital Share Transactions (cont.)
Baird Core Plus Bond Fund
| Institutional Class Shares | Investor Class Shares | ||||||||||||||||
| Year Ended | Year Ended | ||||||||||||||||
| December 31, 2012 | December 31, 2012 | ||||||||||||||||
| Shares | Amount | Shares | Amount | ||||||||||||||
| Shares sold | 82,310,272 | $ | 915,687,272 | Shares sold | 72,083,219 | $ | 829,822,504 | ||||||||||
| Shares issued to | Shares issued to | ||||||||||||||||
| shareholders in | shareholders in | ||||||||||||||||
| reinvestment | reinvestment | ||||||||||||||||
| of dividends | 3,481,543 | 38,771,265 | of dividends | 1,975,404 | 22,796,995 | ||||||||||||
| Shares redeemed | (17,290,129 | ) | (192,491,925 | ) | Shares redeemed | (14,923,677 | ) | (172,523,499 | ) | ||||||||
| Net increase | 68,501,686 | $ | 761,966,612 | Net increase | 59,134,946 | $ | 680,096,000 | ||||||||||
| Shares Outstanding: | Shares Outstanding: | ||||||||||||||||
| Beginning of year | 71,093,096 | Beginning of year | 29,680,841 | ||||||||||||||
| End of year | 139,594,782 | End of year | 88,815,787 | ||||||||||||||
| Institutional Class Shares | Investor Class Shares | ||||||||||||||||
| Year Ended | Year Ended | ||||||||||||||||
| December 31, 2011 | December 31, 2011 | ||||||||||||||||
| Shares | Amount | Shares | Amount | ||||||||||||||
| Shares sold | 36,047,590 | $ | 388,252,142 | Shares sold | 26,760,168 | $ | 298,890,969 | ||||||||||
| Shares issued to | Shares issued to | ||||||||||||||||
| shareholders in | shareholders in | ||||||||||||||||
| reinvestment | reinvestment | ||||||||||||||||
| of dividends | 2,340,028 | 25,063,056 | of dividends | 524,142 | 5,816,376 | ||||||||||||
| Shares redeemed | (10,328,750 | ) | (110,911,182 | ) | Shares redeemed | (2,980,242 | ) | (33,039,933 | ) | ||||||||
| Net increase | 28,058,868 | $ | 302,404,016 | Net increase | 24,304,068 | $ | 271,667,412 | ||||||||||
| Shares Outstanding: | Shares Outstanding: | ||||||||||||||||
| Beginning of year | 43,034,228 | Beginning of year | 5,376,773 | ||||||||||||||
| End of year | 71,093,096 | End of year | 29,680,841 | ||||||||||||||
4.Investment Transactions and Income Tax Information
During the year ended December 31, 2012, purchases and sales of investment securities (excluding short-term investments) were as follows:
| Baird | ||||||||||||||||||||
| Baird | Baird | Intermediate | Baird | Baird | ||||||||||||||||
| Short-Term | Intermediate | Municipal | Aggregate | Core Plus | ||||||||||||||||
| Bond Fund | Bond Fund | Bond Fund | Bond Fund | Bond Fund | ||||||||||||||||
| Purchases: | ||||||||||||||||||||
| U.S. Government | $ | 65,175,203 | $ | 257,641,710 | $ | — | $ | 698,724,121 | $ | 879,594,422 | ||||||||||
| Other | $ | 616,643,469 | $ | 159,782,407 | $ | 213,632,856 | $ | 217,845,347 | $ | 1,185,164,652 | ||||||||||
| Sales: | ||||||||||||||||||||
| U.S. Government | $ | 58,552,472 | $ | 266,325,174 | $ | — | $ | 615,138,524 | $ | 468,700,614 | ||||||||||
| Other | $ | 387,279,929 | $ | 75,295,204 | $ | 58,836,355 | $ | 310,635,943 | $ | 179,268,958 | ||||||||||
Page 90
Notes to the Financial Statements
December 31, 2012
| 4. | Investment Transactions and Income Tax Information (cont.) |
At December 31, 2012, gross unrealized appreciation and depreciation of investments and distributable ordinary income and long-term capital gains for federal tax purposes were as follows:
| Baird | ||||||||||||||||||||
| Baird | Baird | Intermediate | Baird | Baird | ||||||||||||||||
| Short-Term | Intermediate | Municipal | Aggregate | Core Plus | ||||||||||||||||
| Bond Fund | Bond Fund | Bond Fund | Bond Fund | Bond Fund | ||||||||||||||||
| Cost of investments | $ | 1,343,042,158 | $ | 941,814,526 | $ | 1,134,161,153 | $ | 1,529,820,690 | $ | 2,645,307,638 | ||||||||||
| Gross unrealized | ||||||||||||||||||||
| appreciation | $ | 17,955,469 | $ | 40,895,153 | $ | 72,184,849 | $ | 85,709,466 | $ | 96,675,611 | ||||||||||
| Gross unrealized | ||||||||||||||||||||
| depreciation | (3,237,279 | ) | (2,831,377 | ) | (866,733 | ) | (13,460,782 | ) | (8,467,825 | ) | ||||||||||
| Net unrealized | ||||||||||||||||||||
| appreciation | ||||||||||||||||||||
| (depreciation) | $ | 14,718,190 | $ | 38,063,776 | $ | 71,318,116 | $ | 72,248,684 | $ | 88,207,786 | ||||||||||
| Undistributed | ||||||||||||||||||||
| ordinary income | $ | 158,350 | $ | 623,412 | $ | — | $ | 96,715 | $ | 226,423 | ||||||||||
| Undistributed | ||||||||||||||||||||
| long-term | ||||||||||||||||||||
| capital gain | 644,816 | 1,249,269 | — | — | 1,899,485 | |||||||||||||||
| Total distributable | ||||||||||||||||||||
| earnings | $ | 803,166 | $ | 1,872,681 | $ | — | $ | 96,715 | $ | 2,125,908 | ||||||||||
| Other accumulated | ||||||||||||||||||||
| losses | $ | — | $ | — | $ | (717,460 | ) | $ | (660,957 | ) | $ | — | ||||||||
| Total accumulated | ||||||||||||||||||||
| earnings/(losses) | $ | 15,521,356 | $ | 39,936,457 | $ | 70,600,656 | $ | 71,684,442 | $ | 90,333,694 | ||||||||||
Undistributed income or net realized gains for financial statement purposes may differ from amounts recognized for federal income tax purposes due to differences in the recognition and characterization of income, expense and capital gain items. The difference between book-basis and tax-basis unrealized appreciation is attributed primarily to the tax deferral of losses on wash sales.
Additionally, U.S. generally accepted accounting principles require that certain components of net assets relating to permanent differences be reclassified between financial and tax reporting. These reclassifications are primarily due to differing treatments for losses deferred due to wash sales, equalization accounting for tax purposes, and non-deductible expenses. These reclassifications have no effect on net assets or net asset value per share. For the year ended December 31, 2012, the following table shows the reclassifications made:
| Undistributed Net | Accumulated Net | Paid In | ||||||||||
| Investment Income (Loss) | Realized Gain (Loss) | Capital | ||||||||||
| Baird Short-Term Bond Fund | $ | 787,577 | $ | (787,577 | ) | $ | — | |||||
| Baird Intermediate Bond Fund | 296,999 | (1,009,948 | ) | 712,949 | ||||||||
| Baird Intermediate Municipal Bond Fund | 15,537 | — | (15,537 | ) | ||||||||
| Baird Aggregate Bond Fund | 5,483,860 | (11,743,760 | ) | 6,259,900 | ||||||||
| Baird Core Plus Bond Fund | 5,911,016 | (5,911,016 | ) | — | ||||||||
Page 91
Notes to the Financial Statements
December 31, 2012
4.Investment Transactions and Income Tax Information (cont.)
The tax components of dividends paid during the periods shown below were as follows:
| Year Ended | Year Ended | |||||||||||||||
| December 31, 2012 | December 31, 2011 | |||||||||||||||
| Ordinary | Long-Term | Ordinary | Long-Term | |||||||||||||
| Income | Capital Gains | Income | Capital Gains | |||||||||||||
| Distributions | Distributions | Distributions | Distributions | |||||||||||||
| Baird Short-Term Bond Fund | $ | 26,769,714 | $ | 1,477,641 | $ | 26,304,269 | $ | 4,117,819 | ||||||||
| Baird Intermediate Bond Fund | $ | 26,323,540 | $ | 6,933,411 | $ | 24,939,410 | $ | 4,057,553 | ||||||||
| Baird Intermediate Municipal Bond Fund | $ | 203,893 | $ | — | $ | 407,181 | $ | 608,525 | ||||||||
| Baird Aggregate Bond Fund | $ | 58,182,598 | $ | 22,175,299 | $ | 75,902,247 | $ | 22,074,213 | ||||||||
| Baird Core Plus Bond Fund | $ | 63,215,308 | $ | 2,756,875 | $ | 30,406,429 | $ | 2,498,860 | ||||||||
For the years ended December 31, 2012 and December 31, 2011, distributions of $28,633,639 and $25,599,397, respectively, from the Baird Intermediate Municipal Bond Fund were tax-exempt.
The Fund designated as long-term capital gain dividend, pursuant to Internal Revenue Code 852(b)(3), the amount necessary to reduce the earnings and profits of the Fund related to net capital gain to zero for the tax year ended December 31, 2012. To the extent necessary to fully distribute such capital gains, the Aggregate Bond Fund and Intermediate Bond Fund also designated earnings and profits distributed to shareholders on the redemption of shares.
Under the current tax law, capital losses realized after October 31 may be deferred and treated as occurring on the first day of the following fiscal year. For the year ended December 31, 2012, Baird Aggregate Bond Fund elected to defer capital losses occurring between November 1, 2012 and December 31, 2012 in the amount of $660,957.
At December 31, 2012, accumulated net realized capital loss carryovers, if any, and the year(s) in which the capital loss carryovers expire were:
| Capital Loss | Year of | |||||
| Carryover | Character | Expiration | ||||
| Baird Intermediate Municipal Bond Fund | $ 48,216 | Short-Term | Indefinitely | |||
| 669,244 | Long-Term | Indefinitely |
During the year ended December 31, 2012, none of the Funds utilized capital loss carryovers.
Under the Regulated Investment Company Modernization Act of 2010, the Funds are permitted to carry forward capital losses incurred in taxable years beginning after December 22, 2010 for an unlimited period. However, any losses incurred during those future taxable years will be required to be utilized prior to the losses incurred in pre-enactment taxable years. As a result of this, pre-enactment capital loss carryforwards may be more likely to expire unused. Additionally, post-enactment capital losses that are carried forward will retain their character as either short-term or long-term capital losses rather than being considered all short-term as under previous law.
5.Investment Advisory and Other Agreements
The Funds have entered into an Investment Advisory Agreement with Baird for the provision of investment advisory services. Pursuant to the Investment Advisory Agreement, the Advisor is entitled to receive a fee, calculated daily and payable monthly, at the annual rate of 0.25% for the Funds as applied to the respective Fund’s average daily net assets. Certain officers of the Advisor are also officers of the Funds.
The Funds have entered into an Administration Agreement with Baird. Under the Administration Agreement, the Advisor assumes and pays all expenses of the applicable Fund other than the investment advisory fees, fees
Page 92
Notes to the Financial Statements
December 31, 2012
5.Investment Advisory and Other Agreements (cont.)
under the 12b-1 plan, costs related to portfolio securities transactions and extraordinary or non-recurring expenses. Pursuant to the Administration Agreement, the Advisor is entitled to receive a fee, calculated daily and payable monthly, at the annual rate of 0.05% for the Funds as applied to the respective Fund’s average daily net assets.
U.S. Bancorp Fund Services, LLC serves as transfer agent, administrator, and accounting services agent for the Funds. U.S. Bank, N.A. serves as custodian for the Funds.
Baird (the “Distributor”) is the distributor of the Funds pursuant to a distribution agreement.
6.Securities Lending
Each Fund (other than the Intermediate Municipal Bond Fund) may lend up to one-third of its total assets (including such loans) to borrowers under terms of participation in a securities lending program administered by U.S. Bank, N.A., the Funds’ custodian and an affiliate of the Funds’ transfer agent and administrator. The securities lending agreement requires that loans are collateralized at all times in an amount equal to at least 102% of the market value of any loaned securities at the time of the loan, plus accrued interest.
The Funds receive compensation in the form of fees and earn interest on the cash collateral. The amount of fees depends on a number of factors including the type of security and length of the loan. Each Fund continues to receive interest payments or dividends on the securities loaned during the borrowing period. Each Fund has the right under the terms of the securities lending agreement to recall the securities from the borrower on demand.
As of December 31, 2012, the Baird Short-Term Bond Fund, Baird Intermediate Bond Fund, Baird Aggregate Bond Fund and Baird Core Plus Bond Fund had loaned securities that were collateralized by cash equivalents. The cash collateral is invested by the custodian in accordance with approved investment guidelines. Those guidelines require the cash collateral to be invested in readily marketable, high quality, short-term obligations; however, such investments are subject to risk of payment delays or default on the part of the issuer or counterparty or otherwise may not generate sufficient interest to support the costs associated with securities lending. A Fund could also experience delays in recovering its securities and possible loss of income or value if the borrower fails to return the borrowed securities, although the Funds are indemnified from this risk by contract with the securities lending agent.
As of December 31, 2012, the market value of the securities on loan and payable on collateral due to broker were as follows:
| Market Value of | Payable on Collateral | |||||||
| Securities on Loan | due to Broker | |||||||
| Baird Short-Term Bond Fund | $ | 82,723,692 | $ | 84,476,862 | ||||
| Baird Intermediate Bond Fund | 78,411,737 | 80,314,034 | ||||||
| Baird Aggregate Bond Fund | 62,894,298 | 64,509,739 | ||||||
| Baird Core Plus Bond Fund | 108,574,628 | 111,274,488 | ||||||
The Funds receive cash as collateral in return for securities lent as part of the securities lending program. The collateral is invested in the Mount Vernon Securities Lending Prime Portfolio (a securities lending trust subject to Rule 2a-7 under the 1940 Act) and a legacy interest in Atlantic East Funding LLC. The schedules of investments for the Funds include the particular cash collateral holdings as of December 31, 2012.
The Funds’ interest in Atlantic East Funding LLC is priced at fair value by the Valuation Committee of the Advisor. The fair value of the Funds’ interest in Atlantic East Funding LLC is based on the underlying market values of the securities owned by Atlantic East Funding LLC, which are determined by independent pricing sources. In addition, the Funds’ transfer agent and administrator and securities lending agent entered into a support agreement with the Funds to cover potential losses realized by the Funds on their investment in Atlantic East Funding LLC (up to a certain amount). The amounts agreed to be provided to the Funds under the support
Page 93
Notes to the Financial Statements
December 31, 2012
6.Securities Lending (cont.)
agreement are shown in the Funds’ schedules of investments and statements of assets and liabilities. At December 31, 2012, the fair value of the Funds’ interest in Atlantic East Funding LLC, plus the amounts payable under the support agreement, amounted to 100% of the outstanding par value of the Funds’ interest in Atlantic East Funding LLC.
The interest income earned by the Funds on investments of cash collateral received from borrowers for the securities loaned to them (“securities lending income”) is reflected in the Funds’ statements of operations. Interest income earned on collateral investments and recognized by the Funds during the year ended December 31, 2012 for the Baird Short-Term Bond Fund, Baird Intermediate Bond Fund, Baird Aggregate Bond Fund, and Baird Core Plus Bond Fund were $135,381, $129,243, $195,673, and $226,011, respectively.
7.Line of Credit
The Corporation maintains an uncommitted, senior secured line of credit (“LOC”) with U.S. Bank, N.A. (the “Bank”) to provide the Funds a temporary liquidity source to meet unanticipated redemptions. Under the terms of the LOC, borrowings for each Fund are limited to one-third of the total assets (including the amount borrowed) of the respective Fund, or as otherwise indicated within the Funds’ agreement with the Bank. The Bank charged interest at the Bank’s Prime Rate less 1% for the period January 1 through May 17 and the Bank’s Prime Rate less 2% since May 18 (weighted average rate of 1.63% during 2012). For the year ended December 31, 2012, the Baird Intermediate Bond Fund and Baird Intermediate Municipal Bond Fund incurred $72 and $37 in interest charges, respectively, on average daily loan balances of $3,158 and $2,904, respectively. The Baird Short-Term Bond Fund, Baird Aggregate Bond Fund and Baird Core Plus Bond Fund did not borrow from the LOC during the period.
8.Distribution and Shareholder Service Plan
The Funds have adopted a distribution and shareholder service plan (the “Plan”) pursuant to Rule 12b-1 under the 1940 Act. The Plan allows the Funds to compensate the Distributor for the costs incurred in distributing the Funds’ Investor Class Shares, including amounts paid to brokers or dealers, at an annual rate of 0.25% of the average daily net assets of the Funds’ Investor Class Shares. The Baird Short-Term Bond, Baird Intermediate Bond, Baird Intermediate Municipal Bond, Baird Aggregate Bond and Baird Core Plus Bond Funds incurred $343, $46,407, $657,724, $84,129 and $1,684,693, respectively, in fees pursuant to the Plan during the year ended December 31, 2012.
9.Subsequent Event
In preparing these financial statements, the Corporation has evaluated events after December 31, 2012. There were no subsequent events since December 31, 2012 through the date the financial statements were issued that would require adjustment to or additional disclosure in these financial statements.
Page 94
Report of Independent Registered Public
Accounting Firm
Board of Directors and Shareholders
Baird Funds, Inc.
We have audited the accompanying statements of assets and liabilities of Baird Short-Term Bond Fund, Baird Intermediate Bond Fund, Baird Intermediate Municipal Bond Fund, Baird Aggregate Bond Fund and Baird Core Plus Bond Fund (five of the eight funds constituting Baird Funds, Inc.) (collectively the “Funds”), including the summary schedules of investments, as of December 31, 2012 and the related statements of operations for the year then ended, the statements of changes in net assets for each of the two years in the period then ended, and the financial highlights for each of the five years in the period then ended. These financial statements and financial highlights are the responsibility of the Funds’ management. Our responsibility is to express an opinion on these financial statements and financial highlights based on our audits.
We conducted our audits in accordance with the standards of the Public Company Accounting Oversight Board (United States). Those standards require that we plan and perform the audit to obtain reasonable assurance about whether the financial statements and financial highlights are free of material misstatement. The Funds are not required to have, nor were we engaged to perform an audit of its internal control over financial reporting. Our audits included consideration of internal control over financial reporting as a basis for designing audit procedures that are appropriate in the circumstances, but not for the purpose of expressing an opinion on the effectiveness of the Funds’ internal control over financial reporting. Accordingly, we express no such opinion. An audit includes examining, on a test basis, evidence supporting the amounts and disclosures in the financial statements. Our procedures included confirmation of securities owned as of December 31, 2012, by correspondence with the custodian and brokers. An audit also includes assessing the accounting principles used and significant estimates made by management, as well as evaluating the overall financial statement presentation. We believe that our audits provide a reasonable basis for our opinion.
In our opinion, the financial statements and financial highlights referred to above present fairly, in all material respects, the financial position of each of the aforementioned Funds of Baird Funds, Inc. as of December 31, 2012, and the results of their operations for the year then ended, the changes in their net assets for each of the two years in the period then ended and the financial highlights for each of the five years in the period then ended in conformity with accounting principles generally accepted in the United States of America.

Chicago, Illinois
February 27, 2013
Page 95
Directors & Officers
As of December 31, 2012
G. Frederick Kasten, Jr.
Independent Director and Chairman
Term of Office: Indefinite
Length of Time Served: Since September 2000
Age: 73
c/o Robert W. Baird & Co. Incorporated
777 East Wisconsin Avenue
Milwaukee, WI 53202
Principal Occupation(s) During the Past 5 Years: Retired; Chairman, the Advisor (January 2000-December 2005); Chairman and CEO, the Advisor (January 1998-January 2000); President, Chairman and CEO, the Advisor (June 1983-January 1998); President, the Advisor (January 1979-January 1983)
Number of Portfolios in Complex Overseen by Director: 8
Other Directorships Held by Director: None
John W. Feldt
Independent Director
Term of Office: Indefinite
Length of Time Served: Since September 2000
Age: 70
c/o University of Wisconsin Foundation
1848 University Avenue
Madison, WI 53726
Principal Occupation(s) During the Past 5 Years: Retired; Senior Vice President-Finance, University of Wisconsin Foundation (1985-2006); Vice President-Finance, University of Wisconsin Foundation (1980-1985); Associate Director, University of Wisconsin Foundation (1967-1980)
Number of Portfolios in Complex Overseen by Director: 8
Other Directorships Held by Director: Director of Thompson Plumb Funds, Inc., a mutual fund complex (3 portfolios)
Frederick P. Stratton, Jr.
Independent Director
Term of Office: Indefinite
Length of Time Served: Since May 2004
Age: 73
c/o Robert W. Baird & Co. Incorporated
777 East Wisconsin Avenue
Milwaukee, WI 53202
Principal Occupation(s) During the Past 5 Years: Retired; Chairman Emeritus, Briggs & Stratton Corporation, a manufacturing company, since 2003; Chairman of the Board, Briggs & Stratton Corporation (2001-2002); Chairman and CEO, Briggs & Stratton Corporation (1986-2001)
Number of Portfolios in Complex Overseen by Director: 8
Other Directorships Held by Director: Director of Weyco Group, Inc., a men’s footwear distributor.
Marlyn J. Spear, CFA
Independent Director
Term of Office: Indefinite
Length of Time Served: Since January 2008
Age: 59
c/o Robert W. Baird & Co. Incorporated
777 East Wisconsin Avenue
Milwaukee, WI 53202
Principal Occupation(s) During the Past 5 Years: Chief Investment Officer, Building Trades United Pension Trust Fund, since July 1989; Investment Officer, Northwestern Mutual Financial Network (1988-1989); Assistant Vice-President, Firstar Trust Company (1978-1987); Financial Analyst, Harco Holdings, Inc. (1976-1978)
Number of Portfolios in Complex Overseen by Director: 8
Other Directorships Held by Director: Management Trustee of AFL-CIO Housing Investment Trust, a mutual fund complex (1 portfolio)
Page 96
Directors & Officers
As of December 31, 2012
Cory L. Nettles*
Interested Director
Term of Office: Indefinite
Length of Time Served: Since January 2008
Age: 42
c/o Generation Growth Capital, Inc.
411 East Wisconsin Avenue, Suite 1710
Milwaukee, WI 53202
Principal Occupation(s) During the Past 5 Years: Managing Director, Generation Growth Capital, Inc., a private equity fund, since March 2007; Of Counsel, Quarles & Brady LLP, a law firm, since January 2005; Secretary, Wisconsin Department of Commerce (January 2003 – January 2005)
Number of Portfolios in Complex Overseen by Director: 8
Other Directorships Held by Director: Director of Weyco Group, Inc., a men’s footwear distributor
Mary Ellen Stanek
President
Term of Office: Re-elected by Board annually
Length of Time Served: Since September 2000
Age: 56
777 East Wisconsin Avenue
Milwaukee, WI 53202
Principal Occupation(s) During the Past 5 Years: Managing Director, the Advisor, and Chief Investment Officer, Baird Advisors, a department of the Advisor, since March 2000
Charles B. Groeschell
Vice President
Term of Office: Re-elected by Board annually
Length of Time Served: Since January 2010
Age: 59
777 East Wisconsin Avenue
Milwaukee, WI 53202
Principal Occupation(s) During the Past 5 Years: Managing Director, the Advisor, and Senior Portfolio Manager, Baird Advisors, a department of the Advisor, since February 2000
Todd S. Nichol
Vice President and Chief Compliance Officer
Term of Office: Re-elected by Board annually
Length of Time Served: Since August 2004
Age: 50
777 East Wisconsin Avenue
Milwaukee, WI 53202
Principal Occupation(s) During the Past 5 Years: Chief Compliance Officer, the Advisor since October 2004; Assistant Compliance Director, the Advisor since August 2002; Senior Vice President, the Advisor since January 2005; First Vice President, the Advisor (January 2004-January 2005)
Dominick P. Zarcone
Treasurer
Term of Office: Re-elected by Board annually
Length of Time Served: Since March 2011
Age: 54
777 East Wisconsin Avenue
Milwaukee, WI 53202
Principal Occupation(s) During the Past 5 Years: Chief Financial Officer, the Advisor since March 2011; Chief Operating Officer-Investment Banking, the Advisor (June 2004-March 2011); Managing Director, the Advisor since February 1995
Charles M. Weber
Secretary
Term of Office: Re-elected by Board annually
Length of Time Served: Since September 2005
Age: 49
777 East Wisconsin Avenue
Milwaukee, WI 53202
Principal Occupation(s) During the Past 5 Years: Managing Director, the Advisor since January 2009; Senior Vice President, the Advisor (July 2005-December 2008); Associate General Counsel, the Advisor since July 2005; Partner, Quarles & Brady LLP, a law firm (October 1998-June 2005)
Page 97
Directors & Officers
As of December 31, 2012
Peter J. Hammond
Vice President
Term of Office: Re-elected by Board annually
Length of Time Served: Since August 2012
Age: 49
777 East Wisconsin Avenue
Milwaukee, WI 53202
Principal Occupation(s) During the Past 5 Years:
Senior Vice President, the Advisor since March 2012; Executive VP and Chief Administrative Officer, UMB Fund Services (September 1996 to March 2012).
Dustin J. Hutter
Assistant Treasurer
Term of Office: Re-elected by Board annually
Length of Time Served: Since February 2011
Age: 36
777 East Wisconsin Avenue
Milwaukee, WI 53202
Principal Occupation(s) During the Past 5 Years: Senior Vice President, the Advisor since January 2011; First Vice President, the Advisor (January 2008-December 2010); Vice President, the Advisor (January 2006-December 2007); Assistant Controller, the Advisor since January 2006
Andrew D. Ketter
Assistant Secretary
Term of Office: Re-elected by Board annually
Length of Time Served: Since February 2011
Age: 38
777 East Wisconsin Avenue
Milwaukee, WI 53202
Principal Occupation(s) During the Past 5 Years: First Vice President and Associate General Counsel, the Advisor since September 2010; Associate, Quarles & Brady LLP, a law firm (September 2002-August 2010)
| * | Mr. Nettles is considered an “interested person” of the Corporation (as defined in the 1940 Act) because of his association with the law firm, Quarles & Brady LLP, which provides legal services to the Advisor. The legal services that Quarles & Brady LLP has provided to the Advisor include litigation, real estate, trademark and miscellaneous securities related matters that did not relate to the Corporation or the Funds. |
Additional information about the Funds’ directors is available in the Statement of Additional Information which may be obtained without charge, upon request, by calling 1-866-44BAIRD, or at www.bairdfunds.com.
Page 98
Baird Funds, Inc.
Disclosure Regarding the Board of Directors’ Approval of the Investment Advisory Agreement for Baird Fixed Income Funds
The Board of Directors (the “Board”) of Baird Funds, Inc. (the “Corporation”), including the directors who are not “interested persons” of the Corporation within the meaning of the Investment Company Act of 1940 (the “Independent Directors”), met on August 17 and August 23, 2012 to consider the annual renewal of the investment advisory agreement between Robert W. Baird & Co. Incorporated (“Baird” or the “Advisor”) and the Corporation on behalf of the Baird Intermediate Bond, Aggregate Bond, Intermediate Municipal Bond, Core Plus Bond and Short-Term Bond Funds (collectively, the “Funds”). The Board, including the Independent Directors, approved the investment advisory agreement through a process that concluded at the August 23, 2012 meeting. In connection with its consideration of the investment advisory agreement, the Board reviewed and discussed various information, including the investment advisory agreement, memoranda provided by outside legal counsel and the Secretary of the Funds discussing the Board’s fiduciary obligations and factors the Board should assess in considering the renewal of the investment advisory agreement, information in response to requests from the Board from the Advisor (including the Advisor’s Form ADV, Form BD, annual report and financial statements), a profitability analysis, comparative information about the Funds’ performance for periods ended June 30, 2012, management fees and expense ratios and other pertinent information. The Board also discussed relevant case law.
The Independent Directors met separately in executive session with Fund legal counsel to consider the investment advisory agreement. The Board discussed the Advisor’s 15(c) response and supplemental information requested by the Board with the President of the Funds. The Board also took into account information reviewed periodically throughout the year that was relevant to its consideration of the investment advisory agreement, including performance, management fee and other expense information and discussions with the Funds’ portfolio managers. Based on its evaluation of this information, the Board, including a majority of the Independent Directors, approved the continuation of the investment advisory agreement for an additional one-year period.
In considering the investment advisory agreement and reaching its conclusions, the Board reviewed and analyzed various factors that it determined were relevant, including the factors below. In deciding to approve the investment advisory agreement for each Fund, the Board did not identify any single factor as determinative but considered all factors together.
Nature, Extent and Quality of Services Provided to the Funds
The Board analyzed the nature, extent and quality of the services provided by the Advisor to the Funds. The Board reviewed and considered the Advisor’s significant role in establishing the Funds and the construction of their investment objectives, principal strategies, investment limitations and fee structures. The Board noted the Advisor’s overall reputation and positive name recognition, the depth of the Advisor’s personnel, resources and commitment to the Funds, and the experience, credentials and continuity of the portfolio management teams employed to manage the Funds’ investments. The Board further noted that the Advisor has over $27 billion of assets under discretionary management and has strong relationships with numerous institutional accounts. The Funds provide an opportunity for smaller institutional and retail accounts to receive the same professional advice from the Advisor that it offers to its larger institutional clients. However, the Board noted that the provision of investment advisory services to the Funds requires more effort than it does for separately managed accounts due to daily sales and redemption activity and additional regulatory and compliance requirements.
The Board considered the Advisor’s disciplined investment decision-making process used for the Funds. The Board also considered other services that the Advisor provided for the Funds in its capacity as their investment advisor, such as making some of its key personnel available to serve as officers of the Funds, selecting broker-dealers for execution of portfolio transactions, ensuring adherence to the Funds’ investment policies and restrictions, compliance, risk management services, valuation, providing support services to the Board and the Audit Committee of the Board and overseeing the Funds’ other service providers. In addition, the Board considered that the Advisor provides administrative services to each of the Funds at an annual rate of 0.05% of the Fund’s average daily net assets, and is responsible for paying each Fund’s custody, transfer agency, accounting, printing,
Page 99
Baird Funds, Inc.
Disclosure Regarding the Board of Directors’ Approval of the Investment Advisory Agreement for Baird Fixed Income Funds (cont.)
auditing, legal and director fees and other ordinary expenses (except for advisory and 12b-1 fees), which has the effect of capping the Funds’ expense ratios at 0.55% and 0.30% for Investor and Institutional Class shares, respectively. The Board further noted that the Advisor, in its capacity as a registered broker-dealer, also serves as distributor and principal underwriter of shares of the Funds and spends time and effort marketing the Funds. The Board also considered the strength of the Advisor’s compliance department, including the Funds’ chief compliance officer, and the fact that the Advisor has not experienced any significant legal, compliance or regulatory difficulties since the Funds were launched. The Board reviewed a summary of the Advisor’s risk management tools and process. The Board concluded that the nature, extent and quality of the services provided by the Advisor to the Funds were appropriate and that each Fund was likely to continue to benefit from services provided under the respective investment advisory agreement.
Investment Performance of the Advisor and the Funds
In considering the investment performance of each of the Funds, the Board reviewed information as of June 30, 2012 regarding the Fund’s performance in comparison to its benchmark index and its peer groups as determined by Lipper. The Board concluded that the Funds had performed extremely well over most time periods and had achieved consistent performance results. While the Intermediate Municipal Bond Fund has trailed its benchmark index in most periods, the Board noted that the Fund did not hold the higher yielding, lower quality bonds that had outperformed higher quality bonds in recent years due to the Advisor’s disciplined risk management process, and referred to the Advisor’s commentary in this regard. The Board also noted that each of the other Funds (both Institutional and Investor Class shares) had outperformed its Lipper peer group average over most time periods.
The Board also considered the Advisor’s quarterly portfolio commentaries and reviews explaining the Funds’ performance, the Advisor’s consistent and disciplined investment decision process and the investment strategies it employs for the Funds. After considering all of the information, the Board concluded that, although past performance is not a guarantee of future results, each Fund and its shareholders were likely to benefit from the continued management by the Advisor.
Costs of Services Provided and Profits Realized by the Advisor
The Board examined the fee and expense information for each of the Funds, including a comparison of such information to other similarly situated mutual funds as determined by Morningstar. The Board noted that each Fund’s advisory fee and total expense ratio (for both its Investor Class and Institutional Class shares) were significantly lower than the average and median advisory fees and expense ratios for all mutual funds in its Morningstar category.
The Board also reviewed and considered investment management fees charged by the Advisor to other investment advisory clients and found that the fee paid by the Funds (0.25%) was less than the fee that the Advisor charges on the first $25 million (0.30%) of a separately managed account and the same as the fee that the Advisor charges on the next $25 million. The Board noted and discussed the extent of the significant additional services provided to the Funds that the Advisor did not provide in the other advisory relationships. Those services included certain administrative services, oversight of the Funds’ other service providers, director support, risk management, regulatory compliance and various other services. The Board also reviewed the subadvisory fee paid to the Advisor under a subadvisory arrangement with an unaffiliated mutual fund, noting that the subadvisory services were limited to asset management and that the Advisor provided numerous other services under the advisory agreement with the Funds and, accordingly, that the subadvisory fee was expected to be lower than the Funds’ advisory fees.
The Board considered the fees realized, and the costs incurred, by the Advisor in providing investment management services to the Funds and a profitability analysis with respect to each Fund. The Board noted the unique expense structure of the Funds whereby the Institutional Class shareholders were charged only a
Page 100
Baird Funds, Inc.
Disclosure Regarding the Board of Directors’ Approval of the Investment Advisory Agreement for Baird Fixed Income Funds (cont.)
management fee and an administration fee and the Advisor incurred all of the other expenses on behalf of each Fund and that Investor Class shareholders incurred the same expenses as the Institutional Class shareholders plus a 0.25% 12b-1 fee. The Board noted that for the past fiscal year, the Advisor had incurred significantly more in expenses under the Administration Agreement than it received in administrative fees.
The Board concluded that the profits realized by the Advisor from its relationship with the Funds were appropriate. The Board noted that the Advisor’s profitability information does not reflect certain internal resources provided by the Advisor to the Funds, such as legal and compliance support. The Board reviewed and considered the general financial condition of the Advisor and determined it to be sound. The Board also reviewed a report regarding revenue sharing payments, noting that any payments by the Advisor to third party platforms were made from the Advisor’s profits. In light of all of the information that it received and considered, the Board concluded that the management fee and total expense ratio of each Fund were reasonable.
Economies of Scale and Fee Levels Reflecting Those Economies
The Board noted that the Funds’ advisory fee structure does not contain any breakpoint reductions as the Funds grow in size. However, the Board recognized that the Advisor essentially bears all of the Funds’ expenses other than management, 12b-1 and administration fees. The Board also recognized that the advisory fee rates paid by the Funds were designed to be lower than the fees otherwise charged by the Advisor to its separately managed account clients and to be comparable to the second or third breakpoint advisory fee levels paid by other comparable mutual funds. The Board also considered the Advisor’s commitment to continue to evaluate advisory fee breakpoints in the future.
The directors concluded that the current fee structure of each Fund was reasonable and that breakpoint reductions may be considered in the future depending on Fund asset levels.
Benefits Derived from the Relationship with the Funds
The Board noted that the Advisor does not have any soft dollar arrangements and does not realize any other tangible benefits in connection with its management of the Funds. The Board believed that the Funds generally benefit from their association with the Advisor and the use of the “Baird” name. The Board concluded that the other benefits realized by the Advisor from its relationship with the Funds were appropriate.
Based on its evaluation of the above factors, as well as other factors relevant to their consideration of the investment advisory agreement, the directors, including all of the Independent Directors, concluded that the continuation of the investment advisory agreement was in the best interest of each Fund and its shareholders.
Page 101
Additional Information
Proxy Voting
A description of the policies and procedures that the Funds use to determine how to vote proxies relating to portfolio securities is available without charge, upon request, by calling toll free, 1-866-44BAIRD, or by accessing the Funds’ website at www.bairdfunds.com; and by accessing the SEC’s website at www.sec.gov.
Each Fund’s proxy voting record for the most recent 12-month period ended June 30, if applicable, is available without charge, upon request, by calling toll free, 1-866-44BAIRD, or by accessing the Funds’ website at www.bairdfunds.com; and by accessing the SEC’s website at www.sec.gov. The Funds generally do not vote proxies because the securities held in their portfolios, consisting of bonds and other fixed-income securities, are not entitled to vote.
Portfolio Holdings Disclosure
The Funds file a complete schedule of portfolio holdings with the SEC for the first and third quarters of each fiscal year on Form N-Q. The Funds’ Forms N-Q are available on the SEC’s website at www.sec.gov and may be reviewed and copied at the SEC’s Public Reference Room in Washington, D.C. Information on the operation of the Public Reference Room may be obtained by calling 1-800-732-0330. The Funds’ Forms N-Q may also be obtained by calling toll-free 1-866-44BAIRD.
Tax Information
The percentage of taxable ordinary income distributions that are designated as short-term capital gain distributions under Internal Revenue Section 871(k)(2)(c) for the Baird Short-Term Bond Fund, Baird Intermediate Bond Fund, Baird Aggregate Bond Fund and Baird Core Plus Bond Fund were 1.76%, 10.94%, 1.44% and 3.20%, respectively.
Page 102
(This Page Intentionally Left Blank.)
Baird Funds, Inc. Privacy Policy
Protecting the privacy of Fund shareholders is important to us. The following is a description of the practices and policies through which Baird Funds, Inc. protects the privacy and security of your non-public personal information.
What Information We Collect
We collect and maintain information about you so that we can open and maintain your account in the Funds and provide various services to you. We may collect and maintain the following personal information about you:
| • | Information we receive from you or your financial advisor on account applications or other forms, correspondence, or conversations, such as your name, address, e-mail address, phone number, social security number, assets, income and date of birth; and | |
| • | Information about your transactions with us, our affiliates, or others, such as your account number and balance, positions, activity, history, cost basis information, and other financial information. |
What Information We Disclose
We do not sell any non-public personal information about our current or former shareholders to third parties. We do not disclose any non-public personal information about our current or former shareholders to anyone, except as permitted or required by law. We are permitted by law to share any of the information we collect, as described above, with our affiliates. In addition, we may share such information with nonaffiliated third parties to the extent necessary to effect, process, administer or enforce a transaction that the shareholder requests or authorizes, in connection with maintaining or servicing the shareholder’s account, as requested by regulatory authorities or as otherwise permitted or required by law. For example, we are permitted by law to disclose all of the information we collect, as described above, to our transfer agent to process your transactions. We may also provide your name and address to third party service providers who send account statements and other Fund-related material to you.
How We Protect Your Information
We restrict access to your non-public personal information to those persons who require such information to provide products or services to you. We maintain physical, electronic, and procedural safeguards that comply with federal standards to protect the confidentiality, integrity and security of your non-public personal information.
We will continue to adhere to the privacy policies and practices in this notice even after your account is closed or becomes inactive.
In the event that you hold shares of the Fund(s) through a financial intermediary, including, but not limited to, a broker-dealer, bank, or trust company, the privacy policy of your financial intermediary would govern how your non-public personal information would be shared with nonaffiliated third parties.
Page A-1
Baird Funds, Inc.
c/o U.S. Bancorp Fund Services, LLC
P.O. Box 701
Milwaukee, WI 53201-0701
1-866-44BAIRD
Board of Directors
G. Frederick Kasten, Jr. (Chairman)
John W. Feldt
Cory L. Nettles
Marlyn J. Spear
Frederick P. Stratton, Jr.
Investment Advisor and Distributor
Robert W. Baird & Co. Incorporated
777 East Wisconsin Avenue
Milwaukee, WI 53202
Administrator and Transfer Agent
U.S. Bancorp Fund Services, LLC
P.O. Box 701
615 East Michigan Street
Milwaukee, WI 53202
Custodian
U.S. Bank, N.A.
1555 N. RiverCenter Drive, Suite 302
Milwaukee, WI 53212
Legal Counsel
Godfrey & Kahn, S.C.
780 North Water Street
Milwaukee, WI 53202
Independent Registered Public
Accounting Firm
Grant Thornton LLP
175 West Jackson Boulevard, 20th Floor
Chicago, IL 60604
Annual Report –
Baird Funds
December 31, 2012
Baird LargeCap Fund
Baird MidCap Fund
Baird SmallCap Value Fund
| Go Green. | | Go Paperless. |
Sign up to receive your Baird Funds’ prospectuses and reports online.
Table of Contents
| Letter to Shareholders | 1 | |
| 2012 Economic and Stock Market Commentary | 2 | |
| Baird LargeCap Fund | 4 | |
| Baird MidCap Fund | 14 | |
| Baird SmallCap Value Fund | 23 | |
| Additional Information on Fund Expenses | 31 | |
| Statements of Assets and Liabilities | 33 | |
| Statements of Operations | 34 | |
| Statements of Changes in Net Assets | 35 | |
| Financial Highlights | 38 | |
| Notes to the Financial Statements | 44 | |
| Report of Independent Registered Public Accounting Firm | 53 | |
| Directors and Officers | 54 | |
| Disclosure Regarding the Board of Directors’ Approval | ||
| of the Investment Advisory Agreement for Baird Equity Funds | 57 | |
| Additional Information | 62 | |
| Privacy Notice | A-1 |
This report has been prepared for shareholders and may be distributed to others only if preceded or accompanied by a current prospectus.
Cautionary Note on Analyses, Opinions and Outlooks: In this report we offer analyses and opinions on the performance of individual securities, companies, industries, sectors, markets, interest rates and governmental policies, including predictions, forecasts and outlooks regarding possible future events. These can generally be identified as such because the context of the statements may include such words as “believe,” “should,” “will,” “expects,” “anticipates,” “hopes” and words of similar effect. These statements reflect the portfolio managers’ good faith beliefs and judgments and involve risks and uncertainties, including the risk that the portfolio managers’ analyses, opinions and outlooks are or will prove to be inaccurate. It is inherently difficult to correctly assess and explain the performance of particular securities, sectors, markets, interest rate movements, governmental actions or general economic trends and conditions, and many unforeseen factors contribute to the performance of Baird Funds. Investors are, therefore, cautioned not to place undue reliance on subjective judgments contained in this report.
Baird Funds
1-866-442-2473
www.bairdfunds.com
February 27, 2013
Dear Shareholder,
Our equity portfolio management team adds long-term value with its quality conscious investment management approach. Equity returns for investors strengthened in 2012 following a lackluster 2011, and we are pleased with the performance of the Funds in 2012, notably our MidCap product, which offered exceptional value-added performance.
We thank you for your continued investment in Baird Funds. Steady inflows into the Baird Funds family have increased total net assets to $7.5 billion at the end of 2012. We’ve built our reputation on employing a risk controlled process in our approach to investment decision making and portfolio management. Our long-term success is a testament to this focus on risk control and providing excellent stewardship of shareholders’ assets.
On the following pages, we review the equity market in 2012 and the performance and composition of the Baird SmallCap Value, MidCap and LargeCap Funds.
We appreciate the confidence and trust that you have placed in our experienced investment team to help you achieve your financial goals and we welcome the opportunity to continue to serve you.
Sincerely,
Mary Ellen Stanek, CFA
President
Baird Funds
Page 1
2012 Economic and Stock Market Commentary
U.S. equity markets overcame worries about global economic growth and a heavy dose of political uncertainty to produce attractive returns during 2012. The broad-based S&P 500 index rose 16.0% for the year, while the Dow Jones Industrial Average advanced 7.3%. Returns were fairly consistent across the market capitalization spectrum as large cap companies included in the Russell 1000® Growth Index advanced 15.26%, the Russell Midcap Growth® Index increased 15.81%, and the Russell 2000® Value Index increased 18.05% for 2012.
Sector performance within the broad S&P 500 index was varied but mostly positive. As one might expect during a period of favorable market returns more defensive areas of the market, including consumer staples and utilities, lagged. Sectors with more cyclical earnings streams such as materials and industrials moved with the overall market, while healthcare also kept pace. Leading sectors included consumer discretionary, which reflected favorable earnings performance within the sector and financials, which recovered from several years of disappointing performance.
As in most years, equity returns were not steady on a quarter-to-quarter basis. First quarter returns were quite strong as optimism over continued economic progress led stock valuations to rise. However, concerns about U.S. unemployment and slower global growth, particularly in Europe and China, took hold in the middle part of the year and led to a choppier market environment. The market declined during the second quarter after a disappointing employment report showing an increase in the unemployment rate and a reversal of an 11- month long trend of favorable declines. Continued investor anxiety over Europe and fear that secular declines in peripheral countries would spread to core European economies spurred talk of additional easing by European Central Banks. Complicating things somewhat was the difficulty in implementing a mutually-acceptable solution that satisfied banking, fiscal, and political concerns. Commodity prices overall also fell during the second quarter of 2012, including U.S. crude oil, which fell to a two-year low of $81.
At the beginning of the third quarter, the Federal Reserve Board (Fed) reported surprising growth in consumer credit, which is often associated with a better economic outlook. Existing home borrowers, yet again, rushed to refinance mortgages, while some underwater—yet current borrowers—refinanced courtesy of the Home Affordable Refinance Program (“HARP”). Near the end of July, Mario Draghi, European Central Bank President, uttered the words, “Within our mandate, the ECB is ready to do whatever it takes to preserve the Euro. And believe me, it will be enough.” That statement appeared to inspire confidence and begin the process of averting a European meltdown. After another lackluster jobs report in September, concerns over a fiscal cliff, and the upcoming November elections, the general expectation was that the Federal Reserve would take additional quantitative easing action, which was fully priced into the market. By mid-September, Ben Bernanke confirmed the general expectation by extending zero interest rates into 2015 and giving guidance the Fed would not act to raise rates until after the economy strengthened.
Despite the accommodative policy, economic activity slowed in the U.S. during the fourth quarter of 2012, owing to uncertainty over the Presidential election and the pending “fiscal cliff” as business owners hesitated to place orders and instead brought inventories lower. Consumer confidence showed an increase in October when the U.S. Commerce Department reported housing starts increased 15% year over year, which was the fastest pace in four years and beat the highest estimate. The manufacturing sector took a breather in November as its ISM index plummeted to 2009 levels, reflecting business concerns about building too much inventory and whether consumers would stop buying. Central banks remained accommodative, providing liquidity in a continuing attempt to lift risk based assets. U.S. stock markets were roughly flat to slightly higher for the quarter but did better than many had expected for the year.
Economic Outlook
As we put 2012 squarely in the rear view mirror, it is our belief that the prospects for global growth are improving following several difficult years. Despite the noise from Washington and the potential for additional volatility as debates over the debt ceiling loom, there are several positives emerging on the domestic front. Notably, housing statistics have materially improved since the recession. New construction, sales and home values have all turned up, providing a lift to employment, especially in building trades. We expect that trend to continue in 2013, potentially adding upwards of one percent to GDP growth. We believe spending will also remain robust in the
Page 2
2012 Economic and Stock Market Commentary
energy sector, with substantial drilling activity both onshore and in the Gulf of Mexico. Reports of the U.S.’s potential energy independence by the end of the decade have been published, supporting our outlook for spending in this sector.
In Europe, the central bank is following the lead of the Fed by purchasing country debt. This added liquidity for bondholders has reduced borrowing costs for the most troubled countries. Default risk is now much lower, calming both European bond and stock markets, as evidenced by an overall increase in the price of European bank stocks of 25% in 2012. While not yet expanding, it appears to us that Europe has stopped getting worse. As for China, the newly installed leadership has signaled a willingness to resume a more stimulative posture. Recent U.S. economic data has been encouraging and we believe there is more to come in the new year.
In sum, we see an environment characterized by modest domestic and potentially improving international growth. This mix is a change from the past several years. We believe pockets of strength exist and that the Funds’ portfolios are well-positioned to take advantage. We are keeping a watchful eye for market improvements, and should our expectations for Europe and China unfold, increased exposure to multinational companies may be warranted in 2013.
The S&P 500 Index is an unmanaged, market capitalization weighted index of 500 common stocks widely regarded to be representative of the US market in general. Returns include reinvestment of dividends.
The Dow Jones Industrial Average is a price weighted average of 30 high quality stocks selected for total market value and broad public ownership. A price weighted benchmark results in the stocks with the highest prices contributing the most to the performance of the benchmark. The returns of this index do not include the reinvestment of dividend income.
A direct investment in an index is not possible.
Page 3
Baird LargeCap Fund
December 31, 2012
Portfolio Managers’ Commentary
For the year ended December 31, 2012, the Baird LargeCap Fund Institutional Class posted an advance of 13.62% (13.32% for the Investor Class), as compared to a return of 15.26% for the Russell 1000® Growth Index, the LargeCap Fund’s primary benchmark.
We were pleased with the solid absolute return produced by the Fund, but recognize that results trailed the benchmark. We remained positioned for an economic recovery, which was highlighted by the heavier weights in the energy, materials and technology sectors. This positioning has been fairly consistent in recent years as we continue to expect economic progress, albeit at a slower than desired level.
The most difficult sectors from a relative performance standpoint were consumer discretionary, healthcare, industrials and materials. The highlight of the year was the outperformance in the energy, consumer staples and technology sectors.
While we saw strength throughout the discretionary sector, companies with a larger international revenue mix experienced difficulty in the middle part of the year as the global growth outlook waned. In addition, the choppy economic environment and an unexpected lull in retail spending during the all-important holiday shopping season made for an uncertain investment backdrop late in the year. We believe that the consumer spending outlook, particularly on the higher end, remains positive due in part to an improving housing market and job growth.
While the performance of the Fund’s healthcare stocks lagged the benchmark, we were generally pleased with the fundamental results of the companies. Relative performance fell short as the two largest holdings within this sector advanced, but did not keep pace with healthcare’s strong overall performance.
The Fund’s holdings in the basic materials area lagged during the year, which we believe reflects the more conservative nature of the business models owned in the Fund. We tend to avoid commodity-oriented cyclicals, as earnings patterns are often volatile, making them, in our view, more appropriate for shorter term investments rather than our preference for longer term investment prospects. The Fund’s holdings in industrial distributors, positive absolute contributors, did not keep pace with the commodity producers in 2012.
The Fund’s holdings in the energy sector produced solid outperformance. Drilling activity both onshore and in deep water continued at high levels, supporting equipment manufacturers and service suppliers. Also, a recovery in the price of natural gas benefitted the Fund’s holding in an exploration and development company possessing significant acreage and production in the Marcellus shale formation in the eastern U.S.
The consumer staples sector provided a strong contribution to the Fund’s performance owing to the sharp advance in the stock price of a fast-growing food retailer. In addition, the Fund’s underweight in this typically defensive sector helped as performance here lagged the more favorable returns of the broader market.
The technology sector represented the largest weight in the Russell 1000 Growth Index® and was the Fund’s largest sector as well. Despite a challenging environment for technology spending, particularly later in the year, good stock picking in areas such as software, data storage, and mobile communications benefitted performance.
Our investment strategy remains centered on identifying large cap companies in the earlier part of their life cycle (generally less than average cap) where we believe there remains a meaningful runway for attractive growth. We strive to keep the collective portfolio away from the law of large numbers, which eventually affects the growth rate of the biggest and most well-known businesses.
Our focus will remain on expending energy on the things we can control – identifying and investing in what we believe are good businesses, properly allocating capital across sectors and aligning position sizes to account for risk and reward for clients. We are confident in our team and our investment process.
Portfolio Managers:
Douglas E. Guffy
Kenneth M. Hemauer, CFA
Page 4
Baird LargeCap Fund
December 31, 2012
A December 31, 2012 summary of the Fund’s top 10 holdings and equity sector analysis compared to the Russell 1000® Growth Index is shown below.
| Top 10 Holdings* | Equity Sector Analysis** | |
| Apple Inc. | 6.5% | |
| The Coca-Cola Company | 3.4% | 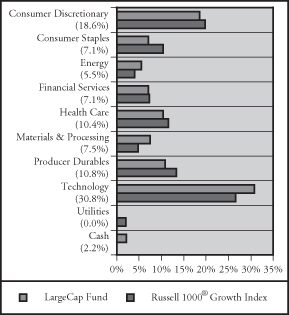 |
| Praxair, Inc. | 3.3% | |
| Microsoft Corporation | 3.2% | |
| Salesforce.com, Inc. | 3.1% | |
| Cognizant Technology | ||
| Solutions Corporation | 3.0% | |
| Whole Foods Market, Inc. | 2.9% | |
| Danaher Corporation | 2.7% | |
| Google, Inc. | 2.7% | |
| Starbucks Corporation | 2.6% | |
| Net Assets: | $24,406,073 | |
| Portfolio Turnover Rate: | 39.2% | |
| Number of Equity Holdings: | 60 | |
| Annualized Portfolio Expense Ratio:*** | ||
| Gross | ||
| INSTITUTIONAL CLASS: | 1.36% | |
| INVESTOR CLASS: | 1.61%**** | |
| Net | ||
| INSTITUTIONAL CLASS: | 0.75% | |
| INVESTOR CLASS: | 1.00%**** | |
| * | The Fund’s portfolio composition is subject to change and there is no assurance that the Fund will continue to hold any particular security. Percentages shown relate to the Fund’s total net assets as of December 31, 2012. | |
| ** | Percentages shown in parentheses relate to the Fund’s total market value of investments as of December 31, 2012, and may not add up to 100% due to rounding. | |
| *** | Reflects expense ratios as stated in the Fund’s current prospectus. The Advisor has contractually agreed to limit the Fund’s total annual fund operating expenses to 0.75% of average daily net assets for the Institutional Class shares and 1.00% of average daily net assets for the Investor Class shares, at least through April 30, 2014. | |
| **** | Includes 0.25% 12b-1 fee. |
Page 5
Baird LargeCap Fund
December 31, 2012
Institutional Class
Value of a $25,000 Investment
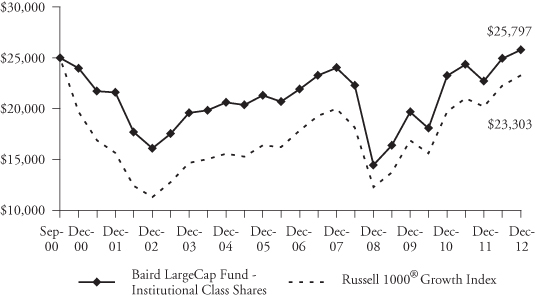
Growth of a hypothetical investment of $25,000 made on the Fund’s inception date (9/29/00), assuming reinvestment of all distributions.
Investor Class
Value of a $10,000 Investment
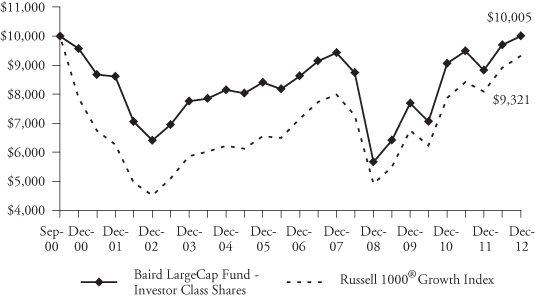
Growth of a hypothetical investment of $10,000 made on the Fund’s inception date (9/29/00), assuming reinvestment of all distributions.
Page 6
Baird LargeCap Fund
December 31, 2012
| Average Annual Total Returns | ||||
| Since | ||||
| For the Periods Ended December 31, 2012 | One Year | Five Years | Ten Years | Inception(1) |
| Institutional Class Shares | 13.62% | 1.42% | 4.83% | 0.26% |
| Investor Class Shares | 13.32% | 1.20% | 4.56% | 0.00% |
Russell 1000® Growth Index(2) | 15.26% | 3.12% | 7.52% | -0.57% |
| (1) | For the period from September 29, 2000 (commencement of operations) through December 31, 2012. | |
| (2) | The Russell 1000® Growth Index measures the performance of the large-cap growth segment of the U.S. equity universe. It includes those Russell 1000® companies with higher price-to-book ratios and higher forecasted growth values. This index does not reflect any deduction for fees, expenses or taxes. A direct investment in the index is not possible. |
The returns shown in the table above and line graphs on the previous page reflect reinvestment of dividends and/or capital gains distributions in additional shares. The returns do not reflect the deduction of taxes that a shareholder would pay on Fund distributions or the redemption of Fund shares. The returns reflect the actual performance for each period and do not include the impact of trades executed on the last business day of the period that were recorded on the first business day of the next period.
The Fund’s gross expense ratio for each Class, as reflected in the Fund’s current prospectus, is set forth under “Portfolio Characteristics”.
The Fund focuses on growth-style stocks and therefore the performance of the Fund will typically be more volatile than the performance of funds that focus on types of stocks that have a broader investment style. The Fund may invest up to 15% of its total assets in ADRs. Foreign investments involve additional risks such as currency rate fluctuations, political and economic instability, and different and sometimes less strict financial reporting standards and regulation.
Past performance does not guarantee future results. Investment return and principal value will fluctuate so that an investor’s shares, when redeemed, may be worth more or less than their original cost.
For information about the performance of the Fund as of the most recent month-end, please call 1-866-44BAIRD or visit www.bairdfunds.com. Mutual fund performance changes over time and current performance may be lower or higher than that stated.
Page 7
Baird LargeCap Fund
Schedule of Investments, December 31, 2012
Common Stocks
| Market | % of | |||||||||||
| Shares | Value | Net Assets | ||||||||||
| Aerospace & Defense | ||||||||||||
| Precision Castparts Corp. | 3,232 | $ | 612,205 | 2.5 | % | |||||||
| Beverages | ||||||||||||
| The Coca-Cola Company | 22,600 | 819,250 | 3.4 | % | ||||||||
| Biotechnology | ||||||||||||
| Gilead Sciences, Inc.*@ | 6,000 | 440,700 | 1.8 | % | ||||||||
| Capital Markets | ||||||||||||
| State Street Corporation | 4,816 | 226,400 | 0.9 | % | ||||||||
| T. Rowe Price Group, Inc. | 4,489 | 292,369 | 1.2 | % | ||||||||
| 518,769 | 2.1 | % | ||||||||||
| Chemicals | ||||||||||||
| Praxair, Inc. | 7,250 | 793,513 | 3.3 | % | ||||||||
| Commercial Services & Supplies | ||||||||||||
| Stericycle, Inc.* | 6,175 | 575,942 | 2.4 | % | ||||||||
| Communications Equipment | ||||||||||||
| F5 Networks, Inc.* | 975 | 94,721 | 0.4 | % | ||||||||
| QUALCOMM Incorporated | 9,225 | 572,135 | 2.3 | % | ||||||||
| 666,856 | 2.7 | % | ||||||||||
| Computers & Peripherals | ||||||||||||
| Apple Inc. | 2,985 | 1,591,095 | 6.5 | % | ||||||||
| EMC Corporation* | 22,950 | 580,635 | 2.4 | % | ||||||||
| 2,171,730 | 8.9 | % | ||||||||||
| Construction & Engineering | ||||||||||||
| Fluor Corporation@ | 5,700 | 334,818 | 1.4 | % | ||||||||
| Electrical Equipment | ||||||||||||
Eaton Corporation PLC f | 8,625 | 467,475 | 1.9 | % | ||||||||
| Rockwell Automation, Inc. | 2,300 | 193,177 | 0.8 | % | ||||||||
| 660,652 | 2.7 | % | ||||||||||
| Energy Equipment & Services | ||||||||||||
Core Laboratories N.V. f | 1,231 | 134,561 | 0.5 | % | ||||||||
| Oceaneering International, Inc. | 3,650 | 196,334 | 0.8 | % | ||||||||
Schlumberger Limited f | 3,412 | 236,417 | 1.0 | % | ||||||||
| 567,312 | 2.3 | % | ||||||||||
| Food & Staples Retailing | ||||||||||||
| Whole Foods Market, Inc. | 7,725 | 705,524 | 2.9 | % | ||||||||
| Health Care Equipment & Supplies | ||||||||||||
| Intuitive Surgical, Inc.* | 700 | 343,259 | 1.4 | % | ||||||||
| Health Care Providers & Services | ||||||||||||
Catamaran Corporation*@ f | 7,040 | 331,654 | 1.4 | % | ||||||||
The accompanying notes are in integral part of these financial statements.
Page 8
Baird LargeCap Fund
Schedule of Investments, December 31, 2012
Common Stocks (cont.)
| Market | % of | |||||||||||
| Shares | Value | Net Assets | ||||||||||
| Health Care Technology | ||||||||||||
| Cerner Corporation*@ | 2,850 | $ | 221,274 | 0.9 | % | |||||||
| Hotels, Restaurants & Leisure | ||||||||||||
| Las Vegas Sands Corp. | 4,350 | 200,796 | 0.8 | % | ||||||||
| Starbucks Corporation | 11,750 | 630,035 | 2.6 | % | ||||||||
| 830,831 | 3.4 | % | ||||||||||
| Household Products | ||||||||||||
| Church & Dwight Co., Inc. | 4,000 | 214,280 | 0.9 | % | ||||||||
| Industrial Conglomerates | ||||||||||||
| Danaher Corporation@ | 11,984 | 669,906 | 2.7 | % | ||||||||
| Insurance | ||||||||||||
| Aflac, Inc. | 2,850 | 151,392 | 0.6 | % | ||||||||
| Internet & Catalog Retail | ||||||||||||
| Amazon.com, Inc.*@ | 1,423 | 357,372 | 1.4 | % | ||||||||
| priceline.com Incorporated* | 346 | 214,935 | 0.9 | % | ||||||||
| 572,307 | 2.3 | % | ||||||||||
| Internet Software & Services | ||||||||||||
| Akamai Technologies, Inc.* | 3,850 | 157,504 | 0.6 | % | ||||||||
| Facebook, Inc.* | 2,150 | 57,254 | 0.2 | % | ||||||||
| Google, Inc. – Class A* | 914 | 648,364 | 2.7 | % | ||||||||
| 863,122 | 3.5 | % | ||||||||||
| IT Services | ||||||||||||
| Cognizant Technology Solutions Corporation – Class A* | 9,975 | 738,649 | 3.0 | % | ||||||||
| MasterCard, Inc. – Class A | 1,187 | 583,149 | 2.4 | % | ||||||||
| Teradata Corporation* | 3,000 | 185,670 | 0.8 | % | ||||||||
| 1,507,468 | 6.2 | % | ||||||||||
| Life Sciences Tools & Services | ||||||||||||
| Illumina, Inc.*@ | 5,975 | 332,150 | 1.4 | % | ||||||||
| Machinery | ||||||||||||
| Caterpillar Inc. | 2,421 | 216,873 | 0.9 | % | ||||||||
| Media | ||||||||||||
| DIRECTV* | 11,350 | 569,316 | 2.3 | % | ||||||||
| Multiline Retail | ||||||||||||
| Dollar General Corporation* | 4,140 | 182,533 | 0.7 | % | ||||||||
| Oil, Gas & Consumable Fuels | ||||||||||||
| Cabot Oil & Gas Corporation | 4,300 | 213,882 | 0.9 | % | ||||||||
| Continental Resources, Inc.* | 4,450 | 327,030 | 1.3 | % | ||||||||
| Southwestern Energy Company* | 7,300 | 243,893 | 1.0 | % | ||||||||
| 784,805 | 3.2 | % | ||||||||||
The accompanying notes are in integral part of these financial statements.
Page 9
Baird LargeCap Fund
Schedule of Investments, December 31, 2012
Common Stocks (cont.)
| Market | % of | |||||||||||
| Shares | Value | Net Assets | ||||||||||
| Pharmaceuticals | ||||||||||||
| Allergan, Inc. | 6,100 | $ | 559,553 | 2.3 | % | |||||||
| Perrigo Company | 2,850 | 296,486 | 1.2 | % | ||||||||
| 856,039 | 3.5 | % | ||||||||||
| Real Estate Investment Trusts (REITs) | ||||||||||||
| American Tower Corp. | 4,775 | 368,964 | 1.5 | % | ||||||||
| Simon Property Group, Inc. | 745 | 117,777 | 0.5 | % | ||||||||
| 486,741 | 2.0 | % | ||||||||||
| Road & Rail | ||||||||||||
| J.B. Hunt Transport Services, Inc.@ | 2,950 | 176,145 | 0.7 | % | ||||||||
| Semiconductors & Semiconductor Equipment | ||||||||||||
| Intel Corporation@ | 16,400 | 338,332 | 1.4 | % | ||||||||
| Software | ||||||||||||
| Citrix Systems, Inc.* | 5,575 | 366,556 | 1.5 | % | ||||||||
| Fortinet, Inc.* | 10,300 | 217,021 | 0.9 | % | ||||||||
| Microsoft Corporation | 29,150 | 779,180 | 3.2 | % | ||||||||
| Oracle Corporation | 13,050 | 434,826 | 1.8 | % | ||||||||
| Salesforce.com, Inc.* | 4,460 | 749,726 | 3.0 | % | ||||||||
| 2,547,309 | 10.4 | % | ||||||||||
| Specialty Retail | ||||||||||||
| Dick’s Sporting Goods, Inc. | 10,600 | 482,194 | 2.0 | % | ||||||||
| O’Reilly Automotive, Inc.* | 6,450 | 576,759 | 2.4 | % | ||||||||
| Tiffany & Co@ | 4,125 | 236,528 | 1.0 | % | ||||||||
| Tractor Supply Company | 3,025 | 267,289 | 1.1 | % | ||||||||
| Urban Outfitters, Inc.* | 7,200 | 283,392 | 1.1 | % | ||||||||
| 1,846,162 | 7.6 | % | ||||||||||
| Textiles, Apparel & Luxury Goods | ||||||||||||
| NIKE, Inc.@ | 4,464 | 230,342 | 0.9 | % | ||||||||
| PVH Corp. | 2,800 | 310,828 | 1.3 | % | ||||||||
| 541,170 | 2.2 | % | ||||||||||
| Trading Companies & Distributors | ||||||||||||
| Fastenal Company | 9,144 | 426,933 | 1.8 | % | ||||||||
| Total Common Stocks | ||||||||||||
| (Cost $18,002,346) | 23,877,272 | 97.8 | % | |||||||||
The accompanying notes are in integral part of these financial statements.
Page 10
Baird LargeCap Fund
Schedule of Investments, December 31, 2012
Short-Term Investments
| Market | % of | |||||||||||
| Shares | Value | Net Assets | ||||||||||
| Money Market Mutual Funds | ||||||||||||
| Short-Term Investments Trust – | ||||||||||||
| Liquid Assets Portfolio, 0.15%« | 233,921 | $ | 233,921 | 1.0 | % | |||||||
| Total Short-Term Investments | ||||||||||||
| (Cost $233,921) | 233,921 | 1.0 | % | |||||||||
| Investments Purchased with Cash | ||||||||||||
| Proceeds from Securities Lending | ||||||||||||
| Principal | ||||||||||||
| Amount | ||||||||||||
| Commercial Paper | ||||||||||||
| Atlantic East Funding LLC, | ||||||||||||
| 0.562%, 03/25/2013†** | $ | 134,493 | 101,690 | 0.4 | % | |||||||
| Total Commercial Paper | ||||||||||||
| (Cost $134,493) | 101,690 | 0.4 | % | |||||||||
| Shares | ||||||||||||
| Investment Companies | ||||||||||||
| Mount Vernon Securities Lending | ||||||||||||
| Trust Prime Portfolio, 0.28%« | 1,696,563 | 1,696,563 | 7.0 | % | ||||||||
| Total Investment Companies | ||||||||||||
| (Cost $1,696,563) | 1,696,563 | 7.0 | % | |||||||||
| Total Investments Purchased With | ||||||||||||
| Cash Proceeds From Securities Lending | ||||||||||||
| (Cost $1,831,056) | 1,798,253 | 7.4 | % | |||||||||
| Total Investments | ||||||||||||
| (Cost $20,067,323) | 25,909,446 | 106.2 | % | |||||||||
| Asset Relating to Securities Lending Investments | ||||||||||||
Support Agreement*a**† | 32,803 | 0.1 | % | |||||||||
| Total | ||||||||||||
| (Cost $0) | 32,803 | 0.1 | % | |||||||||
| Liabilities in Excess of Other Assets | (1,536,176 | ) | (6.3 | %) | ||||||||
| TOTAL NET ASSETS | $ | 24,406,073 | 100.0 | % | ||||||||
The accompanying notes are in integral part of these financial statements.
Page 11
Baird LargeCap Fund
Schedule of Investments, December 31, 2012
Notes to Schedule of Investments
| * | Non-Income Producing | |
| ** | Illiquid Security | |
| @ | This security or portion of this security is out on loan at December 31, 2012. | |
| f | Foreign Security | |
| « | 7-Day Yield | |
| † | Priced at Fair Value by the Valuation Committee as delegated by the Baird Funds’ Board of Directors. | |
| a | The Fund’s transfer agent and administrator and securities lending agent entered into a support agreement with the Fund to cover losses realized by the Fund on its investment in Atlantic East Funding, LLC (up to a certain amount), which investment was made by the Fund’s securities lending agent. |
Industry classifications shown in the Schedule of Investments are based off of the Global Industry Classification Standard (GICS®). GICS was developed by and/or is the exclusive property of MSCI, Inc. and Standard & Poor Financial Services LLC (“S&P”). GICS is a service mark of MSCI and S&P and has been licensed for use by U.S. Bancorp Fund Services, LLC.
The accompanying notes are in integral part of these financial statements.
Page 12
Baird LargeCap Fund
Schedule of Investments, December 31, 2012
Summary of Fair Value Exposure at December 31, 2012
The Fund has adopted authoritative fair valuation accounting standards which establish a definition of fair value and set out a hierarchy for measuring fair value. These standards require additional disclosures about the various inputs and valuation techniques used to develop the measurements of fair value and a discussion on changes in valuation techniques and related inputs during the period. These standards define fair value as the price that would be received to sell an asset or paid to transfer a liability in an orderly transaction between market participants at the measurement date. Management has determined that these standards have no material impact on the Funds’ financial statements. The fair value hierarchy is organized into three levels based upon the assumptions (referred to as “inputs”) used in pricing the asset or liability. These standards state that “observable inputs” reflect the assumptions market participants would use in pricing the asset or liability based on market data obtained from independent sources and “unobservable inputs” reflect an entity’s own assumptions about the assumptions market participants would use in pricing the asset or liability. These inputs are summarized into three broad levels and described below:
Level 1 – | Unadjusted quoted prices in active markets for identical unrestricted securities. |
Level 2 – | Other significant observable inputs (including quoted prices for similar securities, quoted prices in inactive markets, dealer indications, interest rates, yield curves, prepayment speeds, credit risk, default rates, inputs corroborated by observable market data, etc.). |
Level 3 – | Significant unobservable inputs (including the Fund’s own assumptions about the factors that market participants would use in valuing the security) based on the best information available. |
The inputs or methodology used for valuing securities are not necessarily an indication of the risk associated with investing in those securities.
The following is a summary of the inputs used to value the Fund’s investments as of December 31, 2012:
| Level 1 | Level 2 | Level 3 | Total | |||||||||||||
| Equity | ||||||||||||||||
| Common Stocks | $ | 23,877,272 | $ | — | $ | — | $ | 23,877,272 | ||||||||
| Total Equity | 23,877,272 | — | — | 23,877,272 | ||||||||||||
| Short-Term Investments | ||||||||||||||||
| Money Market Mutual Fund | 233,921 | — | — | 233,921 | ||||||||||||
| Total Short-Term Investments | 233,921 | — | — | 233,921 | ||||||||||||
| Investments Purchased with Cash | ||||||||||||||||
| Proceeds from Securities Lending | ||||||||||||||||
| Commercial Paper | — | 101,690 | — | 101,690 | ||||||||||||
| Money Market Mutual Fund | 1,696,563 | — | — | 1,696,563 | ||||||||||||
| Total Investments Purchased with | ||||||||||||||||
| Cash Proceeds from Securities Lending | 1,696,563 | 101,690 | — | 1,798,253 | ||||||||||||
Total Investments* | $ | 25,807,756 | $ | 101,690 | $ | — | $ | 25,909,446 | ||||||||
| Asset Relating to Securities | ||||||||||||||||
| Lending Investments | $ | — | $ | 32,803 | $ | — | $ | 32,803 | ||||||||
| * | Additional information regarding the industry classifications of these investments is disclosed in the Schedule of Investments. |
Changes in valuation techniques may result in transfers into or out of current assigned levels within the hierarchy. There were no transfers between Level 1, Level 2 and Level 3 fair value measurements during the reporting period, as compared to their classification from the prior year’s annual report.
The accompanying notes are in integral part of these financial statements.
Page 13
Baird MidCap Fund
December 31, 2012
Portfolio Managers’ Commentary
For the year ended December 31, 2012, the Baird MidCap Fund Institutional Class posted a total return of 16.49% (16.16% for the Investor Class), as compared with a gain of 15.81% for the Russell MidCap® Growth Index, the MidCap Fund’s primary benchmark.
As we assess the solid relative performance for the year, we note good stock picking in the majority of sectors, the benefit of owning quality companies with above peer growth rates and appropriate assessment of stock and market risk in a year at times overshadowed by significant uncertainty. The Fund’s holdings in healthcare, energy and financials enjoyed the strongest returns during the year. Additionally, the consumer discretionary, producer durables and consumer staples sectors also contributed to outperformance.
Sector weights remained well balanced throughout the year, a continuation of our overall positioning since mid 2011. Nonetheless, a modest pro-cyclical stance within the economically sensitive sectors was also maintained. This was based on positive U.S. economic and profits growth during the year, coupled with the underpinnings of improving conditions elsewhere in the world.
The Fund’s healthcare stocks produced broad strength, which in our view was a reflection of the recognition of superior earnings growth and the more domestic nature of the businesses. Our focus in the healthcare sector has been on those business models that benefit from the cost pressures facing the healthcare system and where capital spending remained strong.
The Fund’s holdings in the energy sector again provided solid performance. Drilling activity both onshore and in deep water continued at high levels, supporting equipment manufacturers and service suppliers. Additionally, a recovery in the price of natural gas benefitted the Fund’s holding in an exploration and development company possessing significant acreage and production in the Marcellus shale formation in the eastern U.S.
Financial services companies held in the Fund also enjoyed positive relative performance during 2012. The combination of modest employment growth and improving credit trends fueled returns for the positions exposed to banking and consumer credit. Double digit returns in the equity markets helped lift shares in the Fund’s holdings in asset managers, which was noteworthy because outflows from domestic equity funds continued at high levels for much of the year.
The Fund’s holdings in the basic materials area lagged somewhat during the year, in our opinion a reflection of the more conservative nature of the business models. We tend to avoid commodity-oriented cyclicals, as earnings patterns are often volatile, making them, in our view, more appropriate for shorter term investments rather than our preference for longer term investment prospects. The Fund’s holdings in industrial distributors, positive absolute contributors, did not keep pace with the commodity producers in 2012.
Technology shares overall also lagged the benchmark sector in 2012. This was especially true in the fourth calendar quarter, when the uncertainty surrounding the so called “fiscal cliff” and federal tax policy hurt multiple stocks. This was particularly true of the Fund’s holdings in software and networking companies, where it appeared that business owners restrained spending and government budgets were reduced.
We believe that the MidCap Fund remains consistently positioned to favor high-quality companies that deliver attractive returns and above average growth relative to peers. Controlling risk at the sector and position level is also a priority of our process, with the goal of providing lower volatility of returns for the Fund relative to its benchmark index. We believe the Fund is positioned to benefit from positive economic growth in the U.S. with an eye to improvement overseas. We believe in our philosophy of focusing on superior business models and paying thoughtful attention to controlling risk.
Portfolio Managers:
Charles F. Severson
Kenneth M. Hemauer
Page 14
Baird MidCap Fund
December 31, 2012
A December 31, 2012 summary of the Fund’s top 10 holdings and equity sector analysis compared to the Russell Midcap® Growth Index is shown below.
| Top 10 Holdings* | Equity Sector Analysis** | |
| O'Reilly Automotive, Inc. | 2.5% | |
| Church & Dwight Co., Inc. | 2.4% | 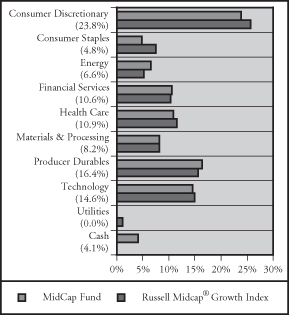 |
| Illumina, Inc. | 2.4% | |
| McCormick & Co, Incorporated | 2.3% | |
| Alliance Data Systems Corporation | 2.3% | |
| Digital Realty Trust, Inc. | 2.3% | |
| Dollar General Corporation | 2.1% | |
| Dick's Sporting Goods, Inc. | 2.1% | |
| J.B. Hunt Transport Services, Inc. | 2.0% | |
| Urban Outfitters, Inc. | 2.0% | |
| Net Assets: | $221,359,261 | |
| Portfolio Turnover Rate: | 29.5% | |
| Number of Equity Holdings: | 58 | |
| Annualized Portfolio Expense Ratio:*** | ||
| Gross | ||
| INSTITUTIONAL CLASS: | 1.21% | |
| INVESTOR CLASS: | 1.46%**** | |
| Net | ||
| INSTITUTIONAL CLASS: | 0.85% | |
| INVESTOR CLASS: | 1.10%**** | |
| * | The Fund’s portfolio composition is subject to change and there is no assurance that the Fund will continue to hold any particular security. Percentages shown relate to the Fund’s total net assets as of December 31, 2012. | |
| ** | Percentages shown in parentheses relate to the Fund’s total market value of investments as of December 31, 2012, and may not add up to 100% due to rounding. | |
| *** | Reflects expense ratios as stated in the Fund’s current prospectus. The Advisor has contractually agreed to limit the Fund’s total annual fund operating expenses to 0.85% of average daily net assets for the Institutional Class shares and 1.10% of average daily net assets for the Investor Class shares, at least through April 30, 2014. | |
| **** | Includes 0.25% 12b-1 fee. |
Page 15
Baird MidCap Fund
Institutional Class
Value of a $25,000 Investment
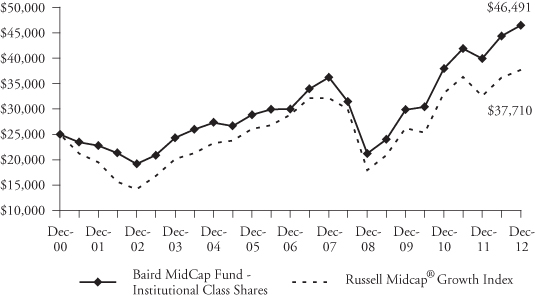
Growth of a hypothetical investment of $25,000 made on the Fund’s inception date (12/29/00), assuming reinvestment of all distributions.
Investor Class
Value of a $10,000 Investment
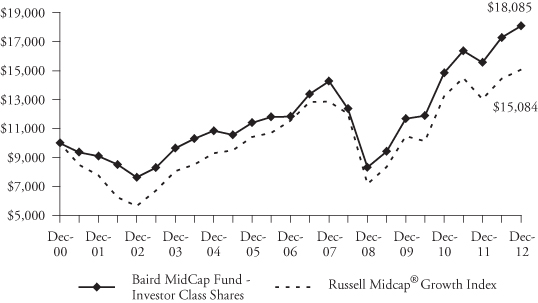
Growth of a hypothetical investment of $10,000 made on the Fund’s inception date (12/29/00), assuming reinvestment of all distributions.
Page 16
Baird MidCap Fund
December 31, 2012
| Average Annual Total Returns | ||||
| Since | ||||
| For the Periods Ended December 31, 2012 | One Year | Five Years | Ten Years | Inception(1) |
| Institutional Class Shares | 16.49% | 5.11% | 9.27% | 5.30% |
| Investor Class Shares | 16.16% | 4.85% | 9.01% | 5.06% |
Russell Midcap® Growth Index(2) | 15.81% | 3.23% | 10.32% | 3.48% |
| (1) | For the period from December 29, 2000 (commencement of operations) through December 31, 2012. | |
| (2) | The Russell Midcap® Growth Index measures the performance of the mid-cap growth segment of the U.S. equity universe. It includes those Russell Midcap® Index companies with higher price-to-book ratios and higher forecasted growth values. This index does not reflect any deduction for fees, expenses or taxes. A direct investment in the index is not possible. |
The returns shown in the table above and line graphs on the previous page reflect reinvestment of dividends and/or capital gains distributions in additional shares. The returns do not reflect the deduction of taxes that a shareholder would pay on Fund distributions or the redemption of Fund shares. The returns reflect the actual performance for each period and do not include the impact of trades executed on the last business day of the period that were recorded on the first business day of the next period.
The Fund’s gross expense ratio for each Class, as reflected in the Fund’s current prospectus, is set forth under “Portfolio Characteristics”.
The Fund focuses on growth-style stocks and therefore the performance of the Fund will typically be more volatile than the performance of funds that focus on types of stocks that have a broader investment style. The Fund may invest up to 15% of its total assets in U.S. dollar denominated foreign securities and ADRs. Foreign investments involve additional risks such as currency rate fluctuations, political and economic instability, and different and sometimes less strict financial reporting standards and regulation. The Fund invests a substantial portion of its assets in the stocks of mid-capitalization companies. Mid-capitalization companies often are more volatile and face greater risks than larger, more established companies.
Past performance does not guarantee future results. Investment return and principal value will fluctuate so that an investor’s shares, when redeemed, may be worth more or less than their original cost.
For information about the performance of the Fund as of the most recent month-end, please call 1-866-44BAIRD or visit www.bairdfunds.com. Mutual fund performance changes over time and current performance may be lower or higher than that stated.
Page 17
Baird MidCap Fund
Schedule of Investments, December 31, 2012
Common Stocks
| Market | % of | |||||||||||
| Shares | Value | Net Assets | ||||||||||
| Auto Components | ||||||||||||
| WABCO Holdings Inc.* | 58,435 | $ | 3,809,378 | 1.7 | % | |||||||
| Capital Markets | ||||||||||||
| Affiliated Managers Group, Inc.* | 30,656 | 3,989,878 | 1.8 | % | ||||||||
| Greenhill & Co., Inc.@ | 62,718 | 3,260,709 | 1.5 | % | ||||||||
Invesco Limited f | 105,080 | 2,741,537 | 1.2 | % | ||||||||
| 9,992,124 | 4.5 | % | ||||||||||
| Chemicals | ||||||||||||
| Airgas, Inc. | 47,120 | 4,301,585 | 1.9 | % | ||||||||
| Commercial Banks | ||||||||||||
| East West Bancorp, Inc. | 148,575 | 3,192,877 | 1.4 | % | ||||||||
| Commercial Services & Supplies | ||||||||||||
| Stericycle, Inc.* | 41,560 | 3,876,301 | 1.8 | % | ||||||||
| Communications Equipment | ||||||||||||
| F5 Networks, Inc.* | 16,365 | 1,589,859 | 0.7 | % | ||||||||
| Plantronics, Inc. | 60,640 | 2,235,797 | 1.0 | % | ||||||||
| Riverbed Technology, Inc.* | 99,665 | 1,965,394 | 0.9 | % | ||||||||
| 5,791,050 | 2.6 | % | ||||||||||
| Construction & Engineering | ||||||||||||
| Fluor Corporation@ | 57,875 | 3,399,578 | 1.5 | % | ||||||||
| Containers & Packaging | ||||||||||||
| AptarGroup, Inc. | 65,207 | 3,111,678 | 1.4 | % | ||||||||
| Distributors | ||||||||||||
| LKQ Corporation* | 104,700 | 2,209,170 | 1.0 | % | ||||||||
| Electrical Equipment | ||||||||||||
| Acuity Brands, Inc. | 51,700 | 3,501,641 | 1.6 | % | ||||||||
| Rockwell Automation, Inc. | 50,845 | 4,270,471 | 1.9 | % | ||||||||
| Roper Industries, Inc. | 31,147 | 3,472,268 | 1.6 | % | ||||||||
| 11,244,380 | 5.1 | % | ||||||||||
| Electronic Equipment, Instruments & Components | ||||||||||||
| Plexus Corp.* | 102,060 | 2,633,148 | 1.2 | % | ||||||||
| Trimble Navigation Limited* | 66,250 | 3,960,425 | 1.8 | % | ||||||||
| 6,593,573 | 3.0 | % | ||||||||||
| Energy Equipment & Services | ||||||||||||
Core Laboratories N.V. f | 30,230 | 3,304,441 | 1.5 | % | ||||||||
| Oceaneering International, Inc. | 80,611 | 4,336,066 | 2.0 | % | ||||||||
| 7,640,507 | 3.5 | % | ||||||||||
| Food Products | ||||||||||||
| McCormick & Co, Incorporated | 81,187 | 5,157,810 | 2.3 | % | ||||||||
The accompanying notes are in integral part of these financial statements.
Page 18
Baird MidCap Fund
Schedule of Investments, December 31, 2012
Common Stocks (cont.)
| Market | % of | |||||||||||
| Shares | Value | Net Assets | ||||||||||
| Health Care Providers & Services | ||||||||||||
Catamaran Corporation* f | 92,828 | $ | 4,373,127 | 2.0 | % | |||||||
| HMS Holdings Corp.*@ | 109,050 | 2,826,576 | 1.3 | % | ||||||||
| 7,199,703 | 3.3 | % | ||||||||||
| Health Care Technology | ||||||||||||
| Cerner Corporation*@ | 41,025 | 3,185,181 | 1.4 | % | ||||||||
| Hotels Restaurants & Leisure | ||||||||||||
| Buffalo Wild Wings Inc.*@ | 46,183 | 3,363,046 | 1.5 | % | ||||||||
InterContinental Hotels Group PLC f | 119,359 | 3,320,567 | 1.5 | % | ||||||||
| 6,683,613 | 3.0 | % | ||||||||||
| Household Products | ||||||||||||
| Church & Dwight Co., Inc. | 99,351 | 5,322,233 | 2.4 | % | ||||||||
| IT Services | ||||||||||||
| Alliance Data Systems Corporation*@ | 35,260 | 5,104,237 | 2.3 | % | ||||||||
| Teradata Corporation* | 66,985 | 4,145,702 | 1.9 | % | ||||||||
| 9,249,939 | 4.2 | % | ||||||||||
| Leisure Equipment & Products | ||||||||||||
| Polaris Industries Inc. | 26,275 | 2,211,041 | 1.0 | % | ||||||||
| Life Sciences Tools & Services | ||||||||||||
ICON PLC ADR* f | 144,456 | 4,010,099 | 1.8 | % | ||||||||
| Illumina, Inc.*@ | 93,575 | 5,201,834 | 2.4 | % | ||||||||
| 9,211,933 | 4.2 | % | ||||||||||
| Machinery | ||||||||||||
| Actuant Corporation | 123,910 | 3,458,328 | 1.6 | % | ||||||||
| Joy Global Inc. | 47,955 | 3,058,570 | 1.4 | % | ||||||||
| 6,516,898 | 3.0 | % | ||||||||||
| Multiline Retail | ||||||||||||
| Dollar General Corporation*@ | 107,395 | 4,735,046 | 2.1 | % | ||||||||
| Office Electronics | ||||||||||||
| Zebra Technologies Corporation* | 67,010 | 2,632,153 | 1.2 | % | ||||||||
| Oil, Gas & Consumable Fuels | ||||||||||||
| Cabot Oil & Gas Corporation | 80,080 | 3,983,179 | 1.8 | % | ||||||||
| Whiting Petroleum Corporation* | 68,335 | 2,963,689 | 1.3 | % | ||||||||
| 6,946,868 | 3.1 | % | ||||||||||
| Pharmaceuticals | ||||||||||||
| Perrigo Company | 43,085 | 4,482,133 | 2.0 | % | ||||||||
| Professional Services | ||||||||||||
| Manpower Inc. | 83,360 | 3,537,798 | 1.6 | % | ||||||||
The accompanying notes are in integral part of these financial statements.
Page 19
Baird MidCap Fund
Schedule of Investments, December 31, 2012
Common Stocks (cont.)
| Market | % of | |||||||||||
| Shares | Value | Net Assets | ||||||||||
| Real Estate Investment Trusts (REITs) | ||||||||||||
| Digital Realty Trust, Inc.@ | 75,140 | $ | 5,101,255 | 2.3 | % | |||||||
| Road & Rail | ||||||||||||
| J.B. Hunt Transport Services, Inc. | 75,495 | 4,507,806 | 2.0 | % | ||||||||
| Semiconductors & Semiconductor Equipment | ||||||||||||
| Altera Corporation | 93,675 | 3,226,167 | 1.5 | % | ||||||||
| Microchip Technology Incorporated@ | 63,088 | 2,056,038 | 0.9 | % | ||||||||
| Skyworks Solutions, Inc.* | 134,900 | 2,738,470 | 1.2 | % | ||||||||
| 8,020,675 | 3.6 | % | ||||||||||
| Software | ||||||||||||
| ANSYS, Inc.* | 62,650 | 4,218,851 | 1.9 | % | ||||||||
| Citrix Systems, Inc.* | 57,110 | 3,754,983 | 1.7 | % | ||||||||
| Sourcefire, Inc.* | 77,050 | 3,638,301 | 1.7 | % | ||||||||
| 11,612,135 | 5.3 | % | ||||||||||
| Specialty Retail | ||||||||||||
| Dick’s Sporting Goods, Inc. | 102,511 | 4,663,225 | 2.1 | % | ||||||||
| O’Reilly Automotive, Inc.* | 62,590 | 5,596,798 | 2.5 | % | ||||||||
| Tiffany & Co.@ | 50,650 | 2,904,271 | 1.3 | % | ||||||||
| Tractor Supply Company | 46,021 | 4,066,415 | 1.9 | % | ||||||||
| Ulta Salon, Cosmetics & Fragrance, Inc.@ | 43,745 | 4,298,384 | 2.0 | % | ||||||||
| Urban Outfitters, Inc.*@ | 114,519 | 4,507,468 | 2.0 | % | ||||||||
| 26,036,561 | 11.8 | % | ||||||||||
| Textiles, Apparel & Luxury Goods | ||||||||||||
| PVH Corp. | 32,266 | 3,581,849 | 1.6 | % | ||||||||
| Under Armour, Inc. – Class A*@ | 66,740 | 3,238,892 | 1.5 | % | ||||||||
| 6,820,741 | 3.1 | % | ||||||||||
| Trading Companies & Distributors | ||||||||||||
| Fastenal Company | 82,392 | 3,846,882 | 1.7 | % | ||||||||
| Watsco, Inc. | 43,315 | 3,244,294 | 1.5 | % | ||||||||
| 7,091,176 | 3.2 | % | ||||||||||
| Total Common Stocks | ||||||||||||
| (Cost $192,968,764) | 211,424,899 | 95.5 | % | |||||||||
| Short-Term Investments | ||||||||||||
| Money Market Mutual Funds | ||||||||||||
| Dreyfus Institutional Cash Advantage Fund, 0.11%« | 8,094,794 | 8,094,794 | 3.7 | % | ||||||||
| Short-Term Investments Trust – | ||||||||||||
| Liquid Assets Portfolio, 0.15%« | 4,000,000 | 4,000,000 | 1.8 | % | ||||||||
| Total Short-Term Investments | ||||||||||||
| (Cost $12,094,794) | 12,094,794 | 5.5 | % | |||||||||
The accompanying notes are in integral part of these financial statements.
Page 20
Baird MidCap Fund
Schedule of Investments, December 31, 2012
Investments Purchased with Cash
Proceeds from Securities Lending
| Principal | Market | % of | ||||||||||
| Amount | Value | Net Assets | ||||||||||
| Commercial Paper | ||||||||||||
| Atlantic East Funding LLC, | ||||||||||||
| 0.562%, 03/25/2013†** | $ | 189,327 | $ | 143,149 | 0.1 | % | ||||||
| Total Commercial Paper | ||||||||||||
| (Cost $189,327) | 143,149 | 0.1 | % | |||||||||
| Shares | ||||||||||||
| Investment Companies | ||||||||||||
| Mount Vernon Securities Lending | ||||||||||||
| Trust Prime Portfolio, 0.28%« | 27,317,519 | 27,317,519 | 12.3 | % | ||||||||
| Total Investment Companies | ||||||||||||
| (Cost $27,317,519) | 27,317,519 | 12.3 | % | |||||||||
| Total Investments Purchased With | ||||||||||||
| Cash Proceeds From Securities Lending | ||||||||||||
| (Cost $27,506,846) | 27,460,668 | 12.4 | % | |||||||||
| Total Investments | ||||||||||||
| (Cost $232,570,404) | 250,980,361 | 113.4 | % | |||||||||
| Asset Relating to Securities Lending Investments | ||||||||||||
Support Agreement*a**† | 46,178 | 0.0 | % | |||||||||
| Total | ||||||||||||
| (Cost $0) | 46,178 | 0.0 | % | |||||||||
| Liabilities in Excess of Other Assets | (29,667,278 | ) | (13.4 | %) | ||||||||
| TOTAL NET ASSETS | $ | 221,359,261 | 100.0 | % | ||||||||
Notes to Schedule of Investments
ADR American Depository Receipt
| * | Non-Income Producing | |
| ** | Illiquid Security | |
| @ | This security or portion of this security is out on loan at December 31, 2012. | |
| f | Foreign Security | |
| « | 7-Day Yield | |
| † | Priced at Fair Value by the Valuation Committee as delegated by the Baird Funds’ Board of Directors. | |
| a | The Fund’s transfer agent and administrator and securities lending agent entered into a support agreement with the Fund to cover losses realized by the Fund on its investment in Atlantic East Funding, LLC (up to a certain amount), which investment was made by the Fund’s securities lending agent. |
Industry classifications shown in the Schedule of Investments are based off of the Global Industry Classification Standard (GICS®). GICS was developed by and/or is the exclusive property of MSCI, Inc. and Standard & Poor Financial Services LLC (“S&P”). GICS is a service mark of MSCI and S&P and has been licensed for use by U.S. Bancorp Fund Services, LLC.
The accompanying notes are in integral part of these financial statements.
Page 21
Baird MidCap Fund
Schedule of Investments, December 31, 2012
Summary of Fair Value Exposure at December 31, 2012
The Fund has adopted authoritative fair valuation accounting standards which establish a definition of fair value and set out a hierarchy for measuring fair value. These standards require additional disclosures about the various inputs and valuation techniques used to develop the measurements of fair value and a discussion on changes in valuation techniques and related inputs during the period. These standards define fair value as the price that would be received to sell an asset or paid to transfer a liability in an orderly transaction between market participants at the measurement date. Management has determined that these standards have no material impact on the Funds’ financial statements. The fair value hierarchy is organized into three levels based upon the assumptions (referred to as “inputs”) used in pricing the asset or liability. These standards state that “observable inputs” reflect the assumptions market participants would use in pricing the asset or liability based on market data obtained from independent sources and “unobservable inputs” reflect an entity’s own assumptions about the assumptions market participants would use in pricing the asset or liability. These inputs are summarized into three broad levels and described below:
Level 1 – | Unadjusted quoted prices in active markets for identical unrestricted securities. |
Level 2 – | Other significant observable inputs (including quoted prices for similar securities, quoted prices in inactive markets, dealer indications, interest rates, yield curves, prepayment speeds, credit risk, default rates, inputs corroborated by observable market data, etc.). |
Level 3 – | Significant unobservable inputs (including the Fund’s own assumptions about the factors that market participants would use in valuing the security) based on the best information available. |
The inputs or methodology used for valuing securities are not necessarily an indication of the risk associated with investing in those securities.
The following is a summary of the inputs used to value the Fund’s investments as of December 31, 2012:
| Level 1 | Level 2 | Level 3 | Total | |||||||||||||
| Equity | ||||||||||||||||
| Common Stocks | $ | 211,424,899 | $ | — | $ | — | $ | 211,424,899 | ||||||||
| Total Equity | 211,424,899 | — | — | 211,424,899 | ||||||||||||
| Short-Term Investments | ||||||||||||||||
| Money Market Mutual Funds | 12,094,794 | — | — | 12,094,794 | ||||||||||||
| Total Short-Term Investments | 12,094,794 | — | — | 12,094,794 | ||||||||||||
| Investments Purchased with Cash | ||||||||||||||||
| Proceeds from Securities Lending | ||||||||||||||||
| Commercial Paper | — | 143,149 | — | 143,149 | ||||||||||||
| Money Market Mutual Fund | 27,317,519 | — | — | 27,317,519 | ||||||||||||
| Total Investments Purchased with | ||||||||||||||||
| Cash Proceeds from Securities Lending | 27,317,519 | 143,149 | — | 27,460,668 | ||||||||||||
Total Investments* | $ | 250,837,212 | $ | 143,149 | $ | — | $ | 250,980,361 | ||||||||
| Asset Relating to Securities | ||||||||||||||||
| Lending Investments | $ | — | $ | 46,178 | $ | — | $ | 46,178 | ||||||||
| * | Additional information regarding the industry classifications of these investments is disclosed in the Schedule of Investments. |
Changes in valuation techniques may result in transfers into or out of current assigned levels within the hierarchy. There were no transfers between Level 1, Level 2 and Level 3 fair value measurements during the reporting period, as compared to their classification from the prior year’s annual report.
The accompanying notes are in integral part of these financial statements.
Page 22
Baird SmallCap Value Fund
December 31, 2012
Portfolio Manager’s Commentary
The Baird SmallCap Value Fund Institutional Class posted a total return of 3.52% (3.32% for the Investor Class), as compared with a gain of 7.34% for the Russell 2000® Value Index, the Fund’s primary benchmark, for the period May 1, 2012 (date of the Fund’s inception) to December 31, 2012.
The Fund’s performance was positively impacted by strong absolute and relative returns in the Industrials sector. Several investments we have made in this sector are well positioned to take advantage of the build out and upgrade to the U.S. domestic energy infrastructure. Quanta Services, MYR Group and Mastec were significant positive contributors. All three companies provide contracting services for electric transmission and distribution projects as well as oil and gas pipeline construction. Our expectations for robust project bidding activity and expanding backlogs have begun to come to fruition and have led to upward profit expectations for these businesses. The Fund’s Information Technology holdings also were generally positive contributors to the Fund’s performance led by strength in WEX and Verisign. The Fund’s best-performing stock for the period was Portfolio Recovery Associates, a company which purchases, collects and manages a portfolio of accounts receivables.
While the Fund’s energy infrastructure holdings had a positive impact on performance, the Fund’s exposure to the Energy sector was a negative contributor for the period. Depressed natural gas prices led to lower demand for drilling products and services offered by Superior Energy and Mitcham Industries. While we expect new supplies of natural gas from domestic shale production to continue to weigh on the commodity price, we believe the markets have overreacted in the near-term and expect better performance for these stocks headed in to 2013. On a positive note, our trimming of the Fund’s exposure to the Energy sector earlier in the year helped to mitigate the negative impact to the Fund. The Fund’s holdings in the Financials area posted in-line gains for the period but lagged the benchmark’s sector return due to weakness in EZCorp. We view this weakness as temporary growing pains as the company diversifies its businesses internationally and into other credit-related offerings.
Throughout the course of the year, we added to the Fund’s Industrial holdings as our thesis for better-than-expected profit potential in the infrastructure space was borne out in the form of rising earnings estimates and backlogs. At the same time, we somewhat reduced the Fund’s exposure to the Energy and Consumer Discretionary space due to a more tepid outlook for oil prices and domestic retail sales, respectively. Finally, we have shifted our Financial exposure slightly to take advantage of improvements in the U.S. housing market and credit conditions. The Fund’s attractive growth prospects and compelling valuation, we believe, position it well as we move into the new year.
Portfolio Manager:
Michelle Stevens
Page 23
Baird SmallCap Value Fund
December 31, 2012
A December 31, 2012 summary of the Fund’s top 10 holdings and equity sector analysis compared to the Russell 2000® Value Index is shown below.
| Top 10 Holdings* | Equity Sector Analysis** | |
| Omega Healthcare Investors, Inc. | 3.8% | |
| Portfolio Recovery Associates, Inc. | 3.3% | 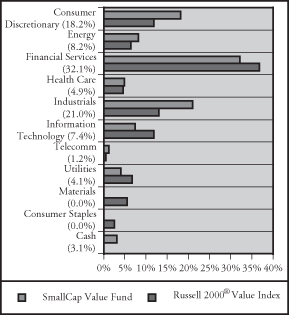 |
| Valmont Industries, Inc. | 3.1% | |
| First Cash Financial Services, Inc. | 3.0% | |
| LTC Properties, Inc. | 3.0% | |
| Hanesbrands, Inc. | 2.9% | |
| WEX Inc. | 2.9% | |
| Jarden Corporation | 2.8% | |
| HCC Insurance Holdings, Inc | 2.8% | |
| Quanta Services, Inc. | 2.8% | |
| Net Assets: | $8,342,050 | |
| Portfolio Turnover Rate: | 24.6%† | |
| Number of Equity Holdings: | 47 | |
| Annualized Portfolio Expense Ratio:*** | ||
| Gross | ||
| INSTITUTIONAL CLASS: | 2.40% | |
| INVESTOR CLASS: | 2.65%**** | |
| Net | ||
| INSTITUTIONAL CLASS: | 1.00% | |
| INVESTOR CLASS: | 1.25%**** | |
| * | The Fund’s portfolio composition is subject to change and there is no assurance that the Fund will continue to hold any particular security. Percentages shown relate to the Fund’s total net assets as of December 31, 2012. | |
| ** | Percentages shown in parentheses relate to the Fund’s total market value of investments as of December 31, 2012, and may not add up to 100% due to rounding. | |
| *** | Reflects expense ratios as stated in the Fund’s current prospectus. The Advisor has contractually agreed to limit the Fund’s total annual fund operating expenses to 1.00% of average daily net assets for the Institutional Class shares and 1.25% of average daily net assets for the Investor Class shares, at least through April 30, 2014. | |
| **** | Includes 0.25% 12b-1 fee. | |
| † | Not annualized. |
Page 24
Baird SmallCap Value Fund
Institutional Class
Value of a $25,000 Investment
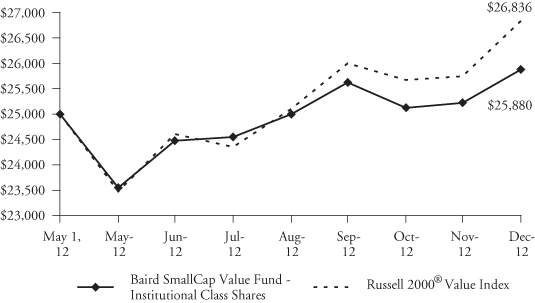
Growth of a hypothetical investment of $25,000 made on the Fund’s inception date (5/1/12), assuming reinvestment of all distributions.
Investor Class
Value of a $10,000 Investment
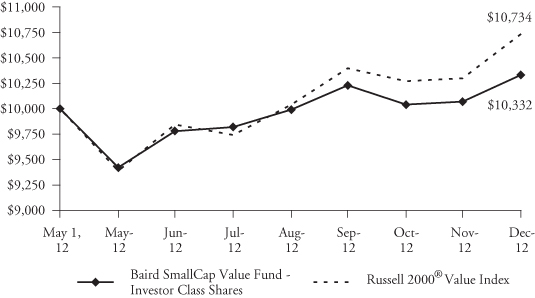
Growth of a hypothetical investment of $10,000 made on the Fund’s inception date (5/1/12), assuming reinvestment of all distributions.
Page 25
Baird SmallCap Value Fund
December 31, 2012
Total Returns
| Since | ||||
| For the Period Ended December 31, 2012 | Inception(1) | |||
| Institutional Class Shares | 3.52% | |||
| Investor Class Shares | 3.32% | |||
Russell 2000® Value Index(2) | 7.34% |
| (1) | For the period from May 1, 2012 (commencement of operations) through December 31, 2012. | |
| (2) | The Russell 2000® Value Index measures the performance of the small-cap value segment of the U.S. equity universe and includes Russell 2000® Index companies with lower price-to-book ratios and lower forecasted growth values. This index does not reflect any deduction for fees, expenses or taxes. A direct investment in the index is not possible. |
The returns shown in the table above and the graphs on the previous page reflect reinvestment of dividends and/or capital gains distributions in additional shares. The returns do not reflect the deduction of taxes that a shareholder would pay on Fund distributions or the redemption of Fund shares. The returns reflect the actual performance for each period and do not include the impact of trades executed on the last business day of the period that were recorded on the first business day of the next period.
The Fund’s gross expense ratio for each Class, as reflected in the Fund’s current prospectus, is set forth under “Portfolio Characteristics”.
The Fund focuses on small cap value style stocks and therefore the performance of the Fund may be more volatile than the performance of funds that focus on types of stocks that have a broader investment style. The Fund may invest up to 15% of its total assets in U.S. dollar denominated foreign securities and ADRs. Foreign investments involve additional risks such as currency rate fluctuations and the potential for political and economic instability, and different and sometimes less strict financial reporting standards and regulation.
Past performance does not guarantee future results. Investment return and principal value will fluctuate so that an investor’s shares, when redeemed, may be worth more or less than their original cost.
For information about the performance of the Fund as of the most recent month-end, please call 1-866-44BAIRD or visit www.bairdfunds.com. Mutual fund performance changes over time and current performance may be lower or higher than that stated.
Page 26
Baird SmallCap Value Fund
Schedule of Investments, December 31, 2012
Common Stocks
| Market | % of | |||||||||||
| Shares | Value | Net Assets | ||||||||||
| Aerospace & Defense | ||||||||||||
| Hexcel Corporation* | 6,688 | $ | 180,309 | 2.1 | % | |||||||
| Triumph Group, Inc. | 3,027 | 197,663 | 2.4 | % | ||||||||
| 377,972 | 4.5 | % | ||||||||||
| Capital Markets | ||||||||||||
| Diamond Hill Investment Group, Inc. | 2,534 | 171,957 | 2.1 | % | ||||||||
| Commercial Services & Supplies | ||||||||||||
| Encore Capital Group, Inc.* | 5,985 | 183,261 | 2.2 | % | ||||||||
| Portfolio Recovery Associates, Inc.* | 2,605 | 278,370 | 3.3 | % | ||||||||
| 461,631 | 5.5 | % | ||||||||||
| Construction & Engineering | ||||||||||||
| MasTec, Inc.* | 8,168 | 203,628 | 2.4 | % | ||||||||
| MYR Group Inc.* | 9,224 | 205,234 | 2.5 | % | ||||||||
| Quanta Services, Inc.* | 8,448 | 230,546 | 2.8 | % | ||||||||
| 639,408 | 7.7 | % | ||||||||||
| Consumer Finance | ||||||||||||
| EZCORP, Inc.* | 8,167 | 162,197 | 1.9 | % | ||||||||
| First Cash Financial Services, Inc.* | 4,999 | 248,050 | 3.0 | % | ||||||||
| 410,247 | 4.9 | % | ||||||||||
| Diversified Consumer Services | ||||||||||||
Steiner Leisure Limited* f | 1,901 | 91,609 | 1.1 | % | ||||||||
| Diversified Telecommunication Services | ||||||||||||
| Windstream Corporation | 11,756 | 97,340 | 1.2 | % | ||||||||
| Electric Utilities | ||||||||||||
| UIL Holdings Corporation | 3,872 | 138,656 | 1.7 | % | ||||||||
| Energy Equipment & Services | ||||||||||||
| Mitcham Industries, Inc.* | 6,829 | 93,079 | 1.1 | % | ||||||||
| Superior Energy Services, Inc.* | 6,621 | 137,187 | 1.6 | % | ||||||||
Vantage Drilling Co* f | 94,255 | 172,487 | 2.1 | % | ||||||||
| 402,753 | 4.8 | % | ||||||||||
| Gas Utilities | ||||||||||||
| South Jersey Industries, Inc. | 4,015 | 202,075 | 2.4 | % | ||||||||
| Health Care Equipment & Supplies | ||||||||||||
| ICU Medical, Inc.* | 2,675 | 162,988 | 2.0 | % | ||||||||
| Health Care Providers & Services | ||||||||||||
| Air Methods Corporation | 4,437 | 163,681 | 2.0 | % | ||||||||
| Hotels Restaurants & Leisure | ||||||||||||
| SHFL entertainment, Inc.* | 11,479 | 166,445 | 2.0 | % | ||||||||
The accompanying notes are in integral part of these financial statements.
Page 27
Baird SmallCap Value Fund
Schedule of Investments, December 31, 2012
Common Stocks (cont.)
| Market | % of | |||||||||||
| Shares | Value | Net Assets | ||||||||||
| Household Durables | ||||||||||||
Helen of Troy Limited* f | 4,647 | $ | 155,163 | 1.9 | % | |||||||
| Jarden Corporation* | 4,576 | 236,579 | 2.8 | % | ||||||||
| 391,742 | 4.7 | % | ||||||||||
| Insurance | ||||||||||||
American Safety Insurance Holdings, Ltd.* f | 7,603 | 143,849 | 1.7 | % | ||||||||
| HCC Insurance Holdings, Inc | 6,266 | 233,158 | 2.8 | % | ||||||||
| 377,007 | 4.5 | % | ||||||||||
| Internet Software & Services | ||||||||||||
| j2 Global, Inc. | 5,210 | 159,322 | 1.9 | % | ||||||||
| VeriSign, Inc.* | 3,379 | 131,173 | 1.6 | % | ||||||||
| 290,495 | 3.5 | % | ||||||||||
| IT Services | ||||||||||||
| Lender Processing Services, Inc. | 3,380 | 83,216 | 1.0 | % | ||||||||
| WEX Inc.* | 3,168 | 238,772 | 2.9 | % | ||||||||
| 321,988 | 3.9 | % | ||||||||||
| Machinery | ||||||||||||
| Valmont Industries, Inc. | 1,901 | 259,582 | 3.1 | % | ||||||||
| Media | ||||||||||||
| John Wiley & Sons, Inc. | 2,886 | 112,352 | 1.3 | % | ||||||||
| Multiline Retail | ||||||||||||
| Dollar Tree Inc* | 3,379 | 137,052 | 1.6 | % | ||||||||
| Oil, Gas & Consumable Fuels | ||||||||||||
| Sandridge Energy, Inc.* | 17,103 | 108,604 | 1.3 | % | ||||||||
| Targa Resources Corp. | 3,238 | 171,096 | 2.0 | % | ||||||||
| 279,700 | 3.3 | % | ||||||||||
| Pharmaceuticals | ||||||||||||
Warner Chilcott PLC f | 6,407 | 77,140 | 0.9 | % | ||||||||
| Real Estate Investment Trusts (REITs) | ||||||||||||
| American Capital Mortgage Investment Corp | 6,476 | 152,639 | 1.8 | % | ||||||||
| BioMed Realty Trust, Inc. | 8,027 | 155,162 | 1.9 | % | ||||||||
| CYS Investments, Inc. | 10,560 | 124,714 | 1.5 | % | ||||||||
| LTC Properties, Inc. | 7,042 | 247,808 | 3.0 | % | ||||||||
| Mid-America Apartment Communities, Inc. | 2,394 | 155,012 | 1.8 | % | ||||||||
| Omega Healthcare Investors, Inc. | 13,446 | 320,687 | 3.8 | % | ||||||||
| 1,156,022 | 13.8 | % | ||||||||||
| Specialty Retail | ||||||||||||
| Ascena Retail Group, Inc.* | 7,462 | 137,972 | 1.7 | % | ||||||||
| Rent-A-Center, Inc. | 6,619 | 227,429 | 2.7 | % | ||||||||
| 365,401 | 4.4 | % | ||||||||||
The accompanying notes are in integral part of these financial statements.
Page 28
Baird SmallCap Value Fund
Schedule of Investments, December 31, 2012
Common Stocks (cont.)
| Market | % of | |||||||||||
| Shares | Value | Net Assets | ||||||||||
| Textiles, Apparel & Luxury Goods | ||||||||||||
| Hanesbrands, Inc.* | 6,759 | $ | 242,107 | 2.9 | % | |||||||
| Thrifts & Mortgage Finance | ||||||||||||
| Bofi Holding, Inc.* | 6,195 | 172,655 | 2.1 | % | ||||||||
| Capitol Federal Financial, Inc. | 9,433 | 110,272 | 1.3 | % | ||||||||
| Chicopee Bancorp, Inc.* | 10,352 | 164,493 | 2.0 | % | ||||||||
| Westfield Financial, Inc. | 13,800 | 99,774 | 1.2 | % | ||||||||
| 547,194 | 6.6 | % | ||||||||||
| Total Common Stocks | ||||||||||||
| (Cost $7,832,429) | 8,044,544 | 96.4 | % | |||||||||
| Short-Term Investments | ||||||||||||
| Money Market Mutual Funds | ||||||||||||
| Dreyfus Institutional Cash Advantage Fund, 0.11%« | 157,069 | 157,069 | 1.9 | % | ||||||||
| Short-Term Investments Trust – | ||||||||||||
| Liquid Assets Portfolio, 0.15%« | 100,000 | 100,000 | 1.2 | % | ||||||||
| Total Short-Term Investments | ||||||||||||
| (Cost $257,069) | 257,069 | 3.1 | % | |||||||||
| Total Investments | ||||||||||||
| (Cost $8,089,498) | 8,301,613 | 99.5 | % | |||||||||
| Other Assets in Excess of Liabilities | 40,437 | 0.5 | % | |||||||||
| TOTAL NET ASSETS | $ | 8,342,050 | 100.0 | % | ||||||||
Notes to Schedule of Investments
| * | Non-Income Producing | |
| f | Foreign Security | |
| « | 7-Day Yield |
Industry classifications shown in the Schedule of Investments are based off of the Global Industry Classification Standard (GICS®). GICS was developed by and/or is the exclusive property of MSCI, Inc. and Standard & Poor Financial Services LLC (“S&P”). GICS is a service mark of MSCI and S&P and has been licensed for use by U.S. Bancorp Fund Services, LLC.
The accompanying notes are in integral part of these financial statements.
Page 29
Baird SmallCap Value Fund
Schedule of Investments, December 31, 2012
Summary of Fair Value Exposure at December 31, 2012
The Fund has adopted authoritative fair valuation accounting standards which establish a definition of fair value and set out a hierarchy for measuring fair value. These standards require additional disclosures about the various inputs and valuation techniques used to develop the measurements of fair value and a discussion on changes in valuation techniques and related inputs during the period. These standards define fair value as the price that would be received to sell an asset or paid to transfer a liability in an orderly transaction between market participants at the measurement date. Management has determined that these standards have no material impact on the Funds’ financial statements. The fair value hierarchy is organized into three levels based upon the assumptions (referred to as “inputs”) used in pricing the asset or liability. These standards state that “observable inputs” reflect the assumptions market participants would use in pricing the asset or liability based on market data obtained from independent sources and “unobservable inputs” reflect an entity’s own assumptions about the assumptions market participants would use in pricing the asset or liability. These inputs are summarized into three broad levels and described below:
Level 1 – | Unadjusted quoted prices in active markets for identical unrestricted securities. |
Level 2 – | Other significant observable inputs (including quoted prices for similar securities, quoted prices in inactive markets, dealer indications, interest rates, yield curves, prepayment speeds, credit risk, default rates, inputs corroborated by observable market data, etc.). |
Level 3 – | Significant unobservable inputs (including the Fund’s own assumptions about the factors that market participants would use in valuing the security) based on the best information available. |
The inputs or methodology used for valuing securities are not necessarily an indication of the risk associated with investing in those securities.
The following is a summary of the inputs used to value the Fund’s investments as of December 31, 2012:
| Level 1 | Level 2 | Level 3 | Total | |||||||||||||
| Equity | ||||||||||||||||
| Common Stocks | $ | 8,044,544 | $ | — | $ | — | $ | 8,044,544 | ||||||||
| Total Equity | 8,044,544 | — | — | 8,044,544 | ||||||||||||
| Short-Term Investments | ||||||||||||||||
| Money Market Mutual Funds | 257,069 | — | — | 257,069 | ||||||||||||
| Total Short-Term Investments | 257,069 | — | — | 257,069 | ||||||||||||
Total Investments* | $ | 8,301,613 | $ | — | $ | — | $ | 8,301,613 | ||||||||
* Additional information regarding the industry classifications of these investments is disclosed in the Schedule of Investments.
Changes in valuation techniques may result in transfers into or out of current assigned levels within the hierarchy. There were no transfers between Level 1, Level 2 and Level 3 fair value measurements during the reporting period.
Page 30
Additional Information on Fund Expenses
December 31, 2012
Example
As a shareholder of a mutual fund, you incur two types of costs: (1) transaction costs, which may include sales charges (loads) on purchase payments, reinvested dividends, or other distributions; redemption fees; and exchange fees; and (2) ongoing costs, such as management fees; distribution and/or service (12b-1) fees; and other fund expenses. Although the Funds do not charge any sales loads, redemption fees, or other transaction fees, you will be assessed fees for outgoing wire transfers, returned checks and stop payment orders at prevailing rates charged by U.S. Bancorp Fund Services, LLC, the Fund’s transfer agent. If you request that a redemption be made by wire transfer, currently the Fund’s transfer agent charges a $15.00 fee.
This Example is intended to help you understand your ongoing costs (in dollars) of investing in each Fund and to compare these costs with the ongoing costs of investing in other mutual funds. The Example is based on an investment of $1,000 invested at the beginning of the period and held for the entire period (7/1/12 – 12/31/12).
Actual Expenses
The third and fourth columns of the following table provide information about account values based on actual returns and actual expenses. You may use the information in these columns, together with the amount you invested, to estimate the expenses that you paid over the period. Simply divide your account value by $1,000 (for example, an $8,600 account value divided by $1,000 = 8.6), then multiply the result by the number in the fourth column entitled “Expenses Paid During Period’’ to estimate the expenses you paid on your account during this period.
Hypothetical Example for Comparison Purposes
The fifth and sixth columns of the following table provide information about hypothetical account values and hypothetical expenses based on the Funds’ actual expense ratios and an assumed rate of return of 5% per year before expenses, which is not the Funds’ actual return. The hypothetical account values and expenses may not be used to estimate the actual ending account balance or expenses you paid for the period. You may use this information to compare the ongoing costs of investing in the Funds and other mutual funds. To do so, compare this 5% hypothetical example with the 5% hypothetical examples that appear in the shareholder reports of the other mutual funds. Please note that the expenses shown in the table are meant to highlight your ongoing costs only and do not reflect any transactional costs. Therefore, the sixth column of the table (entitled “Expenses Paid During Period”) is useful in comparing ongoing costs only, and will not help you determine the relative total costs of owning different mutual funds. In addition, if these transactional costs were included, your costs could have been higher.
Page 31
Additional Information on Fund Expenses
December 31, 2012
Actual vs. Hypothetical Returns
For the Six Months Ended December 31, 2012
| Hypothetical | ||||||||||||||||||||||||
| (5% return | ||||||||||||||||||||||||
| Actual | before expenses) | |||||||||||||||||||||||
| Fund’s | Beginning | Ending | Expenses | Ending | Expenses | |||||||||||||||||||
| Annualized | Account | Account | Paid | Account | Paid | |||||||||||||||||||
| Expense | Value | Value | During | Value | During | |||||||||||||||||||
Ratio(1) | 7/1/12 | 12/31/12 | Period(1) | 12/31/12 | Period(1) | |||||||||||||||||||
| Baird LargeCap Fund | ||||||||||||||||||||||||
| Institutional Class | 0.75 | % | $ | 1,000.00 | $ | 1,034.10 | $ | 3.83 | $ | 1,021.37 | $ | 3.81 | ||||||||||||
| Investor Class | 1.00 | % | $ | 1,000.00 | $ | 1,032.20 | $ | 5.11 | $ | 1,020.11 | $ | 5.08 | ||||||||||||
| Baird MidCap Fund | ||||||||||||||||||||||||
| Institutional Class | 0.85 | % | $ | 1,000.00 | $ | 1,048.30 | $ | 4.38 | $ | 1,020.86 | $ | 4.32 | ||||||||||||
| Investor Class | 1.10 | % | $ | 1,000.00 | $ | 1,046.70 | $ | 5.66 | $ | 1,019.61 | $ | 5.58 | ||||||||||||
| Baird SmallCap Value Fund | ||||||||||||||||||||||||
| Institutional Class | 1.00 | % | $ | 1,000.00 | $ | 1,057.40 | $ | 5.17 | $ | 1,020.11 | $ | 5.08 | ||||||||||||
| Investor Class | 1.25 | % | $ | 1,000.00 | $ | 1,056.40 | $ | 6.46 | $ | 1,018.85 | $ | 6.34 | ||||||||||||
| (1) | Expenses are equal to the Fund’s annualized net expense ratio multiplied by the average account value over the period, multiplied by 184 days and divided by 366 to reflect the one-half year period. |
Page 32
Statements of Assets and Liabilities
December 31, 2012
| Baird | Baird | Baird | ||||||||||
| LargeCap | MidCap | SmallCap | ||||||||||
| Fund | Fund | Value Fund | ||||||||||
| ASSETS: | ||||||||||||
| Investments, at value (cost $20,067,323, | $ | 25,909,446 | $ | 250,980,361 | $ | 8,301,613 | ||||||
| $232,570,404 and $8,089,498; respectively)* | ||||||||||||
| Support Agreement (Note 6) | 32,803 | 46,178 | — | |||||||||
| Dividends receivable | 3,414 | 93,628 | 14,833 | |||||||||
| Interest receivable | 52 | 1,027 | 32 | |||||||||
| Receivable for investments sold | — | 1,576,502 | — | |||||||||
| Receivable for fund shares sold | 325,370 | 2,422,516 | 200,237 | |||||||||
| Uninvested cash | 52 | 855 | — | |||||||||
| Prepaid expenses and other assets | 8,109 | 16,577 | 22,925 | |||||||||
| Total assets | 26,279,246 | 255,137,644 | 8,539,640 | |||||||||
| LIABILITIES: | ||||||||||||
| Payable for collateral received for securities loaned (Note 6) | 1,831,108 | 27,507,686 | — | |||||||||
| Payable for securities purchased | — | 5,847,503 | 172,220 | |||||||||
| Payable for fund shares repurchased | — | 196,474 | — | |||||||||
| Payable to Advisor and Distributor | 8,962 | 153,050 | 1,412 | |||||||||
| Accrued expenses and other liabilities | 33,103 | 73,670 | 23,958 | |||||||||
| Total liabilities | 1,873,173 | 33,778,383 | 197,590 | |||||||||
| NET ASSETS | $ | 24,406,073 | $ | 221,359,261 | $ | 8,342,050 | ||||||
| NET ASSETS CONSIST OF: | ||||||||||||
| Capital stock | $ | 20,740,972 | $ | 203,509,145 | $ | 8,145,272 | ||||||
| Accumulated undistributed net investment income | 94 | — | — | |||||||||
| Accumulated net realized loss | ||||||||||||
| on investments sold | (2,209,919 | ) | (606,019 | ) | (15,337 | ) | ||||||
| Net unrealized appreciation on | ||||||||||||
| investments and support agreement | 5,874,926 | 18,456,135 | 212,115 | |||||||||
| NET ASSETS | $ | 24,406,073 | $ | 221,359,261 | $ | 8,342,050 | ||||||
| INSTITUTIONAL CLASS SHARES | ||||||||||||
| Net Assets | $ | 24,048,754 | $ | 137,225,968 | $ | 8,145,640 | ||||||
| Shares outstanding ($0.01 par value, | ||||||||||||
| unlimited shares authorized) | 2,438,627 | 11,912,989 | 798,745 | |||||||||
| Net asset value, offering and redemption price per share | $ | 9.86 | $ | 11.52 | $ | 10.20 | ||||||
| INVESTOR CLASS SHARES | ||||||||||||
| Net Assets | $ | 357,319 | $ | 84,133,293 | $ | 196,410 | ||||||
| Shares outstanding ($0.01 par value, | ||||||||||||
| unlimited shares authorized) | 36,387 | 7,557,608 | 19,274 | |||||||||
| Net asset value, offering and redemption price per share | $ | 9.82 | $ | 11.13 | $ | 10.19 | ||||||
| * | Includes securities out on loan to brokers with a market value of $1,809,973, $27,281,363, and $0, respectively. |
The accompanying notes are in integral part of these financial statements.
Page 33
Statements of Operations
Year Ended December 31, 2012
| Baird | Baird | Baird | ||||||||||
| LargeCap | MidCap | SmallCap | ||||||||||
| Fund | Fund | Value Fund^ | ||||||||||
| INVESTMENT INCOME: | ||||||||||||
| Dividends (net of foreign taxes | ||||||||||||
| of $450, $5,125 and $0, respectively) | $ | 263,224 | $ | 1,820,931 | $ | 136,977 | ||||||
| Income from securities lending (Note 6) | 2,453 | 15,771 | — | |||||||||
| Interest | 1,593 | 9,088 | 382 | |||||||||
| Other income | — | 549 | — | |||||||||
| Total investment income | 267,270 | 1,846,339 | 137,359 | |||||||||
| EXPENSES: | ||||||||||||
| Investment advisory fees | 154,867 | 922,414 | 37,550 | |||||||||
| Administration fees | 6,321 | 19,005 | 2,753 | |||||||||
| Shareholder servicing fees | 15,172 | 45,848 | 6,417 | |||||||||
| Fund accounting fees | 17,784 | 23,712 | 10,428 | |||||||||
| Professional fees | 30,529 | 30,928 | 21,503 | |||||||||
| Federal and state registration | 38,802 | 67,792 | 30,976 | |||||||||
| Directors fees | 49,231 | 49,262 | 16,578 | |||||||||
| Custody fees | 2,939 | 25,981 | 7,337 | |||||||||
| Reports to shareholders | 4,414 | 13,490 | 1,595 | |||||||||
| Distribution fees – Investor Class Shares (Note 8) | 676 | 104,752 | 193 | |||||||||
| Miscellaneous expenses | 314 | 646 | 217 | |||||||||
| Total expenses | 321,049 | 1,303,830 | 135,547 | |||||||||
| Expense reimbursement by Advisor (Note 5) | (141,680 | ) | (153,676 | ) | (91,176 | ) | ||||||
| Total expenses | 179,369 | 1,150,154 | 44,371 | |||||||||
| NET INVESTMENT INCOME | 87,901 | 696,185 | 92,988 | |||||||||
| REALIZED AND UNREALIZED | ||||||||||||
| GAIN ON INVESTMENTS: | ||||||||||||
| Net realized gain on investments | 1,226,478 | 650,959 | 9,231 | |||||||||
| Change in unrealized appreciation/depreciation on | ||||||||||||
| investments and support agreement | 1,573,815 | 10,853,958 | 212,115 | |||||||||
| Net realized and unrealized gain on investments | 2,800,293 | 11,504,917 | 221,346 | |||||||||
| NET INCREASE IN NET ASSETS | ||||||||||||
| RESULTING FROM OPERATIONS | $ | 2,888,194 | $ | 12,201,102 | $ | 314,334 | ||||||
| ^ | The Baird SmallCap Value Fund commenced operations on May 1, 2012. |
The accompanying notes are in integral part of these financial statements.
Page 34
Statement of Changes in Net Assets
Baird LargeCap Fund
| Year Ended | Year Ended | |||||||
| December 31, 2012 | December 31, 2011 | |||||||
| OPERATIONS: | ||||||||
| Net investment income | $ | 87,901 | $ | 26,870 | ||||
| Net realized gain on investments | 1,226,478 | 1,579,463 | ||||||
| Change in unrealized appreciation/depreciation | ||||||||
| on investments and support agreement | 1,573,815 | (2,097,553 | ) | |||||
| Net increase (decrease) in net assets from operations | 2,888,194 | (491,220 | ) | |||||
| CAPITAL SHARE TRANSACTIONS: | ||||||||
| Proceeds from shares sold | 4,396,047 | 2,788,450 | ||||||
| Shares issued to holders in reinvestment of dividends | 87,560 | 26,756 | ||||||
| Cost of shares redeemed | (3,519,081 | ) | (5,196,123 | ) | ||||
| Net increase (decrease) in net assets resulting | ||||||||
| from capital share transactions | 964,526 | (2,380,917 | ) | |||||
| DISTRIBUTIONS TO | ||||||||
| INSTITUTIONAL CLASS SHAREHOLDERS: | ||||||||
| From net investment income | (87,281 | ) | (26,841 | ) | ||||
| DISTRIBUTIONS TO | ||||||||
| INVESTOR CLASS SHAREHOLDERS: | ||||||||
| From net investment income | (552 | ) | — | |||||
| TOTAL INCREASE (DECREASE) IN NET ASSETS | 3,764,887 | (2,898,978 | ) | |||||
| NET ASSETS: | ||||||||
| Beginning of year | 20,641,186 | 23,540,164 | ||||||
| End of year (including undistributed net | ||||||||
| investment income of $94 and $53, respectively) | $ | 24,406,073 | $ | 20,641,186 | ||||
The accompanying notes are in integral part of these financial statements.
Page 35
Statement of Changes in Net Assets
Baird MidCap Fund
| Year Ended | Year Ended | |||||||
| December 31, 2012 | December 31, 2011 | |||||||
| OPERATIONS: | ||||||||
| Net investment income (loss) | $ | 696,185 | $ | (40,774 | ) | |||
| Net realized gain on investments | 650,959 | 3,717,798 | ||||||
| Change in unrealized appreciation/depreciation | ||||||||
| on investments and support agreement | 10,853,958 | (1,766,260 | ) | |||||
| Net increase in net assets from operations | 12,201,102 | 1,910,764 | ||||||
| CAPITAL SHARE TRANSACTIONS: | ||||||||
| Proceeds from shares sold | 194,674,969 | 11,352,599 | ||||||
| Shares issued to holders in reinvestment of dividends | 1,807,198 | 2,310,237 | ||||||
| Cost of shares redeemed | (28,924,851 | ) | (4,282,939 | ) | ||||
| Net increase in net assets resulting | ||||||||
| from capital share transactions | 167,557,316 | 9,379,897 | ||||||
| DISTRIBUTIONS TO | ||||||||
| INSTITUTIONAL CLASS SHAREHOLDERS: | ||||||||
| From net investment income | (484,795 | ) | — | |||||
| From net realized gains | (704,473 | ) | (2,240,606 | ) | ||||
| (1,189,268 | ) | (2,240,606 | ) | |||||
| DISTRIBUTIONS TO | ||||||||
| INVESTOR CLASS SHAREHOLDERS: | ||||||||
| From net investment income | (211,430 | ) | — | |||||
| From net realized gains | (459,510 | ) | (140,127 | ) | ||||
| (670,940 | ) | (140,127 | ) | |||||
| TOTAL INCREASE IN NET ASSETS | 177,898,210 | 8,909,928 | ||||||
| NET ASSETS: | ||||||||
| Beginning of year | 43,461,051 | 34,551,123 | ||||||
| End of year | $ | 221,359,261 | $ | 43,461,051 | ||||
The accompanying notes are in integral part of these financial statements.
Page 36
Statement of Changes in Net Assets
Baird SmallCap Value Fund
| May 1, 2012^ | ||||
| through | ||||
| December 31, 2012 | ||||
| OPERATIONS: | ||||
| Net investment income | $ | 92,988 | ||
| Net realized gain on investments | 9,231 | |||
| Change in unrealized appreciation on investments | 212,115 | |||
| Net increase in net assets from operations | 314,334 | |||
| CAPITAL SHARE TRANSACTIONS: | ||||
| Proceeds from shares sold | 8,131,922 | |||
| Shares issued to holders in reinvestment of dividends | 117,482 | |||
| Cost of shares redeemed | (104,132 | ) | ||
| Net increase in net assets resulting from capital share transactions | 8,145,272 | |||
| DISTRIBUTIONS TO INSTITUTIONAL CLASS SHAREHOLDERS: | ||||
| From net investment income | (89,865 | ) | ||
| From net realized gains | (25,034 | ) | ||
| (114,899 | ) | |||
| DISTRIBUTIONS TO INVESTOR CLASS SHAREHOLDERS: | ||||
| From net investment income | (2,036 | ) | ||
| From net realized gains | (621 | ) | ||
| (2,657 | ) | |||
| TOTAL INCREASE IN NET ASSETS | 8,342,050 | |||
| NET ASSETS: | ||||
| Beginning of period | — | |||
| End of period | $ | 8,342,050 | ||
| ^ | Commencement of operations. |
The accompanying notes are in integral part of these financial statements.
Page 37
Financial Highlights
Baird LargeCap Fund – Institutional Class
| Year Ended December 31, | ||||||||||||||||||||
| 2012 | 2011 | 2010 | 2009 | 2008 | ||||||||||||||||
| Per Share Data: | ||||||||||||||||||||
| Net asset value, | ||||||||||||||||||||
| beginning of year | $ | 8.71 | $ | 8.93 | $ | 7.57 | $ | 5.59 | $ | 9.33 | ||||||||||
| Income from | ||||||||||||||||||||
| investment operations: | ||||||||||||||||||||
| Net investment income | 0.04 | (1) | 0.01 | 0.01 | 0.03 | 0.03 | ||||||||||||||
| Net realized and unrealized | ||||||||||||||||||||
| gains (losses) on investments | 1.15 | (0.22 | ) | 1.36 | 1.98 | (3.74 | ) | |||||||||||||
| Total from investment operations | 1.19 | (0.21 | ) | 1.37 | 2.01 | (3.71 | ) | |||||||||||||
| Less distributions: | ||||||||||||||||||||
| Distributions from | ||||||||||||||||||||
| net investment income | (0.04 | ) | (0.01 | ) | (0.01 | ) | (0.03 | ) | (0.03 | ) | ||||||||||
| Net asset value, end of year | $ | 9.86 | $ | 8.71 | $ | 8.93 | $ | 7.57 | $ | 5.59 | ||||||||||
| Total return | 13.62 | % | (2.34 | %) | 18.06 | % | 36.27 | % | (39.88 | %) | ||||||||||
| Supplemental data and ratios: | ||||||||||||||||||||
| Net assets, end of year (millions) | $ | 24.0 | $ | 20.5 | $ | 23.4 | $ | 20.7 | $ | 16.3 | ||||||||||
| Ratio of expenses | ||||||||||||||||||||
| to average net assets | 0.75 | % | 0.75 | % | 0.75 | % | 0.75 | % | 0.75 | % | ||||||||||
| Ratio of expenses to average | ||||||||||||||||||||
| net assets (before waivers) | 1.34 | % | 1.35 | % | 1.40 | % | 1.39 | % | 1.17 | % | ||||||||||
| Ratio of net investment income | ||||||||||||||||||||
| to average net assets | 0.37 | % | 0.12 | % | 0.14 | % | 0.46 | % | 0.32 | % | ||||||||||
| Ratio of net investment loss | ||||||||||||||||||||
| to average net assets (before waivers) | (0.22 | %) | (0.48 | %) | (0.51 | %) | (0.18 | %) | (0.10 | %) | ||||||||||
Portfolio turnover rate(2) | 39.2 | % | 38.2 | % | 52.0 | % | 58.7 | % | 43.0 | % | ||||||||||
| (1) | Calculated using average shares outstanding during the year. | |
| (2) | Portfolio turnover is calculated on the basis of the Fund as a whole without distinguishing between the classes of shares issued. |
The accompanying notes are in integral part of these financial statements.
Page 38
Financial Highlights
Baird LargeCap Fund – Investor Class
| Year Ended December 31, | ||||||||||||||||||||
| 2012 | 2011 | 2010 | 2009 | 2008 | ||||||||||||||||
| Per Share Data: | ||||||||||||||||||||
| Net asset value, | ||||||||||||||||||||
| beginning of year | $ | 8.68 | $ | 8.91 | $ | 7.56 | $ | 5.59 | $ | 9.29 | ||||||||||
| Income from | ||||||||||||||||||||
| investment operations: | ||||||||||||||||||||
| Net investment income (loss) | 0.01 | (1) | (0.01 | ) | (0.02 | ) | 0.02 | 0.00 | (2) | |||||||||||
| Net realized and unrealized | ||||||||||||||||||||
| gains (losses) on investments | 1.15 | (0.22 | ) | 1.37 | 1.97 | (3.70 | ) | |||||||||||||
| Total from investment operations | 1.16 | (0.23 | ) | 1.35 | 1.99 | (3.70 | ) | |||||||||||||
| Less distributions: | ||||||||||||||||||||
| Distributions from | ||||||||||||||||||||
| net investment income | (0.02 | ) | — | — | (0.02 | ) | — | |||||||||||||
| Net asset value, end of year | $ | 9.82 | $ | 8.68 | $ | 8.91 | $ | 7.56 | $ | 5.59 | ||||||||||
| Total return | 13.32 | % | (2.58 | %) | 17.86 | % | 35.79 | % | (39.94 | %) | ||||||||||
| Supplemental data and ratios: | ||||||||||||||||||||
| Net assets, end of year (millions) | $ | 0.4 | $ | 0.2 | $ | 0.1 | $ | 0.3 | $ | 0.3 | ||||||||||
| Ratio of expenses | ||||||||||||||||||||
| to average net assets | 1.00 | % | 1.00 | % | 1.00 | % | 1.00 | % | 1.00 | % | ||||||||||
| Ratio of expenses to average | ||||||||||||||||||||
| net assets (before waivers) | 1.59 | % | 1.60 | % | 1.65 | % | 1.64 | % | 1.42 | % | ||||||||||
| Ratio of net investment income (loss) | ||||||||||||||||||||
| to average net assets | 0.12 | % | (0.13 | %) | (0.11 | %) | 0.21 | % | 0.07 | % | ||||||||||
| Ratio of net investment loss | ||||||||||||||||||||
| to average net assets (before waivers) | (0.47 | %) | (0.73 | %) | (0.76 | %) | (0.43 | %) | (0.35 | %) | ||||||||||
Portfolio turnover rate(3) | 39.2 | % | 38.2 | % | 52.0 | % | 58.7 | % | 43.0 | % | ||||||||||
| (1) | Calculated using average shares outstanding during the year. | |
| (2) | Amount is less than $0.005. | |
| (3) | Portfolio turnover is calculated on the basis of the Fund as a whole without distinguishing between the classes of shares issued. |
The accompanying notes are in integral part of these financial statements.
Page 39
Financial Highlights
Baird MidCap Fund – Institutional Class
| Year Ended December 31, | ||||||||||||||||||||
| 2012 | 2011 | 2010 | 2009 | 2008 | ||||||||||||||||
| Per Share Data: | ||||||||||||||||||||
| Net asset value, | ||||||||||||||||||||
| beginning of year | $ | 9.98 | $ | 10.04 | $ | 7.90 | $ | 5.63 | $ | 9.62 | ||||||||||
| Income from | ||||||||||||||||||||
| investment operations: | ||||||||||||||||||||
Net investment income (loss)(1) | 0.07 | (0.01 | ) | (0.01 | ) | 0.02 | 0.01 | |||||||||||||
| Net realized and unrealized | ||||||||||||||||||||
| gains (losses) on investments | 1.57 | 0.54 | 2.15 | 2.27 | (3.99 | ) | ||||||||||||||
| Total from investment operations | 1.64 | 0.53 | 2.14 | 2.29 | (3.98 | ) | ||||||||||||||
| Less distributions: | ||||||||||||||||||||
| Distributions from | ||||||||||||||||||||
| net investment income | (0.04 | ) | — | — | (0.02 | ) | (0.01 | ) | ||||||||||||
| Distributions from net realized gains | (0.06 | ) | (0.59 | ) | — | — | — | |||||||||||||
| Total distributions | (0.10 | ) | (0.59 | ) | — | (0.02 | ) | (0.01 | ) | |||||||||||
| Net asset value, end of year | $ | 11.52 | $ | 9.98 | $ | 10.04 | $ | 7.90 | $ | 5.63 | ||||||||||
| Total return | 16.49 | % | 5.19 | % | 27.09 | % | 40.90 | % | (41.53 | %) | ||||||||||
| Supplemental data and ratios: | ||||||||||||||||||||
| Net assets, end of year (millions) | $ | 137.2 | $ | 40.9 | $ | 33.4 | $ | 25.5 | $ | 18.2 | ||||||||||
| Ratio of expenses to average net assets | 0.85 | % | 0.85 | % | 0.85 | % | 0.85 | % | 0.85 | % | ||||||||||
| Ratio of expenses to average | ||||||||||||||||||||
| net assets (before waivers) | 0.97 | % | 1.21 | % | 1.30 | % | 1.34 | % | 1.19 | % | ||||||||||
| Ratio of net investment income (loss) | ||||||||||||||||||||
| to average net assets | 0.65 | % | (0.10 | %) | (0.10 | %) | 0.25 | % | 0.06 | % | ||||||||||
| Ratio of net investment income (loss) | ||||||||||||||||||||
| to average net assets (before waivers) | 0.53 | % | (0.46 | %) | (0.55 | %) | (0.24 | %) | (0.28 | %) | ||||||||||
Portfolio turnover rate(2) | 29.5 | % | 44.8 | % | 62.7 | % | 61.3 | % | 74.0 | % | ||||||||||
| (1) | Calculated using average shares outstanding during the year. | |
| (2) | Portfolio turnover is calculated on the basis of the Fund as a whole without distinguishing between the classes of shares issued. |
The accompanying notes are in integral part of these financial statements.
Page 40
Financial Highlights
Baird MidCap Fund – Investor Class
| Year Ended December 31, | ||||||||||||||||||||
| 2012 | 2011 | 2010 | 2009 | 2008 | ||||||||||||||||
| Per Share Data: | ||||||||||||||||||||
| Net asset value, | ||||||||||||||||||||
| beginning of year | $ | 9.66 | $ | 9.76 | $ | 7.69 | $ | 5.49 | $ | 9.40 | ||||||||||
| Income from | ||||||||||||||||||||
| investment operations: | ||||||||||||||||||||
Net investment income (loss)(1) | 0.04 | (0.03 | ) | (0.03 | ) | 0.00 | (2) | (0.02 | ) | |||||||||||
| Net realized and unrealized | ||||||||||||||||||||
| gains (losses) on investments | 1.52 | 0.52 | 2.10 | 2.21 | (3.89 | ) | ||||||||||||||
| Total from investment operations | 1.56 | 0.49 | 2.07 | 2.21 | (3.91 | ) | ||||||||||||||
| Less distributions: | ||||||||||||||||||||
| Distributions from | ||||||||||||||||||||
| net investment income | (0.03 | ) | — | — | (0.01 | ) | — | |||||||||||||
| Distributions from net realized gains | (0.06 | ) | (0.59 | ) | — | — | — | |||||||||||||
| Total distributions | (0.09 | ) | (0.59 | ) | — | (0.01 | ) | — | ||||||||||||
| Net asset value, end of year | $ | 11.13 | $ | 9.66 | $ | 9.76 | $ | 7.69 | $ | 5.49 | ||||||||||
| Total return | 16.16 | % | 4.93 | % | 26.92 | % | 40.52 | % | (41.70 | %) | ||||||||||
| Supplemental data and ratios: | ||||||||||||||||||||
| Net assets, end of year (millions) | $ | 84.1 | $ | 2.6 | $ | 1.1 | $ | 1.6 | $ | 1.6 | ||||||||||
| Ratio of expenses | ||||||||||||||||||||
| to average net assets | 1.10 | % | 1.10 | % | 1.10 | % | 1.10 | % | 1.10 | % | ||||||||||
| Ratio of expenses to average | ||||||||||||||||||||
| net assets (before waivers) | 1.22 | % | 1.46 | % | 1.55 | % | 1.59 | % | 1.44 | % | ||||||||||
| Ratio of net investment income (loss) | ||||||||||||||||||||
| to average net assets | 0.40 | % | (0.35 | %) | (0.35 | %) | 0.00 | % | (0.19 | %) | ||||||||||
| Ratio of net investment income (loss) | ||||||||||||||||||||
| to average net assets (before waivers) | 0.28 | % | (0.71 | %) | (0.80 | %) | (0.49 | %) | (0.53 | %) | ||||||||||
Portfolio turnover rate(3) | 29.5 | % | 44.8 | % | 62.7 | % | 61.3 | % | 74.0 | % | ||||||||||
| (1) | Calculated using average shares outstanding during the year. | |
| (2) | Amount is less than $0.005. | |
| (3) | Portfolio turnover is calculated on the basis of the Fund as a whole without distinguishing between the classes of shares issued. |
The accompanying notes are in integral part of these financial statements.
Page 41
Financial Highlights
Baird SmallCap Value Fund – Institutional Class
| May 1, 2012^ | ||||
| through | ||||
| December 31, 2012 | ||||
| Per Share Data: | ||||
| Net asset value, beginning of period | $ | 10.00 | ||
| Income from investment operations: | ||||
| Net investment income | 0.15 | (1) | ||
| Net realized and unrealized gains on investments | 0.20 | |||
| Total from investment operations | 0.35 | |||
| Less distributions: | ||||
| Distributions from net investment income | (0.12 | ) | ||
| Distributions from net realized gains | (0.03 | ) | ||
| Total distributions | (0.15 | ) | ||
| Net asset value, end of period | $ | 10.20 | ||
| Total return | 3.52 | %(2) | ||
| Supplemental data and ratios: | ||||
| Net assets, end of period (millions) | $ | 8.1 | ||
| Ratio of expenses to average net assets | 1.00 | %(3) | ||
| Ratio of expenses to average net assets (before waivers) | 3.06 | %(3) | ||
| Ratio of net investment income to average net assets | 2.32 | %(3) | ||
| Ratio of net investment income to average net assets (before waivers) | 0.26 | %(3) | ||
Portfolio turnover rate(4) | 24.6 | %(2) | ||
| ^ | Commencement of operations. | |
| (1) | Calculated using average shares outstanding during the period. | |
| (2) | Not annualized. | |
| (3) | Annualized. | |
| (4) | Portfolio turnover is calculated on the basis of the Fund as a whole without distinguishing between the classes of shares issued. |
The accompanying notes are in integral part of these financial statements.
Page 42
Financial Highlights
Baird SmallCap Value Fund – Investor Class
| May 1, 2012^ | ||||
| through | ||||
| December 31, 2012 | ||||
| Per Share Data: | ||||
| Net asset value, beginning of period | $ | 10.00 | ||
| Income from investment operations: | ||||
| Net investment income | 0.14 | (1) | ||
| Net realized and unrealized gains on investments | 0.19 | |||
| Total from investment operations | 0.33 | |||
| Less distributions: | ||||
| Distributions from net investment income | (0.11 | ) | ||
| Distributions from net realized gains | (0.03 | ) | ||
| Total distributions | (0.14 | ) | ||
| Net asset value, end of period | $ | 10.19 | ||
| Total return | 3.32 | %(2) | ||
| Supplemental data and ratios: | ||||
| Net assets, end of period (millions) | $ | 0.2 | ||
| Ratio of expenses to average net assets | 1.25 | %(3) | ||
| Ratio of expenses to average net assets (before waivers) | 3.31 | %(3) | ||
| Ratio of net investment income to average net assets | 2.07 | %(3) | ||
| Ratio of net investment income to average net assets (before waivers) | 0.01 | %(3) | ||
Portfolio turnover rate(4) | 24.6 | %(2) | ||
| ^ | Commenced of operations. | |
| (1) | Calculated using average shares outstanding during the period. | |
| (2) | Not annualized. | |
| (3) | Annualized. | |
| (4) | Portfolio turnover is calculated on the basis of the Fund as a whole without distinguishing between the classes of shares issued. |
The accompanying notes are in integral part of these financial statements.
Page 43
Notes to the Financial Statements
December 31, 2012
1.Organization
Baird Funds, Inc. (the “Corporation”) was incorporated on June 9, 2000 as a Wisconsin corporation and is registered as an open-end management investment company under the Investment Company Act of 1940, as amended (the “1940 Act”). The accompanying financial statements include the Baird LargeCap Fund, Baird MidCap Fund and Baird SmallCap Value Fund (each a “Fund” and collectively the “Funds”), three of the eight series comprising the Corporation. Pursuant to the 1940 Act, the Funds are “diversified” series of the Corporation. The investment advisor to the Funds is Robert W. Baird & Co. Incorporated (“Baird” or the “Advisor”).
The Baird LargeCap Fund commenced operations with the sale of both Institutional and Investor Class Shares on September 29, 2000. The Baird MidCap Fund commenced operations with the sale of both Institutional and Investor Class Shares on December 29, 2000. The Baird SmallCap Value Fund commenced operations with the sale of both Institutional and Investor Class Shares on May 1, 2012. The Institutional Class Shares are not subject to a distribution and service (12b-1) fee, while the Investor Class Shares are subject to a distribution and service (12b-1) fee of 0.25%.
The Baird LargeCap Fund seeks long-term growth of capital through investments in equity securities of large-capitalization companies. Dividend income is a secondary consideration.
The Baird MidCap Fund seeks long-term growth of capital through investments in equity securities of mid-capitalization companies.
The Baird SmallCap Value Fund seeks long-term growth of capital through investments in equity securities of small-capitalization companies.
On December 31, 2012, shareholders affiliated with the Advisor held 84% of the Institutional Class shares of the Baird LargeCap Fund, 17% of the Institutional Class shares of the Baird MidCap Fund and 58% of the Institutional Class shares of the Baird SmallCap Value Fund. These shareholders included the Advisor’s participant-directed retirement and deferred compensation plans and the Baird Foundation.
2.Significant Accounting Policies
The following is a summary of significant accounting policies consistently followed by the Funds in the preparation of their financial statements. These policies are in conformity with accounting principles generally accepted in the United States of America.
| a) | Investment Valuation – Section 2(a)(41) of the 1940 Act, together with the rules and interpretations of the SEC, require the Funds, in computing net asset value, to value their portfolio securities using market quotations when they are “readily available.” When market quotations are not readily available (e.g., because there is no regular market quotation for such securities, the market for such security is limited, the validity of quotations is questionable or, for debt securities, Interactive Data Corporation (IDC), the Funds’ independent pricing service, does not provide a price), the Board of Directors of the Corporation must value the securities at “fair value determined in good faith.” The Board has delegated such responsibility to the Advisor pursuant to pricing policies and procedures that the Board has adopted and regularly reviews. In general, the “fair value” of a security means the price that would be received to sell a security in an orderly transaction between market participants at the measurement date. |
The Funds determine the fair value of their investments and compute their net asset value per share as of the close of regular trading of the New York Stock Exchange (4:00 p.m. EST). | |
| Consistent with Section 2(a)(41) of the 1940 Act, the Funds price their securities as follows: common stocks that are listed on a securities exchange (other than NASDAQ) are valued at the last quoted sale price. Securities traded on NASDAQ are valued at the NASDAQ Official Closing Price. Price information on listed stocks is taken from the exchange where the security is primarily traded. Securities that were not traded on the valuation date, as well as stocks that are not listed on an exchange, including NASDAQ, are |
Page 44
Notes to the Financial Statements
December 31, 2012
2.Significant Accounting Policies (cont.)
valued at the average of the current bid and asked price. Debt securities are valued at their bid prices by an independent pricing service using valuation methods that are designed to represent fair value, such as matrix pricing and other analytical pricing models, market transactions and dealer quotations. Debt securities purchased with a remaining maturity of 60 days or less are valued at acquisition cost plus or minus any amortized discount or premium. Investments in mutual funds are valued at their stated net asset value. Other assets and securities for which market quotations are not readily available are valued at fair value as determined in good faith by the Advisor in accordance with procedures approved by the Corporation’s Board of Directors. In accordance with such procedures, the Advisor may use broker quotes or prices obtained from alternative independent pricing services or, if the broker quotes or prices from alternative pricing services are unavailable or deemed to be unreliable, fair value will be determined by a valuation committee of the Advisor. In determining fair value, the valuation committee takes into account all relevant factors and available information. Consequently, the price of the security used by a Fund to calculate its NAV may differ from quoted or published prices for the same security. Fair value pricing involves subjective judgments and there is no single standard for determining a security’s fair value. As a result, different mutual funds could reasonably arrive at a different fair value for the same security. It is possible that the fair value determined for a security is materially different from the value that could be realized upon the sale of that security or from the values that other mutual funds may determine. In addition, given the volatility and periodic illiquidity experienced in recent years, the prices determined for an individual security on any given day may vary significantly from the amount that can be obtained in an actual sale of that security, and the Funds’ NAVs may fluctuate significantly from day to day or from period to period. | |
In May 2011, the FASB issued ASU No. 2011-04 “Amendments to Achieve Common Fair Value Measurement and Disclosure Requirements in GAAP and the International Financial Reporting Standards (“IFRS”) (ASU 2011-04).” ASU 2011-04 amends FASB ASC Topic 820, Fair Value Measurements and Disclosures, to establish common requirements for measuring fair value and for disclosing information about fair value measurements in accordance with GAAP and IFRS. ASU No. 2011-04 is effective for fiscal years beginning after December 15, 2011 and for interim periods within those fiscal years. The Funds have disclosed the applicable requirements of this accounting standard in their financial statements. | |
| b) | Foreign Securities – Foreign securities are defined as securities issued by companies that are organized outside the United States. Investing in securities of foreign companies and foreign governments involves special risks and considerations not typically associated with investing in U.S. companies and the U.S. government. These risks include foreign currency fluctuations and adverse political and economic developments. Moreover, securities of many foreign companies and foreign governments and their markets may be less liquid and their prices more volatile than those of securities of comparable U.S. companies and the U.S. government. Occasionally, events that affect those values and exchange rates may occur after the close of the exchange on which such securities are traded. If such events materially affect the value of a Fund’s securities, these securities may be valued at their fair value pursuant to procedures adopted by the Board of Directors. All of the foreign securities owned by the Funds as of December 31, 2012 are traded directly on the New York Stock Exchange or NASDAQ or through an American Depository Receipt (ADR). |
| c) | Income Tax Status –The Funds intend to continue to qualify as regulated investment companies as provided in subchapter M of the Internal Revenue Code and to distribute substantially all of their taxable income to their shareholders in a manner which results in no tax cost to the Funds. Therefore, no federal income or excise tax provision is recorded. |
| There is no tax liability resulting from unrecognized tax benefits relating to uncertain income tax positions taken or expected to be taken on the tax return for the fiscal year ended December 31, 2012, or for any other tax years which are open for exam. As of December 31, 2012, open tax years include the tax years ended December 31, 2009 through 2012. The Funds are not aware of any tax positions for which it is reasonably possible that the total amounts of unrecognized tax benefits will significantly change in the next 12 months. |
Page 45
Notes to the Financial Statements
December 31, 2012
2.Significant Accounting Policies (cont.)
The Funds recognize interest and penalties, if any, related to unrecognized tax benefits as income tax expense and other expense, respectively, in the Statement of Operations. During the year, the Funds did not incur any interest or penalties. | |
| d) | Distributions to Shareholders – Distributions from net investment income, if any, are declared and paid annually. Distributions of net realized gains, if any, are declared and paid at least annually. The book basis character of distributions may differ from their ultimate characterization for Federal income tax purposes. |
| e) | Allocation of Income and Expenses – Each Fund is charged for those expenses directly attributable to it. Expenses directly attributable to a class of shares, such as Rule 12b-1 distribution fees, are charged to that class of shares. Income, expenses, and realized and unrealized gains and losses are allocated to the classes based on their respective net assets. Expenses that are not directly attributable to a Fund are allocated among the series of the Corporation in proportion to their assets. |
| f) | Use of Estimates – The preparation of financial statements in conformity with accounting principles generally accepted in the United States requires management to make estimates and assumptions that affect the reported amounts of assets and liabilities and disclosure of contingent assets and liabilities at the date of the financial statements and the reported amounts of revenues and expenses during the reporting period. Actual results could differ from those estimates. |
| g) | Securities Transactions and Investment Income – Investment and shareholder transactions are recorded on the trade date. The Funds determine the gain or loss realized from investment transactions by comparing the original cost of the security lot sold with the net sales proceeds. Dividend income is recognized on the ex-dividend date and interest income is recognized on an accrual basis. Accounting principles generally accepted in the United States require that permanent financial reporting and tax differences be reclassified in the capital accounts. |
| h) | Guarantees and Indemnifications – In the normal course of business, the Funds enter into contracts with service providers that contain general indemnification clauses. The Funds’ maximum exposure under these arrangements is unknown and this would involve future claims against the Funds that have not yet occurred. Based on experience, the Funds would expect the risk of loss to be remote. |
3.Capital Share Transactions
The following table summarizes the capital share transactions of each Fund for the past two fiscal years:
Baird LargeCap Fund
| Institutional Class Shares | Investor Class Shares | |||||||||||||||||
| Year Ended | Year Ended | |||||||||||||||||
| December 31, 2012 | December 31, 2012 | |||||||||||||||||
| Shares | Amount | Shares | Amount | |||||||||||||||
| Shares sold | 441,736 | $ | 4,208,785 | Shares sold | 19,311 | $ | 187,262 | |||||||||||
| Shares issued to | Shares issued to | |||||||||||||||||
| shareholders in | shareholders in | |||||||||||||||||
| reinvestment | reinvestment | |||||||||||||||||
| of dividends | 8,906 | 87,008 | of dividends | 57 | 552 | |||||||||||||
| Shares redeemed | (363,417 | ) | (3,510,278 | ) | Shares redeemed | (877 | ) | (8,803 | ) | |||||||||
| Net increase | 87,225 | $ | 785,515 | Net increase | 18,491 | $ | 179,011 | |||||||||||
| Shares Outstanding: | Shares Outstanding: | |||||||||||||||||
| Beginning of period | 2,351,402 | Beginning of period | 17,896 | |||||||||||||||
| End of period | 2,438,627 | End of period | 36,387 | |||||||||||||||
Page 46
Notes to the Financial Statements
December 31, 2012
3.Capital Share Transactions (cont.)
Baird LargeCap Fund (cont.)
| Institutional Class Shares | Investor Class Shares | |||||||||||||||||
| Year Ended | Year Ended | |||||||||||||||||
| December 31, 2011 | December 31, 2011 | |||||||||||||||||
| Shares | Amount | Shares | Amount | |||||||||||||||
| Shares sold | 310,586 | $ | 2,768,012 | Shares sold | 2,275 | $ | 20,438 | |||||||||||
| Shares issued to | Shares issued to | |||||||||||||||||
| shareholders in | shareholders in | |||||||||||||||||
| reinvestment | reinvestment | |||||||||||||||||
| of dividends | 3,047 | 26,756 | of dividends | — | — | |||||||||||||
| Shares redeemed | (581,336 | ) | (5,194,653 | ) | Shares redeemed | (180 | ) | (1,470 | ) | |||||||||
| Net decrease | (267,703 | ) | $ | (2,399,885 | ) | Net increase | 2,095 | $ | 18,968 | |||||||||
| Shares Outstanding: | Shares Outstanding: | |||||||||||||||||
| Beginning of period | 2,619,105 | Beginning of period | 15,801 | |||||||||||||||
| End of period | 2,351,402 | End of period | 17,896 | |||||||||||||||
| Baird MidCap Fund | ||||||||||||||||||
| Institutional Class Shares | Investor Class Shares | |||||||||||||||||
| Year Ended | Year Ended | |||||||||||||||||
| December 31, 2012 | December 31, 2012 | |||||||||||||||||
| Shares | Amount | Shares | Amount | |||||||||||||||
| Shares sold | 9,309,112 | $ | 105,381,603 | Shares sold | 8,244,350 | $ | 89,293,366 | |||||||||||
| Shares issued to | Shares issued to | |||||||||||||||||
| shareholders in | shareholders in | |||||||||||||||||
| reinvestment | reinvestment | |||||||||||||||||
| of dividends | 101,019 | 1,151,612 | of dividends | 59,491 | 655,586 | |||||||||||||
| Shares redeemed | (1,594,189 | ) | (17,822,841 | ) | Shares redeemed | (1,013,547 | ) | (11,102,010 | ) | |||||||||
| Net increase | 7,815,942 | $ | 88,710,374 | Net increase | 7,290,294 | $ | 78,846,942 | |||||||||||
| Shares Outstanding: | Shares Outstanding: | |||||||||||||||||
| Beginning of period | 4,097,047 | Beginning of period | 267,314 | |||||||||||||||
| End of period | 11,912,989 | End of period | 7,557,608 | |||||||||||||||
| Institutional Class Shares | Investor Class Shares | |||||||||||||||||
| Year Ended | Year Ended | |||||||||||||||||
| December 31, 2011 | December 31, 2011 | |||||||||||||||||
| Shares | Amount | Shares | Amount | |||||||||||||||
| Shares sold | 918,529 | $ | 9,487,425 | Shares sold | 187,694 | $ | 1,865,174 | |||||||||||
| Shares issued to | Shares issued to | |||||||||||||||||
| shareholders in | shareholders in | |||||||||||||||||
| reinvestment | reinvestment | |||||||||||||||||
| of distributions | 214,890 | 2,170,393 | of dividends | 14,314 | 139,844 | |||||||||||||
| Shares redeemed | (364,653 | ) | (3,784,255 | ) | Shares redeemed | (49,311 | ) | (498,684 | ) | |||||||||
| Net increase | 768,766 | $ | 7,873,563 | Net increase | 152,697 | $ | 1,506,334 | |||||||||||
| Shares Outstanding: | Shares Outstanding: | |||||||||||||||||
| Beginning of period | 3,328,281 | Beginning of period | 114,617 | |||||||||||||||
| End of period | 4,097,047 | End of period | 267,314 | |||||||||||||||
Page 47
Notes to the Financial Statements
December 31, 2012
3.Capital Share Transactions (cont.)
Baird SmallCap Value Fund
| Institutional Class Shares | Investor Class Shares | |||||||||||||||||
| May 1, 2012^ through | May 1, 2012^ through | |||||||||||||||||
| December 31, 2012 | December 31, 2012 | |||||||||||||||||
| Shares | Amount | Shares | Amount | |||||||||||||||
| Shares sold | 797,462 | $ | 7,940,296 | Shares sold | 19,510 | $ | 191,626 | |||||||||||
| Shares issued to | Shares issued to | |||||||||||||||||
| shareholders in | shareholders in | |||||||||||||||||
| reinvestment | reinvestment | |||||||||||||||||
| of dividends | 11,425 | 114,825 | of dividends | 264 | 2,657 | |||||||||||||
| Shares redeemed | (10,142 | ) | (99,362 | ) | Shares redeemed | (500 | ) | (4,770 | ) | |||||||||
| Net increase | 798,745 | $ | 7,955,759 | Net increase | 19,274 | $ | 189,513 | |||||||||||
| Shares Outstanding: | Shares Outstanding: | |||||||||||||||||
| Beginning of period | — | Beginning of period | — | |||||||||||||||
| End of period | 798,745 | End of period | 19,274 | |||||||||||||||
^ Commencement of operations.
4.Investment Transactions and Income Tax Information
During the year ended December 31, 2012, purchases and sales of investment securities (excluding short-term investments) were as follows:
| Baird | Baird | Baird | ||||||||||
| LargeCap Fund | MidCap Fund | SmallCap Value Fund^ | ||||||||||
| Purchases: | $ | 9,636,412 | $ | 194,777,736 | $ | 9,262,436 | ||||||
| Sales: | $ | 8,943,794 | $ | 34,885,419 | $ | 1,429,749 | ||||||
^ Commenced operations on May 1, 2012.
The Baird LargeCap Fund and Baird MidCap Fund did not purchase or sell U.S. Government securities during the year ended December 31, 2012. The Baird SmallCap Value Fund did not purchase or sell U.S. Government securities during the period May 1, 2012 through December 31, 2012.
At December 31, 2012, accumulated earnings/losses on a tax basis were as follows:
| Baird | Baird | Baird | ||||||||||
| LargeCap | MidCap | SmallCap | ||||||||||
| Fund | Fund | Value Fund | ||||||||||
| Cost of Investments | $ | 20,078,050 | $ | 233,258,302 | $ | 8,091,324 | ||||||
| Gross unrealized appreciation | 6,406,516 | 25,325,790 | 615,763 | |||||||||
| Gross unrealized depreciation | (542,317 | ) | (7,557,553 | ) | (405,474 | ) | ||||||
| Net unrealized appreciation | $ | 5,864,199 | $ | 17,768,237 | $ | 210,289 | ||||||
| Undistributed ordinary income | 94 | — | — | |||||||||
| Undistributed long-term capital gain | — | 81,879 | 2 | |||||||||
| Total distributable earnings | $ | 94 | $ | 81,879 | $ | 2 | ||||||
| Other accumulated losses | $ | (2,199,192 | ) | $ | — | $ | (13,513 | ) | ||||
| Total accumulated earnings | $ | 3,665,101 | $ | 17,850,116 | $ | 196,778 | ||||||
Page 48
Notes to the Financial Statements
December 31, 2012
4.Investment Transactions and Income Tax Information (cont.)
Undistributed income or net realized gains for financial statement purposes may differ from amounts recognized for federal income tax purposes due to differences in the recognition and characterization of income, expense and capital gain items. The difference between book-basis and tax-basis unrealized appreciation is attributable primarily to the tax deferral of losses on wash sales.
Additionally, U.S. generally accepted accounting principles require that certain components of net assets relating to permanent differences be reclassified between financial and tax reporting. These reclassifications are primarily due to differing treatments for losses deferred due to wash sales, equalization accounting for tax purposes, and non-deductible expenses. These reclassifications have no effect on net assets or net asset value per share. For the year ended December 31, 2012, the following table shows the reclassifications made:
| Undistributed | Accumulated | |||||||||||
| Net Investment | Net Realized | Paid In | ||||||||||
| Income/(Loss) | Gain/(Loss) | Capital | ||||||||||
| Baird LargeCap Fund | $ | (27 | ) | $ | 27 | $ | — | |||||
| Baird MidCap Fund | 40 | (129,578 | ) | 129,538 | ||||||||
| Baird SmallCap Value Fund | (1,087 | ) | 1,087 | — | ||||||||
Under the current tax law, capital losses realized after October 31 may be deferred and treated as occurring on the first day of the following fiscal year. For the year ended December 31, 2012, the Baird LargeCap Fund and Baird MidCap Fund did not defer any capital losses occurring between November 1, 2012 and December 31, 2012. For the period May 1, 2012 to December 31, 2012, the Baird SmallCap Value Fund elected to defer capital losses occurring between November 1, 2012 and December 31, 2012 in the amount of $13,513.
At December 31, 2012, accumulated net realized capital loss carryovers, if any, and the year(s) in which the capital loss carryovers expire were:
| Capital Loss Carryover | Year of Expiration | |
| Baird LargeCap Fund | $2,199,192 | 2017 |
To the extent the Fund realizes future net capital gains, those gains will be offset by any unused capital loss carryovers. During the year ended December 31, 2012, the Baird LargeCap Fund and the Baird MidCap Fund utilized capital loss carryovers of $1,225,325 and $0, respectively.
Under the Regulated Investment Company Modernization Act of 2010, the Funds are permitted to carry forward capital losses incurred in taxable years beginning after December 22, 2010 for an unlimited period. However, any losses incurred during those future taxable years will be required to be utilized prior to the losses incurred in pre-enactment taxable years. As a result of this, pre-enactment capital loss carryforwards may be more likely to expire unused. Additionally, post-enactment capital losses that are carried forward will retain their character as either short-term or long-term capital losses rather than being considered all short-term as under previous law.
During the year ended December 31, 2012, the Funds paid the following dividends:
| Ordinary Income Dividends | Net Capital Gain | |
| Baird LargeCap Fund | $ 87,833 | $ — |
| Baird MidCap Fund | 696,185 | 1,164,023 |
| Baird SmallCap Value Fund | 115,676 | 1,880 |
The Funds designated as long-term capital gain dividend, pursuant to Internal Revenue Code Section 852(b)(3), the amount necessary to reduce the earnings and profits of the Funds related to net capital gain to zero for the tax year ended December 31, 2012. To the extent necessary to fully distribute such capital gains, the MidCap Fund also designated earnings and profits distributed to shareholders on the redemption of shares.
Page 49
Notes to the Financial Statements
December 31, 2012
4.Investment Transactions and Income Tax Information (cont.)
During the year ended December 31, 2011, the Funds paid the following dividends:
| Ordinary Income Dividends | Net Capital Gain | |
| Baird LargeCap Fund | $26,841 | $ — |
| Baird MidCap Fund | — | 2,380,733 |
5.Investment Advisory and Other Agreements
The Funds have entered into an Investment Advisory Agreement with Baird for the provision of investment advisory services. Pursuant to the Investment Advisory Agreement, the Advisor is entitled to receive a fee, calculated daily and payable monthly, at the annual rate of 0.65% for the Baird LargeCap Fund, 0.75% for the Baird MidCap Fund and 0.85% for the Baird SmallCap Value Fund as applied to the respective Fund’s average daily net assets. Certain officers of the Advisor are also officers of the Funds.
For the year ended December 31, 2012 and through April 30, 2014, the Advisor has contractually agreed to waive its investment advisory fee and/or reimburse the Funds’ operating expenses (exclusive of brokerage, taxes, and extraordinary expenses) to the extent necessary to ensure that each Fund’s annual operating expenses do not exceed the following percentages of average daily net assets:
| Institutional Class Shares | Investor Class Shares | |
| Baird LargeCap Fund | 0.75% | 1.00% |
| Baird MidCap Fund | 0.85% | 1.10% |
| Baird SmallCap Value Fund | 1.00% | 1.25% |
To the extent that the Advisor reimburses or absorbs fees and expenses, it may seek payment of such amounts for three years after the year in which expenses were reimbursed or absorbed. A Fund will make no such payment, however, if its total annual operating expenses exceed the expense limits in effect at the time the expenses were reimbursed or at the time these payments are proposed.
| Fiscal Year Ended December 31, | ||||||||||||
| 2012 | 2011 | 2010 | ||||||||||
| Reimbursed/Absorbed Expenses Subject | ||||||||||||
| to Recovery by Advisor Until: | 2015 | 2014 | 2013 | |||||||||
| Baird LargeCap Fund | $ | 141,680 | $ | 136,264 | $ | 136,939 | ||||||
| Baird MidCap Fund | $ | 153,676 | $ | 136,295 | $ | 133,302 | ||||||
Baird SmallCap Value Fund(1) | $ | 91,176 | N/A | N/A | ||||||||
| (1) | Amount shown reflects expense reimbursements made by the Advisor from May 1, 2012 (commencement of operations) through December 31, 2012. |
U.S. Bancorp Fund Services, LLC serves as transfer agent, administrator, and accounting services agent for the Funds. U.S. Bank, N.A. serves as custodian for the Funds.
Robert W. Baird & Co. Incorporated (the “Distributor”) is the sole distributor of the Funds pursuant to a distribution agreement.
No commissions were earned by the Distributor for services rendered as a registered broker-dealer in securities transactions for the Baird LargeCap Fund and Baird MidCap Fund for the year ended December 31, 2012 and the Baird SmallCap Value Fund from May 1, 2012 through December 31, 2012.
6.Securities Lending
Each Fund may lend up to one-third of its total assets (including such loans) to borrowers under terms of participation in a securities lending program administered by U.S. Bank N.A., the Funds’ custodian and an
Page 50
Notes to the Financial Statements
December 31, 2012
6.Securities Lending (cont.)
affiliate of the Funds’ transfer agent and administrator. The securities lending agreement requires that loans are collateralized at all times in an amount equal to at least 102% of the market value of any loaned securities at the time of the loan, plus accrued interest.
The Funds receive compensation in the form of fees and earn interest on the cash collateral. The amount of fees depends on a number of factors including the type of security and length of the loan. Each Fund continues to receive interest payments or dividends on the securities loaned during the borrowing period. Each Fund has the right under the terms of the securities lending agreement to recall the securities from the borrower on demand.
As of December 31, 2012, the Baird LargeCap and Baird MidCap Funds had loaned securities that were collateralized by cash equivalents. The cash collateral is invested by the custodian in accordance with approved investment guidelines. Those guidelines require the cash collateral to be invested in readily marketable, high quality, short-term obligations; however, such investments are subject to risk of payment delays or default on the part of the issuer or counterparty or otherwise may not generate sufficient interest to support the costs associated with securities lending. A Fund could also experience delays in recovering its securities and possible loss of income or value if the borrower fails to return the borrowed securities, although the Funds are indemnified from this risk by contract with the securities lending agent.
As of December 31, 2012, the market value of the securities on loan and payable on collateral due to broker were as follows:
| Market Value of | Payable on Collateral | |||||||
| Securities on Loan | due to Broker | |||||||
| Baird LargeCap Fund | $ | 1,809,973 | $ | 1,831,108 | ||||
| Baird MidCap Fund | $ | 27,281,363 | $ | 27,507,686 | ||||
| Baird SmallCap Value Fund | $ | — | $ | — | ||||
The Funds receive cash as collateral in return for securities lent as part of the securities lending program. The collateral is invested in the Mount Vernon Securities Lending Prime Portfolio (a securities lending trust subject to Rule 2a-7 under the 1940 Act), other than a legacy interest in Atlantic East Funding LLC. The schedules of investments for the Funds include the particular cash collateral holdings as of December 31, 2012.
The Funds’ interest in Atlantic East Funding LLC is priced at fair value by the Valuation Committee of the Advisor. The fair value of the Funds’ interest in Atlantic East Funding LLC is based on the underlying market values of the securities owned by Atlantic East Funding LLC, which are determined by independent pricing sources. In addition, the Funds’ transfer agent and administrator and securities lending agent entered into a support agreement with the Funds to cover potential losses realized by the Funds on their investment in Atlantic East Funding LLC (up to a certain amount). The amounts agreed to be provided to the Funds under the support agreement are shown in the Funds’ schedules of investments and statements of assets and liabilities. At December 31, 2012, the fair value of the Funds’ interest in Atlantic East Funding LLC, plus the amounts payable under the support agreement, amounted to 100% of the outstanding par value of the Funds’ interest in Atlantic East Funding LLC.
The interest income earned by the Funds on investments of cash collateral received from borrowers for the securities loaned to them (“securities lending income”) is reflected in the Funds’ statements of operations. Interest income earned on collateral investments and recognized by the Funds during the year ended December 31, 2012 for the Baird LargeCap Fund and Baird MidCap Fund was $2,453 and $15,771. The SmallCap Value Fund has not participated in the securities lending program since the Fund’s inception on May 1, 2012.
Page 51
Notes to the Financial Statements
December 31, 2012
7.Line of Credit
The Corporation maintains an uncommitted, senior secured line of credit (“LOC”) with U.S. Bank, N.A. (the “Bank”) to provide the Funds a temporary liquidity source to meet unanticipated redemptions. Under the terms of the LOC, borrowings for each Fund are limited to one-third of the total assets (including the amount borrowed) of the respective Fund, or as otherwise indicated within the Funds’ agreement with the Bank. The Bank charged interest at the Bank’s Prime Rate less 1% for the period January 1 through May 17 and the Bank’s Prime Rate less 2% since May 18 (weighted average rate of 1.63% during 2012). For the year ended December 31, 2012, the Baird LargeCap Fund, Baird MidCap Fund and Baird SmallCap Value Fund did not borrow on the LOC.
8.Distribution and Shareholder Service Plan
The Funds have adopted a distribution and shareholder service plan (the “Plan”) pursuant to Rule 12b-1 under the 1940 Act. The Plan allows the Funds to compensate the Distributor for the costs incurred in distributing the Funds’ Investor Class Shares, including amounts paid to brokers or dealers, at an annual rate of 0.25% of the average daily net assets of the Funds’ Investor Class Shares. The Baird LargeCap Fund, Baird MidCap Fund and Baird SmallCap Value Fund incurred $676, $104,752 and $193, respectively, in fees pursuant to the Plan during the year ended December 31, 2012.
9.Subsequent Event
In preparing these financial statements, the Corporation has evaluated subsequent events after December 31, 2012 through the date the financial statements were issued. There were no subsequent events since December 31, 2012 that would require adjustment to or additional disclosure in these financial statements.
Page 52
Report of Independent Registered Public
Accounting Firm
Board of Directors and Shareholders
Baird Funds, Inc.
We have audited the accompanying statements of assets and liabilities of Baird LargeCap Fund, Baird MidCap Fund and Baird SmallCap Value Fund (three of the eight funds constituting Baird Funds, Inc.) (collectively the “Funds”), including the schedules of investments, as of December 31, 2012 and the related statements of operations for the year then ended, the statements of changes in net assets for each of the two years in the period then ended, and the financial highlights for each of the five years in the period then ended for the Baird LargeCap Fund and Baird MidCap Fund and the statement of operations, statement of changes in net assets and financial highlights for the period from May 1, 2012 (inception) to December 31, 2012 for the Baird SmallCap Value Fund. These financial statements and financial highlights are the responsibility of the Funds’ management. Our responsibility is to express an opinion on these financial statements and financial highlights based on our audits.
We conducted our audits in accordance with the standards of the Public Company Accounting Oversight Board (United States). Those standards require that we plan and perform the audit to obtain reasonable assurance about whether the financial statements and financial highlights are free of material misstatement. The Funds are not required to have, nor were we engaged to perform an audit of its internal control over financial reporting. Our audits included consideration of internal control over financial reporting as a basis for designing audit procedures that are appropriate in the circumstances, but not for the purpose of expressing an opinion on the effectiveness of the Funds’ internal control over financial reporting. Accordingly, we express no such opinion. An audit includes examining, on a test basis, evidence supporting the amounts and disclosures in the financial statements. Our procedures included confirmation of securities owned as of December 31, 2012, by correspondence with the custodian and brokers. An audit also includes assessing the accounting principles used and significant estimates made by management, as well as evaluating the overall financial statement presentation. We believe that our audits provide a reasonable basis for our opinion.
In our opinion, the financial statements and financial highlights referred to above present fairly, in all material respects, the financial position of each of the aforementioned Funds of Baird Funds, Inc. as of December 31, 2012, and the results of their operations, the changes in their net assets, and the financial highlights for the periods indicated above, in conformity with accounting principles generally accepted in the United States of America.
Chicago, Illinois
February 27, 2013
Page 53
Directors & Officers
As of December 31, 2012
G. Frederick Kasten, Jr.
Independent Director and Chairman
Term of Office: Indefinite
Length of Time Served: Since September 2000
Age: 73
c/o Robert W. Baird & Co. Incorporated
777 East Wisconsin Avenue
Milwaukee, WI 53202
Principal Occupation(s) During the Past 5 Years: Retired; Chairman, the Advisor (January 2000-December 2005); Chairman and CEO, the Advisor (January 1998-January 2000); President, Chairman and CEO, the Advisor (June 1983-January 1998); President, the Advisor (January 1979-January 1983)
Number of Portfolios in Complex Overseen by Director: 8
Other Directorships Held by Director: None
John W. Feldt
Independent Director
Term of Office: Indefinite
Length of Time Served: Since September 2000
Age: 70
c/o University of Wisconsin Foundation
1848 University Avenue
Madison, WI 53726
Principal Occupation(s) During the Past 5 Years: Retired; Senior Vice President-Finance, University of Wisconsin Foundation (1985-2006); Vice President-Finance, University of Wisconsin Foundation (1980-1985); Associate Director, University of Wisconsin Foundation (1967-1980)
Number of Portfolios in Complex Overseen by Director: 8
Other Directorships Held by Director: Director of Thompson Plumb Funds, Inc., a mutual fund complex (3 portfolios)
Frederick P. Stratton, Jr.
Independent Director
Term of Office: Indefinite
Length of Time Served: Since May 2004
Age: 73
c/o Robert W. Baird & Co. Incorporated
777 East Wisconsin Avenue
Milwaukee, WI 53202
Principal Occupation(s) During the Past 5 Years: Retired; Chairman Emeritus, Briggs & Stratton Corporation, a manufacturing company, since 2003; Chairman of the Board, Briggs & Stratton Corporation (2001-2002); Chairman and CEO, Briggs & Stratton Corporation (1986-2001)
Number of Portfolios in Complex Overseen by Director: 8
Other Directorships Held by Director: Director of Weyco Group, Inc., a men’s footwear distributor.
Marlyn J. Spear, CFA
Independent Director
Term of Office: Indefinite
Length of Time Served: Since January 2008
Age: 59
c/o Robert W. Baird & Co. Incorporated
777 East Wisconsin Avenue
Milwaukee, WI 53202
Principal Occupation(s) During the Past 5 Years: Chief Investment Officer, Building Trades United Pension Trust Fund, since July 1989; Investment Officer, Northwestern Mutual Financial Network (1988-1989); Assistant Vice-President, Firstar Trust Company (1978-1987); Financial Analyst, Harco Holdings, Inc. (1976-1978)
Number of Portfolios in Complex Overseen by Director: 8
Other Directorships Held by Director: Management Trustee of AFL-CIO Housing Investment Trust, a mutual fund complex (1 portfolio)
Page 54
Directors & Officers
As of December 31, 2012
Cory L. Nettles*
Interested Director
Term of Office: Indefinite
Length of Time Served: Since January 2008
Age: 42
c/o Generation Growth Capital, Inc.
411 East Wisconsin Avenue, Suite 1710
Milwaukee, WI 53202
Principal Occupation(s) During the Past 5 Years: Managing Director, Generation Growth Capital, Inc., a private equity fund, since March 2007; Of Counsel, Quarles & Brady LLP, a law firm, since January 2005; Secretary, Wisconsin Department of Commerce (January 2003 – January 2005)
Number of Portfolios in Complex Overseen by Director: 8
Other Directorships Held by Director: Director of Weyco Group, Inc., a men’s footwear distributor
Mary Ellen Stanek
President
Term of Office: Re-elected by Board annually
Length of Time Served: Since September 2000
Age: 56
777 East Wisconsin Avenue
Milwaukee, WI 53202
Principal Occupation(s) During the Past 5 Years: Managing Director, the Advisor, and Chief Investment Officer, Baird Advisors, a department of the Advisor, since March 2000
Charles B. Groeschell
Vice President
Term of Office: Re-elected by Board annually
Length of Time Served: Since January 2010
Age: 59
777 East Wisconsin Avenue
Milwaukee, WI 53202
Principal Occupation(s) During the Past 5 Years: Managing Director, the Advisor, and Senior Portfolio Manager, Baird Advisors, a department of the Advisor, since February 2000
Todd S. Nichol
Vice President and Chief Compliance Officer
Term of Office: Re-elected by Board annually
Length of Time Served: Since August 2004
Age: 50
777 East Wisconsin Avenue
Milwaukee, WI 53202
Principal Occupation(s) During the Past 5 Years: Chief Compliance Officer, the Advisor since October 2004; Assistant Compliance Director, the Advisor since August 2002; Senior Vice President, the Advisor since January 2005; First Vice President, the Advisor (January 2004-January 2005)
Dominick P. Zarcone
Treasurer
Term of Office: Re-elected by Board annually
Length of Time Served: Since March 2011
Age: 54
777 East Wisconsin Avenue
Milwaukee, WI 53202
Principal Occupation(s) During the Past 5 Years: Chief Financial Officer, the Advisor since March 2011; Chief Operating Officer-Investment Banking, the Advisor (June 2004-March 2011); Managing Director, the Advisor since February 1995
Charles M. Weber
Secretary
Term of Office: Re-elected by Board annually
Length of Time Served: Since September 2005
Age: 49
777 East Wisconsin Avenue
Milwaukee, WI 53202
Principal Occupation(s) During the Past 5 Years: Managing Director, the Advisor since January 2009; Senior Vice President, the Advisor (July 2005-December 2008); Associate General Counsel, the Advisor since July 2005; Partner, Quarles & Brady LLP, a law firm (October 1998-June 2005)
Page 55
Directors & Officers
As of December 31, 2012
Peter J. Hammond
Vice President
Term of Office: Re-elected by Board annually
Length of Time Served: Since August 2012
Age: 49
777 East Wisconsin Avenue
Milwaukee, WI 53202
Principal Occupation(s) During the Past 5 Years:
Senior Vice President, the Advisor since March 2012; Executive VP and Chief Administrative Officer, UMB Fund Services (September 1996 to March 2012).
Dustin J. Hutter
Assistant Treasurer
Term of Office: Re-elected by Board annually
Length of Time Served: Since February 2011
Age: 36
777 East Wisconsin Avenue
Milwaukee, WI 53202
Principal Occupation(s) During the Past 5 Years: Senior Vice President, the Advisor since January 2011; First Vice President, the Advisor (January 2008-December 2010); Vice President, the Advisor (January 2006-December 2007); Assistant Controller, the Advisor since January 2006
Andrew D. Ketter
Assistant Secretary
Term of Office: Re-elected by Board annually
Length of Time Served: Since February 2011
Age: 38
777 East Wisconsin Avenue
Milwaukee, WI 53202
Principal Occupation(s) During the Past 5 Years: First Vice President and Associate General Counsel, the Advisor since September 2010; Associate, Quarles & Brady LLP, a law firm (September 2002-August 2010)
| * | Mr. Nettles is considered an “interested person” of the Corporation (as defined in the 1940 Act) because of his association with the law firm, Quarles & Brady LLP, which provides legal services to the Advisor. The legal services that Quarles & Brady LLP has provided to the Advisor include litigation, real estate, trademark and miscellaneous securities related matters that did not relate to the Corporation or the Funds. |
Additional information about the Funds’ directors is available in the Statement of Additional Information which may be obtained without charge, upon request, by calling 1-866-44BAIRD, or at www.bairdfunds.com.
Page 56
Baird Funds, Inc.
Disclosure Regarding the Board of Directors’ Approval of the Investment Advisory Agreement for the Baird Equity Funds
The Board of Directors (the “Board”) of Baird Funds, Inc. (the “Corporation”), including the directors who are not “interested persons” of the Corporation within the meaning of the Investment Company Act of 1940 (the “Independent Directors”), met on August 17 and August 23, 2012 to consider the annual renewal of the investment advisory agreement between Robert W. Baird & Co. Incorporated (“Baird” or the “Advisor”) and the Corporation on behalf of the Baird LargeCap and MidCap Funds (the “Funds”). The Board, including the Independent Directors, approved the investment advisory agreement through a process that concluded at the August 23, 2012 meeting. In connection with its consideration of the investment advisory agreement, the Board reviewed and discussed various information, including the investment advisory agreement, memoranda provided by outside legal counsel and the Secretary of the Funds discussing the Board’s fiduciary obligations and factors the Board should assess in considering the renewal of the investment advisory agreement, information in response to requests from the Board from the Advisor (including the Advisor’s Form ADV, Form BD, annual report and financial statements), a profitability analysis, comparative information about the Funds’ performance for periods ended June 30, 2012, management fees and expense ratios and other pertinent information. The Board also discussed relevant case law.
The Independent Directors met separately in executive session with legal counsel to consider the investment advisory agreement. The Board discussed the Advisor’s 15(c) response and supplemental information requested by the Board with the President of the Funds. The Board also took into account information reviewed periodically throughout the year that was relevant to its consideration of the investment advisory agreement, including performance, management fee and other expense information and discussions with the Funds’ portfolio managers. Based on its evaluation of this information, the Board, including a majority of the Independent Directors, approved the continuation of the investment advisory agreement for an additional one-year period.
In considering the investment advisory agreement and reaching its conclusions, the Board reviewed and analyzed various factors that it determined were relevant, including the factors below. In deciding to approve the investment advisory agreement for each Fund, the Board did not identify any single factor as determinative but considered all factors together.
Nature, Extent and Quality of Services Provided to the Funds
The Board analyzed the nature, extent and quality of the services provided by the Advisor to the Funds. The Board reviewed and considered the Advisor’s significant role in establishing the Funds and the construction of their investment objectives, principal strategies, investment limitations and fee structures. The Board noted the Advisor’s overall reputation and positive name recognition, the depth of the Advisor’s personnel, resources and commitment to the Funds, and the experience, credentials and continuity of the portfolio management teams employed to manage the Funds’ investments. The Board further noted that the Advisor has over $27 billion of assets under discretionary management and has strong relationships with numerous institutional accounts. The Funds provide an opportunity for smaller institutional and retail accounts to receive the same professional advice from the Advisor that it offers to its larger institutional clients. However, the Board noted that the provision of investment advisory services to the Funds requires more effort than it does for separately managed accounts due to daily sales and redemption activity and additional regulatory and compliance requirements.
The Board considered the Advisor’s disciplined investment decision-making process used for the Funds. The Board also considered other services that the Advisor provided for the Funds in its capacity as their investment advisor, such as making some of its key personnel available to serve as officers of the Funds, selecting broker-dealers for execution of portfolio transactions, ensuring adherence to the Funds’ investment policies and restrictions, compliance, risk management services, valuation, providing support services to the Board and the Audit Committee of the Board and overseeing the Funds’ other service providers. The Board further noted that the Advisor, in its capacity as a registered broker-dealer, also serves as distributor and principal underwriter of shares of the Funds and spends time and effort marketing the Funds. The Board also considered the strength of the
Page 57
Baird Funds, Inc.
Disclosure Regarding the Board of Directors’ Approval of the Investment Advisory Agreement for the Baird Equity Funds (cont.)
Advisor’s compliance department, including the Funds’ chief compliance officer, and the fact that the Advisor has not experienced any significant legal, compliance or regulatory difficulties since the Funds were launched. The Board reviewed a summary of the Advisor’s risk management tools and process. The Board concluded that the nature, extent and quality of the services provided by the Advisor to the Funds were appropriate and that each Fund was likely to continue to benefit from services provided under the respective investment advisory agreement.
Investment Performance of the Advisor and the Funds
In considering the investment performance of each of the Funds, the Board reviewed information as of June 30, 2012 regarding the Funds’ performance in comparison to various benchmark indices and their peer groups as determined by Lipper. The Board noted that the Baird LargeCap Fund (Institutional Class shares) had outperformed the Lipper peer group average for the one-year, three-year and five-year periods, but lagged the average for the ten-year period and lagged its benchmark index for these periods. The Board also considered the effect of the challenging market environment and Advisor’s quarterly commentary and discussion of the reasons for the LargeCap Fund’s underperformance during such periods. The Board noted that the performance of the Baird Midcap Fund (both Institutional and Investor Class) had exceeded its Lipper peer group average for the one-year, three-year, five-year and ten-year periods and had exceeded its benchmark index for the same periods except for the ten-year period.
The Board also considered the Advisor’s quarterly portfolio commentaries and reviews explaining the Funds’ performance, the Advisor’s consistent and disciplined investment decision process and the investment strategies it employs for the Funds. After considering all of the information, the Board concluded that, although past performance is not a guarantee of future results, each Fund and its shareholders were likely to benefit from the continued management by the Advisor.
Costs of Services Provided and Profits Realized by the Advisor
The Board examined the fee and expense information for each of the Funds, including a comparison of such information to other similarly situated mutual funds as determined by Morningstar. The Board noted that each Fund’s advisory fee was comparable to the average and median for all mutual funds in its Morningstar category. The Board also reviewed and considered management fees charged by the Advisor to other investment advisory clients and found that the investment management fee paid by the Funds was 10 basis points (or 0.10%) less than what the Advisor charges on the first $5 million of a separately managed account. The Board recognized the extent of the significant additional services provided to each Fund that the Advisor did not provide to its other clients, such as certain administrative services, oversight of the Fund’s other service providers, director support, risk management, regulatory compliance and various other services.
The Board also examined the total expense ratio of each Fund relative to all other mutual funds in its Morningstar category. The Board noted that each Fund’s total expense ratio (both for its Institutional and Investor Class shares), after fee waivers and expense reimbursements by the Advisor, was not only lower than the average and median expense ratios for all funds in its Morningstar category, but in the lowest or second lowest quartile.
The Board considered the fees realized, and the costs incurred, by the Advisor in providing investment management services to the Funds and the profitability to the Advisor of having a relationship with the Funds. The Board noted that the Advisor had waived significant fees and/or reimbursed expenses for the Funds since their respective inception dates.
The Board concluded that the profits realized by the Advisor from its relationship with the Funds were appropriate. The Board noted that the Advisor’s profitability information does not reflect certain internal resources provided by the Advisor to the Funds, such as legal and compliance support. The Board reviewed and considered the general financial condition of the Advisor and determined it to be sound. The Board also reviewed a report regarding revenue sharing payments, noting that any payments by the Advisor to third party platforms
Page 58
Baird Funds, Inc.
Disclosure Regarding the Board of Directors’ Approval of the Investment Advisory Agreement for the Baird Equity Funds (cont.)
were made from the Advisor’s profits. In light of all of the information that it received and considered, the Board concluded that the management fee and total expense ratio of each Fund were reasonable.
Economies of Scale and Fee Levels Reflecting Those Economies
The Board noted that the Funds’ advisory fee structure does not contain any breakpoint reductions as the Funds grow in size. However, the Board recognized that the Advisor has been waiving fees and/or reimbursing expenses for the Funds since their inception. The Board also recognized that the advisory fee rates paid by the Funds were designed to be lower than the fees otherwise charged by the Advisor to its separately managed account clients and to be comparable to the second or third breakpoint advisory fee levels paid by other comparable mutual funds.
The directors concluded that the current fee structure of each Fund was reasonable and that breakpoint reductions may be considered in the future depending on Fund asset levels.
Benefits Derived from the Relationship with the Funds
The Board noted that the Advisor derives ancillary benefits from its association with the Funds, in the form of research products and services received from unaffiliated broker-dealers who execute portfolio trades for the Funds. However, the Board determined such products and services have been used for legitimate purposes relating to the Funds by providing assistance in the investment decision-making process. The Board believed that the Funds generally benefit from their association with the Advisor and the use of the “Baird” name. The Board concluded that the other benefits realized by the Advisor from its relationship with the Funds were appropriate.
Based on its evaluation of the above factors, as well as other factors relevant to their consideration of the investment advisory agreement, the directors, including all of the Independent Directors, concluded that the continuation of the investment advisory agreement was in the best interest of each Fund and its shareholders.
Page 59
Baird Funds, Inc.
Disclosure Regarding the Board of Directors’ Approval of the Investment Advisory Agreement for the Baird SmallCap Value Fund
The Board of Directors (the “Board”) of Baird Funds, Inc. (the “Corporation”), including the Directors who are not “interested persons” of the Corporation as defined in the Investment Company Act of 1940, as amended (the “Independent Directors”), met on February 28, 2012 to consider the approval of the investment advisory agreement between Robert W. Baird & Co. Incorporated (the “Advisor”) and the Corporation on behalf of the Baird SmallCap Value Fund (the “SmallCap Value Fund”), a new portfolio of the Corporation. The Advisor’s small cap value team and the Fund’s portfolio manager, Michelle E. Stevens, had been introduced to the Board at its January 30, 2012 meeting, at which time Ms. Stevens made a presentation regarding the team, the prior experience of the team’s principals and their investment philosophy.
The Independent Directors met separately in executive session with Fund legal counsel to review and consider the information provided by the Advisor regarding the investment advisory agreement for the Fund. The Board considered, among other factors, the Advisor’s long-term relationship with the Corporation and the services the Adviser provides for other funds of the Corporation. The Board reviewed and discussed various information, including the investment advisory agreement, memorandum prepared by legal counsel summarizing the guidelines relevant to the Board of Directors’ consideration of the investment advisory agreement with respect to the Fund and the Advisor’s 15(c) response to the request for information from the directors, including a memorandum from the Advisor, information about the Fund’s investment strategies and principal investments, performance information and financial information. The Board also reviewed the fee that would be payable by the Fund under the advisory agreement, the proposed expense cap agreement between the Corporation and the Advisor on behalf of the Fund and comparative fee and expense information provided by an independent third party.
Based on their review, the directors concluded that it was in the best interests of the SmallCap Value Fund to approve the investment advisory agreement. In considering the investment advisory agreement and reaching its conclusions, the Board reviewed and analyzed various factors that it determined were relevant, including the factors below. In deciding to approve the investment advisory agreement for the SmallCap Value Fund, the Board did not identify any single factor as determinative but considered all factors together.
Nature, Extent and Quality of Services to be Provided to the Fund
The Board analyzed the nature, extent and quality of the services to be provided by the Advisor to the Fund. The Board considered the background and experience of the Fund’s portfolio manager and other personnel on the Advisor’s small cap value team. The Board discussed the Advisor’s responsibilities for monitoring the Fund’s compliance with applicable requirements under the securities laws. The Board further noted that the Advisor, in its capacity as a registered broker-dealer, was proposed to serve as distributor and principal underwriter of shares of the Fund. The Board also considered other services the Advisor would provide the Fund, such as providing compliance support and overseeing the Fund’s other service providers. The Board concluded that the nature, extent and quality of the services to be provided by the Advisor to the Fund were appropriate and that the Fund was likely to benefit from services provided under the investment advisory agreement.
Investment Performance
Because the Fund had not yet commenced operations, the Board did not consider any performance information with respect to the Fund. However, the Board reviewed performance information for the small cap value composite for the periods ended December 31, 2011, noting that performance history prior to December 31, 2011 was achieved at predecessor firms. The Board concluded that, although past performance is not a guarantee of future results, the Fund and its shareholders were likely to benefit from the Advisor’s management.
Costs of Services Provided and Profitability
The Board examined the proposed fee and expense information for the Fund, including a comparison of such information to other similarly situated mutual funds as determined by Lipper. The Board noted that the Fund’s
Page 60
Baird Funds, Inc.
Disclosure Regarding the Board of Directors’ Approval of the Investment Advisory Agreement for the Baird SmallCap Value Fund (cont.)
advisory fee was in line with the industry average and the Lipper category median and that the Fund’s total expense ratio for the Investor Class was slightly higher while the total expense ratio for the Institutional Class shares was lower than the average and median expense ratio for all mutual funds in the Fund’s Lipper category, after giving effect to the proposed expense cap agreement. The Board also reviewed and considered advisory fees charged by the Advisor to other investment advisory clients in the Small Cap Value strategy and found that the proposed advisory fee was 10 basis points (or 0.10%) less than what the Advisor charges on the first $20 million of a separately managed account. The Board recognized the extent of the significant additional services to be provided to the Fund that the Advisor does not provide to its other clients, such as certain administrative services, oversight of the Fund’s other service providers, director support, risk management, regulatory compliance and various other services. The Board reviewed and considered the general financial condition of the Advisor and determined it to be sound. The Board considered general information regarding the Advisor and its profitability goals but did not consider any information regarding the costs of services to be provided or the profits the Advisor might realize because the Fund had not yet commenced operations. In light of all of the information that it received and considered, the Board concluded that the proposed management fee and total expense ratio of the Fund were reasonable.
Economies of Scale and Fee Levels Reflecting Those Economies
Because the Fund had not yet commenced operations, the Board did not consider whether any alternative fee structures, such as breakpoint fees, would be appropriate to reflect any economies of scale that may result from increases in the Fund’s assets.
Benefits to be Derived from the Relationship with the Fund
The Board considered other potential benefits to the Advisor from serving as advisor to the Fund (in addition to the advisory fee). The Board noted that the Advisor may receive research products and services from unaffiliated broker-dealers who execute portfolio trades for the Fund. The Board believed that the Fund would generally benefit from its association with the Advisor and the use of the “Baird” name. The Board concluded that other benefits that may be realized by the Advisor from its relationship with the Fund were appropriate.
Based on its evaluation of the above factors, as well as other factors relevant to their consideration of the investment advisory agreement, the directors, including all of the Independent Directors, concluded that the approval of the investment advisory agreement was in the best interest of the SmallCap Value Fund.
Page 61
Additional Information
Proxy Voting
A description of the policies and procedures that the Funds use to determine how to vote proxies relating to portfolio securities is available without charge, upon request, by calling toll free, 1-866-44BAIRD, or by accessing the Funds’ website at www.bairdfunds.com; and by accessing the SEC’s website at www.sec.gov.
Each Fund’s proxy voting record for the most recent 12-month period ended June 30 is available without charge, upon request, by calling toll free, 1-866-44BAIRD, or by accessing the Funds’ website at www.bairdfunds.com; and by accessing the SEC’s website at www.sec.gov.
Portfolio Holdings Disclosure
The Funds file a complete schedule of portfolio holdings with the SEC for the first and third quarters of each fiscal year on Form N-Q. The Funds’ Forms N-Q are available on the SEC’s website at www.sec.gov and may be reviewed and copied at the SEC’s Public Reference Room in Washington, D.C. Information on the operation of the Public Reference Room may be obtained by calling 1-800-732-0330. The Funds’ Forms N-Q may also be obtained by calling toll-free 1-866-44BAIRD.
Qualified Dividend Income/Dividends Received Deduction
For the fiscal year ended December 31, 2012, certain dividends paid by the Funds may be subject to a maximum tax rate of 15%, as provided for by the Jobs and Growth Tax Relief Reconciliation Act of 2003. The percentage of dividends declared from ordinary income designated as qualified dividend income was as follows:
| Baird LargeCap Fund | 100.00% |
| Baird MidCap Fund | 100.00% |
| Baird SmallCap Value Fund | 71.45% |
For corporate shareholders, the percent of ordinary income distributions qualifying for the corporate dividends received deduction for the fiscal year ended December 31, 2012 was as follows:
| Baird LargeCap Fund | 100.00% |
| Baird MidCap Fund | 100.00% |
| Baird SmallCap Value Fund | 63.49% |
Other Tax Information
For the fiscal year ended December 31, 2012, the percentage of taxable ordinary income distributions that are designated as short-term capital gain distributions under Internal Revenue Section 871(k)(2)(C) for each Fund were as follows (unaudited):
| Baird LargeCap Fund | 0.00% |
| Baird MidCap Fund | 0.00% |
| Baird SmallCap Value Fund | 21.24% |
Page 62
(This Page Intentionally Left Blank.)
Baird Funds, Inc. Privacy Policy
Protecting the privacy of Fund shareholders is important to us. The following is a description of the practices and policies through which Baird Funds, Inc. protects the privacy and security of your non-public personal information.
What Information We Collect
We collect and maintain information about you so that we can open and maintain your account in the Funds and provide various services to you. We may collect and maintain the following personal information about you:
| • | Information we receive from you or your financial advisor on account applications or other forms, correspondence, or conversations, such as your name, address, e-mail address, phone number, social security number, assets, income and date of birth; and | |
| • | Information about your transactions with us, our affiliates, or others, such as your account number and balance, positions, activity, history, cost basis information, and other financial information. |
What Information We Disclose
We do not sell any non-public personal information about our current or former shareholders to third parties. We do not disclose any non-public personal information about our current or former shareholders to anyone, except as permitted or required by law. We are permitted by law to share any of the information we collect, as described above, with our affiliates. In addition, we may share such information with nonaffiliated third parties to the extent necessary to effect, process, administer or enforce a transaction that the shareholder requests or authorizes, in connection with maintaining or servicing the shareholder’s account, as requested by regulatory authorities or as otherwise permitted or required by law. For example, we are permitted by law to disclose all of the information we collect, as described above, to our transfer agent to process your transactions. We may also provide your name and address to third party service providers who send account statements and other Fund-related material to you.
How We Protect Your Information
We restrict access to your non-public personal information to those persons who require such information to provide products or services to you. We maintain physical, electronic, and procedural safeguards that comply with federal standards to protect the confidentiality, integrity and security of your non-public personal information.
We will continue to adhere to the privacy policies and practices in this notice even after your account is closed or becomes inactive.
In the event that you hold shares of the Fund(s) through a financial intermediary, including, but not limited to, a broker-dealer, bank, or trust company, the privacy policy of your financial intermediary would govern how your non-public personal information would be shared with nonaffiliated third parties.
Page A-1
Baird Funds, Inc.
c/o U.S. Bancorp Fund Services, LLC
P.O. Box 701
Milwaukee, WI 53201-0701
1-866-44BAIRD
Board of Directors
G. Frederick Kasten, Jr. (Chairman)
John W. Feldt
Cory L. Nettles
Marlyn J. Spear
Frederick P. Stratton, Jr.
Investment Advisor and Distributor
Robert W. Baird & Co. Incorporated
777 East Wisconsin Avenue
Milwaukee, WI 53202
Administrator and Transfer Agent
U.S. Bancorp Fund Services, LLC
P.O. Box 701
615 East Michigan Street
Milwaukee, WI 53202
Custodian
U.S. Bank, N.A.
1555 N. RiverCenter Drive, Suite 302
Milwaukee, WI 53212
Legal Counsel
Godfrey & Kahn, S.C.
780 North Water Street
Milwaukee, WI 53202
Independent Registered Public
Accounting Firm
Grant Thornton LLP
175 West Jackson Boulevard, 20th Floor
Chicago, IL 60604
Item 2. Code of Ethics.
As of the end of the period covered by this report, the Registrant has adopted a code of ethics that applies to the President, Treasurer and Assistant Treasurer of the Registrant. The Registrant has not made any amendments to its code of ethics during the period covered by this report. The Registrant has not granted any waivers from any provisions of the code of ethics during the period covered by this report.
Item 3. Audit Committee Financial Expert.
The Registrant’s board of directors has determined that John W. Feldt, Frederick P. Stratton, Jr., and Marlyn J. Spear, members of the audit committee, each qualify as an “audit committee financial expert” as such term is defined in paragraph (b) of Item 3 of Form N-CSR. Mr. Feldt, Mr. Stratton, and Ms. Spear are each “independent” as such term is defined in paragraph (a)(2) of Item 3 of Form N-CSR.
Item 4. Principal Accountant Fees and Services.
Fees Billed by Grant Thornton LLP. The aggregate fees billed for professional services by Grant Thornton LLP (“GT”) during the last two fiscal years were as follows:
| FYE 12/31/2012 | FYE 12/31/2011 | |
| Audit Fees | $100,800 | $99,960 |
| Audit-Related Fees | - | - |
| Tax Fees | $29,988 | $24,752 |
| All Other Fees | - | - |
In the above table, “audit fees” are fees billed for professional services for the audit of the Registrant’s annual financial statements or for services that are normally provided by the accountant in connection with statutory and regulatory filings or engagements. “Tax fees” are fees billed for professional services rendered for tax compliance, tax advice and tax planning, and specifically relate to GT’s review of the Registrant’s federal and state tax returns.
The audit committee has adopted pre-approval policies and procedures that require the audit committee to pre-approve all audit and non-audit services rendered to the Registrant, as well as all non-audit services provided to the Registrant’s investment adviser and any entity affiliated with the Registrant’s investment adviser with respect to any engagement that relates directly to the operations and financial reporting of the Registrant. In accordance with its policies and procedures, the audit committee pre-approved all audit and tax services provided by GT to the Registrant during fiscal 2012. During the past two fiscal years, the Registrant did not receive any non-audit services from GT pursuant to any waivers of the pre-approval requirement under paragraph (c)(7)(i)(C) of Rule 2-01 of Regulation S-X. All of GT’s hours spent on auditing the Registrant’s financial statements were attributed to work performed by full-time permanent employees of GT.
During the last two fiscal years, GT has served as the auditor to Robert W. Baird & Co. Incorporated (“RWB”), the Registrant’s investment adviser, and has rendered non-audit services to RWB. The non-audit services that GT provided to RWB in 2012 and 2011 consisted of a review of state and federal tax returns, tax and general consulting services and tax services for RWB associates working overseas. GT charged the following amounts for such non-audit services to RWB: $414,768 for 2012 and $457,736 for 2011. None of the non-audit services provided by GT to RWB directly related to the operations or financial reporting of the Registrant. During the last two fiscal years, GT has also provided audit and non-audit services to affiliates of RWB, but those affiliates do not provide ongoing services to the Registrant. Those services include audits of the financial statements of RWB affiliates, investment partnerships (and their management companies) affiliated with RWB and the portfolio companies owned by such partnerships, reviews of tax returns of RWB affiliates and investment partnerships (and their management companies) affiliated with RWB, and advice and consulting services for RWB affiliates. The Audit Committee has concluded that the provision of these audit and non-audit services to RWB and RWB affiliates is compatible with GT’s independence.
Item 5. Audit Committee of Listed Registrants.
Not applicable because the Registrant is not a “listed issuer” within the meaning of Rule 10A-3 under the Securities Exchange Act of 1934.
Item 6. Schedule of Investments.
| Baird Short-Term Bond Fund | |||||||
| Schedule of Investments | |||||||
| December 31, 2012 | |||||||
| Principal Amount | Value | ||||||
| LONG-TERM INVESTMENTS - 96.5% | |||||||
| U.S. Treasury Obligations - 7.0% | |||||||
| $ | 85,700,000 | U.S. Treasury Bonds, | |||||
| 2.375%, 03/31/2016 @ | $ | 91,109,813 | |||||
| 91,109,813 | |||||||
| Taxable Municipal Bonds - 2.8% | |||||||
| 1,000,000 | Alaska Municipal Bond Bank Authority, | ||||||
| 1.918%, 08/01/2013 | 1,006,630 | ||||||
| 1,170,000 | City of Arlington TX, | ||||||
| 4.680%, 08/15/2013 | 1,194,745 | ||||||
| 1,240,000 | City of Des Moines IA, | ||||||
| 2.587%, 06/01/2013 | 1,245,344 | ||||||
| 3,000,000 | City of Frederick MD, | ||||||
| 4.520%, 03/01/2013 | 3,017,550 | ||||||
| City of Trenton NJ: | |||||||
| 1,440,000 | 1.430%, 04/01/2015 | 1,438,401 | |||||
| 1,470,000 | 1.722%, 04/01/2016 | 1,467,222 | |||||
| 6,200,000 | County of Miami-Dade FL Aviation Revenue, | ||||||
| 5.000%, 10/01/2016 | 6,969,730 | ||||||
| 229,232 | Educational Enhancement Funding Corporation, | ||||||
| 6.720%, 06/01/2025 | 234,839 | ||||||
| 6,450,000 | Government Development Bank for Puerto Rico, | ||||||
| 3.670%, 05/01/2014 | 6,428,264 | ||||||
| Illinois State: | |||||||
| 545,000 | 4.071%, 01/01/2014 | 560,980 | |||||
| 1,700,000 | 3.636%, 02/01/2014 | 1,738,386 | |||||
| 2,030,000 | 4.422%, 04/01/2015 | 2,101,882 | |||||
| 1,110,000 | 4.961%, 03/01/2016 | 1,215,794 | |||||
| 2,000,000 | 5.090%, 04/01/2017 | 2,198,400 | |||||
| 5,000,000 | Michigan Strategic Fund, | ||||||
| 4.500%, 12/01/2013 | 5,181,950 | ||||||
| 165,000 | Tobacco Settlement Authority Iowa, | ||||||
| 6.500%, 06/01/2023 (Callable 06/01/2015) | 162,421 | ||||||
| 36,162,538 | |||||||
| Other Government Related Securities - 1.6% | |||||||
| 2,500,000 | Corp Andina de Fomento, | ||||||
| 5.200%, 05/21/2013 f | 2,538,565 | ||||||
| 725,000 | Korea Development Bank, | ||||||
| 5.300%, 01/17/2013 f | 726,161 | ||||||
| 1,987,000 | Korea Electric Power Corporation, | ||||||
| 7.750%, 04/01/2013 f | 2,018,351 | ||||||
| 3,805,000 | Korea Southern Power Co., Ltd., | ||||||
| 5.375%, 04/18/2013 (Acquired 02/22/2011, Cost $3,838,406) * f | 3,848,411 | ||||||
| Petrobras International Finance Company: f | |||||||
| 1,000,000 | 2.875%, 02/06/2015 @ | 1,026,095 | |||||
| 5,200,000 | 3.875%, 01/27/2016 | 5,486,016 | |||||
| 5,270,000 | Petroleos Mexicanos, | ||||||
| 4.875%, 03/15/2015 f @ | 5,678,425 | ||||||
| 21,322,024 | |||||||
| Corporate Bonds - 74.1% | |||||||
| Industrials - 28.0% | |||||||
| 3,000,000 | AbbVie Inc., | ||||||
| 1.750%, 11/06/2017 (Acquired 11/05/2012, Cost $2,993,730) * | 3,032,631 | ||||||
| American Honda Finance Corporation: | |||||||
| 2,000,000 | 1.450%, 02/27/2015 (Acquired 02/21/2012, Cost $1,998,940) * | 2,031,904 | |||||
| 5,000,000 | 1.000%, 08/11/2015 (Acquired 09/04/2012, Cost $4,989,550) * | 5,028,185 | |||||
| 2,775,000 | Amgen Inc., | ||||||
| 1.875%, 11/15/2014 | 2,837,909 | ||||||
| Anadarko Petroleum Corporation: | |||||||
| 5,000,000 | 5.750%, 06/15/2014 @ | 5,319,955 | |||||
| 500,000 | 5.950%, 09/15/2016 | 575,566 | |||||
| Anglo American Capital PLC: f | |||||||
| 6,900,000 | 2.150%, 09/27/2013 (Acquired 09/20/2010 through 03/21/2012, Cost $6,902,572) * | 6,948,928 | |||||
| 900,000 | 9.375%, 04/08/2014 (Acquired 03/23/2012 through 06/19/2012, Cost $984,643) * | 989,388 | |||||
| ArcelorMittal: f | |||||||
| 2,500,000 | 5.375%, 06/01/2013 @ | 2,525,103 | |||||
| 341,000 | 9.500%, 02/15/2015 | 379,476 | |||||
| 1,000,000 | 4.250%, 02/25/2015 | 1,010,062 | |||||
| 1,525,000 | 4.250%, 08/05/2015 @ | 1,540,363 | |||||
| 3,000,000 | Barrick Gold Corporation, | ||||||
| 1.750%, 05/30/2014 f | 3,041,901 | ||||||
| 775,000 | BP Capital Markets PLC, | ||||||
| 3.200%, 03/11/2016 f | 826,710 | ||||||
| 1,000,000 | British Telecommunications PLC, | ||||||
| 1.434%, 12/20/2013 f | 1,008,288 | ||||||
| Bunge Limited Finance Corporation: | |||||||
| 6,550,000 | 5.350%, 04/15/2014 | 6,892,342 | |||||
| 1,520,000 | 5.100%, 07/15/2015 | 1,645,593 | |||||
| 425,000 | Bunge N.A. Finance L.P., | ||||||
| 5.900%, 04/01/2017 | 482,535 | ||||||
| 5,324,000 | Cadbury Schweppes U.S. Finance LLC, | ||||||
| 5.125%, 10/01/2013 (Acquired 09/03/2010 through 02/07/2012, Cost $5,474,862) * | 5,479,077 | ||||||
| 2,300,000 | CNPC HK Overseas Capital Ltd, | ||||||
| 3.125%, 04/28/2016 (Acquired 12/18/2012, Cost $2,399,742) * f | 2,396,524 | ||||||
| 1,000,000 | Computer Sciences Corporation, | ||||||
| 2.500%, 09/15/2015 | 1,019,656 | ||||||
| 3,840,000 | ConAgra Foods Inc., | ||||||
| 1.350%, 09/10/2015 | 3,839,881 | ||||||
| COX Communications Inc.: | |||||||
| 455,000 | 5.450%, 12/15/2014 | 496,216 | |||||
| 2,000,000 | 7.250%, 11/15/2015 | 2,290,992 | |||||
| 1,535,000 | CRH America, Inc., | ||||||
| 6.000%, 09/30/2016 | 1,724,764 | ||||||
| Daimler Finance North America LLC: | |||||||
| 1,750,000 | 6.500%, 11/15/2013 | 1,837,042 | |||||
| 3,600,000 | 2.300%, 01/09/2015 (Acquired 01/04/2012, Cost $3,595,464) * | 3,686,576 | |||||
| Deutsche Telekom International Finance B.V.: f | |||||||
| 550,000 | 5.250%, 07/22/2013 | 564,066 | |||||
| 1,000,000 | 4.875%, 07/08/2014 | 1,058,060 | |||||
| 400,000 | 5.750%, 03/23/2016 | 455,766 | |||||
| 4,275,000 | 3.125%, 04/11/2016 (Acquired 03/14/2012 through 07/16/2012, Cost $4,393,115) * | 4,521,838 | |||||
| 375,000 | Devon Energy Corporation, | ||||||
| 2.400%, 07/15/2016 | 388,410 | ||||||
| 400,000 | DIRECTV Holdings LLC / DIRECTV Financing Co., Inc., | ||||||
| 3.500%, 03/01/2016 | 423,762 | ||||||
| 5,000,000 | Eaton Corp, | ||||||
| 1.500%, 11/02/2017 (Acquired 11/14/2012, Cost $4,994,550) * @ | 5,010,215 | ||||||
| 3,455,000 | EnCana Holdings Finance Corp., | ||||||
| 5.800%, 05/01/2014 f | 3,672,624 | ||||||
| Express Scripts, Inc.: | |||||||
| 5,000,000 | 6.250%, 06/15/2014 | 5,384,390 | |||||
| 3,000,000 | 3.125%, 05/15/2016 | 3,162,876 | |||||
| 515,000 | FBG Finance Limited, | ||||||
| 5.125%, 06/15/2015 (Acquired 03/12/2012, Cost $557,320) * f | 564,956 | ||||||
| 1,522,241 | Federal Express Corp. 1998 Pass Through Trust, | ||||||
| Series 981B, 6.845%, 01/15/2019 | 1,697,299 | ||||||
| 2,355,000 | Federal Express Corp. 2012 Pass Through Trust, | ||||||
| 2.625%, 01/15/2018 | 2,376,619 | ||||||
| 3,291,000 | FedEx Corporation, | ||||||
| 7.375%, 01/15/2014 | 3,516,736 | ||||||
| Fiserv, Inc.: | |||||||
| 2,486,000 | 3.125%, 10/01/2015 | 2,606,454 | |||||
| 1,695,000 | 3.125%, 06/15/2016 | 1,780,550 | |||||
| Ford Motor Credit Company LLC: | |||||||
| 4,000,000 | 2.750%, 05/15/2015 | 4,082,280 | |||||
| 500,000 | 2.500%, 01/15/2016 @ | 506,162 | |||||
| 2,125,000 | France Telecom, | ||||||
| 4.375%, 07/08/2014 f | 2,236,410 | ||||||
| Freeport-McMoRan Copper & Gold Inc.: | |||||||
| 3,500,000 | 1.400%, 02/13/2015 | 3,492,664 | |||||
| 2,000,000 | 2.150%, 03/01/2017 | 2,010,622 | |||||
| 1,000,000 | Gilead Sciences, Inc., | ||||||
| 2.400%, 12/01/2014 | 1,031,228 | ||||||
| 7,120,000 | Glencore Funding LLC, | ||||||
| 6.000%, 04/15/2014 (Acquired 01/12/2010 through 02/27/2012, Cost $7,288,960) * | 7,519,824 | ||||||
| 2,000,000 | Heineken N.V., | ||||||
| 1.400%, 10/01/2017 (Acquired 10/02/2012, Cost $1,993,400) * f | 1,993,962 | ||||||
| 475,000 | Hewlett-Packard Company, | ||||||
| 4.750%, 06/02/2014 | 495,141 | ||||||
| 4,550,000 | Highmark Inc., | ||||||
| 6.800%, 08/15/2013 (Acquired 05/08/2012 through 11/14/2012, Cost $4,701,825) * | 4,672,481 | ||||||
| 5,639,000 | HP Enterprise Services, LLC, | ||||||
| Series B, 6.000%, 08/01/2013 | 5,781,007 | ||||||
| Hutchison Whampoa International Ltd.: f | |||||||
| 2,699,000 | 6.500%, 02/13/2013 (Acquired 07/26/2010 through 01/19/2012, Cost $2,712,356) * | 2,715,396 | |||||
| 7,690,000 | 4.625%, 09/11/2015 (Acquired 09/24/2012 through 12/18/2012, Cost $8,310,025) * | 8,310,045 | |||||
| Hyundai Capital Services Inc.: f | |||||||
| 2,004,000 | 6.000%, 05/05/2015 (Acquired 11/01/2012 through 12/19/2012, Cost $2,207,563) * | 2,200,670 | |||||
| 3,380,000 | 4.375%, 07/27/2016 (Acquired 05/11/2012 through 12/27/2012, Cost $3,548,957) * | 3,634,903 | |||||
| 2,034,000 | Ingersoll-Rand Global Holding Company Limited, | ||||||
| 9.500%, 04/15/2014 f | 2,251,040 | ||||||
| 6,491,000 | Johnson Controls Inc., | ||||||
| 5.500%, 01/15/2016 @ | 7,327,002 | ||||||
| Laboratory Corporation of America Holdings: | |||||||
| 6,025,000 | 5.500%, 02/01/2013 | 6,045,382 | |||||
| 400,000 | 5.625%, 12/15/2015 | 451,136 | |||||
| 5,000,000 | Lafarge North America Inc., | ||||||
| 6.875%, 07/15/2013 @ | 5,097,579 | ||||||
| 903,000 | Marathon Petroleum Corporation, | ||||||
| 3.500%, 03/01/2016 | 961,252 | ||||||
| 3,013,000 | Nabisco, Inc., | ||||||
| 7.550%, 06/15/2015 | 3,494,143 | ||||||
| 4,700,000 | National Oilwell Varco Inc., | ||||||
| Series B, 6.125%, 08/15/2015 | 4,746,770 | ||||||
| Noble Holding International Limited: f | |||||||
| 4,552,000 | 3.450%, 08/01/2015 | 4,796,784 | |||||
| 1,000,000 | 2.500%, 03/15/2017 | 1,032,037 | |||||
| 400,000 | PCCW-HKT Capital No. 2 Limited, | ||||||
| 6.000%, 07/15/2013 (Acquired 06/18/2012, Cost $408,218) * f | 409,196 | ||||||
| 732,000 | Pearson Dollar Finance PLC, | ||||||
| 5.700%, 06/01/2014 (Acquired 06/20/2011 through 08/24/2012, Cost $770,439) * f | 775,038 | ||||||
| 4,426,000 | Pearson Dollar Finance Two PLC, | ||||||
| 5.500%, 05/06/2013 (Acquired 05/31/2011 through 06/15/2011, Cost $4,484,866) * f | 4,492,390 | ||||||
| 5,000,000 | Pentair Finance SA, | ||||||
| 1.350%, 12/01/2015 (Acquired 11/19/2012, Cost $4,998,100) * f | 4,995,570 | ||||||
| Petrohawk Energy Corporation: | |||||||
| 5,000,000 | 7.875%, 06/01/2015 | 5,220,675 | |||||
| 1,000,000 | 7.250%, 08/15/2018 | 1,128,947 | |||||
| 10,000,000 | Pioneer Natural Resources Company, | ||||||
| 5.875%, 07/15/2016 | 11,338,900 | ||||||
| 2,950,000 | Plum Creek Timberlands, L.P., | ||||||
| 5.875%, 11/15/2015 | 3,274,618 | ||||||
| 7,300,000 | POSCO, | ||||||
| 8.750%, 03/26/2014 (Acquired 03/19/2009 through 04/28/2011, Cost $7,670,146) * f | 7,936,881 | ||||||
| 1,452,000 | PPG Industries, Inc., | ||||||
| 1.900%, 01/15/2016 | 1,488,049 | ||||||
| 4,000,000 | Reed Elsevier Capital Inc., | ||||||
| 7.750%, 01/15/2014 | 4,283,288 | ||||||
| 2,332,000 | Rio Tinto Alcan, Inc., | ||||||
| 5.200%, 01/15/2014 f | 2,435,368 | ||||||
| 2,000,000 | SABMiller Holdings Inc, | ||||||
| 1.850%, 01/15/2015 (Acquired 01/10/2012, Cost $1,999,880) * | 2,039,374 | ||||||
| 1,214,000 | SABMiller PLC, | ||||||
| 6.500%, 07/01/2016 (Acquired 03/01/2012 through 03/20/2012, Cost $1,380,153) * f | 1,424,611 | ||||||
| 875,000 | Southwestern Bell Telephone, L.P., | ||||||
| 7.000%, 07/01/2015 | 1,005,168 | ||||||
| 6,327,000 | Staples, Inc., | ||||||
| 9.750%, 01/15/2014 | 6,878,689 | ||||||
| 3,535,000 | TCI Communications, Inc., | ||||||
| 8.750%, 08/01/2015 | 4,218,298 | ||||||
| Telecom Italia Capital, SA: f | |||||||
| 120,000 | 5.250%, 11/15/2013 | 123,300 | |||||
| 5,075,000 | 4.950%, 09/30/2014 | 5,298,300 | |||||
| 175,000 | 5.250%, 10/01/2015 | 186,200 | |||||
| Telefonica Emisiones S.A.U.: f | |||||||
| 2,000,000 | 2.582%, 04/26/2013 | 2,007,000 | |||||
| 3,870,000 | 6.421%, 06/20/2016 @ | 4,282,155 | |||||
| 1,020,000 | Telefonica Moviles Chile SA, | ||||||
| 2.875%, 11/09/2015 (Acquired 11/03/2010 through 04/04/2012, Cost $1,016,462) * f | 1,038,874 | ||||||
| 500,000 | Teva Pharmaceutical Finance Company, LLC, | ||||||
| 5.550%, 02/01/2016 | 565,912 | ||||||
| 4,500,000 | Teva Pharmaceutical Finance III BV, | ||||||
| 0.810%, 03/21/2014 f | 4,518,013 | ||||||
| 6,700,000 | The ADT Corporation, | ||||||
| 2 | .250%, 07/15/2017 (Acquired 06/27/2012 through 12/14/2012, Cost $6,724,436) * | 6,646,789 | |||||
| 5,400,000 | The Interpublic Group of Companies, Inc., | ||||||
| 10.000%, 07/15/2017 | 5,899,500 | ||||||
| 3,400,000 | The Valspar Corporation, | ||||||
| 5.100%, 08/01/2015 | 3,688,415 | ||||||
| 300,000 | Time Warner Cable, Inc., | ||||||
| 5.850%, 05/01/2017 | 354,395 | ||||||
| Toyota Motor Credit Corporation: | |||||||
| 3,000,000 | 0.875%, 07/17/2015 @ | 3,012,357 | |||||
| 400,000 | 2.050%, 01/12/2017 | 413,704 | |||||
| 6,000,000 | Transocean Inc., | ||||||
| 5.050%, 12/15/2016 f @ | 6,680,532 | ||||||
| Tyco Electronics Group S.A.: f | |||||||
| 1,655,000 | 5.950%, 01/15/2014 | 1,742,566 | |||||
| 1,000,000 | 1.600%, 02/03/2015 | 1,014,808 | |||||
| 5,924,000 | Union Pacific Railroad Co. 2004 Pass Through Trust, | ||||||
| 5.214%, 09/30/2014 (Acquired 10/22/2010 through 03/29/2012, Cost $6,227,290) * | 6,295,435 | ||||||
| 1,500,000 | USX Corporation, | ||||||
| 9.125%, 01/15/2013 | 1,503,726 | ||||||
| 3,690,000 | Valero Energy Corporation, | ||||||
| 4.750%, 04/01/2014 | 3,841,759 | ||||||
| Viacom Inc.: | |||||||
| 1,000,000 | 1.250%, 02/27/2015 | 1,009,763 | |||||
| 1,500,000 | 6.250%, 04/30/2016 | 1,738,906 | |||||
| 5,070,000 | Vivendi SA, | ||||||
| 2.400%, 04/10/2015 (Acquired 04/03/2012 through 11/16/2012, Cost $5,103,276) * f @ | 5,171,268 | ||||||
| 2,260,000 | Volkswagen International Finance N.V., | ||||||
| 0.918%, 04/01/2014 (Acquired 03/23/2011 through 12/15/2011, Cost $2,256,942) * f | 2,267,286 | ||||||
| 3,000,000 | Walgreen Co., | ||||||
| 0.810%, 03/13/2014 | 3,004,101 | ||||||
| 3,700,000 | Waste Management, Inc., | ||||||
| 5.000%, 03/15/2014 | 3,883,757 | ||||||
| 2,000,000 | Weyerhaeuser Company, | ||||||
| 7.250%, 07/01/2013 | 2,058,346 | ||||||
| 6,486,000 | Wm. Wrigley Jr. Company, | ||||||
| 3.700%, 06/30/2014 (Acquired 03/15/2012 through 11/14/2012, Cost $6,688,548) * @ | 6,713,166 | ||||||
| Woodside Finance Limited: f | |||||||
| 1,000,000 | 8.125%, 03/01/2014 (Acquired 09/14/2012, Cost $1,066,759) * | 1,078,965 | |||||
| 2,500,000 | 4.500%, 11/10/2014 (Acquired 11/15/2012, Cost $2,651,547) * | 2,644,293 | |||||
| 7,100,000 | Xerox Corporation, | ||||||
| 8.250%, 05/15/2014 | 7,744,581 | ||||||
| 450,000 | Xstrata Canada Corporation, | ||||||
| 6.000%, 10/15/2015 f | 500,019 | ||||||
| 3,000,000 | Xstrata Finance (Canada) Limited, | ||||||
| 1.800%, 10/23/2015 (Acquired 10/18/2012, Cost $2,999,040) * f | 3,016,290 | ||||||
| 7,000,000 | Yara International ASA, | ||||||
| 5.250%, 12/15/2014 (Acquired 09/25/2012 through 10/02/2012, Cost $7,502,440) * f | 7,524,874 | ||||||
| 363,772,523 | |||||||
| Utility - 12.1% | |||||||
| 6,239,000 | Ameren Corporation, | ||||||
| 8.875%, 05/15/2014 | 6,827,462 | ||||||
| 2,137,000 | Beaver Valley Funding Corporation Debentures, | ||||||
| 9.000%, 06/01/2017 | 2,174,547 | ||||||
| 3,000,000 | Centrais Eletricas Brasileiras S.A., | ||||||
| 7.750%, 11/30/2015 (Acquired 12/06/2012, Cost $3,476,758) * f | 3,420,000 | ||||||
| 100,000 | Commonwealth Edison Company, | ||||||
| 6.150%, 09/15/2017 | 121,246 | ||||||
| 5,923,000 | Consolidated Natural Gas, | ||||||
| Series A, 5.000%, 03/01/2014 | 6,213,340 | ||||||
| 250,000 | Constellation Energy Group Inc., | ||||||
| 4.550%, 06/15/2015 | 269,837 | ||||||
| DCP Midstream, LLC: | |||||||
| 3,640,000 | 9.700%, 12/01/2013 (Acquired 07/29/2010 through 03/14/2012, Cost $3,883,799) * | 3,921,267 | |||||
| 1,708,000 | 5.375%, 10/15/2015 (Acquired 01/13/2012, Cost $1,838,075) * | 1,834,349 | |||||
| 125,000 | Dominion Resources, Inc., | ||||||
| Series C, 5.150%, 07/15/2015 | 138,007 | ||||||
| 500,000 | Duke Energy Corp., | ||||||
| 6.300%, 02/01/2014 | 529,723 | ||||||
| 5,286,000 | El Paso Pipeline Partners Operating Co LLC, | ||||||
| 4.100%, 11/15/2015 | 5,669,991 | ||||||
| 4,000,000 | Enel Finance International, | ||||||
| 5.700%, 01/15/2013 (Acquired 03/10/2010 through 03/31/2010, Cost $4,004,733) * f @ | 4,002,516 | ||||||
| Energy Transfer Partners, L.P.: | |||||||
| 3,150,000 | 8.500%, 04/15/2014 | 3,425,250 | |||||
| 2,500,000 | 5.950%, 02/01/2015 | 2,739,628 | |||||
| 350,000 | 6.125%, 02/15/2017 | 405,030 | |||||
| 1,000,000 | 9.700%, 03/15/2019 | 1,347,021 | |||||
| Enterprise Products Operating LLC: | |||||||
| 2,630,000 | 6.125%, 02/01/2013 | 2,639,642 | |||||
| 2,774,000 | Series O, 9.750%, 01/31/2014 | 3,035,031 | |||||
| 950,000 | 3.700%, 06/01/2015 | 1,009,518 | |||||
| 3,000,000 | 1.250%, 08/13/2015 | 3,018,423 | |||||
| 1,759,000 | Exelon Corporation, | ||||||
| 4.900%, 06/15/2015 | 1,914,721 | ||||||
| 4,750,000 | Exelon Generation Company, LLC, | ||||||
| 5.350%, 01/15/2014 | 4,968,519 | ||||||
| 1,000,000 | Florida Gas Transmission Company, LLC, | ||||||
| 4.000%, 07/15/2015 (Acquired 09/12/2012, Cost $1,058,593) * | 1,063,173 | ||||||
| 3,276,108 | GG1C Funding Corporation, | ||||||
| 5.129%, 01/15/2014 (Acquired 04/02/2009 through 07/28/2011, Cost $3,273,942) * | 3,319,185 | ||||||
| 250,000 | Kinder Morgan Energy Partners, L.P., | ||||||
| 6.000%, 02/01/2017 | 292,002 | ||||||
| 830,021 | Kiowa Power Partners LLC, | ||||||
| 4.811%, 12/30/2013 (Acquired 12/29/2011 through 05/29/2012, Cost $838,683) * | 835,731 | ||||||
| 745,000 | MidAmerican Energy Holdings Company, | ||||||
| Series D, 5.000%, 02/15/2014 | 780,128 | ||||||
| 7,911,000 | National Grid PLC, | ||||||
| 6.300%, 08/01/2016 f | 9,179,023 | ||||||
| 2,750,000 | Nevada Power Company, | ||||||
| Series U, 7.375%, 01/15/2014 | 2,937,231 | ||||||
| Nisource Finance Corp.: | |||||||
| 194,000 | 6.150%, 03/01/2013 | 195,611 | |||||
| 5,775,000 | 5.400%, 07/15/2014 | 6,154,169 | |||||
| 6,562,000 | Nustar Pipeline Operating Partnership L.P., | ||||||
| 5.875%, 06/01/2013 | 6,634,923 | ||||||
| 2,000,000 | ONEOK, Inc., | ||||||
| 5.200%, 06/15/2015 | 2,169,726 | ||||||
| ONEOK Partners L.P., | |||||||
| 2,032,000 | 6.150%, 10/01/2016 | 2,365,382 | |||||
| 1,000,000 | 2.000%, 10/01/2017 | 1,008,312 | |||||
| 3,745,000 | Pacific Gas and Electric Company, | ||||||
| 6.250%, 12/01/2013 | 3,934,542 | ||||||
| 1,100,000 | Pennsylvania Electric Co., | ||||||
| 5.125%, 04/01/2014 | 1,153,137 | ||||||
| 2,745,000 | PG&E Corporation, | ||||||
| 5.750%, 04/01/2014 | 2,909,305 | ||||||
| 4,635,000 | Plains All American Pipeline, | ||||||
| 5.625%, 12/15/2013 | 4,860,595 | ||||||
| PPL Energy Supply, LLC: | |||||||
| 738,000 | 6.300%, 07/15/2013 | 759,968 | |||||
| 5,137,000 | Series A, 5.700%, 10/15/2015 | 5,670,822 | |||||
| 350,000 | 6.200%, 05/15/2016 | 400,499 | |||||
| 1,205,000 | PSEG Power LLC, | ||||||
| 5.320%, 09/15/2016 | 1,362,327 | ||||||
| Rockies Express Pipeline LLC: | |||||||
| 4,000,000 | 6.250%, 07/15/2013 (Acquired 05/06/2011 through 05/13/2011, Cost $4,091,482) * | 4,090,000 | |||||
| 2,000,000 | 3.900%, 04/15/2015 (Acquired 02/17/2011, Cost $2,000,177) * | 1,990,000 | |||||
| 2,100,000 | Sempra Energy, | ||||||
| 2.000%, 03/15/2014 | 2,131,773 | ||||||
| 3,000,000 | Southwestern Public Service Company, | ||||||
| 5.600%, 10/01/2016 | 3,362,751 | ||||||
| Spectra Energy Capital LLC: | |||||||
| 1,300,000 | 5.500%, 03/01/2014 | 1,367,486 | |||||
| 6,114,000 | 5.668%, 08/15/2014 | 6,560,120 | |||||
| 5,090,000 | Trans-Allegheny Interstate Line Company, | ||||||
| 4.000%, 01/15/2015 (Acquired 01/19/2010 through 06/19/2012, Cost $5,186,698) * | 5,346,913 | ||||||
| 500,000 | Union Electric Company, | ||||||
| 4.750%, 04/01/2015 | 537,437 | ||||||
| 650,000 | Vectren Utility Holdings, Inc., | ||||||
| 5.250%, 08/01/2013 | 666,145 | ||||||
| 3,809,000 | Veolia Environnement, | ||||||
| 5.250%, 06/03/2013 f | 3,868,074 | ||||||
| 9,000,000 | Williams Partners L.P., | ||||||
| 3.800%, 02/15/2015 | 9,516,483 | ||||||
| 157,048,041 | |||||||
| Finance - 34.0% | |||||||
| 3,722,000 | Abbey National Treasury Services PLC, | ||||||
| 3.875%, 11/10/2014 (Acquired 12/29/2011 through 09/13/2012, Cost $3,713,721) * | 3,861,977 | ||||||
| 5,650,000 | ABN AMRO Bank N.V., | ||||||
| 3.000%, 01/31/2014 (Acquired 01/27/2011 through 04/28/2011, Cost $5,650,497) * f | 5,758,209 | ||||||
| AEGON N.V.: f | |||||||
| 6,722,000 | 4.750%, 06/01/2013 | 6,825,606 | |||||
| 950,000 | 4.625%, 12/01/2015 | 1,035,635 | |||||
| 1,200,000 | American Express Credit Corporation, | ||||||
| 2.750%, 09/15/2015 | 1,258,058 | ||||||
| 3,000,000 | American International Group, Inc., | ||||||
| 5.600%, 10/18/2016 | 3,425,886 | ||||||
| 2,700,000 | Ameriprise Financial, Inc., | ||||||
| 5.650%, 11/15/2015 | 3,056,273 | ||||||
| 4,275,000 | AmSouth Bank, | ||||||
| Series AI, 4.850%, 04/01/2013 | 4,312,406 | ||||||
| 7,678,000 | ANZ National (Int'l) LTD, | ||||||
| 6.200%, 07/19/2013 (Acquired 05/25/2010 through 06/09/2011, Cost $7,839,040) * f | 7,877,329 | ||||||
| AON Corporation,: | |||||||
| 2,877,000 | 3.500%, 09/30/2015 | 3,030,071 | |||||
| 800,000 | 3.125%, 05/27/2016 | 842,219 | |||||
| 1,708,000 | Arden Realty Limited Partnership, | ||||||
| 5.250%, 03/01/2015 | 1,837,941 | ||||||
| 5,165,000 | ASIF Global Financing XIX, | ||||||
| 4.900%, 01/17/2013 (Acquired 05/26/2011 through 09/28/2011, Cost $5,171,620) * | 5,172,293 | ||||||
| 1,500,000 | Banco Santander-Chile, | ||||||
| 2.506%, 02/14/2014 (Acquired 02/09/2012, Cost $1,500,000) * f | 1,482,021 | ||||||
| 5,000,000 | Bank of America Corporation, | ||||||
| 5.750%, 12/01/2017 | 5,827,975 | ||||||
| 2,400,000 | Bank of America Corporation Subordinated Notes, | ||||||
| 10.200%, 07/15/2015 | 2,841,036 | ||||||
| Barclays Bank PLC: f | |||||||
| 4,005,000 | 5.200%, 07/10/2014 @ | 4,261,388 | |||||
| 2,475,000 | Series 1, 5.000%, 09/22/2016 | 2,774,195 | |||||
| 2,000,000 | BB&T Corporation, | ||||||
| 2.050%, 04/28/2014 @ | 2,037,806 | ||||||
| 2,425,000 | BNP Paribas SA, | ||||||
| 3.250%, 03/11/2015 f | 2,530,926 | ||||||
| 850,000 | Canadian Imperial Bank of Commerce, | ||||||
| 2.350%, 12/11/2015 f | 891,970 | ||||||
| 1,654,000 | Capital One Bank USA NA, | ||||||
| 6.500%, 06/13/2013 | 1,697,216 | ||||||
| 5,765,000 | Capital One Financial Corporation, | ||||||
| 7.375%, 05/23/2014 | 6,271,328 | ||||||
| 2,790,000 | CDP Financial Inc., | ||||||
| 3.000%, 11/25/2014 (Acquired 11/20/2009 through 06/25/2010, Cost $2,790,221) * f | 2,915,882 | ||||||
| Cie de Financement Foncier SA: f | |||||||
| 5,500,000 | 2.250%, 03/07/2014 (Acquired 03/01/2011 through 12/14/2011, Cost $5,495,210) * | 5,586,488 | |||||
| 1,000,000 | 2.500%, 09/16/2015 (Acquired 06/19/2012, Cost $1,005,903) * | 1,036,288 | |||||
| Citigroup Inc.,: | |||||||
| 7,350,000 | 6.010%, 01/15/2015 | 8,031,455 | |||||
| 2,000,000 | 5.300%, 01/07/2016 | 2,212,582 | |||||
| CNA Financial Corporation: | |||||||
| 2,125,000 | 5.850%, 12/15/2014 | 2,307,074 | |||||
| 525,000 | 6.500%, 08/15/2016 | 605,706 | |||||
| Comerica Bank: | |||||||
| 4,100,000 | Series AI, 5.700%, 06/01/2014 | 4,372,236 | |||||
| 825,000 | 5.750%, 11/21/2016 | 954,542 | |||||
| Commonwealth Bank of Australia: f | |||||||
| 1,500,000 | 1.038%, 03/17/2014 (Acquired 03/20/2012, Cost $1,499,505) * | 1,509,474 | |||||
| 4,401,000 | 3.500%, 03/19/2015 (Acquired 08/30/2010 through 07/18/2012, Cost $4,503,076) * | 4,652,803 | |||||
| 1,000,000 | Cooperatieve Centrale Raiffeisen-Boerenleenbank BA, | ||||||
| 3.375%, 01/19/2017 f @ | 1,074,286 | ||||||
| 800,000 | Countrywide Financial Corporation, | ||||||
| 6.250%, 05/15/2016 | 878,166 | ||||||
| 1,000,000 | Credit Suisse, | ||||||
| 5.500%, 05/01/2014 f | 1,063,993 | ||||||
| 375,000 | Credit Suisse (USA), Inc., | ||||||
| 5.125%, 08/15/2015 | 416,178 | ||||||
| 400,000 | Deutsche Bank Aktiengesellschaft, | ||||||
| 6.000%, 09/01/2017 f @ | 479,614 | ||||||
| 3,527,000 | Dresdner Bank AG, | ||||||
| 7.250%, 09/15/2015 f | 3,793,073 | ||||||
| Fifth Third Bancorp: | |||||||
| 4,027,000 | 6.250%, 05/01/2013 | 4,103,461 | |||||
| 550,000 | 3.625%, 01/25/2016 | 587,634 | |||||
| 2,900,000 | 0.729%, 12/20/2016 | 2,791,305 | |||||
| 1,000,000 | First Empire Capital Trust I, | ||||||
| 8.234%, 02/01/2027 | 1,006,351 | ||||||
| 1,500,000 | First Hawaiian Capital Trust I, | ||||||
| Series B, 8.343%, 07/01/2027 | 1,515,000 | ||||||
| 1,050,000 | First Horizon National Corporation, | ||||||
| 5.375%, 12/15/2015 | 1,147,823 | ||||||
| 2,083,000 | First Tennessee Bank, National Association, | ||||||
| 5.650%, 04/01/2016 | 2,269,447 | ||||||
| 8,615,000 | FMR LLC, | ||||||
| 4.750%, 03/01/2013 (Acquired 10/04/2010 through 05/30/2012, Cost $8,655,601) * | 8,673,280 | ||||||
| General Electric Capital Corporation: | |||||||
| 2,000,000 | 5.900%, 05/13/2014 @ | 2,143,430 | |||||
| 800,000 | 4.750%, 09/15/2014 @ | 854,073 | |||||
| 5,400,000 | 4.875%, 03/04/2015 | 5,847,768 | |||||
| 2,350,000 | 4.375%, 09/21/2015 | 2,561,284 | |||||
| 5,000,000 | 2.300%, 04/27/2017 | 5,184,405 | |||||
| 175,000 | 5.625%, 05/01/2018 | 207,818 | |||||
| 5,980,000 | Genworth Life Institutional Funding Trust, | ||||||
| 5.875%, 05/03/2013 (Acquired 04/07/2010 through 01/17/2012, Cost $6,032,946) * | 6,071,016 | ||||||
| 787,000 | GMAC Inc., | ||||||
| 7.500%, 12/31/2013 | 831,269 | ||||||
| 5,720,000 | Goldman Sachs Group LP, | ||||||
| 8.000%, 03/01/2013 (Acquired 04/16/2009 through 06/15/2012, Cost $5,759,107) * | 5,777,846 | ||||||
| HSBC Finance Corporation: | |||||||
| 1,594,000 | 4.750%, 07/15/2013 | 1,627,267 | |||||
| 1,950,000 | 5.000%, 06/30/2015 | 2,113,757 | |||||
| 395,000 | 5.500%, 01/19/2016 | 441,395 | |||||
| 221,000 | 6.676%, 01/15/2021 | 262,188 | |||||
| 1,500,000 | HSBC USA Capital Trust II, | ||||||
| 8.380%, 05/15/2027 (Acquired 11/06/2007, Cost $1,529,298) * | 1,514,672 | ||||||
| 400,000 | HSBC USA Inc., | ||||||
| 2.375%, 02/13/2015 | 411,450 | ||||||
| ING Bank N.V.: f | |||||||
| 205,000 | 2.650%, 01/14/2013 (Acquired 04/12/2011, Cost $205,053) * | 205,094 | |||||
| 3,805,000 | 2.000%, 10/18/2013 (Acquired 10/13/2010 through 08/13/2012, Cost $3,804,134) * | 3,820,646 | |||||
| 1,200,000 | 2.375%, 06/09/2014 (Acquired 02/24/2012, Cost $1,193,141) * | 1,215,666 | |||||
| 1,085,000 | 4.000%, 03/15/2016 (Acquired 03/08/2012, Cost $1,104,384) * | 1,154,679 | |||||
| 6,050,000 | Irish Life & Permanent Group Holdings PLC, | ||||||
| 3.600%, 01/14/2013 (Acquired 01/07/2010 through 02/28/2012, Cost $6,047,017) * f | 6,050,042 | ||||||
| J.P. Morgan Chase & Co.: | |||||||
| 723,000 | 5.125%, 09/15/2014 | 768,942 | |||||
| 125,000 | 3.400%, 06/24/2015 @ | 131,882 | |||||
| 5,700,000 | 3.450%, 03/01/2016 | 6,053,463 | |||||
| 1,556,000 | Jefferson-Pilot Corp., | ||||||
| 4.750%, 01/30/2014 | 1,612,769 | ||||||
| 8,500,000 | Kemper Corporation, | ||||||
| 6.000%, 11/30/2015 | 9,167,684 | ||||||
| Key Bank NA: | |||||||
| 5,400,000 | 5.800%, 07/01/2014 | 5,784,280 | |||||
| 4,200,000 | 7.413%, 05/06/2015 | 4,724,883 | |||||
| 774,000 | KeyCorp, | ||||||
| 6.500%, 05/14/2013 | 790,613 | ||||||
| 5,000,000 | Kookmin Bank, | ||||||
| 7.250%, 05/14/2014 (Acquired 05/26/2009 through 12/15/2011, Cost $5,199,686) * f | 5,397,145 | ||||||
| 3,588,000 | Liberty Mutual Group Inc., | ||||||
| 5.750%, 03/15/2014 (Acquired 09/03/2009 through 11/15/2012, Cost $3,524,485) * | 3,757,544 | ||||||
| Lloyds TSB Bank PLC: f | |||||||
| 5,110,000 | 4.375%, 01/12/2015 (Acquired 01/05/2010 through 02/24/2012, Cost $5,176,199) * | 5,416,493 | |||||
| 300,000 | 4.875%, 01/21/2016 | 330,867 | |||||
| M&I Marshall & Ilsley Bank: | |||||||
| 6,357,000 | 4.850%, 06/16/2015 | 6,835,854 | |||||
| 500,000 | 5.000%, 01/17/2017 | 553,287 | |||||
| 4,000,000 | Macquarie Bank Limited, | ||||||
| 3.450%, 07/27/2015 (Acquired 07/19/2012, Cost $3,995,160) * f | 4,159,568 | ||||||
| 6,195,000 | Manulife Financial Corp., | ||||||
| 3.400%, 09/17/2015 f @ | 6,514,117 | ||||||
| Marsh & McLennan Companies, Inc.: | |||||||
| 5,240,000 | 4.850%, 02/15/2013 | 5,265,508 | |||||
| 1,585,000 | 5.750%, 09/15/2015 | 1,776,856 | |||||
| 1,060,000 | 2.300%, 04/01/2017 | 1,081,321 | |||||
| Massmutual Global Funding II: | |||||||
| 2,550,000 | 2.875%, 04/21/2014 (Acquired 10/24/2011, Cost $2,587,659) * | 2,622,945 | |||||
| 3,000,000 | 2.300%, 09/28/2015 (Acquired 11/22/2011, Cost $2,996,460) * | 3,114,816 | |||||
| 2,000,000 | 3.125%, 04/14/2016 (Acquired 01/19/2012, Cost $2,072,818) * @ | 2,120,540 | |||||
| 3,391,000 | Mercantile Bankshares Corporation Subordinated Notes, | ||||||
| Series B, 4.625%, 04/15/2013 | 3,429,898 | ||||||
| Metropolitan Life Global Funding I: | |||||||
| 3,173,000 | 5.200%, 09/18/2013 (Acquired 10/21/2010 through 09/23/2011, Cost $3,253,346) * | 3,271,814 | |||||
| 2,300,000 | 3.125%, 01/11/2016 (Acquired 01/04/2011 through 03/05/2012, Cost $2,315,319) * @ | 2,438,000 | |||||
| 350,000 | Monumental Global Funding III, | ||||||
| 0.485%, 01/25/2013 (Acquired 07/28/2009, Cost $349,070) * | 350,036 | ||||||
| Morgan Stanley: | |||||||
| 2,600,000 | 2.875%, 01/24/2014 @ | 2,643,690 | |||||
| 75,000 | 4.750%, 04/01/2014 | 77,661 | |||||
| 1,000,000 | 4.000%, 07/24/2015 | 1,046,285 | |||||
| 400,000 | 5.450%, 01/09/2017 | 442,632 | |||||
| 3,516,000 | Morgan Stanley Dean Witter & Co., | ||||||
| 6.750%, 10/15/2013 | 3,672,919 | ||||||
| National Australia Bank Limited: f | |||||||
| 800,000 | 5.350%, 06/12/2013 (Acquired 01/31/2012, Cost $812,280) * | 818,005 | |||||
| 500,000 | 3.750%, 03/02/2015 (Acquired 03/14/2012, Cost $517,912) * | 529,568 | |||||
| 2,000,000 | 2.000%, 03/09/2015 | 2,047,842 | |||||
| National City Bank of Cleveland: | |||||||
| 475,000 | 4.625%, 05/01/2013 | 481,203 | |||||
| 250,000 | 5.800%, 06/07/2017 | 294,989 | |||||
| 1,000,000 | Nomura Holdings Inc., | ||||||
| 5.000%, 03/04/2015 f | 1,060,261 | ||||||
| Nordea Bank AB: f | |||||||
| 110,000 | 3.700%, 11/13/2014 (Acquired 07/26/2012, Cost $113,979) * | 115,473 | |||||
| 3,000,000 | 2.250%, 03/20/2015 (Acquired 03/14/2012, Cost $2,993,610) * | 3,073,008 | |||||
| 3,440,000 | 3.125%, 03/20/2017 (Acquired 10/03/2012, Cost $3,615,460) * | 3,663,084 | |||||
| 1,000,000 | North Fork Capital Trust II, | ||||||
| 8.000%, 12/15/2027 | 1,019,000 | ||||||
| 450,000 | PNC Funding Corp, | ||||||
| 4.250%, 09/21/2015 | 490,477 | ||||||
| 1,000,000 | Principal Financial Group, Inc., | ||||||
| 1.850%, 11/15/2017 | 1,005,291 | ||||||
| 2,550,000 | Principal Life Income Funding Trusts, | ||||||
| 5.100%, 04/15/2014 | 2,692,695 | ||||||
| 2,850,000 | Prudential Covered Trust 2012-1, | ||||||
| 2.997%, 09/30/2015 (Acquired 10/16/2012, Cost $2,963,450) * | 2,955,484 | ||||||
| Prudential Financial Inc.: | |||||||
| 2,578,000 | 5.150%, 01/15/2013 | 2,580,885 | |||||
| 4,019,000 | 6.200%, 01/15/2015 | 4,438,507 | |||||
| 1,000,000 | Rabobank Nederland Global Senior Unsecured Notes, | ||||||
| 4.200%, 05/13/2014 (Acquired 05/06/2009, Cost $998,170) * f | 1,045,949 | ||||||
| 3,500,000 | Regions Financial Corporation, | ||||||
| 5.750%, 06/15/2015 | 3,784,375 | ||||||
| 1,600,000 | Santander U.S. Debt S.A. Unipersonal, | ||||||
| 2.991%, 10/07/2013 (Acquired 09/27/2010 through 12/14/2010, Cost $1,598,174) * f | 1,602,704 | ||||||
| 1,500,000 | Scotland International Finance No. 2 B.V., | ||||||
| 4.250%, 05/23/2013 (Acquired 03/16/2012, Cost $1,501,433) * f | 1,511,100 | ||||||
| SLM Corporation: | |||||||
| 2,000,000 | 5.375%, 01/15/2013 | 1,999,988 | |||||
| 5,015,000 | 5.000%, 10/01/2013 | 5,134,106 | |||||
| 5,000,000 | Societe Generale SA, | ||||||
| 2.200%, 09/14/2013 (Acquired 09/07/2010, Cost $4,994,350) * f | 5,028,445 | ||||||
| 1,875,000 | SouthTrust Corporation, | ||||||
| 5.800%, 06/15/2014 | 1,998,009 | ||||||
| 5,500,000 | Sovereign Bank, | ||||||
| 5.125%, 03/15/2013 | 5,499,774 | ||||||
| Sumitomo Mitsui Banking Corporation: f | |||||||
| 4,000,000 | 2.150%, 07/22/2013 (Acquired 07/14/2010, Cost $3,998,480) * | 4,026,212 | |||||
| 2,000,000 | 1.350%, 07/18/2015 | 2,022,512 | |||||
| SunTrust Bank: | |||||||
| 6,880,000 | 0.608%, 04/01/2015 | 6,713,703 | |||||
| 2,396,000 | 5.000%, 09/01/2015 @ | 2,617,798 | |||||
| 488,000 | SUSA Partnership, L.P., | ||||||
| 8.200%, 06/01/2017 | 590,389 | ||||||
| Svenska Handelsbanken AB: f | |||||||
| 4,850,000 | 4.875%, 06/10/2014 (Acquired 09/20/2011 through 12/13/2011, Cost $5,013,485) * @ | 5,125,286 | |||||
| 175,000 | 3.125%, 07/12/2016 | 185,693 | |||||
| 3,350,000 | The Bear Stearns Companies LLC, | ||||||
| 5.300%, 10/30/2015 | 3,712,447 | ||||||
| 3,000,000 | The Charles Schwab Corporation, | ||||||
| 0.850%, 12/04/2015 | 3,006,825 | ||||||
| 4,050,000 | The Dai-ichi Mutual Life Insurance Company, | ||||||
| 5.730%, 03/17/2014 (Acquired 03/02/2011, Cost $4,162,344) * f | 4,157,839 | ||||||
| The Goldman Sachs Group, Inc.: | |||||||
| 2,000,000 | 5.125%, 01/15/2015 | 2,148,570 | |||||
| 225,000 | 3.700%, 08/01/2015 | 237,463 | |||||
| The Hartford Financial Services Group, Inc.: | |||||||
| 3,000,000 | 4.000%, 03/30/2015 | 3,170,058 | |||||
| 500,000 | 7.300%, 11/01/2015 | 569,060 | |||||
| 3,000,000 | 5.500%, 10/15/2016 | 3,357,858 | |||||
| 1,175,000 | 5.375%, 03/15/2017 | 1,327,574 | |||||
| 5,740,000 | The NASDAQ OMX Group Inc., | ||||||
| 4.000%, 01/15/2015 | 6,008,488 | ||||||
| The Royal Bank of Scotland Group PLC: f | |||||||
| 1,000,000 | Series 2, 3.400%, 08/23/2013 | 1,014,839 | |||||
| 3,000,000 | 4.875%, 08/25/2014 (Acquired 08/18/2009 through 01/27/2011, Cost $3,006,894) * | 3,163,680 | |||||
| 2,000,000 | 2.550%, 09/18/2015 | 2,046,820 | |||||
| UBS AG: f | |||||||
| 5,375,000 | Series 001, 2.250%, 01/28/2014 | 5,452,615 | |||||
| 575,000 | 3.875%, 01/15/2015 | 607,581 | |||||
| 7,850,000 | UFJ Finance Aruba A.E.C., | ||||||
| 6.750%, 07/15/2013 f | 8,097,927 | ||||||
| Union Bank, National Association: | |||||||
| 1,200,000 | 3.000%, 06/06/2016 | 1,270,351 | |||||
| 3,150,000 | 2.125%, 06/16/2017 | 3,239,155 | |||||
| 750,000 | UnitedHealth Group, Inc., | ||||||
| 4.750%, 02/10/2014 | 781,939 | ||||||
| 8,005,000 | WEA Finance LLC, | ||||||
| 7.500%, 06/02/2014 (Acquired 12/14/2011 through 09/13/2012, Cost $8,534,839) * | 8,709,688 | ||||||
| 150,000 | Wells Fargo & Company, | ||||||
| 3.676%, 06/15/2016 | 162,166 | ||||||
| 5,250,000 | Wells Fargo Bank NA, | ||||||
| Series AI, 4.750%, 02/09/2015 | 5,638,589 | ||||||
| Westpac Banking Corporation: f | |||||||
| 720,000 | 3.000%, 08/04/2015 | 760,441 | |||||
| 2,000,000 | 2.000%, 08/14/2017 | 2,060,126 | |||||
| 6,650,000 | Willis North America, Inc., | ||||||
| 5.625%, 07/15/2015 | 7,265,378 | ||||||
| 440,663,274 | |||||||
| Residential Mortgage-Backed Securities - 1.2% | |||||||
| U.S. Government Agency Issues - 0.2% | |||||||
| Federal Home Loan Mortgage Corporation (FHLMC): | |||||||
| 71,752 | Series 2910, Class BD, 4.500%, 11/15/2018 | 72,319 | |||||
| 14,933 | Series 5, Class B, 0.950%, 05/15/2019 | 15,068 | |||||
| Federal National Mortgage Association (FNMA): | |||||||
| 87,322 | 5.500%, 07/01/2015 | 93,848 | |||||
| 1,182,196 | Series 2004-W6, Class 1A4, 5.500%, 07/25/2034 | 1,204,922 | |||||
| 602,557 | Series 2004-W6, Class 1A6, 5.500%, 07/25/2034 | 616,738 | |||||
| 2,002,895 | |||||||
| Non-U.S. Government Agency Issues - 1.0% | |||||||
| 1,919,255 | Banc of America Mortgage Securities Inc, | ||||||
| Series 2003-10, Class 3A1, 5.000%, 01/25/2019 | 1,999,819 | ||||||
| Bank of America Alternative Loan Trust: | |||||||
| 276,051 | Series 2003-4, Class 2A1, 5.000%, 06/25/2018 | 285,025 | |||||
| 1,216,373 | Series 2004-2, Class 5A1, 5.500%, 03/25/2019 | 1,251,756 | |||||
| Countrywide Alternative Loan Trust: | |||||||
| 2,851,447 | Series 2004-12CB, Class 1A1, 5.000%, 07/25/2019 | 2,974,555 | |||||
| 510,241 | Series 2005-50CB, Class 4A1, 5.000%, 11/25/2020 | 493,200 | |||||
| 651,791 | Series 2004-J2, Class 3A3, 5.500%, 04/25/2034 | 671,456 | |||||
| 204,403 | Series 2005-73CB, Class 1A7, 5.500%, 01/25/2036 § | 170,815 | |||||
| 1,421,441 | Series 2006-28CB, Class A17, 6.000%, 10/25/2036 § | 1,023,145 | |||||
| 3,400,702 | HSI Asset Securitization Corp Trust, | ||||||
| Series 2005-NC1, Class 2A3, 0.570%, 07/25/2035 | 3,372,932 | ||||||
| 65,659 | J.P. Morgan Alternative Loan Trust, | ||||||
| Series 2006-S2, Class A2, 5.810%, 05/25/2036 | 65,576 | ||||||
| 110,503 | Merrill Lynch Mortgage Investors Trust, | ||||||
| Series 2005-A8, Class A1C1, 5.250%, 08/25/2036 | 111,668 | ||||||
| Washington Mutual, Inc. Pass-Thru Certificates: | |||||||
| 219,457 | Series 2004-CB4, Class 21A, 5.500%, 12/25/2019 | 225,425 | |||||
| 195,148 | Series 2004-CB4, Class 22A, 6.000%, 12/25/2019 | 202,845 | |||||
| 12,848,217 | |||||||
| Asset Backed Securities - 4.4% | |||||||
| 5,072,121 | Argent Securities Inc, | ||||||
| Series 2005-W2, Class A2B1, 0.410%, 10/25/2035 | 5,002,065 | ||||||
| 18,529 | Bombardier Capital Mortgage Securitization, | ||||||
| Series 1998-A, Class A3, 6.230%, 04/15/2028 | 18,381 | ||||||
| 8,686,568 | Carrington Mortgage Loan Trust, | ||||||
| Series 2006-OPT1, Class A3, 0.390%, 02/25/2036 | 8,377,170 | ||||||
| 4,883,123 | Citigroup Mortgage Loan Trust, Inc., | ||||||
| Series 2006-WFH3, Class A3, 0.360%, 10/25/2036 | 4,825,258 | ||||||
| Countrywide Asset-Backed Certificates: | |||||||
| 254,808 | Series 2006-13, Class 1AF2, 5.884%, 01/25/2037 § | 284,598 | |||||
| 2,118,363 | Series 2006-13, Class 1AF3, 5.944%, 01/25/2037 § | 1,870,603 | |||||
| 1,500,000 | Series 2006-9, Class 1AF3, 5.859%, 10/25/2046 | 996,617 | |||||
| 329,502 | Credit Based Asset Servicing and Securitization LLC, | ||||||
| Series 2005-CB8, Class AF2, 5.303%, 12/25/2035 | 311,362 | ||||||
| Green Tree Financial Corporation: | |||||||
| 34,719 | Series 1996-3, Class A5, 7.350%, 05/15/2027 | 35,753 | |||||
| 31,384 | Series 1998-2, Class A5, 6.240%, 12/01/2028 | 32,587 | |||||
| 622,912 | Series 1997-5, Class A6, 6.820%, 05/15/2029 | 667,516 | |||||
| 384,396 | Series 1998-3, Class A5, 6.220%, 03/01/2030 | 420,944 | |||||
| 4,000,000 | JP Morgan Mortgage Acquisition Corp, | ||||||
| Series 2007-CH1, Class AV4, 0.340%, 11/25/2036 | 3,911,116 | ||||||
| 6,725,000 | Master Credit Card Trust, | ||||||
| Series 2012-2A, Class A, 0.780%, 04/21/2017 (Acquired 10/24/2012, Cost $6,723,674) * f | 6,739,304 | ||||||
| 1,992,788 | Renaissance Home Equity Loan Trust, | ||||||
| Series 2007-2, Class AF2, 5.675%, 06/25/2037 | 1,006,882 | ||||||
| Residential Asset Mortgage Products, Inc.: | |||||||
| 84,510 | Series 2003-RS7, Class AI6, 5.340%, 08/25/2033 | 83,059 | |||||
| 995,728 | Series 2003-RS11, Class AI7, 4.828%, 12/25/2033 | 1,009,458 | |||||
| Soundview Home Equity Loan Trust: | |||||||
| 334,607 | Series 2005-OPT2, Class A5, 0.580%, 08/25/2035 | 333,448 | |||||
| 4,757,062 | Series 2005-OPT4, Class 2A3, 0.470%, 12/25/2035 | 4,605,930 | |||||
| 6,690,088 | Specialty Underwriting & Residential Finance, | ||||||
| Series 2006-BC1, Class A2C, 0.410%, 12/25/2036 | 6,520,420 | ||||||
| Springleaf Mortgage Loan Trust: | |||||||
| 3,997,608 | Series 2012-1A, Class A, 2.667%, 09/25/2057 (Acquired 04/11/2012, Cost $3,997,562) * | 4,044,724 | |||||
| 3,647,355 | Series 2012-2A, Class A, 2.220%, 10/25/2057 (Acquired 07/31/2012, Cost $3,646,941) * | 3,757,140 | |||||
| 2,163,359 | Wells Fargo Home Equity Trust, | ||||||
| Series 2005-2, Class AI1B, 0.500%, 08/25/2035 | 2,151,459 | ||||||
| 57,005,794 | |||||||
| Commercial Mortgage Backed Securities - 5.4% | |||||||
| 10,000,000 | Bear Stearns Commercial Mortgage Securities, | ||||||
| Series 2005-PWR9, Class A4A, 4.871%, 09/11/2042 | 10,985,330 | ||||||
| 9,413,000 | Commercial Mortgage Trust, | ||||||
| Series 2005-C6, Class A5A, 5.116%, 06/10/2044 | 10,387,528 | ||||||
| 7,208,250 | Credit Suisse First Boston Mortgage Securities Corporation, | ||||||
| Series 2005-C5, Class A4, 5.100%, 08/15/2038 @ | 7,923,006 | ||||||
| 6,810,031 | GE Capital Commercial Mortgage Corporation, | ||||||
| Series 2004-C3, Class A4, 5.189%, 07/10/2039 | 7,192,564 | ||||||
| 10,729,076 | J.P. Morgan Chase Commercial Mortgage Securities Corp., | ||||||
| Series 2003-CB7, Class A4, 4.879%, 01/12/2038 | 11,013,290 | ||||||
| 8,774,000 | J.P. Morgan Chase Commercial Mortgage Trust, | ||||||
| Series 2005-CB12, Class A4, 4.895%, 09/12/2037 | 9,624,104 | ||||||
| 9,650,000 | Morgan Stanley Capital I Trust, | ||||||
| Series 2005-HQ7, Class A4, 5.208%, 11/14/2042 | 10,658,666 | ||||||
| 2,342,627 | RBSCF Trust, | 2,387,118 | |||||
| Series 2010-MB1, Class A1, 2.367%, 04/15/2024 (Acquired 04/09/2010, Cost $2,342,578) * | 70,171,606 | ||||||
| Total Long-Term Investments (Cost $1,237,354,704) | 1,252,106,725 | ||||||
| Shares | |||||||
| SHORT-TERM INVESTMENTS - 1.7% | |||||||
| Money Market Mutual Funds - 1.7% | |||||||
| 21,179,336 | Short-Term Investments Trust - Liquid Assets Portfolio, 0.15% « | 21,179,336 | |||||
| Total Short-Term Investments (Cost $21,179,336) | 21,179,336 | ||||||
| Principal Amount | |||||||
| INVESTMENTS PURCHASED WITH CASH PROCEEDS FROM | |||||||
| SECURITIES LENDING - 6.5% | |||||||
| Commercial Paper - 0.0% | |||||||
| $ | 735,923 | Atlantic East Funding LLC, 0.562%, 03/25/2013 † * * | 556,429 | ||||
| Total Commercial Paper (Cost $735,923) | 556,429 | ||||||
| Shares | |||||||
| Investment Companies - 6.5% | |||||||
| 83,738,364 | Mount Vernon Securities Lending Trust Prime Portfolio, 0.28% « | 83,738,364 | |||||
| Total Investment Companies (Cost $83,738,364) | 83,738,364 | ||||||
| Total Investments Purchased With Cash Proceeds From | |||||||
| Securities Lending (Cost $84,474,287) | 84,294,793 | ||||||
| Total Investments (Cost $1,343,008,327) - 104.7% | 1,357,580,854 | ||||||
| Asset Relating to Securities Lending Investments - 0.0% | |||||||
Support Agreement * * ^ a † | 179,494 | ||||||
| Total (Cost $0) | 179,494 | ||||||
| Liabilities in Excess of Other Assets - (4.7)% | (60,601,832 | ) | |||||
| TOTAL NET ASSETS - 100.0% | $ | 1,297,158,516 | |||||
| Notes to Schedule of Investments | ||
| * | Restricted Security Deemed Liquid | |
| ** | Illiquid Security | |
| @ | This security or portion of this security is out on loan at December 31, 2012. | |
| f | Foreign Security | |
| ^ | Non-Income Producing | |
| « | 7-Day Yield | |
| § | Security in Default | |
| † | Priced at Fair Value by the Valuation Committee as delegated by the Baird Funds' Board of Directors. | |
| a | The Fund's transfer agent and administrator and securities lending agent entered into a support agreement with the Fund to cover losses realized by the Fund on its investment in Atlantic East Funding, LLC (up to a certain amount), which investment was made by the Fund's securities lending agent. | |
| Summary of Fair Value Exposure at December 31, 2012 |
The Fund has adopted authoritative fair valuation accounting standards which establish a definition of fair value and set out a hierarchy for measuring fair value. These standards require additional disclosures about the various inputs and valuation techniques used to develop the measurements of fair value and a discussion on changes in valuation techniques and related inputs during the period. These standards define fair value as the price that would be received to sell an asset or paid to transfer a liability in an orderly transaction between market participants at the measurement date.
The fair value hierarchy is organized into three levels based upon the assumptions (referred to as "inputs") used in pricing the asset or liability. These standards state that "observable inputs" reflect the assumptions market participants would use in pricing the asset or liability based on market data obtained from independent sources and "unobservable inputs" reflect an entity's own assumptions about the assumptions market participants would use in pricing the asset or liability. These inputs are summarized into three broad levels and described below:
| Level 1 - | Unadjusted quoted prices in active markets for identical unrestricted securities. | ||
| Level 2 - | Other significant observable inputs (including quoted prices for similar securities, quoted prices in inactive markets, dealer indications, interest rates, yield curves, prepayment speeds, credit risk, default rates, inputs corroborated by observable market data, etc.). | ||
| Level 3 - | Significant unobservable inputs (including the Fund's own assumptions about the factors that market participants would use in valuing the security) based on the best information available. |
| The inputs or methodology used for valuing securities are not necessarily an indication of the risk associated with investing in those securities. |
The following is a summary of the inputs used to value the Fund's investments as of December 31, 2012:
| Level 1 | Level 2 | Level 3 | Total | |||||||||||||
| Fixed Income | ||||||||||||||||
| U.S. Treasury Securities | $ | - | $ | 91,109,813 | $ | - | $ | 91,109,813 | ||||||||
| Taxable Municipal Bonds | - | 36,162,538 | - | 36,162,538 | ||||||||||||
| Other Government Related Securities | - | 21,322,024 | - | 21,322,024 | ||||||||||||
| Corporate Debt Securities | - | 961,483,838 | 961,483,838 | |||||||||||||
| Residential Mortgage-Backed Securities - U.S. Government Agency Issues | - | 2,002,895 | - | 2,002,895 | ||||||||||||
| Residential Mortgage-Backed Securities - Non - U.S. Government Agency Issues | - | 12,848,217 | - | 12,848,217 | ||||||||||||
| Asset Backed Securities | - | 57,005,794 | - | 57,005,794 | ||||||||||||
| Commercial Mortgage-Backed Securities | - | 70,171,606 | - | 70,171,606 | ||||||||||||
| Total Fixed Income | - | 1,252,106,725 | - | 1,252,106,725 | ||||||||||||
| Short-Term Investments | ||||||||||||||||
| Money Market Mutual Funds | 21,179,336 | - | - | 21,179,336 | ||||||||||||
| Total Short-Term Investments | 21,179,336 | - | - | 21,179,336 | ||||||||||||
| Investments Purchased with Cash | ||||||||||||||||
| Proceeds from Securities Lending | ||||||||||||||||
| Commercial Paper | - | 556,429 | - | 556,429 | ||||||||||||
| Money Market Mutual Fund | 83,738,364 | - | - | 83,738,364 | ||||||||||||
| Total Investments Purchased with | ||||||||||||||||
| Cash Proceeds from Securities Lending | 83,738,364 | 556,429 | - | 84,294,793 | ||||||||||||
| Total Investments | $ | 104,917,700 | $ | 1,252,663,154 | $ | - | $ | 1,357,580,854 | ||||||||
| Asset Relating to Securities Lending Investments | $ | - | $ | 179,494 | $ | - | $ | 179,494 | ||||||||
Changes in valuation techniques may result in transfers into or out of current assigned levels within the hierarchy. There were no transfers between Level 1, Level 2 and Level 3 fair value measurements during the reporting period, as compared to their classification from the prior year's annual report.
| Baird Intermediate Bond Fund | |||||||
| Schedule of Investments | |||||||
| December 31, 2012 | |||||||
| Principal Amount | Value | ||||||
| LONG-TERM INVESTMENTS - 97.8% | |||||||
| U.S. Treasury Securities - 23.4% | |||||||
| U.S. Treasury Bonds: | |||||||
| $ | 35,475,000 | 2.375%, 07/31/2017 | $ | 38,254,786 | |||
| 11,200,000 | 3.875%, 05/15/2018 @ | 13,015,621 | |||||
| 13,950,000 | 9.125%, 05/15/2018 | 20,079,281 | |||||
| 97,800,000 | 2.250%, 07/31/2018 | 105,341,260 | |||||
| 6,050,000 | 2.625%, 08/15/2020 | 6,643,656 | |||||
| 10,000,000 | 7.875%, 02/15/2021 | 15,050,000 | |||||
| 7,500,000 | 6.250%, 08/15/2023 | 10,753,125 | |||||
| 209,137,729 | |||||||
| U.S. Government Agency Securities - 3.8% | |||||||
| Federal Farm Credit Bank, | |||||||
| 400,000 | 3.000%, 09/22/2014 | 419,015 | |||||
| Federal Home Loan Mortgage Corporation (FHLMC): | |||||||
| 5,050,000 | 1.250%, 05/12/2017 | 5,166,998 | |||||
| 9,200,000 | 1.000%, 06/29/2017 @ | 9,314,301 | |||||
| 5,500,000 | Series 1, 1.000%, 07/28/2017 | 5,555,258 | |||||
| 300,000 | 2.375%, 01/13/2022 | 313,403 | |||||
| Federal National Mortgage Association (FNMA): | |||||||
| 1,100,000 | 2.750%, 03/13/2014 | 1,133,422 | |||||
| 300,000 | 0.750%, 12/19/2014 | 302,662 | |||||
| 6,700,000 | 1.375%, 11/15/2016 @ | 6,902,273 | |||||
| 4,625,000 | 0.875%, 08/28/2017 | 4,638,343 | |||||
| 33,745,675 | |||||||
| Taxable Municipal Bonds - 3.9% | |||||||
| Alaska Municipal Bond Bank Authority: | |||||||
| 1,000,000 | 4.309%, 08/01/2018 | 1,120,220 | |||||
| 1,340,000 | 4.459%, 08/01/2019 | 1,514,240 | |||||
| 3,375,000 | California Qualified School Construction Bonds, | ||||||
| 5.955%, 03/01/2019 | 3,812,906 | ||||||
| 2,500,000 | California School Finance Authority, | ||||||
| 4.426%, 07/01/2020 | 2,784,800 | ||||||
| California State: | |||||||
| 900,000 | 5.450%, 04/01/2015 | 988,542 | |||||
| 500,000 | 5.500%, 03/01/2016 | 558,830 | |||||
| 2,000,000 | Central Valley Support Joint Power Agency, | ||||||
| 5.326%, 09/01/2022 | 2,198,520 | ||||||
| 450,000 | City of Atlantic City NJ, | ||||||
| 2.130%, 12/15/2013 | 455,252 | ||||||
| 2,500,000 | Contra Costa County California Pension Obligation, | ||||||
| 5.140%, 06/01/2017 | 2,777,950 | ||||||
| 1,965,000 | Dallas Independent School District, | ||||||
| 4.950%, 02/15/2022 (Callable 02/15/2021) | 2,356,074 | ||||||
| 1,000,000 | Davie Florida Water & Sewer Revenue, | ||||||
| 6.062%, 10/01/2025 (Callable 10/01/2020) | 1,147,970 | ||||||
| 3,425,000 | Government Development Bank for Puerto Rico, | ||||||
| 4.704%, 05/01/2016 | 3,459,867 | ||||||
| 2,500,000 | Michigan State Housing Development Authority, | ||||||
| 4.625%, 12/01/2015 | 2,592,475 | ||||||
| 415,000 | North Carolina Housing Finance Agency, | ||||||
| 4.000%, 01/01/2030 | 438,319 | ||||||
| 2,100,000 | North East Independent School District Texas, | ||||||
| 5.240%, 08/01/2027 | 2,592,912 | ||||||
| State of Illinois: | |||||||
| 250,000 | 2.926%, 02/01/2013 | 250,390 | |||||
| 5,150,000 | 3.636%, 02/01/2014 | 5,266,287 | |||||
| 1,185,000 | Tobacco Settlement Authority Iowa, | ||||||
| 6.500%, 06/01/2023 (Callable 06/01/2015) | 1,166,478 | ||||||
| 35,482,032 | |||||||
| Other Government Related Securities - 2.0% | |||||||
| 454,000 | Corp Andina de Fomento, | ||||||
| 4.375%, 06/15/2022 f | 491,574 | ||||||
| 3,250,000 | KFW, | ||||||
| 4.875%, 06/17/2019 f | 3,956,225 | ||||||
| 2,000,000 | Korea Development Bank, | ||||||
| 3.875%, 05/04/2017 f | 2,162,238 | ||||||
| 300,000 | Korea Electric Power Corporation, | ||||||
| 6.750%, 08/01/2027 f | 409,749 | ||||||
| 1,000,000 | Korea Hydro & Nuclear Power Co., Ltd., | ||||||
| 6.250%, 06/17/2014 (Acquired 06/10/2009, Cost $989,350) * f | 1,070,368 | ||||||
| 350,000 | National Bank of Hungary Yankee Debentures, | ||||||
| 8.875%, 11/01/2013 f | 363,004 | ||||||
| 4,175,000 | Petrobras International Finance Company, | ||||||
| 3.875%, 01/27/2016 f | 4,404,638 | ||||||
| 2,650,000 | United Mexican States, | ||||||
| 5.125%, 01/15/2020 f | 3,166,750 | ||||||
| 1,495,000 | Westdeutsche Landesbank Subordinated Notes, | ||||||
| 4.796%, 07/15/2015 f | 1,658,581 | ||||||
| 17,683,127 | |||||||
| Corporate Bonds - 53.1% | |||||||
| Industrials - 18.3% | |||||||
| Ameritech Capital Funding Debentures: | |||||||
| 704,100 | 9.100%, 06/01/2016 | 816,244 | |||||
| 2,758,000 | 6.450%, 01/15/2018 | 3,276,526 | |||||
| Anadarko Petroleum Corporation: | |||||||
| 800,000 | 5.950%, 09/15/2016 | 920,905 | |||||
| 2,000,000 | 6.375%, 09/15/2017 | 2,388,990 | |||||
| 1,000,000 | 6.950%, 06/15/2019 | 1,263,817 | |||||
| Anglo American Capital PLC: | |||||||
| 1,200,000 | 9.375%, 04/08/2014 (Acquired 09/05/2012, Cost $1,318,812) * f | 1,319,184 | |||||
| 2,000,000 | 9.375%, 04/08/2019 (Acquired 07/11/2012, Cost $2,637,168) * f | 2,600,800 | |||||
| 2,000,000 | Aristotle Holding, Inc., | ||||||
| 2.650%, 02/15/2017 (Acquired 02/06/2012, Cost $1,980,500) * | 2,078,778 | ||||||
| BP Capital Markets PLC: | |||||||
| 375,000 | 3.200%, 03/11/2016 f | 400,021 | |||||
| 2,500,000 | 4.750%, 03/10/2019 f | 2,898,733 | |||||
| 1,000,000 | 3.245%, 05/06/2022 f | 1,053,507 | |||||
| 2,000,000 | British Telecommunications PLC, | ||||||
| 5.950%, 01/15/2018 @ f | 2,390,090 | ||||||
| Bunge Limited Finance Corporation: | |||||||
| 3,562,000 | 5.350%, 04/15/2014 | 3,748,172 | |||||
| 1,085,000 | 5.100%, 07/15/2015 | 1,174,650 | |||||
| 1,300,000 | 3.200%, 06/15/2017 | 1,356,723 | |||||
| 425,000 | Bunge N.A. Finance L.P., | ||||||
| 5.900%, 04/01/2017 | 482,535 | ||||||
| 150,000 | Caterpillar Financial Services Corporation, | ||||||
| 5.850%, 09/01/2017 | 180,120 | ||||||
| 500,000 | Comcast Cable Communications LLC, | ||||||
| 8.875%, 05/01/2017 | 648,422 | ||||||
| 550,000 | Comcast Cable Holdings, LLC, | ||||||
| 7.875%, 08/01/2013 | 573,069 | ||||||
| 3,650,000 | ConAgra Foods, Inc., | ||||||
| 5.875%, 04/15/2014 | 3,883,501 | ||||||
| 3,600,000 | Cox Communications, Inc., | ||||||
| 3.250%, 12/15/2022 (Acquired 11/26/2012, Cost $3,594,456) * @ | 3,712,529 | ||||||
| 2,300,000 | Daimler Finance North America LLC, | ||||||
| 2.250%, 07/31/2019 (Acquired 07/25/2012, Cost $2,285,234) * | 2,317,404 | ||||||
| Deutsche Telekom International Finance B.V.: | |||||||
| 175,000 | 5.750%, 03/23/2016 f | 199,397 | |||||
| 2,200,000 | 3.125%, 04/11/2016 (Acquired 04/04/2011, Cost $2,197,778) * f | 2,327,028 | |||||
| 1,300,000 | 6.000%, 07/08/2019 @ f | 1,585,388 | |||||
| 150,000 | Devon Energy Corporation, | ||||||
| 2.400%, 07/15/2016 | 155,364 | ||||||
| 250,000 | DIRECTV Holdings LLC / DIRECTV Financing Co., Inc., | ||||||
| 3.500%, 03/01/2016 | 264,851 | ||||||
| Donnelley (R.R.) & Sons Co.: | |||||||
| 1,000,000 | 8.600%, 08/15/2016 | 1,075,000 | |||||
| 875,000 | 6.125%, 01/15/2017 @ | 846,562 | |||||
| 1,000,000 | 7.625%, 06/15/2020 @ | 960,000 | |||||
| 1,000,000 | D.R. Horton, Inc., | ||||||
| 6.500%, 04/15/2016 | 1,110,000 | ||||||
| 4,000,000 | Ecolab Inc., | ||||||
| 1.450%, 12/08/2017 | 3,981,828 | ||||||
| 1,000,000 | Express Scripts Holding Co, | ||||||
| 7.250%, 06/15/2019 | 1,281,587 | ||||||
| 242,481 | Federal Express Corp. 1998 Pass Through Trust, | ||||||
| Series 981B, 6.845%, 01/15/2019 | 270,366 | ||||||
| 453,415 | Federal Express Corp. 1995 Pass Through Trust, | ||||||
| Series B2, 7.110%, 01/02/2014 | 469,285 | ||||||
| 2,250,000 | FedEx Corporation, | ||||||
| 7.375%, 01/15/2014 | 2,404,332 | ||||||
| Fiserv, Inc.: | |||||||
| 275,000 | 3.125%, 06/15/2016 | 288,880 | |||||
| 1,000,000 | 4.750%, 06/15/2021 | 1,102,583 | |||||
| 3,000,000 | Ford Motor Credit Company LLC, | ||||||
| 2.500%, 01/15/2016 @ | 3,036,969 | ||||||
| 2,000,000 | Freeport-McMoRan Copper & Gold Inc., | ||||||
| 2.150%, 03/01/2017 | 2,010,622 | ||||||
| 3,456,000 | Glencore Funding LLC, | ||||||
| 6.000%, 04/15/2014 (Acquired 03/31/2004 through 02/02/2010, Cost $3,461,876) * | 3,650,072 | ||||||
| GTE Corporation: | |||||||
| 1,460,000 | 6.840%, 04/15/2018 | 1,827,879 | |||||
| 150,000 | 8.750%, 11/01/2021 | 210,802 | |||||
| 1,375,000 | Hanson Australia Funding, | ||||||
| 5.250%, 03/15/2013 f | 1,390,125 | ||||||
| �� | 650,000 | Hanson PLC Notes, | |||||
| 6.125%, 08/15/2016 f | 713,375 | ||||||
| 1,200,000 | Hess Corporation, | ||||||
| 8.125%, 02/15/2019 | 1,579,328 | ||||||
| 3,500,000 | Hewlett-Packard Co., | ||||||
| 3.300%, 12/09/2016 | 3,562,611 | ||||||
| 795,000 | Highmark Inc., | ||||||
| 6.800%, 08/15/2013 (Acquired 08/14/2003 through 05/23/2012, Cost $802,937) * | 816,401 | ||||||
| 392,000 | Historic Time Warner Inc., | ||||||
| 6.875%, 06/15/2018 | 493,993 | ||||||
| 375,000 | HP Enterprise Services, LLC, | ||||||
| Series B, 6.000%, 08/01/2013 | 384,444 | ||||||
| Hutchison Whampoa International Ltd.: | |||||||
| 1,000,000 | 6.500%, 02/13/2013 (Acquired 09/25/2012, Cost $1,006,491) * f | 1,006,075 | |||||
| 2,800,000 | 7.625%, 04/09/2019 (Acquired 10/16/2009 through 09/19/2011, Cost $3,117,344) * f | 3,609,385 | |||||
| 1,195,000 | Ingersoll-Rand Company Debentures, | ||||||
| 6.391%, 11/15/2027 | 1,441,431 | ||||||
| 1,275,000 | Ingredion Incorporated, | ||||||
| 1.800%, 09/25/2017 @ | 1,266,616 | ||||||
| 1,625,000 | Johnson Controls Inc., | ||||||
| 5.500%, 01/15/2016 @ | 1,834,290 | ||||||
| 2,000,000 | Kraft Foods Group Inc, | ||||||
| 3.500%, 06/06/2022 (Acquired 05/30/2012, Cost $1,982,000) * | 2,134,734 | ||||||
| Laboratory Corporation of America Holdings: | |||||||
| 1,675,000 | 5.500%, 02/01/2013 | 1,680,666 | |||||
| 325,000 | 4.625%, 11/15/2020 | 361,849 | |||||
| Lafarge SA: | |||||||
| 1,000,000 | 6.200%, 07/09/2015 (Acquired 07/06/2010, Cost $999,140) * f | 1,080,000 | |||||
| 625,000 | 6.500%, 07/15/2016 f | 698,438 | |||||
| 180,000 | Limited Brands, Inc., | ||||||
| 5.250%, 11/01/2014 @ | 189,000 | ||||||
| 75,000 | Martin Marietta Materials, Inc., | ||||||
| 6.600%, 04/15/2018 | 83,032 | ||||||
| 2,000,000 | Masco Corporation, | ||||||
| 6.125%, 10/03/2016 | 2,209,084 | ||||||
| 215,000 | Medco Health Solutions, Inc., | ||||||
| 2.750%, 09/15/2015 | 224,112 | ||||||
| 825,000 | Nabors Industries, Inc., | ||||||
| 6.150%, 02/15/2018 | 970,234 | ||||||
| 700,000 | PCCW-HKT Capital II Limited, | ||||||
| 6.000%, 07/15/2013 (Acquired 07/10/2003, Cost $696,731) * f | 716,094 | ||||||
| 925,000 | Pearson Dollar Finance PLC, | ||||||
| 5.700%, 06/01/2014 (Acquired 09/28/2005 through 12/14/2007, Cost $924,747) * f | 979,385 | ||||||
| 150,000 | PepsiCo, Inc., | ||||||
| 2.500%, 05/10/2016 | 157,979 | ||||||
| 4,000,000 | Petrohawk Energy Corporation, | ||||||
| 7.250%, 08/15/2018 | 4,515,788 | ||||||
| 2,445,000 | Plum Creek Timberlands, L.P., | ||||||
| 5.875%, 11/15/2015 | 2,714,048 | ||||||
| 3,000,000 | POSCO, | ||||||
| 5.250%, 04/14/2021 (Acquired 04/08/2011 through 09/22/2011, Cost $2,978,120) * @ f | 3,420,921 | ||||||
| 125,000 | Potash Corporation of Saskatchewan Inc., | ||||||
| 5.250%, 05/15/2014 f | 132,720 | ||||||
| Rio Tinto Alcan, Inc.: | |||||||
| 100,000 | 5.200%, 01/15/2014 f | 104,432 | |||||
| 450,000 | 5.000%, 06/01/2015 f | 491,856 | |||||
| Rio Tinto Financial USA Ltd.: | |||||||
| 1,800,000 | 6.500%, 07/15/2018 @ f | 2,246,620 | |||||
| 1,000,000 | 9.000%, 05/01/2019 @ f | 1,373,528 | |||||
| 500,000 | 3.500%, 11/02/2020 @ f | 530,008 | |||||
| 2,000,000 | Schneider Electric SA, | ||||||
| 2.950%, 09/27/2022 (Acquired 09/20/2012, Cost $1,994,680) * f | 2,015,800 | ||||||
| 125,000 | Southwestern Bell Telephone, L.P., | ||||||
| 7.000%, 07/01/2015 | 143,595 | ||||||
| 500,000 | Sprint Nextel Corporation, | ||||||
| 6.000%, 12/01/2016 | 543,750 | ||||||
| 2,075,000 | Staples, Inc., | ||||||
| 9.750%, 01/15/2014 | 2,255,932 | ||||||
| 400,000 | Statoil ASA, | ||||||
| 2.900%, 10/15/2014 f | 416,277 | ||||||
| 1,175,000 | Sunoco, Inc. Senior Unsecured Notes, | ||||||
| 5.750%, 01/15/2017 | 1,324,677 | ||||||
| 150,000 | Sysco Corporation, | ||||||
| 2.600%, 06/12/2022 | 153,081 | ||||||
| 3,498,000 | TCI Communications, Inc., | ||||||
| 8.750%, 08/01/2015 | 4,174,146 | ||||||
| 1,000,000 | Teck Resources Limited, | ||||||
| 3.150%, 01/15/2017 f | 1,048,070 | ||||||
| Telecom Italia Capital, SA: | |||||||
| 1,360,000 | 4.950%, 09/30/2014 f | 1,419,840 | |||||
| 2,425,000 | 5.250%, 10/01/2015 f | 2,580,200 | |||||
| Telefonica Emisiones S.A.U.: | |||||||
| 3,150,000 | 6.421%, 06/20/2016 f | 3,485,475 | |||||
| 1,000,000 | 6.221%, 07/03/2017 @ f | 1,112,500 | |||||
| Teva Pharmaceutical Finance IV, LLC: | |||||||
| 400,000 | 1.700%, 11/10/2014 | 409,207 | |||||
| 1,250,000 | 2.250%, 03/18/2020 | 1,261,156 | |||||
| 1,000,000 | Time Warner Cable, Inc., | ||||||
| 5.850%, 05/01/2017 | 1,181,318 | ||||||
| Time Warner, Inc.: | |||||||
| 1,325,000 | 4.700%, 01/15/2021 | 1,508,448 | |||||
| 2,000,000 | 4.750%, 03/29/2021 | 2,298,422 | |||||
| 2,375,000 | Toyota Motor Credit Corporation, | ||||||
| 2.050%, 01/12/2017 | 2,456,365 | ||||||
| 500,000 | Tyco Electronics Group S.A., | ||||||
| 6.550%, 10/01/2017 f | 599,555 | ||||||
| United AirLines, Inc. Pass Through Trust: | |||||||
| 129,700 | Series 91A2, 10.020%, 03/22/2014 | 70,687 | |||||
| 48,704 | Series 002C, 7.762%, 04/29/2049 § † * * | 1,461 | |||||
| 375,000 | United Technologies Corporation, | ||||||
| 3.100%, 06/01/2022 | 397,120 | ||||||
| Vale Overseas Limited: | |||||||
| 1,500,000 | 6.250%, 01/23/2017 f | 1,725,888 | |||||
| 2,425,000 | 4.375%, 01/11/2022 f | 2,588,704 | |||||
| 2,300,000 | Valero Energy Corporation, | ||||||
| 4.750%, 04/01/2014 | 2,394,592 | ||||||
| Verizon Communications, Inc.: | |||||||
| 1,000,000 | 5.550%, 02/15/2016 | 1,138,737 | |||||
| 750,000 | 5.500%, 04/01/2017 | 880,127 | |||||
| 500,000 | Viacom Inc., | ||||||
| 6.250%, 04/30/2016 | 579,636 | ||||||
| 2,000,000 | Vulcan Materials Co., | ||||||
| 7.000%, 06/15/2018 | 2,210,000 | ||||||
| 125,000 | Waste Management, Inc., | ||||||
| 5.000%, 03/15/2014 | 131,208 | ||||||
| 3,000,000 | Xerox Corporation, | ||||||
| 8.250%, 05/15/2014 | 3,272,358 | ||||||
| 1,024,000 | Xstrata Canada Corporation, | ||||||
| 6.000%, 10/15/2015 f | 1,137,821 | ||||||
| 3,000,000 | Xstrata Finance (Canada) Limited, | ||||||
| 2.450%, 10/25/2017 (Acquired 10/18/2012, Cost $2,994,960) * f | 3,029,082 | ||||||
| 163,601,352 | |||||||
| Utility - 8.4% | |||||||
| 4,500,000 | Ameren Corporation, | ||||||
| 8.875%, 05/15/2014 | 4,924,440 | ||||||
| 2,065,000 | Baltimore Gas & Electric Co. Senior Unsecured Notes, | ||||||
| 6.125%, 07/01/2013 | 2,122,101 | ||||||
| 1,150,000 | Centrais Eletricas Brasileiras SA, | ||||||
| 5.750%, 10/27/2021 (Acquired 10/20/2011 through 10/25/2011, Cost $1,152,248) * @ f | 1,236,250 | ||||||
| 375,000 | Commonwealth Edison, | ||||||
| Series 104, 5.950%, 08/15/2016 | 437,042 | ||||||
| DCP Midstream, LLC: | |||||||
| 1,765,000 | 9.700%, 12/01/2013 (Acquired 04/03/2012 through 08/06/2012, Cost $1,892,173) * | 1,901,383 | |||||
| 1,600,000 | 9.750%, 03/15/2019 (Acquired 10/15/2012, Cost $2,092,029) * | 2,116,520 | |||||
| Dominion Resources, Inc.: | |||||||
| 1,000,000 | Series C, 5.150%, 07/15/2015 | 1,104,057 | |||||
| 800,000 | Series 07-A, 6.000%, 11/30/2017 | 964,842 | |||||
| 1,411,000 | DTE Energy Company, | ||||||
| 7.625%, 05/15/2014 | 1,540,575 | ||||||
| 3,000,000 | El Paso Pipeline Partners Operating Co LLC, | ||||||
| 4.100%, 11/15/2015 | 3,217,929 | ||||||
| 2,000,000 | Enel Finance International, | ||||||
| 5.700%, 01/15/2013 (Acquired 03/31/2010, Cost $2,002,349) * f | 2,001,258 | ||||||
| Energy Transfer Partners, L.P.: | |||||||
| 2,084,000 | 8.500%, 04/15/2014 | 2,266,102 | |||||
| 1,336,000 | 5.950%, 02/01/2015 | 1,464,057 | |||||
| 778,000 | 9.700%, 03/15/2019 | 1,047,982 | |||||
| Enterprise Products Operating LLC: | |||||||
| 3,824,000 | Series O, 9.750%, 01/31/2014 | 4,183,835 | |||||
| 200,000 | 3.700%, 06/01/2015 | 212,530 | |||||
| 1,000,000 | Exelon Corporation, | ||||||
| 4.900%, 06/15/2015 | 1,088,528 | ||||||
| 2,585,000 | Exelon Generation Company, LLC, | ||||||
| 5.350%, 01/15/2014 | 2,703,920 | ||||||
| 2,500,000 | Kinder Morgan Finance, | ||||||
| 5.700%, 01/05/2016 f | 2,732,828 | ||||||
| 63,952 | Kiowa Power Partners LLC, | ||||||
| 4.811%, 12/30/2013 (Acquired 11/19/2004, Cost $63,952) * | 64,392 | ||||||
| 3,925,000 | National Grid PLC, | ||||||
| 6.300%, 08/01/2016 f | 4,554,123 | ||||||
| 2,300,000 | National Rural Utilities Corporation, | ||||||
| 10.375%, 11/01/2018 | 3,399,899 | ||||||
| Nisource Finance Corp.: | |||||||
| 35,000 | 6.150%, 03/01/2013 | 35,291 | |||||
| 2,000,000 | 4.450%, 12/01/2021 | 2,190,046 | |||||
| 4,000,000 | Nustar Pipeline Operating Partnership L.P., | ||||||
| 5.875%, 06/01/2013 | 4,044,452 | ||||||
| 1,950,000 | PPL Energy Supply, LLC, | ||||||
| Series A, 5.700%, 10/15/2015 | 2,152,638 | ||||||
| PSEG Power LLC: | |||||||
| 144,000 | 5.320%, 09/15/2016 | 162,801 | |||||
| 220,000 | 5.125%, 04/15/2020 | 253,543 | |||||
| 2,575,000 | Public Service Company of New Mexico, | ||||||
| 7.950%, 05/15/2018 | 3,128,818 | ||||||
| 584,208 | RGS (I&M) Funding Corporation Debentures, | ||||||
| Series F, 9.820%, 12/07/2022 | 705,175 | ||||||
| Rockies Express Pipeline LLC: | |||||||
| 3,000,000 | 3.900%, 04/15/2015 (Acquired 02/17/2011, Cost $3,000,265) * @ | 2,985,000 | |||||
| 1,000,000 | 5.625%, 04/15/2020 (Acquired 03/17/2010, Cost $999,110) * @ | 982,500 | |||||
| 2,000,000 | Sempra Energy, | ||||||
| 2.000%, 03/15/2014 | 2,030,260 | ||||||
| Spectra Energy Capital LLC: | |||||||
| 1,500,000 | 5.500%, 03/01/2014 | 1,577,868 | |||||
| 2,700,000 | 5.668%, 08/15/2014 | 2,897,011 | |||||
| 2,500,000 | Trans-Allegheny Interstate Line Company, | ||||||
| 4.000%, 01/15/2015 (Acquired 01/19/2010, Cost $2,490,650) * | 2,626,185 | ||||||
| 150,000 | TransCanada PipeLines Ltd., | ||||||
| 9.875%, 01/01/2021 f | 221,928 | ||||||
| 575,000 | Vectren Utility Holdings, Inc., | ||||||
| 5.250%, 08/01/2013 | 589,282 | ||||||
| 2,000,000 | West Penn Power Company, | ||||||
| 5.875%, 08/15/2016 (Acquired 10/25/2010, Cost $2,188,382) * | 2,245,526 | ||||||
| Williams Partners L.P.: | |||||||
| 1,000,000 | 5.250%, 03/15/2020 | 1,151,952 | |||||
| 350,000 | 4.125%, 11/15/2020 | 380,057 | |||||
| 75,644,926 | |||||||
| Finance - 26.4% | |||||||
| AEGON N.V.: | |||||||
| 1,725,000 | 4.750%, 06/01/2013 f | 1,751,587 | |||||
| 795,000 | 4.625%, 12/01/2015 f | 866,663 | |||||
| 200,000 | Ally Financial Inc., | ||||||
| 6.750%, 12/01/2014 | 215,946 | ||||||
| 3,000,000 | American International Group, Inc., | ||||||
| 4.875%, 06/01/2022 | 3,424,863 | ||||||
| 630,000 | AmSouth Bancorp, | ||||||
| 6.750%, 11/01/2025 | 627,781 | ||||||
| 2,239,000 | ANZ National (Int' l) LTD, | ||||||
| 3.125%, 08/10/2015 (Acquired 02/28/2012, Cost $2,272,920) * @ f | 2,346,103 | ||||||
| AON Corporation: | |||||||
| 425,000 | 3.500%, 09/30/2015 | 447,612 | |||||
| 150,000 | 3.125%, 05/27/2016 | 157,916 | |||||
| 2,000,000 | ASIF Global Financing XIX, | ||||||
| 4.900%, 01/17/2013 (Acquired 05/02/2012, Cost $2,003,261) * | 2,002,824 | ||||||
| 1,200,000 | Associates Corporation of North America, | ||||||
| 6.950%, 11/01/2018 | 1,445,520 | ||||||
| 1,700,000 | Australia and New Zealand Banking Group Limited, | ||||||
| 3.250%, 03/01/2016 (Acquired 02/22/2011, Cost $1,693,081) * f | 1,808,530 | ||||||
| 1,035,000 | Bank of America Corporation Subordinated Notes, | ||||||
| 10.200%, 07/15/2015 | 1,225,197 | ||||||
| 2,500,000 | Banponce Trust I, | ||||||
| Series A, 8.327%, 02/01/2027 | 1,943,750 | ||||||
| Barclays Bank PLC: | |||||||
| 150,000 | 2.500%, 01/23/2013 f | 150,187 | |||||
| 2,565,000 | Series 1, 5.000%, 09/22/2016 f | 2,875,075 | |||||
| 2,000,000 | 6.750%, 05/22/2019 @ f | 2,442,470 | |||||
| 2,322,000 | BB&T Corporation, | ||||||
| 6.850%, 04/30/2019 @ | 2,956,828 | ||||||
| 3,800,000 | Berkshire Hathaway Finance Corporation, | ||||||
| 1.600%, 05/15/2017 | 3,873,260 | ||||||
| 425,000 | BNP Paribas SA, | ||||||
| 3.250%, 03/11/2015 f | 443,564 | ||||||
| Capital One Financial Corporation: | |||||||
| 1,000,000 | 7.375%, 05/23/2014 | 1,087,828 | |||||
| 2,000,000 | 3.150%, 07/15/2016 | 2,123,372 | |||||
| 1,000,000 | CDP Financial Inc., | ||||||
| 4.400%, 11/25/2019 (Acquired 11/20/2009, Cost $997,520) * f | 1,150,633 | ||||||
| 3,500,000 | Cie de Financement Foncier SA, | ||||||
| 2.250%, 03/07/2014 (Acquired 07/26/2011, Cost $3,517,116) * f | 3,555,038 | ||||||
| Citigroup, Inc.: | |||||||
| 2,225,000 | 6.010%, 01/15/2015 | 2,431,291 | |||||
| 1,800,000 | 4.450%, 01/10/2017 @ | 1,994,040 | |||||
| 200,000 | 6.125%, 11/21/2017 | 238,031 | |||||
| CNA Financial Corporation: | |||||||
| 2,000,000 | 6.500%, 08/15/2016 | 2,307,450 | |||||
| 125,000 | 5.875%, 08/15/2020 | 147,476 | |||||
| 4,000,000 | Commonwealth Bank of Australia, | ||||||
| 5.000%, 10/15/2019 (Acquired 03/02/2012, Cost $4,304,778) * f | 4,648,404 | ||||||
| 2,075,000 | Countrywide Financial Corporation, | ||||||
| 6.250%, 05/15/2016 | 2,277,742 | ||||||
| 325,000 | Credit Suisse (USA), Inc., | ||||||
| 5.125%, 08/15/2015 @ | 360,688 | ||||||
| 2,425,000 | Credit Suisse New York, | ||||||
| 5.300%, 08/13/2019 f | 2,877,585 | ||||||
| 4,250,000 | Deutsche Bank Aktiengesellschaft, | ||||||
| 3.250%, 01/11/2016 f | 4,497,350 | ||||||
| 2,652,000 | Dresdner Bank AG, | ||||||
| 7.250%, 09/15/2015 @ f | 2,852,064 | ||||||
| 2,000,000 | ERP Operating Limited Partnership, | ||||||
| 5.200%, 04/01/2013 | 2,020,912 | ||||||
| 1,495,000 | Fifth Third Bancorp, | ||||||
| 6.250%, 05/01/2013 @ | 1,523,386 | ||||||
| 1,800,000 | Fifth Third Bank, | ||||||
| 4.750%, 02/01/2015 | 1,930,685 | ||||||
| 459,128 | First National Bank of Chicago Pass Through Trust, | ||||||
| Series 93-A, 8.080%, 01/05/2018 | 505,142 | ||||||
| 1,546,000 | FMR LLC, | ||||||
| 4.750%, 03/01/2013 (Acquired 02/26/2003 through 12/01/2009, Cost $1,547,054) * | 1,556,459 | ||||||
| General Electric Capital Corporation: | |||||||
| 2,850,000 | 5.625%, 05/01/2018 @ | 3,384,472 | |||||
| 1,600,000 | 6.000%, 08/07/2019 | 1,946,501 | |||||
| 2,300,000 | 5.500%, 01/08/2020 | 2,722,535 | |||||
| Genworth Financial, Inc.: | |||||||
| 1,150,000 | 5.750%, 06/15/2014 @ | 1,208,760 | |||||
| 400,000 | 4.950%, 10/01/2015 | 423,093 | |||||
| 2,620,000 | Genworth Life Institutional Funding Trust, | ||||||
| 5.875%, 05/03/2013 (Acquired 03/22/2011, Cost $2,648,041) * | 2,659,876 | ||||||
| GMAC Inc.: | |||||||
| 80,000 | 7.500%, 12/31/2013 | 84,500 | |||||
| 96,000 | 8.000%, 12/31/2018 | 112,320 | |||||
| 1,800,000 | Great West Life & Annuity Insurance, | ||||||
| 7.153%, 05/16/2046 (Acquired 05/16/2006 through 11/08/2007, Cost $1,792,736) * | 1,863,000 | ||||||
| 1,868,000 | HSBC Finance Corporation, | ||||||
| 6.676%, 01/15/2021 | 2,216,141 | ||||||
| 1,000,000 | HSBC USA Inc., | ||||||
| 2.375%, 02/13/2015 | 1,028,626 | ||||||
| 2,000,000 | Humana Inc., | ||||||
| 7.200%, 06/15/2018 | 2,466,250 | ||||||
| ING Bank N.V.: | |||||||
| 2,000,000 | 2.000%, 10/18/2013 (Acquired 10/28/2010, Cost $2,000,609) * f | 2,008,224 | |||||
| 2,300,000 | 3.000%, 09/01/2015 (Acquired 08/17/2010 through 09/14/2012, Cost $2,333,043) * f | 2,377,965 | |||||
| 4,225,000 | Invesco Finance PLC, | ||||||
| 3.125%, 11/30/2022 f | 4,267,634 | ||||||
| 4,075,000 | Irish Life & Permanent Group Holdings PLC, | ||||||
| 3.600%, 01/14/2013 (Acquired 01/07/2010 through 08/10/2012, Cost $4,072,768) * f | 4,075,029 | ||||||
| Istar Financial, Inc.: | |||||||
| 1,050,000 | Series B, 5.950%, 10/15/2013 | 1,072,313 | |||||
| 75,000 | 5.850%, 03/15/2017 | 73,500 | |||||
| 2,000,000 | Jefferies Group, Inc., | ||||||
| 6.875%, 04/15/2021 | 2,240,000 | ||||||
| J.P. Morgan Chase & Co.: | |||||||
| 1,725,000 | 3.450%, 03/01/2016 | 1,831,969 | |||||
| 3,000,000 | 4.500%, 01/24/2022 | 3,393,711 | |||||
| 450,000 | Kemper Corporation, | ||||||
| 6.000%, 05/15/2017 | 492,953 | ||||||
| Key Bank NA: | |||||||
| 2,000,000 | 5.800%, 07/01/2014 | 2,142,326 | |||||
| 2,000,000 | 7.413%, 05/06/2015 | 2,249,944 | |||||
| 2,600,000 | Kookmin Bank, | ||||||
| 7.250%, 05/14/2014 (Acquired 06/12/2009, Cost $2,613,740) * f | 2,806,515 | ||||||
| 1,000,000 | Liberty Mutual Group Inc., | ||||||
| 5.750%, 03/15/2014 (Acquired 09/03/2009 through 10/15/2010, Cost $991,273) * | 1,047,253 | ||||||
| Lloyds TSB Bank PLC: | |||||||
| 225,000 | 4.875%, 01/21/2016 f | 248,150 | |||||
| 2,900,000 | 5.800%, 01/13/2020 (Acquired 02/09/2010 through 03/16/2012, Cost $2,905,618) * f | 3,393,821 | |||||
| M&I Marshall & Ilsley Bank: | |||||||
| 3,075,000 | 4.850%, 06/16/2015 | 3,306,631 | |||||
| 1,000,000 | 5.000%, 01/17/2017 | 1,106,574 | |||||
| 1,775,000 | Manulife Financial Corp., | ||||||
| 4.900%, 09/17/2020 @ f | 1,986,488 | ||||||
| Marsh & McLennan Companies, Inc.: | |||||||
| 3,000,000 | 4.850%, 02/15/2013 | 3,014,604 | |||||
| 1,197,000 | 5.750%, 09/15/2015 | 1,341,891 | |||||
| 3,800,000 | MassMutual Global Funding II, | ||||||
| 2.000%, 04/05/2017 (Acquired 03/29/2012, Cost $3,783,470) * | 3,915,170 | ||||||
| 500,000 | MBIA Insurance Corp., | ||||||
| 14.000%, 01/15/2033 (Acquired 01/11/2008, Cost $500,000) * @ | 85,000 | ||||||
| Merrill Lynch & Company: | |||||||
| 1,000,000 | 5.700%, 05/02/2017 | 1,097,500 | |||||
| 1,000,000 | 6.875%, 04/25/2018 | 1,205,454 | |||||
| 3,000,000 | MetLife Institutional Funding II, | ||||||
| 1.205%, 04/04/2014 (Acquired 03/29/2011, Cost $3,000,000) * | 3,025,491 | ||||||
| 1,735,000 | Monumental Global Funding III, | ||||||
| 5.250%, 01/15/2014 (Acquired 04/05/2011 through 12/05/2011, Cost $1,781,993) * | 1,811,614 | ||||||
| Morgan Stanley: | |||||||
| 150,000 | 4.750%, 04/01/2014 @ | 155,321 | |||||
| 125,000 | 3.800%, 04/29/2016 | 131,223 | |||||
| 1,600,000 | 6.625%, 04/01/2018 | 1,885,720 | |||||
| 2,400,000 | Morgan Stanley Dean Witter & Co., | ||||||
| 6.750%, 10/15/2013 | 2,507,112 | ||||||
| 1,725,000 | National Australia Bank Ltd, | ||||||
| 3.000%, 07/27/2016 (Acquired 07/20/2011, Cost $1,720,239) * f | 1,826,258 | ||||||
| 2,320,000 | Navigators Group Inc. Senior Unsecured Notes, | ||||||
| 7.000%, 05/01/2016 | 2,523,670 | ||||||
| 2,500,000 | Nomura Holdings Inc., | ||||||
| 5.000%, 03/04/2015 f | 2,650,652 | ||||||
| 1,000,000 | North Fork Capital Trust II, | ||||||
| 8.000%, 12/15/2027 | 1,019,000 | ||||||
| 175,000 | NYSE Euronext, | ||||||
| 2.000%, 10/05/2017 | 177,901 | ||||||
| 1,585,000 | Principal Life Income Funding Trusts, | ||||||
| 5.550%, 04/27/2015 | 1,751,609 | ||||||
| 1,225,000 | Protective Life Corporation, | ||||||
| 4.300%, 06/01/2013 | 1,242,875 | ||||||
| 1,900,000 | Prudential Covered Trust 2012-1, | ||||||
| 2.997%, 09/30/2015 (Acquired 11/06/2012, Cost $1,974,124) * | 1,970,323 | ||||||
| Prudential Financial, Inc.: | |||||||
| 3,125,000 | 5.150%, 01/15/2013 | 3,128,497 | |||||
| 200,000 | 3.875%, 01/14/2015 | 211,608 | |||||
| 2,000,000 | Rabobank Nederland Global Senior Unsecured Notes, | ||||||
| 4.200%, 05/13/2014 (Acquired 05/06/2009, Cost $1,996,340) * f | 2,091,898 | ||||||
| 1,825,000 | Regions Bank, | ||||||
| 7.500%, 05/15/2018 | 2,201,406 | ||||||
| 1,500,000 | Regions Financial Corporation, | ||||||
| 5.750%, 06/15/2015 | 1,621,875 | ||||||
| 2,800,000 | Royal Bank of Canada, | ||||||
| 1.200%, 09/19/2017 f | 2,806,720 | ||||||
| 400,000 | Simon Property Group, L.P., | ||||||
| 5.750%, 12/01/2015 | 450,578 | ||||||
| SLM Corporation: | |||||||
| 4,000,000 | 5.000%, 10/01/2013 | 4,095,000 | |||||
| 250,000 | 5.375%, 05/15/2014 | 261,379 | |||||
| 2,750,000 | Societe Generale, | ||||||
| 2.750%, 10/12/2017 @ f | 2,797,361 | ||||||
| 2,880,000 | Sovereign Bank, | ||||||
| 8.750%, 05/30/2018 | 3,391,140 | ||||||
| 2,000,000 | St. Paul Travelers, Inc., | ||||||
| 6.250%, 06/20/2016 | 2,350,810 | ||||||
| SunTrust Bank: | |||||||
| 2,450,000 | 3.600%, 04/15/2016 | 2,616,960 | |||||
| 500,000 | 5.450%, 12/01/2017 | 564,895 | |||||
| 1,406,000 | 7.250%, 03/15/2018 | 1,720,770 | |||||
| 2,800,000 | SUSA Partnership, L.P., | ||||||
| 8.200%, 06/01/2017 | 3,387,476 | ||||||
| Svenska Handelsbanken AB: | |||||||
| 275,000 | 3.125%, 07/12/2016 f | 291,803 | |||||
| 1,500,000 | 2.875%, 04/04/2017 f | 1,584,901 | |||||
| 1,000,000 | Symetra Financial Corporation, | ||||||
| 6.125%, 04/01/2016 (Acquired 08/12/2011, Cost $1,055,331) * | 1,082,467 | ||||||
| 3,800,000 | Talent Yield Investments Ltd, | ||||||
| 4.500%, 04/25/2022 (Acquired 04/18/2012, Cost $3,774,008) * @ f | 4,132,325 | ||||||
| 200,000 | The Allstate Corporation, | ||||||
| 7.500%, 06/15/2013 | 206,299 | ||||||
| 150,000 | The Bank of New York Mellon Corporation, | ||||||
| 1.200%, 02/20/2015 | 151,611 | ||||||
| 150,000 | The Bank of Nova Scotia, | ||||||
| 2.550%, 01/12/2017 f | 157,837 | ||||||
| The Bear Stearns Companies LLC: | |||||||
| 125,000 | 5.300%, 10/30/2015 | 138,524 | |||||
| 1,450,000 | 6.400%, 10/02/2017 | 1,741,447 | |||||
| 600,000 | 7.250%, 02/01/2018 | 751,826 | |||||
| 325,000 | The Charles Schwab Corporation, | ||||||
| 6.375%, 09/01/2017 | 390,118 | ||||||
| The Goldman Sachs Group, Inc.: | |||||||
| 2,125,000 | 5.150%, 01/15/2014 | 2,216,175 | |||||
| 125,000 | 3.700%, 08/01/2015 | 131,924 | |||||
| 3,000,000 | 6.150%, 04/01/2018 | 3,524,304 | |||||
| The Hartford Financial Services Group, Inc.: | |||||||
| 1,000,000 | 4.000%, 03/30/2015 | 1,056,686 | |||||
| 2,600,000 | 6.300%, 03/15/2018 | 3,097,583 | |||||
| The Royal Bank of Scotland Group PLC: | |||||||
| 200,000 | 2.550%, 09/18/2015 f | 204,682 | |||||
| 3,100,000 | 5.625%, 08/24/2020 f | 3,599,019 | |||||
| 150,000 | 6.125%, 01/11/2021 f | 181,227 | |||||
| 225,000 | The Travelers Companies, Inc., | ||||||
| 5.750%, 12/15/2017 | 273,258 | ||||||
| UBS AG: | |||||||
| 100,000 | Series 001, 2.250%, 01/28/2014 f | 101,444 | |||||
| 200,000 | 3.875%, 01/15/2015 f | 211,332 | |||||
| Union Bank NA: | |||||||
| 665,000 | 2.125%, 12/16/2013 | 675,404 | |||||
| 1,800,000 | 2.125%, 06/16/2017 @ | 1,850,945 | |||||
| UnionBanCal Corp.: | |||||||
| 650,000 | 5.250%, 12/16/2013 | 675,620 | |||||
| 75,000 | 3.500%, 06/18/2022 | 79,105 | |||||
| 639,000 | Wachovia Bank, NA, | ||||||
| 6.000%, 11/15/2017 | 766,273 | ||||||
| 500,000 | WEA Finance LLC, | ||||||
| 7.500%, 06/02/2014 (Acquired 04/05/2012, Cost $534,350) * | 544,016 | ||||||
| 1,015,000 | Wells Fargo Bank NA, | ||||||
| Series AI, 4.750%, 02/09/2015 | 1,090,127 | ||||||
| 3,000,000 | Westpac Banking Corporation, | ||||||
| 3.000%, 08/04/2015 f | 3,168,504 | ||||||
| 3,250,000 | Willis Group Holdings Limited, | ||||||
| 5.750%, 03/15/2021 f | 3,698,607 | ||||||
| 236,140,480 | |||||||
| Residential Mortgage-Backed Securities - 2.0% | |||||||
| U.S. Government Agency Issues - 0.4% | |||||||
| Federal Gold Loan Mortgage Corporation (FGLMC) Pass-Thru Certificates: | |||||||
| 270,690 | 6.000%, 06/01/2021 | 297,596 | |||||
| 17,209 | 6.000%, 07/01/2028 | 19,137 | |||||
| Federal Home Loan Mortgage Corporation (FHLMC): | |||||||
| 408,222 | Series R003, Class VA, 5.500%, 08/15/2016 | 408,828 | |||||
| 981,382 | Series R010, Class VA, 5.500%, 04/15/2017 | 994,935 | |||||
| 2,305 | Series 74, Class F, 6.000%, 10/15/2020 | 2,509 | |||||
| 17,920 | Series 1395, Class G, 6.000%, 10/15/2022 | 19,923 | |||||
| Federal National Mortgage Association (FNMA): | |||||||
| 10,412 | Series 1989-2, Class D, 8.800%, 01/25/2019 | 11,754 | |||||
| 9,067 | Series 1990-108, Class G, 7.000%, 09/25/2020 | 10,162 | |||||
| 939 | Series G-29, Class O, 8.500%, 09/25/2021 | 1,081 | |||||
| 61,743 | Series 1991-137, Class H, 7.000%, 10/25/2021 | 69,789 | |||||
| 49,013 | Series 1992-136, Class PK, 6.000%, 08/25/2022 | 54,032 | |||||
| 33,644 | Series 1993-32, Class H, 6.000%, 03/25/2023 | 36,815 | |||||
| 926 | Series 2004-90, Class YB, 4.000%, 07/25/2032 | 926 | |||||
| 1,163,398 | Series 2004-W6, Class 1A6, 5.500%, 07/25/2034 | 1,190,780 | |||||
| 183,267 | Government National Mortgage Association (GNMA), | ||||||
| Series 1999-4, Class ZB, 6.000%, 02/20/2029 | 208,889 | ||||||
| 3,327,156 | |||||||
| Non-U.S. Government Agency Issues - 1.6% | |||||||
| Bank of America Alternative Loan Trust: | |||||||
| 192,147 | Series 2003-11, Class 4A1, 4.750%, 01/25/2019 | 195,799 | |||||
| 602,662 | Series 2004-2, Class 5A1, 5.500%, 03/25/2019 | 620,193 | |||||
| 792,311 | Series 2004-11, Class 4A1, 5.500%, 12/25/2019 | 823,765 | |||||
| 32,993 | Series 2005-6, Class 7A1, 5.500%, 07/25/2020 | 34,335 | |||||
| 434,604 | Series 2006-2, Class 7A1, 6.000%, 03/25/2021 | 446,175 | |||||
| 560,832 | Series 2006-3, Class 6A1, 6.000%, 04/25/2036 | 575,128 | |||||
| 700,607 | Series 2006-4, Class 3CB4, 6.000%, 05/25/2046 | 612,940 | |||||
| 394,000 | Bank of America Funding Corporation, | ||||||
| Series 2003-3, Class 1A41, 5.500%, 10/25/2033 | 394,668 | ||||||
| 159,475 | Citicorp Mortgage Securities, Inc., | ||||||
| Series 2004-5, Class 1A25, 5.500%, 10/25/2014 | 159,214 | ||||||
| Countrywide Alternative Loan Trust: | |||||||
| 80,912 | Series 2005-5R, Class A2, 4.750%, 12/25/2018 | 81,176 | |||||
| 586,777 | Series 2005-50CB, Class 4A1, 5.000%, 11/25/2020 | 567,180 | |||||
| 498,356 | Series 2005-85CB, Class 3A1, 5.250%, 02/25/2021 (Acquired 09/26/2007 through 01/28/2009, Cost $486,787) * | 482,242 | |||||
| 871,806 | Series 2006-7CB, Class 3A1, 5.250%, 05/25/2021 § | 830,562 | |||||
| 51,130 | Series 2005-10CB, Class 1A6, 5.500%, 05/25/2035 | 51,265 | |||||
| 98,642 | Series 2005-11CB, Class 2A1, 5.500%, 06/25/2035 | 89,029 | |||||
| 61,111 | Credit Suisse First Boston Mortgage Securities Corporation, | ||||||
| Series 2005-3, Class 3A27, 5.500%, 07/25/2035 | 63,731 | ||||||
| J.P. Morgan Alternative Loan Trust: | |||||||
| 1,496,671 | Series 2005-S1, Class 3A1, 5.500%, 10/25/2020 | 1,509,070 | |||||
| 855,568 | Series 2006-A1, Class 2A1, 2.816%, 03/25/2036 § | 604,827 | |||||
| 98,489 | Series 2006-S2, Class A2, 5.810%, 05/25/2036 | 98,365 | |||||
| 253,838 | Lehman Mortgage Trust, | ||||||
| Series 2006-4, Class 3A1, 5.000%, 08/25/2021 | 248,431 | ||||||
| Master Alternative Loans Trust: | |||||||
| 811,742 | Series 2004-1, Class 1A1, 5.000%, 01/25/2019 | 832,365 | |||||
| 189,706 | Series 2004-3, Class 1A1, 5.000%, 03/25/2019 | 196,704 | |||||
| 168,167 | Series 2005-3, Class 4A1, 5.500%, 03/25/2020 | 176,666 | |||||
| 16,575 | Merrill Lynch Mortgage Investors Trust, | ||||||
| Series 2005-A8, Class A1C1, 5.250%, 08/25/2036 | 16,750 | ||||||
| 100,912 | RAAC Series, | ||||||
| Series 2004-SP1, Class AI4, 5.285%, 08/25/2027 | 101,356 | ||||||
| 73,929 | Residential Accredit Loans, Inc., | ||||||
| Series 2004-QS6, Class A1, 5.000%, 05/25/2019 | 74,932 | ||||||
| 151,383 | Salomon Brothers Mortgage Securities VII, | ||||||
| Series 2003-UP2, Class A2, 4.000%, 06/25/2033 | 162,843 | ||||||
| 12,125 | Structured Asset Securities Corporation, | ||||||
| Series 2005-2XS, Class 1A2A, 4.510%, 02/25/2035 | 12,118 | ||||||
| Washington Mutual, Inc. Pass-Thru Certificates: | |||||||
| 1,034,964 | Series 2004-CB1, Class 5A, 5.000%, 06/25/2019 | 1,071,309 | |||||
| 1,626,229 | Series 2004-CB3, Class 3A, 5.500%, 10/25/2019 | 1,668,513 | |||||
| 515,323 | Series 2004-CB3, Class 4A, 6.000%, 10/25/2019 | 536,193 | |||||
| 526,696 | Series 2004-CB4, Class 21A, 5.500%, 12/25/2019 | 541,019 | |||||
| 390,295 | Series 2004-CB4, Class 22A, 6.000%, 12/25/2019 | 405,690 | |||||
| 14,284,553 | |||||||
| Asset Backed Securities - 2.8% | |||||||
| 33,616 | Amresco Residential Securities Mortgage Loan Trust, | ||||||
| Series 1998-1, Class A6, 6.510%, 08/25/2027 | 33,832 | ||||||
| 3,923,528 | Citigroup Mortgage Loan Trust, Inc., | ||||||
| Series 2006-WFH3, Class A3, 0.360%, 10/25/2036 | 3,877,035 | ||||||
| 3,923 | Cityscape Home Equity Loan Trust, | ||||||
| Series 1997-C, Class A4, 7.000%, 07/25/2028 † * * | – | ||||||
| Countrywide Asset-Backed Certificates: | |||||||
| 967,103 | Series 2006-S3, Class A2, 6.085%, 06/25/2021 § | 851,768 | |||||
| 66,526 | Series 2004-12, Class AF6, 4.634%, 03/25/2035 | 65,082 | |||||
| 3,027,060 | Series 2005-1, Class AF6, 5.030%, 07/25/2035 | 3,034,822 | |||||
| 509,617 | Series 2006-13, Class 1AF2, 5.884%, 01/25/2037 § | 569,197 | |||||
| 318,391 | Series 2006-13, Class 1AF3, 5.944%, 01/25/2037 § | 281,153 | |||||
| 1,380,000 | Series 2006-9, Class 1AF3, 5.859%, 10/25/2046 | 916,887 | |||||
| Delta Funding Home Equity Loan Trust: | |||||||
| 10,233 | Series 1997-2, Class A6, 7.040%, 06/25/2027 | 10,942 | |||||
| 1,509 | Series 1999-1, Class A6F, 6.340%, 12/15/2028 | 1,497 | |||||
| 538,268 | Series 1999-2, Class A7F, 7.030%, 08/15/2030 | 540,858 | |||||
| 5,427 | Equivantage Home Equity Loan Trust, | ||||||
| Series 1996-3, Class A3, 7.700%, 09/25/2027 | 5,383 | ||||||
| Green Tree Financial Corporation: | |||||||
| 30,493 | Series 1993-4, Class A5, 7.050%, 01/15/2019 | 30,854 | |||||
| 488,751 | Series 1998-2, Class A5, 6.240%, 12/01/2028 | 507,473 | |||||
| 702,163 | Series 1998-3, Class A5, 6.220%, 03/01/2030 | 768,924 | |||||
| 271,658 | Series 1998-4, Class A5, 6.180%, 04/01/2030 | 281,448 | |||||
| 11,147 | IMC Home Equity Loan Trust, | ||||||
| Series 1998-1, Class A6, 7.020%, 06/20/2029 | 11,143 | ||||||
| 6,000,000 | Master Credit Card Trust, | ||||||
| Series 2012-2A, Class A, 0.780%, 04/21/2017 (Acquired 10/24/2012, Cost $5,998,817) * f | 6,012,762 | ||||||
| 119,559 | Oakwood Mortgage Investors, Inc., | ||||||
| Series 1999-B, Class A3, 6.450%, 11/15/2017 | 122,980 | ||||||
| Residential Asset Mortgage Products, Inc.: | |||||||
| 25,765 | Series 2003-RS7, Class AI6, 5.340%, 08/25/2033 | 25,323 | |||||
| 317,068 | Series 2005-RS1, Class AI6, 4.713%, 01/25/2035 | 305,520 | |||||
| 2,970,909 | Saxon Asset Securities Trust, | ||||||
| Series 2005-4, Class A1B, 0.590%, 11/25/2037 | 2,608,312 | ||||||
| 3,997,608 | Springleaf Mortgage Loan Trust, | ||||||
| Series 2012-1A, Class A, 2.667%, 09/25/2057 (Acquired 04/11/2012, Cost $3,997,562) * | 4,044,724 | ||||||
| 24,907,919 | |||||||
| Commercial Mortgage Backed Securities - 6.8% | |||||||
| 6,790,000 | Bear Stearns Commercial Mortgage Securities, | ||||||
| Series 2005-PWR9, Class A4A, 4.871%, 09/11/2042 | 7,459,039 | ||||||
| 5,600,000 | Citigroup Deutsche Bank, | ||||||
| Series 2005-CD1, Class A4, 5.219%, 07/15/2044 | 6,214,678 | ||||||
| 4,000,000 | Credit Suisse First Boston Mortgage Securities Corporation, | ||||||
| Series 2005-C5, Class A4, 5.100%, 08/15/2038 @ | 4,396,632 | ||||||
| Federal Home Loan Mortgage Corporation (FHLMC) Multifamily Structured Pass Through Certificates: | |||||||
| 300,000 | Series K-501, Class A2, 1.655%, 11/25/2016 | 309,174 | |||||
| 275,000 | Series K-702, Class A2, 3.154%, 02/25/2018 | 300,818 | |||||
| 300,000 | Series K-704, Class A2, 2.412%, 08/25/2018 | 317,383 | |||||
| 3,000,000 | Series K705, Class A2, 2.303%, 09/25/2018 | 3,157,737 | |||||
| 3,375,000 | Series K706, Class A2, 2.323%, 10/25/2018 | 3,561,098 | |||||
| 8,300,000 | Series K708, Class A2, 2.130%, 01/25/2019 | 8,648,907 | |||||
| 7,325,000 | Series K-710, Class A2, 1.883%, 05/25/2019 | 7,516,798 | |||||
| 4,950,000 | Series K-711, Class A2, 1.730%, 07/25/2019 | 5,027,022 | |||||
| 700,000 | Federal National Mortgage Association (FNMA) Pass-Through Certificates: | ||||||
| Series 2012-M9, Class ASQ2, 1.513%, 12/25/2017 | 714,878 | ||||||
| 1,788,179 | J.P. Morgan Chase Commercial Mortgage Securities Corp., | ||||||
| Series 2003-CB7, Class A4, 4.879%, 01/12/2038 | 1,835,548 | ||||||
| 5,000,000 | J.P. Morgan Chase Commercial Mortgage Trust, | ||||||
| Series 2005-CB12, Class A4, 4.895%, 09/12/2037 | 5,484,445 | ||||||
| 5,000,000 | Wachovia Bank Commercial Mortgage Trust, | ||||||
| Series 2005-C22, Class A4, 5.293%, 12/15/2044 | 5,575,575 | ||||||
| 60,519,732 | |||||||
| Total Long-Term Investments (Cost $836,410,905) | 874,474,681 | ||||||
| Shares | |||||||
| SHORT-TERM INVESTMENTS - 2.8% | |||||||
| Money Market Mutual Funds - 2.8% | |||||||
| 8,092,000 | Dreyfus Institutional Cash Advantage Fund, 0.11% « | 8,092,000 | |||||
| 17,000,000 | Short-Term Investments Trust - Liquid Assets Portfolio, 0.15% « | 17,000,000 | |||||
| Total Short-Term Investments (Cost $25,092,000) | 25,092,000 | ||||||
| Principal Amount | |||||||
| INVESTMENTS PURCHASED WITH CASH PROCEEDS FROM | |||||||
| SECURITIES LENDING - 8.9% | |||||||
| Commercial Paper - 0.1% | |||||||
| $ | 1,859,566 | Atlantic East Funding LLC, 0.562%, 03/25/2013 † * * | 1,406,010 | ||||
| Total Commercial Paper (Cost $1,859,566) | 1,406,010 | ||||||
| Shares | |||||||
| Investment Companies - 8.8% | |||||||
| 78,452,055 | Mount Vernon Securities Lending Trust Prime Portfolio, 0.28% « | 78,452,055 | |||||
| Total Investment Companies (Cost $78,452,055) | 78,452,055 | ||||||
| Total Investments Purchased With Cash Proceeds From | |||||||
| Securities Lending (Cost $80,311,621) | 79,858,065 | ||||||
| Total Investments (Cost $941,814,526) - 109.5% | 979,424,746 | ||||||
| Asset Relating to Securities Lending Investments - 0.1% | |||||||
Support Agreement * * ^ a † | 453,556 | ||||||
| Total (Cost $0) | 453,556 | ||||||
| Liabilities in Excess of Other Assets - (9.6)% | (85,669,929 | ) | |||||
| TOTAL NET ASSETS - 100.0% | $ | 894,208,373 | |||||
| Notes to Schedule of Investments | ||
| * | Restricted Security Deemed Liquid | |
| * * | Illiquid Security | |
| @ | This security or portion of this security is out on loan at December 31, 2012. | |
| f | Foreign Security | |
| ^ | Non-Income Producing | |
| « | 7-Day Yield | |
| § | Security in Default | |
| † | Priced at Fair Value by the Valuation Committee as delegated by the Baird Funds' Board of Directors. | |
| a | The Fund's transfer agent and administrator and securities lending agent entered into a support agreement with the Fund to cover losses realized by the Fund on its investment in Atlantic East Funding, LLC (up to a certain amount), which investment was made by the Fund's securities lending agent. | |
| Summary of Fair Value Exposure at December 31, 2012 |
The Fund has adopted authoritative fair valuation accounting standards which establish a definition of fair value and set out a hierarchy for measuring fair value. These standards require additional disclosures about the various inputs and valuation techniques used to develop the measurements of fair value and a discussion on changes in valuation techniques and related inputs during the period. These standards define fair value as the price that would be received to sell an asset or paid to transfer a liability in an orderly transaction between market participants at the measurement date.
The fair value hierarchy is organized into three levels based upon the assumptions (referred to as "inputs") used in pricing the asset or liability. These standards state that "observable inputs" reflect the assumptions market participants would use in pricing the asset or liability based on market data obtained from independent sources and "unobservable inputs" reflect an entity's own assumptions about the assumptions market participants would use in pricing the asset or liability. These inputs are summarized into three broad levels and described below:
| Level 1 - | Unadjusted quoted prices in active markets for identical unrestricted securities. | ||
| Level 2 - | Other significant observable inputs (including quoted prices for similar securities, quoted prices in inactive markets, dealer indications, interest rates, yield curves, prepayment speeds, credit risk, default rates, inputs corroborated by observable market data, etc.). | ||
| Level 3 - | Significant unobservable inputs (including the Fund's own assumptions about the factors that market participants would use in valuing the security) based on the best information available. | ||
The inputs or methodology used for valuing securities are not necessarily an indication of the risk associated with investing in those securities.
The following is a summary of the inputs used to value the Fund's investments as of December 31, 2012:
| Level 1 | Level 2 | Level 3 | Total | ||||||||||||||
| Fixed Income | |||||||||||||||||
| U.S. Treasury Securities | $ | - | $ | 209,137,729 | $ | - | $ | 209,137,729 | |||||||||
| U.S. Government Agency Securities | - | 33,745,675 | - | 33,745,675 | |||||||||||||
| Taxable Municipal Bonds | - | 35,482,032 | - | 35,482,032 | |||||||||||||
| Other Government Related Securities | - | 17,683,127 | - | 17,683,127 | |||||||||||||
| Corporate Debt Securities | - | 475,385,297 | 1,461 | 475,386,758 | |||||||||||||
| Residential Mortgage-Backed Securities - U.S. Government Agency Issues | - | 3,327,156 | - | 3,327,156 | |||||||||||||
| Residential Mortgage-Backed Securities - Non - U.S. Government Agency Issues | - | 14,284,553 | - | 14,284,553 | |||||||||||||
| Asset Backed Securities | - | 24,907,919 | - | 24,907,919 | |||||||||||||
| Commercial Mortgage-Backed Securities | - | 60,519,732 | - | 60,519,732 | |||||||||||||
| Total Fixed Income | - | 874,473,220 | 1,461 | 874,474,681 | |||||||||||||
| Short-Term Investments | |||||||||||||||||
| Money Market Mutual Funds | 25,092,000 | - | - | 25,092,000 | |||||||||||||
| Total Short-Term Investments | 25,092,000 | - | - | 25,092,000 | |||||||||||||
| Investments Purchased with Cash | |||||||||||||||||
| Proceeds from Securities Lending | |||||||||||||||||
| Commercial Paper | - | 1,406,010 | - | 1,406,010 | |||||||||||||
| Money Market Mutual Fund | 78,452,055 | - | - | 78,452,055 | |||||||||||||
| Total Investments Purchased with | |||||||||||||||||
| Cash Proceeds from Securities Lending | 78,452,055 | 1,406,010 | - | 79,858,065 | |||||||||||||
| Total Investments | $ | 103,544,055 | $ | 875,879,230 | $ | 1,461 | $ | 979,424,746 | |||||||||
| Asset Relating to Securities Lending Investments | $ | - | $ | 453,556 | $ | - | $ | 453,556 | |||||||||
Changes in valuation techniques may result in transfers into or out of current assigned levels within the hierarchy. There were no transfers between Level 1, Level 2 and Level 3 fair value measurements during the reporting period, as compared to their classification from the prior year's annual report. One security that is priced at fair value by the Valuation Committee instead of the Fund's pricing vendor is valued using level 3 inputs.
Level 3 Reconciliation Disclosure
Following is a reconciliation of Level 3 assets for which significant unobservable inputs were used to determine fair value.
| Description | Investments in Securities | |||
| Balance as of December 31, 2011 | $ | 1,461 | ||
| Accrued discounts/premiums | - | |||
| Realized gain (loss) | - | |||
| Change in unrealized appreciation (depreciation) | - | |||
| Purchases | - | |||
| Sales | - | |||
| Transfers in and/or out of Level 3 * | - | |||
| Balance as of December 31, 2012 | $ | 1,461 | ||
* Transfers between levels are recognized at the end of the reporting period.
| Baird Intermediate Municipal Bond Fund | |||||||
| Schedule of Investments | |||||||
| December 31, 2012 | |||||||
| Principal Amount | Value | ||||||
| Municipal Bonds - 98.5% | |||||||
| Alabama - 1.8% | |||||||
| $ | 1,000,000 | Alabama State Public School & College Authority, | |||||
| 5.000%, 05/01/2019 | $ | 1,217,840 | |||||
| 1,000,000 | Camden Alabama Industrial Development Board Revenue, | ||||||
| 6.125%, 12/01/2024 (Pre-refunded to 12/01/2013) | 1,053,170 | ||||||
| 1,080,000 | Gulf Shores Alabama, | ||||||
| 5.000%, 12/15/2018 (Callable 12/15/2017) | 1,283,407 | ||||||
| Montgomery Alabama Special Care Facility Revenue: | |||||||
| 1,540,000 | 5.000%, 11/15/2015 (Pre-refunded to 11/15/2014) | 1,670,500 | |||||
| 11,385,000 | 5.000%, 11/15/2021 (Pre-refunded to 11/15/2014) | 12,372,079 | |||||
| 3,985,000 | 5.250%, 11/15/2029 (Pre-refunded to 11/15/2014) | 4,348,990 | |||||
| 21,945,986 | |||||||
| Alaska - 0.1% | |||||||
| 1,000,000 | Alaska State Housing Finance Corporation, | ||||||
| 5.000%, 06/01/2017 (Callable 06/01/2015)(Insured by NPFGC) | 1,078,520 | ||||||
| Arizona - 1.3% | |||||||
| 2,375,000 | Arizona School Facilities Board Revenue, | ||||||
| 5.750%, 07/01/2018 (Pre-refunded to 07/01/2014) | 2,564,525 | ||||||
| 1,000,000 | Gila County Arizona Unified School District Bonds, | ||||||
| 5.250%, 07/01/2027 (Callable 07/01/2017) | 1,139,870 | ||||||
| 1,860,000 | Maricopa County Arizona University School District No. 48 Scottsdale, | ||||||
| 4.000%, 07/01/2026 (Pre-refunded to 07/01/2016) | 2,075,462 | ||||||
| 1,540,000 | Phoenix Arizona Civic Corporation of Wastewater Systems Revenue, | ||||||
| 5.000%, 07/01/2015 (Callable 07/01/2014)(Partially Pre-refunded)(Insured by NPFGC) | 1,642,857 | ||||||
| Pima County Arizona Industrial Development Authority: | |||||||
| 1,000,000 | 7.125%, 07/01/2024 (Pre-refunded to 07/01/2014) | 1,096,280 | |||||
| 2,870,000 | 7.500%, 07/01/2034 (Pre-refunded to 07/01/2014) | 3,060,539 | |||||
| 3,465,000 | 7.500%, 07/01/2034 (Pre-refunded to 07/01/2014) | 3,817,876 | |||||
| 15,397,409 | |||||||
| California - 4.9% | |||||||
| 6,800,000 | Bakersfield California Certificates Participation, | ||||||
| 0.000%, 04/15/2021 (ETM) ^ | 5,852,692 | ||||||
| 2,450,000 | Coalinga California Regional Medical Center, | ||||||
| 5.125%, 03/01/2032 (Pre-refunded to 03/01/2015) | 2,662,268 | ||||||
| 1,130,000 | Commerce Community Development Commission, | ||||||
| 0.000%, 08/01/2021 ^ | 706,408 | ||||||
| 3,000,000 | Contra Costa County California Certificate Participation, | ||||||
| 0.000%, 11/01/2014 (ETM) ^ | 2,968,470 | ||||||
| 5,915,000 | Golden State Tobacco Securitization Corporation Revenue Bonds, | ||||||
| 6.250%, 06/01/2033 (Callable 06/01/2013)(Pre-refunded to various dates) | 6,058,735 | ||||||
| 420,000 | Mount Diablo California Hospital District Revenue, | ||||||
| 5.000%, 12/01/2013 (ETM) | 437,854 | ||||||
| 3,725,000 | Pittsburg California Redevelopment Agency Residential Mortgage Revenue, | ||||||
| 9.600%, 06/01/2016 (ETM) | 4,797,204 | ||||||
| 1,800,000 | Port Oakland California Revenue, | ||||||
| 5.000%, 11/01/2017 (Insured by NPFGC) | 2,109,546 | ||||||
| San Joaquin Hills California Transportation Corridor Agency Toll Road Revenue: | |||||||
| 6,865,000 | 0.000%, 01/01/2020 (ETM) ^ | 6,192,505 | |||||
| 14,000,000 | 0.000%, 01/01/2023 (ETM) ^ | 11,333,840 | |||||
| 17,295,000 | San Marcos California Public Facilities Authority Revenue, | ||||||
| 0.000%, 09/01/2019 (ETM) ^ | 15,523,127 | ||||||
| 1,130,000 | Woodside California Elementary School District Government School Bonds, | ||||||
| 5.000%, 10/01/2023 (Pre-refunded to 10/01/2016) | 1,311,851 | ||||||
| 59,954,500 | |||||||
| Colorado - 5.4% | |||||||
| 780,000 | Colorado Educational & Cultural Facilities Authority, | ||||||
| 7.625%, 03/15/2032 (Pre-refunded to 03/15/2013) | 788,985 | ||||||
| 1,300,000 | Colorado Springs Colorado Hospital Revenue Bonds, | ||||||
| 5.000%, 12/15/2032 (Pre-refunded to 12/15/2018) | 1,583,556 | ||||||
| 7,410,000 | Colorado Springs Colorado Utilities Revenue Bonds, | ||||||
| 5.875%, 11/15/2017 (ETM) | 8,300,534 | ||||||
| 1,000,000 | Conservatory Metropolitan District Colorado, | ||||||
| 6.750%, 12/01/2034 (Pre-refunded to 12/01/2013) | 1,066,330 | ||||||
| 1,330,000 | County of El Paso Colorado Mortgage Revenue Bonds, | ||||||
| 0.000%, 09/01/2015 (ETM) ^ | 1,305,182 | ||||||
| Dawson Ridge Metropolitan District No. 1 Colorado: | |||||||
| 16,250,000 | 0.000%, 10/01/2022 (ETM) ^ | 13,117,975 | |||||
| 15,795,000 | 0.000%, 10/01/2022 (ETM) ^ | 12,750,672 | |||||
| Denver Colorado Convention Center & Hotel Authority Revenue Bonds: | |||||||
| 1,000,000 | 5.000%, 12/01/2021 (Pre-refunded to 12/01/2013) | 1,042,040 | |||||
| 2,950,000 | 5.000%, 12/01/2022 (Pre-refunded to 12/01/2013) | 3,074,018 | |||||
| 1,500,000 | 5.000%, 12/01/2023 (Pre-refunded to 12/01/2013) | 1,563,060 | |||||
| 5,065,000 | 5.000%, 12/01/2024 (Pre-refunded to 12/01/2013) | 5,277,932 | |||||
| 7,975,000 | Denver Colorado Health & Hospital Authority Healthcare Revenue, | ||||||
| 6.250%, 12/01/2033 (Pre-refunded to 12/01/2014) | 8,859,348 | ||||||
| 6,785,000 | Regional Transportation District Colorado Sales Tax Revenue, | ||||||
| 5.000%, 11/01/2036 (Pre-refunded to 11/01/2016) | 7,900,997 | ||||||
| 66,630,629 | |||||||
| Delaware - 0.0% | |||||||
| 330,000 | Delaware State Economic Development Authority Revenue, | ||||||
| 6.750%, 01/01/2013 (ETM) | 330,000 | ||||||
| Florida - 11.3% | |||||||
| 4,040,000 | Bartram Springs Community Development District Special Assessment, | ||||||
| 6.650%, 05/01/2034 (Pre-refunded to 05/01/2013) | 4,203,297 | ||||||
| 1,925,000 | Brevard County Florida School Board, | ||||||
| 5.000%, 07/01/2020 (Callable 07/01/2017)(Insured by AMBAC) | 2,222,932 | ||||||
| Broward County Florida School Board: | |||||||
| 8,390,000 | 5.250%, 07/01/2022 (Callable 07/01/2021) | 10,109,782 | |||||
| 4,865,000 | 5.250%, 07/01/2023 (Callable 07/01/2021) | 5,829,389 | |||||
| 6,340,000 | County of St. Lucie Florida, | ||||||
| 6.000%, 10/01/2020 (ETM) | 8,236,928 | ||||||
| 1,915,000 | Dade County Florida Health Facility Authority Hospital Revenue, | ||||||
| 5.750%, 05/01/2021 (ETM) | 2,257,498 | ||||||
| 3,200,000 | Escambia County Florida Housing Finance Authority Multifamily Housing Revenue, | ||||||
| 0.000%, 10/15/2018 (ETM) ^ | 2,920,064 | ||||||
| 13,800,000 | Florida State Board of Education, | ||||||
| 5.000%, 06/01/2022 (Callable 06/01/2019) | 16,581,528 | ||||||
| 2,500,000 | Florida State Department of Management Services, | ||||||
| 5.000%, 08/01/2018 | 3,025,800 | ||||||
| Florida State Mid-Bay Bridge Authority Revenue: | |||||||
| 4,675,000 | 6.875%, 10/01/2022 (ETM) | 6,402,927 | |||||
| 3,175,000 | 6.875%, 10/01/2022 (ETM) | 4,348,511 | |||||
| 1,590,000 | Florida State Municipal Power Agency Revenue, | ||||||
| 5.000%, 10/01/2017 (ETM) | 1,898,460 | ||||||
| 1,500,000 | Gulf Environmental Services Inc. Florida Revenue Bonds, | ||||||
| 5.000%, 10/01/2018 (ETM) | 1,675,620 | ||||||
| Highlands County Florida Health Facilities Revenue: | |||||||
| 9,800,000 | 5.875%, 11/15/2029 (Pre-refunded to 11/15/2013) | 10,249,918 | |||||
| 5,010,000 | 5.375%, 11/15/2035 (Pre-refunded to 11/15/2013) | 5,218,466 | |||||
| 2,000,000 | Hillsborough County Florida School Board Master Lease Program, | ||||||
| 5.500%, 07/01/2018 (Insured by NPFGC) | 2,456,920 | ||||||
| Hillsborough County Industrial Development Authority: | |||||||
| 2,285,000 | 5.625%, 08/15/2029 (Pre-refunded to 08/15/2018) | 2,861,940 | |||||
| 1,600,000 | 8.000%, 08/15/2032 (Pre-refunded to 08/15/2019) | 2,257,056 | |||||
| 2,000,000 | Islands At Doral (SW) Community Development District, | ||||||
| 6.375%, 05/01/2035 (Pre-refunded to 05/01/2013) | 2,057,140 | ||||||
| 2,145,000 | Laguna Lakes Community Development District Special Assessment Revenue Bonds, | ||||||
| 6.400%, 05/01/2033 (Pre-refunded to 05/01/2013) | 2,194,335 | ||||||
| 1,470,000 | Miami Beach Florida Resort Tax Revenue, | ||||||
| 6.250%, 10/01/2022 (ETM) | 1,918,703 | ||||||
| 7,100,000 | Miami-Dade County Florida, | ||||||
| 4.500%, 10/01/2020 | 8,294,930 | ||||||
| 3,000,000 | Miami Dade County Florida Entitlement Revenue Bonds, | ||||||
| 5.000%, 08/01/2015 (Insured by NPFGC) | 3,301,050 | ||||||
| 3,000,000 | Miami-Dade County Florida School Board, | ||||||
| 5.000%, 05/01/2016 (Insured by NPFGC) | 3,327,900 | ||||||
| Miami-Dade County Florida Water & Sewer Revenue, | |||||||
| 2,420,000 | 5.000%, 10/01/2013 (Insured by NPFGC) | 2,505,668 | |||||
| 1,125,000 | 5.250%, 10/01/2022 | 1,416,487 | |||||
| 4,220,000 | Orange County Florida Health Facilities Authority Revenue Bond, | ||||||
| 6.250%, 10/01/2013 (ETM) | 4,404,541 | ||||||
| 1,005,000 | Orlando Florida Utilities Commission Water & Electric Revenue, | ||||||
| 6.750%, 10/01/2017 (ETM) | 1,162,775 | ||||||
| 1,000,000 | Palm Beach County Florida Revenue, | ||||||
| 5.000%, 11/01/2018 (Callable 11/01/2017) | 1,187,430 | ||||||
| 2,210,000 | Pinellas County Housing Finance Authority, | ||||||
| 4.250%, 03/01/2027 (Callable 09/01/2019) | 2,356,059 | ||||||
| 1,000,000 | Sarasota County Florida School Board, | ||||||
| 5.000%, 07/01/2015 (Insured by NPFGC) | 1,110,500 | ||||||
| 5,200,000 | Seminole County Florida Water & Sewage Revenue, | ||||||
| 6.000%, 10/01/2019 (ETM) | 6,261,320 | ||||||
| 3,000,000 | Sunrise Florida Utility System Revenue, | ||||||
| 5.500%, 10/01/2018 (ETM) | 3,499,380 | ||||||
| 137,755,254 | |||||||
| Georgia - 4.8% | |||||||
| 8,445,000 | Atlanta Georgia Water & Wastewater Revenue, | ||||||
| 5.500%, 11/01/2017 (Insured by AGM) | 10,098,446 | ||||||
| 8,050,000 | Forsyth County Georgia Hospital Authority Revenue Anticipation Certificates, | ||||||
| 6.375%, 10/01/2028 (Callable 02/04/2013) (ETM) | 10,807,044 | ||||||
| 245,000 | Fulton County Georgia Hospital Authority Revenue, | ||||||
| 7.875%, 10/01/2013 (Callable 02/04/2013) (ETM) | 258,757 | ||||||
| Georgia Municipal Electric Authority Power Revenue: | |||||||
| 120,000 | 6.500%, 01/01/2017 (Insured by AGM) | 135,701 | |||||
| 7,350,000 | 6.500%, 01/01/2017 (Insured by AGM) | 8,229,133 | |||||
| 7,400,000 | Gwinnett County Georgia School District, | ||||||
| 5.000%, 02/01/2026 (Pre-refunded to 02/01/2018) | 8,848,920 | ||||||
| 2,310,000 | Northwestern Gwinnett County Georgia Facilities Corporation I Certificate Participation, | ||||||
| 5.750%, 06/15/2019 (Pre-refunded to 06/15/2014) | 2,462,853 | ||||||
| Richmond County Development Authority, | |||||||
| 425,000 | 0.000%, 12/01/2021 (ETM) ^ | 355,330 | |||||
| 3,510,000 | 0.000%, 12/01/2021 (ETM) ^ | 2,934,606 | |||||
| 12,570,000 | State of Georgia, | ||||||
| 5.000%, 07/01/2020 (Callable 07/01/2017) | 14,760,951 | ||||||
| 58,891,741 | |||||||
| Illinois - 10.2% | |||||||
| 2,360,000 | Chicago Illinois, | ||||||
| 5.000%, 01/01/2017 (Callable 01/01/2016)(Insured by AGM) | 2,614,668 | ||||||
| Chicago Illinois Board of Education: | |||||||
| 4,345,000 | 5.000%, 12/01/2017 (Callable 12/01/2016)(Insured by AGM) | 4,939,613 | |||||
| 2,100,000 | 5.000%, 12/01/2017 (Insured by AMBAC) | 2,429,280 | |||||
| 1,665,000 | 6.000%, 01/01/2020 (Insured by NPFGC) | 1,924,774 | |||||
| Chicago Illinois Public Building Community Building Revenue: | |||||||
| 2,885,000 | 7.000%, 01/01/2015 (ETM) | 3,060,639 | |||||
| 1,555,000 | 7.000%, 01/01/2020 (ETM) | 2,050,703 | |||||
| 2,605,000 | Cook County Illinois School District No. 097, | ||||||
| 9.000%, 12/01/2015 (Insured by NPFGC) | 3,153,926 | ||||||
| 1,430,000 | Cook County Illinois School District No. 100, | ||||||
| 8.100%, 12/01/2016 (ETM) | 1,835,977 | ||||||
| 2,000,000 | Cook County Illinois School District No. 159, | ||||||
| 0.000%, 12/01/2022 (ETM) ^ | 1,569,700 | ||||||
| 1,095,000 | Dupage County Illinois Stormwater Project, | ||||||
| 5.600%, 01/01/2021 | 1,285,585 | ||||||
| 16,610,000 | Illinois Development Financial Authority, | ||||||
| 0.000%, 07/15/2023 (ETM) ^ | 12,746,514 | ||||||
| 9,560,000 | Illinois Finance Authority, | ||||||
| 0.000%, 07/15/2025 (ETM) ^ | 6,848,306 | ||||||
| 2,330,000 | Illinois Finance Authority Revenue, | ||||||
| 5.500%, 08/15/2043 (Pre-refunded to 08/15/2014) | 2,521,759 | ||||||
| 1,000,000 | Illinois Municipal Electric Agency Power Supply Revenue Bonds, | ||||||
| 5.250%, 02/01/2016 (Insured by NPFGC) | 1,121,580 | ||||||
| Illinois State: | |||||||
| 1,000,000 | 5.000%, 01/01/2019 (Insured by AGM) | 1,150,320 | |||||
| 5,000,000 | 4.000%, 09/01/2019 (Callable 09/01/2018)(Insured by AGM) | 5,412,550 | |||||
| 3,000,000 | 6.000%, 11/01/2026 (Insured by NPFGC) | 3,683,940 | |||||
| 2,100,000 | Illinois State Toll Highway Authority Priority Revenue Bonds, | ||||||
| 5.500%, 01/01/2016 (Insured by AGM) | 2,366,553 | ||||||
| Illinois State Toll Highway Authority Revenue Bonds: | |||||||
| 1,065,000 | 5.000%, 01/01/2026 (Pre-refunded to 07/01/2016) | 1,227,072 | |||||
| 2,055,000 | 5.000%, 01/01/2031 (Pre-refunded to 07/01/2016) | 2,367,730 | |||||
| 6,750,000 | Kane Cook & Dupage Counties Illinois Community United School District No. 303, | ||||||
| 5.000%, 01/01/2014 (Insured by AGM) | 7,045,987 | ||||||
| Kane McHenry Cook & De Kalb Counties Illinois School District No. 300: | |||||||
| 1,000,000 | 9.000%, 01/01/2015 (Insured by AMBAC) | 1,137,060 | |||||
| 6,140,000 | 7.000%, 01/01/2018 (Insured by AMBAC) | 7,483,800 | |||||
| 13,625,000 | Kendall Kane & Will Counties Community Unit School District No. 308, | ||||||
| 0.000%, 02/01/2021 ^ | 10,712,929 | ||||||
| Lake County Illinois Community Consolidated School District: | |||||||
| 1,920,000 | 0.000%, 12/01/2013 (Insured by NPFGC) ^ | 1,878,682 | |||||
| 1,875,000 | 0.000%, 12/01/2014 (Insured by NPFGC) ^ | 1,782,787 | |||||
| 1,050,000 | Lake County Illinois Community High School District No. 124 Grant, | ||||||
| 5.000%, 12/01/2017 | 1,240,176 | ||||||
| 1,970,000 | McHenry & Kane Counties Illinois Community School District No. 158, | ||||||
| 0.000%, 01/01/2016 (Insured by NPFGC) ^ | 1,799,437 | ||||||
| Metropolitan Pier & Exposition Authority Illinois: | |||||||
| 1,805,000 | 5.500%, 06/15/2016 (ETM) | 2,093,547 | |||||
| 2,000,000 | 5.500%, 12/15/2023 (ETM) | 2,545,440 | |||||
| 2,000,000 | Northwest Suburban Illinois Municipal Joint Action Revenue, | ||||||
| 5.000%, 05/01/2014 (ETM) | 2,124,480 | ||||||
| 4,705,000 | Regional Transportation Authority Illinois, | ||||||
| 6.000%, 07/01/2022 (Insured by NPFGC) | 6,098,009 | ||||||
| 2,734,000 | Round Lake Illinois, | ||||||
| 6.700%, 03/01/2033 (Pre-refunded to 03/01/2013) | 2,815,801 | ||||||
| Southern Illinois University Revenue: | |||||||
| 1,000,000 | 5.250%, 04/01/2018 (Insured by NPFGC) | 1,157,700 | |||||
| 1,390,000 | 5.250%, 04/01/2019 (Insured by NPFGC) | 1,635,947 | |||||
| 5,750,000 | Village of Schaumburg IL, | ||||||
| 4.000%, 12/01/2024 (Callable 12/01/2022) | 6,600,597 | ||||||
| 950,000 | Winnebago & Boone Counties Illinois School District No. 205, | ||||||
| 5.000%, 02/01/2013 (Insured by AMBAC) | 952,916 | ||||||
| Winnebago County Illinois School District No. 122 Harlam-Loves Park: | |||||||
| 155,000 | 0.000%, 01/01/2018 (ETM) ^ | 146,159 | |||||
| 1,205,000 | 0.000%, 01/01/2018 (Insured by AGM) ^ | 1,055,568 | |||||
| 124,618,211 | |||||||
| Indiana - 1.4% | |||||||
| 1,990,000 | Franklin Community Multi-School Building Corp, | ||||||
| 5.000%, 07/15/2020 | 2,359,563 | ||||||
| Hammond Indiana Multi-School Building Corporation Revenue Bonds: | |||||||
| 1,000,000 | 6.000%, 01/15/2018 (ETM) | 1,143,130 | |||||
| 1,330,000 | 5.000%, 07/15/2018 (Insured by NPFGC) | 1,546,231 | |||||
| 1,115,000 | Indiana State Office Building Commissions Facilities Revenue Bonds, | ||||||
| 5.250%, 07/01/2017 | 1,290,178 | ||||||
| 645,000 | Indiana Toll Road Commission, | ||||||
| 9.000%, 01/01/2015 (ETM) | 700,896 | ||||||
| 1,155,000 | Indianapolis Local Public Improvement Bond Bank, | ||||||
| 5.500%, 01/01/2019 (Insured by NPFGC) | 1,406,963 | ||||||
| 3,460,000 | Indianapolis Local Public Improvement Bond Waterworks Project, | ||||||
| 5.500%, 07/01/2018 (Insured by NPFGC) | 4,182,898 | ||||||
| 1,000,000 | Perry Township Multi School Building Corporation, | ||||||
| 5.000%, 07/10/2018 (Callable 07/10/2015) | 1,095,750 | ||||||
| 1,650,000 | Purdue University Indiana Revenue, | ||||||
| 5.000%, 07/01/2015 | 1,833,199 | ||||||
| 1,000,000 | South Bend Indiana Community School Building Corporation, | ||||||
| 5.000%, 07/15/2017 (Insured by NPFGC) | 1,169,000 | ||||||
| 16,727,808 | |||||||
| Iowa - 0.1% | |||||||
| 1,010,000 | Des Moines Iowa Metropolitan Wastewater Reclamation Authority, | ||||||
| 5.000%, 06/01/2015 (Callable 06/01/2014)(Insured by NPFGC) | 1,076,660 | ||||||
| 90,000 | Muscatine Iowa Electric Revenue, | ||||||
| 6.700%, 01/01/2013 (ETM) | 90,000 | ||||||
| 1,166,660 | |||||||
| Kansas - 0.2% | |||||||
| 1,865,000 | Wyandotte County Kansas Revenue, | ||||||
| 5.000%, 09/01/2019 (Callable 03/01/2019)(Insured by BHAC) | 2,229,384 | ||||||
| Kentucky - 1.7% | |||||||
| 3,340,000 | Jefferson County Kentucky School District Financial School Building Revenue Bonds, | ||||||
| 5.500%, 01/01/2018 (Insured by AGM) | 3,990,866 | ||||||
| 1,035,000 | Kentucky Economic Development Finance Authority Health System Revenue, | ||||||
| 5.800%, 10/01/2014 (Pre-refunded to 10/01/2013) | 1,086,739 | ||||||
| 11,995,000 | Louisville & Jefferson County Metropolitan Government, | ||||||
| 6.125%, 02/01/2037 (Pre-refunded to 02/01/2018) | 15,144,887 | ||||||
| 20,222,492 | |||||||
| Louisiana - 3.0% | |||||||
| Louisiana Public Facilities Authority Revenue: | |||||||
| 1,740,000 | 5.500%, 05/15/2027 (Pre-refunded to 05/15/2026) | 2,263,723 | |||||
| 14,985,000 | 5.500%, 05/15/2032 (Pre-refunded to 05/15/2026) | 20,166,513 | |||||
| State of Louisiana: | |||||||
| 1,775,000 | 5.000%, 11/15/2018 | 2,163,672 | |||||
| 10,000,000 | 5.000%, 11/15/2020 (Callable 05/15/2020) | 12,510,400 | |||||
| 37,104,308 | |||||||
| Maine - 0.4% | |||||||
| 4,340,000 | Maine Health & Higher Education Facilities Authority, | ||||||
| 5.000%, 07/01/2035 (Pre-refunded to 07/01/2015) | 4,827,599 | ||||||
| Maryland - 0.1% | |||||||
| 1,150,000 | City of Baltimore MD, | ||||||
| 5.000%, 07/01/2024 (ETM) | 1,476,680 | ||||||
| Massachusetts - 2.9% | |||||||
| 1,565,000 | Massachusetts Department of Transportation, | ||||||
| 5.000%, 01/01/2020 (ETM) | 1,820,440 | ||||||
| Massachusetts State: | |||||||
| 5,820,000 | 5.000%, 08/01/2020 (Pre-refunded to 08/01/2016) | 6,715,407 | |||||
| 15,000,000 | 4.000%, 12/01/2022 (Callable 12/01/2019) | 17,050,950 | |||||
| Massachusetts State Obligations Tax Revenue: | |||||||
| 1,000,000 | 5.250%, 01/01/2026 (Pre-refunded to 01/01/2014) | 1,048,570 | |||||
| 1,845,000 | 5.750%, 01/01/2032 (Pre-refunded to 01/01/2014) | 1,943,726 | |||||
| Massachusetts State Water Resources Authority: | |||||||
| 3,155,000 | 5.250%, 12/01/2015 (ETM) | 3,419,831 | |||||
| 3,295,000 | 6.500%, 07/15/2019 (ETM) | 3,910,143 | |||||
| 35,909,067 | |||||||
| Michigan - 2.6% | |||||||
| 1,000,000 | Detroit Michigan City School District, | ||||||
| 5.000%, 05/01/2016 (Callable 05/01/2015)(Insured by AGM) | 1,080,850 | ||||||
| 2,185,000 | Detroit Michigan Sewer Disposal Revenue, | ||||||
| 5.000%, 07/01/2030 (Pre-refunded to 07/01/2015) | 2,430,485 | ||||||
| 1,550,000 | Harper Creek Michigan Community School District, | ||||||
| 5.000%, 05/01/2016 (Callable 05/01/2015)(Insured by AGM) | 1,699,637 | ||||||
| 1,390,000 | Jenison Michigan Public Schools, | ||||||
| 5.250%, 05/01/2015 (Insured by NPFGC) | 1,527,777 | ||||||
| 2,275,000 | Lakeview Public School District, | ||||||
| 5.000%, 05/01/2017 (Insured by NPFGC) | 2,554,347 | ||||||
| Livonia Michigan Public Schools School District: | |||||||
| 4,295,000 | 5.000%, 05/01/2017 (Callable 05/01/2014)(Insured by NPFGC) | 4,522,850 | |||||
| 3,000,000 | 5.000%, 05/01/2022 (Callable 05/01/2014)(Insured by NPFGC) | 3,153,030 | |||||
| 7,000,000 | Michigan Finance Authority, | ||||||
| 5.000%, 01/01/2019 | 8,524,320 | ||||||
| 4,000,000 | Michigan State Housing Development Authority, | ||||||
| 4.750%, 06/01/2016 | 4,241,080 | ||||||
| 2,000,000 | State of Michigan, | ||||||
| 0.000%, 06/01/2022 (ETM) ^ | 1,589,020 | ||||||
| 31,323,396 | |||||||
| Minnesota - 1.3% | |||||||
| Minnesota State Housing Finance Agency Homeownership Finance Bond: | |||||||
| 1,035,000 | 4.250%, 07/01/2028 (Callable 01/01/2020) | 1,102,027 | |||||
| 1,940,000 | 4.500%, 07/01/2034 (Callable 07/01/2021) | 2,110,196 | |||||
| 8,455,000 | University of Minnesota, | ||||||
| 5.500%, 07/01/2021 (ETM) | 10,490,541 | ||||||
| 1,555,000 | Western Minnesota Municipal Power Agency, | ||||||
| 6.375%, 01/01/2016 (ETM) | 1,691,622 | ||||||
| 15,394,386 | |||||||
| Mississippi - 0.2% | |||||||
| 1,110,000 | Mississippi Development Bank Special Obligations, | ||||||
| 5.250%, 10/01/2030 (Pre-refunded to 10/01/2015) | 1,253,057 | ||||||
| 1,450,000 | Mississippi Housing Financial Corporation, | ||||||
| 0.000%, 06/01/2015 (ETM) ^ | 1,427,177 | ||||||
| 2,680,234 | |||||||
| Missouri - 0.3% | |||||||
| 1,000,000 | St. Charles County Missouri Francis Howell School District, | ||||||
| 4.500%, 03/01/2018 | 1,168,940 | ||||||
| 2,000,000 | St. Louis County Industrial Development Authority, | ||||||
| 6.625%, 11/15/2035 (Pre-refunded to 11/15/2013) | 2,108,320 | ||||||
| 3,277,260 | |||||||
| Nebraska - 1.0% | |||||||
| 1,640,000 | Nebraska Public Power District Revenue, | ||||||
| 5.000%, 01/01/2015 (Insured by NPFGC) | 1,781,958 | ||||||
| 9,150,000 | Omaha Nebraska Public Electric Power District Revenue, | ||||||
| 6.200%, 02/01/2017 (ETM) | 10,110,110 | ||||||
| 11,892,068 | |||||||
| Nevada - 0.2% | |||||||
| 2,080,000 | Las Vegas Clark County Nevada Library District, | ||||||
| 5.000%, 01/01/2017 | 2,372,323 | ||||||
| New Hampshire - 0.5% | |||||||
| 4,775,000 | New Hampshire Housing Finance Authority Revenue Bonds, | ||||||
| 5.250%, 07/01/2028 (Callable 01/01/2021) | 5,181,639 | ||||||
| 1,000,000 | State of New Hampshire, | ||||||
| 5.000%, 07/01/2021 (Callable 07/01/2020) | 1,251,160 | ||||||
| 6,432,799 | |||||||
| New Jersey - 2.7% | |||||||
| 1,140,000 | County of Hudson NJ, | ||||||
| 3.000%, 03/15/2021 | 1,192,326 | ||||||
| New Jersey Economic Development Authority Revenue Bonds: | |||||||
| 2,250,000 | 6.375%, 04/01/2018 (Pre-refunded to 05/15/2014) | 2,431,372 | |||||
| 6,000,000 | 6.375%, 04/01/2031 (Pre-refunded to 05/15/2014) | 6,483,660 | |||||
| 460,000 | New Jersey Sports & Exposition Authority State Contract Bonds, | ||||||
| 6.500%, 03/01/2013 (ETM) | 464,577 | ||||||
| 8,795,000 | New Jersey State Housing & Mortgage Finance Agency Bonds, | ||||||
| 4.500%, 10/01/2029 (Callable 04/01/2021) | 9,160,520 | ||||||
| New Jersey State Transportation Trust Fund Authority: | |||||||
| 2,595,000 | 5.500%, 12/15/2015 (Insured by AMBAC) | 2,947,090 | |||||
| 5,000,000 | 5.250%, 12/15/2020 | 6,130,800 | |||||
| New Jersey State Turnpike Authority: | |||||||
| 1,180,000 | 6.500%, 01/01/2016 (ETM) | 1,296,997 | |||||
| 100,000 | 6.500%, 01/01/2016 (ETM) | 109,915 | |||||
| 2,000,000 | 5.500%, 01/01/2025 | 2,589,460 | |||||
| 32,806,717 | |||||||
| New Mexico - 0.3% | |||||||
| New Mexico Mortgage Financial Authority: | |||||||
| 1,325,000 | 4.625%, 09/01/2025 (Callable 03/01/2020) | 1,409,429 | |||||
| 1,065,000 | 4.500%, 09/01/2028 (Callable 03/01/2020) | 1,141,424 | |||||
| 1,000,000 | New Mexico State Hospital Equipment Loan Council Hospital Revenue, | ||||||
| 5.250%, 07/01/2025 (Pre-refunded to 07/01/2015) | 1,113,250 | ||||||
| 3,664,103 | |||||||
| New York - 6.2% | |||||||
| Cattaraugus-Little Valley Central School District: | |||||||
| 1,520,000 | 3.125%, 06/15/2016 | 1,606,351 | |||||
| 1,000,000 | 3.125%, 06/15/2017 | 1,057,700 | |||||
| Churchville-Chili Central School District: | |||||||
| 1,045,000 | 3.000%, 06/15/2017 | 1,125,277 | |||||
| 1,070,000 | 3.000%, 06/15/2018 | 1,144,953 | |||||
| 2,000,000 | Long Island Power Authority and Electric System Revenue, | ||||||
| 5.000%, 12/01/2017 (Callable 12/01/2016)(Insured by NPFGC) | 2,291,780 | ||||||
| 13,330,000 | Metropolitan Transit Authority New York, | ||||||
| 6.000%, 04/01/2020 (ETM) | 16,878,713 | ||||||
| New York, New York: | |||||||
| 1,000,000 | 5.000%, 03/01/2016 (Callable 03/01/2015)(Insured by FGIC-TCRS) | 1,092,390 | |||||
| 5,000,000 | 5.000%, 08/01/2017 | 5,877,450 | |||||
| 1,125,000 | 5.250%, 08/15/2021 (Callable 08/15/2018) | 1,358,719 | |||||
| 4,730,000 | New York City, New York Transitional Financial Authority Building Aid Revenue Bonds, | ||||||
| 5.000%, 01/15/2015 (Insured by AGM) | 5,156,457 | ||||||
| 2,000,000 | New York State Dormitory Authority and Personal Income Tax Revenue, | ||||||
| 5.000%, 12/15/2017 | 2,383,060 | ||||||
| 4,040,000 | New York State Thruway Authority, | ||||||
| 5.000%, 03/15/2022 (Callable 03/15/2019) | 4,879,027 | ||||||
| New York State University Dormitory Authority Revenues: | |||||||
| 695,000 | 5.500%, 05/15/2013 (Insured by NPFGC) | 708,309 | |||||
| 5,290,000 | 5.250%, 05/15/2015 | 5,690,506 | |||||
| 4,715,000 | Suffolk County Water Authority, | ||||||
| 6.000%, 06/01/2017 (ETM) | 5,449,220 | ||||||
| Susquehanna Valley Central School District: | |||||||
| 1,155,000 | 3.125%, 06/15/2017 | 1,219,103 | |||||
| 1,375,000 | 3.125%, 06/15/2019 | 1,457,857 | |||||
| 175,000 | TSASC Inc. New York, | ||||||
| 4.750%, 06/01/2022 (Callable 06/01/2016) | 176,305 | ||||||
| 13,075,000 | Westchester Tobacco Asset Securitization Corp. New York, | ||||||
| 6.950%, 07/15/2039 (Pre-refunded to 07/15/2017) | 16,744,891 | ||||||
| 76,298,068 | |||||||
| North Carolina - 3.1% | |||||||
| 6,725,000 | North Carolina Eastern Municipal Power Agency, | ||||||
| 5.000%, 01/01/2021 (ETM) | 8,480,897 | ||||||
| North Carolina Eastern Municipal Power Agency Power Systems Revenue: | |||||||
| 4,560,000 | 5.000%, 01/01/2017 (ETM) | 5,134,104 | |||||
| 5,750,000 | 6.400%, 01/01/2021 (ETM) | 7,017,990 | |||||
| 6,425,000 | 4.500%, 01/01/2024 (Pre-refunded to 01/01/2022) | 7,867,220 | |||||
| 1,835,000 | 6.000%, 01/01/2026 (Pre-refunded to 01/01/2022) | 2,488,517 | |||||
| 6,495,000 | North Carolina Medical Care Community Hospital Revenue, | ||||||
| 5.250%, 11/01/2029 (Pre-refunded to 11/01/2014) | 7,050,972 | ||||||
| 38,039,700 | |||||||
| Ohio - 1.2% | |||||||
| 1,000,000 | Akron Ohio Community Learning Center Income Tax Revenue, | ||||||
| 5.250%, 12/01/2016 (Callable 12/01/2013)(Insured by NPFGC) | 1,045,240 | ||||||
| 2,000,000 | Cincinnati Ohio City School District, | ||||||
| 5.000%, 12/01/2016 (Insured by AGM) | 2,309,200 | ||||||
| Cleveland Municipal School District: | |||||||
| 1,790,000 | 4.000%, 12/01/2017 | 1,960,945 | |||||
| 1,865,000 | 4.000%, 12/01/2018 | 2,056,536 | |||||
| 1,940,000 | 4.000%, 12/01/2019 | 2,135,183 | |||||
| 2,015,000 | 5.000%, 12/01/2020 | 2,344,553 | |||||
| 80,000 | Miamisburg Ohio Water Revenue, | ||||||
| 7.000%, 11/15/2016 (Callable 02/04/2013) (ETM) | 81,371 | ||||||
| 2,490,000 | Ohio Housing Finance Agency, | ||||||
| 5.000%, 11/01/2028 (Callable 05/01/2020) | 2,689,848 | ||||||
| 14,622,876 | |||||||
| Pennsylvania - 3.2% | |||||||
| 1,275,000 | Central Dauphin Pennsylvania School District, | ||||||
| 6.750%, 02/01/2024 (Pre-refunded to 02/01/2016) | 1,513,973 | ||||||
| 1,380,000 | Erie Pennsylvania Sewer Authority Revenue, | ||||||
| 5.125%, 06/01/2020 (ETM) | 1,664,887 | ||||||
| 10,060,000 | Pennsylvania Convention Center Authority Revenue Bonds, | ||||||
| 6.000%, 09/01/2019 (ETM) | 12,782,639 | ||||||
| Pennsylvania Housing Finance Agency: | |||||||
| 2,130,000 | 3.700%, 04/01/2018 | 2,210,131 | |||||
| 1,760,000 | 3.750%, 10/01/2018 | 1,836,648 | |||||
| 1,025,000 | 3.900%, 04/01/2019 | 1,074,138 | |||||
| 1,675,000 | 3.900%, 10/01/2019 (Callable 04/01/2019) | 1,762,117 | |||||
| 3,000,000 | Pennsylvania State Public School Building Authority Lease Revenue, | ||||||
| 5.000%, 11/15/2034 (Pre-refunded to 11/15/2014) | 3,260,100 | ||||||
| 1,790,000 | Philadelphia Pennsylvania Authority For Industrial Development Revenue, | ||||||
| 5.250%, 01/01/2027 (Pre-refunded to 01/01/2017) | 2,096,931 | ||||||
| 2,660,000 | Philadelphia Pennsylvania Gas Works, | ||||||
| 7.000%, 05/15/2020 (ETM) | 3,165,054 | ||||||
| Pittsburgh Pennsylvania Water & Sewer Authority Revenue Bonds: | |||||||
| 600,000 | 7.250%, 09/01/2014 (Callable 01/18/2013) (ETM) | 644,466 | |||||
| 4,500,000 | 5.000%, 09/01/2029 (Pre-refunded to 09/01/2015) | 5,026,455 | |||||
| 1,510,000 | St. Mary Hospital Authority Pennsylvania Health Revenue, | ||||||
| 5.375%, 11/15/2034 (Pre-refunded to 11/15/2014) | 1,645,508 | ||||||
| 38,683,047 | |||||||
| Puerto Rico - 1.3% | |||||||
| 6,000,000 | Commonwealth of Puerto Rico, | ||||||
| 5.000%, 07/01/2021 | 6,108,000 | ||||||
| Puerto Rico Electric Power Authority: | |||||||
| 5,010,000 | 0.000%, 07/01/2017 ^ | 4,453,590 | |||||
| 3,000,000 | 0.000%, 07/01/2017 ^ | 2,628,870 | |||||
| 1,625,000 | Puerto Rico Public Building Authority, | ||||||
| 5.500%, 07/01/2022 (Pre-refunded to 07/01/2014) | 1,748,126 | ||||||
| 1,080,000 | Puerto Rico Public Finance Corp., | ||||||
| 6.000%, 08/01/2026 (ETM) | 1,525,068 | ||||||
| 16,463,654 | |||||||
| South Carolina - 1.1% | |||||||
| 6,375,000 | Piedmont Municipal Power Agency South Carolina Electric Revenue, | ||||||
| 6.750%, 01/01/2020 (ETM) | 8,654,254 | ||||||
| South Carolina Jobs Economic Development Authority Hospital Facilities Revenue: | |||||||
| 2,575,000 | 7.000%, 08/01/2030 (Pre-refunded to 08/01/2013) | 2,672,644 | |||||
| 2,430,000 | 6.375%, 08/01/2034 (Pre-refunded to 08/01/2013) | 2,513,446 | |||||
| 13,840,344 | |||||||
| South Dakota - 0.1% | |||||||
| 850,000 | Heartland Consumers Power District, | ||||||
| 7.000%, 01/01/2016 (ETM) | 931,183 | ||||||
| Tennessee - 0.9% | |||||||
| 1,050,000 | Metropolitan Government Nashville & Davidson County Tennessee H&E, | ||||||
| 0.000%, 06/01/2021 (ETM) ^ | 897,131 | ||||||
| 5,000,000 | Shelby County Tennessee Health Educational & Housing Facilities Revenue, | ||||||
| 5.500%, 08/15/2019 (ETM) | 5,665,450 | ||||||
| 4,500,000 | Tennessee Housing Development Agency, | ||||||
| 4.500%, 07/01/2028 (Callable 01/01/2020) | 4,844,160 | ||||||
| 11,406,741 | |||||||
| Texas - 13.8% | |||||||
| 2,010,000 | Barbers Hill Independent School District, | ||||||
| 5.000%, 02/15/2019 (PSF Guaranteed) | 2,460,260 | ||||||
| 2,125,000 | Barbers Hill Texas Independent School District General Obligation, | ||||||
| 5.000%, 02/15/2017 (Callable 02/15/2015)(PSF Guaranteed) | 2,323,454 | ||||||
| 6,060,000 | Capital Area Housing Finance Corporation Texas, | ||||||
| 0.000%, 01/01/2016 (ETM) ^ | 5,892,320 | ||||||
| 1,500,000 | Central Texas Housing Finance Corporation, | ||||||
| 0.000%, 09/01/2016 (ETM) ^ | 1,446,780 | ||||||
| Conroe Independent School District: | |||||||
| 1,000,000 | 5.000%, 02/15/2022 (Callable 02/15/2021) (PSF Guaranteed) | 1,244,820 | |||||
| 2,680,000 | 5.000%, 02/15/2023 (Callable 02/15/2021) (PSF Guaranteed) | 3,315,562 | |||||
| 1,500,000 | Cypress-Fairbanks Texas Independent School District, | ||||||
| 5.000%, 02/15/2017 (Callable 02/15/2016)(PSF Guaranteed) | 1,695,840 | ||||||
| 2,410,000 | Dallas Texas Independent School District, | ||||||
| 5.000%, 02/15/2020 (PSF Guaranteed) | 3,012,139 | ||||||
| 3,105,000 | Denton Independent School District, | ||||||
| 5.000%, 08/15/2023 (Callable 08/15/2022) (PSF Guaranteed) | 3,915,964 | ||||||
| 1,355,000 | El Paso Texas Waterworks & Sewer Revenue, | ||||||
| 5.000%, 08/15/2018 | 1,629,631 | ||||||
| 1,625,000 | Frisco Texas Independent School District, | ||||||
| 6.000%, 08/15/2018 (Callable 08/15/2016)(PSF Guaranteed) | 1,921,563 | ||||||
| 1,000,000 | Georgetown Texas Independent School District, | ||||||
| 5.000%, 02/15/2016 (Callable 02/15/2015)(PSF Guaranteed) | 1,092,280 | ||||||
| Harris County Texas: | |||||||
| 1,525,000 | 5.000%, 10/01/2019 | 1,882,506 | |||||
| 140,000 | 5.750%, 10/01/2020 (Pre-refunded to 10/01/2018) | 177,104 | |||||
| 5,605,000 | 5.750%, 10/01/2028 (Pre-refunded to 10/01/2018) | 7,090,493 | |||||
| Harris County Texas Health Facilities Development Corporation Hospital Revenue: | |||||||
| 2,810,000 | 5.500%, 10/01/2013 (ETM) | 2,918,382 | |||||
| 4,280,000 | 5.500%, 10/01/2019 (ETM) | 5,147,085 | |||||
| 10,960,000 | Houston Texas Health Facilities Corporate Facilities Revenue, | ||||||
| 7.125%, 02/15/2034 (Pre-refunded to 02/15/2014) | 11,895,217 | ||||||
| 430,000 | Houston Texas Sewer System Revenue, | ||||||
| 9.375%, 10/01/2013 (Callable 04/01/2013) (ETM) | 458,750 | ||||||
| 3,000,000 | Houston Texas Utility System Revenue, | ||||||
| 5.250%, 05/15/2015 (Callable 05/15/2014)(Insured by NPFGC) | 3,194,700 | ||||||
| Houston Texas Water & Sewer System Revenue Bonds, | |||||||
| 1,500,000 | 0.000%, 12/01/2023 (ETM) ^ | 1,152,570 | |||||
| 16,050,000 | 5.500%, 12/01/2029 (ETM) | 22,590,054 | |||||
| 1,500,000 | Humble Texas Independent School District, | ||||||
| 5.000%, 02/15/2021 (PSF Guaranteed) | 1,884,000 | ||||||
| 1,000,000 | Killeen Independent School District, | ||||||
| 4.000%, 02/15/2024 (Callable 02/15/2021) (PSF Guaranteed) | 1,129,900 | ||||||
| La Porte Independent School District/TX: | |||||||
| 1,230,000 | 5.000%, 02/15/2018 (Pre-refunded to 02/15/2015) | 1,349,802 | |||||
| 85,000 | 5.000%, 02/15/2018 (Callable 02/15/2015) | 92,636 | |||||
| 6,760,000 | Lamar Consolidated Independent School District, | ||||||
| 5.000%, 02/15/2021 (PSF Guaranteed) | 8,519,898 | ||||||
| 3,425,000 | Lubbock Texas, | ||||||
| 5.000%, 02/15/2021 (Callable 02/15/2018)(Insured by AGM) | 4,023,998 | ||||||
| 1,730,000 | Lubbock Texas Housing Finance Corp., | ||||||
| 8.000%, 10/01/2021 (ETM) | 2,562,130 | ||||||
| 1,000,000 | Lubbock Texas Independent School District, | ||||||
| 4.000%, 02/15/2022 (Callable 02/15/2020) (PSF Guaranteed) | 1,142,680 | ||||||
| 1,735,000 | Lufkin Texas Independent School District, | ||||||
| 5.000%, 08/15/2015 (Callable 08/15/2014)(PSF Guaranteed) | 1,863,841 | ||||||
| 1,475,000 | Magnolia Texas Independent School District, | ||||||
| 5.000%, 08/15/2016 (PSF Guaranteed) | 1,697,504 | ||||||
| 1,265,000 | Mission Consolidation Independent School District, | ||||||
| 5.000%, 02/15/2019 (Callable 02/15/2015)(PSF Guaranteed) | 1,382,860 | ||||||
| 1,125,000 | North Central Texas Health Facilities Revenue, | ||||||
| 5.750%, 02/15/2015 (ETM) | 1,234,744 | ||||||
| 1,115,000 | Pasadena Independent School District, | ||||||
| 5.000%, 02/15/2022 (Callable 02/15/2021) (PSF Guaranteed) | 1,387,974 | ||||||
| 1,210,000 | Pearland Texas Waterworks & Sewage, | ||||||
| 5.250%, 03/01/2023 (Pre-refunded to 03/01/2014) | 1,279,345 | ||||||
| 2,035,000 | Retama Texas Development Corporation Special Facilites Revenue, | ||||||
| 8.750%, 12/15/2018 (ETM) | 2,908,564 | ||||||
| 1,295,000 | Rockwall Texas Independent School District, | ||||||
| 5.000%, 02/15/2015 (PSF Guaranteed) | 1,416,808 | ||||||
| 11,665,000 | San Antonio Texas Electric & Gas Revenue, | ||||||
| 5.650%, 02/01/2019 (ETM) | 14,135,064 | ||||||
| 2,100,000 | San Antonio Texas Hotel Occupancy Tax Revenue Bonds, | ||||||
| 0.000%, 08/15/2015 (ETM) ^ | 2,058,777 | ||||||
| 2,000,000 | San Antonio Texas Independent School District, | ||||||
| 5.000%, 08/15/2017 (Callable 08/15/2015)(PSF Guaranteed) | 2,231,760 | ||||||
| 1,020,000 | Spring Texas Independent School District, | ||||||
| 5.000%, 08/15/2019 (Callable 08/15/2018)(PSF Guaranteed) | 1,244,053 | ||||||
| 7,990,000 | Tarrant County Texas Health Facilities Revenue, | ||||||
| 6.000%, 09/01/2024 (ETM) | 10,319,165 | ||||||
| 1,800,000 | Tarrant County Texas Housing Finance Corporation Revenue Bonds, | ||||||
| 0.000%, 09/15/2016 (ETM) ^ | 1,741,860 | ||||||
| Texas State: | |||||||
| 6,285,000 | 5.000%, 10/01/2018 | 7,672,539 | |||||
| 3,965,000 | 5.000%, 04/01/2020 (Callable 04/01/2016) | 4,495,438 | |||||
| 2,200,000 | Tomball Hospital Authority, | ||||||
| 5.000%, 07/01/2020 (Pre-refunded to 07/01/2015) | 2,447,170 | ||||||
| 1,225,000 | University of Texas Revenue Bonds, | ||||||
| 5.000%, 08/15/2018 (Pre-refunded to 08/15/2016) | 1,410,747 | ||||||
| 168,090,731 | |||||||
| Utah - 0.6% | |||||||
| Granite School District Board of Education: | |||||||
| 3,900,000 | 5.000%, 06/01/2022 (Callable 06/01/2021) | 4,859,361 | |||||
| 1,750,000 | 5.000%, 06/01/2023 (Callable 06/01/2021) | 2,160,532 | |||||
| 285,000 | Salt Lake City Utah Hospital Revenue, | ||||||
| 8.125%, 05/15/2015 (Callable 02/04/2013) (ETM) | 309,234 | ||||||
| 7,329,127 | |||||||
| Virginia - 1.0% | |||||||
| 1,095,000 | Bristol Virginia Utility Systems General Obligations, | ||||||
| 5.500%, 11/01/2018 (ETM) | 1,314,296 | ||||||
| 1,500,000 | Danville Industrial Development Authority, | ||||||
| 5.250%, 10/01/2028 (ETM) | 1,930,980 | ||||||
| 7,775,000 | Tobacco Settlement Financing Corporation Revenue, | ||||||
| 5.625%, 06/01/2037 (Pre-refunded to 06/01/2015) | 8,725,649 | ||||||
| 11,970,925 | |||||||
| Washington - 5.0% | |||||||
| 11,665,000 | King County Washington, | ||||||
| 5.000%, 12/01/2021 | 14,934,350 | ||||||
| 4,500,000 | Snohomish County School District No. 201, | ||||||
| 4.000%, 12/01/2021 (Callable 12/01/2020) | 5,176,530 | ||||||
| 3,605,000 | Snohomish County Washington Public Utilities Revenue, | ||||||
| 6.800%, 01/01/2020 (Callable 02/04/2013) (ETM) | 4,576,872 | ||||||
| 2,755,000 | Thurston & Pierce Counties Washington Community Schools, | ||||||
| 4.250%, 12/01/2021 (Callable 12/01/2020) | 3,241,533 | ||||||
| 6,505,000 | University of Washington, | ||||||
| 5.000%, 07/01/2022 | 8,229,475 | ||||||
| 1,290,000 | Walla Walla County School District No 250 College Place, | ||||||
| 5.000%, 12/01/2019 | 1,569,169 | ||||||
| 2,660,000 | Washington Health Care Facilities Authority, | ||||||
| 6.250%, 11/15/2041 (Pre-refunded to 05/15/2021) | 3,669,789 | ||||||
| Washington State: | |||||||
| 1,500,000 | 5.000%, 07/01/2018 (Callable 07/01/2013) | 1,534,605 | |||||
| 10,000,000 | 5.000%, 01/01/2021 | 12,541,100 | |||||
| 4,760,000 | 5.500%, 07/01/2023 | 6,183,954 | |||||
| 61,657,377 | |||||||
| West Virginia - 0.7% | |||||||
| 7,365,000 | Berkeley Brooke Fayette Counties West Virginia Single Family Mortgage Revenue, | ||||||
| 0.000%, 12/01/2014 (ETM) ^ | 7,286,857 | ||||||
| 1,130,000 | Ohio County Board of Education, | ||||||
| 5.250%, 06/01/2018 (ETM) | 1,382,883 | ||||||
| 8,669,740 | |||||||
| Wisconsin - 1.6% | |||||||
| 3,000,000 | Ladysmith-Hawkins Wisconsin School District General Obligation, | ||||||
| 5.200%, 04/01/2018 (Callable 04/01/2016)(Insured by NPFGC) | 3,247,680 | ||||||
| 10,000,000 | State of Wisconsin, | ||||||
| 5.000%, 05/01/2022 | 12,598,500 | ||||||
| 3,320,000 | Wisconsin State Health & Educational Facilities Revenue, | ||||||
| 5.000%, 12/01/2019 (Callable 12/01/2014)(Insured by NPFGC) | 3,512,593 | ||||||
| 19,358,773 | |||||||
| Total Municipal Bonds (Cost $1,132,107,322) | 1,203,471,820 | ||||||
| Shares | |||||||
| SHORT-TERM INVESTMENTS - 0.2% | |||||||
| Money Market Mutual Fund - 0.2% | |||||||
| 2,007,449 | Goldman Sachs Financial Square Funds, 0.01% « | 2,007,449 | |||||
| Total Short-Term Investments (Cost $2,007,449) | 2,007,449 | ||||||
| Total Investments (Cost $1,134,114,771) - 98.7% | 1,205,479,269 | ||||||
| Other Assets in Excess of Liabilities - 1.3% | 16,166,996 | ||||||
| TOTAL NET ASSETS - 100.0% | $ | 1,221,646,265 | |||||
| Notes to Schedule of Investments |
| AGM - Assured Guaranty Municipal |
| AMBAC - Ambac Assurance Corporation. Ambac Assurance's plan of rehabilitation transferring certain troubled insurance policies and assets |
| (mostly relating to insurance coverage and credit default swaps on residential mortgage-backed securities) to a segregated account has |
| obtained court approval but has not yet been implemented. |
| BHAC - Berkshire Hathaway Assurance Corp. |
| FGIC-TCRS - Financial Guaranty Insurance Company |
| NPFGC - National Public Finance Guarantee Corp. |
| PSF - Texas Permanent School Fund |
| ETM - Escrowed to Maturity |
| ^ Non-Income Producing |
| « 7-Day Yield |
| Summary of Fair Value Exposure at December 31, 2012 |
The Fund has adopted authoritative fair valuation accounting standards which establish a definition of fair value and set out a hierarchy for measuring fair value. These standards require additional disclosures about the various inputs and valuation techniques used to develop the measurements of fair value and a discussion on changes in valuation techniques and related inputs during the period. These standards define fair value as the price that would be received to sell an asset or paid to transfer a liability in an orderly transaction between market participants at the measurement date.
The fair value hierarchy is organized into three levels based upon the assumptions (referred to as "inputs") used in pricing the asset or liability. These standards state that "observable inputs" reflect the assumptions market participants would use in pricing the asset or liability based on market data obtained from independent sources and "unobservable inputs" reflect an entity's own assumptions about the assumptions market participants would use in pricing the asset or liability. These inputs are summarized into three broad levels and described below:
| Level 1 - | Unadjusted quoted prices in active markets for identical unrestricted securities. | ||
| Level 2 - | Other significant observable inputs (including quoted prices for similar securities, quoted prices in inactive markets, dealer indications, interest rates, yield curves, prepayment speeds, credit risk, default rates, inputs corroborated by observable market data, etc.). | ||
| Level 3 - | Significant unobservable inputs (including the Fund's own assumptions about the factors that market participants would use in valuing the security) based on the best information available. |
The inputs or methodology used for valuing securities are not necessarily an indication of the risk associated with investing in those securities.
The following is a summary of the inputs used to value the Fund's investments as of December 31, 2012:
| Level 1 | Level 2 | Level 3 | Total | ||||||||||||||
| Fixed Income | |||||||||||||||||
| Municipal Bonds | $ | - | $ | 1,203,471,820 | $ | - | $ | 1,203,471,820 | |||||||||
| Total Fixed Income | - | 1,203,471,820 | - | 1,203,471,820 | |||||||||||||
| Short-Term Investments | |||||||||||||||||
| Money Market Mutual Fund | 2,007,449 | - | - | 2,007,449 | |||||||||||||
| Total Short-Term Investments | 2,007,449 | - | - | 2,007,449 | |||||||||||||
| Total Investments | $ | 2,007,449 | $ | 1,203,471,820 | $ | - | $ | 1,205,479,269 | |||||||||
Changes in valuation techniques may result in transfers into or out of current assigned levels within the hierarchy. There were no transfers between Level 1, Level 2 and Level 3
fair value measurements during the reporting period, as compared to their classification from the prior year's annual report.
| Baird Aggregate Bond Fund | |||
| Schedule of Investments | |||
| December 31, 2012 |
| Principal Amount | Value | ||||||
| LONG-TERM INVESTMENTS - 97.6% | |||||||
| U.S. Treasury Securities - 14.9% | |||||||
| U.S. Treasury Bonds: | |||||||
| $ | 118,825,000 | 1.250%, 04/30/2019 | $ | 120,616,643 | |||
| 33,825,000 | 5.250%, 11/15/2028 | 46,731,335 | |||||
| 48,350,000 | 4.375%, 02/15/2038 | 62,734,125 | |||||
| 230,082,103 | |||||||
| Taxable Municipal Bonds - 4.2% | |||||||
| 5,000,000 | Atlanta Independent School System, | ||||||
| 5.557%, 03/01/2026 | 5,966,650 | ||||||
| California Qualified School Construction Bonds: | |||||||
| 2,500,000 | 5.041%, 07/01/2020 | 2,844,775 | |||||
| 7,500,000 | 7.155%, 03/01/2027 | 8,755,725 | |||||
| 2,000,000 | California School Finance Authority, | ||||||
| 5.043%, 01/01/2021 (Callable 12/31/2015) | 2,102,020 | ||||||
| 5,975,000 | Contra Costa County California Pension Obligation, | ||||||
| 5.140%, 06/01/2017 | 6,639,300 | ||||||
| 1,000,000 | Cuyahoga County Ohio Industrial Development Revenue, | ||||||
| 9.125%, 10/01/2023 | 788,410 | ||||||
| 2,580,000 | Eaton Ohio Community City Schools, | ||||||
| 5.390%, 08/25/2027 (Callable 06/01/2020) | 2,808,743 | ||||||
| 4,975,000 | Elgin Ohio LOC School District, | ||||||
| 5.499%, 08/31/2027 (Callable 12/01/2019) | 5,335,339 | ||||||
| 6,500,000 | San Dieguito California Public Facilities, | ||||||
| 6.459%, 05/01/2027 | 7,705,165 | ||||||
| 5,000,000 | State Public School Building Authorities Revenue, | ||||||
| 5.000%, 09/15/2027 | 5,828,950 | ||||||
| 2,650,000 | Three Rivers Ohio LOC School District, | ||||||
| 5.209%, 09/15/2027 (Callable 12/01/2020) | 2,866,373 | ||||||
| 6,960,000 | Tobacco Settlement Authority Iowa, | ||||||
| 6.500%, 06/01/2023 (Callable 06/01/2015) | 6,851,215 | ||||||
| 2,000,000 | West Contra Costa Unified School District, | ||||||
| 6.250%, 08/01/2030 | 2,211,000 | ||||||
| 4,000,000 | Westlake Ohio City School District, | ||||||
| 5.227%, 12/01/2026 (Callable 12/01/2020) | 4,469,480 | ||||||
| 65,173,145 | |||||||
| Other Government Related Securities - 2.1% | |||||||
| 6,242,000 | Corp Andina de Fomento, | ||||||
| 4.375%, 06/15/2022 f | 6,758,607 | ||||||
| 2,165,000 | Korea Electric Power Corporation, | ||||||
| 6.750%, 08/01/2027 f | 2,957,022 | ||||||
| 2,600,000 | Korea Gas Corp., | ||||||
| 4.250%, 11/02/2020 (Acquired 10/26/2010, Cost $2,587,026) * f | 2,854,535 | ||||||
| 510,000 | National Bank of Hungary Yankee Debentures, | ||||||
| 8.875%, 11/01/2013 f | 528,948 | ||||||
| 3,000,000 | PEMEX Finance Ltd., | ||||||
| 10.610%, 08/15/2017 f | 3,624,920 | ||||||
| Pemex Project Funding Master Trust,: | |||||||
| 2,800,000 | 5.750%, 03/01/2018 | 3,269,000 | |||||
| 1,000,000 | 6.625%, 06/15/2035 | 1,270,000 | |||||
| Petrobras International Finance Company: f | |||||||
| 5,000,000 | 3.500%, 02/06/2017 | 5,243,735 | |||||
| 1,000,000 | 5.750%, 01/20/2020 | 1,138,356 | |||||
| 1,600,000 | The Export-Import Bank of Korea, | ||||||
| 4.000%, 01/11/2017 f | 1,734,945 | ||||||
| 2,788,000 | Westdeutsche Landesbank Subordinated Notes, | ||||||
| 4.796%, 07/15/2015 f | 3,093,060 | ||||||
| 32,473,128 | |||||||
| Corporate Bonds - 35.5% | |||||||
| Industrials - 12.9% | |||||||
| 4,200,000 | Acuity Brands Lighting Inc., | ||||||
| 6.000%, 12/15/2019 | 4,802,293 | ||||||
| Ameritech Capital Funding Corporation: | |||||||
| 1,506,774 | 9.100%, 06/01/2016 | 1,746,762 | |||||
| 2,989,000 | 6.450%, 01/15/2018 | 3,550,956 | |||||
| 6,000,000 | Anadarko Petroleum Corporation, | ||||||
| 6.375%, 09/15/2017 | 7,166,970 | ||||||
| Anglo American Capital PLC: f | |||||||
| 4,000,000 | 9.375%, 04/08/2014 (Acquired 08/29/2012, Cost $4,393,892) * | 4,397,280 | |||||
| 2,000,000 | 9.375%, 04/08/2019 (Acquired 04/02/2009, Cost $2,000,000) * | 2,600,800 | |||||
| 3,000,000 | Aristotle Holding, Inc., | ||||||
| 2.650%, 02/15/2017 (Acquired 02/06/2012, Cost $2,970,750) * | 3,118,167 | ||||||
| Bunge Limited Finance Corporation: | |||||||
| 600,000 | 5.350%, 04/15/2014 | 631,360 | |||||
| 1,289,000 | 5.100%, 07/15/2015 | 1,395,506 | |||||
| 3,800,000 | Bunge N.A. Finance L.P., | ||||||
| 5.900%, 04/01/2017 | 4,314,433 | ||||||
| 1,100,000 | Canadian Natural Resources Limited, | ||||||
| 6.500%, 02/15/2037 f | 1,426,693 | ||||||
| 3,000,000 | CenturyLink Inc., | ||||||
| Series R, 5.150%, 06/15/2017 | 3,232,278 | ||||||
| 1,000,000 | Comcast Corporation, | ||||||
| 6.950%, 08/15/2037 | 1,356,066 | ||||||
| ConAgra Foods, Inc.: | |||||||
| 1,687,000 | 5.819%, 06/15/2017 | 1,947,071 | |||||
| 120,000 | 9.750%, 03/01/2021 | 166,653 | |||||
| 292,235 | Continental Airlines, Inc. Pass-Thru Certificates, | ||||||
| Series 974A, 6.900%, 01/02/2018 | 317,805 | ||||||
| 410,000 | Deutsche Telekom International Finance B.V., | ||||||
| 8.750%, 06/15/2030 f | 614,281 | ||||||
| Donnelley (R.R.) & Sons Co.: | |||||||
| 2,500,000 | 8.600%, 08/15/2016 | 2,687,500 | |||||
| 2,000,000 | 6.125%, 01/15/2017 @ | 1,935,000 | |||||
| 1,000,000 | 7.625%, 06/15/2020 @ | 960,000 | |||||
| 1,000,000 | D.R. Horton, Inc., | ||||||
| 6.500%, 04/15/2016 | 1,110,000 | ||||||
| 2,762,667 | Federal Express Corp. 1998 Pass Through Trust, | ||||||
| Series 981B, 6.845%, 01/15/2019 | 3,080,373 | ||||||
| 2,000,000 | Fiserv, Inc., | ||||||
| 4.625%, 10/01/2020 | 2,180,280 | ||||||
| 8,092,000 | Glencore Funding LLC, | ||||||
| 6.000%, 04/15/2014 (Acquired 03/31/2004 through 06/20/2011, Cost $8,127,975) * | 8,546,406 | ||||||
| GTE Corporation: | |||||||
| 2,800,000 | 6.840%, 04/15/2018 | 3,505,522 | |||||
| 100,000 | 8.750%, 11/01/2021 | 140,534 | |||||
| 650,000 | Health Management Association, | ||||||
| 6.125%, 04/15/2016 @ | 702,000 | ||||||
| 3,000,000 | Highmark Inc. Notes, | ||||||
| 4.750%, 05/15/2021 (Acquired 05/03/2011, Cost $2,987,880) * | 3,021,267 | ||||||
| 1,105,000 | Holcim U.S. Finance, | ||||||
| 6.000%, 12/30/2019 (Acquired 09/24/2009 through 06/26/2012, Cost $1,096,344) * f | 1,253,323 | ||||||
| 5,700,000 | Hutchison Whampoa International Ltd., | ||||||
| 7.625%, 04/09/2019 (Acquired 10/22/2009 through 10/29/2009, Cost $6,230,430) * f | 7,347,676 | ||||||
| 1,800,000 | Hyundai Capital Services Inc., | ||||||
| 3.500%, 09/13/2017 (Acquired 03/07/2012, Cost $1,808,376) * f @ | 1,900,818 | ||||||
| 950,000 | Johnson Controls Inc., | ||||||
| 6.000%, 01/15/2036 | 1,129,513 | ||||||
| 1,000,000 | Lafarge SA, | ||||||
| 7.125%, 07/15/2036 f | 1,017,500 | ||||||
| 1,000,000 | Martin Marietta Materials, Inc., | ||||||
| 6.250%, 05/01/2037 @ | 996,299 | ||||||
| 1,000,000 | Masco Corporation, | ||||||
| 6.125%, 10/03/2016 | 1,104,542 | ||||||
| 5,000,000 | Murphy Oil Corporation, | ||||||
| 3.700%, 12/01/2022 @ | 4,980,970 | ||||||
| Nabors Industries, Inc.: | |||||||
| 1,100,000 | 6.150%, 02/15/2018 | 1,293,645 | |||||
| 1,608,000 | 9.250%, 01/15/2019 | 2,125,855 | |||||
| 7,045,000 | National Oilwell Varco Inc., | ||||||
| Series B, 6.125%, 08/15/2015 | 7,115,105 | ||||||
| 1,300,000 | New Cingular Wireless Services, Inc., | ||||||
| 8.750%, 03/01/2031 | 2,109,298 | ||||||
| 320,000 | Pactiv Corporation, | ||||||
| 7.950%, 12/15/2025 | 262,400 | ||||||
| 6,808,000 | Petrohawk Energy Corporation, | ||||||
| 7.250%, 08/15/2018 | 7,685,871 | ||||||
| 4,355,000 | Plum Creek Timberlands, L.P., | ||||||
| 5.875%, 11/15/2015 | 4,834,224 | ||||||
| 1,000,000 | Questar Market Resources Inc., | ||||||
| 6.800%, 03/01/2020 | 1,110,000 | ||||||
| 2,000,000 | Ralcorp Holdings, Inc., | ||||||
| 4.950%, 08/15/2020 | 2,110,702 | ||||||
| 500,000 | Rio Tinto Alcan, Inc., | ||||||
| 5.750%, 06/01/2035 f | 634,389 | ||||||
| 5,000,000 | Rio Tinto Finance (USA) Limited, | ||||||
| 9.000%, 05/01/2019 f | 6,867,640 | ||||||
| 1,500,000 | SK Telecom, | ||||||
| 6.625%, 07/20/2027 (Acquired 07/13/2007, Cost $1,482,015) * f | 1,935,000 | ||||||
| Sprint Capital Corporation: | |||||||
| 2,800,000 | 6.900%, 05/01/2019 | 3,052,000 | |||||
| 358,000 | 8.750%, 03/15/2032 @ | 437,655 | |||||
| 7,431,000 | Staples, Inc., | ||||||
| 9.750%, 01/15/2014 | 8,078,954 | ||||||
| 1,000,000 | Talisman Energy Inc., | ||||||
| 7.750%, 06/01/2019 f | 1,288,889 | ||||||
| Telecom Italia Capital, SA: f | |||||||
| 2,000,000 | 7.175%, 06/18/2019 @ | 2,321,000 | |||||
| 5,519,000 | 7.200%, 07/18/2036 | 5,761,836 | |||||
| Telefonica Emisiones S.A.U.: f | |||||||
| 1,950,000 | 6.421%, 06/20/2016 @ | 2,157,675 | |||||
| 5,075,000 | 6.221%, 07/03/2017 | 5,645,938 | |||||
| Time Warner, Inc.: | |||||||
| 1,100,000 | 7.625%, 04/15/2031 | 1,514,350 | |||||
| 500,000 | 7.700%, 05/01/2032 | 699,089 | |||||
| 1,000,000 | 6.550%, 05/01/2037 | 1,237,214 | |||||
| 3,100,000 | 6.750%, 06/15/2039 | 3,931,959 | |||||
| 3,000,000 | Tyco Electronics Group S.A., | ||||||
| 6.550%, 10/01/2017 f | 3,597,333 | ||||||
| 53,574 | United AirLines, Inc. Pass-Thru Certificates, | ||||||
| Series 002C, 7.762%, 04/29/2049 § † * * | 1,607 | ||||||
| 269,231 | U.S. Airways Pass-Thru Certificate, | ||||||
| Series 981A, 6.850%, 01/30/2018 | 281,346 | ||||||
| Vale Overseas Limited: f | |||||||
| 3,850,000 | 8.250%, 01/17/2034 | 5,265,272 | |||||
| 1,550,000 | 6.875%, 11/21/2036 | 1,921,349 | |||||
| 1,000,000 | 6.875%, 11/10/2039 | 1,253,805 | |||||
| 1,800,000 | Volkswagen International Finance N.V., | ||||||
| 1.060%, 03/21/2014 (Acquired 08/13/2012, Cost $1,806,517) * f | 1,809,590 | ||||||
| Vulcan Materials Co.: | |||||||
| 2,000,000 | 7.000%, 06/15/2018 | 2,210,000 | |||||
| 500,000 | 7.150%, 11/30/2037 @ | 492,500 | |||||
| 100,000 | Westvaco Corporation, | ||||||
| 9.750%, 06/15/2020 | 138,713 | ||||||
| 3,600,000 | Woodside Finance Ltd., | ||||||
| 8.125%, 03/01/2014 (Acquired 02/24/2009, Cost $3,598,884) * f | 3,884,274 | ||||||
| 5,220,000 | Xerox Corporation, | ||||||
| 8.250%, 05/15/2014 | 5,693,903 | ||||||
| 690,000 | Xstrata Finance Canada Ltd, | ||||||
| 5.800%, 11/15/2016 (Acquired 12/06/2011, Cost $735,569) * f | 778,947 | ||||||
| 6,290,000 | Yara International ASA, | ||||||
| 5.250%, 12/15/2014 (Acquired 10/02/2012 through 11/09/2012, Cost $6,748,074) * f | 6,761,637 | ||||||
| 198,685,861 | |||||||
| Utility - 6.1% | |||||||
| 1,900,000 | Allegheny Energy Supply Co. Senior Unsecured Notes, | ||||||
| 5.750%, 10/15/2019 (Acquired 09/22/2009 through 06/30/2010, Cost $1,891,569) * | 2,084,351 | ||||||
| 6,900,000 | Ameren Corporation, | ||||||
| 8.875%, 05/15/2014 | 7,550,808 | ||||||
| 3,000,000 | Appalachian Power Company, | ||||||
| 0.685%, 08/16/2013 | 3,003,849 | ||||||
| 850,000 | Arizona Public Service Senior Unsecured Notes, | ||||||
| 8.750%, 03/01/2019 | 1,120,431 | ||||||
| 1,220,000 | Beaver Valley Funding Corporation Debentures, | ||||||
| 9.000%, 06/01/2017 | 1,241,435 | ||||||
| 5,862,000 | Constellation Energy Group Inc., | ||||||
| 4.550%, 06/15/2015 | 6,327,144 | ||||||
| 5,675,000 | DCP Midstream, LLC, | ||||||
| 9.750%, 03/15/2019 (Acquired 02/29/2012 through 10/15/2012, Cost $7,325,716) * | 7,507,032 | ||||||
| 4,500,000 | El Paso Pipeline Partners Operating Co LLC, | ||||||
| 7.500%, 11/15/2040 | 6,160,928 | ||||||
| Enel Finance International: f | |||||||
| 2,475,000 | 5.125%, 10/07/2019 (Acquired 09/30/2009, Cost $2,464,110) * | 2,615,736 | |||||
| 1,900,000 | 6.800%, 09/15/2037 (Acquired 09/13/2007, Cost $1,894,965) * | 1,984,550 | |||||
| 1,000,000 | Energy Transfer Partners, L.P., | ||||||
| 9.700%, 03/15/2019 | 1,347,021 | ||||||
| 2,200,000 | Exelon Generation Company, LLC, | ||||||
| 6.200%, 10/01/2017 | 2,598,013 | ||||||
| 2,500,000 | FPL Group Capital, Inc., | ||||||
| Series D, 7.300%, 09/01/2067 @ | 2,778,125 | ||||||
| 322,769 | GG1C Funding Corporation, | ||||||
| 5.129%, 01/15/2014 (Acquired 06/27/2006, Cost $320,223) * | 327,013 | ||||||
| Kinder Morgan Energy Partners Senior, L.P.: | |||||||
| 1,000,000 | 9.000%, 02/01/2019 | 1,347,849 | |||||
| 2,250,000 | 6.950%, 01/15/2038 | 2,960,696 | |||||
| 1,000,000 | 6.500%, 09/01/2039 | 1,229,045 | |||||
| 900,000 | Kinder Morgan Finance, | ||||||
| 5.700%, 01/05/2016 f | 983,818 | ||||||
| 120,870 | Kiowa Power Partners LLC, | ||||||
| 4.811%, 12/30/2013 (Acquired 12/23/2011, Cost $122,089) * | 121,701 | ||||||
| 5,500,000 | Mega Advance Investments Ltd, | ||||||
| 5.000%, 05/12/2021 (Acquired 05/09/2011, Cost $5,443,790) * f @ | 6,179,624 | ||||||
| 2,300,000 | National Rural Utilities Corporation, | ||||||
| 8.000%, 03/01/2032 | 3,460,683 | ||||||
| 6,500,000 | NuStar Logistics, L.P., | ||||||
| 6.050%, 03/15/2013 | 6,542,406 | ||||||
| 1,000,000 | Nustar Pipeline Operating Partnership L.P., | ||||||
| 5.875%, 06/01/2013 | 1,011,113 | ||||||
| 3,401,000 | ONEOK Partners L.P., | ||||||
| 6.150%, 10/01/2016 | 3,958,988 | ||||||
| 2,060,000 | PPL Energy Supply, LLC, | ||||||
| Series A, 5.700%, 10/15/2015 | 2,274,069 | ||||||
| PSE&G Power LLC: | |||||||
| 3,223,000 | 5.320%, 09/15/2016 @ | 3,643,801 | |||||
| 4,005,000 | 5.125%, 04/15/2020 | 4,615,639 | |||||
| 1,134,054 | RGS (I&M) Funding Corporation Debentures, | ||||||
| Series F, 9.820%, 12/07/2022 | 1,368,871 | ||||||
| 2,000,000 | Rockies Express Pipeline LLC, | ||||||
| 5.625%, 04/15/2020 (Acquired 03/17/2010, Cost $1,998,220) * @ | 1,965,000 | ||||||
| 1,400,000 | Southern Natural Gas, | ||||||
| 5.900%, 04/01/2017 (Acquired 03/14/2007, Cost $1,397,676) * | 1,645,034 | ||||||
| 1,000,000 | Spectra Energy Capital LLC, | ||||||
| 5.668%, 08/15/2014 | 1,072,967 | ||||||
| 3,100,000 | Williams Partners L.P., | ||||||
| 6.300%, 04/15/2040 | 3,789,859 | ||||||
| 94,817,599 | |||||||
| Finance - 16.5% | |||||||
| 150,000 | Ally Financial Inc., | ||||||
| 6.750%, 12/01/2014 | 161,959 | ||||||
| American General Finance Corporation: | |||||||
| 1,000,000 | 5.850%, 06/01/2013 @ | 1,016,250 | |||||
| 500,000 | 6.900%, 12/15/2017 | 447,500 | |||||
| American International Group, Inc.: | |||||||
| 3,000,000 | 4.875%, 09/15/2016 | 3,355,443 | |||||
| 1,000,000 | 8.175%, 05/15/2058 @ | 1,302,500 | |||||
| 2,000,000 | Ameriprise Financial, Inc., | ||||||
| 7.300%, 06/28/2019 @ | 2,585,940 | ||||||
| 250,000 | AmSouth Bancorp, | ||||||
| 6.750%, 11/01/2025 | 249,120 | ||||||
| 5,125,000 | Associates Corporation of North America, | ||||||
| 6.950%, 11/01/2018 | 6,173,575 | ||||||
| 400,000 | BAC Capital Trust VI | ||||||
| 5.625%, 03/08/2035 | 405,620 | ||||||
| 1,715,000 | Bank of America Corporation Subordinated Notes, | ||||||
| 10.200%, 07/15/2015 | 2,030,157 | ||||||
| 2,175,000 | Banponce Trust I, | ||||||
| Series A, 8.327%, 02/01/2027 | 1,691,062 | ||||||
| 4,000,000 | Barclays Bank PLC, | ||||||
| 6.750%, 05/22/2019 @ f | 4,884,940 | ||||||
| 100,000 | Capital One Financial Corporation, | ||||||
| 6.150%, 09/01/2016 | 114,402 | ||||||
| 1,500,000 | Cie de Financement Foncier SA, | ||||||
| 2.500%, 09/16/2015 (Acquired 08/13/2012 through 08/14/2012, Cost $1,540,080) * f | 1,554,432 | ||||||
| Citigroup, Inc.: | |||||||
| 1,000,000 | 4.450%, 01/10/2017 @ | 1,107,800 | |||||
| 2,775,000 | 6.125%, 11/21/2017 | 3,302,686 | |||||
| 5,000,000 | CNA Financial Corporation, | ||||||
| 6.500%, 08/15/2016 | 5,768,625 | ||||||
| 5,330,000 | Countrywide Financial Corporation, | ||||||
| 6.250%, 05/15/2016 | 5,850,778 | ||||||
| 1,000,000 | Credit Agricole S.A., | ||||||
| 6.637%, 05/29/2049 (Acquired 05/23/2007, Cost $1,000,000) * f @ | 869,741 | ||||||
| 1,575,000 | Credit Suisse New York, | ||||||
| 5.300%, 08/13/2019 f | 1,868,947 | ||||||
| 2,410,000 | Dresdner Bank AG, | ||||||
| 7.250%, 09/15/2015 f | 2,591,808 | ||||||
| 3,135,000 | First Empire Capital Trust I, | ||||||
| 8.234%, 02/01/2027 | 3,154,910 | ||||||
| 1,575,000 | First Empire Capital Trust II, | ||||||
| 8.277%, 06/01/2027 | 1,606,500 | ||||||
| 3,749,000 | First Hawaiian Capital Trust I, | ||||||
| Series B, 8.343%, 07/01/2027 | 3,786,490 | ||||||
| 541,115 | First National Bank of Chicago Pass-Through Certificates, | ||||||
| Series 93-A, 8.080%, 01/05/2018 | 595,345 | ||||||
| General Electric Capital Corporation: | |||||||
| 6,200,000 | 5.625%, 05/01/2018 @ | 7,362,711 | |||||
| 6,000,000 | 4.650%, 10/17/2021 | 6,846,216 | |||||
| 1,416,000 | Genworth Financial, Inc., | ||||||
| 5.750%, 06/15/2014 @ | 1,488,352 | ||||||
| 6,500,000 | Genworth Life Institutional Funding Trust, | ||||||
| 5.875%, 05/03/2013 (Acquired 04/14/2011, Cost $6,568,056) * | 6,598,930 | ||||||
| GMAC Inc.: | |||||||
| 336,000 | 7.500%, 12/31/2013 | 354,900 | |||||
| 403,000 | 8.000%, 12/31/2018 | 471,510 | |||||
| 1,180,000 | Goldman Sachs Capital I, | ||||||
| 6.345%, 02/15/2034 @ | 1,224,823 | ||||||
| 2,800,000 | Great West Life & Annuity Insurance, | ||||||
| 7.153%, 05/16/2046 (Acquired 05/16/2006 through 11/08/2007, Cost $2,783,656) * | 2,898,000 | ||||||
| 2,100,000 | HSBC Holdings PLC, | ||||||
| 6.500%, 09/15/2037 @ f | 2,621,197 | ||||||
| 400,000 | HSBC USA Capital Trust I, | ||||||
| 7.808%, 12/15/2026 (Acquired 03/08/2007, Cost $406,176) * | 406,000 | ||||||
| 500,000 | HSBC USA Capital Trust II, | ||||||
| 8.380%, 05/15/2027 (Acquired 11/06/2007, Cost $509,766) * | 504,890 | ||||||
| 2,000,000 | Humana Inc., | ||||||
| 7.200%, 06/15/2018 | 2,466,250 | ||||||
| 500,000 | Industrial Bank of Korea, | ||||||
| 3.750%, 09/29/2016 (Acquired 03/22/2011, Cost $496,855) * f | 534,792 | ||||||
| ING Bank N.V.: f | |||||||
| 3,650,000 | 4.000%, 03/15/2016 (Acquired 03/08/2011, Cost $3,648,029) * | 3,884,403 | |||||
| 2,150,000 | 3.750%, 03/07/2017 (Acquired 03/28/2012, Cost $2,132,950) * | 2,284,955 | |||||
| 7,525,000 | Irish Life & Permanent Group Holdings PLC, | ||||||
| 3.600%, 01/14/2013 (Acquired 01/07/2010 through 03/09/2012, Cost $7,520,403) * f | 7,525,053 | ||||||
| Jefferies Group, Inc.: | |||||||
| 4,000,000 | 6.875%, 04/15/2021 | 4,480,000 | |||||
| 1,395,000 | 6.250%, 01/15/2036 | 1,443,825 | |||||
| 6,800,000 | John Hancock Mutual Life Insurance Company, | ||||||
| 7.375%, 02/15/2024 (Acquired 08/26/2010, Cost $7,609,543) * | 8,634,783 | ||||||
| 3,000,000 | J.P. Morgan Chase Bank NA, | ||||||
| 5.875%, 06/13/2016 | 3,421,275 | ||||||
| 4,600,000 | J.P. Morgan Chase & Co., | ||||||
| 5.600%, 07/15/2041 | 5,696,833 | ||||||
| 1,250,000 | Kaupthing Bank, | ||||||
| 5.750%, 10/04/2011 (Acquired 06/06/2008 through 07/22/2008, Cost $969,046) * f § * * | 306,250 | ||||||
| 5,000,000 | Kookmin Bank, | ||||||
| 7.250%, 05/14/2014 (Acquired 08/24/2009 through 03/10/2010, Cost $5,167,456) * f | 5,397,145 | ||||||
| 2,500,000 | Liberty Mutual Group Inc., | ||||||
| 10.750%, 06/15/2058 (Acquired 05/21/2008, Cost $2,445,125) * | 3,725,000 | ||||||
| 565,000 | Liberty Mutual Insurance Company, | ||||||
| 7.697%, 10/15/2097 (Acquired 03/26/2003, Cost $361,719) * | 577,587 | ||||||
| 1,125,000 | Lincoln National Corporation, | ||||||
| 6.050%, 04/20/2067 | 1,120,781 | ||||||
| 1,600,000 | Lloyds TSB Bank PLC, | ||||||
| 5.800%, 01/13/2020 (Acquired 02/10/2010, Cost $1,563,439) * f | 1,872,453 | ||||||
| 100,000 | Manulife Financial Corp., | ||||||
| 4.900%, 09/17/2020 f @ | 111,915 | ||||||
| Marsh & McLennan Companies, Inc.: | |||||||
| 2,500,000 | 2.300%, 04/01/2017 @ | 2,550,285 | |||||
| 1,650,000 | 9.250%, 04/15/2019 | 2,225,624 | |||||
| 1,000,000 | Massachusetts Mutual Life Insurance Company, | ||||||
| 8.875%, 06/01/2039 (Acquired 05/27/2009, Cost $987,100) * | 1,510,043 | ||||||
| 800,000 | MBIA Insurance Corp., | ||||||
| 14.000%, 01/15/2033 (Acquired 01/11/2008, Cost $800,000) * @ | 136,000 | ||||||
| Merrill Lynch & Company: | |||||||
| 1,000,000 | 6.400%, 08/28/2017 | 1,174,355 | |||||
| 1,750,000 | 6.875%, 04/25/2018 | 2,109,545 | |||||
| 1,275,000 | 7.750%, 05/14/2038 | 1,659,666 | |||||
| 422,000 | Metlife, Inc., | ||||||
| 6.500%, 12/15/2032 | 550,643 | ||||||
| Morgan Stanley: | |||||||
| 1,075,000 | 4.750%, 04/01/2014 @ | 1,113,136 | |||||
| 1,000,000 | 4.000%, 07/24/2015 | 1,046,285 | |||||
| 150,000 | 6.625%, 04/01/2018 | 176,786 | |||||
| 3,644,000 | Morgan Stanley Dean Witter & Co., | ||||||
| 6.750%, 10/15/2013 | 3,806,632 | ||||||
| 2,000,000 | National City Bank of Cleveland Subordinated Notes, | ||||||
| 5.800%, 06/07/2017 | 2,359,910 | ||||||
| 4,921,000 | Navigators Group Inc. Senior Unsecured Notes, | ||||||
| 7.000%, 05/01/2016 | 5,353,010 | ||||||
| 2,500,000 | North Fork Capital Trust II, | ||||||
| 8.000%, 12/15/2027 | 2,547,500 | ||||||
| 2,950,000 | Protective Life Corp., | ||||||
| 7.375%, 10/15/2019 | 3,585,808 | ||||||
| 7,457,500 | Prudential Covered Trust 2012-1, | ||||||
| 2.997%, 09/30/2015 (Acquired 12/19/2012, Cost $7,756,046) * | 7,733,517 | ||||||
| Regions Financial Corp: | |||||||
| 1,000,000 | 7.750%, 11/10/2014 | 1,108,800 | |||||
| 2,000,000 | 5.750%, 06/15/2015 | 2,162,500 | |||||
| 4,750,000 | Regions Financing Trust II, | ||||||
| 6.625%, 05/15/2047 | 4,726,250 | ||||||
| 1,000,000 | Republic New York Capital I, | ||||||
| 7.750%, 11/15/2026 | 1,018,750 | ||||||
| 700,000 | Republic New York Corporation Debentures, | ||||||
| 9.125%, 05/15/2021 | 950,162 | ||||||
| 1,800,000 | Santander Issuances, | ||||||
| 6.500%, 08/11/2019 (Acquired 10/18/2007 through 03/19/2012, Cost $1,896,202) * @ f | 1,820,675 | ||||||
| 1,100,000 | Santander U.S. Debt S.A. Unipersonal, | ||||||
| 2.991%, 10/07/2013 (Acquired 09/27/2010, Cost $1,100,000) * f | 1,101,859 | ||||||
| SLM Corporation: | |||||||
| 3,912,000 | 5.375%, 05/15/2014 | 4,090,051 | |||||
| 500,000 | 5.625%, 08/01/2033 | 463,750 | |||||
| 4,900,000 | Sovereign Bank, | ||||||
| 8.750%, 05/30/2018 | 5,769,647 | ||||||
| 5,000,000 | Sparebank 1 Boligkreditt AS, | ||||||
| 1.750%, 11/15/2019 (Acquired 11/07/2012, Cost $4,961,150) * f | 4,939,000 | ||||||
| 2,000,000 | SunTrust Bank, | ||||||
| 7.250%, 03/15/2018 | 2,447,752 | ||||||
| 1,032,000 | SUSA Partnership, L.P., | ||||||
| 8.200%, 06/01/2017 | 1,248,527 | ||||||
| 2,000,000 | Swedbank AB, | ||||||
| 2.125%, 09/29/2017 (Acquired 09/24/2012, Cost $1,996,980) * f | 2,043,480 | ||||||
| 1,000,000 | Symetra Financial Corporation, | ||||||
| 6.125%, 04/01/2016 (Acquired 03/23/2006, Cost $995,570) * | 1,082,467 | ||||||
| 2,000,000 | Talent Yield Investments Ltd, | ||||||
| 4.500%, 04/25/2022 (Acquired 04/18/2012, Cost $1,986,320) * f @ | 2,174,908 | ||||||
| 3,300,000 | TD Ameritrade Holding Corporation, | ||||||
| 5.600%, 12/01/2019 | 3,916,509 | ||||||
| 2,400,000 | The Bear Stearns Companies LLC, | ||||||
| 5.300%, 10/30/2015 | 2,659,663 | ||||||
| The Goldman Sachs Group, Inc.: | |||||||
| 2,200,000 | 3.700%, 08/01/2015 | 2,321,858 | |||||
| 1,000,000 | 6.250%, 09/01/2017 | 1,179,617 | |||||
| 4,500,000 | 6.150%, 04/01/2018 | 5,286,456 | |||||
| The Hartford Financial Services Group, Inc.: | |||||||
| 5,000,000 | 4.000%, 10/15/2017 @ | 5,462,010 | |||||
| 2,200,000 | 8.125%, 06/15/2038 @ | 2,532,750 | |||||
| 1,000,000 | The NASDAQ OMX Group Inc., | ||||||
| 4.000%, 01/15/2015 | 1,046,775 | ||||||
| 6,000,000 | UBS AG, | ||||||
| 5.750%, 04/25/2018 f | 7,122,858 | ||||||
| 4,120,000 | Wachovia Bank, NA, | ||||||
| 6.000%, 11/15/2017 | 4,940,605 | ||||||
| 750,000 | Willis North America, Inc., | ||||||
| 5.625%, 07/15/2015 | 819,404 | ||||||
| 254,813,187 | |||||||
| Residential Mortgage-Backed Securities - 30.3% | |||||||
| U.S. Government Agency Issues - 26.1% | |||||||
| Federal Gold Loan Mortgage Corporation (FGLMC): | |||||||
| 10,819 | 6.500%, 07/01/2014 | 11,078 | |||||
| 339,876 | 6.000%, 06/01/2020 | 357,934 | |||||
| 171,356 | 5.500%, 11/01/2022 | 184,952 | |||||
| 199,361 | 5.000%, 06/01/2023 | 214,524 | |||||
| 208,048 | 5.500%, 07/01/2023 | 226,376 | |||||
| 591,260 | 6.500%, 06/01/2029 | 692,260 | |||||
| 1,591,527 | 5.500%, 01/01/2036 | 1,727,748 | |||||
| 1,084,763 | 6.000%, 12/01/2036 | 1,182,187 | |||||
| 11,249,521 | 5.000%, 03/01/2038 | 12,115,713 | |||||
| 6,957,300 | 4.500%, 11/01/2039 | 7,465,823 | |||||
| 15,083,066 | 4.500%, 11/01/2039 | 16,185,516 | |||||
| 11,268,478 | 3.500%, 06/01/2042 | 12,016,802 | |||||
| 18,411,942 | 3.500%, 07/01/2042 | 19,634,654 | |||||
| 29,047,702 | 3.000%, 08/01/2042 | 30,397,641 | |||||
| 13,671,307 | 3.000%, 10/01/2042 | 14,306,656 | |||||
| Federal Home Loan Mortgage Corporation (FHLMC): | |||||||
| 55,339 | Series 206, Class E, 0.000%, 07/15/2019 ^ | 53,030 | |||||
| 33,513 | Series 141, Class D, 5.000%, 05/15/2021 | 35,786 | |||||
| 36,661 | Series 1074, Class I, 6.750%, 05/15/2021 | 40,310 | |||||
| 188,052 | Series 1081, Class K, 7.000%, 05/15/2021 | 211,637 | |||||
| 31,030 | Series 163, Class F, 6.000%, 07/15/2021 | 34,423 | |||||
| 67,446 | Series 188, Class H, 7.000%, 09/15/2021 | 75,341 | |||||
| 26,101 | Series 1286, Class A, 6.000%, 05/15/2022 | 28,471 | |||||
| 5,147,195 | 5.500%, 05/01/2038 | 5,557,192 | |||||
| 15,197,297 | 4.500%, 09/01/2040 | 16,365,087 | |||||
| Federal National Mortgage Association (FNMA): | |||||||
| 17,677 | Series 2002-56, Class MC, 5.500%, 09/25/2017 | 18,950 | |||||
| 216,728 | Series 1989-37, Class G, 8.000%, 07/25/2019 | 242,671 | |||||
| 764,071 | 5.000%, 12/01/2019 | 830,347 | |||||
| 57,137 | Series 1989-94, Class G, 7.500%, 12/25/2019 | 64,246 | |||||
| 8,622 | Series 1990-58, Class J, 7.000%, 05/25/2020 | 9,637 | |||||
| 73,643 | Series 1990-76, Class G, 7.000%, 07/25/2020 | 82,394 | |||||
| 35,246 | Series 1990-105, Class J, 6.500%, 09/25/2020 | 38,514 | |||||
| 11,715 | Series 1990-108, Class G, 7.000%, 09/25/2020 | 13,130 | |||||
| 21,850 | Series 1991-1, Class G, 7.000%, 01/25/2021 | 24,580 | |||||
| 24,240 | Series 1991-86, Class Z, 6.500%, 07/25/2021 | 26,768 | |||||
| 6,560,929 | 5.000%, 11/01/2021 | 7,130,022 | |||||
| 425,569 | 5.500%, 01/01/2023 | 462,394 | |||||
| 343,397 | Series 1993-58, Class H, 5.500%, 04/25/2023 | 377,409 | |||||
| 748,481 | 5.500%, 07/01/2023 | 819,796 | |||||
| 1,821,421 | 5.000%, 11/01/2023 | 2,001,510 | |||||
| 732,642 | 6.000%, 03/01/2026 | 802,104 | |||||
| 1,698,315 | 6.000%, 05/01/2026 | 1,859,334 | |||||
| 18,007,030 | 2.500%, 12/01/2027 | 18,843,607 | |||||
| 1,479,591 | 5.000%, 05/01/2028 | 1,603,689 | |||||
| 208,755 | Series 1998-66, Class C, 6.000%, 12/25/2028 | 230,174 | |||||
| 223,517 | 6.000%, 03/01/2033 | 250,280 | |||||
| 238,864 | 5.000%, 11/01/2033 | 260,241 | |||||
| 5,139,633 | 5.500%, 04/01/2034 | 5,656,161 | |||||
| 910,291 | Series 2004-W6, Class 1A4, 5.500%, 07/25/2034 | 927,790 | |||||
| 2,108,949 | Series 2004-W6, Class 1A6, 5.500%, 07/25/2034 | 2,158,585 | |||||
| 2,356,047 | Series 2004-W10, Class A4, 5.750%, 08/25/2034 | 2,401,656 | |||||
| 975,036 | 5.500%, 09/01/2034 | 1,066,718 | |||||
| 251,047 | 6.000%, 11/01/2034 | 279,164 | |||||
| 3,460,486 | 5.500%, 02/01/2035 | 3,785,873 | |||||
| 16,005,034 | 5.000%, 10/01/2035 | 17,334,341 | |||||
| 7,309,929 | 5.000%, 11/01/2035 | 7,936,741 | |||||
| 1,793,050 | 5.500%, 11/01/2036 | 1,950,442 | |||||
| 7,743,428 | 5.500%, 04/01/2037 | 8,510,254 | |||||
| 400,560 | 6.000%, 08/01/2037 | 433,530 | |||||
| 1,259,202 | 4.500%, 11/01/2039 | 1,360,649 | |||||
| 7,846,488 | 4.000%, 08/01/2040 | 8,419,743 | |||||
| 3,157,764 | 3.500%, 12/01/2040 | 3,369,317 | |||||
| 27,227,492 | 3.500%, 02/01/2041 | 29,051,585 | |||||
| 35,293,119 | 4.000%, 02/01/2041 | 37,871,589 | |||||
| 11,750,435 | 4.000%, 09/01/2041 | 12,612,579 | |||||
| 11,406,756 | 3.000%, 05/01/2042 | 11,964,266 | |||||
| Government National Mortgage Association (GNMA): | |||||||
| 178,955 | 6.000%, 11/20/2033 | 201,509 | |||||
| 10,296,577 | 5.000%, 07/20/2040 | 11,410,024 | |||||
| 29,322,732 | 4.500%, 01/20/2041 | 32,347,890 | |||||
| 24,709,077 | 4.000%, 06/20/2042 | 26,920,610 | |||||
| 403,083,954 | |||||||
| Non-U.S. Government Agency Issues - 4.2% | |||||||
| Bank of America Alternative Loan Trust: | |||||||
| 210,039 | Series 2003-4, Class 2A1, 5.000%, 06/25/2018 | 216,866 | |||||
| 2,820,385 | Series 2003-5, Class 2A1, 5.000%, 07/25/2018 | 2,921,814 | |||||
| 378,957 | Series 2003-11, Class 4A1, 4.750%, 01/25/2019 | 386,160 | |||||
| 256,441 | Series 2004-6, Class 4A1, 5.000%, 07/25/2019 | 261,966 | |||||
| 5,693,759 | Series 2004-7, Class 4A1, 5.000%, 08/25/2019 | 5,864,811 | |||||
| 280,740 | Series 2004-11, Class 4A1, 5.500%, 12/25/2019 | 291,885 | |||||
| 431,021 | Series 2005-2, Class 4A1, 5.500%, 03/25/2020 | 442,612 | |||||
| 1,859,096 | Series 2005-4, Class 3A1, 5.500%, 05/25/2020 | 1,906,583 | |||||
| 1,099,599 | Series 2005-10, Class 5A1, 5.250%, 11/25/2020 | 1,127,546 | |||||
| 2,023,797 | Series 2007-1, Class 1A1, 5.945%, 04/25/2022 | 2,066,596 | |||||
| 936,703 | Series 2003-11, Class 2A1, 6.000%, 01/25/2034 | 978,408 | |||||
| 370,794 | Series 2005-2, Class 1CB2, 5.500%, 03/25/2035 | 362,270 | |||||
| 591,120 | Series 2005-9, Class 1CB3, 5.500%, 10/25/2035 § | 509,130 | |||||
| 353,033 | Series 2005-11, Class 1CB4, 5.500%, 12/25/2035 § | 329,019 | |||||
| 1,327,491 | Series 2006-5, Class CB7, 6.000%, 06/25/2046 § | 1,058,852 | |||||
| 2,029,401 | Bear Stearns Asset Backed Securities Trust, | ||||||
| Series 2004-AC2, Class 2A, 5.000%, 05/25/2034 | 2,041,657 | ||||||
| Chase Mortgage Finance Corporation: | |||||||
| 451,280 | Series 2003-S13, Class A11, 5.500%, 11/25/2033 | 457,092 | |||||
| 4,636,103 | Series 2006-A1, Class 2A3, 5.330%, 09/25/2036 § | 3,959,394 | |||||
| 589,725 | Citigroup Mortgage Loan Trust, Inc., | ||||||
| Series 2005-9, Class 2A2, 5.500%, 11/25/2035 | 579,836 | ||||||
| Countrywide Alternative Loan Trust: | |||||||
| 637,802 | Series 2005-50CB, Class 4A1, 5.000%, 11/25/2020 | 616,500 | |||||
| 2,786,120 | Series 2006-7CB, Class 3A1, 5.250%, 05/25/2021 § | 2,654,314 | |||||
| 572,577 | Series 2006-J5, Class 3A1, 5.800%, 07/25/2021 § | 532,945 | |||||
| 719,600 | Series 2006-43CB, Class 2A1, 6.000%, 02/25/2022 | 716,905 | |||||
| 114,649 | Series 2002-11, Class A4, 6.250%, 10/25/2032 | 117,150 | |||||
| 9,139,488 | Series 2003-20CB, Class 1A1, 5.500%, 10/25/2033 | 9,651,665 | |||||
| 2,617,847 | Series 2005-10CB, Class 1A6, 5.500%, 05/25/2035 | 2,624,771 | |||||
| 1,599,121 | Series 2006-28CB, Class A17, 6.000%, 10/25/2036 § | 1,151,038 | |||||
| Deutsche Mortgage Securities Inc.: | |||||||
| 979,297 | Series 2006-AR5, Class 21A, 6.000%, 10/25/2021 | 840,745 | |||||
| 139,886 | Series 2004-4, Class 1A6, 5.650%, 04/25/2034 | 139,835 | |||||
| First Horizon Alternative Mortgage Securities: | |||||||
| 443,118 | Series 2005-FA7, Class 2A1, 5.000%, 09/25/2020 | 450,399 | |||||
| 630,922 | Series 2006-FA6, Class 3A1, 5.750%, 11/25/2021 | 636,265 | |||||
| 1,936,844 | Series 2006-FA8, Class 2A1, 5.750%, 02/25/2037 | 1,951,434 | |||||
| 209,101 | Impac CMB Trust, | ||||||
| Series 2004-4, Class 2A2, 4.804%, 09/25/2034 | 207,745 | ||||||
| 855,568 | J.P. Morgan Alternative Loan Trust, | ||||||
| Series 2006-A1, Class 2A1, 2.816%, 03/25/2036 § | 604,828 | ||||||
| J.P. Morgan Mortgage Trust: | |||||||
| 481,476 | Series 2006-A7, Class 2A2, 2.904%, 01/25/2037 § | 370,569 | |||||
| 2,057,081 | Series 2006-A7, Class 2A4R, 2.904%, 01/25/2037 § | 1,583,109 | |||||
| 5,276,529 | Series 2007-A2, Class 2A3, 2.937%, 04/25/2037 | 4,095,700 | |||||
| Master Alternative Loans Trust: | |||||||
| 1,136,439 | Series 2004-1, Class 1A1, 5.000%, 01/25/2019 | 1,165,310 | |||||
| 67,368 | Series 2004-2, Class 4A1, 5.000%, 02/25/2019 | 69,829 | |||||
| 843,569 | Series 2004-4, Class 4A1, 5.000%, 04/25/2019 | 869,761 | |||||
| 511,518 | Series 2003-5, Class 6A1, 6.000%, 08/25/2033 | 544,396 | |||||
| 317,872 | RAAC Series, | ||||||
| Series 2004-SP1, Class AI4, 5.285%, 08/25/2027 | 319,270 | ||||||
| 430,529 | Residential Accredit Loans, Inc., | ||||||
| Series 2004-QS6, Class A1, 5.000%, 05/25/2019 | 436,366 | ||||||
| 73,679 | Residential Funding Mortgage Security I, | ||||||
| Series 2003-S11, Class A2, 4.000%, 06/25/2018 | 74,741 | ||||||
| 586,608 | Salomon Brothers Mortgage Securities VII, | ||||||
| Series 2003-UP2, Class A2, 4.000%, 06/25/2033 | 631,017 | ||||||
| 925,742 | Structured Asset Securities Corporation, | ||||||
| Series 2005-7XS, Class 1A4B, 5.440%, 04/25/2035 | 938,884 | ||||||
| Washington Mutual, Inc. Pass-Thru Certificates: | |||||||
| 1,040,742 | Series 2004-CB1, Class 5A, 5.000%, 06/25/2019 | 1,077,290 | |||||
| 1,966,829 | Series 2004-CB2, Class 7A, 5.500%, 08/25/2019 | 2,051,464 | |||||
| 73,662 | Series 2004-CB3, Class 3A, 5.500%, 10/25/2019 | 75,577 | |||||
| 589,078 | Series 2004-CB3, Class 4A, 6.000%, 10/25/2019 | 612,934 | |||||
| 392,827 | Series 2004-CB4, Class 21A, 5.500%, 12/25/2019 | 403,510 | |||||
| 63,978,763 | |||||||
| Asset Backed Securities - 3.4% | |||||||
| 141 | Amresco Residential Securities Mortgage Loan Trust, | ||||||
| Series 1997-3, Class A9, 6.960%, 03/25/2027 | 141 | ||||||
| Bayview Financial Acquisition Trust: | |||||||
| 796,572 | Series 2006-A, Class 1A2, 5.483%, 02/28/2041 | 813,037 | |||||
| 2,500,000 | Series 2007-B, Class 1A2, 6.831%, 08/28/2047 | 1,306,080 | |||||
| 99 | Contimortgage Home Equity Trust, | ||||||
| Series 1997-2, Class A9, 7.090%, 04/15/2028 | 99 | ||||||
| Countrywide Asset-Backed Certificates: | |||||||
| 3,624,688 | Series 2004-13, Class AF4, 4.583%, 01/25/2033 | 3,621,796 | |||||
| 2,143,749 | Series 2004-S1, Class A3, 5.115%, 02/25/2035 | 2,148,506 | |||||
| 4,411,635 | Series 2004-15, Class AF6, 4.613%, 04/25/2035 | 4,293,866 | |||||
| 7,295,215 | Series 2005-1, Class AF6, 5.030%, 07/25/2035 | 7,313,920 | |||||
| 9,414,310 | Series 2005-11, Class AF3, 4.778%, 02/25/2036 | 8,425,648 | |||||
| 4,001,128 | Series 2005-10, Class AF6, 4.915%, 02/25/2036 | 3,647,188 | |||||
| 4,107,627 | Series 2005-13, Class AF3, 5.319%, 04/25/2036 | 3,449,868 | |||||
| 1,568,203 | Series 2005-17, Class 1AF5, 5.387%, 05/25/2036 § | 1,308,038 | |||||
| 690,642 | Series 2005-17, Class 1AF2, 5.363%, 05/25/2036 § | 618,573 | |||||
| 1,382,201 | Series 2007-S1, Class A6, 5.693%, 11/25/2036 | 1,139,549 | |||||
| 891,829 | Series 2006-13, Class 1AF2, 5.884%, 01/25/2037 § | 996,095 | |||||
| 1,500,000 | Series 2006-10, Class 1AF3, 5.498%, 09/25/2046 | 927,651 | |||||
| 351,468 | Credit Based Asset Servicing and Securitization LLC, | ||||||
| Series 2005-CB8, Class AF2, 5.303%, 12/25/2035 | 332,120 | ||||||
| 44,378 | Equivantage Home Equity Loan Trust, | ||||||
| Series 1996-3, Class A3, 7.700%, 09/25/2027 | 44,017 | ||||||
| GE Capital Mortgage Services, Inc.: | |||||||
| 320 | Series 1997-HE4, Class A7, 6.735%, 12/25/2028 | 319 | |||||
| 9,356 | Series 1999-HE1, Class A7, 6.265%, 04/25/2029 | 9,164 | |||||
| Green Tree Financial Corporation: | |||||||
| 228,644 | Series 1993-3, Class A7, 6.400%, 10/15/2018 | 237,266 | |||||
| 163,022 | Series 1993-4, Class A5, 7.050%, 01/15/2019 | 164,951 | |||||
| 19,913 | Series 1997-1, Class A5, 6.860%, 03/15/2028 | 20,864 | |||||
| 1,094,577 | Series 1998-2, Class A5, 6.240%, 12/01/2028 | 1,136,505 | |||||
| 31,590 | Series 1997-6, Class A8, 7.070%, 01/15/2029 | 34,050 | |||||
| 982,772 | Series 1998-3, Class A5, 6.220%, 03/01/2030 | 1,076,213 | |||||
| 611,910 | Series 1998-4, Class A5, 6.180%, 04/01/2030 | 633,961 | |||||
| 19,209 | IMC Home Equity Loan Trust, | ||||||
| Series 1997-5, Class A10, 6.880%, 11/20/2028 | 19,199 | ||||||
| 4,149,000 | JP Morgan Mortgage Acquisition Corp, | ||||||
| Series 2007-CH1, Class AV4, 0.340%, 11/25/2036 | 4,056,805 | ||||||
| 59,780 | Oakwood Mortgage Investors, Inc., | ||||||
| Series 1999-B, Class A3, 6.450%, 11/15/2017 | 61,490 | ||||||
| 2,975,934 | Renaissance Home Equity Loan Trust, | ||||||
| Series 2007-1, Class AF3, 5.612%, 04/25/2037 | 1,579,319 | ||||||
| Residential Asset Mortgage Products, Inc.: | |||||||
| 1,359,382 | Series 2003-RS7, Class AI6, 5.340%, 08/25/2033 | 1,336,036 | |||||
| 452,955 | Series 2005-RS1, Class AI6, 4.713%, 01/25/2035 | 436,457 | |||||
| Residential Asset Securities Corporation: | |||||||
| 1,308,952 | Series 2003-KS2, Class AI6, 3.990%, 04/25/2033 | 1,262,668 | |||||
| 90,129 | Series 2003-KS5, Class AI6, 3.620%, 07/25/2033 | 82,908 | |||||
| 128,097 | Series 2004-KS2, Class AI6, 4.300%, 03/25/2034 | 123,954 | |||||
| 52,658,321 | |||||||
| Commercial Mortgage Backed Securities - 7.2% | |||||||
| 11,139,000 | Bear Stearns Commercial Mortgage Securities, | ||||||
| Series 2005-PWR9, Class A4A, 4.871%, 09/11/2042 | 12,236,559 | ||||||
| Commercial Mortgage Trust, | |||||||
| 11,248,000 | Series 2005-C6, Class A5A, 5.116%, 06/10/2044 | 12,412,505 | |||||
| 11,650,000 | Series 2012-CR2, Class A4, 3.147%, 08/15/2045 | 12,293,954 | |||||
| 10,149,000 | Credit Suisse First Boston Mortgage Securities Corporation, | ||||||
| Series 2005-C5, Class A4, 5.100%, 08/15/2038 @ | 11,155,354 | ||||||
| 10,750,000 | GE Capital Commercial Mortgage Corporation, | ||||||
| Series 2005-C4, Class A4, 5.307%, 11/10/2045 | 12,022,424 | ||||||
| 11,355,000 | J.P. Morgan Chase Commercial Mortgage Trust, | ||||||
| Series 2005-CB12, Class A4, 4.895%, 09/12/2037 | 12,455,175 | ||||||
| 14,000,000 | Morgan Stanley Bank of America Merrill Lynch Trust, | ||||||
| Series 2012-C6, Class A4, 2.858%, 11/15/2045 | 14,471,311 | ||||||
| 10,000,000 | Wachovia Bank Commercial Mortgage Trust, | ||||||
| Series 2005-C22, Class A4, 5.293%, 12/15/2044 | 11,151,150 | ||||||
| 12,000,000 | WF-RBS Commercial Mortgage Trust, | ||||||
| Series 2012-C6, Class A4, 3.440%, 04/15/2045 | 13,029,396 | ||||||
| 111,227,828 | |||||||
| Total Long-Term Investments (Cost $1,434,562,974) | 1,506,993,889 | ||||||
| SHORT-TERM INVESTMENTS - 2.0% | |||||||
| Money Market Mutual Funds - 2.0% | |||||||
| 567,652 | Dreyfus Institutional Cash Advantage Fund, 0.11% « | 567,652 | |||||
| 30,000,000 | Short-Term Investments Trust - Liquid Assets Portfolio, 0.15% « | 30,000,000 | |||||
| Total Short-Term Investments (Cost $30,567,652) | 30,567,652 | ||||||
| Principal Amount | |||||||
| INVESTMENTS PURCHASED WITH CASH PROCEEDS FROM | |||||||
| SECURITIES LENDING - 4.1% | |||||||
| Commercial Paper - 0.1% | |||||||
| $ | 2,553,134 | Atlantic East Funding LLC, 0.562%, 03/25/2013 † * * | 1,930,414 | ||||
| Total Commercial Paper (Cost $2,553,134) | 1,930,414 | ||||||
| Shares | |||||||
| Investment Companies - 4.0% | |||||||
| 61,954,700 | Mount Vernon Securities Lending Trust Prime Portfolio, 0.28% « | 61,954,700 | |||||
| Total Investment Companies (Cost $61,954,700) | 61,954,700 | ||||||
| Total Investments Purchased With Cash Proceeds From | |||||||
| Securities Lending (Cost $64,507,834) | 63,885,114 | ||||||
| Total Investments (Cost $1,529,638,460) - 103.7% | 1,601,446,655 | ||||||
| Asset Relating to Securities Lending Investments - 0.0% | |||||||
Support Agreement * * ^ a † | 622,719 | ||||||
| Total (Cost $0) | 622,719 | ||||||
| Liabilities in Excess of Other Assets - (3.7)% | (57,220,205 | ) | |||||
| TOTAL NET ASSETS - 100.0% | $ | 1,544,849,169 | |||||
| Notes to Schedule of Investments | ||
| * | Restricted Security Deemed Liquid | |
| * * | Illiquid Security | |
| @ | This security or portion of this security is out on loan at December 31, 2012. | |
| f | Foreign Security | |
| ^ | Non-Income Producing | |
| « | 7-Day Yield | |
| § | Security in Default | |
| † | Priced at Fair Value by the Valuation Committee as delegated by the Baird Funds' Board of Directors. | |
| a | The Fund's transfer agent and administrator and securities lending agent entered into a support agreement with the Fund to cover losses realized by the Fund on its investment in Atlantic East Funding, LLC (up to a certain amount), which investment was made by the Fund's securities lending agent. | |
| Summary of Fair Value Exposure at December 31, 2012 |
The Fund has adopted authoritative fair valuation accounting standards which establish a definition of fair value and set out a hierarchy for measuring fair value. These standards require additional disclosures about the various inputs and valuation techniques used to develop the measurements of fair value and a discussion on changes in valuation techniques and related inputs during the period. These standards define fair value as the price that would be received to sell an asset or paid to transfer a liability in an orderly transaction between market participants at the measurement date.
The fair value hierarchy is organized into three levels based upon the assumptions (referred to as "inputs") used in pricing the asset or liability. These standards state that "observable inputs" reflect the assumptions market participants would use in pricing the asset or liability based on market data obtained from independent sources and "unobservable inputs" reflect an entity's own assumptions about the assumptions market participants would use in pricing the asset or liability. These inputs are summarized into three broad levels and described below:
| Level 1 - | Unadjusted quoted prices in active markets for identical unrestricted securities. | ||
| Level 2 - | Other significant observable inputs (including quoted prices for similar securities, quoted prices in inactive markets, dealer indications, interest rates, yield curves, prepayment speeds, credit risk, default rates, inputs corroborated by observable market data, etc.). | ||
| Level 3 - | Significant unobservable inputs (including the Fund's own assumptions about the factors that market participants would use in valuing the security) based on the best information available. | ||
The inputs or methodology used for valuing securities are not necessarily an indication of the risk associated with investing in those securities.
The following is a summary of the inputs used to value the Fund's investments as of December 31, 2012:
| Level 1 | Level 2 | Level 3 | Total | ||||||||||||||
| Fixed Income | |||||||||||||||||
| U.S. Treasury Securities | $ | - | $ | 230,082,103 | $ | - | $ | 230,082,103 | |||||||||
| Taxable Municipal Bonds | - | 65,173,145 | - | 65,173,145 | |||||||||||||
| Other Government Related Securities | - | 32,473,128 | - | 32,473,128 | |||||||||||||
| Corporate Debt Securities | - | 548,315,040 | 1,607 | 548,316,647 | |||||||||||||
| Residential Mortgage-Backed Securities - U.S. Government Agency Issues | - | 403,083,954 | - | 403,083,954 | |||||||||||||
| Residential Mortgage-Backed Securities - Non - U.S. Government Agency Issues | - | 63,978,763 | - | 63,978,763 | |||||||||||||
| Asset Backed Securities | - | 52,658,321 | - | 52,658,321 | |||||||||||||
| Commercial Mortgage-Backed Securities | - | 111,227,828 | - | 111,227,828 | |||||||||||||
| Total Fixed Income | - | 1,506,992,282 | 1,607 | 1,506,993,889 | |||||||||||||
| Short-Term Investments | |||||||||||||||||
| Money Market Mutual Funds | 30,567,652 | - | - | 30,567,652 | |||||||||||||
| Total Short-Term Investments | 30,567,652 | - | - | 30,567,652 | |||||||||||||
| Investments Purchased with Cash | |||||||||||||||||
| Proceeds from Securities Lending | |||||||||||||||||
| Commercial Paper | - | 1,930,414 | - | 1,930,414 | |||||||||||||
| Money Market Mutual Fund | 61,954,700 | - | - | 61,954,700 | |||||||||||||
| Total Investments Purchased with | |||||||||||||||||
| Cash Proceeds from Securities Lending | 61,954,700 | 1,930,414 | - | 63,885,114 | |||||||||||||
| Total Investments | $ | 92,522,352 | $ | 1,508,922,696 | $ | 1,607 | $ | 1,601,446,655 | |||||||||
| Asset Relating to Securities Lending Investments | $ | - | $ | 622,719 | $ | - | $ | 622,719 | |||||||||
Changes in valuation techniques may result in transfers into or out of current assigned levels within the hierarchy. There were no transfers between Level 1, Level 2
and Level 3 fair value measurements during the reporting period, as compared to their classification from the prior year's annual report. One security that is priced at fair value
by the Valuation Committee instead of the Fund's pricing vendor is valued using level 3 inputs.
Level 3 Reconciliation Disclosure
Following is a reconciliation of Level 3 assets for which significant unobservable inputs were used to determine fair value.
| Description | Investments in Securities | |||
| Balance as of December 31, 2011 | $ | 1,607 | ||
| Accrued discounts/premiums | - | |||
| Realized gain (loss) | - | |||
| Change in unrealized appreciation (depreciation) | - | |||
| Purchases | - | |||
| Sales | - | |||
| Transfers in and/or out of Level 3 * | - | |||
| Balance as of December 31, 2012 | $ | 1,607 | ||
* Transfers between levels are recognized at the end of the reporting period.
| Baird Core Plus Bond Fund | |||||||
| Schedule of Investments | |||||||
| December 31, 2012 | |||||||
| Principal Amount | Value | ||||||
| LONG-TERM INVESTMENTS - 97.9% | |||||||
| U.S. Treasury Securities - 9.6% | |||||||
| U.S. Treasury Bonds: | |||||||
| $ | 94,125,000 | 1.250%, 04/30/2019 | $ | 95,544,217 | |||
| 49,025,000 | 5.250%, 11/15/2028 | 67,731,077 | |||||
| 67,600,000 | 4.375%, 02/15/2038 | 87,711,000 | |||||
| 250,986,294 | |||||||
| Taxable Municipal Bonds - 1.8% | |||||||
| 625,000 | Bellevue California Union School District, | ||||||
| 5.000%, 08/01/2028 | 659,075 | ||||||
| 2,415,000 | California Qualified School Bond Joint Powers Authority, | ||||||
| 6.739%, 09/01/2026 | 2,747,835 | ||||||
| California Qualified School Construction Bonds: | |||||||
| 1,500,000 | 5.041%, 07/01/2020 | 1,706,865 | |||||
| 1,700,000 | 7.155%, 03/01/2027 | 1,984,631 | |||||
| 2,000,000 | California State, | ||||||
| 5.500%, 03/01/2016 | 2,235,320 | ||||||
| 1,500,000 | Central Valley Support Joint Powers Agency, | ||||||
| 5.676%, 09/01/2024 | 1,658,505 | ||||||
| 1,250,000 | Colton Joint Unified School District, | ||||||
| 6.008%, 08/01/2026 | 1,415,450 | ||||||
| 1,300,000 | Contra Costa County California Pension Obligation, | ||||||
| 5.140%, 06/01/2017 | 1,444,534 | ||||||
| 1,000,000 | Davie Florida Water & Sewer Revenue, | ||||||
| 6.599%, 10/01/2030 (Callable 10/01/2020) | 1,178,520 | ||||||
| 1,000,000 | Elgin Ohio LOC School District, | ||||||
| 5.499%, 08/31/2027 (Callable 12/01/2019) | 1,072,430 | ||||||
| Illinois State: | |||||||
| 2,000,000 | 4.026%, 03/01/2014 | 2,069,040 | |||||
| 1,600,000 | 4.421%, 01/01/2015 | 1,696,240 | |||||
| 2,000,000 | 4.961%, 03/01/2016 | 2,190,620 | |||||
| 3,000,000 | 5.163%, 02/01/2018 | 3,325,650 | |||||
| 3,000,000 | North East Independent School District Texas, | ||||||
| 5.240%, 08/01/2027 | 3,704,160 | ||||||
| 2,900,000 | Port of Oakland, | ||||||
| 5.000%, 11/01/2020 | 3,216,361 | ||||||
| 1,515,000 | San Dieguito California Public Facilities, | ||||||
| 6.459%, 05/01/2027 | 1,795,896 | ||||||
| 2,000,000 | State Public School Building Authorities Revenue, | ||||||
| 5.000%, 09/15/2027 | 2,331,580 | ||||||
| 1,350,000 | Three Rivers Ohio LOC School District, | ||||||
| 5.209%, 09/15/2027 (Callable 12/01/2020) | 1,460,228 | ||||||
| 3,420,000 | Tobacco Settlement Authority Iowa, | ||||||
| 6.500%, 06/01/2023 (Callable 06/01/2015) | 3,366,546 | ||||||
| 4,320,000 | West Contra Costa Unified School District, | ||||||
| 6.250%, 08/01/2030 | 4,775,760 | ||||||
| 1,160,000 | Westlake Ohio City School District, | ||||||
| 5.227%, 12/01/2026 (Callable 12/01/2020) | 1,296,149 | ||||||
| 47,331,395 | |||||||
| Other Government Related Securities - 2.2% | |||||||
| 3,956,000 | Corp Andina de Fomento, | ||||||
| 4.375%, 06/15/2022 f | 4,283,411 | ||||||
| 10,000,000 | Eksportfinans ASA, | ||||||
| 2.000%, 09/15/2015 f | 9,571,660 | ||||||
| Export-Import Bank of Korea Notes: f | |||||||
| 3,500,000 | 5.875%, 01/14/2015 | 3,827,173 | |||||
| 1,000,000 | 4.000%, 01/29/2021 | 1,075,213 | |||||
| 240,000 | Korea Electric Power Corporation, | ||||||
| 6.750%, 08/01/2027 f | 327,799 | ||||||
| Korea Hydro & Nuclear Power Co., Ltd.: f | |||||||
| 1,000,000 | 6.250%, 06/17/2014 (Acquired 03/21/2011, Cost $1,046,962) * | 1,070,368 | |||||
| 500,000 | 3.125%, 09/16/2015 (Acquired 09/09/2010, Cost $493,770) * | 522,099 | |||||
| 150,000 | National Bank of Hungary Yankee Debentures, | ||||||
| 8.875%, 11/01/2013 f | 155,573 | ||||||
| Petrobras International Finance Company: f | |||||||
| 5,800,000 | 3.875%, 01/27/2016 | 6,119,017 | |||||
| 5,000,000 | 7.875%, 03/15/2019 f | 6,245,380 | |||||
| 3,200,000 | 5.375%, 01/27/2021 @ | 3,602,624 | |||||
| Petroleos Mexicanos: f | |||||||
| 4,809,000 | 4.875%, 03/15/2015 @ | 5,181,698 | |||||
| 2,500,000 | 4.875%, 01/24/2022 @ | 2,821,250 | |||||
| 4,000,000 | 6.500%, 06/02/2041 | 5,020,000 | |||||
| 4,400,000 | The Korea Development Bank, | ||||||
| 3.000%, 09/14/2022 f @ | 4,382,998 | ||||||
| 1,885,000 | Westdeutsche Landesbank Subordinated Notes, | ||||||
| 4.796%, 07/15/2015 f | 2,091,255 | ||||||
| 56,297,518 | |||||||
| Corporate Bonds - 47.3% | |||||||
| Industrials - 17.9% | |||||||
| 2,450,000 | AbbVie Inc., | ||||||
| 1.750%, 11/06/2017 (Acquired 11/05/2012, Cost $2,444,879) * | 2,476,649 | ||||||
| 700,000 | Acuity Brands Lighting Inc., | ||||||
| 6.000%, 12/15/2019 | 800,382 | ||||||
| 3,000,000 | Ameritech Capital Funding Corporation, | ||||||
| 6.450%, 01/15/2018 | 3,564,024 | ||||||
| Anadarko Petroleum Corporation: | |||||||
| 2,225,000 | 5.950%, 09/15/2016 | 2,561,266 | |||||
| 968,000 | 6.375%, 09/15/2017 | 1,156,271 | |||||
| 3,700,000 | 8.700%, 03/15/2019 | 4,993,032 | |||||
| Anglo American Capital PLC: f | |||||||
| 1,800,000 | 9.375%, 04/08/2014 (Acquired 09/05/2012, Cost $1,978,218) * | 1,978,776 | |||||
| 5,500,000 | 9.375%, 04/08/2019 (Acquired 09/20/2011 through 07/11/2012, Cost $7,116,121) * | 7,152,200 | |||||
| 2,000,000 | ArcelorMittal, | ||||||
| 6.750%, 02/25/2022 f @ | 2,099,030 | ||||||
| 5,000,000 | Aristotle Holding, Inc., | ||||||
| 3.500%, 11/15/2016 (Acquired 11/14/2011 through 03/28/2012, Cost $5,036,525) * | 5,345,825 | ||||||
| 1,000,000 | AT&T Inc., | ||||||
| 5.550%, 08/15/2041 | 1,200,124 | ||||||
| 256,030 | Atlas Air, Inc. Pass-Through Certificates, | ||||||
| Series 00-1, 8.707%, 01/02/2019 | 256,030 | ||||||
| 2,000,000 | Beam, Inc., | ||||||
| 3.250%, 05/15/2022 | 2,074,260 | ||||||
| 1,000,000 | Bemis Company, Inc., | ||||||
| 4.500%, 10/15/2021 | 1,083,495 | ||||||
| BP Capital Markets,: f | |||||||
| 3,000,000 | 1.375%, 11/06/2017 @ | 3,002,646 | |||||
| 1,500,000 | 4.750%, 03/10/2019 | 1,739,240 | |||||
| 1,500,000 | Browning-Ferris Industries Inc., | ||||||
| 9.250%, 05/01/2021 | 1,961,337 | ||||||
| Bunge Limited Finance Corporation: | |||||||
| 825,000 | 5.350%, 04/15/2014 | 868,119 | |||||
| 2,527,000 | 5.100%, 07/15/2015 | 2,735,798 | |||||
| 7,100,000 | 8.500%, 06/15/2019 | 9,135,535 | |||||
| 2,335,000 | Bunge N.A. Finance L.P., | ||||||
| 5.900%, 04/01/2017 | 2,651,105 | ||||||
| 2,000,000 | CenturyLink Inc., | ||||||
| Series R, 5.150%, 06/15/2017 | 2,154,852 | ||||||
| 3,544,000 | Chesapeake Energy Corporation, | ||||||
| 6.500%, 08/15/2017 @ | 3,845,240 | ||||||
| 5,000,000 | Cliffs Natural Resources Inc., | ||||||
| 3.950%, 01/15/2018 @ | 5,032,415 | ||||||
| 1,000,000 | CNPC HK Overseas Capital Ltd, | ||||||
| 5.950%, 04/28/2041 (Acquired 04/20/2011, Cost $978,120) * f @ | 1,297,334 | ||||||
| 2,030,000 | Comcast Cable Communications Holdings, Inc., | ||||||
| 9.455%, 11/15/2022 | 3,069,074 | ||||||
| 2,000,000 | Comcast Corporation, | ||||||
| 4.650%, 07/15/2042 @ | 2,108,126 | ||||||
| 2,000,000 | Computer Sciences Corp., | ||||||
| 4.450%, 09/15/2022 | 2,088,694 | ||||||
| 845,000 | ConocoPhillips Canada Funding Company I, | ||||||
| 5.950%, 10/15/2036 f | 1,084,939 | ||||||
| 44,778 | Continental Airlines, Inc. Pass-Through Certificates, | ||||||
| Series 974A, 6.900%, 01/02/2018 | 48,696 | ||||||
| 5,000,000 | Cox Communications, Inc., | ||||||
| 4.700%, 12/15/2042 (Acquired 11/26/2012, Cost $4,999,050) * | 5,101,860 | ||||||
| 175,000 | CSX Corporation, | ||||||
| 6.220%, 04/30/2040 | 225,868 | ||||||
| Daimler Finance North America LLC: | |||||||
| 1,890,000 | 2.300%, 01/09/2015 (Acquired 08/22/2012, Cost $1,932,734) * | 1,935,453 | |||||
| 3,359,000 | 1.650%, 04/10/2015 (Acquired 07/17/2012, Cost $3,384,263) * | 3,400,201 | |||||
| 3,500,000 | Danone, | ||||||
| 3.000%, 06/15/2022 (Acquired 05/29/2012, Cost $3,489,465) * f | 3,596,338 | ||||||
| Deutsche Telekom International Finance B.V.: f | |||||||
| 2,450,000 | 3.125%, 04/11/2016 (Acquired 11/09/2011, Cost $2,480,490) * | 2,591,463 | |||||
| 825,000 | 8.750%, 06/15/2030 | 1,236,052 | |||||
| 5,000,000 | Devon Financing Corporation, L.L.C., | ||||||
| 7.875%, 09/30/2031 | 7,272,090 | ||||||
| 2,500,000 | DISH DBS Corporation, | ||||||
| 5.000%, 03/15/2023 (Acquired 12/19/2012 through 12/20/2012, Cost $2,514,991) * | 2,500,000 | ||||||
| Donnelley (R.R.) & Sons Co.: | |||||||
| 1,250,000 | 8.600%, 08/15/2016 | 1,343,750 | |||||
| 1,200,000 | 6.125%, 01/15/2017 @ | 1,161,000 | |||||
| 1,000,000 | D.R. Horton, Inc., | ||||||
| 4.750%, 05/15/2017 | 1,062,500 | ||||||
| Eaton Corp: | |||||||
| 2,500,000 | 2.750%, 11/02/2022 (Acquired 11/14/2012, Cost $2,491,600) * | 2,492,285 | |||||
| 3,000,000 | 4.000%, 11/02/2032 (Acquired 11/14/2012, Cost $2,990,640) * | 3,085,533 | |||||
| 5,200,000 | Ecolab Inc., | ||||||
| 1.450%, 12/08/2017 | 5,176,376 | ||||||
| 500,000 | Encana Corporation, | ||||||
| 6.500%, 05/15/2019 f @ | 617,156 | ||||||
| 4,600,000 | Express Scripts Holding Co, | ||||||
| 7.250%, 06/15/2019 | 5,895,300 | ||||||
| 198,369 | Federal Express Corp. 1995 Pass Through Trust, | ||||||
| Series B2, 7.110%, 01/02/2014 | 205,312 | ||||||
| 500,000 | First Data Corporation, | ||||||
| 9.875%, 09/24/2015 @ | 510,000 | ||||||
| Fiserv, Inc.: | |||||||
| 2,475,000 | 3.125%, 06/15/2016 | 2,599,918 | |||||
| 3,000,000 | 4.625%, 10/01/2020 | 3,270,420 | |||||
| 5,900,000 | 3.500%, 10/01/2022 | 6,007,008 | |||||
| Ford Motor Credit Company LLC: | |||||||
| 2,000,000 | 3.875%, 01/15/2015 | 2,085,686 | |||||
| 2,000,000 | 2.500%, 01/15/2016 | 2,024,646 | |||||
| 2,680,000 | 4.207%, 04/15/2016 | 2,858,531 | |||||
| 3,000,000 | 3.000%, 06/12/2017 @ | 3,082,275 | |||||
| 1,050,000 | France Telecom SA, | ||||||
| 2.750%, 09/14/2016 f | 1,102,208 | ||||||
| 5,000,000 | Freeport-McMoRan Copper & Gold Inc., | ||||||
| 3.550%, 03/01/2022 @ | 4,958,880 | ||||||
| 1,000,000 | Georgia-Pacific LLC, | ||||||
| 5.400%, 11/01/2020 (Acquired 10/27/2010, Cost $994,130) * | 1,189,634 | ||||||
| 7,115,000 | Glencore Funding LLC, | ||||||
| 6.000%, 04/15/2014 (Acquired 03/31/2004 through 06/19/2012, Cost $7,289,184) * | 7,514,543 | ||||||
| 975,000 | GTE Corporation, | ||||||
| 8.750%, 11/01/2021 | 1,370,211 | ||||||
| 2,200,000 | Hanson Australia Funding, | ||||||
| 5.250%, 03/15/2013 f | 2,224,200 | ||||||
| 2,375,000 | Hanson PLC Notes, | ||||||
| 6.125%, 08/15/2016 f | 2,606,562 | ||||||
| 4,100,000 | Health Management Association, | ||||||
| 6.125%, 04/15/2016 | 4,428,000 | ||||||
| 4,000,000 | Hewlett-Packard Co., | ||||||
| 4.650%, 12/09/2021 @ | 4,015,560 | ||||||
| 425,000 | Highmark Inc. Notes, | ||||||
| 6.800%, 08/15/2013 (Acquired 10/28/2010 through 11/24/2010, Cost $436,428) * | 436,441 | ||||||
| 3,158,000 | HP Enterprise Services, LLC, | ||||||
| Series B, 6.000%, 08/01/2013 | 3,237,528 | ||||||
| Hutchison Whampoa International Ltd.: f | |||||||
| 1,800,000 | 6.500%, 02/13/2013 (Acquired 09/25/2012, Cost $1,811,683) * | 1,810,935 | |||||
| 3,563,000 | 4.625%, 09/11/2015 (Acquired 08/19/2010 through 12/28/2011, Cost $3,693,824) * | 3,850,285 | |||||
| 2,000,000 | Hyundai Capital Services Inc., | ||||||
| 3.500%, 09/13/2017 (Acquired 03/06/2012, Cost $1,992,580) * f @ | 2,112,020 | ||||||
| 5,650,000 | Ingredion Incorporated, | ||||||
| 1.800%, 09/25/2017 | 5,612,846 | ||||||
| 1,114,000 | International Paper Company, | ||||||
| 7.400%, 06/15/2014 @ | 1,206,549 | ||||||
| 1,150,000 | Johnson Controls Inc., | ||||||
| 5.250%, 12/01/2041 | 1,300,710 | ||||||
| 5,100,000 | Kinross Gold Corporation, | ||||||
| 6.875%, 09/01/2041 f | 5,190,153 | ||||||
| 1,000,000 | Kraft Foods Group Inc, | ||||||
| 5.000%, 06/04/2042 (Acquired 05/30/2012, Cost $992,930) * | 1,124,499 | ||||||
| Lafarge SA: f | |||||||
| 1,375,000 | 6.500%, 07/15/2016 | 1,536,563 | |||||
| 875,000 | 7.125%, 07/15/2036 | 890,312 | |||||
| 5,000,000 | LeasePlan Corporation N.V., | ||||||
| 3.000%, 10/23/2017 (Acquired 10/15/2012, Cost $4,996,750) * f | 5,046,750 | ||||||
| Martin Marietta Materials, Inc.: | |||||||
| 475,000 | 6.600%, 04/15/2018 | 525,868 | |||||
| 450,000 | 6.250%, 05/01/2037 | 448,335 | |||||
| Masco Corporation: | |||||||
| 2,150,000 | 6.125%, 10/03/2016 | 2,374,765 | |||||
| 1,000,000 | 7.125%, 03/15/2020 @ | 1,163,431 | |||||
| 9,000,000 | Murphy Oil Corporation, | ||||||
| 3.700%, 12/01/2022 @ | 8,965,746 | ||||||
| Nabors Industries, Inc.: | |||||||
| 250,000 | 6.150%, 02/15/2018 | 294,010 | |||||
| 10,123,000 | 9.250%, 01/15/2019 | 13,383,102 | |||||
| 2,655,000 | National Oilwell Varco Inc., | ||||||
| Series B, 6.125%, 08/15/2015 | 2,681,420 | ||||||
| 2,675,000 | New Cingular Wireless Services, Inc., | ||||||
| 8.750%, 03/01/2031 | 4,340,286 | ||||||
| 250,000 | Northern Tier Energy LLC, | ||||||
| 7.125%, 11/15/2020 (Acquired 11/02/2012, Cost $250,000) * | 258,750 | ||||||
| 3,000,000 | Oi S.A., | ||||||
| 5.750%, 02/10/2022 (Acquired 02/06/2012, Cost $3,000,000) * f @ | 3,127,500 | ||||||
| 50,000 | Pactiv Corporation, | ||||||
| 7.950%, 12/15/2025 | 41,000 | ||||||
| 200,000 | PCCW-HKT Capital II Ltd., | ||||||
| 6.000%, 07/15/2013 (Acquired 07/10/2003, Cost $199,066) * f | 204,598 | ||||||
| 775,000 | PCCW-HKT Capital III Ltd., | ||||||
| 5.250%, 07/20/2015 (Acquired 09/29/2008 through 12/20/2010, Cost $783,752) * f | 841,249 | ||||||
| 8,700,000 | Pearson Funding Two plc, | ||||||
| 4.000%, 05/17/2016 (Acquired 07/17/2012, Cost $9,322,872) * f | 9,354,153 | ||||||
| 5,000,000 | Pentair Finance SA, | ||||||
| 2.650%, 12/01/2019 (Acquired 11/19/2012, Cost $4,988,250) * f | 4,947,805 | ||||||
| Petrohawk Energy Corporation: | |||||||
| 3,000,000 | 7.875%, 06/01/2015 | 3,132,405 | |||||
| 8,510,000 | 7.250%, 08/15/2018 | 9,607,339 | |||||
| 3,000,000 | Phillips 66, | ||||||
| 2.950%, 05/01/2017 (Acquired 03/07/2012, Cost $2,999,460) * | 3,179,511 | ||||||
| Plum Creek Timberlands, L.P.: | |||||||
| 1,200,000 | 5.875%, 11/15/2015 | 1,332,048 | |||||
| 1,200,000 | 4.700%, 03/15/2021 | 1,333,808 | |||||
| 8,375,000 | 3.250%, 03/15/2023 | 8,234,920 | |||||
| POSCO: f | |||||||
| 3,725,000 | 8.750%, 03/26/2014 (Acquired 09/23/2011 through 01/11/2012, Cost $3,975,049) * | 4,049,984 | |||||
| 2,175,000 | 4.250%, 10/28/2020 (Acquired 10/21/2010, Cost $2,165,365) * | 2,318,463 | |||||
| 5,000,000 | PTT Public Company Limited, | ||||||
| 3.375%, 10/25/2022 (Acquired 10/19/2012, Cost $4,958,500) * f @ | 4,970,490 | ||||||
| 2,000,000 | Reliance Holdings USA Inc., | ||||||
| 4.500%, 10/19/2020 (Acquired 10/14/2010 through 10/18/2010, Cost $1,988,700) * | 2,094,132 | ||||||
| 4,000,000 | Republic Services, Inc., | ||||||
| 3.550%, 06/01/2022 | 4,170,464 | ||||||
| Rio Tinto Finance (USA) Ltd.: f | |||||||
| 4,825,000 | 6.500%, 07/15/2018 | 6,022,189 | |||||
| 6,175,000 | 9.000%, 05/01/2019 | 8,481,535 | |||||
| 5,000,000 | Schneider Electric SA, | ||||||
| 2.950%, 09/27/2022 (Acquired 09/20/2012, Cost $4,986,700) * f | 5,039,500 | ||||||
| 2,250,000 | Sealed Air Corp., | ||||||
| 8.375%, 09/15/2021 (Acquired 09/16/2011 through 09/19/2011, Cost $2,288,674) * @ | 2,570,625 | ||||||
| 610,000 | SK Telecom, | ||||||
| 6.625%, 07/20/2027 (Acquired 07/13/2007 through 04/08/2009, Cost $546,593) * f | 786,900 | ||||||
| 1,000,000 | Sonoco Products Co., | ||||||
| 4.375%, 11/01/2021 | 1,072,317 | ||||||
| Sprint Capital Corporation: | |||||||
| 675,000 | 6.900%, 05/01/2019 | 735,750 | |||||
| 300,000 | 8.750%, 03/15/2032 @ | 366,750 | |||||
| 200,000 | Sprint Nextel Corporation, | ||||||
| 6.000%, 12/01/2016 | 217,500 | ||||||
| 10,325,000 | Staples, Inc., | ||||||
| 9.750%, 01/15/2014 | 11,225,299 | ||||||
| 1,031,000 | SunGard Data Systems Inc., | ||||||
| 4.875%, 01/15/2014 | 1,063,219 | ||||||
| 701,000 | Sunoco, Inc. Senior Unsecured Notes, | ||||||
| 5.750%, 01/15/2017 | 790,297 | ||||||
| 1,000,000 | Sunoco Logistics Partners Operations LP, | ||||||
| 6.100%, 02/15/2042 | 1,150,091 | ||||||
| 2,635,000 | TCI Communications, Inc., | ||||||
| 8.750%, 08/01/2015 | 3,144,332 | ||||||
| Telecom Italia Capital, SA: f | |||||||
| 340,000 | 4.950%, 09/30/2014 | 354,960 | |||||
| 4,100,000 | 5.250%, 10/01/2015 | 4,362,400 | |||||
| 2,375,000 | 7.200%, 07/18/2036 | 2,479,500 | |||||
| Telefonica Emisiones S.A.U.: f | |||||||
| 3,950,000 | 6.421%, 06/20/2016 | 4,370,675 | |||||
| 4,942,000 | 6.221%, 07/03/2017 | 5,497,975 | |||||
| 1,000,000 | 5.462%, 02/16/2021 @ | 1,066,250 | |||||
| 100,000 | 7.045%, 06/20/2036 | 108,000 | |||||
| The ADT Corp, | |||||||
| 2,810,000 | 2.250%, 07/15/2017 (Acquired 12/27/2012, Cost $2,772,796) * | 2,787,683 | |||||
| 1,200,000 | 3.500%, 07/15/2022 (Acquired 06/27/2012, Cost $1,197,168) * | 1,167,110 | |||||
| 835,000 | The Dow Chemical Co., | ||||||
| 4.125%, 11/15/2021 @ | 914,763 | ||||||
| 10,250,000 | The Interpublic Group of Companies, Inc., | ||||||
| 10.000%, 07/15/2017 | 11,198,125 | ||||||
| Time Warner, Inc.: | |||||||
| 2,300,000 | 7.250%, 10/15/2017 | 2,888,057 | |||||
| 1,132,000 | 8.750%, 02/14/2019 | 1,527,249 | |||||
| 2,875,000 | 7.625%, 04/15/2031 | 3,957,961 | |||||
| 358,000 | 7.700%, 05/01/2032 | 500,547 | |||||
| 2,000,000 | Toyota Motor Credit Corporation, | ||||||
| 2.050%, 01/12/2017 | 2,068,518 | ||||||
| Transocean Inc.: f | |||||||
| 5,500,000 | 6.375%, 12/15/2021 | 6,684,194 | |||||
| 878,000 | 6.800%, 03/15/2038 | 1,074,820 | |||||
| 500,000 | Tyco Electronics Group S.A., | ||||||
| 7.125%, 10/01/2037 f | 658,980 | ||||||
| United AirLines, Inc. Pass-Through Certificates: | |||||||
| 108,084 | Series 91A2, 10.020%, 03/22/2014 | 58,906 | |||||
| 155,852 | Series 002C, 7.762%, 04/29/2049 § † * * | 4,675 | |||||
| 467,365 | U.S. Airways Pass-Through Trust, | ||||||
| Series 981B, 7.350%, 01/30/2018 | 472,038 | ||||||
| 322,000 | USX Corporation, | ||||||
| 9.125%, 01/15/2013 | 322,800 | ||||||
| Vale Overseas Limited: f | |||||||
| 3,850,000 | 6.250%, 01/23/2017 | 4,429,779 | |||||
| 2,700,000 | 4.375%, 01/11/2022 | 2,882,269 | |||||
| 300,000 | 8.250%, 01/17/2034 | 410,281 | |||||
| 250,000 | 6.875%, 11/21/2036 | 309,895 | |||||
| 5,625,000 | 6.875%, 11/10/2039 | 7,052,653 | |||||
| 2,150,000 | Verizon Wireless Capital LLC, | ||||||
| 7.375%, 11/15/2013 | 2,272,479 | ||||||
| 500,000 | Vodafone Group PLC, | ||||||
| 6.150%, 02/27/2037 f | 661,338 | ||||||
| Vulcan Materials Co.: | |||||||
| 200,000 | 6.400%, 11/30/2017 | 218,500 | |||||
| 1,000,000 | 7.000%, 06/15/2018 | 1,105,000 | |||||
| 500,000 | 7.150%, 11/30/2037 | 492,500 | |||||
| 10,000,000 | Walgreen Co., | ||||||
| 5.250%, 01/15/2019 @ | 11,729,180 | ||||||
| 1,250,000 | Weatherford International Ltd., | ||||||
| 6.750%, 09/15/2040 f | 1,417,485 | ||||||
| Westvaco Corporation: | |||||||
| 505,000 | 9.750%, 06/15/2020 | 700,501 | |||||
| 140,000 | 8.200%, 01/15/2030 | 184,721 | |||||
| 1,000,000 | Weyerhaeuser Company, | ||||||
| 7.250%, 07/01/2013 | 1,029,173 | ||||||
| Woodside Finance Ltd., f | |||||||
| 400,000 | 5.000%, 11/15/2013 (Acquired 11/26/2010, Cost $408,938) * | 413,240 | |||||
| 1,000,000 | 8.125%, 03/01/2014 (Acquired 02/24/2009, Cost $999,690) * | 1,078,965 | |||||
| 4,000,000 | WPX Energy, Inc., | ||||||
| 6.000%, 01/15/2022 @ | 4,310,000 | ||||||
| Xerox Corporation: | |||||||
| 4,140,000 | 1.710%, 09/13/2013 | 4,167,146 | |||||
| 6,587,000 | 8.250%, 05/15/2014 | 7,185,007 | |||||
| 2,000,000 | Xstrata Canada Corp., | ||||||
| 5.375%, 06/01/2015 f | 2,173,824 | ||||||
| Xstrata Canada Financial Corp., f | |||||||
| 2,000,000 | 4.950%, 11/15/2021 (Acquired 11/03/2011, Cost $1,997,480) * | 2,148,130 | |||||
| 2,000,000 | 4.000%, 10/25/2022 (Acquired 10/18/2012, Cost $1,994,940) * | 2,021,620 | |||||
| 1,025,000 | Yara International ASA, | ||||||
| 7.875%, 06/11/2019 (Acquired 12/03/2012, Cost $1,327,786) * f | 1,316,543 | ||||||
| 467,945,225 | |||||||
| Utility - 6.3% | |||||||
| 500,000 | Allegheny Energy Supply Co. Senior Unsecured Notes, | ||||||
| 5.750%, 10/15/2019 (Acquired 09/22/2009, Cost $498,175) * | 548,514 | ||||||
| 1,816,000 | Ameren Corporation, | ||||||
| 8.875%, 05/15/2014 | 1,987,285 | ||||||
| 1,025,000 | Appalachian Power Company Senior Unsecured Notes, | ||||||
| Series P, 6.700%, 08/15/2037 | 1,344,857 | ||||||
| 1,150,000 | Arizona Public Service Senior Unsecured Notes, | ||||||
| 8.750%, 03/01/2019 | 1,515,877 | ||||||
| Centrais Eletricas Brasileiras SA,: f | |||||||
| 3,000,000 | 6.875%, 07/30/2019 (Acquired 12/06/2012, Cost $3,507,710) * | 3,412,500 | |||||
| 4,000,000 | 5.750%, 10/27/2021 (Acquired 10/20/2011, Cost $4,000,000) * @ | 4,300,000 | |||||
| 300,000 | Chesapeake Midstream Partners LP / CHKM Finance Corp, | ||||||
| 6.125%, 07/15/2022 | 323,250 | ||||||
| CMS Energy Corporation: | |||||||
| 3,000,000 | 4.250%, 09/30/2015 | 3,183,177 | |||||
| 1,000,000 | 5.050%, 03/15/2022 | 1,114,466 | |||||
| 5,200,000 | Comision Federal de Electricidad, | ||||||
| 5.750%, 02/14/2042 (Acquired 02/08/2012, Cost $5,116,800) * f | 5,889,000 | ||||||
| 750,000 | Constellation Energy Group Inc., | ||||||
| 4.550%, 06/15/2015 | 809,512 | ||||||
| DCP Midstream, LLC: | |||||||
| 9,155,000 | 9.750%, 03/15/2019 (Acquired 02/29/2012 through 12/12/2012, Cost $11,772,198) * | 12,110,463 | |||||
| 2,245,000 | 4.750%, 09/30/2021 (Acquired 09/14/2011 through 11/18/2011, Cost $2,252,074) * | 2,385,764 | |||||
| 1,880,000 | Dominion Resources, Inc., | ||||||
| Series B, 5.950%, 06/15/2035 | 2,379,441 | ||||||
| 2,500,000 | El Paso Pipeline Partners Operating Co LLC, | ||||||
| 7.500%, 11/15/2040 | 3,422,737 | ||||||
| 500,000 | Enel Finance International, | ||||||
| 6.800%, 09/15/2037 (Acquired 09/13/2007 through 09/29/2008, Cost $498,897) * f | 522,250 | ||||||
| Energy Transfer Partners:, | |||||||
| 125,000 | 6.125%, 02/15/2017 | 144,654 | |||||
| 1,189,000 | 9.700%, 03/15/2019 | 1,601,608 | |||||
| 1,000,000 | 5.200%, 02/01/2022 | 1,140,712 | |||||
| 3,000,000 | Enogex LLC, | ||||||
| 6.250%, 03/15/2020 (Acquired 10/25/2012 through 11/21/2012, Cost $3,465,511) * | 3,429,342 | ||||||
| 223,000 | Entergy Arkansas, Inc., | ||||||
| 5.000%, 07/01/2018 | 222,678 | ||||||
| 500,000 | Exelon Corporation, | ||||||
| 4.900%, 06/15/2015 | 544,264 | ||||||
| Exelon Generation Company, LLC: | |||||||
| 4,350,000 | 6.200%, 10/01/2017 | 5,136,980 | |||||
| 6,100,000 | 5.600%, 06/15/2042 (Acquired 06/13/2012 through 09/25/2012, Cost $6,109,400) * | 6,538,761 | |||||
| 3,000,000 | Florida Gas Transmission Company, LLC, | ||||||
| 3.875%, 07/15/2022 (Acquired 06/12/2012, Cost $2,996,190) * @ | 3,162,564 | ||||||
| 2,500,000 | FPL Group Capital, Inc., | ||||||
| Series D, 7.300%, 09/01/2067 @ | 2,778,125 | ||||||
| 248,284 | GG1C Funding Corporation, | ||||||
| 5.129%, 01/15/2014 (Acquired 11/21/2008, Cost $245,624) * | 251,549 | ||||||
| 3,000,000 | Gulf South Pipeline Company, L.P., | ||||||
| 4.000%, 06/15/2022 (Acquired 06/07/2012, Cost $2,989,230) * | 3,166,485 | ||||||
| 1,000,000 | IPALCO Enterprises Inc., | ||||||
| 5.000%, 05/01/2018 | 1,047,500 | ||||||
| 1,875,000 | KeySpan Corp., | ||||||
| 8.000%, 11/15/2030 | 2,568,696 | ||||||
| Kinder Morgan Energy Partners, L.P.: | |||||||
| 1,658,000 | 9.000%, 02/01/2019 | 2,234,733 | |||||
| 400,000 | 6.500%, 02/01/2037 | 488,319 | |||||
| 350,000 | 6.950%, 01/15/2038 | 460,553 | |||||
| Kinder Morgan Finance: | |||||||
| 1,685,000 | 5.700%, 01/05/2016 f | 1,841,926 | |||||
| 1,000,000 | 6.000%, 01/15/2018 (Acquired 12/06/2010, Cost $999,930) * @ | 1,099,143 | |||||
| 12,790 | Kiowa Power Partners LLC, | ||||||
| 4.811%, 12/30/2013 (Acquired 11/19/2004, Cost $12,790) * | 12,878 | ||||||
| 2,800,000 | Mega Advance Investments Ltd, | ||||||
| 5.000%, 05/12/2021 (Acquired 05/09/2011 through 05/23/2012, Cost $2,819,333) * f @ | 3,145,990 | ||||||
| 4,790,000 | National Grid PLC, | ||||||
| 6.300%, 08/01/2016 f | 5,557,770 | ||||||
| 6,498,000 | National Rural Utilities Corporation, | ||||||
| 10.375%, 11/01/2018 | 9,605,454 | ||||||
| 2,233,000 | Nisource Finance Corp., | ||||||
| 5.400%, 07/15/2014 | 2,379,612 | ||||||
| NuStar Logistics L.P.:, | |||||||
| 7,500,000 | 6.050%, 03/15/2013 | 7,548,930 | |||||
| 4,275,000 | 4.800%, 09/01/2020 | 4,129,539 | |||||
| ONEOK, Inc.:, | |||||||
| 5,650,000 | 4.250%, 02/01/2022 | 6,139,121 | |||||
| 3,000,000 | 3.375%, 10/01/2022 | 3,057,135 | |||||
| PPL Energy Supply, LLC: | |||||||
| 1,500,000 | Series A, 5.700%, 10/15/2015 | 1,655,875 | |||||
| 1,950,000 | 6.200%, 05/15/2016 @ | 2,231,352 | |||||
| 3,077,000 | PSE&G Power LLC, | ||||||
| 5.320%, 09/15/2016 @ | 3,478,739 | ||||||
| 3,910,000 | Public Service Company of New Mexico, | ||||||
| 7.950%, 05/15/2018 | 4,750,943 | ||||||
| 206,191 | RGS (I&M) Funding Corporation Debentures, | ||||||
| Series F, 9.820%, 12/07/2022 | 248,885 | ||||||
| Rockies Express Pipeline LLC: | |||||||
| 850,000 | 3.900%, 04/15/2015 (Acquired 09/15/2011, Cost $859,325) * | 845,750 | |||||
| 2,000,000 | 6.850%, 07/15/2018 (Acquired 12/21/2011, Cost $2,035,460) * @ | 2,090,000 | |||||
| 2,695,000 | 5.625%, 04/15/2020 (Acquired 12/10/2010 through 12/29/2011, Cost $2,702,007) * @ | 2,647,837 | |||||
| 300,000 | Southern Natural Gas, | ||||||
| 5.900%, 04/01/2017 (Acquired 03/14/2007, Cost $299,502) * | 352,507 | ||||||
| 5,030,000 | Spectra Energy Capital LLC, | ||||||
| 5.668%, 08/15/2014 | 5,397,024 | ||||||
| The Williams Companies, Inc.: | |||||||
| 1,034,000 | 7.875%, 09/01/2021 | 1,332,153 | |||||
| 3,000,000 | 3.700%, 01/15/2023 @ | 3,025,962 | |||||
| 2,850,000 | Trans-Allegheny Interstate Line Company, | ||||||
| 4.000%, 01/15/2015 (Acquired 08/03/2012, Cost $2,983,283) * | 2,993,851 | ||||||
| 2,600,000 | Transcontinental Gas Pipe Line Company, LLC, | ||||||
| 4.450%, 08/01/2042 | 2,676,318 | ||||||
| 1,489,000 | Veolia Environnement SA, | ||||||
| 6.000%, 06/01/2018 f | 1,745,759 | ||||||
| Williams Partners L.P.: | |||||||
| 2,000,000 | 7.250%, 02/01/2017 | 2,429,658 | |||||
| 500,000 | 6.300%, 04/15/2040 | 611,267 | |||||
| 163,197,994 | |||||||
| Finance - 23.1% | |||||||
| 1,045,000 | Abbey National Treasury Services PLC, | ||||||
| 3.875%, 11/10/2014 (Acquired 02/25/2010 through 12/29/2011, Cost $1,030,571) * | 1,084,300 | ||||||
| 5,000,000 | ABN AMRO Bank N.V., | ||||||
| 4.250%, 02/02/2017 (Acquired 01/30/2012, Cost $4,995,100) * f @ | 5,453,575 | ||||||
| 2,000,000 | AIG SunAmerica Global Financing X, | ||||||
| 6.900%, 03/15/2032 (Acquired 11/10/2011, Cost $2,134,904) * | 2,651,568 | ||||||
| 175,000 | Allstate Corporation, | ||||||
| 5.350%, 06/01/2033 | 207,088 | ||||||
| Ally Financial Inc.: | |||||||
| 250,000 | 6.750%, 12/01/2014 | 269,932 | |||||
| 1,065,000 | 8.300%, 02/12/2015 | 1,186,144 | |||||
| 2,000,000 | 0.000%, 06/15/2015 ^ | 1,810,400 | |||||
| 5,000,000 | 4.625%, 06/26/2015 | 5,212,380 | |||||
| 3,000,000 | 5.500%, 02/15/2017 | 3,209,289 | |||||
| American General Finance Corporation: | |||||||
| 325,000 | 5.850%, 06/01/2013 @ | 330,281 | |||||
| 1,000,000 | 6.900%, 12/15/2017 | 895,000 | |||||
| American International Group, Inc.: | |||||||
| 2,500,000 | 3.800%, 03/22/2017 @ | 2,705,835 | |||||
| 3,400,000 | 4.875%, 06/01/2022 | 3,881,511 | |||||
| 225,000 | AmSouth Bancorp, | ||||||
| 6.750%, 11/01/2025 | 224,208 | ||||||
| ANZ National (Int'l) LTD: f | |||||||
| 620,000 | 6.200%, 07/19/2013 (Acquired 01/31/2012, Cost $634,245) * | 636,096 | |||||
| 2,000,000 | 1.850%, 10/15/2015 (Acquired 07/26/2012, Cost $1,998,580) * | 2,037,840 | |||||
| 2,500,000 | AON Corporation, | ||||||
| 3.500%, 09/30/2015 | 2,633,013 | ||||||
| 975,000 | Arden Realty Limited Partnership, | ||||||
| 5.250%, 03/01/2015 | 1,049,176 | ||||||
| 2,464,000 | ASIF Global Financing XIX, | ||||||
| 4.900%, 01/17/2013 (Acquired 09/28/2011 through 12/06/2011, Cost $2,466,332) * | 2,467,479 | ||||||
| 6,546,000 | Associates Corporation of North America, | ||||||
| 6.950%, 11/01/2018 | 7,885,312 | ||||||
| 4,300,000 | Australia and New Zealand Banking Group Limited, | ||||||
| 3.250%, 03/01/2016 (Acquired 02/22/2011 through 12/11/2012, Cost $4,435,132) * f | 4,574,516 | ||||||
| 1,000,000 | Banco Santander (Brasil) S.A., | ||||||
| 4.625%, 02/13/2017 (Acquired 02/06/2012, Cost $994,140) * f @ | 1,057,500 | ||||||
| 6,000,000 | Bank of America Corporation, | ||||||
| 7.625%, 06/01/2019 | 7,677,426 | ||||||
| 2,675,000 | Bank of America Corporation Subordinated Notes, | ||||||
| 10.200%, 07/15/2015 | 3,166,571 | ||||||
| 2,060,000 | Banponce Trust I,, | ||||||
| Series A, 8.327%, 02/01/2027 | 1,601,650 | ||||||
| 9,850,000 | Barclays Bank PLC, | ||||||
| 6.750%, 05/22/2019 f | 12,029,165 | ||||||
| 3,500,000 | Berkshire Hathaway Finance Corporation, | ||||||
| 4.400%, 05/15/2042 | 3,620,946 | ||||||
| 3,000,000 | BNP Paribas SA, | ||||||
| 2.375%, 09/14/2017 f | 3,043,041 | ||||||
| Capital One Financial Corporation: | |||||||
| 2,500,000 | 7.375%, 05/23/2014 | 2,719,570 | |||||
| 1,015,000 | 3.150%, 07/15/2016 | 1,077,611 | |||||
| 4,425,000 | 6.150%, 09/01/2016 | 5,062,289 | |||||
| CIT Group, Inc.: | |||||||
| 1,000,000 | 4.250%, 08/15/2017 | 1,029,742 | |||||
| 500,000 | 5.500%, 02/15/2019 (Acquired 02/02/2012, Cost $500,000) * @ | 545,000 | |||||
| Citigroup, Inc.: | |||||||
| 1,954,000 | 6.010%, 01/15/2015 | 2,135,165 | |||||
| 1,800,000 | 4.450%, 01/10/2017 @ | 1,994,040 | |||||
| CNA Financial Corporation: | |||||||
| 1,000,000 | 6.500%, 08/15/2016 | 1,153,725 | |||||
| 1,175,000 | 7.350%, 11/15/2019 | 1,473,734 | |||||
| 3,625,000 | 5.875%, 08/15/2020 @ | 4,276,793 | |||||
| Comerica Bank: | |||||||
| 3,200,000 | 5.750%, 11/21/2016 | 3,702,467 | |||||
| 2,855,000 | 5.200%, 08/22/2017 | 3,306,067 | |||||
| 5,900,000 | Commonwealth Bank of Australia, | ||||||
| 5.000%, 10/15/2019 (Acquired 03/02/2012 through 08/16/2012, Cost $6,385,351) * f | 6,856,396 | ||||||
| Cooperatieve Centrale Raiffeisen-Boerenleenbank BA:, f | |||||||
| 2,000,000 | 3.375%, 01/19/2017 @ | 2,148,572 | |||||
| 4,150,000 | 3.875%, 02/08/2022 | 4,465,915 | |||||
| 2,100,000 | Countrywide Financial Corporation, | ||||||
| 6.250%, 05/15/2016 | 2,305,185 | ||||||
| 5,000,000 | Credit Mutuel-CIC Home Loan SFH, | ||||||
| 1.500%, 11/16/2017 (Acquired 11/08/2012, Cost $4,981,300) * f | 4,954,290 | ||||||
| 6,966,000 | Credit Suisse New York, | ||||||
| 5.300%, 08/13/2019 f | 8,266,085 | ||||||
| 3,000,000 | Credit Suisse (USA), Inc., | ||||||
| 5.125%, 08/15/2015 | 3,329,424 | ||||||
| 3,842,000 | Deutsche Bank Aktiengesellschaft, | ||||||
| 3.450%, 03/30/2015 f | 4,050,805 | ||||||
| 9,850,000 | Dresdner Bank AG, | ||||||
| 7.250%, 09/15/2015 f | 10,593,074 | ||||||
| 500,000 | First Empire Capital Trust I, | ||||||
| 8.234%, 02/01/2027 | 503,176 | ||||||
| 2,300,000 | First Empire Capital Trust II, | ||||||
| 8.277%, 06/01/2027 | 2,346,000 | ||||||
| 2,420,000 | First Horizon National Corporation, | ||||||
| 5.375%, 12/15/2015 | 2,645,459 | ||||||
| 311,551 | First National Bank of Chicago Pass-Through Certificates, | ||||||
| Series 93-A, 8.080%, 01/05/2018 | 342,775 | ||||||
| 1,448,000 | FMR LLC, | ||||||
| 4.750%, 03/01/2013 (Acquired 11/28/2011 through 09/14/2012, Cost $1,454,577) * | 1,457,796 | ||||||
| General Electric Capital Corporation: | |||||||
| 4,150,000 | 5.625%, 05/01/2018 | 4,928,266 | |||||
| 1,875,000 | 5.500%, 01/08/2020 | 2,219,458 | |||||
| 2,925,000 | 4.375%, 09/16/2020 @ | 3,264,435 | |||||
| 3,000,000 | 5.300%, 02/11/2021 @ | 3,482,346 | |||||
| 8,450,000 | 4.650%, 10/17/2021 | 9,641,754 | |||||
| 1,000,000 | Genworth Financial, Inc., | ||||||
| 7.625%, 09/24/2021 @ | 1,103,569 | ||||||
| 3,300,000 | Genworth Life Institutional Funding Trust, | ||||||
| 5.875%, 05/03/2013 (Acquired 08/24/2011 through 01/12/2012, Cost $3,299,232) * | 3,350,226 | ||||||
| GMAC Inc.: | |||||||
| 1,305,000 | 7.500%, 12/31/2013 | 1,378,406 | |||||
| 984,000 | 8.000%, 12/31/2018 | 1,151,280 | |||||
| 125,000 | Goldman Sachs Capital I, | ||||||
| 6.345%, 02/15/2034 @ | 129,748 | ||||||
| 2,055,000 | Goldman Sachs Group LP, | ||||||
| 8.000%, 03/01/2013 (Acquired 05/19/2006 through 10/03/2012, Cost $2,069,371) * | 2,075,782 | ||||||
| HSBC Bank USA NA: | |||||||
| 3,000,000 | 4.625%, 04/01/2014 | 3,134,079 | |||||
| 2,720,000 | 6.000%, 08/09/2017 | 3,178,078 | |||||
| 1,120,000 | HSBC Finance Corporation, | ||||||
| 5.500%, 01/19/2016 @ | 1,251,550 | ||||||
| 800,000 | Humana Inc., | ||||||
| 7.200%, 06/15/2018 | 986,500 | ||||||
| Hutchison Whampoa International Ltd.:, f | |||||||
| 2,000,000 | 3.500%, 01/13/2017 (Acquired 01/10/2012, Cost $1,990,380) * | 2,122,230 | |||||
| 3,600,000 | 3.250%, 11/08/2022 (Acquired 11/05/2012, Cost $3,581,424) * @ | 3,616,214 | |||||
| ING Bank N.V.: f | |||||||
| 1,600,000 | 4.000%, 03/15/2016 (Acquired 03/08/2011 through 09/20/2011, Cost $1,600,861) * | 1,702,752 | |||||
| 4,800,000 | 3.750%, 03/07/2017 (Acquired 02/29/2012, Cost $4,775,328) * | 5,101,296 | |||||
| 2,500,000 | 5.000%, 06/09/2021 (Acquired 10/12/2011, Cost $2,468,800) * @ | 2,816,323 | |||||
| 3,000,000 | ING U.S., Inc., | ||||||
| 5.500%, 07/15/2022 (Acquired 07/10/2012, Cost $2,998,380) * | 3,255,621 | ||||||
| 5,500,000 | Invesco Finance PLC, | ||||||
| 3.125%, 11/30/2022 f | 5,555,501 | ||||||
| 11,400,000 | Irish Life & Permanent Group Holdings PLC, | ||||||
| 3.600%, 01/14/2013 (Acquired 12/01/2010 through 08/10/2012, Cost $11,375,461) * f | 11,400,080 | ||||||
| Istar Financial, Inc.: | |||||||
| 1,600,000 | Series B, 5.950%, 10/15/2013 | 1,634,000 | |||||
| 500,000 | 5.850%, 03/15/2017 | 490,000 | |||||
| 875,000 | Jefferies Group, Inc., | ||||||
| 6.450%, 06/08/2027 | 931,875 | ||||||
| 1,000,000 | Jefferson-Pilot Corp., | ||||||
| 4.750%, 01/30/2014 | 1,036,484 | ||||||
| 3,940,000 | John Hancock Mutual Life Insurance Company, | ||||||
| 7.375%, 02/15/2024 (Acquired 08/26/2010 through 10/10/2012, Cost $4,691,325) * | 5,003,095 | ||||||
| J.P. Morgan Chase & Co.: | |||||||
| 1,075,000 | 3.450%, 03/01/2016 | 1,141,662 | |||||
| 3,100,000 | 4.250%, 10/15/2020 | 3,447,593 | |||||
| 2,400,000 | 4.350%, 08/15/2021 | 2,683,769 | |||||
| 4,400,000 | 4.500%, 01/24/2022 | 4,977,443 | |||||
| 2,500,000 | Kemper Corporation, | ||||||
| 6.000%, 11/30/2015 | 2,696,378 | ||||||
| Key Bank NA: | |||||||
| 2,500,000 | 5.800%, 07/01/2014 | 2,677,908 | |||||
| 2,600,000 | 7.413%, 05/06/2015 | 2,924,927 | |||||
| 820,000 | 4.950%, 09/15/2015 | 893,402 | |||||
| 1,279,000 | 5.450%, 03/03/2016 | 1,429,758 | |||||
| 2,670,000 | 4.625%, 06/15/2018 | 2,755,427 | |||||
| 3,900,000 | Kookmin Bank, | ||||||
| 7.250%, 05/14/2014 (Acquired 03/10/2010 through 01/18/2012, Cost $4,097,153) * f | 4,209,773 | ||||||
| Liberty Mutual Group Inc.: | |||||||
| 980,000 | 5.750%, 03/15/2014 (Acquired 12/21/2010 through 04/24/2012, Cost $1,003,685) * | 1,026,308 | |||||
| 500,000 | 6.500%, 03/15/2035 (Acquired 09/29/2008 through 03/22/2012, Cost $469,609) * | 546,369 | |||||
| 900,000 | 10.750%, 06/15/2058 (Acquired 05/21/2008 through 05/06/2009, Cost $750,656) * | 1,341,000 | |||||
| 375,000 | Liberty Mutual Insurance Company, | ||||||
| 7.697%, 10/15/2097 (Acquired 03/26/2003, Cost $240,079) * | 383,354 | ||||||
| Lincoln National Corporation: | |||||||
| 7,801,000 | 8.750%, 07/01/2019 | 10,432,246 | |||||
| 825,000 | 6.050%, 04/20/2067 | 821,906 | |||||
| Lloyds TSB Bank PLC: f | |||||||
| 2,000,000 | 4.200%, 03/28/2017 @ | 2,217,280 | |||||
| 6,350,000 | 5.800%, 01/13/2020 (Acquired 01/05/2010 through 01/19/2012, Cost $6,415,169) * | 7,431,297 | |||||
| 2,189,000 | M&I Marshall & Ilsley Bank, | ||||||
| 4.850%, 06/16/2015 | 2,353,891 | ||||||
| 3,000,000 | Macquarie Bank Limited, | ||||||
| 3.450%, 07/27/2015 (Acquired 07/19/2012, Cost $2,996,370) * f | 3,119,676 | ||||||
| Manufacturer and Traders Trust Co.: | |||||||
| 1,120,000 | 6.625%, 12/04/2017 | 1,354,740 | |||||
| 265,000 | 5.585%, 12/28/2020 | 263,484 | |||||
| Manulife Financial Corp.: f | |||||||
| 4,716,000 | 3.400%, 09/17/2015 | 4,958,931 | |||||
| 1,740,000 | 4.900%, 09/17/2020 @ | 1,947,317 | |||||
| Marsh & McLennan Companies, Inc.: | |||||||
| 2,600,000 | 4.850%, 02/15/2013 | 2,612,657 | |||||
| 1,000,000 | 4.800%, 07/15/2021 | 1,125,244 | |||||
| Massachusetts Mutual Life Insurance Company: | |||||||
| 3,184,000 | 7.625%, 11/15/2023 (Acquired 10/10/2012, Cost $4,336,659) * | 4,118,991 | |||||
| 1,000,000 | 8.875%, 06/01/2039 (Acquired 10/03/2012, Cost $1,531,514) * | 1,510,043 | |||||
| 700,000 | MBIA Insurance Corp., | ||||||
| 14.000%, 01/15/2033 (Acquired 01/11/2008, Cost $700,000) * @ | 119,000 | ||||||
| Merrill Lynch & Company: | |||||||
| 800,000 | 6.875%, 04/25/2018 | 964,363 | |||||
| 725,000 | 7.750%, 05/14/2038 | 943,732 | |||||
| 500,000 | Metlife Capital Trust IV, | ||||||
| 7.875%, 12/15/2037 (Acquired 03/26/2012, Cost $550,768) * | 612,500 | ||||||
| MetLife, Inc.: | |||||||
| 300,000 | Series A, 6.817%, 08/15/2018 | 377,932 | |||||
| 1,157,000 | 7.717%, 02/15/2019 | 1,516,837 | |||||
| Metropolitan Life Global Funding I: | |||||||
| 2,340,000 | 2.500%, 09/29/2015 (Acquired 01/19/2012 through 09/25/2012, Cost $2,383,318) * @ | 2,440,985 | |||||
| 2,415,000 | 3.125%, 01/11/2016 (Acquired 09/27/2011 through 06/01/2012, Cost $2,438,096) * @ | 2,559,900 | |||||
| 1,500,000 | 3.875%, 04/11/2022 (Acquired 12/18/2012, Cost $1,630,370) * | 1,631,343 | |||||
| Morgan Stanley: | |||||||
| 2,505,000 | 4.750%, 04/01/2014 @ | 2,593,865 | |||||
| 650,000 | 6.000%, 04/28/2015 | 707,985 | |||||
| 300,000 | 5.375%, 10/15/2015 | 326,154 | |||||
| 2,000,000 | 5.450%, 01/09/2017 | 2,213,162 | |||||
| 1,125,000 | 6.625%, 04/01/2018 | 1,325,897 | |||||
| 3,000,000 | 5.625%, 09/23/2019 | 3,392,940 | |||||
| 3,000,000 | National Australia Bank Ltd, | ||||||
| 3.000%, 07/27/2016 (Acquired 07/20/2011, Cost $2,991,720) * f | 3,176,100 | ||||||
| 6,000,000 | National Australia Bank/New York, | ||||||
| 2.750%, 03/09/2017 f | 6,311,424 | ||||||
| 6,170,000 | National City Bank of Cleveland Subordinated Notes, | ||||||
| 5.800%, 06/07/2017 | 7,280,322 | ||||||
| 100,000 | Nationwide Mutual Insurance Company, | ||||||
| 7.875%, 04/01/2033 (Acquired 10/13/2009, Cost $90,436) * | 120,806 | ||||||
| 3,709,000 | Navigators Group Inc. Senior Unsecured Notes, | ||||||
| 7.000%, 05/01/2016 | 4,034,609 | ||||||
| 3,200,000 | New England Mutual Life Insurance Company, | ||||||
| 7.875%, 02/15/2024 (Acquired 11/07/2012, Cost $4,381,797) * | 4,392,182 | ||||||
| 2,000,000 | Nippon Life Insurance Company, | ||||||
| 5.000%, 10/18/2042 (Acquired 10/11/2012, Cost $2,000,000) * f | 2,112,566 | ||||||
| 525,000 | Nomura Holdings Inc., | ||||||
| 6.700%, 03/04/2020 f | 612,703 | ||||||
| Nordea Bank AB: f | |||||||
| 130,000 | 3.700%, 11/13/2014 (Acquired 07/16/2012, Cost $134,467) * | 136,468 | |||||
| 8,000,000 | 3.125%, 03/20/2017 (Acquired 03/14/2012 through 05/09/2012, Cost $8,044,878) * @ | 8,518,800 | |||||
| Principal Financial Group, Inc.: | |||||||
| 1,000,000 | 3.300%, 09/15/2022 | 1,014,429 | |||||
| 3,550,000 | 3.125%, 05/15/2023 | 3,524,724 | |||||
| Prudential Financial Inc.: | |||||||
| 2,797,000 | 6.200%, 01/15/2015 | 3,088,954 | |||||
| 2,000,000 | 6.000%, 12/01/2017 | 2,399,764 | |||||
| 5,776,000 | Prudential Holdings LLC, | ||||||
| 8.695%, 12/18/2023 (Acquired 11/29/2011 through 12/07/2012, Cost $7,275,508) * | 7,565,399 | ||||||
| 9,575,000 | Regions Bank, | ||||||
| 7.500%, 05/15/2018 | 11,549,844 | ||||||
| 1,400,000 | Regions Financing Trust II, | ||||||
| 6.625%, 05/15/2047 | 1,393,000 | ||||||
| 3,500,000 | Reliance Holdings USA Inc, | ||||||
| 5.400%, 02/14/2022 (Acquired 02/09/2012 through 02/23/2012, Cost $3,518,639) * | 3,914,670 | ||||||
| 300,000 | Santander Financial Issuances, | ||||||
| 7.250%, 11/01/2015 f @ | 312,000 | ||||||
| 2,500,000 | Santander U.S. Debt S.A. Unipersonal, | ||||||
| 2.991%, 10/07/2013 (Acquired 08/25/2011, Cost $2,455,674) * f | 2,504,225 | ||||||
| 12,000,000 | Simon Property Group, L.P., | ||||||
| 1.500%, 02/01/2018 (Acquired 12/10/2012, Cost $11,962,200) * | 11,932,260 | ||||||
| SLM Corporation: | |||||||
| 4,000,000 | 5.000%, 10/01/2013 | 4,095,000 | |||||
| 8,000,000 | 5.375%, 05/15/2014 | 8,364,112 | |||||
| 50,000 | 5.625%, 08/01/2033 | 46,375 | |||||
| Societe Generale SA:, f | |||||||
| 3,000,000 | 2.750%, 10/12/2017 @ | 3,051,666 | |||||
| 5,500,000 | 5.200%, 04/15/2021 (Acquired 09/20/2011 through 12/09/2011, Cost $4,799,596) * @ | 6,095,799 | |||||
| 6,909,000 | Sovereign Bank, | ||||||
| 8.750%, 05/30/2018 | 8,135,202 | ||||||
| 5,000,000 | Sparebank 1 Boligkreditt AS, | ||||||
| 1.750%, 11/15/2019 (Acquired 11/07/2012, Cost $4,961,150) * f | 4,939,000 | ||||||
| 7,000,000 | State Bank of India, | ||||||
| 4.125%, 08/01/2017 (Acquired 07/25/2012, Cost $6,939,800) * f | 7,208,600 | ||||||
| 1,500,000 | Sumitomo Mitsui Banking Corporation, | ||||||
| 3.150%, 07/22/2015 (Acquired 09/23/2011, Cost $1,542,174) * f | 1,579,874 | ||||||
| SunTrust Bank Inc.: | |||||||
| 1,500,000 | 3.600%, 04/15/2016 | 1,602,220 | |||||
| 4,250,000 | 3.500%, 01/20/2017 | 4,564,173 | |||||
| 3,922,000 | 7.250%, 03/15/2018 | 4,800,042 | |||||
| 1,000,000 | Susa Partnership, L.P., | ||||||
| 8.200%, 06/01/2017 | 1,209,813 | ||||||
| Svenska Handelsbanken AB: f | |||||||
| 2,040,000 | 4.875%, 06/10/2014 (Acquired 07/16/2012, Cost $2,135,528) * | 2,155,790 | |||||
| 2,425,000 | 2.875%, 04/04/2017 | 2,562,258 | |||||
| 3,000,000 | Swedbank AB, | ||||||
| 2.125%, 09/29/2017 (Acquired 09/24/2012, Cost $2,995,470) * f | 3,065,220 | ||||||
| 3,620,000 | Symetra Financial Corporation, | ||||||
| 6.125%, 04/01/2016 (Acquired 10/12/2010 through 10/16/2012, Cost $3,799,732) * | 3,918,531 | ||||||
| 6,000,000 | Talent Yield Investments Ltd, | ||||||
| 4.500%, 04/25/2022 (Acquired 04/18/2012, Cost $5,958,960) * f @ | 6,524,724 | ||||||
| 1,000,000 | TD Ameritrade Holding Corporation, | ||||||
| 5.600%, 12/01/2019 | 1,186,821 | ||||||
| 6,000,000 | The Bank of Tokyo-Mitsubishi UFJ, Ltd., | ||||||
| 2.350%, 02/23/2017 (Acquired 02/14/2012, Cost $5,996,640) * f | 6,241,644 | ||||||
| 600,000 | The Bear Stearns Companies LLC, | ||||||
| 5.300%, 10/30/2015 | 664,916 | ||||||
| 1,320,000 | The Chubb Corp., | ||||||
| 6.375%, 03/29/2067 | 1,438,800 | ||||||
| The Goldman Sachs Group, Inc.: | |||||||
| 3,000,000 | 5.950%, 01/18/2018 | 3,491,079 | |||||
| 6,500,000 | 6.150%, 04/01/2018 | 7,635,992 | |||||
| 1,000,000 | 5.250%, 07/27/2021 | 1,139,976 | |||||
| 300,000 | 6.750%, 10/01/2037 | 339,998 | |||||
| The Hartford Financial Services Group, Inc.: | |||||||
| 1,000,000 | 7.300%, 11/01/2015 | 1,138,121 | |||||
| 2,913,000 | 5.375%, 03/15/2017 | 3,291,253 | |||||
| 3,000,000 | 4.000%, 10/15/2017 | 3,277,206 | |||||
| 5,400,000 | 6.300%, 03/15/2018 | 6,433,441 | |||||
| 800,000 | 8.125%, 06/15/2038 @ | 921,000 | |||||
| The Royal Bank of Scotland Group PLC: f | |||||||
| 705,000 | 5.000%, 11/12/2013 | 717,300 | |||||
| 1,528,000 | 5.050%, 01/08/2015 | 1,581,161 | |||||
| 4,225,000 | 2.550%, 09/18/2015 | 4,323,907 | |||||
| 2,850,000 | 6.125%, 01/11/2021 | 3,443,304 | |||||
| 1,275,000 | Torchmark Corporation, | ||||||
| 3.800%, 09/15/2022 | 1,306,612 | ||||||
| UBS AG: f | |||||||
| 5,000,000 | Series 001, 2.250%, 01/28/2014 | 5,072,200 | |||||
| 6,800,000 | 5.750%, 04/25/2018 | 8,072,572 | |||||
| 1,100,000 | UnionBanCal Corp., | ||||||
| 3.500%, 06/18/2022 | 1,160,212 | ||||||
| 1,000,000 | UnitedHealth Group, Inc., | ||||||
| 6.000%, 02/15/2018 @ | 1,217,185 | ||||||
| 1,000,000 | Unitrin, Inc. Senior Unsecured Notes, | ||||||
| 6.000%, 05/15/2017 | 1,095,452 | ||||||
| 8,322,000 | Wachovia Bank, NA, | ||||||
| 6.000%, 11/15/2017 | 9,979,543 | ||||||
| 3,970,000 | WEA Finance LLC, | ||||||
| 7.500%, 06/02/2014 (Acquired 12/28/2011 through 07/18/2012, Cost $4,227,977) * | 4,319,483 | ||||||
| Westpac Banking Corporation: f | |||||||
| 8,000,000 | 2.000%, 08/14/2017 | 8,240,504 | |||||
| 150,000 | 4.875%, 11/19/2019 | 174,998 | |||||
| Willis North America, Inc.: | |||||||
| 2,600,000 | 5.625%, 07/15/2015 | 2,840,599 | |||||
| 2,130,000 | 7.000%, 09/29/2019 | 2,510,132 | |||||
| 603,481,773 | |||||||
| Residential Mortgage-Backed Securities - 25.3% | |||||||
| U.S. Government Agency Issues - 21.9% | |||||||
| Federal Gold Loan Mortgage Corporation (FGLMC) Pass-Through Certificates: | |||||||
| 128,218 | 5.000%, 12/01/2020 | 138,087 | |||||
| 240,178 | 5.000%, 05/01/2021 | 258,665 | |||||
| 47,076 | 6.000%, 06/01/2021 | 51,756 | |||||
| 17,081,100 | 3.000%, 05/01/2027 | 18,026,610 | |||||
| 57,241 | 6.500%, 12/01/2028 | 67,282 | |||||
| 26,100 | 6.500%, 06/01/2029 | 30,558 | |||||
| 891,326 | 5.500%, 04/01/2037 | 962,881 | |||||
| 537,833 | 5.500%, 04/01/2038 | 581,010 | |||||
| 955,150 | 5.500%, 05/01/2038 | 1,031,232 | |||||
| 10,729,459 | 4.500%, 11/01/2039 | 11,513,696 | |||||
| 3,638,017 | 4.500%, 11/01/2039 | 3,903,927 | |||||
| 9,488,950 | 4.500%, 08/01/2040 | 10,218,099 | |||||
| 15,780,788 | 4.500%, 08/01/2040 | 16,993,414 | |||||
| 16,034,105 | 3.500%, 06/01/2042 | 17,098,908 | |||||
| 54,338,105 | 3.500%, 07/01/2042 | 57,946,625 | |||||
| 41,808,118 | 3.000%, 08/01/2042 | 43,751,074 | |||||
| 21,874,090 | 3.000%, 10/01/2042 | 22,890,649 | |||||
| Federal Home Loan Mortgage Corporation (FHLMC) Pass-Through Certificates: | |||||||
| 1,619,280 | Series R010, Class VA, 5.500%, 04/15/2017 | 1,641,642 | |||||
| 61,098 | Series R010, Class AB, 5.500%, 12/15/2019 | 61,292 | |||||
| 7,329 | Series 1053, Class G, 7.000%, 03/15/2021 | 8,563 | |||||
| 13,194 | Series 136, Class E, 6.000%, 04/15/2021 | 14,394 | |||||
| 181,354 | Series 2804, Class VC, 5.000%, 07/15/2021 | 199,396 | |||||
| 12,591 | Series 1122, Class G, 7.000%, 08/15/2021 | 14,665 | |||||
| 27,311 | Series 1186, Class I, 7.000%, 12/15/2021 | 30,925 | |||||
| Federal National Mortgage Association (FNMA) Pass-Through Certificates: | |||||||
| 7,325 | Series 1989-94, Class G, 7.500%, 12/25/2019 | 8,237 | |||||
| 23,980 | Series 1990-15, Class J, 7.000%, 02/25/2020 | 26,563 | |||||
| 4,636 | Series 1991-21, Class J, 7.000%, 03/25/2021 | 5,199 | |||||
| 79,736 | Series 1991-43, Class J, 7.000%, 05/25/2021 | 90,136 | |||||
| 106,545 | Series 1991-65, Class Z, 6.500%, 06/25/2021 | 115,777 | |||||
| 950,317 | 5.000%, 11/01/2021 | 1,032,747 | |||||
| 177,121 | Series 1992-129, Class L, 6.000%, 07/25/2022 | 197,097 | |||||
| 90,984 | Series 2003-33, Class LD, 4.250%, 09/25/2022 | 91,750 | |||||
| 501,816 | 5.500%, 03/01/2023 | 549,629 | |||||
| 38,900 | Series 1993-32, Class H, 6.000%, 03/25/2023 | 42,568 | |||||
| 193,987 | Series 1993-58, Class H, 5.500%, 04/25/2023 | 213,201 | |||||
| 227,901 | 5.500%, 07/01/2023 | 249,615 | |||||
| 341,373 | 5.500%, 12/01/2023 | 373,899 | |||||
| 73,264 | 6.000%, 03/01/2026 | 80,210 | |||||
| 29,721,548 | 2.500%, 12/01/2027 | 31,102,362 | |||||
| 277,423 | 5.000%, 05/01/2028 | 300,692 | |||||
| 43,059 | 6.500%, 09/01/2028 | 50,577 | |||||
| 94,193 | 6.500%, 02/01/2029 | 110,638 | |||||
| 45,087 | 5.500%, 01/01/2032 | 49,411 | |||||
| 3,759,396 | 5.500%, 04/01/2034 | 4,137,212 | |||||
| 3,804,031 | 5.500%, 04/01/2034 | 4,180,742 | |||||
| 8,012,347 | Series 2004-90, Class LH, 5.000%, 04/25/2034 | 8,462,737 | |||||
| 302,117 | Series 2004-W6, Class 1A4, 5.500%, 07/25/2034 | 307,924 | |||||
| 361,534 | Series 2004-W6, Class 1A6, 5.500%, 07/25/2034 | 370,043 | |||||
| 861,969 | Series 2004-W10, Class A4, 5.750%, 08/25/2034 | 878,655 | |||||
| 118,176 | 5.500%, 09/01/2034 | 129,288 | |||||
| 60,076 | 5.500%, 02/01/2035 | 65,725 | |||||
| 6,888,686 | 5.000%, 04/01/2035 | 7,487,988 | |||||
| 20,555,827 | 5.000%, 07/01/2035 | 22,363,240 | |||||
| 11,546,771 | 5.000%, 02/01/2036 | 12,557,947 | |||||
| 2,266,679 | 5.000%, 03/01/2036 | 2,467,049 | |||||
| 11,903,076 | 5.500%, 04/01/2036 | 13,007,435 | |||||
| 400,560 | 6.000%, 08/01/2037 | 433,530 | |||||
| 4,553,085 | 4.000%, 08/01/2040 | 4,885,728 | |||||
| 2,951,004 | 4.000%, 10/01/2040 | 3,166,601 | |||||
| 8,695,914 | 4.000%, 12/01/2040 | 9,687,215 | |||||
| 5,969,726 | 3.500%, 01/01/2041 | 6,369,665 | |||||
| 14,064,251 | 4.000%, 01/01/2041 | 15,091,767 | |||||
| 16,279,577 | 3.500%, 02/01/2041 | 17,370,220 | |||||
| 27,353,947 | 4.000%, 02/01/2041 | 29,352,391 | |||||
| 7,582,025 | 3.500%, 03/01/2041 | 8,089,979 | |||||
| 6,292,244 | 4.500%, 07/01/2041 | 6,830,638 | |||||
| 13,692,752 | 4.000%, 09/01/2041 | 14,697,406 | |||||
| 11,287,859 | 4.000%, 12/01/2041 | 12,116,063 | |||||
| 17,396,249 | 3.000%, 05/01/2042 | 18,246,498 | |||||
| 16,760,945 | 3.500%, 06/01/2042 | 17,920,501 | |||||
| Government National Mortgage Association (GNMA) Pass-Through Certificates: | |||||||
| 58,309 | 6.000%, 12/20/2028 | 65,457 | |||||
| 25,388 | 6.500%, 01/20/2029 | 30,101 | |||||
| 106,652 | Series 2003-2, Class PB, 5.500%, 03/20/2032 | 109,457 | |||||
| 47,721 | 6.000%, 11/20/2033 | 53,736 | |||||
| 6,923,935 | 4.500%, 05/20/2040 | 7,633,934 | |||||
| 3,106,588 | 5.000%, 07/20/2040 | 3,442,527 | |||||
| 18,263,488 | 4.500%, 01/20/2041 | 20,147,689 | |||||
| 51,602,091 | 4.000%, 06/20/2042 | 56,220,627 | |||||
| 570,503,373 | |||||||
| Non-U.S. Government Agency Issues - 3.4% | |||||||
| Bank of America Alternative Loan Trust: | |||||||
| 2,128,319 | Series 2004-1, Class 5A2, 5.500%, 02/25/2019 | 2,180,506 | |||||
| 371,642 | Series 2004-2, Class 5A1, 5.500%, 03/25/2019 | 382,452 | |||||
| 2,346,043 | Series 2004-8, Class 3A1, 5.500%, 09/25/2019 | 2,375,481 | |||||
| 76,063 | Series 2005-2, Class 4A1, 5.500%, 03/25/2020 | 78,108 | |||||
| 1,122,343 | Series 2005-4, Class 3A1, 5.500%, 05/25/2020 | 1,151,011 | |||||
| 138,621 | Series 2005-8, Class 5A1, 5.500%, 09/25/2020 | 141,355 | |||||
| 266,636 | Series 2006-2, Class 6A1, 5.500%, 03/25/2021 | 272,348 | |||||
| 1,153,564 | Series 2007-1, Class 1A1, 5.945%, 04/25/2022 | 1,177,960 | |||||
| 4,264,133 | Series 2005-2, Class 1CB2, 5.500%, 03/25/2035 | 4,166,105 | |||||
| 280,416 | Series 2006-3, Class 6A1, 6.000%, 04/25/2036 | 287,564 | |||||
| 376,122 | Series 2006-5, Class CB7, 6.000%, 06/25/2046 § | 300,008 | |||||
| Bank of America Mortgage Securities Inc: | |||||||
| 8,356,977 | Series 2003-L, Class 2A1, 3.038%, 01/25/2034 | 8,338,466 | |||||
| 1,201,178 | Series 2005-9, Class 1A5, 5.500%, 10/25/2035 | 1,211,833 | |||||
| Chase Mortgage Finance Corporation: | |||||||
| 30,769 | Series 2003-S13, Class A11, 5.500%, 11/25/2033 | 31,165 | |||||
| 849,952 | Series 2006-A1, Class 2A3, 5.330%, 09/25/2036 § | 725,889 | |||||
| Citigroup Mortgage Loan Trust, Inc.: | |||||||
| 83,396 | Series 2005-9, Class 2A2, 5.500%, 11/25/2035 § | 81,997 | |||||
| 329,162 | Series 2005-9, Class 22A2, 6.000%, 11/25/2035 § | 299,106 | |||||
| Countrywide Alternative Loan Trust: | |||||||
| 4,124,091 | Series 2005-3CB, Class 2A1, 5.000%, 03/25/2020 | 4,213,922 | |||||
| 656,936 | Series 2005-50CB, Class 4A1, 5.000%, 11/25/2020 | 634,994 | |||||
| 786,454 | Series 2006-7CB, Class 3A1, 5.250%, 05/25/2021 § | 749,248 | |||||
| 457,666 | Series 2006-43CB, Class 2A1, 6.000%, 02/25/2022 | 455,952 | |||||
| 623,784 | Series 2005-10CB, Class 1A6, 5.500%, 05/25/2035 | 625,434 | |||||
| 1,108,681 | Series 2005-73CB, Class 1A7, 5.500%, 01/25/2036 | 926,499 | |||||
| 225,609 | Series 2006-J2, Class A3, 6.000%, 04/25/2036 § | 185,007 | |||||
| 1,217,109 | Series 2006-28CB, Class A17, 6.000%, 10/25/2036 § | 876,068 | |||||
| 2,073,926 | Countrywide Home Loan Mortgage Pass Through Trust, | ||||||
| Series 2005-6, Class 2A1, 5.500%, 04/25/2035 | 2,101,284 | ||||||
| 1,325,725 | Credit Suisse First Boston Mortgage Securities Corp, | ||||||
| Series 2005-7, Class 3A1, 5.000%, 08/25/2020 | 1,350,835 | ||||||
| 1,270,177 | Deutsche ALT-A Securities Inc. Alternate Loan Trust, | ||||||
| Series 2005-3, Class 4A5, 5.250%, 06/25/2035 | 1,255,285 | ||||||
| 183,458 | Deutsche Mortgage Securities Inc., | ||||||
| Series 2006-AR5, Class 21A, 6.000%, 10/25/2021 | 157,502 | ||||||
| First Horizon Alternative Mortgage Securities: | |||||||
| 409,524 | Series 2006-FA6, Class 3A1, 5.750%, 11/25/2021 | 412,992 | |||||
| 1,221,701 | Series 2006-FA8, Class 2A1, 5.750%, 02/25/2037 | 1,230,904 | |||||
| GSR Mortgage Loan Trust:, | |||||||
| 2,807,537 | Series 2004-15F, Class 5A1, 5.500%, 01/25/2020 | 2,896,718 | |||||
| 13,988,348 | Series 2005-3F, Class 2A4, 6.000%, 03/25/2035 | 14,435,696 | |||||
| J.P. Morgan Alternative Loan Trust: | |||||||
| 4,041,012 | Series 2005-S1, Class 3A1, 5.500%, 10/25/2020 | 4,074,488 | |||||
| 171,114 | Series 2006-A1, Class 2A1, 2.816%, 03/25/2036 § | 120,966 | |||||
| 771,825 | Series 2006-S2, Class A2, 5.810%, 05/25/2036 | 770,852 | |||||
| 290,803 | Series 2006-S3, Class A3A, 6.000%, 08/25/2036 | 268,506 | |||||
| J.P. Morgan Mortgage Trust: | |||||||
| 564,038 | Series 2006-A7, Class 2A4R, 2.904%, 01/25/2037 § | 434,078 | |||||
| 13,013,996 | Series 2007-A2, Class 2A3, 2.937%, 04/25/2037 | 10,101,607 | |||||
| Master Alternative Loans Trust: | |||||||
| 324,697 | Series 2004-1, Class 1A1, 5.000%, 01/25/2019 | 332,946 | |||||
| 969,706 | Series 2004-5, Class 4A1, 5.500%, 07/25/2019 | 1,023,630 | |||||
| 1,564,090 | Series 2005-3, Class 4A1, 5.500%, 03/25/2020 | 1,643,136 | |||||
| 100,753 | Series 2003-5, Class 6A1, 6.000%, 08/25/2033 | 107,230 | |||||
| 389,995 | Master Asset Securitization Trust, | ||||||
| Series 2005-2, Class 1A1, 5.250%, 11/25/2035 | 397,914 | ||||||
| 91,165 | Merrill Lynch Mortgage Investors Trust, | ||||||
| Series 2005-A8, Class A1C1, 5.250%, 08/25/2036 | 92,126 | ||||||
| Residential Accredit Loans, Inc.: | |||||||
| 3,317,836 | Series 2004-QS3, Class CB, 5.000%, 03/25/2019 | 3,462,965 | |||||
| 2,624,824 | Series 2004-QS13, Class CB, 5.000%, 09/25/2019 | 2,700,989 | |||||
| 777,621 | Series 2005-QS2, Class A1, 5.500%, 02/25/2035 | 755,880 | |||||
| Structured Asset Securities Corporation:, | |||||||
| 5,516,826 | Series 2003-31A, Class 2A7, 2.795%, 10/25/2033 | 5,514,746 | |||||
| 1,034,653 | Series 2005-7XS, Class 1A4B, 5.440%, 04/25/2035 | 1,049,341 | |||||
| Washington Mutual, Inc. Pass-Through Certificates: | |||||||
| 145,360 | Series 2004-CB1, Class 5A, 5.000%, 06/25/2019 | 150,465 | |||||
| 128,344 | Series 2004-CB2, Class 5A, 5.000%, 07/25/2019 | 132,239 | |||||
| 275,836 | Series 2004-CB2, Class 7A, 5.500%, 08/25/2019 | 287,705 | |||||
| 76,628 | Series 2004-CB3, Class 4A, 6.000%, 10/25/2019 | 79,731 | |||||
| 121,967 | Series 2004-CB4, Class 22A, 6.000%, 12/25/2019 | 126,778 | |||||
| 167,560 | Wells Fargo Alternative Loan Trust, | ||||||
| Series 2007-PA1, Class A4, 6.000%, 03/25/2037 § | 143,035 | ||||||
| 89,481,047 | |||||||
| Asset Backed Securities - 4.0% | |||||||
| 21,053 | Amresco Residential Securities Mortgage Loan Trust, | ||||||
| Series 1998-2, Class A6, 6.450%, 12/25/2027 | 20,504 | ||||||
| Bayview Financial Acquisition Trust: | |||||||
| 570,747 | Series 2007-A, Class 1A2, 6.205%, 05/28/2037 | 577,768 | |||||
| 150,000 | Series 2007-B, Class 1A2, 6.831%, 08/28/2047 | 78,365 | |||||
| 3,725,681 | Carrington Mortgage Loan Trust, | ||||||
| Series 2006-OPT1, Class A3, 0.390%, 02/25/2036 | 3,592,979 | ||||||
| 1,906,036 | Chase Funding Mortgage Loan Asset-Backed Certificates, | ||||||
| Series 2003-5, Class 1A6, 4.597%, 01/25/2015 | 1,930,857 | ||||||
| Citigroup Mortgage Loan Trust, Inc.: | |||||||
| 7,187,975 | Series 2006-WFH3, Class A3, 0.360%, 10/25/2036 | 7,102,797 | |||||
| 2,378,000 | Series 2007-WFH1, Class A3, 0.360%, 01/25/2037 | 2,209,657 | |||||
| Countrywide Asset-Backed Certificates: | |||||||
| 133,051 | Series 2004-12, Class AF6, 4.634%, 03/25/2035 | 130,165 | |||||
| 818,865 | Series 2004-15, Class AF6, 4.613%, 04/25/2035 | 797,005 | |||||
| 2,658,217 | Series 2005-7, Class AF6, 4.693%, 10/25/2035 | 2,519,522 | |||||
| 1,725,286 | Series 2005-11, Class AF3, 4.778%, 02/25/2036 | 1,544,102 | |||||
| 458,144 | Series 2005-10, Class AF6, 4.915%, 02/25/2036 | 417,617 | |||||
| 1,583,646 | Series 2005-13, Class AF3, 5.319%, 04/25/2036 | 1,330,056 | |||||
| 227,392 | Series 2006-S9, Class A3, 5.728%, 08/25/2036 | 203,720 | |||||
| 133,761 | Series 2007-S1, Class A6, 5.693%, 11/25/2036 | 110,279 | |||||
| 127,404 | Series 2006-13, Class 1AF2, 5.884%, 01/25/2037 § | 142,299 | |||||
| 212,261 | Series 2006-13, Class 1AF3, 5.944%, 01/25/2037 § | 187,435 | |||||
| 138,373 | Series 2007-S2, Class A2, 5.649%, 05/25/2037 | 126,956 | |||||
| 1,300,000 | Series 2006-10, Class 1AF3, 5.498%, 09/25/2046 | 803,964 | |||||
| 616,000 | Series 2006-9, Class 1AF3, 5.859%, 10/25/2046 | 409,277 | |||||
| 300,000 | Series 2007-4, Class A3, 5.714%, 04/25/2047 | 213,238 | |||||
| 1,402,359 | Credit Based Asset Servicing and Securitization LLC, | ||||||
| Series 2005-CB8, Class AF2, 5.303%, 12/25/2035 | 1,325,158 | ||||||
| 2,519 | GE Capital Mortgage Services, Inc., | ||||||
| Series 1999-HE1, Class A7, 6.265%, 04/25/2029 | 2,467 | ||||||
| Green Tree Financial Corporation: | |||||||
| 16,420 | Series 1993-4, Class A5, 7.050%, 01/15/2019 | 16,614 | |||||
| 7,965 | Series 1997-1, Class A5, 6.860%, 03/15/2028 | 8,345 | |||||
| 31,670 | Series 1997-4, Class A5, 6.880%, 02/15/2029 | 33,764 | |||||
| 409,342 | �� | Series 1997-5, Class A6, 6.820%, 05/15/2029 | 438,653 | ||||
| 544,817 | Series 1998-3, Class A5, 6.220%, 03/01/2030 | 596,618 | |||||
| 234,305 | Series 1998-4, Class A5, 6.180%, 04/01/2030 | 242,749 | |||||
| 1,683,886 | Home Equity Asset Trust, | ||||||
| Series 2006-4, Class 2A3, 0.380%, 08/25/2036 | 1,621,380 | ||||||
| J.P. Morgan Mortgage Acquisition Corp: | |||||||
| 6,289,173 | Series 2007-CH4, Class A2, 0.270%, 12/25/2029 | 6,187,603 | |||||
| 10,000,000 | Series 2007-CH1, Class AV5, 0.450%, 11/25/2036 | 8,440,430 | |||||
| 10,631,544 | Morgan Stanley ABS Capital I, | ||||||
| Series 2006-HE1, Class A3, 0.390%, 01/25/2036 | 10,425,685 | ||||||
| 19,899,647 | Morgan Stanley Home Equity Loan Trust, | ||||||
| Series 2006-2, Class A3, 0.380%, 02/25/2036 | 19,519,345 | ||||||
| 2,585,000 | Nationstar Home Equity Loan Trust, | ||||||
| Series 2006-B, Class AV3, 0.380%, 09/25/2036 | 2,480,868 | ||||||
| 34,160 | Oakwood Mortgage Investors, Inc., | ||||||
| Series 1999-B, Class A3, 6.450%, 11/15/2017 | 35,137 | ||||||
| 924,423 | Option One Mortgage Loan Trust, | ||||||
| Series 2005-4, Class A3, 0.470%, 11/25/2035 | 908,842 | ||||||
| Renaissance Home Equity Loan Trust: | |||||||
| 210,310 | Series 2005-1, Class AF6, 4.970%, 05/25/2035 | 201,976 | |||||
| 819,000 | Series 2006-2, Class AF3, 5.797%, 08/25/2036 | 470,702 | |||||
| 699,530 | Series 2006-3, Class AF2, 5.580%, 11/25/2036 | 408,662 | |||||
| 495,989 | Series 2007-1, Class AF2, 5.512%, 04/25/2037 | 258,656 | |||||
| 297,593 | Series 2007-1, Class AF3, 5.612%, 04/25/2037 | 157,932 | |||||
| 1,494,591 | Series 2007-2, Class AF2, 5.675%, 06/25/2037 | 755,162 | |||||
| Residential Asset Mortgage Products, Inc.: | |||||||
| 81,392 | Series 2003-RS10, Class A17, 4.850%, 11/25/2033 | 80,231 | |||||
| 4,814,904 | Series 2004-RS4, Class AI6, 5.072%, 04/25/2034 | 4,991,866 | |||||
| Residential Asset Securities Corporation: | |||||||
| 115,880 | Series 2003-KS5, Class AI6, 3.620%, 07/25/2033 | 106,596 | |||||
| 88,013 | Series 2003-KS9, Class AI6, 4.710%, 11/25/2033 | 84,529 | |||||
| 718,197 | Series 2006-EMX8, Class 1A2, 0.330%, 10/25/2036 | 712,056 | |||||
| 14,002,640 | Soundview Home Equity Loan Trust, | ||||||
| Series 2005-OPT4, Class 2A3, 0.470%, 12/25/2035 | 13,557,776 | ||||||
| 5,471,032 | Springleaf Mortgage Loan Trust, | ||||||
| Series 2012-2A, Class A, 2.220%, 10/25/2057 (Acquired 07/31/2012, Cost $5,470,413) * | 5,635,710 | ||||||
| 104,154,074 | |||||||
| Commercial Mortgage Backed Securities - 7.7% | |||||||
| 16,160,000 | Bear Stearns Commercial Mortgage Securities, | ||||||
| Series 2005-PWR9, Class A4A, 4.871%, 09/11/2042 | 17,752,293 | ||||||
| 13,222,000 | Citigroup Deutsche Bank, | ||||||
| Series 2005-CD1, Class A4, 5.219%, 07/15/2044 | 14,673,300 | ||||||
| Commercial Mortgage Trust: | |||||||
| 5,987,000 | Series 2005-C6, Class A5A, 5.116%, 06/10/2044 | 6,606,834 | |||||
| 18,198,000 | Series 2012-CR1, Class A3, 3.391%, 05/15/2045 | 19,610,019 | |||||
| 13,050,000 | Series 2012-CR2, Class A4, 3.147%, 08/15/2045 | 13,771,339 | |||||
| 16,925,000 | Credit Suisse First Boston Mortgage Securities Corporation, | ||||||
| Series 2005-C5, Class A4, 5.100%, 08/15/2038 | 18,603,249 | ||||||
| Federal National Mortgage Association (FNMA) Pass-Through Certificates: | |||||||
| 5,100,000 | Series 2012-M9, Class ASQ2, 1.513%, 12/25/2017 | 5,208,395 | |||||
| GE Capital Commercial Mortgage Corporation: | |||||||
| 1,117,214 | Series 2003-C2, Class A4, 5.145%, 07/10/2037 | 1,128,756 | |||||
| 1,517,556 | Series 2004-C3, Class A4, 5.189%, 07/10/2039 | 1,602,800 | |||||
| 12,795,000 | Series 2005-C4, Class A4, 5.307%, 11/10/2045 | 14,309,480 | |||||
| GMAC Commercial Mortgage Securities, Inc.: | |||||||
| 834,350 | Series 2003-C1, Class A2, 4.079%, 05/10/2036 | 836,845 | |||||
| 6,727,000 | Series 2004-C2, Class A4, 5.301%, 08/10/2038 | 7,133,977 | |||||
| 15,505,000 | J.P. Morgan Chase Commercial Mortgage Trust, | ||||||
| Series 2005-CB12, Class A4, 4.895%, 09/12/2037 | 17,007,264 | ||||||
| 23,100,000 | Morgan Stanley Bank of America Merrill Lynch Trust, | ||||||
| Series 2012-C6, Class A4, 2.858%, 11/15/2045 | 23,877,662 | ||||||
| 19,275,000 | Morgan Stanley Capital I, | ||||||
| Series 2005-HQ7, Class A4, 5.208%, 11/14/2042 | 21,289,719 | ||||||
| 5,000,000 | Wachovia Bank Commercial Mortgage Trust, | ||||||
| Series 2005-C22, Class A4, 5.293%, 12/15/2044 | 5,575,575 | ||||||
| 10,800,000 | WF-RBS Commercial Mortgage Trust, | ||||||
| Series 2012-C6, Class A4, 3.440%, 04/15/2045 | 11,726,456 | ||||||
| 200,713,963 | |||||||
| Total Long-Term Investments (Cost $2,465,752,501) | 2,554,092,656 | ||||||
| Shares | |||||||
| SHORT-TERM INVESTMENTS - 2.6% | |||||||
| Money Market Mutual Funds - 2.6% | |||||||
| 17,151,695 | Dreyfus Institutional Cash Advantage Fund, 0.11% « | 17,151,695 | |||||
| 51,000,000 | Short-Term Investments Trust - Liquid Assets Portfolio, 0.15% « | 51,000,000 | |||||
| Total Short-Term Investments (Cost $68,151,695) | 68,151,695 | ||||||
| Principal Amount | |||||||
| INVESTMENTS PURCHASED WITH CASH PROCEEDS FROM | |||||||
| SECURITIES LENDING - 4.3% | |||||||
| Commercial Paper - 0.0% | |||||||
| $ | 232,082 | Atlantic East Funding LLC, 0.562%, 03/25/2013 † * * | 175,476 | ||||
| Total Commercial Paper (Cost $232,082) | 175,476 | ||||||
| Shares | |||||||
| Investment Companies - 4.3% | |||||||
| 111,038,991 | Mount Vernon Securities Lending Trust Prime Portfolio, 0.28% « | 111,038,991 | |||||
| Total Investment Companies (Cost $111,038,991) | 111,038,991 | ||||||
| Total Investments Purchased With Cash Proceeds From | |||||||
| Securities Lending (Cost $111,271,073) | 111,214,467 | ||||||
| Total Investments (Cost $2,645,175,269) - 104.8% | 2,733,458,818 | ||||||
| Asset Relating to Securities Lending Investments - 0.0% | |||||||
| Support Agreement * * ^ a † | 56,606 | ||||||
| Total (Cost $0) | 56,606 | ||||||
| Liabilities in Excess of Other Assets - (4.8)% | (124,125,961 | ) | |||||
| TOTAL NET ASSETS - 100.0% | $ | 2,609,389,463 | |||||
| Notes to Schedule of Investments | ||
| * | Restricted Security Deemed Liquid | |
| * * | Illiquid Security | |
| @ | This security or portion of this security is out on loan at December 31, 2012. | |
| f | Foreign Security | |
| ^ | Non-Income Producing | |
| « | 7-Day Yield | |
| § | Security in Default | |
| † | Priced at Fair Value by the Valuation Committee as delegated by the Baird Funds' Board of Directors. | |
| a | The Fund's transfer agent and administrator and securities lending agent entered into a support agreement with the Fund to cover losses realized by the Fund on its investment in Atlantic East Funding, LLC (up to a certain amount), which investment was made by the Fund's securities lending agent. | |
| Summary of Fair Value Exposure at December 31, 2012 |
The Fund has adopted authoritative fair valuation accounting standards which establish a definition of fair value and set out a hierarchy for measuring fair value. These standards require additional disclosures about the various inputs and valuation techniques used to develop the measurements of fair value and a discussion on changes in valuation techniques and related inputs during the period. These standards define fair value as the price that would be received to sell an asset or paid to transfer a liability in an orderly transaction between market participants at the measurement date.
The fair value hierarchy is organized into three levels based upon the assumptions (referred to as "inputs") used in pricing the asset or liability. These standards state that "observable inputs" reflect the assumptions market participants would use in pricing the asset or liability based on market data obtained from independent sources and "unobservable inputs" reflect an entity's own assumptions about the assumptions market participants would use in pricing the asset or liability. These inputs are summarized into three broad levels and described below:
| Level 1 - | Unadjusted quoted prices in active markets for identical unrestricted securities. | ||
| Level 2 - | Other significant observable inputs (including quoted prices for similar securities, quoted prices in inactive markets, dealer indications, interest rates, yield curves, prepayment speeds, credit risk, default rates, inputs corroborated by observable market data, etc.). | ||
| Level 3 - | Significant unobservable inputs (including the Fund's own assumptions about the factors that market participants would use in valuing the security) based on the best information available. |
The inputs or methodology used for valuing securities are not necessarily an indication of the risk associated with investing in those securities.
The following is a summary of the inputs used to value the Fund's investments as of December 31, 2012:
| Level 1 | Level 2 | Level 3 | Total | ||||||||||||||
| Fixed Income | |||||||||||||||||
| U.S. Treasury Securities | $ | - | $ | 250,986,294 | $ | - | $ | 250,986,294 | |||||||||
| Taxable Municipal Bonds | - | 47,331,395 | - | 47,331,395 | |||||||||||||
| Other Government Related Securities | - | 56,297,518 | - | 56,297,518 | |||||||||||||
| Corporate Bonds | - | 1,234,620,317 | 4,675 | 1,234,624,992 | |||||||||||||
| Residential Mortgage-Backed Securities - U.S. Government Agency Issues | - | 570,503,373 | - | 570,503,373 | |||||||||||||
| Residential Mortgage-Backed Securities - Non - U.S. Government Agency Issues | - | 89,481,047 | - | 89,481,047 | |||||||||||||
| Asset Backed Securities | - | 104,154,074 | - | 104,154,074 | |||||||||||||
| Commercial Mortgage-Backed Securities | - | 200,713,963 | - | 200,713,963 | |||||||||||||
| Total Fixed Income | - | 2,554,087,981 | 4,675 | 2,554,092,656 | |||||||||||||
| Short-Term Investments | |||||||||||||||||
| Money Market Mutual Funds | 68,151,695 | - | - | 68,151,695 | |||||||||||||
| Total Short-Term Investments | 68,151,695 | - | - | 68,151,695 | |||||||||||||
| Investments Purchased with Cash | |||||||||||||||||
| Proceeds from Securities Lending | |||||||||||||||||
| Commercial Paper | - | 175,476 | - | 175,476 | |||||||||||||
| Money Market Mutual Fund | 111,038,991 | - | - | 111,038,991 | |||||||||||||
| Total Investments Purchased with | |||||||||||||||||
| Cash Proceeds from Securities Lending | 111,038,991 | 175,476 | - | 111,214,467 | |||||||||||||
| Total Investments | $ | 179,190,686 | $ | 2,554,263,457 | $ | 4,675 | $ | 2,733,458,818 | |||||||||
| Asset Relating to Securities Lending Investments | $ | - | $ | 56,606 | $ | - | $ | 56,606 | |||||||||
Changes in valuation techniques may result in transfers into or out of current assigned levels within the hierarchy. There were no transfers between Level 1, Level 2
and Level 3 fair value measurements during the reporting period, as compared to their classification from the prior year's annual report. One security that is priced at fair value
by the Valuation Committee instead of the Fund's pricing vendor is valued using level 3 inputs.
Level 3 Reconciliation Disclosure
Following is a reconciliation of Level 3 assets for which significant unobservable inputs were used to determine fair value.
| Description | Investments in Securities | |||
| Balance as of December 31, 2011 | $ | 4,675 | ||
| Accrued discounts/premiums | - | |||
| Realized gain (loss) | - | |||
| Change in unrealized appreciation (depreciation) | - | |||
| Purchases | - | |||
| Sales | - | |||
| Transfers in and/or out of Level 3 * | - | |||
| Balance as of December 31, 2012 | $ | 4,675 | ||
* Transfers between levels are recognized at the end of the reporting period.
REPORT OF INDEPENDENT REGISTERED PUBLIC ACCOUNTING FIRM
Board of Directors and Shareholders
Baird Funds, Inc.
We have audited the financial statements of Baird Funds, Inc. (including the LargeCap Fund, MidCap Fund, SmallCap Value Fund, Short-Term Bond Fund, Intermediate Bond Fund, Intermediate Municipal Bond Fund, Aggregate Bond Fund and Core Plus Bond Fund) (the “Funds”) as of December 31, 2012, and for the year then ended and have issued our unqualified reports thereon dated February 27, 2013 (which reports and financial statements are included in Item 1 of this Certified Shareholder Report on Form N-CSR). We conducted our audit in accordance with the standards of the Public Company Accounting Oversight Board (United States). Our audits included an audit of Baird Funds, Inc.’s schedules of investments in securities (the “Schedules”) as of December 31, 2012 appearing in Item 6 of this Form N-CSR. These Schedules are the responsibility of the Funds’ management. Our responsibility is to express an opinion on the Schedules based on our audits.
In our opinion, the Schedules referred to above, when read in conjunction with the financial statements of the Funds referred to above, present fairly, in all material respects, the information set forth therein.
/s/ GRANT THORNTON LLP
Chicago, Illinois
March 8, 2013
Item 7. Disclosure of Proxy Voting Policies and Procedures for Closed-End Management Investment Companies.
Not applicable because the Registrant is not a closed-end management investment company.
Item 8. Portfolio Managers of Closed-End Management Investment Companies.
Not applicable because the Registrant is not a closed-end management investment company.
Item 9. Purchases of Equity Securities by Closed-End Management Investment Company and Affiliated Purchasers.
Not applicable because the Registrant is not a closed-end management investment company.
Item 10. Submission of Matters to a Vote of Security Holders.
There have been no material changes to the procedures by which shareholders may recommend nominees to the Registrant’s board of directors.
Item 11. Controls and Procedures.
| (a) | The Registrant’s management, with the participation of its principal executive and principal financial officers, has evaluated the effectiveness of the Registrant's disclosure controls and procedures (as defined in Rule 30a-3(c) under the Investment Company Act of 1940 (the “Act”)), as of a date within 90 days prior to the filing date of this Form N-CSR. Based on such evaluation, the Registrant's principal executive and principal financial officers have concluded that the design and operation of the Registrant's disclosure controls and procedures are effective in providing reasonable assurance that the information required to be disclosed on Form N-CSR is recorded, processed, summarized and reported within the applicable time periods. |
| (b) | There were no changes in the Registrant's internal control over financial reporting (as defined in Rule 30a-3(d) under the Act) that occurred during the second fiscal quarter of the period covered by this report that have materially affected, or are reasonably likely to materially affect, the Registrant's internal control over financial reporting. |
Item 12. Exhibits.
| (a) | (1) Code of ethics. |
Incorporated by reference to the Registrant’s Form N-CSR filed on March 9, 2004.
(2) Certifications pursuant to Section 302 of the Sarbanes-Oxley Act of 2002. Filed herewith.
(3) Any written solicitation to purchase securities under Rule 23c-1 under the Act sent or given during the period covered by the report by or on behalf of the registrant to 10 or more persons. Not applicable because the Registrant is not a closed-end management investment company.
(b) Certification pursuant to Section 906 of the Sarbanes-Oxley Act of 2002. Furnished herewith.
SIGNATURES
Pursuant to the requirements of the Securities Exchange Act of 1934 and the Investment Company Act of 1940, the registrant has duly caused this report to be signed on its behalf by the undersigned, thereunto duly authorized.
BAIRD FUNDS, INC.
By: /s/ Mary Ellen Stanek
Mary Ellen Stanek, President
Date: March 8, 2013
Pursuant to the requirements of the Securities Exchange Act of 1934 and the Investment Company Act of 1940, this report has been signed below by the following persons on behalf of the registrant and in the capacities and on the dates indicated.
By: /s/ Mary Ellen Stanek
Mary Ellen Stanek, President
Date: March 8, 2013
By: /s/Dominick Zarcone
Dominick Zarcone, Treasurer
Date: March 8, 2013