UNITED STATES
SECURITIES AND EXCHANGE COMMISSION
Washington, D.C. 20549
FORM N-CSR
CERTIFIED SHAREHOLDER REPORT OF REGISTERED MANAGEMENT INVESTMENT COMPANIES
Investment Company Act file number 811-21539
First Trust Senior Floating Rate Income Fund II
(Exact name of registrant as specified in charter)
120 East Liberty Drive
Wheaton, IL 60187
(Address of principal executive offices) (Zip code)
W. Scott Jardine, Esq.
First Trust Portfolios L.P.
120 East Liberty Drive
Wheaton, IL 60187
(Name and address of agent for service)
registrant's telephone number, including area code: 630-765-8000
Date of fiscal year end:May 31
Date of reporting period:November 30, 2019
Form N-CSR is to be used by management investment companies to file reports with the Commission not later than 10 days after the transmission to stockholders of any report that is required to be transmitted to stockholders under Rule 30e-1 under the Investment Company Act of 1940 (17 CFR 270.30e-1). The Commission may use the information provided on Form N-CSR in its regulatory, disclosure review, inspection, and policymaking roles.
A registrant is required to disclose the information specified by Form N-CSR, and the Commission will make this information public. A registrant is not required to respond to the collection of information contained in Form N-CSR unless the Form displays a currently valid Office of Management and Budget ("OMB") control number. Please direct comments concerning the accuracy of the information collection burden estimate and any suggestions for reducing the burden to Secretary, Securities and Exchange Commission, 100 F Street, NE, Washington, DC 20549. The OMB has reviewed this collection of information under the clearance requirements of 44 U.S.C. § 3507.
Item 1. Reports to Stockholders.
The Report to Shareholders is attached herewith.

First Trust
Senior Floating Rate Income Fund II (FCT)
Semi-Annual Report
For the Six Months Ended
November 30, 2019
First Trust Senior Floating Rate Income Fund II (FCT)
Semi-Annual Report
November 30, 2019
Caution Regarding Forward-Looking Statements
This report contains certain forward-looking statements within the meaning of the Securities Act of 1933, as amended, and the Securities Exchange Act of 1934, as amended. Forward-looking statements include statements regarding the goals, beliefs, plans or current expectations of First Trust Advisors L.P. (“First Trust” or the “Advisor”) and its representatives, taking into account the information currently available to them. Forward-looking statements include all statements that do not relate solely to current or historical fact. For example, forward-looking statements include the use of words such as “anticipate,” “estimate,” “intend,” “expect,” “believe,” “plan,” “may,” “should,” “would” or other words that convey uncertainty of future events or outcomes.
Forward-looking statements involve known and unknown risks, uncertainties and other factors that may cause the actual results, performance or achievements of First Trust Senior Floating Rate Income Fund II (the “Fund”) to be materially different from any future results, performance or achievements expressed or implied by the forward-looking statements. When evaluating the information included in this report, you are cautioned not to place undue reliance on these forward-looking statements, which reflect the judgment of the Advisor and its representatives only as of the date hereof. We undertake no obligation to publicly revise or update these forward-looking statements to reflect events and circumstances that arise after the date hereof.
Performance and Risk Disclosure
There is no assurance that the Fund will achieve its investment objectives. The Fund is subject to market risk, which is the possibility that the market values of securities owned by the Fund will decline and that the value of the Fund shares may therefore be less than what you paid for them. Accordingly, you can lose money by investing in the Fund. See “Risk Considerations” in the Additional Information section of this report for a discussion of certain other risks of investing in the Fund.
Performance data quoted represents past performance, which is no guarantee of future results, and current performance may be lower or higher than the figures shown. For the most recent month-end performance figures, please visitwww.ftportfolios.com or speak with your financial advisor. Investment returns, net asset value and common share price will fluctuate and Fund shares, when sold, may be worth more or less than their original cost.
The Advisor may also periodically provide additional information on Fund performance on the Fund’s web page atwww.ftportfolios.com.
How to Read This Report
This report contains information that may help you evaluate your investment in the Fund. It includes details about the Fund and presents data and analysis that provide insight into the Fund’s performance and investment approach.
By reading the portfolio commentary by the portfolio management team of the Fund, you may obtain an understanding of how the market environment affected the Fund’s performance. The statistical information that follows may help you understand the Fund’s performance compared to that of a relevant market benchmark.
It is important to keep in mind that the opinions expressed by personnel of the Advisor are just that: informed opinions. They should not be considered to be promises or advice. The opinions, like the statistics, cover the period through the date on the cover of this report. The material risks of investing in the Fund are spelled out in the prospectus, the statement of additional information, this report and other Fund regulatory filings.
First Trust Senior Floating Rate Income Fund II (FCT)
Semi-Annual Letter from the Chairman and CEO
November 30, 2019
Dear Shareholders,
First Trust is pleased to provide you with the semi-annual report for the First Trust Senior Floating Rate Income Fund II (the “Fund”), which contains detailed information about the Fund for the six months ended November 30, 2019, including a market overview and a performance analysis.
A significant event for the markets in the past six months was the decision by the Federal Reserve (the “Fed”) to reverse course with respect to monetary policy. For those who may not follow the Fed closely, after holding its federal funds target rate (upper bound) at an artificially low 0.25% for seven years (December 2008-December 2015) to help stimulate U.S. economic activity, the Fed spent the better part of the next four years (December 2015-July 2019) increasing its benchmark lending rate in an effort to normalize it. Over that period, the Fed increased the rate from 0.25% to 2.50%. To lend some perspective, the average federal funds target rate (upper bound) was 2.96% for the 30-year period ended November 30, 2019, so the Fed came close to achieving its goal of normalizing it, according to data from Bloomberg. From the end of July 2019 through the end of November, however, the Fed initiated three rate cuts that dropped it from 2.50% to 1.75%.
So why did the Fed reverse course on monetary policy? We believe, as well as others in the financial media, that the Fed’s reversal on monetary policy has to do with the trade tariffs. The Trump Administration first began implementing new trade tariffs on imported goods back in March 2018. While the original tariffs targeted just imported steel and aluminum, the use of tariffs quickly escalated to other goods and services. The lion’s share of the tariff conflict today is between the U.S. and China, the two largest economies in the world. In our opinion, it is widely believed that President Donald J. Trump is utilizing tariffs as leverage to try and negotiate more favorable trade agreements between the U.S. and its major trading partners. One of the byproducts of the escalation in the use of tariffs by all parties involved has been a slowdown in global economic growth, particularly in the U.S. The annualized U.S. real gross domestic product growth rate in the second quarter of 2018 (when new tariffs were introduced) was 3.5%. As of the second and third quarters of 2019, that annualized growth rate was down to 2.0% and 2.1%, respectively, according to data from the Bureau of Economic Analysis. For many months, President Trump has publicly challenged the Fed to lower rates aggressively to help offset the tempering of economic growth. President Trump has noted that the Fed has room to lower rates due to the extremely low-to-negative rate levels found in many countries abroad as well as the lack of any significant inflationary pressure in the current climate. While the Fed has delivered some rate cuts in recent months, we believe that President Trump will continue to bang the drum for even more cuts.
Investors continue to flock to income-oriented investment products, such as open-end bond mutual funds and exchange-traded bond funds (ETFs). Net inflows to taxable bond funds and ETFs totaled an estimated $319.0 billion for the 12-month period ended November 30, 2019, according to Morningstar. The current climate featuring low interest rates, low bond yields and low inflation, if sustained, could make closed-end funds an attractive alternative to other income-oriented products moving forward, in our opinion.
Thank you for giving First Trust the opportunity to play a role in your financial future. We value our relationship with you and will report on the Fund again in six months.
Sincerely,
James A. Bowen
Chairman of the Board of Trustees
Chief Executive Officer of First Trust Advisors L.P.
First Trust Senior Floating Rate Income Fund II (FCT)
“AT A GLANCE”
As of November 30, 2019 (Unaudited)
| Fund Statistics | |
| Symbol on New York Stock Exchange | FCT |
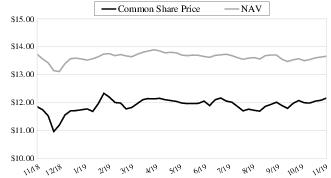
| Common Share Price | $12.16 |
| Common Share Net Asset Value (“NAV”) | $13.66 |
| Premium (Discount) to NAV | (10.98)% |
| Net Assets Applicable to Common Shares | $364,636,886 |
| Current Monthly Distribution per Common Share(1) | $0.0825 |
| Current Annualized Distribution per Common Share | $0.9900 |
| Current Distribution Rate on Common Share Price(2) | 8.14% |
| Current Distribution Rate on NAV(2) | 7.25% |
Common Share Price & NAV (weekly closing price)
| Performance | | | | | |
| | | | Average Annual Total Returns |
| | 6 Months Ended
11/30/19 | 1 Year Ended
11/30/19 | 5 Years Ended
11/30/19 | 10 Years Ended
11/30/19 | Inception
(5/25/04)
to 11/30/19 |
| Fund Performance(3) | | | | | |
| NAV | 3.44% | 6.42% | 4.97% | 6.49% | 4.40% |
| Market Value | 5.30% | 9.76% | 4.91% | 7.47% | 3.31% |
| Index Performance | | | | | |
| S&P/LSTA Leveraged Loan Index | 1.37% | 4.21% | 3.85% | 5.14% | 4.68% |
| (1) | Most recent distribution paid or declared through 11/30/2019. Subject to change in the future. |
| (2) | Distribution rates are calculated by annualizing the most recent distribution paid or declared through the report date and then dividing by Common Share Price or NAV, as applicable, as of 11/30/2019. Subject to change in the future. |
| (3) | Total return is based on the combination of reinvested dividend, capital gain and return of capital distributions, if any, at prices obtained by the Dividend Reinvestment Plan and changes in NAV per share for NAV returns and changes in Common Share Price for market value returns. From inception to October 12, 2010, Four Corners Capital Management, LLC served as the Fund’s sub-advisor. Effective October 12, 2010, the Leveraged Finance Team of First Trust Advisors L.P. assumed the day-to-day responsibility for management of the Fund’s portfolio. Total returns do not reflect sales load and are not annualized for periods of less than one year. Past performance is not indicative of future results. |
First Trust Senior Floating Rate Income Fund II (FCT)
“AT A GLANCE” (Continued)
As of November 30, 2019 (Unaudited)
| Credit Quality (S&P Ratings)(4) | % of Senior
Loans and Other
Debt Securities(5) |
| BBB- | 6.0% |
| BB+ | 3.1 |
| BB | 8.5 |
| BB- | 19.6 |
| B+ | 24.6 |
| B | 26.5 |
| B- | 9.5 |
| CCC+ | 1.4 |
| CCC | 0.6 |
| Privately rated(6) | 0.2 |
| Total | 100.0% |
| Top 10 Issuers | % of Senior
Loans and other
Securities(5) |
| Bausch Health Companies, Inc. (Valeant) | 3.7% |
| Multiplan, Inc. (MPH) | 3.6 |
| HUB International Limited | 3.1 |
| Reynolds Group Holdings, Inc. | 2.6 |
| AlixPartners, LLP | 2.4 |
| Stars Group Holdings B.V. (Amaya) | 2.3 |
| Refinitiv US Holdings, Inc. | 2.3 |
| Amwins Group, Inc. | 2.3 |
| Asurion, LLC | 2.1 |
| CenturyLink, Inc. (Qwest) | 2.0 |
| Total | 26.4% |
| Industry Classification | % of Senior
Loans and Other
Securities(5) |
| Health Care Providers & Services | 15.9% |
| Software | 11.7 |
| Hotels, Restaurants & Leisure | 11.0 |
| Insurance | 8.5 |
| Media | 7.6 |
| Diversified Financial Services | 7.0 |
| Pharmaceuticals | 6.8 |
| Containers & Packaging | 3.7 |
| Life Sciences Tools & Services | 2.7 |
| Food & Staples Retailing | 2.7 |
| Diversified Telecommunication Services | 2.4 |
| Diversified Consumer Services | 2.1 |
| Building Products | 2.0 |
| Entertainment | 2.0 |
| Auto Components | 1.9 |
| Aerospace & Defense | 1.6 |
| Commercial Services & Supplies | 1.6 |
| Food Products | 1.5 |
| Health Care Technology | 1.0 |
| Capital Markets | 0.9 |
| Professional Services | 0.9 |
| Electric Utilities | 0.8 |
| Chemicals | 0.7 |
| Household Durables | 0.6 |
| Independent Power & Renewable Electricity Producers | 0.6 |
| Real Estate Management & Development | 0.5 |
| Oil, Gas & Consumable Fuels | 0.3 |
| Communications Equipment | 0.3 |
| Semiconductors & Semiconductor Equipment | 0.2 |
| Wireless Telecommunication Services | 0.2 |
| Machinery | 0.2 |
| Road & Rail | 0.1 |
| Specialty Retail | 0.0* |
| Construction & Engineering | 0.0* |
| Automobiles | 0.0* |
| Total | 100.0% |
| * | Amount is less than 0.1%. |
| (4) | The ratings are by Standard & Poor’s except where otherwise indicated. A credit rating is an assessment provided by a nationally recognized statistical rating organization (NRSRO) of the creditworthiness of an issuer with respect to debt obligations except for those debt obligations that are only privately rated. Ratings are measured on a scale that generally ranges from AAA (highest) to D (lowest). Investment grade is defined as those issuers that have a long-term credit rating of BBB- or higher. The credit ratings shown relate to the creditworthiness of the issuers of the underlying securities in the Fund, and not to the Fund or its shares. Credit ratings are subject to change. |
| (5) | Percentages are based on long-term positions. Money market funds are excluded. |
| (6) | Represents Senior Loans privately rated upon issuance. The rating agency does not provide ongoing surveillance on the rating. |
Portfolio Commentary
First Trust Senior Floating Rate Income Fund II (FCT)
Semi-Annual Report
November 30, 2019 (Unaudited)
Advisor
The First Trust Advisors L.P. (“First Trust”) Leveraged Finance Team is comprised of 15 experienced investment professionals specializing in below investment grade securities. The team is comprised of portfolio management, research, trading and operations personnel. As of November 30, 2019, the First Trust Leveraged Finance Team managed or supervised approximately $4.30 billion in senior secured bank loans and high-yield bonds. These assets are managed across various strategies, including two closed-end funds, an open-end fund, three exchange-traded funds, and a series of unit investment trusts on behalf of retail and institutional clients.
Portfolio Management Team
William Housey, CFA – Managing Director of Fixed Income, Senior Portfolio Manager
Scott D. Fries, CFA – Senior Vice President, Portfolio Manager
Commentary
First Trust Senior Floating Rate Income Fund II
The primary investment objective of First Trust Senior Floating Rate Income Fund II (“FCT” or the “Fund”) is to seek a high level of current income. As a secondary objective, the Fund attempts to preserve capital. The Fund pursues its investment objectives by investing primarily in a portfolio of senior secured floating-rate corporate loans (“Senior Loans”). Under normal market conditions, at least 80% of the Fund’s Managed Assets are generally invested in lower grade debt instruments. “Managed Assets” means the total asset value of the Fund minus the sum of its liabilities, other than the principal amount of borrowings. There can be no assurance that the Fund will achieve its investment objectives. Investing in Senior Loans involves credit risk, and, during periods of generally declining credit quality, it may be particularly difficult for the Fund to achieve its secondary investment objective. The Fund may not be appropriate for all investors.
Market Recap
During the six-month period ended November 30, 2019 (the “Period”), President Trump and Chinese President Xi Jinping made progress with respect to the ongoing trade dispute by sketching broad brush strokes on “phase one” of a trade agreement, and the Federal Reserve (the “Fed”) cut its policy interest rate three times for a total of 75 basis points (bps), leading risk assets to rise sharply during the period, as evidenced by the equity market, which was up 15.26% during the Period, as measured by the S&P 500® Index. Interest rates, as measured by 10-Year U.S. Treasury yields, experienced volatility during the Period as the prevailing narrative surrounding the probability of a successful trade outcome fluctuated back and forth. Interest rates entered the Period at 2.12% before falling to 1.46% by early September, ultimately rising to 1.78% by the end of November. The senior loan market, as measured by the S&P/LSTA Leveraged Loan Index (the “Index”), returned 1.37% in the Period, and the high-yield bond market, as measured by the ICE BofAML US High Yield Constrained Index, returned 4.21%.1
Senior Loan Market
Although senior loans experienced a positive return during the Period, retail mutual fund and exchange-traded fund demand for senior loans remained muted. The senior loan market has now experienced fourteen consecutive months of outflows from mutual funds totaling $56 billion during that period, and $18 billion of outflows during the last six months.2 Consequently, spreads over 3-month London Interbank Offered Rate (“LIBOR”) increased 58 bps to L+504 bps.3 We believe that retail outflows are primarily due to investors anticipating the rate cuts from the Fed, and LIBOR, the benchmark rate for senior loan coupons, decreasing from 2.81% at the end of 2018 to 1.91% by the end of November 2019.1
Within the senior loan market, higher quality senior loans outperformed lower quality senior loans in the Period, a trend that has persisted since the end of 2018. BB rated issues returned 2.46%, outperforming the 1.31% return of B rated issues and -4.55% return of CCC rated issues in the Period. The average price of senior loans, as measured by the Index, declined in the Period from $96.99 to $95.58. The last twelve months (“LTM”) default rate within the Index ended the period at 1.48%, which compares favorably to the long-term average default rate of 2.90% of the Index, dating back to March 1999.3
| 1 | Source: Bloomberg. Performance of senior loans and high-yield bonds are based on the S&P/LSTA Leveraged Loan Index and ICE BofAML U.S. High Yield Constrained Index, respectively. |
| 2 | Source: JP Morgan High Yield Bond and Leveraged Loan Market Monitor |
| 3 | Source: Standard & Poor’s Leveraged Loan Commentary and Data. |
Portfolio Commentary (Continued)
First Trust Senior Floating Rate Income Fund II (FCT)
Semi-Annual Report
November 30, 2019 (Unaudited)
Performance Analysis
The Fund generated a net asset value (“NAV”) return4 of 3.44% and a market price return4 of 5.30%, while the Index returned 1.37%. The Fund’s market price return benefited from the Fund’s discount to NAV narrowing over the Period ended November 30, 2019. At the start of the Period, the Fund’s market price was at a 12.55% discount to NAV and moved to a 10.98% discount to NAV by the end of the Period, a narrowing of 157 bps.
The largest contributing factor to the Fund’s performance relative to the Index during the Period was the Fund’s underweight position within the oil & gas industry as the industry was one of the worst performing industries within the Index during the Period. The Fund’s overweight position and asset selection within the insurance industry also positively impacted returns during the Period since the industry was one of the best performing industries within the Index. Specifically, several insurance brokers held by the Fund outperformed the broader insurance industry. Additionally, the Fund’s overweight position and asset selection within the electronics/electrical industry contributed positively to returns as a software company held by the Fund outperformed the broader electronics/electrical industry during the Period.
Partially offsetting these contributing factors was the Fund’s use of leverage as senior loan returns underperformed the cost of borrowing during the Period. Also detracting from the Fund’s return during the Period was its asset selection within the automotive and healthcare industries. Within the automotive industry, the Fund’s holdings in a specialty automotive lighting manufacturer underperformed the broader automotive industry. Finally, within the healthcare industry, the Fund’s holdings in two emergency medical services providers and an advanced wound care business underperformed the broader healthcare industry during the Period.
From an income perspective, the monthly distribution rate began the Period at $0.0625 per share and ended at $0.0825 per share. At the $0.0825 per share monthly distribution rate, the annualized distribution rate at the end of November 2019 was 7.25% at NAV and 8.14% at market price.
Market and Fund Outlook
The United States and China have come to a preliminary agreement on “phase one” of a trade deal, which will most likely be signed in early 2020. In our opinion, the signing of the “phase one” trade deal gives the Fed additional confirmation to keep its policy interest rate unchanged after cutting rates three times in the last six months. We believe that a predictable Fed will bode well for the U.S. economy as growth continues on the back of a healthy U.S. consumer.
We remain confident that the favorable backdrop for the macro economy will persist for the near to intermediate term and that we are in a healthy part of the economic cycle to own senior loans and high-yield bonds. We believe senior loans look relatively attractive given their current yields, the low corporate default rate and senior loans secured position in the capital structure. The current senior loan yield-to-maturity (“YTM”) is 6.47%, 8 bps higher than the high-yield bond YTM of 6.39%, a relationship that has existed for the past six months. The last time senior loans yielded more than high-yield bonds in consecutive months was in August and September of 2007.1,3 As we evaluate new investment opportunities, decisions will continue to be rooted in our rigorous bottom-up credit analysis and our focus will remain on identifying the opportunities that we believe offer the best risk and reward balance.
| 4 | Total return is based on the combination of reinvested dividend, capital gain and return of capital distributions, if any, at prices obtained by the Dividend Reinvestment Plan and changes in NAV per share for NAV returns and changes in Common Share Price for market value returns. Total returns do not reflect sales load and are not annualized for periods of less than one year. Past performance is not indicative of future results. |
First Trust Senior Floating Rate Income Fund II (FCT)
Portfolio of Investments
November 30, 2019 (Unaudited)
Principal
Value | | Description | | Rate (a) | | Stated
Maturity (b) | | Value |
| SENIOR FLOATING-RATE LOAN INTERESTS (c) – 136.3% |
| | | Aerospace & Defense – 2.3% | | | | | | |
| $7,382,023 | | Transdigm, Inc., Term Loan F, 1 Mo. LIBOR + 2.50%, 0.00% Floor
| | 4.20% | | 06/09/23 | | $7,382,023 |
| 880,539 | | Transdigm, Inc., Tranche E Term Loan, 1 Mo. LIBOR + 2.50%, 0.00% Floor
| | 4.20% | | 05/30/25 | | 879,377 |
| | | | | 8,261,400 |
| | | Alternative Carriers – 0.5% | | | | | | |
| 1,806,996 | | Level 3 Financing, Inc., Term Loan B, 1 Mo. LIBOR + 1.75%, 0.00% Floor
| | 3.45% | | 03/01/27 | | 1,805,876 |
| | | Application Software – 9.5% | | | | | | |
| 1,552,656 | | CCC Information Services, Inc., Term Loan B, 1 Mo. LIBOR + 2.75%, 1.00% Floor
| | 4.46% | | 04/26/24 | | 1,541,989 |
| 308,927 | | Hyland Software, Inc., 2nd Lien Term Loan, 1 Mo. LIBOR + 7.00%, 0.75% Floor
| | 8.70% | | 07/10/25 | | 312,532 |
| 4,586,224 | | Hyland Software, Inc., Term Loan B, 1 Mo. LIBOR + 3.50%, 0.75% Floor
| | 5.20% | | 07/01/24 | | 4,596,268 |
| 4,724,400 | | Infor (US), Inc. (fka Lawson Software, Inc.), Term Loan B-6, 3 Mo. LIBOR + 2.75%, 1.00% Floor
| | 4.85% | | 02/02/22 | | 4,728,983 |
| 1,110,968 | | Informatica Corporation, Term Loan B, 1 Mo. LIBOR + 3.25%, 0.00% Floor
| | 4.95% | | 08/06/22 | | 1,111,368 |
| 1,043,815 | | Micro Focus International (MA Financeco, LLC), Miami Escrow TL B3, 1 Mo. LIBOR + 2.50%, 0.00% Floor
| | 4.20% | | 06/21/24 | | 1,036,967 |
| 7,049,139 | | Micro Focus International (MA Financeco, LLC), Seattle Spinco TLB, 1 Mo. LIBOR + 2.50%, 0.00% Floor
| | 4.20% | | 06/21/24 | | 7,002,896 |
| 3,789,735 | | Mitchell International, Inc., 1st Lien Term Loan, 1 Mo. LIBOR + 3.25%, 0.00% Floor
| | 4.95% | | 11/30/24 | | 3,623,934 |
| 1,955,940 | | NCR Corporation, Term Loan B, 1 Mo. LIBOR + 2.50%, 0.00% Floor
| | 4.21% | | 08/28/26 | | 1,956,761 |
| 752,400 | | Qlik Technologies (Project Alpha Intermediate Holding, Inc.), 2019 Incremental Term Loan B, 3 Mo. LIBOR + 4.25%, 0.00% Floor
| | 6.24% | | 04/26/24 | | 751,776 |
| 2,529,400 | | Qlik Technologies (Project Alpha Intermediate Holding, Inc.), Term Loan B, 3 Mo. LIBOR + 3.50%, 1.00% Floor
| | 5.49% | | 04/26/24 | | 2,502,006 |
| 5,278,921 | | RP Crown Parent (JDA Software Group), Term Loan B, 1 Mo. LIBOR + 2.75%, 1.00% Floor
| | 4.45% | | 10/12/23 | | 5,277,285 |
| 99,824 | | Ultimate Software Group, Inc., Term Loan B, 1 Mo. LIBOR + 3.75%, 0.00% Floor
| | 5.45% | | 05/03/26 | | 100,268 |
| | | | | 34,543,033 |
| | | Asset Management & Custody Banks – 0.3% | | | | | | |
| 858,422 | | Harbourvest Partners L.P., Term Loan B, 1 Mo. LIBOR + 2.25%, 0.00% Floor
| | 4.02% | | 03/01/25 | | 858,422 |
| 380,847 | | Victory Capital Holdings, Inc., Term Loan B, 3 Mo. LIBOR + 3.25%, 0.00% Floor
| | 5.35% | | 07/01/26 | | 382,435 |
| | | | | 1,240,857 |
| | | Auto Parts & Equipment – 2.4% | | | | | | |
| 1,990,215 | | American Axle & Manufacturing, Inc., Term Loan B, 1 Mo. LIBOR + 2.25%, 0.75% Floor
| | 3.96% | | 04/06/24 | | 1,952,540 |
| 494,817 | | American Axle & Manufacturing, Inc., Term Loan B, 3 Mo. LIBOR + 2.25%, 0.75% Floor
| | 4.19% | | 04/06/24 | | 485,450 |
| 4,916,079 | | Gates Global, LLC, Initial B-2 Dollar Term Loans, 1 Mo. LIBOR + 2.75%, 1.00% Floor
| | 4.45% | | 03/31/24 | | 4,899,414 |
| 950,396 | | Lumileds (Bright Bidco B.V.), Term Loan B, 1 Mo. LIBOR + 3.50%, 1.00% Floor
| | 5.20% | | 06/30/24 | | 448,843 |
Page 6
See Notes to Financial Statements
First Trust Senior Floating Rate Income Fund II (FCT)
Portfolio of Investments (Continued)
November 30, 2019 (Unaudited)
Principal
Value | | Description | | Rate (a) | | Stated
Maturity (b) | | Value |
| SENIOR FLOATING-RATE LOAN INTERESTS (c) (Continued) |
| | | Auto Parts & Equipment (Continued) | | | | | | |
| $1,961,026 | | Lumileds (Bright Bidco B.V.), Term Loan B, 3 Mo. LIBOR + 3.50%, 1.00% Floor
| | 5.60% | | 06/30/24 | | $926,134 |
| | | | | 8,712,381 |
| | | Automotive Retail – 0.0% | | | | | | |
| 188,461 | | KAR Auction Services, Inc. (Adesa), Term Loan B-6, 1 Mo. LIBOR + 2.25%, 0.00% Floor
| | 4.00% | | 09/19/26 | | 189,403 |
| | | Broadcasting – 7.7% | | | | | | |
| 1,245,998 | | Cumulus Media Holdings, Inc., Term Loan B, 1 Mo. LIBOR + 3.75%, 1.00% Floor
| | 5.45% | | 03/31/26 | | 1,252,004 |
| 2,577,013 | | E.W. Scripps Company, Incremental Term Loan B-1, 1 Mo. LIBOR + 2.75%, 0.00% Floor
| | 4.45% | | 05/01/26 | | 2,585,079 |
| 5,056,338 | | Gray Television, Inc., Term C Loan, 1 Mo. LIBOR + 2.50%, 0.00% Floor
| | 4.28% | | 01/02/26 | | 5,071,103 |
| 9,192,349 | | iHeartCommunications, Inc., Exit Term Loan, 1 Mo. LIBOR + 4.00%, 0.00% Floor
| | 5.78% | | 05/01/26 | | 9,245,940 |
| 6,956,522 | | Nexstar Broadcasting, Inc., Incremental Term Loan B-4, 1 Mo. LIBOR + 2.75%, 0.00% Floor
| | 4.45% | | 09/19/26 | | 6,982,609 |
| 473,125 | | Nexstar Broadcasting, Inc., Mission Term Loan B-3, 1 Mo. LIBOR + 2.25%, 0.00% Floor
| | 4.03% | | 01/17/24 | | 473,584 |
| 2,381,039 | | Nexstar Broadcasting, Inc., Nexstar Term Loan B-3, 1 Mo. LIBOR + 2.25%, 0.00% Floor
| | 3.95% | | 01/17/24 | | 2,383,348 |
| | | | | 27,993,667 |
| | | Building Products – 2.8% | | | | | | |
| 186,963 | | Beacon Roofing Supply, Inc., Term Loan B, 1 Mo. LIBOR + 2.25%, 0.00% Floor
| | 3.95% | | 01/02/25 | | 185,385 |
| 85,550 | | JELD-WEN, Inc., Term Loan B-4, 3 Mo. LIBOR + 2.00%, 0.00% Floor
| | 4.10% | | 12/14/24 | | 85,528 |
| 10,065,750 | | Quikrete Holdings, Inc., Term Loan B, 1 Mo. LIBOR + 2.75%, 0.00% Floor
| | 4.45% | | 11/15/23 | | 10,059,509 |
| | | | | 10,330,422 |
| | | Cable & Satellite – 2.6% | | | | | | |
| 2,613,978 | | Cablevision (aka CSC Holdings, Inc.), March 2017 Term Loan B-1, 1 Mo. LIBOR + 2.25%, 0.00% Floor
| | 4.02% | | 07/17/25 | | 2,604,542 |
| 1,506,097 | | Cablevision (aka CSC Holdings, Inc.), Sept. 2019 Term Loan B-5, 2 Mo. LIBOR + 2.50%, 0.00% Floor
| | 4.33% | | 04/15/27 | | 1,506,473 |
| 5,329,500 | | Virgin Media Investment Holdings Limited, Term Loan N, 1 Mo. LIBOR + 2.50%, 0.00% Floor
| | 4.27% | | 01/31/28 | | 5,330,246 |
| | | | | 9,441,261 |
| | | Casinos & Gaming – 11.2% | | | | | | |
| 7,914,643 | | Caesars Resort Collection, LLC, Term Loan B, 1 Mo. LIBOR + 2.75%, 0.00% Floor
| | 4.45% | | 12/22/24 | | 7,849,980 |
| 7,497,713 | | CityCenter Holdings, LLC, Term Loan B, 1 Mo. LIBOR + 2.25%, 0.75% Floor
| | 3.95% | | 04/18/24 | | 7,507,085 |
| 186,548 | | Golden Nugget, Inc., Term Loan B, 1 Mo. LIBOR + 2.75%, 0.75% Floor
| | 4.45% | | 10/04/23 | | 186,412 |
| 3,642,122 | | Golden Nugget, Inc., Term Loan B, 3 Mo. LIBOR + 2.75%, 0.75% Floor
| | 4.68%-4.72% | | 10/04/23 | | 3,639,464 |
| 571,568 | | Penn National Gaming, Inc., Term Loan B, 1 Mo. LIBOR + 2.25%, 0.00% Floor
| | 3.95% | | 10/15/25 | | 573,385 |
| 3,447,936 | | Scientific Games International, Inc., Term Loan B5, 1 Mo. LIBOR + 2.75%, 0.00% Floor
| | 4.45% | | 08/14/24 | | 3,430,697 |
See Notes to Financial Statements
Page 7
First Trust Senior Floating Rate Income Fund II (FCT)
Portfolio of Investments (Continued)
November 30, 2019 (Unaudited)
Principal
Value | | Description | | Rate (a) | | Stated
Maturity (b) | | Value |
| SENIOR FLOATING-RATE LOAN INTERESTS (c) (Continued) |
| | | Casinos & Gaming (Continued) | | | | | | |
| $11,593,427 | | Stars Group Holdings B.V. (Amaya), Term Loan B, 3 Mo. LIBOR + 3.50%, 0.00% Floor
| | 5.60% | | 07/10/25 | | $11,637,946 |
| 5,355,614 | | Station Casinos, Inc. (Red Rocks), Term Loan B, 1 Mo. LIBOR + 2.50%, 0.75% Floor
| | 4.21% | | 06/08/23 | | 5,363,326 |
| 739,546 | | Twin River Worldwide Holdings, Inc., Term Loan B, 1 Mo. LIBOR + 2.75%, 0.00% Floor
| | 4.45% | | 05/10/26 | | 736,906 |
| | | | | 40,925,201 |
| | | Coal & Consumable Fuels – 0.3% | | | | | | |
| 1,020,750 | | Arch Coal, Inc., Term Loan B, 1 Mo. LIBOR + 2.75%, 1.00% Floor
| | 4.45% | | 03/07/24 | | 973,111 |
| 305,209 | | Peabody Energy Corp., Term Loan B, 1 Mo. LIBOR + 2.75%, 0.00% Floor
| | 4.45% | | 03/31/25 | | 255,994 |
| | | | | 1,229,105 |
| | | Communications Equipment – 0.4% | | | | | | |
| 1,483,058 | | Commscope, Inc., Term Loan B, 1 Mo. LIBOR + 3.25%, 0.00% Floor
| | 4.95% | | 04/06/26 | | 1,471,624 |
| | | Construction & Engineering – 0.0% | | | | | | |
| 177,705 | | Pike Corp., 2019 New Term Loans, 1 Mo. LIBOR + 3.25%, 1.00% Floor
| | 4.96% | | 07/24/26 | | 177,967 |
| | | Diversified Support Services – 0.4% | | | | | | |
| 1,369,908 | | Brightview Landscapes, LLC (FKA - Brickman), Term Loan B, 1 Mo. LIBOR + 2.50%, 0.00% Floor
| | 4.25%-4.31% | | 08/15/25 | | 1,372,909 |
| | | Electric Utilities – 0.3% | | | | | | |
| 927,500 | | Vistra Operations Company, LLC (TEX/TXU), Term Loan B3, 1 Mo. LIBOR + 1.75%, 0.00% Floor
| | 3.45%-3.52% | | 12/31/25 | | 930,106 |
| | | Environmental & Facilities Services – 1.6% | | | | | | |
| 2,075,572 | | GFL Environmental, Inc., 2018 Incremental Term Loan B, 1 Mo. LIBOR + 3.00%, 1.00% Floor
| | 4.70% | | 05/31/25 | | 2,052,222 |
| 3,962,084 | | Packers Holdings, LLC, Term Loan B, 3 Mo. LIBOR + 3.25%, 1.00% Floor
| | 5.57% | | 12/04/24 | | 3,921,235 |
| | | | | 5,973,457 |
| | | Food Distributors – 0.4% | | | | | | |
| 1,468,359 | | US Foods, Inc., Incremental B-2019 Term Loan, 1 Mo. LIBOR + 2.00%, 0.00% Floor
| | 3.70% | | 08/31/26 | | 1,470,562 |
| | | Food Retail – 1.5% | | | | | | |
| 5,423,971 | | Albertson’s, LLC, Term Loan B-8, 1 Mo. LIBOR + 2.75%, 0.75% Floor
| | 4.45% | | 08/15/26 | | 5,455,918 |
| | | Health Care Facilities – 2.3% | | | | | | |
| 1,010,848 | | Acadia Healthcare Company, Inc., Term Loan B3, 1 Mo. LIBOR + 2.50%, 0.00% Floor
| | 4.20% | | 02/11/22 | | 1,011,950 |
| 1,157,570 | | Acadia Healthcare Company, Inc., Term Loan B4, 1 Mo. LIBOR + 2.50%, 0.00% Floor
| | 4.20% | | 02/16/23 | | 1,158,832 |
| 3,591,667 | | Concentra, Inc., Term Loan B, 6 Mo. LIBOR + 2.50%, 0.00% Floor
| | 4.54% | | 06/01/22 | | 3,590,158 |
| 1,562,064 | | Gentiva Health Services, Inc. (Kindred at Home), Term Loan B, 1 Mo. LIBOR + 3.75%, 0.00% Floor
| | 5.50% | | 06/30/25 | | 1,566,953 |
| 745 | | Select Medical Corp., Term Loan B, 1 Mo. LIBOR + 2.50%, 0.00% Floor
| | 4.21% | | 03/06/25 | | 741 |
Page 8
See Notes to Financial Statements
First Trust Senior Floating Rate Income Fund II (FCT)
Portfolio of Investments (Continued)
November 30, 2019 (Unaudited)
Principal
Value | | Description | | Rate (a) | | Stated
Maturity (b) | | Value |
| SENIOR FLOATING-RATE LOAN INTERESTS (c) (Continued) |
| | | Health Care Facilities (Continued) | | | | | | |
| $911,805 | | Select Medical Corp., Term Loan B, 6 Mo. LIBOR + 2.50%, 0.00% Floor
| | 4.58% | | 03/06/25 | | $907,246 |
| | | | | 8,235,880 |
| | | Health Care Services – 12.8% | | | | | | |
| 4,095,032 | | 21st Century Oncology Holdings, Inc., Tranche B Term Loan, 3 Mo. LIBOR + 6.13%, 1.00% Floor
| | 8.14% | | 01/16/23 | | 3,854,448 |
| 1,036,649 | | Air Medical Group Holdings, Inc. (Global Medical Response), 2018 New Term Loan, 1 Mo. LIBOR + 3.25%, 1.00% Floor
| | 4.97% | | 04/28/22 | | 976,752 |
| 924,786 | | Air Medical Group Holdings, Inc. (Global Medical Response), Term Loan B, 1 Mo. LIBOR + 3.25%, 1.00% Floor
| | 4.97% | | 03/14/25 | | 859,921 |
| 2,821,937 | | Air Methods Corp. (a/k/a ASP AMC Intermediate Holdings, Inc.), Term Loan B, 3 Mo. LIBOR + 3.50%, 1.00% Floor
| | 5.60% | | 04/21/24 | | 2,326,179 |
| 1,074 | | athenahealth, Inc. (VVC Holding Corp.), Term Loan B, 1 Mo. LIBOR + 4.50%, 0.00% Floor
| | 6.26% | | 02/15/26 | | 1,072 |
| 426,499 | | athenahealth, Inc. (VVC Holding Corp.), Term Loan B, 3 Mo. LIBOR + 4.50%, 0.00% Floor
| | 6.40% | | 02/15/26 | | 425,539 |
| 9,727,122 | | CHG Healthcare Services, Inc., Term Loan, 1 Mo. LIBOR + 3.00%, 1.00% Floor
| | 4.70% | | 06/07/23 | | 9,737,238 |
| 5,716,775 | | DaVita, Inc., Term Loan B, 1 Mo. LIBOR + 2.25%, 0.00% Floor
| | 3.95% | | 08/12/26 | | 5,743,816 |
| 3,621,534 | | DuPage Medical Group (Midwest Physician Admin. Services, LLC), Term Loan B, 1 Mo. LIBOR + 2.75%, 0.75% Floor
| | 4.45% | | 08/15/24 | | 3,552,725 |
| 5,579,756 | | Envision Healthcare Corporation, Term Loan B, 1 Mo. LIBOR + 3.75%, 0.00% Floor
| | 5.45% | | 10/10/25 | | 4,373,134 |
| 802,472 | | Exam Works (Gold Merger Co, Inc.), Term Loan B, 1 Mo. LIBOR + 3.25%, 1.00% Floor
| | 4.95% | | 07/27/23 | | 805,481 |
| 5,183,637 | | Surgery Centers Holdings, Inc., Term Loan B, 1 Mo. LIBOR + 3.25%, 1.00% Floor
| | 4.96% | | 08/31/24 | | 5,103,291 |
| 3,086,505 | | Team Health, Inc., Term Loan B, 1 Mo. LIBOR + 2.75%, 1.00% Floor
| | 4.45% | | 02/06/24 | | 2,167,313 |
| 1,683,589 | | U.S. Renal Care, Inc., Term Loan B, 1 Mo. LIBOR + 5.00%, 0.00% Floor
| | 6.75% | | 06/28/26 | | 1,599,409 |
| 4,804,791 | | Verscend Technologies, Inc., Term Loan B, 1 Mo. LIBOR + 4.50%, 0.00% Floor
| | 6.20% | | 08/27/25 | | 4,808,395 |
| 187,128 | | Vizient, Inc., Term Loan B-5, 1 Mo. LIBOR + 2.75%, 0.00% Floor
| | 4.45% | | 04/30/26 | | 187,186 |
| | | | | 46,521,899 |
| | | Health Care Technology – 1.4% | | | | | | |
| 4,313,745 | | Change Healthcare Holdings, Term Loan B, 1 Mo. LIBOR + 2.50%, 1.00% Floor
| | 4.20% | | 03/01/24 | | 4,310,510 |
| 728,240 | | Press Ganey (Azalea TopCo, Inc.), Term Loan B, 1 Mo. LIBOR + 3.50%, 0.00% Floor
| | 5.20% | | 07/25/26 | | 724,467 |
| | | | | 5,034,977 |
| | | Household Appliances – 0.9% | | | | | | |
| 3,489,465 | | Traeger Grills (TGP Holdings III, LLC), Term Loan B, 1 Mo. LIBOR + 4.25%, 1.00% Floor
| | 5.95% | | 09/25/24 | | 3,253,926 |
| | | Human Resource & Employment Services – 1.2% | | | | | | |
| 4,216,434 | | Alight, Inc. (fka Tempo Acq.), Term Loan B, 1 Mo. LIBOR + 2.75%, 0.00% Floor
| | 4.45% | | 05/01/24 | | 4,217,320 |
| | | Hypermarkets & Super Centers – 1.8% | | | | | | |
| 6,606,902 | | BJ’s Wholesale Club, Inc., Term Loan B, 1 Mo. LIBOR + 2.75%, 0.00% Floor
| | 4.51% | | 02/03/24 | | 6,617,539 |
See Notes to Financial Statements
Page 9
First Trust Senior Floating Rate Income Fund II (FCT)
Portfolio of Investments (Continued)
November 30, 2019 (Unaudited)
Principal
Value | | Description | | Rate (a) | | Stated
Maturity (b) | | Value |
| SENIOR FLOATING-RATE LOAN INTERESTS (c) (Continued) |
| | | Independent Power Producers & Energy Traders – 0.8% | | | | | | |
| $2,907,228 | | Calpine Corporation, New Term Loan B5, 3 Mo. LIBOR + 2.50%, 0.00% Floor
| | 4.61% | | 01/15/24 | | $2,913,944 |
| | | Industrial Machinery – 0.2% | | | | | | |
| 921,305 | | Douglas Dynamics, LLC, Term Loan B, 1 Mo. LIBOR + 3.00%, 1.00% Floor
| | 4.71% | | 12/31/21 | | 917,279 |
| | | Insurance Brokers – 11.8% | | | | | | |
| 545,556 | | Alliant Holdings I, LLC, 2019 New Term Loan, 1 Mo. LIBOR + 3.25%, 0.00% Floor
| | 5.02% | | 05/10/25 | | 542,419 |
| 6,654,345 | | Alliant Holdings I, LLC, Initial Term Loan, 1 Mo. LIBOR + 3.00%, 0.00% Floor
| | 4.70% | | 05/09/25 | | 6,579,484 |
| 11,369,527 | | Amwins Group, Inc., Term Loan B (First Lien), 1 Mo. LIBOR + 2.75%, 1.00% Floor
| | 4.45%-4.52% | | 01/25/24 | | 11,390,902 |
| 40,409 | | HUB International Limited, Term Loan B, 2 Mo. LIBOR + 2.75%, 0.00% Floor
| | 4.65% | | 04/25/25 | | 39,825 |
| 15,921,035 | | HUB International Limited, Term Loan B, 3 Mo. LIBOR + 2.75%, 0.00% Floor
| | 4.69% | | 04/25/25 | | 15,690,816 |
| 2,101,643 | | National Financial Partners Corp. (NFP), Term Loan B, 1 Mo. LIBOR + 3.00%, 0.00% Floor
| | 4.70% | | 01/06/24 | | 2,075,372 |
| 6,641,796 | | USI, Inc. (fka Compass Investors, Inc.), Term Loan B, 3 Mo. LIBOR + 3.00%, 0.00% Floor
| | 5.10% | | 05/15/24 | | 6,551,866 |
| | | | | 42,870,684 |
| | | Integrated Telecommunication Services – 2.8% | | | | | | |
| 10,234,539 | | CenturyLink, Inc. (Qwest), Term Loan B, 1 Mo. LIBOR + 2.75%, 0.00% Floor
| | 4.45% | | 01/31/25 | | 10,228,808 |
| | | Investment Banking & Brokerage – 0.9% | | | | | | |
| 3,372,846 | | Citadel Securities L.P., Term Loan B, 1 Mo. LIBOR + 3.50%, 0.00% Floor
| | 5.20% | | 02/28/26 | | 3,372,846 |
| | | Leisure Facilities – 1.4% | | | | | | |
| 5,669,962 | | ClubCorp Holdings, Inc., Term Loan B, 3 Mo. LIBOR + 2.75%, 0.00% Floor
| | 4.85% | | 09/18/24 | | 5,169,134 |
| | | Life Sciences Tools & Services – 3.8% | | | | | | |
| 2,281,206 | | Ortho-Clinical Diagnostics Holdings Luxembourg, Term Loan B, 3 Mo. LIBOR + 3.25%, 0.00% Floor
| | 5.31% | | 05/31/25 | | 2,248,881 |
| 4,033,948 | | Parexel International Corp., Term Loan B, 1 Mo. LIBOR + 2.75%, 0.00% Floor
| | 4.45% | | 09/27/24 | | 3,889,896 |
| 3,239,753 | | Pharmaceutical Product Development, Inc. (PPDI), Term Loan B, 1 Mo. LIBOR + 2.50%, 1.00% Floor
| | 4.20% | | 08/18/22 | | 3,242,345 |
| 4,538,327 | | Sotera Health Holdings, LLC (Sterigenics), Term Loan B, 3 Mo. LIBOR + 3.00%, 1.00% Floor
| | 4.93% | | 05/15/22 | | 4,508,056 |
| | | | | 13,889,178 |
| | | Managed Health Care – 6.2% | | | | | | |
| 18,879,437 | | Multiplan, Inc. (MPH), Term Loan B, 3 Mo. LIBOR + 2.75%, 1.00% Floor
| | 4.85% | | 06/07/23 | | 18,034,582 |
| 4,683,005 | | Versant Health (Wink Holdco, Inc.), Initial Term Loan, 1 Mo. LIBOR + 3.00%, 1.00% Floor
| | 4.70% | | 12/02/24 | | 4,624,467 |
| | | | | 22,659,049 |
| | | Metal & Glass Containers – 1.5% | | | | | | |
| 5,517,006 | | Berry Global, Inc., Term Loan U, 1 Mo. LIBOR + 2.50%, 0.00% Floor
| | 4.26% | | 07/01/26 | | 5,539,405 |
Page 10
See Notes to Financial Statements
First Trust Senior Floating Rate Income Fund II (FCT)
Portfolio of Investments (Continued)
November 30, 2019 (Unaudited)
Principal
Value | | Description | | Rate (a) | | Stated
Maturity (b) | | Value |
| SENIOR FLOATING-RATE LOAN INTERESTS (c) (Continued) |
| | | Movies & Entertainment – 2.8% | | | | | | |
| $2,715,853 | | AMC Entertainment, Inc., Term Loan B, 3 Mo. LIBOR + 3.00%, 0.00% Floor
| | 5.23% | | 04/22/26 | | $2,725,277 |
| 7,540,480 | | Cineworld Group PLC (Crown), Term Loan B, 1 Mo. LIBOR + 2.25%, 0.00% Floor
| | 3.95% | | 02/05/25 | | 7,510,318 |
| | | | | 10,235,595 |
| | | Other Diversified Financial Services – 9.7% | | | | | | |
| 12,235,876 | | AlixPartners, LLP, Term Loan B, 1 Mo. LIBOR + 2.75%, 0.00% Floor
| | 4.45% | | 04/04/24 | | 12,283,963 |
| 8,518,523 | | Duff & Phelps Corporation (Deerfield Dakota), Initial Term Loan, 1 Mo. LIBOR + 3.25%, 1.00% Floor
| | 4.95% | | 02/13/25 | | 8,399,264 |
| 11,433,790 | | Refinitiv US Holdings, Inc., Initial Dollar Term Loan, 1 Mo. LIBOR + 3.75%, 0.00% Floor
| | 5.45% | | 10/01/25 | | 11,500,448 |
| 3,096,440 | | Wex, Inc., Term Loan B, 1 Mo. LIBOR + 2.25%, 0.00% Floor
| | 3.95% | | 05/17/26 | | 3,105,296 |
| | | | | 35,288,971 |
| | | Packaged Foods & Meats – 2.1% | | | | | | |
| 282,650 | | B&G Foods, Inc., Term Loan B, 1 Mo. LIBOR + 2.50%, 0.00% Floor
| | 4.20% | | 09/30/26 | | 284,298 |
| 415,882 | | BellRing Brands, LLC, Term Loan B, 1 Mo. LIBOR + 5.00%, 1.00% Floor
| | 6.70% | | 10/21/24 | | 415,362 |
| 2,010,582 | | Hostess Brands, LLC (HB Holdings), Term Loan B, 1 Mo. LIBOR + 2.25%, 0.75% Floor
| | 3.95% | | 08/03/25 | | 2,006,822 |
| 4,533,002 | | Hostess Brands, LLC (HB Holdings), Term Loan B, 3 Mo. LIBOR + 2.25%, 0.75% Floor
| | 4.18% | | 08/03/25 | | 4,524,525 |
| 366,937 | | Simply Good Foods (Atkins Nutritionals, Inc.), Term Loan B, 2 Mo. LIBOR + 3.75%, 1.00% Floor
| | 5.73% | | 07/07/24 | | 368,772 |
| | | | | 7,599,779 |
| | | Paper Packaging – 3.6% | | | | | | |
| 12,996,725 | | Reynolds Group Holdings, Inc., U.S. Term Loan, 1 Mo. LIBOR + 2.75%, 0.00% Floor
| | 4.45% | | 02/05/23 | | 13,014,141 |
| | | Pharmaceuticals – 9.5% | | | | | | |
| 1,692,270 | | Akorn, Inc., Loan, 1 Mo. LIBOR + 7.00%, 1.00% Floor
| | 8.70% | | 04/16/21 | | 1,599,804 |
| 18,787,806 | | Bausch Health Companies, Inc. (Valeant), Term Loan B, 1 Mo. LIBOR + 3.00%, 0.00% Floor
| | 4.77% | | 06/01/25 | | 18,864,084 |
| 7,668,355 | | Endo, LLC, Term Loan B, 1 Mo. LIBOR + 4.25%, 0.75% Floor
| | 6.00% | | 04/29/24 | | 7,049,595 |
| 4,592,676 | | GoodRX, Inc., Term Loan B, 1 Mo. LIBOR + 2.75%, 0.00% Floor
| | 4.50% | | 10/15/25 | | 4,583,491 |
| 1,259,446 | | Grifols Worldwide Operations Limited, Term Loan B, 1 Mo. LIBOR + 2.00%, 0.00% Floor
| | 3.77% | | 11/15/27 | | 1,266,222 |
| 910,330 | | Mallinckrodt International Finance S.A., 2017 Term Loan B, 3 Mo. LIBOR + 2.75%, 0.75% Floor
| | 4.85% | | 09/24/24 | | 711,423 |
| 653,052 | | Mallinckrodt International Finance S.A., 2018 Incremental Term Loan, 3 Mo. LIBOR + 3.00%, 0.75% Floor
| | 4.91% | | 02/24/25 | | 506,116 |
| | | | | 34,580,735 |
| | | Railroads – 0.1% | | | | | | |
| 372,659 | | Genesee & Wyoming, Inc., Term Loan B, 1 Mo. LIBOR + 2.00%, 0.00% Floor
| | 3.70% | | 11/05/26 | | 375,122 |
| | | Real Estate Services – 0.5% | | | | | | |
| 232,008 | | Cushman & Wakefield (DTZ U.S. Borrower, LLC), Term Loan, 1 Mo. LIBOR + 3.25%, 0.00% Floor
| | 4.95% | | 08/21/25 | | 232,299 |
See Notes to Financial Statements
Page 11
First Trust Senior Floating Rate Income Fund II (FCT)
Portfolio of Investments (Continued)
November 30, 2019 (Unaudited)
Principal
Value | | Description | | Rate (a) | | Stated
Maturity (b) | | Value |
| SENIOR FLOATING-RATE LOAN INTERESTS (c) (Continued) |
| | | Real Estate Services (Continued) | | | | | | |
| $1,658,228 | | Realogy Corporation, Term Loan B, 1 Mo. LIBOR + 2.25%, 0.75% Floor
| | 3.96% | | 02/08/25 | | $1,598,813 |
| | | | | 1,831,112 |
| | | Research & Consulting Services – 0.1% | | | | | | |
| 338,722 | | Clarivate Analytics PLC (Camelot), Term Loan B, 1 Mo. LIBOR + 3.25%, 0.00% Floor
| | 4.95% | | 10/31/26 | | 339,738 |
| | | Restaurants – 2.5% | | | | | | |
| 4,712,054 | | 1011778 B.C. Unlimited Liability Company (Restaurant Brands) (aka Burger King/Tim Horton’s), Term Loan B, 1 Mo. LIBOR + 1.75%, 0.00% Floor
| | 3.45% | | 11/14/26 | | 4,709,698 |
| 624,069 | | IRB Holding Corp. (Arby’s/Inspire Brands), Term Loan B, 3 Mo. LIBOR + 3.25%, 1.00% Floor
| | 5.19%-5.22% | | 01/18/25 | | 623,757 |
| 4,000,000 | | Portillo’s Holdings, LLC, Term Loan B, 3 Mo. LIBOR + 5.50%, 1.00% Floor
| | 7.20% | | 08/30/24 | | 3,973,320 |
| | | | | 9,306,775 |
| | | Security & Alarm Services – 0.2% | | | | | | |
| 799,642 | | Garda World Security Corp., Term Loan B, 1 Mo. LIBOR + 4.75%, 0.00% Floor
| | 6.55% | | 10/30/26 | | 796,443 |
| | | Semiconductors – 0.3% | | | | | | |
| 649,392 | | ON Semiconductor Corp., Term Loan B, 1 Mo. LIBOR + 2.00%, 0.00% Floor
| | 3.70% | | 09/19/26 | | 651,763 |
| 591,321 | | Western Digital Corporation, U.S. Term B-4 Loan, 1 Mo. LIBOR + 1.75%, 0.00% Floor
| | 3.53% | | 04/29/23 | | 589,423 |
| | | | | 1,241,186 |
| | | Specialized Consumer Services – 2.9% | | | | | | |
| 724,000 | | Asurion, LLC, Second Lien Replacement B-2 Term Loan, 1 Mo. LIBOR + 6.50%, 0.00% Floor
| | 8.20% | | 08/04/25 | | 729,205 |
| 4,949,875 | | Asurion, LLC, Term Loan B7, 1 Mo. LIBOR + 3.00%, 0.00% Floor
| | 4.70% | | 11/03/24 | | 4,953,736 |
| 1,128,432 | | Asurion, LLC, Term Loan B4, 1 Mo. LIBOR + 3.00%, 0.00% Floor
| | 4.70% | | 08/04/22 | | 1,130,317 |
| 3,622,530 | | Asurion, LLC, Term Loan B6, 1 Mo. LIBOR + 3.00%, 0.00% Floor
| | 4.70% | | 11/03/23 | | 3,625,356 |
| | | | | 10,438,614 |
| | | Specialty Chemicals – 0.9% | | | | | | |
| 3,375,440 | | H.B. Fuller Company, Term Loan B, 1 Mo. LIBOR + 2.00%, 0.00% Floor
| | 3.72% | | 10/20/24 | | 3,375,811 |
| | | Systems Software – 6.8% | | | | | | |
| 4,973,714 | | Applied Systems, Inc., 1st Lien Term Loan, 3 Mo. LIBOR + 3.25%, 1.00% Floor
| | 5.35% | | 09/13/24 | | 4,951,631 |
| 1,511,161 | | Applied Systems, Inc., 2nd Lien Term Loan, 3 Mo. LIBOR + 7.00%, 1.00% Floor
| | 9.10% | | 09/13/25 | | 1,533,828 |
| 1,813,913 | | Dynatrace, LLC, Term Loan B, 1 Mo. LIBOR + 2.75%, 0.00% Floor
| | 4.45% | | 08/22/25 | | 1,818,448 |
| 1,702,386 | | McAfee, LLC, Term Loan B, 1 Mo. LIBOR + 3.75%, 0.00% Floor
| | 5.45% | | 09/30/24 | | 1,703,663 |
| 3,385,778 | | Misys Financial Software Ltd. (Almonde, Inc.) (Finastra), Term Loan B, 6 Mo. LIBOR + 3.50%, 1.00% Floor
| | 5.70% | | 06/13/24 | | 3,307,499 |
| 3,271,779 | | Riverbed Technology, Inc., Term Loan B, 1 Mo. LIBOR + 3.25%, 1.00% Floor
| | 4.96% | | 04/24/22 | | 2,591,871 |
Page 12
See Notes to Financial Statements
First Trust Senior Floating Rate Income Fund II (FCT)
Portfolio of Investments (Continued)
November 30, 2019 (Unaudited)
Principal
Value | | Description | | Rate (a) | | Stated
Maturity (b) | | Value |
| SENIOR FLOATING-RATE LOAN INTERESTS (c) (Continued) |
| | | Systems Software (Continued) | | | | | | |
| $1,462,088 | | SS&C European Holdings, S.a.r.l, Term Loan B-3, 1 Mo. LIBOR + 2.25%, 0.00% Floor
| | 3.95% | | 04/16/25 | | $1,468,945 |
| 951,755 | | SS&C European Holdings, S.a.r.l, Term Loan B-4, 1 Mo. LIBOR + 2.25%, 0.00% Floor
| | 3.95% | | 04/16/25 | | 956,218 |
| 1,744,206 | | SS&C European Holdings, S.a.r.l, Term Loan B-5, 1 Mo. LIBOR + 2.25%, 0.00% Floor
| | 3.95% | | 04/16/25 | | 1,752,491 |
| 1,322,436 | | SUSE (Marcel Lux IV SARL), Facility B1 USD, 1 Mo. LIBOR + 3.25%, 0.00% Floor
| | 4.95% | | 03/15/26 | | 1,299,294 |
| 3,374,529 | | Vertafore, Inc., Term Loan B, 1 Mo. LIBOR + 3.25%, 0.00% Floor
| | 4.95% | | 06/15/25 | | 3,271,605 |
| | | | | 24,655,493 |
| | | Wireless Telecommunication Services – 0.3% | | | | | | |
| 1,000,000 | | Frontier Communications Corp., Term Loan B-1, 1 Mo. LIBOR + 3.75%, 0.75% Floor
| | 5.46% | | 06/15/24 | | 995,830 |
| | | Total Senior Floating-Rate Loan Interests
| | 497,042,362 |
| | | (Cost $504,392,950) | | | | | | |
Principal
Value | | Description | | Stated
Coupon | | Stated
Maturity | | Value |
| CORPORATE BONDS AND NOTES (c) – 1.5% |
| | | Auto Parts & Equipment – 0.3% | | | | | | |
| 1,093,000 | | American Axle & Manufacturing, Inc.
| | 6.63% | | 10/15/22 | | 1,109,736 |
| | | Cable & Satellite – 0.2% | | | | | | |
| 150,000 | | CCO Holdings, LLC / CCO Holdings Capital Corp.
| | 5.75% | | 01/15/24 | | 153,625 |
| 557,000 | | CSC Holdings, LLC (d)
| | 5.50% | | 05/15/26 | | 589,714 |
| | | | | 743,339 |
| | | Health Care Facilities – 0.7% | | | | | | |
| 2,136,000 | | Tenet Healthcare Corp.
| | 8.13% | | 04/01/22 | | 2,338,920 |
| | | Health Care Services – 0.1% | | | | | | |
| 438,000 | | DaVita, Inc.
| | 5.13% | | 07/15/24 | | 450,588 |
| | | Real Estate Services – 0.2% | | | | | | |
| 668,000 | | Realogy Group LLC / Realogy Co-Issuer Corp. (d)
| | 5.25% | | 12/01/21 | | 674,513 |
| | | Total Corporate Bonds and Notes
| | 5,317,096 |
| | | (Cost $5,087,131) | | | | | | |
| Shares | | Description | | Value |
| COMMON STOCKS (c) – 1.0% |
| | | Broadcasting – 0.1% | | |
| 25,815 | | Cumulus Media, Class A (e)
| | 447,632 |
| | | Electric Utilities – 0.8% | | |
| 106,607 | | Vistra Energy Corp.
| | 2,828,284 |
| | | Oil & Gas Exploration & Production – 0.1% | | |
| 119,734 | | Ascent Resources - Marcellus, LLC Class A Common Shares (e) (f)
| | 245,455 |
| 3,699 | | Fieldwood Energy Equity (e) (g)
| | 86,926 |
| | | | | 332,381 |
| | | Total Common Stocks
| | 3,608,297 |
| | | (Cost $3,357,339) | | |
See Notes to Financial Statements
Page 13
First Trust Senior Floating Rate Income Fund II (FCT)
Portfolio of Investments (Continued)
November 30, 2019 (Unaudited)
| Shares | | Description | | Value |
| RIGHTS (c) – 0.0% |
| | | Automobile Manufacturers – 0.0% | | |
| 782 | | General Motors Corporation (e)
| | $7,038 |
| | | Electric Utilities – 0.0% | | |
| 106,607 | | Vistra Energy Corp. (e)
| | 114,976 |
| | | Life Sciences Tools & Services – 0.0% | | |
| 1 | | New Millennium Holdco, Inc., Corporate Claim Trust (e) (h) (i) (j)
| | 0 |
| 1 | | New Millennium Holdco, Inc., Lender Claim Trust (e) (h) (i) (j)
| | 0 |
| | | | | 0 |
| | | Total Rights
| | 122,014 |
| | | (Cost $174,661) | | |
| WARRANTS (c) – 0.0% |
| | | Oil & Gas Exploration & Production – 0.0% | | |
| 31,000 | | Ascent Resources - Marcellus, LLC First Lien Warrants (e) (i)
| | 930 |
| | | (Cost $3,100) | | |
| MONEY MARKET FUNDS (c) – 1.2% |
| 4,533,125 | | Morgan Stanley Institutional Liquidity Funds - Treasury Portfolio - Institutional Class - 1.52% (k)
| | 4,533,125 |
| | | (Cost $4,533,125) | | |
| | | Total Investments – 140.0%
| | 510,623,824 |
| | | (Cost $517,548,306) (l) | | |
| | | Outstanding Loans – (40.3)%
| | (147,000,000) |
| | | Net Other Assets and Liabilities – 0.3%
| | 1,013,062 |
| | | Net Assets – 100.0%
| | $364,636,886 |
|
| (a) | Senior Floating-Rate Loan Interests (“Senior Loans”) in which the Fund invests pay interest at rates which are periodically predetermined by reference to a base lending rate plus a premium. These base lending rates are generally (i) the lending rate offered by one or more major European banks, such as the LIBOR, (ii) the prime rate offered by one or more United States banks or (iii) the certificate of deposit rate. Certain Senior Loans are subject to a LIBOR floor that establishes a minimum LIBOR rate. When a range of rates is disclosed, the Fund holds more than one contract within the same tranche with identical LIBOR period, spread and floor, but different LIBOR reset dates. |
| (b) | Senior Loans generally are subject to mandatory and/or optional prepayment. As a result, the actual remaining maturity of Senior Loans may be substantially less than the stated maturities shown. |
| (c) | All of these securities are available to serve as collateral for the outstanding loans. |
| (d) | This security, sold within the terms of a private placement memorandum, is exempt from registration upon resale under Rule 144A under the Securities Act of 1933, as amended (the “1933 Act”), and may be resold in transactions exempt from registration, normally to qualified institutional buyers. Pursuant to procedures adopted by the Fund’s Board of Trustees, this security has been determined to be liquid by First Trust Advisors L.P. (the “Advisor”). Although market instability can result in periods of increased overall market illiquidity, liquidity for each security is determined based on security specific factors and assumptions, which require subjective judgment. At November 30, 2019, securities noted as such amounted to $1,264,227 or 0.3% of net assets. |
| (e) | Non-income producing security. |
| (f) | Security received in a transaction exempt from registration under the 1933 Act. The security may be resold pursuant to an exemption from registration under the 1933 Act, typically to qualified institutional buyers. Pursuant to procedures adopted by the Trust’s Board of Trustees, this security has been determined to be illiquid by the Advisor. Although market instability can result in periods of increased overall market illiquidity, liquidity for the security is determined based on security-specific factors and assumptions, which require subjective judgment. At November 30, 2019, securities noted as such amounted to $245,455 or 0.1% of net assets. |
| (g) | Security received in a transaction exempt from registration under the 1933 Act. The security may be resold pursuant to an exemption from registration under the 1933 Act, typically to qualified institutional buyers. Pursuant to procedures adopted by the Fund’s Board of Trustees, this security has been determined to be liquid by the Advisor. Although market instability can result in periods of increased overall market illiquidity, liquidity for the security is determined based on security-specific factors and assumptions, which require subjective judgment. At November 30, 2019, securities noted as such amounted to $86,296 or 0.0% of net assets. |
Page 14
See Notes to Financial Statements
First Trust Senior Floating Rate Income Fund II (FCT)
Portfolio of Investments (Continued)
November 30, 2019 (Unaudited)
| (h) | This security is fair valued by the Advisor’s Pricing Committee in accordance with procedures adopted by the Fund’s Board of Trustees, and in accordance with the provisions of the Investment Company Act of 1940, as amended. At November 30, 2019, securities noted as such are valued at $0 or 0.0% of net assets. |
| (i) | Pursuant to procedures adopted by the Fund’s Board of Trustees, this security has been determined to be illiquid by the Advisor. |
| (j) | This security’s value was determined using significant unobservable inputs (see Note 2A — Portfolio Valuation in the Notes to Financial Statements). |
| (k) | Rate shown reflects yield as of November 30, 2019. |
| (l) | Aggregate cost for financial reporting purposes approximates the aggregate cost for federal income tax purposes. As of November 30, 2019, the aggregate gross unrealized appreciation for all investments in which there was an excess of value over tax cost was $3,163,728 and the aggregate gross unrealized depreciation for all investments in which there was an excess of tax cost over value was $10,088,210. The net unrealized depreciation was $6,924,482. |
| LIBOR | London Interbank Offered Rate |
Valuation Inputs
A summary of the inputs used to value the Fund’s investments as of November 30, 2019 is as follows (see Note 2A - Portfolio Valuation in the Notes to Financial Statements):
| | Total
Value at
11/30/2019 | Level 1
Quoted
Prices | Level 2
Significant
Observable
Inputs | Level 3
Significant
Unobservable
Inputs |
Senior Floating-Rate Loan Interests*
| $ 497,042,362 | $ — | $ 497,042,362 | $ — |
Corporate Bonds and Notes*
| 5,317,096 | — | 5,317,096 | — |
| Common Stocks: | | | | |
Oil & Gas Exploration & Production
| 332,381 | — | 332,381 | — |
Other industry categories*
| 3,275,916 | 3,275,916 | — | — |
| Rights: | | | | |
Automobile Manufacturers
| 7,038 | 7,038 | — | — |
Electric Utilities
| 114,976 | — | 114,976 | — |
Life Sciences Tools & Services
| —** | — | — | —** |
Warrants*
| 930 | — | 930 | — |
Money Market Funds
| 4,533,125 | 4,533,125 | — | — |
Total Investments
| $ 510,623,824 | $ 7,816,079 | $ 502,807,745 | $—** |
| * | See Portfolio of Investments for industry breakout. |
| ** | Investment is valued at $0. |
As of November 30, 2019, the Fund transferred common stocks and warrants valued at $246,385 from Level 3 to Level 2 of the fair value hierarchy. The common stocks and warrants that transferred from Level 3 to Level 2 did so as a result of being priced by an independent third-party pricing service.
Level 3 Rights that are fair valued by the Advisor’s Pricing Committee are footnoted in the Portfolio of Investments. All Level 3 values are based on unobservable inputs.
See Notes to Financial Statements
Page 15
First Trust Senior Floating Rate Income Fund II (FCT)
Statement of Assets and Liabilities
November 30, 2019 (Unaudited)
| ASSETS: | |
Investments, at value
(Cost $517,548,306)
| $ 510,623,824 |
Cash
| 211,548 |
| Receivables: | |
Investment securities sold
| 9,235,224 |
Interest
| 1,429,697 |
Prepaid expenses
| 7,896 |
Total Assets
| 521,508,189 |
| LIABILITIES: | |
Outstanding loans
| 147,000,000 |
| Payables: | |
Investment securities purchased
| 9,164,596 |
Investment advisory fees
| 315,620 |
Administrative fees
| 141,873 |
Interest and fees on loans
| 133,704 |
Audit and tax fees
| 34,163 |
Custodian fees
| 23,358 |
Shareholder reporting fees
| 22,386 |
Legal fees
| 15,458 |
Trustees’ fees and expenses
| 6,603 |
Transfer agent fees
| 4,294 |
Financial reporting fees
| 771 |
Other liabilities
| 8,477 |
Total Liabilities
| 156,871,303 |
NET ASSETS
| $364,636,886 |
| NET ASSETS consist of: | |
Paid-in capital
| $ 398,920,686 |
Par value
| 266,970 |
Accumulated distributable earnings (loss)
| (34,550,770) |
NET ASSETS
| $364,636,886 |
NET ASSET VALUE,per Common Share (par value $0.01 per Common Share)
| $13.66 |
Number of Common Shares outstanding (unlimited number of Common Shares has been authorized)
| 26,696,982 |
Page 16
See Notes to Financial Statements
First Trust Senior Floating Rate Income Fund II (FCT)
Statement of Operations
For the Six Months Ended November 30, 2019 (Unaudited)
| INVESTMENT INCOME: | |
Interest
| $ 14,079,778 |
Dividends
| 26,652 |
Other
| 100,131 |
Total investment income
| 14,206,561 |
| EXPENSES: | |
Interest and fees on loans
| 2,357,426 |
Investment advisory fees
| 1,943,258 |
Administrative fees
| 180,873 |
Shareholder reporting fees
| 45,574 |
Custodian fees
| 36,745 |
Audit and tax fees
| 31,100 |
Legal fees
| 24,664 |
Listing expense
| 16,347 |
Transfer agent fees
| 12,626 |
Trustees’ fees and expenses
| 8,232 |
Financial reporting fees
| 4,625 |
Other
| 12,733 |
Total expenses
| 4,674,203 |
NET INVESTMENT INCOME (LOSS)
| 9,532,358 |
| NET REALIZED AND UNREALIZED GAIN (LOSS): | |
Net realized gain (loss) on investments
| (1,132,352) |
Net change in unrealized appreciation (depreciation) on investments
| 2,199,127 |
NET REALIZED AND UNREALIZED GAIN (LOSS)
| 1,066,775 |
NET INCREASE (DECREASE) IN NET ASSETS RESULTING FROM OPERATIONS
| $ 10,599,133 |
See Notes to Financial Statements
Page 17
First Trust Senior Floating Rate Income Fund II (FCT)
Statements of Changes in Net Assets
| | Six Months
Ended
11/30/2019
(Unaudited) | | Year
Ended
5/31/2019 |
| OPERATIONS: | | | |
Net investment income (loss)
| $ 9,532,358 | | $ 19,688,863 |
Net realized gain (loss)
| (1,132,352) | | (5,925,300) |
Net change in unrealized appreciation (depreciation)
| 2,199,127 | | (3,619,109) |
Net increase (decrease) in net assets resulting from operations
| 10,599,133 | | 10,144,454 |
| DISTRIBUTIONS TO SHAREHOLDERS FROM: | | | |
Investment operations
| (11,766,695) | | (19,355,312) |
Total increase (decrease) in net assets
| (1,167,562) | | (9,210,858) |
| NET ASSETS: | | | |
Beginning of period
| 365,804,448 | | 375,015,306 |
End of period
| $ 364,636,886 | | $ 365,804,448 |
| COMMON SHARES: | | | |
Common Shares at end of period
| 26,696,982 | | 26,696,982 |
Page 18
See Notes to Financial Statements
First Trust Senior Floating Rate Income Fund II (FCT)
Statement of Cash Flows
For the Six Months Ended November 30, 2019 (Unaudited)
| Cash flows from operating activities: | | |
Net increase (decrease) in net assets resulting from operations
| $10,599,133 | |
| Adjustments to reconcile net increase (decrease) in net assets resulting from operations to net cash provided by operating activities: | | |
Purchases of investments
| (191,061,205) | |
Sales, maturities and paydown of investments
| 208,274,773 | |
Net amortization/accretion of premiums/discounts on investments
| (169,982) | |
Net realized gain/loss on investments
| 1,132,352 | |
Net change in unrealized appreciation/depreciation on investments
| (2,199,127) | |
| Changes in assets and liabilities: | | |
Decrease in interest receivable
| 314,709 | |
Decrease in prepaid expenses
| 11,222 | |
Decrease in interest and fees payable on loans
| (68,053) | |
Decrease in investment advisory fees payable
| (23,117) | |
Decrease in audit and tax fees payable
| (28,037) | |
Increase in legal fees payable
| 1,313 | |
Decrease in shareholder reporting fees payable
| (11,433) | |
Increase in administrative fees payable
| 15,085 | |
Increase in custodian fees payable
| 5,971 | |
Increase in transfer agent fees payable
| 367 | |
Increase in Trustees’ fees and expenses payable
| 4,057 | |
Increase in other liabilities payable
| 3,117 | |
Cash provided by operating activities
| | $26,801,145 |
| Cash flows from financing activities: | | |
Distributions to Common Shareholders from investment operations
| (11,766,695) | |
Repayment of borrowings
| (43,000,000) | |
Proceeds from borrowings
| 27,000,000 | |
Cash used in financing activities
| | (27,766,695) |
Decrease in cash
| | (965,550) |
Cash at beginning of period
| | 1,177,098 |
Cash at end of period
| | $211,548 |
| Supplemental disclosure of cash flow information: | | |
Cash paid during the period for interest and fees
| | $2,425,479 |
See Notes to Financial Statements
Page 19
First Trust Senior Floating Rate Income Fund II (FCT)
Financial Highlights
For a Common Share outstanding throughout each period
| | Six Months
Ended
11/30/2019
(Unaudited) | | Year Ended May 31, |
| 2019 | | 2018 | | 2017 | | 2016 | | 2015 |
Net asset value, beginning of period
| $ 13.70 | | $ 14.05 | | $ 14.28 | | $ 14.03 | | $ 14.71 | | $ 14.95 |
| Income from investment operations: | | | | | | | | | | | |
Net investment income (loss)
| 0.36 | | 0.74 | | 0.70 | | 0.78 | | 0.83 | | 0.87 |
Net realized and unrealized gain (loss)
| 0.04 | | (0.36) | | (0.17) | | 0.30 | | (0.63) | | (0.27) |
Total from investment operations
| 0.40 | | 0.38 | | 0.53 | | 1.08 | | 0.20 | | 0.60 |
| Distributions paid to shareholders from: | | | | | | | | | | | |
Net investment income
| (0.44) | | (0.73) | | (0.70) | | (0.78) | | (0.88) | | (0.84) |
Return of capital
| — | | — | | (0.06) | | (0.05) | | — | | — |
Total distributions paid to Common Shareholders
| (0.44) | | (0.73) | | (0.76) | | (0.83) | | (0.88) | | (0.84) |
Net asset value, end of period
| $13.66 | | $13.70 | | $14.05 | | $14.28 | | $14.03 | | $14.71 |
Market value, end of period
| $12.16 | | $11.98 | | $12.99 | | $13.62 | | $13.05 | | $13.77 |
Total return based on net asset value (a)
| 3.44% | | 3.44% | | 4.24% | | 7.99% | | 2.36% | | 4.68% |
Total return based on market value (a)
| 5.30% | | (2.17)% | | 1.05% | | 10.89% | | 1.56% | | 4.64% |
| Ratios to average net assets/supplemental data: | | | | | | | | | | | |
Net assets, end of period (in 000’s)
| $ 364,637 | | $ 365,804 | | $ 375,015 | | $ 381,298 | | $ 374,685 | | $ 392,699 |
Ratio of total expenses to average net assets
| 2.57% (b) | | 2.53% | | 2.17% | | 2.06% | | 1.79% | | 1.69% |
Ratio of total expenses to average net assets excluding interest expense
| 1.27% (b) | | 1.24% | | 1.26% | | 1.33% | | 1.27% | | 1.28% |
Ratio of net investment income (loss) to average net assets
| 5.24% (b) | | 5.34% | | 4.94% | | 5.47% | | 5.98% | | 5.96% |
Portfolio turnover rate
| 19% | | 58% | | 101% | | 116% (c) | | 43% | | 63% |
| Indebtedness: | | | | | | | | | | | |
Total loans outstanding (in 000’s)
| $ 147,000 | | $ 163,000 | | $ 155,000 | | $ 146,000 | | $ 137,000 | | $ 159,000 |
Asset coverage per $1,000 of indebtedness (d)
| $ 3,481 | | $ 3,244 | | $ 3,419 | | $ 3,612 | | $ 3,735 | | $ 3,470 |
| (a) | Total return is based on the combination of reinvested dividend, capital gain and return of capital distributions, if any, at prices obtained by the Dividend Reinvestment Plan, and changes in net asset value per share for net asset value returns and changes in Common Share Price for market value returns. Total returns do not reflect sales load and are not annualized for periods of less than one year. Past performance is not indicative of future results. |
| (b) | Annualized. |
| (c) | The variation in portfolio turnover rate is due to a significant increase in the refinancing of the Senior Floating-Rate Loan Interests held by the Fund during the year ended May 31, 2017. |
| (d) | Calculated by subtracting the Fund’s total liabilities (not including the loans outstanding) from the Fund’s total assets, and dividing by the outstanding loans balance in 000’s. |
Page 20
See Notes to Financial Statements
Notes to Financial Statements
First Trust Senior Floating Rate Income Fund II (FCT)
November 30, 2019 (Unaudited)
1. Organization
First Trust Senior Floating Rate Income Fund II (the “Fund”) is a diversified, closed-end management investment company organized as a Massachusetts business trust on March 25, 2004, and is registered with the Securities and Exchange Commission under the Investment Company Act of 1940, as amended (the “1940 Act”). The Fund trades under the ticker symbol “FCT” on the New York Stock Exchange (“NYSE”).
The primary investment objective of the Fund is to seek a high level of current income. As a secondary objective, the Fund attempts to preserve capital. The Fund pursues its investment objectives by investing primarily in a portfolio of senior secured floating-rate corporate loans (“Senior Loans”)(1). Under normal market conditions, at least 80% of the Fund’s Managed Assets are generally invested in lower grade debt instruments. “Managed Assets” means the total asset value of the Fund minus the sum of its liabilities, other than the principal amount of borrowings. There can be no assurance that the Fund will achieve its investment objectives. Investing in Senior Loans involves credit risk and, during periods of generally declining credit quality, it may be particularly difficult for the Fund to achieve its secondary investment objective. The Fund may not be appropriate for all investors.
2. Significant Accounting Policies
The Fund is considered an investment company and follows accounting and reporting guidance under Financial Accounting Standards Board (“FASB”) Accounting Standards Codification (“ASC”) Topic 946, “Financial Services-Investment Companies.” The following is a summary of significant accounting policies consistently followed by the Fund in the preparation of the financial statements. The preparation of the financial statements in accordance with accounting principles generally accepted in the United States of America (“U.S. GAAP”) requires management to make estimates and assumptions that affect the reported amounts and disclosures in the financial statements. Actual results could differ from those estimates.
A. Portfolio Valuation
The net asset value (“NAV”) of the Common Shares of the Fund is determined daily as of the close of regular trading on the NYSE, normally 4:00 p.m. Eastern time, on each day the NYSE is open for trading. If the NYSE closes early on a valuation day, the NAV is determined as of that time. Domestic debt securities and foreign securities are priced using data reflecting the earlier closing of the principal markets for those securities. The Fund’s NAV per Common Share is calculated by dividing the value of all assets of the Fund (including accrued interest and dividends), less all liabilities (including accrued expenses, dividends declared but unpaid and any borrowings of the Fund), by the total number of Common Shares outstanding.
The Fund’s investments are valued daily at market value or, in the absence of market value with respect to any portfolio securities, at fair value. Market value prices represent last sale or official closing prices from a national or foreign exchange (i.e., a regulated market) and are primarily obtained from third-party pricing services. Fair value prices represent any prices not considered market value prices and are either obtained from a third-party pricing service or are determined by the Pricing Committee of the Fund’s investment advisor, First Trust Advisors L.P. (“First Trust” or the “Advisor”), in accordance with valuation procedures adopted by the Fund’s Board of Trustees, and in accordance with provisions of the 1940 Act. Investments valued by the Advisor’s Pricing Committee, if any, are footnoted as such in the footnotes to the Portfolio of Investments. The Fund’s investments are valued as follows:
Senior Loans are not listed on any securities exchange or board of trade. Senior Loans are typically bought and sold by institutional investors in individually negotiated private transactions that function in many respects like an over-the-counter secondary market, although typically no formal market-makers exist. This market, while having grown substantially since its inception, generally has fewer trades and less liquidity than the secondary market for other types of securities. Some Senior Loans have few or no trades, or trade infrequently, and information regarding a specific Senior Loan may not be widely available or may be incomplete. Accordingly, determinations of the market value of Senior Loans may be based on infrequent and dated information. Because there is less reliable, objective data available, elements of judgment may play a greater role in valuation of Senior Loans than for other types of securities. Typically, Senior Loans are fair valued using information provided by a third-party pricing service. The third-party pricing service primarily uses over-the-counter pricing from dealer runs and broker quotes from indicative sheets to value the Senior Loans. If the third-party pricing service cannot or does not provide a valuation for a particular Senior Loan or such valuation is deemed unreliable, the Advisor’s Pricing Committee may value such Senior Loan at a fair value according to procedures adopted by the Fund’s Board of Trustees, and in accordance with the provisions of the 1940 Act. Fair valuation of a Senior Loan is based on the consideration of all available information, including, but not limited to the following:
| 1) | the fundamental business data relating to the borrower; |
| 2) | an evaluation of the forces which influence the market in which these securities are purchased and sold; |
| (1) | The terms “security” and “securities” used throughout the Notes to Financial Statements include Senior Loans. |
Notes to Financial Statements (Continued)
First Trust Senior Floating Rate Income Fund II (FCT)
November 30, 2019 (Unaudited)
| 3) | the type, size and cost of the security; |
| 4) | the financial statements of the borrower; |
| 5) | the credit quality and cash flow of the borrower, based on the Advisor’s or external analysis; |
| 6) | the information as to any transactions in or offers for the security; |
| 7) | the price and extent of public trading in similar securities (or equity securities) of the borrower, or comparable companies; |
| 8) | the coupon payments; |
| 9) | the quality, value and salability of collateral, if any, securing the security; |
| 10) | the business prospects of the borrower, including any ability to obtain money or resources from a parent or affiliate and an assessment of the borrower’s management; |
| 11) | the prospects for the borrower’s industry, and multiples (of earnings and/or cash flows) being paid for similar businesses in that industry; |
| 12) | the borrower’s competitive position within the industry; |
| 13) | the borrower’s ability to access additional liquidity through public and/or private markets; and |
| 14) | other relevant factors. |
Common stocks and other equity securities listed on any national or foreign exchange (excluding The Nasdaq Stock Market LLC (“Nasdaq”) and the London Stock Exchange Alternative Investment Market (“AIM”)) are valued at the last sale price on the exchange on which they are principally traded or, for Nasdaq and AIM securities, the official closing price. Securities traded on more than one securities exchange are valued at the last sale price or official closing price, as applicable, at the close of the securities exchange representing the principal market for such securities.
Shares of open-end funds are valued at fair value which is based on NAV per share.
Securities traded in an over-the-counter market are fair valued at the mean of their most recent bid and asked price, if available, and otherwise at their closing bid price.
Corporate bonds, corporate notes and other debt securities are fair valued on the basis of valuations provided by dealers who make markets in such securities or by a third-party pricing service approved by the Fund’s Board of Trustees, which may use the following valuation inputs when available:
| 1) | benchmark yields; |
| 2) | reported trades; |
| 3) | broker/dealer quotes; |
| 4) | issuer spreads; |
| 5) | benchmark securities; |
| 6) | bids and offers; and |
| 7) | reference data including market research publications. |
Certain securities may not be able to be priced by pre-established pricing methods. Such securities may be valued by the Fund’s Board of Trustees or its delegate, the Advisor’s Pricing Committee, at fair value. These securities generally include, but are not limited to, restricted securities (securities which may not be publicly sold without registration under the Securities Act of 1933, as amended) for which a third-party pricing service is unable to provide a market price; securities whose trading has been formally suspended; a security whose market or fair value price is not available from a pre-established pricing source; a security with respect to which an event has occurred that is likely to materially affect the value of the security after the market has closed but before the calculation of the Fund’s NAV or make it difficult or impossible to obtain a reliable market quotation; and a security whose price, as provided by the third-party pricing service, does not reflect the security’s fair value. As a general principle, the current fair value of a security would appear to be the amount which the owner might reasonably expect to receive for the security upon its current sale. When fair value prices are used, generally they will differ from market quotations or official closing prices on the applicable exchanges. A variety of factors may be considered in determining the fair value of such securities, including, but not limited to, the following:
| 1) | the type of security; |
| 2) | the size of the holding; |
| 3) | the initial cost of the security; |
| 4) | transactions in comparable securities; |
| 5) | price quotes from dealers and/or third-party pricing services; |
| 6) | relationships among various securities; |
Notes to Financial Statements (Continued)
First Trust Senior Floating Rate Income Fund II (FCT)
November 30, 2019 (Unaudited)
| 7) | information obtained by contacting the issuer, analysts, or the appropriate stock exchange; |
| 8) | an analysis of the issuer’s financial statements; and |
| 9) | the existence of merger proposals or tender offers that might affect the value of the security. |
The Fund is subject to fair value accounting standards that define fair value, establish the framework for measuring fair value and provide a three-level hierarchy for fair valuation based upon the inputs to the valuation as of the measurement date. The three levels of the fair value hierarchy are as follows:
| • | Level 1 – Level 1 inputs are quoted prices in active markets for identical investments. An active market is a market in which transactions for the investment occur with sufficient frequency and volume to provide pricing information on an ongoing basis. |
| • | Level 2 – Level 2 inputs are observable inputs, either directly or indirectly, and include the following: |
| o | Quoted prices for similar investments in active markets. |
| o | Quoted prices for identical or similar investments in markets that are non-active. A non-active market is a market where there are few transactions for the investment, the prices are not current, or price quotations vary substantially either over time or among market makers, or in which little information is released publicly. |
| o | Inputs other than quoted prices that are observable for the investment (for example, interest rates and yield curves observable at commonly quoted intervals, volatilities, prepayment speeds, loss severities, credit risks, and default rates). |
| o | Inputs that are derived principally from or corroborated by observable market data by correlation or other means. |
| • | Level 3 – Level 3 inputs are unobservable inputs. Unobservable inputs may reflect the reporting entity’s own assumptions about the assumptions that market participants would use in pricing the investment. |
The inputs or methodologies used for valuing investments are not necessarily an indication of the risk associated with investing in those investments. A summary of the inputs used to value the Fund’s investments as of November 30, 2019, is included with the Fund’s Portfolio of Investments.
B. Security Transactions and Investment Income
Security transactions are recorded as of the trade date. Realized gains and losses from securities transactions are recorded on the identified cost basis. Interest income is recorded on the accrual basis. Market premiums and discounts are amortized over the life of each respective borrowing.
On July 27, 2017, the Financial Conduct Authority (“FCA”) announced that it will no longer persuade or compel banks to submit rates for the calculations of the London Interbank Offered Rates (“LIBOR”) after 2021 (the “FCA Announcement”). Furthermore, in the United States, efforts to identify a set of alternative U.S. dollar reference interest rates include proposals by the Alternative References Rates Committee of the Federal Reserve Board and the Federal Reserve Bank of New York. On August 24, 2017, the Federal Reserve Board requested public comment on a proposal by the Federal Reserve Bank of New York, in cooperation with the Office of Financial Research, to produce three new reference rates intended to serve as alternatives to LIBOR. These alternative rates are based on overnight repurchase agreement transactions secured by U.S. Treasury Securities. On December 12, 2017, following consideration of public comments, the Federal Reserve Board concluded that the public would benefit if the Federal Reserve Bank of New York published the three proposed reference rates as alternatives to LIBOR (the “Federal Reserve Board Notice”).
At this time, it is not possible to predict the effect of the FCA Announcement, the Federal Reserve Board Notice, or other regulatory changes or announcements, any establishment of alternative reference rates of any other reforms to LIBOR that may be enacted in the United Kingdom, the United States or elsewhere. As such, the potential effect of any such event on the Fund cannot yet be determined.
Securities purchased or sold on a when-issued, delayed-delivery or forward purchase commitment basis may have extended settlement periods. The value of the security purchased is subject to market fluctuations during this period. Due to the nature of the Senior Loan market, the actual settlement date may not be certain at the time of the purchase or sale for some of the Senior Loans. Interest income on such Senior Loans is not accrued until settlement date. The Fund maintains liquid assets with a current value at least equal to the amount of its when-issued, delayed-delivery or forward purchase commitments until payment is made. At November 30, 2019, the Fund had no when-issued, delayed-delivery or forward purchase commitments.
C. Unfunded Loan Commitments
The Fund may enter into certain credit agreements, all or a portion of which may be unfunded. The Fund is obligated to fund these loan commitments at the borrower’s discretion. The Fund had no unfunded loan commitments as of November 30, 2019.
Notes to Financial Statements (Continued)
First Trust Senior Floating Rate Income Fund II (FCT)
November 30, 2019 (Unaudited)
D. Dividends and Distributions to Shareholders
The Fund will distribute to holders of its Common Shares monthly dividends of all or a portion of its net income after the payment of interest and dividends in connection with leverage, if any. Distributions of any net long-term capital gains earned by the Fund are distributed at least annually. Distributions will automatically be reinvested into additional Common Shares pursuant to the Fund’s Dividend Reinvestment Plan unless cash distributions are elected by the shareholder.
Distributions from net investment income and realized capital gains are determined in accordance with federal income tax regulations, which may differ from U.S. GAAP. Certain capital accounts in the financial statements are periodically adjusted for permanent differences in order to reflect their tax character. These permanent differences are primarily due to the varying treatment of income and gain/loss on portfolio securities held by the Fund and have no impact on net assets or NAV per share. Temporary differences, which arise from recognizing certain items of income, expense and gain/loss in different periods for financial statement and tax purposes, will reverse at some point in the future.
The tax character of distributions paid by the Fund during the fiscal year ended May 31, 2019, was as follows:
| Distributions paid from: | |
Ordinary income
| $19,355,312 |
As of May 31, 2019, the components of distributable earnings and net assets on a tax basis were as follows:
Undistributed ordinary income
| $536,758 |
Undistributed capital gains
| — |
Total undistributed earnings
| 536,758 |
Accumulated capital and other losses
| (24,713,700) |
Net unrealized appreciation (depreciation)
| (9,206,266) |
Total accumulated earnings (losses)
| (33,383,208) |
Other
| — |
Paid-in capital
| 399,187,656 |
Total net assets
| $365,804,448 |
E. Income Taxes
The Fund intends to continue to qualify as a regulated investment company by complying with the requirements under Subchapter M of the Internal Revenue Code of 1986, as amended, which includes distributing substantially all of its net investment income and net realized gains to shareholders. Accordingly, no provision has been made for federal and state income taxes. However, due to the timing and amount of distributions, the Fund may be subject to an excise tax of 4% of the amount by which approximately 98% of the Fund’s taxable income exceeds the distributions from such taxable income for the calendar year.
The Fund intends to utilize provisions of the federal income tax laws, which allow it to carry a realized capital loss forward indefinitely following the year of the loss and offset such loss against any future realized capital gains. The Fund is subject to certain limitations, under U.S. tax rules, on the use of capital loss carryforwards and net unrealized built-in losses. These limitations apply when there has been a 50% change in ownership. At the taxable year ended May 31, 2019, the Fund had $21,181,966 of non-expiring capital loss carryforwards for federal income tax purposes.
At the taxable year ended May 31, 2019, the Fund had $4,665,052 of pre-enactment capital loss carryforward that expired.
Certain losses realized during the current fiscal year may be deferred and treated as occurring on the first day of the following fiscal year for federal income tax purposes. For the fiscal year ended May 31, 2019, the Fund incurred $3,531,704 of late year capital losses.
The Fund is subject to accounting standards that establish a minimum threshold for recognizing, and a system for measuring, the benefits of a tax position taken or expected to be taken in a tax return. Taxable years ended 2016, 2017, 2018, and 2019 remain open to federal and state audit. As of November 30, 2019, management has evaluated the application of these standards to the Fund and has determined that no provision for income tax is required in the Fund’s financial statements for uncertain tax positions.
F. Expenses
The Fund will pay all expenses directly related to its operations.
Notes to Financial Statements (Continued)
First Trust Senior Floating Rate Income Fund II (FCT)
November 30, 2019 (Unaudited)
G. New Accounting Pronouncement
On August 28, 2018, the FASB issued Accounting Standards Update (“ASU”) 2018-13, “Disclosure Framework – Changes to the Disclosure Requirements for Fair Value Measurement,” which amends the fair value measurement disclosure requirements of ASC 820. The amendments of ASU 2018-13 include new, eliminated, and modified disclosure requirements of ASC 820. In addition, the amendments clarify that materiality is an appropriate consideration of entities when evaluating disclosure requirements. The ASU is effective for fiscal years beginning after December 15, 2019, including interim periods therein. Early adoption is permitted for any eliminated or modified disclosures upon issuance of this ASU. The Fund has early adopted ASU 2018-13 for these financial statements, which did not result in a material impact.
3. Investment Advisory Fee, Affiliated Transactions and Other Fee Arrangements
First Trust, the investment advisor to the Fund, is a limited partnership with one limited partner, Grace Partners of DuPage L.P., and one general partner, The Charger Corporation. The Charger Corporation is an Illinois corporation controlled by James A. Bowen, Chief Executive Officer of First Trust. First Trust is responsible for the selection and ongoing monitoring of the Fund’s investment portfolio, managing the Fund’s business affairs and providing certain administrative services necessary for the management of the Fund. For these investment management services, First Trust is entitled to a monthly fee calculated at an annual rate of 0.75% of the Fund’s Managed Assets. First Trust also provides fund reporting services to the Fund for a flat annual fee in the amount of $9,250.
BNY Mellon Investment Servicing (US) Inc. (“BNYM IS”) serves as the Fund’s transfer agent in accordance with certain fee arrangements. As transfer agent, BNYM IS is responsible for maintaining shareholder records for the Fund. The Bank of New York Mellon (“BNYM”) serves as the Fund’s administrator, fund accountant, and custodian in accordance with certain fee arrangements. As administrator and fund accountant, BNYM is responsible for providing certain administrative and accounting services to the Fund, including maintaining the Fund’s books of account, records of the Fund’s securities transactions, and certain other books and records. As custodian, BNYM is responsible for custody of the Fund’s assets. BNYM IS and BNYM are subsidiaries of The Bank of New York Mellon Corporation, a financial holding company.
Each Trustee who is not an officer or employee of First Trust, any sub-advisor or any of their affiliates (“Independent Trustees”) is paid a fixed annual retainer that is allocated equally among each fund in the First Trust Fund Complex. Each Independent Trustee is also paid an annual per fund fee that varies based on whether the fund is a closed-end or other actively managed fund, a defined outcome fund or an index fund.
Additionally, the Lead Independent Trustee and the Chairmen of the Audit Committee, Nominating and Governance Committee and Valuation Committee are paid annual fees to serve in such capacities, with such compensation allocated pro rata among each fund in the First Trust Fund Complex based on net assets. Independent Trustees are reimbursed for travel and out-of-pocket expenses in connection with all meetings. The Lead Independent Trustee and Committee Chairmen rotate every three years. The officers and “Interested” Trustee receive no compensation from the Fund for acting in such capacities.
4. Purchases and Sales of Securities
The cost of purchases and proceeds from sales of securities, excluding short-term investments, for the six months ended November 30, 2019, were $100,727,488 and $127,335,447, respectively.
5. Borrowings
The Fund has a credit agreement with The Bank of Nova Scotia (“Scotia”) that provides a secured line of credit for the Fund. The maximum commitment amount is $170,000,000. The borrowing rate is the applicable LIBOR rate plus 80 basis points. Prior to October 18, 2019, the borrowing rate was the applicable LIBOR rate plus 85 basis points. Under the credit agreement, the Fund pays a commitment fee of 0.25% when the loan balance is less than 75% of the maximum commitment. The average amount outstanding under the facility for the six months ended November 30, 2019 was $154,437,158, with the average weighted average interest rate of 3.00%. As of November 30, 2019, the Fund had three loans outstanding under the facility totaling $147,000,000, which approximates fair value. The borrowings are categorized as Level 2 within the fair value hierarchy. The high and low annual interest rates during the six months ended November 30, 2019 were 3.34% and 2.52%, respectively. The weighted average interest rate at November 30, 2019 was 2.54%. The interest and fees are included in “Interest and fees on loans” on the Statement of Operations.
6. Indemnification
The Fund has a variety of indemnification obligations under contracts with its service providers. The Fund’s maximum exposure under these arrangements is unknown. However, the Fund has not had prior claims or losses pursuant to these contracts and expects the risk of loss to be remote.
Notes to Financial Statements (Continued)
First Trust Senior Floating Rate Income Fund II (FCT)
November 30, 2019 (Unaudited)
7. Litigation
The Fund has been named as a defendant in litigation pending in the Bankruptcy Court for the Southern District of New York as part of the General Motors bankruptcy case. The plaintiff, the Motors Liquidation Company Avoidance Action Trust, is an entity formed under the bankruptcy plan of reorganization to prosecute “avoidance” actions such as preference actions. The lawsuit arises from years of ancillary litigation concerning whether the former holders of a term loan to General Motors (“GM”), for which JP Morgan acted as agent, lost their lien on GM collateral when a Uniform Commercial Code release was mistakenly filed terminating their interest in certain collateral securing the term loan. On January 21, 2015, the federal appeals court in New York ruled that the term lenders’ collateral interest was, indeed, terminated.
By virtue of the federal appellate court’s decision, all of the former holders of the term loan, including the Fund, are now being sued in the bankruptcy court in New York for the avoidance and return of certain payments they received both before and after the GM bankruptcy filing. The bankruptcy court lawsuit is premised on the assertion that the term lenders received payments on account of their status as fully secured creditors when in fact they should not have received the payments because they were not in fact fully secured.
The Fund was first served following the filing of the First Amended Complaint on May 20, 2015. The payments which were received by the Fund in 2009 and which the plaintiff seeks to recover from the Fund total $8,057,298. The Fund has engaged counsel to assist with its defense of this matter.
The parties to the litigation entered into a settlement agreement to resolve the litigation. The settlement agreement was subject to the approval of the United States Bankruptcy Court for the Southern District of New York, which approval was granted on June 13, 2019. Pursuant to the settlement agreement, all claims against the Fund were released by the parties to the settlement agreement, and the case against the Trust was dismissed. The settlement of the litigation did not require any payment by the Fund. Pursuant to the settlement agreement, the Fund was entitled to and did assert a general unsecured claim which allowed the Fund to recover a portion of the attorneys’ fees and costs incurred in the litigation.
8. Subsequent Events
Management has evaluated the impact of all subsequent events to the Fund through the date the financial statements were issued, and has determined that there were no subsequent events requiring recognition or disclosure in the financial statements that have not already been disclosed.
Additional Information
First Trust Senior Floating Rate Income Fund II (FCT)
November 30, 2019 (Unaudited)
Dividend Reinvestment Plan
If your Common Shares are registered directly with the Fund or if you hold your Common Shares with a brokerage firm that participates in the Fund’s Dividend Reinvestment Plan (the “Plan”), unless you elect, by written notice to the Fund, to receive cash distributions, all dividends, including any capital gain distributions, on your Common Shares will be automatically reinvested by BNY Mellon Investment Servicing (US) Inc. (the “Plan Agent”), in additional Common Shares under the Plan. If you elect to receive cash distributions, you will receive all distributions in cash paid by check mailed directly to you by the Plan Agent, as the dividend paying agent.
If you decide to participate in the Plan, the number of Common Shares you will receive will be determined as follows:
| (1) | If Common Shares are trading at or above net asset value (“NAV”) at the time of valuation, the Fund will issue new shares at a price equal to the greater of (i) NAV per Common Share on that date or (ii) 95% of the market price on that date. |
| (2) | If Common Shares are trading below NAV at the time of valuation, the Plan Agent will receive the dividend or distribution in cash and will purchase Common Shares in the open market, on the NYSE or elsewhere, for the participants’ accounts. It is possible that the market price for the Common Shares may increase before the Plan Agent has completed its purchases. Therefore, the average purchase price per share paid by the Plan Agent may exceed the market price at the time of valuation, resulting in the purchase of fewer shares than if the dividend or distribution had been paid in Common Shares issued by the Fund. The Plan Agent will use all dividends and distributions received in cash to purchase Common Shares in the open market within 30 days of the valuation date except where temporary curtailment or suspension of purchases is necessary to comply with federal securities laws. Interest will not be paid on any uninvested cash payments. |
You may elect to opt-out of or withdraw from the Plan at any time by giving written notice to the Plan Agent, or by telephone at (866) 340-1104, in accordance with such reasonable requirements as the Plan Agent and the Fund may agree upon. If you withdraw or the Plan is terminated, you will receive a certificate for each whole share in your account under the Plan, and you will receive a cash payment for any fraction of a share in your account. If you wish, the Plan Agent will sell your shares and send you the proceeds, minus brokerage commissions.
The Plan Agent maintains all Common Shareholders’ accounts in the Plan and gives written confirmation of all transactions in the accounts, including information you may need for tax records. Common Shares in your account will be held by the Plan Agent in non-certificated form. The Plan Agent will forward to each participant any proxy solicitation material and will vote any shares so held only in accordance with proxies returned to the Fund. Any proxy you receive will include all Common Shares you have received under the Plan.
There is no brokerage charge for reinvestment of your dividends or distributions in Common Shares. However, all participants will pay a pro rata share of brokerage commissions incurred by the Plan Agent when it makes open market purchases.
Automatically reinvesting dividends and distributions does not mean that you do not have to pay income taxes due upon receiving dividends and distributions. Capital gains and income are realized although cash is not received by you. Consult your financial advisor for more information.
If you hold your Common Shares with a brokerage firm that does not participate in the Plan, you will not be able to participate in the Plan and any dividend reinvestment may be effected on different terms than those described above.
The Fund reserves the right to amend or terminate the Plan if in the judgment of the Board of Trustees the change is warranted. There is no direct service charge to participants in the Plan; however, the Fund reserves the right to amend the Plan to include a service charge payable by the participants. Additional information about the Plan may be obtained by writing BNY Mellon Investment Servicing (US) Inc., 301 Bellevue Parkway, Wilmington, Delaware 19809.
Proxy Voting Policies and Procedures
A description of the policies and procedures that the Fund uses to determine how to vote proxies and information on how the Fund voted proxies relating to portfolio investments during the most recent 12-month period ended June 30 is available (1) without charge, upon request, by calling (800) 988-5891; (2) on the Fund’s website atwww.ftportfolios.com; and (3) on the Securities and Exchange Commission’s (“SEC”) website atwww.sec.gov.
Portfolio Holdings
The Fund files portfolio holdings information for each month in a fiscal quarter within 60 days after the end of the relevant fiscal quarter on Form N-PORT. Portfolio holdings information for the third month of each fiscal quarter will be publicly available on the
Additional Information (Continued)
First Trust Senior Floating Rate Income Fund II (FCT)
November 30, 2019 (Unaudited)
SEC’s website atwww.sec.gov. The Fund’s complete schedule of portfolio holdings for the second and fourth quarters of each fiscal year is included in the semi-annual and annual reports to shareholders, respectively, and is filed with the SEC on Form N-CSR. The semi-annual and annual report for the Fund is available to investors within 60 days after the period to which it relates. The Fund’s Forms N-PORT and Forms N-CSR are available on the SEC’s website listed above.
Submission of Matters to a Vote of Shareholders
The Fund held its Annual Meeting of Shareholders (the “Annual Meeting”) on September 9, 2019. At the Annual Meeting, James A. Bowen and Robert F. Keith were elected by the Common Shareholders of the First Trust Senior Floating Rate Income Fund II as Class III Trustees for a three-year term expiring at the Fund’s annual meeting of shareholders in 2022. The number of votes cast in favor of Mr. Bowen was 15,277,851, the number of votes against Mr. Bowen was 10,002,295, and the number of broker non-votes was 1,416,836. The number of votes cast in favor of Mr. Keith was 24,924,601, the number of votes against Mr. Keith was 355,545, and the number of broker non-votes was 1,416,836. Richard E. Erickson, Thomas R. Kadlec and Niel B. Nielson are the other current and continuing Trustees.
Risk Considerations
The following discussion summarizes certain (but not all) of the principal risks associated with investing in the Fund. The Fund is subject to the informational requirements of the Securities Exchange Act of 1934 and the Investment Company Act of 1940 and, in accordance therewith, files reports, proxy statements and other information that is available for review. The order of the below risk factors does not indicate the significance of any particular risk factor.
Credit Agency Risk. Credit ratings are determined by credit rating agencies and are only the opinions of such entities. Ratings assigned by a rating agency are not absolute standards of credit quality and do not evaluate market risk or the liquidity of securities. Any shortcomings or inefficiencies in credit rating agencies’ processes for determining credit ratings may adversely affect the credit ratings of securities held by the Fund and, as a result, may adversely affect those securities’ perceived or actual credit risk.
Credit and Below-Investment Grade Securities Risk.Credit risk is the risk that one or more securities in the Fund’s portfolio will decline in price, or the issuer thereof will fail to pay dividends or interest or repay principal when due. Below-investment grade instruments are commonly referred to as high-yield securities or “junk” bonds and are considered speculative with respect to the issuer’s capacity to pay dividends or interest and repay principal and are susceptible to default or decline in market value due to adverse economic and business developments. High-yield securities are often unsecured and subordinated to other creditors of the issuer. The market values for high-yield securities tend to be very volatile, and these securities are generally less liquid than investment grade securities. For these reasons, an investment in the Fund is subject to the following specific risks: (i) increased price sensitivity to changing interest rates and to a deteriorating economic environment; (ii) greater risk of loss due to default or declining credit quality; (iii) adverse company specific events more likely to render the issuer unable to make dividend, interest and/or principal payments; (iv) negative perception of the high-yield market which may depress the price and liquidity of high-yield securities; (v) volatility; and (vi) liquidity.
Cyber Security Risk.The Fund is susceptible to potential operational risks through breaches in cyber security. A breach in cyber security refers to both intentional and unintentional events that may cause the Fund to lose proprietary information, suffer data corruption or lose operational capacity. Such events could cause the Fund to incur regulatory penalties, reputational damage, additional compliance costs associated with corrective measures and/or financial loss. Cyber security breaches may involve unauthorized access to the Fund’s digital information systems through “hacking” or malicious software coding, but may also result from outside attacks such as denial-of-service attacks through efforts to make network services unavailable to intended users. In addition, cyber security breaches of the Fund’s third-party service providers, such as its administrator, transfer agent or custodian, or issuers in which the Fund invests, can also subject the Fund to many of the same risks associated with direct cyber security breaches. The Fund has established risk management systems designed to reduce the risks associated with cyber security. However, there is no guarantee that such efforts will succeed, especially because the Fund does not directly control the cyber security systems of issuers or third party service providers.
Health Care Companies Risk.Through the Fund’s investments in senior loans, the Fund may be significantly exposed to companies in the health care sector. Health care companies are involved in medical services or health care, including biotechnology research and production, drugs and pharmaceuticals and health care facilities and services. These companies are subject to extensive competition, generic drug sales or the loss of patent protection, product liability litigation and increased government regulation. Research and development costs of bringing new drugs to market are substantial, and there is no guarantee that the product will ever come to market. Health care facility operators may be affected by the demand for services, efforts by government or insurers to limit rates, restriction of government financial assistance and competition from other providers.
Additional Information (Continued)
First Trust Senior Floating Rate Income Fund II (FCT)
November 30, 2019 (Unaudited)
Hotels, Restaurants & Leisure Risk.Companies in the hotels, restaurants and leisure industry are subject to, among other things, a highly competitive marketplace; the ongoing need to contribute significant capital expenditures and keep pace with changes in technology and consumer preferences; difficulty in obtaining financing; and rapid obsolescence. In addition, these companies may be more sensitive to adverse economic (general and local), business or regulatory developments than other companies.
Illiquid Securities Risk. The Fund invests a substantial portion of its assets in lower-quality debt issued by companies that are highly leveraged. Lower-quality debt tends to be less liquid than higher-quality debt. Moreover, smaller debt issues tend to be less liquid than larger debt issues. Although the resale or secondary market for senior loans is growing, it is currently limited. There is no organized exchange or board of trade on which senior loans are traded. Instead, the secondary market for senior loans is an unregulated inter-dealer or inter-bank resale market. In addition, senior loans in which the Fund invests may require the consent of the borrower and/or agent prior to the settlement of the sale or assignment. These consent requirements can delay or impede the Fund’s ability to settle the sale of senior loans. Depending on market conditions, the Fund may have difficulty disposing its senior loans, which may adversely impact its ability to obtain cash to repay debt, to pay dividends, to pay expenses or to take advantage of new investment opportunities.
Information Technology Companies Risk. Information technology companies produce and provide hardware, software and information technology systems and services. Information technology companies are generally subject to the following risks: rapidly changing technologies and existing product obsolescence; short product life cycles; fierce competition; aggressive pricing and reduced profit margins; the loss of patent, copyright and trademark protections; cyclical market patterns; evolving industry standards; and frequent new product introductions and new market entrants. Information technology companies may be smaller and less experienced companies, with limited product lines, markets or financial resources and fewer experienced management or marketing personnel. Information technology company stocks, particularly those involved with the internet, have experienced extreme price and volume fluctuations that are often unrelated to their operating performance. In addition, information technology companies are particularly vulnerable to federal, state and local government regulation, and competition and consolidation, both domestically and internationally, including competition from foreign competitors with lower production costs. Information technology companies also face competition for services of qualified personnel and heavily rely on patents and intellectual property rights and the ability to enforce such rights to maintain a competitive advantage.
Interest Rate Risk.The yield on the Fund’s common shares will tend to rise or fall as market interest rates rise and fall, as senior loans pay interest at rates which float in response to changes in market rates. Changes in prevailing interest rates can be expected to cause some fluctuation in the Fund’s net asset value. Similarly, a sudden and significant increase in market interest rates may cause a decline in the Fund’s net asset value.
Many financial instruments use or may use a floating rate based upon the London Interbank Offered Rate (LIBOR), which is being phased out by the end of 2021. There remains some uncertainty regarding the future utilization of LIBOR and the nature of any replacement rate.
Leverage Risk. The use of leverage by the Fund can magnify the effect of any losses. If the income and gains from the securities and investments purchased with leverage proceeds do not cover the cost of leverage, the return to the common shares will be less than if leverage had not been used. Leverage involves risks and special considerations for common shareholders including: the likelihood of greater volatility of net asset value and market price of the common shares than a comparable portfolio without leverage; the risk that fluctuations in interest rates on borrowings will reduce the return to the common shareholders or will result in fluctuations in the dividends paid on the common shares; in a declining market, the use of leverage is likely to cause a greater decline in the net asset value of the common shares than if the Fund were not leveraged, which may result in a greater decline in the market price of the common shares; and when the Fund uses certain types of leverage, the investment advisory fee payable to the Advisor will be higher than if the Fund did not use leverage.
Management Risk and Reliance on Key Personnel. The implementation of the Fund’s investment strategy depends upon the continued contributions of certain key employees of the Advisor, some of whom have unique talents and experience and would be difficult to replace. The loss or interruption of the services of a key member of the portfolio management team could have a negative impact on the Fund.
Market Discount from Net Asset Value. Shares of closed-end investment companies such as the Fund frequently trade at a discount from their net asset value. The Fund cannot predict whether its common shares will trade at, below or above net asset value.
Potential Conflicts of Interest Risk. First Trust and the portfolio managers have interests which may conflict with the interests of the Fund. In particular, First Trust currently manages and may in the future manage and/or advise other investment funds or accounts with the same or substantially similar investment objectives and strategies as the Fund. In addition, while the Fund is using leverage, the
Additional Information (Continued)
First Trust Senior Floating Rate Income Fund II (FCT)
November 30, 2019 (Unaudited)
amount of the fees paid to First Trust for investment advisory and management services are higher than if the Fund did not use leverage because the fees paid are calculated based on managed assets. Therefore, First Trust has a financial incentive to leverage the Fund.
Prepayment Risk. Loans are subject to prepayment risk. Prepayment risk is the risk that the borrower on a loan will repay principal (in part or in whole) prior to the scheduled maturity date. The degree to which borrowers prepay loans, whether as a contractual requirement or at their election, may be affected by general business conditions, the financial condition of the borrower and competitive conditions among loan investors, among others. As such, prepayments cannot be predicted with accuracy. Upon a prepayment, either in part or in full, the actual outstanding debt on which the Fund derives interest income will be reduced. The Fund may not be able to reinvest the proceeds received on terms as favorable as the prepaid loan.
Reinvestment Risk. Reinvestment risk is the risk that income from the Fund’s portfolio will decline if the Fund invests the proceeds from matured, traded or called instruments at market interest rates that are below the Fund’s portfolio’s current earnings rate. A decline in income could affect the common shares’ market price, level of distributions or the overall return of the Fund.
Risks Associated with Investments in Distressed Issuers. The Fund may invest in instruments of distressed issuers, including firms that have defaulted on their debt obligations and/or filed for bankruptcy protection. Investing in such investments involves a far greater level of risk than investing in issuers whose debt obligations are being met and whose debt trades at or close to its “par” value. These investments are highly speculative with respect to the issuer’s ability to continue to make interest payments and/or to pay its principal obligations in full; can be very difficult to properly value, making them susceptible to a high degree of price volatility and rendering them less liquid than performing debt obligations; and, for issuers involved in a bankruptcy proceeding, can be subject to a high degree of uncertainty with regard to both the timing and the amount of the ultimate settlement.
Second Lien Loan Risk. A second lien loan may have a claim on the same collateral pool as the first lien or it may be secured by a separate set of assets. Second lien loans are typically secured by a second priority security interest or lien on specified collateral securing the borrower’s obligation under the interest. Because second lien loans are second to first lien loans, they present a greater degree of investment risk. Specifically, these loans are subject to the additional risk that the cash flow of the borrower and property securing the loan may be insufficient to meet scheduled payments after giving effect to those loans with a higher priority. In addition, loans that have a lower than first lien priority on collateral of the borrower generally have greater price volatility than those loans with a higher priority and may be less liquid.
Senior Loan Risk. In the event a borrower fails to pay scheduled interest or principal payments on a senior loan held by the Fund, the Fund will experience a reduction in its income and a decline in the value of the senior loan, which will likely reduce dividends and lead to a decline in the net asset value of the Fund’s common shares. If the Fund acquires a senior loan from another lender, for example, by acquiring a participation, the Fund may also be subject to credit risks with respect to that lender. Although senior loans may be secured by specific collateral, the value of the collateral may not equal the Fund’s investment when the senior loan is acquired or may decline below the principal amount of the senior loan subsequent to the Fund’s investment. Also, to the extent that collateral consists of stock of the borrower or its subsidiaries or affiliates, the Fund bears the risk that the stock may decline in value, be relatively illiquid, and/or may lose all or substantially all of its value, causing the senior loan to be under collateralized. Therefore, the liquidation of the collateral underlying a senior loan may not satisfy the issuer’s obligation to the Fund in the event of non-payment of scheduled interest or principal, and the collateral may not be readily liquidated. The senior loan market has seen a significant increase in loans with weaker lender protections including, but not limited to, limited financial maintenance covenants or, in some cases, no financial maintenance covenants (i.e., “covenant-lite loans”) that would typically be included in a traditional loan agreement and general weakening of other restrictive covenants applicable to the borrower such as limitations on incurrence of additional debt, restrictions on payments of junior debt or restrictions on dividends and distributions. Weaker lender protections such as the absence of financial maintenance covenants in a loan agreement and the inclusion of “borrower-favorable” terms may impact recovery values and/or trading levels of senior loans in the future. The absence of financial maintenance covenants in a loan agreement generally means that the lender may not be able to declare a default if financial performance deteriorates. This may hinder the Fund’s ability to reprice credit risk associated with a particular borrower and reduce the Fund’s ability to restructure a problematic loan and mitigate potential loss. As a result, the Fund’s exposure to losses on investments in senior loans may be increased, especially during a downturn in the credit cycle or changes in market or economic conditions.
Valuation Risk. Because the secondary market for senior loans is limited, it may be difficult to value the loans held by the Fund. Market quotations may not be readily available for some senior loans and valuation may require more research than for liquid securities. In addition, elements of judgment may play a greater role in the valuation of senior loans than for securities with a secondary market, because there is less reliable objective data available. These difficulties may lead to inaccurate asset pricing.
Additional Information (Continued)
First Trust Senior Floating Rate Income Fund II (FCT)
November 30, 2019 (Unaudited)
Investment Management Agreement
Board Considerations Regarding Approval of Continuation of Investment Management Agreement
The Board of Trustees of First Trust Senior Floating Rate Income Fund II (the “Fund”), including the Independent Trustees, unanimously approved the continuation of the Investment Management Agreement (the “Agreement”) between the Fund and First Trust Advisors L.P. (the “Advisor”). The Board approved the continuation of the Agreement for a one-year period ending June 30, 2020 at a meeting held on June 2, 2019. The Board determined that the continuation of the Agreement is in the best interests of the Fund in light of the nature, extent and quality of the services provided and such other matters as the Board considered to be relevant in the exercise of its reasonable business judgment.
To reach this determination, the Board considered its duties under the Investment Company Act of 1940, as amended (the “1940 Act”), as well as under the general principles of state law, in reviewing and approving advisory contracts; the requirements of the 1940 Act in such matters; the fiduciary duty of investment advisors with respect to advisory agreements and compensation; the standards used by courts in determining whether investment company boards have fulfilled their duties; and the factors to be considered by the Board in voting on such agreements. At meetings held on April 18, 2019 and June 2, 2019, the Board, including the Independent Trustees, reviewed materials provided by the Advisor responding to requests for information from counsel to the Independent Trustees, submitted on behalf of the Independent Trustees, that, among other things, outlined: the services provided by the Advisor to the Fund (including the relevant personnel responsible for these services and their experience); the advisory fee rate payable by the Fund as compared to fees charged to a peer group of funds (the “Expense Group”) and a broad peer universe of funds (the “Expense Universe”), each assembled by Broadridge Financial Solutions, Inc. (“Broadridge”), an independent source, and as compared to fees charged to other clients of the Advisor; the expense ratio of the Fund as compared to expense ratios of the funds in the Fund’s Expense Group and Expense Universe; performance information for the Fund, including comparisons of the Fund’s performance to that of one or more relevant benchmark indexes and to that of a performance group of funds and a broad performance universe of funds (“the Performance Universe”), each assembled by Broadridge; the nature of expenses incurred in providing services to the Fund and the potential for economies of scale, if any; financial data on the Advisor; any fall-out benefits to the Advisor; and information on the Advisor’s compliance program. The Board reviewed initial materials with the Advisor at the meeting held on April 18, 2019, prior to which the Independent Trustees and their counsel met separately to discuss the information provided by the Advisor. Following the April meeting, independent legal counsel on behalf of the Independent Trustees requested certain clarifications and supplements to the materials provided, and the information provided in response to those requests was considered at an executive session of the Independent Trustees and independent legal counsel held prior to the June 2, 2019 meeting, as well as at the meeting held that day. The Board applied its business judgment to determine whether the arrangement between the Fund and the Advisor continues to be a reasonable business arrangement from the Fund’s perspective. The Board determined that, given the totality of the information provided with respect to the Agreement, the Board had received sufficient information to renew the Agreement. The Board considered that shareholders chose to invest or remain invested in the Fund knowing that the Advisor manages the Fund.
In reviewing the Agreement, the Board considered the nature, extent and quality of the services provided by the Advisor under the Agreement. The Board considered that the Advisor is responsible for the overall management and administration of the Fund and reviewed all of the services provided by the Advisor to the Fund, as well as the background and experience of the persons responsible for such services. The Board noted that the Advisor’s Leveraged Finance Investment Team is responsible for the day-to-day management of the Fund’s investments and considered the background and experience of the members of the Leveraged Finance Investment Team. The Board considered the Advisor’s statement that it applies the same oversight model internally with its Leveraged Finance Investment Team as it uses for overseeing external sub-advisors, including portfolio risk monitoring and performance review. In reviewing the services provided, the Board noted the compliance program that had been developed by the Advisor and considered that it includes a robust program for monitoring the Advisor’s and the Fund’s compliance with the 1940 Act, as well as the Fund’s compliance with its investment objectives, policies and restrictions. The Board also considered a report from the Advisor with respect to its risk management functions related to the operation of the Fund. Finally, as part of the Board’s consideration of the Advisor’s services, the Advisor, in its written materials and at the April 18, 2019 meeting, described to the Board the scope of its ongoing investment in additional infrastructure and personnel to maintain and improve the quality of services provided to the Fund and the other funds in the First Trust Fund Complex. In light of the information presented and the considerations made, the Board concluded that the nature, extent and quality of the services provided to the Fund by the Advisor under the Agreement have been and are expected to remain satisfactory and that the Advisor has managed the Fund consistent with its investment objectives, policies and restrictions.
The Board considered the advisory fee rate payable under the Agreement for the services provided. The Board received and reviewed information showing the advisory fee rates and expense ratios of the peer funds in the Expense Group, as well as advisory and unitary fee rates charged by the Advisor to other fund and non-fund clients, as applicable. With respect to the Expense Group, the Board, at the April 18, 2019 meeting, discussed with Broadridge its methodology for assembling peer groups and discussed with the Advisor limitations in creating a relevant peer group for the Fund. The Board took these limitations into account in considering the peer data, and noted that the advisory fee rate payable by the Fund, based on average managed assets, was below the median advisory fee of the
Additional Information (Continued)
First Trust Senior Floating Rate Income Fund II (FCT)
November 30, 2019 (Unaudited)
peer funds in the Expense Group. With respect to fees charged to other clients, the Board considered differences between the Fund and other clients that limited their comparability. In considering the advisory fee rate overall, the Board also considered the Advisor’s statement that it seeks to meet investor needs through innovative and value-added investment solutions and the Advisor’s description of its long-term commitment to the Fund.
The Board considered performance information for the Fund. The Board noted the process it has established for monitoring the Fund’s performance and portfolio risk on an ongoing basis, which includes quarterly performance reporting from the Advisor for the Fund. The Board determined that this process continues to be effective for reviewing the Fund’s performance. The Board received and reviewed information comparing the Fund’s performance for periods ended December 31, 2018 to the performance of the funds in the Performance Universe and to that of a benchmark index. In reviewing the Fund’s performance as compared to the performance of the Performance Universe, the Board took into account the limitations described above with respect to creating a relevant peer group for the Fund. Based on the information provided on net asset value performance, the Board noted that the Fund outperformed the Performance Universe median for the five- and ten-year periods ended December 31, 2018 but underperformed the Performance Universe median for the one- and three-year periods ended December 31, 2018. The Board also noted that the Fund outperformed the benchmark index for the three-, five- and ten-year periods ended December 31, 2018 but underperformed the benchmark index for the one-year period ended December 31, 2018. In addition, the Board considered information provided by the Advisor on the impact of leverage on the Fund’s returns. The Board also received information on the Fund’s annual distribution rate as of December 31, 2018 and the Fund’s average trading discount for various periods and comparable information for a peer group.
On the basis of all the information provided on the fees, expenses and performance of the Fund, and the ongoing oversight by the Board, the Board concluded that the advisory fees continue to be reasonable and appropriate in light of the nature, extent and quality of the services provided by the Advisor to the Fund under the Agreement.
The Board considered information and discussed with the Advisor whether there were any economies of scale in connection with providing advisory services to the Fund and noted the Advisor’s statement that it believes its expenses will likely increase over the next twelve months as the Advisor continues hire personnel and build infrastructure, including technology, to improve the services to the Fund. The Board determined that due to the Fund’s closed-end structure, the potential for realization of economies of scale as Fund assets grow was not a material factor to be considered. The Board considered the revenues and allocated costs (including the allocation methodology) of the Advisor in serving as investment advisor to the Fund for the twelve months ended December 31, 2018 and the estimated profitability level for the Fund calculated by the Advisor based on such data, as well as complex-wide and product-line profitability data, for the same period. The Board noted the inherent limitations in the profitability analysis and concluded that, based on the information provided, the Advisor’s profitability level for the Fund was not unreasonable. In addition, the Board considered fall-out benefits described by the Advisor that may be realized from its relationship with the Fund, including the Advisor’s compensation for fund reporting services pursuant to a separate Fund Reporting Services Agreement. The Board also noted that the Advisor does not utilize soft dollars in connection with the Fund. The Board concluded that the character and amount of potential fall-out benefits to the Advisor were not unreasonable.
Based on all of the information considered and the conclusions reached, the Board, including the Independent Trustees, unanimously determined that the terms of the Agreement continue to be fair and reasonable and that the continuation of the Agreement is in the best interests of the Fund. No single factor was determinative in the Board’s analysis.
INVESTMENT ADVISOR
First Trust Advisors L.P.
120 East Liberty Drive, Suite 400
Wheaton, IL 60187
TRANSFER AGENT
BNY Mellon Investment Servicing (US) Inc.
301 Bellevue Parkway
Wilmington, DE 19809
ADMINISTRATOR,
FUND ACCOUNTANT, AND
CUSTODIAN
The Bank of New York Mellon
240 Greenwich Street
New York, NY 10286
INDEPENDENT REGISTERED
PUBLIC ACCOUNTING FIRM
Deloitte & Touche LLP
111 S. Wacker Drive
Chicago, IL 60606
LEGAL COUNSEL
Chapman and Cutler LLP
111 W. Monroe Street
Chicago, IL 60603
Item 2. Code of Ethics.
Not applicable.
Item 3. Audit Committee Financial Expert.
Not applicable.
Item 4. Principal Accountant Fees and Services.
Not applicable.
Item 5. Audit Committee of Listed registrants.
Not applicable.
Item 6. Investments.
| (a) | | Schedule of Investments in securities of unaffiliated issuers as of the close of the reporting period is included as part of the report to shareholders filed under Item 1 of this form. |
Item 7. Disclosure of Proxy Voting Policies and Procedures for Closed-End Management Investment Companies.
Not applicable.
Item 8. Portfolio Managers of Closed-End Management Investment Companies.
| (b) | | There have been no changes, as of the date of filing, in any of the Portfolio Managers identified in response to paragraph (a)(1) of this item in the Registrant’s most recent annual report on Form N-CSR. |
Item 9. Purchases of Equity Securities by Closed-End Management Investment Company and Affiliated Purchasers.
Not applicable.
Item 10. Submission of Matters to a Vote of Security Holders.
There have been no material changes to the procedures by which the shareholders may recommend nominees to the registrant’s board of trustees, where those changes were implemented after the registrant last provided disclosure in response to the requirements of Item 407(c)(2)(iv) of Regulation S-K (17 CFR 229.407) (as required by Item 22(b)(15) of Schedule 14A (17 CFR 240.14a-101)), or this Item.
Item 11. Controls and Procedures.
| (a) | | The registrant’s principal executive and principal financial officers, or persons performing similar functions, have concluded that the registrant’s disclosure controls and procedures (as defined in Rule 30a-3(c) under the Investment Company Act of 1940, as amended (the “1940 Act”) (17 CFR 270.30a-3(c))) are effective, as of a date within 90 days of the filing date of the report that includes the disclosure required by this paragraph, based on their evaluation of these controls and procedures required by Rule 30a-3(b) under the 1940 Act (17 CFR 270.30a-3(b)) and Rules 13a-15(b) or 15d-15(b) under the Securities Exchange Act of 1934, as amended (17 CFR 240.13a-15(b) or 240.15d-15(b)). |
| (b) | | There were no changes in the registrant’s internal control over financial reporting (as defined in Rule 30a-3(d) under the 1940 Act (17 CFR 270.30a-3(d)) that occurred during the period covered by this report that has materially affected, or is reasonably likely to materially affect, the registrant’s internal control over financial reporting. |
Item 12. Disclosure of Securities Lending Activities for Closed-End Management Investment Companies.
Item 13. Exhibits.
| (a)(2) | | Certifications pursuant to Rule 30a-2(a) under the 1940 Act and Section 302 of the Sarbanes-Oxley Act of 2002 are attached hereto. |
| (b) | | Certifications pursuant to Rule 30a-2(b) under the 1940 Act and Section 906 of the Sarbanes- Oxley Act of 2002 are attached hereto. |
SIGNATURES
Pursuant to the requirements of the Securities Exchange Act of 1934 and the Investment Company Act of 1940, the registrant has duly caused this report to be signed on its behalf by the undersigned, thereunto duly authorized.
| (registrant) | | First Trust Senior Floating Rate Income Fund II |
| By (Signature and Title)* | | /s/ James M. Dykas |
| | | James M. Dykas, President and Chief Executive Officer
(principal executive officer) |
Pursuant to the requirements of the Securities Exchange Act of 1934 and the Investment Company Act of 1940, this report has been signed below by the following persons on behalf of the registrant and in the capacities and on the dates indicated.
| By (Signature and Title)* | | /s/ James M. Dykas |
| | | James M. Dykas, President and Chief Executive Officer
(principal executive officer) |
| By (Signature and Title)* | | /s/ Donald P. Swade |
| | | Donald P. Swade, Treasurer, Chief Financial Officer
and Chief Accounting Officer
(principal financial officer) |
* Print the name and title of each signing officer under his or her signature.