UNITED STATES
SECURITIES AND EXCHANGE COMMISSION
Washington, D.C. 20549
FORM N-CSRS
CERTIFIED SHAREHOLDER REPORT OF REGISTERED MANAGEMENT INVESTMENT COMPANIES
Investment Company Act file number 811-21539
First Trust Senior Floating Rate Income Fund II
(Exact name of registrant as specified in charter)
120 East Liberty Drive
Wheaton, IL 60187
(Address of principal executive offices) (Zip code)
W. Scott Jardine, Esq.
First Trust Portfolios L.P.
120 East Liberty Drive
Wheaton, IL 60187
(Name and address of agent for service)
Registrant's telephone number, including area code: 630-765-8000
Date of fiscal year end: May 31
Date of reporting period: November 30, 2022
Form N-CSR is to be used by management investment companies to file reports with the Commission not later than 10 days after the transmission to stockholders of any report that is required to be transmitted to stockholders under Rule 30e-1 under the Investment Company Act of 1940 (17 CFR 270.30e-1). The Commission may use the information provided on Form N-CSR in its regulatory, disclosure review, inspection, and policymaking roles.
A registrant is required to disclose the information specified by Form N-CSR, and the Commission will make this information public. A registrant is not required to respond to the collection of information contained in Form N-CSR unless the Form displays a currently valid Office of Management and Budget ("OMB") control number. Please direct comments concerning the accuracy of the information collection burden estimate and any suggestions for reducing the burden to Secretary, Securities and Exchange Commission, 100 F Street, NE, Washington, DC 20549. The OMB has reviewed this collection of information under the clearance requirements of 44 U.S.C. § 3507.
Item 1. Reports to Stockholders.
(a) The Report to Shareholders is attached herewith.

First Trust
Senior Floating Rate Income Fund II (FCT)
Semi-Annual Report
For the Six Months Ended
November 30, 2022
First Trust Senior Floating Rate Income Fund II (FCT)
Semi-Annual Report
November 30, 2022
Caution Regarding Forward-Looking Statements
This report contains certain forward-looking statements within the meaning of the Securities Act of 1933, as amended, and the Securities Exchange Act of 1934, as amended. Forward-looking statements include statements regarding the goals, beliefs, plans or current expectations of First Trust Advisors L.P. (“First Trust” or the “Advisor”) and its representatives, taking into account the information currently available to them. Forward-looking statements include all statements that do not relate solely to current or historical fact. For example, forward-looking statements include the use of words such as “anticipate,” “estimate,” “intend,” “expect,” “believe,” “plan,” “may,” “should,” “would” or other words that convey uncertainty of future events or outcomes.
Forward-looking statements involve known and unknown risks, uncertainties and other factors that may cause the actual results, performance or achievements of First Trust Senior Floating Rate Income Fund II (the “Fund”) to be materially different from any future results, performance or achievements expressed or implied by the forward-looking statements. When evaluating the information included in this report, you are cautioned not to place undue reliance on these forward-looking statements, which reflect the judgment of the Advisor and its representatives only as of the date hereof. We undertake no obligation to publicly revise or update these forward-looking statements to reflect events and circumstances that arise after the date hereof.
Performance and Risk Disclosure
There is no assurance that the Fund will achieve its investment objectives. The Fund is subject to market risk, which is the possibility that the market values of securities owned by the Fund will decline and that the value of the Fund’s shares may therefore be less than what you paid for them. Accordingly, you can lose money by investing in the Fund. See “Principal Risks” in the Additional Information section of this report for a discussion of certain other risks of investing in the Fund.
Performance data quoted represents past performance, which is no guarantee of future results, and current performance may be lower or higher than the figures shown. For the most recent month-end performance figures, please visit www.ftportfolios.com or speak with your financial advisor. Investment returns, net asset value and common share price will fluctuate and Fund shares, when sold, may be worth more or less than their original cost.
The Advisor may also periodically provide additional information on Fund performance on the Fund’s web page at www.ftportfolios.com.
How to Read This Report
This report contains information that may help you evaluate your investment in the Fund. It includes details about the Fund and presents data and analysis that provide insight into the Fund’s performance and investment approach.
By reading the portfolio commentary by the portfolio management team of the Fund, you may obtain an understanding of how the market environment affected the Fund’s performance. The statistical information that follows may help you understand the Fund’s performance compared to that of a relevant market benchmark.
It is important to keep in mind that the opinions expressed by personnel of the Advisor are just that: informed opinions. They should not be considered to be promises or advice. The opinions, like the statistics, cover the period through the date on the cover of this report. The material risks of investing in the Fund are spelled out in the prospectus, the statement of additional information, this report and other Fund regulatory filings.
First Trust Senior Floating Rate Income Fund II (FCT)
Semi-Annual Letter from the Chairman and CEO
November 30, 2022
Dear Shareholders,
First Trust is pleased to provide you with the semi-annual report for the First Trust Senior Floating Rate Income Fund II (the “Fund”), which contains detailed information about the Fund for the six months ended November 30, 2022.
The risk of the U.S. economy experiencing a notable recession in 2023 is rising. The Federal Reserve (the “Fed”) has remained steadfast in its battle with stubbornly high inflation, most recently raising the Federal Funds target rate (upper bound) from 4.0% to 4.5% on December 13, 2022. The trailing 12-month rate on the Consumer Price Index (“CPI”) peaked at 9.1% on June 30, 2022, before falling to 7.1% (its lowest level of the year) on November 30, 2022, according to data from the U.S. Bureau of Labor Statistics. For comparative purposes, the CPI rate has averaged 2.5% over the past 30 years. Some pundits are making the case that the recent drop in the CPI should be enough evidence to sway the Fed from initiating any additional rate hikes. The Fed, however, has reiterated its intent to stay the course until the tightening of monetary policy has grown restrictive enough to normalize inflation. Ultimately, the Fed would like to bring the rate of inflation back to its 2.0% target. How high they will have to take the Federal Funds target rate in order to achieve that goal remains to be seen, but we should know more in the first quarter of 2023.
Suffice it to say, many Americans are struggling to cope with the high rate of inflation and they are not just low wage workers. A recent report by PYMNTS, a research, data aggregation and news website, revealed that roughly 45% of workers earning over $100,000 per year and 28% of those earning over $200,000 per year are living paycheck to paycheck. The personal savings rate in the U.S. has been plummeting, registering quarter-over-quarter declines in each of the last five quarters, according to the U.S. Bureau of Economic Analysis. Everything costs more. Preliminary data shows the savings rate fell from 9.1% in the third quarter of 2021, to just 2.8% in the third quarter of 2022. Rising interest rates are another source of pressure. Housing affordability has fallen to a decade low as mortgage rates have surged along with the Federal Funds rate, according to the National Association of Homebuilders. Home prices, as represented by the S&P CoreLogic Case-Shiller U.S. National Home Price Index, have been slowly declining since June 2022, but need to come down further to offset the spike in mortgage rates, in my opinion. With the housing market softening, job creation, which remains strong, may be one of the few bright spots in the U.S. economy.
We’ve talked about how higher inflation and interest rates are causing difficulty for many Americans. I’d like to pause here and note that while times are tough, not everything is negative. Take the bond market for example. Yields have not been this attractive for many years. The yield on the 10-Year Treasury Note (“T-Note”) has risen 208 basis points year-to-date, climbing from 1.51% on December 31, 2021, to 3.59% on December 19, 2022. For comparative purposes, the yield on the 10-Year T-Note averaged 4.03% for the 30-year period ended December 31, 2021. As yields normalize and bond prices fall, investors seeking current income should keep a watchful eye for an attractive entry point, in my opinion. Furthermore, while the equity markets have moved in and out of bear market territory (a bear market is defined as a price decline of 20% or more from a security or index’s recent high) in 2022, equity strategists are predicting a relatively flat market next year, based on estimates from a December 2022 Bloomberg survey for S&P 500® Index forecasts. For some investors, if growth is going to be tough to come by, perhaps stock dividends may be an avenue worth pursuing. In closing, I believe that the markets could be in for a bumpy ride in the first half of 2023, but I am more optimistic about the prospects for the latter half. Stay tuned!
Thank you for giving First Trust the opportunity to play a role in your financial future. We value our relationship with you and will report on the Fund again in six months.
Sincerely,
James A. Bowen
Chairman of the Board of Trustees
Chief Executive Officer of First Trust Advisors L.P.
First Trust Senior Floating Rate Income Fund II (FCT)
“AT A GLANCE”
As of November 30, 2022 (Unaudited)
| Fund Statistics | |
| Symbol on New York Stock Exchange | FCT |
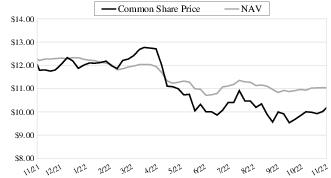
| Common Share Price | $10.18 |
| Common Share Net Asset Value (“NAV”) | $11.03 |
| Premium (Discount) to NAV | (7.71)% |
| Net Assets Applicable to Common Shares | $286,709,541 |
| Current Monthly Distribution per Common Share(1) | $0.0695 |
| Current Annualized Distribution per Common Share | $0.8340 |
| Current Distribution Rate on Common Share Price(2) | 8.19% |
| Current Distribution Rate on NAV(2) | 7.56% |
Common Share Price & NAV (weekly closing price)
| Performance | | | | | |
| | | | Average Annual Total Returns |
| | 6 Months Ended
11/30/22 | 1 Year Ended
11/30/22 | 5 Years Ended
11/30/22 | 10 Years Ended
11/30/22 | Inception
(5/25/04)
to 11/30/22 |
| Fund Performance(3) | | | | | |
| NAV | 1.78% | -2.61% | 3.13% | 4.24% | 4.01% |
| Market Value | -2.61% | -8.47% | 3.25% | 3.19% | 3.30% |
| Index Performance | | | | | |
Morningstar® LSTA® US Leveraged
Loan Index(4) | 1.44% | -0.41% | 3.30% | 3.70% | 4.39% |
| Credit Quality (S&P Ratings) (5) | % of Senior
Loans and other
Debt Securities(6) |
| BBB- | 5.0% |
| BB+ | 7.3 |
| BB | 3.8 |
| BB- | 11.0 |
| B+ | 16.2 |
| B | 38.1 |
| B- | 15.3 |
| CCC+ | 2.0 |
| CCC | 0.6 |
| Not Rated | 0.7 |
| Total | 100.0% |
| Top 10 Issuers | % of Total
Long-Term
Investments(6) |
| HUB International Limited | 4.2% |
| Alliant Holdings I, LLC | 4.2 |
| Internet Brands, Inc. (Web MD/MH Sub I, LLC) | 4.0 |
| Verscend Technologies, Inc. (Cotiviti) | 3.6 |
| Charter Communications Operating, LLC | 3.0 |
| IRB Holding Corp. (Arby’s/Inspire Brands) | 2.7 |
| AssuredPartners, Inc. | 2.6 |
| Applied Systems, Inc. | 2.5 |
| Nexstar Broadcasting, Inc. | 2.4 |
| SS&C Technologies, Inc. | 2.2 |
| Total | 31.4% |
| (1) | Most recent distribution paid or declared through November 30, 2022. Subject to change in the future. |
| (2) | Distribution rates are calculated by annualizing the most recent distribution paid or declared through the report date and then dividing by Common Share Price or NAV, as applicable, as of November 30, 2022. Subject to change in the future. |
| (3) | Total return is based on the combination of reinvested dividend, capital gain and return of capital distributions, if any, at prices obtained by the Dividend Reinvestment Plan and changes in NAV per share for NAV returns and changes in Common Share Price for market value returns. From inception to October 12, 2010, Four Corners Capital Management, LLC served as the Fund’s sub-advisor. Effective October 12, 2010, the Leveraged Finance Team of First Trust Advisors L.Pon to October 12, 2010, Four Corners Capital Management, LLC served as the Fund’s sub-advisor. Effective October 12, 201. assumed the day-to-day responsibility for management of the Fund’s portfolio. Total returns do not reflect sales load and are not annualized for periods of less than one year. Past performance is not indicative of future results. |
| (4) | Formerly, S&P/LSTA Leveraged Loan Index. |
| (5) | The ratings are by S&P Global Ratings except where otherwise indicated. A credit rating is an assessment provided by a nationally recognized statistical rating organization (NRSRO) of the creditworthiness of an issuer with respect to debt obligations except for those debt obligations that are only privately rated. Ratings are measured on a scale that generally ranges from AAA (highest) to D (lowest). Investment grade is defined as those issuers that have a long-term credit rating of BBB- or higher. The credit ratings shown relate to the creditworthiness of the issuers of the underlying securities in the Fund, and not to the Fund or its shares. Credit ratings are subject to change. |
| (6) | Percentages are based on long-term positions. Money market funds are excluded. |
First Trust Senior Floating Rate Income Fund II (FCT)
“AT A GLANCE” (Continued)
As of November 30, 2022 (Unaudited)
| Industry Classification | % of Total
Long-Term
Investments(6) |
| Software | 22.1% |
| Insurance | 12.5 |
| Media | 10.7 |
| Health Care Technology | 10.5 |
| Hotels, Restaurants & Leisure | 8.9 |
| Health Care Providers & Services | 7.6 |
| Commercial Services & Supplies | 3.0 |
| Containers & Packaging | 2.9 |
| Wireless Telecommunication Services | 2.1 |
| Electric Utilities | 2.1 |
| Diversified Telecommunication Services | 2.1 |
| Pharmaceuticals | 1.9 |
| Capital Markets | 1.9 |
| Food Products | 1.9 |
| Professional Services | 1.6 |
| Health Care Equipment & Supplies | 1.5 |
| Aerospace & Defense | 1.2 |
| Specialty Retail | 1.1 |
| Diversified Consumer Services | 1.0 |
| Diversified Financial Services | 0.7 |
| Trading Companies & Distributors | 0.7 |
| Electronic Equipment, Instruments & Components | 0.6 |
| Machinery | 0.3 |
| Auto Components | 0.3 |
| Communications Equipment | 0.2 |
| Food & Staples Retailing | 0.2 |
| Household Durables | 0.2 |
| Building Products | 0.1 |
| IT Services | 0.1 |
| Oil, Gas & Consumable Fuels | 0.0* |
| Entertainment | 0.0* |
| Life Sciences Tools & Services | 0.0* |
| Total | 100.0% |
| * | Amount is less than 0.1%. |
Portfolio Commentary
First Trust Senior Floating Rate Income Fund II (FCT)
Semi-Annual Report
November 30, 2022 (Unaudited)
Advisor
The First Trust Advisors L.P. (“First Trust”) Leveraged Finance Team is comprised of 17 experienced investment professionals specializing in below investment grade securities. The team is comprised of portfolio management, research, trading and operations personnel. As of November 30, 2022, the First Trust Leveraged Finance Team managed or supervised approximately $5.8 billion in senior secured bank loans and high-yield bonds. These assets are managed across various strategies, including two closed-end funds, an open-end fund, and four exchange-traded funds on behalf of retail and institutional clients.
Portfolio Management Team
William Housey, CFA - Managing Director of Fixed Income, Senior Portfolio Manager
Jeffrey Scott, CFA - Senior Vice President, Portfolio Manager
Commentary
First Trust Senior Floating Rate Income Fund II
The primary investment objective of First Trust Senior Floating Rate Income Fund II (“FCT” or the “Fund”) is to seek a high level of current income. As a secondary objective, the Fund attempts to preserve capital. The Fund pursues its investment objectives by investing primarily in a portfolio of senior secured floating-rate corporate loans (“Senior Loans”). Under normal market conditions, the Fund invests at least 80% of its Managed Assets in a diversified portfolio of Senior Loans. It is anticipated that at least 80% of the Fund’s Managed Assets are invested in lower grade debt instruments, although from time to time all of the Fund’s Managed Assets may be invested in such lower grade debt instruments. “Managed Assets” means the total asset value of the Fund minus the sum of its liabilities, other than the principal amount of borrowings. There can be no assurance that the Fund will achieve its investment objectives. Investing in Senior Loans involves credit risk and, during periods of generally declining credit quality, it may be particularly difficult for the Fund to achieve its secondary investment objective. The Fund may not be appropriate for all investors.
Market Recap
During the six-month period ended November 30, 2022, inflation remained stubbornly elevated with the October 2022 Consumer Price Index printing 7.7% on a year-over-year basis; meanwhile, the Federal Reserve (the “Fed”) continues to reiterate its commitment to a 2.0% inflation target. The Fed increased the Federal Funds target rate by 375 basis points (“bps”) since it began raising interest rates in March 2022, moving the upper bound from 0.25% to 4.00% over the course of six meetings. In each of the last four meetings through November 30, 2022, the Fed increased the Federal Funds rate by a full 75 bps. Due to the persistence of the inflation data and how far it is from the Fed’s target inflation rate, we do not believe the Fed can “pivot” to a more accommodative posture until either (1) inflation has been tamed, or (2) a recession is near or already underway, absent any major financial market calamity. Further, Fed Chairman Jerome Powell continues to make the Fed’s position abundantly clear, repeatedly noting that history cautions against rashly loosening interest rate policy despite the potential pain to households and businesses. The 10-Year U.S. Treasury yield increased by 77 bps from 2.84% at the beginning of the period to 3.61% at the end of the period. U.S. Equities traded sideways as investors attempted to reconcile modestly improving inflation expectations with lackluster growth forecasts. After losing as much as 12.90% from the start of the period, the S&P 500® Index returned -0.40% during the six-month period ended November 30, 2022.
Senior Loan Market
Senior loan spreads over the 3-month London Interbank Offered Rate (“LIBOR”) increased by 78 bps to L+629 bps during the six-month period ended November 30, 2022. The current spread is 113 bps above the senior loan market’s long-term average spread of L+516 bps (December 1997 – November 2022). Retail senior loan funds experienced their seventh consecutive monthly outflow in November 2022. Loan fund outflows totaled $26.8 billion throughout the six-month period ended November 30, 2022. Despite higher rates and returns that have been far more resilient than most traditional fixed-income asset classes, demand waned for senior loans as market volatility increased.
BB rated senior loans were up 3.71% and outperformed both B rated (1.20%) and CCC rated senior loans (-6.32%) during the six-month period ended November 30, 2022. The average price of the senior loan asset class decreased from $94.64 at the beginning of the period to $92.78 at the end of the period.
Default rates, as measured by the Morningstar® LSTA® US Leveraged Loan Index (the “Index”), increased modestly throughout the period. During the last twelve-month period (“LTM”), the default rate of the senior loan market rose from 0.21% at the beginning of the period to 0.73% at the end of the period, remaining well below the long-term average of 2.75% (December 1997 – November 2022).
Portfolio Commentary (Continued)
First Trust Senior Floating Rate Income Fund II (FCT)
Semi-Annual Report
November 30, 2022 (Unaudited)
Performance Analysis
| | | | Average Annual Total Returns |
| | 6 Months Ended
11/30/22 | 1 Year Ended
11/30/22 | 5 Years Ended
11/30/22 | 10 Years Ended
11/30/22 | Inception
(5/25/04)
to 11/30/22 |
| Fund Performance(1) | | | | | |
| NAV | 1.78% | -2.61% | 3.13% | 4.24% | 4.01% |
| Market Value | -2.61% | -8.47% | 3.25% | 3.19% | 3.30% |
| Index Performance | | | | | |
| Morningstar® LSTA® US Leveraged Loan Index* | 1.44% | -0.41% | 3.30% | 3.70% | 4.39% |

Performance figures assume reinvestment of all distributions and do not reflect the deduction of taxes that a shareholder would pay on Fund distributions or the redemption or sale of Fund shares. An index is a statistical composite that tracks a specified financial market or sector. Unlike the Fund, the index does not actually hold a portfolio of securities and therefore does not incur the expenses incurred by the Fund. These expenses negatively impact the performance of the Fund. The Fund’s past performance does not predict future performance.
For the six-month period ended November 30, 2022, the Fund returned(1) 1.78%, based on net asset value (“NAV”) and -2.61%, based on market price. The Index returned 1.44% over the same period. At the start of the period, the Fund’s market price represented a 3.54% discount to NAV; by the end of the period, the Fund’s discount to NAV widened by 417 bps to 7.71%.
The Fund’s use of leverage drove performance in the six-month period ended November 30, 2022, as asset prices generated positive returns. The Fund strategically decreased leverage from 28.31% of adjusted net assets (net assets plus borrowings) at the beginning of the period to 15.85% at the end of the period by selling into market strength. The Fund also benefited from strong security selection in the Software industry. Within the Software industry, the Fund’s overweight positions in a digital advertising company, an insurance software provider, and an enterprise software provider drove performance as the companies outperformed the Index’s industry returns. The Fund’s overweight allocation to the Insurance industry further drove performance, as the Fund maintained a 12.51% average weight to the Insurance industry, compared to the Index’s average weight of 2.76%, and the industry outperformed. The Fund’s security selection within the Diversified Telecommunication Services and Media industries partially offset these tailwinds. Within the Diversified Telecommunication Services industry, the Fund’s overweight position in a bandwidth infrastructure services provider proved the primary detractor from performance. Within the Media industry, the Fund’s high-yield bond allocation proved the primary detractor from performance as high-yield bonds (-3.03%) modestly underperformed senior loans in the period (1.44%). As of November 30, 2022 the Fund had a 7.84% allocation to high-yield bonds.
| (1) | Total return is based on the combination of reinvested divided, capital gain, and return of capital distribution, if any, at prices obtained by the Dividend Reinvestment Plan and changes in NAV per Common Share for NAV returns and changes in Common Share price for market value returns. Total returns do not reflect sales load and are not annualized for period of less than one year. |
| * | Formerly, S&P/LSTA Leveraged Loan Index. |
| | |
Portfolio Commentary (Continued)
First Trust Senior Floating Rate Income Fund II (FCT)
Semi-Annual Report
November 30, 2022 (Unaudited)
The Fund held 161 individual positions diversified across 32 industries at the end of the reporting period, compared to 193 individual positions across 31 industries at the beginning of the period. The Software industry (22.07%), the Insurance industry (12.47%), and the Media industry (10.71%) represented the Fund’s top three industry exposures at the end of the period. The Fund increased its allocation to high-yield bonds by 592 bps from 1.92% at the beginning of the period to 7.88% at the end of the period. The Fund’s duration remained low throughout the period, modestly increasing from 0.42 years to 0.59 years.
The Fund has a practice of seeking to maintain a relatively stable monthly distribution, which may be changed at any time. The practice has no impact on the Fund’s investment strategy and may reduce the Fund’s NAV. However, the Advisor believes the practice helps maintain the Fund’s competitiveness and may benefit the Fund’s market price and premium/discount to the Fund’s NAV. The monthly distribution rate began the period at $0.0720 per share and ended the period at $0.0695 per share. At the $0.0695 per share monthly distribution rate, the annualized distribution rate at November 30, 2022 was 7.56% based on NAV and 8.19% based on market price. The Fund’s distributions for the six-month period ended November 30, 2022 will consist of net investment income earned by the Fund and return of capital. The final determination of the source and tax status of all 2022 distributions will be made after the end of 2022 and will be provided on Form 1099-DIV. The foregoing is not to be construed as tax advice. Please consult your tax advisor for further information regarding tax matters.
The Fund experienced one default in the LTM period ended November 30, 2022, compared to 8 defaults within the Index over the same period. The Fund has experienced 13 defaults since the Leveraged Finance Investment Team began managing the Fund in October 2010; this compares to 173 within the Index over the same period. The Fund’s LTM default rate of 1.17% was modestly above the Index’s LTM default rate of 0.73% at the end of the period.
Market and Fund Outlook
Our market framework centers on our view that the Fed will stay the course, ultimately holding interest rates at such a restrictive level that it tilts the economy into recession, most likely in the second half of 2023, in our opinion. We therefore expect market volatility to continue as investors attempt to gauge the ultimate Federal Funds target rate as well as the likelihood, and timing of, a recession. Consequently, we favor increasing credit quality while defensively positioning in sectors with limited cyclicality. Further, improved valuations have created attractive opportunities in the corporate credit landscape. As we assess such market opportunities, we continue to employ our bottom-up credit underwriting process and rigorous approach to risk management.
First Trust Senior Floating Rate Income Fund II (FCT)
Portfolio of Investments
November 30, 2022 (Unaudited)
Principal
Value | | Description | | Rate (a) | | Stated
Maturity (b) | | Value |
| SENIOR FLOATING-RATE LOAN INTERESTS (c) – 109.3% |
| | | Aerospace & Defense – 1.4% | | | | | | |
| $4,082,724 | | Transdigm, Inc., Tranche G Refinancing TL, 3 Mo. LIBOR + 2.25%, 0.00% Floor
| | 5.92% | | 08/22/24 | | $4,062,678 |
| | | Application Software – 20.5% | | | | | | |
| 7,114,966 | | Applied Systems, Inc., 1st Lien Term Loan, 3 Mo. LIBOR + 3.00%, 0.50% Floor
| | 6.67% | | 09/19/24 | | 7,086,648 |
| 1,462,693 | | Applied Systems, Inc., 2nd Lien Term Loan, 3 Mo. LIBOR + 5.50%, 0.75% Floor
| | 9.17% | | 09/19/25 | | 1,448,066 |
| 1,527,408 | | ConnectWise, LLC, Term Loan B, 3 Mo. LIBOR + 3.50%, 0.50% Floor
| | 7.17% | | 09/30/28 | | 1,464,020 |
| 5,118,134 | | Epicor Software Corp., First Lien Term Loan C, 1 Mo. LIBOR + 3.25%, 0.75% Floor
| | 7.32% | | 07/30/27 | | 4,936,850 |
| 82,458 | | Flexera Software, LLC, 2020 Term Loan B, 1 Mo. LIBOR + 3.75%, 0.75% Floor
| | 7.83% | | 01/26/28 | | 79,297 |
| 4,385,854 | | Gainwell Acquisition Corp. (fka Milano), Term Loan B, 3 Mo. LIBOR + 4.00%, 0.75% Floor
| | 7.67% | | 10/01/27 | | 4,271,822 |
| 3,343,529 | | Greeneden U.S. Holdings II, LLC (Genesys Telecommunications Laboratories, Inc.), Initial Dollar Term Loan, 1 Mo. LIBOR + 4.00%, 0.75% Floor
| | 8.07% | | 12/01/27 | | 3,241,150 |
| 611,678 | | Hyland Software, Inc., 2nd Lien Term Loan, 1 Mo. LIBOR + 6.25%, 0.75% Floor
| | 10.32% | | 07/10/25 | | 576,892 |
| 2,005,649 | | Hyland Software, Inc., Term Loan B, 1 Mo. LIBOR + 3.50%, 0.75% Floor
| | 7.57% | | 07/01/24 | | 1,974,320 |
| 4,496,967 | | Internet Brands, Inc. (Web MD/MH Sub I., LLC), 2020 June New Term Loan, 1 Mo. LIBOR + 3.75%, 1.00% Floor
| | 7.82% | | 09/15/24 | | 4,370,513 |
| 1,265,863 | | Internet Brands, Inc. (Web MD/MH Sub I., LLC), 2nd Lien Term Loan, 3 Mo. SOFR + 6.25%, 0.00% Floor
| | 10.65% | | 02/23/29 | | 1,134,530 |
| 8,465,748 | | Internet Brands, Inc. (Web MD/MH Sub I., LLC), Initial Term Loan, 1 Mo. LIBOR + 3.75%, 0.00% Floor
| | 7.82% | | 09/13/24 | | 8,229,385 |
| 279,886 | | ION Trading Technologies Limited, Term Loan B, 3 Mo. LIBOR + 4.75%, 0.00% Floor
| | 8.42% | | 04/01/28 | | 267,291 |
| 4,805,130 | | LogMeIn, Inc. (GoTo Group, Inc.), Term Loan B, 1 Mo. LIBOR + 4.75%, 0.00% Floor
| | 8.77% | | 08/31/27 | | 3,073,265 |
| 2,177,572 | | McAfee Corp. (Condor Merger Sub, Inc.), Term Loan B, 1 Mo. SOFR + 3.75%, 0.50% Floor
| | 7.64% | | 02/28/29 | | 2,064,621 |
| 361,174 | | N-Able, Inc., Term Loan B, 3 Mo. LIBOR + 3.00%, 0.50% Floor
| | 7.73% | | 07/19/28 | | 349,887 |
| 2,092,956 | | Open Text Corporation (GXS), New Term Loan, 1 Mo. SOFR + 3.50%, 0.50% Floor
| | 7.39% | | 12/31/29 | | 2,031,046 |
| 2,209,510 | | Open Text Corporation (GXS), Term Loan, 1 Mo. LIBOR + 1.75%, 0.00% Floor
| | 5.82% | | 05/30/25 | | 2,163,663 |
| 912,941 | | RealPage, Inc., Second Lien Term Loan, 1 Mo. LIBOR + 6.50%, 0.75% Floor
| | 10.57% | | 04/22/29 | | 873,575 |
| 5,731,488 | | RealPage, Inc., Term Loan B, 1 Mo. LIBOR + 3.00%, 0.50% Floor
| | 7.07% | | 04/24/28 | | 5,477,182 |
| 3,073,447 | | SolarWinds Holdings, Inc., Initial Term Loan. 1 Mo. SOFR+ 4.00%, 0.00% Floor
| | 7.95% | | 02/17/27 | | 3,017,757 |
| 488,794 | | Solera Holdings, Inc. (Polaris Newco), Term Loan B, 3 Mo. LIBOR + 4.00%, 0.50% Floor
| | 7.67% | | 06/04/28 | | 445,565 |
| 232,552 | | Ultimate Kronos Group (UKG, Inc.), 2021 Term Loan, 3 Mo. LIBOR + 3.25%, 0.50% Floor
| | 7.00% | | 05/03/26 | | 224,315 |
| | | | | 58,801,660 |
| | | Asset Management & Custody Banks – 2.3% | | | | | | |
| 3,789,412 | | Edelman Financial Engines Center, LLC, Term Loan B, 1 Mo. LIBOR + 3.50%, 0.75% Floor
| | 7.57% | | 04/07/28 | | 3,611,120 |
See Notes to Financial Statements
Page 7
First Trust Senior Floating Rate Income Fund II (FCT)
Portfolio of Investments (Continued)
November 30, 2022 (Unaudited)
Principal
Value | | Description | | Rate (a) | | Stated
Maturity (b) | | Value |
| SENIOR FLOATING-RATE LOAN INTERESTS (c) (Continued) |
| | | Asset Management & Custody Banks (Continued) | | | | | | |
| $3,248,900 | | Edelman Financial Engines Center, LLC, Term Loan Second Lien, 1 Mo. LIBOR + 6.75%, 0.00% Floor
| | 10.82% | | 07/20/26 | | $2,921,996 |
| | | | | 6,533,116 |
| | | Auto Parts & Equipment – 0.3% | | | | | | |
| 547,253 | | Clarios Global LP (Power Solutions), Term Loan B, 1 Mo. LIBOR + 3.25%, 0.00% Floor
| | 7.32% | | 04/30/26 | | 537,791 |
| 519,374 | | Truck Hero, Inc., Term Loan B, 1 Mo. LIBOR + 3.75%, 0.75% Floor
| | 7.82% | | 01/31/28 | | 437,832 |
| | | | | 975,623 |
| | | Broadcasting – 4.5% | | | | | | |
| 329,625 | | E.W. Scripps Company, Tranche B-3 Term Loan, 1 Mo. LIBOR + 2.75%, 0.75% Floor
| | 6.82% | | 01/07/28 | | 319,855 |
| 1,519,988 | | Gray Television, Inc., Term Loan B2, 1 Mo. LIBOR + 2.50%, 0.00% Floor
| | 6.27% | | 02/07/24 | | 1,516,188 |
| 1,719,808 | | Gray Television, Inc., Term Loan C, 1 Mo. LIBOR + 2.50%, 0.00% Floor
| | 6.27% | | 01/02/26 | | 1,669,074 |
| 3,101,009 | | iHeartCommunications, Inc., Second Amendment Incremental Term Loan B, 1 Mo. LIBOR + 3.25%, 0.50% Floor
| | 7.32% | | 05/01/26 | | 2,900,405 |
| 1,199,070 | | iHeartCommunications, Inc., Term Loan B, 1 Mo. LIBOR + 3.00%, 0.00% Floor
| | 7.07% | | 05/01/26 | | 1,121,777 |
| 5,298,604 | | Nexstar Broadcasting, Inc., Incremental Term Loan B-4, 1 Mo. LIBOR + 2.50%, 0.00% Floor
| | 6.57% | | 09/19/26 | | 5,251,128 |
| 21,121 | | Univision Communications, Inc., 2017 Replacement Repriced First Lien Term Loan C-5, 1 Mo. LIBOR + 2.75%, 1.00% Floor
| | 6.82% | | 03/15/24 | | 21,068 |
| 11,616 | | Univision Communications, Inc., 2021 Replacement New First Lien Term Loan, 1 Mo. LIBOR + 3.25%, 0.75% Floor
| | 7.32% | | 03/15/26 | | 11,399 |
| | | | | 12,810,894 |
| | | Building Products – 0.1% | | | | | | |
| 264,822 | | Hunter Douglas, Inc. (Solis), Term Loan B, 3 Mo. SOFR + 3.50%, 0.50% Floor
| | 7.86% | | 02/28/29 | | 230,538 |
| | | Cable & Satellite – 2.8% | | | | | | |
| 4,647,746 | | Cablevision (aka CSC Holdings, LLC), March 2017 Term Loan B-1, 1 Mo. LIBOR + 2.25%, 0.00% Floor
| | 6.12% | | 07/17/25 | | 4,443,246 |
| 3,537,674 | | Charter Communications Operating, LLC, Term Loan B1, 1 Mo. LIBOR + 1.75%, 0.00% Floor
| | 5.83% | | 04/30/25 | | 3,478,524 |
| | | | | 7,921,770 |
| | | Casinos & Gaming – 1.5% | | | | | | |
| 4,433,940 | | Golden Nugget, Inc. (Fertitta Entertainment, LLC), Initial Term Loan B, 1 Mo. SOFR + 4.00%, 0.50% Floor
| | 8.09% | | 01/27/29 | | 4,222,308 |
| 217,409 | | Scientific Games Holdings LP (Scientific Games Lottery), Initial Dollar Term Loan, 3 Mo. SOFR + 3.50%, 0.50% Floor
| | 7.10% | | 04/04/29 | | 207,354 |
| | | | | 4,429,662 |
| | | Coal & Consumable Fuels – 0.0% | | | | | | |
| 36,248 | | Arch Coal, Inc., Term Loan B, 1 Mo. LIBOR + 2.75%, 1.00% Floor
| | 6.82% | | 03/07/24 | | 35,863 |
| | | Communications Equipment – 0.3% | | | | | | |
| 855,069 | | Commscope, Inc., Term Loan B, 1 Mo. LIBOR + 3.25%, 0.00% Floor
| | 7.32% | | 04/06/26 | | 820,601 |
Page 8
See Notes to Financial Statements
First Trust Senior Floating Rate Income Fund II (FCT)
Portfolio of Investments (Continued)
November 30, 2022 (Unaudited)
Principal
Value | | Description | | Rate (a) | | Stated
Maturity (b) | | Value |
| SENIOR FLOATING-RATE LOAN INTERESTS (c) (Continued) |
| | | Data Processing & Outsourced Services – 0.1% | | | | | | |
| $200,204 | | Paysafe Holdings (US) Corp., Facility B1 Loan, 1 Mo. LIBOR + 2.75%, 0.50% Floor
| | 6.82% | | 06/24/28 | | $185,189 |
| | | Education Services – 0.5% | | | | | | |
| 1,471,918 | | Ascensus Holdings, Inc. (Mercury), First Lien Term Loan, 3 Mo. LIBOR + 3.50%, 0.50% Floor
| | 7.19% | | 08/02/28 | | 1,409,361 |
| | | Electric Utilities – 2.5% | | | | | | |
| 7,175,555 | | PG&E Corp., Term Loan B, 1 Mo. LIBOR + 3.00%, 0.50% Floor
| | 7.13% | | 06/23/25 | | 7,057,445 |
| | | Electronic Equipment & Instruments – 0.7% | | | | | | |
| 1,368,043 | | Chamberlain Group, Inc. (Chariot), Term Loan B, 1 Mo. LIBOR + 3.50%, 0.50% Floor
| | 7.57% | | 11/03/28 | | 1,278,696 |
| 870,089 | | Verifone Systems, Inc., Term Loan B, 3 Mo. LIBOR + 4.00%, 0.00% Floor
| | 8.36% | | 08/20/25 | | 784,307 |
| | | | | 2,063,003 |
| | | Environmental & Facilities Services – 2.6% | | | | | | |
| 5,725,622 | | GFL Environmental, Inc., Term Loan B, 3 Mo. LIBOR + 3.00%, 0.50% Floor
| | 7.41% | | 05/31/25 | | 5,711,308 |
| 2,089,291 | | Packers Holdings, LLC (PSSI), Term Loan B, 1 Mo. LIBOR + 3.25%, 0.75% Floor
| | 7.13% | | 03/15/28 | | 1,817,683 |
| | | | | 7,528,991 |
| | | Food Distributors – 0.3% | | | | | | |
| 778,611 | | US Foods, Inc., Incremental B-2019 Term Loan, 1 Mo. LIBOR + 2.00%, 0.00% Floor
| | 6.07% | | 08/31/26 | | 767,041 |
| | | Health Care Equipment – 0.0% | | | | | | |
| 86,399 | | Embecta Corp., Initial Term Loan, 3 Mo. SOFR + 3.00%, 0.50% Floor
| | 6.55% | | 03/31/29 | | 82,997 |
| | | Health Care Facilities – 0.8% | | | | | | |
| 495,273 | | Ardent Health Services Inc (AHP Health Partners, Inc.), Term Loan B, 1 Mo. LIBOR + 3.50%, 0.50% Floor
| | 7.57% | | 08/24/28 | | 481,445 |
| 2,000,000 | | Select Medical Corporation, Term Loan B, 1 Mo. LIBOR + 2.50%, 0.00% Floor
| | 6.58% | | 03/06/25 | | 1,960,620 |
| | | | | 2,442,065 |
| | | Health Care Services – 5.6% | | | | | | |
| 2,988,859 | | ADMI Corp. (Aspen Dental), 2020 Incremental Term Loan B2, 1 Mo. LIBOR + 3.38%, 0.50% Floor
| | 7.45% | | 12/23/27 | | 2,746,014 |
| 2,512,004 | | ADMI Corp. (Aspen Dental), 2021 Incremental Term Loan B3, 1 Mo. LIBOR + 3.75%, 0.50% Floor
| | 7.82% | | 12/23/27 | | 2,292,204 |
| 771,968 | | Aveanna Healthcare, LLC, 2021 Term Loan B, 1 Mo. LIBOR + 3.75%, 0.50% Floor
| | 7.77% | | 07/15/28 | | 592,485 |
| 315,285 | | Brightspring Health (Phoenix Guarantor, Inc.), Incremental Term Loan B-3, 1 Mo. LIBOR + 3.50%, 0.00% Floor
| | 7.57% | | 03/05/26 | | 299,668 |
| 3,289,639 | | CHG Healthcare Services, Inc., Term Loan B, 1 Mo. LIBOR + 3.25%, 0.50% Floor
| | 7.32% | | 09/30/28 | | 3,220,919 |
| 2,690,425 | | DaVita, Inc., Term Loan B, 1 Mo. LIBOR + 1.75%, 0.00% Floor
| | 5.82% | | 08/12/26 | | 2,599,623 |
| 2,622,039 | | ExamWorks Group, Inc. (Electron Bidco), Term Loan B, 1 Mo. LIBOR + 3.00%, 0.50% Floor
| | 7.07% | | 10/29/28 | | 2,541,516 |
| 1,990,294 | | Global Medical Response, Inc. (fka Air Medical), 2021 Refinancing Term Loan, 1 Mo. LIBOR + 4.25%, 1.00% Floor
| | 8.09% | | 10/02/25 | | 1,573,328 |
| 190,480 | | SCP Health (Onex TSG Intermediate Corp.), Term Loan B, 3 Mo. LIBOR + 4.75%, 0.75% Floor
| | 9.16% | | 02/28/28 | | 169,051 |
See Notes to Financial Statements
Page 9
First Trust Senior Floating Rate Income Fund II (FCT)
Portfolio of Investments (Continued)
November 30, 2022 (Unaudited)
Principal
Value | | Description | | Rate (a) | | Stated
Maturity (b) | | Value |
| SENIOR FLOATING-RATE LOAN INTERESTS (c) (Continued) |
| | | Health Care Services (Continued) | | | | | | |
| $62,686 | | Sevita (National Mentor Holdings, Inc.), Term Loan B, 1 Mo. LIBOR + 3.75%, 0.75% Floor
| | 7.83% | | 03/01/28 | | $44,281 |
| 77,454 | | Sevita (National Mentor Holdings, Inc.), Term Loan B, 3 Mo. LIBOR + 3.75%, 0.75% Floor
| | 7.43% | | 03/01/28 | | 54,713 |
| 4,102 | | Sevita (National Mentor Holdings, Inc.), Term Loan C, 3 Mo. LIBOR + 3.75%, 0.75% Floor
| | 7.43% | | 03/01/28 | | 2,898 |
| | | | | 16,136,700 |
| | | Health Care Supplies – 1.7% | | | | | | |
| 5,300,957 | | Medline Borrower, LP (Mozart), Initial Dollar Term Loan, 1 Mo. LIBOR + 3.25%, 0.50% Floor
| | 7.32% | | 10/21/28 | | 5,028,540 |
| | | Health Care Technology – 12.0% | | | | | | |
| 4,675,565 | | athenahealth, Inc. (Minerva Merger Sub, Inc.), Term Loan B, 1 Mo. SOFR + 3.50%, 0.50% Floor
| | 7.41% | | 02/15/29 | | 4,259,440 |
| 3,892,779 | | Ciox Health (Healthport/CT Technologies Intermediate Holdings, Inc.), New Term Loan B, 1 Mo. LIBOR + 4.25%, 0.75% Floor
| | 8.32% | | 12/16/25 | | 3,587,429 |
| 1,808,384 | | Ensemble RCM, LLC (Ensemble Health), Term Loan B, 3 Mo. SOFR + 3.85%, 0.00% Floor
| | 7.94% | | 08/01/26 | | 1,752,631 |
| 2,266,541 | | Mediware (Wellsky/Project Ruby Ultimate Parent Corp.), Term Loan B, 1 Mo. LIBOR + 3.25%, 0.75% Floor
| | 7.32% | | 03/10/28 | | 2,150,789 |
| 1,209,782 | | Navicure, Inc. (Waystar Technologies, Inc.), Term Loan B, 1 Mo. LIBOR + 4.00%, 0.00% Floor
| | 8.07% | | 10/23/26 | | 1,185,587 |
| 1,834,006 | | Press Ganey (Azalea TopCo, Inc.), Term Loan B, 1 Mo. LIBOR + 3.50%, 0.00% Floor
| | 7.57% | | 07/25/26 | | 1,694,163 |
| 12,343,896 | | Verscend Technologies, Inc. (Cotiviti), New Term Loan B-1, 1 Mo. LIBOR + 4.00%, 0.00% Floor
| | 8.07% | | 08/27/25 | | 12,240,330 |
| 7,647,683 | | Zelis Payments Buyer, Inc., New Term Loan B-1, 1 Mo. LIBOR + 3.50%, 0.00% Floor
| | 7.57% | | 09/30/26 | | 7,545,281 |
| | | | | 34,415,650 |
| | | Hotels, Resorts & Cruise Lines – 2.4% | | | | | | |
| 460,665 | | Alterra Mountain Company, Term Loan B-2, 1 Mo. LIBOR + 3.50%, 0.50% Floor
| | 7.57% | | 08/17/28 | | 453,755 |
| 5,926,463 | | Four Seasons Holdings, Inc., Term Loan, 1 Mo. SOFR + 3.25%, 0.50% Floor
| | 7.44% | | 11/30/29 | | 5,915,381 |
| 443,489 | | Wyndham Hotels & Resorts, Inc., Term Loan B, 1 Mo. LIBOR + 1.75%, 0.00% Floor
| | 5.82% | | 05/30/25 | | 441,192 |
| | | | | 6,810,328 |
| | | Household Appliances – 0.2% | | | | | | |
| 677,143 | | Traeger Grills (TGP Holdings III, LLC), Term Loan B, 1 Mo. LIBOR + 3.25%, 0.75% Floor
| | 7.32% | | 06/24/28 | | 541,972 |
| | | Industrial Machinery – 0.4% | | | | | | |
| 255,328 | | Filtration Group Corporation, 2021 Incremental Term Loan B, 1 Mo. LIBOR + 3.50%, 0.50% Floor
| | 7.57% | | 10/21/28 | | 248,498 |
| 213,229 | | Filtration Group Corporation, Initial Term Loan, 1 Mo. LIBOR + 3.00%, 0.00% Floor
| | 7.07% | | 03/29/25 | | 210,218 |
| 618,674 | | TK Elevator Newco GMBH (Vertical U.S. Newco, Inc.), New Term Loan B1 (USD), 6 Mo. LIBOR + 3.50%, 0.50% Floor
| | 6.87% | | 07/31/27 | | 592,380 |
| | | | | 1,051,096 |
| | | Insurance Brokers – 14.7% | | | | | | |
| 4,509,949 | | Alliant Holdings I, LLC, 2019 New Term Loan, 1 Mo. LIBOR + 3.25%, 0.00% Floor
| | 7.32% | | 05/10/25 | | 4,414,112 |
Page 10
See Notes to Financial Statements
First Trust Senior Floating Rate Income Fund II (FCT)
Portfolio of Investments (Continued)
November 30, 2022 (Unaudited)
Principal
Value | | Description | | Rate (a) | | Stated
Maturity (b) | | Value |
| SENIOR FLOATING-RATE LOAN INTERESTS (c) (Continued) |
| | | Insurance Brokers (Continued) | | | | | | |
| $7,543,348 | | Alliant Holdings I, LLC, Initial Term Loan, 1 Mo. LIBOR + 3.25%, 0.00% Floor
| | 7.32% | | 05/09/25 | | $7,391,274 |
| 2,547,300 | | Alliant Holdings I, LLC, TLB-4 New Term Loan, 1 Mo. LIBOR + 3.50%, 0.50% Floor
| | 7.44% | | 11/06/27 | | 2,469,302 |
| 475,455 | | AssuredPartners, Inc., 2021 Term Loan B, 1 Mo. LIBOR + 3.50%, 0.50% Floor
| | 7.57% | | 02/13/27 | | 456,080 |
| 108,172 | | AssuredPartners, Inc., 2022 Incremental Term Loan B4, 1 Mo. SOFR + 4.25%, 0.50% Floor
| | 8.58% | | 02/13/27 | | 106,077 |
| 1,818,498 | | AssuredPartners, Inc., Incremental Term Loan 2022, 1 Mo. SOFR + 3.50%, 0.50% Floor
| | 7.59% | | 02/13/27 | | 1,744,631 |
| 6,445,470 | | AssuredPartners, Inc., Term Loan B, 1 Mo. LIBOR + 3.50%, 0.00% Floor
| | 7.57% | | 02/12/27 | | 6,189,005 |
| 2,786,633 | | BroadStreet Partners, Inc., Term Loan B, 1 Mo. LIBOR + 3.00%, 0.00% Floor
| | 6.75% | | 01/27/27 | | 2,681,800 |
| 35,901 | | HUB International Limited, Initial Term Loan B, 2 Mo. LIBOR + 2.75%, 0.00% Floor
| | 6.98% | | 04/25/25 | | 35,193 |
| 13,714,085 | | HUB International Limited, Initial Term Loan B, 3 Mo. LIBOR + 2.75%, 0.00% Floor
| | 7.33% | | 04/25/25 | | 13,443,781 |
| 2,451 | | HUB International Limited, New Term Loan B-3, 2 Mo. LIBOR + 2.75%, 0.75% Floor
| | 7.23% | | 04/25/25 | | 2,408 |
| 960,599 | | HUB International Limited, New Term Loan B-3, 3 Mo. LIBOR + 2.75%, 0.75% Floor
| | 7.53% | | 04/25/25 | | 944,068 |
| 453,751 | | Ryan Specialty Group, LLC, Term Loan B, 1 Mo. SOFR + 3.00%, 0.75% Floor
| | 7.19% | | 09/01/27 | | 450,234 |
| 1,729,760 | | USI, Inc. (fka Compass Investors, Inc.), 2022 New Term Loan, 1 Mo. SOFR + 3.75%, 0.50% Floor
| | 7.68% | | 11/30/29 | | 1,699,801 |
| | | | | 42,027,766 |
| | | Integrated Telecommunication Services – 2.3% | | | | | | |
| 3,378,830 | | Numericable (Altice France SA or SFR), Term Loan B-11, 3 Mo. LIBOR + 2.75%, 0.00% Floor
| | 7.16% | | 07/31/25 | | 3,235,230 |
| 751,031 | | Zayo Group Holdings, Inc., Incremental Term Loan B-2, 1 Mo. SOFR + 4.25%, 0.50% Floor
| | 8.34% | | 03/09/27 | | 583,506 |
| 3,740,009 | | Zayo Group Holdings, Inc., Initial Dollar Term Loan, 1 Mo. LIBOR + 3.00%, 0.00% Floor
| | 7.07% | | 03/09/27 | | 2,810,542 |
| | | | | 6,629,278 |
| | | Managed Health Care – 0.7% | | | | | | |
| 2,293,123 | | Multiplan, Inc. (MPH), Term Loan B, 3 Mo. LIBOR + 4.25%, 0.50% Floor
| | 8.98% | | 08/31/28 | | 1,963,487 |
| | | Metal & Glass Containers – 0.2% | | | | | | |
| 497,673 | | Berry Global, Inc., Term Loan Z, 1 Mo. LIBOR + 1.75%, 0.00% Floor
| | 5.63% | | 07/01/26 | | 491,203 |
| | | Office Services & Supplies – 0.2% | | | | | | |
| 608,895 | | Dun & Bradstreet Corp., Refinancing Term Loan, 1 Mo. LIBOR + 3.25%, 0.00% Floor
| | 7.29% | | 02/08/26 | | 600,066 |
| | | Packaged Foods & Meats – 2.2% | | | | | | |
| 16,760 | | Hostess Brands, LLC (HB Holdings), Term Loan B, 1 Mo. LIBOR + 2.25%, 0.75% Floor
| | 6.32% | | 08/03/25 | | 16,643 |
| 6,485,964 | | Hostess Brands, LLC (HB Holdings), Term Loan B, 3 Mo. LIBOR + 2.25%, 0.75% Floor
| | 6.66% | | 08/03/25 | | 6,440,692 |
| | | | | 6,457,335 |
See Notes to Financial Statements
Page 11
First Trust Senior Floating Rate Income Fund II (FCT)
Portfolio of Investments (Continued)
November 30, 2022 (Unaudited)
Principal
Value | | Description | | Rate (a) | | Stated
Maturity (b) | | Value |
| SENIOR FLOATING-RATE LOAN INTERESTS (c) (Continued) |
| | | Paper Packaging – 3.3% | | | | | | |
| $4,669,550 | | Graham Packaging Company, LP, Term Loan B, 1 Mo. LIBOR + 3.00%, 0.75% Floor
| | 7.07% | | 08/04/27 | | $4,558,648 |
| 1,598,439 | | Pactiv, LLC / Evergreen Packaging, LLC (fka Reynolds Group Holdings), Term Loan B-2, 1 Mo. LIBOR + 3.25%, 0.00% Floor | | 7.32% | | 02/05/26 | | 1,573,600 |
| 3,348,833 | | Pactiv, LLC / Evergreen Packaging, LLC (fka Reynolds Group Holdings), Tranche B-3 U.S. Term Loan, 1 Mo. LIBOR + 3.25%, 0.50% Floor
| | 7.32% | | 09/20/28 | | 3,295,988 |
| | | | | 9,428,236 |
| | | Pharmaceuticals – 2.0% | | | | | | |
| 972,491 | | Jazz Pharmaceuticals, Inc., Term Loan B, 1 Mo. LIBOR + 3.50%, 0.50% Floor
| | 7.57% | | 05/05/28 | | 963,981 |
| 5,061 | | Mallinckrodt International Finance S.A., Amendment No. 2 Incremental Term Loan, 3 Mo. LIBOR + 5.25%, 0.75% Floor
| | 8.73% | | 09/30/27 | | 3,964 |
| 1,088,938 | | Nestle Skin Health (Sunshine Lux VII SARL/Galderma), 2021 Term Loan B-3, 3 Mo. LIBOR + 3.75%, 0.75% Floor
| | 7.42% | | 10/02/26 | | 1,032,793 |
| 3,811,548 | | Parexel International Corp. (Phoenix Newco), First Lien Term Loan, 1 Mo. LIBOR + 3.25%, 0.50% Floor
| | 7.32% | | 11/15/28 | | 3,660,534 |
| | | | | 5,661,272 |
| | | Research & Consulting Services – 1.9% | | | | | | |
| 4,173,518 | | Clarivate Analytics PLC (Camelot), Term Loan B, 1 Mo. LIBOR + 3.00%, 1.00% Floor
| | 7.07% | | 10/31/26 | | 4,101,775 |
| 975,807 | | Corelogic, Inc., 2021 Incremental Term Loan B, 1 Mo. LIBOR + 3.50%, 0.50% Floor
| | 7.63% | | 06/02/28 | | 802,602 |
| 386,835 | | J.D. Power (Project Boost Purchaser, LLC), Non-Fungible 1st Lien Term Loan, 1 Mo. LIBOR + 3.50%, 0.50% Floor
| | 7.57% | | 05/26/26 | | 372,329 |
| 334,037 | | Veritext Corporation (VT TopCo, Inc.), Term Loan B-4, 1 Mo. LIBOR + 3.75%, 0.75% Floor
| | 7.82% | | 08/10/25 | | 324,433 |
| | | | | 5,601,139 |
| | | Restaurants – 6.4% | | | | | | |
| 4,112,297 | | 1011778 B.C. Unlimited Liability Company (Restaurant Brands) (aka Burger King/Tim Horton’s), Term Loan B, 1 Mo. LIBOR + 1.75%, 0.00% Floor
| | 5.82% | | 11/14/26 | | 4,030,051 |
| 1,218,819 | | 1011778 B.C. Unlimited Liability Company (Restaurant Brands) (aka Burger King/Tim Horton’s), Term Loan B, 3 Mo. LIBOR + 1.75%, 0.00% Floor
| | 6.16% | | 11/14/26 | | 1,194,443 |
| 7,553,655 | | IRB Holding Corp. (Arby’s/Inspire Brands), New Term Loan B 2022, 1 Mo. LIBOR + 2.75%, 1.00% Floor
| | 6.82% | | 02/05/25 | | 7,410,664 |
| 1,965,000 | | IRB Holding Corp. (Arby’s/Inspire Brands), Term Loan B-3, 1 Mo. SOFR + 3.10%, 0.75% Floor
| | 6.89% | | 12/15/27 | | 1,888,365 |
| 3,880,000 | | Portillo’s Holdings, LLC, Term Loan B, 1 Mo. LIBOR + 5.50%, 1.00% Floor
| | 9.57% | | 08/30/24 | | 3,847,680 |
| | | | | 18,371,203 |
| | | Security & Alarm Services – 0.2% | | | | | | |
| 549,406 | | Garda World Security Corporation, Second Lien Term Loan B-3, 3 Mo. LIBOR + 4.25%, 0.00% Floor
| | 8.93% | | 10/30/26 | | 526,469 |
| | | Specialized Consumer Services – 0.7% | | | | | | |
| 926,400 | | Asurion, LLC, Inc. Amendment No. 6 Term Loan, 1 Mo. LIBOR + 3.25%, 0.00% Floor
| | 7.32% | | 12/23/26 | | 809,053 |
Page 12
See Notes to Financial Statements
First Trust Senior Floating Rate Income Fund II (FCT)
Portfolio of Investments (Continued)
November 30, 2022 (Unaudited)
Principal
Value | | Description | | Rate (a) | | Stated
Maturity (b) | | Value |
| SENIOR FLOATING-RATE LOAN INTERESTS (c) (Continued) |
| | | Specialized Consumer Services (Continued) | | | | | | |
| $1,698,479 | | Asurion, LLC, New B-8 Term Loan, 1 Mo. LIBOR + 5.25%, 0.00% Floor
| | 9.32% | | 01/31/28 | | $1,306,130 |
| | | | | 2,115,183 |
| | | Specialized Finance – 0.9% | | | | | | |
| 850,305 | | Radiate Holdco, LLC (Astound), Term Loan B, 1 Mo. LIBOR + 3.25%, 0.75% Floor
| | 7.32% | | 09/25/26 | | 743,881 |
| 731,007 | | WCG Purchaser Corp. (WIRB- Copernicus Group), Initial Term Loan B, 1 Mo. LIBOR + 4.00%, 0.00% Floor
| | 8.07% | | 01/08/27 | | 685,319 |
| 1,211,918 | | WCG Purchaser Corp. (WIRB- Copernicus Group), Initial Term Loan B, 3 Mo. LIBOR + 4.00%, 0.00% Floor
| | 7.67% | | 01/08/27 | | 1,136,173 |
| | | | | 2,565,373 |
| | | Specialty Stores – 1.3% | | | | | | |
| 2,770,775 | | Petco Health and Wellness Company, Inc., 2021 Replacement Dollar Term Loan, 3 Mo. LIBOR + 3.25%, 0.75% Floor
| | 6.92% | | 03/03/28 | | 2,681,889 |
| 1,074,628 | | Petsmart, Inc., Initial Term Loan B, 1 Mo. LIBOR + 3.75%, 0.75% Floor
| | 7.82% | | 02/12/28 | | 1,031,256 |
| | | | | 3,713,145 |
| | | Systems Software – 5.5% | | | | | | |
| 2,689,180 | | BMC Software Finance, Inc. (Boxer Parent), Initial Term Loan, 1 Mo. LIBOR + 3.75%, 0.00% Floor
| | 7.82% | | 10/02/25 | | 2,575,912 |
| 883,272 | | Idera, Inc., Term Loan B, 3 Mo. LIBOR + 3.75%, 0.75% Floor
| | 7.50% | | 02/15/28 | | 835,063 |
| 1,781,852 | | Misys Financial Software Ltd. (Almonde, Inc.) (Finastra), Term Loan B, 3 Mo. LIBOR + 3.50%, 1.00% Floor
| | 6.87% | | 06/13/24 | | 1,608,531 |
| 885,870 | | Proofpoint, Inc., Term Loan B, 3 Mo. LIBOR + 3.25%, 0.50% Floor
| | 7.98% | | 08/31/28 | | 851,268 |
| 1,962,470 | | Sophos Group PLC (Surf), Term Loan B-5, 3 Mo. LIBOR + 3.50%, 0.00% Floor
| | 6.67% | | 03/05/27 | | 1,879,889 |
| 6,804,180 | | SS&C Technologies Holdings, Inc., Facility B1 USD, 1 Mo. LIBOR + 1.75%, 0.00% Floor
| | 5.82% | | 04/16/25 | | 6,671,907 |
| 1,282,564 | | SUSE (Marcel Lux IV SARL), 2021 Refinancing Term Loan, Daily SOFR + 3.25%, 0.00% Floor
| | 7.16% | | 03/15/26 | | 1,260,119 |
| | | | | 15,682,689 |
| | | Trading Companies & Distributors – 0.8% | | | | | | |
| 2,326,073 | | SRS Distribution, Inc., 2022 Refinancing Term Loan, 1 Mo. LIBOR + 3.50%, 0.50% Floor
| | 7.57% | | 06/04/28 | | 2,230,122 |
| 113,313 | | SRS Distribution, Inc., Term Loan B, 1 Mo. SOFR + 3.60%, 0.50% Floor
| | 7.69% | | 06/04/28 | | 108,249 |
| | | | | 2,338,371 |
| | | Wireless Telecommunication Services – 2.5% | | | | | | |
| 7,272,834 | | SBA Senior Finance II, LLC, Term Loan B, 1 Mo. LIBOR + 1.75%, 0.00% Floor
| | 5.83% | | 04/11/25 | | 7,221,924 |
| | | Total Senior Floating-Rate Loan Interests
| | 313,536,922 |
| | | (Cost $324,453,078) | | | | | | |
Principal
Value | | Description | | Stated
Coupon | | Stated
Maturity | | Value |
| CORPORATE BONDS AND NOTES (c) – 8.8% |
| | | Application Software – 0.1% | | | | | | |
| 560,000 | | GoTo Group, Inc. (d)
| | 5.50% | | 09/01/27 | | 328,678 |
See Notes to Financial Statements
Page 13
First Trust Senior Floating Rate Income Fund II (FCT)
Portfolio of Investments (Continued)
November 30, 2022 (Unaudited)
Principal
Value | | Description | | Stated
Coupon | | Stated
Maturity | | Value |
| CORPORATE BONDS AND NOTES (c) (Continued) |
| | | Broadcasting – 2.7% | | | | | | |
| $1,000,000 | | Gray Television, Inc. (d)
| | 5.88% | | 07/15/26 | | $922,500 |
| 2,000,000 | | Gray Television, Inc. (d)
| | 7.00% | | 05/15/27 | | 1,841,250 |
| 52,000 | | iHeartCommunications, Inc. (d)
| | 5.25% | | 08/15/27 | | 46,386 |
| 3,043,000 | | Nexstar Media, Inc. (d)
| | 5.63% | | 07/15/27 | | 2,873,307 |
| 2,395,000 | | Sirius XM Radio, Inc. (d)
| | 3.13% | | 09/01/26 | | 2,165,176 |
| | | | | 7,848,619 |
| | | Cable & Satellite – 2.9% | | | | | | |
| 7,000,000 | | CCO Holdings, LLC / CCO Holdings Capital Corp. (d)
| | 5.13% | | 05/01/27 | | 6,633,305 |
| 2,000,000 | | CSC Holdings, LLC (d)
| | 7.50% | | 04/01/28 | | 1,561,710 |
| | | | | 8,195,015 |
| | | Casinos & Gaming – 0.4% | | | | | | |
| 572,000 | | Fertitta Entertainment, LLC / Fertitta Entertainment Finance Co., Inc. (d)
| | 4.63% | | 01/15/29 | | 505,680 |
| 572,000 | | VICI Properties, L.P. / VICI Note Co., Inc. (d)
| | 4.25% | | 12/01/26 | | 532,801 |
| | | | | 1,038,481 |
| | | Health Care Facilities – 1.7% | | | | | | |
| 2,500,000 | | Tenet Healthcare Corp. (d)
| | 6.25% | | 02/01/27 | | 2,398,600 |
| 2,500,000 | | Tenet Healthcare Corp. (d)
| | 5.13% | | 11/01/27 | | 2,356,963 |
| | | | | 4,755,563 |
| | | Health Care Services – 0.2% | | | | | | |
| 376,000 | | DaVita, Inc. (d)
| | 4.63% | | 06/01/30 | | 304,930 |
| 226,000 | | DaVita, Inc. (d)
| | 3.75% | | 02/15/31 | | 166,453 |
| 324,000 | | Global Medical Response, Inc. (d)
| | 6.50% | | 10/01/25 | | 244,392 |
| | | | | 715,775 |
| | | Insurance Brokers – 0.3% | | | | | | |
| 359,000 | | AmWINS Group, Inc. (d)
| | 4.88% | | 06/30/29 | | 310,638 |
| 500,000 | | AssuredPartners, Inc. (d)
| | 7.00% | | 08/15/25 | | 480,538 |
| | | | | 791,176 |
| | | Integrated Telecommunication Services – 0.2% | | | | | | |
| 769,000 | | Zayo Group Holdings, Inc. (d)
| | 4.00% | | 03/01/27 | | 552,057 |
| | | Systems Software – 0.3% | | | | | | |
| 1,007,000 | | SS&C Technologies, Inc. (d)
| | 5.50% | | 09/30/27 | | 964,008 |
| | | Total Corporate Bonds and Notes
| | 25,189,372 |
| | | (Cost $26,351,987) | | | | | | |
| FOREIGN CORPORATE BONDS AND NOTES (c) – 0.6% |
| | | Application Software – 0.0% | | | | | | |
| 22,000 | | Open Text Corp. (d)
| | 3.88% | | 02/15/28 | | 18,585 |
| | | Environmental & Facilities Services – 0.6% | | | | | | |
| 1,554,000 | | GFL Environmental, Inc. (d)
| | 3.75% | | 08/01/25 | | 1,456,829 |
| 305,000 | | GFL Environmental, Inc. (d)
| | 4.00% | | 08/01/28 | | 262,109 |
| | | | | 1,718,938 |
| | | Total Foreign Corporate Bonds and Notes
| | 1,737,523 |
| | | (Cost $1,766,566) | | | | | | |
Page 14
See Notes to Financial Statements
First Trust Senior Floating Rate Income Fund II (FCT)
Portfolio of Investments (Continued)
November 30, 2022 (Unaudited)
| Shares | | Description | | Value |
| COMMON STOCKS (c) – 0.3% |
| | | Pharmaceuticals – 0.3% | | |
| 150,392 | | Akorn, Inc. (e) (f)
| | $977,548 |
| | | (Cost $1,724,086) | | |
| RIGHTS (c) – 0.1% |
| | | Electric Utilities – 0.1% | | |
| 106,607 | | Vistra Energy Corp., no expiration date (f) (g)
| | 131,500 |
| | | Life Sciences Tools & Services – 0.0% | | |
| 1 | | New Millennium Holdco, Inc., Corporate Claim Trust, no expiration date (f) (g) (h) (i)
| | 0 |
| 1 | | New Millennium Holdco, Inc., Lender Claim Trust, no expiration date (f) (g) (h) (i)
| | 0 |
| | | | | 0 |
| | | Total Rights
| | 131,500 |
| | | (Cost $174,207) | | |
| WARRANTS (c) – 0.0% |
| | | Movies & Entertainment – 0.0% | | |
| 315,514 | | Cineworld Group PLC, expiring 11/23/25 (f) (g) (j)
| | 19,013 |
| | | (Cost $0) | | |
| | | Total Investments – 119.1%
| | 341,591,878 |
| | | (Cost $354,469,924) | | |
| | | Outstanding Loans – (18.8)%
| | (54,000,000) |
| | | Net Other Assets and Liabilities – (0.3)%
| | (882,337) |
| | | Net Assets – 100.0%
| | $286,709,541 |
| (a) | Senior Floating-Rate Loan Interests (“Senior Loans”) in which the Fund invests pay interest at rates which are periodically predetermined by reference to a base lending rate plus a premium. These base lending rates are generally (i) the lending rate offered by one or more major European banks, such as the LIBOR, (ii) the SOFR obtained from the U.S. Department of the Treasury’s Office of Financial Research, (iii) the prime rate offered by one or more United States banks or (iv) the certificate of deposit rate. Certain Senior Loans are subject to a LIBOR or SOFR floor that establishes a minimum LIBOR or SOFR rate. When a range of rates is disclosed, the Fund holds more than one contract within the same tranche with identical LIBOR or SOFR period, spread and floor, but different LIBOR or SOFR reset dates. |
| (b) | Senior Loans generally are subject to mandatory and/or optional prepayment. As a result, the actual remaining maturity of Senior Loans may be substantially less than the stated maturities shown. |
| (c) | All of these securities are available to serve as collateral for the outstanding loans. |
| (d) | This security, sold within the terms of a private placement memorandum, is exempt from registration upon resale under Rule 144A of the Securities Act of 1933, as amended (the “1933 Act”), and may be resold in transactions exempt from registration, normally to qualified institutional buyers. Pursuant to procedures adopted by the Fund’s Board of Trustees, this security has been determined to be liquid by First Trust Advisors L.P. (the “Advisor”). Although market instability can result in periods of increased overall market illiquidity, liquidity for each security is determined based on security specific factors and assumptions, which require subjective judgment. At November 30, 2022, securities noted as such amounted to $26,926,895 or 9.4% of net assets. |
| (e) | Security received in a transaction exempt from registration under the 1933 Act. The security may be resold pursuant to an exemption from registration under the 1933 Act, typically to qualified institutional buyers (see Note 2D - Restricted Securities in the Notes to Financial Statements). |
| (f) | Non-income producing security. |
| (g) | Pursuant to procedures adopted by the Fund’s Board of Trustees, this security has been determined to be illiquid by the Advisor. |
| (h) | This security is fair valued by the Advisor’s Pricing Committee in accordance with procedures approved by the Fund’s Board of Trustees, and in accordance with the provisions of the Investment Company Act of 1940 and rules thereunder, as amended. At November 30, 2022, securities noted as such are valued at $0 or 0.0% of net assets. |
| (i) | This security’s value was determined using significant unobservable inputs (see Note 2A – Portfolio Valuation in the Notes to Financial Statements). |
| (j) | This issuer has filed for protection in bankruptcy court. |
| LIBOR | London Interbank Offered Rate |
| SOFR | Secured Overnight Financing Rate |
See Notes to Financial Statements
Page 15
First Trust Senior Floating Rate Income Fund II (FCT)
Portfolio of Investments (Continued)
November 30, 2022 (Unaudited)
Valuation Inputs
A summary of the inputs used to value the Fund’s investments as of November 30, 2022 is as follows (see Note 2A - Portfolio Valuation in the Notes to Financial Statements):
| | Total
Value at
11/30/2022 | Level 1
Quoted
Prices | Level 2
Significant
Observable
Inputs | Level 3
Significant
Unobservable
Inputs |
Senior Floating-Rate Loan Interests*
| $ 313,536,922 | $ — | $ 313,536,922 | $ — |
Corporate Bonds and Notes*
| 25,189,372 | — | 25,189,372 | — |
Foreign Corporate Bonds and Notes*
| 1,737,523 | — | 1,737,523 | — |
Common Stocks*
| 977,548 | — | 977,548 | — |
| Rights: | | | | |
Electric Utilities
| 131,500 | — | 131,500 | — |
Life Sciences Tools & Services
| —** | — | — | —** |
Warrants*
| 19,013 | — | 19,013 | — |
Total Investments
| $ 341,591,878 | $— | $ 341,591,878 | $—** |
| * | See Portfolio of Investments for industry breakout. |
| ** | Investment is valued at $0. |
Level 3 Rights that are fair valued by the Advisor’s Pricing Committee are footnoted in the Portfolio of Investments. All Level 3 values are based on unobservable inputs.
Page 16
See Notes to Financial Statements
First Trust Senior Floating Rate Income Fund II (FCT)
Statement of Assets and Liabilities
November 30, 2022 (Unaudited)
| ASSETS: | |
Investments, at value
(Cost $354,469,924)
| $ 341,591,878 |
Cash
| 8,617,477 |
| Receivables: | |
Investment securities sold
| 20,522,381 |
Interest
| 1,419,553 |
Prepaid expenses
| 4,321 |
Total Assets
| 372,155,610 |
| LIABILITIES: | |
Outstanding loans
| 54,000,000 |
| Payables: | |
Investment securities purchased
| 30,871,664 |
Investment advisory fees
| 215,248 |
Interest and fees on loans
| 124,940 |
Audit and tax fees
| 42,539 |
Administrative fees
| 28,360 |
Custodian fees
| 12,340 |
Legal fees
| 11,485 |
Trustees’ fees and expenses
| 2,951 |
Shareholder reporting fees
| 2,724 |
Transfer agent fees
| 2,470 |
Financial reporting fees
| 761 |
Unrealized depreciation on unfunded loan commitments
| 126,559 |
Other liabilities
| 4,028 |
Total Liabilities
| 85,446,069 |
NET ASSETS
| $286,709,541 |
| NET ASSETS consist of: | |
Paid-in capital
| $ 355,520,483 |
Par value
| 259,834 |
Accumulated distributable earnings (loss)
| (69,070,776) |
NET ASSETS
| $286,709,541 |
NET ASSET VALUE, per Common Share (par value $0.01 per Common Share)
| $11.03 |
Number of Common Shares outstanding (unlimited number of Common Shares has been authorized)
| 25,983,388 |
See Notes to Financial Statements
Page 17
First Trust Senior Floating Rate Income Fund II (FCT)
Statement of Operations
For the Six Months Ended November 30, 2022 (Unaudited)
| INVESTMENT INCOME: | |
Interest
| $ 12,570,272 |
Dividends
| 32,040 |
Other
| 36,248 |
Total investment income
| 12,638,560 |
| EXPENSES: | |
Investment advisory fees
| 1,390,610 |
Interest and fees on loans
| 1,289,778 |
Administrative fees
| 126,787 |
Shareholder reporting fees
| 41,834 |
Audit and tax fees
| 37,206 |
Legal fees
| 26,707 |
Custodian fees
| 21,020 |
Listing expense
| 18,193 |
Trustees’ fees and expenses
| 9,105 |
Transfer agent fees
| 7,212 |
Financial reporting fees
| 4,616 |
Other
| 17,979 |
Total expenses
| 2,991,047 |
NET INVESTMENT INCOME (LOSS)
| 9,647,513 |
| NET REALIZED AND UNREALIZED GAIN (LOSS): | |
Net realized gain (loss) on investments
| (16,937,923) |
| Net change in unrealized appreciation (depreciation) on: | |
Investments
| 11,368,149 |
Unfunded loan commitments
| (54,034) |
Net change in unrealized appreciation (depreciation)
| 11,314,115 |
NET REALIZED AND UNREALIZED GAIN (LOSS)
| (5,623,808) |
NET INCREASE (DECREASE) IN NET ASSETS RESULTING FROM OPERATIONS
| $ 4,023,705 |
Page 18
See Notes to Financial Statements
First Trust Senior Floating Rate Income Fund II (FCT)
Statements of Changes in Net Assets
| | Six Months
Ended
11/30/2022
(Unaudited) | | Year
Ended
5/31/2022 |
| OPERATIONS: | | | |
Net investment income (loss)
| $ 9,647,513 | | $ 14,768,290 |
Net realized gain (loss)
| (16,937,923) | | (1,184,588) |
Net change in unrealized appreciation (depreciation)
| 11,314,115 | | (24,665,993) |
Net increase (decrease) in net assets resulting from operations
| 4,023,705 | | (11,082,291) |
| DISTRIBUTIONS TO SHAREHOLDERS FROM: | | | |
Investment operations
| (11,029,948) | | (14,904,773) |
Return of capital
| — | | (10,282,054) |
Total distributions to shareholders
| (11,029,948) | | (25,186,827) |
| CAPITAL TRANSACTIONS: | | | |
Proceeds from Common Shares reinvested
| — | | 366,260 |
Repurchase of Common Shares
| — | | — |
Net increase (decrease) in net assets resulting from capital transactions
| — | | 366,260 |
Total increase (decrease) in net assets
| (7,006,243) | | (35,902,858) |
| NET ASSETS: | | | |
Beginning of period
| 293,715,784 | | 329,618,642 |
End of period
| $ 286,709,541 | | $ 293,715,784 |
| CAPITAL TRANSACTIONS were as follows: | | | |
Common Shares at beginning of period
| 25,983,388 | | 25,953,421 |
Common Shares issued as reinvestment under the Dividend Reinvestment Plan
| — | | 29,967 |
Common Shares at end of period
| 25,983,388 | | 25,983,388 |
See Notes to Financial Statements
Page 19
First Trust Senior Floating Rate Income Fund II (FCT)
Statement of Cash Flows
For the Six Months Ended November 30, 2022 (Unaudited)
| Cash flows from operating activities: | | |
Net increase (decrease) in net assets resulting from operations
| $4,023,705 | |
| Adjustments to reconcile net increase (decrease) in net assets resulting from operations to net cash provided by operating activities: | | |
Purchases of investments
| (179,730,082) | |
Sales, maturities and paydown of investments
| 251,833,263 | |
Net amortization/accretion of premiums/discounts on investments
| (845,360) | |
Net realized gain/loss on investments
| 16,937,923 | |
Net change in unrealized appreciation/depreciation on investments and unfunded loan commitments
| (11,314,115) | |
| Changes in assets and liabilities: | | |
Increase in interest receivable
| (97,888) | |
Decrease in prepaid expenses
| 16,916 | |
Decrease in interest and fees payable on loans
| (1,662) | |
Decrease in investment advisory fees payable
| (49,077) | |
Decrease in audit and tax fees payable
| (30,513) | |
Increase in legal fees payable
| 8,735 | |
Decrease in shareholder reporting fees payable
| (17,658) | |
Decrease in administrative fees payable
| (1,488) | |
Increase in custodian fees payable
| 4,534 | |
Decrease in transfer agent fees payable
| (8,307) | |
Decrease in trustees’ fees and expenses payable
| (152) | |
Decrease in financial reporting fees payable
| (10) | |
Increase in other liabilities payable
| 292 | |
Cash provided by operating activities
| | $80,729,056 |
| Cash flows from financing activities: | | |
Distributions to Common Shareholders from investment operations
| (11,029,948) | |
Repayment of borrowings
| (104,000,000) | |
Proceeds from borrowings
| 42,000,000 | |
Cash used in financing activities
| | (73,029,948) |
Increase in cash
| | 7,699,108 |
Cash at beginning of period
| | 918,369 |
Cash at end of period
| | $8,617,477 |
| Supplemental disclosure of cash flow information: | | |
Cash paid during the period for interest and fees
| | $1,291,440 |
Page 20
See Notes to Financial Statements
First Trust Senior Floating Rate Income Fund II (FCT)
Financial Highlights
For a Common Share outstanding throughout each period
| | Six Months
Ended
11/30/2022
(Unaudited) | | Year Ended May 31, |
| | 2022 | | 2021 | | 2020 | | 2019 | | 2018 | |
Net asset value, beginning of period
| $ 11.30 | | $ 12.70 | | $ 12.46 | | $ 13.70 | | $ 14.05 | | $ 14.28 |
| Income from investment operations: | | | | | | | | | | | |
Net investment income (loss)
| 0.37 | | 0.56 | | 0.55 | | 0.67 | | 0.74 | | 0.70 |
Net realized and unrealized gain (loss)
| (0.22) | | (0.99) | | 0.90 | | (0.97) | | (0.36) | | (0.17) |
Total from investment operations
| 0.15 | | (0.43) | | 1.45 | | (0.30) | | 0.38 | | 0.53 |
| Distributions paid to shareholders from: | | | | | | | | | | | |
Net investment income
| (0.42) | | (0.57) | | (0.56) | | (0.69) | | (0.73) | | (0.70) |
Return of capital
| — | | (0.40) | | (0.69) | | (0.25) | | — | | (0.06) |
Total distributions paid to Common Shareholders
| (0.42) | | (0.97) | | (1.25) | | (0.94) | | (0.73) | | (0.76) |
Common Share repurchases
| — | | — | | 0.04 | | — | | — | | — |
Net asset value, end of period
| $11.03 | | $11.30 | | $12.70 | | $12.46 | | $13.70 | | $14.05 |
Market value, end of period
| $10.18 | | $10.90 | | $12.60 | | $11.12 | | $11.98 | | $12.99 |
Total return based on net asset value (a)
| 1.78% | | (3.64)% | | 13.51% | | (1.38)% | | 3.44% | | 4.24% |
Total return based on market value (a)
| (2.61)% | | (6.31)% | | 26.18% | | 0.65% | | (2.17)% | | 1.05% |
| Ratios to average net assets/supplemental data: | | | | | | | | | | | |
Net assets, end of period (in 000’s)
| $ 286,710 | | $ 293,716 | | $ 329,619 | | $ 332,267 | | $ 365,804 | | $ 375,015 |
Ratio of total expenses to average net assets
| 2.08% (b) | | 1.67% | | 1.70% | | 2.35% | | 2.53% | | 2.17% |
Ratio of total expenses to average net assets excluding interest expense
| 1.18% (b) | | 1.24% | | 1.30% | | 1.26% | | 1.24% | | 1.26% |
Ratio of net investment income (loss) to average net assets
| 6.71% (b) | | 4.64% | | 4.37% | | 4.98% | | 5.34% | | 4.94% |
Portfolio turnover rate
| 39% | | 45% | | 78% | | 64% | | 58% | | 101% |
| Indebtedness: | | | | | | | | | | | |
Total loans outstanding (in 000’s)
| $ 54,000 | | $ 116,000 | | $ 136,000 | | $ 119,000 | | $ 163,000 | | $ 155,000 |
Asset coverage per $1,000 of indebtedness (c)
| $ 6,309 | | $ 3,532 | | $ 3,424 | | $ 3,792 | | $ 3,244 | | $ 3,419 |
| (a) | Total return is based on the combination of reinvested dividend, capital gain and return of capital distributions, if any, at prices obtained by the Dividend Reinvestment Plan, and changes in net asset value per share for net asset value returns and changes in Common Share Price for market value returns. Total returns do not reflect sales load and are not annualized for periods of less than one year. Past performance is not indicative of future results. |
| (b) | Annualized. |
| (c) | Calculated by subtracting the Fund’s total liabilities (not including the loans outstanding) from the Fund’s total assets, and dividing by the outstanding loans balance in 000’s. |
See Notes to Financial Statements
Page 21
Notes to Financial Statements
First Trust Senior Floating Rate Income Fund II (FCT)
November 30, 2022 (Unaudited)
1. Organization
First Trust Senior Floating Rate Income Fund II (the “Fund”) is a diversified, closed-end management investment company organized as a Massachusetts business trust on March 25, 2004, and is registered with the Securities and Exchange Commission (“SEC”) under the Investment Company Act of 1940, as amended (the “1940 Act”). The Fund trades under the ticker symbol “FCT” on the New York Stock Exchange (“NYSE”).
The primary investment objective of the Fund is to seek a high level of current income. As a secondary objective, the Fund attempts to preserve capital. The Fund pursues its investment objectives by investing primarily in a portfolio of senior secured floating-rate corporate loans (“Senior Loans”)(1). Under normal market conditions, the Fund invests at least 80% of its Managed Assets in a diversified portfolio of Senior Loans. It is anticipated that at least 80% of the Fund’s Managed Assets are invested in lower grade debt instruments, although from time to time all of the Fund’s Managed Assets may be invested in such lower grade debt instruments. “Managed Assets” means the total asset value of the Fund minus the sum of its liabilities, other than the principal amount of borrowings. There can be no assurance that the Fund will achieve its investment objectives. Investing in Senior Loans involves credit risk and, during periods of generally declining credit quality, it may be particularly difficult for the Fund to achieve its secondary investment objective. The Fund may not be appropriate for all investors.
2. Significant Accounting Policies
The Fund is considered an investment company and follows accounting and reporting guidance under Financial Accounting Standards Board Accounting Standards Codification Topic 946, “Financial Services-Investment Companies.” The following is a summary of significant accounting policies consistently followed by the Fund in the preparation of the financial statements. The preparation of the financial statements in accordance with accounting principles generally accepted in the United States of America (“U.S. GAAP”) requires management to make estimates and assumptions that affect the reported amounts and disclosures in the financial statements. Actual results could differ from those estimates.
A. Portfolio Valuation
The net asset value (“NAV”) of the Common Shares of the Fund is determined daily as of the close of regular trading on the NYSE, normally 4:00 p.m. Eastern time, on each day the NYSE is open for trading. If the NYSE closes early on a valuation day, the NAV is determined as of that time. Domestic debt securities and foreign securities are priced using data reflecting the earlier closing of the principal markets for those securities. The Fund’s NAV per Common Share is calculated by dividing the value of all assets of the Fund (including accrued interest and dividends), less all liabilities (including accrued expenses, dividends declared but unpaid and any borrowings of the Fund), by the total number of Common Shares outstanding.
The Fund’s investments are valued daily at market value or, in the absence of market value with respect to any portfolio securities, at fair value. Market value prices represent readily available market quotations such as last sale or official closing prices from a national or foreign exchange (i.e., a regulated market) and are primarily obtained from third-party pricing services. Fair value prices represent any prices not considered market value prices and are either obtained from a third-party pricing service or are determined by the Pricing Committee of the Fund’s investment advisor, First Trust Advisors L.P. (“First Trust” or the “Advisor”), in accordance with valuation procedures approved by the Fund’s Board of Trustees, and in accordance with provisions of the 1940 Act and rules thereunder. Investments valued by the Advisor’s Pricing Committee, if any, are footnoted as such in the footnotes to the Portfolio of Investments. The Fund’s investments are valued as follows:
Senior Loans are not listed on any securities exchange or board of trade. Senior Loans are typically bought and sold by institutional investors in individually negotiated private transactions that function in many respects like an over-the-counter secondary market, although typically no formal market-makers exist. This market, while having grown substantially since its inception, generally has fewer trades and less liquidity than the secondary market for other types of securities. Some Senior Loans have few or no trades, or trade infrequently, and information regarding a specific Senior Loan may not be widely available or may be incomplete. Accordingly, determinations of the market value of Senior Loans may be based on infrequent and dated information. Because there is less reliable, objective data available, elements of judgment may play a greater role in valuation of Senior Loans than for other types of securities. Typically, Senior Loans are fair valued using information provided by a third-party pricing service. The third-party pricing service primarily uses over-the-counter pricing from dealer runs and broker quotes from indicative sheets to value the Senior Loans. If the third-party pricing service cannot or does not provide a valuation for a particular Senior Loan or such valuation is deemed unreliable, the Advisor’s Pricing Committee may value such Senior Loan at a fair value according to procedures approved by the Fund’s Board of Trustees, and in accordance with the provisions of
| (1) | The terms “security” and “securities” used throughout the Notes to Financial Statements include Senior Loans. |
Notes to Financial Statements (Continued)
First Trust Senior Floating Rate Income Fund II (FCT)
November 30, 2022 (Unaudited)
the 1940 Act and rules thereunder. Fair valuation of a Senior Loan is based on the consideration of all available information, including, but not limited to the following:
| 1) | the most recent price provided by a pricing service; |
| 2) | the fundamental business data relating to the borrower; |
| 3) | an evaluation of the forces which influence the market in which these securities are purchased and sold; |
| 4) | the type, size and cost of the security; |
| 5) | the financial statements of the borrower, or the financial condition of the country of issue; |
| 6) | the credit quality and cash flow of the borrower, or country of issue, based on the Pricing Committee’s, sub-advisor’s or portfolio manager’s analysis, as applicable, or external analysis; |
| 7) | the information as to any transactions in or offers for the security; |
| 8) | the price and extent of public trading in similar securities (or equity securities) of the borrower, or comparable companies; |
| 9) | the coupon payments; |
| 10) | the quality, value and salability of collateral, if any, securing the security; |
| 11) | the business prospects of the borrower, including any ability to obtain money or resources from a parent or affiliate and an assessment of the borrower’s management; |
| 12) | the prospects for the borrower’s industry, and multiples (of earnings and/or cash flows) being paid for similar businesses in that industry; |
| 13) | the borrower’s competitive position within the industry; |
| 14) | the borrower’s ability to access additional liquidity through public and/or private markets; and |
| 15) | other relevant factors. |
Common stocks and other equity securities listed on any national or foreign exchange (excluding The Nasdaq Stock Market LLC (“Nasdaq”) and the London Stock Exchange Alternative Investment Market (“AIM”)) are valued at the last sale price on the exchange on which they are principally traded or, for Nasdaq and AIM securities, the official closing price. Securities traded on more than one securities exchange are valued at the last sale price or official closing price, as applicable, at the close of the securities exchange representing the primary exchange for such securities.
Shares of open-end funds are valued based on NAV per share.
Securities traded in an over-the-counter market are valued at the mean of their most recent bid and asked price, if available, and otherwise at their last trade price.
Corporate bonds, corporate notes and other debt securities are fair valued on the basis of valuations provided by a third-party pricing service approved by the Advisor’s Pricing Committee, which may use the following valuation inputs when available:
| 1) | benchmark yields; |
| 2) | reported trades; |
| 3) | broker/dealer quotes; |
| 4) | issuer spreads; |
| 5) | benchmark securities; |
| 6) | bids and offers; and |
| 7) | reference data including market research publications. |
Certain securities may not be able to be priced by pre-established pricing methods. Such securities may be valued by the Advisor’s Pricing Committee at fair value. These securities generally include, but are not limited to, restricted securities (securities which may not be publicly sold without registration under the Securities Act of 1933, as amended (the “1933 Act”)) for which a third-party pricing service is unable to provide a market price; securities whose trading has been formally suspended; a security whose market or fair value price is not available from a pre-established pricing source; a security with respect to which an event has occurred that is likely to materially affect the value of the security after the market has closed but before the calculation of the Fund’s NAV or make it difficult or impossible to obtain a reliable market quotation; and a security whose price, as provided by the third-party pricing service, does not reflect the security’s fair value. As a general principle, the current fair value of a security would appear to be the amount which the owner might reasonably expect to receive for the security upon its current sale. When fair value prices are used, generally they will differ from market quotations or official closing prices on the applicable exchanges. A variety of factors may be considered in determining the fair value of such securities, including, but not limited to, the following:
Notes to Financial Statements (Continued)
First Trust Senior Floating Rate Income Fund II (FCT)
November 30, 2022 (Unaudited)
| 1) | the last sale price on the exchange on which they are principally traded or, for Nasdaq and AIM securities, the official closing price; |
| 2) | the type of security; |
| 3) | the size of the holding; |
| 4) | the initial cost of the security; |
| 5) | transactions in comparable securities; |
| 6) | price quotes from dealers and/or third-party pricing services; |
| 7) | relationships among various securities; |
| 8) | information obtained by contacting the issuer, analysts, or the appropriate stock exchange; |
| 9) | an analysis of the issuer’s financial statements; |
| 10) | the existence of merger proposals or tender offers that might affect the value of the security; and |
| 11) | other relevant factors. |
The Fund is subject to fair value accounting standards that define fair value, establish the framework for measuring fair value and provide a three-level hierarchy for fair valuation based upon the inputs to the valuation as of the measurement date. The three levels of the fair value hierarchy are as follows:
| • | Level 1 – Level 1 inputs are quoted prices in active markets for identical investments. An active market is a market in which transactions for the investment occur with sufficient frequency and volume to provide pricing information on an ongoing basis. |
| • | Level 2 – Level 2 inputs are observable inputs, either directly or indirectly, and include the following: |
| o | Quoted prices for similar investments in active markets. |
| o | Quoted prices for identical or similar investments in markets that are non-active. A non-active market is a market where there are few transactions for the investment, the prices are not current, or price quotations vary substantially either over time or among market makers, or in which little information is released publicly. |
| o | Inputs other than quoted prices that are observable for the investment (for example, interest rates and yield curves observable at commonly quoted intervals, volatilities, prepayment speeds, loss severities, credit risks, and default rates). |
| o | Inputs that are derived principally from or corroborated by observable market data by correlation or other means. |
| • | Level 3 – Level 3 inputs are unobservable inputs. Unobservable inputs may reflect the reporting entity’s own assumptions about the assumptions that market participants would use in pricing the investment. |
The inputs or methodologies used for valuing investments are not necessarily an indication of the risk associated with investing in those investments. A summary of the inputs used to value the Fund’s investments as of November 30, 2022, is included with the Fund’s Portfolio of Investments.
In December 2020, the SEC adopted Rule 2a-5 under the 1940 Act, establishing requirements to determine fair value in good faith for purposes of the 1940 Act. The rule permits fund boards to designate a fund’s investment advisor to perform fair value determinations, subject to board oversight and certain other conditions. The rule also defines when market quotations are “readily available” for purposes of the 1940 Act and requires a fund to fair value a portfolio investment when a market quotation is not readily available. The SEC also adopted new Rule 31a-4 under the 1940 Act, which sets forth recordkeeping requirements associated with fair value determinations. The compliance date for Rule 2a-5 and Rule 31a-4 was September 8, 2022.
Effective September 8, 2022 and pursuant to the requirements of Rule 2a-5, the Fund’s Board of Trustees designated the Advisor as its valuation designee to perform fair value determinations and approved new Advisor Valuation Procedures for the Fund.
B. Security Transactions and Investment Income
Security transactions are recorded as of the trade date. Realized gains and losses from securities transactions are recorded on the identified cost basis. Interest income is recorded on the accrual basis. Market premiums and discounts are amortized to the earliest call date of each respective borrowing.
The United Kingdom’s Financial Conduct Authority (the “FCA”), which regulates the London Interbank Offered Rates (“LIBOR”), announced on March 5, 2021 that it intended to phase-out all LIBOR reference rates, beginning December 31, 2021. Since that announcement, the FCA has ceased publication of all non-USD LIBOR reference rates and the 1-week and 2-month USD LIBOR reference rates as of December 31, 2021. The remaining USD LIBOR settings will cease to be published or no longer be representative immediately after June 30, 2023. The International Swaps and Derivatives Association, Inc. (“ISDA”) confirmed that the FCA’s
Notes to Financial Statements (Continued)
First Trust Senior Floating Rate Income Fund II (FCT)
November 30, 2022 (Unaudited)
March 5, 2021 announcement of its intention to cease providing LIBOR reference rates, constituted an index cessation event under the Interbank Offered Rates (“IBOR”) Fallbacks Supplement and the ISDA 2020 IBOR Fallbacks Protocol for all 35 LIBOR settings and confirmed that the spread adjustment to be used in ISDA fallbacks was fixed as of the date of the announcement.
In the United States, the Alternative Reference Rates Committee (the “ARRC”), a group of market participants convened by the Board of Governors of the Federal Reserve System and the Federal Reserve Bank of New York in cooperation with other federal and state government agencies, has since 2014 undertaken efforts to identify U.S. dollar reference interest rates as alternatives to LIBOR and to facilitate the mitigation of LIBOR-related risks. In June 2017, the ARRC identified the Secured Overnight Financing Rate (“SOFR”), a broad measure of the cost of cash overnight borrowing collateralized by U.S. Treasury securities, as the preferred alternative for U.S. dollar LIBOR. The Federal Reserve Bank of New York began daily publishing of SOFR in April 2018. There is no assurance that any alternative reference rate, including SOFR, will be similar to or produce the same value or economic equivalence as LIBOR or that instruments using an alternative rate will have the same volume or liquidity.
At this time, it is not possible to predict the full impact of the elimination of LIBOR and the establishment of an alternative reference rate on the Fund or its investments.
Securities purchased or sold on a when-issued, delayed-delivery or forward purchase commitment basis may have extended settlement periods. The value of the security so purchased is subject to market fluctuations during this period. Due to the nature of the Senior Loan market, the actual settlement date may not be certain at the time of the purchase or sale for some of the Senior Loans. Interest income on such Senior Loans is not accrued until settlement date. The Fund maintains liquid assets with a current value at least equal to the amount of its when-issued, delayed-delivery or forward purchase commitments until payment is made. At November 30, 2022, the Fund had no when-issued, delayed-delivery or forward purchase commitments (other than the unfunded commitments discussed below).
C. Unfunded Loan Commitments
The Fund may enter into certain credit agreements, all or a portion of which may be unfunded. The Fund is obligated to fund these loan commitments at the borrower’s discretion. Unfunded loan commitments are marked-to-market daily, and any unrealized appreciation (depreciation) is included in the Statement of Assets and Liabilities and Statement of Operations. In connection with these commitments, the Fund earns a commitment fee typically set as a percentage of the commitment amount. The commitment fees are included in “Other” under Investment Income on the Statement of Operations. As of November 30, 2022, the Fund had the following unfunded loan commitments:
| Borrower | | Principal
Value | | Commitment
Amount | | Value | | Unrealized
Appreciation
(Depreciation) |
| athenahealth, Inc. (Minerva Merger Sub, Inc.), Term Loan | | $ 794,455 | | $ 791,140 | | $ 723,748 | | $ (67,392) |
| Aveanna Healthcare LLC, Term Loan | | 181,205 | | 180,135 | | 139,075 | | (41,060) |
| Traeger Grills (TGP Holdings III LLC), Term Loan | | 89,286 | | 88,929 | | 71,463 | | (17,466) |
| Veritext Corporation (VT TopCo, Inc.), Term Loan | | 22,309 | | 22,309 | | 21,668 | | (641) |
| | | | | $1,082,513 | | $955,954 | | $(126,559) |
D. Restricted Securities
The Fund invests in restricted securities, which are securities that may not be offered for public sale without first being registered under the 1933 Act. Prior to registration, restricted securities may only be resold in transactions exempt from registration under Rule 144A under the 1933 Act, normally to qualified institutional buyers. As of November 30, 2022, the Fund held restricted securities as shown in the following table that the Advisor has deemed illiquid pursuant to procedures adopted by the Fund’s Board of Trustees. Although market instability can result in periods of increased overall market illiquidity, liquidity for each security is determined based on security-specific factors and assumptions, which require subjective judgment. The Fund does not have the right to demand that such securities be registered. These securities are valued according to the valuation procedures as stated in the Portfolio Valuation note (Note 2A) and are not expressed as a discount to the carrying value of a comparable unrestricted security.
| Security | Acquisition
Date | Shares | Current Price | Carrying
Cost | Value | % of
Net
Assets |
| Akorn, Inc. | 10/15/2020 | 150,392 | $6.50 | $1,724,086 | $977,548 | 0.34% |
Notes to Financial Statements (Continued)
First Trust Senior Floating Rate Income Fund II (FCT)
November 30, 2022 (Unaudited)
E. Dividends and Distributions to Shareholders
The Fund will distribute to holders of its Common Shares monthly dividends of all or a portion of its net income after the payment of interest and dividends in connection with leverage, if any. Distributions of any net long-term capital gains earned by the Fund are distributed at least annually. Distributions will automatically be reinvested into additional Common Shares pursuant to the Fund’s Dividend Reinvestment Plan unless cash distributions are elected by the shareholder.
Distributions from net investment income and realized capital gains are determined in accordance with federal income tax regulations, which may differ from U.S. GAAP. Certain capital accounts in the financial statements are periodically adjusted for permanent differences in order to reflect their tax character. These permanent differences are primarily due to the varying treatment of income and gain/loss on portfolio securities held by the Fund and have no impact on net assets or NAV per share. Temporary differences, which arise from recognizing certain items of income, expense and gain/loss in different periods for financial statement and tax purposes, will reverse at some point in the future.
The tax character of distributions paid by the Fund during the fiscal year ended May 31, 2022, was as follows:
| Distributions paid from: | |
Ordinary income
| $14,904,773 |
Return of capital
| 10,282,054 |
As of May 31, 2022, the components of distributable earnings and net assets on a tax basis were as follows:
Undistributed ordinary income
| $— |
Undistributed capital gains
| — |
Total undistributed earnings
| — |
Accumulated capital and other losses
| (37,881,083) |
Net unrealized appreciation (depreciation)
| (24,183,450) |
Total accumulated earnings (losses)
| (62,064,533) |
Other
| — |
Paid-in capital
| 355,780,317 |
Total net assets
| $293,715,784 |
F. Income Taxes
The Fund intends to continue to qualify as a regulated investment company by complying with the requirements under Subchapter M of the Internal Revenue Code of 1986, as amended, which includes distributing substantially all of its net investment income and net realized gains to shareholders. Accordingly, no provision has been made for federal and state income taxes. However, due to the timing and amount of distributions, the Fund may be subject to an excise tax of 4% of the amount by which approximately 98% of the Fund’s taxable income exceeds the distributions from such taxable income for the calendar year.
The Fund intends to utilize provisions of the federal income tax laws, which allow it to carry a realized capital loss forward indefinitely following the year of the loss and offset such loss against any future realized capital gains. The Fund is subject to certain limitations under U.S. tax rules on the use of capital loss carryforwards and net unrealized built-in losses. These limitations apply when there has been a 50% change in ownership. At May 31, 2022, the Fund had $37,317,650 of non-expiring capital loss carryforwards available for federal income tax purposes.
Certain losses realized during the current fiscal year may be deferred and treated as occurring on the first day of the following fiscal year for federal income tax purposes. For the fiscal year ended May 31, 2022, the Fund incurred $563,433 of late year capital losses.
The Fund is subject to accounting standards that establish a minimum threshold for recognizing, and a system for measuring, the benefits of a tax position taken or expected to be taken in a tax return. Taxable years ended 2019, 2020, 2021, and 2022 remain open to
Notes to Financial Statements (Continued)
First Trust Senior Floating Rate Income Fund II (FCT)
November 30, 2022 (Unaudited)
federal and state audit. As of November 30, 2022, management has evaluated the application of these standards to the Fund and has determined that no provision for income tax is required in the Fund’s financial statements for uncertain tax positions.
| Tax Cost | | Gross
Unrealized
Appreciation | | Gross
Unrealized
(Depreciation) | | Net Unrealized
Appreciation
(Depreciation) |
| $354,469,924 | | $600,911 | | $(13,478,957) | | $(12,878,046) |
G. Expenses
The Fund will pay all expenses directly related to its operations.
3. Investment Advisory Fee, Affiliated Transactions and Other Fee Arrangements
First Trust, the investment advisor to the Fund, is a limited partnership with one limited partner, Grace Partners of DuPage L.P., and one general partner, The Charger Corporation. The Charger Corporation is an Illinois corporation controlled by James A. Bowen, Chief Executive Officer of First Trust. First Trust is responsible for the selection and ongoing monitoring of the Fund’s investment portfolio, managing the Fund’s business affairs and providing certain administrative services necessary for the management of the Fund. For these investment management services, First Trust is entitled to a monthly fee calculated at an annual rate of 0.75% of the Fund’s Managed Assets. First Trust also provides fund reporting services to the Fund for a flat annual fee in the amount of $9,250.
The Bank of New York Mellon (“BNYM”) serves as the Fund’s administrator, fund accountant, and custodian in accordance with certain fee arrangements. As administrator and fund accountant, BNYM is responsible for providing certain administrative and accounting services to the Fund, including maintaining the Fund’s books of account, records of the Fund’s securities transactions, and certain other books and records. As custodian, BNYM is responsible for custody of the Fund’s assets. BNYM is a subsidiary of The Bank of New York Mellon Corporation, a financial holding company.
Computershare, Inc. (“Computershare”) serves as the Fund’s transfer agent in accordance with certain fee arrangements. As transfer agent, Computershare is responsible for maintaining shareholder records for the Fund.
Each Trustee who is not an officer or employee of First Trust, any sub-advisor or any of their affiliates (“Independent Trustees”) is paid a fixed annual retainer that is allocated equally among each fund in the First Trust Fund Complex. Each Independent Trustee is also paid an annual per fund fee that varies based on whether the fund is a closed-end or other actively managed fund, a target outcome fund or an index fund.
Additionally, the Lead Independent Trustee and the Chairs of the Audit Committee, Nominating and Governance Committee and Valuation Committee are paid annual fees to serve in such capacities, with such compensation allocated pro rata among each fund in the First Trust Fund Complex based on net assets. Independent Trustees are reimbursed for travel and out-of-pocket expenses in connection with all meetings. The Lead Independent Trustee and Committee Chairs rotate every three years. The officers and “Interested” Trustee receive no compensation from the Fund for acting in such capacities.
4. Purchases and Sales of Securities
The cost of purchases and proceeds from sales of securities, excluding short-term investments, for the six months ended November 30, 2022, were $141,862,767 and $204,233,069, respectively.
5. Borrowings
The Fund has a credit agreement (the “Credit Agreement”) with The Bank of Nova Scotia (“Scotia”) that provides a secured line of credit for the Fund. The maximum commitment amount is $138,000,000. Prior to October 13, 2022, the maximum commitment amount was $148,000,000. At the option of the Fund, the borrowing rate is either: (i) the applicable LIBOR rate plus 80 basis points or (ii) the greater of (a) the prime rate as in effect from time to time, (b) the federal funds effective rate plus 2% and (c) the overnight eurodollar rate plus 2%. Under the Credit Agreement, the Fund pays a commitment fee of 0.25% when the loan balance is less than 75% of the maximum commitment or 0.15% in all other events. The average amount outstanding under the Credit Agreement for the six months ended November 30, 2022 was $82,540,984 with the average weighted average interest rate of 3.23%. As of November 30, 2022, the Fund had two LIBOR loans outstanding under the Credit Agreement totaling $54,000,000, which approximates fair value. In addition to the LIBOR loans, the Fund had Prime Rate loans during the period with interest rates ranging from 4.00% to 6.25%.The borrowings are categorized as Level 2 within the fair value hierarchy. The high and low annual interest rates during the six months ended November 30, 2022 were 6.25% and 1.66%, respectively. The weighted average interest rate at November 30, 2022 was 4.71%. The interest and fees are included in “Interest and fees on loans” on the Statement of Operations.
Notes to Financial Statements (Continued)
First Trust Senior Floating Rate Income Fund II (FCT)
November 30, 2022 (Unaudited)
6. Indemnification
The Fund has a variety of indemnification obligations under contracts with its service providers. The Fund’s maximum exposure under these arrangements is unknown. However, the Fund has not had prior claims or losses pursuant to these contracts and expects the risk of loss to be remote.
7. Subsequent Events
Management has evaluated the impact of all subsequent events to the Fund through the date the financial statements were issued and has determined that there were the following subsequent events:
Effective December 16, 2022, the Fund amended its Credit Agreement with Scotia (“Amended Credit Agreement”). The Amended Credit Agreement maintains the maximum commitment amount of $138,000,000. The Amended Credit Agreement replaces LIBOR as the applicable rate with Term SOFR plus a credit spread adjustment of (a) 10 bps for a loan with a one month interest period, (b) 25 bps for a loan with a three month interest period, and (c) 40 bps for a loan with a six month interest period. The spread on borrowed assets bearing interest at Term SOFR changed to the reference rate + 95 bps (plus the applicable credit spread adjustment). Under the Amended Credit Agreement the committee fee will remain at 0.15% when usage is greater than or equal to 75% or 25 bps if less than 75% of the total facility size is utilized.
On January 3, 2023, the fair value methodology used to value the senior loan investments held by the Fund was changed. Prior to that date, the senior loans were valued using the bid side price provided by a pricing service. After such date, the senior loans were valued using the midpoint between the bid and ask price provided by a pricing service. The change in the Fund’s fair value methodology on January 3, 2023, resulted in a one-time increase in the Fund’s net asset value of approximately $0.046 per share on that date, which represented a positive impact on the Fund’s performance of 0.42%.
Additional Information
First Trust Senior Floating Rate Income Fund II (FCT)
November 30, 2022 (Unaudited)
Dividend Reinvestment Plan
If your Common Shares are registered directly with the Fund or if you hold your Common Shares with a brokerage firm that participates in the Fund’s Dividend Reinvestment Plan (the “Plan”), unless you elect, by written notice to the Fund, to receive cash distributions, all dividends, including any capital gain distributions, on your Common Shares will be automatically reinvested by Computershare Trust Company N.A. (the “Plan Agent”), in additional Common Shares under the Plan. If you elect to receive cash distributions, you will receive all distributions in cash paid by check mailed directly to you by the Plan Agent, as the dividend paying agent.
If you decide to participate in the Plan, the number of Common Shares you will receive will be determined as follows:
| (1) | If Common Shares are trading at or above net asset value (“NAV”) at the time of valuation, the Fund will issue new shares at a price equal to the greater of (i) NAV per Common Share on that date or (ii) 95% of the market price on that date. |
| (2) | If Common Shares are trading below NAV at the time of valuation, the Plan Agent will receive the dividend or distribution in cash and will purchase Common Shares in the open market, on the NYSE or elsewhere, for the participants’ accounts. It is possible that the market price for the Common Shares may increase before the Plan Agent has completed its purchases. Therefore, the average purchase price per share paid by the Plan Agent may exceed the market price at the time of valuation, resulting in the purchase of fewer shares than if the dividend or distribution had been paid in Common Shares issued by the Fund. The Plan Agent will use all dividends and distributions received in cash to purchase Common Shares in the open market within 30 days of the valuation date except where temporary curtailment or suspension of purchases is necessary to comply with federal securities laws. Interest will not be paid on any uninvested cash payments. |
You may elect to opt-out of or withdraw from the Plan at any time by giving written notice to the Plan Agent, or by telephone at (866) 340-1104, in accordance with such reasonable requirements as the Plan Agent and the Fund may agree upon. If you withdraw or the Plan is terminated, you will receive a certificate for each whole share in your account under the Plan, and you will receive a cash payment for any fraction of a share in your account. If you wish, the Plan Agent will sell your shares and send you the proceeds, minus brokerage commissions.
The Plan Agent maintains all Common Shareholders’ accounts in the Plan and gives written confirmation of all transactions in the accounts, including information you may need for tax records. Common Shares in your account will be held by the Plan Agent in non-certificated form. The Plan Agent will forward to each participant any proxy solicitation material and will vote any shares so held only in accordance with proxies returned to the Fund. Any proxy you receive will include all Common Shares you have received under the Plan.
There is no brokerage charge for reinvestment of your dividends or distributions in Common Shares. However, all participants will pay a pro rata share of brokerage commissions incurred by the Plan Agent when it makes open market purchases.
Automatically reinvesting dividends and distributions does not mean that you do not have to pay income taxes due upon receiving dividends and distributions. Capital gains and income are realized although cash is not received by you. Consult your financial advisor for more information.
If you hold your Common Shares with a brokerage firm that does not participate in the Plan, you will not be able to participate in the Plan and any dividend reinvestment may be effected on different terms than those described above.
The Fund reserves the right to amend or terminate the Plan if in the judgment of the Board of Trustees the change is warranted. There is no direct service charge to participants in the Plan; however, the Fund reserves the right to amend the Plan to include a service charge payable by the participants. Additional information about the Plan may be obtained by writing Computershare, Inc., P.O. Box 505000, Louisville, KY 40233-5000.
Proxy Voting Policies and Procedures
A description of the policies and procedures that the Fund uses to determine how to vote proxies and information on how the Fund voted proxies relating to portfolio investments during the most recent 12-month period ended June 30 is available (1) without charge, upon request, by calling (800) 988-5891; (2) on the Fund’s website at www.ftportfolios.com; and (3) on the Securities and Exchange Commission’s (“SEC”) website at www.sec.gov.
Portfolio Holdings
The Fund files portfolio holdings information for each month in a fiscal quarter within 60 days after the end of the relevant fiscal quarter on Form N-PORT. Portfolio holdings information for the third month of each fiscal quarter will be publicly available on the
Additional Information (Continued)
First Trust Senior Floating Rate Income Fund II (FCT)
November 30, 2022 (Unaudited)
SEC’s website at www.sec.gov. The Fund’s complete schedule of portfolio holdings for the second and fourth quarters of each fiscal year is included in the semi-annual and annual reports to shareholders, respectively, and is filed with the SEC on Form N-CSR. The semi-annual and annual report for the Fund is available to investors within 60 days after the period to which it relates. The Fund’s Forms N-PORT and Forms N-CSR are available on the SEC’s website listed above.
Submission of Matters to a Vote of Shareholders
The Fund held its Annual Meeting of Shareholders (the “Annual Meeting”) on September 19, 2022. At the Annual Meeting, James A. Bowen and Robert F. Keith were elected by the Common Shareholders of the First Trust Senior Floating Rate Income Fund II as Class III Trustees for a three-year term expiring at the Fund’s annual meeting of shareholders in 2025. The number of votes cast in favor of Mr. Bowen was 21,119,272 and the number of votes withheld was 304,645. The number of votes cast in favor of Mr. Keith was 21,119,272 and the number of votes withheld was 304,645. Richard E. Erickson, Thomas R. Kadlec, Denise M. Keefe and Niel B. Nielson are the other current and continuing Trustees.
Principal Risks
The Fund is a closed-end management investment company designed primarily as a long-term investment and not as a trading vehicle. The Fund is not intended to be a complete investment program and, due to the uncertainty inherent in all investments, there can be no assurance that the Fund will achieve its investment objectives. The following discussion summarizes the principal risks associated with investing in the Fund, which includes the risk that you could lose some or all of your investment in the Fund. The Fund is subject to the informational requirements of the Securities Exchange Act of 1934 and the Investment Company Act of 1940 and, in accordance therewith, files reports, proxy statements and other information that is available for review. The order of the below risk factors does not indicate the significance of any particular risk factor.
Credit Agency Risk. Credit ratings are determined by credit rating agencies and are only the opinions of such entities. Ratings assigned by a rating agency are not absolute standards of credit quality and do not evaluate market risk or the liquidity of securities. Any shortcomings or inefficiencies in credit rating agencies’ processes for determining credit ratings may adversely affect the credit ratings of securities held by the Fund or such credit rating agency’s ability to evaluate creditworthiness and, as a result, may adversely affect those securities’ perceived or actual credit risk.
Credit and Below-Investment Grade Securities Risk. Credit risk is the risk that the issuer or other obligated party of a debt security in the Fund’s portfolio will fail to pay, or it is perceived that it will fail to pay, dividends or interest and/or repay principal, when due. Below-investment grade instruments, including instruments that are not rated but judged to be of comparable quality, are commonly referred to as high-yield securities or “junk” bonds and are considered speculative with respect to the issuer’s capacity to pay dividends or interest and repay principal and are more susceptible to default or decline in market value than investment grade securities due to adverse economic and business developments. High-yield securities are often unsecured and subordinated to other creditors of the issuer. The market values for high-yield securities tend to be very volatile, and these securities are generally less liquid than investment grade securities. For these reasons, an investment in the Fund is subject to the following specific risks: (i) increased price sensitivity to changing interest rates and to a deteriorating economic environment; (ii) greater risk of loss due to default or declining credit quality; (iii) adverse company specific events more likely to render the issuer unable to make dividend, interest and/or principal payments; (iv) negative perception of the high-yield market which may depress the price and liquidity of high-yield securities; (v) volatility; and (vi) liquidity.
Cyber Security Risk. The Fund is susceptible to potential operational risks through breaches in cyber security. A breach in cyber security refers to both intentional and unintentional events that may cause the Fund to lose proprietary information, suffer data corruption or lose operational capacity. Such events could cause the Fund to incur regulatory penalties, reputational damage, additional compliance costs associated with corrective measures and/or financial loss. Cyber security breaches may involve unauthorized access to the Fund’s digital information systems through “hacking” or malicious software coding, but may also result from outside attacks such as denial-of-service attacks through efforts to make network services unavailable to intended users. In addition, cyber security breaches of the Fund’s third-party service providers, such as its administrator, transfer agent or custodian, or issuers in which the Fund invests, can also subject the Fund to many of the same risks associated with direct cyber security breaches. The Fund has established risk management systems designed to reduce the risks associated with cyber security. However, there is no guarantee that such efforts will succeed, especially because the Fund does not directly control the cyber security systems of issuers or third party service providers. Substantial costs may be incurred by the Fund in order to resolve or prevent cyber incidents in the future.
Health Care Companies Risk. Through the Fund’s investments in senior loans, the Fund may be significantly exposed to companies in the health care sector. Health care companies are involved in medical services or health care, including biotechnology research and production, drugs and pharmaceuticals and health care facilities and services. These companies are subject to extensive competition, generic drug sales or the loss of patent protection, product liability litigation and increased government regulation. Research and
Additional Information (Continued)
First Trust Senior Floating Rate Income Fund II (FCT)
November 30, 2022 (Unaudited)
development costs of bringing new drugs to market are substantial, and there is no guarantee that the product will ever come to market. Health care facility operators may be affected by the demand for services, efforts by government or insurers to limit rates, restriction of government financial assistance and competition from other providers.
Illiquid Securities Risk. The Fund invests a substantial portion of its assets in lower-quality debt issued by companies that are highly leveraged. Lower-quality debt tends to be less liquid than higher-quality debt. Moreover, smaller debt issues tend to be less liquid than larger debt issues. Although the resale or secondary market for senior loans is growing, it is currently limited. There is no organized exchange or board of trade on which senior loans are traded. Instead, the secondary market for senior loans is an unregulated inter-dealer or inter-bank resale market. In addition, senior loans in which the Fund invests may require the consent of the borrower and/or agent prior to the settlement of the sale or assignment. These consent requirements can delay or impede the Fund’s ability to settle the sale of senior loans. Depending on market conditions, the Fund may have difficulty disposing its senior loans, which may adversely impact its ability to obtain cash to repay debt, to pay dividends, to pay expenses or to take advantage of new investment opportunities.
Information Technology Companies Risk. Information technology companies produce and provide hardware, software and information technology systems and services. Information technology companies are generally subject to the following risks: rapidly changing technologies and existing product obsolescence; short product life cycles; fierce competition; aggressive pricing and reduced profit margins; the loss of patent, copyright and trademark protections; cyclical market patterns; evolving industry standards; and frequent new product introductions and new market entrants. Information technology companies may be smaller and less experienced companies, with limited product lines, markets or financial resources and fewer experienced management or marketing personnel. Information technology company stocks, particularly those involved with the internet, have experienced extreme price and volume fluctuations that are often unrelated to their operating performance. In addition, information technology companies are particularly vulnerable to federal, state and local government regulation, and competition and consolidation, both domestically and internationally, including competition from foreign competitors with lower production costs. Information technology companies also face competition for services of qualified personnel and heavily rely on patents and intellectual property rights and the ability to enforce such rights to maintain a competitive advantage.
Interest Rate Risk. The yield on the Fund’s common shares will tend to rise or fall as market interest rates rise and fall, as senior loans pay interest at rates which float in response to changes in market rates. Changes in prevailing interest rates can be expected to cause some fluctuation in the Fund’s net asset value. Similarly, a sudden and significant increase in market interest rates may cause a decline in the Fund’s net asset value.
Many financial instruments use or may use a floating rate based upon the London Interbank Offered Rate (“LIBOR”). The United Kingdom’s Financial Conduct Authority (the “FCA”), which regulates LIBOR, intends to cease making LIBOR available as a reference rate over a phase-out period that began in early 2022. However, subsequent announcements by the FCA, the LIBOR administrators, and other regulators indicate that it is possible that the most widely used LIBOR rates may continue until mid-2023. While some instruments tied to LIBOR may include a replacement rate, not all instruments have such fallback provisions and the effectiveness of such replacement rates remains uncertain. The unavailability or replacement of LIBOR may affect the value, liquidity or return on certain Fund investments and may result in costs incurred in connection with closing out positions and entering into new trades. In the United States, it is anticipated that in many instances the Secured Overnight Financing Rate (“SOFR”) will replace LIBOR as the reference rate for many of the floating rate instruments held by the Fund. There is no assurance that the composition or characteristics of SOFR, or any alternative reference rate, will be similar to or produce the same value or economic equivalence as LIBOR or that instruments using an alternative rate will have the same volume or liquidity. As a result, the transition process might lead to increased volatility and reduced liquidity in markets that currently rely on LIBOR to determine interest rates; a reduction in the value of some LIBOR-based investments; increased difficulty in borrowing or refinancing and diminished effectiveness of any applicable hedging strategies against instruments whose terms currently include LIBOR; and/ or costs incurred in connection with temporary borrowings and closing out positions and entering into new agreements. Any potential effects of the transition away from LIBOR on the Fund or on certain instruments in which the Fund invests can be difficult to ascertain, and they may vary depending on a variety of factors. Any such effects on the transition away from LIBOR, as well as other unforeseen effects, could result in losses to the Fund.
Leverage Risk. The use of leverage by the Fund can magnify the effect of any losses. If the income and gains from the securities and investments purchased with leverage proceeds do not cover the cost of leverage, the return to the common shares will be less than if leverage had not been used. Leverage involves risks and special considerations for common shareholders including: (i) the likelihood of greater volatility of net asset value and market price of the common shares than a comparable portfolio without leverage; (ii) the risk that fluctuations in interest rates on borrowings will reduce the return to the common shareholders or will result in fluctuations in the dividends paid on the common shares; (iii) in a declining market, the use of leverage is likely to cause a greater decline in the net asset value of the common shares than if the Fund were not leveraged, which may result in a greater decline in the market price of the
Additional Information (Continued)
First Trust Senior Floating Rate Income Fund II (FCT)
November 30, 2022 (Unaudited)
common shares; and (iv) when the Fund uses certain types of leverage, the investment advisory fee payable to the Advisor will be higher than if the Fund did not use leverage.
Management Risk and Reliance on Key Personnel. The implementation of the Fund’s investment strategy depends upon the continued contributions of certain key employees of the Advisor, some of whom have unique talents and experience and would be difficult to replace. The loss or interruption of the services of a key member of the portfolio management team could have a negative impact on the Fund.
Market Discount from Net Asset Value. Shares of closed-end investment companies such as the Fund frequently trade at a discount from their net asset value. The Fund cannot predict whether its common shares will trade at, below or above net asset value.
Market Risk. Securities held by a fund, as well as shares of a fund itself, are subject to market fluctuations caused by factors such as general economic conditions, political events, regulatory or market developments, changes in interest rates and perceived trends in securities prices. Shares of a fund could decline in value or underperform other investments as a result of the risk of loss associated with these market fluctuations. In addition, local, regional or global events such as war, acts of terrorism, spread of infectious diseases or other public health issues, recessions, or other events could have a significant negative impact on a fund and its investments. For example, the coronavirus (COVID-19) global pandemic and the aggressive responses taken by many governments, including closing borders, restricting international and domestic travel, and the imposition of prolonged quarantines or similar restrictions, had negative impacts, and in many cases severe impacts, on markets worldwide. While the development of vaccines has slowed the spread of the virus and allowed for the resumption of reasonably normal business activity in the United States, many countries continue to impose lockdown measures in an attempt to slow the spread. Also, in February 2022, Russia invaded Ukraine which has caused and could continue to cause significant market disruptions and volatility across markets globally, including the United States. The hostilities and sanctions resulting from those hostilities could have a significant impact on certain Fund investments as well as Fund performance. As the global pandemic and conflict in Ukraine have illustrated, such events may affect certain geographic regions, countries, sectors and industries more significantly than others. These events also may adversely affect the prices and liquidity of the Fund’s portfolio securities or other instruments and could result in disruptions in the trading markets. Any of such circumstances could have a materially negative impact on the value of the Fund’s shares and result in increased market volatility. During any such events, the Fund’s shares may trade at increased premiums or discounts to their net asset value and the bid/ask spread on the Fund’s shares may widen.
Operational Risk. The Fund is subject to risks arising from various operational factors, including, but not limited to, human error, processing and communication errors, errors of the Fund’s service providers, counterparties or other third-parties, failed or inadequate processes and technology or systems failures. The Fund relies on third parties for a range of services, including custody. Any delay or failure relating to engaging or maintaining such service providers may affect the Fund’s ability to meet its investment objectives. Although the Fund and the Advisor seek to reduce these operational risks through controls and procedures, there is no way to completely protect against such risks.
Potential Conflicts of Interest Risk. First Trust and the portfolio managers have interests which may conflict with the interests of the Fund. In particular, First Trust currently manages and may in the future manage and/or advise other investment funds or accounts with the same or substantially similar investment objectives and strategies as the Fund. In addition, while the Fund is using leverage, the amount of the fees paid to First Trust for investment advisory and management services are higher than if the Fund did not use leverage because the fees paid are calculated based on managed assets. Therefore, First Trust has a financial incentive to leverage the Fund.
Prepayment Risk. Loans are subject to prepayment risk. Prepayment risk is the risk that the borrower on a loan will repay principal (in part or in whole) prior to the scheduled maturity date. The degree to which borrowers prepay loans, whether as a contractual requirement or at their election, may be affected by general business conditions, interest rates, the financial condition of the borrower and competitive conditions among loan investors, among others. As such, prepayments cannot be predicted with accuracy. Upon a prepayment, either in part or in full, the actual outstanding debt on which the Fund derives interest income will be reduced. The Fund may not be able to reinvest the proceeds received on terms as favorable as the prepaid loan.
Reinvestment Risk. Reinvestment risk is the risk that income from the Fund’s portfolio will decline if the Fund invests the proceeds from matured, traded or called instruments at market interest rates that are below the Fund’s portfolio’s current earnings rate. A decline in income could affect the common shares’ market price, level of distributions or the overall return of the Fund.
Risks Associated with Investments in Distressed Issuers. The Fund may invest in instruments of distressed issuers, including firms that have defaulted on their debt obligations and/or filed for bankruptcy protection. Investing in such investments involves a far greater level of risk than investing in issuers whose debt obligations are being met and whose debt trades at or close to its “par” value. These investments are highly speculative with respect to the issuer’s ability to continue to make interest payments and/or to pay its principal
Additional Information (Continued)
First Trust Senior Floating Rate Income Fund II (FCT)
November 30, 2022 (Unaudited)
obligations in full; can be very difficult to properly value, making them susceptible to a high degree of price volatility and rendering them less liquid than performing debt obligations; and, for issuers involved in a bankruptcy proceeding, can be subject to a high degree of uncertainty with regard to both the timing and the amount of the ultimate settlement.
Second Lien Loan Risk. A second lien loan may have a claim on the same collateral pool as the first lien or it may be secured by a separate set of assets. Second lien loans are typically secured by a second priority security interest or lien on specified collateral securing the borrower’s obligation under the interest. Because second lien loans are second to first lien loans, they present a greater degree of investment risk. Specifically, these loans are subject to the additional risk that the cash flow of the borrower and property securing the loan may be insufficient to meet scheduled payments after giving effect to those loans with a higher priority. In addition, loans that have a lower than first lien priority on collateral of the borrower generally have greater price volatility than those loans with a higher priority and may be less liquid.
Senior Loan Risk. The Fund invests in senior loans and therefore is subject to the risks associated therewith. Investments in senior loans are subject to the same risks as investments in other types of debt securities, including credit risk, interest rate risk, liquidity risk and valuation risk (which may be heightened because of the limited public information available regarding senior loans and because loan borrowers may be leveraged and tend to be more adversely affected by changes in market or economic conditions). Further, no active trading market may exist for certain senior loans, which may impair the ability of the Fund to realize full value in the event of the need to sell a senior loan and which may make it difficult to value senior loans. Senior loans may not be considered “securities” and the Fund may not be entitled to rely on the anti-fraud protections of the federal securities laws.
In the event a borrower fails to pay scheduled interest or principal payments on a senior loan held by the Fund, the Fund will experience a reduction in its income and a decline in the value of the senior loan, which will likely reduce dividends and lead to a decline in the net asset value of the Fund’s common shares. If the Fund acquires a senior loan from another lender, for example, by acquiring a participation, the Fund may also be subject to credit risks with respect to that lender. Although senior loans may be secured by specific collateral, the value of the collateral may not equal the Fund’s investment when the senior loan is acquired or may decline below the principal amount of the senior loan subsequent to the Fund’s investment. Also, to the extent that collateral consists of stock of the borrower or its subsidiaries or affiliates, the Fund bears the risk that the stock may decline in value, be relatively illiquid, and/or may lose all or substantially all of its value, causing the senior loan to be under collateralized. Therefore, the liquidation of the collateral underlying a senior loan may not satisfy the issuer’s obligation to the Fund in the event of non-payment of scheduled interest or principal, and the collateral may not be readily liquidated. The senior loan market has seen a significant increase in loans with weaker lender protections including, but not limited to, limited financial maintenance covenants or, in some cases, no financial maintenance covenants (i.e., “covenant-lite loans”) that would typically be included in a traditional loan agreement and general weakening of other restrictive covenants applicable to the borrower such as limitations on incurrence of additional debt, restrictions on payments of junior debt or restrictions on dividends and distributions. Weaker lender protections such as the absence of financial maintenance covenants in a loan agreement and the inclusion of “borrower-favorable” terms may impact recovery values and/or trading levels of senior loans in the future. The absence of financial maintenance covenants in a loan agreement generally means that the lender may not be able to declare a default if financial performance deteriorates. This may hinder the Fund’s ability to reprice credit risk associated with a particular borrower and reduce the Fund’s ability to restructure a problematic loan and mitigate potential loss. As a result, the Fund’s exposure to losses on investments in senior loans may be increased, especially during a downturn in the credit cycle or changes in market or economic conditions.
Valuation Risk. The valuation of senior loans may carry more risk than that of common stock. Because the secondary market for senior loans is limited, it may be difficult to value the loans held by the Fund. Market quotations may not be readily available for some senior loans and valuation may require more research than for liquid securities. In addition, elements of judgment may play a greater role in the valuation of senior loans than for securities with a secondary market, because there is less reliable objective data available. These difficulties may lead to inaccurate asset pricing.
Investment Management Agreement
Board Considerations Regarding Approval of Continuation of Investment Management Agreement
The Board of Trustees of First Trust Senior Floating Rate Income Fund II (the “Fund”), including the Independent Trustees, unanimously approved the continuation of the Investment Management Agreement (the “Agreement”) between the Fund and First Trust Advisors L.P. (the “Advisor”). The Board approved the continuation of the Agreement for a one-year period ending June 30, 2023 at a meeting held on June 12–13, 2022. The Board determined that the continuation of the Agreement is in the best interests of the Fund in light of the nature, extent and quality of the services provided and such other matters as the Board considered to be relevant in the exercise of its business judgment.
Additional Information (Continued)
First Trust Senior Floating Rate Income Fund II (FCT)
November 30, 2022 (Unaudited)
To reach this determination, the Board considered its duties under the Investment Company Act of 1940, as amended (the “1940 Act”), as well as under the general principles of state law, in reviewing and approving advisory contracts; the requirements of the 1940 Act in such matters; the fiduciary duty of investment advisors with respect to advisory agreements and compensation; the standards used by courts in determining whether investment company boards have fulfilled their duties; and the factors to be considered by the Board in voting on such agreements. At meetings held on April 18, 2022 and June 12–13, 2022, the Board, including the Independent Trustees, reviewed materials provided by the Advisor responding to requests for information from counsel to the Independent Trustees, submitted on behalf of the Independent Trustees, that, among other things, outlined: the services provided by the Advisor to the Fund (including the relevant personnel responsible for these services and their experience); the advisory fee rate payable by the Fund as compared to fees charged to a peer group of funds (the “Expense Group”) and a broad peer universe of funds (the “Expense Universe”), each assembled by Broadridge Financial Solutions, Inc. (“Broadridge”), an independent source, and as compared to fees charged to other clients of the Advisor; the expense ratio of the Fund as compared to expense ratios of the funds in the Fund’s Expense Group and Expense Universe; performance information for the Fund, including comparisons of the Fund’s performance to that of one or more relevant benchmark indexes and to that of a performance group of funds and a broad performance universe of funds (the “Performance Universe”), each assembled by Broadridge; the nature of expenses incurred in providing services to the Fund and the potential for the Advisor to realize economies of scale, if any; profitability and other financial data for the Advisor; any indirect benefits to the Advisor; and information on the Advisor’s compliance program. The Board reviewed initial materials with the Advisor at the meeting held on April 18, 2022, prior to which the Independent Trustees and their counsel met separately to discuss the information provided by the Advisor. Following the April meeting, counsel to the Independent Trustees, on behalf of the Independent Trustees, requested certain clarifications and supplements to the materials provided, and the information provided in response to those requests was considered at an executive session of the Independent Trustees and their counsel held prior to the June 12–13, 2022 meeting, as well as at the June meeting. The Board applied its business judgment to determine whether the arrangement between the Fund and the Advisor continues to be a reasonable business arrangement from the Fund’s perspective. The Board determined that, given the totality of the information provided with respect to the Agreement, the Board had received sufficient information to renew the Agreement. The Board considered that shareholders chose to invest or remain invested in the Fund knowing that the Advisor manages the Fund.
In reviewing the Agreement, the Board considered the nature, extent and quality of the services provided by the Advisor under the Agreement. The Board considered that the Advisor is responsible for the overall management and administration of the Fund and reviewed all of the services provided by the Advisor to the Fund, as well as the background and experience of the persons responsible for such services. The Board noted that the Advisor’s Leveraged Finance Investment Team is responsible for the day-to-day management of the Fund’s investments. The Board considered the background and experience of the members of the Leveraged Finance Investment Team and noted the Board’s prior meetings with members of the Team. The Board considered the Advisor’s statement that it applies the same oversight model internally with its Leveraged Finance Investment Team as it uses for overseeing external sub-advisors, including portfolio risk monitoring and performance review. In reviewing the services provided, the Board noted the compliance program that had been developed by the Advisor and considered that it includes a robust program for monitoring the Advisor’s and the Fund’s compliance with the 1940 Act, as well as the Fund’s compliance with its investment objectives, policies and restrictions. The Board also considered a report from the Advisor with respect to its risk management functions related to the operation of the Fund. Finally, as part of the Board’s consideration of the Advisor’s services, the Advisor, in its written materials and at the April 18, 2022 meeting, described to the Board the scope of its ongoing investment in additional personnel and infrastructure to maintain and improve the quality of services provided to the Fund and the other funds in the First Trust Fund Complex. In light of the information presented and the considerations made, the Board concluded that the nature, extent and quality of the services provided to the Fund by the Advisor under the Agreement have been and are expected to remain satisfactory and that the Advisor has managed the Fund consistent with its investment objectives, policies and restrictions.
The Board considered the advisory fee rate payable under the Agreement for the services provided. The Board received and reviewed information showing the fee rates and expense ratios of the peer funds in the Expense Group, as well as advisory and unitary fee rates charged by the Advisor to other fund and non-fund clients, as applicable. With respect to the Expense Group, the Board, at the April 18, 2022 meeting, discussed with Broadridge its methodology for assembling peer groups and discussed with the Advisor limitations in creating a relevant peer group for the Fund. The Board took these limitations into account in considering the peer data, and noted that the contractual advisory fee rate payable by the Fund, based on average managed assets, was below the median contractual advisory fee of the peer funds in the Expense Group. With respect to fees charged to other clients, the Board considered differences between the Fund and other clients that limited their comparability. In considering the advisory fee rate overall, the Board also considered the Advisor’s statement that it seeks to meet investor needs through innovative and value-added investment solutions and the Advisor’s demonstrated long-term commitment to the Fund and the other funds in the First Trust Fund Complex.
The Board considered performance information for the Fund. The Board noted the process it has established for monitoring the Fund’s performance and portfolio risk on an ongoing basis, which includes quarterly performance reporting from the Advisor for the Fund. The Board determined that this process continues to be effective for reviewing the Fund’s performance. The Board received and
Additional Information (Continued)
First Trust Senior Floating Rate Income Fund II (FCT)
November 30, 2022 (Unaudited)
reviewed information comparing the Fund’s performance for periods ended December 31, 2021 to the performance of the funds in the Performance Universe and to that of a benchmark index. In reviewing the Fund’s performance as compared to the performance of the Performance Universe, the Board took into account the limitations described above with respect to creating a relevant peer group for the Fund. Based on the information provided on net asset value performance, the Board noted that the Fund underperformed the Performance Universe median for the one-, three-, five- and ten-year periods ended December 31, 2021, underperformed the benchmark index for the one- and five-year periods ended December 31, 2021 and outperformed the benchmark index for the three- and ten-year periods ended December 31, 2021. In addition, the Board considered information provided by the Advisor on the impact of leverage on the Fund’s returns. The Board also received information on the Fund’s annual distribution rate as of December 31, 2021 and the Fund’s average trading discount for various periods and comparable information for a peer group.
On the basis of all the information provided on the fees, expenses and performance of the Fund, and the ongoing oversight by the Board, the Board concluded that the advisory fee continues to be reasonable and appropriate in light of the nature, extent and quality of the services provided by the Advisor to the Fund under the Agreement.
The Board considered information and discussed with the Advisor whether there were any economies of scale in connection with providing advisory services to the Fund and noted the Advisor’s statement that it believes that its expenses relating to providing advisory services to the Fund will likely increase during the next twelve months as the Advisor continues to build infrastructure and add new staff. The Board determined that due to the Fund’s closed-end structure, the potential for realization of economies of scale as Fund assets grow was not a material factor to be considered. The Board considered the revenues and allocated costs (including the allocation methodology) of the Advisor in serving as investment advisor to the Fund for the twelve months ended December 31, 2021 and the estimated profitability level for the Fund calculated by the Advisor based on such data, as well as complex-wide and product-line profitability data, for the same period. The Board noted the inherent limitations in the profitability analysis and concluded that, based on the information provided, the Advisor’s profitability level for the Fund was not unreasonable. In addition, the Board considered indirect benefits described by the Advisor that may be realized from its relationship with the Fund, including the Advisor’s compensation for fund reporting services pursuant to a separate Fund Reporting Services Agreement. The Board also noted that the Advisor does not utilize soft dollars in connection with the Fund. The Board concluded that the character and amount of potential indirect benefits to the Advisor were not unreasonable.
Based on all of the information considered and the conclusions reached, the Board, including the Independent Trustees, unanimously determined that the terms of the Agreement continue to be fair and reasonable and that the continuation of the Agreement is in the best interests of the Fund. No single factor was determinative in the Board’s analysis.
This page intentionally left blank
INVESTMENT ADVISOR
First Trust Advisors L.P.
120 East Liberty Drive, Suite 400
Wheaton, IL 60187
TRANSFER AGENT
Computershare, Inc.
P.O. Box 505000
Louisville, KY 40233
ADMINISTRATOR,
FUND ACCOUNTANT, AND
CUSTODIAN
The Bank of New York Mellon
240 Greenwich Street
New York, NY 10286
INDEPENDENT REGISTERED
PUBLIC ACCOUNTING FIRM
Deloitte & Touche LLP
111 S. Wacker Drive
Chicago, IL 60606
LEGAL COUNSEL
Chapman and Cutler LLP
320 South Canal Street
Chicago, IL 60606
Item 2. Code of Ethics.
Not applicable.
Item 3. Audit Committee Financial Expert.
Not applicable.
Item 4. Principal Accountant Fees and Services.
Not applicable.
Item 5. Audit Committee of Listed Registrants.
Not applicable.
Item 6. Investments.
| (a) | | Schedule of Investments in securities of unaffiliated issuers as of the close of the reporting period is included as part of the report to shareholders filed under Item 1 of this form. |
Item 7. Disclosure of Proxy Voting Policies and Procedures for Closed-End Management Investment Companies.
Not applicable.
Item 8. Portfolio Managers of Closed-End Management Investment Companies.
| (b) | | There have been no changes, as of the date of filing, in any of the Portfolio Managers identified in response to paragraph (a)(1) of this item in the registrant’s most recent annual report on Form N-CSR. |
Item 9. Purchases of Equity Securities by Closed-End Management Investment Company and Affiliated Purchasers.
Not applicable.
Item 10. Submission of Matters to a Vote of Security Holders.
There have been no material changes to the procedures by which the shareholders may recommend nominees to the registrant’s board of directors, where those changes were implemented after the registrant last provided disclosure in response to the requirements of Item 407(c)(2)(iv) of Regulation S-K (17 CFR 229.407) (as required by Item 22(b)(15) of Schedule 14A (17 CFR 240.14a-101)), or this Item.
Item 11. Controls and Procedures.
| (a) | | The registrant’s principal executive and principal financial officers, or persons performing similar functions, have concluded that the registrant’s disclosure controls and procedures (as defined in Rule 30a-3(c) under the Investment Company Act of 1940, as amended (the “1940 Act”) (17 CFR 270.30a-3(c))) are effective, as of a date within 90 days of the filing date of the report that includes the disclosure required by this paragraph, based on their evaluation of these controls and procedures required by Rule 30a-3(b) under the 1940 Act (17 CFR 270.30a-3(b)) and Rules 13a-15(b) or 15d-15(b) under the Securities Exchange Act of 1934, as amended (17 CFR 240.13a-15(b) or 240.15d-15(b)). |
| (b) | | There were no changes in the registrant’s internal control over financial reporting (as defined in Rule 30a-3(d) under the 1940 Act (17 CFR 270.30a-3(d)) that occurred during the period covered by this report that has materially affected, or is reasonably likely to materially affect, the registrant’s internal control over financial reporting. |
Item 12. Disclosure of Securities Lending Activities for Closed-End Management Investment Companies.
Item 13. Exhibits.
SIGNATURES
Pursuant to the requirements of the Securities Exchange Act of 1934 and the Investment Company Act of 1940, the registrant has duly caused this report to be signed on its behalf by the undersigned, thereunto duly authorized.
| (Registrant) | | First Trust Senior Floating Rate Income Fund II |
| By (Signature and Title)* | | /s/ James M. Dykas |
| | | James M. Dykas, President and Chief Executive Officer
(principal executive officer) |
Pursuant to the requirements of the Securities Exchange Act of 1934 and the Investment Company Act of 1940, this report has been signed below by the following persons on behalf of the registrant and in the capacities and on the dates indicated.
| By (Signature and Title)* | | /s/ James M. Dykas |
| | | James M. Dykas, President and Chief Executive Officer
(principal executive officer) |
| By (Signature and Title)* | | /s/ Donald P. Swade |
| | | Donald P. Swade, Treasurer, Chief Financial Officer
and Chief Accounting Officer
(principal financial officer) |
* Print the name and title of each signing officer under his or her signature.