SEMI-ANNUAL REPORT
April 30, 2010
(Unaudited)
For more information or assistance in opening an account,
please call toll-free 1-888-534-2001.
June 15, 2010
Dear Shareholder,
Enclosed is the Semi-Annual Report to shareholders of the TFS Market Neutral Fund (ticker: TFSMX) and the TFS Small Cap Fund (ticker: TFSSX) for the period ended April 30, 2010. On behalf of the investment manager, TFS Capital LLC (“TFS Capital”), I’d like to thank you for your investment.
During the period, several notable changes took place with the above-mentioned Funds. For one, given its significant asset growth, the TFS Market Neutral Fund filed a prospectus supplement in January to implement a “hard close” and cease its public offering of shares with certain limited exceptions. The intent of the hard close is to greatly limit the growth of the Fund. TFS believes that this action will assist the management team in its effort to maintain the Fund’s high standard of performance.
In addition, the TFS Small Cap Fund implemented a shareholder approved change in the fee arrangement with TFS Capital. More specifically, beginning March 1, 2010, the Fund changed the performance-based fee schedule to a fixed-rate fee schedule.1 While TFS Capital remains a strong supporter of performance-based compensation, this change was implemented based on investor feedback in an effort to facilitate Fund growth.
We would like to emphasize that, although TFSMX implemented a hard close, this action does not mean that TFS Capital intends to reduce its investment in strategy research and development. Rather, we continue to invest heavily in ongoing research as evidenced by our 2009 expenditures in this area which exceeded any prior year. Moreover, we continue to aggressively seek talented individuals to augment the trading and research teams.
It is notable that the TFS Small Cap Fund, along with the private investment funds managed by TFS Capital, will remain open to existing and new investors. These products provide investors with an opportunity to gain exposure to the management team at TFS Capital.
Below are performance highlights for the Funds.
TFS Market Neutral Fund (ticker: TFSMX)
Average annual total returns for periods ended 4/30/2010 and since inception.
| | 1 year return | 3 year return | 5 year return | Since Inception (9/7/2004) |
| TFS Market Neutral Fund | 14.94% | 5.32% | 10.66% | 9.52% |
| S&P 500 Index | 38.84% | -5.05% | 2.63% | 3.10% |
TFSMX’s performance compares favorably to the overall U.S. equity market as measured by the S&P 500 Index. From inception through April 30, 2010, TFSMX generated a 9.52% average annual return and had an annualized standard deviation of 8.67%, whereas the S&P 500 Index generated a 3.10% average annual return and had an annualized standard deviation of 23.02%. Therefore, from inception through April 30, 2010, TFSMX produced an average annual return that was 6.42 percentage points above that of the S&P 500 Index while subjecting investors to only 37.7% of the volatility.
The strategies used in managing TFSMX have resulted in the Fund having a low correlation to other asset classes. According to Modern Portfolio Theory, investors may benefit by combining non-correlated investments. For your reference, below are the Fund’s correlations to several other asset classes.
| Index | Correlation Since Inception |
| S&P 500 Index | 0.52 |
Russell 2000® Index | 0.49 |
| MSCI EAFE Index | 0.47 |
| Barclays Capital U.S. Agg. Bond Index | -0.08 |
| Wilshire REIT ETF Index | 0.36 |
| Dow Jones Commodity Futures | 0.43 |
TFS Small Cap Fund (ticker: TFSSX)
Average annual total returns for periods ended 4/30/2010 and since inception.
| | 1 year return | 3 year return | Since Inception (3/7/2006) |
| TFS Small Cap Fund | 63.66% | 5.56% | 9.02% |
Russell 2000® Index | 48.95% | -2.79% | 1.23% |
As evidenced by the return figures above, TFSSX has continued to achieve its objective of outperforming the Russell 2000® Index. In fact, the Fund now has over a 4-year track record and has achieved an average annual return that is 7.79 percentage points higher than that of the Russell 2000® Index. On a cumulative basis, TFSSX generated a 43.08% total return compared to 5.20% total return for the Russell 2000® Index. At the end of April 2010, the trailing 3-year return placed TFSSX in the top 1% of the Lipper “Small Cap Core” category and in the top 2% of the Morningstar ̶ 0;Small Cap Blend” category.2
Despite the Funds’ excellent performance, we do not recommend allocating a high percentage of one’s assets to either Fund given the risks inherent in the Funds. Rather, we believe that they are best used as a component of a diversified portfolio of investments. If you have any questions about the Funds or TFS Capital, please contact us.
Best regards,
Larry S. Eiben
Chief Operating Officer & Co-Portfolio Manager
TFS Capital LLC
The performance data quoted represents past performance, which is not a guarantee of future results. Current performance may be lower or higher than the performance data quoted. The investment return and principal value of an investment in the Funds will fluctuate so that an investor’s shares, when redeemed, may be worth more or less than their original cost. The Funds charge a 2% redemption penalty on shares invested for less than 90 days. If shares are redeemed within the 90 day period, investment returns would be reduced from those shown above. Fee waivers and/or expense reimbursements by the Adviser have positively impacted the Funds’ performance. Without such waivers and/or reimbursements, performance would have been lower. An investor should consider the investment objectives, risks, charges and expenses of the Funds carefully before investing. To obtain a summary prospectus and/or prospectus, which each contain this and other important information, go to www.TFSCapital.com or call (888) 534-2001. Please read the summary prospectus and/or prospectus carefully before investing. The Funds may not be suitable for all investors.
| 1 | More information on the current fee schedule can be found in the Fund’s Prospectus. It is notable that for the period from March 1, 2010 to March 1, 2011, TFS Capital will continue to be subject to downward fee adjustments based on performance. The maximum fee that can be charged during this period is 1.25% of the Fund’s average daily net assets. |
| 2 | TFSSX was ranked #9 out of 646 in the Lipper “Small Cap Core” category and #8 out of 555 in the Morningstar “Small Blend” category using its 3-year return. TFSSX was ranked #33 out of 755 in the Lipper “Small Cap Core” category and #46 out of 638 in the Morningstar “Small Cap Blend” category using its 1-year return. |
Ranking information provided by Lipper and Morningstar for the periods ended April 30, 2010. TFSSX was assigned by Lipper to the Small-Cap Core category and by Morningstar to the Small Blend category. The Fund is ranked based on total return and is ranked within a universe of funds with similar investment objectives. Rankings include the reinvestment of dividends and capital gains but exclude the effect of a fund’s sales load, if applicable. Fund rankings are calculated monthly by Lipper Analytical Services of New York and Morningstar, Inc. of Chicago. Lipper Inc. and Morningstar Inc. are nationally recognized organizations that rank the performance of mutual funds.
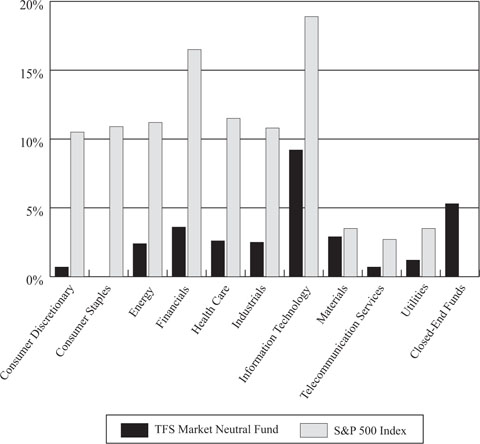
TFS MARKET NEUTRAL FUND PORTFOLIO INFORMATION April 30, 2010 (Unaudited) |
TFS Market Neutral Fund vs S&P 500 Index
Net Sector Exposure*
| * | The net percentages for the TFS Market Neutral Fund are computed by taking the net dollar exposure, including short positions, and dividing by the net assets of the Fund. Consequently, the percentages are not likely to total to 100%. |
Top 10 Long Equity Positions | | Top 10 Short Equity Positions |
| | | | |
| Brocade Communications Systems, Inc. | 0.62% | | Realty Income Corporation | 0.47% |
| Hecla Mining Company | 0.60% | | MBIA, Inc. | 0.37% |
| Quiksilver, Inc. | 0.59% | | Jos. A. Bank Clothiers, Inc. | 0.36% |
| MetroPCS Communications, Inc. | 0.58% | | USG Corporation | 0.36% |
| ON Semiconductor Corporation | 0.58% | | MDC Holdings, Inc. | 0.36% |
| Cinemark Holdings, Inc. | 0.55% | | Hovnanian Enterprises, Inc. - Class A | 0.35% |
| Del Monte Foods Company | 0.54% | | hhgregg, Inc. | 0.35% |
| Domtar Corporation | 0.54% | | Park National Corporation | 0.35% |
| Vishay Intertechnology, Inc. | 0.53% | | Vail Resorts, Inc. | 0.34% |
| Continental Airlines, Inc. - Class B | 0.52% | | NutriSystem, Inc. | 0.34% |
TFS SMALL CAP FUND PORTFOLIO INFORMATION April 30, 2010 (Unaudited) |
TFS Small Cap Fund
Sector Allocation (% of Net Assets)
|
| |
| Quiksilver, Inc. | 0.48% |
| Movado Group, Inc. | 0.48% |
| Overstock.com, Inc. | 0.48% |
| Semtech Corporation | 0.47% |
| Popular, Inc. | 0.46% |
| Chimera Investment Corporation | 0.45% |
| Hersha Hospitality Trust | 0.45% |
| Lattice Semiconductor Corporation | 0.44% |
| Richardson Electronics Ltd. | 0.42% |
| Lawson Software, Inc. | 0.41% |
TFS MARKET NEUTRAL FUND SUMMARY SCHEDULE OF INVESTMENTS April 30, 2010 (Unaudited) |
| | | | | | |
| Consumer Discretionary — 13.9% | | | | | | |
| Auto Components — 1.5% | | | | | | |
Goodyear Tire & Rubber Company (The) (a) (b) | | | 346,165 | | | $ | 4,648,996 | |
Tenneco, Inc. (a) (b) | | | 137,033 | | | | 3,531,340 | |
Other Auto Components (c) | | | | | | | 8,040,758 | |
| | | | | | | | 16,221,094 | |
| Automobiles — 0.1% | | | | | | | | |
Other Automobiles (c) | | | | | | | 796,333 | |
| | | | | | | | | |
| Distributors — 0.0% | | | | | | | | |
Other Distributors (c) | | | | | | | 446,472 | |
| | | | | | | | | |
| Diversified Consumer Services — 0.8% | | | | | | | | |
Other Diversified Consumer Services (c) | | | | | | | 8,430,306 | |
| | | | | | | | | |
| Hotels, Restaurants & Leisure — 1.5% | | | | | | | | |
Other Hotels, Restaurants & Leisure (c) | | | | | | | 15,905,753 | |
| | | | | | | | | |
| Household Durables — 1.2% | | | | | | | | |
Jarden Corporation (b) | | | 174,697 | | | | 5,611,268 | |
Other Household Durables (c) | | | | | | | 7,275,688 | |
| | | | | | | | 12,886,956 | |
| Internet & Catalog Retail — 0.5% | | | | | | | | |
Other Internet & Catalog Retail (c) | | | | | | | 5,062,619 | |
| | | | | | | | | |
| Leisure Equipment & Products — 0.3% | | | | | | | | |
Other Leisure Equipment & Products (c) | | | | | | | 3,564,031 | |
| | | | | | | | | |
| Media — 1.6% | | | | | | | | |
Cinemark Holdings, Inc. (b) | | | 328,244 | | | | 5,993,735 | |
Other Media (c) | | | | | | | 11,419,740 | |
| | | | | | | | 17,413,475 | |
| Multi-Line Retail — 0.7% | | | | | | | | |
Other Multi-Line Retail (c) | | | | | | | 7,385,309 | |
| | | | | | | | | |
| Specialty Retail — 2.8% | | | | | | | | |
Other Specialty Retail (c) | | | | | | | 30,600,443 | |
| | | | | | | | | |
| Textiles, Apparel & Luxury Goods — 2.9% | | | | | | | | |
Jones Apparel Group, Inc. | | | 247,792 | | | | 5,391,954 | |
Quiksilver, Inc. (a) (b) | | | 1,199,086 | | | | 6,391,128 | |
Warnaco Group, Inc. (The) (a) (b) | | | 102,300 | | | | 4,894,032 | |
Other Textiles, Apparel & Luxury Goods (c) | | | | | | | 14,516,906 | |
| | | | | | | | 31,194,020 | |
| Consumer Staples — 3.1% | | | | | | | | |
| Beverages — 0.0% | | | | | | | | |
Other Beverages (c) | | | | | | | 442,067 | |
TFS MARKET NEUTRAL FUND SUMMARY SCHEDULE OF INVESTMENTS (Continued) |
COMMON STOCKS — 91.7% (Continued) | | | | | | |
| Consumer Staples — 3.1% (Continued) | | | | | | |
| Food & Staples Retailing — 0.1% | | | | | | |
Other Food & Staples Retailing (c) | | | | | $ | 1,466,321 | |
| | | | | | | | |
| Food Products — 1.8% | | | | | | | |
Corn Products International, Inc. (b) | | | 130,305 | | | | 4,690,980 | |
Del Monte Foods Company (b) | | | 390,165 | | | | 5,829,065 | |
Origin Agritech Ltd. (a) | | | 406,444 | | | | 3,560,449 | |
Other Food Products (c) | | | | | | | 5,066,906 | |
| | | | | | | | 19,147,400 | |
| Household Products — 0.1% | | | | | | | | |
Other Household Products (c) | | | | | | | 1,473,569 | |
| | | | | | | | | |
| Personal Products — 0.9% | | | | | | | | |
NBTY, Inc. (a) (b) | | | 85,700 | | | | 3,486,276 | |
Other Personal Products (c) | | | | | | | 5,773,599 | |
| | | | | | | | 9,259,875 | |
| Tobacco — 0.2% | | | | | | | | |
Other Tobacco (c) | | | | | | | 2,240,509 | |
| | | | | | | | | |
| Energy — 6.9% | | | | | | | | |
| Energy Equipment & Services — 2.2% | | | | | | | | |
Other Energy Equipment & Services (c) | | | | | | | 23,736,439 | |
| | | | | | | | | |
| Oil, Gas & Consumable Fuels — 4.7% | | | | | | | | |
Petroleum Development Corporation (a) (b) | | | 211,425 | | | | 4,949,459 | |
USEC, Inc. (a) (b) | | | 716,256 | | | | 4,297,536 | |
Other Oil, Gas & Consumable Fuels (c) | | | | | | | 41,880,769 | |
| | | | | | | | 51,127,764 | |
| Financials — 15.0% | | | | | | | | |
| Capital Markets — 3.1% | | | | | | | | |
Apollo Investment Corporation (b) | | | 312,605 | | | | 3,801,277 | |
E*TRADE Financial Corporation (a) | | | 2,672,830 | | | | 4,490,354 | |
Other Capital Markets (c) | | | | | | | 25,059,810 | |
| | | | | | | | 33,351,441 | |
| Commercial Banks — 2.2% | | | | | | | | |
Popular, Inc. (a) | | | 1,387,334 | | | | 5,466,096 | |
Other Commercial Banks (c) | | | | | | | 18,790,694 | |
| | | | | | | | 24,256,790 | |
| Consumer Finance — 1.2% | | | | | | | | |
Nelnet, Inc. - Class A (b) | | | 173,672 | | | | 3,466,493 | |
Other Consumer Finance (c) | | | | | | | 9,819,147 | |
| | | | | | | | 13,285,640 | |
| Diversified Financial Services — 0.6% | | | | | | | | |
Other Diversified Financial Services (c) | | | | | | | 6,906,091 | |
| | | | | | | | | |
| Insurance — 3.5% | | | | | | | | |
Unitrin, Inc. (b) | | | 119,506 | | | | 3,495,551 | |
Other Insurance (c) | | | | | | | 34,539,428 | |
| | | | | | | | 38,034,979 | |
TFS MARKET NEUTRAL FUND SUMMARY SCHEDULE OF INVESTMENTS (Continued) |
COMMON STOCKS — 91.7% (Continued) | | | | | | |
| Financials — 15.0% (Continued) | | | | | | |
| Real Estate Investment Trusts — 2.8% | | | | | | |
Chimera Investment Corporation (b) | | | 1,083,260 | | | $ | 4,408,868 | |
Other Real Estate Investment Trusts (c) | | | | | | | 25,349,141 | |
| | | | | | | | 29,758,009 | |
| Real Estate Management & Development — 0.1% | | | | | | | | |
Other Real Estate Management & Development (c) | | | | | | | 575,149 | |
| | | | | | | | | |
| Thrifts & Mortgage Finance — 1.5% | | | | | | | | |
Federal National Mortgage Association (a) | | | 3,908,900 | | | | 4,768,858 | |
Radian Group, Inc. (b) | | | 285,200 | | | | 4,046,988 | |
Other Thrifts & Mortgage Finance (c) | | | | | | | 7,217,899 | |
| | | | | | | | 16,033,745 | |
| Health Care — 11.0% | | | | | | | | |
| Biotechnology — 2.6% | | | | | | | | |
Incyte Corporation (a) (b) | | | 293,165 | | | | 3,934,274 | |
Other Biotechnology (c) | | | | | | | 23,747,978 | |
| | | | | | | | 27,682,252 | |
| Health Care Equipment & Supplies — 2.3% | | | | | | | | |
STERIS Corporation (b) | | | 121,302 | | | | 4,036,931 | |
Other Health Care Equipment & Supplies (c) | | | | | | | 20,960,793 | |
| | | | | | | | 24,997,724 | |
| Health Care Providers & Services — 3.5% | | | | | | | | |
Health Net, Inc. (a) (b) | | | 159,017 | | | | 3,501,554 | |
Other Health Care Providers & Services (c) | | | | | | | 34,308,069 | |
| | | | | | | | 37,809,623 | |
| Health Care Technology — 0.3% | | | | | | | | |
Other Health Care Technology (c) | | | | | | | 3,626,085 | |
| | | | | | | | | |
| Life Sciences Tools & Services — 1.1% | | | | | | | | |
Bruker Corporation (a) (b) | | | 298,028 | | | | 4,556,848 | |
Other Life Sciences Tools & Services (c) | | | | | | | 7,111,717 | |
| | | | | | | | 11,668,565 | |
| Pharmaceuticals — 1.2% | | | | | | | | |
Nektar Therapeutics (a) (b) | | | 299,622 | | | | 4,182,723 | |
ViroPharma, Inc. (a) (b) | | | 311,487 | | | | 3,962,115 | |
Other Pharmaceuticals (c) | | | | | | | 4,667,368 | |
| | | | | | | | 12,812,206 | |
| Industrials — 13.6% | | | | | | | | |
| Aerospace & Defense — 1.9% | | | | | | | | |
Esterline Technologies Corporation (a) (b) | | | 97,198 | | | | 5,421,704 | |
Other Aerospace & Defense (c) | | | | | | | 15,062,003 | |
| | | | | | | | 20,483,707 | |
| Air Freight & Logistics — 0.6% | | | | | | | | |
Other Air Freight & Logistics (c) | | | | | | | 6,805,143 | |
| | | | | | | | | |
| Airlines — 2.1% | | | | | | | | |
Continental Airlines, Inc. - Class B (a) (b) | | | 252,731 | | | | 5,648,538 | |
TFS MARKET NEUTRAL FUND SUMMARY SCHEDULE OF INVESTMENTS (Continued) |
COMMON STOCKS — 91.7% (Continued) | | | | | | |
| Industrials — 13.6% (Continued) | | | | | | |
| Airlines — 2.1% (Continued) | | | | | | |
JetBlue Airways Corporation (a) (b) | | | 626,731 | | | $ | 3,503,426 | |
Other Airlines (c) | | | | | | | 13,249,136 | |
| | | | | | | | 22,401,100 | |
| Building Products — 0.3% | | | | | | | | |
Other Building Products (c) | | | | | | | 2,770,958 | |
| | | | | | | | | |
| Commercial Services & Supplies — 1.7% | | | | | | | | |
Other Commercial Services & Supplies (c) | | | | | | | 18,352,873 | |
| | | | | | | | | |
| Construction & Engineering — 0.4% | | | | | | | | |
Other Construction & Engineering (c) | | | | | | | 4,285,497 | |
| | | | | | | | | |
| Electrical Equipment — 1.0% | | | | | | | | |
Regal-Beloit Corporation (b) | | | 67,386 | | | | 4,263,512 | |
Other Electrical Equipment (c) | | | | | | | 6,555,621 | |
| | | | | | | | 10,819,133 | |
| Industrial Conglomerates — 0.0% | | | | | | | | |
Other Industrial Conglomerates (c) | | | | | | | 121,403 | |
| | | | | | | | | |
| Machinery — 2.6% | | | | | | | | |
Other Machinery (c) | | | | | | | 28,388,068 | |
| | | | | | | | | |
| Marine — 0.5% | | | | | | | | |
Other Marine (c) | | | | | | | 5,564,273 | |
| | | | | | | | | |
| Professional Services — 0.7% | | | | | | | | |
Other Professional Services (c) | | | | | | | 7,398,285 | |
| | | | | | | | | |
| Road & Rail — 1.0% | | | | | | | | |
Avis Budget Group, Inc. (a) (b) | | | 243,021 | | | | 3,674,477 | |
YRC Worldwide, Inc. (a) | | | 6,722,520 | | | | 3,742,427 | |
Other Road & Rail (c) | | | | | | | 2,911,269 | |
| | | | | | | | 10,328,173 | |
| Trading Companies & Distributors — 0.8% | | | | | | | | |
Aircastle Ltd. (b) | | | 296,627 | | | | 3,562,490 | |
Other Trading Companies & Distributors (c) | | | | | | | 4,961,814 | |
| | | | | | | | 8,524,304 | |
| Transportation Infrastructure — 0.0% | | | | | | | | |
Other Transportation Infrastructure (c) | | | | | | | 425,392 | |
| | | | | | | | | |
| Information Technology — 18.8% | | | | | | | | |
| Communications Equipment — 3.0% | | | | | | | | |
Acme Packet, Inc. (a) (b) | | | 212,619 | | | | 5,557,861 | |
Brocade Communications Systems, Inc. (a) (b) | | | 1,029,703 | | | | 6,682,772 | |
Riverbed Technology, Inc. (a) (b) | | | 115,295 | | | | 3,572,992 | |
Other Communications Equipment (c) | | | | | | | 16,826,646 | |
| | | | | | | | 32,640,271 | |
TFS MARKET NEUTRAL FUND SUMMARY SCHEDULE OF INVESTMENTS (Continued) |
COMMON STOCKS — 91.7% (Continued) | | | | | | |
| Information Technology — 18.8% (Continued) | | | | | | |
| Computers & Peripherals — 1.4% | | | | | | |
Lexmark International, Inc. - Class A (a) (b) | | | 139,140 | | | $ | 5,155,137 | |
Other Computers & Peripherals (c) | | | | | | | 9,969,941 | |
| | | | | | | | 15,125,078 | |
| Electronic Equipment, Instruments & Components — 2.1% | | | | | | | | |
Vishay Intertechnology, Inc. (a) (b) | | | 548,256 | | | | 5,707,345 | |
Other Electronic Equipment, Instruments & Components (c) | | | | | | | 17,073,809 | |
| | | | | | | | 22,781,154 | |
| Internet Software & Services — 2.0% | | | | | | | | |
SAVVIS, Inc. (a) (b) | | | 208,468 | | | | 3,669,037 | |
Other Internet Software & Services (c) | | | | | | | 17,708,272 | |
| | | | | | | | 21,377,309 | |
| IT Services — 1.9% | | | | | | | | |
Other IT Services (c) | | | | | | | 20,633,749 | |
| | | | | | | | | |
| Semiconductors & Semiconductor Equipment — 5.2% | | | | | | | | |
Fairchild Semiconductor International, Inc. (a) | | | 328,453 | | | | 3,685,243 | |
Lattice Semiconductor Corporation (a) (b) | | | 830,392 | | | | 4,376,166 | |
OmniVision Technologies, Inc. (a) | | | 209,511 | | | | 3,679,013 | |
ON Semiconductor Corporation (a) | | | 785,600 | | | | 6,237,664 | |
Veeco Instruments, Inc. (a) (b) | | | 94,800 | | | | 4,170,252 | |
Other Semiconductors & Semiconductor Equipment (c) | | | | | | | 34,633,507 | |
| | | | | | | | 56,781,845 | |
| Software — 3.2% | | | | | | | | |
Other Software (c) | | | | | | | 34,282,203 | |
| | | | | | | | | |
| Materials — 6.1% | | | | | | | | |
| Chemicals — 1.4% | | | | | | | | |
Cytec Industries, Inc. (b) | | | 75,393 | | | | 3,623,388 | |
Other Chemicals (c) | | | | | | | 11,701,636 | |
| | | | | | | | 15,325,024 | |
| Construction Materials — 0.0% | | | | | | | | |
Other Construction Materials (c) | | | | | | | 24,149 | |
| | | | | | | | | |
| Containers & Packaging — 1.6% | | | | | | | | |
Other Containers & Packaging (c) | | | | | | | 16,832,210 | |
| | | | | | | | | |
| Metals & Mining — 2.1% | | | | | | | | |
Hecla Mining Company (a) (b) | | | 1,083,854 | | | | 6,470,608 | |
Silvercorp Metals, Inc. | | | 425,796 | | | | 3,504,301 | |
Other Metals & Mining (c) | | | | | | | 12,620,321 | |
| | | | | | | | 22,595,230 | |
| Paper & Forest Products — 1.0% | | | | | | | | |
Domtar Corporation (a) (b) | | | 81,914 | | | | 5,802,788 | |
Other Paper & Forest Products (c) | | | | | | | 4,828,451 | |
| | | | | | | | 10,631,239 | |
TFS MARKET NEUTRAL FUND SUMMARY SCHEDULE OF INVESTMENTS (Continued) |
COMMON STOCKS — 91.7% (Continued) | | | | | | |
| Telecommunication Services — 1.4% | | | | | | |
| Diversified Telecommunication Services — 0.7% | | | | | | |
Other Diversified Telecommunication Services (c) | | | | | $ | 7,916,378 | |
| | | | | | | | |
| Wireless Telecommunication Services — 0.7% | | | | | | | |
MetroPCS Communications, Inc. (a) (b) | | | 820,063 | | | | 6,257,081 | |
Other Wireless Telecommunication Services (c) | | | | | | | 1,340,053 | |
| | | | | | | | 7,597,134 | |
| Utilities — 1.9% | | | | | | | | |
| Electric Utilities — 0.7% | | | | | | | | |
Other Electric Utilities (c) | | | | | | | 7,471,294 | |
| | | | | | | | | |
| Gas Utilities — 0.9% | | | | | | | | |
Other Gas Utilities (c) | | | | | | | 9,886,956 | |
| | | | | | | | | |
| Independent Power Producers & Energy Traders — 0.2% | | | | | | | | |
Other Independent Power Producers & Energy Traders (c) | | | | | | | 1,872,936 | |
| | | | | | | | | |
| Multi-Utilities — 0.1% | | | | | | | | |
Other Multi-Utilities (c) | | | | | | | 951,466 | |
| | | | | | | | | |
| Water Utilities — 0.0% | | | | | | | | |
Other Water Utilities (c) | | | | | | | 417,322 | |
| | | | | | | | | |
| | | | | | | | | |
Total Common Stocks (Cost $893,592,684) | | | | | | $ | 991,410,310 | |
| | | | |
Other Closed-End Funds (Cost $56,657,421) (c) | | | $ | 56,909,253 | |
| | | | |
Other Rights (Cost $0) (c) | | | $ | 10,472 | |
TFS MARKET NEUTRAL FUND SUMMARY SCHEDULE OF INVESTMENTS (Continued) |
MONEY MARKET FUNDS — 3.6% | | | | | | |
UMB Money Market Fiduciary, 0.03% (d) (Cost $39,145,540) | | | 39,145,540 | | | $ | 39,145,540 | |
| | | | | | | | | |
Total Investments at Value — 100.6% (Cost $989,395,645) | | | | | | $ | 1,087,475,575 | |
| | | | | | | | | |
Liabilities in Excess of Other Assets — (0.6%) | | | | | | | (6,665,661 | ) |
| | | | | | | | | |
Net Assets — 100.0% | | | | | | $ | 1,080,809,914 | |
| (a) | Non-income producing security. |
| | |
| (b) | All or a portion of the shares have been committed as collateral for open short positions. |
| | |
| (c) | Represents issuers not identified as a top 50 holding in terms of market value and issues or issuers not exceeding 1% of net assets individually or in the aggregate, respectively, as of April 30, 2010. All or a portion of these issuers have been committed as collateral for open short positions. |
| | |
| (d) | Variable rate security. The rate shown is the 7-day effective yield as of April 30, 2010. |
| | |
| See accompanying notes to financial statements. |
TFS MARKET NEUTRAL FUND SCHEDULE OF SECURITIES SOLD SHORT April 30, 2010 (Unaudited) |
| | | | | | |
| Consumer Discretionary — 13.2% | | | | | | |
| Auto Components — 0.3% | | | | | | |
Amerigon, Inc. (a) | | | 7,429 | | | $ | 72,879 | |
Cooper Tire & Rubber Company | | | 16,700 | | | | 354,374 | |
Fuel Systems Solutions, Inc. (a) | | | 17,000 | | | | 534,990 | |
Raser Technologies, Inc. (a) | | | 273,611 | | | | 220,640 | |
Superior Industries International, Inc. | | | 86,885 | | | | 1,464,881 | |
Tenneco Automotive, Inc. (a) | | | 34,364 | | | | 885,560 | |
TRW Automotive Holdings Corporation (a) | | | 2,100 | | | | 67,641 | |
| | | | | | | | 3,600,965 | |
| Automobiles — 0.3% | | | | | | | | |
Thor Industries, Inc. | | | 10,700 | | | | 382,097 | |
Winnebago Industries, Inc. (a) | | | 146,227 | | | | 2,431,755 | |
| | | | | | | | 2,813,852 | |
| Distributors — 0.0% | | | | | | | | |
Audiovox Corporation - Class A (a) | | | 4,449 | | | | 41,420 | |
Core-Mark Holding Company, Inc. (a) | | | 8,046 | | | | 245,564 | |
| | | | | | | | 286,984 | |
| Diversified Consumer Services — 1.2% | | | | | | | | |
American Public Education, Inc. (a) | | | 37,257 | | | | 1,577,834 | |
Bridgepoint Education, Inc. (a) | | | 5,601 | | | | 144,002 | |
Capella Education Company (a) | | | 17,001 | | | | 1,540,631 | |
ChinaCast Education Corporation (a) | | | 126,535 | | | | 851,581 | |
Coinstar, Inc. (a) | | | 8,600 | | | | 381,496 | |
Corinthian Colleges, Inc. (a) | | | 20,600 | | | | 321,772 | |
Education Management Corporation (a) | | | 28,603 | | | | 624,403 | |
Grand Canyon Education, Inc. (a) | | | 27,163 | | | | 656,801 | |
ITT Educational Services, Inc. (a) | | | 358 | | | | 36,205 | |
Jackson Hewitt Tax Service, Inc. (a) | | | 16,000 | | | | 27,040 | |
K12, Inc. (a) | | | 90,666 | | | | 2,146,064 | |
Matthews International Corporation - Class A | | | 300 | | | | 10,500 | |
Pre-Paid Legal Services, Inc. (a) | | | 41,182 | | | | 1,831,363 | |
Princeton Review, Inc. (The) (a) | | | 4,314 | | | | 13,503 | |
Stewart Enterprises, Inc. - Class A | | | 302,800 | | | | 2,052,984 | |
Universal Technical Institute, Inc. (a) | | | 2,800 | | | | 67,088 | |
Weight Watchers International, Inc. | | | 14,600 | | | | 387,922 | |
| | | | | | | | 12,671,189 | |
| Hotels, Restaurants & Leisure — 2.3% | | | | | | | | |
Ameristar Casinos, Inc. | | | 78,660 | | | | 1,481,168 | |
Bally Technologies, Inc. (a) | | | 57,540 | | | | 2,653,745 | |
BJ's Restaurants, Inc. (a) | | | 72,786 | | | | 1,756,326 | |
Brinker International, Inc. | | | 92,400 | | | | 1,711,248 | |
Buffalo Wild Wings, Inc. (a) | | | 13,429 | | | | 555,155 | |
CEC Entertainment, Inc. (a) | | | 97 | | | | 3,788 | |
Cheesecake Factory, Inc. (The) (a) | | | 17,600 | | | | 478,192 | |
Churchill Downs, Inc. | | | 6,300 | | | | 241,479 | |
Cracker Barrel Old Country Store, Inc. | | | 12,070 | | | | 595,896 | |
DineEquity, Inc. (a) | | | 10,559 | | | | 434,292 | |
Dover Downs Gaming & Entertainment, Inc. | | | 1,771 | | | | 6,960 | |
TFS MARKET NEUTRAL FUND SCHEDULE OF SECURITIES SOLD SHORT (Continued) |
COMMON STOCKS — 65.9% (Continued) | | | | | | |
| Consumer Discretionary — 13.2% (Continued) | | | | | | |
| Hotels, Restaurants & Leisure — 2.3% (Continued) | | | | | | |
Gaylord Entertainment Company (a) | | | 12,100 | | | $ | 408,375 | |
Isle of Capri Casinos, Inc. (a) | | | 24,200 | | | | 263,538 | |
Jack in the Box, Inc. (a) | | | 14,319 | | | | 336,783 | |
Landry's Restaurants, Inc. (a) | | | 61,296 | | | | 1,415,325 | |
Life Time Fitness, Inc. (a) | | | 42,641 | | | | 1,567,483 | |
Morgans Hotel Group Company (a) | | | 21,621 | | | | 183,130 | |
Multimedia Games, Inc. (a) | | | 21,400 | | | | 97,798 | |
O'Charley's, Inc. (a) | | | 7,400 | | | | 70,670 | |
Orient-Express Hotels Ltd. - Class A (a) | | | 64,700 | | | | 883,155 | |
P.F. Chang's China Bistro, Inc. (a) | | | 75,464 | | | | 3,293,249 | |
Peet's Coffee & Tea, Inc. (a) | | | 6,897 | | | | 273,259 | |
Pinnacle Entertainment, Inc. (a) | | | 5,700 | | | | 77,121 | |
Red Lion Hotels Corporation (a) | | | 8,006 | | | | 61,166 | |
Red Robin Gourmet Burgers, Inc. (a) | | | 1,700 | | | | 41,497 | |
Rick's Cabaret International, Inc. (a) | | | 2,146 | | | | 26,546 | |
Sonic Corporation (a) | | | 61,100 | | | | 715,481 | |
Texas Roadhouse, Inc. (a) | | | 200 | | | | 2,956 | |
Universal Travel Group (a) | | | 16,200 | | | | 147,906 | |
Vail Resorts, Inc. (a) | | | 81,443 | | | | 3,717,058 | |
WMS Industries, Inc. (a) | | | 30,777 | | | | 1,539,465 | |
| | | | | | | | 25,040,210 | |
| Household Durables — 1.9% | | | | | | | | |
American Greetings Corporation | | | 30,100 | | | | 739,256 | |
Beazer Homes USA, Inc. (a) | | | 134,640 | | | | 884,585 | |
Brookfield Homes Corporation (a) | | | 14,430 | | | | 161,760 | |
Cavco Industries, Inc. (a) | | | 25,884 | | | | 1,013,876 | |
Ethan Allen Interiors, Inc. | | | 108,937 | | | | 2,200,528 | |
Hooker Furniture Corporation | | | 1,353 | | | | 21,323 | |
Hovnanian Enterprises, Inc. - Class A (a) | | | 535,258 | | | | 3,805,685 | |
iRobot Corporation (a) | | | 103,928 | | | | 2,097,267 | |
Jarden Corporation | | | 12,700 | | | | 407,924 | |
La-Z-Boy, Inc. (a) | | | 16,729 | | | | 218,146 | |
Lifetime Brands, Inc. (a) | | | 3,400 | | | | 49,300 | |
M/I Homes, Inc. (a) | | | 25,723 | | | | 401,279 | |
MDC Holdings, Inc. | | | 100,572 | | | | 3,851,908 | |
Meritage Homes Corporation (a) | | | 81,176 | | | | 1,930,365 | |
Ryland Group, Inc. (The) | | | 68,700 | | | | 1,564,986 | |
Sealy Corporation (a) | | | 203,800 | | | | 762,212 | |
Skyline Corporation | | | 6,998 | | | | 163,123 | |
Toll Brothers, Inc. (a) | | | 16,900 | | | | 381,433 | |
| | | | | | | | 20,654,956 | |
| Internet & Catalog Retail — 0.8% | | | | | | | | |
1-800-FLOWERS.COM, Inc. (a) | | | 34,800 | | | | 99,528 | |
Bidz.com, Inc. (a) | | | 1,202 | | | | 2,368 | |
Blue Nile, Inc. (a) | | | 14,996 | | | | 809,634 | |
drugstore.com, inc. (a) | | | 21,241 | | | | 77,742 | |
NutriSystem, Inc. | | | 190,596 | | | | 3,684,220 | |
Orbitz Worldwide, Inc. (a) | | | 7,800 | | | | 51,402 | |
TFS MARKET NEUTRAL FUND SCHEDULE OF SECURITIES SOLD SHORT (Continued) |
COMMON STOCKS — 65.9% (Continued) | | | | | | |
| Consumer Discretionary — 13.2% (Continued) | | | | | | |
| Internet & Catalog Retail — 0.8% (Continued) | | | | | | |
Overstock.com, Inc. (a) | | | 3,700 | | | $ | 68,450 | |
PetMed Express, Inc. | | | 131,778 | | | | 2,917,565 | |
Shutterfly, Inc. (a) | | | 19,592 | | | | 461,000 | |
ValueVision Media, Inc. (a) | | | 12,200 | | | | 37,576 | |
| | | | | | | | 8,209,485 | |
| Leisure Equipment & Products — 0.7% | | | | | | | | |
Arctic Cat, Inc. (a) | | | 1,400 | | | | 20,650 | |
Brunswick Corporation | | | 77 | | | | 1,609 | |
Callaway Golf Company | | | 96,235 | | | | 903,647 | |
Eastman Kodak Company (a) | | | 109,200 | | | | 668,304 | |
JAKKS Pacific, Inc. (a) | | | 28,400 | | | | 434,236 | |
Marine Products Corporation (a) | | | 5,400 | | | | 38,340 | |
Nautilus, Inc. (a) | | | 39,258 | | | | 134,262 | |
Polaris Industries, Inc. | | | 290 | | | | 17,159 | |
Pool Corporation | | | 89,369 | | | | 2,192,222 | |
Smith & Wesson Holding Corporation (a) | | | 390,239 | | | | 1,736,563 | |
Sturm Ruger & Company, Inc. | | | 67,781 | | | | 1,131,265 | |
| | | | | | | | 7,278,257 | |
| Media — 0.9% | | | | | | | | |
Alloy, Inc. (a) | | | 1,500 | | | | 11,625 | |
Arbitron, Inc. | | | 24,700 | | | | 761,007 | |
Ascent Media Corporation (a) | | | 2,300 | | | | 67,896 | |
Belo Corporation | | | 3,800 | | | | 32,946 | |
China MediaExpress Holdings, Inc. (a) | | | 100 | | | | 1,304 | |
Clear Channel Outdoor Holdings, Inc. (a) | | | 2,400 | | | | 27,792 | |
CTC Media, Inc. (a) | | | 107,223 | | | | 1,810,996 | |
Harte-Hanks, Inc. | | | 10,900 | | | | 156,960 | |
Lamar Advertising Company - Class A (a) | | | 51,098 | | | | 1,901,868 | |
Lee Enterprises, Inc. (a) | | | 2,100 | | | | 7,938 | |
Liberty Global, Inc. - Class A (a) | | | 13,600 | | | | 372,776 | |
Liberty Media Corporation - Capital - Series A (a) | | | 4,167 | | | | 184,473 | |
LodgeNet Interactive Corporation (a) | | | 54,283 | | | | 358,268 | |
Madison Square Garden, Inc. - Class A (a) | | | 1,613 | | | | 33,470 | |
Martha Stewart Living Omnimedia, Inc. (a) | | | 68,888 | | | | 460,172 | |
McClatchy Company (The) - Class A (a) | | | 44,600 | | | | 243,070 | |
Media General, Inc. (a) | | | 43,376 | | | | 548,706 | |
Morningstar, Inc. (a) | | | 7,350 | | | | 345,523 | |
Playboy Enterprises, Inc. (a) | | | 200 | | | | 836 | |
Scholastic Corporation | | | 58,853 | | | | 1,589,620 | |
Warner Music Group Corporation (a) | | | 148,754 | | | | 1,018,965 | |
| | | | | | | | 9,936,211 | |
| Multi-Line Retail — 0.2% | | | | | | | | |
99¢ Only Stores (a) | | | 3,100 | | | | 48,112 | |
Big Lots, Inc. (a) | | | 15,200 | | | | 580,640 | |
Bon-Ton Stores, Inc. (The) (a) | | | 666 | | | | 11,402 | |
Dillard's, Inc. | | | 62,000 | | | | 1,740,960 | |
| | | | | | | | 2,381,114 | |
TFS MARKET NEUTRAL FUND SCHEDULE OF SECURITIES SOLD SHORT (Continued) |
COMMON STOCKS — 65.9% (Continued) | | | | | | |
| Consumer Discretionary — 13.2% (Continued) | | | | | | |
| Specialty Retail — 3.2% | | | | | | |
Aaron's, Inc. | | | 53,544 | | | $ | 1,208,488 | |
Aéropostale, Inc. (a) | | | 12,000 | | | | 348,480 | |
America's Car-Mart, Inc. (a) | | | 4,046 | | | | 102,485 | |
AnnTaylor Stores Corporation (a) | | | 15,900 | | | | 345,030 | |
Asbury Automotive Group, Inc. (a) | | | 24,600 | | | | 382,530 | |
AutoNation, Inc. (a) | | | 49,700 | | | | 1,003,940 | |
Barnes & Noble, Inc. | | | 39,467 | | | | 869,853 | |
bebe stores, inc. | | | 18,700 | | | | 154,088 | |
Blockbuster, Inc. - Class A (a) | | | 100,400 | | | | 37,399 | |
Buckle, Inc. (The) | | | 49,386 | | | | 1,786,786 | |
Build-A-Bear Workshop, Inc. (a) | | | 17,500 | | | | 167,300 | |
Cabela's, Inc. - Class A (a) | | | 5,200 | | | | 94,432 | |
Casual Male Retail Group, Inc. (a) | | | 100 | | | | 409 | |
Charming Shoppes, Inc. (a) | | | 378,025 | | | | 2,135,841 | |
Children's Place Retail Stores, Inc. (The) (a) | | | 13,601 | | | | 623,198 | |
Conn's, Inc. (a) | | | 63,948 | | | | 609,425 | |
Destination Maternity Corporation (a) | | | 4,194 | | | | 132,530 | |
Dress Barn, Inc. (a) | | | 30,980 | | | | 857,526 | |
DSW, Inc. - Class A (a) | | | 5,800 | | | | 175,160 | |
Foot Locker, Inc. | | | 63,600 | | | | 976,260 | |
GameStop Corporation - Class A (a) | | | 15,900 | | | | 386,529 | |
Group 1 Automotive, Inc. (a) | | | 91,820 | | | | 2,851,011 | |
Haverty Furniture Companies, Inc. (a) | | | 78,289 | | | | 1,276,111 | |
hhgregg, Inc. (a) | | | 131,675 | | | | 3,769,855 | |
Hibbett Sports, Inc. (a) | | | 71,372 | | | | 1,962,730 | |
Jo-Ann Stores, Inc. (a) | | | 21,550 | | | | 950,786 | |
Jos. A. Bank Clothiers, Inc. (a) | | | 64,576 | | | | 3,930,095 | |
Lithia Motors, Inc. (a) | | | 7,300 | | | | 58,254 | |
Lumber Liquidators Holdings, Inc. (a) | | | 57,818 | | | | 1,761,136 | |
MarineMax, Inc. (a) | | | 3,200 | | | | 35,680 | |
Monro Muffler Brake, Inc. | | | 3,400 | | | | 121,924 | |
Pep Boys - Manny Moe & Jack (The) | | | 3,700 | | | | 46,361 | |
Pier 1 Imports, Inc. (a) | | | 3,100 | | | | 25,668 | |
RadioShack Corporation | | | 75,500 | | | | 1,627,025 | |
Rent-A-Center, Inc. (a) | | | 11,800 | | | | 304,676 | |
Select Comfort Corporation (a) | | | 11,200 | | | | 126,784 | |
Sonic Automotive, Inc. - Class A (a) | | | 49,235 | | | | 525,830 | |
Systemax, Inc. (a) | | | 21,613 | | | | 502,070 | |
Talbots, Inc. (The) (a) | | | 3,400 | | | | 55,930 | |
West Marine, Inc. (a) | | | 16,501 | | | | 197,517 | |
Williams-Sonoma, Inc. | | | 12,500 | | | | 360,000 | |
Zale Corporation (a) | | | 18,600 | | | | 60,636 | |
Zumiez, Inc. (a) | | | 121,706 | | | | 2,258,863 | |
| | | | | | | | 35,206,631 | |
| Textiles, Apparel & Luxury Goods — 1.4% | | | | | | | | |
Alpha Pro Tech Ltd. (a) | | | 18,800 | | | | 41,924 | |
Cherokee, Inc. | | | 47,528 | | | | 971,472 | |
Culp, Inc. (a) | | | 16,098 | | | | 192,210 | |
TFS MARKET NEUTRAL FUND SCHEDULE OF SECURITIES SOLD SHORT (Continued) |
COMMON STOCKS — 65.9% (Continued) | | | | | | |
| Consumer Discretionary — 13.2% (Continued) | | | | | | |
| Textiles, Apparel & Luxury Goods — 1.4% (Continued) | | | | | | |
Fossil, Inc. (a) | | | 12,900 | | | $ | 501,810 | |
Fuqi International, Inc. (a) | | | 41,431 | | | | 435,440 | |
Gildan Activewear, Inc. (a) | | | 200 | | | | 5,786 | |
Hanesbrands, Inc. (a) | | | 57,619 | | | | 1,640,413 | |
Jones Apparel Group, Inc. | | | 54,000 | | | | 1,175,040 | |
K-Swiss, Inc. - Class A (a) | | | 107,761 | | | | 1,340,547 | |
Liz Claiborne, Inc. (a) | | | 20,200 | | | | 176,548 | |
Movado Group, Inc. (a) | | | 1,800 | | | | 22,338 | |
Oxford Industries, Inc. | | | 100 | | | | 2,159 | |
Phillips-Van Heusen Corporation | | | 46,725 | | | | 2,944,142 | |
Timberland Company (The) - Class A (a) | | | 15,000 | | | | 322,500 | |
True Religion Apparel, Inc. (a) | | | 34,794 | | | | 1,087,313 | |
Under Armour, Inc. - Class A (a) | | | 6,100 | | | | 205,875 | |
Unifi, Inc. (a) | | | 4,800 | | | | 18,384 | |
UniFirst Corporation - Class A | | | 7,090 | | | | 346,488 | |
Volcom, Inc. (a) | | | 82,774 | | | | 1,973,332 | |
Wolverine World Wide, Inc. | | | 44,141 | | | | 1,351,156 | |
| | | | | | | | 14,754,877 | |
| Consumer Staples — 3.1% | | | | | | | | |
| Beverages — 0.0% | | | | | | | | |
Central European Distribution Corporation (a) | | | 41 | | | | 1,421 | |
| | | | | | | | | |
| Food & Staples Retailing — 0.9% | | | | | | | | |
Diedrich Coffee, Inc. (a) | | | 8,036 | | | | 279,331 | |
Great Atlantic & Pacific Tea Company, Inc. (The) (a) | | | 310,548 | | | | 2,499,911 | |
Ingles Markets, Inc. | | | 800 | | | | 12,824 | |
Nash Finch Company | | | 5,000 | | | | 175,100 | |
Rite Aid Corporation (a) | | | 884,200 | | | | 1,308,616 | |
Ruddick Corporation | | | 56,914 | | | | 2,011,341 | |
Spartan Stores, Inc. | | | 9,400 | | | | 141,846 | |
Susser Holdings Corporation (a) | | | 2,498 | | | | 26,904 | |
United Natural Foods, Inc. (a) | | | 88,797 | | | | 2,725,180 | |
Weis Markets, Inc. | | | 2,400 | | | | 89,472 | |
| | | | | | | | 9,270,525 | |
| Food Products — 1.7% | | | | | | | | |
AgFeed Industries, Inc. (a) | | | 163,344 | | | | 702,379 | |
Alico, Inc. | | | 285 | | | | 7,604 | |
American Dairy, Inc. (a) | | | 36,136 | | | | 686,584 | |
American Italian Pasta Company (a) | | | 2,151 | | | | 84,384 | |
Calavo Growers, Inc. | | | 25,618 | | | | 444,216 | |
Cal-Maine Foods, Inc. | | | 66,830 | | | | 2,230,785 | |
Chiquita Brands International, Inc. (a) | | | 4,100 | | | | 61,664 | |
Dean Foods Company (a) | | | 92,935 | | | | 1,459,079 | |
Diamond Foods, Inc. | | | 49,559 | | | | 2,116,665 | |
Dole Food Company, Inc. (a) | | | 45,587 | | | | 516,045 | |
Farmer Brothers Company | | | 4,274 | | | | 79,967 | |
Flowers Foods, Inc. | | | 32,340 | | | | 852,482 | |
Hain Celestial Group, Inc. (The) (a) | | | 124,531 | | | | 2,463,223 | |
TFS MARKET NEUTRAL FUND SCHEDULE OF SECURITIES SOLD SHORT (Continued) |
COMMON STOCKS — 65.9% (Continued) | | | | | | |
| Consumer Staples — 3.1% (Continued) | | | | | | |
| Food Products — 1.7% (Continued) | | | | | | |
Imperial Sugar Company | | | 10,508 | | | $ | 168,443 | |
John B. Sanfilippo & Son, Inc. (a) | | | 914 | | | | 13,737 | |
Origin Agritech Ltd. (a) | | | 102,714 | | | | 899,775 | |
Sanderson Farms, Inc. | | | 168 | | | | 9,521 | |
Seneca Foods Corporation - Class A (a) | | | 5,949 | | | | 195,365 | |
Smithfield Foods, Inc. (a) | | | 165,077 | | | | 3,093,543 | |
Synutra International, Inc. (a) | | | 9,618 | | | | 225,446 | |
Treehouse Foods, Inc. (a) | | | 46,600 | | | | 1,970,714 | |
Yuhe International, Inc. (a) | | | 300 | | | | 2,664 | |
| | | | | | | | 18,284,285 | |
| Household Products — 0.0% | | | | | | | | |
Orchids Paper Products Company (a) | | | 930 | | | | 13,773 | |
| | | | | | | | | |
| Personal Products — 0.4% | | | | | | | | |
American Oriental Bioengineering, Inc. (a) | | | 511,075 | | | | 2,069,854 | |
China Sky One Medical, Inc. (a) | | | 6,000 | | | | 85,020 | |
Female Health Company (The) | | | 15,801 | | | | 100,968 | |
Medifast, Inc. (a) | | | 20,800 | | | | 663,936 | |
NBTY, Inc. (a) | | | 75 | | | | 3,051 | |
Nutraceutical International Corporation (a) | | | 1,561 | | | | 24,149 | |
USANA Health Sciences, Inc. (a) | | | 39,467 | | | | 1,430,679 | |
| | | | | | | | 4,377,657 | |
| Tobacco — 0.1% | | | | | | | | |
Alliance One International, Inc. (a) | | | 82,877 | | | | 421,844 | |
Star Scientific, Inc. (a) | | | 17,700 | | | | 32,568 | |
Vector Group Ltd. | | | 70,626 | | | | 1,157,560 | |
| | | | | | | | 1,611,972 | |
| Energy — 4.5% | | | | | | | | |
| Energy Equipment & Services — 2.3% | | | | | | | | |
Allis-Chalmers Energy, Inc. (a) | | | 39,000 | | | | 157,170 | |
Basic Energy Services, Inc. (a) | | | 121,648 | | | | 1,242,026 | |
Bronco Drilling Company, Inc. (a) | | | 86,195 | | | | 412,012 | |
CARBO Ceramics, Inc. | | | 23,529 | | | | 1,723,499 | |
Complete Production Services, Inc. (a) | | | 56,870 | | | | 858,168 | |
Core Laboratories N.V. | | | 500 | | | | 74,945 | |
Dawson Geophysical Company (a) | | | 9,962 | | | | 291,787 | |
Global Industries Ltd. (a) | | | 10,000 | | | | 67,000 | |
Gulf Island Fabrication, Inc. | | | 2,831 | | | | 67,859 | |
Helix Energy Solutions Group, Inc. (a) | | | 102,575 | | | | 1,495,543 | |
Hercules Offshore, Inc. (a) | | | 587,933 | | | | 2,328,215 | |
Hornbeck Offshore Services, Inc. (a) | | | 2,200 | | | | 53,834 | |
ION Geophysical Corporation (a) | | | 102,866 | | | | 618,225 | |
Key Energy Services, Inc. (a) | | | 180,828 | | | | 1,963,792 | |
Natural Gas Services Group, Inc. (a) | | | 400 | | | | 7,172 | |
OYO Geospace Corporation (a) | | | 3,040 | | | | 151,088 | |
Parker Drilling Company (a) | | | 9,500 | | | | 52,535 | |
Patterson-UTI Energy, Inc. | | | 186,888 | | | | 2,857,518 | |
Rowan Companies, Inc. (a) | | | 6,800 | | | | 202,640 | |
TFS MARKET NEUTRAL FUND SCHEDULE OF SECURITIES SOLD SHORT (Continued) |
COMMON STOCKS — 65.9% (Continued) | | | | | | |
| Energy — 4.5% (Continued) | | | | | | |
| Energy Equipment & Services — 2.3% (Continued) | | | | | | |
RPC, Inc. | | | 7,928 | | | $ | 108,217 | |
SEACOR Holdings, Inc. (a) | | | 7,177 | | | | 604,088 | |
Seahawk Drilling, Inc. (a) | | | 15,045 | | | | 250,650 | |
SulphCo, Inc. (a) | | | 279,872 | | | | 107,247 | |
Superior Well Services, Inc. (a) | | | 227,855 | | | | 3,303,897 | |
T-3 Energy Services, Inc. (a) | | | 5,600 | | | | 166,600 | |
TETRA Technologies, Inc. (a) | | | 13,600 | | | | 167,144 | |
Tidewater, Inc. | | | 9,411 | | | | 504,524 | |
Unit Corporation (a) | | | 41,400 | | | | 1,977,678 | |
Willbros Group, Inc. (a) | | | 248,600 | | | | 3,119,930 | |
| | | | | | | | 24,935,003 | |
| Oil, Gas & Consumable Fuels — 2.2% | | | | | | | | |
Alon USA Energy, Inc. | | | 25,197 | | | | 184,190 | |
Approach Resources, Inc. (a) | | | 2,000 | | | | 17,900 | |
Atlas Energy, Inc. | | | 4,124 | | | | 148,794 | |
ATP Oil & Gas Corporation (a) | | | 50,720 | | | | 926,147 | |
Berry Petroleum Company - Class A | | | 1,079 | | | | 34,927 | |
BPZ Resources, Inc. (a) | | | 286,744 | | | | 1,898,245 | |
Callon Petroleum Company (a) | | | 2,800 | | | | 16,996 | |
CAMAC Energy, Inc. (a) | | | 8,800 | | | | 39,512 | |
Carrizo Oil & Gas, Inc. (a) | | | 77,440 | | | | 1,699,034 | |
Cheniere Energy Partners, L.P. | | | 1,500 | | | | 26,730 | |
Cheniere Energy, Inc. (a) | | | 11,300 | | | | 46,895 | |
Clayton Williams Energy, Inc. (a) | | | 616 | | | | 28,619 | |
Cloud Peak Energy, Inc. (a) | | | 800 | | | | 12,800 | |
Contango Oil & Gas Company (a) | | | 1,389 | | | | 76,256 | |
Copano Energy, LLC | | | 15,000 | | | | 393,000 | |
Crosstex Energy, Inc. (a) | | | 3,700 | | | | 33,411 | |
CVR Energy, Inc. (a) | | | 87,838 | | | | 745,745 | |
DCP Midstream Partners, L.P. | | | 423 | | | | 14,149 | |
Delek US Holdings, Inc. | | | 8,261 | | | | 57,910 | |
Denison Mines Corporation (a) | | | 122,100 | | | | 192,918 | |
Eagle Rock Energy Partners, L.P. | | | 2,600 | | | | 18,226 | |
Energy XXI (Bermuda) Ltd. (a) | | | 6,100 | | | | 106,811 | |
General Maritime Corporation | | | 27,700 | | | | 224,647 | |
GeoGlobal Resources, Inc. (a) | | | 22,423 | | | | 34,980 | |
GMX Resources, Inc. (a) | | | 107,807 | | | | 863,534 | |
Golar LNG Ltd. (a) | | | 16,500 | | | | 214,335 | |
Goodrich Petroleum Corporation (a) | | | 18,463 | | | | 312,579 | |
GreenHunter Energy, Inc. (a) | | | 1,400 | | | | 1,834 | |
Harvest Natural Resources, Inc. (a) | | | 56,308 | | | | 497,200 | |
Holly Corporation | | | 8,400 | | | | 226,800 | |
Houston American Energy Corporation | | | 11,200 | | | | 146,720 | |
Hyperdynamics Corporation (a) | | | 36,900 | | | | 41,697 | |
James River Coal Company (a) | | | 115,200 | | | | 2,168,064 | |
Knightsbridge Tankers Ltd. | | | 7,900 | | | | 149,626 | |
L & L Energy, Inc. (a) | | | 5,250 | | | | 56,700 | |
Linn Energy, LLC | | | 1,760 | | | | 47,696 | |
TFS MARKET NEUTRAL FUND SCHEDULE OF SECURITIES SOLD SHORT (Continued) |
COMMON STOCKS — 65.9% (Continued) | | | | | | |
| Energy — 4.5% (Continued) | | | | | | |
| Oil, Gas & Consumable Fuels — 2.2% (Continued) | | | | | | |
MarkWest Energy Partners, L.P. | | | 220 | | | $ | 6,765 | |
Nordic American Tanker Shipping Ltd. | | | 7,900 | | | | 246,796 | |
Northern Oil & Gas, Inc. (a) | | | 6,300 | | | | 102,438 | |
Pacific Ethanol, Inc. (a) | | | 144,350 | | | | 154,455 | |
Panhandle Oil & Gas, Inc. | | | 4,676 | | | | 116,713 | |
Patriot Coal Corporation (a) | | | 33,700 | | | | 663,553 | |
Penn Virginia Corporation | | | 10,800 | | | | 275,508 | |
Petroleum Development Corporation (a) | | | 2,300 | | | | 53,843 | |
PetroQuest Energy, Inc. (a) | | | 16,200 | | | | 95,742 | |
Provident Energy Trust | | | 11,200 | | | | 91,728 | |
Quicksilver Resources, Inc. (a) | | | 4,334 | | | | 60,113 | |
Rentech, Inc. (a) | | | 25,400 | | | | 31,750 | |
Resolute Energy Corporation (a) | | | 2,500 | | | | 33,450 | |
Rex Energy Corporation (a) | | | 12,600 | | | | 167,580 | |
San Juan Basin Royalty Trust | | | 9,700 | | | | 239,881 | |
Stone Energy Corporation (a) | | | 9,200 | | | | 149,960 | |
Swift Energy Company (a) | | | 13,200 | | | | 477,576 | |
Syntroleum Corporation (a) | | | 25,200 | | | | 56,952 | |
Teekay Tankers Ltd. - Class A | | | 3,200 | | | | 40,768 | |
Toreador Resources Corporation (a) | | | 30,800 | | | | 279,356 | |
Tri-Valley Corporation (a) | | | 62,216 | | | | 73,415 | |
Uranerz Energy Corporation (a) | | | 6,740 | | | | 11,121 | |
Uranium Energy Corporation (a) | | | 241,172 | | | | 689,752 | |
USEC, Inc. (a) | | | 60,500 | | | | 363,000 | |
Verenium Corporation (a) | | | 10,934 | | | | 45,157 | |
W&T Offshore, Inc. | | | 12,300 | | | | 116,481 | |
Warren Resources, Inc. (a) | | | 3,500 | | | | 12,530 | |
Western Refining, Inc. (a) | | | 633,868 | | | | 3,397,532 | |
Westmoreland Coal Company (a) | | | 3,017 | | | | 42,419 | |
Williams Partners, L.P. | | | 11,345 | | | | 480,007 | |
World Fuel Services Corporation | | | 116,896 | | | | 3,323,353 | |
Zion Oil & Gas, Inc. (a) | | | 27,723 | | | | 177,150 | |
| | | | | | | | 23,782,471 | |
| Financials — 11.4% | | | | | | | | |
| Capital Markets — 1.3% | | | | | | | | |
Affiliated Managers Group, Inc. (a) | | | 219 | | | | 18,435 | |
Ares Capital Corporation | | | 77,400 | | | | 1,227,564 | |
Cohen & Steers, Inc. | | | 6,300 | | | | 170,541 | |
Evercore Partners, Inc. - Class A | | | 3,266 | | | | 117,054 | |
Federated Investors, Inc. | | | 110,747 | | | | 2,671,218 | |
Greenhill & Company, Inc. | | | 12,851 | | | | 1,129,474 | |
International Assets Holding Corporation (a) | | | 1,900 | | | | 30,723 | |
Investment Technology Group, Inc. (a) | | | 3,800 | | | | 66,006 | |
KBW, Inc. (a) | | | 34,055 | | | | 1,019,947 | |
Knight Capital Group, Inc. (a) | | | 18,200 | | | | 283,010 | |
Kohlberg Capital Corporation | | | 21,500 | | | | 121,475 | |
Oppenheimer Holdings, Inc. | | | 697 | | | | 20,262 | |
PennantPark Investment Corporation | | | 1,800 | | | | 19,692 | |
TFS MARKET NEUTRAL FUND SCHEDULE OF SECURITIES SOLD SHORT (Continued) |
COMMON STOCKS — 65.9% (Continued) | | | | | | |
| Financials — 11.4% (Continued) | | | | | | |
| Capital Markets — 1.3% (Continued) | | | | | | |
Penson Worldwide, Inc. (a) | | | 41,616 | | | $ | 391,190 | |
Piper Jaffray Companies, Inc. (a) | | | 11,100 | | | | 436,896 | |
Raymond James Financial, Inc. | | | 78,238 | | | | 2,397,212 | |
Stifel Financial Corporation (a) | | | 56,003 | | | | 3,210,652 | |
SWS Group, Inc. | | | 89,654 | | | | 992,470 | |
TICC Capital Corporation | | | 5,000 | | | | 35,600 | |
| | | | | | | | 14,359,421 | |
| Commercial Banks — 4.6% | | | | | | | | |
1st Source Corporation | | | 1,444 | | | | 27,624 | |
BancFirst Corporation | | | 1,411 | | | | 62,282 | |
BancorpSouth, Inc. | | | 67,380 | | | | 1,491,793 | |
Bank of Hawaii Corporation | | | 200 | | | | 10,576 | |
Bank of the Ozarks, Inc. | | | 45,701 | | | | 1,758,117 | |
Banner Corporation | | | 49,700 | | | | 281,799 | |
Bar Harbor Bankshares, Inc. | | | 1,300 | | | | 38,220 | |
Boston Private Financial Holdings, Inc. | | | 4,400 | | | | 34,892 | |
Capital City Bank Group, Inc. | | | 18,641 | | | | 327,895 | |
Capitol Bancorp Ltd. (a) | | | 8,254 | | | | 20,140 | |
Cardinal Financial Corporation | | | 3,910 | | | | 42,815 | |
Cascade Bancorp, Inc. (a) | | | 43,934 | | | | 33,829 | |
Cathay General Bancorp | | | 5,500 | | | | 68,035 | |
Center Bancorporation, Inc. | | | 1,300 | | | | 10,816 | |
Central Pacific Financial Corporation (a) | | | 40,313 | | | | 87,882 | |
Century Bancorp, Inc. - Class A | | | 105 | | | | 2,032 | |
Chemical Financial Corporation | | | 35,275 | | | | 836,018 | |
City Bank (a) | | | 13,068 | | | | 3,267 | |
City Holding Company | | | 20,873 | | | | 731,390 | |
City National Corporation | | | 26,800 | | | | 1,669,104 | |
CoBiz Financial, Inc. | | | 38,379 | | | | 274,026 | |
Colonial Bancgroup, Inc. (The) (a) | | | 108,955 | | | | 3,835 | |
Columbia Banking Systems, Inc. | | | 30,900 | | | | 694,632 | |
Community Bank System, Inc. | | | 46,457 | | | | 1,146,094 | |
Community Trust Bancorp, Inc. | | | 3,184 | | | | 95,584 | |
CVB Financial Corporation | | | 202,079 | | | | 2,224,890 | |
Danvers Bancorp, Inc. | | | 6,896 | | | | 112,750 | |
Enterprise Financial Services Corporation | | | 4,000 | | | | 42,040 | |
First BanCorp (North Carolina) | | | 14,736 | | | | 240,344 | |
First BanCorp (Puerto Rico) | | | 144,900 | | | | 307,188 | |
First Busey Corporation | | | 43,100 | | | | 217,655 | |
First Commonwealth Financial Corporation | | | 63,500 | | | | 415,925 | |
First Community Bancshares, Inc. | | | 3,387 | | | | 56,394 | |
First Financial Bancorporation | | | 1,300 | | | | 24,843 | |
First Financial Bankshares, Inc. | | | 4,020 | | | | 214,990 | |
First Financial Corporation | | | 402 | | | | 11,718 | |
First of Long Island Corporation (The) | | | 854 | | | | 21,982 | |
First South Bancorp, Inc. | | | 7,192 | | | | 100,256 | |
FirstMerit Corporation | | | 22,500 | | | | 528,750 | |
FNB Corporation | | | 83,002 | | | | 773,579 | |
TFS MARKET NEUTRAL FUND SCHEDULE OF SECURITIES SOLD SHORT (Continued) |
COMMON STOCKS — 65.9% (Continued) | | | | | | |
| Financials — 11.4% (Continued) | | | | | | |
| Commercial Banks — 4.6% (Continued) | | | | | | |
Frontier Financial Corporation (a) | | | 8,859 | | | $ | 31,627 | |
Glacier Bancorp, Inc. | | | 35,200 | | | | 650,848 | |
Great Southern Bancorp, Inc. | | | 19,300 | | | | 470,727 | |
Hancock Holding Company | | | 8,808 | | | | 360,071 | |
Hanmi Financial Corporation (a) | | | 112,400 | | | | 334,952 | |
Heartland Financial USA, Inc. | | | 1,990 | | | | 38,029 | |
Home BancShares, Inc. | | | 8,345 | | | | 234,661 | |
IBERIABANK Corporation | | | 15,799 | | | | 973,850 | |
Independent Bank Corporation | | | 21,017 | | | | 545,181 | |
International Bancshares Corporation | | | 86,794 | | | | 2,097,811 | |
Lakeland Bancorp, Inc. | | | 4,604 | | | | 48,342 | |
Lakeland Financial Corporation | | | 5,988 | | | | 124,910 | |
MB Financial, Inc. | | | 16,400 | | | | 401,800 | |
National Penn Bancshares, Inc. | | | 112,600 | | | | 824,232 | |
NBT Bancorp, Inc. | | | 4,061 | | | | 99,373 | |
Northrim BanCorp, Inc. | | | 400 | | | | 6,904 | |
Old National Bancorp | | | 63,300 | | | | 848,853 | |
Old Second Bancorp, Inc. | | | 41,284 | | | | 236,144 | |
Oriental Financial Group, Inc. | | | 41,000 | | | | 685,520 | |
Pacific Capital Bancorp | | | 81,137 | | | | 141,178 | |
PacWest Bancorp | | | 56,724 | | | | 1,361,943 | |
Park National Corporation | | | 54,923 | | | | 3,762,226 | |
Pinnacle Financial Partners, Inc. (a) | | | 17,400 | | | | 265,872 | |
PrivateBancorp, Inc. | | | 4,200 | | | | 60,144 | |
Renasant Corporation | | | 23,797 | | | | 393,364 | |
S&T Bancorp, Inc. | | | 93,325 | | | | 2,244,466 | |
S.Y. Bancorp, Inc. | | | 8,540 | | | | 202,740 | |
Sandy Spring Bancorp, Inc. | | | 700 | | | | 12,215 | |
SCBT Financial Corporation | | | 838 | | | | 33,344 | |
Security Bank Corporation (a) | | | 32,973 | | | | 33 | |
Signature Bank (a) | | | 2,700 | | | | 109,026 | |
Smithtown Bancorp, Inc. | | | 44,805 | | | | 208,343 | |
Southwest Bancorp, Inc. | | | 14,957 | | | | 219,270 | |
Sterling Bancshares, Inc. | | | 11,200 | | | | 65,856 | |
Suffolk Bancorp | | | 22,785 | | | | 707,474 | |
Susquehanna Bancshares, Inc. | | | 239,706 | | | | 2,612,795 | |
Synovus Financial Corporation | | | 310,100 | | | | 933,401 | |
Taylor Capital Group, Inc. (a) | | | 1,810 | | | | 24,797 | |
TCF Financial Corporation | | | 18,600 | | | | 346,518 | |
Texas Capital Bancshares, Inc. (a) | | | 12,300 | | | | 244,770 | |
Tompkins Financial Corporation | | | 14,693 | | | | 596,830 | |
Tower Bancorp, Inc. | | | 800 | | | | 20,592 | |
Towne Bank | | | 39,231 | | | | 628,873 | |
Trico Bancshares | | | 9,132 | | | | 173,873 | |
Umpqua Holdings Corporation | | | 22,000 | | | | 328,680 | |
Union First Market Bankshares Corporation | | | 700 | | | | 11,746 | |
United Bankshares, Inc. | | | 79,209 | | | | 2,300,229 | |
United Community Banks, Inc. (a) | | | 48,331 | | | | 282,253 | |
United Security Bancshares | | | 518 | | | | 8,045 | |
TFS MARKET NEUTRAL FUND SCHEDULE OF SECURITIES SOLD SHORT (Continued) |
COMMON STOCKS — 65.9% (Continued) | | | | | | |
| Financials — 11.4% (Continued) | | | | | | |
| Commercial Banks — 4.6% (Continued) | | | | | | |
United Security Bancshares, Inc. (a) | | | 1,927 | | | $ | 9,057 | |
Valley National Bancorp | | | 25,002 | | | | 406,032 | |
W Holding Company, Inc. (a) | | | 7,448 | | | | 39,847 | |
Washington Trust Bancorp, Inc. | | | 1,364 | | | | 24,702 | |
Westamerica Bancorporation | | | 6,365 | | | | 374,071 | |
Western Alliance Bancorporation (a) | | | 32,050 | | | | 278,835 | |
Whitney Holding Corporation | | | 63,676 | | | | 872,361 | |
Wilmington Trust Corporation | | | 88,700 | | | | 1,537,171 | |
Wilshire Bancorp, Inc. | | | 100,520 | | | | 1,091,647 | |
Wintrust Financial Corporation | | | 71,860 | | | | 2,680,378 | |
| | | | | | | | 49,674,833 | |
| Consumer Finance — 0.2% | | | | | | | | |
Cash America International, Inc. | | | 18,939 | | | | 701,879 | |
CompuCredit Holdings Corporation (a) | | | 82,933 | | | | 496,769 | |
Dollar Financial Corporation (a) | | | 3,000 | | | | 70,230 | |
EZCORP, Inc. - Class A (a) | | | 500 | | | | 10,355 | |
First Marblehead Corporation (The) (a) | | | 2,300 | | | | 8,073 | |
World Acceptance Corporation (a) | | | 30,278 | | | | 1,068,208 | |
| | | | | | | | 2,355,514 | |
| Diversified Financial Services — 0.4% | | | | | | | | |
Asset Acceptance Capital Corporation (a) | | | 22,734 | | | | 167,322 | |
DJSP Enterprises, Inc. (a) | | | 24,245 | | | | 315,185 | |
Interactive Brokers Group, Inc. - Class A (a) | | | 56,898 | | | | 975,232 | |
Life Partners Holdings, Inc. | | | 71,436 | | | | 1,650,171 | |
Portfolio Recovery Associates, Inc. (a) | | | 9,200 | | | | 611,524 | |
Primus Guaranty Ltd. (a) | | | 1,600 | | | | 7,216 | |
| | | | | | | | 3,726,650 | |
| Insurance — 0.9% | | | | | | | | |
Ambac Financial Group, Inc. (a) | | | 60,000 | | | | 90,600 | |
Berkshire Hathaway, Inc. - Class B (a) | | | 23,000 | | | | 1,771,000 | |
Conseco, Inc. (a) | | | 63,600 | | | | 375,240 | |
eHealth, Inc. (a) | | | 3,597 | | | | 49,315 | |
FBL Financial Group, Inc. - Class A | | | 4,700 | | | | 121,448 | |
Fidelity National Financial, Inc. - Class A | | | 75,805 | | | | 1,150,720 | |
First American Corporation | | | 39 | | | | 1,348 | |
FPIC Insurance Group, Inc. (a) | | | 7,143 | | | | 194,432 | |
Max Capital Group Ltd. | | | 28,910 | | | | 644,693 | |
MBIA, Inc. (a) | | | 414,900 | | | | 3,974,742 | |
Mercury General Corporation | | | 900 | | | | 40,491 | |
Phoenix Companies, Inc. (The) (a) | | | 364,252 | | | | 1,176,534 | |
PMA Capital Corporation (a) | | | 3,550 | | | | 24,389 | |
Protective Life Corporation | | | 200 | | | | 4,814 | |
Stewart Information Services Corporation | | | 34,700 | | | | 394,886 | |
United America Indemnity Ltd. - Class A (a) | | | 8,366 | | | | 79,477 | |
Universal Insurance Holdings, Inc. | | | 14,677 | | | | 74,119 | |
| | | | | | | | 10,168,248 | |
| Real Estate Investment Trusts — 2.6% | | | | | | | | |
Alexandria Real Estate Equities, Inc. | | | 19,400 | | | | 1,373,714 | |
TFS MARKET NEUTRAL FUND SCHEDULE OF SECURITIES SOLD SHORT (Continued) |
COMMON STOCKS — 65.9% (Continued) | | | | | | |
| Financials — 11.4% (Continued) | | | | | | |
| Real Estate Investment Trusts — 2.6% (Continued) | | | | | | |
American Capital Agency Corporation | | | 42,413 | | | $ | 1,166,782 | |
Apartment Investment & Management Company | | | 10,600 | | | | 237,546 | |
Ashford Hospitality Trust (a) | | | 282,619 | | | | 2,628,357 | |
Capital Trust, Inc. - Class A (a) | | | 73,177 | | | | 192,455 | |
CapLease, Inc. | | | 153,999 | | | | 897,814 | |
Douglas Emmett, Inc. | | | 48,950 | | | | 819,423 | |
Equity One, Inc. | | | 96,200 | | | | 1,867,242 | |
Essex Property Trust, Inc. | | | 21,403 | | | | 2,264,865 | |
First Industrial Realty Trust, Inc. (a) | | | 19,000 | | | | 151,620 | |
Invesco Mortgage Capital, Inc. | | | 2,600 | | | | 53,690 | |
iStar Financial, Inc. (a) | | | 504,158 | | | | 3,382,900 | |
LaSalle Hotel Properties | | | 32,800 | | | | 864,280 | |
Parkway Properties, Inc. | | | 2,800 | | | | 55,160 | |
Pennsylvania Real Estate Investment Trust | | | 160,238 | | | | 2,530,158 | |
Post Properties, Inc. | | | 11,555 | | | | 297,657 | |
Potlatch Corporation | | | 18,300 | | | | 685,518 | |
Realty Income Corporation | | | 154,845 | | | | 5,077,368 | |
Regency Centers Corporation | | | 27,500 | | | | 1,128,875 | |
Sun Communities, Inc. | | | 30,674 | | | | 887,092 | |
Taubman Centers, Inc. | | | 21,200 | | | | 919,444 | |
Walter Investment Management Corporation | | | 4,000 | | | | 72,520 | |
| | | | | | | | 27,554,480 | |
| Real Estate Management & Development — 0.3% | | | | | | | | |
China Housing & Land Development, Inc. (a) | | | 23,153 | | | | 80,109 | |
Forestar Group, Inc. (a) | | | 2,800 | | | | 63,112 | |
Jones Lang LaSalle, Inc. | | | 13,776 | | | | 1,086,651 | |
St. Joe Company (The) (a) | | | 57,267 | | | | 1,892,102 | |
Tejon Ranch Company (a) | | | 400 | | | | 11,504 | |
| | | | | | | | 3,133,478 | |
| Thrifts & Mortgage Finance — 1.1% | | | | | | | | |
Astoria Financial Corporation | | | 98,100 | | | | 1,583,334 | |
BankAtlantic Bancorp, Inc. (a) | | | 8,700 | | | | 22,794 | |
Berkshire Hills Bancorporation, Inc. | | | 2,029 | | | | 42,609 | |
BofI Holding, Inc. (a) | | | 5,800 | | | | 102,254 | |
Brookline Bancorp, Inc. | | | 2,800 | | | | 30,772 | |
Dime Community Bancshares, Inc. | | | 14,584 | | | | 185,946 | |
Doral Financial Corporation (a) | | | 16,241 | | | | 87,539 | |
ESB Financial Corporation | | | 603 | | | | 8,623 | |
ESSA Bancorp, Inc. | | | 900 | | | | 11,367 | |
FirstFed Financial Corporation (a) | | | 23,697 | | | | 1,069 | |
Flushing Financial Corporation | | | 2,600 | | | | 35,386 | |
Guaranty Financial Group, Inc. (a) | | | 62,759 | | | | 2,510 | |
Home Federal Bancorp, Inc. | | | 1,951 | | | | 31,079 | |
Kearny Financial Corporation | | | 2,029 | | | | 20,757 | |
MGIC Investment Corporation (a) | | | 240,700 | | | | 2,510,501 | |
NewAlliance Bancshares, Inc. | | | 145,949 | | | | 1,901,715 | |
Oritani Financial Corporation | | | 387 | | | | 6,420 | |
PMI Group, Inc. (The) (a) | | | 630,069 | | | | 3,282,659 | |
TFS MARKET NEUTRAL FUND SCHEDULE OF SECURITIES SOLD SHORT (Continued) |
COMMON STOCKS — 65.9% (Continued) | | | | | | |
| Financials — 11.4% (Continued) | | | | | | |
| Thrifts & Mortgage Finance — 1.1% (Continued) | | | | | | |
Prudential Bancorp, Inc. of Pennsylvania | | | 266 | | | $ | 2,054 | |
Rockville Financial, Inc. | | | 402 | | | | 4,848 | |
Triad Guaranty, Inc. (a) | | | 10,450 | | | | 4,703 | |
TrustCo Bank Corporation | | | 219,458 | | | | 1,459,396 | |
Washington Federal, Inc. | | | 12,698 | | | | 261,198 | |
WSFS Financial Corporation | | | 2,708 | | | | 114,034 | |
| | | | | | | | 11,713,567 | |
| Health Care — 8.4% | | | | | | | | |
| Biotechnology — 3.1% | | | | | | | | |
A.P. Pharma, Inc. (a) | | | 100 | | | | 85 | |
Affymax, Inc. (a) | | | 9,239 | | | | 220,258 | |
Allos Therapeutics, Inc. (a) | | | 289,600 | | | | 2,287,840 | |
Alnylam Pharmaceuticals, Inc. (a) | | | 104,651 | | | | 1,774,881 | |
AMAG Pharmaceuticals, Inc. (a) | | | 20,722 | | | | 707,656 | |
Arena Pharmaceuticals, Inc. (a) | | | 292,985 | | | | 952,201 | |
Ariad Pharmaceuticals, Inc. (a) | | | 621,501 | | | | 2,187,683 | |
ArQule, Inc. (a) | | | 28,495 | | | | 181,513 | |
AVI BioPharma, Inc. (a) | | | 26,900 | | | | 35,777 | |
BioCryst Pharmaceuticals, Inc. (a) | | | 26,213 | | | | 199,219 | |
BioSante Pharmaceuticals, Inc. (a) | | | 33,008 | | | | 77,569 | |
BioTime, Inc. (a) | | | 16,073 | | | | 122,315 | |
Cell Therapeutics, Inc. (a) | | | 72,486 | | | | 44,760 | |
Celldex Therapeutics, Inc. (a) | | | 46,853 | | | | 382,789 | |
Cepheid (a) | | | 48,000 | | | | 959,520 | |
Chelsea Therapeutics International Ltd. (a) | | | 63,903 | | | | 256,251 | |
Clinical Data, Inc. (a) | | | 31,026 | | | | 579,566 | |
Cyclacel Pharmaceuticals, Inc. (a) | | | 140,200 | | | | 321,058 | |
Cytori Therapeutics, Inc. (a) | | | 72,520 | | | | 409,013 | |
Dyax Corporation (a) | | | 17,299 | | | | 60,546 | |
Emergent BioSolutions, Inc. (a) | | | 6,300 | | | | 102,564 | |
Enzon Pharmaceuticals, Inc. (a) | | | 13,700 | | | | 144,946 | |
Exelixis, Inc. (a) | | | 234,918 | | | | 1,357,826 | |
Genomic Health, Inc. (a) | | | 26,357 | | | | 422,239 | |
GenVec, Inc. (a) | | | 70,332 | | | | 47,826 | |
Geron Corporation (a) | | | 201,832 | | | | 1,176,681 | |
GTx, Inc. (a) | | | 281,763 | | | | 924,183 | |
Halozyme Therapeutics, Inc. (a) | | | 100 | | | | 852 | |
Idenix Pharmaceuticals, Inc. (a) | | | 28,750 | | | | 132,825 | |
Idera Pharmaceuticals, Inc. (a) | | | 41,338 | | | | 258,776 | |
ImmunoGen, Inc. (a) | | | 138,977 | | | | 1,377,262 | |
Immunomedics, Inc. (a) | | | 27,000 | | | | 94,500 | |
Infinity Pharmaceuticals, Inc. (a) | | | 2,512 | | | | 17,333 | |
Introgen Therapeutics, Inc. (a) | | | 45,612 | | | | 684 | |
Isis Pharmaceuticals, Inc. (a) | | | 3,000 | | | | 32,250 | |
Keryx Biopharmaceuticals, Inc. (a) | | | 15,800 | | | | 88,796 | |
MannKind Corporation (a) | | | 194,700 | | | | 1,353,165 | |
Martek Biosciences Corporation (a) | | | 70,227 | | | | 1,547,101 | |
Medivation, Inc. (a) | | | 10,500 | | | | 117,180 | |
TFS MARKET NEUTRAL FUND SCHEDULE OF SECURITIES SOLD SHORT (Continued) |
COMMON STOCKS — 65.9% (Continued) | | | | | | |
| Health Care — 8.4% (Continued) | | | | | | |
| Biotechnology — 3.1% (Continued) | | | | | | |
Metabolix, Inc. (a) | | | 161,346 | | | $ | 2,011,985 | |
Momenta Pharmaceuticals, Inc. (a) | | | 8,800 | | | | 122,144 | |
Myriad Pharmaceuticals, Inc. (a) | | | 41,382 | | | | 203,186 | |
Neurocrine Biosciences, Inc. (a) | | | 14,400 | | | | 46,224 | |
NeurogesX, Inc. (a) | | | 10,446 | | | | 104,460 | |
Novavax, Inc. (a) | | | 245,153 | | | | 693,783 | |
OncoGenex Pharmaceuticals, Inc. (a) | | | 2,775 | | | | 61,050 | |
Oncothyreon, Inc. (a) | | | 19,265 | | | | 77,831 | |
Orexigen Therapeutics, Inc. (a) | | | 500 | | | | 3,390 | |
OSI Pharmaceuticals, Inc. (a) | | | 23,594 | | | | 1,384,260 | |
Osiris Therapeutics, Inc. (a) | | | 59,169 | | | | 441,992 | |
Poniard Pharmaceuticals, Inc. (a) | | | 105,700 | | | | 135,296 | |
Progenics Pharmaceuticals, Inc. (a) | | | 79,430 | | | | 511,529 | |
Protalix BioTherapeutics, Inc. (a) | | | 50,800 | | | | 343,916 | |
Rigel Pharmaceuticals, Inc. (a) | | | 303,808 | | | | 2,360,588 | |
RXi Pharmaceuticals Corporation (a) | | | 900 | | | | 3,843 | |
Sangamo Biosciences, Inc. (a) | | | 31,300 | | | | 192,808 | |
Savient Pharmaceuticals, Inc. (a) | | | 32,000 | | | | 464,000 | |
SciClone Pharmaceuticals, Inc. (a) | | | 73,580 | | | | 307,564 | |
Seattle Genetics, Inc. (a) | | | 15,600 | | | | 196,560 | |
SIGA Technologies, Inc. (a) | | | 91,715 | | | | 630,082 | |
Spectrum Pharmaceuticals, Inc. (a) | | | 195,004 | | | | 1,006,221 | |
StemCells, Inc. (a) | | | 146,700 | | | | 168,705 | |
Theravance, Inc. (a) | | | 38,273 | | | | 641,838 | |
Vanda Pharmaceuticals, Inc. (a) | | | 58,300 | | | | 487,971 | |
Vical, Inc. (a) | | | 16,300 | | | | 59,006 | |
| | | | | | | | 33,617,721 | |
| Health Care Equipment & Supplies — 1.4% | | | | | | | | |
Abaxis, Inc. (a) | | | 4,300 | | | | 111,413 | |
Abiomed, Inc. (a) | | | 113,217 | | | | 1,091,412 | |
Align Technology, Inc. (a) | | | 3,700 | | | | 62,826 | |
Bovie Medical Corporation (a) | | | 8,630 | | | | 44,962 | |
Cantel Medical Corporation | | | 2,250 | | | | 44,910 | |
Conceptus, Inc. (a) | | | 16,700 | | | | 316,298 | |
CONMED Corporation (a) | | | 16,300 | | | | 362,512 | |
Cutera, Inc. (a) | | | 1,200 | | | | 13,872 | |
Cyberonics, Inc. (a) | | | 9,600 | | | | 187,488 | |
Delcath Systems, Inc. (a) | | | 3,300 | | | | 50,556 | |
DexCom, Inc. (a) | | | 61,503 | | | | 673,458 | |
Electro-Optical Sciences, Inc. (a) | | | 154,384 | | | | 1,099,214 | |
Greatbatch, Inc. (a) | | | 11,600 | | | | 259,144 | |
Hansen Medical, Inc. (a) | | | 43 | | | | 109 | |
ICU Medical, Inc. (a) | | | 1,500 | | | | 53,415 | |
Insulet Corporation (a) | | | 186,195 | | | | 2,569,491 | |
Invacare Corporation | | | 3,000 | | | | 79,290 | |
Inverness Medical Innovations, Inc. (a) | | | 1,400 | | | | 55,692 | |
Kensey Nash Corporation (a) | | | 15,602 | | | | 353,385 | |
Kinetic Concepts, Inc. (a) | | | 7,700 | | | | 333,410 | |
TFS MARKET NEUTRAL FUND SCHEDULE OF SECURITIES SOLD SHORT (Continued) |
COMMON STOCKS — 65.9% (Continued) | | | | | | |
| Health Care — 8.4% (Continued) | | | | | | |
| Health Care Equipment & Supplies — 1.4% (Continued) | | | | | | |
MAKO Surgical Corporation (a) | | | 42,181 | | | $ | 591,800 | |
Micrus Endovascular Corporation (a) | | | 2,800 | | | | 56,224 | |
Neogen Corporation (a) | | | 15,860 | | | | 416,959 | |
NuVasive, Inc. (a) | | | 20,054 | | | | 834,246 | |
OraSure Technologies, Inc. (a) | | | 35,405 | | | | 224,468 | |
Orthovita, Inc. (a) | | | 16,200 | | | | 64,800 | |
Quidel Corporation (a) | | | 28,900 | | | | 425,986 | |
RTI Biologics, Inc. (a) | | | 48,081 | | | | 184,150 | |
Stereotaxis, Inc. (a) | | | 280,225 | | | | 1,331,069 | |
STERIS Corporation | | | 200 | | | | 6,656 | |
SurModics, Inc. (a) | | | 100,286 | | | | 1,865,320 | |
Thoratec Corporation (a) | | | 13,200 | | | | 588,588 | |
West Pharmaceutical Services, Inc. | | | 20,003 | | | | 837,126 | |
Wright Medical Group, Inc. (a) | | | 18,052 | | | | 339,017 | |
| | | | | | | | 15,529,266 | |
| Health Care Providers & Services — 1.5% | | | | | | | | |
Air Methods Corporation (a) | | | 5,500 | | | | 181,940 | |
Amedisys, Inc. (a) | | | 45,170 | | | | 2,600,888 | |
Assisted Living Concepts, Inc. (a) | | | 400 | | | | 14,040 | |
Bio-Reference Labs, Inc. (a) | | | 6,542 | | | | 153,083 | |
Brookdale Senior Living, Inc. (a) | | | 14,548 | | | | 312,782 | |
CardioNet, Inc. (a) | | | 9,964 | | | | 95,854 | |
Catalyst Health Solutions, Inc. (a) | | | 1,100 | | | | 46,541 | |
Centene Corporation (a) | | | 60,666 | | | | 1,389,251 | |
Coventry Health Care, Inc. (a) | | | 100 | | | | 2,374 | |
Emeritus Corporation (a) | | | 104,924 | | | | 2,350,298 | |
Five Star Quality Care, Inc. (a) | | | 22,200 | | | | 65,712 | |
Genoptix, Inc. (a) | | | 41,755 | | | | 1,615,501 | |
Hanger Orthopedic Group, Inc. (a) | | | 40,309 | | | | 751,360 | |
HealthSouth Corporation (a) | | | 31,800 | | | | 650,628 | |
HMS Holdings Corporation (a) | | | 274 | | | | 14,659 | |
inVentiv Health, Inc. (a) | | | 9,907 | | | | 228,158 | |
LCA-Vision, Inc. (a) | | | 29,424 | | | | 248,044 | |
LHC Group, Inc. (a) | | | 4,938 | | | | 168,386 | |
PSS World Medical, Inc. (a) | | | 12,600 | | | | 295,218 | |
Psychiatric Solutions, Inc. (a) | | | 7,700 | | | | 247,709 | |
RehabCare Group, Inc. (a) | | | 55,025 | | | | 1,569,313 | |
Rural/Metro Corporation (a) | | | 8,000 | | | | 56,400 | |
Sharps Compliance Corporation (a) | | | 13,500 | | | | 90,180 | |
Triple-S Management Corporation (a) | | | 1,500 | | | | 27,300 | |
U.S. Physical Therapy, Inc. (a) | | | 100 | | | | 1,754 | |
VCA Antech, Inc. (a) | | | 103,400 | | | | 2,942,764 | |
Virtual Radiologic Corporation (a) | | | 1,300 | | | | 16,250 | |
| | | | | | | | 16,136,387 | |
| Health Care Technology — 0.4% | | | | | | | | |
athenahealth, Inc. (a) | | | 12,561 | | | | 364,520 | |
Computer Programs and Systems, Inc. | | | 51,718 | | | | 2,330,413 | |
Eclipsys Corporation (a) | | | 3,700 | | | | 76,516 | |
TFS MARKET NEUTRAL FUND SCHEDULE OF SECURITIES SOLD SHORT (Continued) |
COMMON STOCKS — 65.9% (Continued) | | | | | | |
| Health Care — 8.4% (Continued) | | | | | | |
| Health Care Technology — 0.4% (Continued) | | | | | | |
Merge Healthcare, Inc. (a) | | | 11,297 | | | $ | 28,017 | |
Quality Systems, Inc. | | | 26,303 | | | | 1,683,655 | |
Transcend Services, Inc. (a) | | | 5,000 | | | | 74,350 | |
Vital Images, Inc. (a) | | | 2,377 | | | | 37,509 | |
| | | | | | | | 4,594,980 | |
| Life Sciences Tools & Services — 0.6% | | | | | | | | |
Accelrys, Inc. (a) | | | 14,448 | | | | 100,992 | |
Affymetrix, Inc. (a) | | | 18,200 | | | | 126,308 | |
Compugen Ltd. (a) | | | 19,500 | | | | 93,210 | |
Helicos BioSciences Corporation (a) | | | 200 | | | | 144 | |
Kendle International, Inc. (a) | | | 11,227 | | | | 185,807 | |
Luminex Corporation (a) | | | 66,908 | | | | 1,087,924 | |
Mettler-Toledo International, Inc. (a) | | | 1,801 | | | | 225,989 | |
PerkinElmer, Inc. | | | 21,100 | | | | 528,555 | |
Pharmaceutical Product Development, Inc. | | | 8,500 | | | | 233,750 | |
Sequenom, Inc. (a) | | | 525,141 | | | | 3,255,874 | |
Varian, Inc. (a) | | | 6,000 | | | | 310,740 | |
| | | | | | | | 6,149,293 | |
| Pharmaceuticals — 1.4% | | | | | | | | |
Adolor Corporation (a) | | | 500 | | | | 975 | |
Ardea Biosciences, Inc. (a) | | | 4,002 | | | | 101,651 | |
Auxilium Pharmaceuticals, Inc. (a) | | | 56,200 | | | | 2,000,720 | |
AVANIR Pharmaceuticals, Inc. - Class A (a) | | | 28,537 | | | | 91,889 | |
BioMimetic Therapeutics, Inc. (a) | | | 17,943 | | | | 239,180 | |
Cadence Pharmaceuticals, Inc. (a) | | | 214,699 | | | | 2,104,050 | |
Cardiome Pharma Corporation (a) | | | 200 | | | | 1,672 | |
Cumberland Pharmaceuticals, Inc. (a) | | | 8,900 | | | | 94,785 | |
Cypress Bioscience, Inc. (a) | | | 258,284 | | | | 1,301,751 | |
DepoMed, Inc. (a) | | | 103,400 | | | | 416,702 | |
DURECT Corporation (a) | | | 51,400 | | | | 146,490 | |
Hi-Tech Pharmacal Company, Inc. (a) | | | 501 | | | | 12,189 | |
Jazz Pharmaceuticals, Inc. (a) | | | 55,746 | | | | 565,265 | |
K-V Pharmaceutical Company - Class A (a) | | | 49,681 | | | | 77,006 | |
MAP Pharmaceuticals, Inc. (a) | | | 6,100 | | | | 109,556 | |
MDRNA, Inc. (a) | | | 22,000 | | | | 27,280 | |
Medicines Company (The) (a) | | | 169,500 | | | | 1,244,130 | |
Nektar Therapeutics (a) | | | 9,000 | | | | 125,640 | |
Optimer Pharmaceuticals, Inc. (a) | | | 25,040 | | | | 308,242 | |
Pain Therapeutics, Inc. (a) | | | 4,500 | | | | 27,000 | |
POZEN, Inc. (a) | | | 500 | | | | 5,415 | |
Somaxon Pharmaceuticals, Inc. (a) | | | 43,500 | | | | 312,765 | |
SuperGen, Inc. (a) | | | 11,000 | | | | 32,450 | |
Valeant Pharmaceuticals International (a) | | | 75,400 | | | | 3,393,000 | |
VIVUS, Inc. (a) | | | 28,900 | | | | 294,491 | |
XenoPort, Inc. (a) | | | 158,127 | | | | 1,644,521 | |
| | | | | | | | 14,678,815 | |
TFS MARKET NEUTRAL FUND SCHEDULE OF SECURITIES SOLD SHORT (Continued) |
COMMON STOCKS — 65.9% (Continued) | | | | | | |
| Industrials — 11.1% | | | | | | |
| Aerospace & Defense — 0.4% | | | | | | |
AAR Corporation (a) | | | 4,027 | | | $ | 98,178 | |
AeroVironment, Inc. (a) | | | 16,576 | | | | 433,960 | |
Alliant Techsystems, Inc. (a) | | | 400 | | | | 32,364 | |
Applied Signal Technology, Inc. | | | 600 | | | | 11,214 | |
Argon ST, Inc. (a) | | | 18,635 | | | | 484,510 | |
Ascent Solar Technologies, Inc. (a) | | | 109,773 | | | | 418,235 | |
Astronics Corporation (a) | | | 100 | | | | 1,446 | |
Ducommun, Inc. | | | 1,800 | | | | 41,202 | |
DynCorp International, Inc. - Class A (a) | | | 72,435 | | | | 1,245,882 | |
GenCorp, Inc. (a) | | | 12,000 | | | | 74,640 | |
Taser International, Inc. (a) | | | 284,257 | | | | 1,344,536 | |
| | | | | | | | 4,186,167 | |
| Air Freight & Logistics — 0.2% | | | | | | | | |
Atlas Air Worldwide Holdings, Inc. (a) | | | 200 | | | | 11,054 | |
Forward Air Corporation | | | 43,353 | | | | 1,214,751 | |
Hub Group, Inc. (a) | | | 16,900 | | | | 540,969 | |
| | | | | | | | 1,766,774 | |
| Airlines — 0.2% | | | | | | | | |
AirTran Holdings, Inc. (a) | | | 20,700 | | | | 109,296 | |
Alaska Air Group, Inc. (a) | | | 2,600 | | | | 107,666 | |
Allegiant Travel Company (a) | | | 28,011 | | | | 1,440,606 | |
Republic Airways Holdings, Inc. (a) | | | 64,300 | | | | 402,518 | |
US Airways Group, Inc. (a) | | | 15,100 | | | | 106,757 | |
| | | | | | | | 2,166,843 | |
| Building Products — 1.5% | | | | | | | | |
AAON, Inc. | | | 69,899 | | | | 1,687,362 | |
American Woodmark Corporation | | | 33,795 | | | | 781,003 | |
Ameron International Corporation | | | 13,780 | | | | 956,194 | |
Apogee Enterprises, Inc. | | | 34,908 | | | | 479,636 | |
Builders FirstSource, Inc. (a) | | | 367,512 | | | | 1,400,221 | |
Insteel Industries, Inc. | | | 33,598 | | | | 411,912 | |
NCI Building Systems, Inc. (a) | | | 123,600 | | | | 1,703,208 | |
Owens Corning, Inc. (a) | | | 40,326 | | | | 1,402,538 | |
Trex Company, Inc. (a) | | | 88,617 | | | | 2,170,230 | |
Universal Forest Products, Inc. | | | 31,528 | | | | 1,325,752 | |
USG Corporation (a) | | | 165,799 | | | | 3,912,856 | |
| | | | | | | | 16,230,912 | |
| Commercial Services & Supplies — 1.4% | | | | | | | | |
ABM Industries, Inc. | | | 126,144 | | | | 2,710,834 | |
ACCO Brands Corporation (a) | | | 40,200 | | | | 367,026 | |
APAC Customer Services, Inc. (a) | | | 35,600 | | | | 204,700 | |
Bowne & Company, Inc. | | | 6,900 | | | | 77,142 | |
Clean Harbors, Inc. (a) | | | 13,310 | | | | 844,253 | |
Consolidated Graphics, Inc. (a) | | | 901 | | | | 37,761 | |
Copart, Inc. (a) | | | 3,616 | | | | 129,055 | |
Deluxe Corporation | | | 200 | | | | 4,194 | |
EnergySolutions, Inc. | | | 438,785 | | | | 3,181,191 | |
EnerNOC, Inc. (a) | | | 3,400 | | | | 98,872 | |
TFS MARKET NEUTRAL FUND SCHEDULE OF SECURITIES SOLD SHORT (Continued) |
COMMON STOCKS — 65.9% (Continued) | | | | | | |
| Industrials — 11.1% (Continued) | | | | | | |
| Commercial Services & Supplies — 1.4% (Continued) | | | | | | |
G&K Services, Inc. | | | 6,577 | | | $ | 180,802 | |
Healthcare Services Group, Inc. | | | 29,740 | | | | 639,113 | |
HNI Corporation | | | 58,791 | | | | 1,824,873 | |
InnerWorkings, Inc. (a) | | | 134,786 | | | | 806,020 | |
McGrath RentCorp | | | 4,508 | | | | 117,163 | |
Metalico, Inc. (a) | | | 42,600 | | | | 281,160 | |
Mine Safety Appliances Company | | | 15,572 | | | | 457,661 | |
Mobile Mini, Inc. (a) | | | 96,055 | | | | 1,596,434 | |
RINO International Corporation (a) | | | 63,482 | | | | 1,093,160 | |
Ritchie Bros. Auctioneers, Inc. | | | 34,300 | | | | 802,620 | |
Team, Inc. (a) | | | 94 | | | | 1,636 | |
Viad Corp | | | 6,212 | | | | 145,361 | |
| | | | | | | | 15,601,031 | |
| Construction & Engineering — 0.4% | | | | | | | | |
Chicago Bridge & Iron Company (a) | | | 300 | | | | 7,032 | |
Comfort Systems USA, Inc. | | | 36,837 | | | | 518,665 | |
EMCOR Group, Inc. (a) | | | 27,700 | | | | 791,112 | |
Granite Construction, Inc. | | | 53,000 | | | | 1,781,330 | |
Insituform Technologies, Inc. - Class A (a) | | | 3,300 | | | | 79,101 | |
KBR, Inc. | | | 24,314 | | | | 536,853 | |
MasTec, Inc. (a) | | | 5,583 | | | | 69,843 | |
MYR Group, Inc. (a) | | | 2,266 | | | | 40,629 | |
Northwest Pipe Company (a) | | | 900 | | | | 21,708 | |
Pike Electric Corporation (a) | | | 22,217 | | | | 238,833 | |
| | | | | | | | 4,085,106 | |
| Electrical Equipment — 1.5% | | | | | | | | |
Acuity Brands, Inc. | | | 2,000 | | | | 90,420 | |
Advanced Battery Technologies, Inc. (a) | | | 200,006 | | | | 694,021 | |
American Superconductor Corporation (a) | | | 97,346 | | | | 2,840,556 | |
A-Power Energy Generation Systems Ltd. (a) | | | 63,684 | | | | 668,045 | |
AZZ, Inc. | | | 11,117 | | | | 451,573 | |
Baldor Electric Company | | | 11,320 | | | | 434,801 | |
Belden, Inc. | | | 19,100 | | | | 524,486 | |
Capstone Turbine Corporation (a) | | | 9,600 | | | | 11,712 | |
Chase Corporation | | | 700 | | | | 9,191 | |
China BAK Battery, Inc. (a) | | | 327,159 | | | | 657,590 | |
Encore Wire Corporation | | | 71,715 | | | | 1,592,790 | |
Ener1, Inc. (a) | | | 323,001 | | | | 1,343,684 | |
Energy Conversion Devices, Inc. (a) | | | 423,062 | | | | 3,012,202 | |
Evergreen Solar, Inc. (a) | | | 88,448 | | | | 99,062 | |
FuelCell Energy, Inc. (a) | | | 58,072 | | | | 159,698 | |
GT Solar International, Inc. (a) | | | 73,663 | | | | 429,455 | |
Harbin Electric, Inc. (a) | | | 38,362 | | | | 840,512 | |
Hoku Corporation (a) | | | 7,000 | | | | 20,650 | |
II-VI, Inc. (a) | | | 1,100 | | | | 39,446 | |
LaBarge, Inc. (a) | | | 2,500 | | | | 30,900 | |
Lime Energy Company (a) | | | 36,950 | | | | 155,190 | |
Medis Technologies Ltd. (a) | | | 20,819 | | | | 1,353 | |
TFS MARKET NEUTRAL FUND SCHEDULE OF SECURITIES SOLD SHORT (Continued) |
COMMON STOCKS — 65.9% (Continued) | | | | | | |
| Industrials — 11.1% (Continued) | | | | | | |
| Electrical Equipment — 1.5% (Continued) | | | | | | |
Microvision, Inc. (a) | | | 155,895 | | | $ | 487,951 | |
PowerSecure International, Inc. (a) | | | 1,717 | | | | 19,333 | |
Satcon Technology Corporation (a) | | | 49,400 | | | | 138,814 | |
Thomas & Betts Corporation (a) | | | 7,558 | | | | 316,983 | |
Ultralife Corporation (a) | | | 1,411 | | | | 5,912 | |
UQM Technologies, Inc. (a) | | | 39,900 | | | | 174,363 | |
Valence Technology, Inc. (a) | | | 161,041 | | | | 169,093 | |
Vicor Corporation (a) | | | 4,100 | | | | 61,992 | |
Woodward Governor Company | | | 15,822 | | | | 507,095 | |
| | | | | | | | 15,988,873 | |
| Industrial Conglomerates — 0.1% | | | | | | | | |
Carlisle Companies, Inc. | | | 26,044 | | | | 982,640 | |
Otter Tail Corporation | | | 13,897 | | | | 308,791 | |
Raven Industries, Inc. | | | 638 | | | | 19,370 | |
| | | | | | | | 1,310,801 | |
| Machinery — 2.6% | | | | | | | | |
3D Systems Corporation (a) | | | 4,925 | | | | 76,633 | |
Actuant Corporation - Class A | | | 3,500 | | | | 80,255 | |
Albany International Corporation - Class A | | | 24,356 | | | | 620,347 | |
American Railcar Industries, Inc. | | | 10,000 | | | | 163,500 | |
Ampco-Pittsburgh Corporation | | | 3,294 | | | | 84,689 | |
Astec Industries, Inc. (a) | | | 19,500 | | | | 645,840 | |
Badger Meter, Inc. | | | 8,122 | | | | 335,926 | |
Briggs & Stratton Corporation | | | 155,023 | | | | 3,680,246 | |
China Fire & Security Group, Inc. (a) | | | 78,543 | | | | 1,074,468 | |
CLARCOR, Inc. | | | 1,000 | | | | 37,820 | |
Columbus McKinnon Corporation (a) | | | 20,770 | | | | 374,483 | |
Donaldson Company, Inc. | | | 15,000 | | | | 694,500 | |
Energy Recovery, Inc. (a) | | | 164,689 | | | | 993,075 | |
EnPro Industries, Inc. (a) | | | 3,637 | | | | 114,856 | |
Federal Signal Corporation | | | 3,200 | | | | 25,792 | |
Force Protection, Inc. (a) | | | 9 | | | | 48 | |
FreightCar America, Inc. | | | 59,817 | | | | 1,711,963 | |
Gorman-Rupp Company (The) | | | 42,162 | | | | 1,175,898 | |
Kaydon Corporation | | | 90 | | | | 3,747 | |
Lincoln Electric Holdings, Inc. | | | 12,313 | | | | 738,041 | |
Lindsay Corporation | | | 29,199 | | | | 1,110,438 | |
Manitowoc Company, Inc. (The) | | | 85,123 | | | | 1,192,573 | |
Middleby Corporation (The) (a) | | | 19,954 | | | | 1,219,588 | |
Miller Industries, Inc. | | | 6,500 | | | | 92,950 | |
Mueller Industries, Inc. | | | 12,700 | | | | 376,555 | |
SmartHeat, Inc. (a) | | | 215,915 | | | | 1,811,527 | |
Sun Hydraulics Corporation | | | 54,348 | | | | 1,522,288 | |
Terex Corporation (a) | | | 135,500 | | | | 3,593,460 | |
Timken Company | | | 5,300 | | | | 186,454 | |
Titan International, Inc. | | | 167,298 | | | | 2,076,168 | |
Toro Company (The) | | | 10,100 | | | | 575,094 | |
Trinity Industries, Inc. | | | 13,220 | | | | 329,046 | |
TFS MARKET NEUTRAL FUND SCHEDULE OF SECURITIES SOLD SHORT (Continued) |
COMMON STOCKS — 65.9% (Continued) | | | | | | |
| Industrials — 11.1% (Continued) | | | | | | |
| Machinery — 2.6% (Continued) | | | | | | |
Valmont Industries, Inc. | | | 735 | | | $ | 61,218 | |
Wabtec Corporation | | | 21,700 | | | | 1,032,486 | |
Watts Water Technologies, Inc. - Class A | | | 1,800 | | | | 63,864 | |
| | | | | | | | 27,875,836 | |
| Marine — 0.4% | | | | | | | | |
Alexander & Baldwin, Inc. | | | 17,798 | | | | 633,253 | |
American Commercial Lines, Inc. (a) | | | 14,681 | | | | 299,492 | |
Eagle Bulk Shipping, Inc. (a) | | | 501,800 | | | | 2,905,422 | |
Euroseas Ltd. | | | 100 | | | | 403 | |
Genco Shipping & Trading Ltd. (a) | | | 6,800 | | | | 157,488 | |
Horizon Lines, Inc. | | | 73,163 | | | | 400,202 | |
Kirby Coporation (a) | | | 11,055 | | | | 465,194 | |
| | | | | | | | 4,861,454 | |
| Professional Services — 0.7% | | | | | | | | |
Advisory Board Company (The) (a) | | | 800 | | | | 26,344 | |
CBIZ, Inc. (a) | | | 13,800 | | | | 96,738 | |
Corporate Executive Board Company (The) | | | 46,500 | | | | 1,276,890 | |
CoStar Group, Inc. (a) | | | 44,694 | | | | 1,964,301 | |
CRA International, Inc. (a) | | | 659 | | | | 15,309 | |
Diamond Management & Technology Consultants, Inc. | | | 21,263 | | | | 172,656 | |
Exponent, Inc. (a) | | | 1,800 | | | | 53,658 | |
FTI Consulting, Inc. (a) | | | 28,900 | | | | 1,188,657 | |
Hudson Highland Group, Inc. (a) | | | 7,900 | | | | 44,319 | |
Huron Consulting Group, Inc. (a) | | | 23,568 | | | | 551,962 | |
Kelly Services, Inc. - Class A (a) | | | 64,176 | | | | 1,031,950 | |
Korn/Ferry International (a) | | | 54,475 | | | | 883,040 | |
On Assignment, Inc. (a) | | | 16,822 | | | | 118,259 | |
School Specialty, Inc. (a) | | | 14,300 | | | | 335,478 | |
TrueBlue, Inc. (a) | | | 7,852 | | | | 123,983 | |
| | | | | | | | 7,883,544 | |
| Road & Rail — 0.7% | | | | | | | | |
Arkansas Best Corporation | | | 15,880 | | | | 483,705 | |
Avis Budget Group, Inc. (a) | | | 46,000 | | | | 695,520 | |
Con-Way, Inc. | | | 5,700 | | | | 221,388 | |
Dollar Thrifty Automotive Group, Inc. (a) | | | 3,400 | | | | 149,566 | |
Knight Transportation, Inc. | | | 118,442 | | | | 2,521,630 | |
Landstar System, Inc. | | | 36,800 | | | | 1,627,296 | |
Patriot Transportation Holding, Inc. (a) | | | 589 | | | | 49,440 | |
Ryder System, Inc. | | | 26,000 | | | | 1,209,520 | |
Saia, Inc. (a) | | | 61,168 | | | | 1,013,554 | |
Universal Truckload Services, Inc. (a) | | | 600 | | | | 10,956 | |
USA Truck, Inc. (a) | | | 752 | | | | 13,852 | |
| | | | | | | | 7,996,427 | |
| Trading Companies & Distributors — 1.0% | | | | | | | | |
Aceto Corporation | | | 21,010 | | | | 140,137 | |
Beacon Roofing Supply, Inc. (a) | | | 1,200 | | | | 26,640 | |
BlueLinx Holdings, Inc. (a) | | | 10,757 | | | | 53,893 | |
GATX Corporation | | | 11,979 | | | | 390,994 | |
TFS MARKET NEUTRAL FUND SCHEDULE OF SECURITIES SOLD SHORT (Continued) |
COMMON STOCKS — 65.9% (Continued) | | | | | | |
| Industrials — 11.1% (Continued) | | | | | | |
| Trading Companies & Distributors — 1.0% (Continued) | | | | | | |
H&E Equipment Services, Inc. (a) | | | 5,728 | | | $ | 67,648 | |
Houston Wire & Cable Company | | | 63,999 | | | | 841,587 | |
MSC Industrial Direct Company, Inc. | | | 28,267 | | | | 1,540,269 | |
Rush Enterprises, Inc. - Class A (a) | | | 1,000 | | | | 16,220 | |
TAL International Group, Inc. | | | 2,100 | | | | 54,579 | |
Titan Machinery, Inc. (a) | | | 220,280 | | | | 3,167,626 | |
United Rentals, Inc. (a) | | | 5,000 | | | | 71,800 | |
Watsco, Inc. | | | 12,100 | | | | 716,562 | |
WESCO International, Inc. (a) | | | 84,094 | | | | 3,415,898 | |
| | | | | | | | 10,503,853 | |
| Information Technology — 9.6% | | | | | | | | |
| Communications Equipment — 0.9% | | | | | | | | |
ADC Telecommunications, Inc. (a) | | | 800 | | | | 6,408 | |
ADTRAN, Inc. | | | 10,075 | | | | 269,708 | |
Aruba Networks, Inc. (a) | | | 31,508 | | | | 395,740 | |
Aviat Networks, Inc. (a) | | | 52,476 | | | | 341,094 | |
Bel Fuse, Inc. - Class B | | | 1,969 | | | | 46,114 | |
CommScope, Inc. (a) | | | 21,084 | | | | 686,917 | |
Comtech Telecommunications Corporation (a) | | | 3,904 | | | | 121,961 | |
DG FastChannel, Inc. (a) | | | 4,300 | | | | 151,274 | |
Digi International, Inc. (a) | | | 4,240 | | | | 45,410 | |
DragonWave, Inc. (a) | | | 71,010 | | | | 603,585 | |
EMCORE Corporation (a) | | | 92,205 | | | | 123,555 | |
Emulex Corporation (a) | | | 124,682 | | | | 1,465,013 | |
Extreme Networks, Inc. (a) | | | 33,337 | | | | 111,012 | |
Finisar Corporation (a) | | | 37,706 | | | | 564,082 | |
Hughes Communications, Inc. (a) | | | 882 | | | | 24,608 | |
Infinera Corporation (a) | | | 118,037 | | | | 1,080,038 | |
InterDigital, Inc. (a) | | | 23,400 | | | | 647,478 | |
Ixia (a) | | | 13,700 | | | | 140,425 | |
KVH Industries, Inc. (a) | | | 1,940 | | | | 29,236 | |
Network Equipment Technologies, Inc. (a) | | | 2,000 | | | | 10,260 | |
Occam Networks, Inc. (a) | | | 7,100 | | | | 46,292 | |
Oplink Communications, Inc. (a) | | | 48,842 | | | | 738,003 | |
Opnext, Inc. (a) | | | 42,212 | | | | 99,198 | |
Palm, Inc. (a) | | | 119,800 | | | | 694,840 | |
Qiao Xing Mobile Communication Company Ltd. (a) | | | 7,054 | | | | 18,764 | |
SeaChange International, Inc. (a) | | | 74,206 | | | | 618,136 | |
Symmetricom, Inc. (a) | | | 1,000 | | | | 6,630 | |
Telestone Technologies Corporation (a) | | | 51,853 | | | | 708,312 | |
UTStarcom, Inc. (a) | | | 63,680 | | | | 181,488 | |
| | | | | | | | 9,975,581 | |
| Computers & Peripherals — 1.2% | | | | | | | | |
3PAR, Inc. (a) | | | 21,000 | | | | 195,930 | |
Adaptec, Inc. (a) | | | 6,000 | | | | 18,540 | |
Avid Technology, Inc. (a) | | | 146,941 | | | | 2,145,339 | |
Compellent Technologies, Inc. (a) | | | 100 | | | | 1,257 | |
Diebold, Inc. | | | 35,463 | | | | 1,111,765 | |
TFS MARKET NEUTRAL FUND SCHEDULE OF SECURITIES SOLD SHORT (Continued) |
COMMON STOCKS — 65.9% (Continued) | | | | | | |
| Information Technology — 9.6% (Continued) | | | | | | |
| Computers & Peripherals — 1.2% (Continued) | | | | | | |
iGo, Inc. (a) | | | 8,900 | | | $ | 15,219 | |
Imation Corporation (a) | | | 33,500 | | | | 363,140 | |
Immersion Corporation (a) | | | 79,588 | | | | 445,693 | |
Intermec, Inc. (a) | | | 62,005 | | | | 711,197 | |
Intevac, Inc. (a) | | | 12,001 | | | | 167,054 | |
Netezza Corporation (a) | | | 187,921 | | | | 2,572,639 | |
Novatel Wireless, Inc. (a) | | | 91,300 | | | | 625,405 | |
QLogic Corporation (a) | | | 55 | | | | 1,065 | |
Silicon Graphics International Corporation (a) | | | 14,900 | | | | 147,361 | |
STEC, Inc. (a) | | | 21,800 | | | | 302,802 | |
Stratasys, Inc. (a) | | | 82,618 | | | | 1,969,613 | |
Super Micro Computer, Inc. (a) | | | 49,390 | | | | 700,350 | |
Synaptics, Inc. (a) | | | 35,913 | | | | 1,099,656 | |
| | | | | | | | 12,594,025 | |
| Electronic Equipment, Instruments & Components — 2.4% | | | | | | | | |
Agilysys, Inc. | | | 19,217 | | | | 208,504 | |
Anixter International, Inc. (a) | | | 3,400 | | | | 178,160 | |
Bell Microproducts, Inc. (a) | | | 6,300 | | | | 44,100 | |
China Security & Surveillance Technology, Inc. (a) | | | 251,445 | | | | 1,496,098 | |
Cognex Corporation | | | 58,901 | | | | 1,231,620 | |
Comverge, Inc. (a) | | | 240 | | | | 2,722 | |
Daktronics, Inc. | | | 67,500 | | | | 565,650 | |
DTS, Inc. (a) | | | 81,594 | | | | 2,712,185 | |
Echelon Corporation (a) | | | 25,415 | | | | 240,172 | |
Electro Rent Corporation | | | 7,639 | | | | 109,161 | |
Electro Scientific Industries, Inc. (a) | | | 7,008 | | | | 96,500 | |
FARO Technologies, Inc. (a) | | | 6,395 | | | | 161,218 | |
Ingram Micro, Inc. - Class A (a) | | | 158,950 | | | | 2,886,532 | |
Insight Enterprises, Inc. (a) | | | 14,360 | | | | 215,831 | |
Intellicheck Mobilisa, Inc. (a) | | | 6,600 | | | | 12,276 | |
Itron, Inc. (a) | | | 18,500 | | | | 1,472,785 | |
L-1 Identity Solutions, Inc. (a) | | | 2,800 | | | | 24,276 | |
Maxwell Technologies, Inc. (a) | | | 71,216 | | | | 1,027,647 | |
Measurement Specialties, Inc. (a) | | | 7,700 | | | | 126,819 | |
Mercury Computer Systems, Inc. (a) | | | 3,100 | | | | 39,866 | |
Methode Electronics, Inc. | | | 13,000 | | | | 144,300 | |
Molex, Inc. | | | 52,900 | | | | 1,185,489 | |
Netlist, Inc. (a) | | | 167,250 | | | | 496,732 | |
PC Connection, Inc. (a) | | | 710 | | | | 4,885 | |
Plexus Corporation (a) | | | 60,246 | | | | 2,232,114 | |
Power-One, Inc. (a) | | | 23,300 | | | | 183,138 | |
RadiSys Corporation (a) | | | 34,726 | | | | 339,967 | |
Research Frontiers, Inc. (a) | | | 17,962 | | | | 57,658 | |
Sanmina-SCI Corporation (a) | | | 24,600 | | | | 438,618 | |
ScanSource, Inc. (a) | | | 43,225 | | | | 1,204,248 | |
SMART Modular Technologies (WWH), Inc. (a) | | | 240,700 | | | | 1,689,714 | |
SYNNEX Corporation (a) | | | 17,048 | | | | 467,456 | |
Tech Data Corporation (a) | | | 18,900 | | | | 810,810 | |
TFS MARKET NEUTRAL FUND SCHEDULE OF SECURITIES SOLD SHORT (Continued) |
COMMON STOCKS — 65.9% (Continued) | | | | | | |
| Information Technology — 9.6% (Continued) | | | | | | |
| Electronic Equipment, Instruments & Components — 2.4% (Continued) | | | | | | |
Technitrol, Inc. | | | 17,700 | | | $ | 95,580 | |
TTM Technologies, Inc. (a) | | | 98,803 | | | | 1,073,001 | |
Universal Display Corporation (a) | | | 187,643 | | | | 2,505,034 | |
| | | | | | | | 25,780,866 | |
| Internet Software & Services — 0.9% | | | | | | | | |
Art Technology Group, Inc. (a) | | | 186,666 | | | | 798,930 | |
comScore, Inc. (a) | | | 3,700 | | | | 67,155 | |
Constant Contact, Inc. (a) | | | 42,709 | | | | 1,091,215 | |
DealerTrack Holdings, Inc. (a) | | | 6,400 | | | | 97,600 | |
Digital River, Inc. (a) | | | 21,989 | | | | 614,373 | |
DivX, Inc. (a) | | | 30,803 | | | | 257,513 | |
EarthLink, Inc. | | | 14,100 | | | | 127,182 | |
GSI Commerce, Inc. (a) | | | 40,790 | | | | 1,111,527 | |
InfoSpace, Inc. (a) | | | 4,000 | | | | 41,880 | |
Innodata Isogen, Inc. (a) | | | 14,535 | | | | 50,291 | |
Internet Brands, Inc. (a) | | | 11,400 | | | | 117,990 | |
Internet Capital Group, Inc. (a) | | | 17,444 | | | | 172,521 | |
j2 Global Communications, Inc. (a) | | | 24,500 | | | | 589,960 | |
Knot, Inc. (The) (a) | | | 35,578 | | | | 288,538 | |
Liquidity Services, Inc. (a) | | | 6,600 | | | | 75,042 | |
LoopNet, Inc. (a) | | | 9,000 | | | | 101,520 | |
Monster Worldwide, Inc. (a) | | | 27,500 | | | | 479,325 | |
OpenTable, Inc. (a) | | | 5,143 | | | | 199,857 | |
Openwave Systems, Inc. (a) | | | 182,827 | | | | 407,704 | |
Perficient, Inc. (a) | | | 58,351 | | | | 727,637 | |
Saba Software, Inc. (a) | | | 29,400 | | | | 149,940 | |
SAVVIS, Inc. (a) | | | 20,300 | | | | 357,280 | |
support.com, Inc. (a) | | | 34,267 | | | | 149,404 | |
Switch & Data Facilities Company, Inc. (a) | | | 400 | | | | 7,676 | |
Terremark Worldwide, Inc. (a) | | | 149,199 | | | | 1,069,757 | |
TheStreet.com, Inc. | | | 200 | | | | 762 | |
Travelzoo, Inc. (a) | | | 3,019 | | | | 60,199 | |
ValueClick, Inc. (a) | | | 12,300 | | | | 126,444 | |
Vistaprint N.V. (a) | | | 226 | | | | 11,657 | |
Vocus, Inc. (a) | | | 8,800 | | | | 150,040 | |
Web.com Group, Inc. (a) | | | 3,000 | | | | 14,490 | |
WebMD Health Corporation (a) | | | 9,100 | | | | 440,804 | |
Zix Corporation (a) | | | 81,778 | | | | 201,174 | |
| | | | | | | | 10,157,387 | |
| IT Services — 0.6% | | | | | | | | |
Acorn Energy, Inc. (a) | | | 200 | | | | 1,128 | |
Alliance Data Systems Corporation (a) | | | 39,385 | | | | 2,956,238 | |
Broadridge Financial Solutions, Inc. | | | 6,300 | | | | 150,003 | |
CACI International, Inc. (a) | | | 7,500 | | | | 355,725 | |
Cass Information Systems, Inc. | | | 200 | | | | 6,360 | |
CIBER, Inc. (a) | | | 600 | | | | 2,382 | |
CSG Systems International, Inc. (a) | | | 4,900 | | | | 111,328 | |
Echo Global Logistics, Inc. (a) | | | 5,500 | | | | 74,195 | |
TFS MARKET NEUTRAL FUND SCHEDULE OF SECURITIES SOLD SHORT (Continued) |
COMMON STOCKS — 65.9% (Continued) | | | | | | |
| Information Technology — 9.6% (Continued) | | | | | | |
| IT Services — 0.6% (Continued) | | | | | | |
Hackett Group, Inc. (The) (a) | | | 14,690 | | | $ | 41,279 | |
Heartland Payment Systems, Inc. | | | 2,200 | | | | 40,436 | |
Integral Systems, Inc. (a) | | | 14,421 | | | | 125,751 | |
Mantech International Corporation - Class A (a) | | | 2,300 | | | | 103,569 | |
NCI, Inc. - Class A (a) | | | 8,625 | | | | 245,036 | |
SRA International, Inc. (a) | | | 21,002 | | | | 484,726 | |
TeleTech Holdings, Inc. (a) | | | 26,090 | | | | 431,790 | |
Unisys Corporation (a) | | | 39,580 | | | | 1,109,032 | |
| | | | | | | | 6,238,978 | |
| Semiconductors & Semiconductor Equipment — 1.8% | | | | | | | | |
Actel Corporation (a) | | | 7,799 | | | | 121,040 | |
Advanced Analogic Technologies, Inc. (a) | | | 72,215 | | | | 274,417 | |
Amkor Technology, Inc. (a) | | | 400 | | | | 3,016 | |
Applied Micro Circuits Corporation (a) | | | 17,073 | | | | 192,583 | |
Atheros Communications, Inc. (a) | | | 29,090 | | | | 1,129,856 | |
Cabot Microelectronics Corporation (a) | | | 2,400 | | | | 92,064 | |
Cymer, Inc. (a) | | | 48,156 | | | | 1,644,527 | |
Fairchild Semiconductor International, Inc. (a) | | | 27,800 | | | | 311,916 | |
FEI Company (a) | | | 200 | | | | 4,500 | |
FormFactor, Inc. (a) | | | 120,588 | | | | 1,810,026 | |
Ikanos Communications, Inc. (a) | | | 25,814 | | | | 73,054 | |
Integrated Device Technology, Inc. (a) | | | 60,400 | | | | 399,244 | |
International Rectifier Corporation (a) | | | 92,359 | | | | 2,126,104 | |
LDK Solar Company Ltd. (a) | | | 139,532 | | | | 1,085,559 | |
Mattson Technology, Inc. (a) | | | 36,840 | | | | 165,780 | |
MEMC Electronic Materials, Inc. (a) | | | 2 | | | | 26 | |
Microsemi Corporation (a) | | | 5,027 | | | | 83,247 | |
Microtune, Inc. (a) | | | 25,670 | | | | 68,796 | |
Mindspeed Technologies, Inc. (a) | | | 11,000 | | | | 110,330 | |
MKS Instruments, Inc. (a) | | | 26,000 | | | | 589,680 | |
Monolithic Power Systems, Inc. (a) | | | 20,034 | | | | 493,838 | |
Nanometrics, Inc. (a) | | | 9,000 | | | | 96,300 | |
NetLogic Microsystems, Inc. (a) | | | 17,800 | | | | 554,826 | |
Nova Measuring Instruments Ltd. (a) | | | 6,200 | | | | 34,348 | |
NVE Corporation (a) | | | 400 | | | | 19,292 | |
OmniVision Technologies, Inc. (a) | | | 104,942 | | | | 1,842,782 | |
Pericom Semiconductor Corporation (a) | | | 4,556 | | | | 53,214 | |
Photronics, Inc. (a) | | | 42,300 | | | | 230,535 | |
Power Integrations, Inc. | | | 6,600 | | | | 253,968 | |
QuickLogic Corporation (a) | | | 2,700 | | | | 9,666 | |
Rubicon Technology, Inc. (a) | | | 70,527 | | | | 1,914,103 | |
Sigma Designs, Inc. (a) | | | 104,683 | | | | 1,241,540 | |
Silicon Laboratories, Inc. (a) | | | 9,100 | | | | 439,985 | |
Skyworks Solutions, Inc. (a) | | | 39,300 | | | | 661,812 | |
Supertex, Inc. (a) | | | 52,383 | | | | 1,414,865 | |
Ultra Clean Holdings, Inc. (a) | | | 17,200 | | | | 169,764 | |
White Electronic Designs Corporation (a) | | | 12,615 | | | | 88,305 | |
| | | | | | | | 19,804,908 | |
TFS MARKET NEUTRAL FUND SCHEDULE OF SECURITIES SOLD SHORT (Continued) |
COMMON STOCKS — 65.9% (Continued) | | | | | | |
| Information Technology — 9.6% (Continued) | | | | | | |
| Software — 1.8% | | | | | | |
Actuate Corporation (a) | | | 300 | | | $ | 1,698 | |
American Software, Inc. - Class A | | | 9,732 | | | | 62,188 | |
ArcSight, Inc. (a) | | | 3,400 | | | | 77,282 | |
Ariba, Inc. (a) | | | 9,000 | | | | 128,430 | |
Blackboard, Inc. (a) | | | 10,600 | | | | 451,030 | |
Callidus Software, Inc. (a) | | | 2,200 | | | | 6,974 | |
CommVault Systems, Inc. (a) | | | 6,900 | | | | 144,555 | |
Concur Technologies, Inc. (a) | | | 13,106 | | | | 549,272 | |
Deltek, Inc. (a) | | | 100 | | | | 787 | |
Ebix, Inc. (a) | | | 36,855 | | | | 599,631 | |
Epicor Software Corporation (a) | | | 1,600 | | | | 14,688 | |
EPIQ Systems, Inc. (a) | | | 4,401 | | | | 53,032 | |
ePlus, Inc. (a) | | | 425 | | | | 7,909 | |
Fair Isaac Corporation | | | 61,773 | | | | 1,300,939 | |
FalconStor Software, Inc. (a) | | | 11,912 | | | | 35,617 | |
Informatica Corporation (a) | | | 10,471 | | | | 261,880 | |
Magma Design Automation, Inc. (a) | | | 127,900 | | | | 460,440 | |
Manhattan Associates, Inc. (a) | | | 45,281 | | | | 1,297,754 | |
MicroStrategy, Inc. - Class A (a) | | | 3,587 | | | | 274,764 | |
Midway Games, Inc. (a) | | | 51,015 | | | | 612 | |
Net 1 UEPS Technologies, Inc. (a) | | | 30,900 | | | | 506,760 | |
NetSuite, Inc. (a) | | | 75,181 | | | | 1,059,300 | |
Pegasystems, Inc. | | | 43,819 | | | | 1,387,748 | |
PROS Holdings, Inc. (a) | | | 1,500 | | | | 13,650 | |
Rosetta Stone, Inc. (a) | | | 4,506 | | | | 116,435 | |
S1 Corporation (a) | | | 95,000 | | | | 586,150 | |
Smith Micro Software, Inc. (a) | | | 2,500 | | | | 23,725 | |
Sonic Solutions, Inc. (a) | | | 61,400 | | | | 770,570 | |
SuccessFactors, Inc. (a) | | | 18,658 | | | | 390,512 | |
Synopsys, Inc. (a) | | | 25,001 | | | | 567,773 | |
Take-Two Interactive Software, Inc. (a) | | | 260,913 | | | | 2,836,124 | |
TeleCommunication Systems, Inc. (a) | | | 18,100 | | | | 125,071 | |
THQ, Inc. (a) | | | 23,153 | | | | 175,963 | |
TiVo, Inc. (a) | | | 109,005 | | | | 1,909,768 | |
Tyler Technologies, Inc. (a) | | | 56,119 | | | | 956,268 | |
Ultimate Software Group, Inc. (The) (a) | | | 24,700 | | | | 826,215 | |
VASCO Data Security International, Inc. (a) | | | 40,786 | | | | 264,293 | |
VirnetX Holding Corporation (a) | | | 55,004 | | | | 294,271 | |
Wave Systems Corporation (a) | | | 33,700 | | | | 134,463 | |
Websense, Inc. (a) | | | 10,100 | | | | 229,977 | |
| | | | | | | | 18,904,518 | |
| Materials — 3.2% | | | | | | | | |
| Chemicals — 1.2% | | | | | | | | |
A. Schulman, Inc. | | | 15,700 | | | | 408,357 | |
Altair Nanotechnologies, Inc. (a) | | | 168,552 | | | | 98,434 | |
American Vanguard Corporation | | | 33,544 | | | | 271,706 | |
Ampal-American Israel Corporation - Class A (a) | | | 2,400 | | | | 5,424 | |
Arch Chemicals, Inc. | | | 320 | | | | 10,883 | |
TFS MARKET NEUTRAL FUND SCHEDULE OF SECURITIES SOLD SHORT (Continued) |
COMMON STOCKS — 65.9% (Continued) | | | | | | |
| Materials — 3.2% (Continued) | | | | | | |
| Chemicals — 1.2% (Continued) | | | | | | |
Balchem Corporation | | | 3,900 | | | $ | 101,166 | |
Cabot Corporation | | | 52,268 | | | | 1,700,801 | |
Calgon Carbon Corporation (a) | | | 54,049 | | | | 837,760 | |
China Agritech, Inc. (a) | | | 11,500 | | | | 190,095 | |
China Green Agriculture, Inc. (a) | | | 45,760 | | | | 580,237 | |
Cytec Industries, Inc. | | | 5,500 | | | | 264,330 | |
Georgia Gulf Corporation (a) | | | 17,900 | | | | 367,666 | |
Hawkins, Inc. | | | 37,443 | | | | 1,004,221 | |
ICO, Inc. | | | 36,708 | | | | 314,588 | |
Innospec, Inc. (a) | | | 3,300 | | | | 43,923 | |
International Flavors & Fragrances, Inc. | | | 5,466 | | | | 273,792 | |
Intrepid Potash, Inc. (a) | | | 79,427 | | | | 2,085,753 | |
Landec Corporation (a) | | | 4,000 | | | | 24,520 | |
Methanex Corporation | | | 2,100 | | | | 48,678 | |
Minerals Technologies, Inc. | | | 100 | | | | 5,770 | |
Nalco Holding Company | | | 43,680 | | | | 1,080,206 | |
OM Group, Inc. (a) | | | 1,000 | | | | 37,750 | |
Quaker Chemical Corporation | | | 11,645 | | | | 366,468 | |
Scotts Miracle-Gro Company (The) - Class A | | | 9,450 | | | | 457,853 | |
Senomyx, Inc. (a) | | | 300 | | | | 1,281 | |
ShengdaTech, Inc. (a) | | | 6,000 | | | | 41,340 | |
Spartech Corporation (a) | | | 5,300 | | | | 75,472 | |
Stepan Company | | | 1,200 | | | | 90,900 | |
Yongye International, Inc. (a) | | | 3,300 | | | | 25,179 | |
Zep, Inc. | | | 6,700 | | | | 123,548 | |
Zoltek Companies, Inc. (a) | | | 175,893 | | | | 1,730,787 | |
| | | | | | | | 12,668,888 | |
| Construction Materials — 0.3% | | | | | | | | |
Eagle Materials, Inc. | | | 53,823 | | | | 1,715,339 | |
Headwaters, Inc. (a) | | | 6,400 | | | | 38,400 | |
Texas Industries, Inc. | | | 55,330 | | | | 2,093,687 | |
| | | | | | | | 3,847,426 | |
| Containers & Packaging — 0.2% | | | | | | | | |
AEP Industries, Inc. (a) | | | 5,604 | | | | 154,839 | |
Bemis Company, Inc. | | | 13,300 | | | | 404,453 | |
Greif, Inc. - Class A | | | 3,800 | | | | 224,884 | |
Pactiv Corporation (a) | | | 15,008 | | | | 381,353 | |
Rock-Tenn Company | | | 5,800 | | | | 299,280 | |
Silgan Holdings, Inc. | | | 5,700 | | | | 343,881 | |
| | | | | | | | 1,808,690 | |
| Metals & Mining — 1.2% | | | | | | | | |
AK Steel Holding Corporation | | | 94,500 | | | | 1,582,875 | |
Allied Nevada Gold Corporation (a) | | | 3,400 | | | | 62,152 | |
AMCOL International Corporation | | | 62,460 | | | | 1,795,100 | |
Carpenter Technology Corporation | | | 6,200 | | | | 243,474 | |
China Natural Resources, Inc. (a) | | | 21 | | | | 242 | |
China Precision Steel, Inc. (a) | | | 136,139 | | | | 280,446 | |
Commercial Metals Company | | | 133,900 | | | | 1,992,432 | |
TFS MARKET NEUTRAL FUND SCHEDULE OF SECURITIES SOLD SHORT (Continued) |
COMMON STOCKS — 65.9% (Continued) | | | | | | |
| Materials — 3.2% (Continued) | | | | | | |
| Metals & Mining — 1.2% (Continued) | | | | | | |
Entrée Gold, Inc. (a) | | | 200 | | | $ | 542 | |
General Steel Holdings, Inc. (a) | | | 128,286 | | | | 478,507 | |
Golden Star Resources Ltd. (a) | | | 3,100 | | | | 14,043 | |
Great Basin Gold Ltd. (a) | | | 158,908 | | | | 300,336 | |
Horsehead Holding Corporation (a) | | | 2,500 | | | | 29,700 | |
Kaiser Aluminum Corporation | | | 2,300 | | | | 92,437 | |
Northern Dynasty Minerals Ltd. (a) | | | 1,800 | | | | 17,010 | |
NovaGold Resources, Inc. (a) | | | 100 | | | | 885 | |
Olympic Steel, Inc. | | | 26,339 | | | | 837,054 | |
Pan American Silver Corporation | | | 7,600 | | | | 201,248 | |
Paramount Gold and Silver Corporation (a) | | | 53,162 | | | | 101,008 | |
Reliance Steel & Aluminum Company | | | 16,624 | | | | 811,418 | |
RTI International Metals, Inc. (a) | | | 23,245 | | | | 628,777 | |
Seabridge Gold, Inc. (a) | | | 7,500 | | | | 254,550 | |
Stillwater Mining Company (a) | | | 96,000 | | | | 1,622,400 | |
Tanzanian Royalty Exploration Corporation (a) | | | 55,900 | | | | 256,581 | |
US Gold Corporation (a) | | | 77,908 | | | | 265,666 | |
Worthington Industries, Inc. | | | 102,405 | | | | 1,635,408 | |
| | | | | | | | 13,504,291 | |
| Paper & Forest Products — 0.3% | | | | | | | | |
Buckeye Technologies, Inc. (a) | | | 400 | | | | 5,648 | |
Clearwater Paper Corporation (a) | | | 500 | | | | 31,840 | |
Deltic Timber Corporation | | | 21,294 | | | | 1,120,490 | |
KapStone Paper and Packaging Corporation (a) | | | 1,100 | | | | 14,190 | |
Mercer International, Inc. (a) | | | 34,200 | | | | 188,442 | |
Neenah Paper, Inc. | | | 2,300 | | | | 40,250 | |
Orient Paper, Inc. (a) | | | 2,797 | | | | 29,033 | |
P.H. Glatfelter Company | | | 12,800 | | | | 188,032 | |
Schweitzer-Mauduit International, Inc. | | | 20,348 | | | | 1,158,208 | |
Wausau Paper Corporation (a) | | | 29,048 | | | | 257,075 | |
| | | | | | | | 3,033,208 | |
| Telecommunication Services — 0.7% | | | | | | | | |
| Diversified Telecommunication Services — 0.6% | | | | | | | | |
Alaska Communications Systems Group, Inc. | | | 134,102 | | | | 1,147,913 | |
Cbeyond, Inc. (a) | | | 109,504 | | | | 1,684,172 | |
Cincinnati Bell, Inc. (a) | | | 240,062 | | | | 809,009 | |
Cogent Communications Group, Inc. (a) | | | 600 | | | | 6,126 | |
General Communication, Inc. (a) | | | 4,102 | | | | 25,227 | |
Global Crossing Ltd. (a) | | | 14,700 | | | | 218,295 | |
HickoryTech Corporation | | | 1,101 | | | | 9,325 | |
Iowa Telecommunications Services, Inc. | | | 500 | | | | 8,420 | |
Iridium Communications, Inc. (a) | | | 6,200 | | | | 49,972 | |
Neutral Tandem, Inc. (a) | | | 112,900 | | | | 1,913,655 | |
Premiere Global Services, Inc. (a) | | | 47,621 | | | | 446,209 | |
| | | | | | | | 6,318,323 | |
| Wireless Telecommunication Services — 0.1% | | | | | | | | |
Leap Wireless International, Inc. (a) | | | 48,200 | | | | 883,024 | |
Shenandoah Telecommunications Company | | | 180 | | | | 3,197 | |
TFS MARKET NEUTRAL FUND SCHEDULE OF SECURITIES SOLD SHORT (Continued) |
COMMON STOCKS — 65.9% (Continued) | | | | | | |
| Telecommunication Services — 0.7% (Continued) | | | | | | |
| Wireless Telecommunication Services — 0.1% (Continued) | | | | | | |
USA Mobility, Inc. (a) | | | 43,699 | | | $ | 609,164 | |
| | | | | | | | 1,495,385 | |
| Utilities — 0.7% | | | | | | | | |
| Electric Utilities — 0.2% | | | | | | | | |
Central Vermont Public Service Corporation | | | 900 | | | | 19,629 | |
El Paso Electric Company (a) | | | 160 | | | | 3,400 | |
Empire District Electric Company (The) | | | 3,900 | | | | 76,089 | |
Hawaiian Electric Industries, Inc. | | | 70,510 | | | | 1,646,409 | |
MGE Energy, Inc. | | | 1,100 | | | | 40,436 | |
Unitil Corporation | | | 13,314 | | | | 293,973 | |
| | | | | | | | 2,079,936 | |
| Gas Utilities — 0.2% | | | | | | | | |
Chesapeake Utilities Corporation | | | 999 | | | | 30,090 | |
China Natural Gas, Inc. (a) | | | 44,100 | | | | 400,869 | |
Northwest Natural Gas Company | | | 2,635 | | | | 124,873 | |
Piedmont Natural Gas, Inc. | | | 15,800 | | | | 434,500 | |
WGL Holdings, Inc. | | | 13,323 | | | | 476,164 | |
| | | | | | | | 1,466,496 | |
| Multi-Utilities — 0.1% | | | | | | | | |
Black Hills Corporation | | | 37,403 | | | | 1,230,185 | |
CH Energy Group, Inc. | | | 1,958 | | | | 81,100 | |
NorthWestern Corporation | | | 500 | | | | 15,110 | |
| | | | | | | | 1,326,395 | |
| Water Utilities — 0.2% | | | | | | | | |
Aqua America, Inc. | | | 92,895 | | | | 1,702,765 | |
Consolidated Water Company Ltd. | | | 17,288 | | | | 244,625 | |
SJW Corporation | | | 4,737 | | | | 130,173 | |
Southwest Water Company | | | 2,300 | | | | 24,541 | |
| | | | | | | | 2,102,104 | |
| | | | | | | | | |
Total Common Stocks (Proceeds $657,661,014) | | | | | | $ | 712,069,517 | |
| | | | | | |
Alpine Total Dynamic Dividend Fund | | | 10,150 | | | $ | 90,437 | |
Federated Premier Municipal Income Fund | | | 1,250 | | | | 18,687 | |
PIMCO Global StocksPLUS & Income Fund | | | 497 | | | | 9,632 | |
Total Closed-End Funds (Proceeds $120,948) | | | | | | $ | 118,756 | |
| | | | | | | | | |
Total Securities Sold Short — 65.9% (Proceeds $657,781,962) | | | | | | $ | 712,188,273 | |
| (a) | Non-income producing security. |
| | |
| See accompanying notes to financial statements. |
TFS SMALL CAP FUND SUMMARY SCHEDULE OF INVESTMENTS April 30, 2010 (Unaudited) |
| | | | | | |
| Consumer Discretionary — 15.1% | | | | | | |
| Auto Components — 0.9% | | | | | | |
Goodyear Tire & Rubber Company (The) (a) | | | 7,900 | | | $ | 106,097 | |
Other Auto Components (b) | | | | | | | 168,095 | |
| | | | | | | | 274,192 | |
| Distributors — 0.2% | | | | | | | | |
Other Distributors (b) | | | | | | | 80,028 | |
| | | | | | | | | |
| Diversified Consumer Services — 0.9% | | | | | | | | |
Sotheby's | | | 3,000 | | | | 100,200 | |
Other Diversified Consumer Services (b) | | | | | | | 201,828 | |
| | | | | | | | 302,028 | |
| Hotels, Restaurants & Leisure — 2.6% | | | | | | | | |
Other Hotels, Restaurants & Leisure (b) | | | | | | | 829,549 | |
| | | | | | | | | |
| Household Durables — 0.3% | | | | | | | | |
Other Household Durables (b) | | | | | | | 93,568 | |
| | | | | | | | | |
| Internet & Catalog Retail — 0.8% | | | | | | | | |
Overstock.com, Inc. (a) | | | 8,301 | | | | 153,568 | |
Other Internet & Catalog Retail (b) | | | | | | | 104,808 | |
| | | | | | | | 258,376 | |
| Leisure Equipment & Products — 0.3% | | | | | | | | |
Other Leisure Equipment & Products (b) | | | | | | | 106,333 | |
| | | | | | | | | |
| Media — 2.1% | | | | | | | | |
Cinemark Holdings, Inc. | | | 6,000 | | | | 109,560 | |
Other Media (b) | | | | | | | 552,939 | |
| | | | | | | | 662,499 | |
| Multi-Line Retail — 1.0% | | | | | | | | |
Other Multi-Line Retail (b) | | | | | | | 313,429 | |
| | | | | | | | | |
| Specialty Retail — 3.2% | | | | | | | | |
Pier 1 Imports, Inc. (a) | | | 14,600 | | | | 120,888 | |
Other Specialty Retail (b) | | | | | | | 928,359 | |
| | | | | | | | 1,049,247 | |
| Textiles, Apparel & Luxury Goods — 2.8% | | | | | | | | |
G-III Apparel Group Ltd. (a) | | | 3,499 | | | | 100,072 | |
Movado Group, Inc. (a) | | | 12,400 | | | | 153,884 | |
Quiksilver, Inc. (a) | | | 29,000 | | | | 154,570 | |
Other Textiles, Apparel & Luxury Goods (b) | | | | | | | 494,651 | |
| | | | | | | | 903,177 | |
| Consumer Staples — 3.4% | | | | | | | | |
| Beverages — 0.1% | | | | | | | | |
Other Beverages (b) | | | | | | | 34,045 | |
TFS SMALL CAP FUND SUMMARY SCHEDULE OF INVESTMENTS (Continued) |
COMMON STOCKS — 98.6% (Continued) | | | | | | |
| Consumer Staples — 3.4% (Continued) | | | | | | |
| Food & Staples Retailing — 0.4% | | | | | | |
PriceSmart, Inc. | | | 4,353 | | | $ | 108,302 | |
Other Food & Staples Retailing (b) | | | | | | | 14,421 | |
| | | | | | | | 122,723 | |
| Food Products — 1.6% | | | | | | | | |
Corn Products International, Inc. | | | 3,505 | | | | 126,180 | |
Del Monte Foods Company | | | 8,000 | | | | 119,520 | |
Other Food Products (b) | | | | | | | 262,117 | |
| | | | | | | | 507,817 | |
| Household Products — 0.2% | | | | | | | | |
Other Household Products (b) | | | | | | | 67,641 | |
| | | | | | | | | |
| Personal Products — 0.8% | | | | | | | | |
Other Personal Products (b) | | | | | | | 267,811 | |
| | | | | | | | | |
| Tobacco — 0.3% | | | | | | | | |
Other Tobacco (b) | | | | | | | 82,195 | |
| | | | | | | | | |
| Energy — 6.4% | | | | | | | | |
| Energy Equipment & Services — 2.2% | | | | | | | | |
Other Energy Equipment & Services (b) | | | | | | | 716,438 | |
| | | | | | | | | |
| Oil, Gas & Consumable Fuels — 4.2% | | | | | | | | |
Other Oil, Gas & Consumable Fuels (b) | | | | | | | 1,360,680 | |
| | | | | | | | | |
| Financials — 17.5% | | | | | | | | |
| Capital Markets — 4.2% | | | | | | | | |
BlackRock Kelso Capital Corporation | | | 9,500 | | | | 100,795 | |
Duff & Phelps Corporation | | | 6,500 | | | | 102,050 | |
Other Capital Markets (b) | | | | | | | 1,144,721 | |
| | | | | | | | 1,347,566 | |
| Commercial Banks — 3.0% | | | | | | | | |
Popular, Inc. (a) | | | 38,070 | | | | 149,996 | |
Other Commercial Banks (b) | | | | | | | 806,389 | |
| | | | | | | | 956,385 | |
| Consumer Finance — 1.7% | | | | | | | | |
Other Consumer Finance (b) | | | | | | | 546,559 | |
| | | | | | | | | |
| Diversified Financial Services — 0.6% | | | | | | | | |
Other Diversified Financial Services (b) | | | | | | | 212,092 | |
| | | | | | | | | |
| Insurance — 4.2% | | | | | | | | |
American Financial Group, Inc. | | | 3,600 | | | | 105,948 | |
Argo Group International Holdings Ltd. | | | 3,400 | | | | 112,166 | |
HCC Insurance Holdings, Inc. | | | 3,900 | | | | 106,041 | |
Other Insurance (b) | | | | | | | 1,037,683 | |
| | | | | | | | 1,361,838 | |
| Real Estate Investment Trusts — 2.9% | | | | | | | | |
Chimera Investment Corporation | | | 35,700 | | | | 145,299 | |
TFS SMALL CAP FUND SUMMARY SCHEDULE OF INVESTMENTS (Continued) |
COMMON STOCKS — 98.6% (Continued) | | | | | | |
| Financials — 17.5% (Continued) | | | | | | |
| Real Estate Investment Trusts — 2.9% (Continued) | | | | | | |
Hersha Hospitality Trust | | | 25,088 | | | $ | 144,758 | |
Other Real Estate Investment Trusts (b) | | | | | | | 662,693 | |
| | | | | | | | 952,750 | |
| Thrifts & Mortgage Finance — 0.9% | | | | | | | | |
Other Thrifts & Mortgage Finance (b) | | | | | | | 289,804 | |
| | | | | | | | | |
| Health Care — 12.3% | | | | | | | | |
| Biotechnology — 2.4% | | | | | | | | |
SIGA Technologies, Inc. (a) | | | 15,500 | | | | 106,485 | |
Other Biotechnology (b) | | | | | | | 689,705 | |
| | | | | | | | 796,190 | |
| Health Care Equipment & Supplies — 3.1% | | | | | | | | |
Sirona Dental Systems, Inc. (a) | | | 2,400 | | | | 100,056 | |
STERIS Corporation | | | 3,100 | | | | 103,168 | |
Teleflex, Inc. | | | 1,700 | | | | 104,244 | |
Other Health Care Equipment & Supplies (b) | | | | | | | 691,162 | |
| | | | | | | | 998,630 | |
| Health Care Providers & Services — 4.5% | | | | | | | | |
Almost Family, Inc. (a) | | | 2,400 | | | | 101,664 | |
Res-Care, Inc. (a) | | | 9,925 | | | | 115,527 | |
Other Health Care Providers & Services (b) | | | | | | | 1,230,047 | |
| | | | | | | | 1,447,238 | |
| Health Care Technology — 0.7% | | | | | | | | |
Other Health Care Technology (b) | | | | | | | 226,132 | |
| | | | | | | | | |
| Life Sciences Tools & Services — 0.8% | | | | | | | | |
Bruker Corporation (a) | | | 6,700 | | | | 102,443 | |
Other Life Sciences Tools & Services (b) | | | | | | | 145,878 | |
| | | | | | | | 248,321 | |
| Pharmaceuticals — 0.8% | | | | | | | | |
ViroPharma, Inc. (a) | | | 8,100 | | | | 103,032 | |
Other Pharmaceuticals (b) | | | | | | | 153,975 | |
| | | | | | | | 257,007 | |
| Industrials — 14.4% | | | | | | | | |
| Aerospace & Defense — 1.8% | | | | | | | | |
GenCorp, Inc. (a) | | | 19,483 | | | | 121,184 | |
Other Aerospace & Defense (b) | | | | | | | 470,007 | |
| | | | | | | | 591,191 | |
| Air Freight & Logistics — 0.7% | | | | | | | | |
Air Transport Services Group, Inc. (a) | | | 19,600 | | | | 107,800 | |
Other Air Freight & Logistics (b) | | | | | | | 119,541 | |
| | | | | | | | 227,341 | |
| Airlines — 2.4% | | | | | | | | |
AMR Corporation (a) | | | 14,500 | | | | 107,010 | |
Other Airlines (b) | | | | | | | 679,589 | |
| | | | | | | | 786,599 | |
TFS SMALL CAP FUND SUMMARY SCHEDULE OF INVESTMENTS (Continued) |
COMMON STOCKS — 98.6% (Continued) | | | | | | |
| Industrials — 14.4% (Continued) | | | | | | |
| Building Products — 0.5% | | | | | | |
Other Building Products (b) | | | | | $ | 147,368 | |
| | | | | | | | |
| Commercial Services & Supplies — 2.4% | | | | | | | |
Other Commercial Services & Supplies (b) | | | | | | 771,776 | |
| | | | | | | | |
| Construction & Engineering — 0.2% | | | | | | | |
Other Construction & Engineering (b) | | | | | | 79,782 | |
| | | | | | | | |
| Electrical Equipment — 0.8% | | | | | | | |
Other Electrical Equipment (b) | | | | | | 251,181 | |
| | | | | | | | |
| Machinery — 2.4% | | | | | | | |
Other Machinery (b) | | | | | | 761,161 | |
| | | | | | | | |
| Marine — 0.5% | | | | | | | |
Other Marine (b) | | | | | | 173,703 | |
| | | | | | | | |
| Professional Services — 0.7% | | | | | | | |
Other Professional Services (b) | | | | | | 233,911 | |
| | | | | | | | |
| Road & Rail — 0.9% | | | | | | | |
Other Road & Rail (b) | | | | | | 296,732 | |
| | | | | | | | |
| Trading Companies & Distributors — 1.0% | | | | | | | |
United Rentals, Inc. (a) | | | 7,700 | | | | 110,572 | |
Other Trading Companies & Distributors (b) | | | | | | | 198,384 | |
| | | | | | | | 308,956 | |
| Transportation Infrastructure — 0.1% | | | | | | | | |
Other Transportation Infrastructure (b) | | | | | | | 20,992 | |
| | | | | | | | | |
| Information Technology — 22.0% | | | | | | | | |
| Communications Equipment — 3.0% | | | | | | | | |
Acme Packet, Inc. (a) | | | 4,800 | | | | 125,472 | |
Brocade Communications Systems, Inc. (a) | | | 19,680 | | | | 127,723 | |
Sonus Networks, Inc. (a) | | | 43,600 | | | | 112,924 | |
Other Communications Equipment (b) | | | | | | | 609,740 | |
| | | | | | | | 975,859 | |
| Computers & Peripherals — 2.1% | | | | | | | | |
Lexmark International, Inc. - Class A (a) | | | 3,400 | | | | 125,970 | |
Other Computers & Peripherals (b) | | | | | | | 538,000 | |
| | | | | | | | 663,970 | |
| Electronic Equipment, Instruments & Components — 2.8% | | | | | | | | |
Power-One, Inc. (a) | | | 15,000 | | | | 117,900 | |
Richardson Electronics Ltd. | | | 11,800 | | | | 135,582 | |
Other Electronic Equipment, Instruments & Components (b) | | | | | | | 666,880 | |
| | | | | | | | 920,362 | |
TFS SMALL CAP FUND SUMMARY SCHEDULE OF INVESTMENTS (Continued) |
COMMON STOCKS — 98.6% (Continued) | | | | | | |
| Information Technology — 22.0% (Continued) | | | | | | |
| Internet Software & Services — 2.2% | | | | | | |
Other Internet Software & Services (b) | | | | | $ | 703,871 | |
| | | | | | | | |
| IT Services — 2.0% | | | | | | | |
Acxiom Corporation (a) | | | 5,586 | | | | 106,581 | |
Other IT Services (b) | | | | | | | 535,030 | |
| | | | | | | | 641,611 | |
| Semiconductors & Semiconductor Equipment — 6.0% | | | | | | | | |
Integrated Silicon Solution, Inc. (a) | | | 8,950 | | | | 110,354 | |
Lattice Semiconductor Corporation (a) | | | 26,800 | | | | 141,236 | |
OmniVision Technologies, Inc. (a) | | | 5,945 | | | | 104,394 | |
Semtech Corporation (a) | | | 8,400 | | | | 152,460 | |
Other Semiconductors & Semiconductor Equipment (b) | | | | | | | 1,416,161 | |
| | | | | | | | 1,924,605 | |
| Software — 3.9% | | | | | | | | |
Lawson Software, Inc. (a) | | | 17,200 | | | | 133,472 | |
Novell, Inc. (a) | | | 18,400 | | | | 103,224 | |
Progress Software Corporation (a) | | | 4,000 | | | | 129,000 | |
Take-Two Interactive Software, Inc. (a) | | | 9,800 | | | | 106,526 | |
Other Software (b) | | | | | | | 797,445 | |
| | | | | | | | 1,269,667 | |
| Materials — 5.0% | | | | | | | | |
| Chemicals — 2.3% | | | | | | | | |
Other Chemicals (b) | | | | | | | 743,356 | |
| | | | | | | | | |
| Containers & Packaging — 0.8% | | | | | | | | |
Sealed Air Corporation | | | 5,300 | | | | 113,950 | |
Other Containers & Packaging (b) | | | | | | | 149,141 | |
| | | | | | | | 263,091 | |
| Metals & Mining — 1.2% | | | | | | | | |
Hecla Mining Company (a) | | | 19,691 | | | | 117,555 | |
Other Metals & Mining (b) | | | | | | | 271,864 | |
| | | | | | | | 389,419 | |
| Paper & Forest Products — 0.7% | | | | | | | | |
Other Paper & Forest Products (b) | | | | | | | 226,442 | |
| | | | | | | | | |
| Telecommunication Services — 0.7% | | | | | | | | |
| Diversified Telecommunication Services — 0.4% | | | | | | | | |
Other Diversified Telecommunication Services (b) | | | | | | | 128,224 | |
| | | | | | | | | |
| Wireless Telecommunication Services — 0.3% | | | | | | | | |
Other Wireless Telecommunication Services (b) | | | | | | | 87,987 | |
| | | | | | | | | |
| Utilities — 1.8% | | | | | | | | |
| Electric Utilities — 0.6% | | | | | | | | |
NV Energy, Inc. | | | 8,500 | | | | 106,165 | |
Other Electric Utilities (b) | | | | | | | 102,795 | |
| | | | | | | | 208,960 | |
TFS SMALL CAP FUND SUMMARY SCHEDULE OF INVESTMENTS (Continued) |
COMMON STOCKS — 98.6% (Continued) | | | | | | |
| Utilities — 1.8% (Continued) | | | | | | |
| Gas Utilities — 1.0% | | | | | | |
Energen Corporation | | | 2,300 | | | $ | 112,401 | |
Other Gas Utilities (b) | | | | | | | 215,528 | |
| | | | | | | | 327,929 | |
| Independent Power Producers & Energy Traders — 0.2% | | | | | | | | |
Other Independent Power Producers & Energy Traders (b) | | | | | | | 58,940 | |
| | | | | | | | | |
Total Common Stocks (Cost $29,259,001) | | | | | | $ | 31,857,274 | |
MONEY MARKET FUNDS — 3.7% | | | | | | |
UMB Money Market Fiduciary, 0.03% (c) (Cost $1,194,599) | | | 1,194,599 | | | $ | 1,194,599 | |
| | | | | | | | | |
Total Investments at Value — 102.3% (Cost $30,453,600) | | | | | | $ | 33,051,873 | |
| | | | | | | | | |
Liabilities in Excess of Other Assets — (2.3%) | | | | | | | (737,352 | ) |
| | | | | | | | | |
Net Assets — 100.0% | | | | | | $ | 32,314,521 | |
| (a) | Non-income producing security. |
| | |
| (b) | Represents issuers not identified as a top 50 holding in terms of market value and issues or issuers not exceeding 1% of net assets individually or in the aggregate, respectively, as of April 30, 2010. |
| | |
| (c) | Variable rate security. The rate shown is the 7-day effective yield as of April 30, 2010. |
| | |
| See accompanying notes to financial statements. |
TFS CAPITAL INVESTMENT TRUST STATEMENTS OF ASSETS AND LIABILITIES April 30, 2010 (Unaudited) | |
| | | | | | | |
| ASSETS | | | | | | |
| Investments in securities: | | | | | | |
At acquisition cost | | $ | 989,395,645 | | | $ | 30,453,600 | |
At value (Note 2) | | $ | 1,087,475,575 | | | $ | 33,051,873 | |
Deposits with brokers for securities sold short (Note 2) | | | 746,237,165 | | | | — | |
Dividends and interest receivable | | | 339,814 | | | | 6,205 | |
Receivable for investment securities sold | | | 141,486,624 | | | | 2,534,849 | |
Receivable for capital shares sold | | | 1,789,587 | | | | 128,795 | |
Other assets | | | 73,353 | | | | 22,021 | |
TOTAL ASSETS | | | 1,977,402,118 | | | | 35,743,743 | |
| | | | | | | | | |
| LIABILITIES | | | | | | | | |
Securities sold short, at value (Note 2) (proceeds $657,781,962) | | | 712,188,273 | | | | — | |
Payable for investment securities purchased | | | 180,494,368 | | | | 3,392,657 | |
Payable for capital shares redeemed | | | 725,084 | | | | — | |
Dividends payable on securities sold short (Note 2) | | | 163,257 | | | | — | |
Payable to Adviser (Note 4) | | | 2,039,467 | | | | 15,115 | |
Payable to administrator (Note 4) | | | 109,200 | | | | 7,900 | |
Other accrued expenses and liabilities | | | 872,555 | | | | 13,550 | |
TOTAL LIABILITIES | | | 896,592,204 | | | | 3,429,222 | |
| | | | | | | | | |
NET ASSETS | | $ | 1,080,809,914 | | | $ | 32,314,521 | |
| | | | | | | | | |
| Net assets consist of: | | | | | | | | |
Paid-in capital | | $ | 1,008,748,869 | | | $ | 27,060,034 | |
Accumulated net investment loss | | | (14,544,087 | ) | | | (125,104 | ) |
Accumulated net realized gains from security transactions | | | 42,931,513 | | | | 2,781,318 | |
| Net unrealized appreciation (depreciation) on: | | | | | | | | |
Investments | | | 98,079,930 | | | | 2,598,273 | |
Short positions | | | (54,406,311 | ) | | | — | |
Net assets | | $ | 1,080,809,914 | | | $ | 32,314,521 | |
| | | | | | | | | |
Shares of beneficial interest outstanding (unlimited
number of shares authorized, no par value) | | | 69,564,206 | | | | 2,657,000 | |
| | | | | | | | | |
Net asset value, redemption price and offering
price per share (a) (Note 2) | | $ | 15.54 | | | $ | 12.16 | |
| (a) | Redemption price may differ from the net asset value per share depending upon the length of time the shares are held (Note 2). |
| | |
| See accompanying notes to financial statements. |
TFS CAPITAL INVESTMENT TRUST STATEMENTS OF OPERATIONS For the Six Months Ended April 30, 2010 (Unaudited) | |
| | | | | | | |
| INVESTMENT INCOME | | | | | | |
Dividends | | $ | 6,571,542 | | | $ | 117,981 | |
| Foreign tax withholding | | | (3,497 | ) | | | (80 | ) |
Interest | | | 197,862 | | | | 63 | |
TOTAL INVESTMENT INCOME | | | 6,765,907 | | | | 117,964 | |
| | | | | | | | | |
| EXPENSES | | | | | | | | |
Investment advisory fees (Note 4) | | | 11,071,756 | | | | 185,897 | |
Brokerage expense on securities sold short (Note 2) | | | 5,386,185 | | | | — | |
Dividend expense on securities sold short (Note 2) | | | 3,612,840 | | | | — | |
Administration fees (Note 4) | | | 357,950 | | | | 17,095 | |
Accounting services fees (Note 4) | | | 145,304 | | | | 16,140 | |
Custodian fees | | | 128,440 | | | | 22,166 | |
Transfer agent fees (Note 4) | | | 137,894 | | | | 9,000 | |
Registration fees | | | 67,737 | | | | 15,449 | |
Postage and supplies | | | 44,616 | | | | 3,680 | |
Pricing fees | | | 31,156 | | | | 7,238 | |
Professional fees | | | 25,227 | | | | 12,929 | |
Printing of shareholder reports | | | 29,284 | | | | 3,843 | |
Compliance service fees (Note 4) | | | 12,000 | | | | 12,000 | |
Trustees’ fees and expenses | | | 11,495 | | | | 11,495 | |
Insurance expense | | | 16,443 | | | | 773 | |
Borrowing costs (Note 5) | | | 9,018 | | | | 62 | |
Other expenses | | | 8,407 | | | | 3,910 | |
TOTAL EXPENSES | | | 21,095,752 | | | | 321,677 | |
Fees waived by the Adviser (Note 4) | | | — | | | | (78,609 | ) |
Plus previously waived investment advisory fees
recovered by the Adviser (Note 4) | | | 214,244 | | | | — | |
NET EXPENSES | | | 21,309,996 | | | | 243,068 | |
| | | | | | | | | |
NET INVESTMENT LOSS | | | (14,544,089 | ) | | | (125,104 | ) |
| | | | | | | | | |
REALIZED AND UNREALIZED GAINS (LOSSES)
ON INVESTMENTS, SECURITIES SOLD SHORT
AND FOREIGN CURRENCY | | | | | | | | |
| Net realized gains (losses) from: | | | | | | | | |
Investments | | | 172,481,394 | | | | 3,420,641 | |
Securities sold short | | | (87,239,175 | ) | | | (1,623 | ) |
Foreign currency transactions | | | 2 | | | | — | |
| Net change in unrealized appreciation (depreciation) on: | | | | | | | | |
Investments | | | 64,758,695 | | | | 2,700,300 | |
Securities sold short | | | (92,257,287 | ) | | | — | |
| | | | | | | | | |
NET REALIZED AND UNREALIZED
GAINS ON INVESTMENTS | | | 57,743,629 | | | | 6,119,318 | |
| | | | | | | | | |
NET INCREASE IN NET ASSETS
FROM OPERATIONS | | $ | 43,199,540 | | | $ | 5,994,214 | |
| See accompanying notes to financial statements. |
TFS MARKET NEUTRAL FUND STATEMENTS OF CHANGES IN NET ASSETS | |
| | | Six Months Ended April 30, 2010 (Unaudited) | | | | |
| FROM OPERATIONS | | | | | | |
Net investment loss | | $ | (14,544,089 | ) | | $ | (13,332,617 | ) |
| Net realized gains (losses) from: | | | | | | | | |
Investments | | | 172,481,394 | | | | 95,615,019 | |
Short positions | | | (87,239,175 | ) | | | (101,104,859 | ) |
| Foreign currency transactions | | | 2 | | | | 2,046 | |
| Net change in unrealized appreciation (depreciation) on: | | | | | | | | |
Investments | | | 64,758,695 | | | | 97,297,681 | |
Short positions | | | (92,257,287 | ) | | | (1,580,141 | ) |
Net increase in net assets from operations | | | 43,199,540 | | | | 76,897,129 | |
| | | | | | | | | |
| FROM DISTRIBUTIONS | | | | | | | | |
Distributions from net realized gains from security transactions | | | (6,035,121 | ) | | | (7,411,156 | ) |
| | | | | | | | | |
| FROM CAPITAL SHARE TRANSACTIONS | | | | | | | | |
Proceeds from shares sold | | | 319,898,497 | | | | 580,278,792 | |
Net asset value of shares issued in reinvestment of
distributions to shareholders | | | 5,396,118 | | | | 6,647,525 | |
Proceeds from redemption fees collected (Note 2) | | | 171,411 | | | | 960,365 | |
Payments for shares redeemed | | | (110,229,988 | ) | | | (207,527,157 | ) |
Net increase in net assets from capital share transactions | | | 215,236,038 | | | | 380,359,525 | |
| | | | | | | | | |
TOTAL INCREASE IN NET ASSETS | | | 252,400,457 | | | | 449,845,498 | |
| | | | | | | | | |
| NET ASSETS | | | | | | | | |
Beginning of period | | | 828,409,457 | | | | 378,563,959 | |
End of period | | $ | 1,080,809,914 | | | $ | 828,409,457 | |
| | | | | | | | | |
ACCUMULATED NET INVESTMENT LOSS | | $ | (14,544,087 | ) | | $ | — | |
| | | | | | | | | |
| CAPITAL SHARE ACTIVITY | | | | | | | | |
Shares sold | | | 20,834,032 | | | | 41,291,307 | |
Shares issued in reinvestment of
distributions to shareholders | | | 355,008 | | | | 529,683 | |
Shares redeemed | | | (7,156,807 | ) | | | (14,869,822 | ) |
Net increase in shares outstanding | | | 14,032,233 | | | | 26,951,168 | |
Shares outstanding, beginning of period | | | 55,531,973 | | | | 28,580,805 | |
Shares outstanding, end of period | | | 69,564,206 | | | | 55,531,973 | |
| See accompanying notes to financial statements. |
TFS SMALL CAP FUND STATEMENTS OF CHANGES IN NET ASSETS | |
| | | Six Months Ended April 30, 2010 (Unaudited) | | | | |
| FROM OPERATIONS | | | | | | |
Net investment loss | | $ | (125,104 | ) | | $ | (34,717 | ) |
| Net realized gains (losses) from: | | | | | | | | |
Investments | | | 3,420,641 | | | | (527,001 | ) |
Short positions | | | (1,623 | ) | | | (218 | ) |
Net change in unrealized appreciation (depreciation) on investments | | | 2,700,300 | | | | 1,407,015 | |
Net increase in net assets from operations | | | 5,994,214 | | | | 845,079 | |
| | | | | | | | | |
| FROM DISTRIBUTIONS | | | | | | | | |
Distributions from net investment income | | | — | | | | (4,055 | ) |
| | | | | | | | | |
| FROM CAPITAL SHARE TRANSACTIONS | | | | | | | | |
Proceeds from shares sold | | | 12,492,051 | | | | 14,594,124 | |
Net asset value of shares issued in reinvestment of
distributions to shareholders | | | — | | | | 3,976 | |
Proceeds from redemption fees collected (Note 2) | | | 13,775 | | | | 10,459 | |
Payments for shares redeemed | | | (2,808,583 | ) | | | (1,879,603 | ) |
Net increase in net assets from capital share transactions | | | 9,697,243 | | | | 12,728,956 | |
| | | | | | | | | |
TOTAL INCREASE IN NET ASSETS | | | 15,691,457 | | | | 13,569,980 | |
| | | | | | | | | |
| NET ASSETS | | | | | | | | |
Beginning of period | | | 16,623,064 | | | | 3,053,084 | |
End of period | | $ | 32,314,521 | | | $ | 16,623,064 | |
| | | | | | | | | |
ACCUMULATED NET INVESTMENT LOSS | | $ | (125,104 | ) | | $ | — | |
| | | | | | | | | |
| CAPITAL SHARE ACTIVITY | | | | | | | | |
Shares sold | | | 1,130,590 | | | | 1,605,044 | |
Shares issued in reinvestment of distributions to shareholders | | | — | | | | 655 | |
Shares redeemed | | | (256,102 | ) | | | (272,096 | ) |
Net increase in shares outstanding | | | 874,488 | | | | 1,333,603 | |
Shares outstanding, beginning of period | | | 1,782,512 | | | | 448,909 | |
Shares outstanding, end of period | | | 2,657,000 | | | | 1,782,512 | |
| See accompanying notes to financial statements. |
TFS MARKET NEUTRAL FUND FINANCIAL HIGHLIGHTS | |
Per share data for a share outstanding throughout each period: | | Six Months Ended April 30, 2010 (Unaudited) | | | Year Ended October 31, 2009 | | | Four Months Ended October 31, 2008(b) | | | | | | | | | | | | Period Ended June 30, 2005(a) | |
| Net asset value at beginning of period | | $ | 14.92 | | | $ | 13.25 | | | $ | 15.59 | | | $ | 14.59 | | | $ | 12.44 | | | $ | 10.37 | | | $ | 10.00 | |
Income (loss) from investment
operations: | | | | | | | | | | | | | | | | | | | | | | | | | | | | |
| Net investment income (loss) | | | (0.21 | ) | | | (0.24 | ) | | | (0.09 | ) | | | (0.23 | ) | | | 0.01 | | | | (0.04 | ) | | | (0.11 | ) |
Net realized and unrealized gains
(losses) on investments | | | 0.93 | | | | 2.13 | | | | (2.27 | ) | | | 1.56 | | | | 2.35 | | | | 2.12 | | | | 0.49 | |
| Total from investment operations | | | 0.72 | | | | 1.89 | | | | (2.36 | ) | | | 1.33 | | | | 2.36 | | | | 2.08 | | | | 0.38 | |
| Less distributions: | | | | | | | | | | | | | | | | | | | | | | | | | | | | |
Distributions from net
investment income | | | — | | | | — | | | | — | | | | (0.01 | ) | | | — | | | | — | | | | — | |
Distributions from net realized gains
from security transactions | | | (0.10 | ) | | | (0.25 | ) | | | — | | | | (0.40 | ) | | | (0.22 | ) | | | (0.01 | ) | | | — | |
Distributions in excess of net
realized gains (losses) from
security transactions | | | — | | | | — | | | | — | | | | — | | | | — | | | | — | | | | (0.01 | ) |
Total distributions | | | (0.10 | ) | | | (0.25 | ) | | | — | | | | (0.41 | ) | | | (0.22 | ) | | | (0.01 | ) | | | (0.01 | ) |
Proceeds from redemption fees
collected (Note 2) | | | 0.00 | (c) | | | 0.03 | | | | 0.02 | | | | 0.08 | | | | 0.01 | | | | 0.00 | (c) | | | 0.00 | (c) |
| Net asset value at end of period | | $ | 15.54 | | | $ | 14.92 | | | $ | 13.25 | | | $ | 15.59 | | | $ | 14.59 | | | $ | 12.44 | | | $ | 10.37 | |
Total return (d) | | | 4.85% | (e) | | | 14.86% | | | | (15.01% | )(e) | | | 9.93% | | | | 19.18% | | | | 20.04% | | | | 3.77% | (e) |
| Ratios and supplemental data: | | | | | | | | | | | | | | | | | | | | | | | | | | | | |
| Net assets at end of period (000’s) | | $ | 1,080,810 | | | $ | 828,409 | | | $ | 378,564 | | | $ | 271,239 | | | $ | 211,386 | | | $ | 22,478 | | | $ | 8,101 | |
Ratio of gross expenses to
average net assets | | | 4.32% | (h) | | | 4.70% | | | | 4.60% | (h) | | | 4.05% | | | | 3.30% | | | | 5.10% | | | | 6.82% | (h) |
Ratio of net expenses to
average net assets (f) | | | 4.32% | (h) | | | 4.67% | | | | 4.55% | (h) | | | 3.94% | | | | 3.07% | | | | 3.21% | | | | 3.26% | (h) |
Ratio of net expenses to average
net assets excluding
dividend expense (f) (g) | | | 3.59% | (h) | | | 3.84% | | | | 3.68% | (h) | | | 2.80% | | | | 2.48% | | | | 2.49% | | | | 2.49% | (h) |
Ratio of net expenses to average
net assets excluding dividend
expense, borrowing costs and
brokerage expense on securities
sold short (f) (g) | | | 2.50% | (h) | | | 2.49% | | | | 2.49% | (h) | | | 2.50% | | | | 2.48% | | | | 2.49% | | | | 2.49% | (h) |
Ratio of net investment income
(loss) to average net assets | | | (2.95% | )(h) | | | (2.32% | ) | | | (2.24% | )(h) | | | (2.15% | ) | | | 0.09% | | | | (0.69% | ) | | | (1.77% | )(h) |
| Portfolio turnover rate | | | 300% | (e) | | | 429% | | | | 204% | (e) | | | 536% | | | | 492% | | | | 398% | | | | 368% | (h) |
| (a) | Represents the period from the commencement of operations (September 7, 2004) through June 30, 2005. |
| | |
| (b) | Fund changed fiscal year end to October 31. |
| | |
| (c) | Amount rounds to less than $0.01 per share. |
| | |
| (d) | Total return is a measure of the change in value of an investment in the Fund over the period covered, which assumes any dividends or capital gains distributions are reinvested in shares of the Fund. The returns shown do not reflect the deduction of taxes a shareholder would pay on Fund distributions or the redemption of Fund shares. |
| | |
| (e) | Not annualized. |
| | |
| (f) | Ratio was determined after advisory fee waivers and expense reimbursements. |
| | |
| (g) | Dividend expense, borrowing costs and brokerage expense on securities sold short totaled 1.83%(h), 2.18%, 2.06%(h), 1.44%, 0.59%, 0.72% and 0.77%(h) of average net assets for the periods ended April 30, 2010, October 31, 2009 and 2008 and June 30, 2008, 2007, 2006 and 2005, respectively. |
| | |
| (h) | Annualized. |
| | |
| See accompanying notes to financial statements. |
TFS SMALL CAP FUND FINANCIAL HIGHLIGHTS | |
Per share data for a share outstanding throughout each period: | | Six Months Ended April 30, 2010 (Unaudited) | | | Year Ended October 31, 2009 | | | Four Months Ended October 31, 2008(b) | | | | | | | | | Period Ended June 30, 2006(a) | |
| Net asset value at beginning of period | | $ | 9.33 | | | $ | 6.80 | | | $ | 9.31 | | | $ | 13.08 | | | $ | 10.39 | | | $ | 10.00 | |
| | | | | | | | | | | | | | | | | | | | | | | | | |
| Income (loss) from investment operations: | | | | | | | | | | | | | | | | | | | | | | | | |
| Net investment income (loss) | | | (0.05 | ) | | | (0.02 | ) | | | 0.01 | | | | (0.18 | ) | | | (0.07 | ) | | | (0.01 | ) |
Net realized and unrealized gains
(losses) on investments | | | 2.87 | | | | 2.55 | | | | (2.52 | ) | | | (1.79 | ) | | | 2.76 | | | | 0.40 | |
| Total from investment operations | | | 2.82 | | | | 2.53 | | | | (2.51 | ) | | | (1.97 | ) | | | 2.69 | | | | 0.39 | |
| | | | | | | | | | | | | | | | | | | | | | | | | |
| Less distributions: | | | | | | | | | | | | | | | | | | | | | | | | |
Distributions from net
investment income | | | — | | | | (0.01 | ) | | | — | | | | — | | | | — | | | | — | |
Distributions from net realized gains
from security transactions | | | — | | | | — | | | | — | | | | (1.80 | ) | | | (0.00 | )(c) | | | — | |
Total distributions | | | — | | | | (0.01 | ) | | | — | | | | (1.80 | ) | | | (0.00 | ) | | | — | |
| | | | | | | | | | | | | | | | | | | | | | | | | |
Proceeds from redemption fees collected (Note 2) | | | 0.01 | | | | 0.01 | | | | 0.00 | (c) | | | 0.00 | (c) | | | 0.00 | (c) | | | — | |
| | | | | | | | | | | | | | | | | | | | | | | | | |
| Net asset value at end of period | | $ | 12.16 | | | $ | 9.33 | | | $ | 6.80 | | | $ | 9.31 | | | $ | 13.08 | | | $ | 10.39 | |
| | | | | | | | | | | | | | | | | | | | | | | | | |
Total return (d) | | | 30.33% | (e) | | | 37.41% | | | | (26.96% | )(e) | | | (16.40% | ) | | | 25.93% | | | | 3.90% | (e) |
| | | | | | | | | | | | | | | | | | | | | | | | | |
| Ratios and supplemental data: | | | | | | | | | | | | | | | | | | | | | | | | |
| Net assets at end of period (000’s) | | $ | 32,315 | | | $ | 16,623 | | | $ | 3,053 | | | $ | 4,581 | | | $ | 5,638 | | | $ | 3,932 | |
| | | | | | | | | | | | | | | | | | | | | | | | | |
Ratio of gross expenses to
average net assets | | | 2.81% | (g) | | | 5.14% | | | | 4.44% | (g) | | | 5.57% | | | | 5.14% | | | | 8.18% | (g) |
| | | | | | | | | | | | | | | | | | | | | | | | | |
Ratio of net expenses to
average net assets (f) | | | 2.12% | (g) | | | 1.88% | | | | 0.88% | (g) | | | 2.72% | | | | 2.03% | | | | 1.72% | (g) |
| | | | | | | | | | | | | | | | | | | | | | | | | |
Ratio of net expenses to average net
assets excluding borrowing costs (f) | | | 2.12% | (g) | | | 1.87% | | | | 0.87% | (g) | | | 2.68% | | | | 2.03% | | | | 1.72% | (g) |
| | | | | | | | | | | | | | | | | | | | | | | | | |
Ratio of net investment income (loss)
to average net assets | | | (1.09% | )(g) | | | (0.63% | ) | | | 0.28% | (g) | | | (1.76% | ) | | | (0.69% | ) | | | (0.69% | )(g) |
| | | | | | | | | | | | | | | | | | | | | | | | | |
| Portfolio turnover rate | | | 308% | (e) | | | 320% | | | | 123% | (e) | | | 269% | | | | 419% | | | | 184% | (g) |
| (a) | Represents the period from the commencement of operations (March 7, 2006) through June 30, 2006. |
| | |
| (b) | Fund changed fiscal year end to October 31. |
| | |
| (c) | Amount rounds to less than $0.01 per share. |
| | |
| (d) | Total return is a measure of the change in value of an investment in the Fund over the period covered, which assumes any dividends or capital gains distributions are reinvested in shares of the Fund. The returns shown do not reflect the deduction of taxes a shareholder would pay on Fund distributions or the redemption of Fund shares. |
| | |
| (e) | Not annualized. |
| | |
| (f) | Ratio was determined after advisory fee waivers and expense reimbursements. |
| | |
| (g) | Annualized. |
| | |
| See accompanying notes to financial statements. |
TFS CAPITAL INVESTMENT TRUST NOTES TO FINANCIAL STATEMENTS April 30, 2010 (Unaudited) |
1. Organization
The TFS Market Neutral Fund and the TFS Small Cap Fund (individually, a “Fund”, and collectively, the “Funds”) are each a diversified series of TFS Capital Investment Trust (the “Trust”), an open-end management investment company established as an Ohio business trust under a Declaration of Trust dated January 30, 2004. As part of the Trust’s organization, the TFS Market Neutral Fund issued in a private placement on June 28, 2004 10,000 shares of the Fund, at $10.00 per share, to TFS Capital LLC (the “Adviser”), the investment adviser to the Fund. The TFS Market Neutral Fund commenced operations on September 7, 2004. The TFS Small Cap Fund commenced operations on March 7, 2006.
The TFS Market Neutral Fund seeks to produce capital appreciation while having a low correlation to the U.S. equity market, which we define as the S&P 500 Index. In addition, the Fund seeks to produce lower volatility than the movement of the U.S. equity market.
The TFS Small Cap Fund seeks long-term capital appreciation. In addition, the Fund seeks to outperform the Russell 2000® Index.
The TFS Market Neutral Fund is currently closed to new purchases, except as described further in the Fund’s prospectus.
2. Significant Accounting Policies
The following is a summary of the Funds’ significant accounting policies:
Securities valuation – The Funds’ portfolio securities are valued at their value as of the close of the regular trading on the New York Stock Exchange (“NYSE”) (generally 4:00 p.m., Eastern time) on each business day the NYSE is open. Securities listed on the NYSE or other exchanges are valued on the basis of their last sale prices on the exchanges on which they are primarily traded. However, if the last sale price on the NYSE is different than the last sale price on any other exchange, the NYSE price will be used. If there are no sales on that day, the securities are valued at the mean of the most recent bid and ask prices on the NYSE or other primary exchange. Securities which are quoted by NASDAQ are valued at the NASDAQ Official Closing Price. If there are no sales on that day, the securities are valued at t he mean between the closing bid and ask prices as reported by NASDAQ. Other assets and securities for which no quotations are readily available are valued at fair value as determined in good faith under the supervision of the Board of Trustees of the Trust. Such methods of fair valuation may include, but are not limited to: multiple of earnings, discount from market of a similar freely traded security, or a combination of these and other methods.
Accounting principles generally accepted in the United States of America (“GAAP”) establish a single authoritative definition of fair value, set out a framework for measuring fair value and require additional disclosures about fair value measurements.
TFS CAPITAL INVESTMENT TRUST NOTES TO FINANCIAL STATEMENTS (Continued) |
Various inputs are used in determining the value of each of the Fund’s investments. These inputs are summarized in the three broad levels listed below:
| • | Level 1 – quoted prices in active markets for identical securities |
| • | Level 2 – other significant observable inputs |
| • | Level 3 – significant unobservable inputs |
The inputs or methodologies used for valuing securities are not necessarily an indication of the risks associated with investing in those securities.
The following is a summary of the inputs used to value the Funds’ investments and securities sold short as of April 30, 2010:
| | | | | | | | | | | | |
Common Stocks | | $ | 991,410,310 | | | $ | — | | | $ | — | | | $ | 991,410,310 | |
Common Stocks – Sold Short | | | (712,069,517 | ) | | | — | | | | — | | | | (712,069,517 | ) |
Closed-End Funds | | | 56,909,253 | | | | — | | | | — | | | | 56,909,253 | |
| Closed-End Funds – Sold Short | | | (118,756 | ) | | | — | | | | — | | | | (118,756 | ) |
Rights | | | 10,472 | | | | — | | | | — | | | | 10,472 | |
Money Market Funds | | | 39,145,540 | | | | — | | | | — | | | | 39,145,540 | |
Total | | $ | 375,287,302 | | | $ | — | | | $ | — | | | $ | 375,287,302 | |
| | | | | | | | | | | | |
Common Stocks | | $ | 31,857,274 | | | $ | — | | | $ | — | | | $ | 31,857,274 | |
Money Market Funds | | | 1,194,599 | | | | — | | | | — | | | | 1,194,599 | |
Total | | $ | 33,051,873 | | | $ | — | | | $ | — | | | $ | 33,051,873 | |
Refer to each Fund’s Schedule of Investments and Schedule of Securities Sold Short, as applicable, for a listing of the securities valued using Level 1 inputs by security type and industry type.
Share valuation – The net asset value per share of each Fund is calculated daily by dividing the total value of each Fund’s assets, less liabilities, by the number of shares outstanding. The offering price and redemption price per share of each Fund is equal to the net asset value per share, except that shares are subject to a redemption fee of 2% if redeemed within 90 days of the date of purchase. During the periods ended April 30, 2010 and October 31, 2009, proceeds from redemption fees totaled $171,411 and $960,365, respectively, for the TFS Market Neutral Fund and $13,775 and $10,459, respectively, for the TFS Small Cap Fund.
Investment income/expense – Dividend income/expense is recorded on the ex-dividend date. Interest income is accrued as earned.
Security transactions – Security transactions are accounted for on the trade date. Gains and losses on securities sold are determined on a specific identification basis.
Distributions to shareholders – Distributions to shareholders arising from net investment income and net realized capital gains, if any, are distributed at least once each year. The amount of distributions from net investment income and net realized gains are determined in accordance with federal income tax regulations, which may differ from GAAP. These “book/tax” differences
TFS CAPITAL INVESTMENT TRUST NOTES TO FINANCIAL STATEMENTS (Continued) |
are permanent in nature and are primarily due to differing treatments of net short-term gains. The tax character of distributions paid by the Funds during the periods ended April 30, 2010 and October 31, 2009 was as follows:
| | | | | | | |
| TFS Market Neutral Fund | 4/30/2010 | | $ | 6,035,121 | | | $ | 6,035,121 | |
| | 10/31/2009 | | $ | 7,411,156 | | | $ | 7,411,156 | |
| TFS Small Cap Fund | 4/30/2010 | | $ | — | | | $ | — | |
| | 10/31/2009 | | $ | 4,055 | | | $ | 4,055 | |
Short positions – The Funds may sell securities short. For financial statement purposes, an amount equal to the settlement amount is included in the Statements of Assets and Liabilities as an asset and an equivalent liability. The amount of the liability is subsequently marked-to-market to reflect the current value of the short position. Subsequent fluctuations in the market prices of securities sold, but not yet purchased, may require purchasing the securities at prices which may differ from the market value reflected on the Statements of Assets and Liabilities. The Funds are liable for any dividends payable on securities while those securities are in a short position and will also bear other costs, such as charges for the prime brokerage accounts, in connection with the short positions. These costs are reported as brokerage exp enses on securities sold short in the Statements of Operations. As collateral for its short positions, the Funds are required under the Investment Company Act of 1940 to maintain assets consisting of cash, cash equivalents or liquid securities equal to the market value of the securities sold short. The amount of the collateral is required to be adjusted daily to reflect changes in the value of the securities sold short. TFS Market Neutral Fund engages in short selling as a principal investment strategy while the TFS Small Cap Fund does not. The TFS Small Cap Fund intends to limit its exposure to short positions to 5% of its net assets.
Estimates – The preparation of financial statements in conformity with GAAP requires management to make estimates and assumptions that affect the reported amounts of assets and liabilities and disclosures of contingent assets and liabilities at the date of the financial statements and the reported amounts of income and expenses during the reporting period. Actual results could differ from those estimates.
Common expenses – Common expenses of the Trust are allocated between the Funds based on the relative net assets of each Fund or the nature of the services performed and the relative applicability to each Fund.
Federal income tax – It is each Fund’s policy to comply with the special provisions of Subchapter M of the Internal Revenue Code applicable to regulated investment companies. As provided therein, in any fiscal year in which a Fund so qualifies and distributes at least 90% of its taxable net income, the Fund (but not the shareholders) will be relieved of federal income tax on the income distributed. Accordingly, no provision for income taxes has been made.
In order to avoid imposition of the excise tax applicable to regulated investment companies, it is also each Fund’s intention to declare as dividends in each calendar year at least 98% of its net investment income (earned during the calendar year) and 98% of its net realized capital gains (earned during the twelve months ended October 31) plus undistributed amounts from prior years.
TFS CAPITAL INVESTMENT TRUST NOTES TO FINANCIAL STATEMENTS (Continued) |
The following information is computed on a tax basis for each item as of April 30, 2010:
| | | | | | |
| Tax cost of portfolio investments and securities sold short | | $ | 400,947,280 | | | $ | 30,751,073 | |
| Gross unrealized appreciation | | $ | 128,373,979 | | | $ | 3,032,237 | |
| Gross unrealized depreciation | | | (154,033,957 | ) | | | (731,437 | ) |
| Net unrealized appreciation (depreciation) | | | (25,659,978 | ) | | | 2,300,800 | |
| Accumulated net investment loss | | | (14,544,087 | ) | | | (125,104 | ) |
| Capital loss carryforwards | | | — | | | | (519,677 | ) |
| Other gains | | | 112,265,110 | | | | 3,598,468 | |
| Total accumulated earnings | | $ | 72,061,045 | | | $ | 5,254,487 | |
The difference between the federal income tax cost of portfolio of investments and securities sold short and the financial statement cost for the Funds is due to certain timing differences in the recognition of capital gains or losses under GAAP. These “book/tax” differences are temporary in nature and are primarily due to the tax deferral of losses on wash sales.
As of October 31, 2009, the TFS Small Cap Fund had capital loss carryforwards for federal income tax purposes of $519,677. These capital loss carryforwards, which may be utilized in the current and future years to offset net realized capital gains, if any, prior to distribution to shareholders, and expire on the following dates:
| | | |
| June 30, 2016 | | $ | 16,913 | |
| October 31, 2016 | | $ | 87,298 | |
| October 31, 2017 | | $ | 415,466 | |
The Funds recognize tax benefits or expenses of uncertain tax positions only when the position is “more likely than not” to be sustained assuming examination by tax authorities. Management has reviewed the tax positions taken on Federal income tax returns for all open tax periods (June 30, 2006 through October 31, 2009) of each Fund and has concluded that no provision for unrecognized tax benefits or expenses is required in these financial statements.
3. Investment Transactions
During the six months ended April 30, 2010, cost of purchases and proceeds from sales of portfolio securities, other than short-term investments, U.S. government securities and short positions, amounted to $2,822,341,872 and $2,804,634,844, respectively, for the TFS Market Neutral Fund and $79,438,219 and $70,136,761, respectively, for the TFS Small Cap Fund.
4. Transactions with Affiliates
INVESTMENT ADVISORY AGREEMENT
Each Fund’s investments are managed by the Adviser pursuant to the terms of an Investment Advisory Agreement. The TFS Market Neutral Fund pays the Adviser an investment advisory
TFS CAPITAL INVESTMENT TRUST NOTES TO FINANCIAL STATEMENTS (Continued) |
fee, computed and accrued daily and paid monthly, at an annual rate of 2.25% of its average daily net assets. Effective as of March 1, 2010, the Investment Advisory Agreement for the TFS Small Cap Fund was amended to revise the investment advisory fee structure. The amended advisory fee for the TFS Small Cap Fund is a fixed fee that is computed at the annual rate of 1.25% of its average daily net assets and replaces the previous performance fee structure.
As part of the amendment to its Investment Advisory Agreement, the TFS Small Cap Fund, for a transition period of 12 months beginning on March 1, 2010, will pay the Adviser the lesser of the 1.25% fee (the “Fixed Fee”) or the Fixed Fee adjusted for the Fund’s performance relative to its benchmark, the Russell 2000 Index plus 2.50% (“Benchmark”), for the applicable performance period. The applicable performance period is a rolling twelve month period whereby the most recent calendar month is substituted for the earliest month as time passes. During periods where the TFS Small Cap Fund outperforms the Benchmark for the relevant performance period, the Adviser will be paid the Fixed Fee. During periods where the TFS Small Cap Fund underperforms the Benchmark for the relevant performance period, the Fixed Fee will be decreased by one basis point (0.01%) for every two basis points (0.02%) of such underperformance, to a minimum fee of 0.00% per annum. As a result, effective March 1, 2010, the maximum fee that the Adviser will receive from the TFS Small Cap Fund is 1.25% per annum of average daily net assets. During the six months ended April 30, 2010, investment advisory fees paid by the TFS Small Cap Fund were increased $43,118 above the Fixed Fee pursuant to the performance fee adjustment that was in place prior to March 1, 2010.
The Adviser has contractually agreed to reduce its advisory fees and to absorb each Fund’s operating expenses (for the life of the Funds) to the extent necessary to limit each Fund’s aggregate annual ordinary operating expenses (which do not include brokerage costs, taxes, borrowing costs such as interest and dividend expenses on securities sold short and extraordinary expenses) to 2.50% of the TFS Market Neutral Fund’s average daily net assets and 1.75% of the TFS Small Cap Fund’s average daily net assets. Prior to March 1, 2010, the TFS Small Cap Fund’s expense cap was calculated prior to the performance fee adjustment, if any. Therefore, it was possible that the TFS Small Cap Fund’s annual ordinary operating expenses could exceed the 1.75% cap. As a result of these agreements, during the six month s ended April 30, 2010, the Adviser reduced its investment advisory fees by $78,609 with respect to the TFS Small Cap Fund. There were no fee reductions by the Adviser for the TFS Market Neutral Fund Fund.
Advisory fee reductions and expense reimbursements by the Adviser are subject to repayment by the respective Fund for a period of three years after such fees and expenses were incurred, provided that such repayments do not cause ordinary operating expenses to exceed the expense caps of 2.50% and 1.75%, respectively, for the TFS Market Neutral Fund and the TFS Small Cap Fund. During the six months ended April 30, 2010, the Adviser recouped $214,244 of previous fee reductions from the TFS Market Neutral Fund. As of April 30, 2010, the Adviser may in the future recoup fee reductions and expense reimbursements totaling $319,483 and $479,503, respectively, from the TFS Market Neutral Fund and the TFS Small Cap Fund. The Adviser may recapture these amounts no later than the dates as stated below:
| | | | | | | | | | | | | | | | |
| TFS Market Neutral Fund | | $ | - | | | $ | 91,740 | | | $ | 60,676 | | | $ | 167,067 | | | $ | - | |
| TFS Small Cap Fund | | $ | 27,290 | | | $ | 142,256 | | | $ | 51,491 | | | $ | 179,857 | | | $ | 78,609 | |
The President of the Trust is also a Principal of the Adviser.
TFS CAPITAL INVESTMENT TRUST NOTES TO FINANCIAL STATEMENTS (Continued) |
COMPLIANCE CONSULTING AGREEMENT
Under the terms of the Compliance Consulting Agreement, Drake Compliance, LLC (“Drake”) provides ongoing regulatory compliance consulting, monitoring and reporting services for the Trust. In addition, a principal of Drake serves as the Trust’s Chief Compliance Officer. For these services, Drake receives $2,000 per month from each Fund. In addition, each Fund reimburses certain out-of-pocket expenses incurred by Drake, if any, including, but not limited to, postage and supplies and travel expenses.
ADMINISTRATION AGREEMENT
Under the terms of an Administration Agreement, Ultimus Fund Solutions, LLC (“Ultimus”) supplies executive, administrative and regulatory services for the Funds. Ultimus supervises the preparation of tax returns, reports to shareholders of the Funds, reports to and filings with the Securities and Exchange Commission (the “SEC”) and state securities commissions and materials for meetings of the Board of Trustees. For these services, each Fund pays Ultimus a monthly fee at an annual rate of 0.15% of its average daily net assets up to $50 million, 0.125% of such assets between $50 million and $100 million, 0.10% of such assets between $100 million and $250 million, 0.075% of such assets between $250 million and $500 million, and 0.05% of such assets in excess of $500 million, subject to a minimum monthly fee of $2, 000. Certain officers of the Trust are also officers of Ultimus.
ACCOUNTING SERVICES AGREEMENT
Under the terms of an Accounting Services Agreement, Ultimus calculates the daily net asset value per share and maintains the financial books and records of each Fund. For the performance of these services, the TFS Market Neutral Fund pays Ultimus a monthly base fee of $4,000 per month plus an asset based fee of 0.005% of average gross daily assets. In addition, the Fund pays $1 per portfolio trade in excess of 1,000 portfolio trades per month. For the performance of these services, the TFS Small Cap Fund pays Ultimus a base fee of $2,500 per month plus an asset based fee of 0.01% of the first $500 million of average daily net assets and 0.005% of such assets in excess of $500 million. In addition, each Fund reimburses certain out-of-pocket expenses incurred by Ultimus in obtaining valuations of the Funds’ portfolio securities.
TRANSFER AGENT AND SHAREHOLDER SERVICES AGREEMENT
Under the terms of a Transfer Agent and Shareholder Services Agreement, Ultimus maintains the records of each shareholder’s account, answers shareholders’ inquiries concerning their accounts, processes purchases and redemptions of each Fund’s shares, acts as dividend and distribution disbursing agent and performs other shareholder service functions. Each Fund pays Ultimus a monthly fee for these services at an annual rate of $15 to $24 per shareholder account, depending on the nature of the account, subject to a $1,500 minimum monthly fee. In addition, the Funds reimburse Ultimus for out-of-pocket expenses including, but not limited to, postage and supplies.
DISTRIBUTION AGREEMENT
The Trust has entered into a Distribution Agreement with Ultimus Fund Distributors, LLC (the “Distributor”), pursuant to which the Distributor provides distribution services and serves as the principal underwriter to each Fund. The Distributor is a wholly-owned subsidiary of Ultimus. The Distributor’s fees are paid by the Adviser.
TFS CAPITAL INVESTMENT TRUST NOTES TO FINANCIAL STATEMENTS (Continued) |
5. Borrowing Costs
During the six months ended April 30, 2010, the TFS Market Neutral Fund and the TFS Small Cap Fund incurred $9,018 and $62 of borrowing costs, respectively. As of April 30, 2010, the Funds had no outstanding borrowings. The average outstanding borrowings for the six months ended April 30, 2010 for the TFS Market Neutral Fund include 121 days of $0 borrowings and 163 days of $0 borrowings for the TFS Small Cap Fund. The average outstanding borrowing and average interest rate on borrowings during the six months ended April 30, 2010 were as follows:
| | Average Outstanding Borrowing | | | |
| TFS Market Neutral Fund | | $ | 1,454,565 | | | | 1.21% |
| TFS Small Cap Fund | | $ | 16,743 | | | | 1.56% |
6. Contingencies and Commitments
The Funds indemnify the Trust’s officers and Trustees for certain liabilities that might arise from their performance of their duties to the Funds. Additionally, in the normal course of business the Funds enter into contracts that contain a variety of representations and warranties and which provide general indemnifications. The Funds’ maximum exposure under these arrangements is unknown, as this would involve future claims that may be made against the Funds that have not yet occurred. However, based on experience, the Funds expect the risk of loss to be remote.
7. Subsequent Events
The Funds are required to recognize in the financial statements the effects of all subsequent events that provide additional evidence about conditions that existed as of the date of the Statements of Assets and Liabilities. For non-recognized subsequent events that must be disclosed to keep the financial statements from being misleading, the Funds are required to disclose the nature of the event as well as an estimate of its financial effect, or a statement that such an estimate cannot be made. Management has evaluated subsequent events through the issuance of these financial statements and has noted no such events.
8. Recent Accounting Pronouncement
In January 2010, the Financial Accounting Standards Board (“FASB”) issued Accounting Standards Update (“ASU”) No. 2010-06 “Improving Disclosures about Fair Value Measurements.” ASU No. 2010-06 amends FASB Accounting Standards Codification Topic 820, Fair Value Measurements and Disclosures, to require additional disclosures regarding fair value measurements. Certain disclosures required by ASU No. 2010-06 are effective for interim and annual reporting periods beginning after December 31, 2009 and others for fiscal years beginning after December 15, 2010 and for interim periods within those fiscal years. Management is currently evaluating the impact ASU No. 2010-06 will have on the Funds’ financial statement disclosures.
TFS CAPITAL INVESTMENT TRUST ABOUT YOUR FUNDS’ EXPENSES (Unaudited) |
We believe it is important for you to understand the impact of costs on your investment. As a shareholder of the Funds, you incur two types of costs: (1) transaction costs, including redemption fees; and (2) ongoing costs, including management fees and other Fund expenses. The following examples are intended to help you understand your ongoing costs (in dollars) of investing in the Funds and to compare these costs with the ongoing costs of investing in other mutual funds.
A mutual fund’s ongoing costs are expressed as a percentage of its average net assets. This figure is known as the expense ratio. The ongoing costs reflected in the table are based on an investment of $1,000 made at the beginning of the most recent semi-annual period and held until the end of the period (November 1, 2009 through April 30, 2010).
The table below illustrates each Fund’s ongoing costs in two ways:
Actual fund return – This section helps you to estimate the actual expenses that you paid over the period. The “Ending Account Value” shown is derived from each Fund’s actual return, and the third column shows the dollar amount of operating expenses that would have been paid by an investor who started with $1,000 in the Funds. You may use the information here, together with the amount you invested, to estimate the expenses that you paid over the period.
To do so, simply divide your account value by $1,000 (for example, an $8,600 account value divided by $1,000 = 8.6), then multiply the result by the number given for the Funds under the heading “Expenses Paid During Period.”
Hypothetical 5% return – This section is intended to help you compare each Fund’s ongoing costs with those of other mutual funds. It assumes that each Fund had an annual return of 5% before expenses during the period shown, but that the expense ratio is unchanged. In this case, because the return used is not the Fund’s actual return, the results do not apply to your investment. The example is useful in making comparisons because the SEC requires all mutual funds to calculate expenses based on a 5% return. You can assess each Fund’s ongoing costs by comparing this hypothetical example with the hypothetical examples that appear in shareholder reports of other funds.
Note that expenses shown in the table are meant to highlight and help you compare ongoing costs only. The Funds do not charge any sales loads. However, a redemption fee of 2% is applied on the sale of shares purchased within 180 days of the date of their purchase and does not apply to the redemption of shares acquired through reinvestment of dividends and other distributions. The calculations below assume no shares were bought or sold during the period. Your actual costs may have been higher or lower, depending on the amount of your investment and the timing of any purchases or redemptions.
More information about each Fund’s expenses, including annualized expense ratios, can be found in this report. For additional information on operating expenses and other shareholder costs, please refer to the Funds’ prospectus.
TFS CAPITAL INVESTMENT TRUST ABOUT YOUR FUNDS’ EXPENSES (Unaudited) (Continued) |
TFS Market Neutral Fund
| | Beginning Account Value Nov. 1, 2009 | Ending Account Value April 30, 2010 | Expenses Paid During Period* |
| Based on Actual Fund Return | $1,000.00 | $1,048.50 | $ 21.94 |
| Based on Hypothetical 5% Return (before expenses) | $1,000.00 | $1,003.37 | $ 21.46 |
TFS Small Cap Fund
| | Beginning Account Value Nov. 1, 2009 | Ending Account Value April 30, 2010 | Expenses Paid During Period* |
| Based on Actual Fund Return | $1,000.00 | $1,303.30 | $ 12.11 |
| Based on Hypothetical 5% Return (before expenses) | $1,000.00 | $1,014.28 | $ 10.59 |
| * | Expenses are equal to the annualized expense ratio of 4.32% and 2.12%, respectively, for the TFS Market Neutral Fund and the TFS Small Cap Fund for the period, multiplied by the average account value over the period, multiplied by 181/365 (to reflect the applicable period). |
OTHER INFORMATION (Unaudited)
A description of the policies and procedures that the Funds use to determine how to vote proxies relating to portfolio securities is available without charge upon request by calling toll-free 1-888-534-2001, or on the SEC’s website at http://www.sec.gov. Information regarding how the Funds voted proxies relating to portfolio securities during the most recent 12-month period ended June 30 is also available without charge upon request by calling toll-free 1-888-534-2001, or on the SEC’s website at http://www.sec.gov.
The Funds file a complete listing of portfolio holdings with the SEC as of the end of the first and third quarters of each fiscal year on Form N-Q. The filings are available upon request, by calling 1-888-534-2001. Furthermore, you may obtain copies of the filings on the SEC’s website at http://www.sec.gov. The Funds’ Forms N-Q may also be reviewed and copied at the SEC’s Public Reference Room in Washington, DC, and information on the operation of the Public Reference Room may be obtained by calling 1-800-SEC-0330.
TFS SMALL CAP FUND APPROVAL OF AMENDED INVESTMENT ADVISORY AGREEMENT (Unaudited) |
The Board of Trustees, including the Independent Trustees voting separately, reviewed and approved an amended Investment Advisory Agreement for the TFS Small Cap Fund (“Amended Advisory Agreement”), at an in-person meeting, held on December 18, 2009, at which all of the Trustees were present. The Trustees were advised by independent counsel of their fiduciary obligations in approving the Amended Advisory Agreement and the Trustees requested such information from the Adviser as they deemed reasonably necessary to evaluate the terms of the Amended Advisory Agreement and whether the Amended Advisory Agreement is in the best interests of the Fund and its shareholders. The Trustees reviewed: (i) the nature, extent and quality of the services to be provided by the Adviser; (ii) the investment performance of the Fund; (iii) the co sts of the services provided and the potential profits to be realized by the Adviser from its relationship with the Fund; (iv) the extent to which economies of scale would be realized as the Fund grows; and (v) whether fee levels reflect these economies of scale for the benefit of the Fund’s shareholders. At this meeting, the Independent Trustees reviewed and discussed the proposed approval of the Amended Advisory Agreement with management of the Adviser and also met outside the presence of management with their counsel. In considering the Amended Advisory Agreement and reaching their conclusions, the Board of Trustees reviewed and analyzed various factors it determined were relevant, including the factors described below and came to the following conclusions:
| (i) | The nature, extent, and quality of the services provided by the Adviser. In this regard, the Independent Trustees reviewed the services being provided to the Fund by the Adviser. They discussed the responsibilities of the Adviser under the Amended Advisory Agreement and the Adviser’s compensation under the Amended Advisory Agreement. The Independent Trustees reviewed the background and experience of the Adviser’s key investment and operating personnel. They noted the Adviser’s commitment to continue managing the Fund at a very high level and the Adviser’s representation that the removal of the performance fee adjustment will not impact its professional and financial commitment to the Fund. After considering the foregoing information, the Independent Trustees concluded that the quality, extent and nature of the services provi ded by the Adviser have been and will continue to be satisfactory for the Fund. |
| (ii) | The investment performance of the Fund and the Adviser. In this regard, the Independent Trustees compared the performance of the Fund with that of the Russell 2000 Index, the Fund’s primary benchmark, over various periods ended October 31, 2009. It was noted by the Independent Trustees that the Fund has significantly outperformed the Russell 2000 Index over the one year, three year and since inception periods ended October 31, 2009. The Independent Trustees were also provided with comparative performance statistics of the universe of funds categorized by Morningstar as “small cap blend” funds, which is the category to which the Fund has been assigned by Morningstar. The Independent Trustees noted that for the one year period ended October 31, 2009, the Fund’s 37.41% return was significantly higher than the performance of the average fund in the Morningstar small cap blend category (11.45%) over the same period. It was further noted that the Fund was in the top 5% of funds within the small cap blend category for both the one year and three year periods ended October 31, 2009. The Independent Trustees noted that the Fund has a five-star Morningstar rating overall and for three years. They also reviewed performance information with respect to the Adviser’s other managed accounts but concluded that none of these other |
TFS SMALL CAP FUND APPROVAL OF AMENDED INVESTMENT ADVISORY AGREEMENT (Unaudited) (Continued) |
| | accounts provided a good comparison due to differences in investment objectives. The Independent Trustees considered the consistency of the Adviser’s management of the Fund with the Fund’s investment objective and policies and the Adviser’s representation that the elimination of the performance fee adjustment will not impact the Adviser’s professional and financial commitment to the Fund. After a full consideration of the foregoing factors, the Independent Trustees concluded that the investment performance of the Fund has been above average. |
| (iii) | The costs of the services to be provided and profits to be realized by the Adviser from its relationship with the Fund. In this regard, the Independent Trustees considered the Adviser’s staffing, personnel and operations; the financial condition of the Adviser and the level of commitment to the Fund by the principals of the Adviser; the asset levels of the Fund; and the overall expenses of the Fund. The Independent Trustees considered the rate of the management fees paid by the Fund under the current Investment Advisory Agreement for the fiscal year ended October 31, 2009 and also considered the pro-forma fees that would have been paid under the Amended Advisory Agreement for the same period, and compared such fees to average management fee ratios of similar mutual funds compiled from statistics reported by Morningstar. They also compared the total operating expense ratio of the Fund for the fiscal year ended October 31, 2009 and the pro-forma expense ratio under the Amended Advisory Agreement for such year with the average expense ratio of comparable funds, focusing on other funds included in the Morningstar “small cap blend category.” It was noted by the Independent Trustees that the Fund’s actual management fee of 1.38% (including the performance fee adjustment) and its overall expense ratio of 1.88% were each significantly higher than the average management fee (0.77%) and average expense ratio (1.43%) for Morningstar’s “small cap blend” fund category. The Independent Trustees further noted that when the same comparisons were made using the pro-forma management fee of 1.25% and the pro-forma overall expense ratio of 1.75%, the Fund’s expense structure was still significantly higher than the averages for its Morningstar category although the comparisons were more favorable to the Fund under the Amende d Advisory Agreement. The Independent Trustees further noted that, with respect to the Fund’s current Investment Advisory Agreement, the results of this type of comparison may differ significantly from year to year due to the performance fee adjustment and that, under the Amended Advisory Agreement, the Fund’s shareholders and potential investors can more accurately predict their costs of investing in the Fund. The Independent Trustees also considered the Fund’s strong performance record relative to the Russell 2000 Index since inception. They discussed the variability aspect of the performance fee adjustment, noting that despite the unpredictable nature of the current fee structure it is unlikely that the Amended Advisory Agreement will result in a fee increase in the near term assuming that the investment performance is competitive. The Independent Trustees also considered the Adviser’s analysis of its revenues and expenses with respect to its services provided to the Fund through O ctober 31, 2009. It was noted by the Independent Trustees that the Adviser has yet to recognize any profits with respect to its services to the Fund and, in fact, has yet to collect any management fees. It was further noted that not only has the Adviser not collected any of its management fees since the inception of the Fund, it has also reimbursed a significant amount of the Fund’s other operating expenses. The Independent Trustees next considered the Adviser’s commitment to continue (for the life of the Fund) to limit |
TFS SMALL CAP FUND APPROVAL OF AMENDED INVESTMENT ADVISORY AGREEMENT (Unaudited) (Continued) |
| | the Fund’s annual operating expenses to 1.75% per annum of its average daily net assets. It was noted by the Independent Trustees that the Fund has been operating under an Expense Limitation Agreement that allows the Adviser to seek repayment from the Fund for any fee reductions or expense reimbursements for a period of three years after such fees and expenses were incurred, provided that such repayment does not cause the Fund’s annual operating expenses to exceed 1.75%. The Independent Trustees considered that pursuant to the Expense Limitation Agreement, as of October 31, 2009, the Adviser is entitled to recoup $468,998 of fee reductions and expense reimbursements. The Independent Trustees noted that the Adviser has agreed to continue its commitment to limit the Fund’s annual operating expenses to 1.75% for the life of the Fund. It was further noted by the Independent Trustees that the contin uance of the Expense Limitation Agreement provides potential and current shareholders with a predictable cost structure. The Independent Trustees also reviewed the balance sheet of the Adviser as of October 31, 2009 and concluded that the Adviser has the necessary financial resources to serve as the Fund’s investment adviser. The Independent Trustees considered the “fallout benefits” to the Adviser, including the additional exposure the Adviser has received as a result of managing the Fund. After a full discussion and consideration of the foregoing, the Independent Trustees concluded that the fees to be paid by the Fund to the Adviser under the Amended Advisory Agreement are reasonable. |
| (iv) | The extent to which economies of scale would be realized as the Fund grows and whether management fee levels reflect these economies of scale for the benefit of the Fund’s investors. The Independent Trustees considered the current net assets of the Fund and discussed the existing and proposed expense limitation arrangements between the Fund and the Adviser. They noted that the Adviser has not collected any of its management fees and continues to reimburse other expenses in order to limit the Fund’s overall expenses. The Independent Trustees discussed the Adviser’s past fee reductions and expense reimbursements, the Adviser’s ongoing commitment to hiring and maintaining top quality investment professionals and the Adviser’s continued investment in research and development. It was noted that, pursuant to the terms of the Expense Limitation Agreement, shareholders will not benefit from economies of scale during periods in which the Adviser is recovering from the Fund previous investment advisory fee reductions and/or operating expense reimbursements. The Independent Trustees concluded that, at the Fund’s current asset level, it would not be relevant to consider the extent to which economies of scale are being realized. The Independent Trustees noted that, to the extent that the Fund continues to grow, this factor will be a more important consideration for them. The Independent Trustees further determined that it is not necessary or appropriate to introduce fee breakpoints at the present time for the Fund. |
In conclusion, the Trustees did not identify any single factor as all-important or controlling in their determination to approve the Amended Advisory Agreement. The Trustees, including all of the Independent Trustees, concluded that the terms the Amended Advisory Agreement were fair and reasonable, that the Adviser’s fees were reasonable in light of the services provided to the Small Cap Fund and the benefits received by the Adviser, that approval of the Amended Advisory Agreement is in the best interests of each Fund and its shareholders, and that the Amended Advisory Agreement should be presented to shareholders for review and approval.
TFS SMALL CAP FUND RESULTS OF A SPECIAL SHAREHOLDER MEETING OF SHAREHOLDERS (Unaudited) |
On February 26, 2010, a Special Meeting of Shareholders of the TFS Small Cap Fund was held for the purpose of voting on the proposal to approve an amendment to the investment advisory agreement between TFS Capital Investment Trust, on behalf of the TFS Small Cap Fund, and TFS Capital LLC that replaces the performance fee adjustment with a fixed fee structure.
The total number of shares of the TFS Small Cap Fund present in person or by proxy was 1,128,401, which represented 53.50% of the shares entitled to vote at the meeting.
The proposal was approved by shareholders. The results of the voting were as follows:
CUSTOMER PRIVACY POLICY |
| We collect only information that is needed to serve you and administer your account. In the process of serving you, we become stewards of your “nonpublic personal information” – information about you that is not available publicly. This information comes to us from the following sources: • Information you provide directly to us on applications or other forms, correspondence or through conversations (such as your name, social security number, address, phone number, assets, income, date of birth, occupation, etc.). • Information about your transactions with us, our affiliates or others (such as your account numbers, account balances, transaction details and other financial information). • Information we receive from third parties (such as your broker, financial planner or other intermediary you hire). We limit the collection and use of nonpublic personal information to that which is necessary to serve you and administer your account. We carefully limit and control the sharing of your information. To protect your privacy, we carefully control the way in which any information about you is shared. It is our policy not to disclose any nonpublic personal information about customers or former customers to anyone, except as permitted to serve your account or required by law. We are permitted by law to disclose all of the information we collect as described above to our affiliates, advisers, transfer agents, broker-dealers, administrators or any firms that assist us in maintaining and supporting the financial products and services provided to you. For example, our transfer agent needs information to process your transactions, and our outside vendors need information so that your account | | statements can be printed and mailed. However, these parties are not authorized to release, use or transfer your information to any other party for their own purpose. We are committed to the privacy of your nonpublic personal information and will use strict security standards to safeguard it. We are committed to the security of your nonpublic personal information. Our employees and others hired to work for us are held accountable for adhering to strict policies and procedures to prevent any misuse of your nonpublic personal information. Employees are bound by this privacy policy and are educated on implementing our security principles and practices. We maintain safeguards that we believe are reasonably designed to comply with federal standards to guard your nonpublic personal information. This privacy policy explains how we handle nonpublic personal information; however, you should also review the privacy policies adopted by any of your financial intermediaries, such as a broker-dealer, bank, or trust company to understand how they protect your nonpublic personal information in accordance with our internal security standards. This privacy policy notice is for TFS Capital Investment Trust (the “Trust”), TFS Capital LLC, the Trust’s investment adviser, and Ultimus Fund Distributors, LLC, the Trust’s principal underwriter. TFS Capital LLC maintains a different privacy policy for other clients that it services; however, this policy will be the policy adhered to for all shareholders of the TFS Market Neutral Fund and TFS Small Cap Fund. If you have any questions about the confidentiality of your customer information, please call 1-888-534-2001 to talk to a shareholder services representative. |