SEMI-ANNUAL REPORT
April 30, 2013
(Unaudited)
For more information or assistance in opening an account,
please call toll-free 1-888-534-2001.
June 15, 2013
Dear Shareholder,
Enclosed is the Semi-Annual Report to shareholders of the TFS Market Neutral Fund (ticker: TFSMX), the TFS Small Cap Fund (ticker: TFSSX) and the TFS Hedged Futures Fund (ticker: TFSHX) for the period ended April 30, 2013. On behalf of the investment manager, TFS Capital, I would like to thank you for your continued investment.
TFS Capital is pleased to announce that it was chosen as Morningstar’s Alternatives Fund Manager of the Year for the TFS Market Neutral Fund for 2012. This newly created award was established to recognize the performance of investment managers who specialize in strategies outside of the traditional equity and fixed-income categories. According to Morningstar, they considered the managers of 361 alternative funds in choosing the 2012 winner.
Below are the performance updates on each of the mutual funds.
TFS Market Neutral Fund (ticker: TFSMX)
| | | | Since Inception (9/7/2004) |
| TFS Market Neutral Fund | 4.44% | 4.31% | 4.27% | 7.68% |
S&P 500® Index | 16.89% | 12.80% | 5.21% | 6.37% |
Average annual total returns for periods ended April 30, 2013
TFSMX did not produce positive alpha (i.e., the return that cannot be explained by a fund’s market exposure) for the first six months of the current fiscal year. Much of this poor performance can be traced to recent months. For instance, in the month of April 2013, TFSMX was down -2.17% while the S&P 500® Index was up 1.93%. TFS Capital sent a letter by electronic mail to financial intermediaries that are known users of TFSMX which attempts to identify some of the potential causes of this poor performance. If you are interested in receiving a copy of this letter, please contact TFS Capital. In summary, TFS Capital believes that this period of underperformance may have been driven by a “short-squeeze” affecting the portfolio (i.e., a price dislocation that occurs when short positions in thinly traded securities are exited quickly resulting in a rise in price). While TFS Capital believes that the impact from this market action will be temporary and represents a buying opportunity, it is impossible to determine whether prices on certain short positions will improve (i.e., return to pre-short-squeeze levels). It is encouraging that TFSMX has seen strong positive alpha production in June month-to-date.
TFSMX’s performance over longer periods of time compares favorably to the overall U.S. equity market as measured by the S&P 500® Index. From inception through April 30, 2013, TFSMX generated a 7.68% average annual return and had an annualized standard deviation of 8.13%, whereas the S&P 500® Index generated a 6.37% average annual return and had an annualized standard deviation of 21.50%. Therefore, during this time period, TFSMX produced an average annual return that was 1.31 percentage points above that of the S&P 500® Index while subjecting investors to only 37.8% of the S&P 500® Index’s volatility. Based on its trailing 5-year return through April 30, 2013, TFSMX was ranked #2 among 38 funds in the Lipper Equity Market Neutral category.1
The strategies used in managing TFSMX have resulted in its returns having a low correlation to other asset classes since inception. According to Modern Portfolio Theory, portfolios may benefit by combining non-correlated investments. For your reference, below are the TFS Market Neutral Fund’s correlations to several other asset classes since inception. It is notable that TFSMX has observed a rise in correlation to equity indices in recent years, as compared to historical averages.
| Correlation Since Inception |
S&P 500® Index | 0.61 |
Russell 2000® Index | 0.60 |
| MSCI EAFE Index | 0.50 |
| Barclays U.S. Aggregate Bond Index | -0.17 |
| Dow Jones REIT ETF Index | 0.43 |
| Dow Jones Commodity Futures | 0.45 |
The TFS Market Neutral Fund is currently operating under a policy that limits additional investments (the “Subscription Policy”). Given its investment strategies’ capacity limitations, the Subscription Policy allows the TFS Market Neutral Fund to seek stability in its net assets and maintain control of its growth. To date, the Subscription Policy has been effective in enabling TFSMX to maintain a relatively consistent asset level.
TFS Small Cap Fund (ticker: TFSSX)
| | | | Since Inception (3/7/2006) |
| TFS Small Cap Fund | 20.35% | 12.55% | 12.89% | 10.49% |
Russell 2000® Index | 17.69% | 11.25% | 7.27% | 5.32% |
Average annual total returns for periods ended April 30, 2013
During the 12-month period ended April 30, 2013, TFSSX outperformed its benchmark, the Russell 2000® Index. TFSSX’s returns were heavily impacted by the movement of the U.S. “small-cap” equity sector as evidenced by comparing the return of TFSSX and its benchmark return (i.e., 20.35% versus 17.69%). Given its “long-only” mandate, TFSSX is expected to have a high correlation to U.S. small-cap equity market movements with any performance deviation generally attributable to TFS Capital’s equity selection.
TFSSX also achieved its objective of outperforming the Russell 2000® Index over longer periods of time. In fact, it now has over a 7-year track record and has achieved an average annual return since inception that is 5.17 percentage points higher than that of the Russell 2000® Index. Based on its trailing 5-year return through April 30, 2013, TFSSX was ranked #13 among 561 funds in the Lipper Small Cap Core category.2
TFS Hedged Futures Fund (ticker: TFSHX)
| | Since Inception (12/29/2011) |
| TFS Hedged Futures Fund | -0.28% | 4.53% |
| S&P Diversified Trends Indicator | -3.27% | -7.46% |
S&P 500® Index | 16.89% | 21.84% |
Average annual total returns for periods ended April 30, 2013
During the 12-month period ended April 30, 2013, TFSHX failed to generate capital appreciation – posting a -0.28% return during the period. However, from inception through April 30, 2013, TFSHX generated a positive average annual return of 4.53%. The performance over both periods compares favorably to the S&P Diversified Trends Indicator, a commonly-used benchmark for managed futures funds. Though the S&P 500® Index is not generally considered an appropriate benchmark for managed futures funds, it is provided above for your reference.
Like the TFS Market Neutral Fund, the TFS Hedged Futures Fund has demonstrated a low correlation to many market indices. This low correlation suggests the addition of the TFS Hedged Futures Fund may improve the risk-adjusted performance of many investment portfolios. The TFS Hedged Futures Fund has had a slightly negative correlation to the S&P Diversified Trends Indicator, which suggests that it may also have a low correlation to other managed futures funds that track this index. The TFS Hedged Futures Fund also has a low correlation to the TFS Market Neutral Fund which suggests that these two investments may complement each other in an investment portfolio seeking non-correlated return streams. For your reference, below are the TFS Hedged Futures Fund’s correlations to several other asset classes including the TFS Market Neutral Fund.
| Correlation Since Inception |
| TFS Market Neutral Fund (ticker: TFSMX) | 0.36 |
| S&P Diversified Trends Indicator | -0.08 |
S&P 500® Index | 0.31 |
Russell 2000® Index | 0.34 |
| S&P GSCI Index | 0.20 |
| Barclays U.S. Aggregate Bond Index | -0.09 |
As always, we do not recommend allocating a high percentage of one’s assets to any one investment fund managed by TFS Capital given the risks inherent in each product. Rather, we believe that they are best used as a component of a diversified portfolio of investments. If you have any questions regarding this material, please contact us.
Best regards,
Larry S. Eiben
Chief Operating Officer & Co-Portfolio Manager
TFS Capital LLC
The performance data quoted represents past performance, which is not a guarantee of future results. Current performance may be lower or higher than the performance data quoted. The investment return and principal value of an investment in the mutual funds discussed in this report (the “Funds”) will fluctuate so that an investor’s shares, when redeemed, may be worth more or less than their original cost. The Funds charge a 2% redemption penalty on shares invested for less than 90 days. If shares are redeemed within the 90 day period, investment returns would be reduced from those shown above. Fee reductions and/or expense reimbursements by the Adviser have positively impacted the Funds’ performance. Without such reductions and/or reimbursements, performance would have been lower. An investor should consider the investment objectives, risks, charges and expenses of the Funds carefully before investing. To obtain a summary prospectus and/or prospectus, which each contain this and other important information, go to www.TFSCapital.com or call (888) 534-2001. Please read the summary prospectus and/or prospectus carefully before investing. The Funds may not be suitable for all investors.
| 1 | In the Lipper Equity Market Neutral category, TFSMX was ranked #2 out of 38 using its 5-year return and #5 out of 47 using its 3-year return. At 4/30/2013, Lipper did not make 1-year rankings available to the public. |
| 2 | In the Lipper Small Cap Core category, TFSSX was ranked #13 out of 561 using its 5-year return and #161 out of 634 using its 3-year return. At 4/30/2013, Lipper did not make 1-year rankings available to the public. |
Ranking information provided by Lipper for the periods ended April 30, 2013. TFSSX was assigned by Lipper to the Small-Cap Core category. TFSMX was assigned by Lipper to the Equity Market Neutral category. The Funds are ranked based on total return and are ranked within a universe of funds with similar investment objectives. Rankings include the reinvestment of dividends and capital gains but exclude the effect of a fund’s sales load, if applicable. Fund rankings are calculated monthly by Lipper Analytical Services of New York. Lipper Inc. is a nationally recognized organization that ranks the performance of mutual funds.
TFS MARKET NEUTRAL FUND
PORTFOLIO INFORMATION
April 30, 2013 (Unaudited)
Common Stocks vs.
the Standard & Poor’s 500® Index Net Sector Exposure*
| * | The net percentages for TFS Market Neutral Fund are computed by taking the net dollar exposure, including short positions, and dividing by the net assets of the Fund. Consequently, the percentages will not total to 100%. |
Top 10 Long Common Stocks | | Top 10 Short Common Stocks |
| | | | |
| First Solar, Inc. | 0.61% | | Uni-Pixel, Inc. | 0.73% |
| Lufkin Industries, Inc. | 0.61% | | Ebix, Inc. | 0.57% |
| Spirit AeroSystems Holdings, Inc. - Class A | 0.43% | | MannKind Corporation | 0.54% |
| Hanover Insurance Group, Inc. (The) | 0.42% | | Advanced Micro Devices, Inc. | 0.51% |
| Sanmina Corporation | 0.38% | | VIVUS, Inc. | 0.51% |
| Exelis, Inc. | 0.38% | | Solazyme, Inc. | 0.47% |
| Tenneco, Inc. | 0.36% | | Molycorp, Inc. | 0.46% |
| Steven Madden Ltd. | 0.34% | | VirnetX Holding Corporation | 0.45% |
| Mercury General Corporation | 0.34% | | Radian Group, Inc. | 0.43% |
| Gentex Corporation | 0.34% | | RadioShack Corporation | 0.40% |
Please note that the Fund may hold securities other than common stocks.
TFS SMALL CAP FUND
PORTFOLIO INFORMATION
April 30, 2013 (Unaudited)
Sector Allocation (% of Net Assets)
|
| |
| Spirit AeroSystems Holdings, Inc. - Class A | 0.68% |
| AMN Healthcare Services, Inc. | 0.58% |
| LIN TV Corporation - Class A | 0.57% |
| Benchmark Electronics, Inc. | 0.55% |
| Exelis, Inc. | 0.55% |
| AmSurg Corporation | 0.54% |
| Mercury General Corporation | 0.52% |
| Jack in the Box, Inc. | 0.51% |
| Telephone and Data Systems, Inc. | 0.51% |
| Pike Electric Corporation | 0.51% |
TFS HEDGED FUTURES FUND
PORTFOLIO INFORMATION
April 30, 2013 (Unaudited)
Exposure by Type of Futures Contract
(Value as a % of Net Assets)
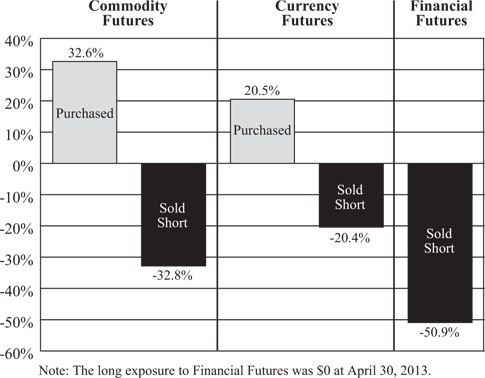
Net Exposure by Type of Futures Contract (Net as a % of Net Assets) |
| Net Commodity Futures Exposure | -0.2% |
| Net Currency Futures Exposure | 0.1% |
| Net Financial Futures Exposure | -50.9% |
TFS MARKET NEUTRAL FUND
SUMMARY SCHEDULE OF INVESTMENTS*
April 30, 2013 (Unaudited)
| | | | | | |
| Consumer Discretionary — 14.1% | | | | | | |
Ascena Retail Group, Inc. (a) (b) | | | 263,018 | | | $ | 4,865,833 | |
Cablevision Systems Corporation - Class A (b) | | | 336,245 | | | | 4,996,601 | |
Cooper Tire & Rubber Company (b) | | | 205,058 | | | | 5,103,894 | |
E.W. Scripps Company (The) - Class A (a) | | | 449,863 | | | | 6,248,597 | |
Express, Inc. (a) (b) | | | 317,889 | | | | 5,788,759 | |
Gentex Corporation (b) | | | 283,347 | | | | 6,375,307 | |
Men's Wearhouse, Inc. (The) (b) | | | 160,141 | | | | 5,364,723 | |
Shutterfly, Inc. (a) (b) | | | 125,514 | | | | 5,589,138 | |
Sinclair Broadcast Group, Inc. - Class A (b) | | | 205,629 | | | | 5,510,857 | |
Steven Madden Ltd. (a) (b) | | | 133,160 | | | | 6,475,571 | |
Tenneco, Inc. (a) (b) | | | 177,001 | | | | 6,844,629 | |
Other Consumer Discretionary (c) | | | | | | | 201,958,364 | |
| | | | | | | | 265,122,273 | |
| Consumer Staples — 2.3% | | | | | | | | |
Prestige Brands Holdings, Inc. (a) (b) | | | 207,957 | | | | 5,604,441 | |
Other Consumer Staples (c) | | | | | | | 38,261,869 | |
| | | | | | | | 43,866,310 | |
| Energy — 8.6% | | | | | | | | |
Exterran Holdings, Inc. (a) (b) | | | 186,300 | | | | 4,922,046 | |
Long Run Exploration Ltd. (a) (d) | | | 1 | | | | 4 | |
| Lufkin Industries, Inc. | | | 129,954 | | | | 11,473,639 | |
Newfield Exploration Company (a) | | | 234,308 | | | | 5,105,571 | |
Other Energy (c) | | | | | | | 140,138,894 | |
| | | | | | | | 161,640,154 | |
| Financials — 16.4% | | | | | | | | |
CNO Financial Group, Inc. (b) | | | 455,644 | | | | 5,157,890 | |
Endurance Specialty Holdings Ltd. (b) | | | 128,382 | | | | 6,286,867 | |
Golub Capital BDC, Inc. (b) | | | 282,832 | | | | 4,986,328 | |
Hanover Insurance Group, Inc. (The) (b) | | | 155,397 | | | | 7,836,671 | |
Mercury General Corporation (b) | | | 141,378 | | | | 6,462,388 | |
Och-Ziff Capital Management Group, LLC (b) | | | 541,203 | | | | 5,552,743 | |
Old Republic International Corporation (b) | | | 429,243 | | | | 5,794,781 | |
Protective Life Corporation (b) | | | 148,541 | | | | 5,653,470 | |
Synovus Financial Corporation (b) | | | 2,341,011 | | | | 6,297,320 | |
Other Financials (c) | | | | | | | 254,536,470 | |
| | | | | | | | 308,564,928 | |
| Health Care — 14.4% | | | | | | | | |
Alkermes plc (a) (b) | | | 169,157 | | | | 5,177,896 | |
AmSurg Corporation (a) (b) | | | 162,006 | | | | 5,436,921 | |
Cubist Pharmaceuticals, Inc. (a) (b) | | | 111,681 | | | | 5,128,392 | |
Health Management Associates, Inc. - Class A (a) (b) | | | 470,085 | | | | 5,401,277 | |
Hill-Rom Holdings, Inc. (b) | | | 151,519 | | | | 5,162,252 | |
Jazz Pharmaceuticals plc (a) (b) | | | 82,841 | | | | 4,833,772 | |
TFS MARKET NEUTRAL FUND
SUMMARY SCHEDULE OF INVESTMENTS* (Continued)
COMMON STOCKS — 92.6% (Continued) | | | | | | |
| Health Care — 14.4% (Continued) | | | | | | |
LifePoint Hospitals, Inc. (a) | | | 104,341 | | | $ | 5,008,368 | |
NuVasive, Inc. (a) (b) | | | 229,161 | | | | 4,805,506 | |
Techne Corporation (b) | | | 88,586 | | | | 5,681,906 | |
United Therapeutics Corporation (a) (b) | | | 85,308 | | | | 5,696,868 | |
WellCare Health Plans, Inc. (a) (b) | | | 92,317 | | | | 5,383,004 | |
Other Health Care (c) | | | | | | | 212,282,658 | |
| | | | | | | | 269,998,820 | |
| Industrials — 13.3% | | | | | | | | |
Astronics Corporation - Class B (a) (d) | | | 1,560 | | | | 42,276 | |
Avis Budget Group, Inc. (a) (b) | | | 214,583 | | | | 6,188,574 | |
Babcock & Wilcox Company (The) (b) | | | 178,526 | | | | 4,855,907 | |
DigitalGlobe, Inc. (a) (b) | | | 198,531 | | | | 5,795,120 | |
EnergySolutions, Inc. (a) (b) | | | 1,164,405 | | | | 4,808,993 | |
Exelis, Inc. (b) | | | 632,972 | | | | 7,070,297 | |
| Primoris Services Corporation | | | 272,256 | | | | 6,000,522 | |
Republic Airways Holdings, Inc. (a) (b) | | | 476,548 | | | | 5,332,572 | |
Ryder System, Inc. (b) | | | 100,939 | | | | 5,861,528 | |
Spirit AeroSystems Holdings, Inc. - Class A (a) (b) | | | 402,859 | | | | 8,053,151 | |
Textainer Group Holdings Ltd. (b) | | | 125,964 | | | | 4,871,028 | |
Other Industrials (c) | | | | | | | 190,629,875 | |
| | | | | | | | 249,509,843 | |
| Information Technology — 15.2% | | | | | | | | |
First Solar, Inc. (a) (b) | | | 247,862 | | | | 11,540,455 | |
Sanmina Corporation (a) (b) | | | 568,415 | | | | 7,173,397 | |
TriQuint Semiconductor, Inc. (a) (b) | | | 1,047,435 | | | | 6,117,020 | |
Other Information Technology (c) | | | | | | | 261,015,810 | |
| | | | | | | | 285,846,682 | |
| Materials — 5.6% | | | | | | | | |
Eagle Materials, Inc. (b) | | | 73,508 | | | | 4,980,167 | |
Other Materials (c) | | | | | | | 99,230,144 | |
| | | | | | | | 104,210,311 | |
| Telecommunication Services — 1.4% | | | | | | | | |
Telephone and Data Systems, Inc. (b) | | | 274,741 | | | | 6,165,188 | |
Other Telecommunication Services (c) | | | | | | | 19,011,726 | |
| | | | | | | | 25,176,914 | |
| Utilities — 1.3% | | | | | | | | |
Other Utilities (c) | | | | | | | 25,104,249 | |
| | | | | | | | | |
Total Common Stocks (Cost $1,597,630,448) | | | | | | $ | 1,739,040,484 | |
PREFERRED STOCKS — 0.0% (e) | | | | |
Other Preferred Stocks (Cost $90,221)(c) | | | $ | 84,780 | |
TFS MARKET NEUTRAL FUND
SUMMARY SCHEDULE OF INVESTMENTS* (Continued)
| | | | |
Other Investments (Cost $75,813,833) (c) | | | $ | 77,705,294 | |
CORPORATE BONDS — 0.0% (e) | | | | |
Financials — 0.0% (e) | | | | |
Other Financials (Cost $0) (c) | | | $ | 2,805 | |
MONEY MARKET FUNDS — 0.9% | | | | | | |
Federated Government Obligations Fund - Institutional Class, 0.01% (f) | | | 13,976,855 | | | $ | 13,976,855 | |
UMB Money Market Fiduciary, 0.01% (f) | | | 3,370,158 | | | | 3,370,158 | |
Total Money Market Funds (Cost $17,347,013) | | | | | | $ | 17,347,013 | |
| | | | | | | | | |
Total Investments at Value — 97.7% (Cost $1,690,881,515) | | | | | | $ | 1,834,180,376 | |
| | | | | | | | | |
| Other Assets in Excess of Liabilities — 2.3% | | | | | | | 43,811,403 | (g) |
| | | | | | | | | |
| Net Assets — 100.0% | | | | | | $ | 1,877,991,779 | |
| * | A complete Schedule of Investments is available without charge upon request by calling toll-free 1-888-534-2001 or on the SEC’s website at http://www.sec.gov. |
| | |
| (a) | Non-income producing security. |
| | |
| (b) | All or a portion of the shares have been committed as collateral for open short positions. |
| | |
| (c) | Represents issuers not identified as either a top 50 holding in terms of value and issues or issuers not exceeding 1% of net assets individually or in the aggregate, respectively, or not a fair-valued security as of April 30, 2013. |
| | |
| (d) | Security has been valued at fair value in accordance with procedures adopted in good faith by the Board of Trustees. Total value of such securities is $42,280 at April 30, 2013, representing less than 0.1% of net assets (Note 2). |
| | |
| (e) | Percentage rounds to less than 0.1%. |
| | |
| (f) | The rate shown is the 7-day effective yield as of April 30, 2013. |
| | |
| (g) | Includes cash held as margin deposits for open short positions. |
| | |
| See accompanying notes to financial statements. |
TFS MARKET NEUTRAL FUND
SCHEDULE OF SECURITIES SOLD SHORT
April 30, 2013 (Unaudited)
| | | | | | |
| Consumer Discretionary — 10.3% | | | | | | |
| Auto Components — 0.4% | | | | | | |
| American Axle & Manufacturing Holdings, Inc. | | | 101 | | | $ | 1,350 | |
| China Automotive Systems, Inc. | | | 93,306 | | | | 420,810 | |
| China XD Plastics Company Ltd. | | | 90,980 | | | | 363,010 | |
| Fuel Systems Solutions, Inc. | | | 20,571 | | | | 323,171 | |
| Gentherm, Inc. | | | 148,690 | | | | 2,264,549 | |
| Goodyear Tire & Rubber Company (The) | | | 349,249 | | | | 4,363,866 | |
| Quantum Fuel Systems Technologies Worldwide, Inc. | | | 666,832 | | | | 380,094 | |
| SORL Auto Parts, Inc. | | | 21,719 | | | | 62,551 | |
| | | | | | | | 8,179,401 | |
| Automobiles — 0.4% | | | | | | | | |
| Kandi Technologies Corporation | | | 136,312 | | | | 576,600 | |
| Tesla Motors, Inc. | | | 84,090 | | | | 4,540,019 | |
| Winnebago Industries, Inc. | | | 76,164 | | | | 1,395,324 | |
| | | | | | | | 6,511,943 | |
| Distributors — 0.1% | | | | | | | | |
| China Metro-Rural Holdings Ltd. | | | 100 | | | | 120 | |
| Pool Corporation | | | 44,823 | | | | 2,197,223 | |
| VOXX International Corporation | | | 856 | | | | 8,158 | |
| | | | | | | | 2,205,501 | |
| Diversified Consumer Services — 1.2% | | | | | | | | |
| American Public Education, Inc. | | | 26,842 | | | | 900,012 | |
| Apollo Group, Inc. - Class A | | | 41,868 | | | | 769,115 | |
| Ascent Capital Group, Inc. | | | 1,813 | | | | 120,547 | |
| Bridgepoint Education, Inc. | | | 40,863 | | | | 440,503 | |
| Bright Horizons Family Solutions, Inc. | | | 56 | | | | 1,817 | |
| ChinaCast Education Corporation | | | 280,803 | | | | 19,656 | |
| Coinstar, Inc. | | | 102,352 | | | | 5,405,209 | |
| Collectors Universe, Inc. | | | 2,754 | | | | 32,800 | |
| Corinthian Colleges, Inc. | | | 807,805 | | | | 1,615,610 | |
| CPI Corporation | | | 4,039 | | | | 86 | |
| Education Management Corporation | | | 109,029 | | | | 618,195 | |
| Grand Canyon Education, Inc. | | | 65,290 | | | | 1,669,465 | |
| ITT Educational Services, Inc. | | | 147,968 | | | | 2,709,294 | |
| K12, Inc. | | | 7,905 | | | | 201,341 | |
| Matthews International Corporation - Class A | | | 13,093 | | | | 481,953 | |
| Regis Corporation | | | 132,759 | | | | 2,489,231 | |
| School Specialty, Inc. | | | 34,783 | | | | 1,705 | |
| Service Corporation International | | | 16,206 | | | | 273,557 | |
| Stewart Enterprises, Inc. - Class A | | | 136,385 | | | | 1,215,190 | |
| StoneMor Partners, L.P. | | | 93,136 | | | | 2,556,583 | |
| Strayer Education, Inc. | | | 22,803 | | | | 1,079,950 | |
TFS MARKET NEUTRAL FUND
SCHEDULE OF SECURITIES SOLD SHORT (Continued)
COMMON STOCKS — 65.7% (Continued) | | | | | | |
| Consumer Discretionary — 10.3% (Continued) | | | | | | |
| Diversified Consumer Services — 1.2% (Continued) | | | | | | |
| Weight Watchers International, Inc. | | | 12,340 | | | $ | 520,378 | |
| | | | | | | | 23,122,197 | |
| Hotels, Restaurants & Leisure — 1.1% | | | | | | | | |
| Arcos Dorados Holdings, Inc. | | | 688 | | | | 9,371 | |
| Asia Entertainment & Resources Ltd. | | | 88,972 | | | | 395,036 | |
| Biglari Holdings, Inc. | | | 274 | | | | 106,115 | |
| BJ's Restaurants, Inc. | | | 148,739 | | | | 5,101,748 | |
| Boyd Gaming Corporation | | | 281,673 | | | | 3,380,076 | |
| Brinker International, Inc. | | | 108,023 | | | | 4,202,095 | |
| Buffalo Wild Wings, Inc. | | | 11,149 | | | | 1,003,326 | |
| Choice Hotels International, Inc. | | | 144 | | | | 5,625 | |
| DineEquity, Inc. | | | 50,069 | | | | 3,566,915 | |
| Kona Grill, Inc. | | | 324 | | | | 3,159 | |
| Life Time Fitness, Inc. | | | 279 | | | | 12,884 | |
| MTR Gaming Group, Inc. | | | 287 | | | | 990 | |
| Nathan's Famous, Inc. | | | 1,095 | | | | 48,892 | |
| PokerTek, Inc. | | | 1,884 | | | | 2,656 | |
| Red Lion Hotels Corporation | | | 25,255 | | | | 164,915 | |
| Ruby Tuesday, Inc. | | | 87,622 | | | | 844,676 | |
| Ryman Hospitality Properties, Inc. | | | 19,739 | | | | 877,596 | |
| Star Buffet, Inc. | | | 325 | | | | 747 | |
| Texas Roadhouse, Inc. | | | 1,114 | | | | 26,179 | |
| Universal Travel Group | | | 237,996 | | | | 47,599 | |
| | | | | | | | 19,800,600 | |
| Household Durables — 1.6% | | | | | | | | |
| American Greetings Corporation - Class A | | | 191 | | | | 3,522 | |
| Bassett Furniture Industries, Inc. | | | 1,536 | | | | 21,550 | |
| Beazer Homes USA, Inc. | | | 56,026 | | | | 905,380 | |
| Blyth, Inc. | | | 258,330 | | | | 4,257,278 | |
| Cavco Industries, Inc. | | | 1,725 | | | | 78,695 | |
| Comstock Holding Companies, Inc. - Class A | | | 3,495 | | | | 9,891 | |
| Deer Consumer Products, Inc. | | | 51,567 | | | | 3,094 | |
| Desarrolladora Homex S.A.B de C.V. - ADR | | | 51,462 | | | | 251,135 | |
| Ethan Allen Interiors, Inc. | | | 27,788 | | | | 813,633 | |
| Furniture Brands International, Inc. | | | 1,558 | | | | 1,714 | |
| Garmin Ltd. | | | 5,047 | | | | 177,049 | |
| Hovnanian Enterprises, Inc. - Class A | | | 91,508 | | | | 498,719 | |
| iRobot Corporation | | | 89 | | | | 2,589 | |
| KB Home | | | 246,257 | | | | 5,550,633 | |
| Location Based Technologies, Inc. | | | 103,181 | | | | 19,088 | |
| M/I Homes, Inc. | | | 9,510 | | | | 233,946 | |
| Mad Catz Interactive, Inc. | | | 489,312 | | | | 200,471 | |
| Ryland Group, Inc. (The) | | | 126,606 | | | | 5,704,866 | |
TFS MARKET NEUTRAL FUND
SCHEDULE OF SECURITIES SOLD SHORT (Continued)
COMMON STOCKS — 65.7% (Continued) | | | | | | |
| Consumer Discretionary — 10.3% (Continued) | | | | | | |
| Household Durables — 1.6% (Continued) | | | | | | |
| Skullcandy, Inc. | | | 631,271 | | | $ | 3,244,733 | |
| SodaStream International Ltd. | | | 43,497 | | | | 2,341,878 | |
| Tempur-Pedic International, Inc. | | | 60,831 | | | | 2,950,304 | |
| ZAGG, Inc. | | | 329,933 | | | | 2,233,646 | |
| | | | | | | | 29,503,814 | |
| Internet & Catalog Retail — 0.4% | | | | | | | | |
| NutriSystem, Inc. | | | 178,484 | | | | 1,445,720 | |
| Overstock.com, Inc. | | | 152,184 | | | | 3,165,427 | |
| PetMed Express, Inc. | | | 225,437 | | | | 2,817,963 | |
| Vitacost.com, Inc. | | | 8,103 | | | | 63,041 | |
| | | | | | | | 7,492,151 | |
| Leisure Equipment & Products — 0.5% | | | | | | | | |
| Arctic Cat, Inc. | | | 3,214 | | | | 144,598 | |
| Black Diamond, Inc. | | | 126,966 | | | | 1,244,267 | |
| Brunswick Corporation | | | 67,073 | | | | 2,123,531 | |
| Callaway Golf Company | | | 82,684 | | | | 553,983 | |
| Eastman Kodak Company | | | 1,275,620 | | | | 471,980 | |
| JAKKS Pacific, Inc. | | | 14,776 | | | | 161,206 | |
| Nautilus, Inc. | | | 1,305 | | | | 8,978 | |
| Smith & Wesson Holding Corporation | | | 362,553 | | | | 3,183,215 | |
| Sturm Ruger & Company, Inc. | | | 10,875 | | | | 557,561 | |
| | | | | | | | 8,449,319 | |
| Media — 0.8% | | | | | | | | |
| Atrinsic, Inc. | | | 87,591 | | | | 350 | |
| Central European Media Enterprises Ltd. | | | 56,274 | | | | 208,214 | |
| China Yida Holding Company | | | 1,079 | | | | 4,273 | |
| Clear Channel Outdoor Holdings, Inc. | | | 24,057 | | | | 173,932 | |
| Cumulus Media, Inc. - Class A | | | 41,619 | | | | 132,765 | |
| Dex One Corporation | | | 425,979 | | | | 1,013,830 | |
Dial Global, Inc. (a) | | | 2,195 | | | | 922 | |
| Digital Domain Media Group, Inc. | | | 75,247 | | | | 1,279 | |
| Digital Generation, Inc. | | | 35,925 | | | | 240,697 | |
| DreamWorks Animation SKG, Inc. - Class A | | | 80,130 | | | | 1,544,906 | |
| IMAX Corporation | | | 100 | | | | 2,553 | |
| Lee Enterprises, Inc. | | | 322,902 | | | | 464,979 | |
| Madison Square Garden Company (The) - Class A | | | 52 | | | | 3,134 | |
| Manchester United plc - Class A | | | 17,453 | | | | 313,805 | |
| Martha Stewart Living Omnimedia, Inc. - Class A | | | 1,501 | | | | 3,707 | |
| McClatchy Company (The) - Class A | | | 731,645 | | | | 1,690,100 | |
| Media General, Inc. - Class A | | | 85,726 | | | | 702,953 | |
| Meredith Corporation | | | 20,644 | | | | 801,400 | |
| New York Times Company (The) | | | 354,252 | | | | 3,138,673 | |
| Pandora Media, Inc. | | | 10,104 | | | | 140,749 | |
TFS MARKET NEUTRAL FUND
SCHEDULE OF SECURITIES SOLD SHORT (Continued)
COMMON STOCKS — 65.7% (Continued) | | | | | | |
| Consumer Discretionary — 10.3% (Continued) | | | | | | |
| Media — 0.8% (Continued) | | | | | | |
| Regal Entertainment Group - Class A | | | 65,640 | | | $ | 1,177,582 | |
| Scholastic Corporation | | | 49,705 | | | | 1,364,402 | |
| SPAR Group, Inc. | | | 705 | | | | 1,382 | |
| SuperMedia, Inc. | | | 50,146 | | | | 263,267 | |
| Tiger Media, Inc. | | | 1,132 | | | | 1,313 | |
| Valassis Communications, Inc. | | | 73,295 | | | | 1,878,551 | |
| World Wrestling Entertainment, Inc. - Class A | | | 27,827 | | | | 255,452 | |
| | | | | | | | 15,525,170 | |
| Multiline Retail — 0.4% | | | | | | | | |
| Bon-Ton Stores, Inc. (The) | | | 297,796 | | | | 4,568,191 | |
| Fred's, Inc. - Class A | | | 78,585 | | | | 1,118,264 | |
| J. C. Penney Company, Inc. | | | 62,627 | | | | 1,028,335 | |
| Saks, Inc. | | | 95,354 | | | | 1,101,339 | |
| Sears Canada, Inc. | | | 9,011 | | | | 83,634 | |
| Sears Holdings Corporation | | | 2,755 | | | | 141,442 | |
| | | | | | | | 8,041,205 | |
| Specialty Retail — 2.9% | | | | | | | | |
| Aéropostale, Inc. | | | 23,489 | | | | 344,349 | |
| America's Car-Mart, Inc. | | | 4,801 | | | | 222,142 | |
| AutoChina International Ltd. | | | 156 | | | | 1,724 | |
| Barnes & Noble, Inc. | | | 324,414 | | | | 5,881,626 | |
| bebe stores, inc. | | | 176,920 | | | | 1,001,367 | |
| Body Central Corporation | | | 7,340 | | | | 74,721 | |
| Books-A-Million, Inc. | | | 12,867 | | | | 33,454 | |
| Brown Shoe Company, Inc. | | | 6,449 | | | | 109,053 | |
| Buckle, Inc. (The) | | | 38,399 | | | | 1,864,271 | |
| Citi Trends, Inc. | | | 10,782 | | | | 126,904 | |
| Coldwater Creek, Inc. | | | 147,888 | | | | 527,960 | |
| Conn's, Inc. | | | 120,773 | | | | 5,230,679 | |
| Finish Line, Inc. (The) | | | 493 | | | | 9,559 | |
| Francesca's Holdings Corporation | | | 46,452 | | | | 1,326,669 | |
| Group 1 Automotive, Inc. | | | 68,453 | | | | 4,140,037 | |
| Guess?, Inc. | | | 7,968 | | | | 220,554 | |
| Hibbett Sports, Inc. | | | 2,815 | | | | 154,403 | |
| Hot Topic, Inc. | | | 231,557 | | | | 3,230,220 | |
| Jos. A. Bank Clothiers, Inc. | | | 49,085 | | | | 2,144,033 | |
| Lithia Motors, Inc. | | | 1,120 | | | | 55,462 | |
| Lumber Liquidators Holdings, Inc. | | | 16,218 | | | | 1,329,227 | |
| MarineMax, Inc. | | | 565 | | | | 6,548 | |
| Mattress Firm Holding Corporation | | | 49,091 | | | | 1,881,167 | |
| Monro Muffler Brake, Inc. | | | 61,849 | | | | 2,558,075 | |
| Office Depot, Inc. | | | 153,773 | | | | 593,564 | |
| OfficeMax, Inc. | | | 33,368 | | | | 384,066 | |
TFS MARKET NEUTRAL FUND
SCHEDULE OF SECURITIES SOLD SHORT (Continued)
COMMON STOCKS — 65.7% (Continued) | | | | | | |
| Consumer Discretionary — 10.3% (Continued) | | | | | | |
| Specialty Retail — 2.9% (Continued) | | | | | | |
| Orchard Supply Hardware Stores Corporation - Class A | | | 5,013 | | | $ | 9,926 | |
| Pep Boys - Manny Moe & Jack (The) | | | 89,919 | | | | 1,043,060 | |
| RadioShack Corporation | | | 2,359,057 | | | | 7,478,211 | |
| Rent-A-Center, Inc. | | | 89,791 | | | | 3,136,400 | |
| rue21, inc. | | | 11,612 | | | | 370,423 | |
| Select Comfort Corporation | | | 44,227 | | | | 938,497 | |
| Sonic Automotive, Inc. - Class A | | | 72,877 | | | | 1,602,565 | |
| Stage Stores, Inc. | | | 162,848 | | | | 4,509,261 | |
| Systemax, Inc. | | | 2,729 | | | | 24,998 | |
| Tile Shop Holdings, Inc. (The) | | | 276 | | | | 6,845 | |
| Trinity Place Holdings, Inc. | | | 160 | | | | 872 | |
| Walking Company Holdings, Inc. (The) | | | 4 | | | | 37 | |
| Zumiez, Inc. | | | 84,737 | | | | 2,454,831 | |
| | | | | | | | 55,027,760 | |
| Textiles, Apparel & Luxury Goods — 0.5% | | | | | | | | |
| American Apparel, Inc. | | | 427,575 | | | | 825,220 | |
| DGSE Companies, Inc. | | | 3,657 | | | | 18,577 | |
| G-III Apparel Group Ltd. | | | 135 | | | | 5,489 | |
| Iconix Brand Group, Inc. | | | 161 | | | | 4,613 | |
| Joe's Jeans, Inc. | | | 100 | | | | 176 | |
| Kingold Jewelry, Inc. | | | 145,407 | | | | 184,667 | |
| Vera Bradley, Inc. | | | 156,150 | | | | 3,563,343 | |
| Wolverine World Wide, Inc. | | | 90,805 | | | | 4,337,755 | |
| | | | | | | | 8,939,840 | |
| Consumer Staples — 1.9% | | | | | | | | |
| Beverages — 0.1% | | | | | | | | |
| Boston Beer Company, Inc. - Class A | | | 2,671 | | | | 452,254 | |
| Central European Distribution Corporation | | | 852,814 | | | | 59,697 | |
| Primo Water Corporation | | | 88,606 | | | | 112,529 | |
| Reed's, Inc. | | | 120,489 | | | | 494,005 | |
| | | | | | | | 1,118,485 | |
| Food & Staples Retailing — 0.4% | | | | | | | | |
| Chefs' Warehouse, Inc. (The) | | | 19,345 | | | | 355,754 | |
| Crumbs Bake Shop, Inc. | | | 466 | | | | 662 | |
| Natural Grocers by Vitamin Cottage, Inc. | | | 5,821 | | | | 145,991 | |
| Pizza Inn Holdings, Inc. | | | 2,087 | | | | 16,571 | |
| Roundy's, Inc. | | | 585,107 | | | | 4,189,366 | |
| Spartan Stores, Inc. | | | 520 | | | | 8,726 | |
| SUPERVALU, Inc. | | | 131,628 | | | | 768,707 | |
| Susser Holdings Corporation | | | 11,123 | | | | 591,410 | |
| United Natural Foods, Inc. | | | 15,267 | | | | 762,434 | |
| Weis Markets, Inc. | | | 8,627 | | | | 360,867 | |
| | | | | | | | 7,200,488 | |
TFS MARKET NEUTRAL FUND
SCHEDULE OF SECURITIES SOLD SHORT (Continued)
COMMON STOCKS — 65.7% (Continued) | | | | | | |
| Consumer Staples — 1.9% (Continued) | | | | | | |
| Food Products — 0.7% | | | | | | |
| AgFeed Industries, Inc. | | | 179,465 | | | $ | 18,126 | |
| Amira Nature Foods Ltd. | | | 9,864 | | | | 75,558 | |
| Annie's, Inc. | | | 34,271 | | | | 1,295,101 | |
| Calavo Growers, Inc. | | | 66,189 | | | | 1,877,120 | |
| Cal-Maine Foods, Inc. | | | 220 | | | | 9,390 | |
| China Marine Food Group Ltd. | | | 69,491 | | | | 55,593 | |
| Chiquita Brands International, Inc. | | | 572 | | | | 4,936 | |
| Coffee Holding Company, Inc. | | | 78,247 | | | | 530,515 | |
| Dean Foods Company | | | 44,394 | | | | 849,701 | |
| Diamond Foods, Inc. | | | 258,977 | | | | 3,905,373 | |
| Dole Food Company, Inc. | | | 45,613 | | | | 490,796 | |
| Feihe International, Inc. | | | 27,039 | | | | 197,926 | |
| Fresh Del Monte Produce, Inc. | | | 16,322 | | | | 414,742 | |
| Green Mountain Coffee Roasters, Inc. | | | 3,171 | | | | 182,015 | |
| Hain Celestial Group, Inc. (The) | | | 12,027 | | | | 784,762 | |
| Le Gaga Holdings Ltd. | | | 3,510 | | | | 11,337 | |
| Lifeway Foods, Inc. | | | 697 | | | | 8,838 | |
| Limoneira Company | | | 32 | | | | 596 | |
| SkyPeople Fruit Juice, Inc. | | | 31,586 | | | | 69,173 | |
| Stevia Corporation | | | 4,596 | | | | 1,289 | |
| Tootsie Roll Industries, Inc. | | | 3,360 | | | | 104,946 | |
| Umami Sustainable Seafood, Inc. | | | 756 | | | | 1,164 | |
| WhiteWave Foods Company | | | 142,547 | | | | 2,410,470 | |
Yuhe International, Inc. (a) | | | 109,183 | | | | 8,735 | |
| Zhongpin, Inc. | | | 495 | | | | 6,415 | |
| | | | | | | | 13,314,617 | |
Household Products — 0.0% (b) | | | | | | | | |
| Central Garden & Pet Company - Class A | | | 20,643 | | | | 181,659 | |
| | | | | | | | | |
| Personal Products — 0.5% | | | | | | | | |
| China Sky One Medical, Inc. | | | 197,454 | | | | 29,618 | |
| China-Biotics, Inc. | | | 532,897 | | | | 969,873 | |
| Elizabeth Arden, Inc. | | | 2,763 | | | | 113,145 | |
| Herbalife Ltd. | | | 40,559 | | | | 1,610,598 | |
| LifeVantage Corporation | | | 400,194 | | | | 912,442 | |
| Medifast, Inc. | | | 33,149 | | | | 868,504 | |
| Nu Skin Enterprises, Inc. | | | 22,536 | | | | 1,143,251 | |
| Synutra International, Inc. | | | 96,374 | | | | 465,486 | |
| USANA Health Sciences, Inc. | | | 74,883 | | | | 4,224,899 | |
| | | | | | | | 10,337,816 | |
| Tobacco — 0.2% | | | | | | | | |
| Alliance One International, Inc. | | | 255,821 | | | | 959,329 | |
| Star Scientific, Inc. | | | 1,655,659 | | | | 2,053,017 | |
| | | | | | | | 3,012,346 | |
TFS MARKET NEUTRAL FUND
SCHEDULE OF SECURITIES SOLD SHORT (Continued)
COMMON STOCKS — 65.7% (Continued) | | | | | | |
| Energy — 5.4% | | | | | | |
| Energy Equipment & Services — 0.7% | | | | | | |
| C&J Energy Services, Inc. | | | 16,826 | | | $ | 332,987 | |
| Cal Dive International, Inc. | | | 896,283 | | | | 1,496,793 | |
| Compressco Partners, L.P. | | | 33 | | | | 782 | |
| Geokinetics, Inc. | | | 1,664 | | | | 17 | |
| Gulfmark Offshore, Inc. - Class A | | | 10,698 | | | | 445,251 | |
| Heckmann Corporation | | | 1,686,209 | | | | 6,222,111 | |
| Helix Energy Solutions Group, Inc. | | | 123,923 | | | | 2,855,186 | |
| Mitcham Industries, Inc. | | | 1,444 | | | | 21,443 | |
| Newpark Resources, Inc. | | | 4,235 | | | | 44,467 | |
| Poseidon Concepts Corporation | | | 5,042 | | | | 61 | |
| Recon Technology Ltd. | | | 900 | | | | 1,872 | |
| RigNet, Inc. | | | 24 | | | | 581 | |
| RPC, Inc. | | | 42,434 | | | | 561,826 | |
| SulphCo, Inc. | | | 486,090 | | | | 389 | |
| Tesco Corporation | | | 3,417 | | | | 41,687 | |
| Tidewater, Inc. | | | 3,524 | | | | 184,834 | |
| Transocean Ltd. | | | 4,161 | | | | 214,167 | |
| USA Compression Partners, L.P. | | | 9,744 | | | | 209,496 | |
| Vantage Drilling Company | | | 406,367 | | | | 686,760 | |
| | | | | | | | 13,320,710 | |
| Oil, Gas & Consumable Fuels — 4.7% | | | | | | | | |
| Alon USA Partners, L.P. | | | 180 | | | | 4,464 | |
| Amyris, Inc. | | | 43,859 | | | | 119,296 | |
| Apco Oil and Gas International, Inc. | | | 2,414 | | | | 24,406 | |
| Approach Resources, Inc. | | | 24,362 | | | | 577,867 | |
| Arch Coal, Inc. | | | 199,556 | | | | 967,847 | |
| ATP Oil & Gas Corporation | | | 376,995 | | | | 52,742 | |
| Berry Petroleum Company - Class A | | | 5,001 | | | | 239,598 | |
| Bill Barrett Corporation | | | 111,667 | | | | 2,217,707 | |
| BioFuel Energy Corporation | | | 112,894 | | | | 487,138 | |
| Blue Dolphin Energy Company | | | 41,521 | | | | 253,278 | |
| BMB Munai, Inc. | | | 5,958 | | | | 120 | |
| BPZ Resources, Inc. | | | 1,147,068 | | | | 2,454,725 | |
| CAMAC Energy, Inc. | | | 237,884 | | | | 128,457 | |
| Chesapeake Granite Wash Trust | | | 32,330 | | | | 524,069 | |
| China Integrated Energy, Inc. | | | 485,749 | | | | 131,152 | |
| Clayton Williams Energy, Inc. | | | 4 | | | | 154 | |
| Clean Energy Fuels Corporation | | | 188,834 | | | | 2,490,720 | |
| Cloud Peak Energy, Inc. | | | 173,969 | | | | 3,399,354 | |
| Contango Oil & Gas Company | | | 5,387 | | | | 202,659 | |
| Cubic Energy, Inc. | | | 8,104 | | | | 2,593 | |
| CVR Energy, Inc. | | | 13,237 | | | | 652,187 | |
| CVR Refining, L.P. | | | 109,796 | | | | 3,499,199 | |
TFS MARKET NEUTRAL FUND
SCHEDULE OF SECURITIES SOLD SHORT (Continued)
COMMON STOCKS — 65.7% (Continued) | | | | | | |
| Energy — 5.4% (Continued) | | | | | | |
| Oil, Gas & Consumable Fuels — 4.7% (Continued) | | | | | | |
| Dominion Resources Black Warrior Trust | | | 1,352 | | | $ | 6,774 | |
| Emerald Oil, Inc. | | | 94,383 | | | | 606,883 | |
| Enbridge Energy Management, LLC | | | 66,091 | | | | 1,963,564 | |
| Endeavour International Corporation | | | 342,498 | | | | 938,445 | |
| EQT Midstream Partners, L.P. | | | 915 | | | | 42,364 | |
| EXCO Resources, Inc. | | | 73,706 | | | | 535,106 | |
| Frontline Ltd. | | | 344,368 | | | | 626,750 | |
| FX Energy, Inc. | | | 2,855 | | | | 10,963 | |
| GeoGlobal Resources, Inc. | | | 321,275 | | | | 6,586 | |
| Global Partners, L.P. | | | 306 | | | | 10,924 | |
| GMX Resources, Inc. | | | 74,803 | | | | 12,342 | |
| GreenHunter Energy, Inc. | | | 36,697 | | | | 41,835 | |
| Harvest Natural Resources, Inc. | | | 101,087 | | | | 331,565 | |
| Houston American Energy Corporation | | | 39,340 | | | | 7,510 | |
| Hugoton Royalty Trust | | | 211 | | | | 1,914 | |
| Hyperdynamics Corporation | | | 890,631 | | | | 492,964 | |
| Inergy Midstream, L.P. | | | 3,001 | | | | 76,195 | |
| InterOil Corporation | | | 43,436 | | | | 3,436,656 | |
| Isramco, Inc. | | | 1,462 | | | | 133,554 | |
| Ivanhoe Energy, Inc. | | | 4,600 | | | | 5,934 | |
| James River Coal Company | | | 3,010,993 | | | | 4,968,138 | |
| Kinder Morgan Management, LLC | | | 11,016 | | | | 972,388 | |
| KiOR, Inc. - Class A | | | 535,458 | | | | 2,607,680 | |
| Knightsbridge Tankers Ltd. | | | 75,571 | | | | 517,661 | |
| L & L Energy, Inc. | | | 256,202 | | | | 991,502 | |
| Linn Energy, LLC | | | 28,137 | | | | 1,086,370 | |
| LinnCo, LLC | | | 60,162 | | | | 2,570,722 | |
| Lucas Energy, Inc. | | | 356,471 | | | | 459,848 | |
| Magnum Hunter Resources Corporation | | | 477,375 | | | | 1,298,460 | |
| McMoRan Exploration Company | | | 63,895 | | | | 1,057,462 | |
| Mexco Energy Corporation | | | 215 | | | | 1,210 | |
| Miller Energy Resources, Inc. | | | 343,668 | | | | 1,305,938 | |
| New Concept Energy, Inc. | | | 12,245 | | | | 12,735 | |
| NGL Energy Partners, L.P. | | | 24,615 | | | | 722,943 | |
| Niska Gas Storage Partners, LLC | | | 2,346 | | | | 35,706 | |
| Nordic American Tankers Ltd. | | | 207,611 | | | | 1,849,814 | |
| Northern Oil & Gas, Inc. | | | 137,298 | | | | 1,769,771 | |
| Overseas Shipholding Group, Inc. | | | 804,229 | | | | 2,670,040 | |
| Oxford Resource Partners, L.P. | | | 177,073 | | | | 571,946 | |
| Pacific Ethanol, Inc. | | | 1,772,585 | | | | 478,598 | |
| Patriot Coal Corporation | | | 447,191 | | | | 41,544 | |
| PBF Energy, Inc. | | | 5,488 | | | | 167,110 | |
| PDC Energy, Inc. | | | 16,345 | | | | 707,738 | |
TFS MARKET NEUTRAL FUND
SCHEDULE OF SECURITIES SOLD SHORT (Continued)
COMMON STOCKS — 65.7% (Continued) | | | | | | |
| Energy — 5.4% (Continued) | | | | | | |
| Oil, Gas & Consumable Fuels — 4.7% (Continued) | | | | | | |
| Pengrowth Energy Corporation | | | 602 | | | $ | 3,046 | |
| PetroBakken Energy Ltd. | | | 767 | | | | 6,527 | |
| Pyramid Oil Company | | | 35,326 | | | | 142,364 | |
| Resolute Energy Corporation | | | 118,114 | | | | 1,089,011 | |
| REX American Resources Corporation | | | 181 | | | | 3,383 | |
| Rex Energy Corporation | | | 85,439 | | | | 1,373,005 | |
| Rhino Resource Partners, L.P. | | | 32,825 | | | | 478,588 | |
| Royale Energy, Inc. | | | 232,388 | | | | 571,674 | |
| San Juan Basin Royalty Trust | | | 293,698 | | | | 4,537,634 | |
| Sanchez Energy Corporation | | | 69,575 | | | | 1,260,003 | |
| SandRidge Energy, Inc. | | | 533,812 | | | | 2,743,794 | |
| Sino Clean Energy, Inc. | | | 214,504 | | | | 42,901 | |
| Solazyme, Inc. | | | 961,373 | | | | 8,748,494 | |
| StealthGas, Inc. | | | 611 | | | | 6,318 | |
| Susser Petroleum Partners, L.P. | | | 8,240 | | | | 254,698 | |
| Teekay Tankers Ltd. - Class A | | | 963,909 | | | | 2,438,690 | |
| Tri-Valley Corporation | | | 568,872 | | | | 1,422 | |
| Ultra Petroleum Corporation | | | 31,171 | | | | 667,059 | |
| Uranerz Energy Corporation | | | 403,486 | | | | 411,556 | |
| Uranium Energy Corporation | | | 1,128,671 | | | | 1,749,440 | |
| Uranium Resources, Inc. | | | 211,338 | | | | 426,903 | |
| USEC, Inc. | | | 932,571 | | | | 298,423 | |
| Verenium Corporation | | | 100,530 | | | | 231,219 | |
| W&T Offshore, Inc. | | | 150,879 | | | | 1,762,267 | |
| Whiting USA Trust I | | | 607,449 | | | | 3,924,121 | |
| Whiting USA Trust II | | | 500 | | | | 7,080 | |
| ZaZa Energy Corporation | | | 100 | | | | 127 | |
| Zion Oil & Gas, Inc. | | | 298,883 | | | | 385,559 | |
| | | | | | | | 88,149,190 | |
| Financials — 9.5% | | | | | | | | |
| Capital Markets — 1.6% | | | | | | | | |
| AllianceBernstein Holding, L.P. | | | 1,030 | | | | 24,401 | |
| Apollo Investment Corporation | | | 2,303 | | | | 20,289 | |
| Calamos Asset Management, Inc. | | | 10,595 | | | | 120,253 | |
| CorEnergy Infrastructure Trust, Inc. | | | 30 | | | | 230 | |
| E*TRADE Financial Corporation | | | 423,330 | | | | 4,356,066 | |
| Fidus Investment Corporation | | | 156,011 | | | | 2,933,007 | |
| Financial Engines, Inc. | | | 95,763 | | | | 3,482,900 | |
| FXCM, Inc. | | | 51,773 | | | | 701,524 | |
| Gladstone Investment Corporation | | | 297,759 | | | | 2,215,327 | |
| Hercules Technology Growth Capital, Inc. | | | 36,366 | | | | 483,668 | |
| Horizon Technology Finance Corporation | | | 122 | | | | 1,792 | |
| INTL FCStone, Inc. | | | 43,417 | | | | 743,299 | |
TFS MARKET NEUTRAL FUND
SCHEDULE OF SECURITIES SOLD SHORT (Continued)
COMMON STOCKS — 65.7% (Continued) | | | | | | |
| Financials — 9.5% (Continued) | | | | | | |
| Capital Markets — 1.6% (Continued) | | | | | | |
| Investment Technology Group, Inc. | | | 269 | | | $ | 2,929 | |
| Investors Capital Holdings Ltd. | | | 131 | | | | 508 | |
| Janus Capital Group, Inc. | | | 18,562 | | | | 165,573 | |
| KCAP Financial, Inc. | | | 102,781 | | | | 1,112,090 | |
| Knight Capital Group, Inc. | | | 642,674 | | | | 2,275,066 | |
| Main Street Capital Corporation | | | 6,374 | | | | 191,603 | |
| Medley Capital Corporation | | | 4,828 | | | | 75,220 | |
| MF Global Holdings Ltd. | | | 489,633 | | | | 12,975 | |
| NGP Capital Resources Company | | | 169,125 | | | | 1,126,373 | |
| Oppenheimer Holdings, Inc. | | | 435 | | | | 8,048 | |
| PennantPark Floating Rate Capital Ltd. | | | 3,393 | | | | 48,045 | |
| Penson Worldwide, Inc. | | | 261,155 | | | | 992 | |
| Piper Jaffray Companies, Inc. | | | 70,120 | | | | 2,367,251 | |
| Rand Capital Corporation | | | 751 | | | | 2,231 | |
| Safeguard Scientifics, Inc. | | | 81,546 | | | | 1,316,152 | |
| SEI Investments Company | | | 2 | | | | 57 | |
| Solar Capital Ltd. | | | 42,021 | | | | 1,005,563 | |
| Stifel Financial Corporation | | | 123,717 | | | | 3,986,162 | |
| TICC Capital Corporation | | | 37,564 | | | | 382,026 | |
| Triangle Capital Corporation | | | 38,200 | | | | 1,068,454 | |
| | | | | | | | 30,230,074 | |
| Commercial Banks — 4.0% | | | | | | | | |
| Ameris Bancorp | | | 81,817 | | | | 1,134,802 | |
| Arrow Financial Corporation | | | 4,431 | | | | 107,186 | |
| Auburn National Bancorporation, Inc. | | | 221 | | | | 4,906 | |
| BancFirst Corporation | | | 174 | | | | 7,280 | |
| BancorpSouth, Inc. | | | 8,902 | | | | 142,432 | |
| Bank of the Ozarks, Inc. | | | 98,517 | | | | 4,032,301 | |
| Banner Corporation | | | 3,118 | | | | 101,865 | |
| BBCN Bancorp, Inc. | | | 60,576 | | | | 780,219 | |
| BNC Bancorp | | | 1,127 | | | | 11,439 | |
| Boston Private Financial Holdings, Inc. | | | 58,096 | | | | 560,045 | |
| Britton & Koontz Capital Corporation | | | 9 | | | | 99 | |
| Bryn Mawr Bank Corporation | | | 2,555 | | | | 59,353 | |
| C&F Financial Corporation | | | 575 | | | | 23,115 | |
| Capital City Bank Group, Inc. | | | 34,488 | | | | 431,100 | |
| Capitol Bancorp Ltd. | | | 40,199 | | | | 3,015 | |
| Cascade Bancorp | | | 27,027 | | | | 161,351 | |
| Cathay General Bancorp | | | 399 | | | | 7,864 | |
| CenterState Banks, Inc. | | | 44 | | | | 366 | |
| Citizens Holding Company | | | 737 | | | | 14,519 | |
| City Bank | | | 13,826 | | | | 1,383 | |
| City Holding Company | | | 85,787 | | | | 3,275,348 | |
TFS MARKET NEUTRAL FUND
SCHEDULE OF SECURITIES SOLD SHORT (Continued)
COMMON STOCKS — 65.7% (Continued) | | | | | | |
| Financials — 9.5% (Continued) | | | | | | |
| Commercial Banks — 4.0% (Continued) | | | | | | |
| CoBiz Financial, Inc. | | | 2,715 | | | $ | 23,240 | |
| Columbia Banking System, Inc. | | | 85,912 | | | | 1,844,531 | |
| Commerce Bancshares, Inc. | | | 16,181 | | | | 649,020 | |
| Community Bank System, Inc. | | | 107,143 | | | | 3,068,576 | |
| Community Trust Bancorp, Inc. | | | 7,963 | | | | 275,679 | |
| Dearborn Bancorp, Inc. | | | 920 | | | | 20 | |
| Fauquier Bankshares, Inc. | | | 228 | | | | 2,741 | |
| First BanCorporation (Puerto Rico) | | | 333,320 | | | | 1,969,921 | |
| First Busey Corporation | | | 237,878 | | | | 1,022,875 | |
| First Commonwealth Financial Corporation | | | 121,959 | | | | 872,007 | |
| First Community Bancshares, Inc. | | | 23,567 | | | | 365,524 | |
| First Financial Bancorporation | | | 9,806 | | | | 150,718 | |
| First Financial Bankshares, Inc. | | | 95,180 | | | | 4,702,844 | |
| First of Long Island Corporation (The) | | | 111 | | | | 3,353 | |
| FirstMerit Corporation | | | 25,582 | | | | 438,220 | |
| FNB Corporation | | | 91,666 | | | | 1,044,076 | |
| FNB United Corporation | | | 14,471 | | | | 108,532 | |
| Frontier Financial Corporation | | | 10,459 | | | | 209 | |
| Glacier Bancorp, Inc. | | | 116,550 | | | | 2,150,348 | |
| Glen Burnie Bancorp | | | 56 | | | | 669 | |
| Hampton Roads Bankshares, Inc. | | | 111,129 | | | | 142,245 | |
| Heartland Financial USA, Inc. | | | 842 | | | | 21,395 | |
| Heritage Financial Corporation | | | 41 | | | | 572 | |
| IBERIABANK Corporation | | | 142 | | | | 6,478 | |
| Independent Bank Corporation (Massachusetts) | | | 91,935 | | | | 2,853,662 | |
| Independent Bank Corporation (Michigan) | | | 90,099 | | | | 637,000 | |
| International Bancshares Corporation | | | 1,528 | | | | 29,643 | |
| Jeffersonville Bancorp | | | 10 | | | | 110 | |
| Lakeland Bancorp, Inc. | | | 75,734 | | | | 724,017 | |
| Macatawa Bank Corporation | | | 48,336 | | | | 270,682 | |
| Mercantile Bancorp, Inc. | | | 867 | | | | 182 | |
| Mercantile Bank Corporation | | | 2,409 | | | | 40,254 | |
| National Bankshares, Inc. | | | 6,377 | | | | 208,847 | |
| National Penn Bancshares, Inc. | | | 75,061 | | | | 734,847 | |
| Oak Valley Bancorp | | | 147 | | | | 1,166 | |
| OFG Bancorp | | | 180,868 | | | | 2,906,549 | |
| Old Second Bancorp, Inc. | | | 53,319 | | | | 245,267 | |
| OmniAmerican Bancorp, Inc. | | | 100 | | | | 2,490 | |
| PAB Bankshares, Inc. | | | 4,809 | | | | 15 | |
| PacWest Bancorp | | | 60,283 | | | | 1,671,648 | |
| Park National Corporation | | | 47,983 | | | | 3,281,078 | |
| Park Sterling Corporation | | | 1,196 | | | | 6,853 | |
| Patriot National Bancorp | | | 638 | | | | 944 | |
TFS MARKET NEUTRAL FUND
SCHEDULE OF SECURITIES SOLD SHORT (Continued)
COMMON STOCKS — 65.7% (Continued) | | | | | | |
| Financials — 9.5% (Continued) | | | | | | |
| Commercial Banks — 4.0% (Continued) | | | | | | |
| Pinnacle Financial Partners, Inc. | | | 112,729 | | | $ | 2,735,933 | |
| Popular, Inc. | | | 145,259 | | | | 4,138,429 | |
| Princeton National Bancorp, Inc. | | | 600 | | | | 7 | |
| Prosperity Bancshares, Inc. | | | 27,804 | | | | 1,277,316 | |
| Renasant Corporation | | | 76,837 | | | | 1,753,420 | |
| Republic Bancorp, Inc. - Class A | | | 62,705 | | | | 1,392,051 | |
| S&T Bancorp, Inc. | | | 22,211 | | | | 419,122 | |
| S.Y. Bancorp, Inc. | | | 3,824 | | | | 87,799 | |
| Seacoast Banking Corporation of Florida | | | 832 | | | | 1,780 | |
| Security Bank Corporation | | | 32,973 | | | | — | |
| Simmons First National Corporation - Class A | | | 39,467 | | | | 967,731 | |
| Southside Bancshares, Inc. | | | 160,135 | | | | 3,423,686 | |
| Southwest Bancorp, Inc. | | | 11,695 | | | | 154,608 | |
| State Bank Financial Corporation | | | 32,113 | | | | 472,382 | |
| StellarOne Corporation | | | 6,251 | | | | 93,702 | |
| Sterling Financial Corporation | | | 1,832 | | | | 39,938 | |
| Taylor Capital Group, Inc. | | | 58,427 | | | | 855,956 | |
| TCF Financial Corporation | | | 30,413 | | | | 442,509 | |
| Texas Capital Bancshares, Inc. | | | 92,285 | | | | 3,844,593 | |
| Tompkins Financial Corporation | | | 650 | | | | 27,170 | |
| TowneBank | | | 67,383 | | | | 964,251 | |
| Trustmark Corporation | | | 50 | | | | 1,228 | |
| Umpqua Holdings Corporation | | | 56,708 | | | | 680,496 | |
| United Bankshares, Inc. | | | 98,142 | | | | 2,483,974 | |
| United Security Bancshares | | | 1,807 | | | | 7,426 | |
| Valley National Bancorp | | | 125,290 | | | | 1,126,357 | |
| Westamerica Bancorporation | | | 56,377 | | | | 2,446,198 | |
| Westbury Bancorp, Inc. | | | 1,667 | | | | 22,004 | |
| Western Alliance Bancorporation | | | 5,248 | | | | 77,198 | |
| Wintrust Financial Corporation | | | 22,772 | | | | 816,604 | |
| | | | | | | | 74,092,903 | |
| Consumer Finance — 0.3% | | | | | | | | |
| Atlanticus Holdings Corporation | | | 109,936 | | | | 406,763 | |
| Encore Capital Group, Inc. | | | 83,384 | | | | 2,375,610 | |
| Green Dot Corporation - Class A | | | 131,110 | | | | 2,059,738 | |
| NetSpend Holdings, Inc. | | | 2,431 | | | | 38,799 | |
| World Acceptance Corporation | | | 9,908 | | | | 880,425 | |
| | | | | | | | 5,761,335 | |
| Diversified Financial Services — 0.1% | | | | | | | | |
| Capital Southwest Corporation | | | 36 | | | | 4,237 | |
| Consumer Portfolio Services, Inc. | | | 228 | | | | 2,102 | |
| DJSP Enterprises, Inc. | | | 15,586 | | | | 1,733 | |
| KKR Financial Holdings, LLC | | | 12,531 | | | | 133,956 | |
TFS MARKET NEUTRAL FUND
SCHEDULE OF SECURITIES SOLD SHORT (Continued)
COMMON STOCKS — 65.7% (Continued) | | | | | | |
| Financials — 9.5% (Continued) | | | | | | |
| Diversified Financial Services — 0.1% (Continued) | | | | | | |
| Life Partners Holdings, Inc. | | | 163,156 | | | $ | 543,310 | |
| Primus Guaranty Ltd. | | | 1,849 | | | | 18,952 | |
| | | | | | | | 704,290 | |
| Insurance — 1.0% | | | | | | | | |
| Allied World Assurance Company Holdings Ltd. | | | 16,040 | | | | 1,456,592 | |
| Ambac Financial Group, Inc. | | | 19,556 | | | | 61 | |
| American Equity Investment Life Holding Company | | | 310,463 | | | | 4,731,456 | |
| American Financial Group, Inc. | | | 3,179 | | | | 153,450 | |
| CNA Financial Corporation | | | 17,235 | | | | 580,992 | |
| eHealth, Inc. | | | 114,741 | | | | 2,402,676 | |
| Gerova Financial Group Ltd. | | | 9,506 | | | | — | |
| Homeowners Choice, Inc. | | | 35,008 | | | | 929,112 | |
| Kingsway Financial Services, Inc. | | | 608 | | | | 2,250 | |
| MBIA, Inc. | | | 20,644 | | | | 195,292 | |
| Montpelier Re Holdings Ltd. | | | 64,762 | | | | 1,668,269 | |
| National Financial Partners Corporation | | | 4,802 | | | | 121,683 | |
| National Western Life Insurance Company | | | 130 | | | | 23,741 | |
| Phoenix Companies, Inc. (The) | | | 16,634 | | | | 484,216 | |
| Primerica, Inc. | | | 106,621 | | | | 3,620,849 | |
| StanCorp Financial Group, Inc. | | | 41,200 | | | | 1,779,016 | |
| Tower Group International Ltd. | | | 19,621 | | | | 371,229 | |
| Universal Insurance Holdings, Inc. | | | 65 | | | | 389 | |
| | | | | | | | 18,521,273 | |
| Real Estate Investment Trusts (REIT) — 1.2% | | | | | | | | |
| Acadia Realty Trust | | | 693 | | | | 19,785 | |
| Arbor Realty Trust, Inc. | | | 103,034 | | | | 795,422 | |
| Ares Commercial Real Estate Corporation | | | 4,225 | | | | 71,107 | |
| Ashford Hospitality Trust, Inc. | | | 77,317 | | | | 995,843 | |
| Colonial Properties Trust | | | 30,257 | | | | 702,265 | |
| CubeSmart | | | 41,908 | | | | 736,324 | |
| CYS Investments, Inc. | | | 18,312 | | | | 227,618 | |
| DuPont Fabros Technology, Inc. | | | 49,015 | | | | 1,232,237 | |
| Extra Space Storage, Inc. | | | 1 | | | | 44 | |
| First Industrial Realty Trust, Inc. | | | 100 | | | | 1,794 | |
| Franklin Street Properties Corporation | | | 28,853 | | | | 440,585 | |
| Geo Group, Inc. (The) | | | 5,736 | | | | 214,813 | |
| Getty Realty Corporation | | | 99,531 | | | | 2,130,959 | |
| Gladstone Commercial Corporation | | | 54,413 | | | | 1,041,465 | |
| Glimcher Realty Trust | | | 13,020 | | | | 163,271 | |
| Home Properties, Inc. | | | 2,383 | | | | 153,608 | |
| Investors Real Estate Trust | | | 3,324 | | | | 32,343 | |
| iStar Financial, Inc. | | | 280,201 | | | | 3,272,748 | |
| JAVELIN Mortgage Investment Corporation | | | 9,868 | | | | 198,742 | |
TFS MARKET NEUTRAL FUND
SCHEDULE OF SECURITIES SOLD SHORT (Continued)
COMMON STOCKS — 65.7% (Continued) | | | | | | |
| Financials — 9.5% (Continued) | | | | | | |
| Real Estate Investment Trusts (REIT) — 1.2% (Continued) | | | | | | |
| Liberty Property Trust | | | 14,187 | | | $ | 609,899 | |
| New York Mortgage Trust, Inc. | | | 444,001 | | | | 3,170,167 | |
| NorthStar Realty Finance Corporation | | | 7,074 | | | | 70,528 | |
| Omega Healthcare Investors, Inc. | | | 2,068 | | | | 67,975 | |
| Parkway Properties, Inc. | | | 5,652 | | | | 103,036 | |
| Pennsylvania Real Estate Investment Trust | | | 17,564 | | | | 364,102 | |
| Ramco-Gershenson Properties Trust | | | 19,105 | | | | 333,764 | |
| Redwood Trust, Inc. | | | 13,028 | | | | 297,299 | |
| Retail Opportunity Investments Corporation | | | 1,567 | | | | 23,207 | |
| Rouse Properties, Inc. | | | 91,435 | | | | 1,732,693 | |
| Sabra Health Care REIT, Inc. | | | 551 | | | | 16,431 | |
| Silver Bay Realty Trust Corporation | | | 34,752 | | | | 663,068 | |
| STAG Industrial, Inc. | | | 381 | | | | 8,397 | |
| Sun Communities, Inc. | | | 43,884 | | | | 2,244,667 | |
| Terreno Realty Corporation | | | 6 | | | | 113 | |
| Walter Investment Management Corporation | | | 2,877 | | | | 96,552 | |
| Western Asset Mortgage Capital Corporation | | | 14,563 | | | | 326,211 | |
| Winthrop Realty Trust | | | 46,209 | | | | 587,316 | |
| | | | | | | | 23,146,398 | |
| Real Estate Management & Development — 0.1% | | | | | | | | |
| Brookfield Property Partners, L.P. | | | 21,059 | | | | 464,983 | |
| China HGS Real Estate, Inc. | | | 100 | | | | 1,090 | |
| China Housing & Land Development, Inc. | | | 143,405 | | | | 255,261 | |
| Gazit-Globe Ltd. | | | 1,949 | | | | 25,824 | |
| Mays (J.W.), Inc. | | | 144 | | | | 3,204 | |
| Novation Companies, Inc. | | | 628 | | | | 302 | |
| St. Joe Company (The) | | | 74,934 | | | | 1,466,458 | |
| | | | | | | | 2,217,122 | |
| Thrifts & Mortgage Finance — 1.2% | | | | | | | | |
| America First Tax Exempt Investors, L.P. | | | 9,810 | | | | 70,142 | |
| Anchor BanCorp Wisconsin, Inc. | | | 35,400 | | | | 22,302 | |
| Astoria Financial Corporation | | | 134,159 | | | | 1,286,585 | |
| BBX Capital Corporation - Class A | | | 98,985 | | | | 1,187,820 | |
| Beneficial Mutual Bancorp, Inc. | | | 30,090 | | | | 257,270 | |
| BofI Holding, Inc. | | | 41,350 | | | | 1,686,253 | |
| Federal Agricultural Mortgage Corporation - Class C | | | 10,180 | | | | 323,520 | |
| Federal National Mortgage Association | | | 589,647 | | | | 487,638 | |
| First Federal Bancshares of Arkansas, Inc. | | | 6,056 | | | | 58,683 | |
| First Pactrust Bancorp, Inc. | | | 774 | | | | 8,793 | |
| Flushing Financial Corporation | | | 4,373 | | | | 66,382 | |
| Impac Mortgage Holdings, Inc. | | | 54,588 | | | | 566,623 | |
| Malvern Bancorp, Inc. | | | 499 | | | | 5,793 | |
| MGIC Investment Corporation | | | 890,012 | | | | 4,806,065 | |
TFS MARKET NEUTRAL FUND
SCHEDULE OF SECURITIES SOLD SHORT (Continued)
COMMON STOCKS — 65.7% (Continued) | | | | | | |
| Financials — 9.5% (Continued) | | | | | | |
| Thrifts & Mortgage Finance — 1.2% (Continued) | | | | | | |
| NASB Financial, Inc. | | | 3,726 | | | $ | 84,953 | |
| Northwest Bancshares, Inc. | | | 140,937 | | | | 1,726,478 | |
| PMI Group, Inc. (The) | | | 7 | | | | — | |
| Provident Financial Holdings, Inc. | | | 11,476 | | | | 185,911 | |
| Radian Group, Inc. | | | 669,823 | | | | 8,004,385 | |
| Security National Financial Corporation - Class A | | | 120,684 | | | | 957,024 | |
| Territorial Bancorp, Inc. | | | 55 | | | | 1,286 | |
Triad Guaranty, Inc. (a) | | | 9,250 | | | | 740 | |
| TrustCo Bank Corporation | | | 264,501 | | | | 1,417,725 | |
| Westfield Financial, Inc. | | | 395 | | | | 2,974 | |
| | | | | | | | 23,215,345 | |
| Health Care — 11.6% | | | | | | | | |
| Biotechnology — 6.6% | | | | | | | | |
| Aastrom Biosciences, Inc. | | | 435,907 | | | | 261,108 | |
| ACADIA Pharmaceuticals, Inc. | | | 163,534 | | | | 2,107,953 | |
| Achillion Pharmaceuticals, Inc. | | | 197,438 | | | | 1,488,682 | |
| Advaxis, Inc. | | | 97,154 | | | | 6,461 | |
| Aegerion Pharmaceuticals, Inc. | | | 135,199 | | | | 5,683,766 | |
| AEterna Zentaris, Inc. | | | 63,638 | | | | 116,458 | |
| Alnylam Pharmaceuticals, Inc. | | | 178,863 | | | | 4,283,769 | |
| Amarin Corporation plc - ADR | | | 624,154 | | | | 4,624,981 | |
| Anthera Pharmaceuticals, Inc. | | | 865,094 | | | | 475,888 | |
| ARCA Biopharma, Inc. | | | 2,683 | | | | 6,386 | |
| Arena Pharmaceuticals, Inc. | | | 644,454 | | | | 5,310,301 | |
| Arrowhead Research Corporation | | | 31,565 | | | | 65,024 | |
| AVEO Pharmaceuticals, Inc. | | | 321,389 | | | | 1,642,298 | |
| BioTime, Inc. | | | 360,977 | | | | 1,306,737 | |
| Cardium Therapeutics, Inc. | | | 106,459 | | | | 10,007 | |
| Celldex Therapeutics, Inc. | | | 36,321 | | | | 473,989 | |
| CEL-SCI Corporation | | | 841,126 | | | | 227,104 | |
| Celsion Corporation | | | 1,629,821 | | | | 1,362,530 | |
| China Biologic Products, Inc. | | | 276 | | | | 7,021 | |
| Cleveland BioLabs, Inc. | | | 278,801 | | | | 493,478 | |
| Curis, Inc. | | | 228 | | | | 855 | |
| Cyclacel Pharmaceuticals, Inc. | | | 83,375 | | | | 384,359 | |
| Cytokinetics, Inc. | | | 388,197 | | | | 496,892 | |
| Cytori Therapeutics, Inc. | | | 636,479 | | | | 1,788,506 | |
| CytRx Corporation | | | 207,818 | | | | 559,030 | |
| DARA BioSciences, Inc. | | | 571,455 | | | | 444,935 | |
| Dendreon Corporation | | | 1,300,007 | | | | 6,123,033 | |
| Discovery Laboratories, Inc. | | | 601 | | | | 1,016 | |
EpiCept Corporation (a) | | | 103,927 | | | | 6,236 | |
| Exact Sciences Corporation | | | 61,419 | | | | 573,653 | |
TFS MARKET NEUTRAL FUND
SCHEDULE OF SECURITIES SOLD SHORT (Continued)
COMMON STOCKS — 65.7% (Continued) | | | | | | |
| Health Care — 11.6% (Continued) | | | | | | |
| Biotechnology — 6.6% (Continued) | | | | | | |
| Exelixis, Inc. | | | 826,583 | | | $ | 4,289,966 | |
| Galectin Therapeutics, Inc. | | | 12,343 | | | | 57,765 | |
| Galena Biopharma, Inc. | | | 2,246,496 | | | | 6,447,444 | |
| Genomic Health, Inc. | | | 22,944 | | | | 696,580 | |
| GTx, Inc. | | | 10,442 | | | | 48,242 | |
| Horizon Pharma, Inc. | | | 185,319 | | | | 444,766 | |
| iBio, Inc. | | | 184,883 | | | | 79,537 | |
| ImmunoCellular Therapeutics Ltd. | | | 239,567 | | | | 603,709 | |
| ImmunoGen, Inc. | | | 6,007 | | | | 96,232 | |
| Immunomedics, Inc. | | | 451,382 | | | | 1,155,538 | |
| Incyte Corporation | | | 15,030 | | | | 332,914 | |
| Infinity Pharmaceuticals, Inc. | | | 108,396 | | | | 4,670,784 | |
| Insmed, Inc. | | | 131,102 | | | | 1,200,894 | |
| InterMune, Inc. | | | 380,050 | | | | 3,545,866 | |
| Introgen Therapeutics, Inc. | | | 45,612 | | | | 46 | |
| Ironwood Pharmaceuticals, Inc. | | | 193,314 | | | | 2,940,306 | |
| IsoRay, Inc. | | | 279,361 | | | | 139,680 | |
| Keryx Biopharmaceuticals, Inc. | | | 720,186 | | | | 5,869,516 | |
| Lexicon Pharmaceuticals, Inc. | | | 19 | | | | 38 | |
| MannKind Corporation | | | 2,590,271 | | | | 10,231,570 | |
| Marina Biotech, Inc. | | | 246,062 | | | | 55,364 | |
| Mast Therapeutics, Inc. | | | 760,949 | | | | 510,292 | |
| Medgenics, Inc. | | | 78,680 | | | | 315,507 | |
| MediciNova, Inc. | | | 102,132 | | | | 321,716 | |
| Medivation, Inc. | | | 4,650 | | | | 245,101 | |
| MEI Pharma, Inc. | | | 47,057 | | | | 419,748 | |
| Metabolix, Inc. | | | 319,501 | | | | 555,932 | |
| Momenta Pharmaceuticals, Inc. | | | 78,721 | | | | 969,843 | |
| Myrexis, Inc. | | | 891 | | | | 77 | |
| Myriad Genetics, Inc. | | | 17,097 | | | | 476,151 | |
| NeoStem, Inc. | | | 819,672 | | | | 409,836 | |
| Neuralstem, Inc. | | | 315,545 | | | | 375,499 | |
| NeurogesX, Inc. | | | 134,170 | | | | 1,852 | |
| NewLink Genetics Corporation | | | 24,289 | | | | 338,589 | |
| Nymox Pharmaceutical Corporation | | | 107,768 | | | | 555,005 | |
| Omeros Corporation | | | 30,647 | | | | 123,507 | |
| OncoGenex Pharmaceuticals, Inc. | | | 54 | | | | 547 | |
| Oncolytics Biotech, Inc. | | | 471,040 | | | | 1,436,672 | |
| Oncothyreon, Inc. | | | 8,432 | | | | 21,164 | |
| Opexa Therapeutics, Inc. | | | 108,570 | | | | 183,483 | |
| OPKO Health, Inc. | | | 581,160 | | | | 3,870,526 | |
| Orexigen Therapeutics, Inc. | | | 550,345 | | | | 3,346,098 | |
| Organovo Holdings, Inc. | | | 5,988 | | | | 26,347 | |
TFS MARKET NEUTRAL FUND
SCHEDULE OF SECURITIES SOLD SHORT (Continued)
COMMON STOCKS — 65.7% (Continued) | | | | | | |
| Health Care — 11.6% (Continued) | | | | | | |
| Biotechnology — 6.6% (Continued) | | | | | | |
| Osiris Therapeutics, Inc. | | | 224,913 | | | $ | 2,523,524 | |
| OXiGENE, Inc. | | | 22,997 | | | | 81,409 | |
| Oxygen Biotherapeutics, Inc. | | | 17,295 | | | | 4,322 | |
| Peregrine Pharmaceuticals, Inc. | | | 722,436 | | | | 1,004,186 | |
| PharmAthene, Inc. | | | 548,291 | | | | 866,300 | |
| Pluristem Therapeutics, Inc. | | | 213,725 | | | | 679,645 | |
| PROLOR Biotech, Inc. | | | 41,286 | | | | 257,625 | |
| Protalix BioTherapeutics, Inc. | | | 76,914 | | | | 436,102 | |
| Raptor Pharmaceutical Corporation | | | 400,622 | | | | 2,764,292 | |
| Repligen Corporation | | | 890 | | | | 7,974 | |
| Rexahn Pharmaceuticals, Inc. | | | 387,738 | | | | 124,076 | |
| Rosetta Genomics Ltd. | | | 156,250 | | | | 518,750 | |
| RXi Pharmaceuticals Corporation | | | 7,093 | | | | 1,490 | |
| Sangamo Biosciences, Inc. | | | 87,952 | | | | 895,351 | |
| Sarepta Therapeutics, Inc. | | | 81,067 | | | | 2,354,186 | |
| Savient Pharmaceuticals, Inc. | | | 1,339,188 | | | | 999,436 | |
| SIGA Technologies, Inc. | | | 222,093 | | | | 732,907 | |
| Sinovac Biotech Ltd. | | | 15,818 | | | | 56,312 | |
| Spectrum Pharmaceuticals, Inc. | | | 482,396 | | | | 3,574,554 | |
| StemCells, Inc. | | | 309,241 | | | | 522,617 | |
| Sunesis Pharmaceuticals, Inc. | | | 412,072 | | | | 2,319,965 | |
| Synta Pharmaceuticals Corporation | | | 419,823 | | | | 4,303,186 | |
| Synthetic Biologics, Inc. | | | 49,908 | | | | 72,866 | |
| Targacept, Inc. | | | 40,283 | | | | 185,705 | |
Tengion, Inc. (a) | | | 812 | | | | 601 | |
| Theravance, Inc. | | | 2,499 | | | | 84,341 | |
| Titan Pharmaceuticals, Inc. | | | 9,900 | | | | 16,434 | |
| TrovaGene, Inc. | | | 12,689 | | | | 75,119 | |
| Venaxis, Inc. | | | 31,268 | | | | 56,908 | |
| ZIOPHARM Oncology, Inc. | | | 62,568 | | | | 105,114 | |
| | | | | | | | 123,368,002 | |
| Health Care Equipment & Supplies — 1.6% | | | | | | | | |
| Abiomed, Inc. | | | 198,022 | | | | 3,657,466 | |
| Accuray, Inc. | | | 579,564 | | | | 2,550,082 | |
| Align Technology, Inc. | | | 5,034 | | | | 166,726 | |
| Antares Pharma, Inc. | | | 216,624 | | | | 821,005 | |
| Atossa Genetics, Inc. | | | 7,689 | | | | 51,362 | |
| Bacterin International Holdings, Inc. | | | 294,288 | | | | 260,710 | |
| BIOLASE, Inc. | | | 494,497 | | | | 2,620,834 | |
| BSD Medical Corporation | | | 961,893 | | | | 1,115,796 | |
| Cerus Corporation | | | 561 | | | | 2,985 | |
| Conceptus, Inc. | | | 16 | | | | 496 | |
| CryoPort, Inc. | | | 4,338 | | | | 2,061 | |
TFS MARKET NEUTRAL FUND
SCHEDULE OF SECURITIES SOLD SHORT (Continued)
COMMON STOCKS — 65.7% (Continued) | | | | | | |
| Health Care — 11.6% (Continued) | | | | | | |
| Health Care Equipment & Supplies — 1.6% (Continued) | | | | | | |
| Cyberonics, Inc. | | | 3,342 | | | $ | 145,110 | |
| D. Medical Industries Ltd. | | | 2,300 | | | | 363 | |
| Dehaier Medical Systems Ltd. | | | 2,070 | | | | 3,933 | |
| Delcath Systems, Inc. | | | 229,652 | | | | 191,070 | |
| Derma Sciences, Inc. | | | 1,014 | | | | 12,259 | |
| Exactech, Inc. | | | 17 | | | | 314 | |
| Fonar Corporation | | | 86,659 | | | | 609,213 | |
| GenMark Diagnostics, Inc. | | | 119,583 | | | | 1,859,516 | |
| Globus Medical, Inc. | | | 2,230 | | | | 33,941 | |
| Hansen Medical, Inc. | | | 282,443 | | | | 553,588 | |
| HeartWare International, Inc. | | | 1,724 | | | | 167,573 | |
| ICU Medical, Inc. | | | 3,173 | | | | 191,173 | |
| Insulet Corporation | | | 133,253 | | | | 3,363,306 | |
| Integra LifeSciences Holdings Corporation | | | 36,706 | | | | 1,285,811 | |
| Intuitive Surgical, Inc. | | | 1 | | | | 492 | |
| InVivo Therapeutics Holdings Corporation | | | 25,140 | | | | 77,934 | |
| Kips Bay Medical, Inc. | | | 5,485 | | | | 7,679 | |
| MELA Sciences, Inc. | | | 542,348 | | | | 667,088 | |
| Meridian Bioscience, Inc. | | | 159,948 | | | | 3,245,345 | |
| Navidea Biopharmaceuticals, Inc. | | | 1,310,254 | | | | 3,210,122 | |
| Neogen Corporation | | | 5,032 | | | | 255,777 | |
| Quidel Corporation | | | 18,076 | | | | 403,456 | |
| STAAR Surgical Company | | | 23,698 | | | | 165,412 | |
| Stereotaxis, Inc. | | | 30,949 | | | | 54,780 | |
| Synergetics USA, Inc. | | | 19,594 | | | | 57,802 | |
| TearLab Corporation | | | 164,148 | | | | 1,227,827 | |
| Unilife Corporation | | | 209,526 | | | | 414,861 | |
| Uroplasty, Inc. | | | 20,189 | | | | 50,472 | |
| Volcano Corporation | | | 7,873 | | | | 159,743 | |
| Wright Medical Group, Inc. | | | 24,890 | | | | 583,422 | |
| ZELTIQ Aesthetics, Inc. | | | 10,237 | | | | 44,838 | |
| | | | | | | | 30,293,743 | |
| Health Care Providers & Services — 0.6% | | | | | | | | |
| Acadia Healthcare Company, Inc. | | | 6,861 | | | | 216,465 | |
| Accretive Health, Inc. | | | 123,649 | | | | 1,303,260 | |
| Addus HomeCare Corporation | | | 8,526 | | | | 100,948 | |
| Air Methods Corporation | | | 22,138 | | | | 810,029 | |
| Amedisys, Inc. | | | 27,417 | | | | 275,267 | |
| Bio-Reference Laboratories, Inc. | | | 111,400 | | | | 2,840,700 | |
| Chemed Corporation | | | 21,080 | | | | 1,720,550 | |
| China Cord Blood Corporation | | | 4,236 | | | | 12,242 | |
| ExamWorks Group, Inc. | | | 18,874 | | | | 341,619 | |
| FAB Universal Corporation | | | 77,352 | | | | 342,669 | |
TFS MARKET NEUTRAL FUND
SCHEDULE OF SECURITIES SOLD SHORT (Continued)
COMMON STOCKS — 65.7% (Continued) | | | | | | |
| Health Care — 11.6% (Continued) | | | | | | |
| Health Care Providers & Services — 0.6% (Continued) | | | | | | |
| IPC The Hospitalist Company, Inc. | | | 46,357 | | | $ | 2,114,806 | |
| Landauer, Inc. | | | 4,023 | | | | 224,765 | |
| Medical Marijuana, Inc. | | | 277,197 | | | | 52,113 | |
| Owens & Minor, Inc. | | | 294 | | | | 9,576 | |
| PharMerica Corporation | | | 2,111 | | | | 27,211 | |
| | | | | | | | 10,392,220 | |
Health Care Technology — 0.0% (b) | | | | | | | | |
| CareView Communications, Inc. | | | 2,133 | | | | 1,173 | |
| HealthStream, Inc. | | | 26 | | | | 597 | |
| MGT Capital Investment, Inc. | | | 2,763 | | | | 10,361 | |
| Quality Systems, Inc. | | | 54,080 | | | | 966,410 | |
| | | | | | | | 978,541 | |
| Life Sciences Tools & Services — 0.4% | | | | | | | | |
| Accelerate Diagnostics, Inc. | | | 1,408 | | | | 8,899 | |
| Affymetrix, Inc. | | | 610,928 | | | | 2,223,778 | |
| Apricus Biosciences, Inc. | | | 209,716 | | | | 564,136 | |
| Bioanalytical Systems, Inc. | | | 4,706 | | | | 6,941 | |
| BioDelivery Sciences International, Inc. | | | 147,213 | | | | 836,170 | |
| CombiMatrix Corporation | | | 134,322 | | | | 456,695 | |
| Furiex Pharmaceuticals, Inc. | | | 170 | | | | 5,771 | |
| Genetic Technologies Ltd. | | | 71,618 | | | | 169,018 | |
| Luminex Corporation | | | 39,685 | | | | 659,962 | |
| NeoGenomics, Inc. | | | 5,712 | | | | 21,363 | |
| PURE Bioscience, Inc. | | | 68,457 | | | | 35,598 | |
| Sequenom, Inc. | | | 750,678 | | | | 2,830,056 | |
| | | | | | | | 7,818,387 | |
| Pharmaceuticals — 2.4% | | | | | | | | |
| Acura Pharmaceuticals, Inc. | | | 183,943 | | | | 450,660 | |
| Akorn, Inc. | | | 136,754 | | | | 2,058,148 | |
| Alexza Pharmaceuticals, Inc. | | | 501,788 | | | | 2,152,670 | |
| Alimera Sciences, Inc. | | | 212 | | | | 619 | |
| Ampio Pharmaceuticals, Inc. | | | 248,726 | | | | 1,253,579 | |
| Aoxing Pharmaceutical Company, Inc. | | | 10,556 | | | | 2,533 | |
| AVANIR Pharmaceuticals, Inc. - Class A | | | 730,780 | | | | 2,331,188 | |
| Biodel, Inc. | | | 81,511 | | | | 245,348 | |
| BioSante Pharmaceuticals, Inc. | | | 403,013 | | | | 455,405 | |
| Cadence Pharmaceuticals, Inc. | | | 1,168 | | | | 8,269 | |
| Echo Therapeutics, Inc. | | | 251 | | | | 151 | |
| Emisphere Technologies, Inc. | | | 8,547 | | | | 1,624 | |
| Hi-Tech Pharmacal Company, Inc. | | | 5,342 | | | | 176,607 | |
| IntelliPharmaCeutics International, Inc. | | | 18,930 | | | | 40,132 | |
| K-V Pharmaceutical Company - Class A | | | 507,105 | | | | 48,682 | |
| Lannett Company, Inc. | | | 843 | | | | 9,787 | |
TFS MARKET NEUTRAL FUND
SCHEDULE OF SECURITIES SOLD SHORT (Continued)
COMMON STOCKS — 65.7% (Continued) | | | | | | |
| Health Care — 11.6% (Continued) | | | | | | |
| Pharmaceuticals — 2.4% (Continued) | | | | | | |
| NuPathe, Inc. | | | 195,608 | | | $ | 655,287 | |
| Oculus Innovative Sciences, Inc. | | | 1,768 | | | | 9,334 | |
| Optimer Pharmaceuticals, Inc. | | | 185,862 | | | | 2,869,709 | |
| Pacira Pharmaceuticals, Inc. | | | 249,082 | | | | 7,190,997 | |
| Pernix Therapeutics Holdings, Inc. | | | 32,682 | | | | 124,845 | |
| Provectus Pharmaceuticals, Inc. | | | 4,588 | | | | 3,120 | |
| Repros Therapeutics, Inc. | | | 311,441 | | | | 6,334,710 | |
| Salix Pharmaceuticals Ltd. | | | 85,026 | | | | 4,446,010 | |
| Santarus, Inc. | | | 65,218 | | | | 1,198,055 | |
| Skystar Bio-Pharmaceutical Company Ltd. | | | 2,610 | | | | 3,811 | |
| Transcept Pharmaceuticals, Inc. | | | 8,595 | | | | 34,036 | |
| ViroPharma, Inc. | | | 140,850 | | | | 3,838,162 | |
| VIVUS, Inc. | | | 714,041 | | | | 9,489,605 | |
| | | | | | | | 45,433,083 | |
| Industrials — 7.2% | | | | | | | | |
| Aerospace & Defense — 0.7% | | | | | | | | |
| American Science & Engineering, Inc. | | | 24 | | | | 1,548 | |
| Arotech Corporation | | | 277 | | | | 294 | |
| Ascent Solar Technologies, Inc. | | | 624,208 | | | | 399,493 | |
| Cubic Corporation | | | 7,720 | | | | 331,728 | |
| Elbit Systems Ltd. | | | 24 | | | | 1,001 | |
| Engility Holdings, Inc. | | | 91,020 | | | | 2,180,839 | |
| GenCorp, Inc. | | | 279,060 | | | | 3,647,314 | |
| KEYW Holding Corporation (The) | | | 186,640 | | | | 2,536,438 | |
| Kratos Defense & Security Solutions, Inc. | | | 94,776 | | | | 482,410 | |
| National Presto Industries, Inc. | | | 36,215 | | | | 2,716,125 | |
| | | | | | | | 12,297,190 | |
| Air Freight & Logistics — 0.3% | | | | | | | | |
| Echo Global Logistics, Inc. | | | 24,129 | | | | 418,638 | |
| XPO Logistics, Inc. | | | 348,331 | | | | 5,681,279 | |
| | | | | | | | 6,099,917 | |
| Airlines — 0.1% | | | | | | | | |
| AMR Corporation | | | 395,525 | | | | 1,673,071 | |
| Hawaiian Holdings, Inc. | | | 8,561 | | | | 47,000 | |
| Pinnacle Airlines Corporation | | | 7,109 | | | | 96 | |
| | | | | | | | 1,720,167 | |
| Building Products — 1.0% | | | | | | | | |
| Apogee Enterprises, Inc. | | | 90,778 | | | | 2,313,023 | |
| Builders FirstSource, Inc. | | | 304,434 | | | | 1,884,447 | |
| Fortune Brands Home & Security, Inc. | | | 161 | | | | 5,859 | |
| Griffon Corporation | | | 13,376 | | | | 137,773 | |
| Lennox International, Inc. | | | 71,839 | | | | 4,454,018 | |
| NCI Building Systems, Inc. | | | 18,274 | | | | 312,851 | |
TFS MARKET NEUTRAL FUND
SCHEDULE OF SECURITIES SOLD SHORT (Continued)
COMMON STOCKS — 65.7% (Continued) | | | | | | |
| Industrials — 7.2% (Continued) | | | | | | |
| Building Products — 1.0% (Continued) | | | | | | |
| PGT, Inc. | | | 1,433 | | | $ | 11,034 | |
| Quanex Building Products Corporation | | | 69,574 | | | | 1,131,969 | |
| Simpson Manufacturing Company, Inc. | | | 11,322 | | | | 325,394 | |
| Trex Company, Inc. | | | 15,272 | | | | 743,441 | |
| Universal Forest Products, Inc. | | | 59,397 | | | | 2,292,724 | |
| USG Corporation | | | 174,149 | | | | 4,526,133 | |
| | | | | | | | 18,138,666 | |
| Commercial Services & Supplies — 1.6% | | | | | | | | |
| A.T. Cross Company - Class A | | | 300 | | | | 3,786 | |
| ABM Industries, Inc. | | | 62,244 | | | | 1,403,602 | |
| ACCO Brands Corporation | | | 83,233 | | | | 561,823 | |
| Cenveo, Inc. | | | 277,612 | | | | 566,329 | |
| Consolidated Graphics, Inc. | | | 36,971 | | | | 1,318,756 | |
| Covanta Holding Corporation | | | 215,341 | | | | 4,306,820 | |
| EnerNOC, Inc. | | | 9,028 | | | | 158,171 | |
| Ennis, Inc. | | | 24,311 | | | | 373,660 | |
| HNI Corporation | | | 67,080 | | | | 2,309,564 | |
| Hudson Technologies, Inc. | | | 2,397 | | | | 9,684 | |
| Industrial Services of America, Inc. | | | 20,961 | | | | 67,075 | |
| InnerWorkings, Inc. | | | 226,168 | | | | 2,277,512 | |
| Interface, Inc. | | | 98,487 | | | | 1,648,672 | |
| Intersections, Inc. | | | 72,006 | | | | 688,377 | |
| McGrath RentCorp | | | 49,602 | | | | 1,540,638 | |
| Mine Safety Appliances Company | | | 22,785 | | | | 1,093,680 | |
| Mobile Mini, Inc. | | | 95,744 | | | | 2,693,279 | |
| Multi-Color Corporation | | | 2,243 | | | | 58,004 | |
| Quad/Graphics, Inc. - Class A | | | 189,742 | | | | 3,965,608 | |
| R.R. Donnelley & Sons Company | | | 218,382 | | | | 2,688,282 | |
| RINO International Corporation | | | 79,543 | | | | 2,784 | |
| Standard Parking Corporation | | | 4,949 | | | | 106,354 | |
| Swisher Hygiene, Inc. | | | 103,064 | | | | 150,473 | |
| United Stationers, Inc. | | | 76,859 | | | | 2,495,612 | |
| Waste Connections, Inc. | | | 202 | | | | 7,666 | |
| | | | | | | | 30,496,211 | |
| Construction & Engineering — 0.1% | | | | | | | | |
| Aegion Corporation | | | 26,206 | | | | 551,898 | |
| India Globalization Capital, Inc. | | | 2,386 | | | | 5,010 | |
| MasTec, Inc. | | | 34,531 | | | | 959,962 | |
| | | | | | | | 1,516,870 | |
| Electrical Equipment — 0.6% | | | | | | | | |
| A123 Systems, Inc. | | | 3,864,942 | | | | 96,237 | |
| Acuity Brands, Inc. | | | 10 | | | | 730 | |
| Advanced Battery Technologies, Inc. | | | 606,543 | | | | 139,505 | |
TFS MARKET NEUTRAL FUND
SCHEDULE OF SECURITIES SOLD SHORT (Continued)
COMMON STOCKS — 65.7% (Continued) | | | | | | |
| Industrials — 7.2% (Continued) | | | | | | |
| Electrical Equipment — 0.6% (Continued) | | | | | | |
| Altair Nanotechnologies, Inc. | | | 61,210 | | | $ | 138,335 | |
Aura Systems, Inc. (a) | | | 177 | | | | 76 | |
| Babcock & Wilcox Company (The) | | | 100 | | | | 2,720 | |
| Beacon Power Corporation | | | 57,124 | | | | 743 | |
| Belden, Inc. | | | 34,057 | | | | 1,683,097 | |
| Broadwind Energy, Inc. | | | 13 | | | | 58 | |
| Capstone Turbine Corporation | | | 237,707 | | | | 209,206 | |
| China BAK Battery, Inc. | | | 86,749 | | | | 56,291 | |
| China Electric Motor, Inc. | | | 1,771 | | | | 159 | |
| Digital Power Corporation | | | 1,323 | | | | 794 | |
| ECOtality, Inc. | | | 5,406 | | | | 10,055 | |
| Encore Wire Corporation | | | 12,227 | | | | 400,434 | |
| FuelCell Energy, Inc. | | | 8,659 | | | | 9,092 | |
| Global Power Equipment Group, Inc. | | | 11,568 | | | | 190,872 | |
| Hoku Corporation | | | 201,745 | | | | 8,877 | |
| Hydrogenics Corporation | | | 3,848 | | | | 31,169 | |
| Lihua International, Inc. | | | 40,953 | | | | 207,632 | |
New Energy Systems Group (a) | | | 9,468 | | | | 805 | |
| Ocean Power Technologies, Inc. | | | 130,605 | | | | 201,132 | |
| Plug Power, Inc. | | | 1,062,673 | | | | 170,028 | |
| Polypore International, Inc. | | | 114,537 | | | | 4,802,536 | |
| Renewable Energy Trade Board Corporation | | | 299 | | | | 75 | |
| Revolution Lighting Technologies, Inc. | | | 17,000 | | | | 64,770 | |
| Satcon Technology Corporation | | | 152,030 | | | | 2,508 | |
| Solarcity Corporation | | | 127,309 | | | | 3,439,889 | |
| Ultralife Corporation | | | 4,286 | | | | 16,887 | |
| Valence Technology, Inc. | | | 710,999 | | | | 14,220 | |
| VU1 Corporation | | | 90 | | | | 131 | |
| Westinghouse Solar, Inc. | | | 34,144 | | | | 1,229 | |
| Yingli Green Energy Holding Company Ltd. - ADR | | | 20,647 | | | | 52,030 | |
| | | | | | | | 11,952,322 | |
| Industrial Conglomerates — 0.1% | | | | | | | | |
| Raven Industries, Inc. | | | 81,286 | | | | 2,727,145 | |
| | | | | | | | | |
| Machinery — 1.2% | | | | | | | | |
| Accuride Corporation | | | 2,589 | | | | 13,308 | |
| Actuant Corporation - Class A | | | 5,274 | | | | 165,076 | |
| Altra Holdings, Inc. | | | 61,177 | | | | 1,630,367 | |
| Art's-Way Manufacturing Company, Inc. | | | 1,712 | | | | 10,563 | |
| Astec Industries, Inc. | | | 58 | | | | 1,904 | |
| Briggs & Stratton Corporation | | | 132,559 | | | | 2,981,252 | |
| Chart Industries, Inc. | | | 2,800 | | | | 237,468 | |
China Valves Technology, Inc. (a) | | | 256,466 | | | | 115,410 | |
TFS MARKET NEUTRAL FUND
SCHEDULE OF SECURITIES SOLD SHORT (Continued)
COMMON STOCKS — 65.7% (Continued) | | | | | | |
| Industrials — 7.2% (Continued) | | | | | | |
| Machinery — 1.2% (Continued) | | | | | | |
| CLARCOR, Inc. | | | 13 | | | $ | 672 | |
| Commercial Vehicle Group, Inc. | | | 468 | | | | 3,281 | |
| Douglas Dynamics, Inc. | | | 29,404 | | | | 411,362 | |
| Dynamic Materials Corporation | | | 557 | | | | 8,845 | |
| Energy Recovery, Inc. | | | 129,231 | | | | 472,985 | |
| EnPro Industries, Inc. | | | 3,583 | | | | 176,570 | |
| ExOne Company (The) | | | 46,555 | | | | 1,787,712 | |
| Federal Signal Corporation | | | 58 | | | | 450 | |
| Flow International Corporation | | | 32,613 | | | | 119,364 | |
| FreightCar America, Inc. | | | 8,986 | | | | 187,628 | |
| Highway Holdings Ltd. | | | 510 | | | | 877 | |
| Lindsay Corporation | | | 30,953 | | | | 2,377,809 | |
| Lydall, Inc. | | | 8,316 | | | | 119,251 | |
| Miller Industries, Inc. | | | 1,329 | | | | 20,081 | |
| Navistar International Corporation | | | 41,543 | | | | 1,375,904 | |
| PMFG, Inc. | | | 12,945 | | | | 74,563 | |
| SmartHeat, Inc. | | | 4,830 | | | | 1,546 | |
| Sun Hydraulics Corporation | | | 30,458 | | | | 997,500 | |
| Tennant Company | | | 12,488 | | | | 597,176 | |
| Titan International, Inc. | | | 4,280 | | | | 95,487 | |
| Toro Company (The) | | | 52,517 | | | | 2,363,790 | |
| Twin Disc, Inc. | | | 67,350 | | | | 1,435,902 | |
| Wabash National Corporation | | | 242 | | | | 2,282 | |
| Westport Innovations, Inc. | | | 168,081 | | | | 5,222,277 | |
| | | | | | | | 23,008,662 | |
| Marine — 0.3% | | | | | | | | |
| Baltic Trading Ltd. | | | 9,386 | | | | 32,570 | |
| Diana Containerships, Inc. | | | 680 | | | | 3,869 | |
| Eagle Bulk Shipping, Inc. | | | 439,355 | | | | 1,546,530 | |
| Excel Maritime Carriers Ltd. | | | 917,152 | | | | 376,032 | |
| FreeSeas, Inc. | | | 508 | | | | 549 | |
| Genco Shipping & Trading Ltd. | | | 673,394 | | | | 1,151,504 | |
| Navios Maritime Partners, L.P. | | | 2,527 | | | | 38,309 | |
| Safe Bulkers, Inc. | | | 254,211 | | | | 1,276,139 | |
| Seaspan Corporation | | | 99,613 | | | | 2,184,513 | |
| | | | | | | | 6,610,015 | |
| Professional Services — 0.5% | | | | | | | | |
| Acacia Research Corporation | | | 112,101 | | | | 2,670,246 | |
| CBIZ, Inc. | | | 313,010 | | | | 2,031,435 | |
| CDI Corporation | | | 3,624 | | | | 56,788 | |
| CRA International, Inc. | | | 1,987 | | | | 36,640 | |
| FTI Consulting, Inc. | | | 43,280 | | | | 1,433,434 | |
| Hudson Global, Inc. | | | 3,449 | | | | 11,382 | |
TFS MARKET NEUTRAL FUND
SCHEDULE OF SECURITIES SOLD SHORT (Continued)
COMMON STOCKS — 65.7% (Continued) | | | | | | |
| Industrials — 7.2% (Continued) | | | | | | |
| Professional Services — 0.5% (Continued) | | | | | | |
| ICF International, Inc. | | | 14,259 | | | $ | 386,561 | |
| Innovaro, Inc. | | | 7,451 | | | | 462 | |
| Lightbridge Corporation | | | 113,980 | | | | 166,411 | |
| Odyssey Marine Exploration, Inc. | | | 668,817 | | | | 1,973,010 | |
| Pendrell Corporation | | | 4,316 | | | | 7,294 | |
| Spherix, Inc. | | | 205 | | | | 1,550 | |
Thomas Group, Inc. (a) | | | 900 | | | | 7 | |
| Volt Information Sciences, Inc. | | | 100 | | | | 810 | |
| VSE Corporation | | | 256 | | | | 7,805 | |
| | | | | | | | 8,783,835 | |
| Road & Rail — 0.3% | | | | | | | | |
| Landstar System, Inc. | | | 74,979 | | | | 4,098,352 | |
| Student Transportation, Inc. | | | 18,904 | | | | 122,309 | |
| YRC Worldwide, Inc. | | | 118,244 | | | | 886,830 | |
| | | | | | | | 5,107,491 | |
| Trading Companies & Distributors — 0.4% | | | | | | | | |
| AeroCentury Corporation | | | 118 | | | | 2,334 | |
| Beacon Roofing Supply, Inc. | | | 86,712 | | | | 3,306,329 | |
| BlueLinx Holdings, Inc. | | | 155 | | | | 451 | |
| China Armco Metals, Inc. | | | 140,785 | | | | 50,697 | |
| H&E Equipment Services, Inc. | | | 57,966 | | | | 1,180,188 | |
| Houston Wire & Cable Company | | | 8,325 | | | | 113,386 | |
| Kaman Corporation | | | 6,571 | | | | 222,034 | |
| TAL International Group, Inc. | | | 6,390 | | | | 264,546 | |
| Titan Machinery, Inc. | | | 83,558 | | | | 1,885,068 | |
| | | | | | | | 7,025,033 | |
Transportation Infrastructure — 0.0% (b) | | | | | | | | |
| Sino-Global Shipping America Ltd. | | | 2,857 | | | | 4,628 | |
| | | | | | | | | |
| Information Technology — 13.3% | | | | | | | | |
| Communications Equipment — 1.7% | | | | | | | | |
| ADTRAN, Inc. | | | 80,614 | | | | 1,692,894 | |
| Ambient Corporation | | | 1,159 | | | | 2,306 | |
| ARRIS Group, Inc. | | | 6,329 | | | | 104,492 | |
| AudioCodes Ltd. | | | 3,247 | | | | 12,793 | |
| Calix, Inc. | | | 6,142 | | | | 52,391 | |
| CIENA Corporation | | | 372,246 | | | | 5,568,800 | |
| DragonWave, Inc. | | | 42,347 | | | | 83,000 | |
| Extreme Networks, Inc. | | | 139,273 | | | | 463,779 | |
| Globecomm Systems, Inc. | | | 102,788 | | | | 1,259,153 | |
| Infinera Corporation | | | 312,463 | | | | 2,630,939 | |
| InterDigital, Inc. | | | 59,331 | | | | 2,634,890 | |
| KVH Industries, Inc. | | | 1,710 | | | | 22,589 | |
TFS MARKET NEUTRAL FUND
SCHEDULE OF SECURITIES SOLD SHORT (Continued)
COMMON STOCKS — 65.7% (Continued) | | | | | | |
| Information Technology — 13.3% (Continued) | | | | | | |
| Communications Equipment — 1.7% (Continued) | | | | | | |
| Oclaro, Inc. | | | 100,433 | | | $ | 136,589 | |
| ParkerVision, Inc. | | | 1,255,368 | | | | 5,008,918 | |
| Polycom, Inc. | | | 155,023 | | | | 1,627,742 | |
| Powerwave Technologies, Inc. | | | 119,142 | | | | 1,668 | |
| Procera Networks, Inc. | | | 55,103 | | | | 611,092 | |
| Research In Motion Ltd. | | | 30,850 | | | | 502,547 | |
| RIT Technologies Ltd. | | | 11,154 | | | | 51,866 | |
Telestone Technologies Corporation (a) | | | 480,451 | | | | 233,019 | |
| TESSCO Technologies, Inc. | | | 2,378 | | | | 48,606 | |
| Ubiquiti Networks, Inc. | | | 276,912 | | | | 4,278,290 | |
| ViaSat, Inc. | | | 80,586 | | | | 3,906,003 | |
| Zoom Technologies, Inc. | | | 176,668 | | | | 62,364 | |
| ZST Digital Networks, Inc. | | | 179,681 | | | | 260,538 | |
| | | | | | | | 31,257,268 | |
| Computers & Peripherals — 1.2% | | | | | | | | |
| 3D Systems Corporation | | | 194,208 | | | | 7,426,514 | |
| Diebold, Inc. | | | 6,545 | | | | 191,703 | |
| Fusion-io, Inc. | | | 254,012 | | | | 4,770,345 | |
| Hauppauge Digital, Inc. | | | 68,415 | | | | 67,047 | |
| iGO, Inc. | | | 469 | | | | 1,168 | |
| Imation Corporation | | | 17,761 | | | | 65,360 | |
| Logitech International S.A. | | | 639,722 | | | | 4,062,235 | |
| OCZ Technology Group, Inc. | | | 2,404,582 | | | | 3,150,002 | |
| Silicon Graphics International Corporation | | | 17,593 | | | | 228,709 | |
| Socket Mobile, Inc. | | | 52 | | | | 96 | |
| STEC, Inc. | | | 260,889 | | | | 947,027 | |
| Stratasys Ltd. | | | 22,136 | | | | 1,838,395 | |
| Super Micro Computer, Inc. | | | 30,659 | | | | 294,940 | |
| Synaptics, Inc. | | | 505 | | | | 20,821 | |
| USA Technologies, Inc. | | | 230,995 | | | | 482,779 | |
| | | | | | | | 23,547,141 | |
| Electronic Equipment, Instruments & Components — 2.2% | | | | | | | | |
| ClearSign Combustion Corporation | | | 2,100 | | | | 18,921 | |
| Digital Ally, Inc. | | | 588 | | | | 3,528 | |
| Document Security Systems, Inc. | | | 160,590 | | | | 489,799 | |
| Dolby Laboratories, Inc. - Class A | | | 48,439 | | | | 1,591,221 | |
| DTS, Inc. | | | 120,585 | | | | 2,023,416 | |
| e.Digital Corporation | | | 10,897 | | | | 1,744 | |
| Electro Rent Corporation | | | 6 | | | | 99 | |
| FARO Technologies, Inc. | | | 120 | | | | 4,655 | |
| FEI Company | | | 7,243 | | | | 462,683 | |
| InvenSense, Inc. | | | 36 | | | | 336 | |
| Itron, Inc. | | | 27,153 | | | | 1,076,616 | |
TFS MARKET NEUTRAL FUND
SCHEDULE OF SECURITIES SOLD SHORT (Continued)
COMMON STOCKS — 65.7% (Continued) | | | | | | |
| Information Technology — 13.3% (Continued) | | | | | | |
| Electronic Equipment, Instruments & Components — 2.2% (Continued) | | | | | | |
| KEMET Corporation | | | 362 | | | $ | 2,255 | |
| Magal Security Systems Ltd. | | | 1,188 | | | | 4,752 | |
| Mercury Systems, Inc. | | | 107,601 | | | | 831,756 | |
| Mesa Laboratories, Inc. | | | 31 | | | | 1,530 | |
| Microvision, Inc. | | | 292,517 | | | | 599,660 | |
| Molex, Inc. | | | 163,133 | | | | 4,497,577 | |
| Nam Tai Electronics, Inc. | | | 13,000 | | | | 98,280 | |
| Neonode, Inc. | | | 378,163 | | | | 2,159,311 | |
| OSI Systems, Inc. | | | 47,877 | | | | 2,743,352 | |
| Parametric Sound Corporation | | | 109,517 | | | | 1,970,211 | |
| Power-One, Inc. | | | 91,634 | | | | 579,127 | |
| RadiSys Corporation | | | 4,115 | | | | 20,410 | |
| RealD, Inc. | | | 248,604 | | | | 3,721,602 | |
| Research Frontiers, Inc. | | | 54,122 | | | | 224,606 | |
SinoHub, Inc. (a) | | | 43,908 | | | | 2,195 | |
| SMTC Corporation | | | 456 | | | | 1,008 | |
| Superconductor Technologies, Inc. | | | 23,595 | | | | 102,402 | |
| SYNNEX Corporation | | | 58,621 | | | | 2,028,287 | |
| Uni-Pixel, Inc. | | | 384,959 | | | | 13,685,292 | |
| Universal Display Corporation | | | 76,941 | | | | 2,419,025 | |
| Viasystems Group, Inc. | | | 12 | | | | 153 | |
| XcelMobility, Inc. | | | 2,874 | | | | 144 | |
| | | | | | | | 41,365,953 | |
| Internet Software & Services — 2.2% | | | | | | | | |
| Active Network, Inc. (The) | | | 327,796 | | | | 1,648,814 | |
| Angie's List, Inc. | | | 122,073 | | | | 2,959,050 | |
| AOL, Inc. | | | 30,425 | | | | 1,175,622 | |
| Bankrate, Inc. | | | 147,115 | | | | 1,983,110 | |
| Blucora, Inc. | | | 90,785 | | | | 1,340,894 | |
| Bridgeline Digital, Inc. | | | 389 | | | | 490 | |
| Carbonite, Inc. | | | 153,509 | | | | 1,633,336 | |
| Constant Contact, Inc. | | | 154,772 | | | | 2,261,219 | |
| Dealertrack Technologies, Inc. | | | 3,824 | | | | 106,498 | |
| Dice Holdings, Inc. | | | 155,358 | | | | 1,311,222 | |
| FriendFinder Networks, Inc. | | | 15,769 | | | | 7,096 | |
| Innodata, Inc. | | | 5,334 | | | | 17,496 | |
| j2 Global, Inc. | | | 61,778 | | | | 2,514,365 | |
| KIT digital, Inc. | | | 1,518,314 | | | | 463,086 | |
| Liquidity Services, Inc. | | | 188,756 | | | | 6,210,072 | |
| LiveDeal, Inc. | | | 6,021 | | | | 18,725 | |
| Local Corporation | | | 174,587 | | | | 291,560 | |
| Marchex, Inc. - Class B | | | 6,678 | | | | 27,580 | |
| Market Leader, Inc. | | | 96,124 | | | | 963,162 | |
TFS MARKET NEUTRAL FUND
SCHEDULE OF SECURITIES SOLD SHORT (Continued)
COMMON STOCKS — 65.7% (Continued) | | | | | | |
| Information Technology — 13.3% (Continued) | | | | | | |
| Internet Software & Services — 2.2% (Continued) | | | | | | |
| MeetMe, Inc. | | | 287,365 | | | $ | 554,614 | |
| Millennial Media, Inc. | | | 145,563 | | | | 1,008,752 | |
| Monster Worldwide, Inc. | | | 366,163 | | | | 1,603,794 | |
| NIC, Inc. | | | 70,719 | | | | 1,190,908 | |
| Qihoo 360 Technology Company Ltd. - ADR | | | 1,081 | | | | 37,078 | |
| QuinStreet, Inc. | | | 99,223 | | | | 648,918 | |
| RealNetworks, Inc. | | | 3,191 | | | | 24,571 | |
| Rediff.com India Ltd. - ADR | | | 78,703 | | | | 214,072 | |
| Remark Media, Inc. | | | 1,842 | | | | 5,986 | |
| Responsys, Inc. | | | 63,087 | | | | 490,186 | |
| Sify Technologies Ltd. - ADR | | | 45,984 | | | | 84,611 | |
| SINA Corporation | | | 100 | | | | 5,632 | |
| Sohu.com, Inc. | | | 1,970 | | | | 101,337 | |
| SPS Commerce, Inc. | | | 7,887 | | | | 371,714 | |
| Stamps.com, Inc. | | | 8 | | | | 271 | |
| StarTek, Inc. | | | 1,518 | | | | 10,520 | |
| Trulia, Inc. | | | 4,414 | | | | 128,271 | |
| ValueClick, Inc. | | | 191 | | | | 5,894 | |
| Velti plc | | | 817,760 | | | | 1,635,520 | |
| Vistaprint N.V. | | | 113,977 | | | | 4,650,262 | |
| WebMD Health Corporation | | | 1 | | | | 24 | |
| Yelp, Inc. | | | 13,942 | | | | 362,910 | |
| Youku Tudou, Inc. - ADR | | | 2,815 | | | | 57,032 | |
| Zillow, Inc. | | | 60,677 | | | | 3,569,628 | |
| | | | | | | | 41,695,902 | |
| IT Services — 1.0% | | | | | | | | |
| Acorn Energy, Inc. | | | 186,149 | | | | 1,396,118 | |
| Booz Allen Hamilton Holding Corporation | | | 105,414 | | | | 1,601,239 | |
| CACI International, Inc. | | | 31,943 | | | | 1,868,346 | |
| Cass Information Systems, Inc. | | | 4,392 | | | | 183,586 | |
| CGI Group, Inc. - Class A | | | 1,761 | | | | 55,753 | |
| China Information Technology, Inc. | | | 14,381 | | | | 19,414 | |
| CIBER, Inc. | | | 152,429 | | | | 649,348 | |
| Computer Task Group, Inc. | | | 30,545 | | | | 626,783 | |
| Convergys Corporation | | | 34,238 | | | | 582,731 | |
| Higher One Holdings, Inc. | | | 392,979 | | | | 3,874,773 | |
| Lender Processing Services, Inc. | | | 90,214 | | | | 2,502,536 | |
| Mantech International Corporation - Class A | | | 105,809 | | | | 2,824,042 | |
| MAXIMUS, Inc. | | | 6,797 | | | | 541,653 | |
| ModusLink Global Solutions, Inc. | | | 1,961 | | | | 5,491 | |
| PRGX Global, Inc. | | | 23,353 | | | | 130,543 | |
| Unisys Corporation | | | 47,688 | | | | 912,271 | |
| VeriFone Systems, Inc. | | | 50,806 | | | | 1,091,313 | |
TFS MARKET NEUTRAL FUND
SCHEDULE OF SECURITIES SOLD SHORT (Continued)
COMMON STOCKS — 65.7% (Continued) | | | | | | |
| Information Technology — 13.3% (Continued) | | | | | | |
| IT Services — 1.0% (Continued) | | | | | | |
| Zanett, Inc. | | | 12,650 | | | $ | 253 | |
| | | | | | | | 18,866,193 | |
| Semiconductors & Semiconductor Equipment — 2.0% | | | | | | | | |
| Advanced Micro Devices, Inc. | | | 3,376,260 | | | | 9,521,053 | |
| Amkor Technology, Inc. | | | 392,462 | | | | 1,660,114 | |
| Applied Micro Circuits Corporation | | | 58,449 | | | | 436,030 | |
| Cabot Microelectronics Corporation | | | 41,441 | | | | 1,388,688 | |
| Camtek Ltd. | | | 8,645 | | | | 12,276 | |
| Canadian Solar, Inc. | | | 52,727 | | | | 296,853 | |
| Cirrus Logic, Inc. | | | 72,103 | | | | 1,392,309 | |
| CSR plc - ADR | | | 1 | | | | 31 | |
| CVD Equipment Corporation | | | 46,075 | | | | 478,719 | |
| Cymer, Inc. | | | 1,125 | | | | 117,855 | |
| DayStar Technologies, Inc. | | | 14,478 | | | | 6,515 | |
| EZchip Semiconductor Ltd. | | | 35,777 | | | | 816,073 | |
| Global-Tech Advanced Innovations, Inc. | | | 175 | | | | 1,313 | |
| GT Advanced Technologies, Inc. | | | 1,672,370 | | | | 6,572,414 | |
| Himax Technologies, Inc. | | | 177,005 | | | | 973,527 | |
| International Rectifier Corporation | | | 3,689 | | | | 78,244 | |
| JA Solar Holdings Company Ltd. - ADR | | | 8,004 | | | | 40,340 | |
| Lattice Semiconductor Corporation | | | 535 | | | | 2,488 | |
| LDK Solar Company Ltd. | | | 265,971 | | | | 351,082 | |
| Mellanox Technologies Ltd. | | | 21,790 | | | | 1,110,854 | |
| Monolithic Power Systems, Inc. | | | 51,648 | | | | 1,245,750 | |
| OmniVision Technologies, Inc. | | | 7,101 | | | | 95,224 | |
| Photronics, Inc. | | | 50,581 | | | | 399,084 | |
| Rubicon Technology, Inc. | | | 394,375 | | | | 2,922,319 | |
| Rudolph Technologies, Inc. | | | 141,335 | | | | 1,649,379 | |
| STR Holdings, Inc. | | | 92,554 | | | | 208,246 | |
| Suntech Power Holdings Company Ltd. - ADR | | | 772,259 | | | | 532,859 | |
| Teradyne, Inc. | | | 275,061 | | | | 4,522,003 | |
| Tessera Technologies, Inc. | | | 17,932 | | | | 365,275 | |
| Tower Semiconductor Ltd. | | | 14,236 | | | | 93,246 | |
| Transwitch Corporation | | | 14,717 | | | | 6,181 | |
| Ultratech, Inc. | | | 16,938 | | | | 499,163 | |
| | | | | | | | 37,795,507 | |
| Software — 3.0% | | | | | | | | |
| Accelrys, Inc. | | | 74,330 | | | | 732,150 | |
| ACI Worldwide, Inc. | | | 51,772 | | | | 2,433,802 | |
| American Software, Inc. - Class A | | | 9,256 | | | | 76,917 | |
| AsiaInfo-Linkage, Inc. | | | 7,947 | | | | 91,232 | |
| Augme Technologies, Inc. | | | 10,081 | | | | 3,579 | |
| AVG Technologies N.V. | | | 114,295 | | | | 1,865,294 | |
TFS MARKET NEUTRAL FUND
SCHEDULE OF SECURITIES SOLD SHORT (Continued)
COMMON STOCKS — 65.7% (Continued) | | | | | | |
| Information Technology — 13.3% (Continued) | | | | | | |
| Software — 3.0% (Continued) | | | | | | |
| Blackbaud, Inc. | | | 58,245 | | | $ | 1,707,161 | |
| BluePhoenix Solutions Ltd. | | | 1,006 | | | | 3,591 | |
| Bottomline Technologies, Inc. | | | 45,071 | | | | 1,180,860 | |
| BroadSoft, Inc. | | | 35,432 | | | | 905,642 | |
| Cadence Design Systems, Inc. | | | 300 | | | | 4,140 | |
| Callidus Software, Inc. | | | 402,637 | | | | 1,727,313 | |
| Changyou.com Ltd. | | | 406 | | | | 11,774 | |
| China CGame, Inc. | | | 12,695 | | | | 2,387 | |
| Ebix, Inc. | | | 575,862 | | | | 10,716,792 | |
| Evergreen Energy, Inc. | | | 172,973 | | | | 865 | |
| Future Healthcare of America | | | 53,356 | | | | 7,256 | |
| Globalscape, Inc. | | | 359 | | | | 582 | |
| Glu Mobile, Inc. | | | 1,805,599 | | | | 5,561,245 | |
| Interactive Intelligence Group, Inc. | | | 4,192 | | | | 173,675 | |
| Jive Software, Inc. | | | 13,988 | | | | 190,097 | |
| Magic Software Enterprises Ltd. | | | 108,892 | | | | 589,106 | |
| Majesco Entertainment Company | | | 261,564 | | | | 156,677 | |
| Mitek Systems, Inc. | | | 614,111 | | | | 3,267,070 | |
| NetSol Technologies, Inc. | | | 2,612 | | | | 32,963 | |
| NQ Mobile, Inc. | | | 78,285 | | | | 675,600 | |
| Progress Software Corporation | | | 68,563 | | | | 1,547,467 | |
| Qlik Technologies, Inc. | | | 2,021 | | | | 52,566 | |
| RealPage, Inc. | | | 42,304 | | | | 863,002 | |
| ServiceNow, Inc. | | | 4,157 | | | | 170,271 | |
| Sky-Mobi Ltd. - ADR | | | 85,408 | | | | 150,318 | |
| Synchronoss Technologies, Inc. | | | 4,286 | | | | 121,465 | |
| Tangoe, Inc. | | | 190,590 | | | | 2,450,987 | |
| THQ, Inc. | | | 57,095 | | | | 1,427 | |
| TiVo, Inc. | | | 254,189 | | | | 2,979,095 | |
| Top Image Systems Ltd. | | | 16,064 | | | | 51,244 | |
Trunkbow International Holdings Ltd. (a) | | | 2,736 | | | | 1,621 | |
| VirnetX Holding Corporation | | | 415,443 | | | | 8,483,346 | |
| Voltari Corporation | | | 76,363 | | | | 454,360 | |
| Vringo, Inc. | | | 1,752,902 | | | | 4,943,184 | |
| Wave Systems Corporation - Class A | | | 834,695 | | | | 400,654 | |
| Websense, Inc. | | | 9,338 | | | | 166,590 | |
| Zynga, Inc. - Class A | | | 236,355 | | | | 753,972 | |
| | | | | | | | 55,709,339 | |
| Materials — 4.2% | | | | | | | | |
| Chemicals — 1.0% | | | | | | | | |
| ADA-ES, Inc. | | | 31,759 | | | | 876,866 | |
| Calgon Carbon Corporation | | | 104,682 | | | | 1,783,781 | |
| Cereplast, Inc. | | | 191,090 | | | | 4,223 | |
TFS MARKET NEUTRAL FUND
SCHEDULE OF SECURITIES SOLD SHORT (Continued)
COMMON STOCKS — 65.7% (Continued) | | | | | | |
| Materials — 4.2% (Continued) | | | | | | |
| Chemicals — 1.0% (Continued) | | | | | | |
| China Gengsheng Minerals, Inc. | | | 66,649 | | | $ | 14,003 | |
| China Green Agriculture, Inc. | | | 130,518 | | | | 396,775 | |
| Clean Diesel Technologies, Inc. | | | 117,273 | | | | 243,928 | |
| CVR Partners, L.P. | | | 30,078 | | | | 791,352 | |
| Ferro Corporation | | | 539,362 | | | | 3,797,108 | |
| Flotek Industries, Inc. | | | 152,388 | | | | 2,444,304 | |
| Gulf Resources, Inc. | | | 292,677 | | | | 301,457 | |
| H.B. Fuller Company | | | 35,537 | | | | 1,346,852 | |
| Hawkins, Inc. | | | 6,427 | | | | 239,020 | |
| Kronos Worldwide, Inc. | | | 179,698 | | | | 3,177,061 | |
| PolyOne Corporation | | | 4,562 | | | | 102,782 | |
| Rentech Nitrogen Partners, L.P. | | | 2,351 | | | | 85,694 | |
| Senomyx, Inc. | | | 1,580 | | | | 3,239 | |
| Sensient Technologies Corporation | | | 16,243 | | | | 639,162 | |
| Stepan Company | | | 11,285 | | | | 642,568 | |
Yongye International, Inc. (a) | | | 17,265 | | | | 42,904 | |
| Zoltek Companies, Inc. | | | 107,824 | | | | 1,424,355 | |
| | | | | | | | 18,357,434 | |
| Construction Materials — 0.1% | | | | | | | | |
| Headwaters, Inc. | | | 51,284 | | | | 556,944 | |
| Texas Industries, Inc. | | | 18,103 | | | | 1,152,799 | |
| US Concrete, Inc. | | | 5,746 | | | | 89,293 | |
| | | | | | | | 1,799,036 | |
| Containers & Packaging — 0.1% | | | | | | | | |
| AEP Industries, Inc. | | | 9,463 | | | | 729,597 | |
| Greif, Inc. - Class A | | | 24,446 | | | | 1,177,564 | |
| | | | | | | | 1,907,161 | |
| Metals & Mining — 2.9% | | | | | | | | |
| A.M. Castle & Company | | | 174,576 | | | | 3,023,656 | |
| AK Steel Holding Corporation | | | 368,051 | | | | 1,232,971 | |
| Allied Nevada Gold Corporation | | | 153,319 | | | | 1,640,513 | |
| AMCOL International Corporation | | | 84,793 | | | | 2,609,081 | |
| Atlatsa Resources Corporation | | | 184,292 | | | | 36,858 | |
| Aurcana Corporation | | | 465 | | | | 1,968 | |
| Aurizon Mines Ltd. | | | 540,302 | | | | 2,334,105 | |
| Avalon Rare Metals, Inc. | | | 237,546 | | | | 249,423 | |
| Avino Silver & Gold Mines Ltd. | | | 111 | | | | 145 | |
| CD International Enterprises, Inc. | | | 17,830 | | | | 1,516 | |
| China Gerui Advanced Materials Group Ltd. | | | 8,567 | | | | 14,393 | |
| China Natural Resources, Inc. | | | 4,328 | | | | 20,298 | |
| China Precision Steel, Inc. | | | 27,364 | | | | 37,215 | |
| China Shen Zhou Mining & Resources, Inc. | | | 198,490 | | | | 37,713 | |
| Cliffs Natural Resources, Inc. | | | 65,275 | | | | 1,392,968 | |
TFS MARKET NEUTRAL FUND
SCHEDULE OF SECURITIES SOLD SHORT (Continued)
COMMON STOCKS — 65.7% (Continued) | | | | | | |
| Materials — 4.2% (Continued) | | | | | | |
| Metals & Mining — 2.9% (Continued) | | | | | | |
| Commercial Metals Company | | | 309,091 | | | $ | 4,518,910 | |
| Crosshair Energy Corporation | | | 176,804 | | | | 10,608 | |
| General Moly, Inc. | | | 88,278 | | | | 164,197 | |
| General Steel Holdings, Inc. | | | 122,667 | | | | 122,667 | |
| Globe Specialty Metals, Inc. | | | 22,074 | | | | 288,286 | |
| Gold Reserve, Inc. | | | 8,846 | | | | 28,307 | |
| Gold Resource Corporation | | | 109,198 | | | | 1,118,188 | |
| Golden Minerals Company | | | 20,369 | | | | 37,072 | |
| Great Northern Iron Ore Properties | | | 4,471 | | | | 311,226 | |
| IAMGOLD Corporation | | | 632 | | | | 3,394 | |
| Jaguar Mining, Inc. | | | 709,423 | | | | 296,752 | |
| Kaiser Aluminum Corporation | | | 21,354 | | | | 1,345,302 | |
| Kimber Resources, Inc. | | | 11,900 | | | | 2,083 | |
| Materion Corporation | | | 7,918 | | | | 209,748 | |
| McEwen Mining, Inc. | | | 854 | | | | 1,990 | |
| Mercator Minerals Ltd. | | | 186 | | | | 51 | |
| Mesabi Trust | | | 100 | | | | 2,140 | |
| Midway Gold Corporation | | | 168,501 | | | | 158,458 | |
| Molycorp, Inc. | | | 1,483,445 | | | | 8,663,319 | |
| Olympic Steel, Inc. | | | 32,566 | | | | 651,320 | |
| Paramount Gold and Silver Corporation | | | 415,954 | | | | 657,207 | |
| Pershing Gold Corporation | | | 36,865 | | | | 15,373 | |
| Polymet Mining Corporation | | | 278,040 | | | | 314,185 | |
| Puda Coal, Inc. | | | 61,600 | | | | 1,540 | |
| Rare Element Resources Ltd. | | | 2,579 | | | | 4,797 | |
| RTI International Metals, Inc. | | | 11,344 | | | | 329,203 | |
| Santa Fe Gold Corporation | | | 2,959 | | | | 710 | |
| Schnitzer Steel Industries, Inc. - Class A | | | 192,166 | | | | 4,713,832 | |
| Seabridge Gold, Inc. | | | 19,276 | | | | 221,096 | |
| Silver Bull Resources, Inc. | | | 133,817 | | | | 50,315 | |
| SinoCoking Coal and Coke Chemical Industries, Inc. | | | 118,762 | | | | 135,389 | |
| Stillwater Mining Company | | | 391,446 | | | | 4,869,588 | |
| SunCoke Energy Partners, L.P. | | | 31,670 | | | | 673,938 | |
| Tanzanian Royalty Exploration Corporation | | | 452,593 | | | | 1,371,357 | |
| Thompson Creek Metals Company, Inc. | | | 489,961 | | | | 1,464,983 | |
| United States Antimony Corporation | | | 44,538 | | | | 67,698 | |
| United States Steel Corporation | | | 81,258 | | | | 1,446,392 | |
| Universal Stainless & Alloy Products, Inc. | | | 7,143 | | | | 249,719 | |
| Walter Energy, Inc. | | | 259,481 | | | | 4,649,900 | |
| Worthington Industries, Inc. | | | 79,372 | | | | 2,554,191 | |
| | | | | | | | 54,358,254 | |
| Paper & Forest Products — 0.1% | | | | | | | | |
| Orient Paper, Inc. | | | 158,641 | | | | 283,968 | |
TFS MARKET NEUTRAL FUND
SCHEDULE OF SECURITIES SOLD SHORT (Continued)
COMMON STOCKS — 65.7% (Continued) | | | | | | |
| Materials — 4.2% (Continued) | | | | | | |
| Paper & Forest Products — 0.1% (Continued) | | | | | | |
| Resolute Forest Products, Inc. | | | 143,613 | | | $ | 2,101,058 | |
| Wausau Paper Corporation | | | 67,741 | | | | 689,603 | |
| | | | | | | | 3,074,629 | |
| Telecommunication Services — 1.4% | | | | | | | | |
| Diversified Telecommunication Services — 0.9% | | | | | | | | |
| 8x8, Inc. | | | 54,022 | | | | 390,579 | |
| Alaska Communications Systems Group, Inc. | | | 496 | | | | 804 | |
| CenturyLink, Inc. | | | 16 | | | | 601 | |
| Elephant Talk Communications, Inc. | | | 283,475 | | | | 325,996 | |
| Fairpoint Communications, Inc. | | | 175,894 | | | | 1,431,777 | |
| Frontier Communications Corporation | | | 1,377 | | | | 5,728 | |
| Globalstar, Inc. | | | 69,904 | | | | 23,068 | |
| inContact, Inc. | | | 95,382 | | | | 772,594 | |
| Iridium Communications, Inc. | | | 257,019 | | | | 1,724,598 | |
| Lumos Networks Corporation | | | 10 | | | | 135 | |
| magicJack VocalTec Ltd. | | | 320,033 | | | | 5,290,146 | |
| Otelco, Inc. | | | 5,919 | | | | 10,062 | |
| Radcom Ltd. | | | 52,298 | | | | 159,509 | |
| Sprint Nextel Corporation | | | 646,729 | | | | 4,559,439 | |
| Towerstream Corporation | | | 585,839 | | | | 1,406,014 | |
| | | | | | | | 16,101,050 | |
| Wireless Telecommunication Services — 0.5% | | | | | | | | |
| Boingo Wireless, Inc. | | | 73,485 | | | | 457,812 | |
| Leap Wireless International, Inc. | | | 373,016 | | | | 2,133,651 | |
| NII Holdings, Inc. | | | 745,389 | | | | 6,484,884 | |
| NTELOS Holdings Corporation | | | 73,366 | | | | 1,079,948 | |
| Shenandoah Telecommunications Company | | | 10,599 | | | | 173,718 | |
| | | | | | | | 10,330,013 | |
| Utilities — 0.9% | | | | | | | | |
| Electric Utilities — 0.2% | | | | | | | | |
| MGE Energy, Inc. | | | 8,513 | | | | 475,451 | |
| Northeast Utilities | | | 160 | | | | 7,253 | |
| NV Energy, Inc. | | | 37,301 | | | | 806,821 | |
| Otter Tail Corporation | | | 59,773 | | | | 1,864,918 | |
| Pinnacle West Capital Corporation | | | 7,915 | | | | 482,023 | |
| | | | | | | | 3,636,466 | |
| Gas Utilities — 0.5% | | | | | | | | |
| AmeriGas Partners, L.P. | | | 28,115 | | | | 1,274,453 | |
| Atmos Energy Corporation | | | 9,553 | | | | 423,867 | |
| China Natural Gas, Inc. | | | 187,992 | | | | 93,996 | |
| Ferrellgas Partners, L.P. | | | 162,532 | | | | 3,223,009 | |
| Laclede Group, Inc. (The) | | | 17,462 | | | | 815,650 | |
| New Jersey Resources Corporation | | | 19,123 | | | | 902,605 | |
TFS MARKET NEUTRAL FUND
SCHEDULE OF SECURITIES SOLD SHORT (Continued)
COMMON STOCKS — 65.7% (Continued) | | | | | | |
| Utilities — 0.9% (Continued) | | | | | | |
| Gas Utilities — 0.5% (Continued) | | | | | | |
| Northwest Natural Gas Company | | | 44,712 | | | $ | 1,988,343 | |
| Piedmont Natural Gas Company, Inc. | | | 27,125 | | | | 933,914 | |
| South Jersey Industries, Inc. | | | 19 | | | | 1,172 | |
| UGI Corporation | | | 200 | | | | 8,196 | |
| | | | | | | | 9,665,205 | |
| Independent Power Producers & Energy Traders — 0.1% | | | | | | | | |
| American DG Energy, Inc. | | | 28,509 | | | | 52,456 | |
| Dynegy, Inc. | | | 12,813 | | | | 316,609 | |
| Ormat Technologies, Inc. | | | 108,815 | | | | 2,365,638 | |
| U.S. Geothermal, Inc. | | | 240,378 | | | | 78,604 | |
| | | | | | | | 2,813,307 | |
| Multi-Utilities — 0.1% | | | | | | | | |
| MDU Resources Group, Inc. | | | 46,827 | | | | 1,168,334 | |
| | | | | | | | | |
Water Utilities — 0.0% (b) | | | | | | | | |
| Connecticut Water Service, Inc. | | | 6 | | | | 171 | |
| Consolidated Water Company Ltd. | | | 210 | | | | 2,094 | |
| Ecosphere Technologies, Inc. | | | 5,869 | | | | 2,230 | |
| | | | | | | | 4,495 | |
| | | | | | | | | |
Total Common Stocks (Proceeds $1,372,736,764) | | | | | | $ | 1,234,547,767 | |
PREFERRED STOCKS — 0.0% (b) | | | | | | |
| Cabco Trust for J. C. Penney (Proceeds $100,026) | | | 5,172 | | | $ | 105,509 | |
OTHER INVESTMENTS — 13.9% | | | | | | |
| iPath S&P 500 VIX Mid-Term Futures ETN | | | 369,985 | | | $ | 7,407,100 | |
| iPath S&P 500 VIX Short-Term Futures ETN | | | 1,887,270 | | | | 35,801,512 | |
| SPDR S&P 500 ETF Trust | | | 822,100 | | | | 131,272,928 | |
| Vanguard S&P 500 ETF | | | 1,183,394 | | | | 86,553,437 | |
Total Other Investments (Proceeds $268,022,615) | | | | | | $ | 261,034,977 | |
TFS MARKET NEUTRAL FUND
SCHEDULE OF SECURITIES SOLD SHORT (Continued)
| | | | | | |
| American International Group, Inc. | | | 854 | | | $ | 15,116 | |
| Magnum Hunter Resources Corporation | | | 15,718 | | | | 2,200 | |
Total Warrants (Proceeds $14,295) | | | | | | $ | 17,316 | |
| | | | | | | | | |
Total Securities Sold Short — 79.6% (Proceeds $1,640,873,700) | | | | | | $ | 1,495,705,569 | |
| ADR - American Depositary Receipt. |
| |
| (a) | Security has been valued at fair value in accordance with procedures adopted in good faith by the Board of Trustees. Total value of such securities is ($413,271) at April 30, 2013, representing greater than (0.1%) of net assets (Note 2). |
| | |
| (b) | Percentage rounds to less than 0.1%. |
| | |
| See accompanying notes to financial statements. |
TFS SMALL CAP FUND
SUMMARY SCHEDULE OF INVESTMENTS*
April 30, 2013 (Unaudited)
| | | | | | |
| Consumer Discretionary — 15.6% | | | | | | |
E.W. Scripps Company (The) - Class A (a) | | | 18,174 | | | $ | 252,437 | |
Gray Television, Inc. (a) | | | 36,829 | | | | 233,864 | |
Jack in the Box, Inc. (a) | | | 8,403 | | | | 301,248 | |
Journal Communications, Inc. (a) | | | 31,466 | | | | 214,283 | |
LIN TV Corporation - Class A (a) | | | 27,211 | | | | 334,967 | |
Multimedia Games Holding Company, Inc. (a) | | | 9,222 | | | | 227,414 | |
| Nexstar Broadcasting Group, Inc. | | | 9,095 | | | | 221,463 | |
Steven Madden Ltd. (a) | | | 5,852 | | | | 284,583 | |
Other Consumer Discretionary (b) | | | | | | | 7,069,400 | |
| | | | | | | | 9,139,659 | |
| Consumer Staples — 4.0% | | | | | | | | |
Prestige Brands Holdings, Inc. (a) | | | 10,749 | | | | 289,685 | |
Rite Aid Corporation (a) | | | 83,799 | | | | 222,067 | |
Other Consumer Staples (b) | | | | | | | 1,810,101 | |
| | | | | | | | 2,321,853 | |
| Energy — 7.6% | | | | | | | | |
Matrix Service Company (a) | | | 17,523 | | | | 263,371 | |
Newfield Exploration Company (a) | | | 11,778 | | | | 256,643 | |
Other Energy (b) | | | | | | | 3,958,913 | |
| | | | | | | | 4,478,927 | |
| Financials — 17.6% | | | | | | | | |
| Geo Group, Inc. (The) | | | 6,166 | | | | 230,917 | |
| Hanover Insurance Group, Inc. (The) | | | 5,933 | | | | 299,201 | |
| Mercury General Corporation | | | 6,709 | | | | 306,668 | |
| Symetra Financial Corporation | | | 20,152 | | | | 274,672 | |
Other Financials (b) | | | | | | | 9,220,531 | |
| | | | | | | | 10,331,989 | |
| Health Care — 15.5% | | | | | | | | |
Albany Molecular Research, Inc. (a) | | | 19,579 | | | | 233,577 | |
Allscripts Healthcare Solutions, Inc. (a) | | | 15,730 | | | | 217,703 | |
AMN Healthcare Services, Inc. (a) | | | 24,556 | | | | 337,154 | |
AmSurg Corporation (a) | | | 9,441 | | | | 316,840 | |
Astex Pharmaceuticals, Inc. (a) | | | 35,170 | | | | 241,970 | |
LifePoint Hospitals, Inc. (a) | | | 5,923 | | | | 284,304 | |
Magellan Health Services, Inc. (a) | | | 5,226 | | | | 267,362 | |
MedAssets, Inc. (a) | | | 14,097 | | | | 264,037 | |
| Select Medical Holdings Corporation | | | 31,128 | | | | 256,806 | |
| Techne Corporation | | | 4,075 | | | | 261,371 | |
Trius Therapeutics, Inc. (a) | | | 31,739 | | | | 221,221 | |
WellCare Health Plans, Inc. (a) | | | 4,878 | | | | 284,436 | |
| West Pharmaceutical Services, Inc. | | | 4,354 | | | | 278,046 | |
Other Health Care (b) | | | | | | | 5,652,857 | |
| | | | | | | | 9,117,684 | |
TFS SMALL CAP FUND
SUMMARY SCHEDULE OF INVESTMENTS* (Continued)
COMMON STOCKS — 98.3% (Continued) | | | | | | |
| Industrials — 15.9% | | | | | | |
CAI International, Inc. (a) | | | 9,096 | | | $ | 231,857 | |
DigitalGlobe, Inc. (a) | | | 9,323 | | | | 272,138 | |
DXP Enterprises, Inc. (a) | | | 3,773 | | | | 252,338 | |
EnergySolutions, Inc. (a) | | | 60,110 | | | | 248,254 | |
| Exelis, Inc. | | | 28,910 | | | | 322,925 | |
| Pike Electric Corporation | | | 19,194 | | | | 300,002 | |
| Primoris Services Corporation | | | 12,897 | | | | 284,250 | |
Republic Airways Holdings, Inc. (a) | | | 22,821 | | | | 255,367 | |
| Ryder System, Inc. | | | 4,918 | | | | 285,588 | |
Spirit AeroSystems Holdings, Inc. - Class A (a) | | | 19,950 | | | | 398,801 | |
Teledyne Technologies, Inc. (a) | | | 3,462 | | | | 259,858 | |
Other Industrials (b) | | | | | | | 6,184,100 | |
| | | | | | | | 9,295,478 | |
| Information Technology — 16.1% | | | | | | | | |
Ambarella, Inc. (a) | | | 15,924 | | | | 218,159 | |
Benchmark Electronics, Inc. (a) | | | 18,116 | | | | 323,190 | |
Electronics For Imaging, Inc. (a) | | | 10,273 | | | | 274,494 | |
Global Cash Access Holdings, Inc. (a) | | | 37,052 | | | | 264,181 | |
PROS Holdings, Inc. (a) | | | 8,185 | | | | 212,155 | |
Rovi Corporation (a) | | | 9,822 | | | | 229,737 | |
SS&C Technologies Holdings, Inc. (a) | | | 7,556 | | | | 231,894 | |
SunPower Corporation (a) | | | 18,916 | | | | 257,068 | |
Other Information Technology (b) | | | | | | | 7,448,576 | |
| | | | | | | | 9,459,454 | |
| Materials — 3.3% | | | | | | | | |
| Boise, Inc. | | | 34,033 | | | | 271,923 | |
Other Materials (b) | | | | | | | 1,657,366 | |
| | | | | | | | 1,929,289 | |
| Telecommunication Services — 1.9% | | | | | | | | |
| Telephone and Data Systems, Inc. | | | 13,390 | | | | 300,472 | |
Other Telecommunication Services (b) | | | | | | | 789,911 | |
| | | | | | | | 1,090,383 | |
| Utilities — 0.8% | | | | | | | | |
Other Utilities (b) | | | | | | | 487,499 | |
| | | | | | | | | |
Total Common Stocks (Cost $53,873,482) | | | | | | $ | 57,652,215 | |
TFS SMALL CAP FUND
SUMMARY SCHEDULE OF INVESTMENTS* (Continued)
MONEY MARKET FUNDS — 1.9% | | | | | | |
UMB Money Market Fiduciary, 0.01% (c) (Cost $1,092,605) | | | 1,092,605 | | | $ | 1,092,605 | |
| | | | | | | | | |
Total Investments at Value — 100.2% (Cost $54,966,087) | | | | | | $ | 58,744,820 | |
| | | | | | | | | |
| Liabilities in Excess of Other Assets — (0.2%) | | | | | | | (117,560 | ) |
| | | | | | | | | |
| Net Assets — 100.0% | | | | | | $ | 58,627,260 | |
| * | A complete Schedule of Investments is available without charge upon request by calling toll-free 1-888-534-2001 or on the SEC’s website at http://www.sec.gov. |
| | |
| (a) | Non-income producing security. |
| | |
| (b) | Represents issuers not identified as a top 50 holding in terms of value and issues or issuers not exceeding 1% of net assets individually or in the aggregate, respectively, as of April 30, 2013. |
| | |
| (c) | The rate shown is the 7-day effective yield as of April 30, 2013. |
| | |
| See accompanying notes to financial statements. |
TFS HEDGED FUTURES FUND
SCHEDULE OF INVESTMENTS
April 30, 2013 (Unaudited)
U.S. TREASURY OBLIGATIONS (a) — 20.6% | | | | | | |
| U.S. Treasury Bills, | | | | | | |
| 0.115%, due 08/08/2013 | | $ | 3,000,000 | | | $ | 2,999,568 | |
| 0.080%, due 08/15/2013 | | | 750,000 | | | | 749,873 | |
| 0.095%, due 08/22/2013 | | | 5,000,000 | | | | 4,999,135 | |
| 0.070%, due 08/29/2013 | | | 1,250,000 | | | | 1,249,813 | |
| 0.085%, due 09/05/2013 | | | 6,000,000 | | | | 5,998,782 | |
| 0.080%, due 09/12/2013 | | | 1,000,000 | | | | 999,749 | |
| 0.075%, due 09/19/2013 | | | 3,000,000 | | | | 2,999,148 | |
| 0.080%, due 10/03/2013 | | | 3,750,000 | | | | 3,748,789 | |
Total U.S. Treasury Obligations (Cost $23,742,823) | | | | | | $ | 23,744,857 | |
MONEY MARKET FUNDS — 58.1% | | | | | | |
BlackRock Liquidity Funds TempFund Portfolio - Institutional Class, 0.08% (b) | | | 12,281,594 | | | $ | 12,281,594 | |
Fidelity Institutional Money Market Portfolio - Class I, 0.10%(b) | | | 26,927,800 | | | | 26,927,800 | |
Goldman Sachs Financial Square Money Market Fund - Institutional Class, 0.10% (b) | | | 12,281,809 | | | | 12,281,809 | |
Morgan Stanley Institutional Liquidity Funds - Money Market Portfolio - Institutional Class, 0.12% (b) | | | 1,527,144 | | | | 1,527,144 | |
PIMCO Money Market Fund - Institutional Class, 0.01% (b) | | | 1,525,929 | | | | 1,525,929 | |
Vanguard Prime Money Market Fund - Investor Shares, 0.01%(b) | | | 12,277,919 | | | | 12,277,919 | |
Total Money Market Funds (Cost $66,822,195) | | | | | | $ | 66,822,195 | |
| | | | | | | | | |
Total Investments at Value — 78.7% (Cost $90,565,018) | | | | | | $ | 90,567,052 | |
| | | | | | | | | |
| Other Assets in Excess of Liabilities — 21.3% | | | | | | | 24,504,881 | (c) |
| | | | | | | | | |
| Net Assets — 100.0% | | | | | | $ | 115,071,933 | |
| (a) | Rate shown is the annualized yield at time of purchase, not a coupon rate. |
| | |
| (b) | The rate shown is the 7-day effective yield as of April 30, 2013. |
| | |
| (c) | Includes cash held as margin deposits for futures contracts. |
| | |
| See accompanying notes to financial statements. |
TFS HEDGED FUTURES FUND
SCHEDULE OF FUTURES CONTRACTS
April 30, 2013 (Unaudited)
| | | | | | Aggregate Market Value of Contracts | | | Unrealized Appreciation (Depreciation) | |
| COMMODITY FUTURES | | | | | | | | | | |
| Cocoa Future | 07/16/2013 | | | 70 | | | $ | 1,657,600 | | | $ | 69,240 | |
| Coffee Future | 07/19/2013 | | | 51 | | | | 2,583,787 | | | | (34,422 | ) |
| Corn Future | 07/12/2013 | | | 133 | | | | 4,322,500 | | | | 164,956 | |
| Frozen Concentrate Orange Juice Future | 07/11/2013 | | | 145 | | | | 3,053,700 | | | | (76,436 | ) |
| Gold Future | 06/26/2013 | | | 11 | | | | 1,623,270 | | | | (149,055 | ) |
| Heating Oil Future | 05/31/2013 | | | 39 | | | | 4,626,203 | | | | 20,178 | |
| Live Cattle Future | 06/28/2013 | | | 39 | | | | 1,905,930 | | | | 7,742 | |
| Oats Future | 07/12/2013 | | | 40 | | | | 783,500 | | | | 1,580 | |
| Rough Rice Future | 07/12/2013 | | | 4 | | | | 120,840 | | | | (5,351 | ) |
| Soybean Future | 07/12/2013 | | | 81 | | | | 5,665,950 | | | | 108,245 | |
| Soybean Meal Future | 07/12/2013 | | | 149 | | | | 6,176,050 | | | | 203,841 | |
| Soybean Oil Future | 07/12/2013 | | | 28 | | | | 826,896 | | | | 4,317 | |
| Sugar No. 11 Future | 06/28/2013 | | | 199 | | | | 3,922,688 | | | | 17,035 | |
| Wheat Future | 07/12/2013 | | | 7 | | | | 255,850 | | | | 12,831 | |
| Total Commodity Futures | | | | | | | | 37,524,764 | | | | 344,701 | |
| | | | | | | | | | | | | | |
| CURRENCY FUTURES | | | | | | | | | | | | | |
| Australian Dollar Future | 06/17/2013 | | | 110 | | | | 11,366,300 | | | | 16,948 | |
| Canadian Dollar Future | 06/18/2013 | | | 1 | | | | 99,180 | | | | 8 | |
| Mexican Peso Future | 06/17/2013 | | | 295 | | | | 12,098,688 | | | | 265,935 | |
| Total Currency Futures | | | | | | | | 23,564,168 | | | | 282,891 | |
| | | | | | | | | | | | | | |
| Total Futures Contracts | | | | | | | $ | 61,088,932 | | | $ | 627,592 | |
| See accompanying notes to financial statements. |
TFS HEDGED FUTURES FUND
SCHEDULE OF FUTURES CONTRACTS SOLD SHORT
April 30, 2013 (Unaudited)
FUTURES CONTRACTS SOLD SHORT | | | | | | Aggregate Market Value of Contracts | | | Unrealized Appreciation (Depreciation) | |
| COMMODITY FUTURES | | | | | | | | | | |
| Brent Crude Oil Future | 05/16/2013 | | | 12 | | | $ | 1,220,880 | | | $ | 2,270 | |
| Class III Milk Future | 06/04/2013 | | | 176 | | | | 6,575,360 | | | | (69,885 | ) |
| Copper Future | 07/29/2013 | | | 19 | | | | 1,513,350 | | | | 1,143 | |
| Cotton No. 2 Future | 07/09/2013 | | | 45 | | | | 1,968,075 | | | | (44,759 | ) |
| Crude Oil Future | 05/21/2013 | | | 29 | | | | 2,697,870 | | | | (93,407 | ) |
| Feeder Cattle Future | 05/24/2013 | | | 51 | | | | 3,556,613 | | | | 60,734 | |
| Feeder Cattle Future | 08/29/2013 | | | 53 | | | | 3,947,175 | | | | 46,454 | |
| Gas Oil Future | 05/10/2013 | | | 8 | | | | 675,200 | | | | 6,911 | |
| Gas Oil Future | 06/12/2013 | | | 21 | | | | 1,781,325 | | | | 2,765 | |
| Lean Hogs Future | 06/14/2013 | | | 163 | | | | 6,034,260 | | | | (133,339 | ) |
| Lumber Future | 07/15/2013 | | | 61 | | | | 2,345,816 | | | | 131,171 | |
| Natural Gas Future | 05/29/2013 | | | 32 | | | | 1,391,680 | | | | (5,594 | ) |
| Palladium Future | 06/26/2013 | | | 33 | | | | 2,306,040 | | | | (16,062 | ) |
| Platinum Future | 07/29/2013 | | | 8 | | | | 602,320 | | | | (17,919 | ) |
| Silver Future | 07/29/2013 | | | 9 | | | | 1,091,250 | | | | (27,621 | ) |
| Total Commodity Futures | | | | | | | | 37,707,214 | | | | (157,138 | ) |
| | | | | | | | | | | | | | |
| CURRENCY FUTURES | | | | | | | | | | | | | |
| British Pound Future | 06/17/2013 | | | 44 | | | | 4,270,475 | | | | (70,403 | ) |
| Euro FX Future | 06/17/2013 | | | 44 | | | | 7,245,150 | | | | (92,346 | ) |
| Japanese Yen Future | 06/17/2013 | | | 31 | | | | 3,975,750 | | | | (12,826 | ) |
| Swiss Franc Future | 06/17/2013 | | | 59 | | | | 7,934,762 | | | | (107,333 | ) |
| Total Currency Futures | | | | | | | | 23,426,137 | | | | (282,908 | ) |
| | | | | | | | | | | | | | |
| FINANCIAL FUTURES | | | | | | | | | | | | | |
| CBOE Volatility Index (VIX) Future | 05/21/2013 | | | 331 | | | | 4,816,050 | | | | 444,355 | |
| CBOE Volatility Index (VIX) Future | 06/18/2013 | | | 375 | | | | 5,775,000 | | | | 468,412 | |
| E-Mini S&P 500 Future | 06/21/2013 | | | 602 | | | | 47,926,725 | | | | (1,406,223 | ) |
| Total Financial Futures | | | | | | | | 58,517,775 | | | | (493,456 | ) |
| | | | | | | | | | | | | | |
Total Futures Contracts Sold Short | | | | | | | $ | 119,651,126 | | | $ | (933,502 | ) |
| See accompanying notes to financial statements. |
TFS CAPITAL INVESTMENT TRUST
STATEMENTS OF ASSETS AND LIABILITIES
April 30, 2013 (Unaudited)
| | | | | | | | | | |
| ASSETS | | | | | | | | | |
| Investments in securities: | | | | | | | | | |
| At acquisition cost | | $ | 1,690,881,515 | | | $ | 54,966,087 | | | $ | 90,565,018 | |
| At value (Note 2) | | $ | 1,834,180,376 | | | $ | 58,744,820 | | | $ | 90,567,052 | |
| Cash | | | 433,359 | | | | — | | | | — | |
| Deposits with brokers for securities sold short (Note 2) | | | 1,540,929,416 | | | | — | | | | — | |
| Margin deposits for futures contracts (Notes 2 and 6) | | | — | | | | — | | | | 24,399,597 | |
| Dividends and interest receivable | | | 629,120 | | | | 12,538 | | | | 4,570 | |
| Receivable for investment securities sold | | | 244,462,088 | | | | 6,326,331 | | | | — | |
| Receivable for capital shares sold | | | 1,551,362 | | | | 9,486 | | | | 89,184 | |
| Variation margin receivable (Notes 2 and 6) | | | — | | | | — | | | | 1,583,370 | |
| Other assets | | | 74,437 | | | | 19,100 | | | | 39,361 | |
| TOTAL ASSETS | | | 3,622,260,158 | | | | 65,112,275 | | | | 116,683,134 | |
| | | | | | | | | | | | | |
| LIABILITIES | | | | | | | | | | | | |
Securities sold short, at value (Note 2) (proceeds $1,640,873,700) | | | 1,495,705,569 | | | | — | | | | — | |
| Variation margin payable (Notes 2 and 6) | | | — | | | | — | | | | 1,191,302 | |
| Payable for investment securities purchased | | | 235,891,822 | | | | 6,398,872 | | | | — | |
| Payable for capital shares redeemed | | | 3,503,160 | | | | 5,684 | | | | 208,852 | |
| Dividends payable on securities sold short (Note 2) | | | 198,020 | | | | — | | | | — | |
| Payable to Adviser (Note 4) | | | 3,535,938 | | | | 54,791 | | | | 185,072 | |
| Payable to administrator (Note 4) | | | 179,595 | | | | 10,940 | | | | 17,239 | |
Accrued brokerage expense on securities sold short (Note 2) | | | 5,140,176 | | | | — | | | | — | |
| Other accrued expenses and liabilities | | | 114,099 | | | | 14,728 | | | | 8,736 | |
| TOTAL LIABILITIES | | | 1,744,268,379 | | | | 6,485,015 | | | | 1,611,201 | |
| | | | | | | | | | | | | |
| NET ASSETS | | $ | 1,877,991,779 | | | $ | 58,627,260 | | | $ | 115,071,933 | |
| | | | | | | | | | | | | |
| Net assets consist of: | | | | | | | | | | | | |
| Paid-in capital | | $ | 1,780,216,034 | | | $ | 49,234,406 | | | $ | 118,922,796 | |
| Accumulated net investment loss | | | (70,867,551 | ) | | | — | | | | (1,006,924 | ) |
| Distributions in excess of net investment income | | | — | | | | (149,499 | ) | | | — | |
Accumulated net realized gains (losses) from security transactions and other financial instruments | | | (119,823,720 | ) | | | 5,763,620 | | | | (2,540,063 | ) |
| Net unrealized appreciation (depreciation) on: | | | | | | | | | | | | |
| Investments | | | 143,298,861 | | | | 3,778,733 | | | | 2,034 | |
| Short positions | | | 145,168,131 | | | | — | | | | — | |
| Futures contracts | | | — | | | | — | | | | (305,910 | ) |
Translation of assets and liabilities in foreign currencies | | | 24 | | | | — | | | | — | |
| Net assets | | $ | 1,877,991,779 | | | $ | 58,627,260 | | | $ | 115,071,933 | |
| | | | | | | | | | | | | |
Shares of beneficial interest outstanding (unlimited number of shares authorized, no par value) | | | 119,231,738 | | | | 4,420,891 | | | | 11,072,183 | |
| | | | | | | | | | | | | |
Net asset value, redemption price and offering price per share (a) (Note 2) | | $ | 15.75 | | | $ | 13.26 | | | $ | 10.39 | |
| * | Consolidated financial statement (Note 1). |
| | |
| (a) | Redemption price may differ from the net asset value per share depending upon the length of time the shares are held (Note 2). |
| | |
| See accompanying notes to financial statements. |
TFS CAPITAL INVESTMENT TRUST
STATEMENTS OF OPERATIONS
For the Six Months Ended April 30, 2013 (Unaudited)
| | | | | | | | | |
| INVESTMENT INCOME | | | | | | | | | |
| Dividends | | $ | 22,940,304 | | | $ | 625,675 | | | $ | 41,043 | |
| Foreign tax withholding | | | (43,213 | ) | | | — | | | | — | |
| Interest | | | 1,279 | | | | 40 | | | | 13,454 | |
| TOTAL INVESTMENT INCOME | | | 22,898,370 | | | | 625,715 | | | | 54,497 | |
| | | | | | | | | | | | | |
| EXPENSES | | | | | | | | | | | | |
| Brokerage expense on securities sold short (Note 2) | | | 46,265,220 | | | | — | | | | — | |
| Investment advisory fees (Note 4) | | | 21,000,714 | | | | 330,170 | | | | 1,311,060 | |
| Dividend expense on securities sold short (Note 2) | | | 10,855,674 | | | | — | | | | — | |
| Administration fees (Note 4) | | | 531,128 | | | | 30,000 | | | | 49,278 | |
| Accounting services fees (Note 4) | | | 322,578 | | | | 21,322 | | | | 33,195 | |
| Custodian fees | | | 252,521 | | | | 27,096 | | | | 16,308 | |
| Transfer agent fees (Note 4) | | | 162,530 | | | | 15,142 | | | | 19,983 | |
| Professional fees | | | 43,836 | | | | 20,555 | | | | 26,120 | |
| Registration and filing fees | | | 35,464 | | | | 15,177 | | | | 31,855 | |
| Pricing fees | | | 53,446 | | | | 7,873 | | | | 569 | |
| Trustees’ fees and expenses (Note 4) | | | 14,429 | | | | 14,429 | | | | 14,429 | |
| Postage and supplies | | | 32,148 | | | | 4,098 | | | | 5,053 | |
| Compliance service fees and expenses (Note 4) | | | 19,838 | | | | 5,718 | | | | 6,323 | |
| Printing of shareholder reports | | | 21,126 | | | | 4,249 | | | | 5,068 | |
| Insurance expense | | | 17,136 | | | | 917 | | | | 911 | |
| Borrowing costs (Note 5) | | | 17,007 | | | | 1,064 | | | | — | |
| Other expenses | | | 6,323 | | | | 4,727 | | | | 3,886 | |
| TOTAL EXPENSES | | | 79,651,118 | | | | 502,537 | | | | 1,524,038 | |
| Investment advisory fee reductions (Note 4) | | | — | | | | (40,299 | ) | | | (16,320 | ) |
| NET EXPENSES | | | 79,651,118 | | | | 462,238 | | | | 1,507,718 | |
| NET INVESTMENT INCOME (LOSS) | | | (56,752,748 | ) | | | 163,477 | | | | (1,453,221 | ) |
| | | | | | | | | | | | | |
| REALIZED AND UNREALIZED GAINS (LOSSES) ON INVESTMENTS, SECURITIES SOLD SHORT, FUTURES CONTRACTS AND FOREIGN CURRENCY TRANSACTIONS | | | | | | | | | | | | |
| Net realized gains (losses) from: | | | | | | | | | | | | |
| Investments | | | 197,081,601 | | | | 7,008,596 | | | | 4,558 | |
| Securities sold short | | | (131,056,229 | ) | | | — | | | | — | |
| Futures contracts | | | — | | | | — | | | | (3,239,667 | ) |
| Foreign currency transactions | | | 25,740 | | | | — | | | | — | |
| Net change in unrealized appreciation (depreciation) on: | | | | | | | | | | | | |
| Investments | | | 89,108,885 | | | | 2,528,185 | | | | 2,386 | |
| Securities sold short | | | (38,200,990 | ) | | | — | | | | — | |
| Futures contracts | | | — | | | | — | | | | (549,376 | ) |
| Foreign currency translation | | | (36,908 | ) | | | — | | | | — | |
NET REALIZED AND UNREALIZED GAINS (LOSSES) ON INVESTMENTS | | | 116,922,099 | | | | 9,536,781 | | | | (3,782,099 | ) |
NET INCREASE (DECREASE) IN NET ASSETS FROM OPERATIONS | | $ | 60,169,351 | | | $ | 9,700,258 | | | $ | (5,235,320 | ) |
| * | Consolidated financial statement (Note 1). |
| | |
| See accompanying notes to financial statements. |
TFS MARKET NEUTRAL FUND
STATEMENTS OF CHANGES IN NET ASSETS
| | Six Months Ended April 30, 2013 (Unaudited) | | | | |
| FROM OPERATIONS | | | | | | |
| Net investment loss | | $ | (56,752,748 | ) | | $ | (116,533,594 | ) |
| Net realized gains (losses) from: | | | | | | | | |
| Investments | | | 197,081,601 | | | | 214,856,225 | |
| Securities sold short | | | (131,056,229 | ) | | | (64,020,799 | ) |
| Foreign currency transactions | | | 25,740 | | | | (30,004 | ) |
| Net change in unrealized appreciation (depreciation) on: | | | | | | | | |
| Investments | | | 89,108,885 | | | | (25,378,884 | ) |
| Securities sold short | | | (38,200,990 | ) | | | 115,098,579 | |
| Foreign currency translation | | | (36,908 | ) | | | 36,951 | |
| Net increase in net assets from operations | | | 60,169,351 | | | | 124,028,474 | |
| | | | | | | | | |
FROM DISTRIBUTIONS (Note 2) | | | | | | | | |
| Distributions from net realized gains from security transactions | | | — | | | | (28,690,939 | ) |
| | | | | | | | | |
| FROM CAPITAL SHARE TRANSACTIONS | | | | | | | | |
| Proceeds from shares sold | | | 308,282,113 | | | | 532,434,224 | |
Net asset value of shares issued in reinvestment of distributions to shareholders | | | — | | | | 21,400,921 | |
| Proceeds from redemption fees collected (Note 2) | | | 76,336 | | | | 131,452 | |
| Payments for shares redeemed | | | (279,838,733 | ) | | | (622,266,606 | ) |
| Net increase (decrease) in net assets from capital share transactions | | | 28,519,716 | | | | (68,300,009 | ) |
| | | | | | | | | |
| TOTAL INCREASE IN NET ASSETS | | | 88,689,067 | | | | 27,037,526 | |
| | | | | | | | | |
| NET ASSETS | | | | | | | | |
| Beginning of period | | | 1,789,302,712 | | | | 1,762,265,186 | |
| End of period | | $ | 1,877,991,779 | | | $ | 1,789,302,712 | |
| | | | | | | | | |
| ACCUMULATED NET INVESTMENT LOSS | | $ | (70,867,551 | ) | | $ | (14,140,543 | ) |
| | | | | | | | | |
| CAPITAL SHARE ACTIVITY | | | | | | | | |
| Shares sold | | | 19,532,570 | | | | 35,586,827 | |
| Shares issued in reinvestment of distributions to shareholders | | | — | | | | 1,500,766 | |
| Shares redeemed | | | (17,761,721 | ) | | | (41,952,004 | ) |
| Net increase (decrease) in shares outstanding | | | 1,770,849 | | | | (4,864,411 | ) |
| Shares outstanding, beginning of period | | | 117,460,889 | | | | 122,325,300 | |
| Shares outstanding, end of period | | | 119,231,738 | | | | 117,460,889 | |
| See accompanying notes to financial statements. |
TFS SMALL CAP FUND
STATEMENTS OF CHANGES IN NET ASSETS
| | Six Months Ended April 30, 2013 (Unaudited) | | | | |
| FROM OPERATIONS | | | | | | |
| Net investment income (loss) | | $ | 163,477 | | | $ | (13,134 | ) |
| Net realized gains from investments | | | 7,008,596 | | | | 8,201,572 | |
Net change in unrealized appreciation (depreciation) on investments | | | 2,528,185 | | | | (2,322,308 | ) |
| Net increase in net assets from operations | | | 9,700,258 | | | | 5,866,130 | |
| | | | | | | | | |
FROM DISTRIBUTIONS (Note 2) | | | | | | | | |
| Distributions from net investment income | | | (312,976 | ) | | | — | |
| Distributions from net realized gains from security transactions | | | (8,873,127 | ) | | | (120,141 | ) |
| Decrease in net assets from distributions | | | (9,186,103 | ) | | | (120,141 | ) |
| | | | | | | | | |
| FROM CAPITAL SHARE TRANSACTIONS | | | | | | | | |
| Proceeds from shares sold | | | 10,511,502 | | | | 12,605,584 | |
Net asset value of shares issued in reinvestment of distributions to shareholders | | | 7,904,955 | | | | 95,370 | |
| Proceeds from redemption fees collected (Note 2) | | | 5,012 | | | | 7,846 | |
| Payments for shares redeemed | | | (10,381,196 | ) | | | (19,655,848 | ) |
| Net increase (decrease) in net assets from capital share transactions | | | 8,040,273 | | | | (6,947,048 | ) |
| | | | | | | | | |
| TOTAL INCREASE (DECREASE) IN NET ASSETS | | | 8,554,428 | | | | (1,201,059 | ) |
| | | | | | | | | |
| NET ASSETS | | | | | | | | |
| Beginning of period | | | 50,072,832 | | | | 51,273,891 | |
| End of period | | $ | 58,627,260 | | | $ | 50,072,832 | |
| | | | | | | | | |
DISTRIBUTIONS IN EXCESS OF NET INVESTMENT INCOME | | $ | (149,499 | ) | | $ | — | |
| | | | | | | | | |
| CAPITAL SHARE ACTIVITY | | | | | | | | |
| Shares sold | | | 836,438 | | | | 973,223 | |
| Shares issued in reinvestment of distributions to shareholders | | | 689,884 | | | | 7,934 | |
| Shares redeemed | | | (799,314 | ) | | | (1,535,278 | ) |
| Net increase (decrease) in shares outstanding | | | 727,008 | | | | (554,121 | ) |
| Shares outstanding, beginning of period | | | 3,693,883 | | | | 4,248,004 | |
| Shares outstanding, end of period | | | 4,420,891 | | | | 3,693,883 | |
| See accompanying notes to financial statements. |
TFS HEDGED FUTURES FUND
STATEMENTS OF CHANGES IN NET ASSETS*
| | Six Months Ended April 30, 2013 (Unaudited) | | | Period Ended October 31, 2012(a) | |
| FROM OPERATIONS | | | | | | |
| Net investment loss | | $ | (1,453,221 | ) | | $ | (954,603 | ) |
| Net realized gains (losses) from: | | | | | | | | |
| Investments | | | 4,558 | | | | 670 | |
| Futures contracts | | | (3,239,667 | ) | | | 2,987,877 | |
| Net change in unrealized appreciation (depreciation) on: | | | | | | | | |
| Investments | | | 2,386 | | | | (352 | ) |
| Futures contracts | | | (549,376 | ) | | | 243,466 | |
| Net increase (decrease) in net assets from operations | | | (5,235,320 | ) | | | 2,277,058 | |
| | | | | | | | | |
FROM DISTRIBUTIONS (Note 2) | | | | | | | | |
| Distributions from net realized gains from security transactions | | | (2,570,373 | ) | | | — | |
| | | | | | | | | |
| FROM CAPITAL SHARE TRANSACTIONS | | | | | | | | |
| Proceeds from shares sold | | | 67,401,837 | | | | 115,630,089 | |
Net asset value of shares issued in reinvestment of distributions to shareholders | | | 2,091,789 | | | | — | |
| Proceeds from redemption fees collected (Note 2) | | | 41,379 | | | | 5,865 | |
| Payments for shares redeemed | | | (60,198,328 | ) | | | (4,372,063 | ) |
| Net increase in net assets from capital share transactions | | | 9,336,677 | | | | 111,263,891 | |
| | | | | | | | | |
| TOTAL INCREASE IN NET ASSETS | | | 1,530,984 | | | | 113,540,949 | |
| | | | | | | | | |
| NET ASSETS | | | | | | | | |
| Beginning of period | | | 113,540,949 | | | | — | |
| End of period | | $ | 115,071,933 | | | $ | 113,540,949 | |
| | | | | | | | | |
| ACCUMULATED NET INVESTMENT LOSS | | $ | (1,006,924 | ) | | $ | (954,603 | ) |
| | | | | | | | | |
| CAPITAL SHARE ACTIVITY | | | | | | | | |
| Shares sold | | | 6,290,271 | | | | 10,688,187 | |
| Shares issued in reinvestment of distributions to shareholders | | | 192,970 | | | | — | |
| Shares redeemed | | | (5,693,841 | ) | | | (405,404 | ) |
| Net increase in shares outstanding | | | 789,400 | | | | 10,282,783 | |
| Shares outstanding, beginning of period | | | 10,282,783 | | | | — | |
| Shares outstanding, end of period | | | 11,072,183 | | | | 10,282,783 | |
| * | Consolidated financial statements (Note 1). |
| | |
| (a) | Represents the period from commencement of operations (December 29, 2011) through October 31, 2012. |
| | |
| See accompanying notes to financial statements. |
TFS MARKET NEUTRAL FUND
FINANCIAL HIGHLIGHTS
Per share data for a share outstanding throughout each period: | | Six Months Ended April 30, 2013 (Unaudited) | | | | | | | | | | | | | | | Four Months Ended October 31, 2008(a) | | | | |
| Net asset value at beginning of period | | $ | 15.23 | | | $ | 14.41 | | | $ | 15.80 | | | $ | 14.92 | | | $ | 13.25 | | | $ | 15.59 | | | $ | 14.59 | |
| | | | | | | | | | | | | | | | | | | | | | | | | | | | | |
Income (loss) from investment operations: | | | | | | | | | | | | | | | | | | | | | | | | | | | | |
| Net investment loss | | | (0.47 | ) | | | (0.99 | ) | | | (0.83 | ) | | | (0.45 | ) | | | (0.24 | ) | | | (0.09 | ) | | | (0.23 | ) |
| Net realized and unrealized gains (losses) on investments | | | 0.99 | | | | 2.05 | | | | 0.93 | | | | 1.43 | | | | 2.13 | | | | (2.27 | ) | | | 1.56 | |
| Total from investment operations | | | 0.52 | | | | 1.06 | | | | 0.10 | | | | 0.98 | | | | 1.89 | | | | (2.36 | ) | | | 1.33 | |
| | | | | | | | | | | | | | | | | | | | | | | | | | | | | |
| Less distributions: | | | | | | | | | | | | | | | | | | | | | | | | | | | | |
Distributions from net investment income | | | — | | | | — | | | | — | | | | — | | | | — | | | | — | | | | (0.01 | ) |
| Distributions from net realized gains from security transactions | | | — | | | | (0.24 | ) | | | (1.49 | ) | | | (0.10 | ) | | | (0.25 | ) | | | — | | | | (0.40 | ) |
| Total distributions | | | — | | | | (0.24 | ) | | | (1.49 | ) | | | (0.10 | ) | | | (0.25 | ) | | | — | | | | (0.41 | ) |
| | | | | | | | | | | | | | | | | | | | | | | | | | | | | |
| Proceeds from redemption fees collected (Note 2) | | | 0.00 | (b) | | | 0.00 | (b) | | | 0.00 | (b) | | | 0.00 | (b) | | | 0.03 | | | | 0.02 | | | | 0.08 | |
| | | | | | | | | | | | | | | | | | | | | | | | | | | | | |
| Net asset value at end of period | | $ | 15.75 | | | $ | 15.23 | | | $ | 14.41 | | | $ | 15.80 | | | $ | 14.92 | | | $ | 13.25 | | | $ | 15.59 | |
| | | | | | | | | | | | | | | | | | | | | | | | | | | | | |
Total return (c) | | | 3.41% | (d) | | | 7.48% | | | | 0.43% | | | | 6.60% | | | | 14.86% | | | | (15.01% | )(d) | | | 9.93% | |
| | | | | | | | | | | | | | | | | | | | | | | | | | | | | |
| Ratios and supplemental data: | | | | | | | | | | | | | | | | | | | | | | | | | | | | |
| Net assets at end of period (000’s) | | $ | 1,877,992 | | | $ | 1,789,303 | | | $ | 1,762,265 | | | $ | 1,142,219 | | | $ | 828,409 | | | $ | 378,564 | | | $ | 271,239 | |
| | | | | | | | | | | | | | | | | | | | | | | | | | | | | |
| Ratio of total expenses to average net assets | | | 8.50% | (e) | | | 8.63% | | | | 8.10% | | | | 4.52% | | | | 4.70% | | | | 4.60% | (e) | | | 4.05% | |
| | | | | | | | | | | | | | | | | | | | | | | | | | | | | |
| Ratio of net expenses to average net assets | | | 8.50% | (e) | | | 8.63% | | | | 8.12% | (f) | | | 4.55% | (f) | | | 4.67% | (g) | | | 4.55% | (e)(g) | | | 3.94% | (g) |
| | | | | | | | | | | | | | | | | | | | | | | | | | | | | |
Ratio of net expenses to average net assets excluding dividend expense (h) | | | 7.34% | (e) | | | 7.75% | | | | 7.38% | (f) | | | 3.81% | (f) | | | 3.84% | (g) | | | 3.68% | (e)(g) | | | 2.80% | (g) |
| | | | | | | | | | | | | | | | | | | | | | | | | | | | | |
Ratio of net expenses to average net assets excluding dividend expense, borrowing costs and brokerage expense on securities sold short (h) | | | 2.40% | (e) | | | 2.42% | | | | 2.47% | (f) | | | 2.50% | (f) | | | 2.49% | (g) | | | 2.49% | (e)(g) | | | 2.50% | (g) |
| | | | | | | | | | | | | | | | | | | | | | | | | | | | | |
| Ratio of net investment loss to average net assets | | | (6.05% | )(e) | | | (6.73% | ) | | | (6.56% | ) | | | (3.16% | ) | | | (2.32% | ) | | | (2.24% | )(e) | | | (2.15% | ) |
| | | | | | | | | | | | | | | | | | | | | | | | | | | | | |
| Portfolio turnover rate | | | 296% | (d) | | | 607% | | | | 751% | | | | 703% | | | | 429% | | | | 204% | (d) | | | 536% | |
| (a) | Fund changed fiscal year end to October 31. |
| | |
| (b) | Amount rounds to less than $0.01 per share. |
| | |
| (c) | Total return is a measure of the change in value of an investment in the Fund over the period covered, which assumes any dividends or capital gains distributions are reinvested in shares of the Fund. The returns shown do not reflect the deduction of taxes a shareholder would pay on Fund distributions or the redemption of Fund shares. |
| | |
| (d) | Not annualized. |
| | |
| (e) | Annualized. |
| | |
| (f) | Includes recoupment by the Advisor of prior years’ advisory fee reductions and expense reimbursements (Note 4). |
| | |
| (g) | Ratio was determined after advisory fee reductions (Note 4). |
| | |
| (h) | Dividend expense, borrowing costs and brokerage expense on securities sold short totaled 6.10%(e), 6.21%, 5.65%, 2.05%, 2.18%, 2.06%(e) and 1.44% of average net assets for the periods ended April 30, 2013, October 31, 2012, 2011, 2010, 2009 and 2008 and June 30, 2008, respectively. |
| | |
| See accompanying notes to financial statements. |
TFS SMALL CAP FUND
FINANCIAL HIGHLIGHTS
Per share data for a share outstanding throughout each period: | | Six Months Ended April 30, 2013 (Unaudited) | | | | | | | | | | | | | | | Four Months Ended October 31, 2008(a) | | | | |
| Net asset value at beginning of period | | $ | 13.56 | | | $ | 12.07 | | | $ | 11.98 | | | $ | 9.33 | | | $ | 6.80 | | | $ | 9.31 | | | $ | 13.08 | |
| | | | | | | | | | | | | | | | | | | | | | | | | | | | | |
Income (loss) from investment operations: | | | | | | | | | | | | | | | | | | | | | | | | | | | | |
| Net investment income (loss) | | | 0.04 | | | | (0.00 | )(b) | | | (0.04 | ) | | | (0.06 | ) | | | (0.02 | ) | | | 0.01 | | | | (0.18 | ) |
| Net realized and unrealized gains (losses) on investments | | | 2.29 | | | | 1.52 | | | | 0.87 | | | | 2.70 | | | | 2.55 | | | | (2.52 | ) | | | (1.79 | ) |
| Total from investment operations | | | 2.33 | | | | 1.52 | | | | 0.83 | | | | 2.64 | | | | 2.53 | | | | (2.51 | ) | | | (1.97 | ) |
| | | | | | | | | | | | | | | | | | | | | | | | | | | | | |
| Less distributions: | | | | | | | | | | | | | | | | | | | | | | | | | | | | |
Distributions from net investment income | | | (0.07 | ) | | | — | | | | — | | | | — | | | | (0.01 | ) | | | — | | | | — | |
| Distributions from net realized gains from security transactions | | | (2.56 | ) | | | (0.03 | ) | | | (0.74 | ) | | | — | | | | — | | | | — | | | | (1.80 | ) |
| Total distributions | | | (2.63 | ) | | | (0.03 | ) | | | (0.74 | ) | | | — | | | | (0.01 | ) | | | — | | | | (1.80 | ) |
| | | | | | | | | | | | | | | | | | | | | | | | | | | | | |
| Proceeds from redemption fees collected (Note 2) | | | 0.00 | (b) | | | 0.00 | (b) | | | 0.00 | (b) | | | 0.01 | | | | 0.01 | | | | 0.00 | (b) | | | 0.00 | (b) |
| | | | | | | | | | | | | | | | | | | | | | | | | | | | | |
| Net asset value at end of period | | $ | 13.26 | | | $ | 13.56 | | | $ | 12.07 | | | $ | 11.98 | | | $ | 9.33 | | | $ | 6.80 | | | $ | 9.31 | |
| | | | | | | | | | | | | | | | | | | | | | | | | | | | | |
Total return (c) | | | 20.44% | (d) | | | 12.62% | | | | 6.68% | | | | 28.40% | | | | 37.41% | | | | (26.96% | )(d) | | | (16.40% | ) |
| | | | | | | | | | | | | | | | | | | | | | | | | | | | | |
| Ratios and supplemental data: | | | | | | | | | | | | | | | | | | | | | | | | | | | | |
| Net assets at end of period (000’s) | | $ | 58,627 | | | $ | 50,073 | | | $ | 51,274 | | | $ | 35,784 | | | $ | 16,623 | | | $ | 3,053 | | | $ | 4,581 | |
| | | | | | | | | | | | | | | | | | | | | | | | | | | | | |
| Ratio of total expenses to average net assets | | | 1.90% | (e) | | | 1.95% | | | | 1.82% | | | | 2.31% | | | | 5.14% | | | | 4.44% | (e) | | | 5.57% | |
| | | | | | | | | | | | | | | | | | | | | | | | | | | | | |
Ratio of net expenses to average net assets (f) | | | 1.75% | (e) | | | 1.75% | | | | 1.69% | | | | 1.78% | | | | 1.88% | | | | 0.88% | (e) | | | 2.72% | |
| | | | | | | | | | | | | | | | | | | | | | | | | | | | | |
Ratio of net expenses to average net assets excluding borrowing costs (f) | | | 1.75% | (e) | | | 1.75% | | | | 1.68% | | | | 1.78% | | | | 1.87% | | | | 0.87% | (e) | | | 2.68% | |
| | | | | | | | | | | | | | | | | | | | | | | | | | | | | |
| Ratio of net investment income (loss) to average net assets | | | 0.62% | (e) | | | (0.03% | ) | | | (0.31% | ) | | | (0.70% | ) | | | (0.63% | ) | | | 0.28% | (e) | | | (1.76% | ) |
| | | | | | | | | | | | | | | | | | | | | | | | | | | | | |
| Portfolio turnover rate | | | 341% | (d) | | | 557% | | | | 525% | | | | 657% | | | | 320% | | | | 123% | (d) | | | 269% | |
| (a) | Fund changed fiscal year end to October 31. |
| | |
| (b) | Amount rounds to less than $0.01 per share. |
| | |
| (c) | Total return is a measure of the change in value of an investment in the Fund over the period covered, which assumes any dividends or capital gains distributions are reinvested in shares of the Fund. The returns shown do not reflect the deduction of taxes a shareholder would pay on Fund distributions or the redemption of Fund shares. |
| | |
| (d) | Not annualized. |
| | |
| (e) | Annualized. |
| | |
| (f) | Ratio was determined after advisory fee reductions and expense reimbursements (Note 4). |
| | |
| See accompanying notes to financial statements. |
TFS HEDGED FUTURES FUND
FINANCIAL HIGHLIGHTS*
Per share data for a share outstanding throughout each period: | | Six Months Ended April 30, 2013 (Unaudited) | | | Period Ended October 31, 2012(a) | |
| Net asset value at beginning of period | | $ | 11.04 | | | $ | 10.00 | |
| | | | | | | | | |
| Income (loss) from investment operations: | | | | | | | | |
| Net investment loss | | | (0.12 | ) | | | (0.09 | ) |
| Net realized and unrealized gains (losses) on investments | | | (0.30 | ) | | | 1.13 | |
| Total from investment operations | | | (0.42 | ) | | | 1.04 | |
| | | | | | | | | |
| Less distributions: | | | | | | | | |
| Distributions from net realized gains from security transactions | | | (0.23 | ) | | | — | |
| | | | | | | | | |
| Proceeds from redemption fees collected (Note 2) | | | 0.00 | (b) | | | 0.00 | (b) |
| | | | | | | | | |
| Net asset value at end of period | | $ | 10.39 | | | $ | 11.04 | |
| | | | | | | | | |
Total return (c) | | | (3.89% | )(d) | | | 10.40% | (d) |
| | | | | | | | | |
| Ratios and supplemental data: | | | | | | | | |
| Net assets at end of period (000’s) | | $ | 115,072 | | | $ | 113,541 | |
| | | | | | | | | |
| Ratio of total expenses to average net assets | | | 2.32% | (e) | | | 2.51% | (e) |
| | | | | | | | | |
Ratio of net expenses to average net assets (f) | | | 2.30% | (e) | | | 2.30% | (e) |
| | | | | | | | | |
| Ratio of net investment loss to average net assets | | | (2.21% | )(e) | | | (2.19% | )(e) |
| | | | | | | | | |
| Portfolio turnover rate | | | 0% | (g) | | | 0% | (g) |
| * | Consolidated financial statements (Note 1). |
| | |
| (a) | Represents the period from commencement of operations (December 29, 2011) through October 31, 2012. |
| | |
| (b) | Amount rounds to less than $0.01 per share. |
| | |
| (c) | Total return is a measure of the change in value of an investment in the Fund over the period covered, which assumes any dividends or capital gains distributions are reinvested in shares of the Fund. The returns shown do not reflect the deduction of taxes a shareholder would pay on Fund distributions or the redemption of Fund shares. |
| | |
| (d) | Not annualized. |
| | |
| (e) | Annualized. |
| | |
| (f) | Ratio was determined after advisory fee reductions (Note 4). |
| | |
| (g) | All investments held are excluded from the calculation as they are considered to be short-term investments whose maturities or expiration dates at the time of acquisition were one year or less. |
| �� | |
| See accompanying notes to financial statements. |
TFS CAPITAL INVESTMENT TRUST
NOTES TO FINANCIAL STATEMENTS
April 30, 2013 (Unaudited)
1. Organization
TFS Market Neutral Fund, TFS Small Cap Fund and TFS Hedged Futures Fund (individually, a “Fund”, and collectively, the “Funds”) are each a series of TFS Capital Investment Trust (the “Trust”), an open-end management investment company established as an Ohio business trust under a Declaration of Trust dated January 30, 2004. TFS Market Neutral Fund commenced operations on September 7, 2004. TFS Small Cap Fund commenced operations on March 7, 2006. TFS Hedged Futures Fund commenced operations on December 29, 2011.
The consolidated financial statements of TFS Hedged Futures Fund include TFS Hedged Futures Strategy Offshore Fund Ltd. (the “Subsidiary”), a wholly-owned and controlled Cayman Islands subsidiary. TFS Hedged Futures Fund may invest up to 25% of its total assets in the Subsidiary. TFS Hedged Futures Fund purchases investments through the Subsidiary to provide exposure to the commodities futures market which otherwise may not be possible in a mutual fund structure. All inter-company accounts and transactions have been eliminated in consolidation for TFS Hedged Futures Fund. TFS Hedged Futures Fund and the Subsidiary each have a fiscal year end of October 31st for financial statement consolidation purposes and a nonconforming tax year end of December 31st and November 30th, respectively.
TFS Market Neutral Fund seeks to produce capital appreciation while having a low correlation to the U.S. equity market, which TFS Capital LLC (the “Adviser”) defines as the S&P 500® Index. In addition, the Fund seeks to produce lower volatility than the movement of the U.S. equity market.
TFS Small Cap Fund seeks long-term capital appreciation. In addition, the Fund seeks to outperform the Russell 2000® Index.
TFS Hedged Futures Fund seeks to achieve long-term capital appreciation.
2. Significant Accounting Policies
The following is a summary of the Funds’ significant accounting policies. The policies are in conformity with accounting principles generally accepted in the United States of America (“GAAP”).
Securities valuation – The Funds’ portfolio securities are valued as of the close of regular trading on the New York Stock Exchange (“NYSE”) (generally 4:00 p.m., Eastern time) on each business day the NYSE is open. Securities listed on the NYSE or other exchanges are valued on the basis of their last sale prices on the exchanges on which they are primarily traded. If there are no sales on that day, the securities are valued at the closing bid price on the NYSE or other primary exchange for long positions and at the closing ask price for short positions for that day. Securities which are quoted by NASDAQ are valued at the NASDAQ Official Closing Price. If there are no sales on that day, the securities are valued at the mean between the closing bid and ask prices as reported by NASDAQ. Futures contracts are generally valued at the last quoted sales price on the applicable valuation date. Futures contracts that trade on exchanges that close before 4:00 p.m. Eastern time are valued at the official settlement price of the primary exchange on which it is traded. Prices for these futures contracts are monitored daily by the Adviser until 4:00 p.m. Eastern time to determine if fair valuation is required. Other assets and securities for which
TFS CAPITAL INVESTMENT TRUST
NOTES TO FINANCIAL STATEMENTS (Continued)
no quotations are readily available are valued at fair value as determined in good faith under the supervision of the Board of Trustees of the Trust (the “Board”) and will be classified as Level 2 or 3 within the fair value hierarchy (see below), depending on the inputs used.
GAAP establishes a single authoritative definition of fair value, sets out a framework for measuring fair value and requires additional disclosures about fair value measurements.
The Funds’ investments and securities sold have been categorized based upon a fair value hierarchy in accordance with the Financial Accounting Standards Board’s guidance on fair value measurement. The levels of the fair value hierarchy and their applicability to the Funds are described below:
| • | Level 1 inputs utilize quoted prices (unadjusted) in active markets for identical assets or liabilities at the reporting date. Level 1 assets and liabilities may include most common stocks, preferred stocks, closed-end, open-end and exchange-traded funds and notes, rights, warrants, futures contracts and cash equivalents. |
| • | Level 2 inputs utilize inputs other than quoted prices included in Level 1 that are observable for the asset or liability, either directly or indirectly. Level 2 inputs may include quoted prices for similar assets and liabilities in active markets and quoted prices for identical or similar assets or liabilities that are not active. Assets and liabilities included in this category may include common stocks that trade infrequently or their trading has been temporarily halted and U.S. treasury obligations and corporate bonds with values that are based on prices provided by an independent pricing service that utilizes various “other significant observable inputs” including bid and ask quotations, prices of similar securities and interest rates, among other factors. |
| • | Level 3 inputs are unobservable inputs for the asset or liability and include situations where there is little, if any, market activity for the asset or liability. Assets and liabilities included in this category may include common stocks that trade infrequently or their trading has been halted for an extended period of time. |
The inputs or methodologies used for valuing securities are not necessarily an indication of the risks associated with investing in those securities. The inputs used to measure fair value may fall into different levels of the fair value hierarchy. In such cases, for disclosure purposes, the level in the fair value hierarchy within which the fair value measurement falls in its entirety is determined based on the lowest level input that is significant to the fair value measurement. The Funds’ assessment of the significance of a particular input to the fair value measurement in its entirety requires judgment and considers factors specific to the asset or liability.
The availability of observable inputs can vary from product to product and is affected by a wide variety of factors, including, for example, the type of product, whether the product is new and not yet established in the marketplace, and other characteristics particular to the transaction. To the extent that valuation is based on models or inputs that are less observable or unobservable in the market, the determination of fair value requires more judgment. Accordingly, the degree of judgment exercised by the Funds in determining fair value is greatest for instruments categorized as Level 3.
TFS CAPITAL INVESTMENT TRUST
NOTES TO FINANCIAL STATEMENTS (Continued)
The following is a summary of the inputs used to value the Funds’ investments, securities sold short and other financial instruments as of April 30, 2013:
| | | | | | | | | | | | |
| Investments in Securities: | |
| Common Stocks | | $ | 1,738,998,204 | | | $ | 42,280 | | | $ | — | | | $ | 1,739,040,484 | |
| Preferred Stocks | | | 84,780 | | | | — | | | | — | | | | 84,780 | |
| Other Investments | | | 77,705,294 | | | | — | | | | — | | | | 77,705,294 | |
| Corporate Bonds | | | — | | | | 2,805 | | | | — | | | | 2,805 | |
| Money Market Funds | | | 17,347,013 | | | | — | | | | — | | | | 17,347,013 | |
| Total | | $ | 1,834,135,291 | | | $ | 45,085 | | | $ | — | | | $ | 1,834,180,376 | |
| Other Financial Instruments: | |
| Common Stocks – Sold Short | | $ | (1,234,134,496 | ) | | $ | (134,922 | ) | | $ | (278,349 | ) | | $ | (1,234,547,767 | ) |
| Preferred Stocks – Sold Short | | | (105,509 | ) | | | — | | | | — | | | | (105,509 | ) |
| Other Investments – Sold Short | | | (261,034,977 | ) | | | — | | | | — | | | | (261,034,977 | ) |
| Warrants – Sold Short | | | (17,316 | ) | | | — | | | | — | | | | (17,316 | ) |
| Total | | $ | (1,495,292,298 | ) | | $ | (134,922 | ) | | $ | (278,349 | ) | | $ | (1,495,705,569 | ) |
| | | | | | | | | | | | |
| Investments in Securities: | |
| Common Stocks | | $ | 57,652,215 | | | $ | — | | | $ | — | | | $ | 57,652,215 | |
| Money Market Funds | | | 1,092,605 | | | | — | | | | — | | | | 1,092,605 | |
| Total | | $ | 58,744,820 | | | $ | — | | | $ | — | | | $ | 58,744,820 | |
| | | | | | | | | | | | |
| Investments in Securities: | |
| U.S. Treasury Obligations | | $ | — | | | $ | 23,744,857 | | | $ | — | | | $ | 23,744,857 | |
| Money Market Funds | | | 66,822,195 | | | | — | | | | — | | | | 66,822,195 | |
| Total | | $ | 66,822,195 | | | $ | 23,744,857 | | | $ | — | | | $ | 90,567,052 | |
| | |
| Other Financial Instruments: | |
| Futures Contracts | | $ | 61,088,932 | | | $ | — | | | $ | — | | | $ | 61,088,932 | |
| Futures Contracts – Sold Short | | | (119,651,126 | ) | | | — | | | | — | | | | (119,651,126 | ) |
| Total | | $ | (58,562,194 | ) | | $ | — | | | $ | — | | | $ | (58,562,194 | ) |
Refer to each Fund’s Summary Schedule of Investments, Schedule of Securities Sold Short, Schedule of Futures Contracts and Schedule of Futures Contracts Sold Short, as applicable, for a listing of the securities valued by security type and industry type.
TFS CAPITAL INVESTMENT TRUST
NOTES TO FINANCIAL STATEMENTS (Continued)
It is the Funds’ policy to recognize transfers into and out of any Level at the end of the reporting period. As of April 30, 2013, TFS Small Cap Fund and TFS Hedged Futures Fund did not have any transfers in and out of any Level. Transfers that occurred between Level 1, Level 2 and Level 3 on April 30, 2013 for TFS Market Neutral Fund due to changes in the availability of quoted prices are as follows:
| | | Investments | | | Securities Sold Short | |
| Transfers from Level 1 to Level 2 | | $ | 42,280 | | | $ | (123,992 | ) |
| Transfers from Level 1 to Level 3 | | | — | | | | (278,349 | ) |
| Transfers from Level 2 to Level 1 | | | 306,425 | | | | (243,175 | ) |
| Transfers from Level 3 to Level 1 | | | 1,747 | | | | (72,184 | ) |
There were no transfers between Level 2 and Level 3 as of April 30, 2013 for TFS Market Neutral Fund. There were no Level 3 securities or derivative instruments held in TFS Small Cap Fund and no Level 3 securities held in TFS Hedged Futures Fund as of April 30, 2013.
The following is a reconciliation of Level 3 investments held and securities sold short in TFS Market Neutral Fund for which significant unobservable inputs were used to determine fair value as of April 30, 2013. Because of the inherent uncertainty of valuation, this may differ from the values that would have been used had a ready market for the security existed and this difference could be material.
| | | Investments | | | Securities Sold Short | |
| Balance as of October 31, 2012 | | $ | 1,747 | | | $ | (72,184 | ) |
| Transfers in and/or out of Level 3 | | | (1,747 | ) | | | (206,165 | ) |
| Balance as of April 30, 2013 | | $ | — | | | $ | (278,349 | ) |
The total amount of net unrealized appreciation on the Level 3 securities sold short at April 30, 2013 was $3,361,556.
The following table summarizes the valuation techniques used and unobservable inputs developed by the Board to determine the fair value of the Level 3 investments:
| Fair Value at April 30, 2013 | | | | Impact to Valuation from an Increase in Input* |
| Common Stocks - Sold Short | $(278,349) | Discount from Last Sale Price | Discount Percentage | 50% | Increase |
| * | This column represents the directional change in the fair value of the Level 3 investments that would result in an increase from the corresponding input. A decrease to the unobservable input would have the opposite effect. Significant increases and decreases in these inputs in isolation could result in significantly higher or lower fair value measurements. |
Share valuation – The net asset value per share of each Fund is calculated daily by dividing the total value of its assets, less liabilities, by the number of shares outstanding. The offering price and redemption price per share of each Fund is equal to the net asset value per share, except that shares are subject to a redemption fee of 2% if redeemed within 90 days of the date of purchase.
TFS CAPITAL INVESTMENT TRUST
NOTES TO FINANCIAL STATEMENTS (Continued)
During the periods ended April 30, 2013 and October 31, 2012, proceeds from redemption fees totaled $76,336 and $131,452, respectively, for TFS Market Neutral Fund, $5,012 and $7,846, respectively, for TFS Small Cap Fund and $41,379 and $5,865, respectively, for TFS Hedged Futures Fund.
Investment income (expense) – Dividend income (expense) is recorded on the ex-dividend date. Interest income is accrued as earned.
Security transactions – Security transactions are accounted for on the trade date. Gains and losses on securities sold are determined on a specific identification basis.
Distributions to shareholders – Distributions to shareholders arising from net investment income and net realized capital gains, if any, are distributed at least once each year. The amount of distributions from net investment income and net realized gains are determined in accordance with federal income tax regulations, which may differ from GAAP. These “book/tax” differences are permanent in nature and are primarily due to differing treatments of net short-term gains. The tax character of distributions paid by the Funds during the periods ended April 30, 2013 and October 31, 2012 was as follows:
| | | | | | | | | | |
| TFS Market Neutral Fund | 4/30/2013 | | $ | — | | | $ | — | | | $ | — | |
| | 10/31/2012 | | $ | 23,397,213 | | | $ | 5,293,726 | | | $ | 28,690,939 | |
| TFS Small Cap Fund | 4/30/2013 | | $ | 8,620,933 | | | $ | 565,170 | | | $ | 9,186,103 | |
| | 10/31/2012 | | $ | 322 | | | $ | 119,819 | | | $ | 120,141 | |
| TFS Hedged Futures Fund | 4/30/2013 | | $ | 338,325 | | | $ | 2,232,048 | | | $ | 2,570,373 | |
| | 10/31/2012 | | $ | — | | | $ | — | | | $ | — | |
Short positions – The Funds may sell securities short. For financial statement purposes, an amount equal to the settlement amount is included in the Statements of Assets and Liabilities as an asset and an equivalent liability is then subsequently marked-to-market daily to reflect the current value of the short position. Subsequent fluctuations in the market prices of securities sold, but not yet purchased, may require purchasing the securities at prices which may differ from the market value reflected on the Statements of Assets and Liabilities. The Funds are liable for any dividends payable on securities while those securities are in a short position and will also bear other costs, such as charges for the prime brokerage accounts, in connection with the short positions. These costs are reported as brokerage expenses on securities sold short in the Statements of Operations. As collateral for its short positions, the Funds are required under the Investment Company Act of 1940 to maintain assets consisting of cash, cash equivalents or liquid securities equal to the market value of the securities sold short. The deposits with brokers for securities sold short are reported on the Statements of Assets and Liabilities. The amount of the collateral is required to be adjusted daily to reflect changes in the value of the securities sold short. TFS Market Neutral Fund and TFS Hedged Futures Fund both engage in short selling as a principal investment strategy while TFS Small Cap Fund does not. TFS Small Cap Fund currently intends to limit its exposure to short positions, if any, to 5% of its net assets.
TFS CAPITAL INVESTMENT TRUST
NOTES TO FINANCIAL STATEMENTS (Continued)
Futures contracts – TFS Hedged Futures Fund is subject to equity price risk, interest rate risk, foreign currency exchange rate risk, and commodity risk in the normal course of pursuing its investment objective. The Fund may use futures contracts to gain exposure or to hedge against changes in the value of equities, interest rates, foreign currencies or commodities. A futures contract represents a commitment for the future purchase or sale of an asset at a specified price on a specified date. When the Fund purchases or sells a futures contract, no price is paid to or received by the Fund upon the purchase or sale of the futures contract. Instead, the Fund is required to deposit in a segregated asset account an amount of cash or qualifying securities currently ranging from 5% to 15% of the contract amount. This is called the “initial margin deposit.” Subsequent payments, known as “variation margin,” are made or received by the Fund each day, depending on the daily fluctuations in the fair value of the underlying asset. The Fund recognizes an unrealized gain or loss equal to the daily variation margin. If market conditions move unexpectedly, the Fund may not achieve the anticipated benefits of the futures contracts and may realize a loss. The margin deposits for futures contracts and the variation margin receivable and/or payable are reported on the Statements of Assets and Liabilities.
Estimates – The preparation of financial statements in conformity with GAAP requires management to make estimates and assumptions that affect the reported amounts of assets and liabilities and disclosures of contingent assets and liabilities as of the date of the financial statements and the reported amounts of income and expenses during the reporting period. Actual results could differ from those estimates.
Common expenses – Common expenses of the Trust are allocated between the Funds based on the relative net assets of each Fund or the nature of the services performed and the relative applicability to each Fund.
Foreign Currency Translation – Amounts denominated in or expected to settle in foreign currencies are translated into U.S. dollars based on exchange rates on the following basis:
| | A. | The value of investment securities and other assets and liabilities are translated at exchange rates as of the NYSE close each day. |
| | B. | Purchases and sales of investment securities and income and expenses are translated at the rate of exchange prevailing on the respective date of such transactions. |
| | C. | The Funds do not isolate that portion of the results of operations caused by changes in foreign exchange rates on investments from those caused by changes in market prices of securities held. Such fluctuations are included with the net realized and unrealized gains or losses on investments. |
Reported net realized foreign exchange gains or losses arise from 1) purchases and sales of foreign currencies, 2) currency gains or losses realized between the trade and settlement dates on securities transactions and 3) the difference between the amounts of dividends, interest and foreign withholding taxes recorded on a Fund’s books and the U.S. dollar equivalent of the amounts actually received or paid. Reported net unrealized foreign exchange gains and losses arise from changes in the value of assets and liabilities that result from changes in exchange rates.
Federal income tax – The tax year end is October 31st for TFS Market Neutral Fund and TFS Small Cap Fund and December 31st for TFS Hedged Futures Fund. It is each Fund’s policy to comply with the special provisions of Subchapter M of the Internal Revenue Code applicable to regulated investment companies. As provided therein, in any fiscal year in which a Fund so
TFS CAPITAL INVESTMENT TRUST
NOTES TO FINANCIAL STATEMENTS (Continued)
qualifies and distributes at least 90% of its taxable net income, the Fund (but not the shareholders) will be relieved of federal income tax on the income distributed. Accordingly, no provision for income taxes has been made.
In order to avoid imposition of the excise tax applicable to regulated investment companies, it is also each Fund’s intention to declare as dividends in each calendar year at least 98% of its ordinary income (net investment income and specified gains and losses) and 98.2% of its net realized capital gains plus undistributed amounts from prior years.
The following information is computed on a tax basis for each item as of April 30, 2013:
| | | | | | | | | |
| Tax cost of portfolio investments | | $ | 1,787,764,256 | | | $ | 55,846,444 | | | $ | 90,565,018 | |
| Gross unrealized appreciation | | $ | 152,421,011 | | | $ | 4,626,923 | | | $ | 2,034 | |
| Gross unrealized depreciation | | | (106,004,891 | ) | | | (1,728,547 | ) | | | — | |
| Net unrealized appreciation on investments | | | 46,416,120 | | | | 2,898,376 | | | | 2,034 | |
| Net unrealized appreciation on securities sold short | | | 7,181,835 | | | | — | | | | — | |
| Net unrealized appreciation on translation of assets and liabilities in foreign currencies | | | 24 | | | | — | | | | — | |
| Accumulated net investment loss | | | (70,867,551 | ) | | | — | | | | (1,010,898 | ) |
| Undistributed long-term gains | | | — | | | | — | | | | 180,107 | |
| Other gains (losses) | | | 115,045,317 | | | | 6,494,478 | | | | (3,022,106 | ) |
| Accumulated earnings (deficit) | | $ | 97,775,745 | | | $ | 9,392,854 | | | $ | (3,850,863 | ) |
As of April 30, 2013, the tax cost of securities sold short is $1,502,887,404 for TFS Market Neutral Fund.
The difference between the federal income tax cost of portfolio investments and securities sold short and the financial statement cost for TFS Market Neutral Fund and TFS Small Cap Fund is due to certain timing differences in the recognition of capital gains or losses under GAAP. These “book/tax” differences are temporary in nature and are primarily due to the tax deferral of losses on wash sales. The tax cost of portfolio investments for TFS Hedged Futures Fund is equal to the financial statement cost disclosed.
For the six months ended April 30, 2013, TFS Market Neutral Fund reclassified $25,740 of net realized gains from foreign currency transactions against accumulated net investment loss on the Statements of Assets and Liabilities. For the tax year ended December 31, 2012, TFS Hedged Futures Fund reclassified $1,400,900 of accumulated net investment losses and $276,872 of accumulated net realized losses against paid-in capital on the Statements of Assets and Liabilities. Such reclassifications, the result of permanent differences between the financial statement and income tax reporting requirements, have no effect on the Funds’ net assets or net asset value per share.
The Funds recognize tax benefits or expenses of uncertain tax positions only when the position is “more likely than not” to be sustained assuming examination by tax authorities. Management has reviewed the tax positions taken on Federal income tax returns for all open tax periods (October 31, 2009 through October 31, 2012) of each Fund, as applicable, and has concluded that no provision for unrecognized tax benefits or expenses is required in these financial statements.
TFS CAPITAL INVESTMENT TRUST
NOTES TO FINANCIAL STATEMENTS (Continued)
3. Investment Transactions
During the six months ended April 30, 2013, cost of purchases and proceeds from sales of portfolio securities, other than short-term investments, U.S. government securities and short positions, amounted to $5,379,686,385 and $5,574,649,334, respectively, for TFS Market Neutral Fund, $180,530,285 and $182,196,800, respectively, for TFS Small Cap Fund and $0 and $0, respectively, for TFS Hedged Futures Fund.
4. Transactions with Related Parties
INVESTMENT ADVISORY AGREEMENT
Each Fund’s investments are managed by the Adviser pursuant to the terms of an Investment Advisory Agreement. TFS Market Neutral Fund pays the Adviser an investment advisory fee, computed and accrued daily and paid monthly, at an annual rate of 2.25% of its average daily net assets up to $1.75 billion and 2.15% of such assets above $1.75 billion. Each of TFS Small Cap Fund and TFS Hedged Futures Fund pay the Adviser an investment advisory fee, computed and accrued daily and paid monthly, at an annual rate of 1.25% and 2.00%, respectively, of its average daily net assets.
The Adviser has contractually agreed to reduce its advisory fees and to absorb each Fund’s operating expenses (for the life of the Funds) to the extent necessary to limit aggregate annual ordinary operating expenses (which do not include brokerage costs, taxes, borrowing costs such as interest and dividend expenses on securities sold short and extraordinary expenses) to 2.50% of TFS Market Neutral Fund’s average daily net assets, 1.75% of TFS Small Cap Fund’s average daily net assets and 2.30% of TFS Hedged Futures Fund’s average daily net assets. During the six months ended April 30, 2013, the Adviser reduced its investment advisory fees by $40,299 with respect to TFS Small Cap Fund and $16,320 with respect to TFS Hedged Futures Fund. There were no fee reductions by the Adviser for TFS Market Neutral Fund.
Advisory fee reductions and expense reimbursements by the Adviser are subject to repayment by the applicable Fund for a period of three years after such fees and expenses were incurred, provided that such repayments do not cause ordinary operating expenses to exceed the expense caps of 2.50%, 1.75% and 2.30%, respectively, for TFS Market Neutral Fund, TFS Small Cap Fund and TFS Hedged Futures Fund. As of April 30, 2013, the Adviser has recouped all previous fee reductions for TFS Market Neutral Fund. As of April 30, 2013, the Adviser may in the future recoup fee reductions and expense reimbursements totaling $272,635 and $109,173, respectively, from TFS Small Cap Fund and TFS Hedged Futures Fund. The Adviser may recapture these amounts no later than the dates as stated below:
| | | | | | | | | | | | |
| TFS Small Cap Fund | | $ | 64,858 | | | $ | 66,738 | | | $ | 100,740 | | | $ | 40,299 | |
| TFS Hedged Futures Fund | | $ | — | | | $ | — | | | $ | 92,853 | | | $ | 16,320 | |
Certain Trustees and officers of the Trust are also officers of the Adviser.
TFS CAPITAL INVESTMENT TRUST
NOTES TO FINANCIAL STATEMENTS (Continued)
AFFILIATED BROKER-DEALER
During the six months ended April 30, 2013, TFS Hedged Futures Fund paid commissions of $122,403 to Interactive Brokers LLC (“IB”). Richard Gates, a principal of the Adviser and a Vice President of the Trust, serves as an independent Director of IB. Based on a factual determination by the Adviser that Mr. Gates does not have a controlling influence over IB’s management or policies, the Adviser does not believe that IB is an affiliate, or an affiliate of an affiliate, of the Trust. Nevertheless, the Adviser and the Trust have determined to subject any transactions between the Funds and IB to the same procedures that would be applicable if such transactions were subject to affiliated broker provisions of Section 17(e) of the Investment Company Act of 1940, and Rule 17(e)-1 thereunder.
COMPLIANCE CONSULTING AGREEMENT
Under the terms of a Compliance Consulting Agreement, Drake Compliance, LLC (“Drake”) provides ongoing regulatory compliance consulting, monitoring and reporting services for the Trust. In addition, a principal of Drake serves as the Trust’s Chief Compliance Officer. Drake receives $5,000 per month from the Trust, of which each Fund pays its proportionate share. In addition, each Fund reimburses certain out-of-pocket expenses incurred by Drake, if any, including, but not limited to, postage and supplies and travel expenses.
ADMINISTRATION AGREEMENT
Under the terms of an Administration Agreement, Ultimus Fund Solutions, LLC (“Ultimus”) supplies executive, administrative and regulatory services for the Funds. Ultimus supervises the preparation of tax returns, reports to shareholders of the Funds, reports to and filings with the Securities and Exchange Commission (the “SEC”) and state securities commissions and materials for meetings of the Board of Trustees. For these services, each Fund pays Ultimus a monthly fee at an annual rate of 0.075% of its average daily net assets up to $500 million, 0.05% of such assets between $500 million and $2 billion, 0.04% of such assets between $2 billion and $3 billion, 0.03% of such assets between $3 billion and $5 billion, and 0.025% of such assets in excess of $5 billion, subject to a minimum monthly fee of $5,000.
ACCOUNTING SERVICES AGREEMENT
Under the terms of an Accounting Services Agreement, Ultimus calculates the daily net asset value per share and maintains the financial books and records of each Fund. For the performance of these services, TFS Market Neutral Fund pays Ultimus a monthly base fee of $4,000 per month plus an asset based fee of 0.005% of average daily gross assets. TFS Small Cap Fund and TFS Hedged Futures Fund each pay Ultimus a base fee of $2,500 per month plus an asset based fee of 0.01% of the first $500 million of average daily net assets and 0.005% of such assets in excess of $500 million. In addition, each Fund pays a trade fee for trades in excess of 2,000 portfolio trades per month. Each Fund reimburses certain out-of-pocket expenses incurred by Ultimus in obtaining valuations of its portfolio securities.
TRANSFER AGENT AND SHAREHOLDER SERVICES AGREEMENT
Under the terms of a Transfer Agent and Shareholder Services Agreement, Ultimus maintains the records of each shareholder’s account, answers shareholders’ inquiries concerning their accounts, processes purchases and redemptions of each Fund’s shares, acts as dividend and distribution disbursing agent and performs other shareholder service functions. Each Fund pays Ultimus a
TFS CAPITAL INVESTMENT TRUST
NOTES TO FINANCIAL STATEMENTS (Continued)
monthly fee for these services at an annual rate of $15 to $24 per shareholder account, depending on the nature of the account, subject to a $1,500 minimum monthly fee. In addition, the Funds reimburse Ultimus for out-of-pocket expenses including, but not limited to, postage and supplies.
DISTRIBUTION AGREEMENT
The Trust has entered into a Distribution Agreement with Ultimus Fund Distributors, LLC (the “Distributor”), pursuant to which the Distributor provides distribution services and serves as the principal underwriter to each Fund. The Distributor is a wholly-owned subsidiary of Ultimus. The Distributor’s fees are paid by the Adviser.
COMPENSATION OF TRUSTEES
Trustees and officers affiliated with the Adviser or Ultimus are not compensated by the Trust for their services. Each Trustee who is not an affiliated person of the Adviser or Ultimus receives from the Trust an annual retainer of $5,000, paid quarterly, a fee of $7,500 for attendance at each in-person meeting of the Board of Trustees, a fee of $2,500 for attendance at each telephonic meeting of the Board of Trustees and a fee of $1,500 for attendance at each telephonic special meeting of the Board of Trustees. The Chairman of the Audit Committee receives an additional fee of $1,000 for each Audit Committee meeting attended. The Trust reimburses each Trustee and officer for his or her travel and other expenses relating to attendance at Board or committee meetings.
5. Borrowing Costs
During the six months ended April 30, 2013, TFS Market Neutral Fund and TFS Small Cap Fund incurred $17,007 and $1,064, respectively, of borrowing costs with the Funds’ custodian bank. TFS Hedged Futures Fund incurred no borrowing costs for the six months ended April 30, 2013. As of April 30, 2013, the Funds had no outstanding borrowings. The average outstanding borrowings for the six months ended April 30, 2013 include 149 days of $0 borrowings for TFS Market Neutral Fund and 150 days of $0 borrowings for TFS Small Cap Fund. The average outstanding borrowings and average interest rate on borrowings during the six months ended April 30, 2013 were as follows:
| | Average Outstanding Borrowing | | | | |
| TFS Market Neutral Fund | | $ | 2,424,371 | | | | 1.57 | % |
| TFS Small Cap Fund | | $ | 114,262 | | | | 1.57 | % |
6. Derivatives Transactions
TFS Hedged Futures Fund’s positions in derivative instruments as of April 30, 2013 are recorded in the following locations in the Statements of Assets and Liabilities:
Derivative Investment Type | Location of Gain (Loss) on Derivatives |
| Futures contracts | Net unrealized appreciation (depreciation) on futures contracts |
TFS CAPITAL INVESTMENT TRUST
NOTES TO FINANCIAL STATEMENTS (Continued)
The following table sets forth the value of TFS Hedged Futures Fund’s derivative contracts by primary risk exposure as of April 30, 2013:
| | | Asset Derivatives | | | Liability Derivatives | | | Net Unrealized | |
| | | | | | | | | | | | | | | |
| Commodity | | $ | 609,965 | | | $ | (265,264 | ) | | $ | 251,448 | | | $ | (408,586 | ) | | $ | 187,563 | |
| Currency | | | 282,891 | | | | — | | | | — | | | | (282,908 | ) | | | (17 | ) |
| Financial | | | — | | | | — | | | | 912,767 | | | | (1,406,223 | ) | | | (493,456 | ) |
| Total | | $ | 892,856 | | | $ | (265,264 | ) | | $ | 1,164,215 | | | $ | (2,097,717 | ) | | $ | (305,910 | ) |
The following is a summary of the location of derivative investments in TFS Hedged Futures Fund’s Statement of Operations for the six months ended April 30, 2013:
Derivative Investment Type | Location of Gain (Loss) on Derivatives |
| Futures contracts | Net realized gains (losses) from futures contracts |
| | Net change in unrealized appreciation (depreciation) on futures contracts |
The following is a summary of TFS Hedged Futures Fund’s realized gains (losses) and change in unrealized appreciation (depreciation) on derivative instruments recognized in the Statement of Operations categorized by primary risk exposure for the six months ended April 30, 2013:
| | Net Realized Gains (Losses) | | | Net Change in Unrealized Appreciation (Depreciation) | |
| Commodity | | $ | (4,951,790 | ) | | $ | 510,476 | |
| Currency | | | 3,091,896 | | | | 79,123 | |
| Financial | | | (1,379,773 | ) | | | (1,138,975 | ) |
| Total | | $ | (3,239,667 | ) | | $ | (549,376 | ) |
TFS Market Neutral Fund and TFS Small Cap Fund had no transactions in derivative instruments during the six months ended April 30, 2013.
7. Investments in Other Investment Companies
In order to maintain sufficient liquidity to implement investment strategies, or for temporary defensive purposes, each Fund may invest a significant portion of its assets in shares of one or more money market mutual funds. An investment in a money market mutual fund is not insured or guaranteed by the Federal Deposit Insurance Corporation or any other governmental agency, entity or person. While investor losses in money market mutual funds have been rare, they have occurred. In addition, additional indirect expenses will be incurred due to acquired fund fees and other costs to the extent of the investment in shares of money market mutual funds. As of April 30, 2013, TFS Hedged Futures Fund had 58.1% of the value of its net assets invested in money
TFS CAPITAL INVESTMENT TRUST
NOTES TO FINANCIAL STATEMENTS (Continued)
market mutual funds registered under the Investment Company Act of 1940. As of April 30, 2013, TFS Market Neutral Fund and TFS Small Cap Fund did not have a significant portion of assets in shares of one or more money market mutual funds.
8. Contingencies and Commitments
The Funds indemnify the Trust’s officers and Trustees for certain liabilities that might arise from their performance of their duties to the Funds. Additionally, in the normal course of business the Funds enter into contracts that contain a variety of representations and warranties and which provide general indemnifications. The Funds’ maximum exposure under these arrangements is unknown, as this would involve future claims that may be made against the Funds that have not yet occurred. However, based on experience, the Funds expect the risk of loss to be remote.
9. Subsequent Events
The Funds are required to recognize in the financial statements the effects of all subsequent events that provide additional evidence about conditions that existed as of the date of the Statements of Assets and Liabilities. For non-recognized subsequent events that must be disclosed to keep the financial statements from being misleading, the Funds are required to disclose the nature of the event as well as an estimate of its financial effect, or a statement that such an estimate cannot be made. Management has evaluated subsequent events through the issuance of these financial statements and has noted no such events.
TFS CAPITAL INVESTMENT TRUST
ABOUT YOUR FUNDS’ EXPENSES (Unaudited)
We believe it is important for you to understand the impact of costs on your investment. As a shareholder of the Funds, you incur two types of costs: (1) transaction costs, including redemption fees; and (2) ongoing costs, including management fees and other Fund expenses. The following examples are intended to help you understand your ongoing costs (in dollars) of investing in the Funds and to compare these costs with the ongoing costs of investing in other mutual funds.
A mutual fund’s ongoing costs are expressed as a percentage of its average net assets. This figure is known as the expense ratio. The ongoing costs reflected in the table are based on an investment of $1,000 made at the beginning of the most recent semi-annual period (November 1, 2012) and held until the end of the period (April 30, 2013).
The table below illustrates each Fund’s ongoing costs in two ways:
Actual fund return – This section helps you to estimate the actual expenses that you paid over the period. The “Ending Account Value” shown is derived from each Fund’s actual return, and the third column shows the dollar amount of operating expenses that would have been paid by an investor who started with $1,000 in the Funds. You may use the information here, together with the amount you invested, to estimate the expenses that you paid over the period.
To do so, simply divide your account value by $1,000 (for example, an $8,600 account value divided by $1,000 = 8.6), then multiply the result by the number given for the Funds under the heading “Expenses Paid During Period.”
Hypothetical 5% return – This section is intended to help you compare each Fund’s ongoing costs with those of other mutual funds. It assumes that each Fund had an annual return of 5% before expenses during the period shown, but that the expense ratio is unchanged. In this case, because the return used is not each Fund’s actual return, the results do not apply to your investment. The example is useful in making comparisons because the SEC requires all mutual funds to calculate expenses based on a 5% return. You can assess each Fund’s ongoing costs by comparing this hypothetical example with the hypothetical examples that appear in shareholder reports of other funds.
Note that expenses shown in the table are meant to highlight and help you compare ongoing costs only. The Funds do not charge any sales loads. However, a redemption fee of 2% is applied on the sale of shares purchased within 90 days of the date of their purchase and does not apply to the redemption of shares acquired through reinvestment of dividends and other distributions. The calculations below assume no shares were bought or sold during the period. Your actual costs may have been higher or lower, depending on the amount of your investment and the timing of any purchases or redemptions.
More information about each Fund’s expenses, including annualized expense ratios, can be found in this report. For additional information on operating expenses and other shareholder costs, please refer to each Fund’s summary prospectus.
TFS CAPITAL INVESTMENT TRUST
ABOUT YOUR FUNDS’ EXPENSES (Unaudited) (Continued)
TFS Market Neutral Fund
| Beginning Account Value November 1, 2012 | Ending Account Value April 30, 2013 | Expenses Paid During Period* |
| Based on Actual Fund Return | $1,000.00 | $1,034.10 | $42.87 |
| Based on Hypothetical 5% Return (before expenses) | $1,000.00 | $982.64 | $41.78 |
| * | Expenses are equal to the annualized expense ratio of 8.50% for the period, multiplied by the average account value over the period, multiplied by 181/365 (to reflect the one-half year period). |
TFS Small Cap Fund
| Beginning Account Value November 1, 2012 | Ending Account Value April 30, 2013 | Expenses Paid During Period* |
| Based on Actual Fund Return | $1,000.00 | $1,204.40 | $9.56 |
| Based on Hypothetical 5% Return (before expenses) | $1,000.00 | $1,016.12 | $8.75 |
| * | Expenses are equal to the annualized expense ratio of 1.75% for the period, multiplied by the average account value over the period, multiplied by 181/365 (to reflect the one-half year period). |
TFS Hedged Futures Fund
| Beginning Account Value November 1, 2012 | Ending Account Value April 30, 2013 | Expenses Paid During Period* |
| Based on Actual Fund Return | $1,000.00 | $961.10 | $11.18 |
| Based on Hypothetical 5% Return (before expenses) | $1,000.00 | $1,013.39 | $11.48 |
| * | Expenses are equal to the annualized expense ratio of 2.30% for the period, multiplied by the average account value over the period, multiplied by 181/365 (to reflect the one-half year period). |
TFS CAPITAL INVESTMENT TRUST
OTHER INFORMATION (Unaudited)
A description of the policies and procedures that the Funds use to determine how to vote proxies relating to portfolio securities is available without charge upon request by calling toll-free 1-888-534-2001, or on the SEC’s website at http://www.sec.gov. Information regarding how the Funds voted proxies relating to portfolio securities during the most recent 12-month period ended June 30 is also available without charge upon request by calling toll-free 1-888-534-2001, or on the SEC’s website at http://www.sec.gov.
The Funds file a complete listing of portfolio holdings with the SEC as of the end of the first and third quarters of each fiscal year on Form N-Q. The filings are available upon request, by calling 1-888-534-2001. Furthermore, you may obtain copies of the filings on the SEC’s website at http://www.sec.gov. The Funds’ Forms N-Q may also be reviewed and copied at the SEC’s Public Reference Room in Washington, DC, and information on the operation of the Public Reference Room may be obtained by calling 1-800-SEC-0330.
| PRIVACY NOTICE |
| FACTS | WHAT DOES THE TFS CAPITAL INVESTMENT TRUST DO WITH YOUR PERSONAL INFORMATION? |
| | |
| Why? | Financial companies choose how they share your personal information. Federal law gives consumers the right to limit some but not all sharing. Federal law also requires us to tell you how we collect, share, and protect your personal information. Please read this notice carefully to understand what we do. |
| | |
| What? | The types of personal information we collect and share depend on the product or service you have with us. This information can include: § Social Security number § Assets § Retirement Assets § Transaction History § Checking Account Information § Purchase History § Account Balances § Account Transactions § Wire Transfer Instructions When you are no longer our customer, we continue to share your information as described in this notice. |
| | |
| How? | All financial companies need to share your personal information to run their everyday business. In the section below, we list the reasons financial companies can share their customers’ personal information; the reasons the TFS Capital Investment Trust chooses to share; and whether you can limit this sharing. |
| | |
| Reasons we can share your personal information | Does the TFS Capital Investment Trust share? | Can you limit this sharing? |
For our everyday business purposes – Such as to process your transactions, maintain your account(s), respond to court orders and legal investigations, or report to credit bureaus | Yes | No |
For our marketing purposes – to offer our products and services to you | No | We don’t share |
| For joint marketing with other financial companies | No | We don’t share |
For our affiliates’ everyday business purposes – information about your transactions and experiences | No | We don’t share |
For our affiliates’ everyday business purposes – information about your creditworthiness | No | We don’t share |
| For nonaffiliates to market to you | No | We don’t share |
| | |
| Questions? | Call 1-888-534-2001 |
| Who we are |
| Who is providing this notice? | TFS Capital Investment Trust Ultimus Fund Distributors, LLC (Distributor) Ultimus Fund Solutions, LLC (Administrator) |
| What we do |
| How does the TFS Capital Investment Trust protect my personal information? | To protect your personal information from unauthorized access and use, we use security measures that comply with federal law. These measures include computer safeguards and secured files and buildings. Our service providers are held accountable for adhering to strict policies and procedures to prevent any misuse of your nonpublic personal information. |
| How does the TFS Capital Investment Trust collect my personal information? | We collect your personal information, for example, when you § Open an account § Provide account information § Give us your contact information § Make deposits or withdrawals from your account § Make a wire transfer § Tell us where to send the money § Tells us who receives the money § Show your government-issued ID § Show your driver’s license We also collect your personal information from other companies. |
| Why can’t I limit all sharing? | Federal law gives you the right to limit only § Sharing for affiliates’ everyday business purposes – information about your creditworthiness § Affiliates from using your information to market to you § Sharing for nonaffiliates to market to you State laws and individual companies may give you additional rights to limit sharing. |
| | |
| Definitions |
| Affiliates | Companies related by common ownership or control. They can be financial and nonfinancial companies. § TFS Capital LLC, the investment adviser to the TFS Capital Investment Trust, could be deemed to be an affiliate. |
| Nonaffiliates | Companies not related by common ownership or control. They can be financial and nonfinancial companies § The TFS Capital Investment Trust does not share with nonaffiliates so they can market to you. |
| Joint marketing | A formal agreement between nonaffiliated financial companies that together market financial products or services to you. § The TFS Capital Investment Trust does not jointly market. |
This page intentionally left blank.
This page intentionally left blank.
Not required
| Item 3. | Audit Committee Financial Expert. |
Not required
| Item 4. | Principal Accountant Fees and Services. |
Not required
| Item 5. | Audit Committee of Listed Registrants. |
Not applicable
| Item 6. | Schedule of Investments. |
| (a) | See Schedule I (Investments in securities of unaffiliated issuers) |
Schedule I
| TFS MARKET NEUTRAL FUND | |
| SCHEDULE OF INVESTMENTS | |
| April 30, 2013 (Unaudited) | |
| | |
COMMON STOCKS - 92.6% | | Shares | | | Value | |
Consumer Discretionary - 14.1% | |
Auto Components - 1.7% | |
American Axle & Manufacturing Holdings, Inc. (a) | | | 18,316 | | | $ | 244,885 | |
Ballard Power Systems, Inc. (a) | | | 107,071 | | | | 99,041 | |
Cooper Tire & Rubber Company (b) | | | 205,058 | | | | 5,103,894 | |
| Dana Holding Corporation | | | 6,535 | | | | 112,729 | |
Dorman Products, Inc. (b) | | | 46,290 | | | | 1,746,985 | |
Drew Industries, Inc. (b) | | | 14,508 | | | | 523,739 | |
Exide Technologies (a) (b) | | | 286,960 | | | | 243,084 | |
Federal-Mogul Corporation (a) (b) | | | 64,166 | | | | 479,962 | |
Fuel Systems Solutions, Inc. (a) | | | 479 | | | | 7,525 | |
Gentex Corporation (b) | | | 283,347 | | | | 6,375,307 | |
Goodyear Tire & Rubber Company (The) (a) | | | 609 | | | | 7,609 | |
Icahn Enterprises, L.P. (a) | | | 15,169 | | | | 1,130,394 | |
| Lear Corporation | | | 3,299 | | | | 190,616 | |
| Magna International, Inc. - Class A | | | 1,671 | | | | 100,544 | |
Modine Manufacturing Company (a) (b) | | | 111,658 | | | | 1,020,554 | |
Motorcar Parts of America, Inc. (a) | | | 15,032 | | | | 89,891 | |
| Shiloh Industries, Inc. | | | 2,062 | | | | 20,311 | |
Spartan Motors, Inc. (b) | | | 29,268 | | | | 155,706 | |
Standard Motor Products, Inc. (b) | | | 53,561 | | | | 1,641,109 | |
Stoneridge, Inc. (a) (b) | | | 98,415 | | | | 745,001 | |
Superior Industries International, Inc. (b) | | | 215,151 | | | | 3,950,172 | |
Tenneco, Inc. (a) (b) | | | 177,001 | | | | 6,844,629 | |
Tongxin International Ltd. (a) | | | 300 | | | | 79 | |
Tower International, Inc. (a) | | | 543 | | | | 8,737 | |
UQM Technologies, Inc. (a) | | | 25,271 | | | | 17,690 | |
Visteon Corporation (a) | | | 11,815 | | | | 694,604 | |
| | | | | | | | 31,554,797 | |
Automobiles - 0.0% (c) | |
Rush Enterprises, Inc. - Class B (a) | | | 1,512 | | | | 29,937 | |
| | | | | | | | | |
Distributors - 0.1% | |
| Core-Mark Holding Company, Inc. | | | 45,301 | | | | 2,357,464 | |
VOXX International Corporation (a) | | | 25,017 | | | | 238,412 | |
| | | | | | | | 2,595,876 | |
Diversified Consumer Services - 0.6% | |
Bright Horizons Family Solutions, Inc. (a) | | | 11,636 | | | | 377,472 | |
Capella Education Company (a) | | | 25,767 | | | | 912,667 | |
Career Education Corporation (a) | | | 209,713 | | | | 459,271 | |
| Carriage Services, Inc. | | | 14,948 | | | | 261,441 | |
China Education Alliance, Inc. (a) | | | 23,244 | | | | 11,903 | |
| Hillenbrand, Inc. | | | 120,094 | | | | 3,017,962 | |
ITT Educational Services, Inc. (a) | | | 46 | | | | 842 | |
K12, Inc. (a) | | | 321 | | | | 8,176 | |
LifeLock, Inc. (a) | | | 49,282 | | | | 443,538 | |
| Lincoln Educational Services Corporation | | | 37,794 | | | | 210,513 | |
| Mac-Gray Corporation | | | 5,514 | | | | 71,406 | |
Sotheby's (b) | | | 126,858 | | | | 4,500,922 | |
Steiner Leisure Ltd. (a) (b) | | | 17,351 | | | | 840,309 | |
| Universal Technical Institute, Inc. | | | 14,679 | | | | 174,240 | |
| | | | | | | | 11,290,662 | |
| TFS MARKET NEUTRAL FUND | |
| SCHEDULE OF INVESTMENTS (Continued) | |
| | |
COMMON STOCKS - 92.6% (Continued) | | Shares | | | Value | |
Consumer Discretionary - 14.1% (Continued) | |
Hotels, Restaurants & Leisure - 2.9% | |
AFC Enterprises, Inc. (a) (b) | | | 57,060 | | | $ | 1,819,073 | |
Ameristar Casinos, Inc. (b) | | | 161,163 | | | | 4,253,091 | |
| Arcos Dorados Holdings, Inc. - Class A | | | 8,157 | | | | 111,098 | |
Bloomin' Brands, Inc. (a) | | | 4,699 | | | | 102,203 | |
| Bob Evans Farms, Inc. | | | 10,741 | | | | 465,515 | |
Bravo Brio Restaurant Group, Inc. (a) | | | 39,701 | | | | 674,917 | |
| Brinker International, Inc. | | | 56 | | | | 2,178 | |
| Burger King Worldwide, Inc. | | | 49,745 | | | | 897,400 | |
Carrols Restaurant Group, Inc. (a) (b) | | | 19,538 | | | | 92,805 | |
| CEC Entertainment, Inc. | | | 8,236 | | | | 274,835 | |
| Cedar Fair, L.P. | | | 4,074 | | | | 171,108 | |
| Cheesecake Factory, Inc. (The) | | | 4,879 | | | | 194,282 | |
| Choice Hotels International, Inc. | | | 7,481 | | | | 292,208 | |
Churchill Downs, Inc. (b) | | | 9,520 | | | | 727,899 | |
| Cracker Barrel Old Country Store, Inc. | | | 3,861 | | | | 319,459 | |
Denny's Corporation (a) | | | 226,386 | | | | 1,283,609 | |
| Domino's Pizza, Inc. | | | 18,437 | | | | 1,017,722 | |
| Einstein Noah Restaurant Group, Inc. | | | 123,519 | | | | 1,779,909 | |
Fiesta Restaurant Group, Inc. (a) (b) | | | 137,457 | | | | 3,747,078 | |
| Frisch's Restaurants, Inc. | | | 14,464 | | | | 236,052 | |
Hyatt Hotels Corporation - Class A (a) (b) | | | 78,549 | | | | 3,352,471 | |
| International Speedway Corporation - Class A | | | 12,948 | | | | 425,601 | |
| Interval Leisure Group, Inc. | | | 11,307 | | | | 215,511 | |
Isle of Capri Casinos, Inc. (a) | | | 30,404 | | | | 232,895 | |
Jack in the Box, Inc. (a) | | | 116,574 | | | | 4,179,178 | |
Jamba, Inc. (a) | | | 761,107 | | | | 2,024,545 | |
Kona Grill, Inc. (a) | | | 578 | | | | 5,635 | |
Krispy Kreme Doughnuts, Inc. (a) (b) | | | 304,256 | | | | 4,156,137 | |
Marcus Corporation (b) | | | 163,241 | | | | 2,096,014 | |
Marriott Vacations Worldwide Corporation (a) | | | 7,602 | | | | 345,739 | |
Morgans Hotel Group Company (a) | | | 2,452 | | | | 15,031 | |
MTR Gaming Group, Inc. (a) | | | 5,956 | | | | 20,548 | |
Multimedia Games Holding Company, Inc. (a) | | | 148,403 | | | | 3,659,618 | |
Nathan's Famous, Inc. (a) | | | 32 | | | | 1,429 | |
Orient-Express Hotels Ltd. - Class A (a) (b) | | | 147,500 | | | | 1,489,750 | |
Panera Bread Company - Class A (a) | | | 1,020 | | | | 180,775 | |
Papa John's International, Inc. (a) (b) | | | 23,116 | | | | 1,456,308 | |
Penn National Gaming, Inc. (a) | | | 2,063 | | | | 120,789 | |
Pinnacle Entertainment, Inc. (a) | | | 77,777 | | | | 1,482,430 | |
Premier Exhibitions, Inc. (a) | | | 5,660 | | | | 15,452 | |
Red Robin Gourmet Burgers, Inc. (a) | | | 12,243 | | | | 592,194 | |
Rick's Cabaret International, Inc. (a) | | | 4,452 | | | | 37,575 | |
Ruth's Hospitality Group, Inc. (a) | | | 85,501 | | | | 847,315 | |
Scientific Games Corporation (a) (b) | | | 298,761 | | | | 2,652,998 | |
SHFL entertainment, Inc. (a) (b) | | | 186,962 | | | | 2,954,000 | |
Sonic Corporation (a) | | | 89,426 | | | | 1,120,508 | |
| Speedway Motorsports, Inc. | | | 5,655 | | | | 101,960 | |
Town Sports International Holdings, Inc. (b) | | | 63,251 | | | | 636,938 | |
| Vail Resorts, Inc. | | | 6,136 | | | | 370,001 | |
| Wendy's Company (The) | | | 110,818 | | | | 630,554 | |
WMS Industries, Inc. (a) | | | 34,404 | | | | 873,173 | |
| | | | | | | | 54,755,513 | |
| TFS MARKET NEUTRAL FUND | |
| SCHEDULE OF INVESTMENTS (Continued) | |
| | |
COMMON STOCKS - 92.6% (Continued) | | Shares | | | Value | |
Consumer Discretionary - 14.1% (Continued) | |
Household Durables - 0.6% | |
| American Greetings Corporation - Class A | | | 89,246 | | | $ | 1,645,696 | |
| Bassett Furniture Industries, Inc. | | | 248 | | | | 3,480 | |
Comstock Holding Companies, Inc. - Class A (a) | | | 5,401 | | | | 15,285 | |
| CSS Industries, Inc. | | | 5,947 | | | | 170,441 | |
| D.R. Horton, Inc. | | | 4,093 | | | | 106,745 | |
Furniture Brands International, Inc. (a) | | | 36,907 | | | | 40,598 | |
Helen of Troy Ltd. (a) (b) | | | 20,733 | | | | 723,167 | |
iRobot Corporation (a) | | | 39,860 | | | | 1,159,527 | |
Kid Brands, Inc. (a) (b) | | | 2,418 | | | | 2,732 | |
| La-Z-Boy, Inc. | | | 39,407 | | | | 711,690 | |
Libbey, Inc. (a) (b) | | | 64,464 | | | | 1,248,668 | |
| MDC Holdings, Inc. | | | 27,810 | | | | 1,045,656 | |
Mohawk Industries, Inc. (a) | | | 1,053 | | | | 116,757 | |
NIVS IntelliMedia Technology Group, Inc. (a) (b) | | | 242,917 | | | | 656 | |
Skyline Corporation (a) | | | 6,997 | | | | 31,696 | |
Taylor Morrison Home Corporation - Class A (a) | | | 57,170 | | | | 1,473,843 | |
TRI Pointe Homes, Inc. (a) | | | 13,646 | | | | 259,274 | |
| Tupperware Brands Corporation | | | 1,635 | | | | 131,291 | |
Universal Electronics, Inc. (a) | | | 59,339 | | | | 1,363,610 | |
| | | | | | | | 10,250,812 | |
Internet & Catalog Retail - 0.6% | |
1-800-FLOWERS.COM, Inc. - Class A (a) | | | 220,318 | | | | 1,306,486 | |
Amazon.com, Inc. (a) | | | 443 | | | | 112,438 | |
Blue Nile, Inc. (a) | | | 43,357 | | | | 1,414,739 | |
CafePress, Inc. (a) | | | 24,948 | | | | 143,950 | |
Geeknet, Inc. (a) | | | 1,286 | | | | 16,821 | |
HomeAway, Inc. (a) | | | 19,348 | | | | 591,081 | |
| HSN, Inc. | | | 3,187 | | | | 167,572 | |
Liberty Ventures - Series A (a) | | | 1,736 | | | | 127,544 | |
MakeMyTrip Ltd. (a) | | | 649 | | | | 8,333 | |
Orbitz Worldwide, Inc. (a) (b) | | | 281,189 | | | | 1,681,510 | |
Shutterfly, Inc. (a) (b) | | | 125,514 | | | | 5,589,138 | |
TripAdviser, Inc. (a) | | | 1,720 | | | | 90,438 | |
ValueVision Media, Inc. (a) (b) | | | 56,823 | | | | 244,339 | |
| | | | | | | | 11,494,389 | |
Leisure Equipment & Products - 0.1% | |
LeapFrog Enterprises, Inc. (a) | | | 241,212 | | | | 2,156,435 | |
Nautilus, Inc. (a) | | | 488 | | | | 3,358 | |
Steinway Musical Instruments, Inc. (a) | | | 10,426 | | | | 260,024 | |
| | | | | | | | 2,419,817 | |
Media - 2.8% | |
AMC Networks, Inc. - Class A (a) | | | 2,321 | | | | 146,246 | |
Arbitron, Inc. (b) | | | 30,564 | | | | 1,427,033 | |
Ballantyne Strong, Inc. (a) | | | 18,904 | | | | 84,879 | |
| Belo Corporation - Class A | | | 58,457 | | | | 626,659 | |
Cablevision Systems Corporation - Class A (b) | | | 336,245 | | | | 4,996,601 | |
Carmike Cinemas, Inc. (a) | | | 89,035 | | | | 1,563,455 | |
| CBS Corporation - Class A | | | 2,090 | | | | 95,806 | |
Charter Communications, Inc. - Class A (a) | | | 979 | | | | 98,624 | |
| Cinemark Holdings, Inc. | | | 5,321 | | | | 164,366 | |
| CTC Media, Inc. | | | 8,448 | | | | 105,515 | |
Discovery Communications, Inc. - Class C (a) | | | 1,683 | | | | 119,308 | |
| TFS MARKET NEUTRAL FUND | |
| SCHEDULE OF INVESTMENTS (Continued) | |
| | |
COMMON STOCKS - 92.6% (Continued) | | Shares | | | Value | |
Consumer Discretionary - 14.1% (Continued) | |
Media - 2.8% (Continued) | |
E.W. Scripps Company (The) - Class A (a) | | | 449,863 | | | $ | 6,248,597 | |
| Entravision Communications Corporation - Class A | | | 848,377 | | | | 3,274,735 | |
Fisher Communications, Inc. (b) | | | 18,254 | | | | 756,081 | |
Global Sources Ltd. (a) | | | 57,840 | | | | 394,469 | |
Gray Television, Inc. (a) | | | 452,282 | | | | 2,871,991 | |
Harte-Hanks, Inc. (b) | | | 225,061 | | | | 1,784,734 | |
IMAX Corporation (a) | | | 100 | | | | 2,553 | |
Insignia Systems, Inc. (a) | | | 21,408 | | | | 42,174 | |
John Wiley & Sons, Inc. - Class A (b) | | | 95,108 | | | | 3,630,272 | |
Journal Communications, Inc. (a) | | | 308,585 | | | | 2,101,464 | |
Lamar Advertising Company - Class A (a) | | | 2,750 | | | | 128,755 | |
Liberty Media Corporation (a) | | | 2,447 | | | | 281,111 | |
LIN TV Corporation - Class A (a) | | | 322,821 | | | | 3,973,926 | |
Live Nation Entertainment, Inc. (a) (b) | | | 272,165 | | | | 3,437,444 | |
Madison Square Garden Company (The) - Class A (a) | | | 52 | | | | 3,134 | |
Martha Stewart Living Omnimedia, Inc. - Class A (a) | | | 30,113 | | | | 74,379 | |
MDC Partners, Inc. (b) | | | 55,314 | | | | 945,316 | |
| National CineMedia, Inc. | | | 70,789 | | | | 1,149,613 | |
| Nexstar Broadcasting Group, Inc. | | | 154,925 | | | | 3,772,424 | |
| Outdoor Channel Holdings, Inc. | | | 1,701 | | | | 14,884 | |
ReachLocal, Inc. (a) | | | 21,091 | | | | 351,587 | |
Reading International, Inc. (a) | | | 2,703 | | | | 15,731 | |
Rentrak Corporation (a) | | | 15,153 | | | | 343,064 | |
| Salem Communications Corporation - Class A | | | 81,253 | | | | 745,903 | |
| Shaw Communications, Inc. - Class B | | | 6,503 | | | | 147,943 | |
Shutterstock, Inc. (a) | | | 12,247 | | | | 510,700 | |
Sinclair Broadcast Group, Inc. - Class A (b) | | | 205,629 | | | | 5,510,857 | |
| Sirius XM Radio, Inc. | | | 43,131 | | | | 140,176 | |
Starz - Series A (a) | | | 33,018 | | | | 771,961 | |
| | | | | | | | 52,854,470 | |
Multiline Retail - 0.3% | |
Big Lots, Inc. (a) (b) | | | 114,072 | | | | 4,154,502 | |
Dillard's, Inc. (b) | | | 1,562 | | | | 128,725 | |
Dollar General Corporation (a) | | | 1,778 | | | | 92,616 | |
Gordmans Stores, Inc. (a) (b) | | | 145,639 | | | | 1,642,808 | |
Tuesday Morning Corporation (a) | | | 27,355 | | | | 221,849 | |
| | | | | | | | 6,240,500 | |
Specialty Retail - 2.8% | |
| Aaron's, Inc. | | | 39,413 | | | | 1,131,547 | |
| Advance Auto Parts, Inc. | | | 4,270 | | | | 358,168 | |
ANN, INC. (a) | | | 24,602 | | | | 726,743 | |
Asbury Automotive Group, Inc. (a) | | | 19,596 | | | | 785,604 | |
Ascena Retail Group, Inc. (a) (b) | | | 263,018 | | | | 4,865,833 | |
AutoNation, Inc. (a) | | | 4,007 | | | | 182,359 | |
| Big 5 Sporting Goods Corporation | | | 13,800 | | | | 231,840 | |
Cato Corporation (The) - Class A (b) | | | 42,069 | | | | 1,010,077 | |
| Chico's FAS, Inc. | | | 37,872 | | | | 691,921 | |
Children's Place Retail Stores, Inc. (The) (a) | | | 7,936 | | | | 388,229 | |
Christopher & Banks Corporation (a) (b) | | | 246,607 | | | | 1,713,919 | |
Destination Maternity Corporation (b) | | | 21,701 | | | | 515,399 | |
Destination XL Group, Inc. (a) | | | 164,729 | | | | 820,350 | |
Express, Inc. (a) (b) | | | 317,889 | | | | 5,788,759 | |
| TFS MARKET NEUTRAL FUND | |
| SCHEDULE OF INVESTMENTS (Continued) | |
| | |
COMMON STOCKS - 92.6% (Continued) | | Shares | | | Value | |
Consumer Discretionary - 14.1% (Continued) | |
Specialty Retail - 2.8% (Continued) | |
| Finish Line, Inc. (The) - Class A | | | 23,269 | | | $ | 451,186 | |
Five Below, Inc. (a) | | | 10,091 | | | | 363,175 | |
| GameStop Corporation - Class A | | | 51,113 | | | | 1,783,844 | |
Genesco, Inc. (a) | | | 6,811 | | | | 419,217 | |
| Haverty Furniture Companies, Inc. | | | 97,607 | | | | 2,321,094 | |
hhgregg, Inc. (a) | | | 110,257 | | | | 1,489,572 | |
Kirkland's, Inc. (a) | | | 166,461 | | | | 2,007,520 | |
MarineMax, Inc. (a) | | | 2,526 | | | | 29,276 | |
Men's Wearhouse, Inc. (The) (b) | | | 160,141 | | | | 5,364,723 | |
New York & Company, Inc. (a) | | | 53,744 | | | | 239,698 | |
O'Reilly Automotive, Inc. (a) | | | 1,523 | | | | 163,448 | |
Pacific Sunwear of California, Inc. (a) | | | 17,924 | | | | 49,291 | |
Penske Automotive Group, Inc. (b) | | | 132,043 | | | | 4,082,770 | |
Perfumania Holdings, Inc. (a) | | | 3,369 | | | | 20,989 | |
Restoration Hardware Holdings, Inc. (a) | | | 12,906 | | | | 502,689 | |
Sears Hometown and Outlet Stores, Inc. (a) | | | 68,963 | | | | 3,076,439 | |
Shoe Carnival, Inc. (b) | | | 97,121 | | | | 2,023,030 | |
| Signet Jewelers Ltd. | | | 1,490 | | | | 102,408 | |
Stein Mart, Inc. (b) | | | 22,886 | | | | 181,028 | |
Tile Shop Holdings, Inc. (The) (a) | | | 18,476 | | | | 458,205 | |
TravelCenters of America, LLC (a) (b) | | | 96,923 | | | | 1,116,553 | |
Trinity Place Holdings, Inc. (a) | | | 160 | | | | 872 | |
Vitamin Shoppe, Inc. (a) | | | 24,615 | | | | 1,209,827 | |
West Marine, Inc. (a) | | | 2,667 | | | | 31,551 | |
Wet Seal, Inc. (The) - Class A (a) (b) | | | 1,346,335 | | | | 4,389,052 | |
| Winmark Corporation | | | 1,409 | | | | 87,175 | |
Zale Corporation (a) | | | 158,433 | | | | 703,442 | |
| | | | | | | | 51,878,822 | |
Textiles, Apparel & Luxury Goods - 1.6% | |
Carter's, Inc. (a) | | | 4,484 | | | | 293,209 | |
| Columbia Sportswear Company | | | 49,393 | | | | 2,894,430 | |
CROCS, Inc. (a) | | | 30,173 | | | | 483,371 | |
| Culp, Inc. | | | 67,828 | | | | 1,101,527 | |
Deckers Outdoor Corporation (a) | | | 70,938 | | | | 3,910,102 | |
Fifth & Pacific Companies, Inc. (a) | | | 43,729 | | | | 901,692 | |
Fossil, Inc. (a) | | | 1,238 | | | | 121,472 | |
Fuqi International, Inc. (a) | | | 116,203 | | | | 159,198 | |
G-III Apparel Group Ltd. (a) | | | 13,230 | | | | 537,932 | |
| Gildan Activewear, Inc. - Class A | | | 4,187 | | | | 168,443 | |
Hanesbrands, Inc. (a) | | | 2,363 | | | | 118,528 | |
Iconix Brand Group, Inc. (a) | | | 10,298 | | | | 295,038 | |
Joe's Jeans, Inc. (a) | | | 163,612 | | | | 287,957 | |
| Jones Group, Inc. (The) | | | 52,494 | | | | 734,916 | |
K-Swiss, Inc. - Class A (a) | | | 21,416 | | | | 101,512 | |
LJ International, Inc. (a) (b) | | | 66,892 | | | | 128,433 | |
Maidenform Brands, Inc. (a) | | | 25,903 | | | | 466,254 | |
| Movado Group, Inc. | | | 85,076 | | | | 2,572,698 | |
| Oxford Industries, Inc. | | | 14,044 | | | | 830,422 | |
| Perry Ellis International, Inc. | | | 15,544 | | | | 273,108 | |
| PVH Corporation | | | 914 | | | | 105,485 | |
Quiksilver, Inc. (a) | | | 58,268 | | | | 392,144 | |
Rocky Brands, Inc. (a) | | | 9,490 | | | | 140,452 | |
| TFS MARKET NEUTRAL FUND | |
| SCHEDULE OF INVESTMENTS (Continued) | |
| | |
COMMON STOCKS - 92.6% (Continued) | | Shares | | | Value | |
Consumer Discretionary - 14.1% (Continued) | |
Textiles, Apparel & Luxury Goods - 1.6% (Continued) | |
Skechers U.S.A., Inc. - Class A (a) | | | 147,528 | | | $ | 3,065,632 | |
Steven Madden Ltd. (a) (b) | | | 133,160 | | | | 6,475,571 | |
| True Religion Apparel, Inc. | | | 21,966 | | | | 594,400 | |
Tumi Holdings, Inc. (a) | | | 35,252 | | | | 811,853 | |
Unifi, Inc. (a) | | | 91,841 | | | | 1,790,899 | |
| | | | | | | | 29,756,678 | |
Consumer Staples - 2.3% | |
Beverages - 0.1% | |
| Brown-Forman Corporation - Class B | | | 3,874 | | | | 273,117 | |
Coca-Cola Bottling Company Consolidated (b) | | | 16,891 | | | | 1,038,796 | |
Cott Corporation (b) | | | 111,750 | | | | 1,223,663 | |
| Dr Pepper Snapple Group, Inc. | | | 3,283 | | | | 160,309 | |
| National Beverage Corporation | | | 12,022 | | | | 177,084 | |
| | | | | | | | 2,872,969 | |
Food & Staples Retailing - 0.5% | |
| Andersons, Inc. (The) | | | 37,139 | | | | 2,024,818 | |
| Casey's General Stores, Inc. | | | 6,748 | | | | 390,777 | |
Fresh Market, Inc. (The) (a) | | | 4,016 | | | | 164,375 | |
| Harris Teeter Supermarkets, Inc. | | | 9,823 | | | | 410,503 | |
Ingles Markets, Inc. - Class A (b) | | | 9,606 | | | | 204,800 | |
Nash Finch Company (b) | | | 11,340 | | | | 233,037 | |
Pantry, Inc. (The) (a) | | | 66,581 | | | | 972,749 | |
Pizza Inn Holdings, Inc. (a) | | | 8,415 | | | | 66,815 | |
| PriceSmart, Inc. | | | 15,217 | | | | 1,357,813 | |
Rite Aid Corporation (a) (b) | | | 1,262,734 | | | | 3,346,245 | |
| Spartan Stores, Inc. | | | 18,953 | | | | 318,031 | |
| Village Super Market, Inc. - Class A | | | 3,306 | | | | 116,371 | |
| | | | | | | | 9,606,334 | |
Food Products - 1.0% | |
Adecoagro, S.A. (a) (b) | | | 174,029 | | | | 1,298,256 | |
| Alico, Inc. | | | 3,873 | | | | 161,930 | |
Amira Nature Foods Ltd. (a) | | | 979 | | | | 7,499 | |
| B&G Foods, Inc. | | | 35 | | | | 1,080 | |
Boulder Brands, Inc. (a) | | | 1,319 | | | | 11,884 | |
| Cal-Maine Foods, Inc. | | | 8,528 | | | | 363,975 | |
| Campbell Soup Company | | | 3,744 | | | | 173,759 | |
Chiquita Brands International, Inc. (a) | | | 109,326 | | | | 943,483 | |
Darling International, Inc. (a) | | | 43,900 | | | | 812,589 | |
DE Master Blenders 1753 N.V. (a) | | | 22,600 | | | | 358,338 | |
Farmer Brothers Company (a) | | | 69,664 | | | | 1,055,410 | |
| Flowers Foods, Inc. | | | 5,036 | | | | 165,886 | |
| H.J. Heinz Company | | | 2,993 | | | | 216,753 | |
| Hormel Foods Corporation | | | 4,246 | | | | 175,232 | |
| Ingredion, Inc. | | | 1,269 | | | | 91,381 | |
Inventure Foods, Inc. (a) | | | 2,961 | | | | 22,681 | |
| J & J Snack Foods Corporation | | | 34,280 | | | | 2,571,686 | |
| John B. Sanfilippo & Son, Inc. | | | 9,957 | | | | 208,898 | |
| Lancaster Colony Corporation | | | 5,064 | | | | 399,702 | |
| Limoneira Company | | | 203 | | | | 3,782 | |
| Mead Johnson Nutrition Company | | | 1,426 | | | | 115,634 | |
| Mondelez International, Inc. - Class A | | | 4,341 | | | | 136,524 | |
Omega Protein Corporation (a) (b) | | | 313,780 | | | | 2,921,292 | |
| TFS MARKET NEUTRAL FUND | |
| SCHEDULE OF INVESTMENTS (Continued) | |
| | |
COMMON STOCKS - 92.6% (Continued) | | Shares | | | Value | |
Consumer Staples - 2.3% (Continued) | |
Food Products - 1.0% (Continued) | |
Origin Agritech Ltd. (a) (b) | | | 51,894 | | | $ | 91,333 | |
Pilgrim's Pride Corporation (a) (b) | | | 234,845 | | | | 2,299,133 | |
Post Holdings, Inc. (a) | | | 15,147 | | | | 663,287 | |
S&W Seed Company (a) | | | 13,578 | | | | 125,325 | |
| Sanderson Farms, Inc. | | | 17,082 | | | | 1,046,443 | |
Seneca Foods Corporation - Class A (a) | | | 15,372 | | | | 500,973 | |
Smithfield Foods, Inc. (a) | | | 12,971 | | | | 332,058 | |
SunOpta, Inc. (a) (b) | | | 43,802 | | | | 318,441 | |
TreeHouse Foods, Inc. (a) | | | 4,139 | | | | 263,696 | |
Zhongpin, Inc. (a) | | | 8,028 | | | | 104,043 | |
| | | | | | | | 17,962,386 | |
Household Products - 0.1% | |
Central Garden & Pet Company (a) | | | 25,949 | | | | 227,054 | |
| Church & Dwight Company, Inc. | | | 2,562 | | | | 163,686 | |
Harbinger Group, Inc. (a) | | | 19,833 | | | | 179,290 | |
| Orchids Paper Products Company | | | 671 | | | | 15,433 | |
| Spectrum Brands Holdings, Inc. | | | 13,494 | | | | 755,664 | |
| WD-40 Company | | | 7,660 | | | | 413,104 | |
| | | | | | | | 1,754,231 | |
Personal Products - 0.6% | |
American Oriental Bioengineering, Inc. (a) | | | 6,349 | | | | 3,175 | |
| Avon Products, Inc. | | | 4,572 | | | | 105,888 | |
Elizabeth Arden, Inc. (a) | | | 521 | | | | 21,335 | |
| Female Health Company (The) | | | 22,803 | | | | 174,899 | |
Inter Parfums, Inc. (b) | | | 102,329 | | | | 2,964,471 | |
| Nature's Sunshine Products, Inc. | | | 2,162 | | | | 31,630 | |
Neptune Technologies & Bioressources, Inc. (a) | | | 81,936 | | | | 217,130 | |
| Nutraceutical International Corporation | | | 11,047 | | | | 204,038 | |
Prestige Brands Holdings, Inc. (a) (b) | | | 207,957 | | | | 5,604,441 | |
Revlon, Inc. (a) (b) | | | 96,731 | | | | 1,871,745 | |
| | | | | | | | 11,198,752 | |
Tobacco - 0.0% (c) | |
| Universal Corporation | | | 4,528 | | | | 260,587 | |
| Vector Group Ltd. | | | 12,940 | | | | 211,051 | |
| | | | | | | | 471,638 | |
Energy - 8.6% | |
Energy Equipment & Services - 2.4% | |
Atwood Oceanics, Inc. (a) (b) | | | 30,844 | | | | 1,512,898 | |
Basic Energy Services, Inc. (a) | | | 144,342 | | | | 1,981,816 | |
| Bolt Technology Corporation | | | 3,424 | | | | 54,784 | |
| Bristow Group, Inc. | | | 5,061 | | | | 319,855 | |
| CARBO Ceramics, Inc. | | | 25,070 | | | | 1,771,195 | |
| Core Laboratories N.V. | | | 1,851 | | | | 267,988 | |
Dawson Geophysical Company (a) (b) | | | 51,735 | | | | 1,590,334 | |
Exterran Holdings, Inc. (a) (b) | | | 186,300 | | | | 4,922,046 | |
| Exterran Partners, L.P. | | | 17,959 | | | | 508,240 | |
Forum Energy Technologies, Inc. (a) | | | 12,850 | | | | 357,359 | |
Geokinetics, Inc. (a) | | | 342 | | | | 3 | |
Geospace Technologies Corporation (a) | | | 6,291 | | | | 530,772 | |
Global Geophysical Services, Inc. (a) | | | 256,244 | | | | 932,728 | |
| Gulf Island Fabrication, Inc. | | | 34,121 | | | | 701,528 | |
Hercules Offshore, Inc. (a) | | | 44,658 | | | | 329,129 | |
| TFS MARKET NEUTRAL FUND | |
| SCHEDULE OF INVESTMENTS (Continued) | |
| | |
COMMON STOCKS - 92.6% (Continued) | | Shares | | | Value | |
Energy - 8.6% (Continued) | |
Energy Equipment & Services - 2.4% (Continued) | |
Hornbeck Offshore Services, Inc. (a) | | | 1,828 | | | $ | 82,114 | |
ION Geophysical Corporation (a) | | | 81,488 | | | | 508,485 | |
Key Energy Services, Inc. (a) | | | 383,759 | | | | 2,279,528 | |
| Lufkin Industries, Inc. | | | 129,954 | | | | 11,473,639 | |
Matrix Service Company (a) | | | 204,991 | | | | 3,081,015 | |
Natural Gas Services Group, Inc. (a) | | | 1,030 | | | | 20,796 | |
North American Energy Partners, Inc. (a) (b) | | | 23,163 | | | | 93,810 | |
Pacific Drilling, S.A. (a) | | | 21,204 | | | | 211,616 | |
Parker Drilling Company (a) (b) | | | 470,530 | | | | 1,938,584 | |
| Patterson-UTI Energy, Inc. | | | 5,522 | | | | 116,459 | |
PHI, Inc. (a) | | | 1,639 | | | | 45,515 | |
Pioneer Energy Services Corporation (a) | | | 457,953 | | | | 3,228,569 | |
| Precision Drilling Corporation | | | 30,897 | | | | 250,266 | |
RigNet, Inc. (a) | | | 9,480 | | | | 229,416 | |
| SEACOR Holdings, Inc. | | | 2,867 | | | | 206,739 | |
| Seadrill Ltd. | | | 7,287 | | | | 280,477 | |
| Seadrill Partners LLC | | | 5,644 | | | | 156,169 | |
Tesco Corporation (a) | | | 1,242 | | | | 15,152 | |
TETRA Technologies, Inc. (a) | | | 47,020 | | | | 429,293 | |
TGC Industries, Inc. (b) | | | 18,635 | | | | 165,295 | |
Unit Corporation (a) (b) | | | 44,778 | | | | 1,882,019 | |
Weatherford International Ltd. (a) | | | 13,270 | | | | 169,723 | |
Willbros Group, Inc. (a) | | | 312,468 | | | | 2,968,446 | |
| | | | | | | | 45,613,800 | |
Oil, Gas & Consumable Fuels - 6.2% | |
Abraxas Petroleum Corporation (a) | | | 445,658 | | | | 998,274 | |
| Adams Resources & Energy, Inc. | | | 2,434 | | | | 120,946 | |
Advantage Oil & Gas Ltd. (a) (b) | | | 297,456 | | | | 1,180,900 | |
| Alliance Holdings GP, L.P. | | | 1,639 | | | | 101,880 | |
Alon USA Energy, Inc. (b) | | | 186,188 | | | | 3,090,721 | |
| Alon USA Partners, L.P. | | | 36 | | | | 893 | |
Alpha Natural Resources, Inc. (a) | | | 432,612 | | | | 3,209,981 | |
| American Midstream Partners, L.P. | | | 3,378 | | | | 63,000 | |
| Atlas Resource Partners, L.P. | | | 27,675 | | | | 707,096 | |
| Baytex Energy Corporation | | | 6,801 | | | | 268,368 | |
Bellatrix Exploration Ltd. (a) | | | 4,985 | | | | 31,057 | |
| Berry Petroleum Company - Class A | | | 32 | | | | 1,533 | |
Boardwalk Pipeline Partners, L.P. (b) | | | 8,081 | | | | 244,289 | |
Bonanza Creek Energy, Inc. (a) | | | 8,772 | | | | 301,318 | |
| Buckeye Partners, L.P. | | | 1,569 | | | | 96,933 | |
Callon Petroleum Company (a) (b) | | | 230,082 | | | | 823,694 | |
| Cameco Corporation | | | 10,898 | | | | 212,620 | |
Carrizo Oil & Gas, Inc. (a) (b) | | | 198,365 | | | | 4,804,400 | |
| Cheniere Energy Partners, L.P. | | | 26,275 | | | | 717,308 | |
Clayton Williams Energy, Inc. (a) | | | 4,448 | | | | 171,693 | |
Cobalt International Energy, Inc. (a) | | | 4,157 | | | | 116,147 | |
Comstock Resources, Inc. (a) | | | 4,427 | | | | 69,327 | |
| ConocoPhillips | | | 2,671 | | | | 161,462 | |
Crestwood Midstream Partners, L.P. (b) | | | 20,083 | | | | 481,590 | |
| Cross Timbers Royalty Trust | | | 21,315 | | | | 615,790 | |
Crosstex Energy, Inc. (b) | | | 86,497 | | | | 1,592,410 | |
| Crosstex Energy, L.P. | | | 34,494 | | | | 623,996 | |
| TFS MARKET NEUTRAL FUND | |
| SCHEDULE OF INVESTMENTS (Continued) | |
| | |
COMMON STOCKS - 92.6% (Continued) | | Shares | | | Value | |
Energy - 8.6% (Continued) | |
Oil, Gas & Consumable Fuels - 6.2% (Continued) | |
| Delek Logistics Partners, L.P. | | | 14,569 | | | $ | 439,984 | |
| Delek US Holdings, Inc. | | | 73,032 | | | | 2,635,725 | |
Denison Mines Corporation (a) | | | 322,050 | | | | 399,342 | |
Diamondback Energy, Inc. (a) | | | 14,720 | | | | 386,547 | |
Dorchester Minerals, L.P. (b) | | | 41,019 | | | | 964,357 | |
| Eagle Rock Energy Partners, L.P. | | | 26,969 | | | | 274,544 | |
| Eastern American Natural Gas Trust | | | 2,855 | | | | 59,498 | |
| ECA Marcellus Trust I | | | 13,462 | | | | 180,256 | |
| El Paso Pipeline Partners, L.P. | | | 2,131 | | | | 91,292 | |
Enbridge Energy Management, LLC (a) | | | 1 | | | | 1 | |
| Encana Corporation | | | 8,787 | | | | 162,120 | |
| Enduro Royalty Trust | | | 51,382 | | | | 838,040 | |
| Energen Corporation | | | 5,189 | | | | 246,062 | |
EPL Oil & Gas, Inc. (a) | | | 27,567 | | | | 900,614 | |
| EQT Midstream Partners, L.P. | | | 1,174 | | | | 54,356 | |
| EV Energy Partners, L.P. | | | 3,104 | | | | 144,522 | |
Evolution Petroleum Corporation (a) | | | 13,534 | | | | 134,528 | |
Forest Oil Corporation (a) (b) | | | 896,024 | | | | 3,754,341 | |
FX Energy, Inc. (a) | | | 196,503 | | | | 754,572 | |
GasLog Ltd. (b) | | | 99,758 | | | | 1,276,902 | |
Gastar Exploration Ltd. (a) | | | 736,074 | | | | 2,061,007 | |
GeoMet, Inc. (a) | | | 1,636 | | | | 262 | |
Golar LNG Ltd. (b) | | | 133,739 | | | | 4,469,557 | |
| Golar LNG Partners, L.P. | | | 25,944 | | | | 847,591 | |
Goodrich Petroleum Corporation (a) (b) | | | 317,793 | | | | 4,144,021 | |
Gran Tierra Energy, Inc. (a) (b) | | | 273,276 | | | | 1,511,216 | |
Green Plains Renewable Energy, Inc. (a) | | | 49,299 | | | | 616,731 | |
Gulfport Energy Corporation (a) | | | 5,152 | | | | 268,883 | |
Halcon Resources Corporation (a) | | | 529,046 | | | | 3,459,961 | |
| Imperial Oil Ltd. | | | 4,819 | | | | 192,134 | |
Inergy, L.P. (b) | | | 10,383 | | | | 228,322 | |
Kinder Morgan Management, LLC (a) | | | 1 | | | | 15 | |
Kodiak Oil & Gas Corporation (a) (b) | | | 603,575 | | | | 4,725,992 | |
Kosmos Energy Ltd. (a) | | | 25,026 | | | | 275,036 | |
Laredo Petroleum Holdings, Inc. (a) | | | 28,262 | | | | 486,106 | |
| Legacy Reserves, L.P. | | | 3,781 | | | | 100,858 | |
| Lehigh Gas Partners, L.P. | | | 30,956 | | | | 741,396 | |
Lone Pine Resources, Inc. (a) (b) | | | 633,931 | | | | 621,252 | |
Long Run Exploration Ltd. (a) (d) | | | 1 | | | | 4 | |
Longwei Petroleum Investment Holding Ltd. (a) | | | 76,597 | | | | 4,297 | |
| LRR Energy, L.P. | | | 38,507 | | | | 644,222 | |
Martin Midstream Partners, L.P. (b) | | | 22,400 | | | | 930,048 | |
McMoRan Exploration Company (a) | | | 31 | | | | 513 | |
| Memorial Production Partners, L.P. | | | 25,070 | | | | 482,848 | |
| Mid-Con Energy Partners, L.P. | | | 32,335 | | | | 807,728 | |
Midstates Petroleum Company, Inc. (a) | | | 249,145 | | | | 1,437,567 | |
| MV Oil Trust | | | 24,616 | | | | 668,571 | |
| Navios Maritime Acquisition Corporation | | | 7,767 | | | | 26,097 | |
| New Source Energy Partners, L.P. | | | 4,324 | | | | 88,642 | |
Newfield Exploration Company (a) | | | 234,308 | | | | 5,105,571 | |
| NGL Energy Partners, L.P. | | | 268 | | | | 7,871 | |
| Niska Gas Storage Partners, LLC | | | 582 | | | | 8,858 | |
| TFS MARKET NEUTRAL FUND | |
| SCHEDULE OF INVESTMENTS (Continued) | |
| | |
COMMON STOCKS - 92.6% (Continued) | | Shares | | | Value | |
Energy - 8.6% (Continued) | |
Oil, Gas & Consumable Fuels - 6.2% (Continued) | |
| North European Oil Royalty Trust | | | 295 | | | $ | 7,292 | |
Northern Tier Energy, L.P. (b) | | | 143,209 | | | | 3,777,853 | |
| NuStar GP Holdings, LLC | | | 28,925 | | | | 880,766 | |
| Oiltanking Partners, L.P. | | | 6,016 | | | | 302,304 | |
PAA Natural Gas Storage, L.P. (b) | | | 34,232 | | | | 776,724 | |
| Pacific Coast Oil Trust | | | 37,192 | | | | 668,340 | |
| Pembina Pipeline Corporation | | | 4,280 | | | | 140,384 | |
| Pengrowth Energy Corporation | | | 123,645 | | | | 625,644 | |
Penn Virginia Corporation (b) | | | 1,051,715 | | | | 4,238,411 | |
| Permian Basin Royalty Trust | | | 53,538 | | | | 679,933 | |
PetroQuest Energy, Inc. (a) | | | 40,710 | | | | 174,239 | |
| Pioneer Southwest Energy Partners, L.P. | | | 21,707 | | | | 568,723 | |
PostRock Energy Corporation (a) | | | 23,547 | | | | 34,143 | |
QEP Resources, Inc. (b) | | | 4,477 | | | | 128,535 | |
| QR Energy, L.P. | | | 41,589 | | | | 759,415 | |
Quicksilver Resources, Inc. (a) (b) | | | 1,500,709 | | | | 3,781,787 | |
| Regency Energy Partners, L.P. | | | 3,360 | | | | 87,696 | |
Rentech, Inc. (b) | | | 1,794,213 | | | | 3,714,021 | |
REX American Resources Corporation (a) | | | 6,114 | | | | 114,271 | |
| Rose Rock Midstream, L.P. | | | 2,325 | | | | 91,559 | |
Rosetta Resources, Inc. (a) | | | 3,056 | | | | 131,133 | |
| SandRidge Mississippian Trust II | | | 62,905 | | | | 775,619 | |
SandRidge Permian Trust (b) | | | 59,361 | | | | 833,428 | |
Scorpio Tankers, Inc. (a) | | | 165,260 | | | | 1,429,499 | |
SemGroup Corporation - Class A (a) | | | 3,517 | | | | 182,356 | |
| Ship Finance International Ltd. | | | 13,832 | | | | 227,951 | |
| Southcross Energy Partners, L.P. | | | 7,037 | | | | 152,210 | |
| Spectra Energy Partners, L.P. | | | 2,309 | | | | 87,603 | |
StealthGas, Inc. (a) | | | 56,788 | | | | 587,188 | |
Stone Energy Corporation (a) | | | 6,848 | | | | 135,111 | |
| Summit Midstream Partners, L.P. | | | 14,738 | | | | 402,642 | |
| Sunoco Logistics Partners, L.P. | | | 1,481 | | | | 91,985 | |
Swift Energy Company (a) | | | 267,603 | | | | 3,462,783 | |
Synergy Resources Corporation (a) | | | 258,207 | | | | 1,742,897 | |
Syntroleum Corporation (a) | | | 284 | | | | 1,173 | |
| Talisman Energy, Inc. | | | 9,159 | | | | 108,901 | |
| Targa Resources Corporation | | | 32,979 | | | | 2,168,699 | |
| Teekay Corporation | | | 19,549 | | | | 695,944 | |
| Teekay LNG Partners, L.P. | | | 2,156 | | | | 89,884 | |
Tengasco, Inc. (a) | | | 45,716 | | | | 25,235 | |
| Tesoro Logistics, L.P. | | | 4,415 | | | | 263,134 | |
TransAtlantic Petroleum Ltd. (a) (b) | | | 198,962 | | | | 159,170 | |
| TransCanada Corporation | | | 3,659 | | | | 181,157 | |
TransGlobe Energy Corporation (a) (b) | | | 124,899 | | | | 989,200 | |
TransMontaigne Partners, L.P. (b) | | | 14,265 | | | | 683,294 | |
Triangle Petroleum Corporation (a) | | | 141,409 | | | | 776,335 | |
Tsakos Energy Navigation Ltd. (b) | | | 227,592 | | | | 860,298 | |
VAALCO Energy, Inc. (a) | | | 108,970 | | | | 732,278 | |
| VOC Energy Trust | | | 39,608 | | | | 527,579 | |
Warren Resources, Inc. (a) (b) | | | 671,860 | | | | 1,766,992 | |
| Western Gas Partners, L.P. | | | 3,577 | | | | 216,265 | |
| Western Refining, Inc. | | | 100,082 | | | | 3,093,535 | |
| TFS MARKET NEUTRAL FUND | |
| SCHEDULE OF INVESTMENTS (Continued) | |
| | |
COMMON STOCKS - 92.6% (Continued) | | Shares | | | Value | |
Energy - 8.6% (Continued) | |
Oil, Gas & Consumable Fuels - 6.2% (Continued) | |
| Whiting USA Trust II | | | 72,985 | | | $ | 1,033,468 | |
WPX Energy, Inc. (a) | | | 23,808 | | | | 372,119 | |
ZaZa Energy Corporation (a) | | | 14,837 | | | | 18,843 | |
| | | | | | | | 116,026,354 | |
Financials - 16.4% | |
Capital Markets - 3.4% | |
Apollo Global Management, LLC - Class A (b) | | | 165,736 | | | | 4,461,613 | |
| Arlington Asset Investment Corporation - Class A | | | 41,851 | | | | 1,133,744 | |
| Artio Global Investors, Inc. | | | 692,436 | | | | 1,897,275 | |
Artisan Partners Asset Management, Inc. (a) | | | 17,411 | | | | 649,430 | |
BGC Partners, Inc. - Class A (b) | | | 738,385 | | | | 4,223,562 | |
| BlackRock Kelso Capital Corporation | | | 103,514 | | | | 1,029,964 | |
Blackstone Group, L.P. (The) (b) | | | 96,684 | | | | 1,986,856 | |
| Capital Southwest Corporation | | | 43 | | | | 5,061 | |
| Carlyle Group, L.P. (The) | | | 119,487 | | | | 3,880,938 | |
Cowen Group, Inc. (a) | | | 235,397 | | | | 602,616 | |
| Eaton Vance Corporation | | | 3,470 | | | | 138,384 | |
| Ellington Financial, LLC | | | 21,167 | | | | 547,802 | |
Evercore Partners, Inc. - Class A (b) | | | 120,329 | | | | 4,542,420 | |
FBR & Company (a) | | | 15,797 | | | | 329,051 | |
Federated Investors, Inc. - Class B (b) | | | 98,395 | | | | 2,259,149 | |
FirstCity Financial Corporation (a) | | | 2,550 | | | | 25,168 | |
Fortress Investment Group, LLC - Class A (b) | | | 141,308 | | | | 910,024 | |
| GAMCO Investors, Inc. - Class A | | | 6,675 | | | | 350,437 | |
Garrison Capital, Inc. (a) | | | 1,876 | | | | 28,403 | |
GFI Group, Inc. (b) | | | 53,474 | | | | 214,431 | |
| Gladstone Capital Corporation | | | 66,333 | | | | 614,907 | |
Gleacher & Company, Inc. (a) | | | 1,509 | | | | 1,038 | |
Golub Capital BDC, Inc. (b) | | | 282,832 | | | | 4,986,328 | |
| Greenhill & Company, Inc. | | | 47,902 | | | | 2,212,593 | |
GSV Capital Corporation (a) | | | 83,932 | | | | 645,437 | |
| HFF, Inc. - Class A | | | 26,975 | | | | 565,126 | |
| Horizon Technology Finance Corporation | | | 30,741 | | | | 451,585 | |
ICG Group, Inc. (a) | | | 10,388 | | | | 123,306 | |
KKR & Company, L.P. (b) | | | 202,777 | | | | 4,258,317 | |
| LPL Financial Holdings, Inc. | | | 9,138 | | | | 315,809 | |
| Manning & Napier, Inc. | | | 41,878 | | | | 733,284 | |
| MCG Capital Corporation | | | 22,474 | | | | 115,516 | |
| Medallion Financial Corporation | | | 88,444 | | | | 1,321,353 | |
| Monroe Capital Corporation | | | 8,961 | | | | 136,297 | |
| New Mountain Finance Corporation | | | 95,599 | | | | 1,456,929 | |
| NGP Capital Resources Company | | | 423 | | | | 2,817 | |
Oaktree Capital Group, LLC (b) | | | 27,664 | | | | 1,436,315 | |
Och-Ziff Capital Management Group, LLC (b) | | | 541,203 | | | | 5,552,743 | |
| Oppenheimer Holdings, Inc. | | | 8,571 | | | | 158,563 | |
| PennantPark Floating Rate Capital Ltd. | | | 612 | | | | 8,666 | |
| PennantPark Investment Corporation | | | 139,430 | | | | 1,631,331 | |
| Prospect Capital Corporation | | | 169,984 | | | | 1,874,924 | |
| SEI Investments Company | | | 8,420 | | | | 241,317 | |
| Solar Senior Capital Ltd. | | | 6,268 | | | | 120,158 | |
Steel Excel, Inc. (a) | | | 7,701 | | | | 207,927 | |
SWS Group, Inc. (a) | | | 86,533 | | | | 492,373 | |
| TFS MARKET NEUTRAL FUND | |
| SCHEDULE OF INVESTMENTS (Continued) | |
| | |
COMMON STOCKS - 92.6% (Continued) | | Shares | | | Value | |
Financials - 16.4% (Continued) | |
Capital Markets - 3.4% (Continued) | |
| TCP Capital Corporation | | | 25,369 | | | $ | 397,532 | |
| TD AMERITRADE Holding Corporation | | | 4,645 | | | | 92,482 | |
| THL Credit, Inc. | | | 137,110 | | | | 2,108,752 | |
Virtus Investment Partners, Inc. (a) (b) | | | 1,119 | | | | 213,729 | |
| Waddell & Reed Financial, Inc. - Class A | | | 3,263 | | | | 139,885 | |
| Westwood Holdings Group, Inc. | | | 336 | | | | 14,683 | |
| WhiteHorse Finance, Inc. | | | 31,608 | | | | 500,987 | |
WisdomTree Investments, Inc. (a) | | | 189,077 | | | | 2,193,293 | |
| | | | | | | | 64,542,630 | |
Commercial Banks - 2.0% | |
| 1st Source Corporation | | | 11,856 | | | | 278,972 | |
| Access National Corporation | | | 3,638 | | | | 45,730 | |
| Associated Banc-Corp | | | 6,398 | | | | 91,299 | |
| BancFirst Corporation | | | 1,807 | | | | 75,605 | |
| Banco Latinoamericano de Comercio Exterior, S.A. - Class E - ADR | | | 11,036 | | | | 250,407 | |
Bancorp, Inc. (The) (a) (b) | | | 21,099 | | | | 274,287 | |
| Bank of Hawaii Corporation | | | 1,847 | | | | 88,083 | |
| Bank of Nova Scotia | | | 1,749 | | | | 100,812 | |
| Banner Corporation | | | 285 | | | | 9,311 | |
| BOK Financial Corporation | | | 2,941 | | | | 183,783 | |
BSB Bancorp, Inc. (a) | | | 675 | | | | 9,281 | |
| Canadian Imperial Bank of Commerce | | | 1,253 | | | | 100,265 | |
Capital Bank Financial Corporation - Class A (a) | | | 21,436 | | | | 383,061 | |
| CapitalSource, Inc. | | | 25,431 | | | | 227,607 | |
| Cardinal Financial Corporation | | | 9,165 | | | | 139,766 | |
| Cathay General Bancorp | | | 393 | | | | 7,746 | |
| CenterState Banks, Inc. | | | 3,224 | | | | 26,824 | |
Central Pacific Financial Corporation (a) | | | 21,487 | | | | 361,841 | |
| Chemical Financial Corporation | | | 1,447 | | | | 35,886 | |
ConnectOne Bancorp, Inc. (a) | | | 6,327 | | | | 183,483 | |
| Credicorp Ltd. | | | 1,214 | | | | 182,816 | |
| CVB Financial Corporation | | | 12,619 | | | | 137,169 | |
Eagle Bancorp, Inc. (a) | | | 14,000 | | | | 323,820 | |
| East West Bancorp, Inc. | | | 4,364 | | | | 106,176 | |
| Financial Institutions, Inc. | | | 331 | | | | 6,332 | |
| First Bancorp (North Carolina) | | | 1,202 | | | | 15,638 | |
| First Commonwealth Financial Corporation | | | 828 | | | | 5,920 | |
| First Financial Corporation | | | 9,523 | | | | 294,165 | |
First Horizon National Corporation (b) | | | 457,063 | | | | 4,753,455 | |
| First Interstate BancSystem, Inc. | | | 111,734 | | | | 2,270,435 | |
| First Merchants Corporation | | | 19,512 | | | | 316,680 | |
| First Midwest Bancorp, Inc. | | | 38,841 | | | | 487,455 | |
| First Niagara Financial Group, Inc. | | | 24,027 | | | | 228,497 | |
| First of Long Island Corporation (The) | | | 1,179 | | | | 35,618 | |
First Republic Bank (b) | | | 7,053 | | | | 267,873 | |
| Great Southern Bancorp, Inc. | | | 5,156 | | | | 135,964 | |
| Hancock Holding Company | | | 43,617 | | | | 1,189,436 | |
Hanmi Financial Corporation (a) | | | 45,486 | | | | 701,849 | |
| Home BancShares, Inc. | | | 31,677 | | | | 1,258,210 | |
HomeTrust Bancshares, Inc. (a) | | | 5,935 | | | | 94,663 | |
| Huntington Bancshares, Inc. | | | 12,782 | | | | 91,647 | |
| TFS MARKET NEUTRAL FUND | |
| SCHEDULE OF INVESTMENTS (Continued) | |
| | |
COMMON STOCKS - 92.6% (Continued) | | Shares | | | Value | |
Financials - 16.4% (Continued) | |
Commercial Banks - 2.0% (Continued) | |
Independent Bank Group, Inc. (a) | | | 2,722 | | | $ | 77,686 | |
| Investors Bancorp, Inc. | | | 71,492 | | | | 1,415,542 | |
| Lakeland Financial Corporation | | | 8,874 | | | | 237,823 | |
| MB Financial, Inc. | | | 13,322 | | | | 329,853 | |
Metro Bancorp, Inc. (a) | | | 6,207 | | | | 110,174 | |
| National Bank Holdings Corporation - Class A | | | 23,141 | | | | 417,926 | |
| NBT Bancorp, Inc. | | | 21,317 | | | | 431,669 | |
| Old National Bancorp | | | 23,148 | | | | 281,943 | |
OptimumBank Holdings, Inc. (a) | | | 3,546 | | | | 1,464 | |
Pacific Premier Bancorp, Inc. (a) | | | 66,025 | | | | 802,204 | |
Park Sterling Corporation (a) | | | 1,899 | | | | 10,881 | |
Patriot National Bancorp (a) | | | 6 | | | | 9 | |
Preferred Bank (a) | | | 488 | | | | 8,052 | |
| PrivateBancorp, Inc. | | | 6,427 | | | | 123,270 | |
| Sandy Spring Bancorp, Inc. | | | 5,379 | | | | 110,162 | |
| SCBT Financial Corporation | | | 4,905 | | | | 234,312 | |
Seacoast Banking Corporation of Florida (a) | | | 17,914 | | | | 38,336 | |
Signature Bank Corporation (a) | | | 11,384 | | | | 815,208 | |
| Sterling Bancorp | | | 46,010 | | | | 518,993 | |
Sun Bancorp, Inc. (a) (b) | | | 42,875 | | | | 138,058 | |
Susquehanna Bancshares, Inc. (b) | | | 228,885 | | | | 2,671,088 | |
SVB Financial Group (a) | | | 1,950 | | | | 138,665 | |
Synovus Financial Corporation (b) | | | 2,341,011 | | | | 6,297,320 | |
| TriCo Bancshares | | | 500 | | | | 8,735 | |
| Trustmark Corporation | | | 52,918 | | | | 1,299,137 | |
| UMB Financial Corporation | | | 3,443 | | | | 173,321 | |
| Union First Market Bankshares Corporation | | | 5,417 | | | | 102,435 | |
United Community Banks, Inc. (a) (b) | | | 231,034 | | | | 2,529,822 | |
Virginia Commerce Bancorp (a) | | | 82,342 | | | | 1,106,676 | |
| Washington Trust Bancorp, Inc. | | | 1,671 | | | | 44,699 | |
| Webster Financial Corporation | | | 6,242 | | | | 145,876 | |
| WesBanco, Inc. | | | 19,378 | | | | 485,031 | |
Westbury Bancorp, Inc. (a) | | | 2,414 | | | | 31,865 | |
Wilshire Bancorp, Inc. (a) | | | 124,748 | | | | 797,140 | |
| | | | | | | | 37,713,242 | |
Consumer Finance - 0.6% | |
| Cash America International, Inc. | | | 62,684 | | | | 2,734,903 | |
DFC Global Corporation (a) | | | 183,461 | | | | 2,476,723 | |
EZCORP, Inc. - Class A (a) (b) | | | 78,057 | | | | 1,319,163 | |
First Cash Financial Services, Inc. (a) | | | 37,014 | | | | 1,905,111 | |
Imperial Holdings, Inc. (a) | | | 293 | | | | 1,178 | |
Nelnet, Inc. - Class A (b) | | | 80,811 | | | | 2,747,574 | |
NetSpend Holdings, Inc. (a) | | | 14,652 | | | | 233,846 | |
| | | | | | | | 11,418,498 | |
Diversified Financial Services - 0.6% | |
Asset Acceptance Capital Corporation (a) | | | 150,427 | | | | 973,263 | |
| Cohen & Steers, Inc. | | | 27,754 | | | | 1,096,561 | |
| Compass Diversified Holdings, Inc. | | | 36,974 | | | | 625,230 | |
Consumer Portfolio Services, Inc. (a) | | | 182,965 | | | | 1,686,937 | |
Global Eagle Entertainment, Inc. (a) | | | 16,868 | | | | 162,270 | |
| Leucadia National Corporation | | | 5,632 | | | | 173,973 | |
MarketAxess Holdings, Inc. (b) | | | 108,567 | | | | 4,594,556 | |
| TFS MARKET NEUTRAL FUND | |
| SCHEDULE OF INVESTMENTS (Continued) | |
| | |
COMMON STOCKS - 92.6% (Continued) | | Shares | | | Value | |
Financials - 16.4% (Continued) | |
Diversified Financial Services - 0.6% (Continued) | |
| Marlin Business Services Corporation | | | 8,513 | | | $ | 206,270 | |
MSCI, Inc. - Class A (a) | | | 3,914 | | | | 133,467 | |
PHH Corporation (a) | | | 80,368 | | | | 1,694,157 | |
PICO Holdings, Inc. (a) | | | 658 | | | | 14,279 | |
Primus Guaranty Ltd. (a) | | | 845 | | | | 8,661 | |
ROI Acquisition Corporation (a) | | | 16,496 | | | | 297,340 | |
| Texas Pacific Land Trust | | | 1,055 | | | | 75,570 | |
| | | | | | | | 11,742,534 | |
Insurance - 4.0% | |
| Alterra Capital Holdings Ltd. | | | 46,147 | | | | 1,502,085 | |
American National Insurance Company (b) | | | 8,701 | | | | 818,155 | |
American Safety Insurance Holdings Ltd. (a) | | | 25,447 | | | | 612,764 | |
| AMERISAFE, Inc. | | | 37,361 | | | | 1,220,210 | |
| AmTrust Financial Services, Inc. | | | 5,646 | | | | 178,752 | |
Arch Capital Group Ltd. (a) | | | 2,818 | | | | 149,523 | |
| Argo Group International Holdings Ltd. | | | 2,984 | | | | 123,687 | |
| Arthur J. Gallagher & Company | | | 3,736 | | | | 158,593 | |
Aspen Insurance Holdings Ltd. (b) | | | 35,401 | | | | 1,351,964 | |
| Assurant, Inc. | | | 2,728 | | | | 129,689 | |
| Axis Capital Holdings Ltd. | | | 6,081 | | | | 271,395 | |
| Berkley (W.R.) Corporation | | | 8,404 | | | | 364,902 | |
Brown & Brown, Inc. (b) | | | 5,075 | | | | 157,274 | |
Citizens, Inc. (a) | | | 6,618 | | | | 43,282 | |
CNO Financial Group, Inc. (b) | | | 455,644 | | | | 5,157,890 | |
Employers Holdings, Inc. (b) | | | 90,467 | | | | 2,049,078 | |
Endurance Specialty Holdings Ltd. (b) | | | 128,382 | | | | 6,286,867 | |
| FBL Financial Group, Inc. - Class A | | | 21,616 | | | | 849,725 | |
| Fidelity National Financial, Inc. - Class A | | | 7,194 | | | | 193,159 | |
First American Financial Corporation (b) | | | 98,817 | | | | 2,645,331 | |
Genworth Financial, Inc. - Class A (a) | | | 16,105 | | | | 161,533 | |
Global Indemnity plc (a) | | | 29 | | | | 646 | |
Greenlight Capital Re Ltd. - Class A (a) | | | 15,830 | | | | 389,576 | |
Hanover Insurance Group, Inc. (The) (b) | | | 155,397 | | | | 7,836,671 | |
HCC Insurance Holdings, Inc. (b) | | | 14,918 | | | | 635,507 | |
Health Insurance Innovations, Inc. (a) | | | 11,304 | | | | 169,560 | |
Hilltop Holdings, Inc. (a) | | | 145,009 | | | | 1,941,671 | |
Horace Mann Educators Corporation (b) | | | 150,432 | | | | 3,392,242 | |
Infinity Property & Casualty Corporation (b) | | | 24,090 | | | | 1,366,867 | |
Kansas City Life Insurance Company (b) | | | 3,631 | | | | 131,079 | |
| Kemper Corporation | | | 16,078 | | | | 512,245 | |
Maiden Holdings Ltd. (b) | | | 97,745 | | | | 1,009,706 | |
Markel Corporation (a) | | | 305 | | | | 163,556 | |
MBIA, Inc. (a) | | | 207 | | | | 1,958 | |
| Meadowbrook Insurance Group, Inc. | | | 53 | | | | 412 | |
Mercury General Corporation (b) | | | 141,378 | | | | 6,462,388 | |
| National Interstate Corporation | | | 4,284 | | | | 124,450 | |
Navigators Group, Inc. (The) (a) | | | 17,369 | | | | 1,005,318 | |
Old Republic International Corporation (b) | | | 429,243 | | | | 5,794,781 | |
| OneBeacon Insurance Group Ltd. - Class A | | | 170,113 | | | | 2,311,836 | |
| Platinum Underwriters Holdings Ltd. | | | 1,492 | | | | 84,671 | |
| ProAssurance Corporation | | | 18,541 | | | | 908,324 | |
Protective Life Corporation (b) | | | 148,541 | | | | 5,653,470 | |
| TFS MARKET NEUTRAL FUND | |
| SCHEDULE OF INVESTMENTS (Continued) | |
| | |
COMMON STOCKS - 92.6% (Continued) | | Shares | | | Value | |
Financials - 16.4% (Continued) | |
Insurance - 4.0% (Continued) | |
| Reinsurance Group of America, Inc. | | | 2,546 | | | $ | 159,252 | |
| RLI Corporation | | | 705 | | | | 50,654 | |
Safety Insurance Group, Inc. (b) | | | 24,828 | | | | 1,233,207 | |
| Selective Insurance Group, Inc. | | | 17,933 | | | | 420,170 | |
| State Auto Financial Corporation | | | 7,330 | | | | 127,395 | |
| Stewart Information Services Corporation | | | 32,619 | | | | 882,996 | |
| Sun Life Financial, Inc. | | | 13,890 | | | | 391,559 | |
Symetra Financial Corporation (b) | | | 285,832 | | | | 3,895,890 | |
United Fire Group, Inc. (b) | | | 59,230 | | | | 1,656,071 | |
| United Insurance Holdings Corporation | | | 6,897 | | | | 39,934 | |
| Universal Insurance Holdings, Inc. | | | 200,345 | | | | 1,198,063 | |
| Validus Holdings Ltd. | | | 3,056 | | | | 117,992 | |
| | | | | | | | 74,495,975 | |
Real Estate Investment Trusts (REIT) - 4.1% | |
| Acadia Realty Trust | | | 693 | | | | 19,785 | |
| Agree Realty Corporation | | | 37,450 | | | | 1,126,121 | |
American Assets Trust, Inc. (b) | | | 8,761 | | | | 295,771 | |
| American Campus Communities, Inc. | | | 2,315 | | | | 103,342 | |
| American Capital Agency Corporation | | | 3,275 | | | | 109,090 | |
| American Capital Mortgage Investment Corporation | | | 35,540 | | | | 943,942 | |
| AmREIT, Inc. - Class B | | | 355 | | | | 6,749 | |
| Annaly Capital Management, Inc. | | | 5,973 | | | | 95,210 | |
| Anworth Mortgage Asset Corporation | | | 293,592 | | | | 1,852,566 | |
| Apartment Investment & Management Company - Class A | | | 4,803 | | | | 149,421 | |
| Apollo Commercial Real Estate Finance, Inc. | | | 115,129 | | | | 2,042,388 | |
| ARMOUR Residential REIT, Inc. | | | 134,740 | | | | 874,463 | |
| Associated Estates Realty Corporation | | | 18,794 | | | | 335,849 | |
| BioMed Realty Trust, Inc. | | | 7,059 | | | | 158,898 | |
| BRE Properties, Inc. | | | 2,200 | | | | 111,056 | |
| Campus Crest Communities, Inc. | | | 72,889 | | | | 995,664 | |
| CapLease, Inc. | | | 429,449 | | | | 3,014,732 | |
| Capstead Mortgage Corporation | | | 188,690 | | | | 2,505,803 | |
| Care Investment Trust, Inc. | | | 18,515 | | | | 120,718 | |
| Cedar Realty Trust, Inc. | | | 252,182 | | | | 1,616,487 | |
| Chatham Lodging Trust | | | 45,167 | | | | 827,008 | |
| Chesapeake Lodging Trust | | | 52,926 | | | | 1,252,229 | |
| Chimera Investment Corporation | | | 224,890 | | | | 742,137 | |
| Colony Financial, Inc. | | | 31,436 | | | | 701,023 | |
| CommonWealth REIT | | | 13,012 | | | | 290,558 | |
| CoreSite Realty Corporation | | | 15,911 | | | | 575,660 | |
| Corporate Office Properties Trust | | | 17,697 | | | | 513,036 | |
| Cousins Properties, Inc. | | | 105,828 | | | | 1,155,642 | |
CreXus Investment Corporation (b) | | | 320,254 | | | | 4,172,910 | |
| DCT Industrial Trust, Inc. | | | 37,370 | | | | 292,607 | |
| DDR Corporation | | | 5,098 | | | | 93,497 | |
| Douglas Emmett, Inc. | | | 6,070 | | | | 158,852 | |
| Dynex Capital, Inc. | | | 81,599 | | | | 877,189 | |
EastGroup Properties, Inc. (b) | | | 20,951 | | | | 1,321,380 | |
| Education Realty Trust, Inc. | | | 33,573 | | | | 368,967 | |
| EPR Properties | | | 14,657 | | | | 828,707 | |
| Equity Lifestyle Properties, Inc. | | | 9,481 | | | | 770,331 | |
| TFS MARKET NEUTRAL FUND | |
| SCHEDULE OF INVESTMENTS (Continued) | |
| | |
COMMON STOCKS - 92.6% (Continued) | | Shares | | | Value | |
Financials - 16.4% (Continued) | |
Real Estate Investment Trusts (REIT) - 4.1% (Continued) | |
| Equity Residential | | | 5,028 | | | $ | 291,926 | |
| Excel Trust, Inc. | | | 26,269 | | | | 400,077 | |
| Federal Realty Investment Trust | | | 1,242 | | | | 145,326 | |
FelCor Lodging Trust, Inc. (a) | | | 288,571 | | | | 1,725,655 | |
| First Industrial Realty Trust, Inc. | | | 24,169 | | | | 433,592 | |
| First Potomac Realty Trust | | | 4,011 | | | | 64,176 | |
| Government Properties Income Trust | | | 10,823 | | | | 281,939 | |
Gramercy Property Trust, Inc. (a) (b) | | | 570,296 | | | | 2,708,906 | |
| Gyrodyne Company of America, Inc. | | | 582 | | | | 42,957 | |
| Hatteras Financial Corporation | | | 30,302 | | | | 828,154 | |
| Healthcare Realty Trust, Inc. | | | 3,175 | | | | 95,313 | |
| Healthcare Trust of America, Inc. | | | 30,322 | | | | 378,419 | |
Hersha Hospitality Trust (b) | | | 673,225 | | | | 4,025,885 | |
| Hospitality Properties Trust | | | 6,006 | | | | 176,636 | |
| Hudson Pacific Properties, Inc. | | | 8,591 | | | | 195,961 | |
| Inland Real Estate Corporation | | | 125,374 | | | | 1,419,234 | |
| Invesco Mortgage Capital, Inc. | | | 14,227 | | | | 304,458 | |
| Investors Real Estate Trust | | | 514 | | | | 5,001 | |
Kite Realty Group Trust (b) | | | 419,864 | | | | 2,771,102 | |
| LaSalle Hotel Properties | | | 3,750 | | | | 97,237 | |
LTC Properties, Inc. (b) | | | 17,556 | | | | 816,354 | |
| Mack-Cali Realty Corporation | | | 17,826 | | | | 495,028 | |
| MFA Financial, Inc. | | | 18,868 | | | | 174,906 | |
| Mid-America Apartment Communities, Inc. | | | 2,561 | | | | 176,018 | |
| Monmouth Real Estate Investment Corporation - Class A | | | 122,231 | | | | 1,300,538 | |
MPG Office Trust, Inc. (a) | | | 120,943 | | | | 377,342 | |
| National Health Investors, Inc. | | | 2,503 | | | | 165,799 | |
| National Retail Properties, Inc. | | | 15,322 | | | | 607,977 | |
Newcastle Investment Corporation (b) | | | 30,903 | | | | 350,131 | |
One Liberty Properties, Inc. (b) | | | 10,326 | | | | 236,878 | |
| Pebblebrook Hotel Trust | | | 31,303 | | | | 850,189 | |
| PennyMac Mortgage Investment Trust | | | 8,002 | | | | 202,051 | |
| Piedmont Office Realty Trust, Inc. - Class A | | | 23,435 | | | | 480,886 | |
| Post Properties, Inc. | | | 2,571 | | | | 127,085 | |
| Potlatch Corporation | | | 48 | | | | 2,273 | |
| PS Business Parks, Inc. | | | 2,217 | | | | 176,917 | |
| RAIT Financial Trust | | | 88,658 | | | | 757,139 | |
| Regency Centers Corporation | | | 2,451 | | | | 137,893 | |
Resource Capital Corporation (b) | | | 652,500 | | | | 4,299,975 | |
RLJ Lodging Trust (b) | | | 56,966 | | | | 1,312,497 | |
Saul Centers, Inc. (b) | | | 31,468 | | | | 1,409,766 | |
Select Income REIT (b) | | | 90,019 | | | | 2,568,242 | |
| Senior Housing Properties Trust | | | 6,294 | | | | 178,938 | |
| Sovran Self Storage, Inc. | | | 27,485 | | | | 1,885,471 | |
| Spirit Realty Capital, Inc. | | | 19,990 | | | | 430,385 | |
| STAG Industrial, Inc. | | | 351 | | | | 7,736 | |
| Starwood Property Trust, Inc. | | | 18,926 | | | | 520,276 | |
Strategic Hotels & Resorts, Inc. (a) | | | 299,411 | | | | 2,416,247 | |
| Summit Hotel Properties, Inc. | | | 155,028 | | | | 1,548,730 | |
Sunstone Hotel Investors, Inc. (a) | | | 18,453 | | | | 229,002 | |
| Terreno Realty Corporation | | | 63,527 | | | | 1,195,578 | |
| TFS MARKET NEUTRAL FUND | |
| SCHEDULE OF INVESTMENTS (Continued) | |
| | |
COMMON STOCKS - 92.6% (Continued) | | Shares | | | Value | |
Financials - 16.4% (Continued) | |
Real Estate Investment Trusts (REIT) - 4.1% (Continued) | |
| Two Harbors Investment Corporation | | | 42,747 | | | $ | 512,109 | |
| UMH Properties, Inc. | | | 16,562 | | | | 183,010 | |
| Universal Health Realty Income Trust | | | 5,729 | | | | 307,819 | |
| Urstadt Biddle Properties, Inc. - Class A | | | 9,064 | | | | 201,855 | |
| W.P. Carey, Inc. | | | 1,379 | | | | 97,247 | |
| Washington Real Estate Investment Trust | | | 7,247 | | | | 206,974 | |
| Weingarten Realty Investors | | | 6,800 | | | | 231,676 | |
| Whitestone REIT - Class B | | | 38,828 | | | | 640,662 | |
ZAIS Financial Corporation (a) | | | 29,518 | | | | 609,842 | |
| | | | | | | | 76,241,183 | |
Real Estate Management & Development - 0.5% | |
Alexander & Baldwin, Inc. (a) | | | 48,240 | | | | 1,643,054 | |
Altisource Portfolio Solutions, S.A. (a) | | | 3,218 | | | | 265,614 | |
Altisource Residential Corporation - Class B (a) | | | 773 | | | | 14,687 | |
| American Realty Capital Properties, Inc. | | | 146,283 | | | | 2,404,892 | |
| Brookfield Office Properties, Inc. | | | 26,199 | | | | 482,324 | |
China HGS Real Estate, Inc. (a) | | | 19,292 | | | | 210,283 | |
FirstService Corporation (a) | | | 16,423 | | | | 541,795 | |
Forest City Enterprises, Inc. - Class A (a) | | | 13,550 | | | | 252,978 | |
Forestar Group, Inc. (a) | | | 38,970 | | | | 839,414 | |
| Gazit-Globe Ltd. | | | 220 | | | | 2,915 | |
Granite Real Estate Investment Trust (b) | | | 3,172 | | | | 125,453 | |
Howard Hughes Corporation (a) | | | 10,559 | | | | 996,558 | |
| Jones Lang LaSalle, Inc. | | | 1,427 | | | | 141,302 | |
| Kennedy-Wilson Holdings, Inc. | | | 19,816 | | | | 329,540 | |
Tejon Ranch Company (a) (b) | | | 22,519 | | | | 657,104 | |
| | | | | | | | 8,907,913 | |
Thrifts & Mortgage Finance - 1.2% | |
| America First Tax Exempt Investors, L.P. | | | 289 | | | | 2,066 | |
| Apollo Residential Mortgage, Inc. | | | 99,892 | | | | 2,223,596 | |
| Bank Mutual Corporation | | | 132,001 | | | | 683,765 | |
| BankFinancial Corporation | | | 196 | | | | 1,547 | |
| BankUnited, Inc. | | | 75,834 | | | | 1,922,392 | |
| Berkshire Hills Bancorp, Inc. | | | 19,354 | | | | 500,495 | |
| Brookline Bancorp, Inc. | | | 48,603 | | | | 408,265 | |
Capitol Federal Financial, Inc. (b) | | | 219,287 | | | | 2,596,358 | |
| Charter Financial Corporation | | | 48,604 | | | | 494,303 | |
| Dime Community Bancshares, Inc. | | | 169,593 | | | | 2,420,092 | |
| First Defiance Financial Corporation | | | 6,584 | | | | 149,062 | |
| First Financial Holdings, Inc. | | | 78,298 | | | | 1,569,092 | |
| Five Oaks Investment Corporation | | | 10,731 | | | | 162,038 | |
Flagstar Bancorp, Inc. (a) | | | 76,809 | | | | 953,200 | |
| Franklin Financial Corporation | | | 4,033 | | | | 73,320 | |
| Hudson City Bancorp, Inc. | | | 2,830 | | | | 23,517 | |
| Northfield Bancorp, Inc. | | | 188,544 | | | | 2,217,277 | |
| OceanFirst Financial Corporation | | | 22,964 | | | | 326,318 | |
Oritani Financial Corporation (b) | | | 34,576 | | | | 534,891 | |
PMI Group, Inc. (The) (a) (b) | | | 394,653 | | | | 18,154 | |
| Provident Financial Holdings, Inc. | | | 446 | | | | 7,225 | |
Provident Financial Services, Inc. (b) | | | 94,910 | | | | 1,454,970 | |
| Provident New York Bancorp | | | 6,303 | | | | 56,979 | |
PVF Capital Corporation (a) | | | 2,565 | | | | 9,644 | |
| TFS MARKET NEUTRAL FUND | |
| SCHEDULE OF INVESTMENTS (Continued) | |
| | |
COMMON STOCKS - 92.6% (Continued) | | Shares | | | Value | |
Financials - 16.4% (Continued) | |
Thrifts & Mortgage Finance - 1.2% (Continued) | |
| Rockville Financial, Inc. | | | 11,553 | | | $ | 150,189 | |
| Roma Financial Corporation | | | 7,913 | | | | 134,679 | |
| SI Financial Group, Inc. | | | 353 | | | | 4,095 | |
| Territorial Bancorp, Inc. | | | 468 | | | | 10,942 | |
TFS Financial Corporation (a) | | | 18,327 | | | | 199,215 | |
| Tree.com, Inc. | | | 25 | | | | 512 | |
| United Financial Bancorp, Inc. | | | 18,335 | | | | 271,541 | |
| ViewPoint Financial Group, Inc. | | | 5,427 | | | | 101,051 | |
Walker & Dunlop, Inc. (a) | | | 57,168 | | | | 1,018,162 | |
| Washington Federal, Inc. | | | 130,358 | | | | 2,238,247 | |
| Westfield Financial, Inc. | | | 742 | | | | 5,587 | |
WSFS Financial Corporation (b) | | | 11,446 | | | | 560,167 | |
| | | | | | | | 23,502,953 | |
Health Care - 14.4% | |
Biotechnology - 4.1% | |
Acorda Therapeutics, Inc. (a) | | | 46,843 | | | | 1,853,577 | |
Affymax, Inc. (a) | | | 263,495 | | | | 237,172 | |
Agenus, Inc. (a) | | | 52,665 | | | | 255,952 | |
Alkermes plc (a) (b) | | | 169,157 | | | | 5,177,896 | |
AMAG Pharmaceuticals, Inc. (a) | | | 72,508 | | | | 1,598,801 | |
Amicus Therapeutics, Inc. (a) (b) | | | 648,008 | | | | 2,106,026 | |
Anacor Pharmaceuticals, Inc. (a) | | | 370,486 | | | | 2,482,256 | |
Ariad Pharmaceuticals, Inc. (a) | | | 14,372 | | | | 256,828 | |
ArQule, Inc. (a) (b) | | | 849,972 | | | | 2,507,417 | |
Array BioPharma, Inc. (a) (b) | | | 412,346 | | | | 2,453,459 | |
Astex Pharmaceuticals, Inc. (a) (b) | | | 383,236 | | | | 2,636,664 | |
Athersys, Inc. (a) | | | 117,734 | | | | 261,369 | |
BioCryst Pharmaceuticals, Inc. (a) | | | 572,552 | | | | 1,150,830 | |
BioMarin Pharmaceutical, Inc. (a) | | | 1,510 | | | | 99,056 | |
Cepheid (a) | | | 25,519 | | | | 973,039 | |
Chelsea Therapeutics International Ltd. (a) | | | 614,365 | | | | 1,191,868 | |
China Biologic Products, Inc. (a) | | | 6,477 | | | | 164,775 | |
Clovis Oncology, Inc. (a) | | | 23,692 | | | | 886,555 | |
Codexis, Inc. (a) (b) | | | 65,426 | | | | 146,554 | |
Coronado Biosciences, Inc. (a) | | | 179,281 | | | | 2,016,911 | |
Cubist Pharmaceuticals, Inc. (a) (b) | | | 111,681 | | | | 5,128,392 | |
Curis, Inc. (a) | | | 248,033 | | | | 930,124 | |
Discovery Laboratories, Inc. (a) | | | 40,169 | | | | 67,886 | |
Dyax Corporation (a) | | | 34,910 | | | | 96,002 | |
Dynavax Technologies Corporation (a) (b) | | | 616,675 | | | | 1,449,186 | |
Emergent BioSolutions, Inc. (a) (b) | | | 139,353 | | | | 2,137,675 | |
Enanta Pharmaceuticals, Inc. (a) | | | 11,838 | | | | 236,286 | |
| Enzon Pharmaceuticals, Inc. | | | 132,974 | | | | 438,814 | |
Geron Corporation (a) (b) | | | 447,328 | | | | 523,374 | |
Halozyme Therapeutics, Inc. (a) | | | 350,601 | | | | 2,117,630 | |
Hyperion Therapeutics, Inc. (a) | | | 9,249 | | | | 198,391 | |
Idenix Pharmaceuticals, Inc. (a) (b) | | | 250,748 | | | | 927,768 | |
Intercept Pharmaceuticals, Inc. (a) | | | 14,407 | | | | 490,558 | |
Isis Pharmaceuticals, Inc. (a) (b) | | | 194,730 | | | | 4,360,005 | |
KYTHERA Biopharmaceuticals, Inc. (a) | | | 18,798 | | | | 460,551 | |
Lexicon Pharmaceuticals, Inc. (a) | | | 139,020 | | | | 275,260 | |
Ligand Pharmaceuticals, Inc. (a) | | | 19,614 | | | | 535,854 | |
| TFS MARKET NEUTRAL FUND | |
| SCHEDULE OF INVESTMENTS (Continued) | |
| | |
COMMON STOCKS - 92.6% (Continued) | | Shares | | | Value | |
Health Care - 14.4% (Continued) | |
Biotechnology - 4.1% (Continued) | |
| Maxygen, Inc. | | | 84,250 | | | $ | 202,200 | |
| Myrexis, Inc. | | | 891 | | | | 77 | |
Nanosphere, Inc. (a) | | | 894,387 | | | | 2,477,452 | |
Neurocrine Biosciences, Inc. (a) (b) | | | 86,769 | | | | 1,001,314 | |
Novavax, Inc. (a) | | | 222,688 | | | | 523,317 | |
NPS Pharmaceuticals, Inc. (a) | | | 92,312 | | | | 1,239,750 | |
OncoGenex Pharmaceuticals, Inc. (a) | | | 329 | | | | 3,333 | |
Onyx Pharmaceuticals, Inc. (a) | | | 1,060 | | | | 100,488 | |
| PDL BioPharma, Inc. | | | 428,270 | | | | 3,314,810 | |
Peregrine Pharmaceuticals, Inc. (a) | | | 2,534 | | | | 3,522 | |
Pharmacyclics, Inc. (a) | | | 1,258 | | | | 102,527 | |
PharmAthene, Inc. (a) | | | 303 | | | | 479 | |
Progenics Pharmaceuticals, Inc. (a) | | | 128,738 | | | | 592,195 | |
Prothena Corporation plc (a) | | | 13,383 | | | | 110,544 | |
Puma Biotechnology, Inc. (a) | | | 20,903 | | | | 672,659 | |
QLT, Inc. (a) (b) | | | 108,915 | | | | 874,587 | |
Repligen Corporation (a) | | | 94,734 | | | | 848,817 | |
Rigel Pharmaceuticals, Inc. (a) (b) | | | 344,470 | | | | 1,650,011 | |
SciClone Pharmaceuticals, Inc. (a) (b) | | | 425,262 | | | | 2,011,489 | |
Seattle Genetics, Inc. (a) (b) | | | 3,415 | | | | 126,184 | |
Stemline Therapeutics, Inc. (a) | | | 1,501 | | | | 21,524 | |
Synageva BioPharma Corporation (a) | | | 313 | | | | 16,179 | |
Synergy Pharmaceuticals, Inc. (a) | | | 153,492 | | | | 805,833 | |
Tekmira Pharmaceuticals Corporation (a) | | | 3,576 | | | | 17,058 | |
TESARO, Inc. (a) | | | 16,461 | | | | 452,842 | |
Threshold Pharmaceuticals, Inc. (a) | | | 168,136 | | | | 810,416 | |
Transition Therapeutics, Inc. (a) | | | 84 | | | | 260 | |
Trius Therapeutics, Inc. (a) | | | 519,411 | | | | 3,620,295 | |
TrovaGene, Inc. (a) | | | 72 | | | | 426 | |
United Therapeutics Corporation (a) (b) | | | 85,308 | | | | 5,696,868 | |
Vanda Pharmaceuticals, Inc. (a) | | | 5,002 | | | | 24,310 | |
Vertex Pharmaceuticals, Inc. (a) | | | 1,570 | | | | 120,607 | |
Vical, Inc. (a) (b) | | | 183,471 | | | | 677,008 | |
XOMA Corporation (a) | | | 53,939 | | | | 188,786 | |
| | | | | | | | 77,138,928 | |
Health Care Equipment & Supplies - 3.6% | |
| Abaxis, Inc. | | | 30,711 | | | | 1,311,053 | |
Alere, Inc. (a) | | | 47,005 | | | | 1,207,089 | |
Analogic Corporation (b) | | | 3,334 | | | | 264,986 | |
AngioDynamics, Inc. (a) | | | 27,751 | | | | 281,118 | |
Anika Therapeutics, Inc. (a) (b) | | | 99,626 | | | | 1,330,007 | |
ArthroCare Corporation (a) | | | 50,425 | | | | 1,747,226 | |
AtriCure, Inc. (a) | | | 88,042 | | | | 734,270 | |
| C.R. Bard, Inc. | | | 868 | | | | 86,245 | |
Cantel Medical Corporation (b) | | | 23,165 | | | | 732,246 | |
Cardiovascular Systems, Inc. (a) | | | 139,494 | | | | 2,393,717 | |
CareFusion Corporation (a) | | | 2,521 | | | | 84,302 | |
Cerus Corporation (a) | | | 130,538 | | | | 694,462 | |
| CONMED Corporation | | | 15,861 | | | | 496,925 | |
| Cooper Companies, Inc. (The) | | | 1,361 | | | | 150,254 | |
| CryoLife, Inc. | | | 10,086 | | | | 60,516 | |
Cutera, Inc. (a) | | | 159,907 | | | | 1,776,567 | |
| TFS MARKET NEUTRAL FUND | |
| SCHEDULE OF INVESTMENTS (Continued) | |
| | |
COMMON STOCKS - 92.6% (Continued) | | Shares | | | Value | |
Health Care - 14.4% (Continued) | |
Health Care Equipment & Supplies - 3.6% (Continued) | |
Cynosure, Inc. - Class A (a) (b) | | | 148,957 | | | $ | 3,852,028 | |
| DENTSPLY International, Inc. | | | 2,337 | | | | 98,972 | |
DexCom, Inc. (a) | | | 11,208 | | | | 183,923 | |
Endologix, Inc. (a) | | | 11,868 | | | | 178,257 | |
EnteroMedics, Inc. (a) | | | 54,077 | | | | 51,914 | |
Exactech, Inc. (a) | | | 358 | | | | 6,623 | |
Given Imaging Ltd. (a) (b) | | | 53,734 | | | | 855,983 | |
Globus Medical, Inc. - Class A (a) | | | 2,230 | | | | 33,941 | |
Greatbatch, Inc. (a) | | | 19,784 | | | | 552,765 | |
Haemonetics Corporation (a) | | | 6,730 | | | | 259,105 | |
Hill-Rom Holdings, Inc. (b) | | | 151,519 | | | | 5,162,252 | |
ICU Medical, Inc. (a) | | | 129 | | | | 7,772 | |
IDEXX Laboratories, Inc. (a) | | | 1,006 | | | | 88,488 | |
IMRIS, Inc. (a) | | | 19,862 | | | | 63,360 | |
| Invacare Corporation | | | 49,823 | | | | 670,119 | |
MAKO Surgical Corporation (a) | | | 258,845 | | | | 2,741,169 | |
| Masimo Corporation | | | 42,290 | | | | 848,337 | |
Merit Medical Systems, Inc. (a) | | | 178,157 | | | | 1,722,778 | |
Natus Medical, Inc. (a) (b) | | | 177,029 | | | | 2,214,633 | |
Novadaq Technologies, Inc. (a) | | | 27,391 | | | | 368,957 | |
NuVasive, Inc. (a) (b) | | | 229,161 | | | | 4,805,506 | |
NxStage Medical, Inc. (a) | | | 6,967 | | | | 77,821 | |
OraSure Technologies, Inc. (a) | | | 411,153 | | | | 1,833,742 | |
Orthofix International N.V. (a) | | | 53,788 | | | | 1,742,731 | |
Palomar Medical Technologies, Inc. (a) | | | 191,526 | | | | 2,595,177 | |
PhotoMedex, Inc. (a) | | | 5,000 | | | | 81,500 | |
Rochester Medical Corporation (a) | | | 60,093 | | | | 816,063 | |
Rockwell Medical Technologies, Inc. (a) | | | 34,612 | | | | 146,755 | |
RTI Biologics, Inc. (a) | | | 50,151 | | | | 199,601 | |
Sirona Dental Systems, Inc. (a) | | | 4,516 | | | | 332,107 | |
Spectranetics Corporation (The) (a) | | | 23,430 | | | | 436,970 | |
STERIS Corporation (b) | | | 4,355 | | | | 181,125 | |
Sunshine Heart, Inc. (a) | | | 31,805 | | | | 164,750 | |
SurModics, Inc. (a) (b) | | | 124,847 | | | | 3,302,203 | |
Symmetry Medical, Inc. (a) (b) | | | 342,722 | | | | 4,085,246 | |
Syneron Medical Ltd. (a) (b) | | | 99,402 | | | | 887,660 | |
Teleflex, Inc. (b) | | | 59,369 | | | | 4,638,500 | |
Thoratec Corporation (a) | | | 3,457 | | | | 125,143 | |
Tornier N.V. (a) (b) | | | 83,184 | | | | 1,513,117 | |
Vascular Solutions, Inc. (a) | | | 61,571 | | | | 979,595 | |
Vermillion, Inc. (a) | | | 3,400 | | | | 4,556 | |
West Pharmaceutical Services, Inc. (b) | | | 62,356 | | | | 3,982,054 | |
Wright Medical Group, Inc. (a) | | | 246 | | | | 5,766 | |
| | | | | | | | 66,250,047 | |
Health Care Providers & Services - 3.9% | |
Alliance Healthcare Services, Inc. (a) (b) | | | 14,156 | | | | 180,489 | |
| Almost Family, Inc. | | | 14,873 | | | | 293,593 | |
AMN Healthcare Services, Inc. (a) | | | 295,059 | | | | 4,051,160 | |
AmSurg Corporation (a) (b) | | | 162,006 | | | | 5,436,921 | |
| Assisted Living Concepts, Inc. - Class A | | | 67,762 | | | | 807,723 | |
BioScrip, Inc. (a) | | | 60,134 | | | | 833,457 | |
Brookdale Senior Living, Inc. (a) | | | 4,834 | | | | 124,669 | |
| TFS MARKET NEUTRAL FUND | |
| SCHEDULE OF INVESTMENTS (Continued) | |
| | |
COMMON STOCKS - 92.6% (Continued) | | Shares | | | Value | |
Health Care - 14.4% (Continued) | |
Health Care Providers & Services - 3.9% (Continued) | |
Capital Senior Living Corporation (a) (b) | | | 74,363 | | | $ | 1,804,046 | |
Catamaran Corporation (a) | | | 1,584 | | | | 91,444 | |
Corvel Corporation (a) | | | 4,417 | | | | 209,675 | |
| Coventry Health Care, Inc. | | | 3,019 | | | | 149,591 | |
Cross Country Healthcare, Inc. (a) (b) | | | 160,249 | | | | 801,245 | |
Emeritus Corporation (a) (b) | | | 104,628 | | | | 2,688,940 | |
| Ensign Group, Inc. (The) | | | 19,695 | | | | 686,765 | |
Five Star Quality Care, Inc. (a) | | | 506,323 | | | | 2,394,908 | |
Gentiva Health Services, Inc. (a) | | | 136,168 | | | | 1,428,402 | |
Hanger, Inc. (a) | | | 9,576 | | | | 291,015 | |
Health Management Associates, Inc. - Class A (a) (b) | | | 470,085 | | | | 5,401,277 | |
Health Net, Inc. (a) | | | 70,221 | | | | 2,064,497 | |
HealthSouth Corporation (a) | | | 54,223 | | | | 1,491,133 | |
Healthways, Inc. (a) | | | 93,865 | | | | 1,303,785 | |
HMS Holdings Corporation (a) (b) | | | 86,754 | | | | 2,187,068 | |
Kindred Healthcare, Inc. (a) | | | 91,602 | | | | 960,905 | |
Laboratory Corporation of America Holdings (a) | | | 2,729 | | | | 254,779 | |
LCA-Vision, Inc. (a) | | | 47,885 | | | | 162,809 | |
LHC Group, Inc. (a) (b) | | | 58,060 | | | | 1,261,063 | |
LifePoint Hospitals, Inc. (a) | | | 104,341 | | | | 5,008,368 | |
Magellan Health Services, Inc. (a) (b) | | | 75,875 | | | | 3,881,765 | |
MEDNAX, Inc. (a) | | | 1,463 | | | | 129,812 | |
Molina Healthcare, Inc. (a) (b) | | | 70,155 | | | | 2,329,146 | |
MWI Veterinary Supply, Inc. (a) | | | 2,257 | | | | 265,672 | |
| National Healthcare Corporation | | | 247 | | | | 11,468 | |
| National Research Corporation | | | 2,236 | | | | 134,048 | |
| Owens & Minor, Inc. | | | 58,301 | | | | 1,898,864 | |
Providence Service Corporation (The) (a) | | | 95,460 | | | | 1,671,505 | |
| Quest Diagnostics, Inc. | | | 6,047 | | | | 340,628 | |
RadNet, Inc. (a) | | | 625 | | | | 1,713 | |
Select Medical Holdings Corporation (b) | | | 472,664 | | | | 3,899,478 | |
Skilled Healthcare Group, Inc. - Class A (a) | | | 44,317 | | | | 311,992 | |
Team Health Holdings, Inc. (a) | | | 73,870 | | | | 2,753,874 | |
Tenet Healthcare Corporation (a) | | | 2,954 | | | | 133,993 | |
Triple-S Management Corporation (a) | | | 7,582 | | | | 136,703 | |
U.S. Physical Therapy, Inc. (b) | | | 70,204 | | | | 1,675,067 | |
Universal American Corporation (b) | | | 180,086 | | | | 1,539,735 | |
| Universal Health Services, Inc. - Class B | | | 2,808 | | | | 186,985 | |
Vanguard Health Systems, Inc. (a) (b) | | | 264,081 | | | | 3,863,505 | |
WellCare Health Plans, Inc. (a) (b) | | | 92,317 | | | | 5,383,004 | |
| | | | | | | | 72,918,684 | |
Health Care Technology - 0.6% | |
Allscripts Healthcare Solutions, Inc. (a) | | | 116,631 | | | | 1,614,173 | |
| Computer Programs & Systems, Inc. | | | 7,128 | | | | 373,935 | |
HealthStream, Inc. (a) | | | 4,288 | | | | 98,452 | |
MedAssets, Inc. (a) (b) | | | 248,201 | | | | 4,648,805 | |
Medidata Solutions, Inc. (a) | | | 192 | | | | 12,741 | |
Merge Healthcare, Inc. (a) | | | 604,323 | | | | 1,885,488 | |
Omnicell, Inc. (a) (b) | | | 155,192 | | | | 2,796,560 | |
| | | | | | | | 11,430,154 | |
Life Sciences Tools & Services - 1.0% | |
Albany Molecular Research, Inc. (a) | | | 135,619 | | | | 1,617,935 | |
| TFS MARKET NEUTRAL FUND | |
| SCHEDULE OF INVESTMENTS (Continued) | |
| | |
COMMON STOCKS - 92.6% (Continued) | | Shares | | | Value | |
Health Care - 14.4% (Continued) | |
Life Sciences Tools & Services - 1.0% (Continued) | |
BG Medicine, Inc. (a) | | | 19,781 | | | $ | 32,639 | |
Bruker Corporation (a) | | | 44,040 | | | | 782,591 | |
Cambrex Corporation (a) | | | 213,550 | | | | 2,667,239 | |
Charles River Laboratories International, Inc. (a) | | | 89,658 | | | | 3,899,226 | |
Covance, Inc. (a) | | | 1,544 | | | | 115,121 | |
Enzo Biochem, Inc. (a) | | | 24 | | | | 54 | |
Fluidigm Corporation (a) | | | 3,695 | | | | 62,224 | |
Furiex Pharmaceuticals, Inc. (a) | | | 19,104 | | | | 648,581 | |
Harvard Bioscience, Inc. (a) | | | 116,106 | | | | 594,463 | |
Illumina, Inc. (a) | | | 1,747 | | | | 113,013 | |
Mettler-Toledo International, Inc. (a) | | | 1,202 | | | | 251,170 | |
NeoGenomics, Inc. (a) | | | 884 | | | | 3,306 | |
Nordion, Inc. (b) | | | 156,861 | | | | 1,099,596 | |
Pacific Biosciences of California, Inc. (a) (b) | | | 198,490 | | | | 508,134 | |
PAREXEL International Corporation (a) | | | 13,620 | | | | 557,739 | |
QIAGEN N.V. (a) | | | 31,812 | | | | 632,422 | |
Techne Corporation (b) | | | 88,586 | | | | 5,681,906 | |
| | | | | | | | 19,267,359 | |
Pharmaceuticals - 1.2% | |
Alimera Sciences, Inc. (a) | | | 31,921 | | | | 93,209 | |
Auxilium Pharmaceuticals, Inc. (a) | | | 39,656 | | | | 592,064 | |
Biota Pharmaceuticals, Inc. (b) | | | 24,905 | | | | 104,850 | |
Cadence Pharmaceuticals, Inc. (a) | | | 124,215 | | | | 879,442 | |
Cardiome Pharma Corporation (a) (b) | | | 23,182 | | | | 50,305 | |
Corcept Therapeutics, Inc. (a) | | | 320,411 | | | | 567,127 | |
Cornerstone Therapeutics, Inc. (a) | | | 86,902 | | | | 728,239 | |
DepoMed, Inc. (a) | | | 371,129 | | | | 2,044,921 | |
DURECT Corporation (a) (b) | | | 51,222 | | | | 80,419 | |
| Eli Lilly & Company | | | 1,624 | | | | 89,937 | |
Endo Health Solutions, Inc. (a) | | | 31,534 | | | | 1,155,406 | |
Endocyte, Inc. (a) | | | 121,148 | | | | 1,682,746 | |
Hospira, Inc. (a) | | | 3,014 | | | | 99,824 | |
Impax Laboratories, Inc. (a) | | | 27,556 | | | | 482,230 | |
Jazz Pharmaceuticals plc (a) (b) | | | 82,841 | | | | 4,833,772 | |
Lannett Company, Inc. (a) | | | 157,051 | | | | 1,823,362 | |
Nektar Therapeutics (a) | | | 64,325 | | | | 697,283 | |
Omthera Pharmaceuticals, Inc. (a) | | | 10,972 | | | | 82,729 | |
Pain Therapeutics, Inc. (a) | | | 25,442 | | | | 104,821 | |
Pernix Therapeutics Holdings, Inc. (a) | | | 9,007 | | | | 34,407 | |
| Perrigo Company | | | 1,982 | | | | 236,671 | |
POZEN, Inc. (a) | | | 189,301 | | | | 933,254 | |
Sagent Pharmaceuticals, Inc. (a) | | | 6,767 | | | | 111,926 | |
Sucampo Pharmaceuticals, Inc. (a) | | | 151,485 | | | | 1,440,622 | |
Ventrus BioSciences, Inc. (a) | | | 42,916 | | | | 115,015 | |
| Warner Chilcott plc - Class A | | | 209,488 | | | | 3,012,437 | |
XenoPort, Inc. (a) | | | 105,158 | | | | 653,031 | |
| Zoetis, Inc. | | | 7,983 | | | | 263,599 | |
| | | | | | | | 22,993,648 | |
Industrials - 13.3% | |
Aerospace & Defense - 1.9% | |
AAR Corporation (b) | | | 28,399 | | | | 507,206 | |
AeroVironment, Inc. (a) | | | 11,513 | | | | 222,892 | |
| TFS MARKET NEUTRAL FUND | |
| SCHEDULE OF INVESTMENTS (Continued) | |
| | |
COMMON STOCKS - 92.6% (Continued) | | Shares | | | Value | |
Industrials - 13.3% (Continued) | |
Aerospace & Defense - 1.9% (Continued) | |
| Alliant Techsystems, Inc. | | | 1,971 | | | $ | 146,564 | |
| American Science & Engineering, Inc. | | | 5,641 | | | | 363,732 | |
Astronics Corporation (a) | | | 4,914 | | | | 136,609 | |
Astronics Corporation - Class B (a) (d) | | | 1,560 | | | | 42,276 | |
Curtiss-Wright Corporation (b) | | | 33,719 | | | | 1,107,332 | |
DigitalGlobe, Inc. (a) (b) | | | 198,531 | | | | 5,795,120 | |
Ducommun, Inc. (a) | | | 44,132 | | | | 1,080,793 | |
EDAC Technology Corporation (a) | | | 9,354 | | | | 165,753 | |
Esterline Technologies Corporation (a) (b) | | | 51,425 | | | | 3,858,932 | |
Exelis, Inc. (b) | | | 632,972 | | | | 7,070,297 | |
| HEICO Corporation | | | 5,529 | | | | 243,331 | |
| HEICO Corporation - Class A | | | 133 | | | | 4,498 | |
Hexcel Corporation (a) | | | 2,773 | | | | 84,577 | |
| Huntington Ingalls Industries, Inc. | | | 4,781 | | | | 252,915 | |
| Innovative Solutions & Support, Inc. | | | 9,922 | | | | 87,214 | |
LMI Aerospace, Inc. (a) (b) | | | 4,197 | | | | 89,774 | |
MOOG, Inc. - Class A (a) | | | 2,884 | | | | 133,270 | |
Orbital Sciences Corporation (a) | | | 10,653 | | | | 191,967 | |
Sparton Corporation (a) | | | 3,523 | | | | 48,934 | |
Spirit AeroSystems Holdings, Inc. - Class A (a) (b) | | | 402,859 | | | | 8,053,151 | |
| Sypris Solutions, Inc. | | | 26,308 | | | | 84,186 | |
Taser International, Inc. (a) | | | 151,296 | | | | 1,332,918 | |
Teledyne Technologies, Inc. (a) (b) | | | 57,040 | | | | 4,281,422 | |
| Triumph Group, Inc. | | | 1,698 | | | | 135,670 | |
| | | | | | | | 35,521,333 | |
Air Freight & Logistics - 0.4% | |
Air Transport Services Group, Inc. (a) (b) | | | 108,466 | | | | 625,849 | |
Atlas Air Worldwide Holdings, Inc. (a) | | | 10,369 | | | | 387,801 | |
Forward Air Corporation (b) | | | 53,797 | | | | 1,984,571 | |
Hub Group, Inc. - Class A (a) (b) | | | 18,090 | | | | 662,998 | |
Pacer International, Inc. (a) | | | 58,552 | | | | 333,161 | |
Park-Ohio Holdings Corporation (a) (b) | | | 92,459 | | | | 3,400,642 | |
| UTi Worldwide, Inc. | | | 56,059 | | | | 823,507 | |
| | | | | | | | 8,218,529 | |
Airlines - 1.0% | |
Alaska Air Group, Inc. (a) | | | 2,186 | | | | 134,745 | |
Era Group, Inc. (a) | | | 72,911 | | | | 1,666,016 | |
JetBlue Airways Corporation (a) (b) | | | 636,658 | | | | 4,386,574 | |
Pinnacle Airlines Corporation (a) | | | 1,270 | | | | 17 | |
Republic Airways Holdings, Inc. (a) (b) | | | 476,548 | | | | 5,332,572 | |
SkyWest, Inc. (b) | | | 232,215 | | | | 3,322,997 | |
Spirit Airlines, Inc. (a) | | | 101,056 | | | | 2,698,195 | |
US Airways Group, Inc. (a) | | | 45,979 | | | | 777,045 | |
| | | | | | | | 18,318,161 | |
Building Products - 0.2% | |
| A.O. Smith Corporation | | | 3,026 | | | | 228,251 | |
| AAON, Inc. | | | 13,960 | | | | 396,604 | |
Ameresco, Inc. - Class A (a) (b) | | | 174,592 | | | | 1,286,743 | |
American Woodmark Corporation (a) | | | 2,191 | | | | 73,727 | |
Armstrong World Industries, Inc. (a) | | | 3,148 | | | | 160,674 | |
Fortune Brands Home & Security, Inc. (a) | | | 2,573 | | | | 93,632 | |
Gibraltar Industries, Inc. (a) | | | 13,969 | | | | 261,220 | |
| TFS MARKET NEUTRAL FUND | |
| SCHEDULE OF INVESTMENTS (Continued) | |
| | |
COMMON STOCKS - 92.6% (Continued) | | Shares | | | Value | |
Industrials - 13.3% (Continued) | |
Building Products - 0.2% (Continued) | |
| Griffon Corporation | | | 551 | | | $ | 5,675 | |
| Insteel Industries, Inc. | | | 11,323 | | | | 187,735 | |
Nortek, Inc. (a) | | | 6,930 | | | | 497,990 | |
Patrick Industries, Inc. (a) | | | 27,161 | | | | 550,282 | |
PGT, Inc. (a) | | | 3,996 | | | | 30,769 | |
| | | | | | | | 3,773,302 | |
Commercial Services & Supplies - 1.6% | |
A.T. Cross Company - Class A (a) | | | 294 | | | | 3,710 | |
ADT Corporation (The) (a) | | | 2,094 | | | | 91,382 | |
ARC Document Solutions, Inc. (a) | | | 63,699 | | | | 204,474 | |
| Avery Dennison Corporation | | | 3,277 | | | | 135,832 | |
Brink's Company (The) (b) | | | 55,858 | | | | 1,480,796 | |
Casella Waste Systems, Inc. (a) (b) | | | 77,520 | | | | 337,987 | |
| CECO Environmental Corporation | | | 24,301 | | | | 282,135 | |
Copart, Inc. (a) | | | 4,921 | | | | 173,465 | |
| Courier Corporation | | | 3,922 | | | | 56,477 | |
| CyrusOne, Inc. | | | 18,327 | | | | 439,665 | |
EnergySolutions, Inc. (a) (b) | | | 1,164,405 | | | | 4,808,993 | |
Fuel Tech, Inc. (a) | | | 22,018 | | | | 88,072 | |
| G&K Services, Inc. | | | 43,633 | | | | 2,050,315 | |
| Healthcare Services Group, Inc. | | | 9,661 | | | | 215,344 | |
| Herman Miller, Inc. | | | 19,842 | | | | 497,836 | |
Hudson Technologies, Inc. (a) | | | 14,722 | | | | 59,477 | |
Iron Mountain, Inc. (b) | | | 4,289 | | | | 162,381 | |
KAR Auction Services, Inc. (b) | | | 53,495 | | | | 1,196,683 | |
| Kimball International, Inc. - Class B | | | 78,571 | | | | 722,067 | |
| Knoll, Inc. | | | 49,216 | | | | 765,801 | |
Metalico, Inc. (a) | | | 24,158 | | | | 35,995 | |
| Multi-Color Corporation | | | 175 | | | | 4,525 | |
Performant Financial Corporation (a) | | | 98,342 | | | | 956,868 | |
| Pitney Bowes, Inc. | | | 301,473 | | | | 4,121,136 | |
Portfolio Recovery Associates, Inc. (a) | | | 812 | | | | 99,673 | |
| Republic Services, Inc. | | | 4,825 | | | | 164,436 | |
| Ritchie Bros. Auctioneers, Inc. | | | 8,754 | | | | 176,568 | |
| Rollins, Inc. | | | 5,281 | | | | 128,434 | |
Schawk, Inc. (b) | | | 4,707 | | | | 47,917 | |
Steelcase, Inc. - Class A (b) | | | 192,858 | | | | 2,449,297 | |
SYKES Enterprises, Inc. (a) (b) | | | 35,814 | | | | 551,177 | |
Team, Inc. (a) (b) | | | 9,881 | | | | 382,987 | |
TMS International Corporation - Class A (a) | | | 116,120 | | | | 1,676,773 | |
TRC Companies, Inc. (a) | | | 12,228 | | | | 73,857 | |
UniFirst Corporation (b) | | | 21,006 | | | | 1,912,596 | |
| US Ecology, Inc. | | | 49,996 | | | | 1,359,891 | |
Viad Corp (b) | | | 73,273 | | | | 1,908,762 | |
| Waste Connections, Inc. | | | 202 | | | | 7,666 | |
| | | | | | | | 29,831,450 | |
Construction & Engineering - 1.3% | |
AECOM Technology Corporation (a) | | | 9,942 | | | | 289,014 | |
| Argan, Inc. | | | 108,233 | | | | 1,915,724 | |
| Chicago Bridge & Iron Company N.V. | | | 1,680 | | | | 90,367 | |
| Comfort Systems USA, Inc. | | | 36,502 | | | | 468,321 | |
Dycom Industries, Inc. (a) (b) | | | 89,336 | | | | 1,725,971 | |
| TFS MARKET NEUTRAL FUND | |
| SCHEDULE OF INVESTMENTS (Continued) | |
| | |
COMMON STOCKS - 92.6% (Continued) | | Shares | | | Value | |
Industrials - 13.3% (Continued) | |
Construction & Engineering - 1.3% (Continued) | |
EMCOR Group, Inc. (b) | | | 97,070 | | | $ | 3,630,418 | |
Furmanite Corporation (a) | | | 34,677 | | | | 220,199 | |
Goldfield Corporation (The) (a) | | | 159,398 | | | | 494,134 | |
| Granite Construction, Inc. | | | 21,636 | | | | 598,668 | |
| Great Lakes Dredge & Dock Corporation | | | 179,375 | | | | 1,241,275 | |
Layne Christensen Company (a) | | | 61,611 | | | | 1,258,713 | |
| Michael Baker Corporation | | | 8,628 | | | | 210,092 | |
MYR Group, Inc. (a) (b) | | | 102,044 | | | | 2,326,603 | |
Northwest Pipe Company (a) | | | 18,472 | | | | 504,101 | |
Orion Marine Group, Inc. (a) | | | 46,162 | | | | 422,844 | |
| Pike Electric Corporation | | | 218,781 | | | | 3,419,547 | |
| Primoris Services Corporation | | | 272,256 | | | | 6,000,522 | |
Sterling Construction Company, Inc. (a) (b) | | | 11,183 | | | | 113,172 | |
Tutor Perini Corporation (a) | �� | | 3,596 | | | | 59,118 | |
| URS Corporation | | | 4,386 | | | | 192,633 | |
| | | | | | | | 25,181,436 | |
Electrical Equipment - 1.2% | |
American Superconductor Corporation (a) | | | 102,787 | | | | 257,995 | |
| AMETEK, Inc. | | | 4,211 | | | | 171,430 | |
AZZ, Inc. (b) | | | 59,883 | | | | 2,532,452 | |
Babcock & Wilcox Company (The) (b) | | | 178,526 | | | | 4,855,907 | |
Broadwind Energy, Inc. (a) | | | 18,694 | | | | 84,123 | |
China Electric Motor, Inc. (a) | | | 1,771 | | | | 159 | |
Coleman Cable, Inc. (b) | | | 63,564 | | | | 953,460 | |
EnerSys, Inc. (a) | | | 5,727 | | | | 262,526 | |
| Franklin Electric Company, Inc. | | | 18,603 | | | | 602,179 | |
FuelCell Energy, Inc. (a) | | | 28,733 | | | | 30,170 | |
General Cable Corporation (a) (b) | | | 137,160 | | | | 4,729,277 | |
GrafTech International Ltd. (a) | | | 303,180 | | | | 2,176,832 | |
| Hubbell, Inc. - Class B | | | 5,792 | | | | 555,800 | |
II-VI, Inc. (a) | | | 10,888 | | | | 168,437 | |
Jinpan International Ltd. (b) | | | 41,358 | | | | 217,543 | |
Powell Industries, Inc. (a) | | | 40,679 | | | | 2,003,034 | |
PowerSecure International, Inc. (a) | | | 87,359 | | | | 1,196,818 | |
Preformed Line Products Company (b) | | | 10,775 | | | | 867,388 | |
Sensata Technologies Holding N.V. (a) | | | 2,824 | | | | 94,463 | |
Thermon Group Holdings, Inc. (a) | | | 42,281 | | | | 828,708 | |
Vicor Corporation (a) (b) | | | 8,294 | | | | 44,539 | |
| | | | | | | | 22,633,240 | |
Industrial Conglomerates - 0.0% (c) | |
| Carlisle Companies, Inc. | | | 2,072 | | | | 134,411 | |
Standex International Corporation (b) | | | 7,179 | | | | 379,769 | |
| | | | | | | | 514,180 | |
Machinery - 2.1% | |
| Alamo Group, Inc. | | | 49,924 | | | | 2,000,455 | |
| Albany International Corporation - Class A | | | 43,305 | | | | 1,258,010 | |
| American Railcar Industries, Inc. | | | 10,675 | | | | 381,204 | |
Ampco-Pittsburgh Corporation (b) | | | 18,102 | | | | 339,232 | |
| Astec Industries, Inc. | | | 4,609 | | | | 151,313 | |
| Barnes Group, Inc. | | | 29,902 | | | | 830,379 | |
Blount International, Inc. (a) | | | 29,260 | | | | 406,421 | |
Chart Industries, Inc. (a) | | | 2,943 | | | | 249,596 | |
| TFS MARKET NEUTRAL FUND | |
| SCHEDULE OF INVESTMENTS (Continued) | |
| | |
COMMON STOCKS - 92.6% (Continued) | | Shares | | | Value | |
Industrials - 13.3% (Continued) | |
Machinery - 2.1% (Continued) | |
China Yuchai International Ltd. (b) | | | 28,272 | | | $ | 403,724 | |
CIRCOR International, Inc. (b) | | | 30,156 | | | | 1,427,284 | |
| CLARCOR, Inc. | | | 4,130 | | | | 213,521 | |
| CNH Global N.V. | | | 1,619 | | | | 66,589 | |
Colfax Corporation (a) | | | 2,933 | | | | 136,883 | |
Columbus McKinnon Corporation (a) (b) | | | 21,796 | | | | 409,329 | |
Commercial Vehicle Group, Inc. (a) | | | 30,568 | | | | 214,282 | |
Crane Company (b) | | | 23,498 | | | | 1,264,897 | |
Duoyuan Printing, Inc. (a) | | | 105,760 | | | | 15,864 | |
| Dynamic Materials Corporation | | | 2,239 | | | | 35,555 | |
Energy Recovery, Inc. (a) | | | 542 | | | | 1,984 | |
EnPro Industries, Inc. (a) | | | 4 | | | | 197 | |
| ESCO Technologies, Inc. | | | 10,844 | | | | 390,059 | |
Federal Signal Corporation (a) | | | 65,095 | | | | 505,137 | |
Flow International Corporation (a) | | | 1,507 | | | | 5,516 | |
| Gardner Denver, Inc. | | | 1,686 | | | | 126,602 | |
Gorman-Rupp Company (The) (b) | | | 10,776 | | | | 304,422 | |
| Graham Corporation | | | 13,410 | | | | 325,863 | |
Greenbrier Companies, Inc. (The) (a) | | | 24 | | | | 541 | |
| Hardinge, Inc. | | | 32,156 | | | | 434,106 | |
| Harsco Corporation | | | 104,147 | | | | 2,273,529 | |
Hyster-Yale Materials Handling, Inc. - Class A (b) | | | 26,455 | | | | 1,380,686 | |
| IDEX Corporation | | | 3,079 | | | | 160,200 | |
| ITT Corporation | | | 5,030 | | | | 138,828 | |
John Bean Technologies Corporation (b) | | | 138,742 | | | | 2,877,509 | |
Kadant, Inc. (b) | | | 22,756 | | | | 629,659 | |
| Kaydon Corporation | | | 47,797 | | | | 1,139,481 | |
| Lincoln Electric Holdings, Inc. | | | 2,127 | | | | 112,221 | |
| Lindsay Corporation | | | 100 | | | | 7,682 | |
Manitex International, Inc. (a) | | | 24,716 | | | | 250,373 | |
Manitowoc Company, Inc. (The) (b) | | | 135,494 | | | | 2,541,867 | |
Meritor, Inc. (a) | | | 16,217 | | | | 94,059 | |
| Met-Pro Corporation | | | 37 | | | | 496 | |
| Mueller Industries, Inc. | | | 52,036 | | | | 2,694,424 | |
Mueller Water Products, Inc. - Class A (b) | | | 668,303 | | | | 3,956,354 | |
NACCO Industries, Inc. - Class A (b) | | | 45,921 | | | | 2,664,336 | |
NN, Inc. (a) | | | 6,350 | | | | 57,214 | |
Oshkosh Corporation (a) | | | 3,694 | | | | 145,026 | |
RBC Bearings, Inc. (a) | | | 7,944 | | | | 382,106 | |
SmartHeat, Inc. (a) | | | 832 | | | | 266 | |
| Snap-on, Inc. | | | 2,002 | | | | 172,572 | |
Tecumseh Products Company - Class A (a) | | | 33,707 | | | | 299,992 | |
Terex Corporation (a) | | | 4,137 | | | | 118,318 | |
Trimas Corporation (a) | | | 59,119 | | | | 1,803,130 | |
Wabash National Corporation (a) (b) | | | 248,269 | | | | 2,341,177 | |
WABCO Holdings, Inc. (a) (b) | | | 7,035 | | | | 508,138 | |
| Wabtec Corporation | | | 2,048 | | | | 214,917 | |
| Woodward, Inc. | | | 3,552 | | | | 127,837 | |
Xerium Technologies, Inc. (a) | | | 8,162 | | | | 77,457 | |
| Xylem, Inc. | | | 15,874 | | | | 440,504 | |
| | | | | | | | 39,509,323 | |
| TFS MARKET NEUTRAL FUND | |
| SCHEDULE OF INVESTMENTS (Continued) | |
| | |
COMMON STOCKS - 92.6% (Continued) | | Shares | | | Value | |
Industrials - 13.3% (Continued) | |
Marine - 0.3% | |
| Box Ships, Inc. | | | 184,995 | | | $ | 891,676 | |
Costamare, Inc. (b) | | | 48,711 | | | | 781,324 | |
| Diana Containerships, Inc. | | | 19,118 | | | | 108,781 | |
Diana Shipping, Inc. (a) (b) | | | 33,223 | | | | 315,286 | |
DryShips, Inc. (a) (b) | | | 596,910 | | | | 1,110,253 | |
Global Ship Lease, Inc. (a) | | | 27,052 | | | | 120,652 | |
| Matson, Inc. | | | 26,135 | | | | 615,218 | |
| Navios Maritime Holdings, Inc. | | | 400,352 | | | | 1,813,595 | |
| Navios Maritime Partners, L.P. | | | 2,527 | | | | 38,309 | |
| Star Bulk Carriers Corporation | | | 3,137 | | | | 19,638 | |
| | | | | | | | 5,814,732 | |
Professional Services - 0.9% | |
| Barrett Business Services, Inc. | | | 11,704 | | | | 619,610 | |
Dolan Company (The) (a) | | | 28,734 | | | | 49,710 | |
| Dun & Bradstreet Corporation (The) | | | 3,250 | | | | 287,463 | |
| Equifax, Inc. | | | 1,945 | | | | 119,034 | |
| Exponent, Inc. | | | 6,892 | | | | 363,208 | |
GP Strategies Corporation (a) | | | 14,842 | | | | 327,266 | |
Heidrick & Struggles International, Inc. (b) | | | 84,813 | | | | 1,121,228 | |
Hudson Global, Inc. (a) | | | 390 | | | | 1,287 | |
Huron Consulting Group, Inc. (a) | | | 52,124 | | | | 2,177,741 | |
| Insperity, Inc. | | | 37,579 | | | | 1,038,308 | |
| Kelly Services, Inc. - Class A | | | 13,936 | | | | 237,191 | |
| Kforce, Inc. | | | 41,575 | | | | 628,614 | |
Korn/Ferry International (a) | | | 51,876 | | | | 858,548 | |
Mistras Group, Inc. (a) | | | 77,133 | | | | 1,461,670 | |
Navigant Consulting, Inc. (a) (b) | | | 94,931 | | | | 1,170,499 | |
On Assignment, Inc. (a) | | | 23,332 | | | | 566,268 | |
Pendrell Corporation (a) | | | 12,962 | | | | 21,906 | |
| Resources Connection, Inc. | | | 60,904 | | | | 691,869 | |
| Robert Half International, Inc. | | | 2,644 | | | | 86,776 | |
RPX Corporation (a) | | | 125,679 | | | | 1,685,355 | |
TrueBlue, Inc. (a) | | | 141,549 | | | | 2,932,895 | |
Verisk Analytics, Inc. - Class A (a) | | | 3,635 | | | | 222,789 | |
Volt Information Sciences, Inc. (a) | | | 14,233 | | | | 115,287 | |
| VSE Corporation | | | 3,222 | | | | 98,239 | |
| | | | | | | | 16,882,761 | |
Road & Rail - 1.4% | |
| Arkansas Best Corporation | | | 85,829 | | | | 902,063 | |
Avis Budget Group, Inc. (a) (b) | | | 214,583 | | | | 6,188,574 | |
Celadon Group, Inc. (b) | | | 35,071 | | | | 588,842 | |
| Con-Way, Inc. | | | 4,006 | | | | 135,403 | |
Genesee & Wyoming, Inc. - Class A (a) | | | 1,541 | | | | 131,293 | |
Heartland Express, Inc. (b) | | | 307,060 | | | | 4,166,804 | |
| J.B. Hunt Transport Services, Inc. | | | 1,340 | | | | 95,234 | |
| Knight Transportation, Inc. | | | 17,495 | | | | 273,272 | |
Marten Transport Ltd. (b) | | | 90,106 | | | | 1,835,459 | |
Quality Distribution, Inc. (a) | | | 14,731 | | | | 117,259 | |
Roadrunner Transportation Systems, Inc. (a) (b) | | | 114,669 | | | | 2,581,199 | |
Ryder System, Inc. (b) | | | 100,939 | | | | 5,861,528 | |
Saia, Inc. (a) (b) | | | 57,220 | | | | 2,341,442 | |
| TFS MARKET NEUTRAL FUND | |
| SCHEDULE OF INVESTMENTS (Continued) | |
| | |
COMMON STOCKS - 92.6% (Continued) | | Shares | | | Value | |
Industrials - 13.3% (Continued) | |
Road & Rail - 1.4% (Continued) | |
Swift Transportation Company (a) | | | 16,372 | | | $ | 229,535 | |
| | | | | | | | 25,447,907 | |
Trading Companies & Distributors - 0.9% | |
| Aceto Corporation | | | 15,789 | | | | 164,205 | |
AerCap Holdings N.V. (a) | | | 11,239 | | | | 178,363 | |
| Air Lease Corporation | | | 5,763 | | | | 158,540 | |
Aircastle Ltd. (b) | | | 213,829 | | | | 2,985,053 | |
| Applied Industrial Technologies, Inc. | | | 5,649 | | | | 238,670 | |
BlueLinx Holdings, Inc. (a) | | | 18,018 | | | | 52,432 | |
CAI International, Inc. (a) (b) | | | 141,561 | | | | 3,608,390 | |
DXP Enterprises, Inc. (a) | | | 40,186 | | | | 2,687,640 | |
Edgen Group, Inc. (a) | | | 19,556 | | | | 133,959 | |
MFC Industrial Ltd. (b) | | | 102,918 | | | | 832,607 | |
Rush Enterprises, Inc. (a) | | | 41,419 | | | | 948,081 | |
Textainer Group Holdings Ltd. (b) | | | 125,964 | | | | 4,871,028 | |
| Watsco, Inc. | | | 1,101 | | | | 92,902 | |
WESCO International, Inc. (a) | | | 1,804 | | | | 129,329 | |
| | | | | | | | 17,081,199 | |
Transportation Infrastructure - 0.1% | |
| Aegean Marine Petroleum Network, Inc. | | | 31,083 | | | | 183,390 | |
China Infrastructure Investment Corporation (a) | | | 24,710 | | | | 1,043 | |
| Macquarie Infrastructure Company, LLC | | | 4,098 | | | | 238,831 | |
Wesco Aircraft Holdings, Inc. (a) | | | 21,746 | | | | 359,026 | |
| | | | | | | | 782,290 | |
Information Technology - 15.2% | |
Communications Equipment - 1.4% | |
| Alliance Fiber Optic Products, Inc. | | | 10,259 | | | | 169,068 | |
Alvarion Ltd. (a) | | | 1,909 | | | | 5,651 | |
Anaren, Inc. (a) | | | 5,754 | | | | 134,701 | |
Aruba Networks, Inc. (a) (b) | | | 181,063 | | | | 4,072,107 | |
AudioCodes Ltd. (a) | | | 1,235 | | | | 4,866 | |
Aviat Networks, Inc. (a) | | | 210,223 | | | | 672,714 | |
| Bel Fuse, Inc. - Class B | | | 200 | | | | 2,944 | |
Black Box Corporation (b) | | | 6,926 | | | | 150,433 | |
CalAmp Corporation (a) | | | 10,080 | | | | 112,190 | |
Ceragon Networks Ltd. (a) (b) | | | 93,191 | | | | 355,058 | |
Communications Systems, Inc. (b) | | | 2,191 | | | | 21,318 | |
| Comtech Telecommunications Corporation | | | 14,039 | | | | 345,500 | |
Digi International, Inc. (a) | | | 34,496 | | | | 314,604 | |
DragonWave, Inc. (a) | | | 1,934 | | | | 3,791 | |
EchoStar Corporation - Class A (a) (b) | | | 74,289 | | | | 2,917,329 | |
EMCORE Corporation (a) | | | 58,209 | | | | 254,373 | |
Emulex Corporation (a) | | | 117,818 | | | | 706,908 | |
EXFO, Inc. (a) | | | 281 | | | | 1,307 | |
Finisar Corporation (a) | | | 44,304 | | | | 568,863 | |
Harmonic, Inc. (a) (b) | | | 503,330 | | | | 2,858,914 | |
Ixia (a) | | | 46,655 | | | | 768,408 | |
JDS Uniphase Corporation (a) | | | 9,833 | | | | 132,745 | |
| Loral Space & Communications, Inc. | | | 19,265 | | | | 1,185,183 | |
Meru Networks, Inc. (a) | | | 9,055 | | | | 51,161 | |
NETGEAR, Inc. (a) | | | 6,350 | | | | 189,166 | |
Oplink Communications, Inc. (a) | | | 87,900 | | | | 1,443,318 | |
| TFS MARKET NEUTRAL FUND | |
| SCHEDULE OF INVESTMENTS (Continued) | |
| | |
COMMON STOCKS - 92.6% (Continued) | | Shares | | | Value | |
Information Technology - 15.2% (Continued) | |
Communications Equipment - 1.4% (Continued) | |
ORBCOMM, Inc. (a) | | | 693 | | | $ | 3,278 | |
| Plantronics, Inc. | | | 2,932 | | | | 128,480 | |
Radware Ltd. (a) | | | 61,693 | | | | 924,778 | |
Riverbed Technology, Inc. (a) | | | 20,458 | | | | 304,006 | |
Ruckus Wireless, Inc. (a) | | | 5,028 | | | | 97,040 | |
ShoreTel, Inc. (a) (b) | | | 141,534 | | | | 510,938 | |
Sierra Wireless, Inc. (a) | | | 68,119 | | | | 756,121 | |
| Silicom Ltd. | | | 16,591 | | | | 507,353 | |
Sonus Networks, Inc. (a) (b) | | | 705,235 | | | | 1,480,994 | |
| Sycamore Networks, Inc. | | | 149,380 | | | | 57,138 | |
Symmetricom, Inc. (a) | | | 5,662 | | | | 29,442 | |
Tellabs, Inc. (b) | | | 2,176,188 | | | | 4,504,709 | |
UTStarcom Holdings Corporation (a) | | | 41,078 | | | | 113,786 | |
| Wi-LAN, Inc. | | | 1,639 | | | | 6,474 | |
| | | | | | | | 26,867,157 | |
Computers & Peripherals - 1.0% | |
| Apple, Inc. | | | 816 | | | | 361,284 | |
Avid Technology, Inc. (a) (b) | | | 53,563 | | | | 352,980 | |
| Concurrent Computer Corporation | | | 5,056 | | | | 35,594 | |
Cray, Inc. (a) | | | 89,037 | | | | 1,884,023 | |
Datalink Corporation (a) (b) | | | 120,095 | | | | 1,343,863 | |
| Dell, Inc. | | | 11,430 | | | | 153,162 | |
Dot Hill Systems Corporation (a) | | | 87,575 | | | | 132,238 | |
Electronics For Imaging, Inc. (a) (b) | | | 115,383 | | | | 3,083,034 | |
| Hewlett-Packard Company | | | 5,574 | | | | 114,824 | |
Hutchinson Technology, Inc. (a) | | | 52,218 | | | | 146,210 | |
Immersion Corporation (a) | | | 77,067 | | | | 816,140 | |
Intermec, Inc. (a) (b) | | | 96,317 | | | | 947,759 | |
| Lexmark International, Inc. - Class A | | | 137,159 | | | | 4,157,289 | |
Novatel Wireless, Inc. (a) | | | 276,524 | | | | 724,493 | |
On Track Innovations Ltd. (a) | | | 25,395 | | | | 26,665 | |
QLogic Corporation (a) | | | 186,639 | | | | 2,026,900 | |
Quantum Corporation (a) (b) | | | 180,018 | | | | 257,426 | |
Silicon Graphics International Corporation (a) | | | 348 | | | | 4,524 | |
SMART Technologies, Inc. - Class A (a) | | | 283,363 | | | | 408,043 | |
Synaptics, Inc. (a) | | | 13,896 | | | | 572,932 | |
| Xyratex Ltd. | | | 54,802 | | | | 585,285 | |
| | | | | | | | 18,134,668 | |
Electronic Equipment, Instruments & Components - 3.2% | |
Aeroflex Holding Corporation (a) (b) | | | 14,156 | | | | 105,321 | |
Agilysys, Inc. (a) | | | 14,213 | | | | 166,008 | |
| Anixter International, Inc. | | | 15,163 | | | | 1,087,794 | |
Audience, Inc. (a) | | | 32,111 | | | | 474,922 | |
| AVX Corporation | | | 148,222 | | | | 1,676,391 | |
| Badger Meter, Inc. | | | 11,197 | | | | 489,085 | |
Benchmark Electronics, Inc. (a) (b) | | | 253,606 | | | | 4,524,331 | |
Celestica, Inc. (a) (b) | | | 188,465 | | | | 1,628,338 | |
Checkpoint Systems, Inc. (a) | | | 84,127 | | | | 973,349 | |
ClearSign Combustion Corporation (a) | | | 3,200 | | | | 28,832 | |
| Cognex Corporation | | | 24,369 | | | | 967,449 | |
Coherent, Inc. (b) | | | 60,923 | | | | 3,407,423 | |
| CTS Corporation | | | 30,289 | | | | 322,578 | |
| TFS MARKET NEUTRAL FUND | |
| SCHEDULE OF INVESTMENTS (Continued) | |
| | |
COMMON STOCKS - 92.6% (Continued) | | Shares | | | Value | |
Information Technology - 15.2% (Continued) | |
Electronic Equipment, Instruments & Components - 3.2% (Continued) | |
| Daktronics, Inc. | | | 227,160 | | | $ | 2,269,328 | |
| Electro Rent Corporation | | | 60,445 | | | | 1,001,574 | |
Electro Scientific Industries, Inc. (b) | | | 110,188 | | | | 1,187,827 | |
eMagin Corporation (b) | | | 1,447 | | | | 5,166 | |
Fabrinet (a) (b) | | | 190,110 | | | | 2,610,210 | |
FARO Technologies, Inc. (a) | | | 2,793 | | | | 108,340 | |
Flextronics International Ltd. (a) | | | 12,739 | | | | 91,084 | |
| FLIR Systems, Inc. | | | 6,093 | | | | 148,121 | |
GSI Group, Inc. (The) (a) | | | 110,437 | | | | 943,132 | |
Hollysys Automation Technologies Ltd. (a) | | | 37,506 | | | | 451,572 | |
Identive Group, Inc. (a) (b) | | | 55,609 | | | | 52,829 | |
Ingram Micro, Inc. - Class A (a) | | | 104,392 | | | | 1,859,222 | |
Insight Enterprises, Inc. (a) | | | 142,045 | | | | 2,573,855 | |
InvenSense, Inc. (a) | | | 66,151 | | | | 616,527 | |
| IPG Photonics Corporation | | | 44,449 | | | | 2,830,512 | |
KEMET Corporation (a) | | | 25,134 | | | | 156,585 | |
Key Tronic Corporation (a) | | | 4,208 | | | | 47,550 | |
| Littelfuse, Inc. | | | 11,935 | | | | 833,302 | |
Maxwell Technologies, Inc. (a) | | | 254,768 | | | | 1,554,085 | |
Measurement Specialties, Inc. (a) | | | 17,139 | | | | 733,035 | |
| Mesa Laboratories, Inc. | | | 479 | | | | 23,643 | |
| Methode Electronics, Inc. | | | 122,606 | | | | 1,763,074 | |
| Molex, Inc. - Class A | | | 6,679 | | | | 155,688 | |
| MTS Systems Corporation | | | 2,719 | | | | 165,723 | |
Multi-Fineline Electronix, Inc. (a) (b) | | | 155,905 | | | | 2,375,992 | |
| National Instruments Corporation | | | 4,557 | | | | 124,543 | |
Netlist, Inc. (a) | | | 28,996 | | | | 16,470 | |
Newport Corporation (a) (b) | | | 71,672 | | | | 1,085,831 | |
Orbotech Ltd. (a) (b) | | | 69,185 | | | | 709,146 | |
| Park Electrochemical Corporation | | | 15,031 | | | | 358,790 | |
| PC Connection, Inc. | | | 46,440 | | | | 717,034 | |
| Perceptron, Inc. | | | 28,290 | | | | 197,747 | |
Plexus Corporation (a) | | | 7,921 | | | | 213,629 | |
| RF Industries, Ltd. | | | 2,767 | | | | 16,574 | |
Rofin-Sinar Technologies, Inc. (a) | | | 1,439 | | | | 35,831 | |
Rogers Corporation (a) | | | 8,344 | | | | 355,788 | |
Sanmina Corporation (a) (b) | | | 568,415 | | | | 7,173,397 | |
ScanSource, Inc. (a) | | | 18,741 | | | | 542,927 | |
SMTC Corporation (a) | | | 100 | | | | 221 | |
Tech Data Corporation (a) | | | 22,371 | | | | 1,045,397 | |
Trimble Navigation Ltd. (a) | | | 139 | | | | 3,995 | |
TTM Technologies, Inc. (a) | | | 418,476 | | | | 3,025,581 | |
Viasystems Group, Inc. (a) | | | 138 | | | | 1,755 | |
Vishay Intertechnology, Inc. (a) (b) | | | 312,866 | | | | 4,392,639 | |
Zygo Corporation (a) | | | 4,760 | | | | 71,210 | |
| | | | | | | | 60,498,302 | |
Internet Software & Services - 1.5% | |
Bazaarvoice, Inc. (a) | | | 21,527 | | | | 156,071 | |
Brightcove, Inc. (a) | | | 162,623 | | | | 978,990 | |
comScore, Inc. (a) | | | 7,135 | | | | 115,373 | |
Cornerstone OnDemand, Inc. (a) | | | 24,350 | | | | 883,418 | |
CoStar Group, Inc. (a) | | | 3,472 | | | | 376,400 | |
| TFS MARKET NEUTRAL FUND | |
| SCHEDULE OF INVESTMENTS (Continued) | |
| | |
COMMON STOCKS - 92.6% (Continued) | | Shares | | | Value | |
Information Technology - 15.2% (Continued) | |
Internet Software & Services - 1.5% (Continued) | |
Demand Media, Inc. (a) | | | 7,791 | | | $ | 67,470 | |
Digital River, Inc. (a) | | | 38,140 | | | | 552,267 | |
E2open, Inc. (a) | | | 1,394 | | | | 19,809 | |
EarthLink, Inc. (b) | | | 139,495 | | | | 793,727 | |
eGain Communications Corporation (a) | | | 3,761 | | | | 30,126 | |
Envestnet, Inc. (a) | | | 35,900 | | | | 654,098 | |
ExactTarget, Inc. (a) | | | 47,516 | | | | 930,363 | |
GigaMedia Ltd. (a) | | | 27,666 | | | | 27,943 | |
Innodata Isogen, Inc. (a) | | | 808 | | | | 2,650 | |
Internap Network Services Corporation (a) (b) | | | 57,011 | | | | 454,948 | |
IntraLinks Holdings, Inc. (a) | | | 169,358 | | | | 968,728 | |
iPass, Inc. (a) | | | 1,012 | | | | 1,953 | |
| Keynote Systems, Inc. | | | 47,775 | | | | 535,558 | |
Limelight Networks, Inc. (a) | | | 134,642 | | | | 259,859 | |
LivePerson, Inc. (a) (b) | | | 34,235 | | | | 438,893 | |
LogMeIn, Inc. (a) | | | 46,659 | | | | 1,053,560 | |
Marin Software, Inc. (a) | | | 22,288 | | | | 327,634 | |
Move, Inc. (a) | | | 292,376 | | | | 3,336,013 | |
Open Text Corporation (a) | | | 2,005 | | | | 131,107 | |
OpenTable, Inc. (a) | | | 73,474 | | | | 4,069,725 | |
Perficient, Inc. (a) | | | 91,617 | | | | 960,146 | |
Perion Network Ltd. (a) | | | 5,653 | | | | 67,553 | |
Points International Ltd. (a) | | | 2,326 | | | | 40,612 | |
Saba Software, Inc. (a) | | | 40,132 | | | | 365,201 | |
SciQuest, Inc. (a) | | | 23,455 | | | | 536,181 | |
SINA Corporation (a) | | | 2,046 | | | | 115,231 | |
Stamps.com, Inc. (a) | | | 16,303 | | | | 551,694 | |
Subaye, Inc. (a) | | | 37,223 | | | | 26 | |
Support.com, Inc. (a) | | | 29,298 | | | | 116,899 | |
Synacor, Inc. (a) | | | 269,319 | | | | 783,718 | |
Travelzoo, Inc. (a) | | | 26,533 | | | | 677,387 | |
Tucows, Inc. (a) | | | 220 | | | | 462 | |
| United Online, Inc. | | | 302,679 | | | | 2,058,217 | |
Unwired Planet, Inc. (a) | | | 179,424 | | | | 355,260 | |
ValueClick, Inc. (a) | | | 13,375 | | | | 412,752 | |
Vocus, Inc. (a) | | | 87,551 | | | | 736,304 | |
Web.com Group, Inc. (a) | | | 23,654 | | | | 411,580 | |
WebMD Health Corporation (a) | | | 44,915 | | | | 1,084,697 | |
XO Group, Inc. (a) | | | 95,062 | | | | 1,070,398 | |
Xoom Corporation (a) | | | 27,475 | | | | 507,188 | |
Zix Corporation (a) | | | 156,220 | | | | 587,387 | |
| | | | | | | | 28,605,576 | |
IT Services - 1.7% | |
Acxiom Corporation (a) (b) | | | 13,148 | | | | 261,514 | |
Cardtronics, Inc. (a) (b) | | | 103,207 | | | | 2,890,828 | |
China Information Technology, Inc. (a) | | | 1,893 | | | | 2,556 | |
CoreLogic, Inc. (a) (b) | | | 83,997 | | | | 2,291,438 | |
CSG Systems International, Inc. (a) | | | 2,913 | | | | 62,950 | |
| DST Systems, Inc. | | | 3,101 | | | | 214,434 | |
Euronet Worldwide, Inc. (a) | | | 53,025 | | | | 1,618,853 | |
ExlService Holdings, Inc. (a) (b) | | | 43,820 | | | | 1,429,409 | |
FleetCor Technologies, Inc. (a) | | | 4,058 | | | | 312,060 | |
| TFS MARKET NEUTRAL FUND | |
| SCHEDULE OF INVESTMENTS (Continued) | |
| | |
COMMON STOCKS - 92.6% (Continued) | | Shares | | | Value | |
Information Technology - 15.2% (Continued) | |
IT Services - 1.7% (Continued) | |
| Forrester Research, Inc. | | | 54,435 | | | $ | 1,951,495 | |
| Genpact Ltd. | | | 8,679 | | | | 161,429 | |
Global Cash Access Holdings, Inc. (a) | | | 441,327 | | | | 3,146,662 | |
Heartland Payment Systems, Inc. (b) | | | 91,920 | | | | 3,023,249 | |
iGATE Corporation (a) (b) | | | 90,917 | | | | 1,517,405 | |
InterXion Holding N.V. (a) | | | 4,771 | | | | 119,418 | |
Lionbridge Technologies, Inc. (a) | | | 274,889 | | | | 940,120 | |
ModusLink Global Solutions, Inc. (a) | | | 2,171 | | | | 6,079 | |
MoneyGram International, Inc. (a) (b) | | | 24,126 | | | | 398,320 | |
NeuStar, Inc. - Class A (a) (b) | | | 106,698 | | | | 4,680,841 | |
| Paychex, Inc. | | | 11,008 | | | | 400,801 | |
PFSweb, Inc. (a) | | | 31,280 | | | | 133,253 | |
Sapient Corporation (a) | | | 23,544 | | | | 274,994 | |
ServiceSource International, Inc. (a) | | | 82,868 | | | | 530,355 | |
| Syntel, Inc. | | | 38,942 | | | | 2,459,966 | |
TeleTech Holdings, Inc. (a) | | | 54,877 | | | | 1,168,331 | |
| Total System Services, Inc. | | | 7,065 | | | | 166,875 | |
Vantiv, Inc. - Class A (a) | | | 14,064 | | | | 316,862 | |
Virtusa Corporation (a) | | | 67,685 | | | | 1,503,284 | |
WEX, Inc. (a) | | | 1,342 | | | | 101,697 | |
| | | | | | | | 32,085,478 | |
Office Electronics - 0.1% | |
Zebra Technologies Corporation - Class A (a) | | | 27,730 | | | | 1,293,604 | |
| | | | | | | | | |
Semiconductors & Semiconductor Equipment - 3.9% | |
Advanced Energy Industries, Inc. (a) (b) | | | 29,034 | | | | 492,997 | |
Alpha & Omega Semiconductor Ltd. (a) | | | 3,918 | | | | 28,366 | |
Ambarella, Inc. (a) | | | 232,779 | | | | 3,189,072 | |
Amtech Systems, Inc. (a) | | | 3,825 | | | | 14,191 | |
ANADIGICS, Inc. (a) (b) | | | 1,213,190 | | | | 2,547,699 | |
ATMI, Inc. (a) | | | 92,507 | | | | 2,012,027 | |
| Avago Technologies Ltd. | | | 2,662 | | | | 85,078 | |
Axcelis Technologies, Inc. (a) (b) | | | 191,296 | | | | 248,685 | |
AXT, Inc. (a) | | | 31,367 | | | | 90,023 | |
| Brooks Automation, Inc. | | | 90,222 | | | | 876,958 | |
Canadian Solar, Inc. (a) | | | 1,600 | | | | 9,008 | |
Cavium, Inc. (a) | | | 4,919 | | | | 154,703 | |
CEVA, Inc. (a) | | | 29,990 | | | | 457,647 | |
ChipMOS TECHNOLOGIES (Bermuda) Ltd. (b) | | | 91,179 | | | | 1,343,067 | |
Cree, Inc. (a) | | | 2,278 | | | | 128,866 | |
| CSR plc - ADR | | | 1,052 | | | | 32,181 | |
Cymer, Inc. (a) | | | 87 | | | | 9,114 | |
Cypress Semiconductor Corporation (a) | | | 18,147 | | | | 183,103 | |
Diodes, Inc. (a) | | | 20,952 | | | | 424,488 | |
DSP Group, Inc. (a) | | | 31,598 | | | | 254,996 | |
Entegris, Inc. (a) (b) | | | 230,199 | | | | 2,182,287 | |
Entropic Communications, Inc. (a) | | | 14,783 | | | | 62,680 | |
Exar Corporation (a) | | | 108,083 | | | | 1,165,135 | |
Fairchild Semiconductor International, Inc. (a) | | | 137,593 | | | | 1,774,950 | |
First Solar, Inc. (a) (b) | | | 247,862 | | | | 11,540,455 | |
FormFactor, Inc. (a) | | | 214,813 | | | | 1,063,324 | |
Hittite Microwave Corporation (a) | | | 2,321 | | | | 130,231 | |
| TFS MARKET NEUTRAL FUND | |
| SCHEDULE OF INVESTMENTS (Continued) | |
| | |
COMMON STOCKS - 92.6% (Continued) | | Shares | | | Value | |
Information Technology - 15.2% (Continued) | |
Semiconductors & Semiconductor Equipment - 3.9% (Continued) | |
Inphi Corporation (a) | | | 17,153 | | | $ | 161,410 | |
Integrated Device Technology, Inc. (a) | | | 79,119 | | | | 562,536 | |
Integrated Silicon Solution, Inc. (a) | | | 112,717 | | | | 1,033,615 | |
Intermolecular, Inc. (a) | | | 25,110 | | | | 218,708 | |
| Intersil Corporation - Class A | | | 315,573 | | | | 2,448,846 | |
IXYS Corporation (b) | | | 52,845 | | | | 478,776 | |
Kopin Corporation (a) | | | 28,885 | | | | 95,609 | |
Kulicke & Soffa Industries, Inc. (a) (b) | | | 407,656 | | | | 4,712,503 | |
Lattice Semiconductor Corporation (a) | | | 453,104 | | | | 2,106,934 | |
LTX-Credence Corporation (a) | | | 155,628 | | | | 918,205 | |
MagnaChip Semiconductor Corporation - ADR (a) | | | 54,108 | | | | 867,892 | |
Mattson Technology, Inc. (a) (b) | | | 343,029 | | | | 528,265 | |
MaxLinear, Inc. - Class A (a) | | | 41,237 | | | | 256,907 | |
MEMC Electronic Materials, Inc. (a) | | | 247,778 | | | | 1,338,001 | |
MEMSIC, Inc. (a) | | | 10,804 | | | | 43,972 | |
| Micrel, Inc. | | | 14,290 | | | | 143,757 | |
Microsemi Corporation (a) | | | 10,312 | | | | 214,490 | |
Mindspeed Technologies, Inc. (a) (b) | | | 431,007 | | | | 987,006 | |
| MKS Instruments, Inc. | | | 24,693 | | | | 663,501 | |
MoSys, Inc. (a) | | | 21,823 | | | | 98,640 | |
Nanometrics, Inc. (a) | | | 32,335 | | | | 453,660 | |
Nova Measuring Instruments Ltd. (a) (b) | | | 73,681 | | | | 675,655 | |
NVE Corporation (a) | | | 338 | | | | 17,938 | |
PDF Solutions, Inc. (a) | | | 67,983 | | | | 1,163,189 | |
Pericom Semiconductor Corporation (a) | | | 32,603 | | | | 210,615 | |
Photronics, Inc. (a) | | | 1,282 | | | | 10,115 | |
PLX Technology, Inc. (a) | | | 37,941 | | | | 177,184 | |
PMC-Sierra, Inc. (a) | | | 501,282 | | | | 2,887,384 | |
| Power Integrations, Inc. | | | 9,171 | | | | 379,771 | |
QuickLogic Corporation (a) | | | 40,819 | | | | 104,497 | |
Rambus, Inc. (a) | | | 304,212 | | | | 2,117,316 | |
RF Micro Devices, Inc. (a) | | | 402,504 | | | | 2,258,047 | |
Semtech Corporation (a) | | | 6,481 | | | | 207,846 | |
Sigma Designs, Inc. (a) | | | 150,326 | | | | 715,552 | |
Silicon Image, Inc. (a) | | | 35,680 | | | | 175,902 | |
Spansion, Inc. - Class A (a) | | | 66,355 | | | | 861,951 | |
SunPower Corporation (a) (b) | | | 319,206 | | | | 4,338,010 | |
| Supertex, Inc. | | | 9,317 | | | | 196,402 | |
Tower Semiconductor Ltd. (a) | | | 116 | | | | 760 | |
TriQuint Semiconductor, Inc. (a) (b) | | | 1,047,435 | | | | 6,117,020 | |
Ultra Clean Holdings, Inc. (a) | | | 19,732 | | | | 123,522 | |
Veeco Instruments, Inc. (a) | | | 1,051 | | | | 40,012 | |
Volterra Semiconductor Corporation (a) (b) | | | 137,975 | | | | 1,795,055 | |
| | | | | | | | 73,408,307 | |
Software - 2.4% | |
Actuate Corporation (a) (b) | | | 186,650 | | | | 1,146,031 | |
Advent Software, Inc. (a) | | | 29,018 | | | | 842,683 | |
Allot Communications Ltd. (a) | | | 68,683 | | | | 777,491 | |
Aspen Technology, Inc. (a) | | | 6,541 | | | | 199,370 | |
BSQUARE Corporation (a) | | | 6,731 | | | | 20,799 | |
Cadence Design Systems, Inc. (a) | | | 13,780 | | | | 190,164 | |
| Cimatron Ltd. | | | 11,963 | | | | 93,192 | |
| TFS MARKET NEUTRAL FUND | |
| SCHEDULE OF INVESTMENTS (Continued) | |
| | |
COMMON STOCKS - 92.6% (Continued) | | Shares | | | Value | |
Information Technology - 15.2% (Continued) | |
Software - 2.4% (Continued) | |
ClickSoftware Technologies Ltd. (b) | | | 66,280 | | | $ | 477,216 | |
Compuware Corporation (a) | | | 162,977 | | | | 1,955,724 | |
Comverse, Inc. (a) | | | 14,990 | | | | 397,685 | |
Digimarc Corporation (b) | | | 319 | | | | 6,999 | |
Ellie Mae, Inc. (a) (b) | | | 103,269 | | | | 2,687,059 | |
| EPIQ Systems, Inc. | | | 145,832 | | | | 2,037,273 | |
| ePlus, Inc. | | | 21,875 | | | | 994,875 | |
FleetMatics Group plc (a) | | | 18,820 | | | | 441,705 | |
Fortinet, Inc. (a) | | | 11,233 | | | | 201,745 | |
Guidance Software, Inc. (a) | | | 122,732 | | | | 1,291,141 | |
Guidewire Software, Inc. (a) | | | 7,694 | | | | 308,375 | |
Imperva, Inc. (a) | | | 11,330 | | | | 441,643 | |
Infoblox, Inc. (a) | | | 36,224 | | | | 800,913 | |
Interactive Intelligence Group, Inc. (a) | | | 181 | | | | 7,499 | |
Jive Software, Inc. (a) | | | 18 | | | | 245 | |
Manhattan Associates, Inc. (a) (b) | | | 51,893 | | | | 3,643,407 | |
| Mentor Graphics Corporation | | | 108,031 | | | | 1,972,646 | |
MicroStrategy, Inc. - Class A (a) (b) | | | 7,010 | | | | 632,232 | |
Model N, Inc. (a) | | | 31,161 | | | | 616,365 | |
| Monotype Imaging Holdings, Inc. | | | 41,193 | | | | 955,266 | |
Net 1 UEPS Technologies, Inc. (a) (b) | | | 125,743 | | | | 944,330 | |
NetScout Systems, Inc. (a) (b) | | | 51,473 | | | | 1,174,099 | |
Nuance Communications, Inc. (a) | | | 7,779 | | | | 148,112 | |
| Pegasystems, Inc. | | | 66,424 | | | | 1,681,191 | |
Proofpoint, Inc. (a) | | | 30,537 | | | | 559,438 | |
PROS Holdings, Inc. (a) | | | 137,654 | | | | 3,567,992 | |
Qualys, Inc. (a) | | | 47,838 | | | | 526,218 | |
Rosetta Stone, Inc. (a) | | | 52,001 | | | | 880,377 | |
Rovi Corporation (a) | | | 44,244 | | | | 1,034,867 | |
| Sapiens International Corporation N.V. | | | 5,163 | | | | 29,894 | |
SeaChange International, Inc. (a) | | | 124,261 | | | | 1,349,474 | |
Smith Micro Software, Inc. (a) | | | 280,242 | | | | 392,339 | |
Solera Holdings, Inc. (b) | | | 1,895 | | | | 109,114 | |
Sourcefire, Inc. (a) | | | 1,084 | | | | 51,772 | |
SS&C Technologies Holdings, Inc. (a) (b) | | | 70,520 | | | | 2,164,259 | |
Take-Two Interactive Software, Inc. (a) (b) | | | 145,913 | | | | 2,226,632 | |
TeleCommunication Systems, Inc. (a) | | | 292,828 | | | | 565,158 | |
TeleNav, Inc. (a) | | | 363,130 | | | | 1,902,801 | |
TIBCO Software, Inc. (a) | | | 7,874 | | | | 152,834 | |
VASCO Data Security International, Inc. (a) | | | 64,372 | | | | 547,806 | |
Verint Systems, Inc. (a) | | | 54,635 | | | | 1,805,140 | |
| | | | | | | | 44,953,590 | |
Materials - 5.6% | |
Chemicals - 1.3% | |
| A. Schulman, Inc. | | | 34,988 | | | | 908,638 | |
American Pacific Corporation (a) | | | 19,912 | | | | 488,043 | |
| American Vanguard Corporation | | | 16,629 | | | | 479,580 | |
| Balchem Corporation | | | 7,343 | | | | 318,246 | |
| Cabot Corporation | | | 57,498 | | | | 2,159,625 | |
Chemtura Corporation (a) | | | 62,430 | | | | 1,327,262 | |
Ecolab, Inc. (b) | | | 1,052 | | | | 89,020 | |
| FutureFuel Corporation | | | 139,987 | | | | 1,714,841 | |
| TFS MARKET NEUTRAL FUND | |
| SCHEDULE OF INVESTMENTS (Continued) | |
| | |
COMMON STOCKS - 92.6% (Continued) | | Shares | | | Value | |
Materials - 5.6% (Continued) | |
Chemicals - 1.3% (Continued) | |
| Huntsman Corporation | | | 7,274 | | | $ | 137,188 | |
| Innophos Holdings, Inc. | | | 4,165 | | | | 213,706 | |
Innospec, Inc. (b) | | | 6,537 | | | | 287,693 | |
| Intrepid Potash, Inc. | | | 19,987 | | | | 367,961 | |
Koppers Holdings, Inc. (b) | | | 9,502 | | | | 417,233 | |
Kraton Performance Polymers, Inc. (a) | | | 30,929 | | | | 702,398 | |
Landec Corporation (a) | | | 33,293 | | | | 446,459 | |
LSB Industries, Inc. (a) (b) | | | 114,203 | | | | 3,729,870 | |
| Methanex Corporation | | | 9 | | | | 381 | |
Minerals Technologies, Inc. (b) | | | 63,769 | | | | 2,590,935 | |
Olin Corporation (b) | | | 124,447 | | | | 3,007,884 | |
OM Group, Inc. (a) (b) | | | 71,855 | | | | 1,758,292 | |
OMNOVA Solutions, Inc. (a) | | | 2,908 | | | | 19,396 | |
| PolyOne Corporation | | | 3,104 | | | | 69,933 | |
| Quaker Chemical Corporation | | | 7,048 | | | | 435,003 | |
| RPM International, Inc. | | | 3,026 | | | | 98,042 | |
| Stepan Company | | | 62 | | | | 3,530 | |
| Tredegar Corporation | | | 37,249 | | | | 1,102,570 | |
| Tronox Ltd. - Class A | | | 4,506 | | | | 92,553 | |
| Zep, Inc. | | | 22,243 | | | | 338,094 | |
| | | | | | | | 23,304,376 | |
Construction Materials - 0.3% | |
CaesarStone Sdot-Yam Ltd. (a) | | | 22,325 | | | | 523,744 | |
Eagle Materials, Inc. (b) | | | 73,508 | | | | 4,980,167 | |
Texas Industries, Inc. (a) | | | 23 | | | | 1,465 | |
United States Lime & Minerals, Inc. (a) | | | 2,766 | | | | 127,734 | |
| | | | | | | | 5,633,110 | |
Containers & Packaging - 0.7% | |
| AptarGroup, Inc. | | | 1,516 | | | | 85,047 | |
| Ball Corporation | | | 2,441 | | | | 107,697 | |
Berry Plastics Group, Inc. (a) | | | 11,561 | | | | 219,659 | |
Boise, Inc. (b) | | | 553,208 | | | | 4,420,132 | |
Graphic Packaging Holding Company (a) (b) | | | 483,656 | | | | 3,637,093 | |
| Myers Industries, Inc. | | | 25,839 | | | | 382,934 | |
| Rock-Tenn Company - Class A | | | 1,085 | | | | 108,652 | |
| Sealed Air Corporation | | | 4,484 | | | | 99,186 | |
Silgan Holdings, Inc. (b) | | | 86,779 | | | | 4,154,111 | |
UFP Technologies, Inc. (a) | | | 16,263 | | | | 329,976 | |
| | | | | | | | 13,544,487 | |
Metals & Mining - 2.6% | |
| Alcoa, Inc. | | | 45,050 | | | | 382,925 | |
Alexco Resource Corporation (a) (b) | | | 618,227 | | | | 1,267,365 | |
Almaden Minerals Ltd. (a) (b) | | | 102,857 | | | | 171,771 | |
Asanko Gold, Inc. (a) (b) | | | 192,615 | | | | 498,873 | |
| AuRico Gold, Inc. | | | 78,863 | | | | 407,722 | |
Banro Corporation (a) (b) | | | 410,511 | | | | 525,454 | |
| Barrick Gold Corporation | | | 52,955 | | | | 1,043,743 | |
Brigus Gold Corporation (a) (b) | | | 42,452 | | | | 29,292 | |
| Carpenter Technology Corporation | | | 39,831 | | | | 1,790,802 | |
CD International Enterprises, Inc. (a) | | | 653 | | | | 55 | |
Century Aluminum Company (a) | | | 67,453 | | | | 550,416 | |
Claude Resources, Inc. (a) (b) | | | 54,133 | | | | 15,958 | |
| TFS MARKET NEUTRAL FUND | |
| SCHEDULE OF INVESTMENTS (Continued) | |
| | |
COMMON STOCKS - 92.6% (Continued) | | Shares | | | Value | |
Materials - 5.6% (Continued) | |
Metals & Mining - 2.6% (Continued) | |
| Compass Minerals International, Inc. | | | 10,448 | | | $ | 904,170 | |
Comstock Mining, Inc. (a) | | | 34,985 | | | | 68,221 | |
Dominion Diamond Corporation (a) (b) | | | 80,923 | | | | 1,279,393 | |
| Eldorado Gold Corporation | | | 159,691 | | | | 1,264,753 | |
Endeavour Silver Corporation (a) (b) | | | 283,332 | | | | 1,476,160 | |
Energy Fuels, Inc. (a) | | | 362,148 | | | | 47,079 | |
Entrée Gold, Inc. (a) (b) | | | 27,450 | | | | 8,029 | |
Exeter Resource Corporation (a) (b) | | | 326,732 | | | | 290,791 | |
First Majestic Silver Corporation (a) | | | 61,154 | | | | 754,640 | |
Fortuna Silver Mines, Inc. (a) | | | 404,595 | | | | 1,278,520 | |
| Franco-Nevada Corporation | | | 8,971 | | | | 391,405 | |
| Goldcorp, Inc. | | | 7,951 | | | | 235,191 | |
Golden Minerals Company (a) | | | 4,619 | | | | 8,407 | |
Golden Star Resources Ltd. (a) | | | 552,478 | | | | 596,676 | |
Great Panther Silver Ltd. (a) (b) | | | 691,192 | | | | 725,752 | |
Handy & Harman Ltd. (a) | | | 249 | | | | 3,830 | |
| Haynes International, Inc. | | | 16,038 | | | | 779,607 | |
| Hecla Mining Company | | | 679,613 | | | | 2,310,684 | |
| Hi-Crush Partners, L.P. | | | 8,972 | | | | 167,507 | |
Horsehead Holding Corporation (a) | | | 51,023 | | | | 545,946 | |
| IAMGOLD Corporation | | | 184,494 | | | | 990,733 | |
International Tower Hill Mines Ltd. (a) (b) | | | 145,934 | | | | 144,475 | |
| Kinross Gold Corporation | | | 243,289 | | | | 1,323,492 | |
MAG Silver Corporation (a) (b) | | | 20,461 | | | | 154,685 | |
McEwen Mining, Inc. (a) | | | 519,884 | | | | 1,211,330 | |
| Mesabi Trust | | | 9,163 | | | | 196,088 | |
Minco Gold Corporation (a) | | | 62,393 | | | | 17,470 | |
Mines Management, Inc. (a) | | | 25,249 | | | | 19,947 | |
Nevsun Resources Ltd. (b) | | | 384,577 | | | | 1,449,855 | |
New Gold, Inc. (a) | | | 80,152 | | | | 639,613 | |
| Newmont Mining Corporation | | | 22,881 | | | | 741,344 | |
Noranda Aluminum Holding Corporation (b) | | | 422,551 | | | | 1,609,919 | |
North American Palladium Ltd. (a) (b) | | | 1,264,705 | | | | 1,745,293 | |
Northern Dynasty Minerals Ltd. (a) (b) | | | 447,749 | | | | 1,173,102 | |
NovaCopper, Inc. (a) | | | 3,753 | | | | 7,093 | |
NovaGold Resources, Inc. (a) | | | 692,223 | | | | 1,709,791 | |
| Pan American Silver Corporation | | | 60,056 | | | | 792,739 | |
Platinum Group Metals Ltd. (a) | | | 285,497 | | | | 356,871 | |
Pretium Resources, Inc. (a) | | | 329,781 | | | | 2,417,295 | |
Primero Mining Corporation (a) (b) | | | 131,186 | | | | 776,621 | |
Quest Rare Minerals Ltd. (a) | | | 119,417 | | | | 57,022 | |
Richmont Mines, Inc. (a) (b) | | | 216,925 | | | | 457,712 | |
| Royal Gold, Inc. | | | 5,997 | | | | 333,313 | |
Rubicon Minerals Corporation (a) (b) | | | 1,071,700 | | | | 1,854,041 | |
Sandstorm Gold Ltd. (a) | | | 22,873 | | | | 184,585 | |
Silver Standard Resources, Inc. (a) (b) | | | 107,618 | | | | 768,393 | |
| Silvercorp Metals, Inc. | | | 695,642 | | | | 2,038,231 | |
Silvercrest Mines, Inc. (a) | | | 1,778 | | | | 4,107 | |
| Southern Copper Corporation | | | 7,099 | | | | 236,610 | |
SunCoke Energy, Inc. (a) | | | 41,254 | | | | 624,173 | |
Sutor Technology Group Ltd. (a) | | | 78,354 | | | | 123,016 | |
Tahoe Resources, Inc. (a) | | | 36,049 | | | | 625,811 | |
| TFS MARKET NEUTRAL FUND | |
| SCHEDULE OF INVESTMENTS (Continued) | |
| | |
COMMON STOCKS - 92.6% (Continued) | | Shares | | | Value | |
Materials - 5.6% (Continued) | |
Metals & Mining - 2.6% (Continued) | |
Taseko Mines Ltd. (a) (b) | | | 1,107,198 | | | $ | 2,590,843 | |
Turquoise Hill Resources Ltd. (a) | | | 66,152 | | | | 465,049 | |
Vista Gold Corporation (a) | | | 463,128 | | | | 778,055 | |
| Yamana Gold, Inc. | | | 24,069 | | | | 296,049 | |
| | | | | | | | 48,735,903 | |
Paper & Forest Products - 0.7% | |
Boise Cascade Company (a) | | | 29,563 | | | | 946,903 | |
Buckeye Technologies, Inc. (b) | | | 59,926 | | | | 2,252,618 | |
Clearwater Paper Corporation (a) | | | 1,973 | | | | 90,797 | |
| Deltic Timber Corporation | | | 5,141 | | | | 321,210 | |
| Domtar Corporation | | | 354 | | | | 24,607 | |
KapStone Paper and Packaging Corporation (b) | | | 35,670 | | | | 1,055,119 | |
Louisiana-Pacific Corporation (a) (b) | | | 236,051 | | | | 4,277,244 | |
Mercer International, Inc. (a) | | | 24,642 | | | | 154,998 | |
| Neenah Paper, Inc. | | | 69,205 | | | | 1,990,336 | |
| P.H. Glatfelter Company | | | 73,666 | | | | 1,767,984 | |
| Schweitzer-Mauduit International, Inc. | | | 2,675 | | | | 107,776 | |
Verso Paper Corporation (a) | | | 2,350 | | | | 2,843 | |
| | | | | | | | 12,992,435 | |
Telecommunication Services - 1.4% | |
Diversified Telecommunication Services - 0.8% | |
| Alaska Communications Systems Group, Inc. | | | 2,097 | | | | 3,397 | |
| Atlantic Tele-Network, Inc. | | | 60,840 | | | | 3,088,847 | |
| BCE, Inc. | | | 1,899 | | | | 88,987 | |
Cbeyond, Inc. (a) | | | 58,444 | | | | 513,138 | |
| CenturyLink, Inc. | | | 4,612 | | | | 173,273 | |
Cincinnati Bell, Inc. (a) | | | 288,334 | | | | 1,014,936 | |
| Cogent Communications Group, Inc. | | | 12,093 | | | | 346,344 | |
| Consolidated Communications Holdings, Inc. | | | 57,938 | | | | 1,067,797 | |
General Communication, Inc. - Class A (a) (b) | | | 53,061 | | | | 515,222 | |
Hawaiian Telcom Holdco, Inc. (a) | | | 6,787 | | | | 164,042 | |
IDT Corporation - Class B (b) | | | 166,179 | | | | 2,457,787 | |
| Lumos Networks Corporation | | | 8,393 | | | | 113,222 | |
| Neutral Tandem, Inc. | | | 607,379 | | | | 1,809,989 | |
Premiere Global Services, Inc. (a) (b) | | | 130,138 | | | | 1,461,450 | |
| Primus Telecommunications Group, Inc. | | | 537 | | | | 6,750 | |
| TELUS Corporation | | | 3,022 | | | | 108,973 | |
tw telecom, inc. (a) | | | 17,189 | | | | 465,478 | |
Vonage Holdings Corporation (a) (b) | | | 577,192 | | | | 1,760,436 | |
| Windstream Corporation | | | 24,891 | | | | 212,071 | |
| | | | | | | | 15,372,139 | |
Wireless Telecommunication Services - 0.6% | |
Cellcom Israel Ltd. (b) | | | 111,602 | | | | 1,091,467 | |
Clearwire Corporation - Class A (a) (b) | | | 85,258 | | | | 286,467 | |
FiberTower Corporation (a) | | | 6,529 | | | | 131 | |
MetroPCS Communications, Inc. (a) | | | 29,044 | | | | 343,881 | |
Telephone and Data Systems, Inc. (b) | | | 274,741 | | | | 6,165,188 | |
United States Cellular Corporation (a) | | | 17,840 | | | | 685,770 | |
| USA Mobility, Inc. | | | 90,779 | | | | 1,231,871 | |
| | | | | | | | 9,804,775 | |
| TFS MARKET NEUTRAL FUND | |
| SCHEDULE OF INVESTMENTS (Continued) | |
| | |
COMMON STOCKS - 92.6% (Continued) | | Shares | | | Value | |
Utilities - 1.3% | |
Electric Utilities - 0.6% | |
| ALLETE, Inc. | | | 2,078 | | | $ | 106,705 | |
| Brookfield Infrastructure Partners, L.P. | | | 4,249 | | | | 164,224 | |
| Cleco Corporation | | | 3,530 | | | | 174,806 | |
El Paso Electric Company (b) | | | 54,612 | | | | 2,045,765 | |
| Empire District Electric Company (The) | | | 19,256 | | | | 444,236 | |
| Exelon Corporation | | | 38,339 | | | | 1,438,096 | |
| Great Plains Energy, Inc. | | | 5,229 | | | | 126,176 | |
| Hawaiian Electric Industries, Inc. | | | 51,456 | | | | 1,456,205 | |
IDACORP, Inc. (b) | | | 19,534 | | | | 961,268 | |
| ITC Holdings Corporation | | | 1,014 | | | | 93,511 | |
| Northeast Utilities | | | 3,837 | | | | 173,931 | |
| OGE Energy Corporation | | | 5,400 | | | | 391,122 | |
| Pepco Holdings, Inc. | | | 6,800 | | | | 153,680 | |
| Pinnacle West Capital Corporation | | | 7 | | | | 426 | |
| PNM Resources, Inc. | | | 7,466 | | | | 179,259 | |
| Portland General Electric Company | | | 4,013 | | | | 129,419 | |
| UIL Holdings Corporation | | | 1,808 | | | | 75,285 | |
| Unitil Corporation | | | 28,387 | | | | 860,410 | |
UNS Energy Corporation (b) | | | 61,284 | | | | 3,123,033 | |
| | | | | | | | 12,097,557 | |
Gas Utilities - 0.1% | |
| AGL Resources, Inc. | | | 9,526 | | | | 417,715 | |
| Chesapeake Utilities Corporation | | | 7,948 | | | | 424,105 | |
| Delta Natural Gas Company, Inc. | | | 587 | | | | 12,726 | |
| ONEOK, Inc. | | | 1,849 | | | | 94,965 | |
| Questar Corporation | | | 5,045 | | | | 128,092 | |
| South Jersey Industries, Inc. | | | 10,071 | | | | 621,381 | |
| UGI Corporation | | | 2,663 | | | | 109,130 | |
| | | | | | | | 1,808,114 | |
Independent Power Producers & Energy Traders - 0.1% | |
| Atlantic Power Corporation | | | 108,903 | | | | 511,844 | |
Calpine Corporation (a) | | | 4,780 | | | | 103,869 | |
Genie Energy Ltd. - Class B (b) | | | 136,571 | | | | 1,472,235 | |
| NRG Energy, Inc. | | | 3,649 | | | | 101,698 | |
Synthesis Energy Systems, Inc. (a) (b) | | | 376,848 | | | | 406,996 | |
| | | | | | | | 2,596,642 | |
Multi-Utilities - 0.2% | |
| Ameren Corporation | | | 2,471 | | | | 89,574 | |
| Avista Corporation | | | 62,186 | | | | 1,744,317 | |
| CenterPoint Energy, Inc. | | | 4,065 | | | | 100,324 | |
| CH Energy Group, Inc. | | | 3,461 | | | | 224,861 | |
| CMS Energy Corporation | | | 8,940 | | | | 267,664 | |
| Just Energy Group, Inc. | | | 40,994 | | | | 275,480 | |
| NorthWestern Corporation | | | 9,887 | | | | 425,339 | |
| PG&E Corporation | | | 1,962 | | | | 95,039 | |
| Public Service Enterprise Group, Inc. | | | 4,232 | | | | 154,933 | |
| SCANA Corporation | | | 1,849 | | | | 100,216 | |
| TECO Energy, Inc. | | | 5,585 | | | | 106,841 | |
| Vectren Corporation | | | 3,982 | | | | 149,564 | |
| Wisconsin Energy Corporation | | | 3,983 | | | | 178,996 | |
| | | | | | | | 3,913,148 | |
| TFS MARKET NEUTRAL FUND | |
| SCHEDULE OF INVESTMENTS (Continued) | |
| | |
COMMON STOCKS - 92.6% (Continued) | | Shares | | | Value | |
Utilities - 1.3% (Continued) | |
Water Utilities - 0.3% | |
| American States Water Company | | | 6,048 | | | $ | 335,543 | |
| American Water Works Company, Inc. | | | 2,650 | | | | 110,982 | |
| Aqua America, Inc. | | | 2,891 | | | | 91,731 | |
California Water Service Group (b) | | | 138,577 | | | | 2,778,469 | |
| Connecticut Water Service, Inc. | | | 28,494 | | | | 811,509 | |
| Consolidated Water Company Ltd. | | | 4,544 | | | | 45,304 | |
| Middlesex Water Company | | | 2,978 | | | | 58,399 | |
| SJW Corporation | | | 17,618 | | | | 446,793 | |
Tri-Tech Holding, Inc. (a) (b) | | | 6,574 | | | | 10,058 | |
| | | | | | | | 4,688,788 | |
| | | | | | | | | |
Total Common Stocks (Cost $1,597,630,448) | | | $ | 1,739,040,484 | |
| | | | | | | | | |
PREFERRED STOCKS - 0.0% (c) | | Shares | | | Value | |
| Beazer Homes USA, Inc. (Cost $90,221) | | | 3,140 | | | $ | 84,780 | |
| | | | | | | | | |
| OTHER INVESTMENTS - 4.2% | | Shares | | | Value | |
| Aberdeen Emerging Markets Smaller Company Opportunities Fund, Inc. | | | 4,000 | | | $ | 86,200 | |
| Aberdeen Indonesia Fund, Inc. | | | 21,775 | | | | 287,212 | |
| Aberdeen Israel Fund, Inc. | | | 4,015 | | | | 57,414 | |
| Aberdeen Latin America Equity Fund, Inc. | | | 2,300 | | | | 85,629 | |
| Adams Express Company (The) | | | 75,411 | | | | 893,620 | |
| Advent/Claymore Enhanced Growth & Income Fund | | | 612 | | | | 6,126 | |
| Advent/Claymore Global Convertible Securities & Income Fund | | | 18,172 | | | | 132,837 | |
| Alliance California Municipal Income Fund, Inc. | | | 3,176 | | | | 45,957 | |
| Alliance New York Municipal Income Fund, Inc. | | | 14,389 | | | | 201,878 | |
| AllianzGI Global Equity & Convertible Income Fund | | | 2,447 | | | | 36,289 | |
| AllianzGI International & Premium Strategy Fund | | | 18,757 | | | | 187,758 | |
| AllianzGI NFJ Dividend, Interest & Premium Strategy Fund | | | 14,868 | | | | 252,013 | |
| Alpine Global Dynamic Dividend Fund | | | 116,631 | | | | 564,494 | |
| Alpine Total Dynamic Dividend Fund | | | 386,941 | | | | 1,601,936 | |
| American Select Portfolio, Inc. | | | 31,045 | | | | 337,149 | |
| American Strategic Income Portfolio, Inc. II | | | 46,041 | | | | 417,592 | |
| Avenue Income Credit Strategies Fund | | | 36,819 | | | | 684,465 | |
| Bancroft Fund Ltd. | | | 7,468 | | | | 130,615 | |
| BlackRock Build America Bond Trust | | | 69,284 | | | | 1,590,068 | |
| BlackRock EcoSolutions Investment Trust | | | 11,378 | | | | 101,264 | |
| BlackRock Energy and Resources Trust | | | 12,203 | | | | 312,885 | |
| BlackRock Enhanced Capital and Income Fund | | | 122,278 | | | | 1,600,619 | |
| BlackRock Enhanced Equity Dividend Trust | | | 204,473 | | | | 1,596,934 | |
| BlackRock Global Opportunities Equity Trust | | | 113,435 | | | | 1,601,702 | |
| BlackRock Health Sciences Trust | | | 9,475 | | | | 295,810 | |
| BlackRock International Growth & Income Trust | | | 206,752 | | | | 1,602,328 | |
| BlackRock Muni New York Intermediate Duration Fund, Inc. | | | 1,171 | | | | 18,326 | |
| BlackRock Municipal Bond Investment Trust | | | 1,886 | | | | 30,440 | |
| BlackRock Municipal Income Investment Quality Trust | | | 15,093 | | | | 236,205 | |
| BlackRock Municipal Income Investment Trust | | | 2,385 | | | | 36,586 | |
| BlackRock MuniHoldings New Jersey Quality Fund, Inc. | | | 6,155 | | | | 97,741 | |
| TFS MARKET NEUTRAL FUND | |
| SCHEDULE OF INVESTMENTS (Continued) | |
| | |
| OTHER INVESTMENTS - 4.2% (Continued) | | Shares | | | Value | |
| BlackRock MuniYield California Quality Fund, Inc. | | | 1,300 | | | $ | 21,008 | |
| BlackRock MuniYield Investment Quality Fund | | | 1,885 | | | | 28,539 | |
| BlackRock MuniYield Michigan Quality Fund II, Inc. | | | 23,430 | | | | 333,878 | |
| BlackRock MuniYield New Jersey Quality Fund, Inc. | | | 8,851 | | | | 139,226 | |
| BlackRock MuniYield New York Quality Fund, Inc. | | | 1,089 | | | | 16,139 | |
| BlackRock MuniYield Pennsylvania Quality Fund | | | 352 | | | | 5,565 | |
| BlackRock New York Municipal 2018 Term Trust | | | 2,908 | | | | 44,929 | |
| BlackRock New York Municipal Income Trust II | | | 7,266 | | | | 115,529 | |
| BlackRock Resources & Commodities Strategy Trust | | | 69,547 | | | | 876,292 | |
| BlackRock S&P Quality Rankings Global Equity Managed Trust | | | 8,304 | | | | 108,450 | |
| BlackRock Utility and Infrastructure Trust | | | 18,477 | | | | 365,845 | |
| Boulder Growth & Income Fund, Inc. | | | 90,954 | | | | 663,055 | |
Boulder Total Return Fund, Inc. (a) | | | 15,518 | | | | 328,671 | |
| CBRE Clarion Global Real Estate Income Fund | | | 161,698 | | | | 1,599,193 | |
| Central Europe & Russia Fund, Inc. (The) | | | 17,236 | | | | 561,032 | |
| China Fund, Inc. (The) | | | 26,471 | | | | 557,744 | |
| Clough Global Allocation Fund | | | 13,210 | | | | 198,150 | |
| Clough Global Equity Fund | | | 19,897 | | | | 287,910 | |
| Cohen & Steers Closed-End Opportunity Fund, Inc. | | | 1,754 | | | | 23,714 | |
| Cohen & Steers Dividend Majors Fund, Inc. | | | 24,382 | | | | 368,168 | |
| Cohen & Steers Infrastructure Fund, Inc. | | | 32,094 | | | | 682,639 | |
| Cohen & Steers REIT & Preferred Income Fund, Inc. | | | 28,723 | | | | 550,045 | |
| Cutwater Select Income Fund | | | 3,110 | | | | 62,707 | |
| Delaware Investments Colorado Municipal Income Fund, Inc. | | | 5,163 | | | | 76,671 | |
| Delaware Investments Dividend & Income Fund, Inc. | | | 7,947 | | | | 72,556 | |
| Delaware Investments Minnesota Municipal Income Fund II | | | 4,884 | | | | 74,090 | |
| Delaware Investments National Municipal Income Fund | | | 3,143 | | | | 45,731 | |
| Denali Fund (The) | | | 1,978 | | | | 37,285 | |
| Dow 30 Enhanced Premium & Income Fund, Inc. | | | 33,768 | | | | 402,177 | |
| Duff & Phelps Global Utility Income Fund, Inc. | | | 80,020 | | | | 1,600,400 | |
| DWS Global High Income Fund, Inc. | | | 7,619 | | | | 68,647 | |
| DWS High Income Opportunities Fund, Inc. | | | 16,291 | | | | 254,954 | |
| Eagle Capital Growth Fund, Inc. | | | 1,300 | | | | 10,062 | |
| Eaton Vance California Municipal Bond Fund | | | 28,626 | | | | 348,092 | |
| Eaton Vance California Municipal Bond Fund II | | | 914 | | | | 12,174 | |
| Eaton Vance Enhanced Equity Income Fund | | | 72,898 | | | | 862,383 | |
| Eaton Vance Enhanced Equity Income Fund II | | | 21,159 | | | | 241,847 | |
| Eaton Vance Massachusetts Municipal Bond Fund | | | 2,890 | | | | 43,379 | |
| Eaton Vance Massachusetts Municipal Income Fund | | | 2,706 | | | | 39,616 | |
| Eaton Vance Michigan Municipal Income Trust | | | 3,214 | | | | 44,193 | |
| Eaton Vance National Municipal Opportunities Trust | | | 21,869 | | | | 481,118 | |
| Eaton Vance New York Municipal Bond Fund | | | 13,114 | | | | 182,416 | |
| Eaton Vance New York Municipal Bond Fund 2 | | | 1,300 | | | | 17,290 | |
| Eaton Vance Pennsylvania Municipal Income Trust | | | 998 | | | | 13,673 | |
| Eaton Vance Tax-Managed Diversified Equity Income Fund | | | 57,173 | | | | 594,599 | |
| Ellsworth Fund Ltd. | | | 17,715 | | | | 137,291 | |
Engex, Inc. (a) | | | 633 | | | | 1,937 | |
| European Equity Fund, Inc. (The) | | | 292 | | | | 2,149 | |
| Federated Enhanced Treasury Income Fund | | | 29,637 | | | | 401,878 | |
| Federated Premier Intermediate Municipal Income Fund | | | 17,734 | | | | 248,276 | |
First Opportunity Fund, Inc. (a) | | | 27,407 | | | | 223,367 | |
| First Trust Active Dividend Income Fund (The) | | | 28,609 | | | | 236,310 | |
| TFS MARKET NEUTRAL FUND | |
| SCHEDULE OF INVESTMENTS (Continued) | |
| | |
| OTHER INVESTMENTS - 4.2% (Continued) | | Shares | | | Value | |
| First Trust Enhanced Equity Income Fund | | | 15,606 | | | $ | 203,658 | |
| First Trust High Income Long/Short Fund | | | 4,053 | | | | 77,412 | |
Firsthand Technology Value Fund, Inc. (a) | | | 4,395 | | | | 81,747 | |
| Fort Dearborn Income Securities, Inc. | | | 2,700 | | | | 42,903 | |
| Gabelli Dividend & Income Trust | | | 83,181 | | | | 1,609,552 | |
| Gabelli Healthcare & WellnessRx Trust (The) | | | 7,877 | | | | 79,952 | |
| Gabelli Multimedia Trust, Inc. (The) | | | 13,606 | | | | 122,454 | |
| GDL Fund (The) | | | 38,158 | | | | 446,067 | |
| General American Investors Company, Inc. | | | 14,551 | | | | 461,267 | |
| Greater China Fund, Inc. | | | 11,963 | | | | 144,992 | |
| Guggenheim Enhanced Equity Income Fund | | | 29,822 | | | | 266,609 | |
| Guggenheim Equal Weight Enhanced Equity Income Fund | | | 5,472 | | | | 102,381 | |
| Helios Advantage Income Fund, Inc. | | | 1 | | | | 2 | |
| Helios Multi-Sector High Income Fund, Inc. | | | 1 | | | | 1 | |
Herzfeld Caribbean Basin Fund, Inc. (a) | | | 4,748 | | | | 41,545 | |
| India Fund, Inc. | | | 47,009 | | | | 1,015,864 | |
| ING Asia Pacific High Dividend Equity Income Fund | | | 12,076 | | | | 184,280 | |
| ING Infrastructure, Industrials and Materials Fund | | | 24 | | | | 405 | |
| ING Risk Managed Natural Resources Fund | | | 23,704 | | | | 250,077 | |
| Invesco Municipal Income Opportunities Trust | | | 88,182 | | | | 636,674 | |
| Invesco Quality Municipal Income Trust | | | 9,342 | | | | 125,650 | |
| Invesco Value Municipal Income Trust | | | 1 | | | | 14 | |
| Invesco Van Kampen Bond Fund | | | 1,861 | | | | 37,239 | |
| Invesco Van Kampen California Value Municipal Income Trust | | | 28,225 | | | | 375,957 | |
| Invesco Van Kampen Pennsylvania Value Municipal Income Trust | | | 8,613 | | | | 128,334 | |
| Japan Equity Fund, Inc. (The) | | | 11,250 | | | | 74,700 | |
| Japan Smaller Capitalization Fund, Inc. | | | 52,749 | | | | 476,323 | |
| JF China Region Fund, Inc. | | | 630 | | | | 9,179 | |
| John Hancock Hedged Equity & Income Fund | | | 29,225 | | | | 489,811 | |
| John Hancock Tax-Advantaged Dividend Income Fund | | | 714 | | | | 14,844 | |
Korea Equity Fund, Inc. (a) | | | 16,195 | | | | 140,897 | |
| Lazard Global Total Return & Income Fund, Inc. | | | 1,275 | | | | 21,828 | |
| Lazard World Dividend & Income Fund, Inc. | | | 3,254 | | | | 46,337 | |
| Liberty All-Star Equity Fund | | | 156,450 | | | | 811,976 | |
| Liberty All-Star Growth Fund, Inc. | | | 8,538 | | | | 37,994 | |
| Macquarie Global Infrastructure Total Return Fund, Inc. | | | 27,294 | | | | 605,381 | |
| Macquarie/First Trust Global Infrastructure/Utilities Dividend & Income Fund | | | 843 | | | | 14,188 | |
| Madison Strategic Sector Premium Fund | | | 6,671 | | | | 78,651 | |
| Madison/Claymore Covered Call & Equity Strategy Fund | | | 22,562 | | | | 181,624 | |
| Mexico Equity and Income Fund, Inc. (The) | | | 18,388 | | | | 316,090 | |
| MFS Investment Grade Municipal Trust | | | 20,565 | | | | 207,707 | |
| Morgan Stanley Asia-Pacific Fund, Inc. | | | 1,856 | | | | 31,515 | |
Morgan Stanley China A Share Fund, Inc. (a) | | | 3,695 | | | | 83,692 | |
| Morgan Stanley Eastern Europe Fund, Inc. | | | 974 | | | | 16,353 | |
| Morgan Stanley Emerging Markets Debt Fund, Inc. | | | 21,740 | | | | 261,532 | |
| Morgan Stanley Emerging Markets Domestic Debt Fund, Inc. | | | 35,033 | | | | 606,421 | |
| Morgan Stanley Emerging Markets Fund, Inc. | | | 1,700 | | | | 27,234 | |
| Morgan Stanley Income Securities, Inc. | | | 501 | | | | 9,203 | |
| Neuberger Berman High Yield Strategies Fund, Inc. | | | 17,639 | | | | 249,592 | |
| Neuberger Berman Real Estate Securities Income Fund, Inc. | | | 124,777 | | | | 673,796 | |
| New America High Income Fund, Inc. | | | 21,973 | | | | 230,936 | |
New Ireland Fund, Inc. (The) (a) | | | 11,164 | | | | 114,654 | |
| TFS MARKET NEUTRAL FUND | |
| SCHEDULE OF INVESTMENTS (Continued) | |
| | |
| OTHER INVESTMENTS - 4.2% (Continued) | | Shares | | | Value | |
| Nuveen AMT-Free Municipal Income Fund | | | 22,463 | | | $ | 328,633 | |
| Nuveen Arizona Premium Income Municipal Fund, Inc. | | | 6,763 | | | | 99,827 | |
| Nuveen Build America Bond Opportunity Fund | | | 11,779 | | | | 266,205 | |
| Nuveen California AMT-Free Municipal Income Fund | | | 58,211 | | | | 846,388 | |
| Nuveen California Dividend Advantage Municipal Fund | | | 16,587 | | | | 252,952 | |
| Nuveen California Dividend Advantage Municipal Fund 2 | | | 9,124 | | | | 141,878 | |
| Nuveen California Dividend Advantage Municipal Fund 3 | | | 29,057 | | | | 398,081 | |
| Nuveen Connecticut Premium Income Municipal Fund | | | 12,840 | | | | 183,484 | |
| Nuveen Core Equity Alpha Fund | | | 29,561 | | | | 450,214 | |
| Nuveen Dividend Advantage Municipal Fund | | | 52,397 | | | | 793,291 | |
| Nuveen Dividend Advantage Municipal Fund 2 | | | 25,200 | | | | 384,300 | |
| Nuveen Dividend Advantage Municipal Fund 3 | | | 72,709 | | | | 1,071,004 | |
| Nuveen Dividend Advantage Municipal Income Fund | | | 68,488 | | | | 1,020,471 | |
| Nuveen Diversified Currency Opportunities Fund | | | 76,283 | | | | 991,679 | |
| Nuveen Equity Premium and Growth Fund | | | 40,713 | | | | 559,804 | |
| Nuveen Equity Premium Income Fund | | | 28,347 | | | | 361,424 | |
| Nuveen Georgia Dividend Advantage Municipal Fund 2 | | | 3,661 | | | | 52,133 | |
| Nuveen Maryland Premium Income Municipal Fund | | | 32,899 | | | | 479,338 | |
| Nuveen Massachusetts AMT-Free Municipal Income Fund | | | 4,391 | | | | 60,113 | |
| Nuveen Massachusetts Premium Income Municipal Fund | | | 866 | | | | 13,111 | |
| Nuveen Municipal Advantage Fund | | | 63,267 | | | | 935,719 | |
| Nuveen Municipal Market Opportunity Fund | | | 32,200 | | | | 461,426 | |
| Nuveen Municipal Opportunity Fund, Inc. | | | 78,458 | | | | 1,183,931 | |
| Nuveen New Jersey Dividend Advantage Municipal Fund | | | 5,548 | | | | 82,832 | |
| Nuveen New Jersey Dividend Advantage Municipal Fund 2 | | | 1,046 | | | | 15,962 | |
| Nuveen New Jersey Municipal Value Fund | | | 1,112 | | | | 17,803 | |
| Nuveen New York Dividend Advantage Municipal Fund 2 | | | 100 | | | | 1,503 | |
| Nuveen New York Municipal Value Fund 2 | | | 3,177 | | | | 49,212 | |
| Nuveen North Carolina Premium Income Municipal Fund | | | 18,579 | | | | 267,723 | |
| Nuveen Ohio Quality Income Municipal Fund | | | 28,303 | | | | 479,170 | |
| Nuveen Pennsylvania Dividend Advantage Municipal Fund | | | 4,646 | | | | 67,413 | |
| Nuveen Pennsylvania Dividend Advantage Municipal Fund 2 | | | 10,139 | | | | 144,684 | |
| Nuveen Pennsylvania Investment Quality Municipal Fund | | | 11,310 | | | | 172,364 | |
| Nuveen Pennsylvania Municipal Value Fund | | | 2,562 | | | | 40,787 | |
| Nuveen Pennsylvania Premium Income Municipal Fund 2 | | | 8,985 | | | | 131,271 | |
| Nuveen Performance Plus Municipal Fund | | | 63,951 | | | | 1,015,542 | |
| Nuveen Premier Municipal Income Fund, Inc. | | | 7,811 | | | | 115,993 | |
| Nuveen Premier Municipal Opportunity Fund, Inc. | | | 20,371 | | | | 308,621 | |
| Nuveen Premium Income Municipal Fund | | | 71,389 | | | | 1,045,849 | |
| Nuveen Premium Income Municipal Fund 2 | | | 92,247 | | | | 1,372,638 | |
| Nuveen Premium Income Municipal Opportunity Fund | | | 23,862 | | | | 336,454 | |
| Nuveen Quality Income Municipal Fund | | | 71,426 | | | | 1,080,675 | |
| Nuveen Quality Municipal Fund, Inc. | | | 28,852 | | | | 424,990 | |
| Nuveen Select Quality Municipal Fund | | | 67,494 | | | | 1,006,336 | |
| Nuveen Tax-Advantaged Dividend Growth Fund | | | 27,107 | | | | 415,550 | |
| Nuveen Tax-Advantaged Total Return Strategy Fund | | | 5,684 | | | | 69,231 | |
| Nuveen Virginia Premium Income Municipal Fund | | | 21,762 | | | | 329,912 | |
| Petroleum & Resources Corporation | | | 23,644 | | | | 607,651 | |
| Putnam Municipal Opportunities Trust | | | 23,321 | | | | 295,477 | |
| Putnam Premier Income Trust | | | 60,756 | | | | 335,981 | |
RENN Global Entrepreneurs Fund, Inc. (a) | | | 10,851 | | | | 16,711 | |
| RMR Real Estate Income Fund | | | 38,987 | | | | 844,070 | |
| Royce Focus Trust, Inc. | | | 32,994 | | | | 224,029 | |
| TFS MARKET NEUTRAL FUND | |
| SCHEDULE OF INVESTMENTS (Continued) | |
| | |
| OTHER INVESTMENTS - 4.2% (Continued) | | Shares | | | Value | |
| Royce Micro-Cap Trust, Inc. | | | 46,030 | | | $ | 479,633 | |
| Royce Value Trust, Inc. | | | 105,686 | | | | 1,566,267 | |
| Singapore Fund, Inc. (The) | | | 11,220 | | | | 162,690 | |
| Special Opportunities Fund, Inc. | | | 5,667 | | | | 96,622 | |
| Strategic Global Income Fund, Inc. | | | 28,240 | | | | 299,062 | |
| Swiss Helvetia Fund, Inc. (The) | | | 33,483 | | | | 423,225 | |
Taiwan Fund, Inc. (The) (a) | | | 500 | | | | 8,490 | |
| Templeton Dragon Fund, Inc. | | | 45,874 | | | | 1,272,086 | |
| Templeton Russia & East European Fund, Inc. | | | 9,002 | | | | 130,889 | |
| Tortoise Power and Energy Infrastructure Fund, Inc. | | | 7,580 | | | | 201,476 | |
| Transamerica Income Shares, Inc. | | | 6,876 | | | | 149,553 | |
| Tri-Continental Corporation | | | 25,890 | | | | 465,761 | |
| Turkish Investment Fund, Inc. (The) | | | 30,485 | | | | 570,070 | |
VelocityShares Daily Inverse VIX Short-Term ETN (a) | | | 102,300 | | | | 2,341,647 | |
| Virtus Total Return Fund | | | 35,710 | | | | 152,482 | |
| Wells Fargo Advantage Global Dividend Opportunity Fund | | | 108,026 | | | | 850,165 | |
| Western Asset Global Corporate Defined Opportunity Fund, Inc. | | | 4,802 | | | | 95,992 | |
| Western Asset Inflation Management Fund, Inc. | | | 6,436 | | | | 118,615 | |
| Western Asset Intermediate Muni Fund, Inc. | | | 15,364 | | | | 155,945 | |
| Western Asset Municipal High Income Fund, Inc. | | | 48,824 | | | | 382,292 | |
| Western Asset Worldwide Income Fund, Inc. | | | 11,345 | | | | 173,805 | |
| Western Asset/Claymore Inflation-Linked Opportunities & Income Fund | | | 85,784 | | | | 1,143,501 | |
| Western Asset/Claymore Inflation-Linked Securities & Income Fund | | | 76,772 | | | | 1,047,170 | |
| Zweig Fund, Inc. (The) | | | 35,580 | | | | 457,559 | |
| Zweig Total Return Fund, Inc. (The) | | | 15,175 | | | | 197,882 | |
Total Other Investments (Cost $75,813,833) | | | $ | 77,705,294 | |
| | | | | | | | | |
CORPORATE BONDS - 0.0% (c) | | Par Value | | | Value | |
Financials - 0.0% (c) | | | | | | | | |
| GAMCO Investors, Inc., 0.00%, due 12/31/2015 (Cost $0) | | $ | 3,100 | | | $ | 2,805 | |
| TFS MARKET NEUTRAL FUND | |
| SCHEDULE OF INVESTMENTS (Continued) | |
| | |
| MONEY MARKET FUNDS - 0.9% | | Shares | | | Value | |
Federated Government Obligations Fund - Institutional Class, 0.01% (e) | | | 13,976,855 | | | $ | 13,976,855 | |
UMB Money Market Fiduciary, 0.01% (e) | | | 3,370,158 | | | | 3,370,158 | |
Total Money Market Funds (Cost $17,347,013) | | | $ | 17,347,013 | |
| | | | | | | | | |
Total Investments at Value - 97.7% (Cost $1,690,881,515) | | | $ | 1,834,180,376 | |
| | | | | | | | | |
| Other Assets in Excess of Liabilities - 2.3% | | | | 43,811,403 | (f) |
| | | | | | | | | |
| Net Assets - 100.0% | | | $ | 1,877,991,779 | |
| ADR | - American Depositary Receipt. |
| (a) | Non-income producing security. |
| (b) | All or a portion of the shares have been committed as collateral for open short positions. |
| (c) | Percentage rounds to less than 0.1%. |
| (d) | Security value has been determined in good faith by the Board of Trustees. Total value of such securities is $42,280 at April 30, 2013, representing less than 0.1% of net assets (Note 2). |
| (e) | The rate shown is the 7-day effective yield as of April 30, 2013. |
| (f) | Includes cash held as margin deposits for open short positions. |
| See accompanying notes to financial statements. |
| TFS MARKET NEUTRAL FUND | |
| SCHEDULE OF SECURITIES SOLD SHORT | |
| April 30, 2013 (Unaudited) | |
| | |
| COMMON STOCKS - 65.7% | | Shares | | | Value | |
| Consumer Discretionary - 10.3% | |
| Auto Components - 0.4% | |
| American Axle & Manufacturing Holdings, Inc. | | | 101 | | | $ | 1,350 | |
| China Automotive Systems, Inc. | | | 93,306 | | | | 420,810 | |
| China XD Plastics Company Ltd. | | | 90,980 | | | | 363,010 | |
| Fuel Systems Solutions, Inc. | | | 20,571 | | | | 323,171 | |
| Gentherm, Inc. | | | 148,690 | | | | 2,264,549 | |
| Goodyear Tire & Rubber Company (The) | | | 349,249 | | | | 4,363,866 | |
| Quantum Fuel Systems Technologies Worldwide, Inc. | | | 666,832 | | | | 380,094 | |
| SORL Auto Parts, Inc. | | | 21,719 | | | | 62,551 | |
| | | | | | | | 8,179,401 | |
| Automobiles - 0.4% | |
| Kandi Technologies Corporation | | | 136,312 | | | | 576,600 | |
| Tesla Motors, Inc. | | | 84,090 | | | | 4,540,019 | |
| Winnebago Industries, Inc. | | | 76,164 | | | | 1,395,324 | |
| | | | | | | | 6,511,943 | |
| Distributors - 0.1% | |
| China Metro-Rural Holdings Ltd. | | | 100 | | | | 120 | |
| Pool Corporation | | | 44,823 | | | | 2,197,223 | |
| VOXX International Corporation | | | 856 | | | | 8,158 | |
| | | | | | | | 2,205,501 | |
| Diversified Consumer Services - 1.2% | |
| American Public Education, Inc. | | | 26,842 | | | | 900,012 | |
| Apollo Group, Inc. - Class A | | | 41,868 | | | | 769,115 | |
| Ascent Capital Group, Inc. | | | 1,813 | | | | 120,547 | |
| Bridgepoint Education, Inc. | | | 40,863 | | | | 440,503 | |
| Bright Horizons Family Solutions, Inc. | | | 56 | | | | 1,817 | |
| ChinaCast Education Corporation | | | 280,803 | | | | 19,656 | |
| Coinstar, Inc. | | | 102,352 | | | | 5,405,209 | |
| Collectors Universe, Inc. | | | 2,754 | | | | 32,800 | |
| Corinthian Colleges, Inc. | | | 807,805 | | | | 1,615,610 | |
| CPI Corporation | | | 4,039 | | | | 86 | |
| Education Management Corporation | | | 109,029 | | | | 618,195 | |
| Grand Canyon Education, Inc. | | | 65,290 | | | | 1,669,465 | |
| ITT Educational Services, Inc. | | | 147,968 | | | | 2,709,294 | |
| K12, Inc. | | | 7,905 | | | | 201,341 | |
| Matthews International Corporation - Class A | | | 13,093 | | | | 481,953 | |
| Regis Corporation | | | 132,759 | | | | 2,489,231 | |
| School Specialty, Inc. | | | 34,783 | | | | 1,705 | |
| Service Corporation International | | | 16,206 | | | | 273,557 | |
| Stewart Enterprises, Inc. - Class A | | | 136,385 | | | | 1,215,190 | |
| StoneMor Partners, L.P. | | | 93,136 | | | | 2,556,583 | |
| Strayer Education, Inc. | | | 22,803 | | | | 1,079,950 | |
| Weight Watchers International, Inc. | | | 12,340 | | | | 520,378 | |
| | | | | | | | 23,122,197 | |
| Hotels, Restaurants & Leisure - 1.1% | |
| Arcos Dorados Holdings, Inc. | | | 688 | | | | 9,371 | |
| Asia Entertainment & Resources Ltd. | | | 88,972 | | | | 395,036 | |
| Biglari Holdings, Inc. | | | 274 | | | | 106,115 | |
| BJ's Restaurants, Inc. | | | 148,739 | | | | 5,101,748 | |
| Boyd Gaming Corporation | | | 281,673 | | | | 3,380,076 | |
| Brinker International, Inc. | | | 108,023 | | | | 4,202,095 | |
| Buffalo Wild Wings, Inc. | | | 11,149 | | | | 1,003,326 | |
| TFS MARKET NEUTRAL FUND | |
| SCHEDULE OF SECURITIES SOLD SHORT (Continued) | |
| | |
| COMMON STOCKS - 65.7% (Continued) | | Shares | | | Value | |
| Consumer Discretionary - 10.3% (Continued) | |
| Hotels, Restaurants & Leisure - 1.1% (Continued) | |
| Choice Hotels International, Inc. | | | 144 | | | $ | 5,625 | |
| DineEquity, Inc. | | | 50,069 | | | | 3,566,915 | |
| Kona Grill, Inc. | | | 324 | | | | 3,159 | |
| Life Time Fitness, Inc. | | | 279 | | | | 12,884 | |
| MTR Gaming Group, Inc. | | | 287 | | | | 990 | |
| Nathan's Famous, Inc. | | | 1,095 | | | | 48,892 | |
| PokerTek, Inc. | | | 1,884 | | | | 2,656 | |
| Red Lion Hotels Corporation | | | 25,255 | | | | 164,915 | |
| Ruby Tuesday, Inc. | | | 87,622 | | | | 844,676 | |
| Ryman Hospitality Properties, Inc. | | | 19,739 | | | | 877,596 | |
| Star Buffet, Inc. | | | 325 | | | | 747 | |
| Texas Roadhouse, Inc. | | | 1,114 | | | | 26,179 | |
| Universal Travel Group | | | 237,996 | | | | 47,599 | |
| | | | | | | | 19,800,600 | |
| Household Durables - 1.6% | |
| American Greetings Corporation - Class A | | | 191 | | | | 3,522 | |
| Bassett Furniture Industries, Inc. | | | 1,536 | | | | 21,550 | |
| Beazer Homes USA, Inc. | | | 56,026 | | | | 905,380 | |
| Blyth, Inc. | | | 258,330 | | | | 4,257,278 | |
| Cavco Industries, Inc. | | | 1,725 | | | | 78,695 | |
| Comstock Holding Companies, Inc. - Class A | | | 3,495 | | | | 9,891 | |
| Deer Consumer Products, Inc. | | | 51,567 | | | | 3,094 | |
| Desarrolladora Homex S.A.B de C.V. - ADR | | | 51,462 | | | | 251,135 | |
| Ethan Allen Interiors, Inc. | | | 27,788 | | | | 813,633 | |
| Furniture Brands International, Inc. | | | 1,558 | | | | 1,714 | |
| Garmin Ltd. | | | 5,047 | | | | 177,049 | |
| Hovnanian Enterprises, Inc. - Class A | | | 91,508 | | | | 498,719 | |
| iRobot Corporation | | | 89 | | | | 2,589 | |
| KB Home | | | 246,257 | | | | 5,550,633 | |
| Location Based Technologies, Inc. | | | 103,181 | | | | 19,088 | |
| M/I Homes, Inc. | | | 9,510 | | | | 233,946 | |
| Mad Catz Interactive, Inc. | | | 489,312 | | | | 200,471 | |
| Ryland Group, Inc. (The) | | | 126,606 | | | | 5,704,866 | |
| Skullcandy, Inc. | | | 631,271 | | | | 3,244,733 | |
| SodaStream International Ltd. | | | 43,497 | | | | 2,341,878 | |
| Tempur-Pedic International, Inc. | | | 60,831 | | | | 2,950,304 | |
| ZAGG, Inc. | | | 329,933 | | | | 2,233,646 | |
| | | | | | | | 29,503,814 | |
| Internet & Catalog Retail - 0.4% | |
| NutriSystem, Inc. | | | 178,484 | | | | 1,445,720 | |
| Overstock.com, Inc. | | | 152,184 | | | | 3,165,427 | |
| PetMed Express, Inc. | | | 225,437 | | | | 2,817,963 | |
| Vitacost.com, Inc. | | | 8,103 | | | | 63,041 | |
| | | | | | | | 7,492,151 | |
| Leisure Equipment & Products - 0.5% | |
| Arctic Cat, Inc. | | | 3,214 | | | | 144,598 | |
| Black Diamond, Inc. | | | 126,966 | | | | 1,244,267 | |
| Brunswick Corporation | | | 67,073 | | | | 2,123,531 | |
| Callaway Golf Company | | | 82,684 | | | | 553,983 | |
| Eastman Kodak Company | | | 1,275,620 | | | | 471,980 | |
| JAKKS Pacific, Inc. | | | 14,776 | | | | 161,206 | |
| Nautilus, Inc. | | | 1,305 | | | | 8,978 | |
| TFS MARKET NEUTRAL FUND | |
| SCHEDULE OF SECURITIES SOLD SHORT (Continued) | |
| | |
| COMMON STOCKS - 65.7% (Continued) | | Shares | | | Value | |
| Consumer Discretionary - 10.3% (Continued) | |
| Leisure Equipment & Products - 0.5% (Continued) | |
| Smith & Wesson Holding Corporation | | | 362,553 | | | $ | 3,183,215 | |
| Sturm Ruger & Company, Inc. | | | 10,875 | | | | 557,561 | |
| | | | | | | | 8,449,319 | |
| Media - 0.8% | |
| Atrinsic, Inc. | | | 87,591 | | | | 350 | |
| Central European Media Enterprises Ltd. | | | 56,274 | | | | 208,214 | |
| China Yida Holding Company | | | 1,079 | | | | 4,273 | |
| Clear Channel Outdoor Holdings, Inc. | | | 24,057 | | | | 173,932 | |
| Cumulus Media, Inc. - Class A | | | 41,619 | | | | 132,765 | |
| Dex One Corporation | | | 425,979 | | | | 1,013,830 | |
Dial Global, Inc. (a) | | | 2,195 | | | | 922 | |
| Digital Domain Media Group, Inc. | | | 75,247 | | | | 1,279 | |
| Digital Generation, Inc. | | | 35,925 | | | | 240,697 | |
| DreamWorks Animation SKG, Inc. - Class A | | | 80,130 | | | | 1,544,906 | |
| IMAX Corporation | | | 100 | | | | 2,553 | |
| Lee Enterprises, Inc. | | | 322,902 | | | | 464,979 | |
| Madison Square Garden Company (The) - Class A | | | 52 | | | | 3,134 | |
| Manchester United plc - Class A | | | 17,453 | | | | 313,805 | |
| Martha Stewart Living Omnimedia, Inc. - Class A | | | 1,501 | | | | 3,707 | |
| McClatchy Company (The) - Class A | | | 731,645 | | | | 1,690,100 | |
| Media General, Inc. - Class A | | | 85,726 | | | | 702,953 | |
| Meredith Corporation | | | 20,644 | | | | 801,400 | |
| New York Times Company (The) | | | 354,252 | | | | 3,138,673 | |
| Pandora Media, Inc. | | | 10,104 | | | | 140,749 | |
| Regal Entertainment Group - Class A | | | 65,640 | | | | 1,177,582 | |
| Scholastic Corporation | | | 49,705 | | | | 1,364,402 | |
| SPAR Group, Inc. | | | 705 | | | | 1,382 | |
| SuperMedia, Inc. | | | 50,146 | | | | 263,267 | |
| Tiger Media, Inc. | | | 1,132 | | | | 1,313 | |
| Valassis Communications, Inc. | | | 73,295 | | | | 1,878,551 | |
| World Wrestling Entertainment, Inc. - Class A | | | 27,827 | | | | 255,452 | |
| | | | | | | | 15,525,170 | |
| Multiline Retail - 0.4% | |
| Bon-Ton Stores, Inc. (The) | | | 297,796 | | | | 4,568,191 | |
| Fred's, Inc. - Class A | | | 78,585 | | | | 1,118,264 | |
| J. C. Penney Company, Inc. | | | 62,627 | | | | 1,028,335 | |
| Saks, Inc. | | | 95,354 | | | | 1,101,339 | |
| Sears Canada, Inc. | | | 9,011 | | | | 83,634 | |
| Sears Holdings Corporation | | | 2,755 | | | | 141,442 | |
| | | | | | | | 8,041,205 | |
| Specialty Retail - 2.9% | |
| Aéropostale, Inc. | | | 23,489 | | | | 344,349 | |
| America's Car-Mart, Inc. | | | 4,801 | | | | 222,142 | |
| AutoChina International Ltd. | | | 156 | | | | 1,724 | |
| Barnes & Noble, Inc. | | | 324,414 | | | | 5,881,626 | |
| bebe stores, inc. | | | 176,920 | | | | 1,001,367 | |
| Body Central Corporation | | | 7,340 | | | | 74,721 | |
| Books-A-Million, Inc. | | | 12,867 | | | | 33,454 | |
| Brown Shoe Company, Inc. | | | 6,449 | | | | 109,053 | |
| Buckle, Inc. (The) | | | 38,399 | | | | 1,864,271 | |
| Citi Trends, Inc. | | | 10,782 | | | | 126,904 | |
| Coldwater Creek, Inc. | | | 147,888 | | | | 527,960 | |
| TFS MARKET NEUTRAL FUND | |
| SCHEDULE OF SECURITIES SOLD SHORT (Continued) | |
| | |
| COMMON STOCKS - 65.7% (Continued) | | Shares | | | Value | |
| Consumer Discretionary - 10.3% (Continued) | |
| Specialty Retail - 2.9% (Continued) | |
| Conn's, Inc. | | | 120,773 | | | $ | 5,230,679 | |
| Finish Line, Inc. (The) | | | 493 | | | | 9,559 | |
| Francesca's Holdings Corporation | | | 46,452 | | | | 1,326,669 | |
| Group 1 Automotive, Inc. | | | 68,453 | | | | 4,140,037 | |
| Guess?, Inc. | | | 7,968 | | | | 220,554 | |
| Hibbett Sports, Inc. | | | 2,815 | | | | 154,403 | |
| Hot Topic, Inc. | | | 231,557 | | | | 3,230,220 | |
| Jos. A. Bank Clothiers, Inc. | | | 49,085 | | | | 2,144,033 | |
| Lithia Motors, Inc. | | | 1,120 | | | | 55,462 | |
| Lumber Liquidators Holdings, Inc. | | | 16,218 | | | | 1,329,227 | |
| MarineMax, Inc. | | | 565 | | | | 6,548 | |
| Mattress Firm Holding Corporation | | | 49,091 | | | | 1,881,167 | |
| Monro Muffler Brake, Inc. | | | 61,849 | | | | 2,558,075 | |
| Office Depot, Inc. | | | 153,773 | | | | 593,564 | |
| OfficeMax, Inc. | | | 33,368 | | | | 384,066 | |
| Orchard Supply Hardware Stores Corporation - Class A | | | 5,013 | | | | 9,926 | |
| Pep Boys - Manny Moe & Jack (The) | | | 89,919 | | | | 1,043,060 | |
| RadioShack Corporation | | | 2,359,057 | | | | 7,478,211 | |
| Rent-A-Center, Inc. | | | 89,791 | | | | 3,136,400 | |
| rue21, inc. | | | 11,612 | | | | 370,423 | |
| Select Comfort Corporation | | | 44,227 | | | | 938,497 | |
| Sonic Automotive, Inc. - Class A | | | 72,877 | | | | 1,602,565 | |
| Stage Stores, Inc. | | | 162,848 | | | | 4,509,261 | |
| Systemax, Inc. | | | 2,729 | | | | 24,998 | |
| Tile Shop Holdings, Inc. (The) | | | 276 | | | | 6,845 | |
| Trinity Place Holdings, Inc. | | | 160 | | | | 872 | |
| Walking Company Holdings, Inc. (The) | | | 4 | | | | 37 | |
| Zumiez, Inc. | | | 84,737 | | | | 2,454,831 | |
| | | | | | | | 55,027,760 | |
| Textiles, Apparel & Luxury Goods - 0.5% | |
| American Apparel, Inc. | | | 427,575 | | | | 825,220 | |
| DGSE Companies, Inc. | | | 3,657 | | | | 18,577 | |
| G-III Apparel Group Ltd. | | | 135 | | | | 5,489 | |
| Iconix Brand Group, Inc. | | | 161 | | | | 4,613 | |
| Joe's Jeans, Inc. | | | 100 | | | | 176 | |
| Kingold Jewelry, Inc. | | | 145,407 | | | | 184,667 | |
| Vera Bradley, Inc. | | | 156,150 | | | | 3,563,343 | |
| Wolverine World Wide, Inc. | | | 90,805 | | | | 4,337,755 | |
| | | | | | | | 8,939,840 | |
| Consumer Staples - 1.9% | |
| Beverages - 0.1% | |
| Boston Beer Company, Inc. - Class A | | | 2,671 | | | | 452,254 | |
| Central European Distribution Corporation | | | 852,814 | | | | 59,697 | |
| Primo Water Corporation | | | 88,606 | | | | 112,529 | |
| Reed's, Inc. | | | 120,489 | | | | 494,005 | |
| | | | | | | | 1,118,485 | |
| Food & Staples Retailing - 0.4% | |
| Chefs' Warehouse, Inc. (The) | | | 19,345 | | | | 355,754 | |
| Crumbs Bake Shop, Inc. | | | 466 | | | | 662 | |
| Natural Grocers by Vitamin Cottage, Inc. | | | 5,821 | | | | 145,991 | |
| Pizza Inn Holdings, Inc. | | | 2,087 | | | | 16,571 | |
| Roundy's, Inc. | | | 585,107 | | | | 4,189,366 | |
| TFS MARKET NEUTRAL FUND | |
| SCHEDULE OF SECURITIES SOLD SHORT (Continued) | |
| | |
| COMMON STOCKS - 65.7% (Continued) | | Shares | | | Value | |
| Consumer Staples - 1.9% (Continued) | |
| Food & Staples Retailing - 0.4% (Continued) | |
| Spartan Stores, Inc. | | | 520 | | | $ | 8,726 | |
| SUPERVALU, Inc. | | | 131,628 | | | | 768,707 | |
| Susser Holdings Corporation | | | 11,123 | | | | 591,410 | |
| United Natural Foods, Inc. | | | 15,267 | | | | 762,434 | |
| Weis Markets, Inc. | | | 8,627 | | | | 360,867 | |
| | | | | | | | 7,200,488 | |
| Food Products - 0.7% | |
| AgFeed Industries, Inc. | | | 179,465 | | | | 18,126 | |
| Amira Nature Foods Ltd. | | | 9,864 | | | | 75,558 | |
| Annie's, Inc. | | | 34,271 | | | | 1,295,101 | |
| Calavo Growers, Inc. | | | 66,189 | | | | 1,877,120 | |
| Cal-Maine Foods, Inc. | | | 220 | | | | 9,390 | |
| China Marine Food Group Ltd. | | | 69,491 | | | | 55,593 | |
| Chiquita Brands International, Inc. | | | 572 | | | | 4,936 | |
| Coffee Holding Company, Inc. | | | 78,247 | | | | 530,515 | |
| Dean Foods Company | | | 44,394 | | | | 849,701 | |
| Diamond Foods, Inc. | | | 258,977 | | | | 3,905,373 | |
| Dole Food Company, Inc. | | | 45,613 | | | | 490,796 | |
| Feihe International, Inc. | | | 27,039 | | | | 197,926 | |
| Fresh Del Monte Produce, Inc. | | | 16,322 | | | | 414,742 | |
| Green Mountain Coffee Roasters, Inc. | | | 3,171 | | | | 182,015 | |
| Hain Celestial Group, Inc. (The) | | | 12,027 | | | | 784,762 | |
| Le Gaga Holdings Ltd. | | | 3,510 | | | | 11,337 | |
| Lifeway Foods, Inc. | | | 697 | | | | 8,838 | |
| Limoneira Company | | | 32 | | | | 596 | |
| SkyPeople Fruit Juice, Inc. | | | 31,586 | | | | 69,173 | |
| Stevia Corporation | | | 4,596 | | | | 1,289 | |
| Tootsie Roll Industries, Inc. | | | 3,360 | | | | 104,946 | |
| Umami Sustainable Seafood, Inc. | | | 756 | | | | 1,164 | |
| WhiteWave Foods Company | | | 142,547 | | | | 2,410,470 | |
Yuhe International, Inc. (a) | | | 109,183 | | | | 8,735 | |
| Zhongpin, Inc. | | | 495 | | | | 6,415 | |
| | | | | | | | 13,314,617 | |
Household Products - 0.0% (b) | |
| Central Garden & Pet Company - Class A | | | 20,643 | | | | 181,659 | |
| | | | | | | | | |
| Personal Products - 0.5% | |
| China Sky One Medical, Inc. | | | 197,454 | | | | 29,618 | |
| China-Biotics, Inc. | | | 532,897 | | | | 969,873 | |
| Elizabeth Arden, Inc. | | | 2,763 | | | | 113,145 | |
| Herbalife Ltd. | | | 40,559 | | | | 1,610,598 | |
| LifeVantage Corporation | | | 400,194 | | | | 912,442 | |
| Medifast, Inc. | | | 33,149 | | | | 868,504 | |
| Nu Skin Enterprises, Inc. | | | 22,536 | | | | 1,143,251 | |
| Synutra International, Inc. | | | 96,374 | | | | 465,486 | |
| USANA Health Sciences, Inc. | | | 74,883 | | | | 4,224,899 | |
| | | | | | | | 10,337,816 | |
| Tobacco - 0.2% | |
| Alliance One International, Inc. | | | 255,821 | | | | 959,329 | |
| Star Scientific, Inc. | | | 1,655,659 | | | | 2,053,017 | |
| | | | | | | | 3,012,346 | |
| TFS MARKET NEUTRAL FUND | |
| SCHEDULE OF SECURITIES SOLD SHORT (Continued) | |
| | |
| COMMON STOCKS - 65.7% (Continued) | | Shares | | | Value | |
| Energy - 5.4% | |
| Energy Equipment & Services - 0.7% | |
| C&J Energy Services, Inc. | | | 16,826 | | | $ | 332,987 | |
| Cal Dive International, Inc. | | | 896,283 | | | | 1,496,793 | |
| Compressco Partners, L.P. | | | 33 | | | | 782 | |
| Geokinetics, Inc. | | | 1,664 | | | | 17 | |
| Gulfmark Offshore, Inc. - Class A | | | 10,698 | | | | 445,251 | |
| Heckmann Corporation | | | 1,686,209 | | | | 6,222,111 | |
| Helix Energy Solutions Group, Inc. | | | 123,923 | | | | 2,855,186 | |
| Mitcham Industries, Inc. | | | 1,444 | | | | 21,443 | |
| Newpark Resources, Inc. | | | 4,235 | | | | 44,467 | |
| Poseidon Concepts Corporation | | | 5,042 | | | | 61 | |
| Recon Technology Ltd. | | | 900 | | | | 1,872 | |
| RigNet, Inc. | | | 24 | | | | 581 | |
| RPC, Inc. | | | 42,434 | | | | 561,826 | |
| SulphCo, Inc. | | | 486,090 | | | | 389 | |
| Tesco Corporation | | | 3,417 | | | | 41,687 | |
| Tidewater, Inc. | | | 3,524 | | | | 184,834 | |
| Transocean Ltd. | | | 4,161 | | | | 214,167 | |
| USA Compression Partners, L.P. | | | 9,744 | | | | 209,496 | |
| Vantage Drilling Company | | | 406,367 | | | | 686,760 | |
| | | | | | | | 13,320,710 | |
| Oil, Gas & Consumable Fuels - 4.7% | |
| Alon USA Partners, L.P. | | | 180 | | | | 4,464 | |
| Amyris, Inc. | | | 43,859 | | | | 119,296 | |
| Apco Oil and Gas International, Inc. | | | 2,414 | | | | 24,406 | |
| Approach Resources, Inc. | | | 24,362 | | | | 577,867 | |
| Arch Coal, Inc. | | | 199,556 | | | | 967,847 | |
| ATP Oil & Gas Corporation | | | 376,995 | | | | 52,742 | |
| Berry Petroleum Company - Class A | | | 5,001 | | | | 239,598 | |
| Bill Barrett Corporation | | | 111,667 | | | | 2,217,707 | |
| BioFuel Energy Corporation | | | 112,894 | | | | 487,138 | |
| Blue Dolphin Energy Company | | | 41,521 | | | | 253,278 | |
| BMB Munai, Inc. | | | 5,958 | | | | 120 | |
| BPZ Resources, Inc. | | | 1,147,068 | | | | 2,454,725 | |
| CAMAC Energy, Inc. | | | 237,884 | | | | 128,457 | |
| Chesapeake Granite Wash Trust | | | 32,330 | | | | 524,069 | |
| China Integrated Energy, Inc. | | | 485,749 | | | | 131,152 | |
| Clayton Williams Energy, Inc. | | | 4 | | | | 154 | |
| Clean Energy Fuels Corporation | | | 188,834 | | | | 2,490,720 | |
| Cloud Peak Energy, Inc. | | | 173,969 | | | | 3,399,354 | |
| Contango Oil & Gas Company | | | 5,387 | | | | 202,659 | |
| Cubic Energy, Inc. | | | 8,104 | | | | 2,593 | |
| CVR Energy, Inc. | | | 13,237 | | | | 652,187 | |
| CVR Refining, L.P. | | | 109,796 | | | | 3,499,199 | |
| Dominion Resources Black Warrior Trust | | | 1,352 | | | | 6,774 | |
| Emerald Oil, Inc. | | | 94,383 | | | | 606,883 | |
| Enbridge Energy Management, LLC | | | 66,091 | | | | 1,963,564 | |
| Endeavour International Corporation | | | 342,498 | | | | 938,445 | |
| EQT Midstream Partners, L.P. | | | 915 | | | | 42,364 | |
| EXCO Resources, Inc. | | | 73,706 | | | | 535,106 | |
| Frontline Ltd. | | | 344,368 | | | | 626,750 | |
| FX Energy, Inc. | | | 2,855 | | | | 10,963 | |
| GeoGlobal Resources, Inc. | | | 321,275 | | | | 6,586 | |
| TFS MARKET NEUTRAL FUND | |
| SCHEDULE OF SECURITIES SOLD SHORT (Continued) | |
| | |
| COMMON STOCKS - 65.7% (Continued) | | Shares | | | Value | |
| Energy - 5.4% (Continued) | |
| Oil, Gas & Consumable Fuels - 4.7% (Continued) | |
| Global Partners, L.P. | | | 306 | | | $ | 10,924 | |
| GMX Resources, Inc. | | | 74,803 | | | | 12,342 | |
| GreenHunter Energy, Inc. | | | 36,697 | | | | 41,835 | |
| Harvest Natural Resources, Inc. | | | 101,087 | | | | 331,565 | |
| Houston American Energy Corporation | | | 39,340 | | | | 7,510 | |
| Hugoton Royalty Trust | | | 211 | | | | 1,914 | |
| Hyperdynamics Corporation | | | 890,631 | | | | 492,964 | |
| Inergy Midstream, L.P. | | | 3,001 | | | | 76,195 | |
| InterOil Corporation | | | 43,436 | | | | 3,436,656 | |
| Isramco, Inc. | | | 1,462 | | | | 133,554 | |
| Ivanhoe Energy, Inc. | | | 4,600 | | | | 5,934 | |
| James River Coal Company | | | 3,010,993 | | | | 4,968,138 | |
| Kinder Morgan Management, LLC | | | 11,016 | | | | 972,388 | |
| KiOR, Inc. - Class A | | | 535,458 | | | | 2,607,680 | |
| Knightsbridge Tankers Ltd. | | | 75,571 | | | | 517,661 | |
| L & L Energy, Inc. | | | 256,202 | | | | 991,502 | |
| Linn Energy, LLC | | | 28,137 | | | | 1,086,370 | |
| LinnCo, LLC | | | 60,162 | | | | 2,570,722 | |
| Lucas Energy, Inc. | | | 356,471 | | | | 459,848 | |
| Magnum Hunter Resources Corporation | | | 477,375 | | | | 1,298,460 | |
| McMoRan Exploration Company | | | 63,895 | | | | 1,057,462 | |
| Mexco Energy Corporation | | | 215 | | | | 1,210 | |
| Miller Energy Resources, Inc. | | | 343,668 | | | | 1,305,938 | |
| New Concept Energy, Inc. | | | 12,245 | | | | 12,735 | |
| NGL Energy Partners, L.P. | | | 24,615 | | | | 722,943 | |
| Niska Gas Storage Partners, LLC | | | 2,346 | | | | 35,706 | |
| Nordic American Tankers Ltd. | | | 207,611 | | | | 1,849,814 | |
| Northern Oil & Gas, Inc. | | | 137,298 | | | | 1,769,771 | |
| Overseas Shipholding Group, Inc. | | | 804,229 | | | | 2,670,040 | |
| Oxford Resource Partners, L.P. | | | 177,073 | | | | 571,946 | |
| Pacific Ethanol, Inc. | | | 1,772,585 | | | | 478,598 | |
| Patriot Coal Corporation | | | 447,191 | | | | 41,544 | |
| PBF Energy, Inc. | | | 5,488 | | | | 167,110 | |
| PDC Energy, Inc. | | | 16,345 | | | | 707,738 | |
| Pengrowth Energy Corporation | | | 602 | | | | 3,046 | |
| PetroBakken Energy Ltd. | | | 767 | | | | 6,527 | |
| Pyramid Oil Company | | | 35,326 | | | | 142,364 | |
| Resolute Energy Corporation | | | 118,114 | | | | 1,089,011 | |
| REX American Resources Corporation | | | 181 | | | | 3,383 | |
| Rex Energy Corporation | | | 85,439 | | | | 1,373,005 | |
| Rhino Resource Partners, L.P. | | | 32,825 | | | | 478,588 | |
| Royale Energy, Inc. | | | 232,388 | | | | 571,674 | |
| San Juan Basin Royalty Trust | | | 293,698 | | | | 4,537,634 | |
| Sanchez Energy Corporation | | | 69,575 | | | | 1,260,003 | |
| SandRidge Energy, Inc. | | | 533,812 | | | | 2,743,794 | |
| Sino Clean Energy, Inc. | | | 214,504 | | | | 42,901 | |
| Solazyme, Inc. | | | 961,373 | | | | 8,748,494 | |
| StealthGas, Inc. | | | 611 | | | | 6,318 | |
| Susser Petroleum Partners, L.P. | | | 8,240 | | | | 254,698 | |
| Teekay Tankers Ltd. - Class A | | | 963,909 | | | | 2,438,690 | |
| Tri-Valley Corporation | | | 568,872 | | | | 1,422 | |
| Ultra Petroleum Corporation | | | 31,171 | | | | 667,059 | |
| TFS MARKET NEUTRAL FUND | |
| SCHEDULE OF SECURITIES SOLD SHORT (Continued) | |
| | |
| COMMON STOCKS - 65.7% (Continued) | | Shares | | | Value | |
| Energy - 5.4% (Continued) | |
| Oil, Gas & Consumable Fuels - 4.7% (Continued) | |
| Uranerz Energy Corporation | | | 403,486 | | | $ | 411,556 | |
| Uranium Energy Corporation | | | 1,128,671 | | | | 1,749,440 | |
| Uranium Resources, Inc. | | | 211,338 | | | | 426,903 | |
| USEC, Inc. | | | 932,571 | | | | 298,423 | |
| Verenium Corporation | | | 100,530 | | | | 231,219 | |
| W&T Offshore, Inc. | | | 150,879 | | | | 1,762,267 | |
| Whiting USA Trust I | | | 607,449 | | | | 3,924,121 | |
| Whiting USA Trust II | | | 500 | | | | 7,080 | |
| ZaZa Energy Corporation | | | 100 | | | | 127 | |
| Zion Oil & Gas, Inc. | | | 298,883 | | | | 385,559 | |
| | | | | | | | 88,149,190 | |
| Financials - 9.5% | |
| Capital Markets - 1.6% | |
| AllianceBernstein Holding, L.P. | | | 1,030 | | | | 24,401 | |
| Apollo Investment Corporation | | | 2,303 | | | | 20,289 | |
| Calamos Asset Management, Inc. | | | 10,595 | | | | 120,253 | |
| CorEnergy Infrastructure Trust, Inc. | | | 30 | | | | 230 | |
| E*TRADE Financial Corporation | | | 423,330 | | | | 4,356,066 | |
| Fidus Investment Corporation | | | 156,011 | | | | 2,933,007 | |
| Financial Engines, Inc. | | | 95,763 | | | | 3,482,900 | |
| FXCM, Inc. | | | 51,773 | | | | 701,524 | |
| Gladstone Investment Corporation | | | 297,759 | | | | 2,215,327 | |
| Hercules Technology Growth Capital, Inc. | | | 36,366 | | | | 483,668 | |
| Horizon Technology Finance Corporation | | | 122 | | | | 1,792 | |
| INTL FCStone, Inc. | | | 43,417 | | | | 743,299 | |
| Investment Technology Group, Inc. | | | 269 | | | | 2,929 | |
| Investors Capital Holdings Ltd. | | | 131 | | | | 508 | |
| Janus Capital Group, Inc. | | | 18,562 | | | | 165,573 | |
| KCAP Financial, Inc. | | | 102,781 | | | | 1,112,090 | |
| Knight Capital Group, Inc. | | | 642,674 | | | | 2,275,066 | |
| Main Street Capital Corporation | | | 6,374 | | | | 191,603 | |
| Medley Capital Corporation | | | 4,828 | | | | 75,220 | |
| MF Global Holdings Ltd. | | | 489,633 | | | | 12,975 | |
| NGP Capital Resources Company | | | 169,125 | | | | 1,126,373 | |
| Oppenheimer Holdings, Inc. | | | 435 | | | | 8,048 | |
| PennantPark Floating Rate Capital Ltd. | | | 3,393 | | | | 48,045 | |
| Penson Worldwide, Inc. | | | 261,155 | | | | 992 | |
| Piper Jaffray Companies, Inc. | | | 70,120 | | | | 2,367,251 | |
| Rand Capital Corporation | | | 751 | | | | 2,231 | |
| Safeguard Scientifics, Inc. | | | 81,546 | | | | 1,316,152 | |
| SEI Investments Company | | | 2 | | | | 57 | |
| Solar Capital Ltd. | | | 42,021 | | | | 1,005,563 | |
| Stifel Financial Corporation | | | 123,717 | | | | 3,986,162 | |
| TICC Capital Corporation | | | 37,564 | | | | 382,026 | |
| Triangle Capital Corporation | | | 38,200 | | | | 1,068,454 | |
| | | | | | | | 30,230,074 | |
| Commercial Banks - 4.0% | |
| Ameris Bancorp | | | 81,817 | | | | 1,134,802 | |
| Arrow Financial Corporation | | | 4,431 | | | | 107,186 | |
| Auburn National Bancorporation, Inc. | | | 221 | | | | 4,906 | |
| BancFirst Corporation | | | 174 | | | | 7,280 | |
| BancorpSouth, Inc. | | | 8,902 | | | | 142,432 | |
| TFS MARKET NEUTRAL FUND | |
| SCHEDULE OF SECURITIES SOLD SHORT (Continued) | |
| | |
| COMMON STOCKS - 65.7% (Continued) | | Shares | | | Value | |
| Financials - 9.5% (Continued) | |
| Commercial Banks - 4.0% (Continued) | |
| Bank of the Ozarks, Inc. | | | 98,517 | | | $ | 4,032,301 | |
| Banner Corporation | | | 3,118 | | | | 101,865 | |
| BBCN Bancorp, Inc. | | | 60,576 | | | | 780,219 | |
| BNC Bancorp | | | 1,127 | | | | 11,439 | |
| Boston Private Financial Holdings, Inc. | | | 58,096 | | | | 560,045 | |
| Britton & Koontz Capital Corporation | | | 9 | | | | 99 | |
| Bryn Mawr Bank Corporation | | | 2,555 | | | | 59,353 | |
| C&F Financial Corporation | | | 575 | | | | 23,115 | |
| Capital City Bank Group, Inc. | | | 34,488 | | | | 431,100 | |
| Capitol Bancorp Ltd. | | | 40,199 | | | | 3,015 | |
| Cascade Bancorp | | | 27,027 | | | | 161,351 | |
| Cathay General Bancorp | | | 399 | | | | 7,864 | |
| CenterState Banks, Inc. | | | 44 | | | | 366 | |
| Citizens Holding Company | | | 737 | | | | 14,519 | |
| City Bank | | | 13,826 | | | | 1,383 | |
| City Holding Company | | | 85,787 | | | | 3,275,348 | |
| CoBiz Financial, Inc. | | | 2,715 | | | | 23,240 | |
| Columbia Banking System, Inc. | | | 85,912 | | | | 1,844,531 | |
| Commerce Bancshares, Inc. | | | 16,181 | | | | 649,020 | |
| Community Bank System, Inc. | | | 107,143 | | | | 3,068,576 | |
| Community Trust Bancorp, Inc. | | | 7,963 | | | | 275,679 | |
| Dearborn Bancorp, Inc. | | | 920 | | | | 20 | |
| Fauquier Bankshares, Inc. | | | 228 | | | | 2,741 | |
| First BanCorporation (Puerto Rico) | | | 333,320 | | | | 1,969,921 | |
| First Busey Corporation | | | 237,878 | | | | 1,022,875 | |
| First Commonwealth Financial Corporation | | | 121,959 | | | | 872,007 | |
| First Community Bancshares, Inc. | | | 23,567 | �� | | | 365,524 | |
| First Financial Bancorporation | | | 9,806 | | | | 150,718 | |
| First Financial Bankshares, Inc. | | | 95,180 | | | | 4,702,844 | |
| First of Long Island Corporation (The) | | | 111 | | | | 3,353 | |
| FirstMerit Corporation | | | 25,582 | | | | 438,220 | |
| FNB Corporation | | | 91,666 | | | | 1,044,076 | |
| FNB United Corporation | | | 14,471 | | | | 108,532 | |
| Frontier Financial Corporation | | | 10,459 | | | | 209 | |
| Glacier Bancorp, Inc. | | | 116,550 | | | | 2,150,348 | |
| Glen Burnie Bancorp | | | 56 | | | | 669 | |
| Hampton Roads Bankshares, Inc. | | | 111,129 | | | | 142,245 | |
| Heartland Financial USA, Inc. | | | 842 | | | | 21,395 | |
| Heritage Financial Corporation | | | 41 | | | | 572 | |
| IBERIABANK Corporation | | | 142 | | | | 6,478 | |
| Independent Bank Corporation (Massachusetts) | | | 91,935 | | | | 2,853,662 | |
| Independent Bank Corporation (Michigan) | | | 90,099 | | | | 637,000 | |
| International Bancshares Corporation | | | 1,528 | | | | 29,643 | |
| Jeffersonville Bancorp | | | 10 | | | | 110 | |
| Lakeland Bancorp, Inc. | | | 75,734 | | | | 724,017 | |
| Macatawa Bank Corporation | | | 48,336 | | | | 270,682 | |
| Mercantile Bancorp, Inc. | | | 867 | | | | 182 | |
| Mercantile Bank Corporation | | | 2,409 | | | | 40,254 | |
| National Bankshares, Inc. | | | 6,377 | | | | 208,847 | |
| National Penn Bancshares, Inc. | | | 75,061 | | | | 734,847 | |
| Oak Valley Bancorp | | | 147 | | | | 1,166 | |
| OFG Bancorp | | | 180,868 | | | | 2,906,549 | |
| TFS MARKET NEUTRAL FUND | |
| SCHEDULE OF SECURITIES SOLD SHORT (Continued) | |
| | |
| COMMON STOCKS - 65.7% (Continued) | | Shares | | | Value | |
| Financials - 9.5% (Continued) | |
| Commercial Banks - 4.0% (Continued) | |
| Old Second Bancorp, Inc. | | | 53,319 | | | $ | 245,267 | |
| OmniAmerican Bancorp, Inc. | | | 100 | | | | 2,490 | |
| PAB Bankshares, Inc. | | | 4,809 | | | | 15 | |
| PacWest Bancorp | | | 60,283 | | | | 1,671,648 | |
| Park National Corporation | | | 47,983 | | | | 3,281,078 | |
| Park Sterling Corporation | | | 1,196 | | | | 6,853 | |
| Patriot National Bancorp | | | 638 | | | | 944 | |
| Pinnacle Financial Partners, Inc. | | | 112,729 | | | | 2,735,933 | |
| Popular, Inc. | | | 145,259 | | | | 4,138,429 | |
| Princeton National Bancorp, Inc. | | | 600 | | | | 7 | |
| Prosperity Bancshares, Inc. | | | 27,804 | | | | 1,277,316 | |
| Renasant Corporation | | | 76,837 | | | | 1,753,420 | |
| Republic Bancorp, Inc. - Class A | | | 62,705 | | | | 1,392,051 | |
| S&T Bancorp, Inc. | | | 22,211 | | | | 419,122 | |
| S.Y. Bancorp, Inc. | | | 3,824 | | | | 87,799 | |
| Seacoast Banking Corporation of Florida | | | 832 | | | | 1,780 | |
| Security Bank Corporation | | | 32,973 | | | | – | |
| Simmons First National Corporation - Class A | | | 39,467 | | | | 967,731 | |
| Southside Bancshares, Inc. | | | 160,135 | | | | 3,423,686 | |
| Southwest Bancorp, Inc. | | | 11,695 | | | | 154,608 | |
| State Bank Financial Corporation | | | 32,113 | | | | 472,382 | |
| StellarOne Corporation | | | 6,251 | | | | 93,702 | |
| Sterling Financial Corporation | | | 1,832 | | | | 39,938 | |
| Taylor Capital Group, Inc. | | | 58,427 | | | | 855,956 | |
| TCF Financial Corporation | | | 30,413 | | | | 442,509 | |
| Texas Capital Bancshares, Inc. | | | 92,285 | | | | 3,844,593 | |
| Tompkins Financial Corporation | | | 650 | | | | 27,170 | |
| TowneBank | | | 67,383 | | | | 964,251 | |
| Trustmark Corporation | | | 50 | | | | 1,228 | |
| Umpqua Holdings Corporation | | | 56,708 | | | | 680,496 | |
| United Bankshares, Inc. | | | 98,142 | | | | 2,483,974 | |
| United Security Bancshares | | | 1,807 | | | | 7,426 | |
| Valley National Bancorp | | | 125,290 | | | | 1,126,357 | |
| Westamerica Bancorporation | | | 56,377 | | | | 2,446,198 | |
| Westbury Bancorp, Inc. | | | 1,667 | | | | 22,004 | |
| Western Alliance Bancorporation | | | 5,248 | | | | 77,198 | |
| Wintrust Financial Corporation | | | 22,772 | | | | 816,604 | |
| | | | | | | | 74,092,903 | |
| Consumer Finance - 0.3% | |
| Atlanticus Holdings Corporation | | | 109,936 | | | | 406,763 | |
| Encore Capital Group, Inc. | | | 83,384 | | | | 2,375,610 | |
| Green Dot Corporation - Class A | | | 131,110 | | | | 2,059,738 | |
| NetSpend Holdings, Inc. | | | 2,431 | | | | 38,799 | |
| World Acceptance Corporation | | | 9,908 | | | | 880,425 | |
| | | | | | | | 5,761,335 | |
| Diversified Financial Services - 0.1% | |
| Capital Southwest Corporation | | | 36 | | | | 4,237 | |
| Consumer Portfolio Services, Inc. | | | 228 | | | | 2,102 | |
| DJSP Enterprises, Inc. | | | 15,586 | | | | 1,733 | |
| KKR Financial Holdings, LLC | | | 12,531 | | | | 133,956 | |
| Life Partners Holdings, Inc. | | | 163,156 | | | | 543,310 | |
| TFS MARKET NEUTRAL FUND | |
| SCHEDULE OF SECURITIES SOLD SHORT (Continued) | |
| | |
| COMMON STOCKS - 65.7% (Continued) | | Shares | | | Value | |
| Financials - 9.5% (Continued) | |
| Diversified Financial Services - 0.1% (Continued) | |
| Primus Guaranty Ltd. | | | 1,849 | | | $ | 18,952 | |
| | | | | | | | 704,290 | |
| Insurance - 1.0% | |
| Allied World Assurance Company Holdings Ltd. | | | 16,040 | | | | 1,456,592 | |
| Ambac Financial Group, Inc. | | | 19,556 | | | | 61 | |
| American Equity Investment Life Holding Company | | | 310,463 | | | | 4,731,456 | |
| American Financial Group, Inc. | | | 3,179 | | | | 153,450 | |
| CNA Financial Corporation | | | 17,235 | | | | 580,992 | |
| eHealth, Inc. | | | 114,741 | | | | 2,402,676 | |
| Gerova Financial Group Ltd. | | | 9,506 | | | | – | |
| Homeowners Choice, Inc. | | | 35,008 | | | | 929,112 | |
| Kingsway Financial Services, Inc. | | | 608 | | | | 2,250 | |
| MBIA, Inc. | | | 20,644 | | | | 195,292 | |
| Montpelier Re Holdings Ltd. | | | 64,762 | | | | 1,668,269 | |
| National Financial Partners Corporation | | | 4,802 | | | | 121,683 | |
| National Western Life Insurance Company | | | 130 | | | | 23,741 | |
| Phoenix Companies, Inc. (The) | | | 16,634 | | | | 484,216 | |
| Primerica, Inc. | | | 106,621 | | | | 3,620,849 | |
| StanCorp Financial Group, Inc. | | | 41,200 | | | | 1,779,016 | |
| Tower Group International Ltd. | | | 19,621 | | | | 371,229 | |
| Universal Insurance Holdings, Inc. | | | 65 | | | | 389 | |
| | | | | | | | 18,521,273 | |
| Real Estate Investment Trusts (REIT) - 1.2% | |
| Acadia Realty Trust | | | 693 | | | | 19,785 | |
| Arbor Realty Trust, Inc. | | | 103,034 | | | | 795,422 | |
| Ares Commercial Real Estate Corporation | | | 4,225 | | | | 71,107 | |
| Ashford Hospitality Trust, Inc. | | | 77,317 | | | | 995,843 | |
| Colonial Properties Trust | | | 30,257 | | | | 702,265 | |
| CubeSmart | | | 41,908 | | | | 736,324 | |
| CYS Investments, Inc. | | | 18,312 | | | | 227,618 | |
| DuPont Fabros Technology, Inc. | | | 49,015 | | | | 1,232,237 | |
| Extra Space Storage, Inc. | | | 1 | | | | 44 | |
| First Industrial Realty Trust, Inc. | | | 100 | | | | 1,794 | |
| Franklin Street Properties Corporation | | | 28,853 | | | | 440,585 | |
| Geo Group, Inc. (The) | | | 5,736 | | | | 214,813 | |
| Getty Realty Corporation | | | 99,531 | | | | 2,130,959 | |
| Gladstone Commercial Corporation | | | 54,413 | | | | 1,041,465 | |
| Glimcher Realty Trust | | | 13,020 | | | | 163,271 | |
| Home Properties, Inc. | | | 2,383 | | | | 153,608 | |
| Investors Real Estate Trust | | | 3,324 | | | | 32,343 | |
| iStar Financial, Inc. | | | 280,201 | | | | 3,272,748 | |
| JAVELIN Mortgage Investment Corporation | | | 9,868 | | | | 198,742 | |
| Liberty Property Trust | | | 14,187 | | | | 609,899 | |
| New York Mortgage Trust, Inc. | | | 444,001 | | | | 3,170,167 | |
| NorthStar Realty Finance Corporation | | | 7,074 | | | | 70,528 | |
| Omega Healthcare Investors, Inc. | | | 2,068 | | | | 67,975 | |
| Parkway Properties, Inc. | | | 5,652 | | | | 103,036 | |
| Pennsylvania Real Estate Investment Trust | | | 17,564 | | | | 364,102 | |
| Ramco-Gershenson Properties Trust | | | 19,105 | | | | 333,764 | |
| Redwood Trust, Inc. | | | 13,028 | | | | 297,299 | |
| Retail Opportunity Investments Corporation | | | 1,567 | | | | 23,207 | |
| Rouse Properties, Inc. | | | 91,435 | | | | 1,732,693 | |
| TFS MARKET NEUTRAL FUND | |
| SCHEDULE OF SECURITIES SOLD SHORT (Continued) | |
| | |
| COMMON STOCKS - 65.7% (Continued) | | Shares | | | Value | |
| Financials - 9.5% (Continued) | |
| Real Estate Investment Trusts (REIT) - 1.2% (Continued) | |
| Sabra Health Care REIT, Inc. | | | 551 | | | $ | 16,431 | |
| Silver Bay Realty Trust Corporation | | | 34,752 | | | | 663,068 | |
| STAG Industrial, Inc. | | | 381 | | | | 8,397 | |
| Sun Communities, Inc. | | | 43,884 | | | | 2,244,667 | |
| Terreno Realty Corporation | | | 6 | | | | 113 | |
| Walter Investment Management Corporation | | | 2,877 | | | | 96,552 | |
| Western Asset Mortgage Capital Corporation | | | 14,563 | | | | 326,211 | |
| Winthrop Realty Trust | | | 46,209 | | | | 587,316 | |
| | | | | | | | 23,146,398 | |
| Real Estate Management & Development - 0.1% | |
| Brookfield Property Partners, L.P. | | | 21,059 | | | | 464,983 | |
| China HGS Real Estate, Inc. | | | 100 | | | | 1,090 | |
| China Housing & Land Development, Inc. | | | 143,405 | | | | 255,261 | |
| Gazit-Globe Ltd. | | | 1,949 | | | | 25,824 | |
| Mays (J.W.), Inc. | | | 144 | | | | 3,204 | |
| Novation Companies, Inc. | | | 628 | | | | 302 | |
| St. Joe Company (The) | | | 74,934 | | | | 1,466,458 | |
| | | | | | | | 2,217,122 | |
| Thrifts & Mortgage Finance - 1.2% | |
| America First Tax Exempt Investors, L.P. | | | 9,810 | | | | 70,142 | |
| Anchor BanCorp Wisconsin, Inc. | | | 35,400 | | | | 22,302 | |
| Astoria Financial Corporation | | | 134,159 | | | | 1,286,585 | |
| BBX Capital Corporation - Class A | | | 98,985 | | | | 1,187,820 | |
| Beneficial Mutual Bancorp, Inc. | | | 30,090 | | | | 257,270 | |
| BofI Holding, Inc. | | | 41,350 | | | | 1,686,253 | |
| Federal Agricultural Mortgage Corporation - Class C | | | 10,180 | | | | 323,520 | |
| Federal National Mortgage Association | | | 589,647 | | | | 487,638 | |
| First Federal Bancshares of Arkansas, Inc. | | | 6,056 | | | | 58,683 | |
| First Pactrust Bancorp, Inc. | | | 774 | | | | 8,793 | |
| Flushing Financial Corporation | | | 4,373 | | | | 66,382 | |
| Impac Mortgage Holdings, Inc. | | | 54,588 | | | | 566,623 | |
| Malvern Bancorp, Inc. | | | 499 | | | | 5,793 | |
| MGIC Investment Corporation | | | 890,012 | | | | 4,806,065 | |
| NASB Financial, Inc. | | | 3,726 | | | | 84,953 | |
| Northwest Bancshares, Inc. | | | 140,937 | | | | 1,726,478 | |
| PMI Group, Inc. (The) | | | 7 | | | | – | |
| Provident Financial Holdings, Inc. | | | 11,476 | | | | 185,911 | |
| Radian Group, Inc. | | | 669,823 | | | | 8,004,385 | |
| Security National Financial Corporation - Class A | | | 120,684 | | | | 957,024 | |
| Territorial Bancorp, Inc. | | | 55 | | | | 1,286 | |
Triad Guaranty, Inc. (a) | | | 9,250 | | | | 740 | |
| TrustCo Bank Corporation | | | 264,501 | | | | 1,417,725 | |
| Westfield Financial, Inc. | | | 395 | | | | 2,974 | |
| | | | | | | | 23,215,345 | |
| Health Care - 11.6% | |
| Biotechnology - 6.6% | |
| Aastrom Biosciences, Inc. | | | 435,907 | | | | 261,108 | |
| ACADIA Pharmaceuticals, Inc. | | | 163,534 | | | | 2,107,953 | |
| Achillion Pharmaceuticals, Inc. | | | 197,438 | | | | 1,488,682 | |
| Advaxis, Inc. | | | 97,154 | | | | 6,461 | |
| Aegerion Pharmaceuticals, Inc. | | | 135,199 | | | | 5,683,766 | |
| AEterna Zentaris, Inc. | | | 63,638 | | | | 116,458 | |
| TFS MARKET NEUTRAL FUND | |
| SCHEDULE OF SECURITIES SOLD SHORT (Continued) | |
| | |
| COMMON STOCKS - 65.7% (Continued) | | Shares | | | Value | |
| Health Care - 11.6% (Continued) | |
| Biotechnology - 6.6% (Continued) | |
| Alnylam Pharmaceuticals, Inc. | | | 178,863 | | | $ | 4,283,769 | |
| Amarin Corporation plc - ADR | | | 624,154 | | | | 4,624,981 | |
| Anthera Pharmaceuticals, Inc. | | | 865,094 | | | | 475,888 | |
| ARCA Biopharma, Inc. | | | 2,683 | | | | 6,386 | |
| Arena Pharmaceuticals, Inc. | | | 644,454 | | | | 5,310,301 | |
| Arrowhead Research Corporation | | | 31,565 | | | | 65,024 | |
| AVEO Pharmaceuticals, Inc. | | | 321,389 | | | | 1,642,298 | |
| BioTime, Inc. | | | 360,977 | | | | 1,306,737 | |
| Cardium Therapeutics, Inc. | | | 106,459 | | | | 10,007 | |
| Celldex Therapeutics, Inc. | | | 36,321 | | | | 473,989 | |
| CEL-SCI Corporation | | | 841,126 | | | | 227,104 | |
| Celsion Corporation | | | 1,629,821 | | | | 1,362,530 | |
| China Biologic Products, Inc. | | | 276 | | | | 7,021 | |
| Cleveland BioLabs, Inc. | | | 278,801 | | | | 493,478 | |
| Curis, Inc. | | | 228 | | | | 855 | |
| Cyclacel Pharmaceuticals, Inc. | | | 83,375 | | | | 384,359 | |
| Cytokinetics, Inc. | | | 388,197 | | | | 496,892 | |
| Cytori Therapeutics, Inc. | | | 636,479 | | | | 1,788,506 | |
| CytRx Corporation | | | 207,818 | | | | 559,030 | |
| DARA BioSciences, Inc. | | | 571,455 | | | | 444,935 | |
| Dendreon Corporation | | | 1,300,007 | | | | 6,123,033 | |
| Discovery Laboratories, Inc. | | | 601 | | | | 1,016 | |
EpiCept Corporation (a) | | | 103,927 | | | | 6,236 | |
| Exact Sciences Corporation | | | 61,419 | | | | 573,653 | |
| Exelixis, Inc. | | | 826,583 | | | | 4,289,966 | |
| Galectin Therapeutics, Inc. | | | 12,343 | | | | 57,765 | |
| Galena Biopharma, Inc. | | | 2,246,496 | | | | 6,447,444 | |
| Genomic Health, Inc. | | | 22,944 | | | | 696,580 | |
| GTx, Inc. | | | 10,442 | | | | 48,242 | |
| Horizon Pharma, Inc. | | | 185,319 | | | | 444,766 | |
| iBio, Inc. | | | 184,883 | | | | 79,537 | |
| ImmunoCellular Therapeutics Ltd. | | | 239,567 | | | | 603,709 | |
| ImmunoGen, Inc. | | | 6,007 | | | | 96,232 | |
| Immunomedics, Inc. | | | 451,382 | | | | 1,155,538 | |
| Incyte Corporation | | | 15,030 | | | | 332,914 | |
| Infinity Pharmaceuticals, Inc. | | | 108,396 | | | | 4,670,784 | |
| Insmed, Inc. | | | 131,102 | | | | 1,200,894 | |
| InterMune, Inc. | | | 380,050 | | | | 3,545,866 | |
| Introgen Therapeutics, Inc. | | | 45,612 | | | | 46 | |
| Ironwood Pharmaceuticals, Inc. | | | 193,314 | | | | 2,940,306 | |
| IsoRay, Inc. | | | 279,361 | | | | 139,680 | |
| Keryx Biopharmaceuticals, Inc. | | | 720,186 | | | | 5,869,516 | |
| Lexicon Pharmaceuticals, Inc. | | | 19 | | | | 38 | |
| MannKind Corporation | | | 2,590,271 | | | | 10,231,570 | |
| Marina Biotech, Inc. | | | 246,062 | | | | 55,364 | |
| Mast Therapeutics, Inc. | | | 760,949 | | | | 510,292 | |
| Medgenics, Inc. | | | 78,680 | | | | 315,507 | |
| MediciNova, Inc. | | | 102,132 | | | | 321,716 | |
| Medivation, Inc. | | | 4,650 | | | | 245,101 | |
| MEI Pharma, Inc. | | | 47,057 | | | | 419,748 | |
| Metabolix, Inc. | | | 319,501 | | | | 555,932 | |
| Momenta Pharmaceuticals, Inc. | | | 78,721 | | | | 969,843 | |
| TFS MARKET NEUTRAL FUND | |
| SCHEDULE OF SECURITIES SOLD SHORT (Continued) | |
| | |
| COMMON STOCKS - 65.7% (Continued) | | Shares | | | Value | |
| Health Care - 11.6% (Continued) | |
| Biotechnology - 6.6% (Continued) | |
| Myrexis, Inc. | | | 891 | | | $ | 77 | |
| Myriad Genetics, Inc. | | | 17,097 | | | | 476,151 | |
| NeoStem, Inc. | | | 819,672 | | | | 409,836 | |
| Neuralstem, Inc. | | | 315,545 | | | | 375,499 | |
| NeurogesX, Inc. | | | 134,170 | | | | 1,852 | |
| NewLink Genetics Corporation | | | 24,289 | | | | 338,589 | |
| Nymox Pharmaceutical Corporation | | | 107,768 | | | | 555,005 | |
| Omeros Corporation | | | 30,647 | | | | 123,507 | |
| OncoGenex Pharmaceuticals, Inc. | | | 54 | | | | 547 | |
| Oncolytics Biotech, Inc. | | | 471,040 | | | | 1,436,672 | |
| Oncothyreon, Inc. | | | 8,432 | | | | 21,164 | |
| Opexa Therapeutics, Inc. | | | 108,570 | | | | 183,483 | |
| OPKO Health, Inc. | | | 581,160 | | | | 3,870,526 | |
| Orexigen Therapeutics, Inc. | | | 550,345 | | | | 3,346,098 | |
| Organovo Holdings, Inc. | | | 5,988 | | | | 26,347 | |
| Osiris Therapeutics, Inc. | | | 224,913 | | | | 2,523,524 | |
| OXiGENE, Inc. | | | 22,997 | | | | 81,409 | |
| Oxygen Biotherapeutics, Inc. | | | 17,295 | | | | 4,322 | |
| Peregrine Pharmaceuticals, Inc. | | | 722,436 | | | | 1,004,186 | |
| PharmAthene, Inc. | | | 548,291 | | | | 866,300 | |
| Pluristem Therapeutics, Inc. | | | 213,725 | | | | 679,645 | |
| PROLOR Biotech, Inc. | | | 41,286 | | | | 257,625 | |
| Protalix BioTherapeutics, Inc. | | | 76,914 | | | | 436,102 | |
| Raptor Pharmaceutical Corporation | | | 400,622 | | | | 2,764,292 | |
| Repligen Corporation | | | 890 | | | | 7,974 | |
| Rexahn Pharmaceuticals, Inc. | | | 387,738 | | | | 124,076 | |
| Rosetta Genomics Ltd. | | | 156,250 | | | | 518,750 | |
| RXi Pharmaceuticals Corporation | | | 7,093 | | | | 1,490 | |
| Sangamo Biosciences, Inc. | | | 87,952 | | | | 895,351 | |
| Sarepta Therapeutics, Inc. | | | 81,067 | | | | 2,354,186 | |
| Savient Pharmaceuticals, Inc. | | | 1,339,188 | | | | 999,436 | |
| SIGA Technologies, Inc. | | | 222,093 | | | | 732,907 | |
| Sinovac Biotech Ltd. | | | 15,818 | | | | 56,312 | |
| Spectrum Pharmaceuticals, Inc. | | | 482,396 | | | | 3,574,554 | |
| StemCells, Inc. | | | 309,241 | | | | 522,617 | |
| Sunesis Pharmaceuticals, Inc. | | | 412,072 | | | | 2,319,965 | |
| Synta Pharmaceuticals Corporation | | | 419,823 | | | | 4,303,186 | |
| Synthetic Biologics, Inc. | | | 49,908 | | | | 72,866 | |
| Targacept, Inc. | | | 40,283 | | | | 185,705 | |
Tengion, Inc. (a) | | | 812 | | | | 601 | |
| Theravance, Inc. | | | 2,499 | | | | 84,341 | |
| Titan Pharmaceuticals, Inc. | | | 9,900 | | | | 16,434 | |
| TrovaGene, Inc. | | | 12,689 | | | | 75,119 | |
| Venaxis, Inc. | | | 31,268 | | | | 56,908 | |
| ZIOPHARM Oncology, Inc. | | | 62,568 | | | | 105,114 | |
| | | | | | | | 123,368,002 | |
| Health Care Equipment & Supplies - 1.6% | |
| Abiomed, Inc. | | | 198,022 | | | | 3,657,466 | |
| Accuray, Inc. | | | 579,564 | | | | 2,550,082 | |
| Align Technology, Inc. | | | 5,034 | | | | 166,726 | |
| Antares Pharma, Inc. | | | 216,624 | | | | 821,005 | |
| Atossa Genetics, Inc. | | | 7,689 | | | | 51,362 | |
| TFS MARKET NEUTRAL FUND | |
| SCHEDULE OF SECURITIES SOLD SHORT (Continued) | |
| | |
| COMMON STOCKS - 65.7% (Continued) | | Shares | | | Value | |
| Health Care - 11.6% (Continued) | |
| Health Care Equipment & Supplies - 1.6% (Continued) | |
| Bacterin International Holdings, Inc. | | | 294,288 | | | $ | 260,710 | |
| BIOLASE, Inc. | | | 494,497 | | | | 2,620,834 | |
| BSD Medical Corporation | | | 961,893 | | | | 1,115,796 | |
| Cerus Corporation | | | 561 | | | | 2,985 | |
| Conceptus, Inc. | | | 16 | | | | 496 | |
| CryoPort, Inc. | | | 4,338 | | | | 2,061 | |
| Cyberonics, Inc. | | | 3,342 | | | | 145,110 | |
| D. Medical Industries Ltd. | | | 2,300 | | | | 363 | |
| Dehaier Medical Systems Ltd. | | | 2,070 | | | | 3,933 | |
| Delcath Systems, Inc. | | | 229,652 | | | | 191,070 | |
| Derma Sciences, Inc. | | | 1,014 | | | | 12,259 | |
| Exactech, Inc. | | | 17 | | | | 314 | |
| Fonar Corporation | | | 86,659 | | | | 609,213 | |
| GenMark Diagnostics, Inc. | | | 119,583 | | | | 1,859,516 | |
| Globus Medical, Inc. | | | 2,230 | | | | 33,941 | |
| Hansen Medical, Inc. | | | 282,443 | | | | 553,588 | |
| HeartWare International, Inc. | | | 1,724 | | | | 167,573 | |
| ICU Medical, Inc. | | | 3,173 | | | | 191,173 | |
| Insulet Corporation | | | 133,253 | | | | 3,363,306 | |
| Integra LifeSciences Holdings Corporation | | | 36,706 | | | | 1,285,811 | |
| Intuitive Surgical, Inc. | | | 1 | | | | 492 | |
| InVivo Therapeutics Holdings Corporation | | | 25,140 | | | | 77,934 | |
| Kips Bay Medical, Inc. | | | 5,485 | | | | 7,679 | |
| MELA Sciences, Inc. | | | 542,348 | | | | 667,088 | |
| Meridian Bioscience, Inc. | | | 159,948 | | | | 3,245,345 | |
| Navidea Biopharmaceuticals, Inc. | | | 1,310,254 | | | | 3,210,122 | |
| Neogen Corporation | | | 5,032 | | | | 255,777 | |
| Quidel Corporation | | | 18,076 | | | | 403,456 | |
| STAAR Surgical Company | | | 23,698 | | | | 165,412 | |
| Stereotaxis, Inc. | | | 30,949 | | | | 54,780 | |
| Synergetics USA, Inc. | | | 19,594 | | | | 57,802 | |
| TearLab Corporation | | | 164,148 | | | | 1,227,827 | |
| Unilife Corporation | | | 209,526 | | | | 414,861 | |
| Uroplasty, Inc. | | | 20,189 | | | | 50,472 | |
| Volcano Corporation | | | 7,873 | | | | 159,743 | |
| Wright Medical Group, Inc. | | | 24,890 | | | | 583,422 | |
| ZELTIQ Aesthetics, Inc. | | | 10,237 | | | | 44,838 | |
| | | | | | | | 30,293,743 | |
| Health Care Providers & Services - 0.6% | |
| Acadia Healthcare Company, Inc. | | | 6,861 | | | | 216,465 | |
| Accretive Health, Inc. | | | 123,649 | | | | 1,303,260 | |
| Addus HomeCare Corporation | | | 8,526 | | | | 100,948 | |
| Air Methods Corporation | | | 22,138 | | | | 810,029 | |
| Amedisys, Inc. | | | 27,417 | | | | 275,267 | |
| Bio-Reference Laboratories, Inc. | | | 111,400 | | | | 2,840,700 | |
| Chemed Corporation | | | 21,080 | | | | 1,720,550 | |
| China Cord Blood Corporation | | | 4,236 | | | | 12,242 | |
| ExamWorks Group, Inc. | | | 18,874 | | | | 341,619 | |
| FAB Universal Corporation | | | 77,352 | | | | 342,669 | |
| IPC The Hospitalist Company, Inc. | | | 46,357 | | | | 2,114,806 | |
| Landauer, Inc. | | | 4,023 | | | | 224,765 | |
| Medical Marijuana, Inc. | | | 277,197 | | | | 52,113 | |
| TFS MARKET NEUTRAL FUND | |
| SCHEDULE OF SECURITIES SOLD SHORT (Continued) | |
| | |
| COMMON STOCKS - 65.7% (Continued) | | Shares | | | Value | |
| Health Care - 11.6% (Continued) | |
| Health Care Providers & Services - 0.6% (Continued) | |
| Owens & Minor, Inc. | | | 294 | | | $ | 9,576 | |
| PharMerica Corporation | | | 2,111 | | | �� | 27,211 | |
| | | | | | | | 10,392,220 | |
Health Care Technology - 0.0% (b) | |
| CareView Communications, Inc. | | | 2,133 | | | | 1,173 | |
| HealthStream, Inc. | | | 26 | | | | 597 | |
| MGT Capital Investment, Inc. | | | 2,763 | | | | 10,361 | |
| Quality Systems, Inc. | | | 54,080 | | | | 966,410 | |
| | | | | | | | 978,541 | |
| Life Sciences Tools & Services - 0.4% | |
| Accelerate Diagnostics, Inc. | | | 1,408 | | | | 8,899 | |
| Affymetrix, Inc. | | | 610,928 | | | | 2,223,778 | |
| Apricus Biosciences, Inc. | | | 209,716 | | | | 564,136 | |
| Bioanalytical Systems, Inc. | | | 4,706 | | | | 6,941 | |
| BioDelivery Sciences International, Inc. | | | 147,213 | | | | 836,170 | |
| CombiMatrix Corporation | | | 134,322 | | | | 456,695 | |
| Furiex Pharmaceuticals, Inc. | | | 170 | | | | 5,771 | |
| Genetic Technologies Ltd. | | | 71,618 | | | | 169,018 | |
| Luminex Corporation | | | 39,685 | | | | 659,962 | |
| NeoGenomics, Inc. | | | 5,712 | | | | 21,363 | |
| PURE Bioscience, Inc. | | | 68,457 | | | | 35,598 | |
| Sequenom, Inc. | | | 750,678 | | | | 2,830,056 | |
| | | | | | | | 7,818,387 | |
| Pharmaceuticals - 2.4% | |
| Acura Pharmaceuticals, Inc. | | | 183,943 | | | | 450,660 | |
| Akorn, Inc. | | | 136,754 | | | | 2,058,148 | |
| Alexza Pharmaceuticals, Inc. | | | 501,788 | | | | 2,152,670 | |
| Alimera Sciences, Inc. | | | 212 | | | | 619 | |
| Ampio Pharmaceuticals, Inc. | | | 248,726 | | | | 1,253,579 | |
| Aoxing Pharmaceutical Company, Inc. | | | 10,556 | | | | 2,533 | |
| AVANIR Pharmaceuticals, Inc. - Class A | | | 730,780 | | | | 2,331,188 | |
| Biodel, Inc. | | | 81,511 | | | | 245,348 | |
| BioSante Pharmaceuticals, Inc. | | | 403,013 | | | | 455,405 | |
| Cadence Pharmaceuticals, Inc. | | | 1,168 | | | | 8,269 | |
| Echo Therapeutics, Inc. | | | 251 | | | | 151 | |
| Emisphere Technologies, Inc. | | | 8,547 | | | | 1,624 | |
| Hi-Tech Pharmacal Company, Inc. | | | 5,342 | | | | 176,607 | |
| IntelliPharmaCeutics International, Inc. | | | 18,930 | | | | 40,132 | |
| K-V Pharmaceutical Company - Class A | | | 507,105 | | | | 48,682 | |
| Lannett Company, Inc. | | | 843 | | | | 9,787 | |
| NuPathe, Inc. | | | 195,608 | | | | 655,287 | |
| Oculus Innovative Sciences, Inc. | | | 1,768 | | | | 9,334 | |
| Optimer Pharmaceuticals, Inc. | | | 185,862 | | | | 2,869,709 | |
| Pacira Pharmaceuticals, Inc. | | | 249,082 | | | | 7,190,997 | |
| Pernix Therapeutics Holdings, Inc. | | | 32,682 | | | | 124,845 | |
| Provectus Pharmaceuticals, Inc. | | | 4,588 | | | | 3,120 | |
| Repros Therapeutics, Inc. | | | 311,441 | | | | 6,334,710 | |
| Salix Pharmaceuticals Ltd. | | | 85,026 | | | | 4,446,010 | |
| Santarus, Inc. | | | 65,218 | | | | 1,198,055 | |
| Skystar Bio-Pharmaceutical Company Ltd. | | | 2,610 | | | | 3,811 | |
| Transcept Pharmaceuticals, Inc. | | | 8,595 | | | | 34,036 | |
| ViroPharma, Inc. | | | 140,850 | | | | 3,838,162 | |
| TFS MARKET NEUTRAL FUND | |
| SCHEDULE OF SECURITIES SOLD SHORT (Continued) | |
| | |
| COMMON STOCKS - 65.7% (Continued) | | Shares | | | Value | |
| Health Care - 11.6% (Continued) | |
| Pharmaceuticals - 2.4% (Continued) | |
| VIVUS, Inc. | | | 714,041 | | | $ | 9,489,605 | |
| | | | | | | | 45,433,083 | |
| Industrials - 7.2% | |
| Aerospace & Defense - 0.7% | |
| American Science & Engineering, Inc. | | | 24 | | | | 1,548 | |
| Arotech Corporation | | | 277 | | | | 294 | |
| Ascent Solar Technologies, Inc. | | | 624,208 | | | | 399,493 | |
| Cubic Corporation | | | 7,720 | | | | 331,728 | |
| Elbit Systems Ltd. | | | 24 | | | | 1,001 | |
| Engility Holdings, Inc. | | | 91,020 | | | | 2,180,839 | |
| GenCorp, Inc. | | | 279,060 | | | | 3,647,314 | |
| KEYW Holding Corporation (The) | | | 186,640 | | | | 2,536,438 | |
| Kratos Defense & Security Solutions, Inc. | | | 94,776 | | | | 482,410 | |
| National Presto Industries, Inc. | | | 36,215 | | | | 2,716,125 | |
| | | | | | | | 12,297,190 | |
| Air Freight & Logistics - 0.3% | |
| Echo Global Logistics, Inc. | | | 24,129 | | | | 418,638 | |
| XPO Logistics, Inc. | | | 348,331 | | | | 5,681,279 | |
| | | | | | | | 6,099,917 | |
| Airlines - 0.1% | |
| AMR Corporation | | | 395,525 | | | | 1,673,071 | |
| Hawaiian Holdings, Inc. | | | 8,561 | | | | 47,000 | |
| Pinnacle Airlines Corporation | | | 7,109 | | | | 96 | |
| | | | | | | | 1,720,167 | |
| Building Products - 1.0% | |
| Apogee Enterprises, Inc. | | | 90,778 | | | | 2,313,023 | |
| Builders FirstSource, Inc. | | | 304,434 | | | | 1,884,447 | |
| Fortune Brands Home & Security, Inc. | | | 161 | | | | 5,859 | |
| Griffon Corporation | | | 13,376 | | | | 137,773 | |
| Lennox International, Inc. | | | 71,839 | | | | 4,454,018 | |
| NCI Building Systems, Inc. | | | 18,274 | | | | 312,851 | |
| PGT, Inc. | | | 1,433 | | | | 11,034 | |
| Quanex Building Products Corporation | | | 69,574 | | | | 1,131,969 | |
| Simpson Manufacturing Company, Inc. | | | 11,322 | | | | 325,394 | |
| Trex Company, Inc. | | | 15,272 | | | | 743,441 | |
| Universal Forest Products, Inc. | | | 59,397 | | | | 2,292,724 | |
| USG Corporation | | | 174,149 | | | | 4,526,133 | |
| | | | | | | | 18,138,666 | |
| Commercial Services & Supplies - 1.6% | |
| A.T. Cross Company - Class A | | | 300 | | | | 3,786 | |
| ABM Industries, Inc. | | | 62,244 | | | | 1,403,602 | |
| ACCO Brands Corporation | | | 83,233 | | | | 561,823 | |
| Cenveo, Inc. | | | 277,612 | | | | 566,329 | |
| Consolidated Graphics, Inc. | | | 36,971 | | | | 1,318,756 | |
| Covanta Holding Corporation | | | 215,341 | | | | 4,306,820 | |
| EnerNOC, Inc. | | | 9,028 | | | | 158,171 | |
| Ennis, Inc. | | | 24,311 | | | | 373,660 | |
| HNI Corporation | | | 67,080 | | | | 2,309,564 | |
| Hudson Technologies, Inc. | | | 2,397 | | | | 9,684 | |
| Industrial Services of America, Inc. | | | 20,961 | | | | 67,075 | |
| InnerWorkings, Inc. | | | 226,168 | | | | 2,277,512 | |
| TFS MARKET NEUTRAL FUND | |
| SCHEDULE OF SECURITIES SOLD SHORT (Continued) | |
| | |
| COMMON STOCKS - 65.7% (Continued) | | Shares | | | Value | |
| Industrials - 7.2% (Continued) | |
| Commercial Services & Supplies - 1.6% (Continued) | |
| Interface, Inc. | | | 98,487 | | | $ | 1,648,672 | |
| Intersections, Inc. | | | 72,006 | | | | 688,377 | |
| McGrath RentCorp | | | 49,602 | | | | 1,540,638 | |
| Mine Safety Appliances Company | | | 22,785 | | | | 1,093,680 | |
| Mobile Mini, Inc. | | | 95,744 | | | | 2,693,279 | |
| Multi-Color Corporation | | | 2,243 | | | | 58,004 | |
| Quad/Graphics, Inc. - Class A | | | 189,742 | | | | 3,965,608 | |
| R.R. Donnelley & Sons Company | | | 218,382 | | | | 2,688,282 | |
| RINO International Corporation | | | 79,543 | | | | 2,784 | |
| Standard Parking Corporation | | | 4,949 | | | | 106,354 | |
| Swisher Hygiene, Inc. | | | 103,064 | | | | 150,473 | |
| United Stationers, Inc. | | | 76,859 | | | | 2,495,612 | |
| Waste Connections, Inc. | | | 202 | | | | 7,666 | |
| | | | | | | | 30,496,211 | |
| Construction & Engineering - 0.1% | |
| Aegion Corporation | | | 26,206 | | | | 551,898 | |
| India Globalization Capital, Inc. | | | 2,386 | | | | 5,010 | |
| MasTec, Inc. | | | 34,531 | | | | 959,962 | |
| | | | | | | | 1,516,870 | |
| Electrical Equipment - 0.6% | |
| A123 Systems, Inc. | | | 3,864,942 | | | | 96,237 | |
| Acuity Brands, Inc. | | | 10 | | | | 730 | |
| Advanced Battery Technologies, Inc. | | | 606,543 | | | | 139,505 | |
| Altair Nanotechnologies, Inc. | | | 61,210 | | | | 138,335 | |
Aura Systems, Inc. (a) | | | 177 | | | | 76 | |
| Babcock & Wilcox Company (The) | | | 100 | | | | 2,720 | |
| Beacon Power Corporation | | | 57,124 | | | | 743 | |
| Belden, Inc. | | | 34,057 | | | | 1,683,097 | |
| Broadwind Energy, Inc. | | | 13 | | | | 58 | |
| Capstone Turbine Corporation | | | 237,707 | | | | 209,206 | |
| China BAK Battery, Inc. | | | 86,749 | | | | 56,291 | |
| China Electric Motor, Inc. | | | 1,771 | | | | 159 | |
| Digital Power Corporation | | | 1,323 | | | | 794 | |
| ECOtality, Inc. | | | 5,406 | | | | 10,055 | |
| Encore Wire Corporation | | | 12,227 | | | | 400,434 | |
| FuelCell Energy, Inc. | | | 8,659 | | | | 9,092 | |
| Global Power Equipment Group, Inc. | | | 11,568 | | | | 190,872 | |
| Hoku Corporation | | | 201,745 | | | | 8,877 | |
| Hydrogenics Corporation | | | 3,848 | | | | 31,169 | |
| Lihua International, Inc. | | | 40,953 | | | | 207,632 | |
New Energy Systems Group (a) | | | 9,468 | | | | 805 | |
| Ocean Power Technologies, Inc. | | | 130,605 | | | | 201,132 | |
| Plug Power, Inc. | | | 1,062,673 | | | | 170,028 | |
| Polypore International, Inc. | | | 114,537 | | | | 4,802,536 | |
| Renewable Energy Trade Board Corporation | | | 299 | | | | 75 | |
| Revolution Lighting Technologies, Inc. | | | 17,000 | | | | 64,770 | |
| Satcon Technology Corporation | | | 152,030 | | | | 2,508 | |
| Solarcity Corporation | | | 127,309 | | | | 3,439,889 | |
| Ultralife Corporation | | | 4,286 | | | | 16,887 | |
| Valence Technology, Inc. | | | 710,999 | | | | 14,220 | |
| VU1 Corporation | | | 90 | | | | 131 | |
| Westinghouse Solar, Inc. | | | 34,144 | | | | 1,229 | |
| TFS MARKET NEUTRAL FUND | |
| SCHEDULE OF SECURITIES SOLD SHORT (Continued) | |
| | |
| COMMON STOCKS - 65.7% (Continued) | | Shares | | | Value | |
| Industrials - 7.2% (Continued) | |
| Electrical Equipment - 0.6% (Continued) | |
| Yingli Green Energy Holding Company Ltd. - ADR | | | 20,647 | | | $ | 52,030 | |
| | | | | | | | 11,952,322 | |
| Industrial Conglomerates - 0.1% | |
| Raven Industries, Inc. | | | 81,286 | | | | 2,727,145 | |
| | | | | | | | | |
| Machinery - 1.2% | |
| Accuride Corporation | | | 2,589 | | | | 13,308 | |
| Actuant Corporation - Class A | | | 5,274 | | | | 165,076 | |
| Altra Holdings, Inc. | | | 61,177 | | | | 1,630,367 | |
| Art's-Way Manufacturing Company, Inc. | | | 1,712 | | | | 10,563 | |
| Astec Industries, Inc. | | | 58 | | | | 1,904 | |
| Briggs & Stratton Corporation | | | 132,559 | | | | 2,981,252 | |
| Chart Industries, Inc. | | | 2,800 | | | | 237,468 | |
China Valves Technology, Inc. (a) | | | 256,466 | | | | 115,410 | |
| CLARCOR, Inc. | | | 13 | | | | 672 | |
| Commercial Vehicle Group, Inc. | | | 468 | | | | 3,281 | |
| Douglas Dynamics, Inc. | | | 29,404 | | | | 411,362 | |
| Dynamic Materials Corporation | | | 557 | | | | 8,845 | |
| Energy Recovery, Inc. | | | 129,231 | | | | 472,985 | |
| EnPro Industries, Inc. | | | 3,583 | | | | 176,570 | |
| ExOne Company (The) | | | 46,555 | | | | 1,787,712 | |
| Federal Signal Corporation | | | 58 | | | | 450 | |
| Flow International Corporation | | | 32,613 | | | | 119,364 | |
| FreightCar America, Inc. | | | 8,986 | | | | 187,628 | |
| Highway Holdings Ltd. | | | 510 | | | | 877 | |
| Lindsay Corporation | | | 30,953 | | | | 2,377,809 | |
| Lydall, Inc. | | | 8,316 | | | | 119,251 | |
| Miller Industries, Inc. | | | 1,329 | | | | 20,081 | |
| Navistar International Corporation | | | 41,543 | | | | 1,375,904 | |
| PMFG, Inc. | | | 12,945 | | | | 74,563 | |
| SmartHeat, Inc. | | | 4,830 | | | | 1,546 | |
| Sun Hydraulics Corporation | | | 30,458 | | | | 997,500 | |
| Tennant Company | | | 12,488 | | | | 597,176 | |
| Titan International, Inc. | | | 4,280 | | | | 95,487 | |
| Toro Company (The) | | | 52,517 | | | | 2,363,790 | |
| Twin Disc, Inc. | | | 67,350 | | | | 1,435,902 | |
| Wabash National Corporation | | | 242 | | | | 2,282 | |
| Westport Innovations, Inc. | | | 168,081 | | | | 5,222,277 | |
| | | | | | | | 23,008,662 | |
| Marine - 0.3% | |
| Baltic Trading Ltd. | | | 9,386 | | | | 32,570 | |
| Diana Containerships, Inc. | | | 680 | | | | 3,869 | |
| Eagle Bulk Shipping, Inc. | | | 439,355 | | | | 1,546,530 | |
| Excel Maritime Carriers Ltd. | | | 917,152 | | | | 376,032 | |
| FreeSeas, Inc. | | | 508 | | | | 549 | |
| Genco Shipping & Trading Ltd. | | | 673,394 | | | | 1,151,504 | |
| Navios Maritime Partners, L.P. | | | 2,527 | | | | 38,309 | |
| Safe Bulkers, Inc. | | | 254,211 | | | | 1,276,139 | |
| Seaspan Corporation | | | 99,613 | | | | 2,184,513 | |
| | | | | | | | 6,610,015 | |
| Professional Services - 0.5% | |
| Acacia Research Corporation | | | 112,101 | | | | 2,670,246 | |
| TFS MARKET NEUTRAL FUND | |
| SCHEDULE OF SECURITIES SOLD SHORT (Continued) | |
| | |
| COMMON STOCKS - 65.7% (Continued) | | Shares | | | Value | |
| Industrials - 7.2% (Continued) | |
| Professional Services - 0.5% (Continued) | |
| CBIZ, Inc. | | | 313,010 | | | $ | 2,031,435 | |
| CDI Corporation | | | 3,624 | | | | 56,788 | |
| CRA International, Inc. | | | 1,987 | | | | 36,640 | |
| FTI Consulting, Inc. | | | 43,280 | | | | 1,433,434 | |
| Hudson Global, Inc. | | | 3,449 | | | | 11,382 | |
| ICF International, Inc. | | | 14,259 | | | | 386,561 | |
| Innovaro, Inc. | | | 7,451 | | | | 462 | |
| Lightbridge Corporation | | | 113,980 | | | | 166,411 | |
| Odyssey Marine Exploration, Inc. | | | 668,817 | | | | 1,973,010 | |
| Pendrell Corporation | | | 4,316 | | | | 7,294 | |
| Spherix, Inc. | | | 205 | | | | 1,550 | |
Thomas Group, Inc. (a) | | | 900 | | | | 7 | |
| Volt Information Sciences, Inc. | | | 100 | | | | 810 | |
| VSE Corporation | | | 256 | | | | 7,805 | |
| | | | | | | | 8,783,835 | |
| Road & Rail - 0.3% | |
| Landstar System, Inc. | | | 74,979 | | | | 4,098,352 | |
| Student Transportation, Inc. | | | 18,904 | | | | 122,309 | |
| YRC Worldwide, Inc. | | | 118,244 | | | | 886,830 | |
| | | | | | | | 5,107,491 | |
| Trading Companies & Distributors - 0.4% | |
| AeroCentury Corporation | | | 118 | | | | 2,334 | |
| Beacon Roofing Supply, Inc. | | | 86,712 | | | | 3,306,329 | |
| BlueLinx Holdings, Inc. | | | 155 | | | | 451 | |
| China Armco Metals, Inc. | | | 140,785 | | | | 50,697 | |
| H&E Equipment Services, Inc. | | | 57,966 | | | | 1,180,188 | |
| Houston Wire & Cable Company | | | 8,325 | | | | 113,386 | |
| Kaman Corporation | | | 6,571 | | | | 222,034 | |
| TAL International Group, Inc. | | | 6,390 | | | | 264,546 | |
| Titan Machinery, Inc. | | | 83,558 | | | | 1,885,068 | |
| | | | | | | | 7,025,033 | |
Transportation Infrastructure - 0.0% (b) | |
| Sino-Global Shipping America Ltd. | | | 2,857 | | | | 4,628 | |
| | | | | | | | | |
| Information Technology - 13.3% | |
| Communications Equipment - 1.7% | |
| ADTRAN, Inc. | | | 80,614 | | | | 1,692,894 | |
| Ambient Corporation | | | 1,159 | | | | 2,306 | |
| ARRIS Group, Inc. | | | 6,329 | | | | 104,492 | |
| AudioCodes Ltd. | | | 3,247 | | | | 12,793 | |
| Calix, Inc. | | | 6,142 | | | | 52,391 | |
| CIENA Corporation | | | 372,246 | | | | 5,568,800 | |
| DragonWave, Inc. | | | 42,347 | | | | 83,000 | |
| Extreme Networks, Inc. | | | 139,273 | | | | 463,779 | |
| Globecomm Systems, Inc. | | | 102,788 | | | | 1,259,153 | |
| Infinera Corporation | | | 312,463 | | | | 2,630,939 | |
| InterDigital, Inc. | | | 59,331 | | | | 2,634,890 | |
| KVH Industries, Inc. | | | 1,710 | | | | 22,589 | |
| Oclaro, Inc. | | | 100,433 | | | | 136,589 | |
| ParkerVision, Inc. | | | 1,255,368 | | | | 5,008,918 | |
| Polycom, Inc. | | | 155,023 | | | | 1,627,742 | |
| Powerwave Technologies, Inc. | | | 119,142 | | | | 1,668 | |
| TFS MARKET NEUTRAL FUND | |
| SCHEDULE OF SECURITIES SOLD SHORT (Continued) | |
| | |
| COMMON STOCKS - 65.7% (Continued) | | Shares | | | Value | |
| Information Technology - 13.3% (Continued) | |
| Communications Equipment - 1.7% (Continued) | |
| Procera Networks, Inc. | | | 55,103 | | | $ | 611,092 | |
| Research In Motion Ltd. | | | 30,850 | | | | 502,547 | |
| RIT Technologies Ltd. | | | 11,154 | | | | 51,866 | |
Telestone Technologies Corporation (a) | | | 480,451 | | | | 233,019 | |
| TESSCO Technologies, Inc. | | | 2,378 | | | | 48,606 | |
| Ubiquiti Networks, Inc. | | | 276,912 | | | | 4,278,290 | |
| ViaSat, Inc. | | | 80,586 | | | | 3,906,003 | |
| Zoom Technologies, Inc. | | | 176,668 | | | | 62,364 | |
| ZST Digital Networks, Inc. | | | 179,681 | | | | 260,538 | |
| | | | | | | | 31,257,268 | |
| Computers & Peripherals - 1.2% | |
| 3D Systems Corporation | | | 194,208 | | | | 7,426,514 | |
| Diebold, Inc. | | | 6,545 | | | | 191,703 | |
| Fusion-io, Inc. | | | 254,012 | | | | 4,770,345 | |
| Hauppauge Digital, Inc. | | | 68,415 | | | | 67,047 | |
| iGO, Inc. | | | 469 | | | | 1,168 | |
| Imation Corporation | | | 17,761 | | | | 65,360 | |
| Logitech International S.A. | | | 639,722 | | | | 4,062,235 | |
| OCZ Technology Group, Inc. | | | 2,404,582 | | | | 3,150,002 | |
| Silicon Graphics International Corporation | | | 17,593 | | | | 228,709 | |
| Socket Mobile, Inc. | | | 52 | | | | 96 | |
| STEC, Inc. | | | 260,889 | | | | 947,027 | |
| Stratasys Ltd. | | | 22,136 | | | | 1,838,395 | |
| Super Micro Computer, Inc. | | | 30,659 | | | | 294,940 | |
| Synaptics, Inc. | | | 505 | | | | 20,821 | |
| USA Technologies, Inc. | | | 230,995 | | | | 482,779 | |
| | | | | | | | 23,547,141 | |
| Electronic Equipment, Instruments & Components - 2.2% | |
| ClearSign Combustion Corporation | | | 2,100 | | | | 18,921 | |
| Digital Ally, Inc. | | | 588 | | | | 3,528 | |
| Document Security Systems, Inc. | | | 160,590 | | | | 489,799 | |
| Dolby Laboratories, Inc. - Class A | | | 48,439 | | | | 1,591,221 | |
| DTS, Inc. | | | 120,585 | | | | 2,023,416 | |
| e.Digital Corporation | | | 10,897 | | | | 1,744 | |
| Electro Rent Corporation | | | 6 | | | | 99 | |
| FARO Technologies, Inc. | | | 120 | | | | 4,655 | |
| FEI Company | | | 7,243 | | | | 462,683 | |
| InvenSense, Inc. | | | 36 | | | | 336 | |
| Itron, Inc. | | | 27,153 | | | | 1,076,616 | |
| KEMET Corporation | | | 362 | | | | 2,255 | |
| Magal Security Systems Ltd. | | | 1,188 | | | | 4,752 | |
| Mercury Systems, Inc. | | | 107,601 | | | | 831,756 | |
| Mesa Laboratories, Inc. | | | 31 | | | | 1,530 | |
| Microvision, Inc. | | | 292,517 | | | | 599,660 | |
| Molex, Inc. | | | 163,133 | | | | 4,497,577 | |
| Nam Tai Electronics, Inc. | | | 13,000 | | | | 98,280 | |
| Neonode, Inc. | | | 378,163 | | | | 2,159,311 | |
| OSI Systems, Inc. | | | 47,877 | | | | 2,743,352 | |
| Parametric Sound Corporation | | | 109,517 | | | | 1,970,211 | |
| Power-One, Inc. | | | 91,634 | | | | 579,127 | |
| RadiSys Corporation | | | 4,115 | | | | 20,410 | |
| RealD, Inc. | | | 248,604 | | | | 3,721,602 | |
| TFS MARKET NEUTRAL FUND | |
| SCHEDULE OF SECURITIES SOLD SHORT (Continued) | |
| | |
| COMMON STOCKS - 65.7% (Continued) | | Shares | | | Value | |
| Information Technology - 13.3% (Continued) | |
| Electronic Equipment, Instruments & Components - 2.2% (Continued) | |
| Research Frontiers, Inc. | | | 54,122 | | | $ | 224,606 | |
SinoHub, Inc. (a) | | | 43,908 | | | | 2,195 | |
| SMTC Corporation | | | 456 | | | | 1,008 | |
| Superconductor Technologies, Inc. | | | 23,595 | | | | 102,402 | |
| SYNNEX Corporation | | | 58,621 | | | | 2,028,287 | |
| Uni-Pixel, Inc. | | | 384,959 | | | | 13,685,292 | |
| Universal Display Corporation | | | 76,941 | | | | 2,419,025 | |
| Viasystems Group, Inc. | | | 12 | | | | 153 | |
| XcelMobility, Inc. | | | 2,874 | | | | 144 | |
| | | | | | | | 41,365,953 | |
| Internet Software & Services - 2.2% | |
| Active Network, Inc. (The) | | | 327,796 | | | | 1,648,814 | |
| Angie's List, Inc. | | | 122,073 | | | | 2,959,050 | |
| AOL, Inc. | | | 30,425 | | | | 1,175,622 | |
| Bankrate, Inc. | | | 147,115 | | | | 1,983,110 | |
| Blucora, Inc. | | | 90,785 | | | | 1,340,894 | |
| Bridgeline Digital, Inc. | | | 389 | | | | 490 | |
| Carbonite, Inc. | | | 153,509 | | | | 1,633,336 | |
| Constant Contact, Inc. | | | 154,772 | | | | 2,261,219 | |
| Dealertrack Technologies, Inc. | | | 3,824 | | | | 106,498 | |
| Dice Holdings, Inc. | | | 155,358 | | | | 1,311,222 | |
| FriendFinder Networks, Inc. | | | 15,769 | | | | 7,096 | |
| Innodata, Inc. | | | 5,334 | | | | 17,496 | |
| j2 Global, Inc. | | | 61,778 | | | | 2,514,365 | |
| KIT digital, Inc. | | | 1,518,314 | | | | 463,086 | |
| Liquidity Services, Inc. | | | 188,756 | | | | 6,210,072 | |
| LiveDeal, Inc. | | | 6,021 | | | | 18,725 | |
| Local Corporation | | | 174,587 | | | | 291,560 | |
| Marchex, Inc. - Class B | | | 6,678 | | | | 27,580 | |
| Market Leader, Inc. | | | 96,124 | | | | 963,162 | |
| MeetMe, Inc. | | | 287,365 | | | | 554,614 | |
| Millennial Media, Inc. | | | 145,563 | | | | 1,008,752 | |
| Monster Worldwide, Inc. | | | 366,163 | | | | 1,603,794 | |
| NIC, Inc. | | | 70,719 | | | | 1,190,908 | |
| Qihoo 360 Technology Company Ltd. - ADR | | | 1,081 | | | | 37,078 | |
| QuinStreet, Inc. | | | 99,223 | | | | 648,918 | |
| RealNetworks, Inc. | | | 3,191 | | | | 24,571 | |
| Rediff.com India Ltd. - ADR | | | 78,703 | | | | 214,072 | |
| Remark Media, Inc. | | | 1,842 | | | | 5,986 | |
| Responsys, Inc. | | | 63,087 | | | | 490,186 | |
| Sify Technologies Ltd. - ADR | | | 45,984 | | | | 84,611 | |
| SINA Corporation | | | 100 | | | | 5,632 | |
| Sohu.com, Inc. | | | 1,970 | | | | 101,337 | |
| SPS Commerce, Inc. | | | 7,887 | | | | 371,714 | |
| Stamps.com, Inc. | | | 8 | | | | 271 | |
| StarTek, Inc. | | | 1,518 | | | | 10,520 | |
| Trulia, Inc. | | | 4,414 | | | | 128,271 | |
| ValueClick, Inc. | | | 191 | | | | 5,894 | |
| Velti plc | | | 817,760 | | | | 1,635,520 | |
| Vistaprint N.V. | | | 113,977 | | | | 4,650,262 | |
| WebMD Health Corporation | | | 1 | | | | 24 | |
| Yelp, Inc. | | | 13,942 | | | | 362,910 | |
| TFS MARKET NEUTRAL FUND | |
| SCHEDULE OF SECURITIES SOLD SHORT (Continued) | |
| | |
| COMMON STOCKS - 65.7% (Continued) | | Shares | | | Value | |
| Information Technology - 13.3% (Continued) | |
| Internet Software & Services - 2.2% (Continued) | |
| Youku Tudou, Inc. - ADR | | | 2,815 | | | $ | 57,032 | |
| Zillow, Inc. | | | 60,677 | | | | 3,569,628 | |
| | | | | | | | 41,695,902 | |
| IT Services - 1.0% | |
| Acorn Energy, Inc. | | | 186,149 | | | | 1,396,118 | |
| Booz Allen Hamilton Holding Corporation | | | 105,414 | | | | 1,601,239 | |
| CACI International, Inc. | | | 31,943 | | | | 1,868,346 | |
| Cass Information Systems, Inc. | | | 4,392 | | | | 183,586 | |
| CGI Group, Inc. - Class A | | | 1,761 | | | | 55,753 | |
| China Information Technology, Inc. | | | 14,381 | | | | 19,414 | |
| CIBER, Inc. | | | 152,429 | | | | 649,348 | |
| Computer Task Group, Inc. | | | 30,545 | | | | 626,783 | |
| Convergys Corporation | | | 34,238 | | | | 582,731 | |
| Higher One Holdings, Inc. | | | 392,979 | | | | 3,874,773 | |
| Lender Processing Services, Inc. | | | 90,214 | | | | 2,502,536 | |
| Mantech International Corporation - Class A | | | 105,809 | | | | 2,824,042 | |
| MAXIMUS, Inc. | | | 6,797 | | | | 541,653 | |
| ModusLink Global Solutions, Inc. | | | 1,961 | | | | 5,491 | |
| PRGX Global, Inc. | | | 23,353 | | | | 130,543 | |
| Unisys Corporation | | | 47,688 | | | | 912,271 | |
| VeriFone Systems, Inc. | | | 50,806 | | | | 1,091,313 | |
| Zanett, Inc. | | | 12,650 | | | | 253 | |
| | | | | | | | 18,866,193 | |
| Semiconductors & Semiconductor Equipment - 2.0% | |
| Advanced Micro Devices, Inc. | | | 3,376,260 | | | | 9,521,053 | |
| Amkor Technology, Inc. | | | 392,462 | | | | 1,660,114 | |
| Applied Micro Circuits Corporation | | | 58,449 | | | | 436,030 | |
| Cabot Microelectronics Corporation | | | 41,441 | | | | 1,388,688 | |
| Camtek Ltd. | | | 8,645 | | | | 12,276 | |
| Canadian Solar, Inc. | | | 52,727 | | | | 296,853 | |
| Cirrus Logic, Inc. | | | 72,103 | | | | 1,392,309 | |
| CSR plc - ADR | | | 1 | | | | 31 | |
| CVD Equipment Corporation | | | 46,075 | | | | 478,719 | |
| Cymer, Inc. | | | 1,125 | | | | 117,855 | |
| DayStar Technologies, Inc. | | | 14,478 | | | | 6,515 | |
| EZchip Semiconductor Ltd. | | | 35,777 | | | | 816,073 | |
| Global-Tech Advanced Innovations, Inc. | | | 175 | | | | 1,313 | |
| GT Advanced Technologies, Inc. | | | 1,672,370 | | | | 6,572,414 | |
| Himax Technologies, Inc. | | | 177,005 | | | | 973,527 | |
| International Rectifier Corporation | | | 3,689 | | | | 78,244 | |
| JA Solar Holdings Company Ltd. - ADR | | | 8,004 | | | | 40,340 | |
| Lattice Semiconductor Corporation | | | 535 | | | | 2,488 | |
| LDK Solar Company Ltd. | | | 265,971 | | | | 351,082 | |
| Mellanox Technologies Ltd. | | | 21,790 | | | | 1,110,854 | |
| Monolithic Power Systems, Inc. | | | 51,648 | | | | 1,245,750 | |
| OmniVision Technologies, Inc. | | | 7,101 | | | | 95,224 | |
| Photronics, Inc. | | | 50,581 | | | | 399,084 | |
| Rubicon Technology, Inc. | | | 394,375 | | | | 2,922,319 | |
| Rudolph Technologies, Inc. | | | 141,335 | | | | 1,649,379 | |
| STR Holdings, Inc. | | | 92,554 | | | | 208,246 | |
| Suntech Power Holdings Company Ltd. - ADR | | | 772,259 | | | | 532,859 | |
| Teradyne, Inc. | | | 275,061 | | | | 4,522,003 | |
| TFS MARKET NEUTRAL FUND | |
| SCHEDULE OF SECURITIES SOLD SHORT (Continued) | |
| | |
| COMMON STOCKS - 65.7% (Continued) | | Shares | | | Value | |
| Information Technology - 13.3% (Continued) | |
| Semiconductors & Semiconductor Equipment - 2.0% (Continued) | |
| Tessera Technologies, Inc. | | | 17,932 | | | $ | 365,275 | |
| Tower Semiconductor Ltd. | | | 14,236 | | | | 93,246 | |
| Transwitch Corporation | | | 14,717 | | | | 6,181 | |
| Ultratech, Inc. | | | 16,938 | | | | 499,163 | |
| | | | | | | | 37,795,507 | |
| Software - 3.0% | |
| Accelrys, Inc. | | | 74,330 | | | | 732,150 | |
| ACI Worldwide, Inc. | | | 51,772 | | | | 2,433,802 | |
| American Software, Inc. - Class A | | | 9,256 | | | | 76,917 | |
| AsiaInfo-Linkage, Inc. | | | 7,947 | | | | 91,232 | |
| Augme Technologies, Inc. | | | 10,081 | | | | 3,579 | |
| AVG Technologies N.V. | | | 114,295 | | | | 1,865,294 | |
| Blackbaud, Inc. | | | 58,245 | | | | 1,707,161 | |
| BluePhoenix Solutions Ltd. | | | 1,006 | | | | 3,591 | |
| Bottomline Technologies, Inc. | | | 45,071 | | | | 1,180,860 | |
| BroadSoft, Inc. | | | 35,432 | | | | 905,642 | |
| Cadence Design Systems, Inc. | | | 300 | | | | 4,140 | |
| Callidus Software, Inc. | | | 402,637 | | | | 1,727,313 | |
| Changyou.com Ltd. | | | 406 | | | | 11,774 | |
| China CGame, Inc. | | | 12,695 | | | | 2,387 | |
| Ebix, Inc. | | | 575,862 | | | | 10,716,792 | |
| Evergreen Energy, Inc. | | | 172,973 | | | | 865 | |
| Future Healthcare of America | | | 53,356 | | | | 7,256 | |
| Globalscape, Inc. | | | 359 | | | | 582 | |
| Glu Mobile, Inc. | | | 1,805,599 | | | | 5,561,245 | |
| Interactive Intelligence Group, Inc. | | | 4,192 | | | | 173,675 | |
| Jive Software, Inc. | | | 13,988 | | | | 190,097 | |
| Magic Software Enterprises Ltd. | | | 108,892 | | | | 589,106 | |
| Majesco Entertainment Company | | | 261,564 | | | | 156,677 | |
| Mitek Systems, Inc. | | | 614,111 | | | | 3,267,070 | |
| NetSol Technologies, Inc. | | | 2,612 | | | | 32,963 | |
| NQ Mobile, Inc. | | | 78,285 | | | | 675,600 | |
| Progress Software Corporation | | | 68,563 | | | | 1,547,467 | |
| Qlik Technologies, Inc. | | | 2,021 | | | | 52,566 | |
| RealPage, Inc. | | | 42,304 | | | | 863,002 | |
| ServiceNow, Inc. | | | 4,157 | | | | 170,271 | |
| Sky-Mobi Ltd. - ADR | | | 85,408 | | | | 150,318 | |
| Synchronoss Technologies, Inc. | | | 4,286 | | | | 121,465 | |
| Tangoe, Inc. | | | 190,590 | | | | 2,450,987 | |
| THQ, Inc. | | | 57,095 | | | | 1,427 | |
| TiVo, Inc. | | | 254,189 | | | | 2,979,095 | |
| Top Image Systems Ltd. | | | 16,064 | | | | 51,244 | |
Trunkbow International Holdings Ltd. (a) | | | 2,736 | | | | 1,621 | |
| VirnetX Holding Corporation | | | 415,443 | | | | 8,483,346 | |
| Voltari Corporation | | | 76,363 | | | | 454,360 | |
| Vringo, Inc. | | | 1,752,902 | | | | 4,943,184 | |
| Wave Systems Corporation - Class A | | | 834,695 | | | | 400,654 | |
| Websense, Inc. | | | 9,338 | | | | 166,590 | |
| Zynga, Inc. - Class A | | | 236,355 | | | | 753,972 | |
| | | | | | | | 55,709,339 | |
| TFS MARKET NEUTRAL FUND | |
| SCHEDULE OF SECURITIES SOLD SHORT (Continued) | |
| | |
| COMMON STOCKS - 65.7% (Continued) | | Shares | | | Value | |
| Materials - 4.2% | |
| Chemicals - 1.0% | |
| ADA-ES, Inc. | | | 31,759 | | | $ | 876,866 | |
| Calgon Carbon Corporation | | | 104,682 | | | | 1,783,781 | |
| Cereplast, Inc. | | | 191,090 | | | | 4,223 | |
| China Gengsheng Minerals, Inc. | | | 66,649 | | | | 14,003 | |
| China Green Agriculture, Inc. | | | 130,518 | | | | 396,775 | |
| Clean Diesel Technologies, Inc. | | | 117,273 | | | | 243,928 | |
| CVR Partners, L.P. | | | 30,078 | | | | 791,352 | |
| Ferro Corporation | | | 539,362 | | | | 3,797,108 | |
| Flotek Industries, Inc. | | | 152,388 | | | | 2,444,304 | |
| Gulf Resources, Inc. | | | 292,677 | | | | 301,457 | |
| H.B. Fuller Company | | | 35,537 | | | | 1,346,852 | |
| Hawkins, Inc. | | | 6,427 | | | | 239,020 | |
| Kronos Worldwide, Inc. | | | 179,698 | | | | 3,177,061 | |
| PolyOne Corporation | | | 4,562 | | | | 102,782 | |
| Rentech Nitrogen Partners, L.P. | | | 2,351 | | | | 85,694 | |
| Senomyx, Inc. | | | 1,580 | | | | 3,239 | |
| Sensient Technologies Corporation | | | 16,243 | | | | 639,162 | |
| Stepan Company | | | 11,285 | | | | 642,568 | |
Yongye International, Inc. (a) | | | 17,265 | | | | 42,904 | |
| Zoltek Companies, Inc. | | | 107,824 | | | | 1,424,355 | |
| | | | | | | | 18,357,434 | |
| Construction Materials - 0.1% | |
| Headwaters, Inc. | | | 51,284 | | | | 556,944 | |
| Texas Industries, Inc. | | | 18,103 | | | | 1,152,799 | |
| US Concrete, Inc. | | | 5,746 | | | | 89,293 | |
| | | | | | | | 1,799,036 | |
| Containers & Packaging - 0.1% | |
| AEP Industries, Inc. | | | 9,463 | | | | 729,597 | |
| Greif, Inc. - Class A | | | 24,446 | | | | 1,177,564 | |
| | | | | | | | 1,907,161 | |
| Metals & Mining - 2.9% | |
| A.M. Castle & Company | | | 174,576 | | | | 3,023,656 | |
| AK Steel Holding Corporation | | | 368,051 | | | | 1,232,971 | |
| Allied Nevada Gold Corporation | | | 153,319 | | | | 1,640,513 | |
| AMCOL International Corporation | | | 84,793 | | | | 2,609,081 | |
| Atlatsa Resources Corporation | | | 184,292 | | | | 36,858 | |
| Aurcana Corporation | | | 465 | | | | 1,968 | |
| Aurizon Mines Ltd. | | | 540,302 | | | | 2,334,105 | |
| Avalon Rare Metals, Inc. | | | 237,546 | | | | 249,423 | |
| Avino Silver & Gold Mines Ltd. | | | 111 | | | | 145 | |
| CD International Enterprises, Inc. | | | 17,830 | | | | 1,516 | |
| China Gerui Advanced Materials Group Ltd. | | | 8,567 | | | | 14,393 | |
| China Natural Resources, Inc. | | | 4,328 | | | | 20,298 | |
| China Precision Steel, Inc. | | | 27,364 | | | | 37,215 | |
| China Shen Zhou Mining & Resources, Inc. | | | 198,490 | | | | 37,713 | |
| Cliffs Natural Resources, Inc. | | | 65,275 | | | | 1,392,968 | |
| Commercial Metals Company | | | 309,091 | | | | 4,518,910 | |
| Crosshair Energy Corporation | | | 176,804 | | | | 10,608 | |
| General Moly, Inc. | | | 88,278 | | | | 164,197 | |
| General Steel Holdings, Inc. | | | 122,667 | | | | 122,667 | |
| Globe Specialty Metals, Inc. | | | 22,074 | | | | 288,286 | |
| Gold Reserve, Inc. | | | 8,846 | | | | 28,307 | |
| TFS MARKET NEUTRAL FUND | |
| SCHEDULE OF SECURITIES SOLD SHORT (Continued) | |
| | |
| COMMON STOCKS - 65.7% (Continued) | | Shares | | | Value | |
| Materials - 4.2% (Continued) | |
| Metals & Mining - 2.9% (Continued) | |
| Gold Resource Corporation | | | 109,198 | | | $ | 1,118,188 | |
| Golden Minerals Company | | | 20,369 | | | | 37,072 | |
| Great Northern Iron Ore Properties | | | 4,471 | | | | 311,226 | |
| IAMGOLD Corporation | | | 632 | | | | 3,394 | |
| Jaguar Mining, Inc. | | | 709,423 | | | | 296,752 | |
| Kaiser Aluminum Corporation | | | 21,354 | | | | 1,345,302 | |
| Kimber Resources, Inc. | | | 11,900 | | | | 2,083 | |
| Materion Corporation | | | 7,918 | | | | 209,748 | |
| McEwen Mining, Inc. | | | 854 | | | | 1,990 | |
| Mercator Minerals Ltd. | | | 186 | | | | 51 | |
| Mesabi Trust | | | 100 | | | | 2,140 | |
| Midway Gold Corporation | | | 168,501 | | | | 158,458 | |
| Molycorp, Inc. | | | 1,483,445 | | | | 8,663,319 | |
| Olympic Steel, Inc. | | | 32,566 | | | | 651,320 | |
| Paramount Gold and Silver Corporation | | | 415,954 | | | | 657,207 | |
| Pershing Gold Corporation | | | 36,865 | | | | 15,373 | |
| Polymet Mining Corporation | | | 278,040 | | | | 314,185 | |
| Puda Coal, Inc. | | | 61,600 | | | | 1,540 | |
| Rare Element Resources Ltd. | | | 2,579 | | | | 4,797 | |
| RTI International Metals, Inc. | | | 11,344 | | | | 329,203 | |
| Santa Fe Gold Corporation | | | 2,959 | | | | 710 | |
| Schnitzer Steel Industries, Inc. - Class A | | | 192,166 | | | | 4,713,832 | |
| Seabridge Gold, Inc. | | | 19,276 | | | | 221,096 | |
| Silver Bull Resources, Inc. | | | 133,817 | | | | 50,315 | |
| SinoCoking Coal and Coke Chemical Industries, Inc. | | | 118,762 | | | | 135,389 | |
| Stillwater Mining Company | | | 391,446 | | | | 4,869,588 | |
| SunCoke Energy Partners, L.P. | | | 31,670 | | | | 673,938 | |
| Tanzanian Royalty Exploration Corporation | | | 452,593 | | | | 1,371,357 | |
| Thompson Creek Metals Company, Inc. | | | 489,961 | | | | 1,464,983 | |
| United States Antimony Corporation | | | 44,538 | | | | 67,698 | |
| United States Steel Corporation | | | 81,258 | | | | 1,446,392 | |
| Universal Stainless & Alloy Products, Inc. | | | 7,143 | | | | 249,719 | |
| Walter Energy, Inc. | | | 259,481 | | | | 4,649,900 | |
| Worthington Industries, Inc. | | | 79,372 | | | | 2,554,191 | |
| | | | | | | | 54,358,254 | |
| Paper & Forest Products - 0.1% | |
| Orient Paper, Inc. | | | 158,641 | | | | 283,968 | |
| Resolute Forest Products, Inc. | | | 143,613 | | | | 2,101,058 | |
| Wausau Paper Corporation | | | 67,741 | | | | 689,603 | |
| | | | | | | | 3,074,629 | |
| Telecommunication Services - 1.4% | |
| Diversified Telecommunication Services - 0.9% | |
| 8x8, Inc. | | | 54,022 | | | | 390,579 | |
| Alaska Communications Systems Group, Inc. | | | 496 | | | | 804 | |
| CenturyLink, Inc. | | | 16 | | | | 601 | |
| Elephant Talk Communications, Inc. | | | 283,475 | | | | 325,996 | |
| Fairpoint Communications, Inc. | | | 175,894 | | | | 1,431,777 | |
| Frontier Communications Corporation | | | 1,377 | | | | 5,728 | |
| Globalstar, Inc. | | | 69,904 | | | | 23,068 | |
| inContact, Inc. | | | 95,382 | | | | 772,594 | |
| Iridium Communications, Inc. | | | 257,019 | | | | 1,724,598 | |
| Lumos Networks Corporation | | | 10 | | | | 135 | |
| TFS MARKET NEUTRAL FUND | |
| SCHEDULE OF SECURITIES SOLD SHORT (Continued) | |
| | |
| COMMON STOCKS - 65.7% (Continued) | | Shares | | | Value | |
| Telecommunication Services - 1.4% (Continued) | |
| Diversified Telecommunication Services - 0.9% (Continued) | |
| magicJack VocalTec Ltd. | | | 320,033 | | | $ | 5,290,146 | |
| Otelco, Inc. | | | 5,919 | | | | 10,062 | |
| Radcom Ltd. | | | 52,298 | | | | 159,509 | |
| Sprint Nextel Corporation | | | 646,729 | | | | 4,559,439 | |
| Towerstream Corporation | | | 585,839 | | | | 1,406,014 | |
| | | | | | | | 16,101,050 | |
| Wireless Telecommunication Services - 0.5% | |
| Boingo Wireless, Inc. | | | 73,485 | | | | 457,812 | |
| Leap Wireless International, Inc. | | | 373,016 | | | | 2,133,651 | |
| NII Holdings, Inc. | | | 745,389 | | | | 6,484,884 | |
| NTELOS Holdings Corporation | | | 73,366 | | | | 1,079,948 | |
| Shenandoah Telecommunications Company | | | 10,599 | | | | 173,718 | |
| | | | | | | | 10,330,013 | |
| Utilities - 0.9% | |
| Electric Utilities - 0.2% | |
| MGE Energy, Inc. | | | 8,513 | | | | 475,451 | |
| Northeast Utilities | | | 160 | | | | 7,253 | |
| NV Energy, Inc. | | | 37,301 | | | | 806,821 | |
| Otter Tail Corporation | | | 59,773 | | | | 1,864,918 | |
| Pinnacle West Capital Corporation | | | 7,915 | | | | 482,023 | |
| | | | | | | | 3,636,466 | |
| Gas Utilities - 0.5% | |
| AmeriGas Partners, L.P. | | | 28,115 | | | | 1,274,453 | |
| Atmos Energy Corporation | | | 9,553 | | | | 423,867 | |
| China Natural Gas, Inc. | | | 187,992 | | | | 93,996 | |
| Ferrellgas Partners, L.P. | | | 162,532 | | | | 3,223,009 | |
| Laclede Group, Inc. (The) | | | 17,462 | | | | 815,650 | |
| New Jersey Resources Corporation | | | 19,123 | | | | 902,605 | |
| Northwest Natural Gas Company | | | 44,712 | | | | 1,988,343 | |
| Piedmont Natural Gas Company, Inc. | | | 27,125 | | | | 933,914 | |
| South Jersey Industries, Inc. | | | 19 | | | | 1,172 | |
| UGI Corporation | | | 200 | | | | 8,196 | |
| | | | | | | | 9,665,205 | |
| Independent Power Producers & Energy Traders - 0.1% | |
| American DG Energy, Inc. | | | 28,509 | | | | 52,456 | |
| Dynegy, Inc. | | | 12,813 | | | | 316,609 | |
| Ormat Technologies, Inc. | | | 108,815 | | | | 2,365,638 | |
| U.S. Geothermal, Inc. | | | 240,378 | | | | 78,604 | |
| | | | | | | | 2,813,307 | |
| Multi-Utilities - 0.1% | |
| MDU Resources Group, Inc. | | | 46,827 | | | | 1,168,334 | |
| | | | | | | | | |
Water Utilities - 0.0% (b) | |
| Connecticut Water Service, Inc. | | | 6 | | | | 171 | |
| Consolidated Water Company Ltd. | | | 210 | | | | 2,094 | |
| Ecosphere Technologies, Inc. | | | 5,869 | | | | 2,230 | |
| | | | | | | | 4,495 | |
| | | | | | | | | |
Total Common Stocks (Proceeds $1,372,736,764) | | | $ | 1,234,547,767 | |
| TFS MARKET NEUTRAL FUND | |
| SCHEDULE OF SECURITIES SOLD SHORT (Continued) | |
| | |
PREFERRED STOCKS - 0.0% (b) | | Shares | | | Value | |
Cabco Trust for J. C. Penney (Proceeds $100,026) | | | 5,172 | | | $ | 105,509 | |
| | | | | | | | | |
| OTHER INVESTMENTS - 13.9% | | Shares | | | Value | |
| iPath S&P 500 VIX Mid-Term Futures ETN | | | 369,985 | | | $ | 7,407,100 | |
| iPath S&P 500 VIX Short-Term Futures ETN | | | 1,887,270 | | | | 35,801,512 | |
| SPDR S&P 500 ETF Trust | | | 822,100 | | | | 131,272,928 | |
| Vanguard S&P 500 ETF | | | 1,183,394 | | | | 86,553,437 | |
Total Other Investments (Proceeds $268,022,615) | | | $ | 261,034,977 | |
| | | | | | | | | |
WARRANTS - 0.0%(b) | | Shares | | | Value | |
| American International Group, Inc. | | | 854 | | | $ | 15,116 | |
| Magnum Hunter Resources Corporation | | | 15,718 | | | | 2,200 | |
Total Warrants (Proceeds $14,295) | | | $ | 17,316 | |
| | | | | | | | | |
Total Securities Sold Short - 79.6% (Proceeds $1,640,873,700) | | | $ | 1,495,705,569 | |
| ADR | - American Depositary Receipt. |
| (a) | Security value has been determined in good faith by the Board of Trustees. Total value of such securities is ($413,271) at April 30, 2013, representing greater than (0.1%) of net assets (Note 2). |
| (b) | Percentage rounds to less than 0.1%. |
| See accompanying notes to financial statements. |
| TFS SMALL CAP FUND | |
| SCHEDULE OF INVESTMENTS | |
| April 30, 2013 (Unaudited) | |
| | |
COMMON STOCKS - 98.3% | | Shares | | | Value | |
Consumer Discretionary - 15.6% | |
Auto Components - 1.2% | |
| Cooper Tire & Rubber Company | | | 6,046 | | | $ | 150,485 | |
| Dorman Products, Inc. | | | 4,156 | | | | 156,847 | |
Stoneridge, Inc. (a) | | | 15,277 | | | | 115,647 | |
| Superior Industries International, Inc. | | | 7,541 | | | | 138,453 | |
Tenneco, Inc. (a) | | | 564 | | | | 21,810 | |
Visteon Corporation (a) | | | 1,930 | | | | 113,465 | |
| | | | | | | | 696,707 | |
Diversified Consumer Services - 0.8% | |
Career Education Corporation (a) | | | 1,351 | | | | 2,959 | |
| Hillenbrand, Inc. | | | 6,920 | | | | 173,900 | |
ITT Educational Services, Inc. (a) | | | 78 | | | | 1,428 | |
K12, Inc. (a) | | | 2,439 | | | | 62,121 | |
| Sotheby's | | | 3,819 | | | | 135,498 | |
Steiner Leisure Ltd. (a) | | | 1,371 | | | | 66,398 | |
| | | | | | | | 442,304 | |
Hotels, Restaurants & Leisure - 3.1% | |
| Ameristar Casinos, Inc. | | | 4,587 | | | | 121,051 | |
Bravo Brio Restaurant Group, Inc. (a) | | | 275 | | | | 4,675 | |
| Domino's Pizza, Inc. | | | 2,833 | | | | 156,382 | |
| Einstein Noah Restaurant Group, Inc. | | | 6,744 | | | | 97,181 | |
Fiesta Restaurant Group, Inc. (a) | | | 4,598 | | | | 125,341 | |
Isle of Capri Casinos, Inc. (a) | | | 1,590 | | | | 12,179 | |
Jack in the Box, Inc. (a) | | | 8,403 | | | | 301,248 | |
Krispy Kreme Doughnuts, Inc. (a) | | | 10,388 | | | | 141,900 | |
| Marcus Corporation | | | 9,218 | | | | 118,359 | |
Multimedia Games Holding Company, Inc. (a) | | | 9,222 | | | | 227,414 | |
Nathan's Famous, Inc. (a) | | | 4 | | | | 179 | |
Papa John's International, Inc. (a) | | | 1,926 | | | | 121,338 | |
Ruth's Hospitality Group, Inc. (a) | | | 5,938 | | | | 58,846 | |
Scientific Games Corporation (a) | | | 16,905 | | | | 150,116 | |
SHFL entertainment, Inc. (a) | | | 10,785 | | | | 170,403 | |
| | | | | | | | 1,806,612 | |
Household Durables - 0.2% | |
| CSS Industries, Inc. | | | 90 | | | | 2,579 | |
Libbey, Inc. (a) | | | 1,591 | | | | 30,818 | |
Universal Electronics, Inc. (a) | | | 2,390 | | | | 54,922 | |
| | | | | | | | 88,319 | |
Internet & Catalog Retail - 0.6% | |
1-800-FLOWERS.COM, Inc. - Class A (a) | | | 19,421 | | | | 115,166 | |
Blue Nile, Inc. (a) | | | 1,628 | | | | 53,122 | |
Shutterfly, Inc. (a) | | | 4,466 | | | | 198,871 | |
| | | | | | | | 367,159 | |
Leisure Equipment & Products - 0.5% | |
| JAKKS Pacific, Inc. | | | 3,593 | | | | 39,200 | |
LeapFrog Enterprises, Inc. (a) | | | 4,477 | | | | 40,024 | |
Nautilus, Inc. (a) | | | 28,420 | | | | 195,530 | |
| TFS SMALL CAP FUND | |
| SCHEDULE OF INVESTMENTS (Continued) | |
| | |
COMMON STOCKS - 98.3% (Continued) | | Shares | | | Value | |
Consumer Discretionary - 15.6% (Continued) | |
Leisure Equipment & Products - 0.5% (Continued) | |
Steinway Musical Instruments, Inc. (a) | | | 1,258 | | | $ | 31,374 | |
| | | | | | | | 306,128 | |
Media - 3.8% | |
Carmike Cinemas, Inc. (a) | | | 6,924 | | | | 121,585 | |
Clear Channel Outdoor Holdings, Inc. (a) | | | 198 | | | | 1,432 | |
Digital Generation, Inc. (a) | | | 3,027 | | | | 20,281 | |
E.W. Scripps Company (The) - Class A (a) | | | 18,174 | | | | 252,437 | |
| Entravision Communications Corporation - Class A | | | 42,300 | | | | 163,278 | |
Global Sources Ltd. (a) | | | 3,658 | | | | 24,948 | |
Gray Television, Inc. (a) | | | 36,829 | | | | 233,864 | |
| Harte-Hanks, Inc. | | | 489 | | | | 3,878 | |
Journal Communications, Inc. (a) | | | 31,466 | | | | 214,283 | |
LIN TV Corporation - Class A (a) | | | 27,211 | | | | 334,967 | |
Live Nation Entertainment, Inc. (a) | | | 14,659 | | | | 185,143 | |
Martha Stewart Living Omnimedia, Inc. - Class A (a) | | | 24,267 | | | | 59,940 | |
| MDC Partners, Inc. | | | 3,165 | | | | 54,090 | |
| National CineMedia, Inc. | | | 7,280 | | | | 118,227 | |
| Nexstar Broadcasting Group, Inc. | | | 9,095 | | | | 221,463 | |
| Outdoor Channel Holdings, Inc. | | | 272 | | | | 2,380 | |
ReachLocal, Inc. (a) | | | 1,257 | | | | 20,954 | |
| Salem Communications Corporation - Class A | | | 11,917 | | | | 109,398 | |
| Sinclair Broadcast Group, Inc. - Class A | | | 100 | | | | 2,680 | |
Starz - Series A (a) | | | 4,720 | | | | 110,354 | |
| | | | | | | | 2,255,582 | |
Multiline Retail - 0.2% | |
Big Lots, Inc. (a) | | | 1,287 | | | | 46,872 | |
Gordmans Stores, Inc. (a) | | | 8,853 | | | | 99,862 | |
| | | | | | | | 146,734 | |
Specialty Retail - 3.3% | |
| Aaron's, Inc. | | | 4,276 | | | | 122,764 | |
Body Central Corporation (a) | | | 10,494 | | | | 106,829 | |
| Chico's FAS, Inc. | | | 6,716 | | | | 122,701 | |
Christopher & Banks Corporation (a) | | | 26,334 | | | | 183,021 | |
Destination XL Group, Inc. (a) | | | 1,074 | | | | 5,348 | |
Express, Inc. (a) | | | 8,219 | | | | 149,668 | |
| Finish Line, Inc. (The) - Class A | | | 7,862 | | | | 152,444 | |
Francesca's Holdings Corporation (a) | | | 1,692 | | | | 48,324 | |
| Haverty Furniture Companies, Inc. | | | 3,633 | | | | 86,393 | |
Kirkland's, Inc. (a) | | | 14,126 | | | | 170,360 | |
| Lithia Motors, Inc. | | | 3,167 | | | | 156,830 | |
| Men's Wearhouse, Inc. (The) | | | 5,160 | | | | 172,860 | |
Sears Hometown and Outlet Stores, Inc. (a) | | | 3,928 | | | | 175,228 | |
| Shoe Carnival, Inc. | | | 1,944 | | | | 40,494 | |
| Sonic Automotive, Inc. - Class A | | | 6,903 | | | | 151,797 | |
| Winmark Corporation | | | 635 | | | | 39,287 | |
Zale Corporation (a) | | | 7,270 | | | | 32,279 | |
| | | | | | | | 1,916,627 | |
| TFS SMALL CAP FUND | |
| SCHEDULE OF INVESTMENTS (Continued) | |
| | |
COMMON STOCKS - 98.3% (Continued) | | Shares | | | Value | |
Consumer Discretionary - 15.6% (Continued) | |
Textiles, Apparel & Luxury Goods - 1.9% | |
| Columbia Sportswear Company | | | 1,279 | | | $ | 74,949 | |
| Culp, Inc. | | | 6,100 | | | | 99,064 | |
Deckers Outdoor Corporation (a) | | | 3,126 | | | | 172,305 | |
K-Swiss, Inc. - Class A (a) | | | 99 | | | | 469 | |
| Movado Group, Inc. | | | 3,995 | | | | 120,809 | |
| Perry Ellis International, Inc. | | | 95 | | | | 1,669 | |
Skechers U.S.A., Inc. - Class A (a) | | | 5,821 | | | | 120,960 | |
Steven Madden Ltd. (a) | | | 5,852 | | | | 284,583 | |
| True Religion Apparel, Inc. | | | 4,346 | | | | 117,603 | |
Unifi, Inc. (a) | | | 6,209 | | | | 121,076 | |
| | | | | | | | 1,113,487 | |
Consumer Staples - 4.0% | |
Beverages - 0.2% | |
| Coca-Cola Bottling Company Consolidated | | | 1,384 | | | | 85,116 | |
| | | | | | | | | |
Food & Staples Retailing - 1.1% | |
| Andersons, Inc. (The) | | | 3,053 | | | | 166,450 | |
Pantry, Inc. (The) (a) | | | 7,959 | | | | 116,281 | |
Rite Aid Corporation (a) | | | 83,799 | | | | 222,067 | |
| Spartan Stores, Inc. | | | 192 | | | | 3,222 | |
| SUPERVALU, Inc. | | | 19,781 | | | | 115,521 | |
| | | | | | | | 623,541 | |
Food Products - 1.3% | |
Boulder Brands, Inc. (a) | | | 16,458 | | | | 148,287 | |
Darling International, Inc. (a) | | | 6,617 | | | | 122,481 | |
Farmer Brothers Company (a) | | | 2 | | | | 30 | |
Feihe International, Inc. (a) | | | 4,735 | | | | 34,660 | |
| J & J Snack Foods Corporation | | | 2,473 | | | | 185,524 | |
| Limoneira Company | | | 2 | | | | 37 | |
Omega Protein Corporation (a) | | | 16,057 | | | | 149,491 | |
Pilgrim's Pride Corporation (a) | | | 12,343 | | | | 120,838 | |
Seneca Foods Corporation - Class A (a) | | | 306 | | | | 9,973 | |
| | | | | | | | 771,321 | |
Household Products - 0.2% | |
| Orchids Paper Products Company | | | 543 | | | | 12,489 | |
| Spectrum Brands Holdings, Inc. | | | 2,153 | | | | 120,568 | |
| | | | | | | | 133,057 | |
Personal Products - 1.1% | |
| Inter Parfums, Inc. | | | 4,211 | | | | 121,993 | |
Neptune Technologies & Bioressources, Inc. (a) | | | 400 | | | | 1,060 | |
| Nutraceutical International Corporation | | | 3,942 | | | | 72,809 | |
Prestige Brands Holdings, Inc. (a) | | | 10,749 | | | | 289,685 | |
Revlon, Inc. (a) | | | 8,153 | | | | 157,760 | |
| | | | | | | | 643,307 | |
Tobacco - 0.1% | |
Alliance One International, Inc. (a) | | | 5,177 | | | | 19,414 | |
| Universal Corporation | | | 801 | | | | 46,097 | |
| | | | | | | | 65,511 | |
| TFS SMALL CAP FUND | |
| SCHEDULE OF INVESTMENTS (Continued) | |
| | |
COMMON STOCKS - 98.3% (Continued) | | Shares | | | Value | |
Energy - 7.6% | |
Energy Equipment & Services - 2.3% | |
Dawson Geophysical Company (a) | | | 2,251 | | | $ | 69,196 | |
Exterran Holdings, Inc. (a) | | | 5,832 | | | | 154,082 | |
| Gulf Island Fabrication, Inc. | | | 4,201 | | | | 86,373 | |
Key Energy Services, Inc. (a) | | | 20,261 | | | | 120,350 | |
| Lufkin Industries, Inc. | | | 2,316 | | | | 204,480 | |
Matrix Service Company (a) | | | 17,523 | | | | 263,371 | |
Parker Drilling Company (a) | | | 29,359 | | | | 120,959 | |
Pioneer Energy Services Corporation (a) | | | 20,858 | | | | 147,049 | |
Tesco Corporation (a) | | | 852 | | | | 10,394 | |
| TGC Industries, Inc. | | | 1,491 | | | | 13,224 | |
Unit Corporation (a) | | | 2,879 | | | | 121,004 | |
Willbros Group, Inc. (a) | | | 6,162 | | | | 58,539 | |
| | | | | | | | 1,369,021 | |
Oil, Gas & Consumable Fuels - 5.3% | |
Abraxas Petroleum Corporation (a) | | | 11,736 | | | | 26,289 | |
| Adams Resources & Energy, Inc. | | | 1,169 | | | | 58,088 | |
| Alon USA Energy, Inc. | | | 7,967 | | | | 132,252 | |
Alpha Natural Resources, Inc. (a) | | | 16,429 | | | | 121,903 | |
Carrizo Oil & Gas, Inc. (a) | | | 6,460 | | | | 156,461 | |
| Crosstex Energy, Inc. | | | 6,570 | | | | 120,954 | |
| Delek US Holdings, Inc. | | | 4,559 | | | | 164,534 | |
Endeavour International Corporation (a) | | | 43,860 | | | | 120,176 | |
Forest Oil Corporation (a) | | | 25,634 | | | | 107,406 | |
| GasLog Ltd. | | | 9,623 | | | | 123,174 | |
Gastar Exploration Ltd. (a) | | | 42,742 | | | | 119,678 | |
| Golar LNG Ltd. | | | 4,249 | | | | 142,002 | |
Goodrich Petroleum Corporation (a) | | | 9,296 | | | | 121,220 | |
Halcon Resources Corporation (a) | | | 22,901 | | | | 149,772 | |
Kodiak Oil & Gas Corporation (a) | | | 16,630 | | | | 130,213 | |
Newfield Exploration Company (a) | | | 11,778 | | | | 256,643 | |
| Penn Virginia Corporation | | | 35,885 | | | | 144,617 | |
Quicksilver Resources, Inc. (a) | | | 47,876 | | | | 120,647 | |
REX American Resources Corporation (a) | | | 1,419 | | | | 26,521 | |
Scorpio Tankers, Inc. (a) | | | 6,240 | | | | 53,976 | |
Swift Energy Company (a) | | | 11,005 | | | | 142,405 | |
Synergy Resources Corporation (a) | | | 14,829 | | | | 100,096 | |
| Targa Resources Corporation | | | 1,815 | | | | 119,354 | |
| Teekay Corporation | | | 3,423 | | | | 121,859 | |
VAALCO Energy, Inc. (a) | | | 11,964 | | | | 80,398 | |
Warren Resources, Inc. (a) | | | 56,756 | | | | 149,268 | |
| | | | | | | | 3,109,906 | |
Financials - 17.6% | |
Capital Markets - 2.9% | |
| Arlington Asset Investment Corporation - Class A | | | 4,428 | | | | 119,954 | |
| Artio Global Investors, Inc. | | | 40,761 | | | | 111,685 | |
| BGC Partners, Inc. - Class A | | | 34,483 | | | | 197,243 | |
| BlackRock Kelso Capital Corporation | | | 14,521 | | | | 144,484 | |
| Diamond Hill Investment Group, Inc. | | | 16 | | | | 1,208 | |
| Evercore Partners, Inc. - Class A | | | 3,574 | | | | 134,918 | |
| TFS SMALL CAP FUND | |
| SCHEDULE OF INVESTMENTS (Continued) | |
| | |
COMMON STOCKS - 98.3% (Continued) | | Shares | | | Value | |
Financials - 17.6% (Continued) | |
Capital Markets - 2.9% (Continued) | |
FBR & Company (a) | | | 4,208 | | | $ | 87,653 | |
| Gladstone Capital Corporation | | | 5,744 | | | | 53,247 | |
| Golub Capital BDC, Inc. | | | 4,182 | | | | 73,729 | |
| Greenhill & Company, Inc. | | | 2,498 | | | | 115,383 | |
ICG Group, Inc. (a) | | | 323 | | | | 3,834 | |
| Manning & Napier, Inc. | | | 5,140 | | | | 90,001 | |
| Medallion Financial Corporation | | | 5,863 | | | | 87,593 | |
| New Mountain Finance Corporation | | | 3,518 | | | | 53,614 | |
| NGP Capital Resources Company | | | 257 | | | | 1,712 | |
Safeguard Scientifics, Inc. (a) | | | 13 | | | | 210 | |
SWS Group, Inc. (a) | | | 19,577 | | | | 111,393 | |
| THL Credit, Inc. | | | 7,942 | | | | 122,148 | |
| U.S. Global Investors, Inc. | | | 3,517 | | | | 9,601 | |
Virtus Investment Partners, Inc. (a) | | | 15 | | | | 2,865 | |
WisdomTree Investments, Inc. (a) | | | 13,503 | | | | 156,635 | |
| | | | | | | | 1,679,110 | |
Commercial Banks - 2.3% | |
| Access National Corporation | | | 311 | | | | 3,909 | |
Eagle Bancorp, Inc. (a) | | | 99 | | | | 2,290 | |
| First Financial Bancorporation | | | 5,423 | | | | 83,352 | |
| First Horizon National Corporation | | | 13,400 | | | | 139,362 | |
| First Interstate BancSystem, Inc. | | | 9,733 | | | | 197,775 | |
| Great Southern Bancorp, Inc. | | | 307 | | | | 8,096 | |
Hanmi Financial Corporation (a) | | | 207 | | | | 3,194 | |
MetroCorp Bancshares, Inc. (a) | | | 2,519 | | | | 25,316 | |
| National Penn Bancshares, Inc. | | | 12,859 | | | | 125,890 | |
| NBT Bancorp, Inc. | | | 2,188 | | | | 44,307 | |
Pacific Premier Bancorp, Inc. (a) | | | 11,670 | | | | 141,790 | |
Preferred Bank (a) | | | 1,849 | | | | 30,508 | |
| Renasant Corporation | | | 139 | | | | 3,172 | |
| SCBT Financial Corporation | | | 775 | | | | 37,022 | |
| State Bank Financial Corporation | | | 256 | | | | 3,766 | |
| Sterling Bancorp | | | 66 | | | | 744 | |
| Susquehanna Bancshares, Inc. | | | 13,043 | | | | 152,212 | |
SVB Financial Group (a) | | | 17 | | | | 1,209 | |
| Synovus Financial Corporation | | | 57,034 | | | | 153,421 | |
Taylor Capital Group, Inc. (a) | | | 165 | | | | 2,417 | |
| Trustmark Corporation | | | 2,010 | | | | 49,345 | |
Virginia Commerce Bancorp (a) | | | 4,862 | | | | 65,345 | |
| WesBanco, Inc. | | | 1,623 | | | | 40,624 | |
| Wintrust Financial Corporation | | | 242 | | | | 8,678 | |
| | | | | | | | 1,323,744 | |
Consumer Finance - 0.9% | |
| Cash America International, Inc. | | | 1,172 | | | | 51,134 | |
DFC Global Corporation (a) | | | 7,808 | | | | 105,408 | |
EZCORP, Inc. - Class A (a) | | | 5,530 | | | | 93,457 | |
First Cash Financial Services, Inc. (a) | | | 2,848 | | | | 146,586 | |
| Nelnet, Inc. - Class A | | | 3,122 | | | | 106,148 | |
| TFS SMALL CAP FUND | |
| SCHEDULE OF INVESTMENTS (Continued) | |
| | |
COMMON STOCKS - 98.3% (Continued) | | Shares | | | Value | |
Financials - 17.6% (Continued) | |
Consumer Finance - 0.9% (Continued) | |
World Acceptance Corporation (a) | | | 510 | | | $ | 45,319 | |
| | | | | | | | 548,052 | |
Diversified Financial Services - 0.8% | |
Asset Acceptance Capital Corporation (a) | | | 12,698 | | | | 82,156 | |
Consumer Portfolio Services, Inc. (a) | | | 19,150 | | | | 176,563 | |
| MarketAxess Holdings, Inc. | | | 2,863 | | | | 121,162 | |
| Marlin Business Services Corporation | | | 1,149 | | | | 27,841 | |
PHH Corporation (a) | | | 1,703 | | | | 35,899 | |
| | | | | | | | 443,621 | |
Insurance - 4.2% | |
| Allied World Assurance Company Holdings A.G. | | | 40 | | | | 3,632 | |
| American National Insurance Company | | | 1,071 | | | | 100,706 | |
American Safety Insurance Holdings Ltd. (a) | | | 207 | | | | 4,985 | |
| AMERISAFE, Inc. | | | 1,152 | | | | 37,624 | |
| AmTrust Financial Services, Inc. | | | 798 | | | | 25,265 | |
| CNO Financial Group, Inc. | | | 13,575 | | | | 153,669 | |
| Employers Holdings, Inc. | | | 3,403 | | | | 77,078 | |
| Endurance Specialty Holdings Ltd. | | | 3,379 | | | | 165,470 | |
| FBL Financial Group, Inc. - Class A | | | 1,516 | | | | 59,594 | |
| Hanover Insurance Group, Inc. (The) | | | 5,933 | | | | 299,201 | |
Hilltop Holdings, Inc. (a) | | | 9,822 | | | | 131,516 | |
| Horace Mann Educators Corporation | | | 5,452 | | | | 122,943 | |
| Infinity Property & Casualty Corporation | | | 1,087 | | | | 61,676 | |
| Kemper Corporation | | | 3,852 | | | | 122,725 | |
| Maiden Holdings Ltd. | | | 1,925 | | | | 19,885 | |
| Mercury General Corporation | | | 6,709 | | | | 306,668 | |
| National Interstate Corporation | | | 110 | | | | 3,196 | |
Navigators Group, Inc. (The) (a) | | | 1 | | | | 58 | |
| OneBeacon Insurance Group Ltd. - Class A | | | 9,007 | | | | 122,405 | |
| Protective Life Corporation | | | 4,584 | | | | 174,467 | |
| Stewart Information Services Corporation | | | 1,987 | | | | 53,788 | |
| Symetra Financial Corporation | | | 20,152 | | | | 274,672 | |
| United Fire Group, Inc. | | | 1,169 | | | | 32,685 | |
| Universal Insurance Holdings, Inc. | | | 20,607 | | | | 123,230 | |
| | | | | | | | 2,477,138 | |
Real Estate Investment Trusts (REIT) - 4.0% | |
| Agree Realty Corporation | | | 3,385 | | | | 101,787 | |
| American Capital Mortgage Investment Corporation | | | 4,599 | | | | 122,149 | |
| Anworth Mortgage Asset Corporation | | | 6,072 | | | | 38,314 | |
| Apollo Commercial Real Estate Finance, Inc. | | | 6,861 | | | | 121,714 | |
| ARMOUR Residential REIT, Inc. | | | 679 | | | | 4,407 | |
| CapLease, Inc. | | | 28,261 | | | | 198,392 | |
| Capstead Mortgage Corporation | | | 13,988 | | | | 185,761 | |
| Chatham Lodging Trust | | | 159 | | | | 2,911 | |
| Chesapeake Lodging Trust | | | 2,244 | | | | 53,093 | |
| Cousins Properties, Inc. | | | 11,037 | | | | 120,524 | |
| Equity Lifestyle Properties, Inc. | | | 31 | | | | 2,519 | |
| First Industrial Realty Trust, Inc. | | | 1,579 | | | | 28,327 | |
| Geo Group, Inc. (The) | | | 6,166 | | | | 230,917 | |
| TFS SMALL CAP FUND | |
| SCHEDULE OF INVESTMENTS (Continued) | |
| | |
COMMON STOCKS - 98.3% (Continued) | | Shares | | | Value | |
Financials - 17.6% (Continued) | |
Real Estate Investment Trusts (REIT) - 4.0% (Continued) | |
Gramercy Property Trust, Inc. (a) | | | 14,886 | | | $ | 70,709 | |
| Hatteras Financial Corporation | | | 4,475 | | | | 122,302 | |
| Hersha Hospitality Trust | | | 18,822 | | | | 112,556 | |
| Kite Realty Group Trust | | | 18,411 | | | | 121,513 | |
| One Liberty Properties, Inc. | | | 179 | | | | 4,106 | |
| Resource Capital Corporation | | | 18,411 | | | | 121,329 | |
| Saul Centers, Inc. | | | 1,158 | | | | 51,878 | |
| Select Income REIT | | | 4,311 | | | | 122,993 | |
| Sovran Self Storage, Inc. | | | 1,804 | | | | 123,754 | |
Strategic Hotels & Resorts, Inc. (a) | | | 14,842 | | | | 119,775 | |
| Summit Hotel Properties, Inc. | | | 18,489 | | | | 184,705 | |
| UMH Properties, Inc. | | | 579 | | | | 6,398 | |
| Winthrop Realty Trust | | | 85 | | | | 1,080 | |
| | | | | | | | 2,373,913 | |
Real Estate Management & Development - 0.4% | |
Alexander & Baldwin, Inc. (a) | | | 3,578 | | | | 121,867 | |
| American Realty Capital Properties, Inc. | | | 7,367 | | | | 121,113 | |
| | | | | | | | 242,980 | |
Thrifts & Mortgage Finance - 2.1% | |
| Apollo Residential Mortgage, Inc. | | | 5,471 | | | | 121,784 | |
| Bank Mutual Corporation | | | 22,618 | | | | 117,161 | |
| BankUnited, Inc. | | | 4,846 | | | | 122,846 | |
| Berkshire Hills Bancorp, Inc. | | | 1,810 | | | | 46,807 | |
| Brookline Bancorp, Inc. | | | 5,945 | | | | 49,938 | |
| Capitol Federal Financial, Inc. | | | 10,165 | | | | 120,354 | |
| Charter Financial Corporation | | | 11,151 | | | | 113,406 | |
| First Defiance Financial Corporation | | | 59 | | | | 1,336 | |
| First Financial Holdings, Inc. | | | 4,619 | | | | 92,565 | |
| Northfield Bancorp, Inc. | | | 14,728 | | | | 173,201 | |
| OceanFirst Financial Corporation | | | 1,389 | | | | 19,738 | |
| Roma Financial Corporation | | | 164 | | | | 2,791 | |
| SI Financial Group, Inc. | | | 380 | | | | 4,408 | |
Walker & Dunlop, Inc. (a) | | | 6,408 | | | | 114,126 | |
| Washington Federal, Inc. | | | 7,141 | | | | 122,611 | |
| WSFS Financial Corporation | | | 416 | | | | 20,359 | |
| | | | | | | | 1,243,431 | |
Health Care - 15.5% | |
Biotechnology - 2.0% | |
ACADIA Pharmaceuticals, Inc. (a) | | | 9,171 | | | | 118,214 | |
AMAG Pharmaceuticals, Inc. (a) | | | 1,867 | | | | 41,167 | |
Array BioPharma, Inc. (a) | | | 1,380 | | | | 8,211 | |
Astex Pharmaceuticals, Inc. (a) | | | 35,170 | | | | 241,970 | |
Cepheid (a) | | | 1,430 | | | | 54,526 | |
Coronado Biosciences, Inc. (a) | | | 1 | | | | 11 | |
Dyax Corporation (a) | | | 10,637 | | | | 29,252 | |
Emergent BioSolutions, Inc. (a) | | | 926 | | | | 14,205 | |
Isis Pharmaceuticals, Inc. (a) | | | 9,125 | | | | 204,309 | |
Nanosphere, Inc. (a) | | | 17,319 | | | | 47,974 | |
| PDL BioPharma, Inc. | | | 21,583 | | | | 167,052 | |
| TFS SMALL CAP FUND | |
| SCHEDULE OF INVESTMENTS (Continued) | |
| | |
COMMON STOCKS - 98.3% (Continued) | | Shares | | | Value | |
Health Care - 15.5% (Continued) | |
Biotechnology - 2.0% (Continued) | |
Trius Therapeutics, Inc. (a) | | | 31,739 | | | $ | 221,221 | |
| | | | | | | | 1,148,112 | |
Health Care Equipment & Supplies - 4.0% | |
| Abaxis, Inc. | | | 3,545 | | | | 151,336 | |
Anika Therapeutics, Inc. (a) | | | 169 | | | | 2,256 | |
ArthroCare Corporation (a) | | | 3,496 | | | | 121,136 | |
AtriCure, Inc. (a) | | | 13,035 | | | | 108,712 | |
Cardiovascular Systems, Inc. (a) | | | 9,040 | | | | 155,126 | |
| CONMED Corporation | | | 129 | | | | 4,042 | |
Cutera, Inc. (a) | | | 10,895 | | | | 121,044 | |
Cynosure, Inc. - Class A (a) | | | 6,313 | | | | 163,254 | |
| Hill-Rom Holdings, Inc. | | | 5,104 | | | | 173,893 | |
| Invacare Corporation | | | 5,395 | | | | 72,563 | |
Mako Surgical Corporation (a) | | | 2,075 | | | | 21,974 | |
Merit Medical Systems, Inc. (a) | | | 17,992 | | | | 173,983 | |
Natus Medical, Inc. (a) | | | 2,550 | | | | 31,901 | |
NuVasive, Inc. (a) | | | 7,600 | | | | 159,372 | |
Orthofix International N.V. (a) | | | 1,111 | | | | 35,996 | |
Palomar Medical Technologies, Inc. (a) | | | 3,380 | | | | 45,799 | |
Quidel Corporation (a) | | | 725 | | | | 16,182 | |
Rochester Medical Corporation (a) | | | 7,726 | | | | 104,919 | |
RTI Biologics, Inc. (a) | | | 3,789 | | | | 15,080 | |
Solta Medical, Inc. (a) | | | 2,301 | | | | 4,487 | |
Spectranetics Corporation (The) (a) | | | 6,441 | | | | 120,125 | |
SurModics, Inc. (a) | | | 7,208 | | | | 190,652 | |
Symmetry Medical, Inc. (a) | | | 416 | | | | 4,959 | |
Tornier N.V. (a) | | | 3,965 | | | | 72,123 | |
Vascular Solutions, Inc. (a) | | | 281 | | | | 4,471 | |
| West Pharmaceutical Services, Inc. | | | 4,354 | | | | 278,046 | |
| | | | | | | | 2,353,431 | |
Health Care Providers & Services - 6.1% | |
Amedisys, Inc. (a) | | | 191 | | | | 1,918 | |
AMN Healthcare Services, Inc. (a) | | | 24,556 | | | | 337,154 | |
AmSurg Corporation (a) | | | 9,441 | | | | 316,840 | |
| Assisted Living Concepts, Inc. - Class A | | | 218 | | | | 2,599 | |
Capital Senior Living Corporation (a) | | | 7,826 | | | | 189,859 | |
Cross Country Healthcare, Inc. (a) | | | 9,507 | | | | 47,535 | |
Emeritus Corporation (a) | | | 4,775 | | | | 122,717 | |
| Ensign Group, Inc. (The) | | | 2,526 | | | | 88,082 | |
Five Star Quality Care, Inc. (a) | | | 28,604 | | | | 135,297 | |
Gentiva Health Services, Inc. (a) | | | 8,347 | | | | 87,560 | |
Health Net, Inc. (a) | | | 6,255 | | | | 183,897 | |
HealthSouth Corporation (a) | | | 5,652 | | | | 155,430 | |
Healthways, Inc. (a) | | | 7,345 | | | | 102,022 | |
Kindred Healthcare, Inc. (a) | | | 9,720 | | | | 101,963 | |
LHC Group, Inc. (a) | | | 851 | | | | 18,484 | |
LifePoint Hospitals, Inc. (a) | | | 5,923 | | | | 284,304 | |
Magellan Health Services, Inc. (a) | | | 5,226 | | | | 267,362 | |
| National Research Corporation | | | 680 | | | | 40,766 | |
| TFS SMALL CAP FUND | |
| SCHEDULE OF INVESTMENTS (Continued) | |
| | |
COMMON STOCKS - 98.3% (Continued) | | Shares | | | Value | |
Health Care - 15.5% (Continued) | |
Health Care Providers & Services - 6.1% (Continued) | |
| Owens & Minor, Inc. | | | 1,360 | | | $ | 44,295 | |
Providence Service Corporation (The) (a) | | | 1,405 | | | | 24,601 | |
| Select Medical Holdings Corporation | | | 31,128 | | | | 256,806 | |
Team Health Holdings, Inc. (a) | | | 5,171 | | | | 192,775 | |
| U.S. Physical Therapy, Inc. | | | 126 | | | | 3,006 | |
| Universal American Corporation | | | 11,046 | | | | 94,443 | |
Vanguard Health Systems, Inc. (a) | | | 11,456 | | | | 167,601 | |
WellCare Health Plans, Inc. (a) | | | 4,878 | | | | 284,436 | |
| | | | | | | | 3,551,752 | |
Health Care Technology - 1.1% | |
Allscripts Healthcare Solutions, Inc. (a) | | | 15,730 | | | | 217,703 | |
MedAssets, Inc. (a) | | | 14,097 | | | | 264,037 | |
Omnicell, Inc. (a) | | | 9,601 | | | | 173,010 | |
| | | | | | | | 654,750 | |
Life Sciences Tools & Services - 1.6% | |
Albany Molecular Research, Inc. (a) | | | 19,579 | | | | 233,577 | |
Bruker Corporation (a) | | | 6,183 | | | | 109,872 | |
Cambrex Corporation (a) | | | 10,841 | | | | 135,404 | |
Charles River Laboratories International, Inc. (a) | | | 4,442 | | | | 193,183 | |
Harvard Bioscience, Inc. (a) | | | 412 | | | | 2,109 | |
Luminex Corporation (a) | | | 2,043 | | | | 33,975 | |
| Techne Corporation | | | 4,075 | | | | 261,371 | |
| | | | | | | | 969,491 | |
Pharmaceuticals - 0.7% | |
Impax Laboratories, Inc. (a) | | | 6,896 | | | | 120,680 | |
Lannett Company, Inc. (a) | | | 10,868 | | | | 126,177 | |
Sucampo Pharmaceuticals, Inc. (a) | | | 20,325 | | | | 193,291 | |
| | | | | | | | 440,148 | |
Industrials - 15.9% | |
Aerospace & Defense - 2.7% | |
API Technologies Corporation (a) | | | 5,188 | | | | 14,319 | |
DigitalGlobe, Inc. (a) | | | 9,323 | | | | 272,138 | |
Ducommun, Inc. (a) | | | 5,209 | | | | 127,568 | |
Engility Holdings, Inc. (a) | | | 75 | | | | 1,797 | |
Esterline Technologies Corporation (a) | | | 2,130 | | | | 159,835 | |
| Exelis, Inc. | | | 28,910 | | | | 322,925 | |
Kratos Defense & Security Solutions, Inc. (a) | | | 782 | | | | 3,980 | |
Sparton Corporation (a) | | | 307 | | | | 4,264 | |
Spirit AeroSystems Holdings, Inc. - Class A (a) | | | 19,950 | | | | 398,801 | |
Teledyne Technologies, Inc. (a) | | | 3,462 | | | | 259,858 | |
| | | | | | | | 1,565,485 | |
Air Freight & Logistics - 0.1% | |
Park-Ohio Holdings Corporation (a) | | | 1,398 | | | | 51,419 | |
| | | | | | | | | |
Airlines - 1.2% | |
JetBlue Airways Corporation (a) | | | 5,984 | | | | 41,230 | |
Republic Airways Holdings, Inc. (a) | | | 22,821 | | | | 255,367 | |
| SkyWest, Inc. | | | 10,800 | | | | 154,548 | |
| TFS SMALL CAP FUND | |
| SCHEDULE OF INVESTMENTS (Continued) | |
| | |
COMMON STOCKS - 98.3% (Continued) | | Shares | | | Value | |
Industrials - 15.9% (Continued) | |
Airlines - 1.2% (Continued) | |
Spirit Airlines, Inc. (a) | | | 4,770 | | | $ | 127,359 | |
US Airways Group, Inc. (a) | | | 8,245 | | | | 139,340 | |
| | | | | | | | 717,844 | |
Building Products - 0.6% | |
Ameresco, Inc. - Class A (a) | | | 19,163 | | | | 141,231 | |
Nortek, Inc. (a) | | | 902 | | | | 64,818 | |
PGT, Inc. (a) | | | 15,930 | | | | 122,661 | |
| | | | | | | | 328,710 | |
Commercial Services & Supplies - 2.1% | |
ACCO Brands Corporation (a) | | | 7,397 | | | | 49,930 | |
ARC Document Solutions, Inc. (a) | | | 8,859 | | | | 28,437 | |
| Brink's Company (The) | | | 4,525 | | | | 119,958 | |
| CECO Environmental Corporation | | | 6,781 | | | | 78,727 | |
EnergySolutions, Inc. (a) | | | 60,110 | | | | 248,254 | |
| G&K Services, Inc. | | | 2,585 | | | | 121,469 | |
Heritage-Crystal Clean, Inc. (a) | | | 110 | | | | 1,711 | |
| Kimball International, Inc. - Class B | | | 6,278 | | | | 57,695 | |
| Steelcase, Inc. - Class A | | | 12,782 | | | | 162,331 | |
TMS International Corporation - Class A (a) | | | 6,472 | | | | 93,456 | |
| UniFirst Corporation | | | 1,330 | | | | 121,097 | |
| US Ecology, Inc. | | | 4,525 | | | | 123,080 | |
| | | | | | | | 1,206,145 | |
Construction & Engineering - 1.9% | |
AECOM Technology Corporation (a) | | | 1,063 | | | | 30,901 | |
| Argan, Inc. | | | 4,848 | | | | 85,810 | |
Dycom Industries, Inc. (a) | | | 6,823 | | | | 131,820 | |
| Great Lakes Dredge & Dock Corporation | | | 21,962 | | | | 151,977 | |
MYR Group, Inc. (a) | | | 5,770 | | | | 131,556 | |
Northwest Pipe Company (a) | | | 607 | | | | 16,565 | |
Orion Marine Group, Inc. (a) | | | 485 | | | | 4,443 | |
| Pike Electric Corporation | | | 19,194 | | | | 300,002 | |
| Primoris Services Corporation | | | 12,897 | | | | 284,250 | |
| | | | | | | | 1,137,324 | |
Electrical Equipment - 1.3% | |
| AZZ, Inc. | | | 3,070 | | | | 129,830 | |
| Coleman Cable, Inc. | | | 6,500 | | | | 97,500 | |
General Cable Corporation (a) | | | 4,528 | | | | 156,126 | |
GrafTech International Ltd. (a) | | | 8,866 | | | | 63,658 | |
Powell Industries, Inc. (a) | | | 1,605 | | | | 79,030 | |
PowerSecure International, Inc. (a) | | | 8,659 | | | | 118,628 | |
| Preformed Line Products Company | | | 1,348 | | | | 108,514 | |
| | | | | | | | 753,286 | |
Machinery - 2.4% | |
| Alamo Group, Inc. | | | 3,968 | | | | 158,998 | |
Blount International, Inc. (a) | | | 161 | | | | 2,236 | |
| CIRCOR International, Inc. | | | 1,164 | | | | 55,092 | |
| ESCO Technologies, Inc. | | | 78 | | | | 2,806 | |
Federal Signal Corporation (a) | | | 509 | | | | 3,950 | |
| TFS SMALL CAP FUND | |
| SCHEDULE OF INVESTMENTS (Continued) | |
| | |
COMMON STOCKS - 98.3% (Continued) | | Shares | | | Value | |
Industrials - 15.9% (Continued) | |
Machinery - 2.4% (Continued) | |
Greenbrier Companies, Inc. (The) (a) | | | 7,170 | | | $ | 161,755 | |
| Hardinge, Inc. | | | 4,200 | | | | 56,700 | |
| Harsco Corporation | | | 6,604 | | | | 144,165 | |
| Hyster-Yale Materials Handling, Inc. - Class A | | | 1,618 | | | | 84,443 | |
| John Bean Technologies Corporation | | | 9,359 | | | | 194,106 | |
| Kaydon Corporation | | | 3,716 | | | | 88,590 | |
Lydall, Inc. (a) | | | 2,559 | | | | 36,696 | |
| Mueller Industries, Inc. | | | 186 | | | | 9,631 | |
| Mueller Water Products, Inc. - Class A | | | 29,301 | | | | 173,462 | |
| NACCO Industries, Inc. - Class A | | | 2,120 | | | | 123,002 | |
NN, Inc. (a) | | | 41 | | | | 369 | |
Tecumseh Products Company - Class A (a) | | | 6,754 | | | | 60,111 | |
| Twin Disc, Inc. | | | 150 | | | | 3,198 | |
Wabash National Corporation (a) | | | 4,512 | | | | 42,548 | |
| | | | | | | | 1,401,858 | |
Professional Services - 1.1% | |
| Barrett Business Services, Inc. | | | 3,920 | | | | 207,525 | |
| Heidrick & Struggles International, Inc. | | | 1,973 | | | | 26,083 | |
| Insperity, Inc. | | | 895 | | | | 24,729 | |
Mistras Group, Inc. (a) | | | 3,834 | | | | 72,654 | |
On Assignment, Inc. (a) | | | 1,636 | | | | 39,706 | |
RPX Corporation (a) | | | 9,095 | | | | 121,964 | |
TrueBlue, Inc. (a) | | | 5,892 | | | | 122,082 | |
| VSE Corporation | | | 752 | | | | 22,928 | |
| | | | | | | | 637,671 | |
Road & Rail - 1.0% | |
| Arkansas Best Corporation | | | 44 | | | | 463 | |
| Heartland Express, Inc. | | | 9,434 | | | | 128,019 | |
| Marten Transport Ltd. | | | 524 | | | | 10,674 | |
Roadrunner Transportation Systems, Inc. (a) | | | 8,146 | | | | 183,367 | |
| Ryder System, Inc. | | | 4,918 | | | | 285,588 | |
| | | | | | | | 608,111 | |
Trading Companies & Distributors - 1.4% | |
| Aircastle Ltd. | | | 10,771 | | | | 150,363 | |
BlueLinx Holdings, Inc. (a) | | | 3,798 | | | | 11,052 | |
CAI International, Inc. (a) | | | 9,096 | | | | 231,857 | |
DXP Enterprises, Inc. (a) | | | 3,773 | | | | 252,338 | |
| Textainer Group Holdings Ltd. | | | 3,689 | | | | 142,654 | |
Titan Machinery, Inc. (a) | | | 2,473 | | | | 55,791 | |
| | | | | | | | 844,055 | |
Transportation Infrastructure - 0.1% | |
Wesco Aircraft Holdings, Inc. (a) | | | 2,639 | | | | 43,570 | |
| | | | | | | | | |
Information Technology - 16.1% | |
Communications Equipment - 0.5% | |
Anaren, Inc. (a) | | | 980 | | | | 22,942 | |
Aruba Networks, Inc. (a) | | | 2,699 | | | | 60,701 | |
Aviat Networks, Inc. (a) | | | 24,217 | | | | 77,494 | |
| TFS SMALL CAP FUND | |
| SCHEDULE OF INVESTMENTS (Continued) | |
| | |
COMMON STOCKS - 98.3% (Continued) | | Shares | | | Value | |
Information Technology - 16.1% (Continued) | |
Communications Equipment - 0.5% (Continued) | |
Digi International, Inc. (a) | | | 176 | | | $ | 1,605 | |
Harmonic, Inc. (a) | | | 13,237 | | | | 75,186 | |
Oplink Communications, Inc. (a) | | | 59 | | | | 969 | |
ORBCOMM, Inc. (a) | | | 1,029 | | | | 4,867 | |
Riverbed Technology, Inc. (a) | | | 358 | | | | 5,320 | |
ShoreTel, Inc. (a) | | | 209 | | | | 755 | |
Symmetricom, Inc. (a) | | | 5,457 | | | | 28,376 | |
| | | | | | | | 278,215 | |
Computers & Peripherals - 1.2% | |
Cray, Inc. (a) | | | 7,335 | | | | 155,209 | |
Datalink Corporation (a) | | | 9,525 | | | | 106,585 | |
Electronics For Imaging, Inc. (a) | | | 10,273 | | | | 274,494 | |
| Lexmark International, Inc. - Class A | | | 2,362 | | | | 71,592 | |
QLogic Corporation (a) | | | 7,279 | | | | 79,050 | |
| | | | | | | | 686,930 | |
Electronic Equipment, Instruments & Components - 4.4% | |
| Anixter International, Inc. | | | 2,118 | | | | 151,945 | |
| AVX Corporation | | | 14,438 | | | | 163,294 | |
Benchmark Electronics, Inc. (a) | | | 18,116 | | | | 323,190 | |
Checkpoint Systems, Inc. (a) | | | 4,869 | | | | 56,334 | |
| Cognex Corporation | | | 3,179 | | | | 126,206 | |
| Coherent, Inc. | | | 2,593 | | | | 145,027 | |
| CTS Corporation | | | 434 | | | | 4,622 | |
| Daktronics, Inc. | | | 11,937 | | | | 119,251 | |
| Electro Rent Corporation | | | 2,531 | | | | 41,939 | |
| Electro Scientific Industries, Inc. | | | 3,356 | | | | 36,178 | |
Fabrinet (a) | | | 12,759 | | | | 175,181 | |
GSI Group, Inc. (The) (a) | | | 10,048 | | | | 85,810 | |
Ingram Micro, Inc. - Class A (a) | | | 6,932 | | | | 123,459 | |
Insight Enterprises, Inc. (a) | | | 6,799 | | | | 123,198 | |
Key Tronic Corporation (a) | | | 39 | | | | 441 | |
Measurement Specialties, Inc. (a) | | | 733 | | | | 31,350 | |
| Methode Electronics, Inc. | | | 6,243 | | | | 89,774 | |
Multi-Fineline Electronix, Inc. (a) | | | 13,750 | | | | 209,550 | |
| Park Electrochemical Corporation | | | 83 | | | | 1,981 | |
| PC Connection, Inc. | | | 7,180 | | | | 110,859 | |
Sanmina Corporation (a) | | | 11,876 | | | | 149,875 | |
Tech Data Corporation (a) | | | 2,643 | | | | 123,507 | |
TTM Technologies, Inc. (a) | | | 24,001 | | | | 173,527 | |
Vishay Precision Group, Inc. (a) | | | 133 | | | | 1,906 | |
| | | | | | | | 2,568,404 | |
Internet Software & Services - 1.2% | |
Cornerstone OnDemand, Inc. (a) | | | 4,853 | | | | 176,067 | |
OpenTable, Inc. (a) | | | 2,774 | | | | 153,652 | |
Perficient, Inc. (a) | | | 8,837 | | | | 92,612 | |
Responsys, Inc. (a) | | | 6,692 | | | | 51,997 | |
SPS Commerce, Inc. (a) | | | 677 | | | | 31,907 | |
| United Online, Inc. | | | 19,090 | | | | 129,812 | |
Unwired Planet, Inc. (a) | | | 2,321 | | | | 4,595 | |
| TFS SMALL CAP FUND | |
| SCHEDULE OF INVESTMENTS (Continued) | |
| | |
COMMON STOCKS - 98.3% (Continued) | | Shares | | | Value | |
Information Technology - 16.1% (Continued) | |
Internet Software & Services - 1.2% (Continued) | |
Vocus, Inc. (a) | | | 7,410 | | | $ | 62,318 | |
Web.com Group, Inc. (a) | | | 1,547 | | | | 26,918 | |
XO Group, Inc. (a) | | | 32 | | | | 360 | |
| | | | | | | | 730,238 | |
IT Services - 1.7% | |
Cardtronics, Inc. (a) | | | 6,495 | | | | 181,925 | |
| Cass Information Systems, Inc. | | | 197 | | | | 8,235 | |
CoreLogic, Inc. (a) | | | 5,983 | | | | 163,216 | |
Euronet Worldwide, Inc. (a) | | | 48 | | | | 1,465 | |
Global Cash Access Holdings, Inc. (a) | | | 37,052 | | | | 264,181 | |
iGATE Corporation (a) | | | 7,222 | | | | 120,535 | |
Lionbridge Technologies, Inc. (a) | | | 22,336 | | | | 76,389 | |
PRGX Global, Inc. (a) | | | 8,869 | | | | 49,578 | |
| Syntel, Inc. | | | 1,909 | | | | 120,592 | |
Virtusa Corporation (a) | | | 315 | | | | 6,996 | |
| | | | | | | | 993,112 | |
Semiconductors & Semiconductor Equipment - 3.5% | |
Alpha & Omega Semiconductor Ltd. (a) | | | 2,884 | | | | 20,880 | |
Ambarella, Inc. (a) | | | 15,924 | | | | 218,159 | |
ATMI, Inc. (a) | | | 5,572 | | | | 121,191 | |
Entegris, Inc. (a) | | | 12,733 | | | | 120,709 | |
Fairchild Semiconductor International, Inc. (a) | | | 9,524 | | | | 122,860 | |
FormFactor, Inc. (a) | | | 18,811 | | | | 93,114 | |
| Intersil Corporation - Class A | | | 15,689 | | | | 121,747 | |
Lattice Semiconductor Corporation (a) | | | 25,627 | | | | 119,165 | |
Mattson Technology, Inc. (a) | | | 1,976 | | | | 3,043 | |
Mindspeed Technologies, Inc. (a) | | | 9,971 | | | | 22,833 | |
OmniVision Technologies, Inc. (a) | | | 11,021 | | | | 147,792 | |
PDF Solutions, Inc. (a) | | | 3,580 | | | | 61,254 | |
Pericom Semiconductor Corporation (a) | | | 3,843 | | | | 24,826 | |
PLX Technology, Inc. (a) | | | 25,691 | | | | 119,977 | |
PMC-Sierra, Inc. (a) | | | 26,274 | | | | 151,338 | |
SunPower Corporation (a) | | | 18,916 | | | | 257,068 | |
| Supertex, Inc. | | | 198 | | | | 4,174 | |
TriQuint Semiconductor, Inc. (a) | | | 32,895 | | | | 192,107 | |
Ultra Clean Holdings, Inc. (a) | | | 5,484 | | | | 34,330 | |
Volterra Semiconductor Corporation (a) | | | 9,305 | | | | 121,058 | |
| | | | | | | | 2,077,625 | |
Software - 3.6% | |
Actuate Corporation (a) | | | 5,796 | | | | 35,587 | |
Compuware Corporation (a) | | | 10,190 | | | | 122,280 | |
Ellie Mae, Inc. (a) | | | 7,455 | | | | 193,979 | |
| EPIQ Systems, Inc. | | | 10,817 | | | | 151,113 | |
| ePlus, Inc. | | | 2,563 | | | | 116,565 | |
Guidance Software, Inc. (a) | | | 8,166 | | | | 85,906 | |
| Mentor Graphics Corporation | | | 6,581 | | | | 120,169 | |
| Pegasystems, Inc. | | | 4,762 | | | | 120,526 | |
PROS Holdings, Inc. (a) | | | 8,185 | | | | 212,155 | |
Rosetta Stone, Inc. (a) | | | 1,260 | | | | 21,332 | |
| TFS SMALL CAP FUND | |
| SCHEDULE OF INVESTMENTS (Continued) | |
| | |
COMMON STOCKS - 98.3% (Continued) | | Shares | | | Value | |
Information Technology - 16.1% (Continued) | |
Software - 3.6% (Continued) | |
Rovi Corporation (a) | | | 9,822 | | | $ | 229,737 | |
| Sapiens International Corporation N.V. | | | 2,958 | | | | 17,127 | |
SeaChange International, Inc. (a) | | | 13,565 | | | | 147,316 | |
SS&C Technologies Holdings, Inc. (a) | | | 7,556 | | | | 231,894 | |
Take-Two Interactive Software, Inc. (a) | | | 2,950 | | | | 45,017 | |
TeleNav, Inc. (a) | | | 18,198 | | | | 95,358 | |
Verint Systems, Inc. (a) | | | 3,681 | | | | 121,620 | |
Websense, Inc. (a) | | | 3,209 | | | | 57,249 | |
| | | | | | | | 2,124,930 | |
Materials - 3.3% | |
Chemicals - 1.3% | |
| A. Schulman, Inc. | | | 405 | | | | 10,518 | |
ADA-ES, Inc. (a) | | | 176 | | | | 4,859 | |
American Pacific Corporation (a) | | | 4,592 | | | | 112,550 | |
Arabian American Development Company (a) | | | 356 | | | | 2,709 | |
Chemtura Corporation (a) | | | 4,896 | | | | 104,089 | |
| FutureFuel Corporation | | | 8,526 | | | | 104,444 | |
LSB Industries, Inc. (a) | | | 3,712 | | | | 121,234 | |
| Minerals Technologies, Inc. | | | 2,519 | | | | 102,347 | |
| Sensient Technologies Corporation | | | 3,927 | | | | 154,527 | |
| Tredegar Corporation | | | 1,935 | | | | 57,276 | |
| | | | | | | | 774,553 | |
Construction Materials - 0.1% | |
United States Lime & Minerals, Inc. (a) | | | 758 | | | | 35,005 | |
US Concrete, Inc. (a) | | | 689 | | | | 10,707 | |
| | | | | | | | 45,712 | |
Containers & Packaging - 0.5% | |
| Boise, Inc. | | | 34,033 | | | | 271,923 | |
Graphic Packaging Holding Company (a) | | | 3,763 | | | | 28,298 | |
| Myers Industries, Inc. | | | 295 | | | | 4,372 | |
| | | | | | | | 304,593 | |
Metals & Mining - 0.8% | |
| Carpenter Technology Corporation | | | 3,395 | | | | 152,639 | |
| Compass Minerals International, Inc. | | | 1,818 | | | | 157,330 | |
| Haynes International, Inc. | | | 186 | | | | 9,042 | |
Horsehead Holding Corporation (a) | | | 96 | | | | 1,027 | |
Tahoe Resources, Inc. (a) | | | 7,012 | | | | 121,728 | |
| | | | | | | | 441,766 | |
Paper & Forest Products - 0.6% | |
| Buckeye Technologies, Inc. | | | 8 | | | | 301 | |
Clearwater Paper Corporation (a) | | | 31 | | | | 1,426 | |
| Deltic Timber Corporation | | | 1,058 | | | | 66,104 | |
| KapStone Paper and Packaging Corporation | | | 4,167 | | | | 123,260 | |
| Neenah Paper, Inc. | | | 4,255 | | | | 122,374 | |
| P.H. Glatfelter Company | | | 2,050 | | | | 49,200 | |
| | | | | | | | 362,665 | |
| TFS SMALL CAP FUND | |
| SCHEDULE OF INVESTMENTS (Continued) | |
| | |
COMMON STOCKS - 98.3% (Continued) | | Shares | | | Value | |
Telecommunication Services - 1.9% | |
Diversified Telecommunication Services - 1.4% | |
| Atlantic Tele-Network, Inc. | | | 2,313 | | | $ | 117,431 | |
Cbeyond, Inc. (a) | | | 11,820 | | | | 103,780 | |
| Consolidated Communications Holdings, Inc. | | | 5,593 | | | | 103,079 | |
General Communication, Inc. - Class A (a) | | | 2,321 | | | | 22,537 | |
| IDT Corporation - Class B | | | 7,498 | | | | 110,895 | |
| Neutral Tandem, Inc. | | | 19,174 | | | | 57,138 | |
Premiere Global Services, Inc. (a) | | | 10,781 | | | | 121,071 | |
Vonage Holdings Corporation (a) | | | 49,600 | | | | 151,280 | |
| | | | | | | | 787,211 | |
Wireless Telecommunication Services - 0.5% | |
| Telephone and Data Systems, Inc. | | | 13,390 | | | | 300,472 | |
| USA Mobility, Inc. | | | 199 | | | | 2,700 | |
| | | | | | | | 303,172 | |
Utilities - 0.8% | |
Electric Utilities - 0.3% | |
| El Paso Electric Company | | | 3,255 | | | | 121,932 | |
| Unitil Corporation | | | 2,544 | | | | 77,109 | |
| | | | | | | | 199,041 | |
Gas Utilities - 0.0% (b) | |
| Chesapeake Utilities Corporation | | | 245 | | | | 13,073 | |
| | | | | | | | | |
Independent Power Producers & Energy Traders - 0.0% (b) | |
| Genie Energy Ltd. - Class B | | | 517 | | | | 5,573 | |
| | | | | | | | | |
Water Utilities - 0.5% | |
| California Water Service Group | | | 6,018 | | | | 120,661 | |
| Connecticut Water Service, Inc. | | | 2,238 | | | | 63,738 | |
| SJW Corporation | | | 3,368 | | | | 85,413 | |
| | | | | | | | 269,812 | |
| | | | | | | | | |
Total Common Stocks (Cost $53,873,482) | | | $ | 57,652,215 | |
| | | | | | | | | |
| MONEY MARKET FUNDS - 1.9% | | Shares | | | Value | |
UMB Money Market Fiduciary, 0.01% (c) (Cost $1,092,605) | | | 1,092,605 | | | $ | 1,092,605 | |
| | | | | | | | | |
Total Investments at Value - 100.2% (Cost $54,966,087) | | | $ | 58,744,820 | |
| | | | | | | | | |
| Liabilities in Excess of Other Assets - (0.2%) | | | | (117,560 | ) |
| | | | | | | | | |
| Net Assets - 100.0% | | | $ | 58,627,260 | |
| (a) | Non-income producing security. |
| (b) | Percentage rounds to less than 0.1%. |
| (c) | The rate shown is the 7-day effective yield as of April 30, 2013. |
| See accompanying notes to financial statements. |
| TFS HEDGED FUTURES FUND | |
| SCHEDULE OF INVESTMENTS | |
| April 30, 2013 (Unaudited) | |
| | |
U.S. TREASURY OBLIGATIONS (a) - 20.6% | | Par Value | | | Value | |
| U.S. Treasury Bills, | | | | | | |
| 0.115%, due 08/08/2013 | | $ | 3,000,000 | | | $ | 2,999,568 | |
| 0.080%, due 08/15/2013 | | | 750,000 | | | | 749,873 | |
| 0.095%, due 08/22/2013 | | | 5,000,000 | | | | 4,999,135 | |
| 0.070%, due 08/29/2013 | | | 1,250,000 | | | | 1,249,813 | |
| 0.085%, due 09/05/2013 | | | 6,000,000 | | | | 5,998,782 | |
| 0.080%, due 09/12/2013 | | | 1,000,000 | | | | 999,749 | |
| 0.075%, due 09/19/2013 | | | 3,000,000 | | | | 2,999,148 | |
| 0.080%, due 10/03/2013 | | | 3,750,000 | | | | 3,748,789 | |
Total U.S. Treasury Obligations (Cost $23,742,823) | | | $ | 23,744,857 | |
| | | | | | | | | |
| MONEY MARKET FUNDS - 58.1% | | Shares | | | Value | |
BlackRock Liquidity Funds TempFund Portfolio - Institutional Class, 0.08% (b) | | | 12,281,594 | | | $ | 12,281,594 | |
Fidelity Institutional Money Market Portfolio - Class I, 0.10% (b) | | | 26,927,800 | | | | 26,927,800 | |
Goldman Sachs Financial Square Money Market Fund - Institutional Class, 0.10% (b) | | | 12,281,809 | | | | 12,281,809 | |
Morgan Stanley Institutional Liquidity Funds - Money Market Portfolio - Institutional Class, 0.12% (b) | | | 1,527,144 | | | | 1,527,144 | |
PIMCO Money Market Fund - Institutional Class, 0.01% (b) | | | 1,525,929 | | | | 1,525,929 | |
Vanguard Prime Money Market Fund - Investor Shares, 0.01% (b) | | | 12,277,919 | | | | 12,277,919 | |
Total Money Market Funds (Cost $66,822,195) | | | $ | 66,822,195 | |
| | | | | | | | | |
Total Investments at Value - 78.7% (Cost $90,565,018) | | | $ | 90,567,052 | |
| | | | | | | | | |
| Other Assets in Excess of Liabilities - 21.3% | | | | 24,504,881 | (c) |
| | | | | | | | | |
| Net Assets - 100.0% | | | $ | 115,071,933 | |
| (a) | Rate shown is the annualized yield at time of purchase, not a coupon rate. |
| (b) | The rate shown is the 7-day effective yield as of April 30, 2013. |
| (c) | Includes cash held as margin deposits for futures contracts. |
| See accompanying notes to financial statements. |
| TFS HEDGED FUTURES FUND | | | | |
| SCHEDULE OF FUTURES CONTRACTS | | | | |
| April 30, 2013 (Unaudited) | | | | |
| | | | | |
| FUTURES CONTRACTS | Expiration Date | | Contracts | | | Aggregate Market Value of Contracts | | | Unrealized Appreciation (Depreciation) | |
| COMMODITY FUTURES | | | | |
| Cocoa Future | 07/16/2013 | | | 70 | | | $ | 1,657,600 | | | $ | 69,240 | |
| Coffee Future | 07/19/2013 | | | 51 | | | | 2,583,787 | | | | (34,422 | ) |
| Corn Future | 07/12/2013 | | | 133 | | | | 4,322,500 | | | | 164,956 | |
| Frozen Concentrate Orange Juice Future | 07/11/2013 | | | 145 | | | | 3,053,700 | | | | (76,436 | ) |
| Gold Future | 06/26/2013 | | | 11 | | | | 1,623,270 | | | | (149,055 | ) |
| Heating Oil Future | 05/31/2013 | | | 39 | | | | 4,626,203 | | | | 20,178 | |
| Live Cattle Future | 06/28/2013 | | | 39 | | | | 1,905,930 | | | | 7,742 | |
| Oats Future | 07/12/2013 | | | 40 | | | | 783,500 | | | | 1,580 | |
| Rough Rice Future | 07/12/2013 | | | 4 | | | | 120,840 | | | | (5,351 | ) |
| Soybean Future | 07/12/2013 | | | 81 | | | | 5,665,950 | | | | 108,245 | |
| Soybean Meal Future | 07/12/2013 | | | 149 | | | | 6,176,050 | | | | 203,841 | |
| Soybean Oil Future | 07/12/2013 | | | 28 | | | | 826,896 | | | | 4,317 | |
| Sugar No. 11 Future | 06/28/2013 | | | 199 | | | | 3,922,688 | | | | 17,035 | |
| Wheat Future | 07/12/2013 | | | 7 | | | | 255,850 | | | | 12,831 | |
| Total Commodity Futures | | | | 37,524,764 | | | | 344,701 | |
| | | | | | | | | | |
| CURRENCY FUTURES | | | | | |
| Australian Dollar Future | 06/17/2013 | | | 110 | | | | 11,366,300 | | | | 16,948 | |
| Canadian Dollar Future | 06/18/2013 | | | 1 | | | | 99,180 | | | | 8 | |
| Mexican Peso Future | 06/17/2013 | | | 295 | | | | 12,098,688 | | | | 265,935 | |
| Total Currency Futures | | | | 23,564,168 | | | | 282,891 | |
| | | | | | | | | | |
| Total Futures Contracts | | | $ | 61,088,932 | | | $ | 627,592 | |
| See accompanying notes to financial statements. |
| TFS HEDGED FUTURES FUND | | | | |
| SCHEDULE OF FUTURES CONTRACTS SOLD SHORT | | | | |
| April 30, 2013 (Unaudited) | | | | |
| | | | | |
| FUTURES CONTRACTS SOLD SHORT | Expiration Date | | Contracts | | | Aggregate Market Value of Contracts | | | Unrealized Appreciation (Depreciation) | |
| COMMODITY FUTURES | | | | |
| Brent Crude Oil Future | 05/16/2013 | | | 12 | | | $ | 1,220,880 | | | $ | 2,270 | |
| Class III Milk Future | 06/04/2013 | | | 176 | | | | 6,575,360 | | | | (69,885 | ) |
| Copper Future | 07/29/2013 | | | 19 | | | | 1,513,350 | | | | 1,143 | |
| Cotton No. 2 Future | 07/09/2013 | | | 45 | | | | 1,968,075 | | | | (44,759 | ) |
| Crude Oil Future | 05/21/2013 | | | 29 | | | | 2,697,870 | | | | (93,407 | ) |
| Feeder Cattle Future | 05/24/2013 | | | 51 | | | | 3,556,613 | | | | 60,734 | |
| Feeder Cattle Future | 08/29/2013 | | | 53 | | | | 3,947,175 | | | | 46,454 | |
| Gas Oil Future | 05/10/2013 | | | 8 | | | | 675,200 | | | | 6,911 | |
| Gas Oil Future | 06/12/2013 | | | 21 | | | | 1,781,325 | | | | 2,765 | |
| Lean Hogs Future | 06/14/2013 | | | 163 | | | | 6,034,260 | | | | (133,339 | ) |
| Lumber Future | 07/15/2013 | | | 61 | | | | 2,345,816 | | | | 131,171 | |
| Natural Gas Future | 05/29/2013 | | | 32 | | | | 1,391,680 | | | | (5,594 | ) |
| Palladium Future | 06/26/2013 | | | 33 | | | | 2,306,040 | | | | (16,062 | ) |
| Platinum Future | 07/29/2013 | | | 8 | | | | 602,320 | | | | (17,919 | ) |
| Silver Future | 07/29/2013 | | | 9 | | | | 1,091,250 | | | | (27,621 | ) |
| Total Commodity Futures | | | | 37,707,214 | | | | (157,138 | ) |
| | | | | | | | | | |
| CURRENCY FUTURES | | | | | |
| British Pound Future | 06/17/2013 | | | 44 | | | | 4,270,475 | | | | (70,403 | ) |
| Euro FX Future | 06/17/2013 | | | 44 | | | | 7,245,150 | | | | (92,346 | ) |
| Japanese Yen Future | 06/17/2013 | | | 31 | | | | 3,975,750 | | | | (12,826 | ) |
| Swiss Franc Future | 06/17/2013 | | | 59 | | | | 7,934,762 | | | | (107,333 | ) |
| Total Currency Futures | | | | 23,426,137 | | | | (282,908 | ) |
| | | | | | | | | | |
| FINANCIAL FUTURES | | | | | |
| CBOE Volatility Index (VIX) Future | 05/21/2013 | | | 331 | | | | 4,816,050 | | | | 444,355 | |
| CBOE Volatility Index (VIX) Future | 06/18/2013 | | | 375 | | | | 5,775,000 | | | | 468,412 | |
| E-Mini S&P 500 Future | 06/21/2013 | | | 602 | | | | 47,926,725 | | | | (1,406,223 | ) |
| Total Financial Futures | | | | 58,517,775 | | | | (493,456 | ) |
| | | | | | | | | | |
| Total Futures Contracts Sold Short | | | $ | 119,651,126 | | | $ | (933,502 | ) |
| See accompanying notes to financial statements. |
| Item 7. | Disclosure of Proxy Voting Policies and Procedures for Closed-End Management Investment Companies. |
Not applicable
| Item 8. | Portfolio Managers of Closed-End Management Investment Companies. |
Not applicable
| Item 9. | Purchases of Equity Securities by Closed-End Management Investment Company and Affiliated Purchasers. |
Not applicable
| Item 10. | Submission of Matters to a Vote of Security Holders. |
The registrant has not adopted procedures by which shareholders may recommend nominees to the registrant’s board of trustees.
| Item 11. | Controls and Procedures. |
(a) Based on their evaluation of the registrant’s disclosure controls and procedures (as defined in Rule 30a-3(c) under the Investment Company Act of 1940) as of a date within 90 days of the filing date of this report, the registrant’s principal executive officer and principal financial officer have concluded that such disclosure controls and procedures are reasonably designed and are operating effectively to ensure that material information relating to the registrant, including its consolidated subsidiaries, is made known to them by others within those entities, particularly during the period in which this report is being prepared, and that the information required in filings on Form N-CSR is recorded, processed, summarized, and reported on a timely basis.
(b) There were no changes in the registrant’s internal control over financial reporting (as defined in Rule 30a-3(d) under the Investment Company Act of 1940) that occurred during the second fiscal quarter of the period covered by this report that have materially affected, or are reasonably likely to materially affect, the registrant’s internal control over financial reporting.
File the exhibits listed below as part of this Form. Letter or number the exhibits in the sequence indicated.
(a)(1) Any code of ethics, or amendment thereto, that is the subject of the disclosure required by Item 2, to the extent that the registrant intends to satisfy the Item 2 requirements through filing of an exhibit: Not required
(a)(2) A separate certification for each principal executive officer and principal financial officer of the registrant as required by Rule 30a-2(a) under the Act (17 CFR 270.30a-2(a)): Attached hereto
(a)(3) Any written solicitation to purchase securities under Rule 23c-1 under the Act (17 CFR 270.23c-1) sent or given during the period covered by the report by or on behalf of the registrant to 10 or more persons: Not applicable
(b) Certifications required by Rule 30a-2(b) under the Act (17 CFR 270.30a-2(b)): Attached hereto
Exhibit 99.CERT | Certifications required by Rule 30a-2(a) under the Act |
Exhibit 99.906CERT | Certifications required by Rule 30a-2(b) under the Act |
SIGNATURES
Pursuant to the requirements of the Securities Exchange Act of 1934 and the Investment Company Act of 1940, the registrant has duly caused this report to be signed on its behalf by the undersigned, thereunto duly authorized.
(Registrant) TFS Capital Investment Trust
| By (Signature and Title)* | /s/ Larry S, Eiben | |
| | | Larry S. Eiben, President | |
| | | | |
| Date | June 26, 2013 | | |
| | | | |
| Pursuant to the requirements of the Securities Exchange Act of 1934 and the Investment Company Act of 1940, this report has been signed below by the following persons on behalf of the registrant and in the capacities and on the dates indicated. |
| | | | |
| By (Signature and Title)* | /s/ Larry S. Eiben | |
| | | Larry S. Eiben, President | |
| | | | |
| Date | June 26, 2013 | | |
| | | | |
| By (Signature and Title)* | /s/ Mark J. Seger | |
| | | Mark J. Seger, Treasurer | |
| | | | |
| Date | June 26, 2013 | | |
* Print the name and title of each signing officer under his or her signature.