| OMB APPROVAL |
OMB Number: 3235-0570
Expires: January 31, 2017
Estimated average burden hours per response: 20.6 |
UNITED STATES
SECURITIES AND EXCHANGE COMMISSION
Washington, D.C. 20549
FORM N-CSR
CERTIFIED SHAREHOLDER REPORT OF REGISTERED
MANAGEMENT INVESTMENT COMPANIES
Investment Company Act file number 811-21531
TFS Capital Investment Trust
(Exact name of registrant as specified in charter)
| 10 N. High Street, Suite 500 West Chester, PA | 19380 |
| (Address of principal executive offices) | (Zip code) |
Wade R. Bridge, Esq.
Ultimus Fund Solutions, LLC 225 Pictoria Drive, Suite 450 Cincinnati, Ohio 45246
(Name and address of agent for service)
Registrant's telephone number, including area code: (804) 484-1401
Date of fiscal year end: October 31, 2014
Date of reporting period: April 30, 2014
Form N-CSR is to be used by management investment companies to file reports with the Commission not later than 10 days after the transmission to stockholders of any report that is required to be transmitted to stockholders under Rule 30e-1 under the Investment Company Act of 1940 (17 CFR 270.30e-1). The Commission may use the information provided on Form N-CSR in its regulatory, disclosure review, inspection, and policymaking roles.
A registrant is required to disclose the information specified by Form N-CSR, and the Commission will make this information public. A registrant is not required to respond to the collection of information contained in Form N-CSR unless the Form displays a currently valid Office of Management and Budget ("OMB") control number. Please direct comments concerning the accuracy of the information collection burden estimate and any suggestions for reducing the burden to Secretary, Securities and Exchange Commission, 450 Fifth Street, NW, Washington, DC 20549-0609. The OMB has reviewed this collection of information under the clearance requirements of 44 U.S.C. § 3507.
| Item 1. | Reports to Stockholders. |

SEMI-ANNUAL REPORT
April 30, 2014
(Unaudited)
For more information or assistance in opening an account,
please call toll-free 1-888-534-2001.
June 15, 2014
Dear Shareholder,
Enclosed is the Semi-Annual Report to shareholders of the TFS Market Neutral Fund (ticker: TFSMX), the TFS Small Cap Fund (ticker: TFSSX) and the TFS Hedged Futures Fund (ticker: TFSHX) for the period ended April 30, 2014. On behalf of the investment manager, TFS Capital LLC (“TFS Capital”), I would like to thank you for your continued investment.
Below you will find performance updates on each of the mutual funds. Also, as previously announced, effective January 1, 2014, the advisory fee rate paid to TFS Capital by each of the three funds was reduced. In addition, the maximum expense ratio of each fund was permanently reduced. TFS Capital believes the fee reductions are in the best interests of the funds’ shareholders and consistent with industry demand for lower fees. We also believe the fee reductions strengthen the firm’s long-term value proposition.
TFS Market Neutral Fund (ticker: TFSMX)
Average annual total returns for periods ended April 30, 2014
| | 1-year
return | 3-year
return | 5-year
return | Since Inception (9/7/2004) |
| TFS Market Neutral Fund | -0.60% | 0.77% | 5.33% | 6.79% |
S&P 500® Index | 20.44% | 13.83% | 19.14% | 7.75% |
TFSMX did not produce positive alpha (i.e., the return that cannot be explained by a fund’s market exposure) for the majority of the first six months of the current fiscal year. Many of the strategies in which the fund invests underperformed during the period. Much of the underperformance is explained by stocks in the fund’s short portfolio, and in particular those stocks with high volatility and/or borrowing costs. These stocks, which have helped the fund in the past, rose more than the overall market, leading to losses for the fund’s short portfolio.
Since inception, TFSMX has produced positive alpha, with performance just below those of long-only indices with significantly lower volatility and market exposure. From inception (September 7, 2004) through April 30, 2014, TFSMX has had an average annual return of 6.79%, as compared to S&P 500® Index performance during the same period of 7.75%. During this period, the fund’s beta (i.e., the performance resulting from market exposure) was only 0.23, meaning that only a small portion of the fund’s performance was caused by market exposure. In addition, during this time period, the fund’s average annual volatility measure is 7.86%, compared to the S&P 500® Index volatility of 20.68%. Based on its trailing 5-year return through April 30, 2014, TFSMX was ranked #14 among 41 funds in the Lipper “Equity Market Neutral” category.1
The strategies used in managing TFSMX have resulted in its returns having a low correlation to other asset classes since inception. According to Modern Portfolio Theory, portfolios may benefit by combining non-correlated investments. For your reference, below are the TFS Market Neutral Fund’s correlations to several other asset classes since inception. It is notable that TFSMX has observed a rise in correlation to the equity indices in recent years, as compared to historical averages.
| Index | Correlation Since Inception |
S&P 500 ® Index | 0.61 |
Russell 2000 ® Index | 0.60 |
| MSCI EAFE Index | 0.49 |
| Barclays U.S. Aggregate Bond Index | -0.17 |
| Dow Jones REIT ETF Index | 0.42 |
| Dow Jones Commodity Futures | 0.43 |
Effective March 1, 2014, TFSMX became available for purchase by all investors. The TFS Market Neutral Fund was closed to new investors on June 30, 2009 in response to an increase in assets. Since then, the fund has either been fully closed to investors or has operated under a policy that was designed to limit purchase activity. At this time, TFS Capital believes the fund has capacity to accept new investments while still maintaining its current investment integrity.
TFS Small Cap Fund (ticker: TFSSX)
Average annual total returns for periods ended April 30, 2014
| | 1-year
return | 3-year
return | 5-year
return | Since Inception (3/7/2006) |
| TFS Small Cap Fund | 26.72% | 13.31% | 24.21% | 12.36% |
Russell 2000 ® Index | 20.50% | 10.74% | 19.84% | 7.08% |
During the 12-month period ended April 30, 2014, TFSSX outperformed its benchmark, the Russell 2000® Index. TFSSX’s returns were heavily impacted by the movement of the U.S. “small-cap” equity sector as evidenced by comparing the return of TFSSX and its benchmark return (i.e., 26.72% versus 20.50%). Given its “long-only” mandate, TFSSX is expected to have a high correlation to U.S. small-cap equity market movements with any performance deviation generally attributable to TFS Capital’s equity selection.
TFSSX also achieved its objective of outperforming the Russell 2000® Index over longer periods of time. In fact, it now has over an 8-year track record and has achieved an average annual return since inception that is more than five percentage points higher than that of the Russell 2000® Index. Based on its trailing 5-year return through April 30, 2014, TFSSX was ranked #21 among 585 funds in the Lipper Small Cap Core category.2
TFS Hedged Futures Fund (ticker: TFSHX)
Average annual total returns for periods ended April 30, 2014
| | 1-year
return | Since Inception (3/7/2006) |
| TFS Hedged Futures Fund | -3.86% | 0.85% |
| S&P Diversified Trends Indicator | 1.13% | -3.88% |
S&P 500® Index | 20.44% | 21.24% |
During the 12-month period ended April 30, 2014, TFSHX failed to generate capital appreciation – posting a -3.86% return during the period. From inception (December 29, 2011) through April 30, 2014, TFSHX generated only a slightly positive average annual return of 0.85%. While performance during the one year period trails the S&P Diversified Trends Indicator, a commonly-used benchmark for managed-futures funds, performance since inception compares favorably. Though the S&P 500® Index is not generally considered an appropriate benchmark for managed-futures funds, it is provided above for your reference.
Like the TFS Market Neutral Fund, the TFS Hedged Futures Fund has demonstrated a low correlation to many market indices. This low correlation suggests the addition of the TFS Hedged Futures Fund may improve the risk-adjusted performance of many investment portfolios. The TFS Hedged Futures Fund has had a slightly negative correlation to the S&P Diversified Trends Indicator, which suggests that it may also have a low correlation to other managed-futures funds that track this index. The TFS Hedged Futures Fund also has a low correlation to the TFS Market Neutral Fund which suggests that these two investments may complement each other in an investment portfolio seeking non-correlated return streams. For your reference, below are the TFS Hedged Futures Fund’s correlations to several other asset classes.
| Index | Correlation Since Inception |
| TFS Market Neutral Fund (ticker: TFSMX) | 0.25 |
| S&P Diversified Trends Indicator | -0.09 |
S&P 500® Index | 0.21 |
Russell 2000® Index | 0.23 |
| S&P GSCI Index | 0.14 |
| Barclays U.S. Aggregate Bond Index | -0.09 |
As always, we do not recommend allocating a high percentage of one’s assets to any one investment fund managed by TFS Capital given the risks inherent in each product. Rather, we believe that they are best used as a component of a diversified portfolio of investments. If you have any questions regarding this material, please contact us.
Best regards,
Larry S. Eiben
Chief Operating Officer & Co-Portfolio Manager
TFS Capital LLC
The performance data quoted represents past performance, which is not a guarantee of future results. Current performance may be lower or higher than the performance data quoted. The investment return and principal value of an investment in the mutual funds discussed in this report (the “Funds”) will fluctuate so that an investor’s shares, when redeemed, may be worth more or less than their original cost. Fee reductions and/or expense reimbursements by the Adviser have positively impacted the Funds’ performance. Without such reductions and/or reimbursements, performance would have been lower. An investor should consider the investment objectives, risks, charges and expenses of the Funds carefully before investing. To obtain a summary prospectus and/or prospectus, which each contain this and other important information, go to www.TFSCapital.com or call (888) 534-2001. Please read the summary prospectus and/or prospectus carefully before investing. The Funds may not be suitable for all investors. Futures investing is speculative. Each Fund’s current NAV per share is available at www.TFSCapital.com.
1 | In the Lipper “Equity Market Neutral” category, TFSMX was ranked #14 out of 41 using its 5-year return and #35 out of 70 using its 3-year return. At 4/30/2014, Lipper did not make 1-year rankings available to the public. |
2 | In the Lipper “Small Cap Core” category, TFSSX was ranked #21 out of 585 using its 5-year return and #101 out of 659 using its 3-year return. At 4/30/2014, Lipper did not make 1-year rankings available to the public. |
Ranking information provided by Lipper for the periods ended April 30, 2014. TFSSX was assigned by Lipper to the Small-Cap Core category. TFSMX was assigned by Lipper to the Equity Market Neutral category. The Funds are ranked based on total return and are ranked within a universe of funds with similar investment objectives. Rankings include the reinvestment of dividends and capital gains but exclude the effect of a fund’s sales load, if applicable. Fund rankings are calculated monthly by Lipper Analytical Services of New York. Lipper Inc. is a nationally recognized organization that ranks the performance of mutual funds.
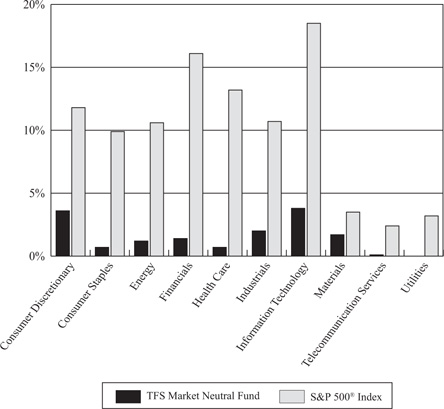
TFS MARKET NEUTRAL FUND
PORTFOLIO INFORMATION
April 30, 2014 (Unaudited)
Common Stocks vs.
the Standard & Poor’s 500® Index Net Sector Exposure*
| * | The net percentages for TFS Market Neutral Fund are computed by taking the net dollar exposure, including short positions, and dividing by the net assets of the Fund. Consequently, the percentages will not total to 100%. |
| Top 10 Long Common Stocks | | Top 10 Short Common Stocks |
| Security Description | % of
Net Assets | | Security Description | % of
Net Assets |
| Tower International, Inc. | 0.51% | | VirnetX Holding Corporation | 0.54% |
| Natus Medical, Inc. | 0.47% | | Molycorp, Inc. | 0.52% |
| Pioneer Energy Services Corporation | 0.47% | | ExOne Company (The) | 0.51% |
| Matrix Service Company | 0.38% | | Arena Pharmaceuticals, Inc. | 0.50% |
| Tech Data Corporation | 0.37% | | GenCorp, Inc. | 0.47% |
| Compass Minerals International, Inc. | 0.35% | | J.C. Penney Company, Inc. | 0.47% |
| EnerNOC, Inc. | 0.33% | | Dendreon Corporation | 0.42% |
| Warren Resources, Inc. | 0.33% | | Sarepta Therapeutics, Inc. | 0.41% |
| OraSure Technologies, Inc. | 0.33% | | Weight Watchers International, Inc. | 0.40% |
| PBF Energy, Inc. - Class A | 0.32% | | Galena Biopharma, Inc. | 0.40% |
Please note that the Fund may hold securities other than common stocks.
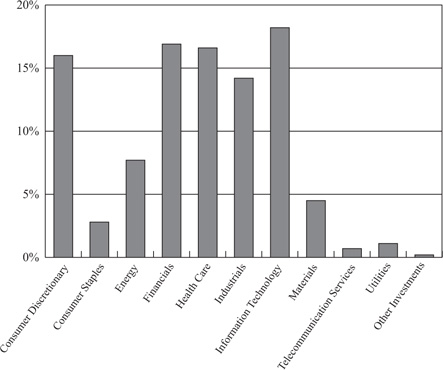
TFS SMALL CAP FUND
PORTFOLIO INFORMATION
April 30, 2014 (Unaudited)
Sector Allocation (% of Net Assets)
| Top 10 Equity Positions |
| Security Description | % of
Net Assets |
| Pioneer Energy Services Corporation | 0.54% |
| Compass Minerals International, Inc. | 0.53% |
| Gentherm, Inc. | 0.52% |
| Magellan Health Services, Inc. | 0.50% |
| Tech Data Corporation | 0.50% |
| Korn/Ferry International | 0.49% |
| Geo Group, Inc. (The) | 0.49% |
| Berry Plastics Group, Inc. | 0.47% |
| Natus Medical, Inc. | 0.47% |
| H&E Equipment Services, Inc. | 0.44% |
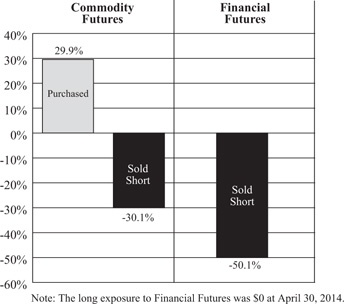
TFS HEDGED FUTURES FUND
PORTFOLIO INFORMATION
April 30, 2014 (Unaudited)
Exposure by Type of Futures Contract
(Value as a % of Net Assets)
Net Exposure by Type of Futures Contract
(Net as a % of Net Assets) |
| Net Commodity Futures Exposure | -0.2% |
| Net Financial Futures Exposure | -50.1% |
TFS MARKET NEUTRAL FUND
SUMMARY SCHEDULE OF INVESTMENTS*
April 30, 2014 (Unaudited)
| COMMON STOCKS — 90.3% | | Shares | | | Value | |
| Consumer Discretionary — 14.1% | | | | | | |
DineEquity, Inc. (a) | | | 35,430 | | | $ | 2,685,948 | |
Gentherm, Inc. (a) (b) | | | 84,384 | | | | 3,067,358 | |
Journal Communications, Inc. - Class A (b) | | | 304,734 | | | | 2,443,967 | |
Marcus Corporation (a) | | | 147,150 | | | | 2,461,820 | |
Modine Manufacturing Company (a) (b) | | | 164,286 | | | | 2,707,433 | |
Motorcar Parts of America, Inc. (a) (b) | | | 91,254 | | | | 2,504,010 | |
Papa John's International, Inc. (a) | | | 59,334 | | | | 2,602,389 | |
Tower International, Inc. (a) (b) | | | 186,481 | | | | 5,186,037 | |
Zale Corporation (a) (b) | | | 124,567 | | | | 2,664,488 | |
Other Consumer Discretionary (c) | | | | | | | 116,390,995 | |
| | | | | | | 142,714,445 | |
| Consumer Staples — 2.9% | | | | | | | | |
Cal-Maine Foods, Inc. (a) | | | 44,285 | | | | 2,640,715 | |
Revlon, Inc. - Class A (a) (b) | | | 86,256 | | | | 2,599,756 | |
Other Consumer Staples (c) | | | | | | | 23,976,960 | |
| | | | | | | 29,217,431 | |
| Energy — 7.7% | | | | | | | | |
Matrix Service Company (b) | | | 123,641 | | | | 3,829,162 | |
PBF Energy, Inc. - Class A (a) | | | 106,648 | | | | 3,282,625 | |
Pioneer Energy Services Corporation (a) (b) | | | 316,433 | | | | 4,737,002 | |
REX American Resources Corporation (b) | | | 44,421 | | | | 2,903,357 | |
Stone Energy Corporation (a) (b) | | | 54,950 | | | | 2,695,298 | |
Warren Resources, Inc. (a) (b) | | | 660,240 | | | | 3,347,417 | |
Other Energy (c) | | | | | | | 56,897,224 | |
| | | | | | | 77,692,085 | |
| Financials — 13.5% | | | | | | | | |
| Aspen Insurance Holdings Ltd. | | | 53,711 | | | | 2,458,890 | |
Gyrodyne Special Distribution, LLC (b) (d) | | | 1,499 | | | | — | |
| Kemper Corporation | | | 72,484 | | | | 2,856,594 | |
Nelnet, Inc. - Class A (a) | | | 59,804 | | | | 2,527,317 | |
Zillow, Inc. - Class A (a) (b) | | | 23,700 | | | | 2,576,190 | |
Other Financials (c) | | | | | | | 126,192,182 | |
| | | | | | | 136,611,173 | |
| Health Care — 15.1% | | | | | | | | |
Greatbatch, Inc. (a) (b) | | | 67,321 | | | | 3,098,786 | |
Natus Medical, Inc. (a) (b) | | | 192,868 | | | | 4,788,912 | |
OraSure Technologies, Inc. (a) (b) | | | 509,746 | | | | 3,338,836 | |
Orthofix International N.V. (a) (b) | | | 108,167 | | | | 3,266,643 | |
Providence Service Corporation (The) (b) | | | 76,832 | | | | 3,120,147 | |
Other Health Care (c) | | | | | | | 135,096,365 | |
| | | | | | | 152,709,689 | |
TFS MARKET NEUTRAL FUND
SUMMARY SCHEDULE OF INVESTMENTS* (Continued)
| COMMON STOCKS — 90.3% (Continued) | | Shares | | | Value | |
| Industrials — 12.6% | | | | | | |
Duoyuan Printing, Inc. (b) (d) | | | 82,994 | | | $ | 1,660 | |
EnerNOC, Inc. (a) (b) | | | 142,442 | | | | 3,361,631 | |
Kelly Services, Inc. - Class A (a) | | | 116,924 | | | | 2,462,419 | |
Marten Transport Ltd. (a) | | | 106,100 | | | | 2,489,106 | |
Republic Airways Holdings, Inc. (a) (b) | | | 308,246 | | | | 2,561,524 | |
Tutor Perini Corporation (a) (b) | | | 110,243 | | | | 3,263,193 | |
Other Industrials (c) | | | | | | | 113,086,715 | |
| | | | | | | 127,226,248 | |
| Information Technology — 17.0% | | | | | | | | |
Amkor Technology, Inc. (a) (b) | | | 407,072 | | | | 3,236,222 | |
Envestnet, Inc. (a) (b) | | | 67,603 | | | | 2,491,171 | |
iGATE Corporation (b) | | | 76,004 | | | | 2,781,746 | |
Insight Enterprises, Inc. (b) | | | 91,272 | | | | 2,384,025 | |
Integrated Device Technology, Inc. (a) (b) | | | 206,165 | | | | 2,405,946 | |
Lattice Semiconductor Corporation (a) (b) | | | 300,306 | | | | 2,528,577 | |
MAXIMUS, Inc. (a) | | | 59,233 | | | | 2,521,549 | |
OmniVision Technologies, Inc. (a) (b) | | | 143,702 | | | | 2,806,500 | |
Perficient, Inc. (b) | | | 134,400 | | | | 2,455,488 | |
Science Applications International Corporation (a) | | | 67,765 | | | | 2,642,835 | |
ShoreTel, Inc. (a) (b) | | | 331,942 | | | | 2,506,162 | |
Take-Two Interactive Software, Inc. (a) (b) | | | 133,849 | | | | 2,727,843 | |
Tech Data Corporation (a) (b) | | | 60,533 | | | | 3,782,707 | |
Other Information Technology (c) | | | | | | | 136,768,897 | |
| | | | | | | 172,039,668 | |
| Materials — 5.5% | | | | | | | | |
Berry Plastics Group, Inc. (a) (b) | | | 122,999 | | | | 2,766,247 | |
Compass Minerals International, Inc. (a) | | | 38,211 | | | | 3,500,128 | |
KapStone Paper and Packaging Corporation (a) (b) | | | 111,176 | | | | 2,932,823 | |
Koppers Holdings, Inc. (a) | | | 64,238 | | | | 2,742,963 | |
P.H. Glatfelter Company (a) | | | 101,464 | | | | 2,589,361 | |
Stepan Company (a) | | | 44,338 | | | | 2,564,067 | |
Other Materials (c) | | | | | | | 38,739,782 | |
| | | | | | | 55,835,371 | |
| Telecommunication Services — 0.9% | | | | | | | | |
Other Telecommunication Services (c) | | | | | | | 9,216,323 | |
| | | | | | | | |
| Utilities — 1.0% | | | | | | | | |
Other Utilities (c) | | | | | | | 10,004,756 | |
| | | | | | | | |
Total Common Stocks (Cost $849,740,612) | | | | | | $ | 913,267,189 | |
TFS MARKET NEUTRAL FUND
SUMMARY SCHEDULE OF INVESTMENTS* (Continued)
| PREFERRED STOCKS — 0.2% | | Shares | | | Value | |
Other Preferred Stocks (Cost $1,307,461) (c) | | | | | | $ | 1,439,851 | |
| OTHER INVESTMENTS — 7.6% | | Shares | | | Value | |
Other Investments (Cost $75,672,532) (c) | | | 123 | | | $ | 76,746,547 | |
CORPORATE BONDS — 0.0% (e) | | Par Value | | | Value | |
Financials — 0.0% (e) | | | | | | |
| GAMCO Investors, Inc., 0.00%, due 12/31/2015 | | $ | 3,100 | | | $ | 2,994 | |
Gyrodyne Company of America, Inc., 5.00%, due 6/30/2017 (d) | | | 12,110 | | | | — | |
Total Corporate Bonds (Cost $12,110) | | | | | | $ | 2,994 | |
| MONEY MARKET FUNDS — 0.8% | | Shares | | | Value | |
Federated Government Obligations Fund - Institutional Class, 0.01% (f) | | | 8,159,309 | | | $ | 8,159,309 | |
UMB Money Market Fiduciary, 0.01% (f) | | | 171,240 | | | | 171,240 | |
Total Money Market Funds (Cost $8,330,549) | | | | | | $ | 8,330,549 | |
| | | | | | | | |
Total Investments at Value — 98.9% (Cost $935,063,264) | | | | | | $ | 999,787,130 | |
| | | | | | | | |
| Other Assets in Excess of Liabilities — 1.1% | | | | | | | 11,612,091 | (g) |
| | | | | | | | |
| Net Assets — 100.0% | | | | | | $ | 1,011,399,221 | |
| * | A complete Schedule of Investments is available without charge upon request by calling toll-free 1-888-534-2001 or on the SEC’s website at http://www.sec.gov. |
| (a) | All or a portion of the shares have been committed as collateral for open short positions. |
| (b) | Non-income producing security. |
| (c) | Represents issuers not identified as either a top 50 holding in terms of value and issues or issuers not exceeding 1% of net assets individually or in the aggregate, respectively, or not a fair-valued security as of April 30, 2014. |
| (d) | Security value has been determined in good faith by the Board of Trustees. The total value of such securities is $1,660 at April 30, 2014, representing 0.0%(e) of net assets (Note 2). |
| (e) | Percentage rounds to less than 0.1%. |
| (f) | The rate shown is the 7-day effective yield as of April 30, 2014. |
| (g) | Includes cash held as margin deposits for open short positions and futures contracts. |
See accompanying notes to financial statements.
TFS MARKET NEUTRAL FUND
SCHEDULE OF SECURITIES SOLD SHORT
April 30, 2014 (Unaudited)
| COMMON STOCKS — 75.1% | | Shares | | | Value | |
| Consumer Discretionary — 10.5% | | | | | | |
| Auto Components — 0.5% | | | | | | |
| Ballard Power Systems, Inc. | | | 568,713 | | | $ | 2,081,490 | |
| BorgWarner, Inc. | | | 4,612 | | | | 286,590 | |
| China XD Plastics Company Ltd. | | | 9,267 | | | | 63,386 | |
| Dorman Products, Inc. | | | 8,482 | | | | 488,139 | |
| Fuel Systems Solutions, Inc. | | | 13,470 | | | | 141,166 | |
| Quantum Fuel Systems Technologies Worldwide, Inc. | | | 309,392 | | | | 2,045,081 | |
| TRW Automotive Holdings Corporation | | | 218 | | | | 17,516 | |
| UQM Technologies, Inc. | | | 92,361 | | | | 204,118 | |
| | | | | | | 5,327,486 | |
| Automobiles — 0.2% | | | | | | | | |
| Kandi Technologies Group, Inc. | | | 138,345 | | | | 1,550,848 | |
| Tesla Motors, Inc. | | | 1,778 | | | | 369,628 | |
| | | | | | | 1,920,476 | |
Distributors — 0.0% (a) | | | | | | | | |
| Pool Corporation | | | 5,958 | | | | 351,641 | |
| | | | | | | | |
| Diversified Consumer Services — 1.0% | | | | | | | | |
| American Public Education, Inc. | | | 28,951 | | | | 1,001,705 | |
| Bridgepoint Education, Inc. | | | 35,063 | | | | 555,748 | |
| Capella Education Company | | | 2,544 | | | | 148,468 | |
| Carriage Services, Inc. | | | 2,719 | | | | 43,749 | |
| Corinthian Colleges, Inc. | | | 494,992 | | | | 569,241 | |
| Education Management Corporation | | | 14,102 | | | | 55,985 | |
| ITT Educational Services, Inc. | | | 40,688 | | | | 1,098,576 | |
| K12, Inc. | | | 19,837 | | | | 469,740 | |
| Lincoln Educational Services Corporation | | | 32,023 | | | | 130,654 | |
| Matthews International Corporation - Class A | | | 2,665 | | | | 107,533 | |
| Outerwall, Inc. | | | 4,035 | | | | 279,827 | |
| StoneMor Partners, L.P. | | | 27,888 | | | | 689,391 | |
| Strayer Education, Inc. | | | 10,988 | | | | 468,418 | |
| Weight Watchers International, Inc. | | | 206,002 | | | | 4,078,840 | |
| | | | | | | 9,697,875 | |
| Hotels, Restaurants & Leisure — 1.0% | | | | | | | | |
| Aramark Holdings Corporation | | | 4,534 | | | | 127,813 | |
| Bally Technologies, Inc. | | | 11,830 | | | | 770,251 | |
| BJ's Restaurants, Inc. | | | 13,969 | | | | 398,815 | |
| Bloomin' Brands, Inc. | | | 455 | | | | 9,701 | |
| Bob Evans Farms, Inc. | | | 20,275 | | | | 950,289 | |
| Caesars Entertainment Corporation | | | 26,138 | | | | 482,769 | |
| Churchill Downs, Inc. | | | 1,841 | | | | 161,695 | |
| Chuy's Holdings, Inc. | | | 9,495 | | | | 341,345 | |
| Darden Restaurants, Inc. | | | 1,463 | | | | 72,726 | |
TFS MARKET NEUTRAL FUND
SCHEDULE OF SECURITIES SOLD SHORT (Continued)
| COMMON STOCKS — 75.1% (Continued) | | Shares | | | Value | |
| Consumer Discretionary — 10.5% (Continued) | | | | | | |
| Hotels, Restaurants & Leisure — 1.0% (Continued) | | | | | | |
| Denny's Corporation | | | 32,979 | | | $ | 222,278 | |
| Empire Resorts, Inc. | | | 70,502 | | | | 477,299 | |
| Famous Dave's of America, Inc. | | | 1,771 | | | | 46,914 | |
| Iao Kun Group Holding Company Ltd. | | | 139 | | | | 407 | |
| International Game Technology | | | 94,687 | | | | 1,188,322 | |
| Interval Leisure Group, Inc. | | | 475 | | | | 12,241 | |
| Jamba, Inc. | | | 33 | | | | 365 | |
| Life Time Fitness, Inc. | | | 25,180 | | | | 1,208,640 | |
| Morgans Hotel Group Company | | | 49,425 | | | | 370,687 | |
| Multimedia Games Holding Company, Inc. | | | 1,716 | | | | 50,107 | |
| Noodles & Company | | | 21,807 | | | | 715,052 | |
| Pinnacle Entertainment, Inc. | | | 21,035 | | | | 489,484 | |
| PokerTek, Inc. | | | 976 | | | | 1,279 | |
| Popeyes Louisiana Kitchen, Inc. | | | 15,322 | | | | 583,768 | |
| Potbelly Corporation | | | 12,609 | | | | 214,353 | |
| Red Lion Hotels Corporation | | | 1,947 | | | | 11,195 | |
| Ryman Hospitality Properties, Inc. | | | 15,398 | | | | 701,379 | |
| Six Flags Entertainment Corporation | | | 1,300 | | | | 52,182 | |
| Starbucks Corporation | | | 830 | | | | 58,615 | |
| | | | | | | 9,719,971 | |
| Household Durables — 1.1% | | | | | | | | |
| Beazer Homes USA, Inc. | | | 22,384 | | | | 424,401 | |
| Blyth, Inc. | | | 216,699 | | | | 2,030,470 | |
| D.R. Horton, Inc. | | | 4,455 | | | | 99,257 | |
| Ethan Allen Interiors, Inc. | | | 51,022 | | | | 1,238,814 | |
| Garmin Ltd. | | | 3,074 | | | | 175,525 | |
| Hovnanian Enterprises, Inc. - Class A | | | 186,097 | | | | 829,993 | |
| iRobot Corporation | | | 8,503 | | | | 284,850 | |
| KB Home | | | 79,013 | | | | 1,304,505 | |
| Lennar Corporation - Class A | | | 7,998 | | | | 308,643 | |
| Meritage Homes Corporation | | | 21,733 | | | | 838,459 | |
| SodaStream International Ltd. | | | 13,220 | | | | 562,247 | |
| Taylor Morrison Home Corporation - Class A | | | 6,889 | | | | 146,116 | |
| Tempur Sealy International, Inc. | | | 7,112 | | | | 356,880 | |
| Toll Brothers, Inc. | | | 956 | | | | 32,733 | |
| TRI Pointe Homes, Inc. | | | 154,530 | | | | 2,483,297 | |
| William Lyon Homes - Class A | | | 10,281 | | | | 268,334 | |
| | | | | | | 11,384,524 | |
| Internet & Catalog Retail — 0.4% | | | | | | | | |
| E-Commerce China Dangdang, Inc. - Class A - ADR | | | 33,193 | | | | 358,152 | |
| FTD Companies, Inc. | | | 27,027 | | | | 819,999 | |
| HomeAway, Inc. | | | 3,011 | | | | 98,219 | |
| Lands' End, Inc. | | | 12,090 | | | | 334,289 | |
TFS MARKET NEUTRAL FUND
SCHEDULE OF SECURITIES SOLD SHORT (Continued)
| COMMON STOCKS — 75.1% (Continued) | | Shares | | | Value | |
| Consumer Discretionary — 10.5% (Continued) | | | | | | |
| Internet & Catalog Retail — 0.4% (Continued) | | | | | | |
| LightInTheBox Holding Company Ltd. - ADR | | | 28,600 | | | $ | 156,156 | |
| Mecox Lane Ltd. - ADR | | | 706 | | | | 2,520 | |
| NutriSystem, Inc. | | | 49,990 | | | | 749,850 | |
| Orbitz Worldwide, Inc. | | | 87,868 | | | | 645,830 | |
| PetMed Express, Inc. | | | 76,986 | | | | 1,007,747 | |
| | | | | | | 4,172,762 | |
| Leisure Products — 1.1% | | | | | | | | |
| Black Diamond, Inc. | | | 105,140 | | | | 1,172,311 | |
| Callaway Golf Company | | | 109,638 | | | | 954,947 | |
| Eastman Kodak Company | | | 38,697 | | | | 1,155,879 | |
| JAKKS Pacific, Inc. | | | 252,698 | | | | 2,213,635 | |
| Smith & Wesson Holding Corporation | | | 169,052 | | | | 2,594,948 | |
| Sturm Ruger & Company, Inc. | | | 53,270 | | | | 3,427,925 | |
| | | | | | | 11,519,645 | |
| Media — 1.9% | | | | | | | | |
| Central European Media Enterprises Ltd. - Class A | | | 471,957 | | | | 1,293,162 | |
| China Yida Holding Company | | | 190 | | | | 580 | |
| Cinemark Holdings, Inc. | | | 2,282 | | | | 67,593 | |
| Cumulus Media, Inc. - Class A | | | 125,811 | | | | 806,449 | |
| Dex Media, Inc. | | | 122,782 | | | | 899,992 | |
| DreamWorks Animation SKG, Inc. - Class A | | | 62,247 | | | | 1,495,795 | |
| Entercom Communications Corporation - Class A | | | 41,565 | | | | 448,902 | |
| Gray Television, Inc. | | | 28,174 | | | | 316,958 | |
| Lamar Advertising Company - Class A | | | 11,218 | | | | 560,003 | |
| Liberty Media Corporation - Class A | | | 444 | | | | 57,591 | |
| McClatchy Company (The) - Class A | | | 70,578 | | | | 386,767 | |
| MDC Partners, Inc. - Class A | | | 66,191 | | | | 1,616,384 | |
| Media General, Inc. | | | 37,694 | | | | 577,472 | |
| New Media Investment Group, Inc. | | | 15,083 | | | | 215,234 | |
| Nexstar Broadcasting Group, Inc. - Class A | | | 63,334 | | | | 2,523,860 | |
| Radio One, Inc. - Class D | | | 165,132 | | | | 746,397 | |
| ReachLocal, Inc. | | | 15,311 | | | | 153,110 | |
| Regal Entertainment Group - Class A | | | 72,935 | | | | 1,371,178 | |
| RRSat Global Communications Network Ltd. | | | 489 | | | | 4,337 | |
| Scholastic Corporation | | | 17,859 | | | | 587,740 | |
| SFX Entertainment, Inc. | | | 7,972 | | | | 52,296 | |
| Sinclair Broadcast Group, Inc. - Class A | | | 54,923 | | | | 1,468,092 | |
| Sizmek, Inc. | | | 100,321 | | | | 961,075 | |
| Thomson Reuters Corporation | | | 12,185 | | | | 440,853 | |
| Tiger Media, Inc. | | | 586 | | | | 469 | |
| VisionChina Media, Inc. - ADR | | | 31,531 | | | | 622,422 | |
| World Wrestling Entertainment, Inc. - Class A | | | 17,530 | | | | 341,835 | |
| YOU On Demand Holdings, Inc. | | | 213,518 | | | | 634,148 | |
| | | | | | | 18,650,694 | |
TFS MARKET NEUTRAL FUND
SCHEDULE OF SECURITIES SOLD SHORT (Continued)
| COMMON STOCKS — 75.1% (Continued) | | Shares | | | Value | |
| Consumer Discretionary — 10.5% (Continued) | | | | | | |
| Multiline Retail — 0.7% | | | | | | |
| J. C. Penney Company, Inc. | | | 554,613 | | | $ | 4,725,303 | |
| Sears Canada, Inc. | | | 299 | | | | 4,413 | |
| Sears Holdings Corporation | | | 39,958 | | | | 1,750,560 | |
| Tuesday Morning Corporation | | | 55,608 | | | | 777,400 | |
| | | | | | | 7,257,676 | |
| Specialty Retail — 2.1% | | | | | | | | |
| Aéropostale, Inc. | | | 118,461 | | | | 588,751 | |
| America's Car-Mart, Inc. | | | 30,241 | | | | 1,092,910 | |
| Birks Group, Inc. | | | 62 | | | | 75 | |
| Books-A-Million, Inc. | | | 7,234 | | | | 17,072 | |
| Buckle, Inc. (The) | | | 12,721 | | | | 597,760 | |
| Cabela's, Inc. | | | 2,734 | | | | 179,378 | |
| CarMax, Inc. | | | 2,181 | | | | 95,484 | |
| Children's Place Retail Stores, Inc. (The) | | | 798 | | | | 38,304 | |
| China Auto Logistics, Inc. | | | 1,210 | | | | 3,182 | |
| Conn's, Inc. | | | 66,480 | | | | 2,940,410 | |
| Container Store Group, Inc. (The) | | | 26,497 | | | | 731,052 | |
| CST Brands, Inc. | | | 301 | | | | 9,822 | |
| Five Below, Inc. | | | 13,618 | | | | 548,941 | |
| Francesca's Holdings Corporation | | | 57,324 | | | | 937,821 | |
| GameStop Corporation - Class A | | | 4,868 | | | | 193,162 | |
| Group 1 Automotive, Inc. | | | 1,051 | | | | 75,809 | |
| hhgregg, Inc. | | | 180,008 | | | | 1,551,669 | |
| Hibbett Sports, Inc. | | | 21,816 | | | | 1,174,792 | |
| Jos. A. Bank Clothiers, Inc. | | | 1,029 | | | | 66,422 | |
| Lithia Motors, Inc. - Class A | | | 14,335 | | | | 1,064,804 | |
| Lumber Liquidators Holdings, Inc. | | | 1,365 | | | | 118,973 | |
| Men's Wearhouse, Inc. (The) | | | 3,422 | | | | 162,134 | |
| Monro Muffler Brake, Inc. | | | 27,118 | | | | 1,529,455 | |
| Office Depot, Inc. | | | 58,146 | | | | 237,817 | |
| RadioShack Corporation | | | 1,998,345 | | | | 2,857,633 | |
| Rent-A-Center, Inc. | | | 68,622 | | | | 2,004,449 | |
| Restoration Hardware Holdings, Inc. | | | 5,094 | | | | 317,815 | |
| Select Comfort Corporation | | | 27,297 | | | | 502,265 | |
| Staples, Inc. | | | 7,358 | | | | 91,975 | |
| Tiffany & Company | | | 4,116 | | | | 360,109 | |
| Tile Shop Holdings, Inc. (The) | | | 88,440 | | | | 1,246,562 | |
| Zumiez, Inc. | | | 1,971 | | | | 48,191 | |
�� | | | | | | | 21,384,998 | |
| Textiles, Apparel & Luxury Goods — 0.5% | | | | | | | | |
| American Apparel, Inc. | | | 742,832 | | | | 480,166 | |
| Coach, Inc. | | | 949 | | | | 42,373 | |
| CROCS, Inc. | | | 33,287 | | | | 503,632 | |
TFS MARKET NEUTRAL FUND
SCHEDULE OF SECURITIES SOLD SHORT (Continued)
| COMMON STOCKS — 75.1% (Continued) | | Shares | | | Value | |
| Consumer Discretionary — 10.5% (Continued) | | | | | | |
| Textiles, Apparel & Luxury Goods — 0.5% (Continued) | | | | | | |
| Perry Ellis International, Inc. | | | 22,818 | | | $ | 344,552 | |
| PVH Corporation | | | 345 | | | | 43,322 | |
| Quiksilver, Inc. | | | 150,879 | | | | 968,643 | |
| Tumi Holdings, Inc. | | | 5,861 | | | | 119,682 | |
| Vera Bradley, Inc. | | | 85,302 | | | | 2,414,046 | |
| Wolverine World Wide, Inc. | | | 2,388 | | | | 67,103 | |
| | | | | | | 4,983,519 | |
| Consumer Staples — 2.2% | | | | | | | | |
Beverages — 0.0% (a) | | | | | | | | |
| Castle Brands, Inc. | | | 2,918 | | | | 2,670 | |
| Craft Brewers Alliance, Inc. | | | 19,724 | | | | 295,268 | |
| Leading Brands, Inc. | | | 31 | | | | 124 | |
| Primo Water Corporation | | | 10,882 | | | | 48,860 | |
| Viña Concha y Toro S.A. - ADR | | | 99 | | | | 4,148 | |
| | | | | | | 351,070 | |
| Food & Staples Retailing — 0.5% | | | | | | | | |
| Alon Blue Square Israel Ltd. - ADR | | | 300 | | | | 1,098 | |
| Chefs' Warehouse, Inc. (The) | | | 43,092 | | | | 865,718 | |
| Fairway Group Holdings Corporation | | | 41,441 | | | | 287,186 | |
| Fresh Market, Inc. (The) | | | 41,755 | | | | 1,549,111 | |
| Liberator Medical Holdings, Inc. | | | 235,156 | | | | 910,054 | |
| Natural Grocers by Vitamin Cottage, Inc. | | | 4,804 | | | | 171,022 | |
| Roundy's, Inc. | | | 103,527 | | | | 700,878 | |
| Sprouts Farmers Market, Inc. | | | 4,915 | | | | 157,133 | |
| SUPERVALU, Inc. | | | 63,867 | | | | 446,430 | |
| Susser Holdings Corporation | | | 2,977 | | | | 230,360 | |
| Weis Markets, Inc. | | | 538 | | | | 24,796 | |
| | | | | | | 5,343,786 | |
| Food Products — 1.2% | | | | | | | | |
| Amira Nature Foods Ltd. | | | 19,619 | | | | 305,272 | |
| Annie's, Inc. | | | 67,850 | | | | 2,205,803 | |
| B&G Foods, Inc. | | | 7,799 | | | | 255,807 | |
| Boulder Brands, Inc. | | | 86,140 | | | | 1,271,426 | |
| Calavo Growers, Inc. | | | 17,135 | | | | 532,727 | |
| Campbell Soup Company | | | 2,347 | | | | 106,765 | |
| Coffee Holding Company, Inc. | | | 68,214 | | | | 488,412 | |
| ConAgra Foods, Inc. | | | 1,261 | | | | 38,473 | |
| Dean Foods Company | | | 96,786 | | | | 1,533,090 | |
| Diamond Foods, Inc. | | | 58,942 | | | | 1,801,857 | |
| Flowers Foods, Inc. | | | 6,029 | | | | 123,715 | |
| Fresh Del Monte Produce, Inc. | | | 46,758 | | | | 1,350,839 | |
| General Mills, Inc. | | | 302 | | | | 16,012 | |
| Keurig Green Mountain, Inc. | | | 375 | | | | 35,130 | |
TFS MARKET NEUTRAL FUND
SCHEDULE OF SECURITIES SOLD SHORT (Continued)
| COMMON STOCKS — 75.1% (Continued) | | Shares | | | Value | |
| Consumer Staples — 2.2% (Continued) | | | | | | |
| Food Products — 1.2% (Continued) | | | | | | |
| Limoneira Company | | | 23,750 | | | $ | 545,538 | |
| McCormick & Company, Inc. | | | 2,743 | | | | 195,302 | |
| Post Holdings, Inc. | | | 5,191 | | | | 271,282 | |
| S&W Seed Company | | | 30,912 | | | | 226,894 | |
| SkyPeople Fruit Juice, Inc. | | | 465 | | | | 753 | |
| Tianli Agritech, Inc. | | | 323 | | | | 669 | |
| Tootsie Roll Industries, Inc. | | | 10,552 | | | | 297,461 | |
| | | | | | | 11,603,227 | |
| Household Products — 0.1% | | | | | | | | |
| Clorox Company | | | 2,356 | | | | 213,689 | |
| Harbinger Group, Inc. | | | 55,570 | | | | 647,947 | |
| | | | | | | 861,636 | |
| Personal Products — 0.4% | | | | | | | | |
| 22nd Century Group, Inc. | | | 390,736 | | | | 1,047,172 | |
China-Biotics, Inc. (b) | | | 535,616 | | | | 696,301 | |
| Female Health Company (The) | | | 103,845 | | | | 785,068 | |
| Herbalife Ltd. | | | 9,900 | | | | 593,802 | |
| USANA Health Sciences, Inc. | | | 10,459 | | | | 709,748 | |
| | | | | | | 3,832,091 | |
Tobacco — 0.0% (a) | | | | | | | | |
| Altria Group, Inc. | | | 1,164 | | | | 46,688 | |
| Star Scientific, Inc. | | | 210,813 | | | | 138,272 | |
| Universal Corporation | | | 2,712 | | | | 147,994 | |
| | | | | | | 332,954 | |
| Energy — 6.5% | | | | | | | | |
| Energy Equipment & Services — 1.1% | | | | | | | | |
| Bristow Group, Inc. | | | 13,409 | | | | 1,029,811 | |
| C&J Energy Services, Inc. | | | 23,496 | | | | 706,290 | |
| Cal Dive International, Inc. | | | 915,018 | | | | 1,354,227 | |
| Dawson Geophysical Company | | | 22,258 | | | | 629,011 | |
| Diamond Offshore Drilling, Inc. | | | 20,468 | | | | 1,117,758 | |
| Exterran Holdings, Inc. | | | 22,701 | | | | 976,597 | |
| Frank's International N.V. | | | 3,972 | | | | 108,952 | |
| Hornbeck Offshore Services, Inc. | | | 5,345 | | | | 221,443 | |
| McDermott International, Inc. | | | 341,027 | | | | 2,465,625 | |
| Newpark Resources, Inc. | | | 20,273 | | | | 244,087 | |
| Nuverra Environmental Solutions, Inc. | | | 107,631 | | | | 1,830,803 | |
| Recon Technology Ltd. | | | 15,452 | | | | 64,899 | |
| Tidewater, Inc. | | | 6,485 | | | | 330,281 | |
| Vantage Drilling Company | | | 63,378 | | | | 105,841 | |
| | | | | | | 11,185,625 | |
TFS MARKET NEUTRAL FUND
SCHEDULE OF SECURITIES SOLD SHORT (Continued)
| COMMON STOCKS — 75.1% (Continued) | | Shares | | | Value | |
| Energy — 6.5% (Continued) | | | | | | |
| Oil, Gas & Consumable Fuels — 5.4% | | | | | | |
| Alon USA Partners, L.P. | | | 15,753 | | | $ | 290,013 | |
| Alpha Natural Resources, Inc. | | | 424,002 | | | | 1,823,209 | |
| American Midstream Partners, L.P. | | | 226 | | | | 6,118 | |
| Amyris, Inc. | | | 760,119 | | | | 2,675,619 | |
| Approach Resources, Inc. | | | 13,749 | | | | 285,292 | |
| Arc Logistics Partners, L.P. | | | 900 | | | | 20,079 | |
| Arch Coal, Inc. | | | 307,983 | | | | 1,410,562 | |
| Atlas Resource Partners, L.P. | | | 931 | | | | 19,765 | |
| Bill Barrett Corporation | | | 10,334 | | | | 244,709 | |
| BioFuel Energy Corporation | | | 22,810 | | | | 169,478 | |
| BP Prudhoe Bay Royalty Trust | | | 6,029 | | | | 527,417 | |
| BPZ Resources, Inc. | | | 596,097 | | | | 1,609,462 | |
| BreitBurn Energy Partners, L.P. | | | 4,619 | | | | 93,627 | |
| CAMAC Energy, Inc. | | | 312,069 | | | | 212,207 | |
| Capital Product Partners, L.P. | | | 21,873 | | | | 240,603 | |
| Cheniere Energy, Inc. | | | 9,201 | | | | 519,396 | |
| Chesapeake Granite Wash Trust | | | 4,397 | | | | 48,411 | |
| China Integrated Energy, Inc. | | | 201,992 | | | | 133,315 | |
| Clean Energy Fuels Corporation | | | 164,779 | | | | 1,458,294 | |
| Cloud Peak Energy, Inc. | | | 25,223 | | | | 496,641 | |
| CONSOL Energy, Inc. | | | 1,311 | | | | 58,353 | |
| Contango Oil & Gas Company | | | 420 | | | | 20,177 | |
| Diamondback Energy, Inc. | | | 2,838 | | | | 204,166 | |
| Emerald Oil, Inc. | | | 192,700 | | | | 1,362,389 | |
| Emerge Energy Services, L.P. | | | 129 | | | | 9,565 | |
| Enbridge Energy Management, LLC | | | 47,234 | | | | 1,387,735 | |
| Endeavour International Corporation | | | 545,179 | | | | 1,875,416 | |
| Energy XXI (Bermuda) Ltd. | | | 12,176 | | | | 291,372 | |
| Evolution Petroleum Corporation | | | 25,265 | | | | 298,127 | |
| Feishang Anthracite Resources Ltd. | | | 12,465 | | | | 11,254 | |
| Forest Oil Corporation | | | 173,089 | | | | 321,946 | |
| Frontline Ltd. | | | 462,075 | | | | 1,571,055 | |
| Gevo, Inc. | | | 197,368 | | | | 203,289 | |
| Global Partners, L.P. | | | 100 | | | | 4,060 | |
| Goodrich Petroleum Corporation | | | 145,303 | | | | 3,654,370 | |
| Green Plains Renewable Energy, Inc. | | | 8,925 | | | | 266,858 | |
| GreenHunter Resources, Inc. | | | 318 | | | | 299 | |
| Gulfport Energy Corporation | | | 376 | | | | 27,700 | |
| Halcon Resources Corporation | | | 418,593 | | | | 2,310,633 | |
| Harvest Natural Resources, Inc. | | | 300,652 | | | | 1,355,941 | |
| Holly Energy Partners, L.P. | | | 13,749 | | | | 444,230 | |
| Hyperdynamics Corporation | | | 17,464 | | | | 25,323 | |
| InterOil Corporation | | | 19,975 | | | | 1,262,620 | |
TFS MARKET NEUTRAL FUND
SCHEDULE OF SECURITIES SOLD SHORT (Continued)
| COMMON STOCKS — 75.1% (Continued) | | Shares | | | Value | |
| Energy — 6.5% (Continued) | | | | | | |
| Oil, Gas & Consumable Fuels — 5.4% (Continued) | | | | | | |
| Kinder Morgan Management, LLC | | | 5,729 | | | $ | 413,650 | |
| LinnCo, LLC | | | 63,300 | | | | 1,744,548 | |
| Lucas Energy, Inc. | | | 24,576 | | | | 15,414 | |
| Magnum Hunter Resources Corporation | | | 69,189 | | | | 588,106 | |
| Matador Resources | | | 1,553 | | | | 44,602 | |
| Midcoast Energy Partners, L.P. | | | 6,421 | | | | 140,491 | |
| Midstates Petroleum Company, Inc. | | | 42,800 | | | | 252,520 | |
| Miller Energy Resources, Inc. | | | 130,178 | | | | 627,458 | |
| Navios Maritime Acquisition Corporation | | | 175 | | | | 621 | |
| New Source Energy Partners, L.P. | | | 28 | | | | 641 | |
| Nordic American Tankers Ltd. | | | 191,893 | | | | 1,656,037 | |
| Northern Oil & Gas, Inc. | | | 99,641 | | | | 1,537,461 | |
| Northern Tier Energy, L.P. | | | 11,676 | | | | 315,369 | |
| Oasis Petroleum, Inc. | | | 5,421 | | | | 252,131 | |
| Pacific Ethanol, Inc. | | | 82,067 | | | | 1,280,245 | |
| PDC Energy, Inc. | | | 2,247 | | | | 143,066 | |
| Pembina Pipeline Corporation | | | 6,764 | | | | 265,960 | |
| Penn Virginia Corporation | | | 41,718 | | | | 694,188 | |
| Pioneer Natural Resources Company | | | 271 | | | | 52,376 | |
| QEP Resources, Inc. | | | 1,992 | | | | 61,134 | |
| Quicksilver Resources, Inc. | | | 780,376 | | | | 2,544,026 | |
| Rentech, Inc. | | | 141,343 | | | | 299,647 | |
| Resolute Energy Corporation | | | 46,482 | | | | 348,615 | |
| Rex Energy Corporation | | | 30,082 | | | | 633,527 | |
| Rhino Resource Partners, L.P. | | | 36,819 | | | | 474,965 | |
| Rosetta Resources, Inc. | | | 2,372 | | | | 112,290 | |
| RSP Permina, Inc. | | | 1,059 | | | | 30,023 | |
| San Juan Basin Royalty Trust | | | 45,455 | | | | 868,645 | |
| SandRidge Energy, Inc. | | | 117,783 | | | | 807,991 | |
| SandRidge Mississippian Trust I | | | 84,466 | | | | 652,922 | |
| Scorpio Tankers, Inc. | | | 12,993 | | | | 117,067 | |
| Solazyme, Inc. | | | 184,569 | | | | 1,985,962 | |
| Spectra Energy Partners, L.P. | | | 25,061 | | | | 1,364,571 | |
| Susser Petroleum Partners, L.P. | | | 3,904 | | | | 162,797 | |
| TC PipeLines, L.P. | | | 965 | | | | 51,184 | |
| Teekay Tankers Ltd. - Class A | | | 70,085 | | | | 244,597 | |
| Transatlantic Petroleum Ltd. | | | 2,484 | | | | 22,753 | |
| Ultra Petroleum Corporation | | | 14,451 | | | | 430,640 | |
| Uranerz Energy Corporation | | | 166,249 | | | | 249,373 | |
| Uranium Energy Corporation | | | 231,479 | | | | 247,683 | |
| Uranium Resources, Inc. | | | 175,518 | | | | 472,143 | |
| Ur-Energy, Inc. | | | 185,116 | | | | 222,139 | |
| USEC, Inc. | | | 83,656 | | | | 282,757 | |
TFS MARKET NEUTRAL FUND
SCHEDULE OF SECURITIES SOLD SHORT (Continued)
| COMMON STOCKS — 75.1% (Continued) | | Shares | | | Value | |
| Energy — 6.5% (Continued) | | | | | | |
| Oil, Gas & Consumable Fuels — 5.4% (Continued) | | | | | | |
| Vanguard Natural Resources, LLC | | | 33,386 | | | $ | 1,007,589 | |
| Western Refining, Inc. | | | 21,534 | | | | 936,729 | |
| Whiting USA Trust I | | | 272,461 | | | | 790,137 | |
| WPX Energy, Inc. | | | 7,434 | | | | 158,196 | |
| Zion Oil & Gas, Inc. | | | 40,947 | | | | 91,312 | |
| | | | | | | 54,947,393 | |
| Financials — 12.1% | | | | | | | | |
| Banks — 4.4% | | | | | | | | |
| Arrow Financial Corporation | | | 20,474 | | | | 512,464 | |
| Bancorp, Inc. (The) | | | 14,104 | | | | 223,125 | |
| BancorpSouth, Inc. | | | 12,203 | | | | 285,062 | |
| Bank of Hawaii Corporation | | | 14,821 | | | | 817,675 | |
| Bank of the Ozarks, Inc. | | | 54,065 | | | | 3,238,494 | |
| Banner Corporation | | | 2,423 | | | | 95,805 | |
| BNC Bancorp | | | 2,223 | | | | 36,235 | |
| Boston Private Financial Holdings, Inc. | | | 6,671 | | | | 83,454 | |
| Capital City Bank Group, Inc. | | | 33 | | | | 459 | |
| Cardinal Financial Corporation | | | 16,023 | | | | 269,186 | |
| Center Bancorporation, Inc. | | | 1,763 | | | | 32,633 | |
| Central Valley Community Bancorp | | | 4 | | | | 46 | |
| City Holding Company | | | 47,108 | | | | 2,025,173 | |
| CoBiz Financial, Inc. | | | 10,748 | | | | 107,910 | |
| Columbia Banking System, Inc. | | | 6,935 | | | | 172,127 | |
| Commerce Bancshares, Inc. | | | 3,296 | | | | 143,310 | |
| Community Bank System, Inc. | | | 59,424 | | | | 2,209,979 | |
| CVB Financial Corporation | | | 31,443 | | | | 454,666 | |
| DNB Financial Corporation | | | 17 | | | | 335 | |
| East West Bancorp, Inc. | | | 357 | | | | 12,320 | |
| Fidelity Southern Corporation | | | 16 | | | | 211 | |
| First BanCorporation (Puerto Rico) | | | 122,538 | | | | 629,845 | |
| First Commonwealth Financial Corporation | | | 22,498 | | | | 193,258 | |
| First Financial Bancorporation | | | 59,828 | | | | 968,615 | |
| First Financial Bankshares, Inc. | | | 44,113 | | | | 2,604,873 | |
| First Financial Holdings, Inc. | | | 3,752 | | | | 215,627 | |
| First Niagara Financial Group, Inc. | | | 3,593 | | | | 32,050 | |
| First of Long Island Corporation (The) | | | 575 | | | | 20,855 | |
| First United Corporation | | | 400 | | | | 3,304 | |
| First West Virginia Bancorp, Inc. | | | 7 | | | | 126 | |
| FirstMerit Corporation | | | 50,065 | | | | 970,760 | |
| Glacier Bancorp, Inc. | | | 43,414 | | | | 1,114,003 | |
| Hanmi Financial Corporation | | | 6,497 | | | | 138,191 | |
| Heartland Financial USA, Inc. | | | 9,904 | | | | 240,667 | |
| Heritage Financial Corporation | | | 62,697 | | | | 1,013,184 | |
TFS MARKET NEUTRAL FUND
SCHEDULE OF SECURITIES SOLD SHORT (Continued)
| COMMON STOCKS — 75.1% (Continued) | | Shares | | | Value | |
| Financials — 12.1% (Continued) | | | | | | |
| Banks — 4.4% (Continued) | | | | | | |
| Home BancShares, Inc. | | | 30,080 | | | $ | 953,837 | |
| Hudson Valley Holding Corporation | | | 1,362 | | | | 25,006 | |
| Independent Bank Corporation (Massachusetts) | | | 33,738 | | | | 1,252,355 | |
| Jacksonville Bancorp, Inc. (Florida) | | | 85 | | | | 887 | |
| Lakeland Bancorp, Inc. | | | 14,698 | | | | 153,447 | |
| Lakeland Financial Corporation | | | 424 | | | | 15,518 | |
| LCNB Corporation | | | 493 | | | | 7,888 | |
| M&T Bank Corporation | | | 2,390 | | | | 291,604 | |
| MB Financial, Inc. | | | 957 | | | | 25,686 | |
| National Bank of Greece S.A. - ADR | | | 143,900 | | | | 564,088 | |
| National Penn Bancshares, Inc. | | | 81,501 | | | | 796,265 | |
| NBT Bancorp, Inc. | | | 1,878 | | | | 42,537 | |
| OFG Bancorp | | | 25,024 | | | | 426,909 | |
| Old National Bancorp | | | 22,357 | | | | 315,681 | |
| OptimumBank Holdings, Inc. | | | 597 | | | | 740 | |
| PacWest Bancorp | | | 34,430 | | | | 1,355,509 | |
| Park National Corporation | | | 26,575 | | | | 1,927,219 | |
| Peoples Bancorp, Inc. | | | 989 | | | | 25,783 | |
| Pinnacle Financial Partners, Inc. | | | 29,795 | | | | 1,030,013 | |
| PrivateBancorp, Inc. | | | 25,245 | | | | 696,005 | |
| Renasant Corporation | | | 19,525 | | | | 531,471 | |
| Republic Bancorp, Inc. - Class A | | | 7,468 | | | | 179,307 | |
| S&T Bancorp, Inc. | | | 5,140 | | | | 119,556 | |
| Simmons First National Corporation - Class A | | | 958 | | | | 34,641 | |
| Southside Bancshares, Inc. | | | 74,455 | | | | 2,053,479 | |
| Sterling Bancorp | | | 40,269 | | | | 481,617 | |
| Texas Capital Bancshares, Inc. | | | 24,190 | | | | 1,359,236 | |
| Tompkins Financial Corporation | | | 3,107 | | | | 146,464 | |
| TowneBank | | | 51,130 | | | | 788,936 | |
| TriCo Bancshares | | | 41,735 | | | | 1,012,074 | |
| Trustmark Corporation | | | 99,988 | | | | 2,286,726 | |
| Umpqua Holdings Corporation | | | 43,656 | | | | 725,999 | |
| United Bankshares, Inc. | | | 16,171 | | | | 473,002 | |
| United Community Banks, Inc. | | | 24,188 | | | | 390,636 | |
| Valley National Bancorp | | | 152,758 | | | | 1,530,635 | |
| Washington Trust Bancorp, Inc. | | | 6,115 | | | | 209,133 | |
| Webster Financial Corporation | | | 1,523 | | | | 45,903 | |
| Westamerica Bancorporation | | | 58,496 | | | | 2,972,767 | |
| Wintrust Financial Corporation | | | 717 | | | | 32,136 | |
| Woori Finance Holdings Company Ltd. - ADR | | | 198 | | | | 6,535 | |
| | | | | | | 44,153,257 | |
TFS MARKET NEUTRAL FUND
SCHEDULE OF SECURITIES SOLD SHORT (Continued)
| COMMON STOCKS — 75.1% (Continued) | | Shares | | | Value | |
| Financials — 12.1% (Continued) | | | | | | |
| Capital Markets — 1.7% | | | | | | |
| American Capital Ltd. | | | 5,000 | | | $ | 74,950 | |
| Apollo Investment Corporation | | | 60,847 | | | | 486,168 | |
| Ares Capital Corporation | | | 11,648 | | | | 199,996 | |
| Arlington Asset Investment Corporation - Class A | | | 184 | | | | 4,867 | |
| Capitala Finance Corporation | | | 3,749 | | | | 68,907 | |
| Cohen & Steers, Inc. | | | 29,683 | | | | 1,202,458 | |
| Cowen Group, Inc. - Class A | | | 207,289 | | | | 851,958 | |
| Eaton Vance Corporation | | | 7,299 | | | | 263,275 | |
| Federated Investors, Inc. - Class B | | | 9,218 | | | | 263,082 | |
| Fidus Investment Corporation | | | 47,340 | | | | 867,269 | |
| Financial Engines, Inc. | | | 8,484 | | | | 375,417 | |
| Full Circle Capital Corporation | | | 42,711 | | | | 320,760 | |
| FXCM, Inc. - Class A | | | 162,499 | | | | 2,515,485 | |
| GFI Group, Inc. | | | 50,727 | | | | 188,704 | |
| Gladstone Capital Corporation | | | 40,427 | | | | 390,929 | |
| Golub Capital BDC, Inc. | | | 45,690 | | | | 763,937 | |
| Greenhill & Company, Inc. | | | 33,581 | | | | 1,684,087 | |
| GSV Capital Corporation | | | 54,720 | | | | 480,442 | |
| Hannon Armstrong Sustainable Infrastructure Capital, Inc. | | | 9,780 | | | | 129,292 | |
| Harris & Harris Group, Inc. | | | 3,410 | | | | 12,242 | |
| Harvest Capital Credit Corporation | | | 400 | | | | 5,764 | |
| Hercules Technology Growth Capital, Inc. | | | 19,135 | | | | 261,767 | |
| Horizon Technology Finance Corporation | | | 5,200 | | | | 68,120 | |
| ICG Group, Inc. | | | 1,501 | | | | 30,590 | |
| INTL FCStone, Inc. | | | 31,185 | | | | 590,020 | |
| Janus Capital Group, Inc. | | | 56,961 | | | | 690,937 | |
| KCAP Financial, Inc. | | | 73,601 | | | | 586,600 | |
| Keating Capital, Inc. | | | 1,400 | | | | 8,862 | |
| Main Street Capital Corporation | | | 4,178 | | | | 131,356 | |
| New Mountain Finance Corporation | | | 18,929 | | | | 270,874 | |
| NGP Capital Resources Company | | | 5,568 | | | | 37,918 | |
| PennantPark Floating Rate Capital Ltd. | | | 28,536 | | | | 396,650 | |
| Rand Capital Corporation | | | 19 | | | | 66 | |
| RCS Capital Corporation - Class A | | | 546 | | | | 18,782 | |
| Safeguard Scientifics, Inc. | | | 75,372 | | | | 1,583,566 | |
| Solar Senior Capital Ltd. | | | 19,218 | | | | 318,058 | |
| TCP Capital Corporation | | | 21,494 | | | | 347,988 | |
| THL Credit, Inc. | | | 2,191 | | | | 29,425 | |
| TICC Capital Corporation | | | 19,577 | | | | 188,526 | |
| Triangle Capital Corporation | | | 2,462 | | | | 64,184 | |
| WisdomTree Investments, Inc. | | | 19,039 | | | | 214,950 | |
| | | | | | | 16,989,228 | |
TFS MARKET NEUTRAL FUND
SCHEDULE OF SECURITIES SOLD SHORT (Continued)
| COMMON STOCKS — 75.1% (Continued) | | Shares | | | Value | |
| Financials — 12.1% (Continued) | | | | | | |
| Consumer Finance — 0.8% | | | | | | |
| Atlanticus Holdings Corporation | | | 103,056 | | | $ | 250,426 | |
| DFC Global Corporation | | | 215,617 | | | | 2,009,551 | |
| Encore Capital Group, Inc. | | | 58,579 | | | | 2,531,784 | |
| EZCORP, Inc. - Class A | | | 94,034 | | | | 980,775 | |
| Imperial Holdings, Inc. | | | 67,626 | | | | 452,418 | |
| JGWPT Holdings, Inc. - Class A | | | 8,289 | | | | 117,455 | |
| World Acceptance Corporation | | | 25,415 | | | | 1,845,129 | |
| | | | | | | 8,187,538 | |
| Diversified Financial Services — 0.2% | | | | | | | | |
| Citigroup, Inc. | | | 405 | | | | 19,404 | |
| CME Group, Inc. | | | 1,877 | | | | 132,122 | |
| Gain Capital Holdings, Inc. | | | 156,167 | | | | 1,577,287 | |
| Global Eagle Entertainment, Inc. | | | 33,014 | | | | 364,144 | |
| Manhattan Bridge Capital, Inc. | | | 1,376 | | | | 2,683 | |
| | | | | | | 2,095,640 | |
| Insurance — 1.8% | | | | | | | | |
| Allied World Assurance Company Holdings Ltd. | | | 1,303 | | | | 140,320 | |
| Ambac Financial Group, Inc. | | | 15,388 | | | | 464,410 | |
| Arch Capital Group Ltd. | | | 731 | | | | 41,901 | |
| Arthur J. Gallagher & Company | | | 1,851 | | | | 83,332 | |
| Aviva plc - ADR | | | 5,600 | | | | 100,408 | |
| Axis Capital Holdings Ltd. | | | 1,167 | | | | 53,390 | |
| Brown & Brown, Inc. | | | 3,757 | | | | 111,883 | |
| Cincinnati Financial Corporation | | | 2,585 | | | | 125,993 | |
| Citizens, Inc. | | | 8,363 | | | | 54,945 | |
| eHealth, Inc. | | | 2,147 | | | | 89,938 | |
| First American Financial Corporation | | | 60,017 | | | | 1,596,452 | |
| Greenlight Capital Re Ltd. - Class A | | | 25,863 | | | | 823,219 | |
| HCC Insurance Holdings, Inc. | | | 5,252 | | | | 241,277 | |
| HCI Group, Inc. | | | 50,543 | | | | 1,955,003 | |
| Health Insurance Innovations, Inc. - Class A | | | 1,074 | | | | 10,837 | |
| Infinity Property & Casualty Corporation | | | 2,297 | | | | 147,398 | |
| Lincoln National Corporation | | | 7,399 | | | | 358,926 | |
| Maiden Holdings Ltd. | | | 55,248 | | | | 651,926 | |
| Markel Corporation | | | 627 | | | | 392,452 | |
| Meadowbrook Insurance Group, Inc. | | | 340,658 | | | | 1,907,685 | |
| Montpelier Re Holdings Ltd. | | | 65,631 | | | | 2,006,996 | |
| Phoenix Companies, Inc. (The) | | | 13,809 | | | | 607,872 | |
| Protective Life Corporation | | | 7,155 | | | | 365,978 | |
| StanCorp Financial Group, Inc. | | | 4,718 | | | | 288,270 | |
| Stewart Information Services Corporation | | | 56,268 | | | | 1,716,174 | |
| Sun Life Financial, Inc. | | | 5,507 | | | | 186,357 | |
| Tower Group International Ltd. | | | 999,005 | | | | 2,457,552 | |
TFS MARKET NEUTRAL FUND
SCHEDULE OF SECURITIES SOLD SHORT (Continued)
| COMMON STOCKS — 75.1% (Continued) | | Shares | | | Value | |
| Financials — 12.1% (Continued) | | | | | | |
| Insurance — 1.8% (Continued) | | | | | | |
| Universal Insurance Holdings, Inc. | | | 45,217 | | | $ | 661,525 | |
| W.R. Berkley Corporation | | | 1,150 | | | | 50,876 | |
| XL Group plc | | | 7,691 | | | | 241,113 | |
| | | | | | | 17,934,408 | |
| Real Estate Investment Trusts (REIT) — 2.2% | | | | | | | | |
| Altisource Residential Corporation | | | 36,298 | | | | 1,020,700 | |
| American Capital Agency Corporation | | | 17,342 | | | | 393,837 | |
| American Residential Properties, Inc. | | | 11,359 | | | | 204,121 | |
| Apollo Commercial Real Estate Finance, Inc. | | | 6,479 | | | | 110,208 | |
| Arbor Realty Trust, Inc. | | | 35,199 | | | | 246,745 | |
| Ares Commercial Real Estate Corporation | | | 5,676 | | | | 72,426 | |
| Associated Estates Realty Corporation | | | 387 | | | | 6,494 | |
| Campus Crest Communities, Inc. | | | 101,198 | | | | 871,315 | |
| Capstead Mortgage Corporation | | | 17,767 | | | | 227,062 | |
| CBL & Associates Properties, Inc. | | | 51,371 | | | | 933,411 | |
| Colony Financial, Inc. | | | 17,410 | | | | 378,667 | |
| Columbia Property Trust, Inc. | | | 5,211 | | | | 147,680 | |
| CYS Investments, Inc. | | | 27,814 | | | | 239,200 | |
| Digital Realty Trust, Inc. | | | 8,123 | | | | 433,768 | |
| Douglas Emmett, Inc. | | | 5,926 | | | | 163,558 | |
| DuPont Fabros Technology, Inc. | | | 65,383 | | | | 1,584,230 | |
| Empire State Realty Trust, Inc. - Class A | | | 39,874 | | | | 610,072 | |
| Equity One, Inc. | | | 2,449 | | | | 55,176 | |
| First Industrial Realty Trust, Inc. | | | 7,298 | | | | 134,064 | |
| First Potomac Realty Trust | | | 29,805 | | | | 388,359 | |
| Gaming and Leisure Properties, Inc. | | | 3,195 | | | | 117,416 | |
| Getty Realty Corporation | | | 16,818 | | | | 318,197 | |
| Gladstone Commercial Corporation | | | 852 | | | | 15,029 | |
| Glimcher Realty Trust | | | 7,685 | | | | 78,310 | |
| Government Properties Income Trust | | | 3,308 | | | | 84,189 | |
| Hatteras Financial Corporation | | | 18,235 | | | | 356,859 | |
| HCP, Inc. | | | 4,624 | | | | 193,561 | |
| Health Care REIT, Inc. | | | 2,594 | | | | 163,655 | |
| Healthcare Realty Trust, Inc. | | | 6,010 | | | | 151,151 | |
| iStar Financial, Inc. | | | 81,554 | | | | 1,211,892 | |
| JAVELIN Mortgage Investment Corporation | | | 99,867 | | | | 1,319,243 | |
| Liberty Property Trust | | | 4,689 | | | | 175,838 | |
| Mack-Cali Realty Corporation | | | 9,041 | | | | 184,165 | |
| Medical Properties Trust, Inc. | | | 50,657 | | | | 683,869 | |
| Monmouth Real Estate Investment Corporation - Class A | | | 22,885 | | | | 214,890 | |
| National Health Investors, Inc. | | | 978 | | | | 60,333 | |
| National Retail Properties, Inc. | | | 11,214 | | | | 382,734 | |
TFS MARKET NEUTRAL FUND
SCHEDULE OF SECURITIES SOLD SHORT (Continued)
| COMMON STOCKS — 75.1% (Continued) | | Shares | | | Value | |
| Financials — 12.1% (Continued) | | | | | | |
| Real Estate Investment Trusts (REIT) — 2.2% (Continued) | | | | | | |
| Newcastle Investment Corporation | | | 209,736 | | | $ | 941,715 | |
| Parkway Properties, Inc. | | | 511 | | | | 9,637 | |
| Pebblebrook Hotel Trust | | | 11,737 | | | | 404,222 | |
| Piedmont Office Realty Trust, Inc. - Class A | | | 61,490 | | | | 1,082,839 | |
| Plum Creek Timber Company, Inc. | | | 345 | | | | 15,042 | |
| RAIT Financial Trust | | | 54,098 | | | | 442,522 | |
| Ramco-Gershenson Properties Trust | | | 27,286 | | | | 449,673 | |
| RE/MAX Holdings, Inc. - Class A | | | 2,295 | | | | 64,765 | |
| Realty Income Corporation | | | 6,739 | | | | 292,810 | |
| Redwood Trust, Inc. | | | 74,582 | | | | 1,625,888 | |
| Retail Properties of America, Inc. - Class A | | | 3,652 | | | | 52,297 | |
| RLJ Lodging Trust | | | 4,626 | | | | 123,375 | |
| Rouse Properties, Inc. | | | 76,500 | | | | 1,284,435 | |
| Sabra Health Care REIT, Inc. | | | 13 | | | | 390 | |
| Silver Bay Realty Trust Corporation | | | 6,108 | | | | 91,498 | |
| UMH Properties, Inc. | | | 35,355 | | | | 348,247 | |
| Ventas, Inc. | | | 2,246 | | | | 148,416 | |
| Washington Real Estate Investment Trust | | | 11,771 | | | | 287,919 | |
| Weingarten Realty Investors | | | 17,134 | | | | 534,581 | |
| Western Asset Mortgage Capital Corporation | | | 20,011 | | | | 295,562 | |
| ZAIS Financial Corporation | | | 2,052 | | | | 33,837 | |
| | | | | | | 22,462,094 | |
| Real Estate Management & Development — 0.2% | | | | | | | | |
| Brookfield Office Properties, Inc. | | | 6,294 | | | | 124,558 | |
| Brookfield Property Partners, L.P. | | | 14,198 | | | | 276,293 | |
| China HGS Real Estate, Inc. | | | 508 | | | | 2,667 | |
| China Housing & Land Development, Inc. | | | 76,855 | | | | 172,924 | |
| St. Joe Company (The) | | | 87,144 | | | | 1,555,520 | |
| | | | | | | 2,131,962 | |
| Thrifts & Mortgage Finance — 0.8% | | | | | | | | |
| Astoria Financial Corporation | | | 782 | | | | 10,369 | |
| Banc of California, Inc. | | | 57,802 | | | | 726,571 | |
| BankUnited, Inc. | | | 11,742 | | | | 387,369 | |
| BofI Holding, Inc. | | | 3,294 | | | | 265,529 | |
| Capitol Federal Financial, Inc. | | | 18,877 | | | | 227,279 | |
| Elmira Savings Bank | | | 100 | | | | 2,312 | |
| Five Oaks Investment Corporation | | | 12,936 | | | | 150,187 | |
| Flushing Financial Corporation | | | 8,329 | | | | 160,084 | |
| Home Loan Servicing Solutions Ltd. | | | 17,729 | | | | 392,697 | |
| Impac Mortgage Holdings, Inc. | | | 2,023 | | | | 11,673 | |
| Nationstar Mortgage Holdings, Inc. | | | 5,000 | | | | 163,650 | |
| Northfield Bancorp, Inc. | | | 889 | | | | 11,530 | |
| Oconee Federal Financial Corporation | | | 16 | | | | 292 | |
TFS MARKET NEUTRAL FUND
SCHEDULE OF SECURITIES SOLD SHORT (Continued)
| COMMON STOCKS — 75.1% (Continued) | | Shares | | | Value | |
| Financials — 12.1% (Continued) | | | | | | |
| Thrifts & Mortgage Finance — 0.8% (Continued) | | | | | | |
| Ocwen Financial Corporation | | | 949 | | | $ | 35,967 | |
| Radian Group, Inc. | | | 182,994 | | | | 2,558,256 | |
| Rockville Financial, Inc. | | | 39,854 | | | | 524,479 | |
| Security National Financial Corporation - Class A | | | 37,761 | | | | 146,890 | |
| Stonegate Mortgage Corporation | | | 20,057 | | | | 253,721 | |
| TrustCo Bank Corporation | | | 356,519 | | | | 2,356,591 | |
| United Financial Bancorporation, Inc. | | | 7,040 | | | | 124,186 | |
| ViewPoint Financial Group, Inc. | | | 5,944 | | | | 154,960 | |
| | | | | | | 8,664,592 | |
| Health Care — 14.4% | | | | | | | | |
| Biotechnology — 8.3% | | | | | | | | |
| Aastrom Biosciences, Inc. | | | 104,029 | | | | 407,794 | |
| ACADIA Pharmaceuticals, Inc. | | | 19,441 | | | | 391,347 | |
| Achillion Pharmaceuticals, Inc. | | | 339,943 | | | | 968,838 | |
| AEterna Zentaris, Inc. | | | 38,200 | | | | 43,548 | |
| Agios Pharmaceuticals, Inc. | | | 6,437 | | | | 270,740 | |
| AMAG Pharmaceuticals, Inc. | | | 7,109 | | | | 129,810 | |
| Amarin Corporation plc - ADR | | | 99,517 | | | | 161,218 | |
| Anthera Pharmaceuticals, Inc. | | | 6,900 | | | | 19,527 | |
| ARCA Biopharma, Inc. | | | 230,269 | | | | 370,733 | |
| Arena Pharmaceuticals, Inc. | | | 788,223 | | | | 5,044,627 | |
| Ariad Pharmaceuticals, Inc. | | | 312,257 | | | | 2,270,108 | |
| Arrowhead Research Corporation | | | 106,561 | | | | 1,161,515 | |
| Athersys, Inc. | | | 24,208 | | | | 35,465 | |
| BiolineRx Ltd. - ADR | | | 9,331 | | | | 18,849 | |
| BioTime, Inc. | | | 5,571 | | | | 14,429 | |
| Burcon NutraScience Corporation | | | 300 | | | | 1,201 | |
| Cara Therapeutics, Inc. | | | 15,105 | | | | 217,361 | |
| Catalyst Pharmaceutical Partners, Inc. | | | 369,103 | | | | 767,734 | |
| Celldex Therapeutics, Inc. | | | 19,444 | | | | 291,660 | |
| CEL-SCI Corporation | | | 298,706 | | | | 355,460 | |
| Celsion Corporation | | | 569,663 | | | | 1,891,281 | |
| Chelsea Therapeutics International Ltd. | | | 11,442 | | | | 55,837 | |
| ChemoCentryx, Inc. | | | 64,237 | | | | 352,019 | |
| Clovis Oncology, Inc. | | | 5,763 | | | | 311,605 | |
| Conatus Pharmaceuticals, Inc. | | | 2,485 | | | | 15,283 | |
| Cyclacel Pharmaceuticals, Inc. | | | 79,533 | | | | 264,050 | |
| CytRx Corporation | | | 972,126 | | | | 2,984,427 | |
| DARA Biosciences, Inc. | | | 11,070 | | | | 18,819 | |
| Dendreon Corporation | | | 1,629,639 | | | | 4,204,469 | |
| Durata Therapeutics, Inc. | | | 18,826 | | | | 254,904 | |
| Dynavax Technologies Corporation | | | 13,692 | | | | 22,318 | |
| Enanta Pharmaceuticals, Inc. | | | 6,485 | | | | 241,307 | |
TFS MARKET NEUTRAL FUND
SCHEDULE OF SECURITIES SOLD SHORT (Continued)
| COMMON STOCKS — 75.1% (Continued) | | Shares | | | Value | |
| Health Care — 14.4% (Continued) | | | | | | |
| Biotechnology — 8.3% (Continued) | | | | | | |
| Exact Sciences Corporation | | | 132,793 | | | $ | 1,593,516 | |
| Exelixis, Inc. | | | 814,326 | | | | 2,882,714 | |
| Fibrocell Science, Inc. | | | 60,682 | | | | 230,592 | |
| Foundation Medicine, Inc. | | | 32,778 | | | | 955,806 | |
| Galectin Therapeutics, Inc. | | | 95,529 | | | | 1,102,405 | |
| Galena Biopharma, Inc. | | | 1,639,329 | | | | 4,016,356 | |
| Genocea Biosciences, Inc. | | | 24 | | | | 466 | |
| GenVec, Inc. | | | 17,086 | | | | 42,373 | |
| Halozyme Therapeutics, Inc. | | | 9,281 | | | | 69,143 | |
| Heat Biologics, Inc. | | | 700 | | | | 3,815 | |
| Horizon Pharma, Inc. | | | 84,252 | | | | 1,194,693 | |
| Idenix Pharmaceuticals, Inc. | | | 305,356 | | | | 1,682,512 | |
| Idera Pharmaceuticals, Inc. | | | 176,309 | | | | 500,718 | |
| ImmunoCellular Therapeutics Ltd. | | | 68,147 | | | | 79,732 | |
| Immunomedics, Inc. | | | 180,695 | | | | 760,726 | |
| Infinity Pharmaceuticals, Inc. | | | 31,319 | | | | 305,987 | |
| Inovio Pharmaceuticals, Inc. | | | 395,540 | | | | 937,430 | |
| Intrexon Corporation | | | 17,638 | | | | 333,005 | |
| Ironwood Pharmaceuticals, Inc. | | | 2,961 | | | | 32,630 | |
| IsoRay, Inc. | | | 713,250 | | | | 1,718,932 | |
| Kamada Ltd. | | | 1,900 | | | | 27,322 | |
| Keryx Biopharmaceuticals, Inc. | | | 111,390 | | | | 1,645,230 | |
| KYTHERA Biopharmaceuticals, Inc. | | | 10,811 | | | | 352,547 | |
| La Jolla Pharmaceutical Company | | | 11,475 | | | | 104,881 | |
| MannKind Corporation | | | 458,973 | | | | 3,006,273 | |
| Mast Therapeutics, Inc. | | | 593,719 | | | | 340,854 | |
| Medgenics, Inc. | | | 2,506 | | | | 16,339 | |
| MEI Pharma, Inc. | | | 122,925 | | | | 961,273 | |
| Merrimack Pharmaceuticals, Inc. | | | 559,781 | | | | 2,457,439 | |
| Metabolix, Inc. | | | 181,332 | | | | 186,772 | |
| Mirati Therapeutics, Inc. | | | 6,259 | | | | 117,920 | |
| Myriad Genetics, Inc. | | | 60,430 | | | | 2,550,750 | |
| NanoViricides, Inc. | | | 202,493 | | | | 643,928 | |
| NeoStem, Inc. | | | 159,668 | | | | 945,235 | |
| Neuralstem, Inc. | | | 182,765 | | | | 657,954 | |
| NewLink Genetics Corporation | | | 25,592 | | | | 563,024 | |
| Northwest Biotherapeutics, Inc. | | | 471,464 | | | | 2,800,496 | |
| Novavax, Inc. | | | 39,968 | | | | 175,060 | |
| NPS Pharmaceuticals, Inc. | | | 2,176 | | | | 57,925 | |
| Ohr Pharmaceutical, Inc. | | | 7,138 | | | | 67,668 | |
| Omeros Corporation | | | 82,286 | | | | 1,018,701 | |
| Oncolytics Biotech, Inc. | | | 112,080 | | | | 163,637 | |
| OncoMed Pharmaceuticals, Inc. | | | 23,435 | | | | 617,278 | |
TFS MARKET NEUTRAL FUND
SCHEDULE OF SECURITIES SOLD SHORT (Continued)
| COMMON STOCKS — 75.1% (Continued) | | Shares | | | Value | |
| Health Care — 14.4% (Continued) | | | | | | |
| Biotechnology — 8.3% (Continued) | | | | | | |
| Opexa Therapeutics, Inc. | | | 117,157 | | | $ | 186,865 | |
| OPKO Health, Inc. | | | 309,398 | | | | 2,558,725 | |
| Oragenics, Inc. | | | 3 | | | | 6 | |
| Orexigen Therapeutics, Inc. | | | 34,269 | | | | 192,592 | |
| Organovo Holdings, Inc. | | | 275,004 | | | | 1,606,023 | |
| Osiris Therapeutics, Inc. | | | 64,143 | | | | 912,755 | |
| OXiGENE, Inc. | | | 246,262 | | | | 797,889 | |
| Oxygen Biotherapeutics, Inc. | | | 339,007 | | | | 1,654,354 | |
| Palatin Technologies, Inc. | | | 69,648 | | | | 87,060 | |
| Peregrine Pharmaceuticals, Inc. | | | 110,280 | | | | 191,887 | |
| PharmAthene, Inc. | | | 458 | | | | 632 | |
| Pluristem Therapeutics, Inc. | | | 14,486 | | | | 51,860 | |
| Prana Biotechnology Ltd. - ADR | | | 66,607 | | | | 117,228 | |
| Prosensa Holding N.V. | | | 10,483 | | | | 73,276 | |
| Puma Biotechnology, Inc. | | | 3,800 | | | | 287,052 | |
| Raptor Pharmaceutical Corporation | | | 104,984 | | | | 868,218 | |
| Retrophin, Inc. | | | 16,882 | | | | 241,244 | |
| Rexahn Pharmaceuticals, Inc. | | | 878,229 | | | | 833,878 | |
| Rosetta Genomics Ltd. | | | 128,530 | | | | 484,558 | |
| RXi Pharmaceuticals Corporation | | | 214 | | | | 698 | |
| Sarepta Therapeutics, Inc. | | | 111,304 | | | | 4,132,718 | |
| SciClone Pharmaceuticals, Inc. | | | 169,374 | | | | 809,608 | |
| SIGA Technologies, Inc. | | | 189 | | | | 542 | |
| Spectrum Pharmaceuticals, Inc. | | | 131,104 | | | | 900,684 | |
| Synageva BioPharma Corporation | | | 5,192 | | | | 448,433 | |
| Synergy Pharmaceuticals, Inc. | | | 98,737 | | | | 443,329 | |
| Synta Pharmaceuticals Corporation | | | 485,346 | | | | 2,043,307 | |
| Tekmira Pharmaceuticals Corporation | | | 2,838 | | | | 37,717 | |
| Theravance, Inc. | | | 13,674 | | | | 368,104 | |
| TrovaGene, Inc. | | | 4,900 | | | | 27,587 | |
| Vanda Pharmaceuticals, Inc. | | | 21,832 | | | | 304,120 | |
| Venaxis, Inc. | | | 61,580 | | | | 128,702 | |
| ZIOPHARM Oncology, Inc. | | | 396,607 | | | | 1,427,785 | |
| | | | | | | 83,699,776 | |
| Health Care Equipment & Supplies — 2.4% | | | | | | | | |
| Abaxis, Inc. | | | 21,378 | | | | 868,161 | |
| Abiomed, Inc. | | | 31,575 | | | | 748,012 | |
| Accuray, Inc. | | | 292,785 | | | | 2,459,394 | |
| Antares Pharma, Inc. | | | 52,284 | | | | 145,349 | |
| AtriCure, Inc. | | | 16,875 | | | | 259,875 | |
| Bacterin International Holdings, Inc. | | | 830 | | | | 578 | |
| Baxano Surgical, Inc. | | | 35,308 | | | | 30,012 | |
| BIOLASE, Inc. | | | 49,801 | | | | 96,115 | |
TFS MARKET NEUTRAL FUND
SCHEDULE OF SECURITIES SOLD SHORT (Continued)
| COMMON STOCKS — 75.1% (Continued) | | Shares | | | Value | |
| Health Care — 14.4% (Continued) | | | | | | |
| Health Care Equipment & Supplies — 2.4% (Continued) | | | | | | |
| BSD Medical Corporation | | | 443,920 | | | $ | 492,751 | |
| Cerus Corporation | | | 135,700 | | | | 587,581 | |
| Cesca Therapeutics, Inc. | | | 180,261 | | | | 295,628 | |
| Delcath Systems, Inc. | | | 46,237 | | | | 165,528 | |
| Echo Therapeutics, Inc. | | | 4,813 | | | | 14,968 | |
| Edwards Lifesciences Corporation | | | 1,524 | | | | 124,160 | |
| EnteroMedics, Inc. | | | 59,677 | | | | 108,612 | |
| GenMark Diagnostics, Inc. | | | 121,749 | | | | 1,089,654 | |
| Hansen Medical, Inc. | | | 133,964 | | | | 278,645 | |
| HeartWare International, Inc. | | | 1,335 | | | | 113,422 | |
| IMRIS, Inc. | | | 23 | | | | 27 | |
| Integra LifeSciences Holdings Corporation | | | 906 | | | | 41,295 | |
| Masimo Corporation | | | 4,629 | | | | 123,872 | |
| Mazor Robotics Ltd. - ADR | | | 7,300 | | | | 131,400 | |
| Meridian Bioscience, Inc. | | | 140,606 | | | | 2,807,902 | |
| Navidea Biopharmaceuticals, Inc. | | | 16,010 | | | | 26,737 | |
| Neogen Corporation | | | 5,261 | | | | 219,778 | |
| PhotoMedex, Inc. | | | 87,791 | | | | 1,326,522 | |
| Quidel Corporation | | | 75,719 | | | | 1,624,173 | |
| ResMed, Inc. | | | 9,628 | | | | 479,956 | |
| Rockwell Medical, Inc. | | | 345,636 | | | | 3,511,662 | |
| Sirona Dental Systems, Inc. | | | 3,131 | | | | 235,514 | |
| Stereotaxis, Inc. | | | 161,342 | | | | 624,394 | |
| SurModics, Inc. | | | 1,660 | | | | 36,122 | |
| Synergetics USA, Inc. | | | 74 | | | | 246 | |
| TearLab Corporation | | | 260,787 | | | | 1,126,600 | |
| Unilife Corporation | | | 605,814 | | | | 1,968,895 | |
| Uroplasty, Inc. | | | 2,209 | | | | 7,687 | |
| Vermillion, Inc. | | | 3,600 | | | | 11,556 | |
| Volcano Corporation | | | 24,908 | | | | 437,384 | |
| Wright Medical Group, Inc. | | | 57,771 | | | | 1,580,037 | |
| | | | | | | 24,200,204 | |
| Health Care Providers & Services — 1.7% | | | | | | | | |
| Air Methods Corporation | | | 29,708 | | | | 1,653,844 | |
| Amedisys, Inc. | | | 45,517 | | | | 620,397 | |
| Bio-Reference Laboratories, Inc. | | | 145,916 | | | | 3,706,266 | |
| BioScrip, Inc. | | | 362,656 | | | | 2,509,580 | |
| Chemed Corporation | | | 32,924 | | | | 2,741,582 | |
| Diversicare Healthcare Services, Inc. | | | 62 | | | | 433 | |
FAB Universal Corporation (b) | | | 558,610 | | | | 558,610 | |
| Healthways, Inc. | | | 128,058 | | | | 2,305,044 | |
| IPC The Hospitalist Company, Inc. | | | 9,345 | | | | 378,473 | |
| Kindred Healthcare, Inc. | | | 10,433 | | | | 261,868 | |
TFS MARKET NEUTRAL FUND
SCHEDULE OF SECURITIES SOLD SHORT (Continued)
| COMMON STOCKS — 75.1% (Continued) | | Shares | | | Value | |
| Health Care — 14.4% (Continued) | | | | | | |
| Health Care Providers & Services — 1.7% (Continued) | | | | | | |
| Laboratory Corporation of America Holdings | | | 389 | | | $ | 38,394 | |
| LHC Group, Inc. | | | 2,682 | | | | 55,732 | |
| Omnicare, Inc. | | | 5,225 | | | | 309,686 | |
| Owens & Minor, Inc. | | | 28,960 | | | | 971,318 | |
| Patterson Companies, Inc. | | | 1,741 | | | | 70,859 | |
| Quest Diagnostics, Inc. | | | 5,422 | | | | 303,252 | |
| Skilled Healthcare Group, Inc. - Class A | | | 2,040 | | | | 10,526 | |
| Tenet Healthcare Corporation | | | 8,109 | | | | 365,554 | |
| Universal American Corporation | | | 12,541 | | | | 89,919 | |
| USMD Holdings, Inc. | | | 26 | | | | 328 | |
| | | | | | | 16,951,665 | |
| Health Care Technology — 0.2% | | | | | | | | |
| Allscripts Healthcare Solutions, Inc. | | | 60,811 | | | | 925,544 | |
| Medidata Solutions, Inc. | | | 10,959 | | | | 397,921 | |
| Veeva Systems, Inc. - Class A | | | 219 | | | | 4,207 | |
| Vocera Communications, Inc. | | | 68,261 | | | | 1,040,980 | |
| | | | | | | 2,368,652 | |
| Life Sciences Tools & Services — 0.7% | | | | | | | | |
| Accelerate Diagnostics, Inc. | | | 142,977 | | | | 2,635,066 | |
| Albany Molecular Research, Inc. | | | 60,895 | | | | 977,974 | |
| Apricus Biosciences, Inc. | | | 151,758 | | | | 336,144 | |
| BG Medicine, Inc. | | | 241,952 | | | | 295,182 | |
| BioDelivery Sciences International, Inc. | | | 9,364 | | | | 83,433 | |
| CombiMatrix Corporation | | | 105,544 | | | | 290,246 | |
| Furiex Pharmaceuticals, Inc. | | | 103 | | | | 10,647 | |
| Harvard Bioscience, Inc. | | | 42,150 | | | | 177,873 | |
| Illumina, Inc. | | | 3,105 | | | | 421,814 | |
| Luminex Corporation | | | 10,580 | | | | 203,242 | |
| Pacific Biosciences of California, Inc. | | | 67,164 | | | | 296,865 | |
| QIAGEN N.V. | | | 866 | | | | 18,965 | |
| Sequenom, Inc. | | | 626,896 | | | | 1,711,426 | |
| Techne Corporation | | | 16 | | | | 1,429 | |
| Thermo Fisher Scientific, Inc. | | | 1,036 | | | | 118,104 | |
| | | | | | | 7,578,410 | |
| Pharmaceuticals — 1.1% | | | | | | | | |
| Acura Pharmaceuticals, Inc. | | | 15,638 | | | | 21,581 | |
| Alexza Pharmaceuticals, Inc. | | | 49,836 | | | | 212,800 | |
| Alimera Sciences, Inc. | | | 211,786 | | | | 1,287,659 | |
| Ampio Pharmaceuticals, Inc. | | | 147,814 | | | | 900,187 | |
| ANI Pharmaceuticals, Inc. | | | 10,404 | | | | 323,668 | |
| Aoxing Pharmaceutical Company, Inc. | | | 1,504 | | | | 692 | |
| Auxilium Pharmaceuticals, Inc. | | | 13,894 | | | | 312,754 | |
| DepoMed, Inc. | | | 2,027 | | | | 28,398 | |
TFS MARKET NEUTRAL FUND
SCHEDULE OF SECURITIES SOLD SHORT (Continued)
| COMMON STOCKS — 75.1% (Continued) | | Shares | | | Value | |
| Health Care — 14.4% (Continued) | | | | | | |
| Pharmaceuticals — 1.1% (Continued) | | | | | | |
| Endocyte, Inc. | | | 50,107 | | | $ | 907,438 | |
| GW Pharmaceuticals plc - ADR | | | 9,100 | | | | 665,210 | |
| IntelliPharmaCeutics International, Inc. | | | 171,332 | | | | 692,181 | |
| Mallinckrodt plc | | | 1,144 | | | | 81,487 | |
| Medicines Company (The) | | | 324 | | | | 8,618 | |
| Oculus Innovative Sciences, Inc. | | | 44,194 | | | | 132,140 | |
| Oramed Pharmaceuticals, Inc. | | | 59,691 | | | | 576,615 | |
| Perrigo Company plc | | | 2,410 | | | | 349,113 | |
| POZEN, Inc. | | | 21,836 | | | | 182,549 | |
| Redhill Biopharma Ltd. - ADR | | | 300 | | | | 4,272 | |
| Repros Therapeutics, Inc. | | | 44,693 | | | | 753,971 | |
| Revance Therapeutics, Inc. | | | 1,460 | | | | 50,049 | |
| Supernus Pharmaceuticals, Inc. | | | 122,010 | | | | 1,001,702 | |
| TherapeuticsMD, Inc. | | | 11,917 | | | | 50,051 | |
| VIVUS, Inc. | | | 357,509 | | | | 1,859,047 | |
| XenoPort, Inc. | | | 126,944 | | | | 515,393 | |
| Zogenix, Inc. | | | 27,198 | | | | 66,363 | |
| | | | | | | 10,983,938 | |
| Industrials — 10.6% | | | | | | | | |
| Aerospace & Defense — 1.0% | | | | | | | | |
| AAR Corporation | | | 13,417 | | | | 347,500 | |
| American Science & Engineering, Inc. | | | 854 | | | | 57,389 | |
| Arotech Corporation | | | 97,549 | | | | 338,495 | |
| DigitalGlobe, Inc. | | | 13,212 | | | | 393,453 | |
| Erickson, Inc. | | | 2,176 | | | | 34,403 | |
| GenCorp, Inc. | | | 272,992 | | | | 4,793,740 | |
| Global Defense & National Security Systems, Inc. | | | 1,785 | | | | 18,136 | |
| KEYW Holding Corporation (The) | | | 122,460 | | | | 1,573,611 | |
| LMI Aerospace, Inc. | | | 23,013 | | | | 313,897 | |
| National Presto Industries, Inc. | | | 16,051 | | | | 1,159,845 | |
| Rockwell Collins, Inc. | | | 5,530 | | | | 429,405 | |
| Spirit Aerosystems Holdings, Inc. - Class A | | | 10,552 | | | | 316,877 | |
| TAT Technologies Ltd. | | | 300 | | | | 2,433 | |
| Transdigm Group, Inc. | | | 1,381 | | | | 245,638 | |
| Triumph Group, Inc. | | | 6,862 | | | | 444,726 | |
| | | | | | | 10,469,548 | |
| Air Freight & Logistics — 0.4% | | | | | | | | |
| Echo Global Logistics, Inc. | | | 76,778 | | | | 1,501,778 | |
| UTi Worldwide, Inc. | | | 106,787 | | | | 1,045,445 | |
| XPO Logistics, Inc. | | | 37,461 | | | | 1,016,691 | |
| | | | | | | 3,563,914 | |
TFS MARKET NEUTRAL FUND
SCHEDULE OF SECURITIES SOLD SHORT (Continued)
| COMMON STOCKS — 75.1% (Continued) | | Shares | | | Value | |
| Industrials — 10.6% (Continued) | | | | | | |
| Airlines — 0.3% | | | | | | |
| American Airlines Group, Inc. | | | 73,849 | | | $ | 2,589,884 | |
| GOL - Linhas Aéreas Inteligentes S.A. - ADR | | | 54,300 | | | | 352,950 | |
| | | | | | | 2,942,834 | |
| Building Products — 0.4% | | | | | | | | |
| Apogee Enterprises, Inc. | | | 19 | | | | 604 | |
| Armstrong World Industries, Inc. | | | 23,353 | | | | 1,227,434 | |
| Fortune Brands Home & Security, Inc. | | | 3,814 | | | | 151,988 | |
| Gilbraltar Industries, Inc. | | | 17,444 | | | | 297,943 | |
| Griffon Corporation | | | 16,487 | | | | 175,422 | |
| Owens Corning, Inc. | | | 415 | | | | 16,953 | |
| Quanex Building Products Corporation | | | 17,498 | | | | 329,662 | |
| Trex Company, Inc. | | | 12,227 | | | | 960,064 | |
| Universal Forest Products, Inc. | | | 15,489 | | | | 782,039 | |
| | | | | | | 3,942,109 | |
| Commercial Services & Supplies — 1.0% | | | | | | | | |
| ABM Industries, Inc. | | | 26,499 | | | | 717,858 | |
| ACCO Brands Corporation | | | 234,726 | | | | 1,438,870 | |
| ADT Corporation (The) | | | 10,480 | | | | 316,915 | |
| Brink's Company (The) | | | 622 | | | | 15,824 | |
| Ceco Environmental Corporation | | | 2,751 | | | | 43,713 | |
| Cenveo, Inc. | | | 332,331 | | | | 1,026,903 | |
| China Recycling Energy Corporation | | | 180,905 | | | | 562,615 | |
| Covanta Holding Corporation | | | 36,947 | | | | 681,672 | |
| Ennis, Inc. | | | 22,150 | | | | 331,364 | |
| Healthcare Services Group, Inc. | | | 9,953 | | | | 289,632 | |
| HNI Corporation | | | 9,278 | | | | 326,864 | |
| Industrial Services of America, Inc. | | | 58 | | | | 268 | |
| InnerWorkings, Inc. | | | 103,261 | | | | 743,479 | |
| Intersections, Inc. | | | 60,558 | | | | 340,336 | |
| Iron Mountain, Inc. | | | 1,080 | | | | 30,715 | |
| MagneGas Corporation | | | 68,480 | | | | 89,709 | |
| Performant Financial Corporation | | | 60,040 | | | | 522,948 | |
| Pointer Telocation Ltd. | | | 4,747 | | | | 38,736 | |
| Portfolio Recovery Associates, Inc. | | | 9,852 | | | | 563,042 | |
| Standard Register Company (The) | | | 729 | | | | 5,293 | |
| Team, Inc. | | | 329 | | | | 14,111 | |
| Tetra Tech, Inc. | | | 17,010 | | | | 487,677 | |
| United Stationers, Inc. | | | 31,062 | | | | 1,165,757 | |
| Waste Connections, Inc. | | | 796 | | | | 35,549 | |
| Waste Management, Inc. | | | 3,761 | | | | 167,176 | |
| West Corporation | | | 11,380 | | | | 277,103 | |
| | | | | | | 10,234,129 | |
TFS MARKET NEUTRAL FUND
SCHEDULE OF SECURITIES SOLD SHORT (Continued)
| COMMON STOCKS — 75.1% (Continued) | | Shares | | | Value | |
| Industrials — 10.6% (Continued) | | | | | | |
| Construction & Engineering — 0.2% | | | | | | |
| Abengoa, S.A. - ADR | | | 1,166 | | | $ | 26,165 | |
| Aegion Corporation | | | 7,114 | | | | 181,336 | |
| Ameresco, Inc. - Class A | | | 502 | | | | 3,218 | |
| EMCOR Group, Inc. | | | 1,819 | | | | 83,656 | |
| Layne Christensen Company | | | 87,547 | | | | 1,525,069 | |
| Northwest Pipe Company | | | 4,802 | | | | 171,767 | |
| Pike Corporation | | | 899 | | | | 8,630 | |
| | | | | | | 1,999,841 | |
| Electrical Equipment — 2.2% | | | | | | | | |
| AZZ, Inc. | | | 10,956 | | | | 475,710 | |
| Capstone Turbine Corporation | | | 937,719 | | | | 1,931,701 | |
| China BAK Battery, Inc. | | | 49,507 | | | | 123,767 | |
| Enphase Energy, Inc. | | | 316,732 | | | | 2,391,327 | |
| Franklin Electric Company, Inc. | | | 4,484 | | | | 173,396 | |
| FuelCell Energy, Inc. | | | 924,848 | | | | 2,099,405 | |
| Global Power Equipment Group, Inc. | | | 1,383 | | | | 24,244 | |
| GrafTech International Ltd. | | | 192,664 | | | | 2,159,763 | |
| Highpower International, Inc. | | | 155,548 | | | | 735,742 | |
| Hydrogenics Corporation | | | 36,327 | | | | 765,773 | |
| II-VI, Inc. | | | 3,114 | | | | 44,842 | |
| Lime Energy Company | | | 1,000 | | | | 2,890 | |
| Ocean Power Technologies, Inc. | | | 181,313 | | | | 489,545 | |
| Plug Power, Inc. | | | 664,493 | | | | 3,089,892 | |
| Polypore International, Inc. | | | 53,004 | | | | 1,838,179 | |
| Power Solutions International, Inc. | | | 1,741 | | | | 144,068 | |
| Real Goods Solar, Inc. - Class A | | | 529,702 | | | | 1,552,027 | |
| Revolution Lighting Technologies, Inc. | | | 787,556 | | | | 2,291,788 | |
| SolarCity Corporation | | | 8,838 | | | | 470,624 | |
| Trina Solar Ltd. - ADR | | | 25,113 | | | | 280,763 | |
| Yingli Green Energy Holding Company Ltd. - ADR | | | 234,383 | | | | 801,590 | |
| | | | | | | 21,887,036 | |
Industrial Conglomerates — 0.0% (a) | | | | | | | | |
| Carlisle Companies, Inc. | | | 717 | | | | 58,973 | |
| Raven Industries, Inc. | | | 1,235 | | | | 38,162 | |
| | | | | | | 97,135 | |
| Machinery — 2.6% | | | | | | | | |
| Accuride Corporation | | | 133,929 | | | | 755,360 | |
| Actuant Corporation - Class A | | | 40,444 | | | | 1,369,434 | |
| Adept Technology, Inc. | | | 53,433 | | | | 639,059 | |
| Albany International Corporation - Class A | | | 10,694 | | | | 384,770 | |
| American Railcar Industries, Inc. | | | 1,815 | | | | 126,034 | |
| ARC Group Worldwide, Inc. | | | 1,789 | | | | 74,100 | |
| Barnes Group, Inc. | | | 9,296 | | | | 358,082 | |
TFS MARKET NEUTRAL FUND
SCHEDULE OF SECURITIES SOLD SHORT (Continued)
| COMMON STOCKS — 75.1% (Continued) | | Shares | | | Value | |
| Industrials — 10.6% (Continued) | | | | | | |
| Machinery — 2.6% (Continued) | | | | | | |
| Briggs & Stratton Corporation | | | 83,934 | | | $ | 1,793,670 | |
| China Valves Technology, Inc. | | | 40,338 | | | | 43,565 | |
| Deere & Company | | | 2,751 | | | | 256,778 | |
| Dynamic Materials Corporation | | | 12,722 | | | | 256,984 | |
| Energy Recovery, Inc. | | | 135,467 | | | | 692,236 | |
| EnPro Industries, Inc. | | | 17,171 | | | | 1,222,747 | |
| ESCO Technologies, Inc. | | | 6,767 | | | | 226,153 | |
| ExOne Company (The) | | | 149,557 | | | | 5,165,699 | |
| Harsco Corporation | | | 39,391 | | | | 942,627 | |
| Joy Global, Inc. | | | 8,161 | | | | 492,761 | |
| Kennametal, Inc. | | | 3,924 | | | | 183,368 | |
| Lindsay Corporation | | | 25,010 | | | | 2,204,131 | |
| Miller Industries, Inc. | | | 53 | | | | 1,027 | |
| Mueller Industries, Inc. | | | 43,773 | | | | 1,266,791 | |
| Navistar International Corporation | | | 36,801 | | | | 1,395,862 | |
| PMFG, Inc. | | | 3,864 | | | | 21,909 | |
| RBC Bearings, Inc. | | | 342 | | | | 21,293 | |
| Sun Hydraulics Corporation | | | 5,889 | | | | 240,742 | |
| Tecumseh Products Company - Class A | | | 3,055 | | | | 18,361 | |
| Tennant Company | | | 6,135 | | | | 391,352 | |
| Titan International, Inc. | | | 52,695 | | | | 922,689 | |
| Valmont Industries, Inc. | | | 1,099 | | | | 163,652 | |
| voxeljet AG - ADR | | | 91,353 | | | | 1,436,069 | |
| Watts Water Technologies, Inc. - Class A | | | 6,026 | | | | 320,583 | |
| Westport Innovations, Inc. | | | 194,999 | | | | 2,558,387 | |
| | | | | | | 25,946,275 | |
| Marine — 0.4% | | | | | | | | |
| Box Ships, Inc. | | | 5,735 | | | | 9,061 | |
| Diana Containerships, Inc. | | | 27,900 | | | | 105,044 | |
| Eagle Bulk Shipping, Inc. | | | 604,310 | | | | 1,764,585 | |
| FreeSeas, Inc. | | | 144,201 | | | | 178,809 | |
| Genco Shipping & Trading Ltd. | | | 892,169 | | | | 1,472,079 | |
| Navios Maritime Partners, L.P. | | | 17,640 | | | | 333,925 | |
| Seanergy Maritime Holdings Corporation | | | 182 | | | | 306 | |
| | | | | | | 3,863,809 | |
| Professional Services — 1.0% | | | | | | | | |
| Acacia Research Corporation | | | 213,440 | | | | 3,423,577 | |
| Advisory Board Company (The) | | | 8,896 | | | | 509,385 | |
| CBIZ, Inc. | | | 317,360 | | | | 2,719,775 | |
| Corporate Resource Services, Inc. | | | 55,279 | | | | 148,148 | |
| Dun & Bradstreet Corporation (The) | | | 539 | | | | 59,700 | |
| FTI Consulting, Inc. | | | 35,474 | | | | 1,216,758 | |
| IHS, Inc. - Class A | | | 836 | | | | 100,847 | |
TFS MARKET NEUTRAL FUND
SCHEDULE OF SECURITIES SOLD SHORT (Continued)
| COMMON STOCKS — 75.1% (Continued) | | Shares | | | Value | |
| Industrials — 10.6% (Continued) | | | | | | |
| Professional Services — 1.0% (Continued) | | | | | | |
| Kforce, Inc. | | | 29,362 | | | $ | 678,849 | |
| Odyssey Marine Exploration, Inc. | | | 712,604 | | | | 1,560,603 | |
| Spherix, Inc. | | | 110,924 | | | | 175,260 | |
| | | | | | | 10,592,902 | |
| Road & Rail — 0.4% | | | | | | | | |
| Heartland Express, Inc. | | | 19,387 | | | | 421,861 | |
| J.B. Hunt Transport Services, Inc. | | | 1,845 | | | | 140,405 | |
| Kansas City Southern | | | 385 | | | | 38,839 | |
| Knight Transportation, Inc. | | | 6,714 | | | | 159,323 | |
| Roadrunner Transportation Systems, Inc. | | | 38,723 | | | | 953,747 | |
| USA Truck, Inc. | | | 42,471 | | | | 707,567 | |
| YRC Worldwide, Inc. | | | 52,870 | | | | 1,185,874 | |
| | | | | | | 3,607,616 | |
| Trading Companies & Distributors — 0.6% | | | | | | | | |
| Aceto Corporation | | | 21,400 | | | | 468,232 | |
| Armco Metals Holdings, Inc. | | | 986 | | | | 296 | |
| Beacon Roofing Supply, Inc. | | | 12,400 | | | | 441,192 | |
| Euro Tech Holdings Company Ltd. | | | 1,211 | | | | 5,244 | |
| Fastenal Company | | | 8,447 | | | | 423,026 | |
| General Finance Corporation | | | 571 | | | | 5,070 | |
| Kaman Corporation | | | 18,379 | | | | 771,367 | |
| MSC Industrial Direct Company, Inc. - Class A | | | 1,850 | | | | 168,461 | |
| Rush Enterprises, Inc. - Class A | | | 17,786 | | | | 570,930 | |
| Titan Machinery, Inc. | | | 203,427 | | | | 3,588,452 | |
| | | | | | | 6,442,270 | |
| Transportation Infrastructure — 0.1% | | | | | | | | |
| Aegean Marine Petroleum Network, Inc. | | | 14,650 | | | | 135,220 | |
| Sino-Global Shipping America Ltd. | | | 5,499 | | | | 14,132 | |
| Wesco Aircraft Holdings, Inc. | | | 56,369 | | | | 1,142,036 | |
| | | | | | | 1,291,388 | |
| Information Technology — 13.2% | | | | | | | | |
| Communications Equipment — 1.6% | | | | | | | | |
| ADTRAN, Inc. | | | 37,439 | | | | 839,757 | |
| Alliance Fiber Optic Products, Inc. | | | 67,729 | | | | 1,301,751 | |
| Ambient Corporation | | | 344 | | | | 337 | |
| Aruba Networks, Inc. | | | 72,084 | | | | 1,425,101 | |
| Black Box Corporation | | | 19,457 | | | | 413,656 | |
| CalAmp Corporation | | | 63,398 | | | | 1,125,314 | |
| Calix, Inc. | | | 7,178 | | | | 63,238 | |
| Ciena Corporation | | | 50,114 | | | | 990,754 | |
| Cisco Systems, Inc. | | | 4,447 | | | | 102,770 | |
| Comtech Telecommunications Corporation | | | 3,414 | | | | 108,395 | |
| Echostar Corporation - Class A | | | 24,016 | | | | 1,079,759 | |
| EMCORE Corporation | | | 105,245 | | | | 508,333 | |
TFS MARKET NEUTRAL FUND
SCHEDULE OF SECURITIES SOLD SHORT (Continued)
| COMMON STOCKS — 75.1% (Continued) | | Shares | | | Value | |
| Information Technology — 13.2% (Continued) | | | | | | |
| Communications Equipment — 1.6% (Continued) | | | | | | |
| Finisar Corporation | | | 5,033 | | | $ | 131,613 | |
| Infinera Corporation | | | 168,144 | | | | 1,506,570 | |
| InterDigital, Inc. | | | 45,569 | | | | 1,582,156 | |
| Ituran Location and Control Ltd. | | | 22 | | | | 528 | |
| KVH Industries, Inc. | | | 3,559 | | | | 48,082 | |
| NETGEAR, Inc. | | | 2,004 | | | | 64,729 | |
| Oplink Communications, Inc. | | | 5,884 | | | | 100,852 | |
| Palo Alto Networks, Inc. | | | 6,611 | | | | 420,327 | |
| ParkerVision, Inc. | | | 726,503 | | | | 3,312,854 | |
| Procera Networks, Inc. | | | 109,768 | | | | 1,016,452 | |
| ZST Digital Networks, Inc. | | | 36,656 | | | | 40,322 | |
| | | | | | | 16,183,650 | |
| Electronic Equipment, Instruments & Components — 1.9% | | | | | | | | |
| Arrow Electronics, Inc. | | | 839 | | | | 47,613 | |
| ClearSign Combustion Corporation | | | 63,686 | | | | 588,459 | |
| Cognex Corporation | | | 819 | | | | 28,198 | |
| Control4 Corporation | | | 27,590 | | | | 487,239 | |
| Document Security Systems, Inc. | | | 200,217 | | | | 254,276 | |
| DTS, Inc. | | | 37,905 | | | | 705,412 | |
| Electro Scientific Industries, Inc. | | | 55,120 | | | | 467,418 | |
| FARO Technologies, Inc. | | | 12,266 | | | | 489,413 | |
| FLIR Systems, Inc. | | | 235 | | | | 7,999 | |
| InvenSense, Inc. | | | 106,007 | | | | 2,282,331 | |
| IPG Photonics Corporation | | | 6,456 | | | | 417,251 | |
| Littelfuse, Inc. | | | 3,999 | | | | 362,109 | |
| Magal Security Systems Ltd. | | | 78 | | | | 286 | |
| Maxwell Technologies, Inc. | | | 54,043 | | | | 813,888 | |
| Measurement Specialties, Inc. | | | 11 | | | | 708 | |
| MTS Systems Corporation | | | 7,223 | | | | 465,667 | |
| Neonode, Inc. | | | 413,026 | | | | 2,209,689 | |
| Parametric Sound Corporation | | | 65,631 | | | | 604,462 | |
| RadiSys Corporation | | | 12,406 | | | | 39,699 | |
| RealD, Inc. | | | 92,799 | | | | 1,017,077 | |
| Research Frontiers, Inc. | | | 72,769 | | | | 331,099 | |
| Rofin-Sinar Technologies, Inc. | | | 72,721 | | | | 1,614,406 | |
| Schmitt Industries, Inc. | | | 200 | | | | 576 | |
| Speed Commerce, Inc. | | | 5,014 | | | | 16,546 | |
| SuperCom Ltd. | | | 19,398 | | | | 153,632 | |
| Superconductor Technologies, Inc. | | | 64,214 | | | | 145,124 | |
| SYNNEX Corporation | | | 18,596 | | | | 1,252,999 | |
| TTM Technologies, Inc. | | | 227,223 | | | | 1,792,790 | |
| Uni-Pixel, Inc. | | | 278,619 | | | | 1,524,046 | |
| Universal Display Corporation | | | 55,186 | | | | 1,437,595 | |
| | | | | | | 19,558,007 | |
TFS MARKET NEUTRAL FUND
SCHEDULE OF SECURITIES SOLD SHORT (Continued)
| COMMON STOCKS — 75.1% (Continued) | | Shares | | | Value | |
| Information Technology — 13.2% (Continued) | | | | | | |
| Internet Software & Services — 2.0% | | | | | | |
| Angie's List, Inc. | | | 119,726 | | | $ | 1,354,101 | |
| Bazaarvoice, Inc. | | | 194,323 | | | | 1,305,850 | |
| ChannelAdvisor Corporation | | | 700 | | | | 18,368 | |
| Chegg, Inc. | | | 7,955 | | | | 41,923 | |
| ChinaCache International Holdings Ltd. - ADR | | | 21,137 | | | | 291,691 | |
| Conversant, Inc. | | | 11,574 | | | | 282,868 | |
| eGain Corporation | | | 768 | | | | 5,023 | |
| Equinix, Inc. | | | 1,469 | | | | 275,893 | |
| Gogo, Inc. | | | 31,670 | | | | 428,178 | |
| Innodata, Inc. | | | 705 | | | | 2,376 | |
| Internap Network Services Corporation | | | 27,236 | | | | 183,026 | |
| j2 Global, Inc. | | | 47,105 | | | | 2,183,788 | |
| LinkedIn Corporation - Class A | | | 457 | | | | 70,136 | |
| Liquidity Services, Inc. | | | 104,377 | | | | 1,800,503 | |
| LiveDeal, Inc. | | | 94,363 | | | | 418,972 | |
| LookSmart Ltd. | | | 300 | | | | 501 | |
| Marin Software, Inc. | | | 91,638 | | | | 859,564 | |
| MeetMe, Inc. | | | 157,908 | | | | 438,984 | |
| Millennial Media, Inc. | | | 351,480 | | | | 2,245,957 | |
| Monster Worldwide, Inc. | | | 83,572 | | | | 575,811 | |
| OpenTable, Inc. | | | 3,245 | | | | 217,934 | |
Piksel, Inc. - Series A-2 (b) | | | 346,880 | | | | — | |
| Professional Diversity Network, Inc. | | | 45 | | | | 158 | |
| Rocket Fuel, Inc. | | | 12,037 | | | | 386,027 | |
| Shutterstock, Inc. | | | 167 | | | | 12,109 | |
| Spark Networks, Inc. | | | 37,113 | | | | 168,122 | |
| StarTek, Inc. | | | 797 | | | | 5,539 | |
| Textura Corporation | | | 42,981 | | | | 765,492 | |
| Trulia, Inc. | | | 64,183 | | | | 2,182,222 | |
| Twitter, Inc. | | | 43,128 | | | | 1,680,698 | |
| Vistaprint N.V. | | | 24,642 | | | | 972,620 | |
| Web.com Group, Inc. | | | 2,299 | | | | 70,602 | |
| WebMD Health Corporation | | | 7,409 | | | | 326,663 | |
| Weibo Corporation - ADR | | | 10,000 | | | | 195,600 | |
| Wix.com Ltd. | | | 12 | | | | 246 | |
| Xoom Corporation | | | 17,312 | | | | 386,231 | |
| Zix Corporation | | | 134,879 | | | | 442,403 | |
| | | | | | | 20,596,179 | |
| IT Services — 1.2% | | | | | | | | |
| Acorn Energy, Inc. | | | 19,761 | | | | 45,846 | |
| BitAuto Holdings Ltd. - ADR | | | 11,471 | | | | 411,006 | |
| Blackhawk Network Holdings, Inc. | | | 68,911 | | | | 1,653,175 | |
| CACI International, Inc. - Class A | | | 19,312 | | | | 1,345,081 | |
TFS MARKET NEUTRAL FUND
SCHEDULE OF SECURITIES SOLD SHORT (Continued)
| COMMON STOCKS — 75.1% (Continued) | | Shares | | | Value | |
| Information Technology — 13.2% (Continued) | | | | | | |
| IT Services — 1.2% (Continued) | | | | | | |
| Cass Information Systems, Inc. | | | 258 | | | $ | 13,032 | |
| CIBER, Inc. | | | 174,867 | | | | 755,425 | |
| Computer Task Group, Inc. | | | 24,624 | | | | 389,305 | |
| CSG Systems International, Inc. | | | 2,005 | | | | 52,852 | |
| Euronet Worldwide, Inc. | | | 12,982 | | | | 597,042 | |
| Forrester Research, Inc. | | | 25,707 | | | | 910,799 | |
| Heartland Payment Systems, Inc. | | | 52,405 | | | | 2,145,461 | |
| Helios and Matheson Analytics, Inc. | | | 146 | | | | 623 | |
| Higher One Holdings, Inc. | | | 40,565 | | | | 242,984 | |
| InterCloud Systems, Inc. | | | 92,075 | | | | 374,745 | |
| International Business Machines Corporation | | | 797 | | | | 156,587 | |
| Jack Henry & Associates, Inc. | | | 1,809 | | | | 99,784 | |
| JetPay Corporation | | | 73 | | | | 150 | |
| Leidos Holdings, Inc. | | | 12,783 | | | | 476,039 | |
| ManTech International Corporation - Class A | | | 13,471 | | | | 401,840 | |
| NeuStar, Inc. - Class A | | | 30,335 | | | | 780,216 | |
| Teradata Corporation | | | 9,731 | | | | 442,371 | |
| Total System Services, Inc. | | | 2,526 | | | | 80,251 | |
| Unisys Corporation | | | 1,902 | | | | 46,352 | |
| Western Union Company (The) | | | 7,488 | | | | 118,835 | |
| WidePoint Corporation | | | 27,692 | | | | 38,215 | |
| WPCS International, Inc. | | | 28,400 | | | | 30,388 | |
| | | | | | | 11,608,404 | |
| Semiconductors & Semiconductor Equipment — 3.0% | | | | | | | | |
| Advanced Micro Devices, Inc. | | | 803,396 | | | | 3,285,890 | |
| Ambarella, Inc. | | | 7,110 | | | | 176,683 | |
| Applied Micro Circuits Corporation | | | 135,131 | | | | 1,312,122 | |
| ASM International N.V. | | | 100 | | | | 4,353 | |
| Camtek Ltd. | | | 354,247 | | | | 1,101,708 | |
| Canadian Solar, Inc. | | | 11,293 | | | | 306,266 | |
| Cirrus Logic, Inc. | | | 30,223 | | | | 673,973 | |
| Cohu, Inc. | | | 2,974 | | | | 30,632 | |
| CSR plc - ADR | | | 532 | | | | 20,594 | |
| CVD Equipment Corporation | | | 3,587 | | | | 47,886 | |
| Daqo New Energy Corporation - ADR | | | 4,400 | | | | 180,708 | |
| Entropic Communications, Inc. | | | 28,043 | | | | 103,479 | |
| Exar Corporation | | | 105,498 | | | | 1,141,488 | |
| EZchip Semiconductor Ltd. | | | 20,102 | | | | 481,443 | |
| Global-Tech Advanced Innovations, Inc. | | | 100 | | | | 579 | |
| GT Advanced Technologies, Inc. | | | 105,564 | | | | 1,753,418 | |
| Hanwha SolarOne Company Ltd. - ADR | | | 37,613 | | | | 97,794 | |
| Himax Technologies, Inc. - ADR | | | 37,819 | | | | 329,782 | |
| Hittite Microwave Corporation | | | 2,056 | | | | 122,044 | |
TFS MARKET NEUTRAL FUND
SCHEDULE OF SECURITIES SOLD SHORT (Continued)
| COMMON STOCKS — 75.1% (Continued) | | Shares | | | Value | |
| Information Technology — 13.2% (Continued) | | | | | | |
| Semiconductors & Semiconductor Equipment — 3.0% (Continued) | | | | | | |
| Intel Corporation | | | 1,625 | | | $ | 43,371 | |
| JA Solar Holdings Company Ltd. - ADR | | | 102,300 | | | | 985,149 | |
| JinkoSolar Holding Company Ltd. - ADR | | | 12,834 | | | | 345,235 | |
| Kopin Corporation | | | 14,100 | | | | 45,966 | |
| Mellanox Technologies Ltd. | | | 2,164 | | | | 75,675 | |
| Microchip Technology, Inc. | | | 5,933 | | | | 282,055 | |
| MKS Instruments, Inc. | | | 10,355 | | | | 291,493 | |
| Montage Technology Group Ltd. | | | 49,766 | | | | 1,034,635 | |
| MoSys, Inc. | | | 147,150 | | | | 575,356 | |
| Peregrine Semiconductor Corporation | | | 12,494 | | | | 67,093 | |
| Photronics, Inc. | | | 264,226 | | | | 2,293,482 | |
| Pixelworks, Inc. | | | 93,311 | | | | 478,685 | |
| QuickLogic Corporation | | | 325,208 | | | | 1,538,234 | |
| Rubicon Technology, Inc. | | | 258,641 | | | | 2,620,033 | |
| Rudolph Technologies, Inc. | | | 176,454 | | | | 1,607,496 | |
| Semtech Corporation | | | 2,073 | | | | 49,711 | |
| Spansion, Inc. | | | 22,069 | | | | 393,490 | |
| SunPower Corporation | | | 60,900 | | | | 2,035,278 | |
| Teradyne, Inc. | | | 26,116 | | | | 461,470 | |
| Tessera Technologies, Inc. | | | 10,976 | | | | 240,704 | |
| Ultratech, Inc. | | | 79,485 | | | | 2,115,891 | |
| Veeco Instruments, Inc. | | | 36,786 | | | | 1,359,978 | |
| | | | | | | 30,111,322 | |
| Software — 3.0% | | | | | | | | |
| Allot Communications Ltd. | | | 818 | | | | 11,158 | |
| AVG Technologies N.V. | | | 43,965 | | | | 823,464 | |
| Barracuda Networks, Inc. | | | 49,271 | | | | 1,272,670 | |
| BluePhoenix Solutions Ltd. | | | 571 | | | | 2,472 | |
| Bottomline Technologies, Inc. | | | 41,947 | | | | 1,327,203 | |
| BroadSoft, Inc. | | | 15,666 | | | | 397,603 | |
| Cadence Design Systems, Inc. | | | 1,257 | | | | 19,559 | |
| China Mobile Games & Entertainment Group Ltd. - ADR | | | 9,500 | | | | 161,785 | |
| CommVault Systems, Inc. | | | 5,599 | | | | 270,992 | |
| Concur Technologies, Inc. | | | 1,867 | | | | 150,237 | |
| Cyan, Inc. | | | 223,848 | | | | 935,685 | |
| Datawatch Corporation | | | 51,909 | | | | 702,329 | |
| Ebix, Inc. | | | 245,691 | | | | 3,877,004 | |
| Ellie Mae, Inc. | | | 27,107 | | | | 661,140 | |
| FireEye, Inc. | | | 2,393 | | | | 93,949 | |
| Fleetmatics Group plc | | | 20,866 | | | | 626,606 | |
| Gigamon, Inc. | | | 18,300 | | | | 288,591 | |
| Glu Mobile, Inc. | | | 252,641 | | | | 1,010,564 | |
TFS MARKET NEUTRAL FUND
SCHEDULE OF SECURITIES SOLD SHORT (Continued)
| COMMON STOCKS — 75.1% (Continued) | | Shares | | | Value | |
| Information Technology — 13.2% (Continued) | | | | | | |
| Software — 3.0% (Continued) | | | | | | |
| Jive Software, Inc. | | | 113,419 | | | $ | 848,374 | |
| Magic Software Enterprises Ltd. | | | 24,710 | | | | 199,904 | |
| Mitek Systems, Inc. | | | 386,004 | | | | 1,258,373 | |
| NQ Mobile, Inc. - ADR | | | 210,772 | | | | 2,605,142 | |
| Nuance Communications, Inc. | | | 9,504 | | | | 152,919 | |
| Park City Group, Inc. | | | 24,589 | | | | 248,595 | |
| Qualys Inc. | | | 6,931 | | | | 133,699 | |
| RealPage, Inc. | | | 16,489 | | | | 292,680 | |
| Rosetta Stone, Inc. | | | 25,045 | | | | 298,286 | |
| salesforce.com, inc. | | | 6,691 | | | | 345,590 | |
| SeaChange International, Inc. | | | 53,719 | | | | 503,347 | |
| ServiceNow, Inc. | | | 6,897 | | | | 342,919 | |
| Splunk, Inc. | | | 327 | | | | 17,844 | |
| Tangoe, Inc. | | | 67,054 | | | | 1,008,492 | |
| Taomee Holdings Ltd. - ADR | | | 4,281 | | | | 22,647 | |
| VirnetX Holding Corporation | | | 348,743 | | | | 5,492,702 | |
| Voltari Corporation | | | 27,986 | | | | 97,951 | |
| Vringo, Inc. | | | 664,869 | | | | 2,719,314 | |
| Workday, Inc. - Class A | | | 4,736 | | | | 346,060 | |
| Zynga, Inc. - Class A | | | 169,603 | | | | 686,892 | |
| | | | | | | 30,254,741 | |
| Technology Hardware, Storage & Peripherals — 0.5% | | | | | | | | |
| 3D Systems Corporation | | | 16,873 | | | | 798,768 | |
| Electronics for Imaging, Inc. | | | 13,260 | | | | 501,095 | |
| Fusion-io, Inc. | | | 168,615 | | | | 1,455,148 | |
| Nimble Storage, Inc. | | | 1,375 | | | | 33,894 | |
| Quantum Corporation | | | 184,720 | | | | 199,498 | |
| Silicon Graphics International Corporation | | | 84,714 | | | | 1,023,345 | |
| Violin Memory, Inc. | | | 206,027 | | | | 741,697 | |
| | | | | | | 4,753,445 | |
| Materials — 3.8% | | | | | | | | |
| Chemicals — 0.8% | | | | | | | | |
| Albemarle Corporation | | | 1,034 | | | | 69,319 | |
| American Vanguard Corporation | | | 76,930 | | | | 1,370,123 | |
| Clean Diesel Technologies, Inc. | | | 154,134 | | | | 369,922 | |
| Flotek Industries, Inc. | | | 1,656 | | | | 46,385 | |
| Gulf Resources, Inc. | | | 8,505 | | | | 15,649 | |
| Intrepid Potash, Inc. | | | 203,118 | | | | 3,310,823 | |
| Landec Corporation | | | 30,916 | | | | 366,664 | |
| LSB Industries, Inc. | | | 893 | | | | 34,104 | |
| Marrone Bio Innovations, Inc. | | | 2,582 | | | | 31,449 | |
| NewMarket Corporation | | | 594 | | | | 221,158 | |
| OCI Partners, L.P. | | | 5,933 | | | | 129,399 | |
TFS MARKET NEUTRAL FUND
SCHEDULE OF SECURITIES SOLD SHORT (Continued)
| COMMON STOCKS — 75.1% (Continued) | | Shares | | | Value | |
| Materials — 3.8% (Continued) | | | | | | |
| Chemicals — 0.8% (Continued) | | | | | | |
| Olin Corporation | | | 30,231 | | | $ | 849,491 | |
| Rentech Nitrogen Partners, L.P. | | | 3,231 | | | | 58,417 | |
| Scotts Miracle-Gro Company (The) - Class A | | | 5,478 | | | | 335,308 | |
| Senomyx, Inc. | | | 45,174 | | | | 369,975 | |
| W.R. Grace & Company | | | 1,080 | | | | 99,468 | |
| Yongye International, Inc. | | | 47,817 | | | | 334,241 | |
| Zep, Inc. | | | 7,498 | | | | 129,640 | |
| | | | | | | 8,141,535 | |
| Construction Materials — 0.2% | | | | | | | | |
| James Hardie Industries plc - ADR | | | 100 | | | | 6,414 | |
| Tecnoglass, Inc. | | | 73 | | | | 756 | |
| Texas Industries, Inc. | | | 19,496 | | | | 1,690,303 | |
| US Concrete, Inc. | | | 8,348 | | | | 205,528 | |
| | | | | | | 1,903,001 | |
| Containers & Packaging — 0.1% | | | | | | | | |
| AptarGroup, Inc. | | | 2,941 | | | | 198,282 | |
| Bemis Company, Inc. | | | 1,464 | | | | 58,912 | |
| Greif, Inc. - Class A | | | 19,946 | | | | 1,080,874 | |
| | | | | | | 1,338,068 | |
| Metals & Mining — 2.4% | | | | | | | | |
| A.M. Castle & Company | | | 130,542 | | | | 1,603,056 | |
| AK Steel Holding Corporation | | | 228,308 | | | | 1,598,156 | |
| Allied Nevada Gold Corporation | | | 252,005 | | | | 854,297 | |
| Century Aluminum Company | | | 4,145 | | | | 56,994 | |
| China Precision Steel, Inc. | | | 7,845 | | | | 16,161 | |
| Cliffs Natural Resources, Inc. | | | 110,185 | | | | 1,952,478 | |
| Coeur Mining, Inc. | | | 205,822 | | | | 1,782,418 | |
| Commercial Metals Company | | | 46,680 | | | | 896,256 | |
| Comstock Mining, Inc. | | | 128 | | | | 227 | |
| Energy Fuels, Inc. | | | 1,604 | | | | 12,399 | |
| General Moly, Inc. | | | 13,615 | | | | 14,976 | |
| General Steel Holdings, Inc. | | | 568 | | | | 585 | |
| Gold Resource Corporation | | | 97,398 | | | | 449,005 | |
| Golden Star Resources Ltd. | | | 363,025 | | | | 207,287 | |
| Great Northern Iron Ore Properties | | | 1,962 | | | | 33,962 | |
| Horsehead Holding Corporation | | | 61,245 | | | | 954,810 | |
| Kaiser Aluminum Corporation | | | 8,175 | | | | 575,520 | |
| Molycorp, Inc. | | | 1,114,824 | | | | 5,295,414 | |
| North American Palladium Ltd. | | | 1,705,321 | | | | 494,543 | |
| NovaGold Resources, Inc. | | | 37,306 | | | | 131,690 | |
| OCI Resources, L.P. | | | 800 | | | | 17,560 | |
| Olympic Steel, Inc. | | | 11,335 | | | | 298,791 | |
| Paramount Gold and Silver Corporation | | | 241,417 | | | | 243,831 | |
| Pretium Resources, Inc. | | | 107,491 | | | | 698,691 | |
TFS MARKET NEUTRAL FUND
SCHEDULE OF SECURITIES SOLD SHORT (Continued)
| COMMON STOCKS — 75.1% (Continued) | | Shares | | | Value | |
| Materials — 3.8% (Continued) | | | | | | |
| Metals & Mining — 2.4% (Continued) | | | | | | |
| Revett Minerals, Inc. | | | 621 | | | $ | 509 | |
| RTI International Metals, Inc. | | | 61,657 | | | | 1,736,261 | |
| Schnitzer Steel Industries, Inc. - Class A | | | 3,103 | | | | 87,101 | |
| Seabridge Gold, Inc. | | | 56,242 | | | | 449,374 | |
| Silver Bull Resources, Inc. | | | 1,577 | | | | 520 | |
| Silver Standard Resources, Inc. | | | 816 | | | | 8,087 | |
| SinoCoking Coal and Coke Chemical Industries, Inc. | | | 111,223 | | | | 130,131 | |
| Tahoe Resources, Inc. | | | 652 | | | | 14,540 | |
| Tanzanian Royalty Exploration Corporation | | | 165,160 | | | | 360,049 | |
| Thompson Creek Metals Company, Inc. | | | 326,384 | | | | 874,709 | |
| United States Antimony Corporation | | | 6,169 | | | | 12,338 | |
| Walter Energy, Inc. | | | 313,472 | | | | 2,256,998 | |
| | | | | | | 24,119,724 | |
| Paper & Forest Products — 0.3% | | | | | | | | |
| Louisiana-Pacific Corporation | | | 102,405 | | | | 1,678,418 | |
| MeadWestvaco Corporation | | | 1,655 | | | | 64,661 | |
| Orient Paper, Inc. | | | 52,733 | | | | 123,923 | |
| Pope Resources, L.P. | | | 30 | | | | 2,047 | |
| Verso Paper Corporation | | | 206,316 | | | | 561,179 | |
| Wausau Paper Corporation | | | 70,380 | | | | 841,745 | |
| | | | | | | 3,271,973 | |
| Telecommunication Services — 0.8% | | | | | | | | |
| Diversified Telecommunication Services — 0.5% | | | | | | | | |
| 8x8, Inc. | | | 21,977 | | | | 213,177 | |
| Atlantic Tele-Network, Inc. | | | 9,147 | | | | 541,228 | |
| Consolidated Communications Holdings, Inc. | | | 27,159 | | | | 541,007 | |
| Elephant Talk Communications Corporation | | | 15,286 | | | | 16,356 | |
| Fairpoint Communications, Inc. | | | 19,031 | | | | 259,583 | |
| Hawaiian Telcom Holdco, Inc. | | | 10,200 | | | | 271,524 | |
| inContact, Inc. | | | 23,904 | | | | 197,208 | |
| Iridium Communications, Inc. | | | 149,813 | | | | 999,253 | |
| magicJack VocalTec Ltd. | | | 66,304 | | | | 1,172,255 | |
| Otelco, Inc. - Class A | | | 662 | | | | 3,316 | |
| Radcom Ltd. | | | 171 | | | | 944 | |
| xG Technology, Inc. | | | 152,028 | | | | 244,765 | |
| | | | | | | 4,460,616 | |
| Wireless Telecommunication Services — 0.3% | | | | | | | | |
| Boingo Wireless, Inc. | | | 24,185 | | | | 159,621 | |
| NII Holdings, Inc. | | | 1,144,938 | | | | 984,532 | |
| NTELOS Holdings Corporation | | | 63,254 | | | | 872,273 | |
| SBA Communications Corporation - Class A | | | 1,136 | | | | 101,967 | |
| Sprint Corporation | | | 4,543 | | | | 38,616 | |
| Telephone & Data Systems, Inc. | | | 14,186 | | | | 385,717 | |
TFS MARKET NEUTRAL FUND
SCHEDULE OF SECURITIES SOLD SHORT (Continued)
| COMMON STOCKS — 75.1% (Continued) | | Shares | | | Value | |
| Utilities — 1.0% | | | | | | |
| Wireless Telecommunication Services — 0.3% (Continued) | | | | | | |
| United States Cellular Corporation | | | 17,248 | | | $ | 716,482 | |
| | | | | | | 3,259,208 | |
| Electric Utilities — 0.2% | | | | | | | | |
| ALLETE, Inc. | | | 5,501 | | | | 284,732 | |
| Empire District Electric Company (The) | | | 11,896 | | | | 289,311 | |
| Hawaiian Electric Industries, Inc. | | | 15,011 | | | | 360,114 | |
| MGE Energy, Inc. | | | 671 | | | | 25,646 | |
| Portland General Electric Company | | | 36,263 | | | | 1,213,722 | |
| Southern Company | | | 341 | | | | 15,628 | |
| UIL Holdings Corporation | | | 1,439 | | | | 52,854 | |
| UNS Energy Corporation | | | 2,348 | | | | 141,021 | |
| | | | | | | 2,383,028 | |
| Gas Utilities — 0.4% | | | | | | | | |
| AGL Resources, Inc. | | | 3,748 | | | | 202,392 | |
| AmeriGas Partners, L.P. | | | 11,400 | | | | 528,732 | |
| China Natural Gas, Inc. | | | 1,282 | | | | 1,026 | |
| Ferrellgas Partners, L.P. | | | 41,850 | | | | 1,039,972 | |
| Northwest Natural Gas Company | | | 33,522 | | | | 1,484,019 | |
| Piedmont Natural Gas Company, Inc. | | | 8,733 | | | | 312,554 | |
| WGL Holdings, Inc. | | | 3,933 | | | | 156,494 | |
| | | | | | | 3,725,189 | |
| Independent Power and Renewable Electricity Producers — 0.2% | | | | | | | | |
| American DG Energy, Inc. | | | 115 | | | | 282 | |
| NRG Energy, Inc. | | | 4,002 | | | | 130,945 | |
| Ormat Technologies, Inc. | | | 56,589 | | | | 1,509,795 | |
| | | | | | | 1,641,022 | |
| Multi-Utilities — 0.2% | | | | | | | | |
| Black Hills Corporation | | | 859 | | | | 49,607 | |
| Consolidated Edison, Inc. | | | 3,394 | | | | 196,954 | |
| Just Energy Group, Inc. | | | 163,650 | | | | 1,301,017 | |
| PG&E Corporation | | | 3,075 | | | | 140,158 | |
| SCANA Corporation | | | 817 | | | | 43,857 | |
| TECO Energy, Inc. | | | 8,480 | | | | 152,301 | |
| Wisconsin Energy Corporation | | | 1,171 | | | | 56,770 | |
| | | | | | | 1,940,664 | |
Water Utilities — 0.0% (a) | | | | | | | | |
| California Water Service Group | | | 11,308 | | | | 254,430 | |
| York Water Company | | | 419 | | | | 8,384 | |
| | | | | | | 262,814 | |
| | | | | | | | |
Total Common Stocks (Proceeds $910,015,472) | | | | | | $ | 759,623,809 | |
TFS MARKET NEUTRAL FUND
SCHEDULE OF SECURITIES SOLD SHORT (Continued)
PREFERRED STOCKS — 0.0% (a) | | Shares | | | Value | |
| Cabco Trust for J. C. Penney, 7.625% | | | 22 | | | $ | 395 | |
| Stanley Black & Decker, Inc., 6.25% | | | 1,804 | | | | 201,741 | |
Total Preferred Stocks (Proceeds $192,281) | | | | | | $ | 202,136 | |
RIGHTS — 0.0% (a) | | Shares | | | Value | |
Accelerate Diagnostics, Inc. (b) | | | 7,443 | | | $ | 12,132 | |
Empire Resorts, Inc. (b) | | | 3,705 | | | | 1,927 | |
Total Rights (Proceeds $—) | | | | | | $ | 14,059 | |
WARRANTS — 0.0% (a) | | Shares | | | Value | |
| American International Group, Inc. | | | 854 | | | $ | 18,993 | |
Magnum Hunter Resources Corporation (b) | | | 15,689 | | | | — | |
Total Warrants (Proceeds $14,295) | | | | | | $ | 18,993 | |
| | | | | | | | |
Total Securities Sold Short — 75.1% (Proceeds $910,222,048) | | | | | | $ | 759,858,997 | |
ADR - American Depositary Receipt.
| (a) | Percentage rounds to less than 0.1%. |
| (b) | Security value has been determined in good faith by the Board of Trustees. The total value of such securities is ($1,268,970) at April 30, 2014, representing (0.1%) of net assets (Note 2). |
See accompanying notes to financial statements.
TFS MARKET NEUTRAL FUND
SCHEDULE OF FUTURES CONTRACTS SOLD SHORT
April 30, 2014 (Unaudited)
FUTURES CONTRACTS
SOLD SHORT | Expiration Date | | Contracts | | | Aggregate Market Value of Contracts | | | Unrealized Appreciation (Depreciation) | |
| FINANCIAL FUTURES | | | | | | | | | | |
| CBOE Volatility Index (VIX) Future | 05/20/2014 | | | 1,091 | | | $ | 16,332,270 | | | $ | 1,550,167 | |
| CBOE Volatility Index (VIX) Future | 06/17/2014 | | | 1,625 | | | | 25,496,250 | | | | 2,101,354 | |
| E-Mini S&P 500 Future | 06/20/2014 | | | 1,187 | | | | 111,563,162 | | | | (2,075,864 | ) |
| | | | | | | | | | | | | |
| Total Futures Contracts Sold Short | | | | | | | $ | 153,391,682 | | | $ | 1,575,657 | |
See accompanying notes to financial statements.
TFS SMALL CAP FUND
SUMMARY SCHEDULE OF INVESTMENTS*
April 30, 2014 (Unaudited)
| COMMON STOCKS — 98.7% | | Shares | | | Value | |
| Consumer Discretionary — 16.0% | | | | | | |
Carmike Cinemas, Inc. (a) | | | 9,327 | | | $ | 276,639 | |
| DineEquity, Inc. | | | 4,525 | | | | 343,040 | |
Gentherm, Inc. (a) | | | 13,173 | | | | 478,839 | |
Modine Manufacturing Company (a) | | | 18,253 | | | | 300,809 | |
Motorcar Parts of America, Inc. (a) | | | 11,919 | | | | 327,057 | |
| Papa John's International, Inc. | | | 8,086 | | | | 354,652 | |
| Superior Industries International, Inc. | | | 12,930 | | | | 273,340 | |
Tower International, Inc. (a) | | | 11,658 | | | | 324,209 | |
Universal Electronics, Inc. (a) | | | 6,776 | | | | 253,084 | |
Other Consumer Discretionary (b) | | | | | | | 11,750,282 | |
| | | | | | | 14,681,951 | |
| Consumer Staples — 2.8% | | | | | | | | |
Revlon, Inc. - Class A (a) | | | 8,177 | | | | 246,455 | |
Other Consumer Staples (b) | | | | | | | 2,351,123 | |
| | | | | | | 2,597,578 | |
| Energy — 7.7% | | | | | | | | |
Pioneer Energy Services Corporation (a) | | | 33,221 | | | | 497,318 | |
Warren Resources, Inc. (a) | | | 61,972 | | | | 314,198 | |
Willbros Group, Inc. (a) | | | 25,584 | | | | 284,238 | |
Other Energy (b) | | | | | | | 6,010,363 | |
| | | | | | | 7,106,117 | |
| Financials — 16.9% | | | | | | | | |
Customers Bancorp, Inc. (a) | | | 12,423 | | | | 273,679 | |
| Federated National Holding Company | | | 13,520 | | | | 262,694 | |
| Geo Group, Inc. (The) | | | 13,474 | | | | 451,783 | |
| Kennedy-Wilson Holdings, Inc. | | | 17,838 | | | | 389,582 | |
| Manning & Napier, Inc. | | | 15,979 | | | | 265,571 | |
| Nelnet, Inc. - Class A | | | 7,724 | | | | 326,416 | |
| United Insurance Holdings Corporation | | | 18,644 | | | | 284,321 | |
| Winthrop Realty Trust | | | 19,263 | | | | 267,756 | |
Other Financials (b) | | | | | | | 13,000,249 | |
| | | | | | | 15,522,051 | |
| Health Care — 16.6% | | | | | | | | |
Akorn, Inc. (a) | | | 10,021 | | | | 252,730 | |
Anika Therapeutics, Inc. (a) | | | 5,858 | | | | 250,371 | |
Cynosure, Inc. - Class A (a) | | | 15,188 | | | | 372,714 | |
Five Star Quality Care, Inc. (a) | | | 51,626 | | | | 249,353 | |
Greatbatch, Inc. (a) | | | 8,076 | | | | 371,738 | |
Magellan Health Services, Inc. (a) | | | 7,965 | | | | 459,740 | |
Natus Medical, Inc. (a) | | | 17,225 | | | | 427,697 | |
OraSure Technologies, Inc. (a) | | | 41,573 | | | | 272,303 | |
| Select Medical Holdings Corporation | | | 25,984 | | | | 362,737 | |
Other Health Care (b) | | | | | | | 12,255,171 | |
| | | | | | | 15,274,554 | |
TFS SMALL CAP FUND
SUMMARY SCHEDULE OF INVESTMENTS* (Continued)
| COMMON STOCKS — 98.7% (Continued) | | Shares | | | Value | |
| Industrials — 14.2% | | | | | | |
| Argan, Inc. | | | 10,262 | | | $ | 274,714 | |
DXP Enterprises, Inc. (a) | | | 2,256 | | | | 255,402 | |
H&E Equipment Services, Inc. (a) | | | 10,593 | | | | 408,360 | |
Hill International, Inc. (a) | | | 36,922 | | | | 248,116 | |
Huron Consulting Group, Inc. (a) | | | 3,895 | | | | 277,324 | |
Korn/Ferry International (a) | | | 15,612 | | | | 453,529 | |
| Standex International Corporation | | | 4,222 | | | | 250,660 | |
Tutor Perini Corporation (a) | | | 12,714 | | | | 376,334 | |
| Viad Corporation | | | 12,602 | | | | 290,476 | |
Other Industrials (b) | | | | | | | 10,212,642 | |
| | | | | | | 13,047,557 | |
| Information Technology — 18.2% | | | | | | | | |
Amkor Technology, Inc. (a) | | | 31,400 | | | | 249,630 | |
Integrated Device Technology, Inc. (a) | | | 30,086 | | | | 351,104 | |
Lionbridge Technologies, Inc. (a) | | | 45,810 | | | | 269,363 | |
LogMeIn, Inc. (a) | | | 5,675 | | | | 257,929 | |
MoneyGram International, Inc. (a) | | | 19,716 | | | | 260,251 | |
Tech Data Corporation (a) | | | 7,333 | | | | 458,239 | |
Other Information Technology (b) | | | | | | | 14,865,580 | |
| | | | | | | 16,712,096 | |
| Materials — 4.5% | | | | | | | | |
Berry Plastics Group, Inc. (a) | | | 19,114 | | | | 429,874 | |
| Compass Minerals International, Inc. | | | 5,340 | | | | 489,144 | |
| Koppers Holdings, Inc. | | | 7,256 | | | | 309,831 | |
| P.H. Glatfelter Company | | | 10,321 | | | | 263,392 | |
Other Materials (b) | | | | | | | 2,701,958 | |
| | | | | | | 4,194,199 | |
| Telecommunication Services — 0.7% | | | | | | | | |
Cbeyond, Inc. (a) | | | 28,232 | | | | 279,215 | |
Other Telecommunication Services (b) | | | | | | | 362,841 | |
| | | | | | | 642,056 | |
| Utilities — 1.1% | | | | | | | | |
Other Utilities (b) | | | | | | | 1,025,481 | |
| | | | | | | | |
Total Common Stocks (Cost $87,515,126) | | | | | | $ | 90,803,640 | |
| OTHER INVESTMENTS — 0.2% | | Shares | | | Value | |
Other Investments (Cost $204,230) (b) | | | | | | $ | 179,659 | |
TFS SMALL CAP FUND
SUMMARY SCHEDULE OF INVESTMENTS* (Continued)
| MONEY MARKET FUNDS — 1.3% | | Shares | | | Value | |
UMB Money Market Fiduciary, 0.01% (c) (Cost $1,173,818) | | | 1,173,818 | | | $ | 1,173,818 | |
| | | | | | | | |
Total Investments at Value — 100.2% (Cost $88,893,174) | | | | | | $ | 92,157,117 | |
| | | | | | | | |
| Liabilities in Excess of Other Assets — (0.2%) | | | | | | | (183,206 | ) |
| | | | | | | | |
| Net Assets — 100.0% | | | | | | $ | 91,973,911 | |
| * | A complete Schedule of Investments is available without charge upon request by calling toll-free 1-888-534-2001 or on the SEC’s website at http://www.sec.gov. |
| (a) | Non-income producing security. |
| (b) | Represents issuers not identified as a top 50 holding in terms of market value and issues or issuers not exceeding 1% of net assets individually or in the aggregate, respectively, as of April 30, 2014. |
| (c) | The rate shown is the 7-day effective yield as of April 30, 2014. |
See accompanying notes to financial statements.
TFS HEDGED FUTURES FUND
SCHEDULE OF INVESTMENTS
April 30, 2014 (Unaudited)
| U.S. TREASURY OBLIGATIONS — 22.7% | | Par Value | | | Value | |
U.S. Treasury Bills (a), | | | | | | |
| 0.065%, due 08/21/2014 | | $ | 2,650,000 | | | $ | 2,649,754 | |
| 0.068%, due 09/04/2014 | | | 3,050,000 | | | | 3,049,680 | |
| 0.037%, due 09/18/2014 | | | 3,125,000 | | | | 3,124,634 | |
| 0.025%, due 09/25/2014 | | | 550,000 | | | | 549,921 | |
| 0.040%, due 10/02/2014 | | | 2,600,000 | | | | 2,599,555 | |
Total U.S. Treasury Obligations (Cost $11,972,787) | | | | | | $ | 11,973,544 | |
| MONEY MARKET FUNDS — 66.6% | | Shares | | | Value | |
BlackRock Liquidity Funds TempFund Portfolio - Institutional Class, 0.03% (b) | | | 6,526,230 | | | $ | 6,526,230 | |
Fidelity Institutional Money Market Portfolio - Class I, 0.05% (b) | | | 14,516,757 | | | | 14,516,757 | |
Goldman Sachs Financial Square Money Market Fund - Institutional Class, 0.06% (b) | | | 6,528,635 | | | | 6,528,635 | |
Morgan Stanley Institutional Liquidity Funds - Money Market Portfolio - Institutional Class, 0.09% (b) | | | 542,832 | | | | 542,832 | |
PIMCO Money Market Fund - Institutional Class, 0.00% (b) | | | 540,989 | | | | 540,989 | |
Vanguard Prime Money Market Fund - Investor Shares, 0.01% (b) | | | 6,526,733 | | | | 6,526,733 | |
Total Money Market Funds (Cost $35,182,176) | | | | | | $ | 35,182,176 | |
| | | | | | | | |
Total Investments at Value — 89.3% (Cost $47,154,963) | | | | | | $ | 47,155,720 | |
| | | | | | | | |
| Other Assets in Excess of Liabilities — 10.7% | | | | | | | 5,637,487 | (c) |
| | | | | | | | |
| Net Assets — 100.0% | | | | | | $ | 52,793,207 | |
| (a) | Rate shown is the annualized yield at time of purchase, not a coupon rate. |
| (b) | The rate shown is the 7-day effective yield as of April 30, 2014. |
| (c) | Includes cash held as margin deposits for futures contracts. |
See accompanying notes to financial statements.
TFS HEDGED FUTURES FUND
SCHEDULE OF FUTURES CONTRACTS
April 30, 2014 (Unaudited)
| FUTURES CONTRACTS | Expiration Date | | Contracts | | | Aggregate Market Value of Contracts | | | Unrealized Appreciation (Depreciation) | |
| COMMODITY FUTURES | | | | | | | | | | |
| Copper Future | 07/29/2014 | | | 17 | | | $ | 1,284,350 | | | $ | (12 | ) |
| Crude Oil Future | 05/20/2014 | | | 12 | | | | 1,198,200 | | | | (29,886 | ) |
| Ethanol Future | 06/04/2014 | | | 33 | | | | 2,092,002 | | | | 27,230 | |
| Live Cattle Future | 06/30/2014 | | | 43 | | | | 2,362,850 | | | | 1,342 | |
| Lumber Future | 07/15/2014 | | | 18 | | | | 655,182 | | | | (160 | ) |
| Oats Future | 07/14/2014 | | | 124 | | | | 2,235,100 | | | | 28,194 | |
| Red Spring Wheat Future | 07/14/2014 | | | 41 | | | | 1,575,937 | | | | 59,709 | |
| Soybean Future | 07/14/2014 | | | 5 | | | | 378,188 | | | | 3,574 | |
| Soybean Meal Future | 07/14/2014 | | | 81 | | | | 3,998,970 | | | | 145,724 | |
| Total Futures Contracts | | | | | | | $ | 15,780,779 | | | $ | 235,715 | |
See accompanying notes to financial statements.
TFS HEDGED FUTURES FUND
SCHEDULE OF FUTURES CONTRACTS SOLD SHORT
April 30, 2014 (Unaudited)
FUTURES CONTRACTS
SOLD SHORT | Expiration Date | | Contracts | | | Aggregate Market Value of Contracts | | | Unrealized Appreciation (Depreciation) | |
| COMMODITY FUTURES | | | | | | | | | | |
| Butter Cash Future | 06/03/2014 | | | 1 | | | $ | 39,250 | | | $ | (2,228 | ) |
| Butter Cash Future | 07/01/2014 | | | 2 | | | | 78,800 | | | | (5,255 | ) |
| Cocoa Future | 07/16/2014 | | | 27 | | | | 804,600 | | | | 3,976 | |
| Coffee Future | 07/21/2014 | | | 21 | | | | 1,621,069 | | | | (50,232 | ) |
| Corn Future | 07/14/2014 | | | 58 | | | | 1,505,100 | | | | (27,792 | ) |
| Cotton No. 2 Future | 07/09/2014 | | | 15 | | | | 707,175 | | | | (15,901 | ) |
| Feeder Cattle Future | 05/22/2014 | | | 7 | | | | 633,850 | | | | (7,207 | ) |
| Feeder Cattle Future | 08/28/2014 | | | 7 | | | | 655,987 | | | | (8,656 | ) |
| Frozen Concentrate Orange Juice Future | 07/11/2014 | | | 16 | | | | 385,440 | | | | 3,061 | |
| Hard Red Winter Wheat Future | 07/14/2014 | | | 1 | | | | 40,625 | | | | (3,315 | ) |
| Lean Hogs Future | 06/13/2014 | | | 6 | | | | 295,440 | | | | 1,313 | |
| Natural Gas Future | 05/28/2014 | | | 9 | | | | 431,820 | | | | (16,820 | ) |
| Palladium Future | 06/26/2014 | | | 3 | | | | 243,015 | | | | (2,362 | ) |
| Platinum Future | 07/29/2014 | | | 2 | | | | 142,750 | | | | 2,096 | |
| Soybean Oil Future | 07/14/2014 | | | 145 | | | | 3,663,570 | | | | 75,345 | |
| Sugar No. 11 Future | 06/30/2014 | | | 89 | | | | 1,766,330 | | | | (22,172 | ) |
| Wheat Future | 07/14/2014 | | | 79 | | | | 2,849,925 | | | | (100,036 | ) |
| Total Commodity Futures | | | | | | | | 15,864,746 | | | | (176,185 | ) |
| | | | | | | | | | | | | |
| FINANCIAL FUTURES | | | | | | | | | | | | | |
| CBOE Volatility Index (VIX) Future | 05/20/2014 | | | 188 | | | | 2,814,360 | | | | 244,150 | |
| CBOE Volatility Index (VIX) Future | 06/17/2014 | | | 280 | | | | 4,393,200 | | | | 366,565 | |
| E-Mini S&P 500 Future | 06/20/2014 | | | 205 | | | | 19,267,437 | | | | (327,211 | ) |
| Total Financial Futures | | | | | | | | 26,474,997 | | | | 283,504 | |
| | | | | | | | | | | | | |
| Total Futures Contracts Sold Short | | | | | | | $ | 42,339,743 | | | $ | 107,319 | |
See accompanying notes to financial statements.
TFS CAPITAL INVESTMENT TRUST
STATEMENTS OF ASSETS AND LIABILITIES
April 30, 2014 (Unaudited)
| | | TFS
Market
Neutral Fund | | | TFS
Small
Cap Fund | | | TFS
Hedged Futures Fund* | |
| ASSETS | | | | | | | | | |
| Investments in securities: | | | | | | | | | |
| At acquisition cost | | $ | 935,063,264 | | | $ | 88,893,174 | | | $ | 47,154,963 | |
| At value (Note 2) | | $ | 999,787,130 | | | $ | 92,157,117 | | | $ | 47,155,720 | |
| Cash | | | 7,568 | | | | — | | | | 990,000 | |
| Deposits with brokers for short positions (Note 2) | | | 767,661,087 | | | | — | | | | — | |
| Margin deposits for futures contracts (Notes 2 and 5) | | | 17,043,745 | | | | — | | | | 4,403,536 | |
| Variation margin receivable (Notes 2 and 5) | | | 3,653,466 | | | | — | | | | 970,162 | |
Unrealized appreciation on forward currency exchange
contracts (Notes 2 and 5) | | | — | | | | — | | | | 27,780 | |
| Dividends and interest receivable | | | 360,921 | | | | 17,019 | | | | 1,142 | |
| Receivable for investment securities sold | | | 169,614,973 | | | | 7,412,370 | | | | — | |
| Receivable for capital shares sold | | | 326,927 | | | | 170,862 | | | | 11,950 | |
| Other assets | | | 61,648 | | | | 21,314 | | | | 23,620 | |
| TOTAL ASSETS | | | 1,958,517,465 | | | | 99,778,682 | | | | 53,583,910 | |
| | | | | | | | | | | | |
| LIABILITIES | | | | | | | | | | | | |
Securities sold short, at value (Note 2)
(proceeds $910,222,048) | | | 759,858,997 | | | | — | | | | — | |
| Variation margin payable (Notes 2 and 5) | | | 2,076,174 | | | | — | | | | 629,916 | |
Unrealized depreciation on forward currency
exchange contracts (Notes 2 and 5) | | | — | | | | — | | | | 25,607 | |
| Dividends payable on securities sold short (Note 2) | | | 173,328 | | | | — | | | | — | |
| Payable for investment securities purchased | | | 177,031,927 | | | | 7,050,582 | | | | — | |
| Payable for capital shares redeemed | | | 4,044,344 | | | | 639,979 | | | | 64,201 | |
| Payable to Adviser (Note 4) | | | 1,433,149 | | | | 79,702 | | | | 52,833 | |
| Payable to administrator (Note 4) | | | 138,980 | | | | 14,895 | | | | 10,410 | |
| Accrued brokerage expense on securities sold short (Note 2) | | | 2,240,067 | | | | — | | | | — | |
| Other accrued expenses and liabilities | | | 121,278 | | | | 19,613 | | | | 7,736 | |
| TOTAL LIABILITIES | | | 947,118,244 | | | | 7,804,771 | | | | 790,703 | |
| | | | | | | | | | | | |
| NET ASSETS | | $ | 1,011,399,221 | | | $ | 91,973,911 | | | $ | 52,793,207 | |
| | | | | | | | | | | | |
| Net assets consist of: | | | | | | | | | | | | |
| Paid-in capital | | $ | 982,880,198 | | | $ | 82,078,695 | | | $ | 55,105,636 | |
| Accumulated net investment income (loss) | | | (49,661,291 | ) | | | (251,139 | ) | | | 738,011 | |
Accumulated net realized gains (losses) from security
transactions and other financial instruments | | | (138,482,260 | ) | | | 6,882,412 | | | | (3,396,404 | ) |
| Net unrealized appreciation on: | | | | | | | | | | | | |
| Investments | | | 64,723,866 | | | | 3,263,943 | | | | 757 | |
| Short positions | | | 150,363,051 | | | | — | | | | — | |
| Futures contracts | | | 1,575,657 | | | | — | | | | 343,034 | |
| Translation of assets and liabilities in foreign currencies | | | — | | | | — | | | | 2,173 | |
| Net assets | | $ | 1,011,399,221 | | | $ | 91,973,911 | | | $ | 52,793,207 | |
| | | | | | | | | | | | |
Shares of beneficial interest outstanding (unlimited
number of shares authorized, no par value) | | | 67,076,424 | | | | 6,829,560 | | | | 5,302,916 | |
| | | | | | | | | | | | |
Net asset value, redemption price and
offering price per share (Note 2) | | $ | 15.08 | | | $ | 13.47 | | | $ | 9.96 | |
| * | Consolidated financial statement (Note 1). |
See accompanying notes to financial statements.
TFS CAPITAL INVESTMENT TRUST
STATEMENTS OF OPERATIONS
For the Six Months Ended April 30, 2014 (Unaudited)
| | | TFS
Market
Neutral Fund | | | TFS
Small
Cap Fund | | | TFS
Hedged Futures Fund* | |
| INVESTMENT INCOME | | | | | | | | | |
| Dividends | | $ | 7,012,751 | | | $ | 485,717 | | | $ | 7,396 | |
| Foreign tax withholding | | | (30,638 | ) | | | (642 | ) | | | — | |
| Interest | | | 13,542 | | | | 67 | | | | 3,859 | |
| TOTAL INVESTMENT INCOME | | | 6,995,655 | | | | 485,142 | | | | 11,255 | |
| | | | | | | | | | | | |
| EXPENSES | | | | | | | | | | | | |
| Brokerage expense on securities sold short (Note 2) | | | 37,529,649 | | | | — | | | | — | |
| Investment advisory fees (Note 4) | | | 12,281,620 | | | | 525,223 | (a) | | | 501,212 | |
| Dividend expense on securities sold short (Note 2) | | | 6,602,858 | | | | — | | | | — | |
| Administration fees (Note 4) | | | 386,922 | | | | 32,893 | | | | 30,000 | |
| Accounting services fees (Note 4) | | | 360,528 | | | | 26,901 | | | | 23,869 | |
| Custodian fees | | | 262,123 | | | | 32,169 | | | | 14,462 | |
| Transfer agent fees (Note 4) | | | 142,198 | | | | 23,017 | | | | 13,262 | |
| Postage and supplies | | | 55,365 | | | | 8,012 | | | | 6,659 | |
| Registration and filing fees | | | 32,008 | | | | 15,663 | | | | 20,478 | |
| Professional fees | | | 29,488 | | | | 13,863 | | | | 16,737 | |
| Trustees’ fees and expenses (Note 4) | | | 18,543 | | | | 18,543 | | | | 18,543 | |
| Pricing fees | | | 42,170 | | | | 8,291 | | | | 1,060 | |
| Compliance service fees and expenses (Note 4) | | | 19,075 | | | | 6,014 | | | | 5,773 | |
| Printing of shareholder reports | | | 19,039 | | | | 4,504 | | | | 5,219 | |
| Insurance expense | | | 22,619 | | | | 1,226 | | | | 1,262 | |
| Borrowing costs | | | 10,322 | | | | 258 | | | | 33 | |
| Other expenses | | | 22,396 | | | | 8,044 | | | | 6,897 | |
| TOTAL EXPENSES | | | 57,836,923 | | | | 724,621 | | | | 665,466 | |
| Investment advisory fee reductions (Note 4) | | | — | | | | (35,174 | ) | | | (75,081 | ) |
| NET EXPENSES | | | 57,836,923 | | | | 689,447 | | | | 590,385 | |
| NET INVESTMENT LOSS | | | (50,841,268 | ) | | | (204,305 | ) | | | (579,130 | ) |
| | | | | | | | | | | | |
REALIZED AND UNREALIZED GAINS (LOSSES)
ON INVESTMENTS, SECURITIES SOLD
SHORT, OPTION AND FUTURES CONTRACTS
AND FOREIGN CURRENCY TRANSACTIONS | | | | | | | | | | | | |
| Net realized gains (losses) from: | | | | | | | | | | | | |
| Investments | | | 189,586,164 | | | | 7,997,544 | | | | 110 | |
| Securities sold short | | | (57,887,395 | ) | | | — | | | | — | |
| Option contracts | | | 25,777 | | | | — | | | | — | |
| Futures contracts | | | (8,460,175 | ) | | | — | | | | 1,148,547 | |
| Foreign currency transactions | | | (8,450 | ) | | | — | | | | (397,374 | ) |
| Net change in unrealized appreciation (depreciation) on: | | | | | | | | | | | | |
| Investments | | | (117,783,951 | ) | | | (3,179,740 | ) | | | 1,683 | |
| Securities sold short | | | (11,707,189 | ) | | | — | | | | — | |
| Option contracts | | | (10,501 | ) | | | — | | | | — | |
| Futures contracts | | | 1,575,657 | | | | — | | | | 495,396 | |
| Foreign currency translation | | | (4 | ) | | | — | | | | (92,161 | ) |
NET REALIZED AND UNREALIZED GAINS
(LOSSES) ON INVESTMENTS | | | (4,670,067 | ) | | | 4,817,804 | | | | 1,156,201 | |
NET INCREASE (DECREASE) IN NET ASSETS
FROM OPERATIONS | | $ | (55,511,335 | ) | | $ | 4,613,499 | | | $ | 577,071 | |
| * | Consolidated financial statement (Note 1). |
| (a) | Includes $9,303 of prior years’ investment advisory fee reductions recouped by the Adviser (Note 4). |
See accompanying notes to financial statements.
TFS MARKET NEUTRAL FUND
STATEMENTS OF CHANGES IN NET ASSETS
| | | Six Months Ended April 30,
2014 (Unaudited) | | | Year
Ended
October 31, 2013 | |
| FROM OPERATIONS | | | | | | |
| Net investment loss | | $ | (50,841,268 | ) | | $ | (120,077,792 | ) |
| Net realized gains (losses) from: | | | | | | | | |
| Investments | | | 189,586,164 | | | | 423,147,517 | |
| Securities sold short | | | (57,887,395 | ) | | | (308,876,468 | ) |
| Option contracts | | | 25,777 | | | | 860,815 | |
| Futures contracts | | | (8,460,175 | ) | | | — | |
| Foreign currency transactions | | | (8,450 | ) | | | 26,798 | |
| Net change in unrealized appreciation (depreciation) on: | | | | | | | | |
| Investments | | | (117,783,951 | ) | | | 128,317,841 | |
| Securities sold short | | | (11,707,189 | ) | | | (21,298,881 | ) |
| Option contracts | | | (10,501 | ) | | | 10,501 | |
| Futures contracts | | | 1,575,657 | | | | — | |
| Foreign currency translation | | | (4 | ) | | | (36,928 | ) |
| Net increase (decrease) in net assets from operations | | | (55,511,335 | ) | | | 102,073,403 | |
| | | | | | | | |
| FROM DISTRIBUTIONS (Note 2) | | | | | | | | |
| Distributions from net realized gains from security transactions | | | (55,650,834 | ) | | | — | |
| | | | | | | | |
| FROM CAPITAL SHARE TRANSACTIONS | | | | | | | | |
| Proceeds from shares sold | | | 123,949,844 | | | | 480,118,243 | |
Net asset value of shares issued in reinvestment of
distributions to shareholders | | | 41,376,438 | | | | — | |
| Proceeds from redemption fees collected (Note 2) | | | 29,157 | | | | 170,982 | |
| Payments for shares redeemed | | | (625,590,764 | ) | | | (788,868,625 | ) |
| Net decrease in net assets from capital share transactions | | | (460,235,325 | ) | | | (308,579,400 | ) |
| | | | | | | | |
| TOTAL DECREASE IN NET ASSETS | | | (571,397,494 | ) | | | (206,505,997 | ) |
| | | | | | | | |
| NET ASSETS | | | | | | | | |
| Beginning of period | | | 1,582,796,715 | | | | 1,789,302,712 | |
| End of period | | $ | 1,011,399,221 | | | $ | 1,582,796,715 | |
| | | | | | | | |
| ACCUMULATED NET INVESTMENT INCOME (LOSS) | | $ | (49,661,291 | ) | | $ | 1,188,427 | |
| | | | | | | | |
| CAPITAL SHARE ACTIVITY | | | | | | | | |
| Shares sold | | | 8,107,802 | | | | 30,497,892 | |
| Shares issued in reinvestment of distributions to shareholders | | | 2,681,558 | | | | — | |
| Shares redeemed | | | (41,466,820 | ) | | | (50,204,897 | ) |
| Net decrease in shares outstanding | | | (30,677,460 | ) | | | (19,707,005 | ) |
| Shares outstanding, beginning of period | | | 97,753,884 | | | | 117,460,889 | |
| Shares outstanding, end of period | | | 67,076,424 | | | | 97,753,884 | |
See accompanying notes to financial statements.
TFS SMALL CAP FUND
STATEMENTS OF CHANGES IN NET ASSETS
| | | Six Months Ended
April 30,
2014 (Unaudited) | | | Year
Ended
October 31, 2013 | |
| FROM OPERATIONS | | | | | | |
| Net investment income (loss) | | $ | (204,305 | ) | | $ | 37,191 | |
| Net realized gains from investments | | | 7,997,544 | | | | 16,812,788 | |
| Net change in unrealized appreciation (depreciation) on investments | | | (3,179,740 | ) | | | 5,193,135 | |
| Net increase in net assets from operations | | | 4,613,499 | | | | 22,043,114 | |
| | | | | | | | |
| FROM DISTRIBUTIONS (Note 2) | | | | | | | | |
| Distributions from net investment income | | | — | | | | (312,976 | ) |
| Distributions from net realized gains from security transactions | | | (16,453,993 | ) | | | (8,873,127 | ) |
| Decrease in net assets from distributions | | | (16,453,993 | ) | | | (9,186,103 | ) |
| | | | | | | | |
| FROM CAPITAL SHARE TRANSACTIONS | | | | | | | | |
| Proceeds from shares sold | | | 20,586,605 | | | | 29,460,786 | |
Net asset value of shares issued in reinvestment of
distributions to shareholders | | | 14,622,207 | | | | 7,904,955 | |
| Proceeds from redemption fees collected (Note 2) | | | 392 | | | | 7,160 | |
| Payments for shares redeemed | | | (12,384,050 | ) | | | (19,313,493 | ) |
| Net increase in net assets from capital share transactions | | | 22,825,154 | | | | 18,059,408 | |
| | | | | | | | |
| TOTAL INCREASE IN NET ASSETS | | | 10,984,660 | | | | 30,916,419 | |
| | | | | | | | |
| NET ASSETS | | | | | | | | |
| Beginning of period | | | 80,989,251 | | | | 50,072,832 | |
| End of period | | $ | 91,973,911 | | | $ | 80,989,251 | |
| | | | | | | | |
| ACCUMULATED NET INVESTMENT LOSS | | $ | (251,139 | ) | | $ | (46,834 | ) |
| | | | | | | | |
| CAPITAL SHARE ACTIVITY | | | | | | | | |
| Shares sold | | | 1,483,647 | | | | 2,133,863 | |
| Shares issued in reinvestment of distributions to shareholders | | | 1,095,296 | | | | 689,884 | |
| Shares redeemed | | | (851,252 | ) | | | (1,415,761 | ) |
| Net increase in shares outstanding | | | 1,727,691 | | | | 1,407,986 | |
| Shares outstanding, beginning of period | | | 5,101,869 | | | | 3,693,883 | |
| Shares outstanding, end of period | | | 6,829,560 | | | | 5,101,869 | |
See accompanying notes to financial statements.
TFS HEDGED FUTURES FUND
STATEMENTS OF CHANGES IN NET ASSETS*
| | | Six Months Ended
April 30,
2014 (Unaudited) | | | Year
Ended
October 31, 2013 | |
| FROM OPERATIONS | | | | | | |
| Net investment loss | | $ | (579,130 | ) | | $ | (2,492,507 | ) |
| Net realized gains (losses) from: | | | | | | | | |
| Investments | | | 110 | | | | 9,291 | |
| Futures contracts | | | 1,148,547 | | | | (5,414,738 | ) |
| Foreign currency transactions | | | (397,374 | ) | | | (1,151,993 | ) |
| Net change in unrealized appreciation (depreciation) on: | | | | | | | | |
| Investments | | | 1,683 | | | | (574 | ) |
| Futures contracts | | | 495,396 | | | | (395,828 | ) |
| Foreign currency translation | | | (92,161 | ) | | | 94,334 | |
| Net increase (decrease) in net assets from operations | | | 577,071 | | | | (9,352,015 | ) |
| | | | | | | | |
| FROM DISTRIBUTIONS (Note 2) | | | | | | | | |
| Distributions from net realized gains from security transactions | | | (180,217 | ) | | | (2,570,373 | ) |
| | | | | | | | |
| FROM CAPITAL SHARE TRANSACTIONS | | | | | | | | |
| Proceeds from shares sold | | | 5,400,003 | | | | 82,353,356 | |
Net asset value of shares issued in reinvestment of
distributions to shareholders | | | 153,704 | | | | 2,091,788 | |
| Proceeds from redemption fees collected (Note 2) | | | 2,970 | | | | 48,752 | |
| Payments for shares redeemed | | | (21,409,912 | ) | | | (117,862,869 | ) |
| Net decrease in net assets from capital share transactions | | | (15,853,235 | ) | | | (33,368,973 | ) |
| | | | | | | | |
| TOTAL DECREASE IN NET ASSETS | | | (15,456,381 | ) | | | (45,291,361 | ) |
| | | | | | | | |
| NET ASSETS | | | | | | | | |
| Beginning of period | | | 68,249,588 | | | | 113,540,949 | |
| End of period | | $ | 52,793,207 | | | $ | 68,249,588 | |
| | | | | | | | |
| ACCUMULATED NET INVESTMENT INCOME (LOSS) | | $ | 738,011 | | | $ | (2,045,004 | ) |
| | | | | | | | |
| CAPITAL SHARE ACTIVITY | | | | | | | | |
| Shares sold | | | 532,282 | | | | 7,753,379 | |
| Shares issued in reinvestment of distributions to shareholders | | | 15,143 | | | | 192,969 | |
| Shares redeemed | | | (2,115,179 | ) | | | (11,358,461 | ) |
| Net decrease in shares outstanding | | | (1,567,754 | ) | | | (3,412,113 | ) |
| Shares outstanding, beginning of period | | | 6,870,670 | | | | 10,282,783 | |
| Shares outstanding, end of period | | | 5,302,916 | | | | 6,870,670 | |
| * | Consolidated financial statements (Note 1). |
See accompanying notes to financial statements.
TFS MARKET NEUTRAL FUND
FINANCIAL HIGHLIGHTS
Per share data for a share
outstanding throughout each period: | | Six Months Ended
April 30,
2014 (Unaudited) | | | Year
Ended
October 31, 2013 | | | Year
Ended
October 31, 2012 | | | Year
Ended
October 31, 2011 | | | Year
Ended
October 31, 2010 | | | Year
Ended
October 31, 2009 | |
Net asset value at
beginning of period | | $ | 16.19 | | | $ | 15.23 | | | $ | 14.41 | | | $ | 15.80 | | | $ | 14.92 | | | $ | 13.25 | |
| | | | | | | | | | | | | | | | | | | | | | | | |
Income (loss) from
investment operations: | | | | | | | | | | | | | | | | | | | | | | | | |
| Net investment loss | | | (0.60 | ) | | | (1.25 | ) | | | (0.99 | ) | | | (0.83 | ) | | | (0.45 | ) | | | (0.24 | ) |
| Net realized and unrealized gains on investments | | | 0.08 | | | | 2.21 | | | | 2.05 | | | | 0.93 | | | | 1.43 | | | | 2.13 | |
| Total from investment operations | | | (0.52 | ) | | | 0.96 | | | | 1.06 | | | | 0.10 | | | | 0.98 | | | | 1.89 | |
| | | | | | | | | | | | | | | | | | | | | | | | |
| Less distributions: | | | | | | | | | | | | | | | | | | | | | | | | |
| Distributions from net realized gains from security transactions | | | (0.59 | ) | | | — | | | | (0.24 | ) | | | (1.49 | ) | | | (0.10 | ) | | | (0.25 | ) |
| | | | | | | | | | | | | | | | | | | | | | | | |
| Proceeds from redemption fees collected (Note 2) | | | 0.00 | (a) | | | 0.00 | (a) | | | 0.00 | (a) | | | 0.00 | (a) | | | 0.00 | (a) | | | 0.03 | |
| | | | | | | | | | | | | | | | | | | | | | | | |
| Net asset value at end of period | | $ | 15.08 | | | $ | 16.19 | | | $ | 15.23 | | | $ | 14.41 | | | $ | 15.80 | | | $ | 14.92 | |
| | | | | | | | | | | | | | | | | | | | | | | | |
Total return (b) | | | (3.30 | )%(c) | | | 6.30 | % | | | 7.48 | % | | | 0.43 | % | | | 6.60 | % | | | 14.86 | % |
| | | | | | | | | | | | | | | | | | | | | | | | |
| Ratios and supplemental data: | | | | | | | | | | | | | | | | | | | | | | | | |
| Net assets at end of period (000’s) | | $ | 1,011,399 | | | $ | 1,582,797 | | | $ | 1,789,303 | | | $ | 1,762,265 | | | $ | 1,142,219 | | | $ | 828,409 | |
| | | | | | | | | | | | | | | | | | | | | | | | |
Ratio of total expenses to
average net assets | | | 8.91 | %(d) | | | 8.67 | % | | | 8.63 | % | | | 8.10 | % | | | 4.52 | % | | | 4.70 | % |
| | | | | | | | | | | | | | | | | | | | | | | | |
Ratio of net expenses to
average net assets | | | 8.91 | %(d) | | | 8.67 | % | | | 8.63 | % | | | 8.12 | %(e) | | | 4.55 | %(e) | | | 4.67 | %(f) |
| | | | | | | | | | | | | | | | | | | | | | | | |
Ratio of net expenses to average net assets excluding dividend expense (g) | | | 7.89 | %(d) | | | 7.59 | % | | | 7.75 | % | | | 7.38 | %(e) | | | 3.81 | %(e) | | | 3.84 | %(f) |
| | | | | | | | | | | | | | | | | | | | | | | | |
Ratio of net expenses to average net assets excluding dividend expense, borrowing costs and brokerage expense on securities sold short (g) | | | 2.11 | %(d) | | | 2.41 | % | | | 2.42 | % | | | 2.47 | %(e) | | | 2.50 | %(e) | | | 2.49 | %(f) |
| | | | | | | | | | | | | | | | | | | | | | | | |
Ratio of net investment loss
to average net assets | | | (7.83 | )%(d) | | | (6.67 | %) | | | (6.73 | %) | | | (6.56 | %) | | | (3.16 | %) | | | (2.32 | %) |
| | | | | | | | | | | | | | | | | | | | | | | | |
| Portfolio turnover rate | | | 308 | %(c) | | | 552 | % | | | 607 | % | | | 751 | % | | | 703 | % | | | 429 | % |
| (a) | Amount rounds to less than $0.01 per share. |
| (b) | Total return is a measure of the change in value of an investment in the Fund over the period covered, which assumes any dividends or capital gains distributions are reinvested in shares of the Fund. The returns shown do not reflect the deduction of taxes a shareholder would pay on Fund distributions or the redemption of Fund shares. |
| (e) | Includes recoupment by the Adviser of prior years’ advisory fee reductions and expense reimbursements (Note 4). |
| (f) | Ratio was determined after advisory fee reductions (Note 4). |
| (g) | Dividend expense, borrowing costs and brokerage expense on securities sold short totaled 6.80%(d), 6.26%, 6.21%, 5.65%, 2.05% and 2.18% of average net assets for the periods ended April 30, 2014, October 31, 2013, 2012, 2011, 2010 and 2009, respectively. |
See accompanying notes to financial statements.
TFS SMALL CAP FUND
FINANCIAL HIGHLIGHTS
Per share data for a share
outstanding throughout each period: | | Six Months Ended
April 30,
2014 (Unaudited) | | | Year
Ended
October 31, 2013 | | | Year
Ended
October 31, 2012 | | | Year
Ended
October 31, 2011 | | | Year
Ended
October 31, 2010 | | | Year
Ended
October 31, 2009 | |
Net asset value at
beginning of period | | $ | 15.87 | | | $ | 13.56 | | | $ | 12.07 | | | $ | 11.98 | | | $ | 9.33 | | | $ | 6.80 | |
| | | | | | | | | | | | | | | | | | | | | | | | |
Income (loss) from
investment operations: | | | | | | | | | | | | | | | | | | | | | | | | |
| Net investment income (loss) | | | (0.03 | ) | | | 0.02 | | | | (0.00 | )(a) | | | (0.04 | ) | | | (0.06 | ) | | | (0.02 | ) |
Net realized and unrealized
gains on investments | | | 0.93 | | | | 4.92 | | | | 1.52 | | | | 0.87 | | | | 2.70 | | | | 2.55 | |
| Total from investment operations | | | 0.90 | | | | 4.94 | | | | 1.52 | | | | 0.83 | | | | 2.64 | | | | 2.53 | |
| | | | | | | | | | | | | | | | | | | | | | | | |
| Less distributions: | | | | | | | | | | | | | | | | | | | | | | | | |
Distributions from net
investment income | | | — | | | | (0.07 | ) | | | — | | | | — | | | | — | | | | (0.01 | ) |
| Distributions from net realized gains from security transactions | | | (3.30 | ) | | | (2.56 | ) | | | (0.03 | ) | | | (0.74 | ) | | | — | | | | — | |
| Total distributions | | | (3.30 | ) | | | (2.63 | ) | | | (0.03 | ) | | | (0.74 | ) | | | — | | | | (0.01 | ) |
| | | | | | | | | | | | | | | | | | | | | | | | |
| Proceeds from redemption fees collected (Note 2) | | | 0.00 | (a) | | | 0.00 | (a) | | | 0.00 | (a) | | | 0.00 | (a) | | | 0.01 | | | | 0.01 | |
| | | | | | | | | | | | | | | | | | | | | | | | |
| Net asset value at end of period | | $ | 13.47 | | | $ | 15.87 | | | $ | 13.56 | | | $ | 12.07 | | | $ | 11.98 | | | $ | 9.33 | |
| | | | | | | | | | | | | | | | | | | | | | | | |
Total return (b) | | | 5.88 | %(c) | | | 44.15 | % | | | 12.62 | % | | | 6.68 | % | | | 28.40 | % | | | 37.41 | % |
| | | | | | | | | | | | | | | | | | | | | | | | |
| Ratios and supplemental data: | | | | | | | | | | | | | | | | | | | | | | | | |
| Net assets at end of period (000’s) | | $ | 91,974 | | | $ | 80,989 | | | $ | 50,073 | | | $ | 51,274 | | | $ | 35,784 | | | $ | 16,623 | |
| | | | | | | | | | | | | | | | | | | | | | | | |
Ratio of total expenses to
average net assets | | | 1.66 | %(d) | | | 1.80 | % | | | 1.95 | % | | | 1.82 | % | | | 2.31 | % | | | 5.14 | % |
| | | | | | | | | | | | | | | | | | | | | | | | |
Ratio of net expenses to
average net assets (e) | | | 1.58 | %(d) | | | 1.75 | % | | | 1.75 | % | | | 1.69 | % | | | 1.78 | % | | | 1.88 | % |
| | | | | | | | | | | | | | | | | | | | | | | | |
Ratio of net expenses to average net assets excluding borrowing costs (e) | | | 1.58 | %(d) | | | 1.75 | % | | | 1.75 | % | | | 1.68 | % | | | 1.78 | % | | | 1.87 | % |
| | | | | | | | | | | | | | | | | | | | | | | | |
| Ratio of net investment income (loss) to average net assets | | | (0.47 | )%(d) | | | 0.06 | % | | | (0.03 | %) | | | (0.31 | %) | | | (0.70 | %) | | | (0.63 | %) |
| | | | | | | | | | | | | | | | | | | | | | | | |
| Portfolio turnover rate | | | 255 | %(c) | | | 601 | % | | | 557 | % | | | 525 | % | | | 657 | % | | | 320 | % |
| (a) | Amount rounds to less than $0.01 per share. |
| (b) | Total return is a measure of the change in value of an investment in the Fund over the period covered, which assumes any dividends or capital gains distributions are reinvested in shares of the Fund. The returns shown do not reflect the deduction of taxes a shareholder would pay on Fund distributions or the redemption of Fund shares. |
| (e) | Ratio was determined after advisory fee reductions and expense reimbursements and includes recoupment by the Adviser of prior years’ investment advisory fee reductions (Note 4). |
See accompanying notes to financial statements.
TFS HEDGED FUTURES FUND
FINANCIAL HIGHLIGHTS*
Per share data for a share
outstanding throughout each period: | | Six Months Ended
April 30,
2014 (Unaudited) | | | Year
Ended
October 31, 2013 | | | Period
Ended October 31, 2012(a) | |
| Net asset value at beginning of period | | $ | 9.93 | | | $ | 11.04 | | | $ | 10.00 | |
| | | | | | | | | | | | |
| Income (loss) from investment operations: | | | | | | | | | | | | |
| Net investment loss | | | (0.20 | ) | | | (0.20 | ) | | | (0.09 | ) |
| Net realized and unrealized gains (losses) on investments | | | 0.26 | | | | (0.68 | ) | | | 1.13 | |
| Total from investment operations | | | 0.06 | | | | (0.88 | ) | | | 1.04 | |
| | | | | | | | | | | | |
| Less distributions: | | | | | | | | | | | | |
| Distributions from net realized gains from security transactions | | | (0.03 | ) | | | (0.23 | ) | | | — | |
| | | | | | | | | | | | |
| Proceeds from redemption fees collected (Note 2) | | | 0.00 | (b) | | | 0.00 | (b) | | | 0.00 | (b) |
| | | | | | | | | | | | |
| Net asset value at end of period | | $ | 9.96 | | | $ | 9.93 | | | $ | 11.04 | |
| | | | | | | | | | | | |
Total return (c) | | | 0.59 | %(d) | | | (8.14 | %) | | | 10.40 | %(d) |
| | | | | | | | | | | | |
| Ratios and supplemental data: | | | | | | | | | | | | |
| Net assets at end of period (000’s) | | $ | 52,793 | | | $ | 68,250 | | | $ | 113,541 | |
| | | | | | | | | | | | |
| Ratio of total expenses to average net assets | | | 2.24 | %(e) | | | 2.35 | % | | | 2.51 | %(e) |
| | | | | | | | | | | | |
Ratio of net expenses to average net assets (f) | | | 1.99 | %(e) | | | 2.30 | % | | | 2.30 | %(e) |
| | | | | | | | | | | | |
| Ratio of net investment loss to average net assets | | | (1.95 | )%(e) | | | (2.23 | %) | | | (2.19 | )%(e) |
| | | | | | | | | | | | |
| Portfolio turnover rate | | | 0 | %(g) | | | 0 | %(g) | | | 0 | %(g) |
| * | Consolidated financial statements (Note 1). |
| (a) | Represents the period from commencement of operations (December 29, 2011) through October 31, 2012. |
| (b) | Amount rounds to less than $0.01 per share. |
| (c) | Total return is a measure of the change in value of an investment in the Fund over the period covered, which assumes any dividends or capital gains distributions are reinvested in shares of the Fund. The returns shown do not reflect the deduction of taxes a shareholder would pay on Fund distributions or the redemption of Fund shares. |
| (f) | Ratio was determined after advisory fee reductions (Note 4). |
| (g) | All investments held are excluded from the calculation as they are considered to be short-term investments whose maturities or expiration dates at the time of acquisition were one year or less. |
See accompanying notes to financial statements.
TFS CAPITAL INVESTMENT TRUST
NOTES TO FINANCIAL STATEMENTS
April 30, 2014 (Unaudited)
1. Organization
TFS Market Neutral Fund, TFS Small Cap Fund and TFS Hedged Futures Fund (individually, a “Fund”, and collectively, the “Funds”) are each a series of TFS Capital Investment Trust (the “Trust”), an open-end management investment company established as an Ohio business trust under a Declaration of Trust dated January 30, 2004. TFS Market Neutral Fund commenced operations on September 7, 2004. TFS Small Cap Fund commenced operations on March 7, 2006. TFS Hedged Futures Fund commenced operations on December 29, 2011.
The consolidated financial statements of TFS Hedged Futures Fund include TFS Hedged Futures Strategy Offshore Fund Ltd. (the “Subsidiary”), a wholly-owned and controlled Cayman Islands subsidiary. TFS Hedged Futures Fund may invest up to 25% of its total assets in the Subsidiary. TFS Hedged Futures Fund purchases investments through the Subsidiary to provide exposure to the commodities futures market which otherwise may not be possible in a mutual fund structure. All inter-company accounts and transactions have been eliminated in consolidation for TFS Hedged Futures Fund. TFS Hedged Futures Fund and the Subsidiary each have a fiscal year end of October 31st for financial statement consolidation purposes and a nonconforming tax year end of December 31st and November 30th, respectively.
TFS Market Neutral Fund seeks to produce capital appreciation while having a low correlation to the U.S. equity market, which TFS Capital LLC (the “Adviser”) defines as the S&P 500® Index. In addition, the Fund seeks to produce lower volatility than the movement of the U.S. equity market.
TFS Small Cap Fund seeks long-term capital appreciation. In addition, the Fund seeks to outperform the Russell 2000® Index.
TFS Hedged Futures Fund seeks to achieve long-term capital appreciation.
2. Significant Accounting Policies
The following is a summary of the Funds’ significant accounting policies. The policies are in conformity with accounting principles generally accepted in the United States of America (“GAAP”).
Securities, options and futures valuation – The Funds’ portfolio securities are valued as of the close of regular trading on the New York Stock Exchange (“NYSE”) (generally 4:00 p.m., Eastern time) on each business day the NYSE is open. Securities listed on the NYSE or other exchanges are valued on the basis of their last sale prices on the exchanges on which they are primarily traded. If there are no sales on that day, the securities are valued at the mean between the closing bid and ask prices on the NYSE or other primary exchange for that day. Securities which are quoted by NASDAQ are valued at the NASDAQ Official Closing Price. If there are no sales on that day, the securities are valued at the mean between the closing bid and ask prices as reported by NASDAQ. Option contracts are valued at the closing price as quoted on the exchanges on which they are primarily traded. If no closing price is readily available at the time of valuation, the option will be valued at the closing bid price for that day. Futures contracts that trade on exchanges that close before 4:00 p.m. Eastern time are valued at their last sale price as of the close of regular trading on the primary exchange on which the contract is traded. Prices
TFS CAPITAL INVESTMENT TRUST
NOTES TO FINANCIAL STATEMENTS (Continued)
for these futures contracts are monitored daily by the Adviser until 4:00 p.m. Eastern time to determine if fair valuation is required. Other assets and securities for which no quotations are readily available are valued at fair value as determined in good faith under the supervision of the Board of Trustees of the Trust (the “Board”) and will be classified as Level 2 or 3 within the fair value hierarchy (see below).
GAAP establishes a single authoritative definition of fair value, sets out a framework for measuring fair value and requires additional disclosures about fair value measurements.
The Funds’ investments, securities sold short, and futures contracts have been categorized based upon a fair value hierarchy in accordance with the Financial Accounting Standards Board’s guidance on fair value measurement. The levels of the fair value hierarchy and their applicability to the Funds are described below:
| • | Level 1 inputs utilize quoted prices (unadjusted) in active markets for identical assets or liabilities at the reporting date. Level 1 assets and liabilities may include most common stocks, preferred stocks, closed-end funds, exchange-traded funds and notes, warrants, futures contracts and money market funds. |
| • | Level 2 inputs utilize inputs other than quoted prices included in Level 1 that are observable for the asset or liability, either directly or indirectly. Level 2 inputs may include quoted prices for similar assets and liabilities in active markets and quoted prices for identical or similar assets or liabilities that are not active. Assets and liabilities included in this category may include common stocks, rights and warrants that trade infrequently or their trading has been temporarily halted and U.S. treasury obligations and corporate bonds with values that are based on prices provided by an independent pricing service that utilizes various “other significant observable inputs” including bid and ask quotations, prices of similar securities and interest rates, among other factors. |
| • | Level 3 inputs are unobservable inputs for the asset or liability and include situations where there is little, if any, market activity for the asset or liability. Assets and liabilities included in this category may include common stocks and corporate bonds that trade infrequently or their trading has been halted for an extended period of time. |
The inputs or methodologies used for valuing securities are not necessarily an indication of the risks associated with investing in those securities. The inputs used to measure fair value may fall into different levels of the fair value hierarchy. In such cases, for disclosure purposes, the level in the fair value hierarchy within which the fair value measurement falls in its entirety is determined based on the lowest level input that is significant to the fair value measurement. The Funds’ assessment of the significance of a particular input to the fair value measurement in its entirety requires judgment and considers factors specific to the asset or liability.
The availability of observable inputs can vary from product to product and is affected by a wide variety of factors, including, for example, the type of product, whether the product is new and not yet established in the marketplace, and other characteristics particular to the transaction. To the extent that valuation is based on models or inputs that are less observable or unobservable in the market, the determination of fair value requires more judgment. Accordingly, the degree of judgment exercised by the Funds in determining fair value is greatest for instruments categorized as Level 3.
TFS CAPITAL INVESTMENT TRUST
NOTES TO FINANCIAL STATEMENTS (Continued)
The following is a summary of the inputs used to value the Funds’ investments, securities sold short and other financial instruments as of April 30, 2014:
| TFS Market Neutral Fund | | Level 1 | | | Level 2 | | | Level 3 | | | Total | |
Investments in Securities: | |
| Common Stocks | | $ | 913,265,529 | | | $ | 1,660 | | | $ | — | | | $ | 913,267,189 | |
| Preferred Stocks | | | 1,439,851 | | | | — | | | | — | | | | 1,439,851 | |
| Other Investments | | | 76,746,547 | | | | — | | | | — | | | | 76,746,547 | |
| Corporate Bonds | | | — | | | | 2,994 | | | | — | | | | 2,994 | |
| Money Market Funds | | | 8,330,549 | | | | — | | | | — | | | | 8,330,549 | |
| Total | | $ | 999,782,476 | | | $ | 4,654 | | | $ | — | | | $ | 999,787,130 | |
| | |
Other Financial Instruments: | |
| Common Stocks – Sold Short | | $ | (758,368,898 | ) | | $ | — | | | $ | (1,254,911 | ) | | $ | (759,623,809 | ) |
| Preferred Stocks – Sold Short | | | (202,136 | ) | | | — | | | | — | | | | (202,136 | ) |
| Rights – Sold Short | | | — | | | | (14,059 | ) | | | — | | | | (14,059 | ) |
| Warrants – Sold Short | | | (18,993 | ) | | | — | | | | — | | | | (18,993 | ) |
| Futures Contracts – Sold Short | | | 1,575,657 | | | | — | | | | — | | | | 1,575,657 | |
| Total | | $ | (757,014,370 | ) | | $ | (14,059 | ) | | $ | (1,254,911 | ) | | $ | (758,283,340 | ) |
| TFS Small Cap Fund | | Level 1 | | | Level 2 | | | Level 3 | | | Total | |
Investments in Securities: | |
| Common Stocks | | $ | 90,803,640 | | | $ | — | | | $ | — | | | $ | 90,803,640 | |
| Other Investments | | | 179,659 | | | | — | | | | — | | | | 179,659 | |
| Money Market Funds | | | 1,173,818 | | | | — | | | | — | | | | 1,173,818 | |
| Total | | $ | 92,157,117 | | | $ | — | | | $ | — | | | $ | 92,157,117 | |
| TFS Hedged Futures Fund | | Level 1 | | | Level 2 | | | Level 3 | | | Total | |
Investments in Securities: | |
| U.S. Treasury Obligations | | $ | — | | | $ | 11,973,544 | | | $ | — | | | $ | 11,973,544 | |
| Money Market Funds | | | 35,182,176 | | | | — | | | | — | | | | 35,182,176 | |
| Total | | $ | 35,182,176 | | | $ | 11,973,544 | | | $ | — | | | $ | 47,155,720 | |
| | |
Other Financial Instruments: | |
| Futures Contracts | | $ | 235,715 | | | $ | — | | | $ | — | | | $ | 235,715 | |
| Futures Contracts – Sold Short | | | 107,319 | | | | — | | | | — | | | | 107,319 | |
| Total | | $ | 343,034 | | | $ | — | | | $ | — | | | $ | 343,034 | |
Refer to each Fund’s Summary Schedule of Investments, Schedule of Securities Sold Short, Schedule of Futures Contracts and Schedule of Futures Contracts Sold Short, as applicable, for a listing of the securities by security type and industry type.
TFS CAPITAL INVESTMENT TRUST
NOTES TO FINANCIAL STATEMENTS (Continued)
It is the Funds’ policy to recognize transfers into and out of any Level at the end of the reporting period. As of April 30, 2014, TFS Small Cap Fund and TFS Hedged Futures Fund did not have any transfers in and out of any Level. Transfers that occurred between Level 1, Level 2 and Level 3 on April 30, 2014 for TFS Market Neutral Fund due to changes in the availability of quoted prices are as follows:
| | | Investments | | | Securities Sold Short | |
| Transfers from Level 1 to Level 2 | | $ | 1,660 | | | $ | — | |
| Transfers from Level 1 to Level 3 | | | — | | | | (1,254,911 | ) |
There were no transfers between Level 2 and Level 3 as of April 30, 2014 for TFS Market Neutral Fund. There were no Level 3 securities held in TFS Small Cap Fund or TFS Hedged Futures Fund as of April 30, 2014.
The following is a reconciliation of Level 3 securities sold short in TFS Market Neutral Fund for which significant unobservable inputs were used to determine fair value between October 31, 2013 and April 30, 2014.
| | | Securities Sold Short | |
| Balance as of October 31, 2013 | | $ | — | |
| Transfers in and/or out of Level 3 | | | (1,254,911 | ) |
| Balance as of April 30, 2014 | | $ | (1,254,911 | ) |
The total amount of unrealized appreciation on Level 3 securities sold short was $7,898,640 at April 30, 2014.
The following table summarizes the valuation techniques used and unobservable inputs developed by the Board to determine the fair value of the Level 3 securities sold short:
| | Fair Value at April 30, 2014 | Valuation
Technique | Unobservable Input | Range | Impact to
Valuation from an Increase in Input* |
| Common Stocks - Sold Short | $(1,254,911) | Discount from Last Sale Price | Discount Percentage | 50% | Increase |
| * | This column represents the directional change in the fair value of the Level 3 investments that would result in an increase from the corresponding input. A decrease to the unobservable input would have the opposite effect. Significant increases and decreases in these inputs in isolation could result in significantly higher or lower fair value measurements. |
Share valuation – The net asset value per share of each Fund is calculated daily by dividing the total value of its assets, less liabilities, by the number of shares outstanding. Effective January 1, 2014, the offering price and redemption price per share of each Fund is equal to the net asset value per share. Prior to January 1, 2014, shares of each Fund were subject to a redemption fee of 2% if redeemed within 90 days of the date of purchase.
TFS CAPITAL INVESTMENT TRUST
NOTES TO FINANCIAL STATEMENTS (Continued)
During the periods ended April 30, 2014 and October 31, 2013, proceeds from redemption fees totaled $29,157 and $170,982, respectively, for TFS Market Neutral Fund, $392 and $7,160, respectively, for TFS Small Cap Fund and $2,970 and $48,752, respectively, for TFS Hedged Futures Fund.
Investment income (expense) – Dividend income (expense) is recorded on the ex-dividend date. Interest income is accrued as earned. Discounts and premiums on fixed income securities are amortized using the interest method.
Security transactions – Security transactions are accounted for on the trade date. Gains and losses on securities sold are determined on a specific identification basis.
Distributions to shareholders – Distributions to shareholders arising from net investment income and net realized capital gains, if any, are distributed at least once each year. The amount of distributions from net investment income and net realized gains are determined in accordance with federal income tax regulations, which may differ from GAAP. These “book/tax” differences are permanent in nature and are primarily due to differing treatments of net short-term gains. The tax character of distributions paid by the Funds during the periods ended April 30, 2014 and October 31, 2013 was as follows:
| Periods Ended | | Ordinary Income | | | Long-Term Gains | | | Total Distributions | |
| TFS Market Neutral Fund | 4/30/2014 | | $ | 11,048,952 | | | $ | 44,601,882 | | | $ | 55,650,834 | |
| 10/31/2013 | | $ | — | | | $ | — | | | $ | — | |
| TFS Small Cap Fund | 4/30/2014 | | $ | 15,431,533 | | | $ | 1,022,460 | | | $ | 16,453,993 | |
| 10/31/2013 | | $ | 8,620,933 | | | $ | 565,170 | | | $ | 9,186,103 | |
| TFS Hedged Futures Fund | 4/30/2014 | | $ | — | | | $ | 180,217 | | | $ | 180,217 | |
| 10/31/2013 | | $ | 338,325 | | | $ | 2,232,048 | | | $ | 2,570,373 | |
Short positions – The Funds may sell securities short. For financial statement purposes, an amount equal to the settlement amount is included in the Statements of Assets and Liabilities as an asset and an equivalent liability is then subsequently marked-to-market daily to reflect the current value of the short position. Subsequent fluctuations in the market prices of securities sold, but not yet purchased, may require purchasing the securities at prices which may differ from the market value reflected on the Statements of Assets and Liabilities. The Funds are liable for any dividends payable on securities while those securities are in a short position and will also bear other costs, such as charges for the prime brokerage accounts, in connection with the short positions. These costs are reported as brokerage expense on securities sold short in the Statements of Operations. As collateral for its short positions, the Funds are required under the Investment Company Act of 1940 (“1940 Act”) to maintain assets consisting of cash, cash equivalents or liquid securities equal to the market value of the securities sold short. The deposits with brokers for securities sold short are reported on the Statements of Assets and Liabilities. The amount of the collateral is required to be adjusted daily to reflect changes in the value of the securities sold short. TFS Market Neutral Fund and TFS Hedged Futures Fund both engage in short selling as a principal investment strategy while TFS Small Cap Fund does not. TFS Small Cap Fund currently intends to limit its exposure to short positions, if any, to 5% of its net assets.
TFS CAPITAL INVESTMENT TRUST
NOTES TO FINANCIAL STATEMENTS (Continued)
Option contracts – The Funds may use option contracts in any manner consistent with their investment objectives and as long as their use is consistent with relevant provisions of the 1940 Act. The Funds may use options for speculative investment purposes as well as for the purpose of seeking to reduce the overall investment risk that would otherwise be associated with the securities in which a Fund invests. When a Fund writes an option, an amount equal to the net premium (the premium less the commission) received by the Fund is recorded as a liability in the Fund’s Statement of Assets and Liabilities and is subsequently marked-to-market daily. Premiums received from writing options which expire are treated as realized gains. Premiums received from writing call options which are exercised increase the proceeds used to calculate the realized gain or loss on the sale of the security. Premiums received from writing put options which are exercised increase the basis of the security purchased. If a closing purchase transaction is used to terminate a Fund’s obligation on an option, a gain or loss will be realized, depending upon whether the price of the closing purchase transaction is more or less than the premium previously received on the option written.
Futures contracts – TFS Market Neutral Fund and TFS Hedged Futures Fund are subject to equity price risk, interest rate risk, foreign currency exchange rate risk, and commodity risk in the normal course of pursuing their investment objectives. The Funds may use futures contracts to gain exposure or to hedge against changes in the value of equities, interest rates, foreign currencies or commodities. A futures contract represents a commitment for the future purchase or sale of an asset at a specified price on a specified date. When the Fund purchases or sells a futures contract, no price is paid to or received by the Fund upon the purchase or sale of the futures contract. Instead, the Fund is required to deposit in a segregated asset account an amount of cash or qualifying securities currently ranging from 5% to 15% of the contract amount. This is called the “initial margin deposit.” Subsequent payments, known as “variation margin,” are made or received by the Fund each day, depending on the daily fluctuations in the fair value of the underlying asset. The Fund recognizes an unrealized gain or loss equal to the daily variation margin. If market conditions change unexpectedly, the Fund may not achieve the anticipated benefits of the futures contracts and may realize a loss. The margin deposits for futures contracts and the variation margin receivable and/or payable are reported on the Statements of Assets and Liabilities.
Estimates – The preparation of financial statements in conformity with GAAP requires management to make estimates and assumptions that affect the reported amounts of assets and liabilities and disclosures of contingent assets and liabilities as of the date of the financial statements and the reported amounts of income and expenses during the reporting period. Actual results could differ from those estimates.
Common expenses – Common expenses of the Trust are allocated among the Funds based on the relative net assets of each Fund or the nature of the services performed and the relative applicability to each Fund.
TFS CAPITAL INVESTMENT TRUST
NOTES TO FINANCIAL STATEMENTS (Continued)
Foreign Currency Translation – Amounts denominated in or expected to settle in foreign currencies are translated into U.S. dollars based on exchange rates on the following basis:
| A. | The value of investment securities and other assets and liabilities are translated at exchange rates as of the NYSE close each day. |
| B. | Purchases and sales of investment securities and income and expenses are translated at the rate of exchange prevailing on the respective date of such transactions. |
| C. | The Funds do not isolate that portion of the results of operations caused by changes in foreign exchange rates on investments from those caused by changes in market prices of securities held. Such fluctuations are included with the net realized and unrealized gains or losses on investments. |
Reported net realized foreign exchange gains or losses arise from 1) purchases and sales of foreign currencies, 2) currency gains or losses realized between the trade and settlement dates on securities transactions and 3) the difference between the amounts of dividends, interest and foreign withholding taxes recorded on a Fund’s books and the U.S. dollar equivalent of the amounts actually received or paid. Reported net unrealized foreign exchange gains and losses arise from changes in the value of assets and liabilities that result from changes in exchange rates.
Forward Foreign Currency Exchange Contracts – TFS Market Neutral Fund may use forward foreign currency exchange contracts to hedge exposure to foreign currency. TFS Hedged Futures Fund may invest in currency forwards for speculative purposes. When the Adviser believes that the currency of a particular country may produce positive returns against the currency of another country, the Funds may purchase or sell currency forward contracts to gain exposure to the differential in currency returns. All foreign currency exchange contracts are “marked-to-market” daily at the applicable translation rates resulting in unrealized gains or losses. Realized and unrealized gains or losses from transactions in foreign currency exchange contracts will be included in a Fund’s Statement of Assets and Liabilities and Statement of Operations. Risks associated with these contracts include the potential inability of counterparties to meet the terms of their contracts and unanticipated movements in the value of a foreign currency relative to the U.S. dollar.
Federal income tax – The tax year end is October 31st for TFS Market Neutral Fund and TFS Small Cap Fund and December 31st for TFS Hedged Futures Fund. Each Fund has qualified and intends to continue to qualify as a regulated investment company under the Internal Revenue Code of 1986 (the “Code”). Qualification generally will relieve the Funds of liability for federal income taxes to the extent 100% of their net investment income and net realized gains are distributed in accordance with the Code.
In order to avoid imposition of the excise tax applicable to regulated investment companies, it is also each Fund’s intention to declare as dividends in each calendar year at least 98% of its ordinary income (net investment income and specified gains and losses) and 98.2% of its net realized capital gains plus undistributed amounts from prior years.
TFS CAPITAL INVESTMENT TRUST
NOTES TO FINANCIAL STATEMENTS (Continued)
The following information is computed on a tax basis for each item as of April 30, 2014:
| | | TFS Market Neutral Fund | | | TFS Small Cap Fund | | | TFS Hedged Futures Fund | |
| Tax cost of portfolio investments | | $ | 1,004,874,093 | | | $ | 90,727,616 | | | $ | 47,154,963 | |
| Gross unrealized appreciation | | $ | 62,433,969 | | | $ | 5,966,553 | | | $ | 795 | |
| Gross unrealized depreciation | | | (67,520,932 | ) | | | (4,537,052 | ) | | | (38 | ) |
| Net unrealized appreciation (depreciation) on investments | | | (5,086,963 | ) | | | 1,429,501 | | | | 757 | |
| Net unrealized appreciation on securities sold short | | | 8,511,569 | | | | — | | | | — | |
| Accumulated net investment loss | | | (49,661,291 | ) | | | (251,139 | ) | | | (427,630 | ) |
| Capital loss carryforwards | | | — | | | | — | | | | (2,124,211 | ) |
| Other gains | | | 74,755,708 | | | | 8,716,854 | | | | 238,655 | |
| Accumulated earnings (deficit) | | $ | 28,519,023 | | | $ | 9,895,216 | | | $ | (2,312,429 | ) |
As of April 30, 2014, the tax cost of securities sold short is $768,370,566 for TFS Market Neutral Fund.
The difference between the federal income tax cost of portfolio investments and securities sold short and the financial statement cost for TFS Market Neutral Fund and TFS Small Cap Fund is due to certain timing differences in the recognition of capital gains or losses under GAAP. These “book/tax” differences are temporary in nature and are primarily due to the tax deferral of losses on wash sales. The tax cost of portfolio investments for TFS Hedged Futures Fund is equal to the financial statement cost disclosed.
For the six months ended April 30, 2014, TFS Market Neutral Fund reclassified $8,450 of net realized losses from foreign currency transactions against accumulated net investment income. For the tax year ended December 31, 2013, TFS Hedged Futures Fund reclassified $3,362,145 of accumulated net investment losses and $1,581,979 of accumulated net realized capital losses against paid-in capital on the Statement of Assets and Liabilities. Such reclassifications, the result of permanent differences between the financial statement and income tax reporting requirements, have no effect on the Funds’ net assets or net asset value per share.
As of December 31, 2013, TFS Hedged Futures Fund had the following capital loss carryforwards:
| Capital loss carryforward – short-term | | $ | 846,534 | |
| Capital loss carryforward – long-term | | | 1,277,677 | |
| Total capital loss carryforwards | | $ | 2,124,211 | |
These capital loss carryforwards, which do not expire, may be utilized in the current and future years to offset net realized capital gains, if any, prior to distributing such gains to shareholders.
TFS CAPITAL INVESTMENT TRUST
NOTES TO FINANCIAL STATEMENTS (Continued)
The Funds recognize tax benefits or expenses of uncertain tax positions only when the position is “more likely than not” to be sustained assuming examination by tax authorities. Management has reviewed the tax positions taken on federal income tax returns for the current and all open tax periods (October 31, 2010 through October 31, 2013 for TFS Market Neutral Fund and TFS Small Cap Fund and December 31, 2012 through December 31, 2013 for TFS Hedged Futures Fund) of each Fund, as applicable, and has concluded that no provision for unrecognized tax benefits or expenses is required in these financial statements and does not expect this to change over the next twelve months. Each Fund identifies its major tax jurisdiction as U.S. Federal.
3. Investment Transactions
During the six months ended April 30, 2014, cost of purchases and proceeds from sales of portfolio securities, other than short-term investments, U.S. government securities and short positions, amounted to $3,938,876,062 and $4,556,972,075, respectively, for TFS Market Neutral Fund, $228,253,267 and $221,663,442, respectively, for TFS Small Cap Fund and $0 and $0, respectively, for TFS Hedged Futures Fund.
4. Transactions with Related Parties
INVESTMENT ADVISORY AGREEMENT
Each Fund’s investments are managed by the Adviser pursuant to the terms of an Investment Advisory Agreement. TFS Market Neutral Fund, TFS Small Cap Fund and TFS Hedged Futures Fund pay the Adviser an investment advisory fee, computed and accrued daily and paid monthly, at an annual rate of 1.65%, 1.15% and 1.50%, respectively, of its average daily net assets. Prior to January 1, 2014, TFS Market Neutral Fund paid the Adviser an investment advisory fee, computed and accrued daily and paid monthly, at annual rates of 2.25% of the first $1.75 billion of average daily net assets of the Fund and 2.15% of such assets above $1.75 billion. Also prior to January 1, 2014, TFS Small Cap Fund and TFS Hedged Futures Fund paid the Adviser an investment advisory fee, computed and accrued daily and paid monthly, at an annual rate of 1.25% and 2.00%, respectively, of its average daily net assets.
The Adviser has contractually agreed to reduce its advisory fees and to absorb each Fund’s operating expenses (for the life of the Funds) to the extent necessary to limit aggregate annual ordinary operating expenses (which do not include brokerage costs, taxes, borrowing costs such as interest and dividend expenses on securities sold short and extraordinary expenses) to 1.90% of TFS Market Neutral Fund’s average daily net assets, 1.50% of TFS Small Cap Fund’s average daily net assets and 1.80% of TFS Hedged Futures Fund’s average daily net assets. Prior to January 1, 2014, the Adviser had agreed to reduce its investment advisory fees and to absorb each Fund’s operating expenses to the extent necessary to limit aggregate annual ordinary operating expenses (which did not include brokerage costs, taxes, borrowing costs such as interest and dividend expenses on securities sold short and extraordinary expenses) to 2.50% of TFS Market Neutral Fund’s average daily net assets, 1.75% of TFS Small Cap Fund’s average daily net assets and 2.30% of TFS Hedged Futures Fund’s average daily net assets. During the six months ended April 30, 2014, the Adviser reduced its investment advisory fees by $35,174 with respect to TFS Small Cap Fund and $75,081 with respect to TFS Hedged Futures Fund. There were no fee reductions by the Adviser for TFS Market Neutral Fund.
TFS CAPITAL INVESTMENT TRUST
NOTES TO FINANCIAL STATEMENTS (Continued)
Advisory fee reductions and expense reimbursements by the Adviser are subject to repayment by the applicable Fund for a period of three years after such fees and expenses were incurred, provided that such repayments do not cause ordinary operating expenses to exceed the expense caps of 1.90%, 1.50% and 1.80%, respectively, for TFS Market Neutral Fund, TFS Small Cap Fund and TFS Hedged Futures Fund. As of April 30, 2014, the Adviser has recouped all previous fee reductions for TFS Market Neutral Fund. During the six months ended April 30, 2014, the Adviser recouped $9,303 of prior years’ investment advisory fee reductions from TFS Small Cap Fund. As of April 30, 2014, the Adviser may in the future recoup fee reductions and expense reimbursements totaling $196,044 and $226,868, respectively, from TFS Small Cap Fund and TFS Hedged Futures Fund. The Adviser may recapture these amounts no later than the dates as stated below:
| | | October 31,
2014 | | | October 31,
2014 | | | October 31,
2015 | | | April 30,
2016 | |
| TFS Small Cap Fund | | $ | 26,766 | | | $ | 100,740 | | | $ | 33,364 | | | $ | 35,174 | |
| TFS Hedged Futures Fund | | $ | — | | | $ | 92,853 | | | $ | 58,934 | | | $ | 75,081 | |
Certain Trustees and officers of the Trust are also officers of the Adviser.
AFFILIATED BROKER-DEALER
During the six months ended April 30, 2014, TFS Hedged Futures Fund paid commissions of $26,942 to Interactive Brokers LLC (“IB”). Richard Gates, a principal of the Adviser and a Vice President of the Trust, serves as an independent Director of IB. Based on a factual determination by the Adviser that Mr. Gates does not have a controlling influence over IB’s management or policies, the Adviser does not believe that IB is an affiliate, or an affiliate of an affiliate, of the Trust. Nevertheless, the Adviser and the Trust have determined to subject any transactions between the Funds and IB to the same procedures that would be applicable if such transactions were subject to affiliated broker provisions of Section 17(e) of the 1940 Act and Rule 17e-1 thereunder.
COMPLIANCE CONSULTING AGREEMENT
Under the terms of a Compliance Consulting Agreement, Drake Compliance, LLC (“Drake”) provides ongoing regulatory compliance consulting, monitoring and reporting services for the Trust. In addition, a principal of Drake serves as the Trust’s Chief Compliance Officer. Drake receives $5,000 per month from the Trust, of which each Fund pays its proportionate share. In addition, each Fund reimburses certain out-of-pocket expenses incurred by Drake, if any, including, but not limited to, postage and supplies and travel expenses.
OTHER SERVICE PROVIDERS
Ultimus Fund Solutions, LLC (“Ultimus”) provides fund administration, fund accounting, compliance and transfer agent services to the Funds. Pursuant to servicing agreements with Ultimus, the Funds pay Ultimus fees in accordance with the agreements for its services. Certain officers of the Trust are also officers of Ultimus or of Ultimus Fund Distributors, LLC (the “Distributor”), the principal underwriter of each Fund’s shares and an affiliate of Ultimus. The distributor is compensated by the Adviser (not the Funds) for acting as principal underwriter.
TFS CAPITAL INVESTMENT TRUST
NOTES TO FINANCIAL STATEMENTS (Continued)
COMPENSATION OF TRUSTEES
Trustees and officers affiliated with the Adviser or Ultimus are not compensated by the Trust for their services. Each Trustee who is not an affiliated person of the Adviser or Ultimus receives from the Trust an annual retainer of $20,000, paid quarterly, a fee of $7,500 for attendance at each in-person meeting of the Board of Trustees, a fee of $2,500 for attendance at each telephonic regular meeting of the Board of Trustees and a fee of $1,500 for attendance at each telephonic special meeting of the Board of Trustees. The Chairman of the Audit Committee receives an additional fee of $1,000 for each Audit Committee meeting attended. The Trust reimburses each Trustee and officer for his or her travel and other expenses relating to attendance at Board or committee meetings. Prior to January 1, 2014, the annual retainer paid to the Independent Trustees was $5,000.
5. Derivatives Transactions
Transactions in option contracts written by TFS Market Neutral Fund during the six months ended April 30, 2014 were as follows:
| | | Options Contracts | | | Option Premiums | |
| Options outstanding at beginning of period | | | 1,502 | | | $ | 29,561 | |
| Options cancelled in a closing purchase transaction | | | (2 | ) | | | (610 | ) |
| Options expired | | | (1,375 | ) | | | (25,368 | ) |
| Options exercised | | | (125 | ) | | | (3,583 | ) |
| Options outstanding at end of period | | | — | | | $ | — | |
The average monthly notional amount of call options written and put options written during the six months ended April 30, 2014 was $778,062 and $814,483, respectively, for TFS Market Neutral Fund.
The locations in the Statements of Assets and Liabilities of the derivative positions of TFS Market Neutral Fund and TFS Hedged Futures Fund as of April 30, 2014 are recorded in the following locations in the Statements of Assets and Liabilities:
| Derivative Investment Type | Location |
| Futures contracts | Variation margin receivable (payable) |
| Forward foreign currency exchange contracts | Unrealized appreciation (depreciation) on forward currency exchange contracts |
TFS CAPITAL INVESTMENT TRUST
NOTES TO FINANCIAL STATEMENTS (Continued)
The following tables set forth the values of derivative contracts of TFS Market Neutral Fund and TFS Hedged Futures Fund as of April 30, 2014:
TFS Market Neutral Fund
| | Variation Margin | | | | |
| | | Receivable | | | (Payable) | | | Total | |
| Liability Derivatives | | | | | | | | | |
| Financial Futures Contracts | | $ | 3,653,466 | | | $ | (2,076,174 | ) | | $ | 1,577,292 | |
| Total | | $ | 3,653,466 | | | $ | (2,076,174 | ) | | $ | 1,577,292 | |
TFS Hedged Futures Fund
Futures Contracts
| | Variation Margin | | | | |
| | | Receivable | | | (Payable) | | | Total | |
| Asset Derivatives | | | | | | | | | |
| Futures Contracts | | | | | | | | | |
| Commodity | | $ | 271,285 | | | $ | (30,057 | ) | | $ | 241,228 | |
| Financial | | | — | | | | — | | | | — | |
| Total Asset Derivatives | | | 271,285 | | | | (30,057 | ) | | | 241,228 | |
| | | | | | | | | | | | |
| Liability Derivatives | | | | | | | | | | | | |
| Futures Contracts | | | | | | | | | | | | |
| Commodity | | | 86,021 | | | | (272,647 | ) | | | (186,626 | ) |
| Financial | | | 612,856 | | | | (327,212 | ) | | | 285,644 | |
| Total Liability Derivatives | | | 698,877 | | | | (599,859 | ) | | | 99,018 | |
| Total | | $ | 970,162 | | | $ | (629,916 | ) | | $ | 340,246 | |
TFS CAPITAL INVESTMENT TRUST
NOTES TO FINANCIAL STATEMENTS (Continued)
TFS Hedged Futures Fund
Forward Foreign Currency Exchange Contracts
| Settlement Date | | To Deliver | | To Receive | | Initial
Value | | | Market
Value | | | Unrealized Appreciation | | | Unrealized Depreciation | | | Net
Unrealized Appreciation (Depreciation) | |
| Asset Derivatives | |
| 5/12/2014 | | | 600,000 | | USD | | | 4,842,000 | | ARS | | $ | 600,000 | | | $ | 604,136 | | | $ | 4,136 | | | $ | — | | | $ | 4,136 | |
| 5/20/2014 | | | 600,000 | | USD | | | 4,860,000 | | ARS | | | 600,000 | | | | 605,615 | | | | 5,615 | | | | — | | | | 5,615 | |
| 5/20/2014 | | | 600,000 | | USD | | | 7,050,000 | | UAH | | | 600,000 | | | | 591,269 | | | | — | | | | (8,731 | ) | | | (8,731 | ) |
| 5/21/2014 | | | 600,000 | | USD | | | 1,359,480 | | BRL | | | 600,000 | | | | 606,768 | | | | 6,768 | | | | — | | | | 6,768 | |
| 5/23/2014 | | | 500,000 | | USD | | | 4,050,000 | | ARS | | | 500,000 | | | | 504,440 | | | | 4,440 | | | | — | | | | 4,440 | |
| 5/23/2014 | | | 500,000 | | USD | | | 1,121,350 | | BRL | | | 500,000 | | | | 500,253 | | | | 253 | | | | — | | | | 253 | |
| 5/23/2014 | | | 500,000 | | USD | | | 5,850,000 | | UAH | | | 500,000 | | | | 487,292 | | | | — | | | | (12,708 | ) | | | (12,708 | ) |
| Total Contracts | | | 3,900,000 | | | | 3,899,773 | | | | 21,212 | | | | (21,439 | ) | | | (227 | ) |
| | |
| | |
| Liabilities Derivatives | |
| 5/12/2014 | | | 87,650 | | CHF | | | 100,000 | | USD | | $ | (100,000 | ) | | $ | (99,602 | ) | | $ | 398 | | | $ | — | | | $ | 398 | |
| 5/12/2014 | | | 10,145,000 | | JPY | | | 100,000 | | USD | | | (100,000 | ) | | | (99,242 | ) | | | 758 | | | | — | | | | 758 | |
| 5/12/2014 | | | 2,998,000 | | TWD | | | 100,000 | | USD | | | (100,000 | ) | | | (99,268 | ) | | | 732 | | | | — | | | | 732 | |
| 5/20/2014 | | | 13,320,000 | | PHP | | | 300,000 | | USD | | | (300,000 | ) | | | (295,320 | ) | | | 4,680 | | | | — | | | | 4,680 | |
| 5/21/2014 | | | 1,618,950 | | DKK | | | 300,000 | | USD | | | (300,000 | ) | | | (300,963 | ) | | | — | | | | (963 | ) | | | (963 | ) |
| 5/21/2014 | | | 178,465 | | GBP | | | 300,000 | | USD | | | (300,000 | ) | | | (301,388 | ) | | | — | | | | (1,388 | ) | | | (1,388 | ) |
| 5/26/2014 | | | 220,500 | | CHF | | | 250,000 | | USD | | | (250,000 | ) | | | (250,623 | ) | | | — | | | | (623 | ) | | | (623 | ) |
| 5/26/2014 | | | 1,349,375 | | DKK | | | 250,000 | | USD | | | (250,000 | ) | | | (250,860 | ) | | | — | | | | (860 | ) | | | (860 | ) |
| 5/26/2014 | | | 25,587,500 | | JPY | | | 250,000 | | USD | | | (250,000 | ) | | | (250,334 | ) | | | — | | | | (334 | ) | | | (334 | ) |
| Total Contracts | | | (1,950,000 | ) | | | (1,947,600 | ) | | | 6,568 | | | | (4,168 | ) | | | 2,400 | |
| Total | | $ | 1,950,000 | | | $ | 1,952,173 | | | $ | 27,780 | | | $ | (25,607 | ) | | $ | 2,173 | |
ARS - Argentine Peso
BRL - Brazilian Real
CHF - Swiss Franc
DKK - Danish Krone
GBP - British Pound Sterling
JPY - Japanese Yen
PHP - Phillipine Peso
TWD - Taiwanese Dollar
UAH - Ukranian Hryvnia
USD - U.S. Dollar
TFS CAPITAL INVESTMENT TRUST
NOTES TO FINANCIAL STATEMENTS (Continued)
Transactions in derivative instruments for TFS Market Neutral Fund and TFS Hedged Futures Fund during the six months ended April 30, 2014 are recorded in the following locations in the Statements of Operations:
| Derivative Investment Type | Location |
| Call options written | Net realized gains (losses) from option contracts |
| Net change in unrealized appreciation (depreciation) on option contracts |
| Put options written | Net realized gains (losses) from option contracts |
| Net change in unrealized appreciation (depreciation) on option contracts |
| Futures contracts | Net realized gains (losses) from futures contracts |
| Net change in unrealized appreciation (depreciation) on futures contracts |
| Forward foreign currency exchange contracts | Net realized gains (losses) from foreign currency transactions |
| Net change in unrealized appreciation (depreciation) on foreign currency translation |
The following is a summary of net realized gains (losses) and net change in unrealized appreciation (depreciation) on derivative instruments for TFS Market Neutral Fund and TFS Hedged Futures Fund recognized in the Statements of Operations during the six months ended April 30, 2014:
| Type of Derivative | | Net Realized Gains (Losses) | | | Net Change in Unrealized Appreciation (Depreciation) | |
| TFS Market Neutral Fund | | | | | | |
| Call options written | | $ | 7,095 | | | $ | (1,658 | ) |
| Put options written | | | 18,682 | | | | (8,843 | ) |
| Total | | | 25,777 | | | | (10,501 | ) |
| | | | | | | | |
| Futures contracts | | | | | | | | |
| Financial | | | (8,460,175 | ) | | | 1,575,657 | |
| | | | | | | | |
| Total | | $ | (8,434,398 | ) | | $ | 1,565,156 | |
TFS CAPITAL INVESTMENT TRUST
NOTES TO FINANCIAL STATEMENTS (Continued)
| Type of Derivative | | Net Realized Gains (Losses) | | | Net Change in Unrealized Appreciation (Depreciation) | |
| TFS Hedged Futures Fund | | | | | | | | |
| Futures contracts | | | | | | | | |
| Commodity | | $ | 1,597,625 | | | $ | 39,130 | |
| Financial | | | (449,078 | ) | | | 456,266 | |
| Total futures contracts | | | 1,148,547 | | | | 495,396 | |
| | | | | | | | |
| Forward foreign currency exchange contracts | | | (397,374 | ) | | | (92,161 | ) |
| | | | | | | | |
| Total | | $ | 751,173 | | | $ | 403,235 | |
TFS Small Cap Fund had no transactions in derivative instruments during the six months ended April 30, 2014.
In January 2013, Accounting Standards Update 2013-01 (“ASU 2013-01”), “Clarifying the Scope of Disclosures about Offsetting Assets and Liabilities,” replaced Accounting Standards Update 2011-11 (“ASU 2011-11”), “Disclosures about Offsetting Assets and Liabilities.” ASU 2013-01 is effective for fiscal years beginning on or after January 1, 2013, and interim periods within those annual periods. ASU 2011-11 was intended to enhance disclosure requirements on the offsetting of financial assets and liabilities. ASU 2013-01 limits the scope of the new balance sheet offsetting disclosures to derivatives to the extent that they are (1) offset in the financial statements or (2) subject to an enforceable master netting arrangement or similar agreement.
In the ordinary course of business, TFS Market Neutral Fund and TFS Hedged Futures Fund may enter into transactions subject to enforceable netting agreements or other similar arrangements (“netting agreements”). Generally, the right to offset in netting agreements allows the Funds to offset any exposure to a specific counterparty with any collateral received or delivered to that counterparty based on the terms of the agreements. Generally, the Funds manage their cash collateral securities and securities collateral on a counterparty basis.
As of April 30, 2014, the offsetting of financial assets and derivatives assets is as follows:
TFS Market Neutral Fund
| Description | | Gross Amounts of Recognized Assets | | | Gross Amounts Offset in Statements of Assets and Liabilities | | | Net Amounts of Assets Presented in Statements of Assets and Liabilities | | | Collateral Pledged | | | Net Amount | |
| Variation margin receivable - futures contracts | | $ | 3,653,466 | | | $ | — | | | $ | 3,653,466 | | | $ | — | | | $ | 3,653,466 | |
| Total subject to a master netting or similar arrangement | | $ | 3,653,466 | | | $ | — | | | $ | 3,653,466 | | | $ | — | | | $ | 3,653,466 | |
TFS CAPITAL INVESTMENT TRUST
NOTES TO FINANCIAL STATEMENTS (Continued)
TFS Hedged Futures Fund
| Description | | Gross Amounts of Recognized Assets | | | Gross Amounts Offset in Statements of Assets and Liabilities | | | Net Amounts of Assets Presented in Statements of Assets and Liabilities | | | Collateral Pledged | | | Net Amount | |
| Variation margin receivable - futures contracts | | $ | 970,162 | | | $ | — | | | $ | 970,162 | | | $ | — | | | $ | 970,162 | |
| Unrealized appreciation on forward currency exchange contracts | | | 27,780 | | | | — | | | | 27,780 | | | | — | | | | 27,780 | |
| Total subject to a master netting or similar arrangement | | $ | 997,942 | | | $ | — | | | $ | 997,942 | | | $ | — | | | $ | 997,942 | |
Offsetting of financial liabilities and derivative liabilities as of April 30, 2014 is as follows:
TFS Market Neutral Fund
| Description | | Gross Amounts of Recognized Liabilities | | | Gross Amounts Offset in Statements of Assets and Liabilities | | | Net Amounts of Assets Presented in Statements of Assets and Liabilities | | | Collateral Pledged | | | Net Amount | |
| Variation margin payable - futures contracts | | $ | 2,076,174 | | | $ | — | | | $ | 2,076,174 | | | $ | — | | | $ | 2,076,174 | |
| Total subject to a master netting or similar arrangement | | $ | 2,076,174 | | | $ | — | | | $ | 2,076,174 | | | $ | — | | | $ | 2,076,174 | |
TFS CAPITAL INVESTMENT TRUST
NOTES TO FINANCIAL STATEMENTS (Continued)
| Description | | Gross Amounts of Recognized Liabilities | | | Gross Amounts Offset in Statements of Assets and Liabilities | | | Net Amounts of Assets Presented in Statements of Assets and Liabilities | | | Collateral Pledged | | | Net Amount | |
| Variation margin payable - futures contracts | | $ | 629,916 | | | $ | — | | | $ | 629,916 | | | $ | — | | | $ | 629,916 | |
| Unrealized depreciation on forward currency exchange contracts | | | 25,607 | | | | — | | | | 25,607 | | | | — | | | | 25,607 | |
| Total subject to a master netting or similar arrangement | | $ | 655,523 | | | $ | — | | | $ | 655,523 | | | $ | — | | | $ | 655,523 | |
6. Investments in Money Market Mutual Funds
In order to maintain sufficient liquidity to implement investment strategies, or for temporary defensive purposes, each Fund may invest a significant portion of its assets in shares of one or more money market mutual funds. An investment in a money market mutual fund is not insured or guaranteed by the Federal Deposit Insurance Corporation or any other governmental agency, entity or person. While investor losses in money market mutual funds have been rare, they have occurred. In addition, additional indirect expenses will be incurred due to acquired fund fees and other costs to the extent of the investment in shares of money market mutual funds. As of April 30, 2014, TFS Hedged Futures Fund had 66.6% of the value of its net assets invested in money market mutual funds registered under the 1940 Act. As of April 30, 2014, TFS Market Neutral Fund and TFS Small Cap Fund did not have a significant portion of assets invested in shares of money market mutual funds.
7. Contingencies and Commitments
The Funds indemnify the Trust’s officers and Trustees for certain liabilities that might arise from their performance of their duties to the Funds. Additionally, in the normal course of business the Funds enter into contracts that contain a variety of representations and warranties and which provide general indemnifications. The Funds’ maximum exposure under these arrangements is unknown, as this would involve future claims that may be made against the Funds that have not yet occurred. However, based on experience, the Funds expect the risk of loss to be remote.
TFS CAPITAL INVESTMENT TRUST
NOTES TO FINANCIAL STATEMENTS (Continued)
8. Subsequent Events
The Funds are required to recognize in the financial statements the effects of all subsequent events that provide additional evidence about conditions that existed as of the date of the Statements of Assets and Liabilities. For non-recognized subsequent events that must be disclosed to keep the financial statements from being misleading, the Funds are required to disclose the nature of the event as well as an estimate of its financial effect, or a statement that such an estimate cannot be made. Management has evaluated subsequent events through the issuance of these financial statements and has noted no such events.
TFS CAPITAL INVESTMENT TRUST
ABOUT YOUR FUNDS’ EXPENSES (Unaudited)
We believe it is important for you to understand the impact of costs on your investment. As a shareholder of the Funds, you incur two types of costs: (1) transaction costs, including redemption fees; and (2) ongoing costs, including management fees and other Fund expenses. The following examples are intended to help you understand your ongoing costs (in dollars) of investing in the Funds and to compare these costs with the ongoing costs of investing in other mutual funds.
A mutual fund’s ongoing costs are expressed as a percentage of its average net assets. This figure is known as the expense ratio. The ongoing costs reflected in the table are based on an investment of $1,000 made at the beginning of the most recent semi-annual period (November 1, 2013) and held until the end of the period (April 30, 2014).
The table below illustrates each Fund’s ongoing costs in two ways:
Actual fund return – This section helps you to estimate the actual expenses that you paid over the period. The “Ending Account Value” shown is derived from each Fund’s actual return, and the third column shows the dollar amount of operating expenses that would have been paid by an investor who started with $1,000 in the Funds. You may use the information here, together with the amount you invested, to estimate the expenses that you paid over the period.
To do so, simply divide your account value by $1,000 (for example, an $8,600 account value divided by $1,000 = 8.6), then multiply the result by the number given for the Funds under the heading “Expenses Paid During Period.”
Hypothetical 5% return – This section is intended to help you compare each Fund’s ongoing costs with those of other mutual funds. It assumes that each Fund had an annual return of 5% before expenses during the period shown, but that the expense ratio is unchanged. In this case, because the return used is not each Fund’s actual return, the results do not apply to your investment. The example is useful in making comparisons because the SEC requires all mutual funds to calculate expenses based on a 5% return. You can assess each Fund’s ongoing costs by comparing this hypothetical example with the hypothetical examples that appear in shareholder reports of other funds.
Note that expenses shown in the table are meant to highlight and help you compare ongoing costs only. The calculations below assume no shares were bought or sold during the period. Your actual costs may have been higher or lower, depending on the amount of your investment and the timing of any purchases or redemptions.
More information about each Fund’s expenses, including annualized expense ratios, can be found in this report. For additional information on operating expenses and other shareholder costs, please refer to each Fund’s summary prospectus.
TFS CAPITAL INVESTMENT TRUST
ABOUT YOUR FUNDS’ EXPENSES (Unaudited) (Continued)
TFS Market Neutral Fund
| | Beginning
Account Value November 1, 2013 | Ending
Account Value April 30, 2014 | Expenses Paid During Period* |
| Based on Actual Fund Return | $1,000.00 | $967.00 | $43.45 |
| Based on Hypothetical 5% Return (before expenses) | $1,000.00 | $980.61 | $43.76 |
| * | Expenses are equal to the annualized expense ratio of 8.91% for the period, multiplied by the average account value over the period, multiplied by 181/365 (to reflect the one-half year period). |
TFS Small Cap Fund
| | Beginning
Account Value November 1, 2013 | Ending
Account Value April 30, 2014 | Expenses Paid During Period* |
| Based on Actual Fund Return | $1,000.00 | $1,058.80 | $8.07 |
| Based on Hypothetical 5% Return (before expenses) | $1,000.00 | $1,016.96 | $7.90 |
| * | Expenses are equal to the annualized expense ratio of 1.58% for the period, multiplied by the average account value over the period, multiplied by 181/365 (to reflect the one-half year period). |
TFS Hedged Futures Fund
| | Beginning
Account Value November 1, 2013 | Ending
Account Value April 30, 2014 | Expenses Paid During Period* |
| Based on Actual Fund Return | $1,000.00 | $1,005.90 | $9.90 |
| Based on Hypothetical 5% Return (before expenses) | $1,000.00 | $1,014.93 | $9.94 |
| * | Expenses are equal to the annualized expense ratio of 1.99% for the period, multiplied by the average account value over the period, multiplied by 181/365 (to reflect the one-half year period). |
TFS CAPITAL INVESTMENT TRUST
OTHER INFORMATION (Unaudited)
A description of the policies and procedures that the Funds use to determine how to vote proxies relating to portfolio securities is available without charge upon request by calling toll-free 1-888-534-2001, or on the SEC’s website at http://www.sec.gov. Information regarding how the Funds voted proxies relating to portfolio securities during the most recent 12-month period ended June 30 is also available without charge upon request by calling toll-free 1-888-534-2001, or on the SEC’s website at http://www.sec.gov.
The Funds file a complete listing of portfolio holdings with the SEC as of the end of the first and third quarters of each fiscal year on Form N-Q. The filings are available upon request, by calling 1-888-534-2001. Furthermore, you may obtain copies of the filings on the SEC’s website at http://www.sec.gov. The Funds’ Forms N-Q may also be reviewed and copied at the SEC’s Public Reference Room in Washington, DC, and information on the operation of the Public Reference Room may be obtained by calling 1-800-SEC-0330.
The net asset value for TFS Hedged Futures Fund is published daily at the Funds’ website at http://www.tfscapital.com.
PRIVACY NOTICE
| FACTS | WHAT DOES THE TFS CAPITAL INVESTMENT TRUST DO WITH YOUR PERSONAL INFORMATION? |
| |
| Why? | Financial companies choose how they share your personal information. Federal law gives consumers the right to limit some but not all sharing. Federal law also requires us to tell you how we collect, share, and protect your personal information. Please read this notice carefully to understand what we do. |
| |
| What? | The types of personal information we collect and share depend on the product or service you have with us. This information can include: ▪ Social Security number ▪ Assets ▪ Retirement Assets ▪ Transaction History ▪ Checking Account Information ▪ Purchase History ▪ Account Balances ▪ Account Transactions ▪ Wire Transfer Instructions When you are no longer our customer, we continue to share your information as described in this notice. |
| |
| How? | All financial companies need to share your personal information to run their everyday business. In the section below, we list the reasons financial companies can share their customers’ personal information; the reasons the TFS Capital Investment Trust chooses to share; and whether you can limit this sharing. |
| |
| Reasons we can share your personal information | Does the TFS Capital Investment Trust share? | Can you limit this sharing? |
For our everyday business purposes – Such as to process your transactions, maintain your account(s), respond to court orders and legal investigations, or report to credit bureaus | Yes | No |
For our marketing purposes – to offer our products and services to you | No | We don’t share |
| For joint marketing with other financial companies | No | We don’t share |
For our affiliates’ everyday business purposes – information about your transactions and experiences | No | We don’t share |
For our affiliates’ everyday business purposes – information about your creditworthiness | No | We don’t share |
| For nonaffiliates to market to you | No | We don’t share |
| |
| Questions? | Call 1-888-534-2001 |
| Who we are |
| Who is providing this notice? | TFS Capital Investment Trust Ultimus Fund Distributors, LLC (Distributor) Ultimus Fund Solutions, LLC (Administrator) |
| What we do |
| How does the TFS Capital Investment Trust protect my personal information? | To protect your personal information from unauthorized access and use, we use security measures that comply with federal law. These measures include computer safeguards and secured files and buildings. Our service providers are held accountable for adhering to strict policies and procedures to prevent any misuse of your nonpublic personal information. |
| How does the TFS Capital Investment Trust collect my personal information? | We collect your personal information, for example, when you ▪ Open an account ▪ Provide account information ▪ Give us your contact information ▪ Make deposits or withdrawals from your account ▪ Make a wire transfer ▪ Tell us where to send the money ▪ Tells us who receives the money ▪ Show your government-issued ID ▪ Show your driver’s license We also collect your personal information from other companies. |
| Why can’t I limit all sharing? | Federal law gives you the right to limit only ▪ Sharing for affiliates’ everyday business purposes – information about your creditworthiness ▪ Affiliates from using your information to market to you ▪ Sharing for nonaffiliates to market to you State laws and individual companies may give you additional rights to limit sharing. |
| |
| Definitions |
| Affiliates | Companies related by common ownership or control. They can be financial and nonfinancial companies. ▪ TFS Capital LLC, the investment adviser to the TFS Capital Investment Trust, could be deemed to be an affiliate. |
| Nonaffiliates | Companies not related by common ownership or control. They can be financial and nonfinancial companies ▪ The TFS Capital Investment Trust does not share with nonaffiliates so they can market to you. |
| Joint marketing | A formal agreement between nonaffiliated financial companies that together market financial products or services to you. ▪ The TFS Capital Investment Trust does not jointly market. |
Not required
| Item 3. | Audit Committee Financial Expert. |
Not required
| Item 4. | Principal Accountant Fees and Services. |
Not required
| Item 5. | Audit Committee of Listed Registrants. |
Not applicable
| Item 6. | Schedule of Investments. |
| (a) | See Schedule I (Investments in securities of unaffiliated issuers) |
TFS MARKET NEUTRAL FUNDSCHEDULE OF INVESTMENTS
April 30, 2014(Unaudited)
COMMON STOCKS - 90.3% | | Shares | | | Value | |
Consumer Discretionary - 14.1% | |
| Auto Components - 2.5% | |
American Axle & Manufacturing Holdings, Inc. (a) (b) | | | 128,432 | | | $ | 2,266,825 | |
Cooper Tire & Rubber Company (b) | | | 55,028 | | | | 1,383,954 | |
Cooper-Standard Holdings, Inc. (a) | | | 1,604 | | | | 108,671 | |
Drew Industries, Inc. (b) | | | 28,936 | | | | 1,456,059 | |
Federal-Mogul Holdings Corporation (a) (b) | | | 19,652 | | | | 338,407 | |
Fox Factory Holding Corporation (a) | | | 28,540 | | | | 484,895 | |
Gentherm, Inc. (a) (b) | | | 84,384 | | | | 3,067,358 | |
| Goodyear Tire & Rubber Company (The) | | | 6,358 | | | | 160,222 | |
| Icahn Enterprises, L.P. | | | 2,145 | | | | 216,602 | |
| Lear Corporation | | | 1,399 | | | | 116,201 | |
Modine Manufacturing Company (a) (b) | | | 164,286 | | | | 2,707,433 | |
Motorcar Parts of America, Inc. (a) (b) | | | 91,254 | | | | 2,504,010 | |
| Remy International, Inc. | | | 46,240 | | | | 1,226,285 | |
Shiloh Industries, Inc. (a) | | | 21,049 | | | | 415,507 | |
| Spartan Motors, Inc. | | | 986 | | | | 5,236 | |
| Standard Motor Products, Inc. | | | 8,945 | | | | 339,821 | |
Stoneridge, Inc. (a) (b) | | | 23,858 | | | | 255,042 | |
| STRATTEC Security Corporation | | | 16,557 | | | | 1,106,173 | |
Superior Industries International, Inc. (b) | | | 99,275 | | | | 2,098,673 | |
Tower International, Inc. (a) (b) | | | 186,481 | | | | 5,186,037 | |
Visteon Corporation (a) | | | 1,564 | | | | 135,771 | |
| | | | | | | | 25,579,182 | |
| Automobiles - 0.1% | |
| General Motors Company | | | 9,785 | | | | 337,387 | |
| Thor Industries, Inc. | | | 2,341 | | | | 142,497 | |
Winnebago Industries, Inc. (a) (b) | | | 12,545 | | | | 299,825 | |
| | | | | | | | 779,709 | |
| Distributors - 0.2% | |
| Core-Mark Holding Company, Inc. | | | 19,360 | | | | 1,559,255 | |
LKQ Corporation (a) | | | 4,503 | | | | 131,127 | |
Stock Building Supply Holdings, Inc. (a) | | | 16,232 | | | | 280,976 | |
VOXX International Corporation (a) | | | 12,055 | | | | 141,646 | |
| | | | | | | | 2,113,004 | |
| Diversified Consumer Services - 0.6% | |
Apollo Education Group, Inc. (a) | | | 2,536 | | | | 73,189 | |
Ascent Capital Group, Inc. - Class A (a) | | | 14,468 | | | | 994,964 | |
Bright Horizons Family Solutions, Inc. (a) | | | 10,846 | | | | 442,300 | |
Career Education Corporation (a) | | | 12,111 | | | | 87,441 | |
China Education Alliance, Inc. (a) | | | 7,355 | | | | 1,619 | |
| Collectors Universe, Inc. | | | 1,540 | | | | 36,159 | |
| DeVry Education Group, Inc. | | | 6,120 | | | | 275,584 | |
Houghton Mifflin Harcourt Company (a) | | | 2,416 | | | | 49,359 | |
JTH Holding, Inc. - Class A (a) | | | 12,802 | | | | 348,214 | |
LifeLock, Inc. (a) | | | 8,735 | | | | 137,140 | |
| Regis Corporation | | | 32,598 | | | | 428,338 | |
Sotheby's (b) | | | 37,539 | | | | 1,578,890 | |
Steiner Leisure Ltd. (a) (b) | | | 20,187 | | | | 871,473 | |
| Universal Technical Institute, Inc. | | | 15,534 | | | | 186,563 | |
| | | | | | �� | | 5,511,233 | |
TFS MARKET NEUTRAL FUND
SCHEDULE OF INVESTMENTS (Continued)
COMMON STOCKS - 90.3%(Continued) | | Shares | | | Value | |
Consumer Discretionary - 14.1%(Continued) | |
| Hotels, Restaurants & Leisure - 2.9% | |
Biglari Holdings, Inc. (a) | | | 468 | | | $ | 200,781 | |
Boyd Gaming Corporation (a) | | | 27,291 | | | | 322,580 | |
Bravo Brio Restaurant Group, Inc. (a) | | | 33,896 | | | | 507,423 | |
Carrols Restaurant Group, Inc. (a) | | | 46,160 | | | | 309,734 | |
Century Casinos, Inc. (a) | | | 182,986 | | | | 1,088,767 | |
| Choice Hotels International, Inc. | | | 7,268 | | | | 321,100 | |
| ClubCorp Holdings, Inc. | | | 13,010 | | | | 245,108 | |
Del Frisco's Restaurant Group, Inc. (a) | | | 29,217 | | | | 759,934 | |
Diamond Resorts International, Inc. (a) | | | 20,386 | | | | 381,422 | |
DineEquity, Inc. (b) | | | 35,430 | | | | 2,685,948 | |
| Domino's Pizza, Inc. | | | 3,013 | | | | 224,107 | |
Einstein Noah Restaurant Group, Inc. (b) | | | 94,306 | | | | 1,448,540 | |
| Extended Stay America, Inc. | | | 2,322 | | | | 50,039 | |
Fiesta Restaurant Group, Inc. (a) | | | 20,764 | | | | 760,170 | |
| Frisch's Restaurants, Inc. | | | 5,314 | | | | 125,836 | |
Hilton Worldwide Holdings, Inc. (a) | | | 805 | | | | 17,573 | |
| Iao Kun Group Holding Company Ltd. | | | 7,888 | | | | 23,112 | |
Ignite Restaurant Group, Inc. (a) | | | 1,501 | | | | 21,224 | |
| International Speedway Corporation - Class A | | | 6,148 | | | | 193,293 | |
Intrawest Resorts Holdings, Inc. (a) | | | 3,191 | | | | 36,186 | |
Isle of Capri Casinos, Inc. (a) | | | 60,359 | | | | 410,441 | |
Jack in the Box, Inc. (a) (b) | | | 22,437 | | | | 1,201,277 | |
Jamba, Inc. (a) | | | 26,000 | | | | 287,560 | |
Kona Grill, Inc. (a) | | | 42,210 | | | | 989,825 | |
Krispy Kreme Doughnuts, Inc. (a) | | | 14,665 | | | | 257,224 | |
Marcus Corporation (b) | | | 147,150 | | | | 2,461,820 | |
Marriott Vacations Worldwide Corporation (a) | | | 13,338 | | | | 726,654 | |
Monarch Casino & Resort, Inc. (a) | | | 429 | | | | 6,881 | |
Orient-Express Hotels Ltd. - Class A (a) | | | 17,266 | | | | 226,185 | |
Papa John's International, Inc. (b) | | | 59,334 | | | | 2,602,389 | |
Penn National Gaming, Inc. (a) | | | 38,844 | | | | 433,499 | |
Red Robin Gourmet Burgers, Inc. (a) (b) | | | 27,655 | | | | 1,879,987 | |
Ruby Tuesday, Inc. (a) | | | 151,526 | | | | 1,168,265 | |
| Ruth's Hospitality Group, Inc. | | | 108,424 | | | | 1,365,058 | |
Scientific Games Corporation - Class A (a) (b) | | | 146,679 | | | | 1,757,214 | |
| SeaWorld Entertainment, Inc. | | | 1,880 | | | | 56,513 | |
Sonic Corporation (a) | | | 3,340 | | | | 63,594 | |
| Speedway Motorsports, Inc. | | | 1,159 | | | | 21,082 | |
Texas Roadhouse, Inc. (b) | | | 90,352 | | | | 2,235,308 | |
Town Sports International Holdings, Inc. (b) | | | 131,051 | | | | 918,668 | |
| Wendy's Company (The) | | | 10,225 | | | | 84,970 | |
| | | | | | | | 28,877,291 | |
| Household Durables - 1.4% | |
| Bassett Furniture Industries, Inc. | | | 6,504 | | | | 89,690 | |
Cavco Industries, Inc. (a) | | | 13,975 | | | | 1,089,351 | |
| CSS Industries, Inc. | | | 11,287 | | | | 270,549 | |
Dixie Group, Inc. (The) (a) | | | 86,832 | | | | 1,308,558 | |
| Flexsteel Industries, Inc. | | | 32,066 | | | | 1,100,505 | |
| Harman International Industries, Inc. | | | 2,585 | | | | 283,342 | |
Helen of Troy Ltd. (a) | | | 27,175 | | | | 1,703,873 | |
TFS MARKET NEUTRAL FUND
SCHEDULE OF INVESTMENTS (Continued)
COMMON STOCKS - 90.3%(Continued) | | Shares | | | Value | |
Consumer Discretionary - 14.1%(Continued) | |
| Household Durables - 1.4% (Continued) | |
Installed Building Products, Inc. (a) | | | 1,860 | | | $ | 25,873 | |
Jarden Corporation (a) | | | 1,801 | | | | 102,927 | |
| La-Z-Boy, Inc. | | | 23,355 | | | | 565,892 | |
LGI Homes, Inc. (a) | | | 14,001 | | | | 206,095 | |
Libbey, Inc. (a) (b) | | | 89,092 | | | | 2,376,084 | |
| Lifetime Brands, Inc. | | | 59,404 | | | | 1,134,616 | |
M/I Homes, Inc. (a) | | | 6,523 | | | | 145,267 | |
| MDC Holdings, Inc. | | | 2,697 | | | | 74,437 | |
New Home Company, Inc. (The) (a) | | | 5,328 | | | | 73,260 | |
Nova Lifestyle, Inc. (a) | | | 1,996 | | | | 8,862 | |
NVR, Inc. (a) | | | 327 | | | | 352,179 | |
Skullcandy, Inc. (a) | | | 7,240 | | | | 55,748 | |
Skyline Corporation (a) | | | 5 | | | | 26 | |
UCP, Inc. - Class A (a) | | | 4,393 | | | | 62,161 | |
Universal Electronics, Inc. (a) | | | 60,014 | | | | 2,241,523 | |
WCI Communities, Inc. (a) | | | 34,661 | | | | 664,451 | |
| Whirlpool Corporation | | | 1,653 | | | | 253,537 | |
ZAGG, Inc. (a) | | | 48,988 | | | | 213,098 | |
| | | | | | | | 14,401,904 | |
| Internet & Catalog Retail - 0.7% | |
1-800-FLOWERS.COM, Inc. - Class A (a) | | | 247,549 | | | | 1,349,142 | |
Amazon.com, Inc. (a) | | | 185 | | | | 56,264 | |
Blue Nile, Inc. (a) (b) | | | 58,025 | | | | 2,015,208 | |
Groupon, Inc. (a) | | | 9,830 | | | | 68,712 | |
Liberty Ventures - Series A (a) | | | 2,008 | | | | 116,544 | |
MakeMyTrip Ltd. (a) | | | 14,178 | | | | 300,432 | |
Overstock.com, Inc. (a) | | | 37,666 | | | | 603,409 | |
RetailMeNot, Inc. (a) | | | 6,748 | | | | 201,158 | |
Shutterfly, Inc. (a) (b) | | | 39,834 | | | | 1,630,406 | |
ValueVision Media, Inc. - Class A (a) | | | 125,011 | | | | 585,052 | |
Vitacost.com, Inc. (a) | | | 9,678 | | | | 64,552 | |
| | | | | | | | 6,990,879 | |
| Leisure Products - 0.1% | |
| Arctic Cat, Inc. | | | 6,624 | | | | 270,855 | |
| Escalade, Inc. | | | 5,562 | | | | 81,873 | |
LeapFrog Enterprises, Inc. (a) | | | 29,069 | | | | 199,123 | |
Malibu Boats, Inc. - Class A (a) | | | 5,814 | | | | 129,420 | |
Nautilus, Inc. (a) | | | 88,019 | | | | 733,198 | |
| | | | | | | | 1,414,469 | |
| Media - 1.7% | |
| A.H. Belo Corporation - Class A | | | 103,076 | | | | 1,186,405 | |
Carmike Cinemas, Inc. (a) | | | 69,880 | | | | 2,072,641 | |
| Clear Channel Outdoor Holdings, Inc. - Class A | | | 43,290 | | | | 347,186 | |
| CTC Media, Inc. | | | 126,310 | | | | 1,095,108 | |
DIRECTV (a) | | | 3,686 | | | | 286,033 | |
DISH Network Corporation - Class A (a) | | | 8,002 | | | | 454,994 | |
E.W. Scripps Company (The) - Class A (a) | | | 22,861 | | | | 391,609 | |
Emmis Communications Corporation - Class A (a) | | | 86,714 | | | | 280,086 | |
| Entravision Communications Corporation - Class A | | | 241,977 | | | | 1,284,898 | |
Eros International plc (a) | | | 14,253 | | | | 228,048 | |
TFS MARKET NEUTRAL FUND
SCHEDULE OF INVESTMENTS (Continued)
COMMON STOCKS - 90.3%(Continued) | | Shares | | | Value | |
Consumer Discretionary - 14.1%(Continued) | |
| Media - 1.7% (Continued) | |
Global Sources Ltd. (a) | | | 40,703 | | | $ | 361,850 | |
| Harte-Hanks, Inc. | | | 22,366 | | | | 179,822 | |
Insignia Systems, Inc. (a) | | | 189 | | | | 554 | |
| Interpublic Group of Companies, Inc. | | | 16,622 | | | | 289,555 | |
| John Wiley & Sons, Inc. - Class A | | | 5,437 | | | | 312,410 | |
Journal Communications, Inc. - Class A (a) | | | 304,734 | | | | 2,443,967 | |
Lee Enterprises, Inc. (a) (b) | | | 21,941 | | | | 88,203 | |
Liberty Global plc - Series C (a) | | | 3,356 | | | | 128,971 | |
LIN Media, LLC - Class A (a) | | | 28,380 | | | | 664,943 | |
| Lions Gate Entertainment Corporation | | | 6,390 | | | | 169,527 | |
Loral Space & Communications, Inc. (a) | | | 9,421 | | | | 678,218 | |
Martha Stewart Living Omnimedia, Inc. - Class A (a) | | | 145,970 | | | | 570,743 | |
| Morningstar, Inc. | | | 1,150 | | | | 84,329 | |
| National CineMedia, Inc. | | | 21,223 | | | | 322,377 | |
New York Times Company (The) - Class A (b) | | | 126,511 | | | | 2,034,297 | |
| Omnicom Group, Inc. | | | 2,422 | | | | 163,921 | |
Rentrak Corporation (a) | | | 7,242 | | | | 412,721 | |
| Saga Communications, Inc. - Class A | | | 9,964 | | | | 441,405 | |
| Salem Communications Corporation - Class A | | | 12,432 | | | | 109,526 | |
Sirius XM Holdings, Inc. (a) | | | 20,997 | | | | 66,980 | |
Starz - Series A (a) | | | 8,595 | | | | 277,361 | |
| Time Warner Cable, Inc. | | | 256 | | | | 36,214 | |
| | | | | | | | 17,464,902 | |
| Multiline Retail - 0.2% | |
Big Lots, Inc. (a) | | | 31,822 | | | | 1,256,969 | |
| Bon-Ton Stores, Inc. (The) | | | 14,663 | | | | 161,293 | |
Dollar Tree, Inc. (a) | | | 9,378 | | | | 488,312 | |
| Fred's, Inc. - Class A | | | 5,639 | | | | 102,743 | |
Gordmans Stores, Inc. (b) | | | 6,060 | | | | 27,209 | |
| Macy's, Inc. | | | 3,737 | | | | 214,616 | |
| | | | | | | | 2,251,142 | |
| Specialty Retail - 2.6% | |
Aaron's, Inc. (b) | | | 65,603 | | | | 1,933,320 | |
| Abercrombie & Fitch Company - Class A | | | 33,260 | | | | 1,222,638 | |
ANN, INC. (a) | | | 6,873 | | | | 269,353 | |
Asbury Automotive Group, Inc. (a) | | | 9,527 | | | | 588,197 | |
Barnes & Noble, Inc. (a) (b) | | | 104,328 | | | | 1,710,979 | |
| bebe stores, Inc. | | | 27,613 | | | | 139,446 | |
Bed Bath & Beyond, Inc. (a) | | | 1,809 | | | | 112,393 | |
| Best Buy Company, Inc. | | | 13,861 | | | | 359,416 | |
| Big 5 Sporting Goods Corporation | | | 25,235 | | | | 308,119 | |
Body Central Corporation (a) | | | 30,406 | | | | 31,622 | |
| Brown Shoe Company, Inc. | | | 15,736 | | | | 371,212 | |
Build-A-Bear Workshop, Inc. (a) | | | 71,262 | | | | 799,560 | |
| Cato Corporation (The) - Class A | | | 2,543 | | | | 72,450 | |
| Chico's FAS, Inc. | | | 32,291 | | | | 512,781 | |
Christopher & Banks Corporation (a) (b) | | | 83,803 | | | | 522,931 | |
Citi Trends, Inc. (a) | | | 8,504 | | | | 144,483 | |
Destination Maternity Corporation (b) | | | 15,748 | | | | 388,346 | |
Destination XL Group, Inc. (a) | | | 2,644 | | | | 14,278 | |
TFS MARKET NEUTRAL FUND
SCHEDULE OF INVESTMENTS (Continued)
COMMON STOCKS - 90.3%(Continued) | | Shares | | | Value | |
Consumer Discretionary - 14.1%(Continued) | |
| Specialty Retail - 2.6% (Continued) | |
| Dick's Sporting Goods, Inc. | | | 1,931 | | | $ | 101,686 | |
Express, Inc. (a) | | | 59,979 | | | | 873,894 | |
| Finish Line, Inc. (The) - Class A | | | 32,555 | | | | 896,239 | |
| Gap, Inc. (The) | | | 1,685 | | | | 66,220 | |
Genesco, Inc. (a) | | | 1,004 | | | | 76,675 | |
| Haverty Furniture Companies, Inc. | | | 32,842 | | | | 838,785 | |
Kirkland's, Inc. (a) | | | 43,922 | | | | 751,505 | |
MarineMax, Inc. (a) | | | 35,779 | | | | 574,611 | |
Mattress Firm Holding Corporation (a) | | | 2,493 | | | | 112,659 | |
Murphy USA, Inc. (a) (b) | | | 18,810 | | | | 799,425 | |
New York & Company, Inc. (a) | | | 79,199 | | | | 331,844 | |
Pacific Sunwear of California, Inc. (a) | | | 247,735 | | | | 713,477 | |
Pep Boys - Manny, Moe & Jack (The) (a) | | | 16,165 | | | | 165,206 | |
Perfumania Holdings, Inc. (a) | | | 1,221 | | | | 8,095 | |
| Pier 1 Imports, Inc. | | | 6,275 | | | | 114,582 | |
| Ross Stores, Inc. | | | 499 | | | | 33,972 | |
Sears Hometown and Outlet Stores, Inc. (a) | | | 10,065 | | | | 237,635 | |
Shoe Carnival, Inc. (b) | | | 17,682 | | | | 403,857 | |
| Signet Jewelers Ltd. | | | 1,074 | | | | 108,818 | |
| Sonic Automotive, Inc. - Class A | | | 26,664 | | | | 649,002 | |
Stage Stores, Inc. (b) | | | 81,216 | | | | 1,557,723 | |
Stein Mart, Inc. (b) | | | 19,375 | | | | 242,187 | |
Systemax, Inc. (a) | | | 3,624 | | | | 62,659 | |
Tilly's, Inc. - Class A (a) | | | 14,163 | | | | 160,042 | |
TravelCenters of America, LLC (a) (b) | | | 84,572 | | | | 640,210 | |
Vitamin Shoppe, Inc. (a) (b) | | | 41,498 | | | | 1,986,924 | |
West Marine, Inc. (a) | | | 2,873 | | | | 30,741 | |
Wet Seal, Inc. (The) - Class A (a) | | | 190,521 | | | | 215,289 | |
| Winmark Corporation | | | 12,078 | | | | 916,237 | |
Zale Corporation (a) (b) | | | 124,567 | | | | 2,664,488 | |
| | | | | | | | 25,836,211 | |
| Textiles, Apparel & Luxury Goods - 1.1% | |
Columbia Sportswear Company (b) | | | 21,432 | | | | 1,842,723 | |
Deckers Outdoor Corporation (a) (b) | | | 28,379 | | | | 2,240,522 | |
G-III Apparel Group Ltd. (a) (b) | | | 32,273 | | | | 2,316,233 | |
Iconix Brand Group, Inc. (a) (b) | | | 35,687 | | | | 1,516,697 | |
Joe's Jeans, Inc. (a) | | | 95,578 | | | | 100,357 | |
Kate Spade & Company (a) | | | 2,754 | | | | 95,757 | |
| Movado Group, Inc. | | | 37,013 | | | | 1,453,871 | |
| Oxford Industries, Inc. | | | 2,426 | | | | 160,140 | |
| R.G. Barry Corporation | | | 842 | | | | 15,392 | |
| Ralpha Lauren Corporation | | | 242 | | | | 36,632 | |
Skechers U.S.A., Inc. - Class A (a) | | | 22,476 | | | | 921,291 | |
Unifi, Inc. (a) | | | 26,572 | | | | 588,304 | |
Vince Holding Corporation (a) | | | 7,510 | | | | 206,600 | |
| | | | | | | | 11,494,519 | |
Consumer Staples - 2.9% | |
| Beverages - 0.3% | |
| Beam, Inc. | | | 3,328 | | | | 277,788 | |
Castle Brands, Inc. (a) | | | 5,045 | | | | 4,616 | |
TFS MARKET NEUTRAL FUND
SCHEDULE OF INVESTMENTS (Continued)
COMMON STOCKS - 90.3%(Continued) | | Shares | | | Value | |
Consumer Staples - 2.9%(Continued) | |
| Beverages - 0.3% (Continued) | |
Coca-Cola Bottling Company Consolidated (b) | | | 24,506 | | | $ | 2,015,129 | |
| Coca-Cola Enterprises, Inc. | | | 757 | | | | 34,398 | |
Cott Corporation (b) | | | 73,341 | | | | 595,529 | |
| | | | | | | | 2,927,460 | |
| Food & Staples Retailing - 0.3% | |
| Andersons, Inc. (The) | | | 5,735 | | | | 357,233 | |
| Costco Wholesale Corporation | | | 664 | | | | 76,812 | |
Ingles Markets, Inc. - Class A (b) | | | 45,105 | | | | 1,036,964 | |
Pantry, Inc. (The) (a) | | | 42,870 | | | | 644,765 | |
| Safeway, Inc. | | | 7,260 | | | | 247,276 | |
| Spartan Stores, Inc. | | | 35,334 | | | | 761,094 | |
| | | | | | | | 3,124,144 | |
| Food Products - 1.3% | |
Adecoagro, S.A. (a) (b) | | | 58,551 | | | | 522,275 | |
| Bunge Ltd. | | | 4,623 | | | | 368,222 | |
Cal-Maine Foods, Inc. (b) | | | 44,285 | | | | 2,640,715 | |
Chiquita Brands International, Inc. (a) | | | 10,200 | | | | 117,096 | |
Farmer Brothers Company (a) | | | 39,316 | | | | 774,918 | |
| Hillshire Brands Company (The) | | | 6,986 | | | | 249,051 | |
Inventure Foods, Inc. (a) | | | 25,397 | | | | 305,272 | |
J & J Snack Foods Corporation (b) | | | 20,649 | | | | 1,932,746 | |
| John B. Sanfilippo & Son, Inc. | | | 3,283 | | | | 75,673 | |
Mondelēz International, Inc. - Class A | | | 8,987 | | | | 320,387 | |
Omega Protein Corporation (a) (b) | | | 58,849 | | | | 668,525 | |
Origin Agritech Ltd. (a) (b) | | | 143,506 | | | | 292,752 | |
| Sanderson Farms, Inc. | | | 3,079 | | | | 253,309 | |
Seneca Foods Corporation - Class A (a) | | | 26,238 | | | | 745,159 | |
Snyder's-Lance, Inc. (b) | | | 56,131 | | | | 1,490,839 | |
SunOpta, Inc. (a) (b) | | | 6,591 | | | | 76,917 | |
TreeHouse Foods, Inc. (a) (b) | | | 23,158 | | | | 1,733,145 | |
| Tyson Foods, Inc. - Class A | | | 1,996 | | | | 83,772 | |
| | | | | | | | 12,650,773 | |
| Household Products - 0.2% | |
Central Garden & Pet Company - Class A (a) | | | 152,373 | | | | 1,260,125 | |
| Kimberly-Clark Corporation | | | 3,593 | | | | 403,314 | |
| Orchids Paper Products Company | | | 21,417 | | | | 575,475 | |
| WD-40 Company | | | 3,265 | | | | 237,822 | |
| | | | | | | | 2,476,736 | |
| Personal Products - 0.7% | |
| Avon Products, Inc. | | | 7,795 | | | | 119,108 | |
Elizabeth Arden, Inc. (a) (b) | | | 56,287 | | | | 2,067,984 | |
IGI Laboratories, Inc. (a) | | | 138,341 | | | | 695,855 | |
Inter Parfums, Inc. (b) | | | 25,088 | | | | 917,970 | |
LifeVantage Corporation (a) | | | 27,841 | | | | 38,421 | |
Medifast, Inc. (a) | | | 12,041 | | | | 381,098 | |
| Nu Skin Enterprises, Inc. - Class A | | | 437 | | | | 38,019 | |
Nutraceutical International Corporation (a) | | | 5,483 | | | | 136,636 | |
Revlon, Inc. - Class A (a) (b) | | | 86,256 | | | | 2,599,756 | |
| | | | | | | | 6,994,847 | |
TFS MARKET NEUTRAL FUND
SCHEDULE OF INVESTMENTS (Continued)
COMMON STOCKS - 90.3%(Continued) | | Shares | | | Value | |
Consumer Staples - 2.9%(Continued) | |
| Tobacco - 0.1% | |
Alliance One International, Inc. (a) | | | 127,337 | | | $ | 327,256 | |
| Reynolds American, Inc. | | | 6,421 | | | | 362,337 | |
| Vector Group Ltd. | | | 16,614 | | | | 353,878 | |
| | | | | | | | 1,043,471 | |
Energy - 7.7% | |
| Energy Equipment & Services - 2.4% | |
| Baker Hughes, Inc. | | | 1,375 | | | | 96,112 | |
Basic Energy Services, Inc. (a) | | | 18,892 | | | | 499,127 | |
| Bolt Technology Corporation | | | 7,278 | | | | 122,853 | |
CHC Group Ltd. (a) | | | 8,355 | | | | 56,396 | |
| Compressco Partners, L.P. | | | 319 | | | | 8,616 | |
Era Group, Inc. (a) | | | 23,021 | | | | 657,250 | |
Forum Energy Technologies, Inc. (a) | | | 3,354 | | | | 100,150 | |
Geospace Technologies Corporation (a) (b) | | | 16,871 | | | | 980,711 | |
| Gulf Island Fabrication, Inc. | | | 16,566 | | | | 332,314 | |
Gulfmark Offshore, Inc. - Class A (b) | | | 36,241 | | | | 1,631,207 | |
| Halliburton Company | | | 3,539 | | | | 223,205 | |
Helix Energy Solutions Group, Inc. (a) | | | 21,419 | | | | 514,913 | |
Hercules Offshore, Inc. (a) | | | 28,971 | | | | 129,500 | |
ION Geophysical Corporation (a) (b) | | | 226,474 | | | | 996,486 | |
Key Energy Services, Inc. (a) | | | 180,738 | | | | 1,814,610 | |
Matrix Service Company (a) | | | 123,641 | | | | 3,829,162 | |
Mitcham Industries, Inc. (a) | | | 3,853 | | | | 53,171 | |
| Nabors Industries Ltd. | | | 13,120 | | | | 334,822 | |
Natural Gas Services Group, Inc. (a) | | | 43,896 | | | | 1,347,168 | |
| North American Energy Partners, Inc. | | | 7,873 | | | | 61,961 | |
| North Atlantic Drilling Ltd. | | | 64 | | | | 549 | |
Parker Drilling Company (a) | | | 146,758 | | | | 973,006 | |
PHI, Inc. (a) | | | 10,339 | | | | 463,187 | |
Pioneer Energy Services Corporation (a) (b) | | | 316,433 | | | | 4,737,002 | |
RigNet, Inc. (a) | | | 13,532 | | | | 632,756 | |
Rowan Companies plc - Class A (a) | | | 576 | | | | 17,810 | |
| RPC, Inc. | | | 857 | | | | 19,051 | |
| Superior Energy Services, Inc. | | | 475 | | | | 15,637 | |
Tesco Corporation (a) | | | 43,172 | | | | 863,440 | |
TETRA Technologies, Inc. (a) | | | 14,979 | | | | 187,238 | |
Unit Corporation (a) | | | 2,802 | | | | 184,792 | |
| USA Compression Partners, L.P. | | | 7,086 | | | | 195,786 | |
Willbros Group, Inc. (a) (b) | | | 205,746 | | | | 2,285,838 | |
| | | | | | | | 24,365,826 | |
| Oil, Gas & Consumable Fuels - 5.3% | |
Abraxas Petroleum Corporation (a) (b) | | | 268,891 | | | | 1,468,145 | |
| Adams Resources & Energy, Inc. | | | 17,032 | | | | 1,227,326 | |
Advantage Oil & Gas Ltd. (a) (b) | | | 59,004 | | | | 373,495 | |
| Alon USA Energy, Inc. | | | 15,617 | | | | 254,401 | |
American Eagle Energy Corporation (a) | | | 18,191 | | | | 125,518 | |
| American Midstream Partners, L.P. | | | 18 | | | | 487 | |
| Ardmore Shipping Corporation | | | 46,698 | | | | 608,942 | |
Bellatrix Exploration Ltd. (a) | | | 42,215 | | | | 410,330 | |
Bonanza Creek Energy, Inc. (a) (b) | | | 42,338 | | | | 2,058,474 | |
TFS MARKET NEUTRAL FUND
SCHEDULE OF INVESTMENTS (Continued)
COMMON STOCKS - 90.3%(Continued) | | Shares | | | Value | |
Energy - 7.7%(Continued) | |
| Oil, Gas & Consumable Fuels - 5.3% (Continued) | |
Callon Petroleum Company (a) (b) | | | 182,382 | | | $ | 1,674,267 | |
| Cameco Corporation | | | 3,819 | | | | 81,307 | |
| Capital Product Partners, L.P. | | | 21,873 | | | | 240,603 | |
| Comstock Resources, Inc. | | | 28,980 | | | | 805,644 | |
| Delek US Holdings, Inc. | | | 13,624 | | | | 435,832 | |
Denison Mines Corporation (a) | | | 87,726 | | | | 120,185 | |
| DHT Holdings, Inc. | | | 119,520 | | | | 933,451 | |
Dorchester Minerals, L.P. (b) | | | 15,196 | | | | 416,067 | |
| Dynagas LNG Partners, L.P. | | | 564 | | | | 12,301 | |
Eagle Rock Energy Partners, L.P. (b) | | | 62,848 | | | | 271,503 | |
| ECA Marcellus Trust I | | | 448 | | | | 3,889 | |
| Enduro Royalty Trust | | | 8,183 | | | | 100,815 | |
| Energen Corporation | | | 3,833 | | | | 298,629 | |
| EOG Resources, Inc. | | | 1,858 | | | | 182,084 | |
EPL Oil & Gas, Inc. (a) | | | 28,871 | | | | 1,130,011 | |
| Equal Energy Ltd. | | | 86,104 | | | | 390,051 | |
| EXCO Resources, Inc. | | | 96,465 | | | | 612,553 | |
FX Energy, Inc. (a) | | | 1,387 | | | | 7,837 | |
GasLog Ltd. (b) | | | 68,796 | | | | 1,842,357 | |
Gastar Exploration, Inc. (a) | | | 21,688 | | | | 143,791 | |
| Global Partners, L.P. | | | 90 | | | | 3,654 | |
| Golar LNG Ltd. | | | 13,982 | | | | 618,004 | |
| Golar LNG Partners, L.P. | | | 6,339 | | | | 196,192 | |
Gran Tierra Energy, Inc. (a) | | | 21,203 | | | | 151,601 | |
| Hugoton Royalty Trust | | | 28,436 | | | | 291,469 | |
Jones Energy, Inc. - Class A (a) | | | 4,235 | | | | 65,516 | |
| Knightsbridge Tankers Ltd. | | | 51,421 | | | | 614,481 | |
Kodiak Oil & Gas Corporation (a) (b) | | | 149,318 | | | | 1,897,832 | |
| Legacy Reserves, L.P. | | | 8,626 | | | | 213,580 | |
| Lehigh Gas Partners, L.P. | | | 5,160 | | | | 138,752 | |
| LRR Energy, L.P. | | | 733 | | | | 12,710 | |
Magellan Petroleum Corporation (a) | | | 5,982 | | | | 13,220 | |
Magnum Hunter Resources Corporation (a) | | | 77 | | | | 655 | |
| Marathon Petroleum Corporation | | | 643 | | | | 59,767 | |
| Marlin Midstream Partners, L.P. | | | 8,932 | | | | 159,347 | |
| Martin Midstream Partners, L.P. | | | 45 | | | | 1,907 | |
| Memorial Production Partners, L.P. | | | 11,550 | | | | 270,732 | |
| Mid-Con Energy Partners, L.P. | | | 14,292 | | | | 330,288 | |
Midstates Petroleum Company, Inc. (a) | | | 5,261 | | | | 31,040 | |
| MV Oil Trust | | | 2,771 | | | | 70,522 | |
Navigator Holdings Ltd. (a) | | | 21,290 | | | | 568,443 | |
| Navios Maritime Acquisition Corporation | | | 175 | | | | 621 | |
| New Source Energy Partners, L.P. | | | 849 | | | | 19,442 | |
| NuStar GP Holdings, LLC | | | 5,766 | | | | 204,116 | |
| Pacific Coast Oil Trust | | | 15,805 | | | | 208,784 | |
Pacific Ethanol, Inc. (a) | | | 46,688 | | | | 728,333 | |
| Panhandle Oil & Gas, Inc. - Class A | | | 18,446 | | | | 808,857 | |
PBF Energy, Inc. - Class A (b) | | | 106,648 | | | | 3,282,625 | |
| Peabody Energy Corporation | | | 4,995 | | | | 94,955 | |
| Permian Basin Royalty Trust | | | 19,377 | | | | 259,846 | |
TFS MARKET NEUTRAL FUND
SCHEDULE OF INVESTMENTS (Continued)
COMMON STOCKS - 90.3%(Continued) | | Shares | | | Value | |
Energy - 7.7%(Continued) | |
| Oil, Gas & Consumable Fuels - 5.3% (Continued) | |
PetroQuest Energy, Inc. (a) | | | 350,410 | | | $ | 2,109,468 | |
| Phillips 66 | | | 4,340 | | | | 361,175 | |
PostRock Energy Corporation (a) | | | 9,291 | | | | 12,729 | |
| QEP Midstream Partners, L.P. | | | 8,534 | | | | 203,109 | |
| QR Energy, L.P. | | | 8,968 | | | | 165,549 | |
Renewable Energy Group, Inc. (a) | | | 3,395 | | | | 39,959 | |
REX American Resources Corporation (a) | | | 44,421 | | | | 2,903,357 | |
Rice Energy, Inc. (a) | | | 554 | | | | 16,454 | |
Ring Energy, Inc. (a) | | | 9,891 | | | | 181,994 | |
| Rose Rock Midstream, L.P. | | | 3,186 | | | | 132,856 | |
| Sabine Royalty Trust | | | 5,322 | | | | 275,147 | |
Sanchez Energy Corporation (a) | | | 34,053 | | | | 963,019 | |
SandRidge Energy, Inc. (a) | | | 117,783 | | | | 807,991 | |
| SandRidge Mississippian Trust II | | | 30,335 | | | | 254,511 | |
SandRidge Permian Trust (b) | | | 21,563 | | | | 269,106 | |
Scorpio Bulkers, Inc. (a) | | | 5,602 | | | | 50,138 | |
| SemGroup Corporation - Class A | | | 1,344 | | | | 85,855 | |
| SM Energy Company | | | 626 | | | | 46,405 | |
| Southcross Energy Partners, L.P. | | | 11,937 | | | | 205,316 | |
| Sprague Resources, L.P. | | | 7,111 | | | | 154,451 | |
StealthGas, Inc. (a) | | | 38,974 | | | | 422,478 | |
Stone Energy Corporation (a) (b) | | | 54,950 | | | | 2,695,298 | |
| Summit Midstream Partners, L.P. | | | 145 | | | | 6,554 | |
Swift Energy Company (a) | | | 14,858 | | | | 183,199 | |
Synergy Resources Corporation (a) | | | 17,402 | | | | 202,559 | |
| Talisman Energy, Inc. | | | 8,095 | | | | 83,621 | |
| Tallgrass Energy Partners, L.P. | | | 5,145 | | | | 190,056 | |
| Targa Resources Partners, L.P. | | | 11 | | | | 651 | |
| Teekay Corporation | | | 5,285 | | | | 296,541 | |
Tengasco, Inc. (a) | | | 590 | | | | 277 | |
TransGlobe Energy Corporation (a) (b) | | | 42,272 | | | | 329,722 | |
TransMontaigne Partners, L.P. (b) | | | 5,496 | | | | 251,167 | |
Triangle Petroleum Corporation (a) | | | 182,965 | | | | 1,760,123 | |
Tsakos Energy Navigation Ltd. (b) | | | 75,186 | | | | 536,076 | |
VAALCO Energy, Inc. (a) | | | 205,639 | | | | 1,895,992 | |
| Valero Energy Corporation | | | 7,020 | | | | 401,333 | |
| Valero Energy Partners, L.P. | | | 4,048 | | | | 166,818 | |
Vertex Energy, Inc. (a) | | | 125,438 | | | | 1,019,811 | |
| VOC Energy Trust | | | 5,384 | | | | 78,122 | |
| W&T Offshore, Inc. | | | 18,476 | | | | 354,739 | |
Warren Resources, Inc. (a) (b) | | | 660,240 | | | | 3,347,417 | |
| Western Refining Logistics, L.P. | | | 1,427 | | | | 46,891 | |
Westmoreland Coal Company (a) | | | 58,872 | | | | 1,743,200 | |
| Whiting USA Trust II | | | 18,476 | | | | 252,567 | |
| World Point Terminals, L.P. | | | 12,416 | | | | 274,021 | |
WPX Energy, Inc. (a) | | | 40 | | | | 851 | |
| | | | | | | | 53,326,259 | |
Financials - 13.5% | |
| Banks - 2.0% | |
| 1st Source Corporation | | | 4,810 | | | | 141,847 | |
TFS MARKET NEUTRAL FUND
SCHEDULE OF INVESTMENTS (Continued)
COMMON STOCKS - 90.3%(Continued) | | Shares | | | Value | |
Financials - 13.5%(Continued) | |
| Banks - 2.0% (Continued) | |
Ameris Bancorp (a) | | | 9,644 | | | $ | 205,128 | |
| BancFirst Corporation | | | 1,489 | | | | 86,675 | |
| Banco Latinoamericano de Comercio Exterior, S.A. - Class E | | | 4,767 | | | | 122,607 | |
| Bank of Kentucky Financial Corporation | | | 329 | | | | 11,354 | |
| Bank of Marin Bancorp | | | 1,127 | | | | 51,177 | |
| BB&T Corporation | | | 10,590 | | | | 395,325 | |
| BBCN Bancorp, Inc. | | | 40,230 | | | | 619,944 | |
| Bridge Bancorp, Inc. | | | 628 | | | | 15,273 | |
Bridge Capital Holdings (a) | | | 2,207 | | | | 49,437 | |
| Bryn Mawr Bank Corporation | | | 3,668 | | | | 100,063 | |
| Camden National Corporation | | | 3,706 | | | | 141,458 | |
Capital Bank Financial Corporation - Class A (a) | | | 42,834 | | | | 1,021,591 | |
| CenterState Banks, Inc. | | | 781 | | | | 8,568 | |
| Central Pacific Financial Corporation | | | 34,006 | | | | 638,293 | |
| Chemical Financial Corporation | | | 12,190 | | | | 342,173 | |
| Comerica, Inc. | | | 4,544 | | | | 219,203 | |
| Community Trust Bancorp, Inc. | | | 824 | | | | 30,381 | |
ConnectOne Bancorp, Inc. (a) | | | 1,149 | | | | 55,152 | |
Customers Bancorp, Inc. (a) | | | 62,570 | | | | 1,378,417 | |
Eagle Bancorp, Inc. (a) (b) | | | 7,167 | | | | 239,306 | |
| Enterprise Financial Services Corporation | | | 26,900 | | | | 480,703 | |
| F.N.B. Corporation | | | 8,506 | | | | 105,815 | |
| Fidelity Southern Corporation | | | 10,095 | | | | 133,355 | |
| Financial Institutions, Inc. | | | 26,869 | | | | 622,017 | |
| First Bancorp (North Carolina) | | | 12,745 | | | | 219,341 | |
| First Busey Corporation | | | 101,963 | | | | 560,796 | |
| First Business Financial Services, Inc. | | | 10,392 | | | | 469,822 | |
| First Community Bancshares, Inc. | | | 682 | | | | 10,100 | |
| First Financial Corporation | | | 5,295 | | | | 169,493 | |
First Horizon National Corporation (b) | | | 166,677 | | | | 1,915,119 | |
| First Interstate BancSystem, Inc. | | | 20,330 | | | | 506,014 | |
| First Merchants Corporation | | | 43,248 | | | | 917,723 | |
| First Midwest Bancorp, Inc. | | | 18,262 | | | | 298,949 | |
First NBC Bank Holding Company (a) | | | 9,360 | | | | 291,096 | |
| First Republic Bank | | | 5,404 | | | | 274,307 | |
| Fulton Financial Corporation | | | 49,488 | | | | 603,259 | |
| German American Bancorp, Inc. | | | 1,236 | | | | 32,185 | |
| Great Southern Bancorp, Inc. | | | 6,010 | | | | 172,307 | |
HomeTrust Bancshares, Inc. (a) | | | 4,565 | | | | 69,708 | |
| IBERIABANK Corporation | | | 687 | | | | 43,212 | |
| Independent Bank Corporation (Michigan) | | | 79,574 | | | | 1,036,053 | |
| Independent Bank Group, Inc. | | | 3,332 | | | | 163,968 | |
| International Bancshares Corporation | | | 6,117 | | | | 140,446 | |
| Investors Bancorp, Inc. | | | 4,481 | | | | 119,777 | |
| MainSource Financial Group, Inc. | | | 2,460 | | | | 40,664 | |
Metro Bancorp, Inc. (a) | | | 1,504 | | | | 30,712 | |
| National Bank Holdings Corporation - Class A | | | 595 | | | | 11,400 | |
| Old Line Bancshares, Inc. | | | 5,590 | | | | 94,862 | |
| Old National Bancorp | | | 860 | | | | 12,143 | |
TFS MARKET NEUTRAL FUND
SCHEDULE OF INVESTMENTS (Continued)
COMMON STOCKS - 90.3%(Continued) | | Shares | | | Value | |
Financials - 13.5%(Continued) | |
| Banks - 2.0% (Continued) | |
| OmniAmerican Bancorp, Inc. | | | 1,623 | | | $ | 40,348 | |
| Pacific Continental Corporation | | | 10,777 | | | | 142,041 | |
Pacific Premier Bancorp, Inc. (a) | | | 351 | | | | 4,791 | |
| PacWest Bancorp | | | 7,879 | | | | 310,196 | |
| Park Sterling Corporation | | | 5,919 | | | | 38,651 | |
| Penns Woods Bancorp, Inc. | | | 639 | | | | 28,116 | |
Preferred Bank (a) | | | 15,762 | | | | 338,095 | |
| Regions Financial Corporation | | | 8,061 | | | | 81,739 | |
| Sandy Spring Bancorp, Inc. | | | 5,352 | | | | 128,716 | |
Seacoast Banking Corporation of Florida (a) | | | 71,875 | | | | 761,875 | |
| Sierra Bancorp | | | 500 | | | | 7,805 | |
| Southwest Bancorp, Inc. | | | 7,458 | | | | 124,549 | |
| State Bank Financial Corporation | | | 1,749 | | | | 28,998 | |
| Stock Yards Bancorp, Inc. | | | 9,077 | | | | 267,590 | |
| Susquehanna Bancshares, Inc. | | | 20,046 | | | | 207,677 | |
Synovus Financial Corporation (b) | | | 99,701 | | | | 320,040 | |
Talmer Bancorp, Inc. - Class A (a) | | | 3,199 | | | | 42,899 | |
Taylor Capital Group, Inc. (a) | | | 11,687 | | | | 248,816 | |
Tristate Capital Holdings, Inc. (a) | | | 1,794 | | | | 23,465 | |
| UMB Financial Corporation | | | 1,579 | | | | 92,703 | |
| Union Bankshares Corporation | | | 8,280 | | | | 211,885 | |
| Univest Corporation of Pennsylvania | | | 837 | | | | 16,497 | |
| Washington Banking Company | | | 10,206 | | | | 175,543 | |
| WesBanco, Inc. | | | 12,549 | | | | 379,482 | |
Western Alliance Bancorp (a) | | | 6,886 | | | | 158,860 | |
| Wilshire Bancorp, Inc. | | | 27,844 | | | | 278,440 | |
Yadkin Financial Corporation (a) | | | 12,601 | | | | 241,309 | |
| | | | | | | | 20,119,844 | |
| Capital Markets - 2.2% | |
| AllianceBernstein Holding, L.P. | | | 2,057 | | | | 52,309 | |
Apollo Global Management, LLC - Class A (b) | | | 32,010 | | | | 868,431 | |
| Arlington Asset Investment Corporation - Class A | | | 1,322 | | | | 34,967 | |
| BGC Partners, Inc. - Class A | | | 50,848 | | | | 364,580 | |
| BlackRock Kelso Capital Corporation | | | 12,270 | | | | 111,412 | |
| Blackstone Group, L.P. (The) | | | 8,677 | | | | 256,232 | |
| Calamos Asset Management, Inc. - Class A | | | 7,425 | | | | 90,436 | |
| Capital Southwest Corporation | | | 2,805 | | | | 98,455 | |
| Carlyle Group, L.P. (The) | | | 36,809 | | | | 1,180,833 | |
| CorEnergy Infrastructure Trust, Inc. | | | 4,810 | | | | 33,574 | |
| Diamond Hill Investment Group, Inc. | | | 886 | | | | 105,186 | |
E*TRADE Financial Corporation (a) | | | 1,973 | | | | 44,294 | |
| Ellington Financial, LLC | | | 18,572 | | | | 439,599 | |
| Evercore Partners, Inc. - Class A | | | 9,783 | | | | 522,706 | |
FBR & Company (a) | | | 45,512 | | | | 1,174,210 | |
| Fortress Investment Group, LLC - Class A | | | 70,955 | | | | 507,328 | |
| GAMCO Investors, Inc. - Class A | | | 7,120 | | | | 540,622 | |
| Gladstone Investment Corporation | | | 38,565 | | | | 303,121 | |
Harris & Harris Group, Inc. (a) | | | 203 | | | | 729 | |
| HFF, Inc. - Class A | | | 28,854 | | | | 981,036 | |
Investment Technology Group, Inc. (a) | | | 12,183 | | | | 251,457 | |
TFS MARKET NEUTRAL FUND
SCHEDULE OF INVESTMENTS (Continued)
COMMON STOCKS - 90.3%(Continued) | | Shares | | | Value | |
Financials - 13.5%(Continued) | |
| Capital Markets - 2.2% (Continued) | |
KCG Holdings, Inc. - Class A (a) | | | 5,386 | | | $ | 53,591 | |
| KKR & Company, L.P. | | | 9,127 | | | | 207,274 | |
Ladenburg Thalmann Financial Services, Inc. (a) | | | 110,416 | | | | 301,436 | |
| Lazard Ltd. - Class A | | | 7,952 | | | | 374,142 | |
| LPL Financial Holdings, Inc. | | | 10,407 | | | | 492,771 | |
| Manning & Napier, Inc. | | | 43,126 | | | | 716,754 | |
Marcus & Millichap, Inc. (a) | | | 5,762 | | | | 95,246 | |
| MCG Capital Corporation | | | 199,242 | | | | 669,453 | |
| Medallion Financial Corporation | | | 5,869 | | | | 79,818 | |
| Medley Capital Corporation | | | 7,426 | | | | 96,835 | |
| Morgan Stanley | | | 8,170 | | | | 252,698 | |
Och-Ziff Capital Management Group, LLC - Class A (b) | | | 108,766 | | | | 1,304,104 | |
| Oppenheimer Holdings, Inc. - Class A | | | 12,600 | | | | 320,796 | |
PennantPark Investment Corporation (b) | | | 95,046 | | | | 1,016,992 | |
Piper Jaffray Companies, Inc. (a) (b) | | | 34,121 | | | | 1,496,547 | |
| Prospect Capital Corporation | | | 99,789 | | | | 1,078,719 | |
| Pzena Investment Management, Inc. - Class A | | | 83,298 | | | | 905,449 | |
| SEI Investments Company | | | 1,911 | | | | 61,878 | |
| Silvercrest Asset Management Group, Inc. - Class A | | | 5 | | | | 87 | |
| Solar Capital Ltd. | | | 20,502 | | | | 448,994 | |
Stifel Financial Corporation (a) (b) | | | 43,771 | | | | 2,047,170 | |
SWS Group, Inc. (a) | | | 189,980 | | | | 1,407,752 | |
| Waddell & Reed Financial, Inc. - Class A | | | 3,225 | | | | 217,526 | |
Walter Investment Management Corporation (a) | | | 18,832 | | | | 500,555 | |
| Westwood Holdings Group, Inc. | | | 3,023 | | | | 175,848 | |
| WhiteHorse Finance, Inc. | | | 27,621 | | | | 376,750 | |
| | | | | | | | 22,660,702 | |
| Consumer Finance - 0.4% | |
| Cash America International, Inc. | | | 3,205 | | | | 139,578 | |
First Cash Financial Services, Inc. (a) | | | 2,760 | | | | 134,605 | |
Green Dot Corporation - Class A (a) | | | 13,545 | | | | 235,276 | |
Nelnet, Inc. - Class A (b) | | | 59,804 | | | | 2,527,317 | |
| Nicholas Financial, Inc. | | | 16,249 | | | | 255,434 | |
Regional Management Corporation (a) | | | 15,806 | | | | 242,464 | |
| Santander Consumer USA Holdings, Inc. | | | 4,651 | | | | 105,764 | |
Springleaf Holdings, Inc. (a) | | | 858 | | | | 19,717 | |
| | | | | | | | 3,660,155 | |
| Diversified Financial Services - 0.3% | |
| CBOE Holdings, Inc. | | | 596 | | | | 31,802 | |
China Commercial Credit, Inc. (a) | | | 46 | | | | 249 | |
| Compass Diversified Holdings, Inc. | | | 20,614 | | | | 381,153 | |
Consumer Portfolio Services, Inc. (a) | | | 33,170 | | | | 231,527 | |
| MarketAxess Holdings, Inc. | | | 19,452 | | | | 1,048,074 | |
| Marlin Business Services Corporation | | | 27,061 | | | | 464,637 | |
NewStar Financial, Inc. (a) | | | 16,511 | | | | 188,556 | |
PHH Corporation (a) | | | 6,053 | | | | 143,880 | |
PICO Holdings, Inc. (a) | | | 2,542 | | | | 59,101 | |
| Texas Pacific Land Trust | | | 2,750 | | | | 361,955 | |
| Tiptree Financial, Inc. - Class A | | | 10,184 | | | | 96,239 | |
TFS MARKET NEUTRAL FUND
SCHEDULE OF INVESTMENTS (Continued)
COMMON STOCKS - 90.3%(Continued) | | Shares | | | Value | |
Financials - 13.5%(Continued) | |
| Diversified Financial Services - 0.3% (Continued) | |
| Voya Financial, Inc. | | | 1,721 | | | $ | 60,906 | |
| | | | | | | | 3,068,079 | |
| Insurance - 2.6% | |
| Aflac, Inc. | | | 500 | | | | 31,360 | |
| American Equity Investment Life Holding Company | | | 10,756 | | | | 250,830 | |
| American Financial Group, Inc. | | | 1,323 | | | | 77,303 | |
AMERISAFE, Inc. (b) | | | 4,129 | | | | 176,102 | |
| Argo Group International Holdings Ltd. | | | 8,939 | | | | 397,070 | |
| Aspen Insurance Holdings Ltd. | | | 53,711 | | | | 2,458,890 | |
| Assurant, Inc. | | | 633 | | | | 42,671 | |
| Assured Guaranty Ltd. | | | 2,939 | | | | 70,272 | |
| Baldwin & Lyons, Inc. - Class B | | | 2,370 | | | | 61,644 | |
| Blue Capital Holdings Ltd. | | | 2,303 | | | | 42,744 | |
| Crawford & Company - Class B | | | 15,373 | | | | 175,560 | |
| EMC Insurance Group, Inc. | | | 35,173 | | | | 1,160,357 | |
| Employers Holdings, Inc. | | | 14,548 | | | | 296,052 | |
| Endurance Specialty Holdings Ltd. | | | 2,077 | | | | 105,553 | |
| Erie Indemnity Company - Class A | | | 822 | | | | 58,896 | |
| FBL Financial Group, Inc. - Class A | | | 2,623 | | | | 117,274 | |
| Federated National Holding Company | | | 44,560 | | | | 865,801 | |
| Fidelity & Guaranty Life | | | 11,209 | | | | 240,321 | |
Hanover Insurance Group, Inc. (The) (b) | | | 17,442 | | | | 1,019,485 | |
Horace Mann Educators Corporation (b) | | | 26,503 | | | | 796,945 | |
| Investors Title Company | | | 877 | | | | 62,057 | |
Kansas City Life Insurance Company (b) | | | 19,150 | | | | 796,257 | |
| Kemper Corporation | | | 72,484 | | | | 2,856,594 | |
| Marsh & McLennan Companies, Inc. | | | 1,508 | | | | 74,359 | |
MBIA, Inc. (a) (b) | | | 191,127 | | | | 2,316,459 | |
| Mercury General Corporation | | | 11,467 | | | | 548,811 | |
| National Interstate Corporation | | | 29,448 | | | | 825,133 | |
| National Western Life Insurance Company - Class A | | | 721 | | | | 168,173 | |
Navigators Group, Inc. (The) (a) | | | 31,441 | | | | 1,791,194 | |
| OneBeacon Insurance Group Ltd. - Class A | | | 52,619 | | | | 812,437 | |
| Platinum Underwriters Holdings Ltd. | | | 871 | | | | 54,620 | |
| ProAssurance Corporation | | | 3,271 | | | | 148,569 | |
| Progressive Corporation (The) | | | 865 | | | | 20,976 | |
| Reinsurance Group of America, Inc. | | | 5,824 | | | | 446,759 | |
Safety Insurance Group, Inc. (b) | | | 30,289 | | | | 1,626,822 | |
Selective Insurance Group, Inc. (b) | | | 53,209 | | | | 1,220,614 | |
| State Auto Financial Corporation | | | 2,548 | | | | 52,132 | |
Symetra Financial Corporation (b) | | | 105,184 | | | | 2,173,101 | |
Third Point Reinsurance Ltd. (a) | | | 7,813 | | | | 122,195 | |
United Fire Group, Inc. (b) | | | 4,919 | | | | 136,847 | |
| United Insurance Holdings Corporation | | | 117,654 | | | | 1,794,224 | |
| | | | | | | | 26,493,463 | |
| Real Estate Investment Trusts (REIT) - 4.1% | |
| Acadia Realty Trust | | | 21,935 | | | | 595,097 | |
| AG Mortgage Investment Trust, Inc. | | | 9,753 | | | | 172,531 | |
| Agree Realty Corporation | | | 12,825 | | | | 383,083 | |
American Assets Trust, Inc. (b) | | | 7,837 | | | | 266,066 | |
TFS MARKET NEUTRAL FUND
SCHEDULE OF INVESTMENTS (Continued)
COMMON STOCKS - 90.3%(Continued) | | Shares | | | Value | |
Financials - 13.5%(Continued) | |
| Real Estate Investment Trusts (REIT) - 4.1% (Continued) | |
| American Capital Mortgage Investment Corporation | | | 11,080 | | | $ | 219,384 | |
| American Homes 4 Rent - Class A | | | 7,157 | | | | 114,870 | |
| AmREIT, Inc. | | | 9,367 | | | | 156,054 | |
| Anworth Mortgage Asset Corporation | | | 20,458 | | | | 110,473 | |
| Armada Hoffler Properties, Inc. | | | 11,688 | | | | 113,140 | |
| ARMOUR Residential REIT, Inc. | | | 108,722 | | | | 460,981 | |
| Ashford Hospitality Prime, Inc. | | | 32,479 | | | | 498,228 | |
Ashford Hospitality Trust, Inc. (b) | | | 76,539 | | | | 785,290 | |
| Aviv REIT, Inc. | | | 24,288 | | | | 640,960 | |
| Blackstone Mortgage Trust, Inc. - Class A | | | 2,640 | | | | 75,055 | |
| Capstead Mortgage Corporation | | | 31 | | | | 396 | |
| CatchMark Timber Trust, Inc. - Class A | | | 1,849 | | | | 24,925 | |
Cedar Realty Trust, Inc. (b) | | | 315,948 | | | | 1,955,718 | |
| Chatham Lodging Trust | | | 12,835 | | | | 260,936 | |
| Cherry Hill Mortage Investment Corporation | | | 11,266 | | | | 213,829 | |
| Chesapeake Lodging Trust | | | 46,828 | | | | 1,263,888 | |
| Chimera Investment Corporation | | | 33,965 | | | | 104,952 | |
| CoreSite Realty Corporation | | | 4,431 | | | | 134,791 | |
| Corporate Office Properties Trust | | | 3,390 | | | | 90,683 | |
| Corrections Corporation of America | | | 8,313 | | | | 272,666 | |
| CubeSmart | | | 6,577 | | | | 122,332 | |
| DCT Industrial Trust, Inc. | | | 124,842 | | | | 976,264 | |
| DiamondRock Hospitality Company | | | 18,920 | | | | 232,148 | |
Dynex Capital, Inc. (b) | | | 187,022 | | | | 1,604,649 | |
| EastGroup Properties, Inc. | | | 382 | | | | 24,162 | |
| Education Realty Trust, Inc. | | | 55,262 | | | | 563,672 | |
| Ellington Residential Mortgage REIT | | | 6,098 | | | | 99,641 | |
| Equity Lifestyle Properties, Inc. | | | 1,246 | | | | 52,170 | |
| Excel Trust, Inc. | | | 63,538 | | | | 801,850 | |
| Extra Space Storage, Inc. | | | 1,775 | | | | 92,886 | |
| FelCor Lodging Trust, Inc. | | | 71,314 | | | | 658,228 | |
| Franklin Street Properties Corporation | | | 53,113 | | | | 646,916 | |
| Geo Group, Inc. (The) | | | 32,929 | | | | 1,104,109 | |
Gramercy Property Trust, Inc. (b) | | | 108,011 | | | | 563,817 | |
Granite Real Estate Investment Trust (b) | | | 1,946 | | | | 74,785 | |
Gyrodyne Special Distribution, LLC (a) (c) | | | 1,499 | | | | – | |
| Healthcare Trust of America, Inc. - Class A | | | 110,602 | | | | 1,292,937 | |
Hersha Hospitality Trust (b) | | | 179,137 | | | | 1,040,786 | |
| Hudson Pacific Properties, Inc. | | | 2,134 | | | | 50,256 | |
| Independence Realty Trust, Inc. | | | 1,364 | | | | 12,208 | |
| Inland Real Estate Corporation | | | 4,440 | | | | 46,398 | |
| Invesco Mortgage Capital, Inc. | | | 25,520 | | | | 425,418 | |
| Investors Real Estate Trust | | | 21,225 | | | | 185,082 | |
| Kite Realty Group Trust | | | 252,148 | | | | 1,563,318 | |
Lexington Realty Trust (b) | | | 82,616 | | | | 888,948 | |
| LTC Properties, Inc. | | | 22,356 | | | | 863,612 | |
| MFA Financial, Inc. | | | 2,660 | | | | 21,094 | |
| New Residential Investment Corporation | | | 220,318 | | | | 1,343,940 | |
| New York Mortgage Trust, Inc. | | | 3,142 | | | | 23,157 | |
| One Liberty Properties, Inc. | | | 15,506 | | | | 343,148 | |
TFS MARKET NEUTRAL FUND
SCHEDULE OF INVESTMENTS (Continued)
COMMON STOCKS - 90.3%(Continued) | | Shares | | | Value | |
Financials - 13.5%(Continued) | |
| Real Estate Investment Trusts (REIT) - 4.1% (Continued) | |
| Orchid Island Capital, Inc. | | | 9,017 | | | $ | 110,819 | |
| Pennsylvania Real Estate Investment Trust | | | 3,322 | | | | 54,979 | |
| Physicians Realty Trust | | | 11,624 | | | | 159,481 | |
| Post Properties, Inc. | | | 7,986 | | | | 400,977 | |
| Potlatch Corporation | | | 6,768 | | | | 258,741 | |
| PS Business Parks, Inc. | | | 9,298 | | | | 797,489 | |
| QTS Realty Trust, Inc. - Class A | | | 7,611 | | | | 207,400 | |
| Rayonier, Inc. | | | 8,222 | | | | 370,812 | |
Resource Capital Corporation (b) | | | 246,641 | | | | 1,356,526 | |
| Retail Opportunity Investments Corporation | | | 56,339 | | | | 881,142 | |
| Rexford Industrial Realty, Inc. | | | 12,745 | | | | 181,234 | |
| Sabra Health Care REIT, Inc. | | | 11,167 | | | | 334,675 | |
Saul Centers, Inc. (b) | | | 19,654 | | | | 901,922 | |
| Select Income REIT | | | 22,930 | | | | 705,785 | |
| Senior Housing Properties Trust | | | 18,101 | | | | 424,830 | |
| Sovran Self Storage, Inc. | | | 8,097 | | | | 614,562 | |
| Spirit Realty Capital, Inc. | | | 8,994 | | | | 96,865 | |
| STAG Industrial, Inc. | | | 9,715 | | | | 228,594 | |
Starwood Property Trust, Inc. (b) | | | 30,882 | | | | 742,712 | |
Starwood Waypoint Residential Trust (a) | | | 43,369 | | | | 1,178,336 | |
Strategic Hotels & Resorts, Inc. (a) | | | 76,413 | | | | 824,496 | |
Summit Hotel Properties, Inc. (b) | | | 55,293 | | | | 500,955 | |
| Sun Communities, Inc. | | | 7,125 | | | | 324,686 | |
| Sunstone Hotel Investors, Inc. | | | 112,877 | | | | 1,615,270 | |
| Terreno Realty Corporation | | | 7,554 | | | | 138,012 | |
| Two Harbors Investment Corporation | | | 12,400 | | | | 128,712 | |
| Universal Health Realty Income Trust | | | 15,854 | | | | 672,685 | |
| Urstadt Biddle Properties, Inc. - Class A | | | 14,817 | | | | 302,415 | |
| Weyerhaeuser Company | | | 14,373 | | | | 429,034 | |
| Whitestone REIT | | | 17,177 | | | | 240,993 | |
| Winthrop Realty Trust | | | 108,414 | | | | 1,506,955 | |
| | | | | | | | 41,324,021 | |
| Real Estate Management & Development - 0.6% | |
| Alexander & Baldwin, Inc. | | | 771 | | | | 28,766 | |
| FirstService Corporation | | | 4,358 | | | | 216,288 | |
Forestar Group, Inc. (a) | | | 16,718 | | | | 285,042 | |
| Jones Lang LaSalle, Inc. | | | 1,682 | | | | 194,927 | |
Kennedy-Wilson Holdings, Inc. (b) | | | 106,228 | | | | 2,320,020 | |
Tejon Ranch Company (a) | | | 8,121 | | | | 251,832 | |
Zillow, Inc. - Class A (a) (b) | | | 23,700 | | | | 2,576,190 | |
ZipRealty, Inc. (a) | | | 10,470 | | | | 34,760 | |
| | | | | | | | 5,907,825 | |
| Thrifts & Mortgage Finance - 1.3% | |
| America First Multifamily Investors, L.P. | | | 93,165 | | | | 559,922 | |
| Apollo Residential Mortgage, Inc. | | | 84,716 | | | | 1,368,163 | |
BBX Capital Corporation - Class A (a) | | | 52,963 | | | | 991,997 | |
Beneficial Mutual Bancorp, Inc. (a) | | | 6,975 | | | | 90,954 | |
| Berkshire Hills Bancorp, Inc. | | | 2,383 | | | | 55,834 | |
| Brookline Bancorp, Inc. | | | 8,167 | | | | 74,156 | |
| Charter Financial Corporation | | | 21,159 | | | | 232,749 | |
TFS MARKET NEUTRAL FUND
SCHEDULE OF INVESTMENTS (Continued)
COMMON STOCKS - 90.3%(Continued) | | Shares | | | Value | |
Financials - 13.5%(Continued) | |
| Thrifts & Mortgage Finance - 1.3% (Continued) | |
| Clifton Bancorp, Inc. | | | 51,777 | | | $ | 600,095 | |
| Dime Community Bancshares, Inc. | | | 56,763 | | | | 925,237 | |
Doral Financial Corporation (a) | | | 2,630 | | | | 25,143 | |
| EverBank Financial Corp | | | 52,352 | | | | 980,029 | |
| Federal Agricultural Mortgage Corporation - Class C | | | 16,011 | | | | 569,671 | |
Flagstar Bancorp, Inc. (a) | | | 21,527 | | | | 378,875 | |
| Home Federal Bancorp, Inc. | | | 2,236 | | | | 33,652 | |
| HomeStreet, Inc. | | | 18,926 | | | | 343,696 | |
Ladder Capital Corporation - Class A (a) | | | 5,007 | | | | 89,575 | |
Meridian Interstate Bancorp, Inc. (a) | | | 7,425 | | | | 187,630 | |
| Meta Financial Group, Inc. | | | 2,519 | | | | 105,571 | |
Nationstar Mortgage Holdings, Inc. (a) | | | 5,000 | | | | 163,650 | |
NMI Holdings, Inc. - Class A (a) | | | 2,188 | | | | 24,834 | |
| Northwest Bancshares, Inc. | | | 9,974 | | | | 132,555 | |
Oritani Financial Corporation (b) | | | 150,735 | | | | 2,235,400 | |
PennyMac Financial Services, Inc. - Class A (a) | | | 8,311 | | | | 131,896 | |
| Provident Financial Services, Inc. | | | 2,223 | | | | 38,636 | |
TFS Financial Corporation (a) | | | 1,226 | | | | 16,416 | |
Tree.com, Inc. (a) | | | 13,294 | | | | 386,590 | |
Walker & Dunlop, Inc. (a) | | | 28,621 | | | | 448,777 | |
| Washington Federal, Inc. | | | 30,387 | | | | 655,752 | |
| Waterstone Financial, Inc. | | | 98,786 | | | | 1,028,362 | |
| WSFS Financial Corporation | | | 7,413 | | | | 501,267 | |
| | | | | | | | 13,377,084 | |
Health Care - 15.1% | |
| Biotechnology - 3.8% | |
Acceleron Pharma, Inc. (a) | | | 12,779 | | | | 438,959 | |
Acorda Therapeutics, Inc. (a) | | | 21,373 | | | | 757,673 | |
Actinium Pharmaceuticals, Inc. (a) | | | 1,000 | | | | 10,990 | |
Aegerion Pharmaceuticals, Inc. (a) (b) | | | 41,515 | | | | 1,837,454 | |
Agenus, Inc. (a) | | | 112,173 | | | | 317,450 | |
| Amgen, Inc. | | | 582 | | | | 65,038 | |
Amicus Therapeutics, Inc. (a) (b) | | | 216,055 | | | | 479,642 | |
Anacor Pharmaceuticals, Inc. (a) (b) | | | 116,957 | | | | 1,926,282 | |
ArQule, Inc. (a) (b) | | | 343,598 | | | | 556,629 | |
Array BioPharma, Inc. (a) | | | 24,082 | | | | 95,846 | |
Auspex Pharmaceuticals, Inc. (a) | | | 6,633 | | | | 142,212 | |
AVEO Pharmaceuticals, Inc. (a) | | | 142,845 | | | | 175,699 | |
BIND Therapeutics, Inc. (a) | | | 34,400 | | | | 324,392 | |
BioCryst Pharmaceuticals, Inc. (a) | | | 18,534 | | | | 159,207 | |
Biogen Idec, Inc. (a) | | | 531 | | | | 152,461 | |
BioSpecifics Technologies Corporation (a) | | | 43,028 | | | | 1,021,054 | |
BioTime, Inc. (a) | | | 5,571 | | | | 14,429 | |
bluebird bio, Inc. (a) | | | 19,980 | | | | 395,604 | |
Cancer Genetics, Inc. (a) | | | 22,162 | | | | 325,781 | |
Celgene Corporation (a) | | | 217 | | | | 31,901 | |
Cell Therapeutics, Inc. (a) (b) | | | 501,325 | | | | 1,478,909 | |
Celladon Corporation (a) | | | 8,353 | | | | 98,148 | |
Cellular Dynamics International, Inc. (a) | | | 3,766 | | | | 45,004 | |
Cel-Sci Corporation (a) | | | 22 | | | | 26 | |
TFS MARKET NEUTRAL FUND
SCHEDULE OF INVESTMENTS (Continued)
COMMON STOCKS - 90.3%(Continued) | | Shares | | | Value | |
Health Care - 15.1%(Continued) | |
| Biotechnology - 3.8% (Continued) | |
Chelsea Therapeutics International Ltd. (a) | | | 126 | | | $ | 615 | |
Chimerix, Inc. (a) | | | 14,295 | | | | 276,179 | |
China Biologic Products, Inc. (a) | | | 2,551 | | | | 93,239 | |
Conatus Pharmaceuticals, Inc. (a) | | | 3,356 | | | | 20,639 | |
Concert Pharmaceuticals, Inc. (a) | | | 1,040 | | | | 9,298 | |
Coronado Biosciences, Inc. (a) | | | 4,957 | | | | 8,625 | |
Curis, Inc. (a) (b) | | | 489,410 | | | | 1,106,067 | |
Cytokinetics, Inc. (a) | | | 3,291 | | | | 14,974 | |
Cytori Therapeutics, Inc. (a) | | | 257,955 | | | | 582,978 | |
Dicerna Pharmaceuticals, Inc. (a) | | | 830 | | | | 15,579 | |
Discovery Laboratories, Inc. (a) (b) | | | 157,518 | | | | 280,382 | |
Dyax Corporation (a) | | | 194,343 | | | | 1,284,607 | |
Eagle Pharmaceuticals, Inc. (a) | | | 5,126 | | | | 50,542 | |
Eleven Biotherapeutics, Inc. (a) | | | 4,368 | | | | 58,924 | |
Emergent BioSolutions, Inc. (a) | | | 14,356 | | | | 378,424 | |
Enzymotec, Ltd. (a) | | | 28,436 | | | | 547,962 | |
Epizyme, Inc. (a) | | | 15,385 | | | | 335,701 | |
Esperion Therapeutics, Inc. (a) | | | 3,684 | | | | 50,802 | |
Five Prime Therapeutics, Inc. (a) | | | 39,137 | | | | 546,744 | |
Genocea Biosciences, Inc. (a) | | | 4,233 | | | | 82,120 | |
Genomic Health, Inc. (a) | | | 4,548 | | | | 119,340 | |
GenVec, Inc. (a) | | | 152 | | | | 377 | |
Geron Corporation (a) | | | 112,579 | | | | 222,906 | |
GlycoMimetics, Inc. (a) | | | 17,406 | | | | 230,978 | |
Harvard Apparatus Regenerative Technology, Inc. (a) | | | 28,653 | | | | 247,844 | |
Heron Therapeutics, Inc. (a) | | | 16,809 | | | | 202,548 | |
Hyperion Therapeutics, Inc. (a) | | | 36,600 | | | | 901,824 | |
ImmunoGen, Inc. (a) | | | 5,849 | | | | 75,686 | |
Insmed, Inc. (a) | | | 1,029 | | | | 14,344 | |
Insys Therapeutics, Inc. (a) | | | 11,501 | | | | 472,231 | |
Intercept Pharmaceuticals, Inc. (a) | | | 163 | | | | 43,052 | |
Isis Pharmaceuticals, Inc. (a) | | | 1,116 | | | | 29,697 | |
KaloBios Pharmaceuticals, Inc. (a) | | | 23,448 | | | | 53,227 | |
Karyopharm Therapeutics, Inc. (a) | | | 7,850 | | | | 210,616 | |
Kindred Biosciences, Inc. (a) | | | 17,901 | | | | 284,447 | |
Lexicon Pharmaceuticals, Inc. (a) | | | 148,704 | | | | 229,004 | |
Ligand Pharmaceuticals, Inc. (a) (b) | | | 28,058 | | | | 1,772,424 | |
MacroGenics, Inc. (a) | | | 16,829 | | | | 335,570 | |
Medivation, Inc. (a) | | | 719 | | | | 43,291 | |
MiMedx Group, Inc. (a) (b) | | | 25,903 | | | | 149,719 | |
Mirati Therapeutics, Inc. (a) | | | 32 | | | | 603 | |
Momenta Pharmaceuticals, Inc. (a) (b) | | | 34,873 | | | | 398,250 | |
Myriad Genetics, Inc. (a) | | | 7,608 | | | | 321,134 | |
Nanosphere, Inc. (a) (b) | | | 551,131 | | | | 942,434 | |
Neurocrine Biosciences, Inc. (a) | | | 16,229 | | | | 227,531 | |
OncoGenex Pharmaceuticals, Inc. (a) (b) | | | 126,452 | | | | 490,634 | |
Onconova Therapeutics, Inc. (a) | | | 81,008 | | | | 452,025 | |
Oncothyreon, Inc. (a) | | | 329,090 | | | | 941,197 | |
Ophthotech Corporation (a) | | | 3,074 | | | | 104,485 | |
OvaScience, Inc. (a) | | | 11,638 | | | | 94,501 | |
TFS MARKET NEUTRAL FUND
SCHEDULE OF INVESTMENTS (Continued)
COMMON STOCKS - 90.3%(Continued) | | Shares | | | Value | |
Health Care - 15.1%(Continued) | |
| Biotechnology - 3.8% (Continued) | |
PDL BioPharma, Inc. (b) | | | 156,087 | | | $ | 1,325,179 | |
Pluristem Therapeutics, Inc. (a) | | | 14,486 | | | | 51,860 | |
Portola Pharmaceuticals, Inc. (a) | | | 26,881 | | | | 630,628 | |
Progenics Pharmaceuticals, Inc. (a) | | | 77,493 | | | | 273,550 | |
Prosensa Holding N.V. (a) | | | 100 | | | | 699 | |
Protalix BioTherapeutics, Inc. (a) | | | 178 | | | | 721 | |
Prothena Corporation plc (a) | | | 22,683 | | | | 499,026 | |
PTC Therapeutics, Inc. (a) | | | 8,815 | | | | 172,245 | |
QLT, Inc. (a) (b) | | | 7,722 | | | | 44,710 | |
Receptos, Inc. (a) | | | 11,212 | | | | 378,853 | |
Regulus Therapeutics, Inc. (a) | | | 2,271 | | | | 16,192 | |
Repligen Corporation (a) | | | 19,393 | | | | 307,379 | |
Rigel Pharmaceuticals, Inc. (a) (b) | | | 285,448 | | | | 913,434 | |
Sangamo Biosciences, Inc. (a) | | | 1,597 | | | | 22,102 | |
SIGA Technologies, Inc. (a) | | | 189 | | | | 542 | |
Sinovac Biotech Ltd. (a) | | | 61,186 | | | | 363,445 | |
Sorrento Therapeutics, Inc. (a) | | | 1,411 | | | | 12,967 | |
Stemline Therapeutics, Inc. (a) | | | 17,396 | | | | 266,333 | |
Sunesis Pharmaceuticals, Inc. (a) | | | 23,627 | | | | 121,207 | |
Synthetic Biologics, Inc. (a) | | | 135,097 | | | | 195,891 | |
Targacept, Inc. (a) (b) | | | 332,558 | | | | 1,476,558 | |
TESARO, Inc. (a) | | | 18,548 | | | | 462,958 | |
TetraLogic Pharmaceuticals Corporation (a) | | | 25,347 | | | | 144,478 | |
Tetraphase Pharmaceuticals, Inc. (a) | | | 50,446 | | | | 541,790 | |
TG Therapeutics, Inc. (a) | | | 166,977 | | | | 889,987 | |
Threshold Pharmaceuticals, Inc. (a) | | | 40,853 | | | | 167,497 | |
Tonix Pharmaceuticals Holding Corporation (a) | | | 28,596 | | | | 278,239 | |
Ultragenyx Pharmaceutical, Inc. (a) | | | 7,145 | | | | 277,083 | |
uniQure B.V. (a) | | | 8,207 | | | | 84,286 | |
United Therapeutics Corporation (a) | | | 578 | | | | 57,806 | |
Verastem, Inc. (a) | | | 21,717 | | | | 181,337 | |
Vical, Inc. (a) (b) | | | 965,921 | | | | 1,091,491 | |
Xencor, Inc. (a) | | | 12,697 | | | | 125,700 | |
XOMA Corporation (a) | | | 181,141 | | | | 804,266 | |
| | | | | | | | 38,387,549 | |
| Health Care Equipment & Supplies - 4.1% | |
Alere, Inc. (a) (b) | | | 68,447 | | | | 2,286,130 | |
Alphatec Holdings, Inc. (a) | | | 130,987 | | | | 176,832 | |
| Analogic Corporation | | | 2,515 | | | | 188,826 | |
AngioDynamics, Inc. (a) | | | 77,012 | | | | 1,035,041 | |
Anika Therapeutics, Inc. (a) | | | 26,665 | | | | 1,139,662 | |
ArthroCare Corporation (a) (b) | | | 47,522 | | | | 2,306,243 | |
| Atrion Corporation | | | 574 | | | | 165,501 | |
BIOLASE, Inc. (a) | | | 313 | | | | 604 | |
| C.R. Bard, Inc. | | | 2,477 | | | | 340,166 | |
Cantel Medical Corporation (b) | | | 22,135 | | | | 733,997 | |
Cardiovascular Systems, Inc. (a) | | | 15,676 | | | | 450,685 | |
CareFusion Corporation (a) | | | 1,316 | | | | 51,403 | |
| CONMED Corporation | | | 15,152 | | | | 701,992 | |
| CryoLife, Inc. | | | 77,423 | | | | 703,001 | |
TFS MARKET NEUTRAL FUND
SCHEDULE OF INVESTMENTS (Continued)
COMMON STOCKS - 90.3%(Continued) | | Shares | | | Value | |
Health Care - 15.1%(Continued) | |
| Health Care Equipment & Supplies - 4.1% (Continued) | |
Cutera, Inc. (a) | | | 22,750 | | | $ | 234,553 | |
Cynosure, Inc. - Class A (a) (b) | | | 79,621 | | | | 1,953,899 | |
Derma Sciences, Inc. (a) | | | 37,954 | | | | 392,444 | |
DexCom, Inc. (a) (b) | | | 64,631 | | | | 2,096,630 | |
Endologix, Inc. (a) | | | 21,926 | | | | 278,022 | |
Exactech, Inc. (a) | | | 16,235 | | | | 360,742 | |
Fonar Corporation (a) | | | 27,980 | | | | 432,851 | |
Globus Medical, Inc. - Class A (a) | | | 23,351 | | | | 570,231 | |
Greatbatch, Inc. (a) (b) | | | 67,321 | | | | 3,098,786 | |
Haemonetics Corporation (a) | | | 64,095 | | | | 1,945,924 | |
| Hill-Rom Holdings, Inc. | | | 3,326 | | | | 124,259 | |
ICU Medical, Inc. (a) | | | 649 | | | | 36,201 | |
IDEXX Laboratories, Inc. (a) | | | 1,477 | | | | 186,752 | |
IMRIS, Inc. (a) | | | 18,087 | | | | 21,524 | |
Intuitive Surgical, Inc. (a) | | | 19 | | | | 6,872 | |
| Invacare Corporation | | | 60,051 | | | | 948,806 | |
IRIDEX Corporation (a) | | | 7,948 | | | | 66,207 | |
LDR Holding Corporation (a) | | | 5,065 | | | | 126,220 | |
Medical Action Industries, Inc. (a) | | | 11,685 | | | | 74,901 | |
Merit Medical Systems, Inc. (a) (b) | | | 71,931 | | | | 925,752 | |
Natus Medical, Inc. (a) (b) | | | 192,868 | | | | 4,788,912 | |
Novadaq Technologies, Inc. (a) | | | 20,932 | | | | 327,586 | |
NuVasive, Inc. (a) | | | 21,196 | | | | 714,517 | |
NxStage Medical, Inc. (a) | | | 24,250 | | | | 277,420 | |
OraSure Technologies, Inc. (a) (b) | | | 509,746 | | | | 3,338,836 | |
Orthofix International N.V. (a) (b) | | | 108,167 | | | | 3,266,643 | |
Oxford Immunotec Global plc (a) | | | 13,078 | | | | 234,096 | |
RTI Surgical, Inc. (a) | | | 46,406 | | | | 199,546 | |
Spectranetics Corporation (The) (a) | | | 12,416 | | | | 263,964 | |
STAAR Surgical Company (a) | | | 3,553 | | | | 60,437 | |
| STERIS Corporation | | | 4,255 | | | | 204,453 | |
Sunshine Heart, Inc. (a) | | | 48,649 | | | | 281,678 | |
Symmetry Medical, Inc. (a) (b) | | | 100,582 | | | | 830,807 | |
Syneron Medical Ltd. (a) (b) | | | 42,111 | | | | 436,691 | |
Tandem Diabetes Care, Inc. (a) | | | 646 | | | | 11,350 | |
Tornier N.V. (a) (b) | | | 62,774 | | | | 1,065,275 | |
Vascular Solutions, Inc. (a) | | | 20,324 | | | | 445,299 | |
| West Pharmaceutical Services, Inc. | | | 1,878 | | | | 81,468 | |
ZELTIQ Aesthetics, Inc. (a) | | | 1,460 | | | | 26,703 | |
| | | | | | | | 41,017,340 | |
| Health Care Providers & Services - 3.8% | |
Addus HomeCare Corporation (a) | | | 47,272 | | | | 1,022,021 | |
Alliance Healthcare Services, Inc. (a) (b) | | | 31,022 | | | | 882,886 | |
Almost Family, Inc. (a) | | | 33,131 | | | | 711,322 | |
| AmerisourceBergen Corporation | | | 1,105 | | | | 72,024 | |
AMN Healthcare Services, Inc. (a) | | | 187,927 | | | | 2,345,329 | |
AmSurg Corporation (a) (b) | | | 54,618 | | | | 2,365,505 | |
BioTelemetry, Inc. (a) | | | 284,156 | | | | 2,256,199 | |
Capital Senior Living Corporation (a) | | | 9,742 | | | | 240,920 | |
| Cardinal Health, Inc. | | | 2,784 | | | | 193,516 | |
TFS MARKET NEUTRAL FUND
SCHEDULE OF INVESTMENTS (Continued)
COMMON STOCKS - 90.3%(Continued) | | Shares | | | Value | |
Health Care - 15.1%(Continued) | |
| Health Care Providers & Services - 3.8% (Continued) | |
Chindex International, Inc. (a) | | | 80,627 | | | $ | 1,921,341 | |
Community Health Systems, Inc. (a) | | | 1,178 | | | | 44,634 | |
Corvel Corporation (a) | | | 46,896 | | | | 2,135,644 | |
Cross Country Healthcare, Inc. (a) | | | 87,797 | | | | 622,481 | |
Emeritus Corporation (a) | | | 56,106 | | | | 1,673,642 | |
| Ensign Group, Inc. (The) | | | 6,691 | | | | 284,367 | |
ExamWorks Group, Inc. (a) | | | 791 | | | | 29,109 | |
Five Star Quality Care, Inc. (a) | | | 329,844 | | | | 1,593,146 | |
Gentiva Health Services, Inc. (a) | | | 98,541 | | | | 742,014 | |
Hanger, Inc. (a) | | | 861 | | | | 29,851 | |
Health Net, Inc. (a) | | | 29,245 | | | | 1,003,981 | |
HealthSouth Corporation (b) | | | 55,425 | | | | 1,919,922 | |
HMS Holdings Corporation (a) | | | 9,223 | | | | 149,136 | |
| Landauer, Inc. | | | 14,324 | | | | 619,370 | |
LCA-Vision, Inc. (a) | | | 49,891 | | | | 267,416 | |
LifePoint Hospitals, Inc. (a) (b) | | | 34,428 | | | | 1,925,214 | |
Magellan Health Services, Inc. (a) (b) | | | 33,965 | | | | 1,960,460 | |
Molina Healthcare, Inc. (a) (b) | | | 40,745 | | | | 1,523,863 | |
| National Healthcare Corporation | | | 2,469 | | | | 135,128 | |
PharMerica Corporation (a) (b) | | | 17,753 | | | | 482,704 | |
Premier, Inc. - Class A (a) | | | 9,041 | | | | 271,230 | |
Providence Service Corporation (The) (a) | | | 76,832 | | | | 3,120,147 | |
RadNet, Inc. (a) | | | 237,244 | | | | 1,179,103 | |
Select Medical Holdings Corporation (b) | | | 88,050 | | | | 1,229,178 | |
Surgical Care Affiliates, Inc. (a) | | | 12,478 | | | | 366,604 | |
Team Health Holdings, Inc. (a) | | | 2,839 | | | | 137,635 | |
Triple-S Management Corporation - Class B (a) (b) | | | 66,092 | | | | 990,058 | |
U.S. Physical Therapy, Inc. (b) | | | 19,580 | | | | 604,043 | |
VCA Antech, Inc. (a) | | | 19,878 | | | | 608,863 | |
Veracyte, Inc. (a) | | | 73 | | | | 935 | |
WellCare Health Plans, Inc. (a) | | | 11,599 | | | | 782,584 | |
| | | | | | | | 38,443,525 | |
| Health Care Technology - 0.5% | |
| Computer Programs & Systems, Inc. | | | 4,012 | | | | 253,278 | |
HealthStream, Inc. (a) | | | 29,882 | | | | 676,827 | |
iCAD, Inc. (a) | | | 22,988 | | | | 199,536 | |
MedAssets, Inc. (a) (b) | | | 16,464 | | | | 375,873 | |
Merge Healthcare, Inc. (a) (b) | | | 481,852 | | | | 1,098,623 | |
Omnicell, Inc. (a) (b) | | | 57,380 | | | | 1,519,422 | |
Quality Systems, Inc. (b) | | | 87,174 | | | | 1,287,560 | |
Veeva Systems, Inc. - Class A (a) | | | 1,953 | | | | 37,517 | |
| | | | | | | | 5,448,636 | |
| Life Sciences Tools & Services - 1.1% | |
Affymetrix, Inc. (a) (b) | | | 222,242 | | | | 1,651,258 | |
Bruker Corporation (a) | | | 10,314 | | | | 213,087 | |
Cambrex Corporation (a) (b) | | | 108,194 | | | | 2,216,895 | |
Charles River Laboratories International, Inc. (a) | | | 34,459 | | | | 1,851,137 | |
Compugen Ltd. (a) | | | 24,197 | | | | 226,726 | |
Enzo Biochem, Inc. (a) | | | 365,504 | | | | 1,535,117 | |
Fluidigm Corporation (a) | | | 5,105 | | | | 191,744 | |
TFS MARKET NEUTRAL FUND
SCHEDULE OF INVESTMENTS (Continued)
COMMON STOCKS - 90.3%(Continued) | | Shares | | | Value | |
Health Care - 15.1%(Continued) | |
| Life Sciences Tools & Services - 1.1% (Continued) | |
NanoString Technologies, Inc. (a) | | | 46,775 | | | $ | 758,691 | |
NeoGenomics, Inc. (a) | | | 174,092 | | | | 576,245 | |
Nordion, Inc. (a) | | | 10,838 | | | | 125,504 | |
PAREXEL International Corporation (a) (b) | | | 22,858 | | | | 1,036,610 | |
pSivida Corporation (a) | | | 6,122 | | | | 22,284 | |
Quintiles Transnational Holdings, Inc. (a) | | | 9,399 | | | | 442,975 | |
| | | | | | | | 10,848,273 | |
| Pharmaceuticals - 1.8% | |
AcelRx Pharmaceuticals, Inc. (a) | | | 115,194 | | | | 1,246,399 | |
Adamis Pharmaceuticals Corporation (a) | | | 16,048 | | | | 86,980 | |
Aerie Pharmaceuticals, Inc. (a) | | | 34,198 | | | | 535,541 | |
Akorn, Inc. (a) | | | 17,134 | | | | 432,119 | |
Aratana Therapeutics, Inc. (a) | | | 67,941 | | | | 936,227 | |
AVANIR Pharmaceuticals, Inc. - Class A (a) | | | 15,035 | | | | 74,874 | |
Biodel, Inc. (a) | | | 206,614 | | | | 485,543 | |
Biota Pharmaceuticals, Inc. (a) | | | 250,830 | | | | 925,563 | |
Cempra, Inc. (a) | | | 16,554 | | | | 150,973 | |
Corcept Therapeutics, Inc. (a) (b) | | | 196,272 | | | | 867,522 | |
DURECT Corporation (a) | | | 64,646 | | | | 84,040 | |
Evoke Pharma, Inc. (a) | | | 4,149 | | | | 35,391 | |
Hospira, Inc. (a) | | | 1,353 | | | | 61,967 | |
Impax Laboratories, Inc. (a) | | | 35,724 | | | | 934,183 | |
Intra-Cellular Therapies, Inc. (a) | | | 12,612 | | | | 210,620 | |
Lannett Company, Inc. (a) | | | 40,053 | | | | 1,383,030 | |
Nektar Therapeutics (a) (b) | | | 201,356 | | | | 2,369,960 | |
Pacira Pharmaceuticals, Inc. (a) (b) | | | 23,202 | | | | 1,589,105 | |
Pain Therapeutics, Inc. (a) | | | 277,089 | | | | 1,576,636 | |
Pernix Therapeutics Holdings, Inc. (a) | | | 270,197 | | | | 1,299,648 | |
| Pfizer, Inc. | | | 14,861 | | | | 464,852 | |
Prestige Brands Holdings, Inc. (a) | | | 20,950 | | | | 702,244 | |
Relypsa, Inc. (a) | | | 12,025 | | | | 268,518 | |
Sagent Pharmaceuticals, Inc. (a) | | | 28,104 | | | | 581,472 | |
Sucampo Pharmaceuticals, Inc. - Class A (a) (b) | | | 144,354 | | | | 997,486 | |
| Zoetis, Inc. | | | 8,676 | | | | 262,536 | |
Zogenix, Inc. (a) | | | 384 | | | | 937 | |
| | | | | | | | 18,564,366 | |
Industrials - 12.6% | |
| Aerospace & Defense - 0.9% | |
AeroVironment, Inc. (a) | | | 19,151 | | | | 646,729 | |
Astronics Corporation (a) | | | 17,248 | | | | 985,206 | |
Astronics Corporation - Class B (a) | | | 628 | | | | 35,733 | |
Astrotech Corporation (a) | | | 13,106 | | | | 27,654 | |
| Cubic Corporation | | | 3,820 | | | | 181,183 | |
Ducommun, Inc. (a) | | | 24,164 | | | | 586,460 | |
Engility Holdings, Inc. (a) (b) | | | 10,023 | | | | 437,404 | |
| Exelis, Inc. | | | 22,882 | | | | 424,232 | |
| Huntington Ingalls Industries, Inc. | | | 4,455 | | | | 458,865 | |
Kratos Defense & Security Solutions, Inc. (a) | | | 16,454 | | | | 118,798 | |
| L-3 Communications Holdings, Inc. | | | 156 | | | | 17,998 | |
| Lockheed Martin Corporation | | | 337 | | | | 55,315 | |
TFS MARKET NEUTRAL FUND
SCHEDULE OF INVESTMENTS (Continued)
COMMON STOCKS - 90.3%(Continued) | | Shares | | | Value | |
Industrials - 12.6%(Continued) | |
| Aerospace & Defense - 0.9% (Continued) | |
Moog, Inc. - Class A (a) (b) | | | 25,105 | | | $ | 1,643,122 | |
Orbital Sciences Corporation (a) | | | 61,046 | | | | 1,794,752 | |
Sparton Corporation (a) | | | 33,746 | | | | 916,541 | |
| Sypris Solutions, Inc. | | | 9,334 | | | | 28,282 | |
Taser International, Inc. (a) | | | 9,977 | | | | 161,129 | |
| Textron, Inc. | | | 2,155 | | | | 88,140 | |
| | | | | | | | 8,607,543 | |
| Air Freight & Logistics - 0.4% | |
Air Transport Services Group, Inc. (a) | | | 91,832 | | | | 719,044 | |
Atlas Air Worldwide Holdings, Inc. (a) (b) | | | 21,385 | | | | 748,261 | |
| Forward Air Corporation | | | 5,633 | | | | 249,148 | |
Hub Group, Inc. - Class A (a) | | | 12,915 | | | | 576,655 | |
Park-Ohio Holdings Corporation (a) (b) | | | 31,928 | | | | 1,864,276 | |
| | | | | | | | 4,157,384 | |
| Airlines - 0.6% | |
Hawaiian Holdings, Inc. (a) | | | 101,572 | | | | 1,467,716 | |
JetBlue Airways Corporation (a) (b) | | | 240,328 | | | | 1,899,793 | |
Republic Airways Holdings, Inc. (a) (b) | | | 308,246 | | | | 2,561,524 | |
SkyWest, Inc. (b) | | | 52,627 | | | | 610,473 | |
| | | | | | | | 6,539,506 | |
| Building Products - 0.7% | |
| AAON, Inc. | | | 6,103 | | | | 173,020 | |
American Woodmark Corporation (a) | | | 1,448 | | | | 43,454 | |
| Apogee Enterprises, Inc. | | | 2,592 | | | | 82,348 | |
Builders FirstSource, Inc. (a) | | | 70,639 | | | | 554,516 | |
Continental Building Products, Inc. (a) | | | 5,584 | | | | 94,928 | |
| Insteel Industries, Inc. | | | 41,584 | | | | 855,799 | |
| Lennox International, Inc. | | | 3,529 | | | | 295,836 | |
NCI Building Systems, Inc. (a) | | | 1,689 | | | | 26,416 | |
Norcraft Companies, Inc. (a) | | | 4,526 | | | | 71,873 | |
Nortek, Inc. (a) | | | 2,974 | | | | 244,344 | |
Patrick Industries, Inc. (a) | | | 54,307 | | | | 2,176,082 | |
PGT, Inc. (a) | | | 137,331 | | | | 1,366,443 | |
Ply Gem Holdings, Inc. (a) | | | 53,996 | | | | 688,449 | |
| Simpson Manufacturing Company, Inc. | | | 3,728 | | | | 122,241 | |
| | | | | | | | 6,795,749 | |
| Commercial Services & Supplies - 2.1% | |
ARC Document Solutions, Inc. (a) | | | 117,480 | | | | 751,872 | |
| Brink's Company (The) | | | 2 | | | | 51 | |
Casella Waste Systems, Inc. - Class A (a) | | | 15,724 | | | | 80,192 | |
Clean Harbors, Inc. (a) | | | 810 | | | | 48,600 | |
Cypress Energy Partners, L.P. (a) | | | 9,567 | | | | 230,852 | |
| CyrusOne, Inc. | | | 22,284 | | | | 445,680 | |
| Deluxe Corporation | | | 34,769 | | | | 1,910,557 | |
EnerNOC, Inc. (a) (b) | | | 142,442 | | | | 3,361,631 | |
Fuel Tech, Inc. (a) | | | 10,331 | | | | 62,916 | |
| G&K Services, Inc. - Class A | | | 4,687 | | | | 248,130 | |
| Herman Miller, Inc. | | | 11,125 | | | | 342,984 | |
Hudson Technologies, Inc. (a) | | | 3,294 | | | | 10,755 | |
| Interface, Inc. | | | 19,545 | | | | 351,615 | |
TFS MARKET NEUTRAL FUND
SCHEDULE OF INVESTMENTS (Continued)
COMMON STOCKS - 90.3%(Continued) | | Shares | | | Value | |
Industrials - 12.6%(Continued) | |
| Commercial Services & Supplies - 2.1% (Continued) | |
| Kimball International, Inc. - Class B | | | 99,165 | | | $ | 1,662,005 | |
| Knoll, Inc. | | | 39,422 | | | | 717,086 | |
| McGrath RentCorp | | | 7,749 | | | | 244,713 | |
Metalico, Inc. (a) | | | 1,643 | | | | 2,530 | |
| MSA Safety, Inc. | | | 4,342 | | | | 229,040 | |
| Multi-Color Corporation | | | 21,100 | | | | 735,335 | |
| Progressive Waste Solutions Ltd. | | | 12,454 | | | | 303,504 | |
| Quad/Graphics, Inc. | | | 50,826 | | | | 1,100,383 | |
| R.R. Donnelley & Sons Company | | | 24,642 | | | | 433,699 | |
| Schawk, Inc. | | | 69,500 | | | | 1,390,000 | |
SP Plus Corporation (a) | | | 13,753 | | | | 335,848 | |
Steelcase, Inc. - Class A (b) | | | 136,715 | | | | 2,253,063 | |
Sykes Enterprises, Inc. (a) (b) | | | 77,697 | | | | 1,537,624 | |
| US Ecology, Inc. | | | 24,763 | | | | 1,105,668 | |
Viad Corporation (b) | | | 71,581 | | | | 1,649,942 | |
| | | | | | | | 21,546,275 | |
| Construction & Engineering - 1.5% | |
AECOM Technology Corporation (a) | | | 2,686 | | | | 87,080 | |
| Argan, Inc. | | | 60,199 | | | | 1,611,527 | |
| Comfort Systems USA, Inc. | | | 31,050 | | | | 465,750 | |
Dycom Industries, Inc. (a) (b) | | | 68,793 | | | | 2,160,100 | |
Furmanite Corporation (a) | | | 19,513 | | | | 204,496 | |
| Granite Construction, Inc. | | | 3,223 | | | | 120,476 | |
Great Lakes Dredge & Dock Corporation (a) (b) | | | 78,568 | | | | 678,042 | |
MasTec, Inc. (a) | | | 3,124 | | | | 123,648 | |
MYR Group, Inc. (a) (b) | | | 58,231 | | | | 1,366,099 | |
Orion Marine Group, Inc. (a) | | | 73,343 | | | | 860,313 | |
Primoris Services Corporation (b) | | | 60,772 | | | | 1,700,401 | |
Sterling Construction Company, Inc. (a) | | | 8,670 | | | | 66,586 | |
Tutor Perini Corporation (a) (b) | | | 110,243 | | | | 3,263,193 | |
URS Corporation (b) | | | 44,636 | | | | 2,103,248 | |
| | | | | | | | 14,810,959 | |
| Electrical Equipment - 0.6% | |
American Superconductor Corporation (a) | | | 154,380 | | | | 197,606 | |
Belden, Inc. (b) | | | 29,443 | | | | 2,173,188 | |
| Brady Corporation - Class A | | | 15,273 | | | | 393,891 | |
Broadwind Energy, Inc. (a) | | | 94,872 | | | | 1,279,823 | |
| Encore Wire Corporation | | | 10,508 | | | | 512,055 | |
| General Cable Corporation | | | 20,436 | | | | 523,570 | |
Orion Energy Systems, Inc. (a) | | | 43,435 | | | | 230,206 | |
| Powell Industries, Inc. | | | 2,545 | | | | 161,149 | |
PowerSecure International, Inc. (a) | | | 12,872 | | | | 286,145 | |
Preformed Line Products Company (b) | | | 2,998 | | | | 179,160 | |
| Regal-Beloit Corporation | | | 1,021 | | | | 76,299 | |
Thermon Group Holdings, Inc. (a) | | | 13,469 | | | | 320,832 | |
Vicor Corporation (a) | | | 7,914 | | | | 66,161 | |
| | | | | | | | 6,400,085 | |
| Industrial Conglomerates - 0.2% | |
| Standex International Corporation | | | 25,958 | | | | 1,541,127 | |
| | | | | | | | | |
TFS MARKET NEUTRAL FUND
SCHEDULE OF INVESTMENTS (Continued)
COMMON STOCKS - 90.3%(Continued) | | Shares | | | Value | |
Industrials - 12.6%(Continued) | |
| Machinery - 2.0% | |
| AGCO Corporation | | | 1,105 | | | $ | 61,549 | |
| Alamo Group, Inc. | | | 27,904 | | | | 1,482,260 | |
| Altra Industrial Motion Corporation | | | 15,269 | | | | 521,589 | |
Ampco-Pittsburgh Corporation (b) | | | 45,575 | | | | 912,867 | |
| Astec Industries, Inc. | | | 464 | | | | 18,537 | |
Blount International, Inc. (a) | | | 29,941 | | | | 334,441 | |
China Yuchai International Ltd. (b) | | | 16,989 | | | | 342,158 | |
CIRCOR International, Inc. (b) | | | 16,435 | | | | 1,334,686 | |
| CNH Industrial N.V. | | | 4,757 | | | | 55,134 | |
Columbus McKinnon Corporation (a) (b) | | | 6,852 | | | | 181,509 | |
Commercial Vehicle Group, Inc. (a) | | | 27,098 | | | | 263,122 | |
| Douglas Dynamics, Inc. | | | 60,341 | | | | 1,017,953 | |
Duoyuan Printing, Inc. (a) (c) | | | 82,994 | | | | 1,660 | |
| Dynamic Materials Corporation | | | 17 | | | | 343 | |
Federal Signal Corporation (a) | | | 43,970 | | | | 667,465 | |
| FreightCar America, Inc. | | | 22,544 | | | | 592,005 | |
| Global Brass & Copper Holdings, Inc. | | | 20,181 | | | | 320,071 | |
| Gorman-Rupp Company (The) | | | 7,220 | | | | 224,181 | |
| Graham Corporation | | | 5,338 | | | | 159,286 | |
Greenbrier Companies, Inc. (The) (a) | | | 8,736 | | | | 458,116 | |
| Hurco Companies, Inc. | | | 5,587 | | | | 148,949 | |
| Hyster-Yale Materials Handling, Inc. | | | 3,337 | | | | 321,653 | |
John Bean Technologies Corporation (b) | | | 17,198 | | | | 498,570 | |
Kadant, Inc. (b) | | | 19,357 | | | | 672,656 | |
| L.B. Foster Company - Class A | | | 11,846 | | | | 560,908 | |
| Lincoln Electric Holdings, Inc. | | | 1,150 | | | | 76,832 | |
Lydall, Inc. (a) | | | 60,086 | | | | 1,406,613 | |
Manitex International, Inc. (a) | | | 46,971 | | | | 773,143 | |
| Manitowoc Company, Inc. (The) | | | 9,711 | | | | 308,616 | |
Meritor, Inc. (a) | | | 38,006 | | | | 451,131 | |
| Miller Industries, Inc. | | | 100 | | | | 1,937 | |
Mueller Water Products, Inc. - Class A (b) | | | 84,831 | | | | 773,659 | |
NACCO Industries, Inc. - Class A (b) | | | 23,716 | | | | 1,270,940 | |
| NN, Inc. | | | 6,331 | | | | 123,898 | |
| Oshkosh Corporation | | | 1,956 | | | | 108,578 | |
Proto Labs, Inc. (a) | | | 1,452 | | | | 87,904 | |
Rexnord Corporation (a) (b) | | | 50,166 | | | | 1,341,439 | |
| SPX Corporation | | | 2,691 | | | | 274,051 | |
Supreme Industries, Inc. - Class A (a) | | | 47,039 | | | | 266,711 | |
| Toro Company (The) | | | 333 | | | | 21,159 | |
Trimas Corporation (a) | | | 6,756 | | | | 242,270 | |
| Twin Disc, Inc. | | | 1,759 | | | | 50,888 | |
Wabash National Corporation (a) (b) | | | 39,020 | | | | 521,307 | |
WABCO Holdings, Inc. (a) | | | 3,238 | | | | 346,498 | |
| Wabtec Corporation | | | 962 | | | | 71,717 | |
| Woodward, Inc. | | | 3,658 | | | | 163,988 | |
Xerium Technologies, Inc. (a) | | | 33,195 | | | | 448,133 | |
| | | | | | | | 20,283,080 | |
| Marine - 0.4% | |
Baltic Trading Ltd. (b) | | | 128,479 | | | | 769,589 | |
TFS MARKET NEUTRAL FUND
SCHEDULE OF INVESTMENTS (Continued)
COMMON STOCKS - 90.3%(Continued) | | Shares | | | Value | |
Industrials - 12.6%(Continued) | |
| Marine - 0.4% (Continued) | |
| Costamare, Inc. | | | 2,460 | | | $ | 52,742 | |
Diana Shipping, Inc. (a) | | | 34,006 | | | | 382,908 | |
DryShips, Inc. (a) | | | 138,823 | | | | 405,363 | |
Global Ship Lease, Inc. - Class A (a) | | | 14,749 | | | | 56,046 | |
| International Shipholding Corporation | | | 2,446 | | | | 65,895 | |
Matson, Inc. (b) | | | 46,088 | | | | 1,091,825 | |
| Navios Maritime Holdings, Inc. | | | 41,001 | | | | 322,678 | |
Paragon Shipping, Inc. - Class A (a) | | | 48,514 | | | | 272,164 | |
| Safe Bulkers, Inc. | | | 12,171 | | | | 98,828 | |
Star Bulk Carriers Corporation (a) | | | 24,144 | | | | 286,831 | |
| | | | | | | | 3,804,869 | |
| Professional Services - 1.9% | |
| Barrett Business Services, Inc. | | | 3,012 | | | | 151,835 | |
| CDI Corporation | | | 32,681 | | | | 500,673 | |
CRA International, Inc. (a) | | | 18,015 | | | | 392,187 | |
| Exponent, Inc. | | | 12,581 | | | | 885,954 | |
Franklin Covey Company (a) | | | 21,561 | | | | 437,041 | |
GP Strategies Corporation (a) | | | 9,206 | | | | 241,934 | |
Heidrick & Struggles International, Inc. (b) | | | 44,980 | | | | 847,873 | |
Hill International, Inc. (a) | | | 139,569 | | | | 937,904 | |
Huron Consulting Group, Inc. (a) | | | 16,271 | | | | 1,158,495 | |
ICF International, Inc. (a) | | | 28,934 | | | | 1,127,558 | |
| Insperity, Inc. | | | 2,468 | | | | 79,124 | |
Kelly Services, Inc. - Class A (b) | | | 116,924 | | | | 2,462,419 | |
Korn/Ferry International (a) (b) | | | 77,819 | | | | 2,260,642 | |
| ManpowerGroup, Inc. | | | 4,766 | | | | 387,666 | |
Mistras Group, Inc. (a) | | | 10,850 | | | | 246,404 | |
Navigant Consulting, Inc. (a) (b) | | | 114,633 | | | | 1,925,834 | |
On Assignment, Inc. (a) (b) | | | 40,690 | | | | 1,424,150 | |
| Resources Connection, Inc. | | | 17,001 | | | | 231,384 | |
RPX Corporation (a) | | | 71,931 | | | | 1,178,230 | |
TrueBlue, Inc. (a) | | | 44,707 | | | | 1,195,912 | |
Volt Information Sciences, Inc. (a) | | | 3,094 | | | | 24,690 | |
| VSE Corporation | | | 14,536 | | | | 908,064 | |
WageWorks, Inc. (a) | | | 2,672 | | | | 113,213 | |
| | | | | | | | 19,119,186 | |
| Road & Rail - 0.5% | |
| Arkansas Best Corporation | | | 11,396 | | | | 449,230 | |
| Celadon Group, Inc. | | | 4,330 | | | | 99,633 | |
| Con-Way, Inc. | | | 693 | | | | 29,439 | |
Covenant Transportation Group, Inc. - Class A (a) | | | 5,666 | | | | 58,077 | |
Genesee & Wyoming, Inc. - Class A (a) | | | 1,115 | | | | 110,396 | |
Hertz Global Holdings, Inc. (a) | | | 4,401 | | | | 125,297 | |
| Landstar System, Inc. | | | 3,379 | | | | 212,843 | |
Marten Transport Ltd. (b) | | | 106,100 | | | | 2,489,106 | |
Patriot Transportation Holding, Inc. (a) | | | 16 | | | | 558 | |
Quality Distribution, Inc. (a) (b) | | | 22,782 | | | | 286,370 | |
Saia, Inc. (a) | | | 17,102 | | | | 704,089 | |
| Student Transportation, Inc. | | | 84,225 | | | | 522,195 | |
TFS MARKET NEUTRAL FUND
SCHEDULE OF INVESTMENTS (Continued)
COMMON STOCKS - 90.3%(Continued) | | Shares | | | Value | |
Industrials - 12.6%(Continued) | |
| Road & Rail - 0.5% (Continued) | |
| Universal Truckload Services, Inc. | | | 16,414 | | | $ | 404,769 | |
| | | | | | | | 5,492,002 | |
| Trading Companies & Distributors - 0.8% | |
| Air Lease Corporation | | | 6,376 | | | | 228,707 | |
| Aircastle Ltd. | | | 55,946 | | | | 982,971 | |
| Applied Industrial Technologies, Inc. | | | 10,947 | | | | 524,580 | |
CAI International, Inc. (a) (b) | | | 45,069 | | | | 980,251 | |
DXP Enterprises, Inc. (a) (b) | | | 5,463 | | | | 618,466 | |
H&E Equipment Services, Inc. (a) (b) | | | 55,611 | | | | 2,143,804 | |
HD Supply Holdings, Inc. (a) | | | 4,337 | | | | 111,808 | |
| Houston Wire & Cable Company | | | 200 | | | | 2,492 | |
MFC Industrial Ltd. (b) | | | 57,423 | | | | 428,376 | |
MRC Global, Inc. (a) | | | 9,160 | | | | 267,381 | |
TAL International Group, Inc. (a) (b) | | | 36,700 | | | | 1,548,006 | |
| Textainer Group Holdings Ltd. | | | 3,181 | | | | 125,013 | |
United Rentals, Inc. (a) | | | 475 | | | | 44,569 | |
| Watsco, Inc. | | | 763 | | | | 78,520 | |
WESCO International, Inc. (a) | | | 496 | | | | 43,539 | |
| | | | | | | | 8,128,483 | |
Information Technology - 17.0% | |
| Communications Equipment - 1.5% | |
Applied Optoelectronics, Inc. (a) | | | 16,332 | | | | 367,470 | |
AudioCodes Ltd. (a) | | | 18,812 | | | | 107,416 | |
Aviat Networks, Inc. (a) | | | 89,726 | | | | 135,486 | |
| Bel Fuse, Inc. - Class B | | | 30,718 | | | | 668,424 | |
Brocade Communications Systems, Inc. (a) | | | 43,464 | | | | 404,650 | |
Ceragon Networks Ltd. (a) (b) | | | 412,851 | | | | 1,110,569 | |
Digi International, Inc. (a) | | | 11,073 | | | | 98,107 | |
Emulex Corporation (a) (b) | | | 304,605 | | | | 2,177,926 | |
Extreme Networks, Inc. (a) | | | 8,692 | | | | 49,718 | |
Harmonic, Inc. (a) (b) | | | 141,380 | | | | 993,901 | |
| Ituran Location and Control Ltd. | | | 2,240 | | | | 53,805 | |
Ixia (a) | | | 10,278 | | | | 127,653 | |
Mitel Networks Corporation (a) | | | 21,871 | | | | 200,120 | |
| Motorola Solutions, Inc. | | | 1,532 | | | | 97,404 | |
Numerex Corp. - Class A (a) | | | 1,985 | | | | 20,346 | |
Oclaro, Inc. (a) | | | 332,157 | | | | 1,129,334 | |
Oplink Communications, Inc. (a) | | | 20 | | | | 343 | |
ORBCOMM, Inc. (a) | | | 13,464 | | | | 84,419 | |
| Plantronics, Inc. | | | 498 | | | | 21,698 | |
Radware Ltd. (a) | | | 25,282 | | | | 417,911 | |
Riverbed Technology, Inc. (a) | | | 4,881 | | | | 94,935 | |
Ruckus Wireless, Inc. (a) | | | 54,315 | | | | 567,592 | |
ShoreTel, Inc. (a) (b) | | | 331,942 | | | | 2,506,162 | |
Sierra Wireless, Inc. (a) | | | 13,604 | | | | 293,302 | |
| Silicom Ltd. | | | 4,678 | | | | 226,883 | |
Sonus Networks, Inc. (a) (b) | | | 538,241 | | | | 1,760,048 | |
Sycamore Networks, Inc. (a) | | | 60,896 | | | | 35,320 | |
| TESSCO Technologies, Inc. | | | 29,664 | | | | 975,649 | |
ViaSat, Inc. (a) | | | 1,584 | | | | 101,709 | |
TFS MARKET NEUTRAL FUND
SCHEDULE OF INVESTMENTS (Continued)
COMMON STOCKS - 90.3%(Continued) | | Shares | | | Value | |
Information Technology - 17.0%(Continued) | |
| Communications Equipment - 1.5% (Continued) | |
Westell Technologies, Inc. - Class A (a) | | | 89,256 | | | $ | 290,975 | |
Zhone Technologies, Inc. (a) | | | 80,454 | | | | 222,858 | |
| | | | | | | | 15,342,133 | |
| Electronic Equipment, Instruments & Components - 2.8% | |
Aeroflex Holding Corporation (a) | | | 8,214 | | | | 62,837 | |
Audience, Inc. (a) | | | 56,651 | | | | 651,487 | |
| AVX Corporation | | | 38,906 | | | | 519,395 | |
| Badger Meter, Inc. | | | 2,719 | | | | 134,726 | |
Benchmark Electronics, Inc. (a) (b) | | | 69,383 | | | | 1,608,298 | |
Celestica, Inc. (a) | | | 29,875 | | | | 331,613 | |
Checkpoint Systems, Inc. (a) | | | 23,647 | | | | 301,972 | |
Clearfield, Inc. (a) | | | 29,925 | | | | 471,618 | |
Coherent, Inc. (a) | | | 17,003 | | | | 1,015,249 | |
| CTS Corporation | | | 12,193 | | | | 216,913 | |
CUI Global, Inc. (a) | | | 45,539 | | | | 414,860 | |
| Daktronics, Inc. | | | 117,826 | | | | 1,534,095 | |
Dolby Laboratories, Inc. - Class A (a) | | | 12,979 | | | | 517,213 | |
Echelon Corporation (a) | | | 214,599 | | | | 555,811 | |
| Electro Rent Corporation | | | 5,224 | | | | 84,368 | |
Fabrinet (a) (b) | | | 35,427 | | | | 765,223 | |
GSI Group, Inc. (The) (a) | | | 16,379 | | | | 198,841 | |
Hollysys Automation Technologies Ltd. (a) | | | 18,780 | | | | 402,080 | |
Ingram Micro, Inc. - Class A (a) | | | 12,053 | | | | 324,949 | |
Insight Enterprises, Inc. (a) | | | 91,272 | | | | 2,384,025 | |
Itron, Inc. (a) | | | 32,413 | | | | 1,231,694 | |
KEMET Corporation (a) | | | 22,948 | | | | 114,969 | |
LoJack Corporation (a) | | | 3,527 | | | | 19,998 | |
Measurement Specialties, Inc. (a) | | | 311 | | | | 20,013 | |
Mercury Systems, Inc. (a) | | | 42,584 | | | | 594,473 | |
| Mesa Laboratories, Inc. | | | 489 | | | | 41,907 | |
| Methode Electronics, Inc. | | | 16,816 | | | | 466,476 | |
Multi-Fineline Electronix, Inc. (a) (b) | | | 7,259 | | | | 89,866 | |
Nam Tai Property, Inc. (b) | | | 89,590 | | | | 619,067 | |
NeoPhotonics Corporation (a) | | | 19,174 | | | | 110,634 | |
Netlist, Inc. (a) | | | 72,052 | | | | 116,724 | |
Newport Corporation (a) (b) | | | 60,286 | | | | 1,126,143 | |
Orbotech Ltd. (a) (b) | | | 29,649 | | | | 437,026 | |
OSI Systems, Inc. (a) (b) | | | 33,721 | | | | 1,881,969 | |
| Park Electrochemical Corporation | | | 2,393 | | | | 63,797 | |
| PC Connection, Inc. | | | 22,751 | | | | 455,248 | |
| Perceptron, Inc. | | | 34,429 | | | | 406,262 | |
Plexus Corporation (a) (b) | | | 11,566 | | | | 484,847 | |
| RF Industries, Ltd. | | | 597 | | | | 3,648 | |
Rogers Corporation (a) | | | 4,800 | | | | 288,096 | |
Sanmina Corporation (a) | | | 27,521 | | | | 557,300 | |
ScanSource, Inc. (a) (b) | | | 27,152 | | | | 1,042,908 | |
Tech Data Corporation (a) (b) | | | 60,533 | | | | 3,782,707 | |
Vishay Intertechnology, Inc. (b) | | | 56,666 | | | | 805,791 | |
Vishay Precision Group, Inc. (a) | | | 1,300 | | | | 21,099 | |
| Wayside Technology Group, Inc. | | | 6,754 | | | | 109,145 | |
TFS MARKET NEUTRAL FUND
SCHEDULE OF INVESTMENTS (Continued)
COMMON STOCKS - 90.3%(Continued) | | Shares | | | Value | |
Information Technology - 17.0%(Continued) | |
| Electronic Equipment, Instruments & Components - 2.8% (Continued) | |
Zebra Technologies Corporation - Class A (a) | | | 525 | | | $ | 36,456 | |
Zygo Corporation (a) | | | 66,209 | | | | 1,273,861 | |
| | | | | | | | 28,697,697 | |
| Internet Software & Services - 2.6% | |
Akamai Technologies, Inc. (a) | | | 579 | | | | 30,728 | |
AOL, Inc. (a) | | | 7,750 | | | | 331,778 | |
Autobytel, Inc. (a) | | | 79,275 | | | | 986,181 | |
Bankrate, Inc. (a) | | | 12,449 | | | | 218,106 | |
Benefitfocus, Inc. (a) | | | 7,012 | | | | 227,189 | |
Blucora, Inc. (a) | | | 44,361 | | | | 853,949 | |
Brightcove, Inc. (a) | | | 40,415 | | | | 348,377 | |
BroadVision, Inc. (a) | | | 785 | | | | 7,787 | |
Carbonite, Inc. (a) | | | 26,393 | | | | 261,027 | |
Care.com, Inc. (a) | | | 4,106 | | | | 50,299 | |
comScore, Inc. (a) | | | 24,148 | | | | 756,557 | |
Constant Contact, Inc. (a) | | | 15,736 | | | | 406,933 | |
Cornerstone OnDemand, Inc. (a) | | | 12,822 | | | | 471,337 | |
Cvent, Inc. (a) | | | 23,864 | | | | 656,976 | |
DealerTrack Holdings, Inc. (a) (b) | | | 38,955 | | | | 1,779,854 | |
Demand Media, Inc. (a) | | | 31,921 | | | | 132,791 | |
Demandware, Inc. (a) | | | 11,353 | | | | 563,449 | |
Dice Holdings, Inc. (a) | | | 16,355 | | | | 125,116 | |
Digital River, Inc. (a) | | | 29,724 | | | | 454,480 | |
E2open, Inc. (a) | | | 2,563 | | | | 44,263 | |
EarthLink Holdings Corporation (b) | | | 550,335 | | | | 1,876,642 | |
Envestnet, Inc. (a) (b) | | | 67,603 | | | | 2,491,171 | |
GigaMedia Ltd. (a) | | | 24,954 | | | | 29,196 | |
GTT Communications, Inc. (a) | | | 11,471 | | | | 138,799 | |
| IAC/InterActiveCorporation | | | 4,986 | | | | 330,472 | |
IntraLinks Holdings, Inc. (a) | | | 23,220 | | | | 212,463 | |
Limelight Networks, Inc. (a) | | | 172,705 | | | | 357,499 | |
LivePerson, Inc. (a) | | | 16,112 | | | | 159,509 | |
LogMeIn, Inc. (a) (b) | | | 51,642 | | | | 2,347,129 | |
| Marchex, Inc. - Class B | | | 62,655 | | | | 579,559 | |
Marketo, Inc. (a) | | | 12,013 | | | | 326,033 | |
Move, Inc. (a) | | | 13,025 | | | | 139,240 | |
| NIC, Inc. | | | 11,257 | | | | 206,453 | |
Perficient, Inc. (a) | | | 134,400 | | | | 2,455,488 | |
Perion Network Ltd. (a) | | | 22,578 | | | | 244,068 | |
Points International Ltd. (a) | | | 1,942 | | | | 43,850 | |
QuinStreet, Inc. (a) | | | 36,568 | | | | 223,065 | |
SciQuest, Inc. (a) | | | 1,205 | | | | 28,896 | |
Sohu.com, Inc. (a) | | | 987 | | | | 54,453 | |
SPS Commerce, Inc. (a) | | | 18,356 | | | | 950,841 | |
Stamps.com, Inc. (a) | | | 6,114 | | | | 212,217 | |
Support.com, Inc. (a) | | | 337,249 | | | | 833,005 | |
| TheStreet, Inc. | | | 51 | | | | 131 | |
Travelzoo, Inc. (a) | | | 8,962 | | | | 160,778 | |
Tremor Video, Inc. (a) | | | 77,008 | | | | 347,306 | |
Tucows, Inc. - Class A (a) | | | 2,257 | | | | 32,456 | |
TFS MARKET NEUTRAL FUND
SCHEDULE OF INVESTMENTS (Continued)
COMMON STOCKS - 90.3%(Continued) | | Shares | | | Value | |
Information Technology - 17.0%(Continued) | |
| Internet Software & Services - 2.6% (Continued) | |
| United Online, Inc. | | | 57,272 | | | $ | 678,673 | |
Unwired Planet, Inc. (a) | | | 101,532 | | | | 231,493 | |
Vocus, Inc. (a) | | | 60,367 | | | | 1,085,399 | |
Wix.com Ltd. (a) | | | 10,044 | | | | 205,802 | |
XO Group, Inc. (a) | | | 52,260 | | | | 555,001 | |
Yahoo!, Inc. (a) | | | 2,155 | | | | 77,472 | |
Yandex N.V. - Class A (a) | | | 1,859 | | | | 49,263 | |
YuMe, Inc. (a) | | | 17,767 | | | | 118,861 | |
| | | | | | | | 26,489,860 | |
| IT Services - 2.8% | |
Acxiom Corporation (a) | | | 20,551 | | | | 580,360 | |
Booz Allen Hamilton Holding Corporation (b) | | | 96,900 | | | | 2,251,956 | |
Cardtronics, Inc. (a) (b) | | | 62,597 | | | | 2,095,748 | |
CGI Group, Inc. - Class A (a) | | | 9,027 | | | | 325,604 | |
China Information Technology, Inc. (a) | | | 4,437 | | | | 18,014 | |
| Computer Sciences Corporation | | | 5,390 | | | | 318,980 | |
Convergys Corporation (b) | | | 61,501 | | | | 1,324,732 | |
CoreLogic, Inc. (a) | | | 21,354 | | | | 598,553 | |
Datalink Corporation (a) | | | 52,903 | | | | 679,275 | |
EPAM Systems, Inc. (a) | | | 34,599 | | | | 1,077,067 | |
ExlService Holdings, Inc. (a) (b) | | | 79,515 | | | | 2,249,877 | |
Global Cash Access Holdings, Inc. (a) (b) | | | 119,842 | | | | 790,957 | |
iGATE Corporation (a) | | | 76,004 | | | | 2,781,746 | |
Information Services Group, Inc. (a) | | | 279,151 | | | | 1,381,797 | |
Lionbridge Technologies, Inc. (a) (b) | | | 402,297 | | | | 2,365,506 | |
Luxoft Holding, Inc. (a) | | | 15,777 | | | | 425,821 | |
Mattersight Corporation (a) | | | 7,425 | | | | 46,852 | |
MAXIMUS, Inc. (b) | | | 59,233 | | | | 2,521,549 | |
ModusLink Global Solutions, Inc. (a) | | | 2,455 | | | | 9,918 | |
MoneyGram International, Inc. (a) (b) | | | 85,329 | | | | 1,126,343 | |
NCI, Inc. - Class A (a) | | | 17,088 | | | | 170,367 | |
PFSweb, Inc. (a) | | | 4,876 | | | | 39,203 | |
Planet Payment, Inc. (a) | | | 3,934 | | | | 10,346 | |
PRGX Global, Inc. (a) | | | 62,710 | | | | 403,225 | |
Science Applications International Corporation (b) | | | 67,765 | | | | 2,642,835 | |
ServiceSource International, Inc. (a) | | | 16,655 | | | | 103,927 | |
TeleTech Holdings, Inc. (a) | | | 31,466 | | | | 759,275 | |
VeriFone Systems, Inc. (a) | | | 4,746 | | | | 158,706 | |
Virtusa Corporation (a) | | | 36,003 | | | | 1,187,019 | |
| Xerox Corporation | | | 2,910 | | | | 35,182 | |
| | | | | | | | 28,480,740 | |
| Semiconductors & Semiconductor Equipment - 3.4% | |
Advanced Energy Industries, Inc. (a) | | | 18,001 | | | | 393,862 | |
Amkor Technology, Inc. (a) (b) | | | 407,072 | | | | 3,236,222 | |
Amtech Systems, Inc. (a) | | | 10,098 | | | | 86,338 | |
ANADIGICS, Inc. (a) (b) | | | 295,627 | | | | 369,534 | |
ATMI, Inc. (a) | | | 60,369 | | | | 2,051,640 | |
Axcelis Technologies, Inc. (a) (b) | | | 415,001 | | | | 742,852 | |
Brooks Automation, Inc. (b) | | | 32,266 | | | | 330,081 | |
Cabot Microelectronics Corporation (a) | | | 5,826 | | | | 252,674 | |
TFS MARKET NEUTRAL FUND
SCHEDULE OF INVESTMENTS (Continued)
COMMON STOCKS - 90.3%(Continued) | | Shares | | | Value | |
Information Technology - 17.0%(Continued) | |
| Semiconductors & Semiconductor Equipment - 3.4% (Continued) | |
Cavium, Inc. (a) (b) | | | 49,383 | | | $ | 2,092,358 | |
CEVA, Inc. (a) | | | 4,519 | | | | 73,343 | |
ChipMOS TECHNOLOGIES (Bermuda) Ltd. (b) | | | 22,630 | | | | 476,135 | |
Cypress Semiconductor Corporation (a) | | | 24,130 | | | | 228,511 | |
Diodes, Inc. (a) | | | 22,849 | | | | 602,528 | |
DSP Group, Inc. (a) | | | 135,387 | | | | 1,077,681 | |
Entegris, Inc. (a) | | | 13,921 | | | | 154,384 | |
Fairchild Semiconductor International, Inc. (a) | | | 13,971 | | | | 177,851 | |
FormFactor, Inc. (a) | | | 37,228 | | | | 214,061 | |
Freescale Semiconductor Ltd. (a) | | | 2,587 | | | | 56,836 | |
Inphi Corporation (a) | | | 85,547 | | | | 1,265,240 | |
Integrated Device Technology, Inc. (a) (b) | | | 206,165 | | | | 2,405,946 | |
Integrated Silicon Solution, Inc. (a) | | | 25,783 | | | | 372,822 | |
Intermolecular, Inc. (a) | | | 33,941 | | | | 92,320 | |
International Rectifier Corporation (a) | | | 5,199 | | | | 135,382 | |
| Intersil Corporation - Class A | | | 52,864 | | | | 652,342 | |
IXYS Corporation (b) | | | 114,346 | | | | 1,233,793 | |
Kulicke & Soffa Industries, Inc. (a) (b) | | | 34,036 | | | | 500,670 | |
Lam Research Corporation (a) | | | 280 | | | | 16,131 | |
Lattice Semiconductor Corporation (a) (b) | | | 300,306 | | | | 2,528,577 | |
| LSI Corporation | | | 20,753 | | | | 231,188 | |
LTX-Credence Corporation (a) | | | 18,779 | | | | 180,842 | |
MA/COM Technology Solutions Holdings, Inc. (a) | | | 37,049 | | | | 648,728 | |
MagnaChip Semiconductor Corporation (a) | | | 27,487 | | | | 384,818 | |
Mattson Technology, Inc. (a) (b) | | | 553,898 | | | | 1,102,257 | |
MaxLinear, Inc. - Class A (a) | | | 40,135 | | | | 315,862 | |
| Micrel, Inc. | | | 3,954 | | | | 39,382 | |
Micron Technology, Inc. (a) | | | 3,590 | | | | 93,771 | |
Microsemi Corporation (a) (b) | | | 12,873 | | | | 302,773 | |
Monolithic Power Systems, Inc. (a) | | | 19,357 | | | | 718,145 | |
Nanometrics, Inc. (a) | | | 3,380 | | | | 54,959 | |
Nova Measuring Instruments Ltd. (a) (b) | | | 37,360 | | | | 392,280 | |
OmniVision Technologies, Inc. (a) (b) | | | 143,702 | | | | 2,806,500 | |
ON Semiconductor Corporation (a) | | | 6,584 | | | | 61,955 | |
PDF Solutions, Inc. (a) (b) | | | 2,578 | | | | 48,389 | |
PLX Technology, Inc. (a) | | | 104,932 | | | | 608,606 | |
PMC-Sierra, Inc. (a) | | | 11,016 | | | | 75,349 | |
Rambus, Inc. (a) | | | 6,727 | | | | 81,329 | |
RF Micro Devices, Inc. (a) | | | 122,066 | | | | 1,030,237 | |
Sigma Designs, Inc. (a) | | | 69,233 | | | | 261,008 | |
Silicon Image, Inc. (a) | | | 237,777 | | | | 1,333,929 | |
Tower Semiconductor Ltd. (a) | | | 53,116 | | | | 418,554 | |
TriQuint Semiconductor, Inc. (a) | | | 35,996 | | | | 510,423 | |
Ultra Clean Holdings, Inc. (a) | | | 23,436 | | | | 199,675 | |
Vitesse Semiconductor Corporation (a) | | | 92,757 | | | | 345,056 | |
| | | | | | | | 34,066,129 | |
| Software - 3.1% | |
ACI Worldwide, Inc. (a) (b) | | | 33,945 | | | | 1,939,957 | |
| Activision Blizzard, Inc. | | | 15,425 | | | | 308,654 | |
Actuate Corporation (a) (b) | | | 159,822 | | | | 899,798 | |
TFS MARKET NEUTRAL FUND
SCHEDULE OF INVESTMENTS (Continued)
COMMON STOCKS - 90.3%(Continued) | | Shares | | | Value | |
Information Technology - 17.0%(Continued) | |
| Software - 3.1% (Continued) | |
| Advent Software, Inc. | | | 19,607 | | | $ | 565,074 | |
| American Software, Inc. - Class A | | | 14,399 | | | | 138,806 | |
Attunity Ltd. (a) | | | 30,247 | | | | 259,822 | |
| Blackbaud, Inc. | | | 3,287 | | | | 100,089 | |
BSQUARE Corporation (a) | | | 2,000 | | | | 6,400 | |
| CA, Inc. | | | 2,134 | | | | 64,319 | |
Callidus Software, Inc. (a) | | | 8,172 | | | | 78,002 | |
Cimatron Ltd. (a) | | | 3,554 | | | | 23,456 | |
Cinedigm Corporation - Class A (a) | | | 290,368 | | | | 725,920 | |
ClickSoftware Technologies Ltd. (b) | | | 31,835 | | | | 294,155 | |
| Compuware Corporation | | | 208,233 | | | | 2,157,294 | |
Comverse, Inc. (a) | | | 31,848 | | | | 794,289 | |
Covisint Corporation (a) | | | 16,011 | | | | 113,038 | |
| Digimarc Corporation | | | 23,043 | | | | 760,880 | |
Electronic Arts, Inc. (a) | | | 10,195 | | | | 288,518 | |
| EPIQ Systems, Inc. | | | 97,587 | | | | 1,248,138 | |
ePlus, Inc. (a) | | | 21,688 | | | | 1,085,267 | |
| Fair Isaac Corporation | | | 503 | | | | 28,772 | |
Imperva, Inc. (a) (b) | | | 13,316 | | | | 304,670 | |
Infoblox, Inc. (a) (b) | | | 86,413 | | | | 1,695,423 | |
Informatica Corporation (a) | | | 1,836 | | | | 65,086 | |
Interactive Intelligence Group, Inc. (a) | | | 15,412 | | | | 964,329 | |
Kofax Ltd. (a) | | | 32,998 | | | | 250,125 | |
Mandalay Digital Group, Inc. (a) | | | 116,694 | | | | 441,103 | |
Manhattan Associates, Inc. (a) | | | 3,452 | | | | 108,842 | |
Mavenir Systems, Inc. (a) | | | 19,520 | | | | 291,238 | |
MicroStrategy, Inc. - Class A (a) | | | 2,214 | | | | 268,846 | |
Model N, Inc. (a) (b) | | | 23,729 | | | | 213,798 | |
| Monotype Imaging Holdings, Inc. | | | 8,928 | | | | 235,788 | |
Net 1 UEPS Technologies, Inc. (a) | | | 59,362 | | | | 531,290 | |
NetScout Systems, Inc. (a) (b) | | | 40,451 | | | | 1,575,971 | |
NetSol Technologies, Inc. (a) | | | 6,236 | | | | 26,815 | |
| Pegasystems, Inc. | | | 61,365 | | | | 1,016,818 | |
Progress Software Corporation (a) (b) | | | 87,297 | | | | 1,873,394 | |
Proofpoint, Inc. (a) | | | 52 | | | | 1,323 | |
PROS Holdings, Inc. (a) | | | 3,642 | | | | 99,791 | |
Rally Software Development Corporation (a) | | | 12,665 | | | | 165,658 | |
Sapiens International Corporation N.V. (a) | | | 91,657 | | | | 721,341 | |
Silver Spring Networks, Inc. (a) | | | 9,113 | | | | 136,513 | |
Smith Micro Software, Inc. (a) | | | 102,567 | | | | 170,261 | |
SolarWinds, Inc. (a) | | | 28,385 | | | | 1,144,483 | |
Synchronoss Technologies, Inc. (a) (b) | | | 55,755 | | | | 1,697,182 | |
Take-Two Interactive Software, Inc. (a) (b) | | | 133,849 | | | | 2,727,843 | |
TeleCommunication Systems, Inc. - Class A (a) | | | 22,870 | | | | 58,318 | |
Telenav, Inc. (a) | | | 162,139 | | | | 993,912 | |
TiVo, Inc. (a) | | | 18,580 | | | | 220,359 | |
VASCO Data Security International, Inc. (a) | | | 18,217 | | | | 207,856 | |
Verint Systems, Inc. (a) (b) | | | 29,873 | | | | 1,307,541 | |
| | | | | | | | 31,396,565 | |
TFS MARKET NEUTRAL FUND
SCHEDULE OF INVESTMENTS (Continued)
COMMON STOCKS - 90.3%(Continued) | | Shares | | | Value | |
Information Technology - 17.0%(Continued) | |
| Technology Hardware, Storage & Peripherals - 0.8% | |
Cray, Inc. (a) (b) | | | 57,880 | | | $ | 1,661,735 | |
Diebold, Inc. (b) | | | 2,598 | | | | 97,711 | |
Dot Hill Systems Corporation (a) | | | 30,183 | | | | 124,656 | |
| Hewlett-Packard Company | | | 6,848 | | | | 226,395 | |
Hutchinson Technology, Inc. (a) | | | 99,634 | | | | 276,982 | |
Imation Corporation (a) | | | 110,686 | | | | 478,164 | |
Immersion Corporation (a) (b) | | | 9,376 | | | | 106,324 | |
Intevac, Inc. (a) | | | 14,492 | | | | 116,661 | |
| Lexmark International, Inc. - Class A | | | 15,338 | | | | 659,534 | |
NCR Corporation (a) | | | 1,185 | | | | 36,154 | |
Novatel Wireless, Inc. (a) | | | 189,079 | | | | 342,233 | |
QLogic Corporation (a) | | | 112,016 | | | | 1,297,145 | |
Synaptics, Inc. (a) (b) | | | 34,208 | | | | 2,126,027 | |
| Western Digital Corporation | | | 191 | | | | 16,823 | |
| | | | | | | | 7,566,544 | |
Materials - 5.5% | |
| Chemicals - 1.7% | |
| A. Schulman, Inc. | | | 20,827 | | | | 748,106 | |
Advanced Emissions Solutions, Inc. (a) | | | 6,136 | | | | 140,698 | |
Arabian American Development Company (a) | | | 28,889 | | | | 315,757 | |
Axiall Corporation (b) | | | 36,332 | | | | 1,693,071 | |
| Balchem Corporation | | | 16,079 | | | | 996,094 | |
BioAmber, Inc. (a) | | | 805 | | | | 8,082 | |
| Cabot Corporation | | | 2,171 | | | | 125,484 | |
Calgon Carbon Corporation (a) | | | 9,303 | | | | 186,339 | |
| Celanese Corporation - Series A | | | 614 | | | | 37,718 | |
| CVR Partners, L.P. | | | 9,989 | | | | 213,165 | |
| Cytec Industries, Inc. | | | 19,866 | | | | 1,893,627 | |
Ferro Corporation (a) | | | 90,834 | | | | 1,179,025 | |
Flotek Industries, Inc. (a) | | | 3 | | | | 84 | |
| FutureFuel Corporation | | | 16,495 | | | | 331,055 | |
| Hawkins, Inc. | | | 1,172 | | | | 42,426 | |
| Huntsman Corporation | | | 14,126 | | | | 353,856 | |
| Innophos Holdings, Inc. | | | 3,207 | | | | 181,003 | |
| Innospec, Inc. | | | 10,791 | | | | 464,660 | |
Koppers Holdings, Inc. (b) | | | 64,238 | | | | 2,742,963 | |
Kraton Performance Polymers, Inc. (a) (b) | | | 7,612 | | | | 198,293 | |
| Kronos Worldwide, Inc. | | | 158 | | | | 2,473 | |
| LyondellBasell Industries N.V. - Class A | | | 991 | | | | 91,668 | |
| Minerals Technologies, Inc. | | | 4,503 | | | | 267,883 | |
| OM Group, Inc. | | | 4,273 | | | | 125,156 | |
OMNOVA Solutions, Inc. (a) | | | 27,353 | | | | 249,459 | |
| Quaker Chemical Corporation | | | 3,569 | | | | 265,641 | |
| Rockwood Holdings, Inc. | | | 1,017 | | | | 72,258 | |
| RPM International, Inc. | | | 852 | | | | 36,346 | |
| Sensient Technologies Corporation | | | 14,630 | | | | 790,752 | |
Stepan Company (b) | | | 44,338 | | | | 2,564,067 | |
Taminco Corporation (a) | | | 13,641 | | | | 274,048 | |
| Tredegar Corporation | | | 26,500 | | | | 551,465 | |
| | | | | | | | 17,142,722 | |
TFS MARKET NEUTRAL FUND
SCHEDULE OF INVESTMENTS (Continued)
COMMON STOCKS - 90.3%(Continued) | | Shares | | | Value | |
Materials - 5.5%(Continued) | |
| Construction Materials - 0.1% | |
Headwaters, Inc. (a) | | | 33,089 | | | $ | 412,951 | |
| United States Lime & Minerals, Inc. | | | 5,291 | | | | 286,031 | |
| | | | | | | | 698,982 | |
| Containers & Packaging - 0.7% | |
AEP Industries, Inc. (a) | | | 2,911 | | | | 103,690 | |
Berry Plastics Group, Inc. (a) (b) | | | 122,999 | | | | 2,766,247 | |
Crown Holdings, Inc. (a) | | | 3,465 | | | | 163,444 | |
Graphic Packaging Holding Company (a) | | | 113,012 | | | | 1,159,503 | |
| Myers Industries, Inc. | | | 40,813 | | | | 763,203 | |
Owens-Illinois, Inc. (a) | | | 1,078 | | | | 34,259 | |
| Rock-Tenn Company - Class A | | | 359 | | | | 34,324 | |
| Sealed Air Corporation | | | 4,292 | | | | 147,259 | |
Silgan Holdings, Inc. (b) | | | 43,529 | | | | 2,165,568 | |
UFP Technologies, Inc. (a) | | | 706 | | | | 17,904 | |
| | | | | | | | 7,355,401 | |
| Metals & Mining - 2.2% | |
| Alamos Gold, Inc. | | | 92,722 | | | | 864,169 | |
Alexco Resource Corporation (a) (b) | | | 128,242 | | | | 165,432 | |
| Allegheny Technologies, Inc. | | | 3,567 | | | | 146,960 | |
AMCOL International Corporation (b) | | | 45,827 | | | | 2,101,168 | |
Asanko Gold, Inc. (a) (b) | | | 190,924 | | | | 402,850 | |
Augusta Resource Corporation (a) | | | 19,187 | | | | 54,491 | |
| AuRico Gold, Inc. | | | 82,531 | | | | 343,329 | |
| Barrick Gold Corporation | | | 18,980 | | | | 331,581 | |
Compass Minerals International, Inc. (b) | | | 38,211 | | | | 3,500,128 | |
Dominion Diamond Corporation (a) (b) | | | 23,953 | | | | 301,568 | |
Endeavour Silver Corporation (a) | | | 97,343 | | | | 444,858 | |
Exeter Resource Corporation (a) (b) | | | 35,771 | | | | 21,463 | |
First Majestic Silver Corporation (a) | | | 36,388 | | | | 345,686 | |
Fortuna Silver Mines, Inc. (a) | | | 44,785 | | | | 185,858 | |
| Globe Specialty Metals, Inc. | | | 27,973 | | | | 542,117 | |
Great Panther Silver Ltd. (a) | | | 156,827 | | | | 170,941 | |
Handy & Harman Ltd. (a) | | | 10 | | | | 226 | |
| Haynes International, Inc. | | | 1,479 | | | | 78,461 | |
| Hecla Mining Company | | | 72,058 | | | | 221,218 | |
IAMGOLD Corporation (b) | | | 85,176 | | | | 297,264 | |
Kinross Gold Corporation (a) | | | 111,354 | | | | 452,097 | |
MAG Silver Corporation (a) | | | 19,186 | | | | 146,005 | |
| Materion Corporation | | | 30,680 | | | | 1,032,382 | |
McEwen Mining, Inc. (a) | | | 187,930 | | | | 451,032 | |
| Mesabi Trust | | | 10,424 | | | | 210,461 | |
Midway Gold Corporation (a) | | | 10,053 | | | | 9,193 | |
Minco Gold Corporation (a) | | | 1,327 | | | | 385 | |
Nevsun Resources Ltd. (b) | | | 189,291 | | | | 689,019 | |
| Newmont Mining Corporation | | | 6,603 | | | | 163,953 | |
Noranda Aluminum Holding Corporation (b) | | | 413,473 | | | | 1,467,829 | |
| Pan American Silver Corporation | | | 18,455 | | | | 239,177 | |
Platinum Group Metals Ltd. (a) | | | 3,390 | | | | 3,526 | |
Pretium Resources, Inc. (a) | | | 36,088 | | | | 234,572 | |
Primero Mining Corporation (a) | | | 39,256 | | | | 248,490 | |
TFS MARKET NEUTRAL FUND
SCHEDULE OF INVESTMENTS (Continued)
COMMON STOCKS - 90.3%(Continued) | | Shares | | | Value | |
Materials - 5.5%(Continued) | |
| Metals & Mining - 2.2% (Continued) | |
Quest Rare Minerals Ltd. (a) | | | 2,950 | | | $ | 1,298 | |
Rare Element Resources Ltd. (a) | | | 174,231 | | | | 224,758 | |
Richmont Mines, Inc. (a) (b) | | | 28,594 | | | | 36,886 | |
Rio Alto Mining Ltd. (a) | | | 82,784 | | | | 164,740 | |
Rubicon Minerals Corporation (a) | | | 309,366 | | | | 337,209 | |
Sandstorm Gold Ltd. (a) | | | 77,140 | | | | 432,755 | |
| Silvercorp Metals, Inc. | | | 364,014 | | | | 757,149 | |
SilverCrest Mines, Inc. (a) | | | 99,687 | | | | 171,462 | |
Stillwater Mining Company (a) | | | 48,992 | | | | 773,094 | |
| SunCoke Energy Partners, L.P. | | | 15,079 | | | | 443,323 | |
SunCoke Energy, Inc. (a) | | | 5,868 | | | | 122,465 | |
Sutor Technology Group Ltd. (a) | | | 2,799 | | | | 4,674 | |
Taseko Mines Ltd. (a) (b) | | | 613,545 | | | | 1,325,257 | |
Turquoise Hill Resources Ltd. (a) | | | 105,069 | | | | 409,769 | |
U.S. Energy Corporation (a) | | | 30,504 | | | | 129,642 | |
| United States Steel Corporation | | | 947 | | | | 24,641 | |
Universal Stainless & Alloy Products, Inc. (a) | | | 581 | | | | 20,852 | |
| US Silica Holdings, Inc. | | | 7,587 | | | | 342,705 | |
| Worthington Industries, Inc. | | | 9,591 | | | | 352,949 | |
| Yamana Gold, Inc. | | | 56,933 | | | | 425,859 | |
| | | | | | | | 22,369,376 | |
| Paper & Forest Products - 0.8% | |
Boise Cascade Company (a) | | | 5,362 | | | | 134,157 | |
Clearwater Paper Corporation (a) | | | 3,072 | | | | 188,590 | |
| Deltic Timber Corporation | | | 1,945 | | | | 118,159 | |
KapStone Paper and Packaging Corporation (a) (b) | | | 111,176 | | | | 2,932,823 | |
Mercer International, Inc. (a) | | | 8,671 | | | | 71,796 | |
| Neenah Paper, Inc. | | | 28,607 | | | | 1,440,934 | |
P.H. Glatfelter Company (b) | | | 101,464 | | | | 2,589,361 | |
| Schweitzer-Mauduit International, Inc. | | | 18,173 | | | | 793,070 | |
| | | | | | | | 8,268,890 | |
Telecommunication Services - 0.9% | |
| Diversified Telecommunication Services - 0.7% | |
Alaska Communications Systems Group, Inc. (a) (b) | | | 288,497 | | | | 545,259 | |
Cbeyond, Inc. (a) | | | 212,108 | | | | 2,097,748 | |
Cincinnati Bell, Inc. (a) | | | 133,989 | | | | 448,863 | |
General Communication, Inc. - Class A (a) (b) | | | 40,433 | | | | 422,121 | |
IDT Corporation - Class B (b) | | | 12,997 | | | | 205,873 | |
| Inteliquent, Inc. | | | 12,610 | | | | 172,000 | |
| Lumos Networks Corporation | | | 53,262 | | | | 703,591 | |
Premiere Global Services, Inc. (a) (b) | | | 28,395 | | | | 361,185 | |
Towerstream Corporation (a) | | | 179,904 | | | | 332,822 | |
Vonage Holdings Corporation (a) (b) | | | 528,832 | | | | 2,030,715 | |
| | | | | | | | 7,320,177 | |
| Wireless Telecommunication Services - 0.2% | |
Cellcom Israel Ltd. (b) | | | 25,354 | | | | 321,489 | |
RingCentral, Inc. - Class A (a) | | | 31,720 | | | | 480,875 | |
| Shenandoah Telecommunications Company | | | 5,027 | | | | 140,907 | |
T-Mobile US, Inc. (a) | | | 2,626 | | | | 76,915 | |
TFS MARKET NEUTRAL FUND
SCHEDULE OF INVESTMENTS (Continued)
COMMON STOCKS - 90.3%(Continued) | | Shares | | | Value | |
Telecommunication Services - 0.9%(Continued) | |
| Wireless Telecommunication Services - 0.2% (Continued) | |
| USA Mobility, Inc. | | | 51,136 | | | $ | 875,960 | |
| | | | | | | | 1,896,146 | |
Utilities - 1.0% | |
| Electric Utilities - 0.2% | |
| Brookfield Infrastructure Partners, L.P. | | | 1,491 | | | | 58,134 | |
| Cleco Corporation | | | 4,412 | | | | 231,851 | |
| El Paso Electric Company | | | 293 | | | | 11,081 | |
| Great Plains Energy, Inc. | | | 2,001 | | | | 53,687 | |
| OGE Energy Corporation | | | 8,196 | | | | 305,957 | |
| Otter Tail Corporation | | | 9,013 | | | | 264,081 | |
| PNM Resources, Inc. | | | 5,619 | | | | 155,534 | |
| Unitil Corporation | | | 30,967 | | | | 1,028,104 | |
| Xcel Energy, Inc. | | | 540 | | | | 17,210 | |
| | | | | | | | 2,125,639 | |
| Gas Utilities - 0.3% | |
| Chesapeake Utilities Corporation | | | 6,153 | | | | 389,239 | |
| Gas Natural, Inc. | | | 29,843 | | | | 325,289 | |
| Laclede Group, Inc. (The) | | | 15,471 | | | | 733,480 | |
| New Jersey Resources Corporation | | | 16,309 | | | | 811,047 | |
| One Gas, Inc. | | | 1,157 | | | | 42,323 | |
| South Jersey Industries, Inc. | | | 2,940 | | | | 168,903 | |
| Southwest Gas Corporation | | | 10,656 | | | | 586,187 | |
| Star Gas Partners, L.P. | | | 2,261 | | | | 14,357 | |
| UGI Corporation | | | 3,718 | | | | 173,593 | |
| | | | | | | | 3,244,418 | |
| Independent Power and Renewable Electricity Producers - 0.1% | |
| AES Corporation (The) | | | 19,309 | | | | 279,015 | |
| Atlantic Power Corporation | | | 111,589 | | | | 331,419 | |
Dynegy, Inc. (a) | | | 19,492 | | | | 554,548 | |
| Pattern Energy Group, Inc. | | | 6,570 | | | | 176,076 | |
Synthesis Energy Systems, Inc. (a) | | | 24,203 | | | | 41,871 | |
| | | | | | | | 1,382,929 | |
| Multi-Utilities - 0.2% | |
| Avista Corporation | | | 11,916 | | | | 383,099 | |
| CenterPoint Energy, Inc. | | | 4,875 | | | | 120,705 | |
| MDU Resources Group, Inc. | | | 4,180 | | | | 148,056 | |
| NorthWestern Corporation | | | 2,476 | | | | 119,789 | |
| Vectren Corporation | | | 20,743 | | | | 841,543 | |
| | | | | | | | 1,613,192 | |
| Water Utilities - 0.2% | |
| American States Water Company | | | 27,052 | | | | 821,299 | |
| Connecticut Water Service, Inc. | | | 2,018 | | | | 65,585 | |
| Consolidated Water Company Ltd. | | | 45,661 | | | | 530,581 | |
| Middlesex Water Company | | | 5,161 | | | | 104,923 | |
| SJW Corporation | | | 4,267 | | | | 116,190 | |
| | | | | | | | 1,638,578 | |
| | | | | | | | | |
Total Common Stocks (Cost $849,740,612) | | | $ | 913,267,189 | |
TFS MARKET NEUTRAL FUND
SCHEDULE OF INVESTMENTS (Continued)
PREFERRED STOCKS - 0.2% | | Shares | | | Value | |
| Beazer Homes USA, Inc., 7.500%, CV | | | 1,854 | | | $ | 55,490 | |
| Dominion Resources, Inc., Series A, 6.125%, CV | | | 6,500 | | | | 381,030 | |
| Dominion Resources, Inc., Series B, 6.000%, CV | | | 2,409 | | | | 141,625 | |
| MetLife, Inc., 5.000%, CV | | | 18,343 | | | | 558,544 | |
| NextEra Energy, Inc., 5.799%, CV | | | 5,343 | | | | 303,162 | |
Total Preferred Stocks (Cost $1,307,461) | | | $ | 1,439,851 | |
| OTHER INVESTMENTS - 7.6% | | Shares | | | Value | |
| Aberdeen Emerging Markets Smaller Company Opportunities Fund, Inc. | | | 10,012 | | | $ | 134,762 | |
Aberdeen Greater China Fund, Inc. (a) | | | 31,194 | | | | 310,692 | |
| Aberdeen Indonesia Fund, Inc. | | | 26,545 | | | | 249,019 | |
| Aberdeen Israel Fund, Inc. | | | 4,300 | | | | 77,142 | |
| Aberdeen Latin America Equity Fund, Inc. | | | 3,890 | | | | 111,254 | |
| Aberdeen Singapore Fund, Inc. | | | 13,073 | | | | 169,295 | |
| Adams Express Company (The) | | | 72,691 | | | | 957,340 | |
| Advent/Claymore Convertible Securities & Income Fund | | | 10,799 | | | | 196,974 | |
| Advent/Claymore Enhanced Growth & Income Fund | | | 33,872 | | | | 338,720 | |
| Advent/Claymore Global Convertible Securities & Income Fund | | | 40,900 | | | | 301,024 | |
| Alliance California Municipal Income Fund, Inc. | | | 11,481 | | | | 148,909 | |
| Alliance New York Municipal Income Fund, Inc. | | | 13,584 | | | | 172,381 | |
| AllianzGI Equity & Convertible Income Fund | | | 49,711 | | | | 983,781 | |
| Alpine Global Dynamic Dividend Fund | | | 13,390 | | | | 134,703 | |
| Alpine Global Premier Properties Fund | | | 184,178 | | | | 1,311,347 | |
| Alpine Total Dynamic Dividend Fund | | | 180,027 | | | | 1,532,030 | |
| American Income Fund, Inc. | | | 7,479 | | | | 57,214 | |
| American Select Portfolio, Inc. | | | 24,924 | | | | 251,732 | |
| American Strategic Income Portfolio, Inc. | | | 14,021 | | | | 138,668 | |
| American Strategic Income Portfolio, Inc. II | | | 5,499 | | | | 46,851 | |
| American Strategic Income Portfolio, Inc. III | | | 2,200 | | | | 15,994 | |
| ASA Gold and Precious Metals Ltd. | | | 16,804 | | | | 230,719 | |
Asia Pacific Fund, Inc. (The) (a) | | | 20,757 | | | | 212,552 | |
| Asia Tigers Fund, Inc. (The) | | | 25,600 | | | | 294,144 | |
| Bancroft Fund Ltd. | | | 6,137 | | | | 121,083 | |
| BlackRock Build America Bond Trust | | | 78,221 | | | | 1,599,619 | |
| BlackRock Core Bond Trust | | | 2,653 | | | | 35,789 | |
| BlackRock Corporate High Yield Fund VI, Inc. | | | 101,197 | | | | 1,236,627 | |
| BlackRock Credit Allocation Income Trust IV | | | 92,912 | | | | 1,271,036 | |
| BlackRock EcoSolutions Investment Trust | | | 22,337 | | | | 182,047 | |
| BlackRock Energy and Resources Trust | | | 63,771 | | | | 1,597,464 | |
| BlackRock Enhanced Equity Dividend Trust | | | 7,200 | | | | 58,320 | |
| BlackRock Income Trust, Inc. | | | 12,746 | | | | 83,231 | |
| BlackRock Municipal Bond Investment Trust | | | 7,769 | | | | 111,874 | |
| BlackRock Municipal Bond Trust | | | 26,701 | | | | 401,850 | |
| BlackRock Municipal Income Investment Quality Trust | | | 12,650 | | | | 177,606 | |
| BlackRock Municipal Income Quality Trust | | | 1,000 | | | | 14,040 | |
| BlackRock MuniHoldings California Quality Fund, Inc. | | | 400 | | | | 5,754 | |
| BlackRock MuniHoldings Investment Quality Fund | | | 13,362 | | | | 182,926 | |
| BlackRock MuniHoldings Quality Fund, Inc. | | | 27,222 | | | | 350,619 | |
| BlackRock MuniYield Investment Quality Fund | | | 12,255 | | | | 163,482 | |
TFS MARKET NEUTRAL FUND
SCHEDULE OF INVESTMENTS (Continued)
| OTHER INVESTMENTS - 7.6% (Continued) | | Shares | | | Value | |
| BlackRock MuniYield Michigan Quality Fund II, Inc. | | | 19,822 | | | $ | 251,145 | |
| BlackRock MuniYield Michigan Quality Fund, Inc. | | | 2,936 | | | | 40,135 | |
| BlackRock MuniYield Pennsylvania Quality Fund | | | 18,050 | | | | 253,783 | |
| BlackRock New Jersey Municipal Income Trust | | | 5,293 | | | | 75,849 | |
| BlackRock New York Municipal Bond Trust | | | 5,255 | | | | 72,624 | |
| BlackRock New York Municipal Income Quality Trust | | | 1,915 | | | | 25,163 | |
| BlackRock Pennsylvania Strategic Municipal Trust | | | 3,148 | | | | 40,656 | |
| BlackRock Real Asset Equity Trust | | | 71,284 | | | | 650,823 | |
| BlackRock Resources & Commodities Strategy Trust | | | 31,253 | | | | 375,661 | |
| BlackRock Utility and Infrastructure Trust | | | 28,374 | | | | 549,037 | |
| Boulder Growth & Income Fund, Inc. | | | 34,600 | | | | 289,256 | |
Boulder Total Return Fund, Inc. (a) | | | 16,583 | | | | 413,746 | |
| CBRE Clarion Global Real Estate Income Fund | | | 151,370 | | | | 1,303,296 | |
| Central Europe & Russia Fund, Inc. (The) | | | 2,571 | | | | 66,640 | |
| Central Securities Corporation | | | 26,640 | | | | 591,941 | |
| China Fund, Inc. (The) | | | 25,828 | | | | 512,944 | |
| Clough Global Allocation Fund | | | 16,170 | | | | 245,622 | |
| Clough Global Equity Fund | | | 19,178 | | | | 289,396 | |
| Clough Global Opportunities Fund | | | 114,618 | | | | 1,435,017 | |
| Cohen & Steers Closed-End Opportunity Fund, Inc. | | | 26,598 | | | | 351,360 | |
| Cohen & Steers Dividend Majors Fund, Inc. | | | 4,880 | | | | 76,421 | |
| Cohen & Steers Infrastructure Fund, Inc. | | | 71,001 | | | | 1,601,073 | |
| Cohen & Steers Quality Income Realty Fund, Inc. | | | 122,942 | | | | 1,322,856 | |
| Cohen & Steers REIT and Preferred Income Fund, Inc. | | | 80,038 | | | | 1,394,262 | |
| Cohen & Steers Total Return Realty Fund, Inc. | | | 3,339 | | | | 42,339 | |
| Cutwater Select Income Fund | | | 1 | | | | 9 | |
| Delaware Investments Colorado Municipal Income Fund, Inc. | | | 1,412 | | | | 19,133 | |
| Delaware Investments Dividend & Income Fund, Inc. | | | 444 | | | | 4,276 | |
| Delaware Investments National Municipal Income Fund | | | 3,290 | | | | 41,651 | |
| Denali Fund (The) | | | 536 | | | | 11,277 | |
| Dividend and Income Fund | | | 21,008 | | | | 329,195 | |
| Dreyfus Municipal Bond Infrastructure Fund, Inc. | | | 1,268 | | | | 14,823 | |
| DTF Tax-Free Income, Inc. | | | 9,767 | | | | 148,458 | |
| Duff & Phelps Global Utility Income Fund, Inc. | | | 69,808 | | | | 1,426,876 | |
| DWS Global High Income Fund, Inc. | | | 11,549 | | | | 94,586 | |
| DWS High Income Opportunities Fund, Inc. | | | 38,630 | | | | 564,384 | |
| DWS Multi-Market Income Trust | | | 35 | | | | 326 | |
| Eagle Capital Growth Fund, Inc. | | | 2,587 | | | | 20,256 | |
| Eaton Vance California Municipal Bond Fund | | | 29,635 | | | | 331,616 | |
| Eaton Vance Massachusetts Municipal Income Fund | | | 200 | | | | 2,704 | |
| Eaton Vance Michigan Municipal Income Trust | | | 3,721 | | | | 45,690 | |
| Eaton Vance Municiapl Income Term Trust | | | 26,647 | | | | 438,343 | |
| Eaton Vance New York Municipal Bond Fund | | | 29,727 | | | | 367,128 | |
| Eaton Vance New York Municipal Bond Fund 2 | | | 4,488 | | | | 53,587 | |
| Eaton Vance Ohio Municipal Bond Fund | | | 956 | | | | 11,749 | |
| Eaton Vance Ohio Municipal Income Trust | | | 2,000 | | | | 27,090 | |
| Eaton Vance Pennsylvania Municipal Income Trust | | | 3,100 | | | | 38,223 | |
| Eaton Vance Risk-Managed Diversified Equity Income Fund | | | 17,269 | | | | 193,931 | |
| Eaton Vance Tax-Advantaged Bond and Options Strategies Fund | | | 48,821 | | | | 688,864 | |
| Eaton Vance Tax-Advantaged Dividend Income Fund | | | 24,182 | | | | 481,705 | |
| Ellsworth Fund Ltd. | | | 16,927 | | | | 144,895 | |
TFS MARKET NEUTRAL FUND
SCHEDULE OF INVESTMENTS (Continued)
| OTHER INVESTMENTS - 7.6% (Continued) | | Shares | | | Value | |
Engex, Inc. (a) | | | 633 | | | $ | 2,849 | |
European Equity Fund, Inc. (The) (a) | | | 3,074 | | | | 27,758 | |
| Federated Enhanced Treasury Income Fund | | | 11,455 | | | | 155,101 | |
| Federated Premier Intermediate Municipal Income Fund | | | 302 | | | | 3,947 | |
| First Trust Dividend and Income Fund | �� | | 39,154 | | | | 343,381 | |
| First Trust Energy Infrastructure Fund | | | 20,319 | | | | 453,926 | |
| First Trust High Income Long/Short Fund | | | 790 | | | | 14,236 | |
| First Trust Specialty Finance & Finance Opportunities Fund | | | 2,621 | | | | 19,893 | |
| First Trust/Aberdeen Emerging Opportunity Fund | | | 25,435 | | | | 467,750 | |
| First Trust/FIDAC Mortgage Income Fund | | | 649 | | | | 10,345 | |
Firsthand Technology Value Fund, Inc. (a) | | | 61,886 | | | | 1,210,490 | |
| Fort Dearborn Income Securities, Inc. | | | 19,863 | | | | 288,411 | |
| Gabelli Dividend & Income Trust | | | 14,629 | | | | 326,227 | |
| Gabelli Global Utility & Income Trust | | | 6,958 | | | | 139,369 | |
| Gabelli Healthcare & WellnessRx Trust (The) | | | 25,351 | | | | 262,890 | |
| GDL Fund (The) | | | 47,352 | | | | 521,346 | |
| General American Investors Company, Inc. | | | 17,988 | | | | 641,272 | |
| Guggenheim Build America Bonds Managed Duration Trust | | | 18,431 | | | | 386,498 | |
| Guggenheim Equal Weight Enhanced Equity Income Fund | | | 6,659 | | | | 125,522 | |
| Helios Multi-Sector High Income Fund, Inc. | | | 1 | | | | 1 | |
Herzfeld Caribbean Basin Fund, Inc. (a) | | | 3,039 | | | | 24,494 | |
| India Fund, Inc. | | | 72,826 | | | | 1,598,531 | |
| ING Asia Pacific High Dividend Equity Income Fund | | | 9,054 | | | | 113,356 | |
| ING Global Advantage and Premium Opportunity Fund | | | 11,342 | | | | 133,609 | |
| ING Risk Managed Natural Resources Fund | | | 757 | | | | 8,138 | |
| Invesco Municipal Opportunity Trust | | | 123,110 | | | | 1,526,564 | |
| Invesco Quality Municipal Income Trust | | | 59,062 | | | | 711,106 | |
| Invesco Value Municipal Income Trust | | | 1 | | | | 13 | |
| Invesco Van Kampen Advantage Municipal Income Trust II | | | 33,721 | | | | 376,326 | |
| Invesco Van Kampen California Value Municipal Income Trust | | | 60,557 | | | | 730,317 | |
| Invesco Van Kampen Municipal Trust | | | 78,685 | | | | 966,252 | |
| Invesco Van Kampen Trust for Investment Grade Municipals | | | 57,960 | | | | 748,264 | |
| Japan Equity Fund, Inc. (The) | | | 35,080 | | | | 225,214 | |
| Japan Smaller Capitalization Fund, Inc. | | | 55,793 | | | | 484,283 | |
| John Hancock Income Securities Trust | | | 5,915 | | | | 86,063 | |
| John Hancock Premium Dividend Fund | | | 9,399 | | | | 126,887 | |
| John Hancock Tax-Advantaged Dividend Income Fund | | | 10,746 | | | | 222,657 | |
| Kayne Anderson Midstream/Energy Fund, Inc. | | | 19,377 | | | | 686,140 | |
Korea Equity Fund, Inc. (a) | | | 21,597 | | | | 180,983 | |
| Latin American Discovery Fund, Inc. | | | 7,614 | | | | 100,657 | |
| Lazard Global Total Return & Income Fund, Inc. | | | 11,175 | | | | 200,480 | |
| Liberty All-Star Equity Fund | | | 93,431 | | | | 538,163 | |
| LMP Real Estate Income Fund, Inc. | | | 9,247 | | | | 104,121 | |
| Macquarie Global Infrastructure Total Return Fund, Inc. | | | 4,474 | | | | 108,495 | |
| Madison/Claymore Covered Call & Equity Strategy Fund | | | 1,513 | | | | 12,649 | |
Mexico Equity and Income Fund, Inc. (The) (a) | | | 7,730 | | | | 113,940 | |
| MFS California Insured Municipal Trust | | | 4,521 | | | | 48,917 | |
| MFS High Income Municipal Trust | | | 44,782 | | | | 213,610 | |
| MFS High Yield Municipal Trust | | | 4,990 | | | | 22,056 | |
| MFS Investment Grade Municipal Trust | | | 4,186 | | | | 38,469 | |
| Montgomery Street Income Securities, Inc. | | | 12,599 | | | | 205,868 | |
| Morgan Stanley Asia-Pacific Fund, Inc. | | | 57,492 | | | | 915,273 | |
TFS MARKET NEUTRAL FUND
SCHEDULE OF INVESTMENTS (Continued)
| OTHER INVESTMENTS - 7.6% (Continued) | | Shares | | | Value | |
| Morgan Stanley China A Share Fund, Inc. | | | 65,408 | | | $ | 1,401,039 | |
| Morgan Stanley Eastern Europe Fund, Inc. | | | 1,638 | | | | 28,206 | |
| Morgan Stanley Emerging Markets Domestic Debt Fund, Inc. | | | 104,448 | | | | 1,371,402 | |
| Morgan Stanley Emerging Markets Fund, Inc. | | | 13,068 | | | | 198,503 | |
| Morgan Stanley Income Securities, Inc. | | | 5,250 | | | | 93,188 | |
| Neuberger Berman High Yield Strategies Fund, Inc. | | | 1,479 | | | | 20,277 | |
| Neuberger Berman Real Estate Securities Income Fund, Inc. | | | 221,052 | | | | 1,069,892 | |
| New America High Income Fund, Inc. | | | 58,523 | | | | 583,474 | |
| New Germany Fund, Inc. (The) | | | 34,013 | | | | 645,567 | |
| New Ireland Fund, Inc. (The) | | �� | 19,875 | | | | 281,231 | |
| Nuveen AMT-Free Municipal Income Fund | | | 1 | | | | 13 | |
| Nuveen Build America Bond Opportunity Fund | | | 18,303 | | | | 383,265 | |
| Nuveen Build America Bond Term Fund | | | 25,977 | | | | 519,020 | |
| Nuveen California Municipal Value Fund 2 | | | 1,820 | | | | 28,847 | |
| Nuveen Connecticut Premium Income Municipal Fund | | | 18,161 | | | | 226,286 | |
| Nuveen Credit Strategies Income Fund | | | 63,354 | | | | 596,795 | |
| Nuveen Diversified Commodity Fund | | | 8,962 | | | | 146,260 | |
| Nuveen Diversified Dividend and Income Fund | | | 39,044 | | | | 461,500 | |
| Nuveen Dividend Advantage Municipal Fund | | | 33,354 | | | | 459,618 | |
| Nuveen Dividend Advantage Municipal Fund 2 | | | 34,729 | | | | 480,649 | |
| Nuveen Dividend Advantage Municipal Fund 3 | | | 47,496 | | | | 635,022 | |
| Nuveen Dividend Advantage Municipal Income Fund | | | 57,424 | | | | 792,451 | |
| Nuveen Equity Premium and Growth Fund | | | 7,800 | | | | 112,632 | |
| Nuveen Georgia Dividend Advantage Municipal Fund 2 | | | 8,082 | | | | 101,510 | |
| Nuveen Global Equity Income Fund | | | 36,670 | | | | 500,912 | |
| Nuveen Intermediate Duration Municipal Term Fund | | | 38,078 | | | | 468,359 | |
| Nuveen Maryland Premium Income Municipal Fund | | | 5,702 | | | | 72,415 | |
| Nuveen Michigan Quality Income Municipal Fund, Inc. | | | 64,084 | | | | 884,359 | |
| Nuveen Municipal Advantage Fund | | | 52,874 | | | | 702,167 | |
| Nuveen Municipal Opportunity Fund, Inc. | | | 20,823 | | | | 292,771 | |
| Nuveen New Jersey Dividend Advantage Municipal Fund | | | 1,400 | | | | 19,096 | |
| Nuveen New Jersey Dividend Advantage Municipal Fund 2 | | | 4,527 | | | | 60,119 | |
| Nuveen New Jersey Investment Quality Municipal Fund, Inc. | | | 21,897 | | | | 295,828 | |
| Nuveen New Jersey Municipal Value Fund | | | 1,170 | | | | 16,942 | |
| Nuveen New York Dividend Advantage Municipal Fund | | | 18,873 | | | | 255,918 | |
| Nuveen New York Dividend Advantage Municipal Fund 2 | | | 297 | | | | 3,971 | |
| Nuveen New York Performance Plus Municipal Fund, Inc. | | | 17,850 | | | | 254,720 | |
| Nuveen North Carolina Premium Income Municipal Fund | | | 13,598 | | | | 177,046 | |
| Nuveen Pennsylvania Municipal Value Fund | | | 1,337 | | | | 19,320 | |
| Nuveen Premier Municipal Income Fund, Inc. | | | 19,944 | | | | 269,842 | |
| Nuveen Premium Income Municipal Fund | | | 47,428 | | | | 638,855 | |
| Nuveen Premium Income Municipal Fund 2 | | | 70,288 | | | | 966,462 | |
| Nuveen Quality Municipal Fund, Inc. | | | 46,587 | | | | 605,165 | |
| Nuveen Quality Preferred Income Fund | | | 1,947 | | | | 16,199 | |
| Nuveen Quality Preferred Income Fund 2 | | | 6,115 | | | | 54,057 | |
| Nuveen Select Quality Municipal Fund | | | 79,879 | | | | 1,081,562 | |
| Nuveen Select Tax-Free Income Portfolio | | | 20,437 | | | | 277,739 | |
| Petroleum & Resources Corporation | | | 23,674 | | | | 689,150 | |
| Putnam Master Intermediate Income Trust | | | 2,797 | | | | 14,349 | |
| Putnam Municipal Opportunities Trust | | | 36,725 | | | | 426,377 | |
RENN Global Entrepreneurs Fund, Inc. (a) | | | 900 | | | | 1,422 | |
| RMR Real Estate Income Fund | | | 38,987 | | | | 743,094 | |
TFS MARKET NEUTRAL FUND
SCHEDULE OF INVESTMENTS (Continued)
| OTHER INVESTMENTS - 7.6% (Continued) | | Shares | | | Value | |
| Royce Micro-Cap Trust, Inc. | | | 32,800 | | | $ | 392,616 | |
| Royce Value Trust, Inc. | | | 26,700 | | | | 415,986 | |
| Source Capital, Inc. | | | 8,604 | | | | 583,781 | |
| Special Opportunities Fund, Inc. | | | 8,700 | | | | 142,158 | |
| Strategic Global Income Fund, Inc. | | | 4,282 | | | | 39,780 | |
| Swiss Helvetia Fund, Inc. (The) | | | 31,775 | | | | 457,878 | |
Taiwan Fund, Inc. (The) (a) | | | 1,175 | | | | 22,043 | |
| Templeton Dragon Fund, Inc. | | | 24,125 | | | | 588,891 | |
| Templeton Emerging Markets Fund | | | 23,381 | | | | 409,168 | |
| Templeton Russia & East European Fund, Inc. | | | 17,595 | | | | 223,632 | |
| Thai Fund, Inc. (The) | | | 33,746 | | | | 388,416 | |
| Tortoise MLP Fund, Inc. | | | 10,906 | | | | 296,643 | |
| Transamerica Income Shares, Inc. | | | 1,641 | | | | 34,346 | |
| Tri-Continental Corporation | | | 35,447 | | | | 719,220 | |
| Turkish Investment Fund, Inc. (The) | | | 30,727 | | | | 345,679 | |
| Virtus Total Return Fund | | | 44,753 | | | | 196,913 | |
| Wells Fargo Advantage Multi-Sector Income Fund | | | 1,182 | | | | 17,458 | |
| Western Asset Intermediate Muni Fund, Inc. | | | 1,385 | | | | 13,225 | |
| Western Asset Municipal Partners Fund, Inc. | | | 16,671 | | | | 243,730 | |
| Western Asset/Claymore Inflation-Linked Securities & Income Fund | | | 2,670 | | | | 31,933 | |
| Zweig Total Return Fund, Inc. (The) | | | 1,613 | | | | 22,647 | |
Total Other Investments (Cost $75,672,532) | | | $ | 76,746,547 | |
CORPORATE BONDS - 0.0% (d) | | Par Value | | | Value | |
Financials - 0.0% (d) | | | | | | | | |
| GAMCO Investors, Inc., 0.00%, due 12/31/2015 | | $ | 3,100 | | | $ | 2,994 | |
Gyrodyne Company of America, Inc., 5.00%, due 6/30/2017 (c) | | | 12,110 | | | | – | |
Total Corporate Bonds (Cost $12,110) | | | $ | 2,994 | |
TFS MARKET NEUTRAL FUND
SCHEDULE OF INVESTMENTS (Continued)
| MONEY MARKET FUNDS - 0.8% | | Shares | | | Value | |
Federated Government Obligations Fund - Institutional Class, 0.01% (e) | | | 8,159,309 | | | $ | 8,159,309 | |
UMB Money Market Fiduciary, 0.01% (e) | | | 171,240 | | | | 171,240 | |
Total Money Market Funds (Cost $8,330,549) | | | $ | 8,330,549 | |
| | | | | | | | | |
Total Investments at Value - 98.9% (Cost $935,063,264) | | | $ | 999,787,130 | |
| | | | | | | | | |
| Other Assets in Excess of Liabilities - 1.1% | | | | 11,612,091 | (f) |
| | | | | | | | | |
| Net Assets - 100.0% | | | $ | 1,011,399,221 | |
| ADR | - American Depositary Receipt. |
CV - Convertible Security. |
| (a) | Non-income producing security. |
| (b) | All or a portion of the shares have been committed as collateral for open short positions. |
| (c) | Security value has been determined in good faith by the Board of Trustees. The total value of such securities is $1,660 at April 30, 2014, representing 0.0% (d) of net assets (Note 2). |
| (d) | Percentage rounds to less than 0.1%. |
| (e) | The rate shown is the 7-day effective yield as of April 30, 2014. |
| (f) | Includes cash held as margin deposits for open short positions and futures contracts. |
See accompanying notes to financial statements.
TFS MARKET NEUTRAL FUND
SCHEDULE OF SECURITIES SOLD SHORT
April 30, 2014(Unaudited)
| COMMON STOCKS - 75.1% | | Shares | | | Value | |
| Consumer Discretionary - 10.5% | |
| Auto Components - 0.5% | |
| Ballard Power Systems, Inc. | | | 568,713 | | | $ | 2,081,490 | |
| BorgWarner, Inc. | | | 4,612 | | | | 286,590 | |
| China XD Plastics Company Ltd. | | | 9,267 | | | | 63,386 | |
| Dorman Products, Inc. | | | 8,482 | | | | 488,139 | |
| Fuel Systems Solutions, Inc. | | | 13,470 | | | | 141,166 | |
| Quantum Fuel Systems Technologies Worldwide, Inc. | | | 309,392 | | | | 2,045,081 | |
| TRW Automotive Holdings Corporation | | | 218 | | | | 17,516 | |
| UQM Technologies, Inc. | | | 92,361 | | | | 204,118 | |
| | | | | | | | 5,327,486 | |
| Automobiles - 0.2% | |
| Kandi Technologies Group, Inc. | | | 138,345 | | | | 1,550,848 | |
| Tesla Motors, Inc. | | | 1,778 | | | | 369,628 | |
| | | | | | | | 1,920,476 | |
Distributors - 0.0% (a) | |
| Pool Corporation | | | 5,958 | | | | 351,641 | |
| | | | | | | | | |
| Diversified Consumer Services - 1.0% | |
| American Public Education, Inc. | | | 28,951 | | | | 1,001,705 | |
| Bridgepoint Education, Inc. | | | 35,063 | | | | 555,748 | |
| Capella Education Company | | | 2,544 | | | | 148,468 | |
| Carriage Services, Inc. | | | 2,719 | | | | 43,749 | |
| Corinthian Colleges, Inc. | | | 494,992 | | | | 569,241 | |
| Education Management Corporation | | | 14,102 | | | | 55,985 | |
| ITT Educational Services, Inc. | | | 40,688 | | | | 1,098,576 | |
| K12, Inc. | | | 19,837 | | | | 469,740 | |
| Lincoln Educational Services Corporation | | | 32,023 | | | | 130,654 | |
| Matthews International Corporation - Class A | | | 2,665 | | | | 107,533 | |
| Outerwall, Inc. | | | 4,035 | | | | 279,827 | |
| StoneMor Partners, L.P. | | | 27,888 | | | | 689,391 | |
| Strayer Education, Inc. | | | 10,988 | | | | 468,418 | |
| Weight Watchers International, Inc. | | | 206,002 | | | | 4,078,840 | |
| | | | | | | | 9,697,875 | |
| Hotels, Restaurants & Leisure - 1.0% | |
| Aramark Holdings Corporation | | | 4,534 | | | | 127,813 | |
| Bally Technologies, Inc. | | | 11,830 | | | | 770,251 | |
| BJ's Restaurants, Inc. | | | 13,969 | | | | 398,815 | |
| Bloomin' Brands, Inc. | | | 455 | | | | 9,701 | |
| Bob Evans Farms, Inc. | | | 20,275 | | | | 950,289 | |
| Caesars Entertainment Corporation | | | 26,138 | | | | 482,769 | |
| Churchill Downs, Inc. | | | 1,841 | | | | 161,695 | |
| Chuy's Holdings, Inc. | | | 9,495 | | | | 341,345 | |
| Darden Restaurants, Inc. | | | 1,463 | | | | 72,726 | |
| Denny's Corporation | | | 32,979 | | | | 222,278 | |
| Empire Resorts, Inc. | | | 70,502 | | | | 477,299 | |
| Famous Dave's of America, Inc. | | | 1,771 | | | | 46,914 | |
| Iao Kun Group Holding Company Ltd. | | | 139 | | | | 407 | |
| International Game Technology | | | 94,687 | | | | 1,188,322 | |
| Interval Leisure Group, Inc. | | | 475 | | | | 12,241 | |
| Jamba, Inc. | | | 33 | | | | 365 | |
| Life Time Fitness, Inc. | | | 25,180 | | | | 1,208,640 | |
| Morgans Hotel Group Company | | | 49,425 | | | | 370,687 | |
TFS MARKET NEUTRAL FUND
SCHEDULE OF SECURITIES SOLD SHORT (Continued)
| COMMON STOCKS - 75.1% (Continued) | | Shares | | | Value | |
| Consumer Discretionary - 10.5% (Continued) | |
| Hotels, Restaurants & Leisure - 1.0% (Continued) | |
| Multimedia Games Holding Company, Inc. | | | 1,716 | | | $ | 50,107 | |
| Noodles & Company | | | 21,807 | | | | 715,052 | |
| Pinnacle Entertainment, Inc. | | | 21,035 | | | | 489,484 | |
| PokerTek, Inc. | | | 976 | | | | 1,279 | |
| Popeyes Louisiana Kitchen, Inc. | | | 15,322 | | | | 583,768 | |
| Potbelly Corporation | | | 12,609 | | | | 214,353 | |
| Red Lion Hotels Corporation | | | 1,947 | | | | 11,195 | |
| Ryman Hospitality Properties, Inc. | | | 15,398 | | | | 701,379 | |
| Six Flags Entertainment Corporation | | | 1,300 | | | | 52,182 | |
| Starbucks Corporation | | | 830 | | | | 58,615 | |
| | | | | | | | 9,719,971 | |
| Household Durables - 1.1% | |
| Beazer Homes USA, Inc. | | | 22,384 | | | | 424,401 | |
| Blyth, Inc. | | | 216,699 | | | | 2,030,470 | |
| D.R. Horton, Inc. | | | 4,455 | | | | 99,257 | |
| Ethan Allen Interiors, Inc. | | | 51,022 | | | | 1,238,814 | |
| Garmin Ltd. | | | 3,074 | | | | 175,525 | |
| Hovnanian Enterprises, Inc. - Class A | | | 186,097 | | | | 829,993 | |
| iRobot Corporation | | | 8,503 | | | | 284,850 | |
| KB Home | | | 79,013 | | | | 1,304,505 | |
| Lennar Corporation - Class A | | | 7,998 | | | | 308,643 | |
| Meritage Homes Corporation | | | 21,733 | | | | 838,459 | |
| SodaStream International Ltd. | | | 13,220 | | | | 562,247 | |
| Taylor Morrison Home Corporation - Class A | | | 6,889 | | | | 146,116 | |
| Tempur Sealy International, Inc. | | | 7,112 | | | | 356,880 | |
| Toll Brothers, Inc. | | | 956 | | | | 32,733 | |
| TRI Pointe Homes, Inc. | | | 154,530 | | | | 2,483,297 | |
| William Lyon Homes - Class A | | | 10,281 | | | | 268,334 | |
| | | | | | | | 11,384,524 | |
| Internet & Catalog Retail - 0.4% | |
| E-Commerce China Dangdang, Inc. - Class A - ADR | | | 33,193 | | | | 358,152 | |
| FTD Companies, Inc. | | | 27,027 | | | | 819,999 | |
| HomeAway, Inc. | | | 3,011 | | | | 98,219 | |
| Lands' End, Inc. | | | 12,090 | | | | 334,289 | |
| LightInTheBox Holding Company Ltd. - ADR | | | 28,600 | | | | 156,156 | |
| Mecox Lane Ltd. - ADR | | | 706 | | | | 2,520 | |
| NutriSystem, Inc. | | | 49,990 | | | | 749,850 | |
| Orbitz Worldwide, Inc. | | | 87,868 | | | | 645,830 | |
| PetMed Express, Inc. | | | 76,986 | | | | 1,007,747 | |
| | | | | | | | 4,172,762 | |
| Leisure Products - 1.1% | |
| Black Diamond, Inc. | | | 105,140 | | | | 1,172,311 | |
| Callaway Golf Company | | | 109,638 | | | | 954,947 | |
| Eastman Kodak Company | | | 38,697 | | | | 1,155,879 | |
| JAKKS Pacific, Inc. | | | 252,698 | | | | 2,213,635 | |
| Smith & Wesson Holding Corporation | | | 169,052 | | | | 2,594,948 | |
| Sturm Ruger & Company, Inc. | | | 53,270 | | | | 3,427,925 | |
| | | | | | | | 11,519,645 | |
| Media - 1.9% | |
| Central European Media Enterprises Ltd. - Class A | | | 471,957 | | | | 1,293,162 | |
| China Yida Holding Company | | | 190 | | | | 580 | |
| Cinemark Holdings, Inc. | | | 2,282 | | | | 67,593 | |
TFS MARKET NEUTRAL FUND
SCHEDULE OF SECURITIES SOLD SHORT (Continued)
| COMMON STOCKS - 75.1% (Continued) | | Shares | | | Value | |
| Consumer Discretionary - 10.5% (Continued) | |
| Media - 1.9% (Continued) | |
| Cumulus Media, Inc. - Class A | | | 125,811 | | | $ | 806,449 | |
| Dex Media, Inc. | | | 122,782 | | | | 899,992 | |
| DreamWorks Animation SKG, Inc. - Class A | | | 62,247 | | | | 1,495,795 | |
| Entercom Communications Corporation - Class A | | | 41,565 | | | | 448,902 | |
| Gray Television, Inc. | | | 28,174 | | | | 316,958 | |
| Lamar Advertising Company - Class A | | | 11,218 | | | | 560,003 | |
| Liberty Media Corporation - Class A | | | 444 | | | | 57,591 | |
| McClatchy Company (The) - Class A | | | 70,578 | | | | 386,767 | |
| MDC Partners, Inc. - Class A | | | 66,191 | | | | 1,616,384 | |
| Media General, Inc. | | | 37,694 | | | | 577,472 | |
| New Media Investment Group, Inc. | | | 15,083 | | | | 215,234 | |
| Nexstar Broadcasting Group, Inc. - Class A | | | 63,334 | | | | 2,523,860 | |
| Radio One, Inc. - Class D | | | 165,132 | | | | 746,397 | |
| ReachLocal, Inc. | | | 15,311 | | | | 153,110 | |
| Regal Entertainment Group - Class A | | | 72,935 | | | | 1,371,178 | |
| RRSat Global Communications Network Ltd. | | | 489 | | | | 4,337 | |
| Scholastic Corporation | | | 17,859 | | | | 587,740 | |
| SFX Entertainment, Inc. | | | 7,972 | | | | 52,296 | |
| Sinclair Broadcast Group, Inc. - Class A | | | 54,923 | | | | 1,468,092 | |
| Sizmek, Inc. | | | 100,321 | | | | 961,075 | |
| Thomson Reuters Corporation | | | 12,185 | | | | 440,853 | |
| Tiger Media, Inc. | | | 586 | | | | 469 | |
| VisionChina Media, Inc. - ADR | | | 31,531 | | | | 622,422 | |
| World Wrestling Entertainment, Inc. - Class A | | | 17,530 | | | | 341,835 | |
| YOU On Demand Holdings, Inc. | | | 213,518 | | | | 634,148 | |
| | | | | | | | 18,650,694 | |
| Multiline Retail - 0.7% | |
| J. C. Penney Company, Inc. | | | 554,613 | | | | 4,725,303 | |
| Sears Canada, Inc. | | | 299 | | | | 4,413 | |
| Sears Holdings Corporation | | | 39,958 | | | | 1,750,560 | |
| Tuesday Morning Corporation | | | 55,608 | | | | 777,400 | |
| | | | | | | | 7,257,676 | |
| Specialty Retail - 2.1% | |
| Aéropostale, Inc. | | | 118,461 | | | | 588,751 | |
| America's Car-Mart, Inc. | | | 30,241 | | | | 1,092,910 | |
| Birks Group, Inc. | | | 62 | | | | 75 | |
| Books-A-Million, Inc. | | | 7,234 | | | | 17,072 | |
| Buckle, Inc. (The) | | | 12,721 | | | | 597,760 | |
| Cabela's, Inc. | | | 2,734 | | | | 179,378 | |
| CarMax, Inc. | | | 2,181 | | | | 95,484 | |
| Children's Place Retail Stores, Inc. (The) | | | 798 | | | | 38,304 | |
| China Auto Logistics, Inc. | | | 1,210 | | | | 3,182 | |
| Conn's, Inc. | | | 66,480 | | | | 2,940,410 | |
| Container Store Group, Inc. (The) | | | 26,497 | | | | 731,052 | |
| CST Brands, Inc. | | | 301 | | | | 9,822 | |
| Five Below, Inc. | | | 13,618 | | | | 548,941 | |
| Francesca's Holdings Corporation | | | 57,324 | | | | 937,821 | |
| GameStop Corporation - Class A | | | 4,868 | | | | 193,162 | |
| Group 1 Automotive, Inc. | | | 1,051 | | | | 75,809 | |
| hhgregg, Inc. | | | 180,008 | | | | 1,551,669 | |
| Hibbett Sports, Inc. | | | 21,816 | | | | 1,174,792 | |
| Jos. A. Bank Clothiers, Inc. | | | 1,029 | | | | 66,422 | |
TFS MARKET NEUTRAL FUND
SCHEDULE OF SECURITIES SOLD SHORT (Continued)
| COMMON STOCKS - 75.1% (Continued) | | Shares | | | Value | |
| Consumer Discretionary - 10.5% (Continued) | |
| Specialty Retail - 2.1% (Continued) | |
| Lithia Motors, Inc. - Class A | | | 14,335 | | | $ | 1,064,804 | |
| Lumber Liquidators Holdings, Inc. | | | 1,365 | | | | 118,973 | |
| Men's Wearhouse, Inc. (The) | | | 3,422 | | | | 162,134 | |
| Monro Muffler Brake, Inc. | | | 27,118 | | | | 1,529,455 | |
| Office Depot, Inc. | | | 58,146 | | | | 237,817 | |
| RadioShack Corporation | | | 1,998,345 | | | | 2,857,633 | |
| Rent-A-Center, Inc. | | | 68,622 | | | | 2,004,449 | |
| Restoration Hardware Holdings, Inc. | | | 5,094 | | | | 317,815 | |
| Select Comfort Corporation | | | 27,297 | | | | 502,265 | |
| Staples, Inc. | | | 7,358 | | | | 91,975 | |
| Tiffany & Company | | | 4,116 | | | | 360,109 | |
| Tile Shop Holdings, Inc. (The) | | | 88,440 | | | | 1,246,562 | |
| Zumiez, Inc. | | | 1,971 | | | | 48,191 | |
| | | | | | | | 21,384,998 | |
| Textiles, Apparel & Luxury Goods - 0.5% | |
| American Apparel, Inc. | | | 742,832 | | | | 480,166 | |
| Coach, Inc. | | | 949 | | | | 42,373 | |
| CROCS, Inc. | | | 33,287 | | | | 503,632 | |
| Perry Ellis International, Inc. | | | 22,818 | | | | 344,552 | |
| PVH Corporation | | | 345 | | | | 43,322 | |
| Quiksilver, Inc. | | | 150,879 | | | | 968,643 | |
| Tumi Holdings, Inc. | | | 5,861 | | | | 119,682 | |
| Vera Bradley, Inc. | | | 85,302 | | | | 2,414,046 | |
| Wolverine World Wide, Inc. | | | 2,388 | | | | 67,103 | |
| | | | | | | | 4,983,519 | |
| Consumer Staples - 2.2% | |
Beverages - 0.0% (a) | |
| Castle Brands, Inc. | | | 2,918 | | | | 2,670 | |
| Craft Brewers Alliance, Inc. | | | 19,724 | | | | 295,268 | |
| Leading Brands, Inc. | | | 31 | | | | 124 | |
| Primo Water Corporation | | | 10,882 | | | | 48,860 | |
| Viña Concha y Toro S.A. - ADR | | | 99 | | | | 4,148 | |
| | | | | | | | 351,070 | |
| Food & Staples Retailing - 0.5% | |
| Alon Blue Square Israel Ltd. - ADR | | | 300 | | | | 1,098 | |
| Chefs' Warehouse, Inc. (The) | | | 43,092 | | | | 865,718 | |
| Fairway Group Holdings Corporation | | | 41,441 | | | | 287,186 | |
| Fresh Market, Inc. (The) | | | 41,755 | | | | 1,549,111 | |
| Liberator Medical Holdings, Inc. | | | 235,156 | | | | 910,054 | |
| Natural Grocers by Vitamin Cottage, Inc. | | | 4,804 | | | | 171,022 | |
| Roundy's, Inc. | | | 103,527 | | | | 700,878 | |
| Sprouts Farmers Market, Inc. | | | 4,915 | | | | 157,133 | |
| SUPERVALU, Inc. | | | 63,867 | | | | 446,430 | |
| Susser Holdings Corporation | | | 2,977 | | | | 230,360 | |
| Weis Markets, Inc. | | | 538 | | | | 24,796 | |
| | | | | | | | 5,343,786 | |
| Food Products - 1.2% | |
| Amira Nature Foods Ltd. | | | 19,619 | | | | 305,272 | |
| Annie's, Inc. | | | 67,850 | | | | 2,205,803 | |
| B&G Foods, Inc. | | | 7,799 | | | | 255,807 | |
| Boulder Brands, Inc. | | | 86,140 | | | | 1,271,426 | |
| Calavo Growers, Inc. | | | 17,135 | | | | 532,727 | |
TFS MARKET NEUTRAL FUND
SCHEDULE OF SECURITIES SOLD SHORT (Continued)
| COMMON STOCKS - 75.1% (Continued) | | Shares | | | Value | |
| Consumer Staples - 2.2% (Continued) | |
| Food Products - 1.2% (Continued) | |
| Campbell Soup Company | | | 2,347 | | | $ | 106,765 | |
| Coffee Holding Company, Inc. | | | 68,214 | | | | 488,412 | |
| ConAgra Foods, Inc. | | | 1,261 | | | | 38,473 | |
| Dean Foods Company | | | 96,786 | | | | 1,533,090 | |
| Diamond Foods, Inc. | | | 58,942 | | | | 1,801,857 | |
| Flowers Foods, Inc. | | | 6,029 | | | | 123,715 | |
| Fresh Del Monte Produce, Inc. | | | 46,758 | | | | 1,350,839 | |
| General Mills, Inc. | | | 302 | | | | 16,012 | |
| Keurig Green Mountain, Inc. | | | 375 | | | | 35,130 | |
| Limoneira Company | | | 23,750 | | | | 545,538 | |
| McCormick & Company, Inc. | | | 2,743 | | | | 195,302 | |
| Post Holdings, Inc. | | | 5,191 | | | | 271,282 | |
| S&W Seed Company | | | 30,912 | | | | 226,894 | |
| SkyPeople Fruit Juice, Inc. | | | 465 | | | | 753 | |
| Tianli Agritech, Inc. | | | 323 | | | | 669 | |
| Tootsie Roll Industries, Inc. | | | 10,552 | | | | 297,461 | |
| | | | | | | | 11,603,227 | |
| Household Products - 0.1% | |
| Clorox Company | | | 2,356 | | | | 213,689 | |
| Harbinger Group, Inc. | | | 55,570 | | | | 647,947 | |
| | | | | | | | 861,636 | |
| Personal Products - 0.4% | |
| 22nd Century Group, Inc. | | | 390,736 | | | | 1,047,172 | |
China-Biotics, Inc. (b) | | | 535,616 | | | | 696,301 | |
| Female Health Company (The) | | | 103,845 | | | | 785,068 | |
| Herbalife Ltd. | | | 9,900 | | | | 593,802 | |
| USANA Health Sciences, Inc. | | | 10,459 | | | | 709,748 | |
| | | | | | | | 3,832,091 | |
Tobacco - 0.0% (a) | |
| Altria Group, Inc. | | | 1,164 | | | | 46,688 | |
| Star Scientific, Inc. | | | 210,813 | | | | 138,272 | |
| Universal Corporation | | | 2,712 | | | | 147,994 | |
| | | | | | | | 332,954 | |
| Energy - 6.5% | |
| Energy Equipment & Services - 1.1% | |
| Bristow Group, Inc. | | | 13,409 | | | | 1,029,811 | |
| C&J Energy Services, Inc. | | | 23,496 | | | | 706,290 | |
| Cal Dive International, Inc. | | | 915,018 | | | | 1,354,227 | |
| Dawson Geophysical Company | | | 22,258 | | | | 629,011 | |
| Diamond Offshore Drilling, Inc. | | | 20,468 | | | | 1,117,758 | |
| Exterran Holdings, Inc. | | | 22,701 | | | | 976,597 | |
| Frank's International N.V. | | | 3,972 | | | | 108,952 | |
| Hornbeck Offshore Services, Inc. | | | 5,345 | | | | 221,443 | |
| McDermott International, Inc. | | | 341,027 | | | | 2,465,625 | |
| Newpark Resources, Inc. | | | 20,273 | | | | 244,087 | |
| Nuverra Environmental Solutions, Inc. | | | 107,631 | | | | 1,830,803 | |
| Recon Technology Ltd. | | | 15,452 | | | | 64,899 | |
| Tidewater, Inc. | | | 6,485 | | | | 330,281 | |
| Vantage Drilling Company | | | 63,378 | | | | 105,841 | |
| | | | | | | | 11,185,625 | |
TFS MARKET NEUTRAL FUND
SCHEDULE OF SECURITIES SOLD SHORT (Continued)
| COMMON STOCKS - 75.1% (Continued) | | Shares | | | Value | |
| Energy - 6.5% (Continued) | |
| Oil, Gas & Consumable Fuels - 5.4% | |
| Alon USA Partners, L.P. | | | 15,753 | | | $ | 290,013 | |
| Alpha Natural Resources, Inc. | | | 424,002 | | | | 1,823,209 | |
| American Midstream Partners, L.P. | | | 226 | | | | 6,118 | |
| Amyris, Inc. | | | 760,119 | | | | 2,675,619 | |
| Approach Resources, Inc. | | | 13,749 | | | | 285,292 | |
| Arc Logistics Partners, L.P. | | | 900 | | | | 20,079 | |
| Arch Coal, Inc. | | | 307,983 | | | | 1,410,562 | |
| Atlas Resource Partners, L.P. | | | 931 | | | | 19,765 | |
| Bill Barrett Corporation | | | 10,334 | | | | 244,709 | |
| BioFuel Energy Corporation | | | 22,810 | | | | 169,478 | |
| BP Prudhoe Bay Royalty Trust | | | 6,029 | | | | 527,417 | |
| BPZ Resources, Inc. | | | 596,097 | | | | 1,609,462 | |
| BreitBurn Energy Partners, L.P. | | | 4,619 | | | | 93,627 | |
| CAMAC Energy, Inc. | | | 312,069 | | | | 212,207 | |
| Capital Product Partners, L.P. | | | 21,873 | | | | 240,603 | |
| Cheniere Energy, Inc. | | | 9,201 | | | | 519,396 | |
| Chesapeake Granite Wash Trust | | | 4,397 | | | | 48,411 | |
| China Integrated Energy, Inc. | | | 201,992 | | | | 133,315 | |
| Clean Energy Fuels Corporation | | | 164,779 | | | | 1,458,294 | |
| Cloud Peak Energy, Inc. | | | 25,223 | | | | 496,641 | |
| CONSOL Energy, Inc. | | | 1,311 | | | | 58,353 | |
| Contango Oil & Gas Company | | | 420 | | | | 20,177 | |
| Diamondback Energy, Inc. | | | 2,838 | | | | 204,166 | |
| Emerald Oil, Inc. | | | 192,700 | | | | 1,362,389 | |
| Emerge Energy Services, L.P. | | | 129 | | | | 9,565 | |
| Enbridge Energy Management, LLC | | | 47,234 | | | | 1,387,735 | |
| Endeavour International Corporation | | | 545,179 | | | | 1,875,416 | |
| Energy XXI (Bermuda) Ltd. | | | 12,176 | | | | 291,372 | |
| Evolution Petroleum Corporation | | | 25,265 | | | | 298,127 | |
| Feishang Anthracite Resources Ltd. | | | 12,465 | | | | 11,254 | |
| Forest Oil Corporation | | | 173,089 | | | | 321,946 | |
| Frontline Ltd. | | | 462,075 | | | | 1,571,055 | |
| Gevo, Inc. | | | 197,368 | | | | 203,289 | |
| Global Partners, L.P. | | | 100 | | | | 4,060 | |
| Goodrich Petroleum Corporation | | | 145,303 | | | | 3,654,370 | |
| Green Plains Renewable Energy, Inc. | | | 8,925 | | | | 266,858 | |
| GreenHunter Resources, Inc. | | | 318 | | | | 299 | |
| Gulfport Energy Corporation | | | 376 | | | | 27,700 | |
| Halcon Resources Corporation | | | 418,593 | | | | 2,310,633 | |
| Harvest Natural Resources, Inc. | | | 300,652 | | | | 1,355,941 | |
| Holly Energy Partners, L.P. | | | 13,749 | | | | 444,230 | |
| Hyperdynamics Corporation | | | 17,464 | | | | 25,323 | |
| InterOil Corporation | | | 19,975 | | | | 1,262,620 | |
| Kinder Morgan Management, LLC | | | 5,729 | | | | 413,650 | |
| LinnCo, LLC | | | 63,300 | | | | 1,744,548 | |
| Lucas Energy, Inc. | | | 24,576 | | | | 15,414 | |
| Magnum Hunter Resources Corporation | | | 69,189 | | | | 588,106 | |
| Matador Resources | | | 1,553 | | | | 44,602 | |
| Midcoast Energy Partners, L.P. | | | 6,421 | | | | 140,491 | |
| Midstates Petroleum Company, Inc. | | | 42,800 | | | | 252,520 | |
| Miller Energy Resources, Inc. | | | 130,178 | | | | 627,458 | |
| Navios Maritime Acquisition Corporation | | | 175 | | | | 621 | |
TFS MARKET NEUTRAL FUND
SCHEDULE OF SECURITIES SOLD SHORT (Continued)
| COMMON STOCKS - 75.1% (Continued) | | Shares | | | Value | |
| Energy - 6.5% (Continued) | |
| Oil, Gas & Consumable Fuels - 5.4% (Continued) | |
| New Source Energy Partners, L.P. | | | 28 | | | $ | 641 | |
| Nordic American Tankers Ltd. | | | 191,893 | | | | 1,656,037 | |
| Northern Oil & Gas, Inc. | | | 99,641 | | | | 1,537,461 | |
| Northern Tier Energy, L.P. | | | 11,676 | | | | 315,369 | |
| Oasis Petroleum, Inc. | | | 5,421 | | | | 252,131 | |
| Pacific Ethanol, Inc. | | | 82,067 | | | | 1,280,245 | |
| PDC Energy, Inc. | | | 2,247 | | | | 143,066 | |
| Pembina Pipeline Corporation | | | 6,764 | | | | 265,960 | |
| Penn Virginia Corporation | | | 41,718 | | | | 694,188 | |
| Pioneer Natural Resources Company | | | 271 | | | | 52,376 | |
| QEP Resources, Inc. | | | 1,992 | | | | 61,134 | |
| Quicksilver Resources, Inc. | | | 780,376 | | | | 2,544,026 | |
| Rentech, Inc. | | | 141,343 | | | | 299,647 | |
| Resolute Energy Corporation | | | 46,482 | | | | 348,615 | |
| Rex Energy Corporation | | | 30,082 | | | | 633,527 | |
| Rhino Resource Partners, L.P. | | | 36,819 | | | | 474,965 | |
| Rosetta Resources, Inc. | | | 2,372 | | | | 112,290 | |
| RSP Permina, Inc. | | | 1,059 | | | | 30,023 | |
| San Juan Basin Royalty Trust | | | 45,455 | | | | 868,645 | |
| SandRidge Energy, Inc. | | | 117,783 | | | | 807,991 | |
| SandRidge Mississippian Trust I | | | 84,466 | | | | 652,922 | |
| Scorpio Tankers, Inc. | | | 12,993 | | | | 117,067 | |
| Solazyme, Inc. | | | 184,569 | | | | 1,985,962 | |
| Spectra Energy Partners, L.P. | | | 25,061 | | | | 1,364,571 | |
| Susser Petroleum Partners, L.P. | | | 3,904 | | | | 162,797 | |
| TC PipeLines, L.P. | | | 965 | | | | 51,184 | |
| Teekay Tankers Ltd. - Class A | | | 70,085 | | | | 244,597 | |
| Transatlantic Petroleum Ltd. | | | 2,484 | | | | 22,753 | |
| Ultra Petroleum Corporation | | | 14,451 | | | | 430,640 | |
| Uranerz Energy Corporation | | | 166,249 | | | | 249,373 | |
| Uranium Energy Corporation | | | 231,479 | | | | 247,683 | |
| Uranium Resources, Inc. | | | 175,518 | | | | 472,143 | |
| Ur-Energy, Inc. | | | 185,116 | | | | 222,139 | |
| USEC, Inc. | | | 83,656 | | | | 282,757 | |
| Vanguard Natural Resources, LLC | | | 33,386 | | | | 1,007,589 | |
| Western Refining, Inc. | | | 21,534 | | | | 936,729 | |
| Whiting USA Trust I | | | 272,461 | | | | 790,137 | |
| WPX Energy, Inc. | | | 7,434 | | | | 158,196 | |
| Zion Oil & Gas, Inc. | | | 40,947 | | | | 91,312 | |
| | | | | | | | 54,947,393 | |
| Financials - 12.1% | |
| Banks - 4.4% | |
| Arrow Financial Corporation | | | 20,474 | | | | 512,464 | |
| Bancorp, Inc. (The) | | | 14,104 | | | | 223,125 | |
| BancorpSouth, Inc. | | | 12,203 | | | | 285,062 | |
| Bank of Hawaii Corporation | | | 14,821 | | | | 817,675 | |
| Bank of the Ozarks, Inc. | | | 54,065 | | | | 3,238,494 | |
| Banner Corporation | | | 2,423 | | | | 95,805 | |
| BNC Bancorp | | | 2,223 | | | | 36,235 | |
| Boston Private Financial Holdings, Inc. | | | 6,671 | | | | 83,454 | |
| Capital City Bank Group, Inc. | | | 33 | | | | 459 | |
| Cardinal Financial Corporation | | | 16,023 | | | | 269,186 | |
TFS MARKET NEUTRAL FUND
SCHEDULE OF SECURITIES SOLD SHORT (Continued)
| COMMON STOCKS - 75.1% (Continued) | | Shares | | | Value | |
| Financials - 12.1% (Continued) | |
| Banks - 4.4% (Continued) | |
| Center Bancorporation, Inc. | | | 1,763 | | | $ | 32,633 | |
| Central Valley Community Bancorp | | | 4 | | | | 46 | |
| City Holding Company | | | 47,108 | | | | 2,025,173 | |
| CoBiz Financial, Inc. | | | 10,748 | | | | 107,910 | |
| Columbia Banking System, Inc. | | | 6,935 | | | | 172,127 | |
| Commerce Bancshares, Inc. | | | 3,296 | | | | 143,310 | |
| Community Bank System, Inc. | | | 59,424 | | | | 2,209,979 | |
| CVB Financial Corporation | | | 31,443 | | | | 454,666 | |
| DNB Financial Corporation | | | 17 | | | | 335 | |
| East West Bancorp, Inc. | | | 357 | | | | 12,320 | |
| Fidelity Southern Corporation | | | 16 | | | | 211 | |
| First BanCorporation (Puerto Rico) | | | 122,538 | | | | 629,845 | |
| First Commonwealth Financial Corporation | | | 22,498 | | | | 193,258 | |
| First Financial Bancorporation | | | 59,828 | | | | 968,615 | |
| First Financial Bankshares, Inc. | | | 44,113 | | | | 2,604,873 | |
| First Financial Holdings, Inc. | | | 3,752 | | | | 215,627 | |
| First Niagara Financial Group, Inc. | | | 3,593 | | | | 32,050 | |
| First of Long Island Corporation (The) | | | 575 | | | | 20,855 | |
| First United Corporation | | | 400 | | | | 3,304 | |
| First West Virginia Bancorp, Inc. | | | 7 | | | | 126 | |
| FirstMerit Corporation | | | 50,065 | | | | 970,760 | |
| Glacier Bancorp, Inc. | | | 43,414 | | | | 1,114,003 | |
| Hanmi Financial Corporation | | | 6,497 | | | | 138,191 | |
| Heartland Financial USA, Inc. | | | 9,904 | | | | 240,667 | |
| Heritage Financial Corporation | | | 62,697 | | | | 1,013,184 | |
| Home BancShares, Inc. | | | 30,080 | | | | 953,837 | |
| Hudson Valley Holding Corporation | | | 1,362 | | | | 25,006 | |
| Independent Bank Corporation (Massachusetts) | | | 33,738 | | | | 1,252,355 | |
| Jacksonville Bancorp, Inc. (Florida) | | | 85 | | | | 887 | |
| Lakeland Bancorp, Inc. | | | 14,698 | | | | 153,447 | |
| Lakeland Financial Corporation | | | 424 | | | | 15,518 | |
| LCNB Corporation | | | 493 | | | | 7,888 | |
| M&T Bank Corporation | | | 2,390 | | | | 291,604 | |
| MB Financial, Inc. | | | 957 | | | | 25,686 | |
| National Bank of Greece S.A. - ADR | | | 143,900 | | | | 564,088 | |
| National Penn Bancshares, Inc. | | | 81,501 | | | | 796,265 | |
| NBT Bancorp, Inc. | | | 1,878 | | | | 42,537 | |
| OFG Bancorp | | | 25,024 | | | | 426,909 | |
| Old National Bancorp | | | 22,357 | | | | 315,681 | |
| OptimumBank Holdings, Inc. | | | 597 | | | | 740 | |
| PacWest Bancorp | | | 34,430 | | | | 1,355,509 | |
| Park National Corporation | | | 26,575 | | | | 1,927,219 | |
| Peoples Bancorp, Inc. | | | 989 | | | | 25,783 | |
| Pinnacle Financial Partners, Inc. | | | 29,795 | | | | 1,030,013 | |
| PrivateBancorp, Inc. | | | 25,245 | | | | 696,005 | |
| Renasant Corporation | | | 19,525 | | | | 531,471 | |
| Republic Bancorp, Inc. - Class A | | | 7,468 | | | | 179,307 | |
| S&T Bancorp, Inc. | | | 5,140 | | | | 119,556 | |
| Simmons First National Corporation - Class A | | | 958 | | | | 34,641 | |
| Southside Bancshares, Inc. | | | 74,455 | | | | 2,053,479 | |
| Sterling Bancorp | | | 40,269 | | | | 481,617 | |
| Texas Capital Bancshares, Inc. | | | 24,190 | | | | 1,359,236 | |
TFS MARKET NEUTRAL FUND
SCHEDULE OF SECURITIES SOLD SHORT (Continued)
| COMMON STOCKS - 75.1% (Continued) | | Shares | | | Value | |
| Financials - 12.1% (Continued) | |
| Banks - 4.4% (Continued) | |
| Tompkins Financial Corporation | | | 3,107 | | | $ | 146,464 | |
| TowneBank | | | 51,130 | | | | 788,936 | |
| TriCo Bancshares | | | 41,735 | | | | 1,012,074 | |
| Trustmark Corporation | | | 99,988 | | | | 2,286,726 | |
| Umpqua Holdings Corporation | | | 43,656 | | | | 725,999 | |
| United Bankshares, Inc. | | | 16,171 | | | | 473,002 | |
| United Community Banks, Inc. | | | 24,188 | | | | 390,636 | |
| Valley National Bancorp | | | 152,758 | | | | 1,530,635 | |
| Washington Trust Bancorp, Inc. | | | 6,115 | | | | 209,133 | |
| Webster Financial Corporation | | | 1,523 | | | | 45,903 | |
| Westamerica Bancorporation | | | 58,496 | | | | 2,972,767 | |
| Wintrust Financial Corporation | | | 717 | | | | 32,136 | |
| Woori Finance Holdings Company Ltd. - ADR | | | 198 | | | | 6,535 | |
| | | | | | | | 44,153,257 | |
| Capital Markets - 1.7% | |
| American Capital Ltd. | | | 5,000 | | | | 74,950 | |
| Apollo Investment Corporation | | | 60,847 | | | | 486,168 | |
| Ares Capital Corporation | | | 11,648 | | | | 199,996 | |
| Arlington Asset Investment Corporation - Class A | | | 184 | | | | 4,867 | |
| Capitala Finance Corporation | | | 3,749 | | | | 68,907 | |
| Cohen & Steers, Inc. | | | 29,683 | | | | 1,202,458 | |
| Cowen Group, Inc. - Class A | | | 207,289 | | | | 851,958 | |
| Eaton Vance Corporation | | | 7,299 | | | | 263,275 | |
| Federated Investors, Inc. - Class B | | | 9,218 | | | | 263,082 | |
| Fidus Investment Corporation | | | 47,340 | | | | 867,269 | |
| Financial Engines, Inc. | | | 8,484 | | | | 375,417 | |
| Full Circle Capital Corporation | | | 42,711 | | | | 320,760 | |
| FXCM, Inc. - Class A | | | 162,499 | | | | 2,515,485 | |
| GFI Group, Inc. | | | 50,727 | | | | 188,704 | |
| Gladstone Capital Corporation | | | 40,427 | | | | 390,929 | |
| Golub Capital BDC, Inc. | | | 45,690 | | | | 763,937 | |
| Greenhill & Company, Inc. | | | 33,581 | | | | 1,684,087 | |
| GSV Capital Corporation | | | 54,720 | | | | 480,442 | |
| Hannon Armstrong Sustainable Infrastructure Capital, Inc. | | | 9,780 | | | | 129,292 | |
| Harris & Harris Group, Inc. | | | 3,410 | | | | 12,242 | |
| Harvest Capital Credit Corporation | | | 400 | | | | 5,764 | |
| Hercules Technology Growth Capital, Inc. | | | 19,135 | | | | 261,767 | |
| Horizon Technology Finance Corporation | | | 5,200 | | | | 68,120 | |
| ICG Group, Inc. | | | 1,501 | | | | 30,590 | |
| INTL FCStone, Inc. | | | 31,185 | | | | 590,020 | |
| Janus Capital Group, Inc. | | | 56,961 | | | | 690,937 | |
| KCAP Financial, Inc. | | | 73,601 | | | | 586,600 | |
| Keating Capital, Inc. | | | 1,400 | | | | 8,862 | |
| Main Street Capital Corporation | | | 4,178 | | | | 131,356 | |
| New Mountain Finance Corporation | | | 18,929 | | | | 270,874 | |
| NGP Capital Resources Company | | | 5,568 | | | | 37,918 | |
| PennantPark Floating Rate Capital Ltd. | | | 28,536 | | | | 396,650 | |
| Rand Capital Corporation | | | 19 | | | | 66 | |
| RCS Capital Corporation - Class A | | | 546 | | | | 18,782 | |
| Safeguard Scientifics, Inc. | | | 75,372 | | | | 1,583,566 | |
| Solar Senior Capital Ltd. | | | 19,218 | | | | 318,058 | |
TFS MARKET NEUTRAL FUND
SCHEDULE OF SECURITIES SOLD SHORT (Continued)
| COMMON STOCKS - 75.1% (Continued) | | Shares | | | Value | |
| Financials - 12.1% (Continued) | |
| Capital Markets - 1.7% (Continued) | |
| TCP Capital Corporation | | | 21,494 | | | $ | 347,988 | |
| THL Credit, Inc. | | | 2,191 | | | | 29,425 | |
| TICC Capital Corporation | | | 19,577 | | | | 188,526 | |
| Triangle Capital Corporation | | | 2,462 | | | | 64,184 | |
| WisdomTree Investments, Inc. | | | 19,039 | | | | 214,950 | |
| | | | | | | | 16,989,228 | |
| Consumer Finance - 0.8% | |
| Atlanticus Holdings Corporation | | | 103,056 | | | | 250,426 | |
| DFC Global Corporation | | | 215,617 | | | | 2,009,551 | |
| Encore Capital Group, Inc. | | | 58,579 | | | | 2,531,784 | |
| EZCORP, Inc. - Class A | | | 94,034 | | | | 980,775 | |
| Imperial Holdings, Inc. | | | 67,626 | | | | 452,418 | |
| JGWPT Holdings, Inc. - Class A | | | 8,289 | | | | 117,455 | |
| World Acceptance Corporation | | | 25,415 | | | | 1,845,129 | |
| | | | | | | | 8,187,538 | |
| Diversified Financial Services - 0.2% | |
| Citigroup, Inc. | | | 405 | | | | 19,404 | |
| CME Group, Inc. | | | 1,877 | | | | 132,122 | |
| Gain Capital Holdings, Inc. | | | 156,167 | | | | 1,577,287 | |
| Global Eagle Entertainment, Inc. | | | 33,014 | | | | 364,144 | |
| Manhattan Bridge Capital, Inc. | | | 1,376 | | | | 2,683 | |
| | | | | | | | 2,095,640 | |
| Insurance - 1.8% | |
| Allied World Assurance Company Holdings Ltd. | | | 1,303 | | | | 140,320 | |
| Ambac Financial Group, Inc. | | | 15,388 | | | | 464,410 | |
| Arch Capital Group Ltd. | | | 731 | | | | 41,901 | |
| Arthur J. Gallagher & Company | | | 1,851 | | | | 83,332 | |
| Aviva plc - ADR | | | 5,600 | | | | 100,408 | |
| Axis Capital Holdings Ltd. | | | 1,167 | | | | 53,390 | |
| Brown & Brown, Inc. | | | 3,757 | | | | 111,883 | |
| Cincinnati Financial Corporation | | | 2,585 | | | | 125,993 | |
| Citizens, Inc. | | | 8,363 | | | | 54,945 | |
| eHealth, Inc. | | | 2,147 | | | | 89,938 | |
| First American Financial Corporation | | | 60,017 | | | | 1,596,452 | |
| Greenlight Capital Re Ltd. - Class A | | | 25,863 | | | | 823,219 | |
| HCC Insurance Holdings, Inc. | | | 5,252 | | | | 241,277 | |
| HCI Group, Inc. | | | 50,543 | | | | 1,955,003 | |
| Health Insurance Innovations, Inc. - Class A | | | 1,074 | | | | 10,837 | |
| Infinity Property & Casualty Corporation | | | 2,297 | | | | 147,398 | |
| Lincoln National Corporation | | | 7,399 | | | | 358,926 | |
| Maiden Holdings Ltd. | | | 55,248 | | | | 651,926 | |
| Markel Corporation | | | 627 | | | | 392,452 | |
| Meadowbrook Insurance Group, Inc. | | | 340,658 | | | | 1,907,685 | |
| Montpelier Re Holdings Ltd. | | | 65,631 | | | | 2,006,996 | |
| Phoenix Companies, Inc. (The) | | | 13,809 | | | | 607,872 | |
| Protective Life Corporation | | | 7,155 | | | | 365,978 | |
| StanCorp Financial Group, Inc. | | | 4,718 | | | | 288,270 | |
| Stewart Information Services Corporation | | | 56,268 | | | | 1,716,174 | |
| Sun Life Financial, Inc. | | | 5,507 | | | | 186,357 | |
| Tower Group International Ltd. | | | 999,005 | | | | 2,457,552 | |
| Universal Insurance Holdings, Inc. | | | 45,217 | | | | 661,525 | |
| W.R. Berkley Corporation | | | 1,150 | | | | 50,876 | |
TFS MARKET NEUTRAL FUND
SCHEDULE OF SECURITIES SOLD SHORT (Continued)
| COMMON STOCKS - 75.1% (Continued) | | Shares | | | Value | |
| Financials - 12.1% (Continued) | |
| Insurance - 1.8% (Continued) | |
| XL Group plc | | | 7,691 | | | $ | 241,113 | |
| | | | | | | | 17,934,408 | |
| Real Estate Investment Trusts (REIT) - 2.2% | |
| Altisource Residential Corporation | | | 36,298 | | | | 1,020,700 | |
| American Capital Agency Corporation | | | 17,342 | | | | 393,837 | |
| American Residential Properties, Inc. | | | 11,359 | | | | 204,121 | |
| Apollo Commercial Real Estate Finance, Inc. | | | 6,479 | | | | 110,208 | |
| Arbor Realty Trust, Inc. | | | 35,199 | | | | 246,745 | |
| Ares Commercial Real Estate Corporation | | | 5,676 | | | | 72,426 | |
| Associated Estates Realty Corporation | | | 387 | | | | 6,494 | |
| Campus Crest Communities, Inc. | | | 101,198 | | | | 871,315 | |
| Capstead Mortgage Corporation | | | 17,767 | | | | 227,062 | |
| CBL & Associates Properties, Inc. | | | 51,371 | | | | 933,411 | |
| Colony Financial, Inc. | | | 17,410 | | | | 378,667 | |
| Columbia Property Trust, Inc. | | | 5,211 | | | | 147,680 | |
| CYS Investments, Inc. | | | 27,814 | | | | 239,200 | |
| Digital Realty Trust, Inc. | | | 8,123 | | | | 433,768 | |
| Douglas Emmett, Inc. | | | 5,926 | | | | 163,558 | |
| DuPont Fabros Technology, Inc. | | | 65,383 | | | | 1,584,230 | |
| Empire State Realty Trust, Inc. - Class A | | | 39,874 | | | | 610,072 | |
| Equity One, Inc. | | | 2,449 | | | | 55,176 | |
| First Industrial Realty Trust, Inc. | | | 7,298 | | | | 134,064 | |
| First Potomac Realty Trust | | | 29,805 | | | | 388,359 | |
| Gaming and Leisure Properties, Inc. | | | 3,195 | | | | 117,416 | |
| Getty Realty Corporation | | | 16,818 | | | | 318,197 | |
| Gladstone Commercial Corporation | | | 852 | | | | 15,029 | |
| Glimcher Realty Trust | | | 7,685 | | | | 78,310 | |
| Government Properties Income Trust | | | 3,308 | | | | 84,189 | |
| Hatteras Financial Corporation | | | 18,235 | | | | 356,859 | |
| HCP, Inc. | | | 4,624 | | | | 193,561 | |
| Health Care REIT, Inc. | | | 2,594 | | | | 163,655 | |
| Healthcare Realty Trust, Inc. | | | 6,010 | | | | 151,151 | |
| iStar Financial, Inc. | | | 81,554 | | | | 1,211,892 | |
| JAVELIN Mortgage Investment Corporation | | | 99,867 | | | | 1,319,243 | |
| Liberty Property Trust | | | 4,689 | | | | 175,838 | |
| Mack-Cali Realty Corporation | | | 9,041 | | | | 184,165 | |
| Medical Properties Trust, Inc. | | | 50,657 | | | | 683,869 | |
| Monmouth Real Estate Investment Corporation - Class A | | | 22,885 | | | | 214,890 | |
| National Health Investors, Inc. | | | 978 | | | | 60,333 | |
| National Retail Properties, Inc. | | | 11,214 | | | | 382,734 | |
| Newcastle Investment Corporation | | | 209,736 | | | | 941,715 | |
| Parkway Properties, Inc. | | | 511 | | | | 9,637 | |
| Pebblebrook Hotel Trust | | | 11,737 | | | | 404,222 | |
| Piedmont Office Realty Trust, Inc. - Class A | | | 61,490 | | | | 1,082,839 | |
| Plum Creek Timber Company, Inc. | | | 345 | | | | 15,042 | |
| RAIT Financial Trust | | | 54,098 | | | | 442,522 | |
| Ramco-Gershenson Properties Trust | | | 27,286 | | | | 449,673 | |
| RE/MAX Holdings, Inc. - Class A | | | 2,295 | | | | 64,765 | |
| Realty Income Corporation | | | 6,739 | | | | 292,810 | |
| Redwood Trust, Inc. | | | 74,582 | | | | 1,625,888 | |
| Retail Properties of America, Inc. - Class A | | | 3,652 | | | | 52,297 | |
| RLJ Lodging Trust | | | 4,626 | | | | 123,375 | |
TFS MARKET NEUTRAL FUND
SCHEDULE OF SECURITIES SOLD SHORT (Continued)
| COMMON STOCKS - 75.1% (Continued) | | Shares | | | Value | |
| Financials - 12.1% (Continued) | |
| Real Estate Investment Trusts (REIT) - 2.2% (Continued) | |
| Rouse Properties, Inc. | | | 76,500 | | | $ | 1,284,435 | |
| Sabra Health Care REIT, Inc. | | | 13 | | | | 390 | |
| Silver Bay Realty Trust Corporation | | | 6,108 | | | | 91,498 | |
| UMH Properties, Inc. | | | 35,355 | | | | 348,247 | |
| Ventas, Inc. | | | 2,246 | | | | 148,416 | |
| Washington Real Estate Investment Trust | | | 11,771 | | | | 287,919 | |
| Weingarten Realty Investors | | | 17,134 | | | | 534,581 | |
| Western Asset Mortgage Capital Corporation | | | 20,011 | | | | 295,562 | |
| ZAIS Financial Corporation | | | 2,052 | | | | 33,837 | |
| | | | | | | | 22,462,094 | |
| Real Estate Management & Development - 0.2% | |
| Brookfield Office Properties, Inc. | | | 6,294 | | | | 124,558 | |
| Brookfield Property Partners, L.P. | | | 14,198 | | | | 276,293 | |
| China HGS Real Estate, Inc. | | | 508 | | | | 2,667 | |
| China Housing & Land Development, Inc. | | | 76,855 | | | | 172,924 | |
| St. Joe Company (The) | | | 87,144 | | | | 1,555,520 | |
| | | | | | | | 2,131,962 | |
| Thrifts & Mortgage Finance - 0.8% | |
| Astoria Financial Corporation | | | 782 | | | | 10,369 | |
| Banc of California, Inc. | | | 57,802 | | | | 726,571 | |
| BankUnited, Inc. | | | 11,742 | | | | 387,369 | |
| BofI Holding, Inc. | | | 3,294 | | | | 265,529 | |
| Capitol Federal Financial, Inc. | | | 18,877 | | | | 227,279 | |
| Elmira Savings Bank | | | 100 | | | | 2,312 | |
| Five Oaks Investment Corporation | | | 12,936 | | | | 150,187 | |
| Flushing Financial Corporation | | | 8,329 | | | | 160,084 | |
| Home Loan Servicing Solutions Ltd. | | | 17,729 | | | | 392,697 | |
| Impac Mortgage Holdings, Inc. | | | 2,023 | | | | 11,673 | |
| Nationstar Mortgage Holdings, Inc. | | | 5,000 | | | | 163,650 | |
| Northfield Bancorp, Inc. | | | 889 | | | | 11,530 | |
| Oconee Federal Financial Corporation | | | 16 | | | | 292 | |
| Ocwen Financial Corporation | | | 949 | | | | 35,967 | |
| Radian Group, Inc. | | | 182,994 | | | | 2,558,256 | |
| Rockville Financial, Inc. | | | 39,854 | | | | 524,479 | |
| Security National Financial Corporation - Class A | | | 37,761 | | | | 146,890 | |
| Stonegate Mortgage Corporation | | | 20,057 | | | | 253,721 | |
| TrustCo Bank Corporation | | | 356,519 | | | | 2,356,591 | |
| United Financial Bancorporation, Inc. | | | 7,040 | | | | 124,186 | |
| ViewPoint Financial Group, Inc. | | | 5,944 | | | | 154,960 | |
| | | | | | | | 8,664,592 | |
| Health Care - 14.4% | |
| Biotechnology - 8.3% | |
| Aastrom Biosciences, Inc. | | | 104,029 | | | | 407,794 | |
| ACADIA Pharmaceuticals, Inc. | | | 19,441 | | | | 391,347 | |
| Achillion Pharmaceuticals, Inc. | | | 339,943 | | | | 968,838 | |
| AEterna Zentaris, Inc. | | | 38,200 | | | | 43,548 | |
| Agios Pharmaceuticals, Inc. | | | 6,437 | | | | 270,740 | |
| AMAG Pharmaceuticals, Inc. | | | 7,109 | | | | 129,810 | |
| Amarin Corporation plc - ADR | | | 99,517 | | | | 161,218 | |
| Anthera Pharmaceuticals, Inc. | | | 6,900 | | | | 19,527 | |
| ARCA Biopharma, Inc. | | | 230,269 | | | | 370,733 | |
| Arena Pharmaceuticals, Inc. | | | 788,223 | | | | 5,044,627 | |
TFS MARKET NEUTRAL FUND
SCHEDULE OF SECURITIES SOLD SHORT (Continued)
| COMMON STOCKS - 75.1% (Continued) | | Shares | | | Value | |
| Health Care - 14.4% (Continued) | |
| Biotechnology - 8.3% (Continued) | |
| Ariad Pharmaceuticals, Inc. | | | 312,257 | | | $ | 2,270,108 | |
| Arrowhead Research Corporation | | | 106,561 | | | | 1,161,515 | |
| Athersys, Inc. | | | 24,208 | | | | 35,465 | |
| BiolineRx Ltd. - ADR | | | 9,331 | | | | 18,849 | |
| BioTime, Inc. | | | 5,571 | | | | 14,429 | |
| Burcon NutraScience Corporation | | | 300 | | | | 1,201 | |
| Cara Therapeutics, Inc. | | | 15,105 | | | | 217,361 | |
| Catalyst Pharmaceutical Partners, Inc. | | | 369,103 | | | | 767,734 | |
| Celldex Therapeutics, Inc. | | | 19,444 | | | | 291,660 | |
| CEL-SCI Corporation | | | 298,706 | | | | 355,460 | |
| Celsion Corporation | | | 569,663 | | | | 1,891,281 | |
| Chelsea Therapeutics International Ltd. | | | 11,442 | | | | 55,837 | |
| ChemoCentryx, Inc. | | | 64,237 | | | | 352,019 | |
| Clovis Oncology, Inc. | | | 5,763 | | | | 311,605 | |
| Conatus Pharmaceuticals, Inc. | | | 2,485 | | | | 15,283 | |
| Cyclacel Pharmaceuticals, Inc. | | | 79,533 | | | | 264,050 | |
| CytRx Corporation | | | 972,126 | | | | 2,984,427 | |
| DARA Biosciences, Inc. | | | 11,070 | | | | 18,819 | |
| Dendreon Corporation | | | 1,629,639 | | | | 4,204,469 | |
| Durata Therapeutics, Inc. | | | 18,826 | | | | 254,904 | |
| Dynavax Technologies Corporation | | | 13,692 | | | | 22,318 | |
| Enanta Pharmaceuticals, Inc. | | | 6,485 | | | | 241,307 | |
| Exact Sciences Corporation | | | 132,793 | | | | 1,593,516 | |
| Exelixis, Inc. | | | 814,326 | | | | 2,882,714 | |
| Fibrocell Science, Inc. | | | 60,682 | | | | 230,592 | |
| Foundation Medicine, Inc. | | | 32,778 | | | | 955,806 | |
| Galectin Therapeutics, Inc. | | | 95,529 | | | | 1,102,405 | |
| Galena Biopharma, Inc. | | | 1,639,329 | | | | 4,016,356 | |
| Genocea Biosciences, Inc. | | | 24 | | | | 466 | |
| GenVec, Inc. | | | 17,086 | | | | 42,373 | |
| Halozyme Therapeutics, Inc. | | | 9,281 | | | | 69,143 | |
| Heat Biologics, Inc. | | | 700 | | | | 3,815 | |
| Horizon Pharma, Inc. | | | 84,252 | | | | 1,194,693 | |
| Idenix Pharmaceuticals, Inc. | | | 305,356 | | | | 1,682,512 | |
| Idera Pharmaceuticals, Inc. | | | 176,309 | | | | 500,718 | |
| ImmunoCellular Therapeutics Ltd. | | | 68,147 | | | | 79,732 | |
| Immunomedics, Inc. | | | 180,695 | | | | 760,726 | |
| Infinity Pharmaceuticals, Inc. | | | 31,319 | | | | 305,987 | |
| Inovio Pharmaceuticals, Inc. | | | 395,540 | | | | 937,430 | |
| Intrexon Corporation | | | 17,638 | | | | 333,005 | |
| Ironwood Pharmaceuticals, Inc. | | | 2,961 | | | | 32,630 | |
| IsoRay, Inc. | | | 713,250 | | | | 1,718,932 | |
| Kamada Ltd. | | | 1,900 | | | | 27,322 | |
| Keryx Biopharmaceuticals, Inc. | | | 111,390 | | | | 1,645,230 | |
| KYTHERA Biopharmaceuticals, Inc. | | | 10,811 | | | | 352,547 | |
| La Jolla Pharmaceutical Company | | | 11,475 | | | | 104,881 | |
| MannKind Corporation | | | 458,973 | | | | 3,006,273 | |
| Mast Therapeutics, Inc. | | | 593,719 | | | | 340,854 | |
| Medgenics, Inc. | | | 2,506 | | | | 16,339 | |
| MEI Pharma, Inc. | | | 122,925 | | | | 961,273 | |
| Merrimack Pharmaceuticals, Inc. | | | 559,781 | | | | 2,457,439 | |
| Metabolix, Inc. | | | 181,332 | | | | 186,772 | |
TFS MARKET NEUTRAL FUND
SCHEDULE OF SECURITIES SOLD SHORT (Continued)
| COMMON STOCKS - 75.1% (Continued) | | Shares | | | Value | |
| Health Care - 14.4% (Continued) | |
| Biotechnology - 8.3% (Continued) | |
| Mirati Therapeutics, Inc. | | | 6,259 | | | $ | 117,920 | |
| Myriad Genetics, Inc. | | | 60,430 | | | | 2,550,750 | |
| NanoViricides, Inc. | | | 202,493 | | | | 643,928 | |
| NeoStem, Inc. | | | 159,668 | | | | 945,235 | |
| Neuralstem, Inc. | | | 182,765 | | | | 657,954 | |
| NewLink Genetics Corporation | | | 25,592 | | | | 563,024 | |
| Northwest Biotherapeutics, Inc. | | | 471,464 | | | | 2,800,496 | |
| Novavax, Inc. | | | 39,968 | | | | 175,060 | |
| NPS Pharmaceuticals, Inc. | | | 2,176 | | | | 57,925 | |
| Ohr Pharmaceutical, Inc. | | | 7,138 | | | | 67,668 | |
| Omeros Corporation | | | 82,286 | | | | 1,018,701 | |
| Oncolytics Biotech, Inc. | | | 112,080 | | | | 163,637 | |
| OncoMed Pharmaceuticals, Inc. | | | 23,435 | | | | 617,278 | |
| Opexa Therapeutics, Inc. | | | 117,157 | | | | 186,865 | |
| OPKO Health, Inc. | | | 309,398 | | | | 2,558,725 | |
| Oragenics, Inc. | | | 3 | | | | 6 | |
| Orexigen Therapeutics, Inc. | | | 34,269 | | | | 192,592 | |
| Organovo Holdings, Inc. | | | 275,004 | | | | 1,606,023 | |
| Osiris Therapeutics, Inc. | | | 64,143 | | | | 912,755 | |
| OXiGENE, Inc. | | | 246,262 | | | | 797,889 | |
| Oxygen Biotherapeutics, Inc. | | | 339,007 | | | | 1,654,354 | |
| Palatin Technologies, Inc. | | | 69,648 | | | | 87,060 | |
| Peregrine Pharmaceuticals, Inc. | | | 110,280 | | | | 191,887 | |
| PharmAthene, Inc. | | | 458 | | | | 632 | |
| Pluristem Therapeutics, Inc. | | | 14,486 | | | | 51,860 | |
| Prana Biotechnology Ltd. - ADR | | | 66,607 | | | | 117,228 | |
| Prosensa Holding N.V. | | | 10,483 | | | | 73,276 | |
| Puma Biotechnology, Inc. | | | 3,800 | | | | 287,052 | |
| Raptor Pharmaceutical Corporation | | | 104,984 | | | | 868,218 | |
| Retrophin, Inc. | | | 16,882 | | | | 241,244 | |
| Rexahn Pharmaceuticals, Inc. | | | 878,229 | | | | 833,878 | |
| Rosetta Genomics Ltd. | | | 128,530 | | | | 484,558 | |
| RXi Pharmaceuticals Corporation | | | 214 | | | | 698 | |
| Sarepta Therapeutics, Inc. | | | 111,304 | | | | 4,132,718 | |
| SciClone Pharmaceuticals, Inc. | | | 169,374 | | | | 809,608 | |
| SIGA Technologies, Inc. | | | 189 | | | | 542 | |
| Spectrum Pharmaceuticals, Inc. | | | 131,104 | | | | 900,684 | |
| Synageva BioPharma Corporation | | | 5,192 | | | | 448,433 | |
| Synergy Pharmaceuticals, Inc. | | | 98,737 | | | | 443,329 | |
| Synta Pharmaceuticals Corporation | | | 485,346 | | | | 2,043,307 | |
| Tekmira Pharmaceuticals Corporation | | | 2,838 | | | | 37,717 | |
| Theravance, Inc. | | | 13,674 | | | | 368,104 | |
| TrovaGene, Inc. | | | 4,900 | | | | 27,587 | |
| Vanda Pharmaceuticals, Inc. | | | 21,832 | | | | 304,120 | |
| Venaxis, Inc. | | | 61,580 | | | | 128,702 | |
| ZIOPHARM Oncology, Inc. | | | 396,607 | | | | 1,427,785 | |
| | | | | | | | 83,699,776 | |
| Health Care Equipment & Supplies - 2.4% | |
| Abaxis, Inc. | | | 21,378 | | | | 868,161 | |
| Abiomed, Inc. | | | 31,575 | | | | 748,012 | |
| Accuray, Inc. | | | 292,785 | | | | 2,459,394 | |
| Antares Pharma, Inc. | | | 52,284 | | | | 145,349 | |
TFS MARKET NEUTRAL FUND
SCHEDULE OF SECURITIES SOLD SHORT (Continued)
| COMMON STOCKS - 75.1% (Continued) | | Shares | | | Value | |
| Health Care - 14.4% (Continued) | |
| Health Care Equipment & Supplies - 2.4% (Continued) | |
| AtriCure, Inc. | | | 16,875 | | | $ | 259,875 | |
| Bacterin International Holdings, Inc. | | | 830 | | | | 578 | |
| Baxano Surgical, Inc. | | | 35,308 | | | | 30,012 | |
| BIOLASE, Inc. | | | 49,801 | | | | 96,115 | |
| BSD Medical Corporation | | | 443,920 | | | | 492,751 | |
| Cerus Corporation | | | 135,700 | | | | 587,581 | |
| Cesca Therapeutics, Inc. | | | 180,261 | | | | 295,628 | |
| Delcath Systems, Inc. | | | 46,237 | | | | 165,528 | |
| Echo Therapeutics, Inc. | | | 4,813 | | | | 14,968 | |
| Edwards Lifesciences Corporation | | | 1,524 | | | | 124,160 | |
| EnteroMedics, Inc. | | | 59,677 | | | | 108,612 | |
| GenMark Diagnostics, Inc. | | | 121,749 | | | | 1,089,654 | |
| Hansen Medical, Inc. | | | 133,964 | | | | 278,645 | |
| HeartWare International, Inc. | | | 1,335 | | | | 113,422 | |
| IMRIS, Inc. | | | 23 | | | | 27 | |
| Integra LifeSciences Holdings Corporation | | | 906 | | | | 41,295 | |
| Masimo Corporation | | | 4,629 | | | | 123,872 | |
| Mazor Robotics Ltd. - ADR | | | 7,300 | | | | 131,400 | |
| Meridian Bioscience, Inc. | | | 140,606 | | | | 2,807,902 | |
| Navidea Biopharmaceuticals, Inc. | | | 16,010 | | | | 26,737 | |
| Neogen Corporation | | | 5,261 | | | | 219,778 | |
| PhotoMedex, Inc. | | | 87,791 | | | | 1,326,522 | |
| Quidel Corporation | | | 75,719 | | | | 1,624,173 | |
| ResMed, Inc. | | | 9,628 | | | | 479,956 | |
| Rockwell Medical, Inc. | | | 345,636 | | | | 3,511,662 | |
| Sirona Dental Systems, Inc. | | | 3,131 | | | | 235,514 | |
| Stereotaxis, Inc. | | | 161,342 | | | | 624,394 | |
| SurModics, Inc. | | | 1,660 | | | | 36,122 | |
| Synergetics USA, Inc. | | | 74 | | | | 246 | |
| TearLab Corporation | | | 260,787 | | | | 1,126,600 | |
| Unilife Corporation | | | 605,814 | | | | 1,968,895 | |
| Uroplasty, Inc. | | | 2,209 | | | | 7,687 | |
| Vermillion, Inc. | | | 3,600 | | | | 11,556 | |
| Volcano Corporation | | | 24,908 | | | | 437,384 | |
| Wright Medical Group, Inc. | | | 57,771 | | | | 1,580,037 | |
| | | | | | | | 24,200,204 | |
| Health Care Providers & Services - 1.7% | |
| Air Methods Corporation | | | 29,708 | | | | 1,653,844 | |
| Amedisys, Inc. | | | 45,517 | | | | 620,397 | |
| Bio-Reference Laboratories, Inc. | | | 145,916 | | | | 3,706,266 | |
| BioScrip, Inc. | | | 362,656 | | | | 2,509,580 | |
| Chemed Corporation | | | 32,924 | | | | 2,741,582 | |
| Diversicare Healthcare Services, Inc. | | | 62 | | | | 433 | |
FAB Universal Corporation (b) | | | 558,610 | | | | 558,610 | |
| Healthways, Inc. | | | 128,058 | | | | 2,305,044 | |
| IPC The Hospitalist Company, Inc. | | | 9,345 | | | | 378,473 | |
| Kindred Healthcare, Inc. | | | 10,433 | | | | 261,868 | |
| Laboratory Corporation of America Holdings | | | 389 | | | | 38,394 | |
| LHC Group, Inc. | | | 2,682 | | | | 55,732 | |
| Omnicare, Inc. | | | 5,225 | | | | 309,686 | |
| Owens & Minor, Inc. | | | 28,960 | | | | 971,318 | |
| Patterson Companies, Inc. | | | 1,741 | | | | 70,859 | |
TFS MARKET NEUTRAL FUND
SCHEDULE OF SECURITIES SOLD SHORT (Continued)
| COMMON STOCKS - 75.1% (Continued) | | Shares | | | Value | |
| Health Care - 14.4% (Continued) | |
| Health Care Providers & Services - 1.7% (Continued) | |
| Quest Diagnostics, Inc. | | | 5,422 | | | $ | 303,252 | |
| Skilled Healthcare Group, Inc. - Class A | | | 2,040 | | | | 10,526 | |
| Tenet Healthcare Corporation | | | 8,109 | | | | 365,554 | |
| Universal American Corporation | | | 12,541 | | | | 89,919 | |
| USMD Holdings, Inc. | | | 26 | | | | 328 | |
| | | | | | | | 16,951,665 | |
| Health Care Technology - 0.2% | |
| Allscripts Healthcare Solutions, Inc. | | | 60,811 | | | | 925,544 | |
| Medidata Solutions, Inc. | | | 10,959 | | | | 397,921 | |
| Veeva Systems, Inc. - Class A | | | 219 | | | | 4,207 | |
| Vocera Communications, Inc. | | | 68,261 | | | | 1,040,980 | |
| | | | | | | | 2,368,652 | |
| Life Sciences Tools & Services - 0.7% | |
| Accelerate Diagnostics, Inc. | | | 142,977 | | | | 2,635,066 | |
| Albany Molecular Research, Inc. | | | 60,895 | | | | 977,974 | |
| Apricus Biosciences, Inc. | | | 151,758 | | | | 336,144 | |
| BG Medicine, Inc. | | | 241,952 | | | | 295,182 | |
| BioDelivery Sciences International, Inc. | | | 9,364 | | | | 83,433 | |
| CombiMatrix Corporation | | | 105,544 | | | | 290,246 | |
| Furiex Pharmaceuticals, Inc. | | | 103 | | | | 10,647 | |
| Harvard Bioscience, Inc. | | | 42,150 | | | | 177,873 | |
| Illumina, Inc. | | | 3,105 | | | | 421,814 | |
| Luminex Corporation | | | 10,580 | | | | 203,242 | |
| Pacific Biosciences of California, Inc. | | | 67,164 | | | | 296,865 | |
| QIAGEN N.V. | | | 866 | | | | 18,965 | |
| Sequenom, Inc. | | | 626,896 | | | | 1,711,426 | |
| Techne Corporation | | | 16 | | | | 1,429 | |
| Thermo Fisher Scientific, Inc. | | | 1,036 | | | | 118,104 | |
| | | | | | | | 7,578,410 | |
| Pharmaceuticals - 1.1% | |
| Acura Pharmaceuticals, Inc. | | | 15,638 | | | | 21,581 | |
| Alexza Pharmaceuticals, Inc. | | | 49,836 | | | | 212,800 | |
| Alimera Sciences, Inc. | | | 211,786 | | | | 1,287,659 | |
| Ampio Pharmaceuticals, Inc. | | | 147,814 | | | | 900,187 | |
| ANI Pharmaceuticals, Inc. | | | 10,404 | | | | 323,668 | |
| Aoxing Pharmaceutical Company, Inc. | | | 1,504 | | | | 692 | |
| Auxilium Pharmaceuticals, Inc. | | | 13,894 | | | | 312,754 | |
| DepoMed, Inc. | | | 2,027 | | | | 28,398 | |
| Endocyte, Inc. | | | 50,107 | | | | 907,438 | |
| GW Pharmaceuticals plc - ADR | | | 9,100 | | | | 665,210 | |
| IntelliPharmaCeutics International, Inc. | | | 171,332 | | | | 692,181 | |
| Mallinckrodt plc | | | 1,144 | | | | 81,487 | |
| Medicines Company (The) | | | 324 | | | | 8,618 | |
| Oculus Innovative Sciences, Inc. | | | 44,194 | | | | 132,140 | |
| Oramed Pharmaceuticals, Inc. | | | 59,691 | | | | 576,615 | |
| Perrigo Company plc | | | 2,410 | | | | 349,113 | |
| POZEN, Inc. | | | 21,836 | | | | 182,549 | |
| Redhill Biopharma Ltd. - ADR | | | 300 | | | | 4,272 | |
| Repros Therapeutics, Inc. | | | 44,693 | | | | 753,971 | |
| Revance Therapeutics, Inc. | | | 1,460 | | | | 50,049 | |
| Supernus Pharmaceuticals, Inc. | | | 122,010 | | | | 1,001,702 | |
| TherapeuticsMD, Inc. | | | 11,917 | | | | 50,051 | |
TFS MARKET NEUTRAL FUND
SCHEDULE OF SECURITIES SOLD SHORT (Continued)
| COMMON STOCKS - 75.1% (Continued) | | Shares | | | Value | |
| Health Care - 14.4% (Continued) | |
| Pharmaceuticals - 1.1% (Continued) | |
| VIVUS, Inc. | | | 357,509 | | | $ | 1,859,047 | |
| XenoPort, Inc. | | | 126,944 | | | | 515,393 | |
| Zogenix, Inc. | | | 27,198 | | | | 66,363 | |
| | | | | | | | 10,983,938 | |
| Industrials - 10.6% | |
| Aerospace & Defense - 1.0% | |
| AAR Corporation | | | 13,417 | | | | 347,500 | |
| American Science & Engineering, Inc. | | | 854 | | | | 57,389 | |
| Arotech Corporation | | | 97,549 | | | | 338,495 | |
| DigitalGlobe, Inc. | | | 13,212 | | | | 393,453 | |
| Erickson, Inc. | | | 2,176 | | | | 34,403 | |
| GenCorp, Inc. | | | 272,992 | | | | 4,793,740 | |
| Global Defense & National Security Systems, Inc. | | | 1,785 | | | | 18,136 | |
| KEYW Holding Corporation (The) | | | 122,460 | | | | 1,573,611 | |
| LMI Aerospace, Inc. | | | 23,013 | | | | 313,897 | |
| National Presto Industries, Inc. | | | 16,051 | | | | 1,159,845 | |
| Rockwell Collins, Inc. | | | 5,530 | | | | 429,405 | |
| Spirit Aerosystems Holdings, Inc. - Class A | | | 10,552 | | | | 316,877 | |
| TAT Technologies Ltd. | | | 300 | | | | 2,433 | |
| Transdigm Group, Inc. | | | 1,381 | | | | 245,638 | |
| Triumph Group, Inc. | | | 6,862 | | | | 444,726 | |
| | | | | | | | 10,469,548 | |
| Air Freight & Logistics - 0.4% | |
| Echo Global Logistics, Inc. | | | 76,778 | | | | 1,501,778 | |
| UTi Worldwide, Inc. | | | 106,787 | | | | 1,045,445 | |
| XPO Logistics, Inc. | | | 37,461 | | | | 1,016,691 | |
| | | | | | | | 3,563,914 | |
| Airlines - 0.3% | |
| American Airlines Group, Inc. | | | 73,849 | | | | 2,589,884 | |
| GOL - Linhas Aéreas Inteligentes S.A. - ADR | | | 54,300 | | | | 352,950 | |
| | | | | | | | 2,942,834 | |
| Building Products - 0.4% | |
| Apogee Enterprises, Inc. | | | 19 | | | | 604 | |
| Armstrong World Industries, Inc. | | | 23,353 | | | | 1,227,434 | |
| Fortune Brands Home & Security, Inc. | | | 3,814 | | | | 151,988 | |
| Gilbraltar Industries, Inc. | | | 17,444 | | | | 297,943 | |
| Griffon Corporation | | | 16,487 | | | | 175,422 | |
| Owens Corning, Inc. | | | 415 | | | | 16,953 | |
| Quanex Building Products Corporation | | | 17,498 | | | | 329,662 | |
| Trex Company, Inc. | | | 12,227 | | | | 960,064 | |
| Universal Forest Products, Inc. | | | 15,489 | | | | 782,039 | |
| | | | | | | | 3,942,109 | |
| Commercial Services & Supplies - 1.0% | |
| ABM Industries, Inc. | | | 26,499 | | | | 717,858 | |
| ACCO Brands Corporation | | | 234,726 | | | | 1,438,870 | |
| ADT Corporation (The) | | | 10,480 | | | | 316,915 | |
| Brink's Company (The) | | | 622 | | | | 15,824 | |
| Ceco Environmental Corporation | | | 2,751 | | | | 43,713 | |
| Cenveo, Inc. | | | 332,331 | | | | 1,026,903 | |
| China Recycling Energy Corporation | | | 180,905 | | | | 562,615 | |
| Covanta Holding Corporation | | | 36,947 | | | | 681,672 | |
TFS MARKET NEUTRAL FUND
SCHEDULE OF SECURITIES SOLD SHORT (Continued)
| COMMON STOCKS - 75.1% (Continued) | | Shares | | | Value | |
| Industrials - 10.6% (Continued) | |
| Commercial Services & Supplies - 1.0% (Continued) | |
| Ennis, Inc. | | | 22,150 | | | $ | 331,364 | |
| Healthcare Services Group, Inc. | | | 9,953 | | | | 289,632 | |
| HNI Corporation | | | 9,278 | | | | 326,864 | |
| Industrial Services of America, Inc. | | | 58 | | | | 268 | |
| InnerWorkings, Inc. | | | 103,261 | | | | 743,479 | |
| Intersections, Inc. | | | 60,558 | | | | 340,336 | |
| Iron Mountain, Inc. | | | 1,080 | | | | 30,715 | |
| MagneGas Corporation | | | 68,480 | | | | 89,709 | |
| Performant Financial Corporation | | | 60,040 | | | | 522,948 | |
| Pointer Telocation Ltd. | | | 4,747 | | | | 38,736 | |
| Portfolio Recovery Associates, Inc. | | | 9,852 | | | | 563,042 | |
| Standard Register Company (The) | | | 729 | | | | 5,293 | |
| Team, Inc. | | | 329 | | | | 14,111 | |
| Tetra Tech, Inc. | | | 17,010 | | | | 487,677 | |
| United Stationers, Inc. | | | 31,062 | | | | 1,165,757 | |
| Waste Connections, Inc. | | | 796 | | | | 35,549 | |
| Waste Management, Inc. | | | 3,761 | | | | 167,176 | |
| West Corporation | | | 11,380 | | | | 277,103 | |
| | | | | | | | 10,234,129 | |
| Construction & Engineering - 0.2% | |
| Abengoa, S.A. - ADR | | | 1,166 | | | | 26,165 | |
| Aegion Corporation | | | 7,114 | | | | 181,336 | |
| Ameresco, Inc. - Class A | | | 502 | | | | 3,218 | |
| EMCOR Group, Inc. | | | 1,819 | | | | 83,656 | |
| Layne Christensen Company | | | 87,547 | | | | 1,525,069 | |
| Northwest Pipe Company | | | 4,802 | | | | 171,767 | |
| Pike Corporation | | | 899 | | | | 8,630 | |
| | | | | | | | 1,999,841 | |
| Electrical Equipment - 2.2% | |
| AZZ, Inc. | | | 10,956 | | | | 475,710 | |
| Capstone Turbine Corporation | | | 937,719 | | | | 1,931,701 | |
| China BAK Battery, Inc. | | | 49,507 | | | | 123,767 | |
| Enphase Energy, Inc. | | | 316,732 | | | | 2,391,327 | |
| Franklin Electric Company, Inc. | | | 4,484 | | | | 173,396 | |
| FuelCell Energy, Inc. | | | 924,848 | | | | 2,099,405 | |
| Global Power Equipment Group, Inc. | | | 1,383 | | | | 24,244 | |
| GrafTech International Ltd. | | | 192,664 | | | | 2,159,763 | |
| Highpower International, Inc. | | | 155,548 | | | | 735,742 | |
| Hydrogenics Corporation | | | 36,327 | | | | 765,773 | |
| II-VI, Inc. | | | 3,114 | | | | 44,842 | |
| Lime Energy Company | | | 1,000 | | | | 2,890 | |
| Ocean Power Technologies, Inc. | | | 181,313 | | | | 489,545 | |
| Plug Power, Inc. | | | 664,493 | | | | 3,089,892 | |
| Polypore International, Inc. | | | 53,004 | | | | 1,838,179 | |
| Power Solutions International, Inc. | | | 1,741 | | | | 144,068 | |
| Real Goods Solar, Inc. - Class A | | | 529,702 | | | | 1,552,027 | |
| Revolution Lighting Technologies, Inc. | | | 787,556 | | | | 2,291,788 | |
| SolarCity Corporation | | | 8,838 | | | | 470,624 | |
| Trina Solar Ltd. - ADR | | | 25,113 | | | | 280,763 | |
| Yingli Green Energy Holding Company Ltd. - ADR | | | 234,383 | | | | 801,590 | |
| | | | | | | | 21,887,036 | |
TFS MARKET NEUTRAL FUND
SCHEDULE OF SECURITIES SOLD SHORT (Continued)
| COMMON STOCKS - 75.1% (Continued) | | Shares | | | Value | |
| Industrials - 10.6% (Continued) | |
Industrial Conglomerates - 0.0% (a) | |
| Carlisle Companies, Inc. | | | 717 | | | $ | 58,973 | |
| Raven Industries, Inc. | | | 1,235 | | | | 38,162 | |
| | | | | | | | 97,135 | |
| Machinery - 2.6% | |
| Accuride Corporation | | | 133,929 | | | | 755,360 | |
| Actuant Corporation - Class A | | | 40,444 | | | | 1,369,434 | |
| Adept Technology, Inc. | | | 53,433 | | | | 639,059 | |
| Albany International Corporation - Class A | | | 10,694 | | | | 384,770 | |
| American Railcar Industries, Inc. | | | 1,815 | | | | 126,034 | |
| ARC Group Worldwide, Inc. | | | 1,789 | | | | 74,100 | |
| Barnes Group, Inc. | | | 9,296 | | | | 358,082 | |
| Briggs & Stratton Corporation | | | 83,934 | | | | 1,793,670 | |
| China Valves Technology, Inc. | | | 40,338 | | | | 43,565 | |
| Deere & Company | | | 2,751 | | | | 256,778 | |
| Dynamic Materials Corporation | | | 12,722 | | | | 256,984 | |
| Energy Recovery, Inc. | | | 135,467 | | | | 692,236 | |
| EnPro Industries, Inc. | | | 17,171 | | | | 1,222,747 | |
| ESCO Technologies, Inc. | | | 6,767 | | | | 226,153 | |
| ExOne Company (The) | | | 149,557 | | | | 5,165,699 | |
| Harsco Corporation | | | 39,391 | | | | 942,627 | |
| Joy Global, Inc. | | | 8,161 | | | | 492,761 | |
| Kennametal, Inc. | | | 3,924 | | | | 183,368 | |
| Lindsay Corporation | | | 25,010 | | | | 2,204,131 | |
| Miller Industries, Inc. | | | 53 | | | | 1,027 | |
| Mueller Industries, Inc. | | | 43,773 | | | | 1,266,791 | |
| Navistar International Corporation | | | 36,801 | | | | 1,395,862 | |
| PMFG, Inc. | | | 3,864 | | | | 21,909 | |
| RBC Bearings, Inc. | | | 342 | | | | 21,293 | |
| Sun Hydraulics Corporation | | | 5,889 | | | | 240,742 | |
| Tecumseh Products Company - Class A | | | 3,055 | | | | 18,361 | |
| Tennant Company | | | 6,135 | | | | 391,352 | |
| Titan International, Inc. | | | 52,695 | | | | 922,689 | |
| Valmont Industries, Inc. | | | 1,099 | | | | 163,652 | |
| voxeljet AG - ADR | | | 91,353 | | | | 1,436,069 | |
| Watts Water Technologies, Inc. - Class A | | | 6,026 | | | | 320,583 | |
| Westport Innovations, Inc. | | | 194,999 | | | | 2,558,387 | |
| | | | | | | | 25,946,275 | |
| Marine - 0.4% | |
| Box Ships, Inc. | | | 5,735 | | | | 9,061 | |
| Diana Containerships, Inc. | | | 27,900 | | | | 105,044 | |
| Eagle Bulk Shipping, Inc. | | | 604,310 | | | | 1,764,585 | |
| FreeSeas, Inc. | | | 144,201 | | | | 178,809 | |
| Genco Shipping & Trading Ltd. | | | 892,169 | | | | 1,472,079 | |
| Navios Maritime Partners, L.P. | | | 17,640 | | | | 333,925 | |
| Seanergy Maritime Holdings Corporation | | | 182 | | | | 306 | |
| | | | | | | | 3,863,809 | |
| Professional Services - 1.0% | |
| Acacia Research Corporation | | | 213,440 | | | | 3,423,577 | |
| Advisory Board Company (The) | | | 8,896 | | | | 509,385 | |
| CBIZ, Inc. | | | 317,360 | | | | 2,719,775 | |
| Corporate Resource Services, Inc. | | | 55,279 | | | | 148,148 | |
| Dun & Bradstreet Corporation (The) | | | 539 | | | | 59,700 | |
TFS MARKET NEUTRAL FUND
SCHEDULE OF SECURITIES SOLD SHORT (Continued)
| COMMON STOCKS - 75.1% (Continued) | | Shares | | | Value | |
| Industrials - 10.6% (Continued) | |
| Professional Services - 1.0% (Continued) | |
| FTI Consulting, Inc. | | | 35,474 | | | $ | 1,216,758 | |
| IHS, Inc. - Class A | | | 836 | | | | 100,847 | |
| Kforce, Inc. | | | 29,362 | | | | 678,849 | |
| Odyssey Marine Exploration, Inc. | | | 712,604 | | | | 1,560,603 | |
| Spherix, Inc. | | | 110,924 | | | | 175,260 | |
| | | | | | | | 10,592,902 | |
| Road & Rail - 0.4% | |
| Heartland Express, Inc. | | | 19,387 | | | | 421,861 | |
| J.B. Hunt Transport Services, Inc. | | | 1,845 | | | | 140,405 | |
| Kansas City Southern | | | 385 | | | | 38,839 | |
| Knight Transportation, Inc. | | | 6,714 | | | | 159,323 | |
| Roadrunner Transportation Systems, Inc. | | | 38,723 | | | | 953,747 | |
| USA Truck, Inc. | | | 42,471 | | | | 707,567 | |
| YRC Worldwide, Inc. | | | 52,870 | | | | 1,185,874 | |
| | | | | | | | 3,607,616 | |
| Trading Companies & Distributors - 0.6% | |
| Aceto Corporation | | | 21,400 | | | | 468,232 | |
| Armco Metals Holdings, Inc. | | | 986 | | | | 296 | |
| Beacon Roofing Supply, Inc. | | | 12,400 | | | | 441,192 | |
| Euro Tech Holdings Company Ltd. | | | 1,211 | | | | 5,244 | |
| Fastenal Company | | | 8,447 | | | | 423,026 | |
| General Finance Corporation | | | 571 | | | | 5,070 | |
| Kaman Corporation | | | 18,379 | | | | 771,367 | |
| MSC Industrial Direct Company, Inc. - Class A | | | 1,850 | | | | 168,461 | |
| Rush Enterprises, Inc. - Class A | | | 17,786 | | | | 570,930 | |
| Titan Machinery, Inc. | | | 203,427 | | | | 3,588,452 | |
| | | | | | | | 6,442,270 | |
| Transportation Infrastructure - 0.1% | |
| Aegean Marine Petroleum Network, Inc. | | | 14,650 | | | | 135,220 | |
| Sino-Global Shipping America Ltd. | | | 5,499 | | | | 14,132 | |
| Wesco Aircraft Holdings, Inc. | | | 56,369 | | | | 1,142,036 | |
| | | | | | | | 1,291,388 | |
| Information Technology - 13.2% | |
| Communications Equipment - 1.6% | |
| ADTRAN, Inc. | | | 37,439 | | | | 839,757 | |
| Alliance Fiber Optic Products, Inc. | | | 67,729 | | | | 1,301,751 | |
| Ambient Corporation | | | 344 | | | | 337 | |
| Aruba Networks, Inc. | | | 72,084 | | | | 1,425,101 | |
| Black Box Corporation | | | 19,457 | | | | 413,656 | |
| CalAmp Corporation | | | 63,398 | | | | 1,125,314 | |
| Calix, Inc. | | | 7,178 | | | | 63,238 | |
| Ciena Corporation | | | 50,114 | | | | 990,754 | |
| Cisco Systems, Inc. | | | 4,447 | | | | 102,770 | |
| Comtech Telecommunications Corporation | | | 3,414 | | | | 108,395 | |
| Echostar Corporation - Class A | | | 24,016 | | | | 1,079,759 | |
| EMCORE Corporation | | | 105,245 | | | | 508,333 | |
| Finisar Corporation | | | 5,033 | | | | 131,613 | |
| Infinera Corporation | | | 168,144 | | | | 1,506,570 | |
| InterDigital, Inc. | | | 45,569 | | | | 1,582,156 | |
| Ituran Location and Control Ltd. | | | 22 | | | | 528 | |
| KVH Industries, Inc. | | | 3,559 | | | | 48,082 | |
| NETGEAR, Inc. | | | 2,004 | | | | 64,729 | |
TFS MARKET NEUTRAL FUND
SCHEDULE OF SECURITIES SOLD SHORT (Continued)
| COMMON STOCKS - 75.1% (Continued) | | Shares | | | Value | |
| Information Technology - 13.2% (Continued) | |
| Communications Equipment - 1.6% (Continued) | |
| Oplink Communications, Inc. | | | 5,884 | | | $ | 100,852 | |
| Palo Alto Networks, Inc. | | | 6,611 | | | | 420,327 | |
| ParkerVision, Inc. | | | 726,503 | | | | 3,312,854 | |
| Procera Networks, Inc. | | | 109,768 | | | | 1,016,452 | |
| ZST Digital Networks, Inc. | | | 36,656 | | | | 40,322 | |
| | | | | | | | 16,183,650 | |
| Electronic Equipment, Instruments & Components - 1.9% | |
| Arrow Electronics, Inc. | | | 839 | | | | 47,613 | |
| ClearSign Combustion Corporation | | | 63,686 | | | | 588,459 | |
| Cognex Corporation | | | 819 | | | | 28,198 | |
| Control4 Corporation | | | 27,590 | | | | 487,239 | |
| Document Security Systems, Inc. | | | 200,217 | | | | 254,276 | |
| DTS, Inc. | | | 37,905 | | | | 705,412 | |
| Electro Scientific Industries, Inc. | | | 55,120 | | | | 467,418 | |
| FARO Technologies, Inc. | | | 12,266 | | | | 489,413 | |
| FLIR Systems, Inc. | | | 235 | | | | 7,999 | |
| InvenSense, Inc. | | | 106,007 | | | | 2,282,331 | |
| IPG Photonics Corporation | | | 6,456 | | | | 417,251 | |
| Littelfuse, Inc. | | | 3,999 | | | | 362,109 | |
| Magal Security Systems Ltd. | | | 78 | | | | 286 | |
| Maxwell Technologies, Inc. | | | 54,043 | | | | 813,888 | |
| Measurement Specialties, Inc. | | | 11 | | | | 708 | |
| MTS Systems Corporation | | | 7,223 | | | | 465,667 | |
| Neonode, Inc. | | | 413,026 | | | | 2,209,689 | |
| Parametric Sound Corporation | | | 65,631 | | | | 604,462 | |
| RadiSys Corporation | | | 12,406 | | | | 39,699 | |
| RealD, Inc. | | | 92,799 | | | | 1,017,077 | |
| Research Frontiers, Inc. | | | 72,769 | | | | 331,099 | |
| Rofin-Sinar Technologies, Inc. | | | 72,721 | | | | 1,614,406 | |
| Schmitt Industries, Inc. | | | 200 | | | | 576 | |
| Speed Commerce, Inc. | | | 5,014 | | | | 16,546 | |
| SuperCom Ltd. | | | 19,398 | | | | 153,632 | |
| Superconductor Technologies, Inc. | | | 64,214 | | | | 145,124 | |
| SYNNEX Corporation | | | 18,596 | | | | 1,252,999 | |
| TTM Technologies, Inc. | | | 227,223 | | | | 1,792,790 | |
| Uni-Pixel, Inc. | | | 278,619 | | | | 1,524,046 | |
| Universal Display Corporation | | | 55,186 | | | | 1,437,595 | |
| | | | | | | | 19,558,007 | |
| Internet Software & Services - 2.0% | |
| Angie's List, Inc. | | | 119,726 | | | | 1,354,101 | |
| Bazaarvoice, Inc. | | | 194,323 | | | | 1,305,850 | |
| ChannelAdvisor Corporation | | | 700 | | | | 18,368 | |
| Chegg, Inc. | | | 7,955 | | | | 41,923 | |
| ChinaCache International Holdings Ltd. - ADR | | | 21,137 | | | | 291,691 | |
| Conversant, Inc. | | | 11,574 | | | | 282,868 | |
| eGain Corporation | | | 768 | | | | 5,023 | |
| Equinix, Inc. | | | 1,469 | | | | 275,893 | |
| Gogo, Inc. | | | 31,670 | | | | 428,178 | |
| Innodata, Inc. | | | 705 | | | | 2,376 | |
| Internap Network Services Corporation | | | 27,236 | | | | 183,026 | |
| j2 Global, Inc. | | | 47,105 | | | | 2,183,788 | |
| LinkedIn Corporation - Class A | | | 457 | | | | 70,136 | |
TFS MARKET NEUTRAL FUND
SCHEDULE OF SECURITIES SOLD SHORT (Continued)
| COMMON STOCKS - 75.1% (Continued) | | Shares | | | Value | |
| Information Technology - 13.2% (Continued) | |
| Internet Software & Services - 2.0% (Continued) | |
| Liquidity Services, Inc. | | | 104,377 | | | $ | 1,800,503 | |
| LiveDeal, Inc. | | | 94,363 | | | | 418,972 | |
| LookSmart Ltd. | | | 300 | | | | 501 | |
| Marin Software, Inc. | | | 91,638 | | | | 859,564 | |
| MeetMe, Inc. | | | 157,908 | | | | 438,984 | |
| Millennial Media, Inc. | | | 351,480 | | | | 2,245,957 | |
| Monster Worldwide, Inc. | | | 83,572 | | | | 575,811 | |
| OpenTable, Inc. | | | 3,245 | | | | 217,934 | |
Piksel, Inc. - Series A-2 (b) | | | 346,880 | | | | – | |
| Professional Diversity Network, Inc. | | | 45 | | | | 158 | |
| Rocket Fuel, Inc. | | | 12,037 | | | | 386,027 | |
| Shutterstock, Inc. | | | 167 | | | | 12,109 | |
| Spark Networks, Inc. | | | 37,113 | | | | 168,122 | |
| StarTek, Inc. | | | 797 | | | | 5,539 | |
| Textura Corporation | | | 42,981 | | | | 765,492 | |
| Trulia, Inc. | | | 64,183 | | | | 2,182,222 | |
| Twitter, Inc. | | | 43,128 | | | | 1,680,698 | |
| Vistaprint N.V. | | | 24,642 | | | | 972,620 | |
| Web.com Group, Inc. | | | 2,299 | | | | 70,602 | |
| WebMD Health Corporation | | | 7,409 | | | | 326,663 | |
| Weibo Corporation - ADR | | | 10,000 | | | | 195,600 | |
| Wix.com Ltd. | | | 12 | | | | 246 | |
| Xoom Corporation | | | 17,312 | | | | 386,231 | |
| Zix Corporation | | | 134,879 | | | | 442,403 | |
| | | | | | | | 20,596,179 | |
| IT Services - 1.2% | |
| Acorn Energy, Inc. | | | 19,761 | | | | 45,846 | |
| BitAuto Holdings Ltd. - ADR | | | 11,471 | | | | 411,006 | |
| Blackhawk Network Holdings, Inc. | | | 68,911 | | | | 1,653,175 | |
| CACI International, Inc. - Class A | | | 19,312 | | | | 1,345,081 | |
| Cass Information Systems, Inc. | | | 258 | | | | 13,032 | |
| CIBER, Inc. | | | 174,867 | | | | 755,425 | |
| Computer Task Group, Inc. | | | 24,624 | | | | 389,305 | |
| CSG Systems International, Inc. | | | 2,005 | | | | 52,852 | |
| Euronet Worldwide, Inc. | | | 12,982 | | | | 597,042 | |
| Forrester Research, Inc. | | | 25,707 | | | | 910,799 | |
| Heartland Payment Systems, Inc. | | | 52,405 | | | | 2,145,461 | |
| Helios and Matheson Analytics, Inc. | | | 146 | | | | 623 | |
| Higher One Holdings, Inc. | | | 40,565 | | | | 242,984 | |
| InterCloud Systems, Inc. | | | 92,075 | | | | 374,745 | |
| International Business Machines Corporation | | | 797 | | | | 156,587 | |
| Jack Henry & Associates, Inc. | | | 1,809 | | | | 99,784 | |
| JetPay Corporation | | | 73 | | | | 150 | |
| Leidos Holdings, Inc. | | | 12,783 | | | | 476,039 | |
| ManTech International Corporation - Class A | | | 13,471 | | | | 401,840 | |
| NeuStar, Inc. - Class A | | | 30,335 | | | | 780,216 | |
| Teradata Corporation | | | 9,731 | | | | 442,371 | |
| Total System Services, Inc. | | | 2,526 | | | | 80,251 | |
| Unisys Corporation | | | 1,902 | | | | 46,352 | |
| Western Union Company (The) | | | 7,488 | | | | 118,835 | |
| WidePoint Corporation | | | 27,692 | | | | 38,215 | |
TFS MARKET NEUTRAL FUND
SCHEDULE OF SECURITIES SOLD SHORT (Continued)
| COMMON STOCKS - 75.1% (Continued) | | Shares | | | Value | |
| Information Technology - 13.2% (Continued) | |
| IT Services - 1.2% (Continued) | |
| WPCS International, Inc. | | | 28,400 | | | $ | 30,388 | |
| | | | | | | | 11,608,404 | |
| Semiconductors & Semiconductor Equipment - 3.0% | |
| Advanced Micro Devices, Inc. | | | 803,396 | | | | 3,285,890 | |
| Ambarella, Inc. | | | 7,110 | | | | 176,683 | |
| Applied Micro Circuits Corporation | | | 135,131 | | | | 1,312,122 | |
| ASM International N.V. | | | 100 | | | | 4,353 | |
| Camtek Ltd. | | | 354,247 | | | | 1,101,708 | |
| Canadian Solar, Inc. | | | 11,293 | | | | 306,266 | |
| Cirrus Logic, Inc. | | | 30,223 | | | | 673,973 | |
| Cohu, Inc. | | | 2,974 | | | | 30,632 | |
| CSR plc - ADR | | | 532 | | | | 20,594 | |
| CVD Equipment Corporation | | | 3,587 | | | | 47,886 | |
| Daqo New Energy Corporation - ADR | | | 4,400 | | | | 180,708 | |
| Entropic Communications, Inc. | | | 28,043 | | | | 103,479 | |
| Exar Corporation | | | 105,498 | | | | 1,141,488 | |
| EZchip Semiconductor Ltd. | | | 20,102 | | | | 481,443 | |
| Global-Tech Advanced Innovations, Inc. | | | 100 | | | | 579 | |
| GT Advanced Technologies, Inc. | | | 105,564 | | | | 1,753,418 | |
| Hanwha SolarOne Company Ltd. - ADR | | | 37,613 | | | | 97,794 | |
| Himax Technologies, Inc. - ADR | | | 37,819 | | | | 329,782 | |
| Hittite Microwave Corporation | | | 2,056 | | | | 122,044 | |
| Intel Corporation | | | 1,625 | | | | 43,371 | |
| JA Solar Holdings Company Ltd. - ADR | | | 102,300 | | | | 985,149 | |
| JinkoSolar Holding Company Ltd. - ADR | | | 12,834 | | | | 345,235 | |
| Kopin Corporation | | | 14,100 | | | | 45,966 | |
| Mellanox Technologies Ltd. | | | 2,164 | | | | 75,675 | |
| Microchip Technology, Inc. | | | 5,933 | | | | 282,055 | |
| MKS Instruments, Inc. | | | 10,355 | | | | 291,493 | |
| Montage Technology Group Ltd. | | | 49,766 | | | | 1,034,635 | |
| MoSys, Inc. | | | 147,150 | | | | 575,356 | |
| Peregrine Semiconductor Corporation | | | 12,494 | | | | 67,093 | |
| Photronics, Inc. | | | 264,226 | | | | 2,293,482 | |
| Pixelworks, Inc. | | | 93,311 | | | | 478,685 | |
| QuickLogic Corporation | | | 325,208 | | | | 1,538,234 | |
| Rubicon Technology, Inc. | | | 258,641 | | | | 2,620,033 | |
| Rudolph Technologies, Inc. | | | 176,454 | | | | 1,607,496 | |
| Semtech Corporation | | | 2,073 | | | | 49,711 | |
| Spansion, Inc. - Class A | | | 22,069 | | | | 393,490 | |
| SunPower Corporation | | | 60,900 | | | | 2,035,278 | |
| Teradyne, Inc. | | | 26,116 | | | | 461,470 | |
| Tessera Technologies, Inc. | | | 10,976 | | | | 240,704 | |
| Ultratech, Inc. | | | 79,485 | | | | 2,115,891 | |
| Veeco Instruments, Inc. | | | 36,786 | | | | 1,359,978 | |
| | | | | | | | 30,111,322 | |
| Software - 3.0% | |
| Allot Communications Ltd. | | | 818 | | | | 11,158 | |
| AVG Technologies N.V. | | | 43,965 | | | | 823,464 | |
| Barracuda Networks, Inc. | | | 49,271 | | | | 1,272,670 | |
| BluePhoenix Solutions Ltd. | | | 571 | | | | 2,472 | |
| Bottomline Technologies, Inc. | | | 41,947 | | | | 1,327,203 | |
| BroadSoft, Inc. | | | 15,666 | | | | 397,603 | |
TFS MARKET NEUTRAL FUND
SCHEDULE OF SECURITIES SOLD SHORT (Continued)
| COMMON STOCKS - 75.1% (Continued) | | Shares | | | Value | |
| Information Technology - 13.2% (Continued) | |
| Software - 3.0% (Continued) | |
| Cadence Design Systems, Inc. | | | 1,257 | | | $ | 19,559 | |
| China Mobile Games & Entertainment Group Ltd. - ADR | | | 9,500 | | | | 161,785 | |
| CommVault Systems, Inc. | | | 5,599 | | | | 270,992 | |
| Concur Technologies, Inc. | | | 1,867 | | | | 150,237 | |
| Cyan, Inc. | | | 223,848 | | | | 935,685 | |
| Datawatch Corporation | | | 51,909 | | | | 702,329 | |
| Ebix, Inc. | | | 245,691 | | | | 3,877,004 | |
| Ellie Mae, Inc. | | | 27,107 | | | | 661,140 | |
| FireEye, Inc. | | | 2,393 | | | | 93,949 | |
| Fleetmatics Group plc | | | 20,866 | | | | 626,606 | |
| Gigamon, Inc. | | | 18,300 | | | | 288,591 | |
| Glu Mobile, Inc. | | | 252,641 | | | | 1,010,564 | |
| Jive Software, Inc. | | | 113,419 | | | | 848,374 | |
| Magic Software Enterprises Ltd. | | | 24,710 | | | | 199,904 | |
| Mitek Systems, Inc. | | | 386,004 | | | | 1,258,373 | |
| NQ Mobile, Inc. - ADR | | | 210,772 | | | | 2,605,142 | |
| Nuance Communications, Inc. | | | 9,504 | | | | 152,919 | |
| Park City Group, Inc. | | | 24,589 | | | | 248,595 | |
| Qualys Inc. | | | 6,931 | | | | 133,699 | |
| RealPage, Inc. | | | 16,489 | | | | 292,680 | |
| Rosetta Stone, Inc. | | | 25,045 | | | | 298,286 | |
| salesforce.com, inc. | | | 6,691 | | | | 345,590 | |
| SeaChange International, Inc. | | | 53,719 | | | | 503,347 | |
| ServiceNow, Inc. | | | 6,897 | | | | 342,919 | |
| Splunk, Inc. | | | 327 | | | | 17,844 | |
| Tangoe, Inc. | | | 67,054 | | | | 1,008,492 | |
| Taomee Holdings Ltd. - ADR | | | 4,281 | | | | 22,647 | |
| VirnetX Holding Corporation | | | 348,743 | | | | 5,492,702 | |
| Voltari Corporation | | | 27,986 | | | | 97,951 | |
| Vringo, Inc. | | | 664,869 | | | | 2,719,314 | |
| Workday, Inc. - Class A | | | 4,736 | | | | 346,060 | |
| Zynga, Inc. - Class A | | | 169,603 | | | | 686,892 | |
| | | | | | | | 30,254,741 | |
| Technology Hardware, Storage & Peripherals - 0.5% | |
| 3D Systems Corporation | | | 16,873 | | | | 798,768 | |
| Electronics for Imaging, Inc. | | | 13,260 | | | | 501,095 | |
| Fusion-io, Inc. | | | 168,615 | | | | 1,455,148 | |
| Nimble Storage, Inc. | | | 1,375 | | | | 33,894 | |
| Quantum Corporation | | | 184,720 | | | | 199,498 | |
| Silicon Graphics International Corporation | | | 84,714 | | | | 1,023,345 | |
| Violin Memory, Inc. | | | 206,027 | | | | 741,697 | |
| | | | | | | | 4,753,445 | |
| Materials - 3.8% | |
| Chemicals - 0.8% | |
| Albemarle Corporation | | | 1,034 | | | | 69,319 | |
| American Vanguard Corporation | | | 76,930 | | | | 1,370,123 | |
| Clean Diesel Technologies, Inc. | | | 154,134 | | | | 369,922 | |
| Flotek Industries, Inc. | | | 1,656 | | | | 46,385 | |
| Gulf Resources, Inc. | | | 8,505 | | | | 15,649 | |
| Intrepid Potash, Inc. | | | 203,118 | | | | 3,310,823 | |
| Landec Corporation | | | 30,916 | | | | 366,664 | |
| LSB Industries, Inc. | | | 893 | | | | 34,104 | |
TFS MARKET NEUTRAL FUND
SCHEDULE OF SECURITIES SOLD SHORT (Continued)
| COMMON STOCKS - 75.1% (Continued) | | Shares | | | Value | |
| Materials - 3.8% (Continued) | |
| Chemicals - 0.8% (Continued) | |
| Marrone Bio Innovations, Inc. | | | 2,582 | | | $ | 31,449 | |
| NewMarket Corporation | | | 594 | | | | 221,158 | |
| OCI Partners, L.P. | | | 5,933 | | | | 129,399 | |
| Olin Corporation | | | 30,231 | | | | 849,491 | |
| Rentech Nitrogen Partners, L.P. | | | 3,231 | | | | 58,417 | |
| Scotts Miracle-Gro Company (The) - Class A | | | 5,478 | | | | 335,308 | |
| Senomyx, Inc. | | | 45,174 | | | | 369,975 | |
| W.R. Grace & Company | | | 1,080 | | | | 99,468 | |
| Yongye International, Inc. | | | 47,817 | | | | 334,241 | |
| Zep, Inc. | | | 7,498 | | | | 129,640 | |
| | | | | | | | 8,141,535 | |
| Construction Materials - 0.2% | |
| James Hardie Industries plc - ADR | | | 100 | | | | 6,414 | |
| Tecnoglass, Inc. | | | 73 | | | | 756 | |
| Texas Industries, Inc. | | | 19,496 | | | | 1,690,303 | |
| US Concrete, Inc. | | | 8,348 | | | | 205,528 | |
| | | | | | | | 1,903,001 | |
| Containers & Packaging - 0.1% | |
| AptarGroup, Inc. | | | 2,941 | | | | 198,282 | |
| Bemis Company, Inc. | | | 1,464 | | | | 58,912 | |
| Greif, Inc. - Class A | | | 19,946 | | | | 1,080,874 | |
| | | | | | | | 1,338,068 | |
| Metals & Mining - 2.4% | |
| A.M. Castle & Company | | | 130,542 | | | | 1,603,056 | |
| AK Steel Holding Corporation | | | 228,308 | | | | 1,598,156 | |
| Allied Nevada Gold Corporation | | | 252,005 | | | | 854,297 | |
| Century Aluminum Company | | | 4,145 | | | | 56,994 | |
| China Precision Steel, Inc. | | | 7,845 | | | | 16,161 | |
| Cliffs Natural Resources, Inc. | | | 110,185 | | | | 1,952,478 | |
| Coeur Mining, Inc. | | | 205,822 | | | | 1,782,418 | |
| Commercial Metals Company | | | 46,680 | | | | 896,256 | |
| Comstock Mining, Inc. | | | 128 | | | | 227 | |
| Energy Fuels, Inc. | | | 1,604 | | | | 12,399 | |
| General Moly, Inc. | | | 13,615 | | | | 14,976 | |
| General Steel Holdings, Inc. | | | 568 | | | | 585 | |
| Gold Resource Corporation | | | 97,398 | | | | 449,005 | |
| Golden Star Resources Ltd. | | | 363,025 | | | | 207,287 | |
| Great Northern Iron Ore Properties | | | 1,962 | | | | 33,962 | |
| Horsehead Holding Corporation | | | 61,245 | | | | 954,810 | |
| Kaiser Aluminum Corporation | | | 8,175 | | | | 575,520 | |
| Molycorp, Inc. | | | 1,114,824 | | | | 5,295,414 | |
| North American Palladium Ltd. | | | 1,705,321 | | | | 494,543 | |
| NovaGold Resources, Inc. | | | 37,306 | | | | 131,690 | |
| OCI Resources, L.P. | | | 800 | | | | 17,560 | |
| Olympic Steel, Inc. | | | 11,335 | | | | 298,791 | |
| Paramount Gold and Silver Corporation | | | 241,417 | | | | 243,831 | |
| Pretium Resources, Inc. | | | 107,491 | | | | 698,691 | |
| Revett Minerals, Inc. | | | 621 | | | | 509 | |
| RTI International Metals, Inc. | | | 61,657 | | | | 1,736,261 | |
| Schnitzer Steel Industries, Inc. - Class A | | | 3,103 | | | | 87,101 | |
| Seabridge Gold, Inc. | | | 56,242 | | | | 449,374 | |
| Silver Bull Resources, Inc. | | | 1,577 | | | | 520 | |
TFS MARKET NEUTRAL FUND
SCHEDULE OF SECURITIES SOLD SHORT (Continued)
| COMMON STOCKS - 75.1% (Continued) | | Shares | | | Value | |
| Materials - 3.8% (Continued) | |
| Metals & Mining - 2.4% (Continued) | |
| Silver Standard Resources, Inc. | | | 816 | | | $ | 8,087 | |
| SinoCoking Coal and Coke Chemical Industries, Inc. | | | 111,223 | | | | 130,131 | |
| Tahoe Resources, Inc. | | | 652 | | | | 14,540 | |
| Tanzanian Royalty Exploration Corporation | | | 165,160 | | | | 360,049 | |
| Thompson Creek Metals Company, Inc. | | | 326,384 | | | | 874,709 | |
| United States Antimony Corporation | | | 6,169 | | | | 12,338 | |
| Walter Energy, Inc. | | | 313,472 | | | | 2,256,998 | |
| | | | | | | | 24,119,724 | |
| Paper & Forest Products - 0.3% | |
| Louisiana-Pacific Corporation | | | 102,405 | | | | 1,678,418 | |
| MeadWestvaco Corporation | | | 1,655 | | | | 64,661 | |
| Orient Paper, Inc. | | | 52,733 | | | | 123,923 | |
| Pope Resources, L.P. | | | 30 | | | | 2,047 | |
| Verso Paper Corporation | | | 206,316 | | | | 561,179 | |
| Wausau Paper Corporation | | | 70,380 | | | | 841,745 | |
| | | | | | | | 3,271,973 | |
| Telecommunication Services - 0.8% | |
| Diversified Telecommunication Services - 0.5% | |
| 8x8, Inc. | | | 21,977 | | | | 213,177 | |
| Atlantic Tele-Network, Inc. | | | 9,147 | | | | 541,228 | |
| Consolidated Communications Holdings, Inc. | | | 27,159 | | | | 541,007 | |
| Elephant Talk Communications Corporation | | | 15,286 | | | | 16,356 | |
| Fairpoint Communications, Inc. | | | 19,031 | | | | 259,583 | |
| Hawaiian Telcom Holdco, Inc. | | | 10,200 | | | | 271,524 | |
| inContact, Inc. | | | 23,904 | | | | 197,208 | |
| Iridium Communications, Inc. | | | 149,813 | | | | 999,253 | |
| magicJack VocalTec Ltd. | | | 66,304 | | | | 1,172,255 | |
| Otelco, Inc. - Class A | | | 662 | | | | 3,316 | |
| Radcom Ltd. | | | 171 | | | | 944 | |
| xG Technology, Inc. | | | 152,028 | | | | 244,765 | |
| | | | | | | | 4,460,616 | |
| Wireless Telecommunication Services - 0.3% | |
| Boingo Wireless, Inc. | | | 24,185 | | | | 159,621 | |
| NII Holdings, Inc. | | | 1,144,938 | | | | 984,532 | |
| NTELOS Holdings Corporation | | | 63,254 | | | | 872,273 | |
| SBA Communications Corporation - Class A | | | 1,136 | | | | 101,967 | |
| Sprint Corporation | | | 4,543 | | | | 38,616 | |
| Telephone & Data Systems, Inc. | | | 14,186 | | | | 385,717 | |
| United States Cellular Corporation | | | 17,248 | | | | 716,482 | |
| | | | | | | | 3,259,208 | |
| Utilities - 1.0% | |
| Electric Utilities - 0.2% | |
| ALLETE, Inc. | | | 5,501 | | | | 284,732 | |
| Empire District Electric Company (The) | | | 11,896 | | | | 289,311 | |
| Hawaiian Electric Industries, Inc. | | | 15,011 | | | | 360,114 | |
| MGE Energy, Inc. | | | 671 | | | | 25,646 | |
| Portland General Electric Company | | | 36,263 | | | | 1,213,722 | |
| Southern Company | | | 341 | | | | 15,628 | |
| UIL Holdings Corporation | | | 1,439 | | | | 52,854 | |
| UNS Energy Corporation | | | 2,348 | | | | 141,021 | |
| | | | | | | | 2,383,028 | |
TFS MARKET NEUTRAL FUND
SCHEDULE OF SECURITIES SOLD SHORT (Continued)
| COMMON STOCKS - 75.1% (Continued) | | Shares | | | Value | |
| Utilities - 1.0% (Continued) | |
| Gas Utilities - 0.4% | |
| AGL Resources, Inc. | | | 3,748 | | | $ | 202,392 | |
| AmeriGas Partners, L.P. | | | 11,400 | | | | 528,732 | |
| China Natural Gas, Inc. | | | 1,282 | | | | 1,026 | |
| Ferrellgas Partners, L.P. | | | 41,850 | | | | 1,039,972 | |
| Northwest Natural Gas Company | | | 33,522 | | | | 1,484,019 | |
| Piedmont Natural Gas Company, Inc. | | | 8,733 | | | | 312,554 | |
| WGL Holdings, Inc. | | | 3,933 | | | | 156,494 | |
| | | | | | | | 3,725,189 | |
| Independent Power and Renewable Electricity Producers - 0.2% | |
| American DG Energy, Inc. | | | 115 | | | | 282 | |
| NRG Energy, Inc. | | | 4,002 | | | | 130,945 | |
| Ormat Technologies, Inc. | | | 56,589 | | | | 1,509,795 | |
| | | | | | | | 1,641,022 | |
| Multi-Utilities - 0.2% | |
| Black Hills Corporation | | | 859 | | | | 49,607 | |
| Consolidated Edison, Inc. | | | 3,394 | | | | 196,954 | |
| Just Energy Group, Inc. | | | 163,650 | | | | 1,301,017 | |
| PG&E Corporation | | | 3,075 | | | | 140,158 | |
| SCANA Corporation | | | 817 | | | | 43,857 | |
| TECO Energy, Inc. | | | 8,480 | | | | 152,301 | |
| Wisconsin Energy Corporation | | | 1,171 | | | | 56,770 | |
| | | | | | | | 1,940,664 | |
Water Utilities - 0.0% (a) | |
| California Water Service Group | | | 11,308 | | | | 254,430 | |
| York Water Company | | | 419 | | | | 8,384 | |
| | | | | | | | 262,814 | |
| | | | | | | | | |
Total Common Stocks (Proceeds $910,015,472) | | | $ | 759,623,809 | |
PREFERRED STOCKS - 0.0% (a) | | Shares | | | Value | |
| Cabco Trust for J. C. Penney, 7.625% | | | 22 | | | $ | 395 | |
| Stanley Black & Decker, Inc., 6.25% | | | 1,804 | | | | 201,741 | |
Total Preferred Stocks (Proceeds $192,281) | | | $ | 202,136 | |
RIGHTS - 0.0% (a) | | Shares | | | Value | |
Accelerate Diagnostics, Inc. (b) | | | 7,443 | | | $ | 12,132 | |
Empire Resorts, Inc. (b) | | | 3,705 | | | | 1,927 | |
Total Rights (Proceeds $–) | | | $ | 14,059 | |
TFS MARKET NEUTRAL FUND
SCHEDULE OF SECURITIES SOLD SHORT (Continued)
WARRANTS - 0.0% (a) | | Shares | | | Value | |
| American International Group, Inc. | | | 854 | | | | 18,993 | |
Magnum Hunter Resources Corporation (b) | | | 15,689 | | | | – | |
Total Warrants (Proceeds $14,295) | | | $ | 18,993 | |
| | | | | | | | | |
Total Securities Sold Short - 75.1% (Proceeds $910,222,048) | | | $ | 759,858,997 | |
| ADR | - American Depositary Receipt. |
| (a) | Percentage rounds to less than 0.1%. |
| (b) | Security value has been determined in good faith by the Board of Trustees. The total value of such securities is ($1,268,970) at April 30, 2014, representing (0.1%) of net assets (Note 2). |
See accompanying notes to financial statements.
TFS MARKET NEUTRAL FUND
SCHEDULE OF FUTURES CONTRACTS SOLD SHORT
April 30, 2014 (Unaudited)
| FUTURES CONTRACTS SOLD SHORT | Expiration Date | | Contracts | | | Aggregate Market Value of Contracts | | | Unrealized Appreciation (Depreciation) | |
| FINANCIAL FUTURES | | | | |
| CBOE Volatility Index (VIX) Future | 05/20/2014 | | | 1,091 | | | $ | 16,332,270 | | | $ | 1,550,167 | |
| CBOE Volatility Index (VIX) Future | 06/17/2014 | | | 1,625 | | | | 25,496,250 | | | | 2,101,354 | |
| E-Mini S&P 500 Future | 06/20/2014 | | | 1,187 | | | | 111,563,162 | | | | (2,075,864 | ) |
| | | | | | | | | | |
| Total Futures Contracts Sold Short | | | $ | 153,391,682 | | | $ | 1,575,657 | |
See accompanying notes to financial statements.
TFS SMALL CAP FUND
SCHEDULE OF INVESTMENTS
April 30, 2014(Unaudited)
COMMON STOCKS - 98.7% | | Shares | | | Value | |
Consumer Discretionary - 16.0% | |
| Auto Components - 3.4% | |
American Axle & Manufacturing Holdings, Inc. (a) | | | 10,010 | | | $ | 176,677 | |
| Cooper Tire & Rubber Company | | | 9,181 | | | | 230,902 | |
| Drew Industries, Inc. | | | 4,433 | | | | 223,069 | |
Federal-Mogul Holdings Corporation (a) | | | 7,592 | | | | 130,734 | |
Gentherm, Inc. (a) | | | 13,173 | | | | 478,839 | |
Modine Manufacturing Company (a) | | | 18,253 | | | | 300,809 | |
Motorcar Parts of America, Inc. (a) | | | 11,919 | | | | 327,057 | |
| Remy International, Inc. | | | 8,603 | | | | 228,152 | |
Shiloh Industries, Inc. (a) | | | 11,766 | | | | 232,261 | |
| Standard Motor Products, Inc. | | | 356 | | | | 13,524 | |
| STRATTEC Security Corporation | | | 3,071 | | | | 205,174 | |
| Superior Industries International, Inc. | | | 12,930 | | | | 273,340 | |
Tower International, Inc. (a) | | | 11,658 | | | | 324,209 | |
Visteon Corporation (a) | | | 4 | | | | 347 | |
| | | | | | | | 3,145,094 | |
| Distributors - 0.3% | |
| Core-Mark Holding Company, Inc. | | | 2,886 | | | | 232,438 | |
| | | | | | | | | |
| Diversified Consumer Services - 0.7% | |
Ascent Capital Group, Inc. - Class A (a) | | | 1,348 | | | | 92,702 | |
Bright Horizons Family Solutions, Inc. (a) | | | 5,294 | | | | 215,889 | |
ITT Educational Services, Inc. (a) | | | 640 | | | | 17,280 | |
JTH Holding, Inc. - Class A (a) | | | 3,747 | | | | 101,918 | |
Steiner Leisure Ltd. (a) | | | 4,279 | | | | 184,725 | |
| | | | | | | | 612,514 | |
| Hotels, Restaurants & Leisure - 3.4% | |
Carrols Restaurant Group, Inc. (a) | | | 1,323 | | | | 8,877 | |
Century Casinos, Inc. (a) | | | 34,473 | | | | 205,114 | |
| Choice Hotels International, Inc. | | | 1,383 | | | | 61,101 | |
Del Frisco's Restaurant Group, Inc. (a) | | | 7,209 | | | | 187,506 | |
| DineEquity, Inc. | | | 4,525 | | | | 343,040 | |
| Einstein Noah Restaurant Group, Inc. | | | 13,492 | | | | 207,237 | |
Jack in the Box, Inc. (a) | | | 1,101 | | | | 58,947 | |
Kona Grill, Inc. (a) | | | 9,694 | | | | 227,324 | |
| Marcus Corporation | | | 12,998 | | | | 217,457 | |
Marriott Vacations Worldwide Corporation (a) | | | 4,248 | | | | 231,431 | |
| Papa John's International, Inc. | | | 8,086 | | | | 354,652 | |
Penn National Gaming, Inc. (a) | | | 7,136 | | | | 79,638 | |
Red Robin Gourmet Burgers, Inc. (a) | | | 2,667 | | | | 181,303 | |
Ruby Tuesday, Inc. (a) | | | 18,822 | | | | 145,118 | |
| Ruth's Hospitality Group, Inc. | | | 19,447 | | | | 244,838 | |
Scientific Games Corporation - Class A (a) | | | 15,812 | | | | 189,428 | |
| Speedway Motorsports, Inc. | | | 290 | | | | 5,275 | |
| Texas Roadhouse, Inc. | | | 9,084 | | | | 224,738 | |
| | | | | | | | 3,173,024 | |
| Household Durables - 1.8% | |
Cavco Industries, Inc. (a) | | | 530 | | | | 41,313 | |
| CSS Industries, Inc. | | | 1,122 | | | | 26,894 | |
Dixie Group, Inc. (The) (a) | | | 14,452 | | | | 217,792 | |
TFS SMALL CAP FUND
SCHEDULE OF INVESTMENTS (Continued)
COMMON STOCKS - 98.7%(Continued) | | Shares | | | Value | |
Consumer Discretionary - 16.0%(Continued) | |
| Household Durables - 1.8% (Continued) | |
| Flexsteel Industries, Inc. | | | 7,101 | | | $ | 243,706 | |
Helen of Troy Ltd. (a) | | | 3,487 | | | | 218,635 | |
Libbey, Inc. (a) | | | 6,908 | | | | 184,236 | |
| Lifetime Brands, Inc. | | | 11,789 | | | | 225,170 | |
Universal Electronics, Inc. (a) | | | 6,776 | | | | 253,084 | |
WCI Communities, Inc. (a) | | | 9,987 | | | | 191,451 | |
William Lyon Homes - Class A (a) | | | 817 | | | | 21,324 | |
| | | | | | | | 1,623,605 | |
| Internet & Catalog Retail - 0.6% | |
1-800-FLOWERS.COM, Inc. - Class A (a) | | | 40,984 | | | | 223,363 | |
Blue Nile, Inc. (a) | | | 2,855 | | | | 99,154 | |
Shutterfly, Inc. (a) | | | 3,712 | | | | 151,932 | |
ValueVision Media, Inc. - Class A (a) | | | 20,388 | | | | 95,416 | |
| | | | | | | | 569,865 | |
| Leisure Products - 0.1% | |
| Escalade, Inc. | | | 1,915 | | | | 28,189 | |
LeapFrog Enterprises, Inc. (a) | | | 953 | | | | 6,528 | |
Nautilus, Inc. (a) | | | 3,576 | | | | 29,788 | |
| | | | | | | | 64,505 | |
| Media - 1.8% | |
| A.H. Belo Corporation - Class A | | | 20,216 | | | | 232,686 | |
Carmike Cinemas, Inc. (a) | | | 9,327 | | | | 276,639 | |
| Clear Channel Outdoor Holdings, Inc. - Class A | | | 7,570 | | | | 60,711 | |
E.W. Scripps Company (The) - Class A (a) | | | 4,566 | | | | 78,216 | |
| Entravision Communications Corporation - Class A | | | 29,014 | | | | 154,064 | |
Global Sources Ltd. (a) | | | 1,829 | | | | 16,260 | |
Journal Communications, Inc. - Class A (a) | | | 26,478 | | | | 212,354 | |
Loral Space & Communications, Inc. (a) | | | 3,178 | | | | 228,784 | |
Martha Stewart Living Omnimedia, Inc. - Class A (a) | | | 4,775 | | | | 18,670 | |
McClatchy Company (The) - Class A (a) | | | 6,277 | | | | 34,398 | |
| New York Times Company (The) - Class A | | | 14,599 | | | | 234,752 | |
| Saga Communications, Inc. - Class A | | | 3,397 | | | | 150,487 | |
| | | | | | | | 1,698,021 | |
Multiline Retail - 0.0% (b) | |
| Bon-Ton Stores, Inc. (The) | | | 124 | | | | 1,364 | |
| | | | | | | | | |
| Specialty Retail - 2.6% | |
| Aaron's, Inc. | | | 6,279 | | | | 185,042 | |
| Abercrombie & Fitch Company - Class A | | | 5,979 | | | | 219,788 | |
Barnes & Noble, Inc. (a) | | | 10,854 | | | | 178,006 | |
Build-A-Bear Workshop, Inc. (a) | | | 9,399 | | | | 105,457 | |
| Chico's FAS, Inc. | | | 14,331 | | | | 227,576 | |
| Destination Maternity Corporation | | | 5,751 | | | | 141,820 | |
Destination XL Group, Inc. (a) | | | 3,477 | | | | 18,776 | |
| DSW, Inc. - Class A | | | 68 | | | | 2,270 | |
| Finish Line, Inc. (The) - Class A | | | 8,207 | | | | 225,939 | |
Kirkland's, Inc. (a) | | | 3,928 | | | | 67,208 | |
New York & Company, Inc. (a) | | | 21,516 | | | | 90,152 | |
| Stage Stores, Inc. | | | 7,322 | | | | 140,436 | |
| Trans World Entertainment Corporation | | | 8 | | | | 26 | |
TFS SMALL CAP FUND
SCHEDULE OF INVESTMENTS (Continued)
COMMON STOCKS - 98.7%(Continued) | | Shares | | | Value | |
Consumer Discretionary - 16.0%(Continued) | |
| Specialty Retail - 2.6% (Continued) | |
Vitamin Shoppe, Inc. (a) | | | 5,140 | | | $ | 246,103 | |
| Winmark Corporation | | | 2,730 | | | | 207,098 | |
Zale Corporation (a) | | | 9,953 | | | | 212,895 | |
Zumiez, Inc. (a) | | | 4,641 | | | | 113,472 | |
| | | | | | | | 2,382,064 | |
| Textiles, Apparel & Luxury Goods - 1.3% | |
Crocs, Inc. (a) | | | 4,955 | | | | 74,969 | |
Deckers Outdoor Corporation (a) | | | 2,670 | | | | 210,796 | |
G-III Apparel Group Ltd. (a) | | | 3,101 | | | | 222,559 | |
Iconix Brand Group, Inc. (a) | | | 2,110 | | | | 89,675 | |
| Movado Group, Inc. | | | 5,488 | | | | 215,569 | |
Perry Ellis International, Inc. (a) | | | 51 | | | | 770 | |
| R.G. Barry Corporation | | | 3,563 | | | | 65,132 | |
Skechers U.S.A., Inc. - Class A (a) | | | 5,777 | | | | 236,799 | |
Unifi, Inc. (a) | | | 2,854 | | | | 63,188 | |
| | | | | | | | 1,179,457 | |
Consumer Staples - 2.8% | |
| Beverages - 0.2% | |
| Coca-Cola Bottling Company Consolidated | | | 2,788 | | | | 229,257 | |
| | | | | | | | | |
| Food & Staples Retailing - 0.5% | |
| Ingles Markets, Inc. - Class A | | | 9,947 | | | | 228,681 | |
| Spartan Stores, Inc. | | | 9,320 | | | | 200,753 | |
| Village Super Market, Inc. - Class A | | | 11 | | | | 266 | |
| | | | | | | | 429,700 | |
| Food Products - 1.0% | |
| Cal-Maine Foods, Inc. | | | 2,241 | | | | 133,631 | |
Farmer Brothers Company (a) | | | 845 | | | | 16,655 | |
Inventure Foods, Inc. (a) | | | 9,700 | | | | 116,594 | |
| J & J Snack Foods Corporation | | | 2,415 | | | | 226,044 | |
| Limoneira Company | | | 175 | | | | 4,020 | |
Omega Protein Corporation (a) | | | 13,379 | | | | 151,985 | |
Seneca Foods Corporation - Class A (a) | | | 6,048 | | | | 171,763 | |
| Snyder's-Lance, Inc. | | | 2,515 | | | | 66,798 | |
| | | | | | | | 887,490 | |
Household Products - 0.0% (b) | |
Central Garden & Pet Company - Class A (a) | | | 2,279 | | | | 18,847 | |
| Orchids Paper Products Company | | | 518 | | | | 13,919 | |
| WD-40 Company | | | 64 | | | | 4,662 | |
| | | | | | | | 37,428 | |
| Personal Products - 1.0% | |
Elizabeth Arden, Inc. (a) | | | 5,315 | | | | 195,273 | |
| Female Health Company (The) | | | 501 | | | | 3,788 | |
IGI Laboratories, Inc. (a) | | | 47,190 | | | | 237,366 | |
| Inter Parfums, Inc. | | | 6,458 | | | | 236,298 | |
Nutraceutical International Corporation (a) | | | 1,358 | | | | 33,841 | |
Revlon, Inc. - Class A (a) | | | 8,177 | | | | 246,455 | |
| | | | | | | | 953,021 | |
TFS SMALL CAP FUND
SCHEDULE OF INVESTMENTS (Continued)
COMMON STOCKS - 98.7%(Continued) | | Shares | | | Value | |
Consumer Staples - 2.8%(Continued) | |
| Tobacco - 0.1% | |
| Universal Corporation | | | 1,112 | | | $ | 60,682 | |
| | | | | | | | | |
Energy - 7.7% | |
| Energy Equipment & Services - 3.2% | |
| Bolt Technology Corporation | | | 815 | | | | 13,757 | |
Era Group, Inc. (a) | | | 7,746 | | | | 221,148 | |
Geospace Technologies Corporation (a) | | | 695 | | | | 40,400 | |
| Gulf Island Fabrication, Inc. | | | 3,319 | | | | 66,579 | |
| Gulfmark Offshore, Inc. - Class A | | | 3,899 | | | | 175,494 | |
Helix Energy Solutions Group, Inc. (a) | | | 9,387 | | | | 225,664 | |
ION Geophysical Corporation (a) | | | 29,683 | | | | 130,605 | |
Key Energy Services, Inc. (a) | | | 22,936 | | | | 230,278 | |
Matrix Service Company (a) | | | 7,161 | | | | 221,776 | |
Natural Gas Services Group, Inc. (a) | | | 6,924 | | | | 212,498 | |
Parker Drilling Company (a) | | | 34,509 | | | | 228,795 | |
Pioneer Energy Services Corporation (a) | | | 33,221 | | | | 497,318 | |
RigNet, Inc. (a) | | | 4,537 | | | | 212,150 | |
Tesco Corporation (a) | | | 7,574 | | | | 151,480 | |
Willbros Group, Inc. (a) | | | 25,584 | | | | 284,238 | |
| | | | | | | | 2,912,180 | |
| Oil, Gas & Consumable Fuels - 4.5% | |
Abraxas Petroleum Corporation (a) | | | 43,353 | | | | 236,707 | |
| Adams Resources & Energy, Inc. | | | 3,403 | | | | 245,220 | |
| Alon USA Energy, Inc. | | | 364 | | | | 5,929 | |
Bonanza Creek Energy, Inc. (a) | | | 4,627 | | | | 224,965 | |
Callon Petroleum Company (a) | | | 25,056 | | | | 230,014 | |
| Delek US Holdings, Inc. | | | 4,587 | | | | 146,738 | |
| DHT Holdings, Inc. | | | 29,880 | | | | 233,363 | |
Endeavour International Corporation (a) | | | 216 | | | | 743 | |
| EXCO Resources, Inc. | | | 37,311 | | | | 236,925 | |
| GasLog Ltd. | | | 8,333 | | | | 223,158 | |
Pacific Ethanol, Inc. (a) | | | 8,490 | | | | 132,444 | |
| Panhandle Oil & Gas, Inc. - Class A | | | 4,851 | | | | 212,716 | |
| PBF Energy, Inc. - Class A | | | 7,601 | | | | 233,959 | |
PetroQuest Energy, Inc. (a) | | | 18,712 | | | | 112,646 | |
REX American Resources Corporation (a) | | | 3,616 | | | | 236,342 | |
Sanchez Energy Corporation (a) | | | 7,878 | | | | 222,790 | |
Stone Energy Corporation (a) | | | 4,593 | | | | 225,287 | |
Swift Energy Company (a) | | | 7,963 | | | | 98,184 | |
Triangle Petroleum Corporation (a) | | | 24,860 | | | | 239,153 | |
VAALCO Energy, Inc. (a) | | | 7,027 | | | | 64,789 | |
Vertex Energy, Inc. (a) | | | 27,641 | | | | 224,721 | |
Warren Resources, Inc. (a) | | | 61,972 | | | | 314,198 | |
Westmoreland Coal Company (a) | | | 3,139 | | | | 92,946 | |
| | | | | | | | 4,193,937 | |
Financials - 16.9% | |
| Banks - 2.2% | |
| 1st Source Corporation | | | 22 | | | | 649 | |
| Bank of Marin Bancorp | | | 6 | | | | 272 | |
| C&F Financial Corporation | | | 68 | | | | 2,125 | |
TFS SMALL CAP FUND
SCHEDULE OF INVESTMENTS (Continued)
COMMON STOCKS - 98.7%(Continued) | | Shares | | | Value | |
Financials - 16.9%(Continued) | |
| Banks - 2.2% (Continued) | |
Capital Bank Financial Corporation - Class A (a) | | | 9,534 | | | $ | 227,386 | |
| Central Pacific Financial Corporation | | | 11,353 | | | | 213,096 | |
ConnectOne Bancorp, Inc. (a) | | | 1 | | | | 48 | |
Customers Bancorp, Inc. (a) | | | 12,423 | | | | 273,679 | |
| Enterprise Financial Services Corporation | | | 132 | | | | 2,359 | |
| Financial Institutions, Inc. | | | 5,745 | | | | 132,997 | |
First BanCorp (Puerto Rico) (a) | | | 13,451 | | | | 69,138 | |
| First Business Financial Services, Inc. | | | 2,038 | | | | 92,138 | |
| First Horizon National Corporation | | | 19,835 | | | | 227,907 | |
| First Interstate BancSystem, Inc. | | | 927 | | | | 23,073 | |
| First Merchants Corporation | | | 1,846 | | | | 39,172 | |
| Fulton Financial Corporation | | | 18,564 | | | | 226,295 | |
| Great Southern Bancorp, Inc. | | | 28 | | | | 803 | |
| Independent Bank Corporation (Michigan) | | | 18,138 | | | | 236,157 | |
| NBT Bancorp, Inc. | | | 19 | | | | 430 | |
| Old Line Bancshares, Inc. | | | 1,257 | | | | 21,331 | |
| Park Sterling Corporation | | | 84 | | | | 548 | |
| PrivateBancorp, Inc. | | | 389 | | | | 10,725 | |
Seacoast Banking Corporation of Florida (a) | | | 18,318 | | | | 194,171 | |
| Synovus Financial Corporation | | | 100 | | | | 321 | |
Taylor Capital Group, Inc. (a) | | | 471 | | | | 10,027 | |
| Washington Banking Company | | | 19 | | | | 327 | |
| Washington Trust Bancorp, Inc. | | | 17 | | | | 581 | |
| WesBanco, Inc. | | | 837 | | | | 25,311 | |
| | | | | | | | 2,031,066 | |
| Capital Markets - 2.1% | |
| Calamos Asset Management, Inc. - Class A | | | 3,909 | | | | 47,611 | |
| Evercore Partners, Inc. - Class A | | | 3,056 | | | | 163,282 | |
FBR & Company (a) | | | 6,726 | | | | 173,531 | |
| GAMCO Investors, Inc. - Class A | | | 2,848 | | | | 216,249 | |
| Garrison Capital, Inc. | | | 20 | | | | 282 | |
| Gladstone Capital Corporation | | | 11 | | | | 106 | |
| HFF, Inc. - Class A | | | 5,327 | | | | 181,118 | |
ICG Group, Inc. (a) | | | 323 | | | | 6,583 | |
| Manning & Napier, Inc. | | | 15,979 | | | | 265,571 | |
| MCG Capital Corporation | | | 14,707 | | | | 49,415 | |
Piper Jaffray Companies, Inc. (a) | | | 1,517 | | | | 66,535 | |
| Pzena Investment Management, Inc. - Class A | | | 18,794 | | | | 204,291 | |
Safeguard Scientifics, Inc. (a) | | | 13 | | | | 273 | |
| Solar Capital Ltd. | | | 4,482 | | | | 98,156 | |
SWS Group, Inc. (a) | | | 31,329 | | | | 232,148 | |
| U.S. Global Investors, Inc. - Class A | | | 187 | | | | 679 | |
Virtus Investment Partners, Inc. (a) | | | 15 | | | | 2,775 | |
Walter Investment Management Corporation (a) | | | 2,677 | | | | 71,155 | |
| Westwood Holdings Group, Inc. | | | 465 | | | | 27,049 | |
| WhiteHorse Finance, Inc. | | | 9,075 | | | | 123,783 | |
| | | | | | | | 1,930,592 | |
| Consumer Finance - 0.6% | |
DFC Global Corporation (a) | | | 9,845 | | | | 91,755 | |
| Nelnet, Inc. - Class A | | | 7,724 | | | | 326,416 | |
TFS SMALL CAP FUND
SCHEDULE OF INVESTMENTS (Continued)
COMMON STOCKS - 98.7%(Continued) | | Shares | | | Value | |
Financials - 16.9%(Continued) | |
| Consumer Finance - 0.6% (Continued) | |
| Nicholas Financial, Inc. | | | 8,512 | | | $ | 133,809 | |
| | | | | | | | 551,980 | |
| Diversified Financial Services - 0.5% | |
| MarketAxess Holdings, Inc. | | | 4,147 | | | | 223,440 | |
| Marlin Business Services Corporation | | | 8,000 | | | | 137,360 | |
PHH Corporation (a) | | | 3,786 | | | | 89,993 | |
PICO Holdings, Inc. (a) | | | 203 | | | | 4,720 | |
| | | | | | | | 455,513 | |
| Insurance - 4.0% | |
| American Equity Investment Life Holding Company | | | 499 | | | | 11,637 | |
| AmTrust Financial Services, Inc. | | | 2,339 | | | | 90,449 | |
| Donegal Group, Inc. - Class A | | | 9 | | | | 133 | |
| EMC Insurance Group, Inc. | | | 5,562 | | | | 183,490 | |
| Endurance Specialty Holdings Ltd. | | | 1,531 | | | | 77,806 | |
| Federated National Holding Company | | | 13,520 | | | | 262,694 | |
| Hanover Insurance Group, Inc. (The) | | | 3,860 | | | | 225,617 | |
| Horace Mann Educators Corporation | | | 6,974 | | | | 209,708 | |
| Kansas City Life Insurance Company | | | 5,216 | | | | 216,881 | |
| Kemper Corporation | | | 6,122 | | | | 241,268 | |
MBIA, Inc. (a) | | | 16,173 | | | | 196,017 | |
| Mercury General Corporation | | | 4,770 | | | | 228,292 | |
| National Interstate Corporation | | | 7,899 | | | | 221,330 | |
Navigators Group, Inc. (The) (a) | | | 3,833 | | | | 218,366 | |
| OneBeacon Insurance Group Ltd. - Class A | | | 13,157 | | | | 203,144 | |
| ProAssurance Corporation | | | 1,681 | | | | 76,351 | |
| Safety Insurance Group, Inc. | | | 3,856 | | | | 207,106 | |
| Selective Insurance Group, Inc. | | | 10,067 | | | | 230,937 | |
| Symetra Financial Corporation | | | 11,646 | | | | 240,606 | |
| United Insurance Holdings Corporation | | | 18,644 | | | | 284,321 | |
| | | | | | | | 3,626,153 | |
| Real Estate Investment Trusts (REIT) - 5.2% | |
| Agree Realty Corporation | | | 1,717 | | | | 51,287 | |
| Aviv REIT, Inc. | | | 8,897 | | | | 234,792 | |
| Cedar Realty Trust, Inc. | | | 38,007 | | | | 235,263 | |
| Chesapeake Lodging Trust | | | 1,834 | | | | 49,500 | |
| DCT Industrial Trust, Inc. | | | 29,528 | | | | 230,909 | |
| Dynex Capital, Inc. | | | 1,945 | | | | 16,688 | |
| Education Realty Trust, Inc. | | | 20,890 | | | | 213,078 | |
| Franklin Street Properties Corporation | | | 13,925 | | | | 169,606 | |
| Geo Group, Inc. (The) | | | 13,474 | | | | 451,783 | |
| Healthcare Trust of America, Inc. - Class A | | | 20,053 | | | | 234,420 | |
| Invesco Mortgage Capital, Inc. | | | 10,236 | | | | 170,634 | |
| Kite Realty Group Trust | | | 38,136 | | | | 236,443 | |
| LTC Properties, Inc. | | | 5,398 | | | | 208,525 | |
| New Residential Investment Corporation | | | 36,585 | | | | 223,168 | |
| Post Properties, Inc. | | | 3,456 | | | | 173,526 | |
| PS Business Parks, Inc. | | | 2,732 | | | | 234,324 | |
| Saul Centers, Inc. | | | 4,913 | | | | 225,458 | |
| Sovran Self Storage, Inc. | | | 3,060 | | | | 232,254 | |
Starwood Waypoint Residential Trust (a) | | | 8,728 | | | | 237,140 | |
TFS SMALL CAP FUND
SCHEDULE OF INVESTMENTS (Continued)
COMMON STOCKS - 98.7%(Continued) | | Shares | | | Value | |
Financials - 16.9%(Continued) | |
| Real Estate Investment Trusts (REIT) - 5.2% (Continued) | |
Strategic Hotels & Resorts, Inc. (a) | | | 22,189 | | | $ | 239,419 | |
| Sun Communities, Inc. | | | 3,403 | | | | 155,075 | |
| Sunstone Hotel Investors, Inc. | | | 12,139 | | | | 173,709 | |
| Universal Health Realty Income Trust | | | 2,729 | | | | 115,791 | |
| Winthrop Realty Trust | | | 19,263 | | | | 267,756 | |
| | | | | | | | 4,780,548 | |
| Real Estate Management & Development - 0.4% | |
Forestar Group, Inc. (a) | | | 191 | | | | 3,257 | |
| Kennedy-Wilson Holdings, Inc. | | | 17,838 | | | | 389,582 | |
| | | | | | | | 392,839 | |
| Thrifts & Mortgage Finance - 1.9% | |
| Apollo Residential Mortgage, Inc. | | | 14,124 | | | | 228,103 | |
BBX Capital Corporation - Class A (a) | | | 11,070 | | | | 207,341 | |
| Brookline Bancorp, Inc. | | | 5,143 | | | | 46,698 | |
| Charter Financial Corporation | | | 4,257 | | | | 46,827 | |
| Clifton Bancorp, Inc. | | | 8,606 | | | | 99,744 | |
| Everbank Financial Corp | | | 9,716 | | | | 181,883 | |
| Federal Agricultural Mortgage Corporation - Class C | | | 293 | | | | 10,425 | |
Flagstar Bancorp, Inc. (a) | | | 5,007 | | | | 88,123 | |
| Home Federal Bancorp, Inc. | | | 4,143 | | | | 62,352 | |
| HomeStreet, Inc. | | | 896 | | | | 16,271 | |
Meridian Interstate Bancorp, Inc. (a) | | | 3,144 | | | | 79,449 | |
| Oritani Financial Corporation | | | 7,372 | | | | 109,327 | |
Walker & Dunlop, Inc. (a) | | | 1,151 | | | | 18,048 | |
| Washington Federal, Inc. | | | 10,388 | | | | 224,173 | |
| Waterstone Financial, Inc. | | | 22,080 | | | | 229,853 | |
| WSFS Financial Corporation | | | 1,549 | | | | 104,743 | |
| | | | | | | | 1,753,360 | |
Health Care - 16.6% | |
| Biotechnology - 1.9% | |
Aegerion Pharmaceuticals, Inc. (a) | | | 4,304 | | | | 190,495 | |
Anacor Pharmaceuticals, Inc. (a) | | | 8,984 | | | | 147,966 | |
BioSpecifics Technologies Corporation (a) | | | 7,242 | | | | 171,853 | |
Coronado Biosciences, Inc. (a) | | | 1 | | | | 2 | |
Durata Therapeutics, Inc. (a) | | | 357 | | | | 4,834 | |
Dyax Corporation (a) | | | 34,299 | | | | 226,716 | |
Harvard Apparatus Regenerative Technology, Inc. (a) | | | 1 | | | | 2 | |
Hyperion Therapeutics, Inc. (a) | | | 1,801 | | | | 44,377 | |
Ligand Pharmaceuticals, Inc. (a) | | | 3,264 | | | | 206,187 | |
Nanosphere, Inc. (a) | | | 100 | | | | 171 | |
| PDL BioPharma, Inc. | | | 28,335 | | | | 240,564 | |
Prothena Corporation plc (a) | | | 6,451 | | | | 141,922 | |
Rigel Pharmaceuticals, Inc. (a) | | | 58,738 | | | | 187,961 | |
Synthetic Biologics, Inc. (a) | | | 57,766 | | | | 83,761 | |
TESARO, Inc. (a) | | | 8 | | | | 200 | |
Tetraphase Pharmaceuticals, Inc. (a) | | | 11,033 | | | | 118,494 | |
TG Therapeutics, Inc. (a) | | | 30 | | | | 160 | |
| | | | | | | | 1,765,665 | |
| Health Care Equipment & Supplies - 5.1% | |
Alere, Inc. (a) | | | 6,756 | | | | 225,650 | |
TFS SMALL CAP FUND
SCHEDULE OF INVESTMENTS (Continued)
COMMON STOCKS - 98.7%(Continued) | | Shares | | | Value | |
Health Care - 16.6%(Continued) | |
| Health Care Equipment & Supplies - 5.1% (Continued) | |
AngioDynamics, Inc. (a) | | | 16,532 | | | $ | 222,190 | |
Anika Therapeutics, Inc. (a) | | | 5,858 | | | | 250,371 | |
ArthroCare Corporation (a) | | | 4,958 | | | | 240,612 | |
AtriCure, Inc. (a) | | | 6,818 | | | | 104,997 | |
| Cantel Medical Corporation | | | 6,252 | | | | 207,316 | |
Cardiovascular Systems, Inc. (a) | | | 5,290 | | | | 152,088 | |
| CryoLife, Inc. | | | 16,226 | | | | 147,332 | |
Cynosure, Inc. - Class A (a) | | | 15,188 | | | | 372,714 | |
Derma Sciences, Inc. (a) | | | 4,895 | | | | 50,614 | |
DexCom, Inc. (a) | | | 4,914 | | | | 159,410 | |
Endologix, Inc. (a) | | | 9,888 | | | | 125,380 | |
Exactech, Inc. (a) | | | 4,495 | | | | 99,879 | |
Globus Medical, Inc. - Class A (a) | | | 3,516 | | | | 85,861 | |
Greatbatch, Inc. (a) | | | 8,076 | | | | 371,738 | |
Haemonetics Corporation (a) | | | 7,255 | | | | 220,262 | |
HeartWare International, Inc. (a) | | | 1,705 | | | | 144,857 | |
| Invacare Corporation | | | 4,896 | | | | 77,357 | |
Merit Medical Systems, Inc. (a) | | | 7,430 | | | | 95,624 | |
Natus Medical, Inc. (a) | | | 17,225 | | | | 427,697 | |
NuVasive, Inc. (a) | | | 6,407 | | | | 215,980 | |
OraSure Technologies, Inc. (a) | | | 41,573 | | | | 272,303 | |
Orthofix International N.V. (a) | | | 4,281 | | | | 129,286 | |
Symmetry Medical, Inc. (a) | | | 2,320 | | | | 19,163 | |
Tornier N.V. (a) | | | 12,726 | | | | 215,960 | |
Vascular Solutions, Inc. (a) | | | 1,155 | | | | 25,306 | |
| | | | | | | | 4,659,947 | |
| Health Care Providers & Services - 5.7% | |
Addus HomeCare Corporation (a) | | | 10,519 | | | | 227,421 | |
Alliance Healthcare Services, Inc. (a) | | | 7,887 | | | | 224,464 | |
Almost Family, Inc. (a) | | | 9,165 | | | | 196,772 | |
AMN Healthcare Services, Inc. (a) | | | 18,963 | | | | 236,658 | |
AmSurg Corporation (a) | | | 3,880 | | | | 168,043 | |
BioTelemetry, Inc. (a) | | | 26,564 | | | | 210,918 | |
Capital Senior Living Corporation (a) | | | 2,622 | | | | 64,842 | |
Chindex International, Inc. (a) | | | 9,960 | | | | 237,347 | |
Corvel Corporation (a) | | | 4,109 | | | | 187,124 | |
Cross Country Healthcare, Inc. (a) | | | 26,975 | | | | 191,253 | |
Emeritus Corporation (a) | | | 7,550 | | | | 225,216 | |
| Ensign Group, Inc. (The) | | | 3,712 | | | | 157,760 | |
Five Star Quality Care, Inc. (a) | | | 51,626 | | | | 249,353 | |
Gentiva Health Services, Inc. (a) | | | 17,300 | | | | 130,269 | |
Health Net, Inc. (a) | | | 7,175 | | | | 246,318 | |
| Landauer, Inc. | | | 509 | | | | 22,009 | |
LHC Group, Inc. (a) | | | 838 | | | | 17,414 | |
LifePoint Hospitals, Inc. (a) | | | 3,935 | | | | 220,045 | |
Magellan Health Services, Inc. (a) | | | 7,965 | | | | 459,740 | |
Molina Healthcare, Inc. (a) | | | 5,866 | | | | 219,388 | |
Providence Service Corporation (The) (a) | | | 2,729 | | | | 110,825 | |
RadNet, Inc. (a) | | | 47,170 | | | | 234,435 | |
| Select Medical Holdings Corporation | | | 25,984 | | | | 362,737 | |
TFS SMALL CAP FUND
SCHEDULE OF INVESTMENTS (Continued)
COMMON STOCKS - 98.7%(Continued) | | Shares | | | Value | |
Health Care - 16.6%(Continued) | |
| Health Care Providers & Services - 5.7% (Continued) | |
Triple-S Management Corporation - Class B (a) | | | 1,245 | | | $ | 18,650 | |
| U.S. Physical Therapy, Inc. | | | 2,432 | | | | 75,027 | |
| Universal American Corporation | | | 14,595 | | | | 104,646 | |
VCA Antech, Inc. (a) | | | 7,493 | | | | 229,511 | |
WellCare Health Plans, Inc. (a) | | | 3,617 | | | | 244,039 | |
| | | | | | | | 5,272,224 | |
| Health Care Technology - 0.6% | |
HealthStream, Inc. (a) | | | 6,236 | | | | 141,245 | |
MedAssets, Inc. (a) | | | 971 | | | | 22,168 | |
Omnicell, Inc. (a) | | | 8,503 | | | | 225,160 | |
| Quality Systems, Inc. | | | 8,826 | | | | 130,360 | |
| | | | | | | | 518,933 | |
| Life Sciences Tools & Services - 0.9% | |
Affymetrix, Inc. (a) | | | 16,414 | | | | 121,956 | |
Cambrex Corporation (a) | | | 7,002 | | | | 143,471 | |
Charles River Laboratories International, Inc. (a) | | | 3,976 | | | | 213,591 | |
Enzo Biochem, Inc. (a) | | | 55,283 | | | | 232,188 | |
Fluidigm Corporation (a) | | | 4,464 | | | | 167,668 | |
Harvard Bioscience, Inc. (a) | | | 9 | | | | 38 | |
| | | | | | | | 878,912 | |
| Pharmaceuticals - 2.4% | |
AcelRx Pharmaceuticals, Inc. (a) | | | 14,888 | | | | 161,088 | |
Akorn, Inc. (a) | | | 10,021 | | | | 252,730 | |
Biota Pharmaceuticals, Inc. (a) | | | 36,989 | | | | 136,490 | |
Impax Laboratories, Inc. (a) | | | 8,565 | | | | 223,975 | |
Lannett Company, Inc. (a) | | | 6,829 | | | | 235,805 | |
Medicines Company (The) (a) | | | 4,880 | | | | 129,808 | |
Nektar Therapeutics (a) | | | 16,238 | | | | 191,121 | |
Pacira Pharmaceuticals, Inc. (a) | | | 2,984 | | | | 204,374 | |
Pain Therapeutics, Inc. (a) | | | 41,316 | | | | 235,088 | |
Pernix Therapeutics Holdings, Inc. (a) | | | 50,298 | | | | 241,934 | |
Prestige Brands Holdings, Inc. (a) | | | 4,966 | | | | 166,460 | |
| | | | | | | | 2,178,873 | |
Industrials - 14.2% | |
| Aerospace & Defense - 0.9% | |
API Technologies Corporation (a) | | | 110 | | | | 251 | |
Astronics Corporation (a) | | | 4,063 | | | | 232,078 | |
Engility Holdings, Inc. (a) | | | 2,892 | | | | 126,207 | |
| Huntington Ingalls Industries, Inc. | | | 63 | | | | 6,489 | |
Moog, Inc. - Class A (a) | | | 3,580 | | | | 234,311 | |
Orbital Sciences Corporation (a) | | | 8,049 | | | | 236,641 | |
Sparton Corporation (a) | | | 549 | | | | 14,911 | |
| | | | | | | | 850,888 | |
| Air Freight & Logistics - 0.3% | |
Air Transport Services Group, Inc. (a) | | | 3,195 | | | | 25,017 | |
Atlas Air Worldwide Holdings, Inc. (a) | | | 792 | | | | 27,712 | |
Park-Ohio Holdings Corporation (a) | | | 3,949 | | | | 230,582 | |
| | | | | | | | 283,311 | |
| Airlines - 0.6% | |
Hawaiian Holdings, Inc. (a) | | | 15,460 | | | | 223,397 | |
TFS SMALL CAP FUND
SCHEDULE OF INVESTMENTS (Continued)
COMMON STOCKS - 98.7%(Continued) | | Shares | | | Value | |
Industrials - 14.2%(Continued) | |
| Airlines - 0.6% (Continued) | |
JetBlue Airways Corporation (a) | | | 23,511 | | | $ | 185,855 | |
Republic Airways Holdings, Inc. (a) | | | 13,346 | | | | 110,905 | |
| | | | | | | | 520,157 | |
| Building Products - 0.7% | |
Builders FirstSource, Inc. (a) | | | 8,292 | | | | 65,092 | |
| Insteel Industries, Inc. | | | 8,622 | | | | 177,441 | |
Patrick Industries, Inc. (a) | | | 5,643 | | | | 226,115 | |
PGT, Inc. (a) | | | 23,292 | | | | 231,756 | |
| | | | | | | | 700,404 | |
| Commercial Services & Supplies - 2.0% | |
ARC Document Solutions, Inc. (a) | | | 29,249 | | | | 187,194 | |
| CECO Environmental Corporation | | | 1,612 | | | | 25,615 | |
| Deluxe Corporation | | | 4,221 | | | | 231,944 | |
EnerNOC, Inc. (a) | | | 4,934 | | | | 116,442 | |
Heritage-Crystal Clean, Inc. (a) | | | 110 | | | | 1,760 | |
| Kimball International, Inc. - Class B | | | 12,060 | | | | 202,126 | |
| Knoll, Inc. | | | 6,950 | | | | 126,420 | |
| Multi-Color Corporation | | | 624 | | | | 21,746 | |
| Quad/Graphics, Inc. | | | 3,536 | | | | 76,554 | |
| Schawk, Inc. | | | 11,244 | | | | 224,880 | |
SP Plus Corporation (a) | | | 974 | | | | 23,785 | |
| Steelcase, Inc. - Class A | | | 14,133 | | | | 232,912 | |
Sykes Enterprises, Inc. (a) | | | 2,064 | | | | 40,847 | |
Team, Inc. (a) | | | 140 | | | | 6,005 | |
| US Ecology, Inc. | | | 439 | | | | 19,601 | |
| Viad Corporation | | | 12,602 | | | | 290,476 | |
| | | | | | | | 1,828,307 | |
| Construction & Engineering - 1.5% | |
| Argan, Inc. | | | 10,262 | | | | 274,714 | |
Dycom Industries, Inc. (a) | | | 4,800 | | | | 150,720 | |
Furmanite Corporation (a) | | | 33 | | | | 346 | |
Great Lakes Dredge & Dock Corporation (a) | | | 4,916 | | | | 42,425 | |
MYR Group, Inc. (a) | | | 5,768 | | | | 135,317 | |
Orion Marine Group, Inc. (a) | | | 13,598 | | | | 159,505 | |
| Primoris Services Corporation | | | 8,526 | | | | 238,557 | |
Tutor Perini Corporation (a) | | | 12,714 | | | | 376,334 | |
| | | | | | | | 1,377,918 | |
| Electrical Equipment - 0.4% | |
Broadwind Energy, Inc. (a) | | | 15,632 | | | | 210,876 | |
| Preformed Line Products Company | | | 2,307 | | | | 137,866 | |
Vicor Corporation (a) | | | 5 | | | | 42 | |
| | | | | | | | 348,784 | |
| Industrial Conglomerates - 0.3% | |
| Standex International Corporation | | | 4,222 | | | | 250,660 | |
| | | | | | | | | |
| Machinery - 2.1% | |
| Alamo Group, Inc. | | | 4,246 | | | | 225,548 | |
| Albany International Corporation - Class A | | | 2,486 | | | | 89,446 | |
| Ampco-Pittsburgh Corporation | | | 8,703 | | | | 174,321 | |
| CIRCOR International, Inc. | | | 2,863 | | | | 232,504 | |
TFS SMALL CAP FUND
SCHEDULE OF INVESTMENTS (Continued)
COMMON STOCKS - 98.7%(Continued) | | Shares | | | Value | |
Industrials - 14.2%(Continued) | |
| Machinery - 2.1% (Continued) | |
| Douglas Dynamics, Inc. | | | 5,393 | | | $ | 90,980 | |
| FreightCar America, Inc. | | | 1,512 | | | | 39,705 | |
| Gorman-Rupp Company (The) | | | 16 | | | | 497 | |
| Harsco Corporation | | | 3,360 | | | | 80,405 | |
| Kadant, Inc. | | | 3,815 | | | | 132,571 | |
Lydall, Inc. (a) | | | 7,635 | | | | 178,735 | |
Manitex International, Inc. (a) | | | 2,220 | | | | 36,541 | |
| Mueller Water Products, Inc. - Class A | | | 22,885 | | | | 208,711 | |
| NACCO Industries, Inc. - Class A | | | 4,523 | | | | 242,388 | |
Rexnord Corporation (a) | | | 6,329 | | | | 169,237 | |
| Twin Disc, Inc. | | | 150 | | | | 4,340 | |
Xerium Technologies, Inc. (a) | | | 2 | | | | 27 | |
| | | | | | | | 1,905,956 | |
| Marine - 0.2% | |
| Baltic Trading Ltd. | | | 9,569 | | | | 57,318 | |
| Matson, Inc. | | | 4,371 | | | | 103,549 | |
| | | | | | | | 160,867 | |
| Professional Services - 3.2% | |
| Barrett Business Services, Inc. | | | 936 | | | | 47,184 | |
| CDI Corporation | | | 6,220 | | | | 95,290 | |
CRA International, Inc. (a) | | | 3,894 | | | | 84,772 | |
| Exponent, Inc. | | | 3,217 | | | | 226,541 | |
Franklin Covey Company (a) | | | 3,972 | | | | 80,512 | |
Hill International, Inc. (a) | | | 36,922 | | | | 248,116 | |
Huron Consulting Group, Inc. (a) | | | 3,895 | | | | 277,324 | |
ICF International, Inc. (a) | | | 5,769 | | | | 224,818 | |
| Insperity, Inc. | | | 2,326 | | | | 74,572 | |
| Kelly Services, Inc. - Class A | | | 3,264 | | | | 68,740 | |
Korn/Ferry International (a) | | | 15,612 | | | | 453,529 | |
Navigant Consulting, Inc. (a) | | | 8,257 | | | | 138,718 | |
On Assignment, Inc. (a) | | | 6,546 | | | | 229,110 | |
| Resources Connection, Inc. | | | 14,180 | | | | 192,990 | |
RPX Corporation (a) | | | 7,014 | | | | 114,889 | |
TrueBlue, Inc. (a) | | | 8,452 | | | | 226,091 | |
| VSE Corporation | | | 2,728 | | | | 170,418 | |
| | | | | | | | 2,953,614 | |
| Road & Rail - 0.4% | |
| Marten Transport Ltd. | | | 9,938 | | | | 233,146 | |
Patriot Transportation Holding, Inc. (a) | | | 24 | | | | 837 | |
| Universal Truckload Services, Inc. | | | 5,590 | | | | 137,849 | |
| | | | | | | | 371,832 | |
| Trading Companies & Distributors - 1.6% | |
| Aircastle Ltd. | | | 9,695 | | | | 170,341 | |
| Applied Industrial Technologies, Inc. | | | 4,439 | | | | 212,717 | |
CAI International, Inc. (a) | | | 1,228 | | | | 26,709 | |
DXP Enterprises, Inc. (a) | | | 2,256 | | | | 255,402 | |
H&E Equipment Services, Inc. (a) | | | 10,593 | | | | 408,360 | |
MRC Global, Inc. (a) | | | 7,813 | | | | 228,061 | |
TAL International Group, Inc. (a) | | | 4,582 | | | | 193,269 | |
| | | | | | | | 1,494,859 | |
TFS SMALL CAP FUND
SCHEDULE OF INVESTMENTS (Continued)
COMMON STOCKS - 98.7%(Continued) | | Shares | | | Value | |
Information Technology - 18.2% | |
| Communications Equipment - 1.1% | |
| Alliance Fiber Optic Products, Inc. | | | 9,246 | | | $ | 177,708 | |
| Bel Fuse, Inc. - Class B | | | 9,360 | | | | 203,674 | |
Digi International, Inc. (a) | | | 63 | | | | 558 | |
Emulex Corporation (a) | | | 17,123 | | | | 122,429 | |
Harmonic, Inc. (a) | | | 17,105 | | | | 120,248 | |
Oclaro, Inc. (a) | | | 2,283 | | | | 7,762 | |
ShoreTel, Inc. (a) | | | 6,329 | | | | 47,784 | |
Sonus Networks, Inc. (a) | | | 74,013 | | | | 242,023 | |
| TESSCO Technologies, Inc. | | | 500 | | | | 16,445 | |
Westell Technologies, Inc. - Class A (a) | | | 21,707 | | | | 70,765 | |
| | | | | | | | 1,009,396 | |
| Electronic Equipment, Instruments & Components - 3.0% | |
Aeroflex Holding Corporation (a) | | | 6,668 | | | | 51,010 | |
Audience, Inc. (a) | | | 16,583 | | | | 190,704 | |
| AVX Corporation | | | 12,323 | | | | 164,512 | |
Benchmark Electronics, Inc. (a) | | | 3,336 | | | | 77,328 | |
Clearfield, Inc. (a) | | | 3,510 | | | | 55,318 | |
Cognex Corporation (a) | | | 67 | | | | 2,307 | |
Coherent, Inc. (a) | | | 3,677 | | | | 219,554 | |
CUI Global, Inc (a) | | | 21,275 | | | | 193,815 | |
| Daktronics, Inc. | | | 16,408 | | | | 213,632 | |
Fabrinet (a) | | | 2,033 | | | | 43,913 | |
Insight Enterprises, Inc. (a) | | | 8,471 | | | | 221,263 | |
Itron, Inc. (a) | | | 2,392 | | | | 90,896 | |
Key Tronic Corporation (a) | | | 39 | | | | 409 | |
| Mesa Laboratories, Inc. | | | 730 | | | | 62,561 | |
Multi-Fineline Electronix, Inc. (a) | | | 38 | | | | 470 | |
Newport Corporation (a) | | | 7,634 | | | | 142,603 | |
OSI Systems, Inc. (a) | | | 3,405 | | | | 190,033 | |
| PC Connection, Inc. | | | 2,728 | | | | 54,587 | |
ScanSource, Inc. (a) | | | 329 | | | | 12,637 | |
Tech Data Corporation (a) | | | 7,333 | | | | 458,239 | |
| Vishay Intertechnology, Inc. | | | 5,139 | | | | 73,077 | |
Vishay Precision Group, Inc. (a) | | | 133 | | | | 2,159 | |
Zygo Corporation (a) | | | 11,688 | | | | 224,877 | |
| | | | | | | | 2,745,904 | |
| Internet Software & Services - 1.9% | |
Blucora, Inc. (a) | | | 3,246 | | | | 62,486 | |
Carbonite, Inc. (a) | | | 1,773 | | | | 17,535 | |
comScore, Inc. (a) | | | 16 | | | | 501 | |
DealerTrack Holdings, Inc. (a) | | | 4,106 | | | | 187,603 | |
Demandware, Inc. (a) | | | 4,630 | | | | 229,787 | |
| EarthLink Holdings Corporation | | | 25,217 | | | | 85,990 | |
eGain Corporation (a) | | | 25 | | | | 164 | |
Envestnet, Inc. (a) | | | 4,692 | | | | 172,900 | |
LogMeIn, Inc. (a) | | | 5,675 | | | | 257,929 | |
| Marchex, Inc. - Class B | | | 2,393 | | | | 22,135 | |
Perficient, Inc. (a) | | | 12,719 | | | | 232,376 | |
SPS Commerce, Inc. (a) | | | 4,266 | | | | 220,979 | |
Unwired Planet, Inc. (a) | | | 31,162 | | | | 71,049 | |
TFS SMALL CAP FUND
SCHEDULE OF INVESTMENTS (Continued)
COMMON STOCKS - 98.7%(Continued) | | Shares | | | Value | |
Information Technology - 18.2%(Continued) | |
| Internet Software & Services - 1.9% (Continued) | |
XO Group, Inc. (a) | | | 18,074 | | | $ | 191,946 | |
| | | | | | | | 1,753,380 | |
| IT Services - 3.5% | |
Acxiom Corporation (a) | | | 2,793 | | | | 78,874 | |
Cardtronics, Inc. (a) | | | 5,016 | | | | 167,936 | |
| Cass Information Systems, Inc. | | | 15 | | | | 758 | |
| Convergys Corporation | | | 9,933 | | | | 213,957 | |
CoreLogic, Inc. (a) | | | 8,085 | | | | 226,622 | |
EPAM Systems, Inc. (a) | | | 7,448 | | | | 231,856 | |
ExlService Holdings, Inc. (a) | | | 8,248 | | | | 233,377 | |
Global Cash Access Holdings, Inc. (a) | | | 24,362 | | | | 160,789 | |
iGATE Corporation (a) | | | 6,295 | | | | 230,397 | |
Information Services Group, Inc. (a) | | | 41,603 | | | | 205,935 | |
Lionbridge Technologies, Inc. (a) | | | 45,810 | | | | 269,363 | |
| MAXIMUS, Inc. | | | 5,415 | | | | 230,517 | |
ModusLink Global Solutions, Inc. (a) | | | 11,316 | | | | 45,717 | |
MoneyGram International, Inc. (a) | | | 19,716 | | | | 260,251 | |
PRGX Global, Inc. (a) | | | 27,650 | | | | 177,789 | |
| Science Applications International Corporation | | | 5,778 | | | | 225,342 | |
TeleTech Holdings, Inc. (a) | | | 2,607 | | | | 62,907 | |
Virtusa Corporation (a) | | | 6,970 | | | | 229,801 | |
| | | | | | | | 3,252,188 | |
| Semiconductors & Semiconductor Equipment - 4.2% | |
Alpha & Omega Semiconductor Ltd. (a) | | | 46 | | | | 331 | |
Amkor Technology, Inc. (a) | | | 31,400 | | | | 249,630 | |
ATMI, Inc. (a) | | | 6,610 | | | | 224,641 | |
Axcelis Technologies, Inc. (a) | | | 93,331 | | | | 167,062 | |
Cavium, Inc. (a) | | | 5,413 | | | | 229,349 | |
CEVA, Inc. (a) | | | 1,966 | | | | 31,908 | |
Cirrus Logic, Inc. (a) | | | 4,806 | | | | 107,174 | |
DSP Group, Inc. (a) | | | 26,144 | | | | 208,106 | |
Inphi Corporation (a) | | | 15,443 | | | | 228,402 | |
Integrated Device Technology, Inc. (a) | | | 30,086 | | | | 351,104 | |
Intermolecular, Inc. (a) | | | 192 | | | | 522 | |
| Intersil Corporation - Class A | | | 6,650 | | | | 82,061 | |
| IXYS Corporation | | | 20,737 | | | | 223,752 | |
Lattice Semiconductor Corporation (a) | | | 25,773 | | | | 217,009 | |
MA/COM Technology Solutions Holdings, Inc. (a) | | | 4,098 | | | | 71,756 | |
Mattson Technology, Inc. (a) | | | 113,145 | | | | 225,159 | |
Microsemi Corporation (a) | | | 734 | | | | 17,264 | |
Monolithic Power Systems, Inc. (a) | | | 5,780 | | | | 214,438 | |
OmniVision Technologies, Inc. (a) | | | 12,389 | | | | 241,957 | |
PLX Technology, Inc. (a) | | | 13,406 | | | | 77,755 | |
RF Micro Devices, Inc. (a) | | | 27,312 | | | | 230,513 | |
Sigma Designs, Inc. (a) | | | 5,706 | | | | 21,512 | |
Silicon Image, Inc. (a) | | | 36,645 | | | | 205,578 | |
Vitesse Semiconductor Corporation (a) | | | 48,376 | | | | 179,959 | |
| | | | | | | | 3,806,942 | |
| Software - 3.5% | |
ACI Worldwide, Inc. (a) | | | 3,851 | | | | 220,085 | |
TFS SMALL CAP FUND
SCHEDULE OF INVESTMENTS (Continued)
COMMON STOCKS - 98.7%(Continued) | | Shares | | | Value | |
Information Technology - 18.2%(Continued) | |
| Software - 3.5% (Continued) | |
Actuate Corporation (a) | | | 4,269 | | | $ | 24,034 | |
| American Software, Inc. - Class A | | | 3,007 | | | | 28,987 | |
Cinedigm Corporation - Class A (a) | | | 78,557 | | | | 196,392 | |
| Compuware Corporation | | | 22,478 | | | | 232,872 | |
Comverse, Inc. (a) | | | 6,064 | | | | 151,236 | |
| Digimarc Corporation | | | 5,204 | | | | 171,836 | |
ePlus, Inc. (a) | | | 3,661 | | | | 183,196 | |
Guidance Software, Inc. (a) | | | 350 | | | | 3,224 | |
Imperva, Inc. (a) | | | 3,295 | | | | 75,390 | |
Infoblox, Inc. (a) | | | 10,063 | | | | 197,436 | |
Interactive Intelligence Group, Inc. (a) | | | 3,402 | | | | 212,863 | |
Model N, Inc. (a) | | | 6,820 | | | | 61,448 | |
NetScout Systems, Inc. (a) | | | 4,216 | | | | 164,255 | |
| Pegasystems, Inc. | | | 13,880 | | | | 229,992 | |
Progress Software Corporation (a) | | | 6,003 | | | | 128,824 | |
Sapiens International Corporation N.V. (a) | | | 23,664 | | | | 186,236 | |
Synchronoss Technologies, Inc. (a) | | | 6,983 | | | | 212,563 | |
Take-Two Interactive Software, Inc. (a) | | | 7,329 | | | | 149,365 | |
Telenav, Inc. (a) | | | 32,043 | | | | 196,424 | |
Verint Systems, Inc. (a) | | | 5,183 | | | | 226,860 | |
| | | | | | | | 3,253,518 | |
| Technology Hardware, Storage & Peripherals - 1.0% | |
Cray, Inc. (a) | | | 6,846 | | | | 196,549 | |
Dot Hill Systems Corporation (a) | | | 42,522 | | | | 175,616 | |
Electronics For Imaging, Inc. (a) | | | 1,693 | | | | 63,978 | |
Intevac, Inc. (a) | | | 5,623 | | | | 45,265 | |
| Lexmark International, Inc. - Class A | | | 221 | | | | 9,503 | |
QLogic Corporation (a) | | | 18,971 | | | | 219,684 | |
Synaptics, Inc. (a) | | | 2,899 | | | | 180,173 | |
| | | | | | | | 890,768 | |
Materials - 4.5% | |
| Chemicals - 1.4% | |
| A. Schulman, Inc. | | | 2,524 | | | | 90,662 | |
Arabian American Development Company (a) | | | 3,534 | | | | 38,627 | |
| Chase Corporation | | | 25 | | | | 778 | |
Chemtura Corporation (a) | | | 8 | | | | 178 | |
Ferro Corporation (a) | | | 18,029 | | | | 234,016 | |
| Innospec, Inc. | | | 2,226 | | | | 95,852 | |
| Koppers Holdings, Inc. | | | 7,256 | | | | 309,831 | |
Penford Corporation (a) | | | 35 | | | | 441 | |
| Quaker Chemical Corporation | | | 743 | | | | 55,301 | |
| Sensient Technologies Corporation | | | 4,210 | | | | 227,551 | |
| Stepan Company | | | 4,132 | | | | 238,954 | |
| Tredegar Corporation | | | 1,373 | | | | 28,572 | |
| | | | | | | | 1,320,763 | |
| Construction Materials - 0.1% | |
| United States Lime & Minerals, Inc. | | | 1,045 | | | | 56,493 | |
| | | | | | | | | |
| Containers & Packaging - 0.6% | |
AEP Industries, Inc. (a) | | | 1,322 | | | | 47,089 | |
TFS SMALL CAP FUND
SCHEDULE OF INVESTMENTS (Continued)
COMMON STOCKS - 98.7%(Continued) | | Shares | | | Value | |
Materials - 4.5%(Continued) | |
| Containers & Packaging - 0.6% (Continued) | |
Berry Plastics Group, Inc. (a) | | | 19,114 | | | $ | 429,874 | |
| Myers Industries, Inc. | | | 4,921 | | | | 92,023 | |
| | | | | | | | 568,986 | |
| Metals & Mining - 1.4% | |
| AMCOL International Corporation | | | 4,921 | | | | 225,628 | |
Charles & Colvard Ltd. (a) | | | 178 | | | | 386 | |
| Compass Minerals International, Inc. | | | 5,340 | | | | 489,144 | |
Horsehead Holding Corporation (a) | | | 96 | | | | 1,497 | |
| Materion Corporation | | | 25 | | | | 841 | |
| Noranda Aluminum Holding Corporation | | | 43,443 | | | | 154,223 | |
Stillwater Mining Company (a) | | | 13,907 | | | | 219,453 | |
Tahoe Resources, Inc. (a) | | | 8 | | | | 178 | |
| Worthington Industries, Inc. | | | 6,109 | | | | 224,811 | |
| | | | | | | | 1,316,161 | |
| Paper & Forest Products - 1.0% | |
KapStone Paper and Packaging Corporation (a) | | | 8,758 | | | | 231,036 | |
| Neenah Paper, Inc. | | | 4,002 | | | | 201,581 | |
| P.H. Glatfelter Company | | | 10,321 | | | | 263,392 | |
| Schweitzer-Mauduit International, Inc. | | | 5,403 | | | | 235,787 | |
| | | | | | | | 931,796 | |
Telecommunication Services - 0.7% | |
| Diversified Telecommunication Services - 0.6% | |
Cbeyond, Inc. (a) | | | 28,232 | | | | 279,215 | |
| Lumos Networks Corporation | | | 2,444 | | | | 32,285 | |
Premiere Global Services, Inc. (a) | | | 3,585 | | | | 45,601 | |
Vonage Holdings Corporation (a) | | | 61,308 | | | | 235,423 | |
| | | | | | | | 592,524 | |
| Wireless Telecommunication Services - 0.1% | |
Boingo Wireless, Inc. (a) | | | 85 | | | | 561 | |
NII Holdings, Inc. (a) | | | 224 | | | | 192 | |
| Telephone and Data Systems, Inc. | | | 1,794 | | | | 48,779 | |
| | | | | | | | 49,532 | |
Utilities - 1.1% | |
| Electric Utilities - 0.2% | |
| Unitil Corporation | | | 6,894 | | | | 228,881 | |
| | | | | | | | | |
| Gas Utilities - 0.5% | |
| Chesapeake Utilities Corporation | | | 64 | | | | 4,049 | |
| Delta Natural Gas Company, Inc. | | | 8 | | | | 152 | |
| Laclede Group, Inc. (The) | | | 4,988 | | | | 236,481 | |
| Southwest Gas Corporation | | | 4,107 | | | | 225,926 | |
| | | | | | | | 466,608 | |
| Water Utilities - 0.4% | |
| American States Water Company | | | 7,319 | | | | 222,205 | |
| Consolidated Water Company Ltd. | | | 9,276 | | | | 107,787 | |
| | | | | | | | 329,992 | |
| | | | | | | | | |
Total Common Stocks (Cost $87,515,126) | | | $ | 90,803,640 | |
TFS SMALL CAP FUND
SCHEDULE OF INVESTMENTS (Continued)
| OTHER INVESTMENTS - 0.2% | | Shares | | | Value | |
Firsthand Technology Value Fund, Inc. (a) (Cost $204,230) | | | 9,185 | | | $ | 179,659 | |
| MONEY MARKET FUNDS - 1.3% | | Shares | | | Value | |
UMB Money Market Fiduciary, 0.01% (c) (Cost $1,173,818) | | | 1,173,818 | | | $ | 1,173,818 | |
| | | | | | | | | |
Total Investments at Value - 100.2% (Cost $88,893,174) | | | $ | 92,157,117 | |
| | | | | | | | | |
| Liabilities in Excess of Other Assets - (0.2%) | | | | (183,206 | ) |
| | | | | | | | | |
| Net Assets - 100.0% | | | $ | 91,973,911 | |
| (a) | Non-income producing security. |
| (b) | Percentage rounds to less than 0.1%. |
| (c) | The rate shown is the 7-day effective yield as of April 30, 2014. |
See accompanying notes to financial statements.
TFS HEDGED FUTURES FUND
SCHEDULE OF INVESTMENTS
April 30, 2014(Unaudited)
U.S. TREASURY OBLIGATIONS (a) - 22.7% | | Par Value | | | Value | |
| U.S. Treasury Bills, | | | | | | |
| 0.065%, due 08/21/2014 | | $ | 2,650,000 | | | $ | 2,649,754 | |
| 0.068%, due 09/04/2014 | | | 3,050,000 | | | | 3,049,680 | |
| 0.037%, due 09/18/2014 | | | 3,125,000 | | | | 3,124,634 | |
| 0.025%, due 09/25/2014 | | | 550,000 | | | | 549,921 | |
| 0.040%, due 10/02/2014 | | | 2,600,000 | | | | 2,599,555 | |
Total U.S. Treasury Obligations (Cost $11,972,787) | | | $ | 11,973,544 | |
| MONEY MARKET FUNDS - 66.6% | | Shares | | | Value | |
BlackRock Liquidity Funds TempFund Portfolio - Institutional Class, 0.03% (b) | | | 6,526,230 | | | $ | 6,526,230 | |
Fidelity Institutional Money Market Portfolio - Class I, 0.05% (b) | | | 14,516,757 | | | | 14,516,757 | |
Goldman Sachs Financial Square Money Market Fund - Institutional Class, 0.06% (b) | | | 6,528,635 | | | | 6,528,635 | |
Morgan Stanley Institutional Liquidity Funds - Money Market Portfolio - Institutional Class, 0.09% (b) | | | 542,832 | | | | 542,832 | |
PIMCO Money Market Fund - Institutional Class, 0.00% (b) | | | 540,989 | | | | 540,989 | |
Vanguard Prime Money Market Fund - Investor Shares, 0.01% (b) | | | 6,526,733 | | | | 6,526,733 | |
Total Money Market Funds (Cost $35,182,176) | | | $ | 35,182,176 | |
| | | | | | | | | |
Total Investments at Value - 89.3% (Cost $47,154,963) | | | $ | 47,155,720 | |
| | | | | | | | | |
| Other Assets in Excess of Liabilities - 10.7% | | | | 5,637,487 | (c) |
| | | | | | | | | |
| Net Assets - 100.0% | | | $ | 52,793,207 | |
| (a) | Rate shown is the annualized yield at time of purchase, not a coupon rate. |
| (b) | The rate shown is the 7-day effective yield as of April 30, 2014. |
| (c) | Includes cash held as margin deposits for futures contracts. |
See accompanying notes to financial statements.
TFS HEDGED FUTURES FUND
SCHEDULE OF FUTURES CONTRACTS
April 30, 2014 (Unaudited)
| FUTURES CONTRACTS | Expiration Date | | Contracts | | | Aggregate Market Value of Contracts | | | Unrealized Appreciation (Depreciation) | |
| COMMODITY FUTURES | | | | |
| Copper Future | 07/29/2014 | | | 17 | | | $ | 1,284,350 | | | $ | (12 | ) |
| Crude Oil Future | 05/20/2014 | | | 12 | | | | 1,198,200 | | | | (29,886 | ) |
| Ethanol Future | 06/04/2014 | | | 33 | | | | 2,092,002 | | | | 27,230 | |
| Live Cattle Future | 06/30/2014 | | | 43 | | | | 2,362,850 | | | | 1,342 | |
| Lumber Future | 07/15/2014 | | | 18 | | | | 655,182 | | | | (160 | ) |
| Oats Future | 07/14/2014 | | | 124 | | | | 2,235,100 | | | | 28,194 | |
| Red Spring Wheat Future | 07/14/2014 | | | 41 | | | | 1,575,937 | | | | 59,709 | |
| Soybean Future | 07/14/2014 | | | 5 | | | | 378,188 | | | | 3,574 | |
| Soybean Meal Future | 07/14/2014 | | | 81 | | | | 3,998,970 | | | | 145,724 | |
| | | | | | | | | | |
| Total Futures Contracts | | | $ | 15,780,779 | | | $ | 235,715 | |
See accompanying notes to financial statements.
TFS HEDGED FUTURES FUND
SCHEDULE OF FUTURES CONTRACTS SOLD SHORT
April 30, 2014 (Unaudited)
| FUTURES CONTRACTS SOLD SHORT | Expiration Date | | Contracts | | | Aggregate Market Value of Contracts | | | Unrealized Appreciation (Depreciation) | |
| COMMODITY FUTURES | | | | |
| Butter Cash Future | 06/03/2014 | | | 1 | | | $ | 39,250 | | | $ | (2,228 | ) |
| Butter Cash Future | 07/01/2014 | | | 2 | | | | 78,800 | | | | (5,255 | ) |
| Cocoa Future | 07/16/2014 | | | 27 | | | | 804,600 | | | | 3,976 | |
| Coffee Future | 07/21/2014 | | | 21 | | | | 1,621,069 | | | | (50,232 | ) |
| Corn Future | 07/14/2014 | | | 58 | | | | 1,505,100 | | | | (27,792 | ) |
| Cotton No. 2 Future | 07/09/2014 | | | 15 | | | | 707,175 | | | | (15,901 | ) |
| Feeder Cattle Future | 05/22/2014 | | | 7 | | | | 633,850 | | | | (7,207 | ) |
| Feeder Cattle Future | 08/28/2014 | | | 7 | | | | 655,987 | | | | (8,656 | ) |
| Frozen Concentrate Orange Juice Future | 07/11/2014 | | | 16 | | | | 385,440 | | | | 3,061 | |
| Hard Red Winter Wheat Future | 07/14/2014 | | | 1 | | | | 40,625 | | | | (3,315 | ) |
| Lean Hogs Future | 06/13/2014 | | | 6 | | | | 295,440 | | | | 1,313 | |
| Natural Gas Future | 05/28/2014 | | | 9 | | | | 431,820 | | | | (16,820 | ) |
| Palladium Future | 06/26/2014 | | | 3 | | | | 243,015 | | | | (2,362 | ) |
| Platinum Future | 07/29/2014 | | | 2 | | | | 142,750 | | | | 2,096 | |
| Soybean Oil Future | 07/14/2014 | | | 145 | | | | 3,663,570 | | | | 75,345 | |
| Sugar No. 11 Future | 06/30/2014 | | | 89 | | | | 1,766,330 | | | | (22,172 | ) |
| Wheat Future | 07/14/2014 | | | 79 | | | | 2,849,925 | | | | (100,036 | ) |
| Total Commodity Futures | | | | 15,864,746 | | | | (176,185 | ) |
| | | | | | | | | | |
| FINANCIAL FUTURES | | | | | |
| CBOE Volatility Index (VIX) Future | 05/20/2014 | | | 188 | | | | 2,814,360 | | | | 244,150 | |
| CBOE Volatility Index (VIX) Future | 06/17/2014 | | | 280 | | | | 4,393,200 | | | | 366,565 | |
| E-Mini S&P 500 Future | 06/20/2014 | | | 205 | | | | 19,267,437 | | | | (327,211 | ) |
| Total Financial Futures | | | | 26,474,997 | | | | 283,504 | |
| | | | | | | | | | |
| Total Futures Contracts Sold Short | | | $ | 42,339,743 | | | $ | 107,319 | |
See accompanying notes to financial statements.
| Item 7. | Disclosure of Proxy Voting Policies and Procedures for Closed-End Management Investment Companies. |
Not applicable
| Item 8. | Portfolio Managers of Closed-End Management Investment Companies. |
Not applicable
| Item 9. | Purchases of Equity Securities by Closed-End Management Investment Company and Affiliated Purchasers. |
Not applicable
| Item 10. | Submission of Matters to a Vote of Security Holders. |
The registrant has not adopted procedures by which shareholders may recommend nominees to the registrant’s board of trustees.
| Item 11. | Controls and Procedures. |
(a) Based on their evaluation of the registrant’s disclosure controls and procedures (as defined in Rule 30a-3(c) under the Investment Company Act of 1940) as of a date within 90 days of the filing date of this report, the registrant’s principal executive officer and principal financial officer have concluded that such disclosure controls and procedures are reasonably designed and are operating effectively to ensure that material information relating to the registrant, including its consolidated subsidiaries, is made known to them by others within those entities, particularly during the period in which this report is being prepared, and that the information required in filings on Form N-CSR is recorded, processed, summarized, and reported on a timely basis.
(b) There were no changes in the registrant’s internal control over financial reporting (as defined in Rule 30a-3(d) under the Investment Company Act of 1940) that occurred during the second fiscal quarter of the period covered by this report that have materially affected, or are reasonably likely to materially affect, the registrant’s internal control over financial reporting.
File the exhibits listed below as part of this Form. Letter or number the exhibits in the sequence indicated.
(a)(1) Any code of ethics, or amendment thereto, that is the subject of the disclosure required by Item 2, to the extent that the registrant intends to satisfy the Item 2 requirements through filing of an exhibit: Not required
(a)(2) A separate certification for each principal executive officer and principal financial officer of the registrant as required by Rule 30a-2(a) under the Act (17 CFR 270.30a-2(a)): Attached hereto
(a)(3) Any written solicitation to purchase securities under Rule 23c-1 under the Act (17 CFR 270.23c-1) sent or given during the period covered by the report by or on behalf of the registrant to 10 or more persons: Not applicable
(b) Certifications required by Rule 30a-2(b) under the Act (17 CFR 270.30a-2(b)): Attached hereto
| Exhibit 99.CERT | Certifications required by Rule 30a-2(a) under the Act |
| Exhibit 99.906CERT | Certifications required by Rule 30a-2(b) under the Act |
SIGNATURES
Pursuant to the requirements of the Securities Exchange Act of 1934 and the Investment Company Act of 1940, the registrant has duly caused this report to be signed on its behalf by the undersigned, thereunto duly authorized.
(Registrant) TFS Capital Investment Trust
| By (Signature and Title)* | /s/ Larry S, Eiben | |
| Larry S. Eiben, President | |
| | | |
| Date | June 26, 2014 | | |
Pursuant to the requirements of the Securities Exchange Act of 1934 and the Investment Company Act of 1940, this report has been signed below by the following persons on behalf of the registrant and in the capacities and on the dates indicated.
| By (Signature and Title)* | /s/ Larry S. Eiben | |
| Larry S. Eiben, President | |
| | | |
| Date | June 26, 2014 | | |
| | | |
| By (Signature and Title)* | /s/ Mark J. Seger | |
| Mark J. Seger, Treasurer | |
| | | |
| Date | June 26, 2014 | | |
| * | Print the name and title of each signing officer under his or her signature. |