Washington, D.C. 20549
Bo J. Howell, Esq.
Form N-CSR is to be used by management investment companies to file reports with the Commission not later than 10 days after the transmission to stockholders of any report that is required to be transmitted to stockholders under Rule 30e-1 under the Investment Company Act of 1940 (17 CFR 270.30e-1). The Commission may use the information provided on Form N-CSR in its regulatory, disclosure review, inspection, and policymaking roles.
A registrant is required to disclose the information specified by Form N-CSR, and the Commission will make this information public. A registrant is not required to respond to the collection of information contained in Form N-CSR unless the Form displays a currently valid Office of Management and Budget ("OMB") control number. Please direct comments concerning the accuracy of the information collection burden estimate and any suggestions for reducing the burden to the Secretary, Securities and Exchange Commission, 450 Fifth Street, NW, Washington, DC 20549-0609. The OMB has reviewed this collection of information under the clearance requirements of 44 U.S.C. § 3507.
SEMI-ANNUAL REPORT
April 30, 2017
(Unaudited)
For more information or assistance in opening an account,
please call toll-free 1-888-534-2001.
LETTER TO SHAREHOLDERS
June 15, 2017
Dear Shareholder,
Enclosed is the Semi-Annual Report to shareholders of the TFS Market Neutral Fund (ticker: TFSMX), the TFS Small Cap Fund (ticker: TFSSX) and the TFS Hedged Futures Fund (ticker: TFSHX) for the six months ended April 30, 2017. On behalf of the investment manager, TFS Capital LLC (“TFS Capital”), I would like to thank you for your continued investment.
Below you will find performance updates on each of the mutual funds.
TFS Market Neutral Fund (ticker: TFSMX)
| 1-year
return | 3-year
return | 5-year
return | 10-year
return | Since Inception (9/7/2004) |
| TFS Market Neutral Fund | 7.55% | 1.60% | 1.72% | 3.29% | 5.54% |
S&P 500® Index | 17.92% | 10.47% | 13.68% | 7.15% | 8.39% |
Average annual total returns for periods ended April 30, 2017. Past performance is not a guarantee of future results.
TFSMX produced significantly positive alpha (i.e., the return that cannot be explained by a fund’s market exposure) overall during the first half of the fiscal year, increasing 5.29% compared to its benchmark, the S&P 500® Index, which increased 13.32%. This was driven by a recovery in the performance of our quantitative investment strategies in small cap stocks during November and December. The Fund’s market exposure, or beta, for the period was very low at 0.06. Only a small portion of the Fund’s performance was driven by the market gains.
Since inception, TFSMX has produced positive alpha, with lower volatility and market exposure than the S&P 500® Index. From inception through April 30, 2017, TFSMX has had an average annual return of 5.54%, as compared to S&P 500® Index performance during the same period of 8.39%.
Since inception, the strategies used in managing TFSMX have resulted in its returns having a low correlation to other asset classes. According to Modern Portfolio Theory, portfolios may benefit by combining non-correlated investments. For your reference, below are the TFS Market Neutral Fund’s correlations to several other asset classes since inception. It is notable that correlation to the equity indices in recent years has risen, as compared to historical averages.
| Index | Correlation Since Inception |
S&P 500® Index | 0.59 |
Russell 2000® Index | 0.57 |
| MSCI EAFE Index | 0.45 |
| Barclays U.S. Aggregate Bond Index | (0.16) |
| Dow Jones Equity REIT Total Index | 0.41 |
| Bloomberg Commodity Index | 0.38 |
1
TFS Small Cap Fund (ticker: TFSSX)
| 1-year
return | 3-year
return | 5-year
return | 10-year
return | Since Inception (3/7/2006) |
| TFS Small Cap Fund | 24.19% | 8.05% | 13.98% | 10.36% | 11.18% |
Russell 2000® Index | 25.63% | 9.03% | 12.95% | 7.05% | 7.60% |
Average annual total returns for periods ended April 30, 2017. Past performance is not a guarantee of future results.
During the six-month period ended April 30, 2017, TFSSX roughly matched its benchmark, the Russell 2000® Index. The Fund was up 18.43% compared to a return of 18.37% for the Benchmark. Given its “long-only” mandate, TFSSX is expected to have a high correlation to U.S. small-cap equity market movements with any performance deviation generally attributable to TFS Capital’s equity selection.
TFSSX achieved its objective of outperforming the Russell 2000® Index over longer periods. Both the 10-year track record and performance since inception are more than three percentage points higher than the performance of the Russell 2000® Index.
TFS Hedged Futures Fund (ticker: TFSHX)
| 1-year
return | 3-year
return | 5-year
return | Since Inception (12/29/2011) |
| TFS Hedged Futures Fund | 0.28% | 2.10% | 0.40% | 1.55% |
Diversified Trends Indicator® | -2.74% | 0.91% | 0.11% | -1.21% |
S&P 500® Index | 17.92% | 10.47% | 13.68% | 15.06% |
Average annual returns for periods ended April 30, 2017. Past performance is not a guarantee of future results.
During the six-month period ended April 30, 2017, TFSHX was up 0.19%. Performance during the six-month period was below that of the Diversified Trends Indicator® (the “DTI®”), a commonly-used benchmark for managed-futures funds. Positive performance in the Fund’s volatility carry strategies were offset by negative performance in the commodity strategies. Though the S&P 500® Index is not generally considered an appropriate benchmark for managed-futures funds, it is provided above for your reference.
2
Like the TFS Market Neutral Fund, the TFS Hedged Futures Fund has demonstrated a low correlation to many market indices. This low correlation suggests the addition of the TFS Hedged Futures Fund may improve the risk-adjusted performance of many investment portfolios. The TFS Hedged Futures Fund has had a slightly negative correlation to the DTI®, which suggests that it may also have a low correlation to other managed futures funds that employ trend-following strategies. For your reference, below are the TFS Hedged Futures Fund’s correlations to several other asset classes.
| Index | Correlation Since Inception |
Diversified Trends Indicator® | (0.05) |
S&P 500® Index | 0.10 |
Russell 2000® Index | 0.13 |
| S&P GSCI Index | (0.06) |
| Barclays U.S. Aggregate Bond Index | (0.02) |
| Bloomberg Commodity Index | (0.03) |
As always, we do not recommend allocating a high percentage of one’s assets to any one investment fund managed by TFS Capital given the risks inherent in each product. Rather, we believe that they are best used as a component of a diversified portfolio of investments. If you have any questions regarding this material, please contact us.
Best regards,
Eric Newman
Chief Investment Officer & Co-Portfolio Manager
TFS Capital LLC
The performance data quoted represents past performance, which is not a guarantee of future results. Current performance may be lower or higher than the performance data quoted. The investment return and principal value of an investment in the mutual funds discussed in this report (the “Funds”) will fluctuate so that an investor’s shares, when redeemed, may be worth more or less than their original cost. Fee reductions and/or expense reimbursements by the Adviser have positively impacted the Funds’ performance. Without such reductions and/or reimbursements, performance would have been lower. An investor should consider the investment objectives, risks, charges and expenses of the Funds carefully before investing. To obtain a summary prospectus and/or prospectus, which each contain this and other important information, go to www.TFSCapital.com or call (888) 534-2001. Please read the summary prospectus and/or prospectus carefully before investing. The Funds may not be suitable for all investors. Futures investing is speculative. Each Fund’s current net asset value per share is available at www.TFSCapital.com.
3
TFS MARKET NEUTRAL FUND
PORTFOLIO INFORMATION
April 30, 2017 (Unaudited)
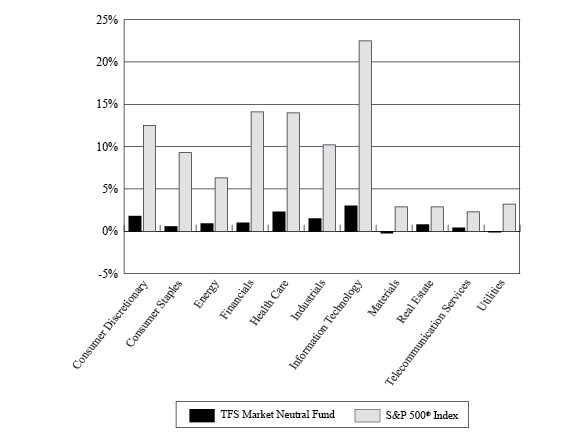
Common Stocks vs.
the S&P 500® Index Net Sector Exposure*
| * | The net percentages for TFS Market Neutral Fund are computed by taking the net dollar exposure, including short positions, and dividing by the net assets of the Fund. Consequently, the percentages will not total to 100%. |
| Top 10 Long Common Stocks | | Top 10 Short Common Stocks |
| Security Description | % of
Net Assets | | Security Description | % of
Net Assets |
| Telephone and Data Systems, Inc. | 0.52% | | Tempur Sealy International, Inc. | (0.50%) |
| Terex Corporation | 0.51% | | Ebix, Inc. | (0.49%) |
| Magellan Health, Inc. | 0.51% | | Sprouts Farmers Market, Inc. | (0.47%) |
| Zynga, Inc. - Class A | 0.51% | | Covanta Holding Corporation | (0.45%) |
| John Wiley & Sons, Inc. - Class A | 0.50% | | Community Bank System, Inc. | (0.45%) |
| R.R. Donnelley & Sons Company | 0.48% | | Tenet Healthcare Corporation | (0.45%) |
| Groupon, Inc. | 0.48% | | Kate Spade & Company | (0.44%) |
| First Potomac Realty Trust | 0.47% | | Credit Acceptance Corporation | (0.42%) |
| Phibro Animal Health Corporation - Class A | 0.43% | | Fitbit, Inc. - Class A | (0.42%) |
| CorEnergy Infrastructure Trust, Inc. | 0.43% | | Dun & Bradstreet Corporation (The) | (0.41%) |
4
TFS SMALL CAP FUND
PORTFOLIO INFORMATION
April 30, 2017 (Unaudited)
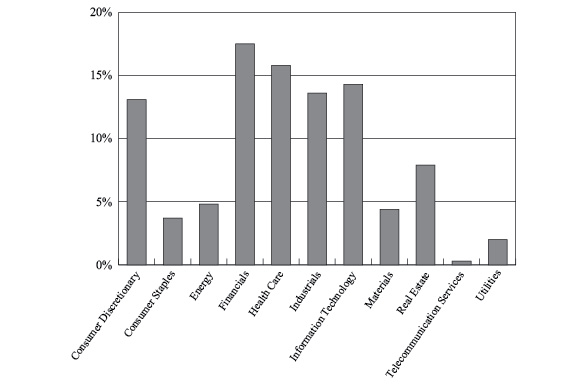
Sector Allocation (% of Net Assets)
| Top 10 Equity Positions |
| Security Description | % of
Net Assets |
| InfraREIT, Inc. | 0.74% |
| Independence Realty Trust, Inc. | 0.64% |
| Monogram Residential Trust, Inc. | 0.63% |
| CBL & Associates Properties, Inc. | 0.62% |
| Kite Realty Group Trust | 0.62% |
| Silver Bay Realty Trust Corporation | 0.61% |
| Hudson Pacific Properties, Inc. | 0.61% |
| Mack-Cali Realty Corporation | 0.60% |
| TIER REIT, Inc. | 0.60% |
| Parkway, Inc. | 0.59% |
5
TFS HEDGED FUTURES FUND
PORTFOLIO INFORMATION
April 30, 2017 (Unaudited)
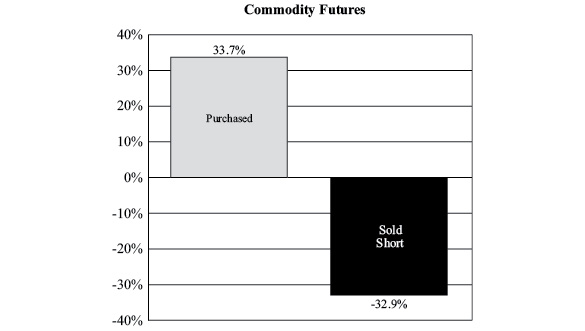
Exposure by Type of Futures Contract
(Notional Value as a % of Net Assets)
Net Exposure by Type of Futures Contract
(Net as a % of Net Assets) |
| Net Commodity Futures Exposure | 0.8% |
| | |
6
TFS MARKET NEUTRAL FUND
SUMMARY SCHEDULE OF INVESTMENTS*
April 30, 2017 (Unaudited) | |
| COMMON STOCKS — 91.9% | | Shares | | | Value | |
| Consumer Discretionary — 15.4% | | | | | | |
Groupon, Inc. (a) | | | 274,054 | | | $ | 1,074,292 | |
| John Wiley & Sons, Inc. - Class A | | | 21,283 | | | | 1,121,614 | |
| Red Rock Resorts, Inc. - Class A | | | 36,269 | | | | 847,969 | |
Taylor Morrison Home Corporation - Class A (a) (b) | | | 38,516 | | | | 889,720 | |
| Tower International, Inc. | | | 32,694 | | | | 886,007 | |
Other Consumer Discretionary (c) | | | | | | | 29,963,823 | |
| | | | | | | | 34,783,425 | |
| Consumer Staples — 5.3% | | | | | | | | |
Avon Products, Inc. (a) | | | 179,348 | | | | 869,838 | |
HRG Group, Inc. (a) | | | 43,405 | | | | 868,534 | |
| Inter Parfums, Inc. | | | 24,019 | | | | 911,521 | |
Other Consumer Staples (c) | | | | | | | 9,266,956 | |
| | | | | | | | 11,916,849 | |
| Energy — 5.8% | | | | | | | | |
Delek US Holdings, Inc. (b) | | | 35,545 | | | | 855,568 | |
Other Energy (c) | | | | | | | 12,208,433 | |
| | | | | | | | 13,064,001 | |
| Financials — 6.0% | | | | | | | | |
| BankUnited, Inc. | | | 24,031 | | | | 848,054 | |
Houlihan Lokey, Inc. (b) | | | 26,394 | | | | 885,255 | |
National General Holdings Corporation (b) | | | 37,846 | | | | 860,618 | |
Other Financials (c) | | | | | | | 10,987,607 | |
| | | | | | | | 13,581,534 | |
| Health Care — 22.2% | | | | | | | | |
Catalent, Inc. (a) (b) | | | 29,282 | | | | 857,377 | |
Exactech, Inc. (a) (b) | | | 29,462 | | | | 873,548 | |
FibroGen, Inc. (a) (b) | | | 31,599 | | | | 884,772 | |
Genomic Health, Inc. (a) (b) | | | 25,993 | | | | 854,130 | |
Haemonetics Corporation (a) (b) | | | 20,291 | | | | 849,787 | |
Halyard Health, Inc. (a) (b) | | | 21,876 | | | | 864,102 | |
Horizon Pharma plc (a) (b) | | | 55,817 | | | | 858,466 | |
Magellan Health, Inc. (a) | | | 16,669 | | | | 1,146,827 | |
Merit Medical Systems, Inc. (a) | | | 28,398 | | | | 957,013 | |
Momenta Pharmaceuticals, Inc. (a) | | | 59,899 | | | | 859,551 | |
Phibro Animal Health Corporation - Class A (b) | | | 32,554 | | | | 968,482 | |
PRA Health Sciences, Inc. (a) (b) | | | 13,242 | | | | 846,958 | |
Providence Service Corporation (The) (a) | | | 19,271 | | | | 847,924 | |
Other Health Care (c) | | | | | | | 38,427,407 | |
| | | | | | | | 50,096,344 | |
| Industrials — 11.6% | | | | | | | | |
Builders FirstSource, Inc. (a) (b) | | | 52,871 | | | | 846,465 | |
| R.R. Donnelley & Sons Company | | | 85,791 | | | | 1,078,393 | |
7
TFS MARKET NEUTRAL FUND
SUMMARY SCHEDULE OF INVESTMENTS* (Continued) | |
| COMMON STOCKS — 91.9% (Continued) | | Shares | | | Value | |
| Industrials — 11.6% (Continued) | | | | | | |
Steelcase, Inc. - Class A (b) | | | 50,769 | | | $ | 865,611 | |
| Terex Corporation | | | 33,222 | | | | 1,162,106 | |
TrueBlue, Inc. (a) (b) | | | 32,420 | | | | 886,687 | |
Other Industrials (c) | | | | | | | 21,394,736 | |
| | | | | | | | 26,233,998 | |
| Information Technology — 13.8% | | | | | | | | |
CommVault Systems, Inc. (a) (b) | | | 16,805 | | | | 847,812 | |
Insight Enterprises, Inc. (a) (b) | | | 20,736 | | | | 872,986 | |
IXYS Corporation (b) | | | 62,457 | | | | 871,275 | |
Jive Software, Inc. (a) (b) | | | 172,252 | | | | 869,873 | |
Progress Software Corporation (b) | | | 29,162 | | | | 866,695 | |
Tech Data Corporation (a) (b) | | | 8,885 | | | | 849,850 | |
Zynga, Inc. - Class A (a) | | | 396,254 | | | | 1,145,174 | |
Other Information Technology (c) | | | | | | | 24,826,697 | |
| | | | | | | | 31,150,362 | |
| Materials — 4.0% | | | | | | | | |
| Innophos Holdings, Inc. | | | 17,752 | | | | 851,031 | |
| Materion Corporation | | | 23,346 | | | | 888,315 | |
Other Materials (c) | | | | | | | 7,252,200 | |
| | | | | | | | 8,991,546 | |
| Real Estate — 4.8% | | | | | | | | |
| CBL & Associates Properties, Inc. | | | 100,304 | | | | 927,812 | |
| CorEnergy Infrastructure Trust, Inc. | | | 26,544 | | | | 968,325 | |
| First Potomac Realty Trust | | | 96,667 | | | | 1,063,337 | |
| Hudson Pacific Properties, Inc. | | | 28,061 | | | | 964,176 | |
| InfraREIT, Inc. | | | 50,000 | | | | 955,000 | |
| Kilroy Realty Corporation | | | 13,255 | | | | 934,875 | |
| Life Storage, Inc. | | | 11,298 | | | | 885,650 | |
| TIER REIT, Inc. | | | 55,092 | | | | 953,642 | |
| Vornado Realty Trust | | | 9,643 | | | | 928,042 | |
| Washington Prime Group, Inc. | | | 105,056 | | | | 924,493 | |
Other Real Estate (c) | | | | | | | 1,307,770 | |
| | | | | | | | 10,813,122 | |
| Telecommunication Services — 1.8% | | | | | | | | |
Telephone and Data Systems, Inc. (b) | | | 42,909 | | | | 1,178,281 | |
Other Telecommunication Services (c) | | | | | | | 2,831,358 | |
| | | | | | | | 4,009,639 | |
| Utilities — 1.2% | | | | | | | | |
Other Utilities (c) | | | | | | | 2,817,293 | |
| | | | | | | | | |
Total Common Stocks (Cost $197,378,918) | | | | | | $ | 207,458,113 | |
8
TFS MARKET NEUTRAL FUND
SUMMARY SCHEDULE OF INVESTMENTS* (Continued) | |
| INVESTMENT COMPANIES — 3.4% | Shares | | Value | |
Other Investment Companies (Cost $7,284,573) (c) | | | $ | 7,686,422 | |
| |
| RIGHTS — 0.0% | | Shares | | | Value | |
Interoil Corporation (d) (Cost $0) | | | 901 | | | $ | 0 | |
| |
| WARRANTS — 0.0% | | Shares | | | Value | |
Imperial Holdings, Inc. (d) (Cost $0) | | | 1,663 | | | $ | 0 | |
| |
CORPORATE BONDS — 0.0% (d) | Par Value | | Value | |
Other Corporate Bonds (Cost $21,000) (c) | | | $ | 21,000 | |
| | | | | | |
Total Investments at Value — 95.3% (Cost $204,684,491) | | | $ | 215,165,535 | |
| | | | | | |
Other Assets in Excess of Liabilities — 4.7% (f) | | | | 10,577,601 | |
| | | | | | |
| Net Assets — 100.0% | | | $ | 225,743,136 | |
| * | A complete Schedule of Investments is available without charge upon request by calling toll-free 1-888-534-2001 or on the SEC’s website at http://www.sec.gov. |
(a) | Non-income producing security. |
(b) | All or a portion of the shares have been committed as collateral for open short positions. |
(c) | Represents issuers not identified as either a top 50 holding in terms of value and issues or issuers not exceeding 1% of net assets individually or in the aggregate, respectively, or not a fair-valued security as of April 30, 2017. |
(d) | Security has been valued at fair value pursuant to procedures adopted by and under the supervision of the Board of Trustees. The total value of such securities is $0 at April 30, 2017, representing 0.0% of net assets (Note 2). |
(e) | Percentage rounds to less than 0.1%. |
(f) | Includes cash held as margin deposits for open short positions. |
| See accompanying notes to financial statements. |
9
TFS MARKET NEUTRAL FUND
SCHEDULE OF SECURITIES SOLD SHORT
April 30, 2017 (Unaudited) | |
| COMMON STOCKS — 79.9% | | Shares | | | Value | |
| Consumer Discretionary — 13.6% | | | | | | |
| Auto Components — 0.8% | | | | | | |
| Ballard Power Systems, Inc. | | | 24,597 | | | $ | 80,432 | |
| China Automotive Systems, Inc. | | | 5,998 | | | | 28,611 | |
| China XD Plastics Company Ltd. | | | 13 | | | | 63 | |
| Cooper Tire & Rubber Company | | | 120 | | | | 4,596 | |
| Gentex Corporation | | | 18,232 | | | | 376,491 | |
| Horizon Global Corporation | | | 43,618 | | | | 614,578 | |
| Motorcar Parts of America, Inc. | | | 23,245 | | | | 704,788 | |
| SORL Auto Parts, Inc. | | | 140 | | | | 588 | |
| | | | | | | | 1,810,147 | |
| Automobiles — 0.5% | | | | | | | | |
| Kandi Technologies Group, Inc. | | | 158,519 | | | | 649,928 | |
| Tesla Motors, Inc. | | | 1,244 | | | | 390,703 | |
| Workhorse Group, Inc. | | | 63,346 | | | | 129,226 | |
| | | | | | | | 1,169,857 | |
| Distributors — 0.1% | | | | | | | | |
| Fenix Parts, Inc. | | | 12,697 | | | | 14,221 | |
| KBS Fashion Group Ltd. | | | 99 | | | | 530 | |
| Weyco Group, Inc. | | | 2,539 | | | | 70,990 | |
| | | | | | | | 85,741 | |
| Diversified Consumer Services — 0.6% | | | | | | | | |
| 2U, Inc. | | | 3,705 | | | | 168,207 | |
| Carriage Services, Inc. | | | 2,341 | | | | 64,026 | |
| Collectors Universe, Inc. | | | 170 | | | | 4,643 | |
| DeVry Education Group, Inc. | | | 18,810 | | | | 711,958 | |
| H&R Block, Inc. | | | 15,249 | | | | 378,023 | |
| Liberty Tax, Inc. | | | 42 | | | | 590 | |
| Sotheby's | | | 365 | | | | 17,286 | |
| Weight Watchers International, Inc. | | | 3,253 | | | | 67,923 | |
| | | | | | | | 1,412,656 | |
| Hotels, Restaurants & Leisure — 1.9% | | | | | | | | |
| Amaya, Inc. | | | 2,077 | | | | 36,971 | |
| Bravo Brio Restaurant Group, Inc. | | | 605 | | | | 2,934 | |
| Caesars Entertainment Corporation | | | 3,479 | | | | 38,617 | |
| Cheesecake Factory, Inc. (The) | | | 95 | | | | 6,095 | |
| Chipotle Mexican Grill, Inc. | | | 833 | | | | 395,233 | |
| Fogo de Chao, Inc. | | | 8,418 | | | | 142,685 | |
| Gaming Partners International Corporation | | | 1,202 | | | | 11,972 | |
| J. Alexander's Holdings, Inc. | | | 413 | | | | 4,543 | |
| Jamba, Inc. | | | 60,257 | | | | 513,390 | |
| Kona Grill, Inc. | | | 2,408 | | | | 13,726 | |
| Lindblad Expeditions Holdings, Inc. | | | 354 | | | | 3,363 | |
| McDonald's Corporation | | | 99 | | | | 13,853 | |
10
TFS MARKET NEUTRAL FUND
SCHEDULE OF SECURITIES SOLD SHORT (Continued) | |
| COMMON STOCKS — 79.9% (Continued) | | Shares | | | Value | |
| Consumer Discretionary — 13.6% (Continued) | | | | | | |
| Hotels, Restaurants & Leisure — 1.9% (Continued) | | | | | | |
| Noodles & Company | | | 6,197 | | | $ | 36,252 | |
| ONE Group Hospitality, Inc. | | | 21,778 | | | | 48,347 | |
| Panera Bread Company - Class A | | | 1,131 | | | | 353,641 | |
| Papa Murphy's Holdings, Inc. | | | 24,571 | | | | 119,906 | |
| Red Robin Gourmet Burgers, Inc. | | | 11,881 | | | | 698,009 | |
| Ruby Tuesday, Inc. | | | 131,231 | | | | 334,639 | |
| Shake Shack, Inc. - Class A | | | 20,221 | | | | 686,301 | |
| Sonic Corporation | | | 4,482 | | | | 120,476 | |
| Town Sports International Holdings, Inc. | | | 1,121 | | | | 4,372 | |
| Wingstop, Inc. | | | 241 | | | | 7,093 | |
| Zoe's Kitchen, Inc. | | | 39,055 | | | | 704,943 | |
| | | | | | | | 4,297,361 | |
| Household Durables — 1.6% | | | | | | | | |
| Garmin Ltd. | | | 7,643 | | | | 388,570 | |
| GoPro, Inc. - Class A | | | 13,171 | | | | 108,661 | |
| Green Brick Partners, Inc. | | | 70 | | | | 721 | |
| iRobot Corporation | | | 8,023 | | | | 639,754 | |
| LGI Homes, Inc. | | | 22,443 | | | | 714,361 | |
| New Home Company, Inc. (The) | | | 79 | | | | 921 | |
| Skyline Corporation | | | 20,219 | | | | 124,549 | |
| Tempur Sealy International, Inc. | | | 24,073 | | | | 1,130,227 | |
| UCP, Inc. - Class A | | | 427 | | | | 4,889 | |
| Vuzix Corporation | | | 57,675 | | | | 340,283 | |
| William Lyon Homes - Class A | | | 258 | | | | 5,676 | |
| ZAGG, Inc. | | | 25,328 | | | | 179,829 | |
| | | | | | | | 3,638,441 | |
| Internet & Direct Marketing Retail — 1.4% | | | | | | | | |
| CafePress, Inc. | | | 238 | | | | 678 | |
| Duluth Holdings, Inc. - Class B | | | 36,115 | | | | 799,947 | |
| EVINE Live, Inc. | | | 8,699 | | | | 12,179 | |
| Gaia, Inc. | | | 6,162 | | | | 67,474 | |
| Lands' End, Inc. | | | 2,420 | | | | 57,112 | |
| Netflix, Inc. | | | 2,566 | | | | 390,545 | |
| PetMed Express, Inc. | | | 9,438 | | | | 218,018 | |
| RetailMeNot, Inc. | | | 53,087 | | | | 615,809 | |
| TripAdvisor, Inc. | | | 9,043 | | | | 407,026 | |
| Wayfair, Inc. - Class A | | | 14,765 | | | | 674,908 | |
| | | | | | | | 3,243,696 | |
| Leisure Products — 0.9% | | | | | | | | |
| American Outdoor Brands Corporation | | | 34,011 | | | | 753,344 | |
| Escalade, Inc. | | | 264 | | | | 3,524 | |
| Marine Products Corporation | | | 1,363 | | | | 16,301 | |
| Polaris Industries, Inc. | | | 404 | | | | 34,445 | |
11
TFS MARKET NEUTRAL FUND
SCHEDULE OF SECURITIES SOLD SHORT (Continued) | |
| COMMON STOCKS — 79.9% (Continued) | | Shares | | | Value | |
| Consumer Discretionary — 13.6% (Continued) | | | | | | |
| Leisure Products — 0.9% (Continued) | | | | | | |
| Sturm Ruger & Company, Inc. | | | 13,651 | | | $ | 825,203 | |
| Vista Outdoor, Inc. | | | 19,146 | | | | 374,496 | |
| | | | | | | | 2,007,313 | |
| Media — 1.7% | | | | | | | | |
| Ballantyne Strong, Inc. | | | 100 | | | | 630 | |
| Beasley Broadcasting Group, Inc. | | | 8,654 | | | | 113,800 | |
| Central European Media Enterprises Ltd. - Class A | | | 28,124 | | | | 115,308 | |
| Charter Communications, Inc. - Class A | | | 871 | | | | 300,634 | |
| Cinemark Holdings, Inc. | | | 97 | | | | 4,190 | |
| Clear Channel Outdoor Holdings, Inc. - Class A | | | 15,980 | | | | 82,297 | |
| Daily Journal Corporation | | | 22 | | | | 4,599 | |
| E.W. Scripps Company (The) - Class A | | | 230 | | | | 5,124 | |
| Entercom Communications Corporation - Class A | | | 2,265 | | | | 28,652 | |
| Entravision Communications Corporation - Class A | | | 23 | | | | 143 | |
| Eros International plc | | | 74,826 | | | | 744,519 | |
| Global Eagle Entertainment, Inc. | | | 211,881 | | | | 656,831 | |
| Hemisphere Media Group, Inc. | | | 70 | | | | 816 | |
| Lee Enterprises, Inc. | | | 272 | | | | 707 | |
| Liberty Broadband - Series C | | | 4,296 | | | | 391,623 | |
| Liberty Global plc LiLAC - Class A | | | 9,267 | | | | 198,963 | |
| Lions Gate Entertainment Corporation - Class B | | | 75 | | | | 1,789 | |
| Meredith Corporation | | | 4,858 | | | | 284,436 | |
| Pandora Media, Inc. | | | 33,579 | | | | 364,332 | |
| Radio One, Inc. - Class D | | | 41,332 | | | | 123,996 | |
| Saga Communications, Inc. - Class A | | | 85 | | | | 4,356 | |
| Sirius XM Holdings, Inc. | | | 69,336 | | | | 343,213 | |
| Walt Disney Company (The) | | | 268 | | | | 30,981 | |
| Xcel Brands, Inc. | | | 906 | | | | 2,129 | |
| | | | | | | | 3,804,068 | |
| Multi-Line Retail — 0.3% | | | | | | | | |
| Big Lots, Inc. | | | 449 | | | | 22,670 | |
| Fred's, Inc. - Class A | | | 3,946 | | | | 58,085 | |
| J. C. Penney Company, Inc. | | | 70,287 | | | | 378,144 | |
| Sears Holdings Corporation | | | 9,438 | | | | 96,457 | |
| | | | | | | | 555,356 | |
| Specialty Retail — 2.5% | | | | | | | | |
| Abercrombie & Fitch Company - Class A | | | 2,138 | | | | 25,635 | |
| Ascena Retail Group, Inc. | | | 8,110 | | | | 31,710 | |
| Big 5 Sporting Goods Corporation | | | 568 | | | | 8,747 | |
| Boot Barn Holdings, Inc. | | | 823 | | | | 8,732 | |
| Buckle, Inc. (The) | | | 46,867 | | | | 876,413 | |
| Cabela's, Inc. | | | 193 | | | | 10,538 | |
| CarMax, Inc. | | | 6,044 | | | | 353,574 | |
12
TFS MARKET NEUTRAL FUND
SCHEDULE OF SECURITIES SOLD SHORT (Continued) | |
| COMMON STOCKS — 79.9% (Continued) | | Shares | | | Value | |
| Consumer Discretionary — 13.6% (Continued) | | | | | | |
| Specialty Retail — 2.5% (Continued) | | | | | | |
| Conn's, Inc. | | | 2,704 | | | $ | 47,590 | |
| DAVIDsTEA, Inc. | | | 38,358 | | | | 239,738 | |
| Destination Maternity Corporation | | | 704 | | | | 2,408 | |
| Destination XL Group, Inc. | | | 48,679 | | | | 124,131 | |
| Express, Inc. | | | 2,630 | | | | 22,697 | |
| GNC Holdings, Inc. - Class A | | | 94,674 | | | | 736,564 | |
| Lumber Liquidators Holdings, Inc. | | | 27,949 | | | | 686,148 | |
| Murphy USA, Inc. | | | 225 | | | | 15,653 | |
| Pier 1 Imports, Inc. | | | 3,810 | | | | 25,679 | |
| Rent-A-Center, Inc. | | | 29,467 | | | | 315,002 | |
| RH | | | 15,882 | | | | 761,860 | |
| Sally Beauty Holdings, Inc. | | | 33 | | | | 628 | |
| Sears Hometown and Outlet Stores, Inc. | | | 1,098 | | | | 3,678 | |
| ServiceMaster Global Holdings, Inc. | | | 8,947 | | | | 340,881 | |
| Sportman's Warehouse Holdings, Inc. | | | 153,802 | | | | 629,050 | |
| Tailored Brands, Inc. | | | 212 | | | | 2,614 | |
| Vitamin Shoppe, Inc. | | | 271 | | | | 5,230 | |
| Williams-Sonoma, Inc. | | | 7,025 | | | | 379,701 | |
| Winmark Corporation | | | 34 | | | | 4,389 | |
| | | | | | | | 5,658,990 | |
| Textiles, Apparel & Luxury Goods — 1.3% | | | | | | | | |
| Cherokee, Inc. | | | 16,073 | | | | 138,228 | |
| Deckers Outdoor Corporation | | | 495 | | | | 29,497 | |
| Delta Apparel, Inc. | | | 1,469 | | | | 25,751 | |
| Differential Brands Group, Inc. | | | 1,174 | | | | 2,172 | |
| Fossil Group, Inc. | | | 308 | | | | 5,313 | |
| G-III Apparel Group Ltd. | | | 7,368 | | | | 174,622 | |
| Iconix Brand Group, Inc. | | | 705 | | | | 4,935 | |
| Kate Spade & Company | | | 57,699 | | | | 1,003,962 | |
| Lululemon Athletica, Inc. | | | 7,134 | | | | 370,968 | |
| NIKE, Inc. - Class B | | | 6,623 | | | | 366,980 | |
| Sequential Brands Group, Inc. | | | 109,491 | | | | 368,985 | |
| Under Armour, Inc. - Class A | | | 19,438 | | | | 417,723 | |
| Vera Bradley, Inc. | | | 593 | | | | 5,426 | |
| Vince Holding Corporation | | | 105,111 | | | | 105,111 | |
| | | | | | | | 3,019,673 | |
| Consumer Staples — 4.7% | | | | | | | | |
| Beverages — 0.5% | | | | | | | | |
| Brown-Forman Corporation - Class B | | | 790 | | | | 37,383 | |
| Castle Brands, Inc. | | | 402,557 | | | | 708,500 | |
| Coca-Cola Company (The) | | | 8,165 | | | | 352,320 | |
| MGP Ingredients, Inc. | | | 166 | | | | 8,692 | |
| National Beverage Corporation | | | 514 | | | | 45,535 | |
| | | | | | | | 1,152,430 | |
13
TFS MARKET NEUTRAL FUND
SCHEDULE OF SECURITIES SOLD SHORT (Continued) | |
| COMMON STOCKS — 79.9% (Continued) | | Shares | | | Value | |
| Consumer Staples — 4.7% (Continued) | | | | | | |
| Food & Staples Retailing — 1.2% | | | | | | |
| Casey's General Stores, Inc. | | | 3,198 | | | $ | 358,400 | |
| Chefs' Warehouse, Inc. (The) | | | 641 | | | | 8,750 | |
| Natural Grocers by Vitamin Cottage, Inc. | | | 16,388 | | | | 179,285 | |
| Smart & Final Stores, Inc. | | | 57,182 | | | | 674,747 | |
| Sprouts Farmers Market, Inc. | | | 47,131 | | | | 1,051,493 | |
| Whole Foods Market, Inc. | | | 9,373 | | | | 340,896 | |
| | | | | | | | 2,613,571 | |
| Food Products — 1.9% | | | | | | | | |
| Alico, Inc. | | | 121 | | | | 3,624 | |
| Amira Nature Foods Ltd. | | | 7,977 | | | | 41,401 | |
| Amplify Snack Brands, Inc. | | | 92,008 | | | | 828,072 | |
| Blue Buffalo Pet Products, Inc. | | | 180 | | | | 4,437 | |
| Calavo Growers, Inc. | | | 10,749 | | | | 705,134 | |
| Cal-Maine Foods, Inc. | | | 22,055 | | | | 832,576 | |
| Dean Foods Company | | | 449 | | | | 8,863 | |
| Freshpet, Inc. | | | 11,235 | | | | 132,011 | |
| Hormel Foods Corporation | | | 10,743 | | | | 376,865 | |
| Mead Johnson Nutrition Company | | | 4,028 | | | | 357,364 | |
| Pilgrim's Pride Corporation | | | 15,177 | | | | 393,995 | |
| Post Holdings, Inc. | | | 3,894 | | | | 327,836 | |
| S&W Seed Company | | | 29,428 | | | | 141,254 | |
| Sanderson Farms, Inc. | | | 66 | | | | 7,642 | |
| Tootsie Roll Industries, Inc. | | | 690 | | | | 25,775 | |
| | | | | | | | 4,186,849 | |
| Household Products — 0.6% | | | | | | | | |
| Church & Dwight Company, Inc. | | | 610 | | | | 30,213 | |
| Clorox Company (The) | | | 49 | | | | 6,551 | |
| HRG Group, Inc. | | | 305 | | | | 6,103 | |
| Orchids Paper Products Company | | | 31,995 | | | | 779,078 | |
| WD-40 Company | | | 6,120 | | | | 641,682 | |
| | | | | | | | 1,463,627 | |
| Personal Products — 0.5% | | | | | | | | |
China-Biotics, Inc. (b) | | | 535,616 | | | | 0 | |
| e.l.f. Beauty, Inc. | | | 24,912 | | | | 678,852 | |
| Herbalife Ltd. | | | 6,235 | | | | 394,426 | |
| LifeVantage Corporation | | | 3,445 | | | | 17,087 | |
| Natural Health Trends Corporation | | | 2,038 | | | | 58,450 | |
| Neptune Technologies & Bioressources, Inc. | | | 10,092 | | | | 10,294 | |
| Shineco, Inc. | | | 9,515 | | | | 42,818 | |
| Synutra International, Inc. | | | 495 | | | | 2,982 | |
| United-Guardian, Inc. | | | 3,272 | | | | 46,135 | |
| | | | | | | | 1,251,044 | |
14
TFS MARKET NEUTRAL FUND
SCHEDULE OF SECURITIES SOLD SHORT (Continued) | |
| COMMON STOCKS — 79.9% (Continued) | | Shares | | | Value | |
| Consumer Staples — 4.7% (Continued) | | | | | | |
Tobacco — 0.0% (a) | | | | | | |
| Alliance One International, Inc. | | | 135 | | | $ | 1,856 | |
| | | | | | | | | |
| Energy — 4.9% | | | | | | | | |
| Energy Equipment & Services — 1.9% | | | | | | | | |
| Aspen Aerogels, Inc. | | | 85 | | | | 345 | |
| Atwood Oceanics, Inc. | | | 2,032 | | | | 15,911 | |
| Bristow Group, Inc. | | | 46,864 | | | | 626,572 | |
| CARBO Ceramics, Inc. | | | 91,571 | | | | 629,093 | |
| Diamond Offshore Drilling, Inc. | | | 340 | | | | 4,903 | |
| Dril-Quip, Inc. | | | 134 | | | | 6,908 | |
| Frank's International N.V. | | | 72,732 | | | | 661,861 | |
| Geospace Technologies Corporation | | | 1,488 | | | | 24,611 | |
| Helmerich & Payne, Inc. | | | 5,650 | | | | 342,616 | |
| Hornbeck Offshore Services, Inc. | | | 198,275 | | | | 676,118 | |
| ION Geophysical Corporation | | | 30,000 | | | | 129,000 | |
| Noble Corporation plc | | | 3,550 | | | | 17,040 | |
| North American Energy Partners, Inc. | | | 9,481 | | | | 45,035 | |
| Oil States International, Inc. | | | 20 | | | | 595 | |
| PHI, Inc. | | | 198 | | | | 2,322 | |
| RPC, Inc. | | | 14,426 | | | | 262,120 | |
| Seadrill Ltd. | | | 65,868 | | | | 45,436 | |
| Superior Energy Services, Inc. | | | 24,150 | | | | 291,732 | |
| US Silica Holdings, Inc. | | | 9,790 | | | | 406,285 | |
| | | | | | | | 4,188,503 | |
| Oil, Gas & Consumable Fuels — 3.0% | | | | | | | | |
| Aegean Marine Petroleum Network, Inc. | | | 796 | | | | 8,875 | |
| Approach Resources, Inc. | | | 30,557 | | | | 63,253 | |
| Ardmore Shipping Corporation | | | 23,350 | | | | 180,963 | |
| Baytex Energy Corporation | | | 11,018 | | | | 33,274 | |
| Bill Barrett Corporation | | | 161,307 | | | | 619,419 | |
| California Resources Corporation | | | 54,375 | | | | 636,187 | |
| Centrus Energy Corporation - Class A | | | 161 | | | | 836 | |
| Cheniere Energy, Inc. | | | 8,145 | | | | 369,376 | |
| Chesapeake Energy Corporation | | | 64,428 | | | | 338,891 | |
| Comstock Resources, Inc. | | | 11,625 | | | | 101,603 | |
| CVR Energy, Inc. | | | 639 | | | | 13,988 | |
| Denbury Resources, Inc. | | | 299,977 | | | | 665,949 | |
| DHT Holdings, Inc. | | | 61,938 | | | | 296,683 | |
| Earthstone Energy, Inc. | | | 3,288 | | | | 44,289 | |
| EP Energy Corporation - Class A | | | 22,088 | | | | 99,838 | |
| Evolution Petroleum Corporation | | | 426 | | | | 3,408 | |
| Extraction Oil & Gas, Inc. | | | 9,450 | | | | 147,893 | |
| Frontline Ltd. | | | 15,497 | | | | 103,055 | |
15
TFS MARKET NEUTRAL FUND
SCHEDULE OF SECURITIES SOLD SHORT (Continued) | |
| COMMON STOCKS — 79.9% (Continued) | | Shares | | | Value | |
| Energy — 4.9% (Continued) | | | | | | |
| Oil, Gas & Consumable Fuels — 3.0% (Continued) | | | | | | |
| Gastar Exploration, Inc. | | | 493,846 | | | $ | 646,938 | |
| Golar LNG Ltd. | | | 194 | | | | 4,949 | |
| Halcon Resources Corporation | | | 2,585 | | | | 17,320 | |
| Harvest Natural Resources, Inc. | | | 20,393 | | | | 140,916 | |
| Jones Energy, Inc. - Class A | | | 19,911 | | | | 39,822 | |
| Laredo Petroleum, Inc. | | | 24,946 | | | | 320,806 | |
| Lonestar Resources US, Inc. - Class A | | | 721 | | | | 3,482 | |
| Navigator Holdings Ltd. | | | 2,018 | | | | 24,317 | |
| Noble Energy, Inc. | | | 463 | | | | 14,959 | |
| Nordic American Tankers Ltd. | | | 14,721 | | | | 122,184 | |
| Northern Oil & Gas, Inc. | | | 287,752 | | | | 647,442 | |
| ONEOK, Inc. | | | 2,600 | | | | 136,786 | |
| Pengrowth Energy Corporation | | | 17,791 | | | | 17,524 | |
| Penn West Petroleum Ltd. | | | 23,117 | | | | 34,444 | |
| Renewable Energy Group, Inc. | | | 2,640 | | | | 27,588 | |
| Resolute Energy Corporation | | | 684 | | | | 25,616 | |
| Rice Energy, Inc. | | | 3,966 | | | | 84,436 | |
| Sanchez Energy Corporation | | | 146 | | | | 1,130 | |
| Scorpio Tankers, Inc. | | | 154,530 | | | | 679,932 | |
| Ship Finance International Ltd. | | | 734 | | | | 10,313 | |
| SRC Energy, Inc. | | | 708 | | | | 5,338 | |
| StealthGas, Inc. | | | 9,363 | | | | 32,021 | |
| Stone Energy Corporation | | | 2 | | | | 39 | |
| Torchlight Energy Resources, Inc. | | | 44,587 | | | | 63,759 | |
| Uranium Energy Corporation | | | 19,198 | | | | 23,806 | |
| W&T Offshore, Inc. | | | 14,551 | | | | 29,684 | |
| | | | | | | | 6,883,331 | |
| Financials — 5.0% | | | | | | | | |
| Banks — 1.0% | | | | | | | | |
| Bancorp, Inc. (The) | | | 1,057 | | | | 6,818 | |
| Bank of America Corporation | | | 2,083 | | | | 48,617 | |
| BCB Bancorp, Inc. | | | 39 | | | | 616 | |
| City Holding Company | | | 130 | | | | 9,242 | |
| Civista Bancshares, Inc. | | | 2,424 | | | | 52,674 | |
| Codorus Valley Bancorp, Inc. | | | 20 | | | | 580 | |
| Community Bank System, Inc. | | | 18,197 | | | | 1,018,122 | |
| County Bancorp, Inc. | | | 959 | | | | 26,325 | |
| Customers Bancorp, Inc. | | | 176 | | | | 5,444 | |
| CVB Financial Corporation | | | 2,592 | | | | 55,832 | |
| Enterprise Financial Services Corporation | | | 43 | | | | 1,817 | |
| Farmers Capital Bank Corporation | | | 221 | | | | 9,171 | |
| First Bancorp (North Carolina) | | | 223 | | | | 6,699 | |
| First Financial Bankshares, Inc. | | | 140 | | | | 5,593 | |
16
TFS MARKET NEUTRAL FUND
SCHEDULE OF SECURITIES SOLD SHORT (Continued) | |
| COMMON STOCKS — 79.9% (Continued) | | Shares | | | Value | |
| Financials — 5.0% (Continued) | | | | | | |
| Banks — 1.0% (Continued) | | | | | | |
| First Interstate BancSystem, Inc. - Class A | | | 169 | | | $ | 6,380 | |
| First Merchants Corporation | | | 109 | | | | 4,510 | |
| First NBC Bank Holding Company | | | 45,093 | | | | 119,496 | |
| German American Bancorp, Inc. | | | 168 | | | | 5,524 | |
| Glacier Bancorp, Inc. | | | 162 | | | | 5,472 | |
| Lakeland Financial Corporation | | | 202 | | | | 9,223 | |
| LegacyTexas Financial Group, Inc. | | | 24 | | | | 907 | |
| Live Oak Bancshares, Inc. | | | 243 | | | | 5,868 | |
| Mackinac Financial Corporation | | | 290 | | | | 4,321 | |
| Merchants Bancshares, Inc. | | | 145 | | | | 7,221 | |
| National Bankshares, Inc. | | | 811 | | | | 34,103 | |
| Northrim BanCorp, Inc. | | | 1,403 | | | | 44,896 | |
| OFG Bancorp | | | 2,351 | | | | 27,507 | |
| Opus Bank | | | 977 | | | | 22,031 | |
| Pacific Mercantile Bancorp | | | 8,596 | | | | 66,619 | |
| Pacific Premier Bancorp, Inc. | | | 11 | | | | 393 | |
| Porter Bancorp, Inc. | | | 3,903 | | | | 39,850 | |
| Republic First Bancorp, Inc. | | | 500 | | | | 4,300 | |
| S&T Bancorp, Inc. | | | 118 | | | | 4,243 | |
| ServisFirst Bancshares, Inc. | | | 156 | | | | 5,897 | |
| Simmons First National Corporation - Class A | | | 99 | | | | 5,410 | |
| Southern First Bancshares, Inc. | | | 18 | | | | 607 | |
| Southside Bancshares, Inc. | | | 162 | | | | 5,625 | |
| Stock Yards Bancorp, Inc. | | | 172 | | | | 7,052 | |
| Summit Financial Group, Inc. | | | 77 | | | | 1,684 | |
| Tompkins Financial Corporation | | | 672 | | | | 55,554 | |
| Trustmark Corporation | | | 770 | | | | 25,579 | |
| Union Bankshares, Inc. | | | 2,034 | | | | 85,530 | |
| United Bankshares, Inc. | | | 40 | | | | 1,596 | |
| West Bancorporation, Inc. | | | 101 | | | | 2,353 | |
| Westamerica Bancorporation | | | 7,043 | | | | 387,506 | |
| | | | | | | | 2,244,807 | |
| Capital Markets — 1.1% | | | | | | | | |
| American Capital Senior Floating Ltd. | | | 149 | | | | 1,997 | |
| Arlington Asset Investment Corporation - Class A | | | 810 | | | | 11,794 | |
| Artisan Partners Asset Management, Inc. - Class A | | | 12,978 | | | | 380,255 | |
| CM Finance, Inc. | | | 195 | | | | 1,969 | |
| Cowen Group, Inc - Class A | | | 5,833 | | | | 92,745 | |
| FBR & Company | | | 7,152 | | | | 129,451 | |
| Federated Investors, Inc. - Class B | | | 318 | | | | 8,529 | |
| Fidus Investment Corporation | | | 179 | | | | 3,209 | |
| Fifth Street Asset Management, Inc. | | | 9,405 | | | | 44,203 | |
| Fifth Street Senior Floating Rate Corporation | | | 107 | | | | 872 | |
17
TFS MARKET NEUTRAL FUND
SCHEDULE OF SECURITIES SOLD SHORT (Continued) | |
| COMMON STOCKS — 79.9% (Continued) | | Shares | | | Value | |
| Financials — 5.0% (Continued) | | | | | | |
| Capital Markets — 1.1% (Continued) | | | | | | |
| Financial Engines, Inc. | | | 3,457 | | | $ | 146,922 | |
| Garrison Capital, Inc. | | | 2,310 | | | | 22,592 | |
| Goldman Sachs BDC, Inc. | | | 754 | | | | 18,850 | |
| Greenhill & Company, Inc. | | | 295 | | | | 7,463 | |
| GSV Capital Corporation | | | 29,596 | | | | 130,814 | |
| Manning & Napier, Inc. | | | 23,036 | | | | 133,609 | |
| MFC Bancorp Ltd. | | | 3,654 | | | | 6,066 | |
| OFS Capital Corporation | | | 121 | | | | 1,750 | |
| OHA Investment Corporation | | | 921 | | | | 1,363 | |
| Prospect Capital Corporation | | | 2,142 | | | | 19,921 | |
| Stellus Capital Investment Corporation | | | 138 | | | | 1,982 | |
| TICC Capital Corporation | | | 24 | | | | 176 | |
| Virtu Financial, Inc. - Class A | | | 40,892 | | | | 629,737 | |
| Virtus Investment Partners, Inc. | | | 80 | | | | 8,512 | |
| Waddell & Reed Financial, Inc. - Class A | | | 288 | | | | 5,181 | |
| WisdomTree Investments, Inc. | | | 80,762 | | | | 674,363 | |
| | | | | | | | 2,484,325 | |
| Consumer Finance — 0.7% | | | | | | | | |
| Credit Acceptance Corporation | | | 4,647 | | | | 944,503 | |
| Encore Capital Group, Inc. | | | 9,255 | | | | 308,654 | |
| Enova International, Inc. | | | 648 | | | | 9,202 | |
| FirstCash, Inc. | | | 73 | | | | 3,792 | |
| PRA Group, Inc. | | | 2,243 | | | | 72,225 | |
| Regional Management Corporation | | | 444 | | | | 8,804 | |
| World Acceptance Corporation | | | 2,306 | | | | 121,987 | |
| | | | | | | | 1,469,167 | |
Diversified Financial Services — 0.0% (a) | | | | | | | | |
| A-Mark Precious Metals, Inc. | | | 129 | | | | 2,272 | |
| Medallion Financial Corporation | | | 22,548 | | | | 45,998 | |
| On Deck Capital, Inc. | | | 1,096 | | | | 5,206 | |
| | | | | | | | 53,476 | |
| Insurance — 1.7% | | | | | | | | |
| Argo Group International Holdings Ltd. | | | 15 | | | | 989 | |
| Assurant, Inc. | | | 42 | | | | 4,042 | |
| Assured Guaranty Ltd. | | | 4,811 | | | | 183,443 | |
| Baldwin & Lyons, Inc. - Class B | | | 40 | | | | 980 | |
| Citizens, Inc. | | | 85,855 | | | | 605,278 | |
| Conifer Holdings, Inc. | | | 2,465 | | | | 19,104 | |
| eHealth, Inc. | | | 56,696 | | | | 803,949 | |
| Fidelity & Guaranty Life | | | 1,087 | | | | 30,925 | |
| HCI Group, Inc. | | | 230 | | | | 10,969 | |
| Health Insurance Innovations, Inc. - Class A | | | 49,229 | | | | 824,586 | |
| MBIA, Inc. | | | 1,026 | | | | 8,618 | |
18
TFS MARKET NEUTRAL FUND
SCHEDULE OF SECURITIES SOLD SHORT (Continued) | |
| COMMON STOCKS — 79.9% (Continued) | | Shares | | | Value | |
| Financials — 5.0% (Continued) | | | | | | |
| Insurance — 1.7% (Continued) | | | | | | |
| Mercury General Corporation | | | 1,146 | | | $ | 70,468 | |
| OneBeacon Insurance Group Ltd. - Class A | | | 222 | | | | 3,541 | |
| Patriot National, Inc. | | | 53,986 | | | | 156,020 | |
| RLI Corporation | | | 11,623 | | | | 665,068 | |
| United Insurance Holdings Corporation | | | 207 | | | | 3,159 | |
| Universal Insurance Holdings, Inc. | | | 1,785 | | | | 46,499 | |
| WMIH Corporation | | | 270,699 | | | | 406,048 | |
| | | | | | | | 3,843,686 | |
| Mortgage Real Estate Investment Trusts (REITs) — 0.1% | | | | | | | | |
| New York Mortgage Trust, Inc. | | | 877 | | | | 5,622 | |
| Orchid Island Capital, Inc. | | | 9,024 | | | | 95,654 | |
| | | | | | | | 101,276 | |
| Thrifts & Mortgage Finance — 0.4% | | | | | | | | |
| Banc of California, Inc. | | | 6,525 | | | | 141,592 | |
| BofI Holding, Inc. | | | 6,240 | | | | 149,074 | |
| Capitol Federal Financial, Inc. | | | 608 | | | | 8,895 | |
| Charter Financial Corporation | | | 161 | | | | 2,954 | |
| Clifton Bancorp, Inc. | | | 326 | | | | 5,444 | |
| Five Oaks Investment Corporation | | | 25,845 | | | | 138,788 | |
| Impac Mortgage Holdings, Inc. | | | 20,332 | | | | 290,747 | |
| LendingTree, Inc. | | | 373 | | | | 52,556 | |
| Nationstar Mortgage Holdings, Inc. | | | 7,188 | | | | 115,799 | |
| Northwest Bancshares, Inc. | | | 1,641 | | | | 26,486 | |
| Oritani Financial Corporation | | | 525 | | | | 8,899 | |
| People's United Financial, Inc. | | | 183 | | | | 3,197 | |
| Walker & Dunlop, Inc. | | | 206 | | | | 9,239 | |
| WSFS Financial Corporation | | | 10 | | | | 472 | |
| | | | | | | | 954,142 | |
| Health Care — 19.9% | | | | | | | | |
| Biotechnology — 8.2% | | | | | | | | |
| AC Immune S.A. | | | 401 | | | | 3,830 | |
| ACADIA Pharmaceuticals, Inc. | | | 10,943 | | | | 375,673 | |
| Adamas Pharmaceuticals, Inc. | | | 534 | | | | 8,747 | |
| Aduro Biotech, Inc. | | | 41,978 | | | | 405,088 | |
| Advaxis, Inc. | | | 12,620 | | | | 108,027 | |
| Agios Pharmaceuticals, Inc. | | | 6,832 | | | | 339,619 | |
| Alder Biopharmaceuticals, Inc. | | | 26,769 | | | | 536,718 | |
| Aldeyra Therapeutics, Inc. | | | 20,363 | | | | 88,579 | |
| Alnylam Pharmaceuticals, Inc. | | | 7,609 | | | | 407,842 | |
| Amicus Therapeutics, Inc. | | | 726 | | | | 5,576 | |
| Anavex Life Sciences Corporation | | | 11,077 | | | | 62,364 | |
| Arbutus Biopharma Corporation | | | 1,453 | | | | 4,868 | |
| ArQule, Inc. | | | 16,863 | | | | 16,694 | |
19
TFS MARKET NEUTRAL FUND
SCHEDULE OF SECURITIES SOLD SHORT (Continued) | |
| COMMON STOCKS — 79.9% (Continued) | | Shares | | | Value | |
| Health Care — 19.9% (Continued) | | | | | | |
| Biotechnology — 8.2% (Continued) | | | | | | |
| Array BioPharma, Inc. | | | 3,695 | | | $ | 32,036 | |
| Atara Biotherapeutics, Inc. | | | 39,563 | | | | 676,527 | |
| Athersys, Inc. | | | 25,792 | | | | 38,172 | |
| aTyr Pharma, Inc. | | | 39,023 | | | | 128,776 | |
| Aurinia Pharmaceuticals, Inc. | | | 110,897 | | | | 777,388 | |
| Avexis, Inc. | | | 3,932 | | | | 316,526 | |
| Brainstorm Cell Therapeutics, Inc. | | | 14,433 | | | | 59,608 | |
| Calithera Biosciences, Inc. | | | 3,521 | | | | 38,203 | |
| Cara Therapeutics, Inc. | | | 44,861 | | | | 712,841 | |
| Cascadian Therapeutics, Inc. | | | 921 | | | | 3,914 | |
| Clovis Oncology, Inc. | | | 722 | | | | 41,797 | |
| Corbus Pharmaceuticals Holdings, Inc. | | | 115,773 | | | | 833,566 | |
| Dynavax Technologies Corporation | | | 8,972 | | | | 49,795 | |
| Eagle Pharmaceuticals, Inc. | | | 59 | | | | 5,345 | |
| Editas Medicine, Inc. | | | 2,603 | | | | 49,067 | |
| Eiger BioPharmaceuticals, Inc. | | | 4,936 | | | | 38,994 | |
| Esperion Therapeutics, Inc. | | | 224 | | | | 8,008 | |
| Flexion Therapeutics, Inc. | | | 23,411 | | | | 477,818 | |
| Fortress Biotech, Inc. | | | 37,540 | | | | 136,646 | |
| Galectin Therapeutics, Inc. | | | 8,790 | | | | 26,897 | |
| Geron Corporation | | | 296,819 | | | | 759,857 | |
| GlycoMimetics, Inc. | | | 952 | | | | 4,094 | |
| GTx, Inc. | | | 4,770 | | | | 20,511 | |
| Halozyme Therapeutics, Inc. | | | 404 | | | | 5,632 | |
| Heron Therapeutics, Inc. | | | 46,496 | | | | 713,714 | |
| Ignyta, Inc. | | | 577 | | | | 5,106 | |
| ImmunoGen, Inc. | | | 172,873 | | | | 750,269 | |
| Immunomedics, Inc. | | | 133,068 | | | | 762,480 | |
| Incyte Corporation | | | 2,820 | | | | 350,470 | |
| Infinity Pharmaceuticals, Inc. | | | 8,777 | | | | 18,871 | |
| Inotek Pharmaceuticals Corporation | | | 66,154 | | | | 132,308 | |
| Inovio Pharmaceuticals, Inc. | | | 5,777 | | | | 36,337 | |
| Insys Therapeutics, Inc. | | | 9,928 | | | | 111,690 | |
| Intellia Therapeutics, Inc. | | | 1,927 | | | | 28,076 | |
| Intercept Pharmaceuticals, Inc. | | | 3,348 | | | | 376,148 | |
| Intrexon Corporation | | | 21,763 | | | | 453,541 | |
| Juno Therapeutics, Inc. | | | 16,399 | | | | 408,991 | |
| Kadmon Holdings, Inc. | | | 76,256 | | | | 209,704 | |
| Keryx Biopharmaceuticals, Inc. | | | 16,571 | | | | 98,100 | |
| Kindred Biosciences, Inc. | | | 354 | | | | 2,460 | |
| La Jolla Pharmaceutical Company | | | 23,778 | | | | 689,562 | |
| Lexicon Pharmaceuticals, Inc. | | | 2,879 | | | | 44,941 | |
| Ligand Pharmaceuticals, Inc. - Class B | | | 55 | | | | 6,114 | |
20
TFS MARKET NEUTRAL FUND
SCHEDULE OF SECURITIES SOLD SHORT (Continued) | |
| COMMON STOCKS — 79.9% (Continued) | | Shares | | | Value | |
| Health Care — 19.9% (Continued) | | | | | | |
| Biotechnology — 8.2% (Continued) | | | | | | |
| Loxo Oncology, Inc. | | | 14,458 | | | $ | 665,935 | |
| MacroGenics, Inc. | | | 80 | | | | 1,729 | |
| MannKind Corporation | | | 157,916 | | | | 137,955 | |
| MediciNova, Inc. | | | 20,099 | | | | 115,569 | |
| Merrimack Pharmaceuticals, Inc. | | | 35,865 | | | | 119,430 | |
| MiMedx Group, Inc. | | | 8,751 | | | | 111,050 | |
| Mirati Therapeutics, Inc. | | | 398 | | | | 1,811 | |
| Myriad Genetics, Inc. | | | 392 | | | | 7,209 | |
| Novavax, Inc. | | | 27,780 | | | | 22,671 | |
| Nymox Pharmaceutical Corporation | | | 6,182 | | | | 29,117 | |
| Omeros Corporation | | | 4,858 | | | | 79,283 | |
| Oncobiologics, Inc. | | | 1,427 | | | | 3,196 | |
| OncoMed Pharmaceuticals, Inc. | | | 160,500 | | | | 632,370 | |
| OPKO Health, Inc. | | | 45 | | | | 350 | |
| Organovo Holdings, Inc. | | | 18,851 | | | | 54,668 | |
| OvaScience, Inc. | | | 84,039 | | | | 126,899 | |
| Pluristem Therapeutics, Inc. | | | 2,107 | | | | 3,034 | |
| ProQR Therapeutics N.V. | | | 966 | | | | 4,733 | |
| Protalix BioTherapeutics, Inc. | | | 68,886 | | | | 64,064 | |
| Proteostasis Therapeutics, Inc. | | | 59,241 | | | | 358,112 | |
| Puma Biotechnology, Inc. | | | 18 | | | | 731 | |
| Radius Health, Inc. | | | 142 | | | | 5,548 | |
| Regulus Therapeutics, Inc. | | | 89,492 | | | | 138,713 | |
| Retrophin, Inc. | | | 285 | | | | 5,583 | |
| Rigel Pharmaceuticals, Inc. | | | 885 | | | | 2,646 | |
| Sangamo Therapeutics, Inc. | | | 141,240 | | | | 677,952 | |
| Sarepta Therapeutics, Inc. | | | 784 | | | | 28,428 | |
| Seattle Genetics, Inc. | | | 5,859 | | | | 400,170 | |
| Seres Therapeutics, Inc. | | | 15,621 | | | | 153,554 | |
| Sorrento Therapeutics, Inc. | | | 11,906 | | | | 23,217 | |
| Spark Therapeutics, Inc. | | | 99 | | | | 5,739 | |
| Spring Bank Pharmaceuticals, Inc. | | | 2,086 | | | | 20,005 | |
| Stonebridge Biopharma plc | | | 32,195 | | | | 144,877 | |
| Syros Pharmaceuticals, Inc. | | | 223 | | | | 3,387 | |
| T2 Biosystems, Inc. | | | 199 | | | | 957 | |
| TG Therapeutics, Inc. | | | 55,446 | | | | 612,678 | |
| Tracon Pharmaceuticals, Inc. | | | 201 | | | | 714 | |
| Trevena, Inc. | | | 170,614 | | | | 557,908 | |
| vTv Therapeutics, Inc. - Class A | | | 3,718 | | | | 20,486 | |
| XBiotech, Inc. | | | 8,135 | | | | 88,509 | |
| Xenon Pharmaceuticals, Inc. | | | 27,224 | | | | 106,854 | |
| ZIOPHARM Oncology, Inc. | | | 24,375 | | | | 171,600 | |
| | | | | | | | 18,513,966 | |
21
TFS MARKET NEUTRAL FUND
SCHEDULE OF SECURITIES SOLD SHORT (Continued) | |
| COMMON STOCKS — 79.9% (Continued) | | Shares | | | Value | |
| Health Care — 19.9% (Continued) | | | | | | |
| Health Care Equipment & Supplies — 4.9% | | | | | | |
| ABIOMED, Inc. | | | 3,013 | | | $ | 392,654 | |
| Accuray, Inc. | | | 68 | | | | 309 | |
| Alere, Inc. | | | 67 | | | | 3,294 | |
| Align Technology, Inc. | | | 3,088 | | | | 415,707 | |
| Antares Pharma, Inc. | | | 2,334 | | | | 7,282 | |
| Avinger, Inc. | | | 162 | | | | 91 | |
| Baxter International, Inc. | | | 7 | | | | 390 | |
| Biolase, Inc. | | | 4,853 | | | | 6,212 | |
| Bovie Medical Corporation | | | 25,394 | | | | 68,564 | |
| Cerus Corporation | | | 149,223 | | | | 649,120 | |
| Check-Cap Ltd. | | | 1,096 | | | | 2,378 | |
| Cogentix Medical, Inc. | | | 21 | | | | 39 | |
| ConforMIS, Inc. | | | 63,405 | | | | 356,336 | |
| Corindus Vascular Robotics, Inc. | | | 497,706 | | | | 627,110 | |
| CRH Medical Corporation | | | 2,490 | | | | 14,691 | |
| CryoPort, Inc. | | | 21,754 | | | | 52,427 | |
| CytoSorbents Corporation | | | 4,917 | | | | 25,568 | |
| DexCom, Inc. | | | 4,813 | | | | 375,222 | |
| Digirad Corporation | | | 19,502 | | | | 91,659 | |
| Endologix, Inc. | | | 95,183 | | | | 712,921 | |
| Entellus Medical, Inc. | | | 50,633 | | | | 720,001 | |
| GenMark Diagnostics, Inc. | | | 53,884 | | | | 690,793 | |
| Glaukos Corporation | | | 14,499 | | | | 689,137 | |
| IDEXX Laboratories, Inc. | | | 2,404 | | | | 403,223 | |
| Integra LifeSciences Holdings Corporation | | | 44 | | | | 2,023 | |
| Intuitive Surgical, Inc. | | | 101 | | | | 84,423 | |
| Invacare Corporation | | | 39,765 | | | | 584,546 | |
| InVivo Therapeutics Holdings Corporation | | | 49,164 | | | | 186,823 | |
| iRadimed Corporation | | | 12,989 | | | | 111,705 | |
| IRIDEX Corporation | | | 1,872 | | | | 21,341 | |
| Lantheus Holdings, Inc. | | | 187 | | | | 2,431 | |
| Neovasc, Inc. | | | 27,603 | | | | 42,785 | |
| Nevro Corporation | | | 59 | | | | 5,559 | |
| Novadaq Technologies, Inc. | | | 1,869 | | | | 13,008 | |
| NovoCure Ltd. | | | 65,973 | | | | 745,495 | |
| Nuvectra Corporation | | | 11,644 | | | | 95,248 | |
| Oxford Immunotec Global plc | | | 7 | | | | 108 | |
| Pulse Biosciences, Inc. | | | 4,219 | | | | 101,762 | |
| Quotient Ltd. | | | 36,560 | | | | 248,974 | |
| ResMed, Inc. | | | 3,599 | | | | 244,696 | |
| Rockwell Medical, Inc. | | | 77,859 | | | | 669,587 | |
| Second Sight Medical Products, Inc. | | | 244 | | | | 283 | |
| Senseonics Holdings, Inc. | | | 27,987 | | | | 47,298 | |
22
TFS MARKET NEUTRAL FUND
SCHEDULE OF SECURITIES SOLD SHORT (Continued) | |
| COMMON STOCKS — 79.9% (Continued) | | Shares | | | Value | |
| Health Care — 19.9% (Continued) | | | | | | |
| Health Care Equipment & Supplies — 4.9% (Continued) | | | | | | |
| Tandem Diabetes Care, Inc. | | | 66,818 | | | $ | 63,658 | |
| TransEnterix, Inc. | | | 288 | | | | 187 | |
| ViewRay, Inc. | | | 108,960 | | | | 751,824 | |
| Viveve Medical, Inc. | | | 93,713 | | | | 758,138 | |
| | | | | | | | 11,087,030 | |
| Health Care Providers & Services — 1.8% | | | | | | | | |
| AAC Holdings, Inc. | | | 91,622 | | | | 656,013 | |
| Acadia Healthcare Company, Inc. | | | 8,107 | | | | 353,303 | |
| Aceto Corporation | | | 15,117 | | | | 239,604 | |
| American Renal Associates Holdings, Inc. | | | 231 | | | | 3,975 | |
| Anthem, Inc. | | | 20 | | | | 3,558 | |
| BioScrip, Inc. | | | 65,373 | | | | 99,367 | |
| Community Health Systems, Inc. | | | 4,837 | | | | 41,647 | |
| Express Scripts Holding Company | | | 37 | | | | 2,270 | |
| Fulgent Genetics, Inc. | | | 4,094 | | | | 41,718 | |
| InfuSystems Holdings, Inc. | | | 6,051 | | | | 12,404 | |
| MEDNAX, Inc. | | | 5,212 | | | | 314,596 | |
| Nobilis Health Corporation | | | 310,732 | | | | 388,415 | |
| Owens & Minor, Inc. | | | 154 | | | | 5,336 | |
| Quorum Health Corporation | | | 58 | | | | 248 | |
| Sharps Compliance Corporation | | | 26,954 | | | | 115,902 | |
| Surgery Partners, Inc. | | | 188 | | | | 3,234 | |
| Teladoc, Inc. | | | 27,037 | | | | 670,518 | |
| Tenet Healthcare Corporation | | | 64,309 | | | | 1,007,722 | |
| Triple-S Management Corporation - Class B | | | 68 | | | | 1,231 | |
| Trupanion, Inc. | | | 6,275 | | | | 99,710 | |
| Veracyte, Inc. | | | 500 | | | | 4,235 | |
| | | | | | | | 4,065,006 | |
| Health Care Services — 0.2% | | | | | | | | |
| Envision Healthcare Corporation | | | 5,869 | | | | 328,840 | |
| | | | | | | | | |
| Health Care Technology — 0.8% | | | | | | | | |
| athenahealth, Inc. | | | 3,264 | | | | 319,905 | |
| Computer Programs & Systems, Inc. | | | 4,123 | | | | 113,176 | |
| Connecture, Inc. | | | 1,929 | | | | 1,647 | |
| Evolent Health, Inc. - Class A | | | 30,592 | | | | 711,264 | |
| HTG Molecular Diagnostics, Inc. | | | 607 | | | | 3,047 | |
| iCAD, Inc. | | | 674 | | | | 3,768 | |
| Inovalon Holdings, Inc. - Class A | | | 4,148 | | | | 50,813 | |
| NantHealth, Inc. | | | 193,373 | | | | 601,390 | |
| Omnicell, Inc. | | | 131 | | | | 5,423 | |
| Simulations Plus, Inc. | | | 3,373 | | | | 39,464 | |
| | | | | | | | 1,849,897 | |
23
TFS MARKET NEUTRAL FUND
SCHEDULE OF SECURITIES SOLD SHORT (Continued) | |
| COMMON STOCKS — 79.9% (Continued) | | Shares | | | Value | |
| Health Care — 19.9% (Continued) | | | | | | |
| Life Sciences Tools & Services — 1.1% | | | | | | |
| Accelerate Diagnostics, Inc. | | | 31,887 | | | $ | 870,515 | |
| Bio-Techne Corporation | | | 3,489 | | | | 373,602 | |
| ChromaDex Corporation | | | 7,997 | | | | 24,871 | |
| Compugen Ltd. | | | 1,810 | | | | 7,330 | |
| Fluidigm Corporation | | | 135,443 | | | | 669,088 | |
| Pacific Biosciences of California, Inc. | | | 158,323 | | | | 623,793 | |
| | | | | | | | 2,569,199 | |
| Pharmaceuticals — 2.9% | | | | | | | | |
| Achaogen, Inc. | | | 29,648 | | | | 713,924 | |
| Adamis Pharmaceuticals Corporation | | | 11,658 | | | | 43,135 | |
| Akorn, Inc. | | | 11,920 | | | | 398,724 | |
| Aralez Pharmaceuticals, Inc. | | | 367,731 | | | | 592,047 | |
| Aratana Therapeutics, Inc. | | | 33,267 | | | | 206,256 | |
| Assembly Biosciences, Inc. | | | 87 | | | | 2,056 | |
| Axsome Therapeutics, Inc. | | | 18,368 | | | | 75,309 | |
| BioDelivery Sciences International, Inc. | | | 58,981 | | | | 107,640 | |
| Cempra, Inc. | | | 11,810 | | | | 50,783 | |
| Clearside Biomedical, Inc. | | | 4,498 | | | | 35,804 | |
| Collegium Pharmaceutical, Inc. | | | 723 | | | | 7,093 | |
| Concordia International Corporation | | | 32,951 | | | | 41,518 | |
| Depomed, Inc. | | | 56,464 | | | | 677,003 | |
| Egalet Corporation | | | 4,220 | | | | 16,120 | |
| Flex Pharma, Inc. | | | 3,304 | | | | 11,366 | |
| Foamix Pharmaceuticals Ltd. | | | 155,011 | | | | 652,596 | |
| Impax Laboratories, Inc. | | | 5,583 | | | | 78,441 | |
| Intra-Cellular Therapies, Inc. | | | 1,970 | | | | 27,225 | |
| KemPharm, Inc. | | | 14,499 | | | | 66,695 | |
| Lannett Company, Inc. | | | 7,343 | | | | 190,918 | |
| Lipocine, Inc. | | | 335 | | | | 1,420 | |
| Neos Therapeutics, Inc. | | | 99,998 | | | | 709,986 | |
| Neuroderm Ltd. | | | 1,622 | | | | 46,835 | |
| Ocular Therapeutix, Inc. | | | 12,151 | | | | 121,024 | |
| Reata Pharmaceuticals, Inc. - Class A | | | 2,239 | | | | 46,437 | |
| Revance Therapeutics, Inc. | | | 2,084 | | | | 45,327 | |
| SteadyMed Ltd. | | | 5,709 | | | | 41,105 | |
| Teligent, Inc. | | | 9,635 | | | | 76,020 | |
| TherapeuticsMD, Inc. | | | 152,539 | | | | 777,949 | |
| Titan Pharmaceuticals, Inc. | | | 504 | | | | 1,487 | |
| WAVE Life Sciences Ltd. | | | 24,544 | | | | 517,879 | |
| Zogenix, Inc. | | | 503 | | | | 5,533 | |
| Zynerba Pharmaceuticals, Inc. | | | 3,444 | | | | 72,255 | |
| | | | | | | | 6,457,910 | |
24
TFS MARKET NEUTRAL FUND
SCHEDULE OF SECURITIES SOLD SHORT (Continued) | |
| COMMON STOCKS — 79.9% (Continued) | | Shares | | | Value | |
| Industrials — 10.1% | | | | | | |
| Aerospace & Defense — 0.9% | | | | | | |
| AeroVironment, Inc. | | | 24,210 | | | $ | 691,680 | |
| Axon Enterprise, Inc. | | | 28,975 | | | | 712,206 | |
| Cubic Corporation | | | 106 | | | | 5,501 | |
| DigitalGlobe, Inc. | | | 271 | | | | 8,726 | |
| HEICO Corporation | | | 18 | | | | 1,244 | |
| KEYW Holding Corporation (The) | | | 20,649 | | | | 195,959 | |
| KLX, Inc. | | | 116 | | | | 5,487 | |
| Kratos Defense & Security Solutions, Inc. | | | 1,182 | | | | 9,007 | |
| TransDigm Group, Inc. | | | 1,574 | | | | 388,353 | |
| Triumph Group, Inc. | | | 207 | | | | 5,423 | |
| | | | | | | | 2,023,586 | |
| Air Freight & Logistics — 0.3% | | | | | | | | |
| Echo Global Logistics, Inc. | | | 34,254 | | | | 642,262 | |
| | | | | | | | | |
| Airlines — 0.1% | | | | | | | | |
| Copa Holdings S.A. - Class A | | | 397 | | | | 46,219 | |
| Spirit Airlines, Inc. | | | 4,312 | | | | 246,948 | |
| | | | | | | | 293,167 | |
| Building Products — 0.7% | | | | | | | | |
| AAON, Inc. | | | 153 | | | | 5,607 | |
| Advanced Drainage Systems, Inc. | | | 31,510 | | | | 726,306 | |
| Apogee Enterprises, Inc. | | | 13,657 | | | | 744,307 | |
| Armstrong Flooring, Inc. | | | 162 | | | | 3,109 | |
| Quanex Building Products Corporation | | | 273 | | | | 5,569 | |
| USG Corporation | | | 1,054 | | | | 31,936 | |
| | | | | | | | 1,516,834 | |
| Commercial Services & Supplies — 1.5% | | | | | | | | |
| Acme United Corporation | | | 3 | | | | 87 | |
| Aqua Metals, Inc. | | | 47,529 | | | | 784,229 | |
| ARC Document Solutions, Inc. | | | 161 | | | | 592 | |
| Asta Funding, Inc. | | | 1,030 | | | | 8,652 | |
| Atento, S.A. | | | 16 | | | | 143 | |
| Avery Dennison Corporation | | | 43 | | | | 3,578 | |
| CompX International, Inc. | | | 258 | | | | 3,844 | |
| Covanta Holding Corporation | | | 70,195 | | | | 1,021,337 | |
| Healthcare Services Group, Inc. | | | 15,240 | | | | 699,668 | |
| Hudson Technologies, Inc. | | | 795 | | | | 5,645 | |
| Interface, Inc. | | | 35 | | | | 697 | |
| Intersections, Inc. | | | 21,559 | | | | 105,639 | |
| Johnson Controls International plc | | | 403 | | | | 16,753 | |
| Mobile Mini, Inc. | | | 23,122 | | | | 663,601 | |
| Multi-Color Corporation | | | 73 | | | | 5,606 | |
| Performant Financial Corporation | | | 45,865 | | | | 104,572 | |
25
TFS MARKET NEUTRAL FUND
SCHEDULE OF SECURITIES SOLD SHORT (Continued) | |
| COMMON STOCKS — 79.9% (Continued) | | Shares | | | Value | |
| Industrials — 10.1% (Continued) | | | | | | |
| Commercial Services & Supplies — 1.5% (Continued) | | | | | | |
| R.R. Donnelley & Sons Company | | | 42 | | | $ | 528 | |
| Team, Inc. | | | 996 | | | | 26,792 | |
| Tetra Tech, Inc. | | | 9 | | | | 396 | |
| Virco Manufacturing Corporation | | | 3,634 | | | | 16,535 | |
| | | | | | | | 3,468,894 | |
| Construction & Engineering — 1.2% | | | | | | | | |
| Goldfield Corporation (The) | | | 121,759 | | | | 663,587 | |
| HC2 Holdings, Inc. | | | 179 | | | | 1,045 | |
| IES Holdings, Inc. | | | 14,964 | | | | 299,280 | |
| Layne Christensen Company | | | 1,657 | | | | 13,206 | |
| Northwest Pipe Company | | | 3,336 | | | | 46,738 | |
| NV5 Global, Inc. | | | 17,074 | | | | 660,764 | |
| Orion Group Holdings, Inc. | | | 75 | | | | 566 | |
| Quanta Services, Inc. | | | 9,564 | | | | 338,948 | |
| Willdan Group, Inc. | | | 22,578 | | | | 640,538 | |
| | | | | | | | 2,664,672 | |
| Electrical Equipment — 1.0% | | | | | | | | |
| Acuity Brands, Inc. | | | 2,041 | | | | 359,420 | |
| American Superconductor Corporation | | | 15,676 | | | | 81,672 | |
| Energous Corporation | | | 61,383 | | | | 774,653 | |
| Energy Focus, Inc. | | | 31 | | | | 96 | |
| Enphase Energy, Inc. | | | 754 | | | | 897 | |
| FuelCell Energy, Inc. | | | 84,590 | | | | 97,278 | |
| Hydrogenics Corporation | | | 15,395 | | | | 115,463 | |
| Plug Power, Inc. | | | 41,509 | | | | 92,980 | |
| Sunrun, Inc. | | | 145,173 | | | | 767,965 | |
| Ultralife Corporation | | | 683 | | | | 3,757 | |
| | | | | | | | 2,294,181 | |
| Industrial Conglomerates — 0.1% | | | | | | | | |
| General Electric Company | | | 11,818 | | | | 342,604 | |
| | | | | | | | | |
| Machinery — 1.5% | | | | | | | | |
| Actuant Corporation - Class A | | | 207 | | | | 5,651 | |
| American Railcar Industries, Inc. | | | 2,129 | | | | 89,312 | |
| ARC Group Worldwide, Inc. | | | 18,856 | | | | 66,939 | |
| Chart Industries, Inc. | | | 155 | | | | 5,659 | |
| CIRCOR International, Inc. | | | 143 | | | | 9,540 | |
| Deere & Company | | | 3,273 | | | | 365,300 | |
| DMC Global, Inc. | | | 2,155 | | | | 32,971 | |
| Energy Recovery, Inc. | | | 54,155 | | | | 457,068 | |
| ExOne Company (The) | | | 3,605 | | | | 36,374 | |
| Graco, Inc. | | | 747 | | | | 80,564 | |
| Greenbrier Companies, Inc. (The) | | | 2,671 | | | | 116,055 | |
26
TFS MARKET NEUTRAL FUND
SCHEDULE OF SECURITIES SOLD SHORT (Continued) | |
| COMMON STOCKS — 79.9% (Continued) | | Shares | | | Value | |
| Industrials — 10.1% (Continued) | | | | | | |
| Machinery — 1.5% (Continued) | | | | | | |
| Hardinge, Inc. | | | 283 | | | $ | 2,971 | |
| Hyster-Yale Materials Handling, Inc. | | | 9,272 | | | | 557,340 | |
| Key Technology, Inc. | | | 2,995 | | | | 39,055 | |
| Kornit Digital Ltd. | | | 4,954 | | | | 99,575 | |
| Lincoln Electric Holdings, Inc. | | | 50 | | | | 4,451 | |
| Lindsay Corporation | | | 2,087 | | | | 181,277 | |
| Manitowoc Company, Inc. (The) | | | 1,601 | | | | 9,558 | |
| Navistar International Corporation | | | 226 | | | | 6,082 | |
| Omega Flex, Inc. | | | 268 | | | | 15,054 | |
| Perma-Pipe International Holdings, Inc. | | | 831 | | | | 6,690 | |
| Proto Labs, Inc. | | | 13,295 | | | | 771,110 | |
| Sun Hydraulics Corporation | | | 150 | | | | 5,826 | |
| Supreme Industries, Inc. - Class A | | | 2,337 | | | | 46,833 | |
| Wabash National Corporation | | | 1,041 | | | | 23,714 | |
| Wabtec Corporation | | | 1,831 | | | | 153,603 | |
| Welbilt, Inc. | | | 453 | | | | 9,286 | |
| Westport Fuel Systems, Inc. | | | 165,306 | | | | 224,816 | |
| | | | | | | | 3,422,674 | |
| Marine — 0.2% | | | | | | | | |
| Danaos Corporation | | | 3,100 | | | | 5,270 | |
| Diana Shipping, Inc. | | | 19,131 | | | | 76,333 | |
| Eagle Bulk Shipping, Inc. | | | 7,626 | | | | 37,596 | |
| Genco Shipping & Trading Ltd. | | | 3,759 | | | | 43,304 | |
| Golden Ocean Group Ltd. | | | 3,023 | | | | 23,035 | |
| Navios Maritime Holdings, Inc. | | | 25,498 | | | | 43,346 | |
| Seaspan Corporation | | | 15,344 | | | | 108,022 | |
| Star Bulk Carriers Corporation | | | 3,032 | | | | 28,683 | |
| | | | | | | | 365,589 | |
| Professional Services — 1.1% | | | | | | | | |
| Acacia Research Corporation | | | 787 | | | | 4,289 | |
| BG Staffing, Inc. | | | 8,227 | | | | 128,341 | |
| CDI Corporation | | | 437 | | | | 3,561 | |
| Cogint, Inc. | | | 131,612 | | | | 697,544 | |
| Dun & Bradstreet Corporation (The) | | | 8,483 | | | | 929,822 | |
| FTI Consulting, Inc. | | | 10,980 | | | | 379,798 | |
| Hill International, Inc. | | | 318 | | | | 1,288 | |
| Paylocity Holding Corporation | | | 9,528 | | | | 375,784 | |
| | | | | | | | 2,520,427 | |
| Road & Rail — 0.5% | | | | | | | | |
| Avis Budget Group, Inc. | | | 187 | | | | 5,704 | |
| CSX Corporation | | | 6,969 | | | | 354,304 | |
| Heartland Express, Inc. | | | 1,314 | | | | 26,438 | |
| Hertz Global Holdings, Inc. | | | 565 | | | | 9,317 | |
27
TFS MARKET NEUTRAL FUND
SCHEDULE OF SECURITIES SOLD SHORT (Continued) | |
| COMMON STOCKS — 79.9% (Continued) | | Shares | | | Value | |
| Industrials — 10.1% (Continued) | | | | | | |
| Road & Rail — 0.5% (Continued) | | | | | | |
| P.A.M. Transportation Services, Inc. | | | 46 | | | $ | 863 | |
| Student Transportation, Inc. | | | 875 | | | | 5,206 | |
| Swift Transportation Company | | | 28,192 | | | | 692,959 | |
| Universal Logistics Holdings, Inc. | | | 1,408 | | | | 19,642 | |
| USA Truck, Inc. | | | 589 | | | | 3,952 | |
| | | | | | | | 1,118,385 | |
| Trading Companies & Distributors — 0.9% | | | | | | | | |
| EnviroStar, Inc. | | | 6,224 | | | | 147,198 | |
| Fastenal Company | | | 547 | | | | 24,440 | |
| GATX Corporation | | | 12,711 | | | | 761,389 | |
| Houston Wire & Cable Company | | | 62 | | | | 388 | |
| Kaman Corporation | | | 1,180 | | | | 56,652 | |
| MSC Industrial Direct Company, Inc. - Class A | | | 2,325 | | | | 208,157 | |
| Neff Corporation - Class A | | | 114 | | | | 2,006 | |
| Nexeo Solutions, Inc. | | | 7,511 | | | | 68,425 | |
| Titan Machinery, Inc. | | | 351 | | | | 5,563 | |
| United Rentals, Inc. | | | 2,819 | | | | 309,132 | |
| W.W. Grainger, Inc. | | | 1,836 | | | | 353,797 | |
| | | | | | | | 1,937,147 | |
| Transportation Infrastructure — 0.1% | | | | | | | | |
| Pingtan Marine Enterprise Ltd. | | | 9,753 | | | | 46,522 | |
| Wesco Aircraft Holdings, Inc. | | | 17,372 | | | | 211,070 | |
| | | | | | | | 257,592 | |
| Information Technology — 10.8% | | | | | | | | |
| Communications Equipment — 2.0% | | | | | | | | |
| Applied Optoelectronics, Inc. | | | 14,371 | | | | 709,784 | |
| Arista Networks, Inc. | | | 2,801 | | | | 391,132 | |
| Bel Fuse, Inc. - Class B | | | 17 | | | | 411 | |
| CalAmp Corporation | | | 39,730 | | | | 712,756 | |
| Ceragon Networks Ltd. | | | 233 | | | | 776 | |
| ClearOne, Inc. | | | 188 | | | | 1,918 | |
| Extreme Networks, Inc. | | | 376 | | | | 2,938 | |
| F5 Networks, Inc. | | | 1,094 | | | | 141,268 | |
| Harmonic, Inc. | | | 20,223 | | | | 117,293 | |
| Infinera Corporation | | | 65,171 | | | | 646,496 | |
| Inseego, Corporation | | | 60,682 | | | | 129,859 | |
| Lantronix, Inc. | | | 21,234 | | | | 59,455 | |
| MRV Communications, Inc. | | | 1,235 | | | | 11,732 | |
| Network-1 Technologies, Inc. | | | 83,902 | | | | 402,730 | |
| Numerex Corporation - Class A | | | 12,039 | | | | 54,175 | |
| Oclaro, Inc. | | | 2,099 | | | | 16,813 | |
| Palo Alto Networks, Inc. | | | 3,375 | | | | 365,884 | |
| PC-TEL, Inc. | | | 231 | | | | 1,788 | |
28
TFS MARKET NEUTRAL FUND
SCHEDULE OF SECURITIES SOLD SHORT (Continued) | |
| COMMON STOCKS — 79.9% (Continued) | | Shares | | | Value | |
| Information Technology — 10.8% (Continued) | | | | | | |
| Communications Equipment — 2.0% (Continued) | | | | | | |
| Resonant, Inc. | | | 26,707 | | | $ | 128,461 | |
| Sierra Wireless, Inc. | | | 605 | | | | 15,307 | |
| Ubiquiti Networks, Inc. | | | 13,380 | | | | 689,338 | |
| Wi-LAN, Inc. | | | 1,476 | | | | 2,967 | |
| | | | | | | | 4,603,281 | |
| Electronic Equipment, Instruments & Components — 1.5% | | | | | | | | |
| Airgain, Inc. | | | 2,996 | | | | 44,670 | |
| Anixter International, Inc. | | | 24 | | | | 1,957 | |
| Applied DNA Science, Inc. | | | 26,459 | | | | 46,303 | |
| ClearSign Combustion Corporation | | | 36,164 | | | | 128,382 | |
| Cognex Corporation | | | 4,566 | | | | 389,662 | |
| CUI Global, Inc. | | | 10,607 | | | | 46,777 | |
| Electro Scientific Industries, Inc. | | | 16,270 | | | | 113,565 | |
| eMagin Corporation | | | 18,989 | | | | 43,675 | |
| Fitbit, Inc. - Class A | | | 163,995 | | | | 938,051 | |
| Identiv, Inc. | | | 749 | | | | 4,299 | |
| Knowles Corporation | | | 5,582 | | | | 98,969 | |
| LightPath Technologies, Inc. - Class A | | | 46,071 | | | | 124,392 | |
| Magal Security Systems Ltd. | | | 4,644 | | | | 31,022 | |
| Maxwell Technologies, Inc. | | | 21,634 | | | | 131,967 | |
| MicroVision, Inc. | | | 296,300 | | | | 666,675 | |
| Neonode, Inc. | | | 77,188 | | | | 130,448 | |
| Netlist, Inc. | | | 105,738 | | | | 135,345 | |
| PAR Technology Corporation | | | 93 | | | | 795 | |
| Radisys Corporation | | | 14 | | | | 56 | |
| SuperCom Ltd. | | | 19,669 | | | | 52,910 | |
| TTM Technologies, Inc. | | | 509 | | | | 8,516 | |
| Universal Display Corporation | | | 2,395 | | | | 213,993 | |
| Vishay Intertechnology, Inc. | | | 6,330 | | | | 103,496 | |
| | | | | | | | 3,455,925 | |
| Internet Software & Services — 1.5% | | | | | | | | |
| Aerohive Networks, Inc. | | | 24,137 | | | | 93,410 | |
| Appfolio, Inc. - Class A | | | 17 | | | | 451 | |
| Benefitfocus, Inc. | | | 198 | | | | 6,237 | |
| Care.com, Inc. | | | 55 | | | | 652 | |
| Chegg, Inc. | | | 11,550 | | | | 104,065 | |
| Cimpress N.V. | | | 103 | | | | 8,454 | |
| Coupa Software, Inc. | | | 26,929 | | | | 747,280 | |
| Five9, Inc. | | | 215 | | | | 3,923 | |
| Gogo, Inc. | | | 11,064 | | | | 139,517 | |
| iPass, Inc. | | | 108,178 | | | | 134,141 | |
| LendingClub Corporation | | | 5,690 | | | | 33,286 | |
| Marin Software, Inc. | | | 29,926 | | | | 50,874 | |
29
TFS MARKET NEUTRAL FUND
SCHEDULE OF SECURITIES SOLD SHORT (Continued) | |
| COMMON STOCKS — 79.9% (Continued) | | Shares | | | Value | |
| Information Technology — 10.8% (Continued) | | | | | | |
| Internet Software & Services — 1.5% (Continued) | | | | | | |
| MINDBODY, Inc. - Class A | | | 65 | | | $ | 1,843 | |
| New Relic, Inc. | | | 118 | | | | 4,718 | |
| Nutanix, Inc. - Class A | | | 4,747 | | | | 72,107 | |
Piksel, Inc. - Series A-2 (b) | | | 346,880 | | | | 0 | |
| Quotient Technology, Inc. | | | 762 | | | | 8,306 | |
| Reis, Inc. | | | 6,657 | | | | 125,152 | |
| Remark Holdings, Inc | | | 44,314 | | | | 134,271 | |
| Rocket Fuel, Inc. | | | 6,656 | | | | 33,446 | |
| Shutterstock, Inc. | | | 211 | | | | 9,122 | |
| Stamps.com, Inc. | | | 299 | | | | 31,739 | |
| StarTek, Inc. | | | 316 | | | | 2,869 | |
| Trade Desk, Inc. (The) - Class A | | | 461 | | | | 17,218 | |
| Tremor Video, Inc. | | | 806 | | | | 1,805 | |
| TrueCar, Inc. | | | 43,133 | | | | 755,690 | |
| Twilio, Inc. - Class A | | | 3,170 | | | | 104,769 | |
| VeriSign, Inc. | | | 4,338 | | | | 385,735 | |
| WebMD Health Corporation | | | 169 | | | | 9,165 | |
| Xactly Corporation | | | 1,648 | | | | 19,117 | |
| Zillow Group, Inc. - Class A | | | 10,506 | | | | 404,376 | |
| | | | | | | | 3,443,738 | |
| IT Services — 1.3% | | | | | | | | |
| ALJ Regional Holdings, Inc. | | | 4,483 | | | | 15,018 | |
| Black Knight Financial Services, Inc. - Class A | | | 189 | | | | 7,825 | |
| CardConnect Corporation | | | 3,299 | | | | 45,196 | |
| China Customer Relations Centers, Inc. | | | 293 | | | | 4,377 | |
| Edgewater Technology, Inc. | | | 28 | | | | 204 | |
| FleetCor Technologies, Inc. | | | 83 | | | | 11,715 | |
| Forrester Research, Inc. | | | 42 | | | | 1,703 | |
| Information Services Group, Inc. | | | 38,244 | | | | 120,469 | |
| Mattersight Corporation | | | 39,781 | | | | 135,255 | |
| ModusLink Global Solutions, Inc. | | | 1,196 | | | | 2,021 | |
| Rightside Group Ltd. | | | 168 | | | | 1,687 | |
| ServiceSource International, Inc. | | | 120,354 | | | | 452,531 | |
| Square, Inc. - Class A | | | 2,465 | | | | 44,962 | |
| Unisys Corporation | | | 25,701 | | | | 290,421 | |
| VeriFone Systems, Inc. | | | 20,237 | | | | 375,194 | |
| Virtusa Corporation | | | 22,951 | | | | 711,022 | |
| Western Union Company (The) | | | 18,011 | | | | 357,698 | |
| WEX, Inc. | | | 3,481 | | | | 353,182 | |
| | | | | | | | 2,930,480 | |
| Semiconductors & Semiconductor Equipment — 1.4% | | | | | | | | |
| Acacia Communications, Inc. | | | 16,214 | | | | 743,250 | |
| Aehr Test Systems | | | 16,145 | | | | 73,783 | |
30
TFS MARKET NEUTRAL FUND
SCHEDULE OF SECURITIES SOLD SHORT (Continued) | |
| COMMON STOCKS — 79.9% (Continued) | | Shares | | | Value | |
| Information Technology — 10.8% (Continued) | | | | | | |
| Semiconductors & Semiconductor Equipment — 1.4% (Continued) | | | | | | |
| Ambarella, Inc. | | | 396 | | | $ | 22,263 | |
| Amtech Systems, Inc. | | | 501 | | | | 3,527 | |
| Canadian Solar, Inc. | | | 2,750 | | | | 36,575 | |
| Cree, Inc. | | | 3,657 | | | | 80,015 | |
| CyberOptics Corporation | | | 75 | | | | 1,624 | |
| Everspin Technologies, Inc. | | | 1,373 | | | | 13,730 | |
| Impinj, Inc. | | | 1,227 | | | | 45,988 | |
| Nova Measuring Instruments Ltd. | | | 98 | | | | 1,967 | |
| NVE Corporation | | | 4 | | | | 325 | |
| NVIDIA Corporation | | | 3,569 | | | | 372,247 | |
| Pixelworks, Inc. | | | 829 | | | | 4,054 | |
| QuickLogic Corporation | | | 365,504 | | | | 615,874 | |
| Sevcon, Inc. | | | 9,219 | | | | 127,222 | |
| Sigma Designs, Inc. | | | 3,776 | | | | 23,411 | |
| SolarEdge Technologies, Inc. | | | 47,052 | | | | 759,890 | |
| SunPower Corporation | | | 16,823 | | | | 116,751 | |
| Ultratech, Inc. | | | 84 | | | | 2,564 | |
| Veeco Instruments, Inc. | | | 189 | | | | 6,237 | |
| | | | | | | | 3,051,297 | |
| Software — 2.9% | | | | | | | | |
| ACI Worldwide, Inc. | | | 768 | | | | 16,504 | |
| Asure Software, Inc. | | | 12,428 | | | | 128,381 | |
| Attunity Ltd. | | | 102 | | | | 780 | |
| Digimarc Corporation | | | 24,533 | | | | 707,777 | |
| Digital Turbine, Inc. | | | 5,770 | | | | 6,520 | |
| Ebix, Inc. | | | 17,970 | | | | 1,108,749 | |
| ePlus, Inc. | | | 4 | | | | 285 | |
| FireEye, Inc. | | | 31,197 | | | | 390,275 | |
| Gigamon, Inc. | | | 1,142 | | | | 36,202 | |
| Globant S.A. | | | 153 | | | | 5,797 | |
| Glu Mobile, Inc. | | | 18,175 | | | | 41,984 | |
| Guidance Software, Inc. | | | 566 | | | | 3,424 | |
| Imperva, Inc. | | | 810 | | | | 36,005 | |
| Mitek Systems, Inc. | | | 80,047 | | | | 700,411 | |
| MobileIron, Inc. | | | 723 | | | | 3,290 | |
| Model N, Inc. | | | 43,976 | | | | 470,543 | |
| Net 1 UEPS Technologies, Inc. | | | 172 | | | | 1,863 | |
| NetSol Technologies, Inc. | | | 1,100 | | | | 5,225 | |
| PROS Holdings, Inc. | | | 29,935 | | | | 737,898 | |
| QAD, Inc. - Class A | | | 30 | | | | 906 | |
| Seachange International, Inc. | | | 30,368 | | | | 76,527 | |
| SecureWorks Corporation - Class A | | | 29,369 | | | | 254,042 | |
| SITO Mobile Ltd. | | | 42,318 | | | | 110,027 | |
31
TFS MARKET NEUTRAL FUND
SCHEDULE OF SECURITIES SOLD SHORT (Continued) | |
| COMMON STOCKS — 79.9% (Continued) | | Shares | | | Value | |
| Information Technology — 10.8% (Continued) | | | | | | |
| Software — 2.9% (Continued) | | | | | | |
| Synchronoss Technologies, Inc. | | | 220 | | | $ | 3,520 | |
| Ultimate Software Group, Inc. (The) | | | 1,683 | | | | 341,094 | |
| VirnetX Holding Corporation | | | 156,613 | | | | 516,823 | |
| VMware, Inc. - Class A | | | 4,199 | | | | 395,210 | |
| Workday, Inc. - Class A | | | 4,538 | | | | 396,621 | |
| | | | | | | | 6,496,683 | |
| Technology Hardware, Storage & Peripherals — 0.2% | | | | | | | | |
| 3D Systems Corporation | | | 3,997 | | | | 63,272 | |
| Avid Technology, Inc. | | | 36,261 | | | | 203,243 | |
| CPI Card Group, Inc. | | | 9,742 | | | | 35,071 | |
| Cray, Inc. | | | 273 | | | | 4,887 | |
| Diebold Nixdorf, Inc. | | | 308 | | | | 8,686 | |
| Electronics For Imaging, Inc. | | | 633 | | | | 28,979 | |
| On Track Innovations Ltd. | | | 4,050 | | | | 6,237 | |
| Pure Storage, Inc. - Class A | | | 375 | | | | 3,979 | |
| Synaptics, Inc. | | | 104 | | | | 5,696 | |
| USA Technologies, Inc. | | | 354 | | | | 1,734 | |
| | | | | | | | 361,784 | |
| Materials — 4.2% | | | | | | | | |
| Chemicals — 1.9% | | | | | | | | |
| Advanced Emissions Solutions, Inc. | | | 312 | | | | 2,933 | |
| AgroFresh Solutions, Inc. | | | 117,561 | | | | 659,517 | |
| Balchem Corporation | | | 129 | | | | 10,470 | |
| BioAmber, Inc. | | | 59,722 | | | | 134,374 | |
| CF Industries Holdings, Inc. | | | 13,109 | | | | 350,535 | |
| China Green Agriculture, Inc. | | | 1,818 | | | | 2,272 | |
| Flotek Industries, Inc. | | | 67,635 | | | | 812,296 | |
| Intrepid Potash, Inc. | | | 371,684 | | | | 672,748 | |
| Kraton Corporation | | | 8,270 | | | | 270,512 | |
| LSB Industries, Inc. | | | 79,684 | | | | 878,118 | |
| Marrone Bio Innovations, Inc. | | | 16,515 | | | | 28,901 | |
| NL Industries, Inc. | | | 12,020 | | | | 97,362 | |
| Platform Specialty Products Corporation | | | 23,430 | | | | 332,003 | |
| Rayonier Advanced Materials, Inc. | | | 1,218 | | | | 16,139 | |
| Scotts Miracle-Gro Company (The) | | | 708 | | | | 68,393 | |
| Senomyx, Inc. | | | 3,637 | | | | 3,819 | |
| | | | | | | | 4,340,392 | |
Construction Materials — 0.0% (a) | | | | | | | | |
| U.S. Concrete, Inc. | | | 105 | | | | 6,510 | |
| | | | | | | | | |
| Containers & Packaging — 0.1% | | | | | | | | |
| AptarGroup, Inc. | | | 1,037 | | | | 83,271 | |
| Ball Corporation | | | 1,714 | | | | 131,789 | |
| | | | | | | | 215,060 | |
32
TFS MARKET NEUTRAL FUND
SCHEDULE OF SECURITIES SOLD SHORT (Continued) | |
| COMMON STOCKS — 79.9% (Continued) | | Shares | | | Value | |
| Materials — 4.2% (Continued) | | | | | | |
| Metals & Mining — 1.9% | | | | | | |
| AK Steel Holding Corporation | | | 3,053 | | | $ | 19,356 | |
| Alexco Resource Corporation | | | 32,968 | | | | 47,144 | |
| Allegheny Technologies, Inc. | | | 1,432 | | | | 26,277 | |
| Asanko Gold, Inc. | | | 278,924 | | | | 683,364 | |
| Avino Silver & Gold Mines Ltd. | | | 45,540 | | | | 68,765 | |
| Carpenter Technology Corporation | | | 1,494 | | | | 60,656 | |
| Century Aluminum Company | | | 445 | | | | 6,070 | |
| Cliffs Natural Resources, Inc. | | | 3,703 | | | | 24,884 | |
| Coeur Mining, Inc. | | | 289 | | | | 2,618 | |
| Compass Minerals International, Inc. | | | 658 | | | | 43,428 | |
| Eldorado Gold Corporation | | | 5,452 | | | | 19,954 | |
| Endeavour Silver Corporation | | | 8,397 | | | | 25,863 | |
| Energy Fuels, Inc. | | | 156,284 | | | | 273,497 | |
| First Majestic Silver Corporation | | | 6,331 | | | | 51,471 | |
| Gold Resource Corporation | | | 2,547 | | | | 8,405 | |
| Gold Standard Ventures Corporation | | | 403,492 | | | | 685,936 | |
| Great Panther Silver Ltd. | | | 35,857 | | | | 45,180 | |
| Hecla Mining Company | | | 3,562 | | | | 19,413 | |
| Hudbay Minerals, Inc. | | | 657 | | | | 3,909 | |
| IAMGOLD Corporation | | | 11,026 | | | | 45,648 | |
| McEwen Mining, Inc. | | | 20,139 | | | | 61,223 | |
| Mountain Province Diamonds, Inc. | | | 19,196 | | | | 54,709 | |
| New Gold, Inc. | | | 5,638 | | | | 16,012 | |
| NN, Inc. | | | 2,958 | | | | 81,641 | |
| Northern Dynasty Minerals Ltd. | | | 494,667 | | | | 791,467 | |
| NOVAGOLD Resources, Inc. | | | 4,896 | | | | 20,465 | |
| Pershing Gold Corporation | | | 260 | | | | 728 | |
| Pretium Resources, Inc. | | | 468 | | | | 4,638 | |
| Royal Gold, Inc. | | | 27 | | | | 1,908 | |
| Sandstorm Gold Ltd. | | | 17,705 | | | | 61,613 | |
| Seabridge Gold, Inc. | | | 75,875 | | | | 781,513 | |
| Stillwater Mining Company | | | 427 | | | | 7,678 | |
| SunCoke Energy, Inc. | | | 609 | | | | 5,585 | |
| Tahoe Resources, Inc. | | | 24,319 | | | | 196,011 | |
| TimkenSteel Corporation | | | 2,836 | | | | 42,767 | |
| Universal Stainless & Alloy Products, Inc. | | | 3 | | | | 54 | |
| Vista Gold Corporation | | | 11,627 | | | | 11,976 | |
| Western Copper & Gold Corporation | | | 13,581 | | | | 15,211 | |
| Yamana Gold, Inc. | | | 7,487 | | | | 20,215 | |
| | | | | | | | 4,337,252 | |
33
TFS MARKET NEUTRAL FUND
SCHEDULE OF SECURITIES SOLD SHORT (Continued) | |
| COMMON STOCKS — 79.9% (Continued) | | Shares | | | Value | |
| Materials — 4.2% (Continued) | | | | | | |
| Paper & Forest Products — 0.3% | | | | | | |
| Clearwater Paper Corporation | | | 13,049 | | | $ | 634,182 | |
| Deltic Timber Corporation | | | 117 | | | | 9,052 | |
| | | | | | | | 643,234 | |
| Real Estate — 4.0% | | | | | | | | |
| Equity Real Estate Investment Trusts (REITs) — 4.0% | | | | | | | | |
| Acadia Realty Trust | | | 23,554 | | | | 684,950 | |
| Agree Realty Corporation | | | 15,267 | | | | 740,144 | |
| AvalonBay Communities, Inc. | | | 2,906 | | | | 551,675 | |
| City Office REIT, Inc. | | | 7,045 | | | | 88,415 | |
| Community Healthcare Trust, Inc. | | | 5,455 | | | | 134,848 | |
| Digital Realty Trust, Inc. | | | 5,170 | | | | 593,723 | |
| Easterly Government Properties, Inc. | | | 26,010 | | | | 523,321 | |
| Gladstone Commercial Corporation | | | 249 | | | | 5,553 | |
| Government Properties Income Trust | | | 21,370 | | | | 455,608 | |
| HCP, Inc. | | | 8,928 | | | | 279,893 | |
| Independence Realty Trust, Inc. | | | 18,084 | | | | 166,373 | |
| Investors Real Estate Trust | | | 43,889 | | | | 259,384 | |
| Liberty Property Trust | | | 13,752 | | | | 557,919 | |
| Medical Properties Trust, Inc. | | | 820 | | | | 10,717 | |
| Mid-America Apartment Communities, Inc. | | | 7,390 | | | | 733,162 | |
| National Health Investors, Inc. | | | 627 | | | | 45,878 | |
| Public Storage | | | 3,616 | | | | 757,118 | |
| Realty Income Corporation | | | 13,471 | | | | 786,033 | |
| Regency Centers Corporation | | | 9,762 | | | | 616,763 | |
| Retail Properties of America, Inc. - Class A | | | 93 | | | | 1,241 | |
| STAG Industrial, Inc. | | | 6,826 | | | | 179,933 | |
| Terreno Realty Corporation | | | 3,425 | | | | 105,764 | |
| Welltower, Inc. | | | 10,734 | | | | 766,837 | |
| Whitestone REIT | | | 3,136 | | | | 39,325 | |
| | | | | | | | 9,084,577 | |
Real Estate Management & Development — 0.0% (a) | | | | | | | | |
| Griffin Industrial Realty, Inc. | | | 113 | | | | 3,420 | |
| | | | | | | | | |
| Telecommunication Services — 1.4% | | | | | | | | |
| Diversified Telecommunication Services — 0.9% | | | | | | | | |
| Aware, Inc. | | | 5,675 | | | | 27,240 | |
| Consolidated Communications Holdings, Inc. | | | 1,462 | | | | 34,606 | |
| Frontier Communications Corporation | | | 478,977 | | | | 900,477 | |
| Globalstar, Inc. | | | 219,164 | | | | 418,603 | |
| Iridium Communications, Inc. | | | 14,885 | | | | 157,781 | |
| magicJack VocalTec Ltd. | | | 15,357 | | | | 125,927 | |
| pdvWireless, Inc. | | | 5,609 | | | | 143,871 | |
| Straight Path Communications, Inc. - Class B | | | 636 | | | | 81,955 | |
34
TFS MARKET NEUTRAL FUND
SCHEDULE OF SECURITIES SOLD SHORT (Continued) | |
| COMMON STOCKS — 79.9% (Continued) | | Shares | | | Value | |
| Telecommunication Services — 1.4% (Continued) | | | | | | |
| Diversified Telecommunication Services — 0.9% (Continued) | | | | | | |
| Windstream Holdings, Inc. | | | 5,649 | | | $ | 31,182 | |
| Zayo Group Holdings, Inc. | | | 73 | | | | 2,560 | |
| | | | | | | | 1,924,202 | |
| Wireless Telecommunication Services — 0.5% | | | | | | | | |
| Shenandoah Telecommunications Company | | | 21,596 | | | | 691,072 | |
| Sprint Corporation | | | 43,631 | | | | 393,988 | |
| | | | | | | | 1,085,060 | |
| Utilities — 1.3% | | | | | | | | |
| Electric Utilities — 0.5% | | | | | | | | |
| ALLETE, Inc. | | | 16 | | | | 1,119 | |
| Duke Energy Corporation | | | 288 | | | | 23,760 | |
| Southern Company (The) | | | 7,440 | | | | 370,512 | |
| Spark Energy, Inc. - Class A | | | 20,779 | | | | 745,966 | |
| | | | | | | | 1,141,357 | |
| Independent Power and Renewable Electricity Producers — 0.5% | | | | | | | | |
| Calpine Corporation | | | 35,429 | | | | 361,376 | |
| Dynegy, Inc. | | | 168 | | | | 1,078 | |
| Pattern Energy Group, Inc. | | | 224 | | | | 4,932 | |
| TerraForm Global, Inc. - Class A | | | 1,077 | | | | 5,116 | |
| TerraForm Power, Inc. - Class A | | | 2,056 | | | | 25,885 | |
| U.S. Geothermal, Inc. | | | 1,105 | | | | 4,619 | |
| Vivint Solar, Inc. | | | 233,287 | | | | 699,861 | |
| | | | | | | | 1,102,867 | |
| Multi-Utilities — 0.2% | | | | | | | | |
| CenterPoint Energy, Inc. | | | 165 | | | | 4,707 | |
| Dominion Resources, Inc. | | | 4,862 | | | | 376,465 | |
| | | | | | | | 381,172 | |
| Water Utilities — 0.1% | | | | | | | | |
| AquaVenture Holdings Ltd. | | | 983 | | | | 18,058 | |
| Cadiz, Inc. | | | 22,151 | | | | 334,480 | |
| | | | | | | | 352,538 | |
| | | | | | | | | |
Total Common Stocks (Proceeds $199,440,616) | | | | | | $ | 180,296,080 | |
35
TFS MARKET NEUTRAL FUND
SCHEDULE OF SECURITIES SOLD SHORT (Continued) | |
WARRANTS — 0.0% (a) | | Shares | | | Value | |
| Sears Holdings Corporation (Proceeds $628) | | | 36 | | | $ | 106 | |
| | | | | | | | | |
Total Securities Sold Short — 79.9% (Proceeds $199,441,244) | | | | | | $ | 180,296,186 | |
(a) | Percentage rounds to less than 0.1%. |
(b) | Security has been valued at fair value pursuant to procedures adopted by and under the supervision of the Board of Trustees. The total value of such securities is $0 at April 30, 2017, representing 0.0% of net assets (Note 2). |
| See accompanying notes to financial statements. |
36
TFS SMALL CAP FUND
SUMMARY SCHEDULE OF INVESTMENTS*
April 30, 2017 (Unaudited) | |
| COMMON STOCKS — 97.4% | | Shares | | | Value | |
| Consumer Discretionary — 13.1% | | | | | | |
Gray Television, Inc. (a) | | | 16,954 | | | $ | 248,376 | |
Taylor Morrison Home Corporation - Class A (a) | | | 15,532 | | | | 358,789 | |
| Tower International, Inc. | | | 11,870 | | | | 321,677 | |
Other Consumer Discretionary (b) | | | | | | | 7,849,239 | |
| | | | | | | | 8,778,081 | |
| Consumer Staples — 3.7% | | | | | | | | |
Avon Products, Inc. (a) | | | 58,183 | | | | 282,187 | |
| Inter Parfums, Inc. | | | 7,307 | | | | 277,301 | |
| SpartanNash Company | | | 7,043 | | | | 259,183 | |
Other Consumer Staples (b) | | | | | | | 1,631,914 | |
| | | | | | | | 2,450,585 | |
| Energy — 4.8% | | | | | | | | |
Overseas Shipholding Group, Inc. - Class A (a) | | | 74,558 | | | | 271,391 | |
Pacific Ethanol, Inc. (a) | | | 46,525 | | | | 316,370 | |
Other Energy (b) | | | | | | | 2,643,387 | |
| | | | | | | | 3,231,148 | |
| Financials — 17.5% | | | | | | | | |
| FBL Financial Group, Inc. - Class A | | | 3,814 | | | | 253,631 | |
| Hope Bancorp, Inc. | | | 13,890 | | | | 254,326 | |
| Houlihan Lokey, Inc. | | | 9,001 | | | | 301,894 | |
| OM Asset Management plc | | | 17,274 | | | | 268,783 | |
PHH Corporation (a) | | | 19,017 | | | | 245,319 | |
Other Financials (b) | | | | | | | 10,414,723 | |
| | | | | | | | 11,738,676 | |
| Health Care — 15.8% | | | | | | | | |
AMAG Pharmaceuticals, Inc. (a) | | | 10,400 | | | | 253,760 | |
Cytokinetics, Inc. (a) | | | 15,252 | | | | 250,133 | |
Exactech, Inc. (a) | | | 8,062 | | | | 239,038 | |
FibroGen, Inc. (a) | | | 9,293 | | | | 260,204 | |
Halyard Health, Inc. (a) | | | 6,520 | | | | 257,540 | |
Heska Corporation (a) | | | 2,676 | | | | 289,677 | |
Horizon Pharma plc (a) | | | 17,202 | | | | 264,567 | |
Magellan Health, Inc. (a) | | | 3,546 | | | | 243,965 | |
Merit Medical Systems, Inc. (a) | | | 8,335 | | | | 280,890 | |
Momenta Pharmaceuticals, Inc. (a) | | | 17,571 | | | | 252,144 | |
| National HealthCare Corporation | | | 3,227 | | | | 240,153 | |
| Phibro Animal Health Corporation - Class A | | | 11,627 | | | | 345,903 | |
Providence Service Corporation (The) (a) | | | 5,616 | | | | 247,104 | |
Select Medical Holdings Corporation (a) | | | 18,985 | | | | 261,044 | |
Other Health Care (b) | | | | | | | 6,861,119 | |
| | | | | | | | 10,547,241 | |
37
TFS SMALL CAP FUND
SUMMARY SCHEDULE OF INVESTMENTS* (Continued) | |
| COMMON STOCKS — 97.4% (Continued) | | Shares | | | Value | |
| Industrials — 13.6% | | | | | | |
| Astec Industries, Inc. | | | 5,141 | | | $ | 325,682 | |
| Mueller Water Products, Inc. - Series A | | | 21,262 | | | | 239,198 | |
Other Industrials (b) | | | | | | | 8,575,250 | |
| | | | | | | | 9,140,130 | |
| Information Technology — 14.3% | | | | | | | | |
Anixter International, Inc. (a) | | | 3,225 | | | | 262,999 | |
Diodes, Inc. (a) | | | 10,568 | | | | 247,185 | |
Envestnet, Inc. (a) | | | 7,731 | | | | 269,039 | |
Insight Enterprises, Inc. (a) | | | 8,087 | | | | 340,463 | |
| IXYS Corporation | | | 18,154 | | | | 253,248 | |
Jive Software, Inc. (a) | | | 53,371 | | | | 269,524 | |
| Progress Software Corporation | | | 8,666 | | | | 257,554 | |
Other Information Technology (b) | | | | | | | 7,671,194 | |
| | | | | | | | 9,571,206 | |
| Materials — 4.4% | | | | | | | | |
| Innophos Holdings, Inc. | | | 6,529 | | | | 313,000 | |
| Materion Corporation | | | 6,597 | | | | 251,016 | |
| Stepan Company | | | 2,842 | | | | 241,002 | |
Other Materials (b) | | | | | | | 2,143,963 | |
| | | | | | | | 2,948,981 | |
| Real Estate — 7.9% | | | | | | | | |
| CBL & Associates Properties, Inc. | | | 44,587 | | | | 412,430 | |
| Farmland Partners, Inc. | | | 31,207 | | | | 340,156 | |
| Hudson Pacific Properties, Inc. | | | 11,838 | | | | 406,754 | |
| Independence Realty Trust, Inc. | | | 46,572 | | | | 428,462 | |
| InfraREIT, Inc. | | | 26,062 | | | | 497,784 | |
| Kite Realty Group Trust | | | 20,249 | | | | 412,270 | |
| Mack-Cali Realty Corporation | | | 14,974 | | | | 405,047 | |
| Monogram Residential Trust, Inc. | | | 41,284 | | | | 420,271 | |
| Parkway, Inc. | | | 19,742 | | | | 397,801 | |
| Silver Bay Realty Trust Corporation | | | 19,062 | | | | 408,499 | |
| TIER REIT, Inc. | | | 23,220 | | | | 401,938 | |
| Washington Prime Group, Inc. | | | 39,311 | | | | 345,937 | |
Other Real Estate (b) | | | | | | | 408,399 | |
| | | | | | | | 5,285,748 | |
| Telecommunication Services — 0.3% | | | | | | | | |
Other Telecommunication Services (b) | | | | | | | 227,662 | |
| | | | | | | | | |
| Utilities — 2.0% | | | | | | | | |
Other Utilities (b) | | | | | | | 1,310,614 | |
| | | | | | | | | |
Total Common Stocks (Cost $61,749,870) | | | | | | $ | 65,230,072 | |
38
TFS SMALL CAP FUND
SUMMARY SCHEDULE OF INVESTMENTS* (Continued) | |
| RIGHTS — 0.1% | | Shares | | | Value | |
Tobira Therapeutics, Inc. (c) (Cost $28,353) | | | 2,038 | | | $ | 31,894 | |
| | |
CORPORATE BONDS — 0.0% (d) | Par Value | | Value | |
| Other Corporate Bonds (Cost $23,038) | | | $ | 24,000 | |
| | | | | | |
Total Investments at Value — 97.5% (Cost $61,801,261) | | | $ | 65,285,966 | |
| | | | | | |
| Other Assets in Excess of Liabilities — 2.5% | | | | 1,669,998 | |
| | | | | | |
| Net Assets — 100.0% | | | $ | 66,955,964 | |
| * | A complete Schedule of Investments is available without charge upon request by calling toll-free 1-888-534-2001 or on the SEC’s website at http://www.sec.gov. |
(a) | Non-income producing security. |
(b) | Represents issuers not identified as a top 50 holding in terms of market value and issues or issuers not exceeding 1% of net assets individually or in the aggregate, respectively, as of April 30, 2017. |
(c) | Security has been valued at fair value pursuant to procedures adopted by and under the supervision of the Board of Trustees. The total value of such securities is $31,894 at April 30, 2017, representing 0.1% of net assets (Note 2). |
(d) | Percentage rounds to less than 0.1%. |
| See accompanying notes to financial statements. |
39
TFS HEDGED FUTURES FUND
SCHEDULE OF INVESTMENTS
April 30, 2017 (Unaudited) | |
| U.S. TREASURY OBLIGATIONS — 15.9% | | Par Value | | | Value | |
U.S. Treasury Bills (a), | | | | | | |
| 0.83%, due 08/24/2017 | | $ | 445,000 | | | $ | 443,868 | |
| 0.84%, due 09/07/2017 | | | 578,000 | | | | 576,227 | |
| 0.90%, due 09/21/2017 | | | 578,000 | | | | 575,997 | |
| 0.93%, due 10/05/2017 | | | 445,000 | | | | 443,229 | |
Total U.S. Treasury Obligations (Cost $2,039,222) | | | | | | $ | 2,039,321 | |
| | |
| MONEY MARKET FUNDS — 44.5% | | Shares | | | Value | |
Federated U.S. Treasury Cash Reserve Fund - Institutional Shares, 0.539% (b) | | | 132,566 | | | $ | 132,566 | |
Fidelity Institutional Money Market Government Portfolio - Class I, 0.609% (b) | | | 2,218,062 | | | | 2,218,062 | |
Invesco Short-Term Investments Trust - Treasury Portfolio - Institutional Shares, 0.639% (b) | | | 1,065,687 | | | | 1,065,687 | |
PIMCO Government Money Market Fund, 0.670% (b) | | | 132,579 | | | | 132,579 | |
Premier U.S. Government Money Portfolio, 0.639% (b) | | | 1,065,726 | | | | 1,065,726 | |
Vanguard Federal Money Market Fund, 0.660% (b) | | | 1,065,752 | | | | 1,065,752 | |
Total Money Market Funds (Cost $5,680,372) | | | | | | $ | 5,680,372 | |
| | | | | | | | | |
Total Investments at Value — 60.4% (Cost $7,719,594) | | | | | | $ | 7,719,693 | |
| | | | | | | | | |
Other Assets in Excess of Liabilities — 39.6% (c) | | | | | | | 5,056,080 | |
| | | | | | | | | |
| Net Assets — 100.0% | | | | | | $ | 12,775,773 | |
(a) | Rate shown is the annualized yield at time of purchase, not a coupon rate. |
(b) | The rate shown is the 7-day effective yield as of April 30, 2017. |
(c) | Includes cash held as margin deposits for futures contracts. |
| See accompanying notes to financial statements. |
40
TFS HEDGED FUTURES FUND
SCHEDULE OF FUTURES CONTRACTS
April 30, 2017 (Unaudited) | |
| FUTURES CONTRACTS | Expiration Date | | Contracts | | | Aggregate Market Value of Contracts | | | Unrealized Appreciation (Depreciation) | |
| COMMODITY FUTURES | | | | | | | | | | |
| Cocoa Future | 07/14/2017 | | | 10 | | | $ | 184,100 | | | $ | (15,094 | ) |
| Copper Future | 07/27/2017 | | | 3 | | | | 195,600 | | | | 2,814 | |
| Cotton No.2 Future | 07/07/2017 | | | 2 | | | | 78,870 | | | | 1,151 | |
| Ethanol Future | 06/05/2017 | | | 8 | | | | 362,384 | | | | (8,995 | ) |
| Feeder Cattle Future | 05/25/2017 | | | 1 | | | | 74,775 | | | | 5,283 | |
| Frozen Concentrate Orange Juice Future | 07/11/2017 | | | 22 | | | | 522,555 | | | | 14,325 | |
| Hard Red Winter Wheat Future | 07/14/2017 | | | 3 | | | | 65,588 | | | | 188 | |
| Live Cattle Future | 06/30/2017 | | | 13 | | | | 644,930 | | | | 67,284 | |
| Oats Future | 07/14/2017 | | | 46 | | | | 524,400 | | | | 19,254 | |
| Palladium Future | 06/28/2017 | | | 4 | | | | 330,460 | | | | 20,280 | |
| Platinum Future | 07/27/2017 | | | 3 | | | | 142,275 | | | | (1,007 | ) |
| Red Spring Wheat Future | 07/14/2017 | | | 40 | | | | 1,109,500 | | | | 7,658 | |
| Sugar No. 11 Future | 06/30/2017 | | | 4 | | | | 72,262 | | | | (1,743 | ) |
| Total Commodity Futures | | | | | | | $ | 4,307,699 | | | $ | 111,398 | |
| See accompanying notes to financial statements. |
41
TFS HEDGED FUTURES FUND
SCHEDULE OF FUTURES CONTRACTS SOLD SHORT
April 30, 2017 (Unaudited) | |
FUTURES CONTRACTS
SOLD SHORT | Expiration Date | | Contracts | | | Aggregate Market Value of Contracts | | | Unrealized Appreciation (Depreciation) | |
| COMMODITY FUTURES | | | | | | | | | | |
| Coffee Future | 07/19/2017 | | | 6 | | | $ | 300,150 | | | $ | 3,255 | |
| Corn Future | 07/14/2017 | | | 25 | | | | 458,125 | | | | 2,218 | |
| Crude Oil Future | 05/22/2017 | | | 4 | | | | 196,560 | | | | 12,335 | |
| Lean Hogs Future | 06/14/2017 | | | 15 | | | | 444,000 | | | | (8,755 | ) |
| Lumber Future | 07/14/2017 | | | 8 | | | | 339,768 | | | | 11,064 | |
| Natural Gas Future | 05/26/2017 | | | 14 | | | | 458,080 | | | | (1,023 | ) |
| Rough Rice Future | 07/14/2017 | | | 22 | | | | 414,480 | | | | 20,096 | |
| Wheat Future | 07/14/2017 | | | 74 | | | | 1,599,325 | | | | (340 | ) |
| Total Commodity Futures | | | | | | | $ | 4,210,488 | | | $ | 38,850 | |
| See accompanying notes to financial statements. |
42
TFS CAPITAL INVESTMENT TRUST
STATEMENTS OF ASSETS AND LIABILITIES
April 30, 2017 (Unaudited) | |
| | | TFS
Market
Neutral Fund | | | TFS
Small
Cap Fund | | | TFS
Hedged
Futures Fund* | |
| ASSETS | | | | | | | | | |
| Investments in securities: | | | | | | | | | |
| At acquisition cost | | $ | 204,684,491 | | | $ | 61,801,261 | | | $ | 7,719,594 | |
| At value (Note 2) | | $ | 215,165,535 | | | $ | 65,285,966 | | | $ | 7,719,693 | |
| Cash | | | — | | | | 1,148,264 | | | | 140,000 | |
| Cash denominated in foreign currency | | | — | | | | — | | | | 239,340 | |
| Deposits with brokers for short positions (Note 2) | | | 187,847,911 | | | | — | | | | — | |
| Margin deposits for futures contracts (Note 2) | | | 3,152,628 | | | | — | | | | 4,507,807 | |
| Variation margin receivable (Notes 2 and 5) | | | — | | | | — | | | | 187,205 | |
| Dividends and interest receivable | | | 38,758 | | | | 14,600 | | | | 2,853 | |
| Receivable for investment securities sold | | | 26,705,576 | | | | 5,882,619 | | | | — | |
| Receivable for capital shares sold | | | 52,572 | | | | 5,110 | | | | 500 | |
| Receivable from Adviser (Note 4) | | | — | | | | — | | | | 8,049 | |
| Other assets | | | 76,016 | | | | 27,167 | | | | 25,240 | |
| TOTAL ASSETS | | | 433,038,996 | | | | 72,363,726 | | | | 12,830,687 | |
| | | | | | | | | | | | | |
| LIABILITIES | | | | | | | | | | | | |
| Bank overdraft | | | 2,004,962 | | | | — | | | | — | |
| Securities sold short, at value (Note 2) (proceeds $199,441,244) | | | 180,296,186 | | | | — | | | | — | |
| Variation margin payable (Notes 2 and 5) | | | — | | | | — | | | | 36,957 | |
| Dividends payable on securities sold short (Note 2) | | | 48,328 | | | | — | | | | — | |
| Payable for investment securities purchased | | | 24,103,306 | | | | 5,324,855 | | | | — | |
| Payable for capital shares redeemed | | | 130,817 | | | | 10,939 | | | | 1,541 | |
| Payable to Adviser (Note 4) | | | 270,857 | | | | 48,442 | | | | — | |
| Payable to administrator (Note 4) | | | 26,849 | | | | 10,388 | | | | 9,606 | |
| Accrued brokerage expense on securities sold short (Note 2) | | | 383,662 | | | | — | | | | — | |
| Other accrued expenses and liabilities | | | 30,893 | | | | 13,138 | | | | 6,810 | |
| TOTAL LIABILITIES | | | 207,295,860 | | | | 5,407,762 | | | | 54,914 | |
| | | | | | | | | | | | | |
| CONTINGENCIES AND COMMITMENTS (Note 7) | | | — | | | | — | | | | — | |
| | | | | | | | | | | | | |
| NET ASSETS | | $ | 225,743,136 | | | $ | 66,955,964 | | | $ | 12,775,773 | |
| | | | | | | | | | | | | |
| Net assets consist of: | | | | | | | | | | | | |
| Paid-in capital | | $ | 221,413,037 | | | $ | 55,565,715 | | | $ | 13,811,947 | |
| Accumulated net investment income (loss) | | | (31,312,352 | ) | | | 144,527 | | | | (734,167 | ) |
| Accumulated net realized gains (losses) from security transactions and other financial instruments | | | 6,016,351 | | | | 7,761,017 | | | | (455,442 | ) |
| Net unrealized appreciation (depreciation) on: | | | | | | | | | | | | |
| Investments | | | 10,481,044 | | | | 3,484,705 | | | | 99 | |
| Short positions | | | 19,145,058 | | | | — | | | | — | |
| Futures contracts | | | — | | | | — | | | | 150,248 | |
| Translation of assets and liabilities in foreign currencies | | | (2 | ) | | | — | | | | 3,088 | |
| Net assets | | $ | 225,743,136 | | | $ | 66,955,964 | | | $ | 12,775,773 | |
| | | | | | | | | | | | | |
| Shares of beneficial interest outstanding (unlimited number of shares authorized, no par value) | | | 15,537,726 | | | | 4,729,251 | | | | 1,205,157 | |
| | | | | | | | | | | | | |
| Net asset value, redemption price and offering price per share (Note 2) | | $ | 14.53 | | | $ | 14.16 | | | $ | 10.60 | |
| * | Consolidated financial statement (Note 1). |
| See accompanying notes to financial statements. |
43
TFS CAPITAL INVESTMENT TRUST
STATEMENTS OF OPERATIONS
For the Six Months Ended April 30, 2017 (Unaudited) | |
| | | TFS
Market
Neutral Fund | | | TFS
Small
Cap Fund | | | TFS
Hedged Futures Fund* | |
| INVESTMENT INCOME | | | | | | | | | |
| Dividends | | $ | 2,836,936 | | | $ | 666,263 | | | $ | 24,782 | |
| Foreign tax withholding | | | (7,445 | ) | | | (40 | ) | | | — | |
| Interest | | | 161 | | | | 196 | | | | 7,500 | |
| TOTAL INVESTMENT INCOME | | | 2,829,652 | | | | 666,419 | | | | 32,282 | |
| | | | | | | | | | | | | |
| EXPENSES | | | | | | | | | | | | |
| Brokerage expense on securities sold short (Note 2) | | | 5,352,862 | | | | — | | | | — | |
| Investment advisory fees (Note 4) | | | 2,237,255 | | | | 399,007 | | | | 107,271 | |
| Dividend expense on securities sold short (Note 2) | | | 1,026,227 | | | | — | | | | — | |
| Administration fees (Note 4) | | | 101,551 | | | | 30,000 | | | | 30,000 | |
| Professional fees | | | 55,405 | | | | 21,828 | | | | 21,288 | |
| Accounting services fees (Note 4) | | | 53,782 | | | | 18,468 | | | | 19,214 | |
| Custodian fees | | | 49,727 | | | | 25,967 | | | | 13,851 | |
| Transfer agent fees (Note 4) | | | 48,967 | | | | 14,301 | | | | 9,000 | |
| Trustees’ fees and expenses (Note 4) | | | 20,875 | | | | 20,875 | | | | 20,875 | |
| Registration and filing fees | | | 26,149 | | | | 14,247 | | | | 14,630 | |
| Pricing fees | | | 35,853 | | | | 6,386 | | | | 372 | |
| Borrowing costs (Note 2) | | | 29,377 | | | | 1,448 | | | | 341 | |
| Compliance service fees and expenses (Note 4) | | | 17,016 | | | | 8,120 | | | | 5,777 | |
| Insurance expense | | | 19,688 | | | | 1,384 | | | | 1,237 | |
| Postage and supplies | | | 14,913 | | | | 4,930 | | | | 2,235 | |
| Printing of shareholder reports | | | 3,282 | | | | 2,324 | | | | 2,515 | |
| Other expenses | | | 19,192 | | | | 12,235 | | | | 4,683 | |
| TOTAL EXPENSES | | | 9,112,121 | | | | 581,520 | | | | 253,289 | |
| Investment advisory fee reductions and expense reimbursements (Note 4) | | | (127,423 | ) | | | (59,628 | ) | | | (124,222 | ) |
| NET EXPENSES | | | 8,984,698 | | | | 521,892 | | | | 129,067 | |
| NET INVESTMENT INCOME (LOSS) | | | (6,155,046 | ) | | | 144,527 | | | | (96,785 | ) |
| | | | | | | | | | | | | |
| REALIZED AND UNREALIZED GAINS (LOSSES) | | | | | | | | | | | | |
| Net realized gains (losses) from: | | | | | | | | | | | | |
| Investments | | | 38,151,814 | | | | 9,537,970 | | | | (2,460 | ) |
| Securities sold short | | | 906,770 | | | | — | | | | — | |
| Futures contracts (Notes 2 and 5) | | | 1,412,577 | | | | — | | | | 2,973 | |
| Foreign currency transactions | | | (2 | ) | | | — | | | | 1,862 | |
| Net change in unrealized appreciation (depreciation) on: | | | | | | | | | | | | |
| Investments | | | 7,600,780 | | | | 2,279,390 | | | | 135 | |
| Securities sold short | | | (26,639,036 | ) | | | — | | | | — | |
| Futures contracts (Notes 2 and 5) | | | — | | | | — | | | | 82,784 | |
| Foreign currency translation | | | (1 | ) | | | — | | | | 3,083 | |
| NET REALIZED AND UNREALIZED GAINS | | | 21,432,902 | | | | 11,817,360 | | | | 88,377 | |
| NET INCREASE (DECREASE) IN NET ASSETS FROM OPERATIONS | | $ | 15,277,856 | | | $ | 11,961,887 | | | $ | (8,408 | ) |
| * | Consolidated financial statement (Note 1). |
| See accompanying notes to financial statements. |
44
TFS MARKET NEUTRAL FUND
STATEMENTS OF CHANGES IN NET ASSETS | |
| | | Six Months
Ended
April 30,
2017
(Unaudited) | | | Year
Ended
October 31,
2016 | |
| FROM OPERATIONS | | | | | | |
| Net investment loss | | $ | (6,155,046 | ) | | $ | (35,112,731 | ) |
| Net realized gains (losses) from: | | | | | | | | |
| Investments | | | 38,151,814 | | | | 3,273,816 | |
| Securities sold short | | | 906,770 | | | | 19,476,795 | |
| Option contracts | | | — | | | | 742,213 | |
| Futures contracts | | | 1,412,577 | | | | 3,498,756 | |
| Foreign currency transactions | | | (2 | ) | | | 571 | |
| Net change in unrealized appreciation (depreciation) on: | | | | | | | | |
| Investments | | | 7,600,780 | | | | (16,280,807 | ) |
| Securities sold short | | | (26,639,036 | ) | | | (41,200,643 | ) |
| Futures contracts | | | — | | | | 1,021,348 | |
| Foreign currency translation | | | (1 | ) | | | (8 | ) |
| Net increase (decrease) in net assets from operations | | | 15,277,856 | | | | (64,580,690 | ) |
| | | | | | | | | |
| FROM DISTRIBUTIONS (Note 2) | | | | | | | | |
| Distributions from net realized gains from security transactions | | | — | | | | (28,447,169 | ) |
| | | | | | | | | |
| FROM CAPITAL SHARE TRANSACTIONS | | | | | | | | |
| Proceeds from shares sold | | | 27,217,731 | | | | 134,742,713 | |
| Net asset value of shares issued in reinvestment of distributions to shareholders | | | — | | | | 19,356,148 | |
| Payments for shares redeemed | | | (125,175,428 | ) | | | (537,713,899 | ) |
| Net decrease in net assets from capital share transactions | | | (97,957,697 | ) | | | (383,615,038 | ) |
| | | | | | | | | |
| TOTAL DECREASE IN NET ASSETS | | | (82,679,841 | ) | | | (476,642,897 | ) |
| | | | | | | | | |
| NET ASSETS | | | | | | | | |
| Beginning of period | | | 308,422,977 | | | | 785,065,874 | |
| End of period | | $ | 225,743,136 | | | $ | 308,422,977 | |
| | | | | | | | | |
| ACCUMULATED NET INVESTMENT LOSS | | $ | (31,312,352 | ) | | $ | (25,157,304 | ) |
| | | | | | | | | |
| CAPITAL SHARE ACTIVITY | | | | | | | | |
| Shares sold | | | 1,899,739 | | | | 9,498,421 | |
| Shares issued in reinvestment of distributions to shareholders | | | — | | | | 1,368,893 | |
| Shares redeemed | | | (8,705,750 | ) | | | (38,832,823 | ) |
| Net decrease in shares outstanding | | | (6,806,011 | ) | | | (27,965,509 | ) |
| Shares outstanding, beginning of period | | | 22,343,737 | | | | 50,309,246 | |
| Shares outstanding, end of period | | | 15,537,726 | | | | 22,343,737 | |
| See accompanying notes to financial statements. |
45
TFS SMALL CAP FUND
STATEMENTS OF CHANGES IN NET ASSETS | |
| | | Six Months
Ended
April 30,
2017
(Unaudited) | | | Year
Ended
October 31,
2016 | |
| FROM OPERATIONS | | | | | | |
| Net investment income (loss) | | $ | 144,527 | | | $ | (222,534 | ) |
| Net realized gains from investments | | | 9,537,970 | | | | 5,587,939 | |
| Net change in unrealized appreciation (depreciation) on investments | | | 2,279,390 | | | | (3,989,830 | ) |
| Net increase in net assets from operations | | | 11,961,887 | | | | 1,375,575 | |
| | | | | | | | | |
| FROM DISTRIBUTIONS (Note 2) | | | | | | | | |
| Distributions from net realized gains from security transactions | | | (4,458,511 | ) | | | (4,457,263 | ) |
| | | | | | | | | |
| FROM CAPITAL SHARE TRANSACTIONS | | | | | | | | |
| Proceeds from shares sold | | | 4,073,211 | | | | 20,317,282 | |
Net asset value of shares issued in reinvestment of
distributions to shareholders | | | 4,138,740 | | | | 4,086,135 | |
| Payments for shares redeemed | | | (15,571,289 | ) | | | (52,648,482 | ) |
| Net decrease in net assets from capital share transactions | | | (7,359,338 | ) | | | (28,245,065 | ) |
| | | | | | | | | |
| TOTAL INCREASE (DECREASE) IN NET ASSETS | | | 144,038 | | | | (31,326,753 | ) |
| | | | | | | | | |
| NET ASSETS | | | | | | | | |
| Beginning of period | | | 66,811,926 | | | | 98,138,679 | |
| End of period | | $ | 66,955,964 | | | $ | 66,811,926 | |
| | | | | | | | | |
| ACCUMULATED NET INVESTMENT INCOME | | $ | 144,527 | | | $ | — | |
| | | | | | | | | |
| CAPITAL SHARE ACTIVITY | | | | | | | | |
| Shares sold | | | 291,044 | | | | 1,728,901 | |
| Shares issued in reinvestment of distributions to shareholders | | | 298,610 | | | | 335,756 | |
| Shares redeemed | | | (1,103,310 | ) | | | (4,318,425 | ) |
| Net decrease in shares outstanding | | | (513,656 | ) | | | (2,253,768 | ) |
| Shares outstanding, beginning of period | | | 5,242,907 | | | | 7,496,675 | |
| Shares outstanding, end of period | | | 4,729,251 | | | | 5,242,907 | |
| See accompanying notes to financial statements. |
46
TFS HEDGED FUTURES FUND
STATEMENTS OF CHANGES IN NET ASSETS* | |
| | | Six Months
Ended
April 30,
2017
(Unaudited) | | | Year
Ended
October 31,
2016 | |
| FROM OPERATIONS | | | | | | |
| Net investment loss | | $ | (96,785 | ) | | $ | (278,104 | ) |
| Net realized gains (losses) from: | | | | | | | | |
| Investments | | | (2,460 | ) | | | 2,894 | |
| Futures contracts | | | 2,973 | | | | 283,342 | |
| Foreign currency transactions | | | 1,862 | | | | (3,118 | ) |
| Net change in unrealized appreciation (depreciation) on: | | | | | | | | |
| Investments | | | 135 | | | | 749 | |
| Futures contracts | | | 82,784 | | | | (26,230 | ) |
| Foreign currency translation | | | 3,083 | | | | 1,015 | |
| Net decrease in net assets from operations | | | (8,408 | ) | | | (19,452 | ) |
| | | | | | | | | |
| FROM CAPITAL SHARE TRANSACTIONS | | | | | | | | |
| Proceeds from shares sold | | | 698,852 | | | | 11,296,813 | |
| Payments for shares redeemed | | | (4,180,745 | ) | | | (11,641,932 | ) |
| Net decrease in net assets from capital share transactions | | | (3,481,893 | ) | | | (345,119 | ) |
| | | | | | | | | |
| TOTAL DECREASE IN NET ASSETS | | | (3,490,301 | ) | | | (364,571 | ) |
| | | | | | | | | |
| NET ASSETS | | | | | | | | |
| Beginning of period | | | 16,266,074 | | | | 16,630,645 | |
| End of period | | $ | 12,775,773 | | | $ | 16,266,074 | |
| | | | | | | | | |
| ACCUMULATED NET INVESTMENT LOSS | | $ | (734,167 | ) | | $ | (639,244 | ) |
| | | | | | | | | |
| CAPITAL SHARE ACTIVITY | | | | | | | | |
| Shares sold | | | 66,145 | | | | 1,067,335 | |
| Shares redeemed | | | (398,192 | ) | | | (1,106,832 | ) |
| Net decrease in shares outstanding | | | (332,047 | ) | | | (39,497 | ) |
| Shares outstanding, beginning of period | | | 1,537,204 | | | | 1,576,701 | |
| Shares outstanding, end of period | | | 1,205,157 | | | | 1,537,204 | |
| * | Consolidated financial statements (Note 1). |
| See accompanying notes to financial statements. |
47
TFS MARKET NEUTRAL FUND
FINANCIAL HIGHLIGHTS | |
| Per share data for a share outstanding throughout each period: | | Six Months
Ended
April 30,
2017
(Unaudited) | | | Year
Ended
October 31, 2016 | | | Year
Ended
October 31, 2015 | | | Year
Ended
October 31,
2014 | | | Year
Ended
October 31,
2013 | | | Year
Ended
October 31,
2012 | |
| Net asset value at beginning of period | | $ | 13.80 | | | $ | 15.60 | | | $ | 15.45 | | | $ | 16.19 | | | $ | 15.23 | | | $ | 14.41 | |
| | | | | | | | | | | | | | | | | | | | | | | | | |
| Income (loss) from investment operations: | | | | | | | | | | | | | | | | | | | | | | | | |
| Net investment loss | | | (0.89 | ) | | | (1.53 | ) | | | (0.95 | ) | | | (1.57 | ) | | | (1.25 | ) | | | (0.99 | ) |
| Net realized and unrealized gains on investments | | | 1.62 | | | | 0.33 | | | | 1.70 | | | | 1.49 | | | | 2.21 | | | | 2.05 | |
| Total from investment operations | | | 0.73 | | | | (1.20 | ) | | | 0.75 | | | | (0.08 | ) | | | 0.96 | | | | 1.06 | |
| | | | | | | | | | | | | | | | | | | | | | | | | |
| Less distributions: | | | | | | | | | | | | | | | | | | | | | | | | |
| Distributions from net realized gains from security transactions | | | — | | | | (0.60 | ) | | | (0.60 | ) | | | (0.66 | ) | | | — | | | | (0.24 | ) |
| | | | | | | | | | | | | | | | | | | | | | | | | |
| Proceeds from redemption fees collected | | | — | | | | — | | | | — | | | | 0.00 | (a) | | | 0.00 | (a) | | | 0.00 | (a) |
| | | | | | | | | | | | | | | | | | | | | | | | | |
| Net asset value at end of period | | $ | 14.53 | | | $ | 13.80 | | | $ | 15.60 | | | $ | 15.45 | | | $ | 16.19 | | | $ | 15.23 | |
| | | | | | | | | | | | | | | | | | | | | | | | | |
Total return (b) | | | 5.29 | %(c) | | | (7.79 | %) | | | 4.99 | % | | | (0.50 | %) | | | 6.30 | % | | | 7.48 | % |
| | | | | | | | | | | | | | | | | | | | | | | | | |
| Ratios and supplemental data: | | | | | | | | | | | | | | | | | | | | | | | | |
| Net assets at end of period (000’s) | | $ | 225,743 | | | $ | 308,423 | | | $ | 785,066 | | | $ | 769,182 | | | $ | 1,582,797 | | | $ | 1,789,303 | |
| | | | | | | | | | | | | | | | | | | | | | | | | |
| Ratio of total expenses to average net assets | | | 6.72 | %(d) | | | 7.70 | % | | | 7.71 | % | | | 8.44 | % | | | 8.67 | % | | | 8.63 | % |
| | | | | | | | | | | | | | | | | | | | | | | | | |
| Ratio of net expenses to average net assets | | | 6.63 | %(d)(e) | | | 7.62 | %(e) | | | 7.65 | %(e) | | | 8.43 | %(e) | | | 8.67 | % | | | 8.63 | % |
| | | | | | | | | | | | | | | | | | | | | | | | | |
Ratio of net expenses to average net assets excluding dividend expense (f) | | | 5.87 | %(d)(e) | | | 6.88 | %(e) | | | 6.92 | %(e) | | | 7.53 | %(e) | | | 7.59 | % | | | 7.75 | % |
| | | | | | | | | | | | | | | | | | | | | | | | | |
Ratio of net expenses to average net assets excluding dividend expense, borrowing costs and brokerage expense on securities sold short (f) | | | 1.90 | %(d)(e) | | | 1.90 | %(e) | | | 1.90 | %(e) | | | 2.02 | %(e)(g) | | | 2.41 | % | | | 2.42 | % |
| | | | | | | | | | | | | | | | | | | | | | | | | |
| Ratio of net investment loss to average net assets | | | (4.54 | %)(d)(e) | | | (6.46 | %)(e) | | | (6.55 | %)(e) | | | (7.17 | %)(e) | | | (6.67 | %) | | | (6.73 | %) |
| | | | | | | | | | | | | | | | | | | | | | | | | |
| Portfolio turnover rate | | | 254 | %(c) | | | 778 | % | | | 795 | % | | | 669 | % | | | 552 | % | | | 607 | % |
(a) | Amount rounds to less than $0.01 per share. |
(b) | Total return is a measure of the change in value of an investment in the Fund over the period covered, which assumes any dividends or capital gains distributions are reinvested in shares of the Fund. The returns shown do not reflect the deduction of taxes a shareholder would pay on Fund distributions or the redemption of Fund shares. |
(c) | Not annualized. |
(d) | Annualized. |
(e) | Ratio was determined after advisory fee reductions (Note 4). |
(f) | Dividend expense, borrowing costs and brokerage expense on securities sold short totaled 4.73%(c), 5.72%, 5.75%, 6.41%, 6.26% and 6.21% of average net assets for the periods ended April 30, 2017, October 31, 2016, 2015, 2014, 2013 and 2012, respectively. |
(g) | Effective January 1, 2014, the Advisor reduced its advisory fee from 2.25% to 1.65% of average daily net assets and agreed to further reduce its advisory fees and to absorb the Fund’s operating expenses to the extent necessary to limit aggregate annual operating expenses (which do not include brokerage costs, taxes, borrowing costs such as interest and dividend expenses on securities sold short, and extraordinary expenses) to 1.90% of average daily net assets. |
| See accompanying notes to financial statements. |
48
TFS SMALL CAP FUND
FINANCIAL HIGHLIGHTS | |
| Per share data for a share outstanding throughout each period: | | Six Months
Ended
April 30,
2017
(Unaudited) | | | Year
Ended
October 31, 2016 | | | Year
Ended
October 31, 2015 | | | Year
Ended
October 31,
2014 | | | Year
Ended
October 31,
2013 | | | Year
Ended
October 31,
2012 | |
| Net asset value at beginning of period | | $ | 12.74 | | | $ | 13.09 | | | $ | 13.93 | | | $ | 15.87 | | | $ | 13.56 | | | $ | 12.07 | |
| | | | | | | | | | | | | | | | | | | | | | | | | |
| Income (loss) from investment operations: | | | | | | | | | | | | | | | | | | | | | | | | |
| Net investment income (loss) | | | 0.03 | | | | (0.04 | ) | | | (0.03 | ) | | | (0.04 | ) | | | 0.02 | | | | (0.00 | )(a) |
| Net realized and unrealized gains on investments | | | 2.30 | | | | 0.33 | | | | 0.12 | | | | 1.40 | | | | 4.92 | | | | 1.52 | |
| Total from investment operations | | | 2.33 | | | | 0.29 | | | | 0.09 | | | | 1.36 | | | | 4.94 | | | | 1.52 | |
| | | | | | | | | | | | | | | | | | | | | | | | | |
| Less distributions: | | | | | | | | | | | | | | | | | | | | | | | | |
| Distributions from net investment income | | | — | | | | — | | | | — | | | | — | | | | (0.07 | ) | | | — | |
| Distributions from net realized gains from security transactions | | | (0.91 | ) | | | (0.64 | ) | | | (0.93 | ) | | | (3.30 | ) | | | (2.56 | ) | | | (0.03 | ) |
| Total distributions | | | (0.91 | ) | | | (0.64 | ) | | | (0.93 | ) | | | (3.30 | ) | | | (2.63 | ) | | | (0.03 | ) |
| | | | | | | | | | | | | | | | | | | | | | | | | |
| Proceeds from redemption fees collected | | | — | | | | — | | | | — | | | | 0.00 | (a) | | | 0.00 | (a) | | | 0.00 | (a) |
| | | | | | | | | | | | | | | | | | | | | | | | | |
| Net asset value at end of period | | $ | 14.16 | | | $ | 12.74 | | | $ | 13.09 | | | $ | 13.93 | | | $ | 15.87 | | | $ | 13.56 | |
| | | | | | | | | | | | | | | | | | | | | | | | | |
Total return (b) | | | 18.43 | %(c) | | | 2.46 | % | | | 0.51 | % | | | 9.50 | % | | | 44.15 | % | | | 12.62 | % |
| | | | | | | | | | | | | | | | | | | | | | | | | |
| Ratios and supplemental data: | | | | | | | | | | | | | | | | | | | | | | | | |
| Net assets at end of period (000’s) | | $ | 66,956 | | | $ | 66,812 | | | $ | 98,139 | | | $ | 97,776 | | | $ | 80,989 | | | $ | 50,073 | |
| | | | | | | | | | | | | | | | | | | | | | | | | |
| Ratio of total expenses to average net assets | | | 1.67 | %(d) | | | 1.75 | % | | | 1.68 | % | | | 1.61 | % | | | 1.80 | % | | | 1.95 | % |
| | | | | | | | | | | | | | | | | | | | | | | | | |
Ratio of net expenses to average net assets (e) | | | 1.50 | %(d) | | | 1.51 | %(f) | | | 1.50 | % | | | 1.54 | %(g) | | | 1.75 | % | | | 1.75 | % |
| | | | | | | | | | | | | | | | | | | | | | | | | |
Ratio of net investment income (loss) to average net assets (e) | | | 0.42 | %(d) | | | (0.28 | %) | | | (0.23 | %) | | | (0.36 | %) | | | 0.06 | % | | | (0.03 | %) |
| | | | | | | | | | | | | | | | | | | | | | | | | |
| Portfolio turnover rate | | | 313 | %(c) | | | 778 | % | | | 639 | % | | | 579 | % | | | 601 | % | | | 557 | % |
(a) | Amount rounds to less than $0.01 per share. |
(b) | Total return is a measure of the change in value of an investment in the Fund over the period covered, which assumes any dividends or capital gains distributions are reinvested in shares of the Fund. The returns shown do not reflect the deduction of taxes a shareholder would pay on Fund distributions or the redemption of Fund shares. |
(c) | Not annualized. |
(d) | Annualized. |
(e) | Ratio was determined after advisory fee reductions (Note 4). |
(f) | Includes borrowing costs of 0.01% of average net assets with respect to the year ended October 31, 2016. |
(g) | Effective January 1, 2014, the Advisor reduced its advisory fee from 1.25% to 1.15% of average daily net assets and agreed to further reduce its advisory fees and to absorb the Fund’s operating expenses to the extent necessary to limit aggregate annual operating expenses (which do not include brokerage costs, taxes, borrowing costs such as interest and dividend expenses on securities sold short, and extraordinary expenses) to 1.50% of average daily net assets. |
| See accompanying notes to financial statements. |
49
TFS HEDGED FUTURES FUND
FINANCIAL HIGHLIGHTS* | |
| Per share data for a share outstanding throughout each period: | | Six Months
Ended
April 30,
2017
(Unaudited) | | | Year
Ended
October 31, 2016 | | | Year
Ended
October 31, 2015 | | | Year
Ended
October 31,
2014 | | | Year
Ended
October 31,
2013 | | | Period
Ended
October 31,
2012(a) | |
| Net asset value at beginning of period | | $ | 10.58 | | | $ | 10.55 | | | $ | 9.88 | | | $ | 9.93 | | | $ | 11.04 | | | $ | 10.00 | |
| | | | | | | | | | | | | | | | | | | | | | | | | |
| Income (loss) from investment operations: | | | | | | | | | | | | | | | | | | | | | | | | |
| Net investment loss | | | (0.19 | ) | | | (0.19 | ) | | | (0.19 | )(b) | | | (0.49 | ) | | | (0.20 | ) | | | (0.09 | ) |
| Net realized and unrealized gains (losses) on investments | | | 0.21 | | | | 0.22 | | | | 0.86 | | | | 0.47 | | | | (0.68 | ) | | | 1.13 | |
| Total from investment operations | | | 0.02 | | | | 0.03 | | | | 0.67 | | | | (0.02 | ) | | | (0.88 | ) | | | 1.04 | |
| | | | | | | | | | | | | | | | | | | | | | | | | |
| Less distributions: | | | | | | | | | | | | | | | | | | | | | | | | |
| Distributions from net realized gains from security transactions | | | — | | | | — | | | | — | | | | (0.03 | ) | | | (0.23 | ) | | | — | |
| | | | | | | | | | | | | | | | | | | | | | | | | |
| Proceeds from redemption fees collected | | | — | | | | — | | | | — | | | | 0.00 | (c) | | | 0.00 | (c) | | | 0.00 | (c) |
| | | | | | | | | | | | | | | | | | | | | | | | | |
| Net asset value at end of period | | $ | 10.60 | | | $ | 10.58 | | | $ | 10.55 | | | $ | 9.88 | | | $ | 9.93 | | | $ | 11.04 | |
| | | | | | | | | | | | | | | | | | | | | | | | | |
Total return (d) | | | 0.19 | %(e) | | | 0.28 | % | | | 6.78 | % | | | (0.22 | %) | | | (8.14 | %) | | | 10.40 | %(e) |
| | | | | | | | | | | | | | | | | | | | | | | | | |
| Ratios and supplemental data: | | | | | | | | | | | | | | | | | | | | | | | | |
| Net assets at end of period (000’s) | | $ | 12,776 | | | $ | 16,266 | | | $ | 16,631 | | | $ | 38,212 | | | $ | 68,250 | | | $ | 113,541 | |
| | | | | | | | | | | | | | | | | | | | | | | | | |
| Ratio of total expenses to average net assets | | | 3.54 | %(f) | | | 3.06 | % | | | 2.90 | % | | | 2.19 | % | | | 2.35 | % | | | 2.51 | %(f) |
| | | | | | | | | | | | | | | | | | | | | | | | | |
Ratio of net expenses to average net assets (g) | | | 1.80 | %(f) | | | 1.80 | % | | | 1.81 | %(i) | | | 1.90 | %(h) | | | 2.30 | % | | | 2.30 | %(f) |
| | | | | | | | | | | | | | | | | | | | | | | | | |
Ratio of net investment loss to average net assets (g) | | | (1.51 | %)(f) | | | (1.51 | %) | | | (1.75 | %) | | | (1.87 | %) | | | (2.23 | %) | | | (2.19 | %)(f) |
| | | | | | | | | | | | | | | | | | | | | | | | | |
Portfolio turnover rate (j) | | | 0 | % | | | 0 | % | | | 0 | % | | | 0 | % | | | 0 | % | | | 0 | % |
| * | Consolidated financial statements (Note 1). |
(a) | Represents the period from commencement of operations (December 29, 2011) through October 31, 2012. |
(b) | Calculated using weighted average shares outstanding during the period. |
(c) | Amount rounds to less than $0.01 per share. |
(d) | Total return is a measure of the change in value of an investment in the Fund over the period covered, which assumes any dividends or capital gains distributions are reinvested in shares of the Fund. The returns shown do not reflect the deduction of taxes a shareholder would pay on Fund distributions or the redemption of Fund shares. |
(e) | Not annualized. |
(f) | Annualized. |
(g) | Ratio was determined after advisory fee reductions and expense reimbursements (Note 4). |
(h) | Effective January 1, 2014, the Advisor reduced its advisory fee from 2.00% to 1.50% of average daily net assets and agreed to further reduce its advisory fees and to absorb the Fund’s operating expenses to the extent necessary to limit aggregate annual operating expenses (which do not include brokerage costs, taxes, borrowing costs such as interest and dividend expenses on securities sold short, and extraordinary expenses) to 1.80% of average daily net assets. |
(i) | Includes borrowing costs of 0.01% of average net assets with respect to the year ended October 31, 2015. |
(j) | All investments held are excluded from the calculation as they are considered to be short-term investments whose maturities or expiration dates at the time of acquisition were one year or less. |
| See accompanying notes to financial statements. |
50
TFS CAPITAL INVESTMENT TRUST
NOTES TO FINANCIAL STATEMENTS
April 30, 2017 (Unaudited)
1. Organization
TFS Market Neutral Fund, TFS Small Cap Fund and TFS Hedged Futures Fund (individually, a “Fund”, and collectively, the “Funds”) are each a series of TFS Capital Investment Trust (the “Trust”), an open-end management investment company established as an Ohio business trust under a Declaration of Trust dated January 30, 2004. TFS Market Neutral Fund commenced operations on September 7, 2004. TFS Small Cap Fund commenced operations on March 7, 2006. TFS Hedged Futures Fund commenced operations on December 29, 2011.
The consolidated financial statements of TFS Hedged Futures Fund include TFS Hedged Futures Strategy Offshore Fund Ltd. (the “Subsidiary”), a wholly-owned and controlled Cayman Islands subsidiary. TFS Hedged Futures Fund may invest up to 25% of its total assets in the Subsidiary. TFS Hedged Futures Fund purchases investments through the Subsidiary to provide exposure to the commodity futures market, which otherwise may not be possible in a mutual fund structure. All inter-company accounts and transactions have been eliminated in consolidation for TFS Hedged Futures Fund.
TFS Market Neutral Fund seeks to produce capital appreciation while having a low correlation to the U.S. equity market, which TFS Capital LLC (the “Adviser”) defines as the S&P 500® Index. In addition, the Fund seeks to produce lower volatility than the movement of the U.S. equity market.
TFS Small Cap Fund seeks long-term capital appreciation. In addition, it seeks to outperform its broad-based securities index benchmark.
TFS Hedged Futures Fund seeks to achieve long-term capital appreciation.
2. Significant Accounting Policies
The following is a summary of the Funds’ significant accounting policies. The policies are in conformity with accounting principles generally accepted in the United States of America (“GAAP”). As an investment company, as defined in Financial Accounting Standards Board (“FASB”) Accounting Standards Update 2013-08, the Funds follow accounting and reporting guidance under FASB Accounting Standards Codification Topic 946, “Financial Services – Investment Companies.”
In October 2016, the U.S. Securities and Exchange Commission (the “SEC”) adopted amendments to Regulation S-X which will impact financial statement presentation, particularly the presentation of derivative investments. Although still evaluating the impact, management believes that many of the Regulation S-X amendments are consistent with the Funds’ current financial statement presentation and expects that the Funds will be able to comply with the amendments by the August 1, 2017 compliance date.
Securities and futures valuation – The Funds’ portfolio securities are valued as of the close of regular trading on the New York Stock Exchange (“NYSE”) (generally 4:00 p.m., Eastern time) on each business day the NYSE is open. Securities listed on the NYSE or other exchanges are valued on the basis of their last sale prices on the exchanges on which they are primarily traded. If there are no sales on that day, the securities are valued at the mean between the closing bid and
51
TFS CAPITAL INVESTMENT TRUST
NOTES TO FINANCIAL STATEMENTS (Continued)
ask prices on the NYSE or other primary exchange for that day. Securities which are quoted by NASDAQ are valued at the NASDAQ Official Closing Price. If there are no sales on that day, the securities are valued at the mean between the closing bid and ask prices as reported by NASDAQ.
Fixed income securities are generally valued using prices provided by an independent pricing service approved by the Trust’s Board of Trustees (the “Board”). The independent pricing service will employ methodologies that they believe are appropriate, including actual market transactions, broker-dealer supplied valuations, matrix pricing, or other electronic data processing techniques. These techniques generally consider such factors as security prices, yields, maturities, call features, ratings, and developments relating to specific securities in arriving at valuations.
Futures contracts that trade on exchanges that close at 4:00 p.m. Eastern time are valued at their closing price as quoted on their primary exchange. Futures contracts that trade on exchanges that close before 4:00 p.m. Eastern time are valued at their last sale price as of the close of regular trading on their primary exchange. Futures contracts that trade on exchanges that close after 4:00 p.m. Eastern time are valued at their last sale price on their primary exchange as of the close of the NYSE. If no closing price is readily available at the time of valuation, the futures contract will be valued at the closing bid price for that day as reported by the primary exchange. Prices for these futures contracts are monitored daily by the Adviser until 4:00 p.m. Eastern time to determine if fair valuation is required.
Investments in securities and other financial instruments for which no quotations are readily available are valued at fair value as determined in good faith under the supervision of the Board and will be classified as Level 2 or 3 within the fair value hierarchy (see below), depending on the inputs used.
GAAP establishes a single authoritative definition of fair value, sets out a framework for measuring fair value and requires additional disclosures about fair value measurements.
The Funds’ investments and other financial instruments have been categorized based upon a fair value hierarchy in accordance with the FASB’s guidance on fair value measurement. The levels of the fair value hierarchy and their applicability to the Funds are described below:
| ● | Level 1 inputs utilize quoted prices (unadjusted) in active markets for identical assets or liabilities at the reporting date. Level 1 assets and liabilities may include most common stocks, investment company shares, warrants, futures contracts and money market funds. |
| ● | Level 2 inputs utilize inputs other than quoted prices included in Level 1 that are observable for the asset or liability, either directly or indirectly. Level 2 inputs may include quoted prices for similar assets and liabilities in active markets and quoted prices for identical or similar assets or liabilities that are not active. Assets and liabilities included in this category may include common stocks and other securities that are not actively traded on an exchange, and fixed income obligations with values that are based on prices provided by an independent pricing service that utilizes various “other significant observable inputs” including bid and ask quotations, prices of similar securities and interest rates, among other factors. |
| ● | Level 3 inputs are unobservable inputs for the asset or liability and include situations where there is little, if any, market activity for the asset or liability. Assets and liabilities included in this category may include common stocks and other securities that trade infrequently or their trading has been halted for an extended period of time. |
52
TFS CAPITAL INVESTMENT TRUST
NOTES TO FINANCIAL STATEMENTS (Continued)
The inputs or methodologies used for valuing securities are not necessarily an indication of the risks associated with investing in those securities. The inputs used to measure fair value may fall into different levels of the fair value hierarchy. In such cases, for disclosure purposes, the level in the fair value hierarchy within which the fair value measurement falls in its entirety is determined based on the lowest level input that is significant to the fair value measurement. The Funds’ assessment of the significance of a particular input to the fair value measurement in its entirety requires judgment and considers factors specific to the asset or liability.
The availability of observable inputs can vary from security to security and is affected by a wide variety of factors, including, for example, the type of security, whether the security is new and not yet established in the marketplace, and other characteristics particular to the transaction. To the extent that valuation is based on models or inputs that are less observable or unobservable in the market, the determination of fair value requires more judgment. Accordingly, the degree of judgment exercised by the Funds in determining fair value is greatest for investments and other financial instruments categorized as Level 3.
The following is a summary of the inputs used to value the Funds’ investments, securities sold short and other financial instruments as of April 30, 2017:
| TFS Market Neutral Fund | | Level 1 | | | Level 2 | | | Level 3 | | | Total | |
Investments in Securities: | |
| Common Stocks | | $ | 207,458,113 | | | $ | — | | | $ | — | | | $ | 207,458,113 | |
| Investment Companies | | | 7,686,422 | | | | — | | | | — | | | | 7,686,422 | |
| Rights | | | — | | | | — | | | | 0 | * | | | 0 | |
| Warrants | | | — | | | | 0 | * | | | — | | | | 0 | |
| Corporate Bonds | | | — | | | | 21,000 | | | | — | | | | 21,000 | |
| Total | | $ | 215,144,535 | | | $ | 21,000 | | | $ | 0 | | | $ | 215,165,535 | |
Other Financial Instruments: | |
| Common Stocks – Sold Short | | $ | (180,296,080 | ) | | $ | — | | | $ | 0 | * | | $ | (180,296,080 | ) |
| Warrants – Sold Short | | | (106 | ) | | | — | | | | — | | | | (106 | ) |
| Total | | $ | (180,296,186 | ) | | $ | — | | | $ | 0 | | | $ | (180,296,186 | ) |
| TFS Small Cap Fund | | Level 1 | | | Level 2 | | | Level 3 | | | Total | |
Investments in Securities: | |
| Common Stocks | | $ | 65,230,072 | | | $ | — | | | $ | — | | | $ | 65,230,072 | |
| Rights | | | — | | | | — | | | | 31,894 | | | | 31,894 | |
| Corporate Bonds | | | — | | | | 24,000 | | | | — | | | | 24,000 | |
| Total | | $ | 65,230,072 | | | $ | 24,000 | | | $ | 31,894 | | | $ | 65,285,966 | |
53
TFS CAPITAL INVESTMENT TRUST
NOTES TO FINANCIAL STATEMENTS (Continued)
| TFS Hedged Futures Fund | | Level 1 | | | Level 2 | | | Level 3 | | | Total | |
Investments in Securities: | |
| U.S. Treasury Obligations | | $ | — | | | $ | 2,039,321 | | | $ | — | | | $ | 2,039,321 | |
| Money Market Funds | | | 5,680,372 | | | | — | | | | — | | | | 5,680,372 | |
| Total | | $ | 5,680,372 | | | $ | 2,039,321 | | | $ | — | | | $ | 7,719,693 | |
Other Financial Instruments: | |
| Futures Contracts | | $ | 111,398 | | | $ | — | | | $ | — | | | $ | 111,398 | |
| Futures Contracts – Sold Short | | | 38,850 | | | | — | | | | — | | | | 38,850 | |
| Total | | $ | 150,248 | | | $ | — | | | $ | — | | | $ | 150,248 | |
| * | TFS Market Neutral Fund holds Rights, Warrants and Common Stocks - Sold Short which have been fair valued at $0. |
Refer to each Fund’s Summary Schedule of Investments, Schedule of Securities Sold Short, Schedule of Futures Contracts and Schedule of Futures Contracts Sold Short, as applicable, for a listing of the securities by security type and sector or industry type.
It is the Funds’ policy to recognize transfers into or out of any Level at the end of the reporting period.
As of April 30, 2017, the Funds did not have any transfers between any Levels. There were no Level 3 securities held by TFS Hedged Futures Fund as of April 30, 2017.
The following is a reconciliation of Level 3 investments and other financial instruments of TFS Market Neutral Fund for which significant unobservable inputs were used to determine fair value between October 31, 2016 and April 30, 2017.
| TFS Market Neutral Fund | | Investments in Securities | | | Other Financial Instruments | |
| Balance as of October 31, 2016 | | $ | — | | | $ | 0 | * |
| Change in unrealized appreciation | | | — | | | | — | |
| Received as a result of a corporate action | | | 0 | | | | — | |
| Balance as of April 30, 2017 | | $ | 0 | * | | $ | 0 | * |
| * | TFS Market Neutral Fund held Common Stocks – Sold Short as of October 31, 2016 and April 30, 2017 and Rights as of April 30, 2017 which have been determined to be Level 3 investments and other financial instruments and have been fair valued at $0. |
The total amount of unrealized appreciation on TFS Market Neutral Fund’s Level 3 investments and other financial instruments was $0 and $5,536,684, respectively, as of April 30, 2017.
54
TFS CAPITAL INVESTMENT TRUST
NOTES TO FINANCIAL STATEMENTS (Continued)
The following table summarizes the valuation techniques used and unobservable inputs approved and monitored by the Board to determine the fair value of TFS Market Neutral Fund’s Level 3 investments and other financial instruments as of April 30, 2017:
| | Fair Value at
April 30,
2017 | Valuation Technique | Unobservable Input | Range | Impact to Valuation from an Increase in Input** |
| Rights | $ 0* | Discount from last sale price | Discount Percentage | 100% | Decrease |
| Common Stocks - Sold Short | $ 0* | Discount from last sale price | Discount Percentage | 100% | Increase |
| * | TFS Market Neutral Fund holds Rights and Common Stocks – Sold Short which have been determined to be Level 3 investments and have been fair valued at $0. |
| ** | This column represents the directional change in the fair value of the Level 3 investments that would result in an increase from the corresponding input. A decrease to the unobservable input would have the opposite effect. Significant increases and decreases in these inputs in isolation could result in significantly higher or lower fair value measurements. |
The following is a reconciliation of Level 3 investments of TFS Small Cap Fund for which significant unobservable inputs were used to determine fair value between October 31, 2016 and April 30, 2017.
| | Investments in Securities | |
| Balance as of October 31, 2016 | | $ | — | |
| Received as a result of a corporate action | | | 31,894 | |
| Balance as of April 30, 2017 | | $ | 31,894 | |
The total amount of unrealized appreciation on TFS Small Cap Fund’s Level 3 investments was $3,541 as of April 30, 2017.
The following table summarizes the valuation techniques used and unobservable inputs approved and monitored by the Board to determine the fair value of TFS Small Cap Fund’s Level 3 investments as of April 30, 2017:
| | Fair Value at
April 30,
2017 | Valuation Technique | Unobservable Input | Range | Impact to Valuation from
an Increase in Input* |
| Rights | $ 31,894 | Management’s Estimate of Fund Cash Flows | N/A | N/A | Increase |
| * | This column represents the directional change in the fair value of the Level 3 investments that would result in an increase from the corresponding input. A decrease to the unobservable input would have the opposite effect. Significant increases and decreases in these inputs in isolation could result in significantly higher or lower fair value measurements. |
55
TFS CAPITAL INVESTMENT TRUST
NOTES TO FINANCIAL STATEMENTS (Continued)
Share valuation – The net asset value per share of each Fund is calculated daily by dividing the total value of its assets, less liabilities, by the number of shares outstanding. The offering price and redemption price per share of each Fund is equal to the net asset value per share.
Investment income (expense) – Dividend income (expense) is recorded on the ex-dividend date. Interest income is accrued as earned. Discounts and premiums on fixed income securities are amortized using the effective interest method. Withholding taxes on foreign dividends have been recorded in accordance with the Funds’ understanding of the appropriate country’s tax rules and tax rates.
Borrowing costs – From time to time, a Fund may have an overdrawn cash balance at the custodian due to redemptions or market movements. When this occurs, the Fund will incur borrowing costs charged by the custodian.
Security transactions – Security transactions are accounted for on the trade date. Realized gains and losses on securities sold are determined on a specific identification basis.
Distributions to shareholders – Distributions to shareholders arising from net investment income and net realized capital gains, if any, are declared and paid at least once each year. The amount of distributions from net investment income and net realized capital gains are determined in accordance with federal income tax regulations, which may differ from GAAP. These “book/tax” differences are permanent in nature and are primarily due to differing treatments of net short-term gains. The tax character of distributions paid by the Funds during the periods ended April 30, 2017 and October 31, 2016 was as follows:
| | Periods
Ended | | Ordinary
Income | | | Long-Term
Capital Gains | | | Total
Distributions | |
| TFS Market Neutral Fund | 4/30/2017 | | $ | — | | | $ | — | | | $ | — | |
| | 10/31/2016 | | $ | 1,589,812 | | | $ | 26,857,357 | | | $ | 28,447,169 | |
| TFS Small Cap Fund | 4/30/2017 | | $ | 3,603,011 | | | $ | 855,500 | | | $ | 4,458,511 | |
| | 10/31/2016 | | $ | 2,778,851 | | | $ | 1,678,412 | | | $ | 4,457,263 | |
There were no distributions paid to shareholders by TFS Hedged Futures Fund during the periods ended April 30, 2017 and October 31, 2016.
Short positions – The Funds may sell securities short. For financial statement purposes, an amount equal to the settlement amount is included in the Statements of Assets and Liabilities as an asset and an equivalent liability is then subsequently marked-to-market daily to reflect the current value of the short position. Subsequent fluctuations in the market prices of securities sold, but not yet purchased, may require purchasing the securities at prices which may differ from the market value reflected on the Statements of Assets and Liabilities. The Funds are liable for any dividends payable on securities while those securities are in a short position and will also bear other costs, such as charges for the prime brokerage accounts, in connection with the short positions. These costs are reported as brokerage expense on securities sold short in the Statements of Operations. As collateral for its short positions, the Funds are required under the Investment Company Act of 1940, as amended, (“1940 Act”) to maintain assets consisting of cash, cash equivalents or liquid securities equal to the market value of the securities sold short. The deposits with brokers for securities sold short are reported on the Statements of Assets and Liabilities. The amount of
56
TFS CAPITAL INVESTMENT TRUST
NOTES TO FINANCIAL STATEMENTS (Continued)
the collateral is required to be adjusted daily to reflect changes in the value of the securities sold short. TFS Market Neutral Fund and TFS Hedged Futures Fund both engage in short selling as a principal investment strategy while TFS Small Cap Fund does not. TFS Small Cap Fund currently intends to limit its exposure to short positions, if any, to 5% of its net assets. Short selling subjects a Fund to the potential for unlimited losses.
Option contracts – The Funds may use option contracts in any manner consistent with their investment objectives and as long as their use is consistent with relevant provisions of the 1940 Act. The Funds may use options for speculative investment purposes as well as for the purpose of seeking to reduce the overall investment risk that would otherwise be associated with the securities in which a Fund invests. When a Fund writes an option, an amount equal to the net premium (the premium less the commission) received by the Fund is recorded as a liability in the Fund’s Statement of Assets and Liabilities and is subsequently marked-to-market daily. Premiums received from writing options which expire are treated as realized gains. Premiums received from writing call options that are exercised increase the proceeds used to calculate the realized gain or loss on the sale of the security. Premiums received from writing put options that are exercised increase the basis of the security purchased. If a closing purchase transaction is used to terminate a Fund’s obligation on an option, a gain or loss will be realized, depending upon whether the price of the closing purchase transaction is more or less than the premium previously received on the option written.
Futures contracts – TFS Market Neutral Fund and TFS Hedged Futures Fund are subject to equity price risk, interest rate risk, foreign currency exchange rate risk, and commodity risk in the normal course of pursuing their investment objectives. These Funds may use futures contracts to gain exposure to or to hedge against changes in the value of equities, interest rates, foreign currencies or commodities. A futures contract represents a commitment for the future purchase or sale of an asset at a specified price on a specified date. When a Fund purchases or sells a futures contract, no price is paid to or received by the Fund upon the purchase or sale of the futures contract. Instead, the Fund is required to deposit in a segregated asset account an amount of cash or qualifying securities currently ranging from 5% to 15% of the contract amount. This is called the “initial margin deposit.” Subsequent payments, known as “variation margin,” are accumulated in a receivable or payable account by the Fund each day, depending on the daily fluctuations in the fair value of the underlying asset. The total of this account is received or paid by the Fund when the position is closed. The Fund recognizes an unrealized gain or loss equal to the daily variation margin. If market conditions change unexpectedly, the Fund may not achieve the anticipated benefits of the futures contracts and may realize a loss. The margin deposits for futures contracts and the variation margin receivable and/or payable are reported on the Statements of Assets and Liabilities.
Estimates – The preparation of financial statements in conformity with GAAP requires management to make estimates and assumptions that affect the reported amounts of assets and liabilities and disclosures of contingent assets and liabilities as of the date of the financial statements and the reported amounts of income and expenses during the reporting period. Actual results could differ from those estimates.
Common expenses – Common expenses of the Trust are allocated among the Funds based on the relative net assets of each Fund or the nature of the services performed and the relative applicability to each Fund.
57
TFS CAPITAL INVESTMENT TRUST
NOTES TO FINANCIAL STATEMENTS (Continued)
Foreign Currency Translation – Amounts denominated in or expected to settle in foreign currencies are translated into U.S. dollars based on exchange rates on the following basis:
| | A. | The value of investment securities and other assets and liabilities are translated at exchange rates as of the NYSE close each day. |
| | B. | Purchases and sales of investment securities and income and expenses are translated at the rate of exchange prevailing on the respective date of such transactions. |
| | C. | The Funds do not isolate that portion of the results of operations caused by changes in foreign exchange rates on investments from those caused by changes in market prices of securities held. Such fluctuations are included with the net realized and unrealized gains or losses on investments. |
Reported net realized foreign exchange gains or losses arise from 1) purchases and sales of foreign currencies, 2) currency gains or losses realized between the trade and settlement dates on securities transactions and 3) the difference between the amounts of dividends, interest and foreign withholding taxes recorded on a Fund’s books and the U.S. dollar equivalent of the amounts actually received or paid. Reported net unrealized foreign exchange gains and losses arise from changes in the value of assets and liabilities that result from changes in exchange rates.
Forward Foreign Currency Exchange Contracts – TFS Market Neutral Fund may use forward foreign currency exchange contracts to hedge exposure to foreign currency. TFS Hedged Futures Fund may invest in forward foreign currency exchange contracts for speculative purposes. When the Adviser believes that the currency of a particular country may produce positive returns against the currency of another country, each of those Funds may purchase or sell forward foreign currency exchange contracts to gain exposure to the differential in currency returns. All foreign currency exchange contracts are “marked-to-market” daily at the applicable translation rates resulting in unrealized gains or losses. Realized and unrealized gains or losses from transactions in foreign currency exchange contracts will be included in a Fund’s Statement of Assets and Liabilities and Statement of Operations. Risks associated with these contracts include the potential inability of counterparties to meet the terms of their contracts and unanticipated movements in the value of a foreign currency relative to the U.S. dollar.
Federal income tax – Each Fund has qualified and intends to continue to qualify as a “regulated investment company” under Subchapter M of the Internal Revenue Code of 1986, as amended, (the “Code”). Qualification generally will relieve the Funds of liability for federal income taxes to the extent 100% of their net investment income and net realized capital gains are distributed in accordance with the Code. Accordingly, no provision for income taxes has been made.
In order to avoid imposition of the federal excise tax applicable to regulated investment companies, it is also each Fund’s intention to declare as dividends in each calendar year at least 98% of its ordinary income (net investment income and specified gains and losses) and 98.2% of its net realized capital gains plus undistributed amounts from prior years.
58
TFS CAPITAL INVESTMENT TRUST
NOTES TO FINANCIAL STATEMENTS (Continued)
The following information is computed on a tax basis for each item as of April 30, 2017:
| | | TFS Market Neutral Fund | | | TFS Small
Cap Fund | | | TFS Hedged Futures Fund | |
| Tax cost of portfolio investments | | $ | 207,583,887 | | | $ | 62,813,302 | | | $ | 7,719,594 | |
| Gross unrealized appreciation | | $ | 14,152,695 | | | $ | 4,554,355 | | | $ | 136 | |
| Gross unrealized depreciation | | | (6,571,047 | ) | | | (2,081,691 | ) | | | (37 | ) |
| Net unrealized depreciation on investments | | $ | 7,581,648 | | | $ | 2,472,664 | | | $ | 99 | |
| Net unrealized appreciation on securities sold short | | $ | 11,504,319 | | | $ | — | | | $ | — | |
As of April 30, 2017, the tax proceeds from securities sold short is $191,800,505 for TFS Market Neutral Fund.
For the six months ended April 30, 2017, the following reclassifications were made as a result of permanent differences between financial statement and income tax reporting requirements:
| | | TFS Market Neutral Fund | | | TFS Small
Cap Fund | | | TFS Hedged Futures Fund | |
| Accumulated net investment income (loss) | | $ | (2 | ) | | $ | — | | | $ | 1,862 | |
| Accumulated net realized gains (losses) from securities transactions and other financial instruments | | | 2 | | | | — | | | | (1,862 | ) |
The following information is computed on a tax basis for each item as of October 31, 2016:
| | | TFS Market Neutral Fund | | | TFS Small
Cap Fund | | | TFS Hedged Futures Fund | |
| Tax cost of portfolio investments | | $ | 318,014,752 | | | $ | 66,943,371 | | | $ | 15,441,670 | |
| Gross unrealized appreciation | | $ | 10,956,686 | | | $ | 3,185,431 | | | $ | — | |
| Gross unrealized depreciation | | | (20,288,853 | ) | | | (3,679,010 | ) | | | (340,147 | ) |
| Net unrealized depreciation on investments | | | (9,332,167 | ) | | | (493,579 | ) | | | (340,147 | ) |
| Net unrealized appreciation on securities sold short | | | 27,661,181 | | | | — | | | | — | |
| Unrealized losses on foreign currency transactions | | | (1 | ) | | | — | | | | (3 | ) |
| Undistributed ordinary income | | | — | | | | 3,525,014 | | | | — | |
| Undistributed long term gains | | | — | | | | 855,438 | | | | — | |
| Accumulated capital and other losses | | | (28,934,535 | ) | | | — | | | | (687,616 | ) |
| Other temporary differences | | | (342,235 | ) | | | — | | | | — | |
| Accumulated earnings (deficit) | | $ | (10,947,757 | ) | | $ | 3,886,873 | | | $ | (1,027,766 | ) |
As of October 31, 2016, the tax proceeds from securities sold short is $278,613,509 for TFS Market Neutral Fund.
The difference between the federal income tax cost of portfolio investments and securities sold short and the financial statement cost for TFS Market Neutral Fund and TFS Small Cap Fund is due to certain timing differences in the recognition of capital gains or losses under GAAP. These “book/tax” differences are temporary in nature and are primarily due to the tax deferral of
59
TFS CAPITAL INVESTMENT TRUST
NOTES TO FINANCIAL STATEMENTS (Continued)
losses on wash sales. The difference between the federal income tax cost of investments and the financial statement cost for TFS Hedged Futures Fund is due to the tax treatment of the Fund’s wholly owned subsidiary as a controlled foreign corporation (CFC).
As of October 31, 2016, TFS Market Neutral Fund and TFS Hedged Futures Fund had the following capital loss carryforwards:
| | | TFS Market Neutral Fund | | | TFS Hedged Futures Fund | |
| Capital loss carryforward – short-term | | $ | — | | | $ | 176,238 | |
| Capital loss carryforward – long-term | | | 2,112,803 | | | | 282,599 | |
| Total capital loss carryforwards | | $ | 2,112,803 | | | $ | 458,837 | |
These capital loss carryforwards, which do not expire, may be utilized in the current and future years to offset net realized capital gains, if any, prior to distributing such gains to shareholders.
The Funds recognize tax benefits or expenses of uncertain tax positions only when the position is “more likely than not” to be sustained assuming examination by tax authorities. Management has reviewed the tax positions taken on federal income tax returns for the current and all open tax periods of each Fund (October 31, 2013 through October 31, 2016 for TFS Market Neutral Fund and TFS Small Cap Fund and December 31, 2013 through October 31, 2016 for TFS Hedged Futures Fund) and has concluded that no provision for unrecognized tax benefits or expenses is required in these financial statements and does not expect this to change over the next twelve months. Each Fund identifies its major tax jurisdiction as U.S. Federal.
3. Investment Transactions
During the six months ended April 30, 2017, cost of purchases and proceeds from sales of portfolio securities, other than short-term investments, U.S. government securities and short positions, amounted to $667,499,736 and $789,569,899, respectively, for TFS Market Neutral Fund; $212,992,866 and $225,934,123, respectively, for TFS Small Cap Fund; and $0 and $0, respectively, for TFS Hedged Futures Fund.
4. Transactions with Related Parties
INVESTMENT ADVISORY AGREEMENT
Each Fund’s investments are managed by the Adviser pursuant to the terms of an Investment Advisory Agreement. TFS Market Neutral Fund, TFS Small Cap Fund and TFS Hedged Futures Fund pay the Adviser an investment advisory fee, computed and accrued daily and paid monthly, at an annual rate of 1.65%, 1.15% and 1.50%, respectively, of average daily net assets.
The Adviser has contractually agreed to reduce its advisory fees and to absorb each Fund’s operating expenses (for the life of the Funds) to the extent necessary to limit other annual ordinary operating expenses (which do not include brokerage costs, taxes, borrowing costs such as interest and dividend expenses on securities sold short, Acquired Fund Fees and Expenses, and extraordinary expenses) to 1.90% of TFS Market Neutral Fund’s average daily net assets, 1.50% of TFS Small Cap Fund’s average daily net assets and 1.80% of TFS Hedged Futures Fund’s
60
TFS CAPITAL INVESTMENT TRUST
NOTES TO FINANCIAL STATEMENTS (Continued)
average daily net assets. During the six months ended April 30, 2017, the Adviser reduced its investment advisory fees by $127,423 with respect to TFS Market Neutral Fund and $59,628 with respect to TFS Small Cap Fund. During the six months ended April 30, 2017, the Adviser did not collect any of its advisory fees and, in addition, reimbursed other operating expenses totaling $16,951 with respect to TFS Hedged Futures Fund.
Advisory fee reductions and expense reimbursements by the Adviser are subject to repayment by the applicable Fund for a period of three years after such fees and expenses were incurred, provided that such repayments do not cause ordinary operating expenses to exceed the expense caps of 1.90%, 1.50% and 1.80% for TFS Market Neutral Fund, TFS Small Cap Fund and TFS Hedged Futures Fund, respectively. As of April 30, 2017, the Adviser may in the future recoup fee reductions and expense reimbursements totaling $1,197,631, $492,461 and $672,536 from TFS Market Neutral Fund, TFS Small Cap Fund and TFS Hedged Futures Fund, respectively. The Adviser may recapture these amounts no later than the dates as stated below:
| | | October 31,
2017 | | | October 31,
2018 | | | October 31,
2019 | | | April 30,
2020 | |
| TFS Market Neutral Fund | | $ | 205,839 | | | $ | 425,955 | | | $ | 438,414 | | | $ | 127,423 | |
| TFS Small Cap Fund | | $ | 42,687 | | | $ | 190,498 | | | $ | 199,648 | | | $ | 59,628 | |
| TFS Hedged Futures Fund | | $ | 82,519 | | | $ | 233,949 | | | $ | 231,846 | | | $ | 124,222 | |
Certain Trustees and officers of the Trust are also officers of the Adviser.
COMPLIANCE CONSULTING AGREEMENT
Under the terms of a Compliance Consulting Agreement, Drake Compliance, LLC (“Drake”) provides ongoing regulatory compliance consulting, monitoring and reporting services for the Trust. In addition, a principal of Drake serves as the Trust’s Chief Compliance Officer. Drake receives $5,000 per month from the Trust, of which each Fund pays its proportionate share. In addition, each Fund reimburses certain out-of-pocket expenses incurred by Drake, if any, including, but not limited to, postage and supplies and travel expenses.
OTHER SERVICE PROVIDERS
Ultimus Fund Solutions, LLC (“Ultimus”) provides administration, fund accounting, compliance and transfer agent services to the Funds. The Funds pay Ultimus fees in accordance with the agreements for such services. In addition, each Fund pays out-of-pocket expenses including, but not limited to, postage, supplies and costs of pricing portfolio securities. Certain officers of the Trust are also officers of Ultimus or of Ultimus Fund Distributors, LLC (the “Distributor”), the principal underwriter of each Fund’s shares and an affiliate of Ultimus. The Distributor is compensated by the Adviser (not the Funds) for acting as principal underwriter.
COMPENSATION OF TRUSTEES
Trustees and officers affiliated with the Adviser or Ultimus are not compensated by the Trust for their services. Each Trustee who is not an affiliated person of the Adviser or Ultimus receives from the Trust an annual retainer of $20,000, paid quarterly; a fee of $7,500 for attendance at each in-person meeting of the Board; a fee of $2,500 for attendance at each telephonic regular meeting of the Board; and a fee of $1,500 for attendance at each telephonic special meeting of the
61
TFS CAPITAL INVESTMENT TRUST
NOTES TO FINANCIAL STATEMENTS (Continued)
Board. The Chairman of the Audit Committee receives an additional fee of $1,000 for each Audit Committee meeting attended. The Funds reimburse each Trustee and officer for his or her travel and other expenses relating to attendance at Board or committee meetings.
TRANSACTIONS WITH AFFILIATED PERSONS
Rule 17a-7 is an exemptive rule under the Investment Company Act that permits purchase and sale transactions among affiliated investment companies, or between an investment company and a person that is affiliated solely by reason of having a common (or affiliated) investment adviser, common directors, and/or common officers. The Funds have policies and procedures pursuant to Rule 17a-7 to permit transactions between a Fund and an affiliated fund, subject to certain requirements. During the six months ended April 30, 2017, none of the Funds entered into any transactions with any other affiliated fund.
5. Derivatives Transactions
The derivative positions of TFS Hedged Futures Fund as of April 30, 2017 are recorded in the following locations in the Statements of Assets and Liabilities:
| Derivative Investment Type | Location |
| Futures contracts | Variation margin receivable (payable) |
The following tables set forth the values of derivative contracts of TFS Hedged Futures Fund as of April 30, 2017:
TFS Hedged Futures Fund
Futures Contracts | |
| | | Variation Margin | | | Total | |
| | | Receivable | | | (Payable) | |
| Asset Derivatives | | | | | | | | | |
| Futures Contracts | | | | | | | | | |
| Commodity | | $ | 138,236 | | | $ | (26,838 | ) | | $ | 111,398 | |
Total Asset Derivatives | | | 138,236 | | | | (26,838 | ) | | | 111,398 | |
| | | | | | | | | | | | | |
| Liability Derivatives | | | | | | | | | | | | |
| Futures Contracts | | | | | | | | | | | | |
| Commodity | | | 48,969 | | | | (10,119 | ) | | | 38,850 | |
| Total Liability Derivatives | | | 48,969 | | | | (10,119 | ) | | | 38,850 | |
| Total | | $ | 187,205 | | | $ | (36,957 | ) | | $ | 150,248 | |
Certain risks may arise upon entering into futures contracts from the potential inability of counterparties to meet the terms of their contracts. The maximum counterparty credit risk to the Funds is measured by the unrealized gain on appreciated contracts. No credit-risk-related contingent features exist for the futures contracts outstanding at April 30, 2017.
62
TFS CAPITAL INVESTMENT TRUST
NOTES TO FINANCIAL STATEMENTS (Continued)
Transactions in derivative instruments for TFS Market Neutral Fund and TFS Hedged Futures Fund during the six months ended April 30, 2017 are recorded in the following locations in the Statements of Operations:
| TFS Market Neutral Fund |
| Derivative Investment Type | Location |
| Futures contracts | Net realized gains (losses) from futures contracts |
| TFS Hedged Futures Fund | |
| Derivative Investment Type | Location |
| Futures contracts | Net realized gains (losses) from futures contracts |
| | Net change in unrealized appreciation (depreciation) on futures contracts |
The following is a summary of net realized gains (losses) and net change in unrealized appreciation (depreciation) on derivative instruments for TFS Market Neutral Fund and TFS Hedged Futures Fund recognized in the Statements of Operations during the six months ended April 30, 2017:
| Type of Derivative | | Net Realized
Gains (Losses) | | | Net Change in Unrealized Appreciation (Depreciation) | |
| TFS Market Neutral Fund | | | | | | |
| Futures contracts | | | | | | |
Financial | | $ | 1,412,577 | | | $ | — | |
| | | | | | | | | |
Total | | $ | 1,412,577 | | | $ | — | |
| TFS Hedged Futures Fund | | | | | | | | |
| Futures contracts | | | | | | | | |
Commodity | | $ | (457,553 | ) | | $ | 79,902 | |
Financial | | | 460,526 | | | | 2,882 | |
Total | | $ | 2,973 | | | $ | 82,784 | |
TFS Small Cap Fund had no transactions in derivative instruments during the six months ended April 30, 2017.
In the ordinary course of business, TFS Market Neutral Fund and TFS Hedged Futures Fund may enter into transactions subject to enforceable netting agreements or other similar arrangements (“netting agreements”). Generally, the right to offset in netting agreements allows the Funds to offset any exposure to a specific counterparty with any collateral received or delivered to that counterparty based on the terms of the agreements. Generally, the Funds manage their cash collateral securities and securities collateral on a counterparty basis.
63
TFS CAPITAL INVESTMENT TRUST
NOTES TO FINANCIAL STATEMENTS (Continued)
As of April 30, 2017, the offsetting of financial assets and derivatives assets is as follows:
| TFS Hedged Futures Fund | |
| Description | | Gross Amounts of Recognized Assets | | | Gross Amounts Offset in Statements of Assets and Liabilities | | | Net Amounts of Assets Presented in Statements of Assets and Liabilities | | | Collateral Pledged | | | Net Amount | |
| Variation margin receivable - futures contracts | | $ | 187,205 | | | $ | — | | | $ | 187,205 | | | $ | — | | | $ | 187,205 | |
| Total subject to a master netting or similar arrangement | | $ | 187,205 | | | $ | — | | | $ | 187,205 | | | $ | — | | | $ | 187,205 | |
Offsetting of financial liabilities and derivative liabilities as of April 30, 2017 is as follows:
| TFS Hedged Futures Fund | |
| Description | | Gross Amounts of Recognized Liabilities | | | Gross Amounts Offset in Statements of Assets and Liabilities | | | Net Amounts of Liabilities Presented in Statements of Assets and Liabilities | | | Collateral Pledged | | | Net Amount | |
| Variation margin payable - futures contracts | | $ | (36,957 | ) | | $ | — | | | $ | (36,957 | ) | | $ | — | | | $ | (36,957 | ) |
| Total subject to a master netting or similar arrangement | | $ | (36,957 | ) | | $ | — | | | $ | (36,957 | ) | | $ | — | | | $ | (36,957 | ) |
6. Certain Investments and Risks
The securities in which the Funds invest, as well as the risks associated with these securities and with the investment programs of the Funds, are described in the Funds’ Prospectuses. Among these risks are those associated with investments in derivative instruments and investments in shares of money market mutual funds.
Risks of Derivative Instruments – The use of derivative instruments, including futures contracts, requires special skills and knowledge of investment techniques that are different than those normally required for purchasing and selling common stock. If the Adviser uses a derivative instrument at the wrong time or incorrectly identifies market conditions, or if the derivative instrument does not perform as expected, these strategies may significantly reduce the Fund’s return. In addition, the Fund may be unable to close out a position because the market for a futures contract may become illiquid.
64
TFS CAPITAL INVESTMENT TRUST
NOTES TO FINANCIAL STATEMENTS (Continued)
Investments in Money Market Funds – In order to maintain sufficient liquidity to implement investment strategies, or for temporary defensive purposes, each Fund may invest a significant portion of its assets in shares of one or more money market mutual funds. An investment in a money market mutual fund is not insured or guaranteed by the Federal Deposit Insurance Corporation or any other governmental agency, entity or person. While investor losses in money market mutual funds have been rare, they have occurred. In addition, indirect expenses will be incurred due to acquired fund fees and other costs to the extent of the investment in shares of money market mutual funds. As of April 30, 2017, TFS Hedged Futures Fund had 44.5% of the value of its net assets invested in shares of money market mutual funds registered under the 1940 Act. As of April 30, 2017, TFS Market Neutral Fund and TFS Small Cap Fund did not have a significant portion of their net assets invested in shares of money market mutual funds.
7. Contingencies and Commitments
The Funds indemnify the Trust’s officers and Trustees for certain liabilities that might arise from their performance of their duties to the Funds. Additionally, in the normal course of business the Funds enter into contracts that contain a variety of representations and warranties and which provide general indemnifications. The Funds’ maximum exposure under these arrangements is unknown, as this would involve future claims that may be made against the Funds that have not yet occurred. However, based on experience, the Funds expect the risk of loss to be remote.
8. Subsequent Events
The Funds are required to recognize in the financial statements the effects of all subsequent events that provide additional evidence about conditions that existed as of the date of the Statements of Assets and Liabilities. For non-recognized subsequent events that must be disclosed to keep the financial statements from being misleading, the Funds are required to disclose the nature of the event as well as an estimate of its financial effect, or a statement that such an estimate cannot be made. Management has evaluated subsequent events through the issuance of these financial statements and has noted no such events.
65
TFS CAPITAL INVESTMENT TRUST
ABOUT YOUR FUNDS’ EXPENSES (Unaudited)
We believe it is important for you to understand the impact of costs on your investment. As a shareholder of the Funds, you incur two types of costs: (1) transaction costs and (2) ongoing costs, including management fees and other Fund expenses. The following examples are intended to help you understand your ongoing costs (in dollars) of investing in the Funds and to compare these costs with the ongoing costs of investing in other mutual funds.
A mutual fund’s ongoing costs are expressed as a percentage of its average net assets. This figure is known as the expense ratio. The ongoing costs reflected in the table are based on an investment of $1,000 made at the beginning of the most recent semi-annual period (November 1, 2016) and held until the end of the period (April 30, 2017).
The table below illustrates each Fund’s ongoing costs in two ways:
Actual fund return – This section helps you to estimate the actual expenses that you paid over the period. The “Ending Account Value” shown is derived from each Fund’s actual return, and the fourth column shows the dollar amount of operating expenses that would have been paid by an investor who started with $1,000 in the Funds. You may use the information here, together with the amount you invested, to estimate the expenses that you paid over the period.
To do so, simply divide your account value by $1,000 (for example, an $8,600 account value divided by $1,000 = 8.6), then multiply the result by the number given for the Funds under the heading “Expenses Paid During Period.”
Hypothetical 5% return – This section is intended to help you compare each Fund’s ongoing costs with those of other mutual funds. It assumes that each Fund had an annual return of 5% before expenses during the period shown, but that the expense ratio is unchanged. In this case, because the return used is not each Fund’s actual return, the results do not apply to your investment. The example is useful in making comparisons because the SEC requires all mutual funds to calculate expenses based on a 5% return. You can assess each Fund’s ongoing costs by comparing this hypothetical example with the hypothetical examples that appear in shareholder reports of other funds.
Note that expenses shown in the table are meant to highlight and help you compare ongoing costs only. The calculations below assume no shares were bought or sold during the period. Your actual costs may have been higher or lower, depending on the amount of your investment and the timing of any purchases or redemptions.
More information about each Fund’s expenses, including annual expense ratios, can be found in this report. For additional information on operating expenses and other shareholder costs, please refer to each Fund’s summary prospectus.
66
TFS CAPITAL INVESTMENT TRUST
ABOUT YOUR FUNDS’ EXPENSES (Unaudited) (Continued)
| | Beginning
Account Value
November 1, 2016 | Ending
Account Value
April 30, 2017 | Net
Expense Ratio(a) | Expenses Paid
During Period(b) |
| TFS Market Neutral Fund | | | | |
| Based on Actual Fund Return | $ 1,000.00 | $ 1,052.90 | 6.63% | $ 33.75 |
| Based on Hypothetical 5% Return (before expenses) | $ 1,000.00 | $ 991.92 | 6.63% | $ 32.74 |
| TFS Small Cap Fund | | | | |
| Based on Actual Fund Return | $ 1,000.00 | $ 1,184.30 | 1.50% | $ 8.12 |
| Based on Hypothetical 5% Return (before expenses) | $ 1,000.00 | $ 1,017.36 | 1.50% | $ 7.50 |
| TFS Hedged Futures Fund | | | | |
| Based on Actual Fund Return | $ 1,000.00 | $ 1,001.90 | 1.80% | $ 8.93 |
| Based on Hypothetical 5% Return (before expenses) | $ 1,000.00 | $ 1,015.87 | 1.80% | $ 9.00 |
(a) | Annualized, based on the Fund’s most recent one-half year expenses. |
(b) | Expenses are equal to each Fund’s annualized net expense ratio multiplied by the average account value over the period, multiplied by 181/365 (to reflect the one-half year period). |
67
TFS CAPITAL INVESTMENT TRUST
OTHER INFORMATION (Unaudited)
A description of the policies and procedures that the Funds use to determine how to vote proxies relating to portfolio securities is available without charge upon request by calling toll-free 1-888-534-2001, or on the SEC’s website at http://www.sec.gov. Information regarding how the Funds voted proxies relating to portfolio securities during the most recent 12-month period ended June 30 is also available without charge upon request by calling toll-free 1-888-534-2001, or on the SEC’s website at http://www.sec.gov.
The Funds file a complete listing of portfolio holdings with the SEC as of the end of the first and third quarters of each fiscal year on Form N-Q. The filings are available upon request, by calling 1-888-534-2001. Furthermore, you may obtain copies of the filings on the SEC’s website at http://www.sec.gov. The Funds’ Forms N-Q may also be reviewed and copied at the SEC’s Public Reference Room in Washington, DC, and information on the operation of the Public Reference Room may be obtained by calling 1-800-SEC-0330.
The net asset values for the Funds are published daily at the Funds’ website at http://www.tfscapital.com.
68
| PRIVACY NOTICE |
| FACTS | WHAT DOES THE TFS CAPITAL INVESTMENT TRUST DO WITH YOUR PERSONAL INFORMATION? |
| | |
| Why? | Financial companies choose how they share your personal information. Federal law gives consumers the right to limit some but not all sharing. Federal law also requires us to tell you how we collect, share, and protect your personal information. Please read this notice carefully to understand what we do. |
| | |
| What? | The types of personal information we collect and share depend on the product or service you have with us. This information can include: § Social Security number § Assets § Retirement Assets § Transaction History § Checking Account Information § Purchase History § Account Balances § Account Transactions § Wire Transfer Instructions When you are no longer our customer, we continue to share your information as described in this notice. |
| | |
| How? | All financial companies need to share your personal information to run their everyday business. In the section below, we list the reasons financial companies can share their customers’ personal information; the reasons the TFS Capital Investment Trust chooses to share; and whether you can limit this sharing. |
| | |
| Reasons we can share your personal information | Does the TFS Capital Investment Trust share? | Can you limit this sharing? |
For our everyday business purposes – Such as to process your transactions, maintain your account(s), respond to court orders and legal investigations, or report to credit bureaus | Yes | No |
For our marketing purposes – to offer our products and services to you | No | We don’t share |
| For joint marketing with other financial companies | No | We don’t share |
For our affiliates’ everyday business purposes – information about your transactions and experiences | No | We don’t share |
For our affiliates’ everyday business purposes – information about your creditworthiness | No | We don’t share |
| For nonaffiliates to market to you | No | We don’t share |
| | |
| Questions? | Call 1-888-534-2001 |
The registrant has not adopted procedures by which shareholders may recommend nominees to the registrant’s board of trustees.
(a) Based on their evaluation of the registrant’s disclosure controls and procedures (as defined in Rule 30a-3(c) under the Investment Company Act of 1940) as of a date within 90 days of the filing date of this report, the registrant’s principal executive officer and principal financial officer have concluded that such disclosure controls and procedures are reasonably designed and are operating effectively to ensure that material information relating to the registrant, including its consolidated subsidiaries, is made known to them by others within those entities, particularly during the period in which this report is being prepared, and that the information required in filings on Form N-CSR is recorded, processed, summarized, and reported on a timely basis.
(b) There were no changes in the registrant’s internal control over financial reporting (as defined in Rule 30a-3(d) under the Investment Company Act of 1940) that occurred during the second fiscal quarter of the period covered by this report that have materially affected, or are reasonably likely to materially affect, the registrant’s internal control over financial reporting.
File the exhibits listed below as part of this Form. Letter or number the exhibits in the sequence indicated.
(a)(1) Any code of ethics, or amendment thereto, that is the subject of the disclosure required by Item 2, to the extent that the registrant intends to satisfy the Item 2 requirements through filing of an exhibit: Not required
(a)(2) A separate certification for each principal executive officer and principal financial officer of the registrant as required by Rule 30a-2(a) under the Act (17 CFR 270.30a-2(a)): Attached hereto
(a)(3) Any written solicitation to purchase securities under Rule 23c-1 under the Act (17 CFR 270.23c-1) sent or given during the period covered by the report by or on behalf of the registrant to 10 or more persons: Not applicable
(b) Certifications required by Rule 30a-2(b) under the Act (17 CFR 270.30a-2(b)): Attached hereto
Pursuant to the requirements of the Securities Exchange Act of 1934 and the Investment Company Act of 1940, the registrant has duly caused this report to be signed on its behalf by the undersigned, thereunto duly authorized.