Washington, D.C. 20549
Wade R. Bridge, Esq.
Form N-CSR is to be used by management investment companies to file reports with the Commission not later than 10 days after the transmission to stockholders of any report that is required to be transmitted to stockholders under Rule 30e-1 under the Investment Company Act of 1940 (17 CFR 270.30e-1). The Commission may use the information provided on Form N-CSR in its regulatory, disclosure review, inspection, and policymaking roles.
A registrant is required to disclose the information specified by Form N-CSR, and the Commission will make this information public. A registrant is not required to respond to the collection of information contained in Form N-CSR unless the Form displays a currently valid Office of Management and Budget ("OMB") control number. Please direct comments concerning the accuracy of the information collection burden estimate and any suggestions for reducing the burden to the Secretary, Securities and Exchange Commission, 450 Fifth Street, NW, Washington, DC 20549-0609. The OMB has reviewed this collection of information under the clearance requirements of 44 U.S.C. § 3507.
SEMI-ANNUAL REPORT
April 30, 2016
(Unaudited)
For more information or assistance in opening an account,
please call toll-free 1-888-534-2001.
LETTER TO SHAREHOLDERS
June 15, 2016
Dear Shareholder,
Enclosed is the Semi-Annual Report to shareholders of the TFS Market Neutral Fund (ticker: TFSMX), the TFS Small Cap Fund (ticker: TFSSX) and the TFS Hedged Futures Fund (ticker: TFSHX) for the six months ended April 30, 2016. On behalf of the investment manager, TFS Capital LLC (“TFS Capital”), I would like to thank you for your continued investment.
Below you will find performance updates on each of the mutual funds.
TFS Market Neutral Fund (ticker: TFSMX)
| | 1-year
return | 3-year
return | 5-year
return | 10-year
return | Since Inception (9/7/2004) |
TFS Market Neutral Fund | -8.56% | -1.03% | -0.04% | 4.31% | 5.36% |
S&P 500® Index | 1.21% | 11.26% | 11.02% | 6.91% | 7.61% |
Average annual total returns for periods ended April 30, 2016. Past performance is not a guarantee of future results.
TFSMX produced significantly negative alpha (i.e., the return that cannot be explained by a fund’s market exposure) overall during the first half of the fiscal year, and returned negative alpha for 4 out of the 6 months of the period. The loss of alpha was broadly spread across most strategies and most sectors in our small cap models. Strategies outside of small cap stocks generally performed well, but the Fund’s focus on small cap stocks limited their impact on performance.
Since inception, TFSMX has produced positive alpha, with lower volatility and market exposure than the S&P 500® Index. From inception through April 30, 2016, TFSMX has had an average annual return of 5.36%, as compared to S&P 500® Index performance during the same period of 7.61%. During this period, the Fund’s beta was 23%. This means that the Fund performed as if 23% of it was allocated to the market. In addition, during this time period, the Fund’s average annual volatility measure was 7.51%, compared to S&P 500® Index volatility of 19.65%.
Since inception, the strategies used in managing TFSMX have resulted in its returns having a low correlation to other asset classes. According to Modern Portfolio Theory, portfolios may benefit by combining non-correlated investments. For your reference, below are the TFS Market Neutral Fund’s correlations to several other asset classes since inception. It is notable that correlation to the equity indices in recent years has risen, as compared to historical averages.
Index | Correlation Since Inception |
S&P 500® Index | 0.60 |
Russell 2000® Index | 0.58 |
MSCI EAFE Index | 0.46 |
Barclays U.S. Aggregate Bond Index | (0.16) |
Dow Jones Equity REIT Total Index | 0.42 |
Bloomberg Commodity Index | 0.39 |
1
TFS Small Cap Fund (ticker: TFSSX)
| | 1-year
return | 3-year
return | 5-year
return | 10-year
return | Since Inception (3/7/2006) |
TFS Small Cap Fund | -8.04% | 8.78% | 8.12% | 9.36% | 9.98% |
Russell 2000® Index | -5.94% | 7.53% | 6.98% | 5.42% | 5.97% |
Average annual total returns for periods ended April 30, 2016. Past performance is not a guarantee of future results.
During the six month period ended April 30, 2016, TFSSX underperformed its benchmark, the Russell 2000® Index. TFSSX’s returns were heavily impacted by the movement of the U.S. “small-cap” equity sector as evidenced by comparing the return of TFSSX and its benchmark return (i.e., -2.28% versus -1.90%. respectively) during this period. Given its “long-only” mandate, TFSSX is expected to have a high correlation to U.S. small-cap equity market movements with any performance deviation generally attributable to TFS Capital’s equity selection.
However, TFSSX achieved its objective of outperforming the Russell 2000® Index over longer periods of time. In fact, it now has over a 10-year track record and has achieved an average annual return since inception that is four percentage points higher than that of the Russell 2000® Index.
TFS Hedged Futures Fund (ticker: TFSHX)
| | 1-year
return | 3-year
return | Since Inception (12/29/2011) |
TFS Hedged Futures Fund | 6.34% | 0.67% | 1.85% |
Diversified Trends Indicator® | -1.42% | 2.23% | -1.96% |
S&P 500® Index | 1.21% | 11.02% | 14.42% |
Average annual returns for periods ended April 30, 2016. Past performance is not a guarantee of future results.
During the 6-month period ended April 30, 2016, TFSHX appreciated by 6.34%. Performance during the six month period exceeded the Diversified Trends Indicator® (the “DTI®”), a commonly-used benchmark for managed-futures funds. Returns in the Fund’s volatility carry strategies were positive, helping performance; these strategies are not employed by the DTI®. Since inception, TFSHX has produced a positive return, while the DTI® has produced a negative return over the same period. Though the S&P 500® Index is not generally considered an appropriate benchmark for managed-futures funds, it is provided above for your reference.
2
Like the TFS Market Neutral Fund, the TFS Hedged Futures Fund has demonstrated a low correlation to many market indices. This low correlation suggests the addition of the TFS Hedged Futures Fund may improve the risk-adjusted performance of many investment portfolios. The TFS Hedged Futures Fund has had a slightly negative correlation to the Diversified Trends Indicator®, which suggests that it may also have a low correlation to other managed-futures funds that employ trend-following strategies. For your reference, below are the TFS Hedged Futures Fund’s correlations to several other asset classes.
Index | Correlation Since Inception |
Diversified Trends Indicator® | (0.02) |
S&P 500® Index | 0.12 |
Russell 2000® Index | 0.15 |
S&P GSCI Index | (0.02) |
Barclays U.S. Aggregate Bond Index | (0.04) |
Bloomberg Commodity Index | 0.02 |
As always, we do not recommend allocating a high percentage of one’s assets to any one investment fund managed by TFS Capital given the risks inherent in each product. Rather, we believe that they are best used as a component of a diversified portfolio of investments. If you have any questions regarding this material, please contact us.
Best regards,
Eric Newman
Chief Investment Officer & Co-Portfolio Manager
TFS Capital LLC
The performance data quoted represents past performance, which is not a guarantee of future results. Current performance may be lower or higher than the performance data quoted. The investment return and principal value of an investment in the mutual funds discussed in this report (the “Funds”) will fluctuate so that an investor’s shares, when redeemed, may be worth more or less than their original cost. Fee reductions and/or expense reimbursements by the Adviser have positively impacted the Funds’ performance. Without such reductions and/or reimbursements, performance would have been lower. An investor should consider the investment objectives, risks, charges and expenses of the Funds carefully before investing. To obtain a summary prospectus and/or prospectus, which each contain this and other important information, go to www.TFSCapital.com or call (888) 534-2001. Please read the summary prospectus and/or prospectus carefully before investing. The Funds may not be suitable for all investors. Futures investing is speculative. Each Fund’s current NAV per share is available at www.TFSCapital.com.
3
TFS MARKET NEUTRAL FUND
PORTFOLIO INFORMATION
April 30, 2016 (Unaudited)
Common Stocks vs.
the S&P 500® Index Net Sector Exposure*
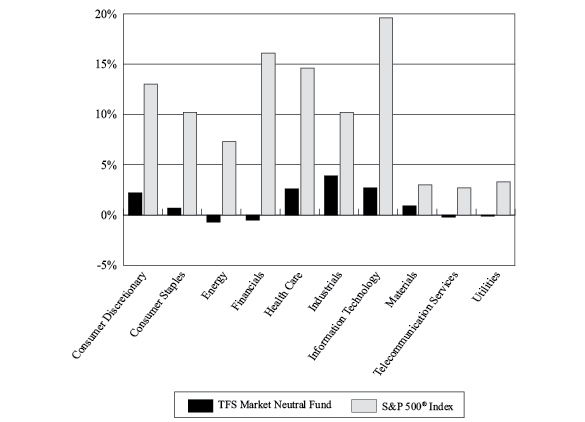
* | The net percentages for TFS Market Neutral Fund are computed by taking the net dollar exposure, including short positions, and dividing by the net assets of the Fund. Consequently, the percentages will not total to 100%. |
Top 10 Long Common Stocks | | Top 10 Short Common Stocks |
Security Description | % of
Net Assets | | Security Description | % of
Net Assets |
Archrock, Inc. | 0.53% | | Cliffs Natural Resources, Inc. | 0.53% |
Avon Products, Inc. | 0.40% | | Basic Energy Services, Inc. | 0.46% |
PDL BioPharma, Inc. | 0.39% | | OPOWER, Inc. | 0.43% |
Magellan Health, Inc. | 0.38% | | Lindsay Corporation | 0.43% |
Triple-S Management Corporation - Class B | 0.38% | | Solazyme, Inc. | 0.42% |
Tribune Publishing Company | 0.38% | | Rockwell Medical, Inc. | 0.42% |
QEP Resources, Inc. | 0.38% | | Conn's, Inc. | 0.42% |
HMS Holdings Corporation | 0.38% | | Straight Path Communications, Inc. - Class B | 0.41% |
Heska Corporation | 0.37% | | AAC Holdings, Inc. | 0.41% |
Ply Gem Holdings, Inc. | 0.37% | | Ebix, Inc. | 0.41% |
4
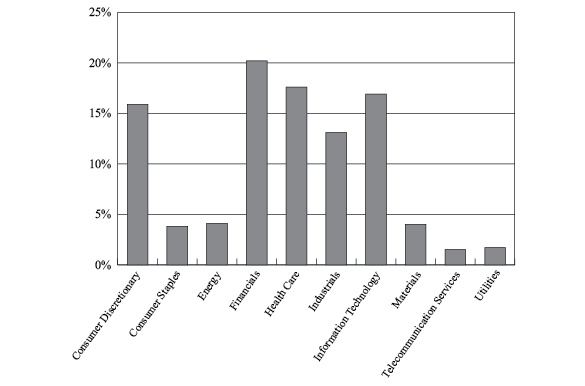
TFS SMALL CAP FUND
PORTFOLIO INFORMATION
April 30, 2016 (Unaudited)
Sector Allocation (% of Net Assets)
Top 10 Equity Positions |
Security Description | % of
Net Assets |
Archrock, Inc. | 0.68% |
INC Research Holdings, Inc. - Class A | 0.61% |
Magellan Health, Inc. | 0.61% |
AMC Entertainment Holdings, Inc. - Class A | 0.53% |
Parkway Properties, Inc. | 0.51% |
Masimo Corporation | 0.51% |
Comtech Telecommunications Corporation | 0.50% |
Isle of Capri Casinos, Inc. | 0.50% |
Cynosure, Inc. - Class A | 0.49% |
La-Z-Boy, Inc. | 0.49% |
5
TFS HEDGED FUTURES FUND
PORTFOLIO INFORMATION
April 30, 2016 (Unaudited)
Exposure by Type of Futures Contract
(Notional Value as a % of Net Assets)
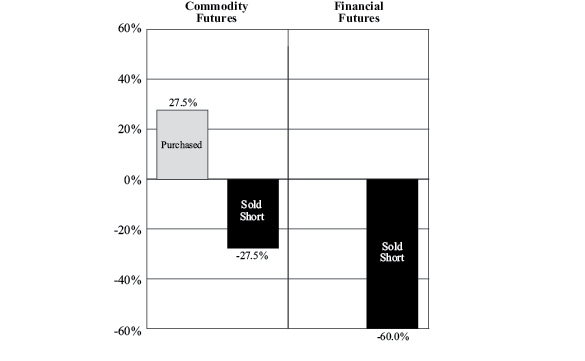
Net Exposure by Type of Futures Contract
(Net as a % of Net Assets) |
Net Commodity Futures Exposure | 0.0% |
Net Financial Futures Exposure | -60.0% |
6
TFS MARKET NEUTRAL FUND
SUMMARY SCHEDULE OF INVESTMENTS*
April 30, 2016 (Unaudited) | |
COMMON STOCKS — 92.3% | | Shares | | | Value | |
Consumer Discretionary — 15.1% | | | | | | |
Barnes & Noble, Inc. (a) | | | 140,865 | | | $ | 1,655,164 | |
Carrols Restaurant Group, Inc. (b) | | | 117,585 | | | | 1,635,607 | |
Genesco, Inc. (b) | | | 24,549 | | | | 1,698,300 | |
Isle of Capri Casinos, Inc. (a)(b) | | | 111,088 | | | | 1,655,211 | |
K12, Inc. (a)(b) | | | 145,081 | | | | 1,783,046 | |
Overstock.com, Inc. (a)(b) | | | 123,126 | | | | 1,796,408 | |
Tribune Publishing Company (a) | | | 180,687 | | | | 2,047,184 | |
Other Consumer Discretionary (c) | | | | | | | 69,431,105 | |
| | | | | | | | 81,702,025 | |
Consumer Staples — 3.4% | | | | | | | | |
Avon Products, Inc. (a) | | | 454,895 | | | | 2,142,555 | |
Seneca Foods Corporation - Class A (a)(b) | | | 57,044 | | | | 1,859,064 | |
Other Consumer Staples (c) | | | | | | | 14,446,653 | |
| | | | | | | | 18,448,272 | |
Energy — 6.8% | | | | | | | | |
Archrock, Inc. | | | 289,861 | | | | 2,855,131 | |
Delek US Holdings, Inc. (a) | | | 102,265 | | | | 1,624,991 | |
PDC Energy, Inc. (b) | | | 30,679 | | | | 1,926,334 | |
QEP Resources, Inc. (a) | | | 114,028 | | | | 2,044,522 | |
TETRA Technologies, Inc. (a)(b) | | | 266,146 | | | | 1,916,251 | |
Other Energy (c) | | | | | | | 26,340,495 | |
| | | | | | | | 36,707,724 | |
Financials — 9.4% | | | | | | | | |
Enova International, Inc. (b) | | | 195,428 | | | | 1,721,721 | |
Other Financials (c) | | | | | | | 49,369,906 | |
| | | | | | | | 51,091,627 | |
Health Care — 22.1% | | | | | | | | |
Acceleron Pharma, Inc. (a)(b) | | | 58,722 | | | | 1,758,724 | |
BioSpecifics Technologies Corporation (a)(b) | | | 45,167 | | | | 1,606,138 | |
Cantel Medical Corporation (a) | | | 24,999 | | | | 1,674,683 | |
Collegium Pharmaceutical, Inc. (a)(b) | | | 96,176 | | | | 1,833,115 | |
Cynosure, Inc. - Class A (a)(b) | | | 37,601 | | | | 1,840,193 | |
Five Prime Therapeutics, Inc. (a)(b) | | | 37,198 | | | | 1,770,253 | |
Genomic Health, Inc. (a)(b) | | | 62,293 | | | | 1,637,060 | |
Heska Corporation (a)(b) | | | 66,027 | | | | 2,020,426 | |
HMS Holdings Corporation (a)(b) | | | 120,226 | | | | 2,030,617 | |
Infinity Pharmaceuticals, Inc. (a)(b) | | | 311,962 | | | | 1,809,380 | |
Invacare Corporation (a) | | | 147,273 | | | | 1,655,349 | |
Magellan Health, Inc. (a)(b) | | | 29,121 | | | | 2,051,866 | |
Masimo Corporation (a)(b) | | | 41,507 | | | | 1,799,328 | |
Orthofix International N.V. (a)(b) | | | 45,465 | | | | 1,989,548 | |
PDL BioPharma, Inc. (a) | | | 562,578 | | | | 2,120,919 | |
Prestige Brands Holdings, Inc. (a)(b) | | | 28,205 | | | | 1,601,480 | |
7
TFS MARKET NEUTRAL FUND
SUMMARY SCHEDULE OF INVESTMENTS* (Continued) | |
COMMON STOCKS — 92.3% (Continued) | | Shares | | | Value | |
Health Care — 22.1% (Continued) | | | | | | |
Rigel Pharmaceuticals, Inc. (a)(b) | | | 616,178 | | | $ | 1,743,784 | |
Sagent Pharmaceuticals, Inc. (a)(b) | | | 149,261 | | | | 1,737,398 | |
Triple-S Management Corporation - Class B (a)(b) | | | 78,690 | | | | 2,049,088 | |
Other Health Care (c) | | | | | | | 84,571,375 | |
| | | | | | | | 119,300,724 | |
Industrials — 13.4% | | | | | | | | |
Babcock & Wilcox Enterprises, Inc. (a)(b) | | | 82,205 | | | | 1,878,384 | |
Harsco Corporation (a) | | | 249,661 | | | | 1,770,096 | |
Ply Gem Holdings, Inc. (a)(b) | | | 136,292 | | | | 1,996,678 | |
SkyWest, Inc. (a) | | | 77,764 | | | | 1,827,454 | |
SPX Corporation (a) | | | 113,892 | | | | 1,833,661 | |
YRC Worldwide, Inc. (a)(b) | | | 184,098 | | | | 1,693,702 | |
Other Industrials (c) | | | | | | | 61,704,689 | |
| | | | | | | | 72,704,664 | |
Information Technology — 15.8% | | | | | | | | |
Autobytel, Inc. (a)(b) | | | 100,551 | | | | 1,669,147 | |
Black Box Corporation (a) | | | 116,823 | | | | 1,707,952 | |
EarthLink Holdings Corporation (a) | | | 324,470 | | | | 1,885,171 | |
Hutchinson Technology, Inc. (a)(b) | | | 454,061 | | | | 1,657,323 | |
Insight Enterprises, Inc. (a)(b) | | | 78,942 | | | | 1,950,657 | |
Mentor Graphics Corporation (a) | | | 80,816 | | | | 1,613,087 | |
Rackspace Hosting, Inc. (a)(b) | | | 69,894 | | | | 1,598,476 | |
Rubicon Project, Inc. (The) (b) | | | 94,029 | | | | 1,821,342 | |
Unisys Corporation (a)(b) | | | 228,748 | | | | 1,763,647 | |
Other Information Technology (c) | | | | | | | 69,984,267 | |
| | | | | | | | 85,651,069 | |
Materials — 4.3% | | | | | | | | |
SunCoke Energy, Inc. (a) | | | 246,985 | | | | 1,835,099 | |
Other Materials (c) | | | | | | | 21,587,252 | |
| | | | | | | | 23,422,351 | |
Telecommunication Services — 1.5% | | | | | | | | |
IDT Corporation - Class B (a) | | | 104,399 | | | | 1,601,481 | |
Other Telecommunication Services (c) | | | | | | | 6,173,048 | |
| | | | | | | | 7,774,529 | |
Utilities — 0.5% | | | | | | | | |
Other Utilities (c) | | | | | | | 2,724,398 | |
| | | | | | | | | |
Total Common Stocks (Cost $460,601,321) | | | | | | $ | 499,527,383 | |
8
TFS MARKET NEUTRAL FUND
SUMMARY SCHEDULE OF INVESTMENTS* (Continued) | |
INVESTMENT COMPANIES — 3.9% | | Shares | | Value | |
Other Investment Companies (Cost $19,221,251) (c) | | | | | | $ | 21,018,835 | |
| | |
WARRANTS — 0.0% | | Shares | | | Value | |
Imperial Holdings, Inc. (b) (d) (Cost $0) | | | 1,663 | | | $ | 0 | |
| | |
MONEY MARKET FUNDS — 0.1% | | Shares | | | Value | |
Federated Government Obligations Fund - Institutional Class, 0.21% (a) (e) | | | 104,582 | | | $ | 104,582 | |
UMB Money Market Fiduciary, 0.01% (a) (e) | | | 445,836 | | | | 445,836 | |
Total Money Market Funds (Cost $550,418) | | | | | | $ | 550,418 | |
| | | | | | | | | |
Total Investments at Value — 96.3% (Cost $480,372,990) | | | | | | $ | 521,096,636 | |
| | | | | | | | | |
Other Assets in Excess of Liabilities — 3.7% (f) | | | | | | | 20,004,486 | |
| | | | | | | | | |
Net Assets — 100.0% | | | | | | $ | 541,101,122 | |
* | A complete Schedule of Investments is available without charge upon request by calling toll-free 1-888-534-2001 or on the SEC’s website at http://www.sec.gov. |
| | |
(a) | All or a portion of the shares have been committed as collateral for open short positions. |
| | |
(b) | Non-income producing security. |
| | |
(c) | Represents issuers not identified as either a top 50 holding in terms of value and issues or issuers not exceeding 1% of net assets individually or in the aggregate, respectively, or not a fair-valued security as of April 30, 2016. |
| | |
(d) | Security has been valued at fair value pursuant to procedures adopted by and under the supervision of the Board of Trustees. The total value of such securities is $0 at April 30, 2016 representing 0.0% of net assets (Note 2). |
| | |
(e) | The rate shown is the 7-day effective yield as of April 30, 2016. |
| | |
(f) | Includes cash held as margin deposits for open short positions and futures contracts. |
| | |
See accompanying notes to financial statements. |
9
TFS MARKET NEUTRAL FUND
SCHEDULE OF SECURITIES SOLD SHORT
April 30, 2016 (Unaudited) | |
COMMON STOCKS — 80.8% | | Shares | | | Value | |
Consumer Discretionary — 12.9% | | | | | | |
Auto Components — 0.8% | | | | | | |
Ballard Power Systems, Inc. | | | 42,988 | | | $ | 68,781 | |
Dorman Products, Inc. | | | 8,974 | | | | 482,711 | |
Drew Industries, Inc. | | | 1,237 | | | | 80,195 | |
Federal Mogul Holdings Corporation | | | 74,018 | | | | 683,926 | |
Fox Factory Holding Corporation | | | 43,719 | | | | 756,776 | |
Gentex Corporation | | | 5,777 | | | | 92,663 | |
Motorcar Parts of America, Inc. | | | 19,368 | | | | 621,132 | |
Spartan Motors, Inc. | | | 56 | | | | 272 | |
Standard Motor Products, Inc. | | | 8,098 | | | | 287,560 | |
Strattec Security Corporation | | | 17,651 | | | | 933,738 | |
Visteon Corporation | | | 2,927 | | | | 233,194 | |
| | | | | | | | 4,240,948 | |
Automobiles — 0.1% | | | | | | | | |
Harley-Davidson, Inc. | | | 59 | | | | 2,822 | |
Kandi Technologies Group, Inc. | | | 37,723 | | | | 271,228 | |
Tesla Motors, Inc. | | | 338 | | | | 81,377 | |
Winnebago Industries, Inc. | | | 5,393 | | | | 116,705 | |
Workhorse Group, Inc. | | | 27,010 | | | | 208,787 | |
| | | | | | | | 680,919 | |
Distributors — 0.0% (a) | | | | | | | | |
Fenix Parts, Inc. | | | 18,261 | | | | 92,035 | |
LKQ Corporation | | | 170 | | | | 5,448 | |
Weyco Group, Inc. | | | 1,016 | | | | 28,489 | |
| | | | | | | | 125,972 | |
Diversified Consumer Services — 1.3% | | | | | | | | |
2U, Inc. | | | 51,259 | | | | 1,436,790 | |
Carriage Services, Inc. | | | 5,315 | | | | 129,845 | |
Collectors Universe, Inc. | | | 2,121 | | | | 36,884 | |
DeVry Education Group, Inc. | | | 15,023 | | | | 260,649 | |
Grand Canyon Education, Inc. | | | 20,681 | | | | 904,380 | |
H&R Block, Inc. | | | 4,271 | | | | 86,445 | |
ITT Educational Services, Inc. | | | 119,625 | | | | 257,194 | |
Liberty Tax, Inc. | | | 5,592 | | | | 66,824 | |
LifeLock, Inc. | | | 46,442 | | | | 540,585 | |
Matthews International Corporation - Class A | | | 3,145 | | | | 165,553 | |
Outerwall, Inc. | | | 37,751 | | | | 1,559,494 | |
Weight Watchers International, Inc. | | | 139,566 | | | | 1,807,380 | |
| | | | | | | | 7,252,023 | |
Hotels, Restaurants & Leisure — 2.8% | | | | | | | | |
Amaya, Inc. | | | 10,161 | | | | 139,511 | |
Belmond Ltd. - Class A | | | 6,653 | | | | 60,941 | |
Bob Evans Farms, Inc. | | | 593 | | | | 27,005 | |
10
TFS MARKET NEUTRAL FUND
SCHEDULE OF SECURITIES SOLD SHORT (Continued) | |
COMMON STOCKS — 80.8% (Continued) | | Shares | | | Value | |
Consumer Discretionary — 12.9% (Continued) | | | | | | |
Hotels, Restaurants & Leisure — 2.8% (Continued) | | | | | | |
Caesars Entertainment Corporation | | | 63,986 | | | $ | 437,024 | |
Chipotle Mexican Grill, Inc. | | | 216 | | | | 90,930 | |
Chuy's Holdings, Inc. | | | 1,523 | | | | 46,512 | |
ClubCorp Holdings, Inc. | | | 17,021 | | | | 227,230 | |
Del Frisco's Restaurant Group, Inc. | | | 12,167 | | | | 193,820 | |
Del Taco Restaurants, Inc. | | | 4,451 | | | | 40,282 | |
Diamond Resorts International, Inc. | | | 58,162 | | | | 1,233,616 | |
Dunkin' Brands Group, Inc. | | | 1,855 | | | | 86,257 | |
Empire Resorts, Inc. | | | 35,239 | | | | 586,025 | |
Good Times Restaurants, Inc. | | | 1,376 | | | | 4,252 | |
Habit Restaurants, Inc. (The) - Class A | | | 55,883 | | | | 936,040 | |
Interval Leisure Group, Inc. | | | 63,615 | | | | 898,244 | |
Intrawest Resorts Holdings, Inc. | | | 293 | | | | 2,532 | |
Jamba, Inc. | | | 104,047 | | | | 1,351,571 | |
Kona Grill, Inc. | | | 23,235 | | | | 309,490 | |
Las Vegas Sands Corporation | | | 152 | | | | 6,863 | |
Marriott Vacations Worldwide Corporation | | | 2,365 | | | | 148,144 | |
McDonald's Corporation | | | 133 | | | | 16,823 | |
Noodles & Company | | | 109,717 | | | | 1,223,345 | |
Papa Murphy's Holdings, Inc. | | | 143,041 | | | | 1,796,595 | |
Planet Fitness, Inc. - Class A | | | 63,035 | | | | 968,218 | |
Rave Restaurant Group, Inc. | | | 62 | | | | 309 | |
RCI Hospitality Holdings, Inc. | | | 4,730 | | | | 48,482 | |
Red Robin Gourmet Burgers, Inc. | | | 226 | | | | 14,658 | |
SeaWorld Entertainment, Inc. | | | 44,924 | | | | 895,335 | |
Shake Shack, Inc. - Class A | | | 35,161 | | | | 1,284,080 | |
Starwood Hotels & Resorts Worldwide, Inc. | | | 154 | | | | 12,609 | |
Town Sports International Holdings, Inc. | | | 9,491 | | | | 31,605 | |
Wingstop, Inc. | | | 7,551 | | | | 188,322 | |
Wynn Resorts Ltd. | | | 607 | | | | 53,598 | |
Zoe's Kitchen, Inc. | | | 48,446 | | | | 1,816,241 | |
| | | | | | | | 15,176,509 | |
Household Durables — 1.5% | | | | | | | | |
Beazer Homes USA, Inc. | | | 2,323 | | | | 19,095 | |
Century Communities, Inc. | | | 13,184 | | | | 227,292 | |
Ethan Allen Interiors, Inc. | | | 25,635 | | | | 872,615 | |
GoPro, Inc. - Class A | | | 108,964 | | | | 1,377,305 | |
Green Brick Partners, Inc. | | | 131,519 | | | | 969,295 | |
Hooker Furniture Corporation | | | 930 | | | | 23,064 | |
Installed Building Products, Inc. | | | 3,554 | | | | 94,465 | |
iRobot Corporation | | | 15,549 | | | | 581,222 | |
KB Home | | | 100,190 | | | | 1,359,578 | |
LGI Homes, Inc. | | | 55,151 | | | | 1,544,780 | |
11
TFS MARKET NEUTRAL FUND
SCHEDULE OF SECURITIES SOLD SHORT (Continued) | |
COMMON STOCKS — 80.8% (Continued) | | Shares | | | Value | |
Consumer Discretionary — 12.9% (Continued) | | | | | | |
Household Durables — 1.5% (Continued) | | | | | | |
Newell Brands, Inc. | | | 591 | | | $ | 26,914 | |
PulteGroup, Inc. | | | 4,787 | | | | 88,033 | |
SodaStream International Ltd. | | | 4,933 | | | | 67,681 | |
Taylor Morrison Home Corporation - Class A | | | 7,591 | | | | 109,311 | |
Tupperware Brands Corporation | | | 5,856 | | | | 340,058 | |
Turtle Beach Corporation | | | 2,630 | | | | 2,919 | |
Vuzix Corporation | | | 38,724 | | | | 182,390 | |
ZAGG, Inc. | | | 10,028 | | | | 80,324 | |
| | | | | | | | 7,966,341 | |
Internet & Catalog Retail — 0.7% | | | | | | | | |
Etsy, Inc. | | | 37,869 | | | | 332,490 | |
Expedia, Inc. | | | 107 | | | | 12,387 | |
Gaiam, Inc. - Class A | | | 9,759 | | | | 64,702 | |
Groupon, Inc. | | | 9,779 | | | | 35,400 | |
Lands' End, Inc. | | | 37,221 | | | | 905,587 | |
MakeMyTrip Ltd. | | | 2,602 | | | | 47,773 | |
Netflix, Inc. | | | 930 | | | | 83,728 | |
PetMed Express, Inc. | | | 31,792 | | | | 581,794 | |
TripAdvisor, Inc. | | | 449 | | | | 29,001 | |
Wayfair, Inc. - Class A | | | 38,070 | | | | 1,437,142 | |
| | | | | | | | 3,530,004 | |
Leisure Equipment & Products — 0.0% (a) | | | | | | | | |
Escalade, Inc. | | | 1,103 | | | | 13,159 | |
| | | | | | | | | |
Leisure Products — 0.3% | | | | | | | | |
JAKKS Pacific, Inc. | | | 23,160 | | | | 173,700 | |
Smith & Wesson Holding Corporation | | | 37,399 | | | | 816,420 | |
Sturm Ruger & Company, Inc. | | | 6,653 | | | | 425,992 | |
| | | | | | | | 1,416,112 | |
Media — 1.6% | | | | | | | | |
AMC Networks, Inc. - Class A | | | 393 | | | | 25,635 | |
Central European Media Enterprises Ltd. - Class A | | | 16,337 | | | | 43,456 | |
Charter Communications, Inc. - Class A | | | 196 | | | | 41,599 | |
Cinemark Holdings, Inc. | | | 97 | | | | 3,361 | |
Clear Channel Outdoor Holdings, Inc. - Class A | | | 22,029 | | | | 112,568 | |
Daily Journal Corporation | | | 1,198 | | | | 235,287 | |
Entercom Communications Corporation - Class A | | | 3,559 | | | | 40,359 | |
Eros International plc | | | 71,823 | | | | 960,992 | |
Hemisphere Media Group, Inc. | | | 3,856 | | | | 46,118 | |
IDI, Inc. | | | 57,590 | | | | 301,196 | |
IMAX Corporation | | | 18,506 | | | | 592,192 | |
Liberty Broadband - Series C | | | 74 | | | | 4,237 | |
Media General, Inc. | | | 67,377 | | | | 1,167,643 | |
12
TFS MARKET NEUTRAL FUND
SCHEDULE OF SECURITIES SOLD SHORT (Continued) | |
COMMON STOCKS — 80.8% (Continued) | | Shares | | | Value | |
Consumer Discretionary — 12.9% (Continued) | | | | | | |
Media — 1.6% (Continued) | | | | | | |
Meredith Corporation | | | 2,808 | | | $ | 144,079 | |
New Media Investment Group, Inc. | | | 35,327 | | | | 566,998 | |
Nexstar Broadcasting Group, Inc. - Class A | | | 1,028 | | | | 52,767 | |
Omnicom Group, Inc. | | | 1,062 | | | | 88,114 | |
Pandora Media, Inc. | | | 140,125 | | | | 1,391,441 | |
Regal Entertainment Group - Class A | | | 42,049 | | | | 876,722 | |
Saga Communications, Inc. - Class A | | | 491 | | | | 20,647 | |
Scholastic Corporation | | | 555 | | | | 20,191 | |
Scripps Networks Interactive, Inc. - Class A | | | 1,347 | | | | 83,986 | |
Thomson Reuters Corporation | | | 49 | | | | 2,015 | |
Walt Disney Company (The) | | | 294 | | | | 30,359 | |
World Wrestling Entertainment, Inc. - Class A | | | 108,063 | | | | 1,798,168 | |
| | | | | | | | 8,650,130 | |
Multiline Retail — 0.4% | | | | | | | | |
Bon-Ton Stores, Inc. (The) | | | 508 | | | | 1,184 | |
Fred's, Inc. - Class A | | | 22,898 | | | | 335,914 | |
Sears Holdings Corporation | | | 122,012 | | | | 1,997,946 | |
Target Corporation | | | 171 | | | | 13,594 | |
| | | | | | | | 2,348,638 | |
Specialty Retail — 2.8% | | | | | | | | |
Aaron's, Inc. | | | 6,614 | | | | 173,353 | |
Abercrombie & Fitch Company - Class A | | | 663 | | | | 17,722 | |
America's Car-Mart, Inc. | | | 13,814 | | | | 367,038 | |
Boot Barn Holdings, Inc. | | | 72,917 | | | | 597,919 | |
Buckle, Inc. (The) | | | 46,838 | | | | 1,355,492 | |
CarMax, Inc. | | | 1,691 | | | | 89,538 | |
Chico's FAS, Inc. | | | 44,404 | | | | 559,934 | |
Children's Place, Inc. (The) | | | 415 | | | | 32,333 | |
Christopher & Banks Corporation | | | 432 | | | | 1,123 | |
Conn's, Inc. | | | 163,499 | | | | 2,246,476 | |
CST Brands, Inc. | | | 992 | | | | 37,468 | |
DavidsTea, Inc. | | | 7,137 | | | | 80,006 | |
Destination Maternity Corporation | | | 3,848 | | | | 26,821 | |
Destination XL Group, Inc. | | | 22,715 | | | | 121,980 | |
Dick's Sporting Goods, Inc. | | | 37 | | | | 1,715 | |
Group 1 Automotive, Inc. | | | 2,393 | | | | 157,555 | |
Guess?, Inc. | | | 17,729 | | | | 325,327 | |
hhgregg, Inc. | | | 4,383 | | | | 8,547 | |
Hibbett Sports, Inc. | | | 39,369 | | | | 1,421,221 | |
Lowe's Companies, Inc. | | | 132 | | | | 10,035 | |
Lumber Liquidators Holdings, Inc. | | | 136,254 | | | | 2,031,547 | |
Mattress Firm Holding Corporation | | | 31,894 | | | | 1,244,504 | |
Monro Muffler Brake, Inc. | | | 3,877 | | | | 268,366 | |
13
TFS MARKET NEUTRAL FUND
SCHEDULE OF SECURITIES SOLD SHORT (Continued) | |
COMMON STOCKS — 80.8% (Continued) | | Shares | | | Value | |
Consumer Discretionary — 12.9% (Continued) | | | | | | |
Specialty Retail — 2.8% (Continued) | | | | | | |
New York & Company, Inc. | | | 1,183 | | | $ | 4,401 | |
Penske Automotive Group, Inc. | | | 5,854 | | | | 229,067 | |
Rent-A-Center, Inc. | | | 11,289 | | | | 165,948 | |
Restoration Hardware Holdings, Inc. | | | 12,150 | | | | 525,731 | |
Sears Hometown and Outlet Stores, Inc. | | | 1,033 | | | | 6,993 | |
Select Comfort Corporation | | | 54,065 | | | | 1,334,324 | |
Stein Mart, Inc. | | | 655 | | | | 4,742 | |
Ulta Salon Cosmetics & Fragrance, Inc. | | | 434 | | | | 90,394 | |
Vitamin Shoppe, Inc. | | | 51,412 | | | | 1,407,146 | |
Zumiez, Inc. | | | 7,185 | | | | 120,564 | |
| | | | | | | | 15,065,330 | |
Textiles, Apparel & Luxury Goods — 0.6% | | | | | | | | |
Cherokee, Inc. | | | 33,761 | | | | 528,022 | |
Crocs, Inc. | | | 14,311 | | | | 119,497 | |
Deckers Outdoor Corporation | | | 494 | | | | 28,558 | |
G-III Apparel Group Ltd. | | | 610 | | | | 27,603 | |
Iconix Brand Group, Inc. | | | 84,130 | | | | 713,422 | |
Lakeland Industries, Inc. | | | 5,180 | | | | 45,014 | |
lululemon athletica, Inc. | | | 1,191 | | | | 78,070 | |
Sequential Brands Group, Inc. | | | 259,995 | | | | 1,442,972 | |
Skechers U.S.A., Inc. - Class A | | | 367 | | | | 12,129 | |
Superior Uniform Group, Inc. | | | 2,271 | | | | 43,194 | |
Under Armour, Inc. - Class A | | | 2,089 | | | | 91,791 | |
Vera Bradley, Inc. | | | 4,438 | | | | 77,843 | |
| | | | | | | | 3,208,115 | |
Consumer Staples — 2.7% | | | | | | | | |
Beverages — 0.1% | | | | | | | | |
Boston Beer Company, Inc. - Class A | | | 3,614 | | | | 564,073 | |
Coca-Cola Company (The) | | | 364 | | | | 16,307 | |
MGP Ingredients, Inc. | | | 825 | | | | 21,797 | |
| | | | | | | | 602,177 | |
Food & Staples Retailing — 0.4% | | | | | | | | |
Chefs' Warehouse, Inc. (The) | | | 21,867 | | | | 421,377 | |
Diplomat Pharmacy, Inc. | | | 12,063 | | | | 365,388 | |
Natural Grocers by Vitamin Cottage, Inc. | | | 110,669 | | | | 1,478,538 | |
Sprouts Farmers Market, Inc. | | | 1,143 | | | | 32,084 | |
Whole Foods Market, Inc. | | | 1,067 | | | | 31,028 | |
| | | | | | | | 2,328,415 | |
Food Products — 1.4% | | | | | | | | |
Alico, Inc. | | | 25,301 | | | | 731,452 | |
Amira Nature Foods Ltd. | | | 42,440 | | | | 307,690 | |
Blue Buffalo Pet Products, Inc | | | 3,766 | | | | 93,246 | |
Calavo Growers, Inc. | | | 320 | | | | 18,294 | |
14
TFS MARKET NEUTRAL FUND
SCHEDULE OF SECURITIES SOLD SHORT (Continued) | |
COMMON STOCKS — 80.8% (Continued) | | Shares | | | Value | |
Consumer Staples — 2.7% (Continued) | | | | | | |
Food Products — 1.4% (Continued) | | | | | | |
Cal-Maine Foods, Inc. | | | 36,547 | | | $ | 1,855,126 | |
Campbell Soup Company | | | 43 | | | | 2,653 | |
Flowers Foods, Inc. | | | 4,737 | | | | 90,761 | |
Freshpet, Inc. | | | 145,306 | | | | 1,203,134 | |
Hormel Foods Corporation | | | 551 | | | | 21,241 | |
Inventure Foods, Inc. | | | 195,217 | | | | 1,397,754 | |
Kraft Heinz Company (The) | | | 381 | | | | 29,745 | |
Limoneira Company | | | 10,993 | | | | 196,665 | |
Pilgrim's Pride Corporation | | | 3,758 | | | | 101,128 | |
S&W Seed Company | | | 2,978 | | | | 13,639 | |
Sanderson Farms, Inc. | | | 12,377 | | | | 1,135,466 | |
Tootsie Roll Industries, Inc. | | | 2,182 | | | | 77,766 | |
| | | | | | | | 7,275,760 | |
Household Products — 0.2% | | | | | | | | |
HRG Group, Inc. | | | 47,367 | | | | 682,085 | |
Orchids Paper Products Company | | | 5,661 | | | | 173,623 | |
Spectrum Brands Holdings, Inc. | | | 804 | | | | 91,334 | |
WD-40 Company | | | 1,957 | | | | 200,201 | |
| | | | | | | | 1,147,243 | |
Personal Products — 0.6% | | | | | | | | |
China-Biotics, Inc. (b) | | | 535,616 | | | | 0 | |
Coty, Inc. - Class A | | | 2,583 | | | | 78,523 | |
Elizabeth Arden, Inc. | | | 64,058 | | | | 655,313 | |
Herbalife Ltd. | | | 1,010 | | | | 58,530 | |
Natural Health Trends Corporation | | | 55,562 | | | | 2,010,789 | |
Neptune Technologies & Bioresources, Inc. | | | 1,118 | | | | 1,297 | |
Nu Skin Enterprises, Inc. - Class A | | | 4,226 | | | | 172,294 | |
United-Guardian, Inc. | | | 2,161 | | | | 38,898 | |
USANA Health Sciences, Inc. | | | 93 | | | | 11,015 | |
| | | | | | | | 3,026,659 | |
Tobacco — 0.0% (a) | | | | | | | | |
Universal Corporation | | | 2,774 | | | | 151,322 | |
Vector Group Ltd. | | | 927 | | | | 20,023 | |
| | | | | | | | 171,345 | |
Energy — 7.5% | | | | | | | | |
Energy Equipment & Services — 2.8% | | | | | | | | |
Atwood Oceanics, Inc. | | | 40,598 | | | | 392,177 | |
Basic Energy Services, Inc. | | | 782,288 | | | | 2,503,322 | |
Bristow Group, Inc. | | | 4,125 | | | | 94,545 | |
C&J Energy Services Ltd. | | | 530,878 | | | | 769,773 | |
CARBO Ceramics, Inc. | | | 78,391 | | | | 1,164,106 | |
Ensco plc - Class A | | | 5,218 | | | | 62,407 | |
Era Group, Inc. | | | 988 | | | | 9,416 | |
15
TFS MARKET NEUTRAL FUND
SCHEDULE OF SECURITIES SOLD SHORT (Continued) | |
COMMON STOCKS — 80.8% (Continued) | | Shares | | | Value | |
Energy — 7.5% (Continued) | | | | | | |
Energy Equipment & Services — 2.8% (Continued) | | | | | | |
Forum Energy Technologies, Inc. | | | 12,742 | | | $ | 213,301 | |
Geospace Technologies Corporation | | | 58,704 | | | | 960,397 | |
Gulfmark Offshore, Inc. - Class A | | | 254,961 | | | | 1,728,636 | |
Helmerich & Payne, Inc. | | | 1,425 | | | | 94,221 | |
Hercules Offshore, Inc. | | | 1,577 | | | | 3,280 | |
Hornbeck Offshore Services, Inc. | | | 123,843 | | | | 1,453,917 | |
Independence Contract Drilling, Inc. | | | 8,361 | | | | 33,277 | |
McDermott International, Inc. | | | 21,116 | | | | 95,867 | |
Natural Gas Services Group, Inc. | | | 26,855 | | | | 617,396 | |
Newpark Resources, Inc. | | | 8,344 | | | | 38,966 | |
Noble Corporation plc | | | 75,574 | | | | 848,696 | |
Ocean Rig UDW, Inc. | | | 113,140 | | | | 237,594 | |
Oceaneering International, Inc. | | | 5,421 | | | | 198,680 | |
Oil States International, Inc. | | | 5,137 | | | | 177,946 | |
Precision Drilling Corporation | | | 12,235 | | | | 63,622 | |
RPC, Inc. | | | 6,388 | | | | 96,586 | |
Schlumberger Ltd. | | | 1 | | | | 29 | |
SEACOR Holdings, Inc. | | | 17,141 | | | | 1,007,377 | |
Seadrill Ltd. | | | 336,700 | | | | 1,609,426 | |
Synthesis Energy Systems, Inc. | | | 71,186 | | | | 85,423 | |
Tesco Corporation | | | 22,592 | | | | 213,720 | |
Tidewater, Inc. | | | 35,247 | | | | 308,764 | |
US Silica Holdings, Inc. | | | 168 | | | | 4,292 | |
| | | | | | | | 15,087,159 | |
Oil, Gas & Consumable Fuels — 4.7% | | | | | | | | |
Amyris, Inc. | | | 235,381 | | | | 240,089 | |
Antero Resources Corporation | | | 1,446 | | | | 40,922 | |
Apache Corporation | | | 366 | | | | 19,910 | |
Approach Resources, Inc. | | | 35,804 | | | | 104,906 | |
Ardmore Shipping Corporation | | | 1,534 | | | | 14,343 | |
Bill Barrett Corporation | | | 2,128 | | | | 16,939 | |
Bonanza Creek Energy, Inc. | | | 121,310 | | | | 470,683 | |
California Resources Corporation | | | 319,165 | | | | 702,164 | |
Centrus Energy Corporation - Class A | | | 12,369 | | | | 39,457 | |
Chesapeake Energy Corporation | | | 256,412 | | | | 1,761,550 | |
Clayton Williams Energy, Inc. | | | 85,805 | | | | 1,555,645 | |
Clean Energy Fuels Corporation | | | 38,924 | | | | 111,323 | |
Cloud Peak Energy, Inc. | | | 251,111 | | | | 554,955 | |
Cobalt International Energy, Inc. | | | 54,657 | | | | 176,542 | |
CONSOL Energy, Inc. | | | 6,095 | | | | 91,730 | |
Continental Resources, Inc. | | | 626 | | | | 23,325 | |
Denbury Resources, Inc. | | | 370,531 | | | | 1,430,250 | |
Dorian LPG Ltd. | | | 28,763 | | | | 292,232 | |
16
TFS MARKET NEUTRAL FUND
SCHEDULE OF SECURITIES SOLD SHORT (Continued) | |
COMMON STOCKS — 80.8% (Continued) | | Shares | | | Value | |
Energy — 7.5% (Continued) | | | | | | |
Oil, Gas & Consumable Fuels — 4.7% (Continued) | | | | | | |
Eclipse Resources Corporation | | | 65,968 | | | $ | 160,302 | |
Enbridge Energy Management, LLC | | | 1 | | | | 26 | |
EnLink Midstream, LLC | | | 164 | | | | 2,350 | |
EP Energy Corporation - Class A | | | 88,502 | | | | 434,545 | |
Erin Energy Corporation | | | 5,090 | | | | 10,180 | |
Evolution Petroleum Corporation | | | 1,478 | | | | 8,188 | |
EXCO Resources, Inc. | | | 207,756 | | | | 315,789 | |
Exxon Mobil Corporation | | | 312 | | | | 27,581 | |
Gastar Exploration, Inc. | | | 93,840 | | | | 186,742 | |
Gener8 Maritime, Inc. | | | 8,639 | | | | 62,460 | |
Halcon Resources Corporation | | | 233,671 | | | | 285,079 | |
Hallador Energy Company | | | 6,702 | | | | 31,298 | |
Jones Energy, Inc. - Class A | | | 213,776 | | | | 1,026,125 | |
Laredo Petroleum, Inc. | | | 122,678 | | | | 1,494,218 | |
Lucas Energy, Inc. | | | 1,727 | | | | 7,288 | |
Navios Maritime Acquisition Corporation | | | 698 | | | | 1,347 | |
Nordic American Offshore Ltd. | | | 178,010 | | | | 1,012,877 | |
Nordic American Tankers Ltd. | | | 135,669 | | | | 2,090,659 | |
Northern Oil & Gas, Inc. | | | 29,563 | | | | 161,414 | |
Oasis Petroleum, Inc. | | | 91,274 | | | | 884,445 | |
Pacific Ethanol, Inc. | | | 47,392 | | | | 224,164 | |
Parsley Energy, Inc. - Class A | | | 8,773 | | | | 205,464 | |
Peabody Energy Corporation | | | 1 | | | | 1 | |
Pengrowth Energy Corporation | | | 29,824 | | | | 48,911 | |
Range Resources Corporation | | | 2,434 | | | | 107,364 | |
Renewable Energy Group, Inc. | | | 24,120 | | | | 234,446 | |
REX American Resources Corporation | | | 2,808 | | | | 152,671 | |
Rex Energy Corporation | | | 156,176 | | | | 157,738 | |
Sanchez Energy Corporation | | | 112,093 | | | | 1,007,716 | |
Ship Finance International Ltd. | | | 5,126 | | | | 77,761 | |
SM Energy Company | | | 34,404 | | | | 1,072,029 | |
Solazyme, Inc. | | | 980,359 | | | | 2,294,040 | |
Southwestern Energy Company | | | 29,657 | | | | 398,293 | |
Stone Energy Corporation | | | 83,286 | | | | 81,629 | |
Synergy Resources Corporation | | | 18,607 | | | | 134,342 | |
W&T Offshore, Inc. | | | 849,883 | | | | 2,048,218 | |
Westmoreland Coal Company | | | 33 | | | | 235 | |
Whiting Petroleum Corporation | | | 124,872 | | | | 1,498,464 | |
WPX Energy, Inc. | | | 5,126 | | | | 49,518 | |
| | | | | | | | 25,642,882 | |
Financials — 10.0% | | | | | | | | |
Banks — 3.8% | | | | | | | | |
1st Century Bancshares, Inc. | | | 1,675 | | | | 18,442 | |
17
TFS MARKET NEUTRAL FUND
SCHEDULE OF SECURITIES SOLD SHORT (Continued) | |
COMMON STOCKS — 80.8% (Continued) | | Shares | | | Value | |
Financials — 10.0% (Continued) | | | | | | |
Banks — 3.8% (Continued) | | | | | | |
Access National Corporation | | | 6,222 | | | $ | 122,324 | |
American National Bankshares, Inc. | | | 1,051 | | | | 28,093 | |
American River Bankshares | | | 68 | | | | 688 | |
Ameris Bancorp | | | 6,277 | | | | 197,098 | |
Ames National Corporation | | | 102 | | | | 2,631 | |
Arrow Financial Corporation | | | 1,562 | | | | 43,986 | |
Associated Banc-Corp | | | 266 | | | | 4,852 | |
Banco Latinoamericano de Comericio Exterior S.A. | | | 262 | | | | 6,775 | |
Bancorp, Inc. (The) | | | 128,717 | | | | 729,825 | |
Bank of Hawaii Corporation | | | 4,962 | | | | 339,450 | |
Bank of Marin Bancorp | | | 53 | | | | 2,598 | |
Banner Corporation | | | 2,983 | | | | 127,613 | |
Bar Harbor Bankshares | | | 1,111 | | | | 38,552 | |
BBCN Bancorp, Inc. | | | 805 | | | | 12,574 | |
BCB Bancorp, Inc. | | | 1,283 | | | | 12,984 | |
Blue Hills Bancorp, Inc. | | | 2,115 | | | | 30,837 | |
BOK Financial Corporation | | | 1,073 | | | | 64,573 | |
Boston Private Financial Holdings, Inc. | | | 9,994 | | | | 122,127 | |
Bridge Bancorp, Inc. | | | 15,678 | | | | 477,238 | |
Bryn Mawr Bank Corporation | | | 44,546 | | | | 1,265,997 | |
C1 Financial, Inc. | | | 4,886 | | | | 119,854 | |
Camden National Corporation | | | 954 | | | | 41,509 | |
Capital City Bank Group, Inc. | | | 6,374 | | | | 94,463 | |
Carolina Bank Holdings, Inc. | | | 68 | | | | 1,022 | |
Chemical Financial Corporation | | | 2,233 | | | | 85,881 | |
Chemung Financial Corporation | | | 159 | | | | 4,231 | |
Citizens & Northern Corporation | | | 223 | | | | 4,502 | |
City Holding Company | | | 30,459 | | | | 1,496,146 | |
Civista Bancshares, Inc. | | | 41 | | | | 472 | |
CoBiz Financial, Inc. | | | 10,726 | | | | 129,892 | |
Columbia Banking System, Inc. | | | 361 | | | | 10,646 | |
Community Bank System, Inc. | | | 19,938 | | | | 788,947 | |
Community Trust Bancorp, Inc. | | | 351 | | | | 12,590 | |
ConnectOne Bancorp, Inc. | | | 7,591 | | | | 130,641 | |
Cullen/Frost Bankers, Inc. | | | 893 | | | | 57,143 | |
CVB Financial Corporation | | | 23,167 | | | | 398,009 | |
Enterprise Bancorp, Inc. | | | 18 | | | | 434 | |
Enterprise Financial Services Corporation | | | 189 | | | | 5,173 | |
Farmers Capital Bank Corporation | | | 3,099 | | | | 87,113 | |
First Bancorp (North Carolina) | | | 1,579 | | | | 32,212 | |
First Busey Corporation | | | 1,193 | | | | 24,385 | |
First Business Financial Services, Inc. | | | 5,429 | | | | 137,408 | |
First Commonwealth Financial Corporation | | | 21,561 | | | | 197,930 | |
18
TFS MARKET NEUTRAL FUND
SCHEDULE OF SECURITIES SOLD SHORT (Continued) | |
COMMON STOCKS — 80.8% (Continued) | | Shares | | | Value | |
Financials — 10.0% (Continued) | | | | | | |
Banks — 3.8% (Continued) | | | | | | |
First Financial Bankshares, Inc. | | | 65,654 | | | $ | 2,125,876 | |
First Financial Corporation | | | 706 | | | | 25,014 | |
First Interstate BancSystem, Inc. - Class A | | | 6,815 | | | | 184,686 | |
First Merchants Corporation | | | 968 | | | | 24,829 | |
First NBC Bank Holding Company | | | 12,545 | | | | 272,728 | |
First Niagara Financial Group, Inc. | | | 3,081 | | | | 32,535 | |
FirstMerit Corporation | | | 306 | | | | 6,781 | |
German American Bancorp, Inc. | | | 2,891 | | | | 93,177 | |
Hampton Roads Bankshares, Inc. | | | 14,352 | | | | 25,259 | |
Hancock Holding Company | | | 1,849 | | | | 48,019 | |
Heritage Financial Corporation | | | 16,602 | | | | 306,307 | |
Heritage Oaks Bancorp | | | 2,522 | | | | 21,059 | |
Independent Bank Corporation (Michigan) | | | 347 | | | | 5,257 | |
Lakeland Bancorp, Inc. | | | 46,463 | | | | 515,275 | |
LegacyTexas Financial Group, Inc. | | | 24 | | | | 592 | |
Mackinac Financial Corporation | | | 754 | | | | 8,007 | |
MB Financial, Inc. | | | 477 | | | | 16,580 | |
MidSouth Bancorp, Inc. | | | 9,886 | | | | 89,468 | |
MidWestOne Financial Group, Inc. | | | 2,524 | | | | 71,581 | |
Monarch Financial Holdings, Inc. | | | 181 | | | | 3,329 | |
National Bank Holdings Corporation - Class A | | | 4,281 | | | | 85,577 | |
National Bankshares, Inc. | | | 38 | | | | 1,368 | |
NBT Bancorp, Inc. | | | 765 | | | | 21,680 | |
Northrim BanCorp, Inc. | | | 69 | | | | 1,780 | |
OFG Bancorp | | | 64,637 | | | | 570,745 | |
Old National Bancorp | | | 2,991 | | | | 40,079 | |
Pacific Mercantile Bancorp | | | 3,075 | | | | 23,093 | |
Park National Corporation | | | 2,947 | | | | 270,535 | |
Park Sterling Corporation | | | 32,175 | | | | 234,877 | |
Penns Woods Bancorp, Inc. | | | 5,240 | | | | 218,089 | |
Peoples Bancorp, Inc. | | | 28,789 | | | | 618,676 | |
Peoples Financial Services Corporation | | | 1,997 | | | | 78,722 | |
Prosperity Bancshares, Inc. | | | 3,589 | | | | 189,392 | |
QCR Holdings, Inc. | | | 604 | | | | 15,565 | |
Republic First Bancorp, Inc. | | | 224 | | | | 1,042 | |
S&T Bancorp, Inc. | | | 10,201 | | | | 261,860 | |
Sandy Spring Bancorp, Inc. | | | 88 | | | �� | 2,516 | |
Seacoast Banking Corporation of Florida | | | 17,297 | | | | 280,557 | |
Simmons First National Corporation - Class A | | | 111 | | | | 5,184 | |
Southside Bancshares, Inc. | | | 38,166 | | | | 1,114,829 | |
Southwest Bancorp, Inc. | | | 29,622 | | | | 475,433 | |
State Bank Financial Corporation | | | 5,591 | | | | 116,740 | |
Stock Yards Bancorp, Inc. | | | 1,379 | | | | 55,767 | |
19
TFS MARKET NEUTRAL FUND
SCHEDULE OF SECURITIES SOLD SHORT (Continued) | |
COMMON STOCKS — 80.8% (Continued) | | Shares | | | Value | |
Financials — 10.0% (Continued) | | | | | | |
Banks — 3.8% (Continued) | | | | | | |
Sun Bancorp, Inc./NJ | | | 728 | | | $ | 15,645 | |
TowneBank | | | 611 | | | | 12,831 | |
Trustmark Corporation | | | 1,385 | | | | 33,946 | |
UMB Financial Corporation | | | 9,629 | | | | 536,817 | |
Union Bankshares Corporation | | | 134 | | | | 3,539 | |
United Bankshares, Inc. | | | 33,167 | | | | 1,283,231 | |
Univest Corporation of Pennsylvania | | | 7,083 | | | | 139,818 | |
Veritex Holdings, Inc. | | | 3,171 | | | | 49,119 | |
Washington Trust Bancorp, Inc. | | | 5,505 | | | | 201,648 | |
WesBanco, Inc. | | | 12,209 | | | | 392,275 | |
West Bancorporation, Inc. | | | 76 | | | | 1,417 | |
Westamerica Bancorporation | | | 34,519 | | | | 1,681,766 | |
Wilshire Bancorp, Inc. | | | 3,095 | | | | 33,333 | |
Wintrust Financial Corporation | | | 2,221 | | | | 115,536 | |
Yadkin Financial Corporation | | | 1 | | | | 25 | |
| | | | | | | | 20,571,271 | |
Capital Markets — 0.8% | | | | | | | | |
Artisan Partners Asset Management, Inc. - Class A | | | 326 | | | | 10,533 | |
Capitala Finance Corporation | | | 3,383 | | | | 45,772 | |
Cowen Group, Inc. - Class A | | | 160,071 | | | | 557,847 | |
Diamond Hill Investment Group, Inc. | | | 294 | | | | 51,526 | |
FBR & Company | | | 2,351 | | | | 43,493 | |
Federated Investors, Inc. - Class B | | | 2,403 | | | | 75,935 | |
Fidus Investment Corporation | | | 2,081 | | | | 33,171 | |
Financial Engines, Inc. | | | 9,431 | | | | 303,773 | |
FS Investment Corporation | | | 154 | | | | 1,434 | |
FXCM, Inc. - Class A | | | 18,308 | | | | 213,471 | |
Gladstone Capital Corporation | | | 4,930 | | | | 37,665 | |
Greenhill & Company, Inc. | | | 7,083 | | | | 155,968 | |
GSV Capital Corporation | | | 12,952 | | | | 74,215 | |
Harvest Capital Credit Corporation | | | 70 | | | | 905 | |
INTL FCStone, Inc. | | | 216 | | | | 5,897 | |
Ladenburg Thalmann Financial Services, Inc. | | | 10,748 | | | | 28,805 | |
LPL Financial Holdings, Inc. | | | 42,074 | | | | 1,110,754 | |
Main Street Capital Corporation | | | 3,887 | | | | 121,352 | |
Manning & Napier, Inc. | | | 38,739 | | | | 331,218 | |
OFS Capital Corporation | | | 110 | | | | 1,452 | |
OHA Investment Corporation | | | 3,090 | | | | 8,745 | |
PJT Partners, Inc. - Class A | | | 3,275 | | | | 73,098 | |
Prospect Capital Corporation | | | 20,591 | | | | 154,021 | |
Pzena Investment Management, Inc. - Class A | | | 7,380 | | | | 66,863 | |
Safeguard Scientifics, Inc. | | | 15,753 | | | | 217,391 | |
Solar Senior Capital Ltd. | | | 294 | | | | 4,410 | |
20
TFS MARKET NEUTRAL FUND
SCHEDULE OF SECURITIES SOLD SHORT (Continued) | |
COMMON STOCKS — 80.8% (Continued) | | Shares | | | Value | |
Financials — 10.0% (Continued) | | | | | | |
Capital Markets — 0.8% (Continued) | | | | | | |
Stifel Financial Corporation | | | 5,013 | | | $ | 164,978 | |
T Rowe Price Group, Inc. | | | 348 | | | | 26,201 | |
Triangle Capital Corporation | | | 45 | | | | 956 | |
Virtu Financial, Inc. - Class A | | | 2,113 | | | | 44,056 | |
Virtus Investment Partners, Inc. | | | 1,469 | | | | 114,905 | |
Westwood Holdings Group, Inc. | | | 171 | | | | 9,841 | |
| | | | | | | | 4,090,651 | |
Consumer Finance — 0.6% | | | | | | | | |
Atlanticus Holdings Corporation | | | 31,353 | | | | 94,686 | |
Cash America International, Inc. | | | 234 | | | | 8,649 | |
Credit Acceptance Corporation | | | 506 | | | | 99,312 | |
Emergent Capital, Inc. | | | 3,228 | | | | 14,139 | |
Encore Capital Group, Inc. | | | 5,438 | | | | 153,080 | |
EZCORP, Inc. - Class A | | | 173,549 | | | | 859,067 | |
First Cash Financial Services, Inc. | | | 4,099 | | | | 187,447 | |
First Data Corporation - Class A | | | 25,177 | | | | 286,766 | |
PRA Group, Inc. | | | 2,243 | | | | 74,423 | |
Regional Management Corporation | | | 7,661 | | | | 126,560 | |
World Acceptance Corporation | | | 33,638 | | | | 1,459,553 | |
| | | | | | | | 3,363,682 | |
Diversified Financial Services — 0.3% | | | | | | | | |
CBOE Holdings, Inc. | | | 46 | | | | 2,850 | |
CME Group, Inc. | | | 417 | | | | 38,326 | |
Consumer Portfolio Services, Inc. | | | 4,681 | | | | 18,490 | |
FNFV Group | | | 848 | | | | 9,133 | |
Medallion Financial Corporation | | | 34,597 | | | | 266,397 | |
On Deck Capital, Inc. | | | 29,346 | | | | 253,256 | |
PHH Corporation | | | 63,720 | | | | 817,528 | |
Resource America, Inc. - Class A | | | 5,200 | | | | 32,864 | |
| | | | | | | | 1,438,844 | |
Insurance — 1.1% | | | | | | | | |
Ambac Financial Group, Inc. | | | 1,929 | | | | 31,308 | |
American Equity Investment Life Holding Company | | | 8,124 | | | | 113,736 | |
AmTrust Financial Services, Inc. | | | 648 | | | | 16,103 | |
Arthur J. Gallagher & Company | | | 440 | | | | 20,257 | |
Assurant, Inc. | | | 42 | | | | 3,552 | |
Baldwin & Lyons, Inc. - Class B | | | 40 | | | | 977 | |
Citizens, Inc. | | | 141,658 | | | | 1,154,513 | |
Conifer Holdings, Inc. | | | 1,718 | | | | 11,648 | |
Donegal Group, Inc. - Class A | | | 6,773 | | | | 103,695 | |
Federated National Holding Company | | | 4,490 | | | | 85,534 | |
Greenlight Capital Re Ltd. - Class A | | | 19,545 | | | | 420,804 | |
HCI Group, Inc. | | | 3,130 | | | | 93,775 | |
21
TFS MARKET NEUTRAL FUND
SCHEDULE OF SECURITIES SOLD SHORT (Continued) | |
COMMON STOCKS — 80.8% (Continued) | | Shares | | | Value | |
Financials — 10.0% (Continued) | | | | | | |
Insurance — 1.1% (Continued) | | | | | | |
Maiden Holdings Ltd. | | | 12,620 | | | $ | 154,343 | |
MBIA, Inc. | | | 105,822 | | | | 825,412 | |
Mercury General Corporation | | | 815 | | | | 43,113 | |
National Western Life Group, Inc. - Class A | | | 10 | | | | 2,167 | |
OneBeacon Insurance Group Ltd. - Class A | | | 2,243 | | | | 27,813 | |
Patriot National, Inc. | | | 165,028 | | | | 1,373,033 | |
Primerica, Inc. | | | 13,494 | | | | 668,763 | |
State Auto Financial Corporation | | | 1,006 | | | | 20,633 | |
Stewart Information Services Corporation | | | 1,540 | | | | 53,623 | |
Third Point Reinsurance Ltd. | | | 3,666 | | | | 41,719 | |
Torchmark Corporation | | | 1,213 | | | | 70,220 | |
Universal Insurance Holdings, Inc. | | | 44,295 | | | | 780,035 | |
W.R. Berkley Corporation | | | 1,604 | | | | 89,824 | |
| | | | | | | | 6,206,600 | |
Real Estate Investment Trusts (REIT) — 1.9% | | | | | | | | |
Acadia Realty Trust | | | 4,998 | | | | 168,433 | |
Agree Realty Corporation | | | 60 | | | | 2,327 | |
Alexandria Real Estate Equities, Inc. | | | 1,262 | | | | 117,303 | |
American Homes 4 Rent - Class A | | | 1 | | | | 16 | |
CareTrust REIT, Inc. | | | 25,060 | | | | 318,763 | |
CorEnergy Infrastructure Trust, Inc. | | | 2 | | | | 43 | |
CoreSite Realty Corporation | | | 319 | | | | 23,903 | |
Crown Castle International Corporation | | | 218 | | | | 18,940 | |
CyrusOne, Inc. | | | 3,725 | | | | 164,384 | |
Douglas Emmett, Inc. | | | 790 | | | | 25,636 | |
Duke Realty Corporation | | | 20,496 | | | | 448,248 | |
DuPont Fabros Technology, Inc. | | | 4,077 | | | | 162,346 | |
Easterly Government Properties, Inc. | | | 13,041 | | | | 240,606 | |
Education Realty Trust, Inc. | | | 2,279 | | | | 90,636 | |
Extra Space Storage, Inc. | | | 8,226 | | | | 698,799 | |
Federal Realty Investment Trust | | | 4,618 | | | | 702,305 | |
Gaming and Leisure Properties, Inc. | | | 1,391 | | | | 45,611 | |
Gladstone Commercial Corporation | | | 249 | | | | 4,191 | |
Government Properties Income Trust | | | 24,734 | | | | 467,967 | |
Gramercy Property Trust | | | 30,771 | | | | 260,630 | |
HCP, Inc. | | | 939 | | | | 31,766 | |
Healthcare Realty Trust, Inc. | | | 4,626 | | | | 140,075 | |
Healthcare Trust of America, Inc. - Class A | | | 7,011 | | | | 202,548 | |
Iron Mountain, Inc. | | | 499 | | | | 18,229 | |
Liberty Property Trust | | | 5,009 | | | | 174,814 | |
LTC Properties, Inc. | | | 15,481 | | | | 718,164 | |
Monogram Residential Trust, Inc. | | | 6,428 | | | | 65,116 | |
National Storage Affiliates Trust | | | 5,368 | | | | 104,783 | |
22
TFS MARKET NEUTRAL FUND
SCHEDULE OF SECURITIES SOLD SHORT (Continued) | |
COMMON STOCKS — 80.8% (Continued) | | Shares | | | Value | |
Financials — 10.0% (Continued) | | | | | | |
Real Estate Investment Trusts (REIT) — 1.9% (Continued) | | | | | | |
New Senior Investment Group, Inc. | | | 13,149 | | | $ | 142,009 | |
Northstar Realty Europe Corporation | | | 15,614 | | | | 186,275 | |
Physicians Realty Trust | | | 1,608 | | | | 29,153 | |
Prologis, Inc. | | | 3,467 | | | | 157,437 | |
Public Storage | | | 488 | | | | 119,467 | |
QTS Realty Trust, Inc. - Class A | | | 2,946 | | | | 142,645 | |
Realty Income Corporation | | | 5,616 | | | | 332,467 | |
Regency Centers Corporation | | | 3,157 | | | | 232,671 | |
Retail Properties of America, Inc. - Class A | | | 93 | | | | 1,487 | |
Seritage Growth Properties - Class A | | | 2,131 | | | | 113,731 | |
STAG Industrial, Inc. | | | 35,869 | | | | 715,945 | |
Universal Health Realty Income Trust | | | 220 | | | | 12,012 | |
Urstadt Biddle Properties, Inc. - Class A | | | 5,849 | | | | 120,255 | |
Ventas, Inc. | | | 3,927 | | | | 243,945 | |
Walter Investment Management Corporation | | | 225,404 | | | | 1,634,179 | |
Welltower, Inc. | | | 10,432 | | | | 724,189 | |
Whitestone REIT | | | 11,097 | | | | 149,033 | |
| | | | | | | | 10,473,482 | |
Real Estate Management & Development — 0.3% | | | | | | | | |
Alexander & Baldwin, Inc. | | | 257 | | | | 9,828 | |
Altisource Portfolio Solutions S.A. | | | 11,993 | | | | 375,261 | |
AV Homes, Inc. | | | 6,195 | | | | 71,242 | |
Consolidated-Tomoka Land Company | | | 2,101 | | | | 103,579 | |
Forestar Group, Inc. | | | 35,800 | | | | 483,300 | |
Realogy Holdings Corporation | | | 81 | | | | 2,895 | |
St. Joe Company (The) | | | 21,072 | | | | 355,063 | |
Tejon Ranch Company | | | 4,340 | | | | 97,737 | |
| | | | | | | | 1,498,905 | |
Thrifts & Mortgage Finance — 1.2% | | | | | | | | |
Atlantic Coast Financial Corporation | | | 388 | | | | 2,491 | |
Banc of California, Inc. | | | 10,950 | | | | 222,833 | |
Bank Mutual Corporation | | | 356 | | | | 2,877 | |
BankFinancial Corporation | | | 11,495 | | | | 142,078 | |
BBX Capital Corporation - Class A | | | 1,591 | | | | 24,533 | |
BofI Holding, Inc. | | | 84,300 | | | | 1,717,191 | |
BSB Bancorp, Inc. | | | 104 | | | | 2,472 | |
Cheviot Financial Corporation | | | 657 | | | | 9,829 | |
Clifton Bancorp, Inc. | | | 19,319 | | | | 287,467 | |
Hingham Institution for Savings | | | 35 | | | | 4,480 | |
HomeStreet, Inc. | | | 12,214 | | | | 263,212 | |
Impac Mortgage Holdings, Inc. | | | 91,380 | | | | 1,297,596 | |
Kearny Financial Corporation | | | 2,444 | | | | 30,843 | |
Lake Sunapee Bank Group | | | 537 | | | | 7,647 | |
23
TFS MARKET NEUTRAL FUND
SCHEDULE OF SECURITIES SOLD SHORT (Continued) | |
COMMON STOCKS — 80.8% (Continued) | | Shares | | | Value | |
Financials — 10.0% (Continued) | | | | | | |
Thrifts & Mortgage Finance — 1.2% (Continued) | | | | | | |
LendingTree, Inc. | | | 14,892 | | | $ | 1,332,387 | |
Meridian Bancorp, Inc. | | | 1,029 | | | | 15,044 | |
MMA Capital Management, LLC | | | 26 | | | | 417 | |
Northfield Bancorp, Inc. | | | 10,419 | | | | 165,245 | |
Northwest Bancshares, Inc. | | | 30,909 | | | | 433,344 | |
OceanFirst Financial Corporation | | | 7,328 | | | | 142,749 | |
Ocwen Financial Corporation | | | 6,887 | | | | 15,565 | |
People's United Financial, Inc. | | | 2,402 | | | | 37,231 | |
Stonegate Mortgage Corporation | | | 8,977 | | | | 51,797 | |
Timberland Bancorp, Inc. | | | 3 | | | | 42 | |
TrustCo Bank Corporation | | | 30,679 | | | | 196,652 | |
United Financial Bancorp, Inc. | | | 16,222 | | | | 210,562 | |
Waterstone Financial, Inc. | | | 1,255 | | | | 17,595 | |
WSFS Financial Corporation | | | 315 | | | | 10,754 | |
| | | | | | | | 6,644,933 | |
Health Care — 19.5% | | | | | | | | |
Biotechnology — 9.1% | | | | | | | | |
Abeona Therapeutics, Inc. | | | 30,661 | | | | 83,398 | |
ACADIA Pharmaceuticals, Inc. | | | 6,765 | | | | 218,509 | |
Actinium Pharmaceuticals, Inc. | | | 848 | | | | 1,594 | |
Adamas Pharmaceuticals, Inc. | | | 7,765 | | | | 131,073 | |
Advaxis, Inc. | | | 7,950 | | | | 61,533 | |
Aegerion Pharmaceuticals, Inc. | | | 58,622 | | | | 167,073 | |
Aeterna Zentaris, Inc. | | | 26,055 | | | | 105,523 | |
Agios Pharmaceuticals, Inc. | | | 609 | | | | 29,811 | |
Akebia Therapeutics, Inc. | | | 10,563 | | | | 99,187 | |
Alder Biopharmaceuticals, Inc. | | | 58,809 | | | | 1,561,379 | |
Amicus Therapeutics, Inc. | | | 106,678 | | | | 796,885 | |
Anacor Pharmaceuticals, Inc. | | | 346 | | | | 21,708 | |
Anavex Life Sciences Corporation | | | 69,373 | | | | 378,777 | |
Aquinox Pharmaceuticals, Inc. | | | 13,190 | | | | 107,367 | |
Argos Therapeutics, Inc. | | | 49,696 | | | | 310,103 | |
ARIAD Pharmaceuticals, Inc. | | | 116,178 | | | | 834,158 | |
Array BioPharma, Inc. | | | 204,686 | | | | 652,948 | |
Arrowhead Pharmaceuticals, Inc. | | | 231,569 | | | | 1,340,785 | |
Asterias Biotherapeutics, Inc. | | | 2,498 | | | | 10,716 | |
Athersys, Inc. | | | 70,693 | | | | 163,301 | |
aTyr Pharma, Inc. | | | 56,466 | | | | 201,019 | |
Aurinia Pharmaceuticals, Inc. | | | 1,507 | | | | 4,400 | |
Axovant Sciences Ltd. | | | 1,619 | | | | 21,047 | |
Bio Blast Pharma Ltd. | | | 11,451 | | | | 26,108 | |
BioTime, Inc. | | | 105,448 | | | | 307,908 | |
bluebird bio, Inc. | | | 1,575 | | | | 69,851 | |
24
TFS MARKET NEUTRAL FUND
SCHEDULE OF SECURITIES SOLD SHORT (Continued) | |
COMMON STOCKS — 80.8% (Continued) | | Shares | | | Value | |
Health Care — 19.5% (Continued) | | | | | | |
Biotechnology — 9.1% (Continued) | | | | | | |
Catabasis Pharmaceuticals, Inc. | | | 349 | | | $ | 1,539 | |
Catalyst Pharmaceutical, Inc. | | | 15,108 | | | | 10,273 | |
Celator Pharmaceuticals, Inc. | | | 41,659 | | | | 627,801 | |
Celldex Therapeutics, Inc. | | | 76,154 | | | | 304,616 | |
Cellular Biomedicine Group, Inc. | | | 4,608 | | | | 79,580 | |
Cerulean Pharma, Inc. | | | 99 | | | | 325 | |
Chiasma, Inc. | | | 273,263 | | | | 920,896 | |
Chimerix, Inc. | | | 127,417 | | | | 761,954 | |
Clovis Oncology, Inc. | | | 122,532 | | | | 1,704,420 | |
Codexis, Inc. | | | 5,525 | | | | 17,404 | |
Conatus Pharmaceuticals, Inc. | | | 10,346 | | | | 29,693 | |
CorMedix, Inc. | | | 32,837 | | | | 137,259 | |
CytRx Corporation | | | 239,738 | | | | 781,546 | |
Dynavax Technologies Corporation | | | 10,269 | | | | 168,514 | |
Eagle Pharmaceuticals, Inc. | | | 34,739 | | | | 1,315,219 | |
Editas Medicine, Inc. | | | 2,441 | | | | 80,675 | |
Exact Sciences Corporation | | | 11,201 | | | | 78,631 | |
Exelixis, Inc. | | | 9,421 | | | | 43,431 | |
Fibrocell Science, Inc. | | | 2,056 | | | | 5,675 | |
Flexion Therapeutics, Inc. | | | 1,952 | | | | 20,301 | |
Galena Biopharma, Inc. | | | 1,189,559 | | | | 1,641,591 | |
Genocea Biosciences, Inc. | | | 215,101 | | | | 946,444 | |
Geron Corporation | | | 16,538 | | | | 48,787 | |
GlycoMimetics, Inc. | | | 705 | | | | 4,441 | |
Heron Therapeutics, Inc. | | | 78,791 | | | | 1,689,279 | |
Idera Pharmaceuticals, Inc. | | | 474,078 | | | | 786,969 | |
Ignyta, Inc. | | | 577 | | | | 3,993 | |
Immunomedics, Inc. | | | 127,911 | | | | 454,084 | |
Inotek Pharmaceuticals Corporation | | | 26,631 | | | | 260,984 | |
Inovio Pharmaceuticals, Inc. | | | 72,313 | | | | 757,840 | |
Insys Therapeutics, Inc. | | | 123,846 | | | | 1,794,529 | |
Intercept Pharmaceuticals, Inc. | | | 1,925 | | | | 290,174 | |
Invitae Corporation | | | 34,997 | | | | 333,871 | |
Ionis Pharmaceuticals, Inc. | | | 2,063 | | | | 84,521 | |
Ironwood Pharmaceuticals, Inc. | | | 921 | | | | 9,624 | |
IsoRay, Inc. | | | 22,521 | | | | 25,899 | |
Juno Therapeutics, Inc. | | | 2,145 | | | | 90,283 | |
Karyopharm Therapeutics, Inc. | | | 11,280 | | | | 104,904 | |
Keryx Biopharmaceuticals, Inc. | | | 288,011 | | | | 1,566,780 | |
Kite Pharma, Inc. | | | 323 | | | | 14,948 | |
La Jolla Pharmaceutical Company | | | 22,460 | | | | 415,735 | |
Lion Biotechnologies, Inc. | | | 43,767 | | | | 248,159 | |
Loxo Oncology, Inc. | | | 28,765 | | | | 663,033 | |
25
TFS MARKET NEUTRAL FUND
SCHEDULE OF SECURITIES SOLD SHORT (Continued) | |
COMMON STOCKS — 80.8% (Continued) | | Shares | | | Value | |
Health Care — 19.5% (Continued) | | | | | | |
Biotechnology — 9.1% (Continued) | | | | | | |
MacroCure Ltd. | | | 66,442 | | | $ | 68,435 | |
MannKind Corporation | | | 1,238,315 | | | | 1,671,725 | |
MediciNova, Inc. | | | 44,944 | | | | 309,215 | |
Merrimack Pharmaceuticals, Inc. | | | 11,508 | | | | 81,477 | |
MiMedx Group, Inc. | | | 21,471 | | | | 161,677 | |
Mirati Therapeutics, Inc. | | | 4,236 | | | | 87,770 | |
Myriad Genetics, Inc. | | | 1,713 | | | | 61,668 | |
NantKwest, Inc. | | | 98,401 | | | | 815,744 | |
Nivalis Therapeutics, Inc. | | | 11,379 | | | | 48,133 | |
Northwest Biotherapeutics, Inc. | | | 677,113 | | | | 947,958 | |
Novavax, Inc. | | | 181,287 | | | | 949,944 | |
Nymox Pharmaceutical Corporation | | | 16,588 | | | | 37,489 | |
Ohr Pharmaceutical, Inc. | | | 12,877 | | | | 42,108 | |
Omeros Corporation | | | 98,474 | | | | 1,304,780 | |
Oncothyreon, Inc. | | | 156,420 | | | | 203,346 | |
OPKO Health, Inc. | | | 7,051 | | | | 75,798 | |
Organovo Holdings, Inc. | | | 351,181 | | | | 955,212 | |
Osiris Therapeutics, Inc. | | | 20,232 | | | | 113,502 | |
OvaScience, Inc. | | | 108,179 | | | | 906,540 | |
Portola Pharmaceuticals, Inc. | | | 22,539 | | | | 535,527 | |
Proteon Therapeutics, Inc. | | | 36 | | | | 351 | |
PTC Therapeutics, Inc. | | | 143,787 | | | | 1,066,900 | |
Puma Biotechnology, Inc. | | | 22,839 | | | | 700,929 | |
Radius Health, Inc. | | | 19,748 | | | | 703,029 | |
Regulus Therapeutics, Inc. | | | 95,383 | | | | 557,037 | |
Sage Therapeutics, Inc. | | | 36 | | | | 1,357 | |
Sarepta Therapeutics, Inc. | | | 123,619 | | | | 1,754,154 | |
Seattle Genetics, Inc. | | | 2,404 | | | | 85,294 | |
Seres Therapeutics, Inc. | | | 570 | | | | 16,826 | |
Synergy Pharmaceuticals, Inc. | | | 245,732 | | | | 771,598 | |
Synthetic Biologics, Inc. | | | 809,577 | | | | 1,805,357 | |
TESARO, Inc. | | | 4,302 | | | | 178,275 | |
Tobira Therapeutics, Inc. | | | 16,279 | | | | 128,116 | |
Tonix Pharmaceuticals Holding Corporation | | | 21,600 | | | | 54,432 | |
Tracon Pharmaceuticals, Inc. | | | 1,803 | | | | 13,054 | |
Trovagene, Inc. | | | 363,159 | | | | 1,459,899 | |
Ultragenyx Pharmaceutical, Inc. | | | 2,540 | | | | 171,755 | |
Versartis, Inc. | | | 13,170 | | | | 119,320 | |
Viking Therapeutics, Inc. | | | 22,836 | | | | 33,112 | |
Vital Therapies, Inc. | | | 31,618 | | | | 270,966 | |
vTv Therapeutics, Inc. - Class A | | | 693 | | | | 4,366 | |
XBiotech, Inc. | | | 67,517 | | | | 860,842 | |
Zafgen, Inc. | | | 105,273 | | | | 670,589 | |
26
TFS MARKET NEUTRAL FUND
SCHEDULE OF SECURITIES SOLD SHORT (Continued) | |
COMMON STOCKS — 80.8% (Continued) | | Shares | | | Value | |
Health Care — 19.5% (Continued) | | | | | | |
Biotechnology — 9.1% (Continued) | | | | | | |
ZIOPHARM Oncology, Inc. | | | 182,780 | | | $ | 1,436,651 | |
| | | | | | | | 49,275,042 | |
Health Care Equipment & Supplies — 3.5% | | | | | | | | |
Abaxis, Inc. | | | 80 | | | | 3,626 | |
Accuray, Inc. | | | 17,143 | | | | 91,887 | |
Amedica Corporation | | | 63,253 | | | | 98,675 | |
Anika Therapeutics, Inc. | | | 140 | | | | 6,392 | |
Antares Pharma, Inc. | | | 31,563 | | | | 34,719 | |
Avinger, Inc. | | | 105,011 | | | | 1,216,027 | |
AxoGen, Inc. | | | 53,252 | | | | 309,927 | |
Biolase, Inc. | | | 21,145 | | | | 30,026 | |
Cardiovascular Systems, Inc. | | | 61,709 | | | | 862,692 | |
Cerus Corporation | | | 4,193 | | | | 26,248 | |
ConforMIS, Inc. | | | 125,533 | | | | 1,555,354 | |
CONMED Corporation | | | 1,622 | | | | 67,183 | |
Corindus Vascular Robotics, Inc. | | | 35,242 | | | | 37,004 | |
CytoSorbents Corporation | | | 32,207 | | | | 139,134 | |
Derma Sciences, Inc. | | | 14,563 | | | | 50,679 | |
DexCom, Inc. | | | 1,322 | | | | 85,110 | |
Digirad Corporation | | | 11,210 | | | | 65,354 | |
EndoChoice Holdings, Inc. | | | 180,642 | | | | 997,144 | |
Entellus Medical, Inc. | | | 227 | | | | 3,301 | |
GenMark Diagnostics, Inc. | | | 201,903 | | | | 1,193,247 | |
Great Basin Scientific, Inc. | | | 32,308 | | | | 99,509 | |
Greatbatch, Inc. | | | 4,483 | | | | 156,008 | |
Hansen Medical, Inc. | | | 27,081 | | | | 109,678 | |
Insulet Corporation | | | 4,879 | | | | 162,471 | |
Invuity, Inc. | | | 4,792 | | | | 32,586 | |
iRadimed Corporation | | | 72,875 | | | | 1,192,964 | |
IRIDEX Corporation | | | 101 | | | | 1,156 | |
LDR Holding Corporation | | | 5,954 | | | | 160,460 | |
Meridian Bioscience, Inc. | | | 5,660 | | | | 108,163 | |
Navidea Biopharmaceuticals, Inc. | | | 198,692 | | | | 274,195 | |
Nevro Corporation | | | 13,381 | | | | 899,872 | |
Novadaq Technologies, Inc. | | | 1,957 | | | | 21,918 | |
Novocure Ltd. | | | 14,862 | | | | 191,720 | |
Quidel Corporation | | | 3,248 | | | | 56,190 | |
Quotient Ltd. | | | 6,514 | | | | 69,439 | |
ReWalk Robotics Ltd. | | | 6,651 | | | | 60,258 | |
Rockwell Medical, Inc. | | | 244,213 | | | | 2,258,970 | |
Second Sight Medical Products, Inc. | | | 292,267 | | | | 1,382,423 | |
Sientra, Inc. | | | 96,695 | | | | 785,163 | |
Spectranetics Corporation (The) | | | 11,443 | | | | 194,531 | |
27
TFS MARKET NEUTRAL FUND
SCHEDULE OF SECURITIES SOLD SHORT (Continued) | |
COMMON STOCKS — 80.8% (Continued) | | Shares | | | Value | |
Health Care — 19.5% (Continued) | | | | | | |
Health Care Equipment & Supplies — 3.5% (Continued) | | | | | | |
STAAR Surgical Company | | | 9,987 | | | $ | 77,000 | |
SurModics, Inc. | | | 626 | | | | 12,595 | |
Tandem Diabetes Care, Inc. | | | 80,989 | | | | 901,408 | |
TransEnterix, Inc. | | | 623,311 | | | | 934,967 | |
Vascular Solutions, Inc. | | | 286 | | | | 9,996 | |
Wright Medical Group N.V. | | | 67,453 | | | | 1,266,767 | |
ZELTIQ Aesthetics, Inc. | | | 16,750 | | | | 500,825 | |
Zimmer Biomet Holdings, Inc. | | | 736 | | | | 85,207 | |
| | | | | | | | 18,880,168 | |
Health Care Providers & Services — 2.7% | | | | | | | | |
AAC Holdings, Inc. | | | 106,637 | | | | 2,195,656 | |
Aceto Corporation | | | 307 | | | | 6,886 | |
Addus HomeCare Corporation | | | 27,973 | | | | 517,500 | |
Adeptus Health, Inc. - Class A | | | 30,165 | | | | 2,054,840 | |
Air Methods Corporation | | | 13,713 | | | | 507,107 | |
AMN Healthcare Services, Inc. | | | 25,075 | | | | 890,413 | |
Anthem, Inc. | | | 20 | | | | 2,815 | |
BioScrip, Inc. | | | 646,504 | | | | 1,706,770 | |
Centene Corporation | | | 1 | | | | 11 | |
Ensign Group, Inc. (The) | | | 1,403 | | | | 31,652 | |
ExamWorks Group, Inc. | | | 18,520 | | | | 667,646 | |
Express Scripts Holding Company | | | 37 | | | | 2,728 | |
Hanger, Inc. | | | 4,970 | | | | 34,243 | |
InfuSystem Holdings, Inc. | | | 14,421 | | | | 51,916 | |
Landauer, Inc. | | | 26,855 | | | | 932,943 | |
MEDNAX, Inc. | | | 1,234 | | | | 87,972 | |
Nobilis Health Corporation | | | 195,789 | | | | 826,230 | |
Patterson Companies, Inc. | | | 1,945 | | | | 84,316 | |
Psychemedics Corporation | | | 1,760 | | | | 25,344 | |
Select Medical Holdings Corporation | | | 46,263 | | | | 618,999 | |
Sharps Compliance Corporation | | | 11,019 | | | | 50,026 | |
Teladoc, Inc. | | | 169,399 | | | | 2,058,198 | |
Trupanion, Inc. | | | 82,227 | | | | 1,025,371 | |
| | | | | | | | 14,379,582 | |
Health Care Technology — 0.8% | | | | | | | | |
Castlight Health, Inc. - Class B | | | 264,100 | | | | 950,760 | |
Computer Programs & Systems, Inc. | | | 20,576 | | | | 1,056,166 | |
Connecture, Inc. | | | 1,356 | | | | 3,133 | |
Evolent Health, Inc. - Class A | | | 43,493 | | | | 522,351 | |
Imprivata, Inc. | | | 2,925 | | | | 35,451 | |
Inovalon Holdings, Inc. - Class A | | | 55,453 | | | | 948,246 | |
Medidata Solutions, Inc. | | | 2,666 | | | | 116,318 | |
Veeva Systems, Inc. - Class A | | | 26,685 | | | | 734,104 | |
| | | | | | | | 4,366,529 | |
28
TFS MARKET NEUTRAL FUND
SCHEDULE OF SECURITIES SOLD SHORT (Continued) | |
COMMON STOCKS — 80.8% (Continued) | | Shares | | | Value | |
Health Care — 19.5% (Continued) | | | | | | |
Life Sciences Tools & Services — 0.7% | | | | | | |
Accelerate Diagnostics, Inc. | | | 149,463 | | | $ | 1,875,761 | |
Albany Molecular Research, Inc. | | | 9,395 | | | | 141,395 | |
Fluidigm Corporation | | | 7,987 | | | | 76,515 | |
Illumina, Inc. | | | 658 | | | | 88,823 | |
Luminex Corporation | | | 2,710 | | | | 54,471 | |
Pacific Biosciences of California, Inc. | | | 138,907 | | | | 1,340,452 | |
pSivida Corporation | | | 16,413 | | | | 47,105 | |
Sequenom, Inc. | | | 185,324 | | | | 237,215 | |
Waters Corporation | | | 667 | | | | 86,817 | |
| | | | | | | | 3,948,554 | |
Pharmaceuticals — 2.7% | | | | | | | | |
AcelRx Pharmaceuticals, Inc. | | | 3,418 | | | | 11,553 | |
Aclaris Therapeutics, Inc. | | | 2,616 | | | | 48,344 | |
Aerie Pharmaceuticals, Inc. | | | 15,139 | | | | 240,105 | |
Akorn, Inc. | | | 14,381 | | | | 365,996 | |
Alcobra Ltd. | | | 1,536 | | | | 6,159 | |
Alimera Sciences, Inc. | | | 16,411 | | | | 36,432 | |
Allergan plc | | | 29 | | | | 6,280 | |
Ampio Pharmaceuticals, Inc. | | | 262,606 | | | | 1,105,571 | |
Aralez Pharmaceuticals, Inc. | | | 55,821 | | | | 218,260 | |
Aratana Therapeutics, Inc. | | | 152,023 | | | | 913,658 | |
Catalent, Inc. | | | 301 | | | | 8,889 | |
Cempra, Inc. | | | 3,264 | | | | 55,260 | |
Concordia Healthcare Corporation | | | 3,092 | | | | 90,101 | |
ContraVir Pharmaceuticals, Inc. | | | 4,050 | | | | 4,050 | |
Cynapsus Therapeutics, Inc. | | | 3,618 | | | | 43,561 | |
Dipexium Pharmaceuticals, Inc. | | | 531 | | | | 6,892 | |
Egalet Corporation | | | 74,633 | | | | 508,997 | |
Endocyte, Inc. | | | 33,017 | | | | 128,766 | |
EyeGate Pharmaceuticals, Inc. | | | 59 | | | | 202 | |
Flex Pharma, Inc. | | | 13,556 | | | | 148,574 | |
Foamix Pharmaceuticals Ltd. | | | 7,681 | | | | 48,467 | |
Horizon Pharma plc | | | 15,280 | | | | 234,854 | |
Innoviva, Inc. | | | 48,042 | | | | 592,838 | |
Intellipharmaceutics International, Inc. | | | 982 | | | | 1,994 | |
KemPharm, Inc. | | | 15,336 | | | | 253,964 | |
Lannett Company, Inc. | | | 599 | | | | 11,489 | |
Lipocine, Inc. | | | 46,455 | | | | 452,936 | |
Marinus Pharmaceuticals, Inc. | | | 35,637 | | | | 195,647 | |
Medicines Company (The) | | | 6,071 | | | | 216,067 | |
MyoKardia, Inc. | | | 309 | | | | 3,535 | |
Ocular Therapeutix, Inc. | | | 48,585 | | | | 596,624 | |
Oculus Innovative Sciences, Inc. | | | 100,962 | | | | 99,952 | |
29
TFS MARKET NEUTRAL FUND
SCHEDULE OF SECURITIES SOLD SHORT (Continued) | |
COMMON STOCKS — 80.8% (Continued) | | Shares | | | Value | |
Health Care — 19.5% (Continued) | | | | | | |
Pharmaceuticals — 2.7% (Continued) | | | | | | |
Pain Therapeutics, Inc. | | | 63,362 | | | $ | 155,871 | |
Pernix Therapeutics Holdings, Inc. | | | 32,907 | | | | 24,684 | |
Perrigo Company plc | | | 258 | | | | 24,941 | |
Relypsa, Inc. | | | 110,579 | | | | 2,001,480 | |
Revance Therapeutics, Inc. | | | 359 | | | | 6,598 | |
Teligent, Inc. | | | 302,986 | | | | 1,672,483 | |
Tetraphase Pharmaceuticals, Inc. | | | 76,180 | | | | 426,608 | |
TherapeuticsMD, Inc. | | | 83,152 | | | | 686,004 | |
Titan Pharmaceuticals, Inc. | | | 1,443 | | | | 8,586 | |
Tokai Pharmaceuticals, Inc. | | | 170,498 | | | | 1,249,750 | |
VIVUS, Inc. | | | 836,895 | | | | 1,380,877 | |
XenoPort, Inc. | | | 990 | | | | 4,356 | |
Zogenix, Inc. | | | 15,104 | | | | 154,816 | |
Zynerba Pharmaceuticals, Inc. | | | 3,443 | | | | 28,060 | |
| | | | | | | | 14,481,131 | |
Industrials — 9.5% | | | | | | | | |
Aerospace & Defense — 1.1% | | | | | | | | |
Aerojet Rocketdyne Holdings, Inc. | | | 103,720 | | | | 1,879,406 | |
AeroVironment, Inc. | | | 310 | | | | 8,953 | |
American Science & Engineering, Inc. | | | 637 | | | | 18,250 | |
Astrotech Corporation | | | 596 | | | | 1,180 | |
CPI Aerostructures, Inc. | | | 3,469 | | | | 23,936 | |
Cubic Corporation | | | 20,989 | | | | 872,513 | |
Engility Holdings, Inc. | | | 7,832 | | | | 154,056 | |
Hexcel Corporation | | | 532 | | | | 24,084 | |
KEYW Holding Corporation (The) | | | 261,235 | | | | 1,799,909 | |
KLX, Inc. | | | 974 | | | | 32,843 | |
National Presto Industries, Inc. | | | 2,964 | | | | 258,431 | |
Rockwell Collins, Inc. | | | 983 | | | | 86,691 | |
Sparton Corporation | | | 3,579 | | | | 76,805 | |
TASER International, Inc. | | | 43,784 | | | | 799,496 | |
TransDigm Group, Inc. | | | 402 | | | | 91,604 | |
| | | | | | | | 6,128,157 | |
Air Freight & Logistics — 0.1% | | | | | | | | |
Echo Global Logistics, Inc. | | | 625 | | | | 14,606 | |
Forward Air Corporation | | | 3,203 | | | | 145,993 | |
Hub Group, Inc. - Class A | | | 3,342 | | | | 128,734 | |
United Parcel Service, Inc. - Class B | | | 380 | | | | 39,927 | |
XPO Logistics, Inc. | | | 1,160 | | | | 34,962 | |
| | | | | | | | 364,222 | |
Airlines — 0.1% | | | | | | | | |
Copa Holdings S.A. - Class A | | | 493 | | | | 31,429 | |
Virgin America, Inc. | | | 6,190 | | | | 344,721 | |
| | | | | | | | 376,150 | |
30
TFS MARKET NEUTRAL FUND
SCHEDULE OF SECURITIES SOLD SHORT (Continued) | |
COMMON STOCKS — 80.8% (Continued) | | Shares | | | Value | |
Industrials — 9.5% (Continued) | | | | | | |
Building Products — 0.5% | | | | | | |
Advanced Drainage Systems, Inc. | | | 42,805 | | | $ | 989,652 | |
American Woodmark Corporation | | | 1,296 | | | | 94,401 | |
Apogee Enterprises, Inc. | | | 1,668 | | | | 69,122 | |
Armstrong Flooring, Inc. | | | 1 | | | | 7 | |
Armstrong World Industries, Inc. | | | 3,775 | | | | 154,058 | |
Griffon Corporation | | | 68,071 | | | | 1,076,202 | |
MFRI, Inc. | | | 831 | | | | 5,800 | |
Simpson Manufacturing Company, Inc. | | | 6 | | | | 226 | |
Trex Company, Inc. | | | 61 | | | | 2,894 | |
| | | | | | | | 2,392,362 | |
Commercial Services & Supplies — 0.9% | | | | | | | | |
ABM Industries, Inc. | | | 7,583 | | | | 243,945 | |
Acme United Corporation | | | 3 | | | | 51 | |
Asta Funding, Inc. | | | 1,271 | | | | 12,723 | |
Avery Dennison Corporation | | | 43 | | | | 3,122 | |
Brady Corporation - Class A | | | 493 | | | | 13,060 | |
CECO Environmental Corporation | | | 62,538 | | | | 412,751 | |
Covanta Holding Corporation | | | 42,410 | | | | 689,587 | |
Deluxe Corporation | | | 501 | | | | 31,453 | |
Essendant, Inc. | | | 6,015 | | | | 185,202 | |
Healthcare Services Group, Inc. | | | 18,013 | | | | 681,792 | |
Hudson Technologies, Inc. | | | 9,449 | | | | 33,071 | |
Interface, Inc. | | | 7,775 | | | | 132,330 | |
Mobile Mini, Inc. | | | 19,230 | | | | 620,167 | |
MSA Safety, Inc. | | | 14,404 | | | | 692,688 | |
Rollins, Inc. | | | 369 | | | | 9,915 | |
Stericycle, Inc. | | | 51 | | | | 4,874 | |
Team, Inc. | | | 656 | | | | 18,848 | |
TRC Companies, Inc. | | | 3,994 | | | | 34,189 | |
US Ecology, Inc. | | | 16,948 | | | | 763,168 | |
Waste Connections, Inc. | | | 1,386 | | | | 93,250 | |
| | | | | | | | 4,676,186 | |
Construction & Engineering — 0.7% | | | | | | | | |
AECOM | | | 788 | | | | 25,602 | |
Ameresco, Inc. - Class A | | | 32,131 | | | | 143,626 | |
Argan, Inc. | | | 18,000 | | | | 615,240 | |
Dycom Industries, Inc. | | | 531 | | | | 37,489 | |
HC2 Holdings, Inc. | | | 85,302 | | | | 329,266 | |
Jacobs Engineering Group, Inc. | | | 700 | | | | 31,206 | |
Layne Christensen Company | | | 171,468 | | | | 1,524,350 | |
MasTec, Inc. | | | 1,514 | | | | 34,307 | |
NV5 Global, Inc. | | | 25,017 | | | | 621,172 | |
Primoris Services Corporation | | | 3,389 | | | | 79,269 | |
31
TFS MARKET NEUTRAL FUND
SCHEDULE OF SECURITIES SOLD SHORT (Continued) | |
COMMON STOCKS — 80.8% (Continued) | | Shares | | | Value | |
Industrials — 9.5% (Continued) | | | | | | |
Construction & Engineering — 0.7% (Continued) | | | | | | |
Tutor Perini Corporation | | | 13,758 | | | $ | 217,651 | |
Willdan Group, Inc. | | | 383 | | | | 4,117 | |
| | | | | | | | 3,663,295 | |
Electrical Equipment — 1.7% | | | | | | | | |
American Superconductor Corporation | | | 28,433 | | | | 283,193 | |
China BAK Battery, Inc. | | | 4,280 | | | | 11,042 | |
Energous Corporation | | | 56,995 | | | | 581,349 | |
Energy Focus, Inc. | | | 57,393 | | | | 447,665 | |
FuelCell Energy, Inc. | | | 187,993 | | | | 1,120,438 | |
Generac Holdings, Inc. | | | 2,338 | | | | 89,125 | |
Highpower International, Inc. | | | 14,268 | | | | 28,251 | |
Ideal Power, Inc. | | | 4,819 | | | | 26,071 | |
LSI Industries, Inc. | | | 330 | | | | 4,175 | |
Plug Power, Inc. | | | 919,319 | | | | 1,893,797 | |
Power Solutions International, Inc. | | | 69,024 | | | | 893,861 | |
Preformed Line Products Company | | | 140 | | | | 5,876 | |
Revolution Lighting Technology, Inc. | | | 530 | | | | 3,487 | |
Rockwell Automation, Inc. | | | 720 | | | | 81,698 | |
SolarCity Corporation | | | 62,540 | | | | 1,896,213 | |
Sunrun, Inc. | | | 236,699 | | | | 1,865,188 | |
Thermon Group Holdings, Inc. | | | 6,176 | | | | 115,738 | |
| | | | | | | | 9,347,167 | |
Industrial Conglomerates — 0.0% (a) | | | | | | | | |
Raven Industries, Inc. | | | 6,683 | | | | 107,529 | |
| | | | | | | | | |
Machinery — 2.5% | | | | | | | | |
Actuant Corporation - Class A | | | 5,903 | | | | 157,669 | |
Altra Industrial Motion Corporation | | | 33,918 | | | | 973,447 | |
American Railcar Industries, Inc. | | | 3,821 | | | | 156,699 | |
Blue Bird Corporation | | | 35,464 | | | | 383,366 | |
Briggs & Stratton Corporation | | | 40,494 | | | | 857,258 | |
Caterpillar, Inc. | | | 1,210 | | | | 94,041 | |
CIRCOR International, Inc. | | | 4,440 | | | | 250,638 | |
Deere & Company | | | 1,179 | | | | 99,166 | |
Donaldson Company, Inc. | | | 309 | | | | 10,098 | |
Douglas Dynamics, Inc. | | | 124 | | | | 2,841 | |
Eastern Company (The) | | | 1,788 | | | | 29,877 | |
ExOne Company (The) | | | 106,620 | | | | 1,409,516 | |
Flowserve Corporation | | | 671 | | | | 32,751 | |
FreightCar America, Inc. | | | 11,561 | | | | 198,271 | |
Gorman-Rupp Company (The) | | | 164 | | | | 4,640 | |
Graco, Inc. | | | 1,086 | | | | 85,132 | |
Graham Corporation | | | 1,183 | | | | 21,897 | |
32
TFS MARKET NEUTRAL FUND
SCHEDULE OF SECURITIES SOLD SHORT (Continued) | |
COMMON STOCKS — 80.8% (Continued) | | Shares | | | Value | |
Industrials — 9.5% (Continued) | | | | | | |
Machinery — 2.5% (Continued) | | | | | | |
Greenbrier Companies, Inc. (The) | | | 252 | | | $ | 7,557 | |
Hurco Companies, Inc. | | | 22,504 | | | | 728,680 | |
Hyster-Yale Materials Handling, Inc. | | | 1,264 | | | | 77,420 | |
Joy Global, Inc. | | | 5,342 | | | | 113,785 | |
Kornit Digital Ltd. | | | 8,382 | | | | 84,910 | |
Lincoln Electric Holdings, Inc. | | | 50 | | | | 3,133 | |
Lindsay Corporation | | | 30,185 | | | | 2,307,945 | |
Manitex International, Inc. | | | 1,511 | | | | 10,033 | |
Manitowoc Company, Inc. (The) | | | 1,570 | | | | 8,949 | |
Manitowoc Foodservice, Inc. | | | 1,515 | | | | 22,740 | |
Middleby Corporation (The) | | | 217 | | | | 23,792 | |
Milacron Holdings Corporation | | | 88 | | | | 1,507 | |
Navistar International Corporation | | | 61,861 | | | | 933,482 | |
Proto Labs, Inc. | | | 19,857 | | | | 1,188,044 | |
RBC Bearings, Inc. | | | 12,519 | | | | 917,643 | |
Sun Hydraulics Corporation | | | 39,368 | | | | 1,392,840 | |
Supreme Industries, Inc. - Class A | | | 92 | | | | 1,144 | |
Tennant Company | | | 7,519 | | | | 401,590 | |
Terex Corporation | | | 4,519 | | | | 107,959 | |
Twin Disc, Inc. | | | 15,128 | | | | 200,446 | |
Wabash National Corporation | | | 4,065 | | | | 57,926 | |
Westport Innovations, Inc. | | | 34,212 | | | | 84,162 | |
| | | | | | | | 13,442,994 | |
Marine — 0.2% | | | | | | | | |
Diana Shipping, Inc. | | | 75,238 | | | | 260,324 | |
Global Ship Lease, Inc. - Class A | | | 12,969 | | | | 29,699 | |
Navios Maritime Holdings, Inc. | | | 115,008 | | | | 134,559 | |
Scorpio Bulkers, Inc. | | | 222,024 | | | | 854,792 | |
| | | | | | | | 1,279,374 | |
Professional Services — 0.4% | | | | | | | | |
Acacia Research Corporation | | | 77,289 | | | | 372,533 | |
Advisory Board Company (The) | | | 4,900 | | | | 155,036 | |
CBIZ, Inc. | | | 7,661 | | | | 77,989 | |
FTI Consulting, Inc. | | | 6,807 | | | | 274,322 | |
Hill International, Inc. | | | 187,612 | | | | 795,475 | |
Huron Consulting Group, Inc. | | | 2 | | | | 111 | |
ICF International, Inc. | | | 2,473 | | | | 97,362 | |
Insperity, Inc. | | | 69 | | | | 3,641 | |
Navigant Consulting, Inc. | | | 3,235 | | | | 51,631 | |
Odyssey Marine Exploration, Inc. | | | 648 | | | | 1,814 | |
Resources Connection, Inc. | | | 10,165 | | | | 150,137 | |
Verisk Analytics, Inc. | | | 1,148 | | | | 89,062 | |
| | | | | | | | 2,069,113 | |
33
TFS MARKET NEUTRAL FUND
SCHEDULE OF SECURITIES SOLD SHORT (Continued) | |
COMMON STOCKS — 80.8% (Continued) | | Shares | | | Value | |
Industrials — 9.5% (Continued) | | | | | | |
Road & Rail — 0.6% | | | | | | |
Covenant Transportation Group, Inc. - Class A | | | 21,365 | | | $ | 425,377 | |
Heartland Express, Inc. | | | 13,374 | | | | 242,203 | |
Kansas City Southern | | | 139 | | | | 13,170 | |
Knight Transportation, Inc. | | | 32,265 | | | | 857,281 | |
Landstar System, Inc. | | | 10,295 | | | | 674,837 | |
P.A.M. Transportation Services, Inc. | | | 13,069 | | | | 322,935 | |
Saia, Inc. | | | 2,548 | | | | 73,688 | |
Student Transportation, Inc. | | | 9,236 | | | | 45,811 | |
Swift Transportation Company | | | 2,111 | | | | 35,085 | |
Universal Truckload Services, Inc. | | | 32 | | | | 456 | |
USA Truck, Inc. | | | 30,012 | | | | 531,813 | |
Werner Enterprises, Inc. | | | 7,966 | | | | 201,859 | |
| | | | | | | | 3,424,515 | |
Trading Companies & Distributors — 0.7% | | | | | | | | |
BMC Stock Holdings, Inc. | | | 14,944 | | | | 262,267 | |
Fastenal Company | | | 1,910 | | | | 89,369 | |
GATX Corporation | | | 12,432 | | | | 571,126 | |
Houston Wire & Cable Company | | | 6,620 | | | | 48,392 | |
Kaman Corporation | | | 23,387 | | | | 984,359 | |
Lawson Products, Inc. | | | 175 | | | | 3,428 | |
Textainer Group Holdings Ltd. | | | 44,734 | | | | 690,246 | |
Titan Machinery, Inc. | | | 78,626 | | | | 1,022,138 | |
Veritiv Corporation | | | 5,859 | | | | 240,336 | |
W.W. Grainger, Inc. | | | 390 | | | | 91,463 | |
| | | | | | | | 4,003,124 | |
Transportation Infrastructure — 0.0% (a) | | | | | | | | |
Aegean Marine Petroleum Network, Inc. | | | 7,388 | | | | 59,400 | |
Wesco Aircraft Holdings, Inc. | | | 1,963 | | | | 28,326 | |
| | | | | | | | 87,726 | |
Information Technology — 13.1% | | | | | | | | |
Communications Equipment — 1.0% | | | | | | | | |
ADTRAN, Inc. | | | 13,905 | | | | 268,645 | |
Alliance Fiber Optic Products, Inc. | | | 50,019 | | | | 926,352 | |
Applied Optoelectronics, Inc. | | | 117,813 | | | | 1,319,506 | |
Arista Networks, Inc. | | | 1,384 | | | | 92,202 | |
CalAmp Corporation | | | 10,840 | | | | 162,275 | |
Calix, Inc. | | | 9,937 | | | | 68,863 | |
DragonWave, Inc. | | | 16,304 | | | | 101,574 | |
Harmonic, Inc. | | | 192,376 | | | | 665,621 | |
Juniper Networks, Inc. | | | 588 | | | | 13,759 | |
KVH Industries, Inc. | | | 2,488 | | | | 24,283 | |
NETGEAR, Inc. | | | 2,936 | | | | 124,486 | |
Novatel Wireless, Inc. | | | 50,000 | | | | 76,500 | |
34
TFS MARKET NEUTRAL FUND
SCHEDULE OF SECURITIES SOLD SHORT (Continued) | |
COMMON STOCKS — 80.8% (Continued) | | Shares | | | Value | |
Information Technology — 13.1% (Continued) | | | | | | |
Communications Equipment — 1.0% (Continued) | | | | | | |
Numerex Corporation - Class A | | | 63 | | | $ | 484 | |
Oclaro, Inc. | | | 33,512 | | | | 169,236 | |
Palo Alto Networks, Inc. | | | 647 | | | | 97,613 | |
PCTEL, Inc. | | | 5,178 | | | | 23,197 | |
Ruckus Wireless, Inc. | | | 16,357 | | | | 224,745 | |
Ubiquiti Networks, Inc. | | | 35,137 | | | | 1,251,580 | |
ViaSat, Inc. | | | 417 | | | | 31,984 | |
Zhone Technologies, Inc. | | | 10,256 | | | | 11,794 | |
| | | | | | | | 5,654,699 | |
Electronic Equipment, Instruments & Components — 2.1% | | | | | | | | |
Applied DNA Science, Inc. | | | 27,273 | | | | 82,637 | |
AVX Corporation | | | 8,518 | | | | 112,608 | |
Badger Meter, Inc. | | | 4,702 | | | | 335,394 | |
Clearfield, Inc. | | | 85,433 | | | | 1,585,636 | |
Cognex Corporation | | | 2,312 | | | | 82,145 | |
Control4 Corporation | | | 226,572 | | | | 1,678,899 | |
CUI Global, Inc. | | | 42,468 | | | | 354,608 | |
Daktronics, Inc. | | | 1,499 | | | | 13,041 | |
Dolby Laboratories, Inc. - Class A | | | 6,665 | | | | 317,321 | |
DTS, Inc. | | | 37,604 | | | | 820,519 | |
Electro Rent Corporation | | | 1,989 | | | | 19,910 | |
Fitbit, Inc. - Class A | | | 99,101 | | | | 1,808,593 | |
GSI Group, Inc. | | | 8,956 | | | | 130,310 | |
InvenSense, Inc. | | | 12,458 | | | | 95,677 | |
Mesa Laboratories, Inc. | | | 12,471 | | | | 1,256,827 | |
MicroVision, Inc. | | | 638,103 | | | | 1,378,302 | |
MTS Systems Corporation | | | 9,867 | | | | 554,723 | |
National Instruments Corporation | | | 991 | | | | 27,322 | |
Neonode, Inc. | | | 50,133 | | | | 99,263 | |
PCM, Inc. | | | 2,746 | | | | 26,334 | |
Research Frontiers, Inc. | | | 4,006 | | | | 18,187 | |
SuperCom Ltd. | | | 3,062 | | | | 12,524 | |
Tech Data Corporation | | | 2,801 | | | | 192,401 | |
Uni-Pixel, Inc. | | | 31,202 | | | | 74,573 | |
Vishay Intertechnology, Inc. | | | 6,330 | | | | 76,973 | |
Vishay Precision Group, Inc. | | | 1,803 | | | | 26,973 | |
| | | | | | | | 11,181,700 | |
Internet Software & Services — 3.6% | | | | | | | | |
Actua Corporation | | | 3,940 | | | | 37,351 | |
Alarm.com Holdings, Inc. | | | 16,082 | | | | 366,830 | |
Amber Road, Inc. | | | 14,221 | | | | 69,825 | |
Angie's List, Inc. | | | 105,974 | | | | 927,272 | |
Apigee Corporation | | | 9,108 | | | | 88,348 | |
35
TFS MARKET NEUTRAL FUND
SCHEDULE OF SECURITIES SOLD SHORT (Continued) | |
COMMON STOCKS — 80.8% (Continued) | | Shares | | | Value | |
Information Technology — 13.1% (Continued) | | | | | | |
Internet Software & Services — 3.6% (Continued) | | | | | | |
Appfolio, Inc. - Class A | | | 42,366 | | | $ | 531,270 | |
Benefitfocus, Inc. | | | 15,296 | | | | 579,718 | |
Chegg, Inc. | | | 254,076 | | | | 1,153,505 | |
Cimpress N.V. | | | 2 | | | | 176 | |
comScore, Inc. | | | 1 | | | | 32 | |
Demandware, Inc. | | | 1,239 | | | | 57,093 | |
eGain Corporation | | | 3,066 | | | | 11,406 | |
Endurance International Group Holdings, Inc. | | | 14,788 | | | | 158,379 | |
Envestnet, Inc. | | | 27,699 | | | | 869,195 | |
Five9, Inc. | | | 6,332 | | | | 58,571 | |
Gogo, Inc. | | | 115,621 | | | | 1,224,426 | |
GrubHub, Inc. | | | 37,030 | | | | 970,927 | |
Hortonworks, Inc. | | | 3,019 | | | | 34,930 | |
Instructure, Inc. | | | 21 | | | | 423 | |
Internet Gold-Golden Lines Ltd. | | | 20 | | | | 275 | |
iPass, Inc. | | | 3,720 | | | | 4,166 | |
LendingClub Corporation | | | 6,278 | | | | 49,596 | |
LogMeIn, Inc. | | | 21 | | | | 1,254 | |
Marchex, Inc. - Class B | | | 7,489 | | | | 31,828 | |
Marketo, Inc. | | | 37,310 | | | | 820,447 | |
MaxPoint Interactive, Inc. | | | 144 | | | | 1,157 | |
MINDBODY, Inc. - Class A | | | 19,894 | | | | 270,757 | |
New Relic, Inc. | | | 2,451 | | | | 63,187 | |
OPOWER, Inc. | | | 296,701 | | | | 2,343,938 | |
Piksel, Inc. - Series A-2 (b) | | | 346,880 | | | | 0 | |
Q2 Holdings, Inc. | | | 459 | | | | 10,975 | |
Quotient Technology, Inc. | | | 183,343 | | | | 2,130,446 | |
RealNetworks, Inc. | | | 986 | | | | 4,496 | |
Reis, Inc. | | | 2,275 | | | | 57,262 | |
Shopify, Inc. - Class A | | | 1,944 | | | | 61,916 | |
Shutterstock, Inc. | | | 18,480 | | | | 758,050 | |
Textura Corporation | | | 43,658 | | | | 1,152,135 | |
TrueCar, Inc. | | | 196,059 | | | | 1,341,044 | |
Tucows, Inc. - Class A | | | 2,964 | | | | 72,781 | |
Unwired Planet, Inc. | | | 8,720 | | | | 70,283 | |
VeriSign, Inc. | | | 368 | | | | 31,795 | |
Web.com Group, Inc. | | | 1,060 | | | | 21,189 | |
WebMD Health Corporation | | | 7,931 | | | | 497,591 | |
Yahoo!, Inc. | | | 257 | | | | 9,406 | |
Yelp, Inc. | | | 27,454 | | | | 576,534 | |
Zillow Group, Inc. - Class A | | | 67,092 | | | | 1,678,642 | |
Zillow Group, Inc. - Class C | | | 3,622 | | | | 87,073 | |
| | | | | | | | 19,287,900 | |
36
TFS MARKET NEUTRAL FUND
SCHEDULE OF SECURITIES SOLD SHORT (Continued) | |
COMMON STOCKS — 80.8% (Continued) | | Shares | | | Value | |
Information Technology — 13.1% (Continued) | | | | | | |
IT Services — 1.0% | | | | | | |
Accenture plc - Class A | | | 36 | | | $ | 4,065 | |
Black Knight Financial Services, Inc. - Class A | | | 2,121 | | | | 67,830 | |
Cardtronics, Inc. | | | 31,271 | | | | 1,232,703 | |
Cass Information Systems, Inc. | | | 4,340 | | | | 214,700 | |
CSG Systems International, Inc. | | | 2,286 | | | | 101,453 | |
EPAM Systems, Inc. | | | 409 | | | | 29,828 | |
FleetCor Technologies, Inc. | | | 18 | | | | 2,784 | |
Forrester Research, Inc. | | | 7,966 | | | | 267,817 | |
Higher One Holdings, Inc. | | | 266,927 | | | | 1,011,653 | |
International Business Machines Corporation | | | 560 | | | | 81,726 | |
Mattersight Corporation | | | 16,657 | | | | 65,795 | |
ModusLink Global Solutions, Inc. | | | 56,241 | | | | 82,112 | |
NeuStar, Inc. - Class A | | | 29,424 | | | | 691,170 | |
Rightside Group Ltd. | | | 9,301 | | | | 84,081 | |
ServiceSource International, Inc. | | | 291,324 | | | | 1,174,036 | |
Square, Inc. - Class A | | | 22,809 | | | | 339,626 | |
Western Union Company (The) | | | 4,592 | | | | 91,840 | |
| | | | | | | | 5,543,219 | |
Semiconductors & Semiconductor Equipment — 1.7% | | | | | | | | |
Advanced Micro Devices, Inc. | | | 8,576 | | | | 30,445 | |
Ambarella, Inc. | | | 37,693 | | | | 1,549,182 | |
Amtech Systems, Inc. | | | 1 | | | | 6 | |
Applied Micro Circuits Corporation | | | 42,007 | | | | 262,124 | |
Broadcom Ltd. | | | 1 | | | | 127 | |
Brooks Automation, Inc. | | | 45,330 | | | | 428,822 | |
Cabot Microelectronics Corporation | | | 13,279 | | | | 556,257 | |
Camtek Ltd. | | | 5,005 | | | | 11,061 | |
Canadian Solar, Inc. | | | 204 | | | | 3,654 | |
Cascade Microtech, Inc. | | | 2,172 | | | | 45,417 | |
Cree, Inc. | | | 31,153 | | | | 763,560 | |
Cypress Semiconductor Corporation | | | 48,717 | | | | 439,915 | |
Exar Corporation | | | 2,159 | | | | 13,170 | |
Fairchild Semiconductor International, Inc. | | | 684 | | | | 13,680 | |
First Solar, Inc. | | | 65 | | | | 3,630 | |
FormFactor, Inc. | | | 21,746 | | | | 167,444 | |
GigPeak, Inc. | | | 71,610 | | | | 164,703 | |
GSI Technology, Inc. | | | 1,250 | | | | 4,937 | |
Kopin Corporation | | | 242,525 | | | | 402,592 | |
Lam Research Corporation | | | 104 | | | | 7,946 | |
Lattice Semiconductor Corporation | | | 165,557 | | | | 922,152 | |
M/A-COM Technology Solutions Holdings, Inc. | | | 1,605 | | | | 65,628 | |
Magnachip Semiconductor Corporation | | | 9,401 | | | | 48,509 | |
Mattson Technology, Inc. | | | 231,652 | | | | 845,530 | |
37
TFS MARKET NEUTRAL FUND
SCHEDULE OF SECURITIES SOLD SHORT (Continued) | |
COMMON STOCKS — 80.8% (Continued) | | Shares | | | Value | |
Information Technology — 13.1% (Continued) | | | | | | |
Semiconductors & Semiconductor Equipment — 1.7% (Continued) | | | | | | |
Microchip Technology, Inc. | | | 450 | | | $ | 21,865 | |
NVIDIA Corporation | | | 2,508 | | | | 89,109 | |
NXP Semiconductors N.V. | | | 1 | | | | 63 | |
QuickLogic Corporation | | | 78,505 | | | | 86,355 | |
Rambus, Inc. | | | 91,650 | | | | 1,064,973 | |
Sigma Designs, Inc. | | | 74,966 | | | | 474,535 | |
SolarEdge Technologies, Inc. | | | 1,607 | | | | 43,052 | |
SunPower Corporation | | | 9,775 | | | | 196,868 | |
Ultratech, Inc. | | | 6,795 | | | | 147,384 | |
Veeco Instruments, Inc. | | | 22,813 | | | | 419,987 | |
Xcerra Corporation | | | 1,467 | | | | 8,655 | |
| | | | | | | | 9,303,337 | |
Software — 2.8% | | | | | | | | |
Atlassian Corporation plc - Class A | | | 1,875 | | | | 43,444 | |
Attunity Ltd. | | | 442 | | | | 3,019 | |
Bottomline Technologies (de), Inc. | | | 4,364 | | | | 107,180 | |
Box, Inc. - Class A | | | 95,334 | | | | 1,232,669 | |
BroadSoft, Inc. | | | 601 | | | | 23,538 | |
Code Rebel Corporation | | | 30,241 | | | | 85,582 | |
Covisint Corporation | | | 1,539 | | | | 2,847 | |
Datawatch Corporation | | | 9,691 | | | | 51,556 | |
Digimarc Corporation | | | 58,141 | | | | 1,735,509 | |
Digital Turbine, Inc. | | | 80,000 | | | | 68,800 | |
Ebix, Inc. | | | 45,546 | | | | 2,191,673 | |
Evolving Systems, Inc. | | | 7,002 | | | | 40,331 | |
FactSet Research Systems, Inc. | | | 97 | | | | 14,623 | |
FalconStor Software, Inc. | | | 5,631 | | | | 5,969 | |
FireEye, Inc. | | | 2,500 | | | | 43,375 | |
Fleetmatics Group plc | | | 438 | | | | 15,877 | |
Globant S.A. | | | 55 | | | | 1,952 | |
Glu Mobile, Inc. | | | 178,837 | | | | 477,495 | |
Guidance Software, Inc. | | | 3,411 | | | | 17,396 | |
HubSpot, Inc. | | | 19,895 | | | | 881,150 | |
Imperva, Inc. | | | 212 | | | | 9,854 | |
Interactive Intelligence Group, Inc. | | | 7,682 | | | | 285,540 | |
MobileIron, Inc. | | | 17,049 | | | | 65,298 | |
Model N, Inc. | | | 97,450 | | | | 1,040,766 | |
Net 1 UEPS Technologies, Inc. | | | 10,834 | | | | 129,141 | |
NetSuite, Inc. | | | 474 | | | | 38,413 | |
Park City Group, Inc. | | | 3,448 | | | | 32,756 | |
Paycom Software, Inc. | | | 25,870 | | | | 988,493 | |
Proofpoint, Inc. | | | 8,662 | | | | 504,648 | |
Qlik Technologies, Inc. | | | 10,459 | | | | 322,033 | |
38
TFS MARKET NEUTRAL FUND
SCHEDULE OF SECURITIES SOLD SHORT (Continued) | |
COMMON STOCKS — 80.8% (Continued) | | Shares | | | Value | |
Information Technology — 13.1% (Continued) | | | | | | |
Software — 2.8% (Continued) | | | | | | |
Rapid7, Inc. | | | 40,297 | | | $ | 504,518 | |
Rovi Corporation | | | 951 | | | | 16,757 | |
Seachange International, Inc. | | | 108,893 | | | | 406,171 | |
Take-Two Interactive Software, Inc. | | | 919 | | | | 31,411 | |
Tangoe, Inc. | | | 28,933 | | | | 255,189 | |
TiVo, Inc. | | | 67,348 | | | | 672,133 | |
TubeMogul, Inc. | | | 23,748 | | | | 307,774 | |
VASCO Data Security International, Inc. | | | 7,250 | | | | 125,642 | |
Verint Systems, Inc. | | | 5,580 | | | | 188,827 | |
VirnetX Holding Corporation | | | 418,089 | | | | 1,877,220 | |
VMware, Inc. - Class A | | | 95 | | | | 5,406 | |
Voltari Corporation | | | 293 | | | | 1,037 | |
Workday, Inc. - Class A | | | 1,150 | | | | 86,227 | |
Xura, Inc. | | | 11,125 | | | | 249,089 | |
| | | | | | | | 15,188,328 | |
Technology Hardware, Storage & Peripherals — 0.9% | | | | | | | | |
3D Systems Corporation | | | 105,273 | | | | 1,862,279 | |
Apple, Inc. | | | 114 | | | | 10,686 | |
Avid Technology, Inc. | | | 16,027 | | | | 89,431 | |
Concurrent Computer Corporation | | | 2,753 | | | | 16,683 | |
CPI Card Group, Inc. | | | 29,026 | | | | 230,176 | |
Diebold, Inc. | | | 9,719 | | | | 255,318 | |
Electronics For Imaging, Inc. | | | 3,221 | | | | 128,325 | |
Imation Corporation | | | 57,464 | | | | 90,219 | |
Pure Storage, Inc. - Class A | | | 5,632 | | | | 81,946 | |
Silicon Graphics International Corporation | | | 8,246 | | | | 36,942 | |
Stratasys Ltd. | | | 52,375 | | | | 1,281,616 | |
Super Micro Computer, Inc. | | | 2,676 | | | | 72,011 | |
USA Technologies, Inc. | | | 140,799 | | | | 616,700 | |
| | | | | | | | 4,772,332 | |
Materials — 3.4% | | | | | | | | |
Chemicals — 1.2% | | | | | | | | |
A. Schulman, Inc. | | | 8,493 | | | | 236,870 | |
AgroFresh Solutions, Inc. | | | 8,596 | | | | 53,553 | |
Albemarle Corporation | | | 885 | | | | 58,552 | |
American Vanguard Corporation | | | 2,215 | | | | 36,658 | |
Balchem Corporation | | | 5,187 | | | | 318,274 | |
BioAmber, Inc. | | | 2,580 | | | | 10,965 | |
CF Industries Holdings, Inc. | | | 2,581 | | | | 85,354 | |
China Green Agriculture, Inc. | | | 6,941 | | | | 9,093 | |
Ferro Corporation | | | 16,153 | | | | 205,789 | |
Flotek Industries, Inc. | | | 130,489 | | | | 1,233,121 | |
FutureFuel Corporation | | | 44,241 | | | | 497,269 | |
39
TFS MARKET NEUTRAL FUND
SCHEDULE OF SECURITIES SOLD SHORT (Continued) | |
COMMON STOCKS — 80.8% (Continued) | | Shares | | | Value | |
Materials — 3.4% (Continued) | | | | | | |
Chemicals — 1.2% (Continued) | | | | | | |
Hawkins, Inc. | | | 17,696 | | | $ | 692,445 | |
International Flavors & Fragrances, Inc. | | | 307 | | | | 36,677 | |
Intrepid Potash, Inc. | | | 96,711 | | | | 123,790 | |
Kraton Performance Polymers, Inc. | | | 14,807 | | | | 336,267 | |
Kronos Worldwide, Inc. | | | 34,750 | | | | 231,088 | |
Landec Corporation | | | 47,051 | | | | 529,324 | |
LSB Industries, Inc. | | | 23,382 | | | | 307,707 | |
Minerals Technologies, Inc. | | | 2,763 | | | | 165,504 | |
NewMarket Corporation | | | 222 | | | | 90,145 | |
OMNOVA Solutions, Inc. | | | 25,423 | | | | 181,774 | |
Platform Specialty Products Corporation | | | 6,078 | | | | 62,603 | |
Praxair, Inc. | | | 240 | | | | 28,190 | |
Senomyx, Inc. | | | 371,183 | | | | 909,398 | |
Trecora Resources | | | 3,573 | | | | 40,911 | |
Valhi, Inc. | | | 1,400 | | | | 2,758 | |
| | | | | | | | 6,484,079 | |
Construction Materials — 0.0% (a) | | | | | | | | |
Vulcan Materials Company | | | 170 | | | | 18,297 | |
| | | | | | | | | |
Containers & Packaging — 0.1% | | | | | | | | |
AEP Industries, Inc. | | | 1,100 | | | | 67,793 | |
AptarGroup, Inc. | | | 174 | | | | 13,224 | |
Multi Packaging Solutions International Ltd. | | | 1,534 | | | | 25,495 | |
Sealed Air Corporation | | | 80 | | | | 3,789 | |
Silgan Holdings, Inc. | | | 4,439 | | | | 225,235 | |
UFP Technologies, Inc. | | | 73 | | | | 1,814 | |
| | | | | | | | 337,350 | |
Metals & Mining — 1.8% | | | | | | | | |
AK Steel Holding Corporation | | | 119,344 | | | | 558,530 | |
Alexco Resource Corporation | | | 4,100 | | | | 5,166 | |
Allegheny Technologies, Inc. | | | 15,057 | | | | 246,031 | |
B2Gold Corporation | | | 266 | | | | 591 | |
Carpenter Technology Corporation | | | 8,176 | | | | 289,512 | |
Century Aluminum Company | | | 22,361 | | | | 197,224 | |
Cliffs Natural Resources, Inc. | | | 545,276 | | | | 2,873,605 | |
Compass Minerals International, Inc. | | | 15,292 | | | | 1,146,288 | |
Energy Fuels, Inc. | | | 11,362 | | | | 26,701 | |
First Majestic Silver Corporation | | | 2,566 | | | | 27,302 | |
Freeport-McMoRan, Inc. | | | 7,494 | | | | 104,916 | |
General Steel Holdings, Inc. | | | 2,977 | | | | 4,138 | |
Gold Resource Corporation | | | 98,062 | | | | 322,624 | |
Hecla Mining Company | | | 68,241 | | | | 294,119 | |
HudBay Minerals, Inc. | | | 29,697 | | | | 147,891 | |
40
TFS MARKET NEUTRAL FUND
SCHEDULE OF SECURITIES SOLD SHORT (Continued) | |
COMMON STOCKS — 80.8% (Continued) | | Shares | | | Value | |
Materials — 3.4% (Continued) | | | | | | |
Metals & Mining — 1.8% (Continued) | | | | | | |
McEwen Mining, Inc. | | | 41,506 | | | $ | 107,916 | |
Mountain Province Diamonds, Inc. | | | 3,025 | | | | 12,856 | |
NN, Inc. | | | 41,312 | | | | 621,332 | |
Pretium Resources, Inc. | | | 1,182 | | | | 9,728 | |
Primero Mining Corporation | | | 147,448 | | | | 277,202 | |
Real Industry, Inc. | | | 5,642 | | | | 49,875 | |
Schnitzer Steel Industries, Inc. - Class A | | | 2,315 | | | | 47,735 | |
Seabridge Gold, Inc. | | | 11,433 | | | | 163,835 | |
Silver Standard Resources, Inc. | | | 4,989 | | | | 46,847 | |
Southern Copper Corporation | | | 1,797 | | | | 53,317 | |
Stillwater Mining Company | | | 77,369 | | | | 943,902 | |
Tahoe Resources, Inc. | | | 41,183 | | | | 581,916 | |
United States Steel Corporation | | | 29,636 | | | | 566,344 | |
| | | | | | | | 9,727,443 | |
Paper & Forest Products — 0.3% | | | | | | | | |
Deltic Timber Corporation | | | 23,684 | | | | 1,480,250 | |
Rentech, Inc. | | | 6,454 | | | | 22,395 | |
Resolute Forest Products, Inc. | | | 9,855 | | | | 57,257 | |
| | | | | | | | 1,559,902 | |
Telecommunication Services — 1.6% | | | | | | | | |
Diversified Telecommunication Services — 1.3% | | | | | | | | |
CenturyLink, Inc. | | | 679 | | | | 21,015 | |
Cincinnati Bell, Inc. | | | 16,735 | | | | 63,928 | |
Consolidated Communications Holdings, Inc. | | | 4,876 | | | | 115,269 | |
FairPoint Communications, Inc. | | | 3,840 | | | | 50,918 | |
Frontier Communications Corporation | | | 15,845 | | | | 88,098 | |
Globalstar, Inc. | | | 424,161 | | | | 827,114 | |
inContact, Inc. | | | 8,452 | | | | 78,688 | |
Intelsat S.A. | | | 334,631 | | | | 1,321,792 | |
Iridium Communications, Inc. | | | 28,221 | | | | 227,744 | |
magicJack VocalTec Ltd. | | | 17,951 | | | | 108,783 | |
pdvWireless, Inc. | | | 24,834 | | | | 1,002,797 | |
Straight Path Communications, Inc. - Class B | | | 60,094 | | | | 2,199,440 | |
Windstream Holdings, Inc. | | | 148,663 | | | | 1,290,395 | |
| | | | | | | | 7,395,981 | |
Wireless Telecommunication Services — 0.3% | | | | | | | | |
Boingo Wireless, Inc. | | | 10,388 | | | | 79,884 | |
NTELOS Holdings Corporation | | | 146,060 | | | | 1,351,055 | |
Sprint Corporation | | | 25,864 | | | | 88,714 | |
| | | | | | | | 1,519,653 | |
Utilities — 0.6% | | | | | | | | |
Electric Utilities — 0.1% | | | | | | | | |
Duke Energy Corporation | | | 39 | | | | 3,072 | |
41
TFS MARKET NEUTRAL FUND
SCHEDULE OF SECURITIES SOLD SHORT (Continued) | |
COMMON STOCKS — 80.8% (Continued) | | Shares | | | Value | |
Utilities — 0.6% (Continued) | | | | | | |
Electric Utilities — 0.1% (Continued) | | | | | | |
El Paso Electric Company | | | 153 | | | $ | 6,900 | |
Empire District Electric Company (The) | | | 1,012 | | | | 34,074 | |
Genie Energy Ltd. - Class B | | | 11,030 | | | | 81,291 | |
ITC Holdings Corporation | | | 2,114 | | | | 93,164 | |
Otter Tail Corporation | | | 2,157 | | | | 62,381 | |
Spark Energy, Inc. - Class A | | | 1,680 | | | | 43,310 | |
Unitil Corporation | | | 238 | | | | 9,406 | |
Westar Energy, Inc. | | | 964 | | | | 49,752 | |
| | | | | | | | 383,350 | |
Gas Utilities — 0.0% (a) | | | | | | | | |
Chesapeake Utilities Corporation | | | 615 | | | | 36,605 | |
Gas Natural, Inc. | | | 529 | | | | 3,862 | |
South Jersey Industries, Inc. | | | 680 | | | | 18,979 | |
Spire, Inc. | | | 1,144 | | | | 73,170 | |
| | | | | | | | 132,616 | |
Independent Power and Renewable Electricity
Producers — 0.4% | | | | | | | | |
Abengoa Yield plc | | | 2,074 | | | | 37,394 | |
Dynegy, Inc. | | | 278 | | | | 4,901 | |
NRG Yield, Inc. - Class C | | | 5,003 | | | | 80,949 | |
Pattern Energy Group, Inc. | | | 1,578 | | | | 33,138 | |
TerraForm Global, Inc. - Class A | | | 249,941 | | | | 727,328 | |
TerraForm Power, Inc. - Class A | | | 30,296 | | | | 323,561 | |
TransAlta Corporation | | | 1,884 | | | | 9,835 | |
Vivint Solar, Inc. | | | 250,126 | | | | 835,421 | |
| | | | | | | | 2,052,527 | |
Multi-Utilities — 0.0% (a) | | | | | | | | |
Avista Corporation | | | 1,166 | | | | 46,722 | |
CenterPoint Energy, Inc. | | | 165 | | | | 3,539 | |
Consolidated Edison, Inc. | | | 153 | | | | 11,414 | |
Just Energy Group, Inc. | | | 3,338 | | | | 21,196 | |
NiSource, Inc. | | | 2,542 | | | | 57,729 | |
OGE Energy Corporation | | | 3,169 | | | | 93,771 | |
TECO Energy, Inc. | | | 3,242 | | | | 90,030 | |
WEC Energy Group, Inc. | | | 494 | | | | 28,756 | |
| | | | | | | | 353,157 | |
Water Utilities — 0.1% | | | | | | | | |
Cadiz, Inc. | | | 1,137 | | | | 7,379 | |
Connecticut Water Service, Inc. | | | 417 | | | | 19,607 | |
York Water Company (The) | | | 15,135 | | | | 448,753 | |
| | | | | | | | 475,739 | |
| | | | | | | | | |
Total Common Stocks (Proceeds $469,943,895) | | | | | | $ | 437,308,737 | |
42
TFS MARKET NEUTRAL FUND
SCHEDULE OF SECURITIES SOLD SHORT (Continued) | |
RIGHTS — 0.0% (a) | | Shares | | | Value | |
Enterprise Bancorp, Inc. (b) (Proceeds $0) | | | 18 | | | $ | 2 | |
| | |
WARRANTS — 0.1% | | Shares | | | Value | |
Central European Media Enterprises Ltd. (b) | | | 115,647 | | | $ | 191,974 | |
Magnum Hunter Resources Corporation (b) | | | 15,689 | | | | 0 | |
Sears Holdings Corporation | | | 36 | | | | 185 | |
Total Warrants (Proceeds $551,328) | | | | | | $ | 192,159 | |
| | | | | | | | | |
Total Securities Sold Short — 80.9% (Proceeds $470,495,223) | | | | | | $ | 437,500,898 | |
(a) | Percentage rounds to less than 0.1%. |
| | |
(b) | Security has been valued at fair value pursuant to procedures adopted by and under the supervision of the Board of Trustees. The total value of such securities is $(191,976) at April 30, 2016, representing 0.0% (a) of net assets (Note 2). |
| | |
See accompanying notes to financial statements. |
43
TFS MARKET NEUTRAL FUND
SCHEDULE OF FUTURES CONTRACTS SOLD SHORT
April 30, 2016 (Unaudited) | |
FUTURES CONTRACTS
SOLD SHORT | Expiration Date | | Contracts | | | Aggregate Market Value of Contracts | | | Unrealized Appreciation (Depreciation) | |
FINANCIAL FUTURES | | | | | | | | | | |
CBOE Volatility Index (VIX) Future | 05/18/2016 | | | 398 | | | $ | 6,766,000 | | | $ | 447,574 | |
CBOE Volatility Index (VIX) Future | 06/15/2016 | | | 360 | | | | 6,840,000 | | | | (552,342 | ) |
E-Mini S&P 500 Future | 06/17/2016 | | | 661 | | | | 68,140,837 | | | | (1,737,443 | ) |
| | | | | | | | | | | | | | |
Total Futures Contracts Sold Short | | | | | | | $ | 81,746,837 | | | $ | (1,842,211 | ) |
44
TFS SMALL CAP FUND
SUMMARY SCHEDULE OF INVESTMENTS*
April 30, 2016 (Unaudited) | |
COMMON STOCKS — 98.8% | | Shares | | | Value | |
Consumer Discretionary — 15.9% | | | | | | |
AMC Entertainment Holdings, Inc. - Class A | | | 16,050 | | | $ | 452,289 | |
Apollo Education Group, Inc. (a) | | | 44,250 | | | | 345,150 | |
Bloomin' Brands, Inc. | | | 18,616 | | | | 348,119 | |
Caleres, Inc. | | | 12,487 | | | | 314,797 | |
Cooper-Standard Holdings, Inc. (a) | | | 5,272 | | | | 406,524 | |
Genesco, Inc. (a) | | | 5,017 | | | | 347,076 | |
Isle of Capri Casinos, Inc. (a) | | | 28,553 | | | | 425,440 | |
La-Z-Boy, Inc. | | | 16,027 | | | | 414,618 | |
Other Consumer Discretionary (b) | | | | | | | 10,457,171 | |
| | | | | | | | 13,511,184 | |
Consumer Staples — 3.8% | | | | | | | | |
Andersons, Inc. (The) | | | 9,668 | | | | 323,975 | |
Other Consumer Staples (b) | | | | | | | 2,942,104 | |
| | | | | | | | 3,266,079 | |
Energy — 4.1% | | | | | | | | |
Archrock, Inc. | | | 58,582 | | | | 577,033 | |
TETRA Technologies, Inc. (a) | | | 47,499 | | | | 341,993 | |
Other Energy (b) | | | | | | | 2,602,398 | |
| | | | | | | | 3,521,424 | |
Financials — 20.2% | | | | | | | | |
CBL & Associates Properties, Inc. | | | 34,072 | | | | 397,961 | |
Corporate Office Properties Trust | | | 15,226 | | | | 391,004 | |
OM Asset Management plc | | | 27,567 | | | | 369,949 | |
Parkway Properties, Inc. | | | 26,473 | | | | 435,481 | |
Sterling Bancorp | | | 21,321 | | | | 348,385 | |
United Fire Group, Inc. | | | 8,419 | | | | 377,340 | |
Other Financials (b) | | | | | | | 14,851,811 | |
| | | | | | | | 17,171,931 | |
Health Care — 17.6% | | | | | | | | |
Cantel Medical Corporation | | | 4,886 | | | | 327,313 | |
Cynosure, Inc. - Class A (a) | | | 8,490 | | | | 415,501 | |
Haemonetics Corporation (a) | | | 9,798 | | | | 317,749 | |
HMS Holdings Corporation (a) | | | 23,073 | | | | 389,703 | |
Impax Laboratories, Inc. (a) | | | 9,888 | | | | 329,765 | |
INC Research Holdings, Inc. - Class A (a) | | | 10,781 | | | | 518,889 | |
Magellan Health, Inc. (a) | | | 7,361 | | | | 518,656 | |
Masimo Corporation (a) | | | 9,989 | | | | 433,023 | |
Orthofix International N.V. (a) | | | 8,885 | | | | 388,808 | |
PDL BioPharma, Inc. | | | 88,318 | | | | 332,959 | |
Other Health Care (b) | | | | | | | 11,025,009 | |
| | | | | | | | 14,997,375 | |
45
TFS SMALL CAP FUND
SUMMARY SCHEDULE OF INVESTMENTS* (Continued) | |
COMMON STOCKS — 98.8% (Continued) | | Shares | | | Value | |
Industrials — 13.1% | | | | | | |
Albany International Corporation - Class A | | | 7,830 | | | $ | 315,471 | |
Belden, Inc. | | | 5,455 | | | | 344,429 | |
Brink's Company (The) | | | 9,557 | | | | 323,409 | |
Esterline Technologies Corporation (a) | | | 4,939 | | | | 339,112 | |
Harsco Corporation | | | 47,924 | | | | 339,781 | |
Matson, Inc. | | | 8,933 | | | | 347,315 | |
Ply Gem Holdings, Inc. (a) | | | 24,503 | | | | 358,969 | |
Powell Industries, Inc. | | | 10,774 | | | | 335,287 | |
SkyWest, Inc. | | | 15,472 | | | | 363,592 | |
Other Industrials (b) | | | | | | | 8,059,626 | |
| | | | | | | | 11,126,991 | |
Information Technology — 16.9% | | | | | | | | |
Bankrate, Inc. (a) | | | 35,838 | | | | 327,559 | |
Comtech Telecommunications Corporation | | | 17,646 | | | | 427,033 | |
Cray, Inc. (a) | | | 8,304 | | | | 314,472 | |
ExlService Holdings, Inc. (a) | | | 7,682 | | | | 371,732 | |
Inphi Corporation (a) | | | 10,683 | | | | 316,965 | |
Insight Enterprises, Inc. (a) | | | 14,114 | | | | 348,757 | |
Photronics, Inc. (a) | | | 29,336 | | | | 310,375 | |
Power Integrations, Inc. | | | 7,003 | | | | 337,895 | |
Rubicon Project, Inc. (The) (a) | | | 16,875 | | | | 326,869 | |
Semtech Corporation (a) | | | 15,515 | | | | 335,745 | |
Synchronoss Technologies, Inc. (a) | | | 10,962 | | | | 340,589 | |
Unisys Corporation (a) | | | 41,691 | | | | 321,438 | |
Other Information Technology (b) | | | | | | | 10,350,002 | |
| | | | | | | | 14,429,431 | |
Materials — 4.0% | | | | | | | | |
SunCoke Energy, Inc. | | | 45,289 | | | | 336,497 | |
Other Materials (b) | | | | | | | 3,039,864 | |
| | | | | | | | 3,376,361 | |
Telecommunication Services — 1.5% | | | | | | | | |
Atlantic Tele-Network, Inc. | | | 4,490 | | | | 322,876 | |
Vonage Holdings Corporation (a) | | | 67,813 | | | | 316,687 | |
Other Telecommunication Services (b) | | | | | | | 662,972 | |
| | | | | | | | 1,302,535 | |
46
TFS SMALL CAP FUND
SUMMARY SCHEDULE OF INVESTMENTS* (Continued) | |
COMMON STOCKS — 98.8% (Continued) | | Shares | | | Value | |
Utilities — 1.7% | | | | | | |
Other Utilities (b) | | | | | $ | 1,453,355 | |
| | | | | | | | |
Total Investments at Value — 98.8% (Cost $79,300,776) | | | | | $ | 84,156,666 | |
| | | | | | | | | |
Other Assets in Excess of Liabilities — 1.2% | | | | | | | 994,879 | |
| | | | | | | | | |
Net Assets — 100.0% | | | | | | $ | 85,151,545 | |
* | A complete Schedule of Investments is available without charge upon request by calling toll-free 1-888-534-2001 or on the SEC's website at http://www.sec.gov. |
| | |
(a) | Non-income producing security. |
| | |
(b) | Represents issuers not identified as a top 50 holding in terms of market value and issues or issuers not exceeding 1% of net assets individually or in the aggregate, respectively, as of April 30, 2016. |
| | |
See accompanying notes to financial statements. |
47
TFS HEDGED FUTURES FUND
SCHEDULE OF INVESTMENTS
April 30, 2016 (Unaudited) | |
U.S. TREASURY OBLIGATIONS — 20.3% | | Par Value | | | Value | |
U.S. Treasury Bills (a) | | | | | | |
0.416%, due 08/18/2016 | | $ | 778,000 | | | $ | 777,413 | |
0.308%, due 09/01/2016 | | | 1,147,000 | | | | 1,146,013 | |
0.281%, due 09/15/2016 | | | 1,147,000 | | | | 1,145,882 | |
0.280%, due 09/29/2016 | | | 807,000 | | | | 806,007 | |
Total U.S. Treasury Obligations (Cost $3,874,643) | | | | | | $ | 3,875,315 | |
| | |
MONEY MARKET FUNDS — 57.9% | | Shares | | | Value | |
BlackRock Liquidity Funds TempFund Portfolio - Institutional Class, 0.42% (b) | | | 1,917,692 | | | $ | 1,917,692 | |
Fidelity Institutional Money Market Portfolio - Class I, 0.34% (b) | | | 4,624,862 | | | | 4,624,862 | |
Goldman Sachs Financial Square Money Market Fund - Institutional Class, 0.43% (b) | | | 1,917,768 | | | | 1,917,768 | |
Morgan Stanley Institutional Liquidity Funds - Money Market Portfolio - Institutional Class, 0.45% (b) | | | 339,874 | | | | 339,874 | |
PIMCO Money Market Fund - Institutional Class, 0.06% (b) | | | 338,777 | | | | 338,777 | |
Vanguard Prime Money Market Fund - Investor Shares, 0.43% (b) | | | 1,917,798 | | | | 1,917,798 | |
Total Money Market Funds (Cost $11,056,771) | | | | | | $ | 11,056,771 | |
| | | | | | | | | |
Total Investments at Value — 78.2% (Cost $14,931,414) | | | | | | $ | 14,932,086 | |
| | | | | | | | | |
Other Assets in Excess of Liabilities — 21.8% (c) | | | | | | | 4,177,411 | |
| | | | | | | | | |
Net Assets — 100.0% | | | | | | $ | 19,109,497 | |
(a) | Rate shown is the annualized yield at time of purchase, not a coupon rate. |
| | |
(b) | The rate shown is the 7-day effective yield as of April 30, 2016. |
| | |
(c) | Includes cash held as margin deposits for futures contracts. |
| | |
See accompanying notes to financial statements. |
48
TFS HEDGED FUTURES FUND
SCHEDULE OF FUTURES CONTRACTS
April 30, 2016 (Unaudited) |
FUTURES CONTRACTS | Expiration Date | Contracts | Aggregate Market Value of Contracts | Unrealized Appreciation (Depreciation) |
COMMODITY FUTURES | | | | |
Copper Future | 07/27/2016 | 7 | $ 399,612 | $ 11,486 |
Cotton No. 2 Future | 07/07/2016 | 18 | 573,930 | 25,777 |
Ethanol Future | 06/03/2016 | 8 | 355,424 | (1,890) |
Feeder Cattle Future | 05/26/2016 | 6 | 421,275 | (29,814) |
Feeder Cattle Future | 08/25/2016 | 3 | 210,562 | (4,663) |
Frozen Concentrate
Orange Juice Future | 07/11/2016 | 11 | 211,943 | (5,327) |
Live Cattle Future | 06/30/2016 | 14 | 643,580 | (58,561) |
Palladium Future | 06/28/2016 | 9 | 565,200 | 36,981 |
Platinum Future | 07/27/2016 | 7 | 377,300 | 31,014 |
Red Spring Wheat Future | 07/14/2016 | 53 | 1,449,550 | 15,095 |
Soybean Future | 07/14/2016 | 1 | 51,488 | 3,484 |
| | | | | |
Total Futures Contracts | | | $ 5,259,864 | $ 23,582 |
See accompanying notes to financial statements. |
49
TFS HEDGED FUTURES FUND
SCHEDULE OF FUTURES CONTRACTS SOLD SHORT
April 30, 2016 (Unaudited) | |
FUTURES CONTRACTS
SOLD SHORT | Expiration Date | | Contracts | | | Aggregate Market Value of Contracts | | | Unrealized Appreciation (Depreciation) | |
COMMODITY FUTURES | | | | | | | | | | |
Crude Oil Future | 05/20/2016 | | | 14 | | | $ | 643,720 | | | $ | (67,513 | ) |
Hard Red Winter Wheat Future | 07/14/2016 | | | 47 | | | | 1,124,475 | | | | (15,925 | ) |
Lean Hogs Future | 06/14/2016 | | | 18 | | | | 588,240 | | | | (2,378 | ) |
Lumber Future | 07/15/2016 | | | 2 | | | | 67,166 | | | | 695 | |
Natural Gas Future | 05/26/2016 | | | 27 | | | | 578,070 | | | | (17,372 | ) |
Oats Future | 07/14/2016 | | | 57 | | | | 586,388 | | | | 2,332 | |
Rough Rice Future | 07/14/2016 | | | 27 | | | | 600,210 | | | | (7,355 | ) |
Sugar No. 11 Future | 06/30/2016 | | | 10 | | | | 182,784 | | | | (6,125 | ) |
Wheat Future | 07/14/2016 | | | 36 | | | | 879,300 | | | | (7,616 | ) |
Total Commodity Futures | | | | | | | | 5,250,353 | | | | (121,257 | ) |
| | | | | | | | | | | | | | |
FINANCIAL FUTURES | | | | | | | | | | | | | |
CBOE Volatility (VIX) Future | 05/18/2016 | | | 46 | | | | 782,000 | | | | 61,599 | |
CBOE Volatility (VIX) Future | 06/15/2016 | | | 42 | | | | 798,000 | | | | (67,742 | ) |
E-Mini S&P 500 Future | 06/17/2016 | | | 77 | | | | 7,937,737 | | | | (228,857 | ) |
EURO STOXX 50 Future | 06/17/2016 | | | 38 | | | | 1,297,052 | | | | (24,127 | ) |
EURO VSTOXX Mini Future | 05/18/2016 | | | 102 | | | | 283,220 | | | | 12,533 | |
EURO VSTOXX Mini Future | 06/15/2016 | | | 115 | | | | 363,428 | | | | (6,188 | ) |
Total Financial Futures | | | | | | | | 11,461,437 | | | | (252,782 | ) |
| | | | | | | | | | | | | | |
Total Futures Contracts Sold Short | | | | | | | $ | 16,711,790 | | | $ | (374,039 | ) |
See accompanying notes to financial statements. |
50
TFS CAPITAL INVESTMENT TRUST
STATEMENTS OF ASSETS AND LIABILITIES
April 30, 2016 (Unaudited) | |
| | | TFS
Market
Neutral Fund | | | TFS
Small
Cap Fund | | | TFS
Hedged
Futures Fund* | |
ASSETS | | | | | | | | | |
Investments in securities: | | | | | | | | | |
At acquisition cost | | $ | 480,372,990 | | | $ | 79,300,776 | | | $ | 14,931,414 | |
At value (Note 2) | | $ | 521,096,636 | | | $ | 84,156,666 | | | $ | 14,932,086 | |
Cash | | | — | | | | — | | | | 140,000 | |
Cash denominated in foreign currency | | | — | | | | — | | | | 111,689 | |
Deposits with brokers for short positions (Note 2) | | | 455,902,364 | | | | — | | | | — | |
Margin deposits for futures contracts (Note 2) | | | 9,321,055 | | | | — | | | | 4,262,996 | |
Variation margin receivable (Notes 2 and 5) | | | 447,574 | | | | — | | | | 200,996 | |
Dividends and interest receivable | | | 134,193 | | | | 27,346 | | | | 3,073 | |
Receivable for investment securities sold | | | 59,939,238 | | | | 7,792,398 | | | | — | |
Receivable for capital shares sold | | | 172,556 | | | | 20,526 | | | | 7,175 | |
Other assets | | | 96,936 | | | | 27,451 | | | | 27,041 | |
TOTAL ASSETS | | | 1,047,110,552 | | | | 92,024,387 | | | | 19,685,056 | |
| | | | | | | | | | | | | |
LIABILITIES | | | | | | | | | | | | |
Bank overdraft | | | 3,720,516 | | | | 20,406 | | | | — | |
Securities sold short, at value (Note 2) (proceeds $470,495,223) | | | 437,500,898 | | | | — | | | | — | |
Variation margin payable (Notes 2 and 5) | | | 2,289,785 | | | | — | | | | 551,453 | |
Dividends payable on securities sold short (Note 2) | | | 78,290 | | | | — | | | | — | |
Payable for investment securities purchased | | | 58,032,555 | | | | 6,733,552 | | | | — | |
Payable for capital shares redeemed | | | 2,149,546 | | | | 7,653 | | | | — | |
Payable to Adviser (Note 4) | | | 733,949 | | | | 58,582 | | | | 7,648 | |
Payable to administrator (Note 4) | | | 85,972 | | | | 19,644 | | | | 9,158 | |
Accrued brokerage expense on securities sold short (Note 2) | | | 1,345,142 | | | | — | | | | — | |
Other accrued expenses and liabilities | | | 72,777 | | | | 33,005 | | | | 7,300 | |
TOTAL LIABILITIES | | | 506,009,430 | | | | 6,872,842 | | | | 575,559 | |
| | | | | | | | | | | | | |
CONTINGENCIES AND COMMITMENTS (Note 7) | | | — | | | | — | | | | — | |
| | | | | | | | | | | | | |
NET ASSETS | | $ | 541,101,122 | | | $ | 85,151,545 | | | $ | 19,109,497 | |
| | | | | | | | | | | | | |
Net assets consist of: | | | | | | | | | | | | |
Paid-in capital | | $ | 566,368,158 | | | $ | 84,846,540 | | | $ | 20,272,079 | |
Accumulated net investment income (loss) | | | (19,799,166 | ) | | | 20,817 | | | | (549,816 | ) |
Accumulated net realized losses from security transactions and other financial instruments | | | (77,343,630 | ) | | | (4,571,702 | ) | | | (263,937 | ) |
Net unrealized appreciation (depreciation) on: | | | | | | | | | | | | |
Investments | | | 40,723,646 | | | | 4,855,890 | | | | 672 | |
Short positions | | | 32,994,325 | | | | — | | | | — | |
Futures contracts | | | (1,842,211 | ) | | | — | | | | (350,257 | ) |
Translation of assets and liabilities in foreign currencies | | | — | | | | — | | | | 756 | |
Net assets | | $ | 541,101,122 | | | $ | 85,151,545 | | | $ | 19,109,497 | |
| | | | | | | | | | | | | |
Shares of beneficial interest outstanding (unlimited number of shares authorized,
no par value) | | 40,040,746 | | | | 7,009,343 | | | | 1,807,854 | |
| | | | | | | | | | | | | |
Net asset value, redemption price and offering price per share (Note 2) | | $ | 13.51 | | | $ | 12.15 | | | $ | 10.57 | |
* | Consolidated financial statement (Note 1). |
| | |
See accompanying notes to financial statements. |
51
TFS CAPITAL INVESTMENT TRUST
STATEMENTS OF OPERATIONS
For the Six Months Ended April 30, 2016 (Unaudited) | |
| | | TFS
Market
Neutral Fund | | | TFS
Small
Cap Fund | | | TFS
Hedged Futures Fund* | |
INVESTMENT INCOME | | | | | | | | | |
Dividends | | $ | 4,821,746 | | | $ | 671,531 | | | $ | 16,085 | |
Foreign tax withholding | | | (3,310 | ) | | | (191 | ) | | | — | |
Interest | | | — | | | | — | | | | 5,685 | |
TOTAL INVESTMENT INCOME | | | 4,818,436 | | | | 671,340 | | | | 21,770 | |
| | | | | | | | | | | | | |
EXPENSES | | | | | | | | | | | | |
Brokerage expense on securities sold short (Note 2) | | | 17,660,538 | | | | — | | | | — | |
Investment advisory fees (Note 4) | | | 5,514,963 | | | | 494,033 | | | | 133,419 | |
Dividend expense on securities sold short (Note 2) | | | 2,310,066 | | | | — | | | | — | |
Accounting services fees (Note 4) | | | 283,322 | | | | 67,132 | | | | 18,932 | |
Administration fees (Note 4) | | | 229,615 | | | | 32,681 | | | | 30,000 | |
Custodian fees | | | 181,565 | | | | 80,207 | | | | 14,267 | |
Transfer agent fees (Note 4) | | | 112,066 | | | | 23,892 | | | | 9,000 | |
Professional fees | | | 56,326 | | | | 21,164 | | | | 21,914 | |
Registration and filing fees | | | 34,065 | | | | 16,981 | | | | 15,530 | |
Trustees’ fees and expenses (Note 4) | | | 20,726 | | | | 20,726 | | | | 20,726 | |
Pricing fees | | | 45,994 | | | | 10,633 | | | | 1,196 | |
Postage and supplies | | | 26,720 | | | | 7,219 | | | | 2,929 | |
Borrowing costs (Note 2) | | | 30,773 | | | | 1,266 | | | | — | |
Compliance service fees and expenses (Note 4) | | | 19,034 | | | | 7,059 | | | | 5,647 | |
Insurance expense | | | 21,833 | | | | 1,519 | | | | 1,318 | |
Printing of shareholder reports | | | 10,615 | | | | 2,726 | | | | 867 | |
Other expenses | | | 12,924 | | | | 10,317 | | | | 5,378 | |
TOTAL EXPENSES | | | 26,571,145 | | | | 797,555 | | | | 281,123 | |
Investment advisory fee reductions (Note 4) | | | (222,921 | ) | | | (151,976 | ) | | | (121,601 | ) |
NET EXPENSES | | | 26,348,224 | | | | 645,579 | | | | 159,522 | |
NET INVESTMENT INCOME (LOSS) | | | (21,529,788 | ) | | | 25,761 | | | | (137,752 | ) |
| | | | | | | | | | | | | |
REALIZED AND UNREALIZED GAINS (LOSSES) | | | | | | | | | | | | |
Net realized gains (losses) from: | | | | | | | | | | | | |
Investments | | | (52,636,876 | ) | | | (1,892,799 | ) | | | 205 | |
Securities sold short | | | 30,814,523 | | | | — | | | | — | |
Options contracts | | | 742,213 | | | | — | | | | — | |
Futures contracts (Note 5) | | | 3,997,058 | | | | — | | | | 580,622 | |
Foreign currency transactions (Note 5) | | | 571 | | | | — | | | | (1,600 | ) |
Net change in unrealized appreciation (depreciation) on: | | | | | | | | | | | | |
Investments | | | 21,562,575 | | | | (339,255 | ) | | | 1,457 | |
Securities sold short | | | (53,990,412 | ) | | | — | | | | — | |
Futures contracts (Note 5) | | | (820,863 | ) | | | — | | | | (443,951 | ) |
Foreign currency translation (Note 5) | | | (7 | ) | | | — | | | | 1,766 | |
NET REALIZED AND UNREALIZED GAINS (LOSSES) | | | (50,331,218 | ) | | | (2,232,054 | ) | | | 138,499 | |
NET INCREASE (DECREASE) IN NET ASSETS FROM OPERATIONS | | $ | (71,861,006 | ) | | $ | (2,206,293 | ) | | $ | 747 | |
* | Consolidated financial statement (Note 1). |
| | |
See accompanying notes to financial statements. |
52
TFS MARKET NEUTRAL FUND
STATEMENTS OF CHANGES IN NET ASSETS | |
| | | Six Months
Ended
April 30,
2016
(Unaudited) | | | Year
Ended
October 31,
2015 | |
FROM OPERATIONS | | | | | | |
Net investment loss | | $ | (21,529,788 | ) | | $ | (48,587,484 | ) |
Net realized gains (losses) from: | | | | | | | | |
Investments | | | (52,636,876 | ) | | | 43,896,660 | |
Securities sold short | | | 30,814,523 | | | | 86,579,676 | |
Option contracts | | | 742,213 | | | | — | |
Futures contracts | | | 3,997,058 | | | | 11,548,157 | |
Foreign currency transactions | | | 571 | | | | 77 | |
Net change in unrealized appreciation (depreciation) on: | | | | | | | | |
Investments | | | 21,562,575 | | | | (54,251,526 | ) |
Securities sold short | | | (53,990,412 | ) | | | (4,731,243 | ) |
Futures contracts | | | (820,863 | ) | | | 1,256,252 | |
Foreign currency translation | | | (7 | ) | | | 7 | |
Net increase (decrease) in net assets from operations | | | (71,861,006 | ) | | | 35,710,576 | |
| | | | | | | | | |
FROM DISTRIBUTIONS (Note 2) | | | | | | | | |
Distributions from net realized gains from security transactions | | | (28,447,169 | ) | | | (28,360,770 | ) |
| | | | | | | | | |
FROM CAPITAL SHARE TRANSACTIONS | | | | | | | | |
Proceeds from shares sold | | | 111,356,018 | | | | 284,326,684 | |
Net asset value of shares issued in reinvestment of distributions to shareholders | | | 19,356,148 | | | | 19,177,908 | |
Payments for shares redeemed | | | (274,368,743 | ) | | | (294,970,033 | ) |
Net increase (decrease) in net assets from capital share transactions | | | (143,656,577 | ) | | | 8,534,559 | |
| | | | | | | | | |
TOTAL INCREASE (DECREASE) IN NET ASSETS | | | (243,964,752 | ) | | | 15,884,365 | |
| | | | | | | | | |
NET ASSETS | | | | | | | | |
Beginning of period | | | 785,065,874 | | | | 769,181,509 | |
End of period | | $ | 541,101,122 | | | $ | 785,065,874 | |
| | | | | | | | | |
ACCUMULATED NET INVESTMENT INCOME (LOSS) | | $ | (19,799,166 | ) | | $ | 1,730,051 | |
| | | | | | | | | |
CAPITAL SHARE ACTIVITY | | | | | | | | |
Shares sold | | | 7,772,917 | | | | 18,358,000 | |
Shares issued in reinvestment of distributions to shareholders | | | 1,368,893 | | | | 1,263,367 | |
Shares redeemed | | | (19,410,310 | ) | | | (19,086,260 | ) |
Net increase (decrease) in shares outstanding | | | (10,268,500 | ) | | | 535,107 | |
Shares outstanding, beginning of period | | | 50,309,246 | | | | 49,774,139 | |
Shares outstanding, end of period | | | 40,040,746 | | | | 50,309,246 | |
See accompanying notes to financial statements. |
53
TFS SMALL CAP FUND
STATEMENTS OF CHANGES IN NET ASSETS | |
| | | Six Months
Ended
April 30,
2016
(Unaudited) | | | Year
Ended
October 31,
2015 | |
FROM OPERATIONS | | | | | | |
Net investment income (loss) | | $ | 25,761 | | | $ | (244,703 | ) |
Net realized gains (losses) from investments | | | (1,892,799 | ) | | | 3,696,746 | |
Net change in unrealized appreciation (depreciation) on investments | | | (339,255 | ) | | | (3,114,635 | ) |
Net increase (decrease) in net assets from operations | | | (2,206,293 | ) | | | 337,408 | |
| | | | | | | | | |
FROM DISTRIBUTIONS (Note 2) | | | | | | | | |
Distributions from net realized gains from security transactions | | | (4,457,263 | ) | | | (6,562,462 | ) |
| | | | | | | | | |
FROM CAPITAL SHARE TRANSACTIONS | | | | | | | | |
Proceeds from shares sold | | | 13,559,438 | | | | 31,304,772 | |
Net asset value of shares issued in reinvestment of distributions to shareholders | | | 4,086,135 | | | | 6,162,314 | |
Payments for shares redeemed | | | (23,969,151 | ) | | | (30,879,354 | ) |
Net increase (decrease) in net assets from capital share transactions | | | (6,323,578 | ) | | | 6,587,732 | |
| | | | | | | | | |
TOTAL INCREASE (DECREASE) IN NET ASSETS | | | (12,987,134 | ) | | | 362,678 | |
| | | | | | | | | |
NET ASSETS | | | | | | | | |
Beginning of period | | | 98,138,679 | | | | 97,776,001 | |
End of period | | $ | 85,151,545 | | | $ | 98,138,679 | |
| | | | | | | | | |
ACCUMULATED NET INVESTMENT INCOME (LOSS) | | $ | 20,817 | | | $ | (4,944 | ) |
| | | | | | | | | |
CAPITAL SHARE ACTIVITY | | | | | | | | |
Shares sold | | | 1,187,484 | | | | 2,273,301 | |
Shares issued in reinvestment of distributions to shareholders | | | 335,756 | | | | 459,531 | |
Shares redeemed | | | (2,010,572 | ) | | | (2,253,891 | ) |
Net increase (decrease) in shares outstanding | | | (487,332 | ) | | | 478,941 | |
Shares outstanding, beginning of period | | | 7,496,675 | | | | 7,017,734 | |
Shares outstanding, end of period | | | 7,009,343 | | | | 7,496,675 | |
See accompanying notes to financial statements. |
54
TFS HEDGED FUTURES FUND
STATEMENTS OF CHANGES IN NET ASSETS* | |
| | | Six Months
Ended
April 30,
2016
(Unaudited) | | | Year
Ended
October 31,
2015 | |
FROM OPERATIONS | | | | | | |
Net investment loss | | $ | (137,752 | ) | | $ | (374,060 | ) |
Net realized gains (losses) from: | | | | | | | | |
Investments | | | 205 | | | | 1,613 | |
Futures contracts | | | 580,622 | | | | 946,092 | |
Foreign currency transactions | | | (1,600 | ) | | | (55,994 | ) |
Net change in unrealized appreciation (depreciation) on: | | | | | | | | |
Investments | | | 1,457 | | | | (264 | ) |
Futures contracts | | | (443,951 | ) | | | 248,862 | |
Foreign currency translation | | | 1,766 | | | | (55,498 | ) |
Net increase in net assets from operations | | | 747 | | | | 710,751 | |
| | | | | | | | | |
FROM CAPITAL SHARE TRANSACTIONS | | | | | | | | |
Proceeds from shares sold | | | 7,875,347 | | | | 5,548,994 | |
Payments for shares redeemed | | | (5,397,242 | ) | | | (27,840,874 | ) |
Net increase (decrease) in net assets from capital share transactions | | | 2,478,105 | | | | (22,291,880 | ) |
| | | | | | | | | |
TOTAL INCREASE (DECREASE) IN NET ASSETS | | | 2,478,852 | | | | (21,581,129 | ) |
| | | | | | | | | |
NET ASSETS | | | | | | | | |
Beginning of period | | | 16,630,645 | | | | 38,211,774 | |
End of period | | $ | 19,109,497 | | | $ | 16,630,645 | |
| | | | | | | | | |
ACCUMULATED NET INVESTMENT LOSS | | $ | (549,816 | ) | | $ | (410,464 | ) |
| | | | | | | | | |
CAPITAL SHARE ACTIVITY | | | | | | | | |
Shares sold | | | 746,846 | | | | 537,173 | |
Shares redeemed | | | (515,693 | ) | | | (2,828,785 | ) |
Net increase (decrease) in shares outstanding | | | 231,153 | | | | (2,291,612 | ) |
Shares outstanding, beginning of period | | | 1,576,701 | | | | 3,868,313 | |
Shares outstanding, end of period | | | 1,807,854 | | | | 1,576,701 | |
* | Consolidated financial statements (Note 1). |
| | |
See accompanying notes to financial statements. |
55
TFS MARKET NEUTRAL FUND
FINANCIAL HIGHLIGHTS | |
Per share data for a share
outstanding throughout each period: | | Six Months
Ended
April 30,
2016 (Unaudited) | | | Year
Ended
October 31, 2015 | | | Year
Ended
October 31,
2014 | | | Year
Ended
October 31,
2013 | | | Year
Ended
October 31,
2012 | | | Year
Ended
October 31,
2011 | |
Net asset value at beginning of period | | $ | 15.60 | | | $ | 15.45 | | | $ | 16.19 | | | $ | 15.23 | | | $ | 14.41 | | | $ | 15.80 | |
| | | | | | | | | | | | | | | | | | | | | | | | | |
Income (loss) from investment operations: | | | | | | | | | | | | | | | | | | | | | | | | |
Net investment loss | | | (0.53 | ) | | | (0.95 | ) | | | (1.57 | ) | | | (1.25 | ) | | | (0.99 | ) | | | (0.83 | ) |
Net realized and unrealized gains (losses) on investments | | | (0.96 | ) | | | 1.70 | | | | 1.49 | | | | 2.21 | | | | 2.05 | | | | 0.93 | |
Total from investment operations | | | (1.49 | ) | | | 0.75 | | | | (0.08 | ) | | | 0.96 | | | | 1.06 | | | | 0.10 | |
| | | | | | | | | | | | | | | | | | | | | | | | | |
Less distributions: | | | | | | | | | | | | | | | | | | | | | | | | |
Distributions from net realized
gains from security transactions | | | (0.60 | ) | | | (0.60 | ) | | | (0.66 | ) | | | — | | | | (0.24 | ) | | | (1.49 | ) |
| | | | | | | | | | | | | | | | | | | | | | | | | |
Proceeds from redemption fees collected (Note 2) | | | — | | | | — | | | | 0.00 | (a) | | | 0.00 | (a) | | | 0.00 | (a) | | | 0.00 | (a) |
| | | | | | | | | | | | | | | | | | | | | | | | | |
Net asset value at end of period | | $ | 13.51 | | | $ | 15.60 | | | $ | 15.45 | | | $ | 16.19 | | | $ | 15.23 | | | $ | 14.41 | |
| | | | | | | | | | | | | | | | | | | | | | | | | |
Total return (b) | | | (9.73% | )(c) | | | 4.99 | % | | | (0.50 | %) | | | 6.30 | % | | | 7.48 | % | | | 0.43 | % |
| | | | | | | | | | | | | | | | | | | | | | | | | |
Ratios and supplemental data: | | | | | | | | | | | | | | | | | | | | | | | | |
Net assets at end of period (000’s) | | $ | 541,101 | | | $ | 785,066 | | | $ | 769,182 | | | $ | 1,582,797 | | | $ | 1,789,303 | | | $ | 1,762,265 | |
| | | | | | | | | | | | | | | | | | | | | | | | | |
Ratio of total expenses to average net assets | | | 7.97 | %(d) | | | 7.71 | % | | | 8.44 | % | | | 8.67 | % | | | 8.63 | % | | | 8.10 | % |
| | | | | | | | | | | | | | | | | | | | | | | | | |
Ratio of net expenses to average net assets | | | 7.91 | %(d)(e) | | | 7.65 | %(e) | | | 8.43 | %(e) | | | 8.67 | % | | | 8.63 | % | | | 8.12 | %(f) |
| | | | | | | | | | | | | | | | | | | | | | | | | |
Ratio of net expenses to average net assets excluding dividend expense (g) | | | 7.21 | %(d)(e) | | | 6.92 | %(e) | | | 7.53 | %(e) | | | 7.59 | % | | | 7.75 | % | | | 7.38 | %(f) |
| | | | | | | | | | | | | | | | | | | | | | | | | |
Ratio of net expenses to average net assets excluding dividend expense, borrowing costs and brokerage expense on securities sold short (g) | | | 1.90 | %(d)(e)(h) | | | 1.90 | %(e)(h) | | | 2.02 | %(e)(h) | | | 2.41 | % | | | 2.42 | % | | | 2.47 | %(f) |
| | | | | | | | | | | | | | | | | | | | | | | | | |
Ratio of net investment loss to average net assets | | | (6.46% | )(d)(e) | | | (6.55% | )(e) | | | (7.17% | )(e) | | | (6.67 | %) | | | (6.73 | %) | | | (6.56% | )(f) |
| | | | | | | | | | | | | | | | | | | | | | | | | |
Portfolio turnover rate | | | 393 | %(c) | | | 795 | % | | | 669 | % | | | 552 | % | | | 607 | % | | | 751 | % |
(a) | Amount rounds to less than $0.01 per share. |
| | |
(b) | Total return is a measure of the change in value of an investment in the Fund over the period covered, which assumes any dividends or capital gains distributions are reinvested in shares of the Fund. The returns shown do not reflect the deduction of taxes a shareholder would pay on Fund distributions or the redemption of Fund shares. |
| | |
(c) | Not annualized. |
| | |
(d) | Annualized. |
| | |
(e) | Ratio was determined after advisory fee reductions (Note 4). |
| | |
(f) | Includes recoupment by the Adviser of prior years’ advisory fee reductions and expense reimbursements (Note 4). |
| | |
(g) | Dividend expense, borrowing costs and brokerage expense on securities sold short totaled 6.01%(d), 5.75%, 6.41%, 6.26%, 6.21% and 5.65% of average net assets for the periods ended April 30, 2016, October 31, 2015, 2014, 2013, 2012 and 2011, respectively. |
| | |
(h) | Effective January 1, 2014, the Advisor reduced its advisory fee from 2.25% to 1.65% of average daily net assets and agreed to further reduce its advisory fees and to absorb the Fund’s operating expenses to the extent necessary to limit aggregate annual operating expenses (which do not include brokerage costs, taxes, borrowing costs such as interest and dividend expenses on securities sold short, and extraordinary expenses) to 1.90% of average daily net assets. |
| | |
See accompanying notes to financial statements. |
56
TFS SMALL CAP FUND
FINANCIAL HIGHLIGHTS | |
Per share data for a share
outstanding throughout each period: | | Six Months
Ended
April 30,
2016
(Unaudited) | | | Year
Ended
October 31, 2015 | | | Year
Ended
October 31,
2014 | | | Year
Ended
October 31,
2013 | | | Year
Ended
October 31,
2012 | | | Year
Ended
October 31,
2011 | |
Net asset value at beginning of period | | $ | 13.09 | | | $ | 13.93 | | | $ | 15.87 | | | $ | 13.56 | | | $ | 12.07 | | | $ | 11.98 | |
| | | | | | | | | | | | | | | | | | | | | | | | | |
Income (loss) from investment operations: | | | | | | | | | | | | | | | | | | | | | | | | |
Net investment income (loss) | | | 0.00 | (a) | | | (0.03 | ) | | | (0.04 | ) | | | 0.02 | | | | (0.00 | )(a) | | | (0.04 | ) |
Net realized and unrealized gains (losses) on investments | | | (0.30 | ) | | | 0.12 | | | | 1.40 | | | | 4.92 | | | | 1.52 | | | | 0.87 | |
Total from investment operations | | | (0.30 | ) | | | 0.09 | | | | 1.36 | | | | 4.94 | | | | 1.52 | | | | 0.83 | |
| | | | | | | | | | | | | | | | | | | | | | | | | |
Less distributions: | | | | | | | | | | | | | | | | | | | | | | | | |
Distributions from net investment income | | | — | | | | — | | | | — | | | | (0.07 | ) | | | — | | | | — | |
Distributions from net realized
gains from security transactions | | | (0.64 | ) | | | (0.93 | ) | | | (3.30 | ) | | | (2.56 | ) | | | (0.03 | ) | | | (0.74 | ) |
Total distributions | | | (0.64 | ) | | | (0.93 | ) | | | (3.30 | ) | | | (2.63 | ) | | | (0.03 | ) | | | (0.74 | ) |
| | | | | | | | | | | | | | | | | | | | | | | | | |
Proceeds from redemption fees collected (Note 2) | | | — | | | | — | | | | 0.00 | (a) | | | 0.00 | (a) | | | 0.00 | (a) | | | 0.00 | (a) |
| | | | | | | | | | | | | | | | | | | | | | | | | |
Net asset value at end of period | | $ | 12.15 | | | $ | 13.09 | | | $ | 13.93 | | | $ | 15.87 | | | $ | 13.56 | | | $ | 12.07 | |
| | | | | | | | | | | | | | | | | | | | | | | | | |
Total return (b) | | | (2.28% | )(c) | | | 0.51 | % | | | 9.50 | % | | | 44.15 | % | | | 12.62 | % | | | 6.68 | % |
| | | | | | | | | | | | | | | | | | | | | | | | | |
Ratios and supplemental data: | | | | | | | | | | | | | | | | | | | | | | | | |
Net assets at end of period (000’s) | | $ | 85,152 | | | $ | 98,139 | | | $ | 97,776 | | | $ | 80,989 | | | $ | 50,073 | | | $ | 51,274 | |
| | | | | | | | | | | | | | | | | | | | | | | | | |
Ratio of total expenses to average net assets | | | 1.86 | %(d) | | | 1.68 | % | | | 1.61 | % | | | 1.80 | % | | | 1.95 | % | | | 1.82 | % |
| | | | | | | | | | | | | | | | | | | | | | | | | |
Ratio of net expenses to average net assets (e) | 1.51 | %(d)(f) | | | 1.50 | %(f) | | | 1.54 | %(f) | | | 1.75 | % | | | 1.75 | % | | | 1.69 | % |
| | | | | | | | | | | | | | | | | | | | | | | | | |
Ratio of net expenses to average net assets excluding borrowing costs (e) | | | 1.50 | %(d)(f) | | | 1.50 | %(f) | | | 1.54 | %(f) | | | 1.75 | % | | | 1.75 | % | | | 1.69 | % |
| | | | | | | | | | | | | | | | | | | | | | | | | |
Ratio of net investment income (loss) to average net assets (e) | | | 0.06 | %(d) | | | (0.23 | %) | | | (0.36 | %) | | | 0.06 | % | | | (0.03 | %) | | | (0.31 | %) |
| | | | | | | | | | | | | | | | | | | | | | | | | |
Portfolio turnover rate | | | 402 | %(c) | | | 639 | % | | | 579 | % | | | 601 | % | | | 557 | % | | | 525 | % |
(a) | Amount rounds to less than $0.01 per share. |
| | |
(b) | Total return is a measure of the change in value of an investment in the Fund over the period covered, which assumes any dividends or capital gains distributions are reinvested in shares of the Fund. The returns shown do not reflect the deduction of taxes a shareholder would pay on Fund distributions or the redemption of Fund shares. |
| | |
(c) | Not annualized. |
| | |
(d) | Annualized. |
| | |
(e) | Ratio was determined after advisory fee reductions (Note 4). |
| | |
(f) | Effective January 1, 2014, the Advisor reduced its advisory fee from 1.25% to 1.15% of average daily net assets and agreed to further reduce its advisory fees and to absorb the Fund’s operating expenses to the extent necessary to limit aggregate annual operating expenses (which do not include brokerage costs, taxes, borrowing costs such as interest and dividend expenses on securities sold short, and extraordinary expenses) to 1.50% of average daily net assets. |
| | |
See accompanying notes to financial statements. |
57
TFS HEDGED FUTURES FUND
FINANCIAL HIGHLIGHTS* | |
Per share data for a share
outstanding throughout each period: | | Six Months Ended
April 30,
2016 (Unaudited) | | | Year
Ended
October 31, 2015 | | | Year
Ended
October 31,
2014 | | | Year
Ended
October 31,
2013 | | | Period
Ended
October 31,
2012(a) | |
Net asset value at beginning of period | | $ | 10.55 | | | $ | 9.88 | | | $ | 9.93 | | | $ | 11.04 | | | $ | 10.00 | |
| | | | | | | | | | | | | | | | | | | | | |
Income (loss) from investment operations: | | | | | | | | | | | | | | | | | | | | |
Net investment loss | | | (0.04 | ) | | | (0.19 | )(b) | | | (0.49 | ) | | | (0.20 | ) | | | (0.09 | ) |
Net realized and unrealized gains (losses) on investments | | | 0.06 | | | | 0.86 | | | | 0.47 | | | | (0.68 | ) | | | 1.13 | |
Total from investment operations | | | 0.02 | | | | 0.67 | | | | (0.02 | ) | | | (0.88 | ) | | | 1.04 | |
| | | | | | | | | | | | | | | | | | | | | |
Less distributions: | | | | | | | | | | | | | | | | | | | | |
Distributions from net realized gains from security transactions | | | — | | | | — | | | | (0.03 | ) | | | (0.23 | ) | | | — | |
| | | | | | | | | | | | | | | | | | | | | |
Proceeds from redemption fees collected (Note 2) | | | — | | | | — | | | | 0.00 | (c) | | | 0.00 | (c) | | | 0.00 | (c) |
| | | | | | | | | | | | | | | | | | | | | |
Net asset value at end of period | | $ | 10.57 | | | $ | 10.55 | | | $ | 9.88 | | | $ | 9.93 | | | $ | 11.04 | |
| | | | | | | | | | | | | | | | | | | | | |
Total return (d) | | | 0.19 | %(e) | | | 6.78 | % | | | (0.22 | %) | | | (8.14 | %) | | | 10.40 | %(e) |
| | | | | | | | | | | | | | | | | | | | | |
Ratios and supplemental data: | | | | | | | | | | | | | | | | | | | | |
Net assets at end of period (000’s) | | $ | 19,109 | | | $ | 16,631 | | | $ | 38,212 | | | $ | 68,250 | | | $ | 113,541 | |
| | | | | | | | | | | | | | | | | | | | | |
Ratio of total expenses to average net assets | | | 3.16 | %(f) | | | 2.90 | % | | | 2.19 | % | | | 2.35 | % | | | 2.51 | %(f) |
| | | | | | | | | | | | | | | | | | | | | |
Ratio of net expenses to average net assets (g) | | | 1.80 | %(f) | | | 1.81 | % | | | 1.90 | % | | | 2.30 | % | | | 2.30 | %(f) |
| | | | | | | | | | | | | | | | | | | | | |
Ratio of net expenses to average net assets excluding borrowing costs (g)(h) | | | 1.80 | %(f)(j) | | | 1.80 | %(j) | | | 1.90 | %(j) | | | 2.30 | % | | | 2.30 | %(f) |
| | | | | | | | | | | | | | | | | | | | | |
Ratio of net investment loss to average net assets (g) | | | (1.55% | )(f) | | | (1.75 | %) | | | (1.87 | %) | | | (2.23 | %) | | | (2.19% | )(f) |
| | | | | | | | | | | | | | | | | | | | | |
Portfolio turnover rate (i) | | | 0 | % | | | 0 | % | | | 0 | % | | | 0 | % | | | 0 | % |
* | Consolidated financial statements (Note 1). |
| | |
(a) | Represents the period from commencement of operations (December 29, 2011) through October 31, 2012. |
| | |
(b) | Calculated using weighted average shares outstanding during the period. |
| | |
(c) | Amount rounds to less than $0.01 per share. |
| | |
(d) | Total return is a measure of the change in value of an investment in the Fund over the period covered, which assumes any dividends or capital gains distributions are reinvested in shares of the Fund. The returns shown do not reflect the deduction of taxes a shareholder would pay on Fund distributions or the redemption of Fund shares. |
| | |
(e) | Not annualized. |
| | |
(f) | Annualized. |
| | |
(g) | Ratio was determined after advisory fee reductions (Note 4). |
| | |
(h) | Borrowing costs totaled 0.00%, 0.01%, 0.00%, 0.00% and 0.00%(e) of average net assets for the periods ended April 30, 2016, October 31, 2015, 2014, 2013 and 2012, respectively. |
| | |
(i) | All investments held are excluded from the calculation as they are considered to be short-term investments whose maturities or expiration dates at the time of acquisition were one year or less. |
| | |
(j) | Effective January 1, 2014, the Advisor reduced its advisory fee from 2.00% to 1.50% of average daily net assets and agreed to further reduce its advisory fees and to absorb the Fund’s operating expenses to the extent necessary to limit aggregate annual operating expenses (which do not include brokerage costs, taxes, borrowing costs such as interest and dividend expenses on securities sold short, and extraordinary expenses) to 1.80% of average daily net assets. |
| | |
See accompanying notes to financial statements. |
58
TFS CAPITAL INVESTMENT TRUST
NOTES TO FINANCIAL STATEMENTS
April 30, 2016 (Unaudited)
1. Organization
TFS Market Neutral Fund, TFS Small Cap Fund and TFS Hedged Futures Fund (individually, a “Fund”, and collectively, the “Funds”) are each a series of TFS Capital Investment Trust (the “Trust”), an open-end management investment company established as an Ohio business trust under a Declaration of Trust dated January 30, 2004. TFS Market Neutral Fund commenced operations on September 7, 2004. TFS Small Cap Fund commenced operations on March 7, 2006. TFS Hedged Futures Fund commenced operations on December 29, 2011.
The consolidated financial statements of TFS Hedged Futures Fund include TFS Hedged Futures Strategy Offshore Fund Ltd. (the “Subsidiary”), a wholly-owned and controlled Cayman Islands subsidiary. TFS Hedged Futures Fund may invest up to 25% of its total assets in the Subsidiary. TFS Hedged Futures Fund purchases investments through the Subsidiary to provide exposure to the commodity futures market which otherwise may not be possible in a mutual fund structure. All inter-company accounts and transactions have been eliminated in consolidation for TFS Hedged Futures Fund.
TFS Market Neutral Fund seeks to produce capital appreciation while having a low correlation to the U.S. equity market, which TFS Capital LLC (the “Adviser”) defines as the S&P 500® Index. In addition, the Fund seeks to produce lower volatility than the movement of the U.S. equity market.
TFS Small Cap Fund seeks long-term capital appreciation. In addition, the Fund seeks to outperform the Russell 2000® Index.
TFS Hedged Futures Fund seeks to achieve long-term capital appreciation.
2. Significant Accounting Policies
The following is a summary of the Funds’ significant accounting policies. The policies are in conformity with accounting principles generally accepted in the United States of America (“GAAP”). As an investment company, as defined in Financial Accounting Standards Board (“FASB”) Accounting Standards Update 2013-08, the Funds follow accounting and reporting guidance under FASB Accounting Standards Codification Topic 946, “Financial Services – Investment Companies.”
Securities and futures valuation – The Funds’ portfolio securities are valued as of the close of regular trading on the New York Stock Exchange (“NYSE”) (generally 4:00 p.m., Eastern time) on each business day the NYSE is open. Securities listed on the NYSE or other exchanges are valued on the basis of their last sale prices on the exchanges on which they are primarily traded. If there are no sales on that day, the securities are valued at the mean between the closing bid and ask prices on the NYSE or other primary exchange for that day. Securities which are quoted by NASDAQ are valued at the NASDAQ Official Closing Price. If there are no sales on that day, the securities are valued at the mean between the closing bid and ask prices as reported by NASDAQ.
Fixed income securities are generally valued using prices provided by an independent pricing service approved by the Trust’s Board of Trustees (the “Board”). The independent pricing service will employ methodologies that they believe are appropriate, including actual market transactions,
59
TFS CAPITAL INVESTMENT TRUST
NOTES TO FINANCIAL STATEMENTS (Continued)
broker-dealer supplied valuations, matrix pricing, or other electronic data processing techniques. These techniques generally consider such factors as security prices, yields, maturities, call features, ratings, and developments relating to specific securities in arriving at valuations.
Futures contracts that trade on exchanges that close at 4:00 p.m. Eastern time are valued at their closing price as quoted on their primary exchange. Futures contracts that trade on exchanges that close before 4:00 p.m. Eastern time are valued at their last sale price as of the close of regular trading on their primary exchange. Futures contracts that trade on exchanges that close after 4:00 p.m. Eastern time are valued at their last sale price on their primary exchange as of the close of the NYSE. If no closing price is readily available at the time of valuation, the futures contract will be valued at the closing bid price for that day as reported by the primary exchange. Prices for these futures contracts are monitored daily by the Adviser until 4:00 p.m. Eastern time to determine if fair valuation is required.
Other assets and securities for which no quotations are readily available are valued at fair value as determined in good faith under the supervision of the Board and will be classified as Level 2 or 3 within the fair value hierarchy (see below), depending on the inputs used.
GAAP establishes a single authoritative definition of fair value, sets out a framework for measuring fair value and requires additional disclosures about fair value measurements.
The Funds’ investments and other financial instruments have been categorized based upon a fair value hierarchy in accordance with the FASB’s guidance on fair value measurement. The levels of the fair value hierarchy and their applicability to the Funds are described below:
● | Level 1 inputs utilize quoted prices (unadjusted) in active markets for identical assets or liabilities at the reporting date. Level 1 assets and liabilities may include most common stocks, investment companies, rights, warrants, futures contracts and money market funds. |
● | Level 2 inputs utilize inputs other than quoted prices included in Level 1 that are observable for the asset or liability, either directly or indirectly. Level 2 inputs may include quoted prices for similar assets and liabilities in active markets and quoted prices for identical or similar assets or liabilities that are not active. Assets and liabilities included in this category may include warrants that are not actively traded on an exchange, and U.S. Treasury obligations with values that are based on prices provided by an independent pricing service that utilizes various “other significant observable inputs” including bid and ask quotations, prices of similar securities and interest rates, among other factors. |
● | Level 3 inputs are unobservable inputs for the asset or liability and include situations where there is little, if any, market activity for the asset or liability. Assets and liabilities included in this category may include common stocks and other securities that trade infrequently or their trading has been halted for an extended period of time. |
The inputs or methodologies used for valuing securities are not necessarily an indication of the risks associated with investing in those securities. The inputs used to measure fair value may fall into different levels of the fair value hierarchy. In such cases, for disclosure purposes, the level in the fair value hierarchy within which the fair value measurement falls in its entirety is determined based on the lowest level input that is significant to the fair value measurement. The Funds’ assessment of the significance of a particular input to the fair value measurement in its entirety requires judgment and considers factors specific to the asset or liability.
60
TFS CAPITAL INVESTMENT TRUST
NOTES TO FINANCIAL STATEMENTS (Continued)
The availability of observable inputs can vary from security to security and is affected by a wide variety of factors, including, for example, the type of security, whether the security is new and not yet established in the marketplace, and other characteristics particular to the transaction. To the extent that valuation is based on models or inputs that are less observable or unobservable in the market, the determination of fair value requires more judgment. Accordingly, the degree of judgment exercised by the Funds in determining fair value is greatest for investments and other financial instruments categorized as Level 3.
The following is a summary of the inputs used to value the Funds’ investments, securities sold short and other financial instruments as of April 30, 2016:
TFS Market Neutral Fund | | Level 1 | | | Level 2 | | | Level 3 | | | Total | |
Investments in Securities: | |
Common Stocks | | $ | 499,527,383 | | | $ | — | | | $ | — | | | $ | 499,527,383 | |
Investment Companies | | | 21,018,835 | | | | — | | | | — | | | | 21,018,835 | |
Warrants | | | — | | | | 0 | * | | | — | | | | 0 | |
Money Market Funds | | | 550,418 | | | | — | | | | — | | | | 550,418 | |
Total | | $ | 521,096,636 | | | $ | 0 | | | $ | — | | | $ | 521,096,636 | |
Other Financial Instruments: | |
Common Stocks – Sold Short | | $ | (437,308,737 | ) | | $ | — | | | $ | 0 | * | | $ | (437,308,737 | ) |
Rights – Sold Short | | | — | | | | (2 | ) | | | — | | | | (2 | ) |
Warrants – Sold Short | | | (185 | ) | | | (191,974 | )* | | | — | | | | (192,159 | ) |
Futures Contracts – Sold Short | | | (1,842,211 | ) | | | — | | | | — | | | | (1,842,211 | ) |
Total | | $ | (439,151,133 | ) | | $ | (191,976 | ) | | $ | 0 | | | $ | (439,343,109 | ) |
TFS Small Cap Fund | | Level 1 | | | Level 2 | | | Level 3 | | | Total | |
Investments in Securities: | |
Common Stocks | | $ | 84,156,666 | | | $ | — | | | $ | — | | | $ | 84,156,666 | |
Total | | $ | 84,156,666 | | | $ | — | | | $ | — | | | $ | 84,156,666 | |
TFS Hedged Futures Fund | | Level 1 | | | Level 2 | | | Level 3 | | | Total | |
Investments in Securities: | |
U.S. Treasury Obligations | | $ | — | | | $ | 3,875,315 | | | $ | — | | | $ | 3,875,315 | |
Money Market Funds | | | 11,056,771 | | | | — | | | | — | | | | 11,056,771 | |
Total | | $ | 11,056,771 | | | $ | 3,875,315 | | | $ | — | | | $ | 14,932,086 | |
Other Financial Instruments: | |
Futures Contracts | | $ | 23,582 | | | $ | — | | | $ | — | | | $ | 23,582 | |
Futures Contracts – Sold Short | | | (374,039 | ) | | | — | | | | — | | | | (374,039 | ) |
Total | | $ | (350,457 | ) | | $ | — | | | $ | — | | | $ | (350,457 | ) |
* | TFS Market Neutral Fund holds Warrants, Common Stocks - Sold Short, and Warrants - Sold Short, which have been fair valued at $0. |
61
TFS CAPITAL INVESTMENT TRUST
NOTES TO FINANCIAL STATEMENTS (Continued)
Refer to each Fund’s Summary Schedule of Investments, Schedule of Securities Sold Short, Schedule of Futures Contracts and Schedule of Futures Contracts Sold Short, as applicable, for a listing of the securities by security type and sector or industry type.
It is the Funds’ policy to recognize transfers into and out of any Level at the end of the reporting period. As of April 30, 2016, the Funds did not have any transfers between any Levels.
There were no Level 3 securities held by TFS Small Cap Fund or TFS Hedged Futures Fund as of April 30, 2016.
The following is a reconciliation of Level 3 other financial instruments of TFS Market Neutral Fund for which significant unobservable inputs were used to determine fair value between October 31, 2015 and April 30, 2016.
| | | Other Financial Instruments | |
Balance as of October 31, 2015 | | $ | 0 | * |
Change in unrealized appreciation | | | — | |
Balance as of April 30, 2016 | | $ | 0 | * |
* | TFS Market Neutral Fund held Common Stocks – Sold Short as of October 31, 2015 and April 30, 2016, which have been determined to be Level 3 other financial instruments. |
The total amount of unrealized appreciation on TFS Market Neutral Fund’s Level 3 other financial instruments was $5,536,684 as of April 30, 2016.
The following table summarizes the valuation techniques used and unobservable inputs developed by the Board to determine the fair value of TFS Market Neutral Fund’s Level 3 other financial instruments as of April 30, 2016:
| | Fair Value at
April 30, 2016 | Valuation Technique | Unobservable Input | Range | Impact to Valuation from an Increase in Input** |
Common Stocks -
Sold Short | $ 0* | Discount from last sale price | Discount Percentage | 100% | Increase |
* | TFS Market Neutral Fund holds Common Stocks – Sold Short which have been determined to be Level 3 investments and have been fair valued at $0. |
** | This column represents the directional change in the fair value of the Level 3 investments that would result in an increase from the corresponding input. A decrease to the unobservable input would have the opposite effect. Significant increases and decreases in these inputs in isolation could result in significantly higher or lower fair value measurements. |
Share valuation – The net asset value per share of each Fund is calculated daily by dividing the total value of its assets, less liabilities, by the number of shares outstanding. The offering price and redemption price per share of each Fund is equal to the net asset value per share. Prior to January 1, 2014, shares of each Fund were subject to a redemption fee of 2% if redeemed within 90 days of the date of purchase.
62
TFS CAPITAL INVESTMENT TRUST
NOTES TO FINANCIAL STATEMENTS (Continued)
Investment income (expense) – Dividend income (expense) is recorded on the ex-dividend date. Interest income is accrued as earned. Discounts and premiums on fixed income securities are amortized using the interest method. Withholding taxes on foreign dividends have been recorded in accordance with the Funds’ understanding of the appropriate country’s tax rules and tax rates.
Borrowing costs – From time to time, a Fund may have an overdrawn cash balance at the custodian due to redemptions or market movements. When this occurs, the Fund will incur borrowing costs charged by the custodian.
Security transactions – Security transactions are accounted for on the trade date. Realized gains and losses on securities sold are determined on a specific identification basis.
Distributions to shareholders – Distributions to shareholders arising from net investment income and net realized capital gains, if any, are paid at least once each year. The amount of distributions from net investment income and net realized capital gains are determined in accordance with federal income tax regulations, which may differ from GAAP. These “book/tax” differences are permanent in nature and are primarily due to differing treatments of net short-term gains. The tax character of distributions paid by the Funds during the periods ended April 30, 2016 and October 31, 2015 was as follows:
| | Periods
Ended | Ordinary Income | Long-Term Capital Gains | Total Distributions |
TFS Market Neutral Fund | 4/30/2016 | $ 1,668,052 | $ 26,779,117 | $ 28,447,169 |
| | 10/31/2015 | $ — | $ 28,360,770 | $ 28,360,770 |
TFS Small Cap Fund | 4/30/2016 | $ 2,778,851 | $ 1,678,412 | $ 4,457,263 |
| | 10/31/2015 | $ 4,947,085 | $ 1,615,377 | $ 6,562,462 |
There were no distributions paid to shareholders by TFS Hedged Futures Fund during the periods ended April 30, 2016 and October 31, 2015.
Short positions – The Funds may sell securities short. For financial statement purposes, an amount equal to the settlement amount is included in the Statements of Assets and Liabilities as an asset and an equivalent liability is then subsequently marked-to-market daily to reflect the current value of the short position. Subsequent fluctuations in the market prices of securities sold, but not yet purchased, may require purchasing the securities at prices which may differ from the market value reflected on the Statements of Assets and Liabilities. The Funds are liable for any dividends payable on securities while those securities are in a short position and will also bear other costs, such as charges for the prime brokerage accounts, in connection with the short positions. These costs are reported as brokerage expense on securities sold short in the Statements of Operations. As collateral for its short positions, the Funds are required under the Investment Company Act of 1940 (“1940 Act”) to maintain assets consisting of cash, cash equivalents or liquid securities equal to the market value of the securities sold short. The deposits with brokers for securities sold short are reported on the Statements of Assets and Liabilities. The amount of the collateral is required to be adjusted daily to reflect changes in the value of the securities sold short. TFS Market Neutral Fund and TFS Hedged Futures Fund both engage in short selling as a principal
63
TFS CAPITAL INVESTMENT TRUST
NOTES TO FINANCIAL STATEMENTS (Continued)
investment strategy while TFS Small Cap Fund does not. TFS Small Cap Fund currently intends to limit its exposure to short positions, if any, to 5% of its net assets. Short selling subjects a Fund to the potential for unlimited losses.
Option contracts – The Funds may use option contracts in any manner consistent with their investment objectives and as long as their use is consistent with relevant provisions of the 1940 Act. The Funds may use options for speculative investment purposes as well as for the purpose of seeking to reduce the overall investment risk that would otherwise be associated with the securities in which a Fund invests. When a Fund writes an option, an amount equal to the net premium (the premium less the commission) received by the Fund is recorded as a liability in the Fund’s Statement of Assets and Liabilities and is subsequently marked-to-market daily. Premiums received from writing options which expire are treated as realized gains. Premiums received from writing call options which are exercised increase the proceeds used to calculate the realized gain or loss on the sale of the security. Premiums received from writing put options which are exercised increase the basis of the security purchased. If a closing purchase transaction is used to terminate a Fund’s obligation on an option, a gain or loss will be realized, depending upon whether the price of the closing purchase transaction is more or less than the premium previously received on the option written.
Futures contracts – TFS Market Neutral Fund and TFS Hedged Futures Fund are subject to equity price risk, interest rate risk, foreign currency exchange rate risk, and commodity risk in the normal course of pursuing their investment objectives. These Funds may use futures contracts to gain exposure to or to hedge against changes in the value of equities, interest rates, foreign currencies or commodities. A futures contract represents a commitment for the future purchase or sale of an asset at a specified price on a specified date. When a Fund purchases or sells a futures contract, no price is paid to or received by the Fund upon the purchase or sale of the futures contract. Instead, the Fund is required to deposit in a segregated asset account an amount of cash or qualifying securities currently ranging from 5% to 15% of the contract amount. This is called the “initial margin deposit.” Subsequent payments, known as “variation margin,” are accumulated in a receivable or payable account by the Fund each day, depending on the daily fluctuations in the fair value of the underlying asset. The total of this account is received or paid by the Fund when the position is closed. The Fund recognizes an unrealized gain or loss equal to the daily variation margin. If market conditions change unexpectedly, the Fund may not achieve the anticipated benefits of the futures contracts and may realize a loss. The margin deposits for futures contracts and the variation margin receivable and/or payable are reported on the Statements of Assets and Liabilities.
Estimates – The preparation of financial statements in conformity with GAAP requires management to make estimates and assumptions that affect the reported amounts of assets and liabilities and disclosures of contingent assets and liabilities as of the date of the financial statements and the reported amounts of income and expenses during the reporting period. Actual results could differ from those estimates.
Common expenses – Common expenses of the Trust are allocated among the Funds based on the relative net assets of each Fund or the nature of the services performed and the relative applicability to each Fund.
64
TFS CAPITAL INVESTMENT TRUST
NOTES TO FINANCIAL STATEMENTS (Continued)
Foreign Currency Translation – Amounts denominated in or expected to settle in foreign currencies are translated into U.S. dollars based on exchange rates on the following basis:
| | A. | The value of investment securities and other assets and liabilities are translated at exchange rates as of the NYSE close each day. |
| | B. | Purchases and sales of investment securities and income and expenses are translated at the rate of exchange prevailing on the respective date of such transactions. |
| | C. | The Funds do not isolate that portion of the results of operations caused by changes in foreign exchange rates on investments from those caused by changes in market prices of securities held. Such fluctuations are included with the net realized and unrealized gains or losses on investments. |
Reported net realized foreign exchange gains or losses arise from 1) purchases and sales of foreign currencies, 2) currency gains or losses realized between the trade and settlement dates on securities transactions and 3) the difference between the amounts of dividends, interest and foreign withholding taxes recorded on a Fund’s books and the U.S. dollar equivalent of the amounts actually received or paid. Reported net unrealized foreign exchange gains and losses arise from changes in the value of assets and liabilities that result from changes in exchange rates.
Forward Foreign Currency Exchange Contracts – TFS Market Neutral Fund may use forward foreign currency exchange contracts to hedge exposure to foreign currency. TFS Hedged Futures Fund may invest in forward foreign currency exchange contracts for speculative purposes. When the Adviser believes that the currency of a particular country may produce positive returns against the currency of another country, each of those Funds may purchase or sell forward foreign currency exchange contracts to gain exposure to the differential in currency returns. All foreign currency exchange contracts are “marked-to-market” daily at the applicable translation rates resulting in unrealized gains or losses. Realized and unrealized gains or losses from transactions in foreign currency exchange contracts will be included in a Fund’s Statement of Assets and Liabilities and Statement of Operations. Risks associated with these contracts include the potential inability of counterparties to meet the terms of their contracts and unanticipated movements in the value of a foreign currency relative to the U.S. dollar.
Federal income tax – Each Fund has qualified and intends to continue to qualify as a regulated investment company under the Internal Revenue Code of 1986 (the “Code”). Qualification generally will relieve the Funds of liability for federal income taxes to the extent 100% of their net investment income and net realized capital gains are distributed in accordance with the Code.
In order to avoid imposition of the excise tax applicable to regulated investment companies, it is also each Fund’s intention to declare as dividends in each calendar year at least 98% of its ordinary income (net investment income and specified gains and losses) and 98.2% of its net realized capital gains plus undistributed amounts from prior years.
65
TFS CAPITAL INVESTMENT TRUST
NOTES TO FINANCIAL STATEMENTS (Continued)
The following information is computed on a tax basis for each item as of April 30, 2016:
| | | TFS Market Neutral Fund | | | TFS Small Cap Fund | | | TFS Hedged Futures Fund | |
Tax cost of portfolio investments | | $ | 532,932,839 | | | $ | 83,346,532 | | | $ | 14,931,414 | |
Gross unrealized appreciation | | $ | 26,984,960 | | | $ | 4,876,422 | | | $ | 717 | |
Gross unrealized depreciation | | | (38,821,163 | ) | | | (4,066,288 | ) | | | (45 | ) |
Net unrealized appreciation
(depreciation) on investments | | | (11,836,203 | ) | | | 810,134 | | | | 672 | |
Net unrealized depreciation on securities sold short | | | (2,176,424 | ) | | | — | | | | — | |
Unrealized gains on foreign currency transactions | | | — | | | | — | | | | 756 | |
Capital loss carryforwards and other losses | | | (794,352 | ) | | | — | | | | (936,951 | ) |
Other gains (losses) | | | (10,460,057 | ) | | | (505,129 | ) | | | (227,059 | ) |
Accumulated earnings (deficit) | | $ | (25,267,036 | ) | | $ | 305,005 | | | $ | (1,162,582 | ) |
As of April 30, 2016, the tax proceeds from securities sold short is $435,324,474 for TFS Market Neutral Fund.
The difference between the federal income tax cost of portfolio investments and securities sold short and the financial statement cost for TFS Market Neutral Fund and TFS Small Cap Fund is due to certain timing differences in the recognition of capital gains or losses under GAAP. These “book/tax” differences are temporary in nature and are primarily due to the tax deferral of losses on wash sales. The difference between the federal income tax cost of investments and the financial statement cost for TFS Hedged Futures Fund is due to the tax treatment of the Fund’s wholly owned subsidiary as a controlled foreign corporation (CFC).
For the six months ended April 30, 2016, the following reclassifications were made as a result of permanent differences between financial statement and income tax reporting requirements:
| | | TFS Market Neutral Fund | | | TFS Small Cap Fund | | | TFS Hedged Futures Fund | |
Accumulated net investment income (loss) | | $ | 571 | | | $ | — | | | $ | (1,600 | ) |
Accumulated net realized losses from securities transactions and other financial instruments | | $ | (571 | ) | | $ | — | | | $ | 1,600 | |
As of October 31, 2015, TFS Hedged Futures Fund had the following capital loss carryforwards:
Capital loss carryforward – short-term | | $ | 368,976 | |
Capital loss carryforward – long-term | | | 567,975 | |
Total capital loss carryforwards | | $ | 936,951 | |
66
TFS CAPITAL INVESTMENT TRUST
NOTES TO FINANCIAL STATEMENTS (Continued)
These capital loss carryforwards, which do not expire, may be utilized in the current and future years to offset net realized capital gains of TFS Hedged Futures Fund, if any, prior to distributing such gains to shareholders.
The Funds recognize tax benefits or expenses of uncertain tax positions only when the position is “more likely than not” to be sustained assuming examination by tax authorities. Management has reviewed the tax positions taken on federal income tax returns for the current and all open tax periods of each Fund (October 31, 2012 through October 31, 2015 for TFS Market Neutral Fund and TFS Small Cap Fund and December 31, 2012 through October 31, 2015 for TFS Hedged Futures Fund) and has concluded that no provision for unrecognized tax benefits or expenses is required in these financial statements and does not expect this to change over the next twelve months. Each Fund identifies its major tax jurisdiction as U.S. Federal.
3. Investment Transactions
During the six months ended April 30, 2016, cost of purchases and proceeds from sales of portfolio securities, other than short-term investments, U.S. government securities and short positions, amounted to $2,566,888,001 and $2,780,844,460, respectively, for TFS Market Neutral Fund; $349,846,819 and $361,046,500, respectively, for TFS Small Cap Fund; and $0 and $0, respectively, for TFS Hedged Futures Fund.
4. Transactions with Related Parties
INVESTMENT ADVISORY AGREEMENT
Each Fund’s investments are managed by the Adviser pursuant to the terms of an Investment Advisory Agreement. TFS Market Neutral Fund, TFS Small Cap Fund and TFS Hedged Futures Fund pay the Adviser an investment advisory fee, computed and accrued daily and paid monthly, at an annual rate of 1.65%, 1.15% and 1.50%, respectively, of average daily net assets.
The Adviser has contractually agreed to reduce its advisory fees and to absorb each Fund’s operating expenses (for the life of the Funds) to the extent necessary to limit aggregate annual ordinary operating expenses (which do not include brokerage costs, taxes, borrowing costs such as interest and dividend expenses on securities sold short and extraordinary expenses) to 1.90% of TFS Market Neutral Fund’s average daily net assets, 1.50% of TFS Small Cap Fund’s average daily net assets and 1.80% of TFS Hedged Futures Fund’s average daily net assets. During the six months ended April 30, 2016, the Adviser reduced its investment advisory fees by $222,921 with respect to TFS Market Neutral Fund, $151,976 with respect to TFS Small Cap Fund and $121,601 with respect to TFS Hedged Futures Fund.
67
TFS CAPITAL INVESTMENT TRUST
NOTES TO FINANCIAL STATEMENTS (Continued)
Advisory fee reductions and expense reimbursements by the Adviser are subject to repayment by the applicable Fund for a period of three years after such fees and expenses were incurred, provided that such repayments do not cause ordinary operating expenses to exceed the expense caps of 1.90%, 1.50% and 1.80%, respectively, for TFS Market Neutral Fund, TFS Small Cap Fund and TFS Hedged Futures Fund. As of April 30, 2016, the Adviser may in the future recoup fee reductions and expense reimbursements totaling $854,715, $420,335 and $555,764, respectively, from TFS Market Neutral Fund, TFS Small Cap Fund and TFS Hedged Futures Fund. The Adviser may recapture these amounts no later than the dates as stated below:
| | | October 31,
2016 | | | October 31,
2017 | | | October 31,
2018 | | | April 30,
2019 | |
TFS Market Neutral Fund | | $ | — | | | $ | 205,839 | | | $ | 425,955 | | | $ | 222,921 | |
TFS Small Cap Fund | | $ | — | | | $ | 77,861 | | | $ | 190,498 | | | $ | 151,976 | |
TFS Hedged Futures Fund | | $ | 42,614 | | | $ | 157,600 | | | $ | 233,949 | | | $ | 121,601 | |
Certain Trustees and officers of the Trust are also officers of the Adviser.
COMPLIANCE CONSULTING AGREEMENT
Under the terms of a Compliance Consulting Agreement, Drake Compliance, LLC (“Drake”) provides ongoing regulatory compliance consulting, monitoring and reporting services for the Trust. In addition, a principal of Drake serves as the Trust’s Chief Compliance Officer. Drake receives $5,000 per month from the Trust, of which each Fund pays its proportionate share. In addition, each Fund reimburses certain out-of-pocket expenses incurred by Drake, if any, including, but not limited to, postage and supplies and travel expenses.
OTHER SERVICE PROVIDERS
Ultimus Fund Solutions, LLC (“Ultimus”) provides fund administration, fund accounting, compliance and transfer agent services to the Funds. The Funds pay Ultimus fees in accordance with the agreements for such services. In addition, each Fund pays out-of-pocket expenses including, but not limited to, postage, supplies and costs of pricing portfolio securities. Certain officers of the Trust are also officers of Ultimus or of Ultimus Fund Distributors, LLC (the “Distributor”), the principal underwriter of each Fund’s shares and an affiliate of Ultimus. The Distributor is compensated by the Adviser (not the Funds) for acting as principal underwriter.
COMPENSATION OF TRUSTEES
Trustees and officers affiliated with the Adviser or Ultimus are not compensated by the Trust for their services. Each Trustee who is not an affiliated person of the Adviser or Ultimus receives from the Trust an annual retainer of $20,000, paid quarterly; a fee of $7,500 for attendance at each in-person meeting of the Board of Trustees; a fee of $2,500 for attendance at each telephonic regular meeting of the Board of Trustees; and a fee of $1,500 for attendance at each telephonic special meeting of the Board of Trustees. The Chairman of the Audit Committee receives an additional fee of $1,000 for each Audit Committee meeting attended. The Trust reimburses each Trustee and officer for his or her travel and other expenses relating to attendance at Board or committee meetings.
68
TFS CAPITAL INVESTMENT TRUST
NOTES TO FINANCIAL STATEMENTS (Continued)
5. Derivatives Transactions
The locations in the Statements of Assets and Liabilities of the derivative positions of TFS Market Neutral Fund and TFS Hedged Futures Fund as of April 30, 2016 are recorded in the following locations in the Statements of Assets and Liabilities:
Derivative Investment Type | Location |
Futures contracts | Variation margin receivable (payable) |
The following tables set forth the values of derivative contracts of TFS Market Neutral Fund and TFS Hedged Futures Fund as of April 30, 2016:
TFS Market Neutral Fund | |
| | | Variation Margin | | | Total | |
| | Receivable | | | (Payable) | |
Liability Derivatives | | | | | | | | | |
Financial Futures Contracts | | $ | 447,574 | | | $ | (2,289,785 | ) | | $ | (1,842,211 | ) |
Total | | $ | 447,574 | | | $ | (2,289,785 | ) | | $ | (1,842,211 | ) |
TFS Hedged Futures Fund
Futures Contracts | |
| | | Variation Margin | | | Total | |
| | Receivable | | | (Payable) | |
Asset Derivatives | | | | | | | | | |
Futures Contracts | | | | | | | | | |
Commodity | | $ | 123,837 | | | $ | (100,255 | ) | | $ | 23,582 | |
Total Asset Derivatives | | | 123,837 | | | | (100,255 | ) | | | 23,582 | |
| | | | | | | | | | | | | |
Liability Derivatives | | | | | | | | | | | | |
Futures Contracts | | | | | | | | | | | | |
Commodity | | | 3,027 | | | | (124,284 | ) | | | (121,257 | ) |
Financial | | | 74,132 | | | | (326,914 | ) | | | (252,782 | ) |
Total Liability Derivatives | | | 77,159 | | | | (451,198 | ) | | | (374,039 | ) |
Total | | $ | 200,996 | | | $ | (551,453 | ) | | $ | (350,457 | ) |
69
TFS CAPITAL INVESTMENT TRUST
NOTES TO FINANCIAL STATEMENTS (Continued)
Transactions in derivative instruments for TFS Market Neutral Fund and TFS Hedged Futures Fund during the six months ended April 30, 2016 are recorded in the following locations in the Statements of Operations:
Derivative Investment Type | Location |
Futures contracts | Net realized gains (losses) from futures contracts |
| | Net change in unrealized appreciation (depreciation) on futures contracts |
The following is a summary of net realized gains (losses) and net change in unrealized appreciation (depreciation) on derivative instruments for TFS Market Neutral Fund and TFS Hedged Futures Fund recognized in the Statements of Operations during the six months ended April 30, 2016:
Type of Derivative | | Net Realized Gains | | | Net Change in Unrealized Appreciation (Depreciation) | |
TFS Market Neutral Fund | | | | | | |
Futures contracts | | | | | | |
Financial | | $ | 3,997,058 | | | $ | (820,863 | ) |
| | | | | | | | | |
Total | | $ | 3,997,058 | | | $ | (820,863 | ) |
| | | | | | | | | |
TFS Hedged Futures Fund | | | | | | | | |
Futures contracts | | | | | | | | |
Commodity | | $ | 163,137 | | | $ | (283,555 | ) |
Financial | | | 417,485 | | | | (160,396 | ) |
Total | | $ | 580,622 | | | $ | (443,951 | ) |
TFS Small Cap Fund had no transactions in derivative instruments during the six months ended April 30, 2016.
In the ordinary course of business, TFS Market Neutral Fund and TFS Hedged Futures Fund may enter into transactions subject to enforceable netting agreements or other similar arrangements (“netting agreements”). Generally, the right to offset in netting agreements allows the Funds to offset any exposure to a specific counterparty with any collateral received or delivered to that counterparty based on the terms of the agreements. Generally, the Funds manage their cash collateral securities and securities collateral on a counterparty basis.
70
TFS CAPITAL INVESTMENT TRUST
NOTES TO FINANCIAL STATEMENTS (Continued)
As of April 30, 2016, the offsetting of financial assets and derivatives assets is as follows:
TFS Market Neutral Fund | |
Description | | Gross Amounts of Recognized Assets | | | Gross Amounts Offset in Statements of Assets and Liabilities | | | Net Amounts of Assets Presented in Statements of Assets and Liabilities | | | Collateral Pledged | | | Net Amount | |
Variation margin receivable - futures contracts | | $ | 447,574 | | | $ | — | | | $ | 447,574 | | | $ | — | | | $ | 447,574 | |
Total subject to a master netting or similar arrangement | | $ | 447,574 | | | $ | — | | | $ | 447,574 | | | $ | — | | | $ | 447,574 | |
TFS Hedged Futures Fund | |
Description | | Gross Amounts of Recognized Assets | | | Gross Amounts Offset in Statements of Assets and Liabilities | | | Net Amounts of Assets Presented in Statements of Assets and Liabilities | | | Collateral Pledged | | | Net Amount | |
Variation margin receivable - futures contracts | | $ | 200,996 | | | $ | — | | | $ | 200,996 | | | $ | — | | | $ | 200,996 | |
Total subject to a master netting or similar arrangement | | $ | 200,996 | | | $ | — | | | $ | 200,996 | | | $ | — | | | $ | 200,996 | |
Offsetting of financial liabilities and derivative liabilities as of April 30, 2016 is as follows:
TFS Market Neutral Fund | |
Description | | Gross Amounts of Recognized Liabilities | | | Gross Amounts Offset in Statements of Assets and Liabilities | | | Net Amounts of Liabilities Presented in Statements of Assets and Liabilities | | | Collateral Pledged | | | Net Amount | |
Variation margin payable - futures contracts | | $ | (2,289,785 | ) | | $ | — | | | $ | (2,289,785 | ) | | $ | — | | | $ | (2,289,785 | ) |
Total subject to a master netting or similar arrangement | | $ | (2,289,785 | ) | | $ | — | | | $ | (2,289,785 | ) | | $ | — | | | $ | (2,289,785 | ) |
71
TFS CAPITAL INVESTMENT TRUST
NOTES TO FINANCIAL STATEMENTS (Continued)
TFS Hedged Futures Fund | |
Description | | Gross Amounts of Recognized Liabilities | | | Gross Amounts Offset in Statements of Assets and Liabilities | | | Net Amounts of Liabilities Presented in Statements of Assets and Liabilities | | | Collateral Pledged | | | Net Amount | |
Variation margin payable - futures contracts | | $ | (551,453 | ) | | $ | — | | | $ | (551,453 | ) | | $ | — | | | $ | (551,453 | ) |
Total subject to a master netting or similar arrangement | | $ | (551,453 | ) | | $ | — | | | $ | (551,453 | ) | | $ | — | | | $ | (551,453 | ) |
6. Investments in Money Market Mutual Funds
In order to maintain sufficient liquidity to implement investment strategies, or for temporary defensive purposes, each Fund may invest a significant portion of its assets in shares of one or more money market mutual funds. An investment in a money market mutual fund is not insured or guaranteed by the Federal Deposit Insurance Corporation or any other governmental agency, entity or person. While investor losses in money market mutual funds have been rare, they have occurred. In addition, additional indirect expenses will be incurred due to acquired fund fees and other costs to the extent of the investment in shares of money market mutual funds. As of April 30, 2016, TFS Hedged Futures Fund had 57.9% of the value of its net assets invested in shares of money market mutual funds registered under the 1940 Act. As of April 30, 2016, TFS Market Neutral Fund and TFS Small Cap Fund did not have a significant portion of their net assets invested in shares of money market mutual funds.
7. Contingencies and Commitments
The Funds indemnify the Trust’s officers and Trustees for certain liabilities that might arise from their performance of their duties to the Funds. Additionally, in the normal course of business the Funds enter into contracts that contain a variety of representations and warranties and which provide general indemnifications. The Funds’ maximum exposure under these arrangements is unknown, as this would involve future claims that may be made against the Funds that have not yet occurred. However, based on experience, the Funds expect the risk of loss to be remote.
8. Subsequent Events
The Funds are required to recognize in the financial statements the effects of all subsequent events that provide additional evidence about conditions that existed as of the date of the Statements of Assets and Liabilities. For non-recognized subsequent events that must be disclosed to keep the financial statements from being misleading, the Funds are required to disclose the nature of the event as well as an estimate of its financial effect, or a statement that such an estimate cannot be made. Management has evaluated subsequent events through the issuance of these financial statements and has noted no such events.
72
TFS CAPITAL INVESTMENT TRUST
ABOUT YOUR FUNDS’ EXPENSES (Unaudited)
We believe it is important for you to understand the impact of costs on your investment. As a shareholder of the Funds, you incur two types of costs: (1) transaction costs and (2) ongoing costs, including management fees and other Fund expenses. The following examples are intended to help you understand your ongoing costs (in dollars) of investing in the Funds and to compare these costs with the ongoing costs of investing in other mutual funds.
A mutual fund’s ongoing costs are expressed as a percentage of its average net assets. This figure is known as the expense ratio. The ongoing costs reflected in the table are based on an investment of $1,000 made at the beginning of the most recent semi-annual period (November 1, 2015) and held until the end of the period (April 30, 2016).
The table below illustrates each Fund’s ongoing costs in two ways:
Actual fund return – This section helps you to estimate the actual expenses that you paid over the period. The “Ending Account Value” shown is derived from each Fund’s actual return, and the fourth column shows the dollar amount of operating expenses that would have been paid by an investor who started with $1,000 in the Funds. You may use the information here, together with the amount you invested, to estimate the expenses that you paid over the period.
To do so, simply divide your account value by $1,000 (for example, an $8,600 account value divided by $1,000 = 8.6), then multiply the result by the number given for the Funds under the heading “Expenses Paid During Period.”
Hypothetical 5% return – This section is intended to help you compare each Fund’s ongoing costs with those of other mutual funds. It assumes that each Fund had an annual return of 5% before expenses during the period shown, but that the expense ratio is unchanged. In this case, because the return used is not each Fund’s actual return, the results do not apply to your investment. The example is useful in making comparisons because the SEC requires all mutual funds to calculate expenses based on a 5% return. You can assess each Fund’s ongoing costs by comparing this hypothetical example with the hypothetical examples that appear in shareholder reports of other funds.
Note that expenses shown in the table are meant to highlight and help you compare ongoing costs only. The calculations below assume no shares were bought or sold during the period. Your actual costs may have been higher or lower, depending on the amount of your investment and the timing of any purchases or redemptions.
More information about each Fund’s expenses, including annual expense ratios, can be found in this report. For additional information on operating expenses and other shareholder costs, please refer to each Fund’s summary prospectus.
73
TFS CAPITAL INVESTMENT TRUST
ABOUT YOUR FUNDS’ EXPENSES (Unaudited) (Continued)
| Beginning
Account Value
November 1, 2015 | Ending
Account Value
April 30, 2016 | Net
Expense Ratio(a) | Expenses Paid During Period(b) |
TFS Market Neutral Fund | | | | |
Based on Actual Fund Return | $ 1,000.00 | $ 902.70 | 7.91% | $ 37.42 |
Based on Hypothetical 5% Return (before expenses) | $ 1,000.00 | $ 985.53 | 7.91% | $ 39.05 |
TFS Small Cap Fund | | | | |
Based on Actual Fund Return | $ 1,000.00 | $ 977.20 | 1.51% | $ 7.42 |
Based on Hypothetical 5% Return (before expenses) | $ 1,000.00 | $ 1,017.35 | 1.51% | $ 7.57 |
TFS Hedged Futures Fund | | | | |
Based on Actual Fund Return | $ 1,000.00 | $ 1,001.90 | 1.80% | $ 8.96 |
Based on Hypothetical 5% Return (before expenses) | $ 1,000.00 | $ 1,015.91 | 1.80% | $ 9.02 |
(a) | Annualized, based on the Fund’s most recent one-half year expenses. |
| | |
(b) | Expenses are equal to each Fund’s annualized expense ratio multiplied by the average account value over the period, multiplied by 182/366 (to reflect the one-half year period). |
74
TFS CAPITAL INVESTMENT TRUST
OTHER INFORMATION (Unaudited)
A description of the policies and procedures that the Funds use to determine how to vote proxies relating to portfolio securities is available without charge upon request by calling toll-free 1-888-534-2001, or on the SEC’s website at http://www.sec.gov. Information regarding how the Funds voted proxies relating to portfolio securities during the most recent 12-month period ended June 30 is also available without charge upon request by calling toll-free 1-888-534-2001, or on the SEC’s website at http://www.sec.gov.
The Funds file a complete listing of portfolio holdings with the SEC as of the end of the first and third quarters of each fiscal year on Form N-Q. The filings are available upon request, by calling 1-888-534-2001. Furthermore, you may obtain copies of the filings on the SEC’s website at http://www.sec.gov. The Funds’ Forms N-Q may also be reviewed and copied at the SEC’s Public Reference Room in Washington, DC, and information on the operation of the Public Reference Room may be obtained by calling 1-800-SEC-0330.
The net asset values for the Funds are published daily at the Funds’ website at http://www.tfscapital.com.
75
TFS CAPITAL INVESTMENT TRUST
APPROVAL OF INVESTMENT ADVISORY AGREEMENTS (Unaudited)
At an in-person meeting held on February 17, 2016, the Board of Trustees considered whether to approve new Investment Advisory Agreements (“New Advisory Agreements”), on behalf of TFS Market Neutral Fund (the “Market Neutral Fund”), the TFS Small Cap Fund (the “Small Cap Fund”), the TFS Hedged Futures Fund and the TFS Hedged Futures Strategy Offshore Fund Ltd (together the “Hedged Futures Fund”, and together with the Market Neutral Fund and the Small Cap Fund, the “Funds”) with TFS Capital LLC (the “Adviser”). The New Advisory Agreements are required because a controlling person of the Adviser entered into an agreement to sell his interest in the Adviser to the remaining shareholders of the Adviser, effective June 30, 2016 (the “Transaction”). The person owned 25.3% of the Adviser and under applicable law, a person who owns 25% or more of the voting securities of a company is presumed to control such company. Because of this presumption the Transaction will result in a change of control of the Adviser. Under the 1940 Act and the terms of each present advisory agreement, those agreements will automatically terminate upon the consummation of the Transaction. Consequently the New Advisory Agreements are required. Each New Advisory Agreement is substantially identical to the present advisory agreement and differs only with respect to the following changes: (i) a change to the effective and termination date; (ii) incorporating into the body of the New Advisory Agreements the January 1, 2014 amendment to the present advisory agreements which lowered the advisory fee rates; and (iii) the addition of a forum selection clause. To assist the Board in considering the New Advisory Agreements, the Adviser provided the Board with various written materials in advance of the meeting, including updated financial and performance information.
The Independent Trustees discussed the proposed approval of the New Advisory Agreements with management and also met in Executive Session where the Independent Trustees were advised by independent counsel of their legal and fiduciary obligations in approving the New Advisory Agreements. The Board determined that the overall arrangement between each Fund and the Adviser, as provided in the New Advisory Agreements, was fair and reasonable and that approval of the New Advisory Agreements was in the best interests of each Fund and its shareholders. The Board of Trustees, with the Independent Trustees voting separately, unanimously approved each of the New Advisory Agreements and recommended approval of the New Advisory Agreements to each Fund’s shareholders to become effective upon consummation of the change of control at the Adviser.
Throughout this process, the Independent Trustees were advised and supported by independent counsel having experience in the 1940 Act and other federal securities law matters. The following describes the Trustees’ considerations at the February 17, 2016 meeting:
Nature, extent and quality of services
The Trustees received and considered information on the responsibilities of the Adviser under the New Advisory Agreements, noting that the Adviser is responsible for providing each Fund with investment research and advice, and determining the securities to be purchased and sold in accordance with the investment objective and policies of each Fund. The Trustees gave weight to the Adviser’s representations that (i) the responsibilities of the Adviser under the New Advisory Agreements are substantially the same in all material respects as under each Fund’s current Investment Advisory Agreement (the “Present Advisory Agreements”); (ii) the operations of the Adviser and the level or quality of advisory services provided to the Funds will not be materially affected as a result of the New Advisory Agreements; (iii) the same personnel of the Adviser who
76
TFS CAPITAL INVESTMENT TRUST
APPROVAL OF INVESTMENT ADVISORY AGREEMENTS (Unaudited) (Continued)
currently provide investment advisory services to the Funds will continue to do so upon approval of the New Advisory Agreements. The Trustees reviewed the qualifications, backgrounds and responsibilities of the advisory personnel primarily responsible for the day-to-day management of the Funds and were mindful that no changes to the personnel responsible for the daily portfolio management of the Funds are contemplated as a result of the Transaction. The Trustees discussed and considered the quality of administrative and other services provided to the Trust, the Adviser’s compliance program and the Adviser’s role in coordinating services and programs for the purpose of mitigating compliance risks. The Trustees considered the operational changes of the Adviser over the past year, which included a reallocation of resources and responsibilities among the Adviser’s existing senior personnel and the hiring of additional personnel. They noted that Eric Newman was named Chief Investment Officer of the Adviser in July 2014, managing the analysis and technology teams of the Adviser and continuing his service as a portfolio manager of the Funds. The Trustees considered that all of the operational and personnel changes at the Adviser noted herein have taken place seamlessly with no negative impact to the Funds and their respective shareholders.
The Trustees considered the Adviser’s responsibilities with regards to brokerage selection and best execution. The Trustees also considered that the Adviser does not participate in “soft dollar” arrangements.
After reviewing the foregoing information, the Trustees concluded that the quality, extent and nature of the services provided by the Adviser to each Fund were satisfactory.
Investment Performance of the Funds
The Trustees compared the performance of the TFS Market Neutral Fund with the performance of the Standard & Poor’s 500 Index (“S&P 500 Index”), the Fund’s primary benchmark, for the one year periods ended October 31, 2013, 2014 and 2015 and the since inception period ended October 31, 2015. They discussed the TFS Market Neutral Fund’s underperformance for the stated periods, finding that the Fund’s investment strategies are not designed to keep pace or outperform the S&P 500 Index during periods when the market is experiencing a broad-based rally and/or when the market is favoring large capitalization companies. The Trustees were also provided with comparative performance statistics of the universe of funds categorized by Morningstar as “market neutral” funds. The Trustees noted that the TFS Market Neutral Fund’s returns were higher than the average fund in the market neutral category over the five and ten year periods ended December 31, 2015 but trailed the performance of the average fund in the category for the one and three year periods ended December 31, 2015. The Trustees reviewed performance information with respect to the Adviser’s other managed accounts, concluding that due to the differences in how these accounts are managed, the comparison is not particularly relevant. The Trustees also considered the consistency of the Adviser’s management of the TFS Market Neutral Fund with the Fund’s investment objective and policies. After considerable discussion, the Trustees concluded that the overall investment performance of the TFS Market Neutral Fund has been above average.
The Trustees compared the performance of the TFS Small Cap Fund with the performance of the Russell 2000 Index, the Fund’s primary benchmark, for the one year periods ended October 31, 2013, 2014 and 2015 and the since inception period ended October 31, 2015. It was noted by the
77
TFS CAPITAL INVESTMENT TRUST
APPROVAL OF INVESTMENT ADVISORY AGREEMENTS (Unaudited) (Continued)
Trustees that the TFS Small Cap Fund outperformed the Russell 2000 Index for each of the stated periods. The Independent Trustees were also provided with comparative performance statistics of the universe of funds categorized by Morningstar as “small cap blend” funds, which is the category to which the TFS Small Cap Fund has been assigned. The Independent Trustees noted that the TFS Small Cap Fund’s returns were higher than the returns of the average fund in the small cap blend category for the three and five year periods ended December 31, 2015 but trailed the performance of the average fund in the category for the one year period ended December 31, 2015. They also reviewed performance information with respect to the Adviser’s other clients but concluded that none of these clients provided a good comparison due to differences in investment objectives. The Trustees considered the consistency of the Adviser’s management of the TFS Small Cap Fund with the Fund’s investment objective and policies. After further discussion, the Trustees concluded that the investment performance of the TFS Small Cap Fund has been above average.
The Trustees next compared the performance of the TFS Hedged Futures Fund to the performance of the Standard & Poor’s Diversified Trends Indicator (“S&P DTI”), the Fund’s primary benchmark, for the one year periods ended October 31, 2013, 2014 and 2015 and the since inception period ended October 31, 2015. It was noted by the Trustees that the TFS Hedged Futures Fund outperformed the S&P DTI for the most recent one year period ended October 31, 2015 and the since inception period ended October 31, 2015, but trailed the performance of the S&P DTI for the one year periods ended October 31, 2013 and 2014. The Trustees were also provided with comparative performance statistics of the universe of funds categorized by Morningstar as “managed futures” funds, which is the category to which the TFS Hedged Futures Fund has been assigned. The Trustees noted that the TFS Hedged Futures Fund outperformed the average returns for the funds in the managed futures category for the one year period ended December 31, 2015 but trailed the performance of the average fund in the category for the three period ended December 31, 2015. The Trustees also reviewed performance information with respect to the Adviser’s other clients but concluded that none of these other clients provided a good comparison due to differences in investment objectives. The Trustees considered the consistency of the Adviser’s management of the TFS Hedged Futures Fund with the Fund’s investment objective and policies. They also discussed the TFS Hedged Futures Fund’s lack of correlation to the other funds in the managed futures category along with other broad based securities indices. After further discussion, the Trustees concluded that the investment performance of the TFS Hedged Futures Fund has been satisfactory.
Cost of Services and Profits to be Realized by the Adviser
The Trustees compared the rate of advisory fees that will be paid by the Funds under the New Advisory Agreements with average advisory fee ratios of similar mutual funds compiled from statistics reported by Morningstar. They also compared the total operating expense ratios of the Funds during the most recent fiscal year with average expense ratios of representative funds in their respective Morningstar categories. The Trustees found that each Fund’s current advisory fee rate was higher than the average advisory fee rate and the overall expense ratios were higher than the average expense ratios in its comparative Morningstar category, except the overall expense ratio for the TFS Hedged Futures Fund was lower than the average expense ratio for the Morningstar managed futures category. The Independent Trustees noted that the Adviser
78
TFS CAPITAL INVESTMENT TRUST
APPROVAL OF INVESTMENT ADVISORY AGREEMENTS (Unaudited) (Continued)
has agreed to continue the expense limitation agreements for each Fund for the life of the Fund (assuming the Adviser continues to serve as investment adviser) following the approval by shareholders of the New Advisory Agreements.
The Independent Trustees next considered the Adviser’s analysis of its revenues and expenses with respect to the services provided to each Fund for the one-year period ended December 31, 2015. They discussed the impact the advisory fee reductions and lower expense cap arrangements have had on the revenues of the Adviser and noted that overall revenues derived by the Adviser from its management of the Funds has decreased over the past two years. They noted that, although the Adviser continues to receive significant revenue from the TFS Market Neutral Fund, there are significant costs associated with managing the TFS Market Neutral Fund, especially in the areas of research and development, retention of its investment professionals and hiring new personnel. The Independent Trustees further considered that the investment and research process utilized by Adviser is broader and more sophisticated than the process used by most other investment advisers as it involves frequent position rebalancing, trading in small capitalization companies, the development of proprietary multiple trading models and the use of a team approach that involves many participants. The Independent Trustees next reviewed the balance sheet of the Adviser as of December 31, 2015, noting that the Adviser is financially stable and has assets sufficient to satisfy its commitments to the Funds. The Independent Trustees also discussed the structure of the Transaction, concluding that the Transaction will not directly impact the financial condition of the Adviser. The Independent Trustees considered the “fallout benefits” to the Adviser, including the additional exposure the Adviser has received as a result of managing the Funds. After a thorough discussion and consideration of the foregoing, the Trustees concluded that the fees to be paid by each Fund to the Adviser are reasonable in light of the quality of the services received.
Economies of Scale
The Independent Trustees noted that each Fund’s New Advisory Agreement does not contain breakpoints. They further noted that the Adviser has agreed to continue its contractual fee reductions and expense reimbursement arrangements with each Fund. The Independent Trustees noted that the Adviser has waived a portion of its advisory fee and absorbed operating expenses for each Fund during the October 31, 2015 fiscal year to the extent necessary to limit the Fund’s annual operating expenses to the contractual amounts. The Independent Trustee concluded that due to the Adviser’s commitment to maintain the advisory fees and expense limitations at their current levels, it is not necessary or appropriate at this time to consider adding fee breakpoints to the advisory fee schedule for the Funds.
79
TFS CAPITAL INVESTMENT TRUST
RESULTS OF SPECIAL MEETING OF SHAREHOLDERS (Unaudited)
On May 5, 2016, a Special Meeting of Shareholders of TFS Market Neutral Fund, TFS Small Cap Fund and TFS Hedged Futures Fund (individually, a “Fund,” collectively, the “Funds”), each a series of TFS Capital Investment Trust (the “Trust”), was held for the purpose of voting on the following Proposals:
PROPOSAL 1. | To approve, with respect to each Fund, a new Investment Advisory Agreement with TFS Capital LLC |
PROPOSAL 2. | To elect four individuals to serve on the Board of Trustees of the Trust |
PROPOSAL 3. | To approve adjournments of the Meeting from time to time to solicit additional proxies if there are insufficient votes at the time of the Meeting to constitute a quorum or to approve the other Proposals. |
The total number of shares of the Funds present in person or by proxy are set forth below:
Fund | | Shares
Outstanding | | | Shares
Present | | | % of Total
Shares
Outstanding | |
TFS Market Neutral Fund | | | 46,056,616 | | | | 32,893,829 | | | | 71.42 | % |
TFS Small Cap Fund | | | 7,253,100 | | | | 3,718,828 | | | | 51.27 | % |
TFS Hedged Futures Fund | | | 1,715,592 | | | | 1,237,501 | | | | 72.13 | % |
Total Trust | | | 55,025,308 | | | | 37,850,158 | | | | 68.78 | % |
The following Proposals were approved by shareholders. The results of the voting were as follows:
Trust Level Vote(all shareholders voting collectively)
Proposal 2: | To elect four individuals to serve on the Board of Trustees of the Trust. |
| | For | Withhold |
Gregory R. Owens | 36,509,720 | 955,835 |
Mark J. Malone | 36,592,945 | 872,610 |
Brian O’Connell | 36,500,568 | 964,987 |
Eric S. Newman | 36,588,475 | 877,080 |
TFS Market Neutral Fund
Proposal 1: | To approve, with respect to the TFS Market Neutral Fund, a new investment advisory agreement with TFS Capital LLC. |
For | Against | Abstain |
23,112,904 | 65,790 | 846,186 |
80
TFS CAPITAL INVESTMENT TRUST
RESULTS OF SPECIAL MEETING OF SHAREHOLDERS (Unaudited) (Continued)
Proposal 3: | To approve adjournments of the meeting from time to time to solicit additional proxies if there are insufficient votes at the time of the meeting to constitute a quorum or to approve Proposals 1 or 2. |
For | Against | Abstain |
31,937,306 | 116,891 | 839,626 |
TFS Small Cap Fund
Proposal 1: | To approve, with respect to the TFS Small Cap Fund, a new investment advisory agreement with TFS Capital LLC. |
For | Against | Abstain |
2,658,793 | 23,954 | 34,865 |
Proposal 3: | To approve adjournments of the meeting from time to time to solicit additional proxies if there are insufficient votes at the time of the meeting to constitute a quorum or to approve Proposals 1 or 2. |
For | Against | Abstain |
3,648,834 | 36,815 | 33,178 |
TFS Hedged Futures Fund
Proposal 1: | To approve, with respect to the TFS Hedged Futures Fund, a new investment advisory agreement with TFS Capital LLC. |
For | Against | Abstain |
884,896 | 2,547 | 2,852 |
Proposal 3: | To approve adjournments of the meeting from time to time to solicit additional proxies if there are insufficient votes at the time of the meeting to constitute a quorum or to approve Proposals 1 or 2. |
For | Against | Abstain |
1,236,078 | 1,423 | 0 |
81
The registrant has not adopted procedures by which shareholders may recommend nominees to the registrant’s board of trustees.
(a) Based on their evaluation of the registrant’s disclosure controls and procedures (as defined in Rule 30a-3(c) under the Investment Company Act of 1940) as of a date within 90 days of the filing date of this report, the registrant’s principal executive officer and principal financial officer have concluded that such disclosure controls and procedures are reasonably designed and are operating effectively to ensure that material information relating to the registrant, including its consolidated subsidiaries, is made known to them by others within those entities, particularly during the period in which this report is being prepared, and that the information required in filings on Form N-CSR is recorded, processed, summarized, and reported on a timely basis.
(b) There were no changes in the registrant’s internal control over financial reporting (as defined in Rule 30a-3(d) under the Investment Company Act of 1940) that occurred during the second fiscal quarter of the period covered by this report that have materially affected, or are reasonably likely to materially affect, the registrant’s internal control over financial reporting.
File the exhibits listed below as part of this Form. Letter or number the exhibits in the sequence indicated.
(a)(1) Any code of ethics, or amendment thereto, that is the subject of the disclosure required by Item 2, to the extent that the registrant intends to satisfy the Item 2 requirements through filing of an exhibit: Not required
(a)(2) A separate certification for each principal executive officer and principal financial officer of the registrant as required by Rule 30a-2(a) under the Act (17 CFR 270.30a-2(a)): Attached hereto
(a)(3) Any written solicitation to purchase securities under Rule 23c-1 under the Act (17 CFR 270.23c-1) sent or given during the period covered by the report by or on behalf of the registrant to 10 or more persons: Not applicable
(b) Certifications required by Rule 30a-2(b) under the Act (17 CFR 270.30a-2(b)): Attached hereto
Pursuant to the requirements of the Securities Exchange Act of 1934 and the Investment Company Act of 1940, the registrant has duly caused this report to be signed on its behalf by the undersigned, thereunto duly authorized.