Exhibit 99.2
Supplemental Analyst Package Third Quarter 2009 Earnings Call October 28, 2009

Table of Contents Financial Highlights 1 Consolidated Balance Sheets 2 Consolidated Statements of Operations 3 Consolidated Statements of Funds from Operations 4 Wholly-owned Property Results of Operations 5 Seasonality of Operations 6 Capital Structure 7 Portfolio Overview 8 Owned Development Update 11 Third-party Development Update 12 Management Services Update 13 Investor Information 14
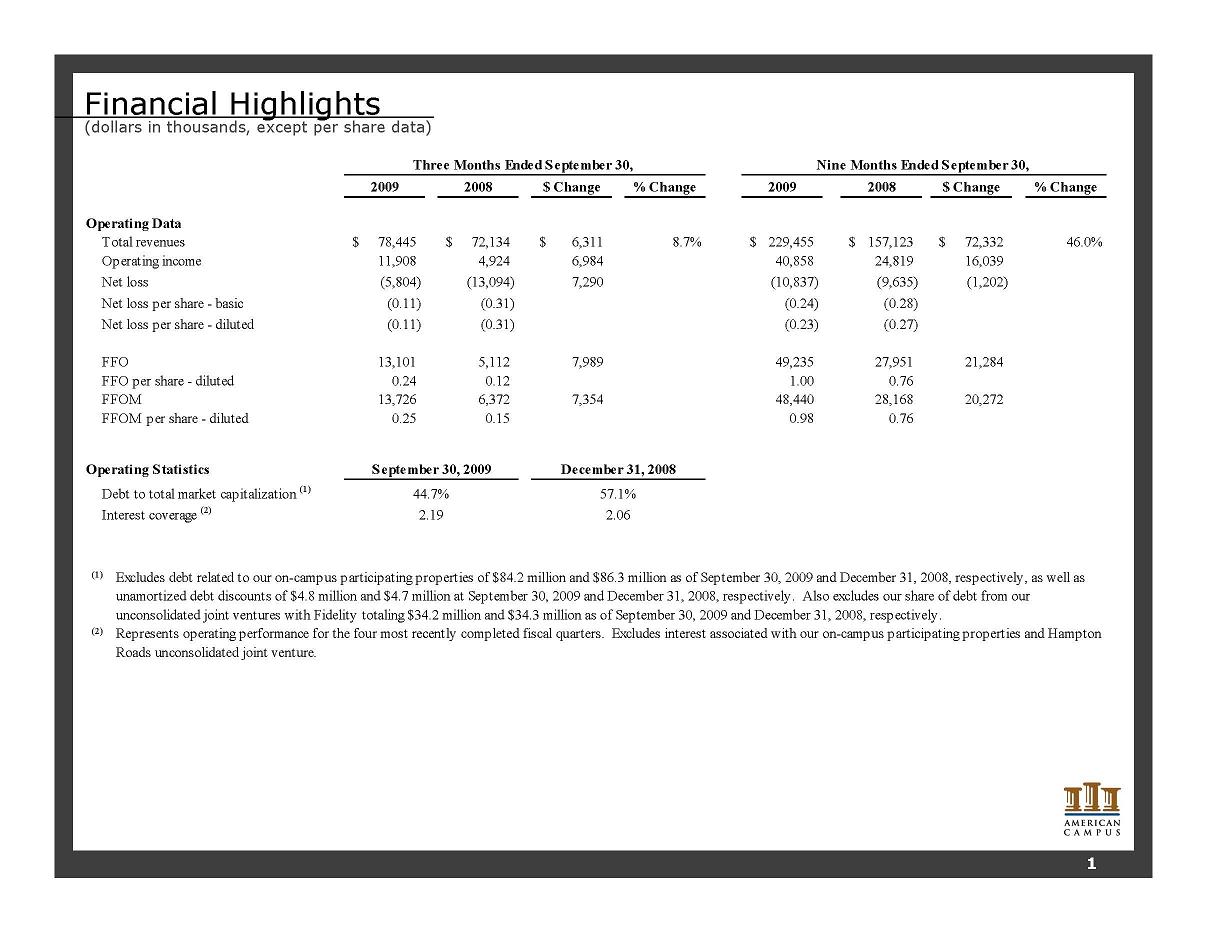
Financial Highlights (dollars in thousands, except per share data) 2009 2008 $ Change % Change 2009 2008 $ Change % Change 78,445 $ 72,134 $ 6,311 $ 8.7% 229,455 $ 157,123 $ 72,332 $ 46.0% 11,908 4,924 6,984 40,858 24,819 16,039 (5,804) (13,094) 7,290 (10,837) (9,635) (1,202) Net loss per share - basic (0.11) (0.31) (0.24) (0.28) Net loss per share - diluted (0.11) (0.31) (0.23) (0.27) 13,101 5,112 7,989 49,235 27,951 21,284 FFO per share - diluted 0.24 0.12 1.00 0.76 13,726 6,372 7,354 48,440 28,168 20,272 FFOM per share - diluted 0.25 0.15 0.98 0.76 Debt to total market capitalization (1) Operating Data Total revenues FFO FFOM Operating income Net loss Operating Statistics 2.19 2.06 Interest coverage (2) (2) (1) Excludes debt related to our on-campus participating properties of $84.2 million and $86.3 million as of September 30, 2009 and December 31, 2008, respectively, as well as unamortized debt discounts of $4.8 million and $4.7 million at September 30, 2009 and December 31, 2008, respectively. Also excludes our share of debt from our unconsolidated joint ventures with Fidelity totaling $34.2 million and $34.3 million as of September 30, 2009 and December 31, 2008, respectively. Represents operating performance for the four most recently completed fiscal quarters. Excludes interest associated with our on-campus participating properties and Hampton Roads unconsolidated joint venture. Nine Months Ended S eptember 30, 44.7% 57.1% Three Months Ended September 30, September 30, 2009 December 31, 2008 1
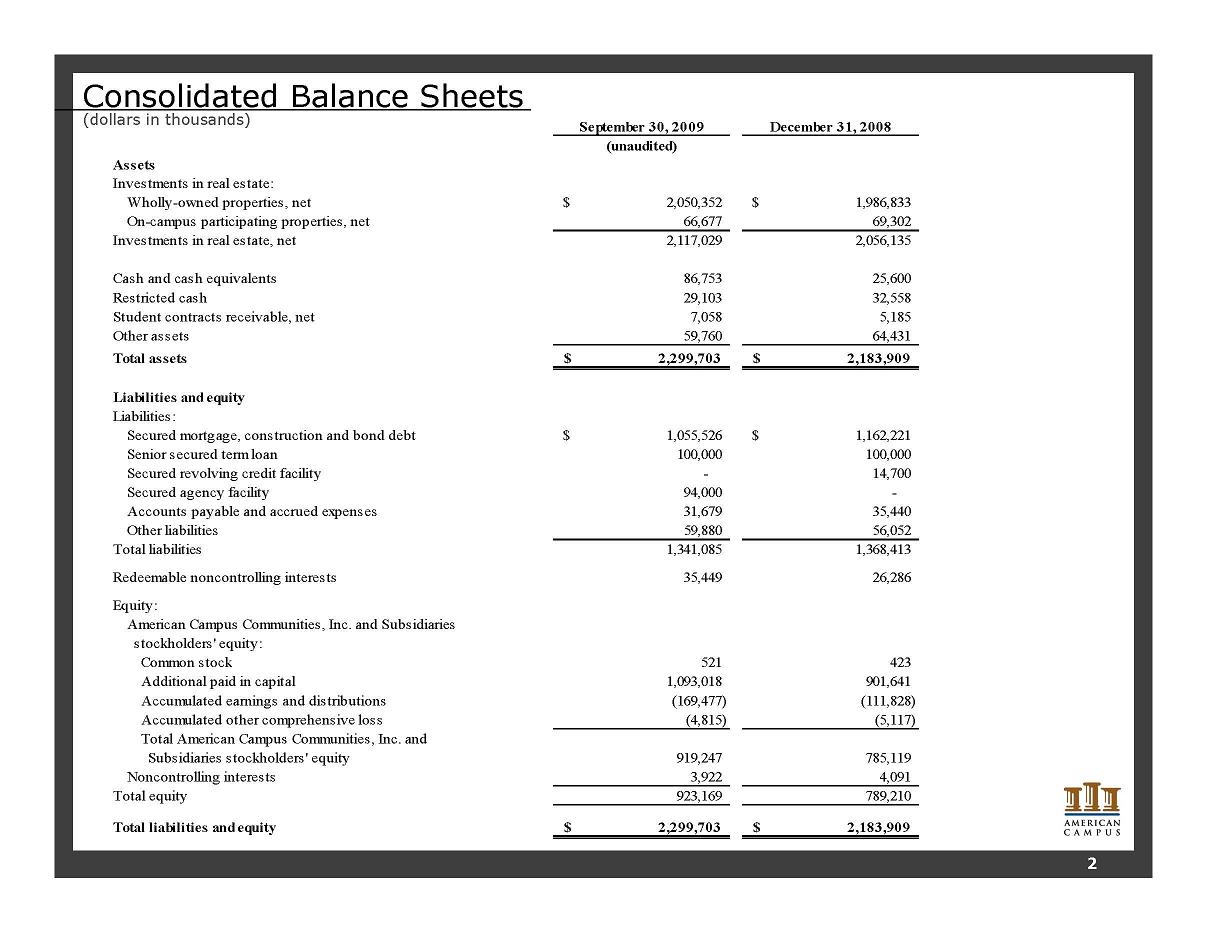
Consolidated Balance Sheets (dollars in thousands) September 30, 2009 December 31, 2008 (unaudited) Assets Investments in real estate: Wholly-owned properties, net 2,050,352 $ 1,986,833 $ On-campus participating properties, net 66,677 69,302 Investments in real estate, net 2,117,029 2,056,135 Cash and cash equivalents 86,753 25,600 Restricted cash 29,103 32,558 Student contracts receivable, net 7,058 5,185 Other assets 59,760 64,431 Total assets 2,299,703 $ 2,183,909 $ Liabilities and equity Liabilities: Secured mortgage, construction and bond debt 1,055,526 $ 1,162,221 $ Senior secured term loan 100,000 100,000 Secured revolving credit facility - 14,700 Secured agency facility 94,000 - Accounts payable and accrued expenses 31,679 35,440 Other liabilities 59,880 56,052 Total liabilities 1,341,085 1,368,413 Redeemable noncontrolling interests 35,449 26,286 Equity: American Campus Communities, Inc. and Subsidiaries stockholders' equity: Common stock 521 423 Additional paid in capital 1,093,018 901,641 Accumulated earnings and distributions (169,477) (111,828) Accumulated other comprehensive loss (4,815) (5,117) 919,247 785,119 Noncontrolling interests 3,922 4,091 Total equity 923,169 789,210 Total liabilities and equity 2,299,703 $ 2,183,909 $ Total American Campus Communities, Inc. and Subsidiaries stockholders' equity 2
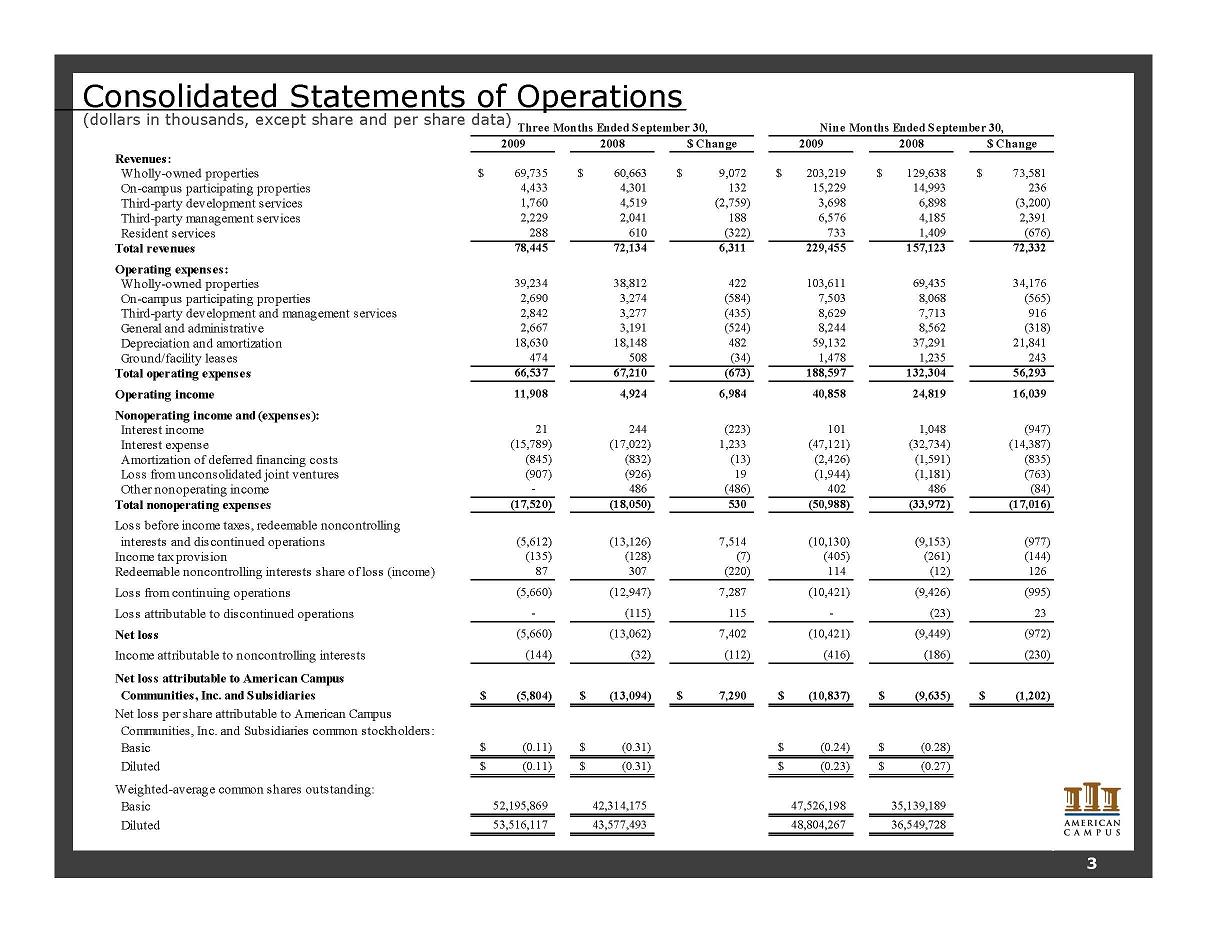
2009 2008 $ Change 2009 2008 $ Change Revenues: Wholly-owned properties 69,735 $ 60,663 $ 9,072 $ 203,219 $ 129,638 $ 73,581 $ On-campus participating properties 4,433 4,301 132 15,229 14,993 236 Third-party development services 1,760 4,519 (2,759) 3,698 6,898 (3,200) Third-party management services 2,229 2,041 188 6,576 4,185 2,391 Resident services 288 610 (322) 733 1,409 (676) Total revenues 78,445 72,134 6,311 229,455 157,123 72,332 Operating expenses: Wholly-owned properties 39,234 38,812 422 103,611 69,435 34,176 On-campus participating properties 2,690 3,274 (584) 7,503 8,068 (565) Third-party development and management services 2,842 3,277 (435) 8,629 7,713 916 General and administrative 2,667 3,191 (524) 8,244 8,562 (318) Depreciation and amortization 18,630 18,148 482 59,132 37,291 21,841 Ground/facility leases 474 508 (34) 1,478 1,235 243 Total operating expenses 66,537 67,210 (673) 188,597 132,304 56,293 Operating income 11,908 4,924 6,984 40,858 24,819 16,039 Nonoperating income and (expenses): Interest income 21 244 (223) 101 1,048 (947) Interest expense (15,789) (17,022) 1,233 (47,121) (32,734) (14,387) Amortization of deferred financing costs (845) (832) (13) (2,426) (1,591) (835) Loss from unconsolidated joint ventures (907) (926) 19 (1,944) (1,181) (763) Other nonoperating income - 486 (486) 402 486 (84) Total nonoperating expenses (17,520) (18,050) 530 (50,988) (33,972) (17,016) Loss before income taxes, redeemable noncontrolling interests and discontinued operations (5,612) (13,126) 7,514 (10,130) (9,153) (977) Income tax provision (135) (128) (7) (405) (261) (144) Redeemable noncontrolling interests share of loss (income) 87 307 (220) 114 (12) 126 Loss from continuing operations (5,660) (12,947) 7,287 (10,421) (9,426) (995) Loss attributable to discontinued operations - (115) 115 - (23) 23 Net loss (5,660) (13,062) 7,402 (10,421) (9,449) (972) Income attributable to noncontrolling interests (144) (32) (112) (416) (186) (230) Net loss attributable to American Campus Communities, Inc. and Subsidiaries (5,804) $ (13,094) $ 7,290 $ (10,837) $ (9,635) $ (1,202) $ Net loss per share attributable to American Campus Communities, Inc. and Subsidiaries common stockholders: Basic (0.11) $ (0.31) $ (0.24) $ (0.28) $ Diluted (0.11) $ (0.31) $ (0.23) $ (0.27) $ Weighted-average common shares outstanding: Basic 52,195,869 42,314,175 47,526,198 35,139,189 Diluted 53,516,117 43,577,493 48,804,267 36,549,728 Three Months Ended S eptember 30, Nine Months Ended September 30, Consolidated Statements of Operations (dollars in thousands, except share and per share data) 3
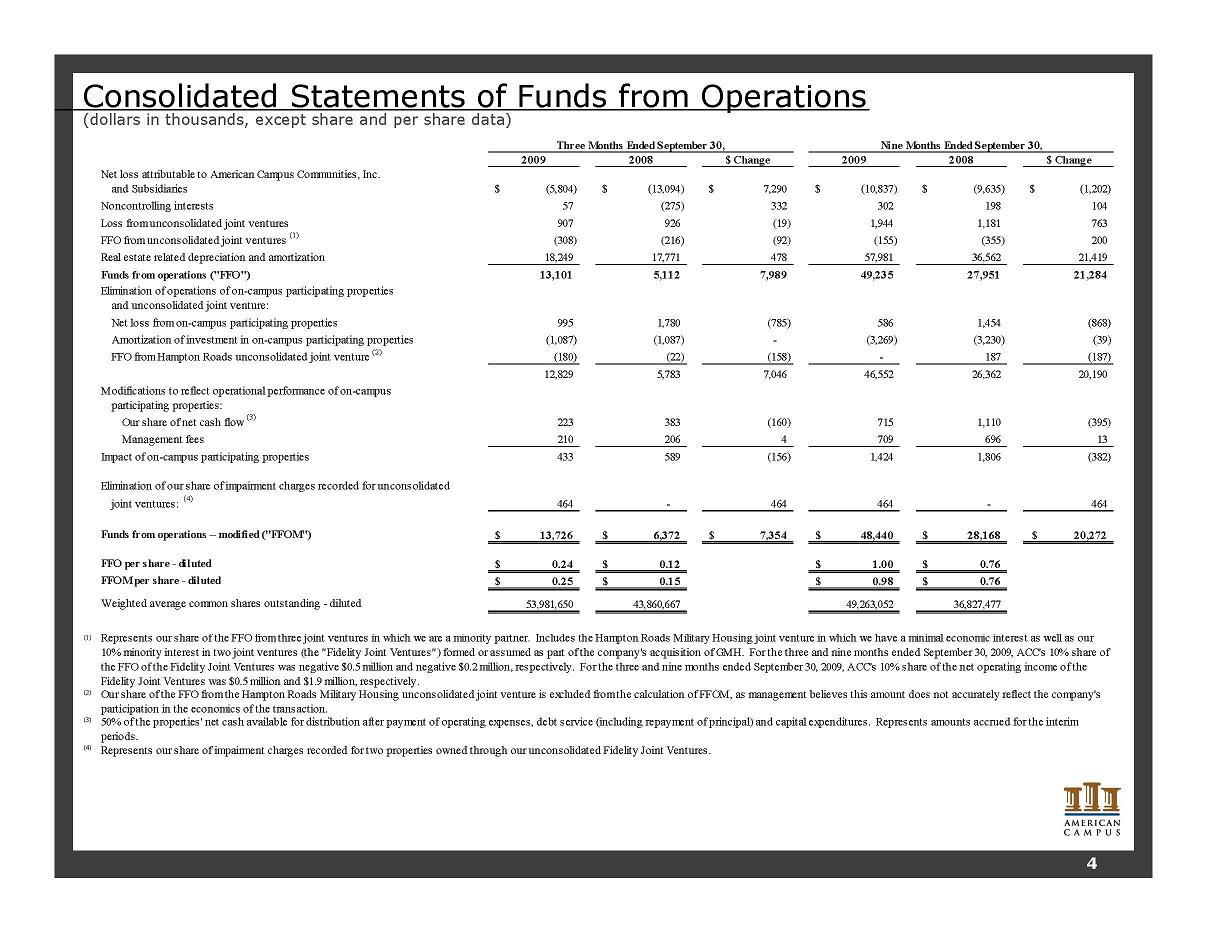
Consolidated Statements of Funds from Operations (dollars in thousands, except share and per share data) 2009 2008 $ Change 2009 2008 $ Change Net loss attributable to American Campus Communities, Inc. and Subsidiaries (5,804) $ (13,094) $ 7,290 $ (10,837) $ (9,635) $ (1,202) $ Noncontrolling interests 57 (275) 332 302 198 104 Loss from unconsolidated joint ventures 907 926 (19) 1,944 1,181 763 FFO from unconsolidated joint ventures (1) (308) (216) (92) (155) (355) 200 Real estate related depreciation and amortization 18,249 17,771 478 57,981 36,562 21,419 Funds from operations ("FFO") 13,101 5,112 7,989 49,235 27,951 21,284 Elimination of operations of on-campus participating properties and unconsolidated joint venture: Net loss from on-campus participating properties 995 1,780 (785) 586 1,454 (868) Amortization of investment in on-campus participating properties (1,087) (1,087) - (3,269) (3,230) (39) FFO from Hampton Roads unconsolidated joint venture (2) (180) (22) (158) - 187 (187) 12,829 5,783 7,046 46,552 26,362 20,190 Modifications to reflect operational performance of on-campus participating properties: Our share of net cash flow (3) 223 383 (160) 715 1,110 (395) Management fees 210 206 4 709 696 13 Impact of on-campus participating properties 433 589 (156) 1,424 1,806 (382) Elimination of our share of impairment charges recorded for unconsolidated joint ventures: (4) 464 - 464 464 - 464 Funds from operations – modified ("FFOM") 13,726 $ 6,372 $ 7,354 $ 48,440 $ 28,168 $ 20,272 $ FFO per share - diluted 0.24 $ 0.12 $ 1.00 $ 0.76 $ FFOM per share - diluted 0.25 $ 0.15 $ 0.98 $ 0.76 $ Weighted average common shares outstanding - diluted 53,981,650 43,860,667 49,263,052 36,827,477 (1) (2) (3) (4) Represents our share of impairment charges recorded for two properties owned through our unconsolidated Fidelity Joint Ventures. Nine Months Ended September 30, Represents our share of the FFO from three joint ventures in which we are a minority partner. Includes the Hampton Roads Military Housing joint venture in which we have a minimal economic interest as well as our 10% minority interest in two joint ventures (the "Fidelity Joint Ventures") formed or assumed as part of the company's acquisition of GMH. For the three and nine months ended September 30, 2009, ACC's 10% share of the FFO of the Fidelity Joint Ventures was negative $0.5 million and negative $0.2 million, respectively. For the three and nine months ended September 30, 2009, ACC's 10% share of the net operating income of the Fidelity Joint Ventures was $0.5 million and $1.9 million, respectively. Our share of the FFO from the Hampton Roads Military Housing unconsolidated joint venture is excluded from the calculation of FFOM, as management believes this amount does not accurately reflect the company's participation in the economics of the transaction. 50% of the properties' net cash available for distribution after payment of operating expenses, debt service (including repayment of principal) and capital expenditures. Represents amounts accrued for the interim periods. Three Months Ended September 30, 4
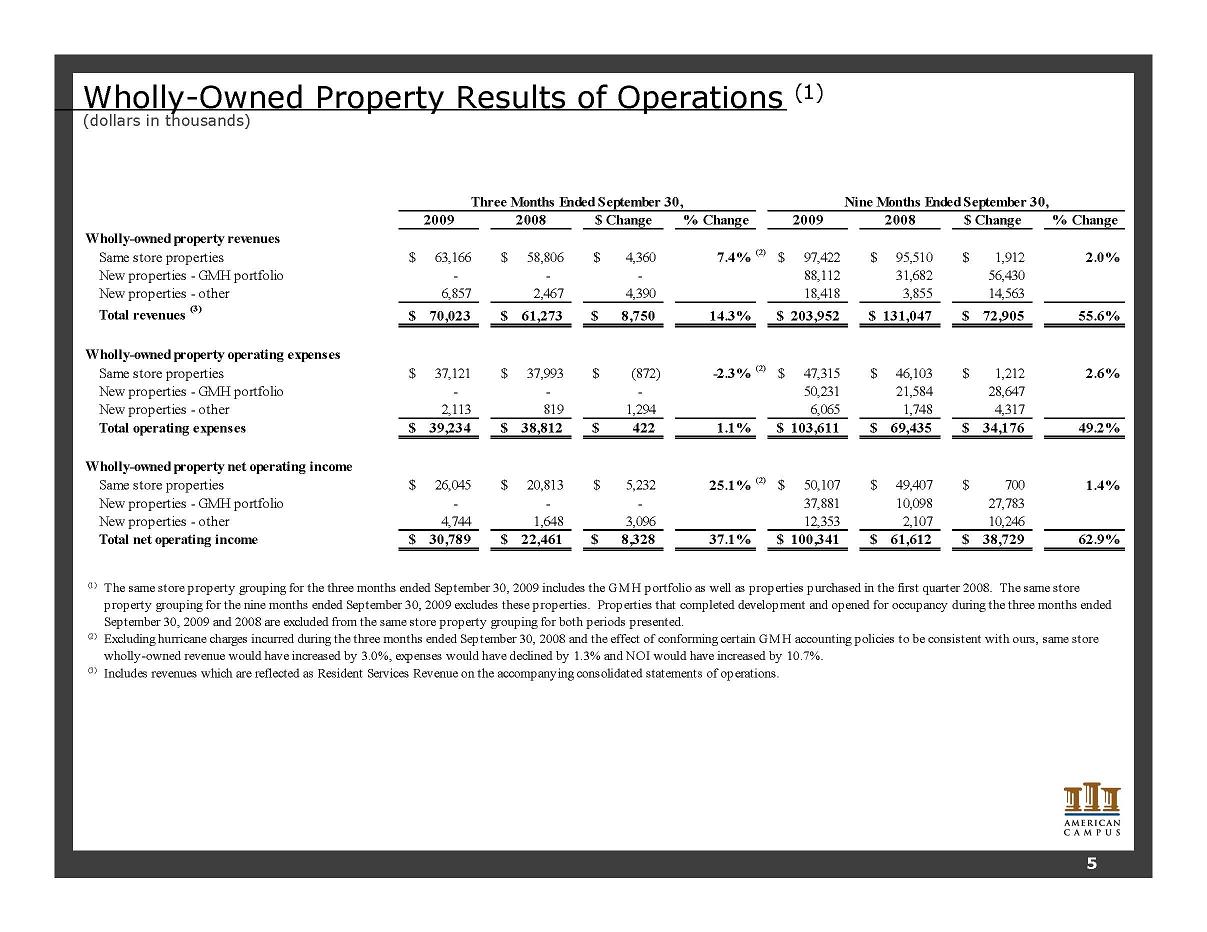
Wholly-Owned Property Results of Operations (1) (dollars in thousands) 2009 2008 $ Change % Change 2009 2008 $ Change % Change Wholly-owned property revenues Same store properties 63,166 $ 58,806 $ 4,360 $ 7.4% (2) 97,422 $ 95,510 $ 1,912 $ 2.0% New properties - GMH portfolio - - - 88,112 31,682 56,430 New properties - other 6,857 2,467 4,390 18,418 3,855 14,563 Total revenues (3) 70,023 $ 61,273 $ 8,750 $ 14.3% 203,952 $ 131,047 $ 72,905 $ 55.6% Wholly-owned property operating expenses Same store properties 37,121 $ 37,993 $ (872) $ -2.3% (2) 47,315 $ 46,103 $ 1,212 $ 2.6% New properties - GMH portfolio - - - 50,231 21,584 28,647 New properties - other 2,113 819 1,294 6,065 1,748 4,317 Total operating expenses 39,234 $ 38,812 $ 422 $ 1.1% 103,611 $ 69,435 $ 34,176 $ 49.2% Wholly-owned property net operating income Same store properties 26,045 $ 20,813 $ 5,232 $ 25.1% (2) 50,107 $ 49,407 $ 700 $ 1.4% New properties - GMH portfolio - - - 37,881 10,098 27,783 New properties - other 4,744 1,648 3,096 12,353 2,107 10,246 Total net operating income 30,789 $ 22,461 $ 8,328 $ 37.1% 100,341 $ 61,612 $ 38,729 $ 62.9% (1) (2) (3) Three Months Ended September 30, Nine Months Ended September 30, Excluding hurricane charges incurred during the three months ended September 30, 2008 and the effect of conforming certain GMH accounting policies to be consistent with ours, same store wholly-owned revenue would have increased by 3.0%, expenses would have declined by 1.3% and NOI would have increased by 10.7%. Includes revenues which are reflected as Resident Services Revenue on the accompanying consolidated statements of operations. The same store property grouping for the three months ended September 30, 2009 includes the GMH portfolio as well as properties purchased in the first quarter 2008. The same store property grouping for the nine months ended September 30, 2009 excludes these properties. Properties that completed development and opened for occupancy during the three months ended September 30, 2009 and 2008 are excluded from the same store property grouping for both periods presented. 5
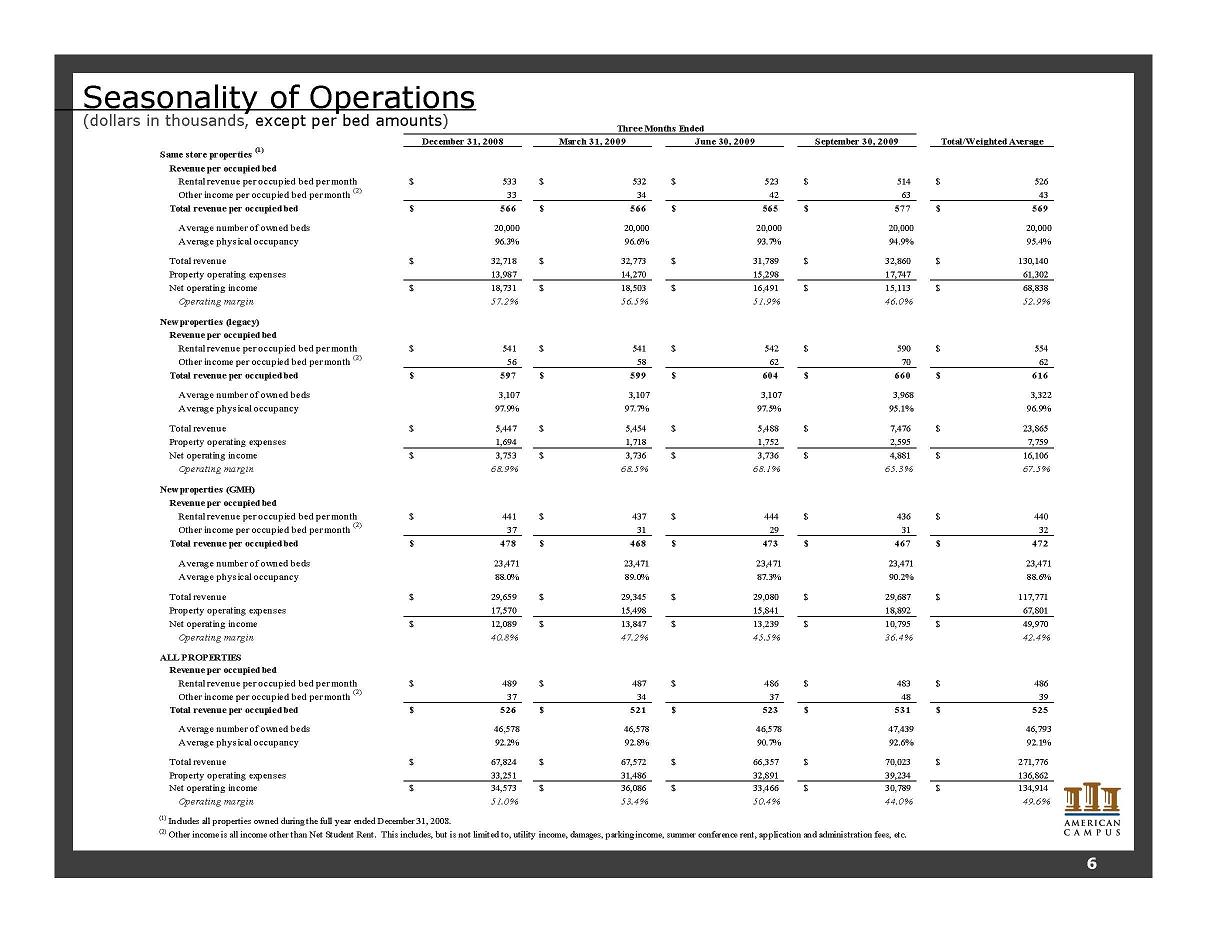
Seasonality of Operations (dollars in thousands, except per bed amounts) December 31, 2008 March 31, 2009 June 30, 2009 September 30, 2009 Total/Weighted Average Same store properties (1) Revenue per occupied bed Rental revenue per occupied bed per month 533 $ 532 $ 523 $ 514 $ 526 $ Other income per occupied bed per month (2) 33 34 42 63 43 Total revenue per occupied bed 566 $ 566 $ 565 $ 577 $ 569 $ Average number of owned beds 20,000 20,000 20,000 20,000 20,000 Average physical occupancy 96.3% 96.6% 93.7% 94.9% 95.4% Total revenue 32,718 $ 32,773 $ 31,789 $ 32,860 $ 130,140 $ Property operating expenses 13,987 14,270 15,298 17,747 61,302 Net operating income 18,731 $ 18,503 $ 16,491 $ 15,113 $ 68,838 $ Operating margin 57.2% 56.5% 51.9% 46.0% 52.9% New properties (legacy) Revenue per occupied bed Rental revenue per occupied bed per month 541 $ 541 $ 542 $ 590 $ 554 $ Other income per occupied bed per month (2) 56 58 62 70 62 Total revenue per occupied bed 597 $ 599 $ 604 $ 660 $ 616 $ Average number of owned beds 3,107 3,107 3,107 3,968 3,322 Average physical occupancy 97.9% 97.7% 97.5% 95.1% 96.9% Total revenue 5,447 $ 5,454 $ 5,488 $ 7,476 $ 23,865 $ Property operating expenses 1,694 1,718 1,752 2,595 7,759 Net operating income 3,753 $ 3,736 $ 3,736 $ 4,881 $ 16,106 $ Operating margin 68.9% 68.5% 68.1% 65.3% 67.5% New properties (GMH) Revenue per occupied bed Rental revenue per occupied bed per month 441 $ 437 $ 444 $ 436 $ 440 $ Other income per occupied bed per month (2) 37 31 29 31 32 Total revenue per occupied bed 478 $ 468 $ 473 $ 467 $ 472 $ Average number of owned beds 23,471 23,471 23,471 23,471 23,471 Average physical occupancy 88.0% 89.0% 87.3% 90.2% 88.6% Total revenue 29,659 $ 29,345 $ 29,080 $ 29,687 $ 117,771 $ Property operating expenses 17,570 15,498 15,841 18,892 67,801 Net operating income 12,089 $ 13,847 $ 13,239 $ 10,795 $ 49,970 $ Operating margin 40.8% 47.2% 45.5% 36.4% 42.4% ALL PROPERTIES Revenue per occupied bed Rental revenue per occupied bed per month 489 $ 487 $ 486 $ 483 $ 486 $ Other income per occupied bed per month (2) 37 34 37 48 39 Total revenue per occupied bed 526 $ 521 $ 523 $ 531 $ 525 $ Average number of owned beds 46,578 46,578 46,578 47,439 46,793 Average physical occupancy 92.2% 92.8% 90.7% 92.6% 92.1% Total revenue 67,824 $ 67,572 $ 66,357 $ 70,023 $ 271,776 $ Property operating expenses 33,251 31,486 32,891 39,234 136,862 Net operating income 34,573 $ 36,086 $ 33,466 $ 30,789 $ 134,914 $ Operating margin 51.0% 53.4% 50.4% 44.0% 49.6% (1) Includes all properties owned during the full year ended December 31, 2008. (2) Other income is all income other than Net Student Rent. This includes, but is not limited to, utility income, damages, parking income, summer conference rent, application and administration fees, etc. Three Months Ended 6
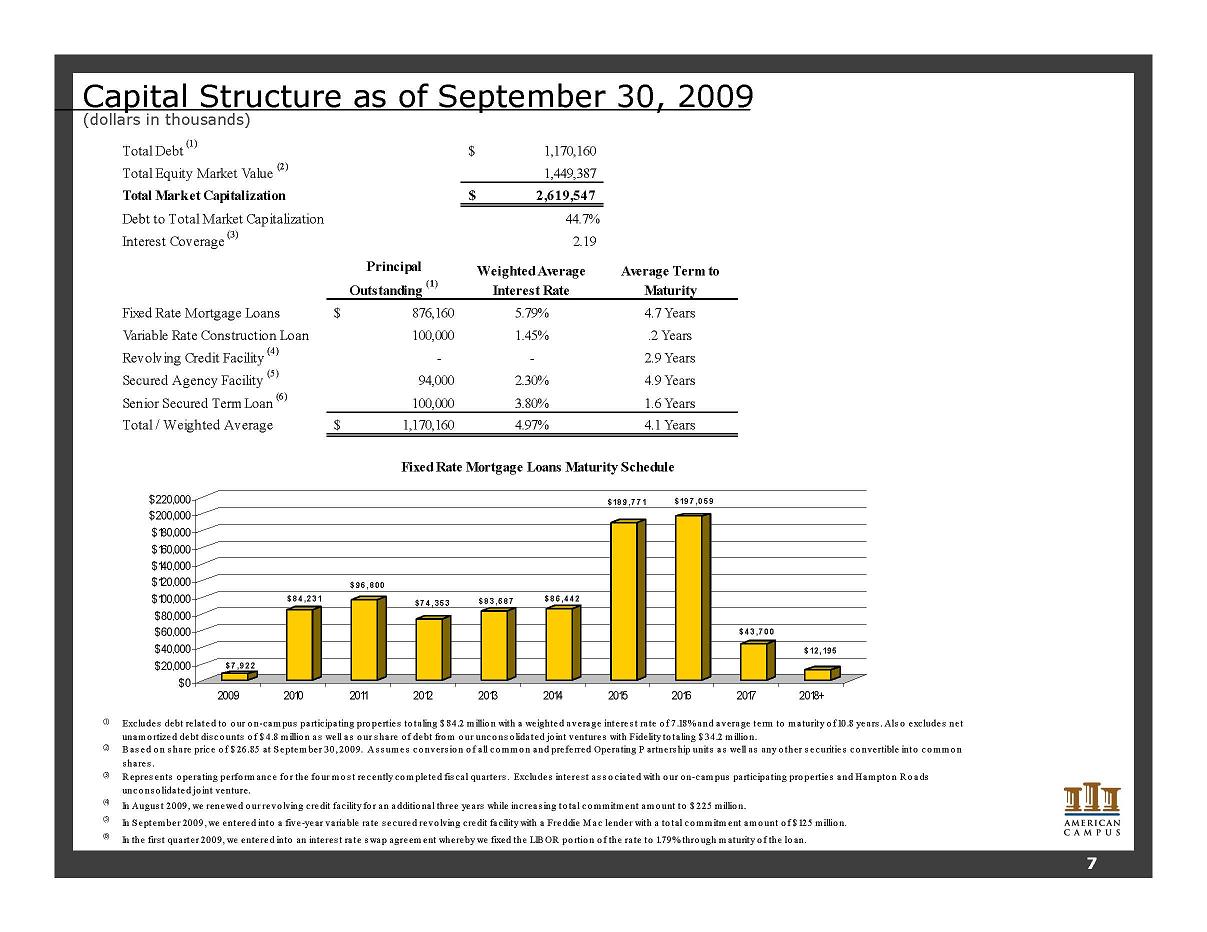
Capital Structure as of September 30, 2009 (dollars in thousands) Total Debt (1) 1,170,160 $ Total Equity Market Value (2) 1,449,387 Total Market Capitalization 2,619,547 $ Debt to Total Market Capitalization 44.7% Interest Coverage (3) 2.19 Principal Outstanding (1) Weighted Average Interest Rate Average Term to Maturity Fixed Rate Mortgage Loans 876,160 $ 5.79% 4.7 Years Variable Rate Construction Loan 100,000 1.45% .2 Years Revolving Credit Facility (4) - - 2.9 Years Secured Agency Facility (5) 94,000 2.30% 4.9 Years Senior Secured Term Loan (6) 100,000 3.80% 1.6 Years Total / Weighted Average 1,170,160 $ 4.97% 4.1 Years (1) (2) (3) (4) In Augus t 2009, we renewed o ur revo lving credit facility fo r an additio nal three years while increas ing to tal commitment amo unt to $ 225 millio n. (5) (6) In the firs t quarter 2009, we entered into an interes t rate swap agreement whereby we fixed the LIBOR po rtio n o f the rate to 1.79% thro ugh maturity o f the lo an. In September 2009, we entered into a five-year variable rate s ecured revo lving credit facility with a Freddie Mac lender with a to tal commitment amo unt o f $ 125 millio n. Fixed Rate Mortgage Loans Maturity Schedule Excludes debt related to o ur o n-campus participating pro perties to taling $ 84.2 millio n with a weighted average interes t rate o f 7.18% and average term to maturity o f 10.8 years . Als o excludes net unamo rtized debt dis co unts o f $ 4.8 millio n as well as o ur s hare o f debt from o ur unco ns o lidated jo int ventures with Fidelity to taling $ 34.2 millio n. Bas ed o n s hare price o f $ 26.85 at September 30, 2009. As s umes co nvers io n o f all commo n and preferred Operating P artners hip units as well as any o ther s ecurities co nvertible into commo n s hares . Repres ents o perating perfo rmance fo r the fo ur mo s t recently completed fis cal quarters . Excludes inte res t as s o ciated with o ur o n-campus participating pro perties and Hampto n Ro ads unco ns o lidated jo int venture. $7,922 $84,231 $96,800 $74,353 $83 ,687 $86,442 $189,771 $197,059 $43,700 $12 ,195 $0 $20,000 $40,000 $60,000 $80,000 $100,000 $120,000 $140,000 $160,000 $180,000 $200,000 $220,000 2009 2010 2011 2012 2013 2014 2015 2016 2017 2018+ 7
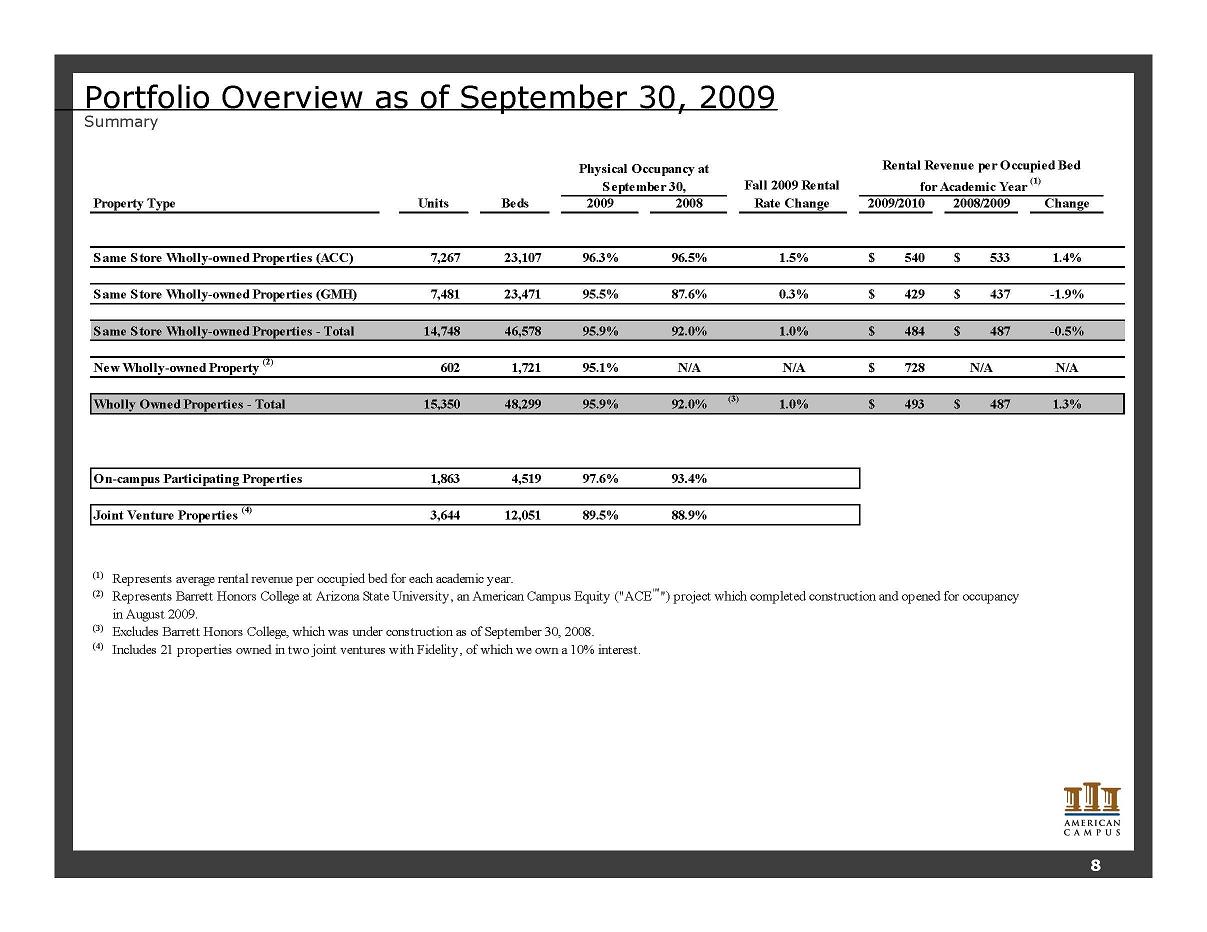
Portfolio Overview as of September 30, 2009 Summary Units Beds 2009 2008 2009/2010 2008/2009 Change Same Store Wholly-owned Properties (ACC) 7,267 23,107 96.3% 96.5% 1.5% 540 $ 533 $ 1.4% Same S tore Wholly-owned Properties (GMH) 7,481 23,471 95.5% 87.6% 0.3% 429 $ 437 $ -1.9% Same S tore Wholly-owned Properties - Total 14,748 46,578 95.9% 92.0% 1.0% 484 $ 487 $ -0.5% New Wholly-owned Property (2) 602 1,721 95.1% N/A N/A 728 $ N/A N/A Wholly Owned Properties - Total 15,350 48,299 95.9% 92.0% (3) 1.0% 493 $ 487 $ 1.3% On-campus Participating Properties 1,863 4,519 97.6% 93.4% Joint Venture Properties (4) 3,644 12,051 89.5% 88.9% (1) Represents average rental revenue per occupied bed for each academic year. (2) (3) Excludes Barrett Honors College, which was under construction as of September 30, 2008. (4) Includes 21 properties owned in two joint ventures with Fidelity, of which we own a 10% interest. Rental Revenue per Occupied Bed for Academic Year (1) Represents Barrett Honors College at Arizona State University, an American Campus Equity ("ACE™") project which completed construction and opened for occupancy in August 2009. Fall 2009 Rental Rate Change Physical Occupancy at September 30, Property Type 8
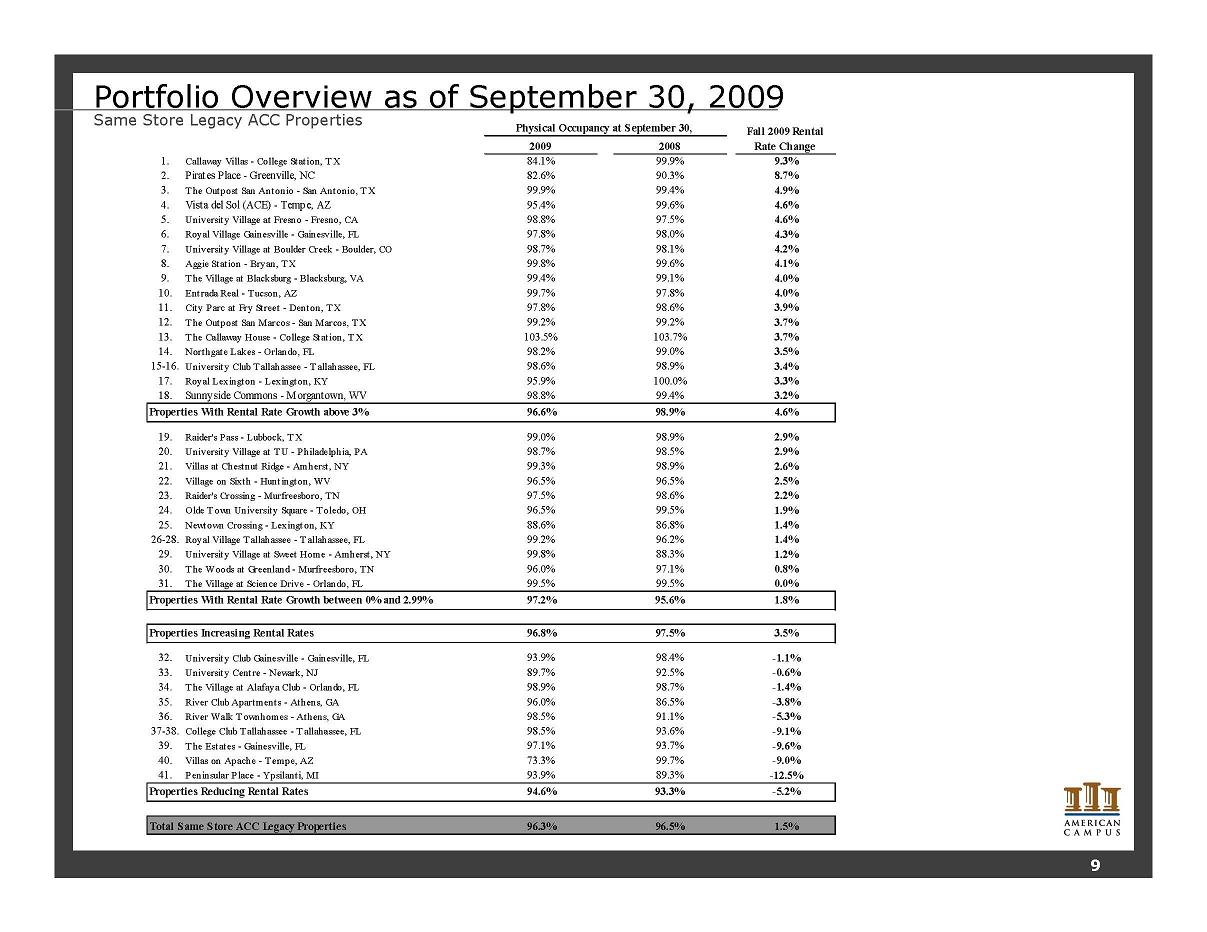
2009 2008 1. Callaway Villas - College Station, TX 84.1% 99.9% 9.3% 2. Pirates Place - Greenville, NC 82.6% 90.3% 8.7% 3. The Outpost San Antonio - San Antonio, TX 99.9% 99.4% 4.9% 4. Vista del Sol (ACE) - Tempe, AZ 95.4% 99.6% 4.6% 5. University Village at Fresno - Fresno, CA 98.8% 97.5% 4.6% 6. Royal Village Gainesville - Gainesville, FL 97.8% 98.0% 4.3% 7. University Village at Boulder Creek - Boulder, CO 98.7% 98.1% 4.2% 8. Aggie Station - Bryan, TX 99.8% 99.6% 4.1% 9. The Village at Blacksburg - Blacksburg, VA 99.4% 99.1% 4.0% 10. Entrada Real - Tucson, AZ 99.7% 97.8% 4.0% 11. City Parc at Fry Street - Denton, TX 97.8% 98.6% 3.9% 12. The Outpost San Marcos - San Marcos, TX 99.2% 99.2% 3.7% 13. The Callaway House - College Station, TX 103.5% 103.7% 3.7% 14. Northgate Lakes - Orlando, FL 98.2% 99.0% 3.5% 15-16. University Club T allahassee - T allahassee, FL 98.6% 98.9% 3.4% 17. Royal Lexington - Lexington, KY 95.9% 100.0% 3.3% 18. Sunnyside Commons - Morgantown, WV 98.8% 99.4% 3.2% Properties With Rental Rate Growth above 3% 96.6% 98.9% 4.6% 19. Raider's Pass - Lubbock, TX 99.0% 98.9% 2.9% 20. University Village at TU - Philadelphia, PA 98.7% 98.5% 2.9% 21. Villas at Chestnut Ridge - Amherst, NY 99.3% 98.9% 2.6% 22. Village on Sixth - Huntington, WV 96.5% 96.5% 2.5% 23. Raider's Crossing - Murfreesboro, TN 97.5% 98.6% 2.2% 24. Olde T own University Square - Toledo, OH 96.5% 99.5% 1.9% 25. Newtown Crossing - Lexington, KY 88.6% 86.8% 1.4% 26-28. Royal Village Tallahassee - T allahassee, FL 99.2% 96.2% 1.4% 29. University Village at Sweet Home - Amherst, NY 99.8% 88.3% 1.2% 30. The Woods at Greenland - Murfreesboro, TN 96.0% 97.1% 0.8% 31. The Village at Science Drive - Orlando, FL 99.5% 99.5% 0.0% Properties With Rental Rate Growth between 0% and 2.99% 97.2% 95.6% 1.8% Properties Increasing Rental Rates 96.8% 97.5% 3.5% 32. University Club Gainesville - Gainesville, FL 93.9% 98.4% -1.1% 33. University Centre - Newark, NJ 89.7% 92.5% -0.6% 34. The Village at Alafaya Club - Orlando, FL 98.9% 98.7% -1.4% 35. River Club Apartments - Athens, GA 96.0% 86.5% -3.8% 36. River Walk Townhomes - Athens, GA 98.5% 91.1% -5.3% 37-38. College Club T allahassee - T allahassee, FL 98.5% 93.6% -9.1% 39. The Estates - Gainesville, FL 97.1% 93.7% -9.6% 40. Villas on Apache - T empe, AZ 73.3% 99.7% -9.0% 41. Peninsular Place - Ypsilanti, MI 93.9% 89.3% -12.5% Properties Reducing Rental Rates 94.6% 93.3% -5.2% 96.3% 96.5% 1.5% Total Same Store ACC Legacy Properties Fall 2009 Rental Rate Change Physical Occupancy at September 30, Portfolio Overview as of September 30, 2009 Same Store Legacy ACC Properties 9
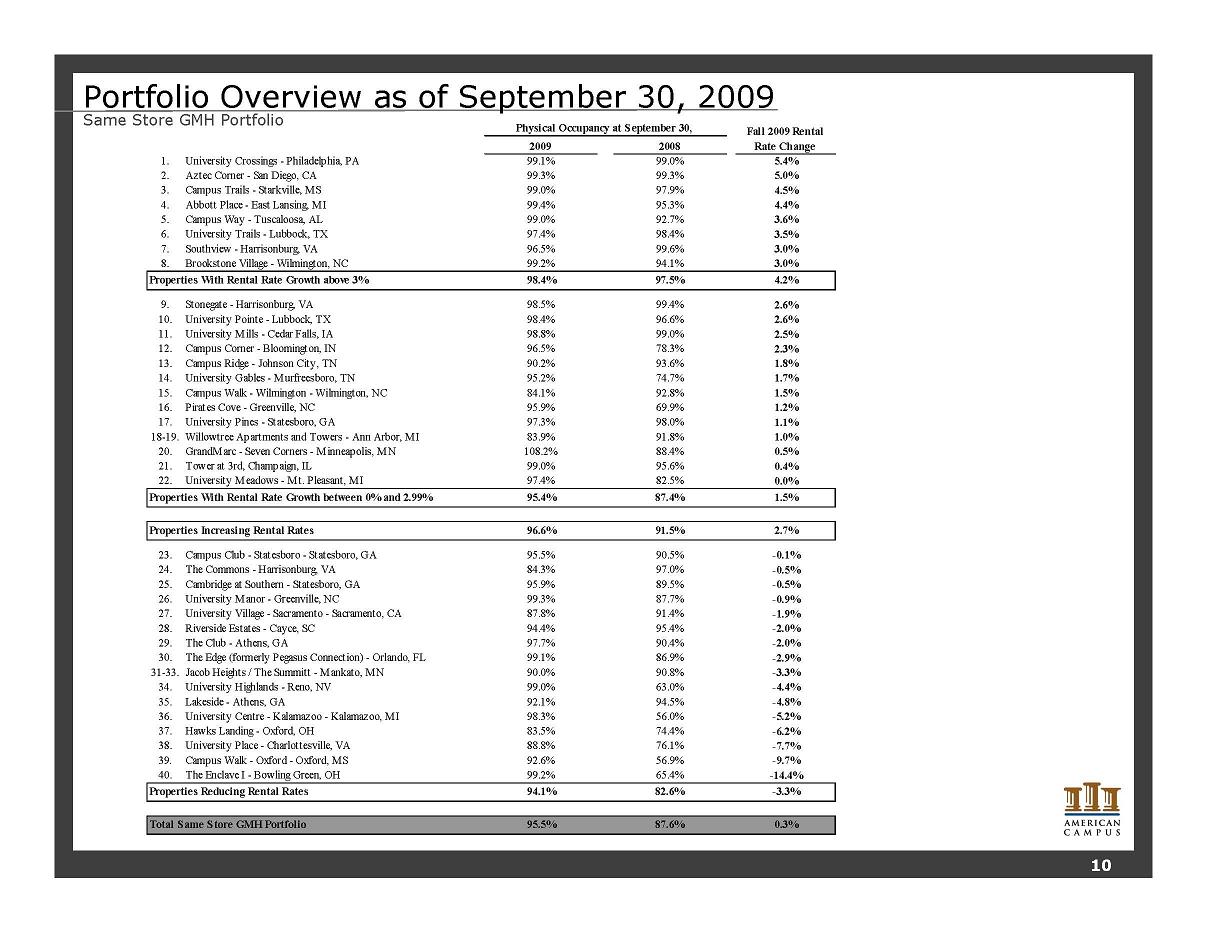
Portfolio Overview as of September 30, 2009 Same Store GMH Portfolio 2009 2008 1. University Crossings - Philadelphia, PA 99.1% 99.0% 5.4% 2. Aztec Corner - San Diego, CA 99.3% 99.3% 5.0% 3. Campus Trails - Starkville, MS 99.0% 97.9% 4.5% 4. Abbott Place - East Lansing, MI 99.4% 95.3% 4.4% 5. Campus Way - Tuscaloosa, AL 99.0% 92.7% 3.6% 6. University Trails - Lubbock, TX 97.4% 98.4% 3.5% 7. Southview - Harrisonburg, VA 96.5% 99.6% 3.0% 8. Brookstone Village - Wilmington, NC 99.2% 94.1% 3.0% Properties With Rental Rate Growth above 3% 98.4% 97.5% 4.2% 9. Stonegate - Harrisonburg, VA 98.5% 99.4% 2.6% 10. University Pointe - Lubbock, TX 98.4% 96.6% 2.6% 11. University Mills - Cedar Falls, IA 98.8% 99.0% 2.5% 12. Campus Corner - Bloomington, IN 96.5% 78.3% 2.3% 13. Campus Ridge - Johnson City, TN 90.2% 93.6% 1.8% 14. University Gables - Murfreesboro, TN 95.2% 74.7% 1.7% 15. Campus Walk - Wilmington - Wilmington, NC 84.1% 92.8% 1.5% 16. Pirates Cove - Greenville, NC 95.9% 69.9% 1.2% 17. University Pines - Statesboro, GA 97.3% 98.0% 1.1% 18-19. Willowtree Apartments and Towers - Ann Arbor, MI 83.9% 91.8% 1.0% 20. GrandMarc - Seven Corners - Minneapolis, MN 108.2% 88.4% 0.5% 21. Tower at 3rd, Champaign, IL 99.0% 95.6% 0.4% 22. University Meadows - Mt. Pleasant, MI 97.4% 82.5% 0.0% Properties With Rental Rate Growth between 0% and 2.99% 95.4% 87.4% 1.5% Properties Increasing Rental Rates 96.6% 91.5% 2.7% 23. Campus Club - Statesboro - Statesboro, GA 95.5% 90.5% -0.1% 24. The Commons - Harrisonburg, VA 84.3% 97.0% -0.5% 25. Cambridge at Southern - Statesboro, GA 95.9% 89.5% -0.5% 26. University Manor - Greenville, NC 99.3% 87.7% -0.9% 27. University Village - Sacramento - Sacramento, CA 87.8% 91.4% -1.9% 28. Riverside Estates - Cayce, SC 94.4% 95.4% -2.0% 29. The Club - Athens, GA 97.7% 90.4% -2.0% 30. The Edge (formerly Pegasus Connection) - Orlando, FL 99.1% 86.9% -2.9% 31-33. Jacob Heights / The Summitt - Mankato, MN 90.0% 90.8% -3.3% 34. University Highlands - Reno, NV 99.0% 63.0% -4.4% 35. Lakeside - Athens, GA 92.1% 94.5% -4.8% 36. University Centre - Kalamazoo - Kalamazoo, MI 98.3% 56.0% -5.2% 37. Hawks Landing - Oxford, OH 83.5% 74.4% -6.2% 38. University Place - Charlottesville, VA 88.8% 76.1% -7.7% 39. Campus Walk - Oxford - Oxford, MS 92.6% 56.9% -9.7% 40. The Enclave I - Bowling Green, OH 99.2% 65.4% -14.4% Properties Reducing Rental Rates 94.1% 82.6% -3.3% Total Same Store GMH Portfolio 95.5% 87.6% 0.3% Fall 2009 Rental Rate Change Physical Occupancy at September 30, 10
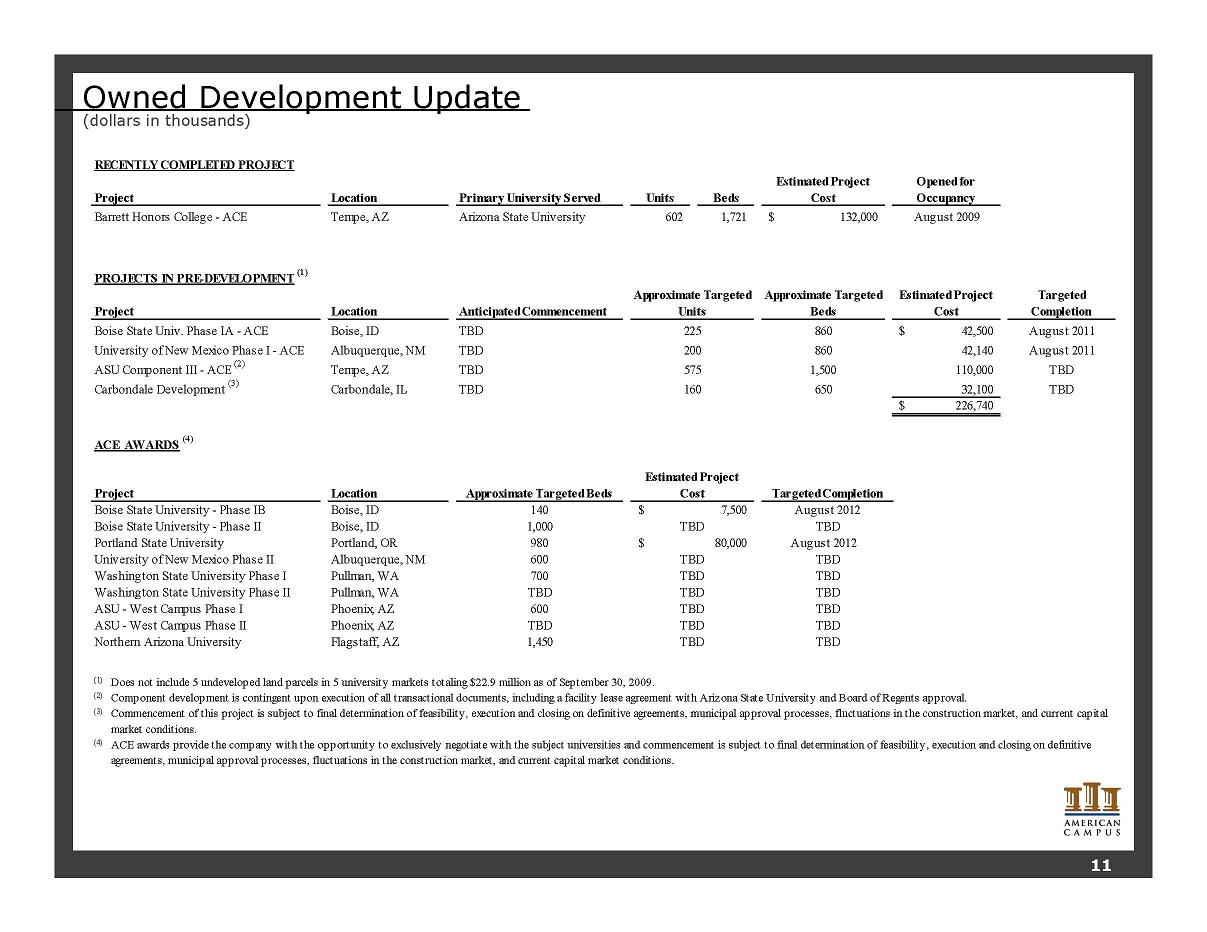
Owned Development Update (dollars in thousands) RECENTLY COMPLETED PROJECT Location Primary University Served Units Beds Estimated Project Cost Opened for Occupancy Tempe, AZ Arizona State University 602 1,721 132,000 $ August 2009 PROJECTS IN PRE-DEVELOPMENT (1) Location Anticipated Commencement Approximate Targeted Beds Estimated Project Cost Targeted Completion TBD 860 42,500 $ August 2011 University of New Mexico Phase I - ACE Albuquerque, NM TBD 860 42,140 August 2011 ASU Component III - ACE (2) Tempe, AZ TBD 1,500 110,000 TBD Carbondale Development (3) Carbondale, IL TBD 650 32,100 TBD 226,740 $ ACE AWARDS (4) Project Location Approximate Targeted Beds 140 1,000 Portland State University Portland, OR 980 August 2012 University of New Mexico Phase II Albuquerque, NM 600 Washington State University Phase I Pullman, WA 700 Washington State University Phase II Pullman, WA TBD ASU - West Campus Phase I Phoenix, AZ 600 ASU - West Campus Phase II Phoenix, AZ TBD Northern Arizona University Flagstaff, AZ 1,450 (1) Does not include 5 undeveloped land parcels in 5 university markets totaling $22.9 million as of September 30, 2009. (2) (3) (4) Boise State University - Phase II Boise State University - Phase IB Boise, ID 7,500 $ Boise, ID TBD 575 Project Approximate Targeted Units Boise State Univ. Phase IA - ACE Boise, ID 225 200 Project Barrett Honors College - ACE ACE awards provide the company with the opportunity to exclusively negotiate with the subject universities and commencement is subject to final determination of feasibility, execution and closing on definitive agreements, municipal approval processes, fluctuations in the construction market, and current capital market conditions. Component development is contingent upon execution of all transactional documents, including a facility lease agreement with Arizona State University and Board of Regents approval. Commencement of this project is subject to final determination of feasibility, execution and closing on definitive agreements, municipal approval processes, fluctuations in the construction market, and current capital market conditions. TBD TBD TBD TBD TBD TBD TBD Targeted Completion TBD August 2012 TBD TBD 80,000 $ 160 TBD Estimated Project Cost TBD TBD 11
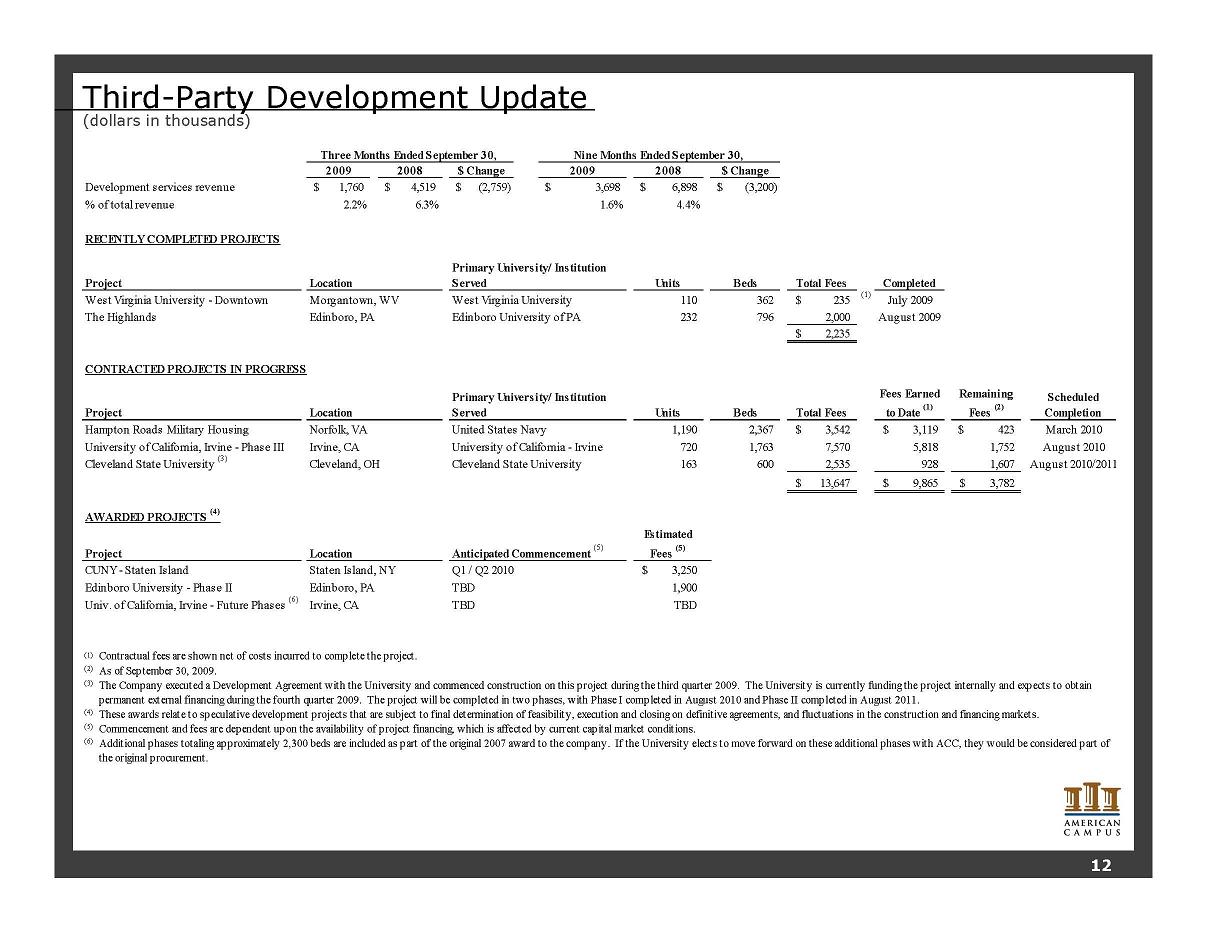
Third-Party Development Update (dollars in thousands) 2009 2008 $ Change 2009 2008 $ Change Development services revenue 1,760 $ 4,519 $ (2,759) $ 3,698 $ 6,898 $ (3,200) $ % of total revenue 2.2% 6.3% 1.6% 4.4% RECENTLY COMPLETED PROJECTS Project Units Beds Total Fees Completed West Virginia University - Downtown West Virginia University 110 362 235 $ (1) July 2009 The Highlands Edinboro, PA Edinboro University of PA 232 796 2,000 August 2009 2,235 $ CONTRACTED PROJECTS IN PROGRESS Project Units Beds Total Fees Fees Earned to Date (1) Remaining Fees (2) Scheduled Completion Hampton Roads Military Housing 1,190 2,367 3,542 $ 3,119 $ 423 $ March 2010 University of California, Irvine - Phase III Irvine, CA University of California - Irvine 720 1,763 7,570 5,818 1,752 August 2010 Cleveland State University (3) Cleveland, OH Cleveland State University 163 600 2,535 928 1,607 August 2010/2011 13,647 $ 9,865 $ 3,782 $ AWARDED PROJECTS (4) Project Estimated Fees (5) CUNY - Staten Island Staten Island, NY Q1 / Q2 2010 3,250 $ Edinboro University - Phase II Edinboro, PA TBD 1,900 Univ. of California, Irvine - Future Phases (6) Irvine, CA TBD TBD (1) Contractual fees are shown net of costs incurred to complete the project. (2) As of September 30, 2009. (3) (4) (5) Commencement and fees are dependent upon the availability of project financing, which is affected by current capital market conditions. (6) These awards relate to speculative development projects that are subject to final determination of feasibility, execution and closing on definitive agreements, and fluctuations in the construction and financing markets. Anticipated Commencement (5) Norfolk, VA United States Navy Location The Company executed a Development Agreement with the University and commenced construction on this project during the third quarter 2009. The University is currently funding the project internally and expects to obtain permanent external financing during the fourth quarter 2009. The project will be completed in two phases, with Phase I completed in August 2010 and Phase II completed in August 2011. Additional phases totaling approximately 2,300 beds are included as part of the original 2007 award to the company. If the University elects to move forward on these additional phases with ACC, they would be considered part of the original procurement. Nine Months Ended September 30, Three Months Ended September 30, Location Primary University/ Institution Served Location Primary University/ Institution Served Morgantown, WV 12
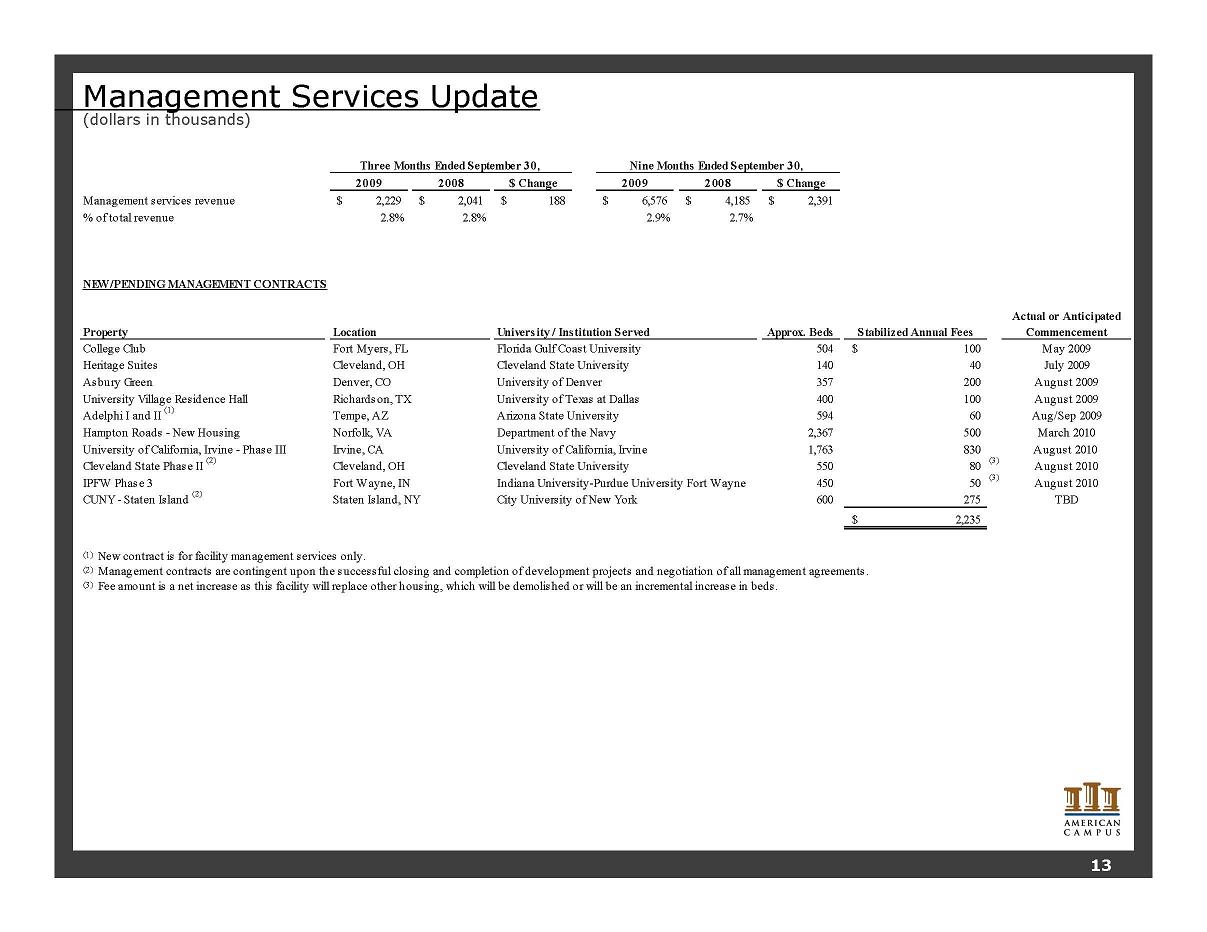
Management Services Update (dollars in thousands) 2009 2008 $ Change 2009 2008 $ Change Management services revenue 2,229 $ 2,041 $ 188 $ 6,576 $ 4,185 $ 2,391 $ % of total revenue 2.8% 2.8% 2.9% 2.7% NEW/PENDING MANAGEMENT CONTRACTS Property Approx. Beds Stabilized Annual Fees Actual or Anticipated Commencement College Club Fort Myers, FL Florida Gulf Coast University 504 100 $ May 2009 Heritage Suites Cleveland, OH Cleveland State University 140 40 July 2009 Asbury Green Denver, CO University of Denver 357 200 August 2009 University Village Residence Hall Richardson, TX University of Texas at Dallas 400 100 August 2009 Adelphi I and II (1) Tempe, AZ Arizona State University 594 60 Aug/Sep 2009 Hampton Roads - New Housing Norfolk, VA Department of the Navy 2,367 500 March 2010 University of California, Irvine - Phase III Irvine, CA University of California, Irvine 1,763 830 August 2010 Cleveland State Phase II (2) Cleveland, OH Cleveland State University 550 80 (3) August 2010 IPFW Phase 3 Fort Wayne, IN Indiana University-Purdue University Fort Wayne 450 50 (3) August 2010 CUNY - Staten Island (2) Staten Island, NY City University of New York 600 275 TBD 2,235 $ (1) (2) (3) Three Months Ended September 30, Location University / Institution Served Nine Months Ended September 30, Management contracts are contingent upon the successful closing and completion of development projects and negotiation of all management agreements. New contract is for facility management services only. Fee amount is a net increase as this facility will replace other housing, which will be demolished or will be an incremental increase in beds. 13
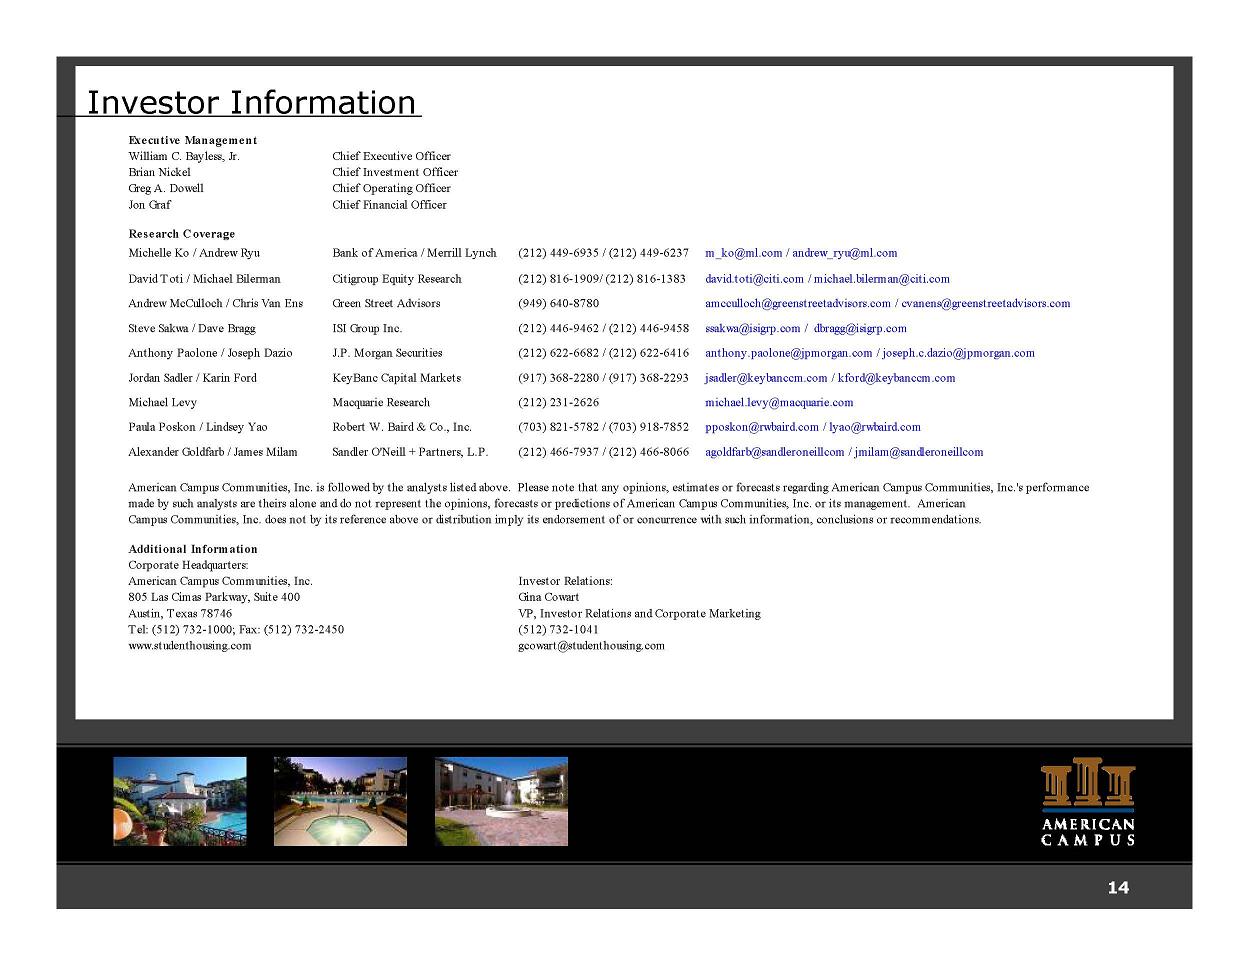
Investor Information Executive Management William C. Bayless, Jr. Chief Executive Officer Brian Nickel Chief Investment Officer Greg A. Dowell Chief Operating Officer Jon Graf Chief Financial Officer Research Coverage Michelle Ko / Andrew Ryu Bank of America / Merrill Lynch (212) 449-6935 / (212) 449-6237 m_ko@ml.com / andrew_ryu@ml.com David Toti / Michael Bilerman Citigroup Equity Research (212) 816-1909/ (212) 816-1383 david.toti@citi.com / michael.bilerman@citi.com Andrew McCulloch / Chris Van Ens Green Street Advisors (949) 640-8780 amcculloch@greenstreetadvisors.com / cvanens@greenstreetadvisors.com Steve Sakwa / Dave Bragg ISI Group Inc. (212) 446-9462 / (212) 446-9458 ssakwa@isigrp.com / dbragg@isigrp.com Anthony Paolone / Joseph Dazio J.P. Morgan Securities (212) 622-6682 / (212) 622-6416 anthony.paolone@jpmorgan.com / joseph.c.dazio@jpmorgan.com Jordan Sadler / Karin Ford KeyBanc Capital Markets (917) 368-2280 / (917) 368-2293 jsadler@keybanccm.com / kford@keybanccm.com Michael Levy Macquarie Research (212) 231-2626 michael.levy@macquarie.com Paula Poskon / Lindsey Yao Robert W. Baird & Co., Inc. (703) 821-5782 / (703) 918-7852 pposkon@rwbaird.com / lyao@rwbaird.com Alexander Goldfarb / James Milam Sandler O'Neill + Partners, L.P. (212) 466-7937 / (212) 466-8066 agoldfarb@sandleroneillcom / jmilam@sandleroneillcom Investor Relations: Gina Cowart VP, Investor Relations and Corporate Marketing (512) 732-1041 gcowart@studenthousing.com 805 Las Cimas Parkway, Suite 400 Austin, Texas 78746 Tel: (512) 732-1000; Fax: (512) 732-2450 www.studenthousing.com American Campus Communities, Inc. is followed by the analysts listed above. Please note that any opinions, estimates or forecasts regarding American Campus Communities, Inc.'s performance made by such analysts are theirs alone and do not represent the opinions, forecasts or predictions of American Campus Communities, Inc. or its management. American Campus Communities, Inc. does not by its reference above or distribution imply its endorsement of or concurrence with such information, conclusions or recommendations. Additional Information Corporate Headquarters: American Campus Communities, Inc. 14
Forward Looking Statements This supplemental package contains forward-looking statements, which express the current beliefs and expectations of management. Except for historical information, the matters discussed in this news release are forward-looking statements and can be identified by the use of the words "anticipate," "believe," "expect," "intend," "may," "might," "plan," "estimate," "project," "should," "will," "result" and similar expressions. Such statements are based on current expectations and involve a number of known and unknown risks and uncertainties that could cause our future results, performance or achievements to differ significantly from the results, performance or achievements expressed or implied by such forward-looking statements. Our actual results could differ materially from those anticipated in these forward-looking statements as a result of various factors, including risks and uncertainties related to the national economy, the real estate industry in general, and in our specific markets; legislative or regulatory changes including changes to laws governing REITS; our dependence on key personnel whose continued service is not guaranteed; availability of qualified acquisition and development targets; availability of capital and financing; rising interest rates; rising insurance rates; impact of ad valorem and income taxation; changes in generally accepted accounting principles; and our continued ability to successfully lease and operate our properties. While we believe these forward-looking statements are based on reasonable assumptions, we can give no assurance that our expectations will be achieved. These forward-looking statements are made as of the date of this news release, and we undertake no obligation to update publicly or revise any forward-looking statement, whether as a result of new information, future developments or otherwise.