Use these links to rapidly review the document
TABLE OF CONTENTS
PART IV
SECURITIES AND EXCHANGE COMMISSION
Washington, D.C. 20549
FORM 10-K/A
Amendment No. 1
| (Mark One) | ||
ý | Annual report pursuant to Section 13 or 15(d) of the Securities Exchange Act of 1934 | |
For the fiscal year ended December 31, 2015. | ||
OR | ||
o | Transition report pursuant to Section 13 or 15(d) of the Securities Exchange Act of 1934 | |
For the transition period from to | ||
Commission File Number 000-50923
WILSHIRE BANCORP, INC.
(Exact name of registrant as specified in its charter)
| California (State or other jurisdiction of incorporation or organization) | 20-0711133 (I.R.S. Employer Identification Number) | |
3200 Wilshire Blvd. Los Angeles, California (Address of principal executive offices) | 90010 (Zip Code) |
(213) 387-3200
(Registrant's telephone number, including area code)
Securities registered pursuant to Section 12(b) of the Act
| Common Stock, no par value (Title of each class) | The NASDAQ Stock Market, LLC (Name of Each Exchange on which registered) |
Securities registered pursuant to Section 12(g) of the Act : None
Indicate by check mark if the registrant is a well-known seasoned issuer, as defined in Rule 405 of the Securities Act. Yes ý No o
Indicate by check mark if the registrant is not required to file reports pursuant to Section 13 or Section 15(d) of the Act. Yes o No ý
Indicate by check mark whether the registrant (1) has filed all reports required to be filed by Section 13 or 15(d) of the Securities Exchange Act of 1934 during the preceding 12 months (or for such shorter period that the registrant was required to file such reports), and (2) has been subject to such filing requirements for the past 90 days. Yes ý No o
Indicate by check mark whether the registrant has submitted electronically and posted on its corporate Web site, if any, every Interactive Data File required to be submitted and posted pursuant to Rule 405 of Regulation S-T (§232.405 of this chapter) during the preceding 12 months (or for such shorter period that the registrant was required to submit and post such files). Yes ý No o
Indicate by check mark if disclosure of delinquent filers pursuant to Item 405 of Regulation S-K (§232.405 of this chapter) is not contained herein, and will not be contained, to the best of registrant's knowledge, in definitive proxy or information statements incorporated by reference in Part III of this Form 10-K/A or any amendment to this Form 10-K/A. ý
Indicate by check mark whether the registrant is a large accelerated filer, an accelerated filer, a non-accelerated filer, or a smaller reporting company. See the definitions of "large accelerated filer," "accelerated filer" and "smaller reporting company" in Rule 12b-2 of the Exchange Act. (Check one):
| Large accelerated filer ý | Accelerated filer o | Non-accelerated filer o | Smaller reporting company o |
Indicate by check mark whether the registrant is a shell company (as defined in Rule 12b-2 of the Exchange Act). Yes o No ý
The aggregate market value of the voting common stock held by non-affiliates of the registrant as of June 30, 2015 was approximately $894.2 million (computed based on the closing sale price of the registrant's common stock at $12.63 per share as of such date as quoted on the NASDAQ Global Select Market).
The number of shares of common stock of the registrant outstanding as of February 12, 2016 was 78,643,353.
DOCUMENTS INCORPORATED BY REFERENCE
Portions of the registrant's Definitive Proxy Statement relating to the registrant's 2016 Annual Meeting of Shareholders are incorporated by reference into Part III of this Annual Report on Form 10-K/A, where indicated.
This amendment to Form 10-K for the year ended December 31, 2015 ("Form 10-K") is being filed solely to include the conformed signature of Jae Whan Yoo on Exhibit 31.1, "Certification of Chief Executive Officer." The conformed signature was inadvertently omitted in the original Form 10-K. While the original Form 10-K is not otherwise amended (except in certain cases to clarify references to this Form 10-K/A), we are refiling the Form 10-K in its entirety. This Form 10-K/A speaks as of the original filing date of the Form 10-K and has not been updated to reflect events occurring subsequent to the original filing date.
2
Cautionary Statement Regarding Forward-Looking Statements and Information | 4 | |||||
PART I |
| |||||
Item 1. | Business | 4 | ||||
Item 1A. | Risk Factors | 34 | ||||
Item 1B. | Unresolved Staff Comments | 48 | ||||
Item 2. | Properties | 48 | ||||
Item 3. | Legal Proceedings | 50 | ||||
Item 4. | Mine Safety Disclosures | 50 | ||||
PART II |
| |||||
Item 5. | Market for Registrant's Common Equity, Related Shareholder Matters and Issuer Purchases of Equity Securities | 51 | ||||
Item 6. | Selected Financial Data | 55 | ||||
Item 7. | Management's Discussion and Analysis of Financial Condition and Results of Operations | 57 | ||||
Item 7A. | Quantitative and Qualitative Disclosures About Market Risk | 101 | ||||
Item 8. | Financial Statements and Supplementary Data | 104 | ||||
Item 9. | Changes in and Disagreements with Accountants on Accounting and Financial Disclosure | 104 | ||||
Item 9A. | Controls and Procedures | 104 | ||||
Item 9B. | Other Information | 105 | ||||
PART III |
| |||||
Item 10. | Directors and Executive Officers of the Registrant | 106 | ||||
Item 11. | Executive Compensation | 106 | ||||
Item 12. | Security Ownership of Certain Beneficial Owners, Management and Related Shareholder Matters | 106 | ||||
Item 13. | Certain Relationships and Related Transactions and Director Independence | 106 | ||||
Item 14. | Principal Accounting Fees and Services | 106 | ||||
PART IV |
| |||||
Item 15. | Exhibits, Financial Statement Schedules | 107 | ||||
3
CAUTIONARY STATEMENT REGARDING
FORWARD-LOOKING STATEMENTS AND INFORMATION
This Annual Report on Form 10-K/A, or the "Report," the other reports, statements, and information that we have previously filed or that we may subsequently file with the Securities and Exchange Commission ("SEC") and public announcements that we have previously made or may subsequently make include, incorporate by reference or may incorporate by reference certain statements that are "forward-looking statements" within the meaning of the Private Securities Litigation Reform Act of 1995 and are intended to enjoy the benefits of that Act. The forward-looking statements included or incorporated by reference in this Form 10-K/A and those reports, statements, information and announcements address activities, events or developments that Wilshire Bancorp, Inc. (together with its subsidiaries hereinafter referred to as "the Company," "we," "us," or "our" unless the context requires otherwise) expects or anticipates will or may occur in the future. Any statements in this document about expectations, beliefs, plans, objectives, assumptions or future events or performance are not historical facts and are forward-looking statements. These statements are often, but not always, made through the use of words or phrases such as "may," "should," "could," "predict," "potential," "believe," "will likely result," "expect," "will continue," "anticipate," "seek," "estimate," "intend," "plan," "projection," "would" and "outlook," and similar expressions. Accordingly, these statements involve estimates, assumptions and uncertainties, which could cause actual results to differ materially from those expressed in them. Any forward-looking statements are qualified in their entirety by reference to the factors discussed throughout this document. It is important to note that our actual results may differ materially from those in such forward-looking statements due to fluctuations in interest rates, inflation, government regulations, economic conditions, customer disintermediation and competitive product and pricing pressures in the geographic and business areas in which we conduct operations, as well as the factors discussed elsewhere in this Report, including the discussion under the section entitled "Risk Factors."
The risk factors referred to in this Report could cause actual results or outcomes to differ materially from those expressed in any forward-looking statements made by us, and you should not place undue reliance on any such forward-looking statements. New factors emerge from time to time, and it is not possible for us to predict which will arise. In addition, we cannot assess the impact of each factor on our business or the extent to which any factor, or combination of factors, may cause actual results to differ materially from those contained in any forward-looking statements. Except as required by applicable law or regulations, we do not undertake, and specifically disclaim any obligation, to update or revise any forward-looking statement.
General
Wilshire Bancorp, Inc. is a bank holding company offering a broad range of financial products and services primarily through our main subsidiary, Wilshire Bank, a California state-chartered commercial bank, which we sometimes refer to in this Report as the "Bank." The Company succeeded to the business and operations of the Bank upon consummation of the reorganization of the Bank into a holding company structure, effective as of August 25, 2004. In October 2013, we changed the name of our subsidiary from Wilshire State Bank to Wilshire Bank. Our corporate headquarters and primary banking facilities are located at 3200 Wilshire Boulevard, Los Angeles, California 90010. The Bank has thirty-five full-service branch offices in Southern California, Texas, Alabama, Georgia, New Jersey, and the greater New York City metropolitan area. We also have six loan production offices, or "LPOs", of which four are utilized primarily for the origination of loans under the Small Business Administration ("SBA") lending program located in California, Colorado, Georgia, and Washington, and two that are utilized primarily for the origination of residential mortgage loans located in Southern California.
4
Deposits in Wilshire Bank are insured up to the maximum limits authorized under the Federal Deposit Insurance Act, as amended, or the "FDIA." Like most state-chartered banks of our size in California, we are not a member of the Federal Reserve System, but we are a member of Federal Home Loan Bank ("FHLB") of San Francisco, a congressionally chartered FHLB. At December 31, 2015, we had approximately $4.71 billion in assets, $3.84 billion in total loans (net of deferred fees and including loans held-for-sale), and $3.84 billion in deposits.
We operate a community bank focused on the general commercial banking business, with our primary market encompassing the multi-ethnic populations of Southern California, Texas, Alabama, Georgia, New Jersey, and the New York metropolitan area. Our client base reflects the ethnic diversity of these communities.
To address the needs of our multi-ethnic customer base, we have many multilingual employees who are able to converse with our clientele in their native languages. We believe that the ability to speak the native language and understand the different cultures of our customers assists us in tailoring products and services for our customers' needs.
Acquisitions
During the fourth quarter of 2013, we completed the acquisitions of BankAsiana, previously headquartered in Palisades Park, New Jersey, and Saehan Bancorp ("Saehan"), previously headquartered in Los Angeles, California. The acquisition of BankAsiana was completed on October 1, 2013, and the acquisition of Saehan was completed on November 20, 2013. With the completion of the acquisitions, three former BankAsiana branches in the New York/New Jersey area, and ten former Saehan branches in Southern California, were added to our existing branch network. Three of these California branches were subsequently closed as part of our acquisition integration plan.
The acquisitions were accounted for in accordance with ASC 805 "Business Combinations," and the assets and liabilities of BankAsiana and Saehan were recorded at fair value at the date of each acquisition. In the third quarter of 2014, the Company finalized its acquisition accounting adjustment for the acquisitions of BankAsiana and Saehan. Goodwill recorded from the 2013 acquisitions totaled $60.8 million in the aggregate, $10.8 million from the acquisition of BankAsiana and $50.0 million from the acquisition of Saehan.
During the first quarter of 2015, the Bank purchased certain assets and partially assumed the operations of Bank of Manhattan's Mortgage Lending Division ("Mortgage Division"). The Mortgage Division was first formed in 2010 and offers conforming, super-conforming, jumbo residential, and other residential mortgage products. The Bank acquired certain assets and liabilities of the Mortgage Division and hired approximately 30 employees consisting of loan managers, loan officers, and operations personnel. In connection with the acquisition, the Bank entered into a sublease agreement with Bank of Manhattan to operate from one of the Mortgage Division's locations in Southern California. The Mortgage Division has been integrated into the Bank's existing Mortgage Department, substantially increasing the Bank's mortgage lending origination platform.
The acquisition of the Mortgage Division was accounted for in accordance with ASC 805 "Business Combinations," using the acquisition method of accounting and was recorded at estimated fair value on the date of the transaction. The transaction resulted in only the acquisition of fixed assets related to the three locations acquired by the Bank. There were no loans or loan commitments acquired in the transaction. The total purchase price paid to Bank of Manhattan in the transaction was $20,000.
Proposed Merger with BBCN Bancorp Inc.
On December 7, 2015, the Company entered into an Agreement and Plan of Merger ("Merger Agreement") with BBCN Bancorp Inc. ("BBCN"). Subject to the terms and conditions of the Merger
5
Agreement, which was approved by the board of directors of both the Company and BBCN, the Company will merge with and into BBCN, with BBCN being the surviving corporation. Concurrently with, or as soon as reasonably practicable after the consummation of the Merger, the Bank will merge with and into BBCN Bank, a California state-chartered bank and a wholly owned subsidiary of BBCN, with BBCN Bank being the surviving bank, pursuant to a separate merger agreement between the Bank and BBCN Bank. The combined company will operate under a new name that will be determined prior to the closing.
Under the Merger Agreement, at the effective time of the merger, each outstanding share of the Company's common stock will be converted into 0.7034 shares of BBCN's common stock, with any fractional shares paid in cash. The board of the surviving corporation will consist of 16 members, with BBCN and the Company designating nine and seven directors, respectively to serve on the board. Steven Koh, the Company's chairman, will serve as chairman of the board and Kevin Kim, BBCN's chief executive officer, will serve as chief executive officer of the combined corporation. The Merger Agreement also provides for the appointment of a consolidation committee consisting of three representatives from each company to oversee the integration process.
The consummation of the merger is subject to customary conditions, including receipt of regulatory approvals, receipt of the requisite approval of the shareholders of the Company and BBCN, the absence of any law or order prohibiting the closing, and effectiveness of the registration statement to be filed by BBCN with respect to the stock to be issued in the merger. In addition, each party's obligation to consummate the merger is subject to certain other conditions, including the accuracy of the representations and warranties of the other party and compliance of the other party with its covenants, in each case subject to certain materiality standards. The merger is expected to close in the second half of 2016. For more information on the merger, please see our Current Report on Form 8-K filed with the SEC on December 7, 2015
Available Information
We maintain an Internet website at www.wilshirebank.com. We post our filings with the SEC on the Investor Relations portion of our website, where such filings are available free of charge, including our Annual Report on Form 10-K, our Quarterly Reports on Form 10-Q, our Current Reports on Form 8-K, our proxy and information statements, and any amendments to those reports or statements as soon as reasonably practicable after such reports are filed or furnished under the Securities Exchange Act of 1934, as amended, or "Exchange Act". In addition to our SEC filings, certain corporate governance documents, including our Personal and Business Code of Conduct can be found on the Investor Relations page of our website. We also post separately on our website all filings made by persons pursuant to Section 16 of the Exchange Act. The information on or accessible through our website is not incorporated by reference into this Report. You may also read and copy any materials we file with the SEC at the SEC's Public Reference Room at 100 F Street, N.E., Washington, D.C. 20549. You may obtain information on the operation of the Public Reference Room by calling the SEC at 1-800-SEC-0220. The SEC maintains an Internet site that contains reports, proxy and information statements, and other information regarding issuers that file electronically with the SEC at www.sec.gov.
Lending Activities
General
Our loan policies set forth the basic guidelines and procedures by which we conduct our lending operations. These policies address the types of loans available, underwriting and collateral requirements, loan terms, interest rate and yield considerations, compliance with laws and regulations, and our internal lending limits. Our Bank Board of Directors reviews and approves our loan policies on an annual basis. We supplement our own supervision of the loan underwriting and approval process with periodic loan audits
6
by experienced external loan specialists who review credit quality, loan documentation, and compliance with laws and regulations. We engage in a full complement of lending activities, including:
- •
- commercial real estate and home mortgage lending,
- •
- commercial business lending and warehouse lending,
- •
- SBA lending,
- •
- consumer loans,
- •
- trade finance, and
- •
- construction lending.
Loan Procedures
Loan applications may be approved by the Directors Loan Committee of our Bank Board of Directors, by our management, or lending officers to the extent of their lending authority. Our Bank Board of Directors authorizes the lending limits of management. The President and the Chief Credit Officer of the Bank are responsible for evaluating the lending authority limits for individual credit officers and recommending lending limits for all other officers to the Bank Board of Directors for approval.
We grant individual lending authority to the President, Chief Credit Officer, and select department managers of the Bank. Loans for which direct and indirect borrower liability exceeds an individual's lending authority are referred to the Management Loan Committee of the Bank (a five-member committee comprised of the President, Chief Credit Officer, Chief CRE Lending Officer, Chief Commercial Banking Officer and alternating between one of the two Senior Credit Managers) or our Bank Directors Loan Committee.
At December 31, 2015, our authorized legal lending limit was $94.4 million for unsecured loans, plus an additional $62.9 million for specifically secured loans. Legal lending limits are calculated in conformance with California law, which prohibits a bank from lending to any one individual or entity or its related interests in an aggregate amount which exceeds 15% of shareholders' equity, plus the allowance for loan losses, and capital notes and debentures, on an unsecured basis, plus an additional 10% on a secured basis. The Bank's shareholders' equity plus allowance for loan losses, and capital notes and debentures at December 31, 2015 totaled $629.2 million.
Since 2012, we have continued to experience an increase in overall gross loans with new originations focusing primarily on commercial real estate, SBA, commercial, and residential mortgage loans, including warehouse lines of credit. In order to gain market shares in a highly competitive environment, we offered new and refinanced loans at current pricing trends which included low fixed rates for terms ranging from 5 to 7 years. In 2013, the acquisitions of BankAsiana and Saehan also contributed to in an increase in total loans and the acquisition of Bank of Manhattan Mortgage Division has helped to grow the Bank's residential loan portfolio through an increase in loan production.
We seek to mitigate the risks inherent in our loan portfolio by adhering to our underwriting policies. The review of each loan application includes analysis of the applicant's prior credit history, income level, cash flow and financial condition, analysis of tax returns, cash flow projections, the value of any collateral used to secure the loan, and also based upon reports of independent appraisers and audits of accounts receivable or inventory pledged as security. In the case of real estate loans over a specified amount, the review of the collateral value includes an appraisal report prepared by an independent Bank-approved appraiser. From time to time, we purchase participation interests in loans made by other financial institutions. These loans are generally subject to the same underwriting criteria and approval process as loans made directly by us.
7
In order to maximize efficiencies and to operate an effective loan underwriting, approval, and renewal processes, our loan officers are separated from marketing officers and branch managers who are generally responsible for loan marketing. In addition, we have a total of five underwriting centers as of December 31, 2015, all of which follow our standardized underwriting procedures. Subsequent to originations, we employ a loan monitoring procedure that requires underwriters to manage their loans by performing periodic assessments of credits. Depending on loan types and risk grades, monitoring is required quarterly, semi-annually, or annually. A standard condensed monitoring form called the "Asset Review Memo" is used to monitor credits by focusing on the most essential credit elements such as cash flows, payment history, property tax delinquency status, credit scores, compliance of covenants and conditions, and proper allocation of loan risk grade.
Real Estate Loans and Home Mortgages
We offer commercial real estate loans to finance the acquisition of, or to refinance the existing mortgages on commercial properties, which include retail shopping centers, office buildings, industrial buildings, warehouses, hotels, automotive industry facilities, apartment buildings, and other commercial properties. Our commercial real estate loans are typically collateralized by first or junior deeds of trust on specific commercial properties, and, when possible, subject to corporate or individual guarantees from financially capable parties. The properties collateralizing real estate loans are principally located in the markets where our retail branches are located. These locations include Southern California, Texas, Alabama, Georgia, New Jersey, and the greater New York City metropolitan area. However, we also provide commercial real estate loans through our LPOs. Real estate loans typically bear an interest rate that floats with our base rate, the prime rate, or another established index. Many of our new real estate loan originations, however, bear fixed rather than floating rates due to today's highly competitive market environment. As such, we have expanded the number of fixed rate commercial mortgages with maturities that generally do not exceed 7 years. Some refinances of existing real estate loans also had higher loan-to-value ("LTV") ratios because collateral values have decreased since initial origination five to seven years earlier. For these refinances, other factors including good payment history, high credit scores, sufficient cash flow, and the guarantor's overall financial strength were considered to mitigate credit risks. At December 31, 2015, real estate loans, including construction loans constituted approximately 78.9% of our loan portfolio.
Commercial real estate loans typically have 7-year maturities with up to 25-year amortization of principal and interest and loan-to-value ratios of 60-70% at origination of the appraised value or purchase price, whichever is lower. We usually impose a prepayment penalty during the period within three to five years of the date of the loan, but typically waive the prepayment penalty if the property is sold to a third party.
Construction loans are provided to build new structures, or to substantially improve the existing structure of commercial, residential, and other income-producing properties. These loans generally have one to two year terms, with an option to extend the loan for additional periods to complete construction and to accommodate the lease-up period. We usually require a 20-30% equity capital investment by the developer and loan-to-value ratios of not more than 60-70% of the anticipated completion value.
Our total home mortgage loan portfolio outstanding at the end of 2015 and 2014 was $244.9 million and $146.2 million, respectively. We did not have any residential loans with interest only payments at December 31, 2015 or 2014.
We consider subprime mortgages to be loans that are secured by real property made to a borrower (or borrowers) with a diminished or impaired credit rating or with a limited credit history. We are focused on producing loans with only prime rated borrowers which we consider borrowers with FICO scores of at least 660. As of December 31, 2015, our loan portfolio currently has no subprime exposure.
8
Our real estate loan portfolio is subject to certain risks, including:
- •
- a decline in the economies of our primary markets,
- •
- interest rate increases,
- •
- a reduction in real estate values in our primary markets,
- •
- increased competition in pricing and loan structure, and
- •
- environmental risks, including natural disasters.
We strive to reduce the exposure to such risks by (a) reviewing each new loan request and renewal individually, (b) using a dual signature approval system for the approval of each loan request for loans over a certain dollar amount, (c) adherence to written loan policies, including, among other factors, minimum collateral requirements, maximum loan-to-value ratio requirements, cash flow requirements, and personal guarantees, (d) independent appraisals, (e) external independent credit reviews, and (f) conducting environmental reviews, where appropriate. We review each loan request on the basis of our ability to recover both principal and interest in view of the inherent risks.
Commercial Business and Warehouse Lending
We offer commercial business loans to business entities such as sole proprietorships, partnerships, and corporations. These loans include business lines of credit and business term loans to finance operations, to provide working capital, or for specific purposes, such as to finance the purchase of assets, equipment, or inventory. Since a borrower's cash flow from operations is generally the primary source of repayment, our policies provide specific guidelines regarding required debt coverage ratio in addition to other important financial ratios.
Lines of credit are extended to businesses or individuals based on the financial strength and integrity of the borrower. These lines of credit are secured primarily by business assets such as accounts receivable or inventory, and have maturities of one year or less. Such lines of credit bear interest rates that floats with our base rate, the prime rate, or another established index. We also provide warehouse lines of credit to mortgage loan originators. The lines of credit are used by these originators to fund mortgages which are then pledged to the Bank as collateral until the mortgage loans are sold after which the lines of credit are paid down. The typical duration of these lines of credit from the time of funding to pay-down ranges from 10-30 days. Although collateralized by mortgage loans, the structure of warehouse lending agreements results in commercial loan treatment. Warehouse loans at December 31, 2015 totaled $245.4 million, up from $166.9 million at December 31, 2014.
Business term loans are typically made to finance the acquisition of fixed assets, refinance short-term debts, or to finance the purchase of businesses. Business term loans generally have terms from one to seven years. They may be collateralized by the assets being acquired or other available assets and bear interest rates, which either float with our base rate, prime rate, another established index, or is fixed for the term of the loan.
We also provide other banking services tailored to the small business market. We try to focus on diversifying our loan portfolio, which has led to an increase in commercial business loans to small- and medium-sized businesses.
Our portfolio of commercial loans is subject to certain risks, including:
- •
- a decline in the economy in our primary markets,
- •
- interest rate increases, and
- •
- deterioration of a borrower's or guarantor's financial capabilities.
9
We attempt to reduce the exposure to such risks by (a) reviewing each new loan request and renewal individually, (b) relying heavily on our committee approval system where inputs from experienced committee members with different types and levels of lending experience are fully utilized, (c) adherence to written loan policies, and (d) external independent credit review. In addition, loans based on short-term assets such as account receivables and inventories are monitored monthly or at a minimum, on a quarterly basis. In general, we receive and review financial statements of borrowing customers on an ongoing basis during the term of the relationship and quickly respond to any noted deterioration.
Small Business Administration Lending Services
SBA lending is an important part of our business. Our SBA lending places an emphasis on minority-owned businesses. Our SBA market area includes the geographic areas encompassed by our full-service banking offices in Southern California, Texas, Alabama, Georgia, New Jersey, and the New York City metropolitan area, as well as the multi-ethnic population areas surrounding our LPOs in other states. We are an SBA Preferred Lender nationwide, which permits us to approve SBA guaranteed loans in all our lending areas without further approval from the SBA. As an SBA Preferred Lender, we are able to provide quick and efficient service to our clientele, enabling them to obtain SBA loans in order to acquire new businesses, expand existing businesses, and acquire locations in which to do business, without having to go through the time-consuming SBA approval process that would be necessary if a prospective SBA borrower were to utilize a lender that is not an SBA Preferred Lender.
Consumer Loans
Consumer loans include personal loans, auto loans, and other loans typically made by banks to individual borrowers. The majority of consumer loans are concentrated on personal lines of credit and installment loans to individuals. Since the second half of 2008, we have not made any new auto loans to new customers. However, on occasion, automobile loans are made to existing loan or deposit customers. Because consumer loans typically present a higher risk potential compared to our other loan products, we have reduced our overall efforts in consumer lending.
Our consumer loan production has historically been comparatively small, and has always represented less than 1% of our total loan portfolio. As of December 31, 2015, our consumer loan portfolio represented 0.4% of the loan portfolio, down from 0.6% at December 31, 2014.
Our consumer loan portfolio is subject to certain risks, including:
- •
- general economic conditions of the markets we serve,
- •
- interest rate increases, and
- •
- consumer bankruptcy laws which allow consumers to discharge certain debts.
We attempt to reduce the exposure to such risks through (a) the direct approval of all consumer loans by reviewing each loan request and renewal individually, (b) using a dual signature system of approval, (c) adherence to written credit policies, (d) utilizing external independent credit review and (e) concentrating mostly on cash secured loans and lines of credits.
Trade Finance Services
Our Trade Finance Department assists our import/export customers with their international business needs. The department primarily deals in letters of credit issued to customers whose businesses involve the international sale of goods. A letter of credit is an arrangement (usually expressed in letter form) whereby we, at the request of and in accordance with customers' instructions, undertake to reimburse or cause to reimburse a third party, provided that certain documents are presented in strict compliance with its terms
10
and conditions. Simply put, a bank is pledging its credit on behalf of the customer. Our Trade Finance Department offers the following types of letters of credit to customers:
- •
- Commercial—An undertaking by the issuing bank to pay for a commercial transaction.
- •
- Standby—An undertaking by the issuing bank to pay for the non-performance of applicant.
- •
- Revocable—Letter of credit that can be modified or cancelled by the issuing bank at any time with notice to the beneficiary (does not provide beneficiary with a firm promise of payment).
- •
- Irrevocable—Letters of credit that cannot be altered or cancelled without mutual consent of all parties.
- •
- Sight—Letter of credit requiring payment upon presentation of conforming shipping documents.
- •
- Usance—Letter of credit which allows the buyer to delay payment up to a designated number of days after presentation of shipping documents.
- •
- Import—Letter of credit issued to assist customers in purchasing goods from overseas.
- •
- Export—Letter of credit issued to assist customers selling goods to overseas.
- •
- Transferable—Letter of credit which allows the beneficiary to transfer their right, in part or full, to another party.
- •
- Non-transferable—Letter of credit which does not allows the beneficiary to transfer their right, in part or full, to another party.
- •
- Documentary Collections—A means of channeling payment for goods through a bank in order to facilitate passing of funds. The bank (banks) involved acts as a conduit through which the funds and documents are transferred between the buyer and seller of goods.
Services offered by the Trade Finance Department include the issuance and negotiation of letters of credit, as well as the handling of documentary collections. On the export side, we provide advice on and negotiation of commercial letters of credit, and we transfer and issue back-to-back letters of credit. We also provide importers with trade finance lines of credit, which allow for issuance of commercial letters of credit and financing of documents received under such letters of credit, as well as documents received under documentary collections. Exporters are assisted through export lines of credit as well as through immediate financing of clean documents presented under export letters of credit.
Most of our revenue from the Trade Finance Department consists of fee income from providing facilities to support import/export customers and interest income from extensions of credit. Our Trade Finance Department's fee income was $1.1 million, $1.4 million, and $950,000 in 2015, 2014 and 2013, respectively.
Investing Activities
Investments are one of our major sources of interest income and are acquired in accordance with a written comprehensive investment policy that addresses strategies, types, and levels of allowable investments. Management of our investment securities portfolio focuses on providing an adequate level of liquidity and establishing a balanced interest rate sensitive position, while earning an adequate level of investment income without taking undue risk. Investment may also be pledged toward deposits, borrowings, or potential lines of credit available to the Bank. Our investment portfolio consists of securities of government sponsored enterprises, mortgage backed securities, collateralized mortgage obligations, corporate securities, and municipal securities.
We classify all our investment securities as "held-to-maturity" or "available-for-sale" pursuant to ASC 320-10. Investment securities that we intend to hold until maturity are classified as held-to-maturity,
11
and all other investment securities are classified as available-for-sale. At December 31, 2015, investment securities available-for-sale totaled $535.5 million, and total investments securities held-to-maturity totaled $21,000.
Deposit Activities and Other Sources of Funds
Our primary sources of funds are deposits and loan repayments. Scheduled loan repayments are a relatively predictable source of funds, whereas deposit inflows and outflows and unscheduled loan prepayments (which are influenced significantly by general interest rate levels, interest rates available on other investments, competition, economic conditions, and other factors) are less predictable. Customer deposits remain our primary source of funds, but these balances may be influenced by adverse market changes in the industry. As a secondary source of funds, borrowings may be used:
- •
- on a short-term basis to compensate for reductions in deposit inflows to less than projected levels, and
- •
- on a longer-term basis to support expanded lending activities and to match the maturity of repricing intervals of assets.
We offer a variety of accounts for depositors which are designed to attract both short-term and long-term deposits. These accounts include certificates of deposit ("CDs"), regular savings accounts, money market accounts, checking and negotiable order of withdrawal ("NOW") accounts, installment savings accounts, and individual retirement accounts. These accounts generally earn interest at rates established by management based on competitive market factors and management's desire to increase or decrease certain types or maturities of deposits. As needed, we augment these customer deposits with brokered deposits. Types of deposit accounts offered by us and other sources of funds are described below:
Certificates of Deposit
We offer several types of CDs with a maximum maturity of five years. The majority of our CDs all have maturities of one to twelve months and typically pay simple interest credited monthly or at maturity.
Regular Savings Accounts
We offer savings accounts that allow for unlimited deposits and withdrawals, provided that depositors maintain a $100 minimum balance. Interest is compounded daily and credited quarterly.
Money Market Accounts
Money market accounts pay a variable interest rate that is tiered depending on the balance maintained in the account. Minimum opening balances vary. Interest is compounded daily and paid monthly.
Checking and NOW Account
Checking and NOW accounts are generally non-interest and interest-bearing accounts, respectively, and may include service fees based on activity and balances. NOW accounts pay interest, but require a higher minimum balance to avoid service charges.
FHLB Borrowings
To supplement our deposits as a source of funds for lending or other investment, we borrow funds in the form of advances from the FHLB of San Francisco. We may use FHLB advances as part of our interest rate risk management, primarily to extend the duration of funding to match the longer term fixed rate loans held in the loan portfolio.
12
As a member of the FHLB system, we are required to invest in FHLB stock based on a predetermined formula. FHLB stock is a restricted investment that can only be sold to other FHLB members or redeemed by the FHLB. As of December 31, 2015, we owned $16.5 million in FHLB stock.
Advances from the FHLB are secured by the FHLB stock. In addition to FHLB stock, under the FHLB's standard credit program, advances can be secured by blanket lien on loans in our portfolio or may be secured by securities which are obligations of or guaranteed by the U.S. government under the FHLB's securities backed program. At December 31, 2015, our borrowing capacity with the FHLB of San Francisco was approximately $1.42 billion, with $220.0 million in borrowings outstanding and $1.19 billion in capacity remaining.
Internet and Mobile Banking
We offer internet banking, which allows our customers to access their deposit and loan accounts through the internet. We also offer mobile banking which allows our customer to access their deposit accounts through personal electronic devices such as smartphones and tablets. Through either Internet or mobile banking, customers are able to obtain transaction history and account information, transfer funds between accounts, make on-line bill payments, and open deposit accounts.
Other Services
We offer automated teller machines ("ATMs") located at selected branch offices, customer access to an ATM network, and armored carrier services. Safety deposit boxes are also offered to customers as a means to secure protection for valuables and important documents.
Marketing
Our marketing efforts rely principally upon local advertising, promotional activity, and upon the personal contacts of our directors, officers, and shareholders to attract business and to acquaint potential customers with our products and personalized services. We emphasize a high degree of personalized client service in order to be able to satisfy each customer's banking needs. Our marketing approach emphasizes our strength as an independent, locally-managed state chartered bank in meeting the particular needs of consumers, professionals, and business customers in the community. Our management team continually evaluates all of our banking services with regard to their profitability and makes conclusions based on these evaluations on whether to continue or modify our business plan, where appropriate.
Competition
Regional Branch Competition
We currently operate thirty-five branch offices, twenty-two in California, three in Texas, one in Alabama, one in Georgia, four in New Jersey, and four in the greater New York City metropolitan area. We consider our Bank to be a community bank focused on the general commercial banking business, with our primary market encompassing the multi-ethnic population of the Los Angeles County area. Our full-service branch offices are located primarily in areas where a majority of the businesses are owned by immigrants or minority groups. Our client base reflects the ethnic diversity of these communities.
Our market has become increasingly competitive in recent years with respect to virtually all products and services that we offer. Although the general banking market is dominated by a relatively small number of major banks with numerous offices covering a wide geographic area, we compete in our niche market directly with other community banks which focus on Korean-American and other minority consumers and businesses.
We continue to experience a high level of competition within the ethnic banking market. In the greater Los Angeles metropolitan area, our primary competitors include seven locally-owned and operated
13
Korean-American banks. These banks have branches located in many of the same neighborhoods in which we operate, provide similar types of products and services, and use the same Korean language publications and media for their marketing purposes. Unlike many other Korean-ethnic community banks, we also focus a significant portion of our marketing efforts on non-Korean customers.
A less significant source of competition in our primary markets includes branch offices of major national and international banks which maintain a limited but increasing number of bilingual staff for Korean-speaking or other language customers. Although these banks have not traditionally focused their marketing efforts on the minority customer base in our markets, their competitive influence could increase should they choose to focus on our markets in the future. Large commercial bank competitors have, among other advantages, the ability to finance wide-ranging and effective advertising campaigns and to allocate their investment resources to areas of highest yield and demand. Many of the major banks operating in our market areas offer certain services that we do not offer directly (but some of which we offer through correspondent institutions). By virtue of their greater total capitalization, such banks likely also have substantially higher lending limits than we do. In order to compete effectively, we provide quality personalized service and fast local decision making which we feel distinguishes us from many of our major bank competitors. For customers whose loan demands exceed our internal lending limit, we attempt to arrange for such loans on a participation basis with our correspondent banks. Similarly, we assist customers requiring services that we do not currently offer in obtaining such services from our correspondent banks.
Regional Loan Production Office Competition
We currently operate LPOs utilized primarily for the origination of loans under the SBA lending program in Newark, California; Federal Way, Washington; Aurora, Colorado; and Atlanta, Georgia. In addition we operate LPOs utilized primarily for the origination of residential mortgage loans in Newport Beach, California and Gardena, California. In most of our LPO locations, we are competing with local lenders as well as Los Angeles-based Korean-American community lenders operating out-of-state LPOs. We anticipate more competition from Korean-American community lenders in most of our LPO locations in the future. In anticipation of slow growth in the U.S. economy and real estate market activity, we plan to maintain a balance of market coverage and operating costs.
Other Competitive Factors
In addition to other banks, our competitors include savings institutions, credit unions, and numerous non-banking institutions, such as finance companies, leasing companies, insurance companies, brokerage firms, and investment banking firms. In recent years, increased competition has also developed from specialized finance and non-finance companies that offer money market and mutual funds, wholesale finance, credit card, and other consumer finance services, including on-line banking services and personal finance software. Strong competition for deposit and loan products affects the rates of those products as well as the terms on which they are offered to customers.
The more general competitive trends in the industry include increased consolidation and competition. Strong competitors, other than financial institutions, have entered banking markets with focused products targeted at highly profitable customer segments. Many of these competitors are able to compete across geographic boundaries and provide customers increasing access to meaningful alternatives to banking services in nearly all significant products. Mergers between financial institutions have placed additional pressure on banks within the industry to streamline their operations, reduce expenses, and increase revenues to remain competitive. Competition has also intensified due to the federal and state interstate banking laws, which permit banking organizations to expand geographically.
Technological innovations have also resulted in increased competition in the financial services industry. Such innovations have, for example, made it possible for non-depository institutions to offer customers automated transfer payment services that were previously considered traditional banking
14
products. In addition, many customers now expect a choice of several delivery systems and channels, including telephone, smartphones, tablets, mail, home computer, ATMs, self-service branches, and/or in store branches. To some extent, such competition has had limited effect on us to date because many recent technological advancements do not yet have Korean or other language capabilities. However, as the technology becomes widely available, the competitive pressure to be at the forefront of such advancements will be significant.
The market for the origination of SBA loans, one of our primary revenue sources, is highly competitive. We compete with other small, mid-size, and major banks that originate these loans in the geographic areas in which our full service branches are located, as well as in the areas where we maintain LPOs. In addition, because these loans are largely broker-driven, we compete to a large extent with banks that originate SBA loans outside of our immediate geographic area. Furthermore, because these loans may be originated out of LPOs specifically set up to originate SBA loans rather than out of full service branches, the barriers to entry in this area, after approval of a bank as an SBA lender, are relatively low. In order to succeed in this highly competitive market, we actively market our SBA loans to minority-owned businesses. However, the resale market for SBA loans may grow, decline or, maintain its current status.
Business Concentration
No individual or single group of related accounts is considered material in relation to our total assets or deposits, or in relation to our overall business. However, approximately 78.9% of our loan portfolio at December 31, 2015 consisted of real estate-related loans, including construction loans, mini-perm loans, residential mortgage loans, and commercial loans secured by real estate. Moreover, our business activities are currently focused primarily in Southern California, with the majority of our business concentrated in Los Angeles and Orange County. Consequently, our results of operations and financial condition are dependent upon the general trends in the Southern California economies and, in particular, the commercial real estate markets. In addition, the concentration of our operations in Southern California exposes us to greater risk than other banking companies with a wider geographic base in the event of catastrophes, such as earthquakes, fires, and floods in this region.
Employees
We had 583 full-time equivalent employees (582 full-time employees and 4 part-time employees) as of December 31, 2015. None of our employees are currently represented by a union or covered by a collective bargaining agreement. Management believes that our employee relations are satisfactory.
Regulation and Supervision
The following is a summary description of the relevant laws, rules, and regulations governing banks and bank holding companies. The descriptions of, and references to, the statutes and regulations below are brief summaries and do not purport to be complete. The descriptions are qualified in their entirety by reference to the specific statutes and regulations discussed.
Generally, the supervision and regulation of bank holding companies and their subsidiaries are intended primarily for the protection of depositors, the deposit insurance funds of the Federal Deposit Insurance Corporation ("FDIC"), and the banking system as a whole, and not for the protection of the bank holding company or its shareholders. The banking agencies have broad enforcement power over bank holding companies and banks, including the power to impose substantial fines and other penalties for violations of laws and regulations.
Various legislation is from time to time introduced in Congress and California's legislature, including proposals to overhaul the bank regulatory system, expand the powers of depository institutions, and limit the investments that depository institutions may make with insured funds. Such legislation may change
15
applicable statutes and the operating environment in substantial and unpredictable ways. We cannot determine the ultimate effect that future legislation or implementing regulations would have upon our financial condition, upon our results of operations, or the results of operations of any of our subsidiaries.
Wilshire Bancorp
Wilshire Bancorp is a bank holding company registered under the Bank Holding Company Act (the "Bank Holding Company Act") and is subject to supervision, regulation, and examination by the Board of Governors of the Federal Reserve System (the "Federal Reserve Board"). The Bank Holding Company Act and other federal laws subject bank holding companies to particular restrictions on the types of activities in which they may engage, and to a range of supervisory requirements and activities, including regulatory enforcement actions for violations of laws and regulations.
Regulatory Restrictions on Dividends; Source of Strength
We are regarded as a legal entity separate and distinct from our subsidiaries. The principal source of our revenue is dividends received from the Bank. Various federal and state statutory provisions limit the amount of dividends the Bank can pay to the Company without prior regulatory approval. In certain circumstances, Wilshire Bancorp may be required to obtain prior approval from the Federal Reserve Board to make capital distributions to its shareholders. The Federal Reserve Board has the authority to prohibit dividends by bank holding companies if their actions constitute unsafe or unsound practices. In addition, the Federal Reserve Board issued Supervisory Letter SR 09-4 on February 24, 2009 and revised such letter on March 27, 2009, which provides guidance on the declaration and payment of dividends, capital redemptions, and capital repurchases by bank holding company. Supervisory Letter SR 09-4 provides that, as a general matter, a bank holding company should eliminate, defer, or significantly reduce its dividends if: (1) the company's net income for the past year is not sufficient to cover the cash dividends, (2) the rate of earnings retention is not consistent with the company's capital needs, asset quality, and overall financial condition, and (3) the minimum regulatory capital adequacy ratios are not met or in danger of not being met. The policy also provides that bank holding companies should not maintain a level of cash dividends that undermines the bank holding company's ability to serve as a source of strength to its banking subsidiaries.
Under Federal Reserve Board policy, a bank holding company is expected to act as a source of financial strength to its banking subsidiaries and commit resources to their support. Such support may be required at times when, absent this Federal Reserve Board policy, a holding company may not be in a financial position to provide such support. A bank holding company's failure to meet its source-of-strength obligations may constitute an unsafe and unsound practice or a violation of the Federal Reserve Board's regulations, or both. As discussed below, a bank holding company, in certain circumstances, could be required to guarantee the capital plan of an undercapitalized banking subsidiary. The source-of-strength doctrine most directly affects bank holding companies in situations where the bank holding company's subsidiary bank fails to maintain adequate capital levels. The Dodd-Frank Act (as defined below) codified this policy as a statutory requirement; however, the Federal Reserve Board has not yet adopted regulations to implement this requirement.
In the event of a bank holding company's bankruptcy under Chapter 11 of the U.S. Bankruptcy Code, the trustee will be deemed to have assumed, and is required to cure immediately, any deficit under any commitment by the debtor holding company to any of the federal banking agencies to maintain the capital of an insured depository institution, and any claim for breach of such obligation will generally have priority over most other unsecured claims.
As a California corporation, Wilshire Bancorp is restricted under the California General Corporation Law ("CGCL") from paying dividends under certain conditions. The shareholders of Wilshire Bancorp will be entitled to receive dividends when and as declared by the Board of Directors, from funds legally
16
available for the payment of dividends, as provided in the CGCL and, as mentioned above, consistent with Federal Reserve Board policy. The CGCL provides that a corporation may make a distribution to its shareholders if retained earnings immediately prior to the dividend payout, equals the amount of proposed distribution. In the event that sufficient retained earnings are not available for the proposed distribution, a corporation may, nevertheless, make a distribution, if it meets both the "quantitative solvency" and the "liquidity" tests. In general, the quantitative solvency test requires that the sum of the assets of the corporation equal at least 11/4 times its liabilities. The liquidity test generally requires that a corporation have current assets at least equal to current liabilities, or, if the average of the earnings of the corporation before taxes on income and before interest expenses for the two preceding fiscal years was less than the average of the interest expense of the corporation for such fiscal years, then current assets must equal to at least 11/4 times current liabilities. Further, the Bank's limitations on paying dividends could, in turn, affect our ability to pay dividends to our shareholders.
Activities "Closely Related" to Banking
The Bank Holding Company Act prohibits a bank holding company, with certain limited exceptions, from acquiring direct or indirect ownership or control of more than 5% of the voting shares of any company which is not a bank or from engaging in any activities other than those of banking, managing or controlling banks and certain other subsidiaries, or furnishing services to or performing services for its subsidiaries. One principal exception to these prohibitions allows the acquisition of interests in companies whose activities are found by the Federal Reserve Board, by order or regulation, to be so closely related to banking or managing or controlling banks, as to be a proper incident thereto. Some of the activities that have been determined by regulation to be closely related to banking are making or servicing loans, performing certain data processing services, acting as an investment or financial advisor to certain investment trusts and investment companies and providing securities brokerage services. Other activities approved by the Federal Reserve Board include consumer financial counseling, tax planning and tax preparation, futures and options advisory services, check guaranty services, collection agency and credit bureau services and personal property appraisals. In approving acquisitions by bank holding companies of companies engaged in banking-related activities, the Federal Reserve Board considers a number of factors, and weighs the expected benefits to the public (such as greater convenience and increased competition or gains in efficiency) against the risks of possible adverse effects (such as undue concentration of resources, decreased or unfair competition, conflicts of interest or unsound banking practices). The Federal Reserve Board is also empowered to differentiate between activities commenced de novo and activities commenced through acquisition of a going concern.
Gramm-Leach-Bliley Act; Financial Holding Companies
The Gramm-Leach-Bliley Financial Modernization Act, or GLBA, signed into law on November 12, 1999, revised and expanded the provisions of the Bank Holding Company Act by including a new section that permits a bank holding company to elect to become a financial holding company to engage in a full range of activities that are "financial in nature." The qualification requirements and the process for a bank holding company that elects to be treated as a financial holding company require that all of the subsidiary banks controlled by the bank holding company at the time of election to become a financial holding company must be and remain at all times "well-capitalized" and "well managed" and must have a Community Reinvestment Act rating of at least "satisfactory." We have not made an election to become a financial holding company, but we may do so at some time in the future.
GLBA specifically provides that the following activities have been determined to be "financial in nature":
- •
- lending, trust and other banking activities;
- •
- insurance activities;
17
- •
- financial or economic advisory services;
- •
- securitization of assets;
- •
- securities underwriting and dealing;
- •
- existing bank holding company domestic activities;
- •
- existing bank holding company foreign activities; and
- •
- merchant banking activities.
In addition, GLBA specifically gives the Federal Reserve Board the authority, by regulation or order, to expand the list of "financial" or "incidental" activities, but requires consultation with the U.S. Treasury Department, and gives the Federal Reserve Board authority to allow a financial holding company to engage in any activity that is "complementary" to a financial activity and does not "pose a substantial risk to the safety and soundness of depository institutions or the financial system generally."
Safe and Sound Banking Practices
The Federal Reserve Board also has the power to order a bank holding company to terminate any activity or investment, or to terminate its ownership or control of any subsidiary, when it has reasonable cause to believe that the continuation of such activity or investment or such ownership or control constitutes a serious risk to the financial safety, soundness, or stability of any subsidiary bank of the bank holding company. The Federal Reserve Board's Regulation Y, for example, generally requires a holding company to give the Federal Reserve Board prior notice of any redemption or repurchase of its own equity securities, if the consideration to be paid, together with the consideration paid for any repurchases or redemptions in the preceding year, is equal to 10% or more of the company's consolidated net worth. The Federal Reserve Board may oppose the transaction if it believes that the transaction would constitute an unsafe or unsound practice or would violate any law or regulation. Depending upon the circumstances, the Federal Reserve Board could take the position that paying a dividend would constitute an unsafe or unsound banking practice.
The Federal Reserve Board has broad authority to prohibit activities of bank holding companies and their nonbanking subsidiaries which represent unsafe and unsound banking practices or which constitute violations of laws or regulations, and can assess civil money penalties for certain activities conducted on a knowing and reckless basis, if those activities caused a substantial loss to a depository institution. The penalties can be as high as $1 million for each day the activity continues.
Annual Reporting; Examinations
We are required to file annual reports with the Federal Reserve Board, and such additional information as the Federal Reserve Board may require pursuant to the Bank Holding Company Act. The Federal Reserve Board may examine a bank holding company or any of its subsidiaries, and charge the company for the cost of such examination. Furthermore, the Bank is subjected to compliance examinations by the FDIC and the California Department of Business Oversight, or "DBO."
Capital Adequacy Requirements
The Federal Reserve Board has adopted a system using risk-based capital guidelines to evaluate the capital adequacy of certain large bank holding companies with capital assets greater than $1 billion. We currently have consolidated assets in excess of $1 billion, and are therefore subject to the Federal Reserve Board's capital adequacy guidelines.
The federal banking agencies' risk-based and leverage ratios are minimum supervisory ratios generally applicable to banking organizations that meet certain specified criteria. In accordance with the Basel III
18
Rules (discussed below), these ratios increased and other capital requirements were implemented effective January 1, 2015. The federal bank regulatory agencies may set capital requirements for a particular banking organization that are higher than the minimum ratios when circumstances warrant. Federal Reserve Board guidelines also provide that banking organizations experiencing internal growth or making acquisitions will be expected to maintain strong capital positions, substantially above the minimum supervisory levels, without significant reliance on intangible assets.
Under the guidelines, specific categories of assets are assigned different risk weights, based generally on the perceived credit risk of the asset. These risk weights are multiplied by corresponding asset balances to determine a "risk-weighted" asset base. The guidelines in effect at December 31, 2015 require a minimum total risk-based capital ratio of 8.0% (of which at least 4.0% is required to consist of Tier 1 capital elements). Total risk-based capital is the sum of Tier 1 and Tier 2 capital. To be considered "well-capitalized," a bank holding company must maintain, on a consolidated basis, (i) a Tier 1 risk-based capital ratio of at least 6.5%, (ii) a Tier 1 risk-based capital ratio of at least 8.0%, and (iii) a total risk-based capital ratio of 10.0% or greater. As of December 31, 2015, our common equity Tier 1 risk-based capital ratio was 11.23%, our Tier 1 risk-based capital ratio was 12.86%, and our total risk-based capital ratio was 14.11%. Thus, we are considered "well-capitalized" for regulatory purposes.
In addition to the risk-based capital guidelines, the Federal Reserve Board uses a leverage ratio as an additional tool to evaluate the capital adequacy of bank holding companies. The leverage ratio is a company's Tier 1 capital divided by its average total consolidated assets. Certain highly-rated bank holding companies may maintain a minimum leverage ratio of 3.0%, but other bank holding companies are required to maintain a leverage ratio of at least 4.0%. To be considered well-capitalized, a bank holding company must maintain a leverage ratio of at least 5.0%. As of December 31, 2015, our leverage ratio was 11.30%.
Imposition of Liability for Undercapitalized Subsidiaries
Bank regulators are required to take "prompt corrective action" to resolve problems associated with insured depository institutions whose capital declines below certain levels. In the event an institution becomes "undercapitalized," it must submit a capital restoration plan. The capital restoration plan will not be accepted by the regulators unless each company having control of the undercapitalized institution guarantees the subsidiary's compliance with the capital restoration plan up to a certain specified amount. Any such guarantee from a depository institution's holding company is entitled to a priority of payment in bankruptcy.
The aggregate liability of the holding company of an undercapitalized bank is limited to the lesser of 5% of the institution's assets at the time it became undercapitalized or the amount necessary to cause the institution to be "adequately capitalized." The bank regulators have greater power in situations where an institution becomes "significantly" or "critically" undercapitalized or fails to submit a capital restoration plan. For example, a bank holding company controlling such an institution can be required to obtain prior Federal Reserve Board approval of proposed dividends, or might be required to consent to a consolidation or to divest itself of the troubled institution or other affiliates.
Anti-tying Restrictions
Bank holding companies and affiliates are prohibited from tying the provision of services, such as extensions of credit, to other services offered by a holding company or its affiliates.
19
Acquisitions by Bank Holding Companies
The Bank Holding Company Act requires every bank holding company to obtain the prior approval of the Federal Reserve Board before it may (i) merge or consolidate with another bank holding company, (ii) acquire all or substantially all of the assets of any bank, or (iii) acquire ownership or control of any voting shares of any bank, if after such acquisition it would own or control, directly or indirectly, more than 5% of the voting shares of such bank. In approving bank acquisitions by bank holding companies, the Federal Reserve Board is required to consider the financial and managerial resources and future prospects of the bank holding company and the bank concerned, the convenience and needs of the communities to be served, and various competitive factors.
Control Acquisitions
The Change in Bank Control Act prohibits a person or group of persons from acquiring "control" of a bank holding company unless the Federal Reserve Board has been notified and has not objected to the transaction. Under a rebuttable presumption established by the Federal Reserve Board, the acquisition of 10% or more, but less than 25% of a class of voting stock of a bank holding company with a class of securities registered under Section 12 of the Exchange Act would, under the circumstances set forth in the presumption, constitute acquisition of control.
In addition, any company is required to obtain the approval of the Federal Reserve Board under the Bank Holding Company Act before acquiring 25% (5% in the case of an acquirer that is a bank holding company) or more of the outstanding common stock of the a bank holding company, or otherwise obtaining control or a "controlling influence" over a bank holding company. On September 22, 2008, the Federal Reserve Board issued a policy statement on equity investments in bank holding companies and banks, which allows the Federal Reserve Board to generally be able to conclude that an entity's investment is not "controlling" if the investment in the form of voting and nonvoting shares represents in the aggregate (i) less than one-third of the total equity of the banking organization (and less than one-third of any class of voting securities, assuming conversion of all convertible nonvoting securities held by the entity) and (ii) less than 15% of any class of voting securities of the banking organization.
FIRREA
The Financial Institutions Reform, Recovery and Enforcement Act, or FIRREA, includes various provisions that affect or may affect the Company and the Bank. Among other matters, FIRREA generally permits bank holding companies to acquire healthy thrifts as well as failed or failing thrifts. FIRREA removed certain cross-marketing prohibitions previously applicable to thrift and bank subsidiaries of a common holding company. Furthermore, a multi-bank holding company may now be required to indemnify the federal Deposit Insurance Fund ("DIF") against losses it incurs with respect to such company's affiliated banks, which in effect makes a bank holding company's equity investments in healthy bank subsidiaries available to the FDIC to assist such company's failing or failed bank subsidiaries.
FIRREA also expanded and increased civil and criminal penalties available for use by the appropriate regulatory agency against certain "institution-affiliated parties" primarily including (i) management, employees and agents of a financial institution, as well as (ii) independent contractors, such as attorneys and accountants and others who participate in the conduct of the financial institution's affairs and who caused or are likely to cause more than minimum financial loss to or a significant adverse effect on the institution, who knowingly or recklessly violate a law or regulation, breach a fiduciary duty or engage in unsafe or unsound practices. Such practices can include the failure of an institution to timely file required reports or the submission of inaccurate reports. Furthermore, FIRREA authorizes the appropriate banking agency to issue cease and desist orders that may, among other things, require affirmative action to correct any harm resulting from a violation or practice, including restitution, reimbursement, indemnifications or guarantees against loss. A financial institution may also be ordered to restrict its
20
growth, dispose of certain assets, or take other action as determined by the ordering agency to be appropriate.
USA PATRIOT Act
On October 26, 2001, The Uniting and Strengthening America by Providing Appropriate Tools Is Required to Intercept and Obstruct Terrorism Act or USA PATRIOT Act, a comprehensive anti-terrorism legislation was enacted. Title III of the USA PATRIOT Act requires financial institutions to help prevent, detect, and prosecute international money laundering and the financing of terrorism. The effectiveness of a financial institution in combating money laundering activities is a factor to be considered in any application submitted by the financial institution under the Bank Merger Act, which applies to the Bank, or the Bank Holding Company Act, which applies to Wilshire Bancorp. We, and our subsidiaries, including the Bank, have adopted systems and procedures to comply with the USA PATRIOT Act and regulations adopted by the Secretary of the Treasury.
The Sarbanes-Oxley Act of 2002
On July 30, 2002, The Sarbanes-Oxley Act of 2002, or "Sarbanes-Oxley Act" was enacted. The Sarbanes-Oxley Act addresses accounting oversight and corporate governance matters relating to the operations of public companies. During 2003, the SEC issued a number of regulations under the directive of the Sarbanes-Oxley Act significantly increasing public company governance-related obligations and filing requirements, including:
- •
- the establishment of an independent public oversight of public company accounting firms by a board that will set auditing, quality and ethical standards for and have investigative and disciplinary powers over such accounting firms,
- •
- the enhanced regulation of the independence, responsibilities and conduct of accounting firms which provide auditing services to public companies,
- •
- the increase of penalties for fraud related crimes,
- •
- the enhanced disclosure, certification, and monitoring of financial statements, internal financial controls and the audit process, and
- •
- the enhanced and accelerated reporting of corporate disclosures and internal governance.
Furthermore, in November 2003, in response to the directives of the Sarbanes-Oxley Act, NASDAQ adopted substantially expanded corporate governance criteria for the issuers of securities quoted on the NASDAQ Global Select Market (the market on which our common stock is listed for trading). The new NASDAQ rules govern, among other things, the enhancement and regulation of corporate disclosure and internal governance of listed companies and of the authority, role and responsibilities of their boards of directors and, in particular, of "independent" members of such boards of directors, in the areas of nominations, corporate governance, compensation and the monitoring of the audit and internal financial control processes.
Dodd-Frank Act
On July 21, 2010, the Dodd-Frank Wall Street Reform and Consumer Protection Act (the "Dodd-Frank Act") was signed into law. The Dodd-Frank Act has and may continue to result in dramatic changes across the financial regulatory system, some of which have become effective and some of which will not become effective until various future dates. Implementation of the Dodd-Frank Act requires many new rules to be made by various federal regulatory agencies over the next several years. Uncertainty remains until final rulemaking is complete as to the ultimate impact of the Dodd-Frank Act, which could have a material adverse impact either on the financial services industry as a whole or on ours and the
21
Bank's business, results of operations, and financial condition. Provisions in the legislation that affect deposit insurance assessments, payment of interest on demand deposits, and interchange fees could increase the costs associated with deposits and place limitations on certain revenues those deposits may generate. The Dodd-Frank Act includes provisions that, among other things, will or already has:
- •
- Centralize responsibility for consumer financial protection by creating a new agency, the Consumer Financial Protection Bureau ("CFPB"), responsible for implementing, examining, and enforcing compliance with federal consumer financial laws. In addition, the Dodd-Frank Act permits states to adopt consumer protection laws and regulations that are stricter than those regulations promulgated by the CFPB.
- •
- Create the Financial Stability Oversight Council that will recommend to the Federal Reserve Board increasingly strict rules for capital, leverage, liquidity, risk management and other requirements as companies grow in size and complexity.
- •
- Provide mortgage reform provisions regarding a customer's ability to repay, restricting variable-rate lending by requiring that the ability to repay variable-rate loans be determined by using the maximum rate that will apply during the first five years of a variable-rate loan term, and making more loans subject to provisions for higher cost loans, new disclosures, and certain other revisions.
- •
- Change the assessment base for federal deposit insurance from the amount of insured deposits to consolidated assets less tangible capital, eliminate the ceiling on the size of the DIF, and increase the floor on the size of the DIF, which generally will require an increase in the level of assessments for institutions with assets in excess of $10 billion.
- •
- Make permanent the $250 thousand limit for federal deposit insurance.
- •
- Restrict the preemption of state law by federal law and disallow subsidiaries and affiliates of national banks from availing themselves of such preemption.
- •
- Require bank holding companies and banks to be well capitalized and well managed in order to acquire banks located outside their home state.
- •
- Mandate certain corporate governance and executive compensation matters be implemented, including (i) an advisory vote on executive compensation by a public company's stockholders; (ii) enhancement of independence requirements for compensation committee members; (iii) adoption of incentive-based compensation claw-back policies for executive officers; and (iv) adoption of proxy access rules allowing stockholders of publicly traded companies to nominate candidates for election as a director and have those nominees included in a company's proxy materials.
- •
- Repeal the federal prohibitions on the payment of interest on demand deposits, thereby permitting depository institutions to pay interest on business transactions accounts.
- •
- Amend the Electronic Fund Transfer Act to, among other things, give the Federal Reserve the authority to establish rules regarding interchange fees charged for electronic debit transactions by payment card issuers having assets over $10 billion and to enforce a new statutory requirement that such fees be reasonable and proportional to the actual cost of a transaction to the issuer.
Many aspects of the Dodd-Frank Act are subject to rulemaking and will take effect over several years, making it difficult to anticipate the overall financial impact on the Company, its customers or the financial industry more generally. Some of the rules that have been proposed and, in some cases, adopted to comply with the Dodd-Frank Act's mandates are discussed below.
22
Volcker Rule
The final rules adopted on December 10, 2013 to implement a part of the Dodd-Frank Act commonly referred to as the "Volcker Rule," prohibit insured depository institutions and companies affiliated with insured depository institutions ("banking entities") from engaging in short-term proprietary trading of certain securities, derivatives, commodity futures and options on these instruments, for their own account. The final rules also impose limits on banking entities' investments in, and other relationships with, hedge funds or private equity funds. These rules became effective on April 1, 2014. Certain collateralized debt obligations, securities backed by trust preferred securities which were initially defined as covered funds subject to the investment prohibitions, have been exempted to address the concern that many community banks holding such collateralized debt obligations securities may have been required to recognize significant losses on those securities.
Like the Dodd-Frank Act, the final rules provide exemptions for certain activities, including market making, underwriting, hedging, trading in government obligations, insurance company activities, and organizing and offering hedge funds or private equity funds. The final rules also clarify that certain activities are not prohibited, including acting as agent, broker, or custodian. The compliance requirements under the final rules vary based on the size of the banking entity and the scope of activities conducted. Banking entities with significant trading operations will be required to establish a detailed compliance program and their CEOs will be required to attest that the program is reasonably designed to achieve compliance with the final rule. Independent testing and analysis of an institution's compliance program will also be required. The final rules reduce the burden on smaller, less-complex institutions by limiting their compliance and reporting requirements. Additionally, a banking entity that does not engage in covered trading activities will not need to establish a compliance program. The Company and the Bank held no investment positions at December 31, 2015 that were subject to the final rule. Therefore, while these new rules may require us to conduct certain internal analysis and reporting, we believe that they will not require any material changes in our operations or business.
Wilshire Bank
In October 2013, we changed the name of our subsidiary from Wilshire State Bank to Wilshire Bank. Wilshire Bank is subject to extensive regulation and examination by the DBO, and the FDIC, which insures its deposits to the maximum extent permitted by law, and is subject to certain Federal Reserve Board regulations of transactions with its affiliates. The federal and state laws and regulations which are applicable to the Bank regulate, among other things, the scope of its business, its investments, its reserves against deposits, the timing of the availability of deposited funds and the nature and amount of and collateral for certain loans. In addition to the impact of such regulations, commercial banks are affected significantly by the actions of the Federal Reserve Board as it attempts to control the money supply and credit availability in order to influence the economy.
Transactions with Affiliates
There are various statutory and regulatory limitations, including those set forth in sections 23A and 23B of the Federal Reserve Act and the related Regulation W implemented by the Federal Reserve Board, governing the extent to which the Bank will be able to purchase assets from or securities of or otherwise finance or transfer funds to us or our nonbanking affiliates. Among other restrictions, such transactions between the Bank and any one affiliate (including the Company) generally will be limited to 10% of the Bank's capital and surplus, and transactions between the Bank and all affiliates will be limited to 20% of the Bank's capital and surplus. Furthermore, loans and extensions of credit are required to be secured in specified amounts and are required to be on terms and conditions consistent with safe and sound banking practices.
23
In addition, any transaction by a bank with an affiliate and any sale of assets or provision of services to an affiliate generally must be on terms that are substantially the same, or at least as favorable, to the bank as those prevailing at the time for comparable transactions with nonaffiliated companies.
Loans to Insiders
Sections 22(g) and (h) of the Federal Reserve Act and its implementing regulation, Regulation O, place restrictions on loans by a bank to executive officers, directors, and principal shareholders. Under Section 22(h), loans to a director, an executive officer and to a greater than 10% shareholder of a bank and certain of their related interests, or insiders, and insiders of affiliates, may not exceed, together with all other outstanding loans to such person and related interests, the bank's loans-to-one-borrower limit (generally equal to 25% of the institution's unimpaired capital and surplus). Section 22(h) also requires that loans to insiders and to insiders of affiliates be made on terms substantially the same as offered in comparable transactions to other persons, unless the loans are made pursuant to a benefit or compensation program that (i) is widely available to employees of the bank, and (ii) does not give preference to insiders over other employees of the bank. Section 22(h) also requires prior Board of Directors approval for certain loans, and the aggregate amount of extensions of credit by a bank to all insiders cannot exceed the institution's unimpaired capital and surplus. Furthermore, Section 22(g) places additional restrictions on loans to executive officers.
The Dodd-Frank Act generally enhances the restrictions on transactions with affiliates under Sections 23A and 23B of the Federal Reserve Act, including an expansion of the definition of "covered transactions" and an increase in the amount of time for which collateral requirements regarding covered credit transactions must be satisfied. Insider transaction limitations are expanded through the strengthening of loan restrictions to insiders and the expansion of the types of transactions subject to the various limits, including derivatives transactions, repurchase agreements, reverse repurchase agreements, and securities lending or borrowing transactions. Restrictions are also placed on certain asset sales to and from an insider to an institution, including requirements that such sales be on market terms and, in certain circumstances, approved by the institution's Board of Directors.
Dividends
The ability of the Bank to pay dividends on its common stock is restricted by the California Financial Code, the FDIA and FDIC regulations. In general terms, California law provides that the Bank may declare a cash dividend out of net profits up to the lesser of retained earnings or net income for the last three fiscal years (less any distributions made to shareholders during such period), or, with the prior written approval of the Commissioner of Department of Business Oversight, in an amount not exceeding the greatest of:
- •
- retained earnings,
- •
- net income for the prior fiscal year, or
- •
- net income for the current fiscal year.
The Bank's ability to pay any cash dividends will depend not only upon its earnings during a specified period, but also on its meeting certain capital requirements. The FDIA and FDIC regulations restrict the payment of dividends when a bank is undercapitalized, when a bank has failed to pay insurance assessments, or when there are safety and soundness concerns regarding a bank.
The payment of dividends by the Bank may also be affected by other regulatory requirements and policies, such as maintenance of adequate capital. If, in the opinion of the regulatory authority, a depository institution under its jurisdiction is engaged in, or is about to engage in, an unsafe or unsound practice (that, depending on the financial condition of the depository institution, could include the payment of dividends), such authority may require, after notice and hearing, that such depository
24
institution cease and desist from such practice. The Federal Reserve Board has issued a policy statement providing that insured banks and bank holding companies should generally pay dividends only out of operating earnings for the current and preceding two years. In addition, all insured depository institutions are subject to the capital-based limitations required by the Federal Deposit Insurance Corporation Improvement Act.
Cross-guarantees
Under the Federal Deposit Insurance Act, or FDIA, a depository institution (which definition includes both banks and savings associations), the deposits of which are insured by the FDIC, can be held liable for any loss incurred by, or reasonably expected to be incurred by, the FDIC in connection with (i) the default of a commonly controlled FDIC-insured depository institution, or (ii) any assistance provided by the FDIC to any commonly controlled FDIC-insured depository institution "in danger of default." "Default" is defined generally as the appointment of a conservator or a receiver and "in danger of default" is defined generally as the existence of certain conditions indicating that default is likely to occur in the absence of regulatory assistance. In some circumstances (depending upon the amount of the loss or anticipated loss suffered by the FDIC), cross-guarantee liability may result in the ultimate failure or insolvency of one or more insured depository institutions in a holding company structure. Any obligation or liability owed by a subsidiary bank to its parent company is subordinated to the subsidiary bank's cross-guarantee liability with respect to commonly controlled insured depository institutions. The Bank is currently the only FDIC-insured depository institution subsidiary.
Because we are a legal entity separate and distinct from the Bank, our right to participate in the distribution of assets of any subsidiary upon the subsidiary's liquidation or reorganization will be subject to the prior claims of the subsidiary's creditors. In the event of a liquidation or other dissolution of the Bank, the claims of depositors and other general or subordinated creditors of the Bank would be entitled to a priority of payment over the claims of holders of any obligation of the Bank to its shareholders, including any depository institution holding company (such as Wilshire Bancorp) or any shareholder or creditor of such holding company.
The FDIC Improvement Act and Prompt Corrective Action
The Federal Deposit Insurance Corporation Improvement Act, or FDICIA, made a number of reforms addressing the safety and soundness of the deposit insurance system, supervision of domestic and foreign depository institutions, and improvement of accounting standards. This statute also limited deposit insurance coverage, implemented changes in consumer protection laws, and provided for least costly resolution and prompt regulatory action with regard to troubled institutions.
FDICIA requires every bank with total assets in excess of $1 billion to have an annual independent audit made of the bank's financial statements by a certified public accountant to verify that the financial statements of the bank are presented in accordance with GAAP and comply with such other disclosure requirements as prescribed by the FDIC.
FDICIA also establishes a prompt corrective action ("PCA") framework that divides banks into five different categories, depending on their level of capital. Under regulations adopted by the FDIC as amended by Basel III, a bank is deemed to be "well-capitalized" if it has a total Risk-Based Capital Ratio of 10.00% or more, a Tier 1 Capital Ratio of 8.00% or more, a Common Equity Tier 1 Capital Ratio of 6.50% or more, and a Leverage Ratio of 5.00% or more, and the bank is not subject to an order or capital directive to meet and maintain a certain capital level. Under such regulations, a bank is deemed to be "adequately capitalized" if it has a total Risk-Based Capital Ratio of 8.00% or more, a Tier 1 Capital Ratio of 6.00% or more, a Common Equity Tier 1 Capital Ratio of 4.50% or more, and a Leverage Ratio of 4.00% or more (unless it receives the highest composite rating at its most recent examination and is not experiencing or anticipating significant growth, in which instance it must maintain a Leverage Ratio of
25
3.00% or more). Under such regulations, a bank is deemed to be "undercapitalized" if it has a total Risk-Based Capital Ratio of less than 8.00%, a Tier 1 Capital Ratio of less than 6.00%, Common Equity Tier 1 Capital Ratio of less than 4.50%, or a Leverage Ratio of less than 4.00%. Under such regulations, a bank is deemed to be "significantly undercapitalized" if it has a total Risk-Based Capital Ratio of less than 6.00%, a Tier 1 Capital Ratio of less than 4.00%, a Common Equity Tier 1 Capital Ratio of less than 3.00%, and a Leverage Ratio of less than 3.00%. Under such regulations, a bank is deemed to be "critically undercapitalized" if it has a Tangible Equity Ratio (tangible equity to total assets) of less than or equal to 2.00%. In addition, the FDIC has the ability to downgrade a bank's classification (but not to "critically undercapitalized") based on other considerations even if the bank meets the capital guidelines. According to these guidelines the Bank's capital ratios were above the requirements for a "well-capitalized" institution as of December 31, 2015.
In addition, FDICIA also places certain restrictions on activities of banks depending on their level of capital. If a bank is classified as undercapitalized, the bank is required to submit a capital restoration plan to the federal banking regulators. Pursuant to FDICIA, an undercapitalized bank is prohibited from increasing its assets, engaging in a new line of business, acquiring any interest in any company or insured depository institution, or opening or acquiring a new branch office, except under certain circumstances, including the acceptance by the federal banking regulators of a capital restoration plan for the bank.
Furthermore, if a bank is classified as undercapitalized, the federal banking regulators may take certain actions to correct the capital position of the bank; if a bank is classified as significantly undercapitalized or critically undercapitalized, the federal banking regulators would be required to take one or more prompt corrective actions. These actions would include, among other things, requiring: sales of new securities to bolster capital, improvements in management, limits on interest rates paid, prohibitions on transactions with affiliates, termination of certain risky activities and restrictions on compensation paid to executive officers. If a bank is classified as critically undercapitalized, FDICIA requires the bank to be placed into conservatorship or receivership within 90 days, unless the federal banking regulators determines that other action would better achieve the purposes of FDICIA regarding prompt corrective action with respect to undercapitalized banks.
The capital classification of a bank affects the frequency of examinations of the bank and impacts the ability of the bank to engage in certain activities and affects the deposit insurance premiums paid by such bank. Under FDICIA, the federal banking regulators are required to conduct a full-scope, on-site examination of every bank at least once every 12 months. There is an exception to this rule, however, that provides that banks (i) with assets of less than $100 million, (ii) that are categorized as "well-capitalized," (iii) were found to be well managed and its composite rating was outstanding, and (iv) have not been subject to a change in control during the last 12 months, need only be examined once every 18 months.
Brokered Deposits
Under FDICIA, banks may be restricted in their ability to accept brokered deposits, depending on their capital classification. "Well-capitalized" banks are permitted to accept brokered deposits, but all banks that are not well-capitalized are not permitted to accept such deposits. The FDIC may, on a case-by-case basis, permit banks that are adequately capitalized to accept brokered deposits if the FDIC determines that acceptance of such deposits would not constitute an unsafe or unsound banking practice with respect to the bank. The Bank is currently well-capitalized and therefore is not subject to any limitations with respect to its brokered deposits.
Federal Limitations on Activities and Investments
The equity investments and activities as a principal of FDIC-insured state-chartered banks, such as the Bank, are generally limited to those that are permissible for national banks. Under regulations dealing with
26
equity investments, an insured state bank generally may not directly or indirectly acquire or retain any equity investment of a type, or in an amount, that is not permissible for a national bank.
FDIC Deposit Insurance Assessments
Banks must pay assessments to the FDIC for federal deposit insurance protection. The FDIC has adopted a risk-based assessment system as required by FDICIA. Under this system, FDIC-insured depository institutions pay insurance premiums at rates based on their risk classification. Institutions assigned to higher risk classifications (that is, institutions that pose a higher risk of loss to the DIF) pay assessments at higher rates than institutions that pose a lower risk. An institution's risk classification is assigned based on its capital levels and the level of supervisory concern the institution poses to the regulators. In addition, the FDIC can impose special assessments in certain instances. The FDIC may terminate its insurance of deposits if it finds that the institution has engaged in unsafe and unsound practices, is in an unsafe or unsound condition to continue operations, or has violated any applicable law, regulation, rule, order, or condition imposed by the FDIC. The Bank's deposit insurance assessments may increase or decrease depending on the risk assessment classification to which it are assigned by the FDIC. Any increase in insurance assessments could have an adverse effect on the Bank's earnings.
Funds in non-interest-bearing transaction deposit accounts held by FDIC-insured banks are 100 percent insured. All other FDIC-insured depository accounts are insured up to $250,000 per owner. The Dodd-Frank Act made permanent the $250,000 limit for federal deposit insurance.
In October 2010, the FDIC adopted a new Restoration Plan for the DIF to ensure that the fund reserve ratio reaches 1.35% by September 30, 2020, as required by the Dodd-Frank Act. Under the Restoration Plan, the FDIC did not institute the uniform three-basis point increase in assessment rates scheduled to take place on January 1, 2011 and maintained the current schedule of assessment rates for all depository institutions. At least semi-annually, the FDIC will update its loss and income projections for the DIF and, if needed, will increase or decrease assessment rates, following notice-and-comment rulemaking, if required.
As required by the Dodd-Frank Act, the FDIC also revised the deposit insurance assessment system, effective April 1, 2011, to base assessments on the average total consolidated assets of insured depository institutions during the assessment period, less the average tangible equity of the institution during the assessment period. Currently, only deposits are included in determining the premium paid by an institution. This base assessment change necessitated that the FDIC adjust the assessment rates to ensure that the revenue collected under the new assessment system, will approximately equal that under the existing assessment system.
Pursuant to this new rule, the assessment base is larger than the current assessment base, but the new rates are lower than current rates, ranging from approximately 2.5 basis points to 45 basis points (depending on applicable adjustments for unsecured debt and brokered deposits) until such time as the FDIC's reserve ratio equals 1.15%. Once the FDIC's reserve ratio equals or exceeds 1.15%, the applicable assessment rates may range from 1.5 basis points to 40 basis points. The Bank's deposit insurance expense has decreased as a result of the changes to the Bank's deposit insurance premium assessment base implemented by the FDIC pursuant to the Dodd-Frank Act.
Community Reinvestment Act
Under the Community Reinvestment Act, or "CRA", as implemented by the Congress in 1977, a financial institution has a continuing and affirmative obligation, consistent with its safe and sound operation, to help meet the credit needs of its entire community, including low and moderate income neighborhoods. CRA does not establish specific lending requirements or programs for financial institutions nor does it limit an institution's discretion to develop the types of products and services that it believes are best suited to its particular community, consistent with CRA. CRA requires federal examiners,
27
in connection with the examination of a financial institution, to assess the institution's record of meeting the credit needs of its community and to take such record into account in its evaluation of certain applications by such institution. CRA also requires all institutions to make public disclosure of their CRA ratings. The Bank has a Compliance Committee, which oversees the planning of products and services offered to the community, especially those aimed to serve low and moderate income communities. The FDIC rated the Bank as "satisfactory" in meeting community credit needs under CRA at its latest completed examination for CRA performance.
Consumer Laws and Regulations
In addition to the laws and regulations discussed herein, the Bank is also subject to certain consumer laws and regulations that are designed to protect consumers in transactions with banks. While the list set forth herein is not exhaustive, these laws and regulations include the Truth in Lending Act, the Truth in Savings Act, the Electronic Funds Transfer Act, the Expedited Funds Availability Act, the Equal Credit Opportunity Act, the Fair Housing Act, the Real Estate Settlement and Procedures Act, the Fair Credit Reporting Act and the Federal Trade Commission Act, among others. These laws and regulations mandate certain disclosure requirements and regulate the manner in which financial institutions must deal with customers when taking deposits or making loans to such customers. The Bank must comply with the applicable provisions of these consumer protection laws and regulations as part of its ongoing customer relations.
Permissible Activities and Subsidiaries
California law permits state-chartered commercial banks to engage in any activity permissible for national banks. Therefore, the Bank may form subsidiaries to engage in the many so-called "closely related to banking" or "non-banking" activities commonly conducted by national banks in operating subsidiaries, and further, pursuant to GLBA, the Bank may conduct certain "financial activities in a subsidiary to the same extent as may a national bank, provided the Bank is and remains "well-capitalized," "well-managed" and in satisfactory compliance with CRA. Presently, the Bank does not have any financial subsidiaries.
Interstate Branching
Under current law, California state banks are permitted to establish branch offices throughout California with prior regulatory approval. In addition, with prior regulatory approval, banks are permitted to acquire branches of existing banks located in California. Finally, California state banks generally may branch across state lines by merging with banks in other states if allowed by the applicable states' laws. With limited exceptions, California law currently permits branching across state lines through interstate mergers resulting in the acquisition of a whole California bank that has been in existence for at least five years. The Bank currently has branches located in the States of California, Texas, Alabama, Georgia, New Jersey, and New York. Under the Dodd-Frank Act, branching requirements have been relaxed so that state banks have the ability to establish branches in any state if that state would permit the establishment of the branch by a state bank chartered in that state.
Federal Home Loan Bank System
The FHLB system of which the Bank is a member, consists of 12 regional FHLB's governed and regulated by the Federal Housing Finance Board, or the FHFB. The FHLB's serve as reserve or credit facilities for member institutions within their assigned regions. They are funded primarily from proceeds derived from the sale of consolidated obligations of the FHLB system. They make loans (i.e., advances) to members in accordance with policies and procedures established by the FHLB and the boards of directors of each regional FHLB.
28
As a system member, the Bank is entitled to borrow from the FHLB of San Francisco, or FHLB-SF, and is required to own capital stock in the FHLB-SF in an amount equal to the greater of 1% of the membership asset value, not exceeding $25 million, or 4.7% of outstanding FHLB-SF advance borrowings. The Bank is in compliance with the stock ownership rules described above with respect to such advances, commitments and letters of credit and home mortgage loans and similar obligations. All loans, advances and other extensions of credit made by the FHLB-SF to the Bank are secured by portions of the Bank's loan portfolio, certain other investments, and the capital stock of the FHLB-SF held by the Bank.
Mortgage Banking Operations
The Bank is subject to the rules and regulations of FNMA with respect to originating, processing, selling and servicing mortgage loans, and the issuance and sale of mortgage-backed securities. Those rules and regulations, among other things, prohibit discrimination and establish underwriting guidelines which include provisions for inspections and appraisals, require credit reports on prospective borrowers, and fix maximum loan amounts. Mortgage origination activities are subject to, among others, the Equal Credit Opportunity Act, Federal Truth-in-Lending Act and the Real Estate Settlement Procedures Act, and the regulations promulgated there-under which, among other things, prohibit discrimination and require the disclosure of certain basic information to mortgagors concerning credit terms and settlement costs. The Bank is also subject to regulation by the California DBO, with respect to, among other things, the establishment of maximum origination fees on certain types of mortgage loan products. Wilshire Bank is an approved Housing and Urban Development or ("HUD") lender or mortgagee and as such we must report to HUD. On an annual basis we are required to report our annual, audited financial and non-financial information necessary for HUD to evaluate compliance with the Fair Housing Act or ("FHA") requirements.
Starting in 2014, the Bank began participating in FHLB of San Francisco's Mortgage Partnership Finance Program. By participating in this program, the Bank is able to deliver to the FHLB conventional, conforming, fixed rate mortgage loans, and FHA/VA-insured mortgage loans. The programs offers the Bank another avenue in which to competitively sell residential mortgage loans that it originates.
In the first quarter of 2015, the Company acquired certain assets and assumed certain operations of Bank of Manhattan's Mortgage Division. The Company currently operates a scaled down model of the Mortgage Division operations. The division was incorporated into our existing mortgage department and has helped to increase overall residential mortgage loan originations and contribute to additional fee income generation through the sales of originated loans.
Future Legislation and Economic Policy
We cannot predict what other legislation or economic and monetary policies of the various regulatory authorities might be enacted or adopted or what other regulations might be adopted or the effects thereof. Future legislation and policies and the effects thereof might have a significant influence on overall growth and distribution of loans, investments, and deposits and affect interest rates charged on loans or paid from time and savings deposits. Such legislation and policies have had a significant effect on the operating results of commercial banks in the past and are expected to continue.
Capital Requirements (Holding Company and Bank)
At December 31, 2015, the Company's and the Bank's capital ratios exceed the minimum percentage requirements for "well capitalized" institutions. See note 17 and Item 7 "Management's Discussion and Analysis of Financial Condition and Results of Operations—Capital Resources and Capital Adequacy Requirements" for further information regarding the regulatory capital guidelines as well as the Company's and the Bank's actual capitalization as of December 31, 2015.
29
The federal banking agencies have adopted risk-based minimum capital guidelines for bank holding companies and banks which are intended to provide a measure of capital that reflects the degree of risk associated with a banking organization's operations for both transactions reported on the statement of financial condition as assets and transactions which are recorded as off-balance sheet items. The risk-based capital ratio is determined by classifying assets and certain off-balance sheet financial instruments into weighted categories, with higher levels of capital being required for those categories perceived as representing greater risk. Under the capital guidelines, a banking organization's total capital is divided into four tiers. The first, "Tier 1 capital" consists of common equity, our Series A Preferred Stock, and trust-preferred securities subject to certain criteria and quantitative limits. The second, "common equity Tier 1 capital" includes only common equity included in Tier 1 capital. The third, "Tier 2 capital" includes hybrid capital instruments, other qualifying debt instruments, a limited amount of the allowance for loan and lease losses, and a limited amount of unrealized holding gains on equity securities.
New Capital Adequacy Requirements Under Basel III
On July 2, 2013, the Federal Reserve Board, and on July 9, 2013, the FDIC and OCC, adopted a final rule that implements the Basel III changes to the international regulatory capital framework, referred to as the "Basel III Rules." The Basel III Rules apply to both depository institutions and (subject to certain exceptions not applicable to the Company) their holding companies. Although parts of the Basel III Rules apply only to large, complex financial institutions, substantial portions of the Basel III Rules apply to the Company and our subsidiary bank. The Basel III Rules include requirements contemplated by the Dodd-Frank Act as well as certain standards initially adopted by the Basel Committee on Banking Supervision in December 2010.
The Basel III Rules include new risk-based and leverage capital ratio requirements and refine the definition of what constitutes "capital" for purposes of calculating those ratios. The minimum capital level requirements applicable to the Company and our subsidiary bank under the Basel III Rules are: (i) a new common equity Tier 1 risk-based capital ratio of 4.5%; (ii) a Tier 1 risk-based capital ratio of 6% (increased from 4%); (iii) a total risk-based capital ratio of 8% (unchanged); and (iv) a Tier 1 leverage ratio of 4% (unchanged) for all institutions. Common equity Tier 1 capital will consist of retained earnings and common stock instruments, subject to certain adjustments.
The Basel III Rules also establish a "capital conservation buffer" of 2.5% above the new regulatory minimum risk-based capital requirements. The conservation buffer, when added to the capital requirements, will result in the following minimum ratios: (i) a common equity Tier 1 risk-based capital ratio of 7.0%, (ii) a Tier 1 risk-based capital ratio of 8.5%, and (iii) a total risk-based capital ratio of 10.5%. The new capital conservation buffer requirement will be phased in beginning in January 2016 at 0.625% of risk-weighted assets and will increase by 0.625% each year until fully implemented at 2.5% in January 2019. An institution would be subject to limitations on certain activities including payment of dividends, share repurchases, and discretionary bonuses to executive officers if its capital level is below the buffered ratio. Although these new capital ratios do not become fully phased in until 2019, the banking regulators will expect bank holding companies and banks to meet these requirements well ahead of that date.
The Basel III Rules also revise the PCA framework, which is designed to place restrictions on insured depository institutions, including our subsidiary bank, if their capital levels do not meet certain thresholds. These revisions became effective January 1, 2015. The prompt correction action rules include a common equity Tier 1 capital component and increase certain other capital requirements for the various thresholds. For example, under the prompt corrective action rules, insured depository institutions are required to meet the following capital levels in order to qualify as "well capitalized:" (i) a common equity Tier 1 risk-based capital ratio of 6.5%; (ii) a Tier 1 risk-based capital ratio of 8% (increased from 6%); (iii) a total risk-based capital ratio of 10% (unchanged); and (iv) a Tier 1 leverage ratio of 5% (unchanged).
30
The Federal Reserve may also set higher capital requirements for holding companies whose circumstances warrant it. For example, holding companies experiencing internal growth or making acquisitions are expected to maintain strong capital positions substantially above the minimum supervisory levels, without significant reliance on intangible assets. At this time, the bank regulatory agencies are more inclined to impose higher capital requirements to meet well-capitalized standards and future regulatory change could impose higher capital standards as a routine matter.
The Basel III Rules set forth certain changes in the methods of calculating certain risk-weighted assets, which in turn will affect the calculation of risk-based ratios. Under the Basel III Rules, higher or more sensitive risk weights are assigned to various categories of assets, including, certain credit facilities that finance the acquisition, development or construction of real property, certain exposures or credits that are 90 days past due or on nonaccrual, foreign exposures and certain corporate exposures. In addition, these rules include greater recognition of collateral and guarantees, and revised capital treatment for derivatives and repo-style transactions.
In addition, the Basel III Rules include certain exemptions to address concerns about the regulatory burden on community banks. For example, banking organizations with less than $15 billion in consolidated assets as of December 31, 2009 are permitted to include in Tier 1 capital trust preferred securities and cumulative perpetual preferred stock issued and included in Tier 1 capital prior to May 19, 2010 on a permanent basis, without any phase out. Community banks may also elect on a one time basis in their March 31, 2015 quarterly filings to opt-out out of the onerous requirement to include most accumulated other comprehensive income components in the calculation of CET1 capital and, in effect, retain the accumulated other comprehensive income treatment under the current capital rules. Under the Final Capital Rule, the Company made the one-time permanent election to continue to exclude accumulated other comprehensive income from risk-based capital. Overall, the rule provides some important concessions for smaller, less complex financial institutions.
The Basel III Rules generally became effective beginning January 1, 2015. The conservation buffer will be phased in beginning in 2016 and will take full effect on January 1, 2019. Certain other calculations under the Basel III Rules will have also have phase-in periods. At December 31, 2015, the Company exceeded all of the capital requirements of BASEL III.
Concentrated Commercial Real Estate Lending Regulations
The Federal Reserve Board, the FDIC, and the OCC promulgated guidance governing financial institutions with concentrations in commercial real estate lending. The guidance provides that a bank has a concentration in commercial real estate lending if (i) total reported loans for construction, land development, and other land represent 100% or more of the Bank's total capital or (ii) total reported loans secured by multifamily and non-farm residential properties and loans for construction, land development, and other land represent 300% or more of the Bank's total capital and the Bank's commercial real estate loan portfolio has increased 50% or more during the prior 36 months. If a concentration is present, management must employ heightened risk management practices including board and management oversight and strategic planning, development of underwriting standards, risk assessment, and monitoring through market analysis and stress testing, and increasing capital requirements.
At December 31, 2015, the concentration of loans secured by multifamily and non-farm residential properties and loans for construction, land development, and other land represented approximately 347.4% for the Bank, over the threshold of 300% stated in the interagency guidance on concentrations in commercial real estate. The increase of this threshold to over 300% since 2014 was primarily due to the acquisition of Saehan which held high concentrations of commercial real estate loans. As a result of the increase in concentration of commercial real estate loans from the acquisition, management has developed a plan to monitor and reduce our concentration of commercial real estate loans. We cannot guarantee that any risk management practices we implement will be effective to prevent losses relating to our commercial
31
real estate portfolio. Management will continue to undertake controls to monitor the Bank's commercial real estate lending, but we cannot predict the extent to which this guidance will continue to impact our operations or capital requirements.
Consumer Financial Protection Bureau
The Consumer Financial Protection Bureau ("CFPB") was created under the Dodd-Frank Act to centralize responsibility for consumer financial protection with broad rulemaking, supervision, and enforcement authority for a wide range of consumer protection laws that would apply to all banks and thrifts, including the Equal Credit Opportunity Act, Truth in Lending Act ("TILA"), Real Estate Settlement Procedures Act, Fair Credit Reporting Act ("RESPA"), Fair Debt Collection Act, the Consumer Financial Privacy provisions of the Gramm-Leach-Bliley Act, and certain other statutes. Banking institutions with total assets of $10.0 billion or less, such as the Bank, remain subject to the supervision and enforcement of their primary federal banking regulator with respect to the federal consumer financial protection laws and such additional regulations as may be adopted by the CFPB.
On January 10, 2013, the CFPB released its final "Ability-to-Repay/Qualified Mortgage" rules, which amended TILA's implementing regulation, Regulation Z. Regulation Z currently prohibits a creditor from making a higher-priced mortgage loan without regard to the consumer's ability to repay the loan. The final rule implements sections 1411 and 1412 of the Dodd-Frank Act, which generally require creditors to make a reasonable, good faith determination of a consumer's ability to repay any consumer credit transaction secured by a dwelling (excluding an open-end credit plan, timeshare plan, reverse mortgage, or temporary loan) and establishes certain protections from liability under this requirement for "qualified mortgages." The final rule also implements section 1414 of the Dodd-Frank Act, which limits prepayment penalties. Finally, the final rule requires creditors to retain evidence of compliance with the rule for three years after a covered loan is consummated. This rule became effective January 10, 2014. The CFPB allowed for a smaller creditor exemption for banks with assets under $2 billion and that originate less than 500 mortgage loans in 2015. Beginning January 1, 2016, the small creditor exemption will be allowed for banks with assets under $2 billion and that originate less than 2,000 mortgage loans.
On November 20, 2013, pursuant to section 1032(f) of the Dodd-Frank Act, the CFPB issued the Know Before You Owe TILA/RESPA Integrated Disclosure Rule ("TRID"), which combined the disclosures required under TILA and sections 4 and 5 of RESPA, into a single, integrated disclosure for mortgage loan transactions covered by those laws. TRID, which requires the use of a Loan Estimate that must be delivered or placed in the mail no later than the third business day after receiving the consumer's application and a Closing Disclosure that must be provided to the consumer at least three business days prior to consummation, became effective for applications received on or after October 3, 2015 for applicable closed-end consumer credit transactions secured by real property. Creditors must only use the Loan Estimate and Closing Disclosure forms for mortgage loan transactions subject to TRID. All other mortgage loan transactions continue to use the Good Faith Estimate and the Initial Truth-in-Lending Disclosure at application and the HUD-1 Settlement Statement and the Final Truth-in-Lending Disclosure at closing. TRID also has new tolerance requirements and record retention requirements. Of note, the creditor must retain evidence of compliance with the Loan Estimate requirements, including providing the Loan Estimate, and the Closing Disclosure requirements for three years after the later of the date of consummation, the date disclosures are required to be made or the date the action is required to be taken. Additionally, the creditor must retain copies of the Closing Disclosure, including all documents related to the Closing Disclosure, for five years after consummation.
UDAP and UDAAP
Recently, banking regulatory agencies have increasingly used a general consumer protection statute to address "unethical" or otherwise "bad" business practices that may not necessarily fall directly under the purview of a specific banking or consumer finance law. The law of choice for enforcement against such
32
business practices has been Section 5 of the Federal Trade Commission Act—the primary federal law that prohibits unfair or deceptive acts or practices and unfair methods of competition in or affecting commerce ("UDAP" or "FTC Act"). "Unjustified consumer injury" is the principal focus of the FTC Act. Prior to the Dodd-Frank Act, there was little formal guidance to provide insight to the parameters for compliance with the UDAP law. However, the UDAP provisions have been expanded under the Dodd-Frank Act to apply to "unfair, deceptive, or abusive acts or practices" ("UDAAP"), which has been delegated to the CFPB for supervision. The CFPB has published its first Supervision and Examination Manual that addresses compliance with and the examination of UDAAP.
Incentive Compensation
In June 2010, the Federal Reserve Board, OCC, and FDIC issued comprehensive final guidance on incentive compensation policies intended to ensure that the incentive compensation policies of banking organizations do not undermine the safety and soundness of such organizations by encouraging excessive risk-taking. The guidance, which covers all employees that have the ability to materially affect the risk profile of an organization, either individually or as part of a group, is based upon the key principles that a banking organization's incentive compensation arrangements should (i) provide incentives that do not encourage risk-taking beyond the organization's ability to effectively identify and manage risks, (ii) be compatible with effective internal controls and risk management, and (iii) be supported by strong corporate governance, including active and effective oversight by the organization's board of directors.
The Federal Reserve Board will review, as part of the regular, risk-focused examination process, the incentive compensation arrangements of banking organizations, such as the Company, that are not "large, complex banking organizations." The findings of the supervisory initiatives will be included in reports of examination. Enforcement actions may be taken against a banking organization if its incentive compensation arrangements, or related risk-management control or governance processes, pose a risk to the organization's safety and soundness and the organization is not taking prompt and effective measures to correct the deficiencies.
In addition, the Dodd-Frank Act requires publicly traded companies to give stockholders a non-binding vote on executive compensation at least every three years and on so-called "golden parachute" payments in connection with approvals of mergers and acquisitions unless previously voted on by shareholders. The Dodd-Frank Act also directs the federal banking regulators to promulgate rules prohibiting excessive compensation paid to executives of depository institutions and their holding companies with assets in excess of $1.0 billion, regardless of whether the company is publicly traded or not. Finally, the Dodd-Frank Act gives the SEC authority to prohibit broker discretionary voting on elections of directors and executive compensation matters.
Technology Risk Management and Consumer Privacy
State and federal banking regulators have issued various policy statements emphasizing the importance of technology risk management and supervision in evaluating the safety and soundness of depository institutions with respect to banks that contract with outside vendors to provide data processing and core banking functions. The use of technology-related products, services, delivery channels, and processes exposes a bank to various risks, particularly operational, privacy, security, strategic, reputation and compliance risk. Banks are generally expected to prudently manage technology-related risks as part of their comprehensive risk management policies by identifying, measuring, monitoring, and controlling risks associated with the use of technology.
Under Section 501 of the Gramm-Leach-Bliley Act, the federal banking agencies have established appropriate standards for financial institutions regarding the implementation of safeguards to ensure the security and confidentiality of customer records and information, protection against any anticipated threats or hazards to the security or integrity of such records and protection against unauthorized access to or use
33
of such records or information in a way that could result in substantial harm or inconvenience to a customer. Among other matters, the rules require each bank to implement a comprehensive written information security program that includes administrative, technical, and physical safeguards relating to customer information.
Under the Gramm-Leach-Bliley Act, a financial institution must also provide its customers with a notice of privacy policies and practices. Section 502 prohibits a financial institution from disclosing nonpublic personal information about a customer to nonaffiliated third parties unless the institution satisfies various notice and opt-out requirements and the customer has not elected to opt out of the disclosure. Under Section 504, the agencies are authorized to issue regulations as necessary to implement notice requirements and restrictions on a financial institution's ability to disclose nonpublic personal information about customers to nonaffiliated third parties. Under the final rule the regulators adopted, all banks must develop initial and annual privacy notices which describe in general terms the bank's information sharing practices. Banks that share nonpublic personal information about customers with nonaffiliated third parties must also provide customers with an opt-out notice and a reasonable period of time for the customer to opt out of any such disclosure (with certain exceptions). Limitations are placed on the extent to which a bank can disclose an account number or access code for credit card, deposit, or transaction accounts to any nonaffiliated third party for use in marketing.
The risks described below could materially and adversely affect our business, financial conditions, and results of operations. You should carefully consider the following risk factors and all other information contained in this Report. In addition, the trading price of our common stock could decline due to any of the events described in these risks.
If a significant number of clients fail to perform under their loans, our business, profitability, and financial condition would be adversely affected.
As a lender, one of the largest risks we face is the possibility that a significant number of our client borrowers will fail to pay their loans when due. If borrower defaults cause losses in excess of our allowance for loan losses, it could have an adverse effect on our business, profitability, and financial condition. We have established an evaluation process designed to determine the adequacy of the allowance for loan losses. Although this evaluation process uses historical, qualitative, and other objective information, the classification of loans and the establishment of loan losses are dependent to a great extent on our experience and judgment. Although we believe that our allowance for loan losses is at a level adequate to absorb any inherent losses in our loan portfolio, we may find it necessary to further increase the allowance for loan losses or our regulators may require us to increase this allowance. If we are unable to effectively measure and limit the risk of default associated with our loan portfolio, our business, financial condition, and profitability may be adversely impacted.
Increases in the level of non-performing loans could adversely affect our business, profitability, and financial condition.
Increases in non-performing loans could have an adverse effect on our earnings as a result of related increases in our provisions for loan losses, charge-offs, and other losses related to non-performing loans which could in turn deplete our capital, leaving the Company undercapitalized. Non-performing loans at the year ended December 31, 2015 were $21.7 million, compared to $37.3 million at the end of 2014, and $37.2 million at the end of 2013.
34
Increases in our allowance for loan losses could have a material adverse effect on our business, financial condition, and results of operations.
Like all financial institutions, we maintain an allowance for loan losses to provide for loan defaults and non-performance. Our allowance for loan losses is based on prior experience, as well as an evaluation of the risks in the current portfolio. However, actual loan losses could increase significantly as the result of changes in economic, operating, and other conditions, including changes in interest rates, which are generally beyond our control. In addition, actual loan losses could increase significantly as a result of deficiencies in our internal controls over financial reporting. Thus, such losses could exceed our current allowance estimates. Either of these occurrences could materially affect our earnings adversely.
In addition, the measure of our allowance for loan losses is dependent on the adoption of new accounting standards. The Financial Accounting Standards Board recently issued a proposed Accounting Standards Update that presents a new credit impairment model, the Current Expected Credit Loss ("CECL") model, which would require financial institutions to estimate and develop a provision for credit losses at origination for the lifetime of the loan, as opposed to reserving for probable incurred losses up to the balance sheet date. Under the CECL model, credit deterioration would be reflected in the income statement in the period of origination or acquisition of the loan, with changes in expected credit losses due to further credit deterioration or improvement reflected in the periods in which the expectation changes. Accordingly, the CECL model could require financial institutions like the Bank to increase their allowances for loan losses. Moreover, the CECL model likely would create more volatility in our level of allowance for loan losses.
Finally, the FDIC and the DBO, as an integral part of their respective supervisory functions, periodically review our allowance for loan losses. Such regulatory agencies may require us to increase our provision for losses on loans and loan commitments or to recognize further loan charge-offs, based upon judgments different from those of management. If we are required to materially increase our level of allowance for loan losses for any reason, such increase could adversely affect our business, financial condition, and results of operations.
Banking organizations are subject to interest rate risk and changes in interest rates may negatively affect our financial performance.
A major portion of our net income comes from our interest rate spread, which is the difference between the interest rates paid by us on interest-bearing liabilities, such as deposits and other borrowings, and the interest rates we receive on interest-earning assets, such as loans we extend to our clients and securities held in our investment portfolio. Net interest spreads are affected by the difference between the maturities and repricing characteristics of interest-earning assets and interest-bearing liabilities. In addition, loan volume and yields are affected by market interest rates on loans, and rising interest rates generally are associated with a lower volume of loan originations.
The federal funds rate and other short-term market interest rates previously decreased substantially, which led to a "steepening" of the market yield curve with short-term rates considerably lower than long-term notes. However, with the recent increase in the federal funds rate by the Federal Open Market Committee, the yield curve has flattened out, but rates are changing on daily basis. We may not be able to minimize our interest rate risk. In addition, an increase in the general level of interest rates may hinder the ability of certain borrowers with variable rate loans to pay the interest on and principal of their obligations, leading to an increase in loan defaults. Accordingly, changes in levels of market interest rates could materially and adversely affect our net interest spread, net interest margin, and our overall profitability.
35
Liquidity risk could impair our ability to fund operations, meet our obligations as they become due, and jeopardize our financial condition.
Liquidity is essential to our business. Liquidity risk is the potential that we will be unable to meet our obligations as they come due because of an inability to liquidate assets or obtain adequate funding. An inability to raise funds through deposits, borrowings, the sale of loans, and other sources could have a substantial negative effect on our liquidity. Our access to funding sources in amounts adequate to finance our activities or on terms which are acceptable to us could be impaired by factors that affect us specifically or the financial services industry or economy in general. Factors that could detrimentally impact our access to liquidity sources include a decrease in the level of our business activity as a result of a downturn in the markets in which our loans are concentrated or adverse regulatory actions against us. Market conditions or other events could also negatively affect the level or cost of funding, affecting our ongoing ability to accommodate liability maturities and deposit withdrawals, meet contractual obligations, and fund asset growth and new business transactions at a reasonable cost in a timely manner and without adverse consequences. Although management has implemented strategies to maintain sufficient and diverse sources of funding to accommodate planned as well as unanticipated changes in assets and liabilities under both normal and adverse conditions, any substantial, unexpected, and/or prolonged change in the level or cost of liquidity could have a material adverse effect on our financial condition and results of operations.
The profitability of Wilshire Bancorp is dependent on the profitability of the Bank.
Because Wilshire Bancorp's principal activity is to act as the holding company of the Bank, the profitability of Wilshire Bancorp is largely dependent on the profitability of the Bank. The Bank operates in an extremely competitive banking environment, competing with a number of banks and other financial institutions which possess greater financial resources than those available to the Bank, in addition to other independent banks. In addition, the banking business is affected by general economic and political conditions, both domestic and international, and by government monetary and fiscal policies. Conditions such as inflation, recession, unemployment, high interest rates, short money supply, scarce natural resources, natural disasters, international terrorism, and other factors beyond the control of the Bank may adversely affect its profitability. Banks are also subject to extensive governmental supervision, regulation, and control, and future legislation and government policy could adversely affect the banking industry and the operations of the Bank.
Wilshire Bancorp relies heavily on the payment of dividends from the Bank.
The Bank is the only source of significant income for Wilshire Bancorp. Accordingly, the ability of Wilshire Bancorp to meet its debt service requirements and to pay dividends depends on the ability of the Bank to pay dividends to it. However, the Bank is subject to regulations limiting the amount of dividends that it may pay to Wilshire Bancorp. For example, any payment of dividends by the Bank is subject to the FDIC's capital adequacy guidelines. All banks and bank holding companies are required to maintain a minimum ratio of qualifying total capital to total risk-weighted assets of 8.00%, Tier 1 capital to total risk-weighted assets of 6.00%, Tier 1 common equity capital to total risk-weighted assets of 4.50%, and a ratio of Tier 1 capital to average adjusted assets of 4.00%. If (i) the FDIC increases any of these required ratios; (ii) the total of risk-weighted assets of the Bank increases significantly; and/or (iii) the Bank's income decreases significantly, the Bank's Board of Directors may decide or be required to retain a greater portion of the Bank's earnings to achieve and maintain the required capital or asset ratios. This will reduce the amount of funds available for the payment of dividends by the Bank to Wilshire Bancorp. Further, in some cases, the FDIC could take the position that it has the power to prohibit the Bank from paying dividends if, in its view, such payments would constitute unsafe or unsound banking practices. Whether dividends are paid, payment frequency, and amount paid will also depend on the financial condition and performance of the Bank, and the discretion of the Board of Directors of the Bank. The foregoing restrictions on dividends paid by the Bank may limit Wilshire Bancorp's ability to obtain funds from such
36
dividends for its cash needs, including funds for payment of its debt service requirements, operating expenses, and for payment of cash dividends to Wilshire Bancorp's shareholders. The amount of dividends the Bank could pay to Wilshire Bancorp as of December 31, 2015 without prior regulatory approval, which is limited by statute to the sum of undivided profits for the current year plus net profits for the preceding two years (less any distributions made to shareholders during such periods), was $21.3 million.
To continue our growth, we are affected by our ability to identify and acquire other financial institutions.
We intend to continue our current growth strategy. This strategy includes opening new branches and acquiring other banks that serve customers or markets we find desirable. The market for acquisitions remains highly competitive, and we may be unable to find satisfactory acquisition candidates in the future that fit our acquisition and growth strategy. To the extent that we are unable to find suitable acquisition candidates, an important component of our growth strategy may be lost. Additionally, our completed acquisitions, or any future acquisitions, may not produce the revenue, earnings, or synergies that we anticipated.
Income that we recognized and continue to recognize in connection with our 2013 acquisitions of BankAsiana and Saehan may be non-recurring or finite in duration.
Mirae Bank was acquired in 2009 and its loan portfolio was acquired at a discount of $54.9 million. Subsequently in 2013, we acquired BankAsiana and Saehan and their loan portfolio at a discount of $9.2 million and $27.7 million, respectively. This discount is amortized and accreted to interest income on a monthly basis. However, as these loans are paid-off, charged-off, sold, or transferred to non-accrual status, the income from the discount accretion is reduced. As the acquired loans are removed from our books, the related discount will no longer be available for accretion into interest income. Accretion of $8.0 million, $11.2 million, and $2.5 million on loans acquired at a discount was recorded as interest income during 2015, 2014, and 2013, respectively.
As of December 31, 2015, the carrying balance of the discount on former Mirae loans was $921,000, down $413,000 from its value of $1.3 million as of December 31, 2014. The carrying value of the discount on former BankAsiana and Saehan loans was $2.0 million and $11.0 million, respectively, at December 31, 2015, and $3.7 million and $17.0 million, respectively at December 31, 2014. We expect the continued reduction of discount accretion recorded as interest income in future quarters.
Our use of appraisals in deciding whether to make a loan on or secured by real property does not ensure the value of the real property collateral.
In considering whether to make a loan secured by real property, we generally require an appraisal of the property. However, an appraisal is only an estimate of the value of the property at the time the appraisal is made, and an error in fact or judgment could adversely affect the reliability of an appraisal. Events occurring after the initial appraisal may also cause the value of the real estate to decrease. As a result of any of these factors, the value of collateral backing a loan may be less than supposed, and if a default occurs, we may not be able recover the outstanding balance of the loan.
We are subject to environmental risks associated with owning real estate or collateral.
The cost of cleaning up or paying damages and penalties associated with environmental problems could increase our operating expenses. When a borrower defaults on a loan secured by real property, the Bank may acquire the property in foreclosure or accept a deed to the property surrendered by the borrower. We may also take over the management of commercial properties whose owners have defaulted on loans. We may also own and lease premises where branches and other facilities are located. While we will have lending, foreclosure, and facilities guidelines intended to exclude properties with an unreasonable
37
risk of contamination, hazardous substances could exist on some of the properties that the Bank may own, manage, or occupy. We face the risk that environmental laws could force us to clean up the properties at the Company's expense. Potentially, it may cost much more to clean a property than the property is worth. We could also be liable for pollution generated by a borrower's operations if the Bank takes a role in managing those operations after a default. The Bank may also find it difficult or impossible to sell contaminated properties.
Adverse changes in domestic or global economic conditions, especially in California, could have a material adverse effect on our business, growth, and profitability.
If economic conditions worsen in the domestic or global economy, especially in California, our business, growth and profitability is likely to be materially adversely affected. A substantial number of our clients are geographically concentrated in California, and adverse economic conditions in California, particularly in the Los Angeles area, could harm the businesses of a disproportionate number of our clients. To the extent that our clients' underlying businesses are harmed, they are more likely to default on their loans. The conditions in the California economy and in the economies of other areas where we operate may deteriorate further in the future and such deterioration may adversely affect us.
Difficult economic and market conditions may continue to adversely affect Wilshire's industry and business.
Wilshire is operating in a challenging and uncertain economic environment, including generally uncertain global, national, and local conditions. The significant economic contraction of 2007 to 2009 adversely affected business activity across a wide range of industries and regions. Businesses and consumers were negatively impacted and capital and credit markets experienced volatility and disruption. Economic conditions affect the ability of borrowers to pay interest on and repay principal of outstanding loans and affect the value of collateral securing loans. The economic contraction and related declines in real estate values caused an elevated level of impaired loans and an associated increase in loan loss provision and charge-offs, leading to net losses for the Company in 2010 and 2011.
Wilshire's business is closely tied to the economies of its primary markets in general and is particularly affected by the economies of Southern California, Texas, New Jersey, and the New York metropolitan area. The economies of California and the East Coast have generally stabilized and/or are recovering. The housing market has improved with prices increasing in 2014. Vacancy rates for commercial properties have stabilized and small business owners are increasingly considering bank borrowings in order to grow. However, slow economic growth and the lingering effect of the 2007 to 2009 downturn continue to make for challenging operating conditions which may continue for some time and may have an adverse impact on Wilshire.
The banking industry and Wilshire operate under certain regulatory requirements that may change significantly and in a manner that further impairs revenues, operating income and financial condition.
Wilshire operates in a highly regulated industry and is subject to examination, supervision, and comprehensive regulation by the DBO, the FDIC, and the Federal Reserve Board. The regulations affect Wilshire's investment practices, lending activities and dividend policy, among other things. Moreover, federal and state banking laws and regulations undergo frequent and often significant changes and have been subject to significant change in recent years, sometimes retroactively applied, and may change significantly in the future. Changes to these laws and regulations or other actions by regulatory agencies could, among other things, make regulatory compliance more difficult or expensive for Wilshire, limit the products Wilshire can offer or increase the ability of non-banks to compete and could adversely affect Wilshire in significant but unpredictable ways, which in turn could have a material adverse effect on Wilshire's financial condition or results of operations.
38
The Dodd-Frank Act instituted major changes to the banking and financial institutions regulatory regimes in light of the performance of and government intervention in the financial services sector. Included in the Dodd-Frank Act are, for example, changes related to deposit insurance assessments, executive compensation and corporate governance requirements, payment of interest on demand deposits, interchange fees, and overdraft services. The Dodd-Frank Act also implemented the "Volcker Rule" for banks and bank holding companies, which would prohibit proprietary trading, investment in and sponsorship of hedge funds and private equity funds, and otherwise limit the relationships with such funds. See the section entitled "Supervision and Regulation—The Dodd-Frank Act" for more information. Many aspects of the Dodd-Frank Act are subject to rulemaking by various regulatory agencies and will take effect over several years, making it difficult at this time to anticipate the overall financial impact of this expansive legislation on Wilshire, its customers or the financial industry generally. Likewise, any new consumer financial protection laws enacted by the CFPB, which was established pursuant to the Dodd-Frank Act, would apply to all banks and thrifts, and may increase Wilshire's compliance and operational costs in the future.
In addition, the banking regulatory agencies adopted a final rule in July 2013 that implements the Basel III changes to the international regulatory capital framework and revises the U.S. risk-based and leverage capital requirements for U.S. banking organizations to strengthen identified areas of weakness in the capital rules and to address relevant provisions of the Dodd-Frank Act. The Basel III Rules, effective January 1, 2015, impose a stricter regulatory capital framework that requires banking organizations to hold more and higher-quality levels of capital to act as a financial cushion to absorb losses and help banking organizations better withstand periods of financial stress. See the risk factor entitled "Wilshire may be subject to more stringent capital and liquidity requirements which would adversely affect Wilshire's net income and future growth" for more information.
We cannot predict the substance or impact of pending or future legislation or regulation. Our compliance with these laws and regulations is costly and may restrict certain activities, including payment of dividends, mergers and acquisitions, investments, interest rates charged on loans, interest rates paid on deposits, access to capital and brokered deposits and locations of banking offices. Failure to comply with these laws or regulations could result in fines, penalties, sanctions, and damage to our reputation which could have an adverse effect on our business and financial results.
The CFPB may reshape the consumer financial laws through rulemaking and enforcement of unfair, deceptive, or abusive practices, which may directly impact the business operations of depository institutions offering consumer financial products or services including the Bank.
The CFPB has broad rulemaking authority to administer and carry out the purposes and objectives of the "Federal consumer financial laws, and to prevent evasions thereof," with respect to all financial institutions that offer financial products and services to consumers. The CFPB is also authorized to prescribe rules applicable to any covered person or service provider identifying and prohibiting acts or practices that are "unfair, deceptive, or abusive" in connection with any transaction with a consumer for a consumer financial product or service, or the offering of a consumer financial product or service ("UDAP authority"). The potential reach of the CFPB's broad rulemaking powers and UDAP authority on the operations of financial institutions offering consumer financial products or services including the Bank is currently unknown.
The Bank is subject to federal and state and fair lending laws, and failure to comply with these laws could lead to material penalties.
Federal and state fair lending laws and regulations, such as the Equal Credit Opportunity Act and the Fair Housing Act, impose nondiscriminatory lending requirements on financial institutions. The Department of Justice, CFPB, and other federal and state agencies are responsible for enforcing these laws and regulations. Private parties may also have the ability to challenge an institution's performance under
39
fair lending laws in private class action litigation. A successful challenge to the Bank's performance under the fair lending laws and regulations could adversely impact the Bank's rating under the Community Reinvestment Act and result in a wide variety of sanctions, including the required payment of damages and civil money penalties, injunctive relief, imposition of restrictions on merger and acquisition activity and restrictions on expansion activity, which could negatively impact the Bank's reputation, business, financial condition and results of operations.
Non-compliance with the USA PATRIOT Act, Bank Secrecy Act, or other laws and regulations could result in fines or sanctions and limit our ability to obtain regulatory approval of acquisitions and new branches.
The USA PATRIOT and Bank Secrecy Acts require financial institutions to develop programs to prevent financial institutions from being used for money laundering and other illegal conduct and terrorist activities. If such activities are detected, financial institutions are obligated to file suspicious activity reports with the U.S. Treasury's Office of Financial Crimes Enforcement Network. These rules require financial institutions to establish procedures for identifying and verifying the identity of customers seeking to open new financial accounts and monitor the activity through such accounts. Failure to comply with these regulations could result in a wide variety of sanctions, including the required payment of damages and civil money penalties, injunctive relief, imposition of restrictions on merger and acquisition activity, and restrictions on expansion activity, which could negatively impact the Bank's reputation, business, financial condition, and results of operations. While we have developed policies and procedures designed to assist in compliance with these laws and regulations, no assurance can be given that these policies and procedures will be effective in preventing violations of these laws and regulations.
The Company relies on other companies to provide key components of its business infrastructure.
Many key components of our operations, including data processing, recording and monitoring transactions, online interfaces and services, internet connections, and network access are provided by other companies. Our vendor management process selects third-party vendors carefully, but we do not control their actions. Problems, including disruptions in communication, security breaches, or failure of a vendor to provide services, could hurt our operations or our relationships with customers. If our vendors suffer financial or operational issues, our operations and reputation could suffer from a failure by the vendor in its ability to serve us and our customers. Third-party vendors are also a source of operational and information security risk to us. Vendors' market power significantly limits our ability to be indemnified for a vendor's negligence. In addition, insurance does not adequately cover all such exposure. Replacing or renegotiating contracts with vendors could entail significant operational expense and delays. The use of third-party vendors represents an unavoidable inherent risk to our company.
We may be subject to potential liability and business risk from actions by our regulators related to supervision of third parties.
Oversight management by us of third parties by which we acquire deposit accounts and offer products and services, may be required to be expanded by our auditors or regulators. Although we have added significant compliance staff and have used outside consultants, our internal and external compliance examiners must be satisfied with the results of such augmentation and enhancement. We cannot assure you that we will satisfy all related requirements. Not achieving a compliance management system which is deemed adequate could result a wide variety of sanctions, including the required payment of damages and civil money penalties, injunctive relief, imposition of restrictions on merger and acquisition activity and restrictions on expansion activity, which could negatively impact the Bank's reputation, business, financial condition and results of operations. Our ongoing review and analysis of our compliance management systems and implementation of any changes resulting from that review and analysis will likely result in increased non-interest expense.
40
Our operations may require us to raise additional capital in the future, but that capital may not be available or may not be on terms acceptable to us when it is needed.
We are required by federal regulatory authorities to maintain adequate levels of capital to support our operations. While we believe our existing capital resources at the Bank are sufficient to satisfy the Bank's capital requirements for the foreseeable future and will be sufficient to offset any problem assets. However, should our asset quality erode and require significant additional provision, resulting in consistent net operating losses at the Bank, our capital levels will decline and we will need to raise capital to support the Bank. In addition, we are subject to separate capital requirements and needs at the holding company. While we are in compliance with capital requirements at the holding company, there may be reasons in the future why we would determine to increase our capital levels at the holding company. Our ability to raise additional capital, if needed, will depend on conditions in the capital markets at that time, which are outside our control, and on our financial performance. Accordingly, we cannot be certain of our ability to raise additional capital if needed or on terms acceptable to us. If we cannot raise additional capital when needed, our ability to operate in substantially the same manner as we have before, including the payment of dividends at the bank and holding company level, could be materially impaired.
Our financial condition, earnings, and asset quality could be adversely affected if our consumer facing operations do not operate in compliance with applicable regulations.
While all aspects of our operations are subject to detailed and complex compliance regimes, bank regulators have increased their focus on risk management and consumer compliance, and we expect this focus to continue. As a result, those portions of our lending operations which most directly deal with consumers, in particular our mortgage operations, credit card and other consumer lending business, pose particular challenges. While we are not aware of any material issues with our compliance, mortgage and other consumer lending raises significant compliance risks resulting from the detailed and complex nature of mortgage and consumer lending regulations imposed by federal regulatory agencies, and the relatively independent operating environment in which loan officers operate. As a result, despite the education, compliance training, supervision and oversight we exercise in these areas, failure to comply with these regulations could result in the Bank being strictly liable for restitution or damages to individual borrowers, and to a wide variety of sanctions, including the required payment of damages and civil money penalties, injunctive relief, imposition of restrictions on merger and acquisition activity and restrictions on expansion activity, which could negatively impact the Bank's reputation, business, financial condition and results of operations.
The success of our mortgage business acquisition depends upon our ability to maintain the operations, integrate and manage the risks of this business, and to successfully market, originate and sell mortgage loans. If we are unable to do so, the profitability of our mortgage business may be adversely affected.
The long-term success of our mortgage business depends upon our ability to market, originate, fund, and sell our mortgage loans. Our mortgage loan origination volume will be largely dependent on our ability to offer competitively priced, desirable loan products under the Wilshire brand and our ability to attract qualified prospective borrowers. In addition, we employ various economic hedging strategies in an attempt to mitigate the interest rate risk and other risks inherent in a mortgage loan commitment. Our hedging activities include entering into derivative instruments. Poorly designed strategies or improperly executed transactions could fail to mitigate our risks and losses, or even increase our risks and losses beyond what they would have been had we not used such hedging strategies.
41
We may be subject to more stringent capital and liquidity requirements which would adversely affect our net income and future growth.
On July 2, 2013, the Federal Reserve Board, and on July 9, 2013, the FDIC and Office of the Comptroller of Currency, adopted the Basel III Rules, which establish a stricter regulatory capital framework that requires banking organizations to hold more and higher-quality capital. The Basel III Rules increased capital ratios for all banking organizations and introduced a "capital conservation buffer" which is in addition to each capital ratio. If a banking organization dips into its capital conservation buffer, it may be restricted in its ability to pay dividends and discretionary bonus payments to its executive officers. The Basel III Rules assign a higher risk weight (150%) to exposures that are more than 90 days past due or are on nonaccrual status and to certain commercial real estate facilities that finance the acquisition, development or construction of real property. The Basel III Rules also require unrealized gains and losses on certain "available-for-sale" securities holdings to be included for purposes of calculating regulatory capital requirements unless a one-time opt-out option is exercised. Basel III includes changes in what constitutes regulatory capital, some of which are subject to a two-year transition period. These changes include the phasing-out of certain instruments as qualifying capital. In addition, Tier 2 capital is no longer limited to the amount of Tier 1 capital included in total capital. Mortgage servicing rights, certain deferred tax assets, and investments in unconsolidated subsidiaries over designated percentages of common stock will be required to be deducted from capital, subject to a two-year transition period. Finally, Tier 1 capital will include accumulated other comprehensive income (which includes all unrealized gains and losses on available for sale debt and equity securities), subject to a two-year transition period. We elected to take the one-time option in the first quarter of 2015 to permanently opt out of the inclusion of accumulated other comprehensive income in our capital calculation in order to reduce the impact of market volatility on its regulatory capital levels.
The Basel III Rules became effective for the company on January 1, 2015. Our failure to comply with the minimum capital requirements could result in our regulators taking formal or informal actions against the Company which could restrict our future growth or operations.
Maintaining or increasing our market share depends on market acceptance and regulatory approval of new products and services.
Our success depends, in part, upon our ability to adapt our products and services to evolving industry standards and consumer demand. There is increasing pressure on financial services companies to provide products and services at lower prices. In addition, the widespread adoption of new technologies, including internet-based services, could require us to make substantial expenditures to modify or adapt our existing products or services. A failure to achieve market acceptance of any new products we introduce, or a failure to introduce products that the market may demand, could have an adverse effect on our business, profitability, or growth prospects.
Significant reliance on loans secured by real estate may increase our vulnerability to downturns in the California real estate market and other variables impacting the value of real estate.
At December 31, 2015, approximately 78.9% of our loans were secured by real estate, a substantial portion of which consist of loans secured by real estate in California. Conditions in the California real estate market historically have influenced the level of our non-performing assets. A real estate recession in Southern California could adversely affect our results of operations. In addition, California has experienced, on occasion, significant natural disasters, including drought, earthquakes, brush fires and flooding attributed to various weather phenomenon. In addition to these catastrophes, California has experienced a moderate decline in housing prices beginning in late 2006. The decline in housing prices subsequently developed into a financial crisis, characterized by the further decline in the real estate market in many parts of the country, including California, starting in the second half of 2007, and the failures of many financial institutions between 2008 and 2011. The availability of insurance to compensate for losses
42
resulting from such crises is limited. The occurrence of one or more of such crises could impair the value of the collateral for our real estate secured loans and adversely affect us.
If we fail to retain our key employees, our growth and profitability could be adversely affected.
Our future success depends in large part upon the continuing contributions of our key management personnel. If we lose the services of one or more key employees within a short period of time, we could be adversely affected. Our future success is also dependent upon our continuing ability to attract and retain highly qualified personnel. Competition for such employees among financial institutions in California is intense. Our inability to attract and retain additional key personnel could adversely affect us.
We rely heavily on technology and computer systems, and computer failure could result in loss of business and adversely affect our financial condition and results of operations.
Advances and changes in technology could significantly affect our business, financial condition, results of operations and future prospects. We face many challenges, including the increased demand for providing customers access to their accounts and the systems to perform banking transactions electronically. Our ability to compete depends on its ability to continue to adapt technology on a timely and cost-effective basis to meet these demands. In addition, our business and operations are susceptible to negative effects from computer system failures, communication and energy disruption, and unethical individuals with the technological ability to cause disruptions or failures of its data processing systems.
Risks associated with our Internet-based systems and online commerce security, including "hacking" and "identify theft," could adversely affect our business.
We have a website and conduct a portion of our business over the Internet. We rely heavily upon data processing, including loan servicing and deposit processing software, communications systems, and information systems from a number of third parties to conduct our business. Third party, or internal, systems and networks may fail to operate properly or become disabled due to deliberate attacks or unintentional events. Our operations are vulnerable to disruptions from human error, natural disasters, power loss, computer viruses, spam attacks, denial of service attacks, unauthorized access and other unforeseen events. Undiscovered data corruption could render our customer information inaccurate. These events may obstruct our ability to provide services and process transactions. While we believe that we are in compliance with all applicable privacy and data security laws, an incident could put our confidential information about our customers at risk.
Although we have not experienced a cyber-incident that has been successful in compromising our data or systems, we can never be certain that all of our systems are entirely free from vulnerability to breaches of security or other technological difficulties or failures. The Company monitors and modifies, as necessary, its protective measures in response to the perpetual evolution of cyber threats.
A breach in the security of any of the Company information systems, or other cyber incident, could have an adverse impact on, among other things, the Company's revenue, ability to attract and maintain customers, and business reputation. In addition, as a result of any breach, we could incur higher costs to conduct our business, to increase protection, or related to remediation.
Furthermore, our customers could incorrectly blame the Company and terminate their accounts with the Company for a cyber-incident which occurred on their own system or with that of an unrelated third party. In addition, a security breach could also subject us to additional regulatory scrutiny and expose us to civil litigation and possible financial liability.
43
In response to the Executive Order released by the Obama Administration, Improving Critical Infrastructure Cybersecurity, referred to as the Executive Order, the Federal Financial Institutions Examination Council developed a cybersecurity assessment tool to help institutions identify their risks and determine their cybersecurity preparedness. The FFIEC has also published cybersecurity guidance on its website, along with observations from recent cybersecurity assessments. The federal banking agencies have indicated that they will use the assessment tool as guidance during a financial institution's safety and soundness examination. Although we have used the assessment tool to develop policies and procedures related to our cybersecurity, no assurance can be given that the regulators will believe that our information security systems are adequate or that these policies and procedures will be effective in preventing cyber threats and attacks.
We continually encounter technological changes which could result in the Company having fewer resources than many of its competitors to continue to invest in technological improvements.
Frequent introductions of new technologically-driven products and services in the financial services industry result in the need for rapid technological change. In addition, the effective use of technology may result in improved customer service and reduced costs. Our future success depends, to a certain extent, on our ability to identify the needs of customers and address those needs by using technology to provide the desired products and services and to create additional efficiencies in operations. Certain competitors may have substantially greater resources to invest in technological improvements. We may not be able to successfully implement new technology-driven products and services or effectively market these products and services to our customers. Failure to implement the necessary technological changes could have a material adverse impact on our business and, in turn, our financial condition, and results of operations.
The market for our common stock is limited, and potentially subject to volatile changes in price.
The market price of our common stock may be subject to significant fluctuation in response to numerous factors, including variations in our annual or quarterly financial results or those of our competitors, changes by financial research analysts in their evaluation of our financial results or those of our competitors, or our failure or that of our competitors to meet such estimates, conditions in the economy in general or the banking industry in particular, or unfavorable publicity affecting us or the banking industry. In addition, the equity markets have, on occasion, experienced significant price and volume fluctuations that have affected the market prices for many companies' securities and have been unrelated to the operating performance of those companies. In addition, the sale by any of our large shareholders of a significant portion of that shareholder's holdings could have a material adverse effect on the market price of our common stock. Further, the issuance or registration by us of any significant amount of additional shares of our common stock will have the effect of increasing the number of outstanding shares or, in the case of registrations, the number of shares of our common stock that are freely tradable; any such increase may cause the market price of our common stock to decline or fluctuate significantly. Any such fluctuations may adversely affect the prevailing market price of the common stock.
We may experience impairment of goodwill.
The Company recognized goodwill in connection with the acquisitions of Liberty Bank of New York, BankAsiana, and Saehan. Goodwill is presumed to have an indefinite useful life and is tested for impairment at least annually, rather than amortized. In addition, the Company tests on an interim basis for triggering events that would indicate impairment. The goodwill impairment analysis is a two-step test. However, under ASU 2011-08, a company can first assess qualitative factors to determine whether it is necessary to perform the two-step quantitative goodwill impairment test. Therefore it would not be required to calculate the fair value unless we determined, based on a qualitative assessment, that it was more-likely-than-not that its fair value was less than its carrying amount. If management's assumptions
44
used to evaluate goodwill are inaccurate, the fair value determined could be inaccurate and impairment may not be recognized in a timely manner. Goodwill may be written down in future periods.
We face substantial competition in our primary market area.
We conduct our banking operations primarily in Southern California. Increased competition in our market may result in reduced loans and deposits. Ultimately, we may not be able to compete successfully against current and future competitors. Many competitors offer the same banking services that we offer in our service area. These competitors include national banks, regional banks, and other community banks. We also face competition from many other types of financial institutions, including without limitation, savings and loan institutions, finance companies, brokerage firms, insurance companies, credit unions, mortgage banks and other financial intermediaries. In particular, our competitors include several major financial companies whose greater resources may afford them a marketplace advantage by enabling them to maintain numerous banking locations and mount extensive promotional and advertising campaigns. Additionally, banks and other financial institutions with larger capitalization and financial intermediaries not subject to bank regulatory restrictions have larger lending limits and are thereby able to serve the credit needs of larger customers. Areas of competition include interest rates for loans and deposits, efforts to obtain deposits, and range and quality of products and services provided, including new technology-driven products and services. Technological innovation continues to contribute to greater competition in domestic and international financial services markets as technological advances enable more companies to provide financial services. We also face competition from out-of-state financial intermediaries that have opened low-end production offices or that solicit deposits in our market areas. If we are unable to attract and retain banking customers, we may be unable to continue our loan growth and level of deposits and our results of operations and financial condition may otherwise be adversely affected.
Anti-takeover provisions of our charter documents may have the effect of delaying or preventing changes in control or management.
Certain provisions in our Articles of Incorporation and Bylaws could discourage unsolicited takeover proposals not approved by the Board of Directors in which shareholders could receive a premium for their shares, thereby potentially limiting the opportunity for our shareholders to dispose of their shares at the higher price generally available in takeover attempts or that may be available under a merger proposal or may have the effect of permitting our current management, including the current Board of Directors, to retain its position, and place it in a better position to resist changes that shareholders may wish to make if they are dissatisfied with the conduct of our business. The anti-takeover measures included in our Articles of Incorporation and Bylaws, include, without limitation, the following:
- •
- the elimination of cumulative voting,
- •
- the adoption of a classified Board of Directors,
- •
- super-majority shareholder voting requirements to modify certain provisions of the Articles of Incorporation and Bylaws, and
- •
- restrictions on certain "business combinations" with third parties who may acquire our securities outside of an action taken by us.
We could be negatively impacted by downturns in the South Korean economy.
Many of our customers are locally based Korean-Americans who also conduct business in South Korea. Although we conduct most of our business with locally-based customers and rely on domestically located assets to collateralize our loans and credit arrangements, we have historically had some exposure
45
to the economy of South Korea in connection with certain portions of our loans and credit transactions with Korean banks. Such exposure has consisted of:
- •
- discounts of acceptances created by banks in South Korea,
- •
- advances made against clean documents presented under sight letters of credit issued by banks in South Korea,
- •
- advances made against clean documents held for later presentation under letters of credit issued by banks in South Korea, and
- •
- extensions of credit to borrowers in the U.S. secured by letters of credit issued by banks in South Korea.
We generally enter into any such loan or credit arrangements, in excess of $200,000 and of longer than 120 days, only with the largest of the Korean banks and spread other lesser or shorter term loan or credit arrangements among a variety of medium-sized Korean banks.
Management closely monitors our exposure to the South Korean economy and the activities of Korean banks with which we conduct business. To date, we have not experienced any significant loss attributable to our exposure to South Korea. Nevertheless, our efforts to minimize exposure to downturns in the South Korean economy may not be successful in the future, and another significant downturn in the South Korean economy could possibly result in significant credit losses for us.
In addition, due to our customer base being largely made up of Korean-Americans, our deposit base could significantly decrease as a result of deterioration in the Korean economy. For example, some of our customers' businesses may rely on funds from South Korea. Further, our customers may temporarily withdraw deposits in order to transfer funds and benefit from gains on foreign exchange and interest rates, and/or to support their relatives in South Korea during downturns in the Korean economy. A significant decrease in our deposits could also have a material adverse effect on our financial condition and results of operations.
Additional shares of our common stock issued in the future could have a dilutive effect.
Shares of our common stock eligible for future issuance and sale could have a dilutive effect on the market for our stock. Our Articles of Incorporation authorize the issuance of 200,000,000 shares of common stock. As of February 12, 2016, there were approximately 78,643,353 shares of our common stock issued and outstanding, 858,525 shares of our authorized but unissued shares of common stock have been granted and are reserved for issuance under the Wilshire Bancorp, Inc. 2008 Stock Option Plan, or the "2008 Stock Option Plan". Thus, approximately 120,368,279 shares of our common stock remain authorized, not reserved for stock options, and available for future issuance and sale at the discretion of our Board of Directors.
Changes in accounting standards may affect how we record and report our financial condition and results of operations.
Our accounting policies and methods are fundamental to how we record and report our financial condition and results of operations. From time to time, the Financial Accounting Standards Board and SEC change the financial accounting and reporting standards that govern the preparation of our financial statements. These changes and their impacts on us can be hard to predict and may result in unexpected and materially adverse impacts on our reported financial condition and results of operations.
46
Our business reputation is important and any damage to it may have a material adverse effect on our business.
Our reputation is very important for our business, as we rely on our relationships with our current, former, and potential clients and stockholders, and in the communities we serve. Any damage to our reputation, whether arising from regulatory, supervisory or enforcement actions, matters affecting our financial reporting or compliance with SEC and exchange listing requirements, negative publicity, our conduct of our business or otherwise may have a material adverse effect on our business.
Weakness in commodity businesses could adversely affect our performance.
In addition to the geographic concentration of our markets, certain industry-specific economic factors also affect us. For example, while we do not have a concentration in energy lending, the industry is cyclical and recently has experienced a significant drop in crude oil prices. A severe and prolonged decline in oil and gas commodity prices would adversely affect that industry and, consequently, may adversely affect our customers who are interdependent with that industry.
The pendency of the proposed merger with BBCN and the related diversion of our management's attention from the operation of our business may adversely affect our business and results of operations.
As described in our Current Report on Form 8-K filed with the SEC on December 7, 2015, we entered into a merger agreement with BBCN which, subject to shareholder approval and various other conditions, would result in Wilshire Bancorp being acquired by BBCN. Our management and Board of Directors have devoted and will continue to devote a significant amount of time and attention to the proposed merger. In addition, in connection with the proposed merger, we have incurred and will continue to incur expenses, which could prove to be significant. Our business and our operating and financial results may be materially adversely affected by the diversion of management's time and attention and the expenses incurred in connection with the proposed merger.
If the proposed merger is not completed and we are not otherwise acquired, we may consider other strategic alternatives which are subject to risks and uncertainties.
If the proposed merger is not completed, our Board of Directors will review and consider various alternatives available to us, including, among others, continuing as a public company with no material changes to our business or capital structure. These alternative transactions or initiatives may involve various additional risks to our business, including, among others, distraction of our management team and associated expenses as described above in connection with the proposed merger. In addition, our ability to consummate any alternative transaction or execute any alternative initiative could be subject to various uncertainties. All of the foregoing could adversely affect our operations or financial condition
The failure to complete the merger with BBCN could negatively impact our business.
There is no assurance that the merger with BBCN or any other transaction will occur or that the conditions to the merger will be satisfied in a timely manner or at all. Further, there is no assurance that any event, change or other circumstances that could give rise to the termination of the merger agreement with BBCN will not occur. If the proposed merger or a similar transaction is not completed, the share price of our common stock may drop to the extent that the current market price of our common stock reflects an assumption that a transaction will be completed. In addition, under circumstances defined in the merger agreement with BBCN, we may be required to pay a termination fee of up to approximately $40.0 million. Certain costs associated with the merger are already incurred or may be payable even if the merger is not completed. Further, a failed transaction may result in negative publicity and a negative impression of us in the investment community. There can be no assurance that our business, these relationships, or our
47
financial condition will not be negatively impacted, as compared to the condition prior to the announcement of the merger, if the merger is not consummated.
Item 1B. Unresolved Staff Comments
None.
Our primary banking facilities (corporate headquarters and various lending offices) are located at 3200 Wilshire Boulevard, Los Angeles, California and consist of approximately 70,134 square feet as of December 31, 2015. This lease expires March 31, 2022, but we have an option to extend the lease for two consecutive five-year periods. The combined monthly rent for the lease is currently $98,000.
At December 31, 2015, we had thirty-five full-service branch banking offices which consist of twenty-two branch offices in Southern California, three in Texas, one in Alabama, one in Georgia, four in New Jersey, and four in New York. We also operate six LPOs of which four are utilized primarily for the origination of loans under the SBA lending program located in California, Colorado, Georgia, and Washington, and two that are utilized primarily for the origination of residential mortgage loans located in California. Information about the properties associated with each of our banking facilities is set forth in the table below:
Property | Address | Ownership Status | Square Feet | Purchase Price | Monthly Rent* | Use | Lease Expiration | ||||||||||
|---|---|---|---|---|---|---|---|---|---|---|---|---|---|---|---|---|---|
Wilshire Office | 3200 Wilshire Boulevard, Suite 103 Los Angeles, California | Leased | 7,426 ft | 2 | N/A | $ | 16,709 | Branch Office | March 2022 | ||||||||
Rowland Heights Office | 19765 East Colima Road Rowland Heights, California | Leased | 2,860 ft | 2 | N/A | $ | 9,297 | Branch Office | May 2016 | ||||||||
Western Office | 841 South Western Avenue Los Angeles, California | Leased | 4,950 ft | 2 | N/A | $ | 29,916 | Branch Office | June 2020 | ||||||||
Olympic Office | 2140 West Olympic Boulevard Los Angeles, California | Leased | 9,247 ft | 2 | N/A | $ | 16,737 | Branch Office | August 2019 | ||||||||
Valley Office | 8401 Reseda Boulevard Northridge, California | Leased | 7,350 ft | 2 | N/A | $ | 12,998 | Branch Office | October 2017 | ||||||||
Downtown Office | 401 East 11th Street, Suites 207-211 Los Angeles, California | Leased | 5,500 ft | 2 | N/A | $ | 17,853 | Branch Office | June 2019 | ||||||||
Cerritos Office | 17500 Carmenita Road Cerritos, California | Leased | 5,702 ft | 2 | N/A | $ | 12,378 | Branch Office | January 2017 | ||||||||
Gardena Office | 1701 West Redondo Beach Blvd, #A Gardena, California | Leased | 3,325 ft | 2 | N/A | $ | 6,783 | Branch Office | November 2021 | ||||||||
Rancho Cucamonga Office | 8045 Archibald Avenue Rancho Cucamonga, California | Leased | 3,000 ft | 2 | N/A | $ | 6,316 | Branch Office | November 2020 | ||||||||
City Center Office | 3500 West 6th Street, #201 Los Angeles, California | Leased | 3,538 ft | 2 | N/A | $ | 19,844 | Branch Office | May 2018 | ||||||||
Mid-Wilshire Office | 3832 Wilshire Boulevard Los Angeles, California | Leased | 3,382 ft | 2 | N/A | $ | 14,354 | Branch Office | December 2016 | ||||||||
Fashion Town Office | 1100 South San Pedro Street, #200 Los Angeles, California | Leased | 3,208 ft | 2 | N/A | $ | 6,374 | Branch Office | March 2019 | ||||||||
Fullerton Office (SELC) | 5254 Beach Boulevard Buena Park, California | Leased | 1,440 ft | 2 | N/A | $ | 5,190 | Loan Office | July 2017 | ||||||||
Huntington Park Office | 6350 Pacific Boulevard Huntington Park, California | Purchased In 2005 | 4,350 ft | 2 | $ | 710,000 | N/A | Branch Office | N/A | ||||||||
48
Property | Address | Ownership Status | Square Feet | Purchase Price | Monthly Rent* | Use | Lease Expiration | ||||||||||
|---|---|---|---|---|---|---|---|---|---|---|---|---|---|---|---|---|---|
Torrance Office | 2424 Sepulveda Boulevard Torrance, California | Leased | 2,360 ft | 2 | N/A | $ | 8,197 | Branch Office | June 2019 | ||||||||
Garden Grove Office | 9672 Garden Grove Boulevard Garden Grove, California | Purchased In 2005 | 2,549 ft | 2 | $ | 1,535,500 | N/A | Branch Office | N/A | ||||||||
Manhattan Office | 308 Fifth Avenue New York, New York | Leased | 7,544 ft | 2 | N/A | $ | 36,981 | Branch Office | September 2019 | ||||||||
Bayside Office | 210-16 Northern Boulevard Bayside, New York | Leased | 2,445 ft | 2 | N/A | $ | 12,374 | Branch Office | April 2017 | ||||||||
Flushing Office | 150-24 Northern Boulevard Flushing, New York | Leased | 2,300 ft | 2 | N/A | $ | 19,386 | Branch Office | July 2018 | ||||||||
Fort Lee Office | 215 Main Street Fort Lee, New Jersey | Leased | 2,264 ft | 2 | N/A | $ | 12,513 | Branch Office | May 2017 | ||||||||
Dallas Office | 2237 Royal Lane Dallas, Texas | Purchased | 7,000 ft | 2 | $ | 1,325,000 | N/A | Branch Office | N/A | ||||||||
Denver Office | 2821 South Parker Road, #415 Aurora, Colorado | Leased | 1,135 ft | 2 | N/A | $ | 1,466 | LPO Office | September 2018 | ||||||||
Georgia Office | 3483 Satellite Boulevard, #309 South Duluth, Georgia | Leased | 1,436 ft | 2 | N/A | $ | 1,867 | LPO Office | March 2018 | ||||||||
Fort Worth Office | 7553 Boulevard, #26 North Richland Hills, Texas | Purchased In 2009 | 3,500 ft | 2 | N/A | N/A | Branch Office | N/A | |||||||||
Northern CA Office | 39899 Balentine Drive, #119 Newark, California | Leased | 700 ft | 2 | N/A | $ | 1,295 | LPO Office | February 2017 | ||||||||
Palisades Park Office | 303 Broad Avenue Palisades Park, New Jersey | Leased | 3,405 ft | 2 | N/A | $ | 11,790 | Branch Office | October 2019 | ||||||||
W. Wilshire Office | 3580 Wilshire Boulevard, #120 Los Angeles, California | Leased | 3,523 ft | 2 | N/A | $ | 9,371 | Branch Office | December 2018 | ||||||||
San Pedro Office | 1100 South San Pedro, #L21-25 Los Angeles, California | Leased | 3,459 ft | 2 | N/A | $ | 7,794 | Branch Office | April 2016 | ||||||||
S. Fullerton Office | 5300 Beach Boulevard, #101 Buena Park, California | Leased | 3,155 ft | 2 | N/A | $ | 14,113 | Branch Office | January 2020 | ||||||||
La Crescenta Office | 2750 Foothill Boulevard La Crescenta, California | Leased | 2,123 ft | 2 | N/A | $ | 7,537 | Branch Office | April 2020 | ||||||||
Irvine Office | 14725 Jeffrey Road Irvine, California | Leased | 2,950 ft | 2 | N/A | $ | 17,587 | Branch Office | June 2017 | ||||||||
W. Olympic Office | 3224 W. Olympic Boulevard, #100 Los Angeles, California | Leased | 3,964 ft | 2 | N/A | $ | 19,820 | Branch Office | March 2018 | ||||||||
W. Gardena Office | 2124 W. Redondo Beach Boulevard Torrance, California | Leased | 3,950 ft | 2 | N/A | $ | 7,787 | Branch Office | April 2016 | ||||||||
New York Office** | 307 Fifth Avenue, 5th Floor New York, New York | Leased | 3,650 ft | 2 | N/A | $ | 13,965 | LPO Office | April 2020 | ||||||||
S. Palisades Park Office | 7 Broad Avenue Palisades Park, New Jersey | Leased | 4,085 ft | 2 | N/A | $ | 21,090 | Branch Office | March 2017 | ||||||||
E. Fort Lee Office | 172 Main Street Fort Lee, New Jersey | Leased | 4,500 ft | 2 | N/A | $ | 15,851 | Branch Office | March 2018 | ||||||||
E. Flushing Office | 162-05 Crocheron Avenue Flushing, New York | Leased | 3,500 ft | 2 | N/A | $ | 11,084 | Branch Office | June 2017 | ||||||||
Washington Office | 31620 23rd Avenue, South #305 Federal Way, Washington | Leased | 683 ft | 2 | N/A | $ | 1,230 | LPO Office | October 2016 | ||||||||
Houston Office | 10000 Harwin Drive Houston, Texas | Leased | 2,500 ft | 2 | N/A | $ | 4,163 | Branch Office | June 2019 | ||||||||
LaGrange Office | 1508 Lafayette Parkway LaGrange, Georgia | Leased | 2,000 ft | 2 | N/A | $ | 4,567 | Branch Office | March 2025 | ||||||||
49
Property | Address | Ownership Status | Square Feet | Purchase Price | Monthly Rent* | Use | Lease Expiration | ||||||||||
|---|---|---|---|---|---|---|---|---|---|---|---|---|---|---|---|---|---|
Montgomery Office | 1605 Eastern Boulevard Montgomery, Alabama | Leased | 1,800 ft | 2 | N/A | $ | 4,952 | Branch Office | January 2023 | ||||||||
Laguna Niguel Office | 28202 Cabot Road, #350, 351 Laguna Niguel, California | Leased | 185 ft | 2 | N/A | $ | 3,492 | LPO Office | April 2016 | ||||||||
Newport Beach | 26 Corporate Plaza Drive, #180 Newport Bach, California | Leased | 5,307 ft | 2 | N/A | $ | 15,404 | LPO Office | February 2016 | ||||||||
- *
- Monthly rent is based on figures at December 31, 2015
- **
- The New York LPO office is currently not operating
Management has determined that all of our premises are adequate for our present and anticipated level of business.
In the normal course of business, we are involved in various legal claims. We have reviewed all legal claims against us with counsel and have taken into consideration the views of such counsel as to the potential outcome of the claims. Accrued loss contingencies for all legal claims totaled $120,000 at December 31, 2015, and $135,000 at December 31, 2014. It is reasonably possible we may incur losses in addition to the amounts we have accrued. However, at this time, we are unable to estimate the range of additional losses that are reasonably possible because of a number of factors, including the fact that certain of these litigation matters are still in their early stages and involve claims for which, at this point, we believe have little to no merit. Management has considered these and other possible loss contingencies and does not expect the amounts to be material to any of the consolidated financial statements.
Item 4. Mine Safety Disclosures
Not Applicable
50
Item 5. Market for Registrant's Common Equity, Related Shareholder Matters, and Issuer Purchases of Equity Securities
Trading History
Wilshire Bancorp's common stock is listed for trading on the NASDAQ Global Select Market under the symbol "WIBC."
| | Closing Sale Price | ||||||
|---|---|---|---|---|---|---|---|
| | High | Low | |||||
Year Ended December 31, 2015 | |||||||
First Quarter | $ | 10.17 | $ | 9.06 | |||
Second Quarter | $ | 12.95 | $ | 9.95 | |||
Third Quarter | $ | 12.76 | $ | 9.94 | |||
Fourth Quarter | $ | 12.40 | $ | 10.29 | |||
Year Ended December 31, 2014 | |||||||
First Quarter | $ | 11.82 | $ | 9.53 | |||
Second Quarter | $ | 11.39 | $ | 9.85 | |||
Third Quarter | $ | 10.50 | $ | 9.17 | |||
Fourth Quarter | $ | 10.30 | $ | 8.94 | |||
On February 12, 2016, the closing sale price for the common stock was $9.80, as reported on the NASDAQ Global Select Market.
Shareholders
As of February 12, 2016, there were 338 shareholders of record of our common stock (not including the number of persons or entities holding stock in nominee or street name through various brokerage firms).
Dividends
As a California corporation, we are restricted under the CGCL from paying dividends under certain conditions. Our shareholders are entitled to receive dividends when and as declared by our Board of Directors, out of funds legally available for the payment of dividends, as provided in the CGCL. The CGCL provides that a corporation may make a distribution to its shareholders if retained earnings, immediately prior to dividend payouts, are at least equal to the amount of proposed distribution. In the event that sufficient retained earnings are not available for the proposed distribution, a corporation may, nevertheless, make a distribution, if it meets both the "quantitative solvency" and the "liquidity" tests. In general, the quantitative solvency test requires that the sum of the assets of the corporation equal at least 11/4 times its liabilities. The liquidity test generally requires that a corporation have current assets at least equal to current liabilities, or, if the average of the earnings of the corporation before taxes on income and before interest expenses for the two preceding fiscal years was less than the average of the interest expense of the corporation for such fiscal years, then current assets must be equal to at least 11/4 times current liabilities. In certain circumstances, we may be required to obtain the prior approval of the Federal Reserve Board to make capital distributions to our shareholders.
On June 4, 2013, the Company's Board of Directors approved quarterly cash dividends of $0.03 per common share. The Board of Directors approved an increase in the Company's quarterly dividend to $0.05 per common share on March 12, 2014, and again approved an increase to $0.06 per common share on May 27, 2015. All dividends are subject to the discretion of our Board of Directors and will depend on a
51
number of factors including future earnings, financial condition, cash needs, and general business conditions. Any dividend to our common shareholders must also comply with the restrictions associated with our junior subordinated debentures as well as applicable bank regulations.
The following table shows cash dividends declared to the Company's common shareholders for the two years ended December 31, 2015:
DECLARATION DATE | PAYABLE DATE | RECORD DATE | AMOUNT | |||
|---|---|---|---|---|---|---|
November 20, 2015 | January 15, 2016 | December 31, 2015 | $0.06 per share | |||
August 31, 2015 | October 15, 2015 | September 30, 2015 | $0.06 per share | |||
May 29, 2015 | July 15, 2015 | June 30, 2015 | $0.06 per share | |||
February 27, 2015 | April 15, 2015 | March 31, 2015 | $0.05 per share | |||
November 24, 2014 | January 15, 2015 | December 31, 2014 | $0.05 per share | |||
August 28, 2014 | October 15, 2014 | September 30, 2014 | $0.05 per share | |||
May 28, 2014 | July 15, 2014 | June 30, 2014 | $0.05 per share | |||
March 13, 2014 | April 15, 2014 | March 31, 2014 | $0.05 per share |
Our ability to pay cash dividends in the future will depend in large part on the ability of the Bank to pay dividends on its capital stock to us. The ability of the Bank to pay dividends is restricted by the California Financial Code, the FDIA, and FDIC regulations. In general terms, California law provides that the Bank may declare a cash dividend out of net profits up to the lesser of retained earnings or net income, for the last three fiscal years (less any distributions made to shareholders during such period), or with the prior written approval of the Commissioner of the Department of Business Oversight, in an amount not exceeding the greatest of:
- •
- retained earnings,
- •
- net income for the prior fiscal year, or
- •
- net income for the current fiscal year.
The Bank's ability to pay any cash dividends will depend not only upon our earnings during a specified period, but also on our meeting certain capital requirements. The FDIA and FDIC regulations restricts the payment of dividends when a bank is undercapitalized, when a bank has failed to pay insurance assessments, or when there are safety and soundness concerns regarding a bank. The payment of dividends by the Bank may also be affected by other regulatory requirements and policies, such as maintenance of adequate capital. If, in the opinion of the regulatory authority, a depository institution under its jurisdiction is engaged in, or is about to engage in, an unsafe or unsound practice (which, depending on the financial condition of the depository institution, could include the payment of dividends), such authority may require, after notice and hearing, that such depository institution cease and desist from such practice.
Securities Authorized for Issuance under Equity Compensation Plans
In June 2008, we established the 2008 Stock Incentive Plan that provides for the issuance of restricted stock and options to purchase up to 2,933,200 shares of our authorized but unissued common stock to employees, directors, and consultants. Exercise prices for options may not be less than the fair value at the date of grant. Compensation expense for awards is recorded over the vesting period. Under the 2008 Stock Incentive Plan, there were outstanding stock options to purchase 885,708 shares of our common stock and 135,874 shares of restricted stock outstanding as of December 31, 2015.
52
The following table summarizes information as of December 31, 2015 relating to the number of securities to be issued upon the exercise of the outstanding options under the 2008 Plan and their weighted-average exercise price.
| | Number of Securities to be Issued Upon Exercise of Outstanding Options, Warrants, and Rights | Weighted-Average Exercise Price of Outstanding Options, Warrants, and Rights | Number of Securities Available for Future Issuance Under Equity Compensation Plans | |||||||
|---|---|---|---|---|---|---|---|---|---|---|
| | (a) | (b) | (c) | |||||||
Equity Compensation Plans Approved by Security Holders | 885,708 | $ | 6.37 | 1,240,084 | ||||||
Equity Compensation Plans Not Approved by Security Holders | — | — | — | |||||||
| | | | | | | | | | | |
Total Equity Compensation Plans | 885,708 | $ | 6.37 | 1,240,084 | ||||||
| | | | | | | | | | | |
| | | | | | | | | | | |
| | | | | | | | | | | |
53
The following graph compares the yearly percentage change in cumulative total shareholders' return on our common stock with the cumulative total return of (i) the NASDAQ market index; (ii) the SNL $1 Billion - $5 Billion Asset-Size Bank Index; and (iii) the SNL Western Bank Index, comprised of banks and bank holding companies located in California, Oregon, Washington, Montana, Hawaii, Nevada, and Alaska. Both the SNL $1 Billion - $5 Billion Asset-Size Bank Index and the SNL Western Bank Index were compiled by SNL Securities LP of Charlottesville, Virginia. The graph assumes an initial investment of $100 and reinvestment of dividends. The graph is not necessarily indicative of future price performance.
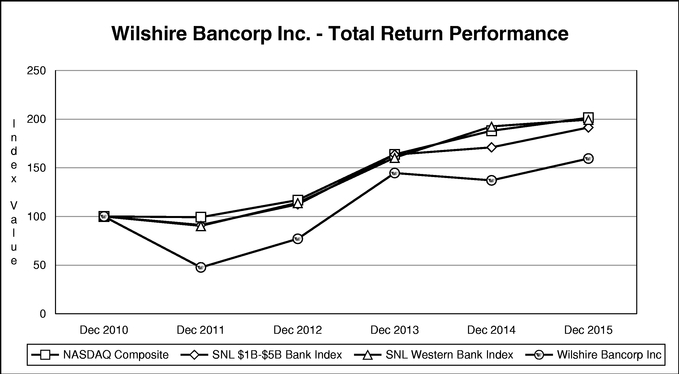
| | At December 31, | ||||||||||||||||||
|---|---|---|---|---|---|---|---|---|---|---|---|---|---|---|---|---|---|---|---|
| | 2010 | 2011 | 2012 | 2013 | 2014 | 2015 | |||||||||||||
Wilshire Bancorp Inc. | $ | 100.00 | $ | 47.64 | $ | 77.03 | $ | 144.61 | $ | 137.07 | $ | 159.49 | |||||||
NASDAQ© Composite | 100.00 | 99.21 | 116.82 | 163.75 | 188.03 | 201.40 | |||||||||||||
SNL© $1B - $5B Bank Index | 100.00 | 91.20 | 112.45 | 163.52 | 170.98 | 191.39 | |||||||||||||
SNL© Western Bank Index | 100.00 | 90.34 | 114.01 | 160.41 | 192.51 | 199.46 | |||||||||||||
Source:- SNL Financial LC, Charlottesville, VA
54
Item 6. Selected Financial Data
The following table presents selected historical financial information as of and for each of the five years ended December 31, 2015. The selected historical financial information is derived from our audited consolidated financial statements and should be read in conjunction with our financial statements and the notes thereto which appear elsewhere in this Annual Report and "Management's Discussion and Analysis of Financial Condition and Results of Operation" in Item 7:
| | As of and For the Years Ended December 31, | |||||||||||||||
|---|---|---|---|---|---|---|---|---|---|---|---|---|---|---|---|---|
(Dollars in Thousands, Except Share and Per Share Data) | 2015 | 2014 | 2013 | 2012 | 2011 | |||||||||||
Summary Statement of Income Data: | ||||||||||||||||
Interest income | $ | 176,893 | $ | 163,704 | $ | 123,739 | $ | 116,957 | $ | 129,964 | ||||||
Interest expense | 26,051 | 18,167 | 13,409 | 17,055 | 22,589 | |||||||||||
Net interest income before (credit) provision for losses on loans and loan commitments | 150,842 | 145,537 | 110,330 | 99,902 | 107,375 | |||||||||||
Provision (credit) for losses on loans and loan commitments | 700 | — | — | (34,000 | ) | 59,100 | ||||||||||
Non-interest income | 45,654 | 41,241 | 34,183 | 28,249 | 23,805 | |||||||||||
Non-interest expenses | 99,890 | 97,514 | 76,856 | 74,179 | 68,785 | |||||||||||
Income before income taxes | 95,906 | 89,264 | 67,657 | 87,972 | 3,295 | |||||||||||
Income taxes provision (benefit) | 34,501 | 30,255 | 22,281 | (4,333 | ) | 33,625 | ||||||||||
Preferred stock cash dividend, accretion of Preferred Stock, and one-time adjustment from repurchase of Preferred Stock | — | — | — | 1,401 | (3,658 | ) | ||||||||||
Net income (loss) available to common shareholders | 61,405 | 59,009 | 45,376 | 93,706 | (33,988 | ) | ||||||||||
Per Common Share Data: | ||||||||||||||||
Net income (loss) available to common shareholders: | ||||||||||||||||
Basic earnings per common share | $ | 0.78 | $ | 0.75 | $ | 0.63 | $ | 1.31 | $ | (0.61 | ) | |||||
Diluted earnings per common share | $ | 0.78 | $ | 0.75 | $ | 0.63 | $ | 1.31 | $ | (0.61 | ) | |||||
Book value per common share | $ | 6.78 | $ | 6.25 | $ | 5.63 | $ | 4.80 | $ | 3.49 | ||||||
Weighted average common shares outstanding: | ||||||||||||||||
Basic | 78,486,883 | 78,250,901 | 71,771,116 | 71,288,484 | 55,710,377 | |||||||||||
Diluted | 78,818,556 | 78,591,374 | 72,037,516 | 71,375,150 | 55,710,377 | |||||||||||
Year-end common shares outstanding | 78,608,717 | 78,322,462 | 78,061,307 | 71,295,144 | 71,282,518 | |||||||||||
55
| | As of and For the Years Ended December 31, | |||||||||||||||
|---|---|---|---|---|---|---|---|---|---|---|---|---|---|---|---|---|
(Dollars in Thousands) | 2015 | 2014 | 2013 | 2012 | 2011 | |||||||||||
Summary Statement of Financial Condition Data: | ||||||||||||||||
Total loans, net of unearned income1 | $ | 3,844,927 | $ | 3,320,080 | $ | 2,864,399 | $ | 2,152,340 | $ | 1,981,486 | ||||||
Allowance for loan losses | 52,405 | 48,624 | 53,563 | 63,285 | 102,982 | |||||||||||
Other real estate owned | 9,179 | 7,922 | 7,600 | 2,080 | 8,221 | |||||||||||
Total assets | 4,713,468 | 4,155,469 | 3,617,735 | 2,750,863 | 2,696,854 | |||||||||||
Total deposits | 3,839,876 | 3,401,259 | 2,871,510 | 2,166,809 | 2,202,309 | |||||||||||
FHLB advances2 | 220,000 | 150,000 | 190,325 | 150,000 | 60,000 | |||||||||||
Junior subordinated debentures | 72,016 | 71,779 | 71,550 | 61,857 | 87,321 | |||||||||||
Total shareholders' equity | 532,930 | 489,411 | 439,418 | 342,417 | 309,582 | |||||||||||
Performance ratios: | ||||||||||||||||
Return on average total equity3 | 11.84 | % | 12.65 | % | 12.39 | % | 30.18 | % | –11.46 | % | ||||||
Return on average common equity4 | 11.84 | % | 12.65 | % | 12.39 | % | 30.18 | % | –16.66 | % | ||||||
Return on average assets5 | 1.36 | % | 1.57 | % | 1.56 | % | 3.55 | % | –1.10 | % | ||||||
Net interest margin6 | 3.58 | % | 4.20 | % | 4.07 | % | 4.07 | % | 4.15 | % | ||||||
Efficiency ratio7 | 50.84 | % | 52.21 | % | 53.18 | % | 57.88 | % | 52.44 | % | ||||||
Net loans to total deposits at year end | 98.77 | % | 96.18 | % | 97.89 | % | 96.41 | % | 85.30 | % | ||||||
Common dividend payout ratio | 29.41 | % | 26.53 | % | 14.51 | % | 0.00 | % | 0.00 | % | ||||||
Capital ratios: | ||||||||||||||||
Average common shareholders' equity to average total assets | 11.49 | % | 12.40 | % | 12.63 | % | 11.76 | % | 7.39 | % | ||||||
Tier 1 capital to quarter-to-date average total assets | 11.30 | % | 12.11 | % | 13.44 | % | 14.87 | % | 13.86 | % | ||||||
Tier 1 common equity capital to total risk-weighted assets | 11.23 | % | N/A | N/A | N/A | N/A | ||||||||||
Tier 1 capital to total risk-weighted assets | 12.86 | % | 14.13 | % | 14.79 | % | 18.47 | % | 19.59 | % | ||||||
Total capital to total risk-weighted assets | 14.11 | % | 15.38 | % | 16.05 | % | 19.74 | % | 20.89 | % | ||||||
Asset quality ratios: | ||||||||||||||||
Non-performing loans to total loans8 | 0.56 | % | 1.12 | % | 1.30 | % | 1.30 | % | 2.21 | % | ||||||
Non-performing assets to total loans and other real estate owned9 | 0.80 | % | 1.36 | % | 1.56 | % | 1.39 | % | 2.62 | % | ||||||
Net charge-offs to average total loans | –0.09 | % | 0.16 | % | 0.43 | % | 0.40 | % | 3.16 | % | ||||||
Allowance for loan losses to gross loans receivable at year end | 1.37 | % | 1.47 | % | 1.90 | % | 3.15 | % | 5.33 | % | ||||||
Allowance for loan losses to non-performing loans | 241.56 | % | 130.48 | % | 143.85 | % | 226.40 | % | 234.95 | % | ||||||
- 1
- Total loans is the sum of loans receivable and loans held-for-sale and is reported at their outstanding principal balances, net of any unearned income (unamortized deferred fees and costs) and discount on acquired loans
- 2
- At December 31, 2015, our borrowing capacity with FHLB was $1.42 billion, with $1.19 billion in remaining capacity
- 3
- Net income divided by average total shareholders' equity
- 4
- Net income available to common shareholders, divided by average common shareholders' equity
- 5
- Net income divided by average total assets
- 6
- Represents net interest income as a percentage of average interest-earning assets
- 7
- Represents the ratio of non-interest expense to the sum of net interest income before (credit) provision for losses on loans and loan commitments and total non-interest income
- 8
- Non-performing loans consist of non-accrual loans, loans past due 90 days or more
- 9
- Non-performing assets consist of non-performing loans (see footnote 8 above), and other real estate owned
56
Item 7. Management's Discussion and Analysis of Financial Condition and Results of Operations
This discussion presents management's analysis of our results of operations and financial condition as of and for each of the years in the three-year period ended December 31, 2015. The discussion should be read in conjunction with our consolidated financial statements and the notes related thereto which appear elsewhere in this Report.
Executive Overview
Introduction
We operate a community bank in the general commercial banking business, with our primary market encompassing the multi-ethnic population of the Los Angeles metropolitan area. Our full-service offices are located primarily in areas where a majority of the businesses are owned by Korean-speaking immigrants, with many of the remaining businesses owned by Hispanic and other minority groups.
In 2011, we experienced significant losses due primarily to an increase in provision for loan losses and loan commitments that resulted from deterioration in the loan portfolio. Management was successful in reversing this trend and returned the Company to its most profitable year in history in 2012. During 2012 and 2013, we experienced improvement in overall credit quality of our loan portfolio evidenced by a reduction in classified loans levels.
On October 1, 2013, the Company acquired BankAsiana, headquartered in Palisades Park, New Jersey, and on November 20, 2013 acquired Saehan, headquartered in Los Angeles, California. The acquisitions were accounted for in accordance with Accounting Standards Codification ("ASC") 805 "Business Combinations." We acquired approximately $793.0 million in assets in aggregate which included $550.2 million in loans. In addition, $666.0 million in total deposits were acquired through these transactions. As a result of these acquisitions, the Company was able to add additional branch offices and LPOs to our existing network of branches. We believe that our market coverage complements our multi-ethnic small business focus. We intend to be cautious about our growth strategy in future years regarding opening of additional branches and LPOs. We expect to continue implementing our growth strategy using strategic planning and market analysis, as our needs and resources permit.
During the first quarter of 2015, the Bank purchased certain assets and partially assumed the operations of Bank of Manhattan's Mortgage Division. The Mortgage Division was first formed in 2010 and offers conforming, super-conforming, jumbo residential, and other residential mortgage products. The Bank acquired certain assets and liabilities of the Mortgage Division and hired approximately 30 employees consisting of loan managers, loan officers, and operations personnel. The Mortgage Division has been integrated into the Bank's existing Mortgage Department, substantially increasing the Bank's mortgage lending origination platform.
On December 7, 2015, the Company entered into a Merger Agreement with BBCN. Under the Merger Agreement, at the effective time of the merger, each outstanding share of the Company's common stock will be converted into 0.7034 shares of BBCN's common stock, with any fractional shares paid in cash. The board of the surviving corporation will consist of 16 members, with BBCN and the Company designating nine and seven directors, respectively to serve on such board, and Steven Koh, the Company's chairman, will serve as chairman of the board and Kevin Kim, BBCN's chief executive officer, will serve as chief executive officer of the combined corporation. The consummation of the merger is subject to customary conditions, including receipt of regulatory approvals, receipt of the requisite approval of the shareholders of the Company and BBCN, the absence of any law or order prohibiting the closing, and effectiveness of the registration statement to be filed by BBCN with respect to the stock to be issued in the merger. The merger is expected to close in the second half of 2016.
At December 31, 2015, we had approximately $4.71 billion in assets, $3.84 billion in total loans (net of deferred fees and including loans held-for-sale), and $3.84 billion in deposits. We have expanded and
57
diversified our business geographically by focusing on the continued development of our East Coast market. In 2015 we opened branch offices in the States of Alabama and Georgia, targeting the multi-ethic communities in the Southeastern Unites States ("U.S.") and U.S. subsidiaries of companies based in Korea.
2015 Key Performance Indicators
We believe the following were key indicators of our operations during 2015:
- •
- Our total assets increased to $4.71 billion at the end of 2015, an increase of 13.4%, from $4.16 billion at the end of 2014.
- •
- Our total deposits increased to $3.84 billion at the end of 2015, an increase of 12.9%, from $3.40 billion at the end of 2014.
- •
- Our total loans increased to $3.84 billion at the end of 2015, an increase of 15.8%, from $3.32 billion at the end of 2014.
- •
- Total net interest income before provision for loan losses increased to $150.8 million in 2015, an increase of 3.6%, from $145.5 million in 2014.
- •
- Provision for losses on loans and loan commitments in 2015 totaled $700,000 compared to no provision for 2014.
- •
- Total non-interest income increased to $45.7 million in 2015, an increase of 10.7%, from $41.2 million in 2014.
- •
- Total non-interest expense increased to $99.9 million, or 2.4%, in 2015, compared to $97.5 million in 2014.
- •
- Net income for 2015 increased to $61.4 million, or $0.78 per basic and diluted common share, compared with net income of $59.0 million, or $0.75 per basic and diluted common share in 2014.
Critical Accounting Policies
The discussion and analysis of our financial condition and results of operations is based upon our financial statements, and has been prepared in accordance with accounting principles generally accepted in the United States of America. The preparation of these consolidated financial statements requires management to make estimates and judgments that affect the reported amounts of assets and liabilities, revenues and expenses, and related disclosures of contingent assets and liabilities at the date of our financial statements. Actual results may differ from these estimates under different assumptions or conditions.
Various elements of our accounting policies, by their nature, are inherently subject to estimation techniques, valuation assumptions, and other subjective assessments. We have identified several accounting policies that, due to judgments, estimates, and assumptions inherent in those policies are critical to an understanding of our consolidated financial statements. These policies relate to the classification and valuation of investment securities, the valuation of retained interests and servicing assets related to the sales of SBA and mortgage loans, the methodologies that determine our allowance for losses on loans, the treatment of non-accrual loans, valuation of held-for-sale loans, treatment of acquired loans, valuation of OREO, valuation of mortgage banking derivatives, the evaluation of goodwill and intangible assets, evaluation of FDIC loss-share indemnification impairment, and the accounting for income tax provisions. In each area, we have identified the variables most important in the estimation process. We believe that we have used the best information available to make the necessary estimates to value the related assets and liabilities. Actual performance that differs from our estimates and future changes in key variables could change future valuations and could have an impact on our net income.
58
Investment Securities
Our investment policy seeks to provide and maintain liquidity, and to produce favorable returns on investments without incurring unnecessary interest rate or credit risk, while complementing our lending activities. Our investment securities portfolio is subject to interest rate risk. Fluctuations in interest rates may cause actual prepayments to vary from the estimated prepayments over the life of a security. This may result in adjustments to the amortization of premiums or accretion of discounts related to these instruments, consequently changing the net yield on such securities. Reinvestment risk is also associated with the cash flows from such securities. The unrealized gain/loss on such securities may also be adversely impacted by changes in interest rates.
Under ASC 320-10, investment securities that management has the positive intent and ability to hold-to-maturity are classified as "held-to-maturity" and recorded at amortized cost. Securities that are bought and held principally for the purpose of selling them in the near term are classified as "trading securities". Securities not classified as held-to-maturity or trading securities are classified as "available-for-sale" and recorded at fair value. Purchase premiums and discounts are recognized in interest income using the interest method over the estimated lives of the securities.
The classification and accounting for investment securities are discussed in detail in Notes 1 and 4 of the notes to the consolidated financial statements presented later in this Report. Under ASC 320-10, investment securities generally must be classified as held-to-maturity, available-for-sale, or trading. The appropriate classification is based partially on our ability to hold the securities to maturity and largely on management's intentions with respect to either holding or selling the securities. The classification of investment securities is significant since it directly impacts the accounting for unrealized gains and losses on securities. Unrealized gains and losses on trading securities flow directly through earnings during the periods in which they arise. Investment securities that are classified as held-to-maturity are recorded at amortized cost. Unrealized gains and losses on available-for-sale securities are recorded as a separate component of shareholders' equity (accumulated other comprehensive income or loss) and do not affect earnings until realized or deemed to be other-than-temporarily impaired.
The Company currently utilizes an independent third party bond accounting service for our investment portfolio accounting. The third party provides fair values derived from a proprietary matrix pricing model which utilizes several different sources for pricing. The fair values for our investment securities are updated on a monthly basis. The values received are tested annually and are validated using prices received from another independent third party source. We also perform an analysis on the broker quotes received from third parties to ensure that the prices represent a reasonable estimate of the fair value. The procedures include, but are not limited to, initial and on-going review of third party pricing methodologies, review of pricing trends, and monitoring of trading volumes. We ensure whether prices received from independent brokers represent a reasonable estimate of fair value through the use of internal and external cash flow models developed based on spreads, and when available, market indices. As a result of this analysis, if we determine there is a more appropriate fair value based upon the available market data, the price received from the third party is adjusted accordingly.
We are obligated to assess, at each reporting date, whether there is an other-than-temporary impairment ("OTTI") to our investment securities. Impairments related to credit issues must be recognized in current earnings rather than in other comprehensive income. The determination of an OTTI is a subjective process involving assessment of valuation and changes in such valuations resulting from deteriorating credit worthiness. We examine all individual securities that are in an unrealized loss position at each reporting date for OTTI impairments. Specific investment-related factors we examine to assess impairment include the nature of the investment, severity and duration of the loss, the probability that we will be unable to collect all amounts due, and analysis of the issuers of the securities and whether there has been any cause for default on the securities and any change in the rating of the securities by the various rating agencies. Additionally, we evaluate whether the creditworthiness of the issuer calls the realization of
59
contractual cash flows into question. We reexamine the financial resources, intent, and the overall ability of the Company to hold the securities until their fair values recover. Management does not believe that there are any investment securities, other than those identified in the current and previous periods, which are deemed to be other-than-temporarily impaired as of December 31, 2015. Investment securities are discussed in more detail in Note 1 and 4 in the footnotes to our consolidated financial statements presented later in this Report.
As required under Financial Accounting Standards Board ("FASB") ASC 320-10-35-18, we consider all available information relevant to the collectability of the security, including information about past events, current conditions, and reasonable and supportable forecasts, when developing the estimate of future cash flows and making an OTTI assessment for our portfolio of residual securities. We consider factors such as remaining payment terms of the security, prepayment speeds, and the financial condition of the issuer(s), expected defaults, and the value of any underlying collateral.
As of December 31, 2015 and December 31, 2014, no investment securities were determined to have an OTTI. The unrealized losses on our government sponsored enterprises ("GSE") bonds, residential collateralized mortgage obligations ("CMOs"), and mortgage-backed securities ("MBS") are attributable to both changes in interest rates and a repricing risk in the market. All GSE bonds, GSE CMO, and GSE MBS securities are backed by U.S. Government Sponsored and Federal Agencies and therefore rated "AAA." We have no exposure to the "Subprime Market" in the form of Asset Backed Securities and Collateralized Debt Obligations that had previously been rated "AAA" but have since been downgraded to below investment grade. We have the intent and ability to hold the securities in an unrealized loss position at December 31, 2015 and 2014, until the fair value recovers or the securities mature.
Municipal bonds and corporate bonds are evaluated by reviewing the creditworthiness of the issuer and general market conditions. There were no unrealized losses on our municipal or corporate securities at December 31, 2015 and 2014. In the event of future unrealized losses on our municipal and corporate securities, we have the intent and ability to hold the securities in an unrealized loss position until the fair value recovers or the securities mature
Small Business Administration Loans
Certain SBA loans that may be sold prior to maturity have been designated as held-for-sale at origination and are recorded at the lower of cost or fair value, determined on an aggregate basis. A valuation allowance is established if the fair value of such loans is lower than their cost, and operations are charged or credited for valuation adjustments. When we sell a loan, we usually sell the guaranteed portion of the loan and retain the non-guaranteed portion. We receive sales proceeds from: (i) the guaranteed principal of the loan, (ii) the deferred premium for the difference between the book value of the retained portion and the fair value allocated to the retained portion, and (iii) the loan excess servicing fee ("ESF"). At the time of sale, the deferred premium, which is amortized over the remaining life of the loan as an adjustment to yield, is recorded for the difference between the book value and the fair value allocated to the retained portion. The gain from the sale is recognized by taking the difference between the proceeds and the book value allocated to the sold portion in accordance with ASC 860 (Transfers and Servicing).
We allocate the book value of the related loans among three portions on the basis of their relative fair value: (i) the sold portion, (ii) the retained portion, and (iii) the ESF. We estimate the fair value of each portion based on the following: (x) the amount received from the sale represents the fair value of the sold portion, (y) the fair value of the retained portion is computed by discounting its future cash flows over the estimated life of the loan, and (z) we calculate the fair value of the ESF for the loan from the cash in-flow of the net servicing fee over the estimated life of the loan, discounted at an above average discount rate and a range of constant prepayment rates of the related loans.
We capitalize the fair value allocated to ESF in intangible servicing assets (the contracted servicing fee less normal servicing costs). The servicing asset is recorded based on the present value of the contractually
60
specified servicing fee, net of servicing cost, over the estimated life of the loan, with an average discount rate and a range of constant prepayment rates of related loans. For purposes of measuring impairment, the servicing assets are stratified by collateral types. Management periodically evaluates the fair value of servicing assets for impairment. A valuation allowance is recorded when the fair value is below the carrying amount and a recovery of the valuation allowance is recorded when its fair value exceeds the carrying amount. Any subsequent increase or decrease in fair value of servicing assets and liabilities is to be included in our current earnings in the Consolidated Statements of Income. An interest-only strip is recorded based on the present value of the excess of future interest income, over the contractually specified servicing fee, calculated using the same assumptions as noted above. Interest-only strips are accounted for at their estimated fair values, with unrealized gains recorded as an adjustment in accumulated other comprehensive income in shareholders' equity. If the estimated fair value is less than its carrying value, the loss is considered an OTTI and it is charged to the current earnings.
Allowance for Loan Losses
Based on the credit risk inherent in our lending business, we set aside an allowance for losses on loans and for unfunded loan commitments which are established by a periodic provision or credit for loan losses charged to earnings. These charges are not only made for the outstanding loan portfolio, but also for off-balance sheet loan commitments, such as commitments to extend credit or letters of credit. The charges made for the outstanding loan portfolio are credited to the allowance for loan losses, whereas charges related to loan commitments are credited to the reserve for loan commitments, which is presented as a component of other liabilities.
The allowance for loan losses is comprised of two components the general valuation allowance ("GVA") and the specific valuation allowance ("SVA"). The GVA allowance is based on loans that are evaluated for losses in pools based on historical experience in addition to qualitative adjustments ("QA"), or estimated losses from factors not captured by historical experience. The SVA portion of the allowance is based on the estimated losses on impaired loans that are individually evaluated. Management performs a review of the historical loss rates used in the GVA as well as the factors in our QA methodology on a quarterly basis due to the increased significance of GVA when estimating losses in the current economic environment.
To establish an adequate allowance, we must be able to recognize when loans have become a problem. A risk grade of either pass, watch, special mention, substandard, or doubtful, is assigned to every loan in the loan portfolio, with the exception of homogeneous loans, or loans that are evaluated together in pools of similar loans (i.e., home mortgage loans, home equity lines of credit, overdraft loans, express business loans, and automobile loans). The following is a brief description of the loan classifications or risk grades used in our allowance calculation:
Pass Loans—Loans that are past due less than 30 days that do not exhibit signs of credit deterioration. The financial condition of the borrower is sound as is the status of any collateral. Loans secured by cash (principal and interest) also fall within this classification.
Watch Loans—Performing loans with borrowers that have experienced adverse financial trends, higher debt/equity ratio, or weak liquidity positions, but not to the degree that the loan is considered a problem.
Special Mention—Loans that are currently protected but exhibit an increasing degree of risk based on weakening credit strength and/or repayment sources. Contingent or remedial plans to improve the Bank's risk exposure documented for these loans.
Substandard—Loans inadequately protected by the current worth and paying capacity of the borrower or pledged collateral, if any. This grade is assigned when inherent credit weakness is apparent.
61
Doubtful—Loans having all the weakness inherent in a "substandard" classification but collection or liquidation is highly questionable with the possibility of loss at some future date.
We currently use migration analysis as a factor in calculating our allowance for loan losses in addition to a software program used to produce historical loss rates for different loan classes used in our GVA estimations. The Company also utilizes a QA matrix to estimate losses not captured by historical experience. The QA matrix takes into consideration both internal and external factors, and includes forecasted economic environments (unemployment and GDP), problem loan trends (non-accrual, delinquency, and impaired loans), trends in real estate value, and other factors. Although the QA takes into consideration different loan segments and loan classes, the adjustments made are to the loan portfolio as a whole. For impaired loans, or SVA allowance, we evaluate loans on an individual basis to determine impairment in accordance with GAAP. All these components are combined for a final allowance for loan losses figure on a quarterly basis.
In 2013, management made enhancements to the overall allowance for loan losses calculation methodology to better reflect potential losses in the loan portfolio in the current economic environment. There were three main enhancements to the methodology, a change to the loss horizon used to calculate historical losses from 12 quarters to 16 quarters, setting a minimum historical loss rate for loan pools, and a change to the impairment calculation methods for impaired loans. There were no changes to the allowance methodology in 2014 or 2015.
Non-Accrual Loan Policy
Interest on loans is credited to income as earned and is accrued only if deemed collectible. Accrual of interest is discontinued when a loan is 90 days or more delinquent unless management believes the loan is adequately collateralized and in the process of collection. Loans that are less than 90 days past due may also be categorized as non-accrual if there is evidence to suggest that a portion or all of the contractual amounts due will not be collected. Generally, payments received on non-accrual loans are recorded as principal reductions. Interest income is recognized after all principal has been repaid or an improvement in the condition of the loan has occurred that would warrant resumption of interest accruals.
Loans Held-For-Sale
Certain mortgage and SBA loans that may be sold prior to maturity have been designated as held-for-sale at origination and are recorded at the lower of cost or fair value. A valuation allowance is established if the fair value of such loans is lower than their cost, and is charged against operating income. The premium on the pro-rata principal of SBA loans sold is recognized as gain on sale of loans. The discount related to the unsold principal of SBA loans is deferred and amortized over the remaining life of the loan as an adjustment to yield.
Acquired Loans
Acquired loans are recorded at fair value at the time they are acquired and any related allowance is not carried over in the acquisition. These acquired loans were segmented into two groups, loans with evidence of credit quality deterioration, and loan without evidence of credit deterioration. Purchased loans with evidence of credit quality deterioration where the Company estimates that it will not receive all contractual payments are accounted for as purchased credit impaired loans in accordance with ASC 310-30, "Loans and Debt Securities Acquired with Deteriorated Credit Quality" and deemed "ASC 310-30 loans." Acquired loans without evidence of credit deterioration are not accounted for under ASC 310-30 and are referred to as "Non-ASC 310-30 loans." At the time of acquisition, Non-ASC 310-30 loans are aggregated into pools based on similar loan characteristics such as type of loans, variable or fixed, payment type, and other factors. Management periodically reassesses the net realizable value of
62
Non-ASC 310-30 loan pools and records interest income resulting from the accretion of the purchase discount in accordance with ASC 310-20.
Credit Impaired Loans (ASC 310-30 Loans)
Purchased loans with evidence of credit quality deterioration where the Company estimates that it will not receive all contractual payments are accounted for as purchased credit impaired loans in accordance with ASC 310-30. At the time of acquisition, ASC 310-30 loans are aggregated into pools based on similar loan characteristics such as type of loans, variable or fixed, payment type, and other factors. The estimated cash flows expected for each pool was estimated at the time the loans were acquired. The excess of the cash flows expected to be collected on purchased credit impaired loans, measured as of the acquisition date, over the estimated fair value is referred to as the "accretable yield," and is recognized in interest income over the remaining life of the loan using a level yield method of accretion. The difference between contractually required payments as of the acquisition date and the cash flows expected to be collected is referred to as the "non-accretable difference," and is not accreted over time. For Non-ASC 310-30 loans, the difference between contractually required payments as of the acquisition date and the fair value is accreted over the remaining life of the loan using a level yield method of accretion.
The Company estimates expected cash flows to be collected over the life of acquired loans on a recurring basis. If the Company determines that expected cashflows have decreased, ASC 310-30 loans would be considered further impaired which would result in a provision for loan losses and a corresponding increase in valuation allowance included in the allowance for loan losses. However, if expected cashflows have increased in subsequent evaluations, the Company will reduce any remaining valuation allowance. If a valuation allowance does not exist, the accretable yield will be recalculated to account for the increase in expected cashflows.
At the time of acquisition, the fair value of loans acquired from Mirae Bank, BankAsiana, and Saehan totaled $285.7 million, $168.6 million, and $381.7 million, respectively, which represented discounts of $54.7 million, $9.2 million, and $27.7 million, respectively. At December 31, 2015, carrying amount of ASC 310-30 loans related to the acquisitions of Mirae Bank, BankAsiana, and Saehan totaled $24.9 million, $93.7 million, and $254.1 million, respectively.
Valuation of Other Real Estate Owned
Other real estate owned ("OREO"), which represents real estate acquired through foreclosure, or deed in lieu of foreclosure in satisfaction of commercial and real estate loans, is carried at the estimated fair value less the selling costs of the real estate. The fair value of the property is based upon a current appraisal. The difference between the fair value of the real estate collateral and the loan balance at the time of transfer is recorded as a loan charge-off if fair value is lower than the loan balance. Subsequent to foreclosure, management periodically performs valuations on OREO and the OREO property is carried at the lower of its carrying value or fair value, less cost to sell. The determination of a property's estimated fair value incorporates (i) revenues projected to be realized from disposal of the property, (ii) construction and renovation costs, (iii) marketing and transaction costs, and (iv) holding costs (e.g., property taxes, insurance, and homeowners' association dues). Any subsequent declines in the fair value of the OREO property after the date of transfer are recorded through a write-down of the asset. Any subsequent operating expenses or income, reduction in estimated fair values, and gains or losses on disposition of such properties are charged or credited to current operations.
63
Valuation of Mortgage Banking Derivatives
The Company enters into various stand-alone mortgage-banking derivatives in order to hedge the risk associated with fluctuations of interest rates. Residential mortgage loans funded with interest rate lock commitments and forward commitments for the future delivery of mortgage loans to third party investors are considered derivatives. The Company accounts for loan commitments related to the origination of mortgage loans that will be held-for-sale as derivatives at fair value on the balance sheet, with changes in fair value recorded in earnings. Commitments to originate mortgage loans that will be held for investment are not accounted for as derivatives and therefore are not recorded at fair value. Subsequent changes in the fair value of a derivative loan commitments are recognized in earnings in the period in which the changes occur.
At December 31, 2015, the Company had approximately $35.7 million of interest rate lock commitments and $17.1 million of forward sales commitments for the future delivery of residential mortgage loans. The fair value of these mortgage banking derivatives was reflected by a derivative asset of $222,000 and a derivative liability of $16,000 respectively. The Company did not have any mortgage derivatives at December 31, 2014.
Goodwill and Intangible Assets
Goodwill and intangible assets arise from the acquisition method of accounting for business combinations. We recognized goodwill of approximately $6.7 million in connection with the acquisition of Liberty Bank of New York in 2006, our four original East Coast branches prior to the acquisition of BankAsiana. An additional $60.8 million in goodwill was recognized with our 2013 acquisitions of which $10.8 million was related to BankAsiana, and $50.0 million was related to Saehan. As of December 31, 2015 and December 31, 2014, goodwill totaled $67.5 million. Other intangibles include $1.6 million and $1.3 million, respectively, in core deposits intangibles were recorded as a result of the Liberty Bank and Mirae Bank acquisitions. In 2013, $725,000 and $3.8 million in additional core deposits intangibles were recorded from the acquisitions of BankAsiana and Saehan, respectively. Remaining core deposits intangibles balance at December 31, 2015 totaled $15,000, $246,000, $599,000, and $2.3 million related to the Liberty Bank, Mirae Bank, BankAsiana, and Saehan, respectively.
The assets acquired and liabilities assumed from BankAsiana and Saehan were accounted for in accordance with ASC 805 "Business Combinations," using the acquisition method of accounting and were recorded at their estimated fair values on the date of each acquisition. These fair value estimates were considered provisional for a period of up to one year from the dates of the acquisitions.
Goodwill and intangible assets that have indefinite useful lives are not amortized but are tested annually for impairment. Intangible assets that have finite useful lives, such as core deposits intangibles and unfavorable lease intangibles, are amortized over their estimated useful lives. An impairment loss is recognized to the extent that the carrying amount exceeds the asset's fair value. The goodwill impairment analysis is a two-step test. The first step, used to identify potential impairment, involves comparing the East Coast branches' estimated fair value to its carrying value, including goodwill. If the estimated fair value exceeds the carrying value, goodwill is considered not to be impaired. If the carrying value exceeds estimated fair value, there is an indication of potential impairment and the second step is performed to measure for actual impairment, if any exists.
If required, the second step involves calculating an implied fair value of goodwill. This fair value amount is determined in a manner similar to the way goodwill is calculated in a business combination, by measuring the excess of the estimated fair value of the unit, as determined in the first step, over the aggregate estimated fair values of the individual assets, liabilities and identifiable intangibles as if the unit was being acquired in a business combination. If the implied fair value of goodwill exceeds the carrying value of goodwill, there is no impairment. If the carrying value of goodwill exceeds the implied fair value of
64
the goodwill, an impairment charge is recorded for the excess and a new basis is established for goodwill. An impairment loss cannot exceed the carrying value of goodwill.
Under ASU 2011-08, a company is given the choice of assessing qualitative factors to determine whether it is more-likely-than-not, that the fair value of a reporting unit is less than its carrying amount as a basis for determining whether it is necessary to perform the two-step goodwill impairment test. Under ASU 2011-08, an entity is not required to calculate the fair value of a reporting unit unless the entity determines that it is more-likely-than-not that its fair value is less than its carrying amount.
Management assessed the qualitative factors for the year ended December 31, 2015 to determine whether it was more-likely-than-not that goodwill was impaired. Based on the analysis of these factors, management determined that it was more-likely-than-not that the fair value of acquired assets related to goodwill exceeded the carrying amount, and therefore concluded that the two-step goodwill impairment test was not required. The Company will continue to monitor goodwill and assess qualitative factors that may indicate impairment on annual basis, or more frequently, on an as-needed basis.
The Company evaluates the remaining useful lives of its core deposits intangible assets and unfavorable lease intangibles, as required by ASC 350, "Intangibles—Goodwill and Other", to determine whether events and circumstances warrant a revision to the remaining period of amortization. If the estimate of an intangible asset's remaining useful life has changed, the remaining carrying amount of the intangible asset is amortized prospectively over that revised remaining useful life. The Company has not revised its estimates of the useful lives of its core deposits intangibles during the year ended December 31, 2015.
Income Taxes
We account for income taxes under the asset and liability method, which requires the recognition of deferred tax assets and liabilities for the expected future tax consequences of events that have been included in the financial statements. Under this method, deferred tax assets and liabilities are determined based on the differences between the financial statements and tax basis of assets and liabilities using enacted tax rates in effect for the year in which the differences are expected to reverse. The effect of a change in tax rates on deferred tax rates on deferred tax assets and liabilities is recognized in income in the period that includes the enacted date.
Generally, income tax expense is the sum of two components: current tax expense and deferred tax expense (benefit). Current tax expense is calculated by applying the current tax rate to taxable income. Deferred tax expense is recorded as deferred tax assets (liabilities) change from year to year. Deferred income tax assets and liabilities represent the tax effects, based on current tax law, of future deductible or taxable amounts attributable to events that have been recognized in our financial statements. Because we traditionally recognize substantially more expenses in our financial statements than we have been allowed to deduct for taxes, we generally have a net deferred tax asset. Valuation allowances are established when necessary to reduce deferred tax assets when it is more-likely-than-not that a portion or all of the deferred tax assets will not be realized.
ASC 740-10-25 provides that a tax benefit from an uncertain tax position may be recognized when it is more-likely-than-not that the position will be sustained upon examination, including resolutions of any related appeals or litigation processes, based on the technical merits. A tax position is recognized as a benefit only if it is "more-likely-than-not" that the tax position would be sustained in a tax examination, with a tax examination being presumed to occur. The amount recognized is the largest amount of tax benefit that is greater than 50% likely of being realized on examination. The Company recognized an increase in the liability for unrecognized tax benefit of $5,000 from the prior year tax position, and a decrease in the liability for unrecognized tax benefit of $1.2 million from settlements with federal and state tax authorities in 2015. As of December 31, 2015, the total unrecognized tax benefit that would affect the
65
effective tax rate if recognized was $483,000. We expect that the unrecognized tax benefits may decrease by approximately $483,000 over the next 12 months due to settlements with state tax authorities.
Net Interest Income and Net Interest Margin
Our primary source of revenue is net interest income, which is the difference between interest and fees derived from earning assets and interest paid on liabilities obtained to fund those assets. Our net interest income is affected by changes in the level and mix of interest-earning assets and interest-bearing liabilities, referred to as volume changes. Net interest income is also affected by changes in the yields earned on assets and rates paid on liabilities, referred to as rate changes. Interest rates charged on our loans are affected principally by the demand for such loans, the supply of money available for lending purposes, competitive, and other factors. Those factors are, in turn, affected by general economic conditions and other factors beyond our control, such as federal economic policies, the general supply of money in the economy, legislative tax policies, the governmental budgetary matters, and the actions of the Federal Reserve Board.
Our average total loans (gross loans including loans held-for-sale, less deferred fees and costs) were $3.50 billion for 2015, compared to $3.02 billion for 2014, and $2.29 billion for 2013, representing an increase of 16.1% in 2015 and 32.0% in 2014, from each of the prior annual periods. Average loan increase in 2015 compared to 2014, due to the increase in loan originations compared to the prior year. The increase in average loans in 2014 compared to 2013 was largely due to the full year impact of loans acquired through the acquisitions of BankAsiana and Saehan. Average interest-earning assets were $4.23 billion in 2015, compared to $3.48 billion in 2014, and $2.73 billion in 2013, representing an increase of 21.6% in 2015, and an increase of 27.4% in 2014, from each of the prior annual periods. Our average interest-bearing deposits increased 28.5% to $2.75 billion in 2015, and increased 30.0% to $2.14 billion in 2014, compared with $1.65 billion in 2013. Together with other borrowings and junior subordinated debentures (see "Financial Condition—Deposits and Other Sources of Funds" below), average interest-bearing liabilities increased 23.9% to $2.94 billion in 2015, and increased 27.5% to $2.37 billion in 2014, compared to $1.86 billion in 2013.
Our yields on interest-earnings assets were 4.19% in 2015, 4.72% in 2014, and 4.56% in 2013. The decline in average yield on interest-earning assets in 2015 compared to 2014 was due to a decline in loan yields as loan rates for newly originated loans were lower than those existing in the portfolio. The increase in yields on interest-earning assets experienced in 2014, compared to 2013, was largely due to the increase in loan yields due to the addition of discount accretion income on acquired loans. Total interest income increased 8.1% in 2015 to $176.9 million, and increased 32.3% in 2014 to $163.7 million, compared with $123.7 million in 2013. Interest income increased in 2015 and 2014 compared to the previous years due to the increase in overall loans and investments and in 2014 the increase was further aided by an increase in discount accretion income. Interest expense increased 43.4% to $26.1 million in 2015, and increased 35.5% to $18.2 million in 2014, compared to $13.4 million in 2013. The increase in interest expense for 2015 was due to an increase in deposits accounts, deposits rates, and FHLB borrowings, while the increase in 2014 was attributable to the acquisition of BankAsiana and Saehan's deposit portfolio.
Net interest income before credit or provision for loan losses and loan commitments increased from $110.3 million in 2013, to $145.5 million in 2014, and then to $150.8 million in 2015. This represents a net interest income increase of 31.9% in 2014 and 3.6% in 2015, when compared to the previous years' figures. Our net interest spread was 3.84% in 2013, 3.96% in 2014, and 3.31% in 2015. Net interest margin was 4.07% for 2013, 4.20% for 2014, and 3.58% for 2015.
66
The following table sets forth, for the periods indicated, average balances of assets, liabilities, and shareholders' equity, in addition to the major components of net interest income and net interest margin:
Distribution, Yield, and Rate Analysis of Net Income
(Dollars in Thousands)
| | For the Year Ended December 31, | |||||||||||||||||||||||||||
|---|---|---|---|---|---|---|---|---|---|---|---|---|---|---|---|---|---|---|---|---|---|---|---|---|---|---|---|---|
| | 2015 | 2014 | 2013 | |||||||||||||||||||||||||
| | Average Balance | Interest Income/ Expense | Average Rate/ Yield | Average Balance | Interest Income/ Expense | Average Rate/ Yield | Average Balance | Interest Income/ Expense | Average Rate/ Yield | |||||||||||||||||||
Assets: | ||||||||||||||||||||||||||||
Earning assets: | ||||||||||||||||||||||||||||
Total loans1 | $ | 3,501,800 | $ | 167,361 | 4.78 | % | $ | 3,017,409 | $ | 155,020 | 5.14 | % | $ | 2,285,623 | $ | 115,722 | 5.06 | % | ||||||||||
Securities of government sponsored enterprises | 348,073 | 7,109 | 2.04 | % | 293,401 | 6,306 | 2.15 | % | 258,019 | 5,203 | 2.02 | % | ||||||||||||||||
Other investment securities2 | 40,110 | 1,436 | 5.20 | % | 57,260 | 1,889 | 4.51 | % | 68,793 | 2,220 | 4.32 | % | ||||||||||||||||
Deposits held in other financial institutions | 6,938 | 118 | 1.70 | % | 17,105 | 238 | 1.39 | % | 3,426 | 38 | 1.11 | % | ||||||||||||||||
Federal funds sold | 336,298 | 869 | 0.26 | % | 94,818 | 251 | 0.26 | % | 115,216 | 556 | 0.48 | % | ||||||||||||||||
| | | | | | | | | | | | | | | | | | | | | | | | | | | | | |
Total interest-earning assets | 4,233,219 | 176,893 | 4.19 | % | 3,479,993 | 163,704 | 4.72 | % | 2,731,077 | 123,739 | 4.56 | % | ||||||||||||||||
Total non-interest-earning assets | 280,085 | 282,407 | 170,147 | |||||||||||||||||||||||||
| | | | | | | | | | | | | | | | | | | | | | | | | | | | | |
Total assets | $ | 4,513,304 | $ | 3,762,400 | $ | 2,901,224 | ||||||||||||||||||||||
| | | | | | | | | | | | | | | | | | | | | | | | | | | | | |
| | | | | | | | | | | | | | | | | | | | | | | | | | | | | |
| | | | | | | | | | | | | | | | | | | | | | | | | | | | | |
Liabilities and Shareholders' Equity: | ||||||||||||||||||||||||||||
Interest-bearing liabilities: | ||||||||||||||||||||||||||||
Money market deposits | $ | 924,673 | $ | 6,211 | 0.67 | % | $ | 770,316 | $ | 5,219 | 0.68 | % | $ | 630,050 | $ | 3,996 | 0.63 | % | ||||||||||
Super NOW deposits | 30,874 | 82 | 0.27 | % | 32,240 | 63 | 0.20 | % | 27,656 | 55 | 0.20 | % | ||||||||||||||||
Savings deposits | 129,961 | 1,993 | 1.53 | % | 121,878 | 1,926 | 1.58 | % | 103,102 | 1,801 | 1.75 | % | ||||||||||||||||
Time deposits of $100,000 or more | 1,393,357 | 12,031 | 0.86 | % | 970,481 | 6,849 | 0.71 | % | 658,483 | 4,300 | 0.65 | % | ||||||||||||||||
Other time deposits | 269,842 | 2,425 | 0.90 | % | 244,144 | 1,869 | 0.77 | % | 225,900 | 1,816 | 0.80 | % | ||||||||||||||||
FHLB borrowings and other borrowings | 118,435 | 1,537 | 1.30 | % | 160,950 | 522 | 0.32 | % | 152,171 | 244 | 0.16 | % | ||||||||||||||||
Junior subordinated debenture | 71,888 | 1,772 | 2.46 | % | 71,659 | 1,719 | 2.40 | % | 62,971 | 1,197 | 1.90 | % | ||||||||||||||||
| | | | | | | | | | | | | | | | | | | | | | | | | | | | | |
Total interest-bearing liabilities | 2,939,030 | 26,051 | 0.89 | % | 2,371,668 | 18,167 | 0.77 | % | 1,860,333 | 13,409 | 0.72 | % | ||||||||||||||||
Non-interest-bearing liabilities: | ||||||||||||||||||||||||||||
Non-interest-bearing deposits | 1,013,616 | 882,333 | 639,957 | |||||||||||||||||||||||||
Other liabilities | 42,211 | 42,001 | 34,577 | |||||||||||||||||||||||||
| | | | | | | | | | | | | | | | | | | | | | | | | | | | | |
Total non-interest-bearing liabilities | 1,055,827 | 924,334 | 674,534 | |||||||||||||||||||||||||
Shareholders' equity | 518,447 | 466,398 | 366,357 | |||||||||||||||||||||||||
| | | | | | | | | | | | | | | | | | | | | | | | | | | | | |
Total liabilities and shareholders' equity | $ | 4,513,304 | $ | 3,762,400 | $ | 2,901,224 | ||||||||||||||||||||||
| | | | | | | | | | | | | | | | | | | | | | | | | | | | | |
| | | | | | | | | | | | | | | | | | | | | | | | | | | | | |
| | | | | | | | | | | | | | | | | | | | | | | | | | | | | |
Net interest income | $ | 150,842 | $ | 145,537 | $ | 110,330 | ||||||||||||||||||||||
| | | | | | | | | | | | | | | | | | | | | | | | | | | | | |
| | | | | | | | | | | | | | | | | | | | | | | | | | | | | |
| | | | | | | | | | | | | | | | | | | | | | | | | | | | | |
Net interest spread3 | 3.31 | % | 3.96 | % | 3.84 | % | ||||||||||||||||||||||
| | | | | | | | | | | | | | | | | | | | | | | | | | | | | |
| | | | | | | | | | | | | | | | | | | | | | | | | | | | | |
| | | | | | | | | | | | | | | | | | | | | | | | | | | | | |
Net interest margin4 | 3.58 | % | 4.20 | % | 4.07 | % | ||||||||||||||||||||||
| | | | | | | | | | | | | | | | | | | | | | | | | | | | | |
| | | | | | | | | | | | | | | | | | | | | | | | | | | | | |
| | | | | | | | | | | | | | | | | | | | | | | | | | | | | |
- 1
- Net loan fees have been included in the calculation of interest income. Net loan fees were approximately $4.3 million, $4.4 million, and $3.2 million for the years ended December 31, 2015, 2014, and 2013, respectively. Loans are net of deferred fees, unearned income, and related direct costs, and include loans placed on non-accrual status and interest income on loans includes discount recognized on acquired loans.
- 2
- Represents tax equivalent yields, non-tax equivalent yields for 2015, 2014, and 2013 were 3.58%, 3.30%, and 3.23%, respectively.
- 3
- Represents the average rate earned on interest-earning assets less the average rate paid on interest-bearing liabilities.
- 4
- Represents net interest income as a percentage of average interest-earning assets.
The following table sets forth, for the periods indicated, the dollar amount of changes in interest earned and paid for interest-earning assets and interest-bearing liabilities and the amount of change attributable to changes in average daily balances (volume) or changes in average daily interest rates (rate). All yields were calculated without the consideration of tax effects, if any, and the variances attributable to
67
both the volume and rate changes have been allocated to volume and rate changes in proportion to the relationship of the absolute dollar amount of the changes in each:
Rate/Volume Analysis of Net Interest Income
(Dollars in Thousands)
| | For the Year Ended December 31, 2015 vs. 2014 Increases (Decreases) Due to Change In | For the Year Ended December 31, 2014 vs. 2013 Increases (Decreases) Due to Change In | |||||||||||||||||
|---|---|---|---|---|---|---|---|---|---|---|---|---|---|---|---|---|---|---|---|
| | Volume | Rate | Total | Volume | Rate | Total | |||||||||||||
Interest income: | |||||||||||||||||||
Total loans | $ | 23,676 | $ | (11,335 | ) | $ | 12,341 | $ | 37,572 | $ | 1,726 | $ | 39,298 | ||||||
Securities of government sponsored enterprises | 1,129 | (326 | ) | 803 | 745 | 358 | 1,103 | ||||||||||||
Other Investment securities | (603 | ) | 150 | (453 | ) | (379 | ) | 48 | (331 | ) | |||||||||
Deposits held in other institutions | (164 | ) | 44 | (120 | ) | 188 | 12 | 200 | |||||||||||
Federal funds sold | 624 | (6 | ) | 618 | (86 | ) | (219 | ) | (305 | ) | |||||||||
| | | | | | | | | | | | | | | | | | | | |
Total interest income | 24,662 | (11,473 | ) | 13,189 | 38,040 | 1,925 | 39,965 | ||||||||||||
| | | | | | | | | | | | | | | | | | | | |
Interest expense: | |||||||||||||||||||
Money market deposits | 1,037 | (45 | ) | 992 | 936 | 287 | 1,223 | ||||||||||||
Super NOW deposits | (3 | ) | 22 | 19 | 9 | (1 | ) | 8 | |||||||||||
Savings deposits | 125 | (58 | ) | 67 | 307 | (182 | ) | 125 | |||||||||||
Time deposit of $100,000 or more | 3,425 | 1,757 | 5,182 | 2,178 | 371 | 2,549 | |||||||||||||
Other time deposits | 210 | 346 | 556 | 142 | (89 | ) | 53 | ||||||||||||
FHLB advances and other borrowings | (171 | ) | 1,186 | 1,015 | 15 | 263 | 278 | ||||||||||||
Junior subordinated debenture | 6 | 47 | 53 | 180 | 342 | 522 | |||||||||||||
| | | | | | | | | | | | | | | | | | | | |
Total interest expense | 4,629 | 3,255 | 7,884 | 3,767 | 991 | 4,758 | |||||||||||||
| | | | | | | | | | | | | | | | | | | | |
Change in net interest income | $ | 20,033 | $ | (14,728 | ) | $ | 5,305 | $ | 34,273 | $ | 934 | $ | 35,207 | ||||||
| | | | | | | | | | | | | | | | | | | | |
| | | | | | | | | | | | | | | | | | | | |
| | | | | | | | | | | | | | | | | | | | |
Provision for Loan Losses and Provision for Loan Commitments
In anticipation of credit risks inherent in our lending business, we set aside allowance for loan losses through charges to earnings. These charges are made not only for our outstanding loan portfolio, but also for off-balance sheet items, such as commitments to extend credits or letters of credit. The charges made for our outstanding loan portfolio are credited to allowance for loan losses, whereas charges for off-balance sheet items are credited to the reserve for off-balance sheet items, presented as a component of other liabilities.
Since 2011, we have continued to experience improvement in overall credit quality of the loan portfolio. In 2015, we experienced a decline in non-performing loans, delinquencies, and classified loans compared to year-end 2014. In addition, we continue to have low levels of net charge-offs with net loan recoveries for 2015. We did not record any provisions or credit for losses on loans and loan commitments during 2014 or 2013. In 2015, we recorded $700,000 in provision for losses on loans and loan commitments mainly due to the growth of the loan portfolio. This increase in provision did not reflect a decline in the credit quality of the loan portfolio.
Total net loan recoveries for 2015 were $3.3 million compared to net charge-offs of $4.9 million in 2014 and $9.7 million in 2013. We did not have any provision for loss on loan commitments in 2014 or 2013, but we recorded $200,000 in provision for off-balance sheet loan commitments in 2015. The procedures for monitoring the adequacy of the allowance for loan losses, as well as detailed information
68
concerning the allowance calculation, is described in the section entitled "Allowance for Loan Losses and Loan Commitments" below.
Non-interest Income
Total non-interest income increased to $45.7 million in 2015, compared to $41.2 million for 2014 and $34.2 million for 2013. Non-interest income was 1.0% of average assets in 2015, 1.1% of average assets in 2014, and 1.2% of average assets in 2013. We currently earn non-interest income from various sources including deposit fees, gains from the sale of loans and securities, fees derived from servicing loans, and other income streams.
The following table sets forth the various components of our non-interest income for the periods indicated:
Non-interest Income
(Dollars in Thousands)
| | For the Years Ended December 31, | ||||||||||||||||||
|---|---|---|---|---|---|---|---|---|---|---|---|---|---|---|---|---|---|---|---|
| | 2015 | 2014 | 2013 | ||||||||||||||||
| | (Amount) | (%) | (Amount) | (%) | (Amount) | (%) | |||||||||||||
Service charges on deposit accounts | $ | 12,253 | 26.8 | % | $ | 12,693 | 30.8 | % | $ | 11,412 | 33.4 | % | |||||||
Gain on sale of SBA loans, net | 8,792 | 19.3 | % | 14,366 | 34.8 | % | 13,308 | 38.9 | % | ||||||||||
Gain on sale of residential loans, net | 3,290 | 7.2 | % | 366 | 0.9 | % | 107 | 0.3 | % | ||||||||||
Gain on sale of other loans, net | 4,988 | 10.9 | % | 230 | 0.6 | % | — | 0.0 | % | ||||||||||
Loan-related servicing fees | 7,357 | 16.1 | % | 6,092 | 14.8 | % | 5,011 | 14.7 | % | ||||||||||
Net change in fair value of derivatives | 206 | 0.5 | % | — | 0.0 | % | — | 0.0 | % | ||||||||||
Gain on sale or call of securities | — | 0.0 | % | — | 0.0 | % | 19 | 0.1 | % | ||||||||||
Other income | 8,768 | 19.2 | % | 7,494 | 18.1 | % | 4,326 | 12.6 | % | ||||||||||
| | | | | | | | | | | | | | | | | | | | |
Total | $ | 45,654 | 100.0 | % | $ | 41,241 | 100.0 | % | $ | 34,183 | 100.0 | % | |||||||
| | | | | | | | | | | | | | | | | | | | |
| | | | | | | | | | | | | | | | | | | | |
| | | | | | | | | | | | | | | | | | | | |
Average assets | $ | 4,513,313 | $ | 3,762,400 | $ | 2,901,224 | |||||||||||||
| | | | | | | | | | | | | | | | | | | | |
| | | | | | | | | | | | | | | | | | | | |
| | | | | | | | | | | | | | | | | | | | |
Non-interest income as a % of average assets | 1.0 | % | 1.1 | % | 1.2 | % | |||||||||||||
| | | | | | | | | | | | | | | | | | | | |
| | | | | | | | | | | | | | | | | | | | |
| | | | | | | | | | | | | | | | | | | | |
Service charges on deposits accounts was the largest source of non-interest income for the year ended December 31, 2015. The decrease in service charges on deposit accounts in 2015, compared to 2014, was due largely to a $610,000 decrease in non-sufficient funds ("NSF") charges from $5.0 million for 2014 to $4.4 million for 2015. With the improvement of the overall economic environment, we have experienced a decline in the number of NSF charges even with an increase in demand deposits accounts. The increase in service charges on deposit accounts in 2014, compared to 2013, was due primarily to an increase in NSF charges of $328,000 and a $739,000 increase in analysis charges on demand deposit accounts. The addition of deposit accounts from the acquisitions of BankAsiana and Saehan helped to contribute to additional service charge income on deposits accounts in 2014.
Gain on sale of SBA loans represented the second largest source of non-interest income for 2015. The change in gain on sale of SBA loans is largely due to the change in volume of SBA loan sold each year. Total SBA loans sold in the years 2015, 2014, and 2013 totaled $98.0 million, $144.5 million, and $134.3 million, respectively. A decline in premium rates for SBA loans sold in 2015 compared to 2014 also contributed to the decline in gain on sale income for 2015.
The Company expanded its mortgage department with the acquisition of Bank of Manhattan's Lending Division during the first quarter of 2015. As a result of this expansion, we experienced a large
69
increase in residential mortgage loan originations and sales which has led to an increase in gain on sale of residential loans. This increase has helped to offset a portion of the reductions in gains from the sale of SBA loans. Total residential mortgage loans sold in 2015, 2014, and 2013 was $161.4 million, $14.8 million, and $8.3 million, respectively.
Gain on sale of other loans represents impaired loans that sold for their underlying properties. Total impaired loans sold during 2015 was $7.3 million compared to $4.4 million in 2014. The Company had $448,000 in impaired loans sold in 2013, but did not record any gain on sale of other loans from these transactions.
Loan-related servicing fee income consists primarily of trade-financing fees and servicing fees on SBA and mortgage loans sold. In 2015, the number of mortgage loans sold with servicing rights increased which grew our mortgage loan servicing portfolio. As a result, loan-related fee income was greater for the year ended December 31, 2015, compared to the year ended December 31, 2014. The increase for the year ended December 31, 2014 compared to the year ended December 31, 2013, was due to the increase in overall loans sold with servicing rights during 2014.
With the acquisition of Bank of Manhattan's Mortgage Division (See "Note 2—Acquisitions"), the Company began utilizing mortgage banking derivatives during the first quarter of 2015. The first type of derivative, an interest rate lock commitment, is a commitment to originate loans whereby the interest rate on the loan is determined prior to funding. To mitigate interest rate risk on these rate lock commitments, the Company also enters into forward commitments, or commitments to deliver residential mortgage loans on a future date, which are also considered derivatives. Net change in the fair value of derivatives represents income recorded from changes in fair value of these mortgage derivatives instruments.
There were no gains from the sale or call of securities in 2015 or 2014. Gains from sales or calls of securities totaled $19,000 in 2013. The gains for 2013 mostly represent gains from the call of investments securities during those periods.
Other non-interest income represents income from the cash surrender value of bank-owned life insurance ("BOLI"), FHLB dividends, wire transfer fees, loan referral fees, expense recoveries, checkbook sales, and other miscellaneous income. The increase in other non-interest income for 2015, compared to 2014, was due to special dividend payments from the FHLB which increased dividend income by $848,000. In addition, total wire fees income for 2015 increased $332,000 compared to wire fee income for 2014. The increase in other non-interest income from 2013 to 2014 was due mainly to a $1.4 million increase in miscellaneous income, a $627,000 increase in dividend income, and a $400,000 increase in OREO rental income.
Non-interest Expense
Total non-interest expense increased to $99.9 million in 2015, from $97.5 million in 2014, and $76.9 million in 2013. The increase in non-interest expense for 2015, compared to 2014, was largely due the increase in salaries and benefits expense from the addition of employees from the Bank of Manhattan's Mortgage Division acquisition. The increase in non-interest expense for 2014, compared to 2013, was due to an increase in salaries and benefits and occupancy and equipment expenses that resulted from the acquisitions of BankAsiana and Saehan. Non-interest expense as a percentage of average assets was 2.2% in 2015 and 2.6% for both 2014 and 2013. The efficiency ratio for the year ended December 31, 2015 was 50.84%, improved from 52.21% in 2014, and 53.18% for 2013.
70
The following table sets forth a summary of non-interest expenses for the periods indicated:
Non-interest Expense
(Dollars in Thousands)
| | For the Years Ended December 31, | ||||||||||||||||||
|---|---|---|---|---|---|---|---|---|---|---|---|---|---|---|---|---|---|---|---|
| | 2015 | 2014 | 2013 | ||||||||||||||||
| | (Amount) | (%) | (Amount) | (%) | (Amount) | (%) | |||||||||||||
Salaries and employee benefits | $ | 54,144 | 54.2 | % | $ | 49,724 | 51.0 | % | $ | 40,131 | 52.2 | % | |||||||
Occupancy and equipment | 13,300 | 13.3 | % | 13,371 | 13.7 | % | 8,851 | 11.5 | % | ||||||||||
Affordable housing partnerships investment losses | 4,981 | 5.0 | % | 4,239 | 4.3 | % | 3,838 | 5.0 | % | ||||||||||
Data processing | 4,406 | 4.4 | % | 3,998 | 4.1 | % | 2,801 | 3.6 | % | ||||||||||
Professional fees | 3,119 | 3.1 | % | 3,270 | 3.4 | % | 3,704 | 4.8 | % | ||||||||||
Advertising and promotional | 2,836 | 2.8 | % | 2,190 | 2.2 | % | 2,391 | 3.1 | % | ||||||||||
Regulatory assessment fee | 2,404 | 2.4 | % | 2,239 | 2.3 | % | 1,391 | 1.8 | % | ||||||||||
Amortization of core deposits intangibles | 970 | 1.0 | % | 1,069 | 1.1 | % | 383 | 0.5 | % | ||||||||||
FDIC Indemnification Impairment | — | 0.0 | % | 597 | 0.6 | % | — | 0.0 | % | ||||||||||
Net gain on sale of OREO | (1,216 | ) | –1.2 | % | (28 | ) | 0.0 | % | (184 | ) | 0.2 | % | |||||||
Merger related one-time costs | 994 | 1.0 | % | 3,577 | 3.7 | % | 2,797 | 3.7 | % | ||||||||||
Other operating expenses | 13,952 | 14.0 | % | 13,268 | 13.6 | % | 10,753 | 13.6 | % | ||||||||||
| | | | | | | | | | | | | | | | | | | | |
Total | $ | 99,890 | 100.0 | % | $ | 97,514 | 100.0 | % | $ | 76,856 | 100.0 | % | |||||||
| | | | | | | | | | | | | | | | | | | | |
| | | | | | | | | | | | | | | | | | | | |
| | | | | | | | | | | | | | | | | | | | |
Average assets | $ | 4,513,313 | $ | 3,762,400 | $ | 2,901,224 | |||||||||||||
| | | | | | | | | | | | | | | | | | | | |
| | | | | | | | | | | | | | | | | | | | |
| | | | | | | | | | | | | | | | | | | | |
Non-interest expense as a % of average assets | 2.2 | % | 2.6 | % | 2.6 | % | |||||||||||||
| | | | | | | | | | | | | | | | | | | | |
| | | | | | | | | | | | | | | | | | | | |
| | | | | | | | | | | | | | | | | | | | |
The number of full-time equivalent employees increased to 583 at the end of 2015, compared to 525 at the end of 2014, and 545 at the end of 2013. The increase in employees at December 31, 2015 compared to December 31, 2014 was due to employees acquired from the acquisition of Bank of Manhattan's Mortgage Division, in addition to employees hired for new branches opened in the Southeastern United States. The decline in full-time employees in 2014 compared to 2013 reflects the closure of branches as part of our acquisition integration plan. The increase in salaries and benefits for 2014 compared to 2013 was due to the full year impact of additional employees from the acquisitions of BankAsiana and Saehan. Severance and retention bonuses related to the acquisitions were excluded from salaries and benefits and included in merger related one-time costs for 2014 and 2013. Assets per employee was $8.1 million for 2015, $7.9 million for 2014, and $6.6 million for 2013.
Occupancy and equipment expenses remained mostly unchanged in 2015 compared to 2014. The increase in occupancy and equipment expenses in 2014, compared to 2013, was primarily due to lease contracts acquired from the acquisitions of BankAsiana and Saehan. The Company acquired 13 branch offices with the acquisitions of BankAsiana and Saehan in 2013. During 2014, three Saehan branches were closed as part of the acquisition consolidation plan. During the third quarter of 2014, the Company opened a new branch office in Houston, Texas. In 2015, the Company opened two additional branches in Montgomery, Alabama, and LaGrange, Georgia expanding into the multiethnic communities located in the Southeast.
Affordable housing partnerships losses are recorded based on financial statements of the investment projects. These losses are based on the performance of the underlying investment. The Company receives updated financial information for its affordable housing partnerships investments and the performance of the investments result in either a reduction of or an addition to this expense.
71
Fluctuations in data processing expenses are related to changes in the number of customer accounts as well as changes in the number of transactions for these accounts. As the Company's loans and deposits grow, these expenses are expected to increase over time is indicated by the increase in 2015 compared to 2014. The large increase in 2014 compared to 2013, was due to the increase in deposits and loans from the acquisition of BankAsiana and Saehan.
Professional fees consist of legal, accounting, auditing, and consulting fees. The change in professional fees from period to period is primarily due to changes in legal fees related to the resolution of problem loans and OREO. Merger related professional fee expenses for all periods are not included here, but rather in merger related one-time costs.
Advertising and promotional expenses represent marketing activities such as media advertisements, promotional gifts for customers, and deposit campaign promotions. These expenses increased for the year 2015 compared to the year 2014, due to advertising and promotions associated with new branch openings, advertising related to our deposit campaign, and the promotion of our expanded residential mortgage department.
Regulatory assessment fees represent FDIC insurance premiums and Financing Corporation assessment fees. The Bank's assessment based increased in 2015 due to the growth of the balance sheet which resulted in a slight increase in regulatory assessment fees for 2015 compared to the prior year. The increase in regulatory assessment fees for 2014, compared to 2013, was primarily due to the Bank's larger assessment base as a result of the acquisitions of BankAsiana and Saehan.
Amortization of core deposits intangibles represents the amortization of core deposits intangibles that were recorded from the acquisitions Bank of Liberty, Mirae Bank, BankAsiana, and Saehan. The amortization of core deposits intangibles are based on amortization schedules calculated at the time of the acquisitions. There have not been any events since the acquisition dates that would warrant a change in amortization period for any of core deposits intangibles.
The Bank previously entered into loss sharing agreements with the FDIC, under which the FDIC shared in the losses and recoveries on covered assets acquired from Mirae Bank. The Company accounted for the receivable balances under the loss sharing agreements as an FDIC loss-share indemnification asset in accordance with ASC 805 (Business Combinations). In June 2014, the loss sharing agreement with the FDIC with respects to losses on loans acquired from Mirae Bank expired. Losses on loans acquired from Mirae Bank after June 2014 are no longer covered under the agreements. During the second quarter of 2014, the Company recorded an impairment on the remaining balance of the FDIC indemnification assets, less balances receivable. Subsequently, the Company no longer carries an FDIC indemnification asset balance. There were no impairment charges during 2013.
Net gain on the sale of OREO increased for 2015 compared to prior periods, due largely to the sale one OREO property in 2015 that resulted in a net gain of $744,000. There were only minimal net gains from the sale of OREO for the years ended 2014 and 2013.
Merger related costs for 2015 represent one-time expenses associated with the proposed merger with BBCN. Merger related costs for 2014 and 2013 were related to the acquisitions of BankAsiana and Saehan. Merger related costs for 2015 consist mainly of legal and consulting fees related to due diligence and the signing and announcement of the merger agreement with BBCN. The bulk of the merger related costs for 2014 was from Saehan's data processing system de-conversion and contract termination expenses which totaled $2.8 million. In addition, there were retention and severance payments to former BankAsiana and Saehan employees totaling $627,000 that were also included in the merger related costs for 2014. Total merger related one-time costs in 2013 totaled $2.8 million, which mainly consisted of outside consulting and legal costs of $1.7 million, severance and retention bonuses totaling $640,000, data processing contract termination fees of $247,000, and other expenses related to the acquisitions.
72
Other operating expenses include expenditure such as office supplies, communications, outsourced services for customers, director's fees, investor relation expenses, amortization of intangible assets, expenses related to the maintenance and sale of OREO, other loan expenses, and other operating expenses. The increase in other non-interest expenses for 2015 compared to 2014 was largely due to an increase in OREO related expenses. The increase in other non-interest expense for 2014, compared to 2013 was also due to an increase in OREO related expenses in addition to an increase in other miscellaneous operating losses.
Provision for Income Taxes
For the year ended December 31, 2015, we had income tax expense of $34.5 million on pretax net income of $95.9 million, representing an effective tax rate of 36.0%, compared with income tax expense of $30.3 million on pretax net income of $89.3 million, representing an effective tax rate of 33.9% for 2014, and income tax expense of $22.3 million on pretax net income of $67.7 million, representing an effective tax rate of 32.9% for 2013. The effective tax rate increased in 2015 compared to 2014 primarily due to an increase in the state tax rate and recognition of merger related expenses that are not generally tax deductible.
Generally, income tax expense is the sum of two components: current tax expense (benefit) and deferred tax expense (benefit). Current tax expense is calculated by applying the current tax rate to taxable income. Deferred tax expense is recorded as deferred tax assets (liabilities) change from year to year. Deferred income tax assets and liabilities represent the tax effects, based on current tax law, of future deductible or taxable amounts attributable to events that have been recognized in our financial statements. Because we traditionally recognize substantially more expenses in our financial statements than we have been allowed to deduct for taxes, we generally have a net deferred tax asset. Valuation allowances are established when necessary to reduce deferred tax assets when it is more-likely-than-not that a portion or all of the deferred tax assets will not be realized.
In assessing the future realization of deferred tax assets, management considers whether it is more-likely-than-not that some portion or all of the deferred tax assets will not be realized. The ultimate realization is dependent upon the generation of sufficient future taxable income during the periods temporary differences become deductible. The Company did not have a valuation allowance on its deferred tax assets as of December 31, 2015, 2014, and 2013. As of December 31, 2015, the Company had a net deferred tax assets of $21.5 million, compared to $22.3 million as of December 31, 2014 and $39.7 million as of December 31, 2013.
In accordance with ASC 740-10, "Accounting for Uncertainty in Income Taxes," the Company recognized an increase in the liability for unrecognized tax benefit of $5,000 from prior year tax positions, and a decrease in the liability for unrecognized tax benefit of $1.2 million from settlements with federal and state tax authorities in 2015. As of December 31, 2015, the total unrecognized tax benefit that would affect the effective rate if recognized was $483,000. We expect that the unrecognized tax benefits may decrease by approximately $483,000 over the next 12 months due to settlements with state tax authorities.
As of December 31, 2015, the total accrued interest related to uncertain tax positions was $154,000. Other than the accrued interest of $66,000 related to uncertain tax positions from an acquired entity in 2013, we accounted for interest related to uncertain tax positions as part of our provision for federal and state income taxes.
The Company files United States federal and state income tax returns in jurisdictions with varying statues of limitations. The 2012 through 2014 tax years remain subject to examination by federal tax authorities, and 2011 through 2014 tax years remain subject to examination by state tax authorities. The Company is currently under examination by the California Franchise Tax Board for the 2011, 2012, and 2013 tax years. The Company is also under examination by the New York State Department of Taxation and Finance for the 2011, 2012, and 2013 tax years. The Company believes that it has adequately provided
73
for or paid income tax amounts for issues not yet resolved with federal and state tax authorities. Based upon consideration of all relevant facts and circumstances, the Company does not expect that federal and state tax examination results will have a material impact on the Company's consolidated financial statement as of December 31, 2015.
Investment Portfolio
Investments are one of our major sources of interest income and are acquired in accordance with a comprehensively written investment policy addressing strategies, categories, and levels of allowable investments. This investment policy is reviewed at least annually by the Board of Directors. Management of our investment portfolio is set in accordance with strategies developed and overseen by our Asset/Liability Committee. Investment balances, including cash equivalents and interest-bearing deposits in other financial institutions, are subject to change over time based on our asset/liability funding needs and interest rate risk management objectives. Our liquidity levels take into consideration anticipated future cash flows and all available sources of credits and is maintained at a level management believes is appropriate for future flexibility in meeting anticipated funding needs.
Cash Equivalents and Interest-bearing Deposits in other Financial Institutions
We sell federal funds, purchase securities under agreements to resell and high-quality money market instruments, and invest in interest-bearing accounts in other financial institutions to help meet liquidity requirements and provide temporary holdings until the funds can be otherwise deployed or invested. As of December 31, 2015, 2014, and 2013, we had $104,000, $254,000, and $46.6 million, respectively, in overnight and term federal funds sold. In addition to federal funds sold, we had $8.0 million in deposits held in other financial institutions at December 31, 2014, consisting of time deposits held in at other banks. Deposits held in other financial institutions at December 31, 2013 totaled $21.0 million. There were no time deposits held in other financial institutions at December 31, 2015.
Investment Securities
Management of our investment securities portfolio focuses on providing an adequate level of liquidity and establishing a balanced interest rate-sensitive position, while earning an adequate level of investment income without taking undue risks. As of December 31, 2015, our investment portfolio was primarily comprised of United States government agency securities, accounting for 92.8% of the entire investment portfolio. Our U.S. government agency securities holdings are all "prime/conforming" residential MBS and residential CMOs guaranteed by FNMA, FHLMC, or GNMA. GNMAs are considered equivalent to U.S. Treasury securities, as they are backed by the full faith and credit of the U.S. government. Currently, there are no subprime mortgages in our investment portfolio. Besides the U.S. government agency securities, we also have a 2.8% investment in corporate bonds and 4.4% in municipal bonds. Among the 7.2% of our investment portfolio that was not comprised of U.S. government securities, 53.4%, or $20.6 million, carry the top two highest "Investment Grade" rating of "Aaa/AAA" or "Aa/AA", while 46.6%, or $18.0 million, carry an upper-medium "Investment Grade" rating of at least "A/A". Our investment portfolio does not contain any government sponsored enterprises, or GSE, preferred securities or any distressed corporate securities that had required OTTI charges as of December 31, 2015. In accordance with ASC 320-10-65-1, "Recognition and Presentation of Other-Than-Temporary Impairments", an OTTI is recognized if the fair value of a debt security is lower than the amortized cost and if the debt security will be sold, it is more-likely-than-not that it will be required to sell the security before recovering the amortized cost or it is expected that not all of the amortized cost will be recovered. Credit related declines in the fair value of debt securities below their amortized cost that are deemed to be other-than-temporary are reflected in earnings as realized losses in the Consolidated Statements of
74
Income. Declines related to factors aside from credit issues are reflected in other comprehensive income, net of taxes.
We classify our investment securities as "held-to-maturity" or "available-for-sale" pursuant to ASC 320-10. We adopted ASC 820-10 and ASC 470-20 effective January 1, 2008, and ASC 820-10-35 effective October 10, 2008. Pursuant to the fair value election option of ASC 470-20, we have chosen to continue classifying our existing instruments of investment securities as "held-to-maturity" or "available-for-sale" under ASC 320-10. Investment securities that we intend to hold until maturity are classified as held-to-maturity securities, and all other investment securities are classified as available-for-sale. The carrying values of available-for-sale investment securities are adjusted for unrealized gains and losses, and any gain or loss is reported on an after-tax basis as a component of other comprehensive income. Credit related declines in the fair value of held-to-maturity and available-for-sale securities below their cost that are deemed to be other-than-temporary are reflected in earnings as realized losses. There were no securities with an OTTI as of December 31, 2015. The fair values of our held-to-maturity and available-for-sale securities were $22,000 and $535.5 million, respectively as of December 31, 2015.
The following table summarizes the amortized cost and fair value and distribution of our investment securities as of the dates indicated:
Investment Securities Portfolio
(Dollars in Thousands)
| | For the Years Ended December 31, | ||||||||||||||||||
|---|---|---|---|---|---|---|---|---|---|---|---|---|---|---|---|---|---|---|---|
| | 2015 | 2014 | 2013 | ||||||||||||||||
| | Amortized Cost | Fair Value | Amortized Cost | Fair Value | Amortized Cost | Fair Value | |||||||||||||
Held-to-Maturity: | |||||||||||||||||||
Collateralized mortgage obligations (residential) | $ | 21 | $ | 22 | $ | 26 | $ | 28 | $ | 35 | $ | 37 | |||||||
| | | | | | | | | | | | | | | | | | | | |
Total investment securities held-to-maturity | $ | 21 | $ | 22 | $ | 26 | $ | 28 | $ | 35 | $ | 37 | |||||||
| | | | | | | | | | | | | | | | | | | | |
| | | | | | | | | | | | | | | | | | | | |
| | | | | | | | | | | | | | | | | | | | |
Available-for-Sale: | |||||||||||||||||||
Securities of government sponsored enterprises | $ | 73,828 | $ | 73,835 | $ | 100,792 | $ | 100,362 | $ | 63,843 | $ | 60,789 | |||||||
Mortgage-backed securities (residential) | 171,781 | 171,698 | 82,454 | 83,367 | 93,402 | 90,869 | |||||||||||||
Collateralized mortgage obligations (residential) | 250,809 | 251,395 | 161,584 | 163,079 | 135,154 | 135,653 | |||||||||||||
Corporate securities | 15,015 | 15,260 | 14,994 | 15,514 | 38,442 | 39,530 | |||||||||||||
Municipal bonds | 21,558 | 23,336 | 23,966 | 26,045 | 24,700 | 25,596 | |||||||||||||
| | | | | | | | | | | | | | | | | | | | |
Total investment securities available-for-sale | $ | 532,991 | $ | 535,524 | $ | 383,790 | $ | 388,367 | $ | 355,541 | $ | 352,437 | |||||||
| | | | | | | | | | | | | | | | | | | | |
| | | | | | | | | | | | | | | | | | | | |
| | | | | | | | | | | | | | | | | | | | |
75
The following table summarizes the maturity and repricing schedule of our investment securities at their carrying values at December 31, 2015:
Investment Maturities and Repricing Schedule
(Dollars in Thousands)
| | Within One Year | After One & Within Five Years | After Five & Within Ten Years | After Ten Years | Total | |||||||||||
|---|---|---|---|---|---|---|---|---|---|---|---|---|---|---|---|---|
Held-to-Maturity: | ||||||||||||||||
Collateralized mortgage obligations (residential) | $ | — | $ | 21 | $ | — | $ | — | $ | 21 | ||||||
| | | | | | | | | | | | | | | | | |
Total investment securities held-to-maturity | $ | — | $ | 21 | $ | — | $ | — | $ | 21 | ||||||
| | | | | | | | | | | | | | | | | |
| | | | | | | | | | | | | | | | | |
| | | | | | | | | | | | | | | | | |
Available-for-Sale: | ||||||||||||||||
Securities of government sponsored enterprises | $ | — | $ | 13,975 | $ | 59,860 | $ | — | $ | 73,835 | ||||||
Mortgage-backed securities (residential) | 4,536 | 1,212 | 1,687 | 164,263 | 171,698 | |||||||||||
Collateralized mortgage obligations (residential) | 4,412 | 246,983 | — | — | 251,395 | |||||||||||
Corporate securities | 7,985 | 7,275 | — | — | 15,260 | |||||||||||
Municipal bonds | — | 1,942 | 7,835 | 13,559 | 23,336 | |||||||||||
| | | | | | | | | | | | | | | | | |
Total investment securities available-for-sale | $ | 16,933 | $ | 271,387 | $ | 69,382 | $ | 177,822 | $ | 535,524 | ||||||
| | | | | | | | | | | | | | | | | |
| | | | | | | | | | | | | | | | | |
| | | | | | | | | | | | | | | | | |
Our investment securities holdings increased by $147.2 million, or 37.9%, to $535.5 million at December 31, 2015, compared to holdings of $388.4 million at December 31, 2014. Investment holdings at December 31, 2013 totaled $352.5 million. Total investment securities as a percentage of total assets were 11.4% at December 31, 2015, 9.3%, at December 31, 2014 and 9.7% at December 31, 2013. As of December 31, 2015, investment securities with total fair value of $425.1 million were pledged to secure public deposits, or for other purposes required or permitted by law. Investments pledged at December 31, 2014 totaled $373.5 million.
Held-to-maturity securities, which are carried at their amortized costs, decreased from $35,000 at December 31, 2013, to $26,000 at December 31, 2014, and $21,000 at December 31, 2015. The annual reduction in held-to-maturity securities is due to the normal pay-down of principal. Available-for-sale securities, which are stated at their fair values, increased to $535.5 million at December 31, 2015, compared to $388.4 million at December 31, 2014, and $352.4 million at December 31, 2013.
76
The following table presents the roll-forward of total investments for the years indicated:
(Dollars in Thousands) | December 31, 2015 | December 31, 2014 | December 31, 2013 | |||||||
|---|---|---|---|---|---|---|---|---|---|---|
Balance at beginning of period | $ | 388,393 | $ | 352,472 | $ | 332,554 | ||||
Purchased investment securities | 308,513 | 98,703 | 71,377 | |||||||
Sold investment securities | — | — | (322 | ) | ||||||
Acquired through acquisition of BankAsiana | — | — | 9,574 | |||||||
Acquired through acquisition of Saehan | — | — | 38,124 | |||||||
Matured investment securities | (1,915 | ) | (23,245 | ) | (7,136 | ) | ||||
Called investment securities | (102,575 | ) | (3,640 | ) | — | |||||
Principal pay-downs received | (52,928 | ) | (41,968 | ) | (77,468 | ) | ||||
Amortization and accretion | (1,899 | ) | (1,610 | ) | (2,786 | ) | ||||
Realized gains | — | — | 19 | |||||||
Change in fair value | (2,044 | ) | 7,681 | (11,464 | ) | |||||
| | | | | | | | | | | |
Balance at end of period | $ | 535,545 | $ | 388,393 | $ | 352,472 | ||||
| | | | | | | | | | | |
| | | | | | | | | | | |
| | | | | | | | | | | |
The following tables show the gross unrealized losses and fair value of investment securities, aggregated by investment category and length of time that individual securities have been in a continuous unrealized loss position, at December 31, 2015 and 2014:
December 31, 2015
| | Less than 12 months | 12 months or longer | Total | ||||||||||||||||
|---|---|---|---|---|---|---|---|---|---|---|---|---|---|---|---|---|---|---|---|
(Dollars in Thousands) | Fair Value | Gross Unrealized Losses | Fair Value | Gross Unrealized Losses | Fair Value | Gross Unrealized Losses | |||||||||||||
Available-for-sale1: | |||||||||||||||||||
Securities of government sponsored enterprises | $ | 29,834 | $ | (80 | ) | $ | — | $ | — | $ | 29,834 | $ | (80 | ) | |||||
Mortgage-backed securities (residential) | 141,282 | (738 | ) | — | — | 141,282 | (738 | ) | |||||||||||
Collateralized mortgage obligations (residential) | 111,746 | (720 | ) | 12,371 | (345 | ) | 124,117 | (1,065 | ) | ||||||||||
| | | | | | | | | | | | | | | | | | | | |
Total | $ | 282,862 | $ | (1,538 | ) | $ | 12,371 | $ | (345 | ) | $ | 295,233 | $ | (1,883 | ) | ||||
| | | | | | | | | | | | | | | | | | | | |
| | | | | | | | | | | | | | | | | | | | |
| | | | | | | | | | | | | | | | | | | | |
December 31, 2014
| | Less than 12 months | 12 months or longer | Total | ||||||||||||||||
|---|---|---|---|---|---|---|---|---|---|---|---|---|---|---|---|---|---|---|---|
(Dollars in Thousands) | Fair Value | Gross Unrealized Losses | Fair Value | Gross Unrealized Losses | Fair Value | Gross Unrealized Losses | |||||||||||||
Available-for-sale1: | |||||||||||||||||||
Securities of government sponsored enterprises | $ | 37,523 | $ | (477 | ) | $ | 6,988 | $ | (13 | ) | $ | 44,511 | $ | (490 | ) | ||||
Mortgage-backed securities (residential) | 34,911 | (147 | ) | — | — | 34,911 | (147 | ) | |||||||||||
Collateralized mortgage obligations (residential) | 22,813 | (588 | ) | 27,955 | (69 | ) | 50,768 | (657 | ) | ||||||||||
| | | | | | | | | | | | | | | | | | | | |
Total | $ | 95,247 | $ | (1,212 | ) | $ | 34,943 | $ | (82 | ) | $ | 130,190 | $ | (1,294 | ) | ||||
| | | | | | | | | | | | | | | | | | | | |
| | | | | | | | | | | | | | | | | | | | |
| | | | | | | | | | | | | | | | | | | | |
- 1
- There were no held-to-maturity investment securities with unrealized losses at December 31, 2015 and December 31, 2014.
77
Declines in the fair value of held-to-maturity and available-for-sale securities below their cost that are deemed to be other-than-temporary are reflected in earnings as realized losses. In estimating OTTI losses, we consider, among other things, (i) the length of time and the extent to which the fair value has been less than cost, (ii) the financial condition and near-term prospects of the issuer, and (iii) our intent and ability to retain our investment in the issuer for a period of time sufficient to allow for any anticipated recovery in fair value.
We performed detailed evaluations of the investment portfolio to assess individual investment positions that have fair values that have declined below cost. In assessing whether there was an OTTI, we consider the following:
- •
- Whether or not all contractual cash flows due on a security will be collected; and
- •
- Our positive intent and ability to hold the debt security until recovery in fair value or maturity
A number of other factors are considered in the analysis, including but not limited to:
- •
- Issuer's credit rating;
- •
- Likelihood of the issuer's default or bankruptcy;
- •
- Collateral underlying the security;
- •
- Industry in which the issuer operates;
- •
- Nature of the investment;
- •
- Severity and duration of the decline in fair value; and
- •
- Analysis of the average life and effective maturity of the security.
We do not believe that any individual unrealized loss as of December 31, 2015 represented an OTTI. The unrealized losses on our GSE bonds, GSE CMOs, and GSE MBS were attributable to both changes in interest rate (U.S. Treasury curve) and a repricing of risk (spreads widening against risk-fee rate) in the market. We do not own any non-agency MBS or CMO. All GSE bonds, GSE CMO, and GSE MBS securities are backed by U.S. Government Sponsored and Federal Agencies and therefore rated "Aaa/AAA." We have no exposure to the "Subprime Market" in the form of Asset Backed Securities and Collateralized Debt Obligations. We have the intent and ability to hold the securities in an unrealized loss position at December 31, 2015 until the fair value recovers or the securities mature.
Municipal bonds and corporate bonds are evaluated by reviewing the credit-worthiness of the issuer and general market conditions. At December 31, 2015, we had no unrealized losses on any of our investments in municipal and corporate securities.
Loan Portfolio
Total loans are the sum of loans receivable reported at their outstanding principal balances net of any unearned income which includes unamortized deferred fees, costs, premiums, and discounts and loans held-for-sale reported at the lower of cost or fair value. Total loans net of unearned income increased $524.8 million, or 15.8%, to $3.84 billion in 2015, from $3.32 billion in 2014. Total loans net of unearned income totaled $2.86 billion, $2.15 billion, and $1.98 billion at December 31, 2013, 2012, and 2011, respectively. Total loans net of unearned income as a percentage of total assets were 81.6%, 79.9%, 79.2%, 78.2%, and 73.5%, at December 31, 2015, 2014, 2013, 2012, and 2011, respectively.
In the ordinary course of our business, we originate and service our own loans. Held-for-sale mortgage and SBA loans that we choose to sell in the secondary market are sold with representations and warranties generally consistent with industry practices, but without recourse. Accordingly, we do not retain a
78
significant amount of the credit risk exposure on the loans sold. For all loans we originate and carry, we have yet to have any subprime loans in our loan portfolio.
Construction loans are generally extended as a temporary financing vehicle only, and historically represents less than 5% of our total loan portfolio. In response to the current real estate market, we have applied stricter loan underwriting policy when making loans in this category. Construction loans decreased to $21.0 million as of December 31, 2015, compared to $22.6 million, $40.4 million, $20.9 million, and $61.8 million at the end of 2014, 2013, 2012, and 2011, respectively.
Real estate secured loans consist primarily of commercial real estate loans and are extended to finance the purchase and/or improvement of commercial real estate, businesses, and mortgage loans. The properties may either be user occupied or used for investment purposes. Our loan policy adheres to the real estate loan guidelines set forth by the FDIC. The policy provides guidelines including, among other things, fair review of appraisal value, limitations on loan-to-value ratio, and minimum cash flow requirements to service debt. Loans secured by real estate totaled $3.02 billion, $2.67 billion, $2.37 billion, $1.82 billion, and $1.63 billion, as of December 31, 2015, 2014, 2013, 2012, and 2011, respectively. Real estate secured loans as a percentage of total loans were 78.4%, 80.3%, 82.4%, 84.3%, and 82.0%, at December 31, 2015, 2014, 2013, 2012, and 2011, respectively.
Our total home mortgage loan portfolio (included in real estate secured loans) outstanding at the end of 2015 and 2014 were $244.9 million and $146.2 million, respectively, and represented only a small fraction of our total loan portfolio at 6.4% in 2015, and 4.4% in 2014.
Commercial and industrial loans include revolving lines of credit, term business loans, and warehouse lines of credit. Commercial and industrial loans were $795.8 million, $613.3 million, $449.7 million, $303.3 million, and $281.4 million, at the end of 2015, 2014, 2013, 2012, and 2011, respectively. Commercial and industrial loans were 20.7%, 18.4%, 15.7%, 14.1%, and 14.2% as a percentage of total loans at the end of 2015, 2014, 2013, 2012, and 2011, respectively. In the current economic environment, we exercise more due diligence in originating new loans, in particular, loans with no collateral. However, with the high concentration of real estate secured loans, we plan to focus more on commercial lending as way to diversify our loan portfolio.
Consumer loans for the last five years represented less than 1% of our total loan portfolio. The majority of consumer loans are concentrated in personal lines of credits. As consumer loans present a higher risk potential compared to our other loan products, we have reduced our effort in consumer lending. Accordingly, as of December 31, 2015, the balance of consumer loans was $15.1 million, compared with $21.1 million, $14.7 million, $13.7 million, and $15.1 million at the end of 2014, 2013, 2012, and 2011, respectively.
Our loan terms vary according to loan type. Commercial term loans have typical maturities of three to five years and are extended to finance the purchase of business entities, business equipment, and leasehold improvements, or to provide permanent working capital. SBA-guaranteed loans usually have longer maturities (8 to 25 years). We generally limit commercial real estate loan maturities to five to eight years. Lines of credit, in general, are extended on an annual basis to businesses that need temporary working capital and/or import/export financing. We generally seek diversification in our loan portfolio, and our borrowers are diverse as to industry, location, and their current and target markets.
The FDIC placed Mirae Bank under receivership upon Mirae Bank's closure by the DBO at the close of business on June 26, 2009. We purchased substantially all of Mirae's assets and assumed all of Mirae's deposits and certain other liabilities. Further, we entered into a loss sharing agreement with the FDIC in connection with the Mirae acquisition. Under the loss sharing agreement, the FDIC shared in the losses on assets covered under the agreement, which generally included loans acquired from Mirae and foreclosed loan collateral existing at June 26, 2009.
79
As a result of the loss sharing agreement with the FDIC, the Company initially recorded an indemnification asset based on the estimated value of the indemnification agreement of $40.2 million at June 26, 2009. At December 31, 2015 and 2014, the Company no longer had an FDIC indemnification balance as the loss sharing agreement related to losses expired in June 2014. The indemnification asset at December 31, 2013 totaled $4.9 million.
On October 1, 2013, we acquired BankAsiana, headquartered in Palisades Park, New Jersey, and on November 1, 2013, we acquired Saehan, headquartered in Los Angeles, California. At the time of the acquisitions, the fair value of loans from BankAsiana totaled $168.6 million and the fair value of loans from Saehan totaled $381.7 million. The loan portfolios of BankAsiana and Saehan were written down to fair value on the dates of the acquisition which resulted in discounts of $9.2 million and $27.7 million, for BankAsiana and Saehan, respectively. At December 31, 2015, the balance of loans acquired from BankAsiana and Saehan totaled $93.7 million and $254.1 million, respectively.
80
A summary of loans is presented in the table below:
| | (Dollars in Thousands) | |||||||||
|---|---|---|---|---|---|---|---|---|---|---|
| | December 31, 2015 | December 31, 2014 | December 31, 2013 | |||||||
Legacy Wilshire loans: | ||||||||||
Construction | $ | 21,025 | $ | 22,635 | $ | 40,367 | ||||
Real estate secured | 3,023,621 | 2,672,984 | 2,296,183 | |||||||
Commercial and industrial | 795,772 | 613,322 | 443,356 | |||||||
Consumer | 15,132 | 21,069 | 14,691 | |||||||
| | | | | | | | | | | |
Gross loans | 3,855,550 | 3,330,010 | 2,794,597 | |||||||
Deferred loans fees and unearned Income | (10,623 | ) | (9,930 | ) | (7,864 | ) | ||||
| | | | | | | | | | | |
Total loans | 3,844,927 | 3,320,080 | 2,786,733 | |||||||
Allowance for losses on loans | (52,405 | ) | (48,624 | ) | (49,620 | ) | ||||
| | | | | | | | | | | |
Net loans | $ | 3,792,522 | $ | 3,271,456 | $ | 2,737,113 | ||||
| | | | | | | | | | | |
| | | | | | | | | | | |
| | | | | | | | | | | |
Former Mirae loans previously covered by the loss-share agreement with the FDIC: | ||||||||||
Construction | $ | — | $ | — | $ | — | ||||
Real estate secured | — | — | 71,347 | |||||||
Commercial and industrial | — | — | 6,316 | |||||||
Consumer | — | — | 3 | |||||||
| | | | | | | | | | | |
Gross loans | — | — | 77,666 | |||||||
Allowance for losses on loans | — | — | (3,943 | ) | ||||||
| | | | | | | | | | | |
Net loans | $ | — | $ | — | $ | 73,723 | ||||
| | | | | | | | | | | |
| | | | | | | | | | | |
| | | | | | | | | | | |
Total loans: | ||||||||||
Construction | $ | 21,025 | $ | 22,635 | $ | 40,367 | ||||
Real estate secured | 3,023,621 | 2,672,984 | 2,367,530 | |||||||
Commercial and industrial | 795,772 | 613,322 | 449,672 | |||||||
Consumer | 15,132 | 21,069 | 14,694 | |||||||
| | | | | | | | | | | |
Gross loans | 3,855,550 | 3,330,010 | 2,872,263 | |||||||
Unearned Income | (10,623 | ) | (9,930 | ) | (7,864 | ) | ||||
| | | | | | | | | | | |
Total loans | 3,844,927 | 3,320,080 | 2,864,399 | |||||||
Allowance for losses on loans | (52,405 | ) | (48,624 | ) | (53,563 | ) | ||||
| | | | | | | | | | | |
Net loans* | $ | 3,792,522 | $ | 3,271,456 | $ | 2,810,836 | ||||
| | | | | | | | | | | |
| | | | | | | | | | | |
| | | | | | | | | | | |
- *
- Includes loans held-for-sale, recorded at the lower of cost or fair value, totaling $25.2 million, $11.8 million, and $47.6 million, at December 31, 2015, December 31, 2014, and December 31, 2013, respectively
81
In accordance with ASC 310-30 (formerly SOP 03-3), acquired loans were divided into "ASC 310-30" and "Non-ASC 310-30", of which ASC 310-30 loans (purchased impaired loans) are loans with evidence of deterioration of credit quality and that it was probable at the time of acquisition, that the Company will be unable to collect all contractually required payments receivable. In contrast, Non-ASC 310-30 loans are all other acquired loans that do not qualify as ASC 310-30 loans. The Company acquired loans with evidence of deterioration of credit quality through the acquisitions of Mirae Bank in 2009 and BankAsiana and Saehan in 2013. The balance of acquired loans broken down by ASC 310-30 and Non-ASC 310-30 loans at December 31, 2015 is presented as follows:
(Dollars in Thousands) | ASC 310-30 Acquired Loans | Non-ASC 310-30 Acquired Loans | Total Acquired Loans | |||||||
|---|---|---|---|---|---|---|---|---|---|---|
Construction | $ | — | $ | — | $ | — | ||||
Real estate secured | 666 | 347,997 | 348,663 | |||||||
Commercial and industrial | 21 | 23,799 | 23,820 | |||||||
Consumer | — | 244 | 244 | |||||||
| | | | | | | | | | | |
Total Acquired Loans | $ | 687 | $ | 372,040 | $ | 372,727 | ||||
| | | | | | | | | | | |
| | | | | | | | | | | |
| | | | | | | | | | | |
The following table represents the carrying value, net of allowance for loan losses, of ASC 310-30 and Non- ASC 310-30 acquired loans at December 31, 2015, 2014, and 2013:
(Dollars in Thousands) | December 31, 2015 | December 31, 2014 | December 31, 2013 | |||||||
|---|---|---|---|---|---|---|---|---|---|---|
Non-ASC 310-30 loans | $ | 372,040 | $ | 488,625 | $ | 616,500 | ||||
ASC 310-30 loans | 687 | 1,341 | 2,686 | |||||||
| | | | | | | | | | | |
Total acquired loan balance | 372,727 | 489,966 | 619,186 | |||||||
Allowance related to these loans | (1,896 | ) | (2,466 | ) | (3,943 | ) | ||||
| | | | | | | | | | | |
Carrying amount, net of allowance | $ | 370,831 | $ | 487,500 | $ | 615,243 | ||||
| | | | | | | | | | | |
| | | | | | | | | | | |
| | | | | | | | | | | |
Allowance for loan losses for loans acquired through the acquisition of Mirae Bank was $1.2 million, $416,000, and $3.9 million for the years ended December 31, 2015, 2014, and 2013, respectively. The increase in allowance for former Mirae loans in 2015 was due to an increase in loan recoveries. Total allowance for loan losses for former BankAsiana and Saehan loans totaled $332,000 and $385,000, respectively at December 31, 2015 and $769,000 and $1.3 million, respectively, at December 31, 2014. There was no allowance for losses on loans acquired from BankAsiana and Saehan at December 31, 2013, as the loans were recorded at fair value and there were no events since the dates of acquisition up to December 31, 2013 that would require an allowance on BankAsiana or Saehan loans.
The following table represents the breakdown of ASC 310-30 acquired loans, for which it was probable at the time of the acquisition, that all of the contractually required payments would not be collected:
(Dollars in Thousands) | December 31, 2015 | December 31, 2014 | December 31, 2013 | |||||||
|---|---|---|---|---|---|---|---|---|---|---|
Breakdown of ASC 310-30 Loans | ||||||||||
Real Estate loans | $ | 666 | $ | 1,266 | $ | 2,254 | ||||
Commercial and industrial loans | $ | 21 | $ | 75 | $ | 432 | ||||
The loan portfolios acquired from former Mirae Bank, BankAsiana, and Saehan were all acquired at a discount. The discounts recorded at the time of the acquisitions of former Mirae Bank, BankAsiana, and Saehan totaled $54.9 million, $9.2 million, and $27.7 million, respectively. Changes to the discount on
82
acquired loans including discount accretion income recognized for the periods indicated is presented in the table below:
(Dollars in Thousands) | December 31, 2015 | December 31, 2014 | December 31, 2013 | |||||||
|---|---|---|---|---|---|---|---|---|---|---|
Balance at beginning of period | $ | 22,056 | $ | 34,201 | $ | 3,448 | ||||
Discount on loans acquired from Saehan | — | — | 27,733 | |||||||
Discount on loans acquired from BankAsiana | — | — | 9,168 | |||||||
Discount accretion income recognized | (7,958 | ) | (11,214 | ) | (2,463 | ) | ||||
Disposals related to charge-offs | (195 | ) | (931 | ) | (3,685 | ) | ||||
| | | | | | | | | | | |
Balance at end of period | $ | 13,903 | $ | 22,056 | $ | 34,201 | ||||
| | | | | | | | | | | |
| | | | | | | | | | | |
| | | | | | | | | | | |
The following table is a breakdown of changes to the accretable portion of the discount related to acquired loans for periods indicated:
(Dollars in Thousands) | December 31, 2015 | December 31, 2014 | December 31, 2013 | |||||||
|---|---|---|---|---|---|---|---|---|---|---|
Balance at beginning of period | $ | 20,400 | $ | 31,450 | $ | 3,275 | ||||
Accretable portion of discount on loans acquired from Saehan | — | — | 24,304 | |||||||
Accretable portion of discount on loans acquired from BankAsiana | — | — | 7,214 | |||||||
Discount accretion income recognized | (7,502 | ) | (10,546 | ) | (2,463 | ) | ||||
Disposals related to charge-offs | (40 | ) | (504 | ) | (880 | ) | ||||
| | | | | | | | | | | |
Balance at end of period | $ | 12,858 | $ | 20,400 | $ | 31,450 | ||||
| | | | | | | | | | | |
| | | | | | | | | | | |
| | | | | | | | | | | |
The following table sets forth the amount of total loans net of unearned income and allowance for loan losses and the percentage distributions in each category, as of the dates indicated:
Distribution of Loans and Percentage Composition of Loan Portfolio
(Dollars in Thousands)
| | Amount Outstanding At December 31, | |||||||||||||||
|---|---|---|---|---|---|---|---|---|---|---|---|---|---|---|---|---|
| | 2015 | 2014 | 2013 | 2012 | 2011 | |||||||||||
Construction | $ | 19,541 | $ | 21,248 | $ | 39,268 | $ | 20,254 | $ | 61,213 | ||||||
Real estate secured | 3,016,264 | 2,666,106 | 2,362,084 | 1,815,953 | 1,624,578 | |||||||||||
Commercial and industrial | 794,026 | 611,690 | 448,379 | 302,475 | 280,630 | |||||||||||
Consumer | 15,096 | 21,036 | 14,668 | 13,658 | 15,065 | |||||||||||
| | | | | | | | | | | | | | | | | |
Total loans, net of unearned income | 3,844,927 | 3,320,080 | 2,864,399 | 2,152,340 | 1,981,486 | |||||||||||
Allowance for losses on loans | (52,405 | ) | (48,624 | ) | (53,563 | ) | (63,285 | ) | (102,982 | ) | ||||||
| | | | | | | | | | | | | | | | | |
Net loans | $ | 3,792,522 | $ | 3,271,456 | $ | 2,810,836 | $ | 2,089,055 | $ | 1,878,504 | ||||||
| | | | | | | | | | | | | | | | | |
| | | | | | | | | | | | | | | | | |
| | | | | | | | | | | | | | | | | |
Held-for-sale loans included in total loans above | $ | 25,223 | $ | 11,783 | $ | 47,557 | $ | 145,973 | $ | 53,814 | ||||||
Participation loans sold and serviced by the Company | $ | 696,218 | $ | 727,938 | $ | 711,468 | $ | 482,891 | $ | 488,288 | ||||||
Percentage breakdown of gross loans: | ||||||||||||||||
Construction | 0.5 | % | 0.7 | % | 1.4 | % | 0.9 | % | 3.1 | % | ||||||
Real estate secured | 78.4 | % | 80.3 | % | 82.4 | % | 84.4 | % | 82.0 | % | ||||||
Commercial and industrial | 20.7 | % | 18.4 | % | 15.7 | % | 14.1 | % | 14.2 | % | ||||||
Consumer | 0.4 | % | 0.6 | % | 0.5 | % | 0.6 | % | 0.7 | % | ||||||
83
Loans held-for-sale at December 31, 2015 increased to $25.2 million compared to $11.8 million at December 31, 2014. Loans held-for-sale totaled $47.6 million, $146.0 million, and $53.8 million at the end of 2013, 2012, and 2011, respectively. SBA loans held-for-sale totaled $5.5 million at December 31, 2015 compared to $11.1 million at December 31, 2014. Residential loans held-for-sale totaled $19.7 million at December 31, 2015 compared to $661,000 at December 31, 2014.
Loans held-for-sale at December 31, 2012 and 2011 included underlying residential mortgage loans in our warehouse lending program. However, starting in 2013, the Company no longer included warehouse lending residential mortgage loans in loans held-for-sale as the underlying mortgage loans in warehouse credit transactions were deemed not to meet the sales accounting criteria under ASC 860-10-40-5. In management's view, warehouse lending transactions do not meet the isolation and effective control requirements of sales transactions. Therefore warehouse line of credit transactions are recorded as secured commercial credits and not included in loans held-for-sale.
The following table shows the contractual maturity and repricing intervals of the outstanding loans in our portfolio as of December 31, 2015. In addition, the table below shows the distribution of such loans between those with variable or floating interest rates and those with fixed or predetermined interest rates. The amounts shown in the table below are gross loan balances (including held-for-sale) at December 31, 2015 before deducting unearned income and allowance for loan losses:
Loan Maturities and Repricing Schedule
(Dollars in Thousands)
| | December 31, 2015 | ||||||||||||
|---|---|---|---|---|---|---|---|---|---|---|---|---|---|
| | Within One Year | After One But within Five Years | After Five Years | Total | |||||||||
Construction | $ | 20,939 | $ | 86 | $ | — | $ | 21,025 | |||||
Real estate secured | 815,950 | 1,980,524 | 227,147 | 3,023,621 | |||||||||
Commercial and industrial | 735,076 | 59,951 | 745 | 795,772 | |||||||||
Consumer | 13,065 | 1,923 | 144 | 15,132 | |||||||||
| | | | | | | | | | | | | | |
Gross loans | $ | 1,585,030 | $ | 2,042,484 | $ | 228,036 | $ | 3,855,550 | |||||
| | | | | | | | | | | | | | |
| | | | | | | | | | | | | | |
| | | | | | | | | | | | | | |
Loans with variable interest rates | $ | 1,415,378 | $ | — | $ | — | $ | 1,415,378 | |||||
Loans with fixed interest rates | $ | 169,652 | $ | 2,042,484 | $ | 228,036 | $ | 2,440,172 | |||||
The majority of the properties that we accept as collateral are located in Southern California. Loans generated by our loan production offices, which are located outside of our main geographical market, are generally collateralized by properties in close proximity to those offices. We employ strict guidelines regarding the use of collateral located in areas which are not familiar to us. As of year-end 2015, 78.9% of our loans are secured by first mortgages on various types of real estate. In 2015, we experienced increases in market values of certain commercial real estate properties, but we still maintain a cautious outlook for 2016.
Non-performing Assets
Non-performing assets ("NPA") consist of non-performing loans ("NPL"), certain troubled debt restructurings ("TDR"), and other NPA. NPLs are reported at their outstanding balances, net of discount and portions guaranteed by the SBA, and consist of loans on non-accrual status and loans 90 days or more past due and still accruing interest. We consider TDR loans as a NPL if the loan is 90 days or more past due. Other NPAs consist of properties, or OREO, acquired by foreclosure or by similar means that management intends to offer for sale. The treatment of non-performing status for held-for-sale loans are the same as for other loans.
84
Our continued emphasis on asset quality control enabled us to maintain a relatively low level of NPLs prior to 2007. The effect of the unfavorable economic environment particularly in 2009 and 2010 impacted the strength of our borrowers' credit and financial position which elevated NPLs levels during this time. However, through note sales, charge-offs, and enhanced monitoring of problem loans, NPLs balances at the end of 2015 are much lower compared to the peak in NPL balances in 2010. NPLs totaled $21.7 million at the end of 2015, compared to $37.3 million, $37.2 million, $28.0 million, and $43.8 million at the end of 2014, 2013, 2012, and 2011, respectively. Of the total $21.7 million in NPLs at December 31, 2015, $223,000 were former Mirae Bank loans, $4.2 million were former BankAsiana loans, and $1.6 million were former Saehan loans. At December 31, 2015, NPLs as a percentage of total loans was 0.56%, compared to 1.12%, 1.30%, 1.30%, and 2.21% at December 31, 2014, 2013, 2012, and 2011, respectively.
As of December 31, 2015, we had $9.2 million in other NPAs, which was comprised of nine OREO properties. These properties are listed for sale or are in the process of being sold. We recorded $316,000 in provision expenses related to the valuation allowance for OREO in 2015. Of the eleven OREO properties sold in 2015, the Bank recorded a net gain of $1.2 million. As of December 31, 2014, we had $7.9 million in other NPAs, which was comprised of thirteen OREO properties. We recorded $405,000 in provision expenses related to the valuation allowance for OREO in 2014. Of the nine OREO properties sold in 2014, the Bank recorded a net gain of $28,000. As of December 31, 2013, we had $7.6 million in other NPAs, which was comprised of thirteen OREO properties. We recorded $24,000 in income related to a reduction in the valuation allowance for OREO in 2013. Of the OREO properties sold in 2013, the Bank recorded a net gain of $184,000. As of December 31, 2012, we had $2.1 million as other NPAs, which was comprised of six OREO properties. For the twelve months ended December 31, 2012, we recorded $157,000 in OREO provisions and recorded a net loss of $616,000 on properties sold during the year. As of December 31, 2011, we had $8.2 million other NPAs, which was comprised of fourteen OREO properties, with thirteen of those foreclosed in 2011. At December 31, 2011, we had $3.8 million in provisions related to OREO. Of the OREO properties sold during 2011, the Bank recorded a loss of $3.1 million. Including OREO, our ratio of NPAs as a percentage of total loans and OREO was 0.80%, 1.36%, 1.56%, 1.39%, and 2.62% at December 31, 2015, 2014, 2013, 2012, and 2011, respectively.
Management believes that the reserve provided for NPAs, together with the tangible collateral, were adequate as of December 31, 2015. See "Allowance for Loan Losses and Loan Commitments" below for further discussion.
85
The following table provides information with respect to the components of our NPAs as of the dates indicated:
Non-performing Assets
(Dollars in Thousands)
| | For the Years Ended December 31, | |||||||||||||||
|---|---|---|---|---|---|---|---|---|---|---|---|---|---|---|---|---|
(Balances are net of SBA guaranteed portions) | 2015 | 2014 | 2013 | 2012 | 2011 | |||||||||||
Total non-accrual loans: | ||||||||||||||||
Construction | $ | — | $ | — | $ | 2,471 | $ | 5,644 | $ | 12,548 | ||||||
Real estate secured | 15,422 | 29,547 | 33,401 | 21,007 | 29,088 | |||||||||||
Commercial and industrial | 6,272 | 7,718 | 1,196 | 1,302 | 2,196 | |||||||||||
Consumer | — | — | — | — | — | |||||||||||
| | | | | | | | | | | | | | | | | |
Total | 21,694 | 37,265 | 37,068 | 27,953 | 43,832 | |||||||||||
| | | | | | | | | | | | | | | | | |
Loans 90 days or more past due and still accruing: | ||||||||||||||||
Real estate secured | — | — | 168 | — | — | |||||||||||
| | | | | | | | | | | | | | | | | |
Total | — | — | 168 | — | — | |||||||||||
| | | | | | | | | | | | | | | | | |
Total non-performing loans1 | 21,694 | 37,265 | 37,236 | 27,953 | 43,832 | |||||||||||
| | | | | | | | | | | | | | | | | |
Other real estate owned | 9,179 | 7,922 | 7,600 | 2,080 | 8,221 | |||||||||||
| | | | | | | | | | | | | | | | | |
Total non-performing assets, net of SBA guarantee | $ | 30,873 | $ | 45,187 | $ | 44,836 | $ | 30,033 | $ | 52,053 | ||||||
| | | | | | | | | | | | | | | | | |
| | | | | | | | | | | | | | | | | |
| | | | | | | | | | | | | | | | | |
Troubled debt restructurings2 | $ | 37,992 | $ | 37,110 | $ | 36,220 | $ | 35,733 | $ | 22,383 | ||||||
Non-performing loans as a percentage of total loans | 0.56 | % | 1.12 | % | 1.30 | % | 1.30 | % | 2.21 | % | ||||||
Non-performing assets to total loans and other real estate owned | 0.80 | % | 1.36 | % | 1.56 | % | 1.39 | % | 2.62 | % | ||||||
Allowance for loan losses as a percentage of non-performing loans | 241.56 | % | 130.48 | % | 143.85 | % | 226.40 | % | 234.95 | % | ||||||
- 1
- During the fiscal year ended December 31, 2015, no interest income related to these loans were included in net income. Additional interest income of approximately $346,000 would have been recorded during the year ended December 31, 2015, if these loans had been paid in accordance with their original terms and had been outstanding throughout the fiscal year ended December 31, 2015 or, if not outstanding throughout the fiscal year ended December 31, 2015, since origination.
- 2
- TDRs that are over 90 days past due are considered non-accrual loans. At December 31, 2015, $8.2 million in TDR were classified as non-accrual.
86
The following table presents non-performing loans at December 31, 2015 by legacy loans originated by the Company and those acquired from the acquisitions of Mirae Bank, BankAsiana, and Saehan:
| | December 31, 2015 | |||||||||
|---|---|---|---|---|---|---|---|---|---|---|
(Dollars In Thousands) (Balances are net of SBA guaranteed portions) | Total Non-Accrual Loans | 90 Days or More Past Due and Still Accruing | Total Non-Performing Loans | |||||||
Legacy Wilshire: | ||||||||||
Construction | $ | — | $ | — | $ | — | ||||
Real Estate Secured: | ||||||||||
Residential Real Estate | 320 | — | 320 | |||||||
SBA Real Estate | 2,140 | — | 2,140 | |||||||
Gas Station | — | — | — | |||||||
Carwash | 770 | — | 770 | |||||||
Hotel/Motel | 943 | — | 943 | |||||||
Land | — | — | — | |||||||
Other | 6,131 | — | 6,131 | |||||||
Commercial & Industrial: | ||||||||||
SBA Commercial | 284 | — | 284 | |||||||
Other Commercial | 5,050 | — | 5,050 | |||||||
Consumer | — | — | — | |||||||
| | | | | | | | | | | |
Total Legacy Loans | 15,638 | — | 15,638 | |||||||
| | | | | | | | | | | |
Acquired Loans: | ||||||||||
Construction | — | — | — | |||||||
Real Estate Secured: | ||||||||||
Residential Real Estate | — | — | — | |||||||
SBA Real Estate | 1,691 | — | 1,691 | |||||||
Gas Station | — | — | — | |||||||
Carwash | — | — | — | |||||||
Hotel/Motel | — | — | — | |||||||
Land | — | — | — | |||||||
Other | 3,427 | — | 3,427 | |||||||
Commercial & Industrial: | ||||||||||
SBA Commercial | 25 | — | 25 | |||||||
Other Commercial | 913 | — | 913 | |||||||
Consumer | — | — | — | |||||||
| | | | | | | | | | | |
Total Acquired Loans | 6,056 | — | 6,056 | |||||||
| | | | | | | | | | | |
Total | $ | 21,694 | $ | — | $ | 21,694 | ||||
| | | | | | | | | | | |
| | | | | | | | | | | |
| | | | | | | | | | | |
Trouble Debt Restructurings
A restructuring of a debt constitutes a TDR if the Company for economic or legal reasons, related to the borrower's financial difficulties, grants a concession to the borrower that it would not otherwise consider. Restructured loans typically present an elevated level of credit risk as the borrowers may not able to perform in accordance with the original contractual terms. Loans that are reported as TDRs are accounted for in accordance with ASC 310-10-35 and are considered impaired and evaluated individually for impairment. TDR loans are reported at their outstanding balances, net of any portions guaranteed by the SBA
87
Loans that are considered TDRs are classified as performing, unless they are in non-accrual status or 90 days or more delinquent as of the end of the most recent quarter. We consider all TDR loans, regardless of whether they are performing or non-performing, as impaired. At December 31, 2015, 2014, and 2013, the balance of TDR loans, net of SBA guaranteed portion, was $38.0 million, $37.1 million, and $36.2 million, respectively. TDR loans that were classified as non-accrual totaled $8.2 million, $9.5 million, and $8.2 million, at December 31, 2015, 2014, and 2013, respectively. The SBA guaranteed portion of TDR loans totaled $2.4 million at December 31, 2015.
Allowance for Loan Losses and Loan Commitments
Based on the credit risk inherent in our lending business, we set aside an allowance for losses on loans and an allowance for unfunded loan commitments which is established by a period provision for loan losses charged to earnings. These charges were not only made for the outstanding loan portfolio, but also for off-balance sheet loan commitments, such as commitments to extend credit, and letters of credit. The charges made for the outstanding loan portfolio are credited to the allowance for loan losses, whereas charges related to loan commitments are credited to the reserve for loan commitments, which is presented as a component of other liabilities. The provision for losses on loans and loan commitments is discussed in the previous section entitled "Provision for Loan Losses and Loan Commitments".
The allowance for loan losses is comprised of two components the general valuation allowance ("GVA") and the specific valuation allowance ("SVA"). The GVA allowance is based on loans that are evaluated for losses in pools based on historical experience in addition to qualitative adjustments ("QA"), or estimated losses from factors not captured by historical experience. The SVA portion of the allowance is based on the estimated losses on impaired loans that are individually evaluated. Management performs a review of the historical loss rates used in the GVA as well as the factors in our QA methodology on a quarterly basis due to the increased significance of GVA when estimating losses in the current economic environment.
Net loan recoveries for 2015 totaled $3.3 million, compared to net loan charge-offs of $4.9 million in 2014. Net recoveries in 2015 were comprised of $5.1 million in real estate secured net loan recoveries, $1.8 million in commercial and industrial net charge-offs, and $10,000 consumer loan net recoveries. The $3.3 million in net recoveries represents 0.09% of average total loans in 2015, compared with 0.16%, 0.43%, 0.40%, and 3.16% in 2014, 2013, 2012, and 2011, respectively.
The net loan recoveries experienced in 2015 resulted in minimal provision for loan losses which led to an increase in the allowance for loan losses by $3.7 million, to $52.4 million at December 31, 2015, compared to $48.6 million at December 31, 2014. The allowance for loan losses totaled $53.6 million, $63.3 million, and $103.0 million, at December 31, 2013, 2012, and 2011, respectively. The ratio of allowance for loan losses to gross loans held for investment was 1.37%, 1.47%, 1.90%, 3.15%, and 5.33% at the end of 2015, 2014, 2013, 2012, and 2011, respectively.
The general valuation allowance at December 31, 2015 totaled $43.3 million, or 82.6% of the total allowance for loan losses, and specific valuation allowance on impaired loans totaled $9.1 million, or 17.4% of the total allowance. The qualitative adjustment included in the general valuation allowance portion of the allowance for loan losses totaled $34.8 million at December 31, 2015. The general valuation allowance at December 31, 2014 totaled $39.6 million, or 81.5% of the total allowance for loan losses, and specific valuation allowance on impaired loans totaled $9.0 million, or 18.5% of the total allowance. The qualitative adjustment included in the general valuation allowance portion of the allowance for loan losses totaled $29.9 million at December 31, 2014.
The previous improvements and continued stability in credit quality through 2015 resulted in a decline in loan losses and charge-offs, reducing the historical loss percentages used in our allowance calculation. Higher level net charge-off periods continue to drop out of our historical loss horizon utilized in the Bank's migration analysis. More recent low level net charge-off or net recovery periods are taking their place,
88
contributing to the lower loss rates in most loan categories, particularly for real estate secured loans, which has experienced a significant decline in the last four years. As a result, the historical loss rates used in our GVA calculation at December 31, 2015 declined by $1.2 million, or 11.9% compared to December 31, 2014. The QA portion of the allowance for loan losses increased $4.8 million, or 16.1% in 2015, compared to the previous year to offset a portion of the large declines in GVA and account for other risk factors. The potential for further deterioration in our local and global economy continues to exist with the possibility of another economic downturn. In addition, the volatile price of oil may be a trigger for economic declines in the US and in Texas, one of the markets we serve. In light of these factors, management increased our QA to account for these and other uncertainties that could results in losses in our loan portfolio.
In 2013, as part our regular review of the allowance for loan losses methodology, management made enhancements to better reflect potential losses in the loan portfolio in the current economic environment. The enhancements made to the methodology included changes to the historical loss calculation, or GVA portion of the allowance, part of which lengthened the historical look-back period for losses. The current methodology is expected to better estimate potential losses. The enhancements to the allowance for loan losses calculation did not result in a material difference in allowance compared to before the enhancements were made.
The reserve for unfunded loan commitments at December 31, 2015 totaled $1.3 million, compared to $1.1 million at December 31, 2014. At December 31, 2015, commitments to extend credit totaled $470.0 million, compared to $391.7 million at December 31, 2014. Total commitments to extend credit increased $78.3 million in 2015, which resulted in an increase in allowance for unfunded loan commitments of $200,000. A reduction in historical loss rates helped to offset a portion of the increase in required allowance for unfunded loan commitments.
In 2013, we completed our acquisitions of BankAsiana and Saehan. At December 31, 2015, the balance of loans acquired from BankAsiana and Saehan totaled $347.9 million, compared to $448.8 million at December 31, 2014. These loans were recorded at fair value in accordance with GAAP. A portion of delinquencies, non-performing, criticized, and classified loans are from loans acquired through the acquisitions of BankAsiana and Saehan. Since the loans were recorded at fair value, loans acquired from BankAsiana and Saehan did not have a significant impact to the allowance for loan losses at year-end 2015 and 2014. Excluding allowance and loans acquired from BankAsiana and Saehan, our ratio of allowance to gross loans held for investment was approximately 1.48% at December 31, 2015, compared to 1.62% at December 31, 2014.
Although management believes our allowance at December 31, 2015 was adequate to absorb losses from any known and inherent risks in the portfolio, economic conditions which adversely affect our service areas or other variables may result in further increased losses in the loan portfolio in the future.
The table below summarizes for the years indicated, loan balances at the end of each period, the daily averages during the period, changes in the allowance for loan losses and reserve for unfunded loan
89
commitments arising from loans charged off, recoveries on loans previously charged off, additions to the allowance, and certain ratios related to the allowance for loan losses and loan commitments:
Allowance for Loan Losses and Reserve for Unfunded Loan Commitments
(Dollars in Thousands)
| | For the Years Ended December 31, | |||||||||||||||
|---|---|---|---|---|---|---|---|---|---|---|---|---|---|---|---|---|
| | 2015 | 2014 | 2013 | 2012 | 2011 | |||||||||||
Allowance for loan losses: | ||||||||||||||||
Balances at beginning of period | $ | 48,624 | $ | 53,563 | $ | 63,285 | $ | 102,982 | $ | 110,953 | ||||||
Actual charge-offs: | ||||||||||||||||
Real estate secured | 1,192 | 8,076 | 11,063 | 10,649 | 62,265 | |||||||||||
Commercial and industrial | 3,971 | 3,451 | 3,690 | 3,282 | 9,930 | |||||||||||
Consumer | — | 1 | 3 | 2 | 260 | |||||||||||
| | | | | | | | | | | | | | | | | |
Total charge-offs | 5,163 | 11,528 | 14,756 | 13,933 | 72,455 | |||||||||||
| | | | | | | | | | | | | | | | | |
Recoveries on loans previously charged off: | ||||||||||||||||
Construction | — | — | — | 20 | — | |||||||||||
Real estate secured | 6,272 | 3,501 | 2,741 | 3,850 | 488 | |||||||||||
Commercial and industrial | 2,162 | 3,072 | 2,280 | 1,812 | 4,328 | |||||||||||
Consumer | 10 | 16 | 13 | 154 | 65 | |||||||||||
| | | | | | | | | | | | | | | | | |
Total recoveries | 8,444 | 6,589 | 5,034 | 5,836 | 4,881 | |||||||||||
Net loan charge-offs | (3,281 | ) | 4,939 | 9,722 | 8,097 | 67,574 | ||||||||||
Provision (credit) for loan losses | 500 | — | — | (31,600 | ) | 59,603 | ||||||||||
| | | | | | | | | | | | | | | | | |
Balances at end of period | $ | 52,405 | $ | 48,624 | $ | 53,563 | $ | 63,285 | $ | 102,982 | ||||||
| | | | | | | | | | | | | | | | | |
| | | | | | | | | | | | | | | | | |
| | | | | | | | | | | | | | | | | |
Reserve for unfunded loan commitments: | ||||||||||||||||
Balances at beginning of year | $ | 1,061 | $ | 1,061 | $ | 1,023 | $ | 3,423 | $ | 3,926 | ||||||
Provision (credit) for losses on loan commitments | 200 | — | 38 | (2,400 | ) | (503 | ) | |||||||||
| | | | | | | | | | | | | | | | | |
Balance at end of period | $ | 1,261 | $ | 1,061 | $ | 1,061 | $ | 1,023 | $ | 3,423 | ||||||
| | | | | | | | | | | | | | | | | |
| | | | | | | | | | | | | | | | | |
| | | | | | | | | | | | | | | | | |
Ratios: | ||||||||||||||||
Net loan (recoveries) charge-offs to average total loans | –0.09 | % | 0.16 | % | 0.43 | % | 0.40 | % | 3.16 | % | ||||||
Allowance for loan losses to gross loans at end of period (less loans held-for-sale) | 1.37 | % | 1.47 | % | 1.90 | % | 3.15 | % | 5.33 | % | ||||||
Net loan (recoveries) charge-offs to allowance for loan losses at end of period | –6.26 | % | 10.16 | % | 18.15 | % | 12.79 | % | 65.62 | % | ||||||
Net loan (recoveries) charge-offs to provision for losses on loans and loan commitments | –468.71 | N/A | N/A | –23.81 | % | 114.34 | % | |||||||||
90
The table below summarizes, for the periods indicated, the balance of the allowance for loan losses and the percentage of such balance for each type of loan as of the dates indicated:
Allowance for Loan Losses Distribution and Loan Percentage Composition
(Dollars in Thousands)
| | Amount Outstanding At December 31, | |||||||||||||||
|---|---|---|---|---|---|---|---|---|---|---|---|---|---|---|---|---|
| | 2015 | 2014 | 2013 | 2012 | 2011 | |||||||||||
Applicable to: | ||||||||||||||||
Construction | $ | 219 | $ | 220 | $ | 814 | $ | 453 | $ | 4,218 | ||||||
Real estate secured | 33,830 | 31,889 | 41,401 | 49,956 | 79,221 | |||||||||||
Commercial and industrial | 18,215 | 16,302 | 11,238 | 12,737 | 19,391 | |||||||||||
Consumer | 141 | 213 | 110 | 139 | 152 | |||||||||||
| | | | | | | | | | | | | | | | | |
Total allowance for loan losses | $ | 52,405 | $ | 48,624 | $ | 53,563 | $ | 63,285 | $ | 102,982 | ||||||
| | | | | | | | | | | | | | | | | |
| | | | | | | | | | | | | | | | | |
| | | | | | | | | | | | | | | | | |
Percentage of gross loans receivable: | ||||||||||||||||
Construction | 0.42 | % | 0.68 | % | 1.43 | % | 1.04 | % | 3.20 | % | ||||||
Real estate secured | 64.55 | % | 80.23 | % | 82.56 | % | 84.14 | % | 81.76 | % | ||||||
Commercial and industrial | 34.76 | % | 18.46 | % | 15.49 | % | 14.14 | % | 14.26 | % | ||||||
Consumer | 0.27 | % | 0.63 | % | 0.52 | % | 0.68 | % | 0.78 | % | ||||||
| | | | | | | | | | | | | | | | | |
Total | 100.0 | % | 100.00 | % | 100.00 | % | 100.00 | % | 100.00 | % | ||||||
| | | | | | | | | | | | | | | | | |
| | | | | | | | | | | | | | | | | |
| | | | | | | | | | | | | | | | | |
At December 31, 2015 and December 31, 2014, loans acquired with deteriorated credit quality (ASC 310-30 loans) totaled $687,000 and $1.3 million, respectively. These loans had an allowance for loan losses of $3,000 at December 31, 2015 and $253,000 at December 31, 2014. The following is a breakdown of loan balances for loans acquired with deteriorated credit quality at December 31, 2015 and December 31, 2014:
| | December 31, 2015 | |||||||||||||||
|---|---|---|---|---|---|---|---|---|---|---|---|---|---|---|---|---|
(Dollars in Thousands) | Construction Loans | Real Estate Secured Loans | Commercial & Industrial loans | Consumer Loans | Total | |||||||||||
Balance of Loans Acquired With Deteriorated Credit Quality | $ | — | $ | 666 | $ | 21 | $ | — | $ | 687 | ||||||
| | | | | | | | | | | | | | | | | |
| | | | | | | | | | | | | | | | | |
| | | | | | | | | | | | | | | | | |
Total Allowance for Loans Acquired With Deteriorated Credit Quality | $ | — | $ | — | $ | 3 | $ | — | $ | 3 | ||||||
| | | | | | | | | | | | | | | | | |
| | | | | | | | | | | | | | | | | |
| | | | | | | | | | | | | | | | | |
| | December 31, 2014 | |||||||||||||||
|---|---|---|---|---|---|---|---|---|---|---|---|---|---|---|---|---|
(Dollars in Thousands) | Construction Loans | Real Estate Secured Loans | Commercial & Industrial loans | Consumer Loans | Total | |||||||||||
Balance of Loans Acquired With Deteriorated Credit Quality | $ | — | $ | 1,266 | $ | 75 | $ | — | $ | 1,341 | ||||||
| | | | | | | | | | | | | | | | | |
| | | | | | | | | | | | | | | | | |
| | | | | | | | | | | | | | | | | |
Total Allowance for Loans Acquired With Deteriorated Credit Quality | $ | — | $ | 220 | $ | 33 | $ | — | $ | 253 | ||||||
| | | | | | | | | | | | | | | | | |
| | | | | | | | | | | | | | | | | |
| | | | | | | | | | | | | | | | | |
91
Contractual Obligations
The following table represents our aggregate contractual obligations (principal and interest) to make future payments as of December 31, 2015:
(Dollars in Thousands) | One Year or Less | Over One Year To Three Years | Over Three Years To Five Years | Over Five Years | Total | |||||||||||
|---|---|---|---|---|---|---|---|---|---|---|---|---|---|---|---|---|
FHLB Advances | $ | 73,415 | $ | 6,826 | $ | 152,496 | $ | — | $ | 232,737 | ||||||
Junior Subordinated Debentures* | 317 | — | — | 82,476 | 82,793 | |||||||||||
Operating Leases | 6,252 | 9,499 | 5,434 | 2,376 | 23,561 | |||||||||||
Investments in Affordable Housing Partnerships | 5,843 | 8,765 | 189 | 933 | 15,730 | |||||||||||
Time Deposits | 1,458,499 | 149,336 | 2,458 | 10 | 1,610,303 | |||||||||||
| | | | | | | | | | | | | | | | | |
Total | $ | 1,544,326 | $ | 174,426 | $ | 160,577 | $ | 85,795 | $ | 1,965,124 | ||||||
| | | | | | | | | | | | | | | | | |
| | | | | | | | | | | | | | | | | |
| | | | | | | | | | | | | | | | | |
- *
- See detailed disclosure of junior subordinated debentures, including interest rates, in the subsection "Junior Subordinated Debenture; Trust Preferred Securities"
Off-Balance Sheet Arrangements
During the ordinary course of business, we provide various forms of credit lines to meet the financing needs of our customers. These commitments, which represent a credit risk to us, are not represented in any form on our statement of financial condition.
At December 31, 2015 and 2014, we had commitments to extend credit of $470.0 million and $391.7 million, respectively. Obligations under standby letters of credit were $15.0 million and $1.4 million at the years ended 2015 and 2014, respectively, and the obligations under commercial letters of credit were $75.9 million and $61.5 million, respectively, for the same periods.
The effect on our revenues, expenses, cash flows, and liquidity from the unused portion of the commitments to provide credit cannot be reasonably predicted because there is no guarantee that the lines of credit will be used. However, the Company records a reserve for loan commitments based on an internally defined utilization rates of exposure and historical loss rates for unused off-balance sheet loan commitments.
The Company invests in affordable housing partnerships that were formed to develop and operate apartment complexes designed as high-quality affordable housing for lower income tenants throughout the United States. At December 31, 2015, the Company had nineteen such investments, with a net carrying value of $48.9 million. Commitments to fund investments in affordable housing partnerships totaled $15.7 million at December 31, 2015, with the last of the commitments ending in 2032. At December 31, 2014, the Company had seventeen such investments, with a net carrying value of $44.1 million. Commitments to fund investments in affordable housing partnerships totaled $9.4 million at December 31, 2014, with the last of the commitments ending in 2031.
In the normal course of business, we are involved in various legal claims. We have reviewed all legal claims against us with counsel and have taken into consideration the views of such counsel as to the potential outcome of the claims. Accrued loss contingencies for all legal claims totaled $120,000 at December 31, 2015, and $135,000 at December 31, 2014. It is reasonably possible we may incur losses in addition to the amounts we have accrued. However, at this time, we are unable to estimate the range of additional losses that are reasonably possible because of a number of factors, including the fact that many of these litigation matters are still in their early stages and involve claims for which, at this point, we
92
believe have little to no merit. Management has considered these and other possible loss contingencies and does not expect the amounts to be material to any of the consolidated financial statements.
Derivatives
It is our practice to enter into forward commitments for the future delivery of residential mortgage loans to third party investors when we enter into interest rate lock commitments in order to economically hedge the effect of changes in interest rates resulting from our commitment to fund the loans. All derivative instruments are recognized on the balance sheet at fair value.
During the first quarter of 2015, the Bank acquired Bank of Manhattan's Mortgage Division to expand its mortgage loan operations. The Mortgage Division was incorporated into the Bank's existing Mortgage Department. The majority of loans underwritten by the Bank's Mortgage Division will be sold in the secondary market. Under ASC 815-10, any interest rate lock commitments entered into with prospective borrowers are considered to be derivatives. Residential mortgage loans funded with interest rate locks to be sold into the secondary market, and forward commitments for the future delivery of mortgage loans to third party investors, are considered derivatives. The Bank began utilizing derivatives in the first quarter of 2015 after its acquisition of Bank of Manhattan's Mortgage Division.
At December 31, 2015, the Bank had approximately $35.7 million in interest rate lock commitments and $17.1 million in forward sales commitments for the future delivery of residential mortgage loans. The fair value of these mortgage banking derivatives is represented by a derivative asset of $222,000 and a derivative liability of $16,000 at December 31, 2015. Fair values were estimated based on changes in mortgage interest rates from the date of the commitments. Changes in the fair values of these mortgage banking derivatives are recorded as other non-interest income. There were no mortgage banking derivative during the year ended December 31, 2014, or any years prior.
Other Earning Assets
For various business purposes, we make investments in earning assets other than loans, investments, and federal funds sold. Other earning assets include FHLB stock, the cash surrender value of the BOLI, affordable housing partnerships investments, and deposits held in other financial institutions.
In an effort to provide additional benefits aimed at retaining key employees and directors while generating a tax-exempt non-interest income stream, we purchased $10.5 million and $3.0 million in BOLI during 2003 and 2005, respectively, from insurance carriers rated AA or above. In 2008, 2009, 2010, 2011, 2012, 2013, 2014, and 2015 we purchased $532,000, $96,000, $0, $619,000, $731,000, $710,000, $538,000, and $1.1 million, respectively, more in BOLI from the same insurance carriers. The Bank is the owner and the primary beneficiary of the life insurance policies and we recognize the increase of the cash surrender value of the policies as tax-exempt other income.
We actively invest in affordable housing partnerships investments to promote our participation in CRA activities. In 2012, we made a $4.5 million commitment to invest in RBC National Fund 15, in order to promote our CRA activities in the assessment area in Dallas-Fort Worth areas in Texas. In 2013, we made $5.0 million and $3.0 million commitments to invest in WNC Institutional Tax Credit Fund X California Series 11 and Raymond James New York Housing Opportunities Fund I-B, respectively, in order to promote our CRA activities in the assessment area in California and in New York. In 2014, we made a $5.0 million commitment to invest in Enterprise Housing Partners XXV, in order to promote our CRA activities in California. In 2015, we made commitments of $4.8 million and $5.0 million, to invest in Hudson Housing Tax Credit Fund LXX and Enterprise Housing Partners Calgreen III Fund, respectively, in order to promote our CRA activities in the assessment area in New York and in California.
We are required by FHLB to invest in FHLB stock in order to participate in FHLB's credit program in addition to being used as collateral for our FHLB borrowings. Our total investment in FHLB stock was
93
$16.5 million at both December 31, 2015 and December 31, 2014, compared to $16.0 million at December 31, 2013. Total cash dividends received from FHLB stock holdings amounted to $2.0 million, $1.2 million, and $543,000 for the years ended December 31, 2015, 2014, and 2013, respectively.
With the acquisitions of BankAsiana and Saehan in 2013, we acquired deposits held at other financial institutions. Similar to short-term investments, BankAsiana and Saehan invested in time deposits at other institutions and received interest income on their funds deposited. At December 31, 2015, we did not have any deposits held in other financial institutions. Deposits held in other financial institutions at December 31, 2014 totaled $8.0 million, consisting of four time deposits with an average weighted rate of 1.1%. At December 31, 2013, deposits held at other financial institution consisted of sixteen time deposits totaling $21.0 million, with an average rate of 1.33%.
The balances of other earning assets as of December 31, 2015 and December 31, 2014 were as follows:
| | Balances At December 31, | ||||||
|---|---|---|---|---|---|---|---|
(Dollars In Thousands) | 2015 | 2014 | |||||
BOLI | $ | 25,028 | $ | 23,330 | |||
Investment in affordable housing partnerships | 48,867 | 44,077 | |||||
FHLB stock | 16,539 | 16,539 | |||||
Deposits held in other financial institutions | — | 8,000 | |||||
Deposits and Other Sources of Funds
Deposits
Deposits are our primary source of funds. Total deposits at December 31, 2015, 2014, and 2013, were $3.84 billion, $3.40 billion, and $2.87 billion, respectively, representing an annual increase of $438.6 million, or 12.9%, in 2015, and an increase of $529.7 million, or 18.4%, in 2014. The increase in deposits in 2015 was mostly due to an increase in money market accounts and demand deposits accounts. The increase in 2014 was due to an increase in time deposits from our CD campaign during the second half of the year. In addition, we obtained $49.2 million in additional time deposits from the State of California time deposit program in 2014.
Total average deposits for the years ended December 31, 2015, 2014, and 2013 were $3.76 billion, $3.02 billion, and $2.29 billion, respectively. Total average deposits increased $740.9 million, or 24.5% in 2015, and increased $736.2 million, or 32.2% during 2014 compared to the previous years. The increase in average deposits in 2015 was mostly due to an increase in time deposits of $100,000 or more and to a lesser extent from an increase in money market and demand deposits accounts. The increase in average deposits in 2014 was due to the increase in time deposits as previously mentioned, in addition to the full-year effect of the increase from the acquisitions of BankAsiana and Saehan.
The percentage of average time deposits divided by average total deposits increased to 44.2% in 2015, compared to 40.2% in 2014 and 38.7% in 2013. With an increase in loan originations in 2014 and 2015, the Bank had a time deposit promotion during the second half of 2014 to raise funds to increase our overall liquidity. This, in addition to securing additional low cost time deposits from the State of California time deposit program in 2014, increased the total percentage of average time deposits to average deposits for 2014, and then again in 2015. With liquidity achieved in the second half of 2015, we ran-off some higher costing time deposits during the fourth quarter of 2015 to reduce costs and deploy excess liquidity. Our primary focus continues to remain on raising core deposits, and we will continue to monitor the level of time deposits as a percentage of total deposits.
The average rate paid on time deposits in denominations of $100,000 or more increased to 0.86% in 2015, compared to 0.71% in 2014 and 0.65% in 2013. Please see "Net Interest Income and Net Interest Margin" for further discussions.
94
The following tables summarize the distribution of average daily deposits and the average rates paid for the years indicated:
Average Deposits
(Dollars in Thousands)
| | For the Years Ended December 31, | ||||||||||||||||||
|---|---|---|---|---|---|---|---|---|---|---|---|---|---|---|---|---|---|---|---|
| | 2015 | 2014 | 2013 | ||||||||||||||||
| | Average Balance | Average Rate | Average Balance | Average Rate | Average Balance | Average Rate | |||||||||||||
Demand, non-interest-bearing | $ | 1,013,616 | — | $ | 882,333 | — | $ | 639,957 | — | ||||||||||
Money market | 924,673 | 0.67 | % | 770,316 | 0.68 | % | 630,050 | 0.63 | % | ||||||||||
Super NOW | 30,874 | 0.27 | % | 32,240 | 0.20 | % | 27,656 | 0.20 | % | ||||||||||
Savings | 129,961 | 1.53 | % | 121,878 | 1.58 | % | 103,102 | 1.75 | % | ||||||||||
Time deposits of $100,000 or more | 1,393,357 | 0.86 | % | 970,481 | 0.71 | % | 658,483 | 0.65 | % | ||||||||||
Other time deposits | 269,842 | 0.90 | % | 244,144 | 0.77 | % | 225,900 | 0.80 | % | ||||||||||
| | | | | | | | | | | | | | | | | | | | |
Total deposits | $ | 3,762,323 | 0.60 | % | $ | 3,021,392 | 0.53 | % | $ | 2,285,148 | 0.53 | % | |||||||
| | | | | | | | | | | | | | | | | | | | |
| | | | | | | | | | | | | | | | | | | | |
| | | | | | | | | | | | | | | | | | | | |
The scheduled maturities of total time deposits by denominations of $100,000 or greater and $250,000 or greater at December 31, 2015 are as follows:
| | Maturity of Time Deposits in Denominations of: | ||||||
|---|---|---|---|---|---|---|---|
(Dollars In Thousands) | $100,000 or Greater | $250,000 or Greater | |||||
Three months or less | $ | 489,810 | $ | 388,146 | |||
Over three months through six months | 154,357 | 71,298 | |||||
Over six months through twelve months | 579,981 | 290,735 | |||||
Over twelve months | 125,292 | 63,404 | |||||
| | | | | | | | |
Total | $ | 1,349,440 | $ | 813,583 | |||
| | | | | | | | |
| | | | | | | | |
| | | | | | | | |
Because our client base is comprised primarily of commercial and industrial accounts, individual account balances are generally higher than those of consumer-oriented banks. At December 31, 2015, 2014, and 2013, the California State Treasury was the only depositor whose aggregate deposit balance was more than 1% of our total deposits.
In addition to our regular customer base, we also accept brokered deposits on a selective basis at reasonable interest rates to augment deposit growth. At December 31, 2015, we had $48.3 million in brokered time deposits, down from $63.6 million in brokered time deposits at December 31, 2014, and $41.4 million in brokered time deposits, at December 31, 2013.
FHLB Borrowings
Although deposits are the primary source of funds for our lending, investment activities, and for general business operations, we may obtain advances from the FHLB as an alternative to retail deposit funds. We have historically utilized borrowings from FHLB in order to take advantage of the flexibility of use and comparatively low cost. Due to the stiff competition for customer deposits among banks in our market, we utilize FHLB borrowings as a secondary alternative to fund the growth of our loan portfolio. See "Liquidity Management" below for the details on the FHLB borrowings program.
95
The following table is a summary of FHLB borrowings for fiscal years 2015 and 2014:
(Dollars in Thousands) | 2015 | 2014 | |||||
|---|---|---|---|---|---|---|---|
Balance at year-end | $ | 220,000 | $ | 150,000 | |||
Average balance during the year | $ | 118,274 | $ | 160,110 | |||
Maximum amount outstanding at any month-end | $ | 220,000 | $ | 190,314 | |||
Average weighted interest rate during the year | 1.30 | % | 0.33 | % | |||
Average weighted interest rate at year-end | 1.63 | % | 0.68 | % | |||
TARP Preferred Stock
On December 12, 2008, the Company issued to the U.S. Treasury 62,158 shares of Series A Preferred Stock and a warrant to purchase 949,460 shares of the Company's common stock for an aggregate purchase price of $62.2 million. The warrant to purchase our common stock had an exercise price of $9.82 per share. In 2012, we repurchased or redeemed the 62,158 shares of Series A Preferred Stock in two different stages. The initial repurchase of 60,000 shares was at a discount of 5.6%, for a total purchase price of $56.6 million. The remaining shares were redeemed at par value, or $1,000 per share, plus accrued dividends for a total purchase price of $2.2 million. The warrant to purchase common stock was also repurchased from the U.S. Treasury at a mutually agreed upon price of $760,000. With the acquisition of BankAsiana on October 1, 2013, we acquired $5.3 million in TARP Community Development Capital Initiative Preferred Stock which we immediately repaid on the date of the acquisition. At December 31, 2015 and 2014, we were no longer a participant in the TARP Capital Purchase Program and had no outstanding shares of Preferred Stock.
Junior Subordinated Debentures; Trust Preferred Securities
2002 Bank Level Junior Subordinated Debenture. In December 2002, the Bank issued $10.0 million in Junior Subordinated Debentures (the "2002 debenture"). The interest rate payable on the debenture adjusted quarterly to the three-month LIBOR plus 3.10% and the maturity date was December 26, 2012. On September 26, 2012, the Company called the entire $10.0 million debenture and related trust preferred securities. The rate of interest on the 2002 debenture was 3.56% at the time of the redemption.
2003 Junior Subordinated Debenture; Trust Preferred Securities Issuance. In December 2003, Wilshire Bancorp was formed as a wholly-owned subsidiary of the Bank, in order to raise additional capital funds through the issuance of trust preferred securities. Prior to the completion of the August 2004 bank holding company reorganization, Wilshire Bancorp organized its wholly owned subsidiary, Wilshire Statutory Trust I, which issued $15.0 million in trust preferred securities. Wilshire Bancorp then purchased all of the common interest in the Wilshire Statutory Trust I ($464,000) and issued the 2003 Junior Subordinated Debenture (the "2003 debenture") in the amount of approximately $15.5 million to the Wilshire Statutory Trust I with terms substantially similar to the 2003 trust preferred securities in exchange for the proceeds from the issuance of the Wilshire Statutory Trust I's 2003 trust preferred securities and common securities. Wilshire Bancorp subsequently deposited the proceeds from the 2003 debenture in a depository account at the Bank and infused $14.5 million as additional equity capital to the Bank immediately following the holding company reorganization. The rate of interest on the 2003 debenture adjusted quarterly to the three-month LIBOR plus 2.85% and the maturity date was December 17, 2033. On December 17, 2012, the Company called the entire $15.5 million debenture and related trust preferred securities. The rate of interest on the 2003 debenture and related trust preferred securities was 3.24% at the time of the redemption.
March 2005 Junior Subordinated Debenture; Trust Preferred Securities Issuance. In March 2005, Wilshire Bancorp's wholly-owned subsidiary, Wilshire Statutory Trust II, issued $20.0 million in trust preferred securities. Wilshire Bancorp then purchased all of the common interest in the Wilshire Statutory
96
Trust II ($619,000) and issued Junior Subordinated Debentures (the "March 2005 debenture") in the amount of $20.6 million to the Wilshire Statutory Trust II with terms substantially similar to the March 2005 trust preferred securities in exchange for the proceeds from the issuance of the Wilshire Statutory Trust II's March 2005 trust preferred securities and common securities. Wilshire Bancorp subsequently deposited the proceeds from the March 2005 debenture in a depository account at the Bank and infused $14.0 million as additional equity capital to the Bank. The rate of interest on the March 2005 debenture and related trust preferred securities was 2.32% at December 31, 2015, which adjusts quarterly to the three-month LIBOR plus 1.79%. The March 2005 debenture and related trust preferred securities will mature on March 17, 2035. The interest on both the March 2005 debenture and related trust preferred securities are payable quarterly and no scheduled payments of principal are due prior to maturity. The Company has the right to redeem the March 2005 debenture (and in turn the trust preferred securities), in whole or in part, at par prior to maturity on any March 17, June 17, September 17, or December 17.
September 2005 Junior Subordinated Debenture; Trust Preferred Securities Issuance. In September 2005, Wilshire Bancorp's wholly-owned subsidiary, Wilshire Statutory Trust III, issued $15.0 million in trust preferred securities. Wilshire Bancorp then purchased all of the common interest in the Wilshire Statutory Trust III ($464,000) and issued Junior Subordinated Debt Securities (the "September 2005 debenture") in the amount of $15.5 million to the Wilshire Statutory Trust III with terms substantially similar to the September 2005 trust preferred securities and common securities. Wilshire Bancorp subsequently deposited the proceeds from the September 2005 debenture in a depository account at the Bank. Until September 15, 2010, the securities were fixed at an annual interest rate of 6.07%, thereafter converting to a floating rate of three-month LIBOR plus 1.40%, resetting quarterly. The rate of interest on the September 2005 debenture and related trust preferred securities was 1.91% at December 31, 2015. The September 2005 debenture and related trust preferred securities will mature on September 15, 2035. The interest on both the September 2005 debenture and related trust preferred securities are payable quarterly and no scheduled payments of principal are due prior to maturity. The Company has the right to redeem the September 2005 debenture (and in turn the trust preferred securities), in whole or in part, at par prior to maturity on any March 15, June 15, September 15, or December 15.
July 2007 Junior Subordinated Debenture; Trust Preferred Securities Issuance. In July 2007, Wilshire Bancorp's wholly-owned subsidiary, Wilshire Statutory Trust IV, issued $25.0 million in trust preferred securities. Wilshire Bancorp then purchased all of the common interest in the Wilshire Statutory Trust IV ($774,000) and issued the 2007 Junior Subordinated Debenture (the "July 2007 debenture") in the amount of $25.8 million to the Wilshire Statutory Trust IV with terms substantially similar to the July 2007 trust preferred securities in exchange for the proceeds from the issuance of the Wilshire Statutory Trust IV's July 2007 trust preferred securities and common securities. Wilshire Bancorp subsequently deposited the proceeds from the July 2007 debenture in a depository account at the Bank. The rate of interest on the July 2007 debenture and related trust preferred securities was 1.89% at December 31, 2015, which adjusts quarterly to the three-month LIBOR plus 1.38%. The July 2007 debenture and related trust preferred securities will mature on September 15, 2037. The interest on both the July 2007 debenture and related trust preferred securities are payable quarterly and no scheduled payments of principal are due prior to maturity. The Company has the right to redeem the July 2007 debenture (and in turn the trust preferred securities) in whole or in part, at par prior to maturity on any March 15, June 15, September 15, or December 15.
March 2007 Junior Subordinated Debenture; Trust Preferred Securities Issuance. In March 2007, Saehan's wholly-owned subsidiary, Saehan Capital Trust I, issued $20.0 million in trust preferred securities. Saehan then purchased all of the common interest in the Saehan Capital Trust I ($619,000) and issued the 2007 Junior Subordinated Debenture (the "March 2007 debenture") in the amount of $20.6 million to the Saehan Capital Trust I with terms substantially similar to the March 2007 trust preferred securities in exchange for the proceeds from the issuance of the Saehan Capital Trust I's March 2007 trust preferred securities and common securities.
97
On November 20, 2013, Wilshire Bancorp acquired Saehan and all of its subsidiaries. As part of the acquisition, Wilshire acquired Saehan Capital Trust I and the March 2007 debenture of $20.6 million at a fair value of $9.7 million, or a discount of $10.9 million. Payments of distributions on the trust preferred securities and payments on redemption of the trust preferred securities are now guaranteed by Wilshire Bancorp. We have the right to defer distributions on the junior subordinated debentures and related trust preferred securities for up to five years, during which time no dividends may be paid to holders of our common stock. The Company has the right to redeem the March 2007 debenture (and in turn the trust preferred securities), in whole or in part, at par prior to maturity on any March 30, June 30, September 30, or December 30. The rate of interest on the March 2007 debenture and related trust preferred securities was 2.22% at December 31, 2015, which adjusts quarterly to the three-month LIBOR plus 1.62%.
On March 1, 2005, the Federal Reserve Board adopted a final rule that allows continued inclusion of trust preferred securities in Tier 1 capital of bank holding companies, subject to stricter quantitative limits. Under the final rule, bank holding companies may include trust preferred securities as Tier 1 capital in an amount (together with other restricted core capital elements) equal to 25% of the sum of core capital elements (including restricted core capital elements), net of goodwill and less any associated deferred tax liability. Amounts in excess of these limits will generally be included in Tier 2 capital. For purposes of this rule, restricted core capital elements are generally to be comprised of qualifying cumulative perpetual Preferred Stock and related surplus, minority interest related to qualifying cumulative perpetual Preferred Stock directly issued by a consolidated U.S. depository institution or foreign bank subsidiary, minority interest related to qualifying common stock or qualifying cumulative perpetual Preferred Stock directly issued by a consolidated subsidiary that is neither a U.S. depository institution or a foreign bank, and qualifying trust preferred securities. Under the final rule, as of December 31, 2015, Wilshire Bancorp categorized $69.5 million trust preferred securities as Tier 1 capital.
Asset/Liability Management
Management seeks to ascertain optimum and stable utilization of available assets and liabilities as a vehicle to attain our overall business plans and objectives. In this regard, management focuses on measurement and control of liquidity risk, interest rate risk and market risk, capital adequacy, operation risk, and credit risk. See "Item 1A—Risk Factors" for further discussion on these risks. Information concerning interest rate risk management is set forth under "Item 7A—Quantitative and Qualitative Disclosures about Market Risk."
Liquidity Management
Liquidity management involves our ability to meet cash flow requirements arising from fluctuations in deposit levels and demands of daily operations, which include funding of securities purchases, providing for customers' credit and deposit needs, and ongoing repayment of borrowings. Maintenance of adequate liquidity requires that sufficient resources be available at all time to meet our cash outflow requirements. Liquidity in a banking institution is required primarily to provide for deposit withdrawals and the credit needs of its customers and to take advantage of investment opportunities as they arise. Liquidity management involves our ability to convert assets into cash or cash equivalents without incurring significant loss, and to raise cash or maintain funds without incurring excessive additional cost. Our liquidity is actively managed on a daily basis and reviewed periodically by the Asset/Liability Committee and the Board of Directors. This process is intended to ensure the maintenance of sufficient funds to meet the needs of the Company, including adequate cash flow for off-balance sheet instruments.
Our primary sources of liquidity are derived from financing activities which include the acceptance of customer and brokered deposits, federal funds facilities, repurchase agreement facilities, advances from the FHLB of San Francisco, and issuance of long-term debt. These funding sources are augmented by payments of principal and interest on loans, the sale of SBA and residential loans, and the routine pay-downs of securities from the available-for-sale portfolio. In addition, government programs may
98
influence deposit behavior. Primary use of funds include withdrawal of and interest payments on deposits, originations and purchases of loans, purchases of investment securities, and payment of operating expenses.
During the years ended December 31, 2015, 2014, and 2013, we experienced a net cash inflow of $41.3 million, a net cash inflow of $90.6 million, and a net cash inflow of $152.8 million, respectively in cashflows from operating activities. During 2015, the largest components of net cash provided by operating activities was cash inflows from net income of $61.4 million and proceeds from the sale of SBA and residential loans held-for-sale totaling $271.5 million, offset by cash outflows of $272.9 million from the origination of SBA and residential loans held-for-sale. For 2014, the largest components of net cash provided by operating activities was cash inflows from net income of $59.0 million and proceeds from the sale of SBA and residential loans held-for-sale totaling $174.1 million, offset by cash outflows of $128.2 million from the origination of SBA and residential loans held-for-sale loans. In 2013, net cash provided by operating activities was primarily attributable to proceeds from the sale of loans held-for-sale totaling $659.2 million offset by an outflow of $547.0 million for the origination of loans held-for-sale.
Net cash outflows from investing activities totaled $649.2 million in 2015, $504.2 million in 2014, and $211.7 million in 2013. In 2015, net cash used in investing activities was largely due to $515.5 million increase in loans receivable and $308.5 million in investments purchases. For 2014, net cash used in investing activities was largely due to $489.3 million increase in loans receivable and $98.7 million in investments purchases. The largest components of cash used in investing activities for 2013 was also from an increase in loans receivable of $271.6 million and the purchase of securities available-for-sale totaling $71.4 million.
Net cash provided by financing activities totaled $492.2 million in 2015, $476.9 million in 2014, compared to cash used in financing activities of $56.1 million in 2013. The increase in cash provided by financing activities in 2015, compared to 2014, was largely due to the cash inflow from an increase in deposits of $438.6 million in addition to the $70.0 million in net FHLB advance increases. The increase in cash provided by financing activities in 2014, compared to 2013, was largely due to the cash inflow from an increase in deposits of $529.7 million.
For the purpose of having liquid cash available for emergencies, we maintain a portion of our funds in liquid assets consisting of cash and cash equivalents, time deposits at other institutions, loans held-for-sale, and securities available-for-sale. Our liquid assets at December 31, 2015, 2014, and 2013 totaled approximately $679.0 million, $642.1 million, and $591.7 million, respectively. Our liquidity level measured as the percentage of liquid assets to total assets was 14.4%, 15.5%, and 16.3%, at December 31, 2015, 2014, and 2013, respectively. The increase in liquid assets in 2015 was due to the increase in the investment portfolio as a result of purchases made throughout the year. The increase in liquid assets in 2014 was primarily due to the increase in deposits during the year which led to an increase in cash and cash equivalents.
As a secondary source of liquidity, we have a combination of available borrowing sources comprised of FHLB advances, the Federal Reserve Bank's discount window borrowings, federal funds lines with various correspondent banks, and several master repurchase agreements with major brokerage companies. Among all these sources, we prefer advances from the FHLB to supplement our supply of lendable funds and to meet deposit withdrawal requirements. Advances from the FHLB are typically secured by our loans and purchased stock issued by the FHLB, but can also be secured by investment securities. Advances are made pursuant to several different programs. Each credit program has its own interest rate and range of maturities. Depending on the program, limitations on the amount of advances are based either on a fixed percentage of an institution's net worth, on the FHLB's assessment of the institution's creditworthiness, and the amount of loan and securities collateral pledged to the FHLB. While this funding source provides flexibility and reasonable cost, we intend to limit our use to 80% of our borrowing capacity as such borrowings do not qualify as core funding sources.
99
As of December 31, 2015, our borrowing capacity from the FHLB was approximately $1.42 billion, and the outstanding balance was $220.0 million, or approximately 15.5% of our borrowing capacity. As of December 31, 2015, we also maintained lines to drawdown up to a combined $70.0 million in federal funds with three correspondent banks. Borrowing capacity at the FRB Discount Window stood at $16.5 million at December 31, 2015, based on the investment securities pledged at the FRB. There were no outstanding balances at any of our correspondent banks or at the FRB discount window at December 31, 2015. It is management's belief that our liquidity at December 31, 2015 is sufficient to meet the Company's short-term and long-term cash flow needs as they arise.
Capital Resources and Capital Adequacy Requirements
Historically, our primary source of capital has been internally generated operating income recorded as retained earnings. In order to ensure adequate levels of capital, we conduct ongoing assessments of projected sources and uses of capital in conjunction with projected increases in assets and levels of risks. We considered, and we will continue to consider, additional sources of capital as the need arises, whether through the issuance of additional equity, debt, or hybrid securities.
We are subject to various regulatory capital requirements administered by federal banking agencies. Under capital adequacy guidelines and the regulatory framework for prompt corrective action, we must meet specific capital guidelines that rely on quantitative measures of our assets, liabilities, and certain off-balance-sheet items as calculated under regulatory accounting practices. Failure to meet minimum capital requirements can trigger regulatory actions under the prompt corrective action rules that could have a material adverse effect on our financial condition and operations. Prompt corrective action may include regulatory enforcement actions that restrict dividend payments, require the adoption of remedial measures to increase capital, terminate FDIC deposit insurance, and/or mandate the appointment of a conservator or receiver in severe cases. In addition, failure to maintain a well-capitalized status may adversely affect the evaluation of regulatory applications for specific transactions and activities including acquisitions, continuation and expansion of existing activities, and commencement of new activities, and could adversely affect our business relationships with our existing and prospective clients. The aforementioned regulatory consequences for failing to maintain adequate ratios of Tier 1, Tier 1 common equity, and Tier 2 capital could have a material adverse effect on our financial condition and results of operations. Our capital levels and classification are also subject to qualitative judgments by regulators about components, risk weightings, and other factors. See Part I, Item 1 "Description of Business—Regulation and Supervision—Capital Adequacy Requirements" in this Annual Report on Form 10-K/A for additional information regarding regulatory capital requirements.
As of December 31, 2015, Wilshire Bank qualified as a "well-capitalized institution" under the regulatory framework for prompt corrective action. The following table presents the regulatory standards
100
for well-capitalized institutions as of December 31, 2015, compared to our capital ratios as of the dates specified for Wilshire Bancorp, Inc. and Wilshire Bank:
| | | | Actual capital ratios as of: | ||||||||||||||||||||||
|---|---|---|---|---|---|---|---|---|---|---|---|---|---|---|---|---|---|---|---|---|---|---|---|---|---|
| | | | December 31, 2015 | December 31, 2014 | December 31, 2013 | ||||||||||||||||||||
| | Regulatory Adequately- Capitalized Standards | Regulatory Well- Capitalized Standards | |||||||||||||||||||||||
Capital Ratios | |||||||||||||||||||||||||
| Wilshire Bancorp & Wilshire Bank | Bancorp | Bank | Bancorp | Bank | Bancorp | Bank | |||||||||||||||||||
Total capital to risk-weighted assets | 8.00 | % | 10.00 | % | 14.11 | % | 13.50 | % | 15.38 | % | 14.97 | % | 16.05 | % | 15.03 | % | |||||||||
Tier I capital to risk-weighted assets* | 6.00 | % | 8.00 | % | 12.86 | % | 12.25 | % | 14.13 | % | 13.71 | % | 14.79 | % | 13.77 | % | |||||||||
Tier 1 common equity to risk-weighted assets** | 4.50 | % | 6.50 | % | 11.23 | % | 12.25 | % | N/A | N/A | N/A | N/A | |||||||||||||
Tier I capital to average assets | 4.00 | % | 5.00 | % | 11.30 | % | 10.77 | % | 12.11 | % | 11.75 | % | 13.44 | % | 12.51 | % | |||||||||
- *
- Effective January 1, 2015, BASEL III increased the minimum Tier 1 capital to risk-weighted assets ratios, for adequately-capitalized and well-capitalized standards, to current levels from 4.00% and 6.00%, respectively.
- **
- Tier 1 common equity to risk weighted-assets was added as a requirement in the BASEL III revision to the Prompt Corrective Action Framework effective January 1, 2015.
At December 31, 2015, total shareholders' equity was $532.9 million, an increase of $43.5 million from shareholders' equity of $489.4 million at December 31, 2014. The increase in shareholders' equity in 2015 was mainly from the $61.4 million in net income earned during the year. Total shareholders' equity for 2014 increased of $50.0 million from shareholders' equity of $439.4 million at December 31, 2013. The increase in equity in 2014 was also primarily attributable to net income of $59.0 million earned during the year.
As of December 31, 2015, we included $69.5 million in junior subordinated debentures in the Company's regulatory capital ratio computations. As of December 31, 2014, junior subordinated debentures in our regulatory capital totaled $69.2 million. At December 31, 2015 and 2014, we did not include any qualifying subordinated debt in our calculation of Tier 2 risk-based capital.
As of December 31, 2015, the Company satisfies the new capital ratio requirements under Basel III and the Bank qualifies as a "well-capitalized" institution under the new regulatory framework for prompt corrective action, as revised by Basel III. For more information see Part I, Item 1 "Description of Business—Regulation and Supervision—New Capital Adequacy Requirements Under Basel III."
Impact of Inflation; Seasonality
Inflation primarily impacts us through its effect on interest rates. Our primary source of income is net interest income, which is affected by changes in interest rates. We attempt to limit the impact of inflation on our net interest margin through management of rate-sensitive assets and liabilities and the analysis of interest rate sensitivity. The effect of inflation on premises and equipment as well as non-interest expenses has not been significant for the periods covered in this Report. Our business is generally not seasonal and is consistent throughout the year.
Item 7A. Quantitative and Qualitative Disclosures about Market Risk
Market risk is the risk of losses from adverse changes in market prices and rates. Our market risk arises primarily from interest rate risk inherent in lending, investing, deposit taking, and borrowing activities. Our profitability is affected by fluctuations in interest rates. A sudden and substantial change in interest rates may adversely impact our earnings to the extent that the interest rates borne by assets and liabilities do not change at the same speed, to the same extent, or on the same basis. We evaluate market
101
risk pursuant to policies reviewed and approved annually by our Board of Directors. The Company's Board delegate responsibility for market risk management to the Asset/Liability Management Committee ("ALCO"), which reports to the Board on activities related to market risk management. As part of the management of market risk, the ALCO may direct changes in the mix of assets and liabilities. To that end, we actively monitor and manage interest rate risk exposure.
Interest rate risk management involves development, analysis, implementation, and monitoring of earnings to provide stable income and capital levels during periods of changing interest rates. In the management of interest rate risk, we utilize gap analysis and simulation modeling to determine the sensitivity of net interest income and economic value of equity. These techniques are complementary and are used together to provide a more accurate measurement of interest rate risk.
Gap analysis measures the repricing mismatches between rate sensitive assets and liabilities. The interest rate sensitivity gap is determined by subtracting the amount of liabilities from the amount of assets that reprice in a particular time interval. If repricing assets exceed repricing liabilities in any given time period, we would be deemed to be "asset-sensitive" for that period. Conversely, if repricing liabilities exceed repricing assets in a given time period, we would be deemed to be "liability-sensitive" for that period.
We usually seek to maintain a balanced position over the period of one year to ensure the stability of net interest income in times of volatile interest rates. This is accomplished by maintaining a similar level of interest-earning assets and interest-paying liabilities available to be repriced within one year.
The change in net interest income may not always follow the general expectations of an "asset-sensitive" or a "liability-sensitive" balance sheet during periods of changing interest rates. This possibility results from interest rates earned or paid changing by differing increments and at different time intervals for each type of interest-sensitive asset and liability. The interest rate gaps arise when assets are funded with liabilities that have different repricing intervals. Because these gaps are actively managed and change daily as adjustments are made in interest rate views and market outlook, positions at the end of any period may not reflect our interest rate sensitivity in subsequent periods. We attempt to balance longer-term economic views against prospects for short-term interest rate changes.
Although the interest rate sensitivity gap analysis is a useful form of measurement and contributes to effective balance sheet management, it is difficult to predict the effect of changing interest rates based solely on that measure. As a result, the ALCO also regularly uses simulation modeling as a tool to measure the sensitivity of earnings and economic value of equity ("EVE") to interest rate changes. The EVE is defined as the net present value of an institution's existing assets less liabilities. The simulation model captures all assets and liabilities, and accounts for significant variables that are believed to be affected by interest rates. These include prepayment speeds on loans, cash flows of loans and deposits, principal amortization, call options on securities, balance sheet growth assumptions, and changes in rate relationships as various rate indices react differently to market rates.
Although the simulation measures the volatility of net interest income and EVE under immediate increase or decrease of market interest rate scenarios in 100 basis point increments, our main concern is the negative effect of a reasonably-possible worst case scenario. The ALCO policy prescribes that for the modeled reasonably-possible worst rate-change scenario, the expected reduction of net interest income and EVE should not exceed 25% of the base net interest income and 30% of the base EVE, respectively.
In general, based upon our current mix of rate sensitive assets and liabilities, a decrease in interest rates would result in decline interest income and EVE. An increase in interest rates would increase net interest income while EVE is expected to increase if interest rate increase by 100 basis points and then decreases if interest rate continue to increase. Based on these results, our balance sheet is currently "asset sensitive" from a net interest income sensitivity perspective in a short-term time horizon.
102
Management believes that the assumptions used to evaluate the vulnerability of our operations to changes in interest rates approximate actual experience and considers them reasonable; however, the interest rate sensitivity of our assets and liabilities and the estimated effects of changes in interest rates on our net interest income and EVE, could vary substantially if different assumptions are used, or actual experience differs from the historical experiences on which they are based.
The following table sets forth the interest rate sensitivity of our interest-earning assets and interest-bearing liabilities as of December 31, 2015 using the interest rate sensitivity gap ratio. For purposes of the following table, an asset or liability is considered rate-sensitive within a specified period when it can be repriced or matures within its contractual terms. Actual payment patterns may differ from contractual payment patterns.
Interest Rate Sensitivity Analysis
(Dollars in Thousands)
| | At December 31, 2015 | |||||||||||||||
|---|---|---|---|---|---|---|---|---|---|---|---|---|---|---|---|---|
| | Amounts Subject to Repricing Within | | ||||||||||||||
| | 0 - 3 months | 3 - 12 months | 1 - 5 years | After 5 years | Total | |||||||||||
Interest-earning assets: | ||||||||||||||||
Gross loans | $ | 1,461,166 | $ | 123,864 | $ | 2,042,484 | $ | 228,036 | $ | 3,855,550 | ||||||
Investment securities | 8,486 | 8,447 | 271,408 | 247,204 | 535,545 | |||||||||||
Deposits held in other financial institutions | — | — | — | — | — | |||||||||||
Federal funds sold and other cash equivalents | 56,554 | — | — | — | 56,554 | |||||||||||
| | | | | | | | | | | | | | | | | |
Total | $ | 1,526,206 | $ | 132,311 | $ | 2,313,892 | $ | 475,240 | $ | 4,447,649 | ||||||
| | | | | | | | | | | | | | | | | |
| | | | | | | | | | | | | | | | | |
| | | | | | | | | | | | | | | | | |
Interest-bearing liabilities: | ||||||||||||||||
Savings deposits | $ | 133,872 | $ | — | $ | — | $ | — | $ | 133,872 | ||||||
Time deposits of $100,000 or more | 489,810 | 734,338 | 125,292 | — | 1,349,440 | |||||||||||
Other time deposits | 56,381 | 170,028 | 25,846 | 10 | 252,265 | |||||||||||
Other interest-bearing deposits | 1,015,863 | — | — | — | 1,015,863 | |||||||||||
FHLB advances | 70,000 | — | 150,000 | — | 220,000 | |||||||||||
Junior subordinated debentures | 72,016 | — | — | — | 72,016 | |||||||||||
| | | | | | | | | | | | | | | | | |
Total | $ | 1,837,942 | $ | 904,366 | $ | 301,138 | $ | 10 | 3,043,456 | |||||||
| | | | | | | | | | | | | | | | | |
| | | | | | | | | | | | | | | | | |
| | | | | | | | | | | | | | | | | |
Interest rate sensitivity gap | $ | (311,736 | ) | $ | (772,055 | ) | $ | 2,012,754 | $ | 475,230 | $ | 1,404,193 | ||||
Cumulative interest rate sensitivity gap | $ | (311,736 | ) | $ | (1,083,791 | ) | $ | 928,963 | $ | 1,404,193 | ||||||
Cumulative interest rate sensitivity gap ratio (based on total assets) | –6.61 | % | –22.99 | % | 19.71 | % | 29.79 | % | 29.79 | % | ||||||
103
The following table sets forth our estimated net interest income over a twelve months period and EVE based on the indicated changes in market interest rates as of December 31, 2015.
Change (In Basis Points) | Net Interest Income Change (%) | Economic Value of Equity (EVE) Change (%) | ||||||
|---|---|---|---|---|---|---|---|---|
| +400 | 15.08 | % | –6.58 | % | ||||
| +300 | 11.36 | % | –3.66 | % | ||||
| +200 | 7.78 | % | –0.57 | % | ||||
| +100 | 3.92 | % | 1.00 | % | ||||
0 | — | — | ||||||
| –100 | –2.94 | % | –6.19 | % | ||||
| –200 | –4.05 | % | 14.71 | % | ||||
| –300 | –4.11 | % | 22.20 | % | ||||
Our strategies in protecting both net interest income and economic value of equity from significant movements in interest rates involve restructuring our investment portfolio and using FHLB advances. Although our policy also permits us to purchase interest rate caps, interest rate floors, and interest rate swaps, we are currently not engaged in any of these types of transactions.
Item 8. Financial Statements and Supplementary Data
The information required by this item is included in Part IV, Item 15(a)(1) and is presented beginning on Page F-1.
Item 9. Changes in and Disagreements with Accountants on Accounting and Financial Disclosure
None
Item 9A. Controls and Procedures
Evaluation of Disclosure Controls and Procedures
As of December 31, 2015, we carried out an evaluation, under the supervision and with the participation of our management, including our Chief Executive Officer and Chief Financial Officer, regarding the effectiveness of the design and operation of our "disclosure controls and procedures," as defined under Exchange Act Rules 13a-15(e) and 15d-15(e).
Based on this evaluation, our Chief Executive Officer and Chief Financial Officer concluded that, as of December 31, 2015, such disclosure controls and procedures were effective to ensure that information required to be disclosed by us in the reports we file or submit under the Exchange Act is recorded, processed, summarized, and reported within the time periods specified in the rules and forms of the SEC, and accumulated and communicated to our management, including our Chief Executive Officer and Chief Financial Officer, as appropriate to allow timely decisions regarding required disclosure.
In designing and evaluating the disclosure controls and procedures, our management recognized that any controls and procedures, no matter how well designed and operated, can only provide reasonable assurance in achieving the desired control objectives and in reaching a reasonable level of assurance our management was necessarily required to apply its judgment in evaluating the cost-benefit relationship of possible controls and procedures.
Management's Report on Internal Control over Financial Reporting
Our management is responsible for establishing and maintaining an adequate system of internal control over financial reporting as defined in Rules 13a-15(f) and 15d-15(f) under the Exchange Act. Our internal control over financial reporting is designed to provide reasonable assurance regarding the
104
reliability of financial reporting and the preparation of financial statements for external purposes in accordance with accounting principles generally accepted in the United States of America. Our internal control over financial reporting includes those policies and procedures that:
- •
- pertain to the maintenance of records that, in reasonable detail, accurately and fairly reflect our transactions and dispositions of our assets;
- •
- provide reasonable assurance that our transactions are recorded as necessary to permit preparation of our financial statements in accordance with accounting principles generally accepted in the United States of America, and that our receipts and expenditures are being made only in accordance with authorizations of our management and our directors; and
- •
- provide reasonable assurance regarding prevention or timely detection of unauthorized acquisition, use, or disposition of our assets that could have a material effect on the financial statements.
Because of its inherent limitations, our management recognizes that any controls and procedures, no matter how well designed and operated, can only provide reasonable assurance in achieving the desired control objectives and may not prevent or detect misstatements. Also, projections of any evaluation of effectiveness as to future periods are subject to risk that controls may become inadequate because of changes in conditions, or that the degree of compliance with the policies or procedures may deteriorate. Further, because of changes in conditions, effectiveness of internal controls over financial reporting may vary over time. Our system contains self-monitoring mechanisms, and actions are taken to correct deficiencies as they are identified. In addition, in reaching a reasonable level of assurance, our management necessarily was required to apply its judgment in evaluating the cost-benefit relationship of possible controls and procedures.
Our management conducted an evaluation of the system of internal control over financial reporting as of December 31, 2015, using the criteria set forth by the "Committee of Sponsoring Organizations of the Treadway Commission in the 2013 Internal Control Integrated Framework", and concluded that our system of internal control over financial reporting was effective as of December 31, 2015.
Management's Report on Internal Control over Financial Reporting and the Report of Independent Registered Public Accounting Firm are set forth in our consolidated financial statements and the reports thereon beginning on page F-1.
Changes in Internal Control over Financial Reporting
Management has determined there were no changes in our internal controls over financial reporting during the quarter ended December 31, 2015 that materially affected, or are reasonably likely to materially affect, our internal controls over financial reporting.
Report of Independent Registered Public Accounting Firm
Our independent registered public accounting firm has issued an audit report on our internal control over financial reporting which is included on page F-4 of this report.
None
105
Item 10. Directors and Executive Officers of the Registrant
Information required by this item is incorporated herein by reference to the Company's definitive proxy statement (Schedule 14A) for its 2016 Annual Meeting of Shareholders, which will be filed with the SEC not later than 120 days after December 31, 2015.
Item 11. Executive Compensation
Information required by this item is incorporated herein by reference to the Company's definitive proxy statement (Schedule 14A) for its 2016 Annual Meeting of Shareholders, which will be filed with the SEC not later than 120 days after December 31, 2015.
Item 12. Security Ownership of Certain Beneficial Owners, and Management and Related Shareholder Matters
Information required by this item is incorporated herein by reference to the Company's definitive proxy statement (Schedule 14A) for its 2016 Annual Meeting of Shareholders, which will be filed with the SEC not later than 120 days after December 31, 2015.
Item 13. Certain Relationships and Related Transactions and Director Independence
Information required by this item is incorporated herein by reference to the Company's definitive proxy statement (Schedule 14A) for its 2016 Annual Meeting of Shareholders, which will be filed with the SEC not later than 120 days after December 31, 2015.
Item 14. Principal Accounting Fees and Services
Information required by this item is incorporated herein by reference to the Company's definitive proxy statement (Schedule 14A) for its 2016 Annual Meeting of Shareholders, which will be filed with the SEC not later than 120 days after December 31, 2015.
106
Item 15. Exhibits, Financial Statement Schedules
- (a)
- List of documents filed as part of this Report
- (1)
- Financial Statements
The following financial statements of Wilshire Bancorp, Inc. are filed as a part of this Form 10-K/A on the pages indicated:
Management's Assertion As to the Effectiveness of Internal Control Over Financial Reporting | F-1 | |
Report of Independent Registered Public Accounting Firm, Control Opinion | F-3 | |
Report of Independent Registered Public Accounting Firm, Audit Opinion | F-5 | |
Consolidated Financial Statements: | ||
Consolidated Statements of Financial Condition | F-6 | |
Consolidated Statements of Income | F-7 | |
Consolidated Statements of Comprehensive Income | F-8 | |
Consolidated Statements of Shareholders' Equity | F-9 | |
Consolidated Statements of Cash Flows | F-10 | |
Notes to Consolidated Financial Statements | F-12 |
- (2)
- Financial Statement Schedules
Schedules to the financial statements are omitted because the required information is not applicable or the information is presented in the Company's consolidated financial statements or related notes.
- (3)
- Exhibits
| Reference Number | Item | ||
|---|---|---|---|
| 2.1 | Agreement and Plan of Merger, dated as of June 8, 2013, by and between Wilshire Bancorp, Inc. a California corporation, and BankAsiana, a New Jersey state chartered commercial bank (Incorporated by reference to Exhibit 2.1 to the Company's Form 10-Q, as filed with the SEC on August 2, 2013) | ||
| 2.2 | Agreement and Plan of Merger and Reorganization by and between Wilshire Bancorp, Inc., a California corporation, WS Merger Acquisition Corp., a California corporation, and Saehan Bancorp, a California corporation, dated as of July 15, 2013 (Incorporated by reference to Exhibit 2.1 to the Company's Form 8-K, as filed with the SEC on July 15, 2013) | ||
| 2.3 | Agreement and Plan of Merger and Reorganization by and between BBCN Bancorp, Inc., a California corporation, Wilshire Bancorp Inc., a California corporation, dated as of December 7, 2015 (Incorporated by reference to Exhibit 2.1 to the Company's Form 8-K, as filed with the SEC on December 7, 2015) | ||
| 3.1 | Articles of Incorporation, as amended and restated (Incorporated by reference to Exhibit 3.1 in the Registration Statement on Form S-4, as filed with the SEC on June 15, 2004) | ||
| 3.2 | Certificate of Amendment to Articles of Incorporation (Incorporated by reference to Exhibit 3.1 to the Company's Form 8-K, as filed with the SEC on June 1, 2011) | ||
| 3.3 | Certificate of Amendment to Articles of Incorporation (Incorporated by reference to Exhibit 3.1 to the Company's Form 8-K, as filed with the SEC on June 1, 2012) | ||
107
| Reference Number | Item | ||
|---|---|---|---|
| 3.4 | Amended and Restated Bylaws of Wilshire Bancorp, Inc. effective May 30, 2012 (Incorporated by reference to Exhibit 3.1 to the Company's Form 8-K, as filed with the SEC on June 1, 2012) | ||
| 4.1 | Specimen of Common Stock Certificate (Incorporated by reference to Exhibit 4.1 in the Registration Statement on Form S-4, as filed with the SEC on April 1, 2004) | ||
| 4.2 | Indenture by and between Wilshire Bancorp, Inc. and Wilmington Trust Company dated as of March 17, 2005 (Incorporated by reference to Exhibit 4.6 to the Company's Form 10-K, as filed with the SEC on March 16, 2007) | ||
| 4.3 | Amended and Restated Declaration of Trust by and among Wilshire Bancorp, Inc., Wilmington Trust Company, Soo Bong Min, Brian E. Cho, and Elaine Jeon dated as of March 17, 2005 (Incorporated by reference to Exhibit 4.7 to the Company's Form 10-K, as filed with the SEC on March 16, 2007) | ||
| 4.4 | Guarantee Agreement by and between Wilshire Bancorp, Inc. and Wilmington Trust Company dated as of March 17, 2005 (Incorporated by reference to Exhibit 4.8 to the Company's Form 10-K, as filed with the SEC on March 16, 2007) | ||
| 4.5 | Indenture by and between Wilshire Bancorp, Inc. and Wilmington Trust Company dated as of September 15, 2005 (Incorporated by reference to Exhibit 4.9 to the Company's Form 10-K, as filed with the SEC on March 16, 2007) | ||
| 4.6 | Amended and Restated Declaration of Trust by and among Wilshire Bancorp, Inc., Wilmington Trust Company, Brian E. Cho and Elaine Jeon dated as of September 15, 2005 (Incorporated by reference to Exhibit 4.10 to the Company's Form 10-K, as filed with the SEC on March 16, 2007) | ||
| 4.7 | Guarantee Agreement by and between Wilshire Bancorp, Inc. and Wilmington Trust Company dated as of September 15, 2005 (Incorporated by reference to Exhibit 4.11 to the Company's Form 10-K, as filed with the SEC on March 16, 2007) | ||
| 4.8 | Indenture by and between Wilshire Bancorp, Inc. and LaSalle Bank National Association dated as of July 10, 2007 (Incorporated by reference to Exhibit 4.12 to the Company's Form 10-Q, as filed with the SEC on November 9, 2007) | ||
| 4.9 | Amended and Restated Declaration of Trust by and among LaSalle National Trust Delaware, LaSalle Bank National Association, Wilshire Bancorp, Inc., Soo Bong Min, and Brian E. Cho dated as of July 10, 2007 (Incorporated by reference to Exhibit 4.13 to the Company's Form 10-Q, as filed with the SEC on November 9, 2007) | ||
| 4.10 | Guarantee Agreement by and between Wilshire Bancorp, Inc. and LaSalle Bank National Association dated as of July 10, 2007 (Incorporated by reference to Exhibit 4.11 to the Company's Form 10-Q, as filed with the SEC on November 9, 2007) | ||
| 4.11 | Indenture by and between Saehan Bancorp, Inc. and Wilmington Trust Company dated as of March 30, 2007 (Incorporated by reference to Exhibit 4.11 to the Company's Form 10-K, as filed with the SEC on March 14, 2014) | ||
| 4.12 | Guarantee Agreement by and between Saehan Bancorp and Wilmington Trust Company dated as of March 30, 2007 (Incorporated by reference to Exhibit 4.12 to the Company's Form 10-K, as filed with the SEC on March 14, 2014) | ||
| 4.13 | Amended and Restated Trust Agreement by and between Saehan Bancorp and Wilmington Trust Company dated as of March 30, 2007 (Incorporated by reference to Exhibit 4.13 to the Company's Form 10-K, as filed with the SEC on March 14, 2014) | ||
| 4.14 | Supplemental Indenture by and between Wilshire Bancorp, Inc. and Wilmington Trust Company dated as of November 20, 2013 (Incorporated by reference to Exhibit 4.14 to the Company's Form 10-K, as filed with the SEC on March 14, 2014) | ||
108
| Reference Number | Item | ||
|---|---|---|---|
| 10.1 | Purchase and Assumption Agreement among Federal Deposit Insurance Corporation, Receiver of Mirae Bank, Federal Deposit Insurance Corporation and Wilshire State Bank, dated as of June 26, 2009 (Incorporated by reference to Exhibit 10.1 to the Company's Form 8-K, as filed with the SEC on July 1, 2009) | ||
| 10.2 | 2008 Stock Incentive Plan of Wilshire Bancorp, Inc. (Incorporated by reference to Appendix A to the Company's Definitive Proxy Statement on Schedule 14A, as filed with the SEC on May 8, 2008)1 | ||
| 10.3 | Lease dated August 12, 2009 between the Company and KamHing Realty-NYC LLC.—Manhattan Branch (Incorporated by reference to Exhibit 10.27 to the Company's Form 10-K, as filed with the SEC on March 15, 2010) | ||
| 10.4 | Employment Agreement by and between the Bank and Jae Whan Yoo, effective February 18, 2014 (Incorporated by reference to Exhibit 10.1 to the Company's Form 8-K, as filed with the SEC on November 13, 2013)1 | ||
| 10.5 | Form of Restricted Stock Agreement (Incorporated by reference to Exhibit 10.1 to the Company's Form 8-K, as filed with the SEC on December 3, 2009)1 | ||
| 10.6 | Wilshire State Bank Directors' Survivor Income Plan, dated July 30, 2003, as amended on September 26, 2012 (Incorporated by reference to Exhibit 10.13 to the Company's Form 10-K, as filed with the SEC on March 14, 2013)1 | ||
| 10.7 | Wilshire State Bank Executive Survivor Income Plan, dated July 30, 2003, as amended on September 26, 2012 (Incorporated by reference to Exhibit 10.14 to the Company's Form 10-K, as filed with the SEC on March 14, 2013)1 | ||
| 10.8 | Wilshire State Bank Directors' Survivor Income Plan, dated July 1, 2005, as amended on September 26, 2012 (Incorporated by reference to Exhibit 10.15 to the Company's Form 10-K, as filed with the SEC on March 14, 2013)1 | ||
| 10.9 | Wilshire State Bank Executive Survivor Income Plan, dated July 1, 2005, as amended on September 26, 2012 (Incorporated by reference to Exhibit 10.16 to the Company's Form 10-K, as filed with the SEC on March 14, 2013)1 | ||
| 10.10 | Headquarter lease agreement dated April 4, 2014 between Wilshire Bank and Wilmont, Inc. (Incorporated by reference to Exhibit 10.1 to the Company's Form 10-Q, as filed with the SEC on May 5, 2014) | ||
| 11.1 | Statement regarding computation of Net Earnings per Share3 | ||
| 12.1 | Statement regarding computation of Ratios of Earnings to Fixed Charges2 | ||
| 21.1 | Subsidiaries of the Registrant2 | ||
| 23.1 | Consent of Independent Registered Public Accounting Firm (Crowe Horwath LLP)2 | ||
| 31.1 | Certification of Chief Executive Officer pursuant to Section 302 of the Sarbanes-Oxley Act of 20022 | ||
| 31.2 | Certification of Chief Financial Officer pursuant to Section 302 of the Sarbanes-Oxley Act of 20022 | ||
| 32.1 | Certifications of Chief Executive Officer and Chief Financial Officer Pursuant to 18 U.S.C. Section 1350, as Adopted Pursuant to Section 906 of the Sarbanes-Oxley Act of 20022 | ||
109
| Reference Number | Item | ||
|---|---|---|---|
| 101 | The following materials from the Company's annual report on Form 10-K/A for the year ended December 31, 2015, formatted in XBRL (eXtensible Business Reporting Language): (i) Consolidated Statements of Financial Condition as of December 31, 2015 and 2014, (ii) Consolidated Statements of Income for the years ended December 31, 2015, 2014, and 2013, (iii) Consolidated Statements of Comprehensive Income for the years ended December 31, 2015, 2014, and 2013, (iv) Consolidated Statements of Shareholders' Equity for the years ended December 31, 2015, 2014, and 2013, (v) Consolidated Statements of Cash Flows for the years ended December 31, 2015, 2014, and 2013, and (vi) Notes to Consolidated Financial Statements, tagged as blocks of text. | ||
- 1
- Indicates compensation or compensatory plan, contract, or arrangement
- 2
- Exhibit is filed with this Annual Report on Form 10-K/A
- 3
- The information required by this Exhibit is incorporated by reference from Note [18] of the Company's Financial Statements included herein
110
Pursuant to the requirements of Section 13 or 15(d) of the Securities Act of 1934, the registrant has duly caused this Amendment to be signed on its behalf by the undersigned, thereunto duly authorized.
| Date: April 11, 2016 | WILSHIRE BANCORP, INC. a California corporation | |||
By: | /s/ ALEX KO Alex Ko Chief Financial Officer | |||
111

Wilshire Bancorp, Inc.
Financial Statements as of December 31, 2015
and 2014 and for each of the years in the three-year
period ended December 31, 2015 and
Reports of Independent Registered Public
Accounting Firm
MANAGEMENT'S ASSERTION AS TO THE EFFECTIVENESS OF INTERNAL CONTROL OVER
FINANCIAL REPORTING
To the Board of Directors and Shareholders of
Wilshire Bancorp, Inc.
Los Angeles, California
In this management report, the following subsidiary institution of Wilshire Bancorp, Inc. (the "Company") that is subject to Part 363 is included in the statement of management's responsibilities; the report on management's assessment of compliance with the Federal laws and regulations pertaining to insider loans and the Federal and, if applicable, State laws and regulations pertaining to dividend restrictions; and the report on management's assessment of internal control over financial reporting: Wilshire Bank.
Financial Statements
The management of the Company is responsible for the preparation, integrity, and fair presentation of its published financial statements and all other information presented in this annual report. The consolidated financial statements have been prepared in accordance with accounting principles generally accepted in the United States of America and, as such, include amounts based on informed judgments and estimates made by management.
Internal Control
The Company's internal control over financial reporting, including the safeguarding of assets, is a process effected by those charged with governance, management, and other personnel, designed to provide reasonable assurance regarding the reliability of financial reporting and the preparation of reliable financial statements in conformity with both accounting principles generally accepted in the United States of America and the instructions for the Consolidated Financial Statements for Bank Holding Companies (Form FR Y-9C) ("Bank Holding Company Instructions").
The Company's internal control over financial reporting includes those policies and procedures that (1) pertain to the maintenance of records that, in reasonable detail, accurately and fairly reflect the transactions and dispositions of the assets of the Company; (2) provide reasonable assurance that transactions are recorded as necessary to permit preparation of financial statements in accordance with accounting principles generally accepted in the United States of America and financial statements for regulatory reporting purposes, and that receipts and expenditures of the Company are being made only in accordance with authorizations of management and directors of the Company; and (3) provide reasonable assurance regarding prevention, or timely detection and correction of unauthorized acquisition, use, or disposition of the Company's assets that could have a material effect on the financial statements.
There are inherent limitations in the effectiveness of any internal control, including the possibility of human error and the circumvention or overriding of controls. Accordingly, even effective internal control can provide only reasonable assurance with respect to financial statement preparation. Further, because of changes in conditions, the effectiveness of internal control may vary over time.
Management is responsible for establishing and maintaining effective internal control over financial reporting including controls over the preparation of regulatory financial statements. Management assessed the Company's internal control over financial reporting, including safeguarding of assets, for financial presentations in conformity with both accounting principles generally accepted in the United States of America and the Bank Holding Company Instructions as of December 31, 2015. This assessment was based on criteria for effective internal control over financial reporting, including safeguarding of assets, described in the 2013Internal Control—Integrated Framework issued by the Committee of Sponsoring Organizations of the Treadway Commission. Based on this assessment, management believes that the Company
F-1
maintained effective internal control over financial reporting, including safeguarding of assets, presented in conformity with both accounting principles generally accepted in the United States of America and Bank Holding Company Instructions, as of December 31, 2015.
Compliance with Laws and Regulations
Management is also responsible for ensuring compliance with the federal laws and regulations concerning loans to insiders and the federal and state laws and regulations concerning dividend restrictions, both of which are designated by the Federal Deposit Insurance Corporation ("FDIC") as safety and soundness laws and regulations.
Management assessed its compliance with the designated safety and soundness laws and regulations and has maintained records of its determinations and assessments as required by the FDIC. Based on this assessment, management believes that the Company has complied, in all material respects, with the designated safety and soundness laws and regulations for the year ended December 31, 2015.
| /s/ JAE WHAN YOO Jae Whan Yoo Chief Executive Officer Wilshire Bancorp | ||
/s/ ALEX KO Alex Ko Chief Financial Officer Wilshire Bancorp |
F-2
REPORT OF INDEPENDENT REGISTERED PUBLIC ACCOUNTING FIRM
To the Board of Directors and Shareholders of
Wilshire Bancorp, Inc.
Los Angeles, California
We have audited Wilshire Bancorp, Inc. and subsidiaries (the "Company") internal control over financial reporting as of December 31, 2015, based on criteria established in the 2013 Internal Control—Integrated Framework issued by the Committee of Sponsoring Organizations of the Treadway Commission (COSO). The Company's management is responsible for maintaining effective internal control over financial reporting, and for its assessment of the effectiveness of internal control over financial reporting, included in the accompanying Management's Assertion As to the Effectiveness of Internal Control over Financial Reporting. Our responsibility is to express an opinion on the Company's internal control over financial reporting based on our audit.
We conducted our audit in accordance with the standards of the Public Company Accounting Oversight Board (United States). Those standards require that we plan and perform the audit to obtain reasonable assurance about whether effective internal control over financial reporting was maintained in all material respects. Our audit included obtaining an understanding of internal control over financial reporting, assessing the risk that a material weakness exists, and testing and evaluating the design and operating effectiveness of internal control based on the assessed risk, and performing such other procedures as we considered necessary in the circumstances. We believe that our audit provides a reasonable basis for our opinion.
A company's internal control over financial reporting is a process designed to provide reasonable assurance regarding the reliability of financial reporting and the preparation of financial statements for external purposes in accordance with accounting principles generally accepted in the United States of America. Because management's assessment and our audit were conducted to also meet the reporting requirements of Section 112 of the Federal Deposit Insurance Corporation Improvement Act (FDICIA), our audit of the Company's internal control over financial reporting included controls over the preparation of financial statements in accordance with the instructions to the Consolidated Financial Statements for Bank Holding Companies (Form FR Y9C).
A company's internal control over financial reporting includes those policies and procedures that (1) pertain to the maintenance of records that, in reasonable detail, accurately and fairly reflect the transactions and dispositions of the assets of the company; (2) provide reasonable assurance that transactions are recorded as necessary to permit preparation of financial statements in accordance with generally accepted accounting principles, and that receipts and expenditures of the company are being made only in accordance with authorizations of management and directors of the company; and (3) provide reasonable assurance regarding prevention or timely detection of unauthorized acquisition, use, or disposition of the company's assets that could have a material effect on the financial statements.
Because of its inherent limitations, internal control over financial reporting may not prevent or detect misstatements. Also, projections of any evaluation of effectiveness to future periods are subject to the risk that controls may become inadequate because of changes in conditions, or that the degree of compliance with the policies or procedures may deteriorate.
In our opinion, the Company maintained, in all material respects, effective internal control over financial reporting as of December 31, 2015 based on criteria established in the 2013 Internal Control—Integrated Framework issued by the Committee of Sponsoring Organizations of the Treadway Commission (COSO).
We have not examined and, accordingly, we do not express an opinion or any other form of assurance on management's statement referring to compliance with laws and regulations
F-3
We also have audited, in accordance with the standards of the Public Company Accounting Oversight Board (United States), the consolidated statements of financial condition, and the related consolidated statements of income, comprehensive income, shareholder's equity, and cash flows of Wilshire Bancorp, Inc. and subsidiaries and our report dated February 16, 2016, expressed an unqualified opinion on those financial statements.
/s/ Crowe Horwath LLP
Sherman Oaks, California
February 16, 2016
F-4
REPORT OF INDEPENDENT REGISTERED PUBLIC ACCOUNTING FIRM
To the Board of Directors and Shareholders of
Wilshire Bancorp, Inc.
Los Angeles, California
We have audited the accompanying consolidated statements of financial condition of Wilshire Bancorp, Inc. and subsidiaries (the "Company") as of December 31, 2015 and 2014, and the related consolidated statements of income, comprehensive income, shareholders' equity, and cash flows for each of the three years in the period ended December 31, 2015. These financial statements are the responsibility of the Company's management. Our responsibility is to express an opinion on these financial statements based on our audits.
We conducted our audits in accordance with the standards of the Public Company Accounting Oversight Board (United States). Those standards require that we plan and perform the audit to obtain reasonable assurance about whether the financial statements are free of material misstatement. An audit includes examining, on a test basis, evidence supporting the amounts and disclosures in the financial statements. An audit also includes assessing the accounting principles used and significant estimates made by management, as well as evaluating the overall financial statement presentation. We believe that our audits provide a reasonable basis for our opinion.
In our opinion, the consolidated financial statements referred to above present fairly, in all material respects, the financial position of the Company as of December 31, 2015 and 2014, and the results of its operations and its cash flows for each of the three years in the period ended December 31, 2015, in conformity with accounting principles generally accepted in the United States of America.
We also have audited, in accordance with the standards of the Public Company Accounting Oversight Board (United States), the Company's internal control over financial reporting as of December 31, 2015, based on criteria established in the 2013 Internal Control—Integrated Framework issued by the Committee of Sponsoring Organizations of the Treadway Commission and our report dated February 16, 2016 expressed an unqualified opinion thereon.
/s/ Crowe Horwath LLP
Sherman Oaks, California
February 16, 2016
F-5
WILSHIRE BANCORP, INC.
CONSOLIDATED STATEMENTS OF FINANCIAL CONDITION (DOLLARS IN THOUSANDS)
| | December 31, 2015 | December 31, 2014 | |||||
|---|---|---|---|---|---|---|---|
ASSETS: | |||||||
Cash and due from banks | $ | 118,089 | $ | 233,699 | |||
Federal funds sold and other cash equivalents | 104 | 254 | |||||
| | | | | | | | |
Cash and cash equivalents | 118,193 | 233,953 | |||||
Deposits held in other financial institutions | — | 8,000 | |||||
Securities available-for-sale, at fair value (amortized cost of $533 million and $384 million at December 31, 2015 and December 31, 2014, respectively) | 535,524 | 388,367 | |||||
Securities held-to-maturity, at amortized cost (fair value of $22 thousand and $28 thousand at December 31, 2015 and December 31, 2014, respectively) | 21 | 26 | |||||
Loans receivable (net of allowance for loan losses of $52 million and $49 million at December 31, 2015 and December 31, 2014, respectively) | 3,767,299 | 3,259,673 | |||||
Loans held-for-sale, at the lower of cost or fair value | 25,223 | 11,783 | |||||
Federal Home Loan Bank ("FHLB") stock, at cost | 16,539 | 16,539 | |||||
Other real estate owned ("OREO") | 9,179 | 7,922 | |||||
Due from customers on acceptances | 7,250 | 5,611 | |||||
Cash surrender value of bank owned life insurance | 25,028 | 23,330 | |||||
Investment in affordable housing partnerships | 48,867 | 44,077 | |||||
Bank premises and equipment | 16,096 | 13,881 | |||||
Accrued interest receivable | 9,226 | 8,792 | |||||
Deferred income taxes | 21,489 | 22,271 | |||||
Servicing assets | 19,894 | 18,031 | |||||
Goodwill | 67,473 | 67,473 | |||||
Core deposits intangibles | 3,185 | 4,155 | |||||
Other assets | 22,982 | 21,585 | |||||
| | | | | | | | |
TOTAL | $ | 4,713,468 | $ | 4,155,469 | |||
| | | | | | | | |
| | | | | | | | |
| | | | | | | | |
LIABILITIES: | |||||||
Deposits: | |||||||
Non-interest-bearing | $ | 1,088,436 | $ | 915,413 | |||
Interest-bearing: | |||||||
Savings | 133,872 | 128,943 | |||||
Money market and NOW accounts | 1,015,863 | 797,666 | |||||
Time deposits of $100,000 or more | 1,349,440 | 1,291,844 | |||||
Other time deposits | 252,265 | 267,393 | |||||
| | | | | | | | |
Total deposits | 3,839,876 | 3,401,259 | |||||
FHLB advances | 220,000 | 150,000 | |||||
Junior subordinated debentures | 72,016 | 71,779 | |||||
Commitments to fund affordable housing partnerships investments | 15,730 | 9,430 | |||||
Accrued interest payable | 2,105 | 2,228 | |||||
Acceptances outstanding | 7,250 | 5,611 | |||||
Other liabilities | 23,561 | 25,751 | |||||
| | | | | | | | |
Total liabilities | 4,180,538 | 3,666,058 | |||||
| | | | | | | | |
SHAREHOLDERS' EQUITY: | |||||||
Preferred stock, $1,000 par value—authorized, 5,000,000 shares; none issued and outstanding, at December 31, 2015 and December 31, 2014 | — | — | |||||
Common stock, no par value—authorized, 200,000,000 shares at December 31, 2015 and December 31, 2014; issued and outstanding, 78,608,717 and 78,322,462 shares at December 31, 2015 and December 31, 2014, respectively | 233,341 | 232,001 | |||||
Accumulated other comprehensive income, net of tax | 3,286 | 4,453 | |||||
Retained earnings | 296,303 | 252,957 | |||||
| | | | | | | | |
Total shareholders' equity | 532,930 | 489,411 | |||||
| | | | | | | | |
TOTAL | $ | 4,713,468 | $ | 4,155,469 | |||
| | | | | | | | |
| | | | | | | | |
| | | | | | | | |
See accompanying notes to consolidated financial statements.
F-6
WILSHIRE BANCORP, INC.
CONSOLIDATED STATEMENTS OF INCOME
(DOLLARS IN THOUSANDS, EXCEPT SHARE AND PER SHARE DATA)
| | For the Years Ended December 31, | |||||||||
|---|---|---|---|---|---|---|---|---|---|---|
| | 2015 | 2014 | 2013 | |||||||
INTEREST INCOME: | ||||||||||
Interest and fees on loans | $ | 167,361 | $ | 155,020 | $ | 115,722 | ||||
Interest on investment securities | 8,545 | 8,195 | 7,423 | |||||||
Interest on federal funds sold and other earning assets | 987 | 489 | 594 | |||||||
| | | | | | | | | | | |
Total interest income | 176,893 | 163,704 | 123,739 | |||||||
| | | | | | | | | | | |
INTEREST EXPENSE: | ||||||||||
Interest on deposits | 22,742 | 15,926 | 11,968 | |||||||
Interest on FHLB advances and other borrowings | 1,537 | 522 | 244 | |||||||
Interest on junior subordinated debentures | 1,772 | 1,719 | 1,197 | |||||||
| | | | | | | | | | | |
Total interest expense | 26,051 | 18,167 | 13,409 | |||||||
| | | | | | | | | | | |
NET INTEREST INCOME BEFORE PROVISION FOR LOAN LOSSES AND LOAN COMMITMENTS | 150,842 | 145,537 | 110,330 | |||||||
PROVISION FOR LOAN LOSSES AND LOAN COMMITMENTS | 700 | — | — | |||||||
| | | | | | | | | | | |
NET INTEREST INCOME AFTER PROVISION FOR LOAN LOSSES AND LOAN COMMITMENTS | 150,142 | 145,537 | 110,330 | |||||||
| | | | | | | | | | | |
NON-INTEREST INCOME: | ||||||||||
Service charges on deposit accounts | 12,253 | 12,693 | 11,412 | |||||||
Gain on sale of SBA loans | 8,792 | 14,366 | 13,307 | |||||||
Gain on sale of residential loans | 3,290 | 366 | 108 | |||||||
Gain on sale of other loans | 4,988 | 230 | — | |||||||
Loan-related servicing fees | 7,357 | 6,092 | 5,011 | |||||||
Net change in fair value of derivatives | 206 | — | — | |||||||
Gain on sale or call of securities | — | — | 19 | |||||||
Other income | 8,768 | 7,494 | 4,326 | |||||||
| | | | | | | | | | | |
Total non-interest income | 45,654 | 41,241 | 34,183 | |||||||
| | | | | | | | | | | |
NON-INTEREST EXPENSE: | ||||||||||
Salaries and employee benefits | 54,144 | 49,724 | 40,131 | |||||||
FDIC loss-share indemnification impairment | — | 597 | — | |||||||
Occupancy and equipment | 13,300 | 13,371 | 8,851 | |||||||
Regulatory assessment fee | 2,404 | 2,239 | 1,391 | |||||||
Professional fees | 3,119 | 3,270 | 3,704 | |||||||
Data processing | 4,406 | 3,998 | 2,801 | |||||||
Affordable housing partnerships investment losses | 4,981 | 4,239 | 3,838 | |||||||
Amortization of core deposits intangibles | 970 | 1,069 | 383 | |||||||
Merger related costs | 994 | 3,577 | 2,797 | |||||||
Other operating expenses | 15,572 | 15,430 | 12,960 | |||||||
| | | | | | | | | | | |
Total non-interest expense | 99,890 | 97,514 | 76,856 | |||||||
| | | | | | | | | | | |
INCOME BEFORE INCOME TAXES | 95,906 | 89,264 | 67,657 | |||||||
INCOME TAX PROVISION | 34,501 | 30,255 | 22,281 | |||||||
| | | | | | | | | | | |
NET INCOME | $ | 61,405 | $ | 59,009 | $ | 45,376 | ||||
| | | | | | | | | | | |
| | | | | | | | | | | |
| | | | | | | | | | | |
EARNINGS PER COMMON SHARE INFORMATION | ||||||||||
Basic | $ | 0.78 | $ | 0.75 | $ | 0.63 | ||||
Diluted | $ | 0.78 | $ | 0.75 | $ | 0.63 | ||||
WEIGHTED-AVERAGE COMMON SHARES OUTSTANDING: | ||||||||||
Basic | 78,486,883 | 78,250,901 | 71,771,116 | |||||||
Diluted | 78,818,556 | 78,591,374 | 72,037,516 | |||||||
See accompanying notes to consolidated financial statements.
F-7
WILSHIRE BANCORP, INC.
CONSOLIDATED STATEMENTS OF COMPREHENSIVE INCOME
(DOLLARS IN THOUSANDS)
| | For the Years Ended December 31, | |||||||||
|---|---|---|---|---|---|---|---|---|---|---|
| | 2015 | 2014 | 2013 | |||||||
NET INCOME | $ | 61,405 | $ | 59,009 | $ | 45,376 | ||||
| | | | | | | | | | | |
| | | | | | | | | | | |
| | | | | | | | | | | |
UNREALIZED (LOSS) GAIN ON SECURITIES AVAILABLE-FOR-SALE: | ||||||||||
Unrealized (losses) gains on securities available-for-sale arising during the period | (2,044 | ) | 7,681 | (11,445 | ) | |||||
Reclassification adjustment for gains realized in net income | — | — | (19 | ) | ||||||
Less income tax (benefit) expense | (860 | ) | 3,224 | (4,815 | ) | |||||
| | | | | | | | | | | |
Net change in net unrealized (losses) gains on securities available-for-sale | (1,184 | ) | 4,457 | (6,649 | ) | |||||
| | | | | | | | | | | |
UNREALIZED (LOSS) GAIN ON INTEREST-ONLY STRIP: | ||||||||||
Net unrealized (losses) gains on interest-only strips arising during period | (56 | ) | (53 | ) | 28 | |||||
Less income tax (benefit) expense | (23 | ) | (22 | ) | 19 | |||||
| | | | | | | | | | | |
Net unrealized changes in net (losses) gains on interest-only strips | (33 | ) | (31 | ) | 9 | |||||
| | | | | | | | | | | |
BOLI UNRECOGNIZED PRIOR SERVICE COST: | ||||||||||
BOLI unrecognized prior service cost | 50 | 50 | (194 | ) | ||||||
| | | | | | | | | | | |
Net change to BOLI unrecognized prior service cost | 50 | 50 | (194 | ) | ||||||
| | | | | | | | | | | |
TOTAL OTHER COMPREHENSIVE (LOSS) INCOME | (1,167 | ) | 4,476 | (6,834 | ) | |||||
| | | | | | | | | | | |
TOTAL COMPREHENSIVE INCOME | $ | 60,238 | $ | 63,485 | $ | 38,542 | ||||
| | | | | | | | | | | |
| | | | | | | | | | | |
| | | | | | | | | | | |
See accompanying notes to consolidated financial statements.
F-8
WILSHIRE BANCORP, INC.
CONSOLIDATED STATEMENTS OF SHAREHOLDERS' EQUITY
(DOLLARS IN THOUSANDS, EXCEPT SHARE DATA)
| | Common Stock | | | | ||||||||||||
|---|---|---|---|---|---|---|---|---|---|---|---|---|---|---|---|---|
| | Accumulated Other Comprehensive Income (Loss) | | | |||||||||||||
| | Numbers of Shares | Amount | Retained Earnings | Total Shareholders' Equity | ||||||||||||
BALANCE—December 31, 2012 | 71,295,144 | $ | 164,790 | $ | 6,811 | $ | 170,816 | $ | 342,417 | |||||||
| | | | | | | | | | | | | | | | | |
| | | | | | | | | | | | | | | | | |
| | | | | | | | | | | | | | | | | |
Stock options exercised/forfeited | 206,911 | 958 | — | — | 958 | |||||||||||
Common stock issued for acquisition of Saehan Bancorp | 7,210,664 | 67,780 | — | — | 67,780 | |||||||||||
Common stock repurchased | (651,412 | ) | (4,287 | ) | — | — | (4,287 | ) | ||||||||
Cash dividend declared or accrued: | ||||||||||||||||
Common stock ($0.09 per share) | — | — | — | (6,587 | ) | (6,587 | ) | |||||||||
Share-based compensation expense | — | 460 | — | — | 460 | |||||||||||
Tax benefit from stock options exercised | — | 135 | — | — | 135 | |||||||||||
Comprehensive income: | ||||||||||||||||
Net income | — | — | — | 45,376 | 45,376 | |||||||||||
Other comprehensive loss | — | — | (6,834 | ) | — | (6,834 | ) | |||||||||
| | | | | | | | | | | | | | | | | |
Comprehensive income | — | — | — | — | 38,542 | |||||||||||
| | | | | | | | | | | | | | | | | |
BALANCE—December 31, 2013 | 78,061,307 | $ | 229,836 | $ | (23 | ) | $ | 209,605 | $ | 439,418 | ||||||
| | | | | | | | | | | | | | | | | |
| | | | | | | | | | | | | | | | | |
| | | | | | | | | | | | | | | | | |
Stock options exercised/forfeited | 192,786 | 974 | — | — | 974 | |||||||||||
Restricted stock granted/forfeited, net | 67,637 | — | — | — | — | |||||||||||
Cash dividend declared or accrued: | ||||||||||||||||
Common stock ($0.20 per share) | — | — | — | (15,647 | ) | (15,647 | ) | |||||||||
Stock dividend related to restricted stock | 732 | — | — | (10 | ) | (10 | ) | |||||||||
Share-based compensation expense | — | 932 | — | — | 932 | |||||||||||
Tax benefit from stock options exercised | — | 259 | — | — | 259 | |||||||||||
Comprehensive income: | ||||||||||||||||
Net income | — | — | — | 59,009 | 59,009 | |||||||||||
Other comprehensive income | — | — | 4,476 | — | 4,476 | |||||||||||
| | | | | | | | | | | | | | | | | |
Comprehensive income | — | — | — | — | 63,485 | |||||||||||
| | | | | | | | | | | | | | | | | |
BALANCE—December 31, 2014 | 78,322,462 | $ | 232,001 | $ | 4,453 | $ | 252,957 | $ | 489,411 | |||||||
| | | | | | | | | | | | | | | | | |
| | | | | | | | | | | | | | | | | |
| | | | | | | | | | | | | | | | | |
Stock options exercised/forfeited | 149,738 | 810 | — | — | 810 | |||||||||||
Restricted stock granted/forfeited, net | 136,517 | — | — | — | — | |||||||||||
Adjustments to additional paid-in capital from non-qualified stock options and restricted stock | — | (545 | ) | — | — | (545 | ) | |||||||||
Cash dividend declared or accrued: | ||||||||||||||||
Common stock ($0.23 per share) | — | — | — | (18,033 | ) | (18,033 | ) | |||||||||
Stock dividend related to restricted stock | — | — | — | (26 | ) | (26 | ) | |||||||||
Share-based compensation expense | — | 1,075 | — | — | 1,075 | |||||||||||
Comprehensive income: | ||||||||||||||||
Net income | — | — | — | 61,405 | 61,405 | |||||||||||
Other comprehensive loss | — | — | (1,167 | ) | — | (1,167 | ) | |||||||||
| | | | | | | | | | | | | | | | | |
Comprehensive income | — | — | — | — | 60,238 | |||||||||||
| | | | | | | | | | | | | | | | | |
BALANCE—December 31, 2015 | 78,608,717 | $ | 233,341 | $ | 3,286 | $ | 296,303 | $ | 532,930 | |||||||
| | | | | | | | | | | | | | | | | |
| | | | | | | | | | | | | | | | | |
| | | | | | | | | | | | | | | | | |
See accompanying notes to consolidated financial statements.
F-9
WILSHIRE BANCORP, INC.
CONSOLIDATED STATEMENTS OF CASH FLOWS (DOLLARS IN THOUSANDS)
| | For the Years Ended December 31, | |||||||||
|---|---|---|---|---|---|---|---|---|---|---|
| | 2015 | 2014 | 2013 | |||||||
CASH FLOWS FROM OPERATING ACTIVITIES: | ||||||||||
Net income | $ | 61,405 | $ | 59,009 | $ | 45,376 | ||||
Adjustments to reconcile net income to net cash provided by operating activities: | ||||||||||
Amortization of investment securities | 1,899 | 1,610 | 2,786 | |||||||
Depreciation of Bank premises and equipment | 3,661 | 3,783 | 2,496 | |||||||
Accretion of discount on acquired loans | (7,958 | ) | (11,214 | ) | (2,463 | ) | ||||
Amortization of liabilities acquired from acquisitions | 393 | (1,270 | ) | (268 | ) | |||||
FDIC loss-share indemnification impairment | — | 597 | — | |||||||
Amortization of core deposits intangibles | 970 | 1,069 | 383 | |||||||
Provision for loan losses and loan commitments | 700 | — | — | |||||||
Provision for other real estate owned losses | 316 | 406 | 221 | |||||||
Deferred tax expense | 1,118 | 13,640 | 948 | |||||||
Loss on disposition of bank premises and equipment | 61 | 143 | 1 | |||||||
Net gain on sale of SBA loans | (8,792 | ) | (14,366 | ) | (13,307 | ) | ||||
Net gain on sale of residential loans | (3,290 | ) | (366 | ) | (108 | ) | ||||
Net gain on sale of other loans | (4,988 | ) | (230 | ) | — | |||||
Origination of SBA loans held-for-sale | (92,438 | ) | (112,679 | ) | (107,504 | ) | ||||
Origination of residential loans held-for-sale | (180,425 | ) | (15,484 | ) | (439,490 | ) | ||||
Proceeds from sale of SBA loans held-for-sale | 106,816 | 158,896 | 147,635 | |||||||
Proceeds from sale of residential loans held-for-sale | 164,690 | 15,188 | 511,586 | |||||||
Net gain on sale/call of available-for-sale securities | — | — | (19 | ) | ||||||
Net change in fair value of servicing assets | 1,166 | 1,062 | 696 | |||||||
Amortization of servicing rights | 1,014 | 1,500 | 415 | |||||||
Net gain on sale of OREO | (1,216 | ) | (28 | ) | (184 | ) | ||||
Gain on sale of previously held equity interests | — | (20 | ) | (16 | ) | |||||
Share-based compensation expense | 1,075 | 932 | 460 | |||||||
Earnings of cash surrender value of life insurance | (574 | ) | (274 | ) | (596 | ) | ||||
Servicing assets capitalized | (4,043 | ) | (4,485 | ) | (3,639 | ) | ||||
Net change in accrued interest receivable | (434 | ) | (442 | ) | 394 | |||||
Loss on investments in affordable housing partnerships | 4,981 | 4,239 | 3,838 | |||||||
Net change in fair value of derivatives | (206 | ) | — | — | ||||||
Net change in other assets | (13,903 | ) | (11,188 | ) | 3,265 | |||||
Dividends of FHLB stock | 2,018 | 1,170 | 543 | |||||||
Net change in accrued interest payable | (123 | ) | (190 | ) | (2,865 | ) | ||||
Net change in other liabilities | 7,365 | (393 | ) | 2,184 | ||||||
| | | | | | | | | | | |
Net cash provided by operating activities | 41,258 | 90,615 | 152,768 | |||||||
| | | | | | | | | | | |
CASH FLOWS FROM INVESTING ACTIVITIES: | ||||||||||
Proceeds from principal repayment of securities held-to-maturity | 5 | 9 | 15 | |||||||
Proceeds from principal repayments, matured, called, or sold securities available-for-sale | 157,413 | 68,844 | 84,910 | |||||||
Purchase of securities available-for-sale | (308,513 | ) | (98,703 | ) | (71,377 | ) | ||||
Net change in interest-bearing deposits in other financial institutions | 8,000 | 13,019 | 8,863 | |||||||
Net change in loans receivable | (514,803 | ) | (489,294 | ) | (271,639 | ) | ||||
(Payment) receipt of FDIC loss-share indemnification | (2,022 | ) | 2,618 | 1,792 | ||||||
Proceeds from sale of other loans | 12,246 | 4,635 | 488 | |||||||
Proceeds from sale of other real estate owned | 6,562 | 3,342 | 3,132 | |||||||
Proceeds from sale of repossessed assets | — | 84 | — | |||||||
Purchases of investments in affordable housing partnerships | (3,471 | ) | (5,806 | ) | (8,273 | ) | ||||
Purchases of bank premises and equipment | (1,123 | ) | (1,870 | ) | (866 | ) | ||||
Purchase of FHLB stock | — | (1,006 | ) | (1,348 | ) | |||||
Redemption of FHLB stock | — | 450 | 379 | |||||||
Purchases of bank owned life insurance | (3,501 | ) | (538 | ) | (710 | ) | ||||
Net cash received from acquisitions | — | — | 42,966 | |||||||
| | | | | | | | | | | |
Net cash used in investing activities | (649,207 | ) | (504,216 | ) | (211,668 | ) | ||||
| | | | | | | | | | | |
(Continued)
See accompanying notes to consolidated financial statements.
F-10
WILSHIRE BANCORP, INC.
CONSOLIDATED STATEMENTS OF CASH FLOWS (DOLLARS IN THOUSANDS, EXCEPT SHARE DATA)
| | For the Years Ended December 31, | |||||||||
|---|---|---|---|---|---|---|---|---|---|---|
| | 2015 | 2014 | 2013 | |||||||
CASH FLOWS FROM FINANCING ACTIVITIES: | ||||||||||
Proceeds from exercise of stock options | $ | 810 | $ | 974 | $ | 958 | ||||
Tax benefit from exercise of stock options | — | 259 | 135 | |||||||
Cash paid for stock repurchases | — | — | (4,287 | ) | ||||||
Payment of cash dividend on common stock | (17,238 | ) | (14,082 | ) | (4,244 | ) | ||||
Cash paid for former BankAsiana CDCI Preferred Stock redemption | — | — | (5,250 | ) | ||||||
Increase in FHLB advances | 170,000 | 50,000 | 80,000 | |||||||
Decrease in FHLB advances | (100,000 | ) | (90,000 | ) | (50,000 | ) | ||||
Net change in deposits | 438,617 | 529,749 | 38,742 | |||||||
| | | | | | | | | | | |
Net cash provided by financing activities | 492,189 | 476,900 | 56,054 | |||||||
| | | | | | | | | | | |
NET CHANGE IN CASH AND CASH EQUIVALENTS | (115,760 | ) | 63,299 | (2,846 | ) | |||||
CASH AND CASH EQUIVALENTS—Beginning of year | 233,953 | 170,654 | 173,500 | |||||||
| | | | | | | | | | | |
CASH AND CASH EQUIVALENTS—End of year | $ | 118,193 | $ | 233,953 | $ | 170,654 | ||||
| | | | | | | | | | | |
| | | | | | | | | | | |
| | | | | | | | | | | |
SUPPLEMENTAL DISCLOSURES OF CASH FLOW INFORMATION: | ||||||||||
Interest paid | $ | 26,173 | $ | 18,358 | $ | 13,029 | ||||
Income taxes paid | $ | 36,103 | $ | 18,577 | $ | 22,852 | ||||
Income tax refunds received | $ | 1,041 | $ | 528 | $ | 2 | ||||
SUPPLEMENTAL SCHEDULE OF NONCASH INVESTING AND | ||||||||||
FINANCING ACTIVITIES: | ||||||||||
Real estate acquired through foreclosures | $ | 7,376 | $ | 4,292 | $ | 3,260 | ||||
Loans transferred to held-for-sale from loans receivable | $ | 8,810 | $ | 3,605 | $ | 1,288 | ||||
Loans transferred to loans receivable from held-for-sale | $ | 1,551 | $ | 3,783 | $ | 404 | ||||
Other assets transferred to bank premises and equipment | $ | 2,436 | $ | 2,075 | $ | 1,196 | ||||
Common stock cash dividend declared, but not paid | $ | 4,720 | $ | 3,917 | $ | 2,342 | ||||
Common stock issued in consideration of Saehan Bancorp acquisition | $ | — | $ | — | $ | 67,780 | ||||
(Concluded)
See accompanying notes to consolidated financial statements.
F-11
WILSHIRE BANCORP, INC.
NOTES TO CONSOLIDATED FINANCIAL STATEMENTS
1. SUMMARY OF SIGNIFICANT ACCOUNTING POLICIES
Wilshire Bancorp, Inc. (the "Company") succeeded to the business and operations of Wilshire Bank (the "Bank"), a California state-chartered commercial bank, upon consummation of the reorganization of the Bank into a holding company structure, effective as of August 25, 2004. Wilshire Bank was incorporated under the laws of the State of California on May 20, 1980 and commenced operations on December 30, 1980. The Company was incorporated in December 2003 as a wholly owned subsidiary of the Bank for the purpose of facilitating the issuance of trust preferred securities and eventually serving as the holding company of the Bank. The Bank's shareholders approved reorganization into a holding company structure on August 25, 2004. As a result of the reorganization, shareholders of the Bank are now shareholders of the Company and the Bank is a direct subsidiary of the Company. The Bank's primary source of revenue is from providing financing for business working capital, commercial real estate, and trade activities, and its investment portfolio. The accounting and reporting policies of the Company and Bank are in accordance with accounting principles generally accepted in the United States of America and conform to general practices in the banking industry.
Principles of Consolidation—The consolidated financial statements include the accounts of the Company and its subsidiaries. Inter-company transactions and accounts have been eliminated in consolidation.
Reclassification—Certain reclassifications have been made to prior years' consolidated financial statements and related notes to conform to current year presentation. There was no effect on net income or total shareholders' equity from the reclassifications.
Cashflows—Cash and cash equivalents include cash and due from banks, term federal funds sold, and overnight federal funds sold. Net cash flows are reported for customer loan and deposit transactions, federal funds purchased, and repurchase agreements.
Deposits held in other financial institutions—Deposits held in other financial institutions consist of time deposits of the Company or Bank held at other financial institutions. These deposits are a source of interest income and are similar to short-term investments.
Investment Securities—Investments are classified into three categories and accounted for as follows:
- (i)
- Securities that the Company has the positive intent and ability to hold to maturity are classified as "held-to-maturity" and reported at amortized cost;
- (ii)
- Securities that are bought and held principally for the purpose of selling them in the near future are classified as "trading securities" and reported at fair value; and
- (iii)
- Securities not classified as held-to-maturity or trading securities are classified as "available-for-sale" and reported at fair value. Unrealized gains and losses are reported, net of taxes, as a separate component of accumulated other comprehensive income in shareholders' equity.
The Company had no trading securities at December 31, 2015 and 2014. Accreted discounts and amortized premiums on investment securities are included in interest income using the effective interest method, and unrealized and realized gains or losses related to holding, selling, or called securities are calculated using the specific-identification method.
In accordance with Accounting Standards Codification ("ASC") 320-10-35-18, "Recognition and Presentation of Other-Than-Temporary Impairments", an other-than-temporary impairment ("OTTI") is
F-12
WILSHIRE BANCORP, INC.
NOTES TO CONSOLIDATED FINANCIAL STATEMENTS (Continued)
1. SUMMARY OF SIGNIFICANT ACCOUNTING POLICIES (Continued)
recognized if the fair value of a debt security is lower than the amortized cost and the debt security will be sold, it is more-likely-than-not that the Company will be required to sell the security before recovering the amortized cost, or if it is expected that not all of the amortized cost will be recovered. Credit related declines in the fair value of investment securities below their amortized cost that are deemed to be other-than-temporary are reflected in earnings as realized losses in the Consolidated Statements of Income. Declines related to factors aside from credit are unrealized losses reflected in other comprehensive income, net of taxes. The Company did not record an OTTI on investment securities in years ended 2015, 2014, and 2013.
Investment in available-for-sale securities are recorded at fair value pursuant to ASC 320-10-35-1. The measurement of fair value is based upon quoted prices for similar securities, if available. If quoted prices are not available, fair value is calculated using matrix pricing models, or other model-based valuation techniques requiring observable inputs other than quoted prices such as yield curves, prepayment speeds, and default rates. The available-for-sale investment portfolio includes federal agency securities, residential mortgage-backed securities, residential collateralized mortgage obligations, municipal bonds, and corporate debt securities. The fair value of the Company's existing available-for-sale security holdings as of December 31, 2015 and 2014 are measured using matrix pricing models in lieu of direct price quotes and are recorded based on Level 2 measurement inputs.
Loans—Loans that management has the intent and ability to hold for the foreseeable future, until maturity, or pay-off are generally reported at their outstanding unpaid principal balances adjusted for charge-offs, allowance for loan losses, discount, and deferred fees or costs.
Interest from loans is credited to income as earned and is accrued only if deemed collectible. Accrual of interest is generally discontinued when a loan is 90 days or more delinquent unless management believes principal and interest on the loan is recoverable. Generally, payments received on non-accrual loans are recorded as principal reductions. Interest income on non-accrual loans is recognized after all principal has been repaid or an improvement in the condition of the loan has occurred that would warrant resumption of interest accruals.
- (i)
- Loans Held-for-Sale
- (ii)
- Acquired Loans
Certain loans that may be sold prior to maturity have been designated as held-for-sale at origination and are recorded at the lower of cost or fair value. A valuation allowance is established if the fair value of held-for-sale loans is lower than their cost, and is charged against operating income. The premium on the pro-rata principal of Small Business Administration ("SBA") and residential loans sold is recognized as gain on sale of loans. The discount related to the unsold principal of SBA loans is deferred and amortized over the remaining life of the loan as an adjustment to yield.
Acquired loans are recorded at fair value at the time they are acquired and any related allowance is not carried over at the acquisition date. At acquisition, acquired loans are segmented into two groups, loans with evidence of credit deterioration, and loan without evidence of credit deterioration. Purchased loans with evidence of credit deterioration where the Company estimates that it will not receive all contractual payments are accounted for as purchased credit impaired loans in accordance with ASC 310-30, "Loans and Debt Securities Acquired with
F-13
WILSHIRE BANCORP, INC.
NOTES TO CONSOLIDATED FINANCIAL STATEMENTS (Continued)
1. SUMMARY OF SIGNIFICANT ACCOUNTING POLICIES (Continued)
- (iii)
- Credit Impaired Loans (ASC 310-30 Loans)
Deteriorated Credit Quality" and are referred to herein as "ASC 310-30 loans." Acquired loans without evidence of credit deterioration are not accounted for under ASC 310-30 and are referred to as "Non-ASC 310-30 loans." At the time of acquisition, Non-ASC 310-30 loans are aggregated into pools based on similar loan characteristics such as type of loans, variable or fixed interest rate, payment type, and other factors. Management periodically reassess the net realizable value of Non-ASC 310-30 loan pools and records interest income resulting from the accretion of the purchase discount in accordance with ASC 310-20.
Purchased loans with evidence of credit deterioration where the Company estimates that it will not receive all contractual payments are accounted for as purchased credit impaired loans in accordance with ASC 310-30. At the time of acquisition, ASC 310-30 loans are aggregated into pools based on similar loan characteristics such as type of loans, variable or fixed interest rate, payment type, and other factors. The estimated cashflows expected for each pool is estimated at the time the loans are acquired. The excess of the cash flows expected to be collected on ASC 310-30 loans, measured as of the acquisition date, over the estimated fair value is referred to as the "accretable yield," and is recognized in interest income over the remaining life of the loan using a level yield method of accretion. The difference between contractually required payments as of the acquisition date and the cash flows expected to be collected is referred to as "non-accretable difference," and is not accreted over time. For Non-ASC 310-30 loans, the difference between contractually required payments as of the acquisition date and the fair value is accreted over the remaining life of the loan using a level yield method of accretion.
The Company estimates expected cash flows to be collected over the life of acquired loans on a recurring basis. If the Company determines that expected cashflows have decreased, ASC 310-30 loans would be considered further impaired which would result in a provision for loan losses and a corresponding increase in valuation allowance included in the allowance for loan losses. However, if expected cashflows have increased in subsequent evaluations, the Company will reduce any remaining valuation allowance. If a valuation allowance does not exist, the accretable yield will be recalculated to account for the increase in expected cashflows.
Nonrefundable fees, net of incremental costs, associated with the origination of loans are deferred and recognized as an adjustment of the loan yield over the life of loans using the effective interest method. Other loan fees and charges, representing service costs for the prepayment of loans, for delinquent payments, or for miscellaneous loan services, are recorded as income when collected.
Allowance for Loan Losses and Loan Commitments—Based on the credit risk inherent in our lending business, we set aside allowance for losses on loans and loan commitments which are charged to earnings. These charges are not only made for the outstanding loan portfolio, but also for off-balance sheet loan commitments, such as commitments to extend credit or letters of credit. The charges made for the outstanding loan portfolio are recorded to the allowance for loan losses, whereas charges related to loan commitments are recorded as a reserve for loan commitments, which is presented as a component of other liabilities.
The allowance for loan losses is comprised of two components the general valuation allowance ("GVA") and the specific valuation allowance ("SVA"). The GVA allowance is based on loans that are evaluated for losses in pools based on historical experience in addition to qualitative adjustments ("QA"),
F-14
WILSHIRE BANCORP, INC.
NOTES TO CONSOLIDATED FINANCIAL STATEMENTS (Continued)
1. SUMMARY OF SIGNIFICANT ACCOUNTING POLICIES (Continued)
or estimated losses from factors not captured by historical experience. The SVA portion of the allowance is based on the estimated losses on impaired loans that are individually evaluated. Management performs a review of the historical loss rates used in the GVA as well as the factors in our QA methodology on a quarterly basis due to the increased significance of GVA when estimating losses in the current economic environment.
To establish an adequate allowance, we must be able to recognize when loans have become a problem. A risk grade of either pass, watch, special mention, substandard, or doubtful, is assigned to every loan in the loan portfolio, with the exception of homogeneous loans, or loans that are evaluated together in pools of similar loans (i.e., home mortgage loans, home equity lines of credit, overdraft loans, express business loans, and automobile loans). The following is a brief description of the loan classifications or risk grades used in our allowance calculation:
Pass Loans—Loans that are past due less than 30 days that do not exhibit signs of credit deterioration. The financial condition of the borrower is sound as is the status of any collateral. Loans secured by cash (principal and interest) also fall within this classification.
Watch Loans—Performing loans with borrowers that have experienced adverse financial trends, higher debt/equity ratio, or weak liquidity positions, but not to the degree that the loan is considered a problem.
Special Mention—Loans that are currently protected but exhibit an increasing degree of risk based on weakening credit strength and/or repayment sources. Contingent or remedial plans to improve the Bank's risk exposure is documented for these loans.
Substandard—Loans inadequately protected by the current worth and paying capacity of the borrower or pledged collateral, if any. This grade is assigned when inherent credit weakness is apparent.
Doubtful—Loans having all the weakness inherent in a "substandard" classification but collection or liquidation is highly questionable with the possibility of loss at some future date.
We currently use a type of migration analysis as a factor in calculating our allowance for loan losses in addition to a software program used to produce historical loss rates for different loan classes used in our GVA estimations. The Company also utilizes a QA matrix to estimate losses not captured by historical experience. The QA matrix takes into consideration both internal and external factors which include forecasted economic indicators (unemployment & GDP), problem loan trends (non-accrual, delinquency, and impaired loans), trends in real estate value, and other factors. Although the QA takes into consideration different loan segments and loan classes, the application is made to the loan portfolio as a whole. For impaired loans, or SVA allowance, we evaluate loans on an individual basis to determine impairment in accordance with generally accepted accounting principles ("GAAP"). All these components are added together for a final allowance for loan losses figure. The allowance calculation is performed on a quarterly basis.
Loans for which the terms have been modified resulting in a concession, and for which the borrower is experiencing financial difficulties, are considered troubled debt restructurings ("TDR"). The Company considers all TDRs to be impaired and are therefore accounted for in the same manner as other impaired loans.
Factors considered by management in determining impairment include payment status, collateral value, and the probability of collecting scheduled principal and interest payments when due. Loans that
F-15
WILSHIRE BANCORP, INC.
NOTES TO CONSOLIDATED FINANCIAL STATEMENTS (Continued)
1. SUMMARY OF SIGNIFICANT ACCOUNTING POLICIES (Continued)
experience insignificant payment delays and payment shortfalls generally are not classified as impaired. Management determines the significance of payment delays and payment shortfalls on case-by-case basis, taking into consideration all of the circumstances surrounding the loan and the borrower, including the length of the delay, the reasons for the delay, the borrower's prior payment record, and the amount of the shortfall in relation to the principal and interest owed.
Commercial and commercial real estate impaired loans are individually evaluated for impairment. If a loan is impaired, a portion of the allowance is allocated so that the loan is reported, at the net present value of estimated future cash flows using the loan's existing rate, or at the fair value of collateral if repayment is expected solely from the collateral. Large groups of smaller balance homogeneous loans, such as consumer and residential real estate loans, are collectively evaluated for impairment, and accordingly, they are not separately identified for impairment disclosures.
TDRs are separately identified for impairment disclosures and are measured at the present value of estimated future cash flows using the loan's effective rate at inception. If a TDR is considered to be a collateral dependent loan, the loan is reported, net, at the fair value of the collateral. For TDRs that subsequently default, the Company determines the amount of reserve in accordance with the accounting policy for the allowance for loan losses.
Allowance for loan commitments represents reserves for unfunded loans commitments or lines of credit that are available but have not yet been utilized by the borrower. The allowance for unfunded loan commitments is calculated by breaking down commitments by loan classes and takes into account such factors as average three month utilization rate and historical losses. The allowance for loan commitments is reported separately from allowance for loan losses in other liabilities in the "Consolidated Statements of Financial Condition".
Loan Commitments and Related Financial Instruments—Loan commitments and related financial instruments include off-balance sheet credit instruments, such as commitments to make loans and commercial letters of credit issued to meet customer financing needs. The face amount for these items represents the loss exposure before considering customer collateral or ability to repay. Such financial instruments are recorded when they are funded.
Servicing Assets—Upon sales of SBA guaranteed and residential mortgage loans, the Company receives a fee for servicing the loans. A servicing asset is initially recorded at fair value with the income statement effect recorded in gain on sale of loans. Fair value is based on the present value of the contractually specified servicing fee, net of servicing cost, over the estimated life of the loan, with an average discount rate and a range of constant prepayment rates of the related loans. Any subsequent increase or decrease in fair value of servicing assets and liabilities is to be included with loan-related servicing fees on the Consolidated Statements of Income.
Bank Premises and Equipment—Bank premises and equipment are stated at cost less accumulated depreciation and amortization while land is carried at cost. Depreciation on building, furniture, fixtures, and equipment is calculated using the straight-line method over the estimated useful lives of the assets, which can range from 3 to 30 years. Leasehold improvements are capitalized and amortized using the straight-line method over the term of the lease or the estimated useful lives of the improvements, whichever is shorter.
F-16
WILSHIRE BANCORP, INC.
NOTES TO CONSOLIDATED FINANCIAL STATEMENTS (Continued)
1. SUMMARY OF SIGNIFICANT ACCOUNTING POLICIES (Continued)
Other Real Estate Owned ("OREO")—OREO, which represents real estate acquired through foreclosures in satisfaction of commercial and real estate loans, are initially recorded at fair value less estimated selling costs of the property, establishing a new cost basis. The fair value of OREO is determined through appraisals or independent valuation. Loan balances in excess of the fair value of the real estate acquired at the date of acquisition are charged to the allowance for loan losses. These assets are subsequently accounted for at the lower of cost or fair value, less estimated costs to sell.
Any subsequent operating expenses or income, reduction in estimated fair values, and gains or losses on disposition of such properties are recorded in Consolidated Statements of Income for the current period.
Mortgage Banking Derivatives—Mortgage banking derivatives are instruments used to hedge the risk to residential mortgage loans sales from changes in interest rates. Residential mortgage loans funded with interest rate lock commitments and forward commitments for the future delivery of mortgage loans to third party investors, are both considered derivatives. The Company accounts for loan commitments related to the origination of mortgage loans that will be held-for-sale as derivatives at fair value on the balance sheet, with changes in fair value recorded in earnings. Commitments to originate mortgage loans that will be held for investment are not accounted for as derivatives and therefore are not recorded at fair value. Subsequent changes in the fair value of a derivative loan commitments are recognized in earnings in the period in which the changes occur.
Impairment of Long-Lived Assets—The Company reviews its long-lived assets for impairment annually or when events or circumstances indicate that the carrying amount of these assets may not be recoverable. An asset is considered impaired when the expected undiscounted cash flows over the remaining useful life are less than the net book value. When impairment is indicated for an asset, the amount of impairment loss is the excess of the net book value over its fair value.
FHLB Stock—The Bank is a member of the FHLB system. Members are required to own a certain amount of stock based on the level of borrowings and other factors, and may invest in additional amounts. FHLB stock is carried at cost, classified as a restricted security, and both cash and stock dividends are reported as income. An impairment analysis of FHLB Stock is performed annually or when events or circumstances indicate possibility of impairment.
Bank Owned Life Insurance ("BOLI") Obligation—The Company has purchased life insurance policies on certain key executives and Directors. BOLI is recorded at the amount that can be realized under the insurance contract at the statement of financial condition date, which is the cash surrender value adjusted for other charges or other amounts due that are probable at settlement. ASC 715-60-35, "Accounting for Deferred Compensation and Postretirement Benefit Aspects of Endorsement Split-Dollar Life Insurance Arrangements," requires an employer to recognize obligations associated with endorsement split-dollar life insurance arrangements that extend into the participant's post-employment benefit cost for the continuing life insurance or based on the future death benefit depending on the contractual terms of the underlying agreement. During 2015, 2014, and 2013, the increase in BOLI expense related to the adoption of ASC 715-60-35 was $272,000, $155,000, and $563,000, respectively, which was included as part of the other expenses in the Consolidated Statements of Income. The accrued liabilities, included in other liabilities, totaled $4.9 million and $4.7 million, at December 31, 2015, and 2014, respectively.
F-17
WILSHIRE BANCORP, INC.
NOTES TO CONSOLIDATED FINANCIAL STATEMENTS (Continued)
1. SUMMARY OF SIGNIFICANT ACCOUNTING POLICIES (Continued)
Affordable Housing Partnerships Investments—The Company invests in limited partnerships formed to develop and operate affordable housing units for lower income tenants throughout the states of California, Texas, and New York. These investments are accounted for using the equity method of accounting. If the partnerships cease to qualify during the compliance period, the credits may be denied for any period in which the projects are not in compliance and a portion of the credits previously taken is subject to recapture with interest. The carrying value of such investments and commitments to fund investment in affordable housing is recorded as "Investment in affordable housing partnerships" in the Consolidated Statement of Financial Condition. Commitment to fund investments in affordable housing is also included in this line items but is also grossed up and recorded as a liability in "Commitments to fund affordable housing partnerships investments".
Goodwill and Intangible Assets—The Company recognized goodwill in connection with the acquisition of Liberty Bank of New York in 2006, and subsequently in 2013 with the acquisitions of BankAsiana and Saehan. Goodwill is presumed to have an indefinite useful life and is tested for impairment, rather than amortized. The goodwill impairment analysis is a two-step test. However, under ASU 2011-08 "Intangibles—Goodwill and Other", a company can first assess qualitative factors to determine whether it is necessary to perform the two-step goodwill impairment test. As such, we perform a qualitative assessment on goodwill at least annually. We are not required to calculate the fair value unless we determined, based on this qualitative assessment, that it is more-likely-than-not that the fair value related to goodwill is less than the carrying amount. The assessment of qualitative factors and goodwill testing involves significant judgment and assumptions by management to which there is always some degree of uncertainty. The Company assessed the qualitative factors related to goodwill and determined goodwill was more-than-likely not impaired at December 31, 2015. Goodwill is the only intangible asset with an indefinite life on our statement of financial condition.
The Company evaluates the remaining useful lives of its core deposits intangibles asset and lease intangibles as required by ASC 350, "Intangibles—Goodwill and Other", to determine whether events and circumstances warrant a revision to the remaining period of amortization. If the estimate of an intangible asset's remaining useful life has changed, the remaining carrying amount of the intangible asset is amortized prospectively over that revised remaining useful life. The Company has determined that a revision to estimates of the useful lives of its core deposits intangibles or lease intangibles was not required as of December 31, 2015.
FDIC Indemnification Asset—With the acquisition of Mirae Bank, the Bank entered into a loss sharing agreement with the FDIC, whereby the FDIC shares in losses and recoveries on acquired loans. The Company accounted for the receivable balances under the loss sharing agreement as an FDIC Indemnification asset in accordance with ASC 805 "Business Combinations". The FDIC indemnification was accounted for on the date of the acquisition by adding the present value of all the cash flows that the Company expected to collect from the FDIC as stated in the loss sharing agreement. The FDIC indemnification balance declined as we received payments from the FDIC. In addition, the FDIC indemnification asset decreased and increased, as expected and actual cash flows increased and decreased, respectively, from what was expected at the time of acquisition.
The loss sharing agreement with the FDIC related to losses on loans acquired from Mirae Bank expired in June 2014, although recoveries remain covered under the agreement for an additional three years from that time. Upon the expiration of the loss sharing agreement in respect to losses, the remaining
F-18
WILSHIRE BANCORP, INC.
NOTES TO CONSOLIDATED FINANCIAL STATEMENTS (Continued)
1. SUMMARY OF SIGNIFICANT ACCOUNTING POLICIES (Continued)
balance of the FDIC indemnification assets was written down. At December 31, 2015, we no longer had an FDIC indemnification asset balance.
Income Taxes—The Company accounts for income taxes under the asset and liability method, which requires the recognition of deferred tax assets and liabilities for the expected future tax consequences of events that have been included in the financial statements. Under this method, deferred tax assets and liabilities are determined based on the differences between the financial statements and tax basis of assets and liabilities using enacted tax rates in effect for the year in which the differences are expected to reverse. The effect of a change in tax rates on deferred tax rates for deferred tax assets and liabilities is recognized in income in the period that includes the enacted date.
Valuation allowances are established when necessary to reduce deferred tax assets when it is more-likely-than-not that a portion or all of the deferred tax assets will not be realized. As of December 31, 2015, management performed an evaluation of all positive and negative evidence regarding the need for a valuation allowance. Positive evidence includes, but is not limited to, 12 quarters (three years) of cumulative positive pre-tax income, 19 continuous quarters of positive earnings, strengthening capital, significantly improved asset quality, and the removal of regulatory orders. Negative evidence includes uncertainty in the recovery or slow growth of U.S. economy, and increased regulatory scrutiny that can adversely affect future earnings. Based on this evaluation, management concluded that the aforementioned available positive evidence outweighed the negative evidence and that deferred tax assets are more-likely-than-not to be realized and therefore no valuation allowance was required.
The Company adopted the provision of ASC 740-10-25, "Accounting for Uncertainty in Income Taxes", which clarifies the accounting for uncertainty in income taxes recognized in the financial statements in accordance with 740-10, "Accounting for Income Taxes". ASC 740-10-25 provides that a tax benefit from an uncertain tax position may be recognized when it is more-likely-than-not that the position will be sustained upon examination, including resolutions of any related appeals or litigation processes, based on the technical merits. A tax position is recognized as a benefit only if it is "more-likely-than-not" that the tax position would be sustained in a tax examination, with a tax examination being presumed to occur. The amount recognized is the largest amount of tax benefit that is greater than 50% likely of being realized on examination. For tax positions not meeting the "more-likely-than-not" test, no tax benefit is recorded. The Company recognized an increase in the liability for unrecognized tax benefit of $5,000 from prior year tax positions, and a decrease in the liability for unrecognized tax benefit of $1.2 million due to settlements with federal and state tax authorities in 2015. As of December 31, 2015, the total unrecognized tax benefit that would affect the effective tax rate if recognized was $483,000. We expect the unrecognized tax benefits to decrease by approximately $483,000 over the next 12 months due to settlements with state tax authorities.
Earnings per Common Share—Basic earnings per common share ("EPS") are computed by dividing net income by the weighted-average number of common shares outstanding for the period. Diluted EPS reflects the potential dilution that could occur if stock options or other contracts to issue common stock were exercised or converted into common stock, or resulted in the issuance of common stock that would then share in the earnings of the Company.
Comprehensive Income—Comprehensive income consists of net income and other comprehensive income (loss). Other comprehensive income includes unrealized gains and losses on interest-only ("I/O") strips, BOLI unrecognized prior service cost, and unrealized gains and losses on securities available-for-sale. The accumulated change in other comprehensive income, net of tax, is recognized as a separate component of shareholders' equity.
F-19
WILSHIRE BANCORP, INC.
NOTES TO CONSOLIDATED FINANCIAL STATEMENTS (Continued)
1. SUMMARY OF SIGNIFICANT ACCOUNTING POLICIES (Continued)
Dividend Restrictions—Banking regulations and state laws require the Company and Bank to maintain certain capital levels and may limit the dividends paid by the Bank to the Company or by the Company to its shareholders.
Stock-Based Compensation—The Company issues stock-based compensation to certain employees, officers, and directors. Stock-based compensation cost is recognized for stock options and restricted stock awards issued to employees and directors, based on the fair value of these awards on the date of grant. The Black-Scholes model is utilized to estimate the fair value of stock options, while the market price of the Company's common stock on the date of grant is used for restricted stock awards. Compensation cost is recognized over the required service period, generally defined as the vesting period. For awards with graded vesting, compensation cost is recognized on a straight-line basis over the requisite service period for the entire award.
Use of Estimates in the Preparation of Financial Statements—The preparation of financial statements in conformity with accounting principles generally accepted in the United States of America requires management to make estimates and assumptions that affect the reported amounts of assets and liabilities, disclosure of contingent assets and liabilities at the date of the financial statements, and the reported amounts of revenues and expenses during the reporting period.
Recent Accounting Pronouncements
In January 2016, the FASB issued ASU 2016-01, "Financial Instruments—Overall (Topic 825-10): "Recognition and Measurement of Financial Assets and Financial Liabilities." ASU 2016-01 amends the guidance on the classification and measurement of financial instruments. Some of the amendments in ASU 2016-01 include the following: 1) requires equity investments (except those accounted for under the equity method of accounting or those that result in consolidation of the investee) to be measured at fair value with changes in fair value recognized in net income; 2) simplifies the impairment assessment of equity investments without readily determinable fair values by requiring a qualitative assessment to identify impairment; 3) requires public business entities to use the exit price notion when measuring the fair value of financial instruments for disclosure purposes; and 4) requires an entity to present separately in other comprehensive income the portion of the total change in the fair value of a liability resulting from a change in the instrument-specific credit risk when the entity has elected to measure the liability at fair value; among others. For public business entities, the amendments of ASU 2016-01 are effective for fiscal years beginning after December 15, 2017, including interim periods within those fiscal years. The Company is currently evaluating the effects of the ASU 2016-01 on its financial statements and disclosures, if any.
2. MERGERS AND ACQUISITIONS
Proposed Merger with BBCN Bancorp Inc.
On December 7, 2015, the Company entered into an Agreement and Plan of Merger ("Merger Agreement") with BBCN Bancorp Inc. ("BBCN"). Subject to the terms and conditions of the Merger Agreement, which was approved by the board of directors of both the Company and BBCN, the Company will merge with and into BBCN, with BBCN being the surviving corporation. Concurrently with, or as soon as reasonably practicable after the consummation of the Merger, the Bank will merge with and into BBCN Bank, a California state-chartered bank and a wholly owned subsidiary of BBCN, with BBCN Bank being
F-20
WILSHIRE BANCORP, INC.
NOTES TO CONSOLIDATED FINANCIAL STATEMENTS (Continued)
2. MERGERS AND ACQUISITIONS (Continued)
the surviving bank, pursuant to a separate merger agreement between the Bank and BBCN Bank. The combined company will operate under a new name that will be determined prior to the closing.
The consummation of the merger is subject to customary conditions, including receipt of regulatory approvals, receipt of the requisite approval of the shareholders of the Company and BBCN, the absence of any law or order prohibiting the closing, and effectiveness of the registration statement to be filed by BBCN with respect to the stock to be issued in the merger. In addition, each party's obligation to consummate the merger is subject to certain other conditions, including the accuracy of the representations and warranties of the other party and compliance of the other party with its covenants, in each case subject to certain materiality standards. The merger is expected to close in the second half of 2016.
During the fourth quarter of 2015, the Company recorded $994,000 in merger related costs associated with the proposed merger with BBCN consisting mainly of legal and consulting fees related to due diligence and the signing and announcement of the merger agreement with BBCN. For more information on the merger, please see our Current Report on Form 8-K filed with the SEC on December 7, 2015.
Acquisition of Bank of Manhattan's Mortgage Lending Division
During the first quarter of 2015, the Bank purchased certain assets and partially assumed the operations of Bank of Manhattan's Mortgage Lending Division ("Mortgage Division"). The Mortgage Division was first formed in 2010 and offers conforming, super-conforming, jumbo residential, and other residential mortgage products. The Bank acquired certain assets and liabilities of the Mortgage Division and hired approximately 30 employees consisting of loan managers, loan officers, and operations personnel. In connection with the acquisition, the Bank entered into a sublease agreement with Bank of Manhattan to operate from one of the Mortgage Division's locations in Southern California. The Mortgage Division has been integrated into the Bank's existing Mortgage Department, substantially increasing the Bank's mortgage lending origination platform.
The acquisition was accounted for in accordance with ASC 805 "Business Combinations," using the acquisition method of accounting and was recorded at estimated fair value on the date of the transaction. The transaction resulted in only the acquisition of fixed assets related to the three locations acquired by the Bank. There were no loans or loan commitments acquired in the transaction. The total purchase price paid to Bank of Manhattan for the transaction was $20,000.
2013 Acquisitions of BankAsiana and Saehan Bancorp
On October 1, 2013, the Company acquired BankAsiana for approximately $32.5 million, or $14.25 per share of BankAsiana's common stock. The entire consideration was paid to BankAsiana shareholders in cash. BankAsiana was a New Jersey state chartered commercial bank serving the East Coast Korean-American community with three branch offices, two in New Jersey, and one in New York.
On November 20, 2013, the Company acquired Saehan Bancorp, Inc. ("Saehan") for approximately $118.2 million. Pursuant to the merger agreement, Saehan shareholders had a right to elect to receive either (a) $0.4247 in cash, (b) 0.06080 shares of Wilshire common stock, or (c) a unit consisting of a mix of $0.21235 in cash and 0.03040 share of Wilshire common stock (subject to proration, adjustment and certain limitations set forth in the Merger Agreement), for each share of Saehan common stock. As a result, 7.2 million shares of the Company's common stock were issued to former Saehan shareholders at $9.40 per
F-21
WILSHIRE BANCORP, INC.
NOTES TO CONSOLIDATED FINANCIAL STATEMENTS (Continued)
2. MERGERS AND ACQUISITIONS (Continued)
share at the date of the acquisition for a total value of $67.8 million. In addition to the stock consideration, Saehan shareholders also received total cash consideration of $50.4 million. Saehan was headquartered in Los Angeles, California and its main subsidiary, Saehan Bank operated ten branches all located in Southern California, and two LPO offices located in the States of Washington and New York.
The acquisition of BankAsiana helped to expand our market presence on the East Coast. The customer base and locations of BankAsiana's branches had significant overlap when compared to the Bank's East Coast customer base and branch locations. Saehan also had a similar customer base and operated in the same markets of our Southern California operations. Both acquisitions resulted in large cost savings synergies with consolidation and the potential for future growth. With the Company's level of excess capital at the time, the acquisitions fit well into the Company's growth strategy. The total fair value of assets acquired from BankAsiana and Saehan were $203.9 million and $589.1 million, respectively. We recorded goodwill of $10.8 million for the acquisition of BankAsiana and $50.0 million for the acquisition of Saehan. Total goodwill of $60.8 million from these two acquisitions is largely the result of the benefits discussed above as well as creating a platform for future operations and strengthening the Company's presence in existing markets. Goodwill is not amortized for book purposes and is not tax deductible.
Federally Assisted Acquisition of Mirae Bank
The FDIC placed Mirae Bank ("Mirae") under receivership upon Mirae's closure by the California Department of Business Oversight ("DBO") at the close of business on June 26, 2009. The Bank purchased substantially all of Mirae's assets and assumed all of Mirae's deposits and certain other liabilities. Further, the Company entered into loss sharing agreements with the FDIC in connection with the Mirae acquisition. In June, 2014, the remaining loss-share agreement with the FDIC related to losses expired. As such, losses on loans acquired from Mirae Bank are no longer covered by the FDIC. However, recoveries will still be shared with the FDIC until June 2017.
The table below reflects changes to the FDIC indemnification asset for years indicated:
FDIC Indemnification Asset
(Dollars in Thousands)
| | 2015 | 2014 | 2013 | |||||||
|---|---|---|---|---|---|---|---|---|---|---|
Beginning balance | $ | — | $ | 4,856 | $ | 5,446 | ||||
Additions resulting from charge-offs or impairment | — | 143 | 3,021 | |||||||
Deletions from loans transferred to OREO | — | — | (48 | ) | ||||||
Payments and reimbursement received from the FDIC | — | (2,618 | ) | (1,792 | ) | |||||
Write-downs from impairment valuations | — | (597 | ) | — | ||||||
Write-downs resulting from loans sold or paid-off | — | (1,050 | ) | (1,771 | ) | |||||
Other write-downs | — | (734 | ) | — | ||||||
| | | | | | | | | | | |
Ending balance | $ | — | $ | — | $ | 4,856 | ||||
| | | | | | | | | | | |
| | | | | | | | | | | |
| | | | | | | | | | | |
F-22
WILSHIRE BANCORP, INC.
NOTES TO CONSOLIDATED FINANCIAL STATEMENTS (Continued)
3. FAIR VALUE MEASUREMENTS FOR FINANCIAL ASSETS AND LIABILITIES
Fair value is the exchange price that would be received for an asset or paid to transfer a liability (exit price) in the principal or most advantageous market for the asset or liability in an orderly transaction between market participants on the measurement date. There are three levels of inputs that may be used to measure fair value. The fair value inputs of the instruments are classified and disclosed in one of the following categories pursuant to ASC 820:
Level 1—Unadjusted quoted prices in active markets for identical assets or liabilities that the reporting entity has the ability to access at the measurement date. The quoted price shall not be adjusted for the blockage factor (i.e., size of the position relative to trading volume).
Level 2—Pricing inputs are inputs other than quoted prices included within Level 1 that are observable for the asset or liability, either directly or indirectly. Fair value is determined through the use of models or other valuation methodologies, including the use of pricing matrices. If the asset or liability has a specified (contractual) term, a Level 2 input must be observable for substantially the full term of the asset or liability.
Level 3—Pricing inputs are inputs unobservable for the asset or liability. Unobservable inputs shall be used to measure fair value to the extent that observable inputs are not available, thereby allowing for situations in which there is little, if any, market activity for the asset or liability at the measurement date. The inputs into the determination of fair value require significant management judgment or estimation.
In certain cases, the inputs used to measure fair value may fall into different levels of the fair value hierarchy. In such cases, an investment's level within the fair value hierarchy is based on the lowest level of input that is significant to the fair value measurement. Our assessment of the significance of a particular input to the fair value measurement in its entirety requires judgment and considers factors specific to the investment.
The Company uses the following methods and assumptions in estimating our fair value disclosures for financial instruments. Financial assets and liabilities recorded at fair value on a recurring and non-recurring basis are listed as follows:
Cash and cash equivalents—The carrying value of our cash and cash equivalents is approximately equal to the fair value resulting in a Level 1 classification.
Federal funds sold—The carrying value of federal funds sold is approximately equal to the fair value resulting in a Level 1 classification.
Deposits held in other financial institutions—The carrying value of deposits held at other financial institutions is approximately equal to the fair value resulting in a Level 1 classification.
Investment securities—Investments securities are recorded at fair value pursuant to ASC 320-10 "Investments—Debt and Equity Securities." Fair value measurements are based upon quoted prices for similar assets, if available (Level 1). If quoted prices are not available, fair values are measured using matrix pricing models, or other model-based valuation techniques requiring observable inputs such as yield curves, prepayment speeds, and default rates (Level 2). Our existing investment security holdings as of December 31, 2015 and December 31, 2014 are measured using matrix pricing models in lieu of direct price quotes and are recorded based on recurring Level 2 measurement inputs. Level 3 measurement inputs are not utilized to measure the fair value for any of our investment securities.
F-23
WILSHIRE BANCORP, INC.
NOTES TO CONSOLIDATED FINANCIAL STATEMENTS (Continued)
3. FAIR VALUE MEASUREMENTS FOR FINANCIAL ASSETS AND LIABILITIES (Continued)
Loans—The fair value of variable rate loans that have no significant changes in credit risk are based on the carrying value of the loans. The fair values of other loans are estimated by discounting the future cash flows using current rates at which similar loans would be made to borrowers with similar risk characteristics. The aforementioned fair valuation technique results in a Level 3 classification. See below for loans held-for-sale and impaired loans.
Loans held-for-sale (excluding impaired loans held-for-sale)—SBA loans and mortgage loans that are held-for-sale are reported at the lower of cost or fair value. Fair value is determined based on quotes, bids, or indications directly from potential purchasing parties. We record SBA and mortgage loans held-for-sale as non-recurring Level 2 measurement inputs.
Impaired loans—At the time a loan is considered impaired, it is valued at the lower of cost or fair value. Impaired loans that are carried at fair value generally having had a charge-off through the allowance for loan losses or a specific valuation allowance. The fair value of impaired loans that are not collateral dependent are measured based on the present value of estimated cash flows. For collateral dependent loans, the fair value is commonly based on recent real estate appraisals of underlying collateral. These appraisals may utilize a single valuation approach or a combination of approaches including comparable sales and the income approach. Adjustments are routinely made in the appraisal process to adjust for differences between the comparable sales and income data available. Such adjustments may be significant and typically result in a Level 3 classification of the inputs for determining fair value. Non-real estate collateral may also be valued using an appraisal, net book value per the borrower's financial statements or aging reports, adjusted or discounted based on management's historical knowledge, based on changes in market conditions from the time of the valuation, and management's expertise and knowledge of the client and client's business resulting in a Level 3 fair value classification. Impaired loans are evaluated on a quarterly basis for additional impairment and are adjustments are recorded accordingly.
Indications of value for both collateral-dependent impaired loans and other real estate owned are obtained from third party providers or estimated internally by the Company's internal Appraisal Department. All indications of value are reviewed for reasonableness by a member of the Appraisal Department who reviews the assumptions and approaches utilized in the appraisal. The resulting fair value is then compared with independent data sources such as recent market data or industry-wide statistics.
Other real estate owned ("OREO")—OREO are measured at fair value less estimated costs to sell when acquired, establishing a new cost basis. Fair value is commonly based on recent real estate appraisals. These appraisals may utilize a single valuation approach or a combination of approaches including comparable sales and the income approach. Adjustments are routinely made in the appraisal process to adjust for differences between the comparable sales and income data available. The Company records OREO as non-recurring with Level 3 measurement inputs.
Servicing assets—SBA and residential real estate loan servicing assets represent the value associated with servicing SBA and residential real estate loans that have been sold. The fair value for servicing assets is determined through discounted cash flow analysis and utilizes discount rates, prepayment speeds, and delinquency rate assumptions as inputs. All of these assumptions require a significant degree of management estimation and judgment. The fair market valuation is performed on a quarterly basis for servicing assets. The Company classifies loan servicing assets as recurring with Level 3 measurement inputs.
F-24
WILSHIRE BANCORP, INC.
NOTES TO CONSOLIDATED FINANCIAL STATEMENTS (Continued)
3. FAIR VALUE MEASUREMENTS FOR FINANCIAL ASSETS AND LIABILITIES (Continued)
FHLB stock—It is not practical to determine the fair value of FHLB stock due to the restrictions placed on the stock's transferability.
Accrued interest receivable—The carrying amount of accrued interest receivable approximates its fair value due to the short-term nature of this asset resulting in a Level 2/Level 3 classification which is consistent with its underlying asset.
Due from customers on acceptances and acceptances outstanding—The carrying value of due from customers on acceptances and acceptances outstanding are approximately equal to the fair value, resulting in a Level 1 classification.
Mortgage banking derivatives—Mortgage banking derivative instruments consist of interest rate lock commitments and forward sale contracts that trade in liquid markets. The fair value is based on the prices available from third party investors. Due to the observable nature of the inputs used in deriving the fair value, the valuation of mortgage banking derivatives are classified as Level 2.
Non-interest-bearings deposits—The carrying value of our non-interest-bearings deposits is approximately equal to the fair value resulting in a Level 1 classification.
Interest-bearings deposits—The fair value of money market and savings accounts is estimated to be the amount that is payable on demand as of the reporting date resulting in Level 2 classification. Fair value for fixed-rate time deposits is estimated using a discounted cash flow analysis which utilizes current interest rates offered on deposits of similar maturities resulting in a Level 2 classification.
Junior subordinated debentures—The fair value for junior subordinated debentures is derived from a discounted cash flow analysis based on current rates that are given for securities with similar risk characteristics, resulting in a Level 2 classification.
Short-term FHLB advances—The carrying value of our short-term FHLB advances is approximately equal to the fair value as the borrowings are usually variable rate and are renewed daily. As such, these liabilities have a Level 1 classification.
Long-term FHLB advances—The fair value for long-term FHLB advances is derived from a discounted cash flow analysis based on current rates that are given for borrowings with similar risk characteristics, resulting in a Level 2 classification.
Accrued interest payable—The carrying amount of accrued interest payable approximates its fair value due to the short-term nature of this liability resulting in a Level 1 or 2 classification consistent with its underlying liabilities.
F-25
WILSHIRE BANCORP, INC.
NOTES TO CONSOLIDATED FINANCIAL STATEMENTS (Continued)
3. FAIR VALUE MEASUREMENTS FOR FINANCIAL ASSETS AND LIABILITIES (Continued)
The tables below summarize the valuation of the Company's financial instruments measured on a recurring basis by the above ASC 820-10 fair value hierarchy levels as of December 31, 2015 and December 31, 2014:
Financial Instruments Measured at Fair Value on a Recurring Basis
(Dollars in Thousands)
| | Fair Value Measurements Using: | ||||||||||||
|---|---|---|---|---|---|---|---|---|---|---|---|---|---|
As of December 31, 2015 | Total Fair Value | Quoted Prices in Active Markets (Level 1) | Significant Other Observable Inputs (Level 2) | Significant Unobservable Inputs (Level 3) | |||||||||
Investments | |||||||||||||
Securities of government sponsored enterprises | $ | 73,835 | $ | — | $ | 73,835 | $ | — | |||||
Mortgage-backed securities (residential) | 171,698 | — | 171,698 | — | |||||||||
Collateralized mortgage obligations (residential) | 251,395 | — | 251,395 | — | |||||||||
Corporate securities | 15,260 | — | 15,260 | — | |||||||||
Municipal bonds | 23,336 | — | 23,336 | — | |||||||||
Servicing assets | 19,894 | — | — | 19,894 | |||||||||
Mortgage banking derivative assets | 222 | — | 222 | — | |||||||||
Mortgage banking derivative liabilities | (16 | ) | — | (16 | ) | — | |||||||
| | Fair Value Measurements Using: | ||||||||||||
|---|---|---|---|---|---|---|---|---|---|---|---|---|---|
As of December 31, 2014 | Total Fair Value | Quoted Prices in Active Markets (Level 1) | Significant Other Observable Inputs (Level 2) | Significant Unobservable Inputs (Level 3) | |||||||||
Investments | |||||||||||||
Securities of government sponsored enterprises | $ | 100,362 | $ | — | $ | 100,362 | $ | — | |||||
Mortgage-backed securities (residential) | 83,367 | — | 83,367 | — | |||||||||
Collateralized mortgage obligations (residential) | 163,079 | — | 163,079 | — | |||||||||
Corporate securities | 15,514 | — | 15,514 | — | |||||||||
Municipal bonds | 26,045 | — | 26,045 | — | |||||||||
Servicing assets | 18,031 | — | — | 18,031 | |||||||||
F-26
WILSHIRE BANCORP, INC.
NOTES TO CONSOLIDATED FINANCIAL STATEMENTS (Continued)
3. FAIR VALUE MEASUREMENTS FOR FINANCIAL ASSETS AND LIABILITIES (Continued)
Servicing assets measured at fair value on a recurring basis, which were deemed to have Level 3 fair value inputs when determining valuation, are identified in the table below with a summary of changes in fair value for the years ended December 31, 2015 and December 31, 2014:
| | Twelve Months Ended December 31, | ||||||
|---|---|---|---|---|---|---|---|
(Dollars in Thousands) | 2015 | 2014 | |||||
Servicing Assets: | |||||||
Balance at beginning of period | $ | 18,031 | $ | 16,108 | |||
Net realized losses in net income | (1,166 | ) | (1,062 | ) | |||
Net purchases, sales, and settlement | 3,029 | 2,985 | |||||
Transfers in or out of Level 3 | — | — | |||||
| | | | | | | | |
Balance at end period | $ | 19,894 | $ | 18,031 | |||
| | | | | | | | |
| | | | | | | | |
| | | | | | | | |
Net cumulative unrealized loss in accumulated other comprehensive income (loss) | $ | — | $ | — | |||
| | | | | | | | |
| | | | | | | | |
| | | | | | | | |
We had no transfers of financial instruments between Levels 1, 2, and 3 during the years ended December 31, 2015 and December 31, 2014.
At December 31, 2015, we had approximately $35.7 million in interest rate lock commitments, and $17.1 million in total forward sales commitments, for the future delivery of residential mortgage loans. The fair value of these mortgage banking derivatives was recorded as a derivative asset of $222,000 and a derivative liability of $16,000. Fair values were estimated based on changes in mortgage interest rates from the date of the commitments. Changes in the fair value of mortgage banking derivatives are included in the Consolidated Statements of Income as "net change in fair value of derivatives," a component of non-interest income. There were no mortgage banking derivatives for the year ended December 31, 2014.
The following table reflects the notional amount and fair value of mortgage banking derivatives for the dates indicated:
| | As of December 31, 2015 | As of December 31, 2014 | |||||||||||
|---|---|---|---|---|---|---|---|---|---|---|---|---|---|
(Dollars in Thousands) | Notional Amount | Fair Value | Notional Amount | Fair Value | |||||||||
Assets: | |||||||||||||
Interest rate lock commitments | $ | 15,481 | $ | 197 | $ | — | $ | — | |||||
Forward sale contracts related to mortgage banking: | $ | 9,682 | $ | 25 | $ | — | $ | — | |||||
Liabilities: | |||||||||||||
Interest rate lock commitments | $ | 1,622 | $ | (3 | ) | $ | — | $ | — | ||||
Forward sale contracts related to mortgage banking: | $ | 7,421 | $ | (13 | ) | $ | — | $ | — | ||||
F-27
WILSHIRE BANCORP, INC.
NOTES TO CONSOLIDATED FINANCIAL STATEMENTS (Continued)
3. FAIR VALUE MEASUREMENTS FOR FINANCIAL ASSETS AND LIABILITIES (Continued)
The tables below present assets measured at estimated fair value on a non-recurring basis and the total losses resulting from these fair value adjustments for each of the twelve month ended December 31, 2015 and December 31, 2014:
Assets Measured at Fair Value on a Non-Recurring Basis
(Dollars in Thousands)
As of December 31, 2015
(Dollars in Thousands) | Level 1 | Level 2 | Level 3 | Total | Net Realized Losses | |||||||||||
|---|---|---|---|---|---|---|---|---|---|---|---|---|---|---|---|---|
Collateral Dependent Impaired Loans: | ||||||||||||||||
Commercial Real Estate | $ | — | $ | — | $ | 4,219 | $ | 4,219 | $ | (405 | ) | |||||
OREO: | ||||||||||||||||
Commercial Real Estate | — | — | 147 | 147 | (188 | ) | ||||||||||
| | | | | | | | | | | | | | | | | |
Total | $ | — | $ | — | $ | 4,366 | 4,366 | $ | (593 | ) | ||||||
| | | | | | | | | | | | | | | | | |
| | | | | | | | | | | | | | | | | |
| | | | | | | | | | | | | | | | | |
As of December 31, 2014
(Dollars in Thousands) | Level 1 | Level 2 | Level 3 | Total | Net Realized Losses | |||||||||||
|---|---|---|---|---|---|---|---|---|---|---|---|---|---|---|---|---|
Collateral Dependent Impaired Loans: | ||||||||||||||||
Commercial Real Estate | $ | — | $ | — | $ | 6,563 | $ | 6,563 | $ | (3,698 | ) | |||||
Residential Real Estate | — | — | 266 | 266 | (179 | ) | ||||||||||
OREO: | ||||||||||||||||
Commercial Real Estate | — | — | 2,770 | 2,770 | (406 | ) | ||||||||||
| | | | | | | | | | | | | | | | | |
Total | $ | — | $ | — | $ | 9,599 | $ | 9,599 | $ | (4,283 | ) | |||||
| | | | | | | | | | | | | | | | | |
| | | | | | | | | | | | | | | | | |
| | | | | | | | | | | | | | | | | |
F-28
WILSHIRE BANCORP, INC.
NOTES TO CONSOLIDATED FINANCIAL STATEMENTS (Continued)
3. FAIR VALUE MEASUREMENTS FOR FINANCIAL ASSETS AND LIABILITIES (Continued)
Quantitative information about the significant unobservable inputs used in the fair value measurement for Level 3 asset and liabilities measured on a recurring and non-recurring basis at December 31, 2015 and December 31, 2014 is presented in the table below:
As of December 31, 2015
(Dollars in Thousands) | Fair Value | Valuation Technique | Significant Unobservable Inputs | Range | |||||
|---|---|---|---|---|---|---|---|---|---|
Servicing assets | $ | 19,894 | Discounted cash flow | Discount rate | 4.0% - 9.3% | ||||
| Constant prepayment rate | 7.2% - 9.0% | ||||||||
Collateral dependent impaired loans: |
|
|
| ||||||
Commercial Real Estate | 4,219 | Sales Comparison Approach | Adjustment for difference between comparable sales and expected sales amounts | 45.7%* | |||||
OREO: |
|
|
| ||||||
Commercial Real Estate | 147 | Sales Comparison Approach | Adjustment for difference between comparable sales and expected sales amounts | 8.0%* | |||||
As of December 31, 2014
(Dollars in Thousands) | Fair Value | Valuation Technique | Significant Unobservable Inputs | Range | |||||
|---|---|---|---|---|---|---|---|---|---|
Servicing assets | $ | 18,031 | Discounted cash flow | Discount rate | 4.0% - 9.3% | ||||
| Constant prepayment rate | 8.8% - 9.4% | ||||||||
Collateral dependent impaired loans: |
|
|
| ||||||
Commercial Real Estate | 6,563 | Sales Comparison Approach | Adjustment for difference between comparable sales and expected sales amounts | 45.6%* | |||||
Residential Real Estate | 266 | Sales Comparison Approach | Adjustment for difference between comparable sales and expected sales amounts | 46.8%* | |||||
OREO: |
|
|
| ||||||
Commercial Real Estate | 2,770 | Sales Comparison Approach | Adjustment for difference between comparable sales and expected sales amounts | 23.3%* | |||||
- *
- Represents weighted average percentage
The fair value estimates presented herein are based on pertinent information available to management at December 31, 2015 and December 31, 2014. Although management is not aware of any factors that would significantly affect the estimated fair value amounts, such amounts have not been comprehensively revalued for purposes of these financial statements since that date, and therefore, current estimates of fair value may differ significantly from the amounts presented herein.
F-29
WILSHIRE BANCORP, INC.
NOTES TO CONSOLIDATED FINANCIAL STATEMENTS (Continued)
3. FAIR VALUE MEASUREMENTS FOR FINANCIAL ASSETS AND LIABILITIES (Continued)
The fair value of OREO and collateral-dependent impaired loans are based on third-party property appraisals. The majority of the appraisals utilize a single valuation approach or a combination of approaches, including a market approach, where prices and other relevant information generated by market transactions involving identical or comparable properties are used to determine fair value. Appraisals may also utilize an income approach, such as the discounted cash flow method, to estimate future income, profits, or cash flows. Appraisals may include an 'as is' sales comparison approach, and an 'upon completion' valuation approach. Adjustments are routinely made in the appraisal process by third-party appraisers to adjust for differences between the comparable sales and income data. Adjustments also result from the consideration of relevant economic and demographic factors with the potential to affect property values. Also, prospective values are based on the market conditions that exist at the date of inspection combined with informed forecasts based on current trends in supply and demand for the property types under appraisal.
The fair value of servicing assets are measured using discounted cash flow valuation. This method requires generating cash flow projections over multiple interest rate scenarios and discounting those cash flows at a risk adjusted rate. As such, increases or decrease in cash flow inputs, including changes to the discount rate and constant prepayment rate, will have a corresponding impact to the fair value of these assets.
The table below is a summary of fair value estimates at December 31, 2015 and December 31, 2014, for financial instruments, as defined by ASC 825-10 "Financial Instruments". During years ended
F-30
WILSHIRE BANCORP, INC.
NOTES TO CONSOLIDATED FINANCIAL STATEMENTS (Continued)
3. FAIR VALUE MEASUREMENTS FOR FINANCIAL ASSETS AND LIABILITIES (Continued)
December 31, 2015 and December 31, 2014, there were no transfers of financial assets between Level 1 and Level 2.
| | | December 31, 2015 | December 31, 2014 | ||||||||||||
|---|---|---|---|---|---|---|---|---|---|---|---|---|---|---|---|
(Dollars in Thousands) | Fair Value Level | Carrying Amount | Estimated Fair Value | Carrying Amount | Estimated Fair Value | ||||||||||
Assets: | |||||||||||||||
Cash and cash equivalents | Level 1 | $ | 118,089 | $ | 118,089 | $ | 233,699 | $ | 233,699 | ||||||
Federal funds sold | Level 1 | 104 | 104 | 254 | 254 | ||||||||||
Deposits held in other financial institutions | Level 1 | — | — | 8,000 | 8,000 | ||||||||||
Investment securities available-for-sale | Level 2 | 535,524 | 535,524 | 388,367 | 388,367 | ||||||||||
Investment securities held-to-maturity | Level 2 | 21 | 22 | 26 | 28 | ||||||||||
Loans held-for-sale | Level 2 | 25,223 | 26,015 | 11,783 | 12,965 | ||||||||||
Loans receivable-net | Level 3 | 3,767,299 | 3,781,007 | 3,259,673 | 3,270,398 | ||||||||||
FHLB stock | N/A | 16,539 | N/A | 16,539 | N/A | ||||||||||
Accrued interest receivable | Level 2/3 | 9,226 | 9,226 | 8,792 | 8,792 | ||||||||||
Mortgage banking derivatives | Level 2 | 222 | 222 | — | — | ||||||||||
Due from customers on acceptances | Level 1 | 7,250 | 7,250 | 5,611 | 5,611 | ||||||||||
Liabilities: | |||||||||||||||
Non-interest-bearing deposits | Level 1 | $ | 1,088,436 | $ | 1,088,436 | $ | 915,413 | $ | 915,413 | ||||||
Interest-bearing deposits | Level 2 | 2,751,440 | 2,703,476 | 2,485,846 | 2,454,488 | ||||||||||
Junior subordinated debentures | Level 2 | 72,016 | 65,722 | 71,779 | 65,834 | ||||||||||
Short-term FHLB advances | Level 1 | 70,000 | 70,000 | 100,000 | 100,000 | ||||||||||
Long-term FHLB advances | Level 2 | 150,000 | 152,359 | 50,000 | 48,698 | ||||||||||
Accrued interest payable | Level 1/2 | 2,105 | 2,105 | 2,228 | 2,228 | ||||||||||
Mortgage banking derivatives | Level 2 | 16 | 16 | — | — | ||||||||||
Acceptances outstanding | Level 1 | 7,250 | 7,250 | 5,611 | 5,611 | ||||||||||
4. INVESTMENT SECURITIES
The following is a summary of the Company's investment securities at December 31, 2015 and 2014:
December 31, 2015 (Dollars in Thousands) | Amortized Cost | Gross Unrealized Gain | Gross Unrealized Loss | Fair Value | |||||||||
|---|---|---|---|---|---|---|---|---|---|---|---|---|---|
Available-for-sale: | |||||||||||||
Securities of government sponsored enterprises | $ | 73,828 | $ | 87 | $ | (80 | ) | $ | 73,835 | ||||
Mortgage-backed securities (residential) | 171,781 | 655 | (738 | ) | 171,698 | ||||||||
Collateralized mortgage obligations (residential) | 250,809 | 1,651 | (1,065 | ) | 251,395 | ||||||||
Corporate securities | 15,015 | 245 | — | 15,260 | |||||||||
Municipal bonds | 21,558 | 1,778 | — | 23,336 | |||||||||
| | | | | | | | | | | | | | |
Total | $ | 532,991 | $ | 4,416 | $ | (1,883 | ) | $ | 535,524 | ||||
| | | | | | | | | | | | | | |
| | | | | | | | | | | | | | |
| | | | | | | | | | | | | | |
F-31
WILSHIRE BANCORP, INC.
NOTES TO CONSOLIDATED FINANCIAL STATEMENTS (Continued)
4. INVESTMENT SECURITIES (Continued)
| | Amortized Cost | Gross Unrecognized Gain | Gross Unrecognized Loss | Fair Value | |||||||||
|---|---|---|---|---|---|---|---|---|---|---|---|---|---|
Held-to-Maturity: | |||||||||||||
Collateralized mortgage obligations (residential) | $ | 21 | $ | 1 | $ | — | $ | 22 | |||||
| | | | | | | | | | | | | | |
Total | $ | 21 | $ | 1 | $ | — | $ | 22 | |||||
| | | | | | | | | | | | | | |
| | | | | | | | | | | | | | |
| | | | | | | | | | | | | | |
December 31, 2014 (Dollars in Thousands) | Amortized Cost | Gross Unrealized Gain | Gross Unrealized Loss | Fair Value | |||||||||
|---|---|---|---|---|---|---|---|---|---|---|---|---|---|
Available-for-sale: | |||||||||||||
Securities of government sponsored enterprises | $ | 100,792 | $ | 60 | $ | (490 | ) | $ | 100,362 | ||||
Mortgage-backed securities (residential) | 82,454 | 1,060 | (147 | ) | 83,367 | ||||||||
Collateralized mortgage obligations (residential) | 161,584 | 2,152 | (657 | ) | 163,079 | ||||||||
Corporate securities | 14,994 | 520 | — | 15,514 | |||||||||
Municipal bonds | 23,966 | 2,079 | — | 26,045 | |||||||||
| | | | | | | | | | | | | | |
Total | $ | 383,790 | $ | 5,871 | $ | (1,294 | ) | $ | 388,367 | ||||
| | | | | | | | | | | | | | |
| | | | | | | | | | | | | | |
| | | | | | | | | | | | | | |
| | Amortized Cost | Gross Unrecognized Gain | Gross Unrecognized Loss | Fair Value | |||||||||
|---|---|---|---|---|---|---|---|---|---|---|---|---|---|
Held-to-Maturity: | |||||||||||||
Collateralized mortgage obligations (residential) | $ | 26 | $ | 2 | $ | — | $ | 28 | |||||
| | | | | | | | | | | | | | |
Total | $ | 26 | $ | 2 | $ | — | $ | 28 | |||||
| | | | | | | | | | | | | | |
| | | | | | | | | | | | | | |
| | | | | | | | | | | | | | |
Held-to-maturity securities, which are carried and reported at amortized cost, decreased from $26,000 at December 31, 2014, to $21,000 at December 31, 2015. The $5,000 reduction in 2015 was due to principal pay-downs received during the year. Available-for-sale securities, stated at fair value, increased to $535.5 million at December 31, 2015, from $388.4 million at December 31, 2014.
There were no investment securities sold during 2015 or 2014. During the twelve months ended December 31, 2013, we sold four investment securities, the net of which did not result in a gain or loss. There were no realized gains on the sale or call of securities in 2015 or 2014. Net realized gains from called investment securities totaled $19,000 for the year ended December 31, 2013. Investment securities transactions are accounted for using "trade date" accounting.
At year-end 2015 and 2014, there were no holdings of securities of any one issuer, other than the U.S. Government and its agencies, in an amount greater than 10% of shareholders' equity.
F-32
WILSHIRE BANCORP, INC.
NOTES TO CONSOLIDATED FINANCIAL STATEMENTS (Continued)
4. INVESTMENT SECURITIES (Continued)
The following tables summarize securities with unrealized losses aggregated by category and length of time that individual securities have been in a continuous unrealized loss position at December 31, 2015 and 2014:
| | Less than 12 months | 12 months or longer | Total | ||||||||||||||||
|---|---|---|---|---|---|---|---|---|---|---|---|---|---|---|---|---|---|---|---|
December 31, 2015 (Dollars in Thousands) | Fair Value | Gross Unrealized Losses | Fair Value | Gross Unrealized Losses | Fair Value | Gross Unrealized Losses | |||||||||||||
Available-for-sale: | |||||||||||||||||||
Securities of government sponsored enterprises | $ | 29,834 | $ | (80 | ) | $ | — | $ | — | $ | 29,834 | $ | (80 | ) | |||||
Mortgage-backed securities (residential) | 141,282 | (738 | ) | — | — | 141,282 | (738 | ) | |||||||||||
Collateralized mortgage obligations (residential) | 111,746 | (720 | ) | 12,371 | (345 | ) | 124,117 | (1,065 | ) | ||||||||||
| | | | | | | | | | | | | | | | | | | | |
Total | $ | 282,862 | $ | (1,538 | ) | $ | 12,371 | $ | (345 | ) | $ | 295,233 | $ | (1,883 | ) | ||||
| | | | | | | | | | | | | | | | | | | | |
| | | | | | | | | | | | | | | | | | | | |
| | | | | | | | | | | | | | | | | | | | |
| | Less than 12 months | 12 months or longer | Total | ||||||||||||||||
|---|---|---|---|---|---|---|---|---|---|---|---|---|---|---|---|---|---|---|---|
December 31, 2014 (Dollars in Thousands) | Fair Value | Gross Unrealized Losses | Fair Value | Gross Unrealized Losses | Fair Value | Gross Unrealized Losses | |||||||||||||
Available-for-sale: | |||||||||||||||||||
Securities of government sponsored enterprises | $ | 37,523 | $ | (477 | ) | $ | 6,988 | $ | (13 | ) | $ | 44,511 | $ | (490 | ) | ||||
Mortgage-backed securities (residential) | 34,911 | (147 | ) | — | — | 34,911 | (147 | ) | |||||||||||
Collateralized mortgage obligations (residential) | 22,813 | (588 | ) | 27,955 | (69 | ) | 50,768 | (657 | ) | ||||||||||
| | | | | | | | | | | | | | | | | | | | |
Total | $ | 95,247 | $ | (1,212 | ) | $ | 34,943 | $ | (82 | ) | $ | 130,190 | $ | (1,294 | ) | ||||
| | | | | | | | | | | | | | | | | | | | |
| | | | | | | | | | | | | | | | | | | | |
| | | | | | | | | | | | | | | | | | | | |
Credit related declines in the fair value of held-to-maturity and available-for-sale securities below their cost that are deemed to be other-than-temporary are reflected in earnings as realized losses in the Consolidated Statements of Income. Declines related to factors aside from credit issues are reflected in other comprehensive income, net of taxes. In estimating OTTI losses, the Company considers, among other things, (i) the length of time and the extent to which the fair value has been less than cost, (ii) the financial condition and near-term prospects of the issuer, and (iii) the Company's intent and ability to retain the investment in the issuer for a period of time sufficient to allow for any anticipated recovery in fair value.
The Company performs an evaluation of the investment portfolio in assessing individual positions that have fair values that have declined below cost. In assessing whether there is OTTI, the Company considers:
- •
- Whether or not all contractual cash flows due on a security will be collected
- •
- The Company's positive intent and ability to hold the debt security until recovery in fair value or maturity
F-33
WILSHIRE BANCORP, INC.
NOTES TO CONSOLIDATED FINANCIAL STATEMENTS (Continued)
4. INVESTMENT SECURITIES (Continued)
A number of other factors are considered in the analysis, including but not limited to:
- •
- Issuer's credit rating
- •
- Likelihood of the issuer's default or bankruptcy
- •
- Collateral underlying the security
- •
- Industry in which the issuer operates
- •
- Nature of the investment
- •
- Severity and duration of the decline in fair value
- •
- Analysis of the average life and effective maturity of the security
The Company does not believe that any individual unrealized loss as of December 31, 2015 and 2014 represent an OTTI. An OTTI is recognized if the fair value of a debt security is lower than the amortized cost and the debt security will be sold, it is more-likely-than-not, that it will be required to sell the security before recovering the amortized cost, or if it is expected that not all of the amortized cost will be recovered. Credit related declines in the fair value of debt securities below their amortized cost that are deemed to be other-than-temporary are reflected in earnings as realized losses in the Consolidated Statements of Income. Declines related to factors aside from credit issues are reflected in other comprehensive income, net of taxes.
The amortized cost and estimated fair value of total investment securities by their contractual maturities are shown below at December 31, 2015 and December 31, 2014:
| | December 31, 2015 | December 31, 2014 | |||||||||||
|---|---|---|---|---|---|---|---|---|---|---|---|---|---|
(Dollars in Thousands) | Amortized Cost | Fair Value | Amortized Cost | Fair Value | |||||||||
Available-for-sale: | |||||||||||||
Due in one year or less | $ | 7,898 | $ | 7,986 | $ | 1,915 | $ | 1,917 | |||||
Due after one year through five years | 23,007 | 23,238 | 38,241 | 38,799 | |||||||||
Due after five years through ten years | 76,065 | 77,200 | 86,874 | 87,008 | |||||||||
Due after ten years | 426,021 | 427,100 | 256,760 | 260,643 | |||||||||
| | | | | | | | | | | | | | |
Total | $ | 532,991 | 535,524 | $ | 383,790 | $ | 388,367 | ||||||
| | | | | | | | | | | | | | |
| | | | | | | | | | | | | | |
| | | | | | | | | | | | | | |
Held-to-maturity: | |||||||||||||
Due after ten years | $ | 21 | $ | 22 | $ | 26 | $ | 28 | |||||
| | | | | | | | | | | | | | |
Total | $ | 21 | $ | 22 | $ | 26 | $ | 28 | |||||
| | | | | | | | | | | | | | |
| | | | | | | | | | | | | | |
| | | | | | | | | | | | | | |
The actual maturities of our mortgage-backed securities and collateralized mortgage obligations can differ from their stated contractual maturities because the underlying borrowers have the right to prepay on their obligations. The yields on the carrying value of these securities may also be affected by
F-34
WILSHIRE BANCORP, INC.
NOTES TO CONSOLIDATED FINANCIAL STATEMENTS (Continued)
4. INVESTMENT SECURITIES (Continued)
prepayments and changes in interest rates. The contractual maturities of our mortgage-backed securities and collateralized mortgage obligations at December 31, 2015 are presented in the table below:
| | Mortgage-Backed Securities | Collateralized Mortgage Obligations | |||||||||||
|---|---|---|---|---|---|---|---|---|---|---|---|---|---|
December 31, 2015 (Dollars in Thousands) | Amortized Cost | Fair Value | Amortized Cost | Fair Value | |||||||||
Available-for-sale: | |||||||||||||
Due in one year or less | $ | 1 | $ | 1 | $ | — | $ | — | |||||
Due after one year through five years | 44 | 46 | — | — | |||||||||
Due after five years through ten years | 1,614 | 1,687 | 7,535 | 7,818 | |||||||||
Due after ten years | 170,122 | 169,964 | 243,274 | 243,577 | |||||||||
| | | | | | | | | | | | | | |
Total | $ | 171,781 | $ | 171,698 | $ | 250,809 | $ | 251,395 | |||||
| | | | | | | | | | | | | | |
| | | | | | | | | | | | | | |
| | | | | | | | | | | | | | |
Held-to-maturity: | |||||||||||||
Due after ten years | $ | — | $ | — | $ | 21 | $ | 22 | |||||
| | | | | | | | | | | | | | |
Total | $ | — | $ | — | $ | 21 | $ | 22 | |||||
| | | | | | | | | | | | | | |
| | | | | | | | | | | | | | |
| | | | | | | | | | | | | | |
Securities with fair values of approximately $425.1 million and $373.5 million, were pledged to secure public deposits and for other purposes as required or permitted by law at December 31, 2015 and 2014, respectively. Of the $425.1 million in investments that were pledged at December 31, 2015, $353.9 million were pledged to secure deposits. In addition to securing deposits, $48.2 million in investments were pledged at the FHLB of San Francisco, $13.1 million were pledged at the Federal Reserve Bank Discount Window, $9.5 million were pledged against secured borrowing lines available at our correspondent banks, and $376,000 were pledged at the New Jersey Department of Banking and Insurance.
5. LOANS RECEIVABLE, LOANS HELD-FOR-SALE, AND ALLOWANCE FOR LOAN LOSSES
The following note disclosure breaks out the Company's loan portfolio in segments and classes. Segments are groupings of similar loans at a level which the Company has adopted systematic methods of documentation for determining its allowance for losses on loans and loan commitments. Classes are a disaggregation of the portfolio segments. The Company's loan portfolio segments are:
Construction loans—The Company originates loans to finance construction projects including one to four family residences, multifamily residences, senior housing, and industrial projects. Residential construction loans are due upon the sale of the completed project and are generally collateralized by first liens on the real estate and have floating interest rates. Construction loans are considered to have higher risks than other loans due to the ultimate repayment being sensitive to interest rate changes, governmental regulation of real property, and the availability of long-term financing. Economic conditions may also impact the Company's ability to recover its investment in construction loans. Adverse economic conditions may negatively impact the real estate market which could affect the borrowers' ability to complete and sell the project. Additionally, the fair value of the underlying collateral may fluctuate as market conditions change. As construction loans make up only a small percentage of the total loan portfolio, these loans are not further broken down into classes.
Real estate secured loans—We offer real estate secured loans to finance the acquisition of, or to refinance the existing mortgages on commercial and residential properties. Real estate secured loans are
F-35
WILSHIRE BANCORP, INC.
NOTES TO CONSOLIDATED FINANCIAL STATEMENTS (Continued)
5. LOANS RECEIVABLE, LOANS HELD-FOR-SALE, AND ALLOWANCE FOR LOAN LOSSES (Continued)
further broken out into classes based on the type of loan and underlying collateral. These classes include SBA loans secured by real estate, residential real estate loans, gas station loans, carwash loans, hotel/motel loans, land loans, and loans secured by all other types of properties.
Our commercial real estate loans are typically collateralized by first or junior deeds of trust on specific commercial properties, and, when possible, subject to corporate or individual guarantees from financially capable parties. The properties collateralizing real estate loans are principally located in the markets where our retail branches are located. Real estate loans typically bear an interest rate that floats with our base rate, the prime rate, or another established index. However, an increasing amount of new real estate secured loan originations bear fixed rather than floating interest rates due to the current competitive market environment and trends. Commercial real estate loans typically have 7-year maturities with up to 25-year amortization of principal and interest and loan-to-value ratios of 60-70% of the appraised value or purchase price, whichever is lower at origination. We usually impose a prepayment penalty on real estate secured loans, usually a period within three to five years of the date of the loan.
We originate mortgage loans secured by a first deed of trust on single family residences under variety of loan products including fixed rate and adjustable rate mortgages with either 30 year or 15 year terms. Adjustable rate mortgage loans are offered with flexible initial and periodic adjustments ranging from five to seven years.
Commercial and industrial loans—We offer commercial and industrial loans to various business enterprises. These loans include business lines of credit and business term loans to finance operations, to provide working capital, or for specific purposes, such as to finance the purchase of assets, equipment, or inventory. Since a borrower's cash flow from operations is generally the primary source of repayment, our policies provide specific guidelines regarding required debt coverage and other important financial ratios.
Lines of credit are extended to businesses or individuals based on the financial strength and integrity of the borrower. These lines of credit are secured primarily by business assets such as accounts receivable or inventory, and have a maturity of one year or less. Such lines of credit bear an interest rate that floats with our base rate, the prime rate, or another established index.
We also provide warehouse lines of credit to mortgage loan originators. The lines of credit are used by these originators to fund mortgages which are then pledged to the Bank as collateral until the mortgage loans are sold and the lines of credit are paid down. The typical duration of these lines of credit from the time of funding to pay-down ranges from 10-30 days. Although collateralized by mortgage loans, the structure of warehouse lending agreements results in the commercial and industrial loan treatment for these types of loans.
Business term loans are typically made to finance the acquisition of fixed assets, refinance short-term debts, or to finance the purchase of businesses. Business term loans generally have terms from one to seven years. They may be collateralized by the assets being acquired or other available assets and bear interest rates which either floats with our base rate, prime rate, another established index, or is fixed for the term of the loan.
Commercial and industrial loans are broken down further into two different classes, SBA loans and other commercial and industrial loans.
F-36
WILSHIRE BANCORP, INC.
NOTES TO CONSOLIDATED FINANCIAL STATEMENTS (Continued)
5. LOANS RECEIVABLE, LOANS HELD-FOR-SALE, AND ALLOWANCE FOR LOAN LOSSES (Continued)
Consumer loans—The Company provides a broad range of consumer loans to customers, including personal lines of credit, cash secured loans, and automobile loans. Repayment of these loans is dependent on the borrowers' ability to pay and the fair value of any underlying collateral.
The following is a summary of the loan portfolio by loan type for the dates indicated:
| | December 31, 2015 | December 31, 2014 | |||||||||||
|---|---|---|---|---|---|---|---|---|---|---|---|---|---|
(Dollars in Thousands) | Loans Held-For-Sale | Loans Receivable | Loans Held for Sale | Loans Receivable | |||||||||
Construction loans | $ | — | $ | 21,025 | $ | — | $ | 22,635 | |||||
Real estate secured loans | 23,440 | 3,000,181 | 10,855 | 2,662,129 | |||||||||
Commercial and industrial loans | 1,783 | 793,989 | 928 | 612,394 | |||||||||
Consumer loans | — | 15,132 | — | 21,069 | |||||||||
| | | | | | | | | | | | | | |
Gross Loans | 25,223 | 3,830,327 | 11,783 | 3,318,227 | |||||||||
Allowance for loan losses | — | (52,405 | ) | — | (48,624 | ) | |||||||
Deferred loan fees & unearned income | — | (10,623 | ) | — | (9,930 | ) | |||||||
| | | | | | | | | | | | | | |
Net loans | $ | 25,223 | $ | 3,767,299 | $ | 11,783 | $ | 3,259,673 | |||||
| | | | | | | | | | | | | | |
| | | | | | | | | | | | | | |
| | | | | | | | | | | | | | |
Total gross real estate secured loans and commercial and industrial loans (before allowance for loan losses and deferred loan fee and unearned income) are further broken down by class as follows:
| | December 31, 2015 | December 31, 2014 | |||||||||||
|---|---|---|---|---|---|---|---|---|---|---|---|---|---|
(Dollars in Thousands) | Loans Held-For-Sale | Loans Receivable | Loans Held-For-Sale | Loans Receivable | |||||||||
Real Estate Secured Loans: | |||||||||||||
Residential real estate | $ | 19,686 | $ | 269,117 | $ | 661 | $ | 161,316 | |||||
SBA real estate | 3,754 | 166,269 | 10,194 | 170,907 | |||||||||
Gas station | — | 177,191 | — | 141,712 | |||||||||
Carwash | — | 51,475 | — | 56,357 | |||||||||
Hotel/Motel | — | 309,247 | — | 203,550 | |||||||||
Land | — | 18,513 | — | 24,601 | |||||||||
Other | — | 2,008,369 | — | 1,903,686 | |||||||||
| | | | | | | | | | | | | | |
Total real estate secured | $ | 23,440 | $ | 3,000,181 | $ | 10,855 | $ | 2,662,129 | |||||
| | | | | | | | | | | | | | |
| | | | | | | | | | | | | | |
| | | | | | | | | | | | | | |
| | December 31, 2015 | December 31, 2014 | |||||||||||
|---|---|---|---|---|---|---|---|---|---|---|---|---|---|
(Dollars in Thousands) | Loans Held-For-Sale | Loans Receivable | Loans Held-For-Sale | Loans Receivable | |||||||||
Commercial & Industrial Loans: | |||||||||||||
SBA commercial | $ | 1,783 | $ | 39,639 | $ | 928 | $ | 41,936 | |||||
Other commercial | — | 754,350 | — | 570,458 | |||||||||
| | | | | | | | | | | | | | |
Total commercial & industrial | $ | 1,783 | $ | 793,989 | $ | 928 | $ | 612,394 | |||||
| | | | | | | | | | | | | | |
| | | | | | | | | | | | | | |
| | | | | | | | | | | | | | |
F-37
WILSHIRE BANCORP, INC.
NOTES TO CONSOLIDATED FINANCIAL STATEMENTS (Continued)
5. LOANS RECEIVABLE, LOANS HELD-FOR-SALE, AND ALLOWANCE FOR LOAN LOSSES (Continued)
At December 31, 2015 and 2014, the Company serviced loans sold to unaffiliated parties in the amounts of $775.9 million and $727.9 million, respectively.
The following table shows the carrying amount of loans acquired through acquisitions and legacy loans for the dates indicated:
| | At December 31, 2015 | |||||||||||||||
|---|---|---|---|---|---|---|---|---|---|---|---|---|---|---|---|---|
| | Loans Acquired From Former: | | | |||||||||||||
| | Legacy Wilshire Loans | | ||||||||||||||
(Dollars in Thousands) | Mirae Bank | BankAsiana | Saehan | Total | ||||||||||||
Construction loans | $ | — | $ | — | $ | — | $ | 21,025 | $ | 21,025 | ||||||
Real estate secured loans | 24,097 | 81,698 | 242,868 | 2,674,958 | 3,023,621 | |||||||||||
Commercial and industrial loans | 778 | 12,042 | 11,000 | 771,952 | 795,772 | |||||||||||
Consumer loans | — | — | 244 | 14,888 | 15,132 | |||||||||||
| | | | | | | | | | | | | | | | | |
Gross loans | 24,875 | 93,740 | 254,112 | 3,482,823 | 3,855,550 | |||||||||||
Deferred loan fees and unearned Income | — | — | — | (10,623 | ) | (10,623 | ) | |||||||||
| | | | | | | | | | | | | | | | | |
Total loans | 24,875 | 93,740 | 254,112 | 3,472,200 | 3,844,927 | |||||||||||
Allowance for loan losses | (1,179 | ) | (332 | ) | (385 | ) | (50,509 | ) | (52,405 | ) | ||||||
| | | | | | | | | | | | | | | | | |
Net loans | $ | 23,696 | $ | 93,408 | $ | 253,727 | $ | 3,421,691 | $ | 3,792,522 | ||||||
| | | | | | | | | | | | | | | | | |
| | | | | | | | | | | | | | | | | |
| | | | | | | | | | | | | | | | | |
Held-for-sale loans included above | $ | — | $ | — | $ | — | $ | 25,223 | $ | 25,223 | ||||||
| | | | | | | | | | | | | | | | | |
| | | | | | | | | | | | | | | | | |
| | | | | | | | | | | | | | | | | |
| | At December 31, 2014 | |||||||||||||||
|---|---|---|---|---|---|---|---|---|---|---|---|---|---|---|---|---|
| | Loans Acquired From Former: | | | |||||||||||||
| | Legacy Wilshire Loans | | ||||||||||||||
(Dollars in Thousands) | Mirae Bank | BankAsiana | Saehan | Total | ||||||||||||
Construction loans | $ | — | $ | 3,947 | $ | — | $ | 18,688 | $ | 22,635 | ||||||
Real estate secured loans | 38,546 | 101,100 | 303,699 | 2,229,639 | 2,672,984 | |||||||||||
Commercial and industrial loans | 2,607 | 20,749 | 18,672 | 571,294 | 613,322 | |||||||||||
Consumer loans | — | — | 646 | 20,423 | 21,069 | |||||||||||
| | | | | | | | | | | | | | | | | |
Gross loans | 41,153 | 125,796 | 323,017 | 2,840,044 | 3,330,010 | |||||||||||
Deferred loan fees and unearned income | — | — | — | (9,930 | ) | (9,930 | ) | |||||||||
| | | | | | | | | | | | | | | | | |
Total loans | 41,153 | 125,796 | 323,017 | 2,830,114 | 3,320,080 | |||||||||||
Allowance for loan losses | (416 | ) | (769 | ) | (1,281 | ) | (46,158 | ) | (48,624 | ) | ||||||
| | | | | | | | | | | | | | | | | |
Net loans | $ | 40,737 | $ | 125,027 | $ | 321,736 | $ | 2,783,956 | $ | 3,271,456 | ||||||
| | | | | | | | | | | | | | | | | |
| | | | | | | | | | | | | | | | | |
| | | | | | | | | | | | | | | | | |
Held-for-sale loans included above | $ | — | $ | — | $ | — | $ | 11,783 | $ | 11,783 | ||||||
| | | | | | | | | | | | | | | | | |
| | | | | | | | | | | | | | | | | |
| | | | | | | | | | | | | | | | | |
In accordance with ASC 310-30, acquired loans were divided into "ASC 310-30" and "Non-ASC 310-30", of which ASC 310-30 loans are loans with evidence of deterioration of credit quality, and that it was probable at the time of acquisition, that the Company would be unable to collect all contractually required payments receivable. In contrast, non-ASC 310-30 loans are all other acquired loans that do not qualify as ASC 310-30 loans. The Company acquired loans with evidence of deterioration of
F-38
WILSHIRE BANCORP, INC.
NOTES TO CONSOLIDATED FINANCIAL STATEMENTS (Continued)
5. LOANS RECEIVABLE, LOANS HELD-FOR-SALE, AND ALLOWANCE FOR LOAN LOSSES (Continued)
credit quality through the acquisitions of Mirae Bank in 2009 and BankAsiana and Saehan in 2013. The outstanding balance of acquired loans broken down by ASC 310-30 and Non-ASC 310-30 loans is presented in the following table for the periods indicated:
(Dollars in Thousands) | December 31, 2015 | December 31, 2014 | December 31, 2013 | |||||||
|---|---|---|---|---|---|---|---|---|---|---|
Non-ASC 310-30 loans | $ | 372,040 | $ | 488,625 | $ | 616,500 | ||||
ASC 310-30 loans | 687 | 1,341 | 2,686 | |||||||
| | | | | | | | | | | |
Total acquired loan balance | $ | 372,727 | $ | 489,966 | $ | 619,186 | ||||
| | | | | | | | | | | |
| | | | | | | | | | | |
| | | | | | | | | | | |
The loan portfolios acquired from former Mirae Bank, BankAsiana, and Saehan were all acquired at a discount. The discounts recorded at the time of acquisitions for former Mirae Bank, BankAsiana, and Saehan totaled $54.9 million, $9.2 million, and $27.7 million, respectively. Discount accretion recognized as interest income on acquired loans for the years ended December 31, 2015, 2014, and 2013, totaled $8.0 million, $11.2 million, and $2.5 million, respectively. Changes to the discount on acquired loans for the periods indicated is presented in the table below:
(Dollars in Thousands) | December 31, 2015 | December 31, 2014 | December 31, 2013 | |||||||
|---|---|---|---|---|---|---|---|---|---|---|
Balance at beginning of period | $ | 22,056 | $ | 34,201 | $ | 3,448 | ||||
Discount on loans acquired from Saehan | — | — | 27,733 | |||||||
Discount on loans acquired from BankAsiana | — | — | 9,168 | |||||||
Discount accretion income recognized | (7,958 | ) | (11,214 | ) | (2,463 | ) | ||||
Disposals related to charge-offs | (195 | ) | (931 | ) | (3,685 | ) | ||||
Disposals related to loan sales | — | — | — | |||||||
| | | | | | | | | | | |
Balance at end of period | $ | 13,903 | $ | 22,056 | $ | 34,201 | ||||
| | | | | | | | | | | |
| | | | | | | | | | | |
| | | | | | | | | | | |
The following table is a breakdown of changes to the accretable portion of the discount on acquired loans for periods indicated:
(Dollars in Thousands) | December 31, 2015 | December 31, 2014 | December 31, 2013 | |||||||
|---|---|---|---|---|---|---|---|---|---|---|
Balance at beginning of period | $ | 20,400 | $ | 31,450 | $ | 3,275 | ||||
Accretable portion of discount on loans acquired from Saehan | — | — | 24,304 | |||||||
Accretable portion of discount on loans acquired from BankAsiana | — | — | 7,214 | |||||||
Discount accretion income recognized | (7,502 | ) | (10,546 | ) | (2,463 | ) | ||||
Disposals related to charge-offs | (40 | ) | (504 | ) | (880 | ) | ||||
| | | | | | | | | | | |
Balance at end of period | $ | 12,858 | $ | 20,400 | $ | 31,450 | ||||
| | | | | | | | | | | |
| | | | | | | | | | | |
| | | | | | | | | | | |
The Company evaluates credit risks associated with the commitments to extend credit and letters of credit at the same time it evaluates credit risk associated with the rest of the loan portfolio. However, the
F-39
WILSHIRE BANCORP, INC.
NOTES TO CONSOLIDATED FINANCIAL STATEMENTS (Continued)
5. LOANS RECEIVABLE, LOANS HELD-FOR-SALE, AND ALLOWANCE FOR LOAN LOSSES (Continued)
allowances necessary for the commitments are reported separately in other liabilities in the accompanying Statements of Financial Condition and are not part of the allowance for loan losses.
The activity in the allowance for unfunded loan commitments was as follows for the years ended:
(Dollars in Thousands) | 2015 | 2014 | 2013 | |||||||
|---|---|---|---|---|---|---|---|---|---|---|
Balance—beginning of year | $ | 1,061 | $ | 1,061 | $ | 1,061 | ||||
Provision for losses on unfunded loan commitments | 200 | — | — | |||||||
| | | | | | | | | | | |
Balance—end of year | $ | 1,261 | $ | 1,061 | $ | 1,061 | ||||
| | | | | | | | | | | |
| | | | | | | | | | | |
| | | | | | | | | | | |
The following tables represent the roll-forward of the allowance for loan losses at December 31, 2015, 2014, and 2013 by loan type:
| | December 31, 2015 | |||||||||||||||
|---|---|---|---|---|---|---|---|---|---|---|---|---|---|---|---|---|
(Dollars in Thousands) | Construction Loans | Real Estate Secured Loans | Commercial & Industrial Loans | Consumer Loans | Total | |||||||||||
Balance at beginning of year | $ | 220 | $ | 31,889 | $ | 16,302 | $ | 213 | $ | 48,624 | ||||||
Total charge-offs | — | (1,192 | ) | (3,971 | ) | — | (5,163 | ) | ||||||||
Total recoveries | — | 6,272 | 2,162 | 10 | 8,444 | |||||||||||
(Credit) provision for loan losses | (1 | ) | (3,139 | ) | 3,722 | (82 | ) | 500 | ||||||||
| | | | | | | | | | | | | | | | | |
Balance at end of year | $ | 219 | $ | 33,830 | $ | 18,215 | $ | 141 | $ | 52,405 | ||||||
| | | | | | | | | | | | | | | | | |
| | | | | | | | | | | | | | | | | |
| | | | | | | | | | | | | | | | | |
| | December 31, 2014 | |||||||||||||||
|---|---|---|---|---|---|---|---|---|---|---|---|---|---|---|---|---|
(Dollars in Thousands) | Construction Loans | Real Estate Secured Loans | Commercial & Industrial Loans | Consumer Loans | Total | |||||||||||
Balance at beginning of year | $ | 814 | $ | 41,401 | $ | 11,238 | $ | 110 | $ | 53,563 | ||||||
Total charge-offs | — | (8,076 | ) | (3,451 | ) | (1 | ) | (11,528 | ) | |||||||
Total recoveries | — | 3,501 | 3,072 | 16 | 6,589 | |||||||||||
(Credit) provision for loan losses | (594 | ) | (4,937 | ) | 5,443 | 88 | — | |||||||||
| | | | | | | | | | | | | | | | | |
Balance at end of year | $ | 220 | $ | 31,889 | $ | 16,302 | $ | 213 | $ | 48,624 | ||||||
| | | | | | | | | | | | | | | | | |
| | | | | | | | | | | | | | | | | |
| | | | | | | | | | | | | | | | | |
| | December 31, 2013 | |||||||||||||||
|---|---|---|---|---|---|---|---|---|---|---|---|---|---|---|---|---|
(Dollars in Thousands) | Construction Loans | Real Estate Secured Loans | Commercial & Industrial Loans | Consumer Loans | Total | |||||||||||
Balance at beginning of year | $ | 453 | $ | 49,956 | $ | 12,737 | $ | 139 | $ | 63,285 | ||||||
Total charge-offs | — | (11,063 | ) | (3,690 | ) | (3 | ) | (14,756 | ) | |||||||
Total recoveries | — | 2,741 | 2,280 | 13 | 5,034 | |||||||||||
Provision (credit) for loan losses | 361 | (233 | ) | (89 | ) | (39 | ) | — | ||||||||
| | | | | | | | | | | | | | | | | |
Balance at end of year | $ | 814 | $ | 41,401 | $ | 11,238 | $ | 110 | $ | 53,563 | ||||||
| | | | | | | | | | | | | | | | | |
| | | | | | | | | | | | | | | | | |
| | | | | | | | | | | | | | | | | |
F-40
WILSHIRE BANCORP, INC.
NOTES TO CONSOLIDATED FINANCIAL STATEMENTS (Continued)
5. LOANS RECEIVABLE, LOANS HELD-FOR-SALE, AND ALLOWANCE FOR LOAN LOSSES (Continued)
The tables below represent the breakdown of the allowance for loan losses by specific valuation allowance and general valuation allowance by loan segment (excluding loans held-for-sale) for each of the three years ended December 31, 2015, 2014, and 2013:
| | December 31, 2015 | |||||||||||||||
|---|---|---|---|---|---|---|---|---|---|---|---|---|---|---|---|---|
(Dollars in Thousands) | Construction Loans | Real Estate Secured Loans | Commercial & Industrial Loans | Consumer Loans | Gross Loans Receivable | |||||||||||
Impaired loans | $ | — | $ | 36,572 | $ | 19,303 | $ | — | $ | 55,875 | ||||||
Specific valuation allowance | $ | — | $ | 1,574 | $ | 7,547 | $ | — | $ | 9,121 | ||||||
Coverage ratio | 0.00 | % | 4.30 | % | 39.10 | % | 0.00 | % | 16.32 | % | ||||||
Non-impaired loans | $ | 21,025 | $ | 2,963,609 | $ | 774,686 | $ | 15,132 | $ | 3,774,452 | ||||||
General valuation allowance | $ | 219 | $ | 32,256 | $ | 10,668 | $ | 141 | $ | 43,284 | ||||||
Coverage ratio | 1.04 | % | 1.09 | % | 1.38 | % | 0.93 | % | 1.15 | % | ||||||
Gross loans receivable | $ | 21,025 | $ | 3,000,181 | $ | 793,989 | $ | 15,132 | $ | 3,830,327 | ||||||
Allowance for loan losses | $ | 219 | $ | 33,830 | $ | 18,215 | $ | 141 | $ | 52,405 | ||||||
Allowance coverage ratio | 1.04 | % | 1.13 | % | 2.29 | % | 0.93 | % | 1.37 | % | ||||||
| | December 31, 2014 | |||||||||||||||
|---|---|---|---|---|---|---|---|---|---|---|---|---|---|---|---|---|
(Dollars in Thousands) | Construction Loans | Real Estate Secured Loans | Commercial & Industrial Loans | Consumer Loans | Gross Loans Receivable | |||||||||||
Impaired loans | $ | — | $ | 52,510 | $ | 17,371 | $ | — | $ | 69,881 | ||||||
Specific valuation allowance | $ | — | $ | 1,886 | $ | 7,123 | $ | — | $ | 9,009 | ||||||
Coverage ratio | 0.00 | % | 3.59 | % | 41.01 | % | 0.00 | % | 12.89 | % | ||||||
Non-impaired loans | $ | 22,635 | $ | 2,609,619 | $ | 595,023 | $ | 21,069 | $ | 3,248,346 | ||||||
General valuation allowance | $ | 220 | $ | 30,003 | $ | 9,179 | $ | 213 | $ | 39,615 | ||||||
Coverage ratio | 0.97 | % | 1.15 | % | 1.54 | % | 1.01 | % | 1.22 | % | ||||||
Gross loans receivable | $ | 22,635 | $ | 2,662,129 | $ | 612,394 | $ | 21,069 | $ | 3,318,227 | ||||||
Allowance for loan losses | $ | 220 | $ | 31,889 | $ | 16,302 | $ | 213 | $ | 48,624 | ||||||
Allowance coverage ratio | 0.97 | % | 1.20 | % | 2.66 | % | 1.01 | % | 1.47 | % | ||||||
| | December 31, 2013 | |||||||||||||||
|---|---|---|---|---|---|---|---|---|---|---|---|---|---|---|---|---|
(Dollars in Thousands) | Construction Loans | Real Estate Secured Loans | Commercial & Industrial Loans | Consumer Loans | Total | |||||||||||
Impaired loans | $ | 2,471 | $ | 63,363 | $ | 6,980 | $ | — | $ | 72,814 | ||||||
Specific valuation allowance | $ | — | $ | 1,857 | $ | 1,958 | $ | — | $ | 3,815 | ||||||
Coverage ratio | 0.00 | % | 2.93 | % | 28.05 | % | 0.00 | % | 5.24 | % | ||||||
Non-impaired loans | $ | 37,896 | $ | 2,268,758 | $ | 430,544 | $ | 14,694 | $ | 2,751,892 | ||||||
General valuation allowance | $ | 814 | $ | 39,544 | $ | 9,280 | $ | 110 | $ | 49,748 | ||||||
Coverage ratio | 2.15 | % | 1.74 | % | 2.16 | % | 0.75 | % | 1.81 | % | ||||||
Gross loans receivable | $ | 40,367 | $ | 2,332,121 | $ | 437,524 | $ | 14,694 | $ | 2,824,706 | ||||||
Allowance for loan losses | $ | 814 | $ | 41,401 | $ | 11,238 | $ | 110 | $ | 53,563 | ||||||
Allowance coverage ratio | 2.02 | % | 1.78 | % | 2.57 | % | 0.75 | % | 1.90 | % | ||||||
F-41
WILSHIRE BANCORP, INC.
NOTES TO CONSOLIDATED FINANCIAL STATEMENTS (Continued)
5. LOANS RECEIVABLE, LOANS HELD-FOR-SALE, AND ALLOWANCE FOR LOAN LOSSES (Continued)
At December 31, 2015 and December 31, 2014, ASC 310-30 loans totaled $687,000 and $1.3 million, respectively. These loans had an allowance for loan losses of $3,000 at December 31, 2015 and $253,000 at December 31, 2014. The following is a breakdown of loan balances for loans acquired with deteriorated credit quality at December 31, 2015 and December 31, 2014:
| | December 31, 2015 | |||||||||||||||
|---|---|---|---|---|---|---|---|---|---|---|---|---|---|---|---|---|
(Dollars in Thousands) | Construction Loans | Real Estate Secured Loans | Commercial & Industrial Loans | Consumer Loans | Total | |||||||||||
Balance of Loans Acquired With Deteriorated Credit Quality | $ | $ | 666 | $ | 21 | $ | — | $ | 687 | |||||||
| | | | | | | | | | | | | | | | | |
| | | | | | | | | | | | | | | | | |
| | | | | | | | | | | | | | | | | |
Total Allowance for Loans Acquired With Deteriorated Credit Quality | $ | — | $ | — | $ | 3 | $ | — | $ | 3 | ||||||
| | | | | | | | | | | | | | | | | |
| | | | | | | | | | | | | | | | | |
| | | | | | | | | | | | | | | | | |
| | December 31, 2014 | |||||||||||||||
|---|---|---|---|---|---|---|---|---|---|---|---|---|---|---|---|---|
(Dollars in Thousands) | Construction Loans | Real Estate Secured Loans | Commercial & Industrial Loans | Consumer Loans | Total | |||||||||||
Balance of Loans Acquired With Deteriorated Credit Quality | $ | — | $ | 1,266 | $ | 75 | $ | — | $ | 1,341 | ||||||
| | | | | | | | | | | | | | | | | |
| | | | | | | | | | | | | | | | | |
| | | | | | | | | | | | | | | | | |
Total Allowance for Loans Acquired With Deteriorated Credit Quality | $ | — | $ | 220 | $ | 33 | $ | — | $ | 253 | ||||||
| | | | | | | | | | | | | | | | | |
| | | | | | | | | | | | | | | | | |
| | | | | | | | | | | | | | | | | |
The table below is a summary of impaired loans at their recorded investment (or net principal balance), with and without specific reserves, as of December 31, 2015 and 2014. The recorded investment in loans excludes adjustments for accrued interest receivable and net deferred fees as these are not deemed significant to the presentation.
| | Balance For Year Ended | ||||||
|---|---|---|---|---|---|---|---|
(Dollars in Thousands) | December 31, 2015 | December 31, 2014 | |||||
With Specific Reserves | |||||||
Without Charge-Offs | $ | 20,434 | $ | 21,597 | |||
With Charge-Offs | 960 | 295 | |||||
Without Specific Reserves | |||||||
Without Charge-Offs | 27,379 | 31,335 | |||||
With Charge-Offs | 7,102 | 16,654 | |||||
| | | | | | | | |
Total Impaired Loans | 55,875 | 69,881 | |||||
Allowance on Impaired Loans | (9,121 | ) | (9,009 | ) | |||
| | | | | | | | |
Impaired Loans Net of Allowance* | $ | 46,754 | $ | 60,872 | |||
| | | | | | | | |
| | | | | | | | |
| | | | | | | | |
- *
- Balances net of SBA guaranteed portions totaled $52.0 million and $65.6 million at December 31, 2015 and December 31, 2014, respectively.
F-42
WILSHIRE BANCORP, INC.
NOTES TO CONSOLIDATED FINANCIAL STATEMENTS (Continued)
5. LOANS RECEIVABLE, LOANS HELD-FOR-SALE, AND ALLOWANCE FOR LOAN LOSSES (Continued)
The cash basis income recognized from impaired loans for the years ended December 31, 2015, 2014, and 2013 were $1.6 million, $2.9 million, and $1.2 million, respectively.
The recorded investment of impaired loans with specific reserves and those without specific reserves as of December 31, 2015 and 2014 is presented in the following table by loan class:
| | December 31, 2015 | December 31, 2014 | |||||||||||||||||
|---|---|---|---|---|---|---|---|---|---|---|---|---|---|---|---|---|---|---|---|
(Dollars In Thousands) | Balance | Related Allowance | Average Balance | Balance | Related Allowance | Average Balance | |||||||||||||
With Specific Reserves | |||||||||||||||||||
Construction | $ | — | $ | — | $ | — | $ | — | $ | — | $ | — | |||||||
Real Estate Secured: | |||||||||||||||||||
Residential Real Estate | — | — | — | 272 | 6 | 379 | |||||||||||||
SBA Real Estate | 2,601 | 808 | 3,359 | 1,145 | 310 | 1,220 | |||||||||||||
Gas Station | 2,102 | 417 | 2,224 | 640 | 65 | 650 | |||||||||||||
Carwash | — | — | — | — | — | — | |||||||||||||
Hotel/Motel | — | — | — | 2,104 | 469 | 2,068 | |||||||||||||
Land | — | — | — | — | — | — | |||||||||||||
Other | 2,311 | 349 | 2,362 | 5,950 | 1,036 | 6,051 | |||||||||||||
Commercial & Industrial: | |||||||||||||||||||
SBA Commercial | 1,098 | 733 | 1,770 | 941 | 725 | 1,041 | |||||||||||||
Commercial | 13,282 | 6,814 | 14,124 | 10,840 | 6,398 | 14,016 | |||||||||||||
| | | | | | | | | | | | | | | | | | | | |
Total With Related Allowance | 21,394 | 9,121 | 23,839 | 21,892 | 9,009 | 25,425 | |||||||||||||
Without Specific Reserves | |||||||||||||||||||
Construction | — | — | — | — | — | — | |||||||||||||
Real Estate Secured: | |||||||||||||||||||
Residential Real Estate | 320 | — | 379 | 561 | — | 580 | |||||||||||||
SBA Real Estate | 6,157 | — | 9,465 | 7,781 | — | 6,336 | |||||||||||||
Gas Station | 1,235 | — | 1,251 | 4,765 | — | 5,086 | |||||||||||||
Carwash | 3,702 | — | 3,852 | 5,626 | — | 6,128 | |||||||||||||
Hotel/Motel | 3,510 | — | 3,775 | 3,629 | — | 3,873 | |||||||||||||
Land | — | — | — | 258 | — | 262 | |||||||||||||
Other | 14,634 | — | 16,810 | 19,779 | — | 22,551 | |||||||||||||
Commercial & Industrial: | |||||||||||||||||||
SBA Commercial | 298 | — | 433 | 446 | — | 516 | |||||||||||||
Commercial | 4,625 | — | 6,877 | 5,144 | — | 5,720 | |||||||||||||
| | | | | | | | | | | | | | | | | | | | |
Total Without Related Allowance | 34,481 | — | 42,842 | 47,989 | — | 51,052 | |||||||||||||
| | | | | | | | | | | | | | | | | | | | |
Total Impaired Loans | $ | 55,875 | $ | 9,121 | $ | 66,681 | $ | 69,881 | $ | 9,009 | $ | 76,477 | |||||||
| | | | | | | | | | | | | | | | | | | | |
| | | | | | | | | | | | | | | | | | | | |
| | | | | | | | | | | | | | | | | | | | |
At December 31, 2015, ASC 310-30 loans acquired from Mirae Bank totaled $358,000, ASC 310-30 loans acquired from BankAsiana totaled $21,000, and ASC 310-30 loans acquired from Saehan totaled $308,000. At December 31, 2015, specific reserves for ASC 310-30 loans totaled $3,000, all which was related to loans acquired from former Saehan. At December 31, 2014, ASC 310-30 loans acquired from
F-43
WILSHIRE BANCORP, INC.
NOTES TO CONSOLIDATED FINANCIAL STATEMENTS (Continued)
5. LOANS RECEIVABLE, LOANS HELD-FOR-SALE, AND ALLOWANCE FOR LOAN LOSSES (Continued)
Mirae Bank totaled $442,000, ASC 310-30 loans acquired from BankAsiana totaled $406,000, and ASC 310-30 loans acquired from Saehan totaled $493,000. At December 31, 2014, ASC 310-30 loans had a specific reserves of $253,000 consisting of $241,000 for former BankAsiana ASC 310-30 loans and $12,000 related to Saehan ASC 310-30 loans.
A restructuring of a debt constitutes a TDR if the Company for economic or legal reasons related to the borrower's financial difficulties, grants a concession to the borrower that it would not otherwise consider. Restructured loans typically present an elevated level of credit risk as the borrowers are not able to perform according to the original contractual terms. Loans that are reported as TDRs are accounted for in accordance with ASC 310-10-35, and are considered impaired and measured for specific impairment.
The following table summarizes the recorded investment, net of SBA guaranteed portions, in TDR loans by type for the dates indicated:
(Dollars In Thousands, Net of SBA Guarantee) | December 31, 2015 | December 31, 2014 | |||||
|---|---|---|---|---|---|---|---|
Real Estate Secured | $ | 22,311 | $ | 25,096 | |||
Commercial & Industrial | 15,681 | 12,014 | |||||
| | | | | | | | |
Total TDRs | $ | 37,992 | $ | 37,110 | |||
| | | | | | | | |
| | | | | | | | |
| | | | | | | | |
Loans that are considered TDRs are classified as performing, unless they are on non-accrual status or greater than 90 days delinquent as of the end of the most recent quarter. All TDR loans are considered impaired by the Company regardless of whether it is performing or non-performing. At December 31, 2015, the balance of non-accrual TDR loans totaled $8.2 million, and TDRs performing in accordance with their modified terms totaled $29.8 million. At December 31, 2014, the balance of non-accrual TDR loans totaled $9.5 million, and TDR loans performing in accordance with their modified terms totaled $27.6 million.
For each of the years ended December 31, 2015, 2014, and 2013, all the Company's TDR loans had modifications of one or a combination of the following concessions: a permanent reduction of the recorded investment in the loan; an extension of the maturity date; or a reduction of the stated interest rate of the loan. A reduction of the recorded investment in a loan usually consist of loans restructured to reduce the monthly payment through a reduction in principal, interest, or a combination of principal and interest payments for a certain period of time. Term or maturity concessions are loans that are restructured to extend the maturity date beyond the original contractual terms. Interest rate concessions consist of TDR loans that are restructured with lower interest rates than the original terms of the loans and lower than the current market interest rates for loans with similar risk characteristics.
The following tables represent the total recorded investment, net of SBA guaranteed portions, in TDR loans by types of concessions made for the dates indicated:
| | December 31, 2015 | ||||||||||||
|---|---|---|---|---|---|---|---|---|---|---|---|---|---|
(Dollars In Thousands, Net of SBA Guarantee) | Balance | Term/Maturity | Interest Rate | Total* | |||||||||
Real Estate Secured | $ | 10,894 | $ | 11,417 | $ | — | $ | 22,311 | |||||
Commercial & Industrial | 1,999 | 11,914 | 1,768 | 15,681 | |||||||||
| | | | | | | | | | | | | | |
Total TDR Loans | $ | 12,893 | $ | 23,331 | $ | 1,768 | $ | 37,992 | |||||
| | | | | | | | | | | | | | |
| | | | | | | | | | | | | | |
| | | | | | | | | | | | | | |
F-44
WILSHIRE BANCORP, INC.
NOTES TO CONSOLIDATED FINANCIAL STATEMENTS (Continued)
5. LOANS RECEIVABLE, LOANS HELD-FOR-SALE, AND ALLOWANCE FOR LOAN LOSSES (Continued)
| | December 31, 2014 | ||||||||||||
|---|---|---|---|---|---|---|---|---|---|---|---|---|---|
(Dollars In Thousands, Net of SBA Guarantee) | Balance | Term/Maturity | Interest Rate | Total* | |||||||||
Real Estate Secured | $ | 16,431 | $ | 7,890 | $ | 775 | $ | 25,096 | |||||
Commercial & Industrial | 2,656 | 7,389 | 1,969 | 12,014 | |||||||||
| | | | | | | | | | | | | | |
Total TDR Loans | $ | 19,087 | $ | 15,279 | $ | 2,744 | $ | 37,110 | |||||
| | | | | | | | | | | | | | |
| | | | | | | | | | | | | | |
| | | | | | | | | | | | | | |
- *
- SBA guaranteed portions totaled $2.4 million and $1.6 million, at December 31, 2015 and December 31, 2014, respectively.
The following table represents the roll-forward of TDR loans with additions and reductions for the years ended December 31, 2015 and December 31, 2014:
(Dollars in Thousands, Net of SBA Guarantee) | December 31, 2015 | December 31, 2014 | |||||
|---|---|---|---|---|---|---|---|
Balance at Beginning of Period | $ | 37,110 | $ | 36,220 | |||
New TDR Loans Added | 15,330 | 14,565 | |||||
Reductions Due to Sales | (2,626 | ) | (4,308 | ) | |||
TDR Loans Paid Off | (8,622 | ) | (4,328 | ) | |||
Reductions Due to Charge-Offs | (670 | ) | (2,184 | ) | |||
Other Changes (Payments, Amortization, & Other) | (2,530 | ) | (2,855 | ) | |||
| | | | | | | | |
Balance at End of Period | $ | 37,992 | $ | 37,110 | |||
| | | | | | | | |
| | | | | | | | |
| | | | | | | | |
The following tables below show the pre-modification and post-modification balances and types of concessions provided for new TDR loans that were modified during the years ended December 31, 2015, 2014, and 2013:
| | December 31, 2015 | ||||||||||||
|---|---|---|---|---|---|---|---|---|---|---|---|---|---|
(Dollars in Thousands, Net of SBA Guarantee) | Balance | Term/Maturity | Interest Rate | Total | |||||||||
Pre-Modification Balance: | |||||||||||||
Real Estate Secured | $ | 1,753 | $ | 6,157 | $ | 402 | $ | 8,312 | |||||
Commercial & Industrial | 220 | 7,339 | — | 7,559 | |||||||||
| | | | | | | | | | | | | | |
Total TDR Loans | $ | 1,973 | $ | 13,496 | $ | 402 | $ | 15,871 | |||||
| | | | | | | | | | | | | | |
| | | | | | | | | | | | | | |
| | | | | | | | | | | | | | |
Post-Modification Balance: | |||||||||||||
Real Estate Secured | $ | 1,750 | $ | 6,669 | $ | 401 | $ | 8,820 | |||||
Commercial & Industrial | 218 | 6,292 | — | 6,510 | |||||||||
| | | | | | | | | | | | | | |
Total TDR Loans | $ | 1,968 | $ | 12,961 | $ | 401 | $ | 15,330 | |||||
| | | | | | | | | | | | | | |
| | | | | | | | | | | | | | |
| | | | | | | | | | | | | | |
Number of Loans: | |||||||||||||
Real Estate Secured | 7 | 5 | 1 | 13 | |||||||||
Commercial & Industrial | 7 | 24 | — | 31 | |||||||||
| | | | | | | | | | | | | | |
Total TDR Loans | 14 | 29 | 1 | 44 | |||||||||
| | | | | | | | | | | | | | |
| | | | | | | | | | | | | | |
| | | | | | | | | | | | | | |
F-45
WILSHIRE BANCORP, INC.
NOTES TO CONSOLIDATED FINANCIAL STATEMENTS (Continued)
5. LOANS RECEIVABLE, LOANS HELD-FOR-SALE, AND ALLOWANCE FOR LOAN LOSSES (Continued)
| | December 31, 2014 | ||||||||||||
|---|---|---|---|---|---|---|---|---|---|---|---|---|---|
(Dollars in Thousands, Net of SBA Guarantee) | Balance | Term/Maturity | Interest Rate | Total | |||||||||
Pre-Modification Balance: | |||||||||||||
Real Estate Secured | $ | — | $ | 2,222 | $ | 4,335 | $ | 6,557 | |||||
Commercial & Industrial | 457 | 7,542 | — | 7,999 | |||||||||
| | | | | | | | | | | | | | |
Total TDR Loans | $ | 457 | $ | 9,764 | $ | 4,335 | $ | 14,556 | |||||
| | | | | | | | | | | | | | |
| | | | | | | | | | | | | | |
| | | | | | | | | | | | | | |
Post-Modification Balance: | |||||||||||||
Real Estate Secured | $ | — | $ | 2,218 | $ | 4,335 | $ | 6,553 | |||||
Commercial & Industrial | 455 | 7,557 | — | 8,012 | |||||||||
| | | | | | | | | | | | | | |
Total TDR Loans | $ | 455 | $ | 9,775 | $ | 4,335 | $ | 14,565 | |||||
| | | | | | | | | | | | | | |
| | | | | | | | | | | | | | |
| | | | | | | | | | | | | | |
Number of Loans: | |||||||||||||
Real Estate Secured | — | 7 | 1 | 8 | |||||||||
Commercial & Industrial | 13 | 7 | — | 20 | |||||||||
| | | | | | | | | | | | | | |
Total TDR Loans | 13 | 14 | 1 | 28 | |||||||||
| | | | | | | | | | | | | | |
| | | | | | | | | | | | | | |
| | | | | | | | | | | | | | |
| | December 31, 2013 | ||||||||||||
|---|---|---|---|---|---|---|---|---|---|---|---|---|---|
(Dollars in Thousands, Net of SBA Guarantee) | Balance | Term/Maturity | Interest Rate | Total | |||||||||
Pre-Modification Balance: | |||||||||||||
Real Estate Secured | $ | 10,376 | $ | 7,472 | $ | — | $ | 17,848 | |||||
Commercial & Industrial | 287 | 1,141 | — | 1,428 | |||||||||
| | | | | | | | | | | | | | |
Total TDR Loans | $ | 10,663 | $ | 8,613 | $ | — | $ | 19,276 | |||||
| | | | | | | | | | | | | | |
| | | | | | | | | | | | | | |
| | | | | | | | | | | | | | |
Post-Modification Balance: | |||||||||||||
Real Estate Secured | $ | 8,124 | $ | 5,109 | $ | — | $ | 13,233 | |||||
Commercial & Industrial | 226 | 914 | — | 1,140 | |||||||||
| | | | | | | | | | | | | | |
Total TDR Loans | $ | 8,350 | $ | 6,023 | $ | — | $ | 14,373 | |||||
| | | | | | | | | | | | | | |
| | | | | | | | | | | | | | |
| | | | | | | | | | | | | | |
Number of Loans: | |||||||||||||
Real Estate Secured | 16 | 12 | — | 28 | |||||||||
Commercial & Industrial | 6 | 10 | — | 16 | |||||||||
| | | | | | | | | | | | | | |
Total TDR Loans | 22 | 22 | — | 44 | |||||||||
| | | | | | | | | | | | | | |
| | | | | | | | | | | | | | |
| | | | | | | | | | | | | | |
The TDR loans in the preceding tables increased the allowance for loan losses by $2.8 million, $2.6 million, and $1.7 million for the years ended December 31, 2015, 2014, and 2013, respectively. Charge-offs related to new TDR loans for the years ended December 31, 2015, 2014, and 2013, totaled $252,000, $928,000, and $75,000, respectively
The tables below summarize TDR loans that were modified in the 12 months preceding the dates indicated and also had payment defaults during that same period. A loan is considered to be in payment default once it is 90 days or more contractually past due under the modified terms, or if the loan has been transferred to non-accrual status. Loans that are classified as non-accrual usually means the loan is past due 90 days or more, but in certain cases a loan that is less than 90 days past due can be deemed a
F-46
WILSHIRE BANCORP, INC.
NOTES TO CONSOLIDATED FINANCIAL STATEMENTS (Continued)
5. LOANS RECEIVABLE, LOANS HELD-FOR-SALE, AND ALLOWANCE FOR LOAN LOSSES (Continued)
non-accrual loan, if there exists evidence that the borrower will not be able to fulfill a portion or all of the obligated contractual payments.
| | TDRs With Payment Defaults During the Year Ended December 31, 2015 | ||||||||||||
|---|---|---|---|---|---|---|---|---|---|---|---|---|---|
(Dollars in Thousands, Net of SBA Guarantee) | Balance | Term/Maturity | Interest Rate | Total | |||||||||
Pre-Modification Balance: | |||||||||||||
Real Estate Secured | $ | — | $ | 1,175 | $ | — | $ | 1,175 | |||||
Commercial & Industrial | 16 | 65 | — | 81 | |||||||||
| | | | | | | | | | | | | | |
Total TDRs Defaulted | $ | 16 | $ | 1,240 | $ | — | $ | 1,256 | |||||
| | | | | | | | | | | | | | |
| | | | | | | | | | | | | | |
| | | | | | | | | | | | | | |
Post-Modification Balance: | |||||||||||||
Real Estate Secured | $ | — | $ | 1,162 | $ | — | $ | 1,162 | |||||
Commercial & Industrial | 16 | 61 | — | 77 | |||||||||
| | | | | | | | | | | | | | |
Total TDRs Defaulted | $ | 16 | $ | 1,223 | $ | — | $ | 1,239 | |||||
| | | | | | | | | | | | | | |
| | | | | | | | | | | | | | |
| | | | | | | | | | | | | | |
Number of Loans: | |||||||||||||
Real Estate Secured | — | 3 | — | 3 | |||||||||
Commercial & Industrial | 1 | 1 | — | 2 | |||||||||
| | | | | | | | | | | | | | |
Total TDRs Defaulted Loans | 1 | 4 | — | 5 | |||||||||
| | | | | | | | | | | | | | |
| | | | | | | | | | | | | | |
| | | | | | | | | | | | | | |
| | TDRs With Payment Defaults During the Year Ended December 31, 2014 | ||||||||||||
|---|---|---|---|---|---|---|---|---|---|---|---|---|---|
(Dollars in Thousands, Net of SBA Guarantee) | Balance | Term/Maturity | Interest Rate | Total | |||||||||
Pre-Modification Balance: | |||||||||||||
Real Estate Secured | $ | — | $ | 691 | $ | 4,335 | $ | 5,026 | |||||
Commercial & Industrial | 25 | 19 | — | 44 | |||||||||
| | | | | | | | | | | | | | |
Total TDRs Defaulted | $ | 25 | $ | 710 | $ | 4,335 | $ | 5,070 | |||||
| | | | | | | | | | | | | | |
| | | | | | | | | | | | | | |
| | | | | | | | | | | | | | |
Post-Modification Balance: | |||||||||||||
Real Estate Secured | $ | — | $ | 688 | $ | 4,335 | $ | 5,023 | |||||
Commercial & Industrial | 24 | 19 | — | 43 | |||||||||
| | | | | | | | | | | | | | |
Total TDRs Defaulted | $ | 24 | $ | 707 | $ | 4,335 | $ | 5,066 | |||||
| | | | | | | | | | | | | | |
| | | | | | | | | | | | | | |
| | | | | | | | | | | | | | |
Number of Loans: | |||||||||||||
Real Estate Secured | — | 2 | 1 | 3 | |||||||||
Commercial & Industrial | 2 | 1 | — | 3 | |||||||||
| | | | | | | | | | | | | | |
Total TDRs Defaulted Loans | 2 | 3 | 1 | 6 | |||||||||
| | | | | | | | | | | | | | |
| | | | | | | | | | | | | | |
| | | | | | | | | | | | | | |
F-47
WILSHIRE BANCORP, INC.
NOTES TO CONSOLIDATED FINANCIAL STATEMENTS (Continued)
5. LOANS RECEIVABLE, LOANS HELD-FOR-SALE, AND ALLOWANCE FOR LOAN LOSSES (Continued)
| | TDRs With Payment Defaults During the Year Ended December 31, 2013 | ||||||||||||
|---|---|---|---|---|---|---|---|---|---|---|---|---|---|
(Dollars in Thousands, Net of SBA Guarantee) | Balance | Term/Maturity | Interest Rate | Total | |||||||||
Pre-Modification Balance: | |||||||||||||
Real Estate Secured | $ | — | $ | 3,445 | $ | — | $ | 3,445 | |||||
Commercial & Industrial | 75 | 207 | — | 282 | |||||||||
| | | | | | | | | | | | | | |
Total TDRs Defaulted | $ | 75 | $ | 3,652 | $ | — | $ | 3,727 | |||||
| | | | | | | | | | | | | | |
| | | | | | | | | | | | | | |
| | | | | | | | | | | | | | |
Post-Modification Balance: | |||||||||||||
Real Estate Secured | $ | — | $ | 2,223 | $ | — | $ | 2,223 | |||||
Commercial & Industrial | 69 | 91 | — | 160 | |||||||||
| | | | | | | | | | | | | | |
Total TDRs Defaulted | $ | 69 | $ | 2,314 | $ | — | $ | 2,383 | |||||
| | | | | | | | | | | | | | |
| | | | | | | | | | | | | | |
| | | | | | | | | | | | | | |
Number of Loans: | |||||||||||||
Real Estate Secured | — | 3 | — | 3 | |||||||||
Commercial & Industrial | 1 | 5 | — | 6 | |||||||||
| | | | | | | | | | | | | | |
Total TDRs Defaulted Loans | 1 | 8 | — | 9 | |||||||||
| | | | | | | | | | | | | | |
| | | | | | | | | | | | | | |
| | | | | | | | | | | | | | |
TDR loans that subsequently defaulted for years ended December 31, 2015 and December 31, 2013, resulted in an allowance for loan losses of $34,000 and $339,000, respectively. The TDR loans that subsequently defaulted for the year ended December 31, 2014 did not have an impact to the allowance for loan losses. There were no charge-offs related to new TDR loans that defaulted in the year ended December 31, 2015. Total charges-offs related to new TDR loans that subsequently defaulted during the years ended December 31, 2014 and 2013, totaled $928,000 and $75,000, respectively.
The terms of certain other loans were modified that did not meet the definition of a TDR. These loans had a total recorded investment as of December 31, 2015, 2014, and 2013, of $35.7 million, $107.5 million, and $107.5 million, respectively. Theses loan modifications were to borrowers who were not experiencing financial difficulties or had three to six month payment delays which were considered to be insignificant.
F-48
WILSHIRE BANCORP, INC.
NOTES TO CONSOLIDATED FINANCIAL STATEMENTS (Continued)
5. LOANS RECEIVABLE, LOANS HELD-FOR-SALE, AND ALLOWANCE FOR LOAN LOSSES (Continued)
The following tables provide information on non-accrual loans and loans 90 days or more past due and still accruing by class:
| | December 31, 2015 | |||||||||
|---|---|---|---|---|---|---|---|---|---|---|
(Dollars In Thousands) (Balances are net of SBA guaranteed portions) | Total Non-Accrual Loans* | 90 Days or More Past Due and Still Accruing | Total Non-Performing Loans | |||||||
Legacy Wilshire: | ||||||||||
Construction | $ | — | $ | — | $ | — | ||||
Real Estate Secured: | ||||||||||
Residential Real Estate | 320 | — | 320 | |||||||
SBA Real Estate | 2,140 | — | 2,140 | |||||||
Gas Station | — | — | — | |||||||
Carwash | 770 | — | 770 | |||||||
Hotel/Motel | 943 | — | 943 | |||||||
Land | — | — | — | |||||||
Other | 6,131 | — | 6,131 | |||||||
Commercial & Industrial: | ||||||||||
SBA Commercial | 284 | — | 284 | |||||||
Other Commercial | 5,050 | — | 5,050 | |||||||
Consumer | — | — | — | |||||||
| | | | | | | | | | | |
Total Legacy Loans | 15,638 | — | 15,638 | |||||||
Acquired Loans: | ||||||||||
Construction | — | — | — | |||||||
Real Estate Secured: | ||||||||||
Residential Real Estate | — | — | — | |||||||
SBA Real Estate | 1,691 | — | 1,691 | |||||||
Gas Station | — | — | — | |||||||
Carwash | — | — | — | |||||||
Hotel/Motel | — | — | — | |||||||
Land | — | — | — | |||||||
Other | 3,427 | — | 3,427 | |||||||
Commercial & Industrial: | ||||||||||
SBA Commercial | 25 | — | 25 | |||||||
Other Commercial | 913 | — | 913 | |||||||
Consumer | — | — | — | |||||||
| | | | | | | | | | | |
Total Acquired Loans | 6,056 | — | 6,056 | |||||||
| | | | | | | | | | | |
Total | $ | 21,694 | $ | — | $ | 21,694 | ||||
| | | | | | | | | | | |
| | | | | | | | | | | |
| | | | | | | | | | | |
F-49
WILSHIRE BANCORP, INC.
NOTES TO CONSOLIDATED FINANCIAL STATEMENTS (Continued)
5. LOANS RECEIVABLE, LOANS HELD-FOR-SALE, AND ALLOWANCE FOR LOAN LOSSES (Continued)
| | December 31, 2014 | |||||||||
|---|---|---|---|---|---|---|---|---|---|---|
(Dollars In Thousands) (Balances are net of SBA guaranteed portions) | Total Non-Accrual Loans* | 90 Days or More Past Due and Still Accruing | Total Non-Performing Loans | |||||||
Legacy Wilshire: | ||||||||||
Construction | $ | — | $ | — | $ | — | ||||
Real Estate Secured: | ||||||||||
Residential Real Estate | 784 | — | 784 | |||||||
SBA Real Estate | 632 | — | 632 | |||||||
Gas Station | 28 | — | 28 | |||||||
Carwash | 2,629 | — | 2,629 | |||||||
Hotel/Motel | 2,328 | — | 2,328 | |||||||
Land | — | — | — | |||||||
Other | 12,852 | — | 12,852 | |||||||
Commercial & Industrial: | ||||||||||
SBA Commercial | 360 | — | 360 | |||||||
Other Commercial | 5,150 | — | 5,150 | |||||||
Consumer | — | — | — | |||||||
| | | | | | | | | | | |
Total Legacy Loans | 24,763 | — | 24,763 | |||||||
Acquired Loans: | ||||||||||
Construction | — | — | — | |||||||
Real Estate Secured: | ||||||||||
Residential Real Estate | 134 | — | 134 | |||||||
SBA Real Estate | 1,828 | — | 1,828 | |||||||
Gas Station | 2,185 | — | 2,185 | |||||||
Carwash | — | — | — | |||||||
Hotel/Motel | 718 | — | 718 | |||||||
Land | — | — | — | |||||||
Other | 5,429 | — | 5,429 | |||||||
Commercial & Industrial: | ||||||||||
SBA Commercial | 42 | — | 42 | |||||||
Other Commercial | 2,166 | — | 2,166 | |||||||
Consumer | — | — | — | |||||||
| | | | | | | | | | | |
Total Acquired Loans | 12,502 | — | 12,502 | |||||||
| | | | | | | | | | | |
Total | $ | 37,265 | $ | — | $ | 37,265 | ||||
| | | | | | | | | | | |
| | | | | | | | | | | |
| | | | | | | | | | | |
- *
- Balances are net of SBA guaranteed portions totaling $5.0 million and $4.1 million at December 31, 2015 and December 31, 2014, respectively.
No interest income related to non-accrual loans was included in net income for the years ended December 31, 2015, 2014, and 2013. Additional interest income of approximately $346,000, $1.1 million, and $1.3 million would have been recorded for the years ended December 31, 2015, 2014, and 2013,
F-50
WILSHIRE BANCORP, INC.
NOTES TO CONSOLIDATED FINANCIAL STATEMENTS (Continued)
5. LOANS RECEIVABLE, LOANS HELD-FOR-SALE, AND ALLOWANCE FOR LOAN LOSSES (Continued)
respectively, if these loans had been paid in accordance with their original terms throughout the periods indicated.
Delinquent loans, including non-accrual loans 30 days or more past due, at December 31, 2015 and December 31, 2014, are presented in the following tables by classes of loans:
| | December 31, 2015 | ||||||||||||
|---|---|---|---|---|---|---|---|---|---|---|---|---|---|
(Dollars In Thousands) (Balances are net of SBA guaranteed portions) | 30 - 59 Days Past Due | 60 - 89 Days Past Due | 90 Days or More Past Due | Total Past Due* | |||||||||
Legacy Wilshire: | |||||||||||||
Construction | $ | — | $ | — | $ | — | $ | — | |||||
Real Estate Secured: | |||||||||||||
Residential Real Estate | — | — | 282 | 282 | |||||||||
SBA Real Estate | 2,787 | 236 | 829 | 3,852 | |||||||||
Gas Station | — | — | — | — | |||||||||
Carwash | — | — | 769 | 769 | |||||||||
Hotel/Motel | — | 530 | — | 530 | |||||||||
Land | — | — | — | — | |||||||||
Other | — | — | 3,030 | 3,030 | |||||||||
Commercial & Industrial: | |||||||||||||
SBA Commercial | 658 | 351 | — | 1,009 | |||||||||
Commercial | 67 | — | 3,228 | 3,295 | |||||||||
Consumer | — | — | — | — | |||||||||
| | | | | | | | | | | | | | |
Total Legacy Loans | 3,512 | 1,117 | 8,138 | 12,767 | |||||||||
Acquired Loans: | |||||||||||||
Construction | — | — | — | — | |||||||||
Real Estate Secured: | |||||||||||||
Residential Real Estate | — | — | — | — | |||||||||
SBA Real Estate | 915 | 754 | 151 | 1,820 | |||||||||
Gas Station | — | — | — | — | |||||||||
Carwash | — | — | — | — | |||||||||
Hotel/Motel | — | — | — | — | |||||||||
Land | — | — | — | — | |||||||||
Other | — | 788 | 732 | 1,520 | |||||||||
Commercial & Industrial: | |||||||||||||
SBA Commercial | 415 | 57 | 8 | 480 | |||||||||
Commercial | 41 | 305 | — | 346 | |||||||||
Consumer | — | — | — | — | |||||||||
| | | | | | | | | | | | | | |
Total Acquired Loans | 1,371 | 1,904 | 891 | 4,166 | |||||||||
| | | | | | | | | | | | | | |
Total Delinquencies | $ | 4,883 | $ | 3,021 | $ | 9,029 | $ | 16,933 | |||||
| | | | | | | | | | | | | | |
| | | | | | | | | | | | | | |
| | | | | | | | | | | | | | |
Non-Accrual Loans 30 Days or More Past Due: | |||||||||||||
Legacy Loans | $ | 208 | $ | 284 | $ | 8,138 | $ | 8,630 | |||||
Acquired Loans | 360 | 1,094 | 891 | 2,345 | |||||||||
| | | | | | | | | | | | | | |
Non-Accrual Loans Listed Above** | $ | 568 | $ | 1,378 | $ | 9,029 | $ | 10,975 | |||||
| | | | | | | | | | | | | | |
| | | | | | | | | | | | | | |
| | | | | | | | | | | | | | |
F-51
WILSHIRE BANCORP, INC.
NOTES TO CONSOLIDATED FINANCIAL STATEMENTS (Continued)
5. LOANS RECEIVABLE, LOANS HELD-FOR-SALE, AND ALLOWANCE FOR LOAN LOSSES (Continued)
| | December 31, 2014 | ||||||||||||
|---|---|---|---|---|---|---|---|---|---|---|---|---|---|
(Dollars In Thousands) (Balances are net of SBA guaranteed portions) | 30 - 59 Days Past Due | 60 - 89 Days Past Due | 90 Days or More Past Due | Total Past Due* | |||||||||
Legacy Wilshire: | |||||||||||||
Construction | $ | — | $ | — | $ | — | $ | — | |||||
Real Estate Secured: | |||||||||||||
Residential Real Estate | 454 | 280 | 449 | 1,183 | |||||||||
SBA Real Estate | 1,623 | 129 | 399 | 2,151 | |||||||||
Gas Station | — | — | — | — | |||||||||
Carwash | — | — | 770 | 770 | |||||||||
Hotel/Motel | — | — | 1,162 | 1,162 | |||||||||
Other | 770 | 1,027 | 9,030 | 10,827 | |||||||||
Commercial & Industrial: | |||||||||||||
SBA Commercial | 193 | 369 | — | 562 | |||||||||
Commercial | 1,281 | 598 | 416 | 2,295 | |||||||||
Consumer | — | — | — | — | |||||||||
| | | | | | | | | | | | | | |
Total Legacy Loans | 4,321 | 2,403 | 12,226 | 18,950 | |||||||||
Acquired Loans: | |||||||||||||
Construction | — | — | — | — | |||||||||
Real Estate Secured: | |||||||||||||
Residential Real Estate | — | — | 134 | 134 | |||||||||
SBA Real Estate | 262 | — | 105 | 367 | |||||||||
Gas Station | — | — | — | — | |||||||||
Carwash | — | — | — | — | |||||||||
Hotel/Motel | 232 | — | — | 232 | |||||||||
Other | 188 | 246 | 3,030 | 3,464 | |||||||||
Commercial & Industrial: | |||||||||||||
SBA Commercial | 176 | 22 | — | 198 | |||||||||
Commercial | 528 | 300 | 2,008 | 2,836 | |||||||||
Consumer | — | — | — | — | |||||||||
| | | | | | | | | | | | | | |
Total Acquired Loans | 1,386 | 568 | 5,277 | 7,231 | |||||||||
| | | | | | | | | | | | | | |
Total Delinquencies | $ | 5,707 | $ | 2,971 | $ | 17,503 | $ | 26,181 | |||||
| | | | | | | | | | | | | | |
| | | | | | | | | | | | | | |
| | | | | | | | | | | | | | |
Non-Accrual Loans 30 Days or More Past Due: | |||||||||||||
Legacy Loans | $ | 116 | $ | 904 | $ | 12,226 | $ | 13,246 | |||||
Acquired Loans | 426 | 246 | 5,277 | 5,949 | |||||||||
| | | | | | | | | | | | | | |
Non-Accrual Loans Listed Above** | $ | 542 | $ | 1,150 | $ | 17,503 | $ | 19,195 | |||||
| | | | | | | | | | | | | | |
| | | | | | | | | | | | | | |
| | | | | | | | | | | | | | |
- *
- Balances are net of SBA guaranteed portions totaling $3.5 million and $7.7 million, at December 31, 2015 and December 31, 2014, respectively.
F-52
WILSHIRE BANCORP, INC.
NOTES TO CONSOLIDATED FINANCIAL STATEMENTS (Continued)
5. LOANS RECEIVABLE, LOANS HELD-FOR-SALE, AND ALLOWANCE FOR LOAN LOSSES (Continued)
- **
- Non-accrual loans less than 30 days past due totaling $10.7 million and $18.1 million, at December 31, 2015 and December 31, 2014, respectively, are not included in the totals for delinquent loans listed above as these loans are not considered delinquent.
Loans with classification of special mention, substandard, and doubtful at December 31, 2015 and December 31, 2014 are presented in the following tables by classes of loans:
| | December 31, 2015 | ||||||||||||
|---|---|---|---|---|---|---|---|---|---|---|---|---|---|
(Dollars In Thousands) (Balances are net of SBA guaranteed portions) | Special Mention | Substandard | Doubtful | Total* | |||||||||
Legacy Loans: | |||||||||||||
Construction | $ | — | $ | — | $ | — | $ | — | |||||
Real Estate Secured: | |||||||||||||
Residential Real Estate | 5,019 | 992 | — | 6,011 | |||||||||
SBA Real Estate | 3,702 | 10,042 | — | 13,744 | |||||||||
Gas Station | 2,829 | 2,942 | — | 5,771 | |||||||||
Carwash | 8,286 | 769 | — | 9,055 | |||||||||
Hotel/Motel | 4,727 | 1,740 | — | 6,467 | |||||||||
Land | 571 | — | — | 571 | |||||||||
Other | 40,956 | 32,219 | — | 73,175 | |||||||||
Commercial & Industrial: | |||||||||||||
SBA Commercial | 1,162 | 1,813 | — | 2,975 | |||||||||
Other Commercial | 29,428 | 14,891 | — | 44,319 | |||||||||
Consumer | 73 | — | — | 73 | |||||||||
| | | | | | | | | | | | | | |
Total Legacy Loans | 96,753 | 65,408 | — | 162,161 | |||||||||
Acquired Loans: | |||||||||||||
Construction | — | — | — | — | |||||||||
Real Estate Secured: | |||||||||||||
Residential Real Estate | — | — | — | — | |||||||||
SBA Real Estate | 1,237 | 4,559 | 41 | 5,837 | |||||||||
Gas Station | — | 781 | — | 781 | |||||||||
Carwash | 4,395 | — | — | 4,395 | |||||||||
Hotel/Motel | 2,811 | 159 | — | 2,970 | |||||||||
Land | — | — | — | — | |||||||||
Other | 13,009 | 6,700 | — | 19,709 | |||||||||
Commercial & Industrial: | |||||||||||||
SBA Commercial | 219 | 1,034 | — | 1,253 | |||||||||
Other Commercial | 1,481 | 1,669 | — | 3,150 | |||||||||
Consumer | 114 | — | — | 114 | |||||||||
| | | | | | | | | | | | | | |
Total Acquired Loans | 23,266 | 14,902 | 41 | 38,209 | |||||||||
| | | | | | | | | | | | | | |
Total Loans | $ | 120,019 | $ | 80,310 | $ | 41 | $ | 200,370 | |||||
| | | | | | | | | | | | | | |
| | | | | | | | | | | | | | |
| | | | | | | | | | | | | | |
F-53
WILSHIRE BANCORP, INC.
NOTES TO CONSOLIDATED FINANCIAL STATEMENTS (Continued)
5. LOANS RECEIVABLE, LOANS HELD-FOR-SALE, AND ALLOWANCE FOR LOAN LOSSES (Continued)
| | December 31, 2014 | ||||||||||||
|---|---|---|---|---|---|---|---|---|---|---|---|---|---|
(Dollars In Thousands) (Balances are net of SBA guaranteed portions) | Special Mention | Substandard | Doubtful | Total* | |||||||||
Legacy Loans: | |||||||||||||
Construction | $ | — | $ | — | $ | — | $ | — | |||||
Real Estate Secured: | |||||||||||||
Residential Real Estate | — | 1,636 | 272 | 1,908 | |||||||||
SBA Real Estate | 2,860 | 5,842 | 189 | 8,891 | |||||||||
Gas Station | 1,126 | 5,794 | — | 6,920 | |||||||||
Carwash | 6,800 | 1,859 | 770 | 9,429 | |||||||||
Hotel/Motel | 1,207 | 1,616 | 1,162 | 3,985 | |||||||||
Land | 258 | — | — | 258 | |||||||||
Other | 28,064 | 16,801 | 9,251 | 54,116 | |||||||||
Commercial & Industrial: | |||||||||||||
SBA Commercial | 690 | 2,145 | — | 2,835 | |||||||||
Other Commercial | 11,914 | 20,699 | — | 32,613 | |||||||||
Consumer | — | 1 | — | 1 | |||||||||
| | | | | | | | | | | | | | |
Total Legacy Loans | 52,919 | 56,393 | 11,644 | 120,956 | |||||||||
Acquired Loans: | |||||||||||||
Construction | — | — | — | — | |||||||||
Real Estate Secured: | |||||||||||||
Residential Real Estate | — | 134 | — | 134 | |||||||||
SBA Real Estate | 2,400 | 4,397 | 41 | 6,838 | |||||||||
Gas Station | 645 | 2,987 | — | 3,632 | |||||||||
Carwash | 8,480 | — | — | 8,480 | |||||||||
Hotel/Motel | — | 4,364 | — | 4,364 | |||||||||
Land | — | — | — | — | |||||||||
Other | 10,503 | 10,279 | 160 | 20,942 | |||||||||
Commercial & Industrial: | |||||||||||||
SBA Commercial | 653 | 639 | — | 1,292 | |||||||||
Other Commercial | 1,175 | 3,112 | 107 | 4,394 | |||||||||
Consumer | 131 | — | — | 131 | |||||||||
| | | | | | | | | | | | | | |
Total Acquired Loans | $ | 23,987 | $ | 25,912 | $ | 308 | $ | 50,207 | |||||
| | | | | | | | | | | | | | |
Total Loans | $ | 76,906 | $ | 82,305 | $ | 11,952 | $ | 171,163 | |||||
| | | | | | | | | | | | | | |
| | | | | | | | | | | | | | |
| | | | | | | | | | | | | | |
- *
- Balances are net of SBA guaranteed portions totaling $6.5 million at both December 31, 2015 and December 31, 2014.
The Company offers residential mortgage lending and offers a wide selection of residential mortgage products. The majority of the loans are sold to the secondary market while certain portions are retained on the Company's books as portfolio loans. The total residential mortgage loan portfolio outstanding at the end of 2015 and 2014 was $244.9 million and $146.2 million, respectively. At December 31, 2015 and 2014, there were no mortgage loans with interest only terms or option adjustable rates. In addition to mortgage
F-54
WILSHIRE BANCORP, INC.
NOTES TO CONSOLIDATED FINANCIAL STATEMENTS (Continued)
5. LOANS RECEIVABLE, LOANS HELD-FOR-SALE, AND ALLOWANCE FOR LOAN LOSSES (Continued)
loans, we have home equity lines of credit and home equity loans that are also secured by 1-4 family residential properties totaling $8.1 million at December 31, 2014 and $15.9 million at December 31, 2014.
The following is an analysis of all loans to officers and directors of the Company and their affiliates as of the dates indicated:
(Dollars in Thousands) | December 31, 2015 | December 31, 2014 | |||||
|---|---|---|---|---|---|---|---|
Outstanding balance—beginning of year | $ | 19,497 | $ | 30,648 | |||
Credit granted, including renewals | 5,750 | — | |||||
Repayments | (6,225 | ) | (513 | ) | |||
Adjustment due to change in affiliation | — | (10,638 | ) | ||||
| | | | | | | | |
Outstanding balance—end of year | $ | 19,022 | $ | 19,497 | |||
| | | | | | | | |
| | | | | | | | |
| | | | | | | | |
6. LOAN SERVICING ASSETS
The principal balance of SBA loans serviced for others at December 31, 2015 was $673.2 million, comprised of $558.7 million in real estate SBA loans, and $114.5 million in commercial SBA loans. SBA loans serviced for others at December 31, 2014 totaled $701.0 million, comprised of $566.2 million in real estate SBA loans and $134.8 million in commercial SBA loans. Mortgage loans serviced at December 31, 2015 totaled $102.7 million, compared to $26.9 million at December 31, 2014.
The following is a summary of activity for servicing assets in the Consolidated Statements of Financial Condition at December 31, 2015 and 2014:
(Dollars in Thousands) | 2015 | 2014 | |||||
|---|---|---|---|---|---|---|---|
Beginning of year | $ | 18,031 | $ | 16,108 | |||
Additions through originations of servicing assets | 4,043 | 4,485 | |||||
Amortization of servicing assets | (1,014 | ) | (1,500 | ) | |||
Changes in fair value | (1,166 | ) | (1,062 | ) | |||
| | | | | | | | |
End of year | $ | 19,894 | $ | 18,031 | |||
| | | | | | | | |
| | | | | | | | |
| | | | | | | | |
The fair value of servicing assets was determined based on the present value of the contractually specified servicing fees, net of servicing costs, over the estimated life of the loan, with an average discount rate and a range of constant prepayment rates.
The servicing fee income which is reported on the Consolidated Statements of Income as "Loan-related servicing fees" is recorded for fee income earned for servicing loans that were previously sold. The fees are based on a contractual percentage of the outstanding principal balance and other ancillary fee incomes. Late fees and ancillary fees related to loan servicing are not material.
F-55
WILSHIRE BANCORP, INC.
NOTES TO CONSOLIDATED FINANCIAL STATEMENTS (Continued)
6. LOAN SERVICING ASSETS (Continued)
The following table is a summary of weighted average discount rates and constant prepayment rates of the Company's servicing loan portfolio as of December 31, 2015 and 2014, respectively:
| | As of December 31, | ||||||
|---|---|---|---|---|---|---|---|
| | 2015 | 2014 | |||||
Average Discount Rate: | 5.52 | % | 5.62 | % | |||
Constant Prepayment Rate: | 7.53 | % | 8.93 | % | |||
Weighted Average Life: | 18 Years | 17 Years | |||||
7. BANK PREMISES AND EQUIPMENT
The following is a summary of the major components of Bank premises and equipment as of December 31:
(Dollars in Thousands) | 2015 | 2014 | |||||
|---|---|---|---|---|---|---|---|
Land | $ | 4,635 | $ | 2,968 | |||
Building | 2,744 | 2,744 | |||||
Furniture and equipment | 12,874 | 11,339 | |||||
Leasehold improvements | 18,610 | 16,606 | |||||
| | | | | | | | |
Total | 38,863 | 33,657 | |||||
Accumulated depreciation and amortization | (22,767 | ) | (19,776 | ) | |||
| | | | | | | | |
Total net of depreciation and amortization | $ | 16,096 | $ | 13,881 | |||
| | | | | | | | |
| | | | | | | | |
| | | | | | | | |
8. INVESTMENTS IN AFFORDABLE HOUSING PARTNERSHIPS
The Company invests in certain limited partnerships that were formed to develop and operate apartment complexes designed as high-quality affordable housing for lower income tenants throughout the United States. As of December 31, 2015, the Company had nineteen such investments, with a net carrying value of $48.9 million. Commitments to fund investments in affordable housing partnerships totaled $15.7 million at December 31, 2015, with the last of the commitments ending in 2032. As of December 31, 2014, the Company had seventeen such investments, with a net carrying value of $44.1 million.
The investments were accounted for using the equity method of accounting. Each of the partnerships must meet the regulatory requirement for affordable housing for a minimum compliance period of 15-years to fully utilize the tax credits. If the partnerships ceases to qualify during the compliance period, the credits may be denied for any period in which the projects are not in compliance and a portion of the credits previously taken may be subject to recapture with interest.
The remaining federal tax credits to be utilized over a maximum of 13 years totaled $40.6 million as of December 31, 2015, and totaled $38.3 million at December 31, 2014. The Company's utilization of federal tax credits was approximately $5.6 million, $5.4 million, and $5.0 million for the years ended December 31, 2015, 2014, and 2013, respectively. Loss on investments in affordable housing partnership investments totaled $5.0 million, $4.2 million, and $3.8 million for the years ended December 31, 2015, 2014, and 2013, respectively.
F-56
WILSHIRE BANCORP, INC.
NOTES TO CONSOLIDATED FINANCIAL STATEMENTS (Continued)
9. DEPOSITS
The scheduled maturities of total time deposits at December 31, 2015 are shown in the following table:
(Dollars in Thousands) | December 31, 2015 | |||
|---|---|---|---|---|
Time Deposit Maturities in 2016 | $ | 1,450,557 | ||
Time Deposit Maturities in 2017 | 138,462 | |||
Time Deposit Maturities in 2018 | 10,259 | |||
Time Deposit Maturities in 2019 | 2,417 | |||
Time Deposit Maturities in 2020 | — | |||
Time Deposit Maturities after 2020 | 10 | |||
| | | | | |
Total Time Deposit Maturities | $ | 1,601,705 | ||
| | | | | |
| | | | | |
| | | | | |
The scheduled maturities of total time deposits by denominations of $100,000 or greater and $250,000 or greater at December 31, 2015 are as follows:
| | Maturity of Time Deposits in Denominations of: | ||||||
|---|---|---|---|---|---|---|---|
(Dollars In Thousands) | $100,000 or Greater | $250,000 or Greater | |||||
Three months or less | $ | 489,810 | $ | 388,146 | |||
Over three months through six months | 154,357 | 71,298 | |||||
Over six months through twelve months | 579,981 | 290,735 | |||||
Over twelve months | 125,292 | 63,404 | |||||
| | | | | | | | |
Total | $ | 1,349,440 | $ | 813,583 | |||
| | | | | | | | |
| | | | | | | | |
| | | | | | | | |
Time deposits that met or exceeded the FDIC insurance limit of $250,000 at year-end 2015 and 2014, were $813.6 million and $767.0 million, respectively.
10. COMMITMENTS AND CONTINGENCIES
The following table represents future commitments and contingencies related to lease payments and investments in affordable housing partnerships at December 31, 2015:
(Dollars in Thousands)
Year | Investments Affordable Housing Partnerships | Lease Payments | |||||
|---|---|---|---|---|---|---|---|
2016 | $ | 5,843 | $ | 6,252 | |||
2017 | 2,937 | 5,275 | |||||
2018 | 5,828 | 4,224 | |||||
2019 | 97 | 3,323 | |||||
2020 | 92 | 2,110 | |||||
Thereafter | 933 | 2,377 | |||||
| | | | | | | | |
Total | $ | 15,730 | $ | 23,561 | |||
| | | | | | | | |
| | | | | | | | |
| | | | | | | | |
F-57
WILSHIRE BANCORP, INC.
NOTES TO CONSOLIDATED FINANCIAL STATEMENTS (Continued)
10. COMMITMENTS AND CONTINGENCIES (Continued)
Rental expense recorded under such leases amounted to approximately $6.9 million, $7.2 million, and $4.3 million for the years ended December 31, 2015, 2014, and 2013, respectively.
In the normal course of business, we are involved in various legal claims. We have reviewed all legal claims against us with counsel and have taken into consideration the views of such counsel as to the potential outcome of the claims. Accrued loss contingencies for all legal claims totaled $120,000 at December 31, 2015, and $135,000 at December 31, 2014. It is reasonably possible we may incur losses in addition to the amounts we have accrued. However, at this time, we are unable to estimate the range of additional losses that are reasonably possible because of a number of factors, including the fact that certain of these litigation matters are still in their early stages and involve claims for which, at this point, we believe have little to no merit. Management has considered these and other possible loss contingencies and does not expect the amounts to be material to any of the consolidated financial statements.
The Company is a party to financial instruments with off-balance-sheet risk in the normal course of business to meet the financing needs of its customers. These financial instruments include commitments to extend credit, standby letters of credit, and commercial letters of credit. These instruments involve, to varying degrees, elements of credit and interest rate risk in excess of the amount recognized in the Consolidated Statements of Financial Condition. The Company's exposure to credit loss in the event of nonperformance by the other party to commitments to extend credit, standby letters of credit, and commercial letters of credit is represented by the contractual notional amount of those instruments. The Company uses the same credit policies in making commitments and conditional obligations as it does for extending loan facilities to customers. The Company evaluates each customer's creditworthiness on a case-by-case basis. The amount of collateral obtained, if deemed necessary by the Company upon extension of credit, is based on management's credit evaluation of the counterparty.
Collateral held varies but may include accounts receivable, inventory, property, plant and equipment, and income-producing properties. The Company had commitments to extend credit of approximately $470.0 million and $391.7 million at December 31, 2015 and 2014, respectively. Obligations under standby letters of credit totaled $15.0 million and $1.4 million at December 31, 2015 and 2014, respectively. Total commercial letters of credit totaled $75.9 million at December 31, 2015 and $61.5 million at December 31, 2014.
The Company enters into various stand-alone mortgage-banking derivatives in order to hedge the risk associated with the fluctuation of interest rates. Changes in fair value are recorded as mortgage banking revenue. Residential mortgage loans funded with interest rate lock commitments and forward commitments for the future delivery of mortgage loans to third party investors are considered derivatives. At December 31, 2015, we had approximately $35.7 million in interest rate lock commitments, and $17.1 million in total forward sales commitments, for the future delivery of residential mortgage loans. There were no interest rate lock or forward commitments at December 31, 2014. All derivative instruments are recognized on the balance sheet at their fair values.
11. FHLB BORROWINGS AND JUNIOR SUBORDINATED DEBENTURES
At December 31, 2015, the Company had approved financing with the San Francisco FHLB for maximum advances of up to 30% of total assets based on qualifying collateral. The Company's borrowing capacity under the FHLB standard credit program per the Company's pledged loan collateral and securities backed credit program per securities collateral was approximately $1.42 billion, with $220.0 million borrowings outstanding, and $1.19 billion of capacity remaining as of December 31, 2015.
F-58
WILSHIRE BANCORP, INC.
NOTES TO CONSOLIDATED FINANCIAL STATEMENTS (Continued)
11. FHLB BORROWINGS AND JUNIOR SUBORDINATED DEBENTURES (Continued)
During 2014, the Company borrowed from the FHLB a five year $50.0 million adjustable rate advance from the standard credit program. The advance matures on September 23, 2019 and interest rate was 1.84% as of December 31, 2015. The interest rate resets on a quarterly basis based on the three month LIBOR plus 1.24%, and has an interest rate adjustment cap of 1.00% over the initial rate of the advance throughout the term. The interest rate cannot exceed 2.48% during the term of the advance regardless of how LIBOR rates moves due to the adjustment cap. At December 31, 2015, the Company also had a fixed rate advance from the FHLB standard credit program totaling $100.0 million that matures on September 23, 2019, with a rate of 2.48%. During the fourth quarter of 2015, the Company borrowed an additional $50.0 million from the standard credit program with interest rate of 0.27%. This advance can be repaid at any time and has a variable rate of interest.
The Company also participates in the San Francisco FHLB securities backed credit program as well. At December 31, 2015, we had $48.1 million in securities pledged with the FHLB, with $20.0 million in borrowings outstanding under the securities backed credit program. The $20.0 million advance had a rate of 0.25% at December 31, 2015, and matures on January 4, 2016. Securities backed credit program advances tend to have slightly lower interest rates as the type of collateral pledged against the advance is less likely to default.
Total FHLB advances at December 31, 2015 were $220.0 million. $200.0 million in advances were part of the standard credit program and backed by the Company's loan collateral, while $20.0 million in advances were part of the securities backed credit program and backed by pledged investments.
The following table shows the Company's outstanding advances from FHLB at December 31, 2015:
(Dollars in Thousands) | Balance | Current Rate | Interest Rate | Issue Date | Maturity Date | Type of Credit | |||||||||
|---|---|---|---|---|---|---|---|---|---|---|---|---|---|---|---|
Advance 1* | $ | 50,000 | 1.84 | % | 3 Month LIBOR + 1.2425% | 09/22/2014 | 09/23/2019 | Standard Credit | |||||||
Advance 2 | 100,000 | 2.48 | % | Fixed Rate | 09/22/2015 | 09/23/2019 | Standard Credit | ||||||||
Advance 3 | 50,000 | 0.27 | % | Variable | 12/29/2015 | Open | Standard Credit | ||||||||
Advance 4 | 20,000 | 0.25 | % | Variable | 12/31/2015 | 01/04/2016 | Securities Backed | ||||||||
| | | | | | | | | | | | | | | | |
Total | $ | 220,000 | 1.63 | % | |||||||||||
| | | | | | | | | | | | | | | | |
| | | | | | | | | | | | | | | | |
| | | | | | | | | | | | | | | | |
- *
- The advance has an interest rate adjustment cap of 1.00% during the term of the advance.
The following table summarizes information relating to the Company's FHLB advances for the periods indicated:
| | Year Ended December 31, | |||||||||
|---|---|---|---|---|---|---|---|---|---|---|
(Dollars in Thousands) | 2015 | 2014 | 2013 | |||||||
Average balance during the year | $ | 118,274 | $ | 160,110 | $ | 140,916 | ||||
Average interest rate during the year | 1.30 | % | 0.33 | % | 0.17 | % | ||||
Maximum month-end balance during the year | $ | 220,000 | $ | 190,314 | $ | 190,325 | ||||
Loans collateralizing the agreements at year-end | $ | 1,839,545 | $ | 1,852,178 | $ | 1,479,886 | ||||
Securities collateralizing the agreements at year-end | $ | 48,146 | $ | — | $ | — | ||||
Total junior subordinated debentures at December 31, 2015 totaled $72.0 million, compared to $71.8 million at December 31, 2014. In December 2002, the Bank issued an aggregate of $10 million of junior subordinated debentures, at times referred to in this Report as the 2002 Junior Subordinated
F-59
WILSHIRE BANCORP, INC.
NOTES TO CONSOLIDATED FINANCIAL STATEMENTS (Continued)
11. FHLB BORROWINGS AND JUNIOR SUBORDINATED DEBENTURES (Continued)
Debentures or the 2002 debentures. In addition, Wilshire Bancorp, as a wholly-owned subsidiary of the Bank in 2003 and as the parent company of the Bank in 2005 and 2007, issued an aggregate of $77.3 million in junior subordinated debentures as part of the issuance of $75.0 million in trust preferred securities by statutory trusts wholly-owned by Wilshire Bancorp. The purpose of these transactions was to raise additional capital. These junior subordinated debentures are senior in liquidation rights to the Company's outstanding shares of common stock.
On November 20, 2013, the Company acquired Saehan. Saehan had previously formed Saehan Capital Trust I, and issued junior subordinated debentures related to the trust totaling $20.6 million in March 2007. This debenture was acquired by Wilshire at a fair value of $9.7 million, or a discount of $10.9 million.
The following table summarizes the Company's outstanding subordinated debentures at December 31, 2015:
(Dollars in Thousands) | Issued Date | Carrying Amount | Interest Rate | Current Rate | Callable Date | Maturity Date | ||||||||||||
|---|---|---|---|---|---|---|---|---|---|---|---|---|---|---|---|---|---|---|
Wilshire Statutory Trust II | 03/17/2005 | $ | 20,619 | 3 Month LIBOR + 1.79% | 2.32 | % | 03/17/2016 | 1 | 03/17/2035 | |||||||||
Wilshire Statutory Trust III | 09/15/2005 | 15,464 | 3 Month LIBOR + 1.40% | 1.91 | % | 03/15/2016 | 2 | 09/15/2035 | ||||||||||
Wilshire Statutory Trust IV | 07/10/2007 | 25,774 | 3 Month LIBOR + 1.38% | 1.89 | % | 03/15/2016 | 3 | 09/15/2037 | ||||||||||
Saehan Capital Trust I | 03/30/2007 | 10,159 | 3 Month LIBOR + 1.62% | 2.22 | % | 03/30/2016 | 4 | 03/30/2037 | ||||||||||
| | | | | | | | | | | | | | | | | | | |
| $ | 72,016 | |||||||||||||||||
| | | | | | | | | | | | | | | | | | | |
| | | | | | | | | | | | | | | | | | | |
| | | | | | | | | | | | | | | | | | | |
- 1
- The Company has the right to redeem the $20.6 million debentures, in whole or in part, on any March 17, June 17, September 17, or December 17. The next callable date as of this Report is March 17, 2016.
- 2
- The Company has the right to redeem the $15.5 million debentures, in whole or in part, on any March 15, June 15, September 15, or December 15. The next callable date as of this Report is March 15, 2016.
- 3
- The Company has the right to redeem the $25.8 million debentures, in whole or in part, on any March 15, June 15, September 15, or December 15. The next callable date as of this Report is March 15, 2016.
- 4
- The Company has the right to redeem the $20.6 million debentures, in whole or in part, on any March 30, June 30, September 30, or December 30. The next callable date as of this Report is March 30, 2016.
12. TROUBLED ASSETS RELIEF PROGRAM ("TARP") SERIES A PREFERRED STOCK AND WARRANTS
On December 12, 2008, the Company issued $62.2 million in Preferred Stock and warrants to the United States Department of the Treasury ("U.S. Treasury") as part of the U.S. Treasury's Capital Purchase Program. The funding of this $62.2 million in Preferred Stock investment from the U.S. Treasury, which is commonly referred to as the TARP investment, marked the completion of the sale to the U.S. Treasury of 62,158 shares of Fixed Rate Cumulative Perpetual Preferred Stock, Series A (each share with a stated liquidation amount of $1,000 per share) and a warrant (100% vesting at grant, with a 10-year term) exercisable for 949,460 shares of the Company's common stock, with an exercise price of $9.82 per share.
F-60
WILSHIRE BANCORP, INC.
NOTES TO CONSOLIDATED FINANCIAL STATEMENTS (Continued)
12. TROUBLED ASSETS RELIEF PROGRAM ("TARP") SERIES A PREFERRED STOCK AND WARRANTS (Continued)
During the first quarter of 2012, the Company repurchased 60,000 of its 62,158 shares of TARP Preferred Stock from the U.S. Treasury in connection with the Company's participation in the TARP Capital Purchase Program. The shares were repurchased at a discount of 5.6% (or an actual cost of $56.6 million) and resulted in a one-time increase to capital totaling $3.4 million offset by the accretion of $1.1 million in Preferred Stock discount. The result was a net increase in capital of approximately $2.3 million. The remaining 2,158 Preferred Shares were redeemed during the second quarter of 2012 at par value or $1,000 per share (or an actual cost of $2.2 million). During the second quarter of 2012, the Company also repurchased from U.S. Treasury the warrant to purchase 949,460 shares of the Company's common at a mutually agreed upon price of $760,000.
During the fourth quarter of 2013, the Company acquired BankAsiana, headquartered in the State of New Jersey. In 2010, BankAsiana issued 5,250 shares of Preferred Stock, with a total par value of $5.25 million, to the U.S. Treasury in connection with their participation in the TARP Community Development Capital Initiative program. The Community Development Capital Initiative program was slightly different from the TARP Capital Purchase Program in that participants were not required to issue a warrant to the U.S. Treasury and the Preferred Stock had lower initial dividend rates. With the acquisition of BankAsiana, the Company acquired the Community Development Capital Initiative Preferred Stock and its obligations. On the date of acquisition, the Company redeemed all of BankAsiana's 5,250 shares of Community Development Capital Initiative Preferred Stock at par value, or $5.25 million.
As a result of our participation in the TARP Capital Purchase Program, among other things, we were subject to U.S. Treasury's standards for executive compensation and corporate governance for the periods during which U.S. Treasury held our Preferred Shares, including the first quarter of 2012. These standards were most recently set forth in the Interim Final Rule on TARP Standards for Compensation and Corporate Governance, published June 15, 2009. Because the Preferred Shares were fully repurchased by the Company, these executive compensation and corporate governance standards are no longer applicable. The restrictions related BankAsiana's participation in the Community Development Capital Initiative program, were not applicable to the Company as we fully redeemed the Preferred Shares at the time of BankAsiana's acquisition.
13. STOCK OPTION AND RESTRICTED STOCK PLANS
Stock Option Plan
The Company issues stock options and restricted stock to directors and employees under the share-based compensation plan. Stock options and restricted stock are issued at the current market price on the date of grant. The vesting period and contractual term are determined at the time of grant, but the contractual term may not exceed 10 years from the date of grant. The grant date fair value of stock option awards are estimated on the date of grant using the Black-Scholes option valuation model. The expected life (estimated period of time outstanding) of options are estimated using the simplified method. The expected volatility is based on historical volatility for a period equal to the stock option's expected life and the risk-free rate is based on the U.S. Treasury yield curve in effect at the time of grant.
In June 2008, the Company established the 2008 stock option plan ("2008 Plan") that provides for the issuance of restricted stock and stock options to purchase up to 2,933,200 shares of its authorized but unissued common shares to employees, directors, and consultants. Exercise prices for options may not be less than the fair value at the date of grant. Compensation expense for awards is recorded over the vesting
F-61
WILSHIRE BANCORP, INC.
NOTES TO CONSOLIDATED FINANCIAL STATEMENTS (Continued)
13. STOCK OPTION AND RESTRICTED STOCK PLANS (Continued)
period. Under the 2008 Plan, there were options outstanding to purchase 885,708 shares of the Company's common stock and 135,874 shares of the Company's restricted stock outstanding as of December 31, 2015. At December 31, 2015, there were 1,240,084 shares available to grant under the 2008 Plan.
Total stock-based compensation expense was $1.1 million, $932,000, and $460,000 for the years ended December 31, 2015, 2014, and 2013, respectively.
For the years 2015, 2014, and 2013, stock options granted totaled 63,807, 241,200, and 64,000, respectively. The weighted average fair value of options granted during 2015, 2014, and 2013 was $2.79, $2.99, and $2.36, respectively, per share. The fair values were estimated on the date of the option grants using the Black-Scholes option-pricing model with the following assumptions for the years indicated:
| | 2015 | 2014 | 2013 | |||||||
|---|---|---|---|---|---|---|---|---|---|---|
Expected life | 3.2 - 6.5 years | 3.0 - 3.0 years | 2.2 - 3.0 years | |||||||
Expected volatility | 28.1% - 47.6 | % | 37.1% - 46.8 | % | 46.9% - 50.7 | % | ||||
Expected dividend yield | 2.23 | % | 2.00 | % | 0.55 | % | ||||
Risk-free interest rate | 1.37 | % | 0.76 | % | 0.64 | % | ||||
Activity in the stock option plan is presented as follows for the year ended December 31, 2015:
2015 | Shares | Weighted Average Exercise Price | Weighted Average Remaining Contractual Term | Aggregate Intrinsic Value (Dollars in Thousands) | |||||||||
|---|---|---|---|---|---|---|---|---|---|---|---|---|---|
Outstanding at January 1, 2015 | 1,024,789 | $ | 6.27 | ||||||||||
Granted | 63,807 | 10.30 | |||||||||||
Exercised | (149,738 | ) | 5.29 | ||||||||||
Forfeited | (2,687 | ) | 6.25 | ||||||||||
Expired | (50,463 | ) | 12.52 | ||||||||||
| | | | | | | | | | | | | | |
Outstanding at December 31, 2015 | 885,708 | $ | 6.37 | 4.50 years | $ | 4,588 | |||||||
| | | | | | | | | | | | | | |
| | | | | | | | | | | | | | |
| | | | | | | | | | | | | | |
Vested or expected to vest at December 31, 20151 | 862,532 | $ | 6.27 | 4.48 years | $ | 4,556 | |||||||
| | | | | | | | | | | | | | |
| | | | | | | | | | | | | | |
| | | | | | | | | | | | | | |
Option exercisable at December 31, 2015 | 713,778 | $ | 5.46 | 4.31 years | $ | 4,349 | |||||||
| | | | | | | | | | | | | | |
| | | | | | | | | | | | | | |
| | | | | | | | | | | | | | |
- 1
- Includes vested shares and non-vested shares after forfeiture rate is applied
F-62
WILSHIRE BANCORP, INC.
NOTES TO CONSOLIDATED FINANCIAL STATEMENTS (Continued)
13. STOCK OPTION AND RESTRICTED STOCK PLANS (Continued)
The following table summarizes information about stock options outstanding as of December 31, 2015:
| | Stock Options Outstanding | Stock Options Exercisable | |||||||||||||
|---|---|---|---|---|---|---|---|---|---|---|---|---|---|---|---|
Range of Exercise Prices | Number Outstanding | Weighted- Average Exercise Price | Weighted- Average Remaining Contractual Life | Number Exercisable | Weighted- Average Exercise Price | ||||||||||
$2.00 - $4.99 | 330,000 | $ | 3.46 | 6.06 years | 330,000 | $ | 3.46 | ||||||||
$5.00 - $7.99 | 254,751 | 5.45 | 1.58 years | 246,626 | 5.43 | ||||||||||
$8.00 - $10.99 | 272,057 | 10.25 | 5.46 years | 122,702 | 10.20 | ||||||||||
$11.00 - $13.99 | 28,900 | 11.10 | 3.25 years | 14,450 | 11.10 | ||||||||||
| | | | | | | | | | | | | | | | |
Outstanding at end of year | 885,708 | $ | 6.37 | 4.50 years | 713,778 | $ | 5.46 | ||||||||
| | | | | | | | | | | | | | | | |
| | | | | | | | | | | | | | | | |
| | | | | | | | | | | | | | | | |
Activities related to stock options are presented as follows for the years indicated:
(Dollars in Thousands, Except Weighted Average Fair Value Price) | 2015 | 2014 | 2013 | |||||||
|---|---|---|---|---|---|---|---|---|---|---|
Total intrinsic value of options exercised | $ | 929 | $ | 984 | $ | 862 | ||||
Total fair value of options vested | $ | 547 | $ | 563 | $ | 457 | ||||
Weighted average fair value of options granted during the year | $ | 2.79 | $ | 2.99 | $ | 2.36 | ||||
As of December 31, 2015, total unrecognized stock compensation cost related to stock options granted totaled $330,000 and unrecognized stock compensation cost related restricted stock granted totaled $1.1 million. These costs are expected to be recognized over a weighted average period of 1.0 year for stock options and 1.3 years for restricted stock.
A summary of the status and changes of the Company's non-vested stock options related to the Company's stock option plan as of and for the year 2015 is presented below:
| | Shares | Weighted Average Grant Date Fair Value | |||||
|---|---|---|---|---|---|---|---|
Non-vested at January 1, 2015 | 389,169 | $ | 2.24 | ||||
Granted | 63,807 | 2.79 | |||||
Vested | (278,358 | ) | 1.97 | ||||
Forfeitures on unvested shares | (2,688 | ) | 2.08 | ||||
| | | | | | | | |
Non-vested at December 31, 2015 | 171,930 | $ | 2.89 | ||||
| | | | | | | | |
| | | | | | | | |
| | | | | | | | |
F-63
WILSHIRE BANCORP, INC.
NOTES TO CONSOLIDATED FINANCIAL STATEMENTS (Continued)
13. STOCK OPTION AND RESTRICTED STOCK PLANS (Continued)
A summary of the status and changes of the Company's non-vested restricted stock related to the Company's stock option plan as of and for the year 2015 is presented below:
| | Shares | Weighted Average Grant Date Fair Value | |||||
|---|---|---|---|---|---|---|---|
Non-vested at January 1, 2015 | 49,668 | $ | 11.10 | ||||
Granted | 138,262 | 10.18 | |||||
Vested | (50,728 | ) | 10.47 | ||||
Forfeitures on unvested shares | (3,296 | ) | 10.73 | ||||
Stock Dividends | 1,948 | N/A | |||||
| | | | | | | | |
Non-vested at December 31, 2015 | 135,874 | N/A | |||||
| | | | | | | | |
| | | | | | | | |
| | | | | | | | |
14. INCOME TAXES
A summary of income tax expense (benefit) for 2015, 2014, and 2013 is shown as follows:
(Dollars in Thousands) | Current | Deferred | Total | |||||||
|---|---|---|---|---|---|---|---|---|---|---|
2015: | ||||||||||
Federal | $ | 24,859 | $ | (307 | ) | $ | 24,552 | |||
State | 8,524 | 1,425 | 9,949 | |||||||
| | | | | | | | | | | |
| $ | 33,383 | $ | 1,118 | $ | 34,501 | |||||
| | | | | | | | | | | |
| | | | | | | | | | | |
| | | | | | | | | | | |
2014: | ||||||||||
Federal | $ | 12,197 | $ | 9,949 | $ | 22,146 | ||||
State | 4,418 | 3,691 | 8,109 | |||||||
| | | | | | | | | | | |
| $ | 16,615 | $ | 13,640 | $ | 30,255 | |||||
| | | | | | | | | | | |
| | | | | | | | | | | |
| | | | | | | | | | | |
2013: | ||||||||||
Federal | $ | 18,049 | $ | (969 | ) | $ | 17,080 | |||
State | 3,284 | 1,917 | 5,201 | |||||||
| | | | | | | | | | | |
| $ | 21,333 | $ | 948 | $ | 22,281 | |||||
| | | | | | | | | | | |
| | | | | | | | | | | |
| | | | | | | | | | | |
The following is a summary of the income taxes receivable (payable). As of December 31, 2015, we included $2.8 million in federal income tax receivable and $737,000 in state tax receivable as a component of other assets. As of December 31, 2014, we included $2.7 million in federal income tax receivable and $855,000 in state tax payable as a component of other assets. As of December 31, 2013, we included
F-64
WILSHIRE BANCORP, INC.
NOTES TO CONSOLIDATED FINANCIAL STATEMENTS (Continued)
14. INCOME TAXES (Continued)
$540,000 in federal income tax receivable and $877,000 in state tax payable as a component of other liabilities.
(Dollars in Thousands) | 2015 | 2014 | 2013 | |||||||
|---|---|---|---|---|---|---|---|---|---|---|
Current income taxes receivable (payable): | ||||||||||
Federal | $ | 2,759 | $ | 2,663 | $ | 540 | ||||
State | 737 | (855 | ) | (877 | ) | |||||
| | | | | | | | | | | |
Total income taxes receivable (payable) | $ | 3,496 | $ | 1,808 | $ | (337 | ) | |||
| | | | | | | | | | | |
| | | | | | | | | | | |
| | | | | | | | | | | |
The cumulative temporary differences, as tax affected, are as follows at December 31, 2015 and 2014:
2015 (Dollars in Thousands) | Federal | State | Total | |||||||
|---|---|---|---|---|---|---|---|---|---|---|
Deferred tax assets: | ||||||||||
Bad debt reserve in excess of tax bad debt deduction | $ | 19,192 | $ | 6,667 | $ | 25,859 | ||||
Tax depreciation less than the financial statement depreciation | 1,168 | 1,095 | 2,263 | |||||||
Net operating loss | 1,129 | 392 | 1,521 | |||||||
OREO reserve | ||||||||||
ASC 718-10 non-qualified stock options | 383 | 133 | 516 | |||||||
Business combinations | 499 | 173 | 672 | |||||||
Charitable contributions | 5 | 38 | 43 | |||||||
Restricted stocks | 109 | 38 | 147 | |||||||
CA Enterprise Zone tax credits | (108 | ) | 307 | 199 | ||||||
Accrued professional fees | 55 | 19 | 74 | |||||||
Others | 3,526 | 222 | 3,748 | |||||||
| | | | | | | | | | | |
Total deferred tax assets | 25,958 | 9,084 | 35,042 | |||||||
| | | | | | | | | | | |
Deferred tax liabilities: | ||||||||||
Prepaid expenses | (388 | ) | (135 | ) | (523 | ) | ||||
Deferred loan origination costs | (2,238 | ) | (777 | ) | (3,015 | ) | ||||
Unrealized gain on loans held-for-sale | (1,954 | ) | (679 | ) | (2,633 | ) | ||||
Unrealized gain on securities available-for-sale | (793 | ) | (306 | ) | (1,099 | ) | ||||
Intangible related to business combination | (868 | ) | (301 | ) | (1,169 | ) | ||||
Gain from acquisition of Mirae Bank | (2,674 | ) | (929 | ) | (3,603 | ) | ||||
ASC 860-50 adjustment | (1,121 | ) | (390 | ) | (1,511 | ) | ||||
| | | | | | | | | | | |
Total deferred tax liabilities | (10,036 | ) | (3,517 | ) | (13,553 | ) | ||||
| | | | | | | | | | | |
Net deferred tax assets | $ | 15,922 | $ | 5,567 | $ | 21,489 | ||||
| | | | | | | | | | | |
| | | | | | | | | | | |
| | | | | | | | | | | |
F-65
WILSHIRE BANCORP, INC.
NOTES TO CONSOLIDATED FINANCIAL STATEMENTS (Continued)
14. INCOME TAXES (Continued)
2014 (Dollars in Thousands) | Federal | State | Total | |||||||
|---|---|---|---|---|---|---|---|---|---|---|
Deferred tax assets: | ||||||||||
Bad debt reserve in excess of tax bad debt deduction | $ | 15,426 | $ | 5,359 | $ | 20,785 | ||||
Tax depreciation less than the financial statement depreciation | 394 | 687 | 1,081 | |||||||
Net operating loss | 2,232 | 1,270 | 3,502 | |||||||
OREO reserve | 722 | 251 | 973 | |||||||
ASC 718-10 non-qualified stock options | 708 | 246 | 954 | |||||||
Business combinations | 3,901 | 1,355 | 5,256 | |||||||
Charitable contributions | 5 | 38 | 43 | |||||||
Restricted stocks | 105 | 36 | 141 | |||||||
CA Enterprise Zone tax credits | (403 | ) | 1,150 | 747 | ||||||
Accrued professional fees | 55 | 19 | 74 | |||||||
Others | 3,268 | 364 | 3,632 | |||||||
| | | | | | | | | | | |
Total deferred tax assets | 26,413 | 10,775 | 37,188 | |||||||
| | | | | | | | | | | |
Deferred tax liabilities: | ||||||||||
Prepaid expenses | (376 | ) | (131 | ) | (507 | ) | ||||
Deferred loan origination costs | (1,982 | ) | (689 | ) | (2,671 | ) | ||||
Unrealized gain on loans held-for-sale | (4,035 | ) | (1,401 | ) | (5,436 | ) | ||||
Unrealized gain on securities available-for-sale | (1,448 | ) | (534 | ) | (1,982 | ) | ||||
Intangible related to business combination | (869 | ) | (302 | ) | (1,171 | ) | ||||
Gain from acquisition of Mirae Bank | (268 | ) | (93 | ) | (361 | ) | ||||
ASC 860-50 adjustment | (2,070 | ) | (719 | ) | (2,789 | ) | ||||
| | | | | | | | | | | |
Total deferred tax liabilities | (11,048 | ) | (3,869 | ) | (14,917 | ) | ||||
| | | | | | | | | | | |
Net deferred tax assets | $ | 15,365 | $ | 6,906 | $ | 22,271 | ||||
| | | | | | | | | | | |
| | | | | | | | | | | |
| | | | | | | | | | | |
In assessing the future realization of deferred tax assets, management considers whether it is more-likely-than-not that some portion or all of the deferred tax assets will not be realized. The ultimate realization is dependent upon the generation of sufficient future taxable income during the periods temporary differences become deductible. As of December 31, 2015, the Company no valuation allowance and had a net deferred tax asset of $21.5 million. As of December 31, 2014, the Company had no valuation allowance and had a net deferred tax asset of $22.3 million.
As of December 31, 2015, the Company had Section 382 limited federal and state net operating loss carryovers of $3.6 million and $3.6 million, respectively, which both begin to expire in 2029. The Company also had Section 382 limited state tax credit of $307,000, which begins to expire in 2023. As of December 31, 2014, the Company had Section 382 limited federal and state net operating loss carryovers of $7.6 million and $11.7 million, respectively. The Company also had Section 382 limited state tax credit of $307,000.
As of December 31, 2015, management performed an evaluation of all positive and negative evidence regarding the need for a valuation allowance. Positive evidence includes, but is not limited to, 12 quarters (three years) of cumulative positive pre-tax income, 19 continuous quarters of positive earnings, strong
F-66
WILSHIRE BANCORP, INC.
NOTES TO CONSOLIDATED FINANCIAL STATEMENTS (Continued)
14. INCOME TAXES (Continued)
capital, significantly improved asset quality, and the lack of regulatory orders. Negative evidence includes uncertainty in the economic recovery or slow growth of the U.S. economy and increased regulatory scrutiny that can adversely affect future earnings. Based on this evaluation, management has concluded that aforementioned available positive evidence outweighed the negative evidence and that deferred tax assets are more-likely-than-not to be realized and therefore no valuation allowance is required.
A reconciliation of the difference between the federal statutory income tax rate and the effective income tax rate is shown in the following table for the years indicated:
| | 2015 | 2014 | 2013 | |||||||
|---|---|---|---|---|---|---|---|---|---|---|
Statutory tax rate | 35 | % | 35 | % | 35 | % | ||||
State taxes—net of California Enterprise Zone tax credit | 7 | % | 6 | % | 5 | % | ||||
Valuation Allowance | 0 | % | 0 | % | 0 | % | ||||
Municipal Bonds | –1 | % | –1 | % | –1 | % | ||||
Tax credits | –6 | % | –6 | % | –7 | % | ||||
Other items | 1 | % | 0 | % | 1 | % | ||||
| | | | | | | | | | | |
Total | 36 | % | 34 | % | 33 | % | ||||
| | | | | | | | | | | |
| | | | | | | | | | | |
| | | | | | | | | | | |
In accordance with ASC 740-10, "Accounting for Uncertainty in Income Taxes," the Company recognized an increase in the liability for unrecognized tax benefit of $5,000 from prior year tax positions, and a decrease in the liability for unrecognized tax benefits of $1.2 million from settlements with federal and state tax authorities in 2015.
(Dollars in Thousands) | 2015 | 2014 | 2013 | |||||||
|---|---|---|---|---|---|---|---|---|---|---|
Unrecognized tax benefit: | ||||||||||
Balance, beginning of the year | $ | 2,935 | $ | 3,736 | $ | 1,586 | ||||
Change in related to current year tax positions | — | — | 144 | |||||||
Change in related to prior year tax positions | 5 | (12 | ) | 2,702 | ||||||
Change related to acquisitions of BankAsiana and Saehan | — | — | 1,266 | |||||||
Settlement with tax authorities | (1,192 | ) | (40 | ) | (1,962 | ) | ||||
Expiration of the statute of limitations for assessment of taxes | — | (749 | ) | — | ||||||
| | | | | | | | | | | |
Balance, end of the year | $ | 1,748 | $ | 2,935 | $ | 3,736 | ||||
| | | | | | | | | | | |
| | | | | | | | | | | |
| | | | | | | | | | | |
As of December 31, 2015, the total unrecognized tax benefit that would affect the effective income tax rate if recognized was $483,000. We expect that the unrecognized tax benefits may decrease by approximately $483,000 over the next 12 months due to settlements with state tax authorities.
As of December 31, 2015, the total accrued interest related to uncertain tax positions was $154,000. Other than the accrued interest of $66,000 related to uncertain tax positions from an acquired entity in 2013, the Company accounts for interest related to uncertain tax positions as part of the Company's provision for federal and state income taxes. Accrued interest was included as part of the current tax payable in the consolidated financial statements.
F-67
WILSHIRE BANCORP, INC.
NOTES TO CONSOLIDATED FINANCIAL STATEMENTS (Continued)
14. INCOME TAXES (Continued)
The Company files United States federal and state income tax returns in jurisdictions with varying statues of limitations. The 2012 through 2014 tax years remain subject to examination by federal tax authorities, and 2011 through 2014 tax years remain subject to examination by state tax authorities. The Company is currently under examination by the California Franchise Tax Board for the 2011, 2012, and 2013 tax years. The Company is also under examination by the New York State Department of Taxation and Finance for tax years 2011, 2012, and 2013. The Company believes that it has adequately provided or paid income tax amounts for issues not yet resolved with federal and state tax authorities. Based upon the consideration of all of the relevant facts and circumstances, the Company does not expect that the federal and state tax examination results will have a material impact on the Company's consolidated financial statements as of December 31, 2015.
15. GOODWILL & OTHER INTANGIBLE ASSETS
The Company recorded goodwill of $6.7 million from the acquisition of Liberty Bank of New York in May 2006. During 2013, additional goodwill of $10.8 million was recorded from the acquisition of BankAsiana, and $50.0 million was recorded from the acquisition of Saehan. The carrying amount of goodwill amounted to $67.5 million at December 31, 2015 and December 31, 2014.
The acquisitions of BankAsiana and Saehan were accounted for in accordance with ASC 805 "Business Combinations," using the acquisition method of accounting, and assets and liabilities were recorded at their estimated fair values on the dates of each acquisition. These fair value estimates were considered provisional for a period of up to one year from the dates of the acquisitions. During the third quarter of 2014, the Company finalized its acquisition accounting adjustment for the acquisitions of BankAsiana and Saehan.
Goodwill represents the excess of the purchase price over the sum of the estimated fair values of the tangible and identifiable intangible assets acquired less the estimated fair value of the liabilities assumed. Goodwill has an indefinite useful life and is evaluated for impairment annually or more frequently if events and circumstances indicate that the asset might be impaired. An impairment loss is recognized to the extent that the carrying amount exceeds the asset's fair value. At December 31, 2015, management assessed the qualitative factors related to goodwill for the year to determine whether it was more-likely-than-not that the fair value was less than its carrying amount. Based on the analysis of these factors, management determined that it was more-likely-than-not that the fair value of goodwill exceeded the carrying value and that the two-step impairment test was not needed.
The Company recorded core deposits intangibles of $1.6 million, $1.3 million, $725,000, and $3.8 million, with the acquisitions of Liberty Bank of New York, Mirae Bank, BankAsiana, and Saehan, respectively. At December 31, 2015, the total balance of core deposits intangibles, net of amortizations, was $3.2 million, compared to $4.2 million at December 31, 2014. To test for impairment of core deposits intangibles at year-end 2015, we looked for core deposits intangibles values for recent acquisitions and recent core deposits mixes. As a result, we concluded that it was more-likely-than-not that core deposits intangibles were not impaired, and that a change to the amortizing schedules were not required.
The acquisitions of BankAsiana and Saehan resulted in unfavorable lease intangibles of $239,000, and $384,000, respectively. These lease intangibles related to two lease contracts acquired from BankAsiana and four acquired from Saehan. The balance of unfavorable lease liabilities at December 31, 2015 was $285,000, compared to $482,000 at December 31, 2014. At December 31, 2015, the remaining unfavorable
F-68
WILSHIRE BANCORP, INC.
NOTES TO CONSOLIDATED FINANCIAL STATEMENTS (Continued)
15. GOODWILL & OTHER INTANGIBLE ASSETS (Continued)
lease intangibles related to BankAsiana totaled $112,000 and unfavorable lease intangibles related to Saehan totaled $173,000.
The gross carrying amount and accumulated amortization for core deposits intangibles and unfavorable lease intangibles from our previous acquisitions at December 31, 2015 and December 31, 2014, are shown in the tables below:
| | 2015 | 2014 | |||||||||||||||||
|---|---|---|---|---|---|---|---|---|---|---|---|---|---|---|---|---|---|---|---|
(Dollars in Thousands) | Original Amount | Accumulated Amortization | Carrying Balance | Original Amount | Accumulated Amortization | Carrying Balance | |||||||||||||
Core deposits intangibles related to: | |||||||||||||||||||
Liberty Bank of New York | $ | 1,640 | $ | (1,625 | ) | $ | 15 | $ | 1,640 | $ | (1,477 | ) | $ | 163 | |||||
Mirae Bank | 1,330 | (1,084 | ) | 246 | 1,330 | (990 | ) | 340 | |||||||||||
BankAsiana | 725 | (125 | ) | 600 | 725 | (70 | ) | 655 | |||||||||||
Saehan | 3,845 | (1,521 | ) | 2,324 | 3,845 | (848 | ) | 2,997 | |||||||||||
| | | | | | | | | | | | | | | | | | | | |
Total core deposits intangibles | $ | 7,540 | $ | (4,355 | ) | $ | 3,185 | $ | 7,540 | $ | (3,385 | ) | $ | 4,155 | |||||
| | | | | | | | | | | | | | | | | | | | |
| | | | | | | | | | | | | | | | | | | | |
| | | | | | | | | | | | | | | | | | | | |
| | 2015 | 2014 | |||||||||||||||||
|---|---|---|---|---|---|---|---|---|---|---|---|---|---|---|---|---|---|---|---|
(Dollars in Thousands) | Original Amount | Accumulated Amortization | Carrying Balance | Original Amount | Accumulated Amortization | Carrying Balance | |||||||||||||
Lease intangibles related to: | |||||||||||||||||||
BankAsiana | $ | (239 | ) | $ | 127 | $ | (112 | ) | $ | (239 | ) | $ | 70 | $ | (169 | ) | |||
Saehan | (384 | ) | 211 | (173 | ) | (384 | ) | 111 | (273 | ) | |||||||||
| | | | | | | | | | | | | | | | | | | | |
Total lease intangibles | $ | (623 | ) | $ | 338 | $ | (285 | ) | $ | (623 | ) | $ | 181 | $ | (442 | ) | |||
| | | | | | | | | | | | | | | | | | | | |
| | | | | | | | | | | | | | | | | | | | |
| | | | | | | | | | | | | | | | | | | | |
The amortization schedule for intangible assets for the next five years as of December 31, 2015, is show in the table below:
(Dollars in Thousands) | 2016 | 2017 | 2018 | 2019 | 2020 | |||||||||||
|---|---|---|---|---|---|---|---|---|---|---|---|---|---|---|---|---|
Core deposits intangibles amortization | $ | 746 | $ | 641 | $ | 550 | $ | 388 | $ | 302 | ||||||
Unfavorable lease intangibles amortization | $ | 142 | $ | 111 | $ | 32 | $ | — | $ | — | ||||||
16. BENEFIT PLANS
401(k) Savings Plan
In 1996, the Company established a 401(k) savings plan, which is open to all eligible employees who are 21 years old or over, and have completed six months of service with the Company. The plan provides for the Company's matching contribution up to 6% of participants' compensation during the plan year. Vesting of the employer contributions is 25% after two years of service, and 25% per year thereafter. Total employer contributions to the plan amounted to approximately $1.3 million, $1.1 million, and $935,000 for the years ended December 31, 2015, 2014, and 2013, respectively.
F-69
WILSHIRE BANCORP, INC.
NOTES TO CONSOLIDATED FINANCIAL STATEMENTS (Continued)
16. BENEFIT PLANS (Continued)
Post-Retirement Benefit Obligations
In 2003, we adopted a Survivor Income Plan for the benefit of the directors and officers of the Bank in order to encourage their continued employment and service, and to reward them for their past contributions. The plan was modified in 2005. We also entered into separate Survivor Income Agreements with officers and directors relating to the Survivor Income Plan. Under the terms of the Survivor Income Plan, each participant is entitled to a base amount of death proceeds as set forth in the participant's election to participate, which base amount increases three percent per calendar year, but only until normal retirement age, which is 65. If the participant remains employed after age 65, the death benefit will be fixed at the amount determined at age 65. If a participant has attained age 65 prior to becoming a participant in the Survivor Income Plan, the death benefit shall be equal to the base amount set forth in their election to participate with no increases. We are obligated to pay any death benefit owed under the Survivor Income Plan in a lump sum within 90 days following the participant's death.
The participant's rights under the Survivor Income Plan terminate upon termination of employment with Wilshire Bank. Upon termination of employment (except for termination for cause), the participant will have the option to convert the amount of death benefits calculated at such termination to a split dollar arrangement, provided such arrangement is available under bank regulations and/or tax laws. If available, Wilshire Bank and the participant will enter into a split dollar agreement and a split dollar policy endorsement. Under such an arrangement, we would annually impute income to the officer or the director based on tax laws or rules in force upon conversion. The Company accrued $222,000 in 2015, $105,000 in 2014, and $272,000 in 2013 for postretirement benefit obligations.
On January 30, 2012, the Board of Directors of the Company approved an increase in BOLI benefits totaling $565,000, for five of the Company's Directors. Subsequently on January 31, 2013, an increase in BOLI benefits totaling $500,000 for the chief executive officer (also a director) was approved by the Board of Directors of the Company. The plan increased benefits retroactively based on the Directors' previous service to the Company. In accordance with ASC 715-60-35, the Company recorded BOLI unrecognized prior service costs in other comprehensive income to account of the prior service cost. At December 31, 2015, BOLI unrecognized prior service costs, a part of other comprehensive income, totaled $445,000, compared to $495,000 at December 31, 2014.
17. REGULATORY MATTERS
The Company and Bank are subject to various regulatory capital requirements administered by the federal banking agencies. Failure to meet minimum capital requirements can initiate certain mandatory and possibly additional discretionary actions by regulators that, if undertaken, could have a direct material effect on the Company's financial statements. Under capital adequacy guidelines and the regulatory framework for prompt corrective action, the Company and Bank must meet specific capital guidelines that involve quantitative measures of assets, liabilities, and certain off-balance sheet items as calculated under regulatory accounting practices. The Company and Bank's capital amounts and classification are also subject to qualitative judgments by the regulators about components, risk weightings, and other factors.
Quantitative measures established by regulation to ensure capital adequacy require the Company and Bank to maintain minimum ratios (set forth in the table below) of total, Tier I capital, and Tier 1 common equity to risk-weighted assets (as defined), and Tier I capital (as defined) to quarterly average assets. Management believes that, as of December 31, 2015 and 2014, the Company and Bank met all capital adequacy requirements to which they were subject.
F-70
WILSHIRE BANCORP, INC.
NOTES TO CONSOLIDATED FINANCIAL STATEMENTS (Continued)
17. REGULATORY MATTERS (Continued)
Federal Reserve Board rules provide that a bank holding company may count proceeds from a trust preferred securities issuance as Tier 1 capital in an amount up to 25% of its total Tier 1 capital. Under the Federal Reserve Board capital guidelines, as of December 31, 2015 and 2014, the Company was able to include part of the proceeds from the previously issued trust preferred securities as Tier 1 capital.
As of December 31, 2015, all of the Bank's capital ratios were in excess of the regulatory requirements for a "well-capitalized institution". To be categorized as well capitalized, the Bank must maintain minimum total risk-based ratio of 10.0%, Tier I risk-based ratio of 8.0%, Tier 1 common equity risk-based ratio of 6.50%, and a Tier I leverage ratio of 5.0%.
F-71
WILSHIRE BANCORP, INC.
NOTES TO CONSOLIDATED FINANCIAL STATEMENTS (Continued)
17. REGULATORY MATTERS (Continued)
The Company and Bank's capital amounts and ratios are presented in the follow table for the dates indicated:
| | Actual | Required For Capital Adequacy Purposes* | Required To Be Well Capitalized Under Prompt Corrective Action Provisions* | ||||||||||||||||||||
|---|---|---|---|---|---|---|---|---|---|---|---|---|---|---|---|---|---|---|---|---|---|---|---|
(Dollars In Thousands) | Amount | Ratio | Amount | | Ratio | Amount | | Ratio | |||||||||||||||
As of December 31, 2015 | |||||||||||||||||||||||
Total Capital (to risk-weighted assets): | |||||||||||||||||||||||
Wilshire Bancorp, Inc. | $ | 576,703 | 14.11 | % | $ | 326,873 | ³ | 8.00 | % | $ | 408,591 | N/A | |||||||||||
Wilshire Bank | $ | 550,898 | 13.50 | % | $ | 326,346 | ³ | 8.00 | % | $ | 407,933 | 10.00 | % | ||||||||||
Tier 1 Capital (to risk-weighted assets): |
|
| |||||||||||||||||||||
Wilshire Bancorp, Inc. | $ | 525,563 | 12.86 | % | $ | 245,155 | ³ | 6.00 | % | $ | 326,873 | N/A | |||||||||||
Wilshire Bank | $ | 499,873 | 12.25 | % | $ | 244,760 | ³ | 6.00 | % | $ | 326,346 | 8.00 | % | ||||||||||
Tier 1 Common Capital (to risk-weighted assets): |
|
| |||||||||||||||||||||
Wilshire Bancorp, Inc. | $ | 458,825 | 11.23 | % | $ | 183,866 | ³ | 4.50 | % | $ | 265,584 | N/A | |||||||||||
Wilshire Bank | $ | 499,873 | 12.32 | % | $ | 183,570 | ³ | 4.50 | % | $ | 265,156 | 6.50 | % | ||||||||||
Tier 1 Capital (to quarterly average assets): |
|
| |||||||||||||||||||||
Wilshire Bancorp, Inc. | $ | 525,563 | 11.30 | % | $ | 186,067 | ³ | 4.00 | % | $ | 232,583 | N/A | |||||||||||
Wilshire Bank | $ | 499,873 | 10.77 | % | $ | 185,733 | ³ | 4.00 | % | $ | 232,167 | 5.00 | % | ||||||||||
As of December 31, 2014 |
|
| |||||||||||||||||||||
Total Capital (to risk-weighted assets): | |||||||||||||||||||||||
Wilshire Bancorp, Inc. | $ | 523,396 | 15.38 | % | $ | 272,227 | ³ | 8.00 | % | N/A | N/A | ||||||||||||
Wilshire Bank | $ | 508,821 | 14.97 | % | $ | 271,982 | ³ | 8.00 | % | $ | 339,978 | ³ | 10.00 | % | |||||||||
Tier 1 Capital (to risk-weighted assets): |
|
| |||||||||||||||||||||
Wilshire Bancorp, Inc. | $ | 480,772 | 14.13 | % | $ | 136,114 | ³ | 4.00 | % | N/A | N/A | ||||||||||||
Wilshire Bank | $ | 466,235 | 13.71 | % | $ | 135,991 | ³ | 4.00 | % | $ | 203,987 | ³ | 6.00 | % | |||||||||
Tier 1 Capital (to quarterly average assets): |
|
| |||||||||||||||||||||
Wilshire Bancorp, Inc. | $ | 480,772 | 12.11 | % | $ | 158,865 | ³ | 4.00 | % | N/A | N/A | ||||||||||||
Wilshire Bank | $ | 466,235 | 11.75 | % | $ | 158,718 | ³ | 4.00 | % | $ | 198,398 | ³ | 5.00 | % | |||||||||
- *
- BASEL III revised the capital adequacy requirements and the Prompt Corrective Action Framework effective January 1, 2015 for the Company and Bank
F-72
WILSHIRE BANCORP, INC.
NOTES TO CONSOLIDATED FINANCIAL STATEMENTS (Continued)
17. REGULATORY MATTERS (Continued)
As a holding company whose only significant asset is the common stock of the Bank, the Company's ability to pay dividends on its common stock and to conduct business activities directly or in non-banking subsidiaries depends significantly on the receipt of dividends or other distributions from the Bank. The Bank's ability to pay any cash dividends will depend not only upon its earnings during a specified period, but also on its meeting certain capital requirements. The Federal Deposit Insurance Act and FDIC regulations restrict the payment of dividends when a bank is undercapitalized, when a bank has failed to pay insurance assessments, or when there are safety and soundness concerns regarding a bank.
The payment of dividends by the Bank may also be affected by other regulatory requirements and policies, such as maintenance of adequate capital. If, in the opinion of the regulatory authority, a depository institution under its jurisdiction is engaged in, or is about to engage in, an unsafe or unsound practice (that, depending on the financial condition of the depository institution, could include the payment of dividends), such authority may require, after notice and hearing, that such depository institution cease and desist from such practice. The Federal Reserve Board has issued a policy statement that provides that insured banks and bank holding companies should generally pay dividends only out of operating earnings for the current and preceding two years. In addition, all insured depository institutions are subject to the capital-based limitations required by the Federal Deposit Insurance Corporation Improvement Act of 1991. In addition to the regulation of dividends and other capital distributions, there are various statutory and regulatory limitations on the extent to which the Bank can finance or otherwise transfer funds to the Company or any of its non-banking subsidiaries, whether in the form of loans, extensions of credit, investments, or asset purchases. The Federal Reserve Act and Regulation may further restrict these transactions in the interest of safety and soundness. The foregoing restrictions on dividends paid by the Bank may limit Wilshire Bancorp's ability to obtain funds from such dividends for its cash needs, including funds for payment of its debt service requirements and operating expenses and for payment of cash dividends to Wilshire Bancorp's shareholders. The amount of dividends the Bank could pay to Wilshire Bancorp as of December 31, 2015 without prior regulatory approval, which is limited by statute to the sum of undivided profits for the current year plus net profits for the preceding two years (less any distributions made to shareholders during such periods), was $21.3 million. Total cash dividends paid to the Company by the Bank in 2015 was $30.0 million. There were no cash dividends paid by the Bank to the Company in 2014.
The Basel III Rules, effective January 1, 2015 for the Company and Bank, include new risk-based and leverage capital ratio requirements and refined the definition of what constitutes "capital" for purposes of calculating those ratios. The minimum capital level requirements applicable to the Company and our subsidiary bank under the Basel III Rules are: (i) a new common equity Tier 1 risk-based capital ratio of 4.5%; (ii) a Tier 1 risk-based capital ratio of 6% (increased from 4%); (iii) a total risk-based capital ratio of 8% (unchanged); and (iv) a Tier 1 leverage ratio of 4% (unchanged) for all institutions. Common equity Tier 1 capital will consist of retained earnings and common stock instruments, subject to certain adjustments.
The Basel III Rules also establish a "capital conservation buffer" of 2.5% above the new regulatory minimum risk-based capital requirements. The conservation buffer, when added to the capital requirements, will result in the following minimum ratios: (i) a common equity Tier 1 risk-based capital ratio of 7.0%, (ii) a Tier 1 risk-based capital ratio of 8.5%, and (iii) a total risk-based capital ratio of 10.5%. The new capital conservation buffer requirement will be phased in beginning in January 2016 at 0.625% of risk-weighted assets and will increase by 0.625% each year until fully implemented at 2.5% in January 2019. An institution would be subject to limitations on certain activities including payment of dividends,
F-73
WILSHIRE BANCORP, INC.
NOTES TO CONSOLIDATED FINANCIAL STATEMENTS (Continued)
17. REGULATORY MATTERS (Continued)
share repurchases, and discretionary bonuses to executive officers if its capital level is below the buffered ratio. Although these new capital ratios do not become fully phased in until 2019, the banking regulators will expect bank holding companies and banks to meet these requirements well ahead of that date.
18. EARNINGS PER COMMON SHARE
The following is a reconciliation of the basic and diluted earnings per common share computations at December 31, 2015, 2014, and 2013:
(Dollars in Thousands, Except per Share Data) | 2015 | 2014 | 2013 | |||||||
|---|---|---|---|---|---|---|---|---|---|---|
Numerator: | ||||||||||
Net income | $ | 61,405 | $ | 59,009 | $ | 45,376 | ||||
| | | | | | | | | | | |
| | | | | | | | | | | |
| | | | | | | | | | | |
Denominator: | ||||||||||
Denominator for basic earnings per share: | ||||||||||
Weighted-average shares | 78,486,883 | 78,250,901 | 71,771,116 | |||||||
Effect of dilutive securities: | ||||||||||
Stock option dilution1 | 331,673 | 340,473 | 266,400 | |||||||
| | | | | | | | | | | |
Denominator for diluted earnings per share: | ||||||||||
Adjusted weighted-average shares | 78,818,556 | 78,591,374 | 72,037,516 | |||||||
| | | | | | | | | | | |
| | | | | | | | | | | |
| | | | | | | | | | | |
Basic earnings per share | $ | 0.78 | $ | 0.75 | $ | 0.63 | ||||
| | | | | | | | | | | |
| | | | | | | | | | | |
| | | | | | | | | | | |
Diluted earnings per share | $ | 0.78 | $ | 0.75 | $ | 0.63 | ||||
| | | | | | | | | | | |
| | | | | | | | | | | |
| | | | | | | | | | | |
- 1
- Excludes 122,451 and 275,800 in stock options outstanding at December 31, 2015 and 2014, respectively, for which the exercise price exceeded the average market price of the Company's common stock. Therefore, these stock options were deemed anti-dilutive, and were excluded from the diluted earnings per share calculation.
19. OTHER COMPREHENSIVE INCOME (LOSS)
Accumulated other comprehensive income (loss) includes net unrealized gains and losses on available-for-sale investment securities, net unrealized gains and losses on interest-only strip, and unrecognized prior service costs on BOLI. Changes to accumulated other comprehensive income (loss) are presented net of tax effect as a component of equity. Reclassifications out of accumulated other comprehensive income (loss) are recorded on the Consolidated Statements of Income as either a gain or loss. The reclassifications for available-for-sale securities are included in the Consolidated Statements of Income as a gain on sale or call of securities.
F-74
WILSHIRE BANCORP, INC.
NOTES TO CONSOLIDATED FINANCIAL STATEMENTS (Continued)
19. OTHER COMPREHENSIVE INCOME (LOSS) (Continued)
Changes to accumulated other comprehensive income (loss) by components are shown in the following tables for the periods indicated:
| | 2015 | ||||||||||||
|---|---|---|---|---|---|---|---|---|---|---|---|---|---|
(Dollars in Thousands) | Net Unrealized Gains and Losses on AFS Securities | Net Unrealized Gains on Interest- Only Strip | BOLI Unrecognized Prior Service Costs | Total | |||||||||
Balance at beginning of year | $ | 4,649 | $ | 299 | $ | (495 | ) | $ | 4,453 | ||||
Other comprehensive income (loss) before reclassification | (2,044 | ) | (56 | ) | 50 | (2,050 | ) | ||||||
Reclassifications from other comprehensive income | — | — | — | — | |||||||||
Tax effect of current period changes | 860 | 23 | — | 883 | |||||||||
| | | | | | | | | | | | | | |
Current period changes net of taxes | (1,184 | ) | (33 | ) | 50 | (1,167 | ) | ||||||
| | | | | | | | | | | | | | |
Balance at end of year | $ | 3,465 | $ | 266 | $ | (445 | ) | $ | 3,286 | ||||
| | | | | | | | | | | | | | |
| | | | | | | | | | | | | | |
| | | | | | | | | | | | | | |
| | 2014 | ||||||||||||
|---|---|---|---|---|---|---|---|---|---|---|---|---|---|
(Dollars in Thousands) | Net Unrealized Gains and Losses on AFS Securities | Net Unrealized Gains on Interest- Only Strip | BOLI Unrecognized Prior Service Costs | Total | |||||||||
Balance at beginning of year | $ | 192 | $ | 330 | $ | (545 | ) | $ | (23 | ) | |||
Other comprehensive income (loss) before reclassification | 7,681 | (53 | ) | 50 | 7,678 | ||||||||
Reclassifications from other comprehensive income | — | — | — | — | |||||||||
Tax effect of current period changes | (3,224 | ) | 22 | — | (3,202 | ) | |||||||
| | | | | | | | | | | | | | |
Current period changes net of taxes | 4,457 | (31 | ) | 50 | 4,476 | ||||||||
| | | | | | | | | | | | | | |
Balance at end of year | $ | 4,649 | $ | 299 | $ | (495 | ) | $ | 4,453 | ||||
| | | | | | | | | | | | | | |
| | | | | | | | | | | | | | |
| | | | | | | | | | | | | | |
| | 2013 | ||||||||||||
|---|---|---|---|---|---|---|---|---|---|---|---|---|---|
(Dollars in Thousands) | Net Unrealized Gains and Losses on AFS Securities | Net Unrealized Gains on Interest- Only Strip | BOLI Unrecognized Prior Service Costs | Total | |||||||||
Balance at beginning of year | $ | 6,841 | $ | 321 | $ | (351 | ) | $ | 6,811 | ||||
Other comprehensive (loss) income before reclassification | (11,445 | ) | 28 | (194 | ) | (11,611 | ) | ||||||
Reclassifications from other comprehensive income | (19 | ) | — | — | (19 | ) | |||||||
Tax effect of current period changes | 4,815 | (19 | ) | — | 4,796 | ||||||||
| | | | | | | | | | | | | | |
Current period changes net of taxes | (6,649 | ) | 9 | (194 | ) | (6,834 | ) | ||||||
| | | | | | | | | | | | | | |
Balance at end of year | $ | 192 | $ | 330 | $ | (545 | ) | $ | (23 | ) | |||
| | | | | | | | | | | | | | |
| | | | | | | | | | | | | | |
| | | | | | | | | | | | | | |
F-75
WILSHIRE BANCORP, INC.
NOTES TO CONSOLIDATED FINANCIAL STATEMENTS (Continued)
19. OTHER COMPREHENSIVE INCOME (LOSS) (Continued)
There were no reclassifications out of other comprehensive income (loss) to realized gains on sale or call of securities in 2015 or 2014. Reclassification out of comprehensive income (loss) to realized gains on sale or call of securities totaled $19,000, for the year ended December 31, 2013. Aside from the reclassification from unrealized gain (losses) on securities in 2013, there were no other reclassifications out of other comprehensive income (loss) for the years ended December 31, 2015, 2014, and 2013.
20. BUSINESS SEGMENT REPORTING
With the acquisitions and integrations of BankAsiana and Saehan, the Company reassessed its classification of its segment reporting units under ASC 280 "Segment Reporting" to better reflect how the Company is managed and how information is internally reviewed. Based on this internal evaluation, the Company determined in 2014, that the previously reported three business segments, "Banking Operation", "SBA Lending Services", and "Trade Finance Services", are no longer applicable. The Company is now managed as a single business segment. The financial performance of the Company is reviewed by the chief operating decision maker on an aggregate basis and financial and strategic decisions are also made based on the Company as a whole. We now consider "Banking Operations" to be our single combined operating segment, which raises funds from deposits and borrowings for loans and investments, and provides lending products, including construction, real estate, commercial, and consumer loans to its customers.
21. CONDENSED FINANCIAL STATEMENTS OF PARENT COMPANY
The following presents the unconsolidated financial statements of only the parent company, Wilshire Bancorp, Inc., for the dates indicated:
STATEMENTS OF FINANCIAL CONDITION
(Dollars in Thousands) | December 31, 2015 | December 31, 2014 | |||||
|---|---|---|---|---|---|---|---|
Assets: | |||||||
Cash and cash equivalents | $ | 26,450 | $ | 13,381 | |||
Investment in subsidiary | 579,256 | 546,596 | |||||
Prepaid income taxes | 3,522 | 3,968 | |||||
Other assets | 493 | 1,213 | |||||
| | | | | | | | |
Total assets | $ | 609,721 | $ | 565,158 | |||
| | | | | | | | |
| | | | | | | | |
| | | | | | | | |
Liabilities: | |||||||
Other borrowings | $ | 72,015 | $ | 71,779 | |||
Accounts payable and other liabilities | 56 | 51 | |||||
Cash dividend payable | 4,720 | 3,917 | |||||
| | | | | | | | |
Total liabilities | 76,791 | 75,747 | |||||
Shareholders' equity | 532,930 | 489,411 | |||||
| | | | | | | | |
Total | $ | 609,721 | $ | 565,158 | |||
| | | | | | | | |
| | | | | | | | |
| | | | | | | | |
F-76
WILSHIRE BANCORP, INC.
NOTES TO CONSOLIDATED FINANCIAL STATEMENTS (Continued)
21. CONDENSED FINANCIAL STATEMENTS OF PARENT COMPANY (Continued)
STATEMENTS OF INCOME
(Dollars in Thousands) | December 31, 2015 | December 31, 2014 | December 31, 2013 | |||||||
|---|---|---|---|---|---|---|---|---|---|---|
Interest expense | $ | 1,772 | $ | 1,719 | $ | 1,197 | ||||
Other operating expense | 2,313 | 2,287 | 3,790 | |||||||
| | | | | | | | | | | |
Total expense | 4,085 | 4,006 | 4,987 | |||||||
Other income | 46 | 45 | 38 | |||||||
Distributed earnings of subsidiary | 30,000 | — | 121,700 | |||||||
Undistributed earnings (loss) of subsidiary | 33,827 | 61,148 | (73,643 | ) | ||||||
| | | | | | | | | | | |
Earnings before income tax benefit | 59,788 | 57,187 | 43,108 | |||||||
Income tax benefit | 1,617 | 1,822 | 2,268 | |||||||
| | | | | | | | | | | |
Net income | $ | 61,405 | $ | 59,009 | $ | 45,376 | ||||
| | | | | | | | | | | |
| | | | | | | | | | | |
| | | | | | | | | | | |
STATEMENTS OF CASH FLOWS
(Dollars In Thousands) | December 31, 2015 | December 31, 2014 | December 31, 2013 | |||||||
|---|---|---|---|---|---|---|---|---|---|---|
Cash flows from operating activities: | ||||||||||
Net income | $ | 61,405 | $ | 59,009 | $ | 45,376 | ||||
Adjustments to reconcile net income to net cash provided by (used in) operating activities: | ||||||||||
Net change in accounts payable and other liabilities | 5 | 2 | — | |||||||
Share-based compensation expense | 1,075 | 932 | 460 | |||||||
Net change in prepaid income taxes | 446 | (1,732 | ) | 223 | ||||||
Net change in other assets | 720 | (1,045 | ) | (166 | ) | |||||
Undistributed (earnings) loss of subsidiary | (33,827 | ) | (61,148 | ) | 73,643 | |||||
| | | | | | | | | | | |
Net cash provided (used in) by operating activities | 29,824 | (3,982 | ) | 119,536 | ||||||
| | | | | | | | | | | |
Cash flows from investing activities: | ||||||||||
(Investments in) payments from subsidiary | (327 | ) | 228 | (90,179 | ) | |||||
| | | | | | | | | | | |
Net cash (used in) provided by investing activities | (327 | ) | 228 | (90,179 | ) | |||||
| | | | | | | | | | | |
Cash flows from financing activities: | ||||||||||
Proceeds from exercise of stock options | 810 | 974 | 958 | |||||||
Tax benefit from exercise of stock options | — | 259 | 135 | |||||||
Cash paid for stock repurchases | — | — | (4,287 | ) | ||||||
Payments of cash dividend on common stock | (17,238 | ) | (14,082 | ) | (4,244 | ) | ||||
| | | | | | | | | | | |
Net cash used in financing activities | (16,428 | ) | (12,849 | ) | (7,438 | ) | ||||
| | | | | | | | | | | |
Net change in cash and cash equivalents | 13,069 | (16,603 | ) | 21,919 | ||||||
Cash and cash equivalents, beginning of year | 13,381 | 29,984 | 8,065 | |||||||
| | | | | | | | | | | |
Cash and cash equivalents, end of year | $ | 26,450 | $ | 13,381 | $ | 29,984 | ||||
| | | | | | | | | | | |
| | | | | | | | | | | |
| | | | | | | | | | | |
F-77
WILSHIRE BANCORP, INC.
NOTES TO CONSOLIDATED FINANCIAL STATEMENTS (Continued)
22. QUARTERLY FINANCIAL DATA (UNAUDITED)
Summarized quarterly financial data follows:
| | Three Months Ended, | | ||||||||||||||
|---|---|---|---|---|---|---|---|---|---|---|---|---|---|---|---|---|
2015 (Dollars in Thousands, Except Share Data) | March 31, | June 30, | September 30, | December 31, | YTD Total | |||||||||||
Net interest income | $ | 36,491 | $ | 37,473 | $ | 37,459 | $ | 39,419 | $ | 150,842 | ||||||
Provision for loan losses and loan commitments | — | — | 700 | — | 700 | |||||||||||
Non-Interest Income | 15,267 | 11,314 | 9,527 | 9,546 | 45,654 | |||||||||||
Non-Interest Expenses | 22,909 | 24,667 | 25,750 | 26,564 | 99,890 | |||||||||||
| | | | | | | | | | | | | | | | | |
Income Before Income Taxes | 28,849 | 24,120 | 20,536 | 22,401 | 95,906 | |||||||||||
Income Tax Provision | 10,230 | 8,567 | 7,251 | 8,453 | 34,501 | |||||||||||
| | | | | | | | | | | | | | | | | |
Net income | 18,619 | 15,553 | 13,285 | 13,948 | 61,405 | |||||||||||
| | | | | | | | | | | | | | | | | |
| | | | | | | | | | | | | | | | | |
| | | | | | | | | | | | | | | | | |
Basic earnings per common share* | $ | 0.24 | $ | 0.20 | $ | 0.17 | $ | 0.18 | $ | 0.78 | ||||||
Diluted earnings per common share* | $ | 0.24 | $ | 0.20 | $ | 0.17 | $ | 0.18 | $ | 0.78 | ||||||
| ||||||||||||||||
2014 | | | | | | |||||||||||
Net interest income | $ | 35,173 | $ | 36,129 | $ | 36,768 | $ | 37,467 | $ | 145,537 | ||||||
Provision for loan losses and loan commitments | — | — | — | — | — | |||||||||||
Non-Interest Income | 10,986 | 10,744 | 9,598 | 9,913 | 41,241 | |||||||||||
Non-Interest Expenses | 26,257 | 24,550 | 23,239 | 23,468 | 97,514 | |||||||||||
| | | | | | | | | | | | | | | | | |
Income Before Income Taxes | 19,902 | 22,323 | 23,127 | 23,912 | 89,264 | |||||||||||
Income Tax Provision | 6,789 | 7,659 | 7,998 | 7,809 | 30,255 | |||||||||||
| | | | | | | | | | | | | | | | | |
Net income | 13,113 | 14,664 | 15,129 | 16,103 | 59,009 | |||||||||||
| | | | | | | | | | | | | | | | | |
| | | | | | | | | | | | | | | | | |
| | | | | | | | | | | | | | | | | |
Basic earnings per common share * | $ | 0.17 | $ | 0.19 | $ | 0.19 | $ | 0.21 | $ | 0.75 | ||||||
Diluted earnings per common share | $ | 0.17 | $ | 0.19 | $ | 0.19 | $ | 0.20 | $ | 0.75 | ||||||
- *
- Quarterly earnings per share do not add up to the year-to-date total due to rounding
F-78