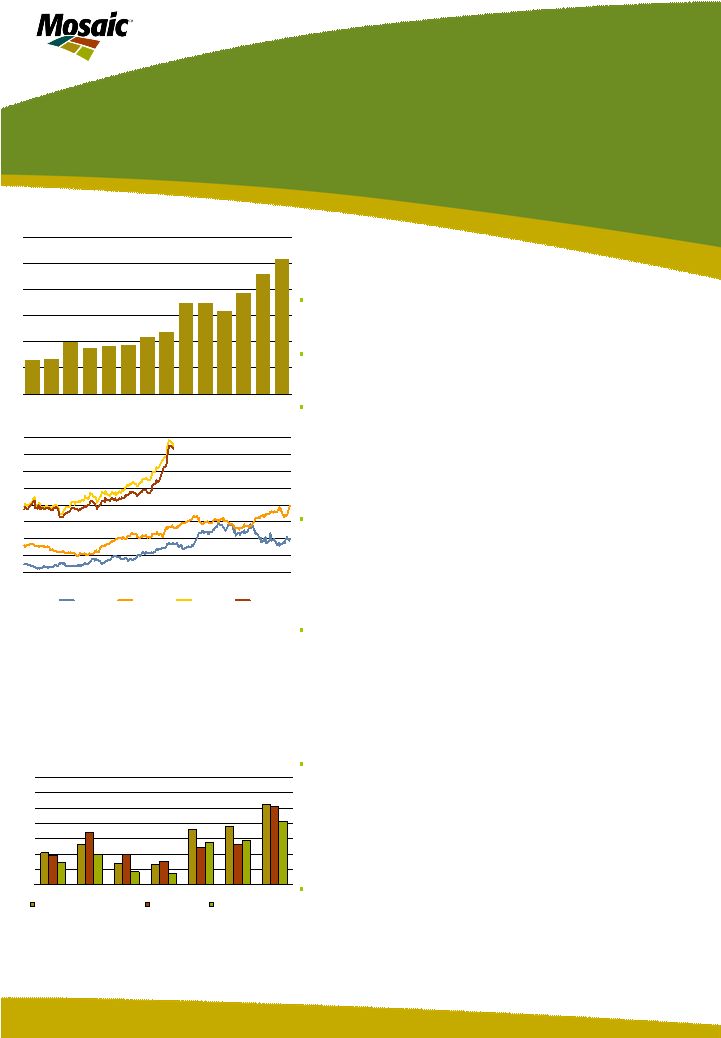
North American potash production during the first half of the fertilizer year (Jul-Dec) totaled 6.4 million tons K2O. That was up 14% from the lower levels of a year ago but up just 5% from the higher levels of two years ago – despite significant capacity expansions during this period. The chart shows that North American mines sputtered for several months last summer and fall. Production set records in July, September and December, but output only equaled or just exceeded the three-year average during the other three months. Expanded mines have not run consistently at higher rates. Producers elsewhere also are struggling to keep up with galloping demand. We estimate that the former Soviet Union exported about as much potash in 2007 as it did in 2005. Production increases at some mines were offset by the loss of the large Berezniki I mine to flooding. The combination of extraordinary demand, the loss of the Russian mine and a number of production hiccups has tightened the global market and is testing the production limits of potash suppliers worldwide. As a result, both domestic and offshore customers are turning to Canadian producers to meet this surge in demand. The North American supply/demand balance remains extremely tight. Potash stocks held by North American producers at both on- and off-site locations declined to record low levels last fall and are projected to stay at the low end of the 10-year range for the remainder of 2007/08. The chart shows that producer stocks typically build from September to February. That seasonal pattern makes sense because retailers want to be fully loaded for Fall application by about October 1 and for the Spring season by about March 1. Producer stocks, however, declined last October and stayed at this low level through November. In fact, producer stocks on November 30 were the lowest ever recorded by about 150,000 tons K 2 O. Producer stocks climbed to almost 1.1 million tons K2O on December 31. This increase caught the attention of market observers, but we estimate that much of the increase was inventory already in place on vessels or at ports for export. Stocks on this date still were the second lowest level ever reported and were 21% or 280,000 tons less than a year earlier. The only lower stock level on December 31 was reported in 2004, but stocks as a percentage of production was higher at the end of 2004 than at the end of last year. Stocks on December 31, 2004 were equal to 91% of production that month. Stocks on December 31, 2007 were equal to 88% of production for the month. The North American supply/demand balance looks tight for the rest of the fertilizer year. On the demand side, both domestic and offshore prospects remain strong due record commodity prices and positive farm economics. Offshore and domestic shipments during the first half of the fertilizer year (Jul-Dec) were up about 2% and 4%, respectively, from the lofty levels of last year and we project that each will increase about 2% for the full year. On the supply side, NA producers continue to struggle to keep up with demand. Producers relied on inventories to meet almost one-quarter of the large increase in domestic and offshore shipments last year. They will need to mine every tonne that is shipped this year. That is the challenge. Certain statements contained herein constitute “forward-looking statements” as that term is defined under the Private Securities Litigation Reform Act of 1995. Although we believe the assumptions made in connection with the forward-looking statements are reasonable, they do involve known and unknown risks, uncertainties and other factors that may cause the actual results, performance or achievements of The Mosaic Company, or industry results generally, to be materially different from those contemplated or projected, forecasted, estimated or budgeted (whether express or implied) by such statements. These risks and uncertainties include but are not limited to the predictability of fertilizer, raw material and energy markets subject to competitive market pressures; changes in foreign currency and exchange rates; international trade risks including, but not limited to, changes in policy by foreign governments; changes in environmental and other governmental regulation; adverse weather conditions affecting operations in central Florida or the Gulf Coast of the United States, including potential hurricanes or excess rainfall; actual costs of closure of the South Pierce, Green Bay and Fort Green facilities differing from management’s current estimates; accidents involving our operations, including brine inflows at our Esterhazy, Saskatchewan potash mine as well as potential mine fires, floods, explosions or releases of hazardous or volatile chemicals, as well as other risks and uncertainties reported from time to time in The Mosaic Company’s reports filed with the Securities and Exchange Commission. Actual results may differ from those set forth in the forward-looking statements. NA Production Sputters Extremely Tight NA Supply/Demand Balance NA Potash Production 2007/08 300 400 500 600 700 800 900 1000 1100 1200 1300 JUL AUG SEP OCT NOV DEC JAN FEB MA APR MAY JUN 1000 ST K 2 O MIN MAX Range (1997/98-2006/07) 2007/08 3 Year Average Source: IPNI and Mosaic North American Potash Production 0 2 4 6 8 10 12 14 16 90 91 92 93 94 95 96 97 98 99 00 01 02 03 04 05 06 07 08 Fertilizer Year Ending June 30 MST K Canada US Source: IPNI and Mosaic NA Potash Stocks at Month End 300 500 700 900 1100 1300 1500 1700 1900 2100 2300 2500 JUL AUG SEP OCT NOV DEC JAN FEB MAR APR MAY JUN 1000 ST K2O MIN MAX Range (1997/98-2006/07) 2007/08 3 Year Average Source: IPNI and Mosaic O 2 |