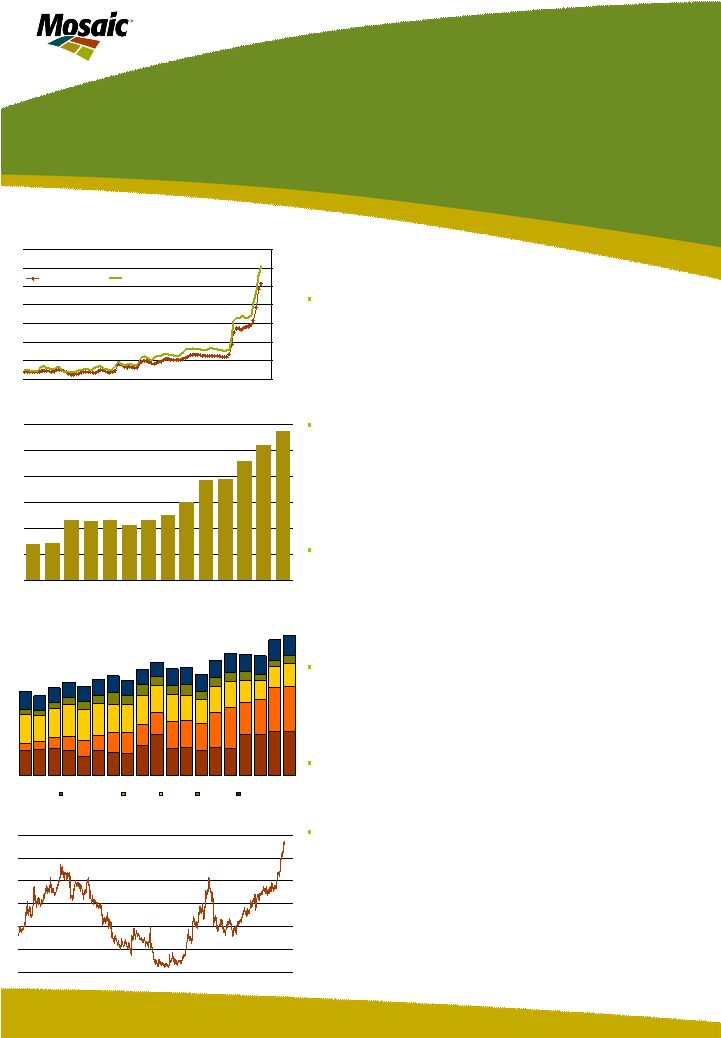
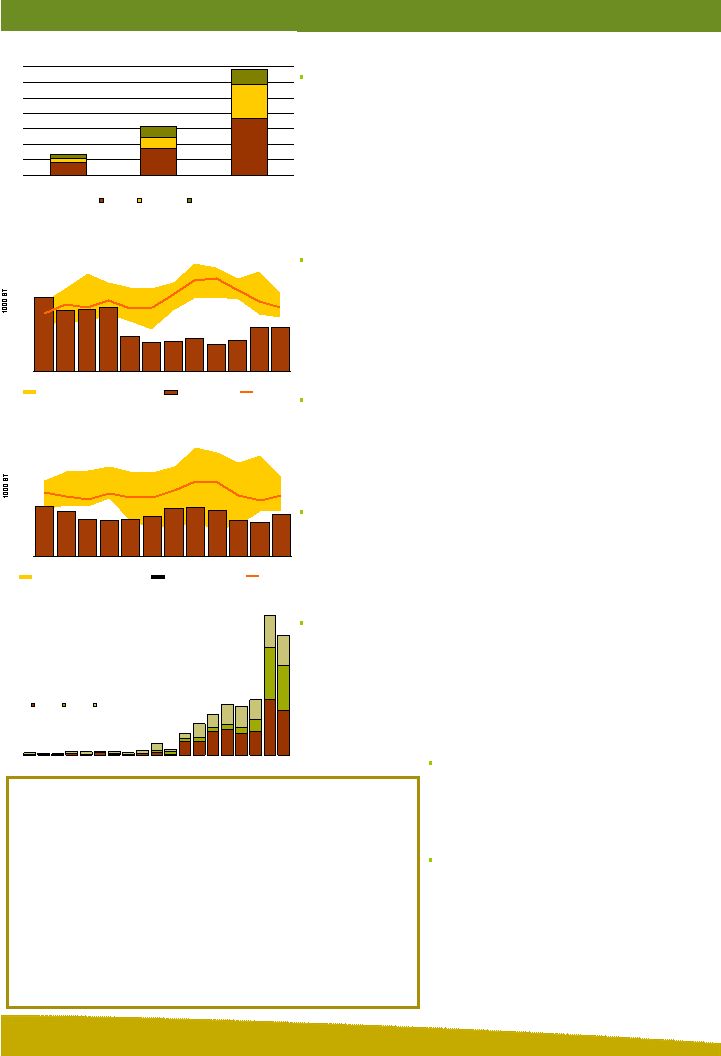
Sharp run-ups in the costs of the three raw materials required to produce DAP – namely phosphate rock, sulphur and ammonia – are the main drivers of the recent step-up in phosphate prices. For example, Moroccan producer OCP, the largest rock exporter by a wide margin, reported that it had settled 2008 rock contracts in the $170 to $210 per tonne fob port range. That is more than double contract prices of last year. Spot prices of sulphur delivered to Asia have increased more than five-fold from less than $100 per tonne at the start of 2007 to the mid- $500 per tonne range today – a level unimaginable a few months ago. Ammonia prices delivered to Tampa also climbed to record levels late last year and continue to rise to more than $500 per tonne so far this year. These jaw-dropping increases have profound implications on phosphate costs, especially for non-integrated players or fabricators that do not mine phosphate rock. For example, we estimate that the cost of these three raw materials delivered to India has increased to almost $700 per tonne of DAP today, up from an average of about $135 per tonne five years ago and up from an average of more than $300 per tonne last year. These costs do not include import duties, discharge and transportation costs to the fabrication plant, other raw materials costs and plant processing costs. Non-integrated fabricators, by our estimate, still account for almost one- third of the world’s phosphate supply. As a result, the world requires output from these high cost players to meet demand and it is the marginal cost of these fabricators that will determine market price. We estimate that U.S. phosphate use increased about 9% during the 2006/07 fertilizer year and will remain flat at this high level in 2007/08. DAP and MAP shipments this year, however, are projected to increase about 8% because pipeline stocks were used to meet demand during the previous two years. In fact, shipments during the first half of this fertilizer year (Jul-Dec) were up a solid 25% from the low levels of a year earlier. The combination of strong domestic shipments and steady if not spectacular offshore movement has resulted in a sharp drawdown of producer stocks. DAP and MAP inventories held by U.S. producers at both on- and off-site locations have declined to record or near-record lows since October 2006 and our forecasts indicate that stocks will remain at low levels for the rest of the 2007/08 fertilizer year. Certain statements contained herein constitute “forward-looking statements” as that term is defined under the Private Securities Litigation Reform Act of 1995. Although we believe the assumptions made in connection with the forward-looking statements are reasonable, they do involve known and unknown risks, uncertainties and other factors that may cause the actual results, performance or achievements of The Mosaic Company, or industry results generally, to be materially different from those contemplated or projected, forecasted, estimated or budgeted (whether express or implied) by such statements. These risks and uncertainties include but are not limited to the predictability of fertilizer, raw material and energy markets subject to competitive market pressures; changes in foreign currency and exchange rates; international trade risks including, but not limited to, changes in policy by foreign governments; changes in environmental and other governmental regulation; adverse weather conditions affecting operations in central Florida or the Gulf Coast of the United States, including potential hurricanes or excess rainfall; actual costs of closure of the South Pierce, Green Bay and Fort Green facilities differing from management’s current estimates; accidents involving our operations, including brine inflows at our Esterhazy, Saskatchewan potash mine as well as potential mine fires, floods, explosions or releases of hazardous or volatile chemicals, as well as other risks and uncertainties reported from time to time in The Mosaic Company’s reports filed with the Securities and Exchange Commission. Actual results may differ from those set forth in the forward-looking statements. Increasingly Tight U.S. Situation China Remains the Swing Factor China Processed Phosphate Exports 0.0 0.5 1.0 1.5 2.0 2.5 3.0 3.5 4.0 4.5 5.0 90 91 92 93 94 95 96 97 98 99 00 01 02 03 04 05 06 07 08 Source: IFA and Mosaic MMT DAP MAP TSP The chart shows that Chinese producers supplied much of the increase in global phosphate demand in 2007. In the process, however, they likely shorted their domestic customers by as much as one million tonnes of phosphate by some accounts. Chinese planners are battling a serious inflation problem caused in part by large increases in food prices. Planners clearly want to keep more phosphate at home and have imposed an export tax on DAP and MAP in order to slow exports. Domestic producers, however, still have incentive to export given the recent run-up in world values. An export tax simply drives a wedge between international and domestic prices. Planners likely will have to impose tougher policies such as export quotas to achieve their objective. A Surge in Raw Materials Costs Raw Materials Cost Non-Integrated Indian DAP Producer 0 100 200 300 400 500 600 700 2002 2007 2008 Source: Fertecon and Mosaic $ MT Rock Sulphur Ammonia U.S. DAP and MAP Producer Total Stocks 400 600 800 1000 1200 1400 1600 1800 2000 JUL AUG SEP OCT NOV DEC JAN FEB MAR APR MAY JUN MIN MAX Range (2001/02-2005/06) 06/07 Actual 3-Yr Avg Source: TFI and Mosaic U.S. DAP and MAP Producer Total Stocks 400 600 800 1000 1200 1400 1600 1800 2000 JUL AUG SEP OCT NOV DEC JAN FEB MAR APR MAY JUN MIN MAX Range (2002/03-2006/07) 07/08 Actual/Forecast 3-Yr Avg Source: TFI and Mosaic |