|
| MicroCrap Opportunities Fund Ultra MicroCap Fund Low Priced Stock Fund | | |
| | | | | | | | | |
| | | | | | | | | |
| | | | | | | | | |
| | | | | | | | | |
| | | | | | | | | |
| | | | | | | | | |
| | | | | | | | | |
| Semi-Annual Report April 30, 2018 (Unaudited) | | | | | | | |

The PERRITT MICROCAP OPPORTUNITIES FUND will, under normal circumstances, invest at least 80% of its net assets in a diversified portfolio of common stocks of United States companies that at the time of initial purchase have a market capitalization (equity market value) that is below $500 million (referred to as “micro-cap” companies). The Fund seeks to invest in micro-cap companies that have demonstrated above-average growth in revenues and/or earnings, possess relatively low levels of long-term debt, have a high percentage of their shares owned by company management, and possess modest price-to-sales ratios and price-to-earnings ratios that are below their long-term annual growth rate. At times, the Fund may also invest in “special situations” such as companies that possess valuable patents, companies undergoing restructuring, and companies involved in large share repurchase programs. Investors should expect the Fund to contain a mix of both value-priced and growth stocks.
The PERRITT ULTRA MICROCAP FUND will, under normal circumstances, invest at least 80% of its net assets in a diversified portfolio of common stocks of United States companies that at the time of initial purchase have a market capitalization (equity market value) that is below $300 million (referred to as “micro-cap” companies). The Fund seeks to invest in micro-cap companies that have a high percentage of their shares owned by company management, possess relatively low levels of long-term debt, have a potential for above average growth in revenues and/or earnings, and possess reasonable valuations based on the ratios of price-to-sales, price-to-earnings, and price-to-book values. The micro-cap companies in which the Fund may invest include “early stage” companies, which are companies that are in a relatively early stage of development with market capitalizations that are below $50 million. At times, the Fund may also invest in unseasoned companies, companies that are undergoing corporate restructuring, initial public offerings, and companies believed to possess undervalued assets.
The PERRITT LOW PRICED STOCK FUND will, under normal circumstances, invest at least 80% of its net assets in a diversified portfolio of low priced common stocks of United States companies that at the time of initial purchase have a market capitalization (equity market value) that is below $3 billion. Low priced stocks are those that are trading at or below $15 per share at the time of initial purchase. Subsequent to the initial purchase, the Fund may purchase such securities at a price above $15 per share. The Fund’s strategy is based on the premise that low priced stocks offer growth potential because these stocks have limited broker research coverage, the companies’ prospects are misunderstood by most investors, and some investors mistakenly believe stocks trading below $15 per share are more “speculative” than those trading at higher levels and therefore avoid low priced stocks. The Fund will invest in “growth” stocks, “value” stocks, or a combination of both. Given the market capitalization restrictions, the Fund will normally invest in securities issued by small-cap companies, including some micro-cap companies. However, micro-cap companies will only make up a small portion of the Fund’s portfolio. Micro-cap companies represent the smallest sector of public companies based on market capitalization. At times, the Fund’s portfolio may contain the shares of unseasoned companies, companies that are undergoing corporate restructuring, initial public offerings, and companies believed to possess undervalued assets.
Semi-Annual Report
April 30, 2018
(Unaudited)
| |
| 2 |
| 6 |
| 8 |
| 9 |
| | |
| |
| 10 |
| 14 |
| 16 |
| 17 |
| | |
| |
| 18 |
| 20 |
| 22 |
| 23 |
| | |
| |
| 24 |
| 34 |
| 35 |
| 36 |
| 39 |
| 42 |
| 51 |
| 53 |
| 57 |
| 60 |
Perr
itt MicroCap Opportunities Fund
Portfo lio Managers’ Message |
| | |
Michael Corbett,
Portfolio Manager | | George Metrou,
Portfolio Manager |
The Perritt MicroCap Opportunities Fund posted a gain of +2.12% during the six-month period ended April 30, 2018, compared to a +3.95% gain for the Russell Microcap Index and +3.27% gain for the Russell 2000 Index. The Fund’s longer-term performance results, as well as the benchmark’s performance, can be found later in this report.
During the period, we continued the strategic reduction in the number of holdings in the fund. We have attempted to concentrate our efforts and our capital in our best ideas. We began the period with 83 positions and ended the period with 74 positions. While the net reduction represents only nine positions, a greater amount of rotation occurred within the portfolio. In gross terms, we eliminated fifteen positions, and initiated six new positions.
Within the six names added to the portfolio, we were able to find new opportunities in various sectors. We added two positions in consumer discretionary, two in technology, one bank, and one industrial company. Each of the companies added adhere to our disciplined focus on companies which can generate free cash flow, have a solid balance sheet, and earn an above average return on capital.
In consumer discretionary, we added BBX Capital Corp. (BBX) a holding company whose primary asset is a 90% ownership stake in a fast-growing public timeshare company, Bluegreen Vacations Corp. (BXG). BBX was trading at a significant discount to implied market value of its BXG holding and other assets. Our second addition in the consumer space was Lazydays Holdings, Inc. (LAZY), a company that owns RV dealerships. LAZY came public via a SPAC offering (Special Purpose Acquisition Company) and plans to use its new capital and public currency to roll-up the fragmented industry. We believe the non-traditional method of going public has created a steep discount in the shares.
In the technology sector, we added Digi International Inc. (DGII) and Limelight Networks, Inc. (LLNW). DGII sells networking hardware and solutions services in the Machine-to-Machine and Internet-of-Things arena. LLNW operates a traditional content delivery network. Both companies are engaged in turnarounds of their businesses and have potentially exciting new growth avenues being cultivated “under the hood.” Both companies were trading at steep discounts to peers, affording us the opportunity to acquire growing tech focused businesses at reasonable prices.
We added one new bank to the portfolio, Bridgewater Bancshares, Inc. (BWB). BWB went public via Initial Public Offering (IPO) in March 2018. We found their laser focus on the Minneapolis commercial market, pristine credit history, and attractive valuation compelling. Furthermore, we were highly impressed with the management team, including the founder and CEO, Jerry Baack and the entire team of highly engaged senior management.
Perritt MicroCap Opportunities Fund
Lastly, we have reintroduced Sparton Corp. (SPA) to our portfolio. Shareholders of the fund may recall that we had previously owned shares in SPA and sold our position after the company received a buyout offer last year. Subsequent to our sale, the announced acquisition of SPA was terminated and the shares were aggressively sold off. We repurchased a position in the company in the wake of the acquisition termination.
The average market capitalization of the positions added was $417 million. The average number of Wall Street analysts covering the companies was two. All the companies added to the portfolio generate cash flow from their operations. These data points on size, coverage, and cash flow speak to our dedication to remain true to our microcap space; investing in undiscovered and under-researched securities of high quality companies. Sticking to our process has yielded promising initial results from the new additions to the portfolio.
During the period, we liquidated fifteen positions. One position, Omega Protein (OME) was sold after receiving a valid buyout offer. Eight companies were sold after reaching our price targets: Aspen Aerogels, Inc. (ASPN), EMC Insurance Group, Inc. (EMCI), The Ensign Group, Inc. (ENSG), Kadant Inc. (KAI), Kforce Inc. (KFRC), OrthoPediatrics Corp. (KIDS), Systemax Inc. (SYX), and Weyco Group, Inc. (WEYS). The remaining six positions removed from the portfolio were sold after a downgrade in our view of the price appreciation potential of the security or to rotate capital to higher conviction ideas.
As of April 30, 2018, the Fund’s portfolio was comprised of 74 common stocks. The Fund’s 10 largest holdings and detailed descriptions can be found later in this report. Based on our earnings estimates, the Fund’s portfolio is trading at approximately 17.1 times 2018 earnings. Stocks in the portfolio are priced at a median 1.0x revenue and the median price to book value is 1.8x. Lastly, the median market capitalization is approximately $311 million.
We are encouraged by the current composition of the portfolio. The Fund’s companies have a median revenue growth rate of 9%, return on invested capital of 8%, free cash flow margin of 7%, and trade at 1.0x revenue. This compares to revenue growth of 7%, return on invested capital of 5%, free cash flow margins of 5%, and a valuation of 1.4x revenue for the Russell Microcap Index. The bottom line is we believe our portfolio has grown faster, is more profitable, has generated more cash, and is cheaper than the broader microcap market. This should serve the Fund’s shareholders well in the future.
I want to thank my fellow shareholders for their continued support and confidence in the Perritt Capital Management team. We remain dedicated to investing in high quality micro-cap companies at attractive valuations. If you have any questions or comments about this report or your investment in the Perritt MicroCap Opportunities Fund, please call us at (800) 331-8936 or visit our website at www.perrittcap.com. Please refer to the prospectus for information about the Fund’s investment objectives and strategies
George Metrou
Portfolio Manager
Perritt MicroCap Opportunities Fund
Mutual fund investing involves risk. Principal loss is possible. The Funds invest in smaller companies, which involve additional risks, such as limited liquidity and greater volatility. The Funds invest in micro-cap companies which tend to perform poorly during times of economic stress.
Past performance does not guarantee future results.
Opinions expressed are subject to change at any time, are not guaranteed and should not be considered investment advice.
Russell Microcap Index is a capitalization weighted index of 2,000 small cap and micro cap stocks that captures the smallest 1,000 companies in the Russell 2000, plus 1,000 smaller U.S.-based listed stocks.
Russell 2000 Index is an index measuring the performance approximately 2,000 small-cap companies in the Russell 3000 Index, which is made up of 3,000 of the biggest U.S. stocks. The Russell 2000 serves as a benchmark for small-cap stocks in the United States.
Return on Equity is a measure of profitability that calculates how many dollars of profit a company generates with each dollar of shareholders’ equity.
Return on Invested Capital is a fundamental method of determining a company’s financial performance. It is used to measure how well a company is investing its capital.
Free Cash Flow is a measure of financial performance calculated as operating cash flow minus capital expenditures. Free cash flow (FCF) represents the cash that a company is able to generate after laying out the money required to maintain or expand its asset base.
Price to Book (P/B) is a ratio used to compare a stock’s market value to its book value. It is calculated by dividing the current closing price of the stock by the latest quarter’s book value per share.
Tangible Book Value is the total net asset value of a company (book value) minus intangible assets and goodwill.
(This Page Intentionally Left Blank.)
Perritt MicroCap Opportunities Fund
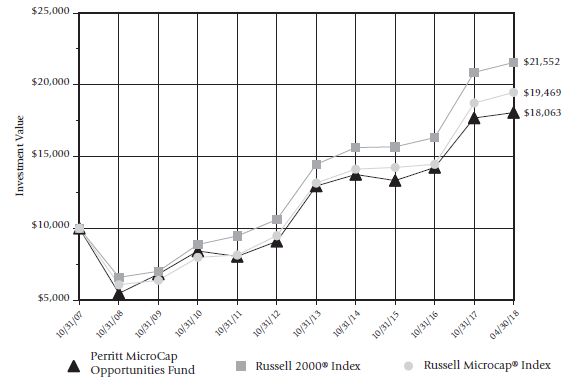
Perritt MicroCap Opportunities Fund versus
Russell 2000® Index and Russell Microcap® Index
There are several ways to evaluate a fund’s historical performance. You can look at the total percentage change in value, the average annual percentage change, or the growth of a hypothetical $10,000 investment. Each performance figure includes changes in a fund’s share price, plus reinvestment of any dividends (or income) and capital gains (the profits the fund earns when it sells stocks that have grown in value).
Cumulative total returns reflect the Fund’s actual performance over a set period. For example, if you invested $1,000 in a fund that had a 5% return over one year, you would end up with $1,050. You can compare the Fund’s returns to the Russell 2000® Index, which reflects a popular measure of the stock performance of small companies, and the Russell Microcap® Index, which measures the performance of the micro-cap segment of the U.S. equity market.
Average annual total returns take the Fund’s actual (or cumulative) return and show you what would have happened if the Fund had performed at a constant rate each year.
| * | The graph illustrates the performance of a hypothetical $10,000 investment made in the period presented. Assumes reinvestment of dividends and capital gains, but does not reflect the effect of any applicable sales charge or redemption fees or the deduction of taxes that a shareholder would pay on the Fund’s distributions or the redemption of the Fund shares. The graph does not imply any future performance. |
Perritt MicroCap Opportunities Fund
| Performance (Unaudited) (Continued) | April 30, 2018 |
| Cumulative Total Returns* |
| Periods ended April 30, 2018 (Unaudited) |
| | Past
6 Months | Past
1 Year | Past
3 Years | Past
5 Years | Past
10 Years | Past
15 Years | Past
25 Years |
| Perritt Microcap Opportunities Fund | 2.12% | 9.78% | 29.05% | 70.14% | 120.42% | 382.51% | 1134.73% |
Russell 2000® Index | 3.27% | 11.54% | 31.79% | 74.22% | 147.49% | 371.63% | 870.53% |
| (reflects no deduction for fees and expenses) | | | | | | | |
| | | | | | | | |
Russell Microcap® Index | 3.95% | 13.76% | 30.75% | 76.65% | 138.89% | 318.29% | N/A |
| (reflects no deduction for fees and expenses) | | | | | | | |
| Average Annual Total Returns* |
| Periods ended April 30, 2018 (Unaudited) |
| | Past
1 Year | Past
3 Years | Past
5 Years | Past
10 Years | Past
15 Years | Past
25 Years |
| Perritt Microcap Opportunities Fund | 9.78% | 8.87% | 11.21% | 8.22% | 11.06% | 10.58% |
Russell 2000® Index | 11.54% | 9.64% | 11.74% | 9.49% | 10.89% | 9.52% |
| (reflects no deduction for fees and expenses) | | | | | | |
| | | | | | | |
Russell Microcap® Index | 13.76% | 9.35% | 12.05% | 9.10% | 10.01% | N/A |
| (reflects no deduction for fees and expenses) | | | | | | |
The Perritt MicroCap Opportunities Fund’s annualized expense ratio for the year ended October 31, 2017, as stated in the statutory prospectus, was 1.24%. The Fund imposes a 2% redemption fee on shares held for 90 days or less. Performance data does not reflect the redemption fee. If reflected, total returns would be reduced.
Performance data quoted represents past performance; past performance does not guarantee future results. The investment return and principal value of an investment will fluctuate so that an investor’s shares, when redeemed, may be worth more or less than their original cost. Current performance of the Fund may be lower or higher than the performance quoted. Performance data current to the most recent month end is available by calling 800-331-8936.
| * | The tables do not reflect the deduction of taxes that a shareholder would pay on the Fund’s distributions or the redemption of Fund shares. |
Perritt MicroCap Opportunities Fund
Ten Largest Co mmon Stock Holdings (Unaudited) |
Bluelinx Holdings, Inc. (BXC) distributes building and industrial products in the United States. The company also provides a range of value-added services and solutions to customers. It serves dealers, industrial manufacturers, manufactured housing producers and home improvement retailers through a network of distribution centers.
Northern Technologies Intl. Corp. (NTIC) develops and markets rust and corrosion inhibiting products and services to automotive, electronics, electrical, mechanical, military, retail consumer, and oil and gas markets. It sells its products and services through a direct sales force, a network of distributors and agents, manufacturer’s sales representatives, strategic partners, and joint venture arrangements primarily in North and South America, Europe, Asia and the Middle East.
First Internet Bancorp (INBK) operates as a bank holding company for First Internet Bank of Indiana that provides commercial and retail banking products and services through its website, firstib.com.
OMNOVA Solutions Inc. (OMN) provides emulsion polymers, specialty chemicals, and engineered surfaces for various commercial, industrial, and residential end uses in the United States, Europe, and Asia. Omnova operates in two segments, Performance Chemicals and Engineered Surfaces.
Silvercrest Asset Management Group Inc. (SAMG) is a wealth management firm that provides financial advisory and related family office services in the United States. The company serves ultra-high net worth individuals and families, as well as their trusts; endowments; foundations; and other institutional investors. It also manages funds of funds and other investment funds.
Addus HomeCare Corporation (ADUS) is a provider of home and community-based personal care services, which are provided primarily in the home, and is focused on the dual eligible (Medicare/Medicaid) population. Addus provides these services on a long-term, continuous basis, with an average duration of over 20 months per consumer.
Ooma, Inc. (OOMA) provides communications solutions and other connected services to small business, home, and mobile users in the United States and Canadian markets. The company offers its products through direct sales, retailers, and online, as well as through distributors and reseller partnership channels.
Miller Industries, Inc. (MLR) engages in the manufacture and sale of towing and recovery equipment. It offers wreckers, such as conventional tow trucks and recovery vehicles. The company also provides transport trailers for moving multiple vehicles, auto auctions, car dealerships, leasing companies, and other similar applications.
Bankwell Financial Group, Inc. (BWFG) operates as the bank holding company for Bankwell Bank, it provides a range of banking services to commercial and consumer customers in Connecticut.
Hill International, Inc. (HIL) provides project and construction management, and other consulting services primarily for the buildings, transportation, environmental, energy, and industrial markets.
Fund holdings and/or sector allocations are subject to change at any time and
are not recommendations to buy or sell any security.
Please refer to the Schedule of Investments in this report for a complete list of Fund holdings.
Perritt MicroCap Opportunities Fund
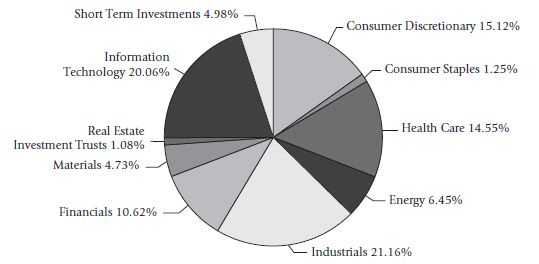
Allocation of Portfolio Investmen ts (Unaudited) | April 30, 2018 |
The sector classifications represented in the graph above and industry classifications represented in the Schedule of Investments are in accordance with Global Industry Classification Standard (GICS®), which was developed by and/or is the exclusive property of MSCI, Inc. and Standard & Poor Financial Services LLC. Percentages are based on total investments, at value.
| Note: | For presentation purposes, the Fund has grouped some of the industry categories. For purposes of categorizing securities for compliance with section 8(b)(1) of the Investment Company Act of 1940, the Fund uses more specific industry classifications. |
Perritt Ul
tra MicroCap Fund
Portfolio Managers’ Messa ge |
|  |
Michael Corbett, Portfolio Manager | Matthew Brackmann, Portfolio Manager |
The Perritt Ultra MicroCap Fund had a negative return of -0.54% for the first half of fiscal 2018. This compares unfavorably to the positive 3.95% for the Russell Microcap Index. The complete performance for the fund and its benchmarks can be found later in this report.
During the first half of the fiscal year, the fund saw its strongest performance from its holdings in the Healthcare and Energy sectors. Our top performers were our investments in healthcare service providers including Addus HomeCare (ADUS), a provider of at home health services for patients that can’t take care of themselves, which increased 45.83% for the six month period. Another was Cynergistek, Inc. (CTEK) which provides managed print services and cyber security services to healthcare providers, which was up 68.58% in the past six months. Our positive contribution from the Energy space was driven entirely by our investment in a product and service company name, Profire Energy, Inc. (PFIE) which has increased 94% in the last six months. Profire manufactures burner management systems for use in the oil in gas rigs on both production wells and downstream pipeline & refining operations. This is a name that had been on our watch list for a number of years before we took a position in it, once we saw the energy markets start to improve after a couple of very tough years. This investment paid off as they have seen large improvement in their markets as energy prices have increased, including a year-over-year revenue increase of 55%! We still hold all three of these names and look forward to future results. Five additional names were added during the period including ASV, Inc. (ASV) which assembles and distributes compact construction equipment nationwide & Juniper Pharmaceuticals, Inc. (JNP) which is a commercial stage pharmaceutical company and lab technical service provider to the biopharma space.
Since the start of fiscal year 2018, the fund sold eight investments and made a “round trip” in one. The round trip was a unique situation where one of our holdings, US Global Investors (GROW), a money manager specializing in precious metals investing traded up rapidly on news they had invested in the crypto currency space. We chose to take advantage of this move in price and sold our position into the news and subsequently repurchased it when it traded back to its book value. Additionally, we had three buy-outs during the period of which we sold two. Hardinge, Inc (HDNG) and MGC Diagnostics Corp. (MGCD) were both purchased in cash deals and sold during the period. Layne Christensen Co. (LAYN) was purchased in an all stock deal by Granite Construction, Inc. (GVA) and while we did sell some of the position, we continue to hold the balance as we see upside in GVA. Three names were sold for reaching their valuation targets: Cutera, Inc. (CUTR), PAR Technologies Corp. (PAR), & Kingstone Companies, Inc. (KINS).
As of April 30, 2018, the Fund holds the common stock of 84 companies which is lower than the 87 names we held at the time of our annual report, October 31, 2017. Based on our earnings estimates, the Fund’s portfolio is trading at 16.1x forward earnings. The median price to sales ratio is 1.11x, the median price to book ratio is 1.69x, the trailing twelve-month P/E is 22.4x and the median market cap is unchanged at $90mm.
Perritt Ultra MicroCap Fund
In terms of allocations within each sector, the fund continues to maintain large underweights to both the Financial and Healthcare sectors. We continue to look for attractive names in the space that have a solid, niche business but will continue to avoid certain areas, such as regional banks and biotech stocks in each respective sector due to valuations, risk exposure and liquidity reasons. As we discuss in each letter, many of these names either have restricted growth prospects or do not generate any revenue which does not meet the investment criteria we have been relying on for almost three decades. We remain heavily overweight in Industrials and Information Technology with modest overweight positions in the Consumer Discretionary and Energy sectors.
The Ultra MicroCap fund tends to have investments that fly under the radar screen of most investors. The microcap universe, particularly the stocks in the Ultra MicroCap’s sweet spot is in the sub $100mm market capitalization companies, are often ignored by investors for an extended period. Therefore, we remind shareholders the potential rewards can take longer to achieve but can be swift. As fellow shareholders, we come to the midpoint of this year unhappy with our relative performance versus our index and are examining each position with fresh eyes to determine if they still meet our original investment thesis. If they do not, the positions will be exited. If they do, we will continue to focus on the long-term potential for each holding based on its sound fundamentals rather than the short-term fluctuations in the markets or lack of attention from the street as we believe this to be in the best interest of our shareholders. As always, we would like to remind investors that the rewards of microcap investing are typically never consistent in the short run but can have the potential to be rewarding in a full market cycle.
We want to thank our fellow shareholders for their continued support and confidence in the Perritt Capital Management team. Each member of our investment committee, as well as other employees have made investments in this Fund and remain shareholders alongside all of you. If you have any questions or comments about this report or your investment in the Perritt Ultra MicroCap Fund, please call us at (800) 331-8936 or visit our web site at www.perrittcap.com. Please refer to the prospectus for information about the Fund’s investment objectives and strategies.
Matthew Brackmann
Portfolio Manager
Perritt Ultra MicroCap Fund
Mutual fund investing involves risk. Principal loss is possible. The Funds invest in smaller companies, which involve additional risks, such as limited liquidity and greater volatility. The Funds invest in micro-cap companies which tend to perform poorly during times of economic stress.
Past performance does not guarantee future results.
Earnings Growth is not a measure of the Fund’s future performance. Opinions expressed are subject to change at any time, are not guaranteed and should not be considered investment advice.
Please refer to the Schedule of Investments in the report for more complete information regarding Fund holdings. Fund holdings and sector allocations are subject to change and should not be considered a recommendation to buy or sell any security.
Russell Microcap Index is a capitalization weighted index of 2,000 small cap and micro cap stocks that captures the smallest 1,000 companies in the Russell 2000, plus 1,000 smaller U.S.-based listed stocks.
Price-to-Book (P/B) is a ratio used to compare a stock’s market value to its book value. It is calculated by dividing the current closing price of the stock by the latest quarter’s book value per share.
Price-to-Sales (P/S) is a valuation ratio that compares a company’s stock price to its revenues. The price-to-sales ratio is an indicator of the value placed on each dollar of a company’s sales or revenues.
Trailing Price-to Earnings (P/E) is calculated by taking the current stock price and dividing it by the trailing earnings per share (EPS) for the past 12 months.
The semi-annual report must be preceded or accompanied by a prospectus. One cannot invest directly in an index.
The Perritt Funds are distributed by Quasar Distributors, LLC.
(This Page Intentionally Left Blank.)
Perritt Ultra MicroCap Fund
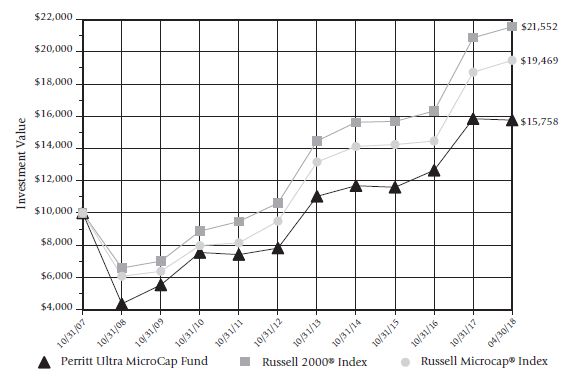
Perritt Ultra MicroCap Fund versus
Russell 2000® Index and Russell Microcap® Index
There are several ways to evaluate a fund’s historical performance. You can look at the total percentage change in value, the average annual percentage change, or the growth of a hypothetical $10,000 investment. Each performance figure includes changes in a fund’s share price, plus reinvestment of any dividends (or income) and capital gains (the profits the fund earns when it sells stocks that have grown in value).
Cumulative total returns reflect the Fund’s actual performance over a set period. For example, if you invested $1,000 in a fund that had a 5% return over one year, you would end up with $1,050. You can compare the Fund’s returns to the Russell 2000® Index, which reflects a popular measure of the stock performance of small companies, and the Russell Microcap® Index, which measures the performance of the micro-cap segment of the U.S. equity market.
Average annual total returns take the Fund’s actual (or cumulative) return and show you what would have happened if the Fund had performed at a constant rate each year.
| * | The graph illustrates the performance of a hypothetical $10,000 investment made in the period presented. Assumes reinvestment of dividends and capital gains, but does not reflect the effect of any applicable sales charge or redemption fees or the deduction of taxes that a shareholder would pay on the Fund’s distributions or the redemption of Fund shares. The graph does not imply any future performance. |
Perritt Ultra MicroCap Fund
| Performance (Unaudited) (Continued) | April 30, 2018 |
| Cumulative Total Returns** |
| Periods ended April 30, 2018 (Unaudited) |
| | Past | Past | Past | Past | Past | Since |
| | 6 Months | 1 Year | 3 Years | 5 Years | 10 Years | Inception* |
| Perritt Ultra Microcap Fund | (0.54)% | 11.72% | 32.26% | 78.35% | 106.09% | 179.46% |
Russell 2000® Index | 3.27% | 11.54% | 31.79% | 74.22% | 147.49% | 240.17% |
| (reflects no deduction for fees and expenses) | | | | | | |
Russell Microcap® Index | 3.95% | 13.76% | 30.75% | 76.65% | 138.89% | 184.75% |
| (reflects no deduction for fees and expenses) | | | | | | |
| Average Annual Total Returns** |
| Periods ended April 30, 2018 (Unaudited) |
| | Past | Past | Past | Past | Since |
| | 1 Year | 3 Years | 5 Years | 10 Years | Inception* |
| Perritt Ultra Microcap Fund | 11.72% | 9.77% | 12.27% | 7.50% | 7.81% |
Russell 2000® Index | 11.54% | 9.64% | 11.74% | 9.49% | 9.37% |
| (reflects no deduction for fees and expenses) | | | | | |
Russell Microcap® Index | 13.76% | 9.35% | 12.05% | 9.10% | 7.96% |
| (reflects no deduction for fees and expenses) | | | | | |
The Perritt Ultra MicroCap Fund’s annualized expense ratio for the year ended October 31, 2017, as stated in the statutory prospectus, was 1.71%. The Fund imposes a 2% redemption fee on shares held for 90 days or less. Performance data does not reflect the redemption fee. If reflected, total returns would be reduced.
Performance data quoted represents past performance; past performance does not guarantee future results. The investment return and principal value of an investment will fluctuate so that an investor’s shares, when redeemed, may be worth more or less than their original cost. Current performance of the Fund may be lower or higher than the performance quoted. Performance data current to the most recent month end is available by calling 800-331-8936.
| * | The since inception date is August 30, 2004. |
| ** | The tables do not reflect the deduction of taxes that a shareholder would pay on the Fund’s distributions or the redemption of Fund shares. |
Perritt Ultra MicroCap Fund
Ten Largest Common Stock Holdings (Unaudited) |
Cynergistek, Inc. (CTEK) provides outsource document solutions, IT consulting data security, and managed print services primarily to the healthcare industry in the United States. The company offers Incident Response, Vendor Security Management, and Patient Privacy Monitoring Service, as well as Compliance Assist Partner Program.
Galaxy Gaming, Inc. (GLXZ) is a gaming company that designs, develops, manufactures, markets, acquires, and licenses proprietary casino table games and associated technology, platforms, and systems for the gaming industry.
Profire Energy, Inc. (PFIE), an oilfield technology company, provides burner- and chemical-management products and services for the oil and gas industry in the United States and Canada. It assists energy production companies in the production and transportation of oil and natural gas.
DLH Holdings Corp. (DLHC) provides healthcare, logistics, and technical services and solutions to Federal Government agencies including the Department of Veteran Affairs, the Department of Defense, and other government clients.
Addus HomeCare Corporation (ADUS) is a provider of home and community-based personal care services, which are provided primarily in the home, and is focused on the dual eligible (Medicare/Medicaid) population. Addus provides these services on a long-term, continuous basis, with an average duration of over 20 months per consumer.
Luna Innovations (LUNA) develops, manufactures, and markets fiber optic sensing, and test and measurement products worldwide. It operates in two segments, Products and Licensing, and Technology Development.
Sensus Healthcare Inc. (SRTS) manufactures and markets superficial radiation therapy devices to healthcare providers worldwide. It also sells disposable lead shielding replacements: and disposable radiation safety items, such as aprons, eye shields, and disposable applicator tips.
Asure Software, Inc. (ASUR) provides cloud-based software-as-a-service (SaaS) time and labor management, and workspace management solutions worldwide. The company offers a suite of solutions to help clients optimize and manage their mobile workforces and their global workspaces.
First Internet Bancorp (INBK) operates as a bank holding company for First Internet Bank of Indiana that provides commercial and retail banking products and services through its website, firstib.com.
Information Services Group Inc. (III) operates as a technology research and advisory company in the Americas, Europe, and the Asia Pacific. The company offers digital transformation services, including automation, cloud, and data analytics; sourcing advisory; managed governance and risk; network carrier; technology strategy and operations design; change management; and market intelligence and technology research and analysis services.
Fund holdings and/or sector allocations are subject to change at any time and
are not recommendations to buy or sell any security.
Please refer to the Schedule of Investments in this report for a complete list of Fund holdings.
Perritt Ultra MicroCap Fund
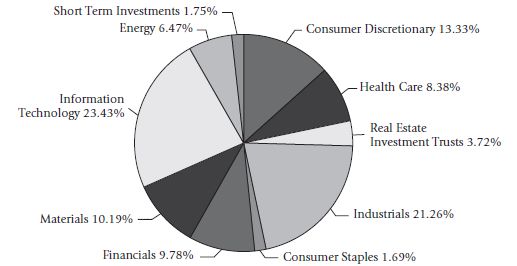
Allocation of Portfolio Investments (Unaudited) | April 30, 2018 |
The sector classifications represented in the graph above and industry classifications represented in the Schedule of Investments are in accordance with Global Industry Classification Standard (GICS®), which was developed by and/or is the exclusive property of MSCI, Inc. and Standard & Poor Financial Services LLC. Percentages are based on total investments, at value.
| Note: | For presentation purposes, the Fund has grouped some of the industry categories. For purposes of categorizing securities for compliance with section 8(b)(1) of the Investment Company Act of 1940, the Fund uses more specific industry classifications. |
Perritt Low Priced Stock Fund
Portfolio Manager’s Message |
Michael Corbett,
Portfolio Manager
The Perritt Low Priced Stock Fund made some material changes to its portfolio in the past six months. We are excited about how the Fund is positioned for the next few years. Details of these changes will be discussed later in this letter. While the Fund performed well in fiscal 2017, these recent portfolio changes impacted the Fund’s short-term performance. For the six-month ended April 30, 2018, the Perritt Low Priced Stock Fund gained 0.19%, which compares to the 3.27% gain for the Russell 2000 Index. More detailed performance results for the Fund for the past year and three years, as well as the results for the Russell 2000 Index can be found later in this report.
During the past six months, we sold 14 companies from the portfolio. Four of these investments were sold due to reporting disappointing operating results. The remaining 10 companies were sold after reaching our price targets. Globus Medical (GMED) was one of the positions sold during the period. We believe GMED is a high-quality company, but the valuation became too rich. We first purchased GMED nearly three years ago when it traded at 20 times earnings and about 3 times revenue. While the company has grown revenue and earnings by 12% and 15% respectively per year during the past three years, the company’s stock rose by nearly three-fold. The net result is that GMED now trades at more than 40 times earnings and nearly 8 times revenue. The remaining 9 companies sold in the portfolio were sold for valuation reasons too, but not to the extreme we experienced with GMED. We reinvested the proceeds in companies we believe are of similar quality, but the valuations were much more attractive.
We added 19 new companies to the portfolio during the period. While we added new names in several different industries, the main changes made to the portfolio include our increased exposure to Energy and Materials while Technology and Consumer Discretionary were reduced. Following are a few examples of the attractive companies we added to the portfolio: Hudbay Minerals (HBM) is an integrated mining company of copper, gold and silver. The company’s stock trades at less than 1.7 times revenue and less than 9 times earnings, yet we expect earnings to grow vigorously this year and next year. Carrizo Oil & Gas (CRZO) engages in exploration, development, and production of oil and gas, mostly in the Eagle Ford region. Despite our expectation that earnings should grow robustly in 2018 and in 2019, the company’s stock trades at 2 times revenue and less than 10 times earnings. TPI Composites (TPIC) manufactures and sells composite wind blades and related precision systems for original equipment manufacturers. The company is investing heavily in its business this year due to huge orders for the next few years. Because of this increase in capital expenditures, earnings will decline this year, but we expect earnings to attractively rebound in 2019. Based on our estimates for 2019, the company’s stock is trading at 0.7 times revenue and less than 14 times earnings. These are just a few of the attractive companies we have added to the portfolio in the past six months and the net result of our changes is that valuations of the portfolio have significantly declined.
Perritt Low Priced Stock Fund
As of April 30, 2018, the Perritt Low Priced Stock Fund was comprised of 84 common stocks. The Fund’s 10 largest holdings and detailed description can be found later in this report. Based on our earnings estimate, the Fund’s portfolio trades at less than 14 times 2018 earnings. The median price to revenue is slightly less than 1.2 times and the median market capitalization is approximately $912 million. Lastly, we estimate that earnings growth should be very robust for our companies for the remainder of 2018, as well as 2019. On a median basis, our companies grew revenue by more than 15% and earnings by more than 28% for the first quarter of 2018. We also estimate that earnings could grow substantially in 2018 and in 2019. Given these robust earnings estimates and low valuations, we are very excited about how the portfolio is positioned for the future.
As we discussed in our annual report message, the markets in the past few years have been lacking a great deal of volatility. We said in the report, “While predicting the future is very difficult, it seems likely to us that volatility will increase in the future.”
The start of this calendar year was met with significant volatility. While the past few years hardly hit a 5% correction, we have already experienced a couple of 5% corrections, as well as a 10% correction in the smaller-cap market so far this year.
Thank you for entrusting your investment with us. The Perritt Capital Management team continues to show their commitment to the Fund’s success with their own personal investment. As a fellow shareholder and the largest shareholder, I am committed to the success of this fund. If you have any questions or comments about this report or your investment in the Perritt Low Priced Stock Fund, please call us at (800) 331-8936 or visit our website at www.perrittcap.com. Please refer to the prospectus for information about the Fund’s investment objectives and strategies.
Michael Corbett
Portfolio Manager
Mutual fund investing involves risk. Principal loss is possible. The Funds invest in smaller companies, which involve additional risks, such as limited liquidity and greater volatility. The Funds invest in micro-cap companies which tend to perform poorly during times of economic stress.
Past performance does not guarantee future results.
Opinions expressed are subject to change at any time, are not guaranteed and should not be considered investment advice.
Russell 2000 Index is an index measuring the performance approximately 2,000 small-cap companies in the Russell 3000 Index, which is made up of 3,000 of the biggest U.S. stocks. The Russell 2000 serves as a benchmark for small-cap stocks in the United States.
Perritt Low Priced Stock Fund
Perritt Low Priced Stock Fund** versus
Russell 2000® Index and Russell Microcap® Index
There are several ways to evaluate a fund’s historical performance. You can look at the total percentage change in value, the average annual percentage change, or the growth of a hypothetical $10,000 investment. Each performance figure includes changes in a fund’s share price, plus reinvestment of any dividends (or income) and capital gains (the profits the fund earns when it sells stocks that have grown in value).
Cumulative total returns reflect the Fund’s actual performance over a set period. For example, if you invested $1,000 in a fund that had a 5% return over one year, you would end up with $1,050. You can compare the Fund’s returns to the Russell 2000® Index, which reflects a popular measure of the stock performance of small companies, and the Russell Microcap® Index, which measures the performance of the micro-cap segment of the U.S. equity market. Average annual total returns take the Fund’s actual (or cumulative) return and show you what would have happened if the Fund had performed at a constant rate each year.
| * | The graph illustrates the performance of a hypothetical $10,000 investment made in the Fund at inception (June 29, 2012) of the Fund’s predecessor account through April 30, 2018. Assumes reinvestment of dividends and capital gains, but does not reflect the effect of any applicable sales charge or redemption fees or the deduction of taxes that a shareholder would pay on the Fund’s distributions or the redemption of Fund shares. The graph does not imply any future performance. |
| ** | June 29, 2012 is the inception date of the Fund’s predecessor account. The Fund commenced operations on February 28, 2014. The investment policies, objectives, guidelines and restrictions of the Fund are in all material respects equivalent to those of the predecessor account. |
Perritt Low Priced Stock Fund
| Performance (Unaudited) (Continued) | April 30, 2018 |
Cumulative Total Returns**
Periods ended April 30, 2018 (Unaudited) | | | | |
| | Past
6 Months | Past
1 Year | Past
3 Years | Since
Inception* |
| Perritt Low Priced Stock Fund | 0.19% | 7.97% | 26.40% | 113.21% |
Russell 2000® Index | 3.27% | 11.54% | 31.79% | 109.14% |
| (reflects no deduction for fees and expenses) | | | | |
Russell Microcap® Index | 3.95% | 13.76% | 30.75% | 110.63% |
| (reflects no deduction for fees and expenses) | | | | |
Average Annual Total Returns**
Periods ended April 30, 2018 (Unaudited) | | | |
| | Past
1 Year | Past
3 Years | Since
Inception* |
| Perritt Low Priced Stock Fund | 7.97% | 8.12% | 13.86% |
Russell 2000® Index | 11.54% | 9.64% | 13.48% |
| (reflects no deduction for fees and expenses) | | | |
Russell Microcap® Index | 13.76% | 9.35% | 13.62% |
| (reflects no deduction for fees and expenses) | | | |
The Perritt Low Priced Stock Fund’s annualized net expense ratio, as stated in the statutory prospectus, dated October 31, 2017, was 1.40%. The Fund imposes a 2% redemption fee on shares held for 90 days or less. Performance data does not reflect the redemption fee. If reflected, total returns would be reduced.
Performance data quoted represents past performance; past performance does not guarantee future results. The investment return and principal value of an investment will fluctuate so that an investor’s shares, when redeemed, may be worth more or less than their original cost. Current performance of the Fund may be lower or higher than the performance quoted. Performance data current to the most recent month end is available by calling 800-331-8936.
| * | The Fund is the successor to a separately managed account. Immediately prior to the Fund commencing operations on February 28, 2014, the predecessor account transferred its assets to the Fund in exchange for the Fund’s shares. The investment policies, objectives, guidelines and restrictions of the Fund are in all material respects equivalent to those of the predecessor. In addition, the predecessor’s portfolio managers are the current portfolio managers of the Fund. As a mutual fund registered under the Investment Company Act of 1940 (the “1940 Act”), the Fund is subject to certain restrictions under the 1940 Act and the Internal Revenue Code to which the predecessor was not subject. Had the predecessor been registered under the 1940 Act and been subject to the provisions of the 1940 Act and the Internal Revenue Code, its investment performance may have been adversely affected. The performance was achieved by the predecessor when Fund assets were relatively small; the same strategies may not be available, and similar performance may not be achieved, when the Fund’s assets are larger. The performance shown includes an annual management fee of 1.00% and does not include any expenses paid by the predecessor’s investment advisor. |
The since inception date is June 29, 2012, the date of inception of the Fund’s predecessor account. The past performance of the Fund and its predecessor account (before and after taxes) is not necessarily an indication of how the Fund will perform in the future.
| ** | The tables do not reflect the deduction of taxes that a shareholder would pay on the Fund’s distributions or the redemption of Fund shares. |
Perritt Low Priced Stock Fund
Ten Largest Common Stock Holdings (Unaudited) |
Kforce Inc. (KFRC) provides professional and technical specialty staffing services and solutions through three segments: Technology (Tech), Finance and Accounting (FA), and Government Solutions (GS). They serve clients in industries primarily in financial services, communications, insurance services, government sectors, and healthcare.
Mitel Networks Corp. (MITL) provides cloud and on-site business communications and collaboration software, services, and solutions through two segments, Enterprise and Cloud. The company sells its solutions through direct and indirect channels, as well as through strategic technology partnerships in the Americas, Europe, the Middle East, Africa, and the Asia-Pacific regions.
New Media Invt. Group, Inc. (NEWM) – invests in, owns, and operates local media in the United States. The company’s principal products include 142 daily newspapers, 326 weekly newspapers, 140 shoppers, and 569 locally-focused Websites, including Internet and mobile devices.
U.S. Silica Hldgs. Inc. (SLCA) produces and sells commercial silica in the United States. The company operates through two segments, Oil & Gas Proppants and Industrial & Specialty Products.
Carrizo Oil & Gas, Inc. (CRZO) together with its subsidiaries, engages in the exploration, development, and production of crude oil, natural gas liquids, and gas from resource plays primarily in the United States.
Gencor Industries, Inc. (GENC) designs, manufactures, and sells machinery and related equipment used to produce asphalt and highway construction materials. The company’s products include asphalt plants, combustion systems, and fluid heat transfer systems, which are manufactured in two facilities in the United States.
Kemet Corp. (KEM) together with its subsidiaries, manufactures and sells passive electronic components under the KEMET brand worldwide and the TOKIN brand in Japan and Korea. It offers tantalum, aluminum polymer, and ceramic capacitors; film, paper, and electrolytic capacitors; and electro magnetically compatible materials and components, piezo materials and actuators, and various types of sensors.
Modine Manufacturing Company (MOD) develops, manufactures, and markets engineered heat transfer systems and heat transfer components for use in on- and off-highway original equipment manufacturer vehicular applications. The company operates through Americas, Europe, Asia, and Building HVAC segments.
SMART Global Holdings, Inc. (SGH) designs, manufactures, and supplies specialty memory solutions worldwide. It also provides flash memory, USB, and serial advanced technology attachment products, as well as supply chain services.
CNO Financial Group, Inc. (CNO) develops, markets and administers health insurance, annuity, individual life insurance and other insurance products. The Company’s segments include Bankers Life, Washington National and Colonial Penn.
Fund holdings and/or sector allocations are subject to change at any time and
are not recommendations to buy or sell any security.
Please refer to the Schedule of Investments in this report for a complete list of Fund holdings.
Perritt Low Priced Stock Fund
Allocation of Portfolio Investments (Unaudited) | April 30, 2018 |
The sector classifications represented in the graph above and industry classifications represented in the Schedule of Investments are in accordance with Global Industry Classification Standard (GICS®), which was developed by and/or is the exclusive property of MSCI, Inc. and Standard & Poor Financial Services LLC. Percentages are based on total investments, at value.
| Note: | For presentation purposes, the Fund has grouped some of the industry categories. For purposes of categorizing securities for compliance with section 8(b)(1) of the Investment Company Act of 1940, the Fund uses more specific industry classifications. |
Perritt MicroCap Opportunities Fund
| Schedule of Investments | April 30, 2018 (Unaudited) |
| Shares | | | COMMON STOCKS – 96.60% | | Value | |
| Aerospace & Defense – 2.07% | | | | |
| | 398,891 | | | CPI Aerostructures, | | | | |
| | | | | Inc.(a) | | $ | 3,809,409 | |
| | | | | | | | 3,809,409 | |
| Auto Parts & Equipment – 4.30% | | | | |
| | 162,271 | | | Miller Industries, Inc. | | | 4,016,207 | |
| | 135,500 | | | Motorcar Parts | | | | |
| | | | | of America, Inc. | | | | |
| | | | | (Acquired 9/10/12 | | | | |
| | | | | through 8/27/14, | | | | |
| | | | | Cost $1,127,230)(a)(b) | | | 2,380,000 | |
| | 10,500 | | | Motorcar Parts | | | | |
| | | | | of America, Inc.(a) | | | 199,920 | |
| | 50,000 | | | Stoneridge, Inc.(a) | | | 1,316,500 | |
| | | | | | | | 7,912,627 | |
| Automotive Retail – 0.34% | | | | |
| | 62,500 | | | Lazydays | | | | |
| | | | | Holdings, Inc.(a) | | | 621,250 | |
| | | | | | | | 621,250 | |
| Building Materials – 9.65% | | | | |
| | 225,000 | | | BlueLinx | | | | |
| | | | | Holdings, Inc.(a) | | | 9,049,500 | |
| | 94,452 | | | Global Brass & Copper | | | | |
| | | | | Holdings, Inc. | | | 2,833,560 | |
| | 471,677 | | | Huttig Building | | | | |
| | | | | Products, Inc.(a) | | | 2,929,114 | |
| | 47,454 | | | Insteel Industries, Inc. | | | 1,425,044 | |
| | 87,400 | | | PGT Innovations, Inc.(a) | | | 1,525,130 | |
| | | | | | | | 17,762,348 | |
| Business Services – 4.52% | | | | |
| | 115,000 | | | GP Strategies Corp.(a) | | | 2,397,750 | |
| | 171,383 | | | PCM, Inc.(a) | | | 2,219,410 | |
| | 397,969 | | | PFSweb, Inc.(a) | | | 3,697,132 | |
| | | | | | | | 8,314,292 | |
| Chemical & Related Products – 8.30% | | | | |
| | 20,000 | | | KMG Chemicals, Inc. | | | 1,229,800 | |
| | 204,165 | | | Northern Technologies | | | | |
| | | | | International Corp. | | | 6,094,325 | |
| | 387,738 | | | OMNOVA | | | | |
| | | | | Solutions, Inc.(a) | | | 4,226,344 | |
| | 287,266 | | | Trecora Resources(a) | | | 3,720,095 | |
| | | | | | | | 15,270,564 | |
| Commercial Banks – 7.33% | | | | |
| | 125,900 | | | Bankwell Financial | | | | |
| | | | | Group, Inc. | | | 3,975,922 | |
| | 87,691 | | | Berkshire Hills | | | | |
| | | | | Bancorp, Inc. | | $ | 3,327,874 | |
| | 25,000 | | | Bridgewater | | | | |
| | | | | Bancshares, Inc.(a) | | | 325,250 | |
| | 50,000 | | | Esquire Financial | | | | |
| | | | | Holdings, Inc.(a) | | | 1,204,500 | |
| | 69,185 | | | Triumph | | | | |
| | | | | Bancorp, Inc.(a) | | | 2,687,837 | |
| | 68,590 | | | Veritex Holdings, | | | | |
| | | | | Inc.(a) | | | 1,969,905 | |
| | | | | | | | 13,491,288 | |
| Commercial Services – 0.88% | | | | |
| | 65,000 | | | TriState Capital | | | | |
| | | | | Holdings, Inc.(a) | | | 1,625,000 | |
| | | | | | | | 1,625,000 | |
| Commercial Services & Supplies – 1.94% | | | | |
| | 352,573 | | | InnerWorkings, Inc.(a) | | | 3,560,987 | |
| | | | | | | | 3,560,987 | |
| Construction & Engineering – 5.82% | | | | |
| | 30,000 | | | Comfort Systems | | | | |
| | | | | USA, Inc. | | | 1,266,000 | |
| | 739,500 | | | Hill International, | | | | |
| | | | | Inc.(a) | | | 3,919,350 | |
| | 132,776 | | | IES Holdings, Inc.(a) | | | 2,243,915 | |
| | 260,700 | | | Limbach Holdings, | | | | |
| | | | | Inc.(a) | | | 3,274,392 | |
| | | | | | | | 10,703,657 | |
| Consumer Products – | | | | |
| Manufacturing – 1.69% | | | | |
| | 114,000 | | | Delta Apparel, Inc.(a) | | | 2,062,260 | |
| | 39,000 | | | Superior Uniform | | | | |
| | | | | Group, Inc. | | | 1,045,980 | |
| | | | | | | | 3,108,240 | |
| Consumer Services – 1.23% | | | | |
| | 173,583 | | | Primo Water Corp.(a) | | | 2,263,523 | |
| | | | | | | | 2,263,523 | |
| Data Processing, Hosting | | | | |
| and Related Services – 3.17% | | | | |
| | 330,000 | | | Limelight | | | | |
| | | | | Networks, Inc.(a) | | | 1,702,800 | |
| | 386,926 | | | Ooma, Inc.(a) | | | 4,120,762 | |
| | | | | | | | 5,823,562 | |
The accompanying notes to financial statements are an integral part of this schedule.
Perritt MicroCap Opportunities Fund
| Schedule of Investments (Continued) | April 30, 2018 (Unaudited) |
| Shares | | | | | Value | |
| Electronic Equipment & Instruments – 1.30% |
| | 123,728 | | | Bel Fuse, Inc. – Class B | | $ | 2,394,137 | |
| | | | | | | | 2,394,137 | |
| Energy & Related Services – 1.70% |
| | 202,564 | | | Matrix Service Co.(a) | | | 3,119,485 | |
| | | | | | | | 3,119,485 | |
| Financial Services – 7.28% |
| | 123,800 | | | First Internet Bancorp | | | 4,233,960 | |
| | 145,092 | | | Hennessy Advisors, Inc. | | | 2,872,822 | |
| | 53,124 | | | Northeast Bancorp | | | 1,035,918 | |
| | 40,950 | | | Oppenheimer Holdings, | | | | |
| | | | | Inc. – Class A | | | 1,099,508 | |
| | 270,006 | | | Silvercrest Asset | | | | |
| | | | | Management Group, | | | | |
| | | | | Inc. – Class A | | | 4,158,092 | |
| | | | | | | | 13,400,300 | |
| Food – 3.74% |
| | 101,533 | | | Crimson Wine | | | | |
| | | | | Group Ltd.(a) | | | 926,996 | |
| | 116,981 | | | Farmer Brothers Co.(a) | | | 3,316,411 | |
| | 198,500 | | | Landec Corp.(a) | | | 2,640,050 | |
| | | | | | | | 6,883,457 | |
| Industrial Goods – 1.89% |
| | 560,000 | | | Hudson Technologies, | | | | |
| | | | | Inc.(a) | | | 2,452,800 | |
| | 35,000 | | | Schnitzer Steel Industries, | | | | |
| | | | | Inc. – Class A | | | 1,030,750 | |
| | | | | | | | 3,483,550 | |
| Insurance – 2.22% |
| | 240,000 | | | Atlas Financial | | | | |
| | | | | Holdings, Inc.(a)(e) | | | 2,520,000 | |
| | 83,049 | | | United Insurance | | | | |
| | | | | Holdings Corp. | | | 1,566,304 | |
| | | | | | | | 4,086,304 | |
| Leisure – 0.83% |
| | 200,000 | | | Century Casinos, Inc.(a) | | | 1,536,000 | |
| | | | | | | | 1,536,000 | |
| Machinery Manufacturing – 1.16% |
| | 98,700 | | | Graham Corp. | | | 2,129,946 | |
| | | | | | | | 2,129,946 | |
| Medical Supplies & Services – 2.26% |
| | 79,150 | | | Addus HomeCare | | | | |
| | | | | Corp.(a) | | | 4,155,375 | |
| | | | | | | | 4,155,375 | |
| Private Equity & Venture Capital – 0.87% |
| | 160,000 | | | BBX Capital Corp. – | | | | |
| | | | | Class A | | $ | 1,596,800 | |
| | | | | | | | 1,596,800 | |
| Real Estate Investment Trust – 4.68% |
| | 191,553 | | | City Office Real Estate | | | | |
| | | | | Investment Trust, Inc. | | | 2,179,873 | |
| | 105,000 | | | Community Healthcare | | | | |
| | | | | Trust, Inc. | | | 2,677,500 | |
| | 232,515 | | | Global Medical | | | | |
| | | | | REIT, Inc. | | | 1,811,292 | |
| | 199,178 | | | Resource Capital Corp. | | | 1,943,977 | |
| | | | | | | | 8,612,642 | |
| Retail – 1.01% |
| | 175,000 | | | Kirkland’s, Inc.(a) | | | 1,853,250 | |
| | | | | | | | 1,853,250 | |
| Security Manufacturing – 0.91% |
| | 222,500 | | | Horizon Global Corp.(a) | | | 1,662,075 | |
| | | | | | | | 1,662,075 | |
| Semiconductor Related Products – 4.86% |
| | 286,367 | | | AXT, Inc.(a) | | | 1,675,247 | |
| | 128,327 | | | DSP Group, Inc.(a) | | | 1,533,508 | |
| | 71,111 | | | PDF Solutions, Inc.(a) | | | 792,888 | |
| | 415,000 | | | Photronics, Inc.(a) | | | 3,174,750 | |
| | 69,000 | | | Rudolph Technologies, | | | | |
| | | | | Inc.(a) | | | 1,749,150 | |
| | | | | | | | 8,925,543 | |
| Software – 2.47% |
| | 190,700 | | | American Software, | | | | |
| | | | | Inc. – Class A | | | 2,433,332 | |
| | 418,000 | | | Zix Corp.(a) | | | 2,110,900 | |
| | | | | | | | 4,544,232 | |
| Specialty Manufacturing – 4.15% |
| | 63,141 | | | Core Molding | | | | |
| | | | | Technologies, Inc. | | | 978,685 | |
| | 82,500 | | | Federal Signal Corp. | | | 1,786,950 | |
| | 327,696 | | | LSI Industries, Inc. | | | 2,008,776 | |
| | 188,733 | | | Manitex International, | | | | |
| | | | | Inc.(a) | | | 1,942,063 | |
| | 50,000 | | | Sparton Corp.(a) | | | 923,500 | |
| | | | | | | | 7,639,974 | |
| Telecommunications – 2.88% |
| | 700,000 | | | Ceragon Networks | | | | |
| | | | | Ltd.(a)(e) | | | 1,841,000 | |
The accompanying notes to financial statements are an integral part of this schedule.
Perritt MicroCap Opportunities Fund
| Schedule of Investments (Continued) | April 30, 2018 (Unaudited) |
| Shares | | | | | Value | |
| Telecommunications (Continued) |
| | 65,552 | | | Digi International, | | | | |
| | | | | Inc.(a) | | $ | 753,848 | |
| | 378,800 | | | PC-Tel, Inc. | | | 2,708,420 | |
| | | | | | | | 5,303,268 | |
| Transportation – 1.15% |
| | 600,000 | | | Radiant | | | | |
| | | | | Logistics, Inc.(a) | | | 2,118,000 | |
| | | | | | | | 2,118,000 | |
| | | | | TOTAL COMMON | | | | |
| | | | | STOCKS | | | | |
| | | | | (Cost $119,614,516) | | $ | 177,711,085 | |
| Contracts | | | WARRANTS – 0.00% | | Value | |
| Insurance – 0.00% | |
| | 38,106 | | | Emergent Capital, | | | | |
| | | | | Inc. Warrant; | | | | |
| | | | | Expiration: 10/06/2019, | | | | |
| | | | | Exercise Price | | | | |
| | | | | $10.75(a)(c) | | $ | — | |
| | | | | TOTAL WARRANTS | | | | |
| | | | | (Cost $0) | | $ | — | |
| Shares | | | SHORT-TERM | | Value | |
| | | | INVESTMENTS – 3.03% | | | |
| | 5,561,463 | | | Invesco Short Term | | | | |
| | | | | Investments Government | | | | |
| | | | | & Agency Portfolio – | | | | |
| | | | | Class I 1.61%(d) | | $ | 5,561,463 | |
| | | | | TOTAL SHORT-TERM | | | | |
| | | | | INVESTMENTS | | | | |
| | | | | (Cost $5,561,463) | | $ | 5,561,463 | |
| | | | | Total Investments | | | | |
| | | | | (Cost $125,175,979) – | | | | |
| | | | | 99.63% | | $ | 183,272,548 | |
| | | | | Other Assets in | | | | |
| | | | | Excess of | | | | |
| | | | | Liabilities – 0.37% | | | 689,117 | |
| | | | | TOTAL NET ASSETS – | | | | |
| | | | | 100.00% | | | | |
| | | | | | | $ | 183,961,665 | |
Percentages are stated as a percent of net assets.
| (a) | Non-income producing security. |
| (b) | Security was purchased in a transaction exempt from registration in the U.S. under the Securities Act of 1933 (the “Act”) and, unless registered under the Act, may only be sold pursuant to exemption from registration and, in the case of a Rule 144A offering under the Act, may only be sold to “qualified institutional buyers.” The value of this security is $2,380,000 or 1.29% of the Fund’s net assets. This security is deemed to be liquid. |
| (c) | The price for this security was derived from an estimate of fair value using methods approved by the Fund’s Board of Directors. This security represents $0 or 0.00% of the Fund’s net assets. This security is classified as Level 2 and is deemed to be illiquid. |
| (d) | Variable rate security; the rate shown is the effective rate as of April 30, 2018. |
| (e) | Foreign issued security. |
The industry classifications listed above are in accordance with Global Industry Classification Standard (GICS®), which was developed by and/or is the exclusive property of MSCI, Inc. and Standard & Poor Financial Services LLC (“S&P”).
The accompanying notes to financial statements are an integral part of this schedule.
Perritt Ultra MicroCap Fund
| Schedule of Investments | April 30, 2018 (Unaudited) |
| Shares | | | COMMON STOCKS – 94.75% | | Value | |
| Aerospace & Defense – 0.87% |
| | 60,000 | | | CPI Aerostructures, Inc.(a) | | $ | 573,000 | |
| | | | | | | | 573,000 | |
| Air Transport – 1.33% |
| | 54,886 | | | AeroCentury Corp.(a) | | | 875,432 | |
| | | | | | | | 875,432 | |
| Auto Parts & Equipment – 1.27% |
| | 90,000 | | | Unique | | | | |
| | | | | Fabricating, Inc. | | | 837,000 | |
| | | | | | | | 837,000 | |
| Business Services – 13.34% |
| | 50,000 | | | BG Staffing, Inc. | | | 953,500 | |
| | 350,000 | | | CynergisTek, Inc.(a) | | | 1,746,498 | |
| | 244,300 | | | DLH Holdings Corp.(a) | | | 1,424,269 | |
| | 275,000 | | | Information Services | | | | |
| | | | | Group, Inc.(a) | | | 1,193,500 | |
| | 109,336 | | | Innodata Isogen, Inc.(a) | | | 125,736 | |
| | 80,000 | | | PCM, Inc.(a) | | | 1,036,000 | |
| | 50,000 | | | Transcat, Inc.(a) | | | 825,000 | |
| | 125,000 | | | USA Technologies, | | | | |
| | | | | Inc.(a) | | | 1,093,750 | |
| | 701,005 | | | WidePoint Corp.(a) | | | 413,383 | |
| | | | | | | | 8,811,636 | |
| Chemical & Related Products – 2.31% |
| | 320,000 | | | Flexible Solutions | | | | |
| | | | | International, Inc.(a) | | | 453,504 | |
| | 36,000 | | | Northern Technologies | | | | |
| | | | | International Corp. | | | 1,074,600 | |
| | | | | | | | 1,528,104 | |
| Chemical Manufacturing – 1.37% |
| | 200,000 | | | Intrepid Potash, Inc.(a) | | | 906,000 | |
| | | | | | | | 906,000 | |
| Computer & Electronic |
| Product Manufacturing – 1.56% |
| | 200,000 | | | Dynatronics Corp.(a) | | | 600,000 | |
| | 1,000,000 | | | Singing Machine | | | | |
| | | | | Co., Inc.(a) | | | 430,000 | |
| | | | | | | | 1,030,000 | |
| Computer and Electronic |
| Product Manufacturing – 1.90% |
| | 381,799 | | | Luna Innovations, | | | | |
| | | | | Inc.(a) | | | 1,256,119 | |
| | | | | | | | 1,256,119 | |
| Computers & Electronics – 0.57% |
| | 35,000 | | | Napco Security | | | | |
| | | | | Technologies, Inc.(a) | | $ | 374,500 | |
| | | | | | | | 374,500 | |
| Construction & Engineering – 4.71% |
| | 65,353 | | | Gencor Industries, | | | | |
| | | | | Inc.(a) | | | 1,016,239 | |
| | 150,000 | | | Hill International, | | | | |
| | | | | Inc.(a) | | | 795,000 | |
| | 40,000 | | | Layne Christensen | | | | |
| | | | | Co.(a) | | | 564,400 | |
| | 12,500 | | | NV5 Global, Inc.(a) | | | 735,625 | |
| | | | | | | | 3,111,264 | |
| Consumer Goods – 1.27% |
| | 35,000 | | | MCBC Holdings, Inc.(a) | | | 840,000 | |
| | | | | | | | 840,000 | |
| Consumer Products – Distributing – 1.09% |
| | 400,000 | | | US Auto Parts | | | | |
| | | | | Network, Inc.(a) | | | 720,000 | |
| | | | | | | | 720,000 | |
| Consumer Services – 1.32% |
| | 100,000 | | | Xcel Brands, Inc.(a) | | | 310,000 | |
| | 50,000 | | | ZAGG, Inc.(a) | | | 560,000 | |
| | | | | | | | 870,000 | |
| Diversified Financials – 1.76% |
| | 90,000 | | | Safeguard | | | | |
| | | | | Scientifics, Inc.(a) | | | 1,165,500 | |
| | | | | | | | 1,165,500 | |
| Electronic Equipment & Instruments – 0.58% |
| | 75,000 | | | Iteris, Inc.(a) | | | 380,250 | |
| | | | | | | | 380,250 | |
| Energy & Related Services – 2.91% |
| | 145,000 | | | DHT Holdings, Inc.(d) | | | 526,350 | |
| | 65,000 | | | Matrix Service Co.(a) | | | 1,001,000 | |
| | 121,000 | | | Mitcham | | | | |
| | | | | Industries, Inc.(a) | | | 394,460 | |
| | | | | | | | 1,921,810 | |
| Environmental Services – 0.68% |
| | 236,801 | | | Quest Resource | | | | |
| | | | | Holding Corp.(a) | | | 447,554 | |
| | | | | | | | 447,554 | |
The accompanying notes to financial statements are an integral part of this schedule.
Perritt Ultra MicroCap Fund
| Schedule of Investments (Continued) | April 30, 2018 (Unaudited) |
| Shares | | | | | Value | |
| Financial Holding Company – 0.62% |
| | 79,300 | | | CCUR Holdings, Inc. | | $ | 412,360 | |
| | | | | | | | 412,360 | |
| Financial Services – 6.60% |
| | 65,000 | | | AMREP Corp.(a) | | | 469,625 | |
| | 35,000 | | | First Internet Bancorp | | | 1,197,000 | |
| | 36,000 | | | Hennessy Advisors, Inc. | | | 712,800 | |
| | 50,000 | | | HopFed Bancorp, Inc. | | | 749,500 | |
| | 52,500 | | | Silvercrest Asset | | | | |
| | | | | Management Group, | | | | |
| | | | | Inc. – Class A | | | 808,500 | |
| | 150,851 | | | US Global Investors, | | | | |
| | | | | Inc. | | | 417,857 | |
| | | | | | | | 4,355,282 | |
| Food – 0.50% |
| | 40,000 | | | Willamette Valley | | | | |
| | | | | Vineyards, Inc.(a) | | | 332,000 | |
| | | | | | | | 332,000 | |
| Health Care – 0.98% |
| | 122,917 | | | Rockwell Medical | | | | |
| | | | | Technologies, Inc.(a) | | | 650,231 | |
| | | | | | | | 650,231 | |
| Industrial Goods – 0.93% |
| | 139,900 | | | Hudson Technologies, | | | | |
| | | | | Inc.(a) | | | 612,762 | |
| | | | | | | | 612,762 | |
| Insurance – 1.79% |
| | 50,000 | | | Atlas Financial | | | | |
| | | | | Holdings, Inc.(a)(d) | | | 525,000 | |
| | 35,000 | | | United Insurance | | | | |
| | | | | Holdings Corp. | | | 660,100 | |
| | | | | | | | 1,185,100 | |
| Leisure – 3.71% |
| | 97,322 | | | Century Casinos, Inc.(a) | | | 747,433 | |
| | 1,534,599 | | | Galaxy Gaming, Inc.(a) | | | 1,703,405 | |
| | | | | | | | 2,450,838 | |
| Machinery Manufacturing – 1.52% |
| | 125,000 | | | ASV Holdings, Inc.(a) | | | 1,001,250 | |
| | | | | | | | 1,001,250 | |
| Medical Supplies & Services – 7.05% |
| | 24,500 | | | Addus HomeCare | | | | |
| | | | | Corp.(a) | | | 1,286,250 | |
| | 75,049 | | | Birner Dental Management | | | | |
| | | | | Services, Inc.(a) | | | 525,343 | |
| | 649,000 | | | First Choice Healthcare | | | | |
| | | | | Solutions, Inc.(a) | | $ | 824,230 | |
| | 62,190 | | | Lakeland Industries, | | | | |
| | | | | Inc.(a) | | | 805,360 | |
| | 200,000 | | | Sensus Healthcare, | | | | |
| | | | | Inc.(a) | | | 1,214,000 | |
| | | | | | | | 4,655,183 | |
| Merchant Wholesalers, Nondurable Goods – 0.74% |
| | 515,000 | | | Innovative Food | | | | |
| | | | | Holdings, Inc.(a) | | | 489,250 | |
| | | | | | | | 489,250 | |
| Motion Pictures – 0.72% |
| | 100,000 | | | Ballantyne | | | | |
| | | | | Strong, Inc.(a) | | | 475,010 | |
| | | | | | | | 475,010 | |
| Oil & Gas Services – 2.16% |
| | 400,000 | | | Profire Energy, Inc.(a) | | | 1,428,000 | |
| | | | | | | | 1,428,000 | |
| Pharmaceuticals – 2.39% |
| | 154,300 | | | ImmuCell Corp.(a) | | | 1,129,476 | |
| | 55,000 | | | Juniper Pharmaceuticals, | | | | |
| | | | | Inc.(a) | | | 448,250 | |
| | | | | | | | 1,577,726 | |
| Professional, Scientific, and Technical Services – 2.60% |
| | 135,000 | | | AutoWeb, Inc.(a) | | | 492,750 | |
| | 350,000 | | | CUI Global, Inc.(a) | | | 962,500 | |
| | 240,000 | | | Sigma Labs, Inc.(a) | | | 261,600 | |
| | | | | | | | 1,716,850 | |
| Real Estate Investment Trusts – 2.22% |
| | 170,000 | | | Global Self | | | | |
| | | | | Storage, Inc. | | | 710,600 | |
| | 210,000 | | | Sachem Capital Corp. | | | 756,000 | |
| | | | | | | | 1,466,600 | |
| Retail – 2.67% |
| | 100,000 | | | Build-A-Bear | | | | |
| | | | | Workshop, Inc.(a) | | | 910,000 | |
| | 500,000 | | | Christopher & | | | | |
| | | | | Banks Corp.(a) | | | 530,000 | |
| | 325,000 | | | OurPet’s Co.(a) | | | 321,750 | |
| | | | | | | | 1,761,750 | |
The accompanying notes to financial statements are an integral part of this schedule.
Perritt Ultra MicroCap Fund
| Schedule of Investments (Continued) | April 30, 2018 (Unaudited) |
| Shares | | | | | Value | |
| Semiconductor Related Products – 1.45% |
| | 82,181 | | | AXT, Inc.(a) | | $ | 480,759 | |
| | 40,000 | | | DSP Group, Inc.(a) | | | 478,000 | |
| | | | | | | | 958,759 | |
| Software – 4.87% |
| | 80,000 | | | Asure Software, Inc.(a) | | | 1,211,200 | |
| | 100,000 | | | BSQUARE Corp.(a) | | | 450,000 | |
| | 215,000 | | | Evolving Systems, Inc.(a) | | | 806,250 | |
| | 200,000 | | | GlobalSCAPE, Inc. | | | 746,000 | |
| | | | | | | | 3,213,450 | |
| Specialized Consumer Services – 0.59% |
| | 550,000 | | | XpresSpa Group, Inc.(a) | | | 390,500 | |
| | | | | | | | 390,500 | |
| Specialty Manufacturing – 10.98% |
| | 200,000 | | | Aspen Aerogels, Inc.(a) | | | 900,000 | |
| | 40,064 | | | Continental | | | | |
| | | | | Materials Corp.(a) | | | 759,530 | |
| | 93,500 | | | CTI Industries Corp.(a) | | | 374,000 | |
| | 120,000 | | | Data I/O Corp.(a) | | | 752,400 | |
| | 12,500 | | | Hurco Companies, Inc. | | | 552,500 | |
| | 33,691 | | | Kewaunee | | | | |
| | | | | Scientific Corp. | | | 1,164,024 | |
| | 88,467 | | | Pioneer Power | | | | |
| | | | | Solutions, Inc.(a) | | | 521,955 | |
| | 170,000 | | | Polar Power, Inc.(a) | | | 1,005,550 | |
| | 29,100 | | | Sparton Corp.(a) | | | 537,477 | |
| | 80,000 | | | Tecnoglass, Inc.(d) | | | 679,200 | |
| | | | | | | | 7,246,636 | |
| Telecommunications – 0.82% |
| | 550,000 | | | Mobivity | | | | |
| | | | | Holdings Corp.(a) | | | 544,500 | |
| | | | | | | | 544,500 | |
| | | | | TOTAL COMMON | | | | |
| | | | | STOCKS | | | | |
| | | | | (Cost $49,235,907) | | $ | 62,572,206 | |
| Contracts | | | WARRANTS – 0.00% | | Value | |
| Telecommunications – 0.00% | |
| | | | | Mobivity Holdings Corp. | | | | |
| | 165,000 | | | Expiration: 03/11/2019, | | | | |
| | | | | Exercise Price $1.20 | | | | |
| | | | | (Acquired 03/11/2014, | | | | |
| | | | | Cost $0)(a)(b) | | $ | — | |
| | | | | TOTAL WARRANTS | | | | |
| | | | | (Cost $0) | | $ | — | |
| Shares | | | SHORT-TERM | | Value | |
| | | | INVESTMENTS – 4.97% | | | |
| | 3,278,694 | | | Invesco Short Term | | | | |
| | | | | Investments Government | | | | |
| | | | | & Agency Portfolio – | | | | |
| | | | | Class I 1.61%(c) | | $ | 3,278,694 | |
| | | | | TOTAL SHORT-TERM | | | | |
| | | | | INVESTMENTS | | | | |
| | | | | (Cost $3,278,694) | | $ | 3,278,694 | |
| | | | | Total Investments | | | | |
| | | | | (Cost $52,514,601) – | | | | |
| | | | | 99.72% | | $ | 65,850,900 | |
| | | | | Other Assets in | | | | |
| | | | | Excess of | | | | |
| | | | | Liabilities – 0.28% | | | 183,808 | |
| | | | | TOTAL NET ASSETS – | | | | |
| | | | | 100.00% | | $ | 66,034,708 | |
Percentages are stated as a percent of net assets.
| (a) | Non-income producing security. |
| (b) | The price for this security was derived from an estimate of fair market value using methods approved by the Fund’s Board of Directors. This security represents $0 or 0.00% of the Fund’s Net Assets. This security was classified as Level 2 and is considered to be illiquid. |
| (c) | Variable rate security; the rate shown is the effective rate as of April 30, 2018. |
| (d) | Foreign issued security. |
The industry classifications listed above are in accordance with Global Industry Classification Standard (GICS®), which was developed by and/or is the exclusive property of MSCI, Inc. and Standard & Poor Financial Services LLC (“S&P”).
The accompanying notes to financial statements are an integral part of this schedule.
Perritt Low Priced Stock Fund
| Schedule of Investments | April 30, 2018 (Unaudited) |
| Shares | | | COMMON STOCKS – 98.19% | | Value | |
| Administrative & Support Services – 2.29% | | | |
| | 7,100 | | | Kforce, Inc. | | $ | 188,505 | |
| | | | | | | | 188,505 | |
| Air Transportation – 1.51% | | | |
| | 3,000 | | | Hawaiian Holdings, | | | | |
| | | | | Inc. | | | 123,600 | |
| | | | | | | | 123,600 | |
| Auto Parts & Equipment – 5.27% | | | |
| | 4,000 | | | Miller Industries, Inc. | | | 99,000 | |
| | 8,000 | | | Modine | | | | |
| | | | | Manufacturing Co.(a) | | | 137,600 | |
| | 6,000 | | | Superior Industries | | | | |
| | | | | International, Inc. | | | 78,900 | |
| | 4,000 | | | Tower International, | | | | |
| | | | | Inc. | | | 118,000 | |
| | | | | | | | 433,500 | |
| Automobile Manufacturers – 0.92% | | | |
| | 2,000 | | | Winnebago | | | | |
| | | | | Industries, Inc. | | | 75,800 | |
| | | | | | | | 75,800 | |
| Biotechnology – 1.23% | | | |
| | 7,000 | | | Innoviva, Inc.(a) | | | 101,500 | |
| | | | | | | | 101,500 | |
| Building Material, Garden | | | |
| Equipment & Supplies Dealers – 0.42% | | | |
| | 2,000 | | | BMC Stock | | | | |
| | | | | Holdings, Inc.(a) | | | 34,500 | |
| | | | | | | | 34,500 | |
| Building Products – 2.29% | | | |
| | 7,000 | | | Builders | | | | |
| | | | | FirstSource, Inc.(a) | | | 127,610 | |
| | 1,500 | | | USG Corp.(a) | | | 60,345 | |
| | | | | | | | 187,955 | |
| Business Services – 3.99% | | | |
| | 2,000 | | | Darling Ingredients, | | | | |
| | | | | Inc.(a) | | | 34,280 | |
| | 29,515 | | | Information Services | | | | |
| | | | | Group, Inc.(a) | | | 128,095 | |
| | 10,000 | | | New Media Investment | | | | |
| | | | | Group, Inc. | | | 165,800 | |
| | | | | | | | 328,175 | |
| Chemical & Related Products – 1.46% | | | |
| | 11,000 | | | OMNOVA Solutions, | | | | |
| | | | | Inc.(a) | | $ | 119,900 | |
| | | | | | | | 119,900 | |
| Commercial Banks – 1.01% | | | |
| | 2,900 | | | Veritex Holdings, Inc.(a) | | | 83,288 | |
| | | | | | | | 83,288 | |
| Commercial Services & Supplies – 2.94% | | | |
| | 10,000 | | | ACCO Brands Corp. | | | 120,500 | |
| | 12,000 | | | InnerWorkings, Inc.(a) | | | 121,200 | |
| | | | | | | | 241,700 | |
| Communications Equipment – 3.21% | | | |
| | 9,000 | | | Extreme Networks, | | | | |
| | | | | Inc.(a) | | | 96,300 | |
| | 15,000 | | | Mitel Networks | | | | |
| | | | | Corp.(a)(c) | | | 167,400 | |
| | | | | | | | 263,700 | |
| Computer & Electronic | | | |
| Product Manufacturing – 1.09% | | | |
| | 5,000 | | | Electro Scientific | | | | |
| | | | | Industries, Inc.(a) | | | 90,000 | |
| | | | | | | | 90,000 | |
| Construction & Engineering – 6.07% | | | |
| | 4,000 | | | Chicago Bridge & | | | | |
| | | | | Iron Co. NV(c) | | | 60,400 | |
| | 9,000 | | | Gencor | | | | |
| | | | | Industries, Inc.(a) | | | 139,950 | |
| | 20,000 | | | Hill International, | | | | |
| | | | | Inc.(a) | | | 106,000 | |
| | 5,000 | | | IES Holdings, Inc.(a) | | | 84,500 | |
| | 6,000 | | | Sterling Construction | | | | |
| | | | | Co, Inc.(a) | | | 66,780 | |
| | 2,000 | | | Tutor Perini Corp.(a) | | | 41,300 | |
| | | | | | | | 498,930 | |
| Consumer Services – 2.22% | | | |
| | 8,000 | | | Primo Water Corp.(a) | | | 104,320 | |
| | 7,000 | | | ZAGG, Inc.(a) | | | 78,400 | |
| | | | | | | | 182,720 | |
| Credit Intermediation | | | |
| & Related Activities – 2.71% | | | |
| | 7,000 | | | FNB Corp. | | | 91,000 | |
| | 13,000 | | | United Community | | | | |
| | | | | Financial Corp. | | | 131,690 | |
| | | | | | | | 222,690 | |
The accompanying notes to financial statements are an integral part of this schedule.
Perritt Low Priced Stock Fund
| Schedule of Investments (Continued) | April 30, 2018 (Unaudited) |
| Shares | | | | | Value | |
| Data Processing, Hosting | | | |
| and Related Services – 0.63% | | | |
| | 10,000 | | | Limelight | | | | |
| | | | | Networks, Inc.(a) | | $ | 51,600 | |
| | | | | | | | 51,600 | |
| Diversified Chemicals – 0.94% | | | |
| | 14,000 | | | LSB Industries, Inc.(a) | | | 77,420 | |
| | | | | | | | 77,420 | |
| Electronic Equipment & Instruments – 2.78% | | | |
| | 2,000 | | | Orbotech Ltd.(a)(c) | | | 116,840 | |
| | 8,000 | | | TTM Technologies, | | | | |
| | | | | Inc.(a) | | | 111,520 | |
| | | | | | | | 228,360 | |
| Electronic Manufacturing Services – 1.68% | | | |
| | 8,000 | | | KEMET Corp.(a) | | | 137,760 | |
| | | | | | | | 137,760 | |
| Energy & Related Services – 2.08% | | | |
| | 10,000 | | | McDermott | | | | |
| | | | | International, Inc.(a)(c) | | | 66,000 | |
| | 10,000 | | | Newpark Resources, | | | | |
| | | | | Inc.(a) | | | 105,000 | |
| | | | | | | | 171,000 | |
| Engines & Turbines – 0.55% | | | |
| | 2,000 | | | TPI Composites, Inc.(a) | | | 45,300 | |
| | | | | | | | 45,300 | |
| Financial Services – 1.47% | | | |
| | 3,000 | | | B of I Holding, Inc.(a) | | | 120,840 | |
| | | | | | | | 120,840 | |
| Gold – 1.90% | | | |
| | 5,400 | | | Kirkland Lake | | | | |
| | | | | Gold Ltd.(c) | | | 94,230 | |
| | 30,000 | | | McEwen Mining, Inc. | | | 62,400 | |
| | | | | | | | 156,630 | |
| Health Care – 0.96% | | | |
| | 15,000 | | | Rockwell Medical, | | | | |
| | | | | Inc.(a) | | | 79,350 | |
| | | | | | | | 79,350 | |
| Health Care Providers & Services – 1.32% | | | |
| | 6,000 | | | Select Medical | | | | |
| | | | | Holdings Corp.(a) | | | 108,300 | |
| | | | | | | | 108,300 | |
| Health Care Services – 1.58% | | | |
| | 4,000 | | | Cross Country | | | | |
| | | | | Healthcare, Inc. (a) | | $ | 50,320 | |
| | 6,000 | | | RadNet, Inc.(a) | | | 79,500 | |
| | | | | | | | 129,820 | |
| Hotels, Resorts & Cruise Lines – 1.13% | | | |
| | 9,000 | | | Playa Hotels | | | | |
| | | | | & Resorts NV(a)(c) | | | 92,700 | |
| | | | | | | | 92,700 | |
| Household Durables – 1.01% | | | |
| | 7,000 | | | Lifetime Brands, Inc. | | | 83,300 | |
| | | | | | | | 83,300 | |
| Industrial Goods – 1.33% | | | |
| | 25,000 | | | Hudson | | | | |
| | | | | Technologies, Inc.(a) | | | 109,500 | |
| | | | | | | | 109,500 | |
| Insurance – 1.64% | | | |
| | 6,300 | | | CNO Financial | | | | |
| | | | | Group, Inc. | | | 135,072 | |
| | | | | | | | 135,072 | |
| Integrated Mining & Precious Metals – 0.76% | | | |
| | 9,000 | | | Hudbay Minerals, Inc.(c) | | | 62,550 | |
| | | | | | | | 62,550 | |
| Internet Software & Services – 1.51% | | | |
| | 4,000 | | | Carbonite, Inc.(a) | | | 124,400 | |
| | | | | | | | 124,400 | |
| Investment Banking & Brokerage – 1.41% | | | |
| | 35,000 | | | Ladenburg Thalmann | | | | |
| | | | | Financial Services, Inc. | | | 116,200 | |
| | | | | | | | 116,200 | |
| IT Consulting – 1.20% | | | |
| | 4,000 | | | Perficient, Inc.(a) | | | 98,920 | |
| | | | | | | | 98,920 | |
| Machinery Manufacturing – 0.96% | | | |
| | 3,000 | | | Nova Measuring | | | | |
| | | | | Instruments Ltd.(a)(c) | | | 78,750 | |
| | | | | | | | 78,750 | |
| Medical Supplies & Services – 1.22% | | | |
| | 1,500 | | | AMN Healthcare | | | | |
| | | | | Services, Inc.(a) | | | 100,275 | |
| | | | | | | | 100,275 | |
The accompanying notes to financial statements are an integral part of this schedule.
Perritt Low Priced Stock Fund
| Schedule of Investments (Continued) April 30, 2018 (Unaudited) |
| Shares | | | | | Value | |
| Mining – 0.93% | | | |
| | 20,000 | | | Hecla Mining | | | | |
| | | | | Co. – ADR | | $ | 76,600 | |
| | | | | | | | 76,600 | |
| Movies & Entertainment – 1.27% | | | | |
| | 6,000 | | | AMC Entertainment | | | | |
| | | | | Holdings, Inc. – | | | | |
| | | | | Class A | | | 104,700 | |
| | | | | | | | 104,700 | |
| Oil & Gas – 0.85% | | | | |
| | 5,000 | | | Callon Petroleum Co.(a) | | | 69,550 | |
| | | | | | | | 69,550 | |
| Oil & Gas – Equipment & Services – 1.83% | | | | |
| | 5,000 | | | US Silica Holdings, Inc. | | | 150,550 | |
| | | | | | | | 150,550 | |
| Oil & Gas – Exploration & Production – 1.71% | | | | |
| | 7,000 | | | Carrizo Oil | | | | |
| | | | | & Gas, Inc.(a) | | | 140,490 | |
| | | | | | | | 140,490 | |
| Paper Products – 1.30% | | | | |
| | 8,000 | | | Mercer International, | | | | |
| | | | | Inc. | | | 107,200 | |
| | | | | | | | 107,200 | |
| Pharmaceuticals – 2.06% | | | | |
| | 1,000 | | | Cambrex Corp.(a) | | | 52,950 | |
| | 7,000 | | | Corcept Therapeutics, | | | | |
| | | | | Inc.(a) | | | 116,760 | |
| | | | | | | | 169,710 | |
| Real Estate Investment Trusts – 3.72% | | | | |
| | 8,000 | | | Medical Properties | | | | |
| | | | | Trust, Inc. | | | 102,240 | |
| | 13,200 | | | New Senior Investment | | | | |
| | | | | Group, Inc. | | | 113,784 | |
| | 6,000 | | | Physicians Realty Trust | | | 89,640 | |
| | | | | | | | 305,664 | |
| Regional Banks – 1.52% | | | | |
| | 7,000 | | | First Foundation, Inc.(a) | | | 125,230 | |
| | | | | | | | 125,230 | |
| Semiconductor Equipment – 2.65% | | | | |
| | 5,000 | | | Cohu, Inc. | | | 107,000 | |
| | 5,000 | | | Ichor Holdings Ltd.(a)(c) | | | 110,500 | |
| | | | | | | | 217,500 | |
| Semiconductor Related Products – 3.90% | | | | |
| | 3,000 | | | Entegris, Inc. | | $ | 96,600 | |
| | 4,000 | | | Kulicke & Soffa | | | | |
| | | | | Industries, Inc.(a) | | | 91,560 | |
| | 11,600 | | | Photronics, Inc.(a) | | | 88,740 | |
| | 2,500 | | | Ultra Clean | | | | |
| | | | | Holdings, Inc.(a) | | | 43,775 | |
| | | | | | | | 320,675 | |
| Semiconductors – 1.67% | | | | |
| | 3,500 | | | SMART Global | | | | |
| | | | | Holdings, Inc.(a)(c) | | | 137,025 | |
| | | | | | | | 137,025 | |
| Software – 0.60% | | | | |
| | 9,700 | | | Zix Corp.(a) | | | 48,985 | |
| | | | | | | | 48,985 | |
| Specialty Chemicals – 1.34% | | | | |
| | 5,000 | | | Ferro Corp.(a) | | | 110,050 | |
| | | | | | | | 110,050 | |
| Specialty Manufacturing – 2.82% | | | | |
| | 4,500 | | | Mueller Water | | | | |
| | | | | Products, Inc. | | | 44,055 | |
| | 15,000 | | | Tecnoglass, Inc.(c) | | | 127,350 | |
| | 3,000 | | | Wabash National Corp. | | | 60,180 | |
| | | | | | | | 231,585 | |
| Specialty Stores – 1.05% | | | | |
| | 4,000 | | | MarineMax, Inc.(a) | | | 86,400 | |
| | | | | | | | 86,400 | |
| Television Broadcasting Stations – 0.90% | | | | |
| | 7,000 | | | TEGNA, Inc. | | | 73,990 | |
| | | | | | | | 73,990 | |
| Trucking – 0.40% | | | | |
| | 4,000 | | | Daseke, Inc.(a) | | | 33,120 | |
| | | | | | | | 33,120 | |
| Water Transportation – 0.98% | | | | |
| | 10,000 | | | Golden Ocean | | | | |
| | | | | Group Ltd.(c) | | | 80,800 | |
| | | | | | | | 80,800 | |
| | | | | TOTAL COMMON | | | | |
| | | | | STOCKS | | | | |
| | | | | (Cost $7,115,936) | | $ | 8,074,334 | |
The accompanying notes to financial statements are an integral part of this schedule.
Perritt Low Priced Stock Fund
| Schedule of Investments (Continued) April 30, 2018 (Unaudited) |
| Shares | | | | Value | |
| | | | SHORT-TERM | | | |
| | | | INVESTMENTS – 1.75% | | | |
| | 143,811 | | | Invesco Short Term | | | | |
| | | | | Investments Government | | | | |
| | | | | & Agency Portfolio – | | | | |
| | | | | Class I 1.61%(b) | | $ | 143,811 | |
| | | | | TOTAL SHORT-TERM | | | | |
| | | | | INVESTMENTS | | | | |
| | | | | (Cost $143,811) | | $ | 143,811 | |
| | | | | Total Investments | | | | |
| | | | | (Cost $7,259,747) – | | | | |
| | | | | 99.94% | | $ | 8,218,145 | |
| | | | | Other Assets in | | | | |
| | | | | Excess of | | | | |
| | | | | Liabilities – 0.06% | | | 4,744 | |
| | | | | TOTAL NET ASSETS – | | | | |
| | | | | 100.00% | | $ | 8,222,889 | |
Percentages are stated as a percent of net assets.
ADR American Depositary Receipt
| (a) | Non-income producing security. |
| (b) | Variable rate security; the rate shown is the effective rate as of April 30, 2018. |
| (c) | Foreign issued security. |
The industry classifications listed above are in accordance with Global Industry Classification Standard (GICS®), which was developed by and/or is the exclusive property of MSCI, Inc. and Standard & Poor Financial Services LLC (“S&P”).
The accompanying notes to financial statements are an integral part of this schedule.
Perritt Funds, Inc.
St atements of Assets and Liabilities |
April 30, 2018 (Unaudited)
| | | Perritt MicroCap
Opportunities Fund | | | Perritt Ultra
MicroCap Fund | | | Perritt Low
Priced Stock Fund | |
| Assets: | | | | | | | | | |
| Investments in securities, at value | | $ | 183,272,548 | | | $ | 65,850,900 | | | $ | 8,218,145 | |
| Receivable for investments sold | | | 861,401 | | | | 430,102 | | | | — | |
| Dividends and interest receivable | | | 14,270 | | | | 4,253 | | | | 1,335 | |
| Prepaid expenses | | | 28,277 | | | | 11,888 | | | | 19,029 | |
| Receivable for fund shares issued | | | 101,261 | | | | 31,699 | | | | — | |
| Total Assets | | | 184,277,757 | | | | 66,328,842 | | | | 8,238,509 | |
| Liabilities: | | | | | | | | | | | | |
| Payable for investments purchased | | | — | | | | 146,868 | | | | — | |
| Payable for fund shares purchased | | | 57,660 | | | | 23,373 | | | | — | |
| Payable to officer & directors | | | 24,536 | | | | 29,980 | | | | — | |
| Payable to Advisor | | | 153,082 | | | | 67,315 | | | | 480 | |
| Accrued expenses & other liabilities | | | 80,814 | | | | 26,598 | | | | 15,140 | |
| Total Liabilities | | | 316,092 | | | | 294,134 | | | | 15,620 | |
| Net Assets | | $ | 183,961,665 | | | $ | 66,034,708 | | | $ | 8,222,889 | |
| | | | | | | | | | | | | |
| Net Assets Consist of: | | | | | | | | | | | | |
| Capital Stock | | $ | 104,609,650 | | | $ | 51,460,242 | | | $ | 6,889,076 | |
| Accumulated net investment loss | | | (351,168 | ) | | | (683,649 | ) | | | (14,322 | ) |
| Accumulated undistributed net realized gain on investments sold | | | 21,606,614 | | | | 1,921,816 | | | | 389,737 | |
| Net unrealized appreciation on investments | | | 58,096,569 | | | | 13,336,299 | | | | 958,398 | |
| Total Net Assets | | $ | 183,961,665 | | | $ | 66,034,708 | | | $ | 8,222,889 | |
| | | | | | | | | | | | | |
| Capital Stock, $0.0001 par value | | | | | | | | | | | | |
| Authorized | | | 100,000,000 | | | | 100,000,000 | | | | 100,000,000 | |
| Outstanding | | | 6,017,488 | | | | 4,006,393 | | | | 434,673 | |
| Net Assets | | $ | 183,961,665 | | | $ | 66,034,708 | | | $ | 8,222,889 | |
| Net asset value and offering price per share | | $ | 30.57 | | | $ | 16.48 | | | $ | 18.92 | |
| Cost of Securities | | $ | 125,175,979 | | | $ | 52,514,601 | | | $ | 7,259,747 | |
The accompanying notes to financial statements are an integral part of this statement.
Perritt Funds, Inc.
For the Six Months Ended April 30, 2018 (Unaudited)
| | | Perritt MicroCap
Opportunities Fund | | | Perritt Ultra
MicroCap Fund | | | Perritt Low
Priced Stock Fund | |
| Investment Income: | | | | | | | | | |
| Dividend income | | $ | 858,217 | | | $ | 237,716 | | | $ | 39,716 | |
| Less: Foreign taxes withheld and issuance fees | | | — | | | | — | | | | (33 | ) |
| Interest income | | | 20,789 | | | | 16,329 | | | | 1,450 | |
| Total investment income | | | 879,006 | | | | 254,045 | | | | 41,133 | |
| Expenses: | | | | | | | | | | | | |
| Investment advisory fee | | | 945,789 | | | | 419,842 | | | | 39,896 | |
| Shareholder servicing | | | 90,583 | | | | 41,729 | | | | 13,654 | |
| Administration fee | | | 57,223 | | | | 19,003 | | | | 5,021 | |
| Fund accounting expenses | | | 40,590 | | | | 13,971 | | | | 3,093 | |
| Officer & directors’ fees & expenses | | | 37,190 | | | | 37,190 | | | | 8,625 | |
| Professional fees | | | 16,696 | | | | 15,975 | | | | 14,632 | |
| Federal & state registration fees | | | 13,340 | | | | 12,722 | | | | 11,025 | |
| Printing & mailing fees | | | 12,210 | | | | 5,849 | | | | 2,897 | |
| Custodian fees | | | 8,098 | | | | 3,877 | | | | 875 | |
| Interest expense | | | 911 | | | | — | | | | — | |
| Other expense | | | 7,544 | | | | 3,201 | | | | 1,618 | |
| Total expenses | | | 1,230,174 | | | | 573,359 | | | | 101,336 | |
| Less contractual waiver | | | — | | | | — | | | | (37,256 | ) |
| Less voluntary waiver | | | — | | | | — | | | | (8,625 | ) |
| Total expenses net of waivers | | | 1,230,174 | | | | 573,359 | | | | 55,455 | |
| Net investment loss | | | (351,168 | ) | | | (319,314 | ) | | | (14,322 | ) |
| | | | | | | | | | | | | |
| Realized and Unrealized Gain (Loss) on Investments: | | | | | | | | | | | | |
| Net realized gain on investments | | | 21,653,306 | | | | 1,916,994 | | | | 401,667 | |
| Change in unrealized depreciation on investments | | | (18,394,779 | ) | | | (1,901,751 | ) | | | (393,576 | ) |
| Net realized and unrealized gain on investments | | | 3,258,527 | | | | 15,243 | | | | 8,091 | |
| Net increase (decrease) in net assets resulting from operations | | $ | 2,907,359 | | | $ | (304,071 | ) | | $ | (6,231 | ) |
The accompanying notes to financial statements are an integral part of this statement.
Perritt MicroCap Opportunities Fund
Statements of C hanges in Net Assets |
| | | For the Six
Months Ended
April 30, 2018
(Unaudited) | | | For the
Year Ended
October 31, 2017 | |
| Operations: | | | | | | |
| Net investment loss | | $ | (351,168 | ) | | $ | (1,062,704 | ) |
| Net realized gain on investments | | | 21,653,306 | | | | 46,860,920 | |
| Net increase (decrease) in unrealized appreciation (depreciation) on investments | | | (18,394,779 | ) | | | 9,414,458 | |
| Net increase in net assets resulting from operations | | | 2,907,359 | | | | 55,212,674 | |
| Dividends and Distributions to Shareholders: | | | | | | | | |
| Net investment income | | | — | | | | (614,595 | ) |
| Net realized gains | | | (45,812,458 | ) | | | (24,942,672 | ) |
| Total dividends and distributions | | | (45,812,458 | ) | | | (25,557,267 | ) |
| Capital Share Transactions: | | | | | | | | |
| Proceeds from shares issued | | | 12,299,276 | | | | 21,713,650 | |
| Reinvestment of distributions | | | 43,395,030 | | | | 24,470,175 | |
| Cost of shares redeemed | | | (54,277,738 | ) | | | (112,669,167 | ) |
| Redemption fees | | | 5,509 | | | | 7,011 | |
| Net increase (decrease) in net assets from capital share transactions | | | 1,422,077 | | | | (66,478,331 | ) |
| Total Decrease in Net Assets | | | (41,483,022 | ) | | | (36,822,924 | ) |
| Net Assets | | | | | | | | |
| Beginning of the period | | | 225,444,687 | | | | 262,267,611 | |
| End of the period | | $ | 183,961,665 | | | $ | 225,444,687 | |
| Accumulated net investment income/(loss) | | $ | (351,168 | ) | | $ | — | |
| Capital Share Transactions: | | | | | | | | |
| Shares sold | | | 403,625 | | | | 609,471 | |
| Shares issued on reinvestment of distributions | | | 1,480,953 | | | | 720,748 | |
| Shares redeemed | | | (1,708,646 | ) | | | (3,160,870 | ) |
| Net increase (decrease) from capital share transactions | | | 175,932 | | | | (1,830,651 | ) |
The accompanying notes to financial statements are an integral part of this statement.
Perritt Ultra MicroCap Fund
| Statements of Changes in Net Assets |
| | | For the Six
Months Ended
April 30, 2018
(Unaudited) | | | For the
Year Ended
October 31, 2017 | |
| Operations: | | | | | | |
| Net investment loss | | $ | (319,314 | ) | | $ | (661,843 | ) |
| Net realized gain on investments | | | 1,916,994 | | | | 7,563,499 | |
| Net increase (decrease) in unrealized appreciation (depreciation) on investments | | | (1,901,751 | ) | | | 6,729,600 | |
| Net increase (decrease) in net assets resulting from operations | | | (304,071 | ) | | | 13,631,256 | |
| Dividends and Distributions to Shareholders: | | | | | | | | |
| Net realized gains | | | (7,255,839 | ) | | | (2,587,145 | ) |
| Total dividends and distributions | | | (7,255,839 | ) | | | (2,587,145 | ) |
| Capital Share Transactions: | | | | | | | | |
| Proceeds from shares issued | | | 3,145,431 | | | | 15,342,310 | |
| Reinvestment of distributions | | | 6,905,064 | | | | 2,426,585 | |
| Cost of shares redeemed | | | (6,092,385 | ) | | | (13,525,515 | ) |
| Redemption fees | | | 524 | | | | 12,098 | |
| Net increase in net assets from capital share transactions | | | 3,958,634 | | | | 4,255,478 | |
| Total Increase/(Decrease) in Net Assets | | | (3,601,276 | ) | | | 15,299,589 | |
| Net Assets | | | | | | | | |
| Beginning of the period | | | 69,635,984 | | | | 54,336,395 | |
| End of the period | | $ | 66,034,708 | | | $ | 69,635,984 | |
| Accumulated undistributed net investment loss | | $ | (683,649 | ) | | $ | (364,335 | ) |
| Capital Share Transactions: | | | | | | | | |
| Shares sold | | | 186,092 | | �� | | 912,976 | |
| Shares issued on reinvestment of distributions | | | 415,217 | | | | 157,163 | |
| Shares redeemed | | | (360,187 | ) | | | (819,460 | ) |
| Net increase from capital share transactions | | | 241,122 | | | | 250,679 | |
The accompanying notes to financial statements are an integral part of this statement.
Perritt Low Priced Stock Fund
| Statements of Changes in Net Assets |
| | | For the Six
Months Ended
April 30, 2018
(Unaudited) | | | For the
Year Ended
October 31, 2017 | |
| Operations: | | | | | | |
| Net investment loss | | $ | (14,322 | ) | | $ | (40,126 | ) |
| Net realized gain on investments | | | 401,667 | | | | 602,089 | |
| Net increase in unrealized appreciation (depreciation) on investments | | | (393,576 | ) | | | 1,057,916 | |
| Net increase (decrease) in net assets resulting from operations | | | (6,231 | ) | | | 1,619,879 | |
| Dividends and Distributions to Shareholders: | | | | | | | | |
| Net realized gains | | | (401,664 | ) | | | — | |
| Total dividends and distributions | | | (401,664 | ) | | | — | |
| Capital Share Transactions: | | | | | | | | |
| Proceeds from shares issued | | | 1,578,037 | | | | 2,202,538 | |
| Reinvestment of distributions | | | 400,458 | | | | — | |
| Cost of shares redeemed | | | (503,555 | ) | | | (2,367,256 | ) |
| Redemption fees | | | 238 | | | | 345 | |
| Net increase/(decrease) in net assets from capital share transactions | | | 1,475,178 | | | | (164,373 | ) |
| Total Increase in Net Assets | | | 1,067,283 | | | | 1,455,506 | |
| Net Assets | | | | | | | | |
| Beginning of the period | | | 7,155,606 | | | | 5,700,100 | |
| End of the period | | $ | 8,222,889 | | | $ | 7,155,606 | |
| Accumulated net investment loss | | $ | (14,322 | ) | | $ | — | |
| Capital Share Transactions: | | | | | | | | |
| Shares Sold | | | 81,352 | | | | 123,609 | |
| Shares issued on reinvestment of distributions | | | 20,987 | | | | — | |
| Shares redeemed | | | (26,327 | ) | | | (131,452 | ) |
| Net increase/(decrease) from capital share transactions | | | 76,011 | | | | (7,843 | ) |
The accompanying notes to financial statements are an integral part of this statement.
Perritt MicroCap Opportunities Fund
For a Fund share outstanding throughout the year/period
| | | For the Six
Months Ended
April 30,
2018 | | | For the Years Ended October 31, | |
| | | | | 2017 | | | 2016 | | | 2015 | | | 2014 | | | 2013 | |
| | | (Unaudited) | | | | | | | | | | | | | | | | |
| Net asset value, beginning of year/period | | $ | 38.59 | | | $ | 34.18 | | | $ | 32.52 | | | $ | 36.00 | | | $ | 37.38 | | | $ | 26.47 | |
| Income/(loss) from investment operations: | | | | | | | | | | | | | | | | | | | | | | | | |
Net investment income/(loss)2 | | | (0.06 | ) | | | (0.15 | ) | | | 0.13 | | | | 0.04 | | | | (0.18 | ) | | | (0.06 | ) |
| Net realized and unrealized gain/(loss) on investments | | | 0.43 | | | | 7.94 | | | | 2.06 | | | | (1.10 | ) | | | 2.29 | | | | 11.21 | |
| Total from investment operations | | | 0.37 | | | | 7.79 | | | | 2.19 | | | | (1.06 | ) | | | 2.11 | | | | 11.15 | |
| Less dividends and distributions: | | | | | | | | | | | | | | | | | | | | | | | | |
| From net investment income | | | — | | | | (0.09 | ) | | | — | | | | — | | | | — | | | | (0.24 | ) |
| Distributions from net realized gains | | | (8.39 | ) | | | (3.29 | ) | | | (0.53 | ) | | | (2.42 | ) | | | (3.49 | ) | | | — | |
| Total dividends and distributions | | | (8.39 | ) | | | (3.38 | ) | | | (0.53 | ) | | | (2.42 | ) | | | (3.49 | ) | | | (0.24 | ) |
Redemption fees2,3 | | | — | | | | — | | | | — | | | | — | | | | — | | | | — | |
| Net asset value, end of year/period | | $ | 30.57 | | | $ | 38.59 | | | $ | 34.18 | | | $ | 32.52 | | | $ | 36.00 | | | $ | 37.38 | |
Total return1 | | | 2.12 | %5 | | | 24.20 | % | | | 6.85 | % | | | (3.07 | )% | | | 6.17 | % | | | 42.46 | % |
| Supplemental data and ratios: | | | | | | | | | | | | | | | | | | | | | | | | |
| Net assets, end of year/period (in thousands) | | $ | 183,962 | | | $ | 225,445 | | | $ | 262,268 | | | $ | 372,768 | | | $ | 462,716 | | | $ | 463,469 | |
| Ratio of net expenses to average net assets | | | 1.30 | %4 | | | 1.23 | % | | | 1.23 | % | | | 1.21 | % | | | 1.19 | % | | | 1.22 | % |
| Ratio of net investment income/(loss) to average net assets | | | (0.37 | %)4 | | | (0.41 | %) | | | 0.41 | % | | | 0.12 | % | | | (0.51 | %) | | | (0.20 | %) |
| Portfolio turnover rate | | | 4.9 | %5 | | | 18.0 | % | | | 6.2 | % | | | 20.7 | % | | | 29.1 | % | | | 41.4 | % |
1 | Total return reflects reinvested dividends but does not reflect the impact of taxes. |
2 | Net investment income (loss) and redemption fees per share has been calculated based on average shares outstanding during the year/period. |
3 | Amount is less than $0.01 per share. |
The accompanying notes to financial statements are an integral part of this schedule.
Perritt Ultra MicroCap Fund\
For a Fund share outstanding throughout the year/period
| | | For the Six
Months Ended
April 30, | | | For the Years Ended October 31, | |
| | | 2018 | | | 2017 | | | 2016 | | | 2015 | | | 2014 | | | 2013 | |
| | | (Unaudited) | | | | | | | | | | | | | | | | |
| Net asset value, beginning of year/period | | $ | 18.49 | | | $ | 15.46 | | | $ | 14.39 | | | $ | 16.79 | | | $ | 16.23 | | | $ | 11.50 | |
| Income/(loss) from investment operations: | | | | | | | | | | | | | | | | | | | | | | | | |
Net investment income/(loss)2 | | | (0.07 | ) | | | (0.18 | ) | | | 0.07 | | | | (0.06 | ) | | | (0.19 | ) | | | (0.15 | ) |
| Net realized and unrealized gain/(loss) on investments | | | (0.01 | ) | | | 3.94 | | | | 1.22 | | | | (0.06 | ) | | | 1.12 | | | | 4.88 | |
| Total from investment operations | | | (0.08 | ) | | | 3.76 | | | | 1.29 | | | | (0.12 | ) | | | 0.93 | | | | 4.73 | |
| Less dividends and distributions: | | | | | | | | | | | | | | | | | | | | | | | | |
| Distributions from net realized gains | | | (1.93 | ) | | | (0.73 | ) | | | (0.22 | ) | | | (2.29 | ) | | | (0.39 | ) | | | — | |
| Total dividends and distributions | | | (1.93 | ) | | | (0.73 | ) | | | (0.22 | ) | | | (2.29 | ) | | | (0.39 | ) | | | — | |
Redemption fees2 | | | — | 3 | | | — | 3 | | | — | 3 | | | 0.01 | | | | 0.02 | | | | — | 3 |
| Net asset value, end of year/period | | $ | 16.48 | | | $ | 18.49 | | | $ | 15.46 | | | $ | 14.39 | | | $ | 16.79 | | | $ | 16.23 | |
Total return1 | | | (0.54 | %)5 | | | 25.27 | % | | | 9.11 | % | | | (0.82 | %) | | | 5.96 | % | | | 41.13 | % |
| Supplemental data and ratios: | | | | | | | | | | | | | | | | | | | | | | | | |
| Net assets, end of year/period (in thousands) | | $ | 66,035 | | | $ | 69,636 | | | $ | 54,336 | | | $ | 60,053 | | | $ | 67,571 | | | $ | 82,000 | |
| Ratio of net expenses to average net assets | | | 1.71 | %4 | | | 1.70 | % | | | 1.77 | % | | | 1.75 | % | | | 1.56 | % | | | 1.75 | % |
| Ratio of net investment income/(loss) to average net assets | | | (0.95 | %)4 | | | (1.07 | %) | | | 0.48 | % | | | (0.43 | %) | | | (1.06 | %) | | | (1.14 | %) |
| Portfolio turnover rate | | | 9.6 | %5 | | | 43.0 | % | | | 18.1 | % | | | 30.1 | % | | | 64.2 | % | | | 33.9 | % |
1 | Total return reflects reinvested dividends but does not reflect the impact of taxes. |
2 | Net investment income (loss) and redemption fees per share has been calculated based on average shares outstanding during the year/period. |
3 | Amount is less than $0.01 per share. |
The accompanying notes to financial statements are an integral part of this schedule.
Perritt Low Priced Stock Fund
For a Fund share outstanding throughout the year/period
| | | For the Six
Months Ended
April 30, | | | For the Years Ended
October 31, | | | For the
Period From
February 28, 20144
to October 31, | |
| | | 2018 | | | 2017 | | | 2016 | | | 2015 | | | 2014 | |
| | | (Unaudited) | | | | | | | | | | | | | |
| Net asset value, beginning of year/period | | $ | 19.95 | | | $ | 15.55 | | | $ | 15.39 | | | $ | 14.15 | | | $ | 15.00 | |
| Income/(loss) from investment operations: | | | | | | | | | | | | | | | | | | | | |
Net investment loss2 | | | (0.03 | ) | | | (0.11 | ) | | | (0.04 | ) | | | (0.01 | ) | | | (0.06 | ) |
| Net realized and unrealized gain/(loss) on investments | | | 0.09 | | | | 4.51 | | | | 0.20 | | | | 1.25 | | | | (0.79 | ) |
| Total from investment operations | | | 0.06 | | | | 4.40 | | | | 0.16 | | | | 1.24 | | | | (0.85 | ) |
| Less dividends and distributions: | | | | | | | | | | | | | | | | | | | | |
| Distributions from net realized gains | | | (1.09 | ) | | | — | | | | — | | | | — | | | | — | |
| Total dividends and distributions | | | (1.09 | ) | | | — | | | | — | | | | — | | | | — | |
Redemption fees2,3 | | | — | | | | — | | | | — | | | | — | | | | — | |
| Net asset value, end of year/period | | $ | 18.92 | | | $ | 19.95 | | | $ | 15.55 | | | $ | 15.39 | | | $ | 14.15 | |
Total return1 | | | 0.19 | %7 | | | 28.28 | % | | | 1.04 | % | | | 8.76 | % | | | (5.67 | %)5 |
| Supplemental data and ratios: | | | | | | | | | | | | | | | | | | | | |
| Net assets, end of period (in thousands) | | $ | 8,223 | | | $ | 7,156 | | | $ | 5,700 | | | $ | 4,612 | | | $ | 2,090 | |
| Ratio of net expenses to average net assets | | | 1.39 | %6 | | | 1.39 | % | | | 1.39 | % | | | 1.49 | %8 | | | 1.50 | %6 |
| Ratio of net investment loss to average net assets | | | (0.36 | %)6 | | | (0.61 | %) | | | (0.28 | %) | | | (0.08 | %) | | | (0.67 | %)6 |
| Ratio of expenses (prior to reimbursement) to average net assets | | | 2.54 | %6 | | | 2.65 | % | | | 3.25 | % | | | 4.90 | % | | | 7.15 | %6 |
| Ratio of net investment loss (prior to reimbursement) to average net assets | | | (1.51 | %)6 | | | (1.87 | %) | | | (2.14 | %) | | | (3.49 | %) | | | (6.32 | %)6 |
| Portfolio turnover rate | | | 25.9 | %7 | | | 75.0 | % | | | 62.7 | % | | | 76.6 | % | | | 49.0 | %7 |
1 | Total return reflects reinvested dividends but does not reflect the impact of taxes. |
2 | Net investment income (loss) and redemption fees per share has been calculated based on average shares outstanding during the year/period. |
3 | Amount is less than $0.01 per share. |
4 | Commencement of operations. |
5 | The total return figure is the since inception return for the Fund which commenced operations on February 28, 2014. |
8 | Effective October 1, 2015, the Advisor expense limit was reduced from 1.50% to 1.39%. See Note 4. |
The accompanying notes to financial statements are an integral part of this schedule.
Perritt Funds, Inc.
| Notes to Financial Statements (Unaudited) |
April 30, 2018 (Unaudited)
Perritt Funds, Inc. (the “Corporation”) was organized on March 19, 2004 as a Maryland corporation and is registered under the Investment Company Act of 1940, as amended (the “1940 Act”), as an open-end investment company, with each series below being a diversified fund. The Corporation currently consists of the following series: Perritt MicroCap Opportunities Fund (“MicroCap Fund”), Perritt Ultra MicroCap Fund (“Ultra MicroCap Fund”) and Perritt Low Priced Stock Fund (“Low Priced Stock Fund”) (each, a “Fund,” and collectively, the “Funds”). Perritt MicroCap Opportunities Fund, Inc., the predecessor to the MicroCap Fund, commenced operations on April 11, 1988. As part of a plan of reorganization, on February 28, 2013, Perritt MicroCap Opportunities Fund, Inc. merged into the MicroCap Fund, a series within the Corporation. The Perritt Low Priced Stock Fund commenced operations on February 28, 2014. The MicroCap Fund’s investment objective is to invest in mainly common stocks of companies with market capitalizations that are below $500 million at the time of the initial purchase. The Ultra MicroCap Fund’s investment objective is to invest in mainly common stocks of companies with market capitalizations that are below $300 million at the time of the initial purchase. The Low Priced Stock Fund’s investment objective is to invest mainly in common stocks of companies with market capitalization that are below $3 billion and traded at or below $15 per share at the time of initial purchase. The Funds are each an investment company and accordingly follow the investment company accounting and reporting guidance of the Financial Accounting Standards Board (“FASB”) Accounting Standards Codification topic 946 “Financial Services – Investment Companies.”
| 2. | Summary of Significant Accounting Policies |
| a. | Exchange-listed securities are generally valued at the last sales price reported by the principal security exchange on which the security is traded, or if no sale is reported, the mean between the latest bid and ask price unless the Funds’ investment advisor believes that the mean does not represent a fair value, in which case the securities are fair valued as set forth below. Securities listed on NASDAQ are valued at the NASDAQ Official Closing Price. Demand notes, commercial paper, U.S. Treasury Bills and warrants are stated at fair value using market prices if available, or a pricing service when such prices are believed to reflect fair value. Securities for which market quotations are not readily available are valued at their fair value as determined in good faith by the Funds’ advisor under procedures established by and under the supervision of the Board of Directors of the Funds. The Funds’ fair value procedures allow for the use of certain methods performed by the Funds’ advisor to value those securities for which market quotations are not readily available, at a price that a Fund might reasonably expect to receive upon a sale of such securities. For example, these methods may be based on a multiple of earnings, or a discount from market of a similar freely traded security, or a yield to maturity with respect to debt issues, or a combination of these and other methods. |
| b. | Net realized gains and losses on securities are computed using the first-in, first-out method. |
Perritt Funds, Inc.
| Notes to Financial Statements (Unaudited) |
| c. | Dividend income is recognized on the ex-dividend date, and interest income is recognized on the accrual basis. Withholding taxes on foreign dividends and capital gains, which are included as a component of net investment income and realized gain (loss) on investments, respectively, have been provided for in accordance with the Funds’ understanding of the applicable country’s tax rules and rates. Discounts and premiums on securities purchased are amortized over the life of the respective securities. Distributions received from real estate investment trusts (“REITs”) are classified as investment income or realized gains based on the U.S. income tax characteristics of the distribution. Return of capital distributions received from REIT securities and partnerships are recorded as an adjustment to the cost of the security and thus may impact unrealized or realized gains or losses on the security. Investment and shareholder transactions are recorded on the trade date. |
| d. | Each Fund is charged for those expenses that are directly attributable to it. Expenses that are not readily identifiable to a specific Fund are generally allocated among the Funds in proportion to the relative net assets of the Funds. |
| e. | Provision has not been made for federal income tax since the Funds have each elected to be taxed as a “regulated investment company” and intend to distribute substantially all income to their shareholders and otherwise comply with the provisions of the Internal Revenue Code applicable to regulated investment companies. |
| f. | The preparation of financial statements in conformity with accounting principles generally accepted in the United States of America (“GAAP”) requires management to make estimates and assumptions that affect the reported amounts of assets and liabilities and disclosure of contingent assets and liabilities at the date of the financial statements and reported amounts of increases and decreases in net assets from operations during the reporting period. Actual results could differ from those estimates. In preparing these financial statements, the Funds have evaluated events and transactions for potential recognition or disclosure through the date the financial statements were issued. |
| g. | Dividends from net investment income and net realized capital gains, if any, are declared and paid annually. Distributions to shareholders are recorded on the ex-dividend date. The Funds may periodically make reclassifications among certain of their capital accounts as a result of the timing and characterization of certain income and realized gain distributions, including reclassifying net operating losses, as determined annually in accordance with federal tax regulations which may differ from GAAP. The MicroCap Fund has reclassified the components of its capital accounts for the year ended October 31, 2017, by increasing paid-in capital by $19,194, decreasing accumulated net investment loss by $1,029,283 and decreasing accumulated net realized gain by $1,048,477. The Ultra MicroCap Fund has reclassified the components of its capital accounts for the year ended October 31, 2017, by decreasing accumulated net investment loss by $297,508 and decreasing accumulated net realized gain by $297,508. The Low Priced Stock Fund has reclassified the components of its capital accounts for the year ended October 31, 2017 by decreasing accumulated net investment loss by $53,094 and increasing accumulated net realized loss by $53,094. |
Perritt Funds, Inc.
| Notes to Financial Statements (Unaudited) (Continued) |
| h. | As of and during the six months ended April 30, 2018, the Funds did not have a liability for any unrecognized tax benefits. The Funds recognize interest and penalties, if any, related to unrecognized tax benefits as income tax expense on the Statements of Operations. During the six months ended April 30, 2018, the Funds did not incur any interest or penalties. The Funds are not subject to examination by U.S. federal tax authorities for any tax years before 2014. |
GAAP establishes an authoritative definition of fair value and sets out a hierarchy for measuring fair value. GAAP also requires additional disclosures about the various inputs used to develop the measurements of fair value. These inputs are summarized in the three broad levels listed below:
| ● Level 1 – | Quoted prices in active markets for identical securities. |
| ● Level 2 – | Other significant observable inputs (including quoted prices for similar securities or the identical security on an inactive market, interest rates, prepayment speeds, credit risk, etc.). |
| ● Level 3 – | Significant unobservable inputs (including the Funds’ own assumptions in determining the fair value of investments). |
The inputs or methodology used for valuing securities are not necessarily an indication of the risk associated with investing in those securities. The following is a summary of the inputs used to value the Funds’ net assets as of April 30, 2018:
Perritt MicroCap Opportunities Fund
| | | | | | | | | | | | | | | |
| | Description | | Level 1 | | Level 2 | | Level 3 | | Total | |
| | Investments in Securities | | | | | | | | | | | | | |
| | Common Stocks | | | | | | | | | | | | | |
| | Consumer Discretionary | | $ | 14,274,035 | | $ | — | | $ | — | | $ | 14,274,035 | |
| | Consumer Staples | | | 9,146,980 | | | — | | | — | | | 9,146,980 | |
| | Energy | | | 3,119,486 | | | — | | | — | | | 3,119,486 | |
| | Financial | | | 34,546,868 | | | — | | | — | | | 34,546,868 | |
| | Health Care | | | 4,155,375 | | | — | | | — | | | 4,155,375 | |
| | Industrials | | | 55,612,393 | | | — | | | — | | | 55,612,393 | |
| | Information Technology | | | 28,786,521 | | | — | | | — | | | 28,786,521 | |
| | Materials | | | 17,280,000 | | | — | | | — | | | 17,280,000 | |
| | Real Estate Investment Trusts | | | 6,668,665 | | | — | | | — | | | 6,668,665 | |
| | Telecommunication Services | | | 4,120,762 | | | — | | | — | | | 4,120,762 | |
| | Total Common Stocks | | | 177,711,085 | | | — | | | — | | | 177,711,085 | |
| | Warrants | | | | | | | | | | | | | |
| | Financial | | | — | | | 0 | | | — | | | — | |
| | Total Warrants | | | — | | | — | | | — | | | — | |
| | Short-Term Investments | | | 5,561,463 | | | — | | | — | | | 5,561,463 | |
| | Total Investments in Securities | | $ | 183,272,548 | | $ | — | | $ | — | | $ | 183,272,548 | |
Perritt Funds, Inc.
| Notes to Financial Statements (Unaudited) (Continued) |
Perritt Ultra MicroCap Fund
| | Description | | Level 1 | | Level 2 | | Level 3 | | Total | |
| | Investments in Securities | | | | | | | | | | | | | |
| | Common Stocks | | | | | | | | | | | | | |
| | Consumer Discretionary | | $ | 9,954,458 | | $ | — | | $ | — | | $ | 9,954,458 | |
| | Consumer Staples | | | 821,250 | | | — | | | — | | | 821,250 | |
| | Energy | | | 4,249,810 | | | — | | | — | | | 4,249,810 | |
| | Financial | | | 6,992,257 | | | — | | | — | | | 6,992,257 | |
| | Health Care | | | 9,588,302 | | | — | | | — | | | 9,588,302 | |
| | Industrials | | | 13,462,643 | | | 469,625 | | | — | | | 13,932,267 | |
| | Information Technology | | | 13,209,957 | | | — | | | — | | | 13,209,957 | |
| | Materials | | | 3,113,304 | | | — | | | — | | | 3,113,304 | |
| | Real Estate Investment Trusts | | | 710,600 | | | — | | | — | | | 710,600 | |
| | Total Common Stocks | | | 62,102,581 | | | 469,625 | | | — | | | 62,572,206 | |
| | Warrants | | | | | | | | | | | | | |
| | Information Technology | | | — | | | 0 | | | — | | | — | |
| | Total Warrants | | | — | | | — | | | — | | | — | |
| | Short-Term Investments | | | 3,278,694 | | | — | | | — | | | 3,278,694 | |
| | Total Investments in Securities | | $ | 65,381,275 | | $ | 469,625 | | $ | — | | $ | 65,850,900 | |
| | Perritt Low Priced Stock Fund | | | | | | | | | | | | | |
| | Description | | Level 1 | | Level 2 | | Level 3 | | Total | |
| | Investments in Securities | | | | | | | | | | | | | |
| | Common Stocks | | | | | | | | | | | | | |
| | Consumer Discretionary | | $ | 1,095,590 | | $ | — | | $ | — | | $ | 1,095,590 | |
| | Consumer Staples | | | 138,600 | | | — | | | — | | | 138,600 | |
| | Energy | | | 531,590 | | | — | | | — | | | 531,590 | |
| | Financial | | | 803,320 | | | — | | | — | | | 803,320 | |
| | Health Care | | | 688,955 | | | — | | | — | | | 688,955 | |
| | Industrials | | | 1,747,145 | | | — | | | — | | | 1,747,145 | |
| | Information Technology | | | 1,925,770 | | | — | | | — | | | 1,925,770 | |
| | Materials | | | 837,700 | | | — | | | — | | | 837,700 | |
| | Real Estate Investment Trusts | | | 305,664 | | | — | | | — | | | 305,664 | |
| | Total Common Stocks | | | 8,074,334 | | | — | | | — | | | 8,074,334 | |
| | Short-Term Investments | | | 143,811 | | | — | | | — | | | 143,811 | |
| | Total Investments in Securities | | $ | 8,218,145 | | $ | — | | $ | — | | $ | 8,218,145 | |
Please refer to the Schedules of Investments for additional information regarding the composition of the amounts listed above.
Perritt Funds, Inc.
| Notes to Financial Statements (Unaudited) (Continued) |
Below are the transfers into or out of Levels 1 and 2 for the Fund using market values measured at the end of the reporting period:
| | | | Ultra MicroCap Fund | |
| | Transfers into Level 1 | | | $ | 895,955 | | |
| | Transfers out of Level 1 | | | | — | | |
| | Net Transfers into/(out of) Level 1 | | | $ | 895,955 | | |
| | Transfers into Level 2 | | | $ | — | | |
| | Transfers out of Level 2 | | | | (895,955 | ) | |
| | Net Transfers into/(out of) Level 2 | | | $ | (895,955 | ) | |
There were no transfers into or out of Levels 1 or 2 during the six months ended April 30, 2018 for Low Priced Stock Fund and Micro Cap Fund.
The securities transferred from Level 2 to Level 1 due to an increase of observable market data from an increase in market activity.
At the beginning and during the six months ended April 30, 2018, the MicroCap Fund, the Ultra MicroCap Fund, and the Low Priced Stock Fund did not hold any Level 3 securities.
| 4. | Investment Advisory Agreement |
For each Fund, the Corporation entered into an investment advisory agreement (collectively, the “Agreements”) with Perritt Capital Management, Inc. (the “Advisor”), with whom certain officers and directors of the Corporation are affiliated, to furnish investment advisory services to the Funds. Under the terms of the Agreements, the MicroCap Fund and the Low Priced Stock Fund pay the Advisor a monthly fee at the annual rate of 1% of each Fund’s daily average net assets, and the Ultra MicroCap Fund pays the Advisor a monthly fee equal to 1.25% of its daily average net assets less than or equal to $100 million; 1.00% with respect to daily average net assets in excess of $100 million and less than or equal to $200 million; and 0.50% with respect to daily average net assets in excess of $200 million. At April 30, 2018, the MicroCap Fund, Ultra MicroCap Fund and Low Priced Stock Fund had fees due to the Advisor of $153,082, $67,315 and $480, respectively. For the six months ended April 30, 2018, the MicroCap Fund, Ultra MicroCap Fund and Low Priced Stock Fund had incurred advisory fees of $945,789, $419,842 and $39,896, respectively.
With regards to the Low Priced Stock Fund, the Advisor has agreed to waive fees and/or reimburse operating expenses (other than interest, brokerage commissions, dividend expense on short sales, taxes, extraordinary expenses and acquired fund fees and expenses) so that total annual operating expenses are not expected to exceed 1.39% of the daily average net assets. This arrangement cannot be terminated prior to February 28, 2019 without the consent of the Board of Directors. The Advisor is permitted to recapture amounts waived and/or reimbursed within three years after the fiscal year in which the Advisor earned the fee or incurred the expense if the total annual operating expenses have fallen to a level below the limit described above. Additionally, the Advisor has voluntarily waived any salaries and fees of all officers and directors of the Low Priced Stock Fund during the year. The salaries and fees waived by the Advisor for the six months ended April 30, 2018 were $8,625 and are not eligible for recapture. Voluntary expense waivers may be discontinued at any time.
Perritt Funds, Inc.
| Notes to Financial Statements (Unaudited) (Continued) |
For the six months ended April 30, 2018, the Advisor waived expenses and/or reimbursed the Low Priced Stock Fund $37,256 which is eligible for recapture through October 31, 2021. $66,290 is eligible for recapture through October 31, 2020. $81,819 is eligible for recapture through October 31, 2019. $87,508 is eligible for recapture through October 31, 2018.
The Advisor manages the Funds’ investments subject to the supervision of the Funds’ Board of Directors. The Advisor is responsible for investment decisions and supplies investment research and portfolio management. Under the Agreements, the Advisor, at its own expense and without reimbursement from the Funds, will furnish office space and all necessary office facilities, equipment and personnel for making the investment decisions necessary for managing the Funds and maintaining their organization, will pay the salaries and fees of all officers and directors of the Funds (except the Chief Compliance Officer’s salary and the fees paid to disinterested directors) and will bear all sales and promotional expenses of the Funds.
The officers of the Funds are affiliated with the Advisor. Such officers, with the exception of the Chief Compliance Officer, receive no compensation from the Funds or the Advisor for serving their respective roles. The Funds pay the salary associated with the office of the Chief Compliance Officer. Such fees are included on the Statements of Operations.
The Funds may reimburse the Advisor for fees paid to intermediaries such as banks, broker-dealers, financial advisors or other financial institutions for sub-transfer agency, sub-administration and other services provided to investors whose shares of record are held in omnibus, other group accounts, retirement plans or accounts traded through registered securities clearing agents. These fees are fees that the Funds are obligated to pay to such intermediaries, and the fees may vary based on, for example, the nature of services provided. The fees paid to such intermediaries by the Funds are only a portion of the full fee that is paid to the intermediaries, and the Advisor is obligated to pay the remaining amount. In determining the portion of the fees paid to the intermediaries that the Funds are obligated to pay, the Funds have used the “avoided cost” method, which is one of several permissible methods to determine the fees are reasonable. Based on this method, the Funds’ Board of Directors determines a fee per sub-account that it believes approximates the transfer agency fee that would otherwise have been payable by the Funds if such intermediaries did not maintain the sub-account. These amounts are included within shareholder servicing fees on the Statements of Operations.
| 5. | Investment Transactions |
Purchases and sales of securities, excluding short-term investments, for the six months ended April 30, 2018, were as follows:
| | | | | | | | | | | | | | | |
| | | | Purchases | | Sales | |
| | | | U.S.
Governments | | Other | | U.S.
Governments | | Other | |
| | MicroCap Fund | | | $ | — | | | | $ | 9,233,589 | | | | $ | — | | | | $ | 51,823,166 | | |
| | Ultra MicroCap Fund | | | $ | — | | | | $ | 6,270,976 | | | | $ | — | | | | $ | 11,485,609 | | |
| | Low Priced Stock Fund | | | $ | — | | | | $ | 3,194,580 | | | | $ | — | | | | $ | 2,004,646 | | |
Perritt Funds, Inc.
| Notes to Financial Statements (Unaudited) (Continued) |
| 6. | Federal Income Tax Matters |
As of October 31, 2017, the components of distributable earnings on a tax basis were as follows:
| | | | MicroCap
Fund | | | Ultra MicroCap
Fund | | | Low Priced
Stock Fund | |
| | Cost of investments for tax purposes | | $ | 147,625,339 | | | $ | 54,482,074 | | | $ | 5,810,467 | |
| | Gross tax unrealized appreciation | | | 80,614,011 | | | | 21,502,761 | | | | 1,524,157 | |
| | Gross tax unrealized depreciation | | | (4,169,255 | ) | | | (6,267,340 | ) | | | (184,112 | ) |
| | Net unrealized appreciation on investments | | | 76,444,756 | | | | 15,235,421 | | | | 1,340,045 | |
| | Distributable ordinary income | | | 2,046,759 | | | | — | | | | 5,713 | |
| | Distributable long-term capital gains | | | 43,765,599 | | | | 7,263,290 | | | | 395,950 | |
| | Total distributable earnings | | | 45,812,358 | | | | 7,263,290 | | | | 401,663 | |
| | Other accumulated losses | | | — | | | | (364,335 | ) | | | — | |
| | Total accumulated earnings | | $ | 122,257,114 | | | $ | 22,134,376 | | | $ | 1,741,708 | |
The difference between book and tax basis distributable earnings is primarily related to the deferral of losses on wash sales.
At October 31, 2017, the Low Priced Stock Fund utilized short-term capital losses of $130,745.
At October 31, 2017, the Ultra MicroCap Fund deferred, on a tax basis, post-October and late year ordinary losses of $364,335.
The tax composition of distributions paid during the periods ended October 31, 2017 and 2016 were as follows:
| | | | Ordinary Income | | | Long-term Capital Gains | |
| | | | 2017 | | | 2016 | | | 2017 | | | 2016 | |
| | MicroCap Fund | | $ | 770,079 | | | $ | — | | | $ | 24,787,188 | | | $ | 6,027,092 | |
| | Ultra MicroCap Fund | | | 75,527 | | | | — | | | | 2,511,618 | | | | 866,370 | |
| | Low Priced Stock Fund | | | — | | | | — | | | | — | | | | — | |
The Funds designated as long-term capital gain dividend, pursuant to Internal Revenue Code Section 852(b)(3), the amount necessary to reduce the earnings and profits of the Funds related to net capital gain to zero for the tax year ended October 31, 2017.
On November 17, 2017, the MicroCap Fund paid long-term capital gains distributions of $8.06541 per share, the Ultra MicroCap Fund paid long-term capital gains distributions of $1.92699 per share, and the Low Priced Stock Fund paid long-term capital gains distributions of $1.07162 per share.
The Funds may own investment securities which are unregistered and thus restricted as to resale. These securities are valued by each Fund after giving due consideration to pertinent factors including recent private sales, market conditions and the issuer’s financial performance. Where future disposition of these securities requires registration under the Securities Act of 1933, each Fund has the right to include these securities in such registration, generally without cost to the Fund. The Funds have no right to require registration of the unregistered securities they hold. At April 30, 2018, the MicroCap Fund held restricted securities with an aggregate value of $2,380,000 which accounted for 1.29% of the MicroCap Fund’s net assets. These restricted securities are deemed to be liquid. During the six months ended April 30, 2018, the Ultra MicroCap Fund and the Low Priced Stock Fund did not hold any restricted securities.
Perritt Funds, Inc.
| Notes to Financial Statements (Unaudited) (Continued) |
| 8. | Guarantees and Indemnifications |
Under the Funds’ organizational documents, their officers and directors are indemnified by the Funds against certain liabilities arising out of the performance of their duties to the Funds. Additionally, in the normal course of business, the Funds enter into contracts with service providers that contain general indemnification clauses. The Funds’ maximum exposure under these arrangements is unknown as this would involve future claims that may be made against the Funds that have not yet occurred. Currently, the Funds expect the risk of loss to be remote.
| 9. | Line of Credit Arrangement |
The MicroCap Fund and Ultra MicroCap Fund are each party to uncommitted line of credit arrangements with U.S. Bank, N.A. with an expiration date of December 11, 2018, under which the MicroCap Fund may borrow up to $18,000,000 and the Ultra MicroCap Fund may borrow up to $10,000,000, subject to certain restrictions and covenants. Interest is charged on borrowings at the prevailing Prime Rate. The Funds have borrowed under these arrangements from time to time to increase the efficiency of cash flow management. At the beginning of the year, the Prime Rate was 4.25% and was increased to 4.50% on December 14, 2017. For the six months ended April 30, 2018, the MicroCap Fund had average borrowings of 4.47% and the weighted average interest rate on the line of credit borrowings was $700,000 which occurred between November 15, 2017 and January 3, 2018. From December 29-31, 2017, the MicroCap Fund had borrowings of $999,000, which represents the largest borrowing amount during the six months ended April 30, 2018. During the six months ended April 30, 2018, the MicroCap Fund and Ultra MicroCap Fund had no outstanding borrowings on the lines of credit. As of April 30, 2018, the Low Priced Stock Fund does not have a line of credit arrangement.
The Funds charge a 2% redemption fee to those who buy and sell shares within 90 calendar days or less. The redemption fee is retained for the benefit of long-term shareholders, and recorded as additional capital in the Statements of Changes in Net Assets.
| 11. | Transactions with Affiliates |
The following issuer was affiliated with the Funds, as the Funds held 5% or more of the outstanding voting securities of the issuer during the period from November 1, 2017 through April 30, 2018. No issuers were affiliated with the MicroCap Opportunities Fund and the Low Priced Stock Fund during the six months ended April 30, 2018. See Section (2)(a)(3) of the Investment Company Act of 1940.
Perritt Funds, Inc.
| Notes to Financial Statements (Unaudited) (Continued) |
Perritt Ultra MicroCap Fund
| Issuer Name | Share
Balance At
November 1,
2017 | | | Additions | | | Reductions | | | Share
Balance At
April 30,
2018 | | | Net
Change in
Unrealized
Depreciation | | | Dividend
Income | | | Net
Realized
Losses | | | Value
At
April 30,
2018 | |
Sigma Labs, Inc.1 | | | 249,640 | | | | 40,000 | | | | (49,640 | ) | | | 240,000 | | | $ | (41,844 | ) | | $ | — | | | $ | (30,579 | ) | | $ | 261,600 | |
1 | Issuer was not an affiliate as of April 30, 2018. |
The Funds are permitted to purchase or sell securities from or to each other under specified conditions outlined in procedures adopted by the Board of Directors. The procedures have been designed to ensure that any purchase or sale of securities by a Fund from or to another Fund complies with Rule 17a-7 of the Investment Company Act of 1940. For the six months ended April 30, 2018, the MicroCap Fund and Ultra MicroCap Fund engaged in two securities transactions pursuant to Rule 17a-7 of the Investment Company Act of 1940. The Low Priced Stock Fund did not engage in any 17a-7 transactions.
Management has performed an evaluation of subsequent events through the date the financial statements were issued.
Perritt Funds, Inc.
Ex pense Example (Unaudited) | April 30, 2018 |
As a shareholder of the Funds, you incur two types of costs: (1) transaction costs, including sales charges (loads) on purchase payments, reinvested dividends, or other distributions; redemption fees (the Funds impose a 2.00% redemption fee on shares held for 90 calendar days or less after purchase); and exchange fees; and (2) ongoing costs, including management fees; distribution and/or service fees; and other Fund expenses. This example is intended to help you understand your ongoing costs (in dollars) of investing in the Fund and to compare these costs with the ongoing costs of investing in other mutual funds. The example is based on an investment of $1,000 invested at the beginning of the period and held for the entire period (November 1, 2017 – April 30, 2018).
Actual Expenses
The first line of the table below provides information about actual account values and actual expenses. Although the Funds charge no sales load or transaction fees (other than a 2.00% redemption fee for shares held for 90 calendar days or less after purchase), you will be assessed fees for outgoing wire transfers, returned checks and stop payment orders at prevailing rates charged by U.S. Bancorp Fund Services, LLC, the Funds transfer agent. If you request that a redemption be made by wire transfer, currently a $15.00 fee is charged by the Funds transfer agent. You will be charged a transaction fee equal to 2.00% of the net amount of the redemption if you redeem your shares within 90 calendar days of purchase. IRA accounts will be charged a $15.00 annual maintenance fee. There is a $25 IRA distribution and transfer out fee, unless set up automatically. Please see IRA Account Agreement for additional fees related to IRA accounts. To the extent the Fund invests in shares of other investment companies as part of its investment strategy, you will indirectly bear your proportionate share of any fees and expenses charged by the underlying funds in which the Fund invests in addition to the expenses of the Fund. Actual expenses of the underlying funds are expected to vary among the various underlying funds. These expenses are not included in the example below. The example below includes, but is not limited to, management fees, shareholder servicing fees, fund accounting, custody and transfer agent fees. However, the example below does not include portfolio trading commissions and related expenses, interest expense and other extraordinary expenses as determined under accounting principles generally accepted in the United States of America. You may use the information in this line, together with the amount you invested, to estimate the expenses that you paid over the period. Simply divide your account value by $1,000 (for example, an $8,600 account value divided by $1,000 = 8.6), then multiply the result by the number in the first line under the heading entitled “Expenses Paid During Period” to estimate the expenses you paid on your account during this period.
Hypothetical Example for Comparison Purposes
The second line of the table below provides information about hypothetical account values and hypothetical expenses based on the Fund’s actual expense ratio and an assumed rate of return of 5% per year before expenses, which is not the Fund’s actual return. The hypothetical account values and expenses may not be used to estimate the actual ending account balance or expenses you paid for the period. You may use this information to compare the ongoing costs of investing in the Fund and other funds. To do so, compare this 5% hypothetical example with the 5% hypothetical examples that appear in the shareholder reports of the other funds.
Perritt Funds, Inc.
| Expense Example (Unaudited) (Continued) | April 30, 2018 |
Please note that the expenses shown in the table are meant to highlight your ongoing costs only and do not reflect any transactional costs, such as sales charges (loads), redemption fees, or exchange fees. Therefore, the second line of the table is useful in comparing ongoing costs only, and will not help you determine the relative total costs of owning different funds. In addition, if these transactional costs were included, your costs would have been higher.
| | | Beginning
Account Value
11/1/17 | | | Ending
Account Value
4/30/18 | | | Expenses Paid
During Period
11/1/17 – 4/30/181 | |
| Actual | | | | | | | | | | | | |
| Perritt MicroCap Opportunities | | $ | 1,000.00 | | | $ | 1,021.20 | | | $ | 6.51 | |
| Perritt Ultra MicroCap Fund | | $ | 1,000.00 | | | $ | 994.60 | | | $ | 8.46 | |
| Perritt Low Priced Stock Fund | | $ | 1,000.00 | | | $ | 1,001.90 | | | $ | 6.90 | |
| | | | | | | | | | | | | |
| Hypothetical | | | | | | | | | | | | |
| Perritt MicroCap Opportunities | | $ | 1,000.00 | | | $ | 1,018.35 | | | $ | 6.51 | |
| Perritt Ultra MicroCap Fund | | $ | 1,000.00 | | | $ | 1,016.31 | | | $ | 8.55 | |
| Perritt Low Priced Stock Fund | | $ | 1,000.00 | | | $ | 1,017.90 | | | $ | 6.95 | |
1 | Expenses are equal to the Fund’s annualized expense ratio of 1.30% for the MicroCap Opportunities Fund, 1.71% for the Ultra MicroCap Fund and 1.39% for the Low Priced Stock Fund for the six-month period, multiplied by the average account value over the period, multiplied by 181/365 (to reflect the one-half year period). |
Perritt Funds, Inc.
Advisory Ag reement Renewal (Unaudited) |
On December 8, 2017, the Board of Directors of Perritt Funds, Inc. (the “Directors”) approved the continuation of the investment advisory agreements for the Perritt MicroCap Opportunities Fund, the Perritt Ultra MicroCap Fund, and the Perritt Low Priced Stock Fund (collectively the “Funds”, or the, “Fund”) with the investment advisor to the Funds, Perritt Capital Management, Inc. (the “Advisor”). As part of the process of approving the continuation of the advisory agreements, the Directors reviewed the fiduciary duties of the Directors with respect to approving the advisory agreements and the relevant factors for the Directors to consider, and the members of the Board of Directors who are not deemed “interested persons” (as that term is defined by the Investment Company Act of 1940) of the Funds (the “Independent Directors”) met in executive session to discuss the approval of the advisory agreements.
In advance of the meeting, the Advisor sent detailed information to the Directors to assist them in their evaluation of the investment advisory agreements. This information included, but was not limited to, a memorandum from Fund counsel that summarized the legal standards applicable to the Directors’ consideration of the advisory agreements; comparative information relating to the Funds’ management fees and other expenses of the Funds; information regarding fees paid and other payments; information on the Advisor’s profitability; information about brokerage commissions; comparative information relating to the Funds’ performance; information about sales and redemptions of the Funds; information about the Funds’ compliance program; and other information the Directors believed was useful in evaluating the approval of advisory agreements.
All of the factors discussed by the Directors were considered as a whole, and were considered separately by the Independent Directors, meeting in executive session. The factors were viewed in their totality by the Directors, with no single factor being the principal or determinative factor in the Directors’ determination of whether to approve the continuation of the investment advisory agreements. The Directors recognized that the management and fee arrangements for the Funds are the result of years of review and discussion between the Independent Directors and the Advisor, that certain aspects of such arrangements may receive greater scrutiny in some years than in others and that the Directors’ conclusions may be based, in part, on their consideration of these same arrangements and information received during the course of the year and in prior years.
Prior to approving the continuation of the investment advisory agreements, the Directors and the Independent Directors in executive session considered, among other items:
| ● | The nature and quality of the investment advisory services provided by the Advisor. |
| ● | A comparison of the fees and expenses of the Funds to other similar funds. |
| ● | A comparison of the fee structures of other accounts managed by the Advisor. |
| ● | Whether economies of scale are recognized by the Funds. |
| ● | The costs and profitability of the Funds to the Advisor. |
| ● | The performance of the Funds. |
| ● | The other benefits to the Advisor from serving as investment advisor to the Funds (in addition to the advisory fee). |
Perritt Funds, Inc.
Advisory Agreement Renewal (Unaudited) (Continued) |
The material considerations and determinations of the Board of Directors, including all of the Independent Directors, are as follows:
Nature and Quality of Investment Advisory Services
The Directors noted that the Advisor supervises the investment portfolios of the Funds, directing the day-to-day management of the Funds’ portfolios, including the purchase and sale of investment securities. They then discussed with management the nature of the investment process employed by the portfolio managers of the Funds, which is research intensive, and discussed staffing at the Advisor. The Directors concluded that the Advisor is well staffed to conduct the research needed to meet the investment objectives of the Funds.
The Directors considered the background and experience of the Advisor’s senior management and the expertise of, and the amount of attention given to the Funds by, investment personnel of the Advisor, concluding that the personnel have significant experience managing investment securities and devote the bulk of their time and attention to the Funds. In addition, the Directors considered the quality of the material service providers to the Funds, who provide administrative and distribution services on behalf of the Funds and are overseen by the Advisor, and the overall reputation and capabilities of the Advisor. They concluded that they are satisfied with the performance of the service providers, and with the Advisor’s oversight of the service providers.
Overall, the Directors believe that the Advisor provides high quality services to the Funds, and they determined that their overall confidence in the Advisor is high.
The Directors also concluded that they were satisfied with the nature, extent and quality of the investment advisory services provided to the Funds by the Advisor, and that the nature and extent of the services provided by the Advisor are appropriate to assure that each Fund’s operations are conducted in compliance with applicable laws, rules and regulations.
Comparative Fees and Expenses
The Directors then discussed with management the variables, in addition to the management fees, such as administrative and transaction fees, that impact costs to the shareholders of the Funds. Management reviewed with the Directors the comparison of the Funds’ expense ratios to other similar funds. As part of the discussion with management, the Directors ensured that they understood and were comfortable with the criteria used by the Advisor to determine the mutual funds that make up the peer universes for purposes of the materials.
The Directors discussed the comparison of the Funds to the peer universes, and noted that the above median total expenses for the Perritt Ultra MicroCap Fund and the Perritt Low Priced Stock Fund are driven by those Funds’ low level of assets under management, which caused certain non-management expenses to be above average for their peer groups.
The Directors discussed the Low Priced Stock Fund and the fee waiver arrangements related to the Fund. Specifically, they noted that the Advisor has contractually agreed, on a voluntary basis, to waive fees and/or reimburse operating expenses so that total annual operating expenses do not exceed 1.39%. This expense limitation cannot be terminated prior to February 28, 2019 without the Board of Directors’ consent.
Perritt Funds, Inc.
Advisory Agreement Renewal (Unaudited) (Continued) |
Following their review, the Directors concluded that the expense ratios of the Funds were within the range of comparable mutual funds, and that the Funds’ fees are reasonable given the asset sizes of the Funds.
Comparison of Fee Structures of Other Accounts
The Directors then inquired of management regarding the distinction between the services performed by the Advisor for separate accounts and those performed by the Advisor for the Funds. The Advisor noted that the management of the Funds involves more comprehensive and substantive duties than the management of separate accounts.
The Directors concluded that the services performed by the Advisor for the Funds require a higher level of service and oversight than the services performed by the Advisor for separate accounts. Based on this determination, the Directors believe that the differential in advisory fees between the Funds and the separate accounts are reasonable, and concluded that the fee rates charged to the Funds in comparison to those charged to the Advisor’s other clients are reasonable.
Performance
The Directors reviewed the Advisor’s quality of investment management, and management history, concluding that the Advisor is taking the steps necessary to address Fund performance. They noted that the performance of the Funds equaled or exceeded the performance of the peer group median, concluding that this is a favorable result, particularly in the existing market environment. The Directors determined that it is their expectation that the Advisor’s discipline will lead to more favorable results in the long-term and concluded that renewal of the existing advisory agreements was in the best interest of the Funds’ shareholders.
The Directors noted that at each quarterly meeting, the Directors review reports regarding the investment performance of the Funds. Based on the information provided at this meeting and the information and quarterly discussions regarding the Funds’ investment performance, the Directors believe that the Advisor manages the Funds in a manner that is materially consistent with their stated investment objective and style.
Costs and Profitability
The Directors considered the cost of services provided and the profits realized by the Advisor, by reviewing reports provided by the Funds’ administrator that compared the Funds’ investment advisory fees to those of other comparable mutual funds. The Directors also considered the Funds overall expense ratios compared to peer group funds, concluding that the Funds’ expense ratios and investment advisory fees are fair and within the range of industry averages.
The Directors discussed in detail the profitability of the Advisor as it relates to the Funds, and they discussed the impact of the intermediary service fees on the profitability. The Directors also considered the resources and revenues that the Advisor has put into managing and distributing the Funds, and concluded that the level of profitability realized by the Advisor from its provision of services to the Funds is reasonable.
Perritt Funds, Inc.
Advisory Agreement Renewal (Unaudited) (Continued) |
Economies of Scale
The Directors then discussed with management whether economies of scale are recognized by the Funds. They noted that as Fund assets grow, certain fixed costs are spread over the larger asset base, which may lead to some economies of scale. On the other hand, the Directors noted that many of the Funds’ expenses are subject to diseconomies of scale. They also noted that the Advisor has entered into a fee waiver arrangement with the Low Priced Stock Fund, to help ensure that reasonable fee levels are maintained.
Given the size of the Funds, the Directors determined that the Funds have not recognized economies of scale, concluding that the current fees are appropriate at foreseeable asset levels.
Fall-Out Benefits
The Directors then considered other benefits to the Advisor from serving as Advisor to the Funds (in addition to the advisory fee). The Directors noted that the Advisor derives ancillary benefits from its association with the Funds in the form of proprietary and third party research products and services received from broker dealers that execute portfolio trades for the Funds. The Directors determined such products and services have been used for legitimate purposes relating to the Funds by providing assistance in the investment decision-making process. The Directors concluded that the other benefits realized by the Advisor from its relationship with the Funds were reasonable.
Conclusion
After reviewing the materials provided at the meeting, management’s presentation, as well as other information regularly provided at the Board’s quarterly meetings throughout the year regarding the quality of services provided by the Advisor, the performance of the Funds, expense information, regulatory compliance issues, trading information and related matters and other factors deemed relevant by the Board, the Directors, including all of the Independent Directors, approved the continuation of the investment advisory agreements.
Perritt Funds, Inc.
Di rectors and Officers (Unaudited) |
The Funds are governed by a Board of Directors that meets regularly to review investments, performance, expenses, and other business matters, and is responsible for protecting the interests of shareholders. The majority of the Funds’ directors are independent of Perritt Capital Management, Inc. The Board of Directors elects the Funds’ officers. The name, address, age and principal occupations for the past five years of the directors and officers are listed below, along with the number of portfolios in the Fund complex overseen by each director. During the past five years none of the directors has served as a director of a public company or a mutual fund other than Perritt MicroCap Opportunities, Inc. and Perritt Funds, Inc. The business address of each director and officer is 300 South Wacker Drive, Suite 2880, Chicago, IL 60606. For additional information about the directors, please call 1-800-331-8936 and request a Statement of Additional Information (SAI) or visit www.perrittcap.com. One will be mailed to you free of charge.
Name,
Address,
and Age | | Position(s) Held
with Funds and
Number of
Portfolios in
Fund Complex
Overseen
by Director | | Term of Office
and Length of
Time Served | | Principal
Occupation(s)
during Past 5 Years | | Other
Directorships
Held by
Director
during the
Past 5 Years |
| | | | | |
| “Disinterested” Directors of the Funds | | | | |
| | | | | |
Dianne C. Click Age: 55 300 South Wacker Drive, Suite 2880 Chicago, IL 60606 | | Director
Portfolios in Fund Complex Overseen: 3 | | Indefinite, until successor elected
Director since 2004 | | Ms. Click is a licensed Real Estate Broker in the State of Montana. She has been a partner and a principal owner of a real estate sales company, Bozeman Broker Group, since 2004. She has been licensed in the state of Montana since 1995. | | Perritt MicroCap Opportunities Fund, Inc. (1994 – 2013) |
| | | | | | | | | |
David S. Maglich
Age: 60 300 South Wacker Drive, Suite 2880 Chicago, IL 60606 | | Director
Portfolios in Fund Complex Overseen: 3 | | Indefinite, until successor elected
Director since 2004 | | Mr. Maglich is a Shareholder with the law firm of Fergeson, Skipper et. al. in Sarasota, Florida and has been employed with such firm since 1989. | | Perritt MicroCap Opportunities Fund, Inc. (1987 – 2013) |
Perritt Funds, Inc.
| Directors and Officers (Unaudited) (Continued) |
Name,
Address,
and Age | | Position(s) Held
with Funds and
Number of
Portfolios in
Fund Complex
Overseen
by Director | | Term of Office
and Length of
Time Served | | Principal
Occupation(s)
during Past 5 Years | | Other
Directorships
Held by
Director
during the
Past 5 Years |
| | | | | |
| “Interested” Director of the Funds | | | | |
| | | | | | | | | |
Michael J. Corbett(1)
Age: 52 300 South Wacker Drive, Suite 2880 Chicago, IL 60606 | | President
Portfolios in Fund Complex Overseen: 3 | | One-year term as President; As Director, indefinite, until successor elected; Director since 2010.
President since 2004 | | Mr. Corbett was President of the Perritt MicroCap Opportunities Fund, Inc. since November 1999 and President of the Perritt Funds, Inc. since August 2004. He has served as President of the Adviser since October 5, 2010, and previously served as Vice President of the Adviser from February 1997 until October 5, 2010. Mr. Corbett began his tenure with Perritt Capital Management in 1990 as a research analyst. He assumed portfolio management responsibilities in 1996 and now serves as portfolio manager for the Funds. | | Perritt MicroCap Opportunities Fund, Inc. (2010 – 2013) |
| (1) | Mr. Corbett is an interested person of the Funds based upon his position with the Adviser. |
Perritt Funds, Inc.
| Directors and Officers (Unaudited) (Continued) |
Name,
Address,
and Age | | Position(s) Held
with Funds and
Number of
Portfolios in
Fund Complex
Overseen
by Director | | Term of Office
and Length of
Time Served | | Principal
Occupation(s)
during Past 5 Years | | Other
Directorships
Held by
Director
during the
Past 5 Years |
| | | | | |
| Officers of the Funds Other Than Mr. Corbett | | | | |
| | | | | |
Mark Buh
Age: 55 300 South Wacker Drive, Suite 2880 Chicago, IL
60606 | | Vice President and Treasurer | | One-year term Since 2012 | | Mr. Buh has been Vice President and Treasurer of the Funds and Chief Financial Officer of the Adviser since February 2012. He has over 25 years of experience in corporate accounting, administration, planning and business development. His previous experience includes tenures at Ernst and Young and CenturyLink Communications. | | N/A |
| | | | | | | | | |
Lynn E. Burmeister
Age: 58 300 South Wacker Drive, Suite 2880 Chicago, IL
60606 | | Vice President, Chief Compliance Officer and Secretary | | One-year term
Chief Compliance Officer Since 2010
Secretary Since 2015 | | Mrs. Burmeister has been the Chief Compliance Officer since May 1, 2010, and oversees all compliance matters for the Funds and the Adviser. She also coordinates the administration of the Funds and is a liaison with the firm’s corporate counsel. Mrs. Burmeister has worked in the financial industry since 1980. Her previous experience includes work at Harris Associates, Gofen & Glossberg and Optimum Investments. | | N/A |
The Funds file their complete schedule of portfolio holdings with the Securities and Exchange Commission for the first and third quarters of each fiscal year on Form N-Q. The Funds’ Forms N-Q are available on the Securities and Exchange Commission’s website at http://www.sec.gov and may be reviewed and copied at the Commission’s Public Reference Room in Washington, D.C. Information on the operation of the Public Reference Room may be obtained by calling 1-800-SEC-0330. The Funds’ latest Forms N-Q are also available without charge upon request by calling 1-800-331-8936.
A description of the policies and procedures that the Funds use to determine how to vote proxies relating to portfolio securities is available without charge, upon request, by calling the Advisor at 1-800-331-8936 and on the Securities and Exchange Commission’s website at http://www.sec.gov.
Information regarding how the Funds voted proxies relating to portfolio securities during the most recent 12-month period ended June 30 is available without charge, upon request, by calling 1-800-331-8936 and on the Securities and Exchange Commission’s website at http://www.sec.gov.
Household Delivery of Shareholder Documents: To reduce expenses, the Funds may mail only one copy of the Funds’ prospectus, SAI and each annual and semi-annual report to those addresses shared by two or more accounts. If you wish to receive individual copies of these documents, please call the Funds at 1-800-331-8936 or contact your financial institution. You will begin receiving individual copies thirty days after receiving your request.
Electronic Delivery of Shareholder Documents: You may choose to receive the Funds’ prospectus and annual and semi-annual reports electronically. To sign up for electronic delivery, visit www.icsdelivery.com and select the first letter of your brokerage firm’s name. Then, select your brokerage institution from the list that follows, fill out the appropriate information and provide an e-mail address where you would like your information sent. If your brokerage firm is not listed, electronic delivery may not be available. Please contact your brokerage firm or financial advisor.
 |
Investment Advisor
Perritt Capital Management, Inc.
300 South Wacker Drive, Suite 2880
Chicago, IL 60606-6703
800-331-8936
Independent Registered Public Accounting Firm
Cohen & Company, Ltd.
1350 Euclid Avenue, Suite 800
Cleveland, OH 44115 Legal Counsel
Foley & Lardner LLP
777 East Wisconsin Avenue
Milwaukee, WI 53202 Custodian
U.S. Bank, NA
1555 North River Center Drive, Suite 302
Milwaukee, WI 53212 Transfer Agent and Dividend Disbursing Agent
U.S. Bancorp Fund Services, LLC
P.O. Box 701
Milwaukee, WI 53201-0701 Distributor
Quasar Distributors, LLC
777 East Wisconsin Avenue
Milwaukee, WI 53202 For assistance with your existing account, call our Shareholder Service Center at 1-800-332-3133. The Funds’ Statements of Additional Information contain information about the Funds’ directors and are available without charge upon request by calling 1-800-332-3133. |
Not applicable for semi-annual reports.
Not applicable for semi-annual reports.
Not applicable for semi-annual reports.
Not applicable to registrants who are not listed issuers (as defined in Rule 10A-3 under the Securities Exchange Act of 1934).
(a). Schedule of Investments is included as part of the report to shareholders filed under Item 1 of this Form.
(b). Not applicable.
Not applicable to open-end investment companies.
Not applicable to open-end investment companies.
Not applicable to open-end investment companies.
There have been no material changes to the procedures by which shareholders may recommend nominees to the registrant's board of directors.
The Registrant's President and Treasurer have reviewed the Registrant's disclosure controls and procedures (as defined in Rule 30a-3(c) under the Investment Company Act of 1940 (the "Act")) as of a date within 90 days of the filing of this report, as required by Rule 30a-3(b) under the Act and Rules 13a-15(b) or 15d‑15(b) under the Securities Exchange Act of 1934. Based on their review, such officers have concluded that the disclosure controls and procedures are effective in ensuring that information required to be disclosed in this report is appropriately recorded, processed, summarized and reported and made known to them by others within the Registrant and by the Registrant's service provider.
There were no changes in the Registrant's internal control over financial reporting (as defined in Rule 30a-3(d) under the Act) that occurred during the second fiscal quarter of the period covered by this report that has materially affected, or is reasonably likely to materially affect, the Registrant's internal control over financial reporting.
Not applicable to open-end investment companies.
Pursuant to the requirements of the Securities Exchange Act of 1934 and the Investment Company Act of 1940, the registrant has duly caused this report to be signed on its behalf by the undersigned, thereunto duly authorized.
Pursuant to the requirements of the Securities Exchange Act of 1934 and the Investment Company Act of 1940, this report has been signed below by the following persons on behalf of the registrant and in the capacities and on the dates indicated.
* Print the name and title of each signing officer under his or her signature.