MicroCap Opportunities Fund
Ultra MicroCap Fund
Semi-Annual Report
April 30, 2021
(Unaudited)
The PERRITT MICROCAP OPPORTUNITIES FUND will, under normal circumstances, invest at least 80% of its net assets in a diversified portfolio of common stocks of United States companies that at the time of initial purchase have a market capitalization (equity market value) that is below $500 million (referred to as “micro-cap” companies). The Fund seeks to invest in micro-cap companies that have demonstrated above-average growth in revenues and/or earnings, possess relatively low levels of long-term debt, have a high percentage of their shares owned by company management, and possess modest price-to-sales ratios and price-to-earnings ratios that are below their long-term annual growth rate. At times, the Fund may also invest in “special situations” such as companies that possess valuable patents, companies undergoing restructuring, and companies involved in large share repurchase programs. Investors should expect the Fund to contain a mix of both value-priced and growth stocks.
The PERRITT ULTRA MICROCAP FUND will, under normal circumstances, invest at least 80% of its net assets in a diversified portfolio of common stocks of United States companies that at the time of initial purchase have a market capitalization (equity market value) that is below $300 million (referred to as “micro-cap” companies). The Fund seeks to invest in micro-cap companies that have a high percentage of their shares owned by company management, possess relatively low levels of long-term debt, have a potential for above average growth in revenues and/or earnings, and possess reasonable valuations based on the ratios of price-to-sales, price-to-earnings, and price-to-book values. The micro-cap companies in which the Fund may invest include “early stage” companies, which are companies that are in a relatively early stage of development with market capitalizations that are below $50 million. At times, the Fund may also invest in unseasoned companies, companies that are undergoing corporate restructuring, initial public offerings, and companies believed to possess undervalued assets.
Semi-Annual Report
April 30, 2021
(Unaudited)
| Perritt MicroCap Opportunities Fund | |
| From the Portfolio Managers | 2 |
| Performance | 6 |
| Ten Largest Common Stock Holdings | 8 |
| Allocation of Portfolio Investments | 9 |
| | |
| Perritt Ultra MicroCap Fund | |
| From the Portfolio Managers | 10 |
| Performance | 14 |
| Ten Largest Common Stock Holdings | 16 |
| Allocation of Portfolio Investments | 17 |
| | |
| Perritt Funds | |
| Schedules of Investments | 18 |
| Statements of Assets and Liabilities | 24 |
| Statements of Operations | 25 |
| Statements of Changes in Net Assets | 26 |
| Financial Highlights | 28 |
| Notes to Financial Statements | 30 |
| Expense Example | 38 |
| Advisory Agreement Renewal | 40 |
| Directors and Officers | 44 |
| Information | 47 |
Perritt MicroCap Opportunities Fund
| Portfolio Manager’s Message |
 | |
| Michael Corbett, | |
| Portfolio Manager | |
The past six months, much like the past year was an historic period on many fronts. Not only did we all experience a pandemic that shut down economies around the world, governments and central banks provided unprecedented fiscal support. The U.S. Federal government has provided more than $4 trillion in fiscal stimulus, and the Federal Reserve has injected another $4 trillion into the economy by purchasing a variety of bonds. These efforts should result in one of the strongest economic recoveries from a recession in decades. Some strategists, such as James Paulsen from The Leuthold Group, estimate that Gross Domestic Product (GDP) growth could approach 10% in the latter half of 2021. While these stimulus injections are great news in the near term for the economy, there may be long-term consequences due to the level of debt in the system. We manage the Perritt MicroCap Opportunities Fund mostly on a bottom up, company by company basis, but the macro environment can create challenges. It can also, however, generate opportunities. We will discuss some of those opportunities in this report, but here are the Fund’s recent results.
For the six months ended April 30, 2021, the Fund rose 54.59%, which compares to the Russell 2000 Index return of 48.05% and the Russell Microcap Index return of 61.13%. The Fund and benchmark performance details can be found later in this report. While the Fund’s holdings within the industrial and information technology industries performed well, the benchmark Russell Microcap holdings within those industries performed slightly better. These two industries are the Fund’s largest active share, or overweight to the benchmark.
During the past six months, we sold 10 companies from the portfolio. One company was sold after receiving an acquisition offer: BioSpecifics Technologies was acquired by Endo International (ENDP) at a near 100% premium from our original purchase price. BioSpecifics is a manufacturer of collagenase-based therapies used to treat the vast number of diseases and medical conditions caused by the excess accumulation of collagen and Qwo™. Federal Signal (FSS) designs, manufactures, and supplies a suite of products and integrated solutions for municipal, governmental, industrial, and commercial customers. We sold FSS since it no longer qualifies as a microcap company. We have held Federal Signal for nearly 10 years and its market cap is more than $2.5 billion, which is well beyond our definition of a microcap stock. We also sold Bankwell Financial Group (BWFG), Esquire Financial Holdings (ESQ) and Energy Fuels (UUUU) after each stock traded above our long-term price target. The remaining five companies were sold due to poor long-term outlooks for their businesses. Some of those sales were done to make room for more attractive investments. We purchased 11 new companies in the past year, most of which were from different industries, but the bulk of them were from industrial and material industries.
One of the additions to the portfolio was A-Mark Precious Metals (AMRK), which operates three segments within the precious metal trading market. We also added to some of our existing holdings in the material industry. One of the results the
Perritt MicroCap Opportunities Fund
Federal Reserve bank is hoping to accomplish from all this stimulus is to not only improve the economy but create some inflation. With interest rates likely locked at low levels for many years, as well as the other Federal Reserve continued bond purchases, we have increased confidence in our material holdings.
Another new holding to the portfolio is Heritage Global (HGBL), which provides market making, acquisitions, dispositions, valuations, and secured lending services. A great deal of the company’s business is helping distressed businesses. The company’s CEO, Ross Dove, has stated several times to us that he expects the business to potentially be very robust for the next few years due to the increased supply of troubled businesses.
As of April 30, 2021, the Fund’s portfolio contained the common stocks of 93 companies. The Fund’s 10 largest holdings and detailed descriptions can be found in the following pages of this report. Based on our earnings estimates, the Fund’s portfolio is trading at approximately 19 times our 2021 earnings estimate. Stocks in the portfolio are priced at slightly more than 1.6 times average revenue and the median market capitalization is approximately $237 million. Finally, the average stock in the Fund is trading at 2.1 times book value and less than 10 times
Enterprise Value to EBITDA (earnings before interest, taxes, depreciation, and amortization). The valuation characteristics for the MicroCap Opportunities Fund are significantly less than the Fund’s benchmark Russell Microcap Index. Lastly, it is important to note than more than 50% of the companies within the Russell Microcap Index are not profitable, which compares to less than 15% for the Perritt MicroCap Opportunities Fund.
I want to thank my fellow shareholders for their continued support and confidence in the Perritt Capital Management team. I have been a shareholder of the Fund for 30 years and have nearly half of my liquid investments in the Perritt Funds. The Perritt team remains dedicated to investing in high quality micro-cap companies at attractive valuations. If you have any questions or comments about this report or your investment in the Perritt MicroCap Opportunities Fund, please call us toll-free at (800) 331-8936 or visit our web site at www.perrittcap.com. Please refer to the prospectus for information about the Fund’s investment objectives and strategies.
Michael Corbett
President
Perritt MicroCap Opportunities Fund
Mutual fund investing involves risk. Principal loss is possible. The Funds invest in smaller companies, which involve additional risks, such as limited liquidity and greater volatility. The Funds invest in micro-cap companies which tend to perform poorly during times of economic stress.
Past performance does not guarantee future results.
Earnings Growth is not a measure of the Fund’s future performance.
Opinions expressed are subject to change at any time, are not guaranteed and should not be considered investment advice.
Please refer to the Schedule of Investments in the report for more complete information regarding Fund holdings. Fund holdings and sector allocations are subject to change and should not be considered a recommendation to buy or sell any security.
Russell Microcap Index is a capitalization weighted index of 2,000 small cap and micro-cap stocks that captures the smallest 1,000 companies in the Russell 2000, plus 1,000 smaller U.S.-based listed stocks.
One cannot invest directly in an index. The index is used herein for comparative purposes in accordance with SEC regulations.
Gross Domestic Product (GDP) is a monetary measure of the market value of all the final goods and services produced in a specific time period.
Book Value is the net asset value of a company calculated as total assets minus intangible asset (patents, goodwill) and liabilities.
Enterprise Value is a measure of a company’s total value, often used as a more comprehensive alternative to equity market capitalization. EV includes in its calculation the market capitalization of a company but also short-term and long-term debt as well as any cash on the company’s balance sheet.
Enterprise value to EBITDA Equals market capitalization + preferred shares + minority interest + debt - total cash divided by EBITDA.
The semi-annual report must be preceded or accompanied by a prospectus.
The Perritt Funds are distributed by Quasar Distributors, LLC.
(This Page Intentionally Left Blank.)
Perritt MicroCap Opportunities Fund
| Performance* (Unaudited) | April 30, 2021
|
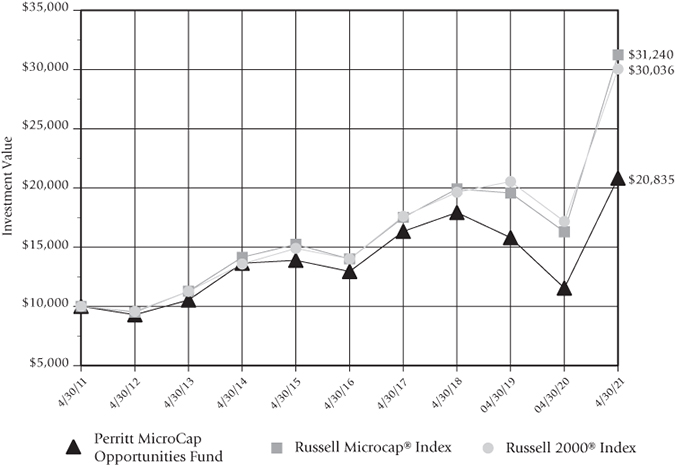
Perritt MicroCap Opportunities Fund versus
Russell Microcap® Index and Russell 2000® Index
There are several ways to evaluate a fund’s historical performance. You can look at the total percentage change in value, the average annual percentage change, or the growth of a hypothetical $10,000 investment. Each performance figure includes changes in a fund’s share price, plus reinvestment of any dividends (or income) and capital gains (the profits the fund earns when it sells stocks that have grown in value).
Cumulative total returns reflect the Fund’s actual performance over a set period. For example, if you invested $1,000 in a fund that had a 5% return over one year, you would end up with $1,050. You can compare the Fund’s returns to the Russell 2000® Index, which reflects a popular measure of the stock performance of small companies, and the Russell Microcap® Index, which measures the performance of the micro-cap segment of the U.S. equity market.
Average annual total returns take the Fund’s actual (or cumulative) return and show you what would have happened if the Fund had performed at a constant rate each year.
| * | The graph illustrates the performance of a hypothetical $10,000 investment made in the period presented. Assumes reinvestment of dividends and capital gains, but does not reflect the effect of any applicable sales charge or redemption fees or the deduction of taxes that a shareholder would pay on the Fund’s distributions or the redemption of the Fund shares. The graph does not imply any future performance. It is not possible to invest directly in an index. |
Perritt MicroCap Opportunities Fund
| Performance (Unaudited) (Continued) | April 30, 2021
|
| Average Annual Total Returns* | | | | | |
| Periods ended April 30, 2021 | | | | | |
| | Past | Past | Past | Past | Past |
| | 1 Year | 5 Years | 10 Years | 15 Years | 25 Years |
| | | | | | |
| Perritt MicroCap Opportunities Fund | 80.49% | 9.98% | 7.62% | 5.88% | 9.48% |
| | | | | | |
Russell Microcap® Index | 91.73% | 17.41% | 12.07% | 7.99% | N/A |
| (reflects no deduction | | | | | |
| for fees and expenses) | | | | | |
| | | | | | |
Russell 2000® Index | 74.91% | 16.48% | 11.63% | 8.99% | 9.22% |
| (reflects no deduction | | | | | |
| for fees and expenses) | | | | | |
Performance data quoted represents past performance; past performance does not guarantee future results. The investment return and principal value of an investment will fluctuate so that an investor’s shares, when redeemed, may be worth more or less than their original cost. Current performance of the Fund may be lower or higher than the performance quoted. Performance data current to the most recent month end is available by calling 800-331-8936.
| * | The performance data quoted does not reflect the deduction of taxes that a shareholder would pay on the Fund’s distributions or the 2% redemption or exchange fee for shares held 90 days or less. If reflected, total return would be reduced. |
The Fund’s gross expense ratio is 1.64% and is as of the most recent prospectus dated February 28, 2021. Please see the Fund’s Financial Highlights in this report for the most recent expense ratio.
Perritt MicroCap Opportunities Fund
| Ten Largest Common Stock Holdings (Unaudited) |
Northern Technologies International, Corp. (NTIC) develops and markets rust and corrosion inhibiting products and services to automotive, electronics, electrical mechanical, military, retail consumer, and oil and gas markets.
Silvercrest Asset Management Group Inc. (SAMG) is a wealth management firm that provides financial advisory and related family office services in the United States. The company serves ultra-high net worth individuals and families, as well as their trusts; endowments; foundations; and other institutional investors. It also manages funds of funds and other investment funds.
U.S. Global Investors, Inc. (GROW) is a publicly owned investment manager. The firm primarily provides its services to investment companies. It also provides its services to pooled investment vehicles. The firm manages equity and fixed income mutual funds, hedge funds and exchange traded funds. It also invests in the public equity and fixed income markets across the globe.
DLH Holdings Corp. (DLHC) provides healthcare and social services in the United States. It offers defense and veterans’ health solutions, including case management, physical and behavioral health examinations, and medical administration and logistics services.
Radiant Logistics, Inc. (RLGT) operates as a third-party logistics and multi-modal transportation services company primarily in the United States and Canada. The company offers domestic and international air and ocean freight forwarding services; and freight brokerage services, including truckload, less than truckload, and intermodal services.
Shyft Group, Inc. (SHYF) through its subsidiary Spartan Motors USA, Inc., manufactures and assembles specialty vehicles for the commercial vehicle and recreational vehicle industries in the United States and internationally. It operates through two segments, Fleet Vehicles and Services (FVS), and Specialty Chassis and Vehicles (SCV).
Miller Industries, Inc. (MLR) engages in the manufacture and sale of towing and recovery equipment. It offers wreckers, such as conventional tow trucks and recovery vehicles. The company also provides transport trailers for moving multiple vehicles, auto auctions, car dealerships, leasing companies, and other similar applications.
Legacy Housing Corp. (LEGH) builds, sells, and finances manufactured homes and tiny houses primarily in the southern United States. The company manufactures and provides for the transport of mobile homes; and offers wholesale financing to dealers and mobile home parks, as well as a range of homes.
Intrusion Inc. (INTZ) develops, markets, and supports entity identification, data mining, cybercrime, and advanced persistent threat detection products in the United States.
IES Holdings, Inc. (IESC) engages in communications, commercial and industrial, infrastructure solutions, and residential businesses in the United States.
Fund holdings and/or sector allocations are subject to change at any time and
are not recommendations to buy or sell any security.
Please refer to the Schedule of Investments in this report for a complete list of Fund holdings.
Perritt MicroCap Opportunities Fund
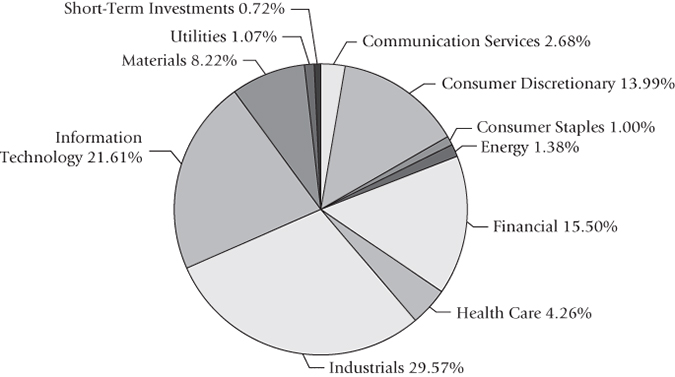
| Allocation of Portfolio Investments (Unaudited) | April 30, 2021
|
The sector classifications represented in the graph above and industry classifications represented in
the Schedule of Investments are in accordance with Global Industry Classification Standard
(GICS®), which was developed by and/or is the exclusive property of MSCI, Inc. and Standard &
Poor Financial Services LLC. Percentages are based on total investments, at value.
| Note: | For presentation purposes, the Fund has grouped some of the industry categories. For purposes of categorizing securities for compliance with section 8(b)(1) of the Investment Company Act of 1940, the Fund uses more specific industry classifications. |
Perritt Ultra MicroCap Fund
| Portfolio Managers’ Message |
| |  | |
| Michael Corbett, | | Matthew Brackmann, |
| Portfolio Manager | | Portfolio Manager | |
The Perritt Ultra MicroCap Fund outperformed the Russell Microcap Index for the first half of fiscal year 2021. We began the year on the backs of a strong recovery for microcap stocks in general and this strength continued into the first half of this fiscal year. In previous letters, we had detailed our observations that the strength in the microcap space had disproportionately been limited to the larger market cap names in the past few years but had also observed this strength shifting to the smaller names in the second half of fiscal 2020. These trends continued in the first half of this year with the smaller market cap names continuing to catch up to their peers which benefited the Ultra Microcap’s holdings relative to the Index. Additionally, we had several successful stock picks that contributed to the fund’s relative performance. Due to these factors, we were able to outperform the Russell Microcap Index by over a thousand basis points.
With the COVID shutdowns largely behind us and the outlook for the economy being the strongest that it has been in recent memory, we are excited for the possible continuation of these trends as we enter the second half of fiscal 2021. We hold several positions that we believe are well positioned to take advantage of the continued economic strength as we move towards a full reopening. Many of our portfolio companies took advantage of the past year to rationalize their cost structures and in our view, should reemerge from the pandemic leaner and more profitable than they were in the past. Some expenses, such as certain travel related expenses will certainly return, but not to the levels that they had been at pre-pandemic, according to our conversations with various management teams. Others have learned through experience that they can do more with less, in terms of real estate and staffing needs. On the other hand, some of our portfolio companies took advantage of the pandemic to hire and position themselves to take advantage of new growth opportunities. One example would be our holding Century Casinos, which was forced to shut down all operations during the height of the pandemic and has since been operating at limited capacity at each of their properties, subject to local restrictions. At the start of the pandemic to keep the company financially viable, they furloughed all non-essential staff. While they have gradually reinstated many of them as they reopened their casinos, they have also found that certain expense cuts are likely to be permanent. We expect them to be able to emerge from the pandemic leaner and with better margins than they would have had otherwise.
For the first half of fiscal 2021, the Ultra MicroCap fund outperformed the Russell Microcap Index by 10.45%, returning 71.58% to shareholders on a net of fee basis compared to the 61.13% return for the Russell Microcap Index. The Fund’s longer-term performance, as well as that of its Index, can be found later in this report. The top contributor to the fund’s out performance came from holdings in the healthcare sector. The fund’s healthcare investments returned 85.61% for the first half of the year, which compared favorably to the 38.22% return for the sector within the Index. Healthcare stocks were the second worst performing sector within the
Perritt Ultra MicroCap Fund
Index for the period. Despite the prominence of the space in our day-to-day lives during the pandemic, many firms that were not directly involved in fighting the pandemic experienced profound disruptions to their business models due to the elimination of elective procedures, delays in the regulatory process, and cutbacks in discretionary budgets from health care providers. Fortunately, through a combination of underweighting the sector relative to the Index and stock picking, the Ultra fund was able to avoid many of the issues the sector experienced.
Since our last update, we have exited three positions and added eight. One was sold due to declining fundamentals, one due to no longer meeting our technical criteria for investment, and another ZAGG , Inc. was sold due to receiving a valid buyout offer. The names we have added were drawn from a number of industries and include a mix of names that we have previously owned and new ideas we have found during our various research activities. A couple of exciting highlights include VirTra, Inc. (VTSI) which manufactures, distributes, and supports various interactive virtual reality training programs for law enforcement and military applications. We are also excited about our new investment in The Eastern Company (EML), which manufactures various vision, safety, and security components for the auto space, as well as offers engineers solutions for packaging where they work with original equipment manufacturers to make reusable metal packaging for large items, such as car seats that are designed to spec in order to fit with their customer’s assembly lines.
As of April 30, 2021, the Fund holds the common stock of 75 companies, which is higher than the last report. We have no plans to deviate from this number of holdings for the foreseeable future. While we continue to monitor several names on various watchlists and look for new opportunities with attractive valuations, new names will likely be added on a rotational basis as others are sold off.
Regarding current portfolio valuations, based on our earnings estimates, the Fund’s portfolio is trading at 18.3x forward price-to-earnings. The median price-to-sales ratio is 2.0x, the median price-to-book is 2.3x and price to trailing twelve-month’s earnings of 29x. The median market cap for the fund is at $120 million. By comparison the Russell Microcap Index has a price-to-sales ratio of 1.8x, a price-to-book ratio of 1.7x and a trailing twelve-month p/e of 16.2. The median market cap for the Index is $328 million. We like to point out the difference in market cap exposure between the two names, as this illustrates the different focus of the two products, as the Ultra MicroCap remains committed to investing in the smallest segment of the microcap space.
We want to genuinely thank our fellow shareholders for their continued support and confidence in the Perritt Capital Management team. Each member of our investment committee, as well as many other employees have made continual investments in this Fund over the years and remain shareholders alongside all of you. We also wish you and your loved ones well and wish you all continued good health as we emerge from the trials of the past year. If you have any questions or comments about this report or your investment in the Perritt Ultra MicroCap Fund, please call us toll free at (800) 331-8936 or visit our web site at www.perrittcap.com. Please refer to the prospectus for information about the Fund’s investment objectives and strategies.
Matt Brackmann
Portfolio Manager
Perritt Ultra MicroCap Fund
Mutual fund investing involves risk. Principal loss is possible. The Funds invest in smaller companies, which involve additional risks, such as limited liquidity and greater volatility. The Funds invest in micro-cap companies which tend to perform poorly during times of economic stress.
Past performance does not guarantee future results.
Earnings Growth is not a measure of the Fund’s future performance.
Opinions expressed are subject to change at any time, are not guaranteed and should not be considered investment advice.
Please refer to the Schedule of Investments in the report for more complete information regarding Fund holdings. Fund holdings and sector allocations are subject to change and should not be considered a recommendation to buy or sell any security.
Any tax or legal information provided is merely a summary of our understanding and interpretation of some of the current income tax regulations and not exhaustive. Investors must consult their tax advisor or legal counsel for advice and information concerning their situation. Neither the fund nor any of its representatives may give legal or tax advice.
Russell Microcap Index is a capitalization weighted index of 2,000 small cap and micro-cap stocks that captures the smallest 1,000 companies in the Russell 2000, plus 1,000 smaller U.S.-based listed stocks.
One cannot invest directly in an index. The index is used herein for comparative purposes in accordance with SEC regulations.
Price-to-Book (P/B) is a ratio used to compare a stock’s market value to its book value. It is calculated by dividing the current closing price of the stock by the latest quarter’s book value per share.
Price-to-Sales (P/S) is a valuation ratio that compares a company’s stock price to its revenues. The price-to-sales ratio is an indicator of the value placed on each dollar of a company’s sales or revenues.
Trailing Price-to Earnings (P/E) is calculated by taking the current stock price and dividing it by the trailing earnings per share (EPS) for the past 12 months.
Forward price-to-earnings (forward P/E) is a version of the ratio of price-to-earnings (P/E) that uses forecasted earnings for the P/E calculation. The forecasted earnings used in the formula typically uses either projected earnings for the following 12 months or for the next full-year fiscal (FY) period.
Basis points - one hundredth of one percent, used chiefly in expressing differences of interest rates.
The semi-annual report must be preceded or accompanied by a prospectus.
The Perritt Funds are distributed by Quasar Distributors, LLC.
(This Page Intentionally Left Blank.)
Perritt Ultra MicroCap Fund
| Performance* (Unaudited) | April 30, 2021
|
Perritt Ultra MicroCap Fund versus
Russell Microcap® Index and Russell 2000® Index
There are several ways to evaluate a fund’s historical performance. You can look at the total percentage change in value, the average annual percentage change, or the growth of a hypothetical $10,000 investment. Each performance figure includes changes in a fund’s share price, plus reinvestment of any dividends (or income) and capital gains (the profits the fund earns when it sells stocks that have grown in value).
Cumulative total returns reflect the Fund’s actual performance over a set period. For example, if you invested $1,000 in a fund that had a 5% return over one year, you would end up with $1,050. You can compare the Fund’s returns to the Russell 2000® Index, which reflects a popular measure of the stock performance of small companies, and the Russell Microcap® Index, which measures the performance of the micro-cap segment of the U.S. equity market.
Average annual total returns take the Fund’s actual (or cumulative) return and show you what would have happened if the Fund had performed at a constant rate each year.
| * | The graph illustrates the performance of a hypothetical $10,000 investment made in the period presented. Assumes reinvestment of dividends and capital gains, but does not reflect the effect of any applicable sales charge or redemption fees or the deduction of taxes that a shareholder would pay on the Fund’s distributions or the redemption of Fund shares. The graph does not imply any future performance. It is not possible to invest directly in an index. |
Perritt Ultra MicroCap Fund
| Performance (Unaudited) (Continued) | April 30, 2021
|
| Average Annual Total Returns* | | | | |
| Periods ended April 30, 2021 (Unaudited) | | | | |
| | Past | Past | Past | Past |
| | 1 Year | 5 Years | 10 Years | 15 Years |
| | | | | |
| Perritt Ultra MicroCap Fund | 89.29% | 11.98% | 8.45% | 6.12% |
| | | | | |
Russell Microcap® Index | 91.73% | 17.41% | 12.07% | 7.99% |
| (reflects no deduction for fees and expenses) | | | | |
| | | | | |
Russell 2000® Index | 74.91% | 16.48% | 11.63% | 8.99% |
| (reflects no deduction for fees and expenses) | | | | |
Performance data quoted represents past performance; past performance does not guarantee future results. The investment return and principal value of an investment will fluctuate so that an investor’s shares, when redeemed, may be worth more or less than their original cost. Current performance of the Fund may be lower or higher than the performance quoted. Performance data current to the most recent month end is available by calling 800-331-8936.
| * | The performance data quoted does not reflect the deduction of taxes that a shareholder would pay on the Fund’s distributions or the 2% redemption or exchange fee for shares held 90 days or less. If reflected, total return would be reduced. |
The Fund’s gross expense ratio is 2.68% and is as of the most recent prospectus dated February 28, 2021. Please see the Fund’s Financial Highlights in this report for the most recent expense ratio.
Perritt Ultra MicroCap Fund
| Ten Largest Common Stock Holdings (Unaudited) |
Galaxy Gaming, Inc. (GLXZ) is a gaming company that designs, develops, manufactures, markets, acquires, and licenses proprietary casino table games and associated technology, platforms, and systems for the gaming industry.
DLH Holdings Corp. (DLHC) provides healthcare, logistics, and technical services and solutions to Federal Government agencies including the Department of Veteran Affairs, the Department of Defense, and other government clients.
Immucell Corp. (ICCC) an animal health company, acquires, develops, manufactures, and sells products that enhance the health and productivity of dairy and beef cattle in the United States and international.
Transcat, Inc. (TRNS) provides calibration and laboratory instrument services in North America and internationally. It operates in two segments, Service and Distribution.
Quest Resource Holding Corp. (QRHC) through its subsidiaries, provides solutions for the reuse, recycling, and disposal of various waste streams and recyclables in the United States.
Fathom Holdings, Inc. (FTHM) provides cloud-based real estate brokerage services in the South, Atlantic, Southwest, and Western parts of the United States. It offers access to various properties for sale or lease through its website, www.FathomRealty.com to buyers, sellers, landlords, and tenants.
Luna Innovations Inc. (LUNA) develops, manufactures, and markets fiber optic sensing, and test and measurement products worldwide. It operates in two segments, Products and Licensing, and Technology Development.
Northern Technology International, Corp. (NTIC) develops and markets rust and corrosion inhibiting products and services to automotive, electronics, electrical mechanical, military, retail consumer, and oil and gas markets.
Indentive, Inc. (INVE) operates as a security technology company that secures data, physical places, and things in the Americas, Europe, the Middle East, and the Asia-Pacific. It operates in two segments, Premises and Identity.
Tecnoglass Inc. (TGLS) through its subsidiaries, manufactures, supplies, and installs architectural glass, windows, and associated aluminum products for the commercial and residential construction industries in North, Central, and South America.
Fund holdings and/or sector allocations are subject to change at any time and
are not recommendations to buy or sell any security.
Please refer to the Schedule of Investments in this report for a complete list of Fund holdings.
Perritt Ultra MicroCap Fund
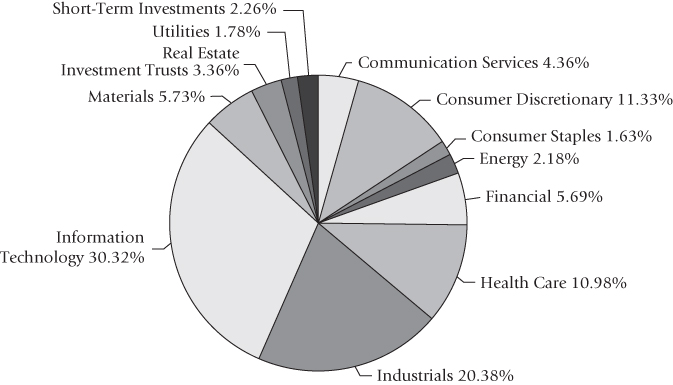
| Allocation of Portfolio Investments (Unaudited) | April 30, 2021
|
The sector classifications represented in the graph above and industry classifications represented in
the Schedule of Investments are in accordance with Global Industry Classification Standard
(GICS®), which was developed by and/or is the exclusive property of MSCI, Inc. and Standard &
Poor Financial Services LLC. Percentages are based on total investments, at value.
| Note: | For presentation purposes, the Fund has grouped some of the industry categories. For purposes of categorizing securities for compliance with section 8(b)(1) of the Investment Company Act of 1940, the Fund uses more specific industry classifications. |
Perritt MicroCap Opportunities Fund
| Schedule of Investments | April 30, 2021 (Unaudited)
|
| Shares | | COMMON STOCKS – 99.23% | | Value | |
| Administrative and | | | |
| Support Services – 2.11% | | | |
| | 25,386 | | BGSF, Inc. | | $ | 355,658 | |
| | 46,746 | | Hudson Global, Inc.(a) | | | 829,741 | |
| | 41,270 | | Select Interior Concepts, | | | | |
| | | | Inc. – Class A(a) | | | 310,763 | |
| | | | | | | 1,496,162 | |
| Auto Parts & Equipment – 3.88% | | | | |
| | 44,000 | | Miller Industries, Inc. | | | 1,892,880 | |
| | 40,000 | | Motorcar Parts | | | | |
| | | | of America, Inc.(a) | | | 864,000 | |
| | | | | | | 2,756,880 | |
| Biotechnology – 0.38% | | | | |
| | 22,500 | | Opiant Pharmaceuticals, | | | | |
| | | | Inc.(a) | | | 272,475 | |
| | | | | | | 272,475 | |
| Building Materials – 3.82% | | | | |
| | 18,000 | | BlueLinx | | | | |
| | | | Holdings, Inc.(a) | | | 908,460 | |
| | 30,000 | | PGT Innovations, Inc.(a) | | | 789,900 | |
| | 85,000 | | Tecnoglass, Inc.(c) | | | 1,016,600 | |
| | | | | | | 2,714,960 | |
| Business Services – 9.43% | | | | |
| | 150,422 | | CynergisTek, Inc.(a) | | | 267,751 | |
| | 258,399 | | DLH Holdings Corp.(a) | | | 2,633,086 | |
| | 66,514 | | GP Strategies Corp.(a) | | | 1,047,595 | |
| | 174,947 | | Information Services | | | | |
| | | | Group, Inc.(a) | | | 796,009 | |
| | 83,000 | | Intrusion, Inc.(a) | | | 1,520,560 | |
| | 60,000 | | PFSweb, Inc.(a) | | | 438,000 | |
| | | | | | | 6,703,001 | |
| Chemical & Related Products – 5.44% | | | | |
| | 23,251 | | Chembio | | | | |
| | | | Diagnostics, Inc.(a) | | | 92,772 | |
| | 242,500 | | Northern Technologies | | | | |
| | | | International Corp. | | | 3,770,875 | |
| | | | | | | 3,863,647 | |
| Chemical Manufacturing – 0.80% | | | | |
| | 400,000 | | Assertio Holdings, Inc.(a) | | | 220,040 | |
| | 65,000 | | ProPhase Labs, Inc.(a) | | | 346,450 | |
| | | | | | | 566,490 | |
| Computer and Electronic Product | | | | |
| Manufacturing – 2.97% | | | | |
| | 93,000 | | Coda Octopus | | | | |
| | | | Group, Inc.(a) | | | 744,000 | |
| | 93,000 | | Magal Security | | | | |
| | | | Systems Ltd.(c) | | | 432,450 | |
| | 50,000 | | Powerfleet, Inc.(a) | | | 378,000 | |
| | 43,722 | | TransAct Technologies, | | | | |
| | | | Inc.(a) | | | 555,707 | |
| | | | | | | 2,110,157 | |
| Construction & Engineering – 3.73% | | | | |
| | 57,655 | | Gencor Industries, | | | | |
| | | | Inc.(a) | | | 691,283 | |
| | 115,943 | | Hill International, | | | | |
| | | | Inc.(a) | | | 311,887 | |
| | 28,700 | | IES Holdings, Inc.(a) | | | 1,515,073 | |
| | 10,000 | | Infrastructure & Energy | | | | |
| | | | Alternatives, Inc.(a) | | | 131,800 | |
| | | | | | | 2,650,043 | |
| Consumer Goods – 1.56% | | | | |
| | 40,000 | | Turtle Beach Corp.(a) | | | 1,111,600 | |
| | | | | | | 1,111,600 | |
| Consumer Products – | | | | |
| Manufacturing – 1.25% | | | | |
| | 14,000 | | Delta Apparel, Inc.(a) | | | 476,140 | |
| | 16,353 | | Superior Group | | | | |
| | | | of Cos., Inc. | | | 412,423 | |
| | | | | | | 888,563 | |
| Consumer Services – 0.43% | | | | |
| | 103,800 | | DHI Group, Inc.(a) | | | 303,096 | |
| | | | | | | 303,096 | |
| Data Processing, Hosting | | | | |
| and Related Services – 0.58% | | | | |
| | 25,000 | | Ooma, Inc.(a) | | | 413,250 | |
| | | | | | | 413,250 | |
| Educational Services – 1.40% | | | | |
| | 75,000 | | Lincoln Educational | | | | |
| | | | Services Corp.(a) | | | 481,500 | |
| | 91,000 | | Universal Technical | | | | |
| | | | Institute, Inc.(a) | | | 512,330 | |
| | | | | | | 993,830 | |
| Electronic Equipment | | | | |
| & Instruments – 2.61% | | | | |
| | 29,000 | | Bel Fuse, Inc. – Class B | | | 577,970 | |
| | 80,000 | | Identiv, Inc.(a) | | | 1,276,000 | |
| | | | | | | 1,853,970 | |
The accompanying notes to financial statements are an integral part of this schedule.
Perritt MicroCap Opportunities Fund
| Schedule of Investments (Continued) | April 30, 2021 (Unaudited)
|
| Shares | | | | Value | |
| Electronics and Appliance Stores – 0.81% | | | |
| | 26,500 | | Aterian, Inc.(a) | | $ | 575,050 | |
| | | | | | | 575,050 | |
| Environmental Services – 0.59% | | | | |
| | 110,000 | | Quest Resource | | | | |
| | | | Holding Corp.(a) | | | 419,100 | |
| | | | | | | 419,100 | |
| Financial Services – 14.37% | | | | |
| | 32,000 | | First Internet Bancorp | | | 1,099,200 | |
| | 26,064 | | Hennessy Advisors, Inc. | | | 252,300 | |
| | 210,000 | | Heritage Global, Inc.(a) | | | 657,300 | |
| | 232,643 | | Silvercrest Asset | | | | |
| | | | Management Group, | | | | |
| | | | Inc. – Class A | | | 3,236,064 | |
| | 22,000 | | Sprott, Inc.(c) | | | 990,660 | |
| | 40,000 | | TriState Capital | | | | |
| | | | Holdings, Inc.(a) | | | 954,800 | |
| | 406,600 | | U.S. Global Investors, | | | | |
| | | | Inc. – Class A | | | 3,025,104 | |
| | | | | | | 10,215,428 | |
| Food – 0.56% | | | | |
| | 35,000 | | Landec Corp.(a) | | | 396,200 | |
| | | | | | | 396,200 | |
| Gold – 2.60% | | | | |
| | 60,000 | | Alexco Resource | | | | |
| | | | Corp.(a)(c) | | | 164,400 | |
| | 41,428 | | Fortitude Gold Corp. | | | 209,212 | |
| | 125,000 | | Fortuna Silver | | | | |
| | | | Mines, Inc.(a)(c) | | | 753,750 | |
| | 145,000 | | Gold Resource Corp. | | | 390,050 | |
| | 280,000 | | McEwen Mining, | | | | |
| | | | Inc.(a)(c) | | | 336,000 | |
| | | | | | | 1,853,412 | |
| Healthcare Services – 1.59% | | | | |
| | 32,500 | | InfuSystem Holdings, | | | | |
| | | | Inc.(a) | | | 735,150 | |
| | 89,981 | | Trxade Group, Inc.(a) | | | 391,417 | |
| | | | | | | 1,126,567 | |
| Home Builder – 3.55% | | | | |
| | 30,100 | | Green Brick Partners, | | | | |
| | | | Inc.(a) | | | 776,881 | |
| | 98,000 | | Legacy Housing Corp.(a) | | | 1,750,280 | |
| | | | | | | 2,527,161 | |
| Leisure – 2.63% | | | | |
| | 84,000 | | Century Casinos, Inc.(a) | | | 1,104,600 | |
| | 180,000 | | Galaxy Gaming, Inc.(a) | | | 603,000 | |
| | 30,000 | | Super League | | | | |
| | | | Gaming, Inc.(a) | | | 161,400 | |
| | | | | | | 1,869,000 | |
| Machinery Manufacturing – 1.17% | | | | |
| | 40,000 | | Graham Corp. | | | 548,400 | |
| | 220,000 | | TechPrecision Corp.(a) | | | 286,000 | |
| | | | | | | 834,400 | |
| Medical Supplies & Services – 1.43% | | | | |
| | 3,000 | | Addus HomeCare | | | | |
| | | | Corp.(a) | | | 317,400 | |
| | 5,853 | | IntriCon Corp.(a) | | | 135,380 | |
| | 20,000 | | Lakeland Industries, | | | | |
| | | | Inc.(a) | | | 564,200 | |
| | | | | | | 1,016,980 | |
| Merchant Wholesalers, | | | | |
| Durable Goods – 1.11% | | | | |
| | 21,250 | | A-Mark Precious | | | | |
| | | | Metals, Inc. | | | 791,987 | |
| | | | | | | 791,987 | |
| Merchant Wholesalers, | | | | |
| Nondurable Goods – 0.45% | | | | |
| | 145,000 | | NewAge, Inc.(a) | | | 317,550 | |
| | | | | | | 317,550 | |
| Miscellaneous Manufacturing – 0.90% | | | | |
| | 21,000 | | Electromed, Inc.(a) | | | 205,170 | |
| | 24,209 | | iCAD, Inc.(a) | | | 436,730 | |
| | | | | | | 641,900 | |
| Motion Pictures and Sound | | | | |
| Recording Industries – 1.44% | | | | |
| | 459,405 | | WildBrain Ltd.(a)(c) | | | 1,024,473 | |
| | | | | | | 1,024,473 | |
| Oil & Gas – 0.75% | | | | |
| | 160,000 | | Evolution Petroleum | | | | |
| | | | Corp. | | | 529,600 | |
| | | | | | | 529,600 | |
| Oil & Gas Services – 0.64% | | | | |
| | 371,895 | | Profire Energy, Inc.(a) | | | 453,712 | |
| | | | | | | 453,712 | |
The accompanying notes to financial statements are an integral part of this schedule.
Perritt MicroCap Opportunities Fund
| Schedule of Investments (Continued) | April 30, 2021 (Unaudited)
|
| Shares | | | | Value | |
| Primary Metal Manufacturing – 0.54% | | | |
| | 50,200 | | Ampco-Pittsburgh | | | |
| | | | Corp.(a) | | $ | 380,014 | |
| | 200 | | The Eastern Co. | | | 5,654 | |
| | | | | | | 385,668 | |
| Professional, Scientific, and | | | | |
| Technical Services – 2.00% | | | | |
| | 8,500 | | CRA International, Inc. | | | 682,210 | |
| | 328,400 | | Research Solutions, | | | | |
| | | | Inc.(a) | | | 738,900 | |
| | | | | | | 1,421,110 | |
| Publishing Industries | | | | |
| (except Internet) – 0.55% | | | | |
| | 40,000 | | eGain Corp.(a) | | | 393,200 | |
| | | | | | | 393,200 | |
| Semiconductor Related | | | | |
| Products – 2.90% | | | | |
| | 80,000 | | AXT, Inc.(a) | | | 788,800 | |
| | 55,000 | | DSP Group, Inc.(a) | | | 763,950 | |
| | 40,000 | | Photronics, Inc.(a) | | | 508,000 | |
| | | | | | | 2,060,750 | |
| Software – 4.74% | | | | |
| | 40,000 | | American Software, | | | | |
| | | | Inc. – Class A | | | 827,600 | |
| | 100,000 | | Asure Software, Inc.(a) | | | 801,000 | |
| | 111,000 | | Immersion Corp.(a) | | | 951,270 | |
| | 100,000 | | Zix Corp.(a) | | | 788,500 | |
| | | | | | | 3,368,370 | |
| Specialty Manufacturing – 2.12% | | | | |
| | 20,000 | | LB Foster | | | | |
| | | | Co. – Class A(a) | | | 322,800 | |
| | 40,000 | | LSI Industries, Inc. | | | 328,800 | |
| | 25,000 | | Manitex International, | | | | |
| | | | Inc.(a) | | | 181,250 | |
| | 20,223 | | Northwest Pipe Co.(a) | | | 672,819 | |
| | | | | | | 1,505,669 | |
| Telecommunications – 2.91% | | | | |
| | 150,000 | | Ceragon Networks, | | | | |
| | | | Ltd.(a)(c) | | | 511,500 | |
| | 34,000 | | Digi International, | | | | |
| | | | Inc.(a) | | | 607,580 | |
| | 142,000 | | PC-Tel, Inc. | | | 948,560 | |
| | | | | | | 2,067,640 | |
| Transportation – 3.55% | | | | |
| | 378,000 | | Radiant Logistics, Inc.(a) | | | 2,525,040 | |
| | | | | | | 2,525,040 | |
| Transportation Equipment | | | | |
| Manufacturing – 2.99% | | | | |
| | 60,000 | | The Shyft Group, Inc. | | | 2,125,200 | |
| | | | | | | 2,125,200 | |
| Utilities – 1.08% | | | | |
| | 50,000 | | Pure Cycle Corp.(a) | | | 763,500 | |
| | | | | | | 763,500 | |
| Waste Management & | | | | |
| Remediation Services – 0.87% | | | | |
| | 82,283 | | Perma-Fix Environmental | | | | |
| | | | Services, Inc.(a) | | | 615,478 | |
| | | | | | | 615,478 | |
| | | | TOTAL COMMON | | | | |
| | | | STOCKS | | | | |
| | | | (Cost $41,592,355) | | $ | 70,522,269 | |
| | | | | | | | |
| | | | SHORT-TERM | | | | |
| | | | INVESTMENTS – 0.72% | | | | |
| | | | | |
| Money Market Funds – 0.72% | | | | |
| | 508,128 | | First American Government | | | | |
| | | | Obligations Fund, | | | | |
| | | | Class X, 0.03%(b) | | $ | 508,128 | |
| | | | TOTAL SHORT-TERM | | | | |
| | | | INVESTMENTS | | | | |
| | | | (Cost $508,128) | | $ | 508,128 | |
| | | | Total Investments | | | | |
| | | | (Cost $42,100,483) – | | | | |
| | | | 99.95% | | $ | 71,030,397 | |
| | | | Other Assets in | | | | |
| | | | Excess of Liabilities – | | | | |
| | | | 0.05% | | | 36,728 | |
| | | | TOTAL NET ASSETS – | | | | |
| | | | 100.00% | | $ | 71,067,124 | |
Percentages are stated as a percent of net assets.
(a) | Non-income producing security. |
(b) | The rate shown is the seven-day yield as of April 30, 2021. |
(c) | Foreign issued security. |
The accompanying notes to financial statements are an integral part of this schedule.
Perritt Ultra MicroCap Fund
| Schedule of Investments | April 30, 2021 (Unaudited)
|
| Shares | | COMMON STOCKS – 97.39% | | Value | |
| Administrative and | | | |
| Support Services – 1.89% | | | |
| | 10,000 | | BGSF, Inc. | | $ | 140,100 | |
| | 12,548 | | Hudson Global, Inc.(a) | | | 222,727 | |
| | | | | | | 362,827 | |
| Auto Parts & Equipment – 1.15% | | | | |
| | 20,000 | | Commercial Vehicle | | | | |
| | | | Group, Inc.(a) | | | 219,800 | |
| | | | | | | 219,800 | |
| Biotechnology – 0.60% | | | | |
| | 9,500 | | Opiant Pharmaceuticals, | | | | |
| | | | Inc.(a) | | | 115,045 | |
| | | | | | | 115,045 | |
| Building Materials – 2.33% | | | | |
| | 37,400 | | Tecnoglass, Inc.(d) | | | 447,304 | |
| | | | | | | 447,304 | |
| Business Services – 15.47% | | | | |
| | 25,000 | | Cantaloupe, Inc.(a) | | | 258,750 | |
| | 90,000 | | CynergisTek, Inc.(a) | | | 160,200 | |
| | 60,000 | | DLH Holdings Corp.(a) | | | 611,400 | |
| | 63,138 | | Information Services | | | | |
| | | | Group, Inc.(a) | | | 287,278 | |
| | 17,500 | | Intrusion, Inc.(a) | | | 320,600 | |
| | 15,000 | | Issuer Direct Corp.(a) | | | 415,950 | |
| | 60,000 | | Medicine Man | | | | |
| | | | Technologies, Inc.(a) | | | 169,200 | |
| | 50,000 | | Support.com, Inc.(a) | | | 190,000 | |
| | 11,000 | | Transcat, Inc.(a) | | | 550,000 | |
| | | | | | | 2,963,378 | |
| Chemical & Related Products – 2.64% | | | | |
| | 32,560 | | Northern Technologies | | | | |
| | | | International Corp. | | | 506,308 | |
| | | | | | | 506,308 | |
| Chemical Manufacturing – 2.37% | | | | |
| | 32,525 | | AgroFresh Solutions, | | | | |
| | | | Inc.(a) | | | 68,953 | |
| | 20,000 | | Alimera Sciences, Inc.(a) | | | 204,800 | |
| | 16,000 | | Aridis Pharmaceuticals, | | | | |
| | | | Inc.(a) | | | 99,680 | |
| | 15,000 | | ProPhase Labs, Inc.(a) | | | 79,950 | |
| | | | | | | 453,383 | |
| Computer & Electronic | | | | |
| Product Manufacturing – 3.88% | | | | |
| | 100,000 | | Dynatronics Corp.(a) | | | 118,000 | |
| | 50,000 | | PC-Tel, Inc. | | | 334,000 | |
| | 700,000 | | Singing Machine Co., | | | | |
| | | | Inc.(a) | | | 290,500 | |
| | | | | | | 742,500 | |
| Computer and Electronic | | | | |
| Product Manufacturing – 7.18% | | | | |
| | 13,000 | | Airgain, Inc.(a) | | | 307,190 | |
| | 45,000 | | Luna Innovations, | | | | |
| | | | Inc.(a) | | | 510,300 | |
| | 55,000 | | One Stop Systems, | | | | |
| | | | Inc.(a) | | | 292,600 | |
| | 21,000 | | TransAct Technologies, | | | | |
| | | | Inc.(a) | | | 266,910 | |
| | | | | | | 1,377,000 | |
| Computers & Electronics – 1.74% | | | | |
| | 10,000 | | Napco Security Technologies, | | | | |
| | | | Inc.(a) | | | 333,100 | |
| | | | | | | 333,100 | |
| Construction & Engineering – 1.60% | | | | |
| | 15,000 | | Gencor Industries, Inc.(a) | | | 179,850 | |
| | 30,000 | | Orbital Energy Group, | | | | |
| | | | Inc.(a) | | | 126,300 | |
| | | | | | | 306,150 | |
| Consumer Goods – 3.25% | | | | |
| | 25,000 | | Jerash Holdings | | | | |
| | | | US, Inc. | | | 165,000 | |
| | 12,000 | | Natural Alternatives | | | | |
| | | | International, Inc.(a) | | | 180,000 | |
| | 10,000 | | Turtle Beach Corp.(a) | | | 277,900 | |
| | | | | | | 622,900 | |
| Consumer Services – 0.91% | | | | |
| | 60,000 | | DHI Group, Inc.(a) | | | 175,200 | |
| | | | | | | 175,200 | |
| Diversified Financials – 0.64% | | | | |
| | 20,000 | | Safeguard Scientifics, | | | | |
| | | | Inc.(a) | | | 123,200 | |
| | | | | | | 123,200 | |
| Educational Services – 1.39% | | | | |
| | 45,000 | | VirTra, Inc.(a) | | | 265,500 | |
| | | | | | | 265,500 | |
The accompanying notes to financial statements are an integral part of this schedule.
Perritt Ultra MicroCap Fund
| Schedule of Investments (Continued) | April 30, 2021 (Unaudited)
|
| Shares | | | | Value | |
| Electronic Equipment | | | |
| & Instruments – 3.64% | | | |
| | 31,000 | | Identiv, Inc.(a) | | $ | 494,450 | |
| | 30,000 | | Iteris, Inc.(a) | | | 202,500 | |
| | | | | | | 696,950 | |
| Environmental Services – 2.78% | | | | |
| | 140,000 | | Quest Resource Holding | | | | |
| | | | Corp.(a) | | | 533,400 | |
| | | | | | | 533,400 | |
| Financial Services – 2.15% | | | | |
| | 17,500 | | Hennessy Advisors, Inc. | | | 169,400 | |
| | 17,500 | | Silvercrest Asset | | | | |
| | | | Management Group, | | | | |
| | | | Inc. – Class A | | | 243,425 | |
| | | | | | | 412,825 | |
| Health Care – 0.30% | | | | |
| | 60,000 | | Rockwell Medical | | | | |
| | | | Technologies, Inc.(a) | | | 57,876 | |
| | | | | | | 57,876 | |
| Healthcare Services – 0.68% | | | | |
| | 30,000 | | Trxade Group, Inc.(a) | | | 130,500 | |
| | | | | | | 130,500 | |
| Leisure – 5.69% | | | | |
| | 30,000 | | Century Casinos, Inc.(a) | | | 394,500 | |
| | 207,655 | | Galaxy Gaming, Inc.(a) | | | 695,644 | |
| | | | | | | 1,090,144 | |
| Machinery Manufacturing – 0.70% | | | | |
| | 5,000 | | Graham Corp. | | | 68,550 | |
| | 50,000 | | TechPrecision Corp.(a) | | | 65,000 | |
| | | | | | | 133,550 | |
| Medical Supplies & Services – 3.97% | | | | |
| | 30,000 | | Biomerica, Inc.(a) | | | 139,800 | |
| | 58,424 | | Check Cap, Ltd.(a)(d) | | | 92,894 | |
| | 7,500 | | Lakeland Industries, | | | | |
| | | | Inc.(a) | | | 211,575 | |
| | 22,500 | | Myomo, Inc.(a) | | | 220,950 | |
| | 25,000 | | Sensus Healthcare, | | | | |
| | | | Inc.(a) | | | 96,250 | |
| | | | | | | 761,469 | |
| Merchant Wholesalers, | | | | |
| Durable Goods – 1.95% | | | | |
| | 10,000 | | A-Mark Precious | | | | |
| | | | Metals, Inc. | | | 372,700 | |
| | | | | | | 372,700 | |
| Merchant Wholesalers, | | | | |
| Nondurable Goods – 0.69% | | | | |
| | 60,000 | | NewAge, Inc.(a) | | | 131,400 | |
| | | | | | | 131,400 | |
| Oil & Gas Services – 0.89% | | | | |
| | 140,010 | | Profire Energy, Inc.(a) | | | 170,812 | |
| | | | | | | 170,812 | |
| Pharmaceuticals – 2.83% | | | | |
| | 50,000 | | ImmuCell Corp.(a) | | | 543,000 | |
| | | | | | | 543,000 | |
| Primary Metal Manufacturing – 2.59% | | | | |
| | 30,000 | | Ampco-Pittsburgh | | | | |
| | | | Corp.(a) | | | 227,100 | |
| | 9,500 | | The Eastern Co. | | | 268,565 | |
| | | | | | | 495,665 | |
| Professional, Scientific, and | | | | |
| Technical Services – 2.57% | | | | |
| | 20,000 | | Perion Network | | | | |
| | | | Ltd.(a)(d) | | | 357,800 | |
| | 60,000 | | Research Solutions, | | | | |
| | | | Inc.(a) | | | 135,000 | |
| | | | | | | 492,800 | |
| Real Estate – 2.69% | | | | |
| | 15,000 | | Fathom Holdings, | | | | |
| | | | Inc.(a) | | | 514,500 | |
| | | | | | | 514,500 | |
| Real Estate Investment Trusts – 1.60% | | | | |
| | 25,495 | | Global Self Storage, | | | | |
| | | | Inc. | | | 126,710 | |
| | 35,000 | | Sachem Capital Corp. | | | 179,550 | |
| | | | | | | 306,260 | |
| Semiconductor Related Products – 3.57% | | | | |
| | 25,000 | | AXT, Inc.(a) | | | 246,500 | |
| | 14,000 | | DSP Group, Inc.(a) | | | 194,460 | |
| | 20,000 | | inTEST Corp.(a) | | | 242,600 | |
| | | | | | | 683,560 | |
| Software – 2.16% | | | | |
| | 30,000 | | Asure Software, Inc.(a) | | | 240,300 | |
| | 40,000 | | NetSol Technologies, | | | | |
| | | | Inc.(a) | | | 174,000 | |
| | | | | | | 414,300 | |
The accompanying notes to financial statements are an integral part of this schedule.
Perritt Ultra MicroCap Fund
| Schedule of Investments (Continued) | April 30, 2021 (Unaudited)
|
| Shares | | | | Value | |
| Specialty Manufacturing – 5.55% | | | |
| | 45,000 | | Data I/O Corp.(a) | | $ | 242,550 | |
| | 17,500 | | GSI Technology, Inc.(a) | | | 103,250 | |
| | 20,000 | | Gulf Island Fabrication, | | | | |
| | | | Inc.(a) | | | 83,200 | |
| | 70,000 | | MIND Technology, | | | | |
| | | | Inc.(a) | | | 162,400 | |
| | 16,211 | | Taylor Devices, Inc.(a) | | | 197,126 | |
| | 5,500 | | UFP Technologies, | | | | |
| | | | Inc.(a) | | | 275,330 | |
| | | | | | | 1,063,856 | |
| Telecommunications – 1.57% | | | | |
| | 172,383 | | Mobivity Holdings | | | | |
| | | | Corp.(a) | | | 301,153 | |
| | | | | | | 301,153 | |
| Utilities – 1.78% | | | | |
| | 20,000 | | Global Water Resources, | | | | |
| | | | Inc. | | | 341,000 | |
| | | | | | | 341,000 | |
| | | | TOTAL COMMON | | | | |
| | | | STOCKS | | | | |
| | | | (Cost $11,526,224) | | $ | 18,661,315 | |
| | | | | | | | |
| Contracts | | WARRANTS – 0.09% | | | | |
| Medical Supplies & Services – 0.00% | | | | |
| | | | Titan Medical, Inc. | | | | |
| | 250,000 | | Expiration: 08/10/2023, | | | | |
| | | | Exercise Price $3.20(a)(b) | | | | |
| | | | | $ | 0 | |
| | | | | |
| Primary Metal Manufacturing – 0.09% | | | | |
| | | | Ampco-Pittsburgh Corp. | | | | |
| | 15,000 | | Expiration: 08/01/2025, | | | | |
| | | | Exercise Price $5.75(a) | | | | |
| | | | | | 17,100 | |
| | | | TOTAL WARRANTS | | | | |
| | | | (Cost $85,000) | | $ | 17,100 | |
| | | | | | | |
| Shares | | SHORT-TERM | | | | |
| | | | INVESTMENTS – 2.26% | | | | |
| | | | | |
| Money Market Funds – 2.26% | | | | |
| | 432,420 | | First American Government | | | | |
| | | | Obligations Fund, 0.03%(c) | | | | |
| | | | | $ | 432,420 | |
| | | | TOTAL SHORT-TERM | | | | |
| | | | INVESTMENTS | | | | |
| | | | (Cost $432,420) | | $ | 432,420 | |
| | | | Total Investments | | | | |
| | | | (Cost $12,043,644) – 99.74% | | | | |
| | | | | $ | 19,110,835 | |
| | | | Other Assets in Excess | | | | |
| | | | of Liabilities – 0.26% | | | 49,670 | |
| | | | TOTAL NET ASSETS – 100.00% | | | | |
| | | | | $ | 19,160,505 | |
Percentages are stated as a percent of net assets.
(a) | Non-income producing security. |
(b) | This security is deemed to be illiquid. This security represents $10 of value or 0.00% of net assets. |
(c) | The rate shown is the seven-day yield as of April 30, 2021. |
(d) | Foreign issued security. |
The accompanying notes to financial statements are an integral part of this schedule.
Perritt Funds, Inc.
| Statements of Assets and Liabilities |
April 30, 2021 (Unaudited)
| | | Perritt MicroCap | | | Perritt Ultra | |
| | | Opportunities Fund | | | MicroCap Fund | |
| Assets: | | | | | | |
| Investments at value | | $ | 71,030,397 | | | $ | 19,110,835 | |
| Receivable for investments sold | | | 76,310 | | | | 112,786 | |
| Receivable for fund shares issued | | | 72,721 | | | | 10,600 | |
| Dividends and interest receivable | | | 3,118 | | | | 12 | |
| Prepaid expenses | | | 18,766 | | | | 13,264 | |
| Total Assets | | | 71,201,311 | | | | 19,247,497 | |
| Liabilities: | | | | | | | | |
| Payable for fund shares purchased | | | 549 | | | | 34,247 | |
| Payable to Advisor | | | 59,767 | | | | 19,595 | |
| Accrued administration expense | | | 23,013 | | | | 1,459 | |
| Accrued accounting expense | | | 19,623 | | | | 5,739 | |
| Accrued audit expense | | | 12,877 | | | | 8,661 | |
| Accrued transfer agent expense | | | 4,434 | | | | 10,469 | |
| Payable to Custodian | | | 4,354 | | | | 2,263 | |
| Payable to Officer & Directors | | | 411 | | | | 418 | |
| Other accrued expenses & liabilities | | | 9,159 | | | | 4,141 | |
| Total Liabilities | | | 134,187 | | | | 86,992 | |
| Net Assets | | $ | 71,067,124 | | | $ | 19,160,505 | |
| Net Assets Consist of: | | | | | | | | |
| Capital Stock | | $ | 35,340,418 | | | $ | 12,821,080 | |
| Total Distributable Earnings | | | 35,726,706 | | | | 6,339,425 | |
| Total Net Assets | | $ | 71,067,124 | | | $ | 19,160,505 | |
| Capital Stock, $0.0001 par value | | | | | | | | |
| Authorized | | | 100,000,000 | | | | 100,000,000 | |
| Outstanding | | | 2,356,024 | | | | 967,883 | |
| Net Assets | | $ | 71,067,124 | | | $ | 19,160,505 | |
| Net asset value and offering price per share | | $ | 30.16 | | | $ | 19.80 | |
| Cost of Investments | | $ | 42,100,483 | | | $ | 12,043,644 | |
The accompanying notes to financial statements are an integral part of these statements.
Perritt Funds, Inc.
For the Period Ended April 30, 2021 (Unaudited)
| | | Perritt MicroCap | | | Perritt Ultra | |
| | | Opportunities Fund | | | MicroCap Fund | |
| Investment Income: | | | | | | |
| Dividend Income (net of $26,737, $0 foreign | | | | | | |
| withholding tax and issuance fees) | | $ | 279,139 | | | $ | 36,184 | |
| Interest income | | | 100 | | | | 55 | |
| Total investment income | | | 279,239 | | | | 36,239 | |
| Expenses: | | | | | | | | |
| Investment advisory fee | | | 335,328 | | | | 101,724 | |
| Shareholder servicing | | | 65,780 | | | | 22,817 | |
| Administration fee | | | 40,630 | | | | 14,709 | |
| Fund accounting expenses | | | 26,939 | | | | 6,854 | |
| Officer & directors’ fees & expenses | | | 25,561 | | | | 13,462 | |
| Professional fees | | | 15,713 | | | | 15,884 | |
| Federal & state registration fees | | | 12,532 | | | | 11,276 | |
| Other expense | | | 11,807 | | | | 15,941 | |
| Custodian fees | | | 5,218 | | | | 2,132 | |
| Printing & mailing fees | | | 4,948 | | | | 1,602 | |
| Total expenses | | | 544,456 | | | | 206,401 | |
| Net investment loss | | | (265,217 | ) | | | (170,162 | ) |
| | | | | | | | | |
| Realized and Unrealized Gain on Investments: | | | | | | | | |
| Net realized gain on investments | | | 7,726,331 | | | | 1,041,965 | |
| Change in unrealized appreciation on investments | | | 19,966,555 | | | | 7,031,016 | |
| Net realized and unrealized gain on investments | | | 27,692,886 | | | | 8,072,981 | |
| Net increase in net assets resulting from operations | | $ | 27,427,669 | | | $ | 7,902,819 | |
The accompanying notes to financial statements are an integral part of these statements.
Perritt MicroCap Opportunities Fund
| Statements of Changes in Net Assets |
| | | For the | | | | |
| | | Period Ended | | | For the | |
| | | April 30, 2021 | | | Year Ended | |
| | | (Unaudited) | | | October 31, 2020 | |
| Operations: | | | | | | |
| Net investment loss | | $ | (265,217 | ) | | $ | (510,080 | ) |
| Net realized gain on investments | | | 7,726,331 | | | | 1,646,827 | |
| Net change in unrealized | | | | | | | | |
| appreciation/(depreciation) on investments | | | 19,966,555 | | | | (15,762,510 | ) |
| Net increase/(decrease) in net | | | | | | | | |
| assets resulting from operations | | | 27,427,669 | | | | (14,625,763 | ) |
| Dividends and Distributions to Shareholders: | | | | | | | | |
| Distributable Earnings | | | — | | | | (3,593,867 | ) |
| Total dividends and distributions | | | — | | | | (3,593,867 | ) |
| Capital Share Transactions: | | | | | | | | |
| Proceeds from shares issued | | | 951,140 | | | | 3,364,259 | |
| Reinvestment of distributions | | | — | | | | 3,508,721 | |
| Cost of shares redeemed | | | (10,068,597 | ) | | | (43,781,601 | ) |
| Redemption fees | | | 1,263 | | | | 9,268 | |
| Net decrease in net assets from capital share transactions | | | (9,116,194 | ) | | | (36,899,353 | ) |
| Total Increase/(Decrease) in Net Assets | | | 18,311,475 | | | | (55,118,983 | ) |
| Net Assets | | | | | | | | |
| Beginning of the period/year | | | 52,755,649 | | | | 107,874,632 | |
| End of the period/year | | $ | 71,067,124 | | | $ | 52,755,649 | |
| Capital Share Transactions: | | | | | | | | |
| Shares sold | | | 34,029 | | | | 183,094 | |
| Shares issued on reinvestment of distributions | | | — | | | | 163,424 | |
| Shares redeemed | | | (382,661 | ) | | | (2,307,998 | ) |
| Net decrease from capital share transactions | | | (348,632 | ) | | | (1,961,480 | ) |
The accompanying notes to financial statements are an integral part of this statement.
Perritt Ultra MicroCap Fund
| Statements of Changes in Net Assets |
| | | For the | | | | |
| | | Period Ended | | | For the | |
| | | April 30, 2021 | | | Year Ended | |
| | | (Unaudited) | | | October 31, 2020 | |
| Operations: | | | | | | |
| Net investment loss | | $ | (170,162 | ) | | $ | (152,246 | ) |
| Net realized gain/(loss) on investments | | | 1,041,965 | | | | (1,147,634 | ) |
| Net change in unrealized | | | | | | | | |
| appreciation/(depreciation) on investments | | | 7,031,016 | | | | (1,333,569 | ) |
| Net increase/(decrease) in net | | | | | | | | |
| assets resulting from operations | | | 7,902,819 | | | | (2,633,449 | ) |
| Dividends and Distributions to Shareholders: | | | | | | | | |
| Distributable Earnings | | | — | | | | (17,594 | ) |
| Return of capital | | | — | | | | (34,626 | ) |
| Total dividends and distributions | | | — | | | | (52,220 | ) |
| Capital Share Transactions: | | | | | | | | |
| Proceeds from shares issued | | | 1,854,980 | | | | 776,958 | |
| Reinvestment of distributions | | | — | | | | 50,759 | |
| Cost of shares redeemed | | | (2,185,832 | ) | | | (20,714,603 | ) |
| Redemption fees | | | 6,864 | | | | 150 | |
| Net decrease in net assets from capital share transactions | | | (323,988 | ) | | | (19,886,736 | ) |
| Total Increase/(Decrease) in Net Assets | | | 7,578,831 | | | | (22,572,405 | ) |
| Net Assets | | | | | | | | |
| Beginning of the period/year | | | 11,581,674 | | | | 34,154,079 | |
| End of the period/year | | $ | 19,160,505 | | | $ | 11,581,674 | |
| Capital Share Transactions: | | | | | | | | |
| Shares sold | | | 97,499 | | | | 64,582 | |
| Shares issued on reinvestment of distributions | | | — | | | | 4,028 | |
| Shares redeemed | | | (132,987 | ) | | | (1,731,047 | ) |
| Net decrease from capital share transactions | | | (35,488 | ) | | | (1,662,437 | ) |
The accompanying notes to financial statements are an integral part of this statement.
Perritt MicroCap Opportunities Fund
For a Fund share outstanding throughout the period/year
| | | For the Six | | | | | | | | | | | | | | | | |
| | | Months Ended | | | For the Years Ended October 31, | |
| | | April 30, | | | |
| | | 2021 | | | 2020 | | | 2019 | | | 2018 | | | 2017 | | | 2016 | |
| | | (Unaudited) | | | | | | | | | | | | | | | | |
| Net asset value, | | | | | | | | | | | | | | | | | | |
| beginning of period/year | | $ | 19.51 | | | $ | 23.12 | | | $ | 28.17 | | | $ | 38.59 | | | $ | 34.18 | | | $ | 32.52 | |
| Income/(loss) from investment operations: | | | | | | | | | | | | | | | | | | | | | | | | |
Net investment income (loss)2 | | | (0.11 | ) | | | (0.15 | ) | | | (0.11 | ) | | | (0.20 | ) | | | (0.15 | ) | | | 0.13 | |
| Net realized and unrealized | | | | | | | | | | | | | | | | | | | | | | | | |
| gain (loss) on investments | | | 10.76 | | | | (2.66 | ) | | | (1.74 | ) | | | (1.83 | ) | | | 7.94 | | | | 2.06 | |
| Total from investment operations | | | 10.65 | | | | (2.81 | ) | | | (1.85 | ) | | | (2.03 | ) | | | 7.79 | | | | 2.19 | |
| Less dividends and distributions: | | | | | | | | | | | | | | | | | | | | | | | | |
| From net investment income | | | — | | | | — | | | | — | | | | — | | | | (0.09 | ) | | | — | |
| From net realized gains | | | — | | | | (0.80 | ) | | | (3.20 | ) | | | (8.39 | ) | | | (3.29 | ) | | | (0.53 | ) |
| Total dividends and distributions | | | — | | | | (0.80 | ) | | | (3.20 | ) | | | (8.39 | ) | | | (3.38 | ) | | | (0.53 | ) |
Redemption fees2,3 | | | 0.00 | | | | 0.00 | | | | 0.00 | | | | 0.00 | | | | 0.00 | | | | 0.00 | |
| Net asset value, end of period/year | | $ | 30.16 | | | $ | 19.51 | | | $ | 23.12 | | | $ | 28.17 | | | $ | 38.59 | | | $ | 34.18 | |
Total return1 | | | 54.59 | %5 | | | (12.46 | %) | | | (6.80 | %) | | | (5.89 | %) | | | 24.20 | % | | | 6.85 | % |
| Supplemental data and ratios: | | | | | | | | | | | | | | | | | | | | | | | | |
| Net assets, end of period/year | | | | | | | | | | | | | | | | | | | | | | | | |
| (in thousands) | | $ | 71,067 | | | $ | 52,756 | | | $ | 107,875 | | | $ | 160,698 | | | $ | 225,445 | | | $ | 262,268 | |
| Ratio of net expenses | | | | | | | | | | | | | | | | | | | | | | | | |
| to average net assets | | | 1.62 | %4 | | | 1.64 | % | | | 1.38 | % | | | 1.28 | % | | | 1.23 | % | | | 1.23 | % |
| Ratio of net investment income (loss) | | | | | | | | | | | | | | | | | | | | | | | | |
| to average net assets | | | (0.79 | %)4 | | | (0.73 | %) | | | (0.48 | %) | | | (0.63 | %) | | | (0.41 | %) | | | 0.41 | % |
| Portfolio turnover rate | | | 10.8 | %5 | | | 19.1 | % | | | 22.1 | % | | | 14.0 | % | | | 18.0 | % | | | 6.2 | % |
1 | Total return reflects reinvested dividends but does not reflect the impact of taxes. |
2 | Net investment income (loss) and redemption fees per share has been calculated based on average shares outstanding during the year. |
3 | Amount is less than $0.01 per share. |
4 | Annualized for periods less than one year. |
5 | Not annualized for periods less than one year. |
The accompanying notes to financial statements are an integral part of this schedule.
Perritt Ultra MicroCap Fund
For a Fund share outstanding throughout the period/year
| | | For the Six | | | | | | | | | | | | | | | | |
| | | Months Ended | | | For the Years Ended October 31, | |
| | | April 30, | | | |
| | | 2021 | | | 2020 | | | 2019 | | | 2018 | | | 2017 | | | 2016 | |
| | | (Unaudited) | | | | | | | | | | | | | | | | |
| Net asset value, | | | | | | | | | | | | | | | | | | |
| beginning of period/year | | $ | 11.54 | | | $ | 12.81 | | | $ | 15.62 | | | $ | 18.49 | | | $ | 15.46 | | | $ | 14.39 | |
| Income/(loss) from investment operations: | | | | | | | | | | | | | | | | | | | | | | | | |
Net investment income (loss)2 | | | (0.17 | ) | | | (0.11 | ) | | | (0.12 | ) | | | (0.17 | ) | | | (0.18 | ) | | | 0.07 | |
| Net realized and unrealized | | | | | | | | | | | | | | | | | | | | | | | | |
| gain (loss) on investments | | | 8.43 | | | | (1.14 | ) | | | (1.60 | ) | | | (0.77 | ) | | | 3.94 | | | | 1.22 | |
| Total from investment operations | | | 8.26 | | | | (1.25 | ) | | | (1.72 | ) | | | (0.94 | ) | | | 3.76 | | | | 1.29 | |
| Less dividends and distributions: | | | | | | | | | | | | | | | | | | | | | | | | |
| From net realized gains | | | — | | | | (0.01 | ) | | | (1.09 | ) | | | (1.93 | ) | | | (0.73 | ) | | | (0.22 | ) |
| From return of capital | | | — | | | | (0.01 | ) | | | — | | | | — | | | | — | | | | — | |
| Total dividends and distributions | | | — | | | | (0.02 | ) | | | (1.09 | ) | | | (1.93 | ) | | | (0.73 | ) | | | (0.22 | ) |
Redemption fees2 | | | 0.01 | | | | 0.00 | 3 | | | 0.00 | 3 | | | 0.00 | 3 | | | 0.00 | 3 | | | 0.00 | 3 |
| Net asset value, end of period/year | | $ | 19.80 | | | $ | 11.54 | | | $ | 12.81 | | | $ | 15.62 | | | $ | 18.49 | | | $ | 15.46 | |
Total return1 | | | 71.58 | %5 | | | (9.75 | %) | | | (11.54 | %) | | | (5.73 | %) | | | 25.27 | % | | | 9.11 | % |
| Supplemental data and ratios: | | | | | | | | | | | | | | | | | | | | | | | | |
| Net assets, end of period/year | | | | | | | | | | | | | | | | | | | | | | | | |
| (in thousands) | | $ | 19,161 | | | $ | 11,582 | | | $ | 34,154 | | | $ | 61,042 | | | $ | 69,636 | | | $ | 54,336 | |
| Ratio of net expenses | | | | | | | | | | | | | | | | | | | | | | | | |
| to average net assets | | | 2.54 | %4 | | | 2.68 | % | | | 1.83 | % | | | 1.71 | % | | | 1.70 | % | | | 1.77 | % |
| Ratio of net investment income (loss) | | | | | | | | | | | | | | | | | | | | | | | | |
| to average net assets | | | (2.09 | %)4 | | | (0.92 | %) | | | (0.85 | %) | | | (0.99 | %) | | | (1.07 | %) | | | 0.48 | % |
| Portfolio turnover rate | | | 11.9 | %5 | | | 14.3 | % | | | 13.3 | % | | | 28.4 | % | | | 43.0 | % | | | 18.1 | % |
1 | Total return reflects reinvested dividends but does not reflect the impact of taxes. |
2 | Net investment income (loss) and redemption fees per share has been calculated based on average shares outstanding during the year. |
3 | Amount is less than $0.01 per share. |
4 | Annualized for periods less than one year. |
5 | Not annualized for periods less than one year. |
The accompanying notes to financial statements are an integral part of this schedule.
Perritt Funds, Inc.
| Notes to Financial Statements |
April 30, 2021 (Unaudited)
| 1. | Organization |
| | |
| | Perritt Funds, Inc. (the “Corporation”) was organized on March 19, 2004 as a Maryland corporation and is registered under the Investment Company Act of 1940, as amended (the “1940 Act”), as an open-end investment company, with each series below being a diversified fund. The Corporation currently consists of the following series: Perritt MicroCap Opportunities Fund (“MicroCap Fund”) and Perritt Ultra MicroCap Fund (“Ultra MicroCap Fund”) (each, a “Fund,” and collectively, the “Funds”). Perritt MicroCap Opportunities Fund, Inc., the predecessor to the MicroCap Fund, commenced operations on April 11, 1988. As part of a plan of reorganization, on February 28, 2013, Perritt MicroCap Opportunities Fund, Inc. merged into the MicroCap Fund, a series within the Corporation. The Ultra MicroCap Fund commenced operations on August 30, 2004. The MicroCap Fund’s investment objective is to invest in mainly common stocks of companies with market capitalizations that are below $500 million at the time of the initial purchase. The Ultra MicroCap Fund’s investment objective is to invest in mainly common stocks of companies with market capitalizations that are below $300 million at the time of the initial purchase. The Funds are each an investment company and accordingly follow the investment company accounting and reporting guidance of the Financial Accounting Standards Board (“FASB”) Accounting Standards Codification Topic 946 “Financial Services – Investment Companies.” |
| | |
| 2. | Summary of Significant Accounting Policies |
| | a. | Exchange-listed securities are generally valued at the last sales price reported by the principal security exchange on which the security is traded, or if no sale is reported, the mean between the latest bid and ask price unless the Funds’ investment advisor believes that the mean does not represent a fair value, in which case the securities are fair valued as set forth below. Securities listed on NASDAQ are valued at the NASDAQ Official Closing Price. Demand notes, commercial paper, U.S. Treasury Bills and warrants are stated at fair value using market prices if available, or a pricing service when such prices are believed to reflect fair value. Money Market Funds are valued at amortized cost. Securities for which market quotations are not readily available are valued at their fair value as determined in good faith by the Funds’ advisor under procedures established by and under the supervision of the Board of Directors of the Funds. The Funds’ fair value procedures allow for the use of certain methods performed by the Funds’ advisor to value those securities for which market quotations are not readily available, at a price that a Fund might reasonably expect to receive upon a sale of such securities. For example, these methods may be based on a multiple of earnings, or a discount from market of a similar freely traded security, or a yield to maturity with respect to debt issues, or a combination of these and other methods. |
| | | |
| | b. | Net realized gains and losses on securities are computed using the first-in, first-out method. |
| | | |
| | c. | Dividend income is recognized on the ex-dividend date, and interest income is recognized on the accrual basis. Withholding taxes on foreign dividends and capital gains, which are included as a component of net investment income and realized gain |
Perritt Funds, Inc.
| Notes to Financial Statements (Continued) |
| | | (loss) on investments, respectively, have been provided for in accordance with the Funds’ understanding of the applicable country’s tax rules and rates. Discounts and premiums on securities purchased are amortized over the life of the respective securities using the interest method. Distributions received from real estate investment trusts (“REITs”) are classified as investment income or realized gains based on the U.S. income tax characteristics of the distribution. Return of capital distributions received from REIT securities and partnerships are recorded as an adjustment to the cost of the security and thus may impact unrealized or realized gains or losses on the security. Investment and shareholder transactions are recorded on the trade date. |
| | | |
| | d. | Each Fund is charged for those expenses that are directly attributable to it. Expenses that are not readily identifiable to a specific Fund are generally allocated among the Funds in proportion to the relative net assets of the Funds. |
| | | |
| | e. | Provision has not been made for federal income tax since the Funds have each elected to be taxed as a “regulated investment company” and intend to distribute substantially all income to their shareholders and otherwise comply with the provisions of the Internal Revenue Code applicable to regulated investment companies. |
| | | |
| | f. | The preparation of financial statements in conformity with accounting principles generally accepted in the United States of America (“GAAP”) requires management to make estimates and assumptions that affect the reported amounts of assets and liabilities and disclosure of contingent assets and liabilities at the date of the financial statements and reported amounts of increases and decreases in net assets from operations during the reporting period. Actual results could differ from those estimates. |
| | | |
| | | In preparing these financial statements, the Funds have evaluated events and transactions for potential recognition or disclosure through the date the financial statements were issued. |
| | | |
| | g. | Dividends from net investment income and net realized capital gains, if any, are declared and paid annually. Distributions to shareholders are recorded on the ex-dividend date. Each Fund may utilize earnings and profit distributed to shareholders on redemption of shares as part of the dividends paid deduction. The Funds may periodically make reclassifications among certain of their capital accounts as a result of the timing and characterization of certain income and realized gain distributions, including reclassifying net operating loss, as determined annually in accordance with federal tax regulations which may differ from GAAP. The MicroCap Fund has reclassified the components of its capital accounts for the year ended October 31, 2020 by increasing paid-in capital by $610,931 and decreasing distributable earnings/(losses) by $610,931. The Ultra Microcap Fund has reclassified the components of its capital accounts for the year ended October 31, 2020 by decreasing paid-in capital by $61,300 and increasing distributable earnings/(losses) by $61,300. These adjustments were primarily due to the utilization of earnings and profits distributed to shareholders on redemptions of shares and the write off of net operating losses. |
| | | |
| | h. | As of and during the six months ended April 30, 2021, the Funds did not have a liability for any unrecognized tax benefits. The Funds recognize interest and penalties, if any, related to unrecognized tax benefits as income tax expense on the Statements of |
Perritt Funds, Inc.
| Notes to Financial Statements (Continued) |
| | | Operations. During the six months ended April 30, 2021, the Funds did not incur any interest or penalties. The Funds are not subject to examination by U.S. federal tax authorities for any tax years before 2018. |
| 3. | Security Valuation |
| | |
| | GAAP establishes an authoritative definition of fair value and sets out a hierarchy for measuring fair value. GAAP also requires additional disclosures about the various inputs used to develop the measurements of fair value. These inputs are summarized in the three broad levels listed below: |
| | • Level 1 – | Quoted prices in active markets for identical securities that the Funds have the ability to access. |
| | | |
| | • Level 2 – | Other significant observable inputs (including quoted prices for similar securities or the identical security on an inactive market, interest rates, prepayment speeds, credit risk, etc.). |
| | | |
| | • Level 3 – | Significant unobservable inputs (including the Funds’ own assumptions in determining the fair value of investments). |
| | The inputs or methodology used for valuing securities are not necessarily an indication of the risk associated with investing in those securities. The following is a summary of the inputs used to value the Funds’ net assets as of April 30, 2021: |
| | |
| | Perritt MicroCap Opportunities Fund |
| | Description | | Level 1 | | | Level 2 | | | Level 3 | | | Total | |
| | Investments in Securities | | | | | | | | | | | | |
| | Common Stocks | | | | | | | | | | | | |
| | Communication Services | | $ | 1,902,219 | | | $ | — | | | $ | — | | | $ | 1,902,219 | |
| | Consumer Discretionary | | | 9,934,185 | | | | — | | | | — | | | | 9,934,185 | |
| | Consumer Staples | | | 713,750 | | | | — | | | | — | | | | 713,750 | |
| | Energy | | | 983,312 | | | | — | | | | — | | | | 983,312 | |
| | Financial | | | 11,007,415 | | | | — | | | | — | | | | 11,007,415 | |
| | Health Care | | | 3,029,318 | | | | — | | | | — | | | | 3,029,318 | |
| | Industrials | | | 21,001,115 | | | | — | | | | — | | | | 21,001,115 | |
| | Information Technology | | | 15,347,555 | | | | — | | | | — | | | | 15,347,555 | |
| | Materials | | | 5,839,900 | | | | — | | | | — | | | | 5,839,900 | |
| | Utilities | | | 763,500 | | | | — | | | | — | | | | 763,500 | |
| | Total Common Stocks | | | 70,522,269 | | | | — | | | | — | | | | 70,522,269 | |
| | Short-Term Investments | | | 508,128 | | | | — | | | | — | | | | 508,128 | |
| | Total Investments | | | | | | | | | | | | | | | | |
| | in Securities | | $ | 71,030,397 | | | $ | — | | | $ | — | | | $ | 71,030,397 | |
Perritt Funds, Inc.
| Notes to Financial Statements (Continued) |
| | Perritt Ultra MicroCap Fund |
| | Description | | Level 1 | | | Level 2 | | | Level 3 | | | Total | |
| | Investments in Securities | | | | | | | | | | | | |
| | Common Stocks | | | | | | | | | | | | |
| | Communication Services | | $ | 834,153 | | | $ | — | | | $ | — | | | $ | 834,153 | |
| | Consumer Discretionary | | | 1,875,119 | | | | 290,500 | | | | — | | | | 2,165,619 | |
| | Consumer Staples | | | 311,400 | | | | — | | | | — | | | | 311,400 | |
| | Energy | | | 416,412 | | | | — | | | | — | | | | 416,412 | |
| | Financial | | | 1,088,275 | | | | — | | | | — | | | | 1,088,275 | |
| | Health Care | | | 2,097,645 | | | | — | | | | — | | | | 2,097,645 | |
| | Industrials | | | 3,895,622 | | | | — | | | | — | | | | 3,895,622 | |
| | Information Technology | | | 5,792,288 | | | | — | | | | — | | | | 5,792,288 | |
| | Materials | | | 1,077,691 | | | | — | | | | — | | | | 1,094,791 | |
| | Real Estate Investment Trusts | | | 641,210 | | | | — | | | | — | | | | 641,210 | |
| | Utilities | | | 341,000 | | | | — | | | | — | | | | 341,000 | |
| | Total Common Stocks | | | 18,370,815 | | | | 290,500 | | | | — | | | | 18,661,315 | |
| | Warrants | | | | | | | | | | | | | | | | |
| | Health Care | | | — | | | | 0 | | | | — | | | | 0 | |
| | Materials | | | 17,100 | | | | — | | | | — | | | | 17,100 | |
| | Total Warrants | | | 17,100 | | | | — | | | | — | | | | 17,100 | |
| | Short-Term Investments | | | 432,420 | | | | — | | | | — | | | | 432,420 | |
| | Total Investments | | | | | | | | | | | | | | | | |
| | in Securities | | $ | 18,820,335 | | | $ | 290,500 | | | $ | — | | | $ | 19,110,835 | |
| | Please refer to the Schedule of Investments for additional information regarding the composition of the amounts listed above. |
| | |
| | During the six months ended April 30, 2021, the MicroCap Fund and the Ultra MicroCap Fund did not hold any Level 3 securities. |
| | |
| 4. | Investment Advisory Agreement |
| | |
| | For each Fund, the Corporation entered into an investment advisory agreement (collectively, the “Agreements”) with Perritt Capital Management, Inc. (the “Advisor”), with whom certain officers and directors of the Corporation are affiliated, to furnish investment advisory services to the Funds. Under the terms of the Agreements, the MicroCap Fund pays the Advisor a monthly fee at the annual rate of 1.00% of the Fund’s daily average net assets, and the Ultra MicroCap Fund pays the Advisor a monthly fee equal to 1.25% of its daily average net assets less than or equal to $100 million; 1.00% with respect to daily average net assets in excess of $100 million and less than or equal to $200 million; and 0.50% with respect to daily average net assets in excess of $200 million. At April 30, 2021, the MicroCap Fund and Ultra MicroCap Fund had fees due to the Advisor of $59,767 and $19,959, respectively. For the six months ended April 30, 2021, the MicroCap Fund and Ultra MicroCap Fund had incurred advisory fees of $335,328 and $101,724, respectively. |
Perritt Funds, Inc.
| Notes to Financial Statements (Continued) |
| | The Advisor manages the Funds’ investments subject to the supervision of the Funds’ Board of Directors. The Advisor is responsible for investment decisions and supplies investment research and portfolio management. Under the Agreements, the Advisor, at its own expense and without reimbursement from the Funds, will furnish office space and all necessary office facilities, equipment and personnel for making the investment decisions necessary for managing the Funds and maintaining their organization, will pay the salaries and fees of all officers and directors of the Funds (except the Chief Compliance Officer’s salary and the fees paid to disinterested directors) and will bear all sales and promotional expenses of the Funds. |
| | |
| | The officers of the Funds are affiliated with the Advisor. Such officers, with the exception of the Chief Compliance Officer, receive no compensation from the Funds or the Advisor for serving their respective roles. The Funds pay the salary associated with the office of the Chief Compliance Officer. Such fees are included on the Statements of Operations within officer & directors’ fees & expenses. |
| | |
| | The Funds reimbursed the Advisor for fees paid to financial intermediaries such as banks, broker-dealers, financial advisors or other financial institutions for sub-transfer agency, sub-administration and other services that the financial intermediaries provided to their clients, who are beneficial owners of shares of the Funds. The financial intermediaries are the record owners of the Funds on the Funds’ records through omnibus accounts, other group accounts, retirement plans or accounts traded through registered securities clearing agents. These fees are fees that the Funds are obligated to pay to such intermediaries, and the fees may vary based on, for example, the nature of services provided. The fees paid to such intermediaries by the Funds are only a portion of the full fee that is paid to the intermediaries, and the Advisor is obligated to pay the remaining amount. In determining the portion of the fees paid to the intermediaries that the Funds are obligated to pay, the Funds have used the “avoided cost” method, which is one of several permissible methods to determine the fees are reasonable. Based on this method, the Funds’ Board of Directors determines a fee per sub-account that it believes approximates the transfer agency fee that would otherwise have been payable by the Funds if such intermediaries did not maintain the sub-account. These amounts are included within shareholder servicing fees on the Statements of Operations. |
| | |
| 5. | Investment Transactions |
| | |
| | Purchases and sales of securities, excluding short-term investments, for the six months ended April 30, 2021, were as follows: |
| | | | Purchases | | | Sales | |
| | | | U.S. | | | | | | U.S. | | | | |
| | | | Governments | | | Other | | | Governments | | | Other | |
| | MicroCap Fund | | $ | — | | | $ | 6,986,076 | | | $ | — | | | $ | 16,898,722 | |
| | Ultra MicroCap Fund | | $ | — | | | $ | 1,860,326 | | | $ | — | | | $ | 2,546,105 | |
Perritt Funds, Inc.
| Notes to Financial Statements (Continued) |
| 6. | Federal Income Tax Matters |
| | |
| | As of October 31, 2020, the components of distributable earnings on a tax basis were as follows: |
| | | | MicroCap | | | Ultra MicroCap | |
| | | | Fund | | | Fund | |
| | Cost of investments for tax purposes | | $ | 43,971,097 | | | $ | 11,569,644 | |
| | Gross tax unrealized appreciation | | | 15,608,716 | | | | 3,010,023 | |
| | Gross tax unrealized depreciation | | | (6,740,054 | ) | | | (2,973,847 | ) |
| | Net unrealized appreciation | | | | | | | | |
| | on investments | | | 8,868,662 | | | | 36,176 | |
| | Other accumulated losses | | | (569,625 | ) | | | (1,599,570 | ) |
| | Total Distributable Earnings/(Losses) | | $ | 8,299,037 | | | $ | (1,563,394 | ) |
| | The difference between book and tax basis distributable earnings is primarily related to the deferral of losses on wash sales. |
| | |
| | A regulated investment company may elect for any taxable year to treat any portion of any qualified late year loss as arising on the first day of the next taxable year. Qualified late year losses are ordinary losses which occur during the portion of the Fund’s taxable year subsequent to December 31. |
| | |
| | At October 31, 2020, the following Funds deferred, on a tax basis, late year ordinary losses of: MicroCap Fund had $567,909 in losses and Ultra MicroCap Fund had $459,274 in losses. The MicroCap Fund has an outstanding short term capital loss carryover of $1,716 to utilize. The Ultra MicroCap Fund has an outstanding long term capital loss carryover of $1,140,295 to utilize. The MicroCap Fund utilized $135,971 in capital loss carryover in the current year. |
| | |
| | The tax composition of distributions paid during the periods ended October 31, 2020 and 2019 were as follows: |
| | | | Ordinary | | | | | | | | | Return of | |
| | | | Income | | | Long-term Capital Gains | | | Capital | |
| | | | 2020 | | | 2019 | | | 2020 | | | 2019 | | | 2020 | | | 2019 | |
| | MicroCap Fund | | $ | — | | | $ | 4,228,890 | | | $ | 3,593,867 | | | $ | 13,909,309 | | | $ | — | | | $ | — | |
| | Ultra MicroCap Fund | | | — | | | | 407,328 | | | | 17,594 | | | | 3,846,297 | | | | 34,626 | | | | — | |
| | The Funds designated as long-term capital gain dividend, pursuant to Internal Revenue Code Section 852(b)(3), the amount necessary to reduce the earnings and profits of the Funds related to net capital gain to zero for the tax year ended October 31, 2020. |
| | |
| 7. | Restricted Securities |
| | |
| | The Funds may own investment securities which are unregistered and thus restricted as to resale. These securities are valued by each Fund after giving due consideration to pertinent factors including recent private sales, market conditions and the issuer’s financial performance. Where future disposition of these securities requires registration under the Securities Act of 1933, each Fund has the right to include these securities in |
Perritt Funds, Inc.
| Notes to Financial Statements (Continued) |
| | such registration, generally without cost to the Fund. The Funds have no right to require registration of the unregistered securities they hold. At April 30, 2021, the Funds did not hold any restricted securities. |
| | |
| 8. | Guarantees and Indemnifications |
| | |
| | Under the Funds’ organizational documents, their officers and directors are indemnified by the Funds against certain liabilities arising out of the performance of their duties to the Funds. Additionally, in the normal course of business, the Funds enter into contracts with service providers that contain general indemnification clauses. The Funds’ maximum exposure under these arrangements is unknown as this would involve future claims that may be made against the Funds that have not yet occurred. Currently, the Funds expect the risk of loss to be remote. |
| | |
| 9. | Line of Credit Arrangement |
| | |
| | The MicroCap Fund and Ultra MicroCap Fund are each party to uncommitted line of credit arrangements with U.S. Bank, N.A. with an expiration date of December 6, 2021, under which the MicroCap Fund may borrow up to $2,500,000 and the Ultra MicroCap Fund may borrow up to $2,000,000, subject to certain restrictions and covenants. Interest is charged on borrowings at the prevailing Prime Rate which was 3.25% as of April 30, 2021. The Funds have borrowed under these arrangements from time to time to increase the efficiency of cash flow management. For the six months ended April 30, 2021, the MicroCap Fund had average borrowings of $599,250 and the weighted average interest rate on the line of credit borrowings was 3.25%. The Ultra MicroCap Fund had average borrowings of $16,750 and the weighted average interest rate on the line of credit borrowings was 3.25%. On January 27, 2021, the MicroCap Fund had borrowings of $1,771,000 and on January 21, 2021, the Ultra MicroCap Fund had borrowings of $19,000, which represent the largest borrowing amounts during the six months ended April 30, 2021. As of April 30, 2021, the MicroCap Fund and Ultra MicroCap Fund had no outstanding borrowings on the lines of credit. Interest charged on the borrowings is recorded as other expense in the Statements of Operations. |
| | |
| 10. | Redemption Fee |
| | |
| | The Funds charge a 2.00% redemption fee to those who buy and sell shares within 90 calendar days or less. The redemption fee is retained for the benefit of long-term shareholders, and recorded as additional capital in the Statements of Changes in Net Assets. |
| | |
| 11. | Transactions with Affiliates |
| | |
| | During the six months ended April 30, 2021, MicroCap Fund and Ultra MicroCap Fund did not hold any securities that were considered affiliated. |
| | |
| | The Funds are permitted to purchase or sell securities from or to each other under specified conditions outlined in procedures adopted by the Board of Directors. The procedures have been designed to ensure that any purchase or sale of securities by a Fund from or to another Fund complies with Rule 17a-7 of the 1940 Act. For the six months ended April 30, 2021, the MicroCap Fund and Ultra MicroCap Fund engaged in 0 securities transactions pursuant to Rule 17a-7 of the 1940 Act. |
Perritt Funds, Inc.
| Notes to Financial Statements (Continued) |
| 12. | Beneficial Ownership |
| | |
| | The beneficial ownership, either directly or indirectly, of more than 25% of voting securities of a fund creates a presumption of control of that fund, under Section 2(a)(9) of the 1940 Act. As of April 30, 2021, the Funds had omnibus shareholder accounts (comprised of a group of individual shareholders), which amounted to more than 25% of the total shares outstanding of the respective Fund. There were no individual shareholders of record who owned more than 5% of the outstanding shares of beneficial interest of a Fund or Class of shares of a Fund. Shareholders with a controlling interest could affect the outcome of proxy voting or direction of management of a Fund. |
| | |
| 13. | Coronavirus (COVID-19) Pandemic |
| | |
| | The global outbreak of COVID-19 (commonly referred to as “coronavirus”) has disrupted economic markets and the prolonged economic impact is uncertain. The ultimate economic fallout from the pandemic, and the long-term impact on economies, markets, industries and individual issuers, are not known. The operational and financial performance of the issuers of securities in which the Funds invest depends on future developments, including the duration and spread of the outbreak, and such uncertainty may in turn adversely affect the value and liquidity of the Funds’ investments, impair the Funds’ ability to satisfy redemption requests, and negatively impact the Funds’ performance. |
Perritt Funds, Inc.
| Expense Example (Unaudited) | April 30, 2021
|
As a shareholder of the Funds, you incur two types of costs: (1) transaction costs, including sales charges (loads) on purchase payments, reinvested dividends, or other distributions; redemption fees (the Funds impose a 2.00% redemption fee on shares held for 90 calendar days or less after purchase); and exchange fees; and (2) ongoing costs, including management fees; distribution and/or service fees; and other Fund expenses. This example is intended to help you understand your ongoing costs (in dollars) of investing in the Fund and to compare these costs with the ongoing costs of investing in other mutual funds. The example is based on an investment of $1,000 invested at the beginning of the period and held for the entire period (November 1, 2020 – April 30, 2021).
Actual Expenses
The first line of the table below provides information about actual account values and actual expenses. Although the Funds charge no sales load or transaction fees (other than a 2.00% redemption fee for shares held for 90 calendar days or less after purchase), you will be assessed fees for outgoing wire transfers, returned checks and stop payment orders at prevailing rates charged by U.S. Bancorp Fund Services, LLC, the Funds transfer agent. If you request that a redemption be made by wire transfer, currently a $15.00 fee is charged by the Funds transfer agent. You will be charged a transaction fee equal to 2.00% of the net amount of the redemption if you redeem your shares within 90 calendar days of purchase. IRA accounts will be charged a $15.00 annual maintenance fee. There is a $25 IRA distribution and transfer out fee, unless set up automatically. Please see IRA Account Agreement for additional fees related to IRA accounts. To the extent the Fund invests in shares of other investment companies as part of its investment strategy, you will indirectly bear your proportionate share of any fees and expenses charged by the underlying funds in which the Fund invests in addition to the expenses of the Fund. Actual expenses of the underlying funds are expected to vary among the various underlying funds. These expenses are not included in the example below. The example below includes, but is not limited to, management fees, shareholder servicing fees, fund accounting, custody and transfer agent fees. However, the example below does not include portfolio trading commissions and related expenses, interest expense and other extraordinary expenses as determined under accounting principles generally accepted in the United States of America. You may use the information in this line, together with the amount you invested, to estimate the expenses that you paid over the period. Simply divide your account value by $1,000 (for example, an $8,600 account value divided by $1,000 = 8.6), then multiply the result by the number in the first line under the heading entitled “Expenses Paid During Period” to estimate the expenses you paid on your account during this period.
Hypothetical Example for Comparison Purposes
The second line of the table below provides information about hypothetical account values and hypothetical expenses based on the Fund’s actual expense ratio and an assumed rate of return of 5% per year before expenses, which is not the Fund’s actual return. The hypothetical account values and expenses may not be used to estimate the actual ending account balance or expenses you paid for the period. You may use this information to compare the ongoing costs of investing in the Fund and other funds. To do so, compare this 5% hypothetical example with the 5% hypothetical examples that appear in the shareholder reports of the other funds.
Perritt Funds, Inc.
| Expense Example (Unaudited) (Continued) | April 30, 2021
|
Please note that the expenses shown in the table are meant to highlight your ongoing costs only and do not reflect any transactional costs, such as sales charges (loads), redemption fees, or exchange fees. Therefore, the second line of the table is useful in comparing ongoing costs only, and will not help you determine the relative total costs of owning different funds. In addition, if these transactional costs were included, your costs would have been higher.
| | Beginning | Ending | Expenses Paid |
| | Account Value | Account Value | During Period |
| | 11/1/20 | 4/30/21 | 11/1/20 – 4/30/211 |
| Actual | | | |
| Perritt MicroCap Opportunities | $1,000.00 | $1,545.90 | $10.23 |
| Perritt Ultra MicroCap Fund | $1,000.00 | $1,715.80 | $17.10 |
| | | | |
| Hypothetical | | | |
| Perritt MicroCap Opportunities | $1,000.00 | $1,016.71 | $ 8.10 |
| Perritt Ultra MicroCap Fund | $1,000.00 | $1,012.00 | $12.67 |
1 | Expenses are equal to the Fund’s annualized expense ratio of 1.62% for the MicroCap Opportunities Fund and 2.54% for the Ultra MicroCap Fund for the six-month period, multiplied by the average account value over the period, multiplied by 181/365 (to reflect the one-half year period). |
Perritt Funds, Inc.
| Advisory Agreement Renewal (Unaudited) |
On December 17, 2020, the Board of Directors of Perritt Funds, Inc. (the “Directors”) approved the continuation of the investment advisory agreements for the Perritt MicroCap Opportunities Fund (the “MicroCap Fund”) and the Perritt Ultra MicroCap Fund (the “Ultra Fund”) (collectively the “Funds”, or the, “Fund”) with the investment advisor to the Funds, Perritt Capital Management, Inc. (the “Advisor”). As part of the process of approving the continuation of the advisory agreements, the Directors reviewed the fiduciary duties of the Directors with respect to approving the advisory agreements and the relevant factors for the Directors to consider, and the members of the Board of Directors who are not deemed “interested persons” (as that term is defined by the Investment Company Act of 1940) of the Funds (the “Independent Directors”) met in executive session to discuss the approval of the advisory agreements.
In advance of the meeting, the Advisor sent detailed information to the Directors to assist them in their evaluation of the investment advisory agreements. This information included, but was not limited to, a memorandum from Fund counsel that summarized the legal standards applicable to the Directors’ consideration of the advisory agreements; comparative information relating to the Funds’ management fees and other expenses of the Funds; information regarding fees paid and other payments; information on the Advisor’s profitability; information about brokerage commissions; comparative information relating to the Funds’ performance; information about sales and redemptions of the Funds; information about the Funds’ compliance program; and other information the Directors believed was useful in evaluating the approval of advisory agreements.
All of the factors discussed by the Directors were considered as a whole, and were considered separately by the Independent Directors, meeting in executive session. The factors were viewed in their totality by the Directors, with no single factor being the principal or determinative factor in the Directors’ determination of whether to approve the continuation of the investment advisory agreements. The Directors recognized that the management and fee arrangements for the Funds are the result of years of review and discussion between the Independent Directors and the Advisor, that certain aspects of such arrangements may receive greater scrutiny in some years than in others and that the Directors’ conclusions may be based, in part, on their consideration of these same arrangements and information received during the course of the year and in prior years.
Prior to approving the continuation of the investment advisory agreements, the Directors and the Independent Directors in executive session considered, among other items:
| • | The nature and quality of the investment advisory services provided by the Advisor. |
| | |
| • | A comparison of the fees and expenses of the Funds to other similar funds. |
| | |
| • | A comparison of the fee structures of other accounts managed by the Advisor. |
| | |
| • | Whether economies of scale are recognized by the Funds. |
| | |
| • | The costs and profitability of the Funds to the Advisor. |
| | |
| • | The performance of the Funds. |
| | |
| • | The other benefits to the Advisor from serving as investment advisor to the Funds (in addition to the advisory fee). |
Perritt Funds, Inc.
| Advisory Agreement Renewal (Unaudited) (Continued) |
The material considerations and determinations of the Board of Directors, including all of the Independent Directors, are as follows:
Nature and Quality of Investment Advisory Services
The Directors noted that the Advisor supervises the investment portfolios of the Funds, directing the day-to-day management of the Funds’ portfolios, including the purchase and sale of investment securities, and that the Advisor employs a research intensive investment process. They concluded that the Advisor dedicates significant resources to managing the investments of the Funds.
The Directors then discussed staffing at the Advisor and concluded that the Advisor is well staffed to conduct the research needed to meet the investment objectives of the Funds.
The Directors also considered the background and experience of the Advisor’s senior management and expertise of, and the amount of attention given to, the Funds by investment personnel of the Advisor. In addition, the Directors considered the quality of the material service providers to the Funds, who provide administrative and distribution services on behalf of the Funds and are overseen by the Advisor, and the overall reputation and capabilities of the Advisor. Based on this review, the Directors determined that the Advisor provides high quality services to the Funds. The Directors also concluded that they were satisfied with the nature, extent and quality of the investment advisory services provided to the Funds by the Advisor, and that the nature and extent of the services provided by the Advisor are appropriate to assure that each Fund’s operations are conducted in compliance with applicable laws, rules and regulations.
Comparative Fees and Expenses
The Directors then discussed with management the variables, in addition to the management fees, such as administrative and transaction fees, that impact costs to the shareholders of the Funds. Management reviewed with the Directors the comparison of the Funds’ expense ratios to other similar funds. As part of the discussion with management, the Directors ensured that they understood and were comfortable with the criteria used by the Advisor to determine the mutual funds that make up the peer group for purposes of the materials.
Following review and discussion, the Board determined that the above median total expenses of the Funds appear to result from a low level of assets under management, which caused certain non-management expenses to be above average as compared to the peer group. The Directors concluded that the Funds’ fees are reasonable given the asset sizes of the Funds, and they concluded that the Advisor is actively working to keep the fees down.
Comparison of Fee Structures of Other Accounts
The Directors then inquired of management regarding the distinction between the services performed by the Advisor for separate accounts and those performed by the Advisor for the Funds. The Advisor noted that the management of the Funds involves more comprehensive and substantive duties than the management of separate accounts. The Director determined that the following items, among others, support the fact that the services performed by the Advisor for the Funds require a higher level of service
Perritt Funds, Inc.
| Advisory Agreement Renewal (Unaudited) (Continued) |
and oversight than the services performed by the Advisor for separate accounts:
| • | The Advisor provides tailored investment advisory services to the Funds in order to accommodate the cash flow volatility presented by the purchases and redemptions of shareholders. |
| | |
| • | With regard to the Funds, the Advisor attempts to serve the needs of thousands of accounts, ranging from direct accounts holding a few thousand dollars to the large omnibus accounts of intermediaries who in turn service thousands of large and small accounts. |
| | |
| • | The Advisor coordinates with the Funds’ Chief Compliance Officer and other service providers to insure compliance with regulatory regimens imposed by Federal law and the Internal Revenue Code. |
| | |
| • | Separate accounts do not require the same level of services and oversight, nor do they present the same compliance obligations. |
Following this discussion, the Directors concluded that the services performed by the Advisor for the Funds require a higher level of service and oversight than the services performed by the Advisor for separate accounts, and that the services performed by the Advisor for the Funds represent a greater demand on the Advisor’s resources, to meet the increased compliance obligations of the Funds. Based on this determination, the Directors determined that the differential in advisory fees between the Funds and the separate accounts are reasonable, and concluded that the fee rates charged to the Funds in comparison to those charged to the Advisor’s other clients are reasonable.
Performance
The Directors reviewed the Advisor’s quality of investment management, management history and ability to successfully market the Funds. They then discussed the performance of the Funds versus their indices and their peer group median. They were pleased that the most recently reported performance of the MicroCap Fund, as contained in the Board Materials, shows the Fund’s performance ahead of the median. The Directors then noted that the most recently reported performance of the Ultra Fund, as contained in the Board Materials, shows the Fund’s performance below the median. So, they discussed the Ultra Fund’s performance with the Advisor, and the steps the Advisor is taking to improve the performance, and they concluded the Advisor is taking appropriate steps. The Directors then noted that while recent performance has not been as good as desired, the Funds have generally performed well over the long term, particularly on a risk-adjusted basis.
Following their discussion, the Directors concluded that the performance of the Funds, adjusting for risk, has been satisfactory. They continue to believe that the Advisor’s discipline should lead to favorable results in the long-term, and concluded that renewal of the existing advisory agreements was in the best interest of the Funds’ shareholders.
Costs and Profitability
The Director considered the cost of services provided and the profits realized by the Advisor, by reviewing reports provided by the Funds’ administrator that compared the Funds’ investment advisory fees to those of other comparable mutual funds. They also considered the Funds total expenses compared to peer group funds. The Directors noted that the total expenses of
Perritt Funds, Inc.
| Advisory Agreement Renewal (Unaudited) (Continued) |
the MicroCap Fund are below the median, and concluded that this supports their belief that the total expenses of the Fund are reasonable. On the other hand, they noted that the Ultra Fund’s total expenses are higher than the median, and discussed with the Advisor the reasons for the higher expenses. The Directors concluded that the Ultra Fund’s low average assets under management contribute significantly to the Fund’s higher total expenses, and that the total expenses of the Fund remain within a reasonable range of its peers.
The Directors discussed in detail the profitability of the Advisor as it relates to the Funds, and they discussed the impact of the intermediary service fees on the profitability. The Directors also considered the resources and revenues that the Advisor has put into managing and distributing the Funds, and concluded that the level of profitability realized by the Advisor from its provision of services to the Funds is reasonable, and that the overall expense ratios and investment advisory fees were fair and within the range of industry averages.
Economies of Scale
The Directors then discussed with management whether economies of scale are recognized by the Funds. They noted that as Fund assets grow, certain fixed costs are spread over the larger asset base, which may lead to some economies of scale. On the other hand, the Directors noted that many of the Funds’ expense are subject to diseconomies of scale. For example, the intermediary service fees increase as the Funds’ assets grow. Given the size of the Funds, the Directors determined that the Funds are not realizing economies of scale, and that the existing advisory fees are acceptable.
Fall-Out Benefits
The Directors then considered other benefits to the Advisor from serving as Advisor to the Funds (in addition to the advisory fee). The Directors noted that the Advisor derives ancillary benefits from its association with the Funds in the form of proprietary and third party research products and services received from broker dealers that execute portfolio trades for the Funds. The Directors determined such products and services have been used for legitimate purposes relating to the Funds by providing assistance in the investment decision-making process. They concluded that the other benefits realized by the Advisor from its relationship with the Funds were reasonable.
Conclusion
After reviewing the materials and management’s presentation, as well as other information regularly provided at the Board’s quarterly meetings throughout the year regarding the quality of services provided by the Advisor, the performance of the Funds, expense information, regulatory compliance issues, trading information and related matters and other factors deemed relevant by the Board, the Directors, including all of the Independent Directors, approved the continuation of the investment advisory agreements.
The Directors noted that all of the factors above were considered by the Board as a whole, and separately by the Independent Directors meeting in executive session. The factors were viewed in their totality by the Directors, with no single factor being the principal or determinative factor in the Board’s determination of whether to approve the continuation of the investment advisory agreements.
Perritt Funds, Inc.
| Directors and Officers (Unaudited) |
The Board is responsible for the overall management of the Funds. This includes establishing the Funds’ policies, approval of all significant agreements between the Funds and persons or companies providing services to the Funds, and the general supervision and review of the Funds’ investment activities. As a Maryland corporation, the day-to-day operations of the Funds are delegated to the officers of the Funds, subject to the investment objectives and policies of the Funds and to general supervision by the Board.
Management Information
The name, age (as of the date of this SAI), address, principal occupations during the past five years, and other information with respect to each of the Directors are set forth in the following tables, along with information for the officers of the Funds. The information is provided as of the date of this SAI.
| | Position(s) Held | | | |
| | with Funds and | | | Other |
| | Number of | | | Directorships |
| | Portfolios in | | | Held by |
| Name, | Fund Complex | Term of Office | Principal | Director |
| Address, | Overseen | and Length of | Occupation(s) | during the |
and Age | by Director | Time Served | during Past 5 Years | Past 5 Years |
| | | |
| “Disinterested” Directors of the Funds | | |
| | | | | |
| Dianne C. Click | Director | Indefinite, until | Ms. Click is a licensed Real | N/A |
| Age: 58 | | successor | Estate Broker in the State | |
| 300 South | Portfolios in | elected | of Montana. She has been | |
| Wacker Drive, | Fund Complex | | a partner and a principal | |
| Suite 600 | Overseen: 2 | Director | owner of a real estate sales | |
| Chicago, IL | | since 2004 | company, Bozeman Brokers, | |
| 60606 | | | since 2004. She has been | |
| | | | licensed in the state of | |
| | | | Montana since 1995. | |
| | | | | |
| David S. Maglich | Director | Indefinite, until | Mr. Maglich is a Shareholder | N/A |
| Age: 63 | | successor | with the law firm of Fergeson, | |
| 300 South | Portfolios in | elected | Skipper et. al. in Sarasota, | |
| Wacker Drive, | Fund Complex | | Florida and has been | |
| Suite 600 | Overseen: 2 | Director | employed with such firm | |
| Chicago, IL | | since 2004 | since 1989. | |
| 60606 | | | | |
Perritt Funds, Inc.
| Directors and Officers (Unaudited) (Continued) |
| | Position(s) Held | | | |
| | with Funds and | | | Other |
| | Number of | | | Directorships |
| | Portfolios in | | | Held by |
| Name, | Fund Complex | Term of Office | Principal | Director |
| Address, | Overseen | and Length of | Occupation(s) | during the |
and Age | by Director | Time Served | during Past 5 Years | Past 5 Years |
| | | |
| “Interested” Director of the Funds | | |
| | | | | |
| Michael J. | President | One-year term | Mr. Corbett was President | N/A |
Corbett(1) | | as President | of the Perritt MicroCap | |
| Age: 55 | Portfolios in | | Opportunities Fund, Inc. | |
| 300 South | Fund Complex | As Director, | (1999–2013) and President | |
| Wacker Drive, | Overseen: 2 | indefinite, | of the Perritt Funds, Inc. | |
| Suite 600 | | until successor | since 2004. He has served | |
| Chicago, IL | | elected | as President of the Adviser | |
| 60606 | | | since 2010, and previously | |
| | | Director | served as Vice President of | |
| | | since 2010 | the Adviser from 1997 until | |
| | | | 2010. Mr. Corbett began his | |
| | | President | tenure with Perritt Capital | |
| | | since 2004 | Management in 1990 as a | |
| | | | research analyst. He assumed | |
| | | | portfolio management | |
| | | | responsibilities in 1996 and | |
| | | | now serves as portfolio | |
| | | | manager for the Funds. | |
____________
(1) | Mr. Corbett is an interested person of the Funds based upon his position with the Adviser. |
Perritt Funds, Inc.
| Directors and Officers (Unaudited) (Continued) |
| | Position(s) Held | | | |
| | with Funds and | | | Other |
| | Number of | | | Directorships |
| | Portfolios in | | | Held by |
| Name, | Fund Complex | Term of Office | Principal | Director |
| Address, | Overseen | and Length of | Occupation(s) | during the |
and Age | by Director | Time Served | during Past 5 Years | Past 5 Years |
| | |
| Officers of the Funds Other Than Mr. Corbett | |
| | | | | |
| Mark Buh | Vice President | One-year term | Mr. Buh has been Vice | N/A |
| Age: 59 | and Treasurer | Since 2012 | President and Treasurer of | |
| 300 South | | | the Funds and Chief Financial | |
| Wacker Drive, | | | Officer of the Adviser since | |
| Suite 600 | | | 2012. He has over 25 years | |
| Chicago, IL | | | of experience in corporate | |
| 60606 | | | accounting, administration, | |
| | | | planning and business | |
| | | | development. His previous | |
| | | | experience includes tenures | |
| | | | at Ernst and Young and | |
| | | | CenturyLink | |
| | | | Communications. | |
| | | | | |
| Lynn E. | Vice President, | One-year term | Mrs. Burmeister has been | N/A |
| Burmeister | Chief | | the Chief Compliance | |
| Age: 61 | Compliance | Chief | Officer since May 1, 2010, | |
| 300 South | Officer and | Compliance | and oversees all compliance | |
| Wacker Drive, | Secretary | Officer | matters for the Funds and the | |
| Suite 600 | | Since 2010 | Adviser. She also coordinates | |
| Chicago, IL | | | the administration of the | |
| 60606 | | Secretary | Funds and is a liaison with | |
| | | Since 2015 | the firm’s corporate counsel. | |
| | | | Mrs. Burmeister has worked | |
| | | | in the financial industry | |
| | | | since 1980. Her previous | |
| | | | experience includes work at | |
| | | | Harris Associates, Gofen & | |
| | | | Glossberg and Optimum | |
| | | | Investments. | |
Perritt Funds
The Statement of Additional Information (SAI) includes additional information about the Funds’ directors and is available, without charge, upon request, by calling 1-800-331-8936.
The Funds file their complete schedule of portfolio holdings with the Commission for the first and third quarters of each fiscal year as an exhibit to its reports on Form N-PORT. The Funds’ Form N-PORT reports are available on the Commission’s website at http://www.sec.gov
A description of the policies and procedures that the Funds use to determine how to vote proxies relating to portfolio securities is available without charge, upon request, by calling the Advisor at 1-800-331-8936 and on the Securities and Exchange Commission’s website at http://www.sec.gov.
Information regarding how the Funds voted proxies relating to portfolio securities during the most recent 12-month period ended June 30 is available without charge, upon request, by calling 1-800-331-8936 and on the Securities and Exchange Commission’s website at http://www.sec.gov.
Household Delivery of Shareholder Documents: To reduce expenses, the Funds may mail only one copy of the Funds’ prospectus, SAI and each annual and semi-annual report to those addresses shared by two or more accounts. If you wish to receive individual copies of these documents, please call the Funds at 1-800-331-8936 or contact your financial institution. You will begin receiving individual copies thirty days after receiving your request.
Electronic Delivery of Shareholder Documents: You may choose to receive the Funds’ prospectus and annual and semi-annual reports electronically. To sign up for electronic delivery, visit www.icsdelivery.com and select the first letter of your brokerage firm’s name. Then, select your brokerage institution from the list that follows, fill out the appropriate information and provide an e-mail address where you would like your information sent. If your brokerage firm is not listed, electronic delivery may not be available. Please contact your brokerage firm or financial advisor.
Privacy Policy
We collect the following nonpublic personal information about you:
| | • | Information we receive from you on or in applications or other forms, including but not limited to, your name, address, phone number, and social security number; and |
| | | |
| | • | Information about your transactions with us, our affiliates or others, including but not limited to, your account number and balance, parties to transactions, cost basis information and other financial information. |
We do not disclose any nonpublic personal information about our current or former shareholders to nonaffiliated third parties, except as permitted by law. For example, we are permitted by law to disclose all the information we collect to our transfer agent to process your transactions. Furthermore, we restrict access to your nonpublic personal information to those persons who require such information to provide products or services to you. We maintain physical, electronic, and procedural safeguards through our transfer agent, U.S. Bank Global Fund Services, that comply with federal standards to guard your nonpublic personal information.
In the event that you hold shares of the Funds through a financial intermediary, including, but not limited to, a broker-dealer, bank or trust company, the privacy policy of your financial intermediary would govern how your nonpublic personal information would be shared with nonaffiliated third parties.
.
Investment Advisor
Perritt Capital Management, Inc.
300 South Wacker Drive, Suite 600
Chicago, IL 60606-6703
800-331-8936
Independent Registered
Public Accounting Firm
Cohen & Company, Ltd.
151 North Franklin Street, Suite 575
Chicago, IL 60606
Legal Counsel
Foley & Lardner LLP
777 East Wisconsin Avenue
Milwaukee, WI 53202
Custodian
U.S. Bank, NA
1555 North River Center Drive, Suite 302
Milwaukee, WI 53212
Transfer Agent
and Dividend Disbursing Agent
U.S. Bancorp Fund Services, LLC,
doing business as U.S. Bank Global Fund Services
P.O. Box 701
Milwaukee, WI 53201-0701
Distributor
Quasar Distributors, LLC
111 East Kilbourn Avenue, Suite 2200
Milwaukee, WI 53202
For assistance with your existing account, call our Shareholder Service Center at 1-800-332-3133.
The Funds’ Statements of Additional Information contain information about the Funds’ directors and are available without charge upon request by calling 1-800-332-3133.
MicroCap Opportunities Fund – PRCGX
Ultra MicroCap Fund – PREOX
Minimum Initial Investment $1,000
IRA Minimum Initial Investment $250
Dividend Reinvestment Plan
Systematic Withdrawal Plan
Automatic Investment Plan
Retirement Plans Including:
| • | IRA | • | Roth IRA |
| • | SEP-IRA | • | Coverdell Education |
| • | Simple IRA | | Savings Account |
2% redemption fee imposed for shares
held ninety (90) calendar days or less.
This report is authorized for distribution
only to shareholders and others who have
received a copy of the prospectus of the
Perritt MicroCap Opportunities Fund
and/or the Perritt Ultra MicroCap Fund.
300 S. Wacker Drive • Suite 600 • Chicago, IL 60606-6703
Tel 312-669-1650 • 800-331-8936 • Fax: 312-669-1235
E-mail: info@PerrittCap.com
Web Site: www.perrittcap.com
| (b) | Not applicable for this Registrant |
Item 2. Code of Ethics.
Not applicable for semi-annual reports.
Item 3. Audit Committee Financial Expert.
Not applicable for semi-annual reports.
Item 4. Principal Accountant Fees and Services.
Not applicable for semi-annual reports.
Item 5. Audit Committee of Listed Registrants.
Not applicable to registrants who are not listed issuers (as defined in Rule 10A-3 under the Securities Exchange Act of 1934).
Item 6. Investments.
(a). Schedule of Investments is included as part of the report to shareholders filed under Item 1 of this Form.
(b). Not applicable.
Item 7. Disclosure of Proxy Voting Policies and Procedures for Closed-End Management Investment Companies.
Not applicable to open-end investment companies.
Item 8. Portfolio Managers of Closed-End Management Investment Companies.
Not applicable to open-end investment companies.
Item 9. Purchases of Equity Securities by Closed‑End Management Investment Company and Affiliated Purchasers.
Not applicable to open-end investment companies.
Item 10. Submission of Matters to a Vote of Security Holders.
There have been no material changes to the procedures by which shareholders may recommend nominees to the registrant’s board of directors.
Item 11. Controls and Procedures.
The Registrant’s President and Treasurer have reviewed the Registrant's disclosure controls and procedures (as defined in Rule 30a-3(c) under the Investment Company Act of 1940 (the “Act”)) as of a date within 90 days of the filing of this report, as required by Rule 30a-3(b) under the Act and Rules 13a-15(b) or 15d‑15(b) under the Securities Exchange Act of 1934. Based on their review, such officers have concluded that the disclosure controls and procedures are effective in ensuring that information required to be disclosed in this report is appropriately recorded, processed, summarized and reported and made known to them by others within the Registrant and by the Registrant’s service provider.
There were no changes in the Registrant's internal control over financial reporting (as defined in Rule 30a-3(d) under the Act) that occurred during the second fiscal quarter of the period covered by this report that has materially affected, or is reasonably likely to materially affect, the Registrant's internal control over financial reporting.
Item 12. Disclosure of Securities Lending Activities for Closed-End Management Investment Companies
Not applicable to open-end investment companies.
Item 13. Exhibits.
| (a) | (1) Any code of ethics or amendment thereto, that is the subject of the disclosure required by Item 2, to the extent that the registrant intends to satisfy Item 2 requirements through filing an exhibit. Incorporated by reference to the registrant’s Form N-CSR filed January 8, 2010. |
(3) Any written solicitation to purchase securities under Rule 23c‑1 under the Act sent or given during the period covered by the report by or on behalf of the registrant to 10 or more persons. Not applicable to open-end investment companies.
(4) Change in the registrant’s independent public accountant. There was no change in the registrant’s independent public accountant for the period covered by this report.
SIGNATURES
Pursuant to the requirements of the Securities Exchange Act of 1934 and the Investment Company Act of 1940, the registrant has duly caused this report to be signed on its behalf by the undersigned, thereunto duly authorized.
(Registrant) Perritt Funds, Inc.
By (Signature and Title)* /s/Michael J. Corbett
Michael J. Corbett, President
Date July 8, 2021
Pursuant to the requirements of the Securities Exchange Act of 1934 and the Investment Company Act of 1940, this report has been signed below by the following persons on behalf of the registrant and in the capacities and on the dates indicated.
By (Signature and Title)* /s/Michael J. Corbett
Michael J. Corbett, President
Date July 8, 2021
By (Signature and Title)* /s/Mark J. Buh
Mark J. Buh, Treasurer/Principal Financial Officer
Date July 8, 2021
* Print the name and title of each signing officer under his or her signature.