UNITED STATES
SECURITIES AND EXCHANGE COMMISSION
Washington, D.C. 20549
FORM N-CSR
CERTIFIED SHAREHOLDER REPORT OF REGISTERED MANAGEMENT
INVESTMENT COMPANIES
Investment Company Act file number 811-21552
J.P. Morgan Access Multi-Strategy Fund, L.L.C.
(Exact name of registrant as specified in charter)
270 Park Avenue, Floor 22
New York, NY 10017
(Address of principal executive offices) (Zip code)
Frank J. Nasta, Esq.
J.P. Morgan Investment Management Inc.
270 Park Avenue, Floor 9
New York, NY 10017
(Name and address of agent for service)
Copy to:
Richard Horowitz, Esq.
Dechert LLP
1095 Avenue of the Americas
New York, NY 10036
Registrant’s telephone number, including area code: (800) 480-4111
Date of fiscal year end: March 31
Date of reporting period: March 31, 2015
Form N-CSR is to be used by management investment companies to file reports with the Commission not later than 10 days after the transmission to stockholders of any report that is required to be transmitted to stockholders under Rule 30e-1 under the Investment Company Act of 1940 (17 CFR 270.30e-1). The Commission may use the information provided on Form N-CSR in its regulatory, disclosure review, inspection, and policymaking roles.
A registrant is required to disclose the information specified by Form N-CSR, and the Commission will make this information public. A registrant is not required to respond to the collection of information contained in Form N-CSR unless the Form displays a currently valid Office of Management and Budget (“OMB”) control number. Please direct comments concerning the accuracy of the information collection burden estimate and any suggestions for reducing the burden to Secretary, Securities and Exchange Commission, 100 F Street, NE, Washington, DC 20549. The OMB has reviewed this collection of information under the clearance requirements of 44 U.S.C. § 3507.
Item 1. Reports to Stockholders.
The Report to Shareholders is attached herewith.
J.P. Morgan Access Multi-Strategy Fund, L.L.C.
Financial Statements
For the year ended March 31, 2015
This report is open and authorized for distribution only to qualified and accredited investors or financial intermediaries who have received a copy of the Fund’s Private Placement Memorandum. This document, although required to be filed with the SEC, may not be copied, faxed or otherwise distributed to the general public.
J.P. Morgan Access Multi-Strategy Fund, L.L.C.
Financial Statements
For the year ended March 31, 2015
Contents
Past performance is no guarantee of future results. Market volatility can significantly impact short-term performance. Results of an investment made today may differ substantially from the Fund’s historical performance. Investment return and principal value will fluctuate so that an investor’s interests, when redeemed, may be worth more or less than original cost.

Report of Independent Registered Public Accounting Firm
To the Board of Directors and Members of J.P. Morgan Access Multi-Strategy Fund, L.L.C:
In our opinion, the accompanying statement of assets, liabilities, and members’ capital, including the schedule of investments, and the related statements of operations, of changes in members’ capital and of cash flows and the financial highlights present fairly, in all material respects, the financial position of J.P. Morgan Access Multi-Strategy Fund, L.L.C. (the “Fund”) at March 31, 2015, the results of its operations and its cash flows for the year then ended, the changes in its members’ capital for each of the two years in the period then ended and the financial highlights for each of the five years in the period then ended, in conformity with accounting principles generally accepted in the United States of America. These financial statements and financial highlights (hereafter referred to as “financial statements”) are the responsibility of the Fund’s management. Our responsibility is to express an opinion on these financial statements based on our audits. We conducted our audits of these financial statements in accordance with the standards of the Public Company Accounting Oversight Board (United States). Those standards require that we plan and perform the audit to obtain reasonable assurance about whether the financial statements are free of material misstatement. An audit includes examining, on a test basis, evidence supporting the amounts and disclosures in the financial statements, assessing the accounting principles used and significant estimates made by management, and evaluating the overall financial statement presentation. We believe that our audits, which included confirmation of investments at March 31, 2015 by correspondence with the underlying investment funds, provide a reasonable basis for our opinion.
PricewaterhouseCoopers LLP
May 29, 2015
| | | | |
| | | | |
| | PricewaterhouseCoopers LLP, PricewaterhouseCoopers Center, 300 Madison Avenue, New York, NY 10017 T: (646) 471 3000, F: (813) 286 6000, www.pwc.com/us | | |
J.P. Morgan Access Multi-Strategy Fund, L.L.C.
Schedule of Investments
March 31, 2015
| | | | | | | | | | | | | | |
| Investment Fund | | Cost ($) | | | Fair Value ($) | | | % of
Members’
Capital | | Liquidity (e) |
| | | | |
Diversified | | | | | | | | | | | | | | |
OZ Domestic Partners II, L.P. (b) | | | 241,719,456 | | | | 282,610,992 | | | | 9.57 | | | Quarterly |
Winton Diversified Futures Fund (US) L.P. | | | 91,000,000 | | | | 100,994,125 | | | | 3.41 | | | Monthly |
| | | | | | | | | | | | | | |
Total | | | 332,719,456 | | | | 383,605,117 | | | | 12.98 | | | |
| | | | | | | | | | | | | | |
Event Driven - Core | | | | | | | | | | | | | | |
Apollo Asia Opportunity Fund, L.P. | | | 94,637 | | | | 22,712 | | | | 0.00 | (a) | | Side Pocket* |
Corvex Partners LP (b) | | | 119,500,000 | | | | 156,970,881 | | | | 5.31 | | | Quarterly |
Deephaven Event Fund LLC | | | 81,842 | | | | 7,780 | | | | 0.00 | (a) | | In Liquidation** |
Paulson Partners Enhanced, L.P. (b) | | | 152,028,900 | | | | 168,548,603 | | | | 5.69 | | | Semi-Annual |
Perry Partners, L.P. | | | 51,403,114 | | | | 49,774,502 | | | | 1.68 | | | Quarterly |
Third Point Partners Qualified L.P. (b) | | | 111,619,644 | | | | 141,014,858 | | | | 4.78 | | | Quarterly |
Tyrus Capital Event Fund, L.P. | | | 4,137,940 | | | | 5,424,687 | | | | 0.18 | | | Quarterly |
ValueAct Capital Partners, L.P. | | | 165,491 | | | | 481,526 | | | | 0.02 | | | Side Pocket* |
| | | | | | | | | | | | | | |
Total | | | 439,031,568 | | | | 522,245,549 | | | | 17.66 | | | |
| | | | | | | | | | | | | | |
Event Driven - Distressed | | | | | | | | | | | | | | |
Caspian Select Credit Fund, L.P. | | | 115,800,000 | | | | 130,449,487 | | | | 4.41 | | | Quarterly |
GSO Special Situations Fund LP | | | 140,243,932 | | | | 133,468,736 | | | | 4.52 | | | Quarterly |
Strategic Value Restructuring Fund, LP | | | 1,493,472 | | | | 194,532 | | | | 0.00 | (a) | | Side Pocket* |
SVRF (Onshore) Holdings LLC | | | 71,440 | | | | 34,741 | | | | 0.00 | (a) | | In Liquidation** |
York Credit Opportunities Fund, L.P. (b) | | | 192,650,000 | | | | 213,836,605 | | | | 7.24 | | | Quarterly |
York European Opportunities Fund L.P. | | | 140,000,000 | | | | 141,521,797 | | | | 4.78 | | | Quarterly |
| | | | | | | | | | | | | | |
Total | | | 590,258,844 | | | | 619,505,898 | | | | 20.95 | | | |
| | | | | | | | | | | | | | |
Long/Short Equities | | | | | | | | | | | | | | |
Brahman Partners III, L.P. (b) | | | 118,850,000 | | | | 154,031,904 | | | | 5.20 | | | Quarterly |
Copper River Partners, L.P. | | | 57,214 | | | | 14,968 | | | | 0.00 | (a) | | In Liquidation** |
Glenview Institutional Partners, L.P. (b) | | | 139,510,816 | | | | 173,684,365 | | | | 5.86 | | | Quarterly/Side Pocket* |
JANA Partners Qualified, L.P. (b) | | | 165,000,000 | | | | 169,950,133 | | | | 5.75 | | | Quarterly |
Miura Global Partners II, LP (b) | | | 135,000,000 | | | | 148,890,057 | | | | 5.05 | | | Monthly |
Pershing Square, L.P. (b) | | | 85,000,000 | | | | 94,382,568 | | | | 3.19 | | | Quarterly |
Shannon River Partners II, LP | | | 98,500,000 | | | | 101,938,168 | | | | 3.46 | | | Quarterly |
| | | | | | | | | | | | | | |
Total | | | 741,918,030 | | | | 842,892,163 | | | | 28.51 | | | |
| | | | | | | | | | | | | | |
Opportunistic/Macro | | | | | | | | | | | | | | |
Black River Commodity Multi-Strategy Fund LLC | | | 512,281 | | | | 216,039 | | | | 0.01 | | | Side Pocket* |
Brevan Howard L.P. (b) | | | 1,324,971 | | | | 3,127,856 | | | | 0.11 | | | Monthly |
D.E. Shaw Oculus Fund, L.L.C. (b) | | | 81,392,961 | | | | 114,641,535 | | | | 3.87 | | | Quarterly |
| | | | | | | | | | | | | | |
Total | | | 83,230,213 | | | | 117,985,430 | | | | 3.99 | | | |
| | | | | | | | | | | | | | |
Relative Value | | | | | | | | | | | | | | |
Aristeia Partners, L.P. (b) | | | 83,000,000 | | | | 80,841,161 | | | | 2.73 | | | Quarterly |
GoldenTree Partners, L.P. (b) | | | 4,177,312 | | | | 10,201,215 | | | | 0.34 | | | In Liquidation** |
Good Hill SPV, Ltd. | | | 213,659 | | | | 182,692 | | | | 0.01 | | | Side Pocket* |
Magnetar Capital Fund, LP | | | 287,730 | | | | 62,214 | | | | 0.00 | (a) | | In Liquidation** |
Magnetar Risk Linked Fund (US), Ltd. | | | 411,795 | | | | 726,273 | | | | 0.02 | | | Side Pocket* |
Magnetar SPV LLC | | | 31,063 | | | | 33,503 | | | | 0.00 | (a) | | In Liquidation** |
Marathon Credit Opportunity Fund, L.P. | | | 40,506,882 | | | | 47,445,274 | | | | 1.62 | | | Quarterly |
Pine River Fund, L.P. (b) | | | 26,000,000 | | | | 27,141,326 | | | | 0.92 | | | Quarterly |
Rose Grove Partners I, LP | | | 35,104,700 | | | | 34,687,279 | | | | 1.16 | | | Quarterly |
Tricadia Credit Strategies L.P. | | | 94,000,000 | | | | 96,565,656 | | | | 3.27 | | | Quarterly |
Waterfall Victoria Fund, L.P. | | | 6,378 | | | | 113,472 | | | | 0.00 | (a) | | Side Pocket* |
| | | | | | | | | | | | | | |
Total | | | 283,739,519 | | | | 298,000,065 | | | | 10.07 | | | |
| | | | | | | | | | | | | | |
Total Investments in Investment Funds | | | 2,470,897,630 | | | | 2,784,234,222 | | | | 94.16 | | | |
| | | | | | | | | | | | | | |
The accompanying notes are an integral part of these financial statements.
2
J.P. Morgan Access Multi-Strategy Fund, L.L.C.
Schedule of Investments (continued)
March 31, 2015
| | | | | | | | | | | | |
| | | Cost ($) | | | Fair Value ($) | | | % of
Members’
Capital | | Liquidity (e) |
Private Equity Investment | | | | | | | | | | | | |
United States: | | | | | | | | | | | | |
Energy | | | | | | | | | | | | |
BlackLight Power, Inc. (f) | | | 179,400 | | | | 134,550 | | | 0.01 | | Illiquid*** |
| | | | | | | | | | | | |
Total Private Equity Investment | | | 179,400 | | | | 134,550 | | | 0.01 | | |
| | | | | | | | | | | | |
| | | | |
Short-Term Investment | | | | | | | | | | | | |
Investment Company | | | | | | | | | | | | |
JPMorgan Prime Money Market Fund, Institutional Class Shares,
0.01% (b),(c),(d) | | | 11,306,668 | | | | 11,306,668 | | | 0.38 | | Daily |
| | | | | | | | | | | | |
Total Investments | | | 2,482,383,698 | | | | 2,795,675,440 | | | 94.55 | | |
| | | | |
Other Assets, less Liabilities | | | | | | | 161,177,039 | | | 5.45 | | |
| | | | | | | | | | | | |
Members’ Capital | | | | | | | 2,956,852,479 | | | 100.00 | | |
| | | | | | | | | | | | |
| (a) | Amount rounds to less than 0.01%. |
| (b) | Partially or wholly held in a pledged account by the Custodian as collateral for existing line of credit. |
| (c) | Investment in affiliate. 11,306,668 shares in the Money market fund, which is registered under the Investment Company Act of 1940, as amended, and advised by J.P. Morgan Investment Management Inc. |
| (d) | The rate shown is the current yield as of March 31, 2015. |
| (e) | Certain funds may be subject to an initial lockup period, as described in Note 1 of the financial statements. |
| (f) | Received 15 shares via an in-kind distribution from Black Bear I, L.P. Fund. |
| * | A side pocket is an account within the Investment Fund that has additional restrictions on liquidity. |
| ** | The Investment Fund is in the process of ceasing its operations or has created a special purpose vehicle to handle the orderly disposition of the underlying assets, which may result in J.P. Morgan Access Multi-Strategy Fund, L.L.C.‘s delayed receipt of redemption proceeds. |
| *** | Subject to in-kind distribution liquidity provisions. |
| | |
The accompanying notes are an integral part of these financial statements. |
| |
3 | | |
J.P. Morgan Access Multi-Strategy Fund, L.L.C.
Schedule of Investments (continued)
March 31, 2015
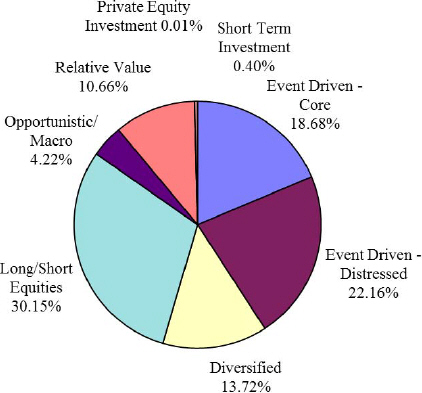
Investment Strategy as a Percentage of Total Investments
The management agreements of the general partners/managers provide for compensation to such general partners/managers in the form of management fees ranging from 1% to 2.5% annually of net assets and incentives of 10% to 25% of net profits earned.
The accompanying notes are an integral part of these financial statements.
4
J.P. Morgan Access Multi-Strategy Fund, L.L.C.
Statement of Assets, Liabilities and Members’ Capital
March 31, 2015
| | | | |
Assets | | | | |
| |
Investments, at fair value (cost $2,471,077,030) | | $ | 2,784,368,772 | |
Investment in affiliate, at fair value (cost $9,813,073) | | | 9,813,073 | |
Investment in affiliate - restricted, at fair value (cost $1,493,595) (see Note 4) | | | 1,493,595 | |
| | | | |
Total Investments, at fair value (cost $2,482,383,698) | | | 2,795,675,440 | |
| |
Receivable for Investment Funds sold | | | 277,374,317 | |
Investments paid in advance (see Note 2c) | | | 138,000,000 | |
Prepaid expenses | | | 96,561 | |
Dividend receivable from affiliate | | | 3,014 | |
| | | | |
Total assets | | | 3,211,149,332 | |
| | | | |
| |
Liabilities | | | | |
Tender offer proceeds payable | | | 195,186,826 | |
Contributions received in advance (see Note 6) | | | 47,126,382 | |
Management Fee payable | | | 6,472,052 | |
Loan payable (see Note 4) | | | 4,000,000 | |
Administration Fee payable | | | 780,431 | |
Professional fees payable | | | 306,894 | |
Credit facility fees payable | | | 87,167 | |
Interest payable | | | 897 | |
Other accrued expenses | | | 336,204 | |
| | | | |
Total liabilities | | | 254,296,853 | |
| | | | |
| |
Members’ capital | | $ | 2,956,852,479 | |
| | | | |
The accompanying notes are an integral part of these financial statements.
5
J.P. Morgan Access Multi-Strategy Fund, L.L.C.
Statement of Operations
For the year ended March 31, 2015
| | | | |
Investment income | | | | |
Dividend income from affiliate | | $ | 20,194 | |
| | | | |
Total investment income | | | 20,194 | |
| | | | |
| |
Expenses | | | | |
Management Fee (see Note 3) | | | 36,252,546 | |
Administration Fee (see Note 3) | | | 4,350,306 | |
Credit facility fees (see Note 4) | | | 1,525,555 | |
Fund accounting and custodian fees | | | 1,221,281 | |
Investor servicing fees | | | 698,363 | |
Professional fees | | | 617,607 | |
Interest (see Note 4) | | | 178,253 | |
Insurance | | | 109,903 | |
Directors’ and Chief Compliance Officer’s fees | | | 23,565 | |
Other | | | 600,839 | |
| | | | |
Total expenses | | | 45,578,218 | |
| | | | |
| |
Less: Waivers and/or expense reimbursements (see Note 3) | | | (169,015 | ) |
| | | | |
Net expenses | | | 45,409,203 | |
| | | | |
| |
Net investment income/(loss) | | | (45,389,009 | ) |
| | | | |
| |
Realized and unrealized gain/(loss) | | | | |
Net realized gain/(loss) from Investment Fund transactions | | | 118,745,975 | |
Net change in unrealized appreciation/(depreciation) on Investment Funds | | | 29,988,782 | |
| | | | |
| |
Net realized and unrealized gain/(loss) | | | 148,734,757 | |
| | | | |
| |
Net increase in members’ capital resulting from operations | | $ | 103,345,748 | |
| | | | |
The accompanying notes are an integral part of these financial statements.
6
J.P. Morgan Access Multi-Strategy Fund, L.L.C.
Statements of Changes in Members’ Capital
For the year ended March 31, 2015
| | | | | | | | | | | | | | | | |
| | | Managing
Member | | | Special
Member | | | Other
Members | | | Total | |
From investment activities | | | | | | | | | | | | | | | | |
Net investment income/(loss) | | $ | (271 | ) | | $ | (11,186 | ) | | $ | (45,377,552 | ) | | $ | (45,389,009 | ) |
Net realized gain/(loss) from Investment Fund transactions | | | 345 | | | | 17,119 | | | | 118,728,511 | | | | 118,745,975 | |
Net change in unrealized appreciation/(depreciation) on Investment Funds | | | 375 | | | | 18,252 | | | | 29,970,155 | | | | 29,988,782 | |
Performance allocation | | | – | | | | 10,096,277 | | | | (10,096,277 | ) | | | – | |
Net increase/(decrease) in members’ capital resulting from operations | | | 449 | | | | 10,120,462 | | | | 93,224,837 | | | | 103,345,748 | |
| | | | |
From members’ capital transactions | | | | | | | | | | | | | | | | |
Capital contributions | | | – | | | | – | | | | 841,386,157 | | | | 841,386,157 | |
Repurchase fee | | | – | | | | 26 | | | | 98,971 | | | | 98,997 | |
Capital repurchases | | | – | | | | (2,354,758 | ) | | | (328,830,695 | ) | | | (331,185,453 | ) |
Net increase/(decrease) in members’ capital resulting from capital transactions | | | – | | | | (2,354,732 | ) | | | 512,654,433 | | | | 510,299,701 | |
Net change in members’ capital | | | 449 | | | | 7,765,730 | | | | 605,879,270 | | | | 613,645,449 | |
| | | | |
Members’ capital at beginning of year | | | 13,983 | | | | 3,127,084 | | | | 2,340,065,963 | | | | 2,343,207,030 | |
| | | | |
Members’ capital at end of year | | $ | 14,432 | | | $ | 10,892,814 | | | $ | 2,945,945,233 | | | $ | 2,956,852,479 | |
| | | | | | | | | | | | | | | | |
For the year ended March 31, 2014
| | | | | | | | | | | | | | | | |
| | | Managing
Member | | | Special
Member | | | Other
Members | | | Total | |
From investment activities | | | | | | | | | | | | | | | | |
Net investment income/(loss) | | $ | (311 | ) | | $ | (6,334 | ) | | $ | (27,572,225 | ) | | $ | (27,578,870 | ) |
Net realized gain/(loss) from Investment Fund transactions | | | 137 | | | | 2,249 | | | | 5,002,395 | | | | 5,004,781 | |
Net change in unrealized appreciation/(depreciation) on Investment Funds | | | 1,099 | | | | 38,799 | | | | 159,273,940 | | | | 159,313,838 | |
Performance allocation | | | – | | | | 13,769,551 | | | | (13,769,551 | ) | | | – | |
Net increase/(decrease) in members’ capital resulting from operations | | | 925 | | | | 13,804,265 | | | | 122,934,559 | | | | 136,739,749 | |
| | | | |
From members’ capital transactions | | | | | | | | | | | | | | | | |
Capital contributions | | | – | | | | – | | | | 1,155,608,000 | | | | 1,155,608,000 | |
Repurchase fee | | | – | | | | 11 | | | | 44,160 | | | | 44,171 | |
Capital repurchases | | | – | | | | (15,275,106 | ) | | | (108,692,749 | ) | | | (123,967,855 | ) |
Net increase/(decrease) in members’ capital resulting from capital transactions | | | – | | | | (15,275,095 | ) | | | 1,046,959,411 | | | | 1,031,684,316 | |
Net change in members’ capital | | | 925 | | | | (1,470,830 | ) | | | 1,169,893,970 | | | | 1,168,424,065 | |
| | | | |
Members’ capital at beginning of year | | | 13,058 | | | | 4,597,914 | | | | 1,170,171,993 | | | | 1,174,782,965 | |
| | | | |
Members’ capital at end of year | | $ | 13,983 | | | $ | 3,127,084 | | | $ | 2,340,065,963 | | | $ | 2,343,207,030 | |
| | | | | | | | | | | | | | | | |
The accompanying notes are an integral part of these financial statements.
7
J.P. Morgan Access Multi-Strategy Fund, L.L.C.
Statement of Cash Flows
For the year ended March 31, 2015
| | | | |
Cash flows from operating activities | | | | |
| |
Net increase in members’ capital resulting from operations | | $ | 103,345,748 | |
| Adjustments to reconcile net increase in members’ capital resulting from operations to net cash used in operating activities: | | | | |
Purchases of Investment Funds | | | (1,321,331,294 | ) |
Sales of Investment Funds | | | 883,367,181 | |
Sales of short-term investments, net | | | 33,840,061 | |
Net realized (gain)/loss from Investment Fund transactions | | | (118,745,975 | ) |
Net change in unrealized (appreciation)/depreciation on Investment Funds | | | (29,988,782 | ) |
Increase in receivable for investment funds sold | | | (202,928,283 | ) |
Decrease in investments paid in advance | | | 58,000,000 | |
Decrease in prepaid expenses | | | 4,563 | |
Decrease in due from Investment Manager | | | 11,417 | |
Increase in dividend receivable from affiliate | | | (2,421 | ) |
Increase in Management Fee payable | | | 3,995,292 | |
Increase in Administration Fee payable | | | 483,220 | |
Decrease in professional fees payable | | | (106,067 | ) |
Increase in credit facility fees payable | | | 58,000 | |
Increase in interest payable | | | 897 | |
Increase in other accrued expenses | | | 71,753 | |
| | | | |
| |
Net cash used in operating activities | | | (589,924,690 | ) |
| | | | |
| |
Cash flows from financing activities | | | | |
| |
Capital contributions, including change in contributions received in advance | | | 757,378,320 | |
Capital redemptions, including change in tender offer proceeds payable and repurchase fees | | | (171,453,630 | ) |
Proceeds from loan payable | | | 127,850,000 | |
Repayment of loan payable | | | (123,850,000 | ) |
| | | | |
| |
Net cash provided by financing activities | | | 589,924,690 | |
| | | | |
| |
Net change in cash and cash equivalents | | | – | |
| |
Cash and cash equivalents at beginning of year | | | – | |
| | | | |
Cash and cash equivalents at end of year | | $ | – | |
| | | | |
| |
Supplemental disclosure of cash flow information | | | | |
| |
Cash paid during the year for interest | | $ | 177,356 | |
| | | | |
In-kind distribution (a) | | $ | 179,400 | |
| | | | |
For purposes of reporting the statement of cash flows, the fund considers all cash accounts that are not subject to withdrawal restrictions or penalties to be cash equivalents.
| (a) | Received 15 shares of BlackLight Power, Inc. from Black Bear I, L.P. Fund. |
The accompanying notes are an integral part of these financial statements.
8
J.P. Morgan Access Multi-Strategy Fund, L.L.C.
Financial Highlights
Ratios and other Financial Highlights
The following represents the ratios to other average Members’ Capital and other financial highlights information for Members’ Capital other than the Managing Member and Special Member.
| | | | | | | | | | | | | | | | | | | | |
| | | | | | Years Ended March 31, | | | | |
| | | 2015 | | | 2014 | | | 2013 | | | 2012 | | | 2011 | |
| | | | | |
Total return | | | 3.56% | | | | 7.88% | | | | 9.05% | | | | (0.92% | ) | | | 5.99% | |
Performance allocation | | | (0.34% | ) | | | (0.81% | ) | | | (0.84% | ) | | | (0.03% | ) | | | (0.36% | ) |
| Total return after performance allocation | | | 3.22% | | | | 7.07% | | | | 8.21% | | | | (0.95% | ) | | | 5.63% | |
| | | | | |
| Ratios to other average members’ capital: | | | | | | | | | | | | | | | | | | | | |
Expenses, before waivers | | | 1.60% | (a) | | | 1.60% | (a) | | | 1.60% | (a) | | | 1.70% | (a) | | | 1.91% | |
Expenses, net of waivers | | | 1.59% | (a) | | | 1.59% | (a) | | | 1.59% | (a) | | | 1.70% | (a) | | | 1.90% | |
Performance allocation | | | 0.35% | | | | 0.79% | | | | 0.83% | | | | 0.04% | | | | 0.53% | |
Expenses, net of performance allocation and net of waivers | | | 1.94% | | | | 2.38% | | | | 2.42% | | | | 1.74% | | | | 2.43% | |
| | | | | |
Net investment income (loss), before waivers | | | (1.60% | ) (a) | | | (1.60% | ) (a) | | | (1.60% | ) (a) | | | (1.69% | ) (a) | | | (1.91% | ) |
Net investment income (loss), net of waivers | | | (1.59% | ) (a) | | | (1.59% | ) (a) | | | (1.59% | ) (a) | | | (1.69% | ) (a) | | | (1.90% | ) |
| | | | | |
Portfolio turnover rate | | | 32.38% | | | | 22.18% | | | | 23.95% | | | | 6.21% | | | | 37.88% | |
| | | | | |
Members’ Capital applicable to Other Members | | $ | 2,945,944,590 | | | $ | 2,340,065,963 | | | $ | 1,170,171,993 | | | $ | 889,423,998 | | | $ | 501,099,254 | |
The above ratios and total returns are calculated for Other Members taken as a whole. An individual investor’s return may vary from these returns based on the timing of capital contributions and performance allocation.
The above expense ratios do not include the expenses from the investment funds and affiliated money market fund. However, total returns take into account all expenses.
| (a) | The Investment Manager waived and/or reimbursed a portion of its fees for the period pursuant to the agreement between the Fund and the Investment Manager. |
The accompanying notes are an integral part of these financial statements.
9
J.P. Morgan Access Multi-Strategy Fund, L.L.C.
Notes to Financial Statements March 31, 2015
1. Organization
J.P. Morgan Access Multi-Strategy Fund, L.L.C. (the “Fund”) was organized as a limited liability company on April 6, 2004 under the laws of the State of Delaware and is registered under the Investment Company Act of 1940, as amended (the “1940 Act”), as a closed-end, non-diversified, management investment company. The Fund’s investment objective is to generate consistent capital appreciation over the long term, with relatively low volatility and a low correlation with traditional equity and fixed-income markets. The Fund will seek to accomplish this objective by allocating its assets primarily among professionally selected investment funds (collectively, “Investment Funds” and each individually, “Investment Fund”) that are managed by experienced third-party investment advisers (“Portfolio Managers”) who invest in a variety of markets and employ, as a group, a range of investment techniques and strategies. There can be no assurance that the Fund will achieve its investment objective.
The following is a description of strategies used by third party investment advisors:
Diversified – Investment Funds within this strategy employ two or more of the strategies described below. Investment Funds within this strategy are generally subject to 30 day redemption notice periods.
Event Driven – Core – Invests in securities of companies involved in mergers, acquisitions, restructurings, liquidations, spin-offs, or other special situations that alter a company’s financial structure or operating strategy. Investment Funds within this strategy are generally subject to 60-90 day redemption notice periods and may have lock up periods of up to two years as of March 31, 2015.
Event Driven - Distressed – Invests in debt and equity securities of companies in financial difficulty, reorganization or bankruptcy, nonperforming and sub-performing bank loans, and emerging market debt. Investment Funds within this strategy are generally subject to 30-90 day redemption notice periods and may have lock up periods of up to one year as of March 31, 2015.
Long/Short Equities – Invests in long and short equity securities that are deemed to be under or overvalued. Investment Funds within this strategy are generally subject to 30-90 day redemption notice periods and may have lock up periods of up to two years as of March 31, 2015.
Opportunistic/Macro – Invests in a wide variety of instruments using a broad range of strategies, often assuming an aggressive risk posture. This strategy uses a combination of macro-economic models and fundamental research to invest across countries, markets, sectors and companies, and have the flexibility to invest in numerous financial instruments. Investment Funds within this strategy are generally subject to 75 day redemption notice periods.
Relative Value – Makes simultaneous purchases and sales of similar securities to exploit pricing differentials or have long exposure in non-equity oriented beta opportunities (such as credit). Different relative value strategies include convertible bond arbitrage, statistical arbitrage, pairs trading, yield curve arbitrage and basis trading. Investment Funds within this strategy are generally subject to 45-180 day redemption notice periods and may have lock up periods of up to three years as of March 31, 2015.
10
J.P. Morgan Access Multi-Strategy Fund, L.L.C.
Notes to Financial Statements March 31, 2015 (continued)
1. Organization (continued)
J.P. Morgan Investment Management, Inc. (“JPMIM” or the “Investment Manager”), a corporation formed under the laws of the State of Delaware and a wholly-owned subsidiary of JPMorgan Chase & Co. (“JPMorgan Chase”), is responsible for the day-to-day management of the Fund, subject to policies adopted by the Board of Directors (the “Board”). The Investment Manager has in turn delegated substantially all investment authority and the allocation of the Fund’s assets among the Investment Funds and other instruments to J.P. Morgan Private Investments Inc. (the “Sub-Advisor” or “JPMPI”), a corporation formed under the laws of the State of Delaware and a wholly-owned subsidiary of JPMorgan Chase. The Sub-Advisor will allocate Fund assets among the Investment Funds and other investments that, in its view, represent attractive investment opportunities. The Investment Manager also serves as the managing member of the Fund (the “Managing Member”).
Both the Investment Manager and the Sub-Advisor are registered as investment advisers under the Investment Advisers Act of 1940, as amended (the “Advisers Act”).
2. Significant Accounting Policies
a. Use of Estimates
The following is a summary of significant accounting policies followed by the Fund in the preparation of its financial statements. The Fund is an investment company and, accordingly, follows the investment company accounting and reporting guidance of the Financial Accounting Standards Board (“FASB”) Accounting Standards Codification Topic 946 - Investment Companies, which is part of U.S. generally accepted accounting principles (“GAAP”). The preparation of financial statements in conformity with GAAP requires management to make estimates and assumptions that affect the reported amounts of assets and liabilities and disclosure of contingent assets and liabilities at the date of the financial statements and the reported amounts of increases and decreases in net assets from operations during the reporting period. Actual results could differ from those estimates.
b. Valuation of Investments
The valuation of the investments is in accordance with GAAP and the Fund’s valuation policies set forth by and under the supervision and responsibility of the Board, which established the following approach to valuation, as described more fully below. The Fund values its investments in Investment Funds at fair value. Fair value as of each month-end ordinarily is the net asset value (“NAV”) determined as of such month-end for each Investment Fund in accordance with the Investment Fund’s valuation policies and reported at the time of the Fund’s valuation.
JPMorgan Funds Management, Inc. (the “Administrator” or “JPMFM”), an indirect, wholly owned subsidiary of JPMorgan Chase, has established the J.P. Morgan Asset Management Americas Valuation Committee (“AVC”) to assist the Board with the oversight and monitoring of the valuation of the Funds’ investments. The Administrator implements the valuation policies of the Fund’s investments, as directed by the Board. The AVC oversees and carries out the policies for the valuation of investments held in the Fund as described in detail below. The Administrator is responsible for discussing and assessing the potential impacts to the fair values on an ongoing basis, and at least on a quarterly basis with the AVC and the Board.
11
J.P. Morgan Access Multi-Strategy Fund, L.L.C.
Notes to Financial Statements March 31, 2015 (continued)
2. Significant Accounting Policies (continued)
b. Valuation of Investments (continued)
On a monthly basis, NAV is used to determine the fair value of all underlying investments which (a) do not have readily determinable fair values and (b) either have the attributes of an investment company or prepare their financial statements consistent with measurement principles of an investment company. As a general matter, the fair value of the Fund’s interest in an Investment Fund will represent the amount that the Fund could reasonably expect to receive from an Investment Fund if the Fund’s interest were redeemed at the time of the valuation, based on information reasonably available at the time the valuation is made and that the Administrator believes to be reliable. In the unlikely event that an Investment Fund does not report a month-end NAV to the Fund on a timely basis, the Administrator would determine the fair value of such Investment Fund based on the most recent value reported by the Investment Fund, as well as any other relevant information available at such time. Considerable judgment is required to interpret the factors used to develop estimates at fair value. These factors include, but are not limited to, a review of the underlying securities of the Investment Fund when available, ongoing due diligence of the style, strategy and valuation methodology employed by each Investment Fund, and a review of market inputs that may be expected to impact the performance of a particular Investment Fund. The use of different factors and estimation methodologies could have a significant effect on the estimated fair value and could be material to the financial statements.
Some of the Investment Funds may invest all or a portion of their assets in investments which may be illiquid. Some of these investments are held in “side pockets”, sub funds within the Investment Funds, which provide for their separate liquidation potentially over a much longer period than the liquidity an investment in the Investment Funds may provide. Should the Fund seek to liquidate its investment in an Investment Fund which maintains investments in a side pocket arrangement or which holds substantially all of its assets in illiquid investments, the Fund might not be able to fully liquidate its investment without considerable delay. In such cases, the value of its investment could fluctuate during the period until the Fund is permitted to fully liquidate its interest in the Investment Funds.
Investments in the affiliated money market fund are valued at such fund’s NAV per share as of the valuation date.
Valuations reflected in this report are as of the report date. As a result, changes in valuation due to market events and/or issuer related events after the report date and prior to issuance of the report are not reflected herein.
The various inputs that are used in determining the fair value of the Fund’s investments are summarized into the three broad levels listed below.
Level 1 – Unadjusted inputs using quoted prices in active markets for identical investments.
12
J.P. Morgan Access Multi-Strategy Fund, L.L.C.
Notes to Financial Statements March 31, 2015 (continued)
2. Significant Accounting Policies (continued)
b. Valuation of Investments (continued)
Level 2 – Other significant observable inputs including, but are not limited to, quoted prices for similar investments or other significant observable inputs.
Level 3 – Significant inputs based on the best information available in the circumstances, to the extent observable inputs are not available (including the Fund’s assumptions in determining the fair value of investments).
A financial instrument’s level within the fair value hierarchy is based on the lowest level of any input both individually and in aggregate that is significant to the fair value measurement. The inputs or methodology used for valuing instruments are not necessarily an indication of the risk associated with investing in those instruments.
The Fund’s investments in an affiliated money market mutual fund and a private equity investment, as disclosed on the Schedule of Investments, are designated as Level 1 and Level 3, respectively.
In May 2015, the FASB issued Accounting Standards Update (“ASU”) No. 2015-07 (“ASU 2015-07”), Fair Value Measurement (Topic 820), Disclosures for Investments in Certain Entities That Calculate Net Asset Value per Share (or Its Equivalent). ASU 2015-07 removes the requirement to categorize within the fair value hierarchy all investments for which fair value is measured using the NAV per share practical expedient. As permitted, the Fund has elected to early adopt ASU 2015-07 for its March 31, 2015 financial statements. Accordingly, Investment Funds with a fair value of $2,784,234,222 have not been categorized in the fair value hierarchy.
c. Investments Paid in Advance
Investments paid in advance represent cash which has been sent to Investment Funds prior to March 31, 2015 but the investment is not effective until April 1, 2015. At March 31, 2015, the Fund made the following commitments to purchase Investment Funds:
| | | | |
| Investment Fund | | Amount | |
| |
Aristeia Partners, L.P. | | $ | 45,000,000 | |
Caxton Global Investments (USA) LLC * | | | 60,000,000 | |
D.E. Shaw Oculus Fund, L.L.C. | | | 8,000,000 | |
Tricadia Credit Strategies L.P | | | 25,000,000 | |
| | | | |
Total | | $ | 138,000,000 | |
| | | | |
* The Investment Fund utilizes the opportunistic/macro strategy subject to a 45 day redemption notice period and has quarterly liquidity.
13
J.P. Morgan Access Multi-Strategy Fund, L.L.C.
Notes to Financial Statements March 31, 2015 (continued)
2. Significant Accounting Policies (continued)
d. Distributions from Investment Funds
Distributions received from Investment Funds, whether in the form of cash or securities, are applied as a reduction of the investment’s cost when identified by the Investment Fund as a return of capital. Once the investment’s cost is received, any further distributions are recognized as realized gains.
e. Income Recognition and Security Transactions
Distributions of net investment income and realized capital gains from the affiliated money market fund, if any, are recorded on the ex-dividend date. Interest income is recorded on an accrual basis. Realized gains and losses from Investment Fund transactions are calculated based on the identified cost basis. Investments are recorded on the effective date of the subscription in the Investment Fund. All changes in the value of the Investment Funds are included in the net change in unrealized appreciation/(depreciation) on the Statement of Operations.
f. Fund Expenses
The Fund bears all expenses incurred in its business other than those that the Investment Manager assumes. The expenses of the Fund include, but are not limited to, the following: all costs and expenses related to investment transactions and positions for the Fund’s account; legal fees; accounting and auditing fees; custodial fees; costs of computing the Fund’s net asset value; costs of insurance; registration expenses; expenses of meetings of the Board; all costs with respect to communications to Members; and other types of expenses as may be approved from time to time by the Board.
The Fund invests in Investment Funds and, as a result, bears a portion of the expenses incurred by these Investment Funds. These expenses are not reflected in the expenses shown on the Statement of Operations and are not included in the ratios to other average net assets shown in the Financial Highlights. Certain expenses incurred indirectly through investment in the affiliated money market fund is waived by the Fund as described in Note 3.
g. Income Taxes
The Fund intends to operate and has elected to be treated as a partnership for federal income tax purposes. Accordingly, no provision for the payment of federal, state or local income taxes has been provided. Each Member is individually responsible to report on its own tax return its distributive share of the Fund’s taxable income or loss.
The Investment Manager evaluates tax positions taken or expected to be taken in the course of preparing the Fund’s financial statements to determine whether the tax positions are “more-likely-than-not” of being sustained by the applicable tax authority. Tax positions with respect to tax at the Fund level not deemed to meet the “more-likely-than-not” threshold would be recorded as a tax benefit or expense in the current year. The Investment Manager is not aware of any tax positions for which it is reasonably possible that the total amounts of unrecognized tax benefits or expense will significantly change in the next twelve months. The Investment Manager’s conclusions regarding tax positions will be subject to review and may be adjusted at a later date based on factors including, but not limited to, on-going analyses of tax laws, regulations and interpretations thereof.
14
J.P. Morgan Access Multi-Strategy Fund, L.L.C.
Notes to Financial Statements March 31, 2015 (continued)
2. Significant Accounting Policies (continued)
g. Income Taxes (continued)
The Investment Manager has reviewed the Fund’s tax positions for all open tax years and has determined that as of March 31, 2015, no liability for income tax is required in the Fund’s financial statements for net unrecognized tax benefits. However, Management’s conclusions may be subject to future review based on changes in, or the interpretation of, the accounting standards or tax laws and regulations. The Fund’s Federal tax returns for the prior three fiscal years remains subject to examination by the Internal Revenue Service.
3. Management Fee, Related Party Transactions and Other
The Fund has entered into an investment management agreement with the Investment Manager. In consideration of the advisory services provided by the Investment Manager to the Fund, the Fund pays the Investment Manager a management fee of 1.25% per year (the “Management Fee”), payable monthly at the rate of 1/12 of 1.25% of the month-end capital account balance of each Member, before giving effect to repurchases, Repurchase Fees (if any, as defined below) or the Performance Allocation (as defined below), but after giving effect to the Fund’s other expenses. The Management Fee is an expense paid out of the Fund’s assets. The Management Fee is paid monthly in arrears within 30 days of the calculation of the Fund’s month-end Members’ Capital of each month. For the year ended March 31, 2015, the Management Fee earned by JPMIM totaled $36,252,546, none of which was waived.
The Investment Manager, on behalf of the Fund, has entered into an investment sub-advisory agreement with JPMPI. For its services as sub-advisor, the Investment Manager pays JPMPI a monthly sub-advisory fee of 1/12 of 1.10% of the month-end capital balance of each Member of the Fund.
The Sub-Advisor is the special member of the Fund (the “Special Member”). The Special Member is entitled to all incentive-based performance allocations, if any, from Members’ accounts (see Note 6).
Pursuant to an Administration Agreement, the Administrator provides certain administration services to the Fund. In consideration of these services, the Administrator receives a fee (the “Administration Fee”) paid monthly at the annual rate of 0.15% of the Fund’s month end net assets before repurchases, repurchase fees, or the performance allocation, but after giving effect to the fund’s other expenses. For the year ended March 31, 2015, the Administration Fee earned by JPMFM totaled $4,350,306, none of which was waived.
The Investment Manager and the Sub-Advisor have contractually agreed to waive fees and/or reimburse the Fund to the extent that total annual operating expenses (excluding acquired fund fees and expenses, interest, brokerage commissions, other transaction-related expenses and any extraordinary expenses as well as any Performance Allocation) exceed 1.92% on an annualized basis of the Fund’s net assets as of the end of each month. This expense limitation agreement is in effect until June 30, 2015. There were no fees waived pursuant to this agreement during the year ended March 31, 2015.
15
J.P. Morgan Access Multi-Strategy Fund, L.L.C.
Notes to Financial Statements March 31, 2015 (continued)
3. Management Fee, Related Party Transactions and Other (continued)
The Fund may invest in one or more money market funds advised by the Investment Manager or its affiliates. The Investment Manager and Administrator waive fees in an amount sufficient to offset the respective fees each charges to the affiliated money market fund on the Fund’s investment in such affiliated money market fund. A portion of the waiver is voluntary. The amount of waivers resulting from investments in the money market fund for the year ended March 31, 2015 was $169,015.
Entities may be retained by the Fund to assist in the placement of Interests. These entities (“Placement Agents” or “Intermediaries”), which may include the Investment Manager and its affiliates, will generally be entitled to receive a placement fee of up to 2.0% of the invested amount from each investor purchasing an Interest through a Placement Agent. The placement fee will be added to a prospective investor’s subscription amount; it will not constitute a capital contribution made by the investor to the Fund nor will it be included as part of the assets of the Fund. The placement fee may be adjusted or waived in the sole discretion of the Placement Agent.
Certain officers of the Fund are affiliated with the Investment Manager and the Administrator. Such officers, with the exception of the Chief Compliance Officer, receive no compensation from the Fund for serving in their respective roles.
The Board appointed a Chief Compliance Officer to the Fund in accordance with Federal securities regulations. The Fund, along with other affiliated funds, makes reimbursement payments, on a pro-rata basis, to the Administrator for a portion of the fees associated with the Office of the Chief Compliance Officer. Such fees are included in Directors’ and Chief Compliance Officer’s fees on the Statement of Operations.
The Fund has adopted a Director Deferred Compensation Plan (the “Plan”) which allows the Independent Directors to defer the receipt of all or a portion of compensation related to performance of their duties as a Director. The deferred fees are invested in various J.P. Morgan Funds until distribution in accordance with the Plan.
4. Line of Credit
The Fund has a line of credit with Credit Suisse International and from time to time may borrow cash under a credit agreement, which has a cap of $280 million. Interest charged on borrowings, which is calculated on any outstanding loan balance, and based on a LIBOR-based rate, is payable on a monthly basis. The Fund also pays a monthly fee on the unused amount of the line of credit. The Fund had an outstanding loan balance of $4 million on this credit facility as of March 31, 2015.
16
J.P. Morgan Access Multi-Strategy Fund, L.L.C.
Notes to Financial Statements March 31, 2015 (continued)
4. Line of Credit (continued)
During the year ended March 31, 2015, the Fund had borrowings under the credit agreement as follows:
| | | | | | | | |
Average Daily Loan Balance* | | Weighted
Average Interest
Rate | | Interest
Expense | | Number of Days Borrowings Were Outstanding | | Credit Facility Fee |
$63,395,898 | | 1.99% | | $178,253 | | 51 | | $1,525,555 |
| * | For the days borrowings were outstanding. |
The Fund is required to pledge cash or securities to Credit Suisse International in an amount equal to a certain percentage of the available line of credit. Securities segregated as collateral are denoted on the Schedule of Investments. Cash collateral posted by the Fund is invested in an affiliated money market fund and reported on the Statement of Assets, Liabilities and Members’ Capital as Investment in affiliate-restricted.
5. Security Transactions
Aggregate purchases and sales of Investment Funds for the year ended March 31, 2015 amounted to $1,321,331,294 and $883,367,181, respectively.
At March 31, 2015, the estimated cost of investments for federal income tax purposes was $2,469,276,572. Accordingly, gross unrealized appreciation on investments was $339,500,383 and gross unrealized depreciation was $13,101,515, resulting in net unrealized appreciation of $326,398,868. The estimated cost of investments for federal income tax purposes is adjusted for items of taxable income or loss allocated to the Fund from the Investment Funds. The allocated taxable income or loss is reported to the Fund by the Investment Funds on their respective Schedule K-1. The Fund has not yet received all such Schedule K-1’s for the tax year ended December 31, 2014; therefore, the tax basis cost of investments as of March 31, 2015 is estimated based on information available, and will not be finalized by the Fund until after the fiscal year end.
6. Contributions, Redemptions, and Performance Allocation
Generally, initial and additional contributions for Interests (“Interests”) by eligible investors may be accepted at such times as the Fund may determine. The Fund reserves the right to reject any contributions for Interests in the Fund. The initial acceptance for contributions for Interests was April 1, 2004 (the “Initial Closing Date”). After the Initial Closing Date, the Fund generally accepts contributions for Interests as of the first day of each month. At March 31, 2015 the Fund received $47,126,382 in contribution proceeds in advance of the April 1, 2015 contribution date, which included Repurchase Fees, as defined below, related to repurchase of Members’ Interests at March 31, 2015. This amount is included in the Statement of Assets, Liabilities and Members’ Capital.
The Fund from time to time may offer to repurchase Interests pursuant to written tenders by Members. These repurchases will be made at such times, and in such amounts, and on such terms as may be determined by the Board, in its sole discretion. The Investment Manager and the Managing Member expect to typically recommend to the Board that the Fund offer to repurchase Interests from Members of up to 25% of the Fund’s net assets quarterly,
17
J.P. Morgan Access Multi-Strategy Fund, L.L.C.
Notes to Financial Statements March 31, 2015 (continued)
6. Contributions, Redemptions, and Performance Allocation (continued)
effective as of the last day of March, June, September, and December. A 1.5% repurchase fee (the “Repurchase Fee”) payable to the Fund will be charged for repurchases of Members’ Interests at any time prior to the day immediately preceding the one-year anniversary of a Member’s purchase of its Interests. For the year ended March 31, 2015, the Fund earned Repurchase Fees of $98,997, which is included on the Statements of Changes in Members’ Capital.
At the end of each Allocation Period of the Fund, any net capital appreciation or net capital depreciation of the Fund (both realized and unrealized), as the case may be, is allocated to the capital accounts of all of the Members (including the Special Member and the Managing Member) in proportion to their respective opening capital account balances for such Allocation Period. The initial “Allocation Period” began on the Initial Closing Date, with each subsequent Allocation Period beginning immediately after the close of the preceding Allocation Period. Each Allocation Period closes on the first to occur of (1) the last day of each month, (2) the date immediately prior to the effective date of (a) the admission of a new Member or (b) an increase in a Member’s capital contribution, (3) the effective date of any repurchase of Interests, or (4) the date when the Fund dissolves.
At the end of each calendar year, each Member’s return on investment for the year is determined and a portion of the net capital appreciation allocated to each Member’s capital account during the year (the “Performance Allocation”) if any, net of the Member’s allocable share of the Management Fee and the Administrative Fee, equal to 10% of the portion of such net capital appreciation that exceeds the Preferred Return (as defined below) will be reallocated to the capital account of the Special Member. The “Preferred Return” is equal to the 3-month U.S. Treasury Bill yield (as defined below) for each month during the relevant calendar year (or any shorter period of calculation). The “3-month U.S. Treasury Bill yield” for any month shall equal one-twelfth of the annual yield for the 3-month U.S. Treasury Bill for the first business day of the then current calendar quarter as set forth in the U.S. Federal Reserve Statistical Release H.15 (519) under the caption “Treasury constant maturities”, or if such measurement is not available, such other source as the Managing Member may determine appropriate in its discretion.
No Performance Allocation is made, however, with respect to a Member’s capital account until any cumulative net capital depreciation previously allocated to such Member’s capital account plus any Management Fees and Administrative Fees charged to such capital account (the “Loss Carry forward”) have been recovered. Any Loss Carry forward of a Member is reduced proportionately to reflect the repurchase of any portion of that Member’s Interest. Upon a repurchase of an Interest (other than at the end of a calendar year) from a Member, a Performance Allocation will be determined and allocated to the Special Member, and in the case of any repurchase of a partial Interest, on a “first in - first out” basis (i.e., the portion of the Interest being repurchased and the amount with respect to which the Performance Allocation is calculated) will be deemed to have been taken from the first capital contribution of such Member (as such contribution has been adjusted for net capital appreciation or depreciation, Management Fees, Manager Administrative Fees and other expenses) until it is decreased to zero and from each subsequent capital contribution until such contribution (as adjusted) is decreased to zero.
Performance Allocation is earned on a calendar year basis, and is accrued and presented on the Statement of Changes in Members’ Capital on a fiscal year basis. The Performance Allocation for the fiscal year ended March 31, 2015 and the year ended March 31, 2014 was $10,096,277 and $13,769,551, respectively. These amounts are reported as Performance Allocation on the Statements of Changes in Members’ Capital.
18
J.P. Morgan Access Multi-Strategy Fund, L.L.C.
Notes to Financial Statements March 31, 2015 (continued)
6. Contributions, Redemptions, and Performance Allocation (continued)
The Performance Allocation for the fiscal year ended March 31, 2015 is comprised of the amounts noted below:
| | | | | | | | | | | | |
| | | Performance Allocation Accrual | | | Performance Allocated
to Special Member | | | Total | |
12/31/2014 | | $ | (2,543,568) | * | | $ | 2,547,061 | | | $ | 3,493 | |
3/31/2015 | | $ | 9,442,525 | ** | | $ | 650,259 | | | $ | 10,092,784 | |
| | | | | | | | | | | | |
| | | | | | | | | | $ | 10,096,277 | |
| | * | Represents the reversal of the prior period fiscal year’s accrual, as no actual Performance Allocation occurred. |
| | ** | The amount accrued for the period January 1, 2015 to March 31, 2015. This amount is subject to change as actual Performance Allocation occurs at the end of the calendar year. |
The Performance Allocation for the fiscal year ended March 31, 2014 is comprised of the amounts noted below:
| | | | | | | | | | | | |
| | | Performance
Allocation Accrual | | | Performance Allocated
to Special Member | | | Total | |
12/31/2013 | | $ | (4,408,440 | ) *** | | $ | 15,597,989 | | | $ | 11,189,549 | |
3/31/2014 | | $ | 2,543,568 | | | $ | 36,434 | | | $ | 2,580,002 | |
| | | | | | | | | | | | |
| | | | | | | | | | $ | 13,769,551 | |
| | *** | Represents the reversal of the prior period fiscal year’s accrual, as no actual Performance Allocation occurred. |
7. Risk Exposure
In the normal course of business, the Investment Funds trade various financial instruments and enter into various investment activities with off-balance sheet risk. These include, but are not limited to, short-selling activities, writing option contracts, contracts for differences, and interest rate, credit default and total return equity swaps contracts. The Fund’s risk of loss in these Investment Funds is limited to the value of the Fund’s investments in the Investment Funds.
In pursuing its investment objectives, the Fund invests in Investment Funds that are not registered under the 1940 Act. These Investment Funds may utilize diverse investment strategies, which are not generally managed against traditional investment indices. The Investment Funds selected by the Fund will invest in and actively trade securities and other financial instruments using a variety of strategies and investment techniques that may involve significant risks. Such risks arise from the volatility of the equity, fixed income, commodity and currency markets, leverage both on and off balance sheet associated with borrowings, short sales and derivative instruments, the potential illiquidity of certain instruments including emerging markets, private transactions, derivatives, and counterparty and broker defaults. Various risks are also associated with an investment in the Fund, including risks relating to the multi-manager structure of the Fund, risks relating to compensation arrangements and risks related to limited liquidity of the Investment Funds. The Investment Funds provide for periodic redemptions generally ranging from monthly to semi-annually, and may be subject to various lock-up provisions and early withdrawal fees.
19
J.P. Morgan Access Multi-Strategy Fund, L.L.C.
Notes to Financial Statements March 31, 2015 (continued)
7. Risk Exposure (continued)
Because of the Fund’s investment in the Investment Funds, the Fund indirectly pays a portion of the expenses incurred by the Investment Funds. As a result, a cost of investing in the Fund may be higher than the cost of investing in a fund that invests directly in individual securities and financial instruments.
The investments of the Investment Funds are subject to normal market fluctuations and other risks inherent in investing in securities and there can be no assurance that any appreciation in value will occur. The value of investments can fall as well as rise and investors may not realize the amount that they invest.
Although the Investment Manager will seek to select Investment Funds that offer the opportunity to have their shares or units redeemed within a reasonable timeframe, there can be no assurance that the liquidity of the investments of such Investment Funds will always be sufficient to meet redemption requests as, and when, made.
The Investment Manager may invest the Fund’s assets in Investment Funds that invest in illiquid securities and do not permit frequent withdrawals. Illiquid securities owned by Investment Funds are generally riskier than liquid securities because the Investment Funds may not be able to dispose of the illiquid securities if their investment performance deteriorates, or may be able to dispose of the illiquid securities only at a greatly reduced price. Similarly, the illiquidity of the Investment Funds may cause Members to incur losses because of an inability to withdraw their investments from the Fund during or following periods of negative performance.
The Investment Funds may invest in the securities of foreign companies that involve special risks and considerations not typically associated with investing in U.S. companies. These risks include devaluation of currencies, less reliable information about issuers, different securities transaction clearance and settlement practices, and future adverse political and economic developments. Moreover, securities of many foreign companies and their markets may be less liquid and their prices more volatile than those securities of comparable U.S. companies.
Since the Fund is non-diversified, it may invest a greater percentage of its assets in a particular issuer or group of issuers than a diversified fund would. This increased investment in fewer issuers may result in the Fund being more sensitive to economic results of those issuing the securities.
8. Indemnifications
In the normal course of business, the Fund enters into contracts that contain a variety of representations that provide general indemnifications. The Fund’s maximum exposure under these arrangements is unknown, as this would involve future claims that may be made against the Fund that have not yet occurred. However, the Fund expects the risk of loss to be remote.
20
J.P. Morgan Access Multi-Strategy Fund, L.L.C.
Notes to Financial Statements March 31, 2015 (continued)
9. Concentrations
An affiliate of the Fund’s Investment Manager has investment discretion with respect to their client’s holdings in the Fund, which collectively represent a significant portion of the Fund’s assets. Significant Member transactions, if any, may impact the Fund’s performance.
10. Subsequent Events
At their meeting in May 2015, the Board approved a change to the managing member of the Fund, from JPMIM to MSFMM, Inc., an entity unaffiliated with JPMorgan and established by Intertrust Group B.V., scheduled to be effective July 1, 2015. In order to effectuate this change, the Fund’s limited liability company agreement (“LLC Agreement”) will be amended to reflect the new managing member and to make related changes. In addition, the LLC Agreement will be amended to reflect that JPMIM will serve as the Fund’s tax matters partner. The amendments are scheduled to take effect on July 1, 2015. The text of the amendments to the LLC Agreement will be furnished to any member upon request.
21
J.P. Morgan Access Multi-Strategy Fund, L.L.C.
Directors and Officers Biographical Data (unaudited)
The business of the Fund is managed under the direction of the Board of Directors. Subject to the provisions of the operating agreement and Delaware law, the Directors have all powers necessary and convenient to carry out this responsibility. The Directors and officers of the Fund, their ages and descriptions of their principal occupations during the past five years are listed below.
| | | | | | |
Name (Year of Birth) Positions With The Fund | | Principal Occupation(s) During
the Past 5 Years | | Number of
Portfolios in
Fund Complex
Overseen by
Director(1) (2) | | Other Directorships Held by Director |
Independent Directors |
John F. Finn (1947); Chairman since 2013; Director since 2010. | | Chairman (1985—present), President and Chief Executive Officer, Gardner, Inc. (supply chain management company serving industrial and consumer markets) (1974—present). | | 155 | | Director, Greif, Inc. (GEF) (industrial package products and services) (2007—present); Trustee, Columbus Association for Performing Arts (1988—present); Director, Cardinal Health, Inc (CAH) (1994—2014). |
Dr. Matthew Goldstein (1941); Chairman since 2013; Director since 2010. | | Chancellor Emeritus, City University of New York (2015—present); Professor, City University of New York (2013— present); Chancellor, City University of New York (1999—2013); President, Adelphi University (New York) (1998—1999). | | 155 | | Director, New Plan Excel (NXL) (1999—2005); Director, National Financial Partners (NFP) (2003—2005); Director, Bronx-Lebanon Hospital Center; Director, United Way of New York City (2002—present); Trustee, Museum of Jewish Heritage (2011—present). |
Robert J. Higgins (1945); Director since 2010. | | Retired; Director of Administration of the State of Rhode Island (2003—2004); President — Consumer Banking and Investment Services, Fleet Boston Financial (1971—2001). | | 155 | | None. |
Frankie D. Hughes (1952); Director since 2010. | | Ashland Hughes Properties (Property Management) (2014—present); President and Chief Investment Officer, Hughes Capital Management, Inc. (fixed income asset management) (1993—2014). | | 155 | | Trustee, The Victory Portfolios (2000—2008). |
Peter C. Marshall (1942); Director since 2010. | | Self-employed business consultant (2000—present). | | 155 | | None. |
Mary E. Martinez (1960); Director since 2013. | | Associate, Special Properties, a Christie’s International Real Estate Affiliate (2010—Present); Managing Director, Bank of America (Asset Management) (2007—2008); Chief Operating Officer, U.S. Trust Asset Management; U.S. Trust Company (asset management) (2003— 2007); President, Excelsior Funds (registered investment companies) (2004—2005). | | 155 | | None. |
22
J.P. Morgan Access Multi-Strategy Fund, L.L.C.
Directors and Officers Biographical Data (unaudited) (continued)
| | | | | | |
Name (Year of Birth) Positions With The Fund | | Principal Occupation(s) During
the Past 5 Years | | Number of
Portfolios in
Fund Complex
Overseen by
Director(1) (2) | | Other Directorships Held by Director |
Independent Directors |
Marilyn McCoy* (1948); Director since 2010. | | Vice President of Administration and Planning, Northwestern University (1985—present). | | 155 | | Trustee, Carleton College (2003—present). |
Mitchell M. Merin (1953); Director since 2013. | | Retired; President and Chief Operating Officer, Morgan Stanley Investment Management, Member Morgan Stanley & Co. Management Committee (registered investment adviser) (1998— 2005). | | 155 | | Director, Sun Life Financial (SLF) (2007—2013) (financial services and insurance); Trustee, Trinity College, Hartford, CT (2002—2010). |
William G. Morton, Jr. (1937); Director since 2010. | | Retired; Chairman Emeritus (2001— 2002), and Chairman and Chief Executive Officer, Boston Stock Exchange (1985— 2001). | | 155 | | Director, Radio Shack Corp. (1987—2008); Director, National Organization of Investment Professionals; Trustee, Stratton Mountain School (2001—present). |
Dr. Robert A. Oden, Jr. (1946); Director since 2010. | | Retired; President, Carleton College (2002—2010); President, Kenyon College (1995—2002). | | 155 | | Trustee, American University in Cairo (1999—present); Chairman, Dartmouth-Hitchcock Medical Center (2011—present); Trustee, American Schools of Oriental Research (2011— present); Trustee, American Museum of Fly Fishing (213—present) |
Marian U. Pardo** (1946); Director since 2013. | | Managing Director and Founder, Virtual Capital Management LLC (Investment Consulting) (2007—present); Managing Director, Credit Suisse Asset Management (portfolio manager) (2003—2006). | | 155 | | Member, Board of Governors, Columbus Citizens Foundation (not-for-profit supporting philanthropic and cultural programs) (2006—present). |
Frederick W. Ruebeck (1939); Director since 2010. | | Consultant (2000—present); Advisor, JP Greene & Associates, LLC (broker-dealer) (2000—2009); Chief Investment Officer, Wabash College (2004— present); Director of Investments, Eli Lilly and Company (pharmaceuticals) (1988—1999). | | 155 | | Trustee, Wabash College (1988—present); Chairman, Indianapolis Symphony Foundation (1994—present). |
James J. Schonbachler (1943); Director since 2010. | | Retired; Managing Director of Bankers Trust Company (financial services) (1968—1998). | | 155 | | None. |
| (1) | Each Director serves for an indefinite term, subject to the Fund’s current retirement policy, which is age 78 for all Directors. |
| (2) | A Fund Complex means two or more registered investment companies that hold themselves out to investors as related companies for purposes of investment and investor services or have a common investment adviser or have an investment adviser that is an affiliated person of the investment adviser of any of the other registered investment companies. The J.P. Morgan Funds Complex for which the Board of Trustees serves currently includes eleven registered investment companies (155 funds). |
23
J.P. Morgan Access Multi-Strategy Fund, L.L.C.
Directors and Officers Biographical Data (unaudited) (continued)
| * | Two members of the Board of Trustees of Northwestern University are executive officers of registered investment advisers (not affiliated with JPMorgan) that are under common control with sub-advisers to certain J.P. Morgan Funds. |
| ** | In connection with prior employment with JPMorgan Chase, Ms. Pardo is the recipient of non-qualified pension plan payments from JPMorgan Chase in the amount of approximately $2,055 per month, which she irrevocably waived effective January 1, 2013, and deferred compensation payments from JPMorgan Chase in the amount of approximately $7,294 per year, which ended in January 2013. In addition, Ms. Pardo receives payments from a fully funded qualified plan, which is not an obligation of JPMorgan Chase. |
The contact address for each of the Directors is 270 Park Avenue, New York, NY 10017.
24
J.P. Morgan Access Multi-Strategy Fund, L.L.C.
Directors and Officers Biographical Data (unaudited) (continued)
| | |
Name (Year of Birth), Positions Held with the Fund | | Principal Occupation(s) During the Past 5 Years |
Officers |
Robert L. Young (1963), President and Principal Executive Officer (2013)** | | Chief Operating Officer and Director, J.P. Morgan Investment Management Inc. since 2010: Senior Vice President, J.P. Morgan Funds (2005-2010), Chief Operating Officer, J.P. Morgan Funds (2005-2010): Director and various officer positions for JPMorgan Funds Management, Inc. (formerly One Group Administrative Services) and JPMorgan Distribution Service, Inc. (formerly One Group Dealer Services, Inc.) from 1999 to present. Mr. Young has been with JPMorgan Chase & Co. (formerly Bank One Corporation) since 1997. |
Laura M. Del Prato (1964,) Treasurer and Principal Financial Officer (2015) | | Managing Director, JPMorgan Funds Management, Inc. since 2014; Partner, Cohen Fund Audit Services (2012 – 2013); Partner (2004-2012) and various other titles (1990 – 2004) at KPMG, LLP. |
Frank J. Nasta (1964); Secretary (2011) | | Managing Director and Associate General Counsel, JPMorgan Chase since 2008; Previously, Director, Managing Director, General Counsel and Corporate Secretary, J. & W. Seligman & Co. Incorporated; Secretary of each of the investment companies of the Seligman Group of Funds and Seligman Data Corp.; Director and Corporate Secretary, Seligman Advisors, Inc. and Seligman Services, Inc. |
Stephen M. Ungerman (1953); Chief Compliance Officer (2011) | | Managing Director, JPMorgan Chase & Co.; Mr. Ungerman has been with JPMorgan Chase & Co. since 2000. |
Valerie-Leila Jaber (1965,) AML Compliance Officer (2014)* | | Managing Director and Global Head of Financial Crime for Asset Management, JPMorgan Chase & Co. since December 2012; Managing Director and Global Head of Financial Crime for Barclay Wealth (2009 – 2012) |
Jessica K. Ditullio (1962); Assistant Secretary (2011) ** | | Executive Director and Assistant General Counsel, JPMorgan Chase since February, 2011; Ms. Ditullio has served as an attorney with various titles for JPMorgan Chase (formerly Bank One Corporation) since 1990. |
John T. Fitzgerald (1975); Assistant Secretary (2011) | | Executive Director and Assistant General Counsel, JPMorgan Chase since February 2011; formerly, Vice President and Assistant General Counsel, JPMorgan Chase from 2005 until February 2011. |
Carmine Lekstutis (1980), Assistant Secretary (2011) | | Vice President and Assistant General Counsel, JPMorgan Chase since 2011; Associate, Skadden, Arps, Slate, Meagher & Flom LLP (law firm) from 2006 to 2011. |
Michael M. D’Ambrosio (1969), Assistant Treasurer (2012) | | Managing Director, JPMorgan Funds Management, Inc. from July 2012; prior to joining JPMorgan Chase, Mr. D’Ambrosio was a Tax Director at PricewaterhouseCoopers LLP since 2006. |
Joseph Parascondola (1963); Assistant Treasurer (2011) | | Vice President, JPMorgan Funds Management, Inc. since August 2006. |
Lauren A. Paino (1973), Assistant Treasurer (2015) | | Treasurer and Principal Financial Officer of the Fund from 2013 to 2014; Executive Director, JPMorgan Funds Management, Inc. since September 2013; Director of Operations & Investor Relations at Credit Suisse Alternative Investments (2005 – 2013) |
Matthew J. Plastina (1970); Assistant Treasurer (2011) | | Vice President, JPMorgan Funds Management, Inc. since August 2010; prior to August 2010, Vice President and Controller, Legg Mason Global Asset Management. |
Julie A. Roach (1971), Assistant Treasurer (2012)** | | Vice President, JPMorgan Funds Management, Inc. from August 2012; prior to joining JPMorgan Chase, Ms. Roach was a Senior Manager with Deloitte since 2001. |
The contact address for each of the officers, unless otherwise noted, is 270 Park Avenue, New York, NY 10017.
| | * | The contact address for the officer is 277 Park Avenue, New York, NY 10172. |
| | ** | The contact address for the officer is 460 Polaris Parkway, Westerville, OH 43082. |
25

| | | | |
| Rev. January 2011 | | |
| | | |
FACTS | | WHAT DOES J.P. MORGAN FUNDS DO WITH YOUR PERSONAL INFORMATION? | | |
| | | | | |
Why? | | Financial companies choose how they share your personal information. Federal law gives consumers the right to limit some but not all sharing. Federal law also requires us to tell you how we collect, share, and protect your personal information. Please read this notice carefully to understand what we do. | | |
| | | | | |
What? | | The types of personal information we collect and share depend on the product or service you have with us. This information can include: | | |
| | ¡ Social Security number and account balances | | |
| | ¡ transaction history and account transactions | | |
| | ¡ checking account information and wire transfer instructions | | |
| | When you are no longer our customer, we continue to share your information as described in this notice. | | |
| | | | | |
How? | | All financial companies need to share customers’ personal information to run their everyday business. In the section below, we list the reasons financial companies can share their customers’ personal information; the reasons J.P. Morgan Funds chooses to share; and whether you can limit this sharing. | | |
| | | | |  |
| | | | | | |
| Reasons we can share your personal information | | Does J.P. Morgan
Funds share? | | Can you limit this sharing? | | |
For our everyday business purposes – such as to process your transactions, maintain your account(s), respond to court orders and legal investigations, or report to credit bureaus | | Yes | | No | | |
For marketing purposes – to offer our products and services to you | | Yes | | No | | |
For joint marketing with other financial companies | | No | | We don’t share | | |
For our affiliates’ everyday business purposes – information about your transactions and experiences | | No | | We don’t share | | |
For our affiliates’ everyday business purposes – information about your creditworthiness | | No | | We don’t share | | |
For nonaffiliates to market to you | | No | | We don’t share | | |
| | | | |
Questions? | | Call 1-800-480-4111 or go to www.jpmorganfunds.com | | |
26
| | |
Who we are |
Who is providing this notice? | | J.P. Morgan Funds |
| | | |
What we do |
How does J.P. Morgan Funds protect my personal information? | | To protect your personal information from unauthorized access and use, we use security measures that comply with federal law. These measures include computer safeguards and secured files and buildings. We authorize our employees to access your information only when they need it to do their work and we require companies that work for us to protect your information. |
| How does J.P. Morgan Funds collect my personal information? | | We collect your personal information, for example, when you: ¡ open an account or provide contact information ¡ give us your account information or pay us by check ¡ make a wire transfer We also collect your personal information from others, such as credit bureaus, affiliates and other companies. |
Why can’t I limit all sharing? | | Federal law gives you the right to limit only ¡ sharing for affiliates’ everyday business purposes - information about your creditworthiness ¡ affiliates from using your information to market to you ¡ sharing for nonaffiliates to market to you State laws and individual companies may give you additional rights to limit sharing. |
| | | |
Definitions |
Affiliates | | Companies related by common ownership or control. They can be financial and nonfinancial companies. ¡ J.P. Morgan Funds does not share with our affiliates. |
Nonaffiliates | | Companies not related by common ownership or control. They can be financial and nonfinancial companies. ¡ J.P. Morgan Funds does not share with nonaffiliates so they can market to you. |
Joint Marketing | | A formal agreement between nonaffiliated financial companies that together market financial products or services to you. ¡ J.P. Morgan Funds doesn’t jointly market. |
27
J.P. Morgan Access Multi-Strategy Fund, L.L.C.
The Fund’s Forms N-Q are available on the Commission’s web site at http://www.sec.gov, and may be reviewed and copied at the Commission’s Public Reference Room in Washington, DC. Information on the operation of the Public Reference Room may be obtained by calling 1-800-SEC-0330.
A description of the policies and procedures that the Fund uses to determine how to vote proxies relating to portfolio securities, as well as information relating to how the Fund voted proxies relating to portfolio securities during the most recent 12-month period ended June 30, is available without charge, upon request, by calling
1-212-648-1953, and (ii) on the Commission’s website at http://www.sec.gov.
28
| | (a) | The registrant, as of the end of the period covered by this report, has adopted a code of ethics that applies to the registrant’s principal executive officer, principal financial officer, principal accounting officer or controller, or persons performing similar functions, regardless of whether these individuals are employed by the registrant or a third party. |
| | (c) | There have been no amendments, during the period covered by this report, to a provision of the code of ethics that applies to the registrant’s principal executive officer, principal financial officer, principal accounting officer or controller, or persons performing similar functions, regardless of whether these individuals are employed by the registrant or a third party, and that relates to any element of the code of ethics description. |
| | (d) | The registrant has not granted any waivers, including an implicit waiver, from a provision of the code of ethics that applies to the registrant’s principal executive officer, principal financial officer, principal accounting officer or controller, or persons performing similar functions, regardless of whether these individuals are employed by the registrant or a third party, that relates to one or more of the items set forth in paragraph (b) of this item’s instructions. |
| Item 3. | Audit Committee Financial Expert. |
As of the end of the period covered by the report, the registrant’s board of directors has determined that Mitchell M. Merin is qualified to serve as an audit committee financial expert serving on its audit committee and that he is “independent,” as defined by Item 3 of Form N-CSR.
| Item 4. | Principal Accountant Fees and Services. |
Audit Fees
| | (a) | The aggregate fees billed for each of the last two fiscal years for professional services rendered by the principal accountant for the audit of the registrant’s annual financial statements or services that are normally provided by the accountant in connection with statutory and regulatory filings or engagements for those fiscal years are $61,200 for 2014 and $62,730 for 2015. |
Audit-Related Fees
| | (b) | The aggregate fees billed in each of the last two fiscal years for assurance and related services by the principal accountant that are reasonably related to the performance of the audit of the registrant’s financial statements and are not reported under paragraph (a) of this Item are $11,960 for 2014 and $12,880 for 2015. Audit-related fees consist of semi-annual financial statement reviews during the Registrant’s fiscal year. |
Tax Fees
| | (c) | The aggregate fees billed in each of the last two fiscal years for professional services rendered by the principal accountant for tax compliance, tax advice, and tax planning are $404,890 for 2014 and $439,810 for 2015. |
The tax fees consist of fees billed in connection with preparing the federal regulated investment company income tax returns for the Registrant for the tax years ended December 31, 2013 and December 31, 2014, respectively.
For the last fiscal year, no tax fees were required to be approved pursuant to paragraph (c)(7)(ii) of Rule 2-01 of Regulation S-X.
All Other Fees
| | (d) | The aggregate fees billed in each of the last two fiscal years for products and services provided by the principal accountant, other than the services reported in paragraphs (a) through (c) of this Item are: |
2015—Not Applicable
2014—Not Applicable
| | (e)(1) | Disclose the audit committee’s pre-approval policies and procedures described in paragraph (c)(7) of Rule 2-01 of Regulation S-X. |
One or more members of the Audit Committee may be appointed as the Committee’s delegate for the purposes of considering whether to approve such services. Any pre-approvals granted by the delegate will be reported, for informational purposes only, to the Audit Committee at its next scheduled meeting. The Audit Committee’s responsibilities to pre-approve services performed by the independent public registered accounting firm are not delegated to management.
| | (e)(2) | The percentage of services described in each of paragraphs (b) through (d) of this Item that were approved by the audit committee pursuant to paragraph (c)(7)(i)(C) of Rule 2-01 of Regulation S-X are as follows: |
| | (f) | The percentage of hours expended on the principal accountant’s engagement to audit the registrant’s financial statements for the most recent fiscal year that were attributed to work performed by persons other than the principal accountant’s full-time, permanent employees was less than fifty percent. |
| | (g) | The aggregate non-audit fees billed by the registrant’s accountant for services rendered to the registrant, and rendered to the registrant’s investment adviser (not including any sub-adviser whose role is primarily portfolio management and is subcontracted with or overseen by another investment adviser), and any entity controlling, controlled by, or under common control with the adviser that provides ongoing services to the registrant for each of the last two fiscal years of the registrant disclosed below. |
The aggregate non-audit fees billed by the independent registered public accounting firm for services rendered to the Registrant, and rendered to Service Affiliates, for the last two calendar years ends were:
2014—$30.6 million
2013—$33.7 million
| | (h) | The registrant’s audit committee of the board of directors has considered whether the provision of non-audit services that were rendered to the registrant’s investment adviser (not including any sub-adviser whose role is primarily portfolio management and is subcontracted with or overseen by another investment adviser), and any entity controlling, controlled by, or under common control with the investment adviser that provides ongoing services to the registrant that were not pre-approved pursuant to paragraph (c)(7)(ii) of Rule 2-01 of Regulation S-X is compatible with maintaining the principal accountant’s independence. |
| Item 5. | Audit Committee of Listed Registrants. |
Not applicable.
| (a) | Schedule of Investments in securities of unaffiliated issuers as of the close of the reporting period is included as part of the report to shareholders filed under Item 1 of this form. |
| Item 7. | Disclosure of Proxy Voting Policies and Procedures for Closed-End Management Investment Companies. |
The Proxy Voting Policies are attached herewith.
J.P. Morgan Private Investments Inc.
Proxy Voting Policies and Procedures
Advisers are fiduciaries and must act in the best interest of the client with respect to functions undertaken on behalf of the client, including proxy voting activities. An adviser must adopt and implement written policies and procedures reasonably designed to ensure that proxies are voted in the best interest of the client, conflicts are identified and handled appropriately; and fiduciary obligations are fulfilled. An adviser must disclose to its clients how they may obtain information on how proxies were voted for securities held for their accounts. An adviser must disclose to clients information about its proxy voting policies and procedures and how clients may obtain the policies and procedures.
This section is applicable to JPMPI in its capacity to provide investment advice and/or administrative functions to the Private Funds.
On occasion, an issuer of an investment held by a Private Fund will request that an action be taken by such issuer’s investors (e.g., the Private Fund). The terms of the partnership or limited liability company agreement of the Private Fund will set forth the policies and procedures for casting the Private Fund’s vote on the action. In cases where the Private Fund’s investors have the right to vote on the matter, depending on the agreement, JPMPI, on behalf of the Private Fund, will either (i) cast votes representing a percentage of the Private Fund’s interest in the issuer based on the percentage of votes JPMPI received from the Private Fund’s investors or (ii) cast votes for the Private Fund’s entire interest in the issuer based on the votes JPMPI received from the Private Fund’s investors. In cases where JPMPI has the sole proxy authority to vote on a matter (and investors do not have voting rights), JPMPI has adopted the following voting policies and procedures:
| | 2. | Proxy Voting Policies and Procedures |
In general, JPMPI will handle all proxies and other corporate actions in a timely manner as part of its authority. JPMPI’s President is ultimately responsible for ensuring that all proxies received by JPMPI, on behalf of Private Funds, are voted in a timely manner and in a manner consistent with the Private Fund’s best interests. JPMPI’s fiduciary obligation to manage accounts in the best interests of the Private Funds extends to proxy voting. When voting proxies or acting with respect to corporate actions for Private Funds, JPMPI will act in a prudent and diligent manner solely with the goal of maximizing the economic value of the assets of the Private Fund’s account and thereby providing the greatest possible return to investors’ investments consistent with governing laws and the investment policies of the Private Fund.
As the management of a company is responsible for its day to day operations, JPMPI believes that management, subject to the oversight of its board of directors, is often in the best position to make decisions that serve the interest of investors. However, JPMPI generally votes against management on proposals where it perceives a conflict may exist between management and client interests, such as those that may insulate management or diminish investor rights. JPMPI also generally votes against management in other cases where the facts and circumstances indicate that the proposal is not in its client’s best interests.
This section is applicable to JPMPI in its capacity as a sub-advisor to the RICs.
| | • | | JPMPI seeks to have each investment management agreement set forth whether JPMPI or the client are responsible for voting proxies. If JPMPI is responsible, it is JPMPI’s obligation to vote proxies in the best interests of the client. |
| | • | | Investment personnel are principally responsible for determining how to vote individual proxies in accordance with the JPMorgan Asset Management Proxy Voting Procedures and Guidelines. |
| | • | | It is the policy of JPMPI to vote all proxies received on stock held in portfolios over which JPMPI has discretionary management and proxy voting authority, unless JPMPI determines that it is not in the best interests of the client to vote any particular proxy. |
| | • | | To assist JPMPI’s investment personnel with proxy voting proposals, JPMAM may retain the services of an independent proxy voting services The services may assist with such items as: coordinating with client custodians to ensure that all proxy materials are processed in a timely fashion; voting all proposals that are clearly covered in the JPMorgan Asset Management Proxy Voting Procedures and Guidelines; providing JPMPI with a comprehensive analysis of each proxy proposal; and providing JPMPI with recommendations on how to vote each proxy proposal based on JPMorgan Asset Management Proxy Voting Procedures and Guidelines. |
| | • | | To oversee the proxy voting process on an on-going basis, JPMAM has established a Proxy Committee has been established that meets at least semi-annually. The Committee is composed of the Proxy Administrator and senior officers from among the Investment, Legal, Compliance, Operations and Risk Management Departments. |
| | • | | The primary functions of the Proxy Committee are to periodically review general proxy voting matters; to review and approve the JPMorgan Asset Management Proxy Voting Procedures and Guidelines annually; and to provide advice and recommendations on general proxy voting matters as well as on specific voting issues to be implemented. |
| | • | | JPMAM has established the role of a Proxy Administrator to oversee the proxy voting process. The Proxy Administrator monitors recommendations from outside proxy services, escalates issues to appropriate investment professionals and confirms the outside services’ recommendation with the appropriate investment professional. The Proxy Administrator utilizes an automated system to communicate, track and store the relevant data regarding the proxy voting process. |
| | • | | Investment personnel, which may include Corporate Governance Specialists*, analyze issues to determine if any direct or indirect conflict regarding proxy voting exists, and if any conflict is identified the matter is referred to the Proxy Administrator. |
| | • | | In situations in which the JPMorgan Asset Management Proxy Voting Procedures and Guidelines are silent or recommend a case by case analysis, the Proxy Administrator will forward the proxy voting services’ voting recommendations to the appropriate investment professional. The investment professional will determine if the recommendations provided should be accepted. |
| | • | | If a material conflict of interest is identified by the Proxy Administrator, investment professional or Corporate Governance Specialist for the particular proxy vote, it is the responsibility of the Proxy Administrator to convene a subset of the Proxy Committee to review and determine what action should be taken, including the possibility of retaining an independent third party to exercise fiduciary responsibility in voting. |
| | • | | An investment professional may override the recommendation of the proxy service and/or the normal JPMPI policy position, if special circumstances apply. If so, certification by the |
| | investment professional is required and must include: a written analysis supporting their recommendation, confirmation that the Safeguard Policy and Information Barriers Policies were not violated and a statement that there is not a conflict of interest. |
| | • | | The Proxy Administrator’s duties include reviewing overrides and determining if they should be referred to the Proxy Committee for review. |
| | • | | The Compliance Department verifies that JPMPI’s ADV contains appropriate disclosure on how to obtain the JPMorgan Asset Management Proxy Voting Policy and Guidelines and voting records. |
| | • | | JPMPI’s clients can obtain voting records for their portfolio(s). |
| | • | | Following a request from a client to their Client Service Manager, JPMPI’s clients can obtain voting records for their portfolio(s) as well as a copy of the JPMorgan Asset Management Proxy Voting Policy and Guidelines. |
*Please note: For international markets, where market practices vary widely and where independent proxy voting services are less-well developed, all voting decisions are made on a case-by-case basis by Corporate Governance Specialists in conjunction with investment professionals, based exclusively on the principles contained in the JPMPI’s Proxy Voting Guidelines, as opposed to the recommendations of third-party agencies based on their interpretation of JPMPI’s Proxy Voting Guidelines.
| Item 8. | Portfolio Managers of Closed-End Management Investment Companies. |
PORTFOLIO MANAGEMENT TEAM
The Fund’s portfolio managers are Lenore Petteruti and Georgiy Zhikharev. The portfolio managers determine the asset allocation for the Fund among Portfolio Managers, Investment Funds and other investments. Ms. Petteruti is a Managing Director and Head Portfolio Manager for the Global Access hedge fund portfolios and the Global Access RIC portfolios. Ms. Petteruti has over 25 years’ experience in Alternative Investments, including Portfolio Management, Manager Due Diligence and Risk Management. Prior to joining J.P. Morgan Private Bank, Ms. Petteruti was the Chief Portfolio Strategist at CQS LLC, a London based hedge fund manager specializing in global credit and structured credit. At CQS, Ms. Petteruti was involved in constructing customized portfolio solutions for institutional and ultra-high net worth clients. Before CQS, Ms. Petteruti was the Chief Risk Officer at Corbin Capital Partners, LLC, a fund of hedge funds manager specializing in hedge fund and direct investments. Prior to Corbin, she was the Chief Investment Officer and President of Mezzacappa Management LLC, a Fund of Funds that managed customized portfolios for both institutional and ultra-high net worth clients. She began her career at J.P. Morgan Chase as a Credit Officer, originating bank loans for noninvestment grade companies. Ms. Petteruti holds a Bachelor of Arts in International Relations and Economics from Brown University. Ms. Petteruti has been a portfolio manager of the Fund since 2014. Mr. Zhikharev is a Managing Director and Global Head of Portfolio Construction at J.P. Morgan Private Bank in New York and is a member of the J.P. Morgan Private Bank’s Global Investment Committee, Hedge Fund Advisory Council and Private Equity Advisory Council. Mr. Zhikharev has been with J.P. Morgan for 14 years. Prior to his current role he was the Global Head of Quantitative Research and Analytics for the Global Markets Strategy Team, spent five years as the Portfolio Manager for the Global Access Hedge Fund Portfolios and the Risk Officer for the Global Access Team overseeing quantitative risk analytics and research, and evaluating the risk impact of portfolio trades. He holds a master’s degree in Business Administration with a concentration in Finance from DePaul University in Chicago. He also holds a
Ph.D.-equivalent degree in Economics from the Kazan State University, Russia. Additionally, Mr. Zhikharev holds a Financial Risk Manager (FRM) designation from the Global Association of Risk Professionals. Mr. Zhikharev has been a portfolio manager of the Fund since 2014.
OTHER ACCOUNTS MANAGED
The following tables show information regarding other accounts managed by portfolio managers of the Fund as of March 31, 2015:
Non-Performance Based Fee Advisory Accounts
($000’s)
| | | | | | | | | | | | | | | | |
| | | Registered Investment
Companies | | Other Pooled Investment
Vehicles | | | | Other Accounts |
| | | | | | | | |
| | | Number of
Accounts | | Total Assets | | | | Number of
Accounts | | Total Assets | | | | Number of
Accounts | | Total Assets |
Lenore Petteruti | | 1 | | $657,270,257 | | | | 1 | | $171,609,669 | | | | 0 | | $0 |
Georgiy Zhikharev | | 1 | | $657,270,257 | | | | 0 | | $0 | | | | 0 | | $0 |
Performance Based Fee Advisory Accounts
($000’s)
| | | | | | | | | | | | | | | | |
| | | Registered Investment
Companies | | Other Pooled Investment
Vehicles | | | | Other Accounts |
| | | | | | | | |
| | | Number of
Accounts | | Total Assets | | | | Number of
Accounts | | Total Assets | | | | Number of
Accounts | | Total Assets |
Lenore Petteruti | | 0 | | $0 | | | | 11 | | $3,691,600,171 | | | | 0 | | $0 |
Georgiy Zhikharev | | 0 | | $0 | | | | 4 | | $1,134,001,250 | | | | 0 | | $0 |
POTENTIAL CONFLICTS OF INTEREST
The Investment Manager and Sub-Adviser provide investment management services to other clients, including other multi-manager funds and discretionary managed accounts, that follow investment programs substantially similar to that of the Fund. As a result, when a limited investment opportunity would be appropriate for the Fund and also for one or more of its other clients, the Investment Manager and Sub-Adviser will be required to choose among the Fund and such other clients in allocating such opportunity, or to allocate less of such opportunity to the Fund than the Investment Manager or Sub-Adviser would ideally allocate if it did not provide investment management services to other clients. In addition, the Investment Manager and/or Sub-Adviser may determine that an investment opportunity is appropriate for a particular client, or for itself or an affiliate, but not for the Fund. Situations may arise in which other client accounts managed by the Investment Manager and/or Sub-Adviser or its affiliates have made investments that would have been suitable for investment by the Fund but, for various reasons, were not pursued by, or available to, the Fund. The Investment Manager and Sub-Adviser attempt to allocate limited investment opportunities among the Fund and their other client accounts in a manner they believe to be reasonable and equitable.
PORTFOLIO MANAGER COMPENSATION
The Adviser’s portfolio managers participate in a competitive compensation program that is designed to attract and retain outstanding people and closely link the performance of investment professionals to client investment objectives. The total compensation program includes a base salary fixed from year to year and a variable performance bonus consisting of cash incentives and restricted stock and may include mandatory notional investments (as described below) in selected mutual funds advised by the Adviser or its affiliates. These elements reflect individual performance and the performance of the Adviser’s business as a whole.
Each portfolio manager’s performance is formally evaluated annually based on a variety of factors including the aggregate size and blended performance of the portfolios such portfolio manager manages. Individual contribution relative to client goals carries the highest impact. Portfolio manager compensation is primarily driven by meeting or exceeding clients’ risk and return objectives, relative performance to competitors or competitive indices and compliance with firm policies and regulatory requirements. In evaluating each portfolio manager’s performance with respect to the mutual funds he or she manages, the Funds’ pre-tax performance is compared to the appropriate market peer group and to each Fund’s benchmark index listed in the Fund’s prospectuses over one, three and five year periods (or such shorter time as the portfolio manager has managed the Fund). Investment performance is generally more heavily weighted to the long-term.
Awards of restricted stock are granted as part of an employee’s annual performance bonus and comprise from 0% to 40% of a portfolio manager’s total bonus. As the level of incentive compensation increases, the percentage of compensation awarded in restricted stock also increases. Up to 50% of the restricted stock portion of a portfolio manager’s bonus may instead be subject to mandatory notional investment in selected mutual funds advised by the Adviser or its affiliates. When these awards vest over time, the portfolio manager receives cash equal to the market value of the notional investment in the selected mutual funds.
(a)(4) Disclosure of Securities Ownership
| | |
Name of Portfolio Manager or Team Member | | Dollar ($) Range of Fund Shares Beneficially Owned |
| |
| Lenore Petteruti | | $0 |
| Georgiy Zhikharev | | $0 |
| Item 9. | Purchases of Equity Securities by Closed-End Management Investment Company and Affiliated Purchasers. |
Not applicable.
| Item 10. | Submission of Matters to a Vote of Security Holders. |
There have been no material changes to the procedures by which the shareholders may recommend nominees to the registrant’s board of directors, where those changes were implemented after the registrant last provided disclosure in response to the requirements of Item 407(c)(2)(iv) of Regulation S-K (17 CFR 229.407) (as required by Item 22(b)(15) of Schedule 14A (17 CFR 240.14a-101)), or this Item.
| Item 11. | Controls and Procedures. |
| | (a) | The registrant’s principal executive and principal financial officers, or persons performing similar functions, have concluded that the registrant’s disclosure controls and procedures (as defined in Rule 30a-3(c) under the Investment Company Act of 1940, as amended (the “1940 Act”) (17 CFR 270.30a-3(c))) are effective, as of a date within 90 days of the filing date of the report that includes the disclosure required by this paragraph, based on their evaluation of these controls and procedures required by Rule 30a-3(b) under the 1940 Act (17 CFR 270.30a-3(b)) and Rules 13a-15(b) or 15d-15(b) under the Securities Exchange Act of 1934, as amended (17 CFR 240.13a-15(b) or 240.15d-15(b)). |
| | (b) | There were no changes in the registrant’s internal control over financial reporting (as defined in Rule 30a-3(d) under the 1940 Act (17 CFR 270.30a-3(d)) that occurred during the registrant’s second fiscal quarter of the period covered by this report that has materially affected, or is reasonably likely to materially affect, the registrant’s internal control over financial reporting. |
| | |
(a)(1) | | Code of ethics, or any amendment thereto, that is the subject of disclosure required by Item 2 is attached hereto. |
| |
(a)(2) | | Certifications pursuant to Rule 30a-2(a) under the 1940 Act and Section 302 of the Sarbanes-Oxley Act of 2002 are attached hereto. |
| |
(a)(3) | | Not applicable. |
| |
(b) | | Not applicable. |
(12.other) Not applicable.
SIGNATURES
Pursuant to the requirements of the Securities Exchange Act of 1934 and the Investment Company Act of 1940, the registrant has duly caused this report to be signed on its behalf by the undersigned, thereunto duly authorized.
(Registrant) J.P. Morgan Access Multi-Strategy Fund, L.L.C.
By (Signature and Title)* /s/ Robert L. Young
Robert L. Young, Principal Executive Officer
(principal executive officer)
Date June 8, 2015
Pursuant to the requirements of the Securities Exchange Act of 1934 and the Investment Company Act of 1940, this report has been signed below by the following persons on behalf of the registrant and in the capacities and on the dates indicated.
By (Signature and Title)* /s/ Robert L. Young
Robert L. Young, Principal Executive Officer
(principal executive officer)
Date June 8, 2015
By (Signature and Title)* /s/ Laura M. Del Prato
Laura M. Del Prato, Principal Financial Officer
(principal financial officer)
Date June 8, 2015
* Print the name and title of each signing officer under his or her signature.