UNITED STATES
SECURITIES AND EXCHANGE COMMISSION
Washington, D.C. 20549
FORM 20-F
(Mark One)
[ ] REGISTRATION STATEMENT PURSUANT TO SECTION 12(b) OR (g) OF THE SECURITIES EXCHANGE ACT OF 1934
OR
[X] ANNUAL REPORT PURSUANT TO SECTION 13 OR 15(d) OF THE SECURITIES EXCHANGE ACT OF 1934
For the fiscal year ended December 31, 2008
OR
[ ] TRANSITION REPORT PURSUANT TO SECTION 13 OR 15(d) OF THE SECURITIES EXCHANGE ACT OF 1934
OR
[ ] SHELL COMPANY REPORT PURSUANT TO SECTION 13 OR 15(d) OF THE SECURITIES EXCHANGE ACT OF 1934
Date of event requiring this shell company report _____________
For the transition period from _____________ to _____________
Commission file number 000-52699
YUKON-NEVADA GOLD CORP.
(Exact name of Registrant as specified in its charter)
N/A
(Translation of Registrant’s name into English)
British Columbia, Canada
(Jurisdiction of incorporation or organization)
688 West Hastings Street, Suite 490, Vancouver, British ColumbiaV6B 1P1
(Address of principal executive offices)
Graham Dickson, (604) 688-9427, graham@yngc.ca, 688 West Hastings Street, Suite 490, Vancouver, British Columbia
V6B 1P1
(Name, Telephone, E-mail and/or Facsimile number and Address of Company Contact Person)
Securities registered or to be registered pursuant to Section 12(b) of the Act.
| Title of each class | Name of each exchange on which registered |
| None | N/A |
2
Securities registered or to be registered pursuant to Section 12(g) of the Act.
Common shares, no par value
(Title of Class)
Securities for which there is a reporting obligation pursuant to Section 15(d) of the Act.
None
(Title of Class)
Indicate the number of outstanding shares of each of the issuer’s classes of capital or common stock as of the close of
the period covered by the annual report.
272,655,430 Common Shares
Indicate by check mark if the registrant is a well-known seasoned issuer, as defined in Rule 405 of the Securities Act.
[ ] Yes [X] No
If this report is an annual or transition report, indicate by check mark if the registrant is not required to file reports
pursuant to Section 13 or 15(d) of the Securities Exchange Act of 1934.
[ ] Yes [X] No
Note – Checking the box above will not relieve any registrant required to file reports pursuant to Section 13 or 15(d)
of the Securities Exchange Act of 1934 from their obligations under those Sections.
Indicate by check mark whether the registrant (1) has filed all reports required to be filed by Section 13 or 15(d) of the
Securities Exchange Act of 1934 during the preceding 12 months (or for such shorter period that the registrant was
required to file such reports), and (2) has been subject to such filing requirements for the past 90 days.
[X] Yes [ ] No
Indicate by check mark whether the registrant is a large accelerated filer, an accelerated filer, or a non-accelerated filer.
See definition of "accelerated filer and large accelerated filer" in Rule 12b-2 of the Exchange Act. (Check One):
Large accelerated filer [ ] Accelerated filer [X] �� Non-accelerated filer [ ]
Indicate by check mark which basis of accounting the registrant has used to prepare the financial statements included
in this filing:
| U.S. GAAP [ ] | International Financial Reporting Standards as issued | Other [X] |
| | By the International Accounting Standards Board [ ] | |
If “Other” has been checked in response to the previous question, indicate by check mark which financial statement item the
registrant has elected to follow.
[X] Item 17 [ ] Item 18
If this is an annual report, indicate by check mark whether the registrant is a shell company (as defined in Rule 12b-2 of the Exchange
Act).
[ ] Yes [X] No
(APPLICABLE ONLY TO ISSUERS INVOLVED IN BANKRUPTCY PROCEEDINGS DURING THE PAST FIVE YEARS)
Indicate by check mark whether the registrant has filed all documents and reports required to be filed by Sections 12, 13 or 15(d)
of the Securities Exchange Act of 1934 subsequent to the distribution of securities under a plan confirmed by a court.
[ ] Yes [ ] No
3
TABLE OF CONTENTS
4
5
PART I
Introduction
Yukon-Nevada Gold Corp. is a corporation incorporated under the laws of Canada and is referred to in this document, together with its subsidiaries, as “us”, “we” or “our”.
Our consolidated financial statements are prepared in accordance with accounting principles generally accepted in Canada ("Canadian GAAP") and are presented in US dollars unless otherwise indicated. All references in this Form 20-F to financial information concerning us refer to such information in accordance with Canadian GAAP and all dollar amounts in this Form 20-F are in US dollars unless otherwise indicated. A reconciliation to US CAAP is included in Note 22 to the consolidated financial statements.
In this document, cross-references relevant to the information being requested may be provided. These cross-references are provided for ease of reference only and are not meant to be exclusionary to other relevant information in this document that may relate to the disclosure in question.
Forward-Looking Information
This report contains “forward-looking statements”, including all statements that are not historical facts, and forward looking information within the meaning of the United States Private Securities Litigation Reform Act of 1995 and applicable Canadian Securities legislation. Forward-looking statements include, but are not limited to, statements with respect to the future price of gold, the realization of mineral reserve estimates, the timing and amount of estimated future production, costs of production, capital expenditures, costs and timing of the development of deposits, success of exploration activities, permitting time lines, currency exchange rate fluctuations, requirements for additional capital, government regulation of mining operations, environmental risks, unanticipated reclamation expenses, title disputes or claims and limitations on insurance coverage. Generally, these forward-looking statements can be identified by the use of forward-looking terminology such as “plans”, “expects” or “does not expect”, “is expected”, “budget”, “scheduled”, “estimates”, “forecasts”, “intends”, “anticipates” or “does not anticipate”, or “believes”, or variations of such words and phrases or state that certain actions, events or results “may”, “could”, “would”, “might” or “will be taken”, “occur” or “be achieved”.
With respect to forward-looking statements and the information included in this document, we have made numerous assumptions, including, among other things, assumptions about the price of gold, anticipated costs and expenditures and our ability to achieve our goals, even though our management believes that the assumptions made and the expectations represented by such statements or information will prove to be accurate. By their nature, forward-looking statements and information are based on assumptions and involve known and unknown risks, uncertainties and other factors that may cause our actual results, performance or achievements, or industry results, to be materially different from future results, performance or achievements expressed or implied by such forward-looking information. Such risks, uncertainties and other factors include among other things the following: gold price volatility; discrepancies between actual and estimated production and mineral reserves and resources; the speculative nature of gold exploration; mining operational and development risk; and regulatory risks. See our Annual Information Form for additional information on risks, uncertainties and other factors related.
Although the Company has attempted to identify important factors that could cause actual results to differ materially from those contained in forward-looking statements, there may be other factors that cause results not to be as anticipated, estimated or intended. There can be no assurance that such statements will prove to be accurate, as actual results and future events could differ materially from those anticipated in such statements. Accordingly, readers should not place undue reliance on forward-looking statements. The Company does not undertake to update any forward-looking statements that are incorporated by reference herein, except in accordance with applicable securities laws.
Cautionary Note to U.S. Investors Concerning Resource Estimates
Resource estimates reported herein are made in accordance with definitions adopted by the Canadian Institute of Mining, Metallurgy and Petroleum and incorporated into National Instrument 43-101 (“NI 43-101”). Estimates of mineral resources were prepared by or under the supervision of qualified persons who are identified in this document and other public filings. Yukon-Nevada reports its reserves and resources in accordance with NI 43-101, as required by Canadian securities regulatory authorities. For U.S. reporting purposes, Industry Guide 7 under the Securities Exchange Act of 1934, as amended (as interpreted by Staff of the U.S. Securities and Exchange Commission (the “SEC”)), applies different standards in order to
6
classify mineralization as a reserve. Accordingly, for U.S. reporting purposes all mineral resources must be considered as mineralized material. Mineral resources are not mineral reserves and do not have demonstrated economic viability, but do have reasonable prospects for economic extraction. Measured and indicated mineral resources are sufficiently well defined to allow geological and grade continuity to be reasonably assumed and permit the application of technical and economic parameters in assessing the economic viability of the resources. Inferred resources are estimated on limited information not sufficient to verify geological and grade continuity or to allow technical and economic parameters to be applied. Inferred resources are too speculative geologically to have economic considerations applied to enable them to be categorized as mineral reserves. There is no certainty that mineral resources will be upgraded to mineral reserves through continued exploration.
7
Item 1. Identity of Directors, Senior Management and Advisers.
Not applicable.
Item 2. Offer Statistics and Expected Timetable.
Not applicable.
Item 3. Key Information.
A. Selected financial data.
The following table summarizes certain of our selected financial information (stated in thousands of U.S. dollars) prepared in accordance with Canadian GAAP. The information in the table was derived from the more detailed financial statements for the period ended December 31, 2004 through the fiscal year ended December 31, 2008, inclusive, and the related notes, and should be read in conjunction with the financial statements and with the information appearing under the headings "Item 5 – Operating and Financial Review and Prospects" and "Item 18 – Financial Statements". Historical results are not necessarily indicative of results to be expected for any future period. No dividends have been paid in any of the fiscal years ended December 31, 2004 throughout the fiscal year ended December 31, 2008.
(In thousands of U.S. dollars, except where noted)
| December
31, 2008 | December
31, 2007 | December
31, 2006 | December
31, 2005 | December
31, 2004 |
| Gold sales | 48,981 | 64,460 | - | n/a | n/a |
| Cost of sales | 58,742, | 48,218 | - | n/a | n/a |
| Gross Margin | (9,761) | 16,242, | - | n/a | n/a |
| Temporary shutdown costs | 13,115 | - | - | n/a | n/a |
| Depletion, depreciation and amortization | 9,279 | 5,731 | 16 | n/a | n/a |
| Accretion | 2,117 | 1,082 | 145 | n/a | n/a |
| Earning (loss) from mining activities | (34,272) | 9,429 | (161) | n/a | n/a |
| Net loss | (105,360) | (1,899) | (1,189) | n/a | n/a |
| Basic and diluted net loss per share | (0.57) | (0.02) | (0.02) | n/a | n/a |
| Total assets | 199,636 | 296,167 | 31,912 | n/a | n/a |
| Share capital, warrants and contributed surplus | 234,579 | 213,415 | 33,867 | 21,587 | n/a |
| Accumulated deficit and accumulated other comprehensive loss | (112,931) | (7,571) | (8,271) | (6,756) | n/a |
| Net assets | 121,648 | 205,844 | 25,596 | n/a | n/a |
| Outstanding shares, in thousands | 272,655 | 175,133 | 58,950 | 46,643 | 25,299 |
Prior to July 1, 2007, the Company’s operations were measured in Canadian dollars and the consolidated financial statements were expressed in Canadian dollars. As a result of the significant operations (sales, assets) that are located in the United States arising from the acquisition of Queenstake Resources Ltd. (Queenstake) on June 20, 2007, it was determined that the Company’s functional currency had changed to the US dollar. Comparable numbers in U.S. dollars are not available for 2005 and 2004.
The following table summarizes certain of our selected financial information (stated in thousands of U.S. dollars) prepared in accordance with U.S GAAP:
(In thousands of U.S. dollars, except where noted)
| | December
31, 2008 | | | December
31, 2007 | | | December
31, 2006 | | | December
31, 2005 | | | December
31, 2004 | |
| Gold sales | | 48,981 | | | 64,460 | | | - | | | n/a | | | n/a | |
8
(In thousands of U.S. dollars, except where noted)
|
| December
31, 2008 |
|
| December
31, 2007 |
|
| December
31, 2006 |
|
| December
31, 2005 |
|
| December
31, 2004 |
|
| Cost of sales | | 58,742, | | | 48,218 | | | - | | | n/a | | | n/a | |
| Gross Margin | | (9,761 | ) | | 16,242, | | | - | | | n/a | | | n/a | |
| Temporary shutdown costs | | 13,115 | | | - | | | - | | | n/a | | | n/a | |
| Depletion, depreciation and amortization | | 9,665 | | | 5,731 | | | 16 | | | n/a | | | n/a | |
| Accretion | | 2,117 | | | 1,082 | | | 145 | | | n/a | | | n/a | |
| Earning (loss) from mining activities | | (34,658 | ) | | 9,429 | | | (161 | ) | | n/a | | | n/a | |
| Exploration expense | | 19,479 | | | 23,629 | | | 6,862 | | | | | | | |
| Net loss | | (111,139 | ) | | (21,631 | ) | | (7,029 | ) | | n/a | | | n/a | |
| Basic and diluted net loss per share | | (0.60 | ) | | (0.18 | ) | | (0.13 | ) | | n/a | | | n/a | |
| Total assets | | 158,119 | | | 260,801 | | | 31,192 | | | n/a | | | n/a | |
| Share capital, warrants and contributed surplus | | 231,408 | | | 214,202 | | | 33,867 | | | n/a | | | n/a | |
| Accumulated deficit and accumulated other comprehensive loss | | (149,157 | ) | | (38,018 | ) | | (8,271 | ) | | n/a | | | n/a | |
| Net assets | | 82,251 | | | 176,184 | | | 25,596 | | | n/a | | | n/a | |
| Outstanding shares, in thousands | | 272,655 | | | 175,133 | | | 58,950 | | | 46,643 | | | 25,299 | |
Prior to July 1, 2007, the Company’s operations were measured in Canadian dollars and the consolidated financial statements were expressed in Canadian dollars. As a result of the significant operations (sales, assets) that are located in the United States arising from the acquisition of Queenstake Resources Ltd. (Queenstake) on June 20, 2007, it was determined that the Company’s functional currency had changed to the US dollar. Comparable numbers in U.S. dollars are not available for 2005 and 2004
The Company acquired the Jerritt Canyon mine on June 20, 2007 with the acquisition of Queenstake Resource Limited (“Queenstake”). Jerritt Canyon consists of a milling facility as well as two underground mines, the Smith and the SSX. Jerritt Canyon operated continuously from the date of acquisition June 20, 2007 until February 22, 2008 when it shut down to address infrastructure and safety concerns noted above. In May 2008, Jerritt Canyon recommenced commercial production at reduced levels. On August 8, 2008 mining at Jerritt Canyon ceased again as a result of increasing costs and dilution resulting from the mine plan as well as the ongoing required development and infrastructure expenditures required resulting from years of neglect. As a result of repair work needed to a critical part of the process mill that was damaged in the subsequent week, the milling operation was also shut-down. Mining and milling operations did not resume for the remainder of 2008 while management pursued additional financing and continued work on addressing environmental concerns raised by the Nevada Division of Environmental Protection (NDEP) in their stop order issued in March of 2008. Milling operations resumed March 25, 2009 when restart approval was received from NDEP.
Currency and Exchange Rates
The following table sets out the exchange rates for currencies expressed in terms of one U.S. dollar in effect at the end of the following periods, and the average exchange rates (based on the average of the exchange rates on the last day of each month in such periods):
In Canadian $ | Year Ended December 31 |
| 2008 | 2007 | 2006 | 2005 | 2004 |
| End of period | 1.224 | 0.988 | 1.165 | 1.166 | 1.203 |
| Average for the period | 1.066 | 1.074 | 1.134 | 1.212 | 1.302 |
9
In Canadian $
| July
2008 | August
2008 | September
2008 | October
2008 | November
2008 | December
2008 |
| High for the month | 1.026 | 1.068 | 1.080 | 1.294 | 1.285 | 1.297 |
| Low for the month | 1.002 | 1.025 | 1.034 | 1.061 | 1.150 | 1.196 |
Exchange rates are based upon the noon buying rate in New York City for cable transfers in foreign currencies, as certified for customs purposes by the Federal Reserve Bank of New York. The noon rate of exchange on March 31, 2009 as reported by the United States Federal Reserve Bank of New York for the conversion of United States dollars into Canadian dollars was C$1.24960 = US$1.00.
B. Capitalization and indebtedness.
This Form 20-F is being filed as an annual report under the Exchange Act, and, as such, there is no requirement to provide any information under this item.
C. Reasons for the offer and use of proceeds.
This Form 20-F is being filed as an annual report under the Exchange Act, and, as such, there is no requirement to provide any information under this item.
D. Risk factors.
We operates in a dynamic and rapidly changing environment that involves numerous risks and uncertainties. Shareholders should carefully consider the risks described below before purchasing our common shares. The occurrence of any of the following events could harm us. If these events occur, the trading price of our common shares could decline, and shareholders may lose part or even all of their investment.
Precious Metal Price Fluctuations
Our profitability from proposed operations will be dependent in part on:
| | | the market price of precious metals; |
| | | |
| | | the price of metals or interests related thereto has fluctuated widely and is affected by numerous factors beyond our control including: |
| | | |
| | | | international economic and political conditions; |
| | | | expectations of inflation |
| | | | international currency exchange rates; |
| | | | interest rates; |
| | | | global or regional consumptive patterns; |
| | | | speculative activities; |
| | | | levels of supply and demand; |
| | | | increased production due to new mine developments and improved mining and production methods; |
| | | | availability and costs of metal substitutes; and |
| | | | metal stock levels maintained by producers and others and inventory carrying costs. |
Although we cannot predict the exact effect of these factors, the combination of these factors may result in not receiving an adequate return on invested capital or an investment retaining its value.
10
Operating Hazards and Risks
Mining operations involve a high degree of risk, such as unusual or unexpected formations and other conditions, which even a combination of experience, knowledge and careful evaluation may not be able to overcome. Operations in which we have a direct or indirect interest are subject to all the hazards and risks normally incidental to exploration, development and production of precious metals, any of which could result in work stoppages, damage to or destruction of mines and other producing facilities, damage to life and property, environmental damage and possible legal liability for any or all damage. We presently carry a limited amount of liability insurance, and may become subject to liability for pollution, cave-ins or other hazards, and the payment of such liabilities could have a material adverse effect on its financial position.
Exploration and Development
Mineral exploration and development involves a high degree of risk as few properties which are explored are developed into producing mines. We cannot provide assurance that our continuing mineral exploration and development activities will result in any discoveries of bodies of commercial ore. The long-term profitability of the operations will be in part directly related to the cost and success of its exploration and development programs, which may be adversely affected by a number of factors.
We will require funding for the substantial expenditures which are required to establish reserves through drilling, to evaluate metallurgical processes to extract metal from ore and to develop the mining and processing facilities and infrastructure at any site chosen for mining. Although substantial benefits may be derived from the discovery of a major mineralized deposit, no assurance can be given that minerals will be discovered in sufficient quantities to justify commercial operations or that the funds required for development can be obtained on a timely basis.
Numerous factors will affect the marketability of any minerals acquired or discovered which are beyond our control and cannot be accurately predicted, including market fluctuations, the proximity and capacity of milling facilities, mineral markets and processing equipment, and such other factors as government regulations, including regulations relating to royalties, allowable production, importing and exporting minerals and environmental protection.
Calculation of Reserves, Resources and Metal Recoveries
There is a degree of uncertainty attributable to the calculation of reserves and resources and corresponding grades being mined or dedicated to future production. Until reserves or resources are actually mined and processed, the quantity of mineralization and grades must be considered as estimates only. In addition, the quantity of reserves and resources may vary depending on metal prices. Any material change in quantity of reserves, resources, grade, stripping ratio, or metallurgical recoveries may affect the economic viability of our properties. In addition, we cannot provide assurance that metallurgical recoveries in small scale laboratory tests will be duplicated in larger scale tests under on-site conditions or during production.
Title to Mining Properties
Although we have taken steps to verify title to our mineral properties in a manner consistent with industry practice for the current stage of its evaluation of our properties, there is no guarantee that its title to the properties will not be challenged or impugned. We have not conducted surveys of some of the claims in which we hold a direct or indirect interest, therefore the precise area and location of the claims may be in doubt. There could be prior unregistered agreements or transfers or native land claims and our title may be affected by undetected defects.
Issuance of Debt
We may enter into transactions to acquire assets or the shares of other corporations which may be financed partially or wholly with debt, which may increase our debt levels above industry standards. Our articles do not limit the amount of indebtedness that we can incur. The level of our indebtedness could impair our ability to obtain additional financing in the future to take advantage of business opportunities that may arise.
11
Dilution
In order to finance its working capital requirements and to raise equity for the development of its projects we may enter into commitments which would require the issuance of additional shares, options, warrants and convertible debt. These commitments will comply with securities laws and could require the approval of the securities regulatory bodies, and in some cases, our shareholders.
Regulatory and environmental matters
The following discussion is necessarily brief and must not be taken to constitute a complete discussion of the various statutes, rules and governmental orders to which our operations may be subject. Our existing properties are located in Canada and the United States, and are subject to extensive federal, provincial and local governmental regulations in these countries. These regulations may be revised or expanded at any time. A broad number of matters are subject to regulation. Generally, compliance with these regulations requires us to obtain permits issued by federal, provincial and local regulatory agencies. Certain permits require periodic renewal or review of their conditions. It is impossible to predict whether it will be possible to obtain or renew such permits or whether material changes in permit conditions will be imposed. The inability to obtain or renew permits or the imposition of additional conditions could have a material adverse effect on our ability to develop and operate its properties.
Environmental laws and regulations to which we are subject as we progresses from the development stage to the production stage give rise to additional concerns and requirements. Failure to comply with applicable laws, regulations and permits can result in injunctive actions, suits for damages, and civil and criminal penalties. The laws and regulations applicable to our activities change frequently and it is not possible to predict the potential impact to us from any such future changes.
Passive Foreign Investment Company (“PFIC”)
We have not determined whether we meet the definition of PFIC, within the meaning of Sections 1291 through 1298 of the U.S. Internal Revenue Code of 1986, as amended, for the current tax year and any prior tax years. We may or may not qualify as a PFIC in subsequent years due to changes in its assets and business operations. A U.S. shareholder who holds stock in a foreign corporation during any year in which such corporation qualifies as a PFIC is subject to numerous special U.S. federal income taxation rules and may elect to be taxed under two alternative tax regimes. A U.S. shareholder should consult their own U.S. tax advisor with respect to an investment in our shares and to ascertain which of the alternative tax regimes, if any, might be beneficial to the U.S. shareholder’s own facts and circumstances.
Enforcement of Civil Liabilities
We are incorporated under the laws of British Columbia, Canada. Some of our assets are located outside the United States and our directors and officers are residents of countries other than the United States. It could be difficult for our investors to effect service of process within the United States upon us and our directors and officers, or to realize in the United States upon judgments of courts of the United States predicated upon civil liability of us and our directors and officers under United States federal securities laws.
Item 4. Information on the Company.
A. History and Development of the Company.
The full corporate name of the company is Yukon-Nevada Gold Corp. (the “Company” or “Yukon-Nevada”). We were incorporated under the laws of the Province of British Columbia, Canada under the name “YGC Resources Ltd.” (“YGC”) on May 30, 1988. On January 25, 2002, we were struck from the Register of Companies for British Columbia and dissolved. We were restored to the Register on August 1, 2003. By Combination Agreement dated March 16, 2007 with Queenstake Resources Ltd. (“Queenstake”), we entered into an Arrangement with Queenstake, providing for, among other things, our acquisition of all of the issued and outstanding shares of Queenstake. The Arrangement closed on June 20, 2007, at which time we changed our name to our current name.
12
| Our head office address is: | #490, 688 West Hastings Street |
| | Vancouver, BC, V6B 1P1 |
| | Telephone: 6074-688-9427 |
| | |
| And our registered office address is: | #1040, 999 West Hastings Street |
| | Vancouver, B.C. V6C 2W2 |
| | Telephone: 604-683-1102 |
We do not have a registered agent in the United States.
We acquired the Jerritt Canyon gold mine upon completion of the plan of arrangement with Queenstake on June 20, 2007. On May 30, 2003, Queenstake entered into a definitive asset purchase and sale agreement with subsidiaries of AngloGold Limited and Meridian Gold Inc. (collectively, the “Sellers”) pursuant to which Queenstake agreed to acquire the Sellers’ respective 70% and 30% interests in the assets comprising the operating Jerritt Canyon gold mine. The acquisition closed on June 30, 2003. The Jerritt Canyon mine is a large-scale underground gold mining operation with significant exploration potential.
The table below shows our principal capital expenditures for the past three years: (in thousands of US dollars):
| Fiscal Year | Property, plant and equipment | Mineral properties |
| Fiscal 2006 | $376 | $6,559 |
| Fiscal 2007 | $6,266 | $26,588 |
| Fiscal 2008 | $25,703 | $29,104 |
For the past three fiscal years, we have financed our operations through the financings listed in the table shown below (in Canadian dollars).
| Date of Offering | Nature of Issuance | Number of Shares | Capital Raised |
| May 30, 2006 | Private Placement (1) | 5,500,000 | $8,250,000 |
| June 14, 2006 | Private Placement (2) | 1,449,298 | $2,170,100 |
| December 21, 2006 | Private Placement (3) | 900,000 | $2,250,000 |
| June 2007 | Private Placement (4) | 65,326,521 | $76,233,355 |
| October 5, 2007 | Private Placement (5) | 5,000,000 | $10,000,000 |
| May 12, 2008 | Private Placement (6) | 10,050,000 | $20,100,000 |
| July 17, 2008 | Promissory Note (7) | - | $4,500,000 |
| December 18, 2008 | Private Placement (8) | 79,800,000 | $3,990,000 |
| (1) | 5,500,000 flow-through shares were sold at C$1.50 per share. A commission of 88,846 Shares was issued to the Agent, as a portion of the Agent’s commission, and 385,000 Agent’s Options were issued at closing; |
| (2) | 1,430,067 Flow-Through Shares (the “FT Shares”) were sold at C$1.50 per FT Share and 19,231 Non-Flow-Through Shares (the “NFT Shares”) were sold at C$1.30 per NFT Share. No commission was paid. |
| (3) | 900,000 Flow-Through Shares were sold at a price of C$2.50 per FT Share. No commission was paid. |
| (4) | 42,351,864 Subscription Receipts (the “Subscription Receipts”) were sold at a price of C$1.80 per Subscription Receipt. Each Subscription Receipt is exercisable into one unit. Each Unit consists of one common share and ½ of one transferable common share purchase warrant (a “Warrant”). Each whole Warrant entitles the holder to purchase one additional share (a “Warrant Share”) at the price of C$3.00 per Warrant Share for a period of five years. A commission of 1,798,725 agents’ options (the “Agents’ Options”) were issued to the Agents. Each Agent’s Option entitled the Agents to purchase for a period of two years from the closing of the Plan of Arrangement, an agents’ share (an “Agent’s Option Share”) at a price of C$2.10 per Agents’ Option Share. |
| (5) | 5,000,000 Flow-Through Shares were issued at a price of C$2.00 per FT Share. No commission was paid. |
| (6) | 10,500,000 Flow-Through Shares were issued at a price of C$2.00 per FT Share. No commission was paid. |
| (7) | 250,000 Warrants were issued exercisable at a price of C$3.00 per share on or before June 20, 2012. |
| (8) | 79,800,000 Units were sold at a price of C$0.05 per unit, each unit comprising one common share (a “Share”), one series “A” share purchase warrant (the “”A” Warrant”), each “A” Warrant entitling the holder to purchase one additional share at a price of C$0.07 for a period of 12 months from the closing and one series “B” share purchase warrant (the ”B” Warrant”), each “B” Warrant entitling the holder to purchase one additional share at a price of C$0.09 for a period of 18 months from the closing. A commission of 7,400,000 Units were issued. |
13
The information contained in this Annual Report is current as at December 31, 2008, other than where a different date is specified.
B. Business overview.
The principal businesses of the Company are the mining of the Jerritt Canyon gold mine in Nevada and toll milling with the existing facility, as well as the acquisition, exploration and development of economically viable natural resource properties with a particular focus on the Ketza River Property in the Yukon Territory.
Jerritt Canyon Property, Nevada, USA
We acquired the Jerritt Canyon gold mine upon completion of its plan of arrangement with Queenstake Resources Inc. (“Queenstake”) on June 20, 2007. On May 30, 2003, Queenstake entered into a definitive asset purchase and sale agreement with subsidiaries of AngloGold Limited and Meridian Gold Inc. (collectively, the “Sellers”) pursuant to which Queenstake agreed to acquire the Sellers’ respective 70% and 30% interests in the assets comprising the operating Jerritt Canyon gold mine. The acquisition closed on June 30, 2003.
Jerritt Canyon is a gold property with two underground mines, ore stockpiles and a 1.5 million ton per year capacity processing plant. In addition, the approximately 119 square miles that comprise the Jerritt Canyon property offer a significant number of advanced, early stage and district-scale exploration targets and potential to expand the currently defined mineral reserves and resources proximal to the producing mines.
Ketza River Property, Yukon, Canada
We have owned the Ketza River Gold Property in the Yukon, since 1994. This former producing mine was shut down in November, 1990, due to the depletion of known reserves of oxide ore. The Ketza River Gold Property includes 308 mineral claims and leases, a gold mill and all associated chattels, tools, equipment and licences. Our President, Mr. Dickson, who is also a chemist and a professional mining consultant, identified areas which were under-explored and which could be mined and processed by different methods than those employed in the past. In particular, he identified the possibility of discovering significant quantities of sulphide ore. We have completed diamond drilling that resulted in the discovery of the Chimney and Fork zones and geologic mapping, prospecting, sampling and diamond drilling on the Shamrock zone. We are also carrying out an aggressive diamond drill program in an effort to increase mineral resources, to prepare a feasibility study and, if the results of the feasibility study are positive, to return the Property to commercial production as a mine.
Principal Markets
Product fabrication and bullion investment are the two principal uses of gold. Within the fabrication category there are a wide variety of end uses, the largest of which is the manufacture of jewelry. Other fabrication purposes include official coins, electronics, miscellaneous industrial and decorative uses, dentistry, medals and medallions.
Revenues
100% of our gold sales are to customers outside of the consolidated entity and are from our Jerritt Canyon property in Nevada, U.S.
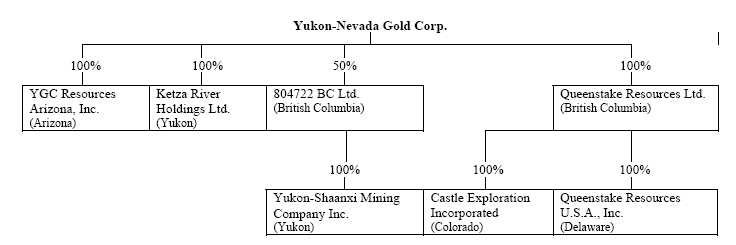
C. Organizational Structure.
Set forth below are the names of our subsidiaries:
14
D. Property, plants and equipment.
(a) Jerritt Canyon Property, Nevada, USA
On June 30, 2003, one of our subsidiaries, Queenstake Resources Ltd. (“Queenstake”), acquired the Jerritt Canyon mine in Nevada. The Jerritt Canyon mine is an operating gold property with two producing underground mines and ore stock piles, currently feeding ore to a 1.5 million ton per year capacity processing plant.
15
Figure 1: General Location Map of the Jerritt Canyon Mine

16
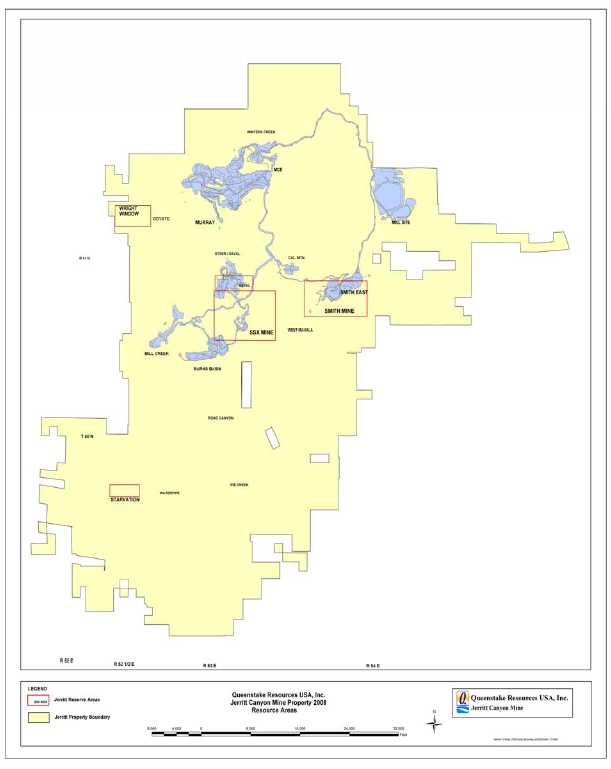
Figure 2: General Land Map of the Jerritt Canyon District
17
Accessibility, Climate, Local Resources, Infrastructure and Physiography
The Jerritt Canyon Mine is located in Elko County, Nevada, approximately 50 miles north of Elko. Access to the property is by State Road 225 to the mine access road. The roads are paved and in excellent condition all the way to the main gate where the administrative offices, process plant, warehouse, and tailings impoundment are located. The mines are accessed by haul roads on Queenstake controlled land.
The climate is temperate with winter temperatures between 0ºF and 40ºF and summer temperatures between 35ºF and 90ºF. Average annual precipitation at the tailings impoundment is estimated at 14 inches per year with an estimated annual average evaporation of 43 inches. A significant amount of the total precipitation falls as snow and increases with elevation to the mining areas. Mine operations are only rarely halted by weather conditions, although ore haulage from the mines may be slowed. The mill, warehouse, shop, and administrative facilities are at a lower elevation and therefore are less exposed to weather extremes.
The vegetation is typical of the Basin and Range province with sagebrush vegetation dominant at the lower elevations. Small stands of aspen and isolated fir trees grow in canyons and drainages.
Jerritt Canyon mine is located in the Independence Mountain Range in the Basin and Range province of northern Nevada. The topography ranges from about 6,400 feet at the administrative facilities and mill site to about 8,000 feet at the highest point of the haul road to the mines.
Elko, Nevada with a population of about 36,000 is the closest city to the mine. The city is on Interstate 80 and is serviced by daily commercial flights to Salt Lake City, Utah. Elko is a center for the mining operations in northern Nevada and services necessary for the mine are readily available there.
History
The Jerritt Canyon mine is wholly owned by Queenstake Resources Ltd. after the purchase by that company from the joint venture of Anglo Gold and Meridian Gold in June 2003. The joint venture was formed in 1976 between Freeport Minerals Company, later Freeport McMoran Inc., and FMC, later Meridian Gold. In 1990, Freeport sold its interest in Jerritt Canyon to Minorco and their wholly owned subsidiary, Independence Mining Company, which became the new joint venture partner and operator of the mine. In 1998, Minorco’s North American gold assets, including a 70% interest in Jerritt Canyon were sold to Anglo Gold.
Prospectors explored for antimony in the 1910’s. Thirty to forty tons of stibnite as antimony ore were reportedly mined and shipped from the Burns Basin mine in the Jerritt Canyon district between 1918 and 1945. In the early 1970’s there was a renewed interest in antimony exploration when its price reached historic highs of $40 per pound. Around 1971, FMC began exploring for antimony in the Independence Mountains. In 1972, FMC, later known as Meridian, discovered a disseminated gold deposit in the Jerritt Canyon area. In 1976, a joint venture was formed with Freeport Minerals Company to explore and develop the area, and mining commenced at Jerritt in 1981.
Open pit mining was conducted at the site from startup in 1981 until 1999. The first underground operation at Jerritt Canyon started up in 1993 at West Generator. The mine during 2006 consisted of three underground mining operations feeding ore to a process plant consisting of a roaster followed by carbon-in-leach processing. The mines are mechanized operations using backfill for ground control and to increase ore recovery. In the early years, the ores mined at the operation were less refractory and were processed through a “wet” mill. This “wet” mill continued to operate until 1997 and is still located on site. With ores becoming more carbonaceous and refractory, as well as with the introduction of higher-grade ore from underground operations, a dry mill with an ore roasting circuit was added in 1989 and is currently in operation.
Since its inception, the Jerritt Canyon Mine has produced over seven million ounces of gold. Annual production has historically averaged between 125,000 and 350,000 ounces of gold. Queenstake reports the 2007 mill production at 175,645 ounces of gold comprised of 126,140 ounces of gold from Jerritt Canyon ores and 49,505 ounces of gold from toll milled ores. This production is from a total of 968,130 tons of ore comprised of 619,933 tons of Jerritt Canyon ore and 348,197 tons of toll milled ore.
18
Surface exploration drilling and underground core drilling which is also used as an exploration tool, decreased from 2001 to 2002, when the former owner, Anglo Gold shifted focus from exploration to reserve development. In 2000, about 445,000 feet of exploration and development were completed, of which 165,000 feet consisted of surface Reverse Circulation (RC) drilling and the remainder was underground (UG) core and RC drilling. In 2001, a total of about 500,450 feet were drilled, 65,450 of which were surface RC holes. In 2002, 435,000 feet were drilled, all of which were from underground. After the acquisition of Jerritt Canyon at mid-2003, Queenstake started more aggressive exploration and mine development programs and those programs have continued throughout 2006. These programs were continued after the merger of Queenstake Resources and YGC Resources in 2007.
The measured and indicated mineral resources, including reserves, at Jerritt Canyon during Queenstake’s ownership, as documented in NI 43-101 filings are given in Table 1.
Table 1: Historic Measured and Indicated Mineral Resources during Queenstake’s Ownership
| Year | Tons | Grade | Ounces |
| 2003 | 9,497,000 | 0.242 | 2,295,000 |
| 2004 | 9,988,000 | 0.241 | 2,410,000 |
| 2005 | 8,812,000 | 0.236 | 2,079,000 |
| 2006 | 8,203,000 | 0.232 | 1,907,000 |
The proven and probable reserves at Jerritt Canyon during Queenstake’s ownership, as documented in NI 43-101 filings are given in Table 2.
Table 2: Historic Proven and Probable Mineral Reserves during Queenstake’s Ownership
| Year | Tons | Grade | Ounces |
| 2003 | 3,065,000 | 0.268 | 820,000 |
| 2004 | 3,511,000 | 0.249 | 875,000 |
| 2005 | 3,723,000 | 0.236 | 878,000 |
| 2006 | 1,985,000 | 0.245 | 486,000 |
Geological Setting
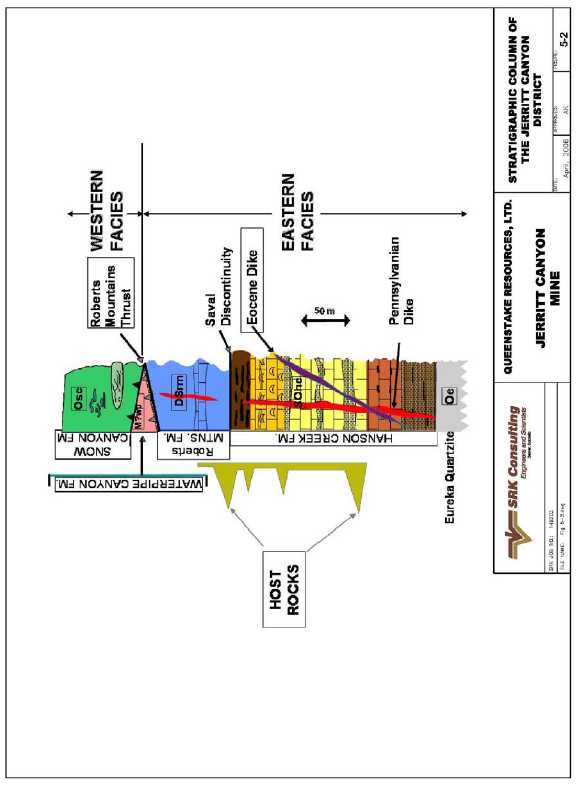
The Jerritt Canyon mining district is located in the Independence Mountain Range in northern Nevada. The range is part of the Basin and Range province of Nevada and is a horst block consisting primarily of Paleozoic sedimentary rocks with lesser Tertiary volcanics and intrusive dikes. A district geologic map is shown in Figure 3 and a stratigraphic column is shown in Figure 4.
There are four distinct assemblages in the district, characterized by their position relative to the Roberts Mountains thrust, a Devonian to Mississippian structure formed during the Antler orogeny:
The western facies, or upper plate of the thrust, consists of the Cambrian to Ordovician Valmy Group and forms about 70% of the exposed rock in the area. In the Jerritt Canyon district, the Valmy Group consists of the Snow Canyon formation, a chert, argillite, greenstone, and carbonaceous siltstone sequence, and the McAfee Quartzite, a sequence of massive quartzite and shale;
The eastern facies, or lower plate of the thrust, consists of a sequence of Ordovician to Devonian shallow water sedimentary rocks that are exposed in tectonic and erosional windows through the upper plate. The gold mineralization in the district is contained with the eastern facies rocks. The Pogonip Group rock is exposed in the west-central part of the district and is composed of fossiliferous limestone with calcareous shale and dolomite interbeds. The Eureka Quartzite is a massive quartzite with minor interbeds of siltstone. The Hansen Creek Formation is one of two principal ore hosts in the district. It is divided into five units, with the contacts between the units being the favorable sites of gold mineralization. The Hansen Creek consists of interbedded silty limestone, calcareous siltstone, dolomite, chert, and carbonaceous limestone. The Roberts Mountains Formation is the second ore host and consists of calcareous, carbonaceous siltstone and thinly bedded, silty limestone. The Waterpipe Canyon formation is thought to have been deposited in a synkinematic foreland basin that formed during the Antler orogeny; it
19
consists of greywacke with interbedded carbonaceous shale, chert pebble conglomerate, bedded chert, sandstone, and siltstone;- The Schoonover sequence occurs north of the district and consists of basaltic and andesitic greenstone, chert, tuff, volcaniclastics, and siliciclastic and limestone turbidites of Devonian to Permian age; and
- The Antler overlap sequence is restricted to the north end of the range and consists of conglomerates, argillite, siltstone and limestone.
There are four sets of dikes: Pennsylvanian basalt dikes, Eocene basalt and quartz monzonite dikes and a Miocene basalt dike. The Pennsylvanian and Eocene basaltic dikes are altered and mineralized in most of the mines.
The regional structural setting of the Jerritt Canyon district is complex, with several regional deformation events being evident. The Devonian to Mississippian Antler orogeny, resulting from west to east compression, is represented in the upper plate Snow Canyon Formation with north-south folds in both the hanging wall and footwall of the thrust. The Permian to Triassic Sonoma orogeny emplaced the Golconda allochthon over parts of the Roberts Mountains allochthon to the north of the district. The northwest to southeast compression associated with this deformation is rarely seen in the district. The Jurassic to Cretaceous Nevadan orogeny resulted in east-west folds that are often associated with mineralization.
Within the Jerritt Canyon area, gold can locally occur within all sedimentary formations, but is preferentially hosted by the Roberts Mountains and Hansen Creek Formations of the eastern facies in the lower plate of the Roberts Mountains thrust . The Roberts Mountains Formation consists of calcareous to dolomitic siltstones and silty limestones. The Hansen Creek Formation is divided into five members, numbered I through V from the top of the formation to the bottom. Hansen Creek I is a thinly bedded sequence of gray, medium-grained limestones and continuous blocky chert beds; it is typically brecciated. Hansen Creek II is a dark to light gray, irregularly bedded to massive, vuggy, dolomitic limestone. Hansen Creek III consists of intercalated carbonaceous micrites and laminated argillaceous limestones. Hansen Creek IV is a thickly bedded, medium to coarse-grained, carbonaceous limestone with discontinuous black chert nodules. Hansen Creek V consists of laminated, carbonaceous siltstone with chert lenses.
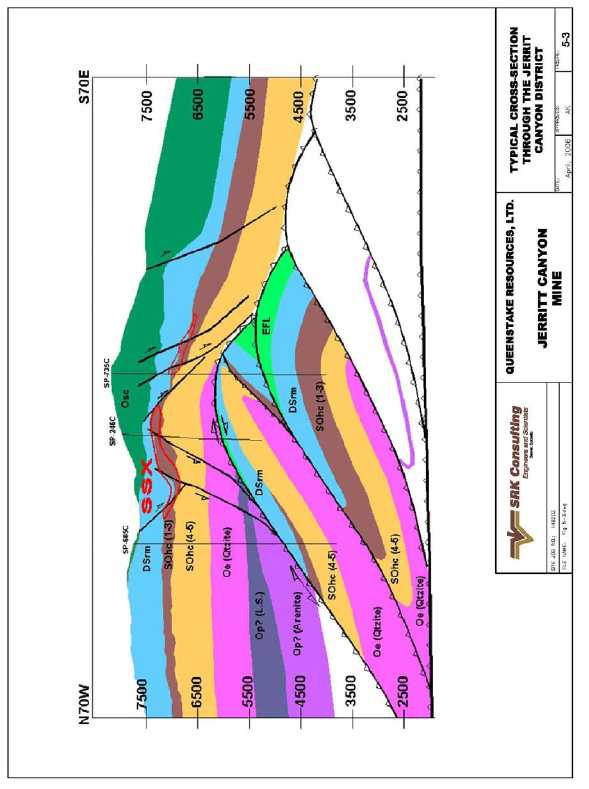
The contact between the Roberts Mountains Formation and the overlying Snow Canyon Formation is a regional thrust fault which transported the Snow Canyon eastward over the Roberts Mountains Formation. The contact between the Roberts Mountain Formation and the underlying Hansen Creek Formation is a discontinuity locally known as the Saval discontinuity. The discontinuity may be an angular unconformity of local extent or a thrust fault. The base of the Hansen Creek is gradational into the Eureka Quartzite. Locally, the stratigraphic section has been repeated by thrust faulting as seen in the cross-section through the SSX mine in Figure 5.
Alteration in the Jerritt Canyon district includes silicification, dolomitization, remobilization, and reconstitution of organic carbon, decalcification, and argillization. The rocks also exhibit hypogene and supergene oxidation and bleaching. The most importation alteration types relative to gold deposition are silicification, remobilization and redeposition of organic carbon and decalcification.
20
Figure 3: General Geology Map of the Jerritt Canyon District

21
Figure 4: Stratigraphic Column of the Jerritt Canyon District
22
Figure 5: Typical Cross-Section through the Jerritt Canyon District
23
Exploration
The Jerritt Canyon district was explored by prospectors looking for antimony in the early 1900’s. FMC Corporation, exploring for antimony in the 1970’s, discovered gold occurrences similar to those in the nearby Carlin trend. In 1976, FMC, then known as Meridian Mining, formed a joint venture with Freeport Minerals to explore and develop the deposits. Mining commenced in 1981 with the North Generator open pit.
Since then, the operators of Jerritt Canyon have conducted exploration programs for the identification and development of new mineralized areas. Several open pit deposits were discovered, developed, and mined during the 1980’s and 1990’s, including North Generator, Alchem, Marlboro Canyon, Burns, Steer, Saval and Dash. Underground targets were also identified, and the first to be exploited was the West Generator underground deposit in 1993. The Murray deposit, originally discovered by condemnation drilling, has produced over 1 million ounces. The SSX deposit was discovered in the early 1990’s by geologists following the structural trends between Burns Basin and California Mountain open pits. The SSX mine has also produced over 1 million ounces. The MCE, Smith, and Steer extension of SSX are more recent discoveries.
The Jerritt Canyon operation has had a history of exploration and discovery since the 1970’s. In the last few years until Queenstake’s acquisition of the property, most of the exploration efforts have been concentrated at and around the existing underground mines. Exploration efforts in the southern part of the range were directed to areas such as Water Pipe, Pie Creek, and Starvation Canyon. Queenstake has increased the exploration effort near the mine areas and also in the south. As a result, the known mineralization at Starvation Canyon has increased in size and quality so that a portion of it was included in the end of 2005 reserves. Additional drilling at Starvation Canyon in 2006 and 2007 was targeted toward further definition and expansion of the resource.
Queenstake has carried out an aggressive program of exploration since its acquisition, with the following footages drilled in the past four years of its ownership of the property:
| | | 2003: | 280,151 feet of underground and surface RC and Core Drilling; |
| | | | |
| | | 2004: | 710,896 feet of underground and surface RC and Core Drilling; |
| | | | |
| | | 2005: | 450,694 feet of underground and surface RC and Core Drilling; |
| | | | |
| | | 2006: | 396,063 feet of underground and surface RC and Core Drilling, and |
| | | | |
| | | 2007: | 467,242 feet of underground and surface RC and Core Drilling; and |
| | | | |
| | | 2008: | 237,517 feet of underground and surface RC and Core Drilling. |
Queenstake continues to evaluate its landholdings with the objective of focusing future exploration and drilling the most promising areas both near and away from the existing mines.
Mineralization
SSX Mine
The drift connecting the SSX and Steer mines was completed in the latter half of 2005 and the mines have been operated as a single unit referred to as the SSX complex since then. In 2007 a drift out to the Saval III portal was completed allowing access to the resource extending in the pit wall.
The SSX deposit was discovered in the early 1990’s following the northeast structural trends between the Burns Basin and California Mountain deposits and the west-northwest trends from the Steer/Saval deposits. Mining started in 1997, and SSX has been the main ore producer for the last few years.
Mineralization at the SSX mine occurs mostly in the micritic unit III of the Hansen Creek Formation. A smaller portion of the mineralization occurs in calcareous siltstone at the base of the Roberts Mountains Formation or in the upper two cherty and dolomitic members of the Hansen Creek Formation. Mineralized zones are localized in and near west-northwest trending steeply dipping dikes (e.g. South Boundary Dike); however, dike material is a minor component of the ore at SSX. Mineralization is also localized along cross-cutting northeast trending faults (the Purple Fault in Zones 4 and 6, and the
24
Crestline Fault in Zone 1). Folding of the mineralized horizons is apparent along axes parallel to the west-northwest dike trend and, more prominently, parallel to the northeast fault set. Gold occurs in decarbonitized rock, commonly in association with variable amounts of orpiment and realgar. Silicification with stibnite can also be associated with gold in portions of the upper cherty member of the Hansen Creek Formation. The intersection of the northeast and west-northwest structural trends remain a primary target for resource expansion. The westward extension of the South Boundary Dike and the West Mahala resource to the east represent exploration opportunities.
Gold mineralization in the Steer portion of the SSX complex has been identified in an area stretching approximately 3,000 feet east from the old Steer pit to halfway along the connection drift to SSX Zone 5. Most gold mineralization at Steer is associated with gently dipping structures cutting through the Hansen Creek III unit. These structures strike northeast and dip southeast, offsetting individual strata. Typical ore zones follow the structures and tend to be broad and relatively thin. The mineralized zones are usually at the contact between the Hansen Creek units III and IV and occasionally follow the structures up through the Hansen III. Both within the Steer portion and the western side of SSX several low-angle features have been observed. These features are at least partly responsible for the gold mineralization at the contact of the Hansen Creek Units III and IV.
In the eastern portion of the Steer area, high-grade mineralization is associated with the Husky fault, a major northeast trending normal fault with at least 300 feet of normal dip-slip displacement to the southeast. Major northwest trending dikes appear to have locally compartmentalized high-grade mineralization. The intersection of these dikes with the Hansen III unit and the Husky fault and its related structures offers excellent exploration potential. One of these dikes is interpreted to be the western extension of the South Boundary dike, which is an important ore-controlling structure at the SSX mine to the east.
At Steer and SSX the structural intersections are the primary targets for resource expansion, as well as the westward extension of the South Boundary dike. In the eastern part of the SSX complex, the West Mahala mineral resource remains an excellent exploration opportunity.
Smith Mine
The Smith Mine, accessed from the Dash open pit, was started in 1999 as the pit was being mined out. The Smith Mine complex consists of several distinct areas that are accessed from the Smith portal, as well as an area to the east, East Dash, that will be accessed from a separate portal in the Dash pit. During 2006 the portal was developed to access mineralization in the east highwall of the Dash pit.
Gold mineralization in the main Smith, Mahala, and West Dash deposits is associated with the northeast trending Coulee Fault and west-northwest trending faults and dikes. In Zone 1, high-grade gold mineralization is hosted in the upper and middle portions of the Hansen Creek Formation unit III within a northwest trending horst block between the South Graben fault and the 170 fault. Mineralization in Zones 2 and 3 is directly associated with west-northwest trending dikes. High-grade mineralization occurs within the Hansen Creek units II and III along the steeply dipping dikes. Lesser amounts of mineralization exist at higher levels where the dikes intersect favorable beds in the Roberts Mountains Formation. An exception to the tight elevation controls on mineralization is at the intersection of the west-northwest trending dikes and Coulee fault. Here, high-grade mineralization blows out into the Hansen Creek unit III along the west plunging intersection of the dikes and the fault for a down-dip depth of 600 ft.
Gold mineralization in the Mahala area is spatially associated with the west-northwest trending Mahala fault and associated dikes and favorable ore-host stratigraphy including units II and III of the Hansen Creek Formation and lower beds of the Roberts Mountains Formation. Mineralization at East Mahala occurs primarily in broad, SE-dipping lenses in Roberts Mountains Formation in the hanging wall of the Coulee Fault
The B-Pit deposit occurs as gently dipping, thin lenses of mineralized material north of the main Smith deposit. Three of the four lenses occur are stratigraphically bound within the Roberts Mountains Formation. The fourth lens occurs at the top of the Hansen unit III in the wall of a NW-trending horst block just to the south of the other three zones.
The West and East Dash deposits occur at the extreme ends of the west-northwest trending Dash Fault system which formed the mineralization mined in the Dash pit. The West Dash deposit occurs at the intersection of the Coulee fault and the west-northwest trending Dash fault. Most gold mineralization at West Dash occurs in fault-bounded slices of Hansen Creek unit III with minor amounts in the overlying Hansen Creek unit II and Roberts Mountains Formation. West Dash is accessed through
25
the Smith Portal. The East Dash deposit lies to the east of the Dash pit. A portion of this deposit has been accessed by a small portal in the pit. At East Dash, most gold occurs in two lenses parallel to the Dash Fault and dipping to the northeast. The largest lens is about 1,100 feet and is 15 feet to 25 feet thick. The north edge of the lens seems to be bounded by a steep east-west trending fault that is locally mineralized with high-grade material. The second lens is smaller at about 350 feet across, but much thicker, up to 120 feet.
In 2007, surface and underground drilling along the western extension of the Coulee and Mahala Dike Trends, revealed additional mineralization which was brought into the resource category during the year. The results from drilling in 2008 are expected to extend the mineralization further.
Murray Mine
The Murray Mine occurs within the Roberts Mountains Formation and the top three units of the Hansen Creek Formation. A minor amount of mineralization also occurs within the silicified unit IV of the Hansen Creek Formation. It was originally discovered by condemnation drilling for a waste dump for one of the early open pits. Mineralization in the main Murray deposit occurs along the New Deep Fault which is a wrench fault striking west -northwest and dipping 50º to 60º to the northeast. Mineralization in Zone 7 located about 750 feet north of the New Deep Fault occurred within calcareous siltstone beds of the Roberts Mountains Formation. Zone 7 and the main Murray have been largely mined out, with remnant pockets of mineralization remaining.
Zone 9 mineralization is located immediately west of the main Murray deposit and is associated with a westward projection of the New Deep Fault and several northeast trending faults. It was the focus of drilling campaigns in 2002-2005. Although there was no additional drilling in this resource it was removed from reserves in 2006 because of economics and possible water issues. It consists of two separate areas, a relatively flat-lying zone at the base of the Roberts Mountains Formation and a main zone which is associated with the New Deep fault. Mineralization is hosted by the Hansen Creek III which is locally overlain by the Snow Canyon Formation
Starvation Canyon
Mineralization at the Starvation Canyon project occurs at the Hansen II-III contact and is localized along a west-northwest fault zone at northeast structural intersections. The majority of the mineralization is within the interbedded micrite and argillaceous limestone of the Hansen Creek III, starting at or just beneath the contact. There are instances where mineralization has formed within the massive limestone of the basal Hansen Creek II, but these are rare. Drilling in 2007 has further defined the resource at Starvation, along its outer edges as well as the internal grade distributions and higher angled structures. In particular, core drilling had an impact as sample recovery increased.
Additional exploration potential exists to increase the resource of the presently known mineralized zones. The southern margin and the western extensions of the western zone have expansion potential along approximately 600 feet of strike length. The northwest structure that appears to be the primary control for the Starvation Canyon resource has potential for additional clusters of mineralization both to the northwest and southeast.
Saval
Gold mineralization in the Saval Basin area to the west of the SSX mine is primarily hosted in favorable Hansen Creek Formation unit III where it has been structurally prepared by faulting and has locally been compartmentalized by northwest-trending dike systems. In this area, a series of west-northwest trending structures have been cut by northeast-trending faults. Notable structural features include the west-northwest trending Saval horst and the northeast-trending Husky fault, which cuts across the older Saval horst and down-drops it to the southeast. Ore zones were mostly formed in Hansen III host in the vicinity of structural intersections, often forming relatively steep, narrow, plunging orebodies. Dikes, such as the Saval 3 pit dike can be traced for thousands of feet. High-grade gold mineralization has been concentrated along the Saval 3 pit dike in several locations, most prominently in the Saval 3 pit and in the north part of zone 5 at SSX. Except at the Saval 4 deposit, most economic zones in the Saval basin area have been mined out leaving relatively small mineralized zones in difficult-to-access pit walls and bottoms. During 2006 access to a small resource in the highwall of the Saval 2 pit was completed with a small amount of production. A small reserve is being carried in the highwall of the Saval 2 pit in 2008.
26
At Saval 4, a significant gold zone has been identified that can be mined from underground with hillside access. A small pit was excavated during 2006 to allow for a portal. This excavation occurred in mineralized Roberts Mountains formation with 2,050 ounces stockpiled. In this zone, relatively steep, confined, and vertically extensive high-grade ore-bodies have formed within the Saval horst beneath a splay fault of the large Sheep Tank fault. It is interpreted that the intersection of the west-northwest trending faults that bound the horst interact with northeast trending faults, forming structurally prepared ore hosts along their intersections. Additional mineralized zones form on the flanks of the horst where it intersects the NE-trending structures. Most notable is a high-grade zone directly in the Sheep Tank fault just to the north of the main pod. Thinner mineralization occurs near the top of the horst along its south bounding fault. Excellent opportunity exists for local resource expansion of the main pod and in the flanking fault-hosted zones with close-in underground drilling after mining has begun.
Other Reserve/Resource Areas
Wright Window Pit
The Wright Window is a small open pit reserve and resource area located on the west side of the Independence Mountains to the west of the Murray mine. The deposit is hosted by the lower Roberts Mountains and Upper Hansen Creek Formations along the Saval Discontinuity. Mineralization occurs on two zones; the west zone mineralization outcrops at the surface and is about 50 feet thick. The higher-grade east area is about 200 x 300 feet wide and 45 feet thick.
Pie Creek Resource
Potentially economic gold mineralization occurs in a series of near-surface zones in the head of the Pie Creek drainage on the east flank of Wheeler Mountain. Indicated and Inferred resources have been modeled and are shallow enough, at a depth of 200 feet, for consideration of open-pit mining. The main pod is about 800 feet long, dips moderately to the southeast at about 300, and is 20 feet to 45 feet in cross-sectional thickness. Mineralization is hosted in the top of unit III of the Hansen Creek Formation and is probably controlled by northeast trending faults. Three other smaller pods near the main pod are similarly in the top of the Hansen III, but strike northwest, dip moderately to the north, and are probably controlled by local faults of similar orientation. The main pod mineralization occurs between two of the mineralized northwesterly cross structures.
Drilling
Numerous drill campaigns have been executed at Jerritt Canyon since its discovery in the 1970’s. Exploration drilling programs typically consist of RC drilling at about 200 foot centers, the spacing is then reduced to about 140 feet and finally, to 100 foot centers or less. Surface core drilling typically makes up about 5% to 10% of the total drilling. At the underground mines, definition drilling consists of core drilling on 50 foot centers from underground stations, using NQ sized core which is 1.875 inches in diameter. Underground RC drilling (Cubex) is used for resource confirmation and is drilled on 20 to 40- foot centers. RC holes are generally less than 150 feet in length, but can be as long as 300 feet. Underground production sample drilling consists of Cubex and rotary percussion drilling (Solo and Secoma). Holes are generally short, less than 60 feet, and are drilled on center as close as 10 to 20 feet. The vast majority of drillholes, except the production holes, are measured for downhole deviation.
Tens of thousands of holes have been drilled on the property over the years. The Murray mine has over 22,000 holes with more than 2 million feet drilled; the Smith mine has over 5,500 holes with more than 1.40 million feet; the SSX mine has nearly 18,500 holes with 2.6 million feet of drilling.
Drilling at Jerritt Canyon for the last seven years is shown in Table 3. Drilling in 2000 through 2002 was conducted by the former owner, and drilling from 2003 to present was conducted by Queenstake.
Table 3: Jerritt Canyon Drilling (2001 through 2008)
| Year | Surface RC | Surface Core | UG Core | UG RC | Production |
| | No. | Footage | No. | Footage | No. | Footage | No. | Footage | No. | Footage |
| 2001 | 59 | 65,450 | 0 | 0 | 268 | 86,134 | 914 | 112,129 | 5,086 | 349,157 |
| 2002 | 27 | 18,905 | 0 | 0 | 186 | 53,940 | 2,939 | 245,536 | 3,593 | 135,824 |
| 2003 | 108 | 47,277 | 0 | 0 | 119 | 41,458 | 2,057 | 191,416 | 3,643 | 141,218 |
| 2004 | 377 | 300,226 | 34 | 21,212 | 297 | 126,091 | 2,643 | 263,367 | 2,739 | 108,780 |
27
| Year | Surface RC | Surface Core | UG Core | UG RC | Production |
| | No. | Footage | No. | Footage | No. | Footage | No. | Footage | No. | Footage |
| 2005 | 126 | 101,413 | 4 | 1,403 | 179 | 80,251 | 2,618 | 267,627 | 2,414 | 94,793 |
| 2006 | 155 | 135,940 | 0 | 0 | 125 | 53,985 | 2,160 | 206,138 | 724 | 28,251 |
| 2007 | 220 | 216,592 | 15 | 12,495 | 44 | 20,580 | | 178,625 | 1,035 | 38,950 |
| 2008 | 101 | 104,182 | 7 | 8,939 | 94 | 41,915 | 240 | 45,661 | 578 | 36,820 |
Sampling and Analysis
Surface Drilling - Reverse Circulation Drilling
Surface exploration drilling programs at Jerritt Canyon consist predominantly of reverse circulation (RC) holes, with some surface core drilling. The drilling is conducted by a contract company and downhole surveys are taken by a contractor using a gyroscopic instrument. Collar locations are surveyed by a contracted survey company and/or in-house surveyors.
The surface RC holes are 5.5 inches in diameter and are sampled on 5 foot intervals, according to a protocol established by Queenstake.
Surface diamond drill core is HQ-sized (2.5 inches), unless it is necessary to reduce to NQ for completion of the hole. Surface core is logged for lithologic information and for geotechnical data according to the Jerritt Canyon logging manual at the logging facility. Surface core is split or cut with a diamond saw or hydraulic splitter and half of the sample is sent to the lab for analysis.
Underground Drilling
Drill hole spacing is targeted at 30 to 50 foot centers throughout the deposit. The attitude of the drill hole can be at any inclination to the mineralized unit although it is preferred to be as close to normal to the ore-controlling structures as possible. Collars of all drill holes are surveyed and the orientation of the holes is determined. All of the holes are surveyed by using a down-hole survey instrument (tropari or Flexit) or by a contract survey crew to measure the hole deviation. All of the collar and downhole surveys must pass quality assurance scrutiny by the site geologist prior to loading the data into the database. Only the actual data taken from the drillhole survey is used. Any projections of the survey beyond the length of the hole when surveyed are discarded. On rare occasions the collars are lost prior to collar or down hole surveys being completed; in this case the planned coordinates and hole orientation are used. However, when geological interpretation is done this factor is heavily considered in determining the validity of using the data from these holes.
Production Samples
Percussive drills (Solo, Airtrack, Secoma and others) are the dominant type used for collection of sludge samples over one rod length or six feet for final definition of the ore zones. It utilizes a rotary percussion drill with 3 inch diameter bits. Cuttings exit the hole via the annulus and are collected in a tray placed beneath the collar of the hole. These holes are drilled no longer than 60 feet in length due to hole deviation and downhole sample contamination issues. The hole and tray are cleaned prior to continuing the drill hole an additional six feet. Collar locations are surveyed but a downhole survey is not generally done. Some twinned data collected in 2001 suggests that there is a greater potential for these holes to have down-hole contamination beyond 36 feet depending largely on the orientation of the hole. For this reason the length of these holes has been decreased in the past few years. These drills are used for definition drilling at Murray and to a much lesser extent at SSX and Smith Mines;
Jumbo drill holes and jackleg holes are drilled for ore control only. This data, when collected, is used to help determine ore waste determinations but is not loaded into the database;
Selective rib and/or face samples are also used to help determine the ore boundaries and for grade control. They can be used to support the constrained ore boundary and in some cases at SSX are used to help estimate the block model grades; and
Cubex drills are sometime used for production drilling.
28
Truck Samples
At all the underground mines each haul truck is sampled for grade control purposes. The samples consist of grab samples taken over the entire load by the truck driver. Samples are placed in bags with pre-attached bar code numbered tags and transported to the Jerritt Canyon lab. Truck sample assays are cut by 8% which is a factor that has been determined through mine to mill reconciliation. The grades are used to state mine production.
Sample Preparation, Analyses and Security
Jerritt Canyon Laboratory Procedures
The mine utilizes the Jerritt Canyon laboratory for analytical work on the underground samples with check samples sent to ALS Chemex for comparisons. The samples for most of the surface drilling in the West Dash resource area in 2006 were also analyzed at the Jerritt Canyon facility. The assay lab is located in a separate building close to the ore processing plant. The laboratory has all the normal sample preparation equipment and facilities. The laboratory operates continually with a crew of 16 and performs about 500 fire assays per day with a 24-hour turn around from receipt of sample to reporting of assays.
Sample Preparation
All of the underground samples received at the Jerritt Canyon assay laboratory arrive with bar coded labels. The labels match drill logs maintained by samplers and drillers in the Jerritt Canyon Underground Department. Sample bar codes are scanned into the LIMS and assay lots are auto-created. The surface drillhole samples are labeled on the sample bag which are then logged into the LIMS system by the lab technicians. All logged samples dry for four to six hours at 325°F prior to prepping.
A rotary (automatic) 1:4 split (50 rotary cuts minimum) follows first stage crushing. Core samples first stage crush to 99% -1 inch prior to split; all other types are typically –1/2 inch prior to first stage split. Second stage crushing (99% - 3/8 inch) automatically passes through a rotary splitter (50 cut minimum). The assay split is then pulverized in a plate mill to 95%-150 mesh (Tyler) and blends for five minutes on a rotary blending wheel. The samples are placed in bar coded sample cups and transferred to fire assay.
Jerritt Canyon Lab Fire Assay Procedures:
A tray of 24 thirty-gram charge crucibles is prepared with a standard litharge flux. Each sample is weighed at one assay ton. Of 24 samples on each tray, one is a repeat sample, one is a standard, one is a blank, and one is a blind standard inserted into the sample stream by the geology department. The samples are fired by the method of fusion/cupellation, with a gravimetric finish. The balance used for the final weighing is a Cahn C-30 microbalance that is serviced and calibrated on a semi-annual basis by Microlab Services.
The laboratory in-house QA/QC procedure for checking the accuracy of the Jerritt Canyon lab consists of submitting saved duplicate samples of the mill feed and tail daily samples to outside labs for comparison. These samples are submitted on a weekly basis to either Rocky Mountain Geochemical or Chemex Laboratories. The data is compiled from the Jerritt Canyon daily assay sheet and compared with the results from the two outside labs. The results of the comparison are entered into a statistical program and a running check is maintained on the data.
Commercial Laboratories
Surface RC and diamond drilling are sent to ALS Chemex and American Assay. Samples above 0.100 opt gold are routinely fire assayed with a gravimetric finish. Blanks, standards, and pulps are routinely inserted into the sample stream for QA/QC, and check assays
The Geology Department at Jerritt Canyon has established laboratory quality assurance/quality control procedures as follows:
Jerritt Canyon Laboratory
- One standard sample per 20 samples;
29
One blank sample, consisting of silica sand, per drillhole;
One pulp of a previously assayed interval is inserted into the sample stream at the geologist’s discretion; and
Check assays consist of coarse rejects and pulps (one sample for every twenty over 0.01 opt and one in ten over 0.07 opt) sent to a commercial laboratory, generally ALS Chemex.
Commercial Laboratory
One standard sample in each batch of samples. A batch contains 40 samples in most commercial labs;
One blank sample of silica sand per hole, inserted at the beginning or end of hole, or after a mineralized zone;
A duplicate sample consisting of a pulp of a previously assayed interval may be used as a substitute for the regular standards; and
10% of the samples that have a value greater than 0.07 opt gold, and 5% of samples between 0.01 opt and 0.07 opt gold are submitted to a second lab for check analysis.
The standards have been prepared from Jerritt Canyon mineralized rock and have several different gold values. Samples that were used throughout the year include High with a value of 0.268 ounces per ton (opt), JCQ01 with a value of 0.117 opt, JCQ02 at 0.256 opt, JCQ03 at 0.051 opt, and JCQ04 at 0.120 opt. Results from the standards or duplicates are reviewed by geologists. If there is significant deviation (generally allowance are between 10% and 20%) from the expected value then the batch of samples is re-fired. If the lab is unable to match the original results within reasonable limits then the sample is re-fired again until assays are matched. The results from these analytical determinations are available in the QA/QC section below. SRK reviewed the Jerritt Canyon assay QA/QC data during 2007 and found the results within industry standards. Various graphs representing the results of the QA/QC program are located in Appendix B.
Data Verification
The Jerritt Canyon mine has tens of thousands of drillholes throughout the land package in the active mines, mined out areas, and exploration targets. Over the years the property has been the subject of many audits in which data verification procedures were carried out.
The geology department has largely completed the task of storing drillhole logging information and assay data into the AcQuire database package. Assay data is directly downloaded from the lab (both commercial and Jerritt Canyon’s) and goes through automatic and visual validations before being recorded, thus eliminating data entry errors.
It is SRK’s opinion that Jerritt Canyon is conducting exploration and development sampling and analysis programs using standard practices and that the data can be effectively used in the estimation of resources and reserves.
Mineral Processing and Metallurgical Testing
The mineral processing operation at Jerritt Canyon is one of only three processing plants in Nevada that uses roasting in its treatment of refractory ores. Initially, Jerritt Canyon was designed to process oxide and mildly refractory gold ores by conventional cyanidation using chlorine gas for pre-oxidation of the refractory ores. In 1989, the roasting circuit was added to the process for the treatment of highly refractory ores which are now being mined and processed at Jerritt Canyon.
The unit operations at the Jerritt Canyon processing plant are comprised of the following circuits:
- Primary crushing;
- Secondary crushing;
30
- Fine ore drying;
- Tertiary crushing;
- Dry grinding;
- Roasting;
- Carbon-in-leach (“CIL”) with cyanidation and carbon adsorption;
- Carbon stripping;
- Carbon reactivation;
- Merrill-Crowe process using zinc cementation of gold and silver;
- Precipitate refining;
- Oxygen plant; and
- Tailing impoundment.
Table 4 contains historic production and cost data for the Jerritt Canyon processing plant as well as the budgeted figures for 2008. The Jerritt Canyon process plant operated at only 80.5% of its budgeted ore production rate in 2007 due to pinion and bullgear problems with the grinding mill and air permit limitations. The pinion was replaced in first quarter 2006. Queenstake replaced the bullgear in June 2007. The production numbers in the 2008 reflect the shutdown periods extending from February 22, 2008 to April 30, 2008 and again on August 15, 2008 to the end of the fiscal year.
Table 4: Jerritt Canyon Historic and Budgeted Process Production and Cost Data (in US Dollars) (1)
| | | Actual | Actual | Actual | Actual | Actual | Actual |
| Operating Data | Units | 2003 | 2004 | 2005 | 2006 | 2007 | 2008 |
| Production Data | | | | | | | |
| Tons Processed: | | | | | | | |
| Annual | 000’s tons | 1,496 | 1,305 | 1,107 | 974 | 968 | 338 |
| Daily Average | Tons | 4,100 | 3,578 | 3,033 | 2,667 | 2,652 | 926 |
| Ore Grade | oz Au/ton | 0.228 | 0.214 | 0.215 | 0.211 | 0.181 | 0.16 |
| Recovery | % | 88.4 | 87.0 | 86.5 | 86.2 | 88.1 | 87.3 |
| Gold Production (1) | 000’s oz | 302 | 243 | 203 | 170 | 176 | 49 |
| Cost Data | | | | | | | |
| Annual Total Cost | $000’s | 25,182 | 28,523 | 26,539 | 29,602 | 35,271 | 17,508 |
| Unit Processing Costs: | | | | | | | |
| Ore | $/ton Milled | 16.83 | 21.86 | 23.97 | 30.41 | 36.43 | 51.75 |
| Gold | $/oz Au | 83.36 | 117.22 | 130.79 | 157.25 | 200.81 | 359.9 |
(1) Includes purchased ores for actual 2007 and 2008.
In July 2007, a revised Ore Purchase agreement was reached between Queenstake and Newmont Canada Limited (Newmont) whereby 1,000,000 tons of ore per year from Newmont operations will be purchased by Queenstake and processed through the Jerritt Canyon processing plant. This agreement was terminated in September of 2008 and a revised purchase agreement is in discussions. These additional tons historically bring the processing plant closer to full capacity and reduce the process operating costs per ton of ore which is reflected in Table 4 due to the high proportion of fixed costs in operating the facility.
Mineral Resource and Mineral Reserve Estimates
At Jerritt Canyon, most gold mineralization occurs within lenticular bodies with relatively sharp hang-wall and foot-wall boundaries. In order to better model this type of mineralization, detailed wireframe solids based on geologic and grade continuity (roughly 0.15 opt Au and above) are created with Minesight software for individual zones. The wireframes are built using assays of similar value that also show geologic continuity along known ore controls. More accurate targeting of economic material for excavation with reduced dilution has been the result. This method is employed at all of the development projects and most new areas of the active underground mines. Mature, mostly-depleted portions of the active mines do not use wireframes, but rely on outlines drawn by the geologist in plan view to define a grade shell with geologic constraints.
31
The drillhole database is divided into the separate resource areas and composited separately. The underground areas are composited into the predominant sample length, generally 5 foot downhole composites starting at the top of the drillhole. The areas that are more amenable to open pit mining are composited into 20 foot lengths starting at the top of the drillhole.
The tonnage factor used for all Jerritt Canyon ore is 12.6 cubic feet per ton. The factor is based on testing done in 2000 at the University of Nevada, Reno and Chemex lab on a total of 67 samples. The weighted tonnage factor returned on the samples was 12.616. Since then 50 samples from Smith Zone 4 (Mahala) and 5 from Steer were analyzed by Zonge Engineering and Research of Tucson, Arizona. The average for Smith Zone 4 was 12.45 cubic feet per ton, which is slightly heavier than the average used for all the mines and the average for Steer was 13.0 cubic feet per ton, which is slightly lighter. Additional tests were done in 2005 on 22 ore grade samples and 24 waste samples from Starvation Canyon. The results were 11.8 cubic feet per ton for the ore grade samples and 12.2 for the waste samples, both of which are heavier than the 12.6 average used at the mines.
Three methods of resource estimation, including Probability Assigned Constrained Kriging (PACK), Inverse-Distance Weighting (IDW), and Block-Polygonal, are employed at Jerritt Canyon. Each resource area is initially interpreted and grade estimated using Mintec Minesight software and subsequently exported to Maptek Vulcan software for engineering design and reserve tabulation.
Most of the areas with active underground mining utilize the PACK method. Development projects and some zones near current mining with wider-spaced drilling are modeled with the Inverse-Distance-Weighting method. A few projects with limited drilling use the Block-Polygon method.
Probability Assigned Constrained Kriging (PACK) is a geostatistical method applied to most reserve areas at Jerritt Canyon. Detailed indicator and gold grade variography is developed for each zone or structural domain interpolated with the PACK method. In areas modeled by PACK, blocks within constraining wireframe solids and interpreted geologic plan-oriented strings are modeled separately from exterior blocks, using composites within the wireframes. Exterior blocks are interpolated in a separate pass using exterior samples. The percentage of model cells that reside within the wireframes is recorded and used for resource tabulation;
Inverse-Distance Weighting (IDW): This method is used in several resource and reserve areas where drilling is too widely spaced to derive variography necessary for interpolation with the PACK method. In areas where lenticular mineralized bodies have been identified, a wireframe is constructed based on geologic and grade continuity. Similar to the PACK method described above, model cells interior and exterior to the wireframes are interpolated separately using only interior or exterior drillhole samples respectively. The percentage of model cells that reside within the wireframes is used for resource tabulation; and
Block-Polygon: A method utilized in some of the resource areas where drill hole spacing is insufficient to conduct mine planning and reserve estimation. It employs a nearest neighbor two-dimensional search without constraining interpretive envelopes.
The PACK method consists of dividing the deposit into low-grade and high-grade probability zones and then estimating the gold grade within each of the zones separately. The methodology is summarized below:
| 1. | The deposit is divided into geological or structural zones within which the geostatistical parameters are expected to be the same. |
| | |
| 2. | Low-grade and high-grade thresholds are chosen based on the cumulative frequency plots of the sample data. The typical low grade threshold is 0.03 opt and the high-grade threshold is typically 0.15 opt. |
| | |
| 3. | For each threshold, composites are assigned indicator values and indicator variograms are calculated from the composite indicators. The block indicator values are estimated by kriging. The block is designated as being within a low-grade envelope if the low-grade indicator is greater than 50% and the high-grade indicator is less than 50%. The block is considered high-grade if the high-grade indicator is greater than 50%. |
32
| 4. | The composites are back-coded from the model as being low-grade or high-grade, and variograms are calculated for both classes. |
| | |
| 5. | Gold grades are estimated for the high-grade blocks using only composites within the high-grade envelope, and likewise, gold grades are estimated for the low-grade blocks using only composites within the low-grade envelope. |
Refer to the Table 5 below for a listing of resource estimation methods by project.
Table 5: Jerritt Canyon Resource Estimation Methods by Project
| Deposit/Area | Interpolation Method |
| Mine Areas | PACK |
| Murray | PACK |
| Murray Zone 9 | PACK – IDW |
| SSX | PACK – IDW in inferred shapes (Steer) |
| Smith | PACK – IDW |
| Smith East | IDW – PACK |
| Saval | IDW – PACK |
| Starvation | IDW |
| Wright Window | PACK – IDW |
| Resource Areas | |
| Burns Basin Pit | IDW |
| California Mtn. Pit (Next) | POLYGONAL |
| Coyote Zone 10 Pit | IDW |
| Pie Creek Pit | IDW |
| Road Canyon Pit | IDW |
| Mill Creek | IDW |
| Burns Basin | IDW |
| California Mtn. | POLYGONAL |
| Coyote Zone 10 | IDW |
| MCE | PACK |
| Waterpipe II | POLYGONAL |
| West Mahala | IDW |
| Winters Creek | IDW |
Most of the reserve and resource areas are built with 15 x 15 x 15 foot blocks, with the exception of the Murray mine where 5 x 5 x 15 foot blocks are used. Starting in 2005, production models using a block size of 5 x 5 x 5 feet were utilized at the Steer mine and portions of the SSX and Smith mines in order to better delineate ore boundaries, and thus reduce dilution. Although these smaller blocks are used, the geologic/grade shapes are drawn to at least the smallest practical mining units (SMU), usually at least 15 x 15 x 15 foot in size. For resource reporting conformity at the resolution of the 15 x 15 x 15 foot SMU, the production models are re-blocked to the 15 foot matrix prior to reporting. As expected, the result of the re-blocking of the 5 foot blocks into 15 foot blocks shows similar contained ounces for zones at lower grades while there is increase in tonnage and decrease in grade at higher mining-grade cutoffs.
Variography
There was no new variography run in 2007 and 2008. All of the geostatistics used in this resource calculation were compiled from geostatistical analysis in previous years. Because of the mature nature of the resource in the areas that geostatical methods are used it is viewed that the new data would not have a significant impact on the variography. Therefore there was no change.
33
Definition of Resource Categories
For resource classification, blocks must lie within interpreted wireframes or grade shells and have demonstrated continuity of ore-tenor material (>0.15 opt Au) over multiple drillhole intercepts to be considered as Measured or Indicated resources. Measured classification requires a minimum of three drillholes, the nearest composite within 20 feet, and mining history in the immediate area. Indicated classification requires that the nearest composite be within 2/3 of the variogram range. Blocks with a distance between drillholes greater than 2/3 of the variogram range are classified as Inferred. All blocks outside interpreted wireframe shapes or plan strings are considered to be Inferred resources.
SRK finds that the resource and reserve models developed by Jerritt Canyon conform to the definitions set forth in National Instrument NI 43-101 in Sections 1.3 and 1.4 which classify the resource into measured, indicated, and inferred categories. The standards applied by Jerritt Canyon conform to the definitions adopted by the Canadian Institute of Mining, Metallurgy and Petroleum – Definitions Adopted by CIM Council August 20, 2000.
Mineral Resource Checks
SRK imported the Jerritt Canyon block models into Vulcan software and conducted a series of checks to reconcile the stated resource tons and grade with the actual block model grades and wireframes and grade shells. SRK also visually compared the block model grades against drillhole assay data.
SRK considers that the Jerritt Canyon block models have been constructed in compliance with accepted engineering practice and can be considered reasonable global predictors of resources within the modeled areas.
Mineral Resource Statement
The Jerritt Canyon mine resources, including reserves, as of December 2008 are listed in Table 6. The resources are contained within areas where mining is currently taking place or where mining is reasonably expected to take place in the future. The metal ounces are on a contained basis without adjustment for process recoveries.
34
Table 6: Jerritt Canyon Mineral Resources, Including Reserves - December 31, 2008 (based on 2007 NI 43-101)
| | Measured | Indicated | Measured + Indicated | Inferred |
| | | | Cont'd | | | Cont'd | | | Cont'd | | | Cont'd |
| Deposit/Area | Tons | oz/st | oz | Tons | oz/st | oz | Tons | oz/st | oz | Tons | oz/st | oz |
| | | | | | | | | | | | | |
| MURRAY | 155.8 | 0.310 | 48.3 | 26.6 | 0.269 | 7.1 | 182.4 | 0.304 | 55.4 | 90.4 | 0.228 | 20.6 |
| MURRAY ZONE 9 | 0.0 | - | 0.0 | 210.9 | 0.277 | 58.5 | 210.9 | 0.277 | 58.5 | 61.6 | 0.209 | 12.9 |
| SSX | 1,815.3 | 0.255 | 462.5 | 746.1 | 0.269 | 200.7 | 2,561.4 | 0.259 | 663.2 | 959.2 | 0.236 | 226.6 |
| SMITH | 587.7 | 0.303 | 178.0 | 649.1 | 0.256 | 166.1 | 1,236.9 | 0.278 | 344.1 | 534.0 | 0.221 | 118.2 |
| SMITH EAST | 19.0 | 0.441 | 8.4 | 1,043.5 | 0.284 | 296.7 | 1,062.5 | 0.287 | 305.0 | 125.2 | 0.280 | 35.1 |
| SAVAL | 12.3 | 0.227 | 2.8 | 367.5 | 0.253 | 93.0 | 379.8 | 0.252 | 95.8 | 107.4 | 0.206 | 22.1 |
| STARVATION | 0.0 | - | 0.0 | 697.3 | 0.287 | 199.9 | 697.3 | 0.287 | 199.9 | 25.5 | 0.252 | 6.4 |
| WRIGHT WINDOW | 0.0 | - | 0.0 | 97.8 | 0.156 | 15.2 | 97.8 | 0.156 | 15.2 | 19.0 | 0.229 | 4.3 |
| | | | | | | | | | | | | |
| Subtotal | 2,590.2 | 0.270 | 699.9 | 3,838.8 | 0.270 | 1,037.2 | 6,429.0 | 0.270 | 1,737.1 | 1,922.4 | 0.232 | 446.2 |
| Stockpiles | 35.9 | 0.173 | 6.2 | 818.3 | 0.059 | 48.1 | 854.1 | 0.064 | 54.3 | 0.0 | - | 0.0 |
| | | | | | | | | | | | | |
| Pit Resources | | | | | | | | | | | | |
| Burns Basin Pit | - | - | - | 29.7 | 0.134 | 4.0 | 29.7 | 0.134 | 4.0 | - | - | - |
| California Mtn. Pit | | | | | | | | | | | | |
| (NEXT) | - | - | - | 8.0 | 0.115 | 0.9 | 8.0 | 0.115 | 0.9 | - | - | - |
| Coyote Zone 10 Pit | - | - | - | 0.0 | | 0.0 | 0.0 | | 0.0 | 20.1 | 0.104 | 2.1 |
| Pie Creek Pit | - | - | - | 190.2 | 0.157 | 29.9 | 190.2 | 0.157 | 29.9 | 28.3 | 0.142 | 4.0 |
| Road Canyon Pit | - | - | - | 148.6 | 0.143 | 21.2 | 148.6 | 0.143 | 21.2 | 74.3 | 0.131 | 9.7 |
| Mill Creek | | | | 78.4 | 0.124 | 9.7 | 78.4 | 0.124 | 9.7 | - | - | - |
| | | | | | | | | | | | | |
| U/G Resources | | | | | | | | | | | | |
| Burns Basin | - | - | - | 30.7 | 0.194 | 6.0 | 30.7 | 0.194 | 6.0 | 50.6 | 0.228 | 11.5 |
| California Mtn. | - | - | - | 32.1 | 0.377 | 12.1 | 32.1 | 0.377 | 12.1 | 9.4 | 0.330 | 3.1 |
| Coyote Zone 10 | - | - | - | 45.2 | 0.212 | 9.6 | 45.2 | 0.212 | 9.6 | 2.7 | 0.184 | 0.5 |
| MCE | - | - | - | 4.4 | 0.201 | 0.9 | 4.4 | 0.201 | 0.9 | 7.8 | 0.189 | 1.5 |
| Waterpipe II | - | - | - | 0.0 | | 0.0 | 0.0 | | 0.0 | 37.4 | 0.206 | 7.7 |
| West Mahala | - | - | - | 197.5 | 0.218 | 43.0 | 197.5 | 0.218 | 43.0 | 129.6 | 0.206 | 26.7 |
| Winters Creek | - | - | - | 148.9 | 0.218 | 32.5 | 148.9 | 0.218 | 32.5 | 37.2 | 0.199 | 7.4 |
| | | | | | | | | | | | | |
| Total | 2,626.0 | 0.269 | 706.1 | 5,570.9 | 0.225 | 1,255.0 | 8,196.9 | 0.239 | 1,961.1 | 2,319.7 | 0.224 | 520.4 |
35
SRK is not aware of any possible adverse or unusual restrictions on mining resulting from legal or title issues, taxation, socioeconomic, or other issues that would affect the Jerritt Canyon operation. The mine has the permits necessary for operation.
Mineral Reserve Estimate
Essentially all of the current reserves at Jerritt Canyon are contained in deposits being developed and mined by underground methods. The exceptions include Wright Window which is planned as an open pit operation, Starvation Canyon which is a new underground reserve area, and the stockpiles reposing at the mine portals or remaining from earlier open pit extraction.
The previous sections describe the approach in evaluating mineralized boundaries and estimating gold grades within the overall resource envelope. In order to determine the portion of the Measured and Indicated resources that would qualify for Proven and Probable reserve status, it is necessary to configure the Measured and Indicated resources into mineable shapes for the selected mining method, and then apply economic tests for establishing validity that the reserve blocks will, indeed, show positive economics.
The economic exercise is normally accomplished by calculating a breakeven cutoff grade, stated in ounces of gold per ton (oz Au/ton), which equates the total operating costs at the property with gold recovery from the process plant, and the expected return from gold sales. Total costs include mining, processing, assessed charges, and site administrative costs. Process recovery has been relatively constant over several years of operations, and this value is projected at 89.0% going forward. Revenues reflect an average gold price experienced during the previous three years, after subtraction of refining charges and royalties.
The objective of this analysis is to derive a minimum gold grade in the ground that will just recoup the costs of production. Material not meeting this hurdle remains a resource, while blocks exceeding the minimum will be in the mining plan and will be extracted over time. It can be appreciated that the average grade of material mined and processed will be in excess of the minimum grade; thus these blocks will cover all variable production costs and will contribute toward fixed charges and profitability.
Incremental cutoff grades are sometimes employed where certain costs have already been expended (sunk costs), and the block now must cover only the remaining down-stream charges. An example is mineralized material which has been taken from underground and placed in stockpiles at a mine portal for assaying. Now that the drilling, blasting, loading and underground haulage have been expended, it may be possible that the rock contains sufficient gold to pay for surface hauling to the process plant, and the process costs as well, rather than being carried to a waste dump for disposal. An incremental cutoff grade calculation at this point will be lower than a breakeven grade, but this material should provide a marginal contribution to the operation as a whole.
The accepted formula for calculating a breakeven cutoff grade is given below:
| Breakeven Cutoff grade | = | Total Costs of Production |
| (Gold Price – Deducts) x Process Recovery |
Breakeven cutoff grades were calculated for each mine or material source and compared to those determined by Jerritt Canyon personnel. The costs figures are averages obtained for the entire year of 2007 (due to the shutdown during 2008, these figures will continue to be used), with a modification for expected processing costs in the coming years. Process charges in the future assume full throughput for the plant using two roasters, and the processing of outside material stemming from an agreement between Queenstake and Newmont Mining Corporation for the purchase of up to 1,000,000 tons of mineralized material per year. Because management will be working both roasters (thereby reducing plant operating costs/ton), the benefits of this approach have been imputed in cutoff grade calculations.
The following parameters, shown in Table 7, have been used in determining the various cutoff grades. Excluded from costs are the district-wide exploration expenses and capitalized development charges.
36
Table 7: Jerritt Canyon Cutoff Grades Parameters
| Gold Price | $580/oz |
| Plant Recovery | 89% |
| Refining Charges | $0.78/oz |
| Total Production Costs, Including Processing, $/ton | |
| SSX | $112.21 |
| Starvation | $108.44 |
| Smith | $103.59 |
| Saval 2 | $112.21 |
| Saval 4 | $112.21 |
| Wright Window | $47.68 |
| Stockpiles | $34.39 |
| East DASH | $111.59 |
Equating these parameters by the formula shown above, cutoff grades for the various sources of material can be calculated. These are presented in Table 8 below:
Table 8: Jerritt Canyon Cutoff Grades
| Material Source | SRK Breakeven Cutoff, opt Au |
| Stockpile Direct | 0.06 |
| Stockpile Screened | 0.07 |
| Wright Window | 0.09 |
| Starvation Canyon | 0.21 |
| Smith | 0.20 |
| Saval 2 | 0.22 |
| Saval 4 | 0.22 |
| SSX Complex | 0.22 |
| East DASH | 0.22 |
Production from the low-grade stockpiles can be either upgraded by screening and collection of the fines, or may be delivered to the processing plant in bulk. Because the mill will be operating at full capacity with the combination of Jerritt Canyon ore and purchased material, the stockpiles most likely will continue to be upgraded by screening.
In addition to the economic justification for the resource, factors for mining dilution and recovery need to be considered before the final mineral reserve statement is issued. At the Jerritt Canyon mines, where the ore is present as irregular pods, and the mining methods are typically sublevel or drift-and-fill stoping, any mining dilution occurs at the fringes of the ore pods or lenses. Within the pods, slices or drifts are extracted and then backfilled with cemented waste material. When the backfill has consolidated, the ore between the primary stopes or drifts is then extracted. In the primary cuts, the interior stope boundaries are surrounded by ore, so little dilution results. Within the secondary cuts, the walls and/or back are cemented backfill, which is stronger than the ore or enclosing rocks, and thus little dilution takes place. It is primarily on the fringes of the individual ore bodies that dilution occurs, with the amount also being dependent upon the mining method. Jerritt Canyon engineers have developed a matrix for the different dilution factors based on experience with the various mining methods, and these are applied in calculating mineral reserves. All dilution material is applied at zero ounces per ton.
Table 9 presents historical and projected dilution factors for the underground operations. Wright Window will be a surface mine, and dilution should be minimal because of the ability to selectively mine based on blast hole analyses. Backfilled stopes can stand over substantial vertical heights. This situation allows the operation to recover nearly all the identified ore-grade material.
37
Table 9: Jerritt Canyon Dilution Factors
| | Mining Method |
| | Rock | Secondary Stope | Sublevel |
| Mine* | Drift-and-Fill | Drift-and-Fill | Stoping |
| SSX Complex | 10 | 10 | 10 |
| Murray | 10 | 10 | 10 |
| Smith | 10 | 7 | 7 |
| Saval (projected) | 10 | 10 | 10 |
* No dilution has been calculated for Starvation Canyon, but it is expected to be similar to SSX at the present time.
Mineral reserves are listed in Table 10, using the respective cutoff grades for each individual mine. It should be noted that the gold price of $580 per ounce is an approximate average of prices published during the past three-year period; i.e., from 2005 through 2007. During this time the price was on an upward trend and certainly the cutoff grades shown in Table 15 are high (conservative) as compared to those that would be calculated using more recent values. For example, the December 2007 price, was $220 per/ounce higher than the three-year average, and thus operational decisions based on short-term prices will allow more material to be recovered and sold at a profit than indicated in the reserve table.
Table 10: Jerritt Canyon Reserves – (based on December 31, 2007 NI 43-101)
| | Proven | Probable | Total |
| | | | Cont'd | | | Cont'd | | | Cont'd |
| Mine | ktons | oz/st | koz | ktons | oz/st | koz | ktons | oz/st | koz |
| | | | | | | | | | |
| Smith | 92.5 | 0.304 | 28.1 | 861.6 | 0.280 | 241.4 | 954.1 | 0.282 | 269.5 |
| SSX | 513.7 | 0.221 | 113.4 | 386.3 | 0.232 | 89.7 | 900.0 | 0.226 | 203.0 |
| Saval | 11.4 | 0.200 | 2.3 | 108.8 | 0.250 | 27.2 | 120.2 | 0.246 | 29.5 |
| Starvation | 0.0 | - | 0.0 | 571.6 | 0.282 | 161.3 | 571.6 | 0.282 | 161.3 |
| Wright Window | 0.0 | - | 0.0 | 32.6 | 0.226 | 7.4 | 32.6 | 0.226 | 7.4 |
| Sub Total | 617.6 | 0.233 | 143.7 | 1,961.0 | 0.269 | 527.0 | 2,578.6 | 0.260 | 670.7 |
| Stockpiles | 35.9 | 0.173 | 6.2 | 540.8 | 0.075 | 40.4 | 576.7 | 0.081 | 46.6 |
| Total | 653.4 | 0.229 | 149.9 | 2,508.1 | 0.227 | 567.4 | 3,155.2 | 0.227 | 717.3 |
Mining Operations
Jerritt Canyon is an operating property with over 25 years of production experience, during which over seven million ounces of gold have been produced. The Jerritt Canyon mine complex consists of two operating underground mines located several miles west of the processing plant and administration facilities which are 50 miles north of Elko, Nevada.
All mines feed the same processing plant, with output from the underground operations and stockpiles totaling nearly 0.619 million tons during 2007 and an additional 0.272 million in 2008 (reduced due to the shutdown during most of the year). The producing properties, and their annual production rates, are given in Table 11 based on 2007 results:
Table 11: Jerritt Canyon 2007 Production
| Property | Annual Production (tons) |
| SSX Complex | 312,208 |
| Smith Mine | 117,394 |
| Stockpiles and Cleanup | 190,331 |
| Total | 619,933 |
38
The full processing plant has the capability of treating approximately 4,200 tons/day. This rate was quite attainable when the feed derived mainly from open pit operations, but has been a significant surplus when accepting material from underground mines simply because the total mine output cannot attain this daily rate. In early 2006 Queenstake entered into an agreement with Newmont Mining Corporation to purchase material delivered to Jerritt Canyon by Newmont, which would supplement mined ores feeding the roasters and thereby reduce certain unit operating costs. During 2007, Queenstake processed 348,197 tons of Newmont material and negotiated an amended agreement to increase the total tons processed. In 2008 the agreement was terminated and revised agreement is under discussion.
The plant processed an average of 2,700 tons per day, or just under 0.97 million tons for the year. Plant capacity is limited to some extent by the “fuel content” of the ore (principally contained pyrite) which tends to enhance temperatures in the roaster and so must be regulated carefully when this type of rock serves as feedstock. Blending of various mined products is practiced constantly to reduce deleterious impacts from rock types with high fuel content, high arsenic content, and so forth. Gold produced in 2007 was 175,646 ounces from 968,130 tons of processed ore and purchased material at a metallurgical recovery that averaged 88%. In 2008 this reduced to 48,648 ounces from 338,350 tons of processed ore and purchased material at a metallurgical recovery that averaged 87% as a result of the shutdown during the year.
The mines reported production of 429,602 tons of ore, along with 229,370 waste tons in 2007 and 135,909 tons of ore and 136,070 of waste tons in 2008. The daily ore production rate calculates at almost 1,176 tons in 2007 and 745 in 2008 for the complex at an average grade of 0.294 and 0.20 opt, respectively. This tonnage figure was less than budgeted amounts of nearly due to the shutdown of the mines during most of 2008.
The mines were operated by trackless equipment. Electric drill jumbos are used in preparation for blasting, and front loaders excavate the broken material into diesel-driven Wagner or Tamrock underground mine trucks for hauling to a pad area outside the portals. Segregation of mined material is effected near the portals by placing the rock into several windrows; after dumping in a windrow the mine-truck operator collects a sample from his load for analysis. Assays from the laboratory then dictate whether that material is high-grade, low-grade, or waste; the latter is excavated and placed in a waste dump, whereas the two ore types may or may not be blended depending on analytical results, and taken to the process facility. Because of the distances from the several mine portals to the processing plant, large (150 ton) off-road haulers are used for surface ore transport. These haul roads appear to be well maintained, they are of adequate width for two-way traffic, and special effort is expended during the winter months to keep the roadways open from drifting snow.
Access to the underground mines is through portals, with internal ramps maintained at grades of 12% to 15%. Typical openings measure 15 x 15 feet in cross section, although consideration is now being given to reducing some drifts to 10 x 12 feet in size to allow more selective mining and to reduce development costs. Ventilation is accomplished through the portal openings (intake air) and through a number of raise bores (exhaust air) six feet to eight feet in diameter that connect the underground workings to the surface. Certain of these raise bores also serve as emergency escapeways and are equipped with personnel capsules and hoisting equipment located on the surface.
Major mine openings are supported with bolts and mesh which seem to hold the back and ribs well. Ore is generally developed by drifting adjacent to the zone in more stable rock and then cross-cutting through the deposit at specified intervals. Drift-and-fill mining is practiced, with secondary openings either alongside a backfilled stope or underneath a previously-filled excavation. In the latter situation, cost savings are accomplished since the cemented fill does not require artificial support. Extraction of ore-grade material is near 100%, and mining dilution for the most part is confined to the stope fringes.
Each mine has its own batch plant located outside the mine portal. The backfill plants receive screened rock which is stored in bins adjacent to the fly-ash and cement tanks. These products are blended according to the backfill mix design, water is added, and the mixture placed into the underground ore haulage trucks for transport back into the mine stopes.
In addition to the backfill plant, the mines’ surface structures generally include a large, well-equipped maintenance shop, mine dry, and mine office building. The most recent additions were the administration and shop buildings located at the Steer portal which were constructed in April, 2005.
On February 22, 2008 Queenstake initiated a voluntary shutdown of operations in the mill and underground mines in order to undertake maintenance, repairs, and capital improvements at the site. Although the mine operations recommenced at the end of April, they were suspended again on August 8, 2008 due to the high cost of mining activity.
39
Gold recovery in 2008 remained reasonably constant during the period of normal operations and averaged 86.1% of contained metal delivered to the process plant (weighted by tonnage). Data were recorded by month, as shown below in Table 12:
Table 12: Jerritt Canyon 2008 Gold Recovery by Month
| Month | % Au Recovery | |
| January | 83.3 | |
| February | 85.8 | |
| March | n/a | |
| April | 75.2 | |
| May | 83.7 | |
| June | 87.6 | |
| July | 87.9 | |
| August | 86.8 | |
| September | n/a | |
| October | n/a | |
| November | n/a | |
| December | n/a | |
| Average (weighted by tonnage) | 86.1 | |
The average for 2008 is typical of process recovery attained in prior years, and is expected to continue and improve as a result of the extensive infrastructure work performed during the shutdown period.
Gold markets are mature, global markets with reputable smelters and refiners located throughout the world. Demand is presently high with prices for gold showing a remarkable increase during the past year--London Final price averaged just over $872 /ounce for 2008.
Markets for doré are readily available. Jerritt Canyon ships its doré to the Johnson Matthey refinery in Salt Lake City, Utah.
Environmental Issues
Environmental management systems are in place and there is a qualified environmental staff on site. Various mitigation programs are in effect as required under the several plans of operations that have been filed and approved for the project. No unusual costs associated with any of these programs were identified.
Environmental liabilities at the Mine include:
High sulfate and Total Dissolved Solids (TDS) in runoff from waste rock in the Marlboro Canyon rock disposal area (RDA). Three other RDA’s are exhibiting high levels of sulfate;
Ongoing control and management of seepage from the tailings impoundment; and
Air emissions from the processing circuit.
Waste Rock Runoff
Mitigation for this issue has been ongoing for a number of years and has been well-defined by Jerritt Canyon staff. Staff has worked with the Nevada Division of Environmental Protection – Bureau of Mining Regulation and Reclamation (NDEP-BMRR) to develop mitigation and monitoring plans.
The Mine has been working with the NDEP-BMRR to address runoff with high concentrations of sulfate and TDS from the RDA’s. The Mine installed a sulfate reduction trench in Marlboro Canyon to reduce the sulfate and TDS concentrations. The trench showed reductions in the concentrations but not to an acceptable level. Monitoring continued through 2007. This information is routinely reported to NDEP. Meetings/discussions with NDEP-BMRR have resulted in the need for Queenstake
40
to look into other possibilities for sulfate reduction. The data from the Marlboro SRT and from the DASH RDA instrumentation project will be the basis for any new proposal. The discharge ultimately flows into Jerritt Creek which flows into Independence Valley through several ranch properties and infiltrates into the sub-surface. However, it should be noted that simple analyses downstream from the SRT show acceptable sulfate and TDS levels
Three other RDA’s are also exhibiting elevated concentrations of sulfate besides Marlboro Canyon. These are: Gracie; Snow Canyon; and, DASH. Under a schedule of compliance item within the Water Pollution Control Permit (WCPC), the Mine drilled three holes in the lower lift of the DASH RDA and one on the middle lift to assess the water flux and sulfate profile of the RDA. The lower lift of the DASH RDA is an unvegetated the angle of repose slope. NDEP-BMRR felt this angle of repose face was a significant contributor to the sulfate generation within the RDA. Preliminarily, this has not been borne out by the data.
Tailings Impoundment Seepage Control
During 2006 NDEP modified the water pollution control permit to include an evaporation pond for disposing of excess water from the existing tailings impoundment and to assist in the ultimate closure and reclamation of the facility. Due to the footprint of the evaporation pond, Queenstake had to plug and abandon some of the wells that make up the seepage remediation system (SRS), as well as a production well, and had to redrill/reinstall these wells at different locations, as approved by the NDEP-BMRR. All of these wells are now in place and are operational.
Air Emissions Violations
On February 15, 2007, the Nevada Division of Environmental Protection – Bureau of Air Pollution Control (BAPC) issued a Compliance Order to Queenstake. The requirements of the original Order have been fulfilled. A final order was issued in December of 2007, which requires submittal of two additional reports to NDEP-BAPC addressing continuous opacity monitors and measures required to address additional sources of leaks in the ore processing system. Queenstake has succeeded in correcting numerous items related to process fugitive emissions from the ore grinding circuit of its mill, required under the original order.
On March 10, 2008 we received two Orders from the Nevada Division of Environmental Protection-Bureau of Air Pollution Control (NDEP-BAPC). The first Order was a “Stop” order for the roasters and all support systems, which required us to shut down the roasters within 7 days, or by March 17, 2008. We had already, on our own accord, shut down operations at the site in order to address housekeeping and maintenance issues, some two weeks prior to the issuance of the “Stop” Order.
The second order was related to on-going concerns that NDEP-BAPC has had with regard to control and monitoring of air emissions related to the processing operations. This order has numerous requirements for the restart of the roasters, principally related to air emissions control, monitoring, and reporting. Additionally, the Order required Queenstake to conduct mercury speciation testing of scrubber discharges within 15 days of start-up after the instrumentation has been installed. Queenstake is planning to install a calomel-based scrubber system on the roasters to reduce mercury emissions in the future.
We are in discussions with NDEP-BAPC and expect a favorable resolution that will allow startup of the Jerritt Canyon processing facility in compliance with NDEP-BAPC regulations and requirements.
Reclamation Bond Cost
Approved reclamation and closure plans are in place and the Mine is concurrently reclaiming disturbance when possible. Reclamation, consisting of earthworks and reseeding, and closure of mine components, consisting of characterization and chemical stabilization, are among the most expensive activities that take place, especially as the operating income begins to wane. Mine staff and the USFS/NDEP update the reclamation bond on an annual basis. As of January 2008, the reclamation bond was estimated to be about $40 million. The 2009 bond is in preparation.
Review of the 2008 bond is being performed using the measurements taken during the shutdown and planning for an acceleration in the timing of costs. Bond increases are a result of more surface disturbance, and increased unit costs (labor, equipment, and fuel costs). Queenstake has already funded the estimated reclamation and closure costs by placing $25.2
41
million in a commutation account with American Insurance Group (AIG). Queenstake has a policy with the American Insurance Group (AIG) for a closure cost and cap insurance policy that has been accepted by the regulatory agencies to serve both to fund the physical reclamation and post-closure site management, and meet agency requirements for bonding.
The evaporation pond is expected to favorably affect the reclamation bond by reducing the post-operational water management from six years to two years. NDEP will review the potential bond reduction after Queenstake operates the evaporation pond for a year to verify performance. The projected reduction is expected to be on the order of $1.1 million per year.
Operating permits for the mine are in place and are presented in Table 13. Environmental management systems are in place and are managed by an experienced and qualified onsite environmental staff. Operating and maintenance staffs are informed of their responsibilities during annual MSHA refresher classes. In addition to MSHA classes, the Mine holds leadership classes for the supervisory staff. During these classes, supervisors are informed of their environmental responsibilities.
Table 13: Operating Permits
| Permit/Approval | Granting Agency | Comments |
| Plan of Operations | USFS | |
| Work Plans | USFS | Annual work plan submitted to USFS and NDEP |
| Clean Water Act Section 404 Permit | U.S. Army Corps of | Will be updating the existing 404 fieldwork and |
| | Engineers | permit in the near future. There are no triggers |
| | | requiring the update. |
| EPA ID Number | U.S. Environmental | The Mine, a large-quantity generator, has the typical hazardous wastes found at a mine such as cupels and crucibles. Seven to eight barrels of waste paint/solvents, a characteristic waste due to the flammability, are generated annually. |
| | Protection Agency |
| | |
| | |
| | |
| Air Quality Permit | Nevada Division of | The Mine has a current Title V air permit received in March 2004. A Compliance Order was received in 2007. |
| | Environmental Protection |
| | (NDEP)/ Bureau of Air |
| | Pollution Control | |
| Reclamation Permit | USFS and NDEP/ | The bond estimate is updated annually with the USFS & NDEP. As of December 2008, the reclamation bond was estimated to be about $40.0 million. The mine is currently in the process of updating the bond for the USFS & NDEP |
| | Bureau of Mining Regulation |
| | and Reclamation (BMRR) |
| | |
| | |
| Water Pollution Control Permit | NDEP-BMRR | One water pollution control permit covers the entire mine area. Two issues exist: the tailings seepage/chloride plume; and the high sulfate/total dissolved solids emanating from four rock disposal areas. |
| | |
| | |
| | |
| | |
| Underground Injection Control | NDEP/ Bureau of Water | Addresses dewatering water from the Murray and Smith underground mines. |
| | Pollution Control |
| Solid Waste Class III Landfill | NDEP/ Bureau of Solid | The Mine has three authorized landfills at the lower mill area, Burns Basin, and Alchem. Employees are instructed during annual MSHA refreshers with regard to what is acceptable to dispose of in the landfill. |
| Waiver | Waste |
| | |
| | |
| | |
| General Stormwater Discharge | NDEP/Bureau of Water | An updated general permit was submitted to NDEP in Dec 2007 due to new permit requirements. No concerns were noted. |
| Permit NVR300000 | Pollution Control |
| | |
| Permit to Appropriate Waters | NV Division of Water | No concerns were identified. The Mine has sufficient appropriations to cover processing and dewatering needs. |
| | Resources |
| | |
| Permit to Construct | NV Division of Water | No concerns identified |
| Impoundments/Dam Safety | Resources | |
42
| Permit/Approval | Granting Agency | Comments |
| Industrial Artificial Pond Permits | Nevada Department of | No concerns identified |
| | Wildlife | |
| Liquefied Petroleum Gas License | NV Board of the Regulation | No concerns identified |
| | of Liquefied Petroleum Gas | |
| Potable Water System | Nevada State Health Division | Potable water systems are located at the Murray, SSX, and millsite. No concerns identified |
| | |
| Septic System Permit | Nevada State Health Division | The Mine has general permits for five systems: SSX; Steer; Murray; USA; and Smith. The mill site has a package plant that discharges to the tailings impoundment. No concerns identified |
| | |
| | |
| | |
The current closure cost estimate for Jerritt Canyon is approximately $41 million, assuming the work is accomplished by an in-house work force. The reclamation cost for the agency bond is somewhat higher at $55 million as calculated under the U.S. Forest Service bonding guidelines; this figure includes agency oversight and administration. Queenstake has a policy with the American Insurance Group (AIG) for a closure cost and cap insurance policy that has been accepted by the regulatory agencies to serve both to fund the physical reclamation and post-closure site management, and meet agency requirements for bonding.
Closure and reclamation will consist of the following actions:
Open pits will be reclaimed by partially backfilling the pits with mine waste rock produced in the underground mining operations. Level areas in the pit bottom will be covered with fine-grained waste rock or growth medium and revegetated.
Portals for the underground mines will be sealed by blasting, backfilling or bulk-heading. Raises extending to the surface will be backfilled. Regional groundwater levels are below the elevation of the mine portals or raises, therefore seepage from the mines is not expected.
Waste rock disposal area will be left in a condition meeting slope stability requirements. Portions of the older rock disposal areas will be left with angle of repose side slopes that are covered with durable non-acid generating rock. Other rock disposal areas will have final slopes of 2.5H to 1V. Tops of the rock disposal areas will be graded to route surface water runoff away from rock disposal area slopes. Level surfaces of the rock disposal areas and the 2.5H to 1V side slopes will be covered with growth media and revegetated.
Haul roads and access roads not included in the final site access requirements will be regraded to conform to the original ground contours and revegetated. It is understood discussion are currently in progress with the USFS to identify roads that will remain. Haul roads that may be left open will likely require some level of reclamation to reduce overall road width.
Sediment control structures will be reclaimed by breaching ponds and basins after sediment and erosion control issues are controlled through reclamation of the areas draining to the structures.
The tailings impoundment will be reclaimed by first removing free water from the pond through evaporation. The tailings surface will be allowed to dry to a consistency to allow operation of earth moving equipment and covered with 2 to 2.5 feet of material to grade the surface to drain and an additional 1.5 to 2 feet of growth medium placed for revegetation. Operation of the seepage recovery and pumpback system will need to continue for a period of time after the tailings impoundment is closed and seepage from the tailings ceases. It is assumed the recovered water will be managed by land application over the tailings impoundment area to assist in revegetation efforts and by evaporation.
Spent heap leach materials from a leach pad adjacent to the tailings impoundment will be excavated and placed as fill for grading the tailings impoundment.
43
Solution ponds associated with the heap leach pad and the processing plant will be reclaimed by removing solution from the pond, and disposal of all contained sludge in the tailings impoundment. Pond liners will be folded into the ponds and backfilled. Growth medium will be placed over the backfilled ponds and revegetated.
Buildings and structures will be dismantled to the level of foundations and either salvaged or disposed of in an approved landfill. Process piping will be rinsed and neutralized. Disposition of underground piping is not specifically addressed, however SRK would assume it will be necessary to remove all piping.
As the mine progresses closer to closure, the overall detail of the closure plan may require refinement. The overall closure plan is considered by SRK to follow proven and accepted industry practices.
Taxes
Queenstake controls more than 119 square miles of ground encompassing the mine area proper and surrounding acreage. The bulk of this is in the form of contiguous unpatented mining claims which are held in force by production from the mining activities. No production royalties are paid for gold deriving from these claims.
Some property is leased from landowners in the region, and a royalty is paid on production from these lands. In the future this amount will average approximately $1.91/recovered ounce.
Nevada does not apply a corporate income tax. Income tax is levied on the federal level. There is a modest sliding scale tax rate generally applicable to smaller operations, but given the size of the Jerritt Canyon activities, the rate is 34.5% of net income after all deductions have been taken. Queenstake has, in total, suffered a loss since acquiring Jerritt Canyon in mid-2003, and so no federal income taxes have been assessed.
Property taxes are assessed annually by Elko County on real estate and personal property controlled by Queenstake.
A sales tax rate of 6.5% is applied to all purchases within Elko County, and the state levies a 0.63% tax on gross incomes paid, less credits for certain health benefits for the workers.
Capital and Operating Cost Estimates
Jerritt Canyon is forecasting an expenditure of $74.4 million over the coming four-year period for mine-related capital items. These include the categories of: equipment, underground development, and mine facilities. The largest expenditure outlays will be for mine development at $22.5 million with an additional $5.0 million for mine equipment. Sustaining capital costs for the ore processing plant is budgeted at $17.1 million for upgrades to existing facilities. Sustaining capital costs for surface services and G&A is budgeted at $1.6 million. G&A sustaining capital at Jerritt Canyon is typically for the replacement of light vehicles and office equipment. Tailings impoundment capital is nearly $10.0 million over the next three years, with an additional $16 million related to the construction of a new tailings pond to begin in the fourth year. A breakdown by property is given in Table 14.
Table 14: Jerritt Canyon Capital Expenditures for LoM ($000’s)
| | | | | | | | | | | | | | | Starvation | | | Wright | | | | |
| Cost Center | | Murray | | | SSX Complex | | | Saval 4 | | | Smith | | | Canyon | | | Window | | | Total | |
| Equipment | | 0.0 | | | 1,500 | | | 0.0 | | | 1,500 | | | 2,000 | | | 0.0 | | | 5,000 | |
| Mine Development | | 0.0 | | | 3,492 | | | 1,238 | | | 14,478 | | | 3,243 | | | 0.0 | | | 22,451 | |
| Mine Facilities | | 0.0 | | | 0.0 | | | 0.0 | | | 0.0 | | | 2,224 | | | 70.0 | | | 2,294 | |
| Process | | | | | | | | | | | | | | | | | | | | 17,115 | |
| Surface Serv; Admn | | | | | | | | | | | | | | | | | | | | 1,560 | |
| Tailings Impoundment | | | | | | | | | | | | | | | | | | 26,000 | |
| Total | $ | 0.0 | | $ | 3,492 | | $ | 1,238 | | $ | 15,553 | | $ | 9,584 | | $ | 70.0 | | $ | 74,420 | |
44
The operating costs per ton of ore for processing have steadily increased over the last 7 years from $15.67 in 2001 to $36.43 in 2007, primarily as a function of the production throughput and energy costs. Of this total, approximately 75% is for operations and 25% is for maintenance.
As previously noted, the budgeted processing costs for 2009 will be about $25.0/ton of ore, down from an actual 2008 cost of $51.7/ton of ore. The cost of $51.7/ton represents a reduced throughput capacity in 2008 due to the shutdown as well as the higher than normal labour cost. Under the current plan and the agreement in place will a third party, milling costs are expected to be $25.0/ton.
The Company is not in a position to determine the operating cost for the organization as whole until it completes the development of its revised mining plan and resources its requirements based on this plan.
The expected life of the Jerritt Canyon operation is five years, based on the current processing rate and reported proven and probable reserves as of December 31, 2008. We control a large land position in the immediate area and it is expected that future exploration will continue to convert certain resources to a reserve category over time.
Exploration and Development
Queenstake has been conducting aggressive resource and reserve development programs throughout its ownership of Jerritt Canyon.
SRK has the following recommendations:
Continue exploration drilling with the target of locating new areas of resource and reserve;
Try to maximize stockpile haulage to the mill during the non-winter seasons;
Continue to work on the mine to mill reconciliation in respect to tons and grade; and
Continue to develop ways to minimize the amount of moisture in the ore that enters the plant. The moisture typically comes from internal mine water, and seasonally from water that enters the stockpiles at the mines and mill.
(b) Ketza River Project, Yukon Territory
Our interest in the Ketza River Property is the subject of a report prepared by (the “SRK Report”), which is dated March 2008, prepared by SKR Consulting (US), Inc. (“SRK”), of #3000, 7175 West Jefferson Avenue, Lakewood, Colorado, USA 80235.
The following description of the Ketza River Property has been summarized primarily from the SRK Report.
Project Description and Location
The Property is located on the headwaters of Cache Creek, a tributary of the Ketza River, in the Watson Lake Mining District of the Yukon Territory, and is centered at 61o 32' N and 132o 13' W on NTS map sheet 105 F/9 (Figure 6).
The Property consists of 620 Yukon quartz claims and fractions of claims as shown in Figure 7. Another 66 quartz claims have been converted to quartz leases covering 853.9ha. All claims are controlled 100% by us.
Included in this total are six leased quartz leases and 114 quartz claims covering a silver-lead-gold vein known as the Silver Valley Property. Silver Valley lies approximately 6km east of the existing Project. The Silver Valley Property is not included in the current resource and will not be discussed further in this report.
The validity of the claims was not reviewed by SRK.
45
An annual royalty is due to the Yukon government on every producing mine according to the Yukon Quartz Mining Act (Canada) however the details of this royalty are currently under review. The royalty is on any profits that exceed the sum of $10,000 during any calendar year. The royalty is as follows:
- On annual profits in excess of $10,000 and up to $1 million, 3%;
- On the excess above $1 million up to $5 million, 5%;
- On the excess above $5 million up to $10 million, 6%; and
- On the excess above $10 million a proportional increase of 1% for each additional $5 million.
Environmental permits are in place for exploration and related activities, as well as the maintenance of the Ketza River camp. We have an environmental staff based at the Ketza River camp to routinely monitor environmental parameters, and also maintains an environmental office in the provincial capital of Whitehorse. Relevant permits are presented in Table 17. All permits except the Water License are issued by the Department of Energy, Mines and Resources or the Department of Environment. The Water License is issued by the Yukon Water Board.
Table 17: Permits for the Ketza River Project
| Permit/Approval | Issuing Agency | Comments |
| Quartz Mining Land Use Permit | Mining Land Use, Department of | |
| LQ00156 | Energy, Mines and Resources | Covers all exploration through June 14, 2014. |
| Government of Yukon Lease | Lands Branch, Department of | For the occupation of land for the purpose of |
| | Energy, Mines and Resources | commercial mine, mill, campsite, tailings |
| | | pond and other facilities. |
| Class A Land Permit | Lands Branch, Department of | Permit to proceed with the land use operations |
| | Energy, Mines and Resources | for road maintenance. |
| Quarry Permit | Lands Branch, Department of | For the removal of 500m3 of gravel and |
| | Energy, Mines and Resources | 500m3 of limestone rip rap from specified |
| | | sites. |
| Water License QZ04-063 | Yukon Water Board | For the storage of water in, and the discharge |
| | | of water from, an existing tailings |
| | | impoundment. |
| Environmental Health Approvals | Department of Environment | Public Health and Safety Act approvals |
| | | needed for drinking water, food safety and |
| | | private sewage disposal. |
| Storage Tank Registration | Department of Environment | For registered AST’s: one 45,000L, one |
| | | 500L, one 10,000L, and four 90,000L_tanks. |
| Air Emissions Permit No. 4201-60-025 | Department of Environment | Permit to operate a solid waste incinerator |
| | | capable of burning >5kg/day. |
| Solid Waste Permit (Commercial Dump | Department of Environment | Permit to operate a dump for commercial |
| Permit No. 81-013) | | purposes and for incineration of solid waste |
| | | generated by commercial activities. |
| Special Waste Permit No. YG41-190 | Department of Environment | Allows for storage and handling of waste, oil, |
| | | waste batteries, waste lead nitrate, unspecified |
| | | substances classified as “Corrosive Solids, |
| | | NOS, Class 8, Packing Group 1. |
The Quartz Mining Land Use Permit requires a lease-security payment to be made each year for a limited time. Under the previous permit, payments of C$26,500 were due April 1 of each year. The recently revised permit will also require payments to be made but at the time of writing the Department of Energy, Mines and Resources has not determined the amount. In addition, the Government of Yukon Lease requires a payment in the amount of C$7,000 to be made on January 1 of each year. A total of C$3,087,600 has been paid of the Water License. No further payments are due under the present permit. We have notified SRK that we hold all permits required for exploration and maintenance of the camp. Additional permits will be required for mine operations. We have notified SRK that there are no environmental liabilities on our Ketza river property.
46
Figure 6 – Location Map

47
Figure 7: Ketza River Project Land Position
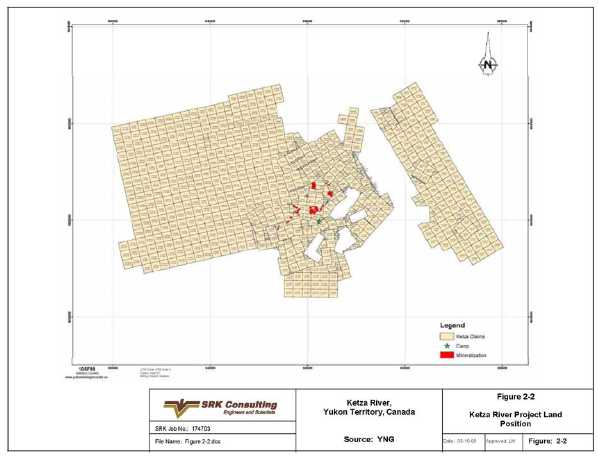
Accessibility, Climate, Land Resources, Infrastructure and Physiography
The Property is located in the Pelly Mountains in south central Yukon. Terrain is mountainous with elevations ranging from 1,300m above mean sea level (amsl) to 2,100m amsl. Land use in the area is limited to mining, trapping, hunting and recreation.
Average daytime temperatures range from highs of +25oC in summer to lows of -40oC in winter. Average annual precipitation in Faro, the nearest location for which weather statistics are available, is 31.6cm and includes annual averages of 21.4cm of rainfall and 111.6cm of snowfall (http://climate.weatheroffice.ec.gc.ca/climate_normals).
Daylight extends to nearly 24hr/day in the summer months, particularly June. There are only short periods of daylight during the winter. Exploration can be conducted year-round but heavy winter snow may limit access to some areas. Mining can be conducted year-round.
Vegetation consists of dwarf birch, spruce, alder and balsam trees up to the tree line at approximately 1,600m amsl.
The Property is accessible by a 40km all-weather road from Km 323 on the Robert Campbell Highway. The Property is approximately 80km by road from Ross River and 460km from Whitehorse (Figures 6 and 8). The 40km access road is kept open year-round and is passable for tractor-trailer-size supply trucks.
48
The surface is owned by the Crown and leased to us under the Government of Yukon Lease. Total annual lease payment for the occupation of land for the purpose of a commercial mine, mill, campsite, tailings pond and other mine-related facilities is C$7,000.
The community of Ross River is 90km from the Project and supplies food, fuel and basic medical service. First aid-trained personnel are on site at the Ketza River camp at all times and a fully stocked Industrial Ambulance is available. There is an airstrip in Ross River and contractors for electrical, plumbing, mechanical and vehicle maintenance are available in Ross River or Whitehorse.
Power to the camp and facilities is provided by 160kV and a 210kV diesel generators. One generator remains off while the other generator provides power. The two are used alternately to allow for maintenance. A smaller 60kV generator is available as backup. Power for any future mining activities will be provided by additional generators.
Water for the camp and facilities is available from three established wells. The primary well is located upstream from the camp, near Cache Creek. Pumps that are in place can individually produce up to 30gal/min. An emergency source for water is Cache Creek itself. Power and a pump are in place so that water can be used from the creek if needed. Water for future mining operations will be provided by water wells to be drilled on the property.
The buildings for the camp, kitchen and offices are Atco trailer units. There are 48 rooms available for lodging. There is a kitchen unit with dining area and an office complex for technical staff. Shop areas in the old mill building are functional and are used for maintenance of camp vehicles and equipment.
The old mill building is in good condition and its use for future milling activities will be investigated in feasibility studies. West of camp there is a core logging and core splitting building. All facilities have available power and water. Core is stored outdoors on-site.
The camp site is permitted for 50 personnel. Technical staff typically work four weeks on and two weeks off with schedules dependent on the needs of the camp. A larger camp will be required for future mining operations. A suitable tailings storage site is present on the property.
Waste generated in camp and from activities associated with the Project are burned in a trash incinerator or hauled to the Ross River land fill. Trash awaiting incineration is stored in bear-proof metal storage containers. There is a chemical treatment facility for sewage located down gradient from the camp.
Suitable mine waste dump sites are present on the property.
Geologists, engineers, surveyors and other technical people are hired on a contract basis or employed through us. There is a Memorandum of Understanding signed with the Dena Band of the Kaska Nation stating that First Nation’s people will be preferentially hired if they qualify for available jobs.
49
Figure 8: Ketza River Project Access
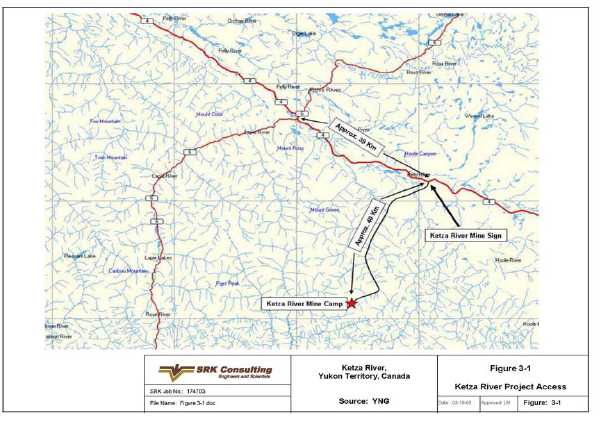
History
The Ketza River Property has a history of exploration and production dating back to the 1940’s. The property consists of several discrete zones of mineralization as shown on Figure 9. The exploration camp, and core shed are shown on the map along with the historic tailings pond and mill site.
In June of 2007 YGC completed a merger with Queenstake Resources Ltd to create us, who are the current owner of the property. The Property is 100% controlled by us. There are no underlying agreements or encumbrances.
Lead-silver veins were discovered in the Ketza River area by prospectors of the Hudson Bay Mining and Smelting Company Limited in 1947. Later explorers carried out trenching, road building and diamond drilling. Exploration adits were subsequently developed on the lead-silver veins but little economic production was achieved.
Gold mineralization on the property was first discovered in 1954 by Conwest Exploration Company Limited (Conwest). Between 1955 and 1960, Conwest explored several mineralized occurrences with trenching and 75 AX diamond drill and packsack drillholes. A non-NI 43-101-compliant historic geological “reserve” of 68kt grading 12g/t-Au was reported for the Peel 3 and Peel 3C deposits (now known as the Peel and Ridge zones). The claims were surveyed and taken to lease during this time.
50
Figure 9: Mineralized Zones and Facilities
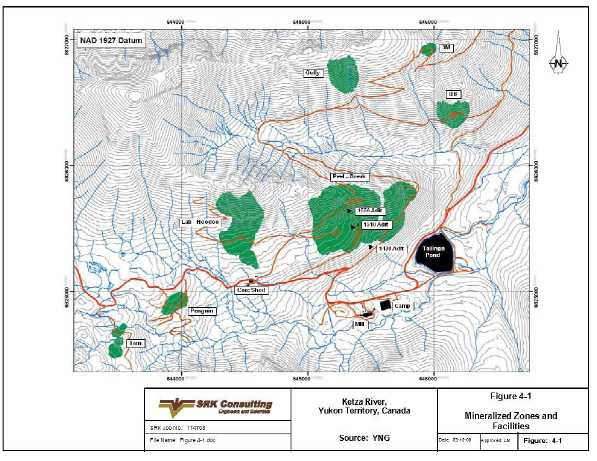
In 1983, Pacific Trans Ocean Resources Ltd. optioned the property from Conwest and carried out limited geochemical and geological surveys before entering into a joint venture with Canamax Resources Inc. (Canamax) in 1984.
In February 1987, a feasibility study was completed by Canamax and reviewed by Wright Engineers Ltd (Canamax Resources Inc, 1987). The study recommended construction of a 320t/d mill and mine complex producing approximately 50koz-Au/year from a mineable ore reserve base of 460kt averaging 15.3g/t -Au. The reserve estimate preceded Ni 43-101 requirements and is not compliant with CIM guidelines. Mine life was to be five years and the average cost per ounce of gold produced was to be in the range of $220 to $250. The estimated cost to build the mine and mill was estimated at $21M. A production decision was made in March 1987, and financing was obtained in October 1987. The mill achieved commercial production in July 1988.
After several months of operation, the oxide ore reserves were significantly reduced from the Wright feasibility study estimates due to an error in estimation of the bulk density of the oxide ore. The grade of feed to the mill was also lower than expected, due to a number of factors including over-weighting of high-grade samples in the data and dilution from the lower than expected grade from the footwall mineralization (Strathcona Mineral Services Limited, 1988). Canamax purchased Pacific Trans-Ocean's interest in the Project in January 1989.
From July 1988 to November 1990, production from the property was 100,033oz-Au from 342,395t at an average millhead grade of 11.6g/t -Au. Average mill throughput over the life of the mine was 364t/d with an average gold recovery of 88.65% . A summary of total production by zone is presented in Table 4.4.1 (Hodgson, 1991). It should be noted that mine production figures were not reconciled with total mill production of 100,033oz-Au. Based on the numbers presented in Table 18, the Mine production should have been 131,046oz as opposed to actual production of 100,033oz.
51
Table 18: Summary of Total Gold Production July 1988 – November 1990
| Zone | Tonnes | g/t-Au |
| Ridge | 95,790 | 13 |
| Peel | 148,844 | 13 |
| Break-Nu | 54,700 | 10 |
| Tarn | 18,169 | 8 |
| QB | 1,987 | 13 |
| Knoll | 2,936 | 6 |
| Gully | 8,136 | 10 |
| 1430 East | 600 | 5 |
| Peel/Ridge Mine Dump | 11,233 | 6 |
| Total | 342,395 | 11.6 |
With the oxide zones nearing depletion, attention was given to the economic viability of the sulfide mineralization and in November 1990 the mine and mill ceased treating oxide material. Metallurgical studies were conducted on sulfide mineralization from several of the deposits. Gold recovery of 78.3% from the sulfides was forecast with limited capital additions required to the existing mill. The mill was permitted to treat oxide ore only and additional permits were required for the treatment of sulfide ore. In June 1991 an amended water license was received but Canamax did not pursue the application due to corporate conditions, low gold prices and adverse market conditions.
Wheaton River Minerals Ltd. (Wheaton) acquired the property from Canamax in 1992 and in 1994 transferred it to YGC Resources Inc. (YGC) in exchange for a controlling interest in YGC, later divested. The claims outside the mine area were optioned to Hemlo Gold Mines Inc. (Hemlo) from 1993 to 1995.
Hemlo carried out soil sampling, magnetic surveys, bulldozer trenching and completed three diamond drillholes totaling 499m in the Shamrock zone area. YGC also conducted diamond drilling in 1994 and 1995 that consisted of 72 HQ-diameter diamond drillholes totaling 5,622m. The program resulted in the discovery of the Chimney and Fork zones.
In 1996, YGC completed 14 HQ-diameter holes totaling 1,954m in the mine area and 21 HQ-diameter holes totaling 3,613m in the Shamrock zone. The 1996 program also consisted of geologic mapping, prospecting and sampling a number of other anomalous zones. During 1997, 11 holes, totaling 1,217m, were drilled along the Fork – Nu-zone trend.
From 1955 through 1997, a total of 914 diamond, RC and percussion drillholes totaling 53,134m of drilling have been completed on the property. A summary of this is presented in Table 19.
University graduate students completed studies on the property (Cathro, 1990 and Stavely, 1992). The studies investigated the geology and mineral deposits of the Ketza district or the mineralogy and geochemistry of the Ketza Mine deposits. A postgraduate investigation was completed on the structural geology, stratigraphy, alteration systems, and possible age relationships of mineralization and postulated intrusive activity (Fonseca, 1997).
Table 19: Summary of Drilling from 1955 to 1997
| Year | | Operator | No. Holes | | Type of Drilling | Length Drilled (m) |
| 1955-60 | | Conwest Exploration Co. | 75 | | Diamond | Unknown |
| 1984 | | Canamax Resources Inc. | 59 | | Diamond | 2,424 |
| 1985 | | Canamax Resources Inc. | 60 | | Diamond | 6,158 |
| 1986 | | Canamax Resources Inc. | 158 | | Diamond | 8,609 |
| 1987 | | Canamax Resources Inc. | 61 | | Diamond | 4,990 |
| 1987 | | Canamax Resources Inc. | 95 | | RC | 5,029 |
| 1988 | | Canamax Resources Inc. | 70 | | Diamond | 5,549 |
| 1989 | | Canamax Resources Inc. | 127 | | Diamond | 5,590 |
| 1989 | | Canamax Resources Inc. | 79 | | Percussion | 1,215 |
| 1990 | | Canamax Resources Inc. | 9 | | Diamond | 1,101 |
| 1994 | | Hemlo Gold Mines Inc./YGC Resources Ltd. | 25 | | Diamond | 2,180 |
| 1995 | | Hemlo Gold Mines Inc./YGC Resources Ltd. | 50 | | Diamond | 3,630 |
52
| Year | Operator | No. Holes | Type of Drilling | Length Drilled (m) |
| 1996 | YGC Resources Ltd. | 35 | Diamond | 5,442 |
| 1997 | YGC Resources Ltd. | 11 | Diamond | 1,217 |
| Total | | 914 | | 53,134 |
Canamax Resources Inc, the previous operator of the mine, expended $11.6 million on exploration and feasibility studies beginning in 1984. Exploration summary reports were prepared annually by Canamax describing geophysical ground and airborne surveys, geochemical soil sampling, prospecting, trenching, percussion drilling, RC drilling, diamond drilling and underground developments.
After YGC acquired the property in 1994, it spent $0.52M in 1994, $0.76M in 1995 and $0.90M in 1996 on exploration. Some 11,090m of exploration diamond drilling in 110 HQ holes were carried out on the extensions of mineralized trends, on the peripheries of developed zones and in other unexplored anomalous areas. The exploration was successful, leading to the discovery of new gold-bearing oxide and sulfide mineralization on the property. A summary report on the 1994 and 1995 drilling programs was prepared at the end of the 1995 season.
Historic Mineral Resource and Reserve Estimates
Pre-production Resource Estimates
Canamax calculated “reserve” estimates prior to production using cross sectional methods in which blocks were drawn halfway to the nearest adjacent drillhole and halfway to the adjacent cross-section except where geology dictated a reduction in block size due to structural discontinuity. These estimates used a variety of cut-offs and included or excluded different satellite deposits, so it is difficult to make meaningful comparisons between the estimates from year to year. These estimates were done before the NI 43-101 standards were required, and the similarity to today’s definitions regarding measured, indicated and inferred resources are uncertain. Specific Gravity (SG) values applied to sulfide and oxide are not mentioned in the 1984 resource, but in 1985 2.8 was used for oxide, and 3.3 was used for sulfide. In 1986 oxide used 3.1 for SG, and sulfide is not mentioned. These pre-production estimates are summarized in Table 20, and Figure 10.
Table 20: Historic Resource Estimates
| | | | Oxide | Sulfide |
| Year | Description | Cut-off | Tonnes | Grade (g/t) | oz | Tonnes | Grade (g/t) | oz |
| 1984 | Peel Pit & UG + | 4g/2.5m (Peel) | 473,397 | 8.52 | 142,991 | | | |
| | Tarn Pit | 2g/2.5m (Tarn) | | | | | | |
| 1985 | Peel Oxide + Misc. | 4g over 2.5m | 439,077 | 14.62 | 187,703 | 430,913 | 7.46 | 330,693 |
| | Sulfides | | | | | | | |
| 1986 | PP&P Oxide, | 4g/t | 535,000 | 15.02 | 258,376 | 543,000 | 7.50 | 130,934 |
| | Possible Sulfide | | | | | | | |
| 1987 | Same as above + | 4g/t | 651,188 | 14.46 | 302,810 | 559,340 | 7.51 | 134,979 |
| | new zones (Gully, | | | | | | | |
| | QB, Break & Knoll) | | | | | | | |
53
Figure 10: Preproduction Resource Estimates
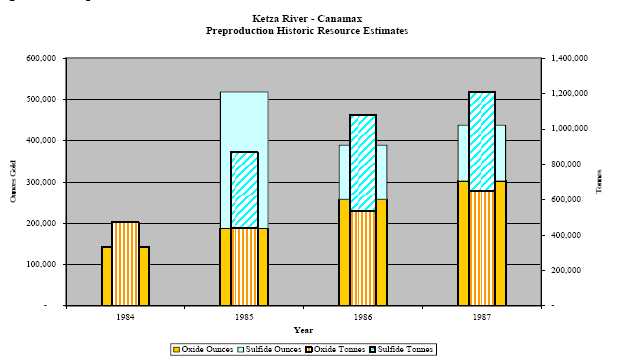
Post-production Resource Estimates
In 2004 and 2005 resource estimates were prepared for YGC by Gary Giroux (Tables 26 and 27). The 2004 resource was divided into two parts: manto-style mineralized zones south of the Peel Fault and disseminated and quartz stockwork mineralization zone north of the Peel fault. This estimate included all of the drillholes drilled by Canamax in the 1980s and 1990s, as well as the holes drilled by YGC in the 1990’s in the Peel and Shamrock areas. The 2005 resource added 37 new drillholes completed in the summer of 2005 along with an additional 121 historic holes in the Bluff, Hoodoo and Lab Zones to the west of the area estimated in 2004. Shamrock was not updated in 2005.
The bulk density for oxide material was 2.3t/m 3. Sulfide material was set at a conservative 3.1t/m 3 based on measurements made by Canamax during the feasibility study.
Table 21: YGC Measured and Indicated Resources, 2004-2005
| | Measured & Indicated |
| | Sulfide + Oxide Resources |
| Year | Area | Tonnes | g/t | oz |
| | Peel | 4,250,000 | 2.81 | 385,500 |
| 2004 | Shamrock | 2,590,000 | 2.19 | 182,000 |
| 2005 | Peel + Peng-Lab + Tarn | 5,950,000 | 3.00 | 574,600 |
54
Table 22: YGC Inferred Resources, 2004-2005
| | Inferred |
| | Sulfide + Oxide Resources |
| Year | Area | Tonnes | g/t | oz |
| 2004 | Peel | 6,270,000 | 1.76 | 354,800 |
| | Shamrock | 4,030,000 | 1.92 | 249,200 |
| 2005 | Peel + Peng-Lab + Tarn | 10,550,000 | 2.37 | 805,200 |
Geological Setting
The Property is located in the Pelly Mountains of central Yukon. The mountains are made up of a shallow marine miogeoclinal sequence of rocks forming a carbonate platform bounded by the Omenica Tectonic Belt to the southwest and a faulted lobe of the Yukon Tanana Terrain to the northeast across the Tintina Fault. This carbonate platform is known as the Cassiar Terrain or Pelly-Cassiar Platform (Pelly-Cassiar).
The Pelly-Cassiar is a displaced continental margin of the ancient North American continent. Rocks of the Pelly-Cassiar consist of a continental margin sedimentary sequence of the Rocky Mountain Assemblage composed of interbedded carbonate and clastic units of Paleozoic age. Several major deformation events have affected the region including a Mesozoic-age arc-continent collision, doming and uplift during the intrusion of mid-Cretaceous stocks and an estimated 450km of dextral strike-slip displacement on the Tintina Fault from the Cretaceous to Tertiary periods.
Four significant thrust faults, the McConnell, Porcupine-Seagull, Cloutier, and St. Cyr thrusts, parallel the Tintina Fault and dip generally southwest (Abbott, 1986). Thrusting is believed to have occurred during the Late Jurassic and Early Cretaceous.
Rocks in the Watson Lake District belong to the Cloutier Thrust Sheet, which is exposed within an erosional window in the overlying Porcupine-Seagull Thrust Sheet. The window, known as the Ketza-Seagull arch, forms an elongated northwest-trending structure probably related to buried Cretaceous intrusions. The intrusions are apparently centered in two areas known as the Ketza Uplift and the Seagull Uplift. Structures in the window are characterized by steeply dipping normal faults.
The Ketza Uplift is thought to be caused by a buried intrusion (Parry and others, 1984 and Parry and others, 1985). The following supporting evidence has been cited for the presence of a buried intrusive:
The presence of a magnetic anomaly;
Development of hornfels in sedimentary rocks; and
Hydrothermal alteration immediately north of the Ketza River gold mantos.
The hornfels has been dated by whole rock K-Ar at 101+/-4Ma, in the Mid-Cretaceous (Cathro, 1988). The uplift exposes the oldest rocks of the Clouthier Thrust Sheet, which are Lower Cambrian carbonates and older clastic rocks. The rocks surrounding the uplift are Upper Cambrian and younger clastic and carbonate rocks.
Geology of the Ketza River Property
The Property is underlain by Lower Cambrian carbonate and clastic sedimentary rock units. The Lower Cambrian units (Map Units 1a, 1b, 1c, 1d, and 1e) form a conformable series (Figure 11) which is unconformably overlain by Late Cambrian black shale (Fonseca, 1998). The lithostratigraphic succession described below was adopted by previous workers (Read 1980). The general surface geology is outlined in Figure 12.
Local Lithology
The oldest rocks are Unit 1a which is composed of interbedded brown to rusty weathering argillite, phyllite, variably bedded impure siltstone, sandstone, quartzite, limestone and calcareous units. The unit outcrops in the center of the Ketza Uplift north of the Peel fault that encompasses the Shamrock target.
55
Unit 1b is a narrow bed (25 to 60m) of fossiliferous, well-laminated silty limestone that appears to be transitional from the underlying argillite to the overlying phyllitic limestone. The unit does not crop out on the property but has been intersected in drillholes.
Unit 1c is a recessive weathering unit of 75 to 105m thickness composed of brown to gray-green phyllitic limestone, calcareous mudstone and argillaceous limestone. The upper contact of the unit is gradational with the overlying massive to thick bedded blue gray limestone. This unit crops out in exposures along Cache Creek above the mill site.
Unit 1d is host to all replacement-type manto mineralization on the property. The lower contact is gradational and arbitrarily defined when the well-bedded limestone becomes the major component. The unit is from 120 to 180m thick. The limestone is a gray, uniformly bedded, clean limestone with distinctive Archeocyathid fossils (FSLT) occurring near the top of the unit. An internal stratigraphy has been reCoGnized in the mine site area. The internal beds are separated on the basis of textures. Beds of massive fine-grained light-gray limestone (MSLT), blue fine-grained crystalline limestone (BXLT), thin and wispy silt banded limestone (WBN), and silty black limestone (BSLT) are reCoGnizable in drill core and outcrop. The unit is locally dolomitized (DOLT), recrystallized and orange weathering near in the vicinity of mineralization. The limestone is resistant and forms prominent cliffs and ridges throughout the region.
Unit 1e is composed of a thin (0 to 50m) green mudstone bed which forms a distinctive marker horizon. The unit is locally to pervasively clay- or talc-altered in the vicinity of mineralization. The mudstone is generally recessive, poorly exposed and often required additional ground support in the underground workings where it formed the hanging wall of the Peel zone.
Unit 2a is composed of carbonaceous to graphitic black shale with a well-developed slaty cleavage. The thickness of the unit is unknown as the top of the unit is not exposed on the property. The unit crops out in the fault-bounded panels at the Peel Oxide zone and in the Sue Creek area north of Cache Creek. A discontinuous unit of dull orange-weathering dolomite, Unit 2b, outcrops in the western portion of the property. This is a regional unit mapped by Read (1980) that was not reCoGnized on the property by Canamax.
Alteration
Dolomitization or iron carbonate replacement (FECO) alteration envelopes the manto mineralization and is especially well developed in areas lateral to the mantos where the host limestones are brecciated. The carbonate replacement deposits result in the migration and precipitation of calcite in the rocks surrounding the mineralization. Sheeted white calcite veins are exposed in the footwall rocks in the Break open pit and amorphous white calcite banding occurs in the BXLT unit in proximity to the Peel/Ridge zones and in the upper plate rocks in the Hoodoo area. The calcite-rich limestone beds are referred to as zebra rock.
Silicification, sulfidization, and bleaching are closely associated with quartz-sulfide veins in sedimentary rocks in the argillite-hosted targets. Skarn mineralization at the Project is rare, and usually does not yield significant gold values. Epidote, biotite and diopside hornfels are wide-spread in Unit 1a, with quartz-sericite enclosing a core of quartz and silicification.Structure The Property lies on the southern flank of a westward plunging anticline which is cored by the Unit 1a argillite exposed along Peel Creek. The strata are strongly folded with limbs ranging from steep to flat-lying. A later deformation has overprinted these structures with broad, open folds and drag folds that occur adjacent to thrust faults.
A synclinal closure has been mapped in the Peel Ridge mine site area where mineralized bodies occur on both limbs of the fold. A major synclinal fold with parasitic anticlinal folds has been mapped northwest of the mine site area in the upper plate rocks overlying the Peel thrust fault. Limestone beds of Unit 1d host gold-bearing oxides and sulfides at the Hoodoo and Comet zones in the core and on the western limb of a tight anticline.
In the region, the thrust faults are northeast-directed with displacements of up to 450m. The Peel fault is thought to be a reactivated thrust fault that pre-dates the block faulting. It is cross cut and offset in the Peel - Ridge fault by northwest-trending faults. The Peel fault intersects the Ridge zone ore deposit and juxtaposes Lower Cambrian argillite Unit 1a over the Lower Cambrian limestone Unit 1d. The fault has two different orientations changing from steeply dipping east of the Ridge zone to shallow dipping over the Ridge zone and to the west. The fault has been traced westward to the area of the Lab deposit.
56
The stratigraphy, thrust faults and folds have been disrupted by numerous reverse, normal and strike-slip faults. High angle block faults related to uplift and doming are prominent. Detailed mapping in the underground workings indicates that the Peel and Ridge oxide deposits occur within a 200m wide zone of structural deformation bounded by two northwest trending block faults.
The Ketza Uplift is composed of uplifted and altered Lower Cambrian Unit 1a strata. Structures within the uplift include thrust faults, upright folds, and high-angle normal faults all of which have strong spatial association with plutonic related type deposits. An apophysis of a mid-Cretaceous stock is postulated to lie beneath the core of the uplift and the Peel Creek anticline. Possible hornfels in the Unit 1a argillite along Peel Creek and a coincident aeromagnetic anomaly are cited as supporting this hypothesis. Block faulting predates, or was contemporaneous with, the mineralizing event and the faults acted as conduits for the metal-bearing solutions.
Figure 11: Stratigraphic Column
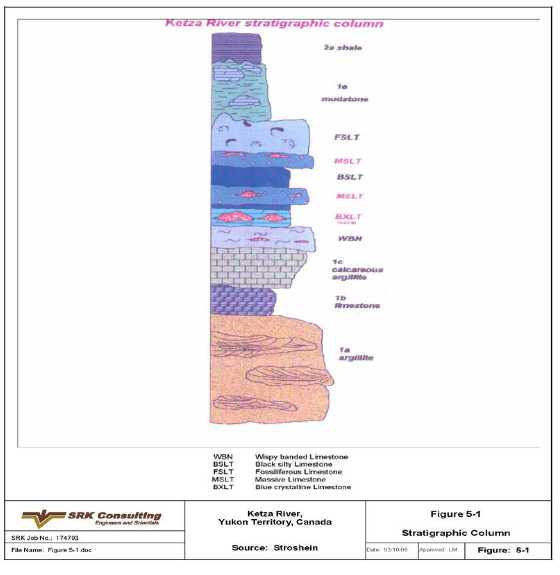
57
Figure 12: Generalized Geology Map

Exploration
In May of 2005, YGC commenced drilling at the Ketza River Project, and has been drilling continuously since then, with the exception of holiday shutdowns. In 2006, the main Project area was flown for new one-meter-contour topographic map coverage. In the spring of 2007 the Ketza claim block was expanded on the south and west. A limited amount of reconnaissance work was conducted in 2006, followed by a major effort in 2007, yielding several new target areas. Ground magnetic and gravity surveys were carried out over known mineralization. A soil sampling program was completed in the area of Peel Ridge north to the top of Shamrock Mountain. A petrographic study was completed for manto-style mineralization.
Samples from three 1996 drillholes were analyzed for multi-element geochemistry in an attempt to determine the presence of a zonation pattern that might point to the location of a postulated buried intrusive as postulated by Fonseca (1998). The holes were located at the QB Zone, the 3M Zone and one in between. The ratios of gold-arsenic and gold-bismuth indicated that the QB Zone hole was closest to the intrusive (Stroshein, 2006).
58
Rock Sampling
Tarn Pit
The wall of the Tarn Pit was channel sampled in the fall of 2006. A total of 40 samples were collected, each one 5.0 m in length. The samples averaged 2g/t-Au, with a high of 9.7g/t -Au.
Creek Zone
Outcrops just above the pad for holes KR-06-920 through 922 contain massive pyrite with black coatings on the crystal surfaces. The black coating is assumed to be chalcocite since the samples ran approximately 0.2% Cu. Other dark grains in the rock were identified as tetrahedrite. All four samples contained gold values.
Gully Pit
The Gully Zone is part of the Shamrock target, and was mined by Canamax in the late 1980’s, yielding approximately 8,000t of oxide grading 10.0g/t -Au (Hodgson, 1991). Mining stopped when sulfide mineralization was encountered, leaving a prominent massive sulfide rib protruding from the pit floor, and a highly oxidized shear zone along its side.
In mid-August of 2006, a series of chip and channel samples were collected across the massive sulfide rib and the adjacent shear zone. The assays of the samples contained significant amounts of gold.
Soil Sampling
Aurora Geosciences was contracted to conduct a soil sampling program large portions of Peel Ridge and Shamrock Mountain in 2007. The sampling was done on a 50m grid, and targeted areas where 200m spaced soil lines had identified anomalous gold. Results are being analyzed at the time of this report.
Topographic Surveys
On August 29, 2006 Aero Geometrics of Vancouver flew the Project, including the existing claim block in 100km2 of new coverage. Two sets of digital topographic maps, with 10m and 1m contour intervals were produced.
In early September 2007, Aero Geometrics of Vancouver flew portions of the Project in which mining claims had been staked since the survey the previous year. The mapping is in progress, and will have a 5m contour interval.
Mineralization
Mineralization on the property is generally of two types: manto and chimney, carbonate-hosted replacement deposits that occur south of the Peel fault and quartz-sulfide fissure veins and quartz-breccia zones in siliciclastic rocks that occur north of the Peel fault. Over 30 targets and prospects have been identified on the property. For purposes of resource estimation the area has been divided into four model areas with most of the targets falling into one of the following areas (Figure 13):
| | | Tarn Area: | Tarn |
| | | | |
| | | Penguin-Lab Area: | Penguin, Flint, Lab and Hoodoo; |
| | | | |
| | | Peel Area: | Ridge, Peel, Nu-Break |
| | | | |
| | | Shamrock Area: | Gully, QB, 3M. |
All areas except Shamrock occur south of the Peel fault and contain manto and chimney, carbonate-hosted replacement deposits while Shamrock occurs north of the Peel fault and contains quartz-sulfide fissure vein and quartz breccia zones in siliciclastic rocks. The Knoll and Freds Vein deposits were not modeled for the resource.
59
Mineralized Zones
Peel, Penguin-Lab and Tarn areas are generally of the gold-rich carbonate-hosted chimney- and manto-style sulfide mineralization and its oxidized equivalent. The lone exception to this is Fred’s Vein East, which is a quartz-sulfide vein hosted by siliciclastic rocks immediately north of the Peel fault. While Fred’s Vein East is geologically similar to the mineralization in the Shamrock area, it falls within the Peel area because of its location on Peel Ridge.
The mantos and steeply-plunging chimneys are preferentially hosted by three limestone facies of Unit 1d: BXLT, MSLT and WBN, which are confined to the south side of the Peel fault. The location of mineralization is controlled by high-angle planar and listric normal faults, fold hinges and by the location of the three favorable carbonate facies. In general, the mantos have an elongate geometry.
Principal sulfide mineralogy consists of pyrrhotite, pyrite, arsenopyrite, marcasite and minor chalcopyrite. Galena and sphalerite are rare. Oxidized mineralogy primarily consists of hematite and goethite. Scorodite, after arsenopyrite, is common. A distinctive lustrous hydrous iron silicate mineral named hisingerite is present, and is often associated with high-grade gold values.
Sulfide mantos include Peel Sulfides, Peal East Sulfides, Penguin, Tarn, Lab and Flint. Oxide mantos include Peel Oxides, Break-Nu, Ridge and Hoodoo.
Tarn Zone
The Tarn zone is located approximately 2km west of the Ketza River Camp in the headwaters of Cache Creek. Mineralization consists of two mixed oxide-sulfide bodies ranging from 85m to 115m in length, 35m to 60m in width and 5m to 8m in thickness. Mineralization is exposed in the Tarn pit and extends to 75m in depth and is approximately horizontal. Strike is about 015o.
Approximately 18kt of oxidized Manto-style mineralization was mined from the Tarn zone in the late 1980’s. Current exploration focuses mainly on the sulfide Manto beneath the oxide.
Penguin Zone
The Penguin zone is manto-style sulfide mineralization located approximately 1.25km west of the Ketza River Camp, also in the Cache Creek drainage. Two mineralized bodies occur within a presently defined area of approximately 425m in length, 100m in width and 15m in thickness. The first zone, formerly known as the Flint zone, is sub-vertical with a plunge of 25o to the southwest. It is approximately 150m in length, 60m in height and 10m in width. This zone occurs 90m below the surface with an azimuth of 050o.
The second zone is more flat-lying with approximate dimensions of 150m in length, 115m in width and 4m in thickness. It occurs approximately 120m below the surface with a plunge of 4o to the southwest and an azimuth of 020o.
Lab Zone
The Lab Zone is manto-style sulfide mineralization located approximately 1.25km northwest of the Ketza River Camp on the southern slope of Peel Ridge. The Lab zone consists of four distinct zones that occur over an area measuring 320m x 400m and average 5m in thickness. The four bodies occur in two pairs at right angles to one another with the arms striking northeast and southeast. The former Calcite zone is now included in this zone.
Hoodoo Zone
The Hoodoo zone is manto-style oxide/sulfide mineralization located approximately 1.5km northeast of the Ketza River Camp on the southern slope of Peel Ridge. Early drilling stopped once sulfide mineralization was reached but recent drilling has been targeting the sulfide mineralization underlying the oxide mineralization exposed at surface. Recent exploration has also been successful in extending the oxide mineralization. Geometrically the Hoodoo zone is a flattened cylinder with a presently defined diameter of 70m and a thickness of 15m.
60
Peel Model Area Occurrences
Peel Zone
The Peel zone is located about 0.75km north of the Ketza River Camp on the south flank of Peel Ridge. Mineralization consists of irregular interconnected lenses and pods in area approximately 400m long x 400m wide zone. The Peel zone consists of the Peel West, Ridge, Main Peel, or Peel oxide, zones. The Nu-Break and Fred’s Vein East zones are also on Peel Ridge but are somewhat to the east of the main grouping of mineralized bodies that comprise the Peel zone.
Peel West Zone
The Peel West zone consists of four mineralized bodies with a generally circular footprint. The four bodies occur over an area measuring 320m x 260m and range in thickness from one to 10m. The mineralized bodies are exposed at the surface and extend to a depth of 60m. The overall azimuth of the zones is 325o.
Ridge Oxide Zone
The Ridge oxide manto zone as presently defined consists of three separate mineralized bodies occurring over an area approximately 500m in length, 85m in width and 50m in thickness. Individual mantos vary from 5 to 10m in thickness. The zone is exposed at the surface and extends to a depth of 120m. Mantos dip from fairly flat-lying to 55o to the north. Azimuths range from 070o to 350o.
Production from the oxide mineralization in the Peel and Ridge deposits was approximately 148,844t at an average grade of 13g/t-Au. Oxide mineralization is cut off by the bounding northwest-trending East Side fault.
Nu-Break Zone
The Nu-Break zone consists of oxide/manto mineralization located approximately 1.0km north-northeast of the Ketza River Camp on the nose of Peel Ridge. The overall dimensions of the mineralized body as presently defined are approximately 175m in length, 75m in width and 30m in thickness. The zone is exposed at the surface and extends to a depth of 95 m below the surface. The azimuth of the zone is approximately 300o with a dip of 75o to the south.
Fred’s Vein East
Fred’s Vein East is a quartz-sulfide vein-like occurrence in siliciclastic rocks on the north side of the Peel fault. The vein is located on the north side of Peel Ridge in the Peel Creek drainage approximately 1.0km north of the Ketza River Camp. The exposed strike of the structure is approximately 100m. The width is difficult to characterize and the down dip extension has not yet been defined. The zone is exposed at the surface. The strike varies from 065o to 080o and dip varies from 80o to 85o south.
Shamrock Model Area Occurrences
All of the mineralization in the Shamrock area occurs in siliciclastic rocks north of the Peel Fault. Mineralization occurs as fissure veins, breccia zones and disseminations rather than chimneys and replacement mantos.
Gully Zone
The Gully Vein is a quartz-sulfide vein occurring in siliciclastic rocks north of the Peel fault. The vein is located approximately 1.75km north of the Ketza River Camp on the south flank of Shamrock Mountain in the Peel Creek drainage. Samples from drilling range up to 37.6g/t -Au. The overall dimensions of the mineralized body as presently defined are approximately 300m in length, 100m in depth and 4m in thickness. The zone extends from the surface to 125m with an azimuth of 165o, a dip of 45o west and a plunge of 9o.
QB Zone
The QB zone consists of multiple irregular lenses of quartz-breccia occurring in siliciclastic rocks north of the Peel fault. The vein is located approximately 1.75km northeast of the Ketza River Camp on the south flank of Shamrock Mountain in the Peel
61
Creek drainage. The overall dimensions of the mineralized body as presently defined are approximately 525m in length, 220m in width and 2m to 70m in thickness. The zone extends from the surface to a depth of 270m with an azimuth of 140o and a plunge of 040o to the south.
3M Zone
The 3M zone is located about 2.5km northeast of the Ketza River Camp on the ridge between Peel and Misery Creeks. Mineralization consists of quartz breccia and disseminations in siliciclastic rocks. The mineralized body is approximately 525m in length, ranges from 2m to 12m in width and extends to 230m in depth. The upper part contact of mineralization ranges from 40m to 90m below the surface. The azimuth of the mineralized body is 150o and the dip is 010o to the west.
Knoll Zone
The Knoll zone is located about 3.0km northeast of the Ketza River Camp on the north slope of Shamrock Mountain. It is just outside of the Northwest edge of the Shamrock model area. It is comprised of a body of oxide mineralization measuring 45m x 35m with a thickness ranging from 4m to 10m. It is exposed at the surface and has been mined on a limited scale in the past.
Figure 13: Drillhole Locations and Modeled Areas with Deposit Names
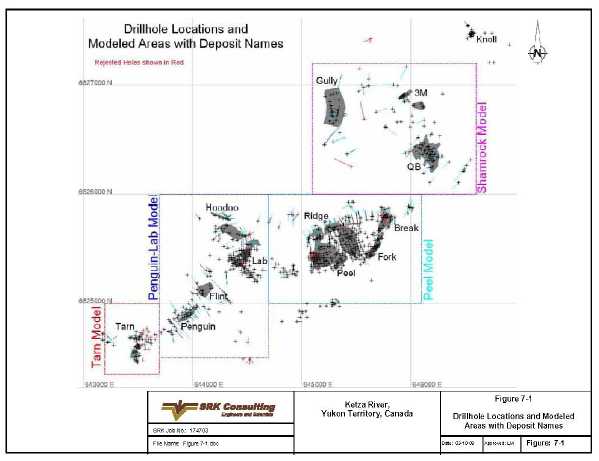
Drilling
From May of 2005 through August of 2008, we drilled a total of 897 holes for a total of 118,347m (Table 23). The principal objective of the drilling programs was the continued definition of known mineralized areas and the testing of newly discovered areas. All diamond drill holes completed in the resource area since 2005 are shown in Figure 13.
62
Table 23: Summary of Diamond Drilling 2005 Through 2008
| Year | Operator | No. of Holes | Type drilling | No. of m Drilled |
| 2005 | YGC Resources Ltd. | 99 | Diamond | 12,734 |
| 2006 | YGC Resources Ltd. | 270 | Diamond | 33,874 |
| 2007 | YGC Resources Ltd. | 305 | Diamond | 41,587 |
| 2008 | YGC Resources Ltd. | 223 | Diamond | 30,151 |
| Total | | 897 | | 118,347 |
All of the drilling from 2005 through 2008 was diamond drilling. Holes were started with NQ-sized core (47.6mm in diameter) or HQ-sized core (63.5mm in diameter) and reduced to NQ-sized core as required. Holes drilled for metallurgical purposes are HQ-sized (63.5mm) .
Collar location are obtained by using a combination of a Leica total station and a Trimble R8 differential GPS. Downhole surveys are done using Reflex Maxibor II downhole survey tool. Prior to 2007 acid tests were used to measure dip changes down hole.
Drill core is currently stored on site. Drill logs are entered directly into a laptop in the core shack using DrillKing software. Recovery and Rock Quality Designation (RQD) are recorded for each hole. Drilling Targets and results:
Drilling was successful in extending and/or defining limits of mineralization on the Peel, Tarn, Gully, QB and Lab zones. Parts of these remain open. Drilling on the Penguin and Calcite extension of Lab Zone was successful in defining mineralization at the location of magnetic highs.
A lack of significant mineralization was found by the drilling of the Peg-Fury (south of QB zone), Creek, Megawatt (south of Peel area), Nose and Bluff zones, as well as the previously untested ground between Lab and Peel. The Thrust vein, near Tarn was found to be cut off by a low angle fault at shallow depth.
The results were inconclusive at the Crest, Freds Vein East, and Break Zones, and more drilling will be required to either define or disprove significant mineralization at these zones. Significant mineralization was drilled at Hoodoo, but definition of the nature and orientation of the mineralization will require more drilling.
Sampling Method and Approach
The sampling procedures associated with the drilling programs utilized by YGC after acquiring the Ketza River property are described in this section. Little is known of the sampling methods employed by earlier operators. Sampling procedures, collection and security for us were completed under the direction of Qualified Person Ed Gates.
During the diamond drilling programs, geological personnel attended the drill at regular intervals as well as during drilling of mineralized intersections of predicted zone drillholes. Geologic personnel are on hand to determine the completion depth of each hole and to shut down the drillhole. The core is delivered to the core shack at the end of each working shift or when the drillhole is completed.
The core is laid out in sequence at the core shack. The core is logged directly into laptop computers by geologists and sample intervals are marked on the core and recorded on the drill logs. The core is then stored within the core shack and samples are split in sequence. Personnel conducting the sampling are supervised by the geologist who logs the core.
All drill core is logged and photographed before sampling. The descriptions are entered onto prepared log forms on laptop computers using coded entries for lithology, texture, structure and mineralogy.
Oxide and sulfide mineralization are sampled on the basis of geologic features. Maximum sample interval for HQ core is 1.5m and 3.05m for NQ core. The minimum sample interval is 0.2m. Once samples are identified and marked, sample tickets are stapled into the sample locations. Sample intervals and geology are then logged into Drill King software.
63
Core is then taken into the splitting room where sampled intervals are split or cut (massive sulfide intervals are cut with a diamond saw. Core from oxide zones often occurs as iron oxide rubble. In these instances, the rubble is sampled with a spoon rather that split or cut.
Half of the sample is placed in the sample bag and half is retained in the core box for future reference. The detachable half of the sample ticket is remove from the core box and placed inside the sample bag. The remaining half of the sample ticket remains in the core box with the corresponding sample number. Core boxes are then remove to a designated core storage yard where they are placed on core racks.
Sealed sample bags are then place in large white rice bags, the rice bags are labeled with the hole number, the contained sample numbers and the rice bag are numbered for transport (i.e. Bag 1 of 6). Rice bags are then placed in an outside storage bin where they await shipping.
Samples are transported by company personnel at least once per week to Canadian Freightways in Whitehorse, Yukon. A sample shipment form is filled out and kept on file, indicating the date, truck being driven, person transporting the samples, hole numbers and number of bags. Upon arrival in Whitehorse, samples are directly loaded upon pallets at Canadian Freightways and shipped to ALS Chemex.
As a rule, core recovery is very good in limestone and sulfide mantos, very good in the Gully vein and the argillite wallrock, moderate in the QB zone stockwork and fault intersections and moderate to poor in the oxide mantos.
Sample Preparation, Analysis and Security of Samples
In the 1980’s Canamax used Northern Analytical Laboratory in Whitehorse, YT and Rossbacher Labs in Burnaby, BC. For sample preparation and analysis. In 2006-2008, YGC used Eco-Tech labs in Kamloops, BC. In 2006-2008 all sample preparation was done by ALS Chemex in their Elko, Nevada or Terrance British Columbia sample preparation facilities. No sample preparation was done on site.
ALS-Chemex (2006-2008):
Samples are dried at 110-120 C and then crushed with either an oscillating jaw crusher or a roll crusher. The ALS Chemex QC specification for crushed material is that >70% of the sample must pass a 2mm (10 mesh) screen. A whole or split portion derived from the crushing process is pulverized using a ring mill. The ALS Chemex QC specification for final pulverizing is that >85% of the sample be less than 75 microns (200 mesh) A 30g split is fire assayed and the resultant bead is parted and digested with aqua regia, and the final result is measured using Atomic Absorption. Assays above 1.0ppm were re-assayed using a gravimetric finish.
Eco-Tech Labs followed essentially the same process.
Quality Controls and Quality Assurance
2005-2008 (YGC-YNGC)
The YGC-YNG laboratory Quality Assurance/Quality Control (QA/QC) program consists of inserting a blank sample into the sample stream at the top of every hole and then inserting either a standard sample or blank sample at every 15th sample. If a hole has less than 15 samples, a standard and blank are inserted at the end of the hole.
The blanks are non-commercial material, composed of locally derived barren limestone, and have not been certified to be of zero grade.
Prior to mid-year 2006, a non-commercial moderate grade “pseudo-standard” was used, which had been collected from a mineralized outcrop in the Ridge pit and blended by hand. When this first “standard” was depleted, a second supply of higher grade material was collected and blended from a local high grade stockpile. These “standards” were inserted simply to ensure that the lab would catch high grade assays, and not necessarily to assess the precision of the lab. The shortfalls of these non-
64
commercial standards was realized, and commercial standards from CDN Resource Laboratories Ltd were used starting in 2006.
After mid-year 2006, for manto-styled mineralization Gold Ore Reference Standard CDN-GS-10A (9.78+/ - 0.53g/t) or CDN-GS-10B (8.6 +/- 0.49g/t) was used. For stockwork-style mineralization Gold Ore Reference Standard: CDN-GS-2B (2.03 +/- 0.12g/t) was used.
Due to communication issues, the standard insertion protocol was not strictly adhered to once a particular standard supply was depleted. There were minor labeling issues where blanks and standards had labels swapped, or the wrong standard label was recorded. These issues were identified and corrected as confirmed by comparing the geochemistry of the multi-element assay results to those of the standards. The problems reflected an issue with check sample handling and not with lab results.
Occasionally, higher-grade gravimetric assays were re-assayed as a check; all of these refires were within acceptable ranges of the original
Interpretation
Graphs were plotted for each set of standards, and blanks. These are shown in Figures 14 to 17. With the exception of a few anomalies which may represent mislabeled samples, most of the commercial standards behave as well can be expected. Only a few assays are outside of the 2 standard deviations range, and most are within one standard deviation. The non-commercial standards assayed with a much wider variation, but consistently showed elevated grades as would be expected, although not at precise grades as one would expect from the commercial standards. The blank samples show several anomalous results which may be due to mislabeled samples, sample preparation contamination, or anomalous gold present within the blank.
Figure 14: Laboratory QA/QC Blank Samples

65
Figure 15: Laboratory QA/QC 1-2g Commercial Standards
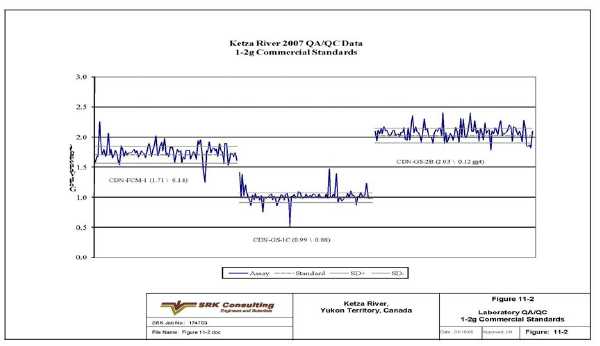
Figure 16: Laboratory QA/QC 10g Commercial Standards
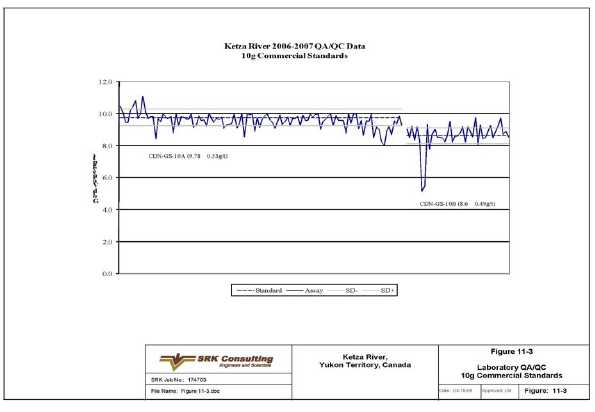
66
Figure 17: Laboratory QA/QC, Non-Commercial Standards

Mineral Processing and Metallurgical Results
Two programs of metallurgical test work have been recorded for Ketza River as follows:
The results of these test programs are summarized below.
YNG is currently conducting a metallurgical test program at PRA in Vancouver, Canada to determine and optimize the metallurgical characteristics and process flow sheets of the ore types that comprise the current resource. At this time, no preferred processing flow sheet has been defined for Ketza River awaiting results from the current program being done at PRA.Lakefield Research 1986-1987 Test Work A series of standard cyanide leach tests were run under various conditions of grind, pre-aeration and leach time, with and without CIL (carbon-in-leach). The precise conditions of the individual tests are reported, along with the results, in Lakefield Research (1986a, 1986b, 1987).
The initial results reported by Lakefield (Lakefield Research (1986a, 1986b) indicated that excellent gold recoveries (over 94%) could be achieved at a relatively coarse grind (69% minus 200 mesh) and 48hr retention time, without pre-aeration. Residues contained significantly less than 1g/t-Au. These tests were carried out on a single composite sample.
A series of nine additional samples from the oxide zone was subjected to confirmatory tests (Lakefield Research, 1987). The recoveries on these tests were significantly lower, with only two samples yielding residues below 1g/t-Au. Average recoveries
67
were 87%. Further tests at finer grinds (80% minus 200 mesh) were carried out on these nine samples, and although recoveries fell short of those anticipated from Lakefield Research (1986a and 1986b), they were consistently over 90%.
YNG is currently conducting a sampling and testing program to determine metallurgical characteristics of the ore types that comprise the current resource.
PRA 2003-2004 Test Work
The most recent metallurgical test work for Ketza River was conducted at PRA in Vancouver, Canada between November 2003 and October 2004. This test work was bench-scale and included:
Flotation (batch) for the production of rougher and scavenger concentrates;
Direct cyanide leaching with and without pre-aeration;
Bulk density determination; and
Specific gravity determination.
None of the tested samples were identified as to representativeness of a specific ore type, and only the bulk density determinations identified the sample source. Others were identified only as a composite.
The results of these tests are summarized below in Table 24.
Table 24: Summary of PRA Metallurgical Test Results 2003-2004
| Date | Test/Description | Sample | Units | Results |
| Nov-03 | Flotation; P80 74µm; | Composite 1; head grade of | % | Au recovery = 82.2 |
| | Rougher-Scavenger Concs (1) | 9.15 g/t Au; 0.8 g/t Ag | % | Ag recovery = 66.2 |
| Nov-03 | Cyanide Leach #1; pH 10.5; 72 hrs; | Composite 1; head grade of | % | Au recovery = 77.3 |
| | 40% solids; P80 74µm; 1 g/L NaCN | 9.15 g/t Au; 0.8 g/t Ag | % | Ag recovery = 19.1 |
| Mar-04 | Cyanide Leach #2; pre-areate 16 hrs; | Composite 1; head grade of | % | Au recovery = 65.9 |
| | pH 10.5; 72 hrs; 40% solids, | 9.15 g/t Au; 0.8 g/t Ag | % | Ag recovery = 70.3 |
| | P80 85µm; 1g/L NaCN | | | |
| Mar-04 | Cyanide Leach #3; pre-areate 16 hrs; | Composite 1; head grade of | % | Au recovery = 91.3 |
| | pH 10.5; 72 hrs; 40% solids, | 9.15 g/t Au; 0.8 g/t Ag | % | Ag recovery = 60.6 |
| | P80 85µm; 1g/L NaCN | | | |
| Mar-04 | Cyanide Leach #4; pre-areate 16 hrs; | Composite 1; head grade of | % | Au recovery = 82.0 |
| | pH 10.5; 72 hrs; 40% solids, | 9.15 g/t Au; 0.8 g/t Ag | % | Ag recovery = 74.6 |
| | P80 54µm; 1g/L NaCN | | | |
| Mar-04 | Cyanide Leach #5; pre-areate 16 hrs; | Composite 1; head grade of | % | Au recovery = 78.0 |
| | pH 10.5; 72 hrs; 40% solids, | 9.15 g/t Au; 0.8 g/t Ag | % | Ag recovery = 66.6 |
| | P80 54µm ; 1g/L NaCN | | | |
| Sep-04 | Specific Gravity | Composite 1 (average 2 tests) | g/cm3 | 4.265 |
| Oct-04 | Bulk Density - Waxed | KR-96-575 57.95m 5.93g/t Au | g/cm3 | 2.58 |
| Oct-04 | Bulk Density - Waxed | KR-96-575 57.95m 5.93g/t Au | g/cm3 | 2.57 |
| Oct-04 | Bulk Density - Waxed | KR-96-575 52.4m 0.86g/t Ag | g/cm3 | 3.66 |
| Oct-04 | Bulk Density - Pulverized | KR-96-575 57.95m 5.93g/t Au | g/cm3 | 2.71 |
| Oct-04 | Bulk Density - Pulverized | KR-96-575 52.4m 0.86g/t Ag | g/cm3 | 3.66 |
(1) Recovery represents total recovery for rougher and scavenger concentrates.
The test results indicate the following:
- Good gold and silver recoveries of 82.2% and 66.2%, respectively, were obtained by flotation into rougher and scavenger concentrates at a fine grind of P80 74µm using standard flotation conditions and reagents;
68
Good gold and silver recoveries averaging 72% and 68%, respectively, were obtained by direct cyanidation with a 16 hour pre-aeration using standard leaching conditions and a 72 hour leach time at fine grinds of P80 54µm and 74µm;
Less favorable recoveries were achieved without pre-aeration at the same leaching conditions;
Bulk density determinations averaged 2.62 and 3.66g/cm3 for the two samples using waxed and pulverized methods; and
Specific gravity determinations averaged 4.265g/cm 3 as an average of two tests on the same sample.
.Mineral Resource and Mineral Reserve Estimates
A series of standard cyanide leach tests was run under various conditions of grind, pre-aeration and leach time, with and without CIL (carbon-in-leach). The precise conditions of the individual tests are reported, along with the results, in Lakefield Research (1986a, 1986b, 1987).
The initial results reported by Lakefield (Lakefield Research (1986a, 1986b) indicated that excellent gold recoveries (over 94%) could be achieved at a relatively course grind (69% minus 200 mesh) and 48hr retention time, without pre-aeration. Residues contained significantly less than 1g/t-Au. These tests were carried out on a single composite sample.
A series of nine additional samples from the oxide zone was subjected to confirmatory tests (Lakefield Research, 1987). The recoveries on these tests were significantly lower, with only two samples yielding residues below 1g/t-Au. Average recoveries were 87%. Further tests at finer grinds (80% minus 200 mesh) were carried out on these nine samples, and although recoveries fell short of those anticipated from Lakefield Research (1986a and 1986b), they were consistently over 90%.
We are currently conducting a sampling and testing program to determine metallurgical characteristics of the ore types that comprise the current resource.
In 2007, we undertook a complete update of the Ketza River resource estimate. Compared to previous estimates, the 2007 update included 637 additional drillholes in the resource database and reflected a significantly enhanced understanding of geologic controls on mineralization in both the manto and Shamrock zones. The 2007 resource estimate was also undertaken with a view to transition the Project from an exploration project to a feasibility/development project.
Accordingly, the focus of the 2007 resource estimate was to identify measured and indicated resource shapes with grades and continuity that could serve as the starting points for definition of mineable shapes and reserves as part of the ongoing pre-feasibility study that we have commenced on the property. Unlike previous resource estimates, a hard geologic boundary was used to tightly constrain resource shapes in three dimensions. During 2008 further definition drilling has been performed to determine the extent of the mineralization.
The resource estimation was done by Russ White (SRK) with assistance in wireframe modeling and input from Larry Snider. Larry Snider also performed the pit optimizations used for distinguishing Open Pit from Underground resources.
The drillhole database is currently maintained at the Ketza Minesite in acQuire software, and was transferred from a Drill King database in late 2007. It contains information for 1,360 drillholes, including 674 core holes from the 2005 to 2007 programs, 591 core holes from pre-2005 programs (1984-1996), and 95 RC holes from 1987.
Data was extracted from acQuire and imported to Vulcan in 4 separate tables.
Collar Location Surveys – Hole ID, Northing, Easting, Elevation and Hole Depth;
Downhole Orientation Surveys - Downhole depth, Azimuth and plunge of hole at various downhole depths;
Geologic Logs – Table 25 lists the fields recorded in drillholes from 2005 to 2007. Only the LCODE field was entered in the database for previously drilled holes. Table 26 lists the common lithologies logged at Ketza River; and
69
- Assays -From, to, and gold assay
Table 25 Geology Database Fields
| Field | Description | Entry |
| LCODE | Lithology Code | Alpha Code |
| STR1 | Structure 1 | Alpha Code |
| STR2 | Structure 2 | Alpha Code |
| TXTR1 | Texture 1 | Alpha Code |
| TXTR2 | Texture 2 | Alpha Code |
| PO | Pyrrhotite | Percentage |
| PY | Pyrite | Percentage |
| APY | Arsenopyrite | Percentage |
| CPY | Chalcopyrite | Percentage |
| OXMIN | Primary Oxide Mineral | Alpha Code |
| OXINT | Intensity of oxidation | Alpha Code |
| Description | Geologic Description | Freeform Alpha |
Table 26 Most Common Lithology Codes
| LCODE | Description | LCODE | Description |
| MSLT | Massive-oolitic limestone | BSLT | Black siltstone |
| WBN | Wispy banded limestone | SQA | Siltstone/Quartzite/Argillite |
| ARG | Argillite | VEIN | Vein |
| LST | Limestone | CAS | Casing |
| FSLT | Fossiliferous limestone | QTE | Quartzite |
| ARS | Argillite/Siltstone | FZ | Fault zone |
| OXIDE | Oxide Mineralization | QAS | Quartzite/Argillite/Siltstone |
| SULF | Massive sulfide(>50%) | BA | Black argillite |
| QSA | Quartzite/Siltstone/Argillite | OVB | Overburden |
| MUD | Mudstone | HFLS | Hornfels |
| SAQ | SLT/ARG/QTE | AQS | Argillite/Quartzite/Siltstone |
| BXLT | Blue crystalline limestone | PHIL | Phyllite |
| SLT | Siltstone | QTZ | Quartz |
| ASQ | Argillite/Siltstone/Quartzite | GO | Gouge |
The gold value was recorded in the database using the following priority: average of fire assays, if available, single fire assay if available, or AA assay. Unsampled intervals are omitted from the database and treated as zero values in the compositing routine, and lost-core intervals recorded as -9. Previous databases had recorded below-detection-limit (BDL) assays as values ranging from 0.015 to 0.000 depending on the detection limit and the person doing data entry. The lowest detection limit from any program was 0.005g/t, so a standard BDL value of 0.001g/t was chosen as a flag that the sample was actually assayed, but had negligible gold. Raw assays were capped at 100g/t for all deposits, which affected 8 assays out of 29,650 assays. Further reduction of risk due to anomalous assays was accomplished with high-grade distance restrictions during estimation.
Of the 1,360 drillholes in the Ketza database, 82 Drillholes were rejected from the database due primarily to irreconcilable location issues. A few were rejected due to the hole orientation which drilled directly down the vein making any given intercept biased or unable to be extrapolated accurately to any given volume. Three RC holes were also rejected due to likely downhole contamination. Figure 18 is a drillhole location map showing the drilling that was used for resource estimation. Another 34 “non-resource” holes contained no significant mineralization and were drilled outside of any deposit of interest. Although they were not specifically excluded they had no influence on this resource estimate. Another 35 were drilled in the
70
Knoll Zone which is essentially mined out and therefore was not estimated. Table 27 is a summary of drillholes used and rejected by model area.
Table 27: Summary of Drillholes used and Rejected by Model Area
| | Used for Resource | Rejected | Non-Resource | Total |
| Model | Number | Length | Length | Number | Length | Length | Number | Length | Length | Number | Length | Length |
| Area | of Holes | Drilled | Sampled | of Holes | Drilled | Sampled | of Holes | Drilled | Sampled | of Holes | Drilled | Sampled |
| PEEL | 583 | 51,502 | 14,111 | 38 | 2,857 | 923 | 26 | 4,121 | 2,510 | 647 | 58,480 | 17,545 |
| PENG | 335 | 38,575 | 12,312 | 20 | 1,871 | 772 | 7 | 790 | 144 | 362 | 41,236 | 13,228 |
| SHAM | 216 | 27,133 | 18,702 | 10 | 2,101 | 1,434 | | | | 226 | 29,234 | 20,136 |
| TARN | 75 | 6,452 | 1,901 | 12 | 442 | 108 | 1 | 106 | 26 | 88 | 7,000 | 2,035 |
| KNOLL | | | | 2 | 327 | 320 | 35 | 1,379 | 246 | 37 | 1,706 | 566 |
| Total | 1209 | 123,662 | 47,028 | 82 | 7,597 | 3,557 | 69 | 6,396 | 2,926 | 1360 | 137,656 | 53,510 |
Mineralized envelopes were defined based upon lithology codes and gold assays, and modeled as wireframes in either Minesite or Vulcan software. In most areas these represent limestone hosted “manto” and “chimney” zones. In the Shamrock model area, these are siliciclastic hosted veins and stockworks. Fifty-two separate wireframes were created, 23 in the Peel Area, 13 in the Penguin-Lab area, 12 in the Shamrock area, and 4 in the Tarn area. The locations of these shapes are shown in Figure 19. Cross-sections are shown in figures 19 through 21.
Figure 18: Drillhole Locations and Modeled Areas with Deposit Names
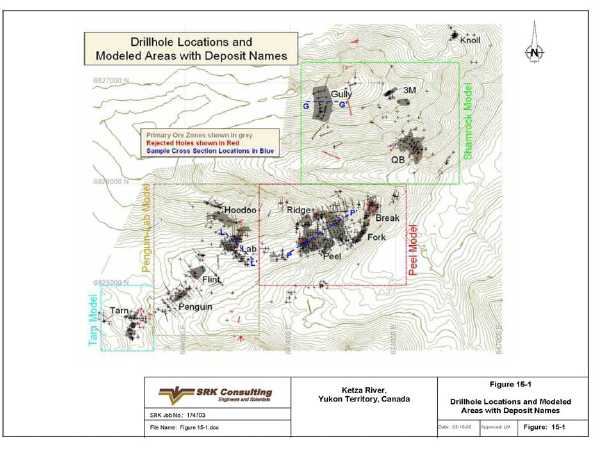
71
Figure 19: Cross-Section, Peel Deposit

Figure 20: Cross-Section, Gulley Deposit

72
Figure 21: Cross-Section, Lab Deposit
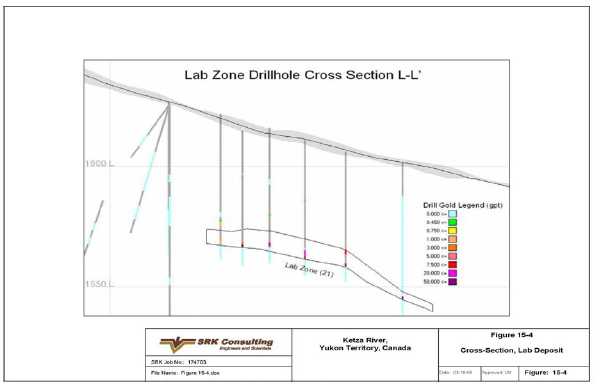
The geologic database was used to determine the intensity of mineralization, and the oxidation state of the mineralization. A temporary field called TotSu was derived by adding the percentages of all of the logged sulfides (PO+PY+APY+CPY).
An oxidation code was calculated based upon the geologic logs, with influence from the LCODE, the total sulfides and the OXINT fields:
The resulting codes (valued 1 through 5) can be described as follows:
| | 1. | Massive Oxide. |
| | 2. | Moderate Oxide. |
| | 3. | Moderate or Unmineralized. |
| | 4. | Moderate Sulfide. |
| | 5. | Massive Sulfide. |
The highly variable specific gravity of the ore mineralization has been a significant issue at Ketza in the past. The oxide mineralization is very light, and the sulfide material is extremely heavy. Estimates made prior to mining did not adequately account for this. Very high-grade oxide material was extrapolated into sulfide areas and ounces were over-estimated. Due to this issue, exhaustive studies were undertaken by Canamax in the late 1980’s to get a more accurate density factor for the oxide material which was their primary mill feed.
In 2006 numerous density measurements were made on sulfide ore, yielding an average density of 4.2 for sulfide ore in the Flint, Gulley, Fred’s Vein and Tarn areas.
In late 2007, specific gravity measurements were collected for 101 samples from across the entire deposit area. Due to the relatively few samples measured and the apparent irrelevance of area on the measurements, samples were analyzed primarily by lithology/ore type. Only a few samples of pure oxide and sulfide material were collected for this program because exhaustive studies had been made of these previously by Canamax in the late 1980’s and YGC in 2005-2006. The samples
73
taken in 2007 confirmed these previous studies and that the average SG of the unmineralized material is 2.75. Based upon the results form all of the studies, the following scheme was used for assigning specific gravity values to each drillhole composite:
- Default: SG = 2.75;
- High-grade default, Au greater than 5.0g/t: SG = 3.1;
- Oxide: SG = 2.2;
- Moderate oxide: SG = 2.5;
- Moderate Sulfide: SG = 3.7; and
- Sulfide: SG = 4.2.
Table 28 lists the average and minimum and maximum SG values for the various rock types at each of the areas.
74
Table 28: Statistics for SG Data
| Material-> | ASQ + Min (Qtz Vn) | Dilution | Host Rock | LS + Min | Oxide | Sulf |
| Area | # | Avg | Min | Max | # | Avg | Min | Max | # | Avg | Min | Max | # | Avg | Min | Max | # | Avg | Min | Max | # | Avg | Min | Max |
| Flint | | | | | 2 | 2.84 | 2.75 | 2.93 | 2 | 2.79 | 2.74 | 2.83 | 3 | 2.74 | 2.69 | 2.81 | | | | | 3 | 4.50 | 4.30 | 4.67 |
| FV | 3 | 2.76 | 2.68 | 2.84 | 2 | 2.77 | 2.73 | 2.80 | 2 | 2.72 | 2.64 | 2.80 | | | | | | | | | 3 | 4.19 | 3.93 | 4.36 |
| Gully | 5 | 2.83 | 2.7 | 3.24 | 3 | 2.76 | 2.72 | 2.79 | 2 | 2.75 | 2.74 | 2.75 | | | | | | | | | 5 | 4.25 | 4.12 | 4.37 |
| HD | | | | | 3 | 2.51 | 2.21 | 2.66 | 3 | 2.69 | 2.68 | 2.72 | | | | | 5 | 2.21 | 1.89 | 2.50 | | | | |
| Lab | | | | | 2 | 2.77 | 2.71 | 2.83 | 2 | 2.75 | 2.68 | 2.81 | | | | | | | | | | | | |
| Peel | | | | | 5 | 2.90 | 2.36 | 3.96 | 3 | 2.67 | 2.56 | 2.73 | | | | | | | | | | | | |
| Peng. | | | | | 2 | 3.04 | 3.01 | 3.07 | 2 | 2.85 | 2.74 | 2.96 | 3 | 2.75 | 2.65 | 2.9 | | | | | | | | |
| QB | 9 | 2.76 | 2.6 | 3.06 | 9 | 2.92 | 2.72 | 3.97 | 3 | 2.84 | 2.81 | 2.86 | | | | | | | | | | | | |
| Tarn | | | | | 3 | 2.73 | 2.73 | 2.74 | 2 | 2.76 | 2.76 | 2.76 | 5 | 2.86 | 2.64 | 3.4 | | | | | 5 | 4.12 | 3.45 | 4.51 |
| Total | 17 | 2.78 | 2.6 | 3.24 | 31 | 2.83 | 2.21 | 3.97 | 21 | 2.75 | 2.56 | 2.96 | 11 | 2.80 | 2.64 | 3.4 | 5 | 2.21 | 1.89 | 2.5 | 16 | 4.24 | 3.45 | 4.67 |
75
After the Specific Gravity value was assigned, another database field (SGAU) was calculated by multiplying SG by the Gold Assay. This was used in the compositing process to weight the composites by SG.
Drillhole assay data was composited at downhole lengths of 1.5m, broken at mineralized envelope boundaries. Unsampled intervals were carried at a zero grade. A very few intervals of lost core, usually resulting from highly oxidized mineralized zones, were omitted from the composites. The majority LCODE field was recorded in composites, while SGAU, REDOX, and SG were length-weight averaged as numeric values. After the composites were created, the gold value was back calculated with the formula: AU = SGAU / SG.
Variograms were generated from 1.5m composites for each main group of ore zones (Figures 22 and 23). Each group had at least one orientation which yielded a recognizable variogram structure, but rarely more than one. This is not uncommon for such discontinuous zones with limited spatial extent and moderate drill spacing. The relative similarity of the recognizable variogram ranges, influenced the choice of Major and Semi-Major axis of the search radius in the grade estimation. Variogram model attributes are listed in Table 29.
Table 29: Variogram Model Parameters
| Deposit Area | Nugget | Sill_Dif | Range |
| Peel | 1.20 | 2.2 | 54 |
| Ridge | 0.28 | 1.6 | 51 |
| Fork/Break | 1.50 | 1.1 | 50 |
| Lab | 1.00 | 2.7 | 51 |
| Hoodoo | 1.00 | 4.6 | 60 |
| Peng/Tarn | 1.00 | 1.6 | 45 |
| Gully | 1.00 | 0.7 | 50 |
| QB | 2.00 | 2.0 | 60 |
| 3M | 0.50 | 1.7 | 47 |
Univariate statistics were used to determine high-grade restriction levels for each individual area. The Gully deposit was treated separately from the rest of Shamrock, as it has more consistent high-grade than the QB and 3m zones. Probability plots and grade histograms were reviewed and are summarized below in Table 30. Inside the mineralized envelopes, the Peel area has the most consistent high-grade material, while Shamrock has the least. The high-grade outside of the mineralized envelopes is relatively insignificant, and in some cases high-grade restrictions were not required.
Table 30: Composite Summary Statistics by Model Area
| | Count | g/t-Au | Quartile g/t-Au | HG Limit |
| Model Area | #Assays | Average | Min | Q1 | Q2 | Q3 | Max | g/t-Au |
| Peel Inside | 2,366 | 5.07 | 0.00 | 0.14 | 1.59 | 5.48 | 92.57 | 65 |
| Penguin Inside | 1,038 | 2.74 | 0.00 | 0.02 | 0.77 | 2.81 | 62.89 | 35 |
| Shamrock Inside | 830 | 1.83 | 0.00 | 0.10 | 0.57 | 1.91 | 28.00 | 20 |
| Tarn Inside | 228 | 4.14 | 0.00 | 0.50 | 1.48 | 4.18 | 48.90 | 25 |
| Gully Inside | 246 | 3.29 | 0.00 | 1.21 | 2.03 | 3.64 | 37.60 | 35 |
| Peel Outside | 8,739 | 0.157 | 0.001 | 0.003 | 0.010 | 0.045 | 68.80 | 35 |
| Penguin Outside | 7,401 | 0.102 | 0.001 | 0.001 | 0.006 | 0.028 | 25.40 | NA |
| Sham. Outside | 7,779 | 0.147 | 0.001 | 0.005 | 0.025 | 0.094 | 25.10 | 15 |
| Tarn Outside | 997 | 0.066 | 0.001 | 0.001 | 0.004 | 0.023 | 3.35 | NA |
| Gully Outside | 4,107 | 0.068 | 0.001 | 0.001 | 0.006 | 0.021 | 14.10 | NA |
Four block models were defined for the model areas as shown in Figure 18. Each block model consists of a framework with 5m cube blocks. Wireframes of the 52 mineralized envelopes were used to assign a percentage inside the envelope, and estimations were made separately for the inside and outside block fractions. Any block which had more than 0.5% inside a mineralized envelope was assigned a code corresponding to the wireframe.
76
Grade estimations were made using the inverse distance squared estimation method. A minimum of 3 samples were required with a maximum of 12 composites used for each block. Based on the relative similarity of the recognizable variograms, a standardized search radius of 50m x 50m was used. The minor axis was generally kept down to between 7 and 12m depending on the zone’s thickness and geometry. Zones which did not conform to a plane required wider minor searches to ensure continuous estimation of blocks.
Estimation of block grades for the blocks and fractions outside the mineralized envelope used a consistently narrow search to avoid smearing grades over a spherical region. The orientation of the search radii for the outside blocks varied from region to region depending upon the apparent alignment of ore grades.
AUSG and SG values were estimated in the block models. This was done as a means of weighting the estimation by the specific gravity of the samples. Other variables include number of composites, distance to the closest composite and average distance to composites used in the estimation. Gold values were back calculated with the following formulas by dividing AUSG by SG.
An extra gold variable was estimated simply as a means of applying the high-grade gold restriction. This restriction prevents a composite above a specific threshold from influencing any block beyond a distance which is shorter than the search radius. In this case the restricted search radii used for samples above the threshold was 35m x 35m x 5m inside the mineralized envelopes, and 20m x 20m x 5m for samples outside the mineralized envelopes.
Resources were classified by distance to nearest sample within most ore shapes. Any block which was within 35m of the nearest sample was designated as indicated, except in a few ore shapes which were forced to the designation of inferred. In a few shallow, well-drilled mineral envelopes, measured resources were allowed where the distance to the nearest composite was less than 15m, and at least 12 composites were used to estimate the block. This was allowed in 2 shapes in Peel, 2 in Lab and in the Gully zone in Shamrock. Blocks which were more than 35m from the nearest sample were designated as inferred in all ore shapes. Since these alignments used for “outside” blocks are approximate and subject to revision, all outside block grades are considered inferred.
This mineral inventory of all estimated (unmined) material above a 1.0g cut-off is supplied for comparison to previous resources which were listed in this fashion (Table 31). This is only considered an inventory, as much of the material will likely never be recoverable with an open pit, and should therefore be listed at a higher cut-off.
77
Figure 22: Peel Model Variograms

78
Figure 23: Penguin-Lab Shamrock Variograms

79
Table 31 Mineral Inventory at a 1.0g/t CoG
| | Measured + Indicated | Inferred |
| Area | kt | koz | g/t-Au | kt | koz | g/t-Au |
| Peel | 2,444 | 409 | 5.21 | 600 | 45 | 2.31 |
| Penguin-Lab | 965 | 138 | 4.44 | 640 | 41 | 2.01 |
| Shamrock | 1,630 | 149 | 2.85 | 1,292 | 101 | 2.44 |
| Tarn | 86 | 10 | 3.50 | 61 | 4 | 2.07 |
| Total | 5,125 | 706 | 4.29 | 2,593 | 191 | 2.29 |
Resource Definition
In order to distinguish between potential Open Pit Resources and Underground Resources, pit optimizations were performed using Minesights Lerchs-Grossmann implementation. The parameters used for these optimizations were fairly liberal, as this exercise was done simply to determine which blocks could reasonably be expected to be mined at open pit cut-offs. A 1.0g/t resource cut-off was applied to any block that could optimistically be mined by an open pit, and a 3.0g/t cut-off was applied to blocks outside of the optimistic pit, to account for higher underground mining costs for those blocks. This was not done as definition of reserves, simply as a way of eliminating the portion of the Mineral Inventory which could not reasonably be expected to be recovered economically.
Pit Optimization Net Value Calculation
A net value was calculated for every block in the model. The net value considers mining cost, ore (process) cost, and recoverable gold value as outlined below. The block model tracks the fractions of blocks within mineralized envelope wireframes separately from the portion outside of the wireframes. The portion inside the wireframe typically is higher-grade and represents the potential ore portion of the block. Ore costs and recoverable values can be applied to the inside and outside block fractions separately. Calculation of the values outlined below results in the net value for each block.
Mining Cost: The calculation for mining cost is fairly simple and involves multiplying the volume of the block by a tonnage factor to come up with a block tonnage. If blocks intersect topography, the block tonnage is reduced by the percent portion of the block above topo. A $2.82/t value is multiplied by the block tonnage to come up with a per block mining cost. For the purposes of the cost to mine a block of material, a blanket tonnage factor of 2.75t/m3 was applied on the premise that changes in density will not markedly change the cost to blast, mine, and haul a given volume of rock as factors such as haul distance and equipment size are usually more important;
Ore Cost: The total process cost and any additional ore tonnage costs are calculated for the potential ore fraction of each block. The per tonnage costs are multiplied only by the tonnage of the potential ore fraction of each block;
Recoverable Value: Likewise, the recoverable value is calculated only for the potential ore fraction of each block. The gold grade is multiplied by price per gram, ore tonnage and the metallurgical recovery;
Ore Revenue: Ore costs per block are then subtracted from the recoverable value, and if the result is positive, this is the ore revenue for the block. If the ore costs exceed the recoverable value, then it is not worth processing the block, and the ore revenue is set to zero; and
Net Value: The net value of the block is simply the ore revenue minus the mining cost. Analysis of net values within the blocks can be used to determine waste, sub-ore, and ore based on mine-cut-off versus mill-cut-off. A waste block will have a negative net value equal to the cost to mine the block. An “ore” block will have a net value of more than zero, and is worth mining by itself. A “sub-ore” block will have a negative net value greater than the mining cost, and is worth processing, but only if it needs to be mined in order to get to an “ore” block.
| Optimization Parameters | |
| Gold Price: | $1,000 $/troy oz |
| Metallurgical recovery | 85% |
80
| Specific Gravity | SG variable as modeled per block |
| (for gold content and process costs) | |
| | |
| Specific Gravity | 2.75 |
| (for mining costs) | |
| | |
| Mining cost/t | $2.82 |
| | |
| Process cost/t-ore | $12.00 |
These parameters are based on a cost profile assuming an operation of 1,500t-ore/d and an overall 8:1 stripping.
Lerchs-Grossmann Pit Optimization
Once the net values have been calculated, the Lerchs-Grossmann process operates solely on these, using the specified pit slope. In the pit optimization analysis, blocks must contain enough revenue in the VAL fields to not only pay for their own mining, but also help pay for waste blocks above them. Very low-grade blocks (with only minor revenue after process to partially offset their own mining) can have their mining paid for by higher-grade blocks below them, thus they can be treated as a form of incremental ore. Note that the cut-off grade for each block will differ slightly as there are a variety of modeled SG’s which influence the net value in conjunction with the gold grade. The output of the process is a surface file, which can be used in tabulating resources from the block model. The mineral resource for Ketza River is presented in Table 32. Figure 25 is a map showing the extent of the pits resulting from this exercise.
Resource Statement
Table 32: Ketza River Resource Statement
| | Open Pit Resource | Underground Resource | Combined (OP+UG) |
| Area | kt | g/t-Au | koz | kt | g/t-Au | koz | kt | g/t-Au | koz |
| Measured | | | | | | | | | |
| Peel | 303.2 | 7.17 | 69.8 | 2.0 | 4.34 | 0.3 | 305.2 | 7.15 | 70.1 |
| Penguin-Lab | 205.2 | 7.70 | 50.8 | 18.5 | 6.78 | 4.0 | 223.7 | 7.62 | 54.8 |
| Shamrock | 182.5 | 3.65 | 21.4 | 0.8 | 3.78 | 0.1 | 183.2 | 3.65 | 21.5 |
| Tarn | 0.0 | | 0.00 | - | | - | | | |
| Total Measured | 690.9 | 6.39 | 142.0 | 21.3 | 6.43 | 4.4 | 712.2 | 6.40 | 146.5 |
| | | | | | | | | | |
| Indicated | | | | | | | | | |
| Peel | 1,878.6 | 5.14 | 310.6 | 98.9 | 5.73 | 18.2 | 1,977.5 | 5.17 | 328.8 |
| Penguin-Lab | 567.7 | 3.56 | 65.0 | 70.7 | 5.05 | 11.5 | 638.4 | 3.72 | 76.5 |
| Shamrock | 519.6 | 3.58 | 59.8 | 175.8 | 4.74 | 26.8 | 695.5 | 3.87 | 86.6 |
| Tarn | 54.6 | 4.26 | 7.5 | 3.6 | 4.92 | 0.6 | 58.2 | 4.30 | 8.0 |
| Total Indicated | 3,020.5 | 4.56 | 442.9 | 349.0 | 5.09 | 57.1 | 3,369.5 | 4.61 | 499.9 |
| | | | | | | | | | |
| Measured and Indicated | | | | | | | | | |
| Peel | 2,181.80 | 5.42 | 380.4 | 100.9 | 5.70 | 18.5 | 2,283 | 5.44 | 399.0 |
| Penguin-Lab | 772.9 | 4.66 | 115.8 | 89.2 | 5.40 | 15.5 | 862.1 | 4.74 | 131.3 |
| Shamrock | 702.1 | 3.60 | 81.2 | 176.6 | 4.74 | 26.9 | 878.7 | 3.83 | 108.1 |
| Tarn | 54.6 | 4.26 | 7.5 | 3.6 | 4.92 | 0.5 | 58.2 | 4.3 | 8.0 |
| Total M&I | 3,711.4 | 4.90 | 584.9 | 370.3 | 5.16 | 61.5 | 4,081.7 | 4.93 | 646.4 |
| | | | | | | | | | |
| Inferred | | | | | | | | | |
| Peel | 298.1 | 2.79 | 26.7 | 27.6 | 3.72 | 3.3 | 325.7 | 2.86 | 30.0 |
| Penguin-Lab | 188.1 | 2.33 | 14.1 | 59.9 | 4.14 | 8.0 | 248.0 | 2.77 | 22.1 |
| Shamrock | 229.7 | 2.83 | 20.9 | 225.9 | 5.03 | 36.5 | 455.6 | 3.92 | 57.5 |
| Tarn | 46.3 | 2.20 | 3.3 | - | - | - | 46.3 | 2.2 | 3.3 |
| Total Inferred | 762.2 | 2.65 | 65.0 | 313.4 | 4.74 | 47.8 | 1,075.6 | 3.26 | 112.8 |
Grade tonnage curves were calculated at 0.5g/t cutoff intervals. Figure 26 shows grade tonnage curves for the entire mineral envelope and the grade tonnage curve only within the $1000 gold optimized pit shapes.
81
Figure 25: Optimized Pits, $1,000 Gold
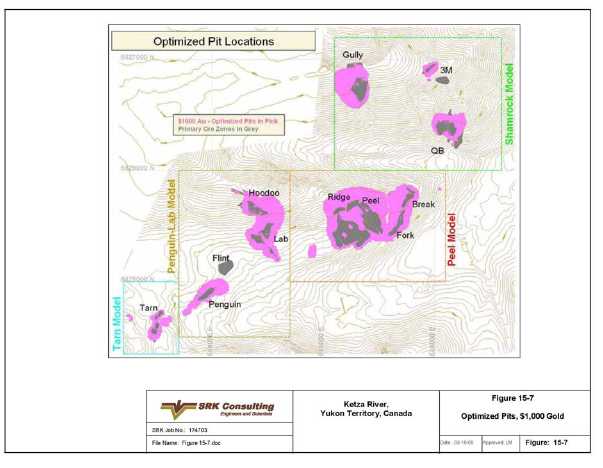
82
Figure 26: Grade Tonnage Curves
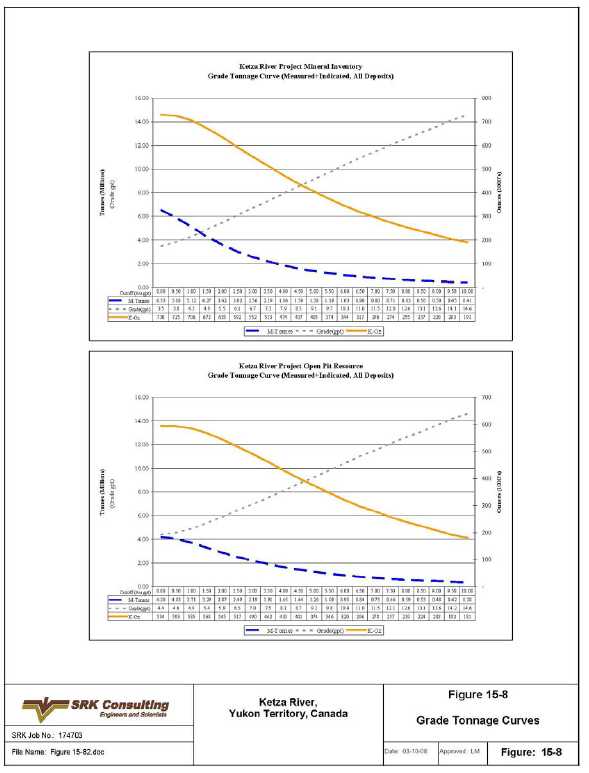
83
(c) Other Properties
Silver Valley Property, Yukon – We were granted an option to acquire a 100% interest in six (6) claims located in the Yukon Territory. The primary focus of exploration for this property will be silver, with a secondary focus on gold, lead and zinc. We have also staked 114 claims around the six claims.
Bay Property, Yukon – We have staked 36 claims near Watson Lake, Yukon. The primary focus of exploration for this property will be silver.
Silver Bar, Arizona –We have a 100% interest in 55 claims in Pinal County, Arizona. The focus of exploration of this property will be gold and copper.
Item 4A. Unresolved Staff Comments.
None.
Item 5. Operating and Financial Review and Prospects.
Management Discussion and Analysis
(in 000s of US Dollars except for per ounce numbers, per share numbers and number of shares, unless otherwise stated)
INTRODUCTION
The following management’s discussion and analysis (‘‘MD&A’’) relates to the financial condition and results of operations of Yukon-Nevada Gold Corp. (the “Company” or “Yukon-Nevada”) together with its wholly owned subsidiaries as of December 31, 2008, and is intended to supplement and complement the Company’s audited consolidated financial statements for the year ended December 31, 2008. The MD&A has been approved by the Company’s Audit Committee and Board of Directors prior to release. Readers are cautioned that the MD&A contains forward-looking statements and that actual events may vary from management’s expectations. The consolidated financial statements and MD&A are presented in United States dollars and have been prepared in accordance with Canadian generally accepted accounting principles (‘‘Canadian GAAP’’).
The Company’s shares are listed on the TSX (trading symbol – “YNG”) and the Frankfurt Stock Exchange (trading symbol – “NG6”) and at March 31, 2009 the Company had 301,388,763 shares outstanding.
OVERALL PERFORMANCE
Yukon-Nevada Gold is engaged in gold mining and related activities, including exploration and acquisition of gold-bearing properties, extraction, processing and reclamation. The Company’s gold production and exploration activities are carried out in Canada and the United States. Gold is produced in the form of dore, which is shipped to refineries for final processing. The profitability and operating cash flow of Yukon-Nevada Gold is affected by various factors, including the amount of gold produced, the market price of gold, operating costs, interest rates, regulatory and environmental compliance, the level of exploration and capital expenditures, general and administrative costs, and other discretionary costs. Yukon-Nevada is also exposed to fluctuations in foreign currency exchange rates and varying levels of taxation that can impact profitability and cash flow. The Company seeks to manage the risks associated with its business operations; however, many of the factors affecting these risks are beyond the Company’s control.
Yukon-Nevada Gold receives its revenues through the sale of gold in U.S. dollars, while costs are incurred in both U.S. and Canadian currencies. Therefore, movements in the exchange rate between the Canadian and the U.S. dollars have an impact on profitability. The Canadian dollar weakened against the U.S. dollar in 2008, resulting in foreign exchange gains on translation due to the net liability position of the Canadian operations.
The global financial markets have experienced significant events which have impacted the global economy with reduced credit availability, reduced availability of funding, high volatility in commodity prices and foreign exchange markets; and a slowdown in general economic activity. These events could have a significant impact on our business such as:
- Reduced availability and higher cost of project financing.
84
- Volatile gold prices will impact our future revenues, earnings and cash flow.
- Stock market volatility impacts the valuation of the Company’s assets.
We will continue to adopt strategies to mitigate these challenges.
Jerritt Canyon
Jerritt Canyon, consisting of a milling facility and two underground mines, the Smith and the SSX, was purchased by the Company on June 20, 2007 with the acquisition of Queenstake Resource Limited (“Queenstake”).
Jerritt Canyon Operating Highlights
| | | Q1 2008 | | | Q2 2008 | | | Q3 2008 | | | Q4 2008 | | | 2008 | |
| Gold - produced from mined ore (troy ounces) | | 8,056 | | | 9,187 | | | 14,888 | | | - | | | 32,131 | |
| Gold – produced from purchased ore (troy | | | | | | | | | | | | | | | |
| ounces) | | 5,414 | | | 2,899 | | | 4,288 | | | - | | | 12,601 | |
| Gold – produced - total (troy ounces) | | 13,470 | | | 12,086 | | | 19,176 | | | - | | | 44,732 | |
| Gold – sold from mined ore (troy ounces) | | 14,890 | | | 6,405 | | | 14,644 | | | 550 | | | 36,489 | |
| Gold – sold from purchased ore (troy ounces) | | 10,700 | | | 2,300 | | | 5,500 | | | 1,371 | | | 19,871 | |
| Gold – sold - total (troy ounces) | | 25,590 | | | 8,705 | | | 20,144 | | | 1,921 | | | 56,360 | |
| Gold sales | $ | 21,789 | | $ | 7,773 | | $ | 17,162 | | $ | 2,257 | | $ | 48,981 | |
| Cost of gold sold | | 22,408 | | | 12,463 | | | 20,606 | | | 3,265 | | | 58,742 | |
| Mine and mill shutdown costs | | 4,360 | | | 3,497 | | | – | | | 5,258 | | | 13,115 | |
| Average gold price per ounce | | 851 | | | 892 | | | 852 | | | 888 | | | 869 | |
| | | Q3 2007 | | | Q4 2007 | | | 2007 | |
| Gold - produced from mined ore (troy ounces) | | 34,636 | | | 24,464 | | | 59,100 | |
| Gold – produced from purchased ore (troy | | | | | | | | | |
| ounces) | | 13,693 | | | 24,405 | | | 38,098 | |
| Gold – produced - total (troy ounces) | | 48,329 | | | 48,869 | | | 97,198 | |
| Gold – sold from mined ore (troy ounces) | | 26,474 | | | 31,040 | | | 57,514 | |
| Gold – sold from purchased ore (troy ounces) | | 12,502 | | | 20,100 | | | 32,602 | |
| Gold – sold - total (troy ounces) | | 38,976 | | | 51,140 | | | 90,116 | |
| Gold sales | $ | 26,236 | | $ | 38,224 | | $ | 64,460 | |
| Cost of gold sold | | 18,757 | | | 28,535 | | | 48,218 | |
| Average gold price per ounce | | 673 | | | 747 | | | 715 | |
| Cash cost per ounce produced (a) | | 354 | | | 504 | | | 416 | |
| (a) | See the Non-GAAP Financial Measures section for a reconciliation of cash costs per ounce to the cost of sales. The Company calculates cash cost as the total cost of producing an ounce of gold from mined ore in the period, which differs from cost of sales which matches the cost of gold sold to the gold sales in the period. Cash cost per ounce does not include the cost attributable to third party ore purchases or depletion, depreciation and amortization. Due to the closure of the mine and mill operations for extended periods in 2008, the calculation of cash cost per ounce does not provide a meaningful number for comparative purposes in 2008. |
During the year the following important developments occurred at the Jerritt Canyon mine site:
Early in 2008, the Company shutdown the mill and the mines for an extended safety, care and maintenance cycle to deal with the effects of a lack of focus in these areas over the last five or more years.
During this period, extensive capital projects were undertaken to improve the infrastructure at the mines and the processing facility designed to improve the performance of the site and increase compliance with state safety and environmental regulations.
85
On August 8, the Company shutdown mining operations due to the increasing costs associated with the current mining plan and the required infrastructure expenditures still required at the mines. Management’s intention was to cease operations until a revised mine plan could be developed and financing obtained to support the plan.
Subsequently, the milling operations were shut-down so that necessary repair work could be performed and discussions with the state regulators commenced on permission to restart.
As a result of the above, the workforce at Jerritt Canyon was reduced to maintenance levels.
During 2008 the Jerritt Canyon milling operations were shutdown for the majority of the year. Early in 2008 the shutdown was undertaken to perform the improvements noted above. Subsequent to this voluntary shutdown, on March 19, 2008, the Company received a “stop order” from the Nevada Division of Environmental Protection (NDEP) due to issues involving the installation and the maintenance of instrumentation necessary to monitor key operating parameters in the emissions control systems. Management worked diligently with the NDEP to comply with the stop order and subsequently received approval to recommence milling operations subject to meeting specific requirements within the order.
In late April 2008, upon completion of the work program undertaken to make infrastructure and safety improvements to the mill and mine sites, the two producing gold mines at Jerritt Canyon (the Smith mine and the SSX mine) and the process mill resumed commercial mining operations.
On August 8, 2008 the Company made the decision to shutdown mining operations due to the increasing costs associated with the current mining plan and the required infrastructure expenditures remaining to be completed. In order to recommence mining at Jerritt Canyon, management began work on a revised mine plan that would involve additional upfront development of the mines but would ultimately reduce the dilution of the mine results. This mine plan, when completed, will require additional financing in order to fund the initial investment in the mines. The plan to continue toll milling after the shutdown of the mines was halted due to necessary repair work on damage to a key component of the process mill that had to be performed in order to continue operations. As a result, the workforce at Jerritt Canyon was reduced to maintenance levels.
Subsequent to the shutdown, the Company has been working with third parties to restart the process mill and commence milling of the remaining stock pile and recommence toll milling operations. Management has worked diligently with the NDEP to address the air emissions, fluids and water management concerns raised in the stop order issued in March of 2008. In the first quarter of 2009, management submitted a full report to the NDEP of their plans for addressing the stop order items, including engineering design plans to install a new gas handling system. This report has been accepted by the NDEP and approval order was received to restart the process mill at Jerritt Canyon on March 25, 2009.
Over the year the Company has invested approximately $15 million in the processing facilities at Jerritt Canyon. These expenditures were made in the areas of:
Infrastructure upgrades; improving the productivity and efficiency of the milling facility.
Safety; dealing with items identified by management and the special safety committees.
Instrument installation; to assist with monitoring emissions control systems.
During the third and fourth quarters of 2008 the Company reviewed the property and based on the uncertainty with respect to their ability to move forward with the development plan, has taken a full charge of $69.4 million against the value of the Jerritt Canyon mineral property and an additional $2.2 million against related property, plant and equipment.
Ketza River
In 2008 the Company focused on completing the geotechnical work required for mine planning, metallurgical test work and on completing its exploration program. The expansion of deposits within the projected open pits will add value to the Pre-feasibility Study. Management plans to return to Ketza River in the second quarter of 2009 and the primary focus will be on further exploration and definition of the ore body, completion of the Pre-feasibility study, the commencement of development at the site and the relocation of unused wet mill assets from the Jerritt Canyon operation.
86
Silver Valley
No work was carried out on the Silver Valley property in 2008. Work on this property will commence in 2009 when additional funding becomes available.
Yukon-Shaanxi Mining Company
In 2008 the Company formed the joint venture Yukon-Shaanxi Mining Company Inc. (“Yukon-Shaanxi”) with contributions of C$1.5 million from each party. An option agreement to acquire 298 claims, in the Mount Nansen area of the Yukon, was signed and an exploration program for this property is ongoing. Yukon-Shaanxi is reviewing other mining interests in the Yukon for further investment. The Company proportionately consolidates its 50% share the accounts of this joint-venture. As at December 31, 2008, Yukon-Shaanxi has spent C$0.2M on exploration activities in the Yukon territories.
SELECTED ANNUAL FINANCIAL INFORMATION
| | | 2008 | | | 2007 | | | 2006 | |
| Gold sales | $ | 48,981 | | $ | 64,460 | | $ | – | |
| Cost of sales | | 58,742 | | | 48,218 | | | – | |
| Gross Margin | | (9,761 | ) | | 16,242 | | | – | |
| Temporary shutdown costs | | 13,115 | | | – | | | – | |
| Depletion, depreciation and amortization | | 9,279 | | | 5,731 | | | 16 | |
| Accretion | | 2,117 | | | 1,082 | | | 145 | |
| Earnings from mining operations | | (34,272 | ) | | 9,429 | | | (161 | ) |
| Net loss | | (105,360 | ) | | (1,899 | ) | | (1,189 | ) |
| Loss per share - basic | | (0.57 | ) | | (0.02 | ) | | (0.02 | ) |
| Weighted average # of shares outstanding (millions) | | 185.1 | | | 121.4 | | | 53 | |
| | | | | | | | | | |
| Total assets | | 199,636 | | | 296,167 | | | 31,912 | |
The Company acquired the Jerritt Canyon mine on June 20, 2007 with the acquisition of Queenstake Resource Limited (“Queenstake”). Jerritt Canyon consists of a milling facility as well as two underground mines, the Smith and the SSX. The Jerritt Canyon operated continuously from the date of acquisition June 20, 2007 until February 22, 2008 when it shut down to address infrastructure and safety concerns noted above. In May 2008, Jerritt Canyon recommenced commercial production at reduced levels. On August 8, 2008 mining at Jerritt Canyon ceased again as a result of increasing costs and dilution resulting from the mine plan as well as the ongoing required development and infrastructure expenditures required resulting from years of neglect. As a result of repair work needed to a critical process mill part that was damaged in the subsequent week, the milling operation was also shut-down. Mining and milling operations did not resume for the remainder of 2008 while management pursued additional financing and continued work on addressing environmental concerns raised by the NDEP in their stop order issued in March of 2008. Milling operations resumed March 25, 2009 when approvals were received from NDEP.
The Company incurred a pre-tax loss of $117.4 million during the year ended December 31, 2008, compared with a pre-tax loss of $0.9 million in the year-ended December 31, 2007. The loss is primarily a result of the shutdown of mining operations in August 2008 and the subsequent impairment charges related to the Jerritt Canyon mineral property and related assets totaling $76.4 million, a $25.0 million reduction in results from mining operations, shutdown related costs of $13.1 million incurred during the closure of Jerritt Canyon as well as restructuring costs relating to the workforce reduction at Jerritt Canyon of $4.5 million.
The Company incurred a net loss of $105.4 million after income taxes during year ended December 31, 2008. The income tax recovery of $12.1 million recorded in 2008 reflects the increase in tax losses recorded as future income tax assets available to offset against future taxable income, net of the valuation allowance that provides for uncertainty of the use of some of the loss carryforwards. Future income taxes are a non-cash item, and due to the availability of these loss carryforwards there will likely be no requirement to pay income taxes in the foreseeable future.
87
RESULTS OF OPERATIONS
Gold sales:
For the year ended December 31, 2008, the Company realized gold sales of $49.0 million on sales of 56,360 ounces of gold compared with $64.5 million on sales of 90,116 ounces in 2007 and nil in 2006. The lower number of ounces sold in 2008 is largely due to the significantly reduced duration of operations during the year. This was partially offset by the higher average price realized of $869 per ounce in 2008 compared with $715 per ounce in 2007. There were no gold sales in 2006 as the operations of Jerritt Canyon were acquired in 2007.
Gross margin – mining operations:
Gross margin from mining operations was a loss of $9.8 million for the year ended December 31, 2008 compared to earnings of $16.2 million in the year ended December 31, 2007 and nil in 2006 (as there were no gold producing operations in 2006). The negative gross margin in 2008 was a result of the higher than normal operating costs for mining operations, due to the extent of development and infrastructure work required in the two operating mines at Jerritt Canyon that was being performed concurrently with mining activities. The Company produced 32,131 ounces of gold from Jerritt Canyon and 12,601 ounces of gold from purchased ore during the year ended December 31, 2008, a 46% and 63% decline, respectively, from the 59,100 ounces of gold from Jerritt Canyon and 38,098 ounces of gold from purchased ore produced in 2007. The mine shut down on August 8, 2008 and will remained closed until the Company completes development of a new mine plan in 2009 and is able to obtain additional financing, preferably debt, to fund the new plan.
Temporary shutdown costs:
In 2008 the Company had $13.1 million in temporary shutdown costs. During the temporary shutdown in the first and second quarters of 2008, the Company capitalized some of these expenditures that the Company determined would benefit the operations beyond the upcoming year. Expenditures that did not have a future economic benefit to the Company beyond the upcoming year or that were deemed to be due to a buildup of maintenance not performed were included in the Statement of Operations as “temporary shutdown costs” in the amount of $7.9 million for the nine months ended September 30, 2008. In the fourth quarter, all costs except for basic operational requirements such as utilities or those relating to the limited ore processing that occurred were classified as shutdown costs, aggregating to $5.3 million. The Company did not incur any shutdown related costs in 2007 and 2006.
Depreciation, depletion and amortization:
The Company had $9.3 million in depreciation, depletion and amortization for the year ended December 31, 2008 compared with $5.7 million and $0.1 million for the years ended December 31, 2007 and 2006, respectively. Depreciation expense was significantly higher as a result of the increase in the property, plant and equipment balances at Jerritt Canyon and ownership of those assets for the full year in 2008 compared to six months in 2007. In 2006 the depreciation is only for the equipment at the corporate office.
Depletion for the 2008 year is lower than the comparable 2007 year as depletion is driven by the number of ounces mined from the Jerritt Canyon mines and there was a 46% reduction in ounces mined during the year due to reasons previously discussed.
Accretion
Accretion expense was $2.1 million in 2008 compared to $1.1 million in 2007 and $0.1 million in 2006 due primarily to the fact that the Jerritt Canyon mine was owned for the full year in 2008 compared to six months in 2007. In 2006 the accretion is only related to the Ketza River property.
Impairment of Mineral Properties and Equipment
During the third quarter management determined that the current mining plan was resulting in unprofitable operations due to high operating costs, low production rates and dilution resulting from years of neglect. To lower the cost of mining and increase efficiency, management has determined that additional backfill and development work must be completed which cannot be performed while continuing to mine concurrently. On August 8, 2008 a decision was made to cease all mining activities until a profitable mine plan could be developed and appropriate financing could be obtained to finance the required infrastructure work. Once management has established a profitable mine plan and funding resources are available, the Company intends to recommence mining.
As a result of the uncertainty regarding the Company’s ability to obtain financing and develop a profitable mine plan, an indicator of impairment arises under existing accounting rules. The Company has reviewed the mineral property and related
88
property, plant and equipment and, based on the uncertainty with respect to their ability to move forward with the development plan, has taken a full charge against the value of the property and certain equipment as noted in the table below.
| | | December 31, 2008 | |
| Fair Value assigned on the Acquisition | $ | 44,306 | |
| Development spending | | 13,995 | |
| Value beyond proven and probable | | 13,713 | |
| Depletion of producing properties | | (2,607 | ) |
| Property, plant and equipment | | 2,243 | |
| Increase in asset retirement obligation | | 4,713 | |
| Net Impairment | $ | 76,363 | |
See the section on “Critical Accounting Estimates” for discussion on impairment testing of long-lived assets.
General and administrative expenses:
The Company incurred $4.1 million in general and administrative expense for the year ended December 31, 2008, compared with $3.6 million and $1.2 million in the comparable 2007 and 2006 periods. The operations of the Company are more complex in 2008 compared with the first half of 2007 and 2006 (Queenstake was acquired late in the second quarter of 2007). Increased costs associated with administering a business in two countries, the addition of numerous employees, an increase in financial and taxation compliance and an increase in legal and corporate governance costs have all been major factors in the increased general and administrative expense of the Company.
Restructuring charges:
As a result of the suspension of both mining and milling activities in Jerritt Canyon the Company undertook a significant work force reduction of 394 employees. The Company is required to provide former employees with severance equivalent to 60 days of wages and was also required to pay out any accumulated vacation amounts. The total of these costs were recorded as a $4.5 million restructuring charge in the third quarter of 2008. As of December 31, 2008, the Company had paid $2.5 million of this obligation.
Interest and other income:
The Company earned $4.6 million of interest and other income in 2008 compared to $2.5 million in 2007 and $0.4 million in 2006. During the third quarter of 2008 the Company sold underground equipment for proceeds of $4.0 million at a gain of $2.5 million. Interest earned on the commutation fund (restricted cash) was $1.0 million in 2008, $0.3 million higher than 2007 due to full year ownership of the fund compared to six months in 2007.
Income taxes:
The Company has recorded an income tax recovery of $12.1 million during 2008. This recovery primarily relates to the recognition of additional loss carryforwards available to offset taxable income. The Company offset the total future income tax assets with a valuation allowance of $36.0 million until there is sufficient evidence that, more likely than not, the Company will be able to utilize these losses to offset income.
89
SUMMARY OF QUARTERLY RESULTS
| | | Q1 2008 | | | Q2 2008 | | | Q3 2008 | | | Q4 2008 | | | Total | |
| Income Statement | | | | | | | | | | | | | | | |
| Gold Sales | $ | 21,789 | | $ | 7,773 | | $ | 17,162 | | $ | 2,257 | | $ | 48,981 | |
| Cost of gold sold | | 22,408 | | | 12,463 | | | 20,606 | | | 3,265 | | | 58,742 | |
| Gross margin - mining operations | | (619 | ) | | (4,690 | ) | | (3,444 | ) | | (1,008 | ) | | (9,761 | ) |
| Loss from mine operations | | (8,872 | ) | | (10,352 | ) | | (6,866 | ) | | (8,182 | ) | | (34,272 | ) |
| Loss before taxes | | (13,201 | ) | | (12,777 | ) | | (77,453 | ) | | (14,004 | ) | | (117,435 | ) |
| Net loss | | (8,884 | ) | | (5,700 | ) | | (77,201 | ) | | (13,575 | ) | | (105,360 | ) |
| Net loss per share | | (0.05 | ) | | (0.03 | ) | | (0.42 | ) | | (0.07 | ) | | (0.57 | ) |
| Weighted average # of shares outstanding | | 175,205,957 | | | 181,886,630 | | | 185,450,430 | | | 197,774,832 | | | 185,124,008 | |
| Balance Sheet | | | | | | | | | | | | | | | |
| Cash and cash equivalents | | 17,620 | | | 4,260 | | | 2,301 | | | 1,106 | | | 1,106 | |
| Total assets | $ | 280,500 | | $ | 306,968 | | $ | 207,824 | | $ | 199,636 | | $ | 199,636 | |
| | | Q1 2007 | | | Q2 2007 | | | Q3 2007 | | | Q4 007 | | | Total | |
| Income statement | | | | | | | | | | | | | | | |
| Gold Sales | $ | - | | $ | - | | $ | 26,236 | | $ | 38,224 | | $ | 64,460 | |
| Cost of gold sold | | - | | | 926 | | | 18,757 | | | 28,535 | | | 48,218 | |
| Gross margin - mining operations | | - | | | - | | | 7,479 | | | 9,689 | | | 17,168 | |
| Income (loss) from mine operations | | - | | | (926 | ) | | 3,248 | | | 7,107 | | | 9,429 | |
| Earnings (loss) before taxes | | (2,360 | ) | | (2,490 | ) | | 547 | | | 3,373 | | | (930 | ) |
| Net earnings (loss) | | (2,360 | ) | | (2,490 | ) | | 547 | | | 2,404 | | | (1,899 | ) |
| Net earnings (loss) per share | | (0.04 | ) | | (0.03 | ) | | - | | | 0.01 | | | (0.02 | ) |
| Weighted average # of shares outstanding | | 60,590,466 | | | 78,893,333 | | | 169,622,435 | | | 174,845,767 | | | 121,434,273 | |
| Balance Sheet | | | | | | | | | | | | | | | |
| Cash and cash equivalents | | 8,120 | | | 67,122 | | | 48,759 | | | 41,104 | | | 41,104 | |
| Total assets | $ | 36,029 | | $ | 268,198 | | $ | 268,279 | | $ | 296,167 | | $ | 296,167 | |
The Company incurred a loss of $13.6 million during the quarter ended December 31, 2008, compared to net earnings of $2.4 million in the quarter ended December 31, 2007. The $16.0 million decrease in earnings is due to lower gross margins from mining operations, temporary mine shut down costs and additional impairments in the fourth quarter of 2008, partially offset by a $2.4 million reduction in the loss on forward sales due to the settlement of all forward contracts in the third quarter. Gross margin from mining operations decreased from $9.7 million in the fourth quarter of 2007 to a loss of $1.0 million. The $10.7 million decrease is primarily a result of the shutdown of mining operations in August 2008. Also related to the temporary suspension of mining operations in August, further impairments of $6.9 million were recorded in the fourth quarter of 2008 and costs of $5.3 million of additional shutdown costs incurred during the quarter.
Gold sales:
During the fourth quarter of 2008, the Company realized gold sales of $2.3 million on sales of 1,921 ounces of gold, compared with $38.2 million on 51,140 ounces, a decrease of $35.9 million due to the cessation of milling operations at Jerritt Canyon on August 15, 2008. Sales in the fourth quarter of 2008 related to ounces that were in-circuit or in process at the end of the third quarter. Jerritt Canyon ore yielded 550 (2007 – 31,040) ounces while third party ore yielded 1,371 (2007 – 20,100) ounces. The average price in dollars realized during the fourth quarter of 2008 on gold produced was $888 per ounce compared with $747 in 2007.
Gross margin – mining operations:
The Company had a gross margin loss on gold sales of $1.0 million in the fourth quarter of 2008, compared with a gross margin of $9.7 million in the same period in 2007. The decrease of $10.7 million is due to the cessation of operations at Jerritt Canyon during the third quarter of 2008. In 2007, Jerritt Canyon produced 24,464 ounces and 24,405 ounces from ore purchased in the fourth quarter.
Depreciation, depletion and amortization:
The Company had $1.4 million in depreciation, depletion and amortization in fourth quarter of 2008 compared to $1.8 million in 2007. Depletion for the fourth quarter of 2008 is significantly less than the comparable 2007 period as depletion is based on units of production, and the mine was closed throughout the fourth quarter and a full impairment taken on mineral properties at the end of the third quarter of 2008. Depreciation expense was not impacted by the shutdown of the mines and mill during the fourth quarter as this expense is not driven by production, but by the passage of time.
90
Impairment of Mineral Properties and Equipment
As discussed in the “Result of Operations” section, at the end of the third quarter of 2008, management recognized an impairment charge against the value of the property. In the fourth quarter of 2008 a further $2.2 million impairment charge was taken related to associated property, plant and equipment and a charge of $4.7 million related to an increase in the provision for asset retirement obligations.
General and administrative expenses:
For the three months ended December 31, 2008, the Company incurred general and administrative expenses of $0.6 million compared with $0.7 million in the comparable 2007 period and $1.1 million in the third quarter of 2008. The fourth quarter is lower in 2008 compared with 2007 and the previous quarter as a result of the closure of the Jerritt Canyon operations and the subsequent workforce reduction and cost curtailment actions taken by the Company.
Income taxes:
The Company recorded an additional $0.4 million of income tax recovery during the period due to the recognition of future income tax assets arising from the additional taxable losses arising during the quarter. In total, the Company incurred $84.0 million of tax loss carryforwards available to offset future taxable income, however the realization of these tax loss carryforwards is not considered more likely than not, so the Company has taken a valuation allowance against the asset.
LIQUIDITY AND CAPITAL RESOURCES
LIQUIDITY
During 2008, cash and cash equivalents decrease from approximately $40.0 million to $1.1 million due to the significant capital and operating costs at Jerritt Canyon. At December 31, 2008 the Company had a working capital deficiency of $7.8 million, compared to working capital of $54.4 million at December 31, 2007 as a result of the following activities:
Operations
In 2008 the Company recorded a loss of $105.4 million, which, adjusted for non-cash items, resulted in cash outflows of $33.3 million before changes in working capital. This is comprised primarily of a negative gross margin of $9.8 million, temporary shut down costs of $13.1 million, general and administrative costs of $4.1 million and restructuring costs of $4.5 million. In 2007 the Company recorded a loss of $1.9 million, which, adjusted for non-cash items, resulted in cash inflows of $11.7 million before changes in working capital. This was a result of a gross margin of $16.2 million, offset by general and administrative costs of $3.6 million.
Changes in non-cash working capital were inflows of $14.9 million in 2008 compared to cash outflows of $23.5 million in 2007. The inflows in 2008 were due to a reduction in inventory levels by $12.8 million, increase in accounts payable by $7.4 million, offset by the payment of payables on ore purchases of $10.6 million. The increase in accounts payable is primarily related to the Jerritt Canyon operation and relates to costs incurred in the third quarter of 2008 prior to closure of the site. Management has worked with many of the suppliers to ensure that long term relationships are maintained while the Company focuses on returning to operations. In 2007 changes to non-cash working capital were outflows of $23.5 million due primarily to a build up of inventories of $15.1 million and a decrease in accounts payable of $8.0 million, offset by a $2.3 million increase in payables on ore purchases.
In 2008 the loss from operations, after adjustments for non-cash items, combined with the change in non-cash working capital, resulted in cash outflows from operating activities of $18.4 million compared to $11.8 million in 2007
Investing
Jerritt Canyon
During the first three quarters of 2008, the Company continued to incur higher than anticipated expenditures on investing activities at Jerritt Canyon as a result of the extensive infrastructure work required at the mine sites and the process mill improvements. Due to the increasing cost of continuing to operate the two mine locations, the Company discontinued all mining activities at Jerritt Canyon on August 8, 2008. A number of vendors have filed liens on Jerritt Canyon assets due to
91
overdue payments for goods and services that, if unresolved by management, could result in the sale of assets in order to settle these liens if sufficient cash is not provided from operations or further financing.
The Company received $4.9 million in refunded reclamation costs from the commutation account, of which $4.8 million related to a payment for the construction of the evaporation pond at Jerritt Canyon. The Company contributed an additional $3.2 million including the $1.0 million of interest earned in the year.
The Company sold underground equipment during the period for proceeds of $4.5 million after management determined that mining would not recommence in the short term.
Ketza River
Exploration expenditures at the Ketza River project during the 2008 totaled $13.0 million, of which $5.5 million was funded by “cash restricted for future exploration” and therefore, had no impact on unrestricted cash.
| | | 2007 | | | 2008 | |
| | | Property, | | | | | | | | | Property, | | | | | | | |
| | | plant and | | | Mineral | | | | | | plant and | | | Mineral | | | | |
| | | equipment | | | properties | | | Total | | | equipment | | | properties | | | Total | |
| Mine capital expenditures - Jerritt Canyon mine | $ | - | | $ | 2,959 | | $ | 2,959 | | $ | - | | $ | 9,626 | | $ | 9,626 | |
| Mill and equipment capital expenditures - Jerritt | | | | | | | | | | | | | | | | | | |
| Canyon mine | | 5,358 | | | - | | | 5,358 | | | 25,522 | | | - | | | 25,522 | |
| Exploration expenditures - Jerritt Canyon mine | | - | | | 7,231 | | | 7,231 | | | - | | | 6,483 | | | 6,483 | |
| Exploration expenditures - Ketza River project | | 861 | | | 16,398 | | | 17,259 | | | 110 | | | 12,826 | | | 12,936 | |
| Exploration expenditures - Yukon-Shaanxi | | - | | | - | | | - | | | 19 | | | 169 | | | 188 | |
| Other | | 47 | | | - | | | 47 | | | 52 | | | | | | 52 | |
| | $ | 6,266 | | $ | 26,588 | | $ | 32,854 | | $ | 25,703 | | $ | 29,104 | | $ | 54,807 | |
Of these amounts, $0.3 million (2007- 3.3 million) and $0.5 million (2007-$12.0 million) was spent on property, plant and equipment and mineral properties respectively in the fourth quarter.
Financing
In May 2008 the Company issued 10.1 million flow-through shares at a price of C$2.00 for proceeds of $19.9 million. Share issue costs paid in cash were $1.0 million.
In December 2008 a further 79.8 million common share units (consisting of one common share and two series of share purchase warrants) were issued at a price of C$0.05 per unit for proceeds of $3.3 million. The first warrant (the "Series "A" Warrant") can be exercised to purchase one additional Share (the ""A" Warrant Share") at a price of C$0.07 per share within 12 months of closing of the private placement and the second warrant (the "Series "B" Warrant") can be exercised to purchase one additional Share (the ""B" Warrant Share")at a price of C$0.09 per share within 18 months of closing of the private placement.
During 2008 the Company made $1.3 million in capital lease payments and retired three of the capital leases related to underground equipment. At the end of the year management was actively marketing an additional asset held under capital lease for $0.8 million which was sold subsequent to year-end.
Liquidity risk
Liquidity risk is the risk that the Company will not be able to meet its financial obligations as they fall due. The Company manages liquidity risk through forecasting its cash flows from operations and anticipating investing and financing activities. Senior management is actively involved in the review and approval of planned expenditures and typically ensures that it has sufficient cash on hand to meet expected operating expenses for 60 days. The shutdown of the Jerritt Canyon operations and current market conditions have increased the difficulty in generating funds to meet the ongoing expenses of operating two mine sites, and management has thus far financed operations through a series of private placements in order to meet ongoing operational costs. When the operations at Jerritt Canyon recommence, management believes that the ability to fund operations
92
through cash generated from toll milling, a return to mining, and financing should be sufficient to meet the ongoing capital and operating requirements of the Company.
During the third quarter of 2008, in order to fund expenditures, the Company withdrew cash that was restricted for exploration expenditures in the Yukon under the terms of the flow through share subscription agreements, referred to in investing activities above. The Company intends to replace the cash withdrawn from the restricted funds account during 2009 from additional financing and funds from ongoing operations.
The following are the contractual maturities of the undiscounted cash flows of financial liabilities at December 31, 2008:
| Contractual obligations | | Less than 3 | | | 4 to 12 | | | 1 to 2 years | | | Greater than | |
| | | months | | | months | | | | | | 2 years | |
| Accounts payable and accrued liabilities | $ | 28,599 | | | – | | | – | | | – | |
| Payable on purchased ore | | 8,257 | | | – | | | – | | | – | |
| Capital lease obligations | | 740 | | | 43 | | | 25 | | | – | |
CAPITAL RESOURCES
The Company had a cash balance of $1.1 million as of December 31, 2008 and a negative working capital balance of $7.8 million. The Company had a nominal cash balance in “cash restricted for future exploration” (part of “Restricted funds” on the balance sheet) as of December 31, 2008. This represents a portion of the remaining C$12.6 million of the required future exploration expenditures to be spent from the flow-through financing in May 2008 that provided C$20.1 million for exploration on the Ketza River project and other exploration activity in Canada. These restricted funds were applied to non-flow-through expenditures during the last six months of 2008, reducing the amount available to fund this requirement. These restricted funds must be spent by the Company, in accordance with the flow-through share agreement, by the end of 2009. Management intends to take steps necessary to bring the Company back into compliance with the flow-through agreements. If it fails to do so, it will be liable to the investors for their additional taxes payable.
The cash on hand at March 31, 2009 is not sufficient to maintain the ongoing operations of the Company for more than six weeks. Management believes that further financing can be obtained in order to ensure the company will continue as a going concern and return to operations. Should a return to operations be determined to be unprofitable, further curtailment of operations would be undertaken to reduce costs.
OUTLOOK
Management’s primary focus has been on working with the NDEP to obtain an order allowing the restart of milling operations at Jerritt Canyon. On March 25, 2009, the Company received the order from the NDEP that will allow the Company to return to full milling operations at Jerritt Canyon. The ability to operate the facility will enable the Company to fund its liabilities and reinvest in the mine plan at Jerritt Canyon and continue work at Ketza River in the Yukon.
The Company’s focus over the coming months at Jerritt Canyon will be on the development of a long term mine plan and obtaining financing, preferably debt, to fund the required development and backfill to support future mining activities. As well, the Company will continue to pursue additional toll milling agreements with properties in the area to supplement production from the Company’s own existing stockpile and future mining activities.
In the Yukon, the Company will be completing the YESSA application using historical drilling results and will continue exploration activity at the Ketza River and Silver Valley properties and begin development toward the end of 2009. These expenditures will be funded through cashflows from Jerritt Canyon as well as external sources of financing. Sources of external financing may include bank borrowings and future equity offerings. There can be no assurance that financing will be available on acceptable terms, or at all. The failure to obtain financing could have a material adverse effect on the Company’s growth strategy and or results of operations and financial condition should cashflows be insufficient to support the operations. There can be no assurance that the Company will be able to secure the financing necessary to retain its rights to, or to begin or sustain production at, any of its mineral properties.
93
The consolidated financial statements are prepared on the basis that the Company will continue as a going concern. The conditions described in the preceding paragraphs raise substantial doubt about the Company’s ability to continue as a going concern. The Company’s ability to continue as a going concern and recover it’s investment in property, plant, and equipment and mineral properties is dependent on its ability to obtain additional financing in order to meet its planned business objectives and generate positive cash flows. However, there can be no assurance that the Company will be able to obtain additional financial resources or achieve profitability or positive cash flows. Failure to continue as a going concern would require that the Company's assets and liabilities be restated on a liquidation basis, which values could differ significantly from the going concern basis.
At March 30, 2009, the Company had $0.8 million of cash and cash equivalents.
Gold Prices
Despite recent volatility, the Company believes that gold prices will continue to benefit from the weakening of the United States dollar against other major currencies, a reduction in hedging of future production by major producers, and an increase in physical demand. It is not possible to accurately forecast the trend of gold prices and their impact on future results from operations; nor is the Company able to forecast the precise timing for the return to commercial production at Jerritt Canyon as well as the commencement of commercial production of the Ketza River Mine.
In 2008, the price of gold (per the London pm fix) ranged from a low of $713 to a high of $1,011. The average price of gold based on the London pm fix in the past 8 quarters is as follows:
| US$/ounce | Q1 | Q2 | Q3 | Q4 | Annual |
| 2008 | $925 | $896 | $872 | $795 | $872 |
| 2007 | $650 | $667 | $680 | $786 | $695 |
OFF-BALANCE SHEET ARRANGEMENTS
The Company has no off-balance sheet arrangements as of December 31, 2008.
SUBSEQUENT EVENTS
Subsequent to year-end, the Company closed the following private placements:
The Company issued 17.3 million units ("Unit 1") at a price of C$0.06 per Unit 1 to net the treasury an aggregate of C$1,040,000. A finder's fee was paid in respect of a portion of the private placement. Each Unit 1 consists of one common share (a "Share") and one Share purchase warrant (the "Warrant"). The Warrant can be exercised to purchase one additional Share (the "Warrant Share") at a price of C$0.08 within 24 months of closing of the private placement. In accordance with securities legislation currently in effect, the Shares, the Warrants and the Warrant Shares will be subject to a "hold period" of four months plus one day expiring on June 26, 2009.
The Company issued 10.0 million units ("Unit 2") at a price of C$0.05 per Unit 2 to net the treasury an aggregate of C$0.5 million. A finder's fee was paid in respect of the private placement. Each Unit 2 consists of one common share (a "Share") and two series of Share purchase warrants. The first warrant (the "Series "A" Warrant") can be exercised to purchase one additional Share (the ""A" Warrant Share") at a price of C$0.07 per share within 12 months of closing of the private placement and the second warrant (the "Series "B" Warrant") can be exercised to purchase one additional Share (the ""B" Warrant Share") at a price of C$0.09 per share within 18 months of closing of the private placement. In accordance with securities legislation currently in effect, the Shares, the "A" Warrants, the "B" Warrants, the "A" Warrant Shares and the "B" Warrant Shares will be subject to "hold period" of four months plus one day expiring on June 25, 2009.
Jerritt Canyon Mine has completed a series of environmental-compliance requirements and the NDEP has approved the restart of the Mine's milling operations.
94
NON-GAAP FINANCIAL MEASURES
Cash cost per ounce is a measure management uses to monitor the cost of producing an ounce of gold extracted from the Company’s property in Jerritt Canyon. This does not include the impact on costs of ore purchased from third parties, nor does it include inventory adjustments required to match cost of sales to sales. For the last two quarters of 2008 the cash cost per ounce does not provide a meaningful figure for comparative purposes and has been excluded from this analysis.
The following is a reconciliation of cash cost per ounce produced from mined ore to Cost of Gold Sold in the Statement of Operations for 2007:
| Cost of gold sold | $ | 48,218 | |
| Less | | | |
| Third party ore processing | | (20,245 | ) |
| Operating expense adjustment | | (936 | ) |
| Production royalties | | (390 | ) |
| Refining costs | | (85 | ) |
| Gold inventory cash costs required to adjust from cost of sales to cost of production | | (1966 | ) |
| Cash cost of producing Jerritt Canyon mined gold | $ | 24,596 | |
| Ounces of gold produced from Jerritt Canyon property | | 59,100 | |
| Cash cost per ounce produced from mined ore | $ | 416 | |
RELATED PARTY TRANSACTIONS
During the year, the Company was charged nil (2007 - $0.1 million) in management fees by a company owned by a director of the Company.
During the year, the Company was charged a total of $0.2 million (2007 - $0.3 million) in legal fees by a law firm in which the corporate secretary of the Company is a partner. The amount owing at December 31, 2008 is $0.1 million. A portion of these fees are included in share issue costs with the remainder included under general and administrative expenses. In 2007, a portion of these costs were also included in the transaction costs associated with the Queenstake business combination.
CRITICAL ACCOUNTING ESTIMATES
The Company prepares its financial statements in accordance with Canadian GAAP. Certain estimates and assumptions must be made by management that affects the reported amounts of assets, liabilities and shareholders’ equity for the period. Critical accounting estimates include estimates that are uncertain and changes in such estimates could materially impact the Company’s financial statements. Management reviews its estimates and assumptions on an ongoing basis based on the most current information available. The following estimates are critical:
Depletion of mineral properties
Depletion of producing mineral properties is impacted by the estimation of proven and probable reserves, in accordance with National Instrument 43-101. There are many uncertainties associated with having a reserve estimate completed. The proven and probable reserve estimate is completed once a year, near the calendar year-end, on the Jerritt Canyon property and this estimate is the basis of depletion for the upcoming year. Consequently, the depletion calculation for each period is directly affected by the reserve estimate at year-end.
Capitalization of long-term mine development costs
The Company capitalizes mining and drilling expenditures that are deemed to have economic value beyond a one-year period. The magnitude of this capitalization involves a certain amount of judgment and estimation by the mine engineers. The magnitude of this capitalization makes this a critical accounting estimate.
95
Impairment testing of long-lived assets
The Company reviews its mineral properties and property, plant & equipment (for each reporting unit) at least once a year to determine whether the recorded value of the asset in the accounts will be recoverable in the future. This process involves comparing the fair value of the assets in a reporting unit to the carrying value in the accounts. In the event the carrying value of the assets in the accounts exceeds the fair value, the excess amount is charged to operations in the period when this determination has been made.
A National Instrument 43-101 compliant estimate of proven and probable reserves and measured, indicated & inferred resources for each mineral property is a critical estimate in evaluating long-lived assets for impairment. In addition, estimates such as the price of gold and certain capital and operating cost estimates are critical estimates in the evaluation of potential impairment of long-lived assets.
Purchase price allocations on business combination
The purchase price allocation of the Queenstake assets and liabilities acquired in the business combination was finalized in the second quarter of 2008. In determining the fair value used in the purchased price, the Company engaged independent professionals to assist in the valuation of (a) the mineral property (b) the processing plant and equipment (c) income tax assets and liabilities and (d) the asset retirement obligation.
Management has used the information provided by the independent professionals to determine the “fair value” of the aforementioned assets and liabilities. All valuation work has a certain amount of assumptions in determining fair value. Management has reviewed major assumptions to ensure they are supportable in the context of today’s operating environment.
Asset retirement obligation
Reclamation costs are estimated at their fair value based on the estimated timing of reclamation activities and management’s interpretation of the current regulatory requirements in the jurisdiction in which the Company operates. Changes in regulatory requirements and new information may result in revisions to these estimates. The estimated asset retirement obligations on both the Jerritt Canyon property and the Ketza River property are fully funded at this date.
Income taxes
The Company uses the asset and liability method of accounting for income taxes. Under this method, incomes taxes are recognized for the estimated income taxes payable for the current year. Future income tax assets and liabilities are recognized based on temporary differences between accounting and tax bases of assets and liabilities as well as the benefit of losses available to be carried forward to future years for tax purposes. Future income tax assets and liabilities are measured using enacted or substantively enacted tax rates and laws that will be in effect when differences are expected to reverse. Future income tax assets and liabilities are evaluated utilizing the guidance provided in FIN 48,Accounting for Uncertainty in Income Taxes, which prescribes a minimum recognition threshold that a tax position is required to meet before being recognized in the financial statements.
Stock-based compensation
The fair value of stock options granted, using the Black-Scholes option pricing model, is used to measure stock-based compensation expense. The Black-Scholes option pricing model requires the usage of certain estimates, which includes the estimated outstanding life of stock options granted. Management currently uses the entire life of the stock option granted as the estimated outstanding life and will continue using this until enough history relating to prior grants has been established to modify this assumption.
96
IMPACT OF ADOPTION OF NEW ACCOUNTING POLICIES
Capital disclosures
On January 1, 2008 the Company adopted the recommendations of The Canadian Institute of Chartered Accountants (CICA) Handbook Section 1535, Capital Disclosures (section 1535). The new standard requires an entity to disclose information to enable users of its financial statements to evaluate the entity’s objectives, policies, and processes for managing capital. As the standard under section 1535 are for disclosure purposes only, the adoption did not have an impact Company’s operating results.
Financial instruments
On January 1, 2008 the Company adopted the recommendations of CICA Handbook Section 3862, Financial Instruments - Disclosures (section 3862) and CICA Handbook Section 3863 – Financial Instruments – Presentation (section 3863). Section 3862 provides standards for disclosures about financial instruments, including disclosures about fair value and the credit, liquidity and market risks associated with the financial instruments. Disclosure requirements pertaining to this section are in note 20. Section 3863 provides standards for presentation of financial instruments and non-financial derivatives. The adoption of these standards did not have an impact on the Company’s operating results.
Inventories
On January 1, 2008 the Company adopted the recommendations of CICA Handbook Section 3031, Inventories. This section provides additional guidance on the determination of cost and its subsequent recognition as an expense, including any write-down to net realizable value, and disclosures made within the financial statements. This section also provides guidance on the reversal of write-downs previously taken and introduces the requirement for the allocation of overhead cost based on normal capacity.
RECENT ACCOUNTING PRONOUNCEMENTS
Recent accounting pronouncements issued which may impact us in the future are as follows:
International Financial Reporting Standards
In 2006, the Canadian Accounting Standards Board (“AcSB”) published a new strategic plan that will significantly affect financial reporting requirements for Canadian companies. The AcSB strategic plan outlines the convergence of Canadian GAAP with International Financial Reporting Standards (“IFRS”) over an expected five-year transitional period. In February 2008, the AcSB announced that 2011 is the transition date for publicly listed companies to use IFRS, which will replace Canadian GAAP. The effective date is for interim and annual financial statements relating to fiscal years beginning on or after January 1, 2011. The transition date of January 1, 2011 will require the restatement for comparative purposes of amounts reported by the Company for the year ended December 31, 2010. While we have begun assessing the adoption of IFRS for 2011 and have identified the primary differences on our financial statements, the financial reporting impact of the transition to IFRS cannot be reasonably estimated at this time.
Goodwill and Intangible Assets
In February 2008, the CICA issued accounting standard Section 3064 Goodwill, and intangible assets, replacing accounting standard Section 3062 Goodwill and other intangible assets and accounting standard Section 3450, Research and development costs. Various changes have been made to other sections of the CICA Handbook for consistency purposes. The new Section will be applicable to financial statements relating to fiscal years beginning on or after October 1, 2008. Accordingly, the Company will adopt the new standards for its fiscal year beginning January 1, 2009. Section 3064 establishes standards for the recognition, measurement, presentation and disclosure of goodwill subsequent to its initial recognition and of intangible assets by profit-oriented enterprises. Standards concerning goodwill are unchanged from the standards included in the previous Section 3062. The Company has not yet determined the effect these new standards will have on its financial position and results of operations.
97
FINANCIAL INSTRUMENTS
The Company’s financial instruments consist of cash and cash equivalents, marketable securities, accounts receivable, inventory, accounts payable, accrued liabilities, payable on third-party purchased ore, forward sales contracts, and other long term liabilities. The carrying amounts of financial instruments, except for as noted below, approximate their fair values.
Previously, the Company engaged in the forward sale of gold produced from ore purchased from third parties to ensure the Company achieves an acceptable profit margin on this activity and to protect against a decline in the price of gold. The Company discontinued this practice in August of 2008 and settled all remaining contracts outstanding at that time, resulting in a realized gain on settlement of $0.3 million.
RISK ASSESSMENT
There are numerous risks involved with gold mining and exploration companies and the Company is subject to these risks. The Company’s major risks (in no particular order) and the strategy for managing these risks are as follows:
Gold price volatility
The price of gold has been historically volatile and this volatility will likely continue both near-term and long-term. Management’s strategy in dealing with this volatility is to expose gold produced by Jerritt Canyon to this volatility (i.e. sell gold at market rates as produced), thus participating in upward movements in price of gold, while being exposed to downward movements in the price of gold. Third party ore purchases are based on market price of gold at date the Company takes possession of the ore. Management sells gold that is projected to be produced from this ore using forward contracts in an effort to insulate the Company from downward pressure in the price of gold, subsequent to the date of purchase.
Estimates of reserves and resources
Resource estimates involve a certain level of interpretation and professional judgment. The Company has opted to utilize the services of SRK Consulting in its 43-101 work for both the Jerritt Canyon mine and the Ketza River project in the past. This ensures a consistent methodology is utilized from property to property. SRK Consulting has done reserve and resource estimate work for numerous years on the Jerritt Canyon mine and is quite familiar with the property.
Environmental risk
Environmental factors must be taken into account at all stages of project development and during mining operations. The Company understands that it is critical to long-term success to operate in an environmentally conscious manner. Management is currently in the process of working with the Nevada Division of Environmental Protection to develop a plan to ensure long-term compliance of the Jerritt Canyon mine.
Safety risk
The mining business can present some significant safety risks during all phases of project/mine life. The Company has undertaken several safety related capital improvements to the Jerritt Canyon facilities during 2008 to mitigate the impact of these risks.
Ability to raise capital
The availability of capital is dependent on both macroeconomic factors and the Company’s track record in utilizing capital. The current tightening of credit and decline in liquidity have presented new challenges to Companies attempting to obtain financing. As well, the significant reduction in the Company’s market capitalization has made it difficult to obtain substantial funding through equity issues without significant dilution of the existing shareholders. Management attempts to use capital resources as efficiently as possible, while being aware of the need to invest money in the finding and developing future gold-bearing ore bodies.
98
Exploration for future gold resources and reserves
Exploration can be a very capital intensive undertaking for the Company. Management understands this risk and attempts to spend as efficiently as possible. The Company determines an appropriate level of exploration expenditures during the budgeting process and the results of these programs are assessed to determine future level of exploration activity.
Notes to the Reconciliation between Canadian and US GAAP
The financial statements of the Company have been prepared by management in accordance with Canadian generally accepted accounting principles. See note 22 to the consolidated financial statements for a reconciliation of Canadian GAAP to U.S. GAAP. The following differences are applicable to the Company.
| (i) | Mineral properties |
| | |
| Under Canadian GAAP, resource property acquisition costs and exploration costs may be deferred and amortized to the extent they meet certain criteria. Capitalized costs under Canadian GAAP are amortized on a unit-of-production basis based on proven, probable and possible reserves. |
| | |
| Under US GAAP, exploration costs must be expensed as incurred unless the resource properties have proven and probable reserves at which time costs incurred to bring the mine into production are capitalized as development costs. Drilling and related costs in delineating an ore body and converting mineral resources to mineral reserves are expensed as exploration costs under US GAAP. Capitalized costs are then amortized on a unit-of-production basis based on proven and probable reserves rather than over the proven and probable reserves of the mine and the applicable portion of resources expected to ultimately be mined. This additional depletion and exploration expense is recognized in the statement of operations under US GAAP. For the purposes of the consolidated statements of cash flows, the exploration costs are classified as cash used in investing activities under Canadian GAAP and cash used in operating activities under US GAAP. |
| | |
| The impact of this difference under Canadian GAAP and US GAAP affected depreciation as a portion of property, plant and equipment is depreciated and capitalized to mineral property for Canadian GAAP which is expensed for US GAAP and equity loss as the incorporated joint venture also capitalizes mineral property costs for Canadian GAAP. |
| | |
| (ii) | Flow-through shares |
| | |
| Under Canadian income tax legislation, the Company is permitted to issue shares whereby the Company agrees to incur Canadian exploration expenditures (as defined in the Income Tax Act, Canada) and renounce the related income tax deductions to investors. Under Canadian GAAP, the full amount of funds received from flow-through share issuances are initially recorded as share capital. Upon renouncing the expenditures, the amount of deferred tax on the expenditures is deducted from share capital. Under US GAAP, the premium paid for the flow-through shares in excess of market value is credited to liabilities and included in income when the related tax benefits are renounced by the Company. |
| | |
| (iii) | Income taxes |
| | |
| Under Canadian GAAP, future tax assets and liabilities are recorded at substantially enacted tax rates. Under Financial Accounting Standards Board (FASB) Statement of Financial Accounting Standards (SFAS) 109, Income taxes for US GAAP, deferred tax assets and liabilities are recorded at enacted tax rates. In 2007 and 2008, there were no differences between enacted and substantially enacted rates. As a result, the application of US GAAP in accounting for income taxes does not result in any material measurement differences from Canadian GAAP for future tax assets or liabilities. |
| | |
| Due to the treatment of exploration costs under US GAAP described in note 1 above, there would be a larger tax benefit arising under US GAAP when compared to Canadian GAAP. With respect to the Canadian operations, any future tax assets arising are fully offset by a valuation allowance as it is not more likely than not that the future tax assets would be realized. For the US operations, a valuation allowance has been taken against all future income tax |
99
| assets in excess of liabilities, therefore the asset arising under US GAAP will not be recognized in 2008 and the balance from 2007 has been adjusted accordingly. |
| | |
| (iv) | Accounting for warrants |
| | |
| Under Canadian GAAP units issued by the Company consisting of a combination of common shares and warrants are valued by assigning the proceeds received to the common share and deducting the value of the warrants as determined by a Black Scholes model. Under US GAAP the value is assigned to common shares and warrants based on the relative fair value. The fair value of the common shares is deteremined by the closing price on the date of the transaction and the fair value of the warrants are determined based on a Black Scholes model. As a result of this difference, share capital was increased by $0.7 million, with an offsetting decrease in the warrants. |
| | |
| (v) | Accounting for uncertainty in income taxes |
| | |
| The Company adopted Financial Accounting Standards Board Interpretation No. 48, Accounting for Uncertainty in Income Taxes (FIN 48) effective January 1, 2007. FIN 48 prescribes a recognition threshold and measurement attribute for the financial statement recognition and measurement of a tax position taken or expected to be taken in a tax return. FIN 48 requires that the Company recognize on adoption only those tax positions that are “more-likely- than-not” (50% or greater) of being sustained on audit, based on the technical merits of the position. Additionally, this standard provides guidance on de-recognition, classification, interest and penalties, accounting in interim periods, disclosure and transition. With the adoption of this standard, the Company has performed a comprehensive review of all material tax positions in accordance with recognition and measurement standards established by FIN 48. |
| | |
| Based on this review, the provisions of FIN 48 did not have a material impact on the Company’s annual consolidated financial statements. The Company has elected to apply the provisions of FIN 48 in assessing their uncertain tax positions under Canadian GAAP as well, removing any differences that would arise with US GAAP. |
| | |
| (vi) | Adoption of New Accounting Standards |
| | |
| In September 2006, FASB issued SFAS No. 157, Fair Value Measurements (SFAS 157). This statement defines fair value, establishes guidelines for measuring fair value and expands disclosures regarding fair value measurements. SFAS 157 does not require any new fair value measurements but rather eliminates inconsistencies in guidance found in various prior accounting pronouncements. SFAS 157 is effective for fiscal years beginning after November 15, 2007. The Company believes that the adoption of SFAS 157 did not have a material effect on the Company’s consolidated financial statements. |
| | |
| In February 2007, the FASB issued SFAS No.159, the Fair Value Option for Financial Assets and Financial Liabilities - including an amendment to FAS 115. This standard permits a company to choose to measure certain financial assets, financial liabilities and firm commitments at fair value. The standard is effective for fiscal years beginning after November 15, 2007. The Company believes that the adoption of SFAS No.159 did not have a material effect on the Company’s consolidated financial statements. |
| | |
| (vii) | New Accounting Pronouncements |
| | |
| In December 2007, the FASB released SFAS 141-R, Business Combinations. This Statement applies prospectively to business combinations for which the acquisition date is on or after the beginning of the first annual reporting period beginning on or after December 15, 2008, which is a business combination in the year ending December 31, 2009 for the Company. The objective of this Statement is to improve the relevance, representational faithfulness, and comparability of the information that a reporting entity provides in its financial reports about a business combination and its effects. The Company will assess the impact of this standard for Business Combinations occurring after January 1, 2009. |
| | |
| In March 2008, FASB issued FASB Statement No. 161, Disclosures about Derivative Instruments and Hedging Activities - an amendment of FASB Statement No. 133. This Statement requires enhanced disclosures about an entity’s derivative and hedging activities and thereby improves the transparency of financial reporting. This Statement |
100
is effective for financial statements issued for fiscal years and interim periods beginning after November 15, 2008, with early application encouraged. This Statement encourages, but does not require, comparative disclosures for earlier periods at initial adoption. The Company is assessing the impact of the new standard.
The Securities and Exchange Commission (“SEC”) and FASB have issued recent interpretations for US GAAP that suggest warrants with an exercise price that is different from the entity’s functional currency cannot be classified as equity. On June 12, 2008, the EITF reached final consensus on the application of EITF 07-5, Determining Whether and Instrument (or an Embedded Feature) is Indexed to an Entity’s Own Stock, to foreign currency denominated warrants and the decision was approved by the FASB. The EITF is applicable for years beginning after December 15, 2008 and will be treated as a change in accounting principle through prospective application. As the Company’s functional currency is the US dollar, upon adoption of this abstract the issued and outstanding warrants that have an exercise price that is denominated in Canadian dollars will be treated as derivative instruments and recorded as liabilities under US GAAP and changes in fair value will be calculated at each reporting period. Any gain or loss arising from this revaluation will be recorded in the statement of operations.
Item 6. Directors, Senior Management and Employees. A.Directors and senior management.
The following table lists as of December 31, 2008 the names of our directors and senior management. Each of the directors and senior officers has served in his respective capacity since his election and/or appointment and will serve until the next annual general meeting of shareholders or until a successor is duly elected, unless the office is vacated in accordance with our Articles. All of our directors are residents of Canada.
Our Directors and Senior Management
Name |
Position with YNG | Date of First
Appointment |
Age |
| Robert E. Chafee(3)(4) | Director | May 2005 | 73 |
| Graham C. Dickson(4) | Director, President and CEO | April 1997 | 61 |
| John R.W. Fox(2)(3) | Director | March 2005 | 61 |
| Iain J. Harris(1)(2)(4) (5) | Director | January 2007 | 63 |
| Peter Holbek(5) | Director | October 2005 | 53 |
| R.J. (Don) MacDonald(1) | Director | July 2005 | 54 |
| Neil J.F. Steenberg(1)(2) (3) (5) | Director | March 2005 | 59 |
| Shaun Heinrichs | CFO | November 2008 | 35 |
| Graham H. Scott | Corporate Secretary | May 2005 | 62 |
| (1) | Member of the Audit Committee |
| (2) | Member of the Corporate Governance Committee |
| (3) | Member of the Compensation Committee |
| (4) | Member of the Acquisition Committee |
| (5) | Member of the Special Committee |
The following is a brief description of the principal business activities ofour directors and senior management:
Graham Dickson, President and Director
Mr. Dickson has been working in the Mining Industry in North America for the last 24 years. He has acted as general manager of a turnkey construction company for gold milling facilities in remote locations, including the Snip Mill for Cominco Ltd., Golden Patricia Mill for Bond Gold and Seabee Mill for Claude Resources. Before joining us, Mr. Dickson served in various capacities with BYG Natural Resources Ltd., which had an operating gold mine in the Yukon Territory. As General Manager
101
of the General Contractor, Mr. Dickson completed the surface facilities for Bema Gold's Julietta mine in Far East Russia, ahead of schedule and under budget.
John R.W. Fox, Director
Mr. Fox has more than 35 years experience in the design, start-up and operation of mine metallurgical process plants. Mr. Fox has held positions with RTZ, Rustenburg Platinum Mines, Rossing Uranium, Wright Engineers, and as Principal Engineer with both Cominco Engineering Services Ltd. and H.A. Simons Ltd. He has worked on more that 100 mining projects in more than 20 countries from the Ketza River mine in the Yukon , Julietta mine in Russia, Buenaventura's Uchucchachua in Peru, Teck projects in Ontario and Panama and gold plants in China, Africa, Philippines , Indonesia and the Americas. Mr. Fox is the President of Laurion Consulting Inc.
Neil J.F. Steenberg, Director
A practising lawyer for more than 30 years, Mr. Steenberg has specialized in corporate finance, securities and mining law advising clients on structuring initial public offerings, private placements and other financings as well as mergers and acquisitions and mineral exploration and development agreements. Mr. Steenberg obtained both his undergraduate degree (B.A. Hons.) in English Literature & History and his law degree (LLB.) at Queen's University in Kingston, Ontario, Canada. Complementing his corporate law practice Mr. Steenberg has 5 years management and operational experience working as in-house counsel and in senior management positions for a group of eight Canadian junior gold exploration and producing enterprises from 1985 to 1990. He was formerly a Partner and chair of the national corporate finance and securities practice at Gowling Lafleur Henderson, LLP, one of the largest Canadian law firms, from 1994 to 2003. Since November, 2003, Mr. Steenberg has operated a private business law and corporate finance boutique practice in downtown Toronto. As well as being our board member, Mr. Steenberg is Secretary and a director of Conquest Resources Limited (TSX Venture Exchange - symbol CQR), Secretary of Labrador Iron Mines Holdings Limited (TSX symbol LIR) and Secretary of Coniagas Resources Limited (TSX Venture Exchange - symbol CNY).
Iain Harris, Director
Mr. Harris was President and CEO of AirBC Limited from 1983 to 1995. Prior to that he was Vice President, Finance & Administration with the Jim Pattison Group. He is a former Chairman of Terasen Inc. (formerly BC Gas Inc.) and the Canadian Depository for Securities Ltd. He is also a former director of several companies including International Forest Products Ltd., TELUS Corporation, and Nav Canada. Mr. Harris is a past Chairman of Tourism Vancouver, the Vancouver Board of Trade and the Air Transport Association of Canada. He is also a former director of the Vancouver Foundation and the Forest Alliance of B.C. He is a Governor of the Vancouver Board of Trade and the recipient of the Governor General's Commemorative Medal in recognition of community and public service.
Robert Chafee, Director
Mr. Chafee has been involved in the mining industry since 1957, originally in Elliot Lake, Manitouwadge and Sudbury as well as in Northwestern Quebec, Manitoba, British Columbia and the Yukon. Mr. Chafee is currently Chairman and director of several trucking and contracting companies, Igeacare Systems Inc. - in the health care communications and emergency response field, Etobicoke Ironworks Inc., - in structural steel and scaffolding design and manufacture, Tonolli Canada - in the secondary lead smelting business. In addition he is a director of Hardrock Mining Inc., Tagish Lake Gold Corp. and Andamios Atlas in Mexico. He was formerly CEO and Chairman of Skyway Canada, Matthews Equipment Ltd. and Antamex International Inc.
R.J. (Don) MacDonald, Director
Mr. MacDonald is Senior VP & CFO of NovaGold Resources Inc. and has over 21 years of experience in the mining industry. He has been directly involved in the operation or development of ten mines in North and South America, and the completion of multiple mine financings and mergers and acquisitions transactions totaling over $2 billion. Mr. MacDonald's experience in the mining industry included Senior VP & CFO of De Beers Canada Mining Inc. (formerly Winspear Diamonds) and Dayton Mining Corporation. Mr. MacDonald holds a Bachelor and Masters degree in engineering from Oxford University and he is a Chartered Accountant.
102
Peter Holbek, Director
Mr. Holbek is a geologist with more than 28 years experience in geology, mineral exploration and mine development. He currently runs a consulting company, Viking GeoScience, which provides exploration and evaluation services for the Mining Industry in addition to serving as Vice President, Exploration for Copper Mountain Mining Corp. From 2003 to recently, he served as Vice President, Exploration for Western Keltic Mines and Blackstone Ventures Inc. From 1996 to 2002, he was Vice President, Exploration for Atna Resources Ltd., and has held senior exploration positions with Princeton Mining Corp., Homestake Canada and Esso Minerals Canada Ltd., among others. In addition to extensive exploration experience, Mr. Holbek has been involved in mine operations, mine development and numerous feasibility and prefeasibility studies. He has directed explorations that lead to the discovery of epithermal gold, volcanogenic massive sulphide, and porphyry copper deposits.
Graham H. Scott, Secretary
Mr. Scott combines 25 years as a resource and corporate finance lawyer with eight years of practical experience as an exploration geologist to give clients expert, balanced advice on all resource-related matters. He represents many Canadian public companies which are listed on the TSX and TSX Venture Exchanges, in addition to clients in the corporate finance business. Mr. Scott also represents a diverse group of clients in the mining industry, ranging from individual prospectors to multinational mining companies. In such work, Mr. Scott has negotiated and prepared participation and joint venture agreements for properties throughout the world. He has presented papers on securities law and mining law matters and has chaired many legal and industry conferences. Mr. Scott is listed in The Lexpert/American Lawyer Guide to the Leading 500 Lawyers in Canada, is one of the 230 lawyers world-wide listed in the International Who's Who of Mining Lawyers and is listed in the The Best Lawyers in Canada.
Shaun Heinrichs, CFO
Mr. Heinrichs has 11 years of financial accounting experience, beginning with 7 years of public practice experience with Ernst & Young in Vancouver. His primary role at Ernst & Young was as a lead assurance or advisory manager on several large US and Canadian public companies within the BC region. He has also held management roles over the last 4 years in two large US public companies and most recently held a senior management role at a large BC utility prior to joining us as the Corporate Controller in February of 2008. Mr. Heinrichs holds a BBA from Simon Fraser University and is both a Chartered Accountant in Canada and a Certified Public Accountant in the state of Illinois, United States.
B.Compensation.
Compensation for our executive officers for the financial year ended December 2008 is as follows:
Name and Principal
Position | Annual Compensation | Long Term Compensation | All Other
Compen-
sation (C$)
|
Salary
(C$)
| Bonus
(C$)
| Other
Annual
Compen-
sation
(C$) | Awards | Payouts |
Securities
Under Options
granted
(#) | Shares or Units
subject to Resale
Restrictions
(C$) |
LTIP
Payouts
(C$) |
Graham Dickson,
President and CEO | $299,068
| $100,000
| Nil
| Nil
| Nil
| Nil
| Nil
|
Christopher Oxner
Former CFO(2) | $123,185
| $32,000
| Nil
| 200,000
| $416,233
| Nil
| Nil
|
Shaun Heinrichs,
CFO(3)(4) | $123,788
| $6,000
| Nil
| 200,000
| $248,244
| Nil
| Nil
|
| (1) | January 1 to December 31. |
| (2) | Chief Financial Officer until August 14, 2008. |
| (3) | Appointed Chief Financial Officer November 21, 2008. |
| (4) | Salary includes $104,029 which was paid to Mr. Heinrichs as the controller during 2008, prior to being appointed to Chief Financial Officer. |
103
Option Grants to Executive Officers During the Most Recently Completed Financial Year
Name |
Securities Under
Options
(#) |
% of Total Options
Granted to Employees
in Financial Year(1) | Exercise or Base
Price
($/Security)
C$ |
Expiration Date |
| Shaun Heinrichs | 200,000 | 19% | $1.60 | March 28, 2013 |
| (1) | Reflected as a percentage of the total number of options to purchase common shares granted (1,050,000) during the Financial Year. |
Each of our Directors is paid an annual retainer of C$12,000, to be paid quarterly and receive C$750 for each meeting of directors attended, with the Chairman of a meeting receiving C$1,000 per meeting. None of our Directors were granted stock options for the financial year ended December 31, 2008 and no stock options were exercised during our most recently completed financial year.
Our former Chairman, E. Lynn Patterson, was paid an annual retainer of C$36,000 and received a payment of C$1,000 per meeting attended.
We do not have any long-term incentive, retirement, pension plan or other arrangement for non-cash compensation to our Directors, except incentive stock options.
Stock Option Plan
The only equity compensation plan which we have in place is an Evergreen Incentive Stock Option Plan (the “Plan”) which was approved by our shareholders on May 18, 2007. The Plan has been established to provide incentives to qualified parties to increase their proprietary interest in us and thereby encourage their continuing association with us. The Plan is administered by our directors and provides that options will be issued to our directors, officers, employees and consultants. The Plan provides that the number of common shares issuable under the Plan, together with all of our other previously established or proposed share compensation arrangements, may not exceed 10% of our total number of issued and outstanding Common Shares.
C.Board practices.
Each director is currently serving a one (1) year term, renewable at the annual shareholder meeting.
None of our directors have any service contracts for serving as directors.
We have an Audit Committee, which recommends to the full Board of Directors the engagement of the independent auditors and reviews with the independent auditors the scope and results of our audits, our internal accounting controls, and the professional services furnished by the independent auditors to us. The Audit Committee meets as required to review the annual and quarterly financial statements, matters relating to the securities commissions, investments and transactions that could adversely affect our well-being and management's recommendations regarding share issues. The Audit Committee also establishes and monitors procedures to reduce conflicts of interest and for reviewing audit and financial matters. Through meetings with external auditors and senior management, the Audit Committee discusses, among other things, the effectiveness of the internal control procedures established for us. At all times, at least one (1) audit committee member possesses accounting or related financial expertise, while the remaining members are, at minimum, possessed of significant experience in analyzing the financial condition of corporations. The Board of Directors has adopted a charter for the audit committee which sets out the responsibilities of the committee and provides guidance to committee members as to their duties which charter is posted on the Corporation’s website atwww.yukon-nevadagold.com under Corporate Info/Governance Policy. Our Audit Committee currently consists of three (3) members: Robert Chafee, Iain Harris and R.J. (Don) MacDonald.
In addition, we have a compensation committee. The Compensation Committee reviews compensation practices and management succession and approves the remuneration of our senior executives, including the Chief Executive Officer. The Compensation Committee reviews matters such as compensation philosophy and remuneration policy, Board retainer fees, performance objectives, evaluation of the performance of the Chief Executive Officer, proposed stock option or share purchase plans, bonuses. The Compensation Committee also monitors the integrity of management through periodic meetings with the
104
Chief Executive Officer. The members of the Compensation Committee are Messrs. John Fox, Neil Steenberg and Robert Chafee (Chair).
D.Employees.
As of December 31, 2008, we had 15 full time employees, 6 located in Nevada, 2 in the Yukon and 7 in British Columbia.
E.Share ownership.
The following table outlines the common shareholdings of the Directors and Senior Management, as at December 31, 2008.
| Name of Beneficial Owner | Amount and Nature of Beneficial Ownership(1) | Percent of Class |
| Robert E. Chafee | 4,092,810 | 1.50% |
| Graham C. Dickson | 2,596,000 | 0.95% |
| John R.W. Fox) | 259,800 | 0.10% |
| Iain J. Harris | 37,500 | 0.01% |
| Shaun Heinrichs | 150,000 | 0.06% |
| Peter Holbek | 15,000 | 0.005% |
| R.J. (Don) MacDonald | 20,000 | 0.01% |
| Neil J.F. Steenberg | 20,000 | 0.01% |
| (1) | These amounts do not reflect the Common Shares which can be acquired pursuant to the exercise of stock options or warrants. |
The following table sets forth our outstanding stock options in Canadian dollars to Directors and Senior Management as at December 31, 2008.
Name of Optionee | Position of Optionee
(Director/Officer) |
Date of Grant | No. of
Shares | Exercise
Price |
Expiry Date |
| Graham Dickson | Director | Apr. 14, 2005 | 500,000 | $0.60 | Apr. 14, 2010 |
| Neil Steenberg | Director | Apr. 14, 2005 | 250,000 | $0.60 | Apr. 14, 2010 |
| John Fox | Director | Apr. 14, 2005 | 250,000 | $0.60 | Apr. 14, 2010 |
| Robert Chafee | Director | Oct. 1, 2005 | 250,000 | $0.60 | Oct. 1, 2010 |
| Lynn Patterson | Director | Oct. 1, 2005 | 250,000 | $0.60 | Oct. 1, 2010 |
| Don MacDonald | Director | Oct. 1, 2005 | 250,000 | $0.60 | Oct. 1, 2010 |
| Peter Holbek | Director | Oct. 1, 2005 | 250,000 | $0.60 | Oct. 1, 2010 |
| Graham Dickson | Director | Jan. 5, 2007 | 600,000 | $2.77 | Jan. 5, 2012 |
| John Fox | Director | Jan. 5, 2007 | 50,000 | $2.77 | Jan. 5, 2012 |
| Neil Steenberg | Director | Jan. 5, 2007 | 50,000 | $2.77 | Jan. 5, 2012 |
| Don MacDonald | Director | Jan. 5, 2007 | 50,000 | $2.77 | Jan. 5, 2012 |
| Robert Chafee | Director | Jan. 5, 2007 | 50,000 | $2.77 | Jan. 5, 2012 |
| Peter Holbek | Director | Jan. 5, 2007 | 50,000 | $2.77 | Jan. 5, 2012 |
| Lynn Patterson | Director | Jan. 5, 2007 | 50,000 | $2.77 | Jan. 5, 2012 |
| Iain Harris | Director | Jan. 5, 2007 | 300,000 | $2.77 | Jan. 5, 2012 |
| Lynn Patterson | Director | Aug. 10, 2007 | 400,000 | $1.74 | Aug. 10, 2012 |
| Graham Dickson | Director | Aug. 10, 2007 | 1,000,000 | $1.74 | Aug. 10, 2012 |
| Robert Chafee | Director | Aug. 10, 2007 | 200,000 | $1.74 | Aug. 10, 2012 |
| John Fox | Director | Aug. 10, 2007 | 200,000 | $1.74 | Aug. 10, 2012 |
| Neil Steenberg | Director | Aug. 10, 2007 | 200,000 | $1.74 | Aug. 10, 2012 |
| Iain Harris | Director | Aug. 10, 2007 | 200,000 | $1.74 | Aug. 10, 2012 |
| Don MacDonald | Director | Aug. 10, 2007 | 200,000 | $1.74 | Aug. 10, 2012 |
| Peter Holbek | Director | Aug. 10, 2007 | 200,000 | $1.74 | Aug. 10, 2012 |
| Shaun Heinrichs | Officer | March 28, 2008 | 200,000 | $1.60 | March 28, 2013 |
The following table sets forth our outstanding stock options in Canadian dollars issued to employees as a group, pursuant to the stock option plan described in Item 6.B,Stock Option Plan, as at December 31, 2008.
105
| Date of Grant | No. of Shares | Exercise Price | Expiry Date |
| January 26, 2006 | 50,000 | $0.82 | January 26, 2011 |
| December 12, 2006 | 25,000 | $2.25 | December 12, 2011 |
| April 2, 2007 | 25,000 | $1.61 | April 2, 2012 |
| June 25, 2007 | 90,000 | $1.63 | June 25,2012 |
| November 13, 2007 | 40,000 | $1.70 | November 13, 2012 |
Item 7. Major Shareholders and Related Party Transactions.
A.Major shareholders.
At December 31, 2008, we had 272,655,430 Shares outstanding. At such date, we believe that Orifer S.A. ("Orifer") was the only entity beneficially owning more than 5% of our outstanding Shares. At such date Orifer was the beneficial owner of 54,000,000 Shares, which represented 19.81% of our outstanding Shares. Orifer is not a party to a voting trust agreement and does not have any different voting rights. With the exception of Orifer, there has not been any significant change in the percentage ownership of Shares held by any major shareholder during the past three years.
At December 31, 2008, we had 46 Canadian holders of record, holding 163,108,793 common shares, which represented 59.82% of our outstanding Shares. At such date, there were no arrangements, the operation of which could result in a change of control. All shareholders have the same voting rights with respect to the Shares.
B.Related party transactions.
By agreement made as of June 1, 2006 between Celec Inc. ("Celec"), and us, Celec agreed to provide the services of Graham C. Dickson as our President and Chief Executive Officer and provide geological and metallurgical services to us. Also, Mr. Dickson was to provide management and administrative services to us for an initial term of two years at a remuneration of C$15,000 per month, exclusive of GST, subject to an annual increase equal to the annual percentage increase in the Consumer Price Index published by Statistics Canada for Vancouver, including the reimbursement of all reasonable expenses incurred by Celec. Celec is a private company, controlled by Graham Dickson, our President and one of our directors. On June 1, 2007 our agreement with Celec Inc. was terminated and Mr. Dickson became an employee.
C.Interests of experts and counsel.Not applicable.
Item 8. Financial Information.
See Item 17.
Item 9. The Offer and Listing.
A. Offer and listing details.
Our Shares are currently listed for trading on the TSX (Toronto Stock Exchange) under the trading symbol "YNG" and on Frankfurt Stock Exchange under the trading symbol “NG6.F”.
Following is information on the trading history of our Shares:
High and Low Price for the Four Most Recent Fiscal Years on the TSX (C$’s)
| Fiscal Year Ended | High | Low |
| December 2008 | $1.80 | $0.02 |
| December 2007 | $2.89 | $1.18 |
| December 2006 | $2.73 | $0.76 |
| December 2005(1) | $0.95 | $0.41 |
| (1) | Our shares commenced trading on the TSX on April 13, 2005. |
106
High and Low Prices for each Quarterly Period for the Past Two Fiscal Years on the TSX (C$’s)
| Period Ended | High | Low |
| December 31, 2008 | $0.12 | $0.02 |
| September 30, 2008 | $1.20 | $0.13 |
| June 30, 2008 | $1.78 | $1.09 |
| March 31, 2008 | $1.80 | $1.45 |
| December 31, 2007 | $1.83 | $1.34 |
| September 30, 2007 | $1.79 | $1.18 |
| June 30, 2007 | $2.20 | $1.62 |
| March 31, 2007 | $2.89 | $1.55 |
High and Low Prices for each Month for the Past Six Months on the TSX (C$’s)
| Month Ended | High | Low |
| February 2009 | $0.09 | $0.05 |
| January 2009 | $0.05 | $0.03 |
| December 2008 | $0.04 | $0.02 |
| November 2008 | $0.05 | $0.03 |
| October 2008 | $0.12 | $0.03 |
| September 2008 | $0.22 | $0.13 |
B. Plan of distribution.
Not applicable.
C.Markets.
Our common shares are listed on the TSX under the symbol "YNG.TO", the Pink Sheets under the symbol “YNGFF.PK”, the FSX under the symbol "NG6.F", [the SSX under the symbol “NG6.SG”, the MSX under the “NG6.MU” and the BSX under the symbol “NG6.BE”].
D.Selling shareholders.
Not applicable.
E.Dilution.
Not applicable.
F.Expenses of the issue.
Not applicable.
Item 10. Additional Information.
A.Share capital.
Not applicable.
B.Memorandum and articles of association.
We were incorporated under the laws of the Province of British Columbia under the name “YGC Resources Ltd.” (“YGC”) on May 30, 1988 under Certificate of Incorporation Number 346183. On January 25, 2002, we were struck from the Register of Companies for British Columbia and dissolved and on August 1, 2003 we were restored to the Register. On January 5, 2004 we consolidated our share capital on a five (5) old for one (1) new basis and increased our authorized share capital from 4,000,000 shares without par value to 100,000,000 shares without par value. On June 23, 2005, we increased our authorized share capital from 100,000,000 Common Shares without par value to an unlimited number of Common Shares without par
107
value. We do not have any stated “objects” or “purposes” as such are not required by the corporate laws of the Province of British Columbia. Rather, we are, by such corporate laws, entitled to carry on any activities whatsoever, which are not specifically precluded by other statutory provisions of the Province of British Columbia.
The powers and functions of the directors are set out in our Articles which were adopted on May 19 2005. They provide:
| (a) | a director is obligated to disclose his potential interest in a proposal, arrangement or contract being considered by us, and may not vote on any proposal, arrangement or contract proposed, but such director shall be counted in the quorum at the meeting of the directors at which the proposal, arrangement or contract is approved; |
| | |
| (b) | the directors may, in the absence of an independent quorum, vote compensation to themselves; |
| | |
| (c) | there are no limitations on the exercise by the directors of our borrowing powers; |
| | |
| (d) | there are no provisions for the retirement or non-retirement of directors under an age limit; and |
| | |
| (e) | there is no requirement for a director to hold any of our shares. |
As all of our authorized and issued shares are of one class there are no special rights or restrictions of any nature or kind attached to any of the shares. All authorized and issued shares rank equally in respect to the declaration and receipt of dividends, the rights to share in any profits or surplus on our liquidation, dissolution or winding. Each share has attached to it one non-cumulative vote.
To alter the rights of holders of our issued shares such alteration must be approved by the majority vote of 2/3% of our issued shares attending and voting at a meeting of our shareholders.
Annual general meetings are called and scheduled upon decision by the Board of Directors. The directors may convene an extraordinary general meeting of the shareholders. The holders of not less than 5% of our issued shares may requisition an extraordinary meeting of the shareholders. All meetings of the shareholders may be attended by registered shareholders or persons who hold powers of attorney or proxies given to them by registered shareholders.
Our Articles do not contain limitations prohibiting shares being held by non-residents, foreigners or any other group.
There are no provisions in our Articles that would have an effect of delaying, deferring or preventing a change in our control, or that would operate with respect to any proposed merger, acquisition or corporate restructuring.
There are no provisions in our Articles requiring share ownership to be disclosed. The securities laws of the Province of British Columbia require disclosure of shareholdings by:
(a) persons who are our directors or senior officers; and
(b) a person who has direct or indirect beneficial ownership of, control or direction over, or a combination of direct or indirect beneficial ownership of and control or direction over our securities carrying more than 10% of the voting rights attached to all of our outstanding voting securities.
C.Material contracts.
The following is a summary of each material contract, other than contracts entered into in the ordinary course of business, to which we or any member of the group is a party, for the two years immediately preceding publication of the document, including dates, parties, general nature of the contracts, terms and conditions, and amount of any consideration passing to or from us or any other member of the group.
| 1. | On March 16, 2007 we entered into a combination agreement (the “Combination Agreement”) with Queenstake Resources Ltd. (“Queenstake”) pursuant to which we acquired all of the issued and outstanding shares of Queenstake. |
108
| Shareholders of Queenstake received one of our shares for each ten (10) shares of Queenstake held.See Item 4B. Business Overview, Jerritt Canyon Property, Nevada; and |
| | |
| 2. | As a condition of the Combination Agreement described in item 1 above we were required to raise approximately C$80,000,000. On May 30, 2007 we entered into an Agency Agreement with Pacific International Securities Inc., Casimir Capital L.P., Blackmont Capital Inc. and Wellington West Capital Markets Inc. (collectively, the “Agents”), wherein the Agents undertook to assist us in finding potential purchasers to purchase up to C$71,100,000 Subscription Receipts, which were exchangeable into shares and warrants upon our achievement of Release Conditions (as defined in the Agency Agreement). The Agents received a cash commission of 5% of the gross proceeds raised by them, an option entitling the Agents to purchase additional shares equal to 5% of the aggregate number of subscription receipts sold, and an over-allotment option to purchase up to 7,200,000 additional Subscription Receipts. |
D. Exchange controls.
There are no laws, governmental decrees or regulations in Canada that restrict the export or import of capital or which affect the remittance of dividends, interest or other payments to non-resident holders of our shares, other than withholding tax requirements. Reference is made toItem 10E. Taxation.
There are no limitations under the laws of Canada or the Province of British Columbia, or in our constituting documents, with respect to the right of non-resident or foreign owners to hold or vote Shares other than those imposed by theInvestment Canada Act.
TheInvestment Canada Act is a federal Canadian statute which regulates the acquisition of control of existing Canadian businesses and the establishment of new Canadian businesses by an individual, a government or entity that is a "non-Canadian" as that term is defined in theInvestment Canada Act.
Our management believes that it is not currently a "non-Canadian" for purposes of theInvestment Canada Act. If we were to become a "non-Canadian" in the future, acquisitions of control of Canadian businesses by us would become subject to theInvestment Canada Act. Generally, the direct acquisition by a "non-Canadian" of an existing Canadian business with gross assets of $5,000,000 or more is reviewable under theInvestment Canada Act, with thresholds of $223 million and $237 million for transactions closing in 2003 and 2004, respectively, for "WTO investors" as defined under theInvestment Canada Act. If we were to become a "non-Canadian" in the future, Management believes we would likely become a "non-Canadian" which is a "WTO investor." Generally, indirect acquisitions of existing Canadian businesses (with gross assets over certain threshold levels) are reviewable under theInvestment Canada Act, except in situations involving "WTO investors" where indirect acquisitions are generally not reviewable. In transactions involving Canadian businesses engaged in the production of uranium, providing financial services, providing transportation services or which are cultural businesses, the benefit of the higher "WTO investor" thresholds do not apply.
Acquisitions of businesses related to Canada's cultural heritage or national identity (regardless of the value of assets involved) may also be reviewable under theInvestment Canada Act. In addition, investments to establish new, unrelated businesses are not generally reviewable. An investment to establish a new business that is related to the non-Canadian's existing business in Canada is not notifiable under the Investment Canada Act unless such investment relates to Canada's cultural heritage or national identity.
Investments which are reviewable under theInvestment Canada Act are reviewed by the Minister, designated as being responsible for the administration of theInvestment Canada Act. Reviewable investments, generally, may not be implemented prior to the Minister’s determining that the investment is likely to be of "net benefit to Canada" based on the criteria set out in theInvestment Canada Act. Generally investments by non-Canadians consisting of the acquisition of control of Canadian businesses which acquisitions are otherwise non-reviewable or the establishment of new Canadian businesses require that a notice be given under theInvestment Canada Act in the prescribed form and manner.
Any proposed take-over of us by a "non-Canadian" would likely be subject only to the simple "notification" requirements of theInvestment Canada Act as in all likelihood that non-Canadian would be a "WTO investor" for purposes of theInvestment Canada Act. Generally, a "WTO investor" is an individual, other than a Canadian, who is a national of a country that is a member of the World Trade Organization. In the case of a person that is not an individual; a WTO investor is a person that
109
generally, is ultimately controlled by individuals, other than Canadians, who are nationals of a WTO member. Currently there are 134 countries that are members of the WTO, including virtually all countries of the Western world.
E.Taxation.
Certain Canadian Federal Income Tax Consequences – General
The following is a brief summary of the principal Canadian federal income tax consequences generally applicable to a person who holds our common shares and who, at all relevant times for the purposes of the Income Tax Act (Canada) (the "Canadian Tax Act") and the Canada - United States Tax Convention, 1980, as amended (the "US Treaty"),
is or is deemed to be a resident solely of the United States,
holds the common shares as capital property and as beneficial owner,
does not and is not deemed to use or hold the common shares in or in the course of a business carried on in Canada, and
does not carry on an insurance business in Canada and elsewhere,
(a "US Holder")
This summary is based on the facts set forth in this Form 20-F, the current provisions of the US Treaty, the Canadian Tax Act and regulations thereunder, and our understanding of the current published administrative and assessing policies and practices of the Canada Revenue Agency (the "CRA"), and takes into account all specific proposals to amend the Canadian Tax Act (the "Proposed Amendments") publicly announced by or on behalf of the Minister of Finance (Canada) prior to the date hereof. It is assumed that all such amendments will be enacted as currently proposed, and that there will be no other change to any relevant law or administrative or assessing policy or practice, although no assurances can be given in this respect. Except as otherwise expressly set out herein, this summary also does not take into account any provincial, territorial or non-Canadian income tax law, the implications of which may differ from the Canadian federal income tax considerations.
On September 21, 2007, the Minister of Finance (Canada) and the United States Secretary of the Treasury signed the fifth protocol to the US Treaty (the "Protocol") which includes amendments to many of the provision of the US Treaty, including significant amendments to the limitation on benefits provision. The Protocol will enter into force once it is ratified by both the Canadian and United States governments (or on January 1, 2008, if it is ratified in 2007) and will have effect in respect of withholding taxes, after the first day of the second month that begins after the date on which the Protocol enters into force. US Holders are urged to consult their own tax advisors to determine the impact of the Protocol and their entitlement to relief under the US Treaty based on their particular circumstances.
The following discussion is not intended to be, nor should it be construed to be, legal or tax advice to any holder or prospective holder of the Company's shares and no opinion or representation with respect to the Canadian federal income tax consequences to any such holder or prospective holder is made. Accordingly, holders and prospective holders of the Company's shares should consult with their own tax advisors about the federal, provincial, local and non-Canadian tax consequences of purchasing, owning and disposing of the Company's shares.
Dividends
Dividends paid or credited or deemed to be paid or credited to a US Holder by the Company will be subject to Canadian withholding tax at the rate of 15% of the gross amount of the dividend (or 5% in the case of a US Holder that is a corporation beneficially owning at least 10% of the Company's "voting stock" within the meaning of the US Treaty). Dividends may be exempt from withholding tax in the case of some US Holders such as qualifying tax exempt entities.
Disposition of Common Shares
A US Holder who realizes a capital gain on the actual or deemed disposition of a common share will not be subject to Canadian federal income tax under the Canadian Tax Act in respect of the capital gain unless such common share constitutes
110
"taxable Canadian property" to the US Holder for purposes of the Canadian Tax Act and the US Holder is not exempt from Canadian federal income tax on such gain pursuant to the terms of the US Treaty.
Generally, a common share owned by a US Holder will not be taxable Canadian property of the US Holder at a particular time provided that, at that time,
our the common shares are listed on the TSX,
neither the US Holder nor persons with whom the US Holder does not deal at arm's length alone or in any combination has owned 25% or more of the shares of any class or series of shares in the capital of the Company at any time in the previous five years, and
the common share was not acquired in a transaction, a result of which it was deemed to be taxable Canadian property of the US Holder.
A US Holder that realizes a capital gain on the disposition of common shares that do qualify as taxable Canadian property will, nevertheless, generally be exempt from Canadian federal income tax thereon by virtue of the US Treaty unless:
more than 50% of the value of the common shares is derived from real property (within the meaning of the US Treaty) that is located in Canada,
the US Holder (i) was a resident of Canada at any time during the 10 years immediately preceding the disposition and for a total of 20 months during any period of 20 consecutive years preceding the disposition, and (ii) owned the common share when the US Holder ceased to be a resident of Canada.
A US Holder who is subject to Canadian federal income tax in respect of a disposition of a common share will realize a capital gain (or capital loss) equal to the amount by which the US Holder's proceeds of disposition, less reasonable costs of disposition, exceed (or are exceeded by) the adjusted cost base of the common share to the US Holder. In these circumstances, a US Holder who realizes a capital gain or capital loss in a taxation year will be required to include one half of the capital gain ( the taxable capital gain) in income for Canadian federal income tax purposes, and may deduct one half of the capital loss (the allowable capital loss) against taxable capital gains incurred in respect of dispositions of taxable Canadian property, subject to and accordance with the provisions of the Canadian Tax Act and the US Treaty.
United States Taxation
The following is a general summary of certain United States federal income tax consequences, under current law, generally applicable to a U.S. Holder (as defined below). This summary does not address all potentially relevant U.S. federal income tax matters and it does not address consequences to persons subject to special provisions of U.S. federal income tax law, such as those described below as excluded from the definition of a U.S. Holder. United States alternative minimum tax considerations are not addressed in this summary. In addition, this summary does not cover any state, local or foreign tax consequences, nor any U.S. federal gift, estate or generation-skipping transfer tax consequences. (Certain, but not all, foreign tax consequences are described above under "Taxation - Certain Canadian Federal Income Tax Consequences - General.")
The following summary is based upon the Internal Revenue Code of 1986, as amended (the "Code"), Treasury Regulations, published Internal Revenue Service ("IRS") rulings, published administrative positions of the IRS, and court decisions that are currently applicable, any of which could be materially and adversely changed, possibly on a retroactive basis, at any time including, without limitation, United States rates of taxation. This summary does not consider the potential effects, both adverse and beneficial, of any recently proposed legislation which, if enacted, could be applied, possibly on a retroactive basis, at any time. No rulings have been or will be sought from the IRS with respect to any of the U.S. federal income tax issues discussed in this summary, and no assurance can be given that the IRS will not successfully challenge any tax positions described herein.
This summary is for general information only and it is not intended to be, nor should it be construed to be, legal or tax advice to any holder or prospective holder of common shares and no opinion or representation with respect to the United States federal income tax consequences to any such holder or prospective holder is made. Accordingly, holders and prospective holders of common shares should consult their own tax advisors about the federal (income and non-
111
income), state, local, and foreign tax consequences of purchasing, owning and disposing of common shares of the Company.
U.S. Holders
As used herein, a "U.S. Holder" means a Holder of our shares who is: (1) a citizen or individual resident (as defined under United States tax laws) of the United States; (2) a corporation created or organized in or under the laws of the United States or of any political subdivision thereof; (3) an estate the income of which is taxable in the United States irrespective of source; or (4) a trust if (a) a court within the United States is able to exercise primary supervision over the trust’s administration and one or more United States persons have the authority to control all of its substantial decisions or (b) the trust was in existence on August 20, 1996 and has properly elected to continue to be treated as a United States person.
This summary does not address the United States tax consequences to, and the term "U.S. Holder" does not include, persons subject to special provisions of United States federal income tax law, including, but not limited to, tax-exempt organizations, qualified retirement plans, individual retirement accounts and other tax-deferred accounts, financial institutions, insurance companies, real estate investment trusts, regulated investment companies, broker-dealers, non-resident alien individuals, U.S. tax expatriates, persons or entities that have a "functional currency" other than the U.S. dollar, persons who common our shares as part of a straddle, hedging or a conversion transaction, and persons who acquire their common shares as compensation for services. This summary is limited to U.S. Holders who own common shares as capital assets and who hold common shares directly (e.g., not through an intermediary entity such as a corporation, partnership, limited liability company, or trust).
Distributions on our Shares
Subject to the discussion below regarding passive foreign investment companies ("PFICs") and controlled foreign corporations ("CFCs"), U.S. Holders receiving dividend distributions (including constructive dividends) with respect to the common shares are required to include in gross income for United States federal income tax purposes the gross amount of such distributions to the extent that the Company has current or accumulated earnings and profits, as defined under U.S. federal tax law, without reduction for any Canadian income tax withheld from such distributions. Such Canadian tax withheld may be credited, subject to certain limitations, against the U.S. Holder’s United States federal income tax liability or, alternatively, may be deducted in computing the U.S. Holder’s United States federal taxable income by those who itemize deductions. (See more detailed discussion at "Foreign Tax Credit" below). To the extent that distributions exceed the Company’s current or accumulated earnings and profits, they will be treated first as a return of capital up to the U.S. Holder's adjusted basis in the shares and thereafter as gain from the sale or exchange of the shares. Preferential tax rates for "long-term" net capital gains (e.g. gains realized on capital assets owned more than one year)are applicable under current law to a U.S. Holder that is an individual, estate or trust. There are currently no preferential tax rates for long-term capital gains for a U.S. Holder that is a corporation.
With effect from January 1, 2003 through December 31, 2010, the United States reduced the maximum tax rate on certain qualifying dividend distributions to 15%. In order for dividends paid by foreign corporations to qualify for the reduced rates, (1) the foreign corporation must meet certain requirements, including that it not be classified as a PFIC for United States federal income tax purposes in either the taxable year of the distribution or the preceding taxable year, and (2) the U.S. Holder must meet the required holding period. In order to meet the required holding period, the U.S. Holder must hold the common shares for more than 60 days during the 121-day period beginning 60 days before the ex-dividend date.
Dividends paid on the common shares will generally not be eligible for the dividends received deduction provided to corporations receiving dividends from certain United States corporations.
In the case of a dividend paid in a foreign currency that is not converted by the recipient into U.S. dollars on the date of receipt, a U.S. Holder will have a tax basis in the foreign currency equal to its U.S. dollar value on the date of receipt. Generally, any gain or loss recognized upon a subsequent sale or other disposition of the foreign currency, including the exchange for U.S. dollars, will be ordinary income or loss.
Disposition of Common Shares
Subject to the PFIC and CFC discussions below, a U.S. Holder will recognize a gain or loss upon the sale of the common shares equal to the difference, if any, between (i) the amount of cash plus the fair market value of any property received, and (ii) the U.S. Holder’s adjusted tax basis in the common shares. This gain or loss will be a capital gain or loss if the common shares are a capital asset in the hands of the U.S. Holder, and will be a short-term or long-term capital gain or loss depending
112
upon the holding period of the U.S. Holder. Preferential tax rates for long-term capital gains are applicable to a U.S. Holder which is an individual, estate or trust, under current law. There are currently no preferential tax rates for long-term capital gains for a U.S. Holder which is a corporation.
Gains and losses are netted and combined according to special rules in arriving at the overall capital gain or loss for a particular tax year. Deductions for net capital losses are subject to significant limitations.
Foreign Tax Credit
A U.S. Holder who pays (or has withheld from distributions) Canadian income tax with respect to the ownership or disposition of the common shares may be entitled, at the option of the U.S. Holder, to either a deduction or a tax credit for such foreign tax paid or withheld. Generally, it will be more advantageous to claim a credit because a credit reduces United States federal income taxes on a dollar-for-dollar basis, while a deduction merely reduces the taxpayer’s income subject to tax. This election is made on a year-by-year basis and applies to all foreign taxes paid by (or withheld from) the U.S. Holder during that year. There are significant and complex limitations that apply to the credit, among which is the general limitation that the credit cannot exceed the proportionate share of the U.S. Holder’s United States federal income tax liability that the U.S. Holder's foreign source income bears to his or its worldwide taxable income. In the determination of the application of this limitation, the various items of income and deduction must be classified into foreign and domestic sources. Complex rules govern this classification process. In addition, this limitation is calculated separately with respect to specific "baskets" of income. Foreign taxes assigned to a particular basket generally cannot offset United States tax on income assigned to another basket. Unused foreign tax credits can generally be carried back one year and carried forward ten years.The availability of the foreign tax credit and the application of the limitations on the credit are fact specific and U.S. Holders should consult their own U.S. tax advisors regarding their ability to utilize foreign tax credits in light of their individual circumstances.
Other Considerations
In the following circumstances, the above sections of this discussion may not describe the United States federal income tax consequences resulting from the holding and disposition of the Company’s shares:
Passive Foreign Investment Company
As a foreign corporation with U.S. Holders, the Company could potentially be treated as a PFIC if 75% or more of its gross income in a taxable year is passive income, or the average percentage of its assets (by value) during the taxable year which produce passive income or which are held for the production of passive income is at least 50%. Passive income is generally defined to include gross income in the nature of dividends, interest, royalties, rents and annuities; excess of gains over losses from certain transactions in any commodities not arisinginter alia from a PFIC whose business is actively, with respect to certain distributions on, or dispositions of, shares of a PFIC, involved in such commodities; certain foreign currency gains; and other similar types of income with respect to certain distributions or, of dispositions of shares, of a PFIC. U.S. Holders are subject to an increased United States federal income tax liability and to an interest charge based on the value of the tax deferral for the period during which the shares of the PFIC are owned.
The PFIC rules are very complex.The Company offers no opinion or representations as to its status as a PFIC for the current year or any prior or future tax years.Each U.S. Holder should consult a U.S. tax advisor with respect to the PFIC rules and their applicability to his or its particular tax situation.
Shareholder Election
The adverse tax consequences associated with a PFIC may be avoided if the U.S. Holder has elected to treat the PFIC as a QEF with respect to that U.S. Holder (a "QEF Election") effective for each of the PFIC's taxable years beginning on or after January 1, 1987, which include any portion of the U.S. Holder’s holding period. In general, U.S. Holders of a QEF are taxable currently on their pro rata share of the QEF’s ordinary income and net capital gain regardless of whether such income or gain is actually distributed. Certain reporting obligations to the IRS must also be met by the U.S. Holder if there is a QEF Election in place.
The procedure a U.S. Holder must comply with in making an effective QEF Election will depend on whether the year of election is the first year in the U.S. Holder's holding period in which the Company is classified as a PFIC. If the U.S. Holder makes a QEF Election in such first year (i.e., a timely QEF Election), then the U.S. Holder may make the QEF Election by simply filing the appropriate documents at the time the U.S. Holder files his tax return for such first year. If, however, the
113
Company was classified as a PFIC in a prior year, then additional considerations apply.U.S. Holders should consult their own U.S. tax advisors regarding making a QEF Election.
Mark to Market Election
As an alternative to making a QEF Election, U.S. Holders who hold, actually or constructively, marketable stock of a foreign corporation that is a PFIC may elect to mark such stock to the market (a "Mark-to-Market Election"). If such an election is made, such U.S. Holder will not be subject to the special PFIC taxation rules described above for the taxable years for which the Mark-to-Market Election is made and subsequent taxable years if not revoked. Instead, a U.S. Holder who makes such an election will include in income for each taxable year an amount equal to the excess, if any, of the fair market value of the common shares as of the close of such tax year over such U.S. Holder's adjusted tax basis in such shares. In addition, the U.S. Holder is allowed a deduction for the lesser of (i) the excess, if any, of such U.S. Holder's adjusted tax basis in the common shares over the fair market value of such shares as of the close of the tax year, or (ii) the excess, if any of (A) the mark-to-market gains for the common shares included by such U.S. Holder for prior tax years, over (B) the mark-to-market losses for shares that were allowed as deductions for prior tax years. Amounts included in income or deducted under the Mark-to-Market Election, and gain or loss on a disposition of shares, are classified as ordinary income or loss. A U.S. Holder's adjusted tax basis in the common shares will be increased or decreased to reflect the amount included or deducted as a result of the Mark-to-Market Election. A Mark-to-Market Election will apply to the tax year for which the election is made and to all later tax years, unless the PFIC stock ceases to be marketable or the IRS consents to the revocation of the election. Various IRS reporting requirements may also apply to a U.S. Holder who makes a Mark-to-Market Election.
The PFIC, QEF Election, and Mark-to-Market Election rules are complex. U.S. Holders should consult their own tax advisors regarding the availability of, procedure for, and consequences of, making an Election.
Controlled Foreign Corporation
If more than 50% of the voting power of all classes of stock or the total value of the Company’s stock is owned, directly or indirectly, by citizens or residents of the United States, United States domestic partnerships, corporations or estates or trusts (other than foreign estates or trusts), each of whom own 10% or more of the total combined voting power of all classes of stock ("United States Shareholders"), the Company could be treated as a CFC under Subpart F of the Code. This classification would cause many complex results, including the required inclusion by such United States Shareholders in income of their pro rata share of "Subpart F income" (as specially defined by the Code). If we are both a PFIC and CFC, we will generally not be treated as a PFIC with respect to United States Shareholders of the CFC that acquired the common shares on or after January 1, 1998. With respect to United States Shareholders that acquired the common shares prior to January 1, 1998 and other U.S. Holders (that are not United States Shareholders), the Company would generally remain a PFIC unless certain elections, if available, were made. In addition, under Section 1248 of the Code, certain gains from the sale or exchange of shares by a U.S. Holder who is or was a United States Shareholder at any time during the five year period ending with the sale or exchange is generally treated as ordinary dividend income to the extent of the Company’s earnings and profits attributable to the stock sold or exchanged. Because of the complexity of Subpart F, and because it is not clear that Subpart F would apply to the U.S. Holders of the common shares, a more detailed review of these rules is outside of the scope of this discussion.The CFC rules are complex. The Company offers no opinion or representations as to its status as a CFC for the current year or any prior or future tax years.U.S. Holders should consult their own U.S. tax advisors regarding the CFC rules and their applicability to such U.S. Holder’s particular tax situation.
F.Dividends and paying agents.
Not applicable.
G.Statement by experts.
Not applicable.
H.Documents on display.
Public documents are available for inspection at our head offices located at 490 – 688 West Hastings Street, Vancouver, British Columbia V6B 1P1, and, for certain documents, on the Internet at www.yukon-nevadagold.com, by accessing the Canadian
114
System for Electronic Data Analysis and Retrieval (SEDAR) website atwww.sedar.com and by the Electronic Data Gathering, Analysis and Retrieval (EDGAR) system at www.sec.gov.
Statements made in this annual report on Form 20-F about the contents of contracts or other documents are not necessarily complete and shareholders are referred to the copy of such contracts or other documents filed as exhibits to this annual report.
Our SEC filings, and the exhibits thereto, are available for inspection and copying at the public reference facilities maintained by the SEC in Judiciary Plaza, Room 1580, 100 F Street N.W., Washington, D.C., 20549. Copies of these filings may be obtained from these offices after the payment of prescribed fees. Please call the SEC at 1-800-SEC-0330 for further information on the public reference rooms. These filings are also available on the SEC’s website at www.sec.gov.
We will also provide our shareholders with proxy statements prepared according to Canadian law. As a Canadian company, we are exempt from the Exchange Act rules regarding the furnishing and content of proxy statements to shareholders and are also exempt from the short-swing profit recovery and disclosure regime of Section 16 of the Exchange Act.
I.Subsidiary Information.
Not applicable.
Item 11. Quantitative and Qualitative Disclosures About Market Risk.
The Company is exposed to the certain risks through its use of financial instruments, including market risk (currency risk, interest rate risk and commodity price risk), credit risk, and liquidity risk. The Company’s manages its exposure to risk through the identification and analysis of risks faced by the Company, setting appropriate risk limits and controls, and monitoring those risks and adherence to the limits and controls that are established. Risk management is carried out by senior management under the approval of the Board of Directors. Risk management practices are reviewed regularly by senior management and the Audit Committee to reflect changes in market conditions and the Company’s activities.
Market risk
| Market risk is the risk or uncertainty arising from possible market price movements and their impact on the future performance of the business. The market price movements that could adversely affect the value of the Company’s financial assets, liabilities and expected future cash flows include foreign currency risk, interest rate risk and commodity price risk. |
| �� | |
| (i) | Currency risk: |
| | |
| The Company has integrated operations in Canada and is exposed to foreign currency risk due to fluctuations in the value of the Canadian dollar. Foreign currency risk arises from purchase transactions as well as financial assets and liabilities denominated in Canadian dollars. |
| | |
| The Company manages this risk by maintaining funds in Canadian dollars to support the cash requirements of those operations. The Company does not use any foreign exchange contracts to hedge these currency risks. |
| | |
| As at December 31 the Company is exposed to currency risk through its cash and cash equivalents, marketable securities, accounts receivable, restricted funds and accounts payable and accrued liabilities denominated in Canadian dollars as follows, based on notional amounts: |
| In thousands of C$ | | 2008 | | | 2007 | | | | |
| Cash and cash equivalents | $ | 1,295 | | $ | 39,756 | | | | |
| Marketable securities | | – | | | 154 | | | | |
| Accounts receivable and prepaid expenses | | 1,482 | | | 2,610 | | | | |
| Restricted funds | | 3,341 | | | 8,704 | | | | |
| Accounts payable and accrued liabilities | | 4,413 | | | 1,350 | | | | |
115
| Based on the above net exposures as at December 31, 2008, a 10% appreciation or depreciation in the Canadian dollar against the US dollar, assuming all other variables remain constant, would result in a $0.1 million increase or decrease, respectively, in operating results and shareholder equity. |
| | |
| (ii) | Interest rate risk: |
| | |
| This is the risk that the future cash flows of a financial instrument will fluctuate because of changes in market interest rates. |
| | |
| The Company’s cash and cash equivalents contain highly liquid investments that earn interest at market rates. The Company manages its interest rate risk by maximizing the interest earned on excess funds while maintaining the liquidity necessary to fund daily operations. Fluctuations in market interest rates do not have a significant impact on the Company’s results from operations due to the short term to maturity of the investments held. |
| | |
| (iii) | Commodity price risk: |
| | |
| The profitability of the Company is directly related to the market price of gold because revenues are derived primarily from gold mining. Gold prices are affected by numerous factors beyond the Company’s control, including central bank sales, producer hedging activities, the relative exchange rate of the US dollar with other major currencies, global and regional demand and political and economic conditions. Worldwide gold production levels also affect gold prices, and the price of gold is occasionally subject to rapid short-term changes due to speculative activities. The Company has not hedged any of its own gold production. Previously, forward sales contracts were entered into for gold produced under its current tolling arrangements with third parties. These forward contracts were recorded at fair value as they were not designated as hedging instruments, with gains and losses recorded in income. However, all forward contracts were settled during 2008. For the year ended December 31, 2008, a 10% increase or decrease in the price of gold would have resulted in an increase and decrease of $4.9 million in gold sales. |
Credit risk
Credit risk is the risk of financial loss to the Company if a customer or counterparty to a financial instrument fails to meet its contractual obligations.
| (i) | Cash and cash equivalents and marketable securities |
| | |
| The Company manages its credit risk on cash and cash equivalent balances and marketable securities by maintaining balances with Tier 1 Canadian banks with a Standard & Poor’s rating of AA. Short-term investments (included in cash and cash equivalents as well as marketable securities) are composed of financial instruments issued by Canadian banks and companies with high investment-grade ratings. These investments mature at various dates over the current operating period. |
| | |
| (ii) | Accounts receivables and prepaid expenses |
| | |
| Substantially all of the Company’s trade receivables are based in the US and are with a single counterparty. The Company has transacted with this counterparty for several years and there is no history of loss arising from receivable amounts. |
| | |
| The Company also maintains funds of $25.7 million, included in restricted funds (note 8), with a third party insurer with a Standard & Poor’s rating of A+ to fund future reclamation costs at Jerritt Canyon. The Company maintains title to these funds should the third party be in default of their obligations or enters into bankruptcy protection. |
| | |
| Other significant deposits and receivables are either held by or due from government agencies and relate to the funding of future closure costs at Jerritt Canyon or goods and services input tax credits. |
| | |
| The Company does not have any receivables or deposits that would be considered impaired or otherwise uncollectible, therefore no allowance for doubtful accounts is required. |
116
Liquidity risk
Liquidity risk is the risk that the Company will not be able to meet its financial obligations as they fall due. The Company manages liquidity risk through forecasting its cash flows from operations and anticipating investing and financing activities. Senior management is actively involved in the review and approval of planned expenditures and typically ensures that it has sufficient cash on demand to meet expected operating expenses for 60 days.
The following are the contractual maturities of the undiscounted cash flows of financial liabilities (in thousands of US dollars) at December 31, 2008:
| Less than 3
months | 4 to 12
months | 1 to 2 years
| Greater than
2 years |
| Account payable and accrued liabilities | $ 28,599 | – | – | – |
| Payable on purchased ore | 8,257 | – | – | – |
| Capital lease obligations | 740 | 43 | 25 | – |
Item 12. Description of Securities Other than Equity Securities.
Not applicable.
PART II
Item 13. Defaults, Dividend Arrearages and Delinquencies.
Not applicable.
Item 14. Material Modifications to the Rights of Security Holders and Use of Proceeds.
Not applicable.
Item 15. Controls and Procedures.
Management’s Report on Internal Control over Financial Reporting
Management is responsible for establishing and maintaining adequate internal control over financial reporting. A company’s internal control over financial reporting is a process designed to provide reasonable assurance regarding the reliability of financial reporting and the preparation of financial statements for external purposes in accordance with generally accepted accounting principles.
A company’s internal control over financial reporting includes those policies and procedures that:
| | (i) | pertain to the maintenance of records that, in reasonable detail, accurately and fairly reflect the transactions and dispositions of the assets of the company; |
| | | |
| | (ii) | provide reasonable assurance that transactions are recorded as necessary to permit preparation of financial statements in accordance with generally accepted accounting principles, and that receipts and expenditures of the company are being made only in accordance with authorizations of management and directors of the company; and |
| | | |
| | (iii) | provide reasonable assurance regarding prevention or timely detection of unauthorized acquisition, use, or disposition of the company’s assets that could have a material effect on the financial statements. |
117
It should be noted that a control system, no matter how well conceived or operated, can only provide reasonable assurance, not absolute assurance, that the objectives of the control system are met. Also, projections of any evaluation of effectiveness to future periods are subject to the risk that controls may become inadequate because of changes in conditions, or that the degree of compliance with policies and procedures may deteriorate.
Management, including our Chief Executive Officer and Chief Financial Officer, assessed the effectiveness of our internal control over financial reporting as of December 31, 2008. In making this assessment, management used the criteria set forth in the Internal Control Integrated Framework issued by the Committee of Sponsoring Organizations of the Treadway Commission (COSO). Based on its assessment, management has concluded that, as of December 31, 2008, the Company did not maintain effective internal control over financial reporting due to the material weaknesses described below.
A material weakness is a deficiency, or combination of deficiencies, in internal control over financial reporting such that there is a reasonable possibility that a material misstatement of the company’s annual or interim financial statements will not be prevented or detected on a timely basis.
| | 1. | Control Environment |
| | | |
| | | A Company’s control environment influences the control consciousness of its people, and is the foundation of all other components of internal control over financial reporting. The Company'scontrol environment did not sufficiently promote effective internal control over financial reporting throughout the organization. Specifically, the Company (i) did not effectively design or communicate the Company’s Whistleblower policy, (ii) did not conduct a comprehensive fraud risk assessment (iii) did not effectively design the Code of Conduct or communicate the Code to employees and (iv) did not maintain records of background checks performed on employees. None of these control deficiencies by themselves directly resulted in a material misstatement to the financial statements, however, deficiencies in the control environment are pervasive in nature. |
| | | |
| | 2. | Information and Communication |
| | | |
| | | The Company did not maintain adequate controls to facilitate the flow of information throughout the Company or between Management and the Board of Directors. The Company did not have effective controls to communicate departures from corporate policies to ensure departures were responded to on a timely basis and discussed with the Board of Directors. Specifically, (i) the Company did have not effective communication with the Board with respect to pre-approval for equity issuances and (ii) the delegation of operating decisions to Management. These control deficiencies did not result in adjustments to the financial statements, however, they are pervasive in nature and create a reasonable possibility that a material misstatement of the financial statements would not be prevented or detected on a timely basis. |
| | | |
| | 3. | Management review |
| | | |
| | | The Company had limited accounting personnel to support the Chief Financial Officer during the annual financial close process.. Specifically, the Company did not have personnel other than the Chief Financial Officer with expertise in complex accounting matters to enable effective review in complex accounting area. As a result, material errors were identified and corrected prior to the issuance of the financial statements for the following accounts: depreciation, prepaids, asset retirement obligations, equity, income taxes and US GAAP. This deficiency creates a reasonable possibly that a material misstatement would not be prevented or detected on a timely basis. |
| | | |
| | 4. | Inventory |
| | | |
| | | The Company’s controls over inventory were not designed effectively. Specifically, (i) a balance in WIP inventory was recorded on the financial statements and the Company’s account reconciliation was insufficiently precise to detect a material error and (ii) the Company did not maintain records of interim stockpile counts and did not perform an annual count on a timely basis. This resulted in a material adjustment to WIP inventory the Company did not maintain records of interim stockpile counts and did not perform an annual count on a timely basis. |
118
Remediation Plans
Management is undertaking the following initiatives for 2009:
| | 1. | Control Environment |
| | | |
| | | During the first quarter of 2009 management has corrected the existing Whistleblower line and communicated the policy to employees within the organization. As well, management is undertaking the development of an employee specific Code of Conduct and will have this in place by the second quarter of 2009. In the interim, employees have been informed to adhere to the existing Code of Conduct which is in place for Officers and Directors and the application of this policy to them has been communicated. A formal fraud risk review program is under review and will be implemented during the second quarter of 2009. |
| | | |
| | 2. | Information and Communication |
| | | |
| | | A formal program for monitoring and enforcing corporate policies will be developed and implemented during 2009. |
| | | |
| | 3. | Resource Constraints |
| | | |
| | | Management is actively evaluating the need for additional accounting resources to support the segregation of duties within the organization. |
| | | |
| | 4. | Inventory |
| | | |
| | | During the first quarter of 2009 resources were identified within the organization to monitor and report on the work- in-process balance as well as conduct and document accurate stockpile counts throughout the year. |
Changes in internal control over financial reporting
Due to the closure of the mine and mill operations in Jerritt Canyon, significant changes in the ICFR arose during the third quarter of 2008. The impact of these changes, which largely arise from the departure of several process owners in that location, has resulted in a reduction in segregation of duties within the Company as well as reduced expertise in complex accounting matters.
Evaluation of Disclosure Controls and Procedures
The Company’s management, with the participation of our Chief Executive Officer and Chief Financial Officer, as of the end of the period covered in this report, evaluated the effectiveness of our disclosure controls and procedure and determined that, as a result of the material weakness in internal control over financial reporting described above, as of December 31, 2008 our disclosure controls and procedures are not effective to ensure that information required to be disclosed by us is recorded, processed, summarized and reported within the time periods specified.
Item 15T. Controls and Procedures.
Not Applicable.
Item 16. [Reserved]
Item 16A. Audit Committee Financial Expert.
We have determined that our all members of the audit committee are “independent” and are financially literate, meaning that he must be able to read and understand financial statements, and that the Chairman of the Audit Committee, Mr. MacDonald, is an audit committee financial expert, as defined under the SEC Rules. The members of the Audit Committee are Messrs. MacDonald, Harris and Chafee.
119
Item 16B. Code of Ethics.
We have adopted a written code of ethics for all our directors and officers entitled “Code of Conduct and Conflict of Interest Guidelines for Directors and Officers” (the “Code”). The Code includes, among other things, written standards for our principal executive officer, principal financial officer and principal accounting officer or controller, or persons performing similar functions that are required by the Commission for a code of ethics applicable to such officers. A copy of the Code is posted on the Corporation’s website atwww.yukon-nevadagold.com under Corporate Info/Governance Policy.
No amendments to the Code were adopted during the year ended December 31, 2008. No “waiver” or “implicit waiver,” as such terms are defined in Form 20-F, were granted relating to any provision of the Code during the year ended December 31, 2008.
Item 16C. Principal Accountant Fees and Services.
The following chart summarizes the aggregate fees in Canadian dollars billed by our external auditors for professional services rendered during the fiscal years ended December 31, 2008 and 2007 for audit and non-audit related services:
Type of Work | Year Ended
December 31, 2008 | Year Ended
December 31, 2007 |
| Audit fees(1) | $444,000 | $230,500 |
| Audit-related fees(2) | $50,000 | $64,580 |
| Tax fees | $35,000 | Nil |
| All other fees | nil | Nil |
| Total | $529,000 | $295,080 |
| 1. | Aggregate fees billed for our annual financial statements and services normally provided by the auditor in connection with the Company’s statutory and regulatory filings. |
| | |
| 2. | Aggregate fees billed for assurance and related services that are reasonably related to the performance of the audit or review of our financial statements and are not reported as "Audit fees", including: assistance with aspects of tax accounting, attest services not required by state or regulation and consultation regarding financial accounting and reporting standards. |
Item 16D. Exemptions from the Listing Standards for Audit Committees.
Not applicable.
Item 16E. Purchases of Equity Securities by the Issuer and Affiliated Purchasers.
Not applicable.
Item 16F. Change in Registrant’s Certifying Accountant.
Not applicable.
Item 16G. Corporate Governance.
Not Applicable.
PART III
Item 17. Financial Statements.
See the attached financial statements.
120
A. Consolidated Statements and Other Financial Information.
See attached financial statements.
B.Significant Changes.Not applicable.
Item 18. Financial Statements.
Not applicable.
Item 19. Exhibits.
The list of exhibits is included following the signature page hereto.
121
SIGNATURES
The Registrant hereby certifies that it meets all of the requirements for filing on Form 20-F and that it has duly caused and authorized the undersigned to sign this annual report on its behalf.
YUKON-NEVADA GOLD CORP.
Per:/s/ Graham C. Dickson
Graham C. Dickson
President and Chief Executive Officer
Date: March 31, 2009
122
ANNUAL REPORT ON FORM 20-F
for the year ended
December 31, 2008
EXHIBIT INDEX
| Exhibit | |
| No. Item | Description of Exhibit |
| | |
| 1.1 | Articles |
| | |
| 4.1 | 2007 Stock Option Plan |
| | |
| 12.1 | Section 302 Certification by Graham C. Dickson, Chief Executive Officer, dated March 31, 2009. |
| | |
| 12.2 | Section 302 Certification by Shaun Heinrichs, Chief Financial Officer, dated March 31, 2009. |
| | |
| 13.1 | Section 906 Certification by Graham C. Dickson, Chief Executive Officer, dated March 31, 2009. |
| | |
| 13.2 | Section 906 Certification by Shaun Heinrichs, Chief Financial Officer, dated March 31, 2009. |
Consolidated Financial Statements
(Expressed in United States dollars)
YUKON-NEVADA GOLD CORP.
Years ended December 31, 2008, 2007 and 2006
MANAGEMENT’S RESPONSIBILITY FOR FINANCIAL REPORTING
The accompanying consolidated financial statements of Yukon-Nevada Gold Corp. (the Company) have been prepared by management in accordance with accounting principles generally accepted in Canada, and within the framework of the summary of significant accounting policies disclosed in the notes to these consolidated financial statements.
A system of internal accounting control is maintained in order to provide reasonable assurance that assets are safeguarded and that transactions are properly recorded and executed in accordance with management’s authorization. This system includes established policies and procedures, the selection and training of qualified personnel and an organization providing for appropriate delegation of authority and segregation of responsibilities.
The Audit Committee of the Board of Directors meets periodically with management and the Company’s independent auditors to review the scope and results of their annual audit and to review the consolidated financial statements and related financial reporting matters prior to submitting the consolidated financial statements to the Board of Directors for approval. The Audit Committee is appointed by the Board of Directors and all of its members are independent directors. The Audit Committee is responsible for engaging or re-appointing the external auditors.
The consolidated financial statements have been audited by external auditors, KPMG LLP, in accordance with accounting principles generally accepted in Canada. KPMG LLP has full and free access to the Audit Committee.
| “Graham Dickson” | “Shaun Heinrichs” |
| | |
| Graham Dickson | Shaun Heinrichs |
| President and | Chief Financial Officer |
| Chief Executive Officer | |
| | |
| | |
| March 31, 2009 | |
MANAGEMENT’S REPORT ON INTERNAL CONTROL OVER
FINANCIAL REPORTING – US
The management of Yukon-Nevada Gold Corp. is responsible for establishing and maintaining adequate internal control over financial reporting. The Securities and Exchange Act of 1934 in Rule 13a-15(f) and 15d-15(f) defines this as a process designed by, or under the supervision of, the Company’s principal executive and principal financial officers and effected by the Company’s Board of Directors, management and other personnel, to provide reasonable assurance regarding the reliability of financial reporting and the preparation of financial statements for external purposes in accordance with generally accepted accounting principles, and includes those policies and procedures that:
Pertain to the maintenance of records that, in reasonable detail, accurately and fairly reflect the transaction and dispositions of the assets of the Company;
Provide reasonable assurance that transactions are recorded as necessary to permit preparation of financial statements in accordance with generally accepted accounting principles, and that receipts and expenditures of the Company are being made only in accordance with authorizations of management and directors of the company; and
Provide reasonable assurance regarding prevention or timely detection of unauthorized acquisitions, use or disposition of the Company’s assets that may have a material effect on the consolidated financial statements.
Because of its inherent limitations, internal control over financial reporting may not prevent or detect misstatements. Projections of any evaluation of effectiveness to future periods are subject to risk that controls may become inadequate because of changes in conditions, or that the degree of compliance with the policies or procedures may deteriorate.
Management assessed the effectiveness of the Company’s internal control over financial reporting as of December 31, 2008. In making this assessment, the Company’s management used the criteria set forth by the Committee of Sponsoring Organizations of the Treadway Commission (COSO) in Internal Control–Integrated Framework.
Based upon our assessment and those criteria, management concluded that the Company’s internal control over financial reporting was not effective as of December 31, 2008 due to the following material weaknesses: (1) Control Environment, (2) Information and Communication, (3) Financial Resources, and (4) Inventory which are further described in the Management Discussion and Analysis.
KPMG LLP, our independent auditors, has issued an attestation report on internal control over financial reporting for the Company as of December 31, 2008, which is included herein.
| “Graham Dickson” | “Shaun Heinrichs” |
| | |
| Graham Dickson | Shaun Heinrichs |
| President and | Chief Financial Officer |
| Chief Executive Officer | |
| | |
| March 31, 2009 | |
1

| | KPMG LLP | Telephone (604) 691-3000 |
| | Chartered Accountants | Fax (604) 691-3031 |
| | PO Box 10426 777 Dunsmuir Street | Internet www.kpmg.ca |
| | Vancouver BC V7Y 1K3 | |
| | Canada | |
REPORT OF INDEPENDENT REGISTERED PUBLIC ACCOUNTING FIRM
To the Board of Directors of Yukon-Nevada Gold Corp.
We have audited the consolidated balance sheets of Yukon-Nevada Gold Corp. (the “Company") as at December 31, 2008 and 2007 and the consolidated statements of operations, comprehensive loss, shareholders’ equity and cash flows for each of the years in the three-year period ended December 31, 2008. These consolidated financial statements are the responsibility of the Company's management. Our responsibility is to express an opinion on these consolidated financial statements based on our audits.
We conducted our audits in accordance with the standards of the Public Company Accounting Oversight Board (United States). Those standards require that we plan and perform the audit to obtain reasonable assurance about whether the financial statements are free of material misstatement. An audit includes examining, on a test basis, evidence supporting the amounts and disclosures in the financial statements. An audit also includes assessing the accounting principles used and significant estimates made by management, as well as evaluating the overall financial statement presentation. We believe that our audits provide a reasonable basis for our opinion.
In our opinion, the consolidated financial statements referred to above present fairly, in all material respects, the financial position of the Company as of December 31, 2008 and 2007, and the results of its operations and its cash flows for each of the years in the three-year period ended December 31, 2008 in conformity with Canadian generally accepted accounting principles.
Canadian generally accepted accounting principles vary in certain significant respects from US generally accepted accounting principles. Information relating to the nature and effect of such differences is presented in Note 22 to the consolidated financial statements.
We also have audited, in accordance with the standards of the Public Company Accounting Oversight Board (United States), the Company's internal control over financial reporting as of December 31, 2008, based on the criteria established in Internal Control—Integrated Framework issued by the Committee of Sponsoring Organizations of the Treadway Commission (COSO), and our report dated March 25, 2009expressed an adverse opinion on the effectiveness of the Company’s internal control over financial reporting.
KPMG LLP (signed)
Chartered Accountants
Vancouver, Canada
March 25, 2009
KPMG LLP, a Canadian limited liability partnership is the Canadian
member firm of KPMG International, a Swiss cooperative.
| | KPMG LLP | Telephone (604) 691-3000 |
| | Chartered Accountants | Fax (604) 691-3031 |
| | PO Box 10426 777 Dunsmuir Street | Internet www.kpmg.ca |
| | Vancouver BC V7Y 1K3 | |
| | Canada | |
REPORT OF INDEPENDENT REGISTERED PUBLIC ACCOUNTING FIRM
To the Shareholders and Board of Directors of Yukon-Nevada Gold Corp.
We have audited Yukon-Nevada Gold Corp. (the “Company")’s internal control over financial reporting as of December 31, 2008, based on the criteria established in Internal Control—Integrated Framework issued by the Committee of Sponsoring Organizations of the Treadway Commission (COSO). The Company's management is responsible for maintaining effective internal control over financial reporting and for its assessment of the effectiveness of internal control over financial reporting, included in the accompanying Management’s Report on Internal Controls over Financial Reporting. Our responsibility is to express an opinion the Company's internal control over financial reporting based on our audit.
We conducted our audit in accordance with the standards of the Public Company Accounting Oversight Board (United States). Those standards require that we plan and perform the audit to obtain reasonable assurance about whether effective internal control over financial reporting was maintained in all material respects. Our audit included obtaining an understanding of internal control over financial reporting, assessing the risk that a material weakness exists, and testing and evaluating the design and operating effectiveness of internal control based on the assessed risk. Our audit also included performing such other procedures as we considered necessary in the circumstances. We believe that our audit provides a reasonable basis for our opinion.
A company's internal control over financial reporting is a process designed to provide reasonable assurance regarding the reliability of financial reporting and the preparation of financial statements for external purposes in accordance with generally accepted accounting principles. A company's internal control over financial reporting includes those policies and procedures that (1) pertain to the maintenance of records that, in reasonable detail, accurately and fairly reflect the transactions and dispositions of the assets of the company; (2) provide reasonable assurance that transactions are recorded as necessary to permit preparation of financial statements in accordance with generally accepted accounting principles, and that receipts and expenditures of the company are being made only in accordance with authorizations of management and directors of the company; and (3) provide reasonable assurance regarding prevention or timely detection of unauthorized acquisition, use, or disposition of the company's assets that could have a material effect on the financial statements.
Because of its inherent limitations, internal control over financial reporting may not prevent or detect misstatements. Also, projections of any evaluation of effectiveness to future periods are subject to the risk that controls may become inadequate because of changes in conditions, or that the degree of compliance with the policies or procedures may deteriorate.
KPMG LLP, a Canadian limited liability partnership is the Canadian
member firm of KPMG International, a Swiss cooperative.

A material weakness is a deficiency, or a combination of deficiencies, in internal control over financial reporting such that there is a reasonable possibility that a material misstatement of the Company’s annual financial statements will not be prevented or detected on a timely basis. The following material weaknesses have been identified and included in management’s assessment: (1) Control Environment, (2) Information and Communication, (3) Financial Resources and (4) Inventory. We also have audited, in accordance with the standards of the Public Company Accounting Oversight Board (United States), the consolidated balance sheet of the Company as at December 31, 2008 and the related consolidated statements of operations, comprehensive loss, shareholders’ equity and cash flows for the year ended December 31, 2008. These material weaknesses were considered in determining the nature, extent and timing of audit tests applied in our audit of the 2008 consolidated financial statements, and this report does not affect our report dated March 25, 2009, which expressed an unqualified opinion on those consolidated financial statements.
In our opinion, because of the aforementioned material weaknesses on the achievement of the objectives of the control criteria, Yukon-Nevada Gold Corp. has not maintained effective internal control over financial reporting as of December 31, 2008, based on the criteria established in Internal Control—Integrated Framework issued by the Committee of Sponsoring Organizations of the Treadway Commission (COSO).
KPMG LLP(signed)
Chartered Accountants
Vancouver, Canada
March 25, 2009
2
Yukon-Nevada Gold Corp.
Consolidated Balance Sheets
(In thousands of US dollars)
As at December 31, 2008 and 2007
| | | 2008 | | | 2007 | |
| | | | | | | |
| Assets | | | | | | |
| | | | | | | |
| Current assets: | | | | | | |
| Cash and cash equivalents | $ | 1,106 | | $ | 41,104 | |
| Marketable securities | | - | | | 173 | |
| Accounts receivable and prepaid expenses | | 2,171 | | | 7,778 | |
| Inventories (note 7) | | 24,019 | | | 37,995 | |
| Future income taxes (note 15) | | 895 | | | 1,453 | |
| Asset held for resale (note 9) | | 841 | | | – | |
| | | 29,032 | | | 88,503 | |
| Restricted funds (note 8) | | 28,484 | | | 36,669 | |
| Property, plant and equipment (note 9) | | 93,850 | | | 81,809 | |
| Mineral properties (note 10) | | 47,347 | | | 88,212 | |
| Other assets (note 11) | | 923 | | | 974 | |
| | | | | | | |
| | $ | 199,636 | | $ | 296,167 | |
| | | | | | | |
| Liabilities and Shareholders’ Equity | | | | | | |
| | | | | | | |
| Current liabilities: | | | | | | |
| Accounts payable and accrued liabilities | $ | 28,599 | | $ | 15,273 | |
| Payable on purchased ore | | 8,257 | | | 18,847 | |
| | | 36,856 | | | 34,120 | |
| Other long-term liabilities (note 13) | | 25 | | | 1,148 | |
| Asset retirement obligations (note 14) | | 32,688 | | | 26,528 | |
| Future income taxes (note 15) | | 8,419 | | | 28,527 | |
| | | 77,988 | | | 90,323 | |
| | | | | | | |
| Shareholders' equity (note 16): | | | | | | |
| Share capital | | 202,441 | | | 184,720 | |
| Warrants | | 23,444 | | | 20,603 | |
| Contributed surplus | | 8,694 | | | 8,092 | |
| Accumulated other comprehensive income | | 2,273 | | | 2,273 | |
| Deficit | | (115,204 | ) | | (9,844 | ) |
| | | 121,648 | | | 205,844 | |
| Going concern (note 1) | | | | | | |
| Commitments and contingencies (note 21) | | | | | | |
| Subsequent events (note 23) | | | | | | |
| | | | | | | |
| | $ | 199,636 | | $ | 296,167 | |
See accompanying notes to consolidated financial statements.
Approved on behalf of the Board:
| “Graham C. Dickson” | Director | “R.J. MacDonald” | Director |
2
YUKON-NEVADA GOLD CORP.
Consolidated Statements of Operations
(In thousands of US dollars, except for share and per share amounts)
Years ended December 31, 2008, 2007 and 2006
| | | 2008 | | | 2007 | | | 2006 | |
| | | | | | | | | | |
| Gold sales | $ | 48,981 | | $ | 64,460 | | $ | - | |
| Cost of gold sold | | 58,742 | | | 48,218 | | | - | |
| Gross margin – mining operations | | (9,761 | ) | | 16,242 | | | - | |
| Temporary shutdown costs (note 6) | | 13,115 | | | - | | | - | |
| Depreciation, depletion, and amortization | | 9,279 | | | 5,731 | | | 16 | |
| Accretion (note 14) | | 2,117 | | | 1,082 | | | 145 | |
| Income (loss) from mine operations | | (34,272 | ) | | 9,429 | | | (161 | ) |
| Impairment of mineral properties and | | | | | | | | | |
| equipment (note 6) | | 76,363 | | | - | | | - | |
| General and administration (note 16(c)(ii)) | | 4,090 | | | 3,550 | | | 1,228 | |
| Stock–based compensation (note 16(d)) | | 1,056 | | | 5,563 | | | 278 | |
| Income (loss) from operations | | (115,781 | ) | | 316 | | | (1,667 | ) |
| Other (loss) income: | | | | | | | | | |
| Interest and other income | | 4,635 | | | 2,503 | | | 377 | |
| Loss on forward sales arrangements | | (1,904 | ) | | (4,324 | ) | | - | |
| Restructuring charges (note 6) | | (4,532 | ) | | - | | | - | |
| Foreign exchange gain | | 814 | | | 793 | | | - | |
| Interest expense | | (667 | ) | | (218 | ) | | - | |
| | | (1,654 | ) | | (1,246 | ) | | 377 | |
| Loss before income taxes | | (117,435 | ) | | (930 | ) | | (1,290 | ) |
| Income tax (expense) recovery (note 15) | | | | | | | | | |
| Current | | - | | | (33 | ) | | - | |
| Future | | 12,075 | | | (936 | ) | | 101 | |
| Loss for the year | $ | (105,360 | ) | $ | (1,899 | ) | $ | (1,189 | ) |
| | | | | | | | | | |
| Loss per share – basic and diluted | $ | (0.57 | ) | $ | (0.02 | ) | $ | (0.02 | ) |
| Weighted average number of shares | | | | | | | | | |
| outstanding (basic and diluted) | | 185,124,008 | | | 121,434,273 | | | 53,147,312 | |
Consolidated Statements of Comprehensive Income (Loss)
(In thousands of US dollars)
Years ended December 31, 2008, 2007 and 2006
| | | 2008 | | | 2007 | | | 2006 | |
| Net loss for the year | $ | (105,360 | ) | $ | (1,899 | ) | $ | (1,189 | ) |
| Foreign exchange adjustment | | - | | | 2,599 | | | (326 | ) |
| Comprehensive income (loss) for the year | $ | (105,360 | ) | $ | 700 | | $ | (1,515 | ) |
See accompanying notes to consolidated financial statements.
3
YUKON-NEVADA GOLD CORP.
Consolidated Statements of Shareholders’ Equity
(In thousands of US dollars, except number of common shares)
Years ended December 31, 2008, 2007 and 2006
| | | Common shares | | | | | | | | | | | | | | | | |
| | | | | | | | | | | | | | | Accumulated | | | | | | | |
| | | | | | | | | | | | | | | other | | | | | | | |
| | | Shares | | | | | | | | | Contributed | | | comprehensive | | | | | | | |
| | | (000's) | | | Amount | | | Warrants | | | surplus | | | income (loss) | | | Deficit | | | Total | |
| Balance January 1, 2006 | | 46,643 | | $ | 19,791 | | $ | 847 | | $ | 949 | | $ | - | | $ | (6,756 | ) | $ | 14,831 | |
| Issued on private placement (note | | | | | | | | | | | | | | | | | | | | | |
| 16(b)(iii)) | | 19 | | | 22 | | | | | | | | | | | | | | | 22 | |
| Issued on private placement, flow | | 7,830 | | | 11,149 | | | | | | | | | | | | | | | 11,149 | |
| through shares (note 16(b)(i)(ii)(iv)) | | | | | | | | | | | | | | | | | | | | | |
| Exercise of options | | 1,760 | | | 1,500 | | | | | | (365 | ) | | | | | | | | 1,135 | |
| Exercise of warrants | | 2,579 | | | 2,456 | | | (160 | ) | | | | | | | | | | | 2,296 | |
| Share issue costs | | 89 | | | (718 | ) | | | | | 116 | | | | | | | | | (602 | ) |
| Flow through share renunciation | | | | | (2,175 | ) | | | | | | | | | | | | | | (2,175 | ) |
| Other | | 30 | | | | | | | | | | | | | | | | | | – | |
| Stockbased compensation (note 16(d)) | | – | | | | | | | | | 455 | | | | | | | | | 455 | |
| Foreign exchange translation adjustment | | – | | | | | | | | | | | | (326 | ) | | | | | (326 | ) |
| Loss for the year | | – | | | | | | | | | | | | | | | (1,189 | ) | | (1,189 | ) |
| Balance at December 31, 2006 | | 58,950 | | | 32,025 | | | 687 | | | 1,155 | | | (326 | ) | | (7,945 | ) | | 25,596 | |
| Issued on private placement (note | | 42,352 | | | 52,900 | | | 18,809 | | | | | | | | | | | | 71,709 | |
| 16(b)(v)) | | | | | | | | | | | | | | | | | | | | | |
| Issued on private placement, flow | | 5,000 | | | 10,192 | | | | | | | | | | | | | | | 10,192 | |
| through shares (note 16(b)(vii)) | | | | | | | | | | | | | | | | | | | | | |
| Exercise of options | | 993 | | | 530 | | | | | | (340 | ) | | | | | | | | 190 | |
| Exercise of warrants | | 8,579 | | | 8,374 | | | (721 | ) | | | | | | | | | | | 7,653 | |
| Exercise of agents options and warrants | | 812 | | | 1,084 | | | | | | | | | | | | | | | 1,084 | |
| Issued on acquisition of mineral | | | | | | | | | | | | | | | | | | | | | |
| properties (note 16(b)(vi)) | | 58,437 | | | 89,049 | | | | | | | | | | | | | | | 89,049 | |
| Share issue costs (note 16(b)(viii)) | | – | | | (5,532 | ) | | | | | 1,127 | | | | | | | | | (4,405 | ) |
| Flow through share renunciation | | – | | | (3,902 | ) | | | | | | | | | | | | | | (3,902 | ) |
| Warrants issued to Queenstake | | | | | | | | | | | | | | | | | | | | | |
| shareholders (note 16(c)(i)) | | – | | | | | | 1,828 | | | | | | | | | | | | 1,828 | |
| Fair value of options issued to | | | | | | | | | | | | | | | | | | | | | |
| Queenstake options holders | | – | | | | | | | | | 116 | | | | | | | | | 116 | |
| Stockbased compensation (note 16(d)) | | – | | | | | | | | | 6,034 | | | | | | | | | 6,034 | |
| Foreign exchange translation adjustment | | – | | | | | | | | | | | | 2,599 | | | | | | 2,599 | |
| Loss for the year | | – | | | | | | | | | | | | | | | (1,899 | ) | | (1,899 | ) |
| Other | | 10 | | | | | | | | | | | | | | | | | | – | |
| Balance at December 31, 2007 | | 175,133 | | | 184,720 | | | 20,603 | | | 8,092 | | | 2,273 | | | (9,844 | ) | | 205,844 | |
| Issued on private placement (note | | | | | | | | | | | | | | | | | | | | | |
| 16(b)(x)) | | 79,800 | | | 838 | | | 2,689 | | | | | | | | | | | | 3,527 | |
| Issued on private placement, flow | | | | | | | | | | | | | | | | | | | | | |
| through shares (note 16 (b)(ix)) | | 10,050 | | | 19,901 | | | | | | | | | | | | | | | 19,901 | |
| Exercise of options | | 267 | | | 356 | | | | | | (147 | ) | | | | | | | | 209 | |
| Share issue costs (note 16 (b)(x)) | | 7,400 | | | (665 | ) | | | | | (307 | ) | | | | | | | | (972 | ) |
| Flow through share renunciation | | – | | | (2,709 | ) | | | | | | | | | | | | | | (2,709 | ) |
| Stockbased compensation (note 16(d)) | | – | | | | | | | | | 1,056 | | | | | | | | | 1,056 | |
| Loss for the year | | – | | | | | | | | | | | | | | | (105,360 | ) | | (105,360 | ) |
| Other | | 5 | | | | | | 152 | | | | | | | | | | | | 152 | |
| Balance at December 31, 2008 | | 272,655 | | $ | 202,441 | | $ | 23,444 | | $ | 8,694 | | $ | 2,273 | | $ | (115,204 | ) | $ | 121,648 | |
See accompanying notes to consolidated financial statements.
4
YUKON-NEVADA GOLD CORP.
Consolidated Statements of Cash Flows
(In thousands of US dollars)
Years ended December 31, 2008 and 2007
| | | 2008 | | | 2007 | | | 2006 | |
| Cash provided by (used in): | | | | | | | | | |
| | | | | | | | | | |
| Operations | | | | | | | | | |
| Net loss for the year | $ | (105,360 | ) | $ | (1,899 | ) | $ | (1,189 | ) |
| Items not affecting cash: | | | | | | | | | |
| Depreciation, depletion, and amortization | | 9,279 | | | 5,731 | | | 16 | |
| Accretion | | 2,117 | | | 1,082 | | | 145 | |
| Impairment of mineral properties and equipment | | 76,363 | | | - | | | - | |
| Stock-based compensation | | 1,056 | | | 5,563 | | | 278 | |
| Gain on disposal of asset | | (2,450 | ) | | (123 | ) | | (1 | ) |
| Reclamation payments | | 195 | | | 187 | | | - | |
| Unrealized (gain) loss on forward sales | | (952 | ) | | 993 | | | - | |
| Future income tax (recovery) expense | | (12,075 | ) | | 936 | | | (101 | ) |
| Unrealized foreign exchange gain | | (1,668 | ) | | (763 | ) | | - | |
| Warrants issues for debt financing | | 152 | | | - | | | - | |
| | | (33,343 | ) | | 11,707 | | | (852 | ) |
| Change in non cash working capital (note 17(a)(iii)) | | 14,931 | | | (23,475 | ) | | 150 | |
| | | (18,412 | ) | | (11,768 | ) | | (702 | ) |
| Investing | | | | | | | | | |
| Acquistion of Queenstake, net of cash acquires of | | | | | | | | | |
| $2,450 (note 3) | | - | | | (233 | ) | | - | |
| Restricted funds | | 7,476 | | | (1,092 | ) | | (5,582 | ) |
| Short-term investments | | 173 | | | 936 | | | 3,623 | |
| Mineral property expenditures | | (29,104 | ) | | (26,588 | ) | | (6,559 | ) |
| Deferred acquistion costs | | - | | | (111 | ) | | - | |
| Property, plant and equipment expenditures | | (25,703 | ) | | (6,266 | ) | | (376 | ) |
| Proceeds from sale of assets | | 4,480 | | | 123 | | | 11 | |
| | | (42,678 | ) | | (33,231 | ) | | (8,883 | ) |
| Financing | | | | | | | | | |
| Due to related parties | | - | | | (12 | ) | | 2 | |
| Notes payable and capital leases | | (1,323 | ) | | (8,382 | ) | | - | |
| Common shares issued for cash | | 23,201 | | | 80,346 | | | 11,171 | |
| Share issue costs | | (995 | ) | | (4,407 | ) | | (602 | ) |
| Common shares issued upon exercise of shareholder | | | | | | | | | |
| warrants | | - | | | 7,654 | | | 1,832 | |
| Common shares issued upon exercise of agents’ | | | | | | | | | |
| options and warrants | | - | | | 744 | | | 1,483 | |
| | | | | | | | | | |
| Common shares issued upon exercise of stock options | | 209 | | | 530 | | | 117 | |
| | | 21,092 | | | 76,473 | | | 14,003 | |
| | | | | | | | | | |
| Effect of exchange rate changes on cash | | - | | | 5,288 | | | (117 | ) |
| Increase in cash and cash equivalents | | (39,998 | ) | | 36,762 | | | 4,301 | |
| | | | | | | | | | |
| Cash and cash equivalents, beginning of year | | 41,104 | | | 4,342 | | | 41 | |
| Cash and cash equivalents, end of year | $ | 1,106 | | $ | 41,104 | | $ | 4,342 | |
| Supplemental cash flow information (note 17) | | | | | | | | | |
See accompanying notes to consolidated financial statements.
5
| YUKON-NEVADA GOLD CORP. |
| (Formerly YGC Resources Ltd.) |
| |
| Notes to Consolidated Financial Statements |
| (Tabular amounts in thousands of US dollars unless otherwise noted) |
| |
| Years ended December 31, 2008, 2007 and 2006 |
| |
| 1. | Going Concern: |
| | |
| Yukon-Nevada Gold Corp.’s (the Company) business is gold mining and related activities, including exploration, development, extraction, processing and reclamation. Gold has been produced in Nevada, USA (Jerritt Canyon), acquired on June 20, 2007. There are gold exploration activities being carried out in Nevada, USA (Jerritt Canyon) and the Yukon Territory, Canada (Ketza River and Silver Valley). |
| | |
| For properties other than the producing mine at Jerritt Canyon, the Company is in the process of mineral exploration and has yet to determine whether these properties contain reserves that are economically recoverable. The recoverability of the amount shown for mineral properties is dependent upon the existence of economically recoverable reserves, confirmation of the Company's ownership interest in the mining claims, the ability of the Company to obtain necessary financing to complete the development, and upon future profitable production or proceeds from the disposition of the mineral properties. |
| | |
| The Company has incurred substantial losses from operations and has a deficiency in working capital of $7.8 million at December 31, 2008. During the third quarter of 2008 the Company determined that under current conditions the Jerritt Canyon mine was not economic, and accordingly the mine was shutdown on August 8, 2008. The company currently does not have persuasive evidence that the capitalized costs associated with the mineral properties and certain related assets can be recovered. Accordingly, management has written off all costs ($69.4 million) related to the mineral property, $2.2 million of property, plant and equipment and a provision of $4.7 million related to the increase in the asset retirement obligation (see note 6). |
| | |
| Subsequent to the mine closure, the Company has been working to address a number of key issues related to the stop order issued by the Nevada Division of Environmental Protection (NDEP) in the first quarter of 2008 in order to receive permission to restart the milling operations. These issues included bringing the recently completed evaporation pond into operational use and begin the drawdown of the tailings pond, finalizing engineering design plans of a new mercury emissions system, and the cleanup of waste materials onsite. The Company has addressed all of these requirements and received approval from the NDEP to restart milling operations on March 25, 2009. |
| | |
| The Company will initially mill the remaining stockpiles on site and recommence toll milling at the Jerritt Canyon site. Further financing is required in order to fund further development of the Jerritt Canyon mines with the intention of returning to mining once the necessary development and backfill work has been completed. Management is currently pursuing financing alternatives and believes it will be able to secure the required financing in the near future. Should such financing be obtained, management believes that the remaining property, plant, and equipment costs can be fully recovered through a combination of toll milling, a return to mining and possibly eventual use of the wet mill circuit at the Ketza River property. |
| | |
| These consolidated financial statements are prepared on the basis that the Company will continue as a going concern. The conditions described in the preceding paragraphs raise substantial doubt about the Company’s ability to continue as a going concern. The Company’s ability to continue as a going concern and recover it’s investment in property, plant, and equipment and mineral properties is dependent on its ability to obtain additional financing in order to meet its planned business objectives and generate positive cash flows. However, there can be no assurance that the Company will be able to obtain additional financial resources or achieve profitability or positive cash flows. Failure to continue as a going concern would require that the Company's assets and liabilities be restated on a liquidation basis, which values could differ significantly from the going concern basis. |
6
| YUKON-NEVADA GOLD CORP. |
| (Formerly YGC Resources Ltd.) |
| |
| Notes to Consolidated Financial Statements |
| (Tabular amounts in thousands of US dollars unless otherwise noted) |
| |
| Years ended December 31, 2008, 2007 and 2006 |
| |
| 2. | Significant accounting policies: |
| | | |
| The financial statements of the Company have been prepared by management in accordance with Canadian generally accepted accounting principles. The financial statements have, in management’s opinion, been properly prepared within reasonable limits of materiality and within the framework of the accounting policies summarized below: |
| | | |
| (a) | Basis of consolidation: |
| | | |
| | These consolidated financial statements include the accounts of the Company and its subsidiaries from their respective dates of acquisition. Yukon-Shaanxi Mining Company is an incorporated joint venture and the pro rata share of the asset and liabilities are included in the accounts of the Company. All material intercompany transactions and balances have been eliminated. The subsidiaries and percentage of ownership at December 31, 2008 are as follows: |
| | | |
| | Ketza River Holdings Ltd. (Yukon) | 100% |
| | YGC Resources Arizona Inc. (Arizona) | 100% |
| | Queenstake Resources Ltd. (British Columbia) | 100% |
| | Queenstake Resources U.S.A. Inc. (Delaware) | 100% |
| | Castle Exploration Inc. (Colorado) | 100% |
| | Yukon-Shaanxi Mining Company - Joint Venture (Yukon) | 50% |
| | | |
| | (b) | Cash and cash equivalents: |
| | | |
| | | Cash and cash equivalents include cash and short-term investments that are readily convertible to cash and have a maturity date within 90 days of the purchase date. The Company does not have any asset backed commercial paper in its short-term investments. |
| | | |
| | (c) | Marketable securities |
| | | |
| | | Marketable securities are classified as available-for-sale and carried at fair value with unrealized gains and losses at the reporting date recognized in comprehensive income in accordance with CICA Handbook section 1530. If a loss is determined to be other than temporary, the loss is recognized in income. |
| | | |
| | (d) | Inventories |
| | | |
| | | Work-in-process inventories are valued at the lower of average production cost and net realizable value, after a reasonable allowance for further processing and sales costs. Production costs include the cost of raw materials, direct labor, mine-site overhead expenses and depreciation and depletion of Jerritt Canyon mine property, plant and equipment and mineral properties. Purchased ore is recorded at cost based upon the contracted purchase price, net of an allowance for the Company’s processing charged to a third party. Finished goods inventories are valued at the lower of average production cost and net realizable value. Cost valuations are based on the related three-month period’s average costs. Net realizable value is after a reasonable allowance for sales costs. Materials and supplies inventories are valued at the lower of average cost and replacement cost, net of a provision for obsolescence with respect to identified inventory items. Stockpiles represent ore that has been mined or purchased and is available for future processing. Stockpiles are measured by estimating the number of tons added and removed from the stockpile, the number of |
7
| YUKON-NEVADA GOLD CORP. |
| (Formerly YGC Resources Ltd.) |
| |
| Notes to Consolidated Financial Statements |
| (Tabular amounts in thousands of US dollars unless otherwise noted) |
| |
| Years ended December 31, 2008, 2007 and 2006 |
| |
| | | contained ounces (based on assay data) and the estimated metallurgical recovery rates (based on expected processing method). Stockpile ore tonnages are verified by periodic surveys. Costs are allocated to stockpiles based on relative values of material stockpiled and processed using current mining costs incurred up to the point of stockpiling the ore. These costs include direct labor, mine-site overhead expenses, and depreciations and depletion on Jerritt Canyon mine equipment and mineral properties. |
| | | |
| | (e) | Assets Held for Resale |
| | | |
| | | Assets held for resale are carried at fair value with unrealized gains and losses at the reporting date recognized in income in accordance with CICA Handbook section 1530. |
| | | |
| | (f) | Property, plant and equipment: |
| | | |
| | | Property, plant and equipment is recorded at cost and depreciated on a straight-line basis over the estimated useful lives of the assets, with a half year of depreciation taken in the year the asset is put into service. Property, plant and equipment used in exploration is depreciated and included in mineral properties. Effective January 1, 2008 the Company changed the useful lives for certain mining and milling assets to the rates shown in the table below. |
| | | |
| | Buildings | 20 years |
| | Computer hardware and software | 3 years |
| | Construction in progress | N/A |
| | Equipment and facilities | 5 - 20 years |
| | Furniture and fixtures | 7 years |
| | Leasehold improvements | straight-line over the term of the lease |
| | Vehicles | 3 - 7 years |
| | | |
| | (g) | Mineral properties: |
| | | |
| | | The acquisition cost of a mineral property and related exploration expenditures net of any option payments or income tax credits received are deferred until the property is placed into production, is sold or abandoned or determined to be impaired. These deferred expenditures are amortized on a units-of-production basis over the estimated useful life of the property based on proven and probable reserves following commencement of production or written off if the property is abandoned or sold or determined to be impaired. |
| | | |
| | (h) | Long-lived assets: |
| | | |
| | | The Company monitors the recoverability of long-lived assets based on factors such as current market value, future asset utilization, business climate and future undiscounted cash flows expected to result from the use of the related assets. The Company's policy is to record an impairment loss in the period it is determined that the carrying amount of the asset may not be recoverable. The impairment loss is calculated as the amount by which the carrying amount of the asset exceeds its fair value. |
| | | |
| | (i) | Asset retirement obligations: |
| | | |
| | | The fair value of an asset retirement obligation is recorded in the period in which it is incurred. When the liability is initially recorded, the cost is capitalized by increasing the carrying amount of the related long-lived |
8
| YUKON-NEVADA GOLD CORP. |
| (Formerly YGC Resources Ltd.) |
| |
| Notes to Consolidated Financial Statements |
| (Tabular amounts in thousands of US dollars unless otherwise noted) |
| |
| Years ended December 31, 2008, 2007 and 2006 |
| |
| | | asset. Over time, the liability is adjusted to reflect the passage of time (accretion expense) and for changes in estimated future cash flows. Accretion expense is charged to income, while adjustments related to changes in estimated cashflows are recorded as increases or decreases in the carrying value of the asset. The capitalized cost is amortized over the useful life of the related asset. Upon settlement of the liability, a gain or loss is recorded if the actual costs incurred are different from the liability recorded. |
| | | |
| | (j) | Stock based compensation: |
| | | |
| | | The CICA Handbook Section 3870,Stock-based Compensation and Other Stock-based Payments, establishes standards for the recognition, measurement and disclosure of stock-based compensation and other stock based payments for goods and or services. The Section requires that awards of stock be measured at fair value. The Company uses the Black-Scholes option pricing model to determine the fair value of each stock option on the date of the grant. The value of the stock options issued to directors, employees and service providers is expensed as stock-based compensation and is credited to contributed surplus. The value of the stock options issued to agents in exchange for brokerage services is netted against share capital as share issuance costs and credited to contributed surplus. Upon exercise, the proceeds of the options are credited to capital stock at the option price and the fair value of the options, as previously recorded, is reclassified from contributed surplus to capital stock. |
| | | |
| | | The Company has established a stock-based compensation plan as described in note 16(d). |
| | | |
| | (k) | Revenue recognition |
| | | |
| | | Revenue is recognized when there is pervasive evidence that a metal sale contract exists, delivery to the customer has occurred, legal title has passed and the sales price and timing of payment has been agreed upon with the purchaser. |
| | | |
| | (l) | Income taxes: |
| | | |
| | | The Company has adopted the asset and liability method of accounting for income taxes as outlined in the provisions of CICA Handbook Section 3465,Income Taxes. Under this method, current income taxes are recognized for the estimated taxes payable for the current year. Future income tax assets and liabilities are recognized for temporary differences between the tax and accounting bases of assets and liabilities as well as for the benefit of losses available for tax purposes to be carried forward to future years. A valuation allowance is provided against future income tax assets to the extent that realization is not considered to be more likely than not. |
| | | |
| | (m) | Flow-through shares: |
| | | |
| | | The Company has financed a portion of its exploration expenditures through the issuance of flow-through shares. Under the terms of these share issues, the tax attributes of the related expenditures are renounced to subscribers. The Company will recognize a future income tax liability, with an offset to share capital, when it renounces these expenditures to shareholders. |
9
| YUKON-NEVADA GOLD CORP. |
| (Formerly YGC Resources Ltd.) |
| |
| Notes to Consolidated Financial Statements |
| (Tabular amounts in thousands of US dollars unless otherwise noted) |
| |
| Years ended December 31, 2008, 2007 and 2006 |
| |
| | (n) | Use of estimates: |
| | | |
| | | The preparation of financial statements in conformity with generally accepted accounting principles requires management to make estimates and assumptions that affect the reported amounts of assets and liabilities at the date of the financial statements and revenues and expenses for the period. By their nature, these estimates are subject to management uncertainty and the effect on the financial statements of changes in such estimates in future periods could be significant. Significant estimates include those relating to the assessment of the Company’s ability to continue as a going concern, mineral properties including amount of expenditures to be capitalized, and estimates required to determine whether impairment of long lived assets is required, asset retirement obligations, the fair valuation of stock options, share purchase warrants and agent's options issued, the recognition of income tax assets and liabilities, and the fair value of assets and liabilities acquired in business combinations. Actual results may differ from those estimates. |
| | | |
| | (o) | Loss per share: |
| | | |
| | | Basic loss per share is computed by dividing the amount of loss for the period by the weighted average number of common shares outstanding during the period. |
| | | |
| | | Diluted loss per share is calculated using the treasury stock method. Under the treasury stock method, the weighted average number of shares outstanding used in the calculation of diluted loss per share assumes that the deemed proceeds received from the exercise of stock options, agents' options and share purchase warrants that are "in the money" would be used to repurchase common shares of the Company at the average market price during the year. |
| | | |
| | | Existing stock options (note 16(d)) and share purchase warrants (note 16(c)) have not been included in the computation of diluted loss per share as to do so would be anti-dilutive. Accordingly, basic and diluted loss per share amounts are the same. |
| | | |
| | (p) | Investment in joint venture: |
| | | |
| | | The Company conducts a portion of its exploration business through the joint venture Yukon-Shaanxi Mining Company (YSMC). The joint venture is bound by a contractual agreement which establishes the joint control for each of the venturers. The Company records its proportionate share of the joint ventures assets, liabilities, revenues and operating costs. |
| | | |
| | | As at December 31, 2008, the Company recorded $1.2 million in assets from YSMC and a nominal amount of interest income. |
| | | |
| | (q) | Financial instruments |
| | | |
| | | Financial assets and financial liabilities, including derivatives, are measured at fair value on initial recognition and recorded on the balance sheet. Measurement in subsequent periods depends on whether the financial instrument has been classified as held-for-trading, available-for-sale, held-to-maturity, loans and receivables or other financial liabilities. |
| | | |
| | | Financial assets and liabilities held-for-trading are measured at fair value with changes in those fair values recognized in net income. Financial assets and financial liabilities considered held-to-maturity, loans and receivables, and other financial liabilities are measured at amortized cost using the effective interest method |
10
| YUKON-NEVADA GOLD CORP. |
| (Formerly YGC Resources Ltd.) |
| |
| Notes to Consolidated Financial Statements |
| (Tabular amounts in thousands of US dollars unless otherwise noted) |
| |
| Years ended December 31, 2008, 2007 and 2006 |
| |
| | | of amortization. Available-for-sale financial assets are measured at fair value with unrealized gains and losses recognized in income. Investments in equity instruments classified as available-for-sale that do not have a quoted market price in an active market are measured at cost. Derivative instruments, including embedded derivatives, are recorded on the balance sheet at fair value. Changes in the fair values of derivative instruments are recognized in net income with the exception of derivatives designated as effective cash flow hedges. The Company has no such designated hedges. |
| | | | |
| | | The disclosure of the Company financial instruments is further described in Note 20. |
| | | | |
| | | The transition adjustment attributable to the re-measurement of financial assets and financial liabilities at fair value for available-for-sale financial assets was recognized in accumulated other comprehensive income as at January 1, 2007. |
| | | | |
| | (q) | Fair value of financial instruments |
| | | | |
| | | The fair values of the Company’s cash and cash equivalents, accounts receivable, and accounts payable and accrued liabilities approximate their carrying values due to their short terms to maturity. |
| | | | |
| | (r) | Comprehensive income/loss |
| | | | |
| | | Other comprehensive income represents changes in shareholders’ equity during a period arising from transactions and other events and circumstances from non-owner sources and includes unrealized gains and losses on financial assets classified as available-for-sale. The components of accumulated comprehensive income are disclosed in the consolidated statement of shareholders’ equity. |
| | | | |
| | (s) | Foreign currency translation |
| | | | |
| | | The Company uses the U.S. dollar as its functional and reporting currency. Therefore accounts denominated in currencies other than the U.S. dollar have been translated as follows: |
| | | | |
| | | • | Revenue and expense items at the rate of exchange in effect on the transaction date; |
| | | • | Non-monetary assets and liabilities at historical exchange rates, unless such items are carried at market, in which case they are translated at the exchange rate in effect on the balance sheet date; and |
| | | • | Monetary assets and liabilities at the exchange rate at the balance sheet date. |
| | | • | Exchange gains and losses are recorded in the statement of operations in the period in which they occur. |
| | | | |
| | (t) | Hedges |
| | | | |
| | | On January 1, 2007, the Company adopted CICA Handbook section 3865,Hedges. In a fair value hedging relationship, the carrying value of the hedged item is adjusted for unrealized gains or losses attributable to the hedged risk and recognized in net income. Changes in the fair value of the hedged item, to the extent that the hedging relationship is effective, are offset by changes in the fair value of the hedging derivative, which is also recorded in net income. When hedge accounting is discontinued, the carrying value of the hedged item is no longer adjusted and the cumulative fair value adjustments to the carrying value of the hedged item are amortized to net income over the remaining term of the original hedging relationship. In a cash flow hedging relationship, the effective portion of the change in the fair value of the hedging derivative is recognized in other comprehensive income. The ineffective portion is recognized in net income. The |
11
| YUKON-NEVADA GOLD CORP. |
| (Formerly YGC Resources Ltd.) |
| |
| Notes to Consolidated Financial Statements |
| (Tabular amounts in thousands of US dollars unless otherwise noted) |
| |
| Years ended December 31, 2008, 2007 and 2006 |
| |
| | | amounts recognized in accumulated other comprehensive income are reclassified to net income in the periods in which net income is affected by the variability in the cash flows of the hedged item. The Company currently does not have any designated hedges. |
| | | |
| | (v) | Comparative figures: |
| | | |
| | | Certain of the comparative figures have been reclassified to conform with the presentation adopted in the current year. |
| 3. | Business acquisition: |
| | |
| Effective June 20, 2007 the Company acquired 100% of the outstanding common shares of Queenstake. This business acquisition has been accounted for as a purchase transaction, with the Company being identified as the acquirer and Queenstake as the acquiree. These consolidated financial statements include 100% of Queenstake’s operating results from June 20, 2007. |
| | |
| The purchase price was determined as follows: |
| | Purchase price: | | | |
| | Share consideration (58,436,531 shares at C$1.62 per share) | $ | 89,049 | |
| | Fair value of share purchase warrants and stock options | | 1,944 | |
| | Acquisition costs | | 2,683 | |
| | | | | |
| | | $ | 93,676 | |
The final purchase price allocation, determined in the three months ended June 30, 2008, is as follows:
| | | | December 31, | | | Purchase Price | | | December 31, | |
| | Net assets acquired: | | 2007 | | | Adjustments | | | 2008 | |
| | Cash | $ | 2,450 | | $ | – | | $ | 2,450 | |
| | Accounts receivable and prepaid expenses | | 3,764 | | | – | | | 3,764 | |
| | Marketable securities | | 32 | | | – | | | 32 | |
| | Inventories | | 21,809 | | | – | | | 21,809 | |
| | Restricted funds | | 27,589 | | | – | | | 27,589 | |
| | Property, plant and equipment | | 79,868 | | | 1,558 | | | 81,426 | |
| | Mineral properties | | 44,733 | | | 1,008 | | | 45,741 | |
| | Other assets | | 1,110 | | | – | | | 1,110 | |
| | Accounts payable and accruals | | (45,498 | ) | | (7,122 | ) | | (52,620 | ) |
| | Future income taxes | | (17,419 | ) | | 4,556 | | | (12,863 | ) |
| | Long-term liabilities | | (24,762 | ) | | – | | | (24,762 | ) |
| | | $ | 93,676 | | | – | | $ | 93,676 | |
The change in the purchase price allocation arises from adjustments to the tax assets and liabilities that were acquired with the Queenstake purchase.
12
| YUKON-NEVADA GOLD CORP. |
| (Formerly YGC Resources Ltd.) |
| |
| Notes to Consolidated Financial Statements |
| (Tabular amounts in thousands of US dollars unless otherwise noted) |
| |
| Years ended December 31, 2008, 2007 and 2006 |
| |
| 4. | Adoption of new accounting standards: |
| | | |
| (a) | Capital management disclosures: |
| | | |
| | Effective January 1, 2008 the Company adopted the recommendations of The Canadian Institute of Chartered Accountants (CICA) Handbook Section 1535,Capital Disclosures. The new standard requires an entity to disclose information to enable users of its financial statements to evaluate the entity’s objectives, policies, and processes for managing capital. Disclosure requirements pertaining to this section are in note 19. |
| | | |
| (b) | Financial Instruments: |
| | | |
| | Effective January 1, 2008 the Company adopted the recommendations of CICA Handbook Section 3862, |
| | | |
| | Financial Instruments - Disclosures(section 3862) and CICA Handbook Section 3863 –Financial Instruments – Presentation (section 3863). Section 3862 provides standards for disclosures about financial instruments, including disclosures about fair value and the credit, liquidity and market risks associated with the financial instruments. Disclosure requirements pertaining to this section are in note 20. Section 3863 provides standards for presentation of financial instruments and non-financial derivatives. Other than the required disclosure this standard has not impacted the financial statements. |
| | | |
| (c) | Inventories: |
| | | |
| | Effective January 1, 2008 the Company adopted the recommendations of CICA Handbook Section 3031,Inventories. This section provides additional guidance on the determination of cost and its subsequent recognition as an expense, including any write-down to net realizable value, and disclosures made within the financial statements. This section also provides guidance on the reversal of write-downs previously taken and introduces the requirement for the allocation of overhead cost based on normal capacity. As a result of lower than normal production during the year, this standard has resulted in a higher proportion of overhead costs being expensed during the year rather than inventoried. |
| | | |
| 5. | Future accounting changes: |
| | | |
| (a) | Goodwill and Intangible Assets: |
| | | |
| | In February 2008, the CICA issued Section 3064Goodwill and Intangible Assets, replacing Section 3062 |
| | | |
| | Goodwill and Other Intangible Assetsand Section 3450,Research and Development Costs. The new Section is applicable to financial statements relating to fiscal years beginning on or after October 1, 2008. Accordingly, the Company will adopt the new standards for its fiscal year beginning January 1, 2009. Section 3064 establishes standards for the recognition, measurement, presentation and disclosure of goodwill subsequent to its initial recognition and of intangible assets by profit-oriented enterprises. Standards concerning goodwill impairment are unchanged from the standards included in the previous Section 3062. The Company has not yet determined the effect this new standard will have on its financial position and results of operations. |
| | | |
| (b) | International Financial Reporting Standards |
| | | |
| | In 2006, the Canadian Accounting Standards Board (“AcSB”) published a new strategic plan that will significantly affect financial reporting requirements for Canadian companies. The AcSB strategic plan |
13
| YUKON-NEVADA GOLD CORP. |
| (Formerly YGC Resources Ltd.) |
| |
| Notes to Consolidated Financial Statements |
| (Tabular amounts in thousands of US dollars unless otherwise noted) |
| |
| Years ended December 31, 2008, 2007 and 2006 |
| |
outlines the convergence of Canadian GAAP with International Financial Reporting Standards (IFRS) over an expected five-year transitional period. In February 2008, the AcSB announced that 2011 is the transition date for publicly listed companies to use IFRS, which will replace existing Canadian GAAP. The effective date is for interim and annual financial statements relating to fiscal years beginning on or after January 1, 2011. The transition date of January 1, 2011 will require the restatement for comparative purposes of amounts reported by the Company for the year ended December 31, 2010. While we have begun assessing the adoption of IFRS for 2011, the financial reporting impact of the transition to IFRS cannot be reasonably estimated at this time.
| 6. | Temporary Suspension of Jerritt Canyon Operations |
| | |
| On February 22, 2008 the Company temporarily suspended mining and processing operations at the Jerritt Canyon mine in order to upgrade and install several components within the mill and the mine facilities. Expenses incurred from this date through to the recommencement of commercial operations on April 30, 2008 were recorded either as capital or, if they were determined to be maintenance or support expenses, as temporary shutdown costs aggregating $7.9 million. |
| | |
| On August 8, 2008 the Company announced the suspension of underground mining activity at the Jerritt Canyon property, with a suspension of the milling operations occurring the following week. The mill has been shut down temporarily and will recommence processing available stockpiles in 2009 and continue to pursue toll milling opportunities and financing to continue mining activities. Prior to recommencing operations the Company has been working to address environmental concerns relating to the stop order issued by the NDEP in the first quarter of 2008 (note 21(a)(i)). |
| | |
| The revised work program resulted in a work force reduction of 394 employees, all located at the Jerritt Canyon location. The related restructuring charge of $4.5 million arises from the severance and vacation payments due to former employees of the Company. As of December 31, 2008, the Company had paid $2.6 million of this obligation. Other expenses incurred relating to the shutdown of the mill, other than normal course operating cost of $5.2 million, have been included in temporary shutdown costs. |
| | |
| During the three months ended September 30, 2008, the Company determined that the costs associated with the current mine plan for Jerritt Canyon exceeded the projected cash flows. Due to inadequate infrastructure which caused high operating costs and low production, mining at the Jerritt Canyon Mine was halted until further financing is obtained to enable the Company to perform the necessary development and infrastructure work to support more cost-efficient ore extraction. |
| | |
| Due to the absence of a profitable long term mine plan, the Company wrote down the Jerritt Canyon mineral properties to their estimated fair value, which management determined to be nil based on current market conditions. The impairment expense recorded during the third quarter was $69.4 million for mineral properties. An additional $2.2 million of property, plant and equipment related to the mine was written off in the fourth quarter. Also included in the impairment expense in the fourth quarter is a provision of $4.7 million related to the increase in the asset retirement obligation. The impairment charge was a non-cash transaction. The following table illustrates the values used in the write-down of the Jerritt Canyon mineral properties, property, plant and equipment and increase in the asset retirement obligation. |
14
| YUKON-NEVADA GOLD CORP. |
| (Formerly YGC Resources Ltd.) |
| |
| Notes to Consolidated Financial Statements |
| (Tabular amounts in thousands of US dollars unless otherwise noted) |
| |
| Years ended December 31, 2008, 2007 and 2006 |
| |
| | Fair value assigned on acquisition | $ | 44,306 | |
| | Development spending | | 13,995 | |
| | Value beyond proven and probable | | 13,713 | |
| | Depletion of producing properties | | (2,607 | ) |
| | Property, plant and equipment | | 2,243 | |
| | Increase in asset retirement obligation | | 4,713 | |
| | | $ | 76,363 | |
| | | | 2008 | | | 2007 | |
| | | | | | | | |
| | Finished goods | $ | 26 | | $ | 7,749 | |
| | Stockpiled ore | | 2,655 | | | 1,827 | |
| | Purchased ore | | 17,872 | | | 21,408 | |
| | Work-in-process | | – | | | 2,962 | |
| | Materials and supplies | | 3,466 | | | 4,049 | |
| | | | | | | | |
| | | $ | 24,019 | | $ | 37,995 | |
| All of the Company’s inventories on hand as of December 31, 2008 and 2007 are located at the Jerritt Canyon mine in Nevada, USA. |
| | |
| Included in cost of gold sold and depreciation, depletion, and amortization expense on the statement of loss are total inventory related costs of $3.4 million (2007 – $9.2 million) and $1.4 million (2007 – $0.9 million), respectively. |
| | |
| 8. | Restricted funds: |
| | | | 2008 | | | 2007 | |
| | | | | | | | |
| | AIG commutation account (a) | $ | 25,741 | | $ | 27,888 | |
| | Cash restricted for future exploration in Canada (b) | | 2 | | | 5,485 | |
| | Water use license letter of credit (c) | | 2,535 | | | 3,114 | |
| | Cash pledged as security for letters of credit | | 206 | | | 182 | |
| | | | | | | | |
| | | $ | 28,484 | | $ | 36,669 | |
| | (a) | On June 30, 2003, Queenstake purchased from American Insurance Group (AIG) an environmental risk transfer program (the “ERTP”) (note 11). As part of the ERTP, $25.8 million was deposited in an interest- bearing account with AIG (the Commutation Account). The Commutation Account principal plus interest earned on the principal is used to fund Jerritt Canyon mine’s ongoing reclamation and mine closure obligations. During 2008 the company received $5.0 million from the account related primarily to a payment settlement for the construction of the evaporation pond at Jerritt Canyon, earned $1.0 million in interest revenue and contributed an additional $2.2 million to the bonding. |
15
| YUKON-NEVADA GOLD CORP. |
| (Formerly YGC Resources Ltd.) |
| |
| Notes to Consolidated Financial Statements |
| (Tabular amounts in thousands of US dollars unless otherwise noted) |
| |
| Years ended December 31, 2008, 2007 and 2006 |
| |
| | (b) | During 2007 and 2008, the Company raised funds by way of private placements of flow-through shares. Under the conditions of these private placements, the funds must be spent in 2006, 2007 and 2008 on Canadian Exploration Expenditures (CEE) on properties located in Canada. A total of C$12.6 million of cash is required to fund future exploration under the terms of the flow through share subscription agreements signed in May 2008, however only a nominal cash balance was available due to the use of cash on non-flow through expenditures at December 31, 2008. The Company is obligated to fund the remaining C$12.6 million of expenditures by December 31, 2009 (see note 21(ii)). |
| | | |
| | (c) | The Yukon Territorial Government has a letter of credit with the Company for $2.5 million which was put in place to secure payment of potential reclamation work relating to the Ketza River project. |
| 9. | Property, plant and equipment: |
| | | | | | | 2008 | | | | | | | | | 2007 | | | | |
| | | | | | | Accumulated | | | Net book | | | | | | Accumulated | | | Net book | |
| | | | Cost | | | amortization | | | value | | | Cost | | | amortization | | | value | |
| | Jerritt Canyon mine USA | $ | 103,935 | | $ | 11,036 | | $ | 92,899 | | $ | 84,948 | | $ | 4,306 | | $ | 80,642 | |
| | Ketza River project, Canada | | 1,643 | | | 780 | | | 863 | | | 1,533 | | | 415 | | | 1,118 | |
| | Corporate and other, Canada | | 185 | | | 97 | | | 88 | | | 114 | | | 65 | | | 49 | |
| | | $ | 105,763 | | $ | 11,913 | | $ | 93,850 | | $ | 86,595 | | $ | 4,786 | | $ | 81,809 | |
| During the year the Company recorded a $2.2 million impairment charge on property, plant and equipment (note 6). With the closure of the mine in August of 2008, the Company disposed of selected mining assets and began actively marketing others. At the end of December 31, 2008, the Company was actively marketing an asset under capital lease of $0.8 million which subsequently sold after year-end. |
| | |
| 10. | Mineral properties: |
| | | | | | | 2008 | | | | | | 2007 | |
| | | | Cost non- | | | Accumulated | | | Net book | | | Cost | | | Cost non- | | | Accumulated | | | Net book | |
| | | | depletable | | | depletion | | | value | | | depletable | | | depletable | | | depletion | | | value | |
| | | | | | | | | | | | | | | | | | | | | | | |
| | Jerritt Canyon mine, USA | $ | – | | $ | – | | $ | – | | $ | 9,551 | | $ | 46,782 | | $ | 2,085 | | $ | 54,248 | |
| | Ketza River project, Canada | | 45,240 | | | – | | | 45,240 | | | – | | | 32,129 | | | – | | | 32,129 | |
| | Silver Valley project, Canada | | 1,334 | | | – | | | 1,334 | | | – | | | 1,297 | | | – | | | 1,297 | |
| | Arizona project, USA | | 589 | | | – | | | 589 | | | – | | | 519 | | | – | | | 519 | |
| | Yukon-Shaanxi project, | | | | | | | | | | | | | | | | | | | | | |
| | Canada (note 17(b)) | | 169 | | | – | | | 169 | | | – | | | – | | | – | | | – | |
| | Other Yukon and BC projects, | | | | | | | | | | | | | | | | | | | | | |
| | Canada | | 15 | | | – | | | 15 | | | – | | | 19 | | | – | | | 19 | |
| | | $ | 47,347 | | $ | – | | $ | 47,347 | | $ | 9,551 | | $ | 80,746 | | $ | 2,085 | | $ | 88,212 | |
| | (a) | Jerritt Canyon, Nevada: |
| | | |
| | | With the acquisition of Queenstake (note 3), the Company has a 100% interest in the Jerritt Canyon property which consists of two gold producing mines, the SSX-Steer complex and the Smith mine. |
| | | |
| | | During the year the Company recorded a $69.4 million impairment charge on Jerritt Canyon mineral properties (note 6). |
16
| YUKON-NEVADA GOLD CORP. |
| (Formerly YGC Resources Ltd.) |
| |
| Notes to Consolidated Financial Statements |
| (Tabular amounts in thousands of US dollars unless otherwise noted) |
| |
| Years ended December 31, 2008, 2007 and 2006 |
| |
| | (b) | Yukon properties: |
| | | | |
| | | (i) | Ketza River properties, Yukon: |
| | | | |
| | | | The Company has a 100% interest of the Ketza River property including 308 mining claims and leases, a mill and all associated equipment. The focus of the Ketza River property is gold. |
| | | | |
| | | (ii) | Silver Valley, Yukon: |
| | | | |
| | | | The Company has a 100% interest in 114 claims and an option to acquire an additional 6 claims from an Optionor. |
| | | | |
| | (c) | Silver Bar, Arizona: |
| | | | |
| | | The Company has a 100% interest in 55 claims in Pinal County, Arizona. The focus of exploration of this property will be gold and copper. |
| | | | |
| | (d) | Mount Nansen, Yukon: |
| | | | |
| | | The Company, through YSMC, has an option agreement to acquire 298 claims, in the Mount Nansen area of the Yukon. Exploration activity is underway in that area and further claims in that area are being evaluated. |
| | | | |
| | (e) | Greenwood properties: |
| | | | |
| | | The Company owns a 75% interest in 31 claims in the Greenwood Mining District in south east British Columbia which are subject to a 2% net smelter returns royalty. The remaining 25% interest in this gold property is owned by Intrepid Minerals Corporation. This property was written down to a nominal amount in 2005. |
| | | | |
| | (f) | Other Yukon Base Metals properties: |
| | | | |
| | | (i) | Money property: |
| | | | |
| | | | The Company has a 100% interest in 46 claims on this gold, silver and copper property located in south central Yukon. The Company entered into an option agreement with Yukon Zinc Corporation (Yukon Zinc) in August 2005 which allows Yukon Zinc to acquire a 25% interest in the property by making cash payments to the Company of C$40,000 over the next five years and incurring C$150,000 of exploration expenditures in the next five years. Upon exercise of the initial option, Yukon Zinc shall have an additional option to acquire an additional 26% interest in the property by paying the Company C$25,000 in cash or shares upon giving notice of its intent to pursue the additional option and undertaking an additional C$500,000 of exploration expenditures over two years from date of election of the additional option. |
| | | | |
| | | (ii) | Wolf property: |
| | | | |
| | | | The Company has a 34.42% joint venture interest in 18 claims in this zinc, lead and silver property in south central Yukon. Atna Resources Ltd. owns the remaining 65.58% interest. |
17
| YUKON-NEVADA GOLD CORP. |
| (Formerly YGC Resources Ltd.) |
| |
| Notes to Consolidated Financial Statements |
| (Tabular amounts in thousands of US dollars unless otherwise noted) |
| |
| Years ended December 31, 2008, 2007 and 2006 |
| |
| | (iii) | Bay property: |
| | | |
| | | The Company staked 36 claims near Watson Lake, Yukon Territory during 2006. These claims are adjacent to claims held by an unrelated third party. The focus of this property, based on preliminary historical geological work, will be silver. |
These properties have nominal carrying values.
| | | | 2008 | | | 2007 | |
| | | | | | | | |
| | Environmental Risk Transfer Program | $ | 923 | | $ | 974 | |
| | (a) | Environmental Risk Transfer Program / Reclamation cost cap insurance: |
| | | |
| | | The ERTP that Queenstake purchased from AIG also includes a reclamation and mine closure cost cap insurance policy. The insurance policy provides coverage for future reclamation and mine closure costs in existence at June 30, 2003, if they exceed those funded by the Commutation Account (note 8). If these reclamation costs are less than the amount in the Commutation Account, the Company would be refunded the excess cash. In the event that these reclamation costs are more than the Commutation Account balance, the cost cap insurance policy will pay the excess costs up to a defined maximum (note 20(b)(ii)). |
| | | |
| | (b) | Pollution legal liability: |
| | | |
| | | The ERTP also includes a pollution legal liability insurance coverage for third-party damage claims against the Company for both pre-existing pollution conditions and new pollution conditions, for a period of 20 years commencing June 30, 2003. |
| | | |
| | (c) | The insurance premium paid for the ERTP in June 2003 is being amortized over the estimated proven and probable reserves at the inception of the policy. Amortization of the insurance premium is calculated based on each respective period’s production ounces with respect to the estimated proven and probable reserves. |
| 12. | Related party transactions: |
| | |
| During the year, the Company was charged nil (2007 - $0.1 million, 2006 - $0.1 million) in management fees by a company owned by a director of the Company. |
| | |
| During the year, the Company was charged a total of $0.2 million (2007 - $0.3 million, 2006 - $0.1 million) in legal fees by a law firm in which the corporate secretary of the Company is a partner. The amount owing at December 31, 2008 is $0.1 million. A portion of these fees are included in share issue costs with the remainder included under general and administrative expenses. In 2007, a portion of these costs were also included in the transaction costs associated with the Queenstake business combination. |
18
| YUKON-NEVADA GOLD CORP. |
| (Formerly YGC Resources Ltd.) |
| |
| Notes to Consolidated Financial Statements |
| (Tabular amounts in thousands of US dollars unless otherwise noted) |
| |
| Years ended December 31, 2008, 2007 and 2006 |
| |
| 13. | Other long-term liabilities: |
| | | | 2008 | | | 2007 | |
| | Capital leases | $ | 810 | | $ | 2,079 | |
| | Current portion of capital leases | | (785 | ) | | (931 | ) |
| | | $ | 25 | | $ | 1,148 | |
| The Company has three capital lease obligations with respect to mine equipment in use at Jerritt Canyon. The lease obligations bear interest at rates between 6 and 9 percent. The current portion of capital leases is primarily comprised of $0.7 million for the property, plant, and equipment classified as held for resale. The current portion is included in accounts payable and accrued liabilities. |
| | |
| 14. | Asset retirement obligations: |
| | | | 2008 | | | 2007 | |
| | | | | | | | |
| | Balance, beginning of year | $ | 26,528 | | $ | 1,903 | |
| | Acquisition of Jerritt Canyon property | | - | | | 23,257 | |
| | Accretion expense | | 2,117 | | | 1,082 | |
| | Revisions in estimates of liabilities | | 4,043 | | | 286 | |
| | | | | | | | |
| | Balance, end of year | $ | 32,688 | | $ | 26,528 | |
| The Company’s asset retirement obligations consist of reclamation and closure costs for both active mines and exploration activities. The present value of obligations relating to active mines which the Company assumed with the acquisition of Queenstake is currently estimated at $25.5 million (2007 - $23.7 million) reflecting payments for approximately the next 20 years. The present value of obligations relating to exploration activity in the Yukon properties are currently estimated at $2.4 million (2007 - $2.8 million) reflecting payments for approximately the next 11 years. Significant reclamation and closure activities include land and water rehabilitation, demolition of buildings and mine facilities, ongoing care and maintenance and other costs. |
| | |
| The Company’s total liability for reclamation and closure cost obligations at December 31, 2008 is $32.7 million (2007 - $26.5 million). The undiscounted value of this liability is $58.0 million (2007-$60.7 million). An inflation rate assumption of 2% has been used. An accretion expense component of $2.1 million (2007 - $1.1 million, 2006 - $0.1 million) has been charged to operations to reflect an increase in the carrying amount of the asset retirement obligation which has been determined using a credit adjusted risk free rate of 8%. Revisions in estimates in costs and timing of reclamation expenditures for 2008 used a credit risk free rate of 14%. |
| | |
| 15. | Income taxes: |
| | |
| The Company has income tax loss carry forwards of approximately $84.0 million (2007 - $22.0 million). Of this amount, $76.4 million relates to the Company’s US operations, a portion of which has been recognized as an asset and a valuation allowance has been provided for the remainder. The loss carry forwards, if unused, will expire as follows: |
19
| YUKON-NEVADA GOLD CORP. |
| (Formerly YGC Resources Ltd.) |
| |
| Notes to Consolidated Financial Statements |
| (Tabular amounts in thousands of US dollars unless otherwise noted) |
| |
| Years ended December 31, 2008, 2007 and 2006 |
| |
| | | | | |
| | 2008 - 2011 | $ | 328 | |
| | 2015 | | 521 | |
| | 2016 | | 978 | |
| | 2024 | | 3,824 | |
| | 2025 | | 6,769 | |
| | 2026 | | 5,554 | |
| | 2027 | | 2,699 | |
| | 2028 | | 63,334 | |
| | | | | |
| | | $ | 84,007 | |
The components of future income taxes are as follows:
| | | | 2008 | | | 2007 | |
| | | | | | | | |
| | Future income tax assets, current: | | | | | | |
| | Non-capital loss carry forwards | $ | 895 | | $ | 1,453 | |
| | | | | | | | |
| | Future income tax assets, non-current: | | | | | | |
| | Asset retirement obligation | | 728 | | | 826 | |
| | Non-capital loss carry forwards | | 22,719 | | | 11,110 | |
| | Share issue costs | | 1,118 | | | 2,063 | |
| | Unrealized foreign exchange | | – | | | 694 | |
| | Mineral properties and property, plant and | | | | | | |
| | equipment book less than tax basis | | 37,168 | | | 21,033 | |
| | Other | | 395 | | | 677 | |
| | | | 62,128 | | | 36,403 | |
| | Valuation allowance | | (36,358 | ) | | (19,082 | ) |
| | | | 25,770 | | | 17,321 | |
| | Future income tax liabilities, non-current: | | | | | | |
| | Mineral properties and property, plant and | | | | | | |
| | equipment book in excess of tax basis | | (32,025 | ) | | (44,566 | ) |
| | Unrealized foreign exchange | | (2,164 | ) | | – | |
| | Other | | – | | | (1,282 | ) |
| | | | (34,189 | ) | | (45,848 | ) |
| | Net future income tax liability, non-current | $ | (8,419 | ) | $ | (28,527 | ) |
The Company has recorded a valuation allowance against certain of its future income tax assets as management does not believe it is more likely than not that sufficient taxable income will be generated during the carry forward period to realize all the future tax assets.
Combined federal, provincial and state statutory tax rates which aggregate to 35.46% have been used for future tax asset and liability calculations to reflect the substantively enacted tax rates expected to apply to taxable income in the years in which the temporary differences are expected to be recovered or settled.
During 2008 the Company renounced C$10.0 million of CEE to flow-through shareholders. The result of this renunciation was that the “Cumulative Canadian Exploration Expenses” pool of the Company resources was reduced and a $3 million future income tax liability was recorded on the date of renunciation.
20
| YUKON-NEVADA GOLD CORP. |
| (Formerly YGC Resources Ltd.) |
| |
| Notes to Consolidated Financial Statements |
| (Tabular amounts in thousands of US dollars unless otherwise noted) |
| |
| Years ended December 31, 2008, 2007 and 2006 |
| |
The following table reconciles income taxes calculated at statutory rates with the income tax expense in these financial statements:
| | | | 2008 | | | 2007 | | | 2006 | |
| | | | | | | | | | | |
| | Net loss before taxes | $ | (117,435 | ) | $ | (930 | ) | $ | (1,290 | ) |
| | Federal statutory tax rate | | 35.46% | | | 37.12% | | | 37.12% | |
| | Tax based on statutory income tax rate | | (41,642 | ) | | (345 | ) | | (479 | ) |
| | Non-deductible expenses | | 121 | | | 18 | | | - | |
| | Share issuance costs | | - | | | (1,948 | ) | | (203 | ) |
| | Non-deductible stock-based compensation | | 311 | | | 1,933 | | | 91 | |
| | Loss (gain) not recognized for tax purposes | | 1,230 | | | (274 | ) | | - | |
| | Change in valuation allowance | | 28,393 | | | 2,385 | | | - | |
| | Change in tax rate and other | | 40 | | | (708 | ) | | (332.00 | ) |
| | Impact of lower foreign taxes | | (528 | ) | | (92 | ) | | - | |
| | Unrecognized tax assets | | - | | | - | | | 822 | |
| | Income tax (recovery) expense | | (12,075 | ) | | 969 | | | (101 | ) |
| 16. | Share capital: |
| | | | |
| (a) | Authorized share capital consists of an unlimited number of common shares |
| | | | |
| (b) | Common shares issued and outstanding: |
| | | | |
| | (i) | On May 30, 2006, the Company closed a brokered private placement of 5.5 million flow-through common shares at a price of C$1.50 per share. A commission of 6% was paid by a combination of cash and issuance of common shares of the Company. Agents’ options were issued entitling the holder to purchase one common share of the Company for C$1.55 per share until May 30, 2007. |
| | | | |
| | (ii) | On June 14, 2006, the Company closed a non-brokered private placement of 1.4 million flowthrough shares at a price of C$1.50 per common share. |
| | | | |
| | (iii) | On June 14, 2006, the Company closed a non-brokered private placement of 19,231 common shares at a price of C$1.30 per share. |
| | | | |
| | (iv) | On December 21, 2006, the Company closed a non-brokered private placement of 900,000 flowthrough shares at a price of C$2.50 per share. |
| | | | |
| | (v) | On June 20, 2007 the Company closed a private-placement of 42.4 million common share units at a price of C$1.80 per unit. Each unit contains one common share of the Company and one-half of one share purchase warrant or 21.2 million share purchase warrants that entitles the holder to purchase one common share of the Company for C$3.00. The share purchase warrants expire on June 20, 2012. Proceeds of $71.7 million were received and the fair value of the 21.2 million share purchase warrants using the Black-Scholes pricing model was $18.8 million (see note (c) for the assumptions used). |
| | | | |
| | (vi) | On June 20, 2007 the Plan of Arrangement to combine the operations of the Company and Queenstake was executed. Pursuant to the Plan of Arrangement, the Company issued one common share for 10 shares of Queenstake for 100% of the outstanding shares of Queenstake, a total of 58.4 million shares. The consideration for each 10 Queenstake shares was valued at C$1.62, the average closing price of |
21
| YUKON-NEVADA GOLD CORP. |
| (Formerly YGC Resources Ltd.) |
| |
| Notes to Consolidated Financial Statements |
| (Tabular amounts in thousands of US dollars unless otherwise noted) |
| |
| Years ended December 31, 2008, 2007 and 2006 |
| |
| | | the Company’s shares on the TSX before and after the announcement date of March 22, 2007. The value of the shares of the Company issued to Queenstake shareholders has been included in the purchase price consideration (note 3). |
| | | |
| | (vii) | On October 5, 2007, the Company closed a non-brokered private placement of 5 million flow-through shares at a price of C$2.00 per share. |
| | | |
| | (viii) | The Company issued 1.8 million agents’ options to brokers in connection with the brokered portion of the June 20, 2007 private placement. Each agents’ option entitles the holder to purchase one common share of the Company for C$2.10. The agents’ options expire on June 20, 2009. A fair value of $1.1 million has been assigned to the agents’ options, using the Black-Scholes pricing model (see the assumptions used in note (c)). |
| | | |
| | (ix) | On May 2, 2008, the Company closed a non-brokered private placement of 10.1 million flow-through shares at a price of C$2.00 per share for proceeds of $19.9 million. |
| | | |
| | (x) | On December 19, 2008, the Company closed a non-brokered private placement for a total of 79.8 million common share units (the "Units") for $3.3 million. Each Unit consists of one common share (a "Share") and two series of Share purchase warrants. The first warrant (the "Series "A" Warrant") can be exercised to purchase one additional Share (the ""A" Warrant Share") at a price of C$0.07 per share within 12 months of closing of the private placement and the second warrant (the "Series "B" Warrant") can be exercised to purchase one additional Share (the ""B" Warrant Share") at a price of C$0.09 per share within 18 months of closing of the private placement. In accordance with securities legislation currently in effect, the Shares, the "A" Warrants, the "B" Warrants, the "A" Warrant Shares and the "B" Warrant Shares will be subject to "hold period" of four months plus one day expiring on expiring on April 18, 2009. |
| | | |
| | | The Company paid a 10% finder's fee to Procter Advisors Ltd. ("Procter") in connection with the private placement, payable in Units of the Company, of 7.4 million Units. |
| | | |
| | | The 87.2 million Series A and 87.2 million Series B share purchase warrants expire on December 19, 2009 and June 19, 2010, respectively and the fair value using the Black-Scholes pricing model was $1.2 million each (see note (c)) for the assumptions used). |
22
| YUKON-NEVADA GOLD CORP. |
| (Formerly YGC Resources Ltd.) |
| |
| Notes to Consolidated Financial Statements |
| (Tabular amounts in thousands of US dollars unless otherwise noted) |
| |
| Years ended December 31, 2008, 2007 and 2006 |
| |
| | (c) | Warrants: |
| | | |
| | | Continuity of warrants outstanding for the year ended December 31, 2008 and 2007 are as follows: |
| | | | | | | | | | Thousands of units | |
| | | | | | | | | | | | | Warrants | | | | | | | |
| | | | | | | Exercise | | | December | | | exercised/ | | | Warrants | | | December | |
| | Expiry date | | Note | | | price (C$) | | | 31, 2006 | | | expired | | | issued | | | 31, 2007 | |
| | January 31, 2007 | | | | | 2.40 | | | 20 | | | (20 | ) | | | | | - | |
| | April 13, 2007 | | | | | 1.00 | | | 5,724 | | | (5,724 | ) | | | | | - | |
| | July 29, 2007 | | | | | 1.00 | | | 2,405 | | | (2,405 | ) | | | | | - | |
| | August 26, 2007 | | | | | 1.00 | | | 466 | | | (466 | ) | | | | | - | |
| | January 16, 2009 | | (i) | | | 1.80 | | | - | | | - | | | 1,000 | | | 1,000 | |
| | April 12, 2010 | | (i) | | | 5.50 | | | - | | | - | | | 2,851 | | | 2,851 | |
| | June 20,2012 | | (ii) | | | 3.00 | | | - | | | - | | | 21,176 | | | 21,176 | |
| | April 13, 2007 | | | | | 1.05 | | | 194 | | | (246 | ) | | 52 | | | - | |
| | July 29, 2007 | | | | | 1.05 | | | 31 | | | (127 | ) | | 96 | | | - | |
| | | | | | | | | | 8,840 | | | (8,988 | ) | | 25,175 | | | 25,027 | |
| | | | | | | | | | Thousands of units | |
| | | | | | | | | | | | | | | | | | | | |
| | | | | | | Exercise | | | December | | | Warrants | | | Warrants | | | December | |
| | Expiry date | | Note | | | price (C$) | | | 31, 2007 | | | exercised | | | issued | | | 31, 2008 | |
| | January 16, 2009 | | (i) | | | 1.80 | | | 1,000 | | | - | | | - | | | 1,000 | |
| | April 12, 2010 | | (i) | | | 5.50 | | | 2,851 | | | - | | | - | | | 2,851 | |
| | June 20,2012 | | (ii) | | | 3.00 | | | 21,176 | | | - | | | 250 | | | 21,426 | |
| | December 19, 2009 | | 16(b)(x) | | | 0.07 | | | - | | | - | | | 87,200 | | | 87,200 | |
| | June 19, 2010 | | 16(b)(x) | | | 0.09 | | | - | | | - | | | 87,200 | | | 87,200 | |
| | | | | | | | | | 25,027 | | | - | | | 174,650 | | | 199,677 | |
Fair value of the shareholder and agents warrants were determined using the Black-Scholes pricing model using the following assumptions:
| | | | | | | | | | Weighted | | | | |
| | | | Risk-free | | | | | | average | | | | |
| | Expiry date | | interest rate | | | Dividend yield | | | expected life | | | Volatility | |
| | January 16, 2009 | | 4.25% | | | 0% | | | 1.6 | | | 79% | |
| | April 12, 2010 | | 4.25% | | | 0% | | | 2.8 | | | 79% | |
| | June 20, 2012 | | 4.25% | | | 0% | | | 5 | | | 79% | |
| | December 19, 2009 | | 1.79% | | | 0% | | | 1 | | | 195% | |
| | June 19, 2010 | | 1.79% | | | 0% | | | 1.5 | | | 161% | |
| | (i) | Pursuant to the terms of the Plan of Arrangement, the Company issued one share purchase warrant for every 10 Queenstake share purchase warrants outstanding as of the date of the business acquisition, June 20, 2007. The strike price of the Queenstake warrants was multiplied by 10 to calculate the exercise price of the warrants issued by the Company for the Queenstake warrants. |
23
| YUKON-NEVADA GOLD CORP. |
| (Formerly YGC Resources Ltd.) |
| |
| Notes to Consolidated Financial Statements |
| (Tabular amounts in thousands of US dollars unless otherwise noted) |
| |
| Years ended December 31, 2008, 2007 and 2006 |
| |
| | | The fair value of the warrants of $1.8 million issued to Queenstake warrant holders has been included as part of the purchase price consideration (note 3) and was determined using the Black-Sholes pricing model (see above for assumptions used). |
| | | |
| | (ii) | During the three months ended June 30, 2008 the Company issued 0.3 million warrants in connection with obtaining $4.5 million in short term financing which was subsequently repaid during the month of July. The fair value of $0.2 million, recorded in general and administration expense, was determined using the Black-Scholes pricing model as follows: |
| | | |
| | Risk-free interest rate | 3.24% |
| | Dividend yield | 0% |
| | Weighted average expected life (years) | 4 |
| | Volatility | 96% |
| | (d) | Stock options: |
| | | |
| | | The Company has a stock option plan (the Plan) in place under which the Board of Directors may grant options to acquire common shares of the Company to directors, employees and service providers. Under the terms of the Plan, the number of securities issuable to insiders, at any time under old security based agreements, cannot exceed 10% of the issued and outstanding securities. |
| | | |
| | | Under the fair value method, the total fair value of the stock based compensation granted to employees, directors, officers and service providers was $1.1 million in 2008 (2007 - $6 million, 2006 - $0.5 million) at a weighted average of C$0.9 per stock option. Of this amount, $1.1 million (2007 - $5.6 million, 2006 - $0.5 million) is included in operations and nil (2007 - $0.5 million, 2006 – nil) is included in mineral properties (cost allocated to fair value of options granted to Ketza River contractors). The fair value of the options at the date of grant has been estimated using the Black-Scholes option pricing model using the following assumptions: |
| | | | | Weighted | |
| | | Risk-free | | average | |
| | Grant date | interest rate | Dividend yield | expected life | Volatility |
| | January 26,2006 | 3.00% | - | 5 | 97% |
| | March 28, 2006 | 3.00% | - | 5 | 90% |
| | November 10, 2006 | 4.50% | - | 5 | 84% |
| | December 12, 2006 | 4.13% | - | 5 | 85% |
| | January 5, 2007 | 4.14% | - | 5 | 84% |
| | April 3, 2007 | 4.24% | - | 5 | 81% |
| | June 25, 2007 | 4.25% | - | 5 | 79% |
| | July 5, 2007 | 4.72% | - | 5 | 78% |
| | August 10, 2007 | 4.53% | - | 5 | 78% |
| | September 14, 2007 | 4.14% | - | 2 | 78% |
| | November 13, 2007 | 3.91% | - | 5 | 77% |
| | February 22, 2008 | 3.22% | - | 2 | 70% |
| | March 28, 2008 | 3.35% | - | 5 | 98% |
| | June 19, 2008 | 3.24% | - | 5 | 96% |
24
| YUKON-NEVADA GOLD CORP. |
| (Formerly YGC Resources Ltd.) |
| |
| Notes to Consolidated Financial Statements |
| (Tabular amounts in thousands of US dollars unless otherwise noted) |
| |
| Years ended December 31, 2008, 2007 and 2006 |
| |
Continuity of stock options outstanding for the years ended December 31, 2008, 2007 and 2006 is as follows:
| | | | | | Number of stock options (000's) | |
| | | Exercise | | | | | | | | | | | | | | | | | | | | | | | | | | | | | | | |
| | | price | | | January 1, | | | | | | Exercised/ | | | December | | | | | | Exercised/ | | | December | | | | | | Exercised/ | | | December | |
| Expiry Date | | (C$) | | | 2006 | | | Issued | | | expired | | | 31, 2006 | | | Issued | | | expired | | | 31, 2007 | | | Issued | | | expired | | | 31, 2008 | |
| April 13, 2010 | | 0.60 | | | 1,400 | | | - | | | (10 | ) | | 1,390 | | | - | | | (510 | ) | | 880 | | | - | | | - | | | 880 | |
| May 17, 2010 | | 0.60 | | | 550 | | | - | | | (100 | ) | | 450 | | | - | | | (450 | ) | | - | | | - | | | - | | | - | |
| October 1, 2010 | | 0.60 | | | 1,150 | | | - | | | (35 | ) | | 1,115 | | | - | | | (23 | ) | | 1,092 | | | - | | | (117 | ) | | 975 | |
| April 13, 2007 | | 0.65 | | | 1,190 | | | - | | | (1,085 | ) | | 105 | | | - | | | (105 | ) | | - | | | - | | | - | | | - | |
| July 28, 2007 | | 0.75 | | | 560 | | | - | | | (369 | ) | | 191 | | | - | | | (191 | ) | | - | | | - | | | - | | | - | |
| May 30, 2007 | | 1.55 | | | - | | | 385 | | | (112 | ) | | 273 | | | - | | | (273 | ) | | - | | | - | | | - | | | - | |
| January 25, 2011 | | 0.82 | | | - | | | 400 | | | (30 | ) | | 370 | | | - | | | - | | | 370 | | | - | | | (230 | ) | | 140 | |
| March 28, 2011 | | 1.06 | | | - | | | 125 | | | (40 | ) | | 85 | | | - | | | (10 | ) | | 75 | | | - | | | - | | | 75 | |
| November 10, 2011 | | 1.71 | | | - | | | 10 | | | - | | | 10 | | | - | | | (10 | ) | | - | | | - | | | - | | | - | |
| December 12, 2011 | | 2.25 | | | - | | | 105 | | | - | | | 105 | | | - | | | (30 | ) | | 75 | | | - | | | - | | | 75 | |
| June 20,2009 | | 2.10 | | | - | | | - | | | - | | | - | | | 1,799 | | | - | | | 1,799 | | | - | | | - | | | 1,799 | |
| January 5, 2012 | | 2.77 | | | - | | | - | | | - | | | - | | | 1,275 | | | - | | | 1,275 | | | - | | | (25 | ) | | 1,250 | |
| April 3, 2012 | | 1.61 | | | - | | | - | | | - | | | - | | | 65 | | | (10 | ) | | 55 | | | - | | | - | | | 55 | |
| June 25, 2012 | | 1.64 | | | - | | | - | | | - | | | - | | | 500 | | | (50 | ) | | 450 | | | - | | | (220 | ) | | 230 | |
| July 5, 2012 | | 1.58 | | | - | | | - | | | - | | | - | | | 500 | | | (50 | ) | | 450 | | | - | | | (450 | ) | | - | |
| August 10, 2012 | | 1.74 | | | - | | | - | | | - | | | - | | | 3,410 | | | - | | | 3,410 | | | - | | | (610 | ) | | 2,800 | |
| September 14, 2009 | | 2.10 | | | - | | | - | | | - | | | - | | | 300 | | | - | | | 300 | | | - | | | - | | | 300 | |
| August 17, 2008 | | 3.70 | | | - | | | - | | | - | | | - | | | 15 | | | (5 | ) | | 10 | | | - | | | (10 | ) | | - | |
| November 13, 2007 | | 2.15 | | | - | | | - | | | - | | | - | | | 5 | | | (5 | ) | | - | | | - | | | - | | | - | |
| May 12, 2010 | | 2.15 | | | - | | | - | | | - | | | - | | | 360 | | | (15 | ) | | 345 | | | - | | | (345 | ) | | - | |
| August 23, 2010 | | 2.15 | | | - | | | - | | | - | | | - | | | 10 | | | - | | | 10 | | | - | | | (10 | ) | | - | |
| August 15, 2010 | | 2.20 | | | - | | | - | | | - | | | - | | | 25 | | | (25 | ) | | - | | | - | | | - | | | - | |
| April 6, 2011 | | 4.20 | | | - | | | - | | | - | | | - | | | 546 | | | (30 | ) | | 516 | | | - | | | (516 | ) | | - | |
| July 27, 2008 | | 3.85 | | | - | | | - | | | - | | | - | | | 145 | | | - | | | 145 | | | - | | | (145 | ) | | - | |
| June 20, 2008 | | 5.70 | | | - | | | - | | | - | | | - | | | 72 | | | - | | | 72 | | | - | | | (72 | ) | | - | |
| July 5, 2009 | | 5.70 | | | - | | | - | | | - | | | - | | | 66 | | | - | | �� | 66 | | | - | | | (66 | ) | | - | |
| October 25, 2009 | | 5.70 | | | - | | | - | | | - | | | - | | | 49 | | | - | | | 49 | | | - | | | (49 | ) | | - | |
| May 3, 2010 | | 2.25 | | | - | | | - | | | - | | | - | | | 50 | | | - | | | 50 | | | - | | | (50 | ) | | - | |
| November 13, 2012 | | 1.70 | | | - | | | - | | | - | | | - | | | 40 | | | - | | | 40 | | | - | | | - | | | 40 | |
| March 28, 2013 | | 1.60 | | | - | | | - | | | - | | | - | | | - | | | - | | | - | | | 500 | | | (300 | ) | | 200 | |
| June 19, 2013 | | 1.12 | | | - | | | - | | | - | | | - | | | - | | | - | | | - | | | 500 | | | (500 | ) | | - | |
| February 22, 2010 | | 1.51 | | | - | | | - | | | - | | | - | | | - | | | - | | | - | | | 50 | | | - | | | 50 | |
| | | | | | 4,850 | | | 1,025 | | | (1,781 | ) | | 4,094 | | | 9,232 | | | (1,792 | ) | | 11,534 | | | 1,050 | | | (3,715 | ) | | 8,869 | |
25
| YUKON-NEVADA GOLD CORP. |
| (Formerly YGC Resources Ltd.) |
| |
| Notes to Consolidated Financial Statements |
| (Tabular amounts in thousands of US dollars unless otherwise noted) |
| |
| Years ended December 31, 2008, 2007 and 2006 |
| |
| 17. | Supplemental information: |
| | (a) | Non cash transactions included in the cash flow |
| | (i) | Supplementary information regarding other non-cash transactions: |
| | | | 2008 | | | 2007 | | | 2006 | |
| | | | | | | | | | | |
| | Shares issued on acquisition of Queenstake | $ | - | | | 89,049 | | $ | - | |
| | Warrants issued on acquisition of Queenstake | | - | | | 1828 | | | - | |
| | Stock options issued on acquisition of Queenstake | | - | | | 116 | | | - | |
| | Stock-based compensation included in mineral properties | | - | | | 47 | | | - | |
| | | | | | | | | | | |
| | (ii) | Operating activities included the following cash payments: |
| | | | 2008 | | | 2007 | | | 2006 | |
| | | | | | | | | | | |
| | Interest paid | $ | 257 | | $ | 217 | | $ | – | |
| | | | | | | | | | | |
| | (iii) | Net change in non-cash working capital: |
| | | | 2008 | | | 2007 | | | 2006 | |
| | | | | | | | | | | |
| | Accounts receivable and prepaid expenses | $ | 5,334 | | $ | (2,682 | ) | $ | (130 | ) |
| | Inventories | | 12,793 | | | (15,094 | ) | | - | |
| | Accounts payable and accrued liabilities | | 7,394 | | | (8,043 | ) | | 280 | |
| | Payable on ore purchase | | (10,590 | ) | | 2,344 | | | - | |
| | | $ | 14,931 | | $ | (23,475 | ) | $ | 150 | |
| | (b) | Interest in joint venture |
| | | |
| | | The Company conducts a portion of its business through joint ventures under which the venturers are bound by contractual arrangements establishing joint control over the ventures. The Company records its proportionate share of assets, liabilities, revenues, operating expenses and other income (expense) of the joint ventures. The following condensed statements of earnings and balance sheets for the year ended December 31, 2008 detail the amounts relating to the Company’s interest in a joint venture that has been proportionately consolidated. |
26
| YUKON-NEVADA GOLD CORP. |
| (Formerly YGC Resources Ltd.) |
| |
| Notes to Consolidated Financial Statements |
| (Tabular amounts in thousands of US dollars unless otherwise noted) |
| |
| Years ended December 31, 2008, 2007 and 2006 |
| |
| | | | 2008 | |
| | | | | |
| | Proportionate share of expenses | $ | 18 | |
| | Proportionate share of assets | | | |
| | Cash | $ | 938 | |
| | Property plant and equipment | | 15 | |
| | Accounts receivable | | 124 | |
| | Mineral properties | | 169 | |
| | | $ | 1,246 | |
| | Proportionate share of liabilities | $ | 8 | |
| 18. | Segmented information: |
| | |
| All of the Company’s operations are related to the gold mining industry. As of the end of December 31, 2008 the Company had one gold mine (Jerritt Canyon) located in Nevada, USA. The Company has exploration properties in Canada and the USA. |
| | |
| Assets and liabilities held by geographic location are as follows: |
| | | | 2008 | | | 2007 | |
| | | | | | | | |
| | Assets: | | | | | | |
| | Canada | $ | 53,329 | | $ | 86,288 | |
| | USA | | 146,307 | | | 209,879 | |
| | | | | | | | |
| | | $ | 199,636 | | $ | 296,167 | |
| | | | | | | | |
| | Liabilities: | | | | | | |
| | Canada | $ | 14,470 | | $ | 12,200 | |
| | USA | | 63,518 | | | 78,123 | |
| | | | | | | | |
| | | $ | 77,988 | | $ | 90,323 | |
| 19. | Capital Management: |
| | |
| The Company manages its common shares, stock options and warrants as capital. The Company’s objectives in managing capital are to safeguard its ability to continue as a going concern to provide returns for shareholders and benefits for other stakeholders. To meet this objective the Company will ensure it has sufficient cash resources to pursue the exploration and development of its mineral properties and fund potential acquisitions and future production in its Jerritt Canyon operations. |
| | |
| To support these objectives the Company manages its capital structure and makes adjustments to it in light of changes in economic conditions and risk characteristics of underlying assets. To maintain or adjust its capital structure, the Company may attempt to issue new shares, issue new debt, acquire or dispose of assets or adjust the amount of cash and cash equivalents. In order to maximize the exploration and development efforts, the Company does not pay out dividends. |
27
| YUKON-NEVADA GOLD CORP. |
| (Formerly YGC Resources Ltd.) |
| |
| Notes to Consolidated Financial Statements |
| (Tabular amounts in thousands of US dollars unless otherwise noted) |
| |
| Years ended December 31, 2008, 2007 and 2006 |
| |
| The Company’s investment policy is to invest its cash in highly liquid short-term interest-bearing investments with maturities 90 days or less from the original date of acquisition, selected with regards to the expected timing of expenditures from continuing operations. |
| | | | |
| The Company is not subject to any externally imposed capital requirements and there has been no change with respect to the overall capital risk management strategy during the year ended December 31, 2008. |
| | | | |
| 20. | Financial instruments: |
| | | | |
| The Company’s financial instruments consist of cash and cash equivalents, receivables, marketable securities, restricted funds, accounts payable and accrued liabilities. Cash and cash equivalents are designated as held for trading and therefore carried at fair value, with the unrealized gain or loss recorded in income. Marketable securities are classified as available for sale with the unrealized gain or loss recognized in income. Restricted funds as designated as held for trading and carried at fair value with unrealized gains and losses at the reporting date recognized in income. Interest income and expense are both recorded in income. |
| | | | |
| The fair values of accounts receivables, accounts payable and accrued liabilities approximate carrying value because of the short term nature of these instruments. There are no significant differences between the carrying values and the fair values of any financial assets or liabilities. |
| | | | |
| The Company is exposed to the certain risks through its use of financial instruments, including market risk (currency risk, interest rate risk and commodity price risk), credit risk, and liquidity risk. |
| | | | |
| The Company’s manages its exposure to risk through the identification and analysis of risks faced by the Company, setting appropriate risk limits and controls, and monitoring those risks and adherence to the limits and controls that are established. Risk management is carried out by senior management under the approval of the Board of Directors. Risk management practices are reviewed regularly by senior management and the Audit Committee to reflect changes in market conditions and the Company’s activities. |
| | | | |
| a) | Market risk: |
| | | | |
| | Market risk is the risk or uncertainty arising from possible market price movements and their impact on the future performance of the business. The market price movements that could adversely affect the value of the Company’s financial assets, liabilities and expected future cash flows include foreign currency risk, interest rate risk and commodity price risk. |
| | | | |
| | (i) | Currency risk: |
| | | | |
| | | The Company has integrated operations in Canada and is exposed to foreign currency risk due to fluctuations in the value of the Canadian dollar. Foreign currency risk arises from purchase transactions as well as financial assets and liabilities denominated in Canadian dollars. |
| | | | |
| | | The Company manages this risk by maintaining funds in Canadian dollars to support the cash requirements of those operations. The Company does not use any foreign exchange contracts to hedge these currency risks. |
28
| YUKON-NEVADA GOLD CORP. |
| (Formerly YGC Resources Ltd.) |
| |
| Notes to Consolidated Financial Statements |
| (Tabular amounts in thousands of US dollars unless otherwise noted) |
| |
| Years ended December 31, 2008, 2007 and 2006 |
| |
As at December 31 the Company is exposed to currency risk through its cash and cash equivalents, marketable securities, accounts receivable, restricted funds and accounts payable and accrued liabilities denominated in Canadian dollars as follows, based on notional amounts:
| | In thousands of CAD | | 2008 | | | 2007 | |
| | Cash and cash equivalents | $ | 1,295 | | $ | 39,756 | |
| | Marketable securities | | – | | | 154 | |
| | Accounts receivable and prepaid expenses | | 1,482 | | | 2,610 | |
| | Restricted funds | | 3,341 | | | 8,704 | |
| | Accounts payable and accrued liabilities | | 4,413 | | | 1,350 | |
| | | Based on the above net exposures as at December 31, 2008, a 10% appreciation or depreciation in the Canadian dollar against the US dollar, assuming all other variables remain constant, would result in a $0.1 million increase or decrease, respectively, in operating results and shareholder equity. |
| | | |
| | (ii) | Interest rate risk: |
| | | |
| | | This is the risk that the future cash flows of a financial instrument will fluctuate because of changes in market interest rates. |
| | | |
| | | The Company’s cash and cash equivalents contain highly liquid investments that earn interest at market rates. The Company manages its interest rate risk by maximizing the interest earned on excess funds while maintaining the liquidity necessary to fund daily operations. Fluctuations in market interest rates do not have a significant impact on the Company’s results from operations due to the short term to maturity of the investments held. |
| | | |
| | (iii) | Commodity price risk: |
| | | |
| | | The profitability of the Company is directly related to the market price of gold because revenues are derived primarily from gold mining. Gold prices are affected by numerous factors beyond the Company’s control, including central bank sales, producer hedging activities, the relative exchange rate of the US dollar with other major currencies, global and regional demand and political and economic conditions. Worldwide gold production levels also affect gold prices, and the price of gold is occasionally subject to rapid short-term changes due to speculative activities. The Company has not hedged any of its own gold production. Previously, forward sales contracts were entered into for gold produced under its current tolling arrangements with third parties. These forward contracts were recorded at fair value as they were not designated as hedging instruments, with gains and losses recorded in income. However, all forward contracts were settled during 2008. For the year ended December 31, 2008, a 10% increase or decrease in the price of gold would have resulted in an increase and decrease of $4.9 million in gold sales. |
| | b) | Credit risk: |
| | | | |
| | | Credit risk is the risk of financial loss to the Company if a customer or counterparty to a financial instrument fails to meet its contractual obligations. |
| | | | |
| | | (i) | Cash and cash equivalents and marketable securities |
| | | | |
| | | | The Company manages its credit risk on cash and cash equivalent balances and marketable securities by maintaining balances with Tier 1 Canadian banks with a Standard & Poor’s rating of AA. Short-term |
29
| YUKON-NEVADA GOLD CORP. |
| (Formerly YGC Resources Ltd.) |
| |
| Notes to Consolidated Financial Statements |
| (Tabular amounts in thousands of US dollars unless otherwise noted) |
| |
| Years ended December 31, 2008, 2007 and 2006 |
| |
| | | investments (included in cash and cash equivalents as well as marketable securities) are composed of financial instruments issued by Canadian banks and companies with high investment-grade ratings. These investments mature at various dates over the current operating period. |
| | | |
| | (ii) | Accounts receivables and prepaid expenses |
| | | |
| | | Substantially all of the Company’s trade receivables are based in the US and are with a single counterparty. The Company has transacted with this counterparty for several years and there is no history of loss arising from receivable amounts. |
| | | |
| | | The Company also maintains funds of $25.7 million, included in restricted funds (note 8), with a third party insurer with a Standard & Poor’s rating of A+ to fund future reclamation costs at Jerritt Canyon. The Company maintains title to these funds should the third party be in default of their obligations or enters into bankruptcy protection. |
| | | |
| | | Other significant deposits and receivables are either held by or due from government agencies and relate to the funding of future closure costs at Jerritt Canyon or goods and services input tax credits. |
| | | |
| | | The Company does not have any receivables or deposits that would be considered impaired or otherwise uncollectible, therefore no allowance for doubtful accounts is required. |
| | c) | Liquidity risk: |
| | | |
| | | Liquidity risk is the risk that the Company will not be able to meet its financial obligations as they fall due. The Company manages liquidity risk through forecasting its cash flows from operations and anticipating investing and financing activities. Senior management is actively involved in the review and approval of planned expenditures and typically ensures that it has sufficient cash on demand to meet expected operating expenses for 60 days. |
| | | |
| | | The following are the contractual maturities of the undiscounted cash flows of financial liabilities at December 31, 2008: |
| | | | Less than 3 | | | 4 to 12 | | | 1 to 2 years | | | Greater than | |
| | | | months | | | months | | | | | | 2 years | |
| | Account payable and accrued liabilities | $ | 28,599 | | | – | | | – | | | – | |
| | Payable on purchased ore | | 8,257 | | | – | | | – | | | – | |
| | Capital lease obligations | | 740 | | | 43 | | | 25 | | | – | |
| 21. | Commitments and contingencies: |
| | | | |
| (a) | Commitments: |
| | | | |
| | (i) | Pursuant to a stop order received from the State of Nevada, Division of Environmental Protection in March of 2008, the Company is committed to the design and installation of a Calomel-based mercury emissions control system for improving the removal of mercury from the west and east roasters at the Jerritt Canyon mill facility. The total cost of installing and testing this system to the standards required within the stop order will be $0.1 million. As discussed in Note 1, the Company has completed the design and begun construction of the Calomel system as a condition of receiving approval from the NDEP to restart milling operations. |
30
| YUKON-NEVADA GOLD CORP. |
| (Formerly YGC Resources Ltd.) |
| |
| Notes to Consolidated Financial Statements |
| (Tabular amounts in thousands of US dollars unless otherwise noted) |
| |
| Years ended December 31, 2008, 2007 and 2006 |
| |
| | (ii) | The Company is required to spend C$12.6 million on future exploration expenditures pursuant to the flow-through financing in May 2008 that provided C$20.1 million for exploration on the Ketza River project and other exploration activity in Canada. These restricted funds were applied to non-flow- through expenditures during the last six months of 2008, reducing the amount available to fund this requirement. These restricted funds must be spent by the Company, in accordance with the flow- through share agreement, by the end of 2009. Management intends to take steps necessary to bring the Company back into compliance with the flow-through agreements. If it fails to do so, it will be liable to the investors for their additional taxes payable. |
| | (b) | Lease Commitments: |
| | | |
| | | The Company is committed under various operating leases to the following annual minimum payments: |
| | | | | |
| | 2009 | $ | 218 | |
| | 2010 | | 124 | |
| | 2011 | | 94 | |
| | 2012 | | 44 | |
| | | | | |
| | | $ | 480 | |
31
| YUKON-NEVADA GOLD CORP. |
| (Formerly YGC Resources Ltd.) |
| |
| Notes to Consolidated Financial Statements |
| (Tabular amounts in thousands of US dollars unless otherwise noted) |
| |
| Years ended December 31, 2008, 2007 and 2006 |
| |
| 22. | Reconciliation between Canadian and United States Generally Accepted Accounting Principles |
| | |
| These consolidated financial statements have been prepared in accordance with Canadian generally accepted accounting principles (Canadian GAAP). Material variations in the accounting principles, practices and methods used in preparing these consolidated financial statements from principles, practices and methods accepted by United States of America generally accepted accounting principles (US GAAP) are described and quantified below. |
| | |
| The impact of US GAAP on the consolidated statement of operations is as follows: |
| | | | | | | For the year ended December 31 | |
| | In thousands | | Note | | | 2008 | | | 2007 | | | 2006 | |
| | | | | | | | | | | | | | |
| | Net loss under Canadian GAAP | | | | $ | (105,360 | ) | $ | (1,899 | ) | $ | (1,189 | ) |
| | Write-off of exploration mineral property costs | | (i) | | | (19,479 | ) | | (23,629 | ) | | (6,862 | ) |
| | Recognition of future income tax asset due to write-off of | | | | | | | | | | |
| | exploration mineral property costs | | (i) | | | (2,278 | ) | | 2,278 | | | - | |
| | Premium received on flow-through shares | | (ii) | | | 2,650 | | | 1,619 | | | 1,022 | |
| | Reduction in impairment due to write-off of exploration | | | | | | | | | | |
| | mineral property costs prior to impairment | | (i) | | | 13,714 | | | - | | | - | |
| | Depreciation capitalized to mineral properties | | (i) | | | (386 | ) | | - | | | - | |
| | | | | | | | | | | | | | |
| | Net loss under US GAAP | | | | $ | (111,139 | ) | $ | (21,631 | ) | $ | (7,029 | ) |
| | Other comprehensive income – foreign exchange adjustment | | | | | - | | | 2,599 | | | (316 | ) |
| | Comprehensive income under US GAAP | | | | $ | (111,139 | ) | $ | (19,032 | ) | $ | (7,345 | ) |
| | | | | | | | | | | | | | |
| | Loss per share under US GAAP - basic and diluted | | | | $ | (0.60 | ) | $ | (0.18 | ) | $ | (0.13 | ) |
The impact of US GAAP on the consolidated balance sheet is as follows:
| | | | | | | As at December 31 | |
| | In thousands | | Note | | | 2008 | | | 2007 | |
| | | | | | | | | | | |
| | Assets under Canadian GAAP | | | | $ | 199,636 | | $ | 296,167 | |
| | Opening adjustment to mineral property costs | | (i) | | | (35,366 | ) | | (11,737 | ) |
| | Write-off of exploration mineral property costs | | (i), (iii) | | | (6,151 | ) | | (23,629 | ) |
| | Equity investment in incorporated joint venture | | (iii) | | | - | | | - | |
| | Assets under US GAAP | | | | | 158,119 | | $ | 260,801 | |
| | Liabilities under Canadian GAAP | | | | $ | 77,988 | | $ | 90,323 | |
| | Opening adjustment to future income tax liabilities | | (ii) | | | (5,706 | ) | | (557 | ) |
| | Recognition of future income tax asset due to write-off of | | | | | | | | | |
| | exploration mineral property costs | | (i) | | | 2,278 | | | (2,278 | ) |
| | Premium received on flow through shares | | (ii) | | | 6,667 | | | 2,650 | |
| | Premium on flow-through shares expensed on renunciation | | (ii) | | | (2,650 | ) | | (1,619 | ) |
| | Reversal of future income tax liability arising from | | | | | | | | | |
| | renunciation under Canadian GAAP | | (ii) | | | (2,709 | ) | | (3,902 | ) |
| | Liabilities under US GAAP | | | | $ | 75,868 | | $ | 84,617 | |
32
| YUKON-NEVADA GOLD CORP. |
| (Formerly YGC Resources Ltd.) |
| |
| Notes to Consolidated Financial Statements |
| (Tabular amounts in thousands of US dollars unless otherwise noted) |
| |
| Years ended December 31, 2008, 2007 and 2006 |
| |
| | | | | | | December 31 | |
| | In thousands | | Notes | | | 2008 | | | 2007 | |
| | Shareholders’ equity under Canadian GAAP | | | | $ | 121,648 | | $ | 205,844 | |
| | Opening adjustments to record the write-off of mineral property | | | | | | | | | |
| | costs and premium on flow-through shares | | | | | (29,660 | ) | | (11,180 | ) |
| | Write-off of exploration mineral property costs | | (i) | | | (19,865 | ) | | (23,629 | ) |
| | Reduction in impairment due to write-off of exploration mineral | | | | | | | | | |
| | property costs prior to impairment | | (i) | | | 13,714 | | | - | |
| | Recognition of future income tax asset due to write-off of | | | | | | | | | |
| | exploration mineral property costs | | (i) | | | (2,278 | ) | | 2,278 | |
| | Premium received on flow through shares | | (ii) | | | (6,667 | ) | | (2,650 | ) |
| | Premium on flow-through shares expensed on renunciation | | (ii) | | | 2,650 | | | 1,619 | |
| | Reversal of future income tax liability arising from renunciation | | | | | | | | | |
| | under Canadian GAAP | | (ii) | | | 2,709 | | | 3,902 | |
| | | | | | | | | | | |
| | Shareholders’ equity under US GAAP | | | | $ | 82,251 | | $ | 176,184 | |
The components of Shareholders’ equity under US GAAP would be as follows:
| | | | | | | December 31 | |
| | In thousands | | | | | 2008 | | | 2007 | |
| | Share capital | | (iv) | | $ | 199,961 | | $ | 185,507 | |
| | Warrants | | (iv) | | | 22,753 | | | 20,603 | |
| | Contributed surplus | | | | | 8,694 | | | 8,092 | |
| | Accumulated other comprehensive income | | | | | 2,264 | | | 2,264 | |
| | Deficit | | | | | (151,421 | ) | | (40,282 | ) |
| | | | | | | | | | | |
| | Total Shareholders’ equity | | | | $ | 82,251 | | $ | 176,184 | |
| | In thousands | | Note | | | 2008 | | | 2007 | | | 2006 | |
| | Cash used in operating activities under Canadian GAAP | | $ | (18,412 | ) | $ | (11,768 | ) | $ | (702 | ) |
| | Write-off of exploration mineral property costs | | (i) | | | (19,865 | ) | | (23,629 | ) | | (6,559 | ) |
| | Premium received on flow-through shares | | (ii) | | | 6,667 | | | 2,650 | | | 1,619 | |
| | Cash used in operating activities under US GAAP | | | | $ | (31,610 | ) | $ | (32,747 | ) | $ | (5,642 | ) |
| | Cash used in investing activities under Canadian GAAP | | $ | (42,628 | ) | $ | (33,231 | ) | $ | (8,883 | ) |
| | Write-off of exploration mineral property costs | | (i) | | | 19,865 | | | 23,629 | | | 6,559 | |
| | Cash used in investing activities under US GAAP | | | | $ | (22,763 | ) | $ | (9,602 | ) | $ | (2,324 | ) |
| | Cash used in financing activities under Canadian GAAP | | $ | 21,092 | | $ | 76,476 | | $ | 14,003 | |
| | Write-off of exploration mineral property costs | | (ii) | | | (6,667 | ) | | (2,650 | ) | | (1,619 | ) |
| | Cash used in financing activities under US GAAP | | | | $ | 14,425 | | $ | 73,826 | | $ | 12,384 | |
Under US GAAP there would be no subtotal to the cashflow from operations in the cashflow statement.
33
| YUKON-NEVADA GOLD CORP. |
| (Formerly YGC Resources Ltd.) |
| |
| Notes to Consolidated Financial Statements |
| (Tabular amounts in thousands of US dollars unless otherwise noted) |
| |
| Years ended December 31, 2008, 2007 and 2006 |
| |
Notes to the Reconciliation between Canadian and US GAAP
| | (i) | Mineral properties |
| | | |
| | | Under Canadian GAAP, resource property acquisition costs and exploration costs may be deferred and amortized to the extent they meet certain criteria. Capitalized costs under Canadian GAAP are amortized on a unit-of-production basis based on proven, probable and possible reserves. |
| | | |
| | | Under US GAAP, exploration costs must be expensed as incurred unless the resource properties have proven and probable reserves at which time costs incurred to bring the mine into production are capitalized as development costs. Drilling and related costs in delineating an ore body and converting mineral resources to mineral reserves are expensed as exploration costs under US GAAP. Capitalized costs are then amortized on a unit-of-production basis based on proven and probable reserves rather than over the proven and probable reserves of the mine and the applicable portion of resources expected to ultimately be mined. This additional depletion and exploration expense is recognized in the statement of operations under US GAAP. For the purposes of the consolidated statements of cash flows, the exploration costs are classified as cash used in investing activities under Canadian GAAP and cash used in operating activities under US GAAP. |
| | | |
| | | The impact of this difference under Canadian GAAP and US GAAP affected depreciation as a portion of property, plant and equipment is depreciated and capitalized to mineral property for Canadian GAAP which is expensed for US GAAP and equity loss as the incorporated joint venture also capitalizes mineral property costs for Canadian GAAP. |
| | | |
| | (ii) | Flow-through shares |
| | | |
| | | Under Canadian income tax legislation, the Company is permitted to issue shares whereby the Company agrees to incur Canadian exploration expenditures (as defined in the Income Tax Act, Canada) and renounce the related income tax deductions to investors. Under Canadian GAAP, the full amount of funds received from flow-through share issuances are initially recorded as share capital. Upon renouncing the expenditures, the amount of deferred tax on the expenditures is deducted from share capital. Under US GAAP, the premium paid for the flow-through shares in excess of market value is credited to liabilities and included in income when the related tax benefits are renounced by the Company. |
| | | |
| | (iii) | Income taxes |
| | | |
| | | Under Canadian GAAP, future tax assets and liabilities are recorded at substantially enacted tax rates. Under Financial Accounting Standards Board (FASB) Statement of Financial Accounting Standards (SFAS) 109, Income taxes for US GAAP, deferred tax assets and liabilities are recorded at enacted tax rates. In 2007 and 2008, there were no differences between enacted and substantially enacted rates. As a result, the application of US GAAP in accounting for income taxes does not result in any material measurement differences from Canadian GAAP for future tax assets or liabilities. |
| | | |
| | | Due to the treatment of exploration costs under US GAAP described in note 1 above, there would be a larger tax benefit arising under US GAAP when compared to Canadian GAAP. With respect to the Canadian operations, any future tax assets arising are fully offset by a valuation allowance as it is not more likely than not that the future tax assets would be realized. For the US operations, a valuation allowance has been |
34
| YUKON-NEVADA GOLD CORP. |
| (Formerly YGC Resources Ltd.) |
| |
| Notes to Consolidated Financial Statements |
| (Tabular amounts in thousands of US dollars unless otherwise noted) |
| |
| Years ended December 31, 2008, 2007 and 2006 |
| |
| | | taken against all future income tax assets in excess of liabilities, therefore the asset arising under US GAAP will not be recognized in 2008 and the balance from 2007 has been adjusted accordingly. |
| | | |
| | (iv) | Accounting for warrants |
| | | |
| | | Under Canadian GAAP units issued by the Company consisting of a combination of common shares and warrants are valued by assigning the proceeds received to the common share and deducting the value of the warrants as determined by a Black Scholes model. Under US GAAP the value is assigned to common shares and warrants based on the relative fair value. The fair value of the common shares is detemined by the closing price on the date of the transaction and the fair value of the warrants are determined based on a Black Scholes model. As a result of this difference, share capital was increased by $0.7 million, with an offsetting decrease in the warrants. |
| | | |
| | (v) | Accounting for uncertainty in income taxes |
| | | |
| | | The Company adopted Financial Accounting Standards Board Interpretation No. 48, Accounting for Uncertainty in Income Taxes (FIN 48) effective January 1, 2007. FIN 48 prescribes a recognition threshold and measurement attribute for the financial statement recognition and measurement of a tax position taken or expected to be taken in a tax return. FIN 48 requires that the Company recognize on adoption only those tax positions that are “more-likely-than-not” (50% or greater) of being sustained on audit, based on the technical merits of the position. Additionally, this standard provides guidance on de-recognition, classification, interest and penalties, accounting in interim periods, disclosure and transition. With the adoption of this standard, the Company has performed a comprehensive review of all material tax positions in accordance with recognition and measurement standards established by FIN 48. |
| | | |
| | | Based on this review, the provisions of FIN 48 did not have a material impact on the Company’s annual consolidated financial statements. The Company has elected to apply the provisions of FIN 48 in assessing their uncertain tax positions under Canadian GAAP as well, removing any differences that would arise with US GAAP. |
| | | |
| | (vi) | Adoption of New Accounting Standards |
| | | |
| | | In September 2006, FASB issued SFAS No. 157, Fair Value Measurements (SFAS 157). This statement defines fair value, establishes guidelines for measuring fair value and expands disclosures regarding fair value measurements. SFAS 157 does not require any new fair value measurements but rather eliminates inconsistencies in guidance found in various prior accounting pronouncements. SFAS 157 is effective for fiscal years beginning after November 15, 2007. The Company believes that the adoption of SFAS 157 did not have a material effect on the Company’s consolidated financial statements. |
| | | |
| | | In February 2007, the FASB issued SFAS No.159, the Fair Value Option for Financial Assets and Financial Liabilities - including an amendment to FAS 115. This standard permits a company to choose to measure certain financial assets, financial liabilities and firm commitments at fair value. The standard is effective for fiscal years beginning after November 15, 2007. The adoption of SFAS No.159 did not have a material effect on the Company’s consolidated financial statements. |
35
| YUKON-NEVADA GOLD CORP. |
| (Formerly YGC Resources Ltd.) |
| |
| Notes to Consolidated Financial Statements |
| (Tabular amounts in thousands of US dollars unless otherwise noted) |
| |
| Years ended December 31, 2008, 2007 and 2006 |
| |
| | (vii) | New Accounting Pronouncements |
| | | |
| | | In December 2007, the FASB released SFAS 141-R, Business Combinations. This Statement applies prospectively to business combinations for which the acquisition date is on or after the beginning of the first annual reporting period beginning on or after December 15, 2008, which is a business combination in the year ending December 31, 2009 for the Company. The objective of this Statement is to improve the relevance, representational faithfulness, and comparability of the information that a reporting entity provides in its financial reports about a business combination and its effects. The Company will assess the impact of this standard for Business Combinations occurring after January 1, 2009. |
| | | |
| | | In March 2008, FASB issued FASB Statement No. 161, Disclosures about Derivative Instruments and Hedging Activities - an amendment of FASB Statement No. 133. This Statement requires enhanced disclosures about an entity’s derivative and hedging activities and thereby improves the transparency of financial reporting. This Statement is effective for financial statements issued for fiscal years and interim periods beginning after November 15, 2008, with early application encouraged. This Statement encourages, but does not require, comparative disclosures for earlier periods at initial adoption. The Company is assessing the impact of the new standard. |
| | | |
| | | FASB has issued recent interpretations for US GAAP that suggest warrants with an exercise price that is different from the entity’s functional currency cannot be classified as equity. On June 12, 2008, the EITF reached final consensus on the application of EITF 07-5, Determining Whether and Instrument (or an Embedded Feature) is Indexed to an Entity’s Own Stock, to foreign currency denominated warrants and the decision was approved by the FASB. The EITF is applicable for years beginning after December 15, 2008 and will be treated as a change in accounting principle through prospective application. As the Company’s functional currency is the US dollar, upon adoption of this abstract the issued and outstanding warrants that have an exercise price that is denominated in Canadian dollars will be treated as derivative instruments and recorded as liabilities under US GAAP instead of equity and changes in fair value will be calculated at each reporting period. Any gain or loss arising from this revaluation will be recorded in the statement of operations. |
| | | |
| | (viii) | Incorporated joint venture |
| | | |
| | | Under Canadian GAAP incorporated joint ventures are proportionately consolidated. Under US GAAP the investment of a joint venture is equity accounted for where there incorporated joint venture is not controlled by the Company or consolidated where control exists. The Company owns 50% of the Yukon-Shanxi Mining Corp. an incorporated joint venture and accordingly has equity accounted for this investment for US GAAP. The impact is to reclassify the earnings of the joint venture to the Equity loss in the income statements and include the net investment as an equity investment on the balance sheet. As the Company files a Form 20-F, they are exempt from difference in accounting principles and has therefore elected not to adopt it. See note 17(b) for the details of the joint venture. |
| | | |
| | (ix) | Stock based compensation |
| | | |
| | | Under Canadian GAAP stock based compensation is included on the Statements of Operations in aggregate under income (loss) from operations. Under US GAAP you are required to segregate between individual line items. For US GAAP the Company allocates as the amount between general and administration of $1.1 million (2007- $5.1 million, 2006 – 0.3 million) and cost of goods sold of nil (2007 - $0.5 million, 2006 – nil). |
36
| YUKON-NEVADA GOLD CORP. |
| (Formerly YGC Resources Ltd.) |
| |
| Notes to Consolidated Financial Statements |
| (Tabular amounts in thousands of US dollars unless otherwise noted) |
| |
| Years ended December 31, 2008, 2007 and 2006 |
| |
| | (a) | On March 25, 2009 the Company received approval from the NDEP for the restart of the Jerritt Canyon milling operations. This followed the determination by the NDEP that the Company had completed all environmental-compliance requirements necessary for the NDEP to authorize the recommencement of operations |
| | | | |
| | (b) | On February 27, 2009 the Company, announced that it has closed two non-brokered private placement as follows: |
| | | | |
| | | (i) | 17.3 million units ("Unit 1") at a price of C$0.06 per Unit 1 to net the treasury an aggregate of C$1,040,000. A finder's fee was paid in respect of a portion of the private placement. Each Unit 1 consists of one common share (a "Share") and one Share purchase warrant (the "Warrant"). The Warrant can be exercised to purchase one additional Share (the "Warrant Share") at a price of C$0.08 within 24 months of closing of the private placement. In accordance with securities legislation currently in effect, the Shares, the Warrants and the Warrant Shares will be subject to a "hold period" of four months plus one day expiring on June 26, 2009. |
| | | | |
| | | (ii) | 10.0 million units ("Unit 2") at a price of C$0.05 per Unit 2 to net the treasury an aggregate of C$0.5 million. A finder's fee was paid in respect of the private placement. Each Unit 2 consists of one common share (a "Share") and two series of Share purchase warrants. The first warrant (the "Series "A" Warrant") can be exercised to purchase one additional Share (the ""A" Warrant Share") at a price of C$0.07 per share within 12 months of closing of the private placement and the second warrant (the "Series "B" Warrant") can be exercised to purchase one additional Share (the ""B" Warrant Share") at a price of C$0.09 per share within 18 months of closing of the private placement. In accordance with securities legislation currently in effect, the Shares, the "A" Warrants, the "B" Warrants, the "A" Warrant Shares and the "B" Warrant Shares will be subject to "hold period" of four months plus one day expiring on June 25, 2009. |
37