UNITED STATES
SECURITIES AND EXCHANGE COMMISSION
Washington, D.C. 20549
FORM N-CSR
CERTIFIED SHAREHOLDER REPORT OF REGISTERED MANAGEMENT INVESTMENT COMPANIES
Investment Company Act file number: 811-21566
Name of Fund: BlackRock Floating Rate Income Trust (BGT)
Fund Address: 100 Bellevue Parkway, Wilmington, DE 19809
Name and address of agent for service: John M. Perlowski, Chief Executive Officer, BlackRock Floating Rate Income Trust, 55 East 52nd Street, New York, NY 10055
Registrant’s telephone number, including area code: (800) 882-0052, Option 4
Date of fiscal year end: 10/31/2018
Date of reporting period: 10/31/2018
Item 1 – Report to Stockholders
OCTOBER 31, 2018
| | |
ANNUAL REPORT | |  |
BlackRock Credit Allocation Income Trust (BTZ)
BlackRock Floating Rate Income Trust (BGT)
BlackRock Multi-Sector Income Trust (BIT)
|
| Not FDIC Insured • May Lose Value • No Bank Guarantee |
The Markets in Review
Dear Shareholder,
In the 12 months ended October 31, 2018, ongoing strength in corporate profits drove the equity market higher, while rising interest rates constrained bond returns. Though the market’s appetite for risk remained healthy, risk-taking was tempered somewhat, as shorter-term, higher-quality securities led the bond market, and U.S. equities outperformed most international stock markets.
In international markets, the rising value of the U.S. dollar limited U.S. investors’ returns for the reporting period. When the U.S. dollar appreciates relative to foreign currencies, the value of international investments declines in U.S. dollar terms. Volatility rose in emerging market stocks, which are relatively sensitive to changes in the U.S. dollar. U.S.-China trade relations and debt concerns adversely affected the Chinese stock market, while Turkey and Argentina became embroiled in currency crises, largely due to hyperinflation in both countries. An economic slowdown in Europe led to negative performance for European equities.
In fixed income markets, short-term U.S. Treasury interest rates rose the fastest, while longer-term rates slightly increased. This led to a negative return for long-term U.S. Treasuries and a substantial flattening of the yield curve. Many investors are concerned with the flattening yield curve as a harbinger of recession. However, given the extraordinary monetary measures in the last decade, we believe a more accurate barometer for the economy is the returns along the risk spectrums in stock and bond markets. Although the fundamentals in credit markets remained relatively solid, investment-grade bonds declined slightly, and high-yield bonds posted modest returns.
In response to rising growth and inflation, the U.S. Federal Reserve (the “Fed”) increased short-term interest rates four times during the reporting period. The Fed also continued to reduce its balance sheet during the reporting period, gradually reversing the unprecedented stimulus measures it enacted after the financial crisis. We believe the Fed is likely to continue to raise interest rates in the coming year. By our estimation, the Fed’s neutral interest rate, or the theoretical rate that is neither stimulative nor restrictive to the economy, is approximately 3.0%. With that perspective, the Fed’s current policy is still mildly stimulative to the U.S. economy, which leaves room for further Fed rate hikes to arrive at monetary policy that is a neutral factor for economic growth.
The U.S. economy continued to gain momentum despite the Fed’s modest reduction of economic stimulus; unemployment declined to 3.7%, the lowest rate of unemployment in almost 50 years. The number of job openings reached a record high of more than 7 million, which exceeded the total number of unemployed workers. Strong economic performance has justified the Fed’s somewhat faster pace of rate hikes, as several inflation measures and investors’ expectations for inflation have already surpassed the Fed’s target of 2.0% per year.
While markets have recently focused on the risk of rising long-term interest rates, we continue to believe the primary risk to economic expansion is trade protectionism that could lead to slower global trade and unintended consequences for the globalized supply chain. So far, U.S. tariffs have only had a modest negative impact on economic growth, but the fear of an escalating trade war has stifled market optimism somewhat, leading to higher volatility in risk assets. The outcome of trade negotiations between the United States and China is likely to influence the global growth trajectory and set the tone for free trade in many other nations. Easing of tensions could lead to greater upside for markets, while additional tariffs could adversely affect investor sentiment.
In this environment, investors need to think globally, extend their scope across a broad array of asset classes, and be nimble as market conditions change. We encourage you to talk with your financial advisor and visit blackrock.com for further insight about investing in today’s markets.
Sincerely,

Rob Kapito
President, BlackRock Advisors, LLC

Rob Kapito
President, BlackRock Advisors, LLC
| | | | |
| Total Returns as of October 31, 2018 |
| | | 6-month | | 12-month |
U.S. large cap equities
(S&P 500® Index) | | 3.40% | | 7.35% |
U.S. small cap equities
(Russell 2000® Index) | | (1.37) | | 1.85 |
International equities
(MSCI Europe, Australasia, Far East Index) | | (9.92) | | (6.85) |
Emerging market equities
(MSCI Emerging Markets Index) | | (16.53) | | (12.52) |
3-month Treasury bills
(ICE BofAML 3-Month U.S. Treasury Bill Index) | | 0.99 | | 1.68 |
U.S. Treasury securities
(ICE BofAML 10-Year U.S. Treasury Index) | | (0.60) | | (4.37) |
U.S. investment grade bonds
(Bloomberg Barclays U.S. Aggregate Bond Index) | | (0.19) | | (2.05) |
Tax-exempt municipal bonds
(S&P Municipal Bond Index) | | 0.45 | | (0.31) |
U.S. high yield bonds
(Bloomberg Barclays U.S. Corporate High Yield 2% Issuer Capped Index) | | 1.14 | | 0.98 |
| Past performance is no guarantee of future results. Index performance is shown for illustrative purposes only. You cannot invest directly in an index. |
| | |
| 2 | | THIS PAGEISNOT PARTOF YOUR FUND REPORT |
Table of Contents
| | |
| Trust Summary as of October 31, 2018 | | BlackRock Credit Allocation Income Trust |
Investment Objective
BlackRock Credit Allocation Income Trust’s (BTZ) (the “Trust”) investment objective is to provide current income, current gains and capital appreciation. The Trust seeks to achieve its investment objective by investing, under normal market conditions, at least 80% of its assets in credit-related securities, including, but not limited to, investment grade corporate bonds, high yield bonds (commonly referred to as “junk” bonds), bank loans, preferred securities or convertible bonds or derivatives with economic characteristics similar to these credit-related securities. The Trust may invest directly in such securities or synthetically through the use of derivatives.
No assurance can be given that the Trust’s investment objective will be achieved.
Trust Information
| | |
Symbol on New York Stock Exchange (“NYSE”) | | BTZ |
Initial Offering Date | | December 27, 2006 |
Current Distribution Rate on Closing Market Price as of October 31, 2018 ($11.72)(a) | | 6.86% |
Current Monthly Distribution per Common Share(b) | | $0.0670 |
Current Annualized Distribution per Common Share(b) | | $0.8040 |
Economic Leverage as of October 31, 2018(c) | | 33% |
| | (a) | Current distribution rate on closing market price is calculated by dividing the current annualized distribution per share by the closing market price. The current distribution rate consists of income, net realized gains and/or a return of capital. Past performance does not guarantee future results. | |
| | (b) | The distribution rate is not constant and is subject to change. A portion of the distribution may be deemed a return of capital or net realized gain. | |
| | (c) | Represents reverse repurchase agreements as a percentage of total managed assets, which is the total assets of the Trust (including any assets attributable to any borrowings) minus the sum of its liabilities (other than borrowings representing financial leverage). For a discussion of leveraging techniques utilized by the Trust, please see The Benefits and Risks of Leveraging on page 13. | |
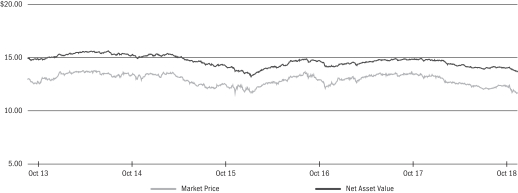
Market Price and Net Asset Value Per Share Summary
| | | | | | | | | | | | | | | | | | | | |
| | | 10/31/18 | | | 10/31/17 | | | Change | | | High | | | Low | |
Market Price | | $ | 11.72 | | | $ | 13.36 | | | | (12.28 | )% | | $ | 13.51 | | | $ | 11.65 | |
Net Asset Value | | | 13.72 | | | | 14.88 | | | | (7.80 | ) | | | 14.92 | | | | 13.71 | |
Market Price and Net Asset Value History For the Past Five Years
| | |
| 4 | | 2018 BLACKROCK ANNUAL REPORTTO SHAREHOLDERS |
| | |
| Trust Summary as of October 31, 2018 (continued) | | BlackRock Credit Allocation Income Trust |
Performance and Portfolio Management Commentary
Returns for the period ended October 31, 2018 were as follows:
| | | | | | | | | | | | | | | | |
| | | | | | Average Annual Total Returns | |
| | | | | | 1 Year | | | 3 Years | | | 5 Years | |
Trust at NAV(a)(b) | | | | | | | (1.72 | )% | | | 5.35 | % | | | 5.30 | % |
Trust at Market Price(a)(b) | | | | | | | (6.49 | ) | | | 4.53 | | | | 5.01 | |
Reference Benchmark(c) | | | | | | | (1.78 | ) | | | 3.82 | | | | 3.69 | |
Bloomberg Barclays U.S. Credit Index(d) | | | | | | | (2.81 | ) | | | 2.34 | | | | 2.81 | |
Bloomberg Barclays U.S. Corporate High Yield 2% Issuer Capped Index(e) | | | | | | | 0.98 | | | | 6.60 | | | | 4.69 | |
Bloomberg Barclays USD Capital Securities Index(f) | | | | | | | (3.29 | ) | | | 3.35 | | | | 4.32 | |
| | (a) | All returns reflect reinvestment of dividends and/or distributions at actual reinvestment prices. Performance results reflect the Trust’s use of leverage. | |
| | (b) | The Trust’s discount to NAV widened during the period, which accounts for the difference between performance based on market price and performance based on NAV. | |
| | (c) | The Reference Benchmark is comprised of the Bloomberg Barclays U.S. Credit Index (50.36%), the Bloomberg Barclays U.S. Corporate High Yield 2% Issuer Capped Index (29.93%), and the Bloomberg Barclays USD Capital Securities Index (19.71%). | |
| | (d) | This unmanaged index measures the investment grade, U.S. dollar-denominated, fixed-rate, taxable corporate and government-related bond markets. | |
| | (e) | An unmanaged index comprised of issues that meet the following criteria: at least $150 million par value outstanding; maximum credit rating of Ba1; at least one year to maturity; and no issuer represents more than 2% of the index. | |
| | (f) | This unmanaged index tracks fixed-rate, investment grade capital securities denominated in USD. | |
Performance results may include adjustments made for financial reporting purposes in accordance with U.S. generally accepted accounting principles.
Past performance is not indicative of future results.
BTZ is presenting the Reference Benchmark to accompany trust performance. The Reference Benchmark is presented for informational purposes only, as the Trust is actively managed and does not seek to track or replicate the performance of the Reference Benchmark or any other index. The portfolio investments of the Trust may differ substantially from the securities that comprise the indices within the Reference Benchmark, which may cause the Trust’s performance to differ materially from that of the Reference Benchmark. The Trust employs leverage as part of its investment strategy, which may change over time at the discretion of BlackRock Advisors, LLC (the “Manager”) as market and other conditions warrant. In contrast, the Reference Benchmark is not adjusted for leverage. Therefore, leverage generally may result in the Trust outperforming the Reference Benchmark in rising markets and underperforming in declining markets. The Board considers additional factors to evaluate the Trust’s performance, such as the performance of the Trust relative to a peer group of funds, a leverage-adjusted benchmark and/or other information provided by the Manager.
More information about the Trust’s historical performance can be found in the “Closed End Funds” section of http://www.blackrock.com.
The following discussion relates to the Trust’s absolute performance based on NAV:
What factors influenced performance?
The Trust’s small allocation to emerging market-related debt had a negative impact on performance as rising interest rates, a strengthening U.S. dollar and idiosyncratic events weighed on the asset class. Additionally, the Trust’s allocations to European investment grade and high yield corporate debt detracted, with exposure to the banking sector weighing most heavily on return.
The Trust’s allocation to U.S. high yield corporate bonds helped performance as a positive technical backdrop supported the asset class amid volatility in other credit markets. An allocation to collateralized loan obligations (“CLOs”) also added to performance as the asset class benefited from rising short-term rates and investor appetite for floating rate debt. Positioning with respect to overall portfolio duration (and corresponding sensitivity to interest rate changes) was positive for performance as well, as the Trust had a relatively short duration in a period of rising rates.
Describe recent portfolio activity.
Over the period, the Trust’s out-of-benchmark exposure to CLOs was increased in order to benefit from demand for floating rate products in a rising rate environment. Additionally, the Trust increased its exposure to U.S. high yield corporate bonds over the period with an emphasis on the technology and energy sectors, as strong credit fundamentals and an improved technical backdrop have supported the asset class.
The Trust utilized derivatives including financial futures over the period in order to manage interest rate risk in the portfolio. The use of derivatives had a positive impact on performance.
Describe portfolio positioning at period end.
The Trust was positioned with a constructive view on credit as growth remained strong and corporate fundamentals remained healthy, although increased downside risks led the investment adviser to adopt a slightly more cautious stance. The Trust maintained an underweight position with respect to duration (and interest rate sensitivity) on the view that rates could continue to rise, along with an allocation to CLOs, which benefit from rising short-term rates. The largest overweight positions were to banks within financials and to midstream energy and telecommunication services companies within industrials. The Trust was underweight in sectors viewed as facing structural challenges such as retailers and life insurance companies.
The views expressed reflect the opinions of BlackRock as of the date of this report and are subject to change based on changes in market, economic or other conditions. These views are not intended to be a forecast of future events and are no guarantee of future results.
| | |
| Trust Summary as of October 31, 2018 (continued) | | BlackRock Credit Allocation Income Trust |
Overview of the Trust’s Total Investments
PORTFOLIO COMPOSITION
| | | | | | | | |
| | | 10/31/18 | | | 10/31/17 | |
Corporate Bonds | | | 74 | % | | | 73 | % |
Preferred Securities | | | 17 | | | | 19 | |
Asset-Backed Securities | | | 6 | | | | 3 | |
U.S. Treasury Obligations | | | — | | | | 1 | |
Foreign Agency Obligations | | | 2 | | | | 2 | |
Municipal Bonds | | | 1 | | | | 1 | |
Other | | | — | (a) | | | 1 | (b) |
| | (a) | Includes a less than 1% holding in each of the following investment types: Short-Term Securities, U.S. Government Sponsored Agency Securities, Options Purchased and Options Written. | |
| | (b) | Includes a less than 1% holding in each of the following investment types: Short-Term Securities, U.S. Government Sponsored Agency Securities and Options Purchased. | |
CREDIT QUALITY ALLOCATION (c)(d)
| | | | | | | | |
| | | 10/31/18 | | | 10/31/17 | |
AAA/Aaa(e) | | | 1 | % | | | 2 | % |
AA/Aa | | | 2 | | | | 3 | |
A | | | 18 | | | | 16 | |
BBB/Baa | | | 50 | | | | 51 | |
BB/Ba | | | 17 | | | | 19 | |
B | | | 10 | | | | 8 | |
CCC/Caa | | | 2 | | | | 1 | |
CC/Ca(f) | | | — | | | | — | |
| | (c) | For financial reporting purposes, credit quality ratings shown above reflect the highest rating assigned by either Standard & Poor’s (“S&P”) or Moody’s Investors Service (“Moody’s”) if ratings differ. These rating agencies are independent, nationally recognized statistical rating organizations and are widely used. Investment grade ratings are credit ratings of BBB/Baa or higher. Below investment grade ratings are credit ratings of BB/Ba or lower. Investments designated N/R are not rated by either rating agency. Unrated investments do not necessarily indicate low credit quality. Credit quality ratings are subject to change. | |
| | (d) | Excludes Short-Term Securities, Options Purchased and Options Written. | |
| | (e) | The investment adviser evaluates the credit quality of not-rated investments based upon certain factors including, but not limited to, credit ratings for similar investments and financial analysis of sectors, individual investments and/or issuer. Using this approach, the investment adviser has deemed U.S. Government Sponsored Agency Securities and U.S. Treasury Obligations as AAA/Aaa. | |
| | (f) | Represents less than 1% of total investments. | |
| | |
| 6 | | 2018 BLACKROCK ANNUAL REPORTTO SHAREHOLDERS |
| | |
| Trust Summary as of October 31, 2018 | | BlackRock Floating Rate Income Trust |
Investment Objective
BlackRock Floating Rate Income Trust’s (BGT) (the “Trust”) primary investment objective is to provide a high level of current income. The Trust’s secondary investment objective is to seek the preservation of capital to the extent consistent with its primary objective of high current income. The Trust seeks to achieve its investment objectives by investing primarily, under normal conditions, at least 80% of its assets in floating and variable rate instruments of U.S. and non-U.S. issuers, including a substantial portion of its assets in global floating and variable rate securities including senior secured floating rate loans made to corporate and other business entities. Under normal market conditions, the Trust expects that the average effective duration of its portfolio will be no more than 1.5 years. The Trust may invest directly in such securities or synthetically through the use of derivatives.
No assurance can be given that the Trust’s investment objectives will be achieved.
Trust Information
| | |
Symbol on NYSE | | BGT |
Initial Offering Date | | August 30, 2004 |
Current Distribution Rate on Closing Market Price as of October 31, 2018 ($12.72)(a) | | 5.83% |
Current Monthly Distribution per Common Share(b) | | $0.0618 |
Current Annualized Distribution per Common Share(b) | | $0.7416 |
Economic Leverage as of October 31, 2018(c) | | 30% |
| | (a) | Current distribution rate on closing market price is calculated by dividing the current annualized distribution per share by the closing market price. The current distribution rate consists of income, net realized gains and/or a return of capital. Past performance does not guarantee future results. | |
| | (b) | The distribution rate is not constant and is subject to change. | |
| | (c) | Represents bank borrowings outstanding as a percentage of total managed assets, which is the total assets of the Trust (including any assets attributable to any borrowings) minus the sum of its liabilities (other than borrowings representing financial leverage). For a discussion of leveraging techniques utilized by the Trust, please see The Benefits and Risks of Leveraging on page 13. | |
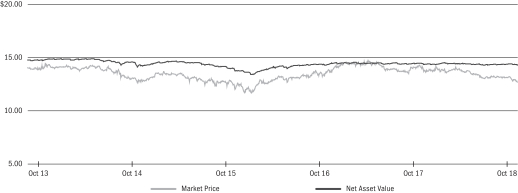
Market Price and Net Asset Value Per Share Summary
| | | | | | | | | | | | | | | | | | | | |
| | | 10/31/18 | | | 10/31/17 | | | Change | | | High | | | Low | |
Market Price | | $ | 12.72 | | | $ | 14.31 | | |
| (11.11
| )%
| | $ | 14.32 | | | $ | 12.72 | |
Net Asset Value | | | 14.33 | | | | 14.49 | | | | (1.10 | ) | | | 14.54 | | | | 14.29 | |
Market Price and Net Asset Value History For the Past Five Years
| | |
| Trust Summary as of October 31, 2018 (continued) | | BlackRock Floating Rate Income Trust |
Performance and Portfolio Management Commentary
Returns for the period ended October 31, 2018 were as follows:
| | | | | | | | | | | | | | | | |
| | | | | | Average Annual Total Returns | |
| | | | | | 1 Year | | | 3 Years | | | 5 Years | |
Trust at NAV(a)(b) | | | | | | | 4.25 | % | | | 5.87 | % | | | 5.15 | % |
Trust at Market Price(a)(b) | | | | | | | (6.30 | ) | | | 5.37 | | | | 3.63 | |
S&P/LSTA Leveraged Loan Index(c) | | | | | | | 4.54 | | | | 5.37 | | | | 3.97 | |
| | (a) | All returns reflect reinvestment of dividends and/or distributions at actual reinvestment prices. Performance results reflect the Trust’s use of leverage. | |
| | (b) | The Trust’s discount to NAV widened during the period, which accounts for the difference between performance based on market price and performance based on NAV. | |
| | (c) | This unmanaged market value-weighted index (the “Reference Benchmark”) is designed to measure the performance of the U.S. leveraged loan market based upon market weightings, spreads and interest payments. | |
Performance results may include adjustments made for financial reporting purposes in accordance with U.S. generally accepted accounting principles.
Past performance is not indicative of future results.
BGT is presenting the Reference Benchmark to accompany trust performance. The Reference Benchmark is presented for informational purposes only, as the Trust is actively managed and does not seek to track or replicate the performance of the Reference Benchmark or any other index. The portfolio investments of the Trust may differ substantially from the securities that comprise the indices within the Reference Benchmark, which may cause the Trust’s performance to differ materially from that of the Reference Benchmark. The Trust employs leverage as part of its investment strategy, which may change over time at the discretion of BlackRock Advisors, LLC (the “Manager”) as market and other conditions warrant. In contrast, the Reference Benchmark is not adjusted for leverage. Therefore, leverage generally may result in the Trust outperforming the Reference Benchmark in rising markets and underperforming in declining markets. The Board considers additional factors to evaluate the Trust’s performance, such as the performance of the Trust relative to a peer group of funds, a leverage-adjusted benchmark and/or other information provided by the Manager.
More information about the Trust’s historical performance can be found in the “Closed End Funds” section of http://www.blackrock.com.
The following discussion relates to the Trust’s absolute performance based on NAV:
What factors influenced performance?
From a sector perspective, the technology, health care and consumer cyclical services sectors were the largest contributors to the Trust’s performance. By credit rating, B-rated positions were the largest contributors to performance, followed by BB-rated and CCC-rated positions. In terms of asset allocation, contributions to performance were led by floating rate loan interests (“bank loans”), followed by high yield bonds and collateralized loan obligations (“CLOs”).
On the downside, at the sector level, wireless, banking and integrated energy holdings were the largest detractors from the Trust’s performance. There were no detractors from a credit rating perspective. Small positions in high yield credit default swaps and bank loan index products detracted slightly as well.
Describe recent portfolio activity.
The majority of the Trust was invested in B-rated bank loans over the 12-month period, with BB-rated names as the second largest allocation. Over the period, the Trust decreased its position in BB-rated loans in favor of B-rated positions. Additionally, the Trust trimmed its small CCC-rated allocation. On a sector basis, the Trust reduced its allocation to the communications space, particularly with respect to cable & satellite and wireless companies. The Trust also decreased its allocation to the gaming sector and continued to avoid cyclical sectors such as retailers and leisure. The Trust reduced its high yield bond exposure over the period and increased its allocation to CLOs.
Describe portfolio positioning at period end.
At period end, the Trust held the majority of its portfolio in floating rate bank loans, along with modest allocations to high yield bonds and CLOs. The Trust maintained its highest concentration in B-rated loans of select issuers, while limiting exposure to both higher quality loans with less-compelling risk/reward profiles and lower-rated loans with more equity-like profiles and greater downside risk should credit sentiment weaken. From a sector perspective, the Trust’s largest overweight positions were within health care, technology and pharmaceuticals issuers. By contrast, the Trust was underweight in the broad consumer cyclicals space, particularly to retailers, automotive and leisure issuers. Within energy, the Trust was focused on higher-quality issuers within the independent energy segment as opposed to the potentially more volatile oil field services space. The Trust remained focused on industries and companies with stable business profiles and consistent cash flows, while avoiding areas of the market with secular concerns and/or deteriorating fundamental trends.
The views expressed reflect the opinions of BlackRock as of the date of this report and are subject to change based on changes in market, economic or other conditions. These views are not intended to be a forecast of future events and are no guarantee of future results.
| | |
| 8 | | 2018 BLACKROCK ANNUAL REPORTTO SHAREHOLDERS |
| | |
| Trust Summary as of October 31, 2018 (continued) | | BlackRock Floating Rate Income Trust |
Overview of the Trust’s Total Investments
PORTFOLIO COMPOSITION
| | | | | | | | |
| | | 10/31/18 | | | 10/31/17 | |
Floating Rate Loan Interests | | | 92 | % | | | 93 | % |
Asset-Backed Securities | | | 5 | | | | 1 | |
Corporate Bonds | | | 2 | | | | 5 | |
Investment Companies | | | 1 | | | | — | (a) |
Other | | | — | (b) | | | 1 | (b) |
| | (a) | Represents less than 1% of total investments. | |
| | (b) | Includes a less than 1% holding in each of the following investment types: Common Stocks, Other Interests, Rights, Warrants, Short-Term Securities and Options Purchased. | |
CREDIT QUALITY ALLOCATION (c)(d)
| | | | | | | | |
| | | 10/31/18 | | | 10/31/17 | |
AA/Aa | | | 1 | % | | | — | (a)% |
A | | | 1 | | | | 1 | |
BBB/Baa | | | 10 | | | | 8 | |
BB/Ba | | | 39 | | | | 42 | |
B | | | 43 | | | | 42 | |
CCC/Caa | | | 3 | | | | 3 | |
N/R | | | 3 | | | | 4 | |
| | (c) | For financial reporting purposes, credit quality ratings shown above reflect the highest rating assigned by either S&P’s or Moody’s if ratings differ. These rating agencies are independent, nationally recognized statistical rating organizations and are widely used. Investment grade ratings are credit ratings of BBB/Baa or higher. Below investment grade ratings are credit ratings of BB/Ba or lower. Investments designated N/R are not rated by either rating agency. Unrated investments do not necessarily indicate low credit quality. Credit quality ratings are subject to change. | |
| | (d) | Excludes Short-Term Securities and Options Purchased. | |
| | |
| Trust Summary as of October 31, 2018 | | BlackRock Multi-Sector Income Trust |
Investment Objective
BlackRock Multi-Sector Income Trust’s (BIT) (the “Trust”) primary investment objective is to seek high current income, with a secondary objective of capital appreciation. The Trust seeks to achieve its investment objectives by investing, under normal market conditions, at least 80% of its assets in loan and debt instruments and other investments with similar economic characteristics. The Trust may invest directly in such securities or synthetically through the use of derivatives. Additionally, as part of the Trust’s investments in loans, the Trust may make loans directly to borrowers either as a sole lender or by acting as a member of a syndicate of original lenders.
No assurance can be given that the Trust’s investment objectives will be achieved.
Trust Information
| | |
Symbol on NYSE | | BIT |
Initial Offering Date | | February 27, 2013 |
Current Distribution Rate on Closing Market Price as of October 31, 2018 ($16.25)(a) | | 8.62% |
Current Monthly Distribution per Common Share(b) | | $0.1167 |
Current Annualized Distribution per Common Share(b) | | $1.4004 |
Economic Leverage as of October 31, 2018(c) | | 35% |
| | (a) | Current distribution rate on closing market price is calculated by dividing the current annualized distribution per share by the closing market price. The current distribution rate consists of income, net realized gains and/or a return of capital. Past performance does not guarantee future results. | |
| | (b) | The distribution rate is not constant and is subject to change. A portion of the distribution may be deemed a return of capital or net realized gain. | |
| | (c) | Represents reverse repurchase agreements as a percentage of total managed assets, which is the total assets of the Trust (including any assets attributable to any borrowings) minus the sum of its liabilities (other than borrowings representing financial leverage). For a discussion of leveraging techniques utilized by the Trust, please see The Benefits and Risks of Leveraging on page 13. | |
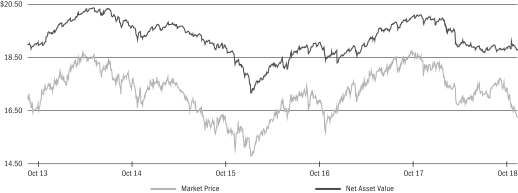
Market Price and Net Asset Value Per Share Summary
| | | | | | | | | | | | | | | | | | | | |
| | | 10/31/18 | | | 10/31/17 | | | Change | | | High | | | Low | |
Market Price | | $ | 16.25 | | | $ | 18.55 | | | | (12.40 | )% | | $ | 18.59 | | | $ | 16.18 | |
Net Asset Value | | | 18.79 | | | | 20.07 | | | | (6.38 | ) | | | 20.09 | | | | 18.68 | |
Market Price and Net Asset Value History For the Past Five Years
| | |
| 10 | | 2018 BLACKROCK ANNUAL REPORTTO SHAREHOLDERS |
| | |
| Trust Summary as of October 31, 2018 (continued) | | BlackRock Multi-Sector Income Trust |
Performance and Portfolio Management Commentary
Returns for the period ended October 31, 2018 were as follows:
| | | | | | | | | | | | | | | | |
| | | | | | Average Annual Total Returns | |
| | | | | | 1 Year | | | 3 Years | | | 5 Years | |
Trust at NAV(a)(b) | | | | | | | 2.18 | % | | | 9.95 | % | | | 9.31 | % |
Trust at Market Price(a)(b) | | | | | | | (4.40 | ) | | | 9.93 | | | | 8.46 | |
Lipper General Bond Funds at NAV(c) | | | | | | | 3.21 | | | | 7.21 | | | | 6.07 | |
Lipper General Bond Funds at Market Price(c) | | | | | | | (0.36 | ) | | | 9.10 | | | | 6.67 | |
| | (a) | All returns reflect reinvestment of dividends and/or distributions at actual reinvestment prices. Performance results reflect the Trust’s use of leverage. | |
| | (b) | The Trust’s discount to NAV widened during the period, which accounts for the difference between performance based on market price and performance based on NAV. | |
| | (c) | Average return. Returns reflect reinvestment of dividends and/or distributions at NAV on the ex-dividend date as calculated by Lipper. Historical performance shown is calculated based on the composition of the Lipper General Bond Fund category at the time of preparation of this report to shareholders. | |
Performance results may include adjustments made for financial reporting purposes in accordance with U.S. generally accepted accounting principles.
Past performance is not indicative of future results.
More information about the Trust’s historical performance can be found in the “Closed End Funds” section of http://www.blackrock.com.
The following discussion relates to the Trust’s absolute performance based on NAV:
What factors influenced performance?
The Trust’s positions in asset-backed securities (“ABS”), senior loans, commercial mortgage-backed securities (“CMBS”), and non-agency mortgage-backed securities (“MBS”) were the largest contributors to Trust performance for the period. Allocations to collateralized loan obligations and high yield corporate issues also contributed.
The Trust’s allocation to sovereign plus securities represented the largest detractor from performance during the period. Holdings in investment grade corporate securities, capital securities and emerging market issues also detracted from returns.
For the period, the Trust held derivatives including interest rate swaps and futures as part of its investment strategy. Interest rate derivatives were utilized to manage duration (sensitivity to interest rates) and to express views on swap spreads. The use of these derivative securities had a positive impact on performance during the period.
Describe recent portfolio activity.
At the start of the 12-month period, the Trust was positioned to benefit from a generally supportive market environment for risk assets given synchronized global growth, low volatility and robust economic data, particularly in the United States. As market volatility began to pick up over the course of the period, the Trust’s positioning shifted to a more defensive posture, and the investment adviser began to focus on allocating to more liquid sectors within the fixed income market. In addition, the Trust’s allocation to emerging market debt was reduced as the segment came under pressure in the latter half of the period due to a stronger U.S. dollar, heightened political uncertainty and global trade tensions. Securitized sectors had been resilient despite broad market volatility, but given that spreads in many areas of the securitized market were at their narrowest levels since the 2008 financial crisis, the Trust reduced its allocations to ABS and CMBS. As valuations improved based on waning demand from banks and overseas investors, the Trust rotated into sectors such as agency MBS. The Trust also added some exposure to U.S. Treasuries. The Trust’s duration was reduced over the period, as the investment adviser believed that a combination of increased U.S. Treasury issuance and monetary policy tightening by global central banks would continue to push rates higher.
Describe portfolio positioning at period end.
At period end, the Trust maintained diversified exposure mainly across non-government spread sectors including securitized products, high yield and investment-grade corporate issues, and emerging market debt.
The views expressed reflect the opinions of BlackRock as of the date of this report and are subject to change based on changes in market, economic or other conditions. These views are not intended to be a forecast of future events and are no guarantee of future results.
| | |
| Trust Summary as of October 31, 2018 (continued) | | BlackRock Multi-Sector Income Trust |
Overview of the Trust’s Total Investments
PORTFOLIO COMPOSITION
| | | | | | | | |
| | | 10/31/18 | | | 10/31/17 | |
Corporate Bonds | | | 42 | % | | | 42 | % |
Asset-Backed Securities | | | 15 | | | | 17 | |
Non-Agency Mortgage-Backed Securities | | | 11 | | | | 13 | |
Preferred Securities | | | 11 | | | | 11 | |
Foreign Agency Obligations | | | 10 | | | | 6 | |
Floating Rate Loan Interests | | | 6 | | | | 9 | |
U.S. Government Sponsored Agency Securities | | | 3 | | | | 2 | |
Short-Term Securities | | | 2 | | | | — | (a) |
Other | | | — | (b) | | | — | (c) |
| | (a) | Represents less than 1% of total investments. | |
| | (b) | Includes a less than 1% holding in Common Stocks. | |
| | (c) | Includes a less than 1% holding in each of the following investment types: Common Stocks, Options Purchased and Options Written. | |
CREDIT QUALITY ALLOCATION (d)(e)
| | | | | | | | |
| | | 10/31/18 | | | 10/31/17 | |
AAA/Aaa(f) | | | 2 | % | | | — | %(a) |
AA/Aa | | | 7 | | | | 1 | |
A | | | 5 | | | | 5 | |
BBB/Baa | | | 18 | | | | 16 | |
BB/Ba | | | 20 | | | | 29 | |
B | | | 17 | | | | 18 | |
CCC/Caa | | | 7 | | | | 16 | |
CC/Ca | | | 8 | | | | — | (a) |
C | | | 4 | | | | 4 | |
N/R | | | 12 | | | | 11 | |
| | (d) | For financial reporting purposes, credit quality ratings shown above reflect the highest rating assigned by either S&P’s or Moody’s if ratings differ. These rating agencies are independent, nationally recognized statistical rating organizations and are widely used. Investment grade ratings are credit ratings of BBB/Baa or higher. Below investment grade ratings are credit ratings of BB/Ba or lower. Investments designated N/R are not rated by either rating agency. Unrated investments do not necessarily indicate low credit quality. Credit quality ratings are subject to change. | |
| | (e) | Excludes Short-Term Securities, Options Purchased and Options Written. | |
| | (f) | The investment adviser evaluates the credit quality of not-rated investments based upon certain factors including, but not limited to, credit ratings for similar investments and financial analysis of sectors, individual investments and/or issuer. Using this approach, the investment adviser has deemed U.S. Government Sponsored Agency Securities and U.S. Treasury Obligations as AAA/Aaa. | |
| | |
| 12 | | 2018 BLACKROCK ANNUAL REPORTTO SHAREHOLDERS |
The Benefits and Risks of Leveraging
The Trusts may utilize leverage to seek to enhance the distribution rate on, and net asset value (“NAV”) of, their common shares (“Common Shares”). However, there is no guarantee that these objectives can be achieved in all interest rate environments.
In general, the concept of leveraging is based on the premise that the financing cost of leverage, which is based on short-term interest rates, is normally lower than the income earned by a Trust on its longer-term portfolio investments purchased with the proceeds from leverage. To the extent that the total assets of the Trusts (including the assets obtained from leverage) are invested in higher-yielding portfolio investments, the Trusts’ shareholders benefit from the incremental net income. The interest earned on securities purchased with the proceeds from leverage is paid to shareholders in the form of dividends, and the value of these portfolio holdings is reflected in the per share NAV.
To illustrate these concepts, assume a Trust’s capitalization is $100 million and it utilizes leverage for an additional $30 million, creating a total value of $130 million available for investment in longer-term income securities. If prevailing short-term interest rates are 3% and longer-term interest rates are 6%, the yield curve has a strongly positive slope. In this case, a Trust’s financing costs on the $30 million of proceeds obtained from leverage are based on the lower short-term interest rates. At the same time, the securities purchased by a Trust with the proceeds from leverage earn income based on longer-term interest rates. In this case, a Trust’s financing cost of leverage is significantly lower than the income earned on a Trust’s longer-term investments acquired from such leverage proceeds, and therefore the holders of Common Shares (“Common Shareholders”) are the beneficiaries of the incremental net income.
However, in order to benefit shareholders, the return on assets purchased with leverage proceeds must exceed the ongoing costs associated with the leverage. If interest and other costs of leverage exceed the Trusts’ return on assets purchased with leverage proceeds, income to shareholders is lower than if the Trusts had not used leverage. Furthermore, the value of the Trusts’ portfolio investments generally varies inversely with the direction of long-term interest rates, although other factors can influence the value of portfolio investments. In contrast, the value of the Trusts’ obligations under their respective leverage arrangements generally does not fluctuate in relation to interest rates. As a result, changes in interest rates can influence the Trusts’ NAVs positively or negatively. Changes in the future direction of interest rates are very difficult to predict accurately, and there is no assurance that the Trusts’ intended leveraging strategy will be successful.
The use of leverage also generally causes greater changes in each Trust’s NAV, market price and dividend rates than comparable portfolios without leverage. In a declining market, leverage is likely to cause a greater decline in the NAV and market price of a Trust’s shares than if the Trust were not leveraged. In addition, each Trust may be required to sell portfolio securities at inopportune times or at distressed values in order to comply with regulatory requirements applicable to the use of leverage or as required by the terms of leverage instruments, which may cause the Trusts to incur losses. The use of leverage may limit a Trust’s ability to invest in certain types of securities or use certain types of hedging strategies. Each Trust incurs expenses in connection with the use of leverage, all of which are borne by shareholders and may reduce income to the shareholders. Moreover, to the extent the calculation of the Trusts’ investment advisory fees includes assets purchased with the proceeds of leverage, the investment advisory fees payable to the Trusts’ investment adviser will be higher than if the Trusts did not use leverage.
Each Trust may utilize leverage through a credit facility or reverse repurchase agreements as described in the Notes to Financial Statements.
Under the Investment Company Act of 1940, as amended (the “1940 Act”), each Trust is permitted to issue debt up to 33 1/3% of its total managed assets. A Trust may voluntarily elect to limit its leverage to less than the maximum amount permitted under the 1940 Act. In addition, a Trust may also be subject to certain asset coverage, leverage or portfolio composition requirements imposed by its credit facility, which may be more stringent than those imposed by the 1940 Act.
If a Trust segregates or designates on its books and records cash or liquid assets having a value not less than the value of a Trust’s obligations under the reverse repurchase agreement (including accrued interest), then such transaction is not considered a senior security and is not subject to the foregoing limitations and requirements imposed by the 1940 Act.
Derivative Financial Instruments
The Trusts may invest in various derivative financial instruments. These instruments are used to obtain exposure to a security, commodity, index, market and/or other assets without owning or taking physical custody of securities, commodities and/or other referenced assets or to manage market, equity, credit, interest rate, foreign currency exchange rate, commodity and/or other risks. Derivative financial instruments may give rise to a form of economic leverage and involve risks, including the imperfect correlation between the value of a derivative financial instrument and the underlying asset, possible default of the counterparty to the transaction or illiquidity of the instrument. BIT may use economic leverage of up to 100% of its net assets (50% of its total managed assets). The Trusts’ successful use of a derivative financial instrument depends on the investment adviser’s ability to predict pertinent market movements accurately, which cannot be assured. The use of these instruments may result in losses greater than if they had not been used, may limit the amount of appreciation a Trust can realize on an investment and/or may result in lower distributions paid to shareholders. The Trusts’ investments in these instruments, if any, are discussed in detail in the Notes to Financial Statements.
| | | | |
| THE BENEFITSAND RISKSOF LEVERAGING / DERIVATIVE FINANCIAL INSTRUMENTS | | | 13 | |
| | |
Schedule of Investments October 31, 2018 | | BlackRock Credit Allocation Income Trust (BTZ) (Percentages shown are based on Net Assets) |
| | | | | | | | | | | | |
| Security | | Par
(000) | | | Value | |
Asset-Backed Securities — 8.6% | |
Allegro CLO II-S Ltd., Series 2014-1RA, Class B, 4.30%, 10/21/28(a)(b) | | | USD | | | | 500 | | | $ | 499,729 | |
Allegro CLO VI Ltd., Series 2017-2A(a)(b): | | | | | | | | | | | | |
Class B, 3.95%, 01/17/31 | | | | | | | 360 | | | | 355,441 | |
Class C, 4.25%, 01/17/31 | | | | | | | 2,400 | | | | 2,381,761 | |
Class D, 5.20%, 01/17/31 | | | | | | | 1,300 | | | | 1,280,475 | |
ALM VI Ltd., Series 2012-6A, Class BR3, 4.19%, 07/15/26(a)(b) | | | | | | | 1,500 | | | | 1,483,899 | |
ALM VII R Ltd., Series 2013-7R2A(a)(b): | | | | | | | | | | | | |
Class A2R2, 4.09%, 10/15/27 | | | | | | | 750 | | | | 749,907 | |
Class BR2, 4.64%, 10/15/27 | | | | | | | 400 | | | | 399,759 | |
ALM XVI Ltd./ALM XVI LLC, Series 2015-16A(a)(b): | | | | | | | | | | | | |
Class BR2, 4.34%, 07/15/27 | | | | | | | 1,000 | | | | 996,541 | |
Class CR2, 5.14%, 07/15/27 | | | | | | | 1,000 | | | | 983,157 | |
AMMC CLO 22 Ltd., Series 2018-22A, Class D, 5.19%, 04/25/31(a)(b) | | | | | | | 1,000 | | | | 988,193 | |
AMMC CLO XII Ltd., Series 2013-12A, Class CR, 4.24%, 11/10/30(a)(b) | | | | | | | 1,500 | | | | 1,480,772 | |
Anchorage Capital CLO Ltd.(a)(b): | | | | | | | | | | | | |
Series 2013-1A, Class BR, 4.59%, 10/13/30 | | | | | | | 1,000 | | | | 1,000,414 | |
Series 2014-3RA, Class C, 4.36%, 01/28/31 | | | | | | | 1,000 | | | | 983,739 | |
Series 2014-3RA, Class D, 5.11%, 01/28/31 | | | | | | | 1,000 | | | | 985,622 | |
Series 2015-7A, Class CR, 4.14%, 10/15/27 | | | | | | | 1,750 | | | | 1,735,710 | |
Series 2015-7A, Class DR, 5.14%, 10/15/27 | | | | | | | 1,000 | | | | 998,669 | |
Apidos CLO XV, Series 2013-15A(a)(b): | | | | | | | | | | | | |
Class CRR, 4.32%, 04/20/31 | | | | | | | 1,000 | | | | 991,423 | |
Class DRR, 5.17%, 04/20/31 | | | | | | | 1,000 | | | | 977,885 | |
Apidos CLO XX, Series 2015-20A, Class BRR, 4.39%, 07/16/31(a)(b) | | | | | | | 1,000 | | | | 991,823 | |
Ares CLO Ltd.(a)(b): | | | | | | | | | | | | |
3.94%, 10/15/30 | | | | | | | 1,000 | | | | 992,891 | |
4.24%, 10/15/30 | | | | | | | 1,750 | | | | 1,737,657 | |
Ares XLIX CLO Ltd., Series 2018-49A, Class D, 5.34%, 07/22/30(a)(b)(c) | | | | | | | 1,000 | | | | 1,001,016 | |
Ares XLVII CLO Ltd.(a)(b): | | | | | | | | | | | | |
Series 2018-47A, Class D, 5.14%, 04/15/30 | | | | | | | 1,500 | | | | 1,482,088 | |
Series 2018-48A, Class C, 4.14%, 07/20/30 | | | | | | | 500 | | | | 495,800 | |
Ares XXXVR CLO Ltd., Series 2015-35RA, Class D, 5.44%, 07/15/30(a)(b) | | | | | | | 1,000 | | | | 1,005,001 | |
Atlas Senior Loan Fund X Ltd., Series 2018-10A(a)(b): | | | | | | | | | | | | |
Class B, 3.94%, 01/15/31 | | | | | | | 500 | | | | 493,506 | |
Class C, 4.29%, 01/15/31 | | | | | | | 1,000 | | | | 991,621 | |
Class D, 5.19%, 01/15/31 | | | | | | | 1,700 | | | | 1,674,423 | |
Atlas Senior Loan Fund XII Ltd., Series 2018-12A, Class A1,
3.63%, 10/24/31(a)(b) | | | | | | | 400 | | | | 399,210 | |
Benefit Street Partners CLO XII Ltd., Series 2017-12A(a)(b): | | | | | | | | | | | | |
Class B, 4.44%, 10/15/30 | | | | | | | 1,000 | | | | 992,427 | |
Class C, 5.49%, 10/15/30 | | | | | | | 2,000 | | | | 2,001,390 | |
BlueMountain CLO Ltd., Series 2012-2A, Class AR, (3 mo. LIBOR US + 1.42%), 3.74%, 11/20/28(a)(d) | | | | | | | 2,000 | | | | 2,001,103 | |
Bowman Park CLO Ltd., Series 2014-1A, Class D2R, (3 mo. LIBOR US + 3.35%), 5.66%, 11/23/25(a)(d) | | | | | | | 1,000 | | | | 1,000,837 | |
Carlyle Global Market Strategies CLO Ltd.(a): | | | | | | | | | | | | |
Series 2013-4A, Class DRR, 5.09%, 01/15/31(b) | | | | | | | 1,000 | | | | 981,615 | |
Series 2014-5A, Class A1RR, 3.47%, 07/15/31(b) | | | | | | | 2,300 | | | | 2,300,004 | |
Series 2016-3A, Class C, (3 mo. LIBOR US + 4.00%), 6.47%, 10/20/29(d) | | | | | | | 1,000 | | | | 1,001,531 | |
Carlyle US CLO Ltd.(a): | | | | | | | | | | | | |
Series 2016-4A, Class BR,
4.57%, 10/20/27(b) | | | | | | | 250 | | | | 249,860 | |
Series 2017-2A, Class C, (3 mo. LIBOR US + 3.70%), 6.17%, 07/20/31(d) | | | | | | | 500 | | | | 503,949 | |
| | | | | | | | | | | | |
| Security | | Par
(000) | | | Value | |
| Asset-Backed Securities (continued) | |
Cedar Funding VI CLO Ltd., Series 2016-6A, Class BR, 4.07%, 10/20/28(a)(b) | | | USD | | | | 250 | | | $ | 249,981 | |
Cent CLO 17 Ltd., Series C17A(a)(b): | | | | | | | | | | | | |
Class BR, 4.37%, 04/30/31 | | | | | | | 1,000 | | | | 995,143 | |
Class CR, 5.32%, 04/30/31 | | | | | | | 1,000 | | | | 995,158 | |
CIFC Funding Ltd.(a)(b): | | | | | | | | | | | | |
5.09%, 04/18/31 | | | | | | | 1,200 | | | | 1,181,688 | |
Series 2013-2A, Class A3LR, 4.39%, 10/18/30 | | | | | | | 1,000 | | | | 992,444 | |
Series 2013-2A, Class B1LR, 5.49%, 10/18/30 | | | | | | | 1,000 | | | | 1,001,775 | |
Series 2014-4RA, Class A2,
4.11%, 10/17/30(e) | | | | | | | 600 | | | | 600,000 | |
Series 2014-4RA, Class B, 4.66%, 10/17/30(e) | | | | | | | 400 | | | | 400,000 | |
Series 2014-4RA, Class C, 5.66%, 10/17/30(e) | | | | | | | 400 | | | | 400,000 | |
Series 2018-1A, Class C, 4.19%, 04/18/31 | | | | | | | 1,000 | | | | 995,599 | |
Elevation CLO Ltd., Series 2017-7A, Class C, 4.34%, 07/15/30(a)(b) | | | | | | | 1,500 | | | | 1,472,171 | |
Galaxy XX CLO Ltd., Series 2015-20A, Class D1R, 5.07%, 04/20/31(a)(b) | | | | | | | 1,000 | | | | 983,282 | |
Galaxy XXVII CLO Ltd., Series 2018-27A, Class C, 4.12%, 05/16/31(a)(b) | | | | | | | 1,500 | | | | 1,486,988 | |
Greenwood Park CLO Ltd., Series 2018-1A, Class D, 4.94%, 04/15/31(a)(b) | | | | | | | 1,000 | | | | 977,810 | |
Highbridge Loan Management Ltd.(a)(b): | | | | | | | | | | | | |
Series 12A-18, Class B, 4.22%, 07/18/31 | | | | | | | 1,250 | | | | 1,237,964 | |
Series 4A-2014, Class A2R, 4.01%, 01/28/30 | | | | | | | 650 | | | | 641,843 | |
Series 4A-2014, Class BR, 4.36%, 01/28/30 | | | | | | | 750 | | | | 743,928 | |
Series 6A-2015, Class BR, 4.09%, 02/05/31 | | | | | | | 1,500 | | | | 1,477,746 | |
Series 7A-2015, Class CR, 4.01%, 03/15/27 | | | | | | | 2,000 | | | | 1,987,881 | |
Series 7A-2015, Class DR, 4.71%, 03/15/27 | | | | | | | 1,000 | | | | 978,666 | |
Series 8A-2016, Class DR, 5.25%, 07/20/30 | | | | | | | 500 | | | | 496,222 | |
Limerock CLO III LLC, Series 2014-3A, Class C, (3 mo. LIBOR US + 3.60%),
6.07%, 10/20/26(a)(d) | | | | | | | 1,000 | | | | 1,002,562 | |
Long Point Park CLO Ltd., Series 2017-1A, Class B, 4.15%, 01/17/30(a)(b) | | | | | | | 1,000 | | | | 988,705 | |
Madison Park Funding Ltd., Series 2018-27A, Class B, 4.27%, 04/20/30(a)(b) | | | | | | | 1,000 | | | | 991,377 | |
Madison Park Funding XIII Ltd., Series 2014-13A, Class CR2, 4.35%, 04/19/30(a)(b) | | | | | | | 1,000 | | | | 998,976 | |
Madison Park Funding XV Ltd., Series 2014-15A, Class B1R, (3 mo. LIBOR US + 2.20%), 4.71%, 01/27/26(a)(d) | | | | | | | 2,000 | | | | 2,003,451 | |
Madison Park Funding XXVII Ltd., Series 2018-27A, Class C,
5.07%, 04/20/30(a)(b) | | | | | | | 1,000 | | | | 984,997 | |
Madison Park Funding XXX Ltd., Series 2018-30A, Class D,
4.94%, 04/15/29(a)(b) | | | | | | | 1,000 | | | | 985,057 | |
Marble Point CLO XI Ltd., Series 2017-2A(a)(b): | | | | | | | | | | | | |
Class A, 3.62%, 12/18/30 | | | | | | | 1,500 | | | | 1,497,146 | |
Class B, 3.94%, 12/18/30 | | | | | | | 1,000 | | | | 989,678 | |
Mill Creek II CLO Ltd., Series 2016-1A, Class D, (3 mo. LIBOR US + 4.85%),
7.32%, 04/20/28(a)(d) | | | | | | | 1,000 | | | | 1,000,492 | |
MP CLO III Ltd., Series 2013-1A, Class CR, 4.47%, 10/20/30(a)(b) | | | | | | | 1,000 | | | | 993,951 | |
Neuberger Berman CLO XV Ltd., Series 2013-15A, Class CR, 4.49%, 10/15/29(a)(b) | | | | | | | 1,000 | | | | 995,544 | |
Neuberger Berman CLO XXI Ltd., Series 2016-21A(a)(b): | | | | | | | | | | | | |
Class CR, 4.07%, 04/20/27 | | | | | | | 1,000 | | | | 991,793 | |
Class DR, 4.87%, 04/20/27 | | | | | | | 1,000 | | | | 978,200 | |
Neuberger Berman CLO XXII Ltd., Series 2016-22A(a)(b): | | | | | | | | | | | | |
Class BR, 4.10%, 10/17/30 | | | | | | | 400 | | | | 399,923 | |
Class CR, 4.65%, 10/17/30 | | | | | | | 1,000 | | | | 999,169 | |
Neuberger Berman Loan Advisers CLO 26 Ltd., Series 2017-26A(a)(b): | | | | | | | | | | | | |
Class A, 3.61%, 10/18/30 | | | | | | | 2,000 | | | | 2,003,416 | |
| | |
| 14 | | 2018 BLACKROCK ANNUAL REPORTTO SHAREHOLDERS |
| | |
Schedule of Investments (continued) October 31, 2018 | | BlackRock Credit Allocation Income Trust (BTZ) (Percentages shown are based on Net Assets) |
| | | | | | | | | | | | |
| Security | | Par
(000) | | | Value | |
| Asset-Backed Securities (continued) | |
Class B, 3.94%, 10/18/30 | | | USD | | | | 1,000 | | | $ | 990,431 | |
Class C, 5.12%, 10/18/30 | | | | | | | 1,500 | | | | 1,475,714 | |
Neuberger Berman Loan Advisers CLO 27 Ltd., Series 2018-27A, Class D, 5.04%, 01/15/30(a)(b) | | | | | | | 1,000 | | | | 983,081 | |
Oak Hill Credit Partners XII Ltd., Series 2015-12A, Class DR, 5.38%, 07/23/30(a)(b) | | | | | | | 600 | | | | 596,999 | |
OCP CLO Ltd.(a)(b): | | | | | | | | | | | | |
Series 2015-8A, Class CR, 5.25%, 04/17/27 | | | | | | | 1,000 | | | | 1,001,050 | |
Series 2017-14A, Class B, 4.27%, 11/20/30 | | | | | | | 1,000 | | | | 982,177 | |
Octagon Investment Partners Ltd.(a)(b): | | | | | | | | | | | | |
Series 2016-1A, Class DR, 5.29%, 07/15/30 | | | | | | | 500 | | | | 500,093 | |
Series 2017-1A, Class B1, 3.87%, 01/20/30 | | | | | | | 1,000 | | | | 990,234 | |
Series 2017-1A, Class C, 5.22%, 01/20/31 | | | | | | | 1,000 | | | | 995,003 | |
Octagon Investment Partners XIV Ltd., Series 2012-1A, Class A1AR, (3 mo. LIBOR US + 1.17%), 3.61%, 07/15/29(a)(d) | | | | | | | 1,000 | | | | 1,000,765 | |
Octagon Investment Partners XVII Ltd., Series 2013-1A(a)(b): | | | | | | | | | | | | |
Class BR2, 3.89%, 01/25/31 | | | | | | | 1,000 | | | | 993,279 | |
Class CR2, 4.19%, 01/25/31 | | | | | | | 1,000 | | | | 985,888 | |
Octagon Investment Partners XXII Ltd., Series 2014-1A, Class CRR, 4.37%, 01/22/30(a)(b) | | | | | | | 900 | | | | 892,500 | |
OHA Credit Partners XIV Ltd., Series 2017-14A, Class C, 4.27%, 01/21/30(a)(b) | | | | | | | 1,250 | | | | 1,236,000 | |
OZLM Funding IV Ltd., 4.67%, 10/22/30(a)(b) | | | | | | | 1,000 | | | | 1,001,763 | |
OZLM VI Ltd., Series 2014-6A, Class CS, 5.58%, 04/17/31(a)(b) | | | | | | | 500 | | | | 503,445 | |
OZLM XIX Ltd., Series 2017-19A, Class C, 5.54%, 11/22/30(a)(b) | | | | | | | 1,000 | | | | 1,002,692 | |
OZLM XXI Ltd., Series 2017-21A, Class B, 4.37%, 01/20/31(a)(b) | | | | | | | 1,800 | | | | 1,796,747 | |
Palmer Square CLO Ltd.(a)(b): | | | | | | | | | | | | |
Series 2013-2A, Class A2RR, 4.20%, 10/17/31(e) | | | | | | | 650 | | | | 649,935 | |
Series 2013-2A, Class BRR, 4.65%, 10/17/31(e) | | | | | | | 750 | | | | 750,000 | |
Series 2013-2A, Class CRR, 5.65%, 10/17/31(e) | | | | | | | 250 | | | | 250,000 | |
Series 2018-1A, Class A2, 3.89%, 04/18/31 | | | | | | | 1,500 | | | | 1,480,058 | |
Recette CLO Ltd., Series 2015-1A(a)(b): | | | | | | | | | | | | |
Class CR, 4.17%, 10/20/27 | | | | | | | 1,500 | | | | 1,487,567 | |
Class DR, 5.22%, 10/20/27 | | | | | | | 1,000 | | | | 996,735 | |
Rockford Tower CLO Ltd.,
Series 2017-3A(a)(b): | | | | | | | | | | | | |
Class A, 3.66%, 10/20/30 | | | | | | | 2,000 | | | | 2,001,483 | |
Class D, 5.12%, 10/20/30 | | | | | | | 1,000 | | | | 977,748 | |
Sound Point Clo XXI Ltd., Series 2018-3A, Class A1A, 3.59%, 10/26/31(a)(b) | | | | | | | 1,400 | | | | 1,399,189 | |
Stewart Park CLO Ltd., Series 2015-1A(a)(b): | | | | | | | | | | | | |
Class CR, 4.24%, 01/15/30 | | | | | | | 1,500 | | | | 1,480,693 | |
Class DR, 5.04%, 01/15/30 | | | | | | | 1,500 | | | | 1,482,291 | |
Symphony CLO XV Ltd.,
Series 2014-15A(a)(d): | | | | | | | | | | | | |
Class CR, (3 mo. LIBOR US + 2.20%), 4.65%, 10/17/26 | | | | | | | 2,500 | | | | 2,497,007 | |
Class DR, (3 mo. LIBOR US + 3.35%), 5.80%, 10/17/26 | | | | | | | 1,000 | | | | 1,002,129 | |
Tiaa CLO III Ltd., Series 2017-2A, Class A, 3.59%, 01/16/31(a)(b) | | | | | | | 2,500 | | | | 2,494,401 | |
Voya CLO Ltd., Series 2018-1A, Class C, 4.94%, 04/19/31(a)(b) | | | | | | | 1,000 | | | | 980,100 | |
York CLO 1 Ltd., Series 2014-1A, Class ARR, 3.29%, 10/22/29(a)(b) | | | | | | | 2,000 | | | | 1,996,705 | |
York CLO-2 Ltd., Series 2015-1A(a)(b): | | | | | | | | | | | | |
Class CR, 4.32%, 01/22/31 | | | | | | | 1,500 | | | | 1,484,295 | |
Class DR, 5.07%, 01/22/31 | | | | | | | 1,800 | | | | 1,752,572 | |
| | | | | | | | | | | | |
Total Asset-Backed Securities — 8.6%
(Cost — $124,689,930) | | | | 123,762,343 | |
| | | | | | | | | | | | |
| | | | | | | | | | | | |
| Security | | Par
(000) | | | Value | |
Corporate Bonds — 109.0% | |
|
| Aerospace & Defense — 2.1% | |
Arconic, Inc.: | | | | | | | | | | | | |
5.13%, 10/01/24 | | | USD | | | | 3,551 | | | $ | 3,517,976 | |
5.90%, 02/01/27 | | | | | | | 1,877 | | | | 1,862,922 | |
BBA US Holdings, Inc., 5.38%, 05/01/26(a) | | | | | | | 672 | | | | 664,440 | |
Bombardier, Inc.(a): | | | | | | | | | | | | |
7.75%, 03/15/20 | | | | | | | 354 | | | | 367,275 | |
8.75%, 12/01/21 | | | | | | | 2,034 | | | | 2,186,550 | |
5.75%, 03/15/22 | | | | | | | 286 | | | | 282,783 | |
6.00%, 10/15/22 | | | | | | | 14 | | | | 13,738 | |
6.13%, 01/15/23 | | | | | | | 629 | | | | 621,138 | |
7.50%, 12/01/24 | | | | | | | 992 | | | | 1,008,120 | |
7.50%, 03/15/25 | | | | | | | 3,592 | | | | 3,590,922 | |
KLX, Inc., 5.88%, 12/01/22(a) | | | | | | | 2,165 | | | | 2,229,950 | |
Northrop Grumman Corp., 4.03%, 10/15/47 | | | | | | | 6,425 | | | | 5,729,935 | |
TransDigm UK Holdings PLC,
6.88%, 05/15/26(a) | | | | | | | 500 | | | | 498,750 | |
TransDigm, Inc.: | | | | | | | | | | | | |
6.00%, 07/15/22 | | | | | | | 3,765 | | | | 3,783,825 | |
6.50%, 07/15/24 | | | | | | | 1,260 | | | | 1,273,658 | |
6.38%, 06/15/26 | | | | | | | 395 | | | | 387,100 | |
United Technologies Corp., 4.63%, 11/16/48 | | | | | | | 2,805 | | | | 2,698,381 | |
| | | | | | | | | | | | |
| | | | | | | | | | | 30,717,463 | |
| Air Freight & Logistics — 0.1% | |
XPO Logistics, Inc., 6.50%, 06/15/22(a) | | | | | | | 1,174 | | | | 1,203,350 | |
| | | | | | | | | | | | |
| Airlines — 1.0% | |
American Airlines Group, Inc.: | |
4.63%, 03/01/20(a) | | | | | | | 692 | | | | 692,000 | |
5.18%, 08/15/23 | | | | | | | 2,945 | | | | 2,952,363 | |
5.18%, 10/15/23 | | | | | | | 2,830 | | | | 2,829,881 | |
Delta Air Lines Pass-Through Trust, Series 2002-1, Class G-1, 6.72%, 07/02/24 | | | | | | | 2,728 | | | | 2,898,160 | |
Turkish Airlines Pass-Through Trust, Series 2015-1 Class A, 4.20%, 09/15/28(a) | | | | | | | 2,398 | | | | 2,169,815 | |
United Airlines Pass-Through Trust, Series 2014-1, Class B, 4.75%, 10/11/23 | | | | | | | 2,854 | | | | 2,875,932 | |
Virgin Australia Trust, Series 2013-1, Class B, 6.00%, 04/23/22(a) | | | | | | | 300 | | | | 303,074 | |
| | | | | | | | | | | | |
| | | | | | | | | | | 14,721,225 | |
| Auto Components — 0.6% | |
Allison Transmission, Inc., 5.00%, 10/01/24(a) | | | | | | | 68 | | | | 66,002 | |
General Motors Co., 5.95%, 04/01/49 | | | | | | | 3,455 | | | | 3,207,681 | |
Goodyear Tire & Rubber Co., 5.00%, 05/31/26 | | | | | | | 535 | | | | 486,850 | |
Icahn Enterprises LP/Icahn Enterprises Finance Corp.: | | | | | | | | | | | | |
6.00%, 08/01/20 | | | | | | | 3,108 | | | | 3,135,195 | |
6.38%, 12/15/25 | | | | | | | 388 | | | | 385,575 | |
Tesla, Inc., 5.30%, 08/15/25(a) | | | | | | | 1,043 | | | | 926,966 | |
| | | | | | | | | | | | |
| | | | | | | | | | | 8,208,269 | |
| Automobiles — 0.5% | |
Ford Motor Co., 7.45%, 07/16/31 | | | | | | | 3,660 | | | | 3,851,910 | |
General Motors Co.: | | | | | | | | | | | | |
4.88%, 10/02/23 | | | | | | | 1,875 | | | | 1,897,771 | |
6.25%, 10/02/43 | | | | | | | 940 | | | | 899,618 | |
| | | | | | | | | | | | |
| | | | | | | | | | | 6,649,299 | |
| Banks — 6.4% | |
Barclays PLC: | | | | | | | | | | | | |
4.84%, 05/09/28 | | | | | | | 4,000 | | | | 3,691,778 | |
4.97%, 05/16/29(b) | | | | | | | 3,220 | | | | 3,124,892 | |
CIT Group, Inc.: | | | | | | | | | | | | |
5.00%, 08/01/23 | | | | | | | 370 | | | | 370,925 | |
5.25%, 03/07/25 | | | | | | | 925 | | | | 930,781 | |
| | | | |
| SCHEDULES OF INVESTMENTS | | | 15 | |
| | |
Schedule of Investments (continued) October 31, 2018 | | BlackRock Credit Allocation Income Trust (BTZ) (Percentages shown are based on Net Assets) |
| | | | | | | | | | | | |
| Security | | Par
(000) | | | Value | |
| Banks (continued) | |
City National Corp., 5.25%, 09/15/20 | | | USD | | | | 2,900 | | | $ | 2,987,197 | |
Cooperatieve Rabobank UA, 3.95%, 11/09/22(f) | | | | | | | 3,775 | | | | 3,739,522 | |
Credit Suisse Group AG, 6.50%, 08/08/23(a) | | | | | | | 6,000 | | | | 6,338,304 | |
Discover Bank/Greenwood, 8.70%, 11/18/19 | | | | | | | 748 | | | | 785,333 | |
Fifth Third Bancorp (3 mo. LIBOR US + 3.03%), 5.10%(g)(h) | | | | | | | 5,000 | | | | 4,762,500 | |
HSBC Finance Corp., 6.68%, 01/15/21(f) | | | | | | | 5,150 | | | | 5,444,737 | |
Intesa Sanpaolo SpA, 5.71%, 01/15/26(a) | | | | | | | 9,840 | | | | 8,735,856 | |
Lloyds Banking Group PLC(f): | | | | | | | | | | | | |
4.45%, 05/08/25 | | | | | | | 3,665 | | | | 3,645,499 | |
4.65%, 03/24/26 | | | | | | | 8,650 | | | | 8,371,230 | |
Royal Bank of Scotland Group PLC,
6.00%, 12/19/23(f) | | | | | | | 10,080 | | | | 10,357,586 | |
Santander Holdings USA, Inc., 4.40%, 07/13/27 | | | | | | | 830 | | | | 774,633 | |
SunTrust Banks, Inc. (3 mo. LIBOR US + 3.10%), 5.05%(g)(h) | | | | | | | 5,270 | | | | 5,093,982 | |
Wells Fargo & Co.(f): | | | | | | | | | | | | |
4.13%, 08/15/23 | | | | | | | 4,000 | | | | 4,009,584 | |
4.10%, 06/03/26 | | | | | | | 15,000 | | | | 14,610,560 | |
5.61%, 01/15/44 | | | | | | | 4,119 | | | | 4,385,128 | |
| | | | | | | | | | | | |
| | | | | | | | | | | 92,160,027 | |
| Beverages — 1.0% | |
Anheuser-Busch InBev Finance, Inc., 4.90%, 02/01/46 | | | | | | | 6,170 | | | | 5,812,094 | |
Anheuser-Busch InBev Worldwide, Inc., 4.75%, 04/15/58 | | | | | | | 4,000 | | | | 3,568,593 | |
Keurig Dr. Pepper, Inc., 4.60%, 05/25/28(a) | | | | | | | 3,215 | | | | 3,168,419 | |
Molson Coors Brewing Co., 4.20%, 07/15/46 | | | | | | | 1,665 | | | | 1,405,859 | |
| | | | | | | | | | | | |
| | | | | | | | | | | 13,954,965 | |
| Biotechnology — 0.8% | |
Amgen, Inc., 4.66%, 06/15/51(f) | | | | | | | 6,709 | | | | 6,211,790 | |
Baxalta, Inc., 5.25%, 06/23/45 | | | | | | | 6,000 | | | | 6,029,417 | |
| | | | | | | | | | | | |
| | | | | | | | | | | 12,241,207 | |
| Building Products — 0.3% | |
American Builders & Contractors Supply Co., Inc., 5.75%, 12/15/23(a) | | | | | | | 371 | | | | 366,363 | |
Building Materials Corp. of America,
6.00%, 10/15/25(a) | | | | | | | 1,832 | | | | 1,802,230 | |
Masonite International Corp.(a): | | | | | | | | | | | | |
5.63%, 03/15/23 | | | | | | | 488 | | | | 484,950 | |
5.75%, 09/15/26 | | | | | | | 382 | | | | 362,900 | |
Standard Industries, Inc.(a): | | | | | | | | | | | | |
5.50%, 02/15/23 | | | | | | | 335 | | | | 328,300 | |
5.38%, 11/15/24 | | | | | | | 410 | | | | 393,600 | |
USG Corp., 4.88%, 06/01/27(a) | | | | | | | 445 | | | | 445,973 | |
| | | | | | | | | | | | |
| | | | | | | | | | | 4,184,316 | |
| Capital Markets — 3.6% | |
Goldman Sachs Group, Inc.: | | | | | | | | | | | | |
7.50%, 02/15/19(f) | | | | | | | 5,165 | | | | 5,231,017 | |
5.25%, 07/27/21 | | | | | | | 1,175 | | | | 1,222,021 | |
5.75%, 01/24/22(f) | | | | | | | 5,500 | | | | 5,811,740 | |
6.25%, 02/01/41(f) | | | | | | | 15,000 | | | | 17,412,649 | |
Morgan Stanley(f): | | | | | | | | | | | | |
5.63%, 09/23/19 | | | | | | | 6,770 | | | | 6,915,171 | |
5.00%, 11/24/25 | | | | | | | 15,000 | | | | 15,337,156 | |
NFP Corp., 6.88%, 07/15/25(a) | | | | | | | 222 | | | | 215,340 | |
| | | | | | | | | | | | |
| | | | | | | | | | | 52,145,094 | |
| Chemicals — 1.4% | |
Axalta Coating Systems LLC, 4.88%, 08/15/24(a) | | | | | | | 715 | | | | 674,781 | |
Basell Finance Co. BV, 8.10%, 03/15/27(a)(f) | | | | | | | 6,000 | | | | 7,302,954 | |
Chemours Co., 5.38%, 05/15/27 | | | | | | | 207 | | | | 192,510 | |
| | | | | | | | | | | | |
| Security | | Par
(000) | | | Value | |
| Chemicals (continued) | |
GCP Applied Technologies, Inc., 5.50%, 04/15/26(a) | | | USD | | | | 448 | | | $ | 433,440 | |
Huntsman International LLC, 5.13%, 11/15/22 | | | | | | | 2,495 | | | | 2,516,831 | |
NOVA Chemicals Corp., 4.88%, 06/01/24(a) | | | | | | | 956 | | | | 878,325 | |
Olin Corp.: | | | | | | | | | | | | |
5.13%, 09/15/27 | | | | | | | 270 | | | | 251,438 | |
5.00%, 02/01/30 | | | | | | | 297 | | | | 266,656 | |
Platform Specialty Products Corp.(a): | | | | | | | | | | | | |
6.50%, 02/01/22 | | | | | | | 3,006 | | | | 3,047,332 | |
5.88%, 12/01/25 | | | | | | | 2,718 | | | | 2,582,100 | |
PQ Corp., 6.75%, 11/15/22(a) | | | | | | | 935 | | | | 963,050 | |
WR Grace & Co-Conn, 5.63%, 10/01/24(a) | | | | | | | 1,660 | | | | 1,689,050 | |
| | | | | | | | | | | | |
| | | | | | | | | | | 20,798,467 | |
| Commercial Services & Supplies — 3.2% | |
ADT Corp.: | | | | | | | | | | | | |
3.50%, 07/15/22 | | | | | | | 53 | | | | 49,158 | |
4.13%, 06/15/23 | | | | | | | 810 | | | | 751,275 | |
4.88%, 07/15/32(a) | | | | | | | 884 | | | | 696,150 | |
Aviation Capital Group Corp.(a): | | | | | | | | | | | | |
7.13%, 10/15/20(f) | | | | | | | 31,000 | | | | 32,966,435 | |
6.75%, 04/06/21 | | | | | | | 7,850 | | | | 8,360,707 | |
Avolon Holdings Funding Ltd., 5.13%, 10/01/23(a) | | | | | | | 918 | | | | 900,788 | |
CD&R Waterworks Merger Sub LLC, 6.13%, 08/15/25(a) | | | | | | | 1,061 | | | | 994,687 | |
KAR Auction Services, Inc.,
5.13%, 06/01/25(a) | | | | | | | 595 | | | | 559,300 | |
Park Aerospace Holdings Ltd., 5.50%, 02/15/24(a) | | | | | | | 356 | | | | 352,529 | |
| | | | | | | | | | | | |
| | | | | | | | | | | 45,631,029 | |
| Communications Equipment — 0.2% | |
CommScope Technologies LLC(a): | | | | | | | | | | | | |
6.00%, 06/15/25 | | | | | | | 467 | | | | 454,157 | |
5.00%, 03/15/27 | | | | | | | 677 | | | | 604,338 | |
CommScope, Inc., 5.50%, 06/15/24(a) | | | | | | | 254 | | | | 245,428 | |
Zayo Group LLC/Zayo Capital, Inc.: | | | | | | | | | | | | |
6.38%, 05/15/25 | | | | | | | 750 | | | | 766,875 | |
5.75%, 01/15/27(a) | | | | | | | 1,360 | | | | 1,333,072 | |
| | | | | | | | | | | | |
| | | | | | | | | | | 3,403,870 | |
| Construction & Engineering — 0.3% | |
BlueLine Rental Finance Corp., 9.25%, 03/15/24(a) | | | | | | | 2,320 | | | | 2,421,500 | |
Brand Energy & Infrastructure Services, Inc., 8.50%, 07/15/25(a) | | | | | | | 714 | | | | 703,290 | |
Engility Corp., 8.88%, 09/01/24 | | | | | | | 727 | | | | 786,069 | |
Pisces Midco, Inc., 8.00%, 04/15/26(a) | | | | | | | 422 | | | | 409,867 | |
| | | | | | | | | | | | |
| | | | | | | | | | | 4,320,726 | |
| Construction Materials — 0.3% | |
American Builders & Contractors Supply Co., Inc., 5.88%, 05/15/26(a) | | | | | | | 537 | | | | 520,890 | |
HD Supply, Inc., 5.38%, 10/15/26(a) | | | | | | | 4,222 | | | | 4,037,287 | |
| | | | | | | | | | | | |
| | | | | | | | | | | 4,558,177 | |
| Consumer Discretionary — 0.1% | |
Viking Cruises Ltd., 5.88%, 09/15/27(a) | | | | | | | 2,159 | | | | 2,045,652 | |
| | | | | | | | | | | | |
| Consumer Finance — 2.0% | |
Ally Financial, Inc.: | | | | | | | | | | | | |
5.13%, 09/30/24 | | | | | | | 590 | | | | 599,588 | |
8.00%, 11/01/31(f) | | | | | | | 3,832 | | | | 4,607,980 | |
Capital One Bank USA NA, 3.38%, 02/15/23(f) | | | | | | | 2,000 | | | | 1,933,174 | |
Capital One Financial Corp., 3.75%, 03/09/27 | | | | | | | 6,500 | | | | 6,015,973 | |
Discover Financial Services, 3.85%, 11/21/22 | | | | | | | 3,252 | | | | 3,188,779 | |
Financial & Risk US Holdings, Inc.(a): | | | | | | | | | | | | |
6.25%, 05/15/26 | | | | | | | 4,037 | | | | 4,016,815 | |
8.25%, 11/15/26 | | | | | | | 1,294 | | | | 1,258,415 | |
Navient Corp.: | | | | | | | | | | | | |
6.63%, 07/26/21 | | | | | | | 461 | | | | 474,254 | |
| | |
| 16 | | 2018 BLACKROCK ANNUAL REPORTTO SHAREHOLDERS |
| | |
Schedule of Investments (continued) October 31, 2018 | | BlackRock Credit Allocation Income Trust (BTZ) (Percentages shown are based on Net Assets) |
| | | | | | | | | | | | |
| Security | | Par
(000) | | | Value | |
| Consumer Finance (continued) | |
6.50%, 06/15/22 | | | USD | | | | 434 | | | $ | 441,595 | |
7.25%, 09/25/23 | | | | | | | 996 | | | | 1,030,860 | |
6.75%, 06/15/26 | | | | | | | 516 | | | | 492,780 | |
Springleaf Finance Corp., 7.13%, 03/15/26 | | | | | | | 1,039 | | | | 984,452 | |
Total System Services, Inc.,
3.80%, 04/01/21 | | | | | | | 1,630 | | | | 1,632,912 | |
Verscend Escrow Corp., 9.75%, 08/15/26(a) | | | | | | | 1,634 | | | | 1,638,085 | |
| | | | | | | | | | | | |
| | | | | | | | | | | 28,315,662 | |
| Containers & Packaging — 0.6% | |
Ardagh Packaging Finance PLC/Ardagh Holdings USA, Inc.(a): | | | | | | | | | | | | |
4.63%, 05/15/23 | | | | | | | 760 | | | | 739,100 | |
7.25%, 05/15/24 | | | | | | | 944 | | | | 948,720 | |
Crown Americas LLC/Crown Americas Capital Corp.: | | | | | | | | | | | | |
4.75%, 02/01/26(a) | | | | | | | 947 | | | | 893,731 | |
4.25%, 09/30/26 | | | | | | | 724 | | | | 657,030 | |
Reynolds Group Issuer, Inc./Reynolds Group Issuer LLC/Reynolds Group Issuer Lu: | | | | | | | | | | | | |
5.75%, 10/15/20 | | | | | | | 2,777 | | | | 2,777,463 | |
6.88%, 02/15/21 | | | | | | | 37 | | | | 36,659 | |
5.13%, 07/15/23(a) | | | | | | | 222 | | | | 217,005 | |
7.00%, 07/15/24(a) | | | | | | | 1,593 | | | | 1,593,996 | |
Sealed Air Corp., 6.88%, 07/15/33(a) | | | | | | | 182 | | | | 187,460 | |
| | | | | | | | | | | | |
| | | | 8,051,164 | |
|
| Diversified Consumer Services — 0.7% | |
Prime Security Services Borrower LLC/Prime Finance, Inc.,
9.25%, 05/15/23(a) | | | | | | | 6,034 | | | | 6,376,128 | |
Service Corp. International, 4.50%, 11/15/20 | | | | | | | 4,382 | | | | 4,373,784 | |
| | | | | | | | | | | | |
| | | | 10,749,912 | |
|
| Diversified Financial Services — 6.9% | |
AerCap Ireland Capital DAC/AerCap Global Aviation Trust, 3.95%, 02/01/22 | | | | | | | 1,500 | | | | 1,484,381 | |
Air Lease Corp., 3.75%, 02/01/22 | | | | | | | 5,000 | | | | 4,971,515 | |
Aircastle Ltd., 6.25%, 12/01/19 | | | | | | | 3,937 | | | | 4,046,055 | |
Bank of America Corp.(f): | | | | | | | | | | | | |
5.00%, 05/13/21 | | | | | | | 17,100 | | | | 17,701,451 | |
4.45%, 03/03/26 | | | | | | | 11,765 | | | | 11,636,812 | |
BNP Paribas SA, 4.38%, 03/01/33(a)(b) | | | | | | | 4,000 | | | | 3,712,941 | |
Citigroup, Inc.: | | | | | | | | | | | | |
4.04%, 06/01/24(b) | | | | | | | 4,000 | | | | 3,989,800 | |
3.70%, 01/12/26(f) | | | | | | | 6,000 | | | | 5,737,295 | |
6.68%, 09/13/43(f) | | | | | | | 4,125 | | | | 4,858,508 | |
Ford Motor Credit Co. LLC,
5.88%, 08/02/21(f) | | | | | | | 9,420 | | | | 9,750,436 | |
General Motors Financial Co., Inc.: | | | | | | | | | | | | |
4.38%, 09/25/21 | | | | | | | 2,260 | | | | 2,280,075 | |
4.25%, 05/15/23 | | | | | | | 1,681 | | | | 1,659,538 | |
4.35%, 01/17/27 | | | | | | | 4,710 | | | | 4,374,924 | |
Jefferies Finance LLC/JFIN Co-Issuer Corp., 7.38%, 04/01/20(a) | | | | | | | 1,705 | | | | 1,722,050 | |
Leucadia National Corp., 5.50%, 10/18/23 | | | | | | | 4,000 | | | | 4,137,163 | |
Macquarie Group Ltd., 4.15%, 03/27/24(a)(b) | | | | | | | 4,000 | | | | 3,961,954 | |
Resparcs Funding LP I, 8.00%(h)(i)(j) | | | | | | | 4,000 | | | | 1,420,000 | |
Royal Bank of Scotland Group PLC: | | | | | | | | | | | | |
6.10%, 06/10/23 | | | | | | | 2,500 | | | | 2,574,927 | |
5.13%, 05/28/24(f) | | | | | | | 5,250 | | | | 5,174,096 | |
UniCredit SpA (5 year USD ICE Swap + 3.70%), 5.86%, 06/19/32(a)(g) | | | | | | | 4,000 | | | | 3,422,192 | |
Vantiv LLC/Vanity Issuer Corp., 4.38%, 11/15/25(a) | | | | | | | 464 | | | | 437,900 | |
| | | | | | | | | | | | |
| | | | 99,054,013 | |
| Diversified Telecommunication Services — 5.5% | |
AT&T, Inc.: | | | | | | | | | | | | |
6.30%, 01/15/38(f) | | | | | | | 12,000 | | | | 12,827,561 | |
| | | | | | | | | | | | |
| Security | | Par
(000) | | | Value | |
| Diversified Telecommunication Services (continued) | |
5.15%, 03/15/42 | | | USD | | | | 250 | | | $ | 230,027 | |
4.35%, 06/15/45 | | | | | | | 367 | | | | 300,930 | |
CenturyLink, Inc.: | | | | | | | | | | | | |
5.63%, 04/01/25(f) | | | | | | | 1,318 | | | | 1,265,280 | |
Series S, 6.45%, 06/15/21 | | | | | | | 1,176 | | | | 1,202,460 | |
Series U, 7.65%, 03/15/42 | | | | | | | 121 | | | | 104,060 | |
Series Y, 7.50%, 04/01/24 | | | | | | | 824 | | | | 865,200 | |
Embarq Corp., 8.00%, 06/01/36 | | | | | | | 1,048 | | | | 998,220 | |
Frontier Communications Corp.: | | | | | | | | | | | | |
10.50%, 09/15/22 | | | | | | | 551 | | | | 458,708 | |
11.00%, 09/15/25 | | | | | | | 3,846 | | | | 2,817,195 | |
Level 3 Financing, Inc.: | | | | | | | | | | | | |
5.38%, 08/15/22 | | | | | | | 2,095 | | | | 2,100,237 | |
5.13%, 05/01/23 | | | | | | | 1,183 | | | | 1,174,128 | |
5.38%, 01/15/24 | | | | | | | 754 | | | | 746,460 | |
5.38%, 05/01/25 | | | | | | | 2,003 | | | | 1,955,429 | |
5.25%, 03/15/26 | | | | | | | 320 | | | | 307,200 | |
Telecom Italia Capital SA, 6.00%, 09/30/34 | | | | | | | 960 | | | | 866,400 | |
Telefonica Emisiones SAU, 5.21%, 03/08/47 | | | | | | | 6,000 | | | | 5,596,464 | |
Verizon Communications, Inc.(f): | | | | | | | | | | | | |
5.15%, 09/15/23 | | | | | | | 8,775 | | | | 9,310,878 | |
6.40%, 09/15/33 | | | | | | | 9,475 | | | | 10,860,846 | |
6.55%, 09/15/43 | | | | | | | 13,225 | | | | 15,239,861 | |
5.01%, 04/15/49 | | | | | | | 10,578 | | | | 10,294,578 | |
| | | | | | | | | | | | |
| | | | 79,522,122 | |
| Electric Utilities — 5.0% | |
AES Corp., 5.50%, 04/15/25 | | | | | | | 304 | | | | 304,760 | |
CMS Energy Corp., 5.05%, 03/15/22(f) | | | | | | | 9,900 | | | | 10,289,898 | |
DPL, Inc., 7.25%, 10/15/21 | | | | | | | 94 | | | | 99,817 | |
Duke Energy Corp., 3.55%, 09/15/21 | | | | | | | 3,650 | | | | 3,647,627 | |
Emera, Inc., Series 16-A, (3 mo. LIBOR US + 5.44%), 6.75%, 06/15/76(g) | | | | | | | 7,500 | | | | 7,800,000 | |
Evergy Inc., 5.29%, 06/15/22(f)(k) | | | | | | | 5,550 | | | | 5,749,927 | |
Midland Cogeneration Venture LP,
5.25%, 03/15/25(a)(f) | | | | | | | 3,307 | | | | 3,188,157 | |
NextEra Energy Capital Holdings, Inc., 4.80%, 12/01/77(b) | | | | | | | 5,000 | | | | 4,500,000 | |
NextEra Energy Operating Partners LP(a): | | | | | | | | | | | | |
4.25%, 09/15/24 | | | | | | | 290 | | | | 275,500 | |
4.50%, 09/15/27 | | | | | | | 31 | | | | 28,598 | |
Oncor Electric Delivery Co. LLC(f): | | | | | | | | | | | | |
4.10%, 06/01/22 | | | | | | | 4,150 | | | | 4,229,396 | |
5.30%, 06/01/42 | | | | | | | 2,750 | | | | 3,066,035 | |
Progress Energy, Inc., 7.00%, 10/30/31(f) | | | | | | | 12,000 | | | | 14,846,720 | |
Puget Energy, Inc.: | | | | | | | | | | | | |
6.00%, 09/01/21 | | | | | | | 275 | | | | 290,954 | |
5.63%, 07/15/22(f) | | | | | | | 5,550 | | | | 5,840,856 | |
Southern Co., 4.40%, 07/01/46(f) | | | | | | | 7,500 | | | | 6,891,040 | |
TerraForm Power Operating LLC(a): | | | | | | | | | | | | |
4.25%, 01/31/23 | | | | | | | 470 | | | | 445,325 | |
5.00%, 01/31/28 | | | | | | | 470 | | | | 420,063 | |
| | | | | | | | | | | | |
| | | | 71,914,673 | |
| Electronic Equipment, Instruments & Components — 0.3% | |
CDW LLC/CDW Finance Corp.: | | | | | | | | | | | | |
5.00%, 09/01/23 | | | | | | | 306 | | | | 304,470 | |
5.50%, 12/01/24 | | | | | | | 2,517 | | | | 2,542,170 | |
Energizer Gamma Acquisition, Inc.,
6.38%, 07/15/26(a) | | | | | | | 222 | | | | 222,000 | |
Sanmina Corp., 4.38%, 06/01/19(a) | | | | | | | 1,415 | | | | 1,413,231 | |
| | | | | | | | | | | | |
| | | | 4,481,871 | |
| Energy Equipment & Services — 0.7% | |
Ensco PLC: | | | | | | | | | | | | |
4.50%, 10/01/24 | | | | | | | 196 | | | | 159,250 | |
| | | | |
| SCHEDULES OF INVESTMENTS | | | 17 | |
| | |
Schedule of Investments (continued) October 31, 2018 | | BlackRock Credit Allocation Income Trust (BTZ) (Percentages shown are based on Net Assets) |
| | | | | | | | | | | | |
| Security | | Par
(000) | | | Value | |
| Energy Equipment & Services (continued) | |
7.75%, 02/01/26 | | | USD | | | | 956 | | | $ | 891,470 | |
Halliburton Co., 5.00%, 11/15/45(f) | | | | | | | 6,615 | | | | 6,643,893 | |
Noble Holding International Ltd., 5.25%, 03/15/42 | | | | | | | 118 | | | | 82,010 | |
Oceaneering International, Inc., 4.65%, 11/15/24 | | | | | | | 196 | | | | 181,980 | |
Precision Drilling Corp., 7.13%, 01/15/26(a) | | | | | | | 112 | | | | 111,160 | |
Transocean, Inc., 9.00%, 07/15/23(a) | | | | | | | 670 | | | | 702,662 | |
USA Compression Partners LP/USA Compression Finance Corp., 6.88%, 04/01/26(a) | | | | | | | 855 | | | | 863,550 | |
Weatherford International Ltd.: | | | | | | | | | | | | |
7.75%, 06/15/21 | | | | | | | 775 | | | | 643,250 | |
8.25%, 06/15/23 | | | | | | | 150 | | | | 114,375 | |
6.50%, 08/01/36 | | | | | | | 521 | | | | 346,465 | |
| | | | | | | | | | | | |
| | | | 10,740,065 | |
| Environmental, Maintenance, & Security Service — 0.0% | |
Waste Pro USA, Inc., 5.50%, 02/15/26(a) | | | | | | | 622 | | | | 589,345 | |
| | | | | | | | | | | | |
| Equity Real Estate Investment Trusts (REITs) — 2.3% | |
American Tower Corp.: | | | | | | | | | | | | |
5.05%, 09/01/20 | | | | | | | 500 | | | | 512,644 | |
5.90%, 11/01/21(f) | | | | | | | 3,770 | | | | 3,991,395 | |
3.60%, 01/15/28 | | | | | | | 4,000 | | | | 3,679,799 | |
AvalonBay Communities, Inc., 6.10%, 03/15/20(f) | | | | | | | 10,000 | | | | 10,371,068 | |
Hilton Domestic Operating Co., Inc.: | | | | | | | | | | | | |
4.25%, 09/01/24 | | | | | | | 1,133 | | | | 1,088,020 | |
5.13%, 05/01/26(a) | | | | | | | 1,185 | | | | 1,158,338 | |
Host Hotels & Resorts LP, 3.75%, 10/15/23(f) | | | | | | | 3,600 | | | | 3,500,824 | |
MGM Growth Properties Operating Partnership LP/MGP Finance Co-Issuer, Inc.: | | | | | | | | | | | | |
5.63%, 05/01/24 | | | | | | | 4,627 | | | | 4,632,784 | |
4.50%, 09/01/26 | | | | | | | 2,750 | | | | 2,488,750 | |
4.50%, 01/15/28 | | | | | | | 464 | | | | 412,380 | |
MPT Operating Partnership LP/MPT Finance Corp., 5.00%, 10/15/27 | | | | | | | 459 | | | | 431,322 | |
Starwood Property Trust, Inc., 5.00%, 12/15/21 | | | | | | | 627 | | | | 623,865 | |
| | | | | | | | | | | | |
| | | | 32,891,189 | |
| Food & Staples Retailing — 0.9% | |
Albertsons Cos. LLC/Safeway, Inc./New Albertson’s, Inc./Albertson’s LLC: | | | | | | | | | | | | |
6.63%, 06/15/24 | | | | | | | 775 | | | | 732,375 | |
5.75%, 03/15/25 | | | | | | | 1,120 | | | | 985,600 | |
General Mills, Inc., 4.20%, 04/17/28 | | | | | | | 620 | | | | 598,488 | |
H.J. Heinz Finance Co., 7.13%, 08/01/39(a) | | | | | | | 4,415 | | | | 5,131,057 | |
Wal-Mart Stores, Inc., 5.25%, 09/01/35(f) | | | | | | | 5,150 | | | | 5,770,569 | |
| | | | | | | | | | | | |
| | | | 13,218,089 | |
| Food Products — 0.5% | |
Aramark Services, Inc.: | | | | | | | | | | | | |
5.13%, 01/15/24 | | | | | | | 1,470 | | | | 1,462,650 | |
5.00%, 02/01/28(a) | | | | | | | 228 | | | | 216,315 | |
JBS USA LUX SA/JBS USA Finance, Inc.(a): | | | | | | | | | | | | |
5.88%, 07/15/24 | | | | | | | 390 | | | | 382,785 | |
5.75%, 06/15/25 | | | | | | | 1,947 | | | | 1,869,120 | |
6.75%, 02/15/28 | | | | | | | 827 | | | | 797,021 | |
Kraft Heinz Foods Co., 4.38%, 06/01/46 | | | | | | | 2,475 | | | | 2,059,206 | |
Post Holdings, Inc., 5.63%, 01/15/28(a) | | | | | | | 428 | | | | 402,449 | |
| | | | | | | | | | | | |
| | | | 7,189,546 | |
| Health Care Equipment & Supplies — 1.3% | |
Avantor, Inc.(a): | | | | | | | | | | | | |
6.00%, 10/01/24(f) | | | | | | | 6,054 | | | | 6,038,865 | |
9.00%, 10/01/25 | | | | | | | 1,514 | | | | 1,526,687 | |
DJO Finance LLC/DJO Finance Corp., 8.13%, 06/15/21(a) | | | | | | | 3,343 | | | | 3,365,398 | |
| | | | | | | | | | | | |
| Security | | Par
(000) | | | Value | |
| Health Care Equipment & Supplies (continued) | |
Mallinckrodt International Finance SA/Mallinckrodt CB LLC(a): | | | | | | | | | | | | |
4.88%, 04/15/20 | | | USD | | | | 517 | | | $ | 510,538 | |
5.75%, 08/01/22 | | | | | | | 2,312 | | | | 2,063,460 | |
5.63%, 10/15/23 | | | | | | | 108 | | | | 92,610 | |
5.50%, 04/15/25 | | | | | | | 33 | | | | 26,565 | |
Medtronic, Inc., 4.63%, 03/15/45(f) | | | | | | | 4,565 | | | | 4,624,162 | |
| | | | | | | | | | | | |
| | | | 18,248,285 | |
|
| Health Care Providers & Services — 4.5% | |
Acadia Healthcare Co., Inc., 5.13%, 07/01/22 | | | | | | | 191 | | | | 190,523 | |
Aetna, Inc., 3.88%, 08/15/47 | | | | | | | 3,500 | | | | 2,953,009 | |
Anthem, Inc., 4.55%, 03/01/48 | | | | | | | 5,000 | | | | 4,637,180 | |
Centene Corp.: | | | | | | | | | | | | |
6.13%, 02/15/24 | | | | | | | 1,370 | | | | 1,431,650 | |
5.38%, 06/01/26(a) | | | | | | | 3,456 | | | | 3,507,840 | |
CHS/Community Health Systems, Inc., 8.63%, 01/15/24(a) | | | | | | | 980 | | | | 991,025 | |
DaVita, Inc., 5.13%, 07/15/24 | | | | | | | 761 | | | | 726,755 | |
HCA, Inc.: | | | | | | | | | | | | |
7.50%, 02/15/22 | | | | | | | 2,214 | | | | 2,402,190 | |
4.75%, 05/01/23(f) | | | | | | | 5,628 | | | | 5,684,280 | |
5.00%, 03/15/24 | | | | | | | 3,451 | | | | 3,491,981 | |
5.25%, 04/15/25 | | | | | | | 3,966 | | | | 4,050,277 | |
5.38%, 09/01/26 | | | | | | | 861 | | | | 854,542 | |
5.63%, 09/01/28 | | | | | | | 911 | | | | 901,890 | |
5.50%, 06/15/47 | | | | | | | 3,970 | | | | 3,906,480 | |
HealthSouth Corp., 5.75%, 11/01/24 | | | | | | | 637 | | | | 635,408 | |
MEDNAX, Inc., 5.25%, 12/01/23(a) | | | | | | | 144 | | | | 143,820 | |
MPH Acquisition Holdings LLC, 7.13%, 06/01/24(a) | | | | | | | 829 | | | | 842,115 | |
NVA Holdings, Inc., 6.88%, 04/01/26(a) | | | | | | | 793 | | | | 783,087 | |
Polaris Intermediate Corp., (8.50% Cash), 8.50%, 12/01/22(a)(l) | | | | | | | 2,124 | | | | 2,177,100 | |
Regional Care Hospital Partners Holdings, Inc., 8.25%, 05/01/23(a) | | | | | | | 398 | | | | 420,388 | |
Tenet Healthcare Corp.: | | | | | | | | | | | | |
6.00%, 10/01/20 | | | | | | | 4,102 | | | | 4,200,653 | |
7.50%, 01/01/22(a) | | | | | | | 394 | | | | 410,745 | |
8.13%, 04/01/22 | | | | | | | 2,645 | | | | 2,754,106 | |
6.75%, 06/15/23 | | | | | | | 1,561 | | | | 1,551,244 | |
4.63%, 07/15/24 | | | | | | | 1,145 | | | | 1,103,608 | |
6.88%, 11/15/31 | | | | | | | 320 | | | | 281,600 | |
UnitedHealth Group, Inc., 6.88%, 02/15/38(f) | | | | | | | 10,000 | | | | 12,962,651 | |
WellCare Health Plans, Inc.,
5.38%, 08/15/26(a) | | | | | | | 757 | | | | 755,108 | |
| | | | | | | | | | | | |
| | | | 64,751,255 | |
| Health Care Technology — 0.0% | |
Change Healthcare Holdings LLC/Change Healthcare Finance, Inc.,
5.75%, 03/01/25(a) | | | | | | | 466 | | | | 455,515 | |
| | | | | | | | | | | | |
| Hotels, Restaurants & Leisure — 1.4% | |
Boyd Gaming Corp., 6.00%, 08/15/26 | | | | | | | 472 | | | | 456,070 | |
Churchill Downs, Inc., 4.75%, 01/15/28(a) | | | | | | | 190 | | | | 172,900 | |
CRC Escrow Issuer LLC/CRC Finco, Inc., 5.25%, 10/15/25(a) | | | | | | | 886 | | | | 824,534 | |
Delta Merger Sub, Inc., 6.00%, 09/15/26(a) | | | | | | | 277 | | | | 271,294 | |
ESH Hospitality, Inc., 5.25%, 05/01/25(a) | | | | | | | 1,278 | | | | 1,209,307 | |
International Game Technology PLC, 6.25%, 01/15/27(a) | | | | | | | 338 | | | | 331,663 | |
IRB Holding Corp., 6.75%, 02/15/26(a) | | | | | | | 156 | | | | 149,370 | |
KFC Holding Co./Pizza Hut Holdings LLC/Taco Bell of America LLC(a): | | | | | | | | | | | | |
5.00%, 06/01/24 | | | | | | | 600 | | | | 591,750 | |
5.25%, 06/01/26 | | | | | | | 650 | | | | 638,625 | |
4.75%, 06/01/27 | | | | | | | 817 | | | | 767,980 | |
| | |
| 18 | | 2018 BLACKROCK ANNUAL REPORTTO SHAREHOLDERS |
| | |
Schedule of Investments (continued) October 31, 2018 | | BlackRock Credit Allocation Income Trust (BTZ) (Percentages shown are based on Net Assets) |
| | | | | | | | | | | | |
| Security | | Par
(000) | | | Value | |
| Hotels, Restaurants & Leisure (continued) | |
Melco Resorts Finance Ltd.,
4.88%, 06/06/25(a) | | | USD | | | | 444 | | | $ | 407,011 | |
MGM Resorts International: | | | | | | | | | | | | |
6.63%, 12/15/21 | | | | | | | 4,805 | | | | 5,031,748 | |
7.75%, 03/15/22 | | | | | | | 104 | | | | 111,670 | |
New Red Finance, Inc.(a): | | | | | | | | | | | | |
4.25%, 05/15/24 | | | | | | | 1,577 | | | | 1,482,380 | |
5.00%, 10/15/25 | | | | | | | 2,910 | | | | 2,728,125 | |
Sabre GLBL, Inc.(a): | | | | | | | | | | | | |
5.38%, 04/15/23 | | | | | | | 594 | | | | 594,000 | |
5.25%, 11/15/23 | | | | | | | 294 | | | | 290,290 | |
Scientific Games International, Inc.,
5.00%, 10/15/25(a) | | | | | | | 914 | | | | 850,020 | |
Station Casinos LLC, 5.00%, 10/01/25(a) | | | | | | | 1,137 | | | | 1,056,000 | |
Wyndham Destinations, Inc.: | | | | | | | | | | | | |
5.40%, 04/01/24 | | | | | | | 883 | | | | 849,887 | |
5.75%, 04/01/27 | | | | | | | 308 | | | | 285,285 | |
Wyndham Hotels & Resorts, Inc.,
5.38%, 04/15/26(a) | | | | | | | 453 | | | | 439,410 | |
| | | | | | | | | | | | |
| | | | 19,539,319 | |
| Household Durables — 0.9% | |
Brookfield Residential Properties, Inc./Brookfield Residential US Corp., 6.13%, 07/01/22(a) | | | | | | | 1,314 | | | | 1,281,150 | |
Lennar Corp.: | | | | | | | | | | | | |
2.95%, 11/29/20 | | | | | | | 520 | | | | 505,700 | |
8.38%, 01/15/21 | | | | | | | 3,015 | | | | 3,248,662 | |
4.75%, 11/15/22 | | | | | | | 1,805 | | | | 1,787,311 | |
4.88%, 12/15/23 | | | | | | | 466 | | | | 454,932 | |
5.25%, 06/01/26 | | | | | | | 176 | | | | 168,091 | |
Newell Brands, Inc.: | | | | | | | | | | | | |
4.00%, 12/01/24 | | | | | | | 3,000 | | | | 2,851,861 | |
4.20%, 04/01/26 | | | | | | | 955 | | | | 877,360 | |
PulteGroup, Inc., 5.50%, 03/01/26 | | | | | | | 734 | | | | 719,320 | |
TRI Pointe Group, Inc./TRI Pointe Homes, Inc.: | | | | | | | | | | | | |
4.38%, 06/15/19 | | | | | | | 717 | | | | 717,000 | |
5.88%, 06/15/24 | | | | | | | 572 | | | | 534,105 | |
| | | | | | | | | | | | |
| | | | | | | | | | | 13,145,492 | |
| Household Products — 0.2% | |
Spectrum Brands, Inc.: | | | | | | | | | | | | |
6.63%, 11/15/22 | | | | | | | 1,110 | | | | 1,133,587 | |
6.13%, 12/15/24 | | | | | | | 231 | | | | 229,845 | |
5.75%, 07/15/25 | | | | | | | 1,002 | | | | 974,445 | |
| | | | | | | | | | | | |
| | | | | | | | | | | 2,337,877 | |
| Independent Power and Renewable Electricity Producers — 0.8% | |
AES Corp.: | | | | | | | | | | | | |
4.50%, 03/15/23 | | | | | | | 400 | | | | 394,500 | |
4.88%, 05/15/23 | | | | | | | 32 | | | | 31,680 | |
6.00%, 05/15/26 | | | | | | | 843 | | | | 861,967 | |
5.13%, 09/01/27 | | | | | | | 777 | | | | 767,288 | |
Calpine Corp.: | | | | | | | | | | | | |
6.00%, 01/15/22(a) | | | | | | | 1,858 | | | | 1,867,290 | |
5.38%, 01/15/23 | | | | | | | 742 | | | | 703,045 | |
5.88%, 01/15/24(a) | | | | | | | 628 | | | | 628,000 | |
5.25%, 06/01/26(a) | | | | | | | 2,719 | | | | 2,498,081 | |
Clearway Energy Operating LLC, 5.75%, 10/15/25(a) | | | | | | | 1,044 | | | | 1,028,340 | |
NRG Energy, Inc.: | | | | | | | | | | | | |
6.63%, 01/15/27 | | | | | | | 2,746 | | | | 2,842,110 | |
5.75%, 01/15/28 | | | | | | | 650 | | | | 648,375 | |
| | | | | | | | | | | | |
| | | | | | | | | | | 12,270,676 | |
| Industrial Conglomerates — 0.1% | |
BWX Technologies, Inc., 5.38%, 07/15/26(a) | | | | | | | 746 | | | | 747,865 | |
Vertiv Group Corp., 9.25%, 10/15/24(a) | | | | | | | 1,193 | | | | 1,187,035 | |
| | | | | | | | | | | | |
| | | | | | | | | | | 1,934,900 | |
| | | | | | | | | | | | |
| Security | | Par
(000) | | | Value | |
| Insurance — 3.6% | |
American International Group, Inc.,
6.40%, 12/15/20(f) | | | USD | | | | 8,710 | | | $ | 9,193,270 | |
Aon Corp., 5.00%, 09/30/20(f) | | | | | | | 7,700 | | | | 7,925,052 | |
Aon PLC, 4.25%, 12/12/42(f) | | | | | | | 6,500 | | | | 5,735,407 | |
Forethought Financial Group, Inc.,
8.63%, 04/15/21(a) | | | | | | | 3,400 | | | | 3,738,138 | |
HUB International Ltd., 7.00%, 05/01/26(a) | | | | | | | 1,373 | | | | 1,340,048 | |
Nationwide Building Society,
4.13%, 10/18/32(a)(b) | | | | | | | 2,520 | | | | 2,244,288 | |
Northwestern Mutual Life Insurance Co., 6.06%, 03/30/40(a)(f) | | | | | | | 12,000 | | | | 14,389,893 | |
Progressive Corp., Series B, 5.38%(b)(h) | | | | | | | 5,000 | | | | 4,912,500 | |
Wand Merger Corp.(a): | | | | | | | | | | | | |
8.13%, 07/15/23 | | | | | | | 871 | | | | 886,243 | |
9.13%, 07/15/26 | | | | | | | 447 | | | | 453,705 | |
Wayne Merger Sub LLC, 8.25%, 08/01/23(a) | | | | | | | 1,040 | | | | 1,074,975 | |
| | | | | | | | | | | | |
| | | | | | | | | | | 51,893,519 | |
| Internet Software & Services — 0.7% | |
Alibaba Group Holding Ltd., 4.20%, 12/06/47 | | | | | | | 1,470 | | | | 1,272,295 | |
Booking Holdings, Inc., 3.55%, 03/15/28 | | | | | | | 3,375 | | | | 3,156,531 | |
Equinix, Inc., 5.88%, 01/15/26 | | | | | | | 1,061 | | | | 1,079,567 | |
Netflix, Inc.: | | | | | | | | | | | | |
5.50%, 02/15/22 | | | | | | | 563 | | | | 574,198 | |
4.38%, 11/15/26 | | | | | | | 905 | | | | 831,469 | |
5.88%, 11/15/28(a) | | | | | | | 1,550 | | | | 1,522,875 | |
Rackspace Hosting, Inc., 8.63%, 11/15/24(a)(f) | | | | | | | 402 | | | | 377,880 | |
Symantec Corp., 5.00%, 04/15/25(a) | | | | | | | 347 | | | | 326,403 | |
Uber Technologies, Inc., 7.50%, 11/01/23(a)(e) | | | | | | | 290 | | | | 288,823 | |
| | | | | | | | | | | | |
| | | | | | | | | | | 9,430,041 | |
| IT Services — 1.0% | |
Banff Merger Sub, Inc., 9.75%, 09/01/26(a) | | | | | | | 560 | | | | 537,600 | |
Fidelity National Information Services, Inc., 5.00%, 10/15/25 | | | | | | | 538 | | | | 561,002 | |
First Data Corp.(a): | | | | | | | | | | | | |
5.38%, 08/15/23 | | | | | | | 1,509 | | | | 1,522,204 | |
7.00%, 12/01/23 | | | | | | | 4,908 | | | | 5,089,596 | |
5.75%, 01/15/24(f) | | | | | | | 5,700 | | | | 5,735,625 | |
Gartner, Inc., 5.13%, 04/01/25(a) | | | | | | | 399 | | | | 396,007 | |
WEX, Inc., 4.75%, 02/01/23(a) | | | | | | | 760 | | | | 756,200 | |
| | | | | | | | | | | | |
| | | | | | | | | | | 14,598,234 | |
| Life Sciences Tools & Services — 0.9% | |
Life Technologies Corp., 6.00%, 03/01/20(f) | | | | | | | 12,000 | | | | 12,382,328 | |
| | | | | | | | | | | | |
| Machinery — 0.1% | |
RBS Global, Inc./Rexnord LLC, 4.88%, 12/15/25(a) | | | | | | | 558 | | | | 523,125 | |
Titan Acquisition Ltd./Titan Co-Borrower LLC, 7.75%, 04/15/26(a) | | | | | | | 1,209 | | | | 1,006,492 | |
| | | | | | | | | | | | |
| | | | | | | | | | | 1,529,617 | |
| Media — 9.7% | |
21st Century Fox America, Inc., 6.15%, 03/01/37(f) | | | | | | | 9,575 | | | | 11,476,577 | |
A&E Television Networks LLC, 3.11%, 08/22/19(e) | | | | | | | 5,000 | | | | 4,961,000 | |
Altice Financing SA(a): | | | | | | | | | | | | |
6.63%, 02/15/23 | | | | | | | 400 | | | | 395,920 | |
7.50%, 05/15/26 | | | | | | | 1,772 | | | | 1,665,680 | |
Altice France SA(a): | | | | | | | | | | | | |
7.38%, 05/01/26 | | | | | | | 3,616 | | | | 3,461,199 | |
8.13%, 02/01/27 | | | | | | | 825 | | | | 816,750 | |
Altice Luxembourg SA, 7.75%, 05/15/22(a) | | | | | | | 5,426 | | | | 5,052,962 | |
Altice US Finance I Corp.(a): | | | | | | | | | | | | |
5.38%, 07/15/23 | | | | | | | 2,432 | | | | 2,431,538 | |
5.50%, 05/15/26 | | | | | | | 2,866 | | | | 2,791,656 | |
AMC Networks, Inc.: | | | | | | | | | | | | |
4.75%, 12/15/22 | | | | | | | 685 | | | | 674,725 | |
| | | | |
| SCHEDULES OF INVESTMENTS | | | 19 | |
| | |
Schedule of Investments (continued) October 31, 2018 | | BlackRock Credit Allocation Income Trust (BTZ) (Percentages shown are based on Net Assets) |
| | | | | | | | | | | | |
| Security | | Par
(000) | | | Value | |
| Media (continued) | |
4.75%, 08/01/25 | | | USD | | | | 978 | | | $ | 909,149 | |
CCO Holdings LLC/CCO Holdings Capital Corp.(a): | | | | | | | | | | | | |
4.00%, 03/01/23 | | | | | | | 1,216 | | | | 1,158,240 | |
5.13%, 05/01/27(f) | | | | | | | 5,664 | | | | 5,331,240 | |
5.00%, 02/01/28 | | | | | | | 404 | | | | 376,478 | |
Cequel Communications Holdings I LLC / Cequel Capital Corp.(a): | | | | | | | | | | | | |
7.75%, 07/15/25 | | | | | | | 4,129 | | | | 4,366,417 | |
7.50%, 04/01/28 | | | | | | | 1,200 | | | | 1,243,764 | |
Charter Communications Operating LLC/Charter Communications Operating Capital: | | | | | | | | | | | | |
6.38%, 10/23/35 | | | | | | | 479 | | | | 494,674 | |
6.48%, 10/23/45 | | | | | | | 9,584 | | | | 9,729,275 | |
5.38%, 05/01/47 | | | | | | | 1,500 | | | | 1,350,067 | |
6.83%, 10/23/55 | | | | | | | 3,540 | | | | 3,688,480 | |
Cinemark USA, Inc., 5.13%, 12/15/22 | | | | | | | 349 | | | | 349,873 | |
Clear Channel Worldwide Holdings, Inc.: | | | | | | | | | | | | |
6.50%, 11/15/22 | | | | | | | 2,758 | | | | 2,768,342 | |
6.50%, 11/15/22(f) | | | | | | | 7,431 | | | | 7,543,951 | |
Comcast Corp., 4.95%, 10/15/58 | | | | | | | 3,795 | | | | 3,716,156 | |
Cox Communications, Inc.(a): | | | | | | | | | | | | |
8.38%, 03/01/39(f) | | | | | | | 5,000 | | | | 6,276,436 | |
4.60%, 08/15/47 | | | | | | | 625 | | | | 556,434 | |
CSC Holdings LLC: | | | | | | | | | | | | |
8.63%, 02/15/19 | | | | | | | 4,005 | | | | 4,045,050 | |
5.25%, 06/01/24 | | | | | | | 1,054 | | | | 1,015,792 | |
6.63%, 10/15/25(a) | | | | | | | 1,072 | | | | 1,122,920 | |
10.88%, 10/15/25(a) | | | | | | | 620 | | | | 715,325 | |
Discovery Communications LLC: | | | | | | | | | | | | |
3.95%, 03/20/28(f) | | | | | | | 8,515 | | | | 7,927,262 | |
4.88%, 04/01/43 | | | | | | | 4,000 | | | | 3,534,544 | |
DISH DBS Corp.: | | | | | | | | | | | | |
5.88%, 07/15/22 | | | | | | | 1,732 | | | | 1,636,740 | |
5.88%, 11/15/24 | | | | | | | 338 | | | | 287,300 | |
7.75%, 07/01/26 | | | | | | | 818 | | | | 732,110 | |
Grupo Televisa SAB, 5.00%, 05/13/45(f) | | | | | | | 3,345 | | | | 2,885,065 | |
Hughes Satellite Systems Corp., 5.25%, 08/01/26 | | | | | | | 1,017 | | | | 966,150 | |
Inmarsat Finance PLC, 4.88%, 05/15/22(a) | | | | | | | 228 | | | | 223,331 | |
Intelsat Jackson Holdings SA: | | | | | | | | | | | | |
5.50%, 08/01/23 | | | | | | | 268 | | | | 239,860 | |
8.50%, 10/15/24(a) | | | | | | | 1,336 | | | | 1,312,620 | |
9.75%, 07/15/25(a) | | | | | | | 3,003 | | | | 3,145,642 | |
Interpublic Group of Cos., Inc.: | | | | | | | | | | | | |
3.75%, 02/15/23(f) | | | | | | | 6,025 | | | | 5,939,059 | |
5.40%, 10/01/48 | | | | | | | 2,215 | | | | 2,086,052 | |
MDC Partners, Inc., 6.50%, 05/01/24(a) | | | | | | | 1,036 | | | | 849,520 | |
Meredith Corp., 6.88%, 02/01/26(a) | | | | | | | 396 | | | | 396,000 | |
Nielsen Finance LLC/Nielsen Finance Co., 5.00%, 04/15/22(a) | | | | | | | 1,081 | | | | 1,052,624 | |
Sirius XM Radio, Inc., 5.00%, 08/01/27(a) | | | | | | | 597 | | | | 560,995 | |
TEGNA, Inc., 5.50%, 09/15/24(a) | | | | | | | 351 | | | | 350,561 | |
Telenet Finance Luxembourg Notes Sarl,
5.50%, 03/01/28(a) | | | | | | | 1,400 | | | | 1,298,500 | |
Time Warner Cable LLC, 6.55%, 05/01/37 | | | | | | | 3,519 | | | | 3,645,866 | |
Tribune Media Co., 5.88%, 07/15/22 | | | | | | | 1,308 | | | | 1,324,350 | |
Univision Communications, Inc.(a): | | | | | | | | | | | | |
5.13%, 05/15/23 | | | | | | | 5,293 | | | | 4,986,006 | |
5.13%, 02/15/25 | | | | | | | 375 | | | | 342,750 | |
UPCB Finance IV Ltd., 5.38%, 01/15/25(a) | | | | | | | 420 | | | | 408,660 | |
Viacom, Inc., 5.85%, 09/01/43 | | | | | | | 1,300 | | | | 1,283,988 | |
Videotron Ltd., 5.13%, 04/15/27(a) | | | | | | | 1,099 | | | | 1,041,302 | |
Virgin Media Secured Finance PLC, 5.50%, 08/15/26(a) | | | | | | | 487 | | | | 458,998 | |
| | | | | | | | | | | | |
| Security | | Par
(000) | | | Value | |
| Media (continued) | |
Warner Media LLC: | | | | | | | | | | | | |
4.65%, 06/01/44 | | | USD | | | | 28 | | | $ | 24,120 | |
4.85%, 07/15/45 | | | | | | | 97 | | | | 86,789 | |
Ziggo Secured Finance BV,
5.50%, 01/15/27(a) | | | | | | | 663 | | | | 608,303 | |
| | | | | | | | |
| | | | | | | | | | | 140,121,137 | |
| Metals & Mining — 2.7% | |
Alcoa Nederland Holding BV(a): | | | | | | | | | | | | |
7.00%, 09/30/26 | | | | | | | 291 | | | | 307,005 | |
6.13%, 05/15/28 | | | | | | | 236 | | | | 235,410 | |
AngloGold Ashanti Holdings PLC, 5.13%, 08/01/22 | | | | | | | 5,000 | | | | 5,037,500 | |
Commercial Metals Co., 4.88%, 05/15/23 | | | | | | | 2,194 | | | | 2,139,150 | |
Constellium NV: | | | | | | | | | | | | |
4.63%, 05/15/21 | | | EUR | | | | 490 | | | | 559,772 | |
6.63%, 03/01/25(a) | | | USD | | | | 609 | | | | 596,820 | |
5.88%, 02/15/26(a) | | | | | | | 1,451 | | | | 1,353,057 | |
First Quantum Minerals Ltd.(a): | | | | | | | | | | | | |
7.25%, 05/15/22 | | | | | | | 912 | | | | 870,960 | |
6.50%, 03/01/24 | | | | | | | 311 | | | | 272,125 | |
Freeport-McMoRan, Inc.: | | | | | | | | | | | | |
4.00%, 11/14/21 | | | | | | | 500 | | | | 486,875 | |
3.55%, 03/01/22 | | | | | | | 236 | | | | 223,315 | |
3.88%, 03/15/23 | | | | | | | 6,250 | | | | 5,781,250 | |
5.40%, 11/14/34 | | | | | | | 2,250 | | | | 1,968,750 | |
5.45%, 03/15/43 | | | | | | | 4,056 | | | | 3,437,460 | |
Grinding Media, Inc./Moly-Cop AltaSteel Ltd., 7.38%, 12/15/23(a) | | | | | | | 725 | | | | 744,937 | |
Novelis Corp.(a): | | | | | | | | | | | | |
6.25%, 08/15/24 | | | | | | | 2,369 | | | | 2,345,310 | |
5.88%, 09/30/26 | | | | | | | 2,190 | | | | 2,064,075 | |
Southern Copper Corp., 5.88%, 04/23/45 | | | | | | | 3,870 | | | | 4,033,421 | |
Steel Dynamics, Inc.: | | | | | | | | | | | | |
5.13%, 10/01/21 | | | | | | | 1,105 | | | | 1,110,525 | |
5.25%, 04/15/23 | | | | | | | 309 | | | | 309,772 | |
5.50%, 10/01/24 | | | | | | | 240 | | | | 241,500 | |
4.13%, 09/15/25 | | | | | | | 1,808 | | | | 1,690,480 | |
5.00%, 12/15/26 | | | | | | | 35 | | | | 34,213 | |
Teck Resources Ltd.: | | | | | | | | | | | | |
4.50%, 01/15/21 | | | | | | | 89 | | | | 89,223 | |
8.50%, 06/01/24(a) | | | | | | | 1,623 | | | | 1,760,955 | |
United States Steel Corp., 6.25%, 03/15/26 | | | | | | | 813 | | | | 766,252 | |
| | | | | | | | |
| | | | | | | | | | | 38,460,112 | |
| Oil, Gas & Consumable Fuels — 18.1% | |
Aker BP ASA, 5.88%, 03/31/25(a) | | | | | | | 570 | | | | 574,988 | |
Antero Resources Corp., 5.00%, 03/01/25 | | | | | | | 600 | | | | 582,750 | |
Ascent Resources Utica Holdings LLC/ARU Finance Corp., 7.00%, 11/01/26(a) | | | | | | | 948 | | | | 919,560 | |
Berry Petroleum Co. LLC, 7.00%, 02/15/26(a) | | | | | | | 131 | | | | 129,847 | |
California Resources Corp.,
8.00%, 12/15/22(a) | | | | | | | 1,671 | | | | 1,487,190 | |
Calumet Specialty Products Partners LP/Calumet Finance Corp., 6.50%, 04/15/21 | | | | | | | 87 | | | | 83,520 | |
Carrizo Oil & Gas, Inc.: | | | | | | | | | | | | |
6.25%, 04/15/23 | | | | | | | 279 | | | | 274,118 | |
8.25%, 07/15/25 | | | | | | | 1,047 | | | | 1,086,262 | |
Cheniere Corpus Christi Holdings LLC: | | | | | | | | | | | | |
7.00%, 06/30/24 | | | | | | | 1,916 | | | | 2,071,675 | |
5.13%, 06/30/27 | | | | | | | 2,981 | | | | 2,921,380 | |
Cheniere Energy Partners LP, Series WI, 5.25%, 10/01/25 | | | | | | | 596 | | | | 584,825 | |
Chesapeake Energy Corp.: | | | | | | | | | | | | |
6.63%, 08/15/20 | | | | | | | 704 | | | | 725,120 | |
4.88%, 04/15/22 | | | | | | | 2,682 | | | | 2,547,900 | |
8.00%, 12/15/22(a) | | | | | | | 830 | | | | 866,935 | |
| | |
| 20 | | 2018 BLACKROCK ANNUAL REPORTTO SHAREHOLDERS |
| | |
Schedule of Investments (continued) October 31, 2018 | | BlackRock Credit Allocation Income Trust (BTZ) (Percentages shown are based on Net Assets) |
| | | | | | | | | | | | |
| Security | | Par
(000) | | | Value | |
| Oil, Gas & Consumable Fuels (continued) | |
7.00%, 10/01/24 | | | USD | | | | 2,445 | | | $ | 2,393,044 | |
8.00%, 01/15/25 | | | | | | | 944 | | | | 955,800 | |
7.50%, 10/01/26 | | | | | | | 407 | | | | 398,860 | |
CNX Resources Corp., 5.88%, 04/15/22(f) | | | | | | | 8,704 | | | | 8,546,284 | |
Concho Resources, Inc., 4.88%, 10/01/47 | | | | | | | 3,815 | | | | 3,605,943 | |
CONSOL Energy, Inc., 11.00%, 11/15/25(a) | | | | | | | 328 | | | | 368,180 | |
Continental Resources, Inc., 4.90%, 06/01/44 | | | | | | | 3,500 | | | | 3,258,186 | |
Covey Park Energy LLC/Covey Park Finance Corp.,
7.50%, 05/15/25(a) | | | | | | | 426 | | | | 418,545 | |
CrownRock LP/CrownRock Finance, Inc., 5.63%, 10/15/25(a) | | | | | | | 2,880 | | | | 2,739,600 | |
DCP Midstream LLC(a): | | | | | | | | | | | | |
6.45%, 11/03/36 | | | | | | | 247 | | | | 255,028 | |
6.75%, 09/15/37 | | | | | | | 1,527 | | | | 1,588,080 | |
DCP Midstream Operating LP, 5.38%, 07/15/25 | | | | | | | 246 | | | | 249,456 | |
Denbury Resources, Inc., 9.25%, 03/31/22(a) | | | | | | | 1,136 | | | | 1,184,280 | |
Devon Energy Corp., 5.85%, 12/15/25 | | | | | | | 4,000 | | | | 4,252,443 | |
Diamond Offshore Drilling, Inc., 5.70%, 10/15/39 | | | | | | | 695 | | | | 524,725 | |
Diamondback Energy, Inc.,
4.75%, 11/01/24(a) | | | | | | | 1,380 | | | | 1,342,050 | |
El Paso LLC: | | | | | | | | | | | | |
7.80%, 08/01/31 | | | | | | | 197 | | | | 239,139 | |
7.75%, 01/15/32 | | | | | | | 4,586 | | | | 5,627,761 | |
El Paso Natural Gas Co. LLC, 8.63%, 01/15/22 | | | | | | | 2,345 | | | | 2,664,937 | |
El Paso Pipeline Partners Operating Co. LLC,
6.50%, 04/01/20(f) | | | | | | | 5,075 | | | | 5,287,539 | |
Enbridge Energy Partners LP, 9.88%, 03/01/19(f) | | | | | | | 6,000 | | | | 6,136,960 | |
Enbridge, Inc., 6.25%, 03/01/78(b) | | | | | | | 5,000 | | | | 4,678,578 | |
Endeavor Energy Resources LP/EER Finance, Inc.(a): | | | | | | | | | | | | |
5.50%, 01/30/26 | | | | | | | 1,268 | | | | 1,302,870 | |
5.75%, 01/30/28 | | | | | | | 249 | | | | 257,093 | |
Energy Transfer Equity LP: | | | | | | | | | | | | |
7.50%, 10/15/20 | | | | | | | 598 | | | | 633,132 | |
4.25%, 03/15/23 | | | | | | | 553 | | | | 547,470 | |
5.88%, 01/15/24 | | | | | | | 3,366 | | | | 3,538,507 | |
5.50%, 06/01/27 | | | | | | | 406 | | | | 412,719 | |
Energy Transfer Partners LP: | | | | | | | | | | | | |
5.20%, 02/01/22(f) | | | | | | | 10,200 | | | | 10,547,567 | |
6.13%, 12/15/45 | | | | | | | 3,579 | | | | 3,554,595 | |
EnLink Midstream Partners LP: | | | | | | | | | | | | |
4.40%, 04/01/24 | | | | | | | 613 | | | | 590,707 | |
4.15%, 06/01/25 | | | | | | | 66 | | | | 61,349 | |
4.85%, 07/15/26 | | | | | | | 92 | | | | 87,015 | |
5.05%, 04/01/45 | | | | | | | 203 | | | | 160,611 | |
5.45%, 06/01/47 | | | | | | | 239 | | | | 201,373 | |
Ensco PLC, 5.75%, 10/01/44 | | | | | | | 512 | | | | 358,400 | |
Enterprise Products Operating LLC: | | | | | | | | | | | | |
4.90%, 05/15/46(f) | | | | | | | 5,375 | | | | 5,218,993 | |
Series E, 5.25%, 08/16/77(b) | | | | | | | 4,800 | | | | 4,299,485 | |
EP Energy LLC/Everest Acquisition Finance, Inc.(a): | | | | | | | | | | | | |
9.38%, 05/01/24 | | | | | | | 351 | | | | 266,760 | |
8.00%, 11/29/24 | | | | | | | 673 | | | | 649,445 | |
7.75%, 05/15/26 | | | | | | | 762 | | | | 762,000 | |
Extraction Oil & Gas, Inc.(a): | | | | | | | | | | | | |
7.38%, 05/15/24 | | | | | | | 72 | | | | 67,500 | |
5.63%, 02/01/26 | | | | | | | 1,392 | | | | 1,176,240 | |
Gulfport Energy Corp., 6.00%, 10/15/24 | | | | | | | 361 | | | | 337,535 | |
Hess Corp., 5.80%, 04/01/47 | | | | | | | 5,000 | | | | 4,841,939 | |
Hess Infrastructure Partners LP/Hess Infrastructure Partners Finance Corp., 5.63%, 02/15/26(a) | | | | | | | 611 | | | | 612,528 | |
Indigo Natural Resources LLC, 6.88%, 02/15/26(a) | | | | | | | 239 | | | | 225,855 | |
Jagged Peak Energy LLC,
5.88%, 05/01/26(a) | | | | | | | 176 | | | | 171,600 | |
| | | | | | | | | | | | |
| Security | | Par
(000) | | | Value | |
| Oil, Gas & Consumable Fuels (continued) | |
Kinder Morgan Energy Partners LP: | | | | | | | | | | | | |
6.85%, 02/15/20(f) | | | USD | | | | 12,000 | | | $ | 12,514,982 | |
4.25%, 09/01/24 | | | | | | | 2,170 | | | | 2,172,328 | |
5.40%, 09/01/44 | | | | | | | 3,615 | | | | 3,503,652 | |
Marathon Petroleum Corp.(a): | | | | | | | | | | | | |
4.75%, 12/15/23 | | | | | | | 1,230 | | | | 1,266,976 | |
5.13%, 12/15/26 | | | | | | | 937 | | | | 961,595 | |
Matador Resources Co., 5.88%, 09/15/26(a) | | | | | | | 1,289 | | | | 1,259,997 | |
MEG Energy Corp.(a): | | | | | | | | | | | | |
6.38%, 01/30/23 | | | | | | | 309 | | | | 298,185 | |
6.50%, 01/15/25 | | | | | | | 1,968 | | | | 2,036,880 | |
Midcontinent Express Pipeline LLC,
6.70%, 09/15/19(a) | | | | | | | 3,500 | | | | 3,569,038 | |
MPLX LP: | | | | | | | | | | | | |
4.13%, 03/01/27 | | | | | | | 825 | | | | 787,091 | |
5.20%, 03/01/47 | | | | | | | 3,500 | | | | 3,310,273 | |
4.70%, 04/15/48(f) | | | | | | | 5,000 | | | | 4,391,072 | |
Nabors Industries, Inc., 5.75%, 02/01/25 | | | | | | | 395 | | | | 364,556 | |
Newfield Exploration Co., 5.38%, 01/01/26 | | | | | | | 480 | | | | 484,502 | |
Nexen Energy ULC, 6.40%, 05/15/37 | | | | | | | 2,000 | | | | 2,368,722 | |
NGPL PipeCo LLC(a): | | | | | | | | | | | | |
4.38%, 08/15/22 | | | | | | | 509 | | | | 502,638 | |
4.88%, 08/15/27 | | | | | | | 931 | | | | 896,087 | |
7.77%, 12/15/37 | | | | | | | 1,370 | | | | 1,602,900 | |
Noble Energy, Inc., 5.05%, 11/15/44 | | | | | | | 3,500 | | | | 3,219,203 | |
Noble Holding International Ltd.: | | | | | | | | | | | | |
7.75%, 01/15/24(f) | | | | | | | 1,259 | | | | 1,175,591 | |
7.88%, 02/01/26(a) | | | | | | | 1,545 | | | | 1,533,412 | |
Oasis Petroleum, Inc., 6.88%, 01/15/23 | | | | | | | 57 | | | | 57,499 | |
ONEOK Partners LP, 8.63%, 03/01/19(f) | | | | | | | 10,000 | | | | 10,178,410 | |
Pacific Drilling First Lien Escrow Issuer Ltd., 8.38%, 10/01/23(a) | | | | | | | 1,424 | | | | 1,441,800 | |
Parsley Energy LLC/Parsley Finance Corp.(a): | | | | | | | | | | | | |
5.25%, 08/15/25 | | | | | | | 780 | | | | 753,675 | |
5.63%, 10/15/27 | | | | | | | 1,289 | | | | 1,270,658 | |
Petroleos Mexicanos: | | | | | | | | | | | | |
3.50%, 01/30/23(f) | | | | | | | 5,000 | | | | 4,595,000 | |
4.63%, 09/21/23 | | | | | | | 3,965 | | | | 3,780,588 | |
4.88%, 01/18/24(f) | | | | | | | 2,000 | | | | 1,902,620 | |
Plains All American Pipeline LP,
Series B, 6.13%(b)(f)(h) | | | | | | | 2,215 | | | | 2,076,562 | |
Plains All American Pipeline LP/PAA Finance Corp.: | | | | | | | | | | | | |
4.70%, 06/15/44 | | | | | | | 1,498 | | | | 1,294,812 | |
4.90%, 02/15/45 | | | | | | | 2,102 | | | | 1,837,162 | |
QEP Resources, Inc.: | | | | | | | | | | | | |
5.38%, 10/01/22 | | | | | | | 1,927 | | | | 1,898,095 | |
5.63%, 03/01/26 | | | | | | | 1,040 | | | | 978,900 | |
Range Resources Corp.: | | | | | | | | | | | | |
5.00%, 08/15/22 | | | | | | | 32 | | | | 31,440 | |
4.88%, 05/15/25 | | | | | | | 175 | | | | 162,313 | |
Rockies Express Pipeline LLC(a): | | | | | | | | | | | | |
5.63%, 04/15/20 | | | | | | | 295 | | | | 301,402 | |
6.88%, 04/15/40 | | | | | | | 580 | | | | 630,750 | |
Rowan Cos., Inc., 4.88%, 06/01/22 | | | | | | | 1,446 | | | | 1,384,545 | |
Ruby Pipeline LLC, 6.00%, 04/01/22(a)(f) | | | | | | | 8,409 | | | | 8,715,579 | |
Sabine Pass Liquefaction LLC: | | | | | | | | | | | | |
5.63%, 02/01/21 | | | | | | | 405 | | | | 419,065 | |
5.63%, 04/15/23(f) | | | | | | | 10,510 | | | | 11,064,192 | |
5.75%, 05/15/24 | | | | | | | 2,575 | | | | 2,727,020 | |
5.88%, 06/30/26 | | | | | | | 1,481 | | | | 1,572,264 | |
| | | | |
| SCHEDULES OF INVESTMENTS | | | 21 | |
| | |
Schedule of Investments (continued) October 31, 2018 | | BlackRock Credit Allocation Income Trust (BTZ) (Percentages shown are based on Net Assets) |
| | | | | | | | | | | | |
| Security | | Par
(000) | | | Value | |
| Oil, Gas & Consumable Fuels (continued) | |
Sanchez Energy Corp.: | | | | | | | | | | | | |
7.75%, 06/15/21 | | | USD | | | | 982 | | | $ | 491,000 | |
6.13%, 01/15/23 | | | | | | | 847 | | | | 313,390 | |
Seven Generations Energy Ltd.,
5.38%, 09/30/25(a) | | | | | | | 1,110 | | | | 1,035,075 | |
SM Energy Co.: | | | | | | | | | | | | |
5.00%, 01/15/24 | | | | | | | 297 | | | | 282,893 | |
5.63%, 06/01/25(f) | | | | | | | 350 | | | | 336,875 | |
6.75%, 09/15/26 | | | | | | | 682 | | | | 683,705 | |
6.63%, 01/15/27 | | | | | | | 463 | | | | 465,315 | |
Southwestern Energy Co.: | | | | | | | | | | | | |
6.20%, 01/23/25 | | | | | | | 725 | | | | 705,062 | |
7.50%, 04/01/26 | | | | | | | 890 | | | | 905,575 | |
7.75%, 10/01/27 | | | | | | | 259 | | | | 262,238 | |
Sunoco LP/Sunoco Finance Corp.(a): | | | | | | | | | | | | |
4.88%, 01/15/23 | | | | | | | 1,071 | | | | 1,032,176 | |
5.88%, 03/15/28 | | | | | | | 317 | | | | 295,603 | |
Tallgrass Energy Partners LP/Tallgrass Energy Finance Corp.(a): | | | | | | | | | | | | |
5.50%, 09/15/24 | | | | | | | 145 | | | | 145,906 | |
5.50%, 01/15/28 | | | | | | | 1,388 | | | | 1,372,121 | |
Targa Resources Partners LP/Targa Resources Partners Finance Corp.: | | | | | | | | | | | | |
5.25%, 05/01/23 | | | | | | | 37 | | | | 36,908 | |
6.75%, 03/15/24 | | | | | | | 184 | | | | 192,740 | |
5.88%, 04/15/26(a) | | | | | | | 848 | | | | 852,240 | |
5.00%, 01/15/28 | | | | | | | 1,009 | | | | 956,027 | |
TransCanada PipeLines Ltd.: | | | | | | | | | | | | |
4.88%, 01/15/26(f) | | | | | | | 4,485 | | | | 4,621,880 | |
4.88%, 05/15/48 | | | | | | | 4,000 | | | | 3,862,357 | |
TransCanada Trust(3 mo. LIBOR US + 3.53%), 5.63%, 05/20/75(g) | | | | | | | 2,755 | | | | 2,622,402 | |
Transocean Guardian Ltd., 5.88%, 01/15/24(a) | | | | | | | 648 | | | | 641,520 | |
Transocean Pontus Ltd.,
6.13%, 08/01/25(a) | | | | | | | 769 | | | | 764,194 | |
Transocean, Inc., 7.25%, 11/01/25(a) | | | | | | | 750 | | | | 729,375 | |
Western Gas Partners LP,
5.38%, 06/01/21(f) | | | | | | | 5,125 | | | | 5,285,264 | |
Whiting Petroleum Corp., 6.63%, 01/15/26 | | | | | | | 700 | | | | 699,125 | |
Williams Cos., Inc.: | | | | | | | | | | | | |
3.70%, 01/15/23 | | | | | | | 2,245 | | | | 2,203,178 | |
4.55%, 06/24/24 | | | | | | | 527 | | | | 530,737 | |
8.75%, 03/15/32 | | | | | | | 2,478 | | | | 3,244,071 | |
5.10%, 09/15/45(f) | | | | | | | 5,075 | | | | 4,795,754 | |
WPX Energy, Inc.: | | | | | | | | | | | | |
6.00%, 01/15/22 | | | | | | | 72 | | | | 73,620 | |
5.25%, 09/15/24 | | | | | | | 22 | | | | 21,725 | |
| | | | | | | | |
| | | | | | | | | | | 260,208,858 | |
| Paper & Forest Products — 1.8% | |
International Paper Co.(f): | | | | | | | | | | | | |
7.50%, 08/15/21 | | | | | | | 7,209 | | | | 7,940,746 | |
8.70%, 06/15/38 | | | | | | | 4,000 | | | | 5,351,738 | |
7.30%, 11/15/39 | | | | | | | 10,000 | | | | 12,021,285 | |
| | | | | | | | |
| | | | | | | | | | | 25,313,769 | |
| Pharmaceuticals — 4.0% | |
Abbott Laboratories, 4.90%, 11/30/46 | | | | | | | 5,500 | | | | 5,667,151 | |
AbbVie, Inc., 4.70%, 05/14/45 | | | | | | | 3,255 | | | | 2,934,469 | |
Allergan Funding SCS, 4.75%, 03/15/45 | | | | | | | 5,485 | | | | 5,140,196 | |
Allergan Sales LLC, 5.00%, 12/15/21(a) | | | | | | | 1,631 | | | | 1,682,244 | |
Allergan, Inc., 2.80%, 03/15/23 | | | | | | | 3,000 | | | | 2,846,876 | |
Bausch Health Cos., Inc.(a): | | | | | | | | | | | | |
6.13%, 04/15/25 | | | | | | | 815 | | | | 749,555 | |
5.50%, 11/01/25 | | | | | | | 869 | | | | 851,620 | |
8.50%, 01/31/27 | | | | | | | 1,186 | | | | 1,206,755 | |
| | | | | | | | | | | | |
| Security | | Par
(000) | | | Value | |
| Pharmaceuticals (continued) | |
Bayer US Finance II LLC, 4.88%, 06/25/48(a) | | | USD | | | | 7,500 | | | $ | 6,994,431 | |
Charles River Laboratories International, Inc.,
5.50%, 04/01/26(a) | | | | | | | 317 | | | | 316,207 | |
CVS Health Corp.: | | | | | | | | | | | | |
4.75%, 12/01/22 | | | | | | | 289 | | | | 298,028 | |
5.00%, 12/01/24 | | | | | | | 183 | | | | 189,499 | |
5.13%, 07/20/45 | | | | | | | 3,879 | | | | 3,804,833 | |
5.05%, 03/25/48(f) | | | | | | | 8,205 | | | | 8,000,377 | |
Elanco Animal Health, Inc.(a): | | | | | | | | | | | | |
4.27%, 08/28/23 | | | | | | | 314 | | | | 312,556 | |
4.90%, 08/28/28 | | | | | | | 336 | | | | 331,929 | |
Endo Finance LLC/Endo Finco, Inc.,
6.00%, 07/15/23(a) | | | | | | | 1,514 | | | | 1,302,040 | |
inVentiv Group Holdings, Inc./inVentiv Health, Inc./inVentiv Health Clinical, Inc., 7.50%, 10/01/24(a) | | | | | | | 297 | | | | 312,593 | |
Merck & Co., Inc., 6.50%, 12/01/33(f) | | | | | | | 6,420 | | | | 8,071,862 | |
Valeant Pharmaceuticals International, Inc.(a): | | | | | | | | | | | | |
7.50%, 07/15/21 | | | | | | | 41 | | | | 41,615 | |
5.63%, 12/01/21 | | | | | | | 643 | | | | 632,551 | |
6.50%, 03/15/22 | | | | | | | 829 | | | | 858,015 | |
5.50%, 03/01/23 | | | | | | | 2,365 | | | | 2,240,837 | |
5.88%, 05/15/23 | | | | | | | 622 | | | | 593,232 | |
7.00%, 03/15/24 | | | | | | | 1,303 | | | | 1,364,489 | |
9.00%, 12/15/25 | | | | | | | 316 | | | | 329,430 | |
9.25%, 04/01/26 | | | | | | | 176 | | | | 184,580 | |
| | | | | | | | |
| | | | | | | | | | | 57,257,970 | |
| Real Estate Management & Development — 0.4% | |
Greystar Real Estate Partners LLC,
5.75%, 12/01/25(a) | | | | | | | 460 | | | | 446,200 | |
Northwest Florida Timber Finance LLC,
4.75%, 03/04/29(a)(f) | | | | | | | 4,485 | | | | 4,095,164 | |
Realogy Group LLC/Realogy Co-Issuer Corp.,
4.50%, 04/15/19(a) | | | | | | | 803 | | | | 798,985 | |
| | | | | | | | |
| | | | | | | | | | | 5,340,349 | |
| Road & Rail — 1.2% | |
Norfolk Southern Corp., 6.00%, 03/15/05 | | | | | | | 12,700 | | | | 13,431,827 | |
United Rentals North America, Inc.: | | | | | | | | | | | | |
4.63%, 07/15/23 | | | | | | | 1,616 | | | | 1,601,860 | |
4.63%, 10/15/25 | | | | | | | 1,034 | | | | 957,743 | |
5.88%, 09/15/26 | | | | | | | 274 | | | | 268,520 | |
4.88%, 01/15/28 | | | | | | | 877 | | | | 790,133 | |
| | | | | | | | |
| | | | | | | | | | | 17,050,083 | |
| Semiconductors & Semiconductor Equipment — 1.0% | |
Broadcom Corp./Broadcom Cayman Finance Ltd.,
3.88%, 01/15/27(f) | | | | | | | 7,500 | | | | 6,886,795 | |
NXP BV/NXP Funding LLC,
4.63%, 06/15/22(a) | | | | | | | 490 | | | | 486,937 | |
QUALCOMM, Inc.: | | | | | | | | | | | | |
3.25%, 05/20/27(f) | | | | | | | 2,500 | | | | 2,311,988 | |
4.30%, 05/20/47 | | | | | | | 3,500 | | | | 3,137,568 | |
Sensata Technologies BV(a): | | | | | | | | | | | | |
5.63%, 11/01/24 | | | | | | | 695 | | | | 691,525 | |
5.00%, 10/01/25 | | | | | | | 772 | | | | 744,980 | |
| | | | | | | | |
| | | | | | | | | | | 14,259,793 | |
| Software — 1.1% | |
CDK Global, Inc., 5.88%, 06/15/26 | | | | | | | 378 | | | | 380,835 | |
Genesys Telecommunications Laboratories, Inc./Greeneden Lux 3 Sarl/Greeneden US Holdings LLC, 10.00%, 11/30/24(a) | | | | | | | 988 | | | | 1,071,980 | |
Infor US, Inc., 6.50%, 05/15/22 | | | | | | | 8,585 | | | | 8,563,537 | |
Informatica LLC, 7.13%, 07/15/23(a) | | | | | | | 1,599 | | | | 1,631,476 | |
Nuance Communications, Inc.,
5.38%, 08/15/20(a) | | | | | | | 1,267 | | | | 1,267,792 | |
| | |
| 22 | | 2018 BLACKROCK ANNUAL REPORTTO SHAREHOLDERS |
| | |
Schedule of Investments (continued) October 31, 2018 | | BlackRock Credit Allocation Income Trust (BTZ) (Percentages shown are based on Net Assets) |
| | | | | | | | | | | | |
| Security | | Par
(000) | | | Value | |
| Software (continued) | |
PTC, Inc., 6.00%, 05/15/24 | | | USD | | | | 313 | | | $ | 320,043 | |
Solera LLC/Solera Finance, Inc.,
10.50%, 03/01/24(a) | | | | | | | 2,040 | | | | 2,213,461 | |
Sophia LP/Sophia Finance, Inc.,
9.00%, 09/30/23(a) | | | | | | | 740 | | | | 765,900 | |
| | | | | | | | |
| | | | | | | | | | | 16,215,024 | |
| Specialty Retail — 0.4% | |
L Brands, Inc.: | | | | | | | | | | | | |
7.00%, 05/01/20 | | | | | | | 3,050 | | | | 3,172,000 | |
6.88%, 11/01/35 | | | | | | | 1,119 | | | | 951,150 | |
Penske Automotive Group, Inc.,
5.50%, 05/15/26 | | | | | | | 1,160 | | | | 1,102,000 | |
| | | | | | | | |
| | | | | | | | | | | 5,225,150 | |
| Technology Hardware, Storage & Peripherals — 0.5% | |
Dell International LLC/EMC Corp.(a): | | | | | | | | | | | | |
5.88%, 06/15/21 | | | | | | | 615 | | | | 623,469 | |
7.13%, 06/15/24 | | | | | | | 747 | | | | 790,561 | |
8.35%, 07/15/46 | | | | | | | 2,355 | | | | 2,736,681 | |
Western Digital Corp., 4.75%, 02/15/26 | | | | | | | 2,900 | | | | 2,678,875 | |
| | | | | | | | |
| | | | | | | | | | | 6,829,586 | |
| Textiles, Apparel & Luxury Goods — 0.1% | |
Levi Strauss & Co., 5.00%, 05/01/25 | | | | | | | 699 | | | | 688,515 | |
William Carter Co., 5.25%, 08/15/21 | | | | | | | 1,406 | | | | 1,411,272 | |
| | | | | | | | |
| | | | | | | | | | | 2,099,787 | |
| Thrifts & Mortgage Finance — 0.1% | |
Ladder Capital Finance Holdings LLLP/Ladder Capital Finance Corp.(a): | | | | | | | | | | | | |
5.25%, 03/15/22 | | | | | | | 480 | | | | 477,600 | |
5.25%, 10/01/25 | | | | | | | 268 | | | | 247,900 | |
| | | | | | | | |
| | | | | | | | | | | 725,500 | |
| Tobacco — 2.2% | |
Altria Group, Inc., 10.20%, 02/06/39(f) | | | | | | | 13,392 | | | | 20,854,664 | |
BAT Capital Corp., 4.54%, 08/15/47(a) | | | | | | | 8,000 | | | | 6,965,763 | |
Reynolds American, Inc.: | | | | | | | | | | | | |
4.85%, 09/15/23 | | | | | | | 1,120 | | | | 1,155,748 | |
5.85%, 08/15/45 | | | | | | | 2,335 | | | | 2,398,305 | |
| | | | | | | | |
| | | | | | | | | | | 31,374,480 | |
| Trading Companies & Distributors — 0.2% | |
Doric Nimrod Air Alpha Ltd. Pass-Through Trust, Series 2013-1(a): | | | | | | | | | | | | |
Class A, 5.25%, 05/30/25 | | | | | | | 1,732 | | | | 1,770,571 | |
Class B, 6.13%, 11/30/21 | | | | | | | 1,122 | | | | 1,139,144 | |
| | | | | | | | |
| | | | | | | | | | | 2,909,715 | |
| Transportation Infrastructure — 0.7% | |
Penske Truck Leasing Co. LP/PTL Finance Corp.,
4.88%, 07/11/22(a)(f) | | | | | | | 10,500 | | | | 10,791,812 | |
| | | | | | | | |
| Utilities — 0.1% | |
Vistra Operations Co. LLC,
5.50%, 09/01/26(a) | | | | | | | 747 | | | | 735,795 | |
| | | | | | | | |
| Wireless Telecommunication Services — 1.9% | |
Crown Castle International Corp.: | | | | | | | | | | | | |
4.88%, 04/15/22 | | | | | | | 2,500 | | | | 2,575,321 | |
3.65%, 09/01/27(f) | | | | | | | 8,000 | | | | 7,396,715 | |
CyrusOne LP/CyrusOne Finance Corp.,
5.38%, 03/15/27 | | | | | | | 129 | | | | 128,033 | |
Digicel Group Ltd., 8.25%, 09/30/20(a) | | | | | | | 200 | | | | 143,002 | |
Digicel Ltd., 6.00%, 04/15/21(a) | | | | | | | 1,285 | | | | 1,166,137 | |
Frontier Communications Corp., 8.50%, 04/01/26(a) | | | | | | | 711 | | | | 660,341 | |
SBA Communications Corp.: | | | | | | | | | | | | |
4.00%, 10/01/22 | | | | | | | 1,045 | | | | 1,000,588 | |
| | | | | | | | | | | | |
| Security | | Par
(000) | | | Value | |
| Wireless Telecommunication Services (continued) | |
4.88%, 09/01/24 | | | USD | | | | 1,708 | | | $ | 1,648,220 | |
Sprint Capital Corp.: | | | | | | | | | | | | |
6.88%, 11/15/28 | | | | | | | 841 | | | | 827,334 | |
8.75%, 03/15/32 | | | | | | | 1,197 | | | | 1,307,722 | |
Sprint Communications, Inc.(a): | | | | | | | | | | | | |
9.00%, 11/15/18 | | | | | | | 1,576 | | | | 1,579,152 | |
7.00%, 03/01/20 | | | | | | | 389 | | | | 403,101 | |
Sprint Corp.: | | | | | | | | | | | | |
7.88%, 09/15/23 | | | | | | | 884 | | | | 943,670 | |
7.13%, 06/15/24 | | | | | | | 3,442 | | | | 3,519,445 | |
7.63%, 02/15/25 | | | | | | | 36 | | | | 37,395 | |
7.63%, 03/01/26 | | | | | | | 1,929 | | | | 2,006,160 | |
T-Mobile USA, Inc.: | | | | | | | | | | | | |
6.50%, 01/15/26 | | | | | | | 960 | | | | 1,010,400 | |
4.50%, 02/01/26 | | | | | | | 815 | | | | 762,791 | |
4.75%, 02/01/28 | | | | | | | 1,076 | | | | 995,300 | |
| | | | | | | | |
| | | | | | | | | | | 28,110,827 | |
| | | | | | | | |
Total Corporate Bonds — 109.0%
(Cost — $1,561,359,738) | | | | 1,569,207,592 | |
| | | | | | | | |
|
Foreign Agency Obligations — 2.3% | |
Argentine Republic Government International Bond, 5.63%, 01/26/22 | | | | | | | 6,485 | | | | 5,820,287 | |
Brazilian Government International Bond, 5.00%, 01/27/45 | | | | | | | 6,525 | | | | 5,448,375 | |
Colombia Government International Bond, 5.63%, 02/26/44 | | | | | | | 4,000 | | | | 4,096,000 | |
Indonesia Government International Bond, 5.88%, 01/15/24(a) | | | | | | | 4,400 | | | | 4,628,378 | |
Mexico Government International Bond: | | | | | | | | | | | | |
4.75%, 03/08/44 | | | | | | | 5,800 | | | | 5,141,758 | |
4.60%, 02/10/48 | | | | | | | 5,000 | | | | 4,337,600 | |
Uruguay Government International Bond, 5.10%, 06/18/50 | | | | | | | 3,500 | | | | 3,316,250 | |
| | | | | | | | |
Total Foreign Agency Obligations — 2.3%
(Cost — $35,090,454) | | | | 32,788,648 | |
| | | | | | | | |
|
Municipal Bonds — 1.2% | |
City of Chicago Illinois, Refunding ARB, O’Hare International Airport, General 3rd Lien, Build America Bonds, Series B, 6.85%, 01/01/38 | | | | | | | 5,000 | | | | 5,192,050 | |
Metropolitan Transportation Authority, RB, Build America Bonds, Series B-1, 6.55%, 11/15/31 | | | | | | | 10,000 | | | | 12,008,900 | |
| | | | | | | | |
Total Municipal Bonds — 1.2%
(Cost — $14,845,121) | | | | 17,200,950 | |
| | | | | | | | |
|
Preferred Securities — 25.0% | |
| | | |
| Capital Trusts — 22.5% | | | | | | | | | |
| Banks — 6.3% | | | | | | | | | |
BNP Paribas SA(a)(g)(h): | | | | | | | | | | | | |
7.20% | | | | | | | 5,000 | | | | 5,209,200 | |
7.38% | | | | | | | 4,535 | | | | 4,659,712 | |
Capital One Financial Corp., Series E, 5.55%(g)(h) | | | | | | | 5,000 | | | | 5,050,000 | |
CIT Group, Inc., Series A, 5.80%(g)(h) | | | | | | | 3,000 | | | | 2,950,500 | |
Citigroup, Inc., 5.90%(g)(h) | | | | | | | 2,210 | | | | 2,210,000 | |
Credit Suisse Group AG(a)(g)(h): | | | | | | | | | | | | |
6.25% | | | | | | | 7,255 | | | | 7,059,957 | |
7.50% | | | | | | | 3,250 | | | | 3,383,770 | |
HSBC Capital Funding LP, 10.18%(a)(f)(g)(h) | | | | | | | 11,835 | | | | 17,397,450 | |
Lloyds Banking Group PLC, 7.50%(b)(h) | | | | | | | 8,285 | | | | 8,326,425 | |
Macquarie Bank Ltd., 6.13%(a)(g)(h) | | | | | | | 1,885 | | | | 1,691,787 | |
Nordea Bank AB, 6.13%(a)(g)(h) | | | | | | | 5,540 | | | | 5,318,400 | |
| | | | |
| SCHEDULES OF INVESTMENTS | | | 23 | |
| | |
Schedule of Investments (continued) October 31, 2018 | | BlackRock Credit Allocation Income Trust (BTZ) (Percentages shown are based on Net Assets) |
| | | | | | | | | | | | |
| Security | | Par
(000) | | | Value | |
| Banks (continued) | | | | | | | | | |
U.S. Bancorp, Series J, 5.30%(g)(h) | | | USD | | | | 10,415 | | | $ | 10,180,662 | |
Wells Fargo & Co.(g)(h): | | | | | | | | | | | | |
Series K, 6.10% | | | | | | | 809 | | | | 815,068 | |
Series Q, 5.85% | | | | | | | 551 | | | | 14,092,800 | |
Series S, 5.90% | | | | | | | 281 | | | | 283,108 | |
Series U, 5.88% | | | | | | | 2,655 | | | | 2,734,650 | |
| | | | | | | | |
| | | | | | | | | | | 91,363,489 | |
| Capital Markets — 2.9% | |
Charles Schwab Corp.,
Series E, 4.63%(f)(g)(h) | | | | | | | 6,805 | | | | 6,750,560 | |
Goldman Sachs Group, Inc., Series L, 5.70%(g)(h) | | | | | | | 2,950 | | | | 2,957,375 | |
Morgan Stanley, Series H, 5.45%(g)(h) | | | | | | | 8,675 | | | | 8,752,034 | |
State Street Corp: | | | | | | | | | | | | |
3.33%, 06/01/77(d)(f) | | | | | | | 17,845 | | | | 15,670,765 | |
Series D, 5.90%(g)(h) | | | | | | | 220 | | | | 5,741,690 | |
Series F, 5.25%(g)(h) | | | | | | | 1,855 | | | | 1,875,869 | |
| | | | | | | | |
| | | | | | | | | | | 41,748,293 | |
| Commercial Services & Supplies — 0.4% | |
AerCap Global Aviation Trust, 6.50%, 06/15/45(a)(g) | | | | | | | 5,000 | | | | 5,125,000 | |
| | | | | | | | |
| Consumer Finance — 0.3% | |
American Express Co., Series C, 4.90%(g)(h) | | | | | | | 4,510 | | | | 4,493,088 | |
| | | | | | | | |
| Diversified Financial Services — 5.6% | |
Bank of America Corp.(g)(h): | | | | | | | | | | | | |
Series AA, 6.10% | | | | | | | 8,630 | | | | 8,856,537 | |
Series U, 5.20% | | | | | | | 5,785 | | | | 5,640,375 | |
Barclays PLC, 6.63%(g)(h) | | | | | | | 3,135 | | | | 3,154,594 | |
Barclays PLC, 7.75%(b)(h) | | | | | | | 4,135 | | | | 4,125,490 | |
BNP Paribas SA, 6.75%(a)(g)(h) | | | | | | | 5,000 | | | | 5,056,250 | |
Credit Agricole SA, 8.13%(a)(g)(h) | | | | | | | 5,000 | | | | 5,362,830 | |
Credit Suisse Group AG, 7.50%(a)(b)(h) | | | | | | | 1,865 | | | | 1,897,638 | |
HSBC Holdings PLC: | | | | | | | | | | | | |
6.00%(g)(h) | | | | | | | 1,550 | | | | 1,426,000 | |
6.50%(b)(h) | | | | | | | 2,615 | | | | 2,454,831 | |
JPMorgan Chase & Co.: | | | | | | | | | | | | |
8.75%, 09/01/30 | | | | | | | 2,000 | | | | 2,710,355 | |
Series 1, 5.99%(g)(h) | | | | | | | 2,618 | | | | 2,632,032 | |
Series Q, 5.15%(g)(h) | | | | | | | 4,000 | | | | 3,926,400 | |
Series R, 6.00%(f)(g)(h) | | | | | | | 14,130 | | | | 14,200,650 | |
Series S, 6.75%(f)(g)(h) | | | | | | | 9,775 | | | | 10,425,037 | |
Royal Bank of Scotland Group PLC(g)(h): | | | | | | | | | | | | |
8.00% | | | | | | | 970 | | | | 1,000,919 | |
8.63% | | | | | | | 5,135 | | | | 5,398,169 | |
Societe Generale SA, 7.38%(a)(g)(h) | | | | | | | 1,980 | | | | 2,007,225 | |
| | | | | | | | |
| | | | | | | | | | | 80,275,332 | |
| Electric Utilities — 0.6% | |
PPL Capital Funding, Inc., Series A, 5.05%, 03/30/67(g) | | | | | | | 8,300 | | | | 8,051,000 | |
| | | | | | | | |
| Equity Real Estate Investment Trusts (REITs) — 0.5% | |
Sovereign Real Estate Investment Trust, 12.00%(a)(h) | | | | | | | 7 | | | | 7,787,500 | |
| | | | | | | | |
| Industrial Conglomerates — 0.5% | |
General Electric Co., Series D, 5.00%(g)(h) | | | | | | | 7,502 | | | | 6,948,727 | |
| | | | | | | | |
| Insurance — 2.8% | |
ACE Capital Trust II, 9.70%, 04/01/30 | | | | | | | 7,000 | | | | 9,741,410 | |
Allstate Corp., Series B, 5.75%, 08/15/53(g) | | | | | | | 5,000 | | | | 5,050,500 | |
American International Group, Inc.,
8.18%, 05/15/68(g) | | | | | | | 3,755 | | | | 4,609,262 | |
Equitable of Iowa Cos. Capital Trust II, Series B, 8.42%, 04/01/27 | | | | | | | 5,000 | | | | 5,348,635 | |
Farmers Exchange Capital II,
6.15%, 11/01/53(a)(g) | | | | | | | 4,890 | | | | 5,207,842 | |
MetLife, Inc., 6.40%, 12/15/36 | | | | | | | 5,000 | | | | 5,185,000 | |
Principal Financial Group, Inc., 4.70%, 05/15/55(g) | | | | | | | 5,000 | | | | 4,950,000 | |
| | | | | | | | |
| | | | | | | | | | | 40,092,649 | |
| | | | | | | | | | | | |
| Security | | Par
(000) | | | Value | |
| Media — 0.1% | |
Viacom, Inc., 5.88%, 02/28/57(g) | | | USD | | | | 2,111 | | | $ | 2,028,144 | |
| | | | | | | | |
| Oil, Gas & Consumable Fuels — 0.9% | |
Enbridge, Inc., Series 16-A,
6.00%, 01/15/77(g) | | | | | | | 5,880 | | | | 5,497,542 | |
Energy Transfer Partners LP, Series B, 6.63%(b)(h) | | | | | | | 5,000 | | | | 4,600,000 | |
Enterprise Products Operating LLC, 5.10%, 06/01/67(g) | | | | | | | 2,500 | | | | 2,469,067 | |
| | | | | | | | |
| | | | | | | | | | | 12,566,609 | |
| Road & Rail — 0.5% | |
BNSF Funding Trust I,
6.61%, 12/15/55(g) | | | | | | | 6,125 | | | | 6,691,563 | |
| | | | | | | | |
| Wireless Telecommunication Services — 1.1% | |
Centaur Funding Corp.,
9.08%, 04/21/20(a) | | | | | | | 15 | | | | 16,278,725 | |
| | | | | | | | |
Total Capital Trusts — 22.5%
(Cost — $320,332,083) | | | | 323,450,119 | |
| | | | | | | | |
| | | |
| | | | | | Shares | | | | |
Preferred Stocks — 2.0% | |
|
| Banks — 0.9% | |
Citigroup, Inc., Series K, 6.88%(g)(h) | | | | | | | 488,320 | | | | 13,345,786 | |
| | | | | | | | |
| Capital Markets — 0.3% | |
Goldman Sachs Group, Inc., Series J, 5.50%(g)(h) | | | | | | | 162,450 | | | | 4,100,238 | |
SCE Trust III, Series H, 5.75%(g)(h) | | | | | | | 31,650 | | | | 795,364 | |
| | | | | | | | |
| | | | | | | | | | | 4,895,602 | |
| Electric Utilities — 0.2% | |
Entergy Louisiana LLC, 5.25%, 07/01/52 | | | | | | | 90,000 | | | | 2,146,500 | |
| | | | | | | | |
| Equity Real Estate Investment Trusts (REITs) — 0.2% | |
Ventas Realty LP/Ventas Capital Corp., 5.45%, 03/15/43 | | | | | | | 75,000 | | | | 1,785,000 | |
Vornado Realty Trust, Series K,
5.70%(h) | | | | | | | 50,000 | | | | 1,181,500 | |
| | | | | | | | |
| | | | | | | | | | | 2,966,500 | |
| Media — 0.4% | |
NBCUniversal Enterprise, Inc.,
5.25%(a)(h) | | | | | | | 5,600,000 | | | | 5,670,000 | |
| | | | | | | | |
Total Preferred Stocks — 2.0%
(Cost — $27,930,653) | | | | 29,024,388 | |
| | | | | | | | |
|
Trust Preferred – 0.5% | |
|
| Diversified Financial Services — 0.5% | |
GMAC Capital Trust I, Series 2,
8.10%, 02/15/40(g) | | | | | | | 300,141 | | | | 7,881,703 | |
| | | | | | | | |
Total Trust Preferred — 0.5%
(Cost — $7,299,341) | | | | 7,881,703 | |
| | | | | | | | |
| |
Total Preferred Securities — 25.0%
(Cost — $355,562,077) | | | | 360,356,210 | |
| | | | | | | | |
| | | |
| | | | | | Par
(000) | | | | |
U.S. Government Sponsored Agency Securities — 0.3% | |
|
| Agency Obligations — 0.3% | |
Fannie Mae, 0.00%, 10/09/19(f)(m) | | | USD | | | | 3,945 | | | | 3,842,515 | |
| | | | | | | | |
Total U.S. Government Sponsored Agency Securities — 0.3%
(Cost — $3,793,489) | | | | 3,842,515 | |
| | | | | | | | |
| |
Total Long-Term Investments — 146.4%
(Cost — $2,095,340,809) | | | | 2,107,158,258 | |
| | | | | | | | |
| | |
| 24 | | 2018 BLACKROCK ANNUAL REPORTTO SHAREHOLDERS |
| | |
Schedule of Investments (continued) October 31, 2018 | | BlackRock Credit Allocation Income Trust (BTZ) (Percentages shown are based on Net Assets) |
| | | | | | | | | | | | |
| Security | | |
Shares | | | Value | |
Short-Term Securities — 0.5% | |
BlackRock Liquidity Funds, T-Fund, Institutional Class, 2.07%(n)(o) | | | | | | | 7,903,560 | | | $ | 7,903,560 | |
| | | | | | | | |
Total Short-Term Securities — 0.5%
(Cost — $7,903,560) | | | | 7,903,560 | |
| | | | | | | | |
Options Purchased — 0.1%
(Cost — $2,221,037) | | | | 1,711,826 | |
| | | | | | | | |
Total Investments Before Options Written — 147.0%
(Cost — $2,105,465,406) | | | | 2,116,773,644 | |
| | | | | | | | |
Options Written — (0.0)%
(Premiums Received — $64,068) | | | | (10,964 | ) |
| | | | | | | | |
| |
Total Investments, Net of Options Written — 147.0%
(Cost — $2,105,401,338) | | | | 2,116,762,680 | |
Liabilities in Excess of Other Assets — (47.0)% | | | | (676,809,125 | ) |
| | | | | | | | |
Net Assets — 100.0% | | | $ | 1,439,953,555 | |
| | | | | | | | |
| (a) | Security exempt from registration pursuant to Rule 144A under the Securities Act of 1933, as amended. These securities may be resold in transactions exempt from registration to qualified institutional investors. |
| (b) | Variable or floating rate security, which interest rate adjusts periodically based on changes in current interest rates and prepayments on the underlying pool of assets. Rate shown is the rate in effect as of period end. |
| (c) | When-issued security. |
| (d) | Variable rate security. Rate shown is the rate in effect as of period end. |
| (e) | Security is valued using significant unobservable inputs and is classified as Level 3 in the fair value hierarchy. |
| (f) | All or a portion of the security has been pledged as collateral in connection with outstanding reverse repurchase agreements. |
| (g) | Variable rate security. Security may be issued at a fixed coupon rate, which converts to a variable rate at a specified date. Rate shown is the rate in effect as of period end. |
| (h) | Perpetual security with no stated maturity date. |
| (i) | Issuer filed for bankruptcy and/or is in default. |
| (j) | Non-income producing security. |
| (k) | Step-up bond that pays an initial coupon rate for the first period and then a higher coupon rate for the following periods. Rate as of period end. |
| (l) | Payment-in-kind security which may pay interest/dividends in additional par/shares and/or in cash. Rates shown are the current rate and possible payment rates. |
| (n) | Annualized 7-day yield as of period end. |
| (o) | During the year ended October 31, 2018, investments in issuers considered to be an affiliate of the Trust for purposes of Section 2(a)(3) of the Investment Company Act of 1940, as amended, were as follows: |
| | | | | | | | | | | | | | | | | | | | | | | | | | | | |
| Affiliate | | Shares
Held at
10/31/17 | | | Net
Activity | | | Shares
Held at
10/31/18 | | | Value at
10/31/18 | | | Income | | | Net
Realized
Gain (Loss) (a) | | | Change in
Unrealized
Appreciation
(Depreciation) | |
BlackRock Liquidity Funds, T-Fund, Institutional Class | | | 9,139,477 | | | | (1,235,917 | ) | | | 7,903,560 | | | $ | 7,903,560 | | | $ | 137,025 | | | $ | 32 | | | $ | — | |
| | | | | | | | | | | | | | | | | | | | | | | | | | | | |
| | (a) | Includes net capital gain distributions, if applicable. | |
For Trust compliance purposes, the Trust’s industry classifications refer to one or more of the industry sub-classifications used by one or more widely recognized market indexes or rating group indexes, and/or as defined by the investment adviser. These definitions may not apply for purposes of this report, which may combine such industry sub-classifications for reporting ease.
Reverse Repurchase Agreements
| | | | | | | | | | | | | | | | | | | | | | | | |
| Counterparty | | Interest
Rate | | | Trade
Date | | | Maturity
Date (a) | | | Face Value | | | Face Value
Including
Accrued Interest | | | Type of Non-Cash Underlying Collateral | | Remaining Contractual
Maturity of the Agreements (a) |
Deutsche Bank Securities, Inc. | | | 2.37 | % | | | 05/08/18 | | | | Open | | | $ | 3,806,000 | | | $ | 3,841,781 | | | U.S. Government Sponsored Agency Securities | | Open/Demand |
Credit Suisse Securities (USA) LLC | | | 2.50 | | | | 07/16/18 | | | | Open | | | | 3,007,813 | | | | 3,025,734 | | | Corporate Bonds | | Open/Demand |
Credit Suisse Securities (USA) LLC | | | 2.50 | | | | 07/16/18 | | | | Open | | | | 3,661,226 | | | | 3,683,041 | | | Corporate Bonds | | Open/Demand |
Credit Suisse Securities (USA) LLC | | | 2.50 | | | | 07/16/18 | | | | Open | | | | 5,297,906 | | | | 5,329,473 | | | Corporate Bonds | | Open/Demand |
Credit Suisse Securities (USA) LLC | | | 2.50 | | | | 07/16/18 | | | | Open | | | | 13,062,500 | | | | 13,140,331 | | | Corporate Bonds | | Open/Demand |
Credit Suisse Securities (USA) LLC | | | 2.55 | | | | 07/16/18 | | | | Open | | | | 3,194,125 | | | | 3,213,631 | | | Corporate Bonds | | Open/Demand |
Credit Suisse Securities (USA) LLC | | | 2.55 | | | | 07/16/18 | | | | Open | | | | 4,721,483 | | | | 4,750,316 | | | Corporate Bonds | | Open/Demand |
RBC Capital Markets LLC | | | 2.59 | | | | 07/16/18 | | | | Open | | | | 7,896,600 | | | | 7,953,385 | | | Corporate Bonds | | Open/Demand |
RBC Capital Markets LLC | | | 2.59 | | | | 07/16/18 | | | | Open | | | | 2,212,500 | | | | 2,228,410 | | | Corporate Bonds | | Open/Demand |
RBC Capital Markets LLC | | | 2.59 | | | | 07/16/18 | | | | Open | | | | 5,012,500 | | | | 5,048,545 | | | Corporate Bonds | | Open/Demand |
RBC Capital Markets LLC | | | 2.59 | | | | 07/16/18 | | | | Open | | | | 4,887,500 | | | | 4,922,647 | | | Corporate Bonds | | Open/Demand |
RBC Capital Markets LLC | | | 2.59 | | | | 07/16/18 | | | | Open | | | | 7,320,000 | | | | 7,372,639 | | | Corporate Bonds | | Open/Demand |
RBC Capital Markets LLC | | | 2.59 | | | | 07/16/18 | | | | Open | | | | 4,925,000 | | | | 4,960,736 | | | Corporate Bonds | | Open/Demand |
RBC Capital Markets LLC | | | 2.59 | | | | 07/16/18 | | | | Open | | | | 2,857,500 | | | | 2,878,234 | | | Corporate Bonds | | Open/Demand |
RBC Capital Markets LLC | | | 2.85 | | | �� | 07/16/18 | | | | Open | | | | 3,717,040 | | | | 3,746,642 | | | Corporate Bonds | | Open/Demand |
RBC Capital Markets LLC | | | 2.85 | | | | 07/16/18 | | | | Open | | | | 4,675,000 | | | | 4,712,231 | | | Corporate Bonds | | Open/Demand |
RBC Capital Markets LLC | | | 2.85 | | | | 07/16/18 | | | | Open | | | | 4,075,000 | | | | 4,107,453 | | | Corporate Bonds | | Open/Demand |
BNP Paribas S.A. | | | 2.84 | | | | 07/17/18 | | | | Open | | | | 6,957,274 | | | | 7,010,379 | | | Corporate Bonds | | Open/Demand |
BNP Paribas S.A. | | | 2.84 | | | | 07/17/18 | | | | Open | | | | 7,787,100 | | | | 7,846,539 | | | Corporate Bonds | | Open/Demand |
| | | | |
| SCHEDULES OF INVESTMENTS | | | 25 | |
| | |
Schedule of Investments (continued) October 31, 2018 | | BlackRock Credit Allocation Income Trust (BTZ) |
Reverse Repurchase Agreements (continued)
| | | | | | | | | | | | | | | | | | | | | | | | |
| Counterparty | | Interest
Rate | | | Trade
Date | | | Maturity
Date (a) | | | Face Value | | | Face Value
Including
Accrued Interest | | | Type of Non-Cash Underlying Collateral | | Remaining Contractual
Maturity of the Agreements (a) |
BNP Paribas S.A. | | | 2.84 | % | | | 07/17/18 | | | | Open | | | $ | 8,083,840 | | | $ | 8,145,544 | | | Corporate Bonds | | Open/Demand |
RBC Capital Markets LLC | | | 2.59 | | | | 07/17/18 | | | | Open | | | | 8,880,000 | | | | 8,943,280 | | | Corporate Bonds | | Open/Demand |
RBC Capital Markets LLC | | | 2.59 | | | | 07/17/18 | | | | Open | | | | 7,584,500 | | | | 7,638,548 | | | Corporate Bonds | | Open/Demand |
RBC Capital Markets LLC | | | 2.59 | | | | 07/17/18 | | | | Open | | | | 14,310,000 | | | | 14,411,975 | | | Corporate Bonds | | Open/Demand |
RBC Capital Markets LLC | | | 2.59 | | | | 07/17/18 | | | | Open | | | | 7,095,188 | | | | 7,145,749 | | | Corporate Bonds | | Open/Demand |
RBC Capital Markets LLC | | | 2.59 | | | | 07/17/18 | | | | Open | | | | 6,075,000 | | | | 6,118,291 | | | Corporate Bonds | | Open/Demand |
RBC Capital Markets LLC | | | 2.59 | | | | 07/17/18 | | | | Open | | | | 4,204,688 | | | | 4,234,651 | | | Corporate Bonds | | Open/Demand |
RBC Capital Markets LLC | | | 2.59 | | | | 07/17/18 | | | | Open | | | | 5,300,000 | | | | 5,337,768 | | | Corporate Bonds | | Open/Demand |
RBC Capital Markets LLC | | | 2.59 | | | | 07/17/18 | | | | Open | | | | 3,330,000 | | | | 3,353,730 | | | Corporate Bonds | | Open/Demand |
RBC Capital Markets LLC | | | 2.59 | | | | 07/17/18 | | | | Open | | | | 3,180,113 | | | | 3,202,774 | | | Corporate Bonds | | Open/Demand |
RBC Capital Markets LLC | | | 2.59 | | | | 07/17/18 | | | | Open | | | | 4,015,125 | | | | 4,043,737 | | | Corporate Bonds | | Open/Demand |
RBC Capital Markets LLC | | | 2.59 | | | | 07/17/18 | | | | Open | | | | 4,724,775 | | | | 4,758,444 | | | Corporate Bonds | | Open/Demand |
RBC Capital Markets LLC | | | 2.59 | | | | 07/17/18 | | | | Open | | | | 16,929,000 | | | | 17,049,638 | | | Corporate Bonds | | Open/Demand |
RBC Capital Markets LLC | | | 2.59 | | | | 07/17/18 | | | | Open | | | | 21,125,880 | | | | 21,276,425 | | | Corporate Bonds | | Open/Demand |
RBC Capital Markets LLC | | | 2.59 | | | | 07/17/18 | | | | Open | | | | 3,850,000 | | | | 3,877,436 | | | Corporate Bonds | | Open/Demand |
RBC Capital Markets LLC | | | 2.59 | | | | 07/17/18 | | | | Open | | | | 7,012,500 | | | | 7,062,472 | | | Corporate Bonds | | Open/Demand |
BNP Paribas S.A. | | | 2.56 | | | | 07/23/18 | | | | Open | | | | 5,793,750 | | | | 5,830,967 | | | Corporate Bonds | | Open/Demand |
BNP Paribas S.A. | | | 2.56 | | | | 07/23/18 | | | | Open | | | | 15,274,875 | | | | 15,372,995 | | | Corporate Bonds | | Open/Demand |
BNP Paribas S.A. | | | 2.56 | | | | 07/23/18 | | | | Open | | | | 5,656,313 | | | | 5,692,646 | | | Corporate Bonds | | Open/Demand |
BNP Paribas S.A. | | | 2.56 | | | | 07/23/18 | | | | Open | | | | 4,882,969 | | | | 4,914,335 | | | Corporate Bonds | | Open/Demand |
BNP Paribas S.A. | | | 2.56 | | | | 07/23/18 | | | | Open | | | | 3,086,250 | | | | 3,106,075 | | | Corporate Bonds | | Open/Demand |
BNP Paribas S.A. | | | 2.56 | | | | 07/23/18 | | | | Open | | | | 4,930,750 | | | | 4,962,423 | | | Corporate Bonds | | Open/Demand |
BNP Paribas S.A. | | | 2.56 | | | | 07/23/18 | | | | Open | | | | 6,753,075 | | | | 6,796,454 | | | Corporate Bonds | | Open/Demand |
BNP Paribas S.A. | | | 2.56 | | | | 07/23/18 | | | | Open | | | | 10,128,435 | | | | 10,193,496 | | | Corporate Bonds | | Open/Demand |
BNP Paribas S.A. | | | 2.56 | | | | 07/23/18 | | | | Open | | | | 10,175,000 | | | | 10,240,360 | | | Corporate Bonds | | Open/Demand |
BNP Paribas S.A. | | | 2.56 | | | | 07/23/18 | | | | Open | | | | 9,082,125 | | | | 9,140,465 | | | Corporate Bonds | | Open/Demand |
BNP Paribas S.A. | | | 2.60 | | | | 07/23/18 | | | | Open | | | | 10,137,500 | | | | 10,203,746 | | | Corporate Bonds | | Open/Demand |
BNP Paribas S.A. | | | 2.60 | | | | 07/23/18 | | | | Open | | | | 10,275,000 | | | | 10,342,144 | | | Corporate Bonds | | Open/Demand |
BNP Paribas S.A. | | | 2.62 | | | | 07/23/18 | | | | Open | | | | 10,048,500 | | | | 10,114,722 | | | Corporate Bonds | | Open/Demand |
BNP Paribas S.A. | | | 2.63 | | | | 07/23/18 | | | | Open | | | | 9,749,700 | | | | 9,814,224 | | | Corporate Bonds | | Open/Demand |
Barclays Capital, Inc. | | | 2.45 | | | | 07/25/18 | | | | Open | | | | 10,809,094 | | | | 10,873,903 | | | Corporate Bonds | | Open/Demand |
Barclays Capital, Inc. | | | 2.45 | | | | 07/25/18 | | | | Open | | | | 9,568,781 | | | | 9,626,154 | | | Capital Trusts | | Open/Demand |
Barclays Capital, Inc. | | | 2.45 | | | | 07/25/18 | | | | Open | | | | 16,184,363 | | | | 16,281,401 | | | Capital Trusts | | Open/Demand |
Barclays Capital, Inc. | | | 2.45 | | | | 07/25/18 | | | | Open | | | | 9,921,625 | | | | 9,981,113 | | | Capital Trusts | | Open/Demand |
Barclays Capital, Inc. | | | 2.45 | | | | 07/25/18 | | | | Open | | | | 14,062,500 | | | | 14,146,816 | | | Corporate Bonds | | Open/Demand |
Barclays Capital, Inc. | | | 2.45 | | | | 07/25/18 | | | | Open | | | | 13,299,863 | | | | 13,379,606 | | | Capital Trusts | | Open/Demand |
Barclays Capital, Inc. | | | 2.45 | | | | 07/25/18 | | | | Open | | | | 13,350,000 | | | | 13,430,044 | | | Corporate Bonds | | Open/Demand |
RBC Capital Markets LLC | | | 2.59 | | | | 07/25/18 | | | | Open | | | | 5,522,250 | | | | 5,558,731 | | | Corporate Bonds | | Open/Demand |
RBC Capital Markets LLC | | | 2.59 | | | | 07/25/18 | | | | Open | | | | 8,131,000 | | | | 8,184,714 | | | Corporate Bonds | | Open/Demand |
RBC Capital Markets LLC | | | 2.85 | | | | 07/25/18 | | | | Open | | | | 4,347,120 | | | | 4,378,914 | | | Corporate Bonds | | Open/Demand |
RBC Capital Markets LLC | | | 2.85 | | | | 07/25/18 | | | | Open | | | | 4,617,000 | | | | 4,650,768 | | | Corporate Bonds | | Open/Demand |
RBC Capital Markets LLC | | | 2.59 | | | | 07/31/18 | | | | Open | | | | 5,505,000 | | | | 5,539,578 | | | Corporate Bonds | | Open/Demand |
BNP Paribas S.A. | | | 2.56 | | | | 08/20/18 | | | | Open | | | | 2,840,800 | | | | 2,853,944 | | | Corporate Bonds | | Open/Demand |
Barclays Capital, Inc. | | | 1.50 | | | | 09/07/18 | | | | Open | | | | 332,655 | | | | 333,293 | | | Corporate Bonds | | Open/Demand |
Barclays Bank PLC | | | 3.05 | | | | 09/10/18 | | | | Open | | | | 1,585,000 | | | | 1,591,298 | | | Corporate Bonds | | Open/Demand |
Barclays Capital, Inc. | | | 2.80 | | | | 09/10/18 | | | | Open | | | | 12,179,213 | | | | 12,223,294 | | | Capital Trusts | | Open/Demand |
RBC Capital Markets LLC | | | 2.59 | | | | 09/10/18 | | | | Open | | | | 8,840,650 | | | | 8,872,044 | | | Corporate Bonds | | Open/Demand |
RBC Capital Markets LLC | | | 2.59 | | | | 09/10/18 | | | | Open | | | | 5,703,750 | | | | 5,724,005 | | | Corporate Bonds | | Open/Demand |
RBC Capital Markets LLC | | | 2.59 | | | | 09/10/18 | | | | Open | | | | 7,230,000 | | | | 7,255,675 | | | Corporate Bonds | | Open/Demand |
RBC Capital Markets LLC | | | 2.59 | | | | 09/10/18 | | | | Open | | | | 3,595,688 | | | | 3,608,456 | | | Corporate Bonds | | Open/Demand |
Citigroup Global Markets, Inc. | | | 0.25 | | | | 09/11/18 | | | | Open | | | | 283,150 | | | | 283,217 | | | Corporate Bonds | | Open/Demand |
RBC Capital Markets LLC | | | 2.59 | | | | 09/14/18 | | | | Open | | | | 6,747,300 | | | | 6,768,629 | | | Corporate Bonds | | Open/Demand |
RBC Capital Markets LLC | | | 2.59 | | | | 09/14/18 | | | | Open | | | | 9,775,000 | | | | 9,805,900 | | | Corporate Bonds | | Open/Demand |
RBC Capital Markets LLC | | | 2.59 | | | | 09/14/18 | | | | Open | | | | 4,440,150 | | | | 4,454,186 | | | Corporate Bonds | | Open/Demand |
RBC Capital Markets LLC | | | 2.59 | | | | 09/14/18 | | | | Open | | | | 10,290,000 | | | | 10,322,528 | | | Corporate Bonds | | Open/Demand |
RBC Capital Markets LLC | | | 2.59 | | | | 09/14/18 | | | | Open | | | | 9,925,000 | | | | 9,956,374 | | | Corporate Bonds | | Open/Demand |
RBC Capital Markets LLC | | | 2.59 | | | | 09/14/18 | | | | Open | | | | 12,480,000 | | | | 12,519,451 | | | Corporate Bonds | | Open/Demand |
RBC Capital Markets LLC | | | 2.59 | | | | 09/14/18 | | | | Open | | | | 14,340,000 | | | | 14,385,330 | | | Corporate Bonds | | Open/Demand |
RBC Capital Markets LLC | | | 2.59 | | | | 09/14/18 | | | | Open | | | | 5,573,125 | | | | 5,590,742 | | | Corporate Bonds | | Open/Demand |
RBC Capital Markets LLC | | | 2.59 | | | | 09/14/18 | | | | Open | | | | 5,555,000 | | | | 5,572,560 | | | Corporate Bonds | | Open/Demand |
RBC Capital Markets LLC | | | 2.59 | | | | 09/14/18 | | | | Open | | | | 11,730,000 | | | | 11,767,080 | | | Corporate Bonds | | Open/Demand |
RBC Capital Markets LLC | | | 2.59 | | | | 09/14/18 | | | | Open | | | | 1,835,000 | | | | 1,840,801 | | | Corporate Bonds | | Open/Demand |
RBC Capital Markets LLC | | | 2.59 | | | | 09/14/18 | | | | Open | | | | 10,375,000 | | | | 10,407,797 | | | Corporate Bonds | | Open/Demand |
RBC Capital Markets LLC | | | 2.59 | | | | 09/14/18 | | | | Open | | | | 11,880,000 | | | | 11,917,554 | | | Corporate Bonds | | Open/Demand |
RBC Capital Markets LLC | | | 2.59 | | | | 09/14/18 | | | | Open | | | | 17,137,500 | | | | 17,191,674 | | | Corporate Bonds | | Open/Demand |
| | |
| 26 | | 2018 BLACKROCK ANNUAL REPORTTO SHAREHOLDERS |
| | |
Schedule of Investments (continued) October 31, 2018 | | BlackRock Credit Allocation Income Trust (BTZ) |
Reverse Repurchase Agreements (continued)
| | | | | | | | | | | | | | | | | | | | | | | | |
| Counterparty | | Interest
Rate | | | Trade
Date | | | Maturity
Date (a) | | | Face Value | | | Face Value
Including
Accrued Interest | | | Type of Non-Cash Underlying Collateral | | Remaining Contractual
Maturity of the Agreements (a) |
Barclays Bank PLC | | | 1.75 | % | | | 09/19/18 | | | | Open | | | $ | 1,813,531 | | | $ | 1,816,718 | | | Corporate Bonds | | Open/Demand |
Barclays Capital, Inc. | | | (1.00 | ) | | | 09/19/18 | | | | Open | | | | 877,133 | | | | 875,610 | | | Corporate Bonds | | Open/Demand |
BNP Paribas S.A. | | | 2.31 | | | | 09/19/18 | | | | Open | | | | 1,895,000 | | | | 1,900,107 | | | Corporate Bonds | | Open/Demand |
BNP Paribas S.A. | | | 2.31 | | | | 09/19/18 | | | | Open | | | | 2,964,506 | | | | 2,972,496 | | | Corporate Bonds | | Open/Demand |
BNP Paribas S.A. | | | 2.31 | | | | 09/19/18 | | | | Open | | | | 4,518,750 | | | | 4,530,928 | | | Corporate Bonds | | Open/Demand |
UBS Securities LLC | | | 2.25 | | | | 09/19/18 | | | | Open | | | | 5,022,957 | | | | 5,036,152 | | | Corporate Bonds | | Open/Demand |
UBS Securities LLC | | | 2.25 | | | | 09/19/18 | | | | Open | | | | 2,939,688 | | | | 2,947,404 | | | Corporate Bonds | | Open/Demand |
RBC Capital Markets LLC | | | 2.59 | | | | 09/20/18 | | | | Open | | | | 6,656,250 | | | | 6,675,561 | | | Corporate Bonds | | Open/Demand |
Barclays Capital, Inc. | | | 1.25 | | | | 09/27/18 | | | | Open | | | | 1,077,465 | | | | 1,078,662 | | | Corporate Bonds | | Open/Demand |
RBC Capital Markets LLC | | | 2.59 | | | | 09/27/18 | | | | Open | | | | 7,700,000 | | | | 7,717,571 | | | Corporate Bonds | | Open/Demand |
BNP Paribas S.A. | | | 2.80 | | | | 09/28/18 | | | | Open | | | | 5,652,923 | | | | 5,666,552 | | | Corporate Bonds | | Open/Demand |
BNP Paribas S.A. | | | 2.80 | | | | 09/28/18 | | | | Open | | | | 5,311,425 | | | | 5,324,231 | | | Corporate Bonds | | Open/Demand |
RBC Capital Markets LLC | | | 2.56 | | | | 09/28/18 | | | | Open | | | | 7,120,000 | | | | 7,137,214 | | | Corporate Bonds | | Open/Demand |
Barclays Capital, Inc. | | | 2.55 | | | | 10/01/18 | | | | Open | | | | 4,535,781 | | | | 4,545,741 | | | Corporate Bonds | | Open/Demand |
Barclays Capital, Inc. | | | 2.55 | | | | 10/01/18 | | | | Open | | | | 4,700,000 | | | | 4,710,320 | | | Corporate Bonds | | Open/Demand |
Barclays Capital, Inc. | | | 2.55 | | | | 10/01/18 | | | | Open | | | | 4,337,500 | | | | 4,347,024 | | | Corporate Bonds | | Open/Demand |
Barclays Capital, Inc. | | | 2.00 | | | | 10/26/18 | | | | Open | | | | 5,444,000 | | | | 5,444,907 | | | Capital Trusts | | Open/Demand |
| | | | | | | | | | | | | | | | | | | | | | | | |
| | | $ | 703,308,404 | | | $ | 707,102,433 | | | | | |
| | | | | | | | | | | | | |
| | (a) | Certain agreements have no stated maturity and can be terminated by either party at any time. | |
Derivative Financial Instruments Outstanding as of Period End
Futures Contracts
| | | | | | | | | | | | | | | | |
| Description | | Number of
Contracts | | | Expiration
Date | | | Notional
Amount (000) | | | Value/
Unrealized
Appreciation
(Depreciation) | |
Long Contracts: | | | | | | | | | | | | | | | | |
2-Year U.S. Treasury Note | | | 533 | | | | 12/31/18 | | | $ | 112,280 | | | $ | (17,296 | ) |
5-Year U.S. Treasury Note | | | 385 | | | | 12/31/18 | | | | 43,267 | | | | (315,305 | ) |
| | | | | | | | | | | | | | | | |
| | | | | | | | | | | | | | | (332,601 | ) |
| | | | | | | | | | | | | | | | |
Short Contracts: | | | | | | | | | | | | | | | | |
10-Year U.S. Treasury Note | | | 1,643 | | | | 12/19/18 | | | | 194,593 | | | | 1,646,889 | |
10-Year U.S. Ultra Long Treasury Note | | | 342 | | | | 12/19/18 | | | | 42,787 | | | | 1,093,653 | |
Long U.S. Treasury Bond | | | 493 | | | | 12/19/18 | | | | 68,096 | | | | 3,085,040 | |
U.S. Ultra Bond | | | 128 | | | | 12/19/18 | | | | 19,100 | | | | 1,125,041 | |
| | | | | | | | | | | | | | | | |
| | | | | | | | | | | | | | | 6,950,623 | |
| | | | | | | | | | | | | | | | |
| | | | | | | | | | | | | | $ | 6,618,022 | |
| | | | | | | | | | | | | | | | |
Exchange-Traded Options Purchased
| | | | | | | | | | | | | | | | | | | | | | | | |
| Description | | Number of
Contracts | | | Expiration
Date | | | Exercise
Price | | | Notional
Amount (000) | | | Value | |
| Call | | | | | | | | | | | | | | | | | | | |
iShares Russell 2000 ETF | | | 7,309 | | | | 11/16/18 | | | USD | | | 166.00 | | | USD | | | 1,097 | | | $ | 32,890 | |
| Put | | | | | | | | | | | | | | | | | | | |
10-Year US Treasury Note | | | 1,849 | | | | 11/23/18 | | | USD | | | 118.00 | | | USD | | | 218,182 | | | | 548,922 | |
10-Year US Treasury Note | | | 1,193 | | | | 11/23/18 | | | USD | | | 117.00 | | | USD | | | 139,581 | | | | 93,203 | |
| | | | | | | | | | | | | | | | | | | | | | | | |
| | | | | | | | | | | | | | | | | | | | | | | 642,125 | |
| | | | | | | | | | | | | | | | | | | | | | | | |
| | | | | | | | | | | | | | | | | | | | | | $ | 675,015 | |
| | | | | | | | | | | | | | | | | | | | | | | | |
| | | | |
| SCHEDULES OF INVESTMENTS | | | 27 | |
| | |
Schedule of Investments (continued) October 31, 2018 | | BlackRock Credit Allocation Income Trust (BTZ) |
OTC Interest Rate Swaptions Purchased
| | | | | | | | | | | | | | | | | | | | | | | | | | | | | | | | | | |
| | | Paid by the Trust | | Received by the Trust | | | | | | | | | | | | | | |
| Description | | Rate | | | Frequency | | Rate | | | Frequency | | Counterparty | | Expiration
Date | | | Exercise
Rate | | | Notional
Amount (000) | | | Value | |
| Put | | | | | | | | | | | | | | | | | | | | | | | | | | | |
30-Year Interest Rate Swap, 06/08/49 | | | 3.50 | % | | Semi-Annual | | | 3-Month LIBOR, 2.56 | %, | | Quarterly | | JPMorgan Chase Bank N.A. | | | 06/06/19 | | | | 3.50 | % | | | USD | | | | 22,700 | | | $ | 490,019 | |
30-Year Interest Rate Swap, 06/08/49 | | | 3.50 | | | Semi-Annual | | | 3-Month LIBOR 2.56 | % | | Quarterly | | Goldman Sachs Bank USA | | | 06/06/19 | | | | 3.50 | | | | USD | | | | 25,330 | | | | 546,792 | |
| | | | | | | | | | | | | | | | | | | | | | | | | | | | | | | | | | |
| | | | | | | | | | | | | | | | | | | | | | | | | | | | | | | | $ | 1,036,811 | |
| | | | | | | | | | | | | | | | | | | | | | | | | | | | | | | | | | |
Exchange-Traded Options Written
| | | | | | | | | | | | | | | | | | | | | | | | |
| Description | | Number of
Contracts | | | Expiration
Date | | | Exercise
Price | | | Notional
Amount (000) | | | Value | |
| Call | | | | | | | | | | | | | | | | | | | |
iShares Russell 2000 ETF | | | 7,309 | | | | 11/16/18 | | | USD | | | 170.00 | | | USD | | | 1,097 | | | $ | (10,964 | ) |
Centrally Cleared Credit Default Swaps — Sell Protection
| | | | | | | | | | | | | | | | | | | | | | | | | | | | | | | | |
| Reference Obligation/Index | | Financing
Rate Received
by the Trust | | | Payment
Frequency | | Termination
Date | | | Credit
Rating (a) | | Notional Amount (000) (b) | | | Value | | | Upfront
Premium
Paid
(Received) | | | Unrealized
Appreciation
(Depreciation) | |
CDX.NA.IG.30.V1 | | | 1.00 | % | | Quarterly | | | 06/20/23 | | | BBB+ | | | USD | | | | 100,000 | | | $ | 1,705,567 | | | $ | 1,572,884 | | | $ | 132,683 | |
| | | | | | | | | | | | | | | | | | | | | | | | | | | | | | | | |
| | (a) | Using Standard & Poor’s (“S&P’s”) rating of the issuer or the underlying securities of the index, as applicable. | |
| | (b) | The maximum potential amount the Trust may pay should a negative credit event take place as defined under the terms of the agreement. | |
Centrally Cleared Interest Rate Swaps
| | | | | | | | | | | | | | | | | | | | | | | | | | | | |
Paid by the Trust | | Received by the Trust | | Termination
Date | | | Notional
Amount (000) | | | Value | | | Upfront
Premium
Paid
(Received) | | | Unrealized
Appreciation
(Depreciation) | |
| Rate | | Frequency | | Rate | | Frequency |
| 3-Month LIBOR 2.56% | | Quarterly | | 1.79% | | Semi-annual | | | 09/30/19 | | | USD | | | 100,370 | | | $ | (1,051,715 | ) | | $ | 224 | | | $ | (1,051,939 | ) |
| | | | | | | | | | | | | | | | | | | | | | | | | | | | |
OTC Credit Default Swaps — Buy Protection
| | | | | | | | | | | | | | | | | | | | | | | | | | | | | | |
| Reference Obligation/Index | | Financing
Rate Paid
by the Trust | | | Payment
Frequency | | Counterparty | | Termination
Date | | | Notional Amount (000) | | | Value | | | Upfront
Premium
Paid
(Received) | | | Unrealized
Appreciation
(Depreciation) | |
Citigroup, Inc. | | | 1.00 | % | | Quarterly | | Deutsche Bank AG | | | 03/20/19 | | | USD | | | 16,700 | | | $ | (67,853 | ) | | $ | (5,742 | ) | | $ | (62,111 | ) |
Prudential Financial, Inc. | | | 1.00 | | | Quarterly | | Citibank N.A. | | | 06/20/21 | | | USD | | | 1,920 | | | | (36,013 | ) | | | 14,853 | | | | (50,866 | ) |
Prudential Financial, Inc. | | | 1.00 | | | Quarterly | | Goldman Sachs International | | | 06/20/21 | | | USD | | | 1,155 | | | | (21,664 | ) | | | 9,504 | | | | (31,168 | ) |
Prudential Financial, Inc. | | | 1.00 | | | Quarterly | | JPMorgan Chase Bank N.A. | | | 06/20/21 | | | USD | | | 9,500 | | | | (178,190 | ) | | | 64,306 | | | | (242,496 | ) |
| | | | | | | | | | | | | | | | | | | | | | | | | | | | | | |
| | | $ | (303,720 | ) | | $ | 82,921 | | | $ | (386,641 | ) |
| | | | | | | | | | | | | | | | |
OTC Credit Default Swaps — Sell Protection
| | | | | | | | | | | | | | | | | | | | | | | | | | | | | | | | | | | | |
| Reference Obligation/Index | | Financing
Rate Received
by the Trust | | | Payment
Frequency | | | Counterparty | | Termination
Date | | | Credit
Rating (a) | | Notional Amount (000) (b) | | | Value | | | Upfront
Premium
Paid
(Received) | | | Unrealized
Appreciation
(Depreciation) | |
Bank of America Corp. | | | 1.00 | % | | | Quarterly | | | Deutsche Bank AG | | | 03/20/19 | | | A- | | | USD | | | | 16,700 | | | $ | 74,020 | | | $ | 10,237 | | | $ | 63,783 | |
American Tower Corp. | | | 1.00 | | | | Quarterly | | | Morgan Stanley & Co. International PLC | | | 06/20/21 | | | BBB- | | | USD | | | | 10,000 | | | | (25,084 | ) | | | (219,075 | ) | | | 193,991 | |
| | | | | | | | | | | | | | | | | | | | | | | | | | | | | | | | | | | | |
| | | $ | 48,936 | | | $ | (208,838 | ) | | $ | 257,774 | |
| | | | | | | | | | | | | | | | | | | | | | | | | | | | | | | | | | | | |
| | (a) | Using Standard & Poor’s (“S&P’s”) rating of the issuer or the underlying securities of the index, as applicable. | |
| | (b) | The maximum potential amount the Trust may pay should a negative credit event take place as defined under the terms of the agreement. | |
| | |
| 28 | | 2018 BLACKROCK ANNUAL REPORTTO SHAREHOLDERS |
| | |
Schedule of Investments (continued) October 31, 2018 | | BlackRock Credit Allocation Income Trust (BTZ) |
Balances Reported in the Statements of Assets and Liabilities for Centrally Cleared Swaps, OTC Swaps and Options Written
| | | | | | | | | | | | | | | | |
| | | Swap
Premiums
Paid | | Swap
Premiums
Received | | | Unrealized
Appreciation | | Unrealized
Depreciation | | | Value | |
Centrally Cleared Swaps(a) | | $1,573,108 | | $ | — | | | $132,683 | | $ | (1,051,939 | ) | | $ | — | |
OTC Swaps | | 98,900 | | | (224,817 | ) | | 257,774 | | | (386,641 | ) | | | — | |
Options Written | | N/A | | | N/A | | | 53,104 | | | — | | | | (10,964 | ) |
| | (a) | Includes cumulative appreciation (depreciation) on centrally cleared swaps, as reported in the Schedule of Investments. Only current day’s variation margin is reported within the Statememts of Assets and Liabilities and is net of any previously paid (received) swap premium amounts. | |
|
Derivative Financial Instruments Categorized by Risk Exposure As of year end, the fair values of derivative financial instruments located in the Statements of Assets and Liabilities were as follows: |
| | | | | | | | | | | | | | | | | | | | | | | | | | | | |
| | | Commodity
Contracts | | | Credit
Contracts | | | Equity
Contracts | | | Foreign
Currency
Exchange
Contracts | | | Interest
Rate
Contracts | | | Other
Contracts | | | Total | |
Assets — Derivative Financial Instruments | | | | | | | | | | | | | | | | | | | | | | | | | | | | |
Futures contracts | | | | | | | | | | | | | | | | | | | | | | | | | | | | |
Net unrealized appreciation(a) | | $ | — | | | $ | — | | | $ | — | | | $ | — | | | $ | 6,950,623 | | | $ | — | | | $ | 6,950,623 | |
Options purchased | | | | | | | | | | | | | | | | | | | | | | | | | | | | |
Investments at value — unaffiliated(b) | | | — | | | | — | | | | 32,890 | | | | — | | | | 1,678,936 | | | | — | | | | 1,711,826 | |
Swaps — centrally cleared | | | | | | | | | | | | | | | | | | | | | | | | | | | | |
Net unrealized appreciation(a) | | | — | | | | 132,683 | | | | — | | | | — | | | | — | | | | — | | | | 132,683 | |
Swaps — OTC | | | | | | | | | | | | | | | | | | | | | | | | | | | | |
Unrealized appreciation on OTC swaps; Swap premiums paid | | | — | | | | 356,674 | | | | — | | | | — | | | | — | | | | — | | | | 356,674 | |
| | | | | | | | | | | | | | | | | | | | | | | | | | | | |
| | $ | — | | | $ | 489,357 | | | $ | 32,890 | | | $ | — | | | $ | 8,629,559 | | | $ | — | | | $ | 9,151,806 | |
| | | | | | | | | | | | | | | | | | | | | | | | | | | | |
| Liabilities — Derivative Financial Instruments | | | | | | | | | | | | | | | | | | | | | |
Futures contracts | | | | | | | | | | | | | | | | | | | | | | | | | | | | |
Net unrealized depreciation(a) | | $ | — | | | $ | — | | | $ | — | | | $ | — | | | $ | 332,601 | | | $ | — | | | $ | 332,601 | |
Options written | | | | | | | | | | | | | | | | | | | | | | | | | | | | |
Options written at value | | | — | | | | — | | | | 10,964 | | | | — | | | | | | | | — | | | | 10,964 | |
Swaps — centrally cleared | | | | | | | | | | | | | | | | | | | | | | | | | | | | |
Net unrealized depreciation(a) | | | — | | | | — | | | | — | | | | — | | | | 1,051,939 | | | | — | | | | 1,051,939 | |
Swaps — OTC | | | | | | | | | | | | | | | | | | | | | | | | | | | | |
Unrealized depreciation on OTC swaps; Swap premiums received | | | — | | | | 611,458 | | | | — | | | | — | | | | — | | | | — | | | | 611,458 | |
| | | | | | | | | | | | | | | | | | | | | | | | | | | | |
| | $ | — | | | $ | 611,458 | | | $ | 10,964 | | | $ | — | | | $ | 1,384,540 | | | $ | — | | | $ | 2,006,962 | |
| | | | | | | | | | | | | | | | | | | | | | | | | | | | |
| | (a) | Includes cumulative appreciation (depreciation) on futures contracts and centrally cleared swaps, if any, as reported in the Schedule of Investments. Only current day’s variation margin is reported within the Statements of Assets and Liabilities. | |
| | (b) | Includes options purchased at value as reported in the Schedule of Investments. | |
For the year ended October 31, 2018, the effect of derivative financial instruments in the Statements of Operations was as follows:
| | | | | | | | | | | | | | | | | | | | | | | | | | | | |
| | | Commodity
Contracts | | | Credit
Contracts | | | Equity
Contracts | | | Foreign
Currency
Exchange
Contracts | | | Interest
Rate
Contracts | | | Other
Contracts | | | Total | |
Net Realized Gain (Loss) from: | | | | | | | | | | | | | | | | | | | | | | | | | | | | |
Futures contracts | | $ | — | | | $ | — | | | $ | — | | | $ | — | | | $ | 10,634,400 | | | $ | — | | | $ | 10,634,400 | |
Options purchased(a) | | | — | | | | — | | | | (335,043 | ) | | | — | | | | 516,364 | | | | — | | | | 181,321 | |
Options written | | | | | | | | | | | 120,877 | | | | | | | | | | | | | | | | 120,877 | |
Swaps | | | — | | | | 235,417 | | | | — | | | | — | | | | (409,159 | ) | | | — | | | | (173,742 | ) |
| | | | | | | | | | | | | | | | | | | | | | | | | | | | |
| | $ | — | | | $ | 235,417 | | | $ | (214,166 | ) | | $ | — | | | $ | 10,741,605 | | | $ | — | | | $ | 10,762,856 | |
| | | | | | | | | | | | | | | | | | | | | | | | | | | | |
| Net Change in Unrealized Appreciation (Depreciation) on: | | | | | | | | | | | | | | | | | | | | | |
Futures contracts | | $ | — | | | $ | — | | | $ | — | | | $ | — | | | $ | 5,009,796 | | | $ | — | | | $ | 5,009,796 | |
Options purchased(b) | | | — | | | | | | | | (173,474 | ) | | | — | | | | (11,575 | ) | | | — | | | | (185,049 | ) |
Options written | | | — | | | | — | | | | 53,104 | | | | — | | | | — | | | | — | | | | 53,104 | |
Swaps | �� | | — | | | | 242,161 | | | | — | | | | — | | | | (948,708 | ) | | | — | | | | (706,547 | ) |
| | | | | | | | | | | | | | | | | | | | | | | | | | | | |
| | $ | — | | | $ | 242,161 | | | $ | (120,370 | ) | | $ | — | | | $ | 4,049,513 | | | $ | — | | | $ | 4,171,304 | |
| | | | | | | | | | | | | | | | | | | | | | | | | | | | |
| | | | |
| SCHEDULES OF INVESTMENTS | | | 29 | |
| | |
Schedule of Investments (continued) October 31, 2018 | | BlackRock Credit Allocation Income Trust (BTZ) |
|
(a) Options purchased are included in net realized gain (loss) from investments. (b) Options purchased are included in net change in unrealized appreciation (depreciation) on investments. |
Average Quarterly Balances of Outstanding Derivative Financial Instruments
| | | | |
Futures contracts: | | | | |
Average notional value of contracts — long | | $ | 65,040,246 | |
Average notional value of contracts — short | | $ | 394,890,506 | |
Options: | |
Average value of option contracts purchased | | $ | 168,754 | |
Average value of option contracts written | | $ | 2,741 | |
Average notional value of swaption contracts purchased | | $ | 48,030,000 | |
Credit default swaps: | |
Average notional value — buy protection | | $ | 29,579,755 | |
Average notional value — sell protection | | $ | 102,456,250 | |
Interest rate swaps: | |
Average notional value — receives fixed rate | | $ | 131,340,000 | |
For more information about the Trust’s investment risks regarding derivative financial instruments, refer to the Notes to Financial Statements.
Derivative Financial Instruments — Offsetting as of Period End
The Trust’s derivative assets and liabilities (by type) were as follows:
| | | | | | | | |
| | | Assets | | | Liabilities | |
Futures contracts | | $ | 1,262,251 | | | $ | 150,844 | |
Options | | | 1,711,826 | (a) | | | 10,964 | |
Swaps — Centrally cleared | | | — | | | | 992 | |
Swaps — OTC(b) | | | 356,674 | | | | 611,458 | |
| | | | | | | | |
Total derivative assets and liabilities in the Statements of Assets and Liabilities | | $ | 3,330,751 | | | $ | 774,258 | |
Derivatives not subject to a Master Netting Agreement or similar agreement (“MNA”) | | | (1,937,266 | ) | | | (162,800 | ) |
| | | | | | | | |
Total derivative assets and liabilities subject to an MNA | | $ | 1,393,485 | | | $ | 611,458 | |
| | | | | | | | |
| | (a) | Includes options purchased at value which is included in Investments at value — unaffiliated in the Statements of Assets and Liabilities and reported in the Schedule of Investments. | |
| | (b) | Includes unrealized appreciation (depreciation) on OTC swaps and swap premiums (paid/received) in the Statements of Assets and Liabilities. | |
The following table presents the Trust’s derivative assets (and liabilities) by counterparty net of amounts available for offset under an MNA and net of the related collateral received (and pledged) by the Trust:
| | | | | | | | | | | | | | | | | | | | |
| Counterparty | | Derivative
Assets
Subject to an MNA by
Counterparty | | | Derivatives
Available for Offset (a) | | | Non-cash
Collateral
Received | | | Cash
Collateral
Received (b) | | | Net Amount
of Derivative
Assets (c) | |
Citibank N.A. | | $ | 14,853 | | | $ | (14,853 | ) | | $ | — | | | $ | — | | | $ | — | |
Deutsche Bank AG | | | 74,020 | | | | (67,853 | ) | | | — | | | | — | | | | 6,167 | |
Goldman Sachs Bank USA | | | 546,792 | | | | — | | | | — | | | | (300,000 | ) | | | 246,792 | |
Goldman Sachs International | | | 9,504 | | | | (9,504 | ) | | | — | | | | — | | | | — | |
JPMorgan Chase Bank N.A. | | | 554,325 | | | | (242,496 | ) | | | — | | | | (311,829 | ) | | | — | |
Morgan Stanley & Co. International PLC | | | 193,991 | | | | (193,991 | ) | | | — | | | | — | | | | — | |
| | | | | | | | | | | | | | | | | | | | |
| | $ | 1,393,485 | | | $ | (528,697 | ) | | $ | — | | | $ | (611,829 | ) | | $ | 252,959 | |
| | | | | | | | | | | | | | | | | | | | |
| | | | | | | | | | | | | | | | | | | | |
| Counterparty | | Derivative
Liabilities
Subject to
an MNA by
Counterparty | | | Derivatives
Available for Offset (a) | | | Non-cash
Collateral
Pledged | | | Cash
Collateral
Pledged | | | Net Amount
of Derivative
Liabilities (d) | |
Citibank N.A. | | $ | 50,866 | | | $ | (14,853 | ) | | $ | — | | | $ | — | | | $ | 36,013 | |
Deutsche Bank AG | | | 67,853 | | | | (67,853 | ) | | | — | | | | — | | | | — | |
Goldman Sachs International | | | 31,168 | | | | (9,504 | ) | | | — | | | | — | | | | 21,664 | |
JPMorgan Chase Bank N.A. | | | 242,496 | | | | (242,496 | ) | | | — | | | | — | | | | — | |
Morgan Stanley & Co International PLC | | | 219,075 | | | | (193,991 | ) | | | — | | | | — | | | | 25,084 | |
| | | | | | | | | | | | | | | | | | | | |
| | $ | 611,458 | | | $ | (528,697 | ) | | $ | — | | | $ | — | | | $ | 82,761 | |
| | | | | | | | | | | | | | | | | | | | |
| | (a) | The amount of derivatives available for offset is limited to the amount of derivative assets and/or liabilities that are subject to an MNA. | |
| | |
| 30 | | 2018 BLACKROCK ANNUAL REPORTTO SHAREHOLDERS |
| | |
Schedule of Investments (continued) October 31, 2018 | | BlackRock Credit Allocation Income Trust (BTZ) |
| | (b) | Excess of collateral received from the individual counterparty is not shown for financial reporting purposes. | |
| | (c) | Net amount represents the net amount receivable from the counterparty in the event of default. | |
| | (d) | Net amount represents the net amount payable due to counterparty in the event of default. Net amount may be offset further by the options written receivable/payable on the Statements of Assets and Liabilities. | |
Fair Value Hierarchy as of Period End
Various inputs are used in determining the fair value of investments and derivative financial instruments. For information about the Trust’s policy regarding valuation of investments and derivative financial instruments, refer to the Notes to Financial Statements.
The following tables summarize the Trust’s investments and derivative financial instruments categorized in the disclosure hierarchy:
| | | | | | | | | | | | | | | | |
| | | Level 1 | | | Level 2 | | | Level 3 | | | Total | |
Assets: | |
Investments: | |
Long-Term Investments: | |
Asset-Backed Securities | | $ | — | | | $ | 120,712,408 | | | $ | 3,049,935 | | | $ | 123,762,343 | |
Corporate Bonds | | | — | | | | 1,563,957,769 | | | | 5,249,823 | | | | 1,569,207,592 | |
Foreign Agency Obligations | | | — | | | | 32,788,648 | | | | — | | | | 32,788,648 | |
Municipal Bonds | | | — | | | | 17,200,950 | | | | — | | | | 17,200,950 | |
Preferred Securities | | | 51,070,581 | | | | 309,285,629 | | | | — | | | | 360,356,210 | |
U.S. Government Sponsored Agency Securities | | | — | �� | | | 3,842,515 | | | | — | | | | 3,842,515 | |
Short-Term Securities | | | 7,903,560 | | | | — | | | | — | | | | 7,903,560 | |
Options Purchased: | | | | | | | | | | | | | | | | |
Equity contracts | | | 32,890 | | | | — | | | | — | | | | 32,890 | |
Interest rate contracts | | | 642,125 | | | | 1,036,811 | | | | — | | | | 1,678,936 | |
| | | | | | | | | | | | | | | | |
| | $ | 59,649,156 | | | $ | 2,048,824,730 | | | $ | 8,299,758 | | | $ | 2,116,773,644 | |
| | | | | | | | | | | | | | | | |
Derivative Financial Instruments(a) | |
Assets: | |
Credit contracts | | $ | — | | | $ | 390,457 | | | $ | — | | | $ | 390,457 | |
Interest rate contracts | | | 6,950,623 | | | | — | | | | — | | | | 6,950,623 | |
Liabilities: | |
Credit contracts | | | — | | | | (386,641 | ) | | | — | | | | (386,641 | ) |
Equity contracts | | | (10,964 | ) | | | — | | | | — | | | | (10,964 | ) |
Interest rate contracts | | | (332,601 | ) | | | (1,051,939 | ) | | | — | | | | (1,384,540 | ) |
| | | | | | | | | | | | | | | | |
| | $ | 6,607,058 | | | $ | (1,048,123 | ) | | $ | — | | | $ | 5,558,935 | |
| | | | | | | | | | | | | | | | |
| | (a) | Derivative financial instruments are swaps, futures contracts and options written. Swaps and futures contracts are valued at the unrealized appreciation (depreciation) on the instrument and options written are shown at value. | |
The Trust may hold liabilities in which the fair value approximates the carrying amount or face value, including accrued interest, for financial statement purposes. As of period end, reverse repurchase agreements of $ 707,102,433 are categorized as Level 2 within the disclosure hierarchy.
During the year ended October 31, 2018, there were no transfers between Level 1 and Level 2.
A reconciliation of Level 3 investments is presented when the Trust had a significant amount of Level 3 investments at the beginning and/or end of the period in relation to net assets. The following table is a reconciliation of Level 3 investments for which significant unobservable inputs were used in determining fair value:
| | | | | | | | | | | | |
| | | Asset-Backed
Securities | | | Corporate
Bonds | | | Total | |
Assets: | | | | | | | | | | | | |
Opening balance, as of October 31, 2017 | | $ | 7,500,000 | | | $ | 5,007,000 | | | $ | 12,507,000 | |
Transfers into Level 3 | | | — | | | | — | | | | — | |
Transfers out of Level 3(a) | | | (7,500,000 | ) | | | — | | | | (7,500,000 | ) |
Accrued discounts/premiums | | | — | | | | — | | | | — | |
Net realized gain (loss) | | | — | | | | — | | | | — | |
Net change in unrealized appreciation (depreciation)(b)(c) | | | (65 | ) | | | (47,177 | ) | | | (47,242 | ) |
Purchases | | | 3,050,000 | | | | 290,000 | | | | 3,340,000 | |
Sales | | | — | | | | — | | | | — | |
| | | | | | | | | | | | |
Closing Balance, as of October 31, 2018 | | $ | 3,049,935 | | | $ | 5,249,823 | | | $ | 8,299,758 | |
| | | | | | | | | | | | |
Net change in unrealized appreciation (depreciation) on investments still held at October 31, 2018(c) | | $ | (65 | ) | | $ | (47,177 | ) | | $ | (47,242 | ) |
| | | | | | | | | | | | |
| | (a) | As of October 31, 2017, the Trust used significant unobservable inputs in determining the value of certain investments. As of October 31, 2018, the Trust used observable inputs in determining the value of the same investments. As a result, investments at beginning of period value were transferred from Level 3 to Level 2 in the disclosure hierarchy. | |
| | (b) | Included in the related net change in unrealized appreciation (depreciation) in the Statements of Operations. | |
| | | | |
| SCHEDULES OF INVESTMENTS | | | 31 | |
| | |
Schedule of Investments (continued) October 31, 2018 | | BlackRock Credit Allocation Income Trust (BTZ) |
| | (c) | Any difference between net change in unrealized appreciation (depreciation) and net change in unrealized appreciation (depreciation) on investments still held at October 31, 2018 is generally due to investments no longer held or categorized as Level 3 at period end. | |
The Trust’s investments that are categorized as Level 3 were valued utilizing third party pricing information without adjustment. Such valuations are based on unobservable inputs. A significant change in third party information could result in a significantly lower or higher value of such Level 3 investments.
See notes to financial statements.
| | |
| 32 | | 2018 BLACKROCK ANNUAL REPORTTO SHAREHOLDERS |
| | |
Schedule of Investments October 31, 2018 | | BlackRock Floating Rate Income Trust (BGT) (Percentages shown are based on Net Assets) |
| | | | | | | | | | | | |
| Security | | | | |
Shares | | | Value | |
Common Stocks — 0.2% | |
| Auto Components — 0.0% | |
Lear Corp. | | | | | | | 89 | | | $ | 11,828 | |
| | | | | | | | | | | | |
| Health Care Management Services — 0.0% | |
New Millennium HoldCo, Inc.(a) | | | | | | | 9,191 | | | | 533 | |
| | | | | | | | | | | | |
| Hotels, Restaurants & Leisure — 0.0% | |
Caesars Entertainment Corp.(a) | | | | | | | 11,672 | | | | 100,263 | |
| | | | | | | | | | | | |
| Household Durables — 0.0% | |
Berkline Benchcraft Equity LLC(a)(b) | | | | | | | 6,155 | | | | — | |
| | | | | | | | | | | | |
| Internet Software & Services — 0.1% | |
New Holdings LLC(a)(b) | | | | | | | 365 | | | | 118,625 | |
| | | | | | | | | | | | |
| Metals & Mining — 0.0% | |
Ameriforge Group, Inc.(a) | | | | | | | 832 | | | | 49,088 | |
| | | | | | | | | | | | |
| Software — 0.0% | |
Avaya Holdings Corp.(a) | | | | | | | 38 | | | | 525 | |
| | | | | | | | | | | | |
| Utilities — 0.1% | |
Texgen LLC(a)(b) | | | | | | | 10,393 | | | | 410,524 | |
| | | | | | | | | | | | |
Total Common Stocks — 0.2%
(Cost — $986,989) | | | | 691,386 | |
| | | | | | | | | | | | |
| | | |
| | | | | | Par
(000) | | | | |
|
Asset-Backed Securities — 6.2% | |
ALM VII R Ltd., Series 2013-7RA, Class BR, (3 mo. LIBOR US + 2.70%),
5.14%, 10/15/28(c)(d) | | | USD | | | | 250 | | | | 251,250 | |
AMMC CLO Ltd., Series 2014-15A, Class D, (3 mo. LIBOR US + 4.20%),
6.53%, 12/09/26(c)(d) | | | | | | | 250 | | | | 251,606 | |
Anchorage Capital CLO Ltd., Series 2018-10A, Class A1A, 3.63%, 10/15/31(c)(e) | | | | | | | 1,000 | | | | 1,000,263 | |
Apidos CLO XXX Ltd., Series XXXA, Class A1A, 3.56%, 10/18/31(c)(e) | | | | | | | 250 | | | | 249,836 | |
Ares XLVII CLO Ltd., Series 2018-48A, Class C, 4.14%, 07/20/30(c)(e) | | | | | | | 375 | | | | 371,850 | |
Ares XLVIII CLO, Series 2018-48A, Class D, 5.04%, 07/20/30(c)(e) | | | | | | | 250 | | | | 246,735 | |
Ares XXXIII CLO Ltd., Series 2015-1A, Class A2R, (3 mo. LIBOR US + 1.95%), 4.27%, 12/05/25(c)(d) | | | | | | | 300 | | | | 300,183 | |
Atlas Senior Loan Fund X Ltd., Series 2018-10A, Class B, 3.94%, 01/15/31(c)(e) | | | | | | | 500 | | | | 493,506 | |
Atrium XIV LLC, Series 14A, Class C,
4.26%, 08/23/30(c)(e) | | | | | | | 500 | | | | 497,216 | |
Benefit Street Partners CLO XII Ltd., Series 2017-12A, Class C, 5.49%, 10/15/30(c)(e) | | | | | | | 250 | | | | 250,174 | |
Benefit Street Partners CLO XV Ltd., Series 2018-15A, Class A1, 3.31%, 07/18/31(c)(e) | | | | | | | 250 | | | | 249,715 | |
Carlyle Global Market Strategies CLO Ltd., Series 2015-3A, Class A2R,
4.11%, 07/28/28(c)(e) | | | | | | | 500 | | | | 498,561 | |
Cedar Funding II CLO Ltd., Series 2013-1A, Class A1R, (3 mo. LIBOR US + 1.23%), 3.56%, 06/09/30(c)(d) | | | | | | | 500 | | | | 500,676 | |
CIFC Funding Ltd.(c)(e): | | | | | | | | | | | | |
Series 2014-4RA, Class C,
5.66%, 10/17/30(b) | | | | | | | 250 | | | | 250,000 | |
Series 2018-1A, Class B, 3.84%, 04/18/31 | | | | | | | 375 | | | | 371,184 | |
Series 2018-1A, Class C, 4.19%, 04/18/31 | | | | | | | 375 | | | | 373,350 | |
Series 2018-4A, Class B, 4.53%, 10/17/31 | | | | | | | 425 | | | | 422,343 | |
Series 2018-4A, Class D, 8.33%, 10/17/31 | | | | | | | 300 | | | | 295,335 | |
Galaxy XVIII CLO Ltd., Series 2018-28A, Class A1,
3.44%, 07/15/31(c)(e) | | | | | | | 1,000 | | | | 996,885 | |
Galaxy XVIII CLO, Ltd., Series 2018-28A, Class D,
5.34%, 07/15/31(c)(e) | | | | | | | 500 | | | | 495,749 | |
| | | | | | | | | | | | |
| Security | | | | | Par
(000) | | | Value | |
| Asset-Backed Securities (continued) | |
GoldenTree Loan Opportunities IX Ltd., Series 2014-9A, Class AR2, 3.62%, 10/29/29(b)(c)(e) | | | USD | | | | 400 | | | $ | 400,000 | |
GoldentTree Loan Management US CLO Ltd., Series 2017-1A, Class C, (3 mo. LIBOR US + 2.20%), 4.67%, 04/20/29(c)(d) | | | | | | | 250 | | | | 250,612 | |
Highbridge Loan Management Ltd., Series 12A-18(c)(e): | | | | | | | | | | | | |
Class B, 4.22%, 07/18/31 | | | | | | | 250 | | | | 247,593 | |
Class C, 5.12%, 07/18/31 | | | | | | | 250 | | | | 242,294 | |
Jay Park CLO Ltd., Series 2016-1A, Class CR, 5.18%, 10/20/27(c)(e) | | | | | | | 250 | | | | 250,000 | |
LCM XVIII LP(c)(e): | | | | | | | | | | | | |
Series 18A, Class INC, 1.00%, 04/20/31 | | | | | | | 1,000 | | | | 613,128 | |
Series 27A, Class A1, 3.53%, 07/16/31 | | | | | | | 500 | | | | 499,003 | |
LCM XXIV Ltd., Series 24A, Class C, (3 mo. LIBOR US + 2.25%), 4.72%, 03/20/30(c)(d) | | | | | | | 500 | | | | 499,615 | |
Octagon Investment Partners XVI Ltd., Series 2013-1A, Class CR, 4.19%, 07/17/30(c)(e) | | | | | | | 500 | | | | 495,013 | |
Octagon Investment Partners XVII Ltd., Series 2013-1A(c)(e): | | | | | | | | | | | | |
Class BR2, 3.89%, 01/25/31 | | | | | | | 350 | | | | 347,648 | |
Class CR2, 4.19%, 01/25/31 | | | | | | | 350 | | | | 345,061 | |
Class ER2, 7.64%, 01/25/31 | | | | | | | 250 | | | | 242,471 | |
Palmer Square CLO Ltd.(c): | | | | | | | | | | | | |
Series 2013-2A, Class BRR, 4.65%, 10/17/31(b)(e) | | | | | | | 700 | | | | 700,000 | |
Series 2013-2A, Class CRR, 5.65%, 10/17/31(b)(e) | | | | | | | 400 | | | | 400,000 | |
Series 2015-2A, Class A1AR, (3 mo. LIBOR US + 1.27%), 3.74%, 07/20/30(d) | | | | | | | 250 | | | | 250,389 | |
Series 2018-1A, Class A2, 3.89%, 04/18/31(e) | | | | | | | 250 | | | | 246,676 | |
Series 2018-1A, Class B, 4.19%, 04/18/31(e) | | | | | | | 250 | | | | 246,197 | |
Series 2018-1A, Class D, 7.59%, 04/18/31(e) | | | | | | | 250 | | | | 247,809 | |
Rockford Tower CLO Ltd., Series 2018-2A, Class A, 3.59%, 10/20/31(c)(e) | | | | | | | 500 | | | | 498,871 | |
RR 5 Ltd., Series 2018-5A, Class B, 4.68%, 10/15/31(b)(c)(e) | | | | | | | 250 | | | | 249,975 | |
Sound Point Clo XXI Ltd., Series 2018-3A, Class A1A, 3.59%, 10/26/31(c)(e) | | | | | | | 750 | | | | 749,565 | |
TCI-Cent CLO Ltd., Series 2016-1A, Class A2, (3 mo. LIBOR US + 2.20%), 4.71%, 12/21/29(c)(d) | | | | | | | 250 | | | | 250,821 | |
TICP CLO VI Ltd., Series 2016-5A, Class ER,
8.20%, 07/17/31(c)(e) | | | | | | | 500 | | | | 491,391 | |
TICP CLO XI Ltd., Series 2018-11A, Class A, 3.62%, 10/20/31(c)(e) | | | | | | | 500 | | | | 499,735 | |
Treman Park CLO Ltd., Series 2015-1A(c): | | | | | | | | | | | | |
Class D, (3 mo. LIBOR US + 3.86%),
6.33%, 04/20/27(d) | | | | | | | 700 | | | | 702,147 | |
Class DRR, 1.00%, 10/20/28(b)(e)(f) | | | | | | | 700 | | | | 700,000 | |
Voya CLO Ltd., Series 2014-4A, Class BR2, 4.53%, 07/14/31(c)(e) | | | | | | | 400 | | | | 398,214 | |
Webster Park CLO Ltd., Series 2015-1A, Class CR, 5.37%, 07/20/30(c)(e) | | | | | | | 250 | | | | 249,501 | |
York CLO 1 Ltd., Series 2014-1A(c)(e): | | | | | | | | | | | | |
Class ARR, 3.29%, 10/22/29 | | | | | | | 1,000 | | | | 998,353 | |
Class BRR, 3.82%, 10/22/29 | | | | | | | 300 | | | | 299,734 | |
| | | | | | | | | | | | |
Total Asset-Backed Securities — 6.2%
(Cost — $21,205,743) | | | | 20,978,233 | |
| | | | | | | | |
Corporate Bonds — 3.1% | |
| Aerospace & Defense — 0.2% | |
Bombardier, Inc., 7.50%, 03/15/25(c) | | | | | | | 713 | | | | 712,786 | |
| | | | | | | | |
| Capital Markets — 0.3% | |
Blackstone CQP Holdco LP(c): | | | | | | | | | | | | |
6.50%, 03/20/21 | | | | | | | 941 | | | | 943,190 | |
6.00%, 08/18/21 | | | | | | | 153 | | | | 152,799 | |
| | | | | | | | |
| | | | | | | | | | | 1,095,989 | |
| | | | |
| SCHEDULES OF INVESTMENTS | | | 33 | |
| | |
Schedule of Investments (continued) October 31, 2018 | | BlackRock Floating Rate Income Trust (BGT) (Percentages shown are based on Net Assets) |
| | | | | | | | | | | | |
| Security | | | | | Par
(000) | | | Value | |
| Chemicals — 0.3% | |
Chemours Co., 6.63%, 05/15/23 | | | USD | | | | 175 | | | $ | 178,938 | |
Momentive Performance Materials, Inc., 3.88%, 10/24/21 | | | | | | | 665 | | | | 713,212 | |
| | | | | | | | |
| | | | | | | | | | | 892,150 | |
| Diversified Consumer Services — 0.4% | |
Prime Security Services Borrower LLC/Prime Finance, Inc., 9.25%, 05/15/23(c) | | | | | | | 1,251 | | | | 1,321,932 | |
| | | | | | | | |
| Diversified Telecommunication Services — 0.1% | |
Level 3 Financing, Inc., 6.13%, 01/15/21 | | | | | | | 337 | | | | 337,843 | |
| | | | | | | | |
| Electric Utilities — 0.0% | |
Texas Competitive Electric Holdings Co. LLC/TCEH Finance, Inc.,
11.50%, 10/01/20(b)(c)(g) | | | | | | | 654 | | | | — | |
| | | | | | | | |
| Equity Real Estate Investment Trusts (REITs) — 0.0% | |
VICI Properties 1 LLC/VICI FC, Inc., 8.00%, 10/15/23 | | | | | | | 29 | | | | 31,331 | |
| | | | | | | | |
| Health Care Providers & Services — 0.1% | |
NVA Holdings, Inc., 6.88%, 04/01/26(c) | | | | | | | 188 | | | | 185,650 | |
| | | | | | | | |
| Health Care Services — 0.0% | |
Aveta Inc. Escrow, 7.00%, 04/01/19(b)(c) | | | | | | | 827 | | | | — | |
| | | | | | | | |
| Hotels, Restaurants & Leisure — 0.2% | |
New Red Finance, Inc., 5.00%, 10/15/25(c) | | | | | | | 600 | | | | 562,500 | |
| | | | | | | | |
| Household Products — 0.0% | |
Berkline Benchcraft LLC,
4.50%, 06/01/19(b)(g) | | | | | | | 400 | | | | — | |
| | | | | | | | |
| Media — 0.3% | |
Clear Channel Worldwide Holdings, Inc.: | | | | | | | | | | | | |
6.50%, 11/15/22 | | | | | | | 602 | | | | 611,150 | |
Series B, 7.63%, 03/15/20 | | | | | | | 335 | | | | 334,581 | |
CSC Holdings LLC, 10.88%, 10/15/25(c) | | | | | | | 65 | | | | 74,994 | |
| | | | | | | | |
| | | | | | | | | | | 1,020,725 | |
| Metals & Mining — 0.2% | |
Freeport-McMoRan, Inc.: | | | | | | | | | | | | |
3.10%, 03/15/20 | | | | | | | 350 | | | | 344,312 | |
3.88%, 03/15/23 | | | | | | | 375 | | | | 346,875 | |
| | | | | | | | |
| | | | | | | | | | | 691,187 | |
| Oil, Gas & Consumable Fuels — 0.7% | |
CNX Resources Corp., 5.88%, 04/15/22 | | | | | | | 1,380 | | | | 1,354,994 | |
CONSOL Energy, Inc., 11.00%, 11/15/25(c) | | | | | | | 605 | | | | 679,113 | |
Great Western Petroleum LLC/Great Western Finance, Inc., 9.00%, 09/30/21(c) | | | | | | | 540 | | | | 513,000 | |
| | | | | | | | |
| | | | | | | | | | | 2,547,107 | |
| Software — 0.3% | |
Infor US, Inc., 6.50%, 05/15/22 | | | | | | | 720 | | | | 718,200 | |
Informatica LLC, 7.13%, 07/15/23(c) | | | | | | | 405 | | | | 413,226 | |
| | | | | | | | |
| | | | | | | | | | | 1,131,426 | |
Total Corporate Bonds — 3.1%
(Cost — $10,642,552) | | | | 10,530,626 | |
| | | | | | | | |
|
Floating Rate Loan Interests (d) — 133.5% | |
|
| Aerospace & Defense — 1.4% | |
Accudyne Industries LLC, 2017 Term Loan, (1 mo. LIBOR + 3.00%, 1.00% Floor), 5.30%, 08/18/24 | | | | | | | 2,194 | | | | 2,185,380 | |
DAE Aviation Holdings, Inc., 1st Lien Term Loan, (1 mo. LIBOR + 3.75%, 1.00% Floor), 6.05%, 07/07/22 | | | | | | | 312 | | | | 312,609 | |
TransDigm, Inc., 2018 Term Loan F, (1 mo. LIBOR + 2.50%), 4.80%, 06/09/23 | | | | | | | 2,042 | | | | 2,030,816 | |
WP CPP Holdings LLC, 2018 Term Loan, (1 mo. LIBOR + 3.75%), 6.28%, 04/30/25 | | | | | | | 246 | | | | 246,718 | |
| | | | | | | | |
| | | | | | | | | | | 4,775,523 | |
| | | | | | | | | | | | |
| Security | | | | | Par
(000) | | | Value | |
| Air Freight & Logistics — 0.2% | |
Avolon TLB Borrower 1 (US) LLC, Term Loan B3, (1 mo. LIBOR + 2.00%), 4.28%, 01/15/25 | | | USD | | | | 397 | | | $ | 396,086 | |
XPO Logistics, Inc., 2018 Term Loan B, (3 mo. LIBOR + 2.00%), 4.51%, 02/24/25 | | | | | | | 163 | | | | 163,030 | |
| | | | | | | | |
| | | | | | | | | | | 559,116 | |
| Auto Components — 0.3% | |
GPX International Tire Corp., Term Loan(b)(g): | | | | | | | | | | | | |
12.25%, 12/31/49 | | | | | | | 274 | | | | — | |
PIK, 0.13%, 12/31/49(h) | | | | | | | 5 | | | | — | |
USI, Inc., 2017 Repriced Term Loan, (3 mo. LIBOR + 3.00%), 5.39%, 05/16/24 | | | | | | | 976 | | | | 969,970 | |
| | | | | | | | |
| | | | | | | | | | | 969,970 | |
| Auto Parts — 0.1% | |
Mavis Tire Express Services Corp.(b): | | | | | | | | | | | | |
2018 1st Lien Term Loan, (1 mo. LIBOR + 3.25%), 5.53%, 03/20/25 | | | | | | | 273 | | | | 236,848 | |
2018 Delayed Draw Term Loan, (3 mo. LIBOR + 3.25%), 1.25%, 03/20/25 | | | | | | | 44 | | | | 6,170 | |
| | | | | | | | |
| | | | | | | | | | | 243,018 | |
| Automobiles — 0.3% | |
CH Hold Corp.: | | | | | | | | | | | | |
1st Lien Term Loan, (1 mo. LIBOR + 3.00%), 5.30%, 02/01/24 | | | | | | | 783 | | | | 782,762 | |
2nd Lien Term Loan, (1 mo. LIBOR + 7.25%), 9.55%, 02/01/25(b) | | | | | | | 150 | | | | 150,750 | |
| | | | | | | | |
| | | | | | | | | | | 933,512 | |
| Banks — 0.3% | |
Capri Finance LLC, 2017 1st Lien Term Loan, (3 mo. LIBOR + 3.25%), 5.78%, 11/01/24 | | | | | | | 997 | | | | 993,105 | |
| | | | | | | | |
| Beverages — 0.1% | |
Jacobs Douwe Egberts International BV, 2018 USD Term Loan B, 10/18/25(i) | | | | | | | 500 | | | | 499,935 | |
| | | | | | | | |
| Building Materials — 0.3% | |
Allied Universal HoldCo LLC, 2015 Term Loan, (3 mo. LIBOR + 3.75%, 1.00% Floor), 6.14%, 07/28/22 | | | | | | | 510 | | | | 505,211 | |
USAGM HoldCo LLC, 2015 2nd Lien Term Loan, (2 mo. LIBOR + 8.50%, 1.00% Floor), 10.79%, 07/28/23 | | | | | | | 395 | | | | 389,569 | |
| | | | | | | | |
| | | | | | | | | | | 894,780 | |
| Building Products — 1.2% | |
Continental Building Products LLC, 2017 1st Lien Term Loan B, (1 mo. LIBOR + 2.25%), 4.55%, 08/18/23 | | | | | | | 239 | | | | 238,555 | |
CPG International, Inc., 2017 Term Loan, (6 mo. LIBOR + 3.75%, 1.00% Floor), 6.25%, 05/05/24 | | | | | | | 885 | | | | 886,408 | |
Jeld-Wen, Inc., 2017 1st Lien Term Loan, (3 mo. LIBOR + 2.00%), 4.39%, 12/14/24 | | | | | | | 737 | | | | 734,314 | |
Reece Ltd., 2018 Term Loan B, (1 mo. LIBOR + 2.00%), 4.40%, 07/02/25(b) | | | | | | | 618 | | | | 619,223 | |
Wilsonart LLC, 2017 Term Loan B, (3 mo. LIBOR + 3.25%, 1.00% Floor), 5.64%, 12/19/23 | | | | | | | 1,612 | | | | 1,608,823 | |
| | | | | | | | |
| | | | | | | | | | | 4,087,323 | |
| Capital Markets — 1.6% | |
Duff & Phelps Corp., 2017 Term Loan B, (1 mo. LIBOR + 3.25%, 1.00% Floor), 5.55%, 02/13/25 | | | | | | | 527 | | | | 526,253 | |
EIG Management Co. LLC, 2018 Term Loan B, (3 mo. LIBOR + 3.75%), 6.06%, 02/22/25(b) | | | | | | | 1,043 | | | | 1,042,829 | |
Fortress Investment Group LLC, 2018 Term Loan B, (1 mo. LIBOR + 2.00%), 4.30%, 12/27/22 | | | | | | | 822 | | | | 820,718 | |
Greenhill & Co., Inc., 1st Lien Term Loan, (1 mo. LIBOR + 3.75%, 1.00% Floor), 6.05%, 10/12/22 | | | | | | | 934 | | | | 938,092 | |
| | |
| 34 | | 2018 BLACKROCK ANNUAL REPORTTO SHAREHOLDERS |
| | |
Schedule of Investments (continued) October 31, 2018 | | BlackRock Floating Rate Income Trust (BGT) (Percentages shown are based on Net Assets) |
| | | | | | | | | | | | |
| Security | | | | | Par
(000) | | | Value | |
| Capital Markets (continued) | |
GreenSky Holdings LLC, 2018 Term Loan B, (1 mo. LIBOR + 3.25%), 5.56%, 03/31/25(b) | | | USD | | | | 657 | | | $ | 658,342 | |
RPI Finance Trust, Term Loan B6, (3 mo. LIBOR + 2.00%), 4.39%, 03/27/23 | | | | | | | 1,608 | | | | 1,607,933 | |
| | | | | | | | |
| | | | | | | | | | | 5,594,167 | |
| Chemicals — 5.4% | |
Alpha 3 BV, 2017 Term Loan B1, (3 mo. LIBOR + 3.00%, 1.00% Floor), 5.39%, 01/31/24 | | | | | | | 1,956 | | | | 1,954,527 | |
Axalta Coating Systems US Holdings, Inc., Term Loan, (3 mo. LIBOR + 1.75%), 4.14%, 06/01/24 | | | | | | | 2,182 | | | | 2,175,090 | |
Charter NEX US Holdings, Inc., 2017 Term Loan B, (1 mo. LIBOR + 3.00%, 1.00% Floor), 5.05%, 05/16/24 | | | | | | | 884 | | | | 881,789 | |
Chemours Co., 2018 Term Loan B, (1 mo. LIBOR + 1.75%), 4.05%, 04/03/25 | | | | | | | 552 | | | | 549,866 | |
Element Materials Technology Group US Holdings, Inc., 2017 Term Loan B, (1 mo. LIBOR + 3.50%, 1.00% Floor), 5.80%, 06/28/24 | | | | | | | 377 | | | | 378,093 | |
Encapsys LLC, 1st Lien Term Loan, (1 mo. LIBOR + 3.25%, 1.00% Floor), 5.55%, 11/07/24 | | | | | | | 637 | | | | 638,125 | |
Evergreen Acqco 1 LP, Term Loan, (3 mo. LIBOR + 3.75%), 6.22%, 07/09/19 | | | | | | | 269 | | | | 259,568 | |
Invictus US LLC: | | | | | | | | | | | | |
1st Lien Term Loan, (1 mo. LIBOR + 3.00%), 5.30%, 03/28/25 | | | | | | | 1,006 | | | | 1,009,378 | |
2nd Lien Term Loan, (1 mo. LIBOR + 6.75%), 9.05%, 03/25/26(b) | | | | | | | 265 | | | | 263,013 | |
MacDermid, Inc.: | | | | | | | | | | | | |
Term Loan B6, (1 mo. LIBOR + 3.00%, 1.00% Floor), 5.30%, 06/07/23 | | | | | | | 800 | | | | 800,010 | |
Term Loan B7, (1 mo. LIBOR + 2.50%, 1.00% Floor), 4.80%, 06/07/20 | | | | | | | 1,178 | | | | 1,178,378 | |
Messer Industries LLC, 2018 USD Term Loan, 10/01/25(i) | | | | | | | 2,626 | | | | 2,625,343 | |
Oxea Holding Drei GmbH, 2017 Term Loan B2, (3 mo. LIBOR + 3.50%),
5.94%, 10/11/24(b) | | | | | | | 2,243 | | | | 2,248,739 | |
PQ Corp., 2018 Term Loan B, (3 mo. LIBOR + 2.50%), 5.03%, 02/08/25 | | | | | | | 1,679 | | | | 1,676,348 | |
Starfruit Finco BV, 2018 USD Term Loan B, (1 mo. LIBOR + 3.25%), 5.51%, 10/01/25 | | | | | | | 785 | | | | 782,056 | |
Tata Chemicals North America, Inc., Term Loan B, (3 mo. LIBOR + 2.75%, 1.00% Floor), 5.19%, 08/07/20 | | | | | | | 254 | | | | 252,957 | |
Vectra Co., 1st Lien Term Loan, (1 mo. LIBOR + 3.25%), 5.55%, 03/08/25 | | | | | | | 683 | | | | 681,292 | |
| | | | | | | | |
| | | | | | | | | | | 18,354,572 | |
| Commercial Services & Supplies — 8.2% | |
Advanced Disposal Services, Inc., Term Loan B3, (1 Week LIBOR + 2.25%), 4.46%, 11/10/23 | | | | | | | 1,909 | | | | 1,907,528 | |
Aramark Services, Inc., 2018 Term Loan B3, (1 mo. LIBOR + 1.75%), 4.05%, 03/11/25 | | | | | | | 168 | | | | 168,439 | |
Asurion LLC: | | | | | | | | | | | | |
2017 2nd Lien Term Loan, (1 mo. LIBOR + 6.50%), 8.80%, 08/04/25 | | | | | | | 1,406 | | | | 1,442,204 | |
2017 Term Loan B4, (1 mo. LIBOR + 3.00%), 5.30%, 08/04/22 | | | | | | | 1,167 | | | | 1,168,411 | |
2018 Term Loan B6, (1 mo. LIBOR + 3.00%), 5.30%, 11/03/23 | | | | | | | 1,838 | | | | 1,838,852 | |
2018 Term Loan B7, (1 mo. LIBOR + 3.00%), 5.30%, 11/03/24 | | | | | | | 721 | | | | 721,582 | |
Camelot UK Holdco Ltd., 2017 Repriced Term Loan, (1 mo. LIBOR + 3.25%, 1.00% Floor), 5.55%, 10/03/23 | | | | | | | 1,086 | | | | 1,084,542 | |
Catalent Pharma Solutions, Inc., Term Loan B, (1 mo. LIBOR + 2.25%, 1.00% Floor), 4.55%, 05/20/24 | | | | | | | 1,408 | | | | 1,412,586 | |
| | | | | | | | | | | | |
| Security | | | | | Par
(000) | | | Value | |
| Commercial Services & Supplies (continued) | |
Creative Artists Agency LLC, 2018 Term Loan B, (Prime + 3.00%), 5.29%, 02/15/24 | | | USD | | | | 1,870 | | | $ | 1,872,406 | |
Dealer Tire LLC, 2017 Term Loan B, (3 mo. LIBOR + 3.25%, 1.00% Floor), 5.62%, 12/22/21 | | | | | | | 510 | | | | 506,655 | |
EnergySolutions LLC, 2018 Term Loan B, (3 mo. LIBOR + 3.75%, 1.00% Floor), 6.14%, 05/09/25 | | | | | | | 358 | | | | 360,119 | |
Garda World Security Corp., 2017 Term Loan, (PRIME + 3.50%), 5.82%, 05/24/24 | | | | | | | 561 | | | | 562,643 | |
GFL Environmental Inc.: | | | | | | | | | | | | |
2018 Term Loan, 7.00%, 05/30/25 | | | | | | | 77 | | | | 76,155 | |
2018 USD Term Loan B, (3 mo. LIBOR + 2.75%, 1.00% Floor), 5.14%, 05/30/25 | | | | | | | 1,937 | | | | 1,905,145 | |
Harland Clarke Holdings Corp., Term Loan, (3 mo. LIBOR + 4.75%, 1.00% Floor), 7.14%, 11/03/23 | | | | | | | 560 | | | | 523,333 | |
KAR Auction Services, Inc., Term Loan B5, (3 mo. LIBOR + 2.50%), 4.94%, 03/09/23 | | | | | | | 1,538 | | | | 1,538,910 | |
Multi Color Corporation, 2017 Term Loan B, 10/31/24(i) | | | | | | | 470 | | | | 470,748 | |
Prime Security Services Borrower LLC, 2016 1st Lien Term Loan, (1 mo. LIBOR + 2.75%, 1.00% Floor), 5.05%, 05/02/22 | | | | | | | 1,700 | | | | 1,698,999 | |
Verscend Holding Corp., 2018 Term Loan B, (1 mo. LIBOR + 4.50%), 6.80%, 08/27/25 | | | | | | | 3,895 | | | | 3,922,984 | |
West Corp., 2017 Term Loan, (1 mo. LIBOR + 4.00%, 1.00% Floor), 6.53%, 10/10/24 | | | | | | | 2,049 | | | | 2,037,517 | |
Wrangler Buyer Corp., Term Loan B, (3 mo. LIBOR + 2.75%), 5.01%, 09/27/24 | | | | | | | 2,428 | | | | 2,428,383 | |
| | | | | | | | |
| | | | | | | | | | | 27,648,141 | |
| Communications Equipment — 1.1% | |
Avantor, Inc., 2017 1st Lien Term Loan, (1 mo. LIBOR + 4.00%, 1.00% Floor), 6.30%, 11/21/24 | | | | | | | 1,986 | | | | 1,998,764 | |
Avaya, Inc.: | | | | | | | | | | | | |
2018 Term Loan B, (1 mo. LIBOR + 4.25%), 6.53%, 12/15/24 | | | | | | | 895 | | | | 897,694 | |
Exit Term Loan B, 05/29/20(i) | | | | | | | 152 | | | | — | |
Ciena Corp., 2018 Term Loan B, 09/26/25(i) | | | | | | | 332 | | | | 332,209 | |
CommScope, Inc., Term Loan B5, (1 mo. LIBOR + 2.00%), 4.30%, 12/29/22 | | | | | | | 218 | | | | 218,249 | |
Securus Technologies Holdings, Inc., 2017 1st Lien Term Loan, (1 mo. LIBOR + 4.50%, 1.00% Floor), 6.80%, 11/01/24 | | | | | | | 180 | | | | 180,147 | |
| | | | | | | | |
| | | | | | | | | | | 3,627,063 | |
| Construction & Engineering — 2.1% | |
AECOM, Term Loan B, (1 mo. LIBOR + 1.75%), 4.05%, 03/13/25 | | | | | | | 447 | | | | 446,717 | |
Brand Energy & Infrastructure Services, Inc., 2017 Term Loan, (3 mo. LIBOR + 4.25%, 1.00% Floor), 6.73%, 06/21/24 | | | | | | | 4,025 | | | | 4,038,888 | |
Engility Corp., Term Loan B1, (1 mo. LIBOR + 2.25%), 4.55%, 08/12/20 | | | | | | | 115 | | | | 114,684 | |
Pike Corp., 2018 Term Loan B, (1 mo. LIBOR + 3.50%, 1.00% Floor), 5.81%, 03/23/25 | | | | | | | 680 | | | | 683,249 | |
SRS Distribution, Inc., 2018 1st Lien Term Loan, (1 mo. LIBOR + 3.25%), 5.55%, 05/23/25 | | | | | | | 1,419 | | | | 1,386,986 | |
USIC Holdings, Inc., 2017 Term Loan B, (1 mo. LIBOR + 3.25%, 1.00% Floor), 5.55%, 12/08/23 | | | | | | | 563 | | | | 563,645 | |
| | | | | | | | |
| | | | | | | | | | | 7,234,169 | |
| Construction Materials — 1.5% | |
Core & Main LP, 2017 Term Loan B, (3 mo. LIBOR + 3.00%, 1.00% Floor),
5.32%, 08/01/24(b) | | | | | | | 1,693 | | | | 1,690,784 | |
Filtration Group Corp., 2018 1st Lien Term Loan, (1 mo. LIBOR + 3.00%), 5.30%, 03/29/25 | | | | | | | 3,010 | | | | 3,020,620 | |
| | | | |
| SCHEDULES OF INVESTMENTS | | | 35 | |
| | |
Schedule of Investments (continued) October 31, 2018 | | BlackRock Floating Rate Income Trust (BGT) (Percentages shown are based on Net Assets) |
| | | | | | | | | | | | |
| Security | | | | | Par
(000) | | | Value | |
| Construction Materials (continued) | |
GYP Holdings III Corp., 2018 Term Loan B, (1 mo. LIBOR + 2.75%), 5.05%, 06/01/25 | | | USD | | | | 481 | | | $ | 473,431 | |
| | | | | | | | |
| | | | | | | | | | | 5,184,835 | |
| Consumer Finance — 1.2% | |
Financial & Risk US Holdings, Inc., 2018 USD Term Loan, (1 mo. LIBOR + 3.75%), 6.05%, 10/01/25 | | | | | | | 4,156 | | | | 4,110,991 | |
| | | | | | | | |
| Containers & Packaging — 1.5% | |
Berry Global, Inc., Term Loan Q, (1 mo. LIBOR + 2.00%), 4.28%, 10/01/22 | | | | | | | 2,723 | | | | 2,720,561 | |
BWAY Holding Co., 2017 Term Loan B, (3 mo. LIBOR + 3.25%), 5.66%, 04/03/24 | | | | | | | 1,089 | | | | 1,082,176 | |
Flex Acquisition Co., Inc., 2018 Incremental Term Loan, (1 mo. LIBOR + 3.25%), 5.51%, 06/29/25 | | | | | | | 1,130 | | | | 1,130,778 | |
| | | | | | | | |
| | | | | | | | | | | 4,933,515 | |
| Distributors — 1.1% | | | | | | | | | |
American Builders & Contractors Supply Co., Inc., 2018 Term Loan B, (1 mo. LIBOR + 2.00%), 4.30%, 10/31/23 | | | | | | | 1,769 | | | | 1,749,043 | |
TriMark USA LLC, 2017 1st Lien Term Loan, (1 mo. LIBOR + 3.50%), 5.81%, 08/28/24 | | | | | | | 2,020 | | | | 1,946,063 | |
| | | | | | | | |
| | | | | | | | | | | 3,695,106 | |
| Diversified Consumer Services — 4.5% | |
AI Aqua Merger Sub, Inc., 2017 Incremental Term Loan, (1 mo. LIBOR + 3.25%, 1.00% Floor), 5.55%, 12/13/23 | | | | | | | 1,277 | | | | 1,271,519 | |
Ascend Learning LLC, 2017 Term Loan B, (1 mo. LIBOR + 3.00%, 1.00% Floor), 5.30%, 07/12/24 | | | | | | | 708 | | | | 708,296 | |
Bright Horizons Family Solutions, Inc., 2017 Term Loan B, (PRIME + 0.75%), 4.05%, 11/07/23 | | | | | | | 1,980 | | | | 1,979,611 | |
CHG PPC Parent LLC, 2018 Term Loan B, (1 mo. LIBOR + 2.75%), 5.05%, 03/31/25(b) | | | | | | | 429 | | | | 427,316 | |
Equian LLC, Add on Term Loan B, (1 mo. LIBOR + 3.25%, 1.00% Floor), 5.54%, 05/20/24 | | | | | | | 1,366 | | | | 1,365,552 | |
Genuine Financial Holdings LLC, 2018 1st Lien Term Loan, (3 mo. LIBOR + 3.75%), 6.14%, 07/12/25 | | | | | | | 859 | | | | 860,615 | |
J.D. Power and Associates, 2018 1st Lien Term Loan, (1 mo. LIBOR + 3.75%, 1.00% Floor), 6.05%, 09/07/23 | | | | | | | 853 | | | | 856,466 | |
Nomad Foods Europe Midco Ltd., 2017 Term Loan B4, (1 mo. LIBOR + 2.25%), 4.53%, 05/15/24 | | | | | | | 1,036 | | | | 1,030,850 | |
Serta Simmons Bedding LLC: | | | | | | | | | | | | |
1st Lien Term Loan, (1 mo. LIBOR + 3.50%, 1.00% Floor), 5.77%, 11/08/23 | | | | | | | 1,704 | | | | 1,533,133 | |
2nd Lien Term Loan, (3 mo. LIBOR + 8.00%, 1.00% Floor), 10.28%, 11/08/24 | | | | | | | 591 | | | | 457,325 | |
ServiceMaster Co., 2016 Term Loan B, (1 mo. LIBOR + 2.50%), 4.80%, 11/08/23 | | | | | | | 589 | | | | 591,525 | |
Spin Holdco, Inc., 2017 Term Loan B, (3 mo. LIBOR + 3.25%, 1.00% Floor), 5.69%, 11/14/22 | | | | | | | 1,106 | | | | 1,106,149 | |
Uber Technologies, 2018 Term Loan, (1 mo. LIBOR + 4.00%, 1.00% Floor), 6.28%, 04/04/25 | | | | | | | 798 | | | | 797,338 | |
Wand Intermediate I LP, 2017 1st Lien Term Loan, (2 mo. LIBOR + 3.00%, 1.00% Floor), 5.39%, 09/17/21 | | | | | | | 778 | | | | 778,998 | |
Weight Watchers International, Inc., 2017 Term Loan B, (3 mo. LIBOR + 4.75%), 7.15%, 11/29/24 | | | | | | | 1,655 | | | | 1,662,760 | |
| | | | | | | | |
| | | | | | | | | | | 15,427,453 | |
| Diversified Financial Services — 2.3% | |
AL Alpine AT Bidco GmbH, 2018 Term Loan B, 09/30/25(b)(i) | | | | | | | 433 | | | | 433,000 | |
| | | | | | | | | | | | |
| Security | | | | | Par
(000) | | | Value | |
| Diversified Financial Services (continued) | |
AlixPartners LLP, 2017 Term Loan B, (1 mo. LIBOR + 2.75%, 1.00% Floor), 5.05%, 04/04/24 | | | USD | | | | 2,475 | | | $ | 2,475,381 | |
CRCI Holdings Inc., 2018 1st Lien Term Loan, (1 mo. LIBOR + 3.50%), 5.78%, 08/08/25 | | | | | | | 449 | | | | 450,122 | |
Edelman Financial Center LLC, 2018 1st Lien Term Loan, (3 mo. LIBOR + 3.25%), 5.69%, 07/21/25 | | | | | | | 482 | | | | 483,509 | |
EG Finco Ltd., 2018 Term Loan, (3 mo. LIBOR + 4.00%), 6.39%, 02/07/25 | | | | | | | 1,131 | | | | 1,130,288 | |
Global Business Travel Holdings Limited, 2018 Term Loan B, (3 mo. LIBOR + 2.50%), 4.84%, 07/20/25 | | | | | | | 260 | | | | 260,975 | |
Kingpin Intermediate Holdings LLC, 2018 Term Loan B, (1 mo. LIBOR + 3.50%, 1.00% Floor), 5.81%, 07/03/24 | | | | | | | 1,010 | | | | 1,014,311 | |
LTI Holdings, Inc., 2018 Add On 1st Lien Term Loan, (1 mo. LIBOR + 3.50%), 5.80%, 09/06/25 | | | | | | | 634 | | | | 633,207 | |
Oryx Southern Delaware Holdings LLC, Term Loan, (1 mo. LIBOR + 3.25%, 1.00% Floor), 5.55%, 02/28/25 | | | | | | | 428 | | | | 421,621 | |
SSH Group Holdings, Inc., 2018 1st Lien Term Loan, (2 mo. LIBOR + 4.25%), 6.77%, 07/30/25(b) | | | | | | | 449 | | | | 449,000 | |
| | | | | | | | |
| | | | | | | | | | | 7,751,414 | |
| Diversified Telecommunication Services — 4.7% | |
CenturyLink, Inc.: | | | | | | | | | | | | |
2017 Term Loan A, (1 mo. LIBOR + 2.75%), 5.05%, 11/01/22 | | | | | | | 379 | | | | 377,747 | |
2017 Term Loan B, (1 mo. LIBOR + 2.75%), 5.05%, 01/31/25 | | | | | | | 1,775 | | | | 1,754,472 | |
Consolidated Communications, Inc., 2016 Term Loan B, (1 mo. LIBOR + 3.00%, 1.00% Floor), 5.31%, 10/04/23 | | | | | | | 254 | | | | 249,949 | |
Frontier Communications Corp., Delayed Draw Term Loan A, (1 mo. LIBOR + 2.75%), 5.06%, 03/31/21 | | | | | | | 1,590 | | | | 1,540,630 | |
Hargray Communications Group, Inc., 2017 Term Loan B, (1 mo. LIBOR + 3.00%, 1.00% Floor), 5.30%, 05/16/24 | | | | | | | 918 | | | | 916,538 | |
Level 3 Financing, Inc., 2017 Term Loan B, (1 mo. LIBOR + 2.25%), 4.53%, 02/22/24 | | | | | | | 1,753 | | | | 1,754,078 | |
MTN Infrastructure TopCo, Inc, 1st Lien Term Loan B, (1 mo. LIBOR + 3.00%, 1.00% Floor), 5.30%, 11/15/24 | | | | | | | 1,185 | | | | 1,184,629 | |
Sprint Communications, Inc., 1st Lien Term Loan B, (1 mo. LIBOR + 2.50%), 4.81%, 02/02/24 | | | | | | | 1,758 | | | | 1,756,572 | |
TDC A/S, Term Loan, (EURIBOR + 3.50%), 3.50%, 05/31/25 | | | EUR | | | | 820 | | | | 931,817 | |
Telenet Financing USD LLC, Term Loan AN, (1 mo. LIBOR + 2.25%), 4.53%, 08/15/26 | | | USD | | | | 2,640 | | | | 2,630,100 | |
Telesat Canada, Term Loan B4, (3 mo. LIBOR + 2.50%), 4.89%, 11/17/23 | | | | | | | 501 | | | | 501,180 | |
Virgin Media Investment Holdings Ltd., Term Loan L, (LIBOR — GBP + 3.25%), 3.97%, 01/15/27 | | | GBP | | | | 600 | | | | 765,003 | |
Zayo Group LLC: | | | | | | | | | | | | |
2017 Incremental Term Loan, (1 mo. LIBOR + 2.25%, 1.00% Floor), 4.55%, 01/19/24 | | | USD | | | | 175 | | | | 175,082 | |
2017 Term Loan B1, (1 mo. LIBOR + 2.00%), 4.30%, 01/19/21 | | | | | | | 1,448 | | | | 1,448,229 | |
| | | | | | | | |
| | | | | | | | | | | 15,986,026 | |
| Electric Utilities — 1.1% | |
Dayton Power & Light Co., Term Loan B, (1 mo. LIBOR + 2.00%), 4.31%, 08/24/22 | | | | | | | 316 | | | | 315,618 | |
TEX Operations Co. LLC, Exit Term Loan B, (1 mo. LIBOR + 2.00%), 4.30%, 08/04/23 | | | | | | | 1,245 | | | | 1,241,507 | |
Texas Competitive Electric Holdings Co. LLC/TCEH Finance, Inc., Term Loan,
5.03%, 11/10/18(b) | | | | | | | 1,050 | | | | — | |
| | |
| 36 | | 2018 BLACKROCK ANNUAL REPORTTO SHAREHOLDERS |
| | |
Schedule of Investments (continued) October 31, 2018 | | BlackRock Floating Rate Income Trust (BGT) (Percentages shown are based on Net Assets) |
| | | | | | | | | | | | |
| Security | | | | | Par
(000) | | | Value | |
| Electric Utilities (continued) | |
Vistra Energy Corp., 1st Lien Term Loan B3, (1 mo. LIBOR + 2.00%), 4.29%, 12/31/25 | | | USD | | | | 1,920 | | | $ | 1,913,198 | |
Vistra Operations Co. LLC, 2016 Term Loan B2, (1 mo. LIBOR + 2.25%), 4.55%, 12/14/23 | | | | | | | 224 | | | | 224,427 | |
| | | | | | | | |
| | | | | | | | | | | 3,694,750 | |
| Electrical Equipment — 1.0% | |
EXC Holdings III Corp., 2017 1st Lien Term Loan, (3 mo. LIBOR + 3.50%, 1.00% Floor),
5.89%, 12/02/24(b) | | | | | | | 571 | | | | 572,114 | |
Gates Global LLC, 2017 Repriced Term Loan B, (1 mo. LIBOR + 2.75%, 1.00% Floor), 5.05%, 04/01/24 | | | | | | | 2,438 | | | | 2,439,749 | |
MLN US HoldCo LLC, 2018 1st Lien Term Loan, 07/11/25(i) | | | | | | | 524 | | | | 527,013 | |
| | | | | | | | |
| | | | | | | | | | | 3,538,876 | |
| Energy Equipment & Services — 1.1% | |
Gavilan Resources LLC, 2nd Lien Term Loan, (1 mo. LIBOR + 6.00%, 1.00% Floor), 8.28%, 03/01/24 | | | | | | | 999 | | | | 930,608 | |
GrafTech Finance, Inc., 2018 Term Loan B, (1 mo. LIBOR + 3.50%, 1.00% Floor), 5.80%, 02/12/25(b) | | | | | | | 1,101 | | | | 1,101,062 | |
Ocean Rig UDW, Inc., Term Loan, (Fixed + 8.00%), 8.00%, 09/20/24 | | | | | | | 63 | | | | 65,981 | |
Pioneer Energy Services Corp., Term Loan, (1 mo. LIBOR + 7.75%, 1.00% Floor), 10.03%, 11/08/22(b) | | | | | | | 520 | | | | 529,100 | |
Seadrill Partners Finco LLC, Term Loan B, (3 mo. LIBOR + 6.00%, 1.00% Floor), 8.39%, 02/21/21 | | | | | | | 382 | | | | 353,358 | |
Weatherford International Ltd., Term Loan, (1 mo. LIBOR + 1.43%), 3.73%, 07/13/20(b) | | | | | | | 711 | | | | 689,379 | |
| | | | | | | | |
| | | | | | | | | | | 3,669,488 | |
| Equity Real Estate Investment Trusts (REITs) — 2.3% | |
Capital Automotive LP, 2017 1st Lien Term Loan, (1 mo. LIBOR + 2.50%, 1.00% Floor), 4.81%, 03/24/24 | | | | | | | 466 | | | | 465,850 | |
Iron Mountain, Inc., 2018 Term Loan B, (1 mo. LIBOR + 1.75%), 4.05%, 01/02/26 | | | | | | | 519 | | | | 510,787 | |
MGM Growth Properties Operating Partnership LP, 2016 Term Loan B, (1 mo. LIBOR + 2.00%), 4.30%, 03/21/25 | | | | | | | 2,810 | | | | 2,799,688 | |
RHP Hotel Properties LP, 2017 Term Loan B, (3 mo. LIBOR + 2.00%), 4.44%, 05/11/24 | | | | | | | 827 | | | | 825,745 | |
VICI Properties 1 LLC, Replacement Term Loan B, (1 mo. LIBOR + 2.00%), 4.28%, 12/20/24 | | | | | | | 3,293 | | | | 3,282,885 | |
| | | | | | | | |
| | | | | | | | | | | 7,884,955 | |
| Food & Staples Retailing — 1.2% | |
Albertsons LLC: | | | | | | | | | | | | |
2017 Term Loan B4, (1 mo. LIBOR + 2.75%), 5.05%, 08/25/21 | | | | | | | 516 | | | | 515,425 | |
Term Loan B7, 10/29/25(i) | | | | | | | 720 | | | | 714,380 | |
Hearthside Food Solutions LLC, 2018 Term Loan B, (1 mo. LIBOR + 3.00%), 5.30%, 05/23/25 | | | | | | | 358 | | | | 350,917 | |
Hostess Brands LLC, 2017 Repriced Term Loan, (3 mo. LIBOR + 2.25%), 4.69%, 08/03/22 | | | | | | | 1,487 | | | | 1,478,019 | |
US Foods, Inc., 2016 Term Loan B, (1 mo. LIBOR + 2.00%), 4.30%, 06/27/23 | | | | | | | 983 | | | | 980,584 | |
| | | | | | | | |
| | | | | | | | | | | 4,039,325 | |
| Food Products — 2.2% | |
8th Avenue Food & Provisions, Inc., 2018 1st Lien Term Loan, (3 mo. LIBOR + 3.75%), 6.01%, 10/01/25 | | | | | | | 353 | | | | 355,647 | |
CFSP Acquisition Corp., 2018 1st Lien Term Loan, (1 mo. LIBOR + 3.00%, 1.00% Floor), 5.29%, 03/20/25 | | | | | | | 330 | | | | 325,598 | |
| | | | | | | | | | | | |
| Security | | | | | Par
(000) | | | Value | |
| Food Products (continued) | |
Chobani LLC, 2017 Term Loan B, (1 mo. LIBOR + 3.50%, 1.00% Floor), 5.80%, 10/10/23 | | | USD | | | | 2,009 | | | $ | 1,960,255 | |
JBS USA LLC, 2017 Term Loan B, (3 mo. LIBOR + 2.50%), 4.84%, 10/30/22 | | | | | | | 3,084 | | | | 3,082,366 | |
Reynolds Group Holdings, Inc., 2017 Term Loan, (1 mo. LIBOR + 2.75%), 5.05%, 02/05/23 | | | | | | | 1,690 | | | | 1,690,110 | |
| | | | | | | | |
| | | | | | | | | | | 7,413,976 | |
| Gas Utilities — 0.3% | |
AL Midcoast Holdings LLC, 2018 Term Loan B, (3 mo. LIBOR + 3.50%), 7.89%, 07/31/25 | | | | | | | 880 | | | | 877,770 | |
| | | | | | | | |
| Health Care Equipment & Supplies — 3.4% | |
CryoLife, Inc., Term Loan B, (3 mo. LIBOR + 3.25%, 1.00% Floor), 5.64%, 12/02/24 | | | | | | | 1,121 | | | | 1,125,035 | |
DJO Finance LLC, 2015 Term Loan, (3 mo. LIBOR + 3.25%, 1.00% Floor), 5.60%, 06/08/20 | | | | | | | 4,031 | | | | 4,021,758 | |
Immucor, Inc., Extended Term Loan B, (3 mo. LIBOR + 5.00%, 1.00% Floor), 7.39%, 06/15/21 | | | | | | | 2,183 | | | | 2,215,332 | |
Mallinckrodt International Finance SA, Term Loan B, (3 mo. LIBOR + 2.75%), 5.14%, 09/24/24 | | | | | | | 893 | | | | 880,509 | |
Ortho-Clinical Diagnostics SA, 2018 Term Loan B, (1 mo. LIBOR + 3.25%), 5.54%, 06/30/25 | | | | | | | 3,279 | | | | 3,266,746 | |
| | | | | | | | |
| | | | | | | | | | | 11,509,380 | |
| Health Care Providers & Services — 7.5% | |
Acadia Healthcare Co., Inc.: | | | | | | | | | | | | |
2018 Term Loan B3, (1 mo. LIBOR + 2.50%), 4.80%, 02/11/22 | | | | | | | 276 | | | | 276,596 | |
2018 Term Loan B4, (1 mo. LIBOR + 2.50%), 4.80%, 02/16/23 | | | | | | | 1,258 | | | | 1,259,413 | |
AHP Health Partners, Inc., 2018 Term Loan, (1 mo. LIBOR + 4.50%, 1.00% Floor), 6.80%, 06/30/25 | | | | | | | 507 | | | | 508,473 | |
Auris Luxembourg III Sarl, 2017 Term Loan B7, (3 mo. LIBOR + 3.00%, 1.00% Floor), 5.39%, 01/17/22(b) | | | | | | | 1,479 | | | | 1,477,224 | |
CHG Healthcare Services, Inc., 2017 1st Lien Term Loan B, (1 mo. LIBOR + 3.00%, 1.00% Floor), 5.45%, 06/07/23 | | | | | | | 2,068 | | | | 2,073,128 | |
Concentra Inc.: | | | | | | | | | | | | |
2018 1st Lien Term Loan, (1 mo. LIBOR + 2.75%), 5.03%, 06/01/22 | | | | | | | 1,164 | | | | 1,165,455 | |
2018 2nd Lien Term Loan, 06/01/23(i) | | | | | | | 850 | | | | 858,500 | |
DaVita HealthCare Partners, Inc., Term Loan B, (1 mo. LIBOR + 2.75%), 5.05%, 06/24/21 | | | | | | | 506 | | | | 506,582 | |
DentalCorp Perfect Smile ULC(b): | | | | | | | | | | | | |
1st Lien Delayed Draw Term Loan, (1 mo. LIBOR + 3.75%), 4.52%, 06/06/25 | | | | | | | 133 | | | | 44,705 | |
1st Lien Term Loan, (1 mo. LIBOR + 3.75%, 1.00% Floor), 6.05%, 06/06/25 | | | | | | | 530 | | | | 531,866 | |
Diplomat Pharmacy, Inc., 2017 Term Loan B, (1 mo. LIBOR + 4.50%, 1.00% Floor), 6.81%, 12/20/24 | | | | | | | 614 | | | | 615,534 | |
DuPage Medical Group Ltd.: | | | | | | | | | | | | |
2018 Term Loan, (1 mo. LIBOR + 2.75%), 5.05%, 08/15/24 | | | | | | | 526 | | | | 521,758 | |
2nd Lien Term Loan, (1 mo. LIBOR + 7.00%), 9.28%, 08/15/25(b) | | | | | | | 245 | | | | 245,000 | |
Envision Healthcare Corp., 2018 1st Lien Term Loan, (1 mo. LIBOR + 3.75%), 6.05%, 10/10/25 | | | | | | | 2,216 | | | | 2,168,223 | |
Explorer Holdings, Inc., 2016 Term Loan B, (1 mo. LIBOR + 3.75%, 1.00% Floor), 6.14%, 05/02/23 | | | | | | | 657 | | | | 657,017 | |
Gentiva Health Services, Inc.: | | | | | | | | | | | | |
2018 1st Lien Term Loan, (1 mo. LIBOR + 3.75%), 6.06%, 07/02/25(b) | | | | | | | 669 | | | | 671,603 | |
| | | | |
| SCHEDULES OF INVESTMENTS | | | 37 | |
| | |
Schedule of Investments (continued) October 31, 2018 | | BlackRock Floating Rate Income Trust (BGT) (Percentages shown are based on Net Assets) |
| | | | | | | | | | | | |
| Security | | | | | Par
(000) | | | Value | |
| Health Care Providers & Services (continued) | |
2018 2nd Lien Term Loan, (1 mo. LIBOR + 7.00%), 9.31%, 07/02/26 | | | USD | | | | 164 | | | $ | 167,099 | |
HC Group Holdings III, Inc., 2018 Term Loan B, (1 mo. LIBOR + 3.75%), 6.05%, 04/07/22 | | | | | | | 868 | | | | 869,111 | |
HCA, Inc.: | | | | | | | | | | | | |
2018 Term Loan B10, (1 mo. LIBOR + 2.00%), 4.30%, 03/13/25 | | | | | | | 592 | | | | 594,245 | |
Term Loan B11, (1 mo. LIBOR + 1.75%), 4.05%, 03/18/23 | | | | | | | 1,387 | | | | 1,391,486 | |
Lifescan Global Corp., 2018 1st Lien Term Loan, (1 mo. LIBOR + 6.00%), 8.40%, 09/27/24 | | | | | | | 221 | | | | 215,568 | |
MPH Acquisition Holdings LLC, 2016 Term Loan B, (3 mo. LIBOR + 2.75%, 1.00% Floor), 5.14%, 06/07/23 | | | | | | | 1,884 | | | | 1,877,338 | |
National Mentor Holdings, Inc., Term Loan B, (3 mo. LIBOR + 3.00%), 5.39%, 01/31/21 | | | | | | | 290 | | | | 290,232 | |
nThrive, Inc., 2016 1st Lien Term Loan, (1 mo. LIBOR + 4.50%, 1.00% Floor), 6.80%, 10/20/22 | | | | | | | 1,093 | | | | 1,095,489 | |
NVA Holdings, Inc., Term Loan B3, (1 mo. LIBOR + 2.75%, 1.00% Floor), 5.05%, 02/02/25(b) | | | | | | | 1,112 | | | | 1,100,574 | |
ScribeAmerica Intermediate Holdco LLC, 2018 Term Loan, 04/03/25(i) | | | | | | | 643 | | | | 638,981 | |
Team Health Holdings, Inc., 1st Lien Term Loan, (1 mo. LIBOR + 2.75%, 1.00% Floor), 5.05%, 02/06/24 | | | | | | | 1,164 | | | | 1,098,713 | |
Universal Health Services, Inc., Term Loan B, 10/18/25(b)(i) | | | | | | | 285 | | | | 285,538 | |
Universal Hospital Services, Inc., Term Loan, 10/18/25(b)(i) | | | | | | | 452 | | | | 454,260 | |
Vizient, Inc., 2017 Term Loan B, (1 mo. LIBOR + 2.75%, 1.00% Floor), 5.05%, 02/13/23 | | | | | | | 377 | | | | 378,209 | |
WP CityMD Bidco LLC, 2018 1st Lien Term Loan, (3 mo. LIBOR + 3.50%, 1.00% Floor), 5.89%, 06/07/24 | | | | | | | 644 | | | | 643,449 | |
Zotec Partners, LLC, 2018 Term Loan, (1 mo. LIBOR + 5.00%, 1.00% Floor), 7.28%, 02/14/24(b) | | | | | | | 746 | | | | 745,563 | |
| | | | | | | | |
| | | | | | | | | | | 25,426,932 | |
| Health Care Services — 0.2% | |
Sound Inpatient Physicians: | | | | | | | | | | | | |
2018 1st Lien Term Loan, (1 mo. LIBOR + 3.00%), 5.30%, 06/27/25 | | | | | | | 431 | | | | 432,670 | |
2018 2nd Lien Term Loan, (1 mo. LIBOR + 6.75%), 9.05%, 06/26/26 | | | | | | | 234 | | | | 234,000 | |
| | | | | | | | |
| | | | | | | | | | | 666,670 | |
| Health Care Technology — 1.0% | |
Change Healthcare Holdings, Inc., 2017 Term Loan B, (1 mo. LIBOR + 2.75%, 1.00% Floor), 5.05%, 03/01/24 | | | | | | | 1,518 | | | | 1,515,286 | |
GoodRx, Inc., 1st Lien Term Loan, (3 mo. LIBOR + 3.00%), 5.28%, 10/10/25 | | | | | | | 354 | | | | 355,476 | |
Press Ganey Holdings, Inc.: | | | | | | | | | | | | |
2018 1st Lien Term Loan, (1 mo. LIBOR + 2.75%), 5.05%, 10/23/23 | | | | | | | 1,174 | | | | 1,174,011 | |
2nd Lien Term Loan, (1 mo. LIBOR + 6.50%), 8.80%, 10/21/24(b) | | | | | | | 139 | | | | 140,023 | |
Quintiles IMS, Inc., 2017 Term Loan B, (3 mo. LIBOR + 2.00%), 4.39%, 03/07/24 | | | | | | | 306 | | | | 306,940 | |
| | | | | | | | |
| | | | | | | | | | | 3,491,736 | |
| Hotels, Restaurants & Leisure — 8.1% | |
Aristocrat Technologies, Inc., 2018 1st Lien Term Loan, (3 mo. LIBOR + 1.75%), 4.22%, 10/19/24 | | | | | | | 806 | | | | 802,634 | |
Boyd Gaming Corp., Term Loan B3, (1 Week LIBOR + 2.25%), 4.47%, 09/15/23 | | | | | | | 1,126 | | | | 1,126,216 | |
| | | | | | | | | | | | |
| Security | | | | | Par
(000) | | | Value | |
| Hotels, Restaurants & Leisure (continued) | |
Bronco Midstream Funding LLC, Term Loan B, (1 mo. LIBOR + 3.50%, 1.00% Floor), 5.78%, 08/14/23 | | | USD | | | | 399 | | | $ | 398,798 | |
Burger King Newco Unlimited Liability Co., Term Loan B3, (1 mo. LIBOR + 2.25%, 1.00% Floor), 4.55%, 02/16/24 | | | | | | | 4,419 | | | | 4,400,523 | |
Caesars Resort Collection LLC, 2017 1st Lien Term Loan B, (1 mo. LIBOR + 2.75%), 5.05%, 12/22/24 | | | | | | | 2,712 | | | | 2,712,123 | |
CCM Merger, Inc., Term Loan B, (1 mo. LIBOR + 2.25%), 4.55%, 08/08/21 | | | | | | | 987 | | | | 987,455 | |
CEC Entertainment, Inc., Term Loan B, (1 mo. LIBOR + 3.25%, 1.00% Floor), 5.55%, 02/14/21 | | | | | | | 355 | | | | 338,232 | |
ESH Hospitality, Inc., 2018 Term Loan B, (1 mo. LIBOR + 2.00%), 4.30%, 08/30/23 | | | | | | | 1,869 | | | | 1,865,188 | |
Four Seasons Hotels Ltd., 1st Lien Term Loan, (1 mo. LIBOR + 2.00%), 4.30%, 11/30/23 | | | | | | | 138 | | | | 137,476 | |
Gateway Casinos & Entertainment Limited, 2018 Term Loan B, (3 mo. LIBOR + 3.00%), 5.39%, 12/01/23 | | | | | | | 95 | | | | 94,910 | |
GVC Holdings PLC, 2018 Term Loan, (1 mo. LIBOR + 2.50%, 1.00% Floor), 4.80%, 03/29/24 | | | | | | | 577 | | | | 578,254 | |
Hilton Worldwide Finance LLC, Term Loan B2, (1 mo. LIBOR + 1.75%), 4.03%, 10/25/23 | | | | | | | 962 | | | | 962,905 | |
IRB Holding Corp., 1st Lien Term Loan, (2 mo. LIBOR + 3.25%, 1.00% Floor), 5.46%, 02/05/25 | | | | | | | 1,730 | | | | 1,725,003 | |
KFC Holding Co., 2018 Term Loan B, (1 mo. LIBOR + 1.75%), 4.04%, 04/03/25 | | | | | | | 882 | | | | 881,195 | |
Lakeland Tours LLC, 2017 1st Lien Term Loan B, (3 mo. LIBOR + 4.00%, 1.00% Floor), 6.33%, 12/15/24 | | | | | | | 648 | | | | 649,898 | |
Marriott Ownership Resorts, Inc., 2018 Term Loan B, (1 mo. LIBOR + 2.25%), 4.55%, 08/29/25 | | | | | | | 756 | | | | 757,890 | |
Penn National Gaming, Inc., 2018 1st Lien Term Loan B, 10/15/25(i) | | | | | | | 370 | | | | 370,925 | |
Playa Resorts Holding BV, 2017 Term Loan B, (1 mo. LIBOR + 2.75%, 1.00% Floor), 5.05%, 04/29/24 | | | | | | | 880 | | | | 866,807 | |
Sabre GLBL, Inc., 2018 Term Loan B, (1 mo. LIBOR + 2.00%), 4.30%, 02/22/24 | | | | | | | 1,554 | | | | 1,552,353 | |
Scientific Games International, Inc., 2018 Term Loan B5, (2 mo. LIBOR + 2.75%), 5.05%, 08/14/24 | | | | | | | 1,482 | | | | 1,466,861 | |
Stars Group Holdings BV, 2018 Incremental Term Loan, (3 mo. LIBOR + 3.50%), 5.89%, 07/10/25 | | | | | | | 3,928 | | | | 3,942,336 | |
Wyndham Hotels & Resorts, Inc., Term Loan B, (1 mo. LIBOR + 1.75%), 4.05%, 05/30/25 | | | | | | | 970 | | | | 968,991 | |
| | | | | | | | |
| | | | | | | | | | | 27,586,973 | |
| Household Products — 1.1% | |
Energizer Holdings, Inc., 2018 Term Loan B, 06/20/25(i) | | | | | | | 435 | | | | 435,274 | |
Mastronardi Produce Ltd., Term Loan B, (1 mo. LIBOR + 3.25%), 5.51%, 05/01/25 | | | | | | | 359 | | | | 360,896 | |
SIWF Holdings, Inc., 1st Lien Term Loan, (1 mo. LIBOR + 4.25%), 6.54%, 06/15/25(b) | | | | | | | 539 | | | | 538,650 | |
Spectrum Brands, Inc., 2017 Term Loan B, (2 mo. LIBOR + 2.00%), 4.35%, 06/23/22 | | | | | | | 2,328 | | | | 2,327,044 | |
| | | | | | | | |
| | | | | | | | | | | 3,661,864 | |
| Independent Power and Renewable Electricity Producers — 1.8% | |
AES Corp., 2018 Term Loan B, (3 mo. LIBOR + 1.75%), 4.07%, 05/31/22 | | | | | | | 645 | | | | 644,724 | |
Aria Energy Operating LLC, Term Loan, (1 mo. LIBOR + 4.50%, 1.00% Floor), 6.80%, 05/27/22(b) | | | | | | | 665 | | | | 664,616 | |
Calpine Construction Finance Co. LP, 2017 Term Loan B, (1 mo. LIBOR + 2.50%), 4.80%, 01/15/25 | | | | | | | 769 | | | | 768,016 | |
Calpine Corp., Term Loan B6, (3 mo. LIBOR + 2.50%, 1.00% Floor), 4.89%, 01/15/23 | | | | | | | 1,120 | | | | 1,117,859 | |
| | |
| 38 | | 2018 BLACKROCK ANNUAL REPORTTO SHAREHOLDERS |
| | |
Schedule of Investments (continued) October 31, 2018 | | BlackRock Floating Rate Income Trust (BGT) (Percentages shown are based on Net Assets) |
| | | | | | | | | | | | |
| Security | | | | | Par
(000) | | | Value | |
| Independent Power and Renewable Electricity Producers (continued) | |
Compass Power Generation LLC, 2018 Term Loan B, (1 mo. LIBOR + 3.50%, 1.00% Floor), 5.80%, 12/20/24 | | | USD | | | | 723 | | | $ | 726,455 | |
EIF Channelview Cogeneration LLC, 2018 Term Loan B, (1 mo. LIBOR + 4.25%, 1.00% Floor), 6.56%, 05/03/25 | | | | | | | 274 | | | | 275,277 | |
Granite Acquisition, Inc.: | | | | | | | | | | | | |
Term Loan B, (3 mo. LIBOR + 3.50%), 5.90%, 12/19/21 | | | | | | | 1,257 | | | | 1,258,941 | |
Term Loan C, (3 mo. LIBOR + 3.50%), 5.89%, 12/19/21 | | | | | | | 166 | | | | 165,977 | |
Terra-Gen Finance Co. LLC, Term Loan B, (1 mo. LIBOR + 4.25%, 1.00% Floor), 6.56%, 12/09/21(b) | | | | | | | 607 | | | | 507,148 | |
| | | | | | | | |
| | | | | | | | | | | 6,129,013 | |
| Industrial Conglomerates — 1.0% | |
Cortes NP Acquisition Corp., 2017 Term Loan B, (3 mo. LIBOR + 4.00%, 1.00% Floor), 6.31%, 11/30/23 | | | | | | | 2,469 | | | | 2,440,865 | |
Sequa Mezzanine Holdings LLC, 1st Lien Term Loan, (3 mo. LIBOR + 5.00%, 1.00% Floor), 7.41%, 11/28/21 | | | | | | | 948 | | | | 935,063 | |
| | | | | | | | |
| | | | | | | | | | | 3,375,928 | |
| Insurance — 3.2% | |
Achilles Acquisition LLC, 2018 Term Loan, (1 mo. LIBOR + 4.00%), 6.31%, 10/03/25(b) | | | | | | | 505 | | | | 507,525 | |
Alliant Holdings I, Inc., 2018 Term Loan B, (1 mo. LIBOR + 3.00%), 5.28%, 05/09/25 | | | | | | | 1,830 | | | | 1,827,651 | |
AmWINS Group, Inc., 2017 Term Loan B, (1 mo. LIBOR + 2.75%, 1.00% Floor), 5.05%, 01/25/24 | | | | | | | 1,622 | | | | 1,623,171 | |
AssuredPartners, Inc., 2017 1st Lien Add-On Term Loan, (1 mo. LIBOR + 3.25%), 5.55%, 10/22/24 | | | | | | | 964 | | | | 960,414 | |
Davis Vision, Inc., 1st Lien Term Loan B, (1 mo. LIBOR + 3.00%, 1.00% Floor), 5.30%, 12/02/24 | | | | | | | 1,127 | | | | 1,123,534 | |
Hub International Ltd., 2018 Term Loan B, (3 mo. LIBOR + 3.00%), 5.49%, 04/25/25 | | | | | | | 989 | | | | 986,116 | |
Sedgwick Claims Management Services, Inc.: | | | | | | | | | | | | |
1st Lien Term Loan, (1 mo. LIBOR + 2.75%,, 1.00% Floor), 5.05%, 03/01/21 | | | | | | | 1,870 | | | | 1,869,062 | |
2nd Lien Term Loan, (1 mo. LIBOR + 5.75%, 1.00% Floor), 8.05%, 02/28/22 | | | | | | | 1,595 | | | | 1,595,000 | |
Stratose Intermediate Holdings II LLC, 1st Lien Term Loan, (1 mo. LIBOR + 3.25%, 1.00% Floor), 5.55%, 06/22/23 | | | | | | | 509 | | | | 510,157 | |
| | | | | | | | |
| | | | | | | | | | | 11,002,630 | |
| Internet & Direct Marketing Retail — 0.3% | |
Harbor Freight Tools USA, Inc., 2018 Term Loan B, (1 mo. LIBOR + 2.50%), 4.80%, 08/18/23 | | | | | | | 892 | | | | 876,182 | |
| | | | | | | | |
| Internet Software & Services — 2.1% | |
Go Daddy Operating Co. LLC, 2017 Repriced Term Loan, (1 mo. LIBOR + 2.25%), 4.55%, 02/15/24 | | | | | | | 2,287 | | | | 2,289,011 | |
Inmar Holdings, Inc., 2017 1st Lien Term Loan, (1 mo. LIBOR + 3.50%, 1.00% Floor), 5.80%, 05/01/24 | | | | | | | 642 | | | | 643,749 | |
Intralinks, Inc., 1st Lien Term Loan, (3 mo. LIBOR + 4.00%), 6.31%, 11/14/24 | | | | | | | 658 | | | | 658,695 | |
Rackspace Hosting, Inc., 2017 Incremental 1st Lien Term Loan, (3 mo. LIBOR + 3.00%, 1.00% Floor), 5.35%, 11/03/23 | | | | | | | 1,520 | | | | 1,472,723 | |
TierPoint LLC, 2017 1st Lien Term Loan, (1 mo. LIBOR + 3.75%, 1.00% Floor), 6.05%, 05/06/24 | | | | | | | 845 | | | | 828,785 | |
ZPG PLC, 2018 Term Loan B, (LIB-GBP, 4.75%), 5.47%, 06/30/25 | | | GBP | | | | 1,000 | | | | 1,278,839 | |
| | | | | | | | |
| | | | | | | | | | | 7,171,802 | |
| | | | | | | | | | | | |
| Security | | | | | Par
(000) | | | Value | |
| IT Services — 6.2% | |
Access CIG LLC: | | | | | | | | | | | | |
2018 1st Lien Term Loan, (1 mo. LIBOR + 3.75%), 6.05%, 02/27/25 | | | USD | | | | 323 | | | $ | 323,710 | |
2018 2nd Lien Incremental Term Loan, (1 mo. LIBOR + 7.75%), 10.05%, 02/27/26 | | | | | | | 10 | | | | 10,000 | |
2018 2nd Lien Term Loan, (1 mo. LIBOR + 7.75%), 10.05%, 02/27/26 | | | | | | | 140 | | | | 140,209 | |
2018 Incremental Term Loan, (1 mo. LIBOR + 3.75%), 6.05%, 02/27/25 | | | | | | | 45 | | | | 44,853 | |
Altran Technologies SA, 1st Lien Term Loan, (3 mo. LIBOR + 2.25%), 4.59%, 03/20/25 | | | | | | | 413 | | | | 412,719 | |
Blackhawk Network Holdings, Inc, 2018 1st Lien Term Loan, (3 mo. LIBOR + 3.00%), 5.39%, 06/15/25 | | | | | | | 1,011 | | | | 1,011,720 | |
First Data Corp., 2024 Term Loan, (1 mo. LIBOR + 2.00%), 4.29%, 04/26/24 | | | | | | | 4,952 | | | | 4,922,850 | |
Flexential Intermediate Corp., 2017 1st Lien Term Loan, (3 mo. LIBOR + 3.50%), 5.89%, 08/01/24 | | | | | | | 832 | | | | 818,086 | |
Global Payments Inc.(i): | | | | | | | | | | | | |
2018 Term Loan B3, 04/21/23 | | | | | | | 525 | | | | 524,344 | |
2018 Term Loan B4, 10/10/25 | | | | | | | 175 | | | | 174,454 | |
Greeneden US Holdings II LLC, 2018 Term Loan B, (1 mo. LIBOR + 3.50%), 5.80%, 12/01/23 | | | | | | | 1,370 | | | | 1,374,908 | |
Optiv Security, Inc.: | | | | | | | | | | | | |
1st Lien Term Loan, (1 mo. LIBOR + 3.25%,, 1.00% Floor), 5.55%, 02/01/24 | | | | | | | 1,320 | | | | 1,278,991 | |
2nd Lien Term Loan, (1 mo. LIBOR + 7.25%,, 1.00% Floor), 9.55%, 02/01/25 | | | | | | | 371 | | | | 356,583 | |
Peak 10 Holding Corp., 2nd Lien Term Loan, (3 mo. LIBOR + 7.25%, 1.00% Floor), 9.59%, 08/01/25 | | | | | | | 995 | | | | 973,856 | |
TKC Holdings, Inc.: | | | | | | | | | | | | |
2017 1st Lien Term Loan, (1 mo. LIBOR + 3.75%), 6.06%, 02/01/23 | | | | | | | 1,407 | | | | 1,406,187 | |
2017 2nd Lien Term Loan, (1 mo. LIBOR + 8.00%), 10.31%, 02/01/24 | | | | | | | 985 | | | | 981,306 | |
Trans Union LLC: | | | | | | | | | | | | |
2018 Term Loan B4, (1 mo. LIBOR + 2.00%), 4.30%, 06/19/25 | | | | | | | 11 | | | | 10,943 | |
Term Loan B3, (1 mo. LIBOR + 2.00%), 4.30%, 04/10/23 | | | | | | | 3,241 | | | | 3,233,561 | |
Vantiv LLC, 2018 1st Lien Term Loan B3, (1 mo. LIBOR + 1.75%), 4.03%, 10/14/23 | | | | | | | 545 | | | | 543,370 | |
WEX, Inc., 2017 Term Loan B2, (1 mo. LIBOR + 2.25%), 4.55%, 06/30/23 | | | | | | | 2,397 | | | | 2,398,651 | |
| | | | | | | | |
| | | | | | | | | | | 20,941,301 | |
| Leisure Products — 0.2% | |
MND Holdings III Corp, 2018 1st Lien Term Loan, (3 mo. LIBOR + 3.50%, 1.00% Floor), 5.89%, 06/19/24(b) | | | | | | | 637 | | | | 638,902 | |
| | | | | | | | |
| Life Sciences Tools & Services — 0.2% | |
Albany Molecular Research, Inc.: | | | | | | | | | | | | |
2017 1st Lien Term Loan, (1 mo. LIBOR + 3.25%), 5.55%, 08/30/24 | | | | | | | 340 | | | | 340,049 | |
2017 2nd Lien Term Loan, (1 mo. LIBOR + 7.00%, 1.00% Floor), 9.30%, 08/30/25 | | | | | | | 240 | | | | 240,199 | |
| | | | | | | | |
| | | | | | | | | | | 580,248 | |
| Machinery — 2.3% | |
Clark Equipment Co., 2018 Term Loan B, (3 mo. LIBOR + 2.00%), 4.38%, 05/18/24 | | | | | | | 544 | | | | 542,392 | |
Columbus McKinnon Corp., 2018 Term Loan B, (3 mo. LIBOR + 2.50%, 1.00% Floor), 4.89%, 01/31/24(b) | | | | | | | 111 | | | | 111,431 | |
CPM Holdings, Inc., 2018 1st Lien Term Loan,
10/24/25(i) | | | | | | | 295 | | | | 295,982 | |
| | | | |
| SCHEDULES OF INVESTMENTS | | | 39 | |
| | |
Schedule of Investments (continued) October 31, 2018 | | BlackRock Floating Rate Income Trust (BGT) (Percentages shown are based on Net Assets) |
| | | | | | | | | | | | |
| Security | | | | | Par
(000) | | | Value | |
| Machinery (continued) | |
Gardner Denver, Inc., 2017 Term Loan B, (1 mo. LIBOR + 2.75%), 5.05%, 07/30/24 | | | USD | | | | 1,350 | | | $ | 1,351,925 | |
Hayward Industries, Inc., 1st Lien Term Loan, (1 mo. LIBOR + 3.50%), 5.79%, 08/05/24 | | | | | | | 996 | | | | 996,884 | |
Infiltrator Systems, Inc., 2017 1st Lien Term Loan B, (3 mo. LIBOR + 3.00%, 1.00% Floor), 5.39%, 05/27/22 | | | | | | | 1,195 | | | | 1,197,741 | |
Tecomet, Inc., 2017 Repriced Term Loan, (PRIME + 3.50%), 5.78%, 05/01/24 | | | | | | | 992 | | | | 992,305 | |
Titan Acquisition Ltd., 2018 Term Loan B, (1 mo. LIBOR + 3.00%), 5.30%, 03/28/25 | | | | | | | 1,897 | | | | 1,784,127 | |
Welbilt, Inc., 2018 Term Loan B, 10/11/25(b)(i) | | | | | | | 636 | | | | 634,410 | |
| | | | | | | | |
| | | | | | | | | | | 7,907,197 | |
| Media — 11.1% | |
Altice Financing SA: | | | | | | | | | | | | |
2017 1st Lien Term Loan, (1 mo. LIBOR + 2.75%), 5.04%, 01/31/26 | | | | | | | 427 | | | | 416,016 | |
2017 Term Loan B, (1 mo. LIBOR + 2.75%), 5.04%, 07/15/25 | | | | | | | 166 | | | | 161,571 | |
Altice France SA, 2018 Term Loan B13, (1 mo. LIBOR + 2.75%), 6.28%, 08/14/26 | | | | | | | 3,270 | | | | 3,198,485 | |
Altice US Finance I Corp., 2017 Term Loan, (1 mo. LIBOR + 2.25%), 4.55%, 07/28/25 | | | | | | | 1,814 | | | | 1,809,855 | |
Charter Communications Operating LLC: | | | | | | | | | | | | |
2017 Term Loan A2, (1 mo. LIBOR + 1.50%), 3.81%, 03/31/23 | | | | | | | 1,706 | | | | 1,704,668 | |
2017 Term Loan B, (1 mo. LIBOR + 2.00%), 4.31%, 04/30/25 | | | | | | | 3,095 | | | | 3,094,250 | |
CSC Holdings LLC: | | | | | | | | | | | | |
2017 1st Lien Term Loan, (1 mo. LIBOR + 2.25%), 4.53%, 07/17/25 | | | | | | | 2,145 | | | | 2,138,482 | |
2018 Term Loan B, (1 mo. LIBOR + 2.50%), 4.78%, 01/25/26 | | | | | | | 1,040 | | | | 1,037,498 | |
Getty Images, Inc., Term Loan B, (1 mo. LIBOR + 3.50%), 5.80%, 10/18/19 | | | | | | | 251 | | | | 247,385 | |
Gray Television, Inc., 2017 Term Loan B, (3 mo. LIBOR + 2.25%), 4.52%, 02/07/24 | | | | | | | 371 | | | | 370,671 | |
Hubbard Radio LLC, 2015 Term Loan B, (1 mo. LIBOR + 3.00%, 1.00% Floor), 5.31%, 03/28/25 | | | | | | | 136 | | | | 135,664 | |
iHeartCommunications, Inc.(g): | | | | | | | | | | | | |
Extended Term Loan E, 9.74%, 07/30/19 | | | | | | | 315 | | | | 226,362 | |
Term Loan D, 8.99%, 01/30/19 | | | | | | | 2,569 | | | | 1,850,173 | |
Intelsat Jackson Holdings SA, 2017 Term Loan B4, (1 mo. LIBOR + 4.50%, 1.00% Floor), 6.79%, 01/02/24 | | | | | | | 1,123 | | | | 1,161,995 | |
Learfield Communications LLC(b): | | | | | | | | | | | | |
2016 1st Lien Term Loan, (1 mo. LIBOR + 3.25%, 1.00% Floor), 5.56%, 12/01/23 | | | | | | | 1,153 | | | | 1,152,664 | |
2017 1st Lien Term Loan, 12/01/23(i) | | | | | | | 387 | | | | 386,355 | |
Lions Gate Capital Holdings LLC, 2018 Term Loan B, (1 mo. LIBOR + 2.25%), 4.55%, 03/24/25 | | | | | | | 746 | | | | 742,865 | |
Live Nation Entertainment, Inc., Term Loan B3, (1 mo. LIBOR + 1.75%), 4.06%, 10/31/23 | | | | | | | 290 | | | | 290,100 | |
MCC Iowa LLC, Term Loan N, (1 Week LIBOR + 1.75%), 3.97%, 02/15/24 | | | | | | | 490 | | | | 488,266 | |
Meredith Corporation, Term Loan B, (1 mo. LIBOR + 2.75%), 5.05%, 01/31/25 | | | | | | | 676 | | | | 674,732 | |
MH Sub I LLC, 2017 1st Lien Term Loan, (1 mo. LIBOR + 3.75%), 6.03%, 09/13/24 | | | | | | | 516 | | | | 517,380 | |
Mission Broadcasting, Inc., 2018 Term Loan B3,
01/17/24(i) | | | | | | | 179 | | | | 179,109 | |
Nexstar Broadcasting, Inc., 2018 Term Loan B3,
01/17/24(i) | | | | | | | 1,121 | | | | 1,119,656 | |
Numericable Group SA, Term Loan B12, (1 mo. LIBOR + 3.00%), 5.97%, 01/31/26 | | | | | | | 335 | | | | 325,907 | |
| | | | | | | | | | | | |
| Security | | | | | Par
(000) | | | Value | |
| Media (continued) | |
PSAV Holdings LLC, 2018 1st Lien Term Loan, (3 mo. LIBOR + 3.25%, 1.00% Floor), 5.57%, 03/01/25 | | | USD | | | | 631 | | | $ | 626,066 | |
Radiate Holdco LLC, 1st Lien Term Loan, (1 mo. LIBOR + 3.00%), 5.30%, 02/01/24 | | | | | | | 625 | | | | 620,115 | |
Sinclair Television Group, Inc., Term Loan B2, (1 mo. LIBOR + 2.25%), 4.56%, 01/03/24 | | | | | | | 623 | | | | 623,919 | |
Trader Corp., 2017 Term Loan B, (1 mo. LIBOR + 3.00%, 1.00% Floor), 5.29%, 09/28/23 | | | | | | | 1,859 | | | | 1,854,448 | |
Tribune Media Co., Term Loan C, (1 mo. LIBOR + 3.00%), 5.30%, 01/27/24 | | | | | | | 2,255 | | | | 2,259,104 | |
Unitymedia Finance LLC: | | | | | | | | | | | | |
Term Loan B, (1 mo. LIBOR + 2.25%), 4.53%, 09/30/25 | | | | | | | 1,245 | | | | 1,242,983 | |
USD Term Loan D, (1 mo. LIBOR + 2.25%), 4.53%, 01/15/26 | | | | | | | 225 | | | | 224,564 | |
Unitymedia Hessen GmbH & Co. KG, 2018 Term Loan E, (1 mo. LIBOR + 2.00%), 4.28%, 06/01/23 | | | | | | | 599 | | | | 597,595 | |
Univision Communications, Inc., Term Loan C5, (1 mo. LIBOR + 2.75%, 1.00% Floor), 5.05%, 03/15/24 | | | | | | | 728 | | | | 698,312 | |
Virgin Media Bristol LLC, 2017 Term Loan, (1 mo. LIBOR + 2.50%), 4.78%, 01/15/26 | | | | | | | 2,416 | | | | 2,413,222 | |
William Morris Endeavor Entertainment LLC, 2018 1st Lien Term Loan, (3 mo. LIBOR + 2.75%), 5.28%, 05/18/25 | | | | | | | 1,534 | | | | 1,530,444 | |
Ziggo Secured Finance Partnership, Term Loan E, (1 mo. LIBOR + 2.50%), 4.78%, 04/15/25 | | | | | | | 1,646 | | | | 1,613,170 | |
| | | | | | | | |
| | | | | | | | | | | 37,734,051 | |
| Metals & Mining — 0.3% | |
AMG Advanced Metallurgical Group NV, 2018 Term Loan B, (1 mo. LIBOR + 3.00%), 5.29%, 02/01/25 | | | | | | | 588 | | | | 588,434 | |
Ball Metalpack LLC, 2018 1st Lien Term Loan B, 6.80%, 07/24/25 | | | | | | | 439 | | | | 441,095 | |
Preferred Proppants LLC, Term Loan B2, (3 mo. LIBOR + 7.75%), 10.14%, 07/27/20(b) | | | | | | | 135 | | | | 81,006 | |
| | | | | | | | |
| | | | | | | | | | | 1,110,535 | |
| Multiline Retail — 0.8% | |
Eyemart Express LLC, 2017 Term Loan B, (1 mo. LIBOR + 3.00%, 1.00% Floor), 5.31%, 08/04/24 | | | | | | | 599 | | | | 598,698 | |
Hudson’s Bay Co., 2015 Term Loan B, (1 mo. LIBOR + 3.25%, 1.00% Floor), 5.54%, 09/30/22 | | | | | | | 1,361 | | | | 1,331,923 | |
Neiman Marcus Group, Inc., 2020 Term Loan, (1 mo. LIBOR + 3.25%, 1.00% Floor), 5.53%, 10/25/20 | | | | | | | 743 | | | | 675,849 | |
| | | | | | | | |
| | | | | | | | | | | 2,606,470 | |
| Oil & Gas Equipment & Services — 0.5% | |
Kestrel Acquisition LLC, 2018 Term Loan B, (1 mo. LIBOR + 4.25%, 1.00% Floor), 6.56%, 06/02/25 | | | | | | | 748 | | | | 752,487 | |
McDermott Technology Americas, Inc., 2018 1st Lien Term Loan, (1 mo. LIBOR + 5.00%, 1.00% Floor), 7.30%, 05/10/25 | | | | | | | 978 | | | | 964,493 | |
| | | | | | | | |
| | | | | | | | | | | 1,716,980 | |
| Oil, Gas & Consumable Fuels — 3.1% | |
BCP Raptor II LLC, 1st Lien Term Loan, 11/03/25(b)(i) | | | | | | | 733 | | | | 727,503 | |
BCP Raptor LLC, Term Loan B, (2 mo. LIBOR + 4.25%, 1.00% Floor), 6.64%, 06/24/24 | | | | | | | 823 | | | | 810,693 | |
California Resources Corp.: | | | | | | | | | | | | |
2017 1st Lien Term Loan, (1 mo. LIBOR + 4.75%), 7.04%, 12/31/22 | | | | | | | 1,492 | | | | 1,511,888 | |
Second Out Term Loan, (1 mo. LIBOR + 10.37%, 1.00% Floor), 12.67%, 12/31/21 | | | | | | | 1,327 | | | | 1,476,815 | |
CONSOL Energy, Inc.: | | | | | | | | | | | | |
1st Lien Term Loan A, (1 mo. LIBOR + 4.25%), 6.56%, 11/26/21(b) | | | | | | | 181 | | | | 180,688 | |
| | |
| 40 | | 2018 BLACKROCK ANNUAL REPORTTO SHAREHOLDERS |
| | |
Schedule of Investments (continued) October 31, 2018 | | BlackRock Floating Rate Income Trust (BGT) (Percentages shown are based on Net Assets) |
| | | | | | | | | | | | |
| Security | | | | | Par
(000) | | | Value | |
| Oil, Gas & Consumable Fuels (continued) | |
1st Lien Term Loan B, (1 mo. LIBOR + 6.00%, 1.00% Floor), 8.31%, 11/28/22 | | | USD | | | | 1,306 | | | $ | 1,334,644 | |
EG Group Ltd., 2018 USD Term Loan B, (3 mo. LIBOR + 4.00%), 6.39%, 02/07/25 | | | | | | | 493 | | | | 492,402 | |
EWT Holdings III Corp., 2017 Repriced Term Loan, (1 mo. LIBOR + 3.00%), 5.30%, 12/20/24 | | | | | | | 481 | | | | 479,468 | |
Keane Group Holdings LLC, 2018 1st Lien Term Loan, (1 mo. LIBOR + 3.75%, 1.00% Floor), 6.06%, 05/25/25 | | | | | | | 699 | | | | 680,867 | |
Lucid Energy Group II LLC, 2018 1st Lien Term Loan, (1 mo. LIBOR + 3.00%, 1.00% Floor), 5.28%, 02/17/25 | | | | | | | 1,035 | | | | 1,016,049 | |
Medallion Midland Acquisition LLC, 1st Lien Term Loan, (1 mo. LIBOR + 3.25%, 1.00% Floor), 5.55%, 10/30/24 | | | | | | | 327 | | | | 324,450 | |
MEG Energy Corp., 2017 Term Loan B, (1 mo. LIBOR + 3.50%, 1.00% Floor), 5.81%, 12/31/23 | | | | | | | 260 | | | | 260,661 | |
Moda Ingleside Energy Center LLC, 2018 Term Loan B, (1 mo. LIBOR + 3.25%), 5.54%, 09/29/25 | | | | | | | 453 | | | | 455,831 | |
Woodford Express LLC, 2018 Term Loan B, (1 mo. LIBOR + 5.00%, 1.00% Floor), 7.30%, 01/17/25 | | | | | | | 920 | | | | 910,021 | |
| | | | | | | | |
| | | | | | | | | | | 10,661,980 | |
| Personal Products — 0.8% | |
Clover Merger Sub, Inc.: | | | | | | | | | | | | |
2017 1st Lien Term Loan, (1 mo. LIBOR + 3.50%), 5.80%, 09/26/24 | | | | | | | 1,248 | | | | 1,192,334 | |
2017 2nd Lien Term Loan, (1 mo. LIBOR + 7.75%), 10.05%, 09/26/25 | | | | | | | 875 | | | | 776,195 | |
Prestige Brands, Inc., Term Loan B4, (1 mo. LIBOR + 2.00%), 4.30%, 01/26/24 | | | | | | | 595 | | | | 595,664 | |
| | | | | | | | |
| | | | | | | | | | | 2,564,193 | |
| Pharmaceuticals — 3.7% | |
Akorn, Inc., Term Loan B, (1 mo. LIBOR + 4.75%, 1.00% Floor), 7.81%, 04/16/21 | | | | | | | 855 | | | | 788,835 | |
Amneal Pharmaceuticals LLC, 2018 Term Loan B, (1 mo. LIBOR + 3.50%), 5.81%, 05/04/25 | | | | | | | 2,114 | | | | 2,124,253 | |
Endo Luxembourg Finance Company I Sarl, 2017 Term Loan B, (1 mo. LIBOR + 4.25%), 6.56%, 04/29/24 | | | | | | | 1,322 | | | | 1,326,498 | |
Grifols Worldwide Operations USA, Inc., 2017 Acquisition Term Loan, (1 Week LIBOR + 2.25%), 4.47%, 01/31/25 | | | | | | | 2,480 | | | | 2,480,909 | |
Jaguar Holding Co. II, 2018 Term Loan, (1 mo. LIBOR + 2.50%, 1.00% Floor), 4.80%, 08/18/22 | | | | | | | 2,371 | | | | 2,362,393 | |
Valeant Pharmaceuticals International, Inc., 2018 Term Loan B, (1 mo. LIBOR + 3.00%), 5.27%, 06/01/25 | | | | | | | 3,643 | | | | 3,642,235 | |
| | | | | | | | |
| | | | | | | | | | | 12,725,123 | |
| Professional Services — 1.2% | |
Cast and Crew Payroll LLC, 2017 1st Lien Term Loan B, (1 mo. LIBOR + 2.75%), 5.06%, 09/27/24 | | | | | | | 1,493 | | | | 1,493,307 | |
Information Resources, Inc., 1st Lien Term Loan, (3 mo. LIBOR + 4.25%, 1.00% Floor), 6.57%, 01/18/24 | | | | | | | 473 | | | | 472,407 | |
ON Assignment, Inc., 2018 Term Loan B, (1 mo. LIBOR + 2.00%), 4.30%, 04/02/25 | | | | | | | 721 | | | | 721,675 | |
PricewaterhouseCoopers LLP, 2018 Term Loan, (1 mo. LIBOR + 3.25%), 5.55%, 05/01/25(b) | | | | | | | 584 | | | | 582,079 | |
SIRVA Worldwide, Inc., 2016 1st Lien Term Loan, (1 mo. LIBOR + 5.50%), 7.81%, 07/20/25(b) | | | | | | | 700 | | | | 700,875 | |
| | | | | | | | |
| | | | | | | | | | | 3,970,343 | |
| Real Estate Management & Development — 1.9% | |
CityCenter Holdings LLC, 2017 Term Loan B, (1 mo. LIBOR + 2.25%), 4.55%, 04/18/24 | | | | | | | 2,636 | | | | 2,628,312 | |
| | | | | | | | | | | | |
| Security | | | | | Par
(000) | | | Value | |
| Real Estate Management & Development (continued) | |
DTZ US Borrower LLC, 2018 Add On Term Loan B, (1 mo. LIBOR + 3.25%), 5.55%, 08/21/25 | | | USD | | | | 1,663 | | | $ | 1,661,437 | |
Forest City Enterprises LP, Term Loan B, 10/24/25(i) | | | | | | | 1,056 | | | | 1,059,516 | |
Realogy Corp., 2018 Term Loan B, (1 mo. LIBOR + 2.25%), 4.53%, 02/08/25 | | | | | | | 487 | | | | 485,341 | |
SMG Holdings, Inc., 2017 1st Lien Term Loan, (1 mo. LIBOR + 3.00%), 5.30%, 01/23/25 | | | | | | | 740 | | | | 739,267 | |
| | | | | | | | |
| | | | | | | | | | | 6,573,873 | |
| Road & Rail — 0.2% | |
Road Infrastructure Investment LLC, 2016 1st Lien Term Loan, (1 mo. LIBOR + 3.50%, 1.00% Floor), 5.80%, 06/13/23 | | | | | | | 755 | | | | 739,508 | |
| | | | | | | | |
| Semiconductors & Semiconductor Equipment — 1.0% | |
MaxLinear, Inc., Term Loan B, (1 mo. LIBOR + 2.50%), 4.78%, 05/12/24(b) | | | | | | | 168 | | | | 171,854 | |
Microchip Technology Inc., 2018 Term Loan B, (1 mo. LIBOR + 2.00%), 4.31%, 05/29/25 | | | | | | | 2,236 | | | | 2,226,835 | |
ON Semiconductor Corp., 2018 1st Lien Term Loan B, (1 mo. LIBOR + 1.75%), 4.05%, 03/31/23 | | | | | | | 314 | | | | 313,199 | |
Versum Materials, Inc., Term Loan, (3 mo. LIBOR + 2.00%), 4.39%, 09/29/23 | | | | | | | 578 | | | | 578,564 | |
| | | | | | | | |
| | | | | | | | | | | 3,290,452 | |
| Software — 13.7% | |
Almonde, Inc., 1st Lien Term Loan, (3 mo. LIBOR + 3.50%, 1.00% Floor), 5.89%, 06/13/24 | | | | | | | 1,157 | | | | 1,150,091 | |
Applied Systems, Inc.: | | | | | | | | | | | | |
2017 1st Lien Term Loan, (3 mo. LIBOR + 3.00%), 5.39%, 09/19/24 | | | | | | | 1,273 | | | | 1,276,985 | |
2017 2nd Lien Term Loan, (3 mo. LIBOR + 7.00%), 9.39%, 09/19/25 | | | | | | | 301 | | | | 305,873 | |
Aptean, Inc., 2017 1st Lien Term Loan, (3 mo. LIBOR + 4.25%, 1.00% Floor), 6.64%, 12/20/22 | | | | | | | 402 | | | | 401,989 | |
BMC Software Finance, Inc., 2017 Term Loan B, (3 mo. LIBOR + 4.25%), 6.65%, 10/02/25 | | | | | | | 2,970 | | | | 2,977,128 | |
Cypress Intermediate Holdings III, Inc.: | | | | | | | | | | | | |
2017 1st Lien Term Loan, (1 mo. LIBOR + 3.00%), 5.31%, 04/26/24 | | | | | | | 559 | | | | 558,892 | |
2017 2nd Lien Term Loan, (1 mo. LIBOR + 6.75%), 9.05%, 04/27/25 | | | | | | | 496 | | | | 498,480 | |
Dell, Inc., 2017 1st Lien Term Loan, (1 mo. LIBOR + 2.00%), 4.31%, 09/07/23 | | | | | | | 1,523 | | | | 1,521,138 | |
Digicel International Finance Ltd., 2017 Term Loan B, (1 mo. LIBOR + 3.25%), 5.57%, 05/28/24 | | | | | | | 1,014 | | | | 969,613 | |
DTI Holdco, Inc., 2018 Term Loan B, (2 mo. LIBOR + 4.75%, 1.00% Floor), 7.28%, 09/30/23 | | | | | | | 883 | | | | 840,791 | |
Flexera Software LLC, 2018 1st Lien Term Loan, (1 mo. LIBOR + 3.25%, 1.00% Floor), 5.56%, 02/26/25 | | | | | | | 378 | | | | 379,832 | |
Help/Systems Holdings, Inc, 2018 1st Lien Term Loan, (1 mo. LIBOR + 3.75%), 6.05%, 03/28/25(b) | | | | | | | 723 | | | | 726,803 | |
Hyland Software, Inc., 2018 Term Loan, (1 mo. LIBOR + 3.25%), 5.55%, 07/01/24 | | | | | | | 335 | | | | 336,254 | |
Infor (US), Inc., Term Loan B6, (3 mo. LIBOR + 2.75%, 1.00% Floor), 5.14%, 02/01/22 | | | | | | | 2,246 | | | | 2,236,596 | |
Informatica Corp., 2018 Term Loan, (1 mo. LIBOR + 3.25%), 5.55%, 08/05/22 | | | | | | | 1,717 | | | | 1,723,080 | |
IQOR US, Inc., Term Loan B, (3 mo. LIBOR + 5.00%, 1.00% Floor), 7.40%, 04/01/21 | | | | | | | 785 | | | | 725,613 | |
Kronos, Inc.: | | | | | | | | | | | | |
2017 Term Loan B, (3 mo. LIBOR + 3.00%), 5.34%, 11/01/23 | | | | | | | 2,793 | | | | 2,794,848 | |
| | | | |
| SCHEDULES OF INVESTMENTS | | | 41 | |
| | |
Schedule of Investments (continued) October 31, 2018 | | BlackRock Floating Rate Income Trust (BGT) (Percentages shown are based on Net Assets) |
| | | | | | | | | | | | |
| Security | | | | | Par
(000) | | | Value | |
| Software (continued) | |
2nd Lien Term Loan, (3 mo. LIBOR + 8.25%), 10.59%, 11/01/24 | | | USD | | | | 1,045 | | | $ | 1,058,209 | |
MA FinanceCo. LLC, Term Loan B3, (1 mo. LIBOR + 2.50%), 4.80%, 06/21/24 | | | | | | | 97 | | | | 96,413 | |
McAfee LLC, 2017 Term Loan B, (1 mo. LIBOR + 4.50%, 1.00% Floor), 6.79%, 09/30/24 | | | | | | | 1,998 | | | | 2,002,140 | |
Mitchell International, Inc.: | | | | | | | | | | | | |
2017 1st Lien Term Loan, (1 mo. LIBOR + 3.25%), 5.55%, 11/29/24 | | | | | | | 3,415 | | | | 3,397,990 | |
2017 2nd Lien Term Loan, (1 mo. LIBOR + 7.25%), 9.54%, 12/01/25 | | | | | | | 785 | | | | 786,962 | |
PowerSchool, 2018 Term Loan B, (1 wk. LIBOR + 3.25%), 5.52%, 08/01/25 | | | | | | | 619 | | | | 617,855 | |
Renaissance Learning, Inc., 2018 Add On Term Loan, (1 mo. LIBOR + 3.25%), 5.55%, 05/30/25 | | | | | | | 434 | | | | 431,634 | |
SolarWinds Holdings, Inc., 2018 Term Loan B, (1 mo. LIBOR + 3.00%), 5.30%, 02/05/24 | | | | | | | 2,275 | | | | 2,278,456 | |
Solera LLC, Term Loan B, (1 mo. LIBOR + 2.75%), 5.05%, 03/03/23 | | | | | | | 2,767 | | | | 2,760,938 | |
SonicWALL, Inc., 1st Lien Term Loan, (3 mo. LIBOR + 3.50%), 5.82%, 05/16/25 | | | | | | | 350 | | | | 350,221 | |
Sophia LP, 2017 Term Loan B, (3 mo. LIBOR + 3.25%, 1.00% Floor), 5.64%, 09/30/22 | | | | | | | 2,709 | | | | 2,712,686 | |
SS&C Technologies Holdings Europe SARL, 2018 Term Loan B4, (1 mo. LIBOR + 2.25%), 4.55%, 04/16/25 | | | | | | | 1,171 | | | | 1,164,701 | |
SS&C Technologies, Inc.: | | | | | | | | | | | | |
2017 Term Loan B1, (1 mo. LIBOR + 2.25%), 4.55%, 07/08/22 | | | | | | | 1,865 | | | | 1,859,723 | |
2018 Term Loan B3, (1 mo. LIBOR + 2.25%), 4.55%, 04/16/25 | | | | | | | 3,022 | | | | 3,005,112 | |
2018 Term Loan B5, (1 mo. LIBOR + 2.25%), 4.55%, 04/16/25 | | | | | | | 1,101 | | | | 1,094,317 | |
Tempo Acquisition LLC, Term Loan, (1 mo. LIBOR + 3.00%), 5.30%, 05/01/24 | | | | | | | 2,024 | | | | 2,023,869 | |
Tibco Software, Inc., Repriced Term Loan B, (3 mo. LIBOR + 3.50%, 1.00% Floor), 5.80%, 12/04/20 | | | | | | | 1,473 | | | | 1,474,255 | |
| | | | | | | | |
| | | | | | | | | | | 46,539,487 | |
| Specialty Retail — 2.0% | |
Academy Ltd., 2015 Term Loan B, (1 mo. LIBOR + 4.00%, 1.00% Floor), 6.26%, 07/01/22 | | | | | | | 847 | | | | 629,250 | |
Belron Finance US LLC, Term Loan B, (3 mo. LIBOR + 2.50%), 4.59%, 11/07/24 | | | | | | | 1,499 | | | | 1,500,548 | |
CD&R Firefly Bidco Ltd., 2018 Term Loan B1, (LIBOR - GBP + 4.50%), 5.32%, 06/23/25 | | | GBP | | | | 1,000 | | | | 1,276,603 | |
Leslie’s Poolmart, Inc., 2018 Term Loan, (1 mo. LIBOR + 3.50%, 1.00% Floor), 5.80%, 08/16/23 | | | USD | | | | 755 | | | | 752,366 | |
National Vision, Inc., 2017 Repriced Term Loan, (1 mo. LIBOR + 2.50%), 4.80%, 11/20/24 | | | | | | | 153 | | | | 153,570 | |
Petco Animal Supplies, Inc., 2017 Term Loan B, (3 mo. LIBOR + 3.25%, 1.00% Floor), 5.78%, 01/26/23 | | | | | | | 527 | | | | 406,529 | |
Research Now Group, Inc., 2017 1st Lien Term Loan, (1 mo. LIBOR + 5.50%, 1.00% Floor), 7.80%, 12/20/24 | | | | | | | 774 | | | | 775,443 | |
Staples, Inc., 2017 Term Loan B, (3 mo. LIBOR + 4.00%, 1.00% Floor), 6.34%, 09/12/24 | | | | | | | 516 | | | | 514,320 | |
TruGreen LP, 2017 Term Loan, (1 mo. LIBOR + 4.00%, 1.00% Floor), 6.29%, 04/13/23 | | | | | | | 706 | | | | 709,213 | |
| | | | | | | | |
| | | | | | | | | | | 6,717,842 | |
| Technology Hardware, Storage & Peripherals — 0.9% | |
Seattle Spinco, Inc., Term Loan B3, (1 mo. LIBOR + 2.50%), 4.80%, 06/21/24 | | | | | | | 653 | | | | 651,099 | |
Western Digital Corp., 2018 Term Loan B4, (1 mo. LIBOR + 1.75%), 4.04%, 04/29/23 | | | | | | | 2,507 | | | | 2,488,943 | |
| | | | | | | | |
| | | | | | | | | | | 3,140,042 | |
| | | | | | | | | | | | |
| Security | | | | | Par
(000) | | | Value | |
| Textiles, Apparel & Luxury Goods — 0.5% | | | | | | | | | |
Ascend Performance Materials Operations LLC, Term Loan B, (3 mo. LIBOR + 5.25%, 1.00% Floor), 7.64%, 08/12/22 | | | USD | | | | 1,463 | | | $ | 1,463,147 | |
Varsity Brands, Inc., 2017 Term Loan B, (1 mo. LIBOR + 3.50%, 1.00% Floor), 5.80%, 12/15/24 | | | | | | | 328 | | | | 327,732 | |
| | | | | | | | |
| | | | | | | | | | | 1,790,879 | |
| Thrifts & Mortgage Finance — 0.6% | |
IG Investment Holdings LLC, 2018 1st Lien Term Loan, (1 mo. LIBOR + 3.50%, 1.00% Floor), 5.84%, 05/23/25 | | | | | | | 1,977 | | | | 1,982,278 | |
| | | | | | | | |
| Trading Companies & Distributors — 1.3% | |
Beacon Roofing Supply, Inc., 2017 Term Loan B, (3 mo. LIBOR + 2.25%), 4.53%, 01/02/25 | | | | | | | 735 | | | | 726,942 | |
Foundation Building Materials LLC, 2018 Term Loan B, (1 mo. LIBOR + 3.25%), 5.53%, 08/13/25(b) | | | | | | | 664 | | | | 656,530 | |
HD Supply, Inc., Term Loan B5, (3 mo. LIBOR + 1.75%), 4.03%, 10/17/23 | | | | | | | 2,426 | | | | 2,423,686 | |
Nexeo Solutions LLC, 2017 Repriced Term Loan, (3 mo. LIBOR + 3.25%), 5.66%, 06/09/23 | | | | | | | 152 | | | | 152,295 | |
Oxbow Carbon LLC, 2017 1st Lien Term Loan B, (1 mo. LIBOR + 3.50%), 5.80%, 01/04/23 | | | | | | | 168 | | | | 169,490 | |
United Rentals, Inc., Term Loan B, 10/01/25(i) | | | | | | | 138 | | | | 138,231 | |
| | | | | | | | |
| | | | | | | | | | | 4,267,174 | |
| Transportation — 0.5% | |
Gruden Acquisition, Inc., 2017 Term Loan, (3 mo. LIBOR + 5.50%, 1.00% Floor), 7.89%, 08/18/22 | | | | | | | 477 | | | | 481,380 | |
Safe Fleet Holdings LLC: | | | | | | | | | | | | |
2018 1st Lien Term Loan, (1 mo. LIBOR + 3.00%), 5.28%, 02/01/25 | | | | | | | 796 | | | | 786,385 | |
2018 2nd Lien Term Loan, (1 mo. LIBOR + 6.75%), 9.03%, 02/01/26(b) | | | | | | | 325 | | | | 318,500 | |
| | | | | | | | |
| | | | | | | | | | | 1,586,265 | |
| Utilities — 0.1% | | | | |
ExGen Renewables IV LLC, Term Loan B, (3 mo. LIBOR + 3.00%, 1.00% Floor), 5.32%, 11/28/24(b) | | | | | | | 299 | | | | 301,357 | |
| | | | | | | | |
| Wireless Telecommunication Services — 2.1% | |
Geo Group, Inc., 2018 Term Loan B, (1 mo. LIBOR + 2.00%), 4.31%, 03/22/24 | | | | | | | 1,225 | | | | 1,220,057 | |
Ligado Networks LLC, PIK Exit Term Loan (9.75% PIK), 9.75%, 12/07/20(h) | | | | | | | 3,252 | | | | 2,392,626 | |
SBA Senior Finance II LLC, 2018 Term Loan B, (1 mo. LIBOR + 2.00%), 4.31%, 04/11/25 | | | | | | | 2,635 | | | | 2,627,801 | |
Xplornet Communications, Inc., Term Loan B, (3 mo. LIBOR + 4.00%, 1.00% Floor), 6.39%, 09/09/21(b) | | | | | | | 816 | | | | 817,875 | |
| | | | | | | | |
| | | | | | | | | | | 7,058,359 | |
| | | | | | | | |
Total Floating Rate Loan Interests — 133.5%
(Cost — $455,888,192) | | | | 452,666,823 | |
| | | | | | | | |
| | | |
| | | | | | Shares | | | | |
Investment Companies — 1.6% | | | | | | | | | | | | |
| | | |
| United States — 1.6% | | | | | | | | | |
Invesco Senior Loan ETF | | | | | | | 245,000 | | | | 5,637,450 | |
| | | | | | | | |
Total Investment Companies — 1.6%
(Cost — $5,673,500) | | | | 5,637,450 | |
| | | | | | | | |
| | |
| 42 | | 2018 BLACKROCK ANNUAL REPORTTO SHAREHOLDERS |
| | |
Schedule of Investments (continued) October 31, 2018 | | BlackRock Floating Rate Income Trust (BGT) (Percentages shown are based on Net Assets) |
| | | | | | | | | | | | |
| Security | | | | | Beneficial
Interests (000) | | | Value | |
Other Interests(j) — 0.0% | | | | | | | | | | | | |
| | | |
| Afghanistan — 0.0% | | | | | | | | | |
Lear Corp. Escrow(b) | | | USD | | | | 500 | | | $ | 5 | |
| | | | | | | | |
| United States — 0.0% | | | | | | | | | |
Millennium Corp.(b) | | | | | | | 991 | | | | — | |
Millennium Lender Claims(b) | | | | | | | 930 | | | | — | |
| | | | | | | | |
| | | | | | | | | | | — | |
| | | | | | | | |
Total Other Interests — 0.0%
(Cost — $0) | | | | 5 | |
| | | | | | | | |
| | | |
Warrants — 0.0% | | | | | | | | | | | | |
| | | |
| Chemicals — 0.0% | | | | | | | | | |
British Vita Holdings Co. (Non-Expiring)(b) | | | | | | | 166 | | | | — | |
| | | | | | | | |
| Metals & Mining — 0.0% | | | | | | | | | |
AFGlobal Corp. (Expires 12/20/20)(b) | | | | | | | 2,642 | | | | — | |
| | | | | | | | |
| Software — 0.0% | | | | | | | | | |
Bankruptcy Management Solutions, Inc. (Expires 07/01/19)(b) | | | | | | | 195 | | | | — | |
Bankruptcy Management Solutions, Inc. (Expires 07/01/20)(b) | | | | | | | 292 | | | | — | |
HMH Holdings/EduMedia (Issued/exercisable 3/09/10, 19 Shares for 1 Warrant, Expires 6/22/19, Strike Price $42.27)(b) | | | | | | | 1,501 | | | | — | |
| | | | | | | | |
| | | | | | | | | | | — | |
| | | | | | | | |
Total Warrants — 0.0%
(Cost — $49,118) | | | | — | |
| | | | | | | | |
Total Long-Term Investments — 144.6%
(Cost — $494,446,094) | | | | 490,504,523 | |
| | | | | | | | |
| | | | | | | | | | | | |
| | | | | |
Shares | | | Value | |
Short-Term Securities — 0.1% | | | | | | | | | | | | |
BlackRock Liquidity Funds, T-Fund, Institutional Class, 2.07%(k)(l) | | | | | | | 282,908 | | | $ | 282,908 | |
| | | | | | | | |
Total Short-Term Securities — 0.1%
(Cost — $282,908) | | | | 282,908 | |
| | | | | | | | |
Options Purchased — 0.0%
(Cost — $25,422) | | | | — | |
| | | | | | | | |
| |
Total Investments — 144.7%
(Cost — $494,754,424) | | | | 490,787,431 | |
Liabilities in Excess of Other Assets — (44.7)% | | | | (151,691,640 | ) |
| | | | | | | | |
Net Assets — 100.0% | | | $ | 339,095,791 | |
| | | | | | | | |
| (a) | Non-income producing security. |
| (b) | Security is valued using significant unobservable inputs and is classified as Level 3 in the fair value hierarchy. |
| (c) | Security exempt from registration pursuant to Rule 144A under the Securities Act of 1933, as amended. These securities may be resold in transactions exempt from registration to qualified institutional investors. |
| (d) | Variable rate security. Rate shown is the rate in effect as of period end. |
| (e) | Variable or floating rate security, which interest rate adjusts periodically based on changes in current interest rates and prepayments on the underlying pool of assets. Rate shown is the rate in effect as of period end. |
| (f) | When-issued security. |
| (g) | Issuer filed for bankruptcy and/or is in default. |
| (h) | Payment-in-kind security which may pay interest/dividends in additional par/shares and/ or in cash. Rates shown are the current rate and possible payment rates. |
| (i) | Represents an unsettled loan commitment at period end. Certain details associated with this purchase are not known prior to the settlement date, including coupon rate. |
| (j) | Other interests represent beneficial interests in liquidation trusts and other reorganization or private entities. |
| (k) | Annualized 7-day yield as of period end. |
| (l) | During the year ended October 31, 2018, investments in issuers considered to be affiliates of the Trust for purposes of Section 2(a)(3) of the Investment Company Act of 1940, as amended, and/or related parties of the Trust were as follows: |
| | | | | | | | | | | | | | | | | | | | | | | | | | | | | | | | |
| Affiliate Persons and/or Related Parties | |
| Shares
Held at
10/31/17 |
| |
| Shares
Purchased |
| |
| Shares
Sold |
| |
| Shares
Held at
10/31/18 |
| |
| Value at
10/31/18 |
| | | Income | | |
| Net Realized
Gain (Loss) |
(a) | |
| Change in
Unrealized
Appreciation
(Depreciation) |
|
BlackRock Liquidity Funds, T-Fund, Institutional Class | | | 1,895,053 | | | | — | | | | (1,612,145 | ) (b) | | | 282,908 | | | $ | 282,908 | | | $ | 27,439 | | | $ | 8 | | | $ | — | |
iShares iBoxx USD High Yield Corporate Bond ETF | | | 19,000 | | | | 70,000 | | | | (89,000 | ) | | | — | | | | — | | | | 60,813 | | | | (42,986 | ) | | | (1,767 | ) |
| | | | | | | | | | | | | | | | | | | | | | | | | | | | | | | | |
| | | | | | | | | | | | | | | | | | $ | 282,908 | | | $ | 88,252 | | | $ | (42,978 | ) | | $ | (1,767 | ) |
| | | | | | | | | | | | | | | | | | | | | | | | | | | | | | | | |
| | (a) | Includes net capital gain distributions, if applicable. | |
| | (b) | Represents net shares sold. | |
For Trust compliance purposes, the Trust’s industry classifications refer to one or more of the industry sub-classifications used by one or more widely recognized market indexes or rating group indexes, and/or as defined by the investment adviser. These definitions may not apply for purposes of this report, which may combine such industry sub-classifications for reporting ease.
| | | | |
| SCHEDULES OF INVESTMENTS | | | 43 | |
| | |
Schedule of Investments (continued) October 31, 2018 | | BlackRock Floating Rate Income Trust (BGT) |
Derivative Financial Instruments Outstanding as of Period End
Forward Foreign Currency Exchange Contracts
| | | | | | | | | | | | | | | | | | | | |
| Currency Purchased | | | Currency Sold | | | Counterparty | | Settlement Date | | | Unrealized
Appreciation
(Depreciation) | |
| EUR | | | 980,000 | | | USD | | | 1,109,360 | | | JPMorgan Chase Bank N.A. | | | 11/05/18 | | | $ | 893 | |
| GBP | | | 2,574,000 | | | USD | | | 3,282,880 | | | Barclays Bank PLC | | | 11/05/18 | | | | 7,616 | |
| USD | | | 1,145,804 | | | EUR | | | 987,000 | | | UBS AG | | | 11/05/18 | | | | 27,621 | |
| USD | | | 3,382,117 | | | GBP | | | 2,589,000 | | | Citibank N.A. | | | 11/05/18 | | | | 72,446 | |
| | | | | | | | | | | | | | | | | | | | |
| | | | | | | | | | | | | | | | | | | 108,576 | |
| | | | | | | | | | | | | | | | | | | | |
| USD | | | 1,111,929 | | | EUR | | | 980,000 | | | JPMorgan Chase Bank N.A. | | | 12/05/18 | | | | (978 | ) |
| USD | | | 3,287,073 | | | GBP | | | 2,574,000 | | | Barclays Bank PLC | | | 12/05/18 | | | | (7,833 | ) |
| | | | | | | | | | | | | | | | | | | | |
| | | | | | | | | | | | | | | | | | | (8,811 | ) |
| | | | | | | | | | | | | | | | | | | | |
| | | | | | | | | | | | | | | | | | $ | 99,765 | |
| | | | | | | | | | | | | | | | | | | | |
OTC Options Purchased
| | | | | | | | | | | | | | | | | | | | | | | | | | | | |
| Description | | Counterparty | | Number of
Contracts | | Expiration
Date | | | Exercise
Price | | | Notional
Amount (000) | | | Value | |
Call | | | | | | | | | | | | | | | | | | | | | | | | | | | | |
Marsico Parent Superholdco LLC | | Goldman Sachs & Co. | | 26 | | | 12/14/19 | | | | USD | | | | 942.86 | | | | USD | | | | — | | | $ | — | |
| | | | | | | | | | | | | | | | | | | | | | | | | | | | |
OTC Total Return Swaps
| | | | | | | | | | | | | | | | | | | | | | | | | | | | | | | | | | |
Paid by the Trust | | Received by the Trust | | Counterparty | | Termination
Date | | | Notional
Amount (000) | | | Value | | | Upfront
Premium
Paid
(Received) | | | Unrealized
Appreciation
(Depreciation) | |
| Reference | | Frequency | | Rate | | | Frequency |
3-Month LIBOR, 2.56%, | | Quarterly | |
| Markit iboxx
USDLiquid
Leveraged Loans
Total Return
Index |
| | Quarterly | | Credit Suisse International | | | 12/20/18 | | | | USD | | | | 5,015 | | | $ | 10,889 | | | $ | — | | | $ | 10,889 | |
3-Month LIBOR, 2.56%, | | Quarterly | |
| Markit iboxx
USDLiquid
Leveraged Loans
Total Return
Index |
| | At Termination | | Credit Suisse International | | | 12/20/18 | | | | USD | | | | 5,015 | | | | (8,389 | ) | | | — | | | | (8,389 | ) |
| | | | | | | | | | | | | | | | | | | | | | | | | | | | | | | | | | |
| | | | | | | | | | | | | | | | | | | | | | | | $ | 2,500 | | | $ | — | | | $ | 2,500 | |
| | | | | | | | | | | | | | | | | | | | | | | | | | | | | | | | | | |
Balances Reported in the Statements of Assets and Liabilities for OTC Swaps
| | | | | | | | | | | | | | | | |
| | | Swap Premiums
Paid | | | Swap Premiums
Received | | | Unrealized
Appreciation | | | Unrealized
Depreciation | |
OTC Swaps | | $ | — | | | $ | — | | | $ | 10,889 | | | $ | (8,389 | ) |
| | | | | | | | | | | | | | | | |
Derivative Financial Instruments Categorized by Risk Exposure
As of period end, the fair values of derivative financial instruments located in the Statements of Assets and Liabilities were as follows:
| | | | | | | | | | | | | | | | | | | | | | | | | | | | |
| | | Commodity
Contracts | | | Credit
Contracts | | | Equity
Contracts | | | Foreign
Currency
Exchange
Contracts | | | Interest
Rate
Contracts | | | Other
Contracts | | | Total | |
Assets — Derivative Financial Instruments | | | | | | | | | | | | | | | | | | | | | | | | | | | | |
Forward foreign currency exchange contracts | | | | | | | | | | | | | | | | | | | | | | | | | | | | |
Unrealized appreciation on forward foreign currency exchange contracts | | $ | — | | | $ | — | | | $ | — | | | $ | 108,576 | | | $ | — | | | $ | — | | | $ | 108,576 | |
Swaps — OTC | | | | | | | | | | | | | | | | | | | | | | | | | | | | |
Unrealized appreciation on OTC swaps; Swap premiums paid | | | — | | | | — | | | | — | | | | — | | | | 10,889 | | | | — | | | | 10,889 | |
| | | | | | | | | | | | | | | | | | | | | | | | | | | | |
| | $ | — | | | $ | — | | | $ | — | | | $ | 108,576 | | | $ | 10,889 | | | $ | — | | | $ | 119,465 | |
| | | | | | | | | | | | | | | | | | | | | | | | | | | | |
| | |
| 44 | | 2018 BLACKROCK ANNUAL REPORTTO SHAREHOLDERS |
| | |
Schedule of Investments (continued) October 31, 2018 | | BlackRock Floating Rate Income Trust (BGT) |
| | | | | | | | | | | | | | | | | | | | | | | | | | | | |
| | | Commodity
Contracts | | | Credit
Contracts | | | Equity
Contracts | | | Foreign
Currency
Exchange
Contracts | | | Interest
Rate
Contracts | | | Other
Contracts | | | Total | |
Liabilities — Derivative Financial Instruments | | | | | | | | | | | | | | | | | | | | | | | | | | | | |
Forward foreign currency exchange contracts | | | | | | | | | | | | | | | | | | | | | | | | | | | | |
Unrealized depreciation on forward foreign currency exchange contracts | | $ | — | | | $ | — | | | $ | — | | | $ | 8,811 | | | $ | — | | | $ | — | | | $ | 8,811 | |
Swaps — OTC | | | | | | | | | | | | | | | | | | | | | | | | | | | | |
Unrealized depreciation on OTC swaps; Swap premiums received | | | — | | | | — | | | | — | | | | — | | | | 8,389 | | | | — | | | | 8,389 | |
| | | | | | | | | | | | | | | | | | | | | | | | | | | | |
| | $ | — | | | $ | — | | | $ | — | | | $ | 8,811 | | | $ | 8,389 | | | $ | — | | | $ | 17,200 | |
| | | | | | | | | | | | | | | | | | | | | | | | | | | | |
For the year ended October 31, 2018, the effect of derivative financial instruments in the Statements of Operations was as follows:
| | | | | | | | | | | | | | | | | | | | | | | | | | | | |
| | | Commodity
Contracts | | | Credit
Contracts | | | Equity
Contracts | | | Foreign
Currency
Exchange
Contracts | | | Interest
Rate
Contracts | | | Other
Contracts | | | Total | |
Net Realized Gain (Loss) from: | | | | | | | | | | | | | | | | | | | | | | | | | | | | |
Forward foreign currency exchange contracts | | $ | — | | | $ | — | | | $ | — | | | $ | 100,014 | | | $ | — | | | $ | — | | | $ | 100,014 | |
Options purchased(a) | | | — | | | | — | | | | — | | | | — | | | | 93,782 | | | | — | | | | 93,782 | |
Swaps | | | — | | | | (2,682 | ) | | | — | | | | — | | | | (4,542 | ) | | | — | | | | (7,224 | ) |
| | | | | | | | | | | | | | | | | | | | | | | | | | | | |
| | $ | — | | | $ | (2,682 | ) | | $ | — | | | $ | 100,014 | | | $ | 89,240 | | | $ | — | | | $ | 186,572 | |
| | | | | | | | | | | | | | | | | | | | | | | | | | | | |
| Net Change in Unrealized Appreciation (Depreciation) on: | | | | | | | | | | | | | | | | | | | | | |
Forward foreign currency exchange contracts | | $ | — | | | $ | — | | | $ | — | | | $ | 91,222 | | | $ | — | | | $ | — | | | $ | 91,222 | |
Options purchased(b) | | | — | | | | — | | | | — | | | | — | | | | 7,800 | | | | — | | | | 7,800 | |
Swaps | | | — | | | | 36,737 | | | | — | | | | — | | | | 2,500 | | | | — | | | | 39,237 | |
| | | | | | | | | | | | | | | | | | | | | | | | | | | | |
| | $ | — | | | $ | 36,737 | | | $ | — | | | $ | 91,222 | | | $ | 10,300 | | | $ | — | | | $ | 138,259 | |
| | | | | | | | | | | | | | | | | | | | | | | | | | | | |
| | (a) | Options purchased are included in net realized gain (loss) from investments. | |
| | (b) | Options purchased are included in net change in unrealized appreciation (depreciation) on investments. | |
Average Quarterly Balances of Outstanding Derivative Financial Instruments
| | | | |
Forward foreign currency exchange contracts: | | | | |
Average amounts purchased — in USD | | $ | 4,444,668 | |
Average amounts sold — in USD | | $ | 1,837,036 | |
Options: | | | | |
Average notional value of swaption contracts purchased | | $ | 5,775,000 | |
Credit default swaps: | | | | |
Average notional value — buy protection | | $ | 582,250 | |
Average notional value — sell protection | | $ | — | (a) |
Total return swaps: | | | | |
Average notional value | | $ | 2,507,500 | |
| | (a) | Derivative not held at quarter-end. The amount shown in the Statements of Operations reflect the results of activity during the period. | |
For more information about the Trust’s investment risks regarding derivative financial instruments, refer to the Notes to Financial Statements.
Derivative Financial Instruments — Offsetting as of Period End
The Trust’s derivative assets and liabilities (by type) were as follows:
| | | | | | | | |
| | | Assets | | | Liabilities | |
Forward foreign currency exchange contracts | | $ | 108,576 | | | $ | 8,811 | |
Swaps — OTC(a) | | | 10,889 | | | | 8,389 | |
| | | | | | | | |
Total derivative assets and liabilities in the Statements of Assets and Liabilities | | $ | 119,465 | | | $ | 17,200 | |
Derivatives not subject to a Master Netting Agreement or similar agreement (“MNA”) | | | — | | | | — | |
| | | | | | | | |
Total derivative assets and liabilities subject to an MNA | | $ | 119,465 | | | $ | 17,200 | |
| | | | | | | | |
| | (a) | Includes unrealized appreciation (depreciation) on OTC swaps and swap premiums (paid/received) in the Statements of Assets and Liabilities. | |
| | | | |
| SCHEDULES OF INVESTMENTS | | | 45 | |
| | |
Schedule of Investments (continued) October 31, 2018 | | BlackRock Floating Rate Income Trust (BGT) |
The following tables present the Trust’s derivative assets (and liabilities) by counterparty net of amounts available for offset under a MNA and net of the related collateral received (and pledged) by the Trust:
| | | | | | | | | | | | | | | | | | | | |
| Counterparty | | Derivative
Assets
Subject to
an MNA by
Counterparty | | | Derivatives
Available
for Offset (a) | | | Non-cash
Collateral
Received | | | Cash
Collateral
Received | | | Net Amount
of Derivative
Assets (b) | |
Barclays Bank PLC | | $ | 7,616 | | | $ | (7,616 | ) | | $ | — | | | $ | — | | | $ | — | |
Citibank N.A. | | | 72,446 | | | | — | | | | — | | | | — | | | | 72,446 | |
Credit Suisse International | | | 10,889 | | | | (8,389 | ) | | | — | | | | — | | | | 2,500 | |
JPMorgan Chase Bank N.A. | | | 893 | | | | (893 | ) | | | — | | | | — | | | | — | |
UBS AG | | | 27,621 | | | | — | | | | — | | | | — | | | | 27,621 | |
| | | | | | | | | | | | | | | | | | | | |
| | $ | 119,465 | | | $ | (16,898 | ) | | $ | — | | | $ | — | | | $ | 102,567 | |
| | | | | | | | | | | | | | | | | | | | |
| | | | | | | | | | | | | | | | | | | | |
| Counterparty | | Derivative
Liabilities
Subject to
an MNA by
Counterparty | | | Derivatives
Available
for Offset (a) | | | Non-cash
Collateral
Pledged | | | Cash
Collateral
Pledged | | | Net Amount
of Derivative
Liabilities (c)(d) | |
Barclays Bank PLC | | $ | 7,833 | | | $ | (7,616 | ) | | $ | — | | | $ | — | | | $ | 217 | |
Credit Suisse International | | | 8,389 | | | | (8,389 | ) | | | — | | | | — | | | | — | |
JPMorgan Chase Bank N.A. | | | 978 | | | | (893 | ) | | | — | | | | — | | | | 85 | |
| | | | | | | | | | | | | | | | | | | | |
| | $ | 17,200 | | | $ | (16,898 | ) | | $ | — | | | $ | — | | | $ | 302 | |
| | | | | | | | | | | | | | | | | | | | |
| | (a) | The amount of derivatives available for offset is limited to the amount of derivative assets and/or liabilities that are subject to an MNA. | |
| | (b) | Net amount represents the net amount receivable from the counterparty in the event of default. | |
| | (c) | Net amount represents the net amount payable due to counterparty in the event of default. | |
| | (d) | Net amount may also include forward foreign currency exchange contracts that are not required to be collateralized. | |
Fair Value Hierarchy as of Period End
Various inputs are used in determining the fair value of investments and derivative financial instruments. For information about the Trust’s policy regarding valuation of investments and derivative financial instruments, refer to the Notes to Financial Statements.
The following tables summarize the Trust’s investments and derivative financial instruments categorized in the disclosure hierarchy:
| | | | | | | | | | | | | | | | |
| | | Level 1 | | | Level 2 | | | Level 3 | | | Total | |
Assets: | | | | | | | | | | | | | | | | |
Investments: | | | | | | | | | | | | | | | | |
Long-Term Investments: | | | | | | | | | | | | | | | | |
Asset-Backed Securities | | $ | — | | | $ | 18,278,258 | | | $ | 2,699,975 | | | $ | 20,978,233 | |
Common Stocks | | | 112,616 | | | | 49,621 | | | | 529,149 | | | | 691,386 | |
Corporate Bonds | | | — | | | | 10,530,626 | | | | — | | | | 10,530,626 | |
Floating Rate Loan Interests | | | — | | | | 425,446,027 | | | | 27,220,796 | | | | 452,666,823 | |
Investment Companies | | | 5,637,450 | | | | — | | | | — | | | | 5,637,450 | |
Other Interests | | | — | | | | — | | | | 5 | | | | 5 | |
Short-Term Securities | | | 282,908 | | | | — | | | | — | | | | 282,908 | |
Liabilities: | | | | | | | | | | | | | | | | |
Unfunded Floating Rate Loan Interests(a) | | | — | | | | (676 | ) | | | (138 | ) | | | (814 | ) |
| | | | | | | | | | | | | | | | |
| | $ | 6,032,974 | | | $ | 454,303,856 | | | $ | 30,449,787 | | | $ | 490,786,617 | |
| | | | | | | | | | | | | | | | |
Derivative Financial Instruments(b) | | | | | | | | | | | | | | | | |
Assets: | | | | | | | | | | | | | | | | |
Forward foreign currency contracts | | $ | — | | | $ | 108,576 | | | $ | — | | | $ | 108,576 | |
Interest Rate Contracts | | | — | | | | 10,889 | | | | — | | | | 10,889 | |
Liabilities: | | | | | | | | | | | | | | | | |
Forward foreign currency contracts | | | — | | | | (8,811 | ) | | | — | | | | (8,811 | ) |
Interest Rate Contracts | | | — | | | | (8,389 | ) | | | — | | | | (8,389 | ) |
| | | | | | | | | | | | | | | | |
| | $ | | | | $ | 102,265 | | | $ | | | | $ | 102,265 | |
| | | | | | | | | | | | | | | | |
| | (a) | Unfunded floating rate loan interests are valued at the unrealized appreciation (depreciation) on the commitment. | |
| | (b) | Derivative financial instruments are swaps and forward foreign currency exchange contracts. Swaps and forward foreign currency exchange contracts are valued at the unrealized appreciation (depreciation) on the instrument. | |
| | |
| 46 | | 2018 BLACKROCK ANNUAL REPORTTO SHAREHOLDERS |
| | |
Schedule of Investments (continued) October 31, 2018 | | BlackRock Floating Rate Income Trust (BGT) |
The Trust may hold assets and/or liabilities in which the fair value approximates the carrying amount for financial statement purposes. As of period end, bank borrowings payable of $142,000,000 are categorized as Level 2 within the disclosure hierarchy.
During the year ended October 31, 2018, there were no transfers between Level 1 and Level 2.
A reconciliation of Level 3 investments is presented when the Trust had a significant amount of Level 3 investments at the beginning and/or end of the period in relation to net assets. The following table is a reconciliation of Level 3 investments for which significant unobservable inputs were used in determining fair value:
| | | | | | | | | | | | | | | | | | | | | | | | | | | | | | | | |
| | | Asset-Backed
Securities | | | Common
Stocks | | | Floating Rate
Loan
Interests | | | Rights | | | Other
Interests | | | Unfunded
Floating Rate
Loan Interests | | | Warrants | | | Total | |
Assets: | | | | | | | | | | | | | | | | | | | | | | | | | | | | | | | | |
Opening balance, as of October 31, 2017 | | $ | — | | | $ | 6 | | | $ | 17,889,778 | | | $ | 27,272 | | | $ | 5 | | | $ | — | | | $ | 45 | | | $ | 17,917,106 | |
Transfers into Level 3(a) | | | — | | | | 125,925 | | | | 8,629,734 | | | | — | | | | — | | | | — | | | | — | | | | 8,755,659 | |
Transfers out of Level 3(b) | | | — | | | | — | | | | (5,187,437 | ) | | | — | | | | — | | | | — | | | | — | | | | (5,187,437 | ) |
Accrued discounts/premiums | | | — | | | | — | | | | 56,113 | | | | — | | | | — | | | | — | | | | — | | | | 56,113 | |
Net realized gain (loss) | | | — | | | | — | | | | (410,428 | ) | | | 18,947 | | | | — | | | | — | | | | (937 | ) | | | (392,418 | ) |
Net change in unrealized appreciation (depreciation)(c)(d) | | | (25 | ) | | | 75,610 | | | | 238,481 | | | | (27,272 | ) | | | — | | | | (138 | ) | | | 892 | | | | 287,548 | |
Purchases | | | 2,700,000 | | | | 327,608 | | | | 20,125,144 | | | | — | | | | — | | | | — | | | | — | | | | 23,152,752 | |
Sales | | | — | | | | — | | | | (14,120,589 | ) | | | (18,947 | ) | | | — | | | | — | | | | — | | | | (14,139,536 | ) |
| | | | | | | | | | | | | | | | | | | | | | | | | | | | | | | | |
Closing Balance, as of October 31, 2018 | | $ | 2,699,975 | | | $ | 529,149 | | | $ | 27,220,796 | | | $ | — | | | $ | 5 | | | $ | (138 | ) | | $ | — | | | $ | 30,449,787 | |
| | | | | | | | | | | | | | | | | | | | | | | | | | | | | | | | |
Net change in unrealized appreciation (depreciation) on investments still held at October 31, 2018(d) | | $ | (25 | ) | | $ | 75,616 | | | $ | (67,316 | ) | | $ | — | | | $ | — | | | $ | (138 | ) | | $ | (45 | ) | | $ | 8,092 | |
| | | | | | | | | | | | | | | | | | | | | | | | | | | | | | | | |
| | (a) | As of October 31, 2017, the Trust used observable inputs in determining the value of certain investments. As of October 31, 2018, the Trust used significant unobservable inputs in determining the value of the same investments. As a result, investments at beginning of period value were transferred from Level 2 to Level 3 in the disclosure hierarchy. | |
| | (b) | As of October 31, 2017, the Trust used significant unobservable inputs in determining the value of certain investments. As of October 31, 2018, the Trust used observable inputs in determining the value of the same investments. As a result, investments at beginning of period value were transferred from Level 3 to Level 2 in the disclosure hierarchy. | |
| | (c) | Included in the related net change in unrealized appreciation (depreciation) in the Statements of Operations. | |
| | (d) | Any difference between net change in unrealized appreciation (depreciation) and net change in unrealized appreciation (depreciation) on investments still held at October 31, 2018 is generally due to investments no longer held or categorized as Level 3 at period end. | |
The Trust’s investments that are categorized as Level 3 were valued utilizing third party pricing information without adjustment. Such valuations are based on unobservable inputs. A significant change in third party information could result in a significantly lower or higher value of such Level 3 investments.
See notes to financial statements.
| | | | |
| SCHEDULES OF INVESTMENTS | | | 47 | |
| | |
Consolidated Schedule of Investments October 31, 2018 | | BlackRock Multi-Sector Income Trust (BIT) (Percentages shown are based on Net Assets) |
| | | | | | | | | | | | |
| Security | | |
Shares | | | Value | |
Common Stocks — 0.4% | |
|
| Aerospace & Defense — 0.4% | |
United Technologies Corp. | | | | | | | 25,647 | | | $ | 3,185,987 | |
| | | | | | | | | | | | |
Total Common Stocks — 0.4%
(Cost — $2,968,841) | | | | | | | | | | | 3,185,987 | |
| | | | | | | | | | | | |
| | | | | | Par
(000) | | | | |
Asset-Backed Securities — 23.4% | | | | | | | | | | | | |
Ajax Mortgage Loan Trust, Series 2017-D(b): | | | | | | | | | | | | |
Class A, 3.75%, 12/25/57 | | | USD | | | | 3,458 | | | | 3,418,346 | |
Class B, 0.01%, 12/25/57(a)(c) | | | | | | | 951 | | | | 465,925 | |
ALM Loan Funding, 5.14%, 07/15/26(b)(c) | | | | | | | 1,010 | | | | 1,003,531 | |
ALM VI Ltd., Series 2012-6A, Class BR3,
4.19%, 07/15/26(b)(c) | | | | | | | 1,200 | | | | 1,187,119 | |
ALM XII Ltd., Series 2015-12A, Class C1R2, 5.09%, 04/16/27(b)(c) | | | | | | | 545 | | | | 540,920 | |
American Homes 4 Rent Trust, Series 2014-SFR2, Class E, 6.23%, 10/17/36(b) | | | | | | | 2,000 | | | | 2,147,548 | |
AMMC CLO 19 Ltd., Series 2016-1A, Class E, (3 mo. LIBOR US + 7.00%), 9.44%, 10/15/28(b)(d) | | | | | | | 1,000 | | | | 1,009,187 | |
Anchorage Capital CLO Ltd.(b): | | | | | | | | | | | | |
Series 2014-3RA, Class C, 4.36%, 01/28/31(c) | | | | | | | 1,000 | | | | 983,739 | |
Series 2014-5RA, Class E, 7.84%, 01/15/30(c) | | | | | | | 1,140 | | | | 1,145,789 | |
Series 2015-6A, Class DR, (3 mo. LIBOR US + 3.55%), 5.99%, 07/15/30(d) | | | | | | | 1,000 | | | | 1,005,626 | |
Series 2016-8A, Class DR, 5.51%, 07/28/28(c) | | | | | | | 1,000 | | | | 998,839 | |
Ares CLO Ltd.(b)(d): | | | | | | | | | | | | |
Series 2015-1A, Class D, (3 mo. LIBOR US + 6.23%), 8.55%, 12/05/25 | | | | | | | 1,000 | | | | 1,024,669 | |
Series 2016-41A, Class D, (3 mo. LIBOR US + 4.20%), 6.64%, 01/15/29 | | | | | | | 900 | | | | 910,356 | |
Ares XL CLO Ltd., Series 2016-40A, Class D, (3 mo. LIBOR US + 6.60%), 9.04%, 10/15/27(b)(d) | | | | | | | 500 | | | | 501,193 | |
Battalion CLO XI Ltd., Series 2017-11A, Class E, 8.47%, 10/24/29(b)(c) | | | | | | | 1,175 | | | | 1,181,018 | |
Bear Stearns Asset-Backed Securities I Trust, Series 2006-HE9, Class 2A, (1 mo. LIBOR US + 0.14%), 2.42%, 11/25/36(d) | | | | | | | 3,124 | | | | 3,038,301 | |
Benefit Street Partners CLO II Ltd., Series 2013-IIA, Class CR, (3 mo. LIBOR US + 3.70%), 6.14%, 07/15/29(b)(d) | | | | | | | 1,750 | | | | 1,761,989 | |
Benefit Street Partners CLO VI Ltd., Series 2015-VIA(b)(c): | | | | | | | | | | | | |
Class BR, 4.84%, 10/18/29 | | | | | | | 1,000 | | | | 1,003,094 | |
Class CR, 5.89%, 10/18/29 | | | | | | | 1,000 | | | | 1,008,786 | |
Benefit Street Partners CLO XII Ltd., Series 2017-12A, Class D, 8.85%, 10/15/30(b)(c) | | | | | | | 500 | | | | 504,485 | |
C-BASS Trust, Series 2006-CB7, Class A4, (1 mo. LIBOR US + 0.16%), 2.44%, 10/25/36(d) | | | | | | | 7,115 | | | | 5,479,692 | |
Carrington Mortgage Loan Trust, Series 2006-FRE2(d): | | | | | | | | | | | | |
Class A2, (1 mo. LIBOR US + 0.12%), 2.40%, 10/25/36 | | | | | | | 4,727 | | | | 3,558,274 | |
Class A5, (1 mo. LIBOR US + 0.08%), 2.36%, 10/25/36 | | | | | | | 9,737 | | | | 7,304,022 | |
DCP Rights LLC, Series 2014-1A, Class A,
5.46%, 10/25/44(b) | | | | | | | 3,530 | | | | 3,488,865 | |
Elevation CLO Ltd., Series 2013-1A, Class CR, (3 mo. LIBOR + 4.68%), 6.99%, 11/15/28(b)(d) | | | | | | | 800 | | | | 802,185 | |
Fremont Home Loan Trust(d): | | | | | | | | | |
Series 2006-A, Class 2A3, (1 mo. LIBOR US + 0.16%), 2.44%, 05/25/36 | | | | | | | 23,502 | | | | 15,445,633 | |
Series 2006-D, Class 2A3, (1 mo. LIBOR US + 0.15%), 2.43%, 11/25/36 | | | | | | | 21,386 | | | | 10,276,514 | |
| | | | | | | | | | | | |
| Security | | | | | Par
(000) | | | Value | |
| Asset-Backed Securities (continued) | | | | | | | | | |
Galaxy CLO Ltd., Series 2015-21A, 7.72%, 04/20/31(b)(c) | | | USD | | | | 500 | | | $ | 486,242 | |
Galaxy XXIX CLO Ltd., Series 2018-29A, Class D, 4.71%, 11/15/26(b)(c) | | | | | | | 530 | | | | 527,693 | |
GSAMP Trust(d): | | | | | | | | | | | | |
Series 2006-FM2, Class A2C, (1 mo. LIBOR US + 0.15%), 2.43%, 09/25/36 | | | | | | | 10,746 | | | | 5,255,955 | |
Series 2007-FM2, Class A2B, (1 mo. LIBOR US + 0.09%), 2.37%, 01/25/37 | | | | | | | 7,042 | | | | 4,722,880 | |
Highbridge Loan Management Ltd.(b)(c): | | | | | | | | | | | | |
Series 4A-2014, Class BR, 4.36%, 01/28/30 | | | | | | | 1,750 | | | | 1,735,832 | |
Series 8A-2016, Class ER, 7.85%, 07/20/30 | | | | | | | 1,000 | | | | 987,300 | |
Home Equity Mortgage Loan Asset-Backed Trust, Series 2006-E, Class 2A3, (1 mo. LIBOR US + 0.17%), 2.45%, 04/25/37(d) | | | | | | | 11,230 | | | | 8,585,149 | |
HPS Loan Management Ltd., Series 10A-16(b)(d): | | | | | | | | | | | | |
Class C, (3 mo. LIBOR US + 3.65%), 6.12%, 01/20/28 | | | | | | | 2,500 | | | | 2,510,443 | |
Class D, (3 mo. LIBOR US + 6.50%), 8.97%, 01/20/28 | | | | | | | 1,000 | | | | 1,007,001 | |
Invitation Homes Trust, Series 2018-SFR2, Class E, 4.28%, 06/17/37(b)(c)(e) | | | | | | | 3,000 | | | | 3,017,231 | |
Long Beach Mortgage Loan Trust(d): | | | | | | | | | | | | |
Series 2006-10, Class 2A3, (1 mo. LIBOR US + 0.16%), 2.44%, 11/25/36 | | | | | | | 12,100 | | | | 5,417,808 | |
Series 2006-7, Class 2A3, (1 mo. LIBOR US + 0.16%), 2.44%, 08/25/36 | | | | | | | 6,711 | | | | 3,664,323 | |
Madison Park Funding X Ltd., Series 2012-10A, Class ER, (3 mo. LIBOR US + 7.62%),
10.09%, 01/20/29(b)(d) | | | | | | | 1,500 | | | | 1,521,246 | |
Madison Park Funding XI Ltd., Series 2013-11A, Class ER, 8.93%, 07/23/29(b)(c) | | | | | | | 750 | | | | 750,307 | |
Madison Park Funding XVI Ltd., Series 2015-16A, Class C, (3 mo. LIBOR US + 3.70%),
6.17%, 04/20/26(b)(d) | | | | | | | 1,000 | | | | 1,004,291 | |
Mastr Asset-Backed Securities Trust(d): | | | | | | | | | | | | |
Series 2006-HE2, Class A3, (1 mo. LIBOR US + 0.15%), 2.43%, 06/25/36 | | | | | | | 10,230 | | | | 5,804,117 | |
Series 2006-WMC2, Class A5, (1 mo. LIBOR US + 0.25%), 2.53%, 04/25/36 | | | | | | | 7,624 | | | | 3,020,321 | |
Neuberger Berman CLO XVIII Ltd., Series 2014-18A, Class DR, (3 mo. LIBOR US + 7.75%), 10.07%, 11/14/27(b)(d) | | | | | | | 1,000 | | | | 1,007,289 | |
Neuberger Berman CLO XX Ltd., Series 2015-20A, Class ER, 7.44%, 01/15/28(b)(c) | | | | | | | 1,250 | | | | 1,243,665 | |
Oaktree CLO Ltd., Series 2015-1A, Class DR, 7.67%, 10/20/27(b)(c) | | | | | | | 1,000 | | | | 1,000,339 | |
Octagon Investment Partners LLC, Series 2017-1A, Class E, (3 mo. LIBOR US + 6.30%),
8.77%, 07/20/30(b)(d) | | | | | | | 500 | | | | 505,024 | |
Octagon Investment Partners XXI Ltd., Series 2014-1A, Class C, (3 mo. LIBOR US + 3.65%),
5.97%, 11/14/26(b)(d) | | | | | | | 1,000 | | | | 1,002,296 | |
Octagon Investment Partners XXII Ltd., Series 2014-1A, Class DRR, 5.22%, 01/22/30(b)(c) | | | | | | | 500 | | | | 495,300 | |
OHA Credit Partners XIII Ltd., Series 2016-13A, Class E, (3 mo. LIBOR US + 7.15%), 9.62%, 01/21/30(b)(d) | | | | | | | 405 | | | | 409,218 | |
OneMain Financial Issuance Trust, Series 2015-2A, Class C, 4.32%, 07/18/25(b) | | | | | | | 5,000 | | | | 5,014,192 | |
OZLM XIV Ltd., Series 2015-14A, Class CR,
5.44%, 01/15/29(b)(c) | | | | | | | 1,000 | | | | 999,446 | |
OZLM XIX Ltd., Series 2017-19A, Class D,
9.04%, 11/22/30(b)(c) | | | | | | | 500 | | | | 507,844 | |
OZLM XV Ltd., Series 2016-15A, Class D, (3 mo. LIBOR US + 7.15%), 9.62%, 01/20/29(b)(d) | | | | | | | 1,000 | | | | 1,012,953 | |
OZLM XXI, Series 2017-21A, Class D,
8.01%, 01/20/31(b)(c) | | | | | | | 250 | | | | 240,622 | |
| | |
| 48 | | 2018 BLACKROCK ANNUAL REPORTTO SHAREHOLDERS |
| | |
Consolidated Schedule of Investments (continued) October 31, 2018 | | BlackRock Multi-Sector Income Trust (BIT) (Percentages shown are based on Net Assets) |
| | | | | | | | | | | | |
| Security | | | | | Par
(000) | | | Value | |
| Asset-Backed Securities (continued) | | | | | | | | | |
Park Avenue Institutional Advisers CLO Ltd., Series 2017-1A, Class D, 8.54%, 11/14/29(b)(c) | | | USD | | | | 1,750 | | | $ | 1,763,085 | |
Renaissance Home Equity Loan Trust, Series 2007-3, Class AF2, 7.00%, 09/25/37 | | | | | | | 4,255 | | | | 2,518,387 | |
Rockford Tower CLO Ltd., Series 2017-2A, Class D, (3 mo. LIBOR US + 3.45%), 5.89%, 10/15/29(b)(d) | | | | | | | 500 | | | | 501,868 | |
Saxon Asset Securities Trust, Series 2007-3, Class 2A3, (1 mo. LIBOR US + 0.40%), 2.68%, 09/25/47(d) | | | | | | | 5,000 | | | | 4,702,238 | |
Scholar Funding Trust, Series 2013-A, Class R, 0.00%(a) | | | | | | | — | (f) | | | 1,726,434 | |
Sound Point CLO X Ltd., Series 2015-3A, Class ER, 7.72%, 01/20/28(b)(c) | | | | | | | 1,000 | | | | 1,001,773 | |
Sound Point CLO XII Ltd., Series 2016-2A, Class D, (3 mo. LIBOR US + 4.25%), 6.72%, 10/20/28(b)(d) | | | | | | | 285 | | | | 285,468 | |
Sound Point CLO XIV Ltd., Series 2016-3A, Class E, (3 mo. LIBOR US + 6.65%), 9.13%, 01/23/29(b)(d) | | | | | | | 1,000 | | | | 1,011,822 | |
Symphony CLO XV Ltd., Series 2014-15A, Class DR, (3 mo. LIBOR US + 3.35%), 5.80%, 10/17/26(b)(d) | | | | | | | 3,500 | | | | 3,507,451 | |
Thayer Park CLO Ltd., Series 2017-1A, Class D, (3 mo. LIBOR US + 6.10%), 8.57%, 04/20/29(b)(d) | | | | | | | 500 | | | | 502,992 | |
TICP CLO VII Ltd., Series 2017-7A, Class E, (3 mo. LIBOR US + 6.51%), 8.95%, 07/15/29(b)(d) | | | | | | | 500 | | | | 504,147 | |
Treman Park CLO Ltd., Series 2015-1A(b): | | | | | | | | | | | | |
Class D, (3 mo. LIBOR US + 3.86%), 6.33%, 04/20/27(d) | | | | | | | 1,500 | | | | 1,504,601 | |
Class DRR, 6.00%, 10/20/28(a)(c)(e) | | | | | | | 1,500 | | | | 1,500,000 | |
Venture XXVI CLO Ltd., Series 2017-26A, Class E, (3 mo. LIBOR US + 6.80%), 9.27%, 01/20/29(b)(d) | | | | | | | 500 | | | | 507,412 | |
WaMu Asset-Backed Certificates Trust, Series 2007-HE3, Class 2A3, (1 mo. LIBOR US + 0.24%),
2.52%, 05/25/47(d) | | | | | | | 9,204 | | | | 7,742,357 | |
Wellfleet CLO Ltd., Series 2017-3A, Class B, 4.40%, 01/17/31(b)(c) | | | | | | | 500 | | | | 494,365 | |
York CLO Ltd., Series 2015-1A, Class ER, 8.12%, 01/22/31(b)(c) | | | | | | | 750 | | | | 745,766 | |
York CLO-3 Ltd., Series 2016-1A, Class ER, (3 mo. LIBOR US + 6.40%), 8.87%, 10/20/29(b)(d) | | | | | | | 1,000 | | | | 1,009,150 | |
| | | | | | | | |
Total Asset-Backed Securities — 23.4%
(Cost — $158,605,691) | | | | 166,181,288 | |
| | | | | | | | |
|
Corporate Bonds — 63.9% | |
|
| Aerospace — 0.1% | |
Axtel SAB de CV, 6.38%, 11/14/24(b)(g) | | | | | | | 525 | | | | 502,031 | |
SoftBank Group Corp., 4.00%, 04/20/23 | | | EUR | | | | 100 | | | | 117,371 | |
| | | | | | | | |
| | | | 619,402 | |
| Aerospace & Defense — 1.6% | |
Arconic, Inc.: | | | | | | | | | | | | |
5.87%, 02/23/22(g) | | | USD | | | | 1,065 | | | | 1,080,442 | |
5.13%, 10/01/24(g) | | | | | | | 554 | | | | 548,848 | |
5.90%, 02/01/27 | | | | | | | 211 | | | | 209,418 | |
BBA US Holdings, Inc., 5.38%, 05/01/26(b) | | | | | | | 322 | | | | 318,378 | |
Bombardier, Inc.(b): | | | | | | | | | | | | |
7.75%, 03/15/20 | | | | | | | 204 | | | | 211,650 | |
8.75%, 12/01/21(g) | | | | | | | 801 | | | | 861,075 | |
5.75%, 03/15/22 | | | | | | | 113 | | | | 111,729 | |
6.00%, 10/15/22(g) | | | | | | | 25 | | | | 24,531 | |
6.13%, 01/15/23(g) | | | | | | | 1,153 | | | | 1,138,587 | |
7.50%, 12/01/24 | | | | | | | 852 | | | | 865,845 | |
7.50%, 03/15/25(g) | | | | | | | 1,093 | | | | 1,092,672 | |
7.45%, 05/01/34 | | | | | | | 209 | | | | 202,730 | |
Harris Corp., 3.83%, 04/27/25(g) | | | | | | | 750 | | | | 730,189 | |
KLX, Inc., 5.88%, 12/01/22(b)(g) | | | | | | | 935 | | | | 963,050 | |
| | | | | | | | | | | | |
| Security | | | | | Par
(000) | | | Value | |
| Aerospace & Defense (continued) | |
Koppers, Inc., 6.00%, 02/15/25(b)(g) | | | USD | | | | 218 | | | $ | 208,800 | |
Kratos Defense & Security Solutions, Inc.,
6.50%, 11/30/25(b)(g) | | | | | | | 236 | | | | 243,788 | |
Lockheed Martin Corp., 4.09%, 09/15/52(g) | | | | | | | 451 | | | | 407,736 | |
Pioneer Holdings LLC/Pioneer Finance Corp., 9.00%, 11/01/22(b)(g) | | | | | | | 192 | | | | 196,320 | |
TransDigm UK Holdings PLC, 6.88%, 05/15/26(b) | | | | | | | 631 | | | | 629,422 | |
TransDigm, Inc.: | | | | | | | | | | | | |
6.00%, 07/15/22(g) | | | | | | | 643 | | | | 646,215 | |
6.50%, 07/15/24 | | | | | | | 143 | | | | 144,550 | |
6.50%, 05/15/25 | | | | | | | 114 | | | | 113,573 | |
United Technologies Corp., 3.75%, 11/01/46(g) | | | | | | | 700 | | | | 582,499 | |
| | | | | | | | |
| | | | 11,532,047 | |
| Air Freight & Logistics — 0.2% | |
FedEx Corp.(g): | | | | | | | | | | | | |
3.90%, 02/01/35 | | | | | | | 500 | | | | 453,557 | |
4.75%, 11/15/45 | | | | | | | 500 | | | | 474,834 | |
XPO Logistics, Inc.,
6.50%, 06/15/22(b)(g) | | | | | | | 228 | | | | 233,700 | |
| | | | | | | | |
| | | | 1,162,091 | |
| Airlines — 2.3% | |
Air Canada Pass-Through Trust, Series 2013-1, Class B, 5.38%, 11/15/22(b) | | | | | | | 2,225 | | | | 2,266,282 | |
American Airlines Pass-Through Trust: | | | | | | | | | | | | |
Series 2013-2, Class A, 4.95%, 07/15/24(g) | | | | | | | 1,666 | | | | 1,702,082 | |
Series 2017-1, Class B, 4.95%, 08/15/26 | | | | | | | 1,522 | | | | 1,535,855 | |
Avianca Holdings SA/Avianca Leasing LLC/Grupo Taca Holdings Ltd., 8.38%, 05/10/20 | | | | | | | 865 | | | | 862,846 | |
Continental Airlines Pass-Through Trust, Class B: | | | | | | | | | | | | |
Series 2007-1, 6.90%, 10/19/23(g) | | | | | | | 168 | | | | 172,644 | |
Series 2012-1, 6.25%, 10/11/21 | | | | | | | 255 | | | | 260,783 | |
Delta Air Lines Pass-Through Trust, Class B: | | | | | | | | | | | | |
Series 2007-1, 8.02%, 02/10/24 | | | | | | | 1,316 | | | | 1,443,719 | |
Series 2012-1, 6.88%, 05/07/19(b)(g) | | | | | | | 2,098 | | | | 2,134,937 | |
Latam Finance Ltd., 6.88%, 04/11/24(b) | | | | | | | 737 | | | | 717,469 | |
United Airlines Pass-Through Trust(g): | | | | | | | | | | | | |
Series 2014-2, Class B, 4.63%, 03/03/24 | | | | | | | 1,976 | | | | 1,980,871 | |
Series 2015-1, Class A, 3.70%, 06/01/24 | | | | | | | 3,570 | | | | 3,525,018 | |
| | | | | | | | |
| | | | 16,602,506 | |
| Auto Components — 0.6% | |
Adient Global Holdings Ltd., 3.50%, 08/15/24 | | | EUR | | | | 111 | | | | 110,090 | |
Allison Transmission, Inc., 5.00%, 10/01/24(b) | | | USD | | | | 38 | | | | 36,884 | |
Aptiv PLC(g): | | | | | | | | | | | | |
4.25%, 01/15/26 | | | | | | | 400 | | | | 393,808 | |
4.40%, 10/01/46 | | | | | | | 280 | | | | 242,785 | |
Federal-Mogul LLC/Federal-Mogul Financing Corp., 5.00%, 07/15/24 | | | EUR | | | | 177 | | | | 210,940 | |
Fiat Chrysler Finance Europe, 4.75%, 07/15/22 | | | | | | | 131 | | | | 164,119 | |
GKN Holdings PLC, 3.38%, 05/12/32 | | | GBP | | | | 100 | | | | 119,727 | |
Goodyear Dunlop Tires Europe BV, 3.75%, 12/15/23 | | | EUR | | | | 100 | | | | 113,925 | |
Goodyear Tire & Rubber Co., 5.00%, 05/31/26 | | | USD | | | | 77 | | | | 70,070 | |
HP Pelzer Holding GmbH, 4.13%, 04/01/24 | | | EUR | | | | 100 | | | | 108,734 | |
Icahn Enterprises LP/Icahn Enterprises Finance Corp.: | | | | | | | | | | | | |
6.00%, 08/01/20 | | | USD | | | | 115 | | | | 116,006 | |
6.25%, 02/01/22(g) | | | | | | | 341 | | | | 344,260 | |
6.75%, 02/01/24(g) | | | | | | | 392 | | | | 393,960 | |
6.38%, 12/15/25(g) | | | | | | | 284 | | | | 282,225 | |
IHO Verwaltungs GmbH(j): | | | | | | | | | | | | |
(2.75% Cash or 3.50% PIK), 2.75%, 09/15/21 | | | EUR | | | | 100 | | | | 113,689 | |
(3.25% Cash or 4.00% PIK), 3.25%, 09/15/23 | | | | | | | 100 | | | | 113,407 | |
| | | | |
| CONSOLIDATED SCHEDULES OF INVESTMENTS | | | 49 | |
| | |
Consolidated Schedule of Investments (continued) October 31, 2018 | | BlackRock Multi-Sector Income Trust (BIT) (Percentages shown are based on Net Assets) |
| | | | | | | | | | | | |
| Security | | | | | Par
(000) | | | Value | |
| Auto Components (continued) | |
(3.75% Cash or 4.50% PIK), 3.75%, 09/15/26 | | | EUR | | | | 100 | | | $ | 112,280 | |
(4.13% Cash or 4.88% PIK), 4.13%, 09/15/21(b)(g) | | | USD | | | | 214 | | | | 207,580 | |
(4.50% Cash or 5.25% PIK), 4.50%, 09/15/23(b)(g) | | | | | | | 229 | | | | 213,256 | |
Tesla, Inc., 5.30%, 08/15/25(b)(g) | | | | | | | 558 | | | | 495,923 | |
Volvo Car AB, 2.00%, 01/24/25 | | | EUR | | | | 100 | | | | 106,752 | |
| | | | | | | | |
| | | | | | | | | | | 4,070,420 | |
| Automobiles — 0.3% | | | | | | | | | |
General Motors Co., 6.25%, 10/02/43 | | | USD | | | | 2,194 | | | | 2,099,747 | |
| | | | | | | | |
| Banks — 1.1% | | | | | | | | | |
Allied Irish Banks PLC(5 year EUR Swap + 3.95%), 4.13%, 11/26/25(h) | | | EUR | | | | 100 | | | | 118,362 | |
Banco BPM SpA, 1.75%, 04/24/23 | | | | | | | 100 | | | | 102,196 | |
Banco Popolare, 2.75%, 07/27/20 | | | | | | | 100 | | | | 112,983 | |
Bank of Ireland(5 year EUR Swap + 3.55%), 4.25%, 06/11/24(h) | | | | | | | 100 | | | | 115,394 | |
Bankia SA: | | | | | | | | | | | | |
(5 year EUR Swap + 3.17%), 4.00%, 05/22/24(h) | | | | | | | 200 | | | | 229,645 | |
(5 year EUR Swap + 3.35%), 3.38%, 03/15/27(h) | | | | | | | 100 | | | | 115,836 | |
Barclays PLC: | | | | | | | | | | | | |
4.38%, 09/11/24(g) | | | USD | | | | 720 | | | | 687,027 | |
5.20%, 05/12/26 | | | | | | | 200 | | | | 194,125 | |
CaixaBank SA(5 year EUR Swap + 3.35%),
3.50%, 02/15/27(h) | | | EUR | | | | 100 | | | | 118,533 | |
CIT Group, Inc.: | | | | | | | | | | | | |
5.00%, 08/01/23(g) | | | USD | | | | 847 | | | | 849,118 | |
5.25%, 03/07/25 | | | | | | | 151 | | | | 151,944 | |
6.13%, 03/09/28 | | | | | | | 116 | | | | 120,060 | |
HSBC Holdings PLC, 4.38%, 11/23/26(g) | | | | | | | 370 | | | | 358,790 | |
Northwest Florida Timber Finance LLC, 4.75%, 03/04/29(b)(g) | | | | | | | 4,360 | | | | 3,981,029 | |
Standard Chartered PLC, 4.87%, 03/15/33(b)(c)(g) | | | | | | | 500 | | | | 477,980 | |
| | | | | | | | |
| | | | | | | | | | | 7,733,022 | |
| Beverages — 0.4% | | | | | | | | | |
Anheuser-Busch InBev Finance, Inc.,
4.90%, 02/01/46(g) | | | | | | | 2,160 | | | | 2,034,704 | |
Central American Bottling Corp., 5.75%, 01/31/27(b) | | | | | | | 637 | | | | 627,770 | |
Horizon Parent Holdings Sarl, (8.25% Cash or 9.00% PIK), 8.25%, 02/15/22(j) | | | EUR | | | | 100 | | | | 117,173 | |
OI European Group BV, 4.00%, 03/15/23(b) | | | USD | | | | 209 | | | | 195,676 | |
| | | | | | | | |
| | | | | | | | | | | 2,975,323 | |
| Biotechnology — 0.3% | | | | | | | | | |
Amgen, Inc., 4.40%, 05/01/45(g) | | | | | | | 1,100 | | | | 1,000,786 | |
Gilead Sciences, Inc., 4.75%, 03/01/46(g) | | | | | | | 700 | | | | 676,748 | |
Illumina, Inc., 0.50%, 06/15/21(k) | | | | | | | 359 | | | | 483,628 | |
| | | | | | | | |
| | | | | | | | | | | 2,161,162 | |
| Building Materials — 0.0% | | | | | | | | | |
Jeld-Wen, Inc.(b): | | | | | | | | | | | | |
4.63%, 12/15/25 | | | | | | | 163 | | | | 146,089 | |
4.88%, 12/15/27 | | | | | | | 23 | | | | 20,010 | |
| | | | | | | | |
| | | | | | | | | | | 166,099 | |
| Building Products — 0.3% | | | | | | | | | |
American Builders & Contractors Supply Co., Inc.(b): | | | | | | | | | | | | |
5.75%, 12/15/23 | | | | | | | 136 | | | | 134,300 | |
5.88%, 05/15/26 | | | | | | | 281 | | | | 272,570 | |
Building Materials Corp. of America, 6.00%, 10/15/25(b)(g) | | | | | | | 247 | | | | 242,986 | |
Masonite International Corp.(b): | | | | | | | | | | | | |
5.63%, 03/15/23(g) | | | | | | | 373 | | | | 370,669 | |
5.75%, 09/15/26 | | | | | | | 188 | | | | 178,600 | |
| | | | | | | | | | | | |
| Security | | | | | Par
(000) | | | Value | |
| Building Products (continued) | | | | | | | | | |
PGT Escrow Issuer, Inc., 6.75%, 08/01/26(b) | | | USD | | | | 125 | | | $ | 128,750 | |
Standard Industries, Inc.(b): | | | | | | | | | | | | |
5.50%, 02/15/23 | | | | | | | 72 | | | | 70,560 | |
5.38%, 11/15/24 | | | | | | | 136 | | | | 130,560 | |
USG Corp.(b)(g): | | | | | | | | | | | | |
5.50%, 03/01/25 | | | | | | | 299 | | | | 301,990 | |
4.88%, 06/01/27 | | | | | | | 366 | | | | 366,801 | |
| | | | | | | | |
| | | | 2,197,786 | |
| Cable Television Services — 0.0% | |
CB Escrow Corp.,
8.00%, 10/15/25(b)(g) | | | | | | | 173 | | | | 157,430 | |
| | | | | | | | |
| Capital Markets — 0.5% | |
Blackstone CQP Holdco LP(b): | | | | | | | | | | | | |
6.50%, 03/20/21(g) | | | | | | | 2,427 | | | | 2,432,648 | |
6.00%, 08/18/21 | | | | | | | 395 | | | | 394,481 | |
Lions Gate Capital Holdings LLC, 5.88%, 11/01/24(b) | | | | | | | 101 | | | | 101,505 | |
NFP Corp., 6.88%, 07/15/25(b) | | | | | | | 102 | | | | 98,940 | |
Raymond James Financial, Inc., 4.95%, 07/15/46(g) | | | | | | | 400 | | | | 385,042 | |
Stevens Holding Co., Inc., 6.13%, 10/01/26(b) | | | | | | | 225 | | | | 224,183 | |
| | | | | | | | |
| | | | 3,636,799 | |
| Chemicals — 1.8% | |
Alpha 2 BV, (8.75% Cash or 9.50% PIK), 8.75%, 06/01/23(b)(j) | | | | | | | 306 | | | | 305,235 | |
Alpha 3 BV/Alpha US Bidco, Inc., 6.25%, 02/01/25(b)(g) | | | | | | | 1,100 | | | | 1,049,125 | |
Axalta Coating Systems Dutch Holding B BV, 3.75%, 01/15/25 | | | EUR | | | | 100 | | | | 111,603 | |
Axalta Coating Systems LLC, 4.88%, 08/15/24(b)(g) | | | USD | | | | 265 | | | | 250,094 | |
Blue Cube Spinco, Inc.(g): | | | | | | | | | | | | |
9.75%, 10/15/23 | | | | | | | 502 | | | | 558,475 | |
10.00%, 10/15/25 | | | | | | | 344 | | | | 389,580 | |
CF Industries, Inc.: | | | | | | | | | | | | |
5.15%, 03/15/34 | | | | | | | 69 | | | | 62,790 | |
4.95%, 06/01/43 | | | | | | | 191 | | | | 161,395 | |
Chemours Co.: | | | | | | | | | | | | |
6.63%, 05/15/23 | | | | | | | 172 | | | | 175,870 | |
7.00%, 05/15/25 | | | | | | | 66 | | | | 67,980 | |
4.00%, 05/15/26 | | | EUR | | | | 100 | | | | 108,401 | |
5.38%, 05/15/27(g) | | | USD | | | | 309 | | | | 287,370 | |
Cydsa SAB de CV, 6.25%, 10/04/27(b)(g) | | | | | | | 914 | | | | 849,572 | |
GCP Applied Technologies, Inc., 5.50%, 04/15/26(b) | | | | | | | 188 | | | | 181,890 | |
Hexion, Inc., 10.38%, 02/01/22(b)(g) | | | | | | | 102 | | | | 91,163 | |
Huntsman International LLC, 5.13%, 11/15/22 | | | | | | | 165 | | | | 166,444 | |
INEOS Finance PLC, 4.00%, 05/01/23 | | | EUR | | | | 115 | | | | 132,697 | |
INEOS Group Holdings SA, 5.38%, 08/01/24 | | | USD | | | | 100 | | | | 115,934 | |
Mexichem SAB de CV, 5.50%, 01/15/48(b)(g) | | | | | | | 526 | | | | 462,622 | |
Momentive Performance Materials, Inc., 3.88%, 10/24/21(g) | | | | | | | 959 | | | | 1,028,528 | |
NOVA Chemicals Corp., 4.88%, 06/01/24(b)(g) | | | | | | | 319 | | | | 293,081 | |
Olin Corp., 5.00%, 02/01/30 | | | | | | | 135 | | | | 121,207 | |
Platform Specialty Products Corp.(b)(g): | | | | | | | | | | | | |
6.50%, 02/01/22 | | | | | | | 2,322 | | | | 2,353,927 | |
5.88%, 12/01/25 | | | | | | | 1,425 | | | | 1,353,750 | |
PQ Corp.(b)(g): | | | | | | | | | | | | |
6.75%, 11/15/22 | | | | | | | 437 | | | | 450,110 | |
5.75%, 12/15/25 | | | | | | | 629 | | | | 606,199 | |
PSPC Escrow Corp., 6.00%, 02/01/23 | | | EUR | | | | 153 | | | | 179,647 | |
Sherwin-Williams Co., 4.50%, 06/01/47(g) | | | USD | | | | 310 | | | | 278,278 | |
Starfruit Finco BV/ tarfruit US Holdco LLC, 6.50%, 10/01/26 | | | EUR | | | | 100 | | | | 110,694 | |
| | |
| 50 | | 2018 BLACKROCK ANNUAL REPORTTO SHAREHOLDERS |
| | |
Consolidated Schedule of Investments (continued) October 31, 2018 | | BlackRock Multi-Sector Income Trust (BIT) (Percentages shown are based on Net Assets) |
| | | | | | | | | | | | |
| Security | | | | | Par
(000) | | | Value | |
| Chemicals (continued) | |
Versum Materials, Inc., 5.50%, 09/30/24(b) | | | USD | | | | 54 | | | $ | 53,460 | |
WR Grace & Co-Conn(b)(g): | | | | | | | | | | | | |
5.13%, 10/01/21 | | | | | | | 277 | | | | 279,078 | |
5.63%, 10/01/24 | | | | | | | 300 | | | | 305,250 | |
| | | | | | | | |
| | | | 12,941,449 | |
| Commercial Services & Supplies — 1.7% | |
ADT Corp.(g): | | | | | | | | | | | | |
6.25%, 10/15/21 | | | | | | | 234 | | | | 241,020 | |
3.50%, 07/15/22 | | | | | | | 367 | | | | 340,393 | |
4.13%, 06/15/23 | | | | | | | 188 | | | | 174,370 | |
4.88%, 07/15/32(b) | | | | | | | 491 | | | | 386,662 | |
Advanced Disposal Services, Inc., 5.63%, 11/15/24(b)(g) | | | | | | | 191 | | | | 186,225 | |
Aviation Capital Group Corp., 6.75%, 04/06/21(b)(g) | | | | | | | 5,000 | | | | 5,325,291 | |
Avolon Holdings Funding Ltd., 5.13%, 10/01/23(b) | | | | | | | 456 | | | | 447,450 | |
Booz Allen Hamilton, Inc., 5.13%, 05/01/25(b)(g) | | | | | | | 241 | | | | 235,276 | |
CD&R Waterworks Merger Sub LLC,
6.13%, 08/15/25(b)(g) | | | | | | | 485 | | | | 454,687 | |
Fortress Transportation & Infrastructure Investors LLC(b): | | | | | | | | | | | | |
6.75%, 03/15/22 | | | | | | | 85 | | | | 86,913 | |
6.50%, 10/01/25 | | | | | | | 92 | | | | 90,390 | |
GFL Environmental, Inc., 5.38%, 03/01/23(b) | | | | | | | 70 | | | | 64,225 | |
Harland Clarke Holdings Corp., 8.38%, 08/15/22(b)(g) | | | | | | | 488 | | | | 440,420 | |
KAR Auction Services, Inc., 5.13%, 06/01/25(b)(g) | | | | | | | 359 | | | | 337,460 | |
Mobile Mini, Inc., 5.88%, 07/01/24(g) | | | | | | | 585 | | | | 587,925 | |
Paprec Holding SA, 4.00%, 03/31/25 | | | EUR | | | | 100 | | | | 113,055 | |
Park Aerospace Holdings Ltd.(b) | | | | | | | | | | | | |
3.63%, 03/15/21 | | | USD | | | | 269 | | | | 258,240 | |
5.25%, 08/15/22(g) | | | | | | | 438 | | | | 434,715 | |
5.50%, 02/15/24 | | | | | | | 14 | | | | 13,864 | |
Ritchie Bros Auctioneers, Inc., 5.38%, 01/15/25(b)(g) | | | | | | | 188 | | | | 185,180 | |
United Rentals North America, Inc.: | | | | | | | | | | | | |
5.75%, 11/15/24(g) | | | | | | | 342 | | | | 342,855 | |
4.63%, 10/15/25(g) | | | | | | | 453 | | | | 419,591 | |
5.88%, 09/15/26 | | | | | | | 151 | | | | 147,980 | |
5.50%, 05/15/27 | | | | | | | 465 | | | | 441,169 | |
Wrangler Buyer Corp., 6.00%, 10/01/25(b) | | | | | | | 278 | | | | 298,155 | |
| | | | | | | | |
| | | | | | | | | | | 12,053,511 | |
| Communications Equipment — 0.4% | |
CommScope Technologies LLC(b): | | | | | | | | | | | | |
6.00%, 06/15/25 | | | | | | | 5 | | | | 4,863 | |
5.00%, 03/15/27 | | | | | | | 107 | | | | 95,516 | |
CommScope, Inc.(b)(g): | | | | | | | | | | | | |
5.00%, 06/15/21 | | | | | | | 170 | | | | 169,447 | |
5.50%, 06/15/24 | | | | | | | 530 | | | | 512,112 | |
Nokia OYJ(g): | | | | | | | | | | | | |
3.38%, 06/12/22 | | | | | | | 126 | | | | 120,645 | |
4.38%, 06/12/27 | | | | | | | 177 | | | | 166,469 | |
6.63%, 05/15/39 | | | | | | | 245 | | | | 255,412 | |
Zayo Group LLC/Zayo Capital, Inc.(g): | | | | | | | | | | | | |
6.38%, 05/15/25 | | | | | | | 206 | | | | 210,635 | |
5.75%, 01/15/27(b) | | | | | | | 1,486 | | | | 1,456,577 | |
| | | | | | | | |
| | | | | | | | | | | 2,991,676 | |
| Construction & Engineering — 0.7% | |
Aeropuertos Argentina 2000 SA, 6.88%, 02/01/27(b)(g) | | | | | | | 1,061 | | | | 992,046 | |
Aeropuertos Dominicanos Siglo XXI SA, 6.75%, 03/30/29(b)(g) | | | | | | | 1,061 | | | | 1,058,347 | |
BlueLine Rental Finance Corp., 9.25%, 03/15/24(b)(g) | | | | | | | 1,311 | | | | 1,368,356 | |
Brand Energy & Infrastructure Services, Inc., 8.50%, 07/15/25(b)(g) | | | | | | | 335 | | | | 329,975 | |
Engility Corp., 8.88%, 09/01/24(g) | | | | | | | 298 | | | | 322,213 | |
frontdoor, Inc., 6.75%, 08/15/26(b) | | | | | | | 174 | | | | 177,480 | |
| | | | | | | | | | | | |
| Security | | | | | Par
(000) | | | Value | |
| Construction & Engineering (continued) | |
Pisces Midco, Inc., 8.00%, 04/15/26(b) | | | USD | | | | 111 | | | $ | 107,809 | |
SPIE SA, 3.13%, 03/22/24 | | | EUR | | | | 100 | | | | 114,186 | |
SRS Distribution, Inc., 8.25%, 07/01/26(b)(g) | | | USD | | | | 220 | | | | 206,250 | |
Tutor Perini Corp., 6.88%, 05/01/25(b)(g) | | | | | | | 260 | | | | 260,325 | |
Weekley Homes LLC/Weekley Finance Corp., 6.63%, 08/15/25 | | | | | | | 73 | | | | 68,985 | |
| | | | | | | | |
| | | | | | | | | | | 5,005,972 | |
| Construction Materials — 0.5% | |
HD Supply, Inc., 5.38%, 10/15/26(b) | | | | | | | 2,100 | | | | 2,008,125 | |
LKQ Italia Bondco SpA, 3.88%, 04/01/24 | | | EUR | | | | 102 | | | | 119,968 | |
Navistar International Corp., 6.63%, 11/01/25(b)(g) | | | USD | | | | 319 | | | | 325,380 | |
New Enterprise Stone & Lime Co., Inc.(b): | | | | | | | | | | | | |
10.13%, 04/01/22 | | | | | | | 190 | | | | 198,550 | |
6.25%, 03/15/26 | | | | | | | 88 | | | | 85,800 | |
Rexel SA, 3.50%, 06/15/23 | | | EUR | | | | 223 | | | | 259,704 | |
Williams Scotsman International, Inc.(b): | | | | | | | | | | | | |
7.88%, 12/15/22 | | | USD | | | | 129 | | | | 132,547 | |
6.88%, 08/15/23 | | | | | | | 220 | | | | 218,350 | |
| | | | | | | | |
| | | | | | | | | | | 3,348,424 | |
| Consumer Discretionary — 0.3% | |
AA Bond Co. Ltd., 4.88%, 07/31/43 | | | GBP | | | | 125 | | | | 159,772 | |
Blitz F18-674 GmbH, 6.00%, 07/30/26 | | | EUR | | | | 100 | | | | 114,398 | |
Nielsen Co. Luxembourg Sarl, 5.00%, 02/01/25(b)(g) | | | USD | | | | 104 | | | | 101,108 | |
Staples, Inc., 8.50%, 09/15/25(b)(g) | | | | | | | 311 | | | | 281,455 | |
Viking Cruises Ltd.(b)(g): | | | | | | | | | | | | |
6.25%, 05/15/25 | | | | | | | 238 | | | | 238,523 | |
5.88%, 09/15/27 | | | | | | | 925 | | | | 876,437 | |
| | | | | | | | |
| | | | | | | | | | | 1,771,693 | |
| Consumer Finance — 1.2% | |
Ally Financial, Inc., 8.00%, 11/01/31(g) | | | | | | | 1,617 | | | | 1,944,442 | |
Credivalores-Crediservicios SAS,
9.75%, 07/27/22(b) | | | | | | | 457 | | | | 446,489 | |
Financial & Risk US Holdings, Inc.(b): | | | | | | | | | | | | |
6.25%, 05/15/26 | | | | | | | 361 | | | | 359,195 | |
8.25%, 11/15/26 | | | | | | | 748 | | | | 727,430 | |
Iron Mountain UK PLC, 3.88%, 11/15/25 | | | GBP | | | | 100 | | | | 120,455 | |
Mulhacen Pte Ltd., (6.5% Cash or 7.25% PIK), 6.50%, 08/01/23(j) | | | EUR | | | | 144 | | | | 162,595 | |
Navient Corp.: | | | | | | | | | | | | |
5.00%, 10/26/20(g) | | | USD | | | | 370 | | | | 372,035 | |
6.63%, 07/26/21(g) | | | | | | | 141 | | | | 145,054 | |
6.50%, 06/15/22(g) | | | | | | | 460 | | | | 468,050 | |
5.50%, 01/25/23 | | | | | | | 162 | | | | 159,079 | |
7.25%, 09/25/23(g) | | | | | | | 306 | | | | 316,710 | |
5.88%, 10/25/24 | | | | | | | 71 | | | | 66,917 | |
6.75%, 06/25/25(g) | | | | | | | 123 | | | | 119,925 | |
6.75%, 06/15/26 | | | | | | | 252 | | | | 240,660 | |
5.63%, 08/01/33 | | | | | | | 105 | | | | 85,384 | |
Nexi Capital SpA, 3.63%, 05/01/23(c) | | | EUR | | | | 100 | | | | 113,147 | |
Refinitiv US Holdings, Inc.: | | | | | | | | | | | | |
4.50%, 05/15/26 | | | | | | | 118 | | | | 133,653 | |
4.50%, 05/15/26(b) | | | | | | | 480 | | | | 543,672 | |
Springleaf Finance Corp.: | | | | | | | | | | | | |
6.13%, 05/15/22 | | | USD | | | | 85 | | | | 85,425 | |
5.63%, 03/15/23 | | | | | | | 9 | | | | 8,708 | |
6.88%, 03/15/25 | | | | | | | 368 | | | | 352,360 | |
7.13%, 03/15/26 | | | | | | | 502 | | | | 475,645 | |
Verscend Escrow Corp., 9.75%, 08/15/26(b) | | | | | | | 732 | | | | 733,830 | |
| | | | | | | | |
| | | | | | | | | | | 8,180,860 | |
| | | | |
| CONSOLIDATED SCHEDULES OF INVESTMENTS | | | 51 | |
| | |
Consolidated Schedule of Investments (continued) October 31, 2018 | | BlackRock Multi-Sector Income Trust (BIT) (Percentages shown are based on Net Assets) |
| | | | | | | | | | | | |
| Security | | | | | Par
(000) | | | Value | |
| Containers & Packaging — 1.1% | |
Ardagh Packaging Finance PLC/Ardagh Holdings USA, Inc.: | | | | | | | | | | | | |
4.63%, 05/15/23(b) | | | USD | | | | 912 | | | $ | 886,920 | |
6.75%, 05/15/24 | | | EUR | | | | 156 | | | | 187,304 | |
7.25%, 05/15/24(b)(g) | | | USD | | | | 949 | | | | 953,745 | |
4.75%, 07/15/27 | | | GBP | | | | 100 | | | | 121,301 | |
4.75%, 07/15/27(b) | | | | | | | 100 | | | | 121,301 | |
BWAY Holding Co.: | | | | | | | | | | | | |
4.75%, 04/15/24 | | | EUR | | | | 100 | | | | 114,047 | |
5.50%, 04/15/24(b)(g) | | | USD | | | | 842 | | | | 808,320 | |
Crown Americas LLC/Crown Americas Capital Corp.: | | | | | | | | | | | | |
4.75%, 02/01/26(b) | | | | | | | 290 | | | | 273,687 | |
4.25%, 09/30/26 | | | | | | | 265 | | | | 240,487 | |
Intertape Polymer Group, Inc., 7.00%, 10/15/26(b) | | | | | | | 144 | | | | 144,000 | |
Mercer International, Inc.: | | | | | | | | | | | | |
6.50%, 02/01/24 | | | | | | | 134 | | | | 135,340 | |
5.50%, 01/15/26 | | | | | | | 139 | | | | 134,788 | |
Reynolds Group Issuer, Inc./Reynolds Group Issuer LLC/Reynolds Group Issuer Lu: | | | | | | | | | | | | |
5.75%, 10/15/20(g) | | | | | | | 906 | | | | 906,116 | |
5.13%, 07/15/23(b) | | | | | | | 48 | | | | 46,920 | |
7.00%, 07/15/24(b) | | | | | | | 839 | | | | 839,524 | |
Sappi Papier Holding GmbH, 4.00%, 04/01/23 | | | EUR | | | | 200 | | | | 232,760 | |
Sealed Air Corp.: | | | | | | | | | | | | |
4.88%, 12/01/22(b)(g) | | | USD | | | | 268 | | | | 265,320 | |
4.50%, 09/15/23 | | | EUR | | | | 100 | | | | 125,387 | |
6.88%, 07/15/33(b) | | | USD | | | | 44 | | | | 45,320 | |
Silgan Holdings, Inc., 3.25%, 03/15/25 | | | EUR | | | | 100 | | | | 115,669 | |
Smurfit Kappa Acquisitions ULC, 2.88%, 01/15/26 | | | | | | | 117 | | | | 135,336 | |
Suzano Austria GmbH, 6.00%, 01/15/29(b) | | | USD | | | | 1,201 | | | | 1,223,519 | |
| | | | | | | | |
| | | | | | | | | | | 8,057,111 | |
| Diversified Consumer Services — 0.4% | |
APX Group, Inc.(g): | | | | | | | | | | | | |
8.75%, 12/01/20 | | | | | | | 312 | | | | 304,200 | |
7.88%, 12/01/22 | | | | | | | 185 | | | | 185,925 | |
Ascend Learning LLC, 6.88%, 08/01/25(b)(g) | | | | | | | 324 | | | | 322,380 | |
Carriage Services, Inc., 6.63%, 06/01/26(b) | | | | | | | 36 | | | | 36,090 | |
Graham Holdings Co., 5.75%, 06/01/26(b) | | | | | | | 204 | | | | 205,530 | |
Laureate Education, Inc., 8.25%, 05/01/25(b) | | | | | | | 138 | | | | 147,315 | |
Matthews International Corp., 5.25%, 12/01/25(b) | | | | | | | 72 | | | | 67,500 | |
Pinnacle Bidco PLC, 6.38%, 02/15/25 | | | GBP | | | | 100 | | | | 130,402 | |
Prime Security Services Borrower LLC/Prime Finance, Inc., 9.25%, 05/15/23(b) | | | USD | | | | 1,236 | | | | 1,306,081 | |
ServiceMaster Co. LLC, 5.13%, 11/15/24(b)(g) | | | | | | | 288 | | | | 277,200 | |
| | | | | | | | |
| | | | | | | | | | | 2,982,623 | |
| Diversified Financial Services — 1.2% | |
Banca IFIS SpA, 4.50%, 10/17/27(c) | | | EUR | | | | 100 | | | | 90,216 | |
Controladora Mabe SA de C.V.,
5.60%, 10/23/28(b) | | | USD | | | | 624 | | | | 599,040 | |
Docuformas SAPI de C.V., 9.25%, 10/11/22(b)(g) | | | | | | | 508 | | | | 449,580 | |
Ford Motor Credit Co. LLC, 4.39%, 01/08/26(g) | | | | | | | 1,250 | | | | 1,146,559 | |
FS Energy & Power Fund, 7.50%, 08/15/23(b) | | | | | | | 308 | | | | 312,312 | |
Garfunkelux Holdco 3 SA, 4.50%, 09/01/23(c) | | | EUR | | | | 100 | | | | 103,332 | |
General Motors Financial Co., Inc., 4.25%, 05/15/23(g) | | | USD | | | | 326 | | | | 321,838 | |
Gilex Holding Sarl, 8.50%, 05/02/23(b)(e) | | | | | | | 256 | | | | 259,843 | |
HSBC Holdings PLC 6.25%(c)(g)(i) | | | | | | | 510,000 | | | | 495,338 | |
Intesa Sanpaolo SpA, 5.02%, 06/26/24(b)(g) | | | | | | | 2,888 | | | | 2,546,073 | |
| | | | | | | | | | | | |
| Security | | | | | Par
(000) | | | Value | |
| Diversified Financial Services (continued) | |
Intrum Justitia AB (3 mo. Euribor + 2.63%),
2.63%, 07/15/22(d) | | | EUR | | | | 100 | | | $ | 110,704 | |
Jefferies Finance LLC/JFIN Co-Issuer Corp., 7.38%, 04/01/20(b) | | | USD | | | | 845 | | | | 853,450 | |
LHC3 PLC, (4.13% Cash or 4.88% PIK),
4.13%, 08/15/24(j) | | | EUR | | | | 101 | | | | 113,510 | |
MSCI, Inc., 5.25%, 11/15/24(b) | | | USD | | | | 127 | | | | 127,952 | |
Tempo Acquisition LLC/Tempo Acquisition Finance Corp., 6.75%, 06/01/25(b)(g) | | | | | | | 584 | | | | 556,085 | |
Travelport Corporate Finance PLC, 6.00%, 03/15/26(b) | | | | | | | 204 | | | | 204,510 | |
UniCredit SpA: | | | | | | | | | | | | |
6.95%, 10/31/22 | | | EUR | | | | 100 | | | | 126,023 | |
(5 year EUR Swap + 4.10%),
5.75%, 10/28/25(h) | | | | | | | 100 | | | | 117,242 | |
Vantiv LLC/Vanity Issuer Corp.(b): | | | | | | | | | | | | |
3.88%, 11/15/25 | | | GBP | | | | 100 | | | | 124,587 | |
4.38%, 11/15/25 | | | USD | | | | 211 | | | | 199,131 | |
Verisure Midholding AB, 5.75%, 12/01/23 | | | EUR | | | | 100 | | | | 114,256 | |
WMG Acquisition Corp.: | | | | | | | | | | | | |
4.13%, 11/01/24 | | | | | | | 90 | | | | 105,975 | |
5.50%, 04/15/26(b) | | | USD | | | | 143 | | | | 139,425 | |
| | | | | | | | |
| | | | | | | | | | | 9,216,981 | |
| Diversified Telecommunication Services — 2.7% | |
AT&T, Inc., 4.75%, 05/15/46(g) | | | | | | | 2,545 | | | | 2,197,628 | |
CenturyLink, Inc.: | | | | | | | | | | | | |
Series P, 7.60%, 09/15/39 | | | | | | | 61 | | | | 52,460 | |
Series S, 6.45%, 06/15/21(g) | | | | | | | 516 | | | | 527,610 | |
Series U, 7.65%, 03/15/42(g) | | | | | | | 563 | | | | 484,180 | |
Series W, 6.75%, 12/01/23(g) | | | | | | | 386 | | | | 393,720 | |
Series Y, 7.50%, 04/01/24(g) | | | | | | | 435 | | | | 456,750 | |
Cincinnati Bell, Inc., 7.00%, 07/15/24(b)(g) | | | | | | | 480 | | | | 430,800 | |
Embarq Corp., 8.00%, 06/01/36 | | | | | | | 507 | | | | 482,917 | |
Frontier Communications Corp.: | | | | | | | | | | | | |
7.13%, 03/15/19 | | | | | | | 380 | | | | 380,950 | |
10.50%, 09/15/22 | | | | | | | 203 | | | | 168,997 | |
11.00%, 09/15/25 | | | | | | | 1,373 | | | | 1,005,722 | |
8.50%, 04/01/26(b) | | | | | | | 447 | | | | 415,151 | |
Level 3 Financing, Inc.: | | | | | | | | | | | | |
5.38%, 08/15/22 | | | | | | | 108 | | | | 108,270 | |
5.63%, 02/01/23 | | | | | | | 280 | | | | 281,050 | |
5.13%, 05/01/23(g) | | | | | | | 360 | | | | 357,300 | |
5.38%, 01/15/24(g) | | | | | | | 414 | | | | 409,860 | |
5.38%, 05/01/25(g) | | | | | | | 482 | | | | 470,552 | |
5.25%, 03/15/26(g) | | | | | | | 950 | | | | 912,000 | |
Oi SA, (8.00% Cash or 4.00% PIK),
10.00%, 07/27/25(j) | | | | | | | 507 | | | | 534,733 | |
OTE PLC, 3.50%, 07/09/20 | | | EUR | | | | 100 | | | | 117,591 | |
SoftBank Group Corp.(5 year USD ICE Swap + 4.85%), 6.88%(h)(i) | | | USD | | | | 345 | | | | 298,684 | |
Telecom Italia Capital SA: | | | | | | | | | | | | |
6.38%, 11/15/33 | | | | | | | 128 | | | | 117,120 | |
6.00%, 09/30/34(g) | | | | | | | 912 | | | | 823,080 | |
7.72%, 06/04/38 | | | | | | | 62 | | | | 62,775 | |
Telecom Italia Finance SA, 7.75%, 01/24/33 | | | EUR | | | | 81 | | | | 117,042 | |
Telecom Italia SpA: | | | | | | | | | | | | |
1.13%, 03/26/22(k) | | | | | | | 100 | | | | 107,186 | |
3.25%, 01/16/23 | | | | | | | 100 | | | | 116,296 | |
Telecom Italia SpA/Milano, 2.88%, 01/28/26 | | | | | | | 100 | | | | 108,584 | |
Verizon Communications, Inc., 6.55%, 09/15/43(g) | | | USD | | | | 6,500 | | | | 7,490,291 | |
| | | | | | | | |
| | | | | | | | | | | 19,429,299 | |
| | |
| 52 | | 2018 BLACKROCK ANNUAL REPORTTO SHAREHOLDERS |
| | |
Consolidated Schedule of Investments (continued) October 31, 2018 | | BlackRock Multi-Sector Income Trust (BIT) (Percentages shown are based on Net Assets) |
| | | | | | | | | | | | |
| Security | | | | | Par
(000) | | | Value | |
| Electric Utilities — 1.3% | |
Celeo Redes Operacion Chile SA,
5.20%, 06/22/47(b) | | | USD | | | | 1,177 | | | $ | 1,148,823 | |
Centrais Eletricas Brasileiras SA,
5.75%, 10/27/21(b) | | | | | | | 1,300 | | | | 1,305,200 | |
DPL, Inc., 7.25%, 10/15/21 | | | | | | | 34 | | | | 36,104 | |
Duke Energy Corp., 4.80%, 12/15/45(g) | | | | | | | 1,500 | | | | 1,487,603 | |
Emera US Finance LP, 4.75%, 06/15/46(g) | | | | | | | 200 | | | | 187,033 | |
Enel Finance International NV,
3.63%, 05/25/27(b)(g) | | | | | | | 1,250 | | | | 1,085,319 | |
Energuate Trust, 5.88%, 05/03/27(b)(g) | | | | | | | 575 | | | | 544,100 | |
Eskom Holdings SOC Ltd., 6.35%, 08/10/28(b) | | | | | | | 1,137 | | | | 1,095,556 | |
Inkia Energy Ltd., 5.88%, 11/09/27(b)(g) | | | | | | | 455 | | | | 429,866 | |
NextEra Energy Operating Partners LP(b): | | | | | | | | | | | | |
4.25%, 09/15/24 | | | | | | | 119 | | | | 113,050 | |
4.50%, 09/15/27 | | | | | | | 12 | | | | 11,070 | |
Southern Co., 4.40%, 07/01/46(g) | | | | | | | 1,000 | | | | 918,805 | |
Talen Energy Supply LLC, 6.50%, 06/01/25 | | | | | | | 209 | | | | 155,705 | |
Virginia Electric & Power Co., Series A, 6.00%, 05/15/37(g) | | | | | | | 750 | | | | 886,633 | |
| | | | | | | | |
| | | | | | | | | | | 9,404,867 | |
| Electrical Equipment — 0.0% | |
Areva SA, 4.88%, 09/23/24 | | | EUR | | | | 100 | | | | 117,195 | |
| | | | | | | | |
| Electronic Equipment, Instruments & Components — 0.4% | |
CDW LLC/CDW Finance Corp.: | | | | | | | | | | | | |
5.00%, 09/01/23(g) | | | USD | | | | 325 | | | | 323,375 | |
5.50%, 12/01/24(g) | | | | | | | 306 | | | | 309,060 | |
5.00%, 09/01/25 | | | | | | | 127 | | | | 123,825 | |
Corning, Inc., 4.38%, 11/15/57(g) | | | | | | | 1,915 | | | | 1,556,464 | |
Energizer Gamma Acquisition BV, 4.63%, 07/15/26 | | | EUR | | | | 100 | | | | 115,984 | |
Energizer Gamma Acquisition, Inc., 6.38%, 07/15/26(b) | | | USD | | | | 89 | | | | 89,000 | |
Itron, Inc., 5.00%, 01/15/26(b) | | | | | | | 29 | | | | 27,006 | |
| | | | | | | | |
| | | | | | | | | | | 2,544,714 | |
| Energy Equipment & Services — 1.0% | |
Calfrac Holdings LP, 8.50%, 06/15/26(b) | | | | | | | 195 | | | | 175,500 | |
CSI Compressco LP/CSI Compressco Finance, Inc., 7.50%, 04/01/25(b) | | | | | | | 391 | | | | 391,977 | |
Ensco PLC: | | | | | | | | | | | | |
4.50%, 10/01/24 | | | | | | | 34 | | | | 27,625 | |
5.20%, 03/15/25 | | | | | | | 364 | | | | 298,480 | |
7.75%, 02/01/26(g) | | | | | | | 752 | | | | 701,240 | |
5.75%, 10/01/44 | | | | | | | 39 | | | | 27,300 | |
Gates Global LLC/Gates Global Co., 6.00%, 07/15/22(b)(g) | | | | | | | 601 | | | | 597,995 | |
McDermott Technology Americas, Inc./McDermott Technology U.S., Inc., 10.63%, 05/01/24(b) | | | | | | | 129 | | | | 117,068 | |
Oceaneering International, Inc., 4.65%, 11/15/24 | | | | | | | 52 | | | | 48,280 | |
Odebrecht Oil & Gas Finance Ltd., 0.00%(b)(i)(l) | | | BRL | | | | 155 | | | | 2,799 | |
Pattern Energy Group, Inc., 5.88%, 02/01/24(b) | | | USD | | | | 263 | | | | 260,370 | |
Pioneer Energy Services Corp., 6.13%, 03/15/22(g) | | | | | | | 233 | | | | 198,632 | |
Precision Drilling Corp.: | | | | | | | | | | | | |
G29 | | | | | | | | | | | | |
6.50%, 12/15/21 | | | | | | | 65 | | | | 66,001 | |
7.75%, 12/15/23 | | | | | | | 90 | | | | 93,600 | |
7.13%, 01/15/26(b) | | | | | | | 13 | | | | 12,903 | |
Transocean, Inc.: | | | | | | | | | | | | |
8.38%, 12/15/21 | | | | | | | 47 | | | | 50,290 | |
5.80%, 10/15/22(g) | | | | | | | 619 | | | | 601,977 | |
9.00%, 07/15/23(b)(g) | | | | | | | 956 | | | | 1,002,605 | |
7.25%, 11/01/25(b) | | | | | | | 380 | | | | 369,550 | |
7.50%, 01/15/26(b) | | | | | | | 144 | | | | 141,480 | |
Trinidad Drilling Ltd., 6.63%, 02/15/25(b)(g) | | | | | | | 314 | | | | 314,000 | |
| | | | | | | | | | | | |
| Security | | | | | Par
(000) | | | Value | |
| Energy Equipment & Services (continued) | |
USA Compression Partners LP/USA Compression Finance Corp., 6.88%, 04/01/26(b)(g) | | | USD | | | | 329 | | | $ | 332,290 | |
Weatherford International Ltd.: | | | | | | | | | | | | |
7.75%, 06/15/21(g) | | | | | | | 770 | | | | 639,100 | |
8.25%, 06/15/23 | | | | | | | 153 | | | | 116,663 | |
6.50%, 08/01/36(g) | | | | | | | 144 | | | | 95,760 | |
7.00%, 03/15/38(g) | | | | | | | 197 | | | | 132,975 | |
5.95%, 04/15/42 | | | | | | | 256 | | | | 165,120 | |
| | | | | | | | |
| | | | 6,981,580 | |
| Environmental, Maintenance, & Security Service — 0.1% | |
Hulk Finance Corp., 7.00%, 06/01/26(b) | | | | | | | 238 | | | | 220,150 | |
Tervita Escrow Corp., 7.63%, 12/01/21(b)(g) | | | | | | | 465 | | | | 471,975 | |
Waste Pro USA, Inc., 5.50%, 02/15/26(b) | | | | | | | 260 | | | | 246,350 | |
| | | | | | | | |
| | | | 938,475 | |
| Equity Real Estate Investment Trusts (REITs) — 1.0% | |
Five Point Operating Co. LP/Five Point Capital Corp., 7.88%, 11/15/25(b)(g) | | | | | | | 171 | | | | 169,410 | |
GEO Group, Inc.: | | | | | | | | | | | | |
5.13%, 04/01/23(g) | | | | | | | 337 | | | | 316,359 | |
5.88%, 10/15/24(g) | | | | | | | 285 | | | | 264,280 | |
6.00%, 04/15/26 | | | | | | | 12 | | | | 10,980 | |
Hilton Domestic Operating Co., Inc.(g): | | | | | | | | | | | | |
4.25%, 09/01/24 | | | | | | | 304 | | | | 291,931 | |
5.13%, 05/01/26(b) | | | | | | | 351 | | | | 343,102 | |
Hilton Worldwide Finance LLC/Hilton Worldwide Finance Corp., 4.63%, 04/01/25 | | | | | | | 34 | | | | 32,980 | |
iStar, Inc.: | | | | | | | | | | | | |
4.63%, 09/15/20 | | | | | | | 40 | | | | 39,700 | |
6.00%, 04/01/22(g) | | | | | | | 96 | | | | 96,000 | |
5.25%, 09/15/22(g) | | | | | | | 81 | | | | 78,368 | |
Marriott Ownership Resorts, Inc., 6.50%, 09/15/26(b) | | | | | | | 169 | | | | 170,690 | |
MGM Growth Properties Operating Partnership LP/MGP Finance Co-Issuer, Inc.(g): | | | | | | | | | | | | |
5.63%, 05/01/24 | | | | | | | 1,547 | | | | 1,548,934 | |
4.50%, 09/01/26 | | | | | | | 741 | | | | 670,605 | |
MPT Operating Partnership LP/MPT Finance Corp.: | | | | | | | | | | | | |
6.38%, 03/01/24 | | | | | | | 48 | | | | 49,680 | |
5.50%, 05/01/24 | | | | | | | 60 | | | | 60,600 | |
5.00%, 10/15/27 | | | | | | | 286 | | | | 268,754 | |
NH Hotel Group SA, 3.75%, 10/01/23 | | | EUR | | | | 129 | | | | 150,707 | |
Starwood Property Trust, Inc., 5.00%,
12/15/21(g) | | | USD | | | | 278 | | | | 276,610 | |
Trust F/1401, 6.95%, 01/30/44 | | | | | | | 1,738 | | | | 1,728,024 | |
VICI Properties 1 LLC/VICI FC, Inc.,
8.00%, 10/15/23(g) | | | | | | | 168 | | | | 184,051 | |
Wyndham Hotels & Resorts, Inc., 5.38%, 04/15/26(b) | | | | | | | 148 | | | | 143,560 | |
| | | | | | | | |
| | | | 6,895,325 | |
| Food & Staples Retailing — 0.2% | |
Albertsons Cos. LLC/Safeway, Inc./New Albertson’s, Inc./Albertson’s LLC: | | | | | | | | | | | | |
6.63%, 06/15/24(g) | | | | | | | 206 | | | | 194,670 | |
5.75%, 03/15/25 | | | | | | | 134 | | | | 117,920 | |
B&M European Value Retail SA, 4.13%, 02/01/22 | | | GBP | | | | 100 | | | | 127,903 | |
Casino Guichard Perrachon SA, 4.56%, 01/25/23 | | | EUR | | | | 100 | | | | 110,132 | |
Rite Aid Corp., 6.13%, 04/01/23(b) | | | USD | | | | 132 | | | | 112,118 | |
Walgreens Boots Alliance, Inc.,
4.80%, 11/18/44(g) | | | | | | | 750 | | | | 692,073 | |
| | | | | | | | |
| | | | | | | | | | | 1,354,816 | |
| | | | |
| CONSOLIDATED SCHEDULES OF INVESTMENTS | | | 53 | |
| | |
Consolidated Schedule of Investments (continued) October 31, 2018 | | BlackRock Multi-Sector Income Trust (BIT) (Percentages shown are based on Net Assets) |
| | | | | | | | | | | | |
| Security | | | | | Par
(000) | | | Value | |
| Food Products — 0.8% | |
Aramark Services, Inc.: | | | | | | | | | | | | |
5.13%, 01/15/24 | | | USD | | | | 111 | | | $ | 110,445 | |
5.00%, 04/01/25(b) | | | | | | | 14 | | | | 13,790 | |
4.75%, 06/01/26(g) | | | | | | | 252 | | | | 240,030 | |
5.00%, 02/01/28(b)(g) | | | | | | | 440 | | | | 417,450 | |
Arcor SAIC, 6.00%, 07/06/23(b) | | | | | | | 539 | | | | 528,220 | |
B&G Foods, Inc., 5.25%, 04/01/25 | | | | | | | 61 | | | | 58,103 | |
Chobani LLC/Chobani Finance Corp., Inc., 7.50%, 04/15/25(b)(g) | | | | | | | 317 | | | | 271,035 | |
JBS USA LUX SA/JBS USA Finance, Inc.(b): | | | | | | | | | | | | |
5.88%, 07/15/24 | | | | | | | 503 | | | | 493,694 | |
5.75%, 06/15/25(g) | | | | | | | 1,007 | | | | 966,720 | |
6.75%, 02/15/28(g) | | | | | | | 380 | | | | 366,225 | |
MARB BondCo PLC: | | | | | | | | | | | | |
7.00%, 03/15/24 | | | | | | | 229 | | | | 219,485 | |
6.88%, 01/19/25(b) | | | | | | | 637 | | | | 598,589 | |
Minerva Luxembourg SA, 6.50%, 09/20/26(b) | | | | | | | 637 | | | | 588,429 | |
Post Holdings, Inc.(b): | | | | | | | | | | | | |
5.50%, 03/01/25(g) | | | | | | | 273 | | | | 264,127 | |
5.75%, 03/01/27(g) | | | | | | | 294 | | | | 280,770 | |
5.63%, 01/15/28 | | | | | | | 86 | | | | 80,866 | |
Simmons Foods, Inc., 7.75%, 01/15/24(b) | | | | | | | 159 | | | | 160,590 | |
| | | | | | | | |
| | | | | | | | | | | 5,658,568 | |
| Health Care Equipment & Supplies — 0.9% | |
Avantor, Inc.(b)(g): | | | | | | | | | | | | |
6.00%, 10/01/24 | | | | | | | 1,645 | | | | 1,640,887 | |
9.00%, 10/01/25 | | | | | | | 615 | | | | 620,154 | |
Crimson Merger Sub, Inc., 6.63%, 05/15/22(b)(g) | | | | | | | 1,764 | | | | 1,695,204 | |
DJO Finance LLC/DJO Finance Corp., 8.13%, 06/15/21(b)(g) | | | | | | | 998 | | | | 1,004,687 | |
Immucor, Inc., 11.13%, 02/15/22(b) | | | | | | | 112 | | | | 114,940 | |
Mallinckrodt International Finance SA/Mallinckrodt CB LLC(b): | | | | | | | | | | | | |
5.75%, 08/01/22 | | | | | | | 388 | | | | 346,290 | |
5.63%, 10/15/23(g) | | | | | | | 164 | | | | 140,630 | |
5.50%, 04/15/25(g) | | | | | | | 95 | | | | 76,475 | |
Medtronic, Inc., 4.50%, 03/15/42(g) | | | | | | | 1,000 | | | | 979,499 | |
Teleflex, Inc., 4.88%, 06/01/26 | | | | | | | 63 | | | | 61,425 | |
| | | | | | | | |
| | | | | | | | | | | 6,680,191 | |
| Health Care Providers & Services — 2.9% | |
Acadia Healthcare Co., Inc.: | | | | | | | | | | | | |
5.63%, 02/15/23(g) | | | | | | | 210 | | | | 210,263 | |
6.50%, 03/01/24 | | | | | | | 565 | | | | 574,322 | |
AHP Health Partners, Inc., 9.75%, 07/15/26(b) | | | | | | | 164 | | | | 166,870 | |
Centene Corp.: | | | | | | | | | | | | |
4.75%, 05/15/22(g) | | | | | | | 402 | | | | 402,503 | |
6.13%, 02/15/24 | | | | | | | 40 | | | | 41,800 | |
5.38%, 06/01/26(b)(g) | | | | | | | 1,675 | | | | 1,700,125 | |
CHS/Community Health Systems, Inc.,
8.63%, 01/15/24(b) | | | | | | | 495 | | | | 500,569 | |
DaVita, Inc., 5.13%, 07/15/24(g) | | | | | | | 276 | | | | 263,580 | |
Eagle Holding Co. II LLC, (7.63% Cash or 8.38% PIK), 7.63%, 05/15/22(b)(g)(j) | | | | | | | 219 | | | | 220,095 | |
HCA, Inc.: | | | | | | | | | | | | |
4.75%, 05/01/23(g) | | | | | | | 224 | | | | 226,240 | |
5.00%, 03/15/24(g) | | | | | | | 1,158 | | | | 1,171,751 | |
5.25%, 04/15/25(g) | | | | | | | 1,683 | | | | 1,718,764 | |
5.25%, 06/15/26(g) | | | | | | | 440 | | | | 447,700 | |
5.38%, 09/01/26 | | | | | | | 425 | | | | 421,812 | |
5.63%, 09/01/28 | | | | | | | 450 | | | | 445,500 | |
5.50%, 06/15/47(g) | | | | | | | 1,550 | | | | 1,525,200 | |
| | | | | | | | | | | | |
| Security | | | | | Par
(000) | | | Value | |
| Health Care Providers & Services (continued) | |
HealthSouth Corp., 5.75%, 11/01/24 | | | USD | | | | 76 | | | $ | 75,810 | |
MEDNAX, Inc., 5.25%, 12/01/23(b)(g) | | | | | | | 143 | | | | 142,821 | |
Molina Healthcare, Inc., 4.88%, 06/15/25(b) | | | | | | | 126 | | | | 120,330 | |
MPH Acquisition Holdings LLC,
7.13%, 06/01/24(b)(g) | | | | | | | 590 | | | | 599,334 | |
Northwell Healthcare, Inc., 4.26%, 11/01/47(g) | | | | | | | 686 | | | | 623,593 | |
NVA Holdings, Inc., 6.88%, 04/01/26(b) | | | | | | | 287 | | | | 283,413 | |
Polaris Intermediate Corp., (8.50% Cash), 8.50%, 12/01/22(b)(g)(j) | | | | | | | 1,046 | | | | 1,072,150 | |
Regional Care Hospital Partners Holdings, Inc., 8.25%, 05/01/23(b)(g) | | | | | | | 222 | | | | 234,488 | |
Sterigenics-Nordion Holdings LLC,
6.50%, 05/15/23(b) | | | | | | | 218 | | | | 213,095 | |
Surgery Center Holdings, Inc.(b): | | | | | | | | | | | | |
8.88%, 04/15/21 | | | | | | | 162 | | | | 166,455 | |
6.75%, 07/01/25(g) | | | | | | | 324 | | | | 304,560 | |
Team Health Holdings, Inc., 6.38%, 02/01/25(b)(g) | | | | | | | 496 | | | | 427,800 | |
Tenet Healthcare Corp.: | | | | | | | | | | | | |
6.00%, 10/01/20(g) | | | | | | | 806 | | | | 825,384 | |
7.50%, 01/01/22(b) | | | | | | | 206 | | | | 214,755 | |
8.13%, 04/01/22(g) | | | | | | | 1,538 | | | | 1,601,442 | |
6.75%, 06/15/23 | | | | | | | 531 | | | | 527,681 | |
4.63%, 07/15/24(g) | | | | | | | 419 | | | | 403,853 | |
6.88%, 11/15/31 | | | | | | | 8 | | | | 7,040 | |
Thermo Fisher Scientific, Inc., 2.95%, 09/19/26(g) | | | | | | | 1,000 | | | | 913,173 | |
UnitedHealth Group, Inc., 4.38%, 03/15/42(g) | | | | | | | 750 | | | | 732,897 | |
Vizient, Inc., 10.38%, 03/01/24(b)(g) | | | | | | | 382 | | | | 415,425 | |
WellCare Health Plans, Inc.: | | | | | | | | | | | | |
5.25%, 04/01/25 | | | | | | | 101 | | | | 100,748 | |
5.38%, 08/15/26(b) | | | | | | | 372 | | | | 371,070 | |
| | | | | | | | |
| | | | | | | | | | | 20,414,411 | |
| Health Care Technology — 0.1% | |
Change Healthcare Holdings LLC/Change Healthcare Finance, Inc., 5.75%, 03/01/25(b) | | | | | | | 284 | | | | 277,610 | |
Quintiles IMS, Inc.: | | | | | | | | | | | | |
3.25%, 03/15/25(b) | | | EUR | | | | 100 | | | | 114,444 | |
3.25%, 03/15/25 | | | | | | | 194 | | | | 222,021 | |
| | | | | | | | |
| | | | | | | | | | | 614,075 | |
| Hotels, Restaurants & Leisure — 4.0% | |
Boyd Gaming Corp., 6.00%, 08/15/26 | | | USD | | | | 231 | | | | 223,204 | |
Boyne USA, Inc., 7.25%, 05/01/25(b) | | | | | | | 94 | | | | 97,995 | |
Churchill Downs, Inc., 4.75%, 01/15/28(b) | | | | | | | 82 | | | | 74,620 | |
Codere Finance 2 Luxembourg SA, 6.75%, 11/01/21 | | | EUR | | | | 100 | | | | 106,756 | |
CPUK Finance Ltd., 4.25%, 02/28/47 | | | GBP | | | | 100 | | | | 128,295 | |
CRC Escrow Issuer LLC/CRC Finco, Inc., 5.25%, 10/15/25(b)(g) | | | USD | | | | 353 | | | | 328,511 | |
Delta Merger Sub, Inc., 6.00%, 09/15/26(b) | | | | | | | 138 | | | | 135,157 | |
Eldorado Resorts, Inc., 6.00%, 04/01/25 | | | | | | | 106 | | | | 104,675 | |
Enterprise Inns PLC, 6.00%, 10/06/23 | | | GBP | | | | 3,320 | | | | 4,581,468 | |
ESH Hospitality, Inc., 5.25%, 05/01/25(b)(g) | | | USD | | | | 242 | | | | 228,992 | |
GLP Capital LP/GLP Financing II, Inc.: | | | | | | | | | | | | |
5.38%, 11/01/23 | | | | | | | 148 | | | | 151,836 | |
5.25%, 06/01/25 | | | | | | | 54 | | | | 54,271 | |
5.75%, 06/01/28 | | | | | | | 19 | | | | 19,202 | |
Golden Nugget, Inc., 6.75%, 10/15/24(b)(g) | | | | | | | 619 | | | | 617,452 | |
International Game Technology PLC: | | | | | | | | | | | | |
4.75%, 02/15/23 | | | EUR | | | | 107 | | | | 129,402 | |
6.25%, 01/15/27(b) | | | USD | | | | 264 | | | | 259,050 | |
IRB Holding Corp., 6.75%, 02/15/26(b) | | | | | | | 81 | | | | 77,558 | |
| | |
| 54 | | 2018 BLACKROCK ANNUAL REPORTTO SHAREHOLDERS |
| | |
Consolidated Schedule of Investments (continued) October 31, 2018 | | BlackRock Multi-Sector Income Trust (BIT) (Percentages shown are based on Net Assets) |
| | | | | | | | | | | | |
| Security | | | | | Par
(000) | | | Value | |
| Hotels, Restaurants & Leisure (continued) | |
KFC Holding Co./Pizza Hut Holdings LLC/Taco Bell of America LLC(b): | | | | | | | | | | | | |
5.00%, 06/01/24 | | | USD | | | | 45 | | | $ | 44,381 | |
5.25%, 06/01/26(g) | | | | | | | 406 | | | | 398,895 | |
4.75%, 06/01/27 | | | | | | | 9 | | | | 8,460 | |
Ladbrokes Group Finance PLC, 5.13%, 09/08/23 | | | GBP | | | | 200 | | | | 265,975 | |
McDonald’s Corp., 3.70%, 01/30/26(g) | | | USD | | | | 750 | | | | 731,734 | |
Melco Resorts Finance Ltd., 4.88%, 06/06/25(b)(g) | | | | | | | 245 | | | | 224,589 | |
MGM Resorts International: | | | | | | | | | | | | |
6.63%, 12/15/21(g) | | | | | | | 1,390 | | | | 1,455,594 | |
7.75%, 03/15/22(g) | | | | | | | 180 | | | | 193,275 | |
4.63%, 09/01/26 | | | | | | | 38 | | | | 34,295 | |
New Red Finance, Inc.(b)(g): | | | | | | | | | | | | |
4.25%, 05/15/24 | | | | | | | 291 | | | | 273,540 | |
5.00%, 10/15/25 | | | | | | | 2,160 | | | | 2,025,000 | |
RHP Hotel Properties LP/RHP Finance Corp., 5.00%, 04/15/21(g) | | | | | | | 460 | | | | 459,425 | |
Scientific Games International, Inc.: | | | | | | | | | | | | |
10.00%, 12/01/22(g) | | | | | | | 600 | | | | 627,000 | |
5.00%, 10/15/25 (b)(g) | | | | | | | 520 | | | | 483,600 | |
3.38%, 02/15/26 | | | EUR | | | | 300 | | | | 314,548 | |
Six Flags Entertainment Corp.,
4.88%, 07/31/24(b)(g) | | | USD | | | | 1,045 | | | | 987,525 | |
Stars Group Holdings BV/Stars Group US Co-Borrower LLC, 7.00%, 07/15/26(b) | | | | | | | 216 | | | | 219,240 | |
Station Casinos LLC, 5.00%, 10/01/25(b)(g) | | | | | | | 343 | | | | 318,565 | |
Stonegate Pub Co. Financing PLC,
4.88%, 03/15/22 | | | GBP | | | | 100 | | | | 125,322 | |
Unique Pub Finance Co. PLC: | | | | | | | | | | | | |
Series A3, 6.54%, 03/30/21 | | | | | | | 1,163 | | | | 1,553,167 | |
Series M, 7.40%, 03/28/24 | | | | | | | 6,400 | | | | 9,015,750 | |
Vue International Bidco PLC, 7.88%, 07/15/20 | | | | | | | 117 | | | | 149,549 | |
Wyndham Destinations, Inc.: | | | | | | | | | | | | |
4.15%, 04/01/24 | | | USD | | | | 16 | | | | 15,400 | |
4.50%, 04/01/27 | | | | | | | 76 | | | | 70,395 | |
Wyndham Worldwide Corp., 3.90%, 03/01/23 | | | | | | | 202 | | | | 186,850 | |
Wynn Macau Ltd., 5.50%, 10/01/27(b)(g) | | | | | | | 600 | | | | 541,500 | |
Yum! Brands, Inc.: | | | | | | | | | | | | |
3.88%, 11/01/23 | | | | | | | 110 | | | | 103,950 | |
5.35%, 11/01/43 | | | | | | | 7 | | | | 6,090 | |
| | | | | | | | |
| | | | | | | | | | | 28,152,058 | |
| Household Durables — 0.9% | |
Algeco Scotsman Global Finance PLC, 8.00%, 02/15/23(b) | | | | | | | 761 | | | | 764,805 | |
Brookfield Residential Properties, Inc./Brookfield Residential US Corp., 6.13%, 07/01/22(b)(g) | | | | | | | 599 | | | | 584,025 | |
Century Communities, Inc., 6.88%, 05/15/22(g) | | | | | | | 569 | | | | 566,155 | |
K Hovnanian Enterprises, Inc.,
10.00%, 07/15/22(b) | | | | | | | 242 | | | | 233,530 | |
Lennar Corp.: | | | | | | | | | | | | |
8.38%, 01/15/21 | | | | | | | 144 | | | | 155,160 | |
6.25%, 12/15/21(g) | | | | | | | 450 | | | | 464,625 | |
4.88%, 12/15/23 | | | | | | | 146 | | | | 142,532 | |
4.75%, 05/30/25(g) | | | | | | | 410 | | | | 390,525 | |
5.25%, 06/01/26 | | | | | | | 32 | | | | 30,562 | |
4.75%, 11/29/27(g) | | | | | | | 425 | | | | 397,375 | |
Mattamy Group Corp.(b): | | | | | | | | | | | | |
6.88%, 12/15/23 | | | | | | | 169 | | | | 164,564 | |
6.50%, 10/01/25 | | | | | | | 205 | | | | 192,700 | |
MDC Holdings, Inc., 6.00%, 01/15/43 | | | | | | | 144 | | | | 115,200 | |
Meritage Homes Corp., 5.13%, 06/06/27 | | | | | | | 91 | | | | 80,080 | |
| | | | | | | | | | | | |
| Security | | | | | Par
(000) | | | Value | |
| Household Durables (continued) | |
Newell Brands, Inc., 4.20%, 04/01/26(g) | | | USD | | | | 1,000 | | | $ | 918,702 | |
PulteGroup, Inc.: | | | | | | | | | | | | |
6.38%, 05/15/33(g) | | | | | | | 469 | | | | 434,997 | |
6.00%, 02/15/35 | | | | | | | 48 | | | | 43,440 | |
Tempur Sealy International, Inc.,
5.50%, 06/15/26(g) | | | | | | | 191 | | | | 174,765 | |
TRI Pointe Group, Inc.: | | | | | | | | | | | | |
4.88%, 07/01/21 | | | | | | | 124 | | | | 122,760 | |
5.25%, 06/01/27(g) | | | | | | | 46 | | | | 39,273 | |
TRI Pointe Group, Inc./TRI Pointe Homes, Inc.: | | | | | | | | | | | | |
4.38%, 06/15/19(g) | | | | | | | 225 | | | | 225,000 | |
5.88%, 06/15/24 | | | | | | | 207 | | | | 193,286 | |
| | | | | | | | |
| | | | | | | | | | | 6,434,061 | |
| Household Products — 0.0% | |
ACCO Brands Corp., 5.25%, 12/15/24(b) | | | | | | | 102 | | | | 94,860 | |
| | | | | | | | |
| Independent Power and Renewable Electricity Producers — 1.0% | |
AES Corp.: | | | | | | | | | | | | |
4.50%, 03/15/23 | | | | | | | 227 | | | | 223,879 | |
4.88%, 05/15/23(g) | | | | | | | 204 | | | | 201,960 | |
5.50%, 04/15/25 | | | | | | | 97 | | | | 97,242 | |
6.00%, 05/15/26(g) | | | | | | | 352 | | | | 359,920 | |
5.13%, 09/01/27 | | | | | | | 316 | | | | 312,050 | |
Calpine Corp.: | | | | | | | | | | | | |
5.38%, 01/15/23 | | | | | | | 440 | | | | 416,900 | |
5.88%, 01/15/24(b)(g) | | | | | | | 481 | | | | 481,000 | |
5.75%, 01/15/25 | | | | | | | 110 | | | | 98,290 | |
5.25%, 06/01/26(b)(g) | | | | | | | 921 | | | | 846,169 | |
Clearway Energy Operating LLC,
5.75%, 10/15/25(b) | | | | | | | 423 | | | | 416,655 | |
Dynegy, Inc.: | | | | | | | | | | | | |
7.38%, 11/01/22 | | | | | | | 43 | | | | 44,613 | |
7.63%, 11/01/24 | | | | | | | 148 | | | | 156,510 | |
Genneia SA, 8.75%, 01/20/22(b)(g) | | | | | | | 1,061 | | | | 986,741 | |
NRG Energy, Inc.(g): | | | | | | | | | | | | |
6.63%, 01/15/27 | | | | | | | 1,080 | | | | 1,117,800 | |
5.75%, 01/15/28 | | | | | | | 237 | | | | 236,407 | |
NRG Yield Operating LLC, 5.38%, 08/15/24(g) | | | | | | | 254 | | | | 251,301 | |
QEP Resources, Inc., 5.38%, 10/01/22(g) | | | | | | | 516 | | | | 508,260 | |
TerraForm Power Operating LLC(b): | | | | | | | | | | | | |
4.25%, 01/31/23 | | | | | | | 214 | | | | 202,765 | |
6.63%, 06/15/25(m) | | | | | | | 35 | | | | 36,488 | |
5.00%, 01/31/28 | | | | | | | 214 | | | | 191,262 | |
| | | | | | | | |
| | | | | | | | | | | 7,186,212 | |
| Industrial Conglomerates — 0.3% | |
Algeco Global Finance PLC, 6.50%, 02/15/23 | | | EUR | | | | 100 | | | | 116,940 | |
Apergy Corp., 6.38%, 05/01/26(b)(e) | | | USD | | | | 119 | | | | 120,488 | |
BWX Technologies, Inc., 5.38%, 07/15/26(b) | | | | | | | 181 | | | | 181,452 | |
Colfax Corp., 3.25%, 05/15/25 | | | EUR | | | | 100 | | | | 113,282 | |
General Electric Co., 4.13%, 10/09/42(g) | | | USD | | | | 750 | | | | 618,683 | |
Vertiv Group Corp., 9.25%, 10/15/24(b)(g) | | | | | | | 728 | | | | 724,360 | |
| | | | | | | | |
| | | | | | | | | | | 1,875,205 | |
| Insurance — 0.9% | |
American International Group, Inc.,
4.80%, 07/10/45(g) | | | | | | | 500 | | | | 465,215 | |
AmWINS Group, Inc., 7.75%, 07/01/26(b) | | | | | | | 226 | | | | 232,215 | |
Aon PLC, 3.88%, 12/15/25(g) | | | | | | | 1,280 | | | | 1,255,077 | |
Assicurazioni Generali SpA(h): | | | | | | | | | | | | |
(3 mo. Euribor + 7.11%), 7.75%, 12/12/42 | | | EUR | | | | 100 | | | | 131,027 | |
(3 mo. Euribor + 5.35%), 5.50%, 10/27/47 | | | | | | | 100 | | | | 117,549 | |
| | | | |
| CONSOLIDATED SCHEDULES OF INVESTMENTS | | | 55 | |
| | |
Consolidated Schedule of Investments (continued) October 31, 2018 | | BlackRock Multi-Sector Income Trust (BIT) (Percentages shown are based on Net Assets) |
| | | | | | | | | | | | |
| Security | | | | | Par
(000) | | | Value | |
| Insurance (continued) | |
AssuredPartners, Inc., 7.00%, 08/15/25(b) | | | USD | | | | 18 | | | $ | 17,707 | |
Groupama SA, 6.00%, 01/23/27 | | | EUR | | | | 100 | | | | 131,387 | |
HUB International Ltd., 7.00%, 05/01/26(b) | | | USD | | | | 656 | | | | 640,256 | |
Nationwide Building Society,
4.13%, 10/18/32(b)(c)(g) | | | | | | | 690 | | | | 614,507 | |
Teachers Insurance & Annuity Association of America, 4.27%, 05/15/47(b)(g) | | | | | | | 700 | | | | 655,578 | |
USIS Merger Sub, Inc., 6.88%, 05/01/25(b) | | | | | | | 72 | | | | 70,560 | |
Wand Merger Corp.(b): | | | | | | | | | | | | |
8.13%, 07/15/23 | | | | | | | 322 | | | | 327,635 | |
9.13%, 07/15/26 | | | | | | | 220 | | | | 223,300 | |
Wayne Merger Sub LLC, 8.25%, 08/01/23(b)(g) | | | | | | | 1,174 | | | | 1,213,482 | |
| | | | | | | | |
| | | | | | | | | | | 6,095,495 | |
| Internet Software & Services — 0.4% | |
Equinix, Inc.: | | | | | | | | | | | | |
2.88%, 03/15/24 | | | EUR | | | | 100 | | | | 114,681 | |
2.88%, 10/01/25 | | | | | | | 100 | | | | 110,968 | |
5.88%, 01/15/26(g) | | | USD | | | | 566 | | | | 575,905 | |
Netflix, Inc.: | | | | | | | | | | | | |
5.50%, 02/15/22 | | | | | | | 15 | | | | 15,298 | |
4.38%, 11/15/26(g) | | | | | | | 119 | | | | 109,331 | |
5.88%, 11/15/28(b)(g) | | | | | | | 596 | | | | 585,570 | |
4.63%, 05/15/29 | | | EUR | | | | 100 | | | | 113,548 | |
Rackspace Hosting, Inc., 8.63%, 11/15/24(b)(g) | | | USD | | | | 182 | | | | 171,080 | |
Sabre GLBL, Inc., 5.25%, 11/15/23(b)(g) | | | | | | | 269 | | | | 265,605 | |
Symantec Corp., 5.00%, 04/15/25(b)(g) | | | | | | | 187 | | | | 175,900 | |
Uber Technologies, Inc., 7.50%, 11/01/23(a)(b) | | | | | | | 146 | | | | 145,407 | |
United Group BV(3 mo. Euribor + 4.38%), 4.38%, 07/01/23(d) | | | EUR | | | | 100 | | | | 113,653 | |
| | | | | | | | |
| | | | | | | | | | | 2,496,946 | |
| IT Services — 1.0% | |
Banff Merger Sub, Inc.: | | | | | | | | | | | | |
8.38%, 09/01/26 | | | | | | | 130 | | | | 145,728 | |
9.75%, 09/01/26(b) | | | USD | | | | 1,493 | | | | 1,433,280 | |
Fidelity National Information Services, Inc., 3.00%, 08/15/26(g) | | | | | | | 1,000 | | | | 909,149 | |
First Data Corp.(b): | | | | | | | | | | | | |
7.00%, 12/01/23(g) | | | | | | | 1,335 | | | | 1,384,395 | |
5.00%, 01/15/24 | | | | | | | 160 | | | | 158,000 | |
5.75%, 01/15/24(g) | | | | | | | 2,668 | | | | 2,684,675 | |
Gartner, Inc., 5.13%, 04/01/25(b)(g) | | | | | | | 207 | | | | 205,447 | |
InterXion Holding NV, 4.75%, 06/15/25 | | | EUR | | | | 100 | | | | 118,079 | |
WEX, Inc., 4.75%, 02/01/23(b) | | | USD | | | | 108 | | | | 107,460 | |
| | | | | | | | |
| | | | | | | | | | | 7,146,213 | |
| Leisure Products — 0.1% | |
Mattel, Inc.: | | | | | | | | | | | | |
6.75%, 12/31/25(b) | | | | | | | 385 | | | | 368,638 | |
6.20%, 10/01/40 | | | | | | | 80 | | | | 65,200 | |
5.45%, 11/01/41 | | | | | | | 47 | | | | 37,600 | |
| | | | | | | | |
| | | | | | | | | | | 471,438 | |
| Machinery — 0.3% | |
Mueller Water Products, Inc., 5.50%, 06/15/26(b) | | | | | | | 201 | | | | 198,990 | |
Platin 1426 GmbH, 5.38%, 06/15/23 | | | EUR | | | | 118 | | | | 129,476 | |
RBS Global, Inc./Rexnord LLC,
4.88%, 12/15/25(b)(g) | | | USD | | | | 255 | | | | 239,062 | |
SPX FLOW, Inc.(b): | | | | | | | | | | | | |
5.63%, 08/15/24(g) | | | | | | | 330 | | | | 320,100 | |
5.88%, 08/15/26 | | | | | | | 153 | | | | 146,880 | |
Terex Corp., 5.63%, 02/01/25(b)(g) | | | | | | | 419 | | | | 398,574 | |
| | | | | | | | | | | | |
| Security | | | | | Par
(000) | | | Value | |
| Machinery (continued) | |
Titan Acquisition Ltd./Titan Co-Borrower LLC, 7.75%, 04/15/26(b)(g) | | | USD | | | | 632 | | | $ | 526,140 | |
Wabash National Corp., 5.50%, 10/01/25(b)(g) | | | | | | | 286 | | | | 257,400 | |
| | | | | | | | |
| | | | | | | | | | | 2,216,622 | |
| Media — 6.5% | |
Altice Financing SA(b)(g): | | | | | | | | | | | | |
6.63%, 02/15/23 | | | | | | | 400 | | | | 395,920 | |
7.50%, 05/15/26 | | | | | | | 613 | | | | 576,220 | |
Altice France SA(b): | | | | | | | | | | | | |
7.38%, 05/01/26(g) | | | | | | | 951 | | | | 910,288 | |
8.13%, 02/01/27 | | | | | | | 1,400 | | | | 1,386,000 | |
Altice Luxembourg SA, 7.75%, 05/15/22(b)(g) | | | | | | | 1,199 | | | | 1,116,569 | |
Altice US Finance I Corp.(b): | | | | | | | | | | | | |
5.38%, 07/15/23(g) | | | | | | | 980 | | | | 979,814 | |
5.50%, 05/15/26 | | | | | | | 800 | | | | 779,248 | |
AMC Networks, Inc., 4.75%, 08/01/25(g) | | | | | | | 610 | | | | 567,056 | |
Cablevision SA, 6.50%, 06/15/21(b) | | | | | | | 637 | | | | 622,667 | |
Cablevision Systems Corp., 8.00%, 04/15/20(g) | | | | | | | 286 | | | | 299,228 | |
CBS Radio, Inc., 7.25%, 11/01/24(b) | | | | | | | 18 | | | | 16,943 | |
CCO Holdings LLC/CCO Holdings Capital Corp.(g): | | | | | | | | | | | | |
5.13%, 02/15/23 | | | | | | | 709 | | | | 705,455 | |
4.00%, 03/01/23(b) | | | | | | | 421 | | | | 401,002 | |
5.13%, 05/01/23(b) | | | | | | | 145 | | | | 144,275 | |
5.13%, 05/01/27(b) | | | | | | | 2,425 | | | | 2,282,531 | |
5.00%, 02/01/28(b) | | | | | | | 328 | | | | 305,655 | |
Cequel Communications Holdings I LLC/Cequel Capital Corp.(b): | | | | | | | | | | | | |
5.13%, 12/15/21 | | | | | | | 760 | | | | 757,933 | |
7.75%, 07/15/25 | | | | | | | 830 | | | | 877,725 | |
7.50%, 04/01/28 | | | | | | | 569 | | | | 589,751 | |
Charter Communications Operating LLC/Charter Communications Operating Capital,
6.48%, 10/23/45(g) | | | | | | | 3,000 | | | | 3,045,474 | |
Clear Channel International BV,
8.75%, 12/15/20(b)(g) | | | | | | | 906 | | | | 924,120 | |
Clear Channel Worldwide Holdings, Inc.(g): | | | | | | | | | | | | |
6.50%, 11/15/22 | | | | | | | 2,938 | | | | 2,979,669 | |
Series B, 7.63%, 03/15/20 | | | | | | | 837 | | | | 835,954 | |
Comcast Corp.(g): | | | | | | | | | | | | |
4.60%, 08/15/45 | | | | | | | 1,750 | | | | 1,672,914 | |
4.70%, 10/15/48 | | | | | | | 2,750 | | | | 2,674,619 | |
CSC Holdings LLC: | | | | | | | | | | | | |
10.13%, 01/15/23(b)(g) | | | | | | | 1,388 | | | | 1,510,005 | |
5.25%, 06/01/24(g) | | | | | | | 755 | | | | 727,631 | |
6.63%, 10/15/25(b) | | | | | | | 288 | | | | 301,680 | |
10.88%, 10/15/25(b)(g) | | | | | | | 1,603 | | | | 1,849,461 | |
Discovery Communications LLC,
4.95%, 05/15/42(g) | | | | | | | 400 | | | | 359,284 | |
DISH DBS Corp.: | | | | | | | | | | | | |
6.75%, 06/01/21(g) | | | | | | | 343 | | | | 346,430 | |
5.88%, 07/15/22(g) | | | | | | | 1,037 | | | | 979,965 | |
5.00%, 03/15/23(g) | | | | | | | 303 | | | | 265,125 | |
5.88%, 11/15/24(g) | | | | | | | 268 | | | | 227,800 | |
7.75%, 07/01/26 | | | | | | | 102 | | | | 91,290 | |
DKT Finance ApS, 7.00%, 06/17/23 | | | EUR | | | | 181 | | | | 219,873 | |
eircom Finance DAC, 4.50%, 05/31/22 | | | | | | | 100 | | | | 115,611 | |
Hughes Satellite Systems Corp.: | | | | | | | | | | | | |
7.63%, 06/15/21 | | | USD | | | | 113 | | | | 119,837 | |
5.25%, 08/01/26(g) | | | | | | | 564 | | | | 535,800 | |
| | |
| 56 | | 2018 BLACKROCK ANNUAL REPORTTO SHAREHOLDERS |
| | |
Consolidated Schedule of Investments (continued) October 31, 2018 | | BlackRock Multi-Sector Income Trust (BIT) (Percentages shown are based on Net Assets) |
| | | | | | | | | | | | |
| Security | | | | | Par
(000) | | | Value | |
| Media (continued) | |
Inmarsat Finance PLC, 4.88%, 05/15/22(b) | | | USD | | | | 100 | | | $ | 97,952 | |
Intelsat Jackson Holdings SA: | | | | | | | | | | | | |
5.50%, 08/01/23 | | | | | | | 954 | | | | 853,830 | |
8.50%, 10/15/24(b) | | | | | | | 1,249 | | | | 1,227,142 | |
9.75%, 07/15/25(b) | | | | | | | 1,077 | | | | 1,128,157 | |
Intelsat SA, 4.50%, 06/15/25(b)(k) | | | | | | | 28 | | | | 47,095 | |
Interpublic Group of Cos., Inc.,
4.20%, 04/15/24(g) | | | | | | | 1,000 | | | | 993,573 | |
Level 3 Parent LLC, 5.75%, 12/01/22 | | | | | | | 99 | | | | 98,732 | |
LGE HoldCo VI BV, 7.13%, 05/15/24 | | | EUR | | | | 177 | | | | 213,200 | |
Live Nation Entertainment, Inc.,
4.88%, 11/01/24(b) | | | USD | | | | 34 | | | | 32,555 | |
MDC Partners, Inc.,
6.50%, 05/01/24(b)(g) | | | | | | | 404 | | | | 331,280 | |
Meredith Corp., 6.88%, 02/01/26(b) | | | | | | | 184 | | | | 184,000 | |
Midcontinent Communications/Midcontinent Finance Corp., 6.88%, 08/15/23(b)(g) | | | | | | | 282 | | | | 293,985 | |
Nielsen Finance LLC/Nielsen Finance Co.,
5.00%, 04/15/22(b) | | | | | | | 397 | | | | 386,579 | |
Qualitytech LP/QTS Finance Corp.,
4.75%, 11/15/25(b) | | | | | | | 172 | | | | 160,390 | |
Radiate Holdco LLC/Radiate Finance, Inc.(b): | | | | | | | | | | | | |
6.88%, 02/15/23 | | | | | | | 71 | | | | 68,160 | |
6.63%, 02/15/25(g) | | | | | | | 256 | | | | 239,360 | |
Sirius XM Radio, Inc., 5.00%, 08/01/27(b)(g) | | | | | | | 270 | | | | 253,716 | |
TEGNA, Inc., 5.50%, 09/15/24 (b) | | | | | | | 79 | | | | 78,901 | |
Telenet Finance Luxembourg Notes Sarl,
5.50%, 03/01/28(b) | | | | | | | 600 | | | | 556,500 | |
Telenet Finance VI Luxembourg SCA, 4.88%, 07/15/27 | | | EUR | | | | 90 | | | | 109,867 | |
Telesat Canada/Telesat LLC,
8.88%, 11/15/24(b)(g) | | | USD | | | | 286 | | | | 304,590 | |
Tribune Media Co., 5.88%, 07/15/22 | | | | | | | 361 | | | | 365,513 | |
Unitymedia Hessen GmbH & Co. KG/Unitymedia NRW GmbH: | | | | | | | | | | | | |
3.50%, 01/15/27 | | | EUR | | | | 100 | | | | 119,070 | |
6.25%, 01/15/29 | | | | | | | 90 | | | | 114,645 | |
Univision Communications, Inc.(b): | | | | | | | | | | | | |
5.13%, 05/15/23(g) | | | USD | | | | 556 | | | | 523,752 | |
5.13%, 02/15/25 | | | | | | | 70 | | | | 63,980 | |
UPCB Finance IV Ltd.: | | | | | | | | | | | | |
5.38%, 01/15/25(b) | | | | | | | 200 | | | | 194,600 | |
4.00%, 01/15/27 | | | EUR | | | | 103 | | | | 120,235 | |
Viacom, Inc., 5.85%, 09/01/43(g) | | | USD | | | | 645 | | | | 637,055 | |
Videotron Ltd., 5.13%, 04/15/27(b)(g) | | | | | | | 387 | | | | 366,682 | |
Virgin Media Finance PLC, 5.75%, 01/15/25(b)(g) | | | | | | | 1,050 | | | | 1,011,937 | |
Virgin Media Receivables Financing Notes I DAC, 5.50%, 09/15/24 | | | GBP | | | | 200 | | | | 254,062 | |
Virgin Media Receivables Financing Notes II DAC, 5.75%, 04/15/23 | | | | | | | 100 | | | | 130,057 | |
Virgin Media Secured Finance PLC: | | | | | | | | | | | | |
4.88%, 01/15/27 | | | | | | | 130 | | | | 161,804 | |
6.25%, 03/28/29 | | | | | | | 175 | | | | 231,718 | |
Warner Media LLC(g): | | | | | | | | | | | | |
4.65%, 06/01/44 | | | USD | | | | 111 | | | | 95,619 | |
4.85%, 07/15/45 | | | | | | | 389 | | | | 348,050 | |
Ziggo Secured Finance BV, 5.50%, 01/15/27(b)(g) | | | | | | | 328 | | | | 300,940 | |
| | | | | | | | |
| | | | | | | | | | | 46,196,105 | |
| Metals & Mining — 1.8% | |
Alcoa Nederland Holding BV(b): | | | | | | | | | | | | |
7.00%, 09/30/26 | | | | | | | 200 | | | | 211,000 | |
6.13%, 05/15/28 | | | | | | | 200 | | | | 199,500 | |
| | | | | | | | | | | | |
| Security | | | | | Par
(000) | | | Value | |
| Metals & Mining (continued) | |
BHP Billiton Finance USA Ltd.,
4.13%, 02/24/42(g) | | | USD | | | | 250 | | | $ | 238,084 | |
Big River Steel LLC/BRS Finance Corp., 7.25%, 09/01/25(b) | | | | | | | 209 | | | | 217,883 | |
Cleveland-Cliffs, Inc., 4.88%, 01/15/24(b) | | | | | | | 220 | | | | 210,100 | |
Constellium NV(b): | | | | | | | | | | | | |
5.75%, 05/15/24 | | | | | | | 250 | | | | 237,813 | |
6.63%, 03/01/25 | | | | | | | 300 | | | | 294,000 | |
5.88%, 02/15/26(g) | | | | | | | 743 | | | | 692,847 | |
Freeport-McMoRan, Inc.: | | | | | | | | | | | | |
4.00%, 11/14/21 | | | | | | | 276 | | | | 268,755 | |
3.55%, 03/01/22 | | | | | | | 754 | | | | 713,472 | |
3.88%, 03/15/23 | | | | | | | 1,126 | | | | 1,041,550 | |
4.55%, 11/14/24 | | | | | | | 177 | | | | 163,946 | |
5.40%, 11/14/34 | | | | | | | 250 | | | | 218,750 | |
5.45%, 03/15/43 | | | | | | | 1,458 | | | | 1,235,655 | |
Grinding Media, Inc./Moly-Cop AltaSteel Ltd., 7.38%, 12/15/23(b)(g) | | | | | | | 571 | | | | 586,702 | |
Joseph T Ryerson & Son, Inc.,
11.00%, 05/15/22(b) | | | | | | | 192 | | | | 205,440 | |
Kaiser Aluminum Corp., 5.88%, 05/15/24 | | | | | | | 124 | | | | 124,155 | |
Novelis Corp.(b): | | | | | | | | | | | | |
6.25%, 08/15/24 | | | | | | | 968 | | | | 958,320 | |
5.88%, 09/30/26 | | | | | | | 617 | | | | 581,522 | |
Rio Tinto Finance USA PLC, 4.75%, 03/22/42(g) | | | | | | | 400 | | | | 411,629 | |
Steel Dynamics, Inc.: | | | | | | | | | | | | |
5.25%, 04/15/23(g) | | | | | | | 525 | | | | 526,313 | |
4.13%, 09/15/25(g) | | | | | | | 231 | | | | 215,985 | |
5.00%, 12/15/26 | | | | | | | 15 | | | | 14,663 | |
SunCoke Energy Partners LP/SunCoke Energy Partners Finance Corp., 7.50%, 06/15/25(b)(g) | | | | | | | 332 | | | | 337,810 | |
Teck Resources Ltd.: | | | | | | | | | | | | |
4.50%, 01/15/21 | | | | | | | 20 | | | | 20,050 | |
5.20%, 03/01/42(g) | | | | | | | 615 | | | | 545,812 | |
5.40%, 02/01/43(g) | | | | | | | 174 | | | | 158,340 | |
United States Steel Corp.: | | | | | | | | | | | | |
6.88%, 08/15/25(g) | | | | | | | 309 | | | | 302,820 | |
6.25%, 03/15/26 | | | | | | | 383 | | | | 360,978 | |
Vale Overseas Ltd., 6.25%, 08/10/26(g) | | | | | | | 680 | | | | 726,764 | |
VM Holdings SA, 5.38%, 05/04/27(b)(g) | | | | | | | 857 | | | | 833,441 | |
| | | | | | | | |
| | | | | | | | | | | 12,854,099 | |
| Multi-Utilities — 0.1% | |
NGL Energy Partners LP/NGL Energy Finance Corp., 5.13%, 07/15/19(g) | | | | | | | 150 | | | | 150,375 | |
Superior Plus LP/Superior General Partner, Inc., 7.00%, 07/15/26(b) | | | | | | | 371 | | | | 370,073 | |
| | | | | | | | |
| | | | | | | | | | | 520,448 | |
| Multiline Retail — 0.1% | |
Neiman Marcus Group Ltd.,
8.00%, 10/15/21(b)(g) | | | | | | | 257 | | | | 154,200 | |
Target Corp., 4.00%, 07/01/42(g) | | | | | | | 300 | | | | 279,519 | |
| | | | | | | | |
| | | | | | | | | | | 433,719 | |
| Offshore Drilling & Other Services — 0.0% | |
Entegris, Inc., 4.63%, 02/10/26(b) | | | | | | | 225 | | | | 209,039 | |
| | | | | | | | |
| Oil, Gas & Consumable Fuels — 8.2% | |
Anadarko Petroleum Corp., 4.50%, 07/15/44(g) | | | | | | | 500 | | | | 437,035 | |
Andeavor Logistics LP/Tesoro Logistics Finance Corp., 4.25%, 12/01/27(g) | | | | | | | 235 | | | | 223,651 | |
| | | | |
| CONSOLIDATED SCHEDULES OF INVESTMENTS | | | 57 | |
| | |
Consolidated Schedule of Investments (continued) October 31, 2018 | | BlackRock Multi-Sector Income Trust (BIT) (Percentages shown are based on Net Assets) |
| | | | | | | | | | | | |
| Security | | | | | Par
(000) | | | Value | |
| Oil, Gas & Consumable Fuels (continued) | |
Antero Midstream Partners LP/Antero Midstream Finance Corp., 5.38%, 09/15/24 | | | USD | | | | 65 | | | $ | 63,375 | |
Antero Resources Corp.: | | | | | | | | | | | | |
5.13%, 12/01/22 | | | | | | | 92 | | | | 91,368 | |
5.63%, 06/01/23 | | | | | | | 123 | | | | 123,000 | |
5.00%, 03/01/25 | | | | | | | 420 | | | | 407,925 | |
Apache Corp., 4.75%, 04/15/43(g) | | | | | | | 800 | | | | 710,452 | |
Ascent Resources Utica Holdings LLC/ARU Finance Corp.(b): | | | | | | | | | | | | |
10.00%, 04/01/22 | | | | | | | 161 | | | | 177,301 | |
7.00%, 11/01/26 | | | | | | | 238 | | | | 230,860 | |
Berry Petroleum Co. LLC, 7.00%, 02/15/26(b) | | | | | | | 350 | | | | 346,920 | |
Bruin E&P Partners LLC, 8.88%, 08/01/23(b) | | | | | | | 504 | | | | 496,440 | |
California Resources Corp., 8.00%, 12/15/22(b) | | | | | | | 459 | | | | 408,510 | |
Callon Petroleum Co.: | | | | | | | | | | | | |
6.13%, 10/01/24(g) | | | | | | | 242 | | | | 235,950 | |
Series WI, 6.38%, 07/01/26 | | | | | | | 128 | | | | 127,040 | |
Calumet Specialty Products Partners LP/Calumet Finance Corp., 6.50%, 04/15/21 | | | | | | | 10 | | | | 9,600 | |
Carrizo Oil & Gas, Inc.: | | | | | | | | | | | | |
6.25%, 04/15/23(g) | | | | | | | 286 | | | | 280,995 | |
8.25%, 07/15/25 | | | | | | | 309 | | | | 320,587 | |
Chaparral Energy, Inc., 8.75%, 07/15/23(b) | | | | | | | 327 | | | | 313,626 | |
Cheniere Corpus Christi Holdings LLC(g): | | | | | | | | | | | | |
7.00%, 06/30/24 | | | | | | | 578 | | | | 624,962 | |
5.88%, 03/31/25 | | | | | | | 428 | | | | 440,840 | |
5.13%, 06/30/27 | | | | | | | 830 | | | | 813,400 | |
Cheniere Energy Partners LP, Series WI,
5.25%, 10/01/25(g) | | | | | | | 377 | | | | 369,931 | |
Chesapeake Energy Corp.: | | | | | | | | | | | | |
6.63%, 08/15/20 | | | | | | | 184 | | | | 189,520 | |
4.88%, 04/15/22 | | | | | | | 50 | | | | 47,500 | |
7.00%, 10/01/24 | | | | | | | 1,165 | | | | 1,140,244 | |
8.00%, 01/15/25 | | | | | | | 407 | | | | 412,087 | |
7.50%, 10/01/26 | | | | | | | 204 | | | | 199,920 | |
8.00%, 06/15/27(g) | | | | | | | 651 | | | | 646,931 | |
Citgo Holding, Inc., 10.75%, 02/15/20(b) | | | | | | | 170 | | | | 176,800 | |
CNX Resources Corp., 5.88%, 04/15/22(g) | | | | | | | 2,199 | | | | 2,159,154 | |
Comstock Escrow Corp., 9.75%, 08/15/26(b) | | | | | | | 246 | | | | 237,390 | |
CONSOL Energy, Inc., 11.00%, 11/15/25(b)(g) | | | | | | | 444 | | | | 498,390 | |
Covey Park Energy LLC/Covey Park Finance Corp., 7.50%, 05/15/25(b)(g) | | | | | | | 362 | | | | 355,665 | |
Crestwood Midstream Partners LP/Crestwood Midstream Finance Corp., 6.25%, 04/01/23 | | | | | | | 35 | | | | 35,700 | |
CrownRock LP/CrownRock Finance, Inc., 5.63%, 10/15/25(b)(g) | | | | | | | 1,020 | | | | 970,275 | |
DCP Midstream LLC(b): | | | | | | | | | | | | |
4.75%, 09/30/21 | | | | | | | 160 | | | | 160,400 | |
6.45%, 11/03/36(g) | | | | | | | 254 | | | | 262,255 | |
6.75%, 09/15/37(g) | | | | | | | 396 | | | | 411,840 | |
DCP Midstream Operating LP, 5.38%, 07/15/25 | | | | | | | 110 | | | | 111,546 | |
DEA Finance SA, 7.50%, 10/15/22 | | | EUR | | | | 100 | | | | 120,072 | |
Denbury Resources, Inc.(b): | | | | | | | | | | | | |
9.25%, 03/31/22(g) | | | USD | | | | 475 | | | | 495,187 | |
7.50%, 02/15/24 | | | | | | | 242 | | | | 236,555 | |
Diamond Offshore Drilling, Inc.: | | | | | | | | | | | | |
7.88%, 08/15/25 | | | | | | | 218 | | | | 214,730 | |
5.70%, 10/15/39 | | | | | | | 38 | | | | 28,690 | |
4.88%, 11/01/43 | | | | | | | 340 | | | | 231,200 | |
| | | | | | | | | | | | |
| Security | | | | | Par
(000) | | | Value | |
| Oil, Gas & Consumable Fuels (continued) | |
Diamondback Energy, Inc.: | | | | | | | | | | | | |
4.75%, 11/01/24 | | | USD | | | | 137 | | | $ | 133,233 | |
5.38%, 05/31/25(g) | | | | | | | 130 | | | | 129,350 | |
Eclipse Resources Corp., 8.88%, 07/15/23 | | | | | | | 80 | | | | 79,600 | |
Enbridge, Inc., 6.25%, 03/01/78(c) | | | | | | | 1,865 | | | | 1,745,109 | |
Endeavor Energy Resources LP/EER Finance, Inc.(b): | | | | | | | | | | | | |
5.50%, 01/30/26 | | | | | | | 422 | | | | 433,605 | |
5.75%, 01/30/28 | | | | | | | 242 | | | | 249,865 | |
Energy Transfer Partners LP(g): | | | | | | | | | | | | |
6.13%, 12/15/45 | | | | | | | 500 | | | | 496,591 | |
5.30%, 04/15/47 | | | | | | | 350 | | | | 314,662 | |
EnLink Midstream Partners LP: | | | | | | | | | | | | |
4.40%, 04/01/24 | | | | | | | 281 | | | | 270,781 | |
4.15%, 06/01/25 | | | | | | | 28 | | | | 26,027 | |
4.85%, 07/15/26 | | | | | | | 46 | | | | 43,508 | |
5.05%, 04/01/45 | | | | | | | 91 | | | | 71,998 | |
5.45%, 06/01/47 | | | | | | | 244 | | | | 205,586 | |
Ensco Jersey Finance Ltd., 3.00%, 01/31/24(k) | | | | | | | 868 | | | | 792,652 | |
Enterprise Products Operating LLC, 5.38%, 02/15/78(c)(g) | | | | | | | 420 | | | | 374,529 | |
EP Energy LLC/Everest Acquisition Finance, Inc.: | | | | | | | | | | | | |
9.38%, 05/01/20 | | | | | | | 10 | | | | 9,775 | |
9.38%, 05/01/24(b)(g) | | | | | | | 547 | | | | 415,720 | |
7.75%, 05/15/26(b) | | | | | | | 494 | | | | 494,000 | |
Extraction Oil & Gas, Inc.(b): | | | | | | | | | | | | |
7.38%, 05/15/24 | | | | | | | 91 | | | | 85,313 | |
5.63%, 02/01/26(g) | | | | | | | 676 | | | | 571,220 | |
Frontera Energy Corp., 9.70%, 06/25/23(b) | | | | | | | 697 | | | | 737,426 | |
Genesis Energy LP/Genesis Energy Finance Corp.(g): | | | | | | | | | | | | |
6.50%, 10/01/25 | | | | | | | 111 | | | | 102,398 | |
6.25%, 05/15/26 | | | | | | | 188 | | | | 169,670 | |
Geopark Ltd., 6.50%, 09/21/24(b) | | | | | | | 228 | | | | 226,860 | |
Great Western Petroleum LLC/Great Western Finance, Inc., 9.00%, 09/30/21(b)(g) | | | | | | | 649 | | | | 616,550 | |
Gulfport Energy Corp.: | | | | | | | | | | | | |
6.63%, 05/01/23 | | | | | | | 228 | | | | 228,000 | |
6.00%, 10/15/24 | | | | | | | 66 | | | | 61,710 | |
6.38%, 01/15/26 | | | | | | | 132 | | | | 123,090 | |
Halcon Resources Corp., 6.75%, 02/15/25(g) | | | | | | | 495 | | | | 450,450 | |
Hess Corp., 4.30%, 04/01/27(g) | | | | | | | 750 | | | | 703,354 | |
Hess Infrastructure Partners LP/Hess Infrastructure Partners Finance Corp., 5.63%, 02/15/26(b)(g) | | | | | | | 313 | | | | 313,782 | |
Impulsora Pipeline LLC, 6.05%, 12/31/42(a)(d) | | | | | | | 1,700 | | | | 1,652,897 | |
Jagged Peak Energy LLC, 5.88%, 05/01/26(b) | | | | | | | 16 | | | | 15,600 | |
Kinder Morgan Energy Partners LP,
4.25%, 09/01/24(g) | | | | | | | 2,500 | | | | 2,502,682 | |
Magnolia Oil & Gas Operating LLC/Magnolia Oil & Gas Finance Corp., 6.00%, 08/01/26(b) | | | | | | | 133 | | | | 131,338 | |
Matador Resources Co., 5.88%, 09/15/26(b) | | | | | | | 460 | | | | 449,650 | |
MEG Energy Corp.(b): | | | | | | | | | | | | |
6.38%, 01/30/23 | | | | | | | 129 | | | | 124,485 | |
6.50%, 01/15/25(g) | | | | | | | 409 | | | | 423,315 | |
MGM Growth Properties Operating Partnership LP/MGP Finance Co-Issuer, Inc., 4.50%, 01/15/28 | | | | | | | 338 | | | | 300,397 | |
Nabors Industries, Inc., 5.75%, 02/01/25(g) | | | | | | | 185 | | | | 170,741 | |
| | |
| 58 | | 2018 BLACKROCK ANNUAL REPORTTO SHAREHOLDERS |
| | |
Consolidated Schedule of Investments (continued) October 31, 2018 | | BlackRock Multi-Sector Income Trust (BIT) (Percentages shown are based on Net Assets) |
| | | | | | | | | | | | |
| Security | | | | | Par
(000) | | | Value | |
| Oil, Gas & Consumable Fuels (continued) | |
Newfield Exploration Co., 5.38%, 01/01/26 | | | USD | | | | 253 | | | $ | 255,373 | |
NGPL PipeCo LLC(b): | | | | | | | | | | | | |
4.88%, 08/15/27 | | | | | | | 301 | | | | 289,712 | |
7.77%, 12/15/37(g) | | | | | | | 421 | | | | 492,570 | |
Noble Holding International Ltd.: | | | | | | | | | | | | |
7.75%, 01/15/24(g) | | | | | | | 228 | | | | 212,895 | |
7.88%, 02/01/26(b)(g) | | | | | | | 1,104 | | | | 1,095,720 | |
5.25%, 03/15/42 | | | | | | | 140 | | | | 97,300 | |
Northern Oil and Gas, Inc., (9.50% Cash or 8.50% PIK), 9.50%, 05/15/23(b)(j) | | | | | | | 338 | | | | 349,407 | |
Odebrecht Offshore Drilling Finance(b): | | | | | | | | | | | | |
6.72%, 12/01/22(g) | | | BRL | | | | 293 | | | | 279,303 | |
7.72%, 12/01/26(j) | | | | | | | 29 | | | | 8,823 | |
Pacific Drilling First Lien Escrow Issuer Ltd.,
8.38%, 10/01/23(b) | | | USD | | | | 633 | | | | 640,912 | |
Paramount Resources Ltd., 6.88%, 06/30/23(b)(g) | | | | | | | 499 | | | | 513,970 | |
Parsley Energy LLC/Parsley Finance Corp.(b): | | | | | | | | | | | | |
6.25%, 06/01/24 | | | | | | | 79 | | | | 81,173 | |
5.38%, 01/15/25(g) | | | | | | | 361 | | | | 353,780 | |
5.25%, 08/15/25 | | | | | | | 91 | | | | 87,929 | |
5.63%, 10/15/27 | | | | | | | 469 | | | | 462,326 | |
PBF Holding Co. LLC/ PBF Finance Corp., 7.25%, 06/15/25(g) | | | | | | | 252 | | | | 259,560 | |
PDC Energy, Inc.: | | | | | | | | | | | | |
1.13%, 09/15/21(k) | | | | | | | 1,047 | | | | 984,180 | |
6.13%, 09/15/24 | | | | | | | 42 | | | | 40,110 | |
5.75%, 05/15/26 | | | | | | | 133 | | | | 122,028 | |
Petrobras Global Finance BV: | | | | | | | | | | | | |
8.38%, 05/23/21(g) | | | | | | | 126 | | | | 137,120 | |
6.13%, 01/17/22(g) | | | | | | | 310 | | | | 321,237 | |
5.30%, 01/27/25 | | | | | | | 1,008 | | | | 961,380 | |
8.75%, 05/23/26 | | | | | | | 637 | | | | 711,433 | |
6.00%, 01/27/28(g) | | | | | | | 1,093 | | | | 1,037,257 | |
Petroleos Mexicanos: | | | | | | | | | | | | |
5.38%, 03/13/22 | | | | | | | 47 | | | | 46,911 | |
6.50%, 03/13/27(g) | | | | | | | 424 | | | | 410,432 | |
5.35%, 02/12/28(b) | | | | | | | 199 | | | | 177,289 | |
QEP Resources, Inc.: | | | | | | | | | | | | |
6.88%, 03/01/21 | | | | | | | 57 | | | | 59,280 | |
5.63%, 03/01/26 | | | | | | | 514 | | | | 483,802 | |
Range Resources Corp.: | | | | | | | | | | | | |
5.88%, 07/01/22(g) | | | | | | | 263 | | | | 264,644 | |
5.00%, 08/15/22(g) | | | | | | | 91 | | | | 89,408 | |
5.00%, 03/15/23 | | | | | | | 91 | | | | 88,043 | |
4.88%, 05/15/25(g) | | | | | | | 177 | | | | 164,168 | |
Resolute Energy Corp., 8.50%, 05/01/20(g) | | | | | | | 492 | | | | 490,770 | |
Rockies Express Pipeline LLC, 6.88%, 04/15/40(b) | | | | | | | 309 | | | | 336,037 | |
Rowan Cos., Inc.: | | | | | | | | | | | | |
4.88%, 06/01/22 | | | | | | | 281 | | | | 269,057 | |
4.75%, 01/15/24 | | | | | | | 13 | | | | 11,278 | |
7.38%, 06/15/25 | | | | | | | 139 | | | | 132,050 | |
Sabine Pass Liquefaction LLC, 5.75%, 05/15/24 | | | | | | | 10 | | | | 10,590 | |
Sanchez Energy Corp.: | | | | | | | | | | | | |
7.75%, 06/15/21(g) | | | | | | | 1,353 | | | | 676,500 | |
7.25%, 02/15/23(b) | | | | | | | 139 | | | | 127,359 | |
SESI LLC: | | | | | | | | | | | | |
7.13%, 12/15/21 | | | | | | | 100 | | | | 99,250 | |
7.75%, 09/15/24 | | | | | | | 247 | | | | 242,677 | |
Seven Generations Energy Ltd., 5.38%, 09/30/25(b) | | | | | | | 125 | | | | 116,563 | |
Shell International Finance BV, 4.38%, 05/11/45(g) | | | | | | | 450 | | | | 443,080 | |
SM Energy Co.: | | | | | | | | | | | | |
5.00%, 01/15/24 | | | | | | | 227 | | | | 216,217 | |
5.63%, 06/01/25(g) | | | | | | | 412 | | | | 396,550 | |
| | | | | | | | | | | | |
| Security | | | | | Par
(000) | | | Value | |
| Oil, Gas & Consumable Fuels (continued) | |
6.75%, 09/15/26 | | | USD | | | | 42 | | | $ | 42,105 | |
6.63%, 01/15/27 | | | | | | | 178 | | | | 178,890 | |
Southwestern Energy Co.: | | | | | | | | | | | | |
6.20%, 01/23/25 | | | | | | | 203 | | | | 197,418 | |
7.50%, 04/01/26(g) | | | | | | | 207 | | | | 210,622 | |
7.75%, 10/01/27(g) | | | | | | | 466 | | | | 471,825 | |
Suncor Energy, Inc.,
6.50%, 06/15/38(g) | | | | | | | 800 | | | | 939,669 | |
Sunoco LP/Sunoco Finance Corp.(b): | | | | | | | | | | | | |
4.88%, 01/15/23 | | | | | | | 392 | | | | 377,790 | |
5.50%, 02/15/26 | | | | | | | 120 | | | | 114,300 | |
5.88%, 03/15/28 | | | | | | | 147 | | | | 137,078 | |
Tallgrass Energy Partners LP/Tallgrass Energy Finance Corp.(b): | | | | | | | | | | | | |
4.75%, 10/01/23 | | | | | | | 31 | | | | 30,671 | |
5.50%, 09/15/24(g) | | | | | | | 572 | | | | 575,575 | |
5.50%, 01/15/28(g) | | | | | | | 1,161 | | | | 1,147,718 | |
Targa Resources Partners LP/Targa Resources Partners Finance Corp.: | | | | | | | | | | | | |
5.25%, 05/01/23 | | | | | | | 16 | | | | 15,960 | |
5.13%, 02/01/25 | | | | | | | 87 | | | | 84,608 | |
5.88%, 04/15/26(b)(g) | | | | | | | 402 | | | | 404,010 | |
5.00%, 01/15/28(g) | | | | | | | 424 | | | | 401,740 | |
Transocean Guardian Ltd., 5.88%, 01/15/24(b) | | | | | | | 319 | | | | 315,810 | |
Transocean Pontus Ltd., 6.13%, 08/01/25(b) | | | | | | | 376 | | | | 373,650 | |
W&T Offshore, Inc., 2018 Term Loan,
9.75%, 11/01/23(b) | | | | | | | 180 | | | | 174,186 | |
Whiting Petroleum Corp., 6.63%, 01/15/26(g) | | | | | | | 395 | | | | 394,506 | |
WildHorse Resource Development Corp., 6.88%, 02/01/25 | | | | | | | 188 | | | | 187,060 | |
Williams Partners LP, 4.50%, 11/15/23(g) | | | | | | | 1,750 | | | | 1,774,479 | |
WPX Energy, Inc.: | | | | | | | | | | | | |
8.25%, 08/01/23 | | | | | | | 101 | | | | 113,499 | |
5.25%, 09/15/24(g) | | | | | | | 184 | | | | 181,700 | |
5.75%, 06/01/26 | | | | | | | 200 | | | | 199,000 | |
YPF SA, 8.50%, 07/28/25 | | | | | | | 906 | | | | 858,208 | |
| | | | | | | | |
| | | | | | | | | | | 58,092,868 | |
| Paper & Forest Products — 0.0% | |
Norbord, Inc., 6.25%, 04/15/23(b) | | | | | | | 182 | | | | 184,730 | |
| | | | | | | | |
| Pharmaceuticals — 2.1% | |
AbbVie, Inc.(g): | | | | | | | | | | | | |
3.20%, 05/14/26 | | | | | | | 775 | | | | 709,301 | |
4.45%, 05/14/46 | | | | | | | 1,000 | | | | 874,894 | |
Allergan Funding SCS(g): | | | | | | | | | | | | |
3.80%, 03/15/25 | | | | | | | 1,000 | | | | 963,589 | |
4.75%, 03/15/45 | | | | | | | 500 | | | | 468,568 | |
Allergan Sales LLC, 5.00%, 12/15/21(b)(g) | | | | | | | 718 | | | | 740,559 | |
Bausch Health Cos., Inc.(b): | | | | | | | | | | | | |
6.13%, 04/15/25(g) | | | | | | | 446 | | | | 410,186 | |
5.50%, 11/01/25(g) | | | | | | | 677 | | | | 663,460 | |
8.50%, 01/31/27 | | | | | | | 566 | | | | 575,905 | |
Charles River Laboratories International, Inc., 5.50%, 04/01/26(b) | | | | | | | 150 | | | | 149,625 | |
CVS Health Corp., 5.05%, 03/25/48(g) | | | | | | | 1,110 | | | | 1,082,318 | |
Elanco Animal Health, Inc.(b): | | | | | | | | | | | | |
4.27%, 08/28/23 | | | | | | | 154 | | | | 153,292 | |
4.90%, 08/28/28 | | | | | | | 166 | | | | 163,989 | |
Endo Finance LLC/Endo Finco, Inc.,
5.38%, 01/15/23(b)(g) | | | | | | | 620 | | | | 528,550 | |
inVentiv Group Holdings, Inc./inVentiv Health, Inc./inVentiv Health Clinical, Inc., 7.50%, 10/01/24(b)(g) | | | | | | | 190 | | | | 199,975 | |
| | | | |
| CONSOLIDATED SCHEDULES OF INVESTMENTS | | | 59 | |
| | |
Consolidated Schedule of Investments (continued) October 31, 2018 | | BlackRock Multi-Sector Income Trust (BIT) (Percentages shown are based on Net Assets) |
| | | | | | | | | | | | |
| Security | | | | | Par
(000) | | | Value | |
| Pharmaceuticals (continued) | |
Jaguar Holding Co. II/Pharmaceutical Product Development LLC, 6.38%, 08/01/23(b)(g) | | | USD | | | | 1,166 | | | $ | 1,165,650 | |
Mylan NV, 3.95%, 06/15/26(g) | | | | | | | 650 | | | | 596,443 | |
Rossini Sarl, 6.75%, 10/30/25 | | | EUR | | | | 216 | | | | 248,934 | |
Synlab Bondco PLC, 6.25%, 07/01/22 | | | | | | | 145 | | | | 169,367 | |
Synlab Unsecured Bondco PLC, 8.25%, 07/01/23 | | | | | | | 100 | | | | 120,514 | |
Valeant Pharmaceuticals International, Inc.: | | | | | | | | | | | | |
7.50%, 07/15/21(b) | | | USD | | | | 10 | | | | 10,150 | |
5.63%, 12/01/21(b)(g) | | | | | | | 554 | | | | 544,997 | |
6.50%, 03/15/22(b)(g) | | | | | | | 408 | | | | 422,280 | |
5.50%, 03/01/23(b)(g) | | | | | | | 2,119 | | | | 2,007,752 | |
4.50%, 05/15/23 | | | EUR | | | | 452 | | | | 495,340 | |
5.88%, 05/15/23(b)(g) | | | USD | | | | 500 | | | | 476,875 | |
7.00%, 03/15/24(b)(g) | | | | | | | 566 | | | | 592,709 | |
9.00%, 12/15/25(b) | | | | | | | 170 | | | | 177,225 | |
9.25%, 04/01/26(b) | | | | | | | 257 | | | | 269,529 | |
| | | | | | | | |
| | | | | | | | | | | 14,981,976 | |
| Real Estate Management & Development — 0.2% | |
ADLER Real Estate AG: | | | | | | | | | | | | |
1.88%, 04/27/23 | | | EUR | | | | 100 | | | | 109,726 | |
2.13%, 02/06/24 | | | | | | | 100 | | | | 109,561 | |
3.00%, 04/27/26 | | | | | | | 100 | | | | 109,600 | |
Greystar Real Estate Partners LLC,
5.75%, 12/01/25(b) | | | USD | | | | 208 | | | | 201,760 | |
Howard Hughes Corp., 5.38%, 03/15/25(b)(g) | | | | | | | 256 | | | | 245,760 | |
Realogy Group LLC/Realogy Co-Issuer Corp., 4.50%, 04/15/19(b)(g) | | | | | | | 205 | | | | 203,975 | |
RESIDOMO Sro, 3.38%, 10/15/24 | | | EUR | | | | 100 | | | | 113,661 | |
| | | | | | | | |
| | | | | | | | | | | 1,094,043 | |
| Road & Rail — 1.0% | |
Ashtead Capital, Inc.,
5.25%, 08/01/26(b) | | | USD | | | | 278 | | | | 273,580 | |
Avis Budget Car Rental LLC/Avis Budget Finance, Inc.,
5.13%, 06/01/22(b)(g) | | | | | | | 462 | | | | 473,841 | |
Avis Budget Finance PLC, 4.75%, 01/30/26 | | | EUR | | | | 177 | | | | 194,465 | |
Burlington Northern Santa Fe LLC,
4.38%, 09/01/42(g) | | | USD | | | | 500 | | | | 488,291 | |
CMA CGM SA, 5.25%, 01/15/25 | | | EUR | | | | 100 | | | | 95,709 | |
EC Finance PLC, 2.38%, 11/15/22 | | | | | | | 200 | | | | 224,503 | |
Flexi-Van Leasing, Inc., 10.00%, 02/15/23(b) | | | USD | | | | 203 | | | | 168,490 | |
Herc Rentals, Inc.(b): | | | | | | | | | | | | |
7.50%, 06/01/22 | | | | | | | 59 | | | | 61,360 | |
7.75%, 06/01/24(g) | | | | | | | 199 | | | | 209,945 | |
Hertz Corp., 7.63%, 06/01/22(b)(g) | | | | | | | 478 | | | | 457,900 | |
Hertz Holdings Netherlands BV, 5.50%, 03/30/23 | | | EUR | | | | 100 | | | | 113,386 | |
Lima Metro Line 2 Finance Ltd., 5.88%, 07/05/34(b)(g) | | | USD | | | | 4,000 | | | | 4,030,000 | |
Loxam SAS, 3.50%, 05/03/23 | | | EUR | | | | 100 | | | | 115,966 | |
Union Pacific Corp.,
4.05%, 11/15/45(g) | | | USD | | | | 500 | | | | 455,919 | |
| | | | | | | | |
| | | | | | | | | | | 7,363,355 | |
| Semiconductors & Semiconductor Equipment — 0.7% | |
Advanced Micro Devices, Inc., 7.50%, 08/15/22 | | | | | | | 89 | | | | 97,455 | |
Broadcom Corp./Broadcom Cayman Finance Ltd., 3.88%, 01/15/27(g) | | | | | | | 2,600 | | | | 2,387,422 | |
Microchip Technology, Inc., 1.63%, 02/15/25(k) | | | | | | | 570 | | | | 742,410 | |
ON Semiconductor Corp., 1.00%, 12/01/20(k) | | | | | | | 594 | | | | 665,684 | |
Qorvo, Inc., 5.50%, 07/15/26(b) | | | | | | | 500 | | | | 501,250 | |
QUALCOMM, Inc., 4.65%, 05/20/35(g) | | | | | | | 400 | | | | 393,235 | |
Sensata Technologies BV,
5.00%, 10/01/25(b) | | | | | | | 84 | | | | 81,060 | |
| | | | | | | | | | | | |
| Security | | | | | Par
(000) | | | Value | |
| Semiconductors & Semiconductor Equipment (continued) | |
Sensata Technologies UK Financing Co. PLC, 6.25%, 02/15/26(b) | | | USD | | | | 222 | | | $ | 225,885 | |
| | | | | | | | |
| | | | | | | | | | | 5,094,401 | |
| Software — 1.9% | |
ACI Worldwide, Inc.,
5.75%, 08/15/26(b) | | | | | | | 656 | | | | 656,000 | |
CA, Inc., 3.60%, 08/15/22(g) | | | | | | | 660 | | | | 652,640 | |
CDK Global, Inc., 4.88%, 06/01/27(g) | | | | | | | 580 | | | | 543,025 | |
Citrix Systems, Inc.,
0.50%, 04/15/19(k) | | | | | | | 166 | | | | 235,182 | |
Genesys Telecommunications Laboratories, Inc./Greeneden Lux 3 Sarl/Greeneden US Holdings LLC, 10.00%, 11/30/24(b)(g) | | | | | | | 889 | | | | 964,565 | |
Infor US, Inc., 6.50%, 05/15/22(g) | | | | | | | 2,142 | | | | 2,136,645 | |
Informatica LLC, 7.13%, 07/15/23(b)(g) | | | | | | | 1,047 | | | | 1,068,265 | |
Microsoft Corp., 3.70%, 08/08/46(g) | | | | | | | 1,750 | | | | 1,610,693 | |
Nuance Communications, Inc.: | | | | | | | | | | | | |
5.38%, 08/15/20(b)(g) | | | | | | | 31 | | | | 31,019 | |
6.00%, 07/01/24(g) | | | | | | | 238 | | | | 240,975 | |
5.63%, 12/15/26 | | | | | | | 153 | | | | 149,940 | |
Oracle Corp., 4.00%, 07/15/46(g) | | | | | | | 1,500 | | | | 1,351,553 | |
PTC, Inc., 6.00%, 05/15/24(g) | | | | | | | 269 | | | | 275,053 | |
RP Crown Parent LLC, 7.38%, 10/15/24(b)(g) | | | | | | | 544 | | | | 557,600 | |
Solera LLC/Solera Finance, Inc.,
10.50%, 03/01/24(b)(g) | | | | | | | 1,792 | | | | 1,944,374 | |
TIBCO Software, Inc., 11.38%, 12/01/21(b)(g) | | | | | | | 929 | | | | 984,740 | |
| | | | | | | | |
| | | | | | | | | | | 13,402,269 | |
| Specialty Retail — 0.3% | |
Asbury Automotive Group, Inc., 6.00%, 12/15/24(g) | | | | | | | 395 | | | | 388,087 | |
Catalent Pharma Solutions, Inc., 4.88%, 01/15/26(b)(g) | | | | | | | 384 | | | | 360,000 | |
Group 1 Automotive, Inc., 5.25%, 12/15/23(b) | | | | | | | 53 | | | | 51,013 | |
Hexion US Finance Corp., 6.63%, 04/15/20 | | | | | | | 129 | | | | 114,165 | |
L Brands, Inc.: | | | | | | | | | | | | |
6.88%, 11/01/35(g) | | | | | | | 478 | | | | 406,300 | |
6.75%, 07/01/36 | | | | | | | 79 | | | | 65,274 | |
Lowe’s Cos., Inc., 4.65%, 04/15/42(g) | | | | | | | 400 | | | | 397,744 | |
Masaria Investments SAU, 5.00%, 09/15/24 | | | EUR | | | | 100 | | | | 105,333 | |
Penske Automotive Group, Inc., 5.50%, 05/15/26 | | | USD | | | | 32 | | | | 30,400 | |
PVH Corp., 3.13%, 12/15/27 | | | EUR | | | | 114 | | | | 126,042 | |
Shop Direct Funding PLC, 7.75%, 11/15/22 | | | GBP | | | | 100 | | | | 113,443 | |
| | | | | | | | |
| | | | | | | | | | | 2,157,801 | |
| Technology Hardware, Storage & Peripherals — 0.6% | |
Apple, Inc., 4.65%, 02/23/46(g) | | | USD | | | | 1,500 | | | | 1,547,337 | |
Dell International LLC/EMC Corp.(b): | | | | | | | | | | | | |
4.42%, 06/15/21 | | | | | | | 25 | | | | 25,208 | |
7.13%, 06/15/24(g) | | | | | | | 774 | | | | 819,135 | |
6.02%, 06/15/26(g) | | | | | | | 170 | | | | 176,162 | |
8.35%, 07/15/46(g) | | | | | | | 100 | | | | 116,207 | |
Western Digital Corp.,
4.75%, 02/15/26(g) | | | | | | | 1,288 | | | | 1,189,790 | |
| | | | | | | | |
| | | | | | | | | | | 3,873,839 | |
| Textiles, Apparel & Luxury Goods — 0.0% | |
BiSoho SAS, 5.88%, 05/01/23 | | | EUR | | | | 49 | | | | 57,657 | |
| | | | | | | | |
| Thrifts & Mortgage Finance — 0.1% | |
Bracken MidCo1 PLC,
8.88%, 10/15/23(j) | | | GBP | | | | 100 | | | | 125,929 | |
Jerrold Finco PLC, 6.25%, 09/15/21 | | | | | | | 100 | | | | 130,696 | |
Ladder Capital Finance Holdings LLLP/Ladder Capital Finance Corp.(b)(g): | | | | | | | | | | | | |
5.25%, 03/15/22 | | | USD | | | | 27 | | | | 26,865 | |
| | |
| 60 | | 2018 BLACKROCK ANNUAL REPORTTO SHAREHOLDERS |
| | |
Consolidated Schedule of Investments (continued) October 31, 2018 | | BlackRock Multi-Sector Income Trust (BIT) (Percentages shown are based on Net Assets) |
| | | | | | | | | | | | |
| Security | | | | | Par
(000) | | | Value | |
| Thrifts & Mortgage Finance (continued) | |
5.25%, 10/01/25 | | | USD | | | | 338 | | | $ | 312,650 | |
| | | | | | | | |
| | | | | | | | | | | 596,140 | |
| Tobacco — 0.3% | |
Altria Group, Inc., 4.50%, 05/02/43(g) | | | | | | | 750 | | | | 684,449 | |
Philip Morris International, Inc., 4.38%, 11/15/41(g) | | | | | | | 900 | | | | 822,247 | |
Reynolds American, Inc., 5.85%, 08/15/45(g) | | | | | | | 715 | | | | 734,384 | |
| | | | | | | | |
| | | | | | | | | | | 2,241,080 | |
| Trading Companies & Distributors — 0.0% | |
Doric Nimrod Air Alpha Ltd. Pass-Through Trust, Series 2012-1, Class B, 6.50%, 05/30/21(b) | | | | | | | 151 | | | | 151,708 | |
| | | | | | | | |
| Transportation — 0.0% | |
JB Poindexter & Co., Inc., 7.13%, 04/15/26(b) | | | | | | | 73 | | | | 75,190 | |
| | | | | | | | |
| Transportation Infrastructure — 0.2% | |
Rumo Luxembourg Sarl, 7.38%, 02/09/24(b)(g) | | | | | | | 1,061 | | | | 1,098,135 | |
Transurban Finance Co. Property Ltd., 4.13%, 02/02/26(b)(g) | | | | | | | 520 | | | | 507,463 | |
| | | | | | | | |
| | | | | | | | | | | 1,605,598 | |
| Utilities — 0.3% | |
ContourGlobal Power Holdings SA, 3.38%, 08/01/23 | | | EUR | | | | 100 | | | | 111,238 | |
Generacion Mediterranea SA/Generacion Frias SA/Central Termica Roca SA, 9.63%, 07/27/23(b) | | | USD | | | | 1,061 | | | | 893,903 | |
Stoneway Capital Corp., 10.00%, 03/01/27(b)(g) | | | | | | | 1,022 | | | | 950,840 | |
Vistra Operations Co. LLC, 5.50%, 09/01/26(b) | | | | | | | 249 | | | | 245,265 | |
| | | | | | | | |
| | | | | | | | | | | 2,201,246 | |
| Wireless Telecommunication Services — 2.2% | |
Comunicaciones Celulares SA Via Comcel Trust, 6.88%, 02/06/24(b) | | | | | | | 5,000 | | | | 5,114,375 | |
CoreCivic, Inc., 4.75%, 10/15/27 | | | | | | | 200 | | | | 170,500 | |
CyrusOne LP/CyrusOne Finance Corp., 5.38%, 03/15/27 | | | | | | | 78 | | | | 77,415 | |
Iron Mountain, Inc., 3.00%, 01/15/25 | | | EUR | | | | 100 | | | | 111,181 | |
Matterhorn Telecom SA (3 mo. Euribor + 3.25%), 3.25%, 02/01/23(d) | | | | | | | 14 | | | | 16,181 | |
SBA Communications Corp.(g): | | | | | | | | | | | | |
4.00%, 10/01/22 | | | USD | | | | 475 | | | | 454,813 | |
4.88%, 09/01/24 | | | | | | | 392 | | | | 378,280 | |
Sprint Capital Corp.: | | | | | | | | | | | | |
6.90%, 05/01/19 | | | | | | | 155 | | | | 157,029 | |
6.88%, 11/15/28 | | | | | | | 455 | | | | 447,606 | |
8.75%, 03/15/32 | | | | | | | 751 | | | | 820,468 | |
Sprint Communications, Inc., 7.00%, 03/01/20(b)(g) | | | | | | | 1,302 | | | | 1,349,197 | |
Sprint Corp.: | | | | | | | | | | | | |
7.88%, 09/15/23 | | | | | | | 1,123 | | | | 1,198,802 | |
7.13%, 06/15/24(g) | | | | | | | 1,658 | | | | 1,695,305 | |
7.63%, 02/15/25 | | | | | | | 299 | | | | 310,586 | |
7.63%, 03/01/26(g) | | | | | | | 1,210 | | | | 1,258,400 | |
T-Mobile USA, Inc.: | | | | | | | | | | | | |
4.00%, 04/15/22(g) | | | | | | | 234 | | | | 231,075 | |
6.38%, 03/01/25 | | | | | | | 220 | | | | 226,875 | |
6.50%, 01/15/26 | | | | | | | 286 | | | | 301,015 | |
4.50%, 02/01/26(g) | | | | | | | 556 | | | | 520,383 | |
4.75%, 02/01/28(g) | | | | | | | 490 | | | | 453,250 | |
Wind Tre SpA, 3.13%, 01/20/25 | | | EUR | | | | 200 | | | | 206,142 | |
| | | | | | | | |
| | | | | | | | | | | 15,498,878 | |
| | | | | | | | |
Total Corporate Bonds — 63.9%
(Cost — $467,671,595) | | | | 453,752,949 | |
| | | | | | | | |
| | | | | | | | | | | | |
| Security | | | | | Par
(000) | | | Value | |
Floating Rate Loan Interests(d) — 15.0% | |
| Aerospace & Defense — 0.1% | |
Accudyne Industries LLC, 2017 Term Loan, (1 mo. LIBOR + 3.00%, 1.00% Floor), 5.30%, 08/18/24 | | | USD | | | | 526 | | | $ | 524,358 | |
WP CPP Holdings LLC, 2018 Term Loan, (1 mo. LIBOR + 3.75%, 1.00% Floor), 6.28%, 04/30/25 | | | | | | | 62 | | | | 62,181 | |
| | | | | | | | |
| | | | | | | | | | | 586,539 | |
| Auto Components — 0.0% | |
USI, Inc., 2017 Repriced Term Loan, (3 mo. LIBOR + 3.00%), 5.39%, 05/16/24 | | | | | | | 214 | | | | 213,057 | |
| | | | | | | | |
| Auto Parts — 0.0% | |
Mavis Tire Express Services Corp.(a): | | | | | | | | | | | | |
2018 1st Lien Term Loan, (1 mo. LIBOR + 3.25%), 5.53%, 03/20/25 | | | | | | | 86 | | | | 85,196 | |
2018 Delayed Draw Term Loan, (1 mo. LIBOR + 3.25%), 1.25%, 03/20/25 | | | | | | | 14 | | | | 752 | |
| | | | | | | | |
| | | | | | | | | | | 85,948 | |
| Building Products — 0.1% | |
Ply Gem Industries, Inc., 2018 Term Loan, (3 mo. LIBOR + 3.75%), 6.18%, 04/12/25 | | | | | | | 520 | | | | 518,007 | |
| | | | | | | | |
| Chemicals — 0.4% | |
Alpha 3 BV, 2017 Term Loan B1, (3 mo. LIBOR + 3.00%, 1.00% Floor), 5.39%, 01/31/24 | | | | | | | 358 | | | | 357,884 | |
Element Materials Technology Group US Holdings, Inc., 2017 Term Loan B, (1 mo. LIBOR + 3.50%, 1.00% Floor), 5.80%, 06/28/24 | | | | | | | 61 | | | | 60,694 | |
Invictus US LLC: | | | | | | | | | | | | |
1st Lien Term Loan, (1 mo. LIBOR + 3.00%), 5.30%, 03/28/25 | | | | | | | 125 | | | | 125,317 | |
2nd Lien Term Loan, (1 mo. LIBOR + 6.75%), 9.05%, 03/25/26(a) | | | | | | | 68 | | | | 67,490 | |
Messer Industries LLC, 2018 USD Term Loan, 10/01/25(n) | | | | | | | 1,005 | | | | 1,004,749 | |
Starfruit Finco BV, 2018 USD Term Loan B, (1 mo. LIBOR + 3.25%), 5.51%, 10/01/25 | | | | | | | 1,339 | | | | 1,333,979 | |
| | | | | | | | |
| | | | | | | | | | | 2,950,113 | |
| Commercial Services & Supplies — 0.5% | |
Asurion LLC, 2017 2nd Lien Term Loan, (1 mo. LIBOR + 6.50%), 8.80%, 08/04/25 | | | | | | | 514 | | | | 527,235 | |
GFL Environmental Inc., 2018 USD Term Loan B, 05/30/25(n) | | | | | | | 800 | | | | 787,000 | |
Verscend Holding Corp., 2018 Term Loan B, (1 mo. LIBOR + 4.50%), 6.80%, 08/27/25 | | | | | | | 1,565 | | | | 1,576,547 | |
West Corp., | | | | | | | | | | | | |
2017 Term Loan, (1 mo. LIBOR + 4.00%, 1.00% Floor), 6.53%, 10/10/24 | | | | | | | 585 | | | | 581,902 | |
2018 Term Loan B1, (3 mo. LIBOR + 3.50%, 1.00% Floor), 6.03%, 10/10/24 | | | | | | | 86 | | | | 84,701 | |
| | | | | | | | |
| | | | 3,557,385 | |
| Construction & Engineering — 0.3% | |
Brand Energy & Infrastructure Services, Inc., 2017 Term Loan, (3 mo. LIBOR + 4.25%, 1.00% Floor), 6.73%, 06/21/24 | | | | | | | 1,780 | | | | 1,786,516 | |
SRS Distribution, Inc., 2018 1st Lien Term Loan, (1 mo. LIBOR + 3.25%), 5.55%, 05/23/25 | | | | | | | 442 | | | | 431,764 | |
| | | | | | | | |
| | | | 2,218,280 | |
| Construction Materials — 0.0% | |
Filtration Group Corp., 2018 1st Lien Term Loan, (1 mo. LIBOR + 3.00%), 5.30%, 03/29/25 | | | | | | | 67 | | | | 66,903 | |
| | | | | | | | |
| | | | |
| CONSOLIDATED SCHEDULES OF INVESTMENTS | | | 61 | |
| | |
Consolidated Schedule of Investments (continued) October 31, 2018 | | BlackRock Multi-Sector Income Trust (BIT) (Percentages shown are based on Net Assets) |
| | | | | | | | | | | | |
| Security | | | | | Par
(000) | | | Value | |
| Consumer Finance — 0.5% | |
Financial & Risk US Holdings, Inc., 2018 USD Term Loan, (1 mo. LIBOR + 3.75%), 6.05%, 10/01/25 | | | USD | | | | 3,592 | | | $ | 3,553,099 | |
| | | | | | | | |
| Diversified Consumer Services — 0.1% | |
Ascend Learning LLC, 2017 Term Loan B, (1 mo. LIBOR + 3.00%, 1.00% Floor), 5.30%, 07/12/24 | | | | | | | 71 | | | | 71,325 | |
CHG PPC Parent LLC, 2018 Term Loan B, (1 mo. LIBOR + 2.75%), 5.05%, 03/31/25(a) | | | | | | | 129 | | | | 128,195 | |
Laureate Education, Inc., 2017 Term Loan B, (3 mo. LIBOR + 3.50%, 1.00% Floor), 6.03%, 04/26/24 | | | | | | | 146 | | | | 146,289 | |
| | | | | | | | |
| | | | 345,809 | |
| Diversified Financial Services — 9.0% | |
Aviron Capital LLC, 2017 Term Loan, (3 mo. LIBOR + 5.00%), 5.00%, 07/17/20(a) | | | | | | | 63,318 | | | | 63,083,736 | |
Lone Star LSPT Future Funding, Mezzanine Term Loan, (1 mo. LIBOR + 4.35%), 6.63%, 09/09/20(a) | | | | | | | 508 | | | | 507,562 | |
LTI Holdings, Inc., 2018 Add On 1st Lien Term Loan, (1 mo. LIBOR + 3.50%), 5.80%, 09/06/25 | | | | | | | 161 | | | | 160,799 | |
| | | | | | | | |
| | | | | | | | | | | 63,752,097 | |
| Diversified Telecommunication Services — 0.1% | |
CenturyLink, Inc., 2017 Term Loan B, (1 mo. LIBOR + 2.75%), 5.05%, 01/31/25 | | | | | | | 902 | | | | 892,033 | |
| | | | | | | | |
| Energy Equipment & Services — 0.2% | |
Gavilan Resources LLC, 2nd Lien Term Loan, (1 mo. LIBOR + 6.00%, 1.00% Floor), 8.28%, 03/01/24 | | | | | | | 174 | | | | 161,740 | |
Pioneer Energy Services Corp., Term Loan, (1 mo. LIBOR + 7.75%, 1.00% Floor),
10.03%, 11/08/22(a) | | | | | | | 865 | | | | 880,137 | |
Weatherford International Ltd., Term Loan, (1 mo. LIBOR + 1.43%), 3.73%, 07/13/20(a) | | | | | | | 237 | | | | 230,232 | |
| | | | | | | | |
| | | | 1,272,109 | |
| Food Products — 0.0% | |
Chobani LLC, 2017 Term Loan B, (1 mo. LIBOR + 3.50%, 1.00% Floor), 5.80%, 10/10/23 | | | | | | | 70 | | | | 68,231 | |
JBS USA LLC, 2017 Term Loan B, (3 mo. LIBOR + 2.50%), 4.84%, 10/30/22 | | | | | | | 111 | | | | 110,682 | |
| | | | | | | | |
| | | | | | | | | | | 178,913 | |
| Gas Utilities — 0.0% | |
AL Midcoast Holdings LLC, 2018 Term Loan B, (2 mo. LIBOR + 5.50%), 7.89%, 07/31/25 | | | | | | | 306 | | | | 305,364 | |
| | | | | | | | |
| Health Care Equipment & Supplies — 0.3% | |
DJO Finance LLC, 2015 Term Loan, (1 mo. LIBOR + 3.25%, 1.00% Floor), 5.60%, 06/08/20 | | | | | | | 924 | | | | 921,827 | |
Immucor, Inc., Extended Term Loan B, (3 mo. LIBOR + 5.00%, 1.00% Floor), 7.39%, 06/15/21 | | | | | | | 850 | | | | 862,343 | |
Ortho-Clinical Diagnostics SA, 2018 Term Loan B, (1 mo. LIBOR + 3.25%), 5.54%, 06/30/25 | | | | | | | 220 | | | | 219,341 | |
| | | | | | | | |
| | | | 2,003,511 | |
| Health Care Providers & Services — 0.5% | |
AHP Health Partners, Inc., 2018 Term Loan, (1 mo. LIBOR + 4.50%, 1.00% Floor), 6.80%, 06/30/25 | | | | | | | 174 | | | | 174,162 | |
Concentra Inc., 2018 2nd Lien Term Loan, 06/01/23(n) | | | | | | | 262 | | | | 264,620 | |
DentalCorp Perfect Smile ULC(a): | | | | | | | | | | | | |
1st Lien Delayed Draw Term Loan, (1 mo. LIBOR + 3.75%), 6.05%, 06/06/25 | | | | | | | 10 | | | | 9,538 | |
1st Lien Term Loan, (1 mo. LIBOR + 3.75%, 1.00% Floor), 6.05%, 06/06/25 | | | | | | | 113 | | | | 113,474 | |
Envision Healthcare Corp., 2018 1st Lien Term Loan, (1 mo. LIBOR + 3.75%), 6.05%, 10/10/25 | | | | | | | 1,487 | | | | 1,454,940 | |
| | | | | | | | | | | | |
| Security | | | | | Par
(000) | | | Value | |
| Health Care Providers & Services (continued) | |
Gentiva Health Services, Inc.: | | | | | | | | | | | | |
2018 1st Lien Term Loan, (1 mo. LIBOR + 3.75%), 6.06%, 07/02/25(a) | | | USD | | | | 455 | | | $ | 456,818 | |
2018 2nd Lien Term Loan, (1 mo. LIBOR + 7.00%), 9.31%, 07/02/26 | | | | | | | 67 | | | | 68,594 | |
Quorum Health Corporation, Term Loan B, (1 mo. LIBOR + 6.75%, 1.00% Floor), 9.05%, 04/29/22 | | | | | | | 251 | | | | 253,425 | |
Team Health Holdings, Inc., 1st Lien Term Loan, (1 mo. LIBOR + 2.75%, 1.00% Floor), 5.05%, 02/06/24 | | | | | | | 282 | | | | 265,662 | |
Universal Hospital Services, Inc., Term Loan, 10/18/25(a)(n) | | | | | | | 99 | | | | 99,495 | |
| | | | | | | | |
| | | | | | | | | | | 3,160,728 | |
| Health Care Technology — 0.0% | |
GoodRx, Inc., 1st Lien Term Loan, (3 mo. LIBOR + 3.00%), 5.28%, 10/10/25 | | | | | | | 103 | | | | 103,429 | |
| | | | | | | | |
| Hotels, Restaurants & Leisure — 0.4% | |
Bronco Midstream Funding LLC, Term Loan B, (1 mo. LIBOR + 3.50%), 5.78%, 08/14/23 | | | | | | | 39 | | | | 39,508 | |
IRB Holding Corp., 1st Lien Term Loan, 02/05/25(n) | | | | | | | 287 | | | | 286,162 | |
Las Vegas Sands LLC, 2018 Term Loan B, (1 mo. LIBOR + 1.75%), 4.05%, 03/27/25 | | | | | | | 697 | | | | 693,575 | |
Penn National Gaming, Inc., 2018 1st Lien Term Loan B, 10/15/25(n) | | | | | | | 84 | | | | 84,210 | |
Stars Group Holdings BV, 2018 Incremental Term Loan, (3 mo. LIBOR + 3.50%), 5.89%, 07/10/25 | | | | | | | 1,732 | | | | 1,737,911 | |
| | | | | | | | |
| | | | | | | | | | | 2,841,366 | |
| Household Products — 0.0% | |
Energizer Holdings, Inc., 2018 Term Loan B,
06/20/25(n) | | | | | | | 73 | | | | 73,046 | |
| | | | | | | | |
| Industrial Conglomerates — 0.1% | |
Cortes NP Acquisition Corp., 2017 Term Loan B, (3 mo. LIBOR + 4.00%, 1.00% Floor), 6.31%, 11/30/23 | | | | | | | 361 | | | | 356,874 | |
Sequa Mezzanine Holdings LLC: | | | | | | | | | | | | |
1st Lien Term Loan, (3 mo. LIBOR + 5.00%, 1.00% Floor), 7.41%, 11/28/21 | | | | | | | 200 | | | | 197,706 | |
2nd Lien Term Loan, (3 mo. LIBOR + 9.00%, 1.00% Floor), 11.52%, 04/28/22 | | | | | | | 73 | | | | 71,358 | |
| | | | | | | | |
| | | | | | | | | | | 625,938 | |
| Insurance — 0.1% | |
Alliant Holdings I, Inc., 2018 Term Loan B, (1 mo. LIBOR + 3.00%), 5.28%, 05/09/25 | | | | | | | 61 | | | | 60,763 | |
Sedgwick Claims Management Services, Inc.: | | | | | | | | | | | | |
1st Lien Term Loan, (1 mo. LIBOR + 2.75%, 1.00% Floor), 5.05%, 03/01/21 | | | | | | | 786 | | | | 785,476 | |
2nd Lien Term Loan, (3 mo. LIBOR + 5.75%, 1.00% Floor), 8.05%, 02/28/22 | | | | | | | 109 | | | | 109,000 | |
| | | | | | | | |
| | | | | | | | | | | 955,239 | |
| Internet Software & Services — 0.0% | |
TierPoint LLC, 2017 1st Lien Term Loan, (1 mo. LIBOR + 3.75%, 1.00% Floor), 6.05%, 05/06/24 | | | | | | | 173 | | | | 169,791 | |
| | | | | | | | |
| IT Services — 0.1% | |
Access CIG LLC: | | | | | | | | | | | | |
2018 1st Lien Term Loan, (1 mo. LIBOR + 3.75%), 6.05%, 02/27/25 | | | | | | | 74 | | | | 73,816 | |
2018 2nd Lien Incremental Term Loan, (1 mo. LIBOR + 7.75%), 10.05%, 02/27/26 | | | | | | | 3 | | | | 3,000 | |
2018 2nd Lien Term Loan, (1 mo. LIBOR + 7.75%), 10.05%, 02/27/26 | | | | | | | 27 | | | | 26,608 | |
2018 Incremental Term Loan, (1 mo. LIBOR + 3.75%), 6.05%, 02/27/25 | | | | | | | 11 | | | | 10,964 | |
| | |
| 62 | | 2018 BLACKROCK ANNUAL REPORTTO SHAREHOLDERS |
| | |
Consolidated Schedule of Investments (continued) October 31, 2018 | | BlackRock Multi-Sector Income Trust (BIT) (Percentages shown are based on Net Assets) |
| | | | | | | | | | | | |
| Security | | | | | Par
(000) | | | Value | |
| IT Services (continued) | |
Flexential Intermediate Corp., 2017 1st Lien Term Loan, (3 mo. LIBOR + 3.50%), 5.89%, 08/01/24 | | | USD | | | | 176 | | | $ | 173,357 | |
Peak 10 Holding Corp., 2nd Lien Term Loan, (3 mo. LIBOR + 7.25%, 1.00% Floor), 9.59%, 08/01/25 | | | | | | | 75 | | | | 73,406 | |
| | | | | | | | |
| | | | | | | | | | | 361,151 | |
| Life Sciences Tools & Services — 0.0% | |
Albany Molecular Research, Inc., 2017 1st Lien Term Loan, (1 mo. LIBOR + 3.25%, 1.00% Floor), 5.55%, 08/30/24 | | | | | | | 101 | | | | 100,697 | |
| | | | | | | | |
| Machinery — 0.2% | |
Altra Industrial Motion Corp., 2018 Term Loan B, (1 mo. LIBOR + 2.00%), 4.30%, 10/01/25 | | | | | | | 212 | | | | 211,735 | |
Brookfield WEC Holdings Inc., 2018 2nd Lien Term Loan, (1 mo. LIBOR + 6.75%), 9.05%, 08/03/26 | | | | | | | 105 | | | | 106,417 | |
Titan Acquisition Ltd., 2018 Term Loan B, (1 mo. LIBOR + 3.00%), 5.30%, 03/28/25 | | | | | | | 762 | | | | 716,753 | |
| | | | | | | | |
| | | | | | | | | | | 1,034,905 | |
| Media — 0.7% | |
Altice France SA, 2018 Term Loan B13, (1 mo. LIBOR + 4.00%), 6.28%, 08/14/26 | | | | | | | 780 | | | | 762,941 | |
Charter Communications Operating LLC, 2017 Term Loan A2, (1 mo. LIBOR + 1.50%), 3.81%, 03/31/23 | | | | | | | 1,543 | | | | 1,541,345 | |
Intelsat Jackson Holdings SA: | | | | | | | | | | | | |
2017 Term Loan B3, (1 mo. LIBOR + 3.75%, 1.00% Floor), 6.04%, 11/27/23 | | | | | | | 107 | | | | 107,100 | |
2017 Term Loan B4, (1 mo. LIBOR + 4.50%, 1.00% Floor), 6.79%, 01/02/24 | | | | | | | 330 | | | | 341,384 | |
2017 Term Loan B5, (Fixed + 6.63%), 6.63%, 01/02/24 | | | | | | | 1,841 | | | | 1,885,448 | |
PSAV Holdings LLC: | | | | | | | | | | | | |
2018 1st Lien Term Loan, (3 mo. LIBOR + 3.25%, 1.00% Floor), 5.57%, 03/01/25 | | | | | | | 150 | | | | 149,055 | |
2018 2nd Lien Term Loan, (3 mo. LIBOR + 7.25%, 1.00% Floor), 9.78%, 09/01/25 | | | | | | | 122 | | | | 119,865 | |
| | | | | | | | |
| | | | | | | | | | | 4,907,138 | |
| Multiline Retail — 0.0% | |
Neiman Marcus Group, Inc., 2020 Term Loan, (1 mo. LIBOR + 3.25%, 1.00% Floor), 5.53%, 10/25/20 | | | | | | | 324 | | | | 294,291 | |
| | | | | | | | |
| Oil & Gas Equipment & Services — 0.3% | |
McDermott Technology Americas, Inc., 2018 1st Lien Term Loan, (1 mo. LIBOR + 5.00%, 1.00% Floor), 7.30%, 05/10/25 | | | | | | | 1,855 | | | | 1,829,186 | |
| | | | | | | | |
| Oil, Gas & Consumable Fuels — 0.2% | |
BCP Raptor II LLC, 1st Lien Term Loan,
11/03/25(a)(n) | | | | | | | 103 | | | | 102,227 | |
California Resources Corp.: | | | | | | | | | | | | |
2017 1st Lien Term Loan, (1 mo. LIBOR + 4.75%, 1.00% Floor), 7.04%, 12/31/22 | | | | | | | 826 | | | | 837,011 | |
Second Out Term Loan, (1 mo. LIBOR + 10.37%, 1.00% Floor), 12.67%, 12/31/21 | | | | | | | 321 | | | | 357,789 | |
CONSOL Energy, Inc., 1st Lien Term Loan B, (1 mo. LIBOR + 6.00%, 1.00% Floor), 8.31%, 11/28/22 | | | | | | | 359 | | | | 366,422 | |
Medallion Midland Acquisition LLC, 1st Lien Term Loan, (1 mo. LIBOR + 3.25%, 1.00% Floor), 5.55%, 10/30/24 | | | | | | | 39 | | | | 38,669 | |
| | | | | | | | |
| | | | | | | | | | | 1,702,118 | |
| | | | | | | | | | | | |
| Security | | | | | Par
(000) | | | Value | |
| Pharmaceuticals — 0.2% | |
Amneal Pharmaceuticals LLC, 2018 Term Loan B, (1 mo. LIBOR + 3.50%), 5.81%, 05/04/25 | | | USD | | | | 365 | | | $ | 367,011 | |
Auris Luxembourg III Sarl, 2018 USD Term Loan B, 07/20/25(n) | | | | | | | 182 | | | | 182,986 | |
Endo Luxembourg Finance Company I Sarl, 2017 Term Loan B, (1 mo. LIBOR + 4.25%), 6.56%, 04/29/24 | | | | | | | 649 | | | | 651,441 | |
Valeant Pharmaceuticals International, Inc., 2018 Term Loan B, (1 mo. LIBOR + 3.00%), 5.27%, 06/01/25 | | | | | | | 179 | | | | 178,536 | |
| | | | | | | | | | | | |
| | | | | | | | | | | 1,379,974 | |
| Real Estate Management & Development — 0.0% | |
Forest City Enterprises LP, Term Loan B, 10/24/25(n) | | | | | | | 104 | | | | 104,346 | |
| | | | | | | | | | | | |
| Software — 0.5% | |
Applied Systems, Inc., 2017 2nd Lien Term Loan, (3 mo. LIBOR + 7.00%, 1.00% Floor), 9.39%, 09/19/25 | | | | | | | 34 | | | | 34,493 | |
BMC Software Finance, Inc., 2017 Term Loan B, (3 mo. LIBOR + 4.25%), 6.65%, 10/02/25 | | | | | | | 550 | | | | 551,320 | |
Cypress Intermediate Holdings III, Inc.: | | | | | | | | | | | | |
2017 1st Lien Term Loan, (1 mo. LIBOR + 3.00%, 1.00% Floor), 5.31%, 04/26/24 | | | | | | | 132 | | | | 131,695 | |
2017 2nd Lien Term Loan, (1 mo. LIBOR + 6.75%, 1.00% Floor), 9.05%, 04/27/25 | | | | | | | 40 | | | | 40,200 | |
Digicel International Finance Ltd., 2017 Term Loan B, (1 mo. LIBOR + 3.25%), 5.57%, 05/28/24 | | | | | | | 264 | | | | 252,926 | |
Kronos, Inc., 2nd Lien Term Loan, (3 mo. LIBOR + 8.25%, 1.00% Floor), 10.59%, 11/01/24 | | | | | | | 624 | | | | 631,381 | |
McAfee LLC, 2017 Term Loan B, (1 mo. LIBOR + 4.50%, 1.00% Floor), 6.79%, 09/30/24 | | | | | | | 321 | | | | 321,504 | |
Mitchell International, Inc.: | | | | | | | | | | | | |
2017 1st Lien Term Loan, (1 mo. LIBOR + 3.25%), 5.55%, 11/29/24 | | | | | | | 242 | | | | 241,028 | |
2017 2nd Lien Term Loan, (1 mo. LIBOR + 7.25%), 9.54%, 12/01/25 | | | | | | | 168 | | | | 163,618 | |
PowerSchool, 2018 Term Loan B, (1 mo. LIBOR + 3.25%), 5.52%, 08/01/25 | | | | | | | 111 | | | | 110,795 | |
Renaissance Learning, Inc., 2018 Add On Term Loan, (1 mo. LIBOR + 3.25%), 5.55%, 05/30/25 | | | | | | | 129 | | | | 128,002 | |
SS&C Technologies Holdings Europe SARL, 2018 Term Loan B4, (1 mo. LIBOR + 2.25%), 4.55%, 04/16/25 | | | | | | | 149 | | | | 148,254 | |
SS&C Technologies, Inc.: | | | | | | | | | | | | |
2018 Term Loan B3, (1 mo. LIBOR + 2.25%), 4.55%, 04/16/25 | | | | | | | 419 | | | | 416,855 | |
2018 Term Loan B5, (1 mo. LIBOR + 2.25%), 4.55%, 04/16/25 | | | | | | | 269 | | | | 267,367 | |
Tempo Acquisition LLC, Term Loan, (1 mo. LIBOR + 3.00%), 5.30%, 05/01/24 | | | | | | | 154 | | | | 154,356 | |
| | | | | | | | | | | | |
| | | | | | | | | | | 3,593,794 | |
| Specialty Retail — 0.0% | |
Belron Finance US LLC, Term Loan B, (3 mo. LIBOR + 2.50%), 4.84%, 11/07/24 | | | | | | | 143 | | | | 143,099 | |
| | | | | | | | | | | | |
| Textiles, Apparel & Luxury Goods — 0.0% | |
Ascend Performance Materials Operations LLC, Term Loan B, (3 mo. LIBOR + 5.25%, 1.00% Floor), 7.64%, 08/12/22 | | | | | | | 306 | | | | 306,327 | |
| | | | | | | | | | | | |
| Trading Companies & Distributors — 0.0% | |
Beacon Roofing Supply, Inc., 2017 Term Loan B, (3 mo. LIBOR + 2.25%), 4.53%, 01/02/25 | | | | | | | 152 | | | | 150,637 | |
| | | | | | | | | | | | |
| | | | |
| CONSOLIDATED SCHEDULES OF INVESTMENTS | | | 63 | |
| | |
Consolidated Schedule of Investments (continued) October 31, 2018 | | BlackRock Multi-Sector Income Trust (BIT) (Percentages shown are based on Net Assets) |
| | | | | | | | | | | | |
| Security | | | | | Par
(000) | | | Value | |
| Transportation — 0.0% | |
Direct ChassisLink, Inc., 2017 2nd Lien Term Loan, (3 mo. LIBOR + 6.00%), 8.53%, 06/15/23(a) | | | USD | | | | 30 | | | $ | 29,883 | |
| | | | | | | | | | | | |
| Utilities — 0.0% | |
ExGen Renewables IV LLC, Term Loan B, (3 mo. LIBOR + 3.00%, 1.00% Floor), 5.32%, 11/28/24(a) | | | | | | | 91 | | | | 91,889 | |
| | | | | | | | | | | | |
| Wireless Telecommunication Services — 0.1% | |
Xplornet Communications, Inc., Term Loan B, (3 mo. LIBOR + 4.00%, 1.00% Floor), 6.39%, 09/09/21(a) | | | | | | | 343 | | | | 344,263 | |
| | | | | | | | | | | | |
Total Floating Rate Loan Interests — 15.0%
(Cost — $106,915,104) | | | | 106,802,402 | |
| | | | | | | | | | | | |
|
Foreign Agency Obligations — 5.2% | |
| | | |
Argentine Republic Government International Bond: | | | | | | | | | | | | |
7.50%, 04/22/26 | | | | | | | 3,437 | | | | 2,998,782 | |
7.63%, 04/22/46 | | | | | | | 2,767 | | | | 2,165,177 | |
Colombia Government International Bond: | | | | | | | | | | | | |
4.38%, 07/12/21(g) | | | | | | | 247 | | | | 250,211 | |
4.50%, 01/28/26(g) | | | | | | | 715 | | | | 715,000 | |
3.88%, 04/25/27 | | | | | | | 1,216 | | | | 1,157,632 | |
4.50%, 03/15/29 | | | | | | | 826 | | | | 814,444 | |
Cyprus Government International Bond, 4.63%, 02/03/20(b) | | | EUR | | | | 2,950 | | | | 3,519,344 | |
Egypt Government International Bond: | | | | | | | | | | | | |
5.75%, 04/29/20 | | | USD | | | | 2,360 | | | | 2,374,113 | |
5.58%, 02/21/23(b) | | | | | | | 400 | | | | 381,752 | |
Iceland Government International Bond, 5.88%, 05/11/22 | | | | | | | 3,415 | | | | 3,700,021 | |
Indonesia Government International Bond: | | | | | | | | | | | | |
4.75%, 01/08/26 | | | | | | | 670 | | | | 662,159 | |
4.10%, 04/24/28(g) | | | | | | | 774 | | | | 727,025 | |
Indonesia Treasury Bond: | | | | | | | | | | | | |
7.88%, 04/15/19 | | | IDR | | | | 35,807,000 | | | | 2,366,296 | |
8.38%, 09/15/26 | | | | | | | 17,965,000 | | | | 1,164,280 | |
Mexico Government International Bond: | | | | | | | | | | | | |
4.15%, 03/28/27 | | | USD | | | | 730 | | | | 694,135 | |
3.75%, 01/11/28 | | | | | | | 1,156 | | | | 1,064,688 | |
Portugal Government International Bond, 5.13%, 10/15/24(b) | | | | | | | 3,680 | | | | 3,822,710 | |
Qatar Government International Bond: | | | | | | | | | | | | |
4.63%, 06/02/46 | | | | | | | 519 | | | | 516,405 | |
5.10%, 04/23/48(b) | | | | | | | 330 | | | | 334,950 | |
Republic of South Africa Government International Bond(g): | | | | | | | | | | | | |
5.88%, 05/30/22 | | | | | | | 2,698 | | | | 2,752,769 | |
4.88%, 04/14/26 | | | | | | | 843 | | | | 779,775 | |
Russian Federal Bond - OFZ, 7.05%, 01/19/28 | | | RUB | | | | 124,934 | | | | 1,732,268 | |
Russian Foreign Bond - Eurobond: | | | | | | | | | | | | |
4.75%, 05/27/26 | | | USD | | | | 400 | | | | 394,600 | |
4.25%, 06/23/27 | | | | | | | 600 | | | | 568,012 | |
Turkey Government International Bond: | | | | | | | | | | | | |
6.25%, 09/26/22 | | | | | | | 467 | | | | 452,394 | |
4.88%, 04/16/43 | | | | | | | 450 | | | | 319,131 | |
5.75%, 05/11/47 | | | | | | | 365 | | | | 276,487 | |
| | | | | | | | |
Total Foreign Agency Obligations — 5.2%
(Cost — $39,250,912) | | | | 36,704,560 | |
| | | | | | | | |
| | | | | | | | | | | | |
| Security | | | | | Par
(000) | | | Value | |
Non-Agency Mortgage-Backed Securities — 16.6% | |
|
| Collateralized Mortgage Obligations — 15.9% | |
American Home Mortgage Assets Trust, Series 2006-5, Class A1, (12 mo. MTA + 0.92%),
2.87%, 11/25/46(d) | | | USD | | | | 5,545 | | | $ | 2,933,977 | |
CHL Mortgage Pass-Through Trust: | | | | | | | | | | | | |
Series 2006-3, Class 1A1, (1 mo. LIBOR US + 0.24%), 2.52%, 03/25/36(d) | | | | | | | 9,519 | | | | 9,145,345 | |
Series 2007-J2, Class 2A1, (1 mo. LIBOR US + 0.65%), 2.93%, 07/25/37(d) | | | | | | | 4,111 | | | | 2,252,411 | |
Series 2007-J2, Class 2A8, 6.00%, 07/25/37 | | | | | | | 2,270 | | | | 1,621,592 | |
CIM Trust, Series 2017-6, Class A1,
3.02%, 06/25/57 (a)(b)(c) | | | | | | | 8,995 | | | | 8,631,474 | |
Citigroup Mortgage Loan Trust, Series 2006-AR7, Class 2A3A, 4.28%, 11/25/36(c) | | | | | | | 4,824 | | | | 4,550,409 | |
Countrywide Alternative Loan Trust: | | | | | | | | | | | | |
Series 2005-9CB, Class 1A3, (1 mo. LIBOR US + 0.45%), 2.73%, 05/25/35(d) | | | | | | | 3,043 | | | | 2,807,173 | |
Series 2006-40T1, Class 2A5, (1 mo. LIBOR US + 0.40%), 2.68%, 12/25/36(d) | | | | | | | 2,393 | | | | 708,194 | |
Series 2006-7CB, Class 2A1, 6.50%, 05/25/36 | | | | | | | 2,532 | | | | 1,806,822 | |
Series 2006-J7, Class 2A1, (11th District Cost of Funds + 1.50%), 2.52%, 11/20/46(d) | | | | | | | 5,851 | | | | 4,127,913 | |
Series 2006-J8, Class A5, 6.00%, 02/25/37 | | | | | | | 1,811 | | | | 1,279,869 | |
Series 2006-OA14, Class 3A1, (12 mo. MTA + 0.85%), 2.80%, 11/25/46(d) | | | | | | | 8,377 | | | | 7,333,802 | |
Series 2006-OA16, Class A2, (1 mo. LIBOR US + 0.19%), 2.47%, 10/25/46(d) | | | | | | | 5,774 | | | | 5,664,308 | |
Series 2006-OA18, Class A1, (1 mo. LIBOR US + 0.12%), 2.40%, 12/25/46(d) | | | | | | | 3,542 | | | | 3,422,191 | |
Series 2006-OA6, Class 1A1A, (1 mo. LIBOR US + 0.21%), 2.49%, 07/25/46(d) | | | | | | | 6,962 | | | | 5,952,890 | |
Series 2006-OA8, Class 1A1, (1 mo. LIBOR US + 0.19%), 2.47%, 07/25/46(d) | | | | | | | 2,548 | | | | 2,456,313 | |
Series 2007-12T1, Class A22, 5.75%, 06/25/37 | | | | | | | 5,040 | | | | 3,662,465 | |
Series 2007-12T1, Class A5, 6.00%, 06/25/37 | | | | | | | 2,445 | | | | 1,826,357 | |
Series 2007-22, Class 2A16, 6.50%, 09/25/37 | | | | | | | 9,071 | | | | 6,250,005 | |
Series 2007-23CB, Class A1, 6.00%, 09/25/37 | | | | | | | 6,495 | | | | 5,301,741 | |
Series 2007-4CB, Class 1A3, (1 mo. LIBOR US + 0.35%), 2.63%, 04/25/37(d) | | | | | | | 3,656 | | | | 2,915,962 | |
Series 2007-OA2, Class 1A1, (12 mo. MTA + 0.84%), 2.79%, 03/25/47(d) | | | | | | | 4,254 | | | | 3,561,712 | |
Countrywide Home Loan Mortgage Pass-Through Trust, Series 2006-OA5, Class 3A1, (1 mo. LIBOR US + 0.20%), 2.48%, 04/25/46(d) | | | | | | | 7,892 | | | | 7,334,909 | |
Morgan Stanley Re-REMIC Trust, Series 2010-R5, Class 7B, 3.23%, 05/26/37(a)(b) | | | | | | | 10,622 | | | | 8,816,249 | |
Nomura Asset Acceptance Corp. Alternative Loan Trust, Series 2006-AF1, Class 1A2, 6.16%, 05/25/36(c) | | | | | | | 8,150 | | | | 3,120,422 | |
Residential Asset Securitization Trust, Series 2006-A8, Class 2A5, (1 mo. LIBOR US + 0.60%), 2.88%, 08/25/36(d)(e) | | | | | | | 6,674 | | | | 1,914,888 | |
WaMu Mortgage Pass-Through Certificates, Series 2007-OA4, Class 1A, (12 mo. MTA + 0.77%), 2.72%, 05/25/47(d) | | | | | | | 4,174 | | | | 3,937,945 | |
| | | | | | | | |
| | | | | | | | | | | 113,337,338 | |
| Commercial Mortgage-Backed Securities — 0.7% | |
Commercial Mortgage Pass-Through Certificates, Series 2014-PAT(b)(d): | | | | | | | | | | | | |
Class E, (1 mo. LIBOR + 3.15%), 5.43%, 08/13/27 | | | | | | | 1,000 | | | | 1,010,593 | |
| | |
| 64 | | 2018 BLACKROCK ANNUAL REPORTTO SHAREHOLDERS |
| | |
Consolidated Schedule of Investments (continued) October 31, 2018 | | BlackRock Multi-Sector Income Trust (BIT) (Percentages shown are based on Net Assets) |
| | | | | | | | | | | | |
| Security | | | | | Par
(000) | | | Value | |
| Commercial Mortgage-Backed Securities (continued) | |
Class F, (1 mo. LIBOR + 2.44%), 4.72%, 08/13/27 | | | USD | | | | 3,000 | | | $ | 3,012,626 | |
Class G, (1 mo. LIBOR + 1.59%), 3.87%, 08/13/27 | | | | | | | 1,040 | | | | 1,036,126 | |
| | | | | | | | |
| | | | | | | | | | | 5,059,345 | |
| | | | | | | | |
Total Non-Agency Mortgage-Backed Securities — 16.6%
(Cost — $116,828,978) | | | | 118,396,683 | |
| | | | | | | | |
|
Preferred Securities — 16.0% | |
|
| Capital Trusts — 11.7% | |
| Banks(i) — 4.2% | |
ABN AMRO Bank NV, 5.75%(c) | | | | | | | 200 | | | | 237,290 | |
Banco Bilbao Vizcaya Argentaria SA(c): | | | | | | | | | | | | |
6.13% | | | | | | | 2,000 | | | | 1,722,500 | |
8.88% | | | | | | | 200 | | | | 251,732 | |
Banco Santander SA, 6.25%(c) | | | | | | | 100 | | | | 112,699 | |
Bankia SA 6.38%(c) | | | | | | | 200 | | | | 223,698 | |
BNP Paribas SA, 7.20%(b)(c)(g) | | | | | | | 4,000 | | | | 4,167,360 | |
Capital One Financial Corp., Series E, 5.55%(c)(g) | | | | | | | 3,500 | | | | 3,535,000 | |
CIT Group, Inc., Series A, 5.80%(c)(g) | | | | | | | 282 | | | | 277,347 | |
Citigroup, Inc.(c)(g): | | | | | | | | | | | | |
5.90% | | | | | | | 2,250 | | | | 2,250,000 | |
Series P, 5.95% | | | | | | | 3,700 | | | | 3,646,812 | |
Cooperatieve Rabobank UA, 6.63%(c) | | | | | | | 200 | | | | 248,664 | |
Fifth Third Bancorp, Series J, 4.90%(c) | | | | | | | 3,000 | | | | 2,958,750 | |
Hongkong & Shanghai Banking Corp. Ltd., Series 3H, 2.56% | | | | | | | 100 | | | | 75,900 | |
Intesa Sanpaolo SpA, 7.00%(c) | | | | | | | 234 | | | | 269,843 | |
Wells Fargo & Co.(c)(g): | | | | | | | | | | | | |
Series S, 5.90% | | | | | | | 8,905 | | | | 8,971,787 | |
Series U, 5.88% | | | | | | | 700 | | | | 721,000 | |
| | | | | | | | |
| | | | | | | | | | | 29,670,382 | |
| Capital Markets(c)(i) — 1.1% | |
Goldman Sachs Group, Inc., Series P, 5.00%(g) | | | | | | | 278 | | | | 255,760 | |
Morgan Stanley, Series H, 5.45%(g) | | | | | | | 5,007 | | | | 5,051,462 | |
State Street Corp., Series F, 5.25%(g) | | | | | | | 1,875 | | | | 1,896,094 | |
UBS Group AG, 5.75% | | | | | | | 200 | | | | 246,068 | |
UBS Group Funding Switzerland AG, 5.00% | | | | | | | 200 | | | | 171,222 | |
| | | | | | | | |
| | | | | | | | | | | 7,620,606 | |
| Chemicals — 0.0% | |
Solvay Finance SA, 5.12%(c)(i) | | | | | | | 100 | | | | 122,836 | |
| | | | | | | | |
| Diversified Financial Services(i) — 4.4% | |
ATF Netherlands BV, 3.75%(c) | | | | | | | 100 | | | | 112,696 | |
Banco Santander SA, 6.75%(c) | | | | | | | 200 | | | | 241,189 | |
Bank of America Corp.(c): | | | | | | | | | | | | |
Series AA, 6.10% | | | | | | | 3,820 | | | | 3,920,275 | |
Series U, 5.20% | | | | | | | 1,750 | | | | 1,706,250 | |
Series V, 5.13%(g) | | | | | | | 705 | | | | 703,238 | |
Series X, 6.25%(g) | | | | | | | 6,175 | | | | 6,360,250 | |
Bank of New York Mellon Corp., Series D, 4.50%(c)(g) | | | | | | | 4,567 | | | | 4,315,815 | |
Credit Agricole SA, 6.50%(c) | | | | | | | 100 | | | | 122,043 | |
Credit Suisse Group AG, 7.50%(b)(c) | | | | | | | 200 | | | | 203,500 | |
HBOS Capital Funding LP, 6.85% | | | | | | | 200 | | | | 201,392 | |
HSBC Holdings PLC(g): | | | | | | | | | | | | |
6.00%(c) | | | | | | | 695 | | | | 639,400 | |
6.50%(c) | | | | | | | 655 | | | | 614,881 | |
JPMorgan Chase & Co.(c): | | | | | | | | | | | | |
Series Q, 5.15%(g) | | | | | | | 5,500 | | | | 5,398,800 | |
| | | | | | | | | | | | |
| Security | | | | | Par
(000) | | | Value | |
| Diversified Financial Services(i) (continued) | |
Series R, 6.00% | | | USD | | | | 228 | | | $ | 229,140 | |
Series V, 5.00%(g) | | | | | | | 3,830 | | | | 3,830,000 | |
Royal Bank of Scotland Group PLC, 8.63%(c) | | | | | | | 200 | | | | 210,250 | |
Societe Generale SA, 6.75%(b)(c)(g) | | | | | | | 3,000 | | | | 2,647,500 | |
| | | | | | | | |
| | | | | | | | | | | 31,456,619 | |
| Diversified Telecommunication Services — 0.1% | |
Telefonica Europe BV(c)(i): | | | | | | | | | | | | |
3.75% | | | | | | | 100 | | | | 115,728 | |
4.20% | | | | | | | 300 | | | | 349,989 | |
5.88% | | | | | | | 100 | | | | 124,798 | |
| | | | | | | | |
| | | | | | | | | | | 590,515 | |
| Electric Utilities(c) — 1.1% | |
Electricite de France SA, 5.25%(b)(g)(i) | | | | | | | 7,500 | | | | 7,265,625 | |
Enel SpA, 7.75%, 09/10/75 | | | | | | | 100 | | | | 136,947 | |
Gas Natural Fenosa Finance BV, 4.13%(i) | | | | | | | 100 | | | | 118,220 | |
RWE AG, 2.75%, 04/21/75 | | | | | | | 20 | | | | 22,966 | |
| | | | | | | | |
| | | | | | | | | | | 7,543,758 | |
| Electronic Equipment, Instruments & Components — 0.0% | |
Belden, Inc., 4.13%, 10/15/26 | | | | | | | 100 | | | | 116,852 | |
| | | | | | | | |
| Industrial Conglomerates — 0.4% | |
General Electric Co., Series D, 5.00%(c)(g)(i) | | | | | | | 3,000 | | | | 2,778,750 | |
| | | | | | | | |
| Insurance(c)(g) — 0.4% | |
Allstate Corp., Series B, 5.75%, 08/15/53 | | | | | | | 2,000 | | | | 2,020,200 | |
Voya Financial, Inc., 5.65%, 05/15/53 | | | | | | | 1,090 | | | | 1,073,650 | |
| | | | | | | | |
| | | | | | | | | | | 3,093,850 | |
| | | | | | | | |
Total Capital Trusts — 11.7%
(Cost — $83,832,350) | | | | 82,994,168 | |
| | | | | | | | |
| | | |
| | | | | | Shares | | | | |
| Preferred Stocks — 4.3% | |
|
| Banks — 0.3% | |
Citigroup, Inc., Series K, 6.88%(c) | | | | | | | 75,000 | | | | 2,049,750 | |
| | | | | | | | |
| Capital Markets — 2.0% | |
Goldman Sachs Group, Inc., Series J, 5.50%(c) | | | | | | | 395,017 | | | | 9,970,229 | |
Morgan Stanley(c) | | | | | | | | | | | | |
Series F, 6.88% | | | | | | | 100,000 | | | | 2,681,000 | |
Series K, 5.85% | | | | | | | 60,125 | | | | 1,515,150 | |
SCE Trust III, Series H, 5.75%(c) | | | | | | | 23,730 | | | | 596,335 | |
| | | | | | | | |
| | | | | | | | | | | 14,762,714 | |
| Equity Real Estate Investment Trusts (REITs) — 1.9% | |
Firstar Realty LLC, 8.88%(b)(i) | | | | | | | 10,000 | | | | 11,600,000 | |
SunTrust Real Estate Investment Corp., 9.00%(a)(b)(i) | | | | | | | 15 | | | | 1,637,441 | |
| | | | | | | | |
| | | | | | | | | | | 13,237,441 | |
| Machinery — 0.1% | |
Stanley Black & Decker, Inc., 5.38%(k) | | | | | | | 4,170 | | | | 382,597 | |
| | | | | | | | |
Total Preferred Stocks — 4.3%
(Cost — $31,860,863) | | | | 30,432,502 | |
| | | | | | | | |
Total Preferred Securities — 16.0%
(Cost — $115,693,213) | | | | 113,426,670 | |
| | | | | | | | |
| | | | |
| CONSOLIDATED SCHEDULES OF INVESTMENTS | | | 65 | |
| | |
Consolidated Schedule of Investments (continued) October 31, 2018 | | BlackRock Multi-Sector Income Trust (BIT) (Percentages shown are based on Net Assets) |
| | | | | | | | | | | | |
| Security | | | | | Par
(000) | | | Value | |
| U.S. Government Sponsored Agency Securities — 9.5% | |
|
| Collateralized Mortgage Obligations — 0.8% | |
Fannie Mae Connecticut Avenue Securities, Series 2016-C06, Class 1M2, (1 mo. LIBOR US + 4.25%), 6.53%, 04/25/29(d) | | | USD | | | | 545 | | | $ | 615,583 | |
Freddie Mac Mortgage-Backed Securities, Series 4480, Class ZX, 4.00%, 11/15/44(g) | | | | | | | 5,141 | | | | 4,977,828 | |
| | | | | | | | |
| | | | | | | | | | | 5,593,411 | |
| Mortgage-Backed Securities — 8.7% | |
Fannie Mae Mortgage-Backed Securities(g): | | | | | | | | | | | | |
4.00%, 11/01/47 — 04/01/56 | | | | | | | 20,190 | | | | 20,294,840 | |
4.50%, 09/01/48 — 07/01/55(e) | | | | | | | 40,507 | | | | 41,833,744 | |
| | | | | | | | |
| | | | | | | | | | | 62,128,584 | |
| | | | | | | | |
Total U.S. Government Sponsored Agency Securities — 9.5%
(Cost — $70,088,966) | | | | 67,721,995 | |
| | | | | | | | |
|
U.S. Treasury Obligations — 2.7% | |
U.S. Treasury Note: | | | | | | | | | | | | |
2.75%, 09/30/20(g) | | | | | | | 2,700 | | | | 2,693,672 | |
2.88%, 10/31/20 | | | | | | | 5,000 | | | | 4,999,609 | |
2.75%, 08/31/25(g) | | | | | | | 7,000 | | | | 6,860,547 | |
3.00%, 09/30/25(g) | | | | | | | 4,500 | | | | 4,478,731 | |
| | | | | | | | |
Total U.S. Treasury Obligations — 2.7%
(Cost — $19,087,463) | | | | 19,032,559 | |
| | | | | | | | |
| | |
| | | | Shares | | | | |
Warrants — 0.0% | |
|
| Diversified Financial Services — 0.0% | |
Aviron Capital LLC(o) | | | | | | | 10 | | | | — | |
| | | | | | | | |
Total Warrants — 0.0%
(Cost — $—) | | | | — | |
| | | | | | | | |
Total Long-Term Investments — 152.7%
(Cost — $1,097,110,763) | | | | 1,085,205,093 | |
| | | | | | | | |
| | | | | | | | | | | | |
| Security | | | Par
(000) | | | Value | |
| Short-Term Securities — 0.3% | |
Egypt Treasury Bills, 0.00%, 04/02/19(l) | | | EGP | | | | 40,125 | | | $ | 2,072,629 | |
| | | | | | | | |
Total Short-Term Securities — 0.3%
(Cost — $2,072,649) | | | | 2,072,629 | |
| | | | | | | | |
| |
Total Investments — 153.0%
(Cost — $1,099,183,412) | | | | 1,087,277,722 | |
Liabilities in Excess of Other Assets — (53.0)% | | | | (376,446,192 | ) |
| | | | | | | | |
Net Assets — 100.0% | | | $ | 710,831,530 | |
| | | | | | | | |
| (a) | Security is valued using significant unobservable inputs and is classified as Level 3 in the fair value hierarchy. |
| (b) | Security exempt from registration pursuant to Rule 144A under the Securities Act of 1933, as amended. These securities may be resold in transactions exempt from registration to qualified institutional investors. |
| (c) | Variable or floating rate security, which interest rate adjusts periodically based on changes in current interest rates and prepayments on the underlying pool of assets. Rate shown is the rate in effect as of period end. |
| (d) | Variable rate security. Rate shown is the rate in effect as of period end. |
| (e) | When-issued security. |
| (f) | Amount is less than $500. |
| (g) | All or a portion of the security has been pledged as collateral in connection with outstanding reverse repurchase agreements. |
| (h) | Variable rate security. Security may be issued at a fixed coupon rate, which converts to a variable rate at a specified date. Rate shown is the rate in effect as of period end. |
| (i) | Perpetual security with no stated maturity date. |
| (j) | Payment-in-kind security which may pay interest/dividends in additional par/shares and/or in cash. Rates shown are the current rate and possible payment rates. |
| (k) | Convertible security. |
| (m) | Step-up bond that pays an initial coupon rate for the first period and then a higher coupon rate for the following periods. Rate as of period end. |
| (n) | Represents an unsettled loan commitment at period end. Certain details associated with this purchase are not known prior to the settlement date, including coupon rate. |
| (o) | All or a portion of the security is held by a wholly-owned subsidiary. See Note 1 of the Notes to Financial Statements for details on the wholly-owned subsidiary. |
During the year ended October 31, 2018, investments in issuers considered to an affiliate of the Trust for purposes of Section 2(a)(3) of the Investment Company Act of 1940, as amended, were as follows:
| | | | | | | | | | | | | | | | | | | | | | | | | | | | |
| Affiliate | | Shares
Held at
10/31/17 | | | Net
Activity | | | Shares
Held at
10/31/18 | | | Value at
10/31/18 | | | Income | | | Net Realized Gain (Loss) (b) | | | Change in
Unrealized
Appreciation
(Depreciation) | |
BlackRock Liquidity Funds, T-Fund, Institutional Class(a) | | | 347,225 | | | | (347,225 | ) | | | — | | | $ | — | | | $ | 111,086 | | | $ | — | | | $ | — | |
| | | | | | | | | | | | | | | | | | | | | | | | | | | | |
| | (a) | No longer held by the Trust. | |
| | (b) | Includes net capital gain distributions, if applicable. | |
For Trust compliance purposes, the Trust’s industry classifications refer to one or more of the industry sub-classifications used by one or more widely recognized market indexes or rating group indexes, and/or as defined by the investment adviser. These definitions may not apply for purposes of this report, which may combine such industry sub-classifications for reporting ease.
Reverse Repurchase Agreements
| | | | | | | | | | | | | | | | | | | | | | | | |
| Counterparty | | Interest
Rate | | | Trade
Date | | | Maturity
Date (a) | | | Face Value | | | Face Value
Including
Accrued Interest | | | Type of Non-Cash Underlying Collateral | | Remaining Contractual
Maturity of the Agreements (a) |
BNP Paribas S.A. | | | 2.87 | % | | | 07/11/18 | | | | Open | | | $ | 280,638 | | | $ | 282,927 | | | Corporate Bonds | | Open/Demand |
RBC Capital Markets, LLC | | | 2.85 | | | | 07/11/18 | | | | Open | | | | 367,901 | | | | 370,991 | | | Corporate Bonds | | Open/Demand |
| | |
| 66 | | 2018 BLACKROCK ANNUAL REPORTTO SHAREHOLDERS |
| | |
Consolidated Schedule of Investments (continued) October 31, 2018 | | BlackRock Multi-Sector Income Trust (BIT) |
Reverse Repurchase Agreements (continued)
| | | | | | | | | | | | | | | | | | | | | | | | |
| Counterparty | | Interest
Rate | | | Trade
Date | | | Maturity
Date (a) | | | Face Value | | | Face Value
Including
Accrued Interest | | | Type of Non-Cash Underlying Collateral | | Remaining Contractual
Maturity of the Agreements (a) |
RBC Capital Markets, LLC | | | 2.85 | % | | | 07/12/18 | | | | Open | | | $ | 171,140 | | | $ | 172,565 | | | Corporate Bonds | | Open/Demand |
Barclays Bank PLC | | | 2.75 | | | | 07/16/18 | | | | Open | | | | 411,810 | | | | 414,873 | | | Corporate Bonds | | Open/Demand |
Barclays Bank PLC | | | 2.75 | | | | 07/16/18 | | | | Open | | | | 128,048 | | | | 129,000 | | | Corporate Bonds | | Open/Demand |
Barclays Bank PLC | | | 2.80 | | | | 07/16/18 | | | | Open | | | | 1,012,833 | | | | 1,020,448 | | | Corporate Bonds | | Open/Demand |
Barclays Capital, Inc. | | | 2.80 | | | | 07/16/18 | | | | Open | | | | 229,133 | | | | 230,871 | | | Corporate Bonds | | Open/Demand |
Barclays Capital, Inc. | | | 2.80 | | | | 07/16/18 | | | | Open | | | | 225,600 | | | | 227,311 | | | Capital Trusts | | Open/Demand |
Barclays Capital, Inc. | | | 2.80 | | | | 07/16/18 | | | | Open | | | | 268,898 | | | | 270,937 | | | Corporate Bonds | | Open/Demand |
Barclays Capital, Inc. | | | 2.80 | | | | 07/16/18 | | | | Open | | | | 247,903 | | | | 249,783 | | | Corporate Bonds | | Open/Demand |
Barclays Capital, Inc. | | | 2.80 | | | | 07/16/18 | | | | Open | | | | 242,110 | | | | 243,947 | | | Corporate Bonds | | Open/Demand |
Barclays Capital, Inc. | | | 2.80 | | | | 07/16/18 | | | | Open | | | | 245,520 | | | | 247,383 | | | Corporate Bonds | | Open/Demand |
Barclays Capital, Inc. | | | 2.80 | | | | 07/16/18 | | | | Open | | | | 232,825 | | | | 234,591 | | | Corporate Bonds | | Open/Demand |
BNP Paribas S.A. | | | 2.70 | | | | 07/16/18 | | | | Open | | | | 945,000 | | | | 951,888 | | | Corporate Bonds | | Open/Demand |
BNP Paribas S.A. | | | 2.70 | | | | 07/16/18 | | | | Open | | | | 688,125 | | | | 693,141 | | | Corporate Bonds | | Open/Demand |
BNP Paribas S.A. | | | 2.70 | | | | 07/16/18 | | | | Open | | | | 470,625 | | | | 474,055 | | | Corporate Bonds | | Open/Demand |
BNP Paribas S.A. | | | 2.85 | | | | 07/16/18 | | | | Open | | | | 450,450 | | | | 453,934 | | | Corporate Bonds | | Open/Demand |
BNP Paribas S.A. | | | 2.85 | | | | 07/16/18 | | | | Open | | | | 676,875 | | | | 682,110 | | | Corporate Bonds | | Open/Demand |
BNP Paribas S.A. | | | 2.85 | | | | 07/16/18 | | | | Open | | | | 1,021,355 | | | | 1,029,255 | | | Corporate Bonds | | Open/Demand |
BNP Paribas S.A. | | | 2.88 | | | | 07/16/18 | | | | Open | | | | 132,224 | | | | 133,258 | | | Corporate Bonds | | Open/Demand |
BNP Paribas S.A. | | | 2.88 | | | | 07/16/18 | | | | Open | | | | 151,800 | | | | 152,988 | | | Capital Trusts | | Open/Demand |
BNP Paribas S.A. | | | 2.95 | | | | 07/16/18 | | | | Open | | | | 752,378 | | | | 758,421 | | | Foreign Agency Obligations | | Open/Demand |
Deutsche Bank Securities, Inc. | | | 2.80 | | | | 07/16/18 | | | | Open | | | | 1,785,000 | | | | 1,798,541 | | | Capital Trusts | | Open/Demand |
Deutsche Bank Securities, Inc. | | | 2.80 | | | | 07/16/18 | | | | Open | | | | 2,320,000 | | | | 2,337,600 | | | Corporate Bonds | | Open/Demand |
Deutsche Bank Securities, Inc. | | | 2.80 | | | | 07/16/18 | | | | Open | | | | 1,901,000 | | | | 1,915,421 | | | Capital Trusts | | Open/Demand |
Deutsche Bank Securities, Inc. | | | 2.95 | | | | 07/16/18 | | | | Open | | | | 267,000 | | | | 269,145 | | | Corporate Bonds | | Open/Demand |
Deutsche Bank Securities, Inc. | | | 2.95 | | | | 07/16/18 | | | | Open | | | | 198,000 | | | | 199,590 | | | Corporate Bonds | | Open/Demand |
Deutsche Bank Securities, Inc. | | | 2.95 | | | | 07/16/18 | | | | Open | | | | 141,000 | | | | 142,133 | | | Corporate Bonds | | Open/Demand |
HSBC Securities (USA), Inc. | | | 2.70 | | | | 07/16/18 | | | | Open | | | | 538,000 | | | | 541,921 | | | Corporate Bonds | | Open/Demand |
RBC Capital Markets, LLC | | | 2.59 | | | | 07/16/18 | | | | Open | | | | 2,176,200 | | | | 2,191,849 | | | Corporate Bonds | | Open/Demand |
RBC Capital Markets, LLC | | | 2.85 | | | | 07/16/18 | | | | Open | | | | 520,830 | | | | 524,978 | | | Corporate Bonds | | Open/Demand |
RBC Capital Markets, LLC | | | 2.85 | | | | 07/16/18 | | | | Open | | | | 487,335 | | | | 491,216 | | | Corporate Bonds | | Open/Demand |
RBC Capital Markets, LLC | | | 2.85 | | | | 07/16/18 | | | | Open | | | | 435,070 | | | | 438,535 | | | Corporate Bonds | | Open/Demand |
RBC Capital Markets, LLC | | | 2.85 | | | | 07/16/18 | | | | Open | | | | 266,230 | | | | 268,350 | | | Corporate Bonds | | Open/Demand |
RBC Capital Markets, LLC | | | 2.85 | | | | 07/16/18 | | | | Open | | | | 153,755 | | | | 154,979 | | | Corporate Bonds | | Open/Demand |
RBC Capital Markets, LLC | | | 2.85 | | | | 07/16/18 | | | | Open | | | | 366,818 | | | | 369,739 | | | Corporate Bonds | | Open/Demand |
RBC Capital Markets, LLC | | | 2.85 | | | | 07/16/18 | | | | Open | | | | 464,313 | | | | 468,010 | | | Corporate Bonds | | Open/Demand |
RBC Capital Markets, LLC | | | 2.85 | | | | 07/16/18 | | | | Open | | | | 727,575 | | | | 733,369 | | | Corporate Bonds | | Open/Demand |
RBC Capital Markets, LLC | | | 2.85 | | | | 07/16/18 | | | | Open | | | | 93,240 | | | | 93,983 | | | Corporate Bonds | | Open/Demand |
RBC Capital Markets, LLC | | | 2.85 | | | | 07/16/18 | | | | Open | | | | 985,725 | | | | 993,575 | | | Corporate Bonds | | Open/Demand |
RBC Capital Markets, LLC | | | 2.85 | | | | 07/16/18 | | | | Open | | | | 378,730 | | | | 381,746 | | | Corporate Bonds | | Open/Demand |
RBC Capital Markets, LLC | | | 2.85 | | | | 07/16/18 | | | | Open | | | | 165,600 | | | | 166,919 | | | Corporate Bonds | | Open/Demand |
RBC Capital Markets, LLC | | | 2.85 | | | | 07/16/18 | | | | Open | | | | 187,200 | | | | 188,691 | | | Corporate Bonds | | Open/Demand |
RBC Capital Markets, LLC | | | 2.85 | | | | 07/16/18 | | | | Open | | | | 370,450 | | | | 373,400 | | | Corporate Bonds | | Open/Demand |
RBC Capital Markets, LLC | | | 2.85 | | | | 07/16/18 | | | | Open | | | | 259,260 | | | | 261,325 | | | Corporate Bonds | | Open/Demand |
RBC Capital Markets, LLC | | | 2.85 | | | | 07/16/18 | | | | Open | | | | 436,050 | | | | 439,523 | | | Corporate Bonds | | Open/Demand |
RBC Capital Markets, LLC | | | 2.85 | | | | 07/16/18 | | | | Open | | | | 694,200 | | | | 699,729 | | | Corporate Bonds | | Open/Demand |
RBC Capital Markets, LLC | | | 2.85 | | | | 07/16/18 | | | | Open | | | | 172,010 | | | | 173,380 | | | Corporate Bonds | | Open/Demand |
RBC Capital Markets, LLC | | | 2.85 | | | | 07/16/18 | | | | Open | | | | 87,413 | | | | 88,109 | | | Corporate Bonds | | Open/Demand |
RBC Capital Markets, LLC | | | 2.85 | | | | 07/16/18 | | | | Open | | | | 250,400 | | | | 252,394 | | | Corporate Bonds | | Open/Demand |
RBC Capital Markets, LLC | | | 2.85 | | | | 07/16/18 | | | | Open | | | | 509,220 | | | | 513,275 | | | Corporate Bonds | | Open/Demand |
Barclays Capital, Inc. | | | 2.80 | | | | 07/17/18 | | | | Open | | | | 348,735 | | | | 351,356 | | | Corporate Bonds | | Open/Demand |
Barclays Capital, Inc. | | | 2.80 | | | | 07/17/18 | | | | Open | | | | 492,069 | | | | 495,767 | | | Capital Trusts | | Open/Demand |
Barclays Capital, Inc. | | | 2.80 | | | | 07/17/18 | | | | Open | | | | 827,038 | | | | 833,253 | | | Capital Trusts | | Open/Demand |
Barclays Capital, Inc. | | | 2.80 | | | | 07/17/18 | | | | Open | | | | 2,156,250 | | | | 2,172,455 | | | Capital Trusts | | Open/Demand |
Barclays Capital, Inc. | | | 2.90 | | | | 07/17/18 | | | | Open | | | | 293,693 | | | | 295,986 | | | Corporate Bonds | | Open/Demand |
BNP Paribas S.A. | | | 2.70 | | | | 07/17/18 | | | | Open | | | | 316,030 | | | | 318,552 | | | Corporate Bonds | | Open/Demand |
BNP Paribas S.A. | | | 2.70 | | | | 07/17/18 | | | | Open | | | | 260,925 | | | | 262,809 | | | Corporate Bonds | | Open/Demand |
BNP Paribas S.A. | | | 2.85 | | | | 07/17/18 | | | | Open | | | | 669,375 | | | | 674,504 | | | Corporate Bonds | | Open/Demand |
BNP Paribas S.A. | | | 2.91 | | | | 07/17/18 | | | | Open | | | | 285,289 | | | | 287,525 | | | Corporate Bonds | | Open/Demand |
Deutsche Bank Securities, Inc. | | | 2.95 | | | | 07/17/18 | | | | Open | | | | 2,008,000 | | | | 2,023,978 | | | Capital Trusts | | Open/Demand |
Deutsche Bank Securities, Inc. | | | 2.95 | | | | 07/17/18 | | | | Open | | | | 671,000 | | | | 676,339 | | | Corporate Bonds | | Open/Demand |
Deutsche Bank Securities, Inc. | | | 2.95 | | | | 07/17/18 | | | | Open | | | | 2,528,000 | | | | 2,548,115 | | | Corporate Bonds | | Open/Demand |
Deutsche Bank Securities, Inc. | | | 2.95 | | | | 07/17/18 | | | | Open | | | | 297,000 | | | | 299,363 | | | Corporate Bonds | | Open/Demand |
Deutsche Bank Securities, Inc. | | | 2.95 | | | | 07/17/18 | | | | Open | | | | 750,000 | | | | 755,968 | | | Corporate Bonds | | Open/Demand |
| | | | |
| CONSOLIDATED SCHEDULES OF INVESTMENTS | | | 67 | |
| | |
Consolidated Schedule of Investments (continued) October 31, 2018 | | BlackRock Multi-Sector Income Trust (BIT) |
Reverse Repurchase Agreements (continued)
| | | | | | | | | | | | | | | | | | | | | | | | |
| Counterparty | | Interest
Rate | | | Trade
Date | | | Maturity
Date (a) | | | Face Value | | | Face Value
Including
Accrued Interest | | | Type of Non-Cash Underlying Collateral | | Remaining Contractual
Maturity of the Agreements (a) |
RBC Capital Markets, LLC | | | 2.85 | % | | | 07/17/18 | | | | Open | | | $ | 729,125 | | | $ | 734,879 | | | Corporate Bonds | | Open/Demand |
RBC Capital Markets, LLC | | | 2.85 | | | | 07/17/18 | | | | Open | | | | 257,400 | | | | 259,431 | | | Corporate Bonds | | Open/Demand |
RBC Capital Markets, LLC | | | 2.85 | | | | 07/17/18 | | | | Open | | | | 330,750 | | | | 333,360 | | | Corporate Bonds | | Open/Demand |
RBC Capital Markets, LLC | | | 2.85 | | | | 07/17/18 | | | | Open | | | | 299,700 | | | | 302,065 | | | Corporate Bonds | | Open/Demand |
RBC Capital Markets, LLC | | | 2.85 | | | | 07/17/18 | | | | Open | | | | 164,730 | | | | 166,030 | | | Corporate Bonds | | Open/Demand |
RBC Capital Markets, LLC | | | 2.85 | | | | 07/17/18 | | | | Open | | | | 190,390 | | | | 191,892 | | | Corporate Bonds | | Open/Demand |
RBC Capital Markets, LLC | | | 2.85 | | | | 07/17/18 | | | | Open | | | | 268,800 | | | | 270,921 | | | Corporate Bonds | | Open/Demand |
RBC Capital Markets, LLC | | | 2.85 | | | | 07/17/18 | | | | Open | | | | 268,000 | | | | 270,115 | | | Corporate Bonds | | Open/Demand |
RBC Capital Markets, LLC | | | 2.85 | | | | 07/17/18 | | | | Open | | | | 256,500 | | | | 258,524 | | | Corporate Bonds | | Open/Demand |
RBC Capital Markets, LLC | | | 2.85 | | | | 07/17/18 | | | | Open | | | | 321,850 | | | | 324,390 | | | Corporate Bonds | | Open/Demand |
RBC Capital Markets, LLC | | | 2.85 | | | | 07/17/18 | | | | Open | | | | 412,300 | | | | 415,554 | | | Corporate Bonds | | Open/Demand |
RBC Capital Markets, LLC | | | 2.85 | | | | 07/17/18 | | | | Open | | | | 34,270 | | | | 34,540 | | | Corporate Bonds | | Open/Demand |
RBC Capital Markets, LLC | | | 2.85 | | | | 07/18/18 | | | | Open | | | | 213,030 | | | | 214,696 | | | Corporate Bonds | | Open/Demand |
RBC Capital Markets, LLC | | | 2.85 | | | | 07/18/18 | | | | Open | | | | 199,650 | | | | 201,211 | | | Corporate Bonds | | Open/Demand |
BNP Paribas S.A. | | | 2.66 | | | | 07/20/18 | | | | Open | | | | 319,125 | | | | 321,349 | | | Corporate Bonds | | Open/Demand |
BNP Paribas S.A. | | | 2.70 | | | | 07/23/18 | | | | Open | | | | 207,863 | | | | 209,279 | | | Corporate Bonds | | Open/Demand |
BNP Paribas S.A. | | | 2.70 | | | | 07/23/18 | | | | Open | | | | 241,870 | | | | 243,518 | | | Corporate Bonds | | Open/Demand |
BNP Paribas S.A. | | | 2.70 | | | | 07/23/18 | | | | Open | | | | 272,483 | | | | 274,339 | | | Corporate Bonds | | Open/Demand |
BNP Paribas S.A. | | | 2.70 | | | | 07/23/18 | | | | Open | | | | 248,105 | | | | 249,795 | | | Corporate Bonds | | Open/Demand |
BNP Paribas S.A. | | | 2.70 | | | | 07/23/18 | | | | Open | | | | 249,840 | | | | 251,542 | | | Corporate Bonds | | Open/Demand |
Deutsche Bank Securities, Inc. | | | 2.95 | | | | 07/23/18 | | | | Open | | | | 1,274,000 | | | | 1,283,564 | | | Corporate Bonds | | Open/Demand |
Deutsche Bank Securities, Inc. | | | 2.95 | | | | 07/23/18 | | | | Open | | | | 2,016,000 | | | | 2,031,134 | | | Corporate Bonds | | Open/Demand |
Deutsche Bank Securities, Inc. | | | 2.95 | | | | 07/23/18 | | | | Open | | | | 440,000 | | | | 443,303 | | | Corporate Bonds | | Open/Demand |
Deutsche Bank Securities, Inc. | | | 2.95 | | | | 07/23/18 | | | | Open | | | | 873,000 | | | | 879,554 | | | Corporate Bonds | | Open/Demand |
Deutsche Bank Securities, Inc. | | | 2.95 | | | | 07/23/18 | | | | Open | | | | 2,666,000 | | | | 2,686,014 | | | Capital Trusts | | Open/Demand |
Deutsche Bank Securities, Inc. | | | 2.95 | | | | 07/23/18 | | | | Open | | | | 296,000 | | | | 298,222 | | | Corporate Bonds | | Open/Demand |
Deutsche Bank Securities, Inc. | | | 2.95 | | | | 07/23/18 | | | | Open | | | | 490,000 | | | | 493,678 | | | Corporate Bonds | | Open/Demand |
RBC Capital Markets, LLC | | | 2.85 | | | | 07/24/18 | | | | Open | | | | 359,100 | | | | 361,752 | | | Corporate Bonds | | Open/Demand |
Barclays Capital, Inc. | | | (1.00 | ) | | | 07/25/18 | | | | Open | | | | 48,191 | | | | 48,060 | | | Corporate Bonds | | Open/Demand |
Barclays Capital, Inc. | | | 2.80 | | | | 07/25/18 | | | | Open | | | | 300,544 | | | | 302,632 | | | Corporate Bonds | | Open/Demand |
Barclays Capital, Inc. | | | 2.80 | | | | 07/25/18 | | | | Open | | | | 162,240 | | | | 163,367 | | | Corporate Bonds | | Open/Demand |
BNP Paribas S.A. | | | 2.85 | | | | 07/25/18 | | | | Open | | | | 102,638 | | | | 103,365 | | | Corporate Bonds | | Open/Demand |
BNP Paribas S.A. | | | 2.91 | | | | 07/25/18 | | | | Open | | | | 250,013 | | | | 251,825 | | | Corporate Bonds | | Open/Demand |
RBC Capital Markets, LLC | | | 2.85 | | | | 07/25/18 | | | | Open | | | | 503,010 | | | | 506,689 | | | Corporate Bonds | | Open/Demand |
RBC Capital Markets, LLC | | | 2.85 | | | | 07/25/18 | | | | Open | | | | 149,850 | | | | 150,946 | | | Corporate Bonds | | Open/Demand |
RBC Capital Markets, LLC | | | 2.85 | | | | 07/25/18 | | | | Open | | | | 307,545 | | | | 309,794 | | | Corporate Bonds | | Open/Demand |
Barclays Capital, Inc. | | | 2.80 | | | | 07/30/18 | | | | Open | | | | 233,761 | | | | 235,319 | | | Corporate Bonds | | Open/Demand |
Barclays Capital, Inc. | | | 2.80 | | | | 07/31/18 | | | | Open | | | | 241,349 | | | | 242,941 | | | Corporate Bonds | | Open/Demand |
RBC Capital Markets, LLC | | | 2.85 | | | | 08/01/18 | | | | Open | | | | 128,760 | | | | 129,637 | | | Corporate Bonds | | Open/Demand |
RBC Capital Markets, LLC | | | 2.85 | | | | 08/01/18 | | | | Open | | | | 78,720 | | | | 79,256 | | | Corporate Bonds | | Open/Demand |
BNP Paribas S.A. | | | 2.70 | | | | 08/02/18 | | | | Open | | | | 2,209,550 | | | | 2,223,249 | | | Corporate Bonds | | Open/Demand |
BNP Paribas S.A. | | | 2.80 | | | | 08/02/18 | | | | Open | | | | 2,148,750 | | | | 2,162,615 | | | Capital Trusts | | Open/Demand |
BNP Paribas S.A. | | | 2.92 | | | | 08/02/18 | | | | Open | | | | 239,080 | | | | 240,678 | | | Capital Trusts | | Open/Demand |
RBC Capital Markets, LLC | | | 2.85 | | | | 08/02/18 | | | | Open | | | | 1,287,877 | | | | 1,296,552 | | | Corporate Bonds | | Open/Demand |
RBC Capital Markets, LLC | | | 2.05 | | | | 08/13/18 | | | | Open | | | | 190,380 | | | | 191,286 | | | Corporate Bonds | | Open/Demand |
RBC Capital Markets, LLC | | | 2.85 | | | | 08/14/18 | | | | Open | | | | 434,730 | | | | 437,282 | | | Corporate Bonds | | Open/Demand |
RBC Capital Markets, LLC | | | 2.85 | | | | 08/15/18 | | | | Open | | | | 415,625 | | | | 418,034 | | | Corporate Bonds | | Open/Demand |
RBC Capital Markets, LLC | | | 2.85 | | | | 08/16/18 | | | | Open | | | | 2,194,430 | | | | 2,206,993 | | | Corporate Bonds | | Open/Demand |
RBC Capital Markets, LLC | | | 2.85 | | | | 08/17/18 | | | | Open | | | | 150,880 | | | | 151,631 | | | Corporate Bonds | | Open/Demand |
Barclays Bank PLC | | | 2.30 | | | | 08/20/18 | | | | Open | | | | 8,107,000 | | | | 8,144,292 | | | Capital Trusts | | Open/Demand |
Barclays Bank PLC | | | 2.55 | | | | 08/20/18 | | | | Open | | | | 4,054,406 | | | | 4,075,084 | | | Capital Trusts | | Open/Demand |
Barclays Bank PLC | | | 2.55 | | | | 08/20/18 | | | | Open | | | | 567,665 | | | | 570,560 | | | Corporate Bonds | | Open/Demand |
Barclays Bank PLC | | | 2.55 | | | | 08/20/18 | | | | Open | | | | 3,251,375 | | | | 3,267,957 | | | Capital Trusts | | Open/Demand |
Barclays Bank PLC | | | 2.55 | | | | 08/20/18 | | | | Open | | | | 3,093,125 | | | | 3,108,900 | | | Capital Trusts | | Open/Demand |
Barclays Bank PLC | | | 2.75 | | | | 08/20/18 | | | | Open | | | | 792,895 | | | | 796,865 | | | Corporate Bonds | | Open/Demand |
Barclays Bank PLC | | | 2.95 | | | | 08/20/18 | | | | Open | | | | 1,859,546 | | | | 1,868,867 | | | Corporate Bonds | | Open/Demand |
BNP Paribas S.A. | | | 2.56 | | | | 08/20/18 | | | | Open | | | | 7,702,500 | | | | 7,738,139 | | | Corporate Bonds | | Open/Demand |
BNP Paribas S.A. | | | 2.65 | | | | 08/20/18 | | | | Open | | | | 455,648 | | | | 457,838 | | | Corporate Bonds | | Open/Demand |
BNP Paribas S.A. | | | 2.70 | | | | 08/20/18 | | | | Open | | | | 5,355,625 | | | | 5,381,905 | | | Capital Trusts | | Open/Demand |
BNP Paribas S.A. | | | 2.70 | | | | 08/20/18 | | | | Open | | | | 280,720 | | | | 282,097 | | | Corporate Bonds | | Open/Demand |
BNP Paribas S.A. | | | 2.70 | | | | 08/20/18 | | | | Open | | | | 387,600 | | | | 389,502 | | | Corporate Bonds | | Open/Demand |
BNP Paribas S.A. | | | 2.70 | | | | 08/20/18 | | | | Open | | | | 226,528 | | | | 227,639 | | | Corporate Bonds | | Open/Demand |
| | |
| 68 | | 2018 BLACKROCK ANNUAL REPORTTO SHAREHOLDERS |
| | |
Consolidated Schedule of Investments (continued) October 31, 2018 | | BlackRock Multi-Sector Income Trust (BIT) |
Reverse Repurchase Agreements (continued)
| | | | | | | | | | | | | | | | | | | | | | | | |
| Counterparty | | Interest
Rate | | | Trade
Date | | | Maturity
Date (a) | | | Face Value | | | Face Value
Including
Accrued Interest | | | Type of Non-Cash Underlying Collateral | | Remaining Contractual
Maturity of the Agreements (a) |
BNP Paribas S.A. | | | 2.94 | % | | | 08/20/18 | | | | Open | | | $ | 1,262,479 | | | $ | 1,269,280 | | | Capital Trusts | | Open/Demand |
Credit Suisse Securities (USA) LLC | | | 2.50 | | | | 08/20/18 | | | | Open | | | | 811,714 | | | | 815,372 | | | Corporate Bonds | | Open/Demand |
Credit Suisse Securities (USA) LLC | | | 2.55 | | | | 08/20/18 | | | | Open | | | | 745,388 | | | | 748,821 | | | Corporate Bonds | | Open/Demand |
Deutsche Bank Securities, Inc. | | | 2.95 | | | | 08/20/18 | | | | Open | | | | 934,000 | | | | 939,050 | | | Corporate Bonds | | Open/Demand |
Deutsche Bank Securities, Inc. | | | 2.95 | | | | 08/20/18 | | | | Open | | | | 517,000 | | | | 519,795 | | | Corporate Bonds | | Open/Demand |
HSBC Securities (USA), Inc. | | | 2.70 | | | | 08/20/18 | | | | Open | | | | 273,000 | | | | 274,340 | | | Corporate Bonds | | Open/Demand |
RBC Capital Markets, LLC | | | 2.59 | | | | 08/20/18 | | | | Open | | | | 613,800 | | | | 616,818 | | | Corporate Bonds | | Open/Demand |
RBC Capital Markets, LLC | | | 2.59 | | | | 08/20/18 | | | | Open | | | | 324,625 | | | | 326,221 | | | Corporate Bonds | | Open/Demand |
RBC Capital Markets, LLC | | | 2.85 | | | | 08/20/18 | | | | Open | | | | 175,055 | | | | 176,007 | | | Corporate Bonds | | Open/Demand |
RBC Capital Markets, LLC | | | 2.85 | | | | 08/20/18 | | | | Open | | | | 59,940 | | | | 60,266 | | | Corporate Bonds | | Open/Demand |
Barclays Bank PLC | | | 2.55 | | | | 08/21/18 | | | | Open | | | | 179,975 | | | | 180,781 | | | Capital Trusts | | Open/Demand |
Barclays Bank PLC | | | 2.75 | | | | 08/21/18 | | | | Open | | | | 648,795 | | | | 651,998 | | | Corporate Bonds | | Open/Demand |
Barclays Bank PLC | | | 2.75 | | | | 08/21/18 | | | | Open | | | | 480,844 | | | | 483,218 | | | Corporate Bonds | | Open/Demand |
Barclays Bank PLC | | | 2.75 | | | | 08/21/18 | | | | Open | | | | 322,455 | | | | 324,047 | | | Corporate Bonds | | Open/Demand |
Barclays Bank PLC | | | 2.80 | | | | 08/21/18 | | | | Open | | | | 939,103 | | | | 943,765 | | | Corporate Bonds | | Open/Demand |
Barclays Capital, Inc. | | | 2.55 | | | | 08/21/18 | | | | Open | | | | 363,863 | | | | 365,492 | | | Capital Trusts | | Open/Demand |
Barclays Capital, Inc. | | | 2.75 | | | | 08/21/18 | | | | Open | | | | 207,025 | | | | 208,033 | | | Corporate Bonds | | Open/Demand |
BNP Paribas S.A. | | | 2.75 | | | | 08/21/18 | | | | Open | | | | 482,183 | | | | 484,496 | | | Corporate Bonds | | Open/Demand |
BNP Paribas S.A. | | | 2.75 | | | | 08/21/18 | | | | Open | | | | 81,218 | | | | 81,607 | | | Corporate Bonds | | Open/Demand |
BNP Paribas S.A. | | | 2.75 | | | | 08/21/18 | | | | Open | | | | 1,310,128 | | | | 1,316,414 | | | Corporate Bonds | | Open/Demand |
BNP Paribas S.A. | | | 2.75 | | | | 08/21/18 | | | | Open | | | | 842,906 | | | | 846,951 | | | Corporate Bonds | | Open/Demand |
BNP Paribas S.A. | | | 2.75 | | | | 08/21/18 | | | | Open | | | | 333,568 | | | | 335,168 | | | Corporate Bonds | | Open/Demand |
Barclays Capital, Inc. | | | 1.25 | | | | 09/07/18 | | | | Open | | | | 150,605 | | | | 150,893 | | | Corporate Bonds | | Open/Demand |
Barclays Capital, Inc. | | | 1.25 | | | | 09/07/18 | | | | Open | | | | 40,885 | | | | 40,944 | | | Corporate Bonds | | Open/Demand |
Barclays Capital, Inc. | | | 2.80 | | | | 09/07/18 | | | | Open | | | | 179,314 | | | | 179,975 | | | Corporate Bonds | | Open/Demand |
Deutsche Bank Securities, Inc. | | | 2.95 | | | | 09/07/18 | | | | Open | | | | 28,362 | | | | 28,479 | | | Corporate Bonds | | Open/Demand |
Barclays Bank PLC | | | 2.75 | | | | 09/10/18 | | | | Open | | | | 479,719 | | | | 481,421 | | | Corporate Bonds | | Open/Demand |
Barclays Bank PLC | | | 2.80 | | | | 09/10/18 | | | | Open | | | | 1,548,756 | | | | 1,554,362 | | | Corporate Bonds | | Open/Demand |
Barclays Bank PLC | | | 2.80 | | | | 09/10/18 | | | | Open | | | | 402,675 | | | | 404,132 | | | Corporate Bonds | | Open/Demand |
Barclays Bank PLC | | | 2.85 | | | | 09/10/18 | | | | Open | | | | 405,765 | | | | 407,262 | | | Corporate Bonds | | Open/Demand |
Barclays Capital, Inc. | | | 2.80 | | | | 09/10/18 | | | | Open | | | | 266,430 | | | | 267,394 | | | Corporate Bonds | | Open/Demand |
RBC Capital Markets, LLC | | | 2.59 | | | | 09/10/18 | | | | Open | | | | 955,000 | | | | 958,391 | | | Corporate Bonds | | Open/Demand |
RBC Capital Markets, LLC | | | 2.59 | | | | 09/10/18 | | | | Open | | | | 271,500 | | | | 272,464 | | | Corporate Bonds | | Open/Demand |
RBC Capital Markets, LLC | | | 2.59 | | | | 09/10/18 | | | | Open | | | | 945,000 | | | | 948,356 | | | Corporate Bonds | | Open/Demand |
RBC Capital Markets, LLC | | | 2.59 | | | | 09/10/18 | | | | Open | | | | 697,500 | | | | 699,977 | | | Corporate Bonds | | Open/Demand |
RBC Capital Markets, LLC | | | 2.59 | | | | 09/10/18 | | | | Open | | | | 701,250 | | | | 703,740 | | | Corporate Bonds | | Open/Demand |
RBC Capital Markets, LLC | | | 2.59 | | | | 09/10/18 | | | | Open | | | | 406,000 | | | | 407,442 | | | Corporate Bonds | | Open/Demand |
RBC Capital Markets, LLC | | | 2.59 | | | | 09/10/18 | | | | Open | | | | 731,250 | | | | 733,847 | | | Corporate Bonds | | Open/Demand |
RBC Capital Markets, LLC | | | 2.59 | | | | 09/10/18 | | | | Open | | | | 351,000 | | | | 352,246 | | | Corporate Bonds | | Open/Demand |
RBC Capital Markets, LLC | | | 2.59 | | | | 09/10/18 | | | | Open | | | | 484,900 | | | | 486,622 | | | Corporate Bonds | | Open/Demand |
RBC Capital Markets, LLC | | | 2.59 | | | | 09/10/18 | | | | Open | | | | 902,500 | | | | 905,705 | | | Corporate Bonds | | Open/Demand |
RBC Capital Markets, LLC | | | 2.59 | | | | 09/10/18 | | | | Open | | | | 930,000 | | | | 933,303 | | | Corporate Bonds | | Open/Demand |
RBC Capital Markets, LLC | | | 2.59 | | | | 09/10/18 | | | | Open | | | | 1,455,000 | | | | 1,460,167 | | | Corporate Bonds | | Open/Demand |
RBC Capital Markets, LLC | | | 2.59 | | | | 09/10/18 | | | | Open | | | | 511,250 | | | | 513,066 | | | Corporate Bonds | | Open/Demand |
RBC Capital Markets, LLC | | | 2.59 | | | | 09/10/18 | | | | Open | | | | 433,125 | | | | 434,663 | | | Corporate Bonds | | Open/Demand |
RBC Capital Markets, LLC | | | 2.59 | | | | 09/10/18 | | | | Open | | | | 585,000 | | | | 587,077 | | | Corporate Bonds | | Open/Demand |
RBC Capital Markets, LLC | | | 2.59 | | | | 09/10/18 | | | | Open | | | | 242,500 | | | | 243,361 | | | Corporate Bonds | | Open/Demand |
RBC Capital Markets, LLC | | | 2.59 | | | | 09/10/18 | | | | Open | | | | 383,000 | | | | 384,360 | | | Corporate Bonds | | Open/Demand |
RBC Capital Markets, LLC | | | 2.59 | | | | 09/10/18 | | | | Open | | | | 492,500 | | | | 494,249 | | | Corporate Bonds | | Open/Demand |
RBC Capital Markets, LLC | | | 2.59 | | | | 09/10/18 | | | | Open | | | | 1,134,375 | | | | 1,138,403 | | | Corporate Bonds | | Open/Demand |
RBC Capital Markets, LLC | | | 2.59 | | | | 09/10/18 | | | | Open | | | | 676,875 | | | | 679,279 | | | Corporate Bonds | | Open/Demand |
RBC Capital Markets, LLC | | | 2.59 | | | | 09/10/18 | | | | Open | | | | 885,000 | | | | 888,143 | | | Corporate Bonds | | Open/Demand |
RBC Capital Markets, LLC | | | 2.59 | | | | 09/10/18 | | | | Open | | | | 915,000 | | | | 918,249 | | | Corporate Bonds | | Open/Demand |
RBC Capital Markets, LLC | | | 2.59 | | | | 09/10/18 | | | | Open | | | | 1,417,500 | | | | 1,422,534 | | | Corporate Bonds | | Open/Demand |
RBC Capital Markets, LLC | | | 2.59 | | | | 09/10/18 | | | | Open | | | | 452,500 | | | | 454,107 | | | Corporate Bonds | | Open/Demand |
RBC Capital Markets, LLC | | | 2.59 | | | | 09/10/18 | | | | Open | | | | 456,250 | | | | 457,870 | | | Corporate Bonds | | Open/Demand |
RBC Capital Markets, LLC | | | 2.59 | | | | 09/10/18 | | | | Open | | | | 1,022,500 | | | | 1,026,131 | | | Corporate Bonds | | Open/Demand |
RBC Capital Markets, LLC | | | 2.59 | | | | 09/10/18 | | | | Open | | | | 821,250 | | | | 824,166 | | | Corporate Bonds | | Open/Demand |
RBC Capital Markets, LLC | | | 2.59 | | | | 09/10/18 | | | | Open | | | | 689,750 | | | | 692,199 | | | Corporate Bonds | | Open/Demand |
RBC Capital Markets, LLC | | | 2.59 | | | | 09/10/18 | | | | Open | | | | 985,000 | | | | 988,498 | | | Corporate Bonds | | Open/Demand |
RBC Capital Markets, LLC | | | 2.59 | | | | 09/10/18 | | | | Open | | | | 439,875 | | | | 441,437 | | | Corporate Bonds | | Open/Demand |
| | | | |
| CONSOLIDATED SCHEDULES OF INVESTMENTS | | | 69 | |
| | |
Consolidated Schedule of Investments (continued) October 31, 2018 | | BlackRock Multi-Sector Income Trust (BIT) |
Reverse Repurchase Agreements (continued)
| | | | | | | | | | | | | | | | | | | | | | | | |
| Counterparty | | Interest
Rate | | | Trade
Date | | | Maturity
Date (a) | | | Face Value | | | Face Value
Including
Accrued Interest | | | Type of Non-Cash Underlying Collateral | | Remaining Contractual
Maturity of the Agreements (a) |
RBC Capital Markets, LLC | | | 2.59 | % | | | 09/10/18 | | | | Open | | | $ | 701,250 | | | $ | 703,740 | | | Corporate Bonds | | Open/Demand |
RBC Capital Markets, LLC | | | 2.59 | | | | 09/10/18 | | | | Open | | | | 690,000 | | | | 692,450 | | | Corporate Bonds | | Open/Demand |
RBC Capital Markets, LLC | | | 2.59 | | | | 09/10/18 | | | | Open | | | | 547,500 | | | | 549,444 | | | Corporate Bonds | | Open/Demand |
RBC Capital Markets, LLC | | | 2.59 | | | | 09/10/18 | | | | Open | | | | 475,000 | | | | 476,687 | | | Corporate Bonds | | Open/Demand |
RBC Capital Markets, LLC | | | 2.59 | | | | 09/10/18 | | | | Open | | | | 872,500 | | | | 875,598 | | | Corporate Bonds | | Open/Demand |
RBC Capital Markets, LLC | | | 2.59 | | | | 09/10/18 | | | | Open | | | | 502,500 | | | | 504,284 | | | Corporate Bonds | | Open/Demand |
RBC Capital Markets, LLC | | | 2.59 | | | | 09/10/18 | | | | Open | | | | 353,000 | | | | 354,254 | | | Corporate Bonds | | Open/Demand |
RBC Capital Markets, LLC | | | 2.59 | | | | 09/10/18 | | | | Open | | | | 902,500 | | | | 905,705 | | | Corporate Bonds | | Open/Demand |
RBC Capital Markets, LLC | | | 2.59 | | | | 09/10/18 | | | | Open | | | | 1,350,000 | | | | 1,354,794 | | | Corporate Bonds | | Open/Demand |
RBC Capital Markets, LLC | | | 2.59 | | | | 09/10/18 | | | | Open | | | | 864,375 | | | | 867,444 | | | Corporate Bonds | | Open/Demand |
RBC Capital Markets, LLC | | | 2.85 | | | | 09/10/18 | | | | Open | | | | 225,863 | | | | 226,748 | | | Corporate Bonds | | Open/Demand |
RBC Capital Markets, LLC | | | 2.85 | | | | 09/10/18 | | | | Open | | | | 914,338 | | | | 917,921 | | | Corporate Bonds | | Open/Demand |
RBC Capital Markets, LLC | | | 2.85 | | | | 09/10/18 | | | | Open | | | | 216,213 | | | | 217,060 | | | Corporate Bonds | | Open/Demand |
RBC Capital Markets, LLC | | | 2.85 | | | | 09/10/18 | | | | Open | | | | 214,475 | | | | 215,316 | | | Corporate Bonds | | Open/Demand |
RBC Capital Markets, LLC | | | 2.85 | | | | 09/10/18 | | | | Open | | | | 226,448 | | | | 227,335 | | | Corporate Bonds | | Open/Demand |
RBC Capital Markets, LLC | | | 2.85 | | | | 09/10/18 | | | | Open | | | | 164,500 | | | | 165,145 | | | Corporate Bonds | | Open/Demand |
RBC Capital Markets, LLC | | | 2.85 | | | | 09/10/18 | | | | Open | | | | 218,400 | | | | 219,256 | | | Corporate Bonds | | Open/Demand |
RBC Capital Markets, LLC | | | 2.85 | | | | 09/10/18 | | | | Open | | | | 408,688 | | | | 410,289 | | | Corporate Bonds | | Open/Demand |
RBC Capital Markets, LLC | | | 2.85 | | | | 09/10/18 | | | | Open | | | | 188,940 | | | | 189,681 | | | Corporate Bonds | | Open/Demand |
RBC Capital Markets, LLC | | | 2.85 | | | | 09/10/18 | | | | Open | | | | 209,528 | | | | 210,349 | | | Corporate Bonds | | Open/Demand |
RBC Capital Markets, LLC | | | 2.85 | | | | 09/10/18 | | | | Open | | | | 318,835 | | | | 320,085 | | | Corporate Bonds | | Open/Demand |
RBC Capital Markets, LLC | | | 2.85 | | | | 09/10/18 | | | | Open | | | | 183,180 | | | | 183,898 | | | Corporate Bonds | | Open/Demand |
RBC Capital Markets, LLC | | | 2.85 | | | | 09/10/18 | | | | Open | | | | 193,200 | | | | 193,957 | | | Corporate Bonds | | Open/Demand |
RBC Capital Markets, LLC | | | 2.85 | | | | 09/10/18 | | | | Open | | | | 217,283 | | | | 218,134 | | | Corporate Bonds | | Open/Demand |
RBC Capital Markets, LLC | | | 2.85 | | | | 09/10/18 | | | | Open | | | | 292,410 | | | | 293,556 | | | Corporate Bonds | | Open/Demand |
RBC Capital Markets, LLC | | | 2.85 | | | | 09/10/18 | | | | Open | | | | 183,150 | | | | 183,868 | | | Corporate Bonds | | Open/Demand |
RBC Capital Markets, LLC | | | 2.85 | | | | 09/10/18 | | | | Open | | | | 288,090 | | | | 289,219 | | | Corporate Bonds | | Open/Demand |
RBC Capital Markets, LLC | | | 2.85 | | | | 09/10/18 | | | | Open | | | | 229,323 | | | | 230,221 | | | Corporate Bonds | | Open/Demand |
RBC Capital Markets, LLC | | | 2.85 | | | | 09/10/18 | | | | Open | | | | 157,590 | | | | 158,208 | | | Corporate Bonds | | Open/Demand |
RBC Capital Markets, LLC | | | 2.85 | | | | 09/10/18 | | | | Open | | | | 422,300 | | | | 423,955 | | | Corporate Bonds | | Open/Demand |
RBC Capital Markets, LLC | | | 2.85 | | | | 09/10/18 | | | | Open | | | | 375,000 | | | | 376,470 | | | Corporate Bonds | | Open/Demand |
RBC Capital Markets, LLC | | | 2.85 | | | | 09/10/18 | | | | Open | | | | 2,955,000 | | | | 2,966,582 | | | Corporate Bonds | | Open/Demand |
RBC Capital Markets, LLC | | | 2.85 | | | | 09/10/18 | | | | Open | | | | 291,555 | | | | 292,698 | | | Corporate Bonds | | Open/Demand |
RBC Capital Markets, LLC | | | 2.85 | | | | 09/10/18 | | | | Open | | | | 483,923 | | | | 485,819 | | | Corporate Bonds | | Open/Demand |
RBC Capital Markets, LLC | | | 2.85 | | | | 09/10/18 | | | | Open | | | | 191,625 | | | | 192,376 | | | Corporate Bonds | | Open/Demand |
RBC Capital Markets, LLC | | | 2.85 | | | | 09/10/18 | | | | Open | | | | 171,293 | | | | 171,964 | | | Corporate Bonds | | Open/Demand |
RBC Capital Markets, LLC | | | 2.85 | | | | 09/10/18 | | | | Open | | | | 558,000 | | | | 560,187 | | | Corporate Bonds | | Open/Demand |
RBC Capital Markets, LLC | | | 2.85 | | | | 09/10/18 | | | | Open | | | | 429,260 | | | | 430,942 | | | Corporate Bonds | | Open/Demand |
RBC Capital Markets, LLC | | | 2.85 | | | | 09/10/18 | | | | Open | | | | 217,035 | | | | 217,886 | | | Corporate Bonds | | Open/Demand |
Barclays Capital, Inc. | | | 2.80 | | | | 09/11/18 | | | | Open | | | | 484,270 | | | | 485,988 | | | Corporate Bonds | | Open/Demand |
BNP Paribas S.A. | | | 2.91 | | | | 09/11/18 | | | | Open | | | | 288,135 | | | | 289,202 | | | Corporate Bonds | | Open/Demand |
BNP Paribas S.A. | | | 2.91 | | | | 09/11/18 | | | | Open | | | | 330,240 | | | | 331,462 | | | Corporate Bonds | | Open/Demand |
BNP Paribas S.A. | | | 2.91 | | | | 09/11/18 | | | | Open | | | | 614,378 | | | | 616,652 | | | Corporate Bonds | | Open/Demand |
BNP Paribas S.A. | | | 2.91 | | | | 09/11/18 | | | | Open | | | | 299,130 | | | | 300,237 | | | Corporate Bonds | | Open/Demand |
BNP Paribas S.A. | | | 2.91 | | | | 09/11/18 | | | | Open | | | | 368,510 | | | | 369,874 | | | Corporate Bonds | | Open/Demand |
Citigroup Global Markets, Inc. | | | 0.25 | | | | 09/11/18 | | | | Open | | | | 22,652 | | | | 22,657 | | | Corporate Bonds | | Open/Demand |
RBC Capital Markets, LLC | | | 2.59 | | | | 09/11/18 | | | | Open | | | | 385,000 | | | | 386,342 | | | Corporate Bonds | | Open/Demand |
RBC Capital Markets, LLC | | | 2.59 | | | | 09/11/18 | | | | Open | | | | 188,500 | | | | 189,157 | | | Corporate Bonds | | Open/Demand |
RBC Capital Markets, LLC | | | 2.59 | | | | 09/11/18 | | | | Open | | | | 1,385,720 | | | | 1,390,551 | | | Corporate Bonds | | Open/Demand |
RBC Capital Markets, LLC | | | 2.59 | | | | 09/11/18 | | | | Open | | | | 1,209,600 | | | | 1,213,817 | | | Corporate Bonds | | Open/Demand |
RBC Capital Markets, LLC | | | 2.59 | | | | 09/11/18 | | | | Open | | | | 283,650 | | | | 284,639 | | | Corporate Bonds | | Open/Demand |
RBC Capital Markets, LLC | | | 2.59 | | | | 09/11/18 | | | | Open | | | | 652,750 | | | | 655,026 | | | Corporate Bonds | | Open/Demand |
RBC Capital Markets, LLC | | | 2.85 | | | | 09/11/18 | | | | Open | | | | 1,153,680 | | | | 1,158,118 | | | Corporate Bonds | | Open/Demand |
RBC Capital Markets, LLC | | | 2.85 | | | | 09/11/18 | | | | Open | | | | 2,151,560 | | | | 2,159,838 | | | Corporate Bonds | | Open/Demand |
RBC Capital Markets, LLC | | | 2.85 | | | | 09/11/18 | | | | Open | | | | 172,270 | | | | 172,933 | | | Corporate Bonds | | Open/Demand |
RBC Capital Markets, LLC | | | 2.85 | | | | 09/11/18 | | | | Open | | | | 180,910 | | | | 181,606 | | | Corporate Bonds | | Open/Demand |
RBC Capital Markets, LLC | | | 2.85 | | | | 09/11/18 | | | | Open | | | | 180,180 | | | | 180,873 | | | Corporate Bonds | | Open/Demand |
RBC Capital Markets, LLC | | | 2.85 | | | | 09/11/18 | | | | Open | | | | 230,850 | | | | 231,738 | | | Corporate Bonds | | Open/Demand |
RBC Capital Markets, LLC | | | 2.85 | | | | 09/11/18 | | | | Open | | | | 229,500 | | | | 230,383 | | | Corporate Bonds | | Open/Demand |
RBC Capital Markets, LLC | | | 2.85 | | | | 09/11/18 | | | | Open | | | | 209,925 | | | | 210,733 | | | Corporate Bonds | | Open/Demand |
RBC Capital Markets, LLC | | | 2.85 | | | | 09/11/18 | | | | Open | | | | 435,750 | | | | 437,426 | | | Corporate Bonds | | Open/Demand |
RBC Capital Markets, LLC | | | 2.85 | | | | 09/11/18 | | | | Open | | | | 227,960 | | | | 228,837 | | | Corporate Bonds | | Open/Demand |
RBC Capital Markets, LLC | | | 2.85 | | | | 09/11/18 | | | | Open | | | | 325,718 | | | | 326,971 | | | Corporate Bonds | | Open/Demand |
| | |
| 70 | | 2018 BLACKROCK ANNUAL REPORTTO SHAREHOLDERS |
| | |
Consolidated Schedule of Investments (continued) October 31, 2018 | | BlackRock Multi-Sector Income Trust (BIT) |
Reverse Repurchase Agreements (continued)
| | | | | | | | | | | | | | | | | | | | | | | | |
| Counterparty | | Interest
Rate | | | Trade
Date | | | Maturity
Date (a) | | | Face Value | | | Face Value
Including
Accrued Interest | | | Type of Non-Cash Underlying Collateral | | Remaining Contractual
Maturity of the Agreements (a) |
RBC Capital Markets, LLC | | | 2.85 | % | | | 09/11/18 | | | | Open | | | $ | 221,253 | | | $ | 222,104 | | | Corporate Bonds | | Open/Demand |
RBC Capital Markets, LLC | | | 2.85 | | | | 09/11/18 | | | | Open | | | | 173,775 | | | | 174,444 | | | Corporate Bonds | | Open/Demand |
RBC Capital Markets, LLC | | | 2.85 | | | | 09/11/18 | | | | Open | | | | 296,140 | | | | 297,279 | | | Corporate Bonds | | Open/Demand |
RBC Capital Markets, LLC | | | 2.85 | | | | 09/11/18 | | | | Open | | | | 351,323 | | | | 352,674 | | | Corporate Bonds | | Open/Demand |
RBC Capital Markets, LLC | | | 2.85 | | | | 09/11/18 | | | | Open | | | | 335,200 | | | | 336,490 | | | Corporate Bonds | | Open/Demand |
RBC Capital Markets, LLC | | | 2.85 | | | | 09/11/18 | | | | Open | | | | 245,180 | | | | 246,123 | | | Corporate Bonds | | Open/Demand |
RBC Capital Markets, LLC | | | 2.85 | | | | 09/11/18 | | | | Open | | | | 124,603 | | | | 125,082 | | | Corporate Bonds | | Open/Demand |
RBC Capital Markets, LLC | | | 2.85 | | | | 09/11/18 | | | | Open | | | | 665,125 | | | | 667,684 | | | Corporate Bonds | | Open/Demand |
RBC Capital Markets, LLC | | | 2.85 | | | | 09/11/18 | | | | Open | | | | 300,120 | | | | 301,275 | | | Corporate Bonds | | Open/Demand |
RBC Capital Markets, LLC | | | 2.85 | | | | 09/11/18 | | | | Open | | | | 253,530 | | | | 254,505 | | | Corporate Bonds | | Open/Demand |
Barclays Capital, Inc. | | | 2.80 | | | | 09/12/18 | | | | Open | | | | 273,880 | | | | 274,852 | | | Corporate Bonds | | Open/Demand |
Barclays Capital, Inc. | | | 2.80 | | | | 09/12/18 | | | | Open | | | | 280,884 | | | | 281,881 | | | Corporate Bonds | | Open/Demand |
RBC Capital Markets, LLC | | | 2.85 | | | | 09/12/18 | | | | Open | | | | 313,320 | | | | 314,525 | | | Corporate Bonds | | Open/Demand |
Barclays Capital, Inc. | | | 1.00 | | | | 09/13/18 | | | | Open | | | | 184,110 | | | | 184,327 | | | Corporate Bonds | | Open/Demand |
Deutsche Bank Securities, Inc. | | | 0.75 | | | | 09/13/18 | | | | Open | | | | 91,160 | | | | 91,225 | | | Corporate Bonds | | Open/Demand |
RBC Capital Markets, LLC | | | 2.85 | | | | 09/13/18 | | | | Open | | | | 816,140 | | | | 819,162 | | | Corporate Bonds | | Open/Demand |
RBC Capital Markets, LLC | | | (0.75 | ) | | | 09/14/18 | | | | Open | | | | 295,740 | | | | 295,366 | | | Corporate Bonds | | Open/Demand |
RBC Capital Markets, LLC | | | 2.59 | | | | 09/14/18 | | | | Open | | | | 173,400 | | | | 173,948 | | | Corporate Bonds | | Open/Demand |
RBC Capital Markets, LLC | | | 2.59 | | | | 09/14/18 | | | | Open | | | | 118,750 | | | | 119,125 | | | Corporate Bonds | | Open/Demand |
RBC Capital Markets, LLC | | | 2.85 | | | | 09/14/18 | | | | Open | | | | 378,840 | | | | 380,161 | | | Corporate Bonds | | Open/Demand |
RBC Capital Markets, LLC | | | 2.85 | | | | 09/14/18 | | | | Open | | | | 200,340 | | | | 201,038 | | | Corporate Bonds | | Open/Demand |
RBC Capital Markets, LLC | | | 2.85 | | | | 09/14/18 | | | | Open | | | | 255,000 | | | | 255,889 | | | Corporate Bonds | | Open/Demand |
RBC Capital Markets, LLC | | | 2.85 | | | | 09/14/18 | | | | Open | | | | 167,983 | | | | 168,568 | | | Corporate Bonds | | Open/Demand |
RBC Capital Markets, LLC | | | 2.85 | | | | 09/14/18 | | | | Open | | | | 332,500 | | | | 333,659 | | | Corporate Bonds | | Open/Demand |
RBC Capital Markets, LLC | | | 2.85 | | | | 09/14/18 | | | | Open | | | | 285,548 | | | | 286,543 | | | Corporate Bonds | | Open/Demand |
RBC Capital Markets, LLC | | | 2.85 | | | | 09/14/18 | | | | Open | | | | 273,600 | | | | 274,554 | | | Corporate Bonds | | Open/Demand |
RBC Capital Markets, LLC | | | 2.85 | | | | 09/14/18 | | | | Open | | | | 194,560 | | | | 195,238 | | | Corporate Bonds | | Open/Demand |
RBC Capital Markets, LLC | | | 2.85 | | | | 09/14/18 | | | | Open | | | | 252,395 | | | | 253,275 | | | Corporate Bonds | | Open/Demand |
RBC Capital Markets, LLC | | | 2.85 | | | | 09/14/18 | | | | Open | | | | 498,550 | | | | 500,288 | | | Corporate Bonds | | Open/Demand |
RBC Capital Markets, LLC | | | 2.85 | | | | 09/14/18 | | | | Open | | | | 694,450 | | | | 696,871 | | | Corporate Bonds | | Open/Demand |
RBC Capital Markets, LLC | | | 2.85 | | | | 09/14/18 | | | | Open | | | | 98,910 | | | | 99,255 | | | Corporate Bonds | | Open/Demand |
RBC Capital Markets, LLC | | | 2.85 | | | | 09/14/18 | | | | Open | | | | 217,350 | | | | 218,108 | | | Corporate Bonds | | Open/Demand |
RBC Capital Markets, LLC | | | 2.85 | | | | 09/14/18 | | | | Open | | | | 281,325 | | | | 282,306 | | | Corporate Bonds | | Open/Demand |
RBC Capital Markets, LLC | | | 2.85 | | | | 09/14/18 | | | | Open | | | | 539,200 | | | | 541,080 | | | Corporate Bonds | | Open/Demand |
RBC Capital Markets, LLC | | | 2.85 | | | | 09/14/18 | | | | Open | | | | 166,250 | | | | 166,830 | | | Corporate Bonds | | Open/Demand |
RBC Capital Markets, LLC | | | 2.85 | | | | 09/14/18 | | | | Open | | | | 178,500 | | | | 179,122 | | | Corporate Bonds | | Open/Demand |
RBC Capital Markets, LLC | | | 2.85 | | | | 09/14/18 | | | | Open | | | | 209,990 | | | | 210,722 | | | Corporate Bonds | | Open/Demand |
RBC Capital Markets, LLC | | | 2.85 | | | | 09/14/18 | | | | Open | | | | 409,078 | | | | 410,504 | | | Corporate Bonds | | Open/Demand |
RBC Capital Markets, LLC | | | 2.85 | | | | 09/14/18 | | | | Open | | | | 681,120 | | | | 683,494 | | | Corporate Bonds | | Open/Demand |
RBC Capital Markets, LLC | | | 2.85 | | | | 09/14/18 | | | | Open | | | | 285,830 | | | | 286,826 | | | Corporate Bonds | | Open/Demand |
RBC Capital Markets, LLC | | | 2.85 | | | | 09/14/18 | | | | Open | | | | 1,536,668 | | | | 1,542,024 | | | Corporate Bonds | | Open/Demand |
RBC Capital Markets, LLC | | | 2.85 | | | | 09/14/18 | | | | Open | | | | 282,900 | | | | 283,886 | | | Corporate Bonds | | Open/Demand |
RBC Capital Markets, LLC | | | 2.85 | | | | 09/14/18 | | | | Open | | | | 190,325 | | | | 190,989 | | | Corporate Bonds | | Open/Demand |
RBC Capital Markets, LLC | | | 2.85 | | | | 09/14/18 | | | | Open | | | | 335,340 | | | | 336,509 | | | Corporate Bonds | | Open/Demand |
RBC Capital Markets, LLC | | | 2.85 | | | | 09/14/18 | | | | Open | | | | 236,338 | | | | 237,161 | | | Corporate Bonds | | Open/Demand |
RBC Capital Markets, LLC | | | 2.85 | | | | 09/14/18 | | | | Open | | | | 473,123 | | | | 474,772 | | | Corporate Bonds | | Open/Demand |
RBC Capital Markets, LLC | | | 2.85 | | | | 09/14/18 | | | | Open | | | | 116,188 | | | | 116,593 | | | Corporate Bonds | | Open/Demand |
RBC Capital Markets, LLC | | | 2.85 | | | | 09/14/18 | | | | Open | | | | 397,500 | | | | 398,886 | | | Corporate Bonds | | Open/Demand |
RBC Capital Markets, LLC | | | 2.85 | | | | 09/14/18 | | | | Open | | | | 109,855 | | | | 110,238 | | | Corporate Bonds | | Open/Demand |
RBC Capital Markets, LLC | | | 2.85 | | | | 09/14/18 | | | | Open | | | | 244,833 | | | | 245,686 | | | Corporate Bonds | | Open/Demand |
RBC Capital Markets, LLC | | | 2.85 | | | | 09/14/18 | | | | Open | | | | 115,900 | | | | 116,304 | | | Corporate Bonds | | Open/Demand |
RBC Capital Markets, LLC | | | 2.85 | | | | 09/14/18 | | | | Open | | | | 161,195 | | | | 161,757 | | | Corporate Bonds | | Open/Demand |
RBC Capital Markets, LLC | | | 2.85 | | | | 09/14/18 | | | | Open | | | | 206,815 | | | | 207,536 | | | Corporate Bonds | | Open/Demand |
RBC Capital Markets, LLC | | | 2.85 | | | | 09/14/18 | | | | Open | | | | 140,250 | | | | 140,739 | | | Corporate Bonds | | Open/Demand |
RBC Capital Markets, LLC | | | 2.85 | | | | 09/14/18 | | | | Open | | | | 324,815 | | | | 325,947 | | | Corporate Bonds | | Open/Demand |
RBC Capital Markets, LLC | | | 2.85 | | | | 09/14/18 | | | | Open | | | | 675,315 | | | | 677,669 | | | Corporate Bonds | | Open/Demand |
RBC Capital Markets, LLC | | | 2.85 | | | | 09/14/18 | | | | Open | | | | 215,970 | | | | 216,723 | | | Corporate Bonds | | Open/Demand |
RBC Capital Markets, LLC | | | 2.85 | | | | 09/14/18 | | | | Open | | | | 349,200 | | | | 350,417 | | | Corporate Bonds | | Open/Demand |
RBC Capital Markets, LLC | | | 2.85 | | | | 09/14/18 | | | | Open | | | | 248,820 | | | | 249,687 | | | Corporate Bonds | | Open/Demand |
RBC Capital Markets, LLC | | | 2.85 | | | | 09/14/18 | | | | Open | | | | 583,255 | | | | 585,288 | | | Corporate Bonds | | Open/Demand |
RBC Capital Markets, LLC | | | 2.85 | | | | 09/14/18 | | | | Open | | | | 130,900 | | | | 131,356 | | | Corporate Bonds | | Open/Demand |
RBC Capital Markets, LLC | | | 2.85 | | | | 09/14/18 | | | | Open | | | | 216,645 | | | | 217,400 | | | Corporate Bonds | | Open/Demand |
RBC Capital Markets, LLC | | | 2.85 | | | | 09/14/18 | | | | Open | | | | 210,013 | | | | 210,745 | | | Corporate Bonds | | Open/Demand |
| | | | |
| CONSOLIDATED SCHEDULES OF INVESTMENTS | | | 71 | |
| | |
Consolidated Schedule of Investments (continued) October 31, 2018 | | BlackRock Multi-Sector Income Trust (BIT) |
Reverse Repurchase Agreements (continued)
| | | | | | | | | | | | | | | | | | | | | | | | |
| Counterparty | | Interest
Rate | | | Trade
Date | | | Maturity
Date (a) | | | Face Value | | | Face Value
Including
Accrued Interest | | | Type of Non-Cash Underlying Collateral | | Remaining Contractual
Maturity of the Agreements (a) |
RBC Capital Markets, LLC | | | 2.85 | % | | | 09/14/18 | | | | Open | | | $ | 20,563 | | | $ | 20,634 | | | Corporate Bonds | | Open/Demand |
RBC Capital Markets, LLC | | | 2.85 | | | | 09/14/18 | | | | Open | | | | 298,150 | | | | 299,189 | | | Corporate Bonds | | Open/Demand |
RBC Capital Markets, LLC | | | 2.85 | | | | 09/14/18 | | | | Open | | | | 822,165 | | | | 825,031 | | | Corporate Bonds | | Open/Demand |
RBC Capital Markets, LLC | | | 2.85 | | | | 09/14/18 | | | | Open | | | | 199,565 | | | | 200,261 | | | Corporate Bonds | | Open/Demand |
RBC Capital Markets, LLC | | | 2.85 | | | | 09/14/18 | | | | Open | | | | 333,325 | | | | 334,487 | | | Corporate Bonds | | Open/Demand |
RBC Capital Markets, LLC | | | 2.85 | | | | 09/14/18 | | | | Open | | | | 172,200 | | | | 172,800 | | | Corporate Bonds | | Open/Demand |
RBC Capital Markets, LLC | | | 2.85 | | | | 09/14/18 | | | | Open | | | | 233,373 | | | | 234,186 | | | Corporate Bonds | | Open/Demand |
RBC Capital Markets, LLC | | | 2.85 | | | | 09/14/18 | | | | Open | | | | 240,470 | | | | 241,308 | | | Corporate Bonds | | Open/Demand |
RBC Capital Markets, LLC | | | 2.85 | | | | 09/14/18 | | | | Open | | | | 946,890 | | | | 950,191 | | | Corporate Bonds | | Open/Demand |
RBC Capital Markets, LLC | | | 2.85 | | | | 09/14/18 | | | | Open | | | | 431,950 | | | | 433,456 | | | Corporate Bonds | | Open/Demand |
RBC Capital Markets, LLC | | | 2.85 | | | | 09/14/18 | | | | Open | | | | 323,850 | | | | 324,979 | | | Corporate Bonds | | Open/Demand |
RBC Capital Markets, LLC | | | 2.85 | | | | 09/14/18 | | | | Open | | | | 247,350 | | | | 248,212 | | | Corporate Bonds | | Open/Demand |
RBC Capital Markets, LLC | | | 2.85 | | | | 09/14/18 | | | | Open | | | | 729,605 | | | | 732,148 | | | Corporate Bonds | | Open/Demand |
RBC Capital Markets, LLC | | | 2.85 | | | | 09/14/18 | | | | Open | | | | 1,947,668 | | | | 1,954,457 | | | Corporate Bonds | | Open/Demand |
RBC Capital Markets, LLC | | | 2.85 | | | | 09/14/18 | | | | Open | | | | 119,145 | | | | 119,560 | | | Corporate Bonds | | Open/Demand |
RBC Capital Markets, LLC | | | 2.85 | | | | 09/14/18 | | | | Open | | | | 357,870 | | | | 359,118 | | | Corporate Bonds | | Open/Demand |
RBC Capital Markets, LLC | | | 2.85 | | | | 09/14/18 | | | | Open | | | | 83,363 | | | | 83,653 | | | Corporate Bonds | | Open/Demand |
RBC Capital Markets, LLC | | | 2.85 | | | | 09/14/18 | | | | Open | | | | 403,425 | | | | 404,831 | | | Corporate Bonds | | Open/Demand |
RBC Capital Markets, LLC | | | 2.85 | | | | 09/14/18 | | | | Open | | | | 1,238,790 | | | | 1,243,109 | | | Corporate Bonds | | Open/Demand |
RBC Capital Markets, LLC | | | 2.85 | | | | 09/14/18 | | | | Open | | | | 266,985 | | | | 267,916 | | | Corporate Bonds | | Open/Demand |
RBC Capital Markets, LLC | | | 2.85 | | | | 09/14/18 | | | | Open | | | | 137,618 | | | | 138,097 | | | Corporate Bonds | | Open/Demand |
RBC Capital Markets, LLC | | | 2.85 | | | | 09/14/18 | | | | Open | | | | 678,615 | | | | 680,981 | | | Corporate Bonds | | Open/Demand |
RBC Capital Markets, LLC | | | 2.85 | | | | 09/14/18 | | | | Open | | | | 267,300 | | | | 268,232 | | | Corporate Bonds | | Open/Demand |
RBC Capital Markets, LLC | | | 2.85 | | | | 09/14/18 | | | | Open | | | | 404,250 | | | | 405,659 | | | Corporate Bonds | | Open/Demand |
Barclays Bank PLC | | | 2.25 | | | | 09/19/18 | | | | Open | | | | 167,929 | | | | 168,370 | | | Corporate Bonds | | Open/Demand |
Barclays Capital, Inc. | | | 2.55 | | | | 09/19/18 | | | | Open | | | | 393,975 | | | | 395,147 | | | Capital Trusts | | Open/Demand |
BNP Paribas S.A. | | | 2.39 | | | | 09/19/18 | | | | Open | | | | 460,625 | | | | 461,909 | | | Corporate Bonds | | Open/Demand |
BNP Paribas S.A. | | | 2.39 | | | | 09/19/18 | | | | Open | | | | 697,125 | | | | 699,069 | | | Foreign Agency Obligations | | Open/Demand |
BNP Paribas S.A. | | | 2.60 | | | | 09/19/18 | | | | Open | | | | 111,930 | | | | 112,270 | | | Corporate Bonds | | Open/Demand |
BNP Paribas S.A. | | | 2.63 | | | | 09/19/18 | | | | Open | | | | 405,150 | | | | 406,393 | | | Corporate Bonds | | Open/Demand |
BNP Paribas S.A. | | | 2.67 | | | | 09/19/18 | | | | Open | | | | 648,735 | | | | 650,756 | | | Corporate Bonds | | Open/Demand |
BNP Paribas S.A. | | | 2.67 | | | | 09/19/18 | | | | Open | | | | 466,613 | | | | 468,066 | | | Corporate Bonds | | Open/Demand |
BNP Paribas S.A. | | | 2.67 | | | | 09/19/18 | | | | Open | | | | 476,545 | | | | 478,029 | | | Corporate Bonds | | Open/Demand |
BNP Paribas S.A. | | | 2.67 | | | | 09/19/18 | | | | Open | | | | 351,500 | | | | 352,595 | | | Corporate Bonds | | Open/Demand |
BNP Paribas S.A. | | | 2.67 | | | | 09/19/18 | | | | Open | | | | 175,873 | | | | 176,420 | | | Corporate Bonds | | Open/Demand |
BNP Paribas S.A. | | | 2.67 | | | | 09/19/18 | | | | Open | | | | 1,549,586 | | | | 1,554,413 | | | Corporate Bonds | | Open/Demand |
BNP Paribas S.A. | | | 2.70 | | | | 09/19/18 | | | | Open | | | | 2,522,630 | | | | 2,530,576 | | | Foreign Agency Obligations | | Open/Demand |
HSBC Securities (USA), Inc. | | | 2.20 | | | | 09/19/18 | | | | Open | | | | 3,381,000 | | | | 3,389,678 | | | Corporate Bonds | | Open/Demand |
HSBC Securities (USA), Inc. | | | 2.20 | | | | 09/19/18 | | | | Open | | | | 2,807,000 | | | | 2,814,205 | | | Capital Trusts | | Open/Demand |
RBC Capital Markets, LLC | | | 2.34 | | | | 09/19/18 | | | | Open | | | | 341,348 | | | | 342,279 | | | Corporate Bonds | | Open/Demand |
RBC Capital Markets, LLC | | | 2.34 | | | | 09/19/18 | | | | Open | | | | 581,750 | | | | 583,338 | | | Corporate Bonds | | Open/Demand |
RBC Capital Markets, LLC | | | 2.34 | | | | 09/19/18 | | | | Open | | | | 441,250 | | | | 442,455 | | | Corporate Bonds | | Open/Demand |
RBC Capital Markets, LLC | | | 2.34 | | | | 09/19/18 | | | | Open | | | | 240,800 | | | | 241,457 | | | Corporate Bonds | | Open/Demand |
RBC Capital Markets, LLC | | | 2.34 | | | | 09/19/18 | | | | Open | | | | 463,750 | | | | 465,016 | | | Corporate Bonds | | Open/Demand |
RBC Capital Markets, LLC | | | 2.34 | | | | 09/19/18 | | | | Open | | | | 400,263 | | | | 401,355 | | | Corporate Bonds | | Open/Demand |
RBC Capital Markets, LLC | | | 2.34 | | | | 09/19/18 | | | | Open | | | | 230,625 | | | | 231,255 | | | Corporate Bonds | | Open/Demand |
RBC Capital Markets, LLC | | | 2.34 | | | | 09/19/18 | | | | Open | | | | 960,000 | | | | 962,621 | | | Corporate Bonds | | Open/Demand |
RBC Capital Markets, LLC | | | 2.34 | | | | 09/19/18 | | | | Open | | | | 471,250 | | | | 472,537 | | | Corporate Bonds | | Open/Demand |
RBC Capital Markets, LLC | | | 2.34 | | | | 09/19/18 | | | | Open | | | | 272,250 | | | | 272,993 | | | Corporate Bonds | | Open/Demand |
RBC Capital Markets, LLC | | | 2.34 | | | | 09/19/18 | | | | Open | | | | 654,375 | | | | 656,161 | | | Corporate Bonds | | Open/Demand |
RBC Capital Markets, LLC | | | 2.34 | | | | 09/19/18 | | | | Open | | | | 450,000 | | | | 451,229 | | | Corporate Bonds | | Open/Demand |
RBC Capital Markets, LLC | | | 2.34 | | | | 09/19/18 | | | | Open | | | | 605,475 | | | | 607,128 | | | Corporate Bonds | | Open/Demand |
RBC Capital Markets, LLC | | | 2.34 | | | | 09/19/18 | | | | Open | | | | 395,000 | | | | 396,078 | | | Corporate Bonds | | Open/Demand |
RBC Capital Markets, LLC | | | 2.34 | | | | 09/19/18 | | | | Open | | | | 579,250 | | | | 580,831 | | | Corporate Bonds | | Open/Demand |
RBC Capital Markets, LLC | | | 2.34 | | | | 09/19/18 | | | | Open | | | | 241,875 | | | | 242,535 | | | Corporate Bonds | | Open/Demand |
RBC Capital Markets, LLC | | | 2.34 | | | | 09/19/18 | | | | Open | | | | 345,950 | | | | 346,894 | | | Corporate Bonds | | Open/Demand |
RBC Capital Markets, LLC | | | 2.34 | | | | 09/19/18 | | | | Open | | | | 374,000 | | | | 375,021 | | | Corporate Bonds | | Open/Demand |
RBC Capital Markets, LLC | | | 2.34 | | | | 09/19/18 | | | | Open | | | | 94,628 | | | | 94,886 | | | Corporate Bonds | | Open/Demand |
RBC Capital Markets, LLC | | | 2.45 | | | | 09/19/18 | | | | Open | | | | 385,875 | | | | 386,978 | | | Corporate Bonds | | Open/Demand |
RBC Capital Markets, LLC | | | 2.60 | | | | 09/19/18 | | | | Open | | | | 809,933 | | | | 812,389 | | | Corporate Bonds | | Open/Demand |
RBC Capital Markets, LLC | | | 2.60 | | | | 09/19/18 | | | | Open | | | | 265,688 | | | | 266,493 | | | Corporate Bonds | | Open/Demand |
RBC Capital Markets, LLC | | | 2.60 | | | | 09/19/18 | | | | Open | | | | 696,658 | | | | 698,771 | | | Corporate Bonds | | Open/Demand |
RBC Capital Markets, LLC | | | 2.60 | | | | 09/19/18 | | | | Open | | | | 882,750 | | | | 885,428 | | | Corporate Bonds | | Open/Demand |
| | |
| 72 | | 2018 BLACKROCK ANNUAL REPORTTO SHAREHOLDERS |
| | |
Consolidated Schedule of Investments (continued) October 31, 2018 | | BlackRock Multi-Sector Income Trust (BIT) |
Reverse Repurchase Agreements (continued)
| | | | | | | | | | | | | | | | | | | | | | | | |
| Counterparty | | Interest
Rate | | | Trade
Date | | | Maturity
Date (a) | | | Face Value | | | Face Value
Including
Accrued Interest | | | Type of Non-Cash Underlying Collateral | | Remaining Contractual
Maturity of the Agreements (a) |
RBC Capital Markets, LLC | | | 2.60 | % | | | 09/19/18 | | | | Open | | | $ | 560,298 | | | $ | 561,997 | | | Corporate Bonds | | Open/Demand |
RBC Capital Markets, LLC | | | 2.60 | | | | 09/19/18 | | | | Open | | | | 208,098 | | | | 208,729 | | | Corporate Bonds | | Open/Demand |
RBC Capital Markets, LLC | | | 2.60 | | | | 09/19/18 | | | | Open | | | | 71,775 | | | | 71,993 | | | Corporate Bonds | | Open/Demand |
RBC Capital Markets, LLC | | | 2.60 | | | | 09/19/18 | | | | Open | | | | 63,990 | | | | 64,184 | | | Corporate Bonds | | Open/Demand |
RBC Capital Markets, LLC | | | 2.60 | | | | 09/19/18 | | | | Open | | | | 168,100 | | | | 168,610 | | | Corporate Bonds | | Open/Demand |
RBC Capital Markets, LLC | | | 2.60 | | | | 09/19/18 | | | | Open | | | | 1,885,438 | | | | 1,891,157 | | | Corporate Bonds | | Open/Demand |
RBC Capital Markets, LLC | | | 2.60 | | | | 09/19/18 | | | | Open | | | | 165,430 | | | | 165,932 | | | Corporate Bonds | | Open/Demand |
RBC Capital Markets, LLC | | | 2.60 | | | | 09/19/18 | | | | Open | | | | 287,200 | | | | 288,071 | | | Corporate Bonds | | Open/Demand |
RBC Capital Markets, LLC | | | 2.60 | | | | 09/19/18 | | | | Open | | | | 379,500 | | | | 380,651 | | | Corporate Bonds | | Open/Demand |
RBC Capital Markets, LLC | | | 2.60 | | | | 09/19/18 | | | | Open | | | | 684,125 | | | | 686,200 | | | Corporate Bonds | | Open/Demand |
RBC Capital Markets, LLC | | | 2.60 | | | | 09/19/18 | | | | Open | | | | 244,110 | | | | 244,850 | | | Corporate Bonds | | Open/Demand |
RBC Capital Markets, LLC | | | 2.60 | | | | 09/19/18 | | | | Open | | | | 633,955 | | | | 635,878 | | | Corporate Bonds | | Open/Demand |
RBC Capital Markets, LLC | | | 2.60 | | | | 09/19/18 | | | | Open | | | | 1,220,625 | | | | 1,224,328 | | | Corporate Bonds | | Open/Demand |
RBC Capital Markets, LLC | | | 2.60 | | | | 09/19/18 | | | | Open | | | | 21,803 | | | | 21,869 | | | Corporate Bonds | | Open/Demand |
RBC Capital Markets, LLC | | | 2.60 | | | | 09/19/18 | | | | Open | | | | 346,040 | | | | 347,090 | | | Corporate Bonds | | Open/Demand |
RBC Capital Markets, LLC | | | 2.60 | | | | 09/19/18 | | | | Open | | | | 460,750 | | | | 462,148 | | | Corporate Bonds | | Open/Demand |
RBC Capital Markets, LLC | | | 2.60 | | | | 09/19/18 | | | | Open | | | | 201,825 | | | | 202,437 | | | Corporate Bonds | | Open/Demand |
RBC Capital Markets, LLC | | | 2.60 | | | | 09/19/18 | | | | Open | | | | 891,938 | | | | 894,643 | | | Corporate Bonds | | Open/Demand |
UBS Securities LLC | | | 2.25 | | | | 09/19/18 | | | | Open | | | | 3,860,000 | | | | 3,870,133 | | | Corporate Bonds | | Open/Demand |
UBS Securities LLC | | | 2.25 | | | | 09/19/18 | | | | Open | | | | 355,380 | | | | 356,313 | | | Corporate Bonds | | Open/Demand |
UBS Securities LLC | | | 2.25 | | | | 09/19/18 | | | | Open | | | | 4,950,000 | | | | 4,962,994 | | | Corporate Bonds | | Open/Demand |
UBS Securities LLC | | | 2.25 | | | | 09/19/18 | | | | Open | | | | 7,162,500 | | | | 7,181,302 | | | Capital Trusts | | Open/Demand |
UBS Securities LLC | | | 2.30 | | | | 09/19/18 | | | | Open | | | | 325,350 | | | | 326,223 | | | Corporate Bonds | | Open/Demand |
UBS Securities LLC | | | 2.35 | | | | 09/19/18 | | | | Open | | | | 376,950 | | | | 377,983 | | | Corporate Bonds | | Open/Demand |
UBS Securities LLC | | | 2.50 | | | | 09/19/18 | | | | Open | | | | 396,031 | | | | 397,186 | | | Corporate Bonds | | Open/Demand |
UBS Securities LLC | | | 2.50 | | | | 09/19/18 | | | | Open | | | | 406,100 | | | | 407,284 | | | Corporate Bonds | | Open/Demand |
UBS Securities LLC | | | 2.50 | | | | 09/19/18 | | | | Open | | | | 3,738,700 | | | | 3,749,605 | | | Corporate Bonds | | Open/Demand |
UBS Securities LLC | | | 2.50 | | | | 09/19/18 | | | | Open | | | | 946,943 | | | | 949,704 | | | Corporate Bonds | | Open/Demand |
UBS Securities LLC | | | 2.50 | | | | 09/19/18 | | | | Open | | | | 152,625 | | | | 153,070 | | | Corporate Bonds | | Open/Demand |
UBS Securities LLC | | | 2.50 | | | | 09/19/18 | | | | Open | | | | 410,320 | | | | 411,517 | | | Corporate Bonds | | Open/Demand |
UBS Securities LLC | | | 2.50 | | | | 09/19/18 | | | | Open | | | | 1,831,253 | | | | 1,836,594 | | | Corporate Bonds | | Open/Demand |
UBS Securities LLC | | | 2.50 | | | | 09/19/18 | | | | Open | | | | 417,410 | | | | 418,627 | | | Corporate Bonds | | Open/Demand |
UBS Securities LLC | | | 2.50 | | | | 09/19/18 | | | | Open | | | | 348,446 | | | | 349,463 | | | Corporate Bonds | | Open/Demand |
UBS Securities LLC | | | 2.50 | | | | 09/19/18 | | | | Open | | | | 498,550 | | | | 500,004 | | | Corporate Bonds | | Open/Demand |
UBS Securities LLC | | | 2.50 | | | | 09/19/18 | | | | Open | | | | 654,881 | | | | 656,791 | | | Corporate Bonds | | Open/Demand |
UBS Securities LLC | | | 2.50 | | | | 09/19/18 | | | | Open | | | | 511,523 | | | | 513,014 | | | Corporate Bonds | | Open/Demand |
UBS Securities LLC | | | 2.50 | | | | 09/19/18 | | | | Open | | | | 270,593 | | | | 271,382 | | | Corporate Bonds | | Open/Demand |
UBS Securities LLC | | | 2.50 | | | | 09/19/18 | | | | Open | | | | 134,365 | | | | 134,757 | | | Corporate Bonds | | Open/Demand |
UBS Securities LLC | | | 2.50 | | | | 09/19/18 | | | | Open | | | | 363,810 | | | | 364,871 | | | Corporate Bonds | | Open/Demand |
UBS Securities LLC | | | 2.50 | | | | 09/19/18 | | | | Open | | | | 322,763 | | | | 323,704 | | | Corporate Bonds | | Open/Demand |
UBS Securities LLC | | | 2.50 | | | | 09/19/18 | | | | Open | | | | 252,079 | | | | 252,814 | | | Corporate Bonds | | Open/Demand |
UBS Securities LLC | | | 2.50 | | | | 09/19/18 | | | | Open | | | | 757,485 | | | | 759,694 | | | Corporate Bonds | | Open/Demand |
UBS Securities LLC | | | 2.50 | | | | 09/19/18 | | | | Open | | | | 466,715 | | | | 468,076 | | | Corporate Bonds | | Open/Demand |
UBS Securities LLC | | | 2.50 | | | | 09/19/18 | | | | Open | | | | 3,924,800 | | | | 3,936,247 | | | Capital Trusts | | Open/Demand |
UBS Securities LLC | | | 2.60 | | | | 09/19/18 | | | | Open | | | | 830,233 | | | | 832,751 | | | Corporate Bonds | | Open/Demand |
Deutsche Bank Securities, Inc. | | | 2.95 | | | | 09/20/18 | | | | Open | | | | 335,000 | | | | 336,032 | | | Corporate Bonds | | Open/Demand |
Deutsche Bank Securities, Inc. | | | 2.95 | | | | 09/20/18 | | | | Open | | | | 266,000 | | | | 266,820 | | | Corporate Bonds | | Open/Demand |
Deutsche Bank Securities, Inc. | | | 2.95 | | | | 09/20/18 | | | | Open | | | | 788,000 | | | | 790,429 | | | Corporate Bonds | | Open/Demand |
RBC Capital Markets, LLC | | | 2.59 | | | | 09/20/18 | | | | Open | | | | 2,307,500 | | | | 2,314,194 | | | Corporate Bonds | | Open/Demand |
RBC Capital Markets, LLC | | | 2.85 | | | | 09/20/18 | | | | Open | | | | 459,103 | | | | 460,570 | | | Corporate Bonds | | Open/Demand |
RBC Capital Markets, LLC | | | 2.85 | | | | 09/20/18 | | | | Open | | | | 145,230 | | | | 145,694 | | | Corporate Bonds | | Open/Demand |
RBC Capital Markets, LLC | | | 2.85 | | | | 09/20/18 | | | | Open | | | | 363,800 | | | | 364,963 | | | Corporate Bonds | | Open/Demand |
RBC Capital Markets, LLC | | | 2.85 | | | | 09/20/18 | | | | Open | | | | 202,880 | | | | 203,529 | | | Corporate Bonds | | Open/Demand |
RBC Capital Markets, LLC | | | 2.85 | | | | 09/20/18 | | | | Open | | | | 804,000 | | | | 806,571 | | | Corporate Bonds | | Open/Demand |
RBC Capital Markets, LLC | | | 2.85 | | | | 09/20/18 | | | | Open | | | | 118,793 | | | | 119,172 | | | Corporate Bonds | | Open/Demand |
RBC Capital Markets, LLC | | | 2.85 | | | | 09/20/18 | | | | Open | | | | 151,810 | | | | 152,295 | | | Corporate Bonds | | Open/Demand |
RBC Capital Markets, LLC | | | 2.85 | | | | 09/20/18 | | | | Open | | | | 135,725 | | | | 136,159 | | | Corporate Bonds | | Open/Demand |
RBC Capital Markets, LLC | | | 2.85 | | | | 09/20/18 | | | | Open | | | | 756,000 | | | | 758,417 | | | Corporate Bonds | | Open/Demand |
RBC Capital Markets, LLC | | | 2.85 | | | | 09/20/18 | | | | Open | | | | 172,890 | | | | 173,443 | | | Corporate Bonds | | Open/Demand |
RBC Capital Markets, LLC | | | 2.85 | | | | 09/20/18 | | | | Open | | | | 1,068,930 | | | | 1,072,348 | | | Corporate Bonds | | Open/Demand |
RBC Capital Markets, LLC | | | 2.85 | | | | 09/20/18 | | | | Open | | | | 118,538 | | | | 118,916 | | | Corporate Bonds | | Open/Demand |
RBC Capital Markets, LLC | | | 2.85 | | | | 09/20/18 | | | | Open | | | | 310,545 | | | | 311,538 | | | Corporate Bonds | | Open/Demand |
RBC Capital Markets, LLC | | | 2.85 | | | | 09/20/18 | | | | Open | | | | 141,930 | | | | 142,384 | | | Corporate Bonds | | Open/Demand |
| | | | |
| CONSOLIDATED SCHEDULES OF INVESTMENTS | | | 73 | |
| | |
Consolidated Schedule of Investments (continued) October 31, 2018 | | BlackRock Multi-Sector Income Trust (BIT) |
Reverse Repurchase Agreements (continued)
| | | | | | | | | | | | | | | | | | | | | | | | |
| Counterparty | | Interest
Rate | | | Trade
Date | | | Maturity
Date (a) | | | Face Value | | | Face Value
Including
Accrued Interest | | | Type of Non-Cash Underlying Collateral | | Remaining Contractual
Maturity of the Agreements (a) |
RBC Capital Markets, LLC | | | 2.85 | % | | | 09/20/18 | | | | Open | | | $ | 1,544,630 | | | $ | 1,549,569 | | | Corporate Bonds | | Open/Demand |
RBC Capital Markets, LLC | | | 2.85 | | | | 09/20/18 | | | | Open | | | | 159,125 | | | | 159,634 | | | Corporate Bonds | | Open/Demand |
RBC Capital Markets, LLC | | | 2.85 | | | | 09/20/18 | | | | Open | | | | 318,565 | | | | 319,584 | | | Corporate Bonds | | Open/Demand |
RBC Capital Markets, LLC | | | 2.85 | | | | 09/20/18 | | | | Open | | | | 332,910 | | | | 333,974 | | | Corporate Bonds | | Open/Demand |
RBC Capital Markets, LLC | | | 2.85 | | | | 09/20/18 | | | | Open | | | | 415,800 | | | | 417,129 | | | Corporate Bonds | | Open/Demand |
RBC Capital Markets, LLC | | | 2.85 | | | | 09/20/18 | | | | Open | | | | 200,175 | | | | 200,815 | | | Corporate Bonds | | Open/Demand |
RBC Capital Markets, LLC | | | 2.85 | | | | 09/20/18 | | | | Open | | | | 150,068 | | | | 150,547 | | | Corporate Bonds | | Open/Demand |
RBC Capital Markets, LLC | | | 2.85 | | | | 09/20/18 | | | | Open | | | | 219,050 | | | | 219,750 | | | Corporate Bonds | | Open/Demand |
RBC Capital Markets, LLC | | | 2.85 | | | | 09/20/18 | | | | Open | | | | 151,368 | | | | 151,851 | | | Corporate Bonds | | Open/Demand |
RBC Capital Markets, LLC | | | 2.85 | | | | 09/20/18 | | | | Open | | | | 130,615 | | | | 131,033 | | | Corporate Bonds | | Open/Demand |
RBC Capital Markets, LLC | | | 2.85 | | | | 09/20/18 | | | | Open | | | | 359,013 | | | | 360,160 | | | Corporate Bonds | | Open/Demand |
RBC Capital Markets, LLC | | | 2.85 | | | | 09/20/18 | | | | Open | | | | 228,790 | | | | 229,521 | | | Corporate Bonds | | Open/Demand |
RBC Capital Markets, LLC | | | 2.85 | | | | 09/20/18 | | | | Open | | | | 205,105 | | | | 205,761 | | | Corporate Bonds | | Open/Demand |
RBC Capital Markets, LLC | | | 2.85 | | | | 09/20/18 | | | | Open | | | | 370,880 | | | | 372,066 | | | Corporate Bonds | | Open/Demand |
RBC Capital Markets, LLC | | | 2.85 | | | | 09/20/18 | | | | Open | | | | 323,400 | | | | 324,434 | | | Corporate Bonds | | Open/Demand |
RBC Capital Markets, LLC | | | 2.85 | | | | 09/20/18 | | | | Open | | | | 137,250 | | | | 137,689 | | | Corporate Bonds | | Open/Demand |
RBC Capital Markets, LLC | | | 2.85 | | | | 09/20/18 | | | | Open | | | | 843,670 | | | | 846,367 | | | Corporate Bonds | | Open/Demand |
RBC Capital Markets, LLC | | | 2.85 | | | | 09/20/18 | | | | Open | | | | 350,960 | | | | 352,082 | | | Corporate Bonds | | Open/Demand |
UBS Ltd. | | | 2.60 | | | | 09/20/18 | | | | Open | | | | 3,410,731 | | | | 3,420,665 | | | Capital Trusts | | Open/Demand |
UBS Ltd. | | | 2.75 | | | | 09/20/18 | | | | Open | | | | 283,511 | | | | 284,385 | | | Corporate Bonds | | Open/Demand |
UBS Ltd. | | | 2.75 | | | | 09/20/18 | | | | Open | | | | 3,468,400 | | | | 3,479,094 | | | Corporate Bonds | | Open/Demand |
UBS Ltd. | | | 2.75 | | | | 09/20/18 | | | | Open | | | | 273,700 | | | | 274,544 | | | Corporate Bonds | | Open/Demand |
UBS Ltd. | | | 2.75 | | | | 09/20/18 | | | | Open | | | | 320,744 | | | | 321,733 | | | Corporate Bonds | | Open/Demand |
UBS Ltd. | | | 2.75 | | | | 09/20/18 | | | | Open | | | | 768,400 | | | | 770,769 | | | Corporate Bonds | | Open/Demand |
UBS Ltd. | | | 2.75 | | | | 09/20/18 | | | | Open | | | | 379,225 | | | | 380,394 | | | Corporate Bonds | | Open/Demand |
UBS Ltd. | | | 2.75 | | | | 09/20/18 | | | | Open | | | | 355,260 | | | | 356,355 | | | Corporate Bonds | | Open/Demand |
UBS Ltd. | | | 2.75 | | | | 09/20/18 | | | | Open | | | | 279,650 | | | | 280,512 | | | Corporate Bonds | | Open/Demand |
UBS Ltd. | | | 2.75 | | | | 09/20/18 | | | | Open | | | | 405,350 | | | | 406,600 | | | Corporate Bonds | | Open/Demand |
BNP Paribas S.A. | | | 2.75 | | | | 09/24/18 | | | | Open | | | | 912,655 | | | | 915,070 | | | Corporate Bonds | | Open/Demand |
Barclays Capital, Inc. | | | 0.75 | | | | 09/25/18 | | | | Open | | | | 283,125 | | | | 283,269 | | | Corporate Bonds | | Open/Demand |
RBC Capital Markets, LLC | | | 2.85 | | | | 09/25/18 | | | | Open | | | | 839,125 | | | | 841,313 | | | Corporate Bonds | | Open/Demand |
BNP Paribas S.A. | | | 2.89 | | | | 09/26/18 | | | | Open | | | | 559,860 | | | | 561,301 | | | Corporate Bonds | | Open/Demand |
BNP Paribas S.A. | | | 2.92 | | | | 09/26/18 | | | | Open | | | | 1,577,173 | | | | 1,581,278 | | | Corporate Bonds | | Open/Demand |
RBC Capital Markets, LLC | | | 2.60 | | | | 09/27/18 | | | | Open | | | | 811,665 | | | | 813,658 | | | Corporate Bonds | | Open/Demand |
RBC Capital Markets, LLC | | | 2.85 | | | | 09/27/18 | | | | Open | | | | 302,270 | | | | 303,084 | | | Corporate Bonds | | Open/Demand |
RBC Capital Markets, LLC | | | 2.85 | | | | 09/27/18 | | | | Open | | | | 389,610 | | | | 390,659 | | | Corporate Bonds | | Open/Demand |
BNP Paribas S.A. | | | 2.80 | | | | 09/28/18 | | | | Open | | | | 1,564,806 | | | | 1,568,579 | | | Corporate Bonds | | Open/Demand |
BNP Paribas S.A. | | | 2.80 | | | | 09/28/18 | | | | Open | | | | 208,880 | | | | 209,384 | | | Corporate Bonds | | Open/Demand |
RBC Capital Markets, LLC | | | 2.85 | | | | 10/01/18 | | | | Open | | | | 143,019 | | | | 143,370 | | | Corporate Bonds | | Open/Demand |
BNP Paribas S.A. | | | 2.65 | | | | 10/03/18 | | | | Open | | | | 234,650 | | | | 235,134 | | | Foreign Agency Obligations | | Open/Demand |
RBC Capital Markets, LLC | | | 2.85 | | | | 10/04/18 | | | | Open | | | | 145,700 | | | | 146,011 | | | Corporate Bonds | | Open/Demand |
RBC Capital Markets, LLC | | | 2.85 | | | | 10/04/18 | | | | Open | | | | 276,223 | | | | 276,813 | | | Corporate Bonds | | Open/Demand |
RBC Capital Markets, LLC | | | 2.85 | | | | 10/04/18 | | | | Open | | | | 250,920 | | | | 251,456 | | | Corporate Bonds | | Open/Demand |
BNP Paribas S.A. | | | 2.70 | | | | 10/09/18 | | | | Open | | | | 289,835 | | | | 290,313 | | | Corporate Bonds | | Open/Demand |
HSBC Securities (USA), Inc. | | | 2.45 | | | | 10/09/18 | | | | Open | | | | 2,545,000 | | | | 2,548,984 | | | Corporate Bonds | | Open/Demand |
HSBC Securities (USA), Inc. | | | 2.70 | | | | 10/09/18 | | | | Open | | | | 566,000 | | | | 566,976 | | | Corporate Bonds | | Open/Demand |
RBC Capital Markets, LLC | | | 2.85 | | | | 10/09/18 | | | | Open | | | | 254,312 | | | | 254,748 | | | Corporate Bonds | | Open/Demand |
Credit Suisse Securities (USA) LLC | | | 2.29 | | | | 10/10/18 | | | | 11/13/18 | | | | 4,146,000 | | | | 4,151,538 | | | U.S. Government Sponsored Agency Securities | | Up to 30 Days |
HSBC Securities (USA), Inc. | | | 2.33 | | | | 10/10/18 | | | | 11/13/18 | | | | 4,960,000 | | | | 4,966,741 | | | U.S. Government Sponsored Agency Securities | | Up to 30 Days |
HSBC Securities (USA), Inc. | | | 2.33 | | | | 10/10/18 | | | | 11/13/18 | | | | 10,586,000 | | | | 10,600,388 | | | U.S. Government Sponsored Agency Securities | | Up to 30 Days |
HSBC Securities (USA), Inc. | | | 2.33 | | | | 10/10/18 | | | | 11/13/18 | | | | 15,569,000 | | | | 15,590,161 | | | U.S. Government Sponsored Agency Securities | | Up to 30 Days |
BNP Paribas S.A. | | | 2.55 | | | | 10/12/18 | | | | Open | | | | 1,012,095 | | | | 1,013,242 | | | Capital Trusts | | Open/Demand |
BNP Paribas S.A. | | | 2.79 | | | | 10/12/18 | | | | Open | | | | 213,038 | | | | 213,302 | | | Corporate Bonds | | Open/Demand |
BNP Paribas S.A. | | | 2.79 | | | | 10/12/18 | | | | Open | | | | 1,417,460 | | | | 1,419,218 | | | Capital Trusts | | Open/Demand |
BNP Paribas S.A. | | | 2.79 | | | | 10/12/18 | | | | Open | | | | 540,960 | | | | 541,631 | | | Corporate Bonds | | Open/Demand |
BNP Paribas S.A. | | | 2.79 | | | | 10/12/18 | | | | Open | | | | 489,375 | | | | 489,982 | | | Corporate Bonds | | Open/Demand |
BNP Paribas S.A. | | | 2.79 | | | | 10/12/18 | | | | Open | | | | 111,471 | | | | 111,609 | | | Corporate Bonds | | Open/Demand |
BNP Paribas S.A. | | | 2.79 | | | | 10/12/18 | | | | Open | | | | 527,461 | | | | 528,115 | | | Capital Trusts | | Open/Demand |
BNP Paribas S.A. | | | 2.79 | | | | 10/12/18 | | | | Open | | | | 127,410 | | | | 127,568 | | | Corporate Bonds | | Open/Demand |
| | |
| 74 | | 2018 BLACKROCK ANNUAL REPORTTO SHAREHOLDERS |
| | |
Consolidated Schedule of Investments (continued) October 31, 2018 | | BlackRock Multi-Sector Income Trust (BIT) |
Reverse Repurchase Agreements (continued)
| | | | | | | | | | | | | | | | | | | | | | | | |
| Counterparty | | Interest
Rate | | | Trade
Date | | | Maturity
Date (a) | | | Face Value | | | Face Value
Including
Accrued Interest | | | Type of Non-Cash Underlying Collateral | | Remaining Contractual
Maturity of the Agreements (a) |
BNP Paribas S.A. | | | 2.79 | % | | | 10/12/18 | | | | Open | | | $ | 188,700 | | | $ | 188,934 | | | Corporate Bonds | | Open/Demand |
BNP Paribas S.A. | | | 2.79 | | | | 10/12/18 | | | | Open | | | | 550,078 | | | | 550,760 | | | Corporate Bonds | | Open/Demand |
BNP Paribas S.A. | | | 2.79 | | | | 10/12/18 | | | | Open | | | | 1,061,524 | | | | 1,062,840 | | | Corporate Bonds | | Open/Demand |
Barclays Bank PLC | | | 2.65 | | | | 10/15/18 | | | | Open | | | | 669,800 | | | | 669,935 | | | Corporate Bonds | | Open/Demand |
BNP Paribas S.A. | | | 2.65 | | | | 10/15/18 | | | | Open | | | | 114,660 | | | | 115,498 | | | Corporate Bonds | | Open/Demand |
HSBC Securities (USA), Inc. | | | 2.21 | | | | 10/15/18 | | | | Open | | | | 2,696,625 | | | | 2,699,427 | | | U.S. Treasury Obligations | | Open/Demand |
HSBC Securities (USA), Inc. | | | 2.26 | | | | 10/15/18 | | | | Open | | | | 6,877,500 | | | | 6,884,932 | | | U.S. Treasury Obligations | | Open/Demand |
RBC Capital Markets, LLC | | | 2.59 | | | | 10/15/18 | | | | Open | | | | 630,487 | | | | 631,258 | | | Corporate Bonds | | Open/Demand |
RBC Capital Markets, LLC | | | 2.85 | | | | 10/15/18 | | | | Open | | | | 182,125 | | | | 182,370 | | | Corporate Bonds | | Open/Demand |
Barclays Capital, Inc. | | | 1.50 | | | | 10/16/18 | | | | Open | | | | 175,175 | | | | 175,284 | | | Corporate Bonds | | Open/Demand |
BNP Paribas S.A. | | | 2.89 | | | | 10/16/18 | | | | Open | | | | 136,069 | | | | 136,233 | | | Corporate Bonds | | Open/Demand |
BNP Paribas S.A. | | | 2.66 | | | | 10/17/18 | | | | Open | | | | 370,470 | | | | 370,881 | | | Corporate Bonds | | Open/Demand |
RBC Capital Markets, LLC | | | 2.85 | | | | 10/17/18 | | | | Open | | | | 172,220 | | | | 172,411 | | | Corporate Bonds | | Open/Demand |
Barclays Capital, Inc. | | | 2.80 | | | | 10/18/18 | | | | Open | | | | 480,425 | | | | 480,948 | | | Corporate Bonds | | Open/Demand |
Credit Suisse Securities (USA) LLC | | | 1.75 | | | | 10/18/18 | | | | Open | | | | 637,583 | | | | 638,016 | | | Foreign Agency Obligations | | Open/Demand |
RBC Capital Markets, LLC | | | 2.85 | | | | 10/18/18 | | | | Open | | | | 800,022 | | | | 800,909 | | | Corporate Bonds | | Open/Demand |
RBC Capital Markets, LLC | | | 2.85 | | | | 10/18/18 | | | | Open | | | | 177,076 | | | | 177,273 | | | Corporate Bonds | | Open/Demand |
RBC Capital Markets, LLC | | | 2.85 | | | | 10/18/18 | | | | Open | | | | 347,650 | | | | 348,008 | | | Corporate Bonds | | Open/Demand |
UBS Securities LLC | | | 2.58 | | | | 10/18/18 | | | | Open | | | | 792,059 | | | | 792,854 | | | Capital Trusts | | Open/Demand |
BNP Paribas S.A. | | | 2.79 | | | | 10/22/18 | | | | Open | | | | 547,336 | | | | 547,718 | | | Corporate Bonds | | Open/Demand |
BNP Paribas S.A. | | | 2.84 | | | | 10/22/18 | | | | Open | | | | 470,000 | | | | 470,334 | | | Corporate Bonds | | Open/Demand |
RBC Capital Markets, LLC | | | 2.85 | | | | 10/22/18 | | | | Open | | | | 390,600 | | | | 390,878 | | | Corporate Bonds | | Open/Demand |
Royal Bank of Canada | | | 2.35 | | | | 10/23/18 | | | | 11/26/18 | | | | 4,824,000 | | | | 4,826,519 | | | U.S. Government Sponsored Agency Securities | | Up to 30 Days |
RBC Capital Markets, LLC | | | 2.85 | | | | 10/25/18 | | | | Open | | | | 137,175 | | | | 137,240 | | | Corporate Bonds | | Open/Demand |
BNP Paribas S.A. | | | 2.28 | | | | 10/29/18 | | | | Open | | | | 4,500,000 | | | | 4,500,855 | | | U.S. Government Sponsored Agency Securities | | Open/Demand |
RBC Capital Markets, LLC | | | 2.85 | | | | 10/30/18 | | | | Open | | | | 182,865 | | | | 182,879 | | | Corporate Bonds | | Open/Demand |
RBC Capital Markets, LLC | | | 2.85 | | | | 10/30/18 | | | | Open | | | | 78,030 | | | | 78,036 | | | Corporate Bonds | | Open/Demand |
RBC Capital Markets, LLC | | | 2.85 | | | | 10/30/18 | | | | Open | | | | 271,350 | | | | 271,371 | | | Corporate Bonds | | Open/Demand |
UBS Securities LLC | | | 2.70 | | | | 10/30/18 | | | | Open | | | | 2,272,148 | | | | 2,272,318 | | | Corporate Bonds | | Open/Demand |
RBC Capital Markets, LLC | | | 2.85 | | | | 10/31/18 | | | | Open | | | | 195,540 | | | | 195,556 | | | Corporate Bonds | | Open/Demand |
| | | | | | | | | | | | | | | | | | | | | | | | |
| | | $ | 374,908,062 | | | $ | 376,301,922 | | | | | |
| | | | | | | | | | | | | |
| | (a) | Certain agreements have no stated maturity and can be terminated by either party at any time. | |
Derivative Financial Instruments Outstanding as of Period End
Futures Contracts
| | | | | | | | | | | | | | | | |
| Description | | Number of
Contracts | | | Expiration
Date | | | Notional
Amount (000) | | | Value/
Unrealized
Appreciation
(Depreciation) | |
Long Contracts: | | | | | | | | | | | | | | | | |
10-Year U.S. Treasury Note | | | 12 | | | | 12/19/18 | | | $ | 1,421 | | | $ | (19,692 | ) |
10-Year U.S. Ultra Long Treasury Note | | | 13 | | | | 12/19/18 | | | | 1,626 | | | | (20,533 | ) |
Ultra Long U.S. Treasury Bond | | | 39 | | | | 12/19/18 | | | | 5,820 | | | | (64,023 | ) |
Euro STOXX 600 Index | | | 1 | | | | 12/21/18 | | | | 8 | | | | (670 | ) |
| | | | | | | | | | | | | | | | |
| | | | | | | | | | | | | | | (104,918 | ) |
| | | | | | | | | | | | | | | | |
Short Contracts: | | | | | | | | | | | | | | | | |
Euro-Bobl Future | | | 1 | | | | 12/06/18 | | | | 149 | | | | 158 | |
Euro Bund Futures | | | 1 | | | | 12/06/18 | | | | 182 | | | | (624 | ) |
Long Gilt Future | | | 1 | | | | 12/27/18 | | | | 156 | | | | (436 | ) |
2-Year U.S. Treasury Note | | | 24 | | | | 12/31/18 | | | | 5,056 | | | | 8,405 | |
5-Year U.S. Treasury Note | | | 15 | | | | 12/31/18 | | | | 1,686 | | | | (956 | ) |
| | | | | | | | | | | | | | | | |
| | | | | | | | | | | | | | | 6,547 | |
| | | | | | | | | | | | | | | | |
| | | | | | | | | | | | | | $ | (98,371 | ) |
| | | | | | | | | | | | | | | | |
| | | | |
| CONSOLIDATED SCHEDULES OF INVESTMENTS | | | 75 | |
| | |
Consolidated Schedule of Investments (continued) October 31, 2018 | | BlackRock Multi-Sector Income Trust (BIT) |
Forward Foreign Currency Exchange Contracts
| | | | | | | | | | | | | | | | | | | | |
Currency
Purchased | | | Currency
Sold | | | Counterparty | | Settlement Date | | | Unrealized
Appreciation
(Depreciation) | |
| EUR | | | 11,000 | | | USD | | | 12,452 | | | JPMorgan Chase Bank N.A. | | | 11/05/18 | | | $ | 10 | |
| EUR | | | 765,000 | | | USD | | | 865,980 | | | JPMorgan Chase Bank N.A. | | | 11/05/18 | | | | 697 | |
| GBP | | | 176,000 | | | USD | | | 224,611 | | | BNP Paribas S.A. | | | 11/05/18 | | | | 380 | |
| GBP | | | 173,000 | | | USD | | | 220,644 | | | Barclays Bank PLC | | | 11/05/18 | | | | 512 | |
| GBP | | | 1,362,000 | | | USD | | | 1,737,095 | | | Barclays Bank PLC | | | 11/05/18 | | | | 4,030 | |
| GBP | | | 1,958,000 | | | USD | | | 2,500,758 | | | Citibank N.A. | | | 11/05/18 | | | | 2,269 | |
| GBP | | | 10,962,000 | | | USD | | | 14,000,666 | | | Citibank N.A. | | | 11/05/18 | | | | 12,703 | |
| GBP | | | 93,000 | | | USD | | | 118,660 | | | Deutsche Bank AG | | | 11/05/18 | | | | 227 | |
| GBP | | | 303,000 | | | USD | | | 386,603 | | | Deutsche Bank AG | | | 11/05/18 | | | | 740 | |
| USD | | | 1,439,669 | | | EUR | | | 1,222,000 | | | BNP Paribas S.A. | | | 11/05/18 | | | | 55,251 | |
| USD | | | 4,430,353 | | | EUR | | | 3,760,774 | | | Citibank N.A. | | | 11/05/18 | | | | 169,729 | |
| USD | | | 16,927,038 | | | EUR | | | 14,368,778 | | | Citibank N.A. | | | 11/05/18 | | | | 648,482 | |
| USD | | | 739,474 | | | EUR | | | 650,000 | | | Deutsche Bank AG | | | 11/05/18 | | | | 3,082 | |
| USD | | | 1,043,228 | | | EUR | | | 917,000 | | | Deutsche Bank AG | | | 11/05/18 | | | | 4,348 | |
| USD | | | 625,106 | | | EUR | | | 531,000 | | | JPMorgan Chase Bank N.A. | | | 11/05/18 | | | | 23,530 | |
| USD | | | 12,770 | | | EUR | | | 11,000 | | | UBS AG | | | 11/05/18 | | | | 308 | |
| USD | | | 797,536 | | | EUR | | | 687,000 | | | UBS AG | | | 11/05/18 | | | | 19,225 | |
| USD | | | 232,273 | | | GBP | | | 176,000 | | | BNP Paribas S.A. | | | 11/05/18 | | | | 7,282 | |
| USD | | | 676,685 | | | GBP | | | 518,000 | | | Citibank N.A. | | | 11/05/18 | | | | 14,495 | |
| USD | | | 1,784,462 | | | GBP | | | 1,366,000 | | | Citibank N.A. | | | 11/05/18 | | | | 38,224 | |
| USD | | | 2,584,266 | | | GBP | | | 1,958,000 | | | Citibank N.A. | | | 11/05/18 | | | | 81,240 | |
| USD | | | 14,468,196 | | | GBP | | | 10,962,000 | | | Citibank N.A. | | | 11/05/18 | | | | 454,826 | |
| USD | | | 122,715 | | | GBP | | | 93,000 | | | Deutsche Bank AG | | | 11/05/18 | | | | 3,827 | |
| USD | | | 399,812 | | | GBP | | | 303,000 | | | Deutsche Bank AG | | | 11/05/18 | | | | 12,470 | |
| USD | | | 1,673,260 | | | MXN | | | 31,843,000 | | | Goldman Sachs International | | | 11/05/18 | | | | 105,663 | |
| ZAR | | | 16,314,373 | | | USD | | | 1,098,500 | | | BNP Paribas S.A. | | | 11/13/18 | | | | 5,916 | |
| USD | | | 1,392,515 | | | EUR | | | 1,222,000 | | | BNP Paribas S.A. | | | 12/05/18 | | | | 4,789 | |
| USD | | | 4,288,956 | | | EUR | | | 3,760,774 | | | Citibank N.A. | | | 12/05/18 | | | | 18,150 | |
| USD | | | 16,386,801 | | | EUR | | | 14,368,778 | | | Citibank N.A. | | | 12/05/18 | | | | 69,346 | |
| | | | | | | | | | | | | | | | | | | | |
| | | | | | | | | | | | | | | | | | | 1,761,751 | |
| | | | | | | | | | | | | | | | | | | | |
| EUR | | | 1,222,000 | | | USD | | | 1,389,292 | | | BNP Paribas S.A. | | | 11/05/18 | | | | (4,874 | ) |
| EUR | | | 3,760,774 | | | USD | | | 4,279,009 | | | Citibank N.A. | | | 11/05/18 | | | | (18,384 | ) |
| EUR | | | 14,368,778 | | | USD | | | 16,348,796 | | | Citibank N.A. | | | 11/05/18 | | | | (70,239 | ) |
| EUR | | | 650,000 | | | USD | | | 765,838 | | | Deutsche Bank AG | | | 11/05/18 | | | | (29,446 | ) |
| EUR | | | 917,000 | | | USD | | | 1,080,421 | | | Deutsche Bank AG | | | 11/05/18 | | | | (41,541 | ) |
| IDR | | | 16,628,547,540 | | | USD | | | 1,091,828 | | | JPMorgan Chase Bank N.A. | | | 11/13/18 | | | | (143 | ) |
| USD | | | 1,076,769 | | | IDR | | | 16,628,547,540 | | | Bank of America N.A. | | | 11/13/18 | | | | (14,916 | ) |
| USD | | | 1,098,500 | | | ZAR | | | 17,175,840 | | | Bank of America N.A. | | | 11/13/18 | | | | (64,234 | ) |
| EUR | | | 650,000 | | | USD | | | 741,196 | | | Deutsche Bank AG | | | 12/05/18 | | | | (3,043 | ) |
| EUR | | | 917,000 | | | USD | | | 1,045,656 | | | Deutsche Bank AG | | | 12/05/18 | | | | (4,294 | ) |
| USD | | | 12,481 | | | EUR | | | 11,000 | | | JPMorgan Chase Bank N.A. | | | 12/05/18 | | | | (11 | ) |
| USD | | | 867,985 | | | EUR | | | 765,000 | | | JPMorgan Chase Bank N.A. | | | 12/05/18 | | | | (763 | ) |
| USD | | | 224,904 | | | GBP | | | 176,000 | | | BNP Paribas S.A. | | | 12/05/18 | | | | (389 | ) |
| USD | | | 220,926 | | | GBP | | | 173,000 | | | Barclays Bank PLC | | | 12/05/18 | | | | (527 | ) |
| USD | | | 1,739,314 | | | GBP | | | 1,362,000 | | | Barclays Bank PLC | | | 12/05/18 | | | | (4,145 | ) |
| USD | | | 2,504,008 | | | GBP | | | 1,958,000 | | | Citibank N.A. | | | 12/05/18 | | | | (2,373 | ) |
| USD | | | 14,018,863 | | | GBP | | | 10,962,000 | | | Citibank N.A. | | | 12/05/18 | | | | (13,286 | ) |
| USD | | | 118,814 | | | GBP | | | 93,000 | | | Deutsche Bank AG | | | 12/05/18 | | | | (233 | ) |
| USD | | | 387,103 | | | GBP | | | 303,000 | | | Deutsche Bank AG | | | 12/05/18 | | | | (758 | ) |
| USD | | | 1,406,438 | | | RUB | | | 93,756,000 | | | Bank of America N.A. | | | 12/19/18 | | | | (8,841 | ) |
| USD | | | 1,079,145 | | | IDR | | | 16,628,547,540 | | | JPMorgan Chase Bank N.A. | | | 01/11/19 | | | | (663 | ) |
| | | | | | | | | | | | | | | | | | | | |
| | | | | | | | | | | | | | | | | | | (283,103 | ) |
| | | | | | | | | | | | | | | | | | | | |
| | | Net Unrealized Appreciation | | | $ | 1,478,648 | |
| | | | | | | | | | | | | | | | | | | | |
| | |
| 76 | | 2018 BLACKROCK ANNUAL REPORTTO SHAREHOLDERS |
| | |
Consolidated Schedule of Investments (continued) October 31, 2018 | | BlackRock Multi-Sector Income Trust (BIT) |
Centrally Cleared Credit Default Swaps — Sell Protection
| | | | | | | | | | | | | | | | | | | | | | | | | | | | | | | | | | | | |
| Reference Obligation/Index | | Financing Rate Received
by the Trust | | | Payment
Frequency | | | Termination
Date | | | Credit
Rating(a) | | | Notional
Amount (000)(b) | | | Value | | | Upfront
Premium
Paid
(Received) | | | Unrealized
Appreciation
(Depreciation) | |
Chesapeake Energy Corp. | | | 5.00 | % | | | Quarterly | | | | 12/20/21 | | | | CCC+ | | | | USD | | | | 319 | | | $ | 22,572 | | | $ | (8,425 | ) | | $ | 30,997 | |
| | (a) | Using Standard & Poor’s (“S&P”) rating of the issuer or the underlying securities of the index, as applicable. | |
| | (b) | The maximum potential amount the Trust may pay should a negative credit event take place as defined under the terms of the agreement. | |
Centrally Cleared Interest Rate Swaps
| | | | | | | | | | | | | | | | | | | | | | | | | | | | |
| Paid by the Trust | | Received by the Trust | | Termination
Date | | | Notional
Amount (000) | | | Value | | | Upfront
Premium
Paid
(Received) | | | Unrealized
Appreciation
(Depreciation) | |
| Rate | | Frequency | | Rate | | Frequency |
| 1.50% | | Semi-annual | | 3-Month LIBOR, 2.56% | | Quarterly | | | 02/02/19 | | | USD | | | 8,000 | | | $ | 40,670 | | | $ | 14 | | | $ | 40,656 | |
| 1.62 | | Semi-annual | | 3-Month LIBOR, 2.56% | | Quarterly | | | 04/04/19 | | | USD | | | 7,600 | | | | 38,061 | | | | — | | | | 38,061 | |
3-Month
LIBOR,
2.56% | | Quarterly | | 2.39% | | Semi-annual | | | 02/12/20 | | | USD | | | 193,500 | | | | (1,452,436 | ) | | | 1,718 | | | | (1,454,154 | ) |
3-Month
LIBOR,
2.56% | | Quarterly | | 2.36% | | Semi-annual | | | 02/13/20 | | | USD | | | 150,000 | | | | (1,183,299 | ) | | | 1,333 | | | | (1,184,632 | ) |
| 2.01 | | Semi-annual | | 3-Month LIBOR, 2.56% | | Quarterly | | | 02/02/22 | | | USD | | | 15,000 | | | | 531,680 | | | | 140 | | | | 531,540 | |
| 2.01 | | Semi-annual | | 3-Month LIBOR, 2.56% | | Quarterly | | | 07/12/22 | | | USD | | | 3,000 | | | | 102,970 | | | | — | | | | 102,970 | |
| 1.46 | | Semi-annual | | 3-Month LIBOR, 2.56% | | Quarterly | | | 06/28/26 | | | USD | | | 1,427 | | | | 163,294 | | | | 16 | | | | 163,278 | |
| 1.46 | | Semi-annual | | 3-Month LIBOR, 2.56% | | Quarterly | | | 06/28/26 | | | USD | | | 357 | | | | 40,802 | | | | 4 | | | | 40,798 | |
| 2.47 | | Semi-annual | | 3-Month LIBOR, 2.56% | | Quarterly | | | 12/29/26 | | | USD | | | 3,000 | | | | 136,107 | | | | 41 | | | | 136,066 | |
| 2.25 | | Semi-annual | | 3-Month LIBOR, 2.56% | | Quarterly | | | 01/19/27 | | | USD | | | 3,400 | | | | 218,841 | | | | 45 | | | | 218,796 | |
| 2.42 | | Semi-annual | | 3-Month LIBOR, 2.56% | | Quarterly | | | 04/04/27 | | | USD | | | 18,300 | | | | 1,080,037 | | | | 247 | | | | 1,079,790 | |
| 2.30 | | Semi-annual | | 3-Month LIBOR, 2.56% | | Quarterly | | | 05/02/27 | | | USD | | | 3,000 | | | | 190,086 | | | | — | | | | 190,086 | |
| 2.28 | | Semi-annual | | 3-Month LIBOR, 2.56% | | Quarterly | | | 05/17/27 | | | USD | | | 1,700 | | | | 110,636 | | | | — | | | | 110,636 | |
| 2.18 | | Semi-annual | | 3-Month LIBOR, 2.56% | | Quarterly | | | 06/05/27 | | | USD | | | 2,300 | | | | 168,960 | | | | — | | | | 168,960 | |
| 2.90 | | Semi-annual | | 3-Month LIBOR, 2.56% | | Quarterly | | | 02/06/28 | | | USD | | | 57,000 | | | | 1,479,411 | | | | 942 | | | | 1,478,469 | |
| 2.92 | | Semi-annual | | 3-Month LIBOR, 2.56% | | Quarterly | | | 03/26/28 | | | USD | | | 10,500 | | | | 268,180 | | | | 176 | | | | 268,004 | |
| 2.70 | | Semi-annual | | 3-Month LIBOR, 2.56% | | Quarterly | | | 04/04/47 | | | USD | | | 13,200 | | | | 1,587,497 | | | | — | | | | 1,587,497 | |
| 3.01 | | Semi-annual | | 3-Month LIBOR, 2.56% | | Quarterly | | | 02/13/48 | | | USD | | | 18,000 | | | | 1,103,877 | | | | 433 | | | | 1,103,444 | |
| 2.98 | | Semi-annual | | 3-Month LIBOR, 2.56% | | Quarterly | | | 02/13/48 | | | USD | | | 9,000 | | | | 599,804 | | | | 216 | | | | 599,588 | |
| 3.01 | | Semi-annual | | 3-Month LIBOR, 2.56% | | Quarterly | | | 02/14/48 | | | USD | | | 6,500 | | | | 399,714 | | | | 156 | | | | 399,558 | |
| 3.03 | | Semi-annual | | 3-Month LIBOR, 2.56% | | Quarterly | | | 02/20/48 | | | USD | | | 4,300 | | | | 242,916 | | | | 103 | | | | 242,813 | |
| | | | | | | | | | | | | | | | | | | | | | | | | | | | |
| | | | | | | | | | | | | | | | | | $ | 5,867,808 | | | $ | 5,584 | | | $ | 5,862,224 | |
| | | | | | | | | | | | | | | | | | | | | | | | | | | | |
OTC Credit Default Swaps — Buy Protection
| | | | | | | | | | | | | | | | | | | | | | | | | | | | | | | | | | | | |
| Reference Obligation/Index | | Financing
Rate Paid
by the Trust | | | Payment
Frequency | | | Counterparty | | | Termination
Date | | | Notional
Amount
(000) | | | Value | | | Upfront
Premium
Paid
(Received) | | | Unrealized
Appreciation
(Depreciation) | |
United Mexican States | | | 1.00 | % | | | Quarterly | | | | Citibank N.A. | | | | 06/20/20 | | | | USD | | | | 604 | | | $ | (2,940 | ) | | $ | 1,962 | | | $ | (4,902 | ) |
United Mexican States | | | 1.00 | | | | Quarterly | | | | Bank of America N.A. | | | | 09/20/20 | | | | USD | | | | 604 | | | | (3,022 | ) | | | 2,930 | | | | (5,952 | ) |
Republic of Colombia | | | 1.00 | | | | Quarterly | | | | Citibank N.A. | | | | 12/20/23 | | | | USD | | | | 511 | | | | 5,910 | | | | 4,041 | | | | 1,869 | |
CMBX NA.7 | | | 3.00 | | | | Monthly | | | | Deutsche Bank AG | | | | 01/17/47 | | | | USD | | | | 25,000 | | | | 1,488,050 | | | | 1,865,272 | | | | (377,222 | ) |
| | | | | | | | | | | | | | | | | | | | | | | | | | | | | | | | | | | | |
| | | | | | | | | | | | | | | | | | | | | | | | | | $ | 1,487,998 | | | $ | 1,874,205 | | | | $ (386,207 | ) |
| | | | | | | | | | | | | | | | | | | | | | | | | | | | | | | | | | | | |
| | | | |
| CONSOLIDATED SCHEDULES OF INVESTMENTS | | | 77 | |
| | |
Consolidated Schedule of Investments (continued) October 31, 2018 | | BlackRock Multi-Sector Income Trust (BIT) |
OTC Credit Default Swaps — Sell Protection
| | | | | | | | | | | | | | | | | | | | | | | | | | | | | | | | | | | | | | |
| Reference Obligation/Index | | Financing
Rate Received
by the Trust | | | Payment
Frequency | | | Counterparty | | | Termination
Date | | | Credit
Rating(a) | | Notional
Amount
(000)(b) | | | Value | | | Upfront
Premium
Paid
(Received) | | | Unrealized
Appreciation
(Depreciation) | |
United Mexican States | | | 1.00 | % | | | Quarterly | | | | Bank of America N.A. | | | | 06/20/20 | | | BBB+ | | | USD | | | | 604 | | | $ | 2,941 | | | $ | (2,056 | ) | | $ | 4,997 | |
United Mexican States | | | 1.00 | | | | Quarterly | | | | Citibank N.A. | | | | 09/20/20 | | | BBB+ | | | USD | | | | 604 | | | | 3,022 | | | | 2,778 | | | | 244 | |
Casino Guichard Perrachon SA | | | 1.00 | | | | Quarterly | | | | JPMorgan Chase Bank N.A. | | | | 12/20/22 | | | BB | | | EUR | | | | 50 | | | | (7,638 | ) | | | (1,821 | ) | | | (5,817 | ) |
Telecom Italia SpA/Milano | | | 1.00 | | | | Quarterly | | | | Citibank N.A. | | | | 12/20/22 | | | BB+ | | | EUR | | | | 30 | | | | (1,635 | ) | | | (522 | ) | | | (1,113 | ) |
Casino Guichard Perrachon SA | | | 1.00 | | | | Quarterly | | | | BNP Paribas S.A. | | | | 06/20/23 | | | BB | | | EUR | | | | 10 | | | | (1,732 | ) | | | (950 | ) | | | (782 | ) |
Casino Guichard Perrachon SA | | | 1.00 | | | | Quarterly | | | | BNP Paribas S.A. | | | | 06/20/23 | | | BB | | | EUR | | | | 10 | | | | (1,732 | ) | | | (950 | ) | | | (782 | ) |
Casino Guichard Perrachon SA | | | 1.00 | | | | Quarterly | | | | JPMorgan Chase Bank N.A. | | | | 06/20/23 | | | BB | | | EUR | | | | 10 | | | | (1,731 | ) | | | (940 | ) | | | (791 | ) |
Casino Guichard Perrachon SA | | | 1.00 | | | | Quarterly | | | | Bank of America N.A. | | | | 06/20/23 | | | BB | | | EUR | | | | 12 | | | | (2,135 | ) | | | (1,793 | ) | | | (342 | ) |
Casino Guichard Perrachon SA | | | 1.00 | | | | Quarterly | | | | Citibank N.A. | | | | 06/20/23 | | | BB | | | EUR | | | | 28 | | | | (4,790 | ) | | | (3,793 | ) | | | (997 | ) |
Casino Guichard Perrachon SA | | | 1.00 | | | | Quarterly | | | | JPMorgan Chase Bank N.A. | | | | 06/20/23 | | | BB | | | EUR | | | | 7 | | | | (1,256 | ) | | | (903 | ) | | | (353 | ) |
Casino Guichard Perrachon SA | | | 1.00 | | | | Quarterly | | | | Citibank N.A. | | | | 06/20/23 | | | BB | | | EUR | | | | 12 | | | | (2,092 | ) | | | (1,607 | ) | | | (485 | ) |
Casino Guichard Perrachon SA | | | 1.00 | | | | Quarterly | | | | JPMorgan Chase Bank N.A. | | | | 06/20/23 | | | BB | | | EUR | | | | 12 | | | | (2,094 | ) | | | (1,608 | ) | | | (486 | ) |
Casino Guichard Perrachon SA | | | 1.00 | | | | Quarterly | | | | JPMorgan Chase Bank N.A. | | | | 06/20/23 | | | BB | | | EUR | | | | 5 | | | | (838 | ) | | | (602 | ) | | | (236 | ) |
Casino Guichard Perrachon SA | | | 1.00 | | | | Quarterly | | | | Barclays Bank PLC | | | | 06/20/23 | | | BB | | | EUR | | | | 13 | | | | (2,242 | ) | | | (1,550 | ) | | | (692 | ) |
Casino Guichard Perrachon SA | | | 1.00 | | | | Quarterly | | | | Barclays Bank PLC | | | | 06/20/23 | | | BB | | | EUR | | | | 47 | | | | (8,146 | ) | | | (5,800 | ) | | | (2,346 | ) |
Intrum Justitia AB | | | 5.00 | | | | Quarterly | | | | Credit Suisse International | | | | 06/20/23 | | | BB+ | | | EUR | | | | 20 | | | | 999 | | | | 1,892 | | | | (893 | ) |
Intrum Justitia AB | | | 5.00 | | | | Quarterly | | | | Credit Suisse International | | | | 06/20/23 | | | BB+ | | | EUR | | | | 50 | | | | 2,499 | | | | 5,010 | | | | (2,511 | ) |
Intrum Justitia AB | | | 5.00 | | | | Quarterly | | | | Credit Suisse International | | | | 06/20/23 | | | BB+ | | | EUR | | | | 7 | | | | 342 | | | | 767 | | | | (425 | ) |
Intrum Justitia AB | | | 5.00 | | | | Quarterly | | | | Morgan Stanley & Co. International PLC | | | | 06/20/23 | | | BB+ | | | EUR | | | | 23 | | | | 1,156 | | | | 2,587 | | | | (1,431 | ) |
Intrum Justitia AB | | | 5.00 | | | | Quarterly | | | | Citibank N.A. | | | | 06/20/23 | | | BB+ | | | EUR | | | | 9 | | | | 466 | | | | 440 | | | | 26 | |
Intrum Justitia AB | | | 5.00 | | | | Quarterly | | | | Citibank N.A. | | | | 06/20/23 | | | BB+ | | | EUR | | | | 21 | | | | 1,033 | | | | 975 | | | | 58 | |
Thomas Cook Finance 2 PLC | | | 5.00 | | | | Quarterly | | | | Citibank N.A. | | | | 06/20/23 | | | B+ | | | EUR | | | | 50 | | | | 3,352 | | | | 6,350 | | | | (2,998 | ) |
Thomas Cook Finance 2 PLC | | | 5.00 | | | | Quarterly | | | | Morgan Stanley & Co. International PLC | | | | 06/20/23 | | | B+ | | | EUR | | | | 60 | | | | 4,023 | | | | 7,603 | | | | (3,580 | ) |
Casino Guichard-Perrachon SA | | | 1.00 | | | | Quarterly | | | | Barclays Bank PLC | | | | 12/20/23 | | | BB | | | EUR | | | | 80 | | | | (15,498 | ) | | | (13,015 | ) | | | (2,483 | ) |
Chesapeake Energy Corp. | | | 5.00 | | | | Quarterly | | | | Barclays Bank PLC | | | | 12/20/23 | | | B- | | | USD | | | | 94 | | | | 553 | | | | 185 | | | | 368 | |
Garfunkelux Holdco 2 SA | | | 5.00 | | | | Quarterly | | | | JPMorgan Chase Bank N.A. | | | | 12/20/23 | | | B- | | | EUR | | | | 13 | | | | (222 | ) | | | (94 | ) | | | (128 | ) |
Garfunkelux Holdco 2 SA | | | 5.00 | | | | Quarterly | | | | Credit Suisse International | | | | 12/20/23 | | | B- | | | EUR | | | | 6 | | | | (97 | ) | | | 110 | | | | (207 | ) |
Garfunkelux Holdco 2 SA | | | 5.00 | | | | Quarterly | | | | Credit Suisse International | | | | 12/20/23 | | | B- | | | EUR | | | | 24 | | | | (423 | ) | | | 481 | | | | (904 | ) |
Vougeot Bidco PLC | | | 5.00 | | | | Quarterly | | | | Citibank N.A. | | | | 12/20/23 | | | B | | | EUR | | | | 15 | | | | 1,605 | | | | 1,577 | | | | 28 | |
Vougeot Bidco PLC | | | 5.00 | | | | Quarterly | | | | Citibank N.A. | | | | 12/20/23 | | | B | | | EUR | | | | 36 | | | | 3,744 | | | | 3,638 | | | | 106 | |
CMBX NA.7 | | | 3.00 | | | | Monthly | | | | Barclays Bank PLC | | | | 01/17/47 | | | BBB- | | | USD | | | | 10,000 | | | | (616,053 | ) | | | (519,062 | ) | | | (96,991 | ) |
CMBX NA.7 | | | 3.00 | | | | Monthly | | | | Barclays Bank PLC | | | | 01/17/47 | | | BBB- | | | USD | | | | 5,000 | | | | (308,026 | ) | | | (259,167 | ) | | | (48,859 | ) |
CMBX NA.7 | | | 3.00 | | | | Monthly | | | | Barclays Bank PLC | | | | 01/17/47 | | | BBB- | | | USD | | | | 10,000 | | | | (616,054 | ) | | | (251,341 | ) | | | (364,713 | ) |
CMBX NA.8 | | | 2.00 | | | | Monthly | | | | Morgan Stanley & Co. International PLC | | | | 10/17/57 | | | A | | | USD | | | | 5,000 | | | | (69,050 | ) | | | (562,531 | ) | | | 493,481 | |
CMBX NA.9 | | | 2.00 | | | | Monthly | | | | Morgan Stanley & Co. International PLC | | | | 09/17/58 | | | A | | | USD | | | | 2,500 | | | | (27,318 | ) | | | (344,317 | ) | | | 316,999 | |
CMBX NA.9 | | | 2.00 | | | | Monthly | | | | Credit Suisse International | | | | 09/17/58 | | | A | | | USD | | | | 2,500 | | | | (27,319 | ) | | | (347,675 | ) | | | 320,356 | |
CMBX NA.9 | | | 2.00 | | | | Monthly | | | | Morgan Stanley & Co. International PLC | | | | 09/17/58 | | | BBB- | | | USD | | | | 5,000 | | | | (54,637 | ) | | | (682,222 | ) | | | 627,585 | |
CMBX NA.9 | | | 3.00 | | | | Monthly | | | | Morgan Stanley & Co. International PLC | | | | 09/17/58 | | | BBB- | | | USD | | | | 2,500 | | | | (191,882 | ) | | | (556,480 | ) | | | 364,598 | |
CMBX NA.9 | | | 3.00 | | | | Monthly | | | | Deutsche Bank AG | | | | 09/17/58 | | | BBB- | | | USD | | | | 25,000 | | | | (1,918,817 | ) | | | (2,481,704 | ) | | | 562,887 | |
CMBX NA.9 | | | 3.00 | | | | Monthly | | | | Goldman Sachs International | | | | 09/17/58 | | | BBB- | | | USD | | | | 5,000 | | | | (383,764 | ) | | | (532,556 | ) | | | 148,792 | |
CMBX NA.9 | | | 3.00 | | | | Monthly | | | | Credit Suisse International | | | | 09/17/58 | | | BBB- | | | USD | | | | 5,000 | | | | (383,763 | ) | | | (548,102 | ) | | | 164,339 | |
CMBX NA.9 | | | 3.00 | | | | Monthly | | | | Morgan Stanley & Co. International PLC | | | | 09/17/58 | | | BBB- | | | USD | | | | 5,000 | | | | (383,764 | ) | | | (547,468 | ) | | | 163,704 | |
| | | | | | | | | | | | | | | | | | | | | | | | | | | | | | | | | | | | | | |
| | | | | | | | | | | | | | | | | | | | | | | | | | | | $ | (5,009,013 | ) | | $ | (7,636,236 | ) | | $ | 2,627,223 | |
| | | | | | | | | | | | | | | | | | | | | | | | | | | | | | | | | | | | | | |
| | (a) | Using S&P’s rating of the issuer or the underlying securities of the index, as applicable. | |
| | (b) | The maximum potential amount the Trust may pay should a negative credit event take place as defined under the terms of the agreement. | |
OTC Interest Rate Swaps
| | | | | | | | | | | | | | | | | | | | | | | | | | | | | | |
| Paid by the Trust | | Received by the Trust | | Counterparty | | Termination
Date | | | Notional
Amount (000) | | | Value | | | Upfront
Premium
Paid
(Received) | | | Unrealized
Appreciation
(Depreciation) | |
| Rate | | Frequency | | Rate | | Frequency |
| MXIBTIIE 28-day | | Monthly | | 6.26% | | Monthly | | Bank of America N.A. | | | 06/15/26 | | | MXN | | | 38,640 | | | $ | (288,061 | ) | | $ | — | | | $ | (288,061 | ) |
| | | | | | | | | | | | | | | | | | | | | | | | | | | | | | |
| | |
| 78 | | 2018 BLACKROCK ANNUAL REPORTTO SHAREHOLDERS |
| | |
Consolidated Schedule of Investments (continued) October 31, 2018 | | BlackRock Multi-Sector Income Trust (BIT) |
Balances Reported in the Statements of Assets and Liabilities for Centrally Cleared Swaps and OTC Swaps
| | | | | | | | | | | | | | | | |
| | | Swap
Premiums
Paid | | | Swap
Premiums
Received | | | Unrealized
Appreciation | | | Unrealized
Depreciation | |
Centrally Cleared Swaps(a) | | $ | 5,584 | | | $ | (8,425 | ) | | $ | 8,532,007 | | | $ | (2,638,786 | ) |
OTC Swaps | | $ | 1,908,598 | | | $ | (7,670,629 | ) | | $ | 3,170,437 | | | $ | (1,217,482 | ) |
| | (a) | Includes cumulative appreciation (depreciation) on centrally cleared swaps, as reported in the Consolidated Schedule of Investments. Only current day’s variation margin is reported within the Consolidated Statements of Assets and Liabilities and is net of any previously paid (received) swap premium amounts | |
Derivative Financial Instruments Categorized by Risk Exposure
As of period end, the fair values of derivative financial instruments located in the Consolidated Statement of Assets and Liabilities were as follows:
| | | | | | | | | | | | | | | | | | | | | | | | | | | | |
| | | Commodity
Contracts | | | Credit
Contracts | | | Equity
Contracts | | | Foreign
Currency
Exchange
Contracts | | | Interest
Rate
Contracts | | | Other Contracts | | | Total | |
Assets — Derivative Financial Instruments | | | | | | | | | | | | | | | | | | | | | | | | | | | | |
Futures contracts | | | | | | | | | | | | | | | | | | | | | | | | | | | | |
Net unrealized appreciation(a) | | $ | — | | | $ | — | | | $ | — | | | $ | — | | | $ | 8,563 | | | $ | — | | | $ | 8,563 | |
Forward foreign currency exchange contracts | | | | | | | | | | | | | | | | | | | | | | | | | | | | |
Unrealized appreciation on forward foreign currency exchange contracts | | | — | | | | — | | | | — | | | | 1,761,751 | | | | — | | | | — | | | | 1,761,751 | |
Swaps — centrally cleared | | | | | | | | | | | | | | | | | | | | | | | | | | | | |
Net unrealized appreciation(a) | | | — | | | | 30,997 | | | | — | | | | — | | | | 8,501,010 | | | | — | | | | 8,532,007 | |
Swaps — OTC | | | | | | | | | | | | | | | | | | | | | | | | | | | | |
Unrealized appreciation on OTC swaps; Swap premiums paid | | | — | | | | 5,079,035 | | | | — | | | | — | | | | — | | | | — | | | | 5,079,035 | |
| | | | | | | | | | | | | | | | | | | | | | | | | | | | |
| | $ | — | | | $ | 5,110,032 | | | $ | — | | | $ | 1,761,751 | | | $ | 8,509,573 | | | $ | — | | | $ | 15,381,356 | |
| | | | | | | | | | | | | | | | | | | | | | | | | | | | |
| Liabilities — Derivative Financial Instruments | | | | | | | | | | | | | | | | | | | | | |
Futures contracts | | | | | | | | | | | | | | | | | | | | | | | | | | | | |
Net unrealized depreciation(a) | | $ | — | | | $ | — | | | $ | 670 | | | $ | — | | | $ | 106,264 | | | $ | — | | | $ | 106,934 | |
Forward foreign currency exchange contracts | | | | | | | | | | | | | | | | | | | | | | | | | | | | |
Unrealized depreciation on forward foreign currency exchange contracts | | | — | | | | — | | | | — | | | | 283,103 | | | | — | | | | — | | | | 283,103 | |
Swaps — centrally cleared | | | | | | | | | | | | | | | | | | | | | | | | | | | | |
Net unrealized depreciation(a) | | | — | | | | — | | | | — | | | | — | | | | 2,638,786 | | | | — | | | | 2,638,786 | |
Swaps — OTC | | | | | | | | | | | | | | | | | | | | | | | | | | | | |
Unrealized depreciation on OTC swaps; Swap premiums received | | | — | | | | 8,600,050 | | | | — | | | | — | | | | 288,061 | | | | — | | | | 8,888,111 | |
| | | | | | | | | | | | | | | | | | | | | | | | | | | | |
| | $ | — | | | $ | 8,600,050 | | | $ | 670 | | | $ | 283,103 | | | $ | 3,033,111 | | | $ | — | | | $ | 11,916,934 | |
| | | | | | | | | | | | | | | | | | | | | | | | | | | | |
| | (a) | Includes cumulative appreciation (depreciation) on futures contracts and centrally cleared swaps, if any, as reported in the Consolidated Schedule of Investments. Only current day’s variation margin is reported within the Consolidated Statement of Assets and Liabilities. | |
For the year ended October 31, 2018, the effect of derivative financial instruments in the Consolidated Statement of Operations was as follows:
| | | | | | | | | | | | | | | | | | | | | | | | | | | | |
| | | Commodity
Contracts | | | Credit
Contracts | | | Equity
Contracts | | | Foreign
Currency
Exchange
Contracts | | | Interest
Rate
Contracts | | | Other
Contracts | | | Total | |
Net Realized Gain (Loss) from: | |
Futures contracts | | $ | — | | | $ | — | | | $ | (1,617 | ) | | $ | — | | | $ | 1,549,253 | | | $ | — | | | $ | 1,547,636 | |
Forward foreign currency exchange contracts | | | — | | | | — | | | | — | | | | 1,488,235 | | | | — | | | | — | | | | 1,488,235 | |
Options purchased(a) | | | — | | | | — | | | | — | | | | (72,378 | ) | | | (1,662 | ) | | | — | | | | (74,040 | ) |
Options written | | | — | | | | — | | | | — | | | | 37,307 | | | | — | | | | — | | | | 37,307 | |
Swaps | | | — | | | | 3,401,408 | | | | — | | | | — | | | | (162,864 | ) | | | — | | | | 3,238,544 | |
| | | | | | | | | | | | | | | | | | | | | | | | | | | | |
| | $ | — | | | $ | 3,401,408 | | | $ | (1,617 | ) | | $ | 1,453,164 | | | $ | 1,384,727 | | | $ | — | | | $ | 6,237,682 | |
| | | | | | | | | | | | | | | | | | | | | | | | | | | | |
| | | | |
| CONSOLIDATED SCHEDULES OF INVESTMENTS | | | 79 | |
| | |
Consolidated Schedule of Investments (continued) October 31, 2018 | | BlackRock Multi-Sector Income Trust (BIT) |
| | | | | | | | | | | | | | | | | | | | | | | | | | | | |
| | | Commodity
Contracts | | | Credit
Contracts | | | Equity
Contracts | | | Foreign
Currency
Exchange
Contracts | | | Interest
Rate
Contracts | | | Other
Contracts | | | Total | |
Net Change in Unrealized Appreciation (Depreciation) on: | |
Futures contracts | | $ | — | | | $ | — | | | $ | (670 | ) | | $ | — | | | $ | (146,738 | ) | | $ | — | | | $ | (147,408 | ) |
Forward foreign currency exchange contracts | | | — | | | | — | | | | — | | | | 340,615 | | | | — | | | | — | | | | 340,615 | |
Options purchased(b) | | | — | | | | — | | | | — | | | | (9,100 | ) | | | — | | | | — | | | | (9,100 | ) |
Options written | | | — | | | | — | | | | — | | | | 31,954 | | | | — | | | | — | | | | 31,954 | |
Swaps | | | — | | | | 2,339,307 | | | | — | | | | — | | | | 6,024,682 | | | | — | | | | 8,363,989 | |
| | | | | | | | | | | | | | | | | | | | | | | | | | | | |
| | $ | — | | | $ | 2,339,307 | | | $ | (670 | ) | | $ | 363,469 | | | $ | 5,877,944 | | | $ | — | | | $ | 8,580,050 | |
| | | | | | | | | | | | | | | | | | | | | | | | | | | | |
| | (a) | Options purchased are included in net realized gain (loss) from investments. | |
| | (b) | Options purchased are included in net change in unrealized appreciation (depreciation) on investments. | |
Average Quarterly Balances of Outstanding Derivative Financial Instruments
| | | | |
Futures contracts: | |
Average notional value of contracts — long | | $ | 3,179,417 | |
Average notional value of contracts — short | | $ | 25,593,435 | |
Forward foreign currency exchange contracts: | |
Average amounts purchased — in USD | | $ | 112,159,563 | |
Average amounts sold — in USD | | $ | 65,060,156 | |
Options: | |
Average value of option contracts purchased | | $ | — | (a) |
Average value of option contracts written | | $ | 6,327 | |
Credit default swaps: | |
Average notional value — buy protection | | $ | 26,932,365 | |
Average notional value — sell protection | | $ | 99,648,411 | |
Interest rate swaps: | |
Average notional value — pays fixed rate | | $ | 161,858,386 | |
Average notional value — receives fixed rate | | $ | 259,654,428 | |
| | (a) | The risk exposure table serves as an indicator of the volume of activity. | |
For more information about the Trust’s investment risks regarding derivative financial instruments, refer to the Notes to Financial Statements.
Derivative Financial Instruments — Offsetting as of Period End
| | | | | | | | |
| | | Assets | | | Liabilities | |
Futures contracts | | $ | 7,199 | | | $ | 56,529 | |
Forward foreign currency exchange contracts | | | 1,761,751 | | | | 283,103 | |
Swaps — Centrally cleared | | | 738,900 | | | | — | |
Swaps — OTC(a) | | | 5,079,035 | | | | 8,888,111 | |
| | | | | | | | |
Total derivative assets and liabilities in the Consolidated Statement of Assets and Liabilities | | $ | 7,586,885 | | | $ | 9,227,743 | |
| | | | | | | | |
Derivatives not subject to a Master Netting Agreement or similar agreement (“MNA”) | | | (746,099 | ) | | | (56,529 | ) |
| | | | | | | | |
Total derivative assets and liabilities subject to an MNA | | $ | 6,840,786 | | | $ | 9,171,214 | |
| | | | | | | | |
| | (a) | Includes unrealized appreciation (depreciation) on OTC swaps and swap premiums (paid/received) in the Consolidated Statement of Assets and Liabilities. | |
The following table presents the Trust’s derivative assets (and liabilities) by counterparty net of amounts available for offset under an MNA and net of the related collateral received (and pledged) by the Trust:
| | | | | | | | | | | | | | | | | | | | |
| Counterparty | | Derivative
Assets
Subject to
an MNA by
Counterparty | | | Derivatives
Available
for Offset (a) | | | Non-cash
Collateral
Received | | | Cash
Collateral
Received (b) | | | Net Amount
of Derivative
Assets (c)(d) | |
Bank of America N.A. | | $ | 7,927 | | | $ | (7,927 | ) | | $ | — | | | $ | — | | | $ | — | |
Barclays Bank PLC | | | 5,095 | | | | (5,095 | ) | | | — | | | | — | | | | — | |
BNP Paribas S.A. | | | 73,618 | | | | (8,727 | ) | | | — | | | | — | | | | 64,891 | |
Citibank N.A. | | | 1,533,556 | | | | (120,699 | ) | | | — | | | | (1,360,000 | ) | | | 52,857 | |
Credit Suisse International | | | 492,955 | | | | (492,955 | ) | | | — | | | | — | | | | — | |
Deutsche Bank AG | | | 2,452,853 | | | | (2,452,853 | ) | | | — | | | | — | | | | — | |
Goldman Sachs International | | | 254,455 | | | | (254,455 | ) | | | — | | | | — | | | | — | |
| | |
| 80 | | 2018 BLACKROCK ANNUAL REPORTTO SHAREHOLDERS |
| | |
Consolidated Schedule of Investments (continued) October 31, 2018 | | BlackRock Multi-Sector Income Trust (BIT) |
| | | | | | | | | | | | | | | | | | | | |
| Counterparty | | Derivative
Assets
Subject to
an MNA by
Counterparty | | | Derivatives
Available
for Offset (a) | | | Non-cash
Collateral
Received | | | Cash
Collateral
Received (b) | | | Net Amount
of Derivative
Assets (c)(d) | |
JPMorgan Chase Bank N.A. | | $ | 24,237 | | | $ | (15,359 | ) | | $ | — | | | $ | — | | | $ | 8,878 | |
Morgan Stanley & Co. International PLC | | | 1,976,557 | | | | (1,976,557 | ) | | | — | | | | — | | | | — | |
UBS AG | | | 19,533 | | | | — | | | | — | | | | — | | | | 19,533 | |
| | | | | | | | | | | | | | | | | | | | |
| | $ | 6,840,786 | | | $ | (5,334,627 | ) | | $ | — | | | $ | (1,360,000 | ) | | $ | 146,159 | |
| | | | | | | | | | | | | | | | | | | | |
| | | | | | | | | | | | | | | | | | | | |
| Counterparty | | Derivative
Liabilities
Subject to
an MNA by
Counterparty | | | Derivatives
Available
for Offset (a) | | | Non-cash
Collateral
Pledged | | | Cash
Collateral
Pledged (e) | | | Net Amount
of Derivative
Liabilities (d)(f) | |
Bank of America N.A. | | $ | 386,195 | | | $ | (7,927 | ) | | $ | — | | | $ | — | | | $ | 378,268 | |
Barclays Bank PLC | | | 1,570,691 | | | | (5,095 | ) | | | — | | | | (1,530,000 | ) | | | 35,596 | |
BNP Paribas S.A. | | | 8,727 | | | | (8,727 | ) | | | — | | | | — | | | | — | |
Citibank N.A. | | | 120,699 | | | | (120,699 | ) | | | — | | | | — | | | | — | |
Credit Suisse International | | | 900,717 | | | | (492,955 | ) | | | — | | | | (310,000 | ) | | | 97,762 | |
Deutsche Bank AG | | | 2,938,241 | | | | (2,452,853 | ) | | | — | | | | (440,000 | ) | | | 45,388 | |
Goldman Sachs International | | | 532,556 | | | | (254,455 | ) | | | — | | | | (278,101 | ) | | | — | |
JPMorgan Chase Bank N.A. | | | 15,359 | | | | (15,359 | ) | | | — | | | | — | | | | — | |
Morgan Stanley & Co. International PLC | | | 2,698,029 | | | | (1,976,557 | ) | | | — | | | | (630,000 | ) | | | 91,472 | |
| | | | | | | | | | | | | | | | | | | | |
| | $ | 9,171,214 | | | $ | (5,334,627 | ) | | $ | — | | | $ | (3,188,101 | ) | | $ | 648,486 | |
| | | | | | | | | | | | | | | | | | | | |
| | (a) | The amount of derivatives available for offset is limited to the amount of derivative asset and/or liabilities that are subject to an MNA. | |
| | (b) | Excess of collateral received from the individual counterparty is not shown for financial reporting purposes. | |
| | (c) | Net amount represents the net amount receivable from the counterparty in the event of default. | |
| | (d) | Net amount may also include forward foreign currency exchange contracts and currency options that are not required to be collateralized. | |
| | (e) | Excess of collateral pledged to the individual counterparty is not shown for financial reporting purposes. | |
| | (f) | Net amount represents the net amount payable due to counterparty in the event of default. | |
Fair Value Hierarchy as of Period End
Various inputs are used in determining the fair value of investments and derivative financial instruments. For information about the Trust’s policy regarding valuation of investments and derivative financial instruments, refer to the Notes to Financial Statements.
The following tables summarize the Trust’s investments and derivative financial instruments categorized in the disclosure hierarchy:
| | | | | | | | | | | | | | | | |
| | | Level 1 | | | Level 2 | | | Level 3 | | | Total | |
Assets: | |
Investments: | |
Long-Term Investments: | |
Asset-Backed Securities | | $ | — | | | $ | 162,488,929 | | | $ | 3,692,359 | | | $ | 166,181,288 | |
Common Stocks | | | 3,185,987 | | | | — | | | | — | | | | 3,185,987 | |
Corporate Bonds | | | 107,186 | | | | 451,847,459 | | | | 1,798,304 | | | | 453,752,949 | |
Floating Rate Loan Interests | | | — | | | | 40,571,515 | | | | 66,230,887 | | | | 106,802,402 | |
Foreign Agency Obligations | | | — | | | | 36,704,560 | | | | — | | | | 36,704,560 | |
Non-Agency Mortgage-Backed Securities | | | — | | | | 100,948,960 | | | | 17,447,723 | | | | 118,396,683 | |
Preferred Securities | | | 17,195,061 | | | | 94,594,168 | | | | 1,637,441 | | | | 113,426,670 | |
U.S. Government Sponsored Agency Securities | | | — | | | | 67,721,995 | | | | — | | | | 67,721,995 | |
U.S. Treasury Obligations | | | — | | | | 19,032,559 | | | | — | | | | 19,032,559 | |
Short-Term Securities | | | — | | | | 2,072,629 | | | | — | | | | 2,072,629 | |
Unfunded Floating Rate Loan Interests(a) | | | — | | | | 16 | | | | — | | | | 16 | |
Liabilities: | | | | | | | | | | | | | | | | |
Unfunded Floating Rate Loan Interests(a) | | | — | | | | — | | | | (60 | ) | | | (60 | ) |
| | | | | | | | | | | | | | | | |
| | $ | 20,488,234 | | | $ | 975,982,790 | | | $ | 90,806,654 | | | $ | 1,087,277,678 | |
| | | | | | | | | | | | | | | | |
| | | | | | | | | | | | | | | | |
| | | | |
| CONSOLIDATED SCHEDULES OF INVESTMENTS | | | 81 | |
| | |
Consolidated Schedule of Investments (continued) October 31, 2018 | | BlackRock Multi-Sector Income Trust (BIT) |
| | | | | | | | | | | | | | | | |
| | | Level 1 | | | Level 2 | | | Level 3 | | | Total | |
Derivative Financial Instruments(b) | |
Assets: | |
Credit contracts | | $ | — | | | $ | 3,201,434 | | | $ | — | | | $ | 3,201,434 | |
Foreign currency exchange contracts | | | — | | | | 1,761,751 | | | | — | | | | 1,761,751 | |
Interest rate contracts | | | 8,563 | | | | 8,501,010 | | | | — | | | | 8,509,573 | |
Liabilities: | |
Credit contracts | | | — | | | | (929,421 | ) | | | — | | | | (929,421 | ) |
Equity contracts | | | (670 | ) | | | — | | | | — | | | | (670 | ) |
Foreign currency exchange contracts | | | — | | | | (283,103 | ) | | | — | | | | (283,103 | ) |
Interest rate contracts | | | (106,264 | ) | | | (2,926,847 | ) | | | — | | | | (3,033,111 | ) |
| | | | | | | | | | | | | | | | |
| | $ | (98,371 | ) | | $ | 9,324,824 | | | $ | — | | | $ | 9,226,453 | |
| | | | | | | | | | | | | | | | |
| | (a) | Unfunded floating rate loan interests are valued at the unrealized appreciation (depreciation) on the commitment. | |
| | (b) | Derivative financial instruments are swaps, futures contracts and forward foreign currency exchange contracts. Swaps, futures contracts and forward foreign currency exchange contracts are valued at the unrealized appreciation (depreciation) on the instrument are shown at value. | |
The Trust may hold assets and/or liabilities in which the fair value approximates the carrying amount or face value, including accrued interest, for financial statement purposes. As of period end, reverse repurchase agreements payable of $376,301,922 is categorized as Level 2 within the disclosure hierarchy.
During the year ended October 31, 2018, there were no transfers between Level 1 and Level 2.
A reconciliation of Level 3 investments is presented when the Trust had a significant amount of Level 3 investments at the beginning and/or end of the period in relation to net assets. The following table is a reconciliation of Level 3 investments for which significant unobservable inputs were used in determining fair value:
| | | | | | | | | | | | | | | | | | | | | | | | | | | | |
| | | Asset-
Backed
Securities | | | Corporate
Bonds | | | Floating Rate
Loan
Interests | | | Non-Agency
Mortgage- Backed
Securities | | | Preferred
Securities | | | Unfunded
Floating Rate
Loan
Interests | | | Total | |
Assets: | | | | | | | | | | | | | | | | | | | | |
Opening balance, as of October 31, 2017 | | $ | 3,678,179 | | | $ | — | | | $ | 89,614,421 | | | $ | 16,674,165 | | | $ | 1,707,834 | | | $ | — | | | $ | 111,674,599 | |
Transfers into Level 3(a) | | | — | | | | — | | | | 264,852 | | | | 10,658,935 | | | | — | | | | — | | | | 10,923,787 | |
Transfers out of Level 3(b) | | | — | | | | — | | | | (311,782 | ) | | | — | | | | — | | | | — | | | | (311,782 | ) |
Accrued discounts/premiums | | | 27,750 | | | | — | | | | 15,409 | | | | 188,797 | | | | — | | | | — | | | | 231,956 | |
Net realized gain (loss) | | | 6,705 | | | | — | | | | 12,873 | | | | 967,794 | | | | — | | | | — | | | | 987,372 | |
Net change in unrealized appreciation (depreciation)(c)(d) | | | (143,352 | ) | | | (47,696 | ) | | | (110,813 | ) | | | (1,000,550 | ) | | | (70,393 | ) | | | (60 | ) | | | (1,372,864 | ) |
Purchases | | | 2,182,650 | | | | 1,846,000 | | | | 2,474,795 | | | | — | | | | — | | | | — | | | | 6,503,445 | |
Sales | | | (2,059,573 | ) | | | — | | | | (25,728,868 | ) | | | (10,041,418 | ) | | | — | | | | — | | | | (37,829,859 | ) |
| | | | | | | | | | | | | | | | | | | | | | | | | | | | |
Closing Balance, as of October 31, 2018 | | $ | 3,692,359 | | | $ | 1,798,304 | | | $ | 66,230,887 | | | $ | 17,447,723 | | | $ | 1,637,441 | | | $ | (60 | ) | | $ | 90,806,654 | |
| | | | | | | | | | | | | | | | | | | | | | | | | | | | |
Net change in unrealized appreciation (depreciation) on investments still held at October 31, 2018(d) | | $ | (132,477 | ) | | $ | (47,696 | ) | | $ | (216,744 | ) | | $ | (989,004 | ) | | $ | (70,393 | ) | | $ | (60 | ) | | $ | (1,456,374 | ) |
| | | | | | | | | | | | | | | | | | | | | | | | | | | | |
| | (a) | As of October 31, 2017, the Trust used observable inputs in determining the value of certain investments. As of October 31, 2018, the Trust used significant unobservable inputs in determining the value of the same investments. As a result, investments at beginning of period value were transferred from Level 2 to Level 3 in the disclosure hierarchy. | |
| | (b) | As of October 31, 2017, the Trust used significant unobservable inputs in determining the value of certain investments. As of October 31, 2018, the Trust used observable inputs in determining the value of the same investments. As a result, investments at beginning of period value were transferred from Level 3 to Level 2 in the disclosure hierarchy. | |
| | (c) | Included in the related net change in unrealized appreciation (depreciation) in the Consolidated Statement of Operations. | |
| | (d) | Any difference between net change in unrealized appreciation (depreciation) and net change in unrealized appreciation (depreciation) on investments still held at October 31, 2018 is generally due to investments no longer held or categorized as Level 3 at period end. | |
The following table summarizes the valuation methodologies used and unobservable inputs utilized by the BlackRock Global Valuation Methodologies Committee (the “Global Valuation Committee”) to determine the value of certain of the Trust’s Level 3 investments as of period end. The table does not include Level 3 investments with values based upon unadjusted third party pricing information in the amount of $24,432,580. A significant change in the third party information could result in a significantly lower or higher value of such Level 3 investments.
| | | | | | | | | | | | | | |
| | | Value | | | Valuation
Approaches | | Unobservable Inputs | | | Range of
Unobservable
Inputs
Utilized | |
Assets: | | | | | | | | | | | | | | |
Floating Rate Loan Interests | | $ | 63,083,736 | | | Income | | | Discount Rate | (a) | | | 15% | |
Corporate Bond | | | 1,652,897 | | | Income | | | Credit Spread | (a) | | | 310 | |
Preferred Securities | | | 1,637,441 | | | Market | | | Illiquidity Discount | (a) | | | 1 | % |
| | | | | | | | | | | | | | |
| | $ | 66,374,074 | | | | | | | | | | | |
| | | | | | | | | | | | | | |
| | (a) | Decrease in unobservable input may result in a significant increase to value, while an increase in unobservable input may result in a significant decrease to value | |
See notes to financial statements.
| | |
| 82 | | 2018 BLACKROCK ANNUAL REPORTTO SHAREHOLDERS |
Statements of Assets and Liabilities
October 31, 2018
| | | | | | | | | | | | |
| | | BTZ | | | BGT | | | BIT (a) | |
|
ASSETS | |
Investments at value — unaffiliated(b) | | $ | 2,108,870,084 | | | $ | 490,504,523 | | | $ | 1,087,277,722 | |
Investments at value — affiliated(c) | | | 7,903,560 | | | | 282,908 | | | | — | |
Cash | | | 69,768 | | | | 793,986 | | | | — | |
Cash Pledged: | | | | | | | | | | | | |
Centrally cleared swaps | | | 2,011,000 | | | | — | | | | 6,565,590 | |
Futures contracts | | | 3,774,000 | | | | — | | | | 156,329 | |
Collateral — OTC derivatives | | | — | | | | — | | | | 3,320,000 | |
Collateral — reverse repurchase agreements | | | — | | | | — | | | | 2,953,000 | |
Foreign currency at value(d) | | | 24,305 | | | | 1,182,426 | | | | 6,512,846 | |
Receivables: | |
Interest — unaffiliated | | | 27,338,850 | | | | 1,248,212 | | | | 11,139,012 | |
Investments sold | | | 10,090,211 | | | | 11,157,048 | | | | 11,992,018 | |
Variation margin on futures contracts | | | 1,262,251 | | | | — | | | | 7,199 | |
Variation margin on centrally cleared swaps | | | — | | | | — | | | | 738,900 | |
Dividends — unaffiliated | | | 55,842 | | | | — | | | | 141,403 | |
Dividends — affiliated | | | 22,696 | | | | 2,384 | | | | 12,877 | |
Reverse repurchase agreements | | | — | | | | — | | | | 5,722,088 | |
Swap premiums paid | | | 98,900 | | | | — | | | | 1,908,598 | |
Unrealized appreciation on: | |
OTC swaps | | | 257,774 | | | | 10,889 | | | | 3,170,437 | |
Forward foreign currency exchange contracts | | | — | | | | 108,576 | | | | 1,761,751 | |
Prepaid expenses | | | 87,100 | | | | 2,703 | | | | 3,768 | |
| | | | | | | | | | | | |
Total assets | | | 2,161,866,341 | | | | 505,293,655 | | | | 1,143,383,538 | |
| | | | | | | | | | | | |
|
LIABILITIES | |
Bank overdraft | | | — | | | | — | | | | 220,196 | |
Cash Received: | | | | | | | | | | | | |
Collateral — OTC derivatives | | | 670,000 | | | | — | | | | 1,360,000 | |
Collateral — reverse repurchase agreements | | | — | | | | — | | | | 145,000 | |
Options written at value(e) | | | 10,964 | | | | — | | | | — | |
Reverse repurchase agreements at value | | | 707,102,433 | | | | — | | | | 376,301,922 | |
Payables: | |
Investments purchased | | | 2,211,551 | | | | 22,713,951 | | | | 35,551,845 | |
Reverse repurchase agreements | | | 7,979,458 | | | | — | | | | 7,700,401 | |
Investment advisory fees | | | 1,144,191 | | | | 306,665 | | | | 758,122 | |
Variation margin on centrally cleared swaps | | | 992 | | | | — | | | | — | |
Trustees’ and Officer’s fees | | | 794,882 | | | | 230,359 | | | | 111,285 | |
Capital shares redeemed | | | 520,521 | | | | — | | | | — | |
Other accrued expenses | | | 478,975 | | | | 321,143 | | | | 586,274 | |
Due to counterparty | | | — | | | | 212,836 | | | | 306,330 | |
Income dividend distributions | | | 236,517 | | | | 27,530 | | | | 158,149 | |
Variation margin on futures contracts | | | 150,844 | | | | — | | | | 56,529 | |
Bank borrowings | | | — | | | | 142,000,000 | | | | — | |
Principal paydowns | | | — | | | | — | | | | 118,420 | |
Swaps | | | — | | | | — | | | | 6,277 | |
Interest expense | | | — | | | | 367,366 | | | | — | |
Swap premiums received | | | 224,817 | | | | — | | | | 7,670,629 | |
Unrealized depreciation on: | |
OTC swaps | | | 386,641 | | | | 8,389 | | | | 1,217,482 | |
Forward foreign currency exchange contracts | | | — | | | | 8,811 | | | | 283,103 | |
Unfunded floating rate loan interests | | | — | | | | 814 | | | | 44 | |
| | | | | | | | | | | | |
Total liabilities | | | 721,912,786 | | | | 166,197,864 | | | | 432,552,008 | |
| | | | | | | | | | | | |
| | | |
NET ASSETS | | $ | 1,439,953,555 | | | $ | 339,095,791 | | | $ | 710,831,530 | |
| | | | | | | | | | | | |
See notes to financial statements.
Statements of Assets and Liabilities (continued)
October 31, 2018
| | | | | | | | | | | | |
| | | BTZ | | | BGT | | | BIT (a) | |
| | | |
NET ASSETS CONSIST OF | | | | | | | | | | | | |
Paid-in capital(f)(g)(h) | | $ | 1,464,856,165 | | | $ | 351,383,005 | | | $ | 715,876,112 | |
Accumulated loss | | | (24,902,610 | ) | | | (12,287,214 | ) | | | (5,044,582 | ) |
| | | | | | | | | | | | |
NET ASSETS | | $ | 1,439,953,555 | | | $ | 339,095,791 | | | $ | 710,831,530 | |
| | | | | | | | | | | | |
| | | |
Net asset value | | $ | 13.72 | | | $ | 14.33 | | | $ | 18.79 | |
| | | | | | | | | | | | |
| | | |
(a) Consolidated Statement of Assets and Liabilities | | | | | | | | | | | | |
(b) Investments at cost — unaffiliated | | $ | 2,097,561,846 | | | $ | 494,471,516 | | | $ | 1,099,183,412 | |
(c) Investments at cost — affiliated | | $ | 7,903,560 | | | $ | 282,908 | | | $ | — | |
(d) Foreign currency at cost | | $ | 25,470 | | | $ | 1,182,459 | | | $ | 6,887,093 | |
(e) Premiums received | | $ | 64,068 | | | $ | — | | | $ | — | |
(f) Par Value | | $ | 0.001 | | | $ | 0.001 | | | $ | 0.001 | |
(g) Shares outstanding | | | 104,922,963 | | | | 23,667,022 | | | | 37,821,680 | |
(h) Shares authorized. | | | Unlimited | | | | Unlimited | | | | Unlimited | |
See notes to financial statements.
| | |
| 84 | | 2018 BLACKROCK ANNUAL REPORTTO SHAREHOLDERS |
Statements of Operations
Year Ended October 31, 2018
| | | | | | | | | | | | |
| | | BTZ | | | BGT | | | BIT (a) | |
|
INVESTMENT INCOME | |
Interest — unaffiliated | | $ | 109,158,059 | | | $ | 25,254,659 | | | $ | 71,100,763 | |
Dividends — unaffiliated | | | 5,180,372 | | | | 117,945 | | | | 2,288,677 | |
Dividends — affiliated | | | 137,025 | | | | 88,252 | | | | 111,086 | |
Other income | | | — | | | | 319,605 | | | | 78,143 | |
Foreign taxes withheld | | | — | | | | — | | | | (62,555 | ) |
| | | | | | | | | | | | |
Total investment income | | | 114,475,456 | | | | 25,780,461 | | | | 73,516,114 | |
| | | | | | | | | | | | |
|
EXPENSES | |
Investment advisory | | | 13,438,301 | | | | 3,640,286 | | | | 9,586,536 | |
Accounting services | | | 183,490 | | | | 58,983 | | | | 117,162 | |
Transfer agent | | | 128,096 | | | | 38,402 | | | | 67,152 | |
Professional | | | 110,748 | | | | 150,664 | | | | 176,251 | |
Trustees and Officer | | | 103,854 | | | | 20,192 | | | | 63,715 | |
Custodian | | | 95,878 | | | | 170,565 | | | | 160,974 | |
Registration | | | 41,495 | | | | 9,431 | | | | 14,757 | |
Printing | | | 33,894 | | | | 21,003 | | | | 29,775 | |
Miscellaneous | | | 117,337 | | | | 29,649 | | | | 178,933 | |
| | | | | | | | | | | | |
Total expenses excluding interest expense | | | 14,253,093 | | | | 4,139,175 | | | | 10,395,255 | |
Interest expense | | | 13,493,211 | | | | 3,683,013 | | | | 10,745,930 | |
| | | | | | | | | | | | |
Total expenses | | | 27,746,304 | | | | 7,822,188 | | | | 21,141,185 | |
Less fees waived and/or reimbursed by the Manager | | | (6,500 | ) | | | (9,747 | ) | | | (5,065 | ) |
| | | | | | | | | | | | |
Total expenses after fees waived and/or reimbursed | | | 27,739,804 | | | | 7,812,441 | | | | 21,136,120 | |
| | | | | | | | | | | | |
Net investment income | | | 86,735,652 | | | | 17,968,020 | | | | 52,379,994 | |
| | | | | | | | | | | | |
|
REALIZED AND UNREALIZED GAIN (LOSS) | |
Net realized gain (loss) from: | |
Investments | | | (7,388,668 | ) | | | (736,340 | ) | | | (584,830 | ) |
Investments — affiliated | | | — | | | | (42,986 | ) | | | — | |
Futures contracts | | | 10,634,400 | | | | — | | | | 1,547,636 | |
Forward foreign currency exchange contracts | | | — | | | | 100,014 | | | | 1,488,235 | |
Foreign currency transactions | | | 2,492 | | | | 62,217 | | | | (265,350 | ) |
Capital gain distributions from investment companies — affiliated | | | 32 | | | | 8 | | | | — | |
Options written | | | 120,877 | | | | — | | | | 37,307 | |
Payment from affiliate(b) | | | — | | | | — | | | | 1,943 | |
Swaps | | | (173,742 | ) | | | (7,224 | ) | | | 3,238,544 | |
| | | | | | | | | | | | |
| | | 3,195,391 | | | | (624,311 | ) | | | 5,463,485 | |
| | | | | | | | | | | | |
Net change in unrealized appreciation (depreciation) on: | |
Investments | | | (135,758,772 | ) | | | (4,371,957 | ) | | | (57,049,229 | ) |
Investments — affiliated | | | — | | | | (1,767 | ) | | | — | |
Futures contracts | | | 5,009,796 | | | | — | | | | (147,408 | ) |
Forward foreign currency exchange contracts | | | — | | | | 91,222 | | | | 340,615 | |
Foreign currency translations | | | (3,516 | ) | | | (4,732 | ) | | | (356,300 | ) |
Options written | | | 53,104 | | | | — | | | | 31,954 | |
Swaps | | | (706,547 | ) | | | 39,237 | | | | 8,363,989 | |
Unfunded floating rate loan interests | | | — | | | | (814 | ) | | | (44 | ) |
| | | | | | | | | | | | |
| | | (131,405,935 | ) | | | (4,248,811 | ) | | | (48,816,423 | ) |
| | | | | | | | | | | | |
Net realized and unrealized loss | | | (128,210,544 | ) | | | (4,873,122 | ) | | | (43,352,938 | ) |
| | | | | | | | | | | | |
NET INCREASE (DECREASE) IN NET ASSETS RESULTING FROM OPERATIONS | | $ | (41,474,892 | ) | | $ | 13,094,898 | | | $ | 9,027,056 | |
| | | | | | | | | | | | |
| (a) | Consolidated Statement of Operations. |
| (b) | See Note 6 of the Notes to Financial Statements. |
See notes to financial statements.
Statements of Changes in Net Assets
| | | | | | | | | | | | | | | | | | | | |
| | | BTZ | | | | | | BGT | |
| | | Year Ended October 31, | | | | | | Year Ended October 31, | |
| | | 2018 | | | 2017 | | | | | | 2018 | | | 2017 | |
| | | | | |
INCREASE (DECREASE) IN NET ASSETS | | | | | | | | | | | | | | | | | | | | |
| | | |
OPERATIONS | | | | | | | | | | | | | |
Net investment income | | $ | 86,735,652 | | | $ | 86,831,951 | | | | | | | $ | 17,968,020 | | | $ | 17,188,619 | |
Net realized gain (loss) | | | 3,195,391 | | | | 7,924,929 | | | | | | | | (624,311 | ) | | | 2,604,388 | |
Net change in unrealized appreciation (depreciation) | | | (131,405,935 | ) | | | 23,622,031 | | | | | | | | (4,248,811 | ) | | | 239,045 | |
| | | | | | | | | | | | | | | | | | | | |
Net increase (decrease) in net assets resulting from operations | | | (41,474,892 | ) | | | 118,378,911 | | | | | | | | 13,094,898 | | | | 20,032,052 | |
| | | | | | | | | | | | | | | | | | | | |
| | | |
DISTRIBUTIONS TO SHAREHOLDERS(a)(b) | | | | | | | | | | | | | |
From net investment income | | | (85,614,025 | ) | | | (84,934,828 | ) | | | | | | | (16,888,787 | ) | | | (18,141,462 | ) |
From return of capital | | | — | | | | (5,757,690 | ) | | | | | | | — | | | | — | |
| | | | | | | | | | | | | | | | | | | | |
Decrease in net assets resulting from distributions to shareholders | | | (85,614,025 | ) | | | (90,692,518 | ) | | | | | | | (16,888,787 | ) | | | (18,141,462 | ) |
| | | | | | | | | | | | | | | | | | | | |
| | | |
CAPITAL SHARE TRANSACTIONS | | | | | | | | | | | | | |
Redemption of shares resulting from share repurchase program (including transaction costs) | | | (30,991,477 | ) | | | (8,822,801 | ) | | | | | | | — | | | | — | |
Reinvestment of common distributions | | | — | | | | — | | | | | | | | — | | | | 54,996 | |
| | | | | | | | | | | | | | | | | | | | |
Net increase (decrease) in net assets derived from capital share transactions | | | (30,991,477 | ) | | | (8,822,801 | ) | | | | | | | — | | | | 54,996 | |
| | | | | | | | | | | | | | | | | | | | |
| | | |
NET ASSETS(b) | | | | | | | | | | | | | |
Total increase (decrease) in net assets | | | (158,080,394 | ) | | | 18,863,592 | | | | | | | | (3,793,889 | ) | | | 1,945,586 | |
Beginning of year | | | 1,598,033,949 | | | | 1,579,170,357 | | | | | | | | 342,889,680 | | | | 340,944,094 | |
| | | | | | | | | | | | | | | | | | | | |
End of year | | $ | 1,439,953,555 | | | $ | 1,598,033,949 | | | | | | | $ | 339,095,791 | | | $ | 342,889,680 | |
| | | | | | | | | | | | | | | | | | | | |
| (a) | Distributions for annual periods determined in accordance with U.S. federal income tax regulations. |
| (b) | Prior year distribution character information and undistributed net investment income has been modified or removed to conform with current year Regulation S-X presentation changes. Refer to Note 12 for this prior year information. |
See notes to financial statements.
| | |
| 86 | | 2018 BLACKROCK ANNUAL REPORTTO SHAREHOLDERS |
Consolidated Statements of Changes in Net Assets
| | | | | | | | |
| | | BIT | |
| | | Year Ended October 31, | |
| | | 2018 | | | 2017 | |
| | |
INCREASE (DECREASE) IN NET ASSETS | | | | | | | | |
|
OPERATIONS | |
Net investment income | | $ | 52,379,994 | | | $ | 57,681,034 | |
Net realized gain | | | 5,463,485 | | | | 12,036,324 | |
Net change in unrealized appreciation (depreciation) | | | (48,816,423 | ) | | | 41,903,130 | |
| | | | | | | | |
Net increase in net assets resulting from operations | | | 9,027,056 | | | | 111,620,488 | |
| | | | | | | | |
|
DISTRIBUTIONS TO SHAREHOLDERS(a)(b) | |
From net investment income | | | (56,503,375 | ) | | | (67,788,341 | ) |
From return of capital | | | (1,708,837 | ) | | | — | |
| | | | | | | | |
Decrease in net assets resulting from distributions to shareholders | | | (58,212,212 | ) | | | (67,788,341 | ) |
| | | | | | | | |
|
CAPITAL SHARE TRANSACTIONS | |
Redemption of shares resulting from share repurchase program (including transaction costs) | | | (5,842,460 | ) | | | (4,354,046 | ) |
| | | | | | | | |
|
NET ASSETS(b) | |
Total increase (decrease) in net assets | | | (55,027,616 | ) | | | 39,478,101 | |
Beginning of year | | | 765,859,146 | | | | 726,381,045 | |
| | | | | | | | |
End of year | | $ | 710,831,530 | | | $ | 765,859,146 | |
| | | | | | | | |
| (a) | Distributions for annual periods determined in accordance with U.S. federal income tax regulations. |
| (b) | Prior year distribution character information and undistributed net investment income has been modified or removed to conform with current year Regulation S-X presentation changes. Refer to Note 12 for this prior year information. |
See notes to financial statements.
Statements of Cash Flows
Year Ended October 31, 2018
| | | | | | | | | | | | | | | | |
| | | BTZ | | | BGT | | | BIT (a) | |
|
CASH PROVIDED BY (USED FOR) OPERATING ACTIVITIES | |
Net increase (decrease) in net assets resulting from operations | | $ | | | | | (41,474,892 | ) | | $ | 13,094,898 | | | $ | 9,027,056 | |
Adjustments to reconcile net decrease in net assets resulting from operations to net cash provided by (used for) operating activities: | | | | | | | | | | | | | | | | |
Proceeds from sales of long-term investments and principal paydowns | | | 642,430,891 | | | | 297,095,706 | | | | 518,393,099 | |
Purchases of long-term investments | | | (862,355,005) | | | | (291,599,640 | ) | | | (420,415,952 | ) |
Net proceeds from sales (purchases) of short-term securities | | | 1,235,917 | | | | 1,612,145 | | | | (1,725,424 | ) |
Amortization of premium and accretion of discount on investments and other fees | | | 2,827,701 | | | | (448,773 | ) | | | (9,884,593 | ) |
Paid-in-kind income | | | — | | | | (472,028 | ) | | | — | |
Premiums received from options written | | | 240,727 | | | | — | | | | — | |
Premiums paid on closing options written | | | (55,783) | | | | — | | | | (15,340 | ) |
Net realized loss on investments and options written | | | 7,504,425 | | | | 953,621 | | | | 530,317 | |
Net unrealized depreciation on investments, options written, swaps, unfunded floating rate loan interests and foreign currency translations | | | 135,596,189 | | | | 4,244,079 | | | | 54,846,299 | |
| (Increase) Decrease in Assets: | |
Receivables: | |
Interest — unaffiliated | | | (2,522,659) | | | | 311,936 | | | | 748,829 | |
Dividends — affiliated | | | (15,953) | | | | (1,076 | ) | | | (3,404 | ) |
Dividends — unaffiliated | | | — | | | | — | | | | (5,597 | ) |
Variation margin on futures contracts | | | (1,143,216) | | | | — | | | | (5,491 | ) |
Variation margin on centrally cleared swaps | | | — | | | | — | | | | (736,324 | ) |
Swap premiums paid | | | 59,050 | | | | 211,869 | | | | 22,870 | |
Prepaid expenses | | | (77,548) | | | | 593 | | | | (95 | ) |
| Increase (Decrease) in Liabilities: | |
Cash received: | | | | | | | | | | | | | | | | |
Collateral — OTC derivatives | | | (330,000) | | | | — | | | | 510,000 | |
Collateral — reverse repurchase agreements | | | (120,000) | | | | — | | | | (2,153,000 | ) |
Payables: | |
Investment advisory fees | | | 66,268 | | | | (5,712 | ) | | | (78,190 | ) |
Interest expense and fees | | | — | | | | 111,082 | | | | — | |
Trustees’ and Officer’s | | | (41,623) | | | | (14,057 | ) | | | 12,706 | |
Variation margin on futures contracts | | | 147,594 | | | | — | | | | 52,862 | |
Variation margin on centrally cleared swaps | | | (15,485) | | | | — | | | | — | |
Swaps | | | — | | | | — | | | | 6,277 | |
Other accrued expenses | | | 149,234 | | | | 127,878 | | | | 174,793 | |
Due to counterparty | | | — | | | | 212,836 | | | | 306,330 | |
Swap premiums received | | | (105,987) | | | | — | | | | (2,629,440 | ) |
| | | | | | | | | | | | |
Net cash provided by (used for) operating activities | | | (118,000,155) | | | | 25,435,357 | | | | 146,978,588 | |
| | | | | | | | | | | | |
|
CASH PROVIDED BY (USED FOR) FINANCING ACTIVITIES | |
Payments on redemption of Common Shares | | | (30,470,956) | | | | — | | | | (5,842,460 | ) |
Net borrowing of reverse repurchase agreements | | | 237,260,380 | | | | — | | | | (88,475,250 | ) |
Proceeds from bank borrowings | | | — | | | | 192,000,000 | | | | — | |
Payments for bank borrowings | | | — | | | | (200,000,000 | ) | | | — | |
Cash dividends paid to Common Shareholders | | | (85,631,463) | | | | (16,889,850 | ) | | | (58,214,591 | ) |
Increase (decrease) in bank overdraft | | | (40,773) | | | | — | | | | 133,670 | |
| | | | | | | | | | | | |
Net cash (provided by) used for financing activities | | | 121,117,188 | | | | (24,889,850 | ) | | | (152,398,631 | ) |
| | | | | | | | | | | | |
| (a) | Consolidated Statement of Cash Flows. |
See notes to financial statements.
| | |
| 88 | | 2018 BLACKROCK ANNUAL REPORTTO SHAREHOLDERS |
Statements of Cash Flows (continued)
Year Ended October 31, 2018
| | | | | | | | | | | | |
| | | BTZ | | | BGT | | | BIT (a) | |
| | | |
CASH IMPACT FROM FOREIGN EXCHANGE FLUCTUATIONS | | | | | | | | | | | | |
Cash impact from foreign exchange fluctuations | | $ | (3,153 | ) | | $ | (485 | ) | | $ | (331,931 | ) |
| | | | | | | | | | | | |
|
CASH | |
Net increase (decrease) in restricted and unrestricted cash and foreign currency | | | 3,113,880 | | | | 545,022 | | | | (5,751,974 | ) |
Restricted and unrestricted cash and foreign currency at beginning of year | | | 2,765,193 | | | | 1,431,390 | | | | 25,259,739 | |
| | | | | | | | | | | | |
Restricted and unrestricted cash and foreign currency at end of year | | $ | 5,879,073 | | | $ | 1,976,412 | | | $ | 19,507,765 | |
| | | | | | | | | | | | |
|
SUPPLEMENTAL DISCLOSURE OF CASH FLOW INFORMATION | |
Cash paid during the year for interest expense | | $ | 13,493,211 | | | $ | 3,571,931 | | | $ | 10,745,930 | |
| | | | | | | | | | | | |
|
RECONCILIATION OF RESTRICTED AND UNRESTRICTED CASH AT THE END OF YEAR TO THE STATEMENTS OF
ASSETS AND LIABILITIES | |
Cash | | $ | 69,768 | | | $ | 793,986 | | | $ | — | |
Cash pledged: | | | | | | | | | | | | |
Collateral — reverse repurchase agreements | | | — | | | | — | | | | 2,953,000 | |
Collateral — OTC derivatives | | | — | | | | — | | | | 3,320,000 | |
Futures contracts | | | 3,774,000 | | | | — | | | | 156,329 | |
Centrally cleared swaps | | | 2,011,000 | | | | — | | | | 6,565,590 | |
Foreign currency at value | | | 24,305 | | | | 1,182,426 | | | | 6,512,846 | |
| | | | | | | | | | | | |
| | $ | 5,879,073 | | | $ | 1,976,412 | | | $ | 19,507,765 | |
| | | | | | | | | | | | |
|
RECONCILIATION OF RESTRICTED AND UNRESTRICTED CASH AT THE BEGINNING OF YEAR TO THE STATEMENTS
OF ASSETS AND LIABILITIES | |
Cash | | $ | — | | | $ | 1,412,165 | | | $ | — | |
Cash pledged: | | | | | | | | | | | | |
Collateral — reverse repurchase agreements | | | 1,173,000 | | | | — | | | | — | |
Collateral — OTC derivatives | | | — | | | | — | | | | 8,960,000 | |
Futures contracts | | | 1,124,000 | | | | — | | | | 109,532 | |
Centrally cleared swaps | | | 437,000 | | | | — | | | | 2,798,590 | |
Foreign currency at value | | | 31,193 | | | | 19,225 | | | | 13,391,617 | |
| | | | | | | | | | | | |
| | $ | 2,765,193 | | | $ | 1,431,390 | | | $ | 25,259,739 | |
| | | | | | | | | | | | |
| (a) | Consolidated Statement of Cash Flows. |
See notes to financial statements.
Financial Highlights
(For a share outstanding throughout each period)
| | | | | | | | | | | | | | | | | | | | |
| | | BTZ | |
| | | Year Ended October 31, | |
| | | 2018 | | | 2017 | | | 2016 | | | 2015 | | | 2014 | |
Net asset value, beginning of year | | $ | 14.88 | | | $ | 14.61 | | | $ | 14.33 | | | $ | 15.36 | | | $ | 14.99 | |
| | | | | | | | | | | | | | | | | | | | |
Net investment income(a) | | | 0.81 | | | | 0.81 | | | | 0.88 | | | | 0.96 | | | | 0.99 | |
Net realized and unrealized gain (loss) | | | (1.17 | ) | | | 0.30 | | | | 0.32 | | | | (1.02 | ) | | | 0.35 | |
| | | | | | | | | | | | | | | | | | | | |
Net increase (decrease) from investment operations | | | (0.36 | ) | | | 1.11 | | | | 1.20 | | | | (0.06 | ) | | | 1.34 | |
| | | | | | | | | | | | | | | | | | | | |
| Distributions(b) | | | | | | | | | | | | | | | |
From net investment income | | | (0.80 | ) | | | (0.79 | ) | | | (0.86 | ) | | | (0.91 | ) | | | (0.97 | ) |
From return of capital | | | — | | | | (0.05 | ) | | | (0.06 | ) | | | (0.06 | ) | | | — | |
| | | | | | | | | | | | | | | | | | | | |
Total distributions | | | (0.80 | ) | | | (0.84 | ) | | | (0.92 | ) | | | (0.97 | ) | | | (0.97 | ) |
| | | | | | | | | | | | | | | | | | | | |
Net asset value, end of year | | $ | 13.72 | | | $ | 14.88 | | | $ | 14.61 | | | $ | 14.33 | | | $ | 15.36 | |
| | | | | | | | | | | | | | | | | | | | |
Market price, end of year | | $ | 11.72 | | | $ | 13.36 | | | $ | 12.87 | | | $ | 12.53 | | | $ | 13.54 | |
| | | | | | | | | | | | | | | | | | | | |
| | | | | |
Total Return(c) | | | | | | | | | | | | | | | | | | | | |
Based on net asset value | | | (1.72 | )% | | | 8.53 | % | | | 9.61 | % | | | 0.48 | % | | | 10.11 | % |
| | | | | | | | | | | | | | | | | | | | |
Based on market price | | | (6.49 | )% | | | 10.62 | % | | | 10.43 | % | | | (0.33 | )% | | | 12.18 | % |
| | | | | | | | | | | | | | | | | | | | |
| | | | | |
Ratios to Average Net Assets | | | | | | | | | | | | | | | | | | | | |
Total expenses | | | 1.82 | % | | | 1.23 | % | | | 1.20 | % | | | 1.16 | % | | | 1.11 | % |
| | | | | | | | | | | | | | | | | | | | |
Total expenses after fees waived and/or paid indirectly | | | 1.82 | % | | | 1.23 | % | | | 1.20 | % | | | 1.15 | % | | | 1.11 | % |
| | | | | | | | | | | | | | | | | | | | |
Total expenses after fees waived and/or paid indirectly and excluding interest expense | | | 0.94 | % | | | 0.87 | % | | | 0.95 | % | | | 0.97 | % | | | 0.96 | % |
| | | | | | | | | | | | | | | | | | | | |
Net investment income | | | 5.69 | % | | | 5.53 | % | | | 6.21 | % | | | 6.40 | % | | | 6.48 | % |
| | | | | | | | | | | | | | | | | | | | |
| | | | | |
Supplemental Data | | | | | | | | | | | | | | | | | | | | |
Net assets, end of year (000) | | $ | 1,439,954 | | | $ | 1,598,034 | | | $ | 1,579,170 | | | $ | 1,549,123 | | | $ | 1,660,442 | |
| | | | | | | | | | | | | | | | | | | | |
Borrowings outstanding, end of year (000) | | $ | 707,102 | | | $ | 477,822 | | | $ | 638,327 | | | $ | 685,716 | | | $ | 759,752 | |
| | | | | | | | | | | | | | | | | | | | |
Portfolio turnover rate | | | 30 | % | | | 25 | % | | | 29 | % | | | 19 | % | | | 29 | % |
| | | | | | | | | | | | | | | | | | | | |
| (a) | Based on average shares outstanding. |
| (b) | Distributions for annual periods determined in accordance with U.S. federal income tax regulations. |
| (c) | Total returns based on market price, which can be significantly greater or less than the net asset value, may result in substantially different returns. Where applicable, excludes the effects of any sales charges and assumes the reinvestment of distributions at actual reinvestment prices. |
See notes to financial statements.
| | |
| 90 | | 2018 BLACKROCK ANNUAL REPORTTO SHAREHOLDERS |
Financial Highlights (continued)
(For a share outstanding throughout each period)
| | | | | | | | | | | | | | | | | | | | |
| | | BGT | |
| | | Year Ended October 31, | |
| | | 2018 | | | 2017 | | | 2016 | | | 2015 (a) | | | 2014 (a) | |
Net asset value, beginning of year | | $ | 14.49 | | | $ | 14.41 | | | $ | 14.18 | | | $ | 14.57 | | | $ | 14.79 | |
| | | | | | | | | | | | | | | | | | | | |
Net investment income(b) | | | 0.76 | | | | 0.73 | | | | 0.74 | | | | 0.78 | | | | 0.84 | |
Net realized and unrealized gain (loss) | | | (0.21 | ) | | | 0.12 | | | | 0.19 | | | | (0.36 | ) | | | (0.22 | ) |
| | | | | | | | | | | | | | | | | | | | |
Net increase from investment operations | | | 0.55 | | | | 0.85 | | | | 0.93 | | | | 0.42 | | | | 0.62 | |
| | | | | | | | | | | | | | | | | | | | |
Distributions from net investment income(c) | | | (0.71 | ) | | | (0.77 | ) | | | (0.70 | ) | | | (0.81 | ) | | | (0.84 | ) |
| | | | | | | | | | | | | | | | | | | | |
Net asset value, end of year | | $ | 14.33 | | | $ | 14.49 | | | $ | 14.41 | | | $ | 14.18 | | | $ | 14.57 | |
| | | | | | | | | | | | | | | | | | | | |
Market price, end of year | | $ | 12.72 | | | $ | 14.31 | | | $ | 13.58 | | | $ | 12.77 | | | $ | 13.18 | |
| | | | | | | | | | | | | | | | | | | | |
| | | | | |
Total Return(d) | | | | | | | | | | | | | | | | | | | | |
Based on net asset value | | | 4.25 | % | | | 6.13 | % | | | 7.27 | % | | | 3.54 | % | | | 4.60 | % |
| | | | | | | | | | | | | | | | | | | | |
Based on market price | | | (6.30 | )% | | | 11.21 | % | | | 12.25 | % | | | 3.08 | % | | | (0.89 | )% |
| | | | | | | | | | | | | | | | | | | | |
| | | | | |
Ratios to Average Net Assets | | | | | | | | | | | | | | | | | | | | |
Total expenses | | | 2.29 | %(e) | | | 1.92 | % | | | 1.58 | % | | | 1.55 | % | | | 1.52 | % |
| | | | | | | | | | | | | | | | | | | | |
Total expenses after fees waived and paid indirectly | | | 2.29 | %(e) | | | 1.92 | % | | | 1.58 | % | | | 1.54 | % | | | 1.52 | % |
| | | | | | | | | | | | | | | | | | | | |
Total expenses after fees waived and paid indirectly and excluding interest expense | | | 1.21 | %(e) | | | 1.20 | % | | | 1.16 | % | | | 1.19 | % | | | 1.18 | % |
| | | | | | | | | | | | | | | | | | | | |
Net investment income | | | 5.27 | %(e) | | | 5.02 | % | | | 5.29 | % | | | 5.37 | % | | | 5.71 | % |
| | | | | | | | | | | | | | | | | | | | |
| | | | | |
Supplemental Data | | | | | | | | | | | | | | | | | | | | |
Net assets, end of year (000) | | $ | 339,096 | | | $ | 342,890 | | | $ | 340,944 | | | $ | 335,444 | | | $ | 344,668 | |
| | | | | | | | | | | | | | | | | | | | |
Borrowings outstanding, end of year (000) | | $ | 142,000 | | | $ | 150,000 | | | $ | 148,000 | | | $ | 104,000 | | | $ | 145,000 | |
| | | | | | | | | | | | | | | | | | | | |
Asset coverage, end of year per $1,000 of bank borrowings | | $ | 3,389 | | | $ | 3,287 | | | $ | 3,304 | | | $ | 4,225 | | | $ | 3,377 | |
| | | | | | | | | | | | | | | | | | | | |
Portfolio turnover rate | | | 57 | % | | | 63 | % | | | 47 | % | | | 42 | % | | | 64 | % |
| | | | | | | | | | | | | | | | | | | | |
| (a) | Consolidated Financial Highlights. |
| (b) | Based on average shares outstanding. |
| (c) | Distributions for annual periods determined in accordance with U.S. federal income tax regulations. |
| (d) | Total returns based on market price, which can be significantly greater or less than the net asset value, may result in substantially different returns. Where applicable, excludes the effects of any sales charges and assumes the reinvestment of distributions at actual reinvestment prices. |
| (e) | Excludes expenses incurred indirectly as a result of investments in underlying funds of 0.01%. |
See notes to financial statements.
Financial Highlights (continued)
(For a share outstanding throughout each period)
| | | | | | | | | | | | | | | | | | | | |
| | | BIT | |
| | | Year Ended October 31, | |
| | | 2018 (a) | | | 2017 (a) | | | 2016 (a) | | | 2015 | | | 2014 | |
Net asset value, beginning of year | | $ | 20.07 | | | $ | 18.91 | | | $ | 18.91 | | | $ | 19.87 | | | $ | 18.95 | |
| | | | | | | | | | | | | | | | | | | | |
Net investment income(b) | | | 1.38 | | | | 1.51 | | | | 1.69 | | | | 1.55 | | | | 1.62 | |
Net realized and unrealized gain (loss) | | | (1.13 | ) | | | 1.42 | | | | (0.05 | ) | | | (1.03 | ) | | | 0.70 | |
| | | | | | | | | | | | | | | | | | | | |
Net increase from investment operations | | | 0.25 | | | | 2.93 | | | | 1.64 | | | | 0.52 | | | | 2.32 | |
| | | | | | | | | | | | | | | | | | | | |
| Distributions(c) | | | | | | | | | | | | | | | |
From net investment income | | | (1.49 | ) | | | (1.77 | ) | | | (1.64 | ) | | | (1.40 | ) | | | (1.40 | ) |
From net realized gain | | | — | | | | — | | | | — | | | | (0.08 | ) | | | — | |
From return of capital | | | (0.04 | ) | | | — | | | | — | | | | — | | | | — | |
| | | | | | | | | | | | | | | | | | | | |
Total distributions | | | (1.53 | ) | | | (1.77 | ) | | | (1.64 | ) | | | (1.48 | ) | | | (1.40 | ) |
| | | | | | | | | | | | | | | | | | | | |
Net asset value, end of year | | $ | 18.79 | | | $ | 20.07 | | | $ | 18.91 | | | $ | 18.91 | (d) | | $ | 19.87 | |
| | | | | | | | | | | | | | | | | | | | |
Market price, end of year | | $ | 16.25 | | | $ | 18.55 | | | $ | 16.76 | | | $ | 16.31 | | | $ | 17.79 | |
| | | | | | | | | | | | | | | | | | | | |
| | | | | |
Total Return(e) | | | | | | | | | | | | | | | | | | | | |
Based on net asset value | | | 2.18 | %(f) | | | 17.34 | %(g) | | | 10.51 | %(f) | | | 3.87 | %(d) | | | 13.40 | % |
| | | | | | | | | | | | | | | | | | | | |
Based on market price | | | (4.40 | )% | | | 22.36 | % | | | 13.56 | % | | | 0.06 | % | | | 12.91 | % |
| | | | | | | | | | | | | | | | | | | | |
| | | | | |
Ratios to Average Net Assets | | | | | | | | | | | | | | | | | | | | |
Total expenses | | | 2.90 | % | | | 2.33 | % | | | 2.05 | %(h) | | | 2.09 | %(h) | | | 2.04 | % |
| | | | | | | | | | | | | | | | | | | | |
Total expenses after fees waived and paid indirectly | | | 2.89 | % | | | 2.33 | % | | | 2.05 | %(h) | | | 2.09 | %(h) | | | 2.04 | % |
| | | | | | | | | | | | | | | | | | | | |
Total expenses after fees waived and paid indirectly and excluding interest expense and fees | | | 1.42 | % | | | 1.39 | % | | | 1.43 | %(h) | | | 1.53 | %(h) | | | 1.52 | % |
| | | | | | | | | | | | | | | | | | | | |
Net investment income | | | 7.17 | % | | | 7.86 | % | | | 9.24 | %(h) | | | 7.97 | %(h) | | | 8.27 | % |
| | | | | | | | | | | | | | | | | | | | |
| | | | | |
Supplemental Data | | | | | | | | | | | | | | | | | | | | |
Net assets, end of year (000) | | $ | 710,832 | | | $ | 765,859 | | | $ | 726,381 | | | $ | 726,432 | | | $ | 763,360 | |
| | | | | | | | | | | | | | | | | | | | |
Borrowings outstanding, end of year (000) | | $ | 376,302 | | | $ | 471,082 | | | $ | 427,329 | | | $ | 510,352 | | | $ | 707,294 | |
| | | | | | | | | | | | | | | | | | | | |
Portfolio turnover rate | | | 38 | % | | | 53 | % | | | 52 | % | | | 21 | % | | | 29 | % |
| | | | | | | | | | | | | | | | | | | | |
| (a) | Consolidated Financial Highlights. |
| (b) | Based on average shares outstanding. |
| (c) | Distributions for annual periods determined in accordance with U.S. federal income tax regulations. |
| (d) | For financial reporting purposes, the market value of certain investments was adjusted as of report date. Accordingly, the net asset value (“NAV”) per share and total return performance based on net asset value presented herein are different than the information previously published on October 31, 2015. |
| (e) | Total returns based on market price, which can be significantly greater or less than the net asset value, may result in substantially different returns. Where applicable, excludes the effects of any sales charges and assumes the reinvestment of distributions at actual reinvestment prices. |
| (f) | Includes payment received from an affiliate, which had no impact on the Trust’s total return. |
| (g) | Includes payment received from a settlement of litigation, which impacted the Trust’s total return. Excluding the payment from a settlement of litigation, the Trust’s total return is 16.70%. |
| (h) | Excludes expenses incurred indirectly as a result of investments in underlying funds of approximately 0.01% for the years ended October 31, 2016 and October 31, 2015. |
See notes to financial statements.
| | |
| 92 | | 2018 BLACKROCK ANNUAL REPORTTO SHAREHOLDERS |
Notes to Financial Statements
The following are registered under the Investment Company Act of 1940, as amended (the “1940 Act”), as closed-end management investment companies and are referred to herein collectively as the “Trusts”, or individually as a “Trust”:
| | | | | | | | |
| Trust Name | | Herein Referred To As | | Organized | | Diversification Classification | |
BlackRock Credit Allocation Income Trust | | BTZ | | Delaware | | | Diversified | |
BlackRock Floating Rate Income Trust | | BGT | | Delaware | | | Diversified | |
BlackRock Multi-Sector Income Trust | | BIT | | Delaware | | | Diversified | * |
| | * | The Trust’s classification changed from non-diversified to diversified during the reporting period. | |
The Boards of Trustees of the Trusts are collectively referred to throughout this report as the “Board of Trustees” or the “Board,” and the trustees thereof are collectively referred to throughout this report as “Trustees”. The Trusts determine and make available for publication the net asset values (“NAVs”) of their Common Shares on a daily basis.
The Trusts, together with certain other registered investment companies advised by BlackRock Advisors, LLC (the “Manager”) or its affiliates, are included in a complex of closed-end funds referred to as the Closed-End Complex.
Basis of Consolidation: The accompanying consolidated financial statements of BIT include the accounts of BIT Subsidiary, LLC (the “Taxable Subsidiary”), which is a wholly-owned taxable subsidiary of BIT. The Taxable Subsidiary enables BIT to hold an investment in an operating partnership and satisfy Regulated Investment Company (“RIC”) tax requirements. Income earned and gains realized on the investment held by the Taxable Subsidiary are taxable to such subsidiary. A tax provision for income, if any, is shown as income tax in the Consolidated Statements of Operations for BIT. A tax provision for realized and unrealized gains, if any, is included as a reduction of realized and/or unrealized gain (loss) in the Consolidated Statement of Operations for BIT. BIT may invest up to 25% of its total assets in the Taxable Subsidiary. The net assets of the Taxable Subsidiary as of period end were $0, which is 0.0% of BIT’s consolidated net assets. Intercompany accounts and transactions, if any, have been eliminated. The Taxable Subsidiary is subject to the same investment policies and restrictions that apply to BIT.
| 2. | SIGNIFICANT ACCOUNTING POLICIES |
The financial statements are prepared in conformity with accounting principles generally accepted in the United States of America (“U.S. GAAP”), which may require management to make estimates and assumptions that affect the reported amounts of assets and liabilities in the financial statements, disclosure of contingent assets and liabilities at the date of the financial statements and the reported amounts of increases and decreases in net assets from operations during the reporting period. Actual results could differ from those estimates. Each Trust is considered an investment company under U.S. GAAP and follows the accounting and reporting guidance applicable to investment companies. Below is a summary of significant accounting policies:
Investment Transactions and Income Recognition: For financial reporting purposes, investment transactions are recorded on the dates the transactions are entered into (the “trade dates”). Realized gains and losses on investment transactions are determined on the identified cost basis. Dividend income is recorded on the ex-dividend date. Dividends from foreign securities where the ex-dividend date may have passed are subsequently recorded when the Trusts are informed of the ex-dividend date. Under the applicable foreign tax laws, a withholding tax at various rates may be imposed on capital gains, dividends and interest. Upon notification from issuers, a portion of the dividend income received from a real estate investment trust may be redesignated as a reduction of cost of the related investment and/or realized gain. Interest income, including amortization and accretion of premiums and discounts on debt securities, is recognized on an accrual basis.
Foreign Currency Translation: Each Trust’s books and records are maintained in U.S. dollars. Securities and other assets and liabilities denominated in foreign currencies are translated into U.S. dollars using exchange rates determined as of the close of trading on the New York Stock Exchange (“NYSE”). Purchases and sales of investments are recorded at the rates of exchange prevailing on the respective dates of such transactions. Generally, when the U.S. dollar rises in value against a foreign currency, the investments denominated in that currency will lose value; the opposite effect occurs if the U.S. dollar falls in relative value.
Each Trust does not isolate the portion of the results of operations arising as a result of changes in the exchange rates from the changes in the market prices of investments held or sold for financial reporting purposes. Accordingly, the effects of changes in exchange rates on investments are not segregated in the Statements of Operations from the effects of changes in market prices of those investments, but are included as a component of net realized and unrealized gain (loss) from investments. Each Trust reports realized currency gains (losses) on foreign currency related transactions as components of net realized gain (loss) for financial reporting purposes, whereas such components are generally treated as ordinary income for U.S. federal income tax purposes.
Segregation and Collateralization: In cases where a Trust enters into certain investments (e.g., futures contracts, forward foreign currency exchange contracts, options written and swaps) or certain borrowings (e.g., reverse repurchase transactions,) that would be treated as “senior securities” for 1940 Act purposes, a Trust may segregate or designate on its books and records cash or liquid assets having a market value at least equal to the amount of its future obligations under such investments or borrowings. Doing so allows the investment or borrowing to be excluded from treatment as a “senior security.” Furthermore, if required by an exchange or counterparty agreement, the Trusts may be required to deliver/deposit cash and/or securities to/with an exchange, or broker-dealer or custodian as collateral for certain investments or obligations.
Distributions: Distributions from net investment income are declared and paid monthly. Distributions of capital gains are recorded on the ex-dividend date and made at least annually. Portions of return of capital distributions under U.S. GAAP may be taxed at ordinary income rates. The character of distributions is determined in accordance with U.S. federal income tax regulations, which may differ from U.S. GAAP. The portion of distributions that exceeds a Trust’s current and accumulated earnings and profits, as measured on a tax basis, constitute a non-taxable return of capital. Realized net capital gains can be offset by capital losses carried forward from
| | | | |
| NOTESTO FINANCIAL STATEMENTS | | | 93 | |
Notes to Financial Statements (continued)
prior years. However, certain Trusts have capital loss carryforwards from pre-2012 tax years that offset realized net capital gains but do not offset current earnings and profits. Consequently, if distributions in any tax year are less than the Trust’s current earnings and profits but greater than net investment income and net realized capital gains (taxable income), distributions in excess of taxable income are not treated as non-taxable return of capital, but rather may be taxable to shareholders at ordinary income rates. Under certain circumstances, taxable excess distributions could be significant. See Note 8, Income Tax Information, for the tax character of each Trust’s distributions paid during the year.
Deferred Compensation Plan: Under the Deferred Compensation Plan (the “Plan”) approved by each Trust’s Board, the independent Trustees (“Independent Trustees”) may defer a portion of their annual complex-wide compensation. Deferred amounts earn an approximate return as though equivalent dollar amounts had been invested in common shares of certain other BlackRock Closed-End Funds selected by the Independent Trustees. This has the same economic effect for the Independent Trustees as if the Independent Trustees had invested the deferred amounts directly in certain other BlackRock Closed-End Funds.
The Plan is not funded and obligations thereunder represent general unsecured claims against the general assets of each Trust, if applicable. Deferred compensation liabilities are included in the Trustees’ and Officer’s fees payable in the Statements of Assets and Liabilities and will remain as a liability of the Trusts until such amounts are distributed in accordance with the Plan.
Recent Accounting Standards: In March 2017, the Financial Accounting Standards Board issued Accounting Standards Update “Premium Amortization of Purchased Callable Debt Securities” which amends the amortization period for certain purchased callable debt securities. Under the new guidance, the premium amortization of purchased callable debt securities that have explicit, non-contingent call features and are callable at fixed prices will be amortized to the earliest call date. The guidance will be applied on a modified retrospective basis and is effective for fiscal years, and their interim periods, beginning after December 15, 2018. Management is currently evaluating the impact of this guidance to the Trusts.
In August 2018, the Financial Accounting Standards Board issued Accounting Standards Update 2018-13 “Changes to the Disclosure Requirements for Fair Value Measurement” which modifies disclosure requirements for fair value measurements. The guidance is effective for fiscal years beginning after December 15, 2019 and for interim periods within those fiscal years. Management is currently evaluating the impact of this guidance to the Trusts.
Indemnifications: In the normal course of business, a Trust enters into contracts that contain a variety of representations that provide general indemnification. A Trust’s maximum exposure under these arrangements is unknown because it involves future potential claims against a Trust, which cannot be predicted with any certainty.
Other: Expenses directly related to a Trust are charged to that Trust. Other operating expenses shared by several funds, including other funds managed by the Manager, are prorated among those funds on the basis of relative net assets or other appropriate methods.
| 3. | INVESTMENT VALUATION AND FAIR VALUE MEASUREMENTS |
Investment Valuation Policies: The Trusts’ investments are valued at fair value (also referred to as “market value” within the financial statements) as of the close of trading on the New York Stock Exchange (“NYSE”) (generally 4:00 p.m., Eastern time). U.S. GAAP defines fair value as the price the Trusts would receive to sell an asset or pay to transfer a liability in an orderly transaction between market participants at the measurement date. The Trusts determine the fair values of their financial instruments using various independent dealers or pricing services under policies approved by the Board of Trustees of each Trust (the “Board”). The BlackRock Global Valuation Methodologies Committee (the “Global Valuation Committee”) is the committee formed by management to develop global pricing policies and procedures and to oversee the pricing function for all financial instruments.
Fair Value Inputs and Methodologies: The following methods and inputs are used to establish the fair value of each Trust’s assets and liabilities:
| | • | | Equity investments traded on a recognized securities exchange are valued at the official closing price each day, if available. For equity investments traded on more than one exchange, the official closing price on the exchange where the stock is primarily traded is used. Equity investments traded on a recognized exchange for which there were no sales on that day may be valued at the last available bid (long positions) or ask (short positions) price. |
| | • | | Fixed-income securities for which market quotations are readily available are generally valued using the last available bid prices or current market quotations provided by independent dealers or third party pricing services. Floating rate loan interests are valued at the mean of the bid prices from one or more independent brokers or dealers as obtained from a third party pricing service. Pricing services generally value fixed-income securities assuming orderly transactions of an institutional round lot size, but a fund may hold or transact in such securities in smaller, odd lot sizes. Odd lots may trade at lower prices than institutional round lots. The pricing services may use matrix pricing or valuation models that utilize certain inputs and assumptions to derive values, including transaction data (e.g., recent representative bids and offers), credit quality information, perceived market movements, news, and other relevant information. Certain fixed-income securities, including asset-backed and mortgage related securities may be valued based on valuation models that consider the estimated cash flows of each tranche of the entity, establish a benchmark yield and develop an estimated tranche specific spread to the benchmark yield based on the unique attributes of the tranche. The amortized cost method of valuation may be used with respect to debt obligations with sixty days or less remaining to maturity unless the Manager determines such method does not represent fair value. |
Generally, trading in foreign instruments is substantially completed each day at various times prior to the close of trading on the NYSE. Occasionally, events affecting the values of such instruments may occur between the foreign market close and the close of trading on the NYSE that may not be reflected in the computation of the Trusts’ net assets. Each business day, the Trusts use a pricing service to assist with the valuation of certain foreign exchange-traded equity securities and foreign exchange-traded over-the-counter (“OTC”) options (the “Systematic Fair Value Price”). Using current market factors, the Systematic Fair Value Price is designed to value such foreign securities and foreign options at fair value as of the close of trading on the NYSE, which follows the close of the local markets.
| | |
| 94 | | 2018 BLACKROCK ANNUAL REPORTTO SHAREHOLDERS |
Notes to Financial Statements (continued)
| | • | | Municipal investments (including commitments to purchase such investments on a “when-issued” basis) are valued on the basis of prices provided by dealers or pricing services. In determining the value of a particular investment, pricing services may use certain information with respect to transactions in such investments, quotations from dealers, pricing matrixes, market transactions in comparable investments and information with respect to various relationships between investments. |
| | • | | Investments in open-end U.S. mutual funds are valued at NAV each business day. |
| | • | | Futures contracts traded on exchanges are valued at their last sale price. |
| | • | | Forward foreign currency exchange contracts are valued at the mean between the bid and ask prices and are determined as of the close of trading on the NYSE. Interpolated values are derived when the settlement date of the contract is an interim date for which quotations are not available. |
| | • | | Exchange-traded options are valued at the mean between the last bid and ask prices at the close of the options market in which the options trade. An exchange-traded option for which there is no mean price is valued at the last bid (long positions) or ask (short positions) price. If no bid or ask price is available, the prior day’s price will be used, unless it is determined that the prior day’s price no longer reflects the fair value of the option. OTC options and options on swaps (“swaptions”) are valued by an independent pricing service using a mathematical model, which incorporates a number of market data factors, such as the trades and prices of the underlying instruments. |
| | • | | Swap agreements are valued utilizing quotes received daily by the Trusts’ pricing service or through brokers, which are derived using daily swap curves and models that incorporate a number of market data factors, such as discounted cash flows, trades and values of the underlying reference instruments. |
If events (e.g., a company announcement, market volatility or a natural disaster) occur that are expected to materially affect the value of such investments, or in the event that the application of these methods of valuation results in a price for an investment that is deemed not to be representative of the market value of such investment, or if a price is not available, the investment will be valued by the Global Valuation Committee, or its delegate, in accordance with a policy approved by the Board as reflecting fair value (“Fair Valued Investments”). The fair valuation approaches that may be used by the Global Valuation Committee will include market approach, income approach and cost approach. Valuation techniques such as discounted cash flow, use of market comparables and matrix pricing are types of valuation approaches and are typically used in determining fair value. When determining the price for Fair Valued Investments, the Global Valuation Committee, or its delegate, seeks to determine the price that each Trust might reasonably expect to receive or pay from the current sale or purchase of that asset or liability in an arm’s-length transaction. Fair value determinations shall be based upon all available factors that the Global Valuation Committee, or its delegate, deems relevant and consistent with the principles of fair value measurement.
The Global Valuation Committee, or its delegate, employs various methods for calibrating valuation approaches for investments where an active market does not exist, including regular due diligence of each Trust’s pricing vendors, regular reviews of key inputs and assumptions, transactional back-testing or disposition analysis to compare unrealized gains and losses to realized gains and losses, reviews of missing or stale prices and large movements in market values and reviews of any market related activity. The pricing of all Fair Valued Investments is subsequently reported to the Board or a committee thereof on a quarterly basis. As a result of the inherent uncertainty in valuation of these investments, the fair values may differ from the values that would have been used had an active market existed.
For investments in equity or debt issued by privately held companies or funds (“Private Company” or collectively, the “Private Companies”) and other Fair Valued Investments, the fair valuation approaches that are used by third party pricing services utilize one or a combination of, but not limited to, the following inputs.
| | |
| | | Standard Inputs Generally Considered By Third Party Pricing Services |
Market approach | | (i) recent market transactions, including subsequent rounds of financing, in the underlying investment or comparable issuers; (ii) recapitalizations and other transactions across the capital structure; and (iii) market multiples of comparable issuers. |
Income approach | | (i) future cash flows discounted to present and adjusted as appropriate for liquidity, credit, and/or market risks; (ii) quoted prices for similar investments or assets in active markets; and (iii) other risk factors, such as interest rates, yield curves, volatilities, prepayment speeds, loss severities, credit risks, recovery rates, liquidation amounts and/or default rates. |
Cost approach | | (i) audited or unaudited financial statements, investor communications and financial or operational metrics issued by the Private Company; (ii) changes in the valuation of relevant indices or publicly traded companies comparable to the Private Company; (iii) relevant news and other public sources; and (iv) known secondary market transactions in the Private Company’s interests and merger or acquisition activity in companies comparable to the Private Company. |
Investments in series of preferred stock issued by Private Companies are typically valued utilizing market approach in determining the enterprise value of the company. Such investments often contain rights and preferences that differ from other series of preferred and common stock of the same issuer. Valuation techniques such as an option pricing model (“OPM”), a probability weighted expected return model (“PWERM”) or a hybrid of those techniques are used in allocating enterprise value of the company, as deemed appropriate under the circumstances. The use of OPM and PWERM techniques involve a determination of the exit scenarios of the investment in order to appropriately allocate the enterprise value of the company among the various parts of its capital structure.
The Private Companies are not subject to the public company disclosure, timing, and reporting standards as other investments held by a Trust. Typically, the most recently available information by a Private Company is as of a date that is earlier than the date a Trust is calculating its NAV. This factor may result in a difference between the value of the investment and the price a Trust could receive upon the sale of the investment.
| | | | |
| NOTESTO FINANCIAL STATEMENTS | | | 95 | |
Notes to Financial Statements (continued)
Fair Value Hierarchy: Various inputs are used in determining the fair value of investments and derivative financial instruments. These inputs to valuation techniques are categorized into a fair value hierarchy consisting of three broad levels for financial statement purposes as follows:
| | • | | Level 1 — Unadjusted price quotations in active markets/exchanges for identical assets or liabilities that each Trust has the ability to access |
| | • | | Level 2 — Other observable inputs (including, but not limited to, quoted prices for similar assets or liabilities in markets that are active, quoted prices for identical or similar assets or liabilities in markets that are not active, inputs other than quoted prices that are observable for the assets or liabilities (such as interest rates, yield curves, volatilities, prepayment speeds, loss severities, credit risks and default rates) or other market–corroborated inputs) |
| | • | | Level 3 — Unobservable inputs based on the best information available in the circumstances, to the extent observable inputs are not available (including each Trust’s own assumptions used in determining the fair value of investments and derivative financial instruments) |
The hierarchy gives the highest priority to unadjusted quoted prices in active markets for identical assets or liabilities (Level 1 measurements) and the lowest priority to unobservable inputs (Level 3 measurements). Accordingly, the degree of judgment exercised in determining fair value is greatest for instruments categorized in Level 3. The inputs used to measure fair value may fall into different levels of the fair value hierarchy. In such cases, for disclosure purposes, the fair value hierarchy classification is determined based on the lowest level input that is significant to the fair value measurement in its entirety. Investments classified within Level 3 have significant unobservable inputs used by the Global Valuation Committee in determining the price for Fair Valued Investments. Level 3 investments include equity or debt issued by Private Companies. There may not be a secondary market, and/or there are a limited number of investors. Level 3 investments may also be adjusted to reflect illiquidity and/or non-transferability, with the amount of such discount estimated by the Global Valuation Committee in the absence of market information.
Changes in valuation techniques may result in transfers into or out of an assigned level within the hierarchy. In accordance with each Trust’s policy, transfers between different levels of the fair value hierarchy are deemed to have occurred as of the beginning of the reporting period. The categorization of a value determined for investments and derivative financial instruments is based on the pricing transparency of the investments and derivative financial instruments and is not necessarily an indication of the risks associated with investing in those securities.
| 4. | SECURITIES AND OTHER INVESTMENTS |
Asset-Backed and Mortgage-Backed Securities: Asset-backed securities are generally issued as pass-through certificates or as debt instruments. Asset-backed securities issued as pass-through certificates represent undivided fractional ownership interests in an underlying pool of assets. Asset-backed securities issued as debt instruments, which are also known as collateralized obligations, are typically issued as the debt of a special purpose entity organized solely for the purpose of owning such assets and issuing such debt. Asset-backed securities are often backed by a pool of assets representing the obligations of a number of different parties. The yield characteristics of certain asset-backed securities may differ from traditional debt securities. One such major difference is that all or a principal part of the obligations may be prepaid at any time because the underlying assets (i.e., loans) may be prepaid at any time. As a result, a decrease in interest rates in the market may result in increases in the level of prepayments as borrowers, particularly mortgagors, refinance and repay their loans. An increased prepayment rate with respect to an asset-backed security will have the effect of shortening the maturity of the security. In addition, a trust may subsequently have to reinvest the proceeds at lower interest rates. If a trust has purchased such an asset-backed security at a premium, a faster than anticipated prepayment rate could result in a loss of principal to the extent of the premium paid.
For mortgage pass-through securities (the “Mortgage Assets”) there are a number of important differences among the agencies and instrumentalities of the U.S. Government that issue mortgage-related securities and among the securities that they issue. For example, mortgage-related securities guaranteed by Ginnie Mae are guaranteed as to the timely payment of principal and interest by Ginnie Mae and such guarantee is backed by the full faith and credit of the United States. However, mortgage-related securities issued by Freddie Mac and Fannie Mae, including Freddie Mac and Fannie Mae guaranteed mortgage pass-through certificates, which are solely the obligations of Freddie Mac and Fannie Mae, are not backed by or entitled to the full faith and credit of the United States, but are supported by the right of the issuer to borrow from the U.S. Treasury.
Non-agency mortgage-backed securities are securities issued by non-governmental issuers and have no direct or indirect government guarantees of payment and are subject to various risks. Non-agency mortgage loans are obligations of the borrowers thereunder only and are not typically insured or guaranteed by any other person or entity. The ability of a borrower to repay a loan is dependent upon the income or assets of the borrower. A number of factors, including a general economic downturn, acts of God, terrorism, social unrest and civil disturbances, may impair a borrower’s ability to repay its loans.
Collateralized Debt Obligations: Collateralized debt obligations (“CDOs”), including collateralized bond obligations (“CBOs”) and collateralized loan obligations (“CLOs”), are types of asset-backed securities. A CDO is an entity that is backed by a diversified pool of debt securities (CBOs) or syndicated bank loans (CLOs). The cash flows of the CDO can be split into multiple segments, called “tranches,” which will vary in risk profile and yield. The riskiest segment is the subordinated or “equity” tranche. This tranche bears the greatest risk of defaults from the underlying assets in the CDO and serves to protect the other, more senior, tranches from default in all but the most severe circumstances. Since it is shielded from defaults by the more junior tranches, a “senior” tranche will typically have higher credit ratings and lower yields than their underlying securities, and often receive investment grade ratings from one or more of the nationally recognized rating agencies. Despite the protection from the more junior tranches, senior tranches can experience substantial losses due to actual defaults, increased sensitivity to future defaults and the disappearance of one or more protecting tranches as a result of changes in the credit profile of the underlying pool of assets.
Inflation-Indexed Bonds: Inflation-indexed bonds (other than municipal inflation-indexed and certain corporate inflation-indexed bonds) are fixed-income securities whose principal value is periodically adjusted according to the rate of inflation. If the index measuring inflation rises or falls, the principal value of inflation-indexed bonds (other than municipal inflation-indexed and certain corporate inflation-indexed bonds) will be adjusted upward or downward, and consequently the interest payable on these securities (calculated with respect to a larger or smaller principal amount) will be increased or reduced, respectively. Any upward or downward adjustment in the principal amount of an inflation-indexed bond will be included as interest income in the Statements of Operations, even though investors do not receive their principal until maturity.
| | |
| 96 | | 2018 BLACKROCK ANNUAL REPORTTO SHAREHOLDERS |
Notes to Financial Statements (continued)
Repayment of the original bond principal upon maturity (as adjusted for inflation) is guaranteed in the case of U.S. Treasury inflation-indexed bonds. For bonds that do not provide a similar guarantee, the adjusted principal value of the bond repaid at maturity may be less than the original principal. With regard to municipal inflation-indexed bonds and certain corporate inflation-indexed bonds, the inflation adjustment is typically reflected in the semi-annual coupon payment. As a result, the principal value of municipal inflation-indexed bonds and such corporate inflation-indexed bonds does not adjust according to the rate of inflation.
Multiple Class Pass-Through Securities: Multiple class pass-through securities, including collateralized mortgage obligations (“CMOs”) and commercial mortgage-backed securities, may be issued by Ginnie Mae, U.S. Government agencies or instrumentalities or by trusts formed by private originators of, or investors in, mortgage loans. In general, CMOs are debt obligations of a legal entity that are collateralized by a pool of residential or commercial mortgage loans or mortgage pass-through securities (the “Mortgage Assets”). The payments on these are used to make payments on the CMOs or multiple pass-through securities. Multiple class pass-through securities represent direct ownership interests in the Mortgage Assets. Classes of CMOs include interest only (“IOs”), principal only (“POs”), planned amortization classes and targeted amortization classes. IOs and POs are stripped mortgage-backed securities representing interests in a pool of mortgages, the cash flow from which has been separated into interest and principal components. IOs receive the interest portion of the cash flow while POs receive the principal portion. IOs and POs can be extremely volatile in response to changes in interest rates. As interest rates rise and fall, the value of IOs tends to move in the same direction as interest rates. POs perform best when prepayments on the underlying mortgages rise since this increases the rate at which the principal is returned and the yield to maturity on the PO. When payments on mortgages underlying a PO are slower than anticipated, the life of the PO is lengthened and the yield to maturity is reduced. If the underlying Mortgage Assets experience greater than anticipated prepayments of principal, a trust’s initial investment in the IOs may not fully recoup.
Zero-Coupon Bonds: Zero-coupon bonds are normally issued at a significant discount from face value and do not provide for periodic interest payments. These bonds may experience greater volatility in market value than other debt obligations of similar maturity which provide for regular interest payments.
Capital Securities and Trust Preferred Securities: Capital securities, including trust preferred securities, are typically issued by corporations, generally in the form of interest-bearing notes with preferred securities characteristics. In the case of trust preferred securities, an affiliated business trust of a corporation issues these securities, generally in the form of beneficial interests in subordinated debentures or similarly structured securities. The securities can be structured with either a fixed or adjustable coupon that can have either a perpetual or stated maturity date. For trust preferred securities, the issuing bank or corporation pays interest to the trust, which is then distributed to holders of these securities as a dividend. Dividends can be deferred without creating an event of default or acceleration, although maturity cannot take place unless all cumulative payment obligations have been met. The deferral of payments does not affect the purchase or sale of these securities in the open market. These securities generally are rated below that of the issuing company’s senior debt securities and are freely callable at the issuer’s option.
Preferred Stocks: Preferred stock has a preference over common stock in liquidation (and generally in receiving dividends as well), but is subordinated to the liabilities of the issuer in all respects. As a general rule, the market value of preferred stock with a fixed dividend rate and no conversion element varies inversely with interest rates and perceived credit risk, while the market price of convertible preferred stock generally also reflects some element of conversion value. Because preferred stock is junior to debt securities and other obligations of the issuer, deterioration in the credit quality of the issuer will cause greater changes in the value of a preferred stock than in a more senior debt security with similar stated yield characteristics. Unlike interest payments on debt securities, preferred stock dividends are payable only if declared by the issuer’s board of directors. Preferred stock also may be subject to optional or mandatory redemption provisions.
Warrants: Warrants entitle a fund to purchase a specified number of shares of common stock and are non-income producing. The purchase price and number of shares are subject to adjustment under certain conditions until the expiration date of the warrants, if any. If the price of the underlying stock does not rise above the strike price before the warrant expires, the warrant generally expires without any value and a trust will lose any amount it paid for the warrant. Thus, investments in warrants may involve more risk than investments in common stock. Warrants may trade in the same markets as their underlying stock; however, the price of the warrant does not necessarily move with the price of the underlying stock.
Floating Rate Loan Interests: Floating rate loan interests are typically issued to companies (the “borrower”) by banks, other financial institutions, or privately and publicly offered corporations (the “lender”). Floating rate loan interests are generally non-investment grade, often involve borrowers whose financial condition is troubled or uncertain and companies that are highly leveraged or in bankruptcy proceedings. In addition, transactions in floating rate loan interests may settle on a delayed basis, which may result in proceeds from the sale not being readily available for a trust to make additional investments or meet its redemption obligations. Floating rate loan interests may include fully funded term loans or revolving lines of credit. Floating rate loan interests are typically senior in the corporate capital structure of the borrower. Floating rate loan interests generally pay interest at rates that are periodically determined by reference to a base lending rate plus a premium. Since the rates reset only periodically, changes in prevailing interest rates (and particularly sudden and significant changes) can be expected to cause some fluctuations in the NAV of a trust to the extent that it invests in floating rate loan interests. The base lending rates are generally the lending rate offered by one or more European banks, such as the London Interbank Offered Rate (“LIBOR”), the prime rate offered by one or more U.S. banks or the certificate of deposit rate. Floating rate loan interests may involve foreign borrowers, and investments may be denominated in foreign currencies. These investments are treated as investments in debt securities for purposes of a trust’s investment policies.
When a trust purchases a floating rate loan interest, it may receive a facility fee and when it sells a floating rate loan interest, it may pay a facility fee. On an ongoing basis, a trust may receive a commitment fee based on the undrawn portion of the underlying line of credit amount of a floating rate loan interest. Facility and commitment fees are typically amortized to income over the term of the loan or term of the commitment, respectively. Consent and amendment fees are recorded to income as earned. Prepayment penalty fees, which may be received by a trust upon the prepayment of a floating rate loan interest by a borrower, are recorded as realized gains. A trust may invest in multiple series or tranches of a loan. A different series or tranche may have varying terms and carry different associated risks.
Floating rate loan interests are usually freely callable at the borrower’s option. A trust may invest in such loans in the form of participations in loans (“Participations”) or assignments (“Assignments”) of all or a portion of loans from third parties. Participations typically will result in a trust having a contractual relationship only with the lender, not with the borrower. A trust has the right to receive payments of principal, interest and any fees to which it is entitled only from the lender selling the Participation and only upon receipt by the lender of the payments from the borrower. In connection with purchasing Participations, a trust generally will have no right to enforce compliance by the borrower with the terms of the loan agreement, nor any rights of offset against the borrower. A trust may not benefit directly from any collateral supporting the loan
| | | | |
| NOTESTO FINANCIAL STATEMENTS | | | 97 | |
Notes to Financial Statements (continued)
in which it has purchased the Participation. As a result, a trust assumes the credit risk of both the borrower and the lender that is selling the Participation. A trust’s investment in loan participation interests involves the risk of insolvency of the financial intermediaries who are parties to the transactions. In the event of the insolvency of the lender selling the Participation, a trust may be treated as a general creditor of the lender and may not benefit from any offset between the lender and the borrower. Assignments typically result in a trust having a direct contractual relationship with the borrower, and a trust may enforce compliance by the borrower with the terms of the loan agreement.
In connection with floating rate loan interests, certain trusts may also enter into unfunded floating rate loan interests (“commitments”). In connection with these commitments, a trust earns a commitment fee, typically set as a percentage of the commitment amount. Such fee income, which is included in interest income in the Statements of Operations, is recognized ratably over the commitment period. Unfunded floating rate loan interests are marked-to-market daily, and any unrealized appreciation (depreciation) is included in the Statements of Assets and Liabilities and Statements of Operations. As of period end, the trusts had the following unfunded floating rate loan interests:
| | | | | | | | | | | | | | | | | | |
| | | Borrower | | Par | | | Commitment Amount | | | Value | | | Unrealized
Appreciation
(Depreciation) | |
BGT | | Access CIG LLC | | $ | 7,562 | | | $ | 7,562 | | | $ | 7,562 | | | $ | — | |
| | Access CIG LLC | | | 40,439 | | | | 40,439 | | | | 40,510 | | | | 71 | |
| | CFSP Acquisition Corp. | | | 74,747 | | | | 74,560 | | | | 73,812 | | | | (748 | ) |
| | DentalCorp Perfect Smile ULC | | | 88,180 | | | | 88,326 | | | | 88,511 | | | | 185 | |
| | | Mavis Tire Express Services Corp. | | | 107,362 | | | | 32,249 | | | | 31,927 | | | | (322 | ) |
BIT | | Access CIG LLC | | | 1,444 | | | | 1,444 | | | | 1,444 | | | | — | |
| | Access CIG LLC | | | 9,279 | | | | 9,279 | | | | 9,295 | | | | 16 | |
| | DentalCorp Perfect Smile ULC | | | 18,813 | | | | 18,813 | | | | 18,884 | | | | 71 | |
| | | Mavis Tire Express Services Corp. | | | 13,083 | | | | 13,083 | | | | 12,952 | | �� | | (131 | ) |
Forward Commitments and When-Issued Delayed Delivery Securities: Certain trusts may purchase securities on a when-issued basis and may purchase or sell securities on a forward commitment basis. Settlement of such transactions normally occurs within a month or more after the purchase or sale commitment is made. A trust may purchase securities under such conditions with the intention of actually acquiring them, but may enter into a separate agreement to sell the securities before the settlement date. Since the value of securities purchased may fluctuate prior to settlement, a trust may be required to pay more at settlement than the security is worth. In addition, a trust is not entitled to any of the interest earned prior to settlement. When purchasing a security on a delayed delivery basis, a trust assumes the rights and risks of ownership of the security, including the risk of price and yield fluctuations. In the event of default by the counterparty, a trust’s maximum amount of loss is the unrealized appreciation of unsettled when-issued transactions.
Reverse Repurchase Agreements: Reverse repurchase agreements are agreements with qualified third party broker dealers in which a trust sells securities to a bank or broker-dealer and agrees to repurchase the same securities at a mutually agreed upon date and price. A trust receives cash from the sale to use for other investment purposes. During the term of the reverse repurchase agreement, a trust continues to receive the principal and interest payments on the securities sold. Certain agreements have no stated maturity and can be terminated by either party at any time. Interest on the value of the reverse repurchase agreements issued and outstanding is based upon competitive market rates determined at the time of issuance. A trust may utilize reverse repurchase agreements when it is anticipated that the interest income to be earned from the investment of the proceeds of the transaction is greater than the interest expense of the transaction. Reverse repurchase agreements involve leverage risk. If a trust suffers a loss on its investment of the transaction proceeds from a reverse repurchase agreement, a trust would still be required to pay the full repurchase price. Further, a trust remains subject to the risk that the market value of the securities repurchased declines below the repurchase price. In such cases, a trust would be required to return a portion of the cash received from the transaction or provide additional securities to the counterparty.
Cash received in exchange for securities delivered plus accrued interest due to the counterparty is recorded as a liability in the Statements of Assets and Liabilities at face value including accrued interest. Due to the short-term nature of the reverse repurchase agreements, face value approximates fair value. Interest payments made by a trust to the counterparties are recorded as a component of interest expense in the Statements of Operations. In periods of increased demand for the security, a trust may receive a fee for the use of the security by the counterparty, which may result in interest income to a trust.
For the year ended October 31, 2018, the average amount of reverse repurchase agreements outstanding and the daily weighted average interest rate for the Trusts were as follows:
| | | | | | | | |
| | | Average Amount
Outstanding | | | Daily Weighted Average Interest Rate | |
BTZ | | $ | 643,986,829 | | | | 2.10 | % |
BIT | | | 467,879,150 | | | | 2.30 | |
Reverse repurchase transactions are entered into by a trust under Master Repurchase Agreements (each, an “MRA”), which permit a trust, under certain circumstances, including an event of default (such as bankruptcy or insolvency), to offset payables and/or receivables under the MRA with collateral held and/or posted to the counterparty and create one single net payment due to or from a trust. With reverse repurchase transactions, typically a trust and counterparty under an MRA are permitted to sell, re-pledge, or use the collateral associated with the transaction. Bankruptcy or insolvency laws of a particular jurisdiction may impose restrictions on or prohibitions against such a right of offset in the event of the MRA counterparty’s bankruptcy or insolvency. Pursuant to the terms of the MRA, a trust receives or posts securities and cash as collateral with a market value in excess of the repurchase price to be paid or received by a trust upon the maturity of the transaction. Upon a bankruptcy or insolvency of the MRA counterparty, a trust is considered an unsecured creditor with respect to excess collateral and, as such, the return of excess collateral may be delayed.
| | |
| 98 | | 2018 BLACKROCK ANNUAL REPORTTO SHAREHOLDERS |
Notes to Financial Statements (continued)
As of period end, the following table is a summary of a Trust’s open reverse repurchase agreements by counterparty which are subject to offset under an MRA on a net basis:
| | | | | | | | | | | | | | | | |
| BTZ | | | | | | | | | |
| Counterparty | | Reverse
Repurchase
Agreements | | | Fair Value of Non-cash Collateral
Pledged Including Accrued Interest (a) | | | Cash Collateral
Pledged/Received | | | Net
Amount | |
Barclays Bank PLC | | $ | 3,408,016 | | | $ | (3,408,016 | ) | | $ | — | | | $ | — | |
Barclays Capital, Inc. | | | 121,277,888 | | | | (121,277,888 | ) | | | — | | | | — | |
BNP Paribas S.A. | | | 162,975,772 | | | | (162,975,772 | ) | | | — | | | | — | |
Citigroup Global Markets, Inc. | | | 283,217 | | | | (283,217 | ) | | | — | | | | — | |
Credit Suisse Securities (USA) LLC | | | 33,142,526 | | | | (33,142,526 | ) | | | — | | | | — | |
Deutsche Bank Securities, Inc. | | | 3,841,781 | | | | (3,841,781 | ) | | | — | | | | — | |
RBC Capital Markets LLC | | | 374,189,677 | | | | (374,189,677 | ) | | | — | | | | — | |
UBS Securities LLC | | | 7,983,556 | | | | (7,983,556 | ) | | | — | | | | — | |
| | | | | | | | | | | | | | | | |
| | $ | 707,102,433 | | | $ | (707,102,433 | ) | | $ | — | | | $ | — | |
| | | | | | | | | | | | | | | | |
| | (a) | Net collateral, including accrued interest, with a value of $762,050,015 has been pledged/received in connection with open reverse repurchase agreements. Excess of net collateral pledged to the individual counterparty is not shown for financial reporting purposes. | |
| | | | | | | | | | | | | | | | |
| BIT | | | | | | | | | |
| Counterparty | | Reverse
Repurchase
Agreements | | | Fair Value of Non-cash Collateral
Pledged Including Accrued Interest (a) | | | Cash Collateral
Pledged/Received | | | Net Amount (b) | |
Barclays Bank PLC | | $ | 29,666,137 | | | $ | (29,666,137 | ) | | $ | — | | | $ | — | |
Barclays Capital, Inc. | | | 10,620,386 | | | | (10,620,386 | ) | | | — | | | | — | |
BNP Paribas S.A. | | | 60,045,659 | | | | (60,045,659 | ) | | | — | | | | — | |
Citigroup Global Markets, Inc. | | | 22,657 | | | | (22,657 | ) | | | — | | | | — | |
Credit Suisse Securities (USA) LLC | | | 6,353,747 | | | | (6,353,747 | ) | | | — | | | | — | |
Deutsche Bank Securities, Inc. | | | 24,053,492 | | | | (24,053,492 | ) | | | — | | | | — | |
HSBC Securities (USA), Inc. | | | 50,877,753 | | | | (50,877,753 | ) | | | — | | | | — | |
RBC Capital Markets, LLC | | | 142,033,246 | | | | (142,033,246 | ) | | | — | | | | — | |
Royal Bank of Canada | | | 4,826,519 | | | | (4,372,428 | ) | | | — | | | | 454,091 | |
| UBS Ltd. | | | 9,975,051 | | | | (9,975,051 | ) | | | — | | | | — | |
UBS Securities LLC | | | 37,827,275 | | | | (37,827,275 | ) | | | — | | | | — | |
| | | | | | | | | | | | | | | | |
| | $ | 376,301,922 | | | $ | (375,847,831 | ) | | $ | — | | | $ | 454,091 | |
| | | | | | | | | | | | | | | | |
| | (a) | Net collateral, including accrued interest, with a value of $415,158,614 has been pledged/received in connection with open reverse repurchase agreements. Excess of net collateral pledged to the individual counterparty is not shown for financial reporting purposes. | |
| | (b) | Net amount represents the net amount payable due to the counterparty in the event of default. | |
In the event the counterparty of securities under an MRA files for bankruptcy or becomes insolvent, a trust’s use of the proceeds from the agreement may be restricted while the counterparty, or its trustee or receiver, determines whether or not to enforce a trust’s obligation to repurchase the securities.
| 5. | DERIVATIVE FINANCIAL INSTRUMENTS |
The Trusts engage in various portfolio investment strategies using derivative contracts both to increase the returns of the Trusts and/or to manage their exposure to certain risks such as credit risk, equity risk, interest rate risk, foreign currency exchange rate risk, commodity price risk or other risks (e.g., inflation risk). Derivative financial instruments categorized by risk exposure are included in the Schedules of Investments. These contracts may be transacted on an exchange or OTC.
Futures Contracts: Futures contracts are purchased or sold to gain exposure to, or manage exposure to, changes in interest rates (interest rate risk), and changes in the value of equity securities (equity risk) or foreign currencies (foreign currency exchange rate risk).
Futures contracts are agreements between the Trusts and a counterparty to buy or sell a specific quantity of an underlying instrument at a specified price and on a specified date. Depending on the terms of a contract, it is settled either through physical delivery of the underlying instrument on the settlement date or by payment of a cash amount on the settlement date. Upon entering into a futures contract, the Trusts are required to deposit initial margin with the broker in the form of cash or securities in an amount that varies depending on a contract’s size and risk profile. The initial margin deposit must then be maintained at an established level over the life of the contract. Amounts pledged, which are considered restricted, are included in cash pledged for futures contracts in the Statements of Assets and Liabilities.
Securities deposited as initial margin are designated in the Schedules of Investments and cash deposited, if any, is shown as cash pledged for futures contracts in the Statements of Assets and Liabilities. Pursuant to the contract, the Trusts agree to receive from or pay to the broker an amount of cash equal to the daily fluctuation in market value of the contract (“variation margin”). Variation margin is recorded as unrealized appreciation (depreciation) and, if any, shown as variation margin receivable (or payable) on futures contracts in the Statements of Assets and Liabilities. When the contract is closed, a realized gain or loss is recorded in the Statements of
| | | | |
| NOTESTO FINANCIAL STATEMENTS | | | 99 | |
Notes to Financial Statements (continued)
Operations equal to the difference between the notional amount of the contract at the time it was opened and the notional amount at the time it was closed. The use of futures contracts involves the risk of an imperfect correlation in the movements in the price of futures contracts and interest, foreign currency exchange rates or underlying assets.
Forward Foreign Currency Exchange Contracts: Forward foreign currency exchange contracts are entered into to gain or reduce exposure to foreign currencies (foreign currency exchange rate risk).
A forward foreign currency exchange contract is an agreement between two parties to buy and sell a currency at a set exchange rate on a specified date. These contracts help to manage the overall exposure to the currencies in which some of the investments held by the Trusts are denominated and in some cases, may be used to obtain exposure to a particular market.
The contract is marked-to-market daily and the change in market value is recorded as unrealized appreciation (depreciation) in the Statements of Assets and Liabilities. When a contract is closed, a realized gain or loss is recorded in the Statements of Operations equal to the difference between the value at the time it was opened and the value at the time it was closed. Non-deliverable forward foreign currency exchange contracts are settled with the counterparty in cash without the delivery of foreign currency. The use of forward foreign currency exchange contracts involves the risk that the value of a forward foreign currency exchange contract changes unfavorably due to movements in the value of the referenced foreign currencies. Cash amounts pledged for forward foreign currency exchange contracts are considered restricted and are included in cash pledged as collateral for OTC derivatives in the Statements of Assets and Liabilities.
Options: Certain Trusts purchase and write call and put options to increase or decrease their exposure to the risks of underlying instruments, including equity risk, interest rate risk and/or commodity price risk and/or, in the case of options written, to generate gains from options premiums.
A call option gives the purchaser (holder) of the option the right (but not the obligation) to buy, and obligates the seller (writer) to sell (when the option is exercised) the underlying instrument at the exercise or strike price at any time or at a specified time during the option period. A put option gives the holder the right to sell and obligates the writer to buy the underlying instrument at the exercise or strike price at any time or at a specified time during the option period.
Premiums paid on options purchased and premiums received on options written, as well as the daily fluctuation in market value, are included in investments at value — unaffiliated and options written at value, respectively, in the Statements of Assets and Liabilities. When an instrument is purchased or sold through the exercise of an option, the premium is offset against the cost or proceeds of the underlying instrument. When an option expires, a realized gain or loss is recorded in the Statements of Operations to the extent of the premiums received or paid. When an option is closed or sold, a gain or loss is recorded in the Statements of Operations to the extent the cost of the closing transaction exceeds the premiums received or paid. When the Trusts write a call option, such option is typically “covered,” meaning that they hold the underlying instrument subject to being called by the option counterparty. When the Trusts write a put option, such option is covered by cash in an amount sufficient to cover the obligation. These amounts, which are considered restricted, are included in cash pledged as collateral for options written in the Statements of Assets and Liabilities.
| | • | | Swaptions — Certain Trusts purchase and write options on swaps (“swaptions”) primarily to preserve a return or spread on a particular investment or portion of the Trusts’ holdings, as a duration management technique or to protect against an increase in the price of securities it anticipates purchasing at a later date. The purchaser and writer of a swaption is buying or granting the right to enter into a previously agreed upon interest rate or credit default swap agreement (interest rate risk and/or credit risk) at any time before the expiration of the option. |
| | • | | Foreign currency options — Certain Trusts purchase and write foreign currency options, foreign currency futures and options on foreign currency futures to gain or reduce exposure to foreign currencies (foreign currency exchange rate risk). Foreign currency options give the purchaser the right to buy from or sell to the writer a foreign currency at any time before the expiration of the option. |
| | • | | Barrier options — Certain Trusts may purchase and write a variety of options with non-standard payout structures or other features (“barrier options”) that are generally traded OTC. |
The Trusts may invest in various types of barrier options, including down-and-out options, down-and-in options, double no-touch options, one-touch options, up-and-out options and up-and-in options. Down-and-out options expire worthless to the purchaser if the price of the underlying instrument falls below a specific barrier price level prior to the expiration date. Down-and-in options expire worthless to the purchaser unless the price of the underlying instrument falls below a specific barrier price level prior to the expiration date. Double no-touch options provide the purchaser an agreed-upon payout if the price of the underlying instrument does not reach or surpass predetermined barrier price levels prior to the option’s expiration date. One-touch options provide the purchaser an agreed-upon payout if the price of the underlying instrument reaches or surpasses predetermined barrier price levels prior to the expiration date. Up-and-out options expire worthless to the purchaser if the price of the underlying instrument increases beyond a predetermined barrier price level prior to the expiration date. Up-and-in options can only be exercised when the price of the underlying instrument increases beyond a predetermined barrier price level.
In purchasing and writing options, the Trusts bear the risk of an unfavorable change in the value of the underlying instrument or the risk that they may not be able to enter into a closing transaction due to an illiquid market. Exercise of a written option could result in the Trusts purchasing or selling a security when it otherwise would not, or at a price different from the current market value.
Swaps: Swap contracts are entered into to manage exposure to issuers, markets and securities. Such contracts are agreements between the Trusts and a counterparty to make periodic net payments on a specified notional amount or a net payment upon termination. Swap agreements are privately negotiated in the OTC market and may be entered into as a bilateral contract (“OTC swaps”) or centrally cleared (“centrally cleared swaps”).
For OTC swaps, any upfront premiums paid and any upfront fees received are shown as swap premiums paid and swap premiums received, respectively, in the Statements of Assets and Liabilities and amortized over the term of the contract. The daily fluctuation in market value is recorded as unrealized appreciation (depreciation)
| | |
| 100 | | 2018 BLACKROCK ANNUAL REPORTTO SHAREHOLDERS |
Notes to Financial Statements (continued)
on OTC Swaps in the Statements of Assets and Liabilities. Payments received or paid are recorded in the Statements of Operations as realized gains or losses, respectively. When an OTC swap is terminated, a realized gain or loss is recorded in the Statements of Operations equal to the difference between the proceeds from (or cost of) the closing transaction and the Trusts’ basis in the contract, if any. Generally, the basis of the contract is the premium received or paid.
In a centrally cleared swap, immediately following execution of the swap contract, the swap contract is novated to a central counterparty (the “CCP”) and the Trusts’ counterparty on the swap agreement becomes the CCP. The Trusts are required to interface with the CCP through the broker. Upon entering into a centrally cleared swap, the Trusts are required to deposit initial margin with the broker in the form of cash or securities in an amount that varies depending on the size and risk profile of the particular swap. Securities deposited as initial margin are designated in the Schedules of Investments and cash deposited is shown as cash pledged for centrally cleared swaps in the Statements of Assets and Liabilities. Amounts pledged, which are considered restricted cash, are included in cash pledged for centrally cleared swaps in the Statements of Assets and Liabilities. Pursuant to the contract, the Trusts agree to receive from or pay to the broker an amount of cash equal to the daily fluctuation in market value of the contract (“variation margin”). Variation margin is recorded as unrealized appreciation (depreciation) and shown as variation margin receivable (or payable) on centrally cleared swaps in the Statements of Assets and Liabilities. Payments received from (paid to) the counterparty, including at termination, are recorded as realized gains (losses) in the Statements of Operations.
| | • | | Credit default swaps — Credit default swaps are entered into to manage exposure to the market or certain sectors of the market, to reduce risk exposure to defaults of corporate and/or sovereign issuers or to create exposure to corporate and/or sovereign issuers to which a trust is not otherwise exposed (credit risk). |
The Trusts may either buy or sell (write) credit default swaps on single-name issuers (corporate or sovereign), a combination or basket of single-name issuers or traded indexes. Credit default swaps are agreements in which the protection buyer pays fixed periodic payments to the seller in consideration for a promise from the protection seller to make a specific payment should a negative credit event take place with respect to the referenced entity (e.g., bankruptcy, failure to pay, obligation acceleration, repudiation, moratorium or restructuring). As a buyer, if an underlying credit event occurs, the Trusts will either (i) receive from the seller an amount equal to the notional amount of the swap and deliver the referenced security or underlying securities comprising the index, or (ii) receive a net settlement of cash equal to the notional amount of the swap less the recovery value of the security or underlying securities comprising the index. As a seller (writer), if an underlying credit event occurs, the Trusts will either pay the buyer an amount equal to the notional amount of the swap and take delivery of the referenced security or underlying securities comprising the index or pay a net settlement of cash equal to the notional amount of the swap less the recovery value of the security or underlying securities comprising the index.
| | • | | Total return swaps — Total return swaps are entered into to obtain exposure to a security or market without owning such security or investing directly in such market or to exchange the risk/return of one market (e.g., fixed-income) with another market (e.g., equity or commodity prices) (equity risk, commodity price risk and/or interest rate risk). |
Total return swaps are agreements in which there is an exchange of cash flows whereby one party commits to make payments based on the total return (distributions plus capital gains/losses) of an underlying instrument, or basket or underlying instruments, in exchange for fixed or floating rate interest payments. If the total return of the instruments or index underlying the transaction exceeds or falls short of the offsetting fixed or floating interest rate obligation, the Trusts receive payment from or make a payment to the counterparty.
| | • | | Interest rate swaps — Interest rate swaps are entered into to gain or reduce exposure to interest rates or to manage duration, the yield curve or interest rate (interest rate risk). |
Interest rate swaps are agreements in which one party pays a stream of interest payments, either fixed or floating, in exchange for another party’s stream of interest payments, either fixed or floating, on the same notional amount for a specified period of time. In more complex interest rate swaps, the notional principal amount may decline (or amortize) over time.
| | • | | Forward swaps — Certain Trusts enter into forward interest rate swaps and forward total return swaps. In a forward swap, each Trust and the counterparty agree to make periodic net payments beginning on a specified date or a net payment at termination. |
| | • | | Inflation swaps — Inflation swaps are entered into to gain or reduce exposure to inflation (inflation risk). In an inflation swap, one party makes fixed interest payments on a notional principal amount in exchange for another party’s variable payments based on an inflation index, such as the Consumer Price Index. |
Swap transactions involve, to varying degrees, elements of interest rate, credit and market risk in excess of the amounts recognized in the Statements of Assets and Liabilities. Such risks involve the possibility that there will be no liquid market for these agreements, that the counterparty to the agreements may default on its obligation to perform or disagree as to the meaning of the contractual terms in the agreements, and that there may be unfavorable changes in interest rates and/or market values associated with these transactions.
Master Netting Arrangements: In order to define their contractual rights and to secure rights that will help them mitigate their counterparty risk, the Trusts may enter into an International Swaps and Derivatives Association, Inc. Master Agreement (“ISDA Master Agreement”) or similar agreement with their counterparties. An ISDA Master Agreement is a bilateral agreement between each Trust and a counterparty that governs certain OTC derivatives and typically contains, among other things, collateral posting terms and netting provisions in the event of a default and/or termination event. Under an ISDA Master Agreement, each Trust may, under certain circumstances, offset with the counterparty certain derivative financial instruments’ payables and/or receivables with collateral held and/or posted and create one single net payment. The provisions of the ISDA Master Agreement typically permit a single net payment in the event of default including the bankruptcy or insolvency of the counterparty. Bankruptcy or insolvency laws of a particular jurisdiction may restrict or prohibit the right of offset in bankruptcy, insolvency or other events.
Collateral Requirements: For derivatives traded under an ISDA Master Agreement, the collateral requirements are typically calculated by netting the mark-to-market amount for each transaction under such agreement and comparing that amount to the value of any collateral currently pledged by the Trusts and the counterparty.
| | | | |
| NOTESTO FINANCIAL STATEMENTS | | | 101 | |
Notes to Financial Statements (continued)
Cash collateral that has been pledged to cover obligations of the Trusts and cash collateral received from the counterparty, if any, is reported separately in the Statements of Assets and Liabilities as cash pledged as collateral and cash received as collateral, respectively. Non-cash collateral pledged by the Trusts, if any, is noted in the Schedules of Investments. Generally, the amount of collateral due from or to a counterparty is subject to a certain minimum transfer amount threshold before a transfer is required, which is determined at the close of business of the Trusts. Any additional required collateral is delivered to/pledged by the Trusts on the next business day. Typically, the counterparty is not permitted to sell, re-pledge or use cash and non-cash collateral it receives. A Trust generally agrees not to use non-cash collateral that it receives but may, absent default or certain other circumstances defined in the underlying ISDA Master Agreement, be permitted to use cash collateral received. In such cases, interest may be paid pursuant to the collateral arrangement with the counterparty. To the extent amounts due to the Trusts from their counterparties are not fully collateralized, they bear the risk of loss from counterparty non-performance. Likewise, to the extent the Trusts have delivered collateral to a counterparty and stand ready to perform under the terms of their agreement with such counterparty, they bear the risk of loss from a counterparty in the amount of the value of the collateral in the event the counterparty fails to return such collateral. Based on the terms of agreements, collateral may not be required for all derivative contracts.
For financial reporting purposes, the Trusts do not offset derivative assets and derivative liabilities that are subject to netting arrangements, if any, in the Statements of Assets and Liabilities.
| 6. | INVESTMENT ADVISORY AGREEMENT AND OTHER TRANSACTIONS WITH AFFILIATES |
The PNC Financial Services Group, Inc. is the largest stockholder and an affiliate of BlackRock, Inc. (“BlackRock”) for 1940 Act purposes.
Investment Advisory: Each Trust entered into an Investment Advisory Agreement with the Manager, the Trusts’ investment adviser and an indirect, wholly-owned subsidiary of BlackRock, to provide investment advisory and administrative services. The Manager is responsible for the management of each Trust’s portfolio and provides the personnel, facilities, equipment and certain other services necessary to the operations of each Trust.
For such services, BTZ and BGT each pay the Manager a monthly fee at an annual rate equal to 0.62% and 0.75%, respectively, of the average weekly value of each Trust’s managed assets. For purposes of calculating these fees, “managed assets” mean the total assets of the Trust minus the sum of its accrued liabilities (other than the aggregate indebtedness constituting financial leverage).
For such services, BIT pays the Manager a monthly fee at an annual rate equal to 0.80% of the average daily value of Trust’s managed assets. For purposes of calculating the investment advisory fee, “managed assets” means the total assets of the Trust (including any assets attributable to money borrowed for investment purposes) minus the sum of its accrued liabilities (other than money borrowed for investment purposes).
The Manager provides investment management and other services to the Taxable Subsidiary. The Manager does not receive separate compensation from the Taxable Subsidiary for providing investment management or administrative services. However, BIT pays the Manager based on BIT’s net assets, plus the proceeds of any debt securities or outstanding borrowings used for leverage, which includes the assets of the Taxable Subsidiary.
With respect to BIT, the Manager entered into a sub-advisory agreement with BlackRock (Singapore) Limited (“BRS”), an affiliate of the Manager. The Manager pays BRS, for services it provides for that portion of BIT for which BRS acts as sub-adviser, a monthly fee that is a percentage of the investment advisory fees paid by BIT to the Manager.
Expense Waivers: With respect to each Trust, the Manager voluntarily agreed to waive its investment advisory fees by the amount of investment advisory fees each Trust pays to the Manager indirectly through its investment in affiliated money market funds (the “affiliated money market fund waiver”). These amounts are included in fees waived and/or reimbursed by the Manager in the Statements of Operations. For the year ended October 31, 2018, the amounts waived were as follows:
| | | | | | | | | | | | |
| | | BTZ | | | BGT | | | BIT | |
Amounts waived | | $ | 6,500 | | | $ | 1,313 | | | $ | 5,065 | |
The Manager has contractually agreed to waive its investment advisory fee with respect to any portion of each Trust’s assets invested in affiliated equity and fixed-income mutual funds and affiliated exchange-traded funds that have a contractual management fee through June 30, 2019. The agreement can be renewed for annual periods thereafter, and may be terminated on 90 days’ notice, each subject to approval by a majority of the Trusts’ Independent Trustees. For the year ended October 31, 2018, BGT waived $8,434 in investment advisory fees pursuant to these arrangements.
Trustees and Officers: Certain trustees and/or officers of the Trusts are trustees and/or officers of BlackRock or its affiliates. The Trusts reimburse the Manager for a portion of the compensation paid to the Trusts’ Chief Compliance Officer, which is included in Trustees and Officer in the Statements of Operations.
Other Transactions: During the year ended October 31, 2018, BIT received a reimbursement of $1,943 from an affiliate, which is included in payment by affiliate in the Consolidated Statement of Operations, related to an operating event.
The Trusts may purchase securities from, or sell securities to, an affiliated fund provided the affiliation is due solely to having a common investment adviser, common officers, or common trustees. For the year ended October 31, 2018, the purchase and sale transactions and any net realized gains (losses) with an affiliated fund in compliance with Rule 17a-7 under the 1940 Act were as follows:
| | | | | | | | | | | | |
| | | Purchases | | | Sales | | | Net Realized
Gain | |
BIT | | $ | 607,936 | | | $ | 917,283 | | | $ | 25,772 | |
| | |
| 102 | | 2018 BLACKROCK ANNUAL REPORTTO SHAREHOLDERS |
Notes to Financial Statements (continued)
For the year ended October 31, 2018, purchases and sales of investments, including paydowns and excluding short-term securities, were as follows:
| | | | | | | | | | | | |
| Purchases | | BTZ | | | BGT | | | BIT | |
Non-U.S. Government Securities | | $ | 698,919,282 | | | $ | 287,041,834 | | | $ | 423,718,640 | |
U.S. Government Securities | | | 144,256,128 | | | | — | | | | 19,087,247 | |
| | | | | | | | | | | | |
Total Purchases | | $ | 843,175,410 | | | $ | 287,041,834 | | | $ | 442,805,887 | |
| | | | | | | | | | | | |
| | | | | | | | | | | | |
| Sales | | | | | | | | | |
Non-U.S. Government Securities | | $ | 482,948,639 | | | $ | 302,255,780 | | | $ | 524,713,820 | |
U.S. Government Securities | | | 166,233,982 | | | | — | | | | — | |
| | | | | | | | | | | | |
Total Sales | | $ | 649,182,621 | | | $ | 302,255,780 | | | $ | 524,713,820 | |
| | | | | | | | | | | | |
It is each Trust’s policy to comply with the requirements of the Internal Revenue Code of 1986, as amended, applicable to regulated investment companies, and to distribute substantially all of its taxable income to its shareholders. Therefore, no U.S. federal income tax provision is required.
Each Trust files U.S. federal and various state and local tax returns. No income tax returns are currently under examination. The statute of limitations on each Trust’s U.S. federal tax returns generally remains open for each of the four years ended October 31, 2018. The statutes of limitations on each Trust’s state and local tax returns may remain open for an additional year depending upon the jurisdiction.
Management has analyzed tax laws and regulations and their application to the Trusts as of October 31, 2018, inclusive of the open tax return years, and does not believe that there are any uncertain tax positions that require recognition of a tax liability in the Trusts’ financial statements.
U.S. GAAP requires that certain components of net assets be adjusted to reflect permanent differences between financial and tax reporting. These reclassifications have no effect on net assets or net asset values per share. As of period end, the following permanent differences attributable to the expiration of capital loss carryforwards were reclassified to the following accounts:
| | | | | | | | | | | | |
| | | BTZ | | | BGT | | | BIT | |
Paid-in capital | | $ | (31,756,723 | ) | | $ | (16,526,601 | ) | | $ | — | |
Accumulated loss | | | 31,756,723 | | | | 16,526,601 | | | | — | |
The tax character of distributions paid was as follows:
| | | | | | | | | | | | | | | | |
| | | | | | BTZ | | | BGT | | | BIT | |
Ordinary income | | | 10/31/18 | | | $ | 85,614,025 | | | $ | 16,888,787 | | | $ | 56,503,375 | |
| | | 10/31/17 | | | | 84,934,828 | | | | 18,141,462 | | | | 67,788,341 | |
Return of capital | | | 10/31/18 | | | | — | | | | — | | | | 1,708,837 | |
| | | 10/31/17 | | | | 5,757,690 | | | | — | | | | — | |
| | | | | | | | | | | | | | | | |
Total | | | 10/31/18 | | | $ | 85,614,025 | | | $ | 16,888,787 | | | $ | 58,212,212 | |
| | | | | | | | | | | | | | | | |
| | | 10/31/17 | | | $ | 90,692,518 | | | $ | 18,141,462 | | | $ | 67,788,341 | |
| | | | | | | | | | | | | | | | |
As of period end, the tax components of accumulated net earnings (losses) were as follows:
| | | | | | | | | | | | |
| | | BTZ | | | BGT | | | BIT | |
Undistributed ordinary income | | $ | 983,173 | | | $ | 2,313,349 | | | $ | — | |
Capital loss carryforwards | | | (37,063,666 | ) | | | (10,335,289 | ) | | | (23,849,561 | ) |
Net unrealized gains (losses)(a) | | | 11,177,883 | | | | (4,265,274 | ) | | | 18,804,979 | |
| | | | | | | | | | | | |
| | $ | (24,902,610 | ) | | $ | (12,287,214 | ) | | $ | (5,044,582 | ) |
| | | | | | | | | | | | |
| | (a) | The difference between book-basis and tax-basis net unrealized gains (losses) was attributable primarily to the tax deferral of losses on wash sales and straddles, the realization for tax purposes of unrealized gains/losses on certain futures, options and foreign currency exchange contracts, the realization for tax purposes of unrealized gains on investments in passive foreign investment companies amortization methods for premiums and discounts on fixed income securities, the accrual of income on securities in default, the timing and recognition of partnership income, the accounting for swap agreements, the deferral of compensation to Directors and the classification of investments. | |
| | | | |
| NOTESTO FINANCIAL STATEMENTS | | | 103 | |
Notes to Financial Statements (continued)
As of October 31, 2018, the Trusts had capital loss carryforwards available to offset future realized capital gains through the indicated expiration dates as follows:
| | | | | | | | | | | | |
| Expires October 31, | | BTZ | | | BGT | | | BIT | |
No expiration date(a) | | $ | 26,710,391 | | | $ | 9,925,865 | | | $ | 23,849,561 | |
2019 | | | 10,353,275 | | | | 409,424 | | | | — | |
| | | | | | | | | | | | |
| | $ | 37,063,666 | | | $ | 10,335,289 | | | $ | 23,849,561 | |
| | | | | | | | | | | | |
| | (a) | Must be utilized prior to losses subject to expiration. | |
During the year ended October 31, 2018, the Trusts listed below utilized the following amounts of their respective capital loss carryforward:
| | | | | | | | |
| | | BTZ | | | BIT | |
Amount utilized | | $ | 8,576,677 | | | $ | 4,772,145 | |
As of October 31, 2018, gross unrealized appreciation and depreciation for investments and derivatives based on cost for U.S. federal income tax purposes were as follows:
| | | | | | | | | | | | |
| | | BTZ | | | BGT | | | BIT | |
Tax cost | | $ | 2,103,852,041 | | | $ | 494,822,818 | | | $ | 1,075,839,010 | |
| | | | | | | | | | | | |
Gross unrealized appreciation | | $ | 67,407,998 | | | $ | 1,584,042 | | | $ | 41,105,655 | |
Gross unrealized depreciation | | | (55,333,748 | ) | | | (5,619,429 | ) | | | (21,551,532 | ) |
| | | | | | | | | | | | |
Net unrealized appreciation (depreciation) | | $ | 12,074,250 | | | $ | (4,035,387 | ) | | $ | 19,554,123 | |
| | | | | | | | | | | | |
BGT is party to a senior committed secured, 360-day rolling line of credit facility and a separate security agreement (the “SSB Agreement”) with State Street Bank and Trust Company (“SSB”). SSB may elect to terminate its commitment upon 360-days written notice to BGT. As of period end, BGT has not received any notice to terminate. BGT has granted a security interest in substantially all of its assets to SSB.
The SSB Agreement allows for the maximum commitment amount of $168,000,000 for BGT.
Advances will be made by SSB to BGT, at BGT’s option of (a) the higher of (i) 0.80% above the Fed Funds rate and (ii) 0.80% above Overnight LIBOR or (b) 0.80% above 7-day, 30-day, 60-day or 90-day LIBOR. Overnight LIBOR and LIBOR rates are subject to a 0% floor.
In addition, BGT paid a commitment fee (based on the daily unused portion of the commitments). The fees associated with each of the agreements are included in the Statements of Operations as borrowing costs, if any. Advances to BGT as of period end are shown in the Statements of Assets and Liabilities as bank borrowings payable. Based on the short-term nature of the borrowings under the line of credit and the variable interest rate, the carrying amount of the borrowings approximates fair value.
BGT may not declare dividends or make other distributions on shares or purchase any such shares if, at the time of the declaration, distribution or purchase, asset coverage with respect to the outstanding short-term borrowings is less than 300%.
For the year ended October 31, 2018, the average amount of bank borrowings and the daily weighted average interest rates for BGT for loans under the revolving credit agreements were $144,490,411 and 2.55%, respectively.
In the normal course of business, certain Trusts invest in securities or other instruments and may enter into certain transactions, and such activities subject each Trust to various risks, including among others, fluctuations in the market (market risk) or failure of an issuer to meet all of its obligations. The value of securities or other instruments may also be affected by various factors, including, without limitation: (i) the general economy; (ii) the overall market as well as local, regional or global political and/or social instability; (iii) regulation, taxation or international tax treaties between various countries; or (iv) currency, interest rate and price fluctuations.
Each Trust may be exposed to prepayment risk, which is the risk that borrowers may exercise their option to prepay principal earlier than scheduled during periods of declining interest rates, which would force each Trust to reinvest in lower yielding securities. Each Trust may also be exposed to reinvestment risk, which is the risk that income from each Trust’s portfolio will decline if each Trust invests the proceeds from matured, traded or called fixed-income securities at market interest rates that are below each Trust portfolio’s current earnings rate.
Valuation Risk: The market values of equities, such as common stocks and preferred securities or equity related investments, such as futures and options, may decline due to general market conditions which are not specifically related to a particular company. They may also decline due to factors which affect a particular industry or industries. A Trust may invest in illiquid investments and may experience difficulty in selling those investments in a timely manner at the price that it believes the investments are worth. Prices may fluctuate widely over short or extended periods in response to company, market or economic news. Markets also tend to move in cycles, with periods of rising and falling prices. This volatility may cause each Trust’s NAV to experience significant increases or decreases over short periods of time. If there is a general decline in the securities and other markets, the NAV of a Trust may lose value, regardless of the individual results of the securities and other instruments in which a Trust invests.
| | |
| 104 | | 2018 BLACKROCK ANNUAL REPORTTO SHAREHOLDERS |
Notes to Financial Statements (continued)
The price a Trust could receive upon the sale of any particular portfolio investment may differ from a Trust’s valuation of the investment, particularly for securities that trade in thin or volatile markets or that are valued using a fair valuation technique or a price provided by an independent pricing service. Changes to significant unobservable inputs and assumptions (i.e., publicly traded company multiples, growth rate, time to exit) due to the lack of observable inputs may significantly impact the resulting fair value and therefore a Trust’s results of operations. As a result, the price received upon the sale of an investment may be less than the value ascribed by a Trust, and a Trust could realize a greater than expected loss or lesser than expected gain upon the sale of the investment. A Trust’s ability to value its investments may also be impacted by technological issues and/or errors by pricing services or other third party service providers.
Counterparty Credit Risk: The Trusts may be exposed to counterparty credit risk, or the risk that an entity may fail to or be unable to perform on its commitments related to unsettled or open transactions. The Trusts manage counterparty credit risk by entering into transactions only with counterparties that the Manager believes have the financial resources to honor their obligations and by monitoring the financial stability of those counterparties. Financial assets, which potentially expose the Trusts to market, issuer and counterparty credit risks, consist principally of financial instruments and receivables due from counterparties. The extent of the Trusts’ exposure to market, issuer and counterparty credit risks with respect to these financial assets is approximately their value recorded in the Statements of Assets and Liabilities, less any collateral held by the Trusts.
A derivative contract may suffer a mark-to-market loss if the value of the contract decreases due to an unfavorable change in the market rates or values of the underlying instrument. Losses can also occur if the counterparty does not perform under the contract.
A Trust’s risk of loss from counterparty credit risk on OTC derivatives is generally limited to the aggregate unrealized gain less the value of any collateral held by such Trust.
For OTC options purchased, each Trust bears the risk of loss in the amount of the premiums paid plus the positive change in market values net of any collateral held by the Trusts should the counterparty fail to perform under the contracts. Options written by the Trusts do not typically give rise to counterparty credit risk, as options written generally obligate the Trusts, and not the counterparty, to perform. The Trusts may be exposed to counterparty credit risk with respect to options written to the extent each Trust deposits collateral with its counterparty to a written option.
With exchange-traded options purchased, futures and centrally cleared swaps, there is less counterparty credit risk to the Trusts since the exchange or clearinghouse, as counterparty to such instruments, guarantees against a possible default. The clearinghouse stands between the buyer and the seller of the contract; therefore, credit risk is limited to failure of the clearinghouse. While offset rights may exist under applicable law, a Trust does not have a contractual right of offset against a clearing broker or clearinghouse in the event of a default (including the bankruptcy or insolvency). Additionally, credit risk exists in exchange-traded futures and centrally cleared swaps with respect to initial and variation margin that is held in a clearing broker’s customer accounts. While clearing brokers are required to segregate customer margin from their own assets, in the event that a clearing broker becomes insolvent or goes into bankruptcy and at that time there is a shortfall in the aggregate amount of margin held by the clearing broker for all its clients, typically the shortfall would be allocated on a pro rata basis across all the clearing broker’s customers, potentially resulting in losses to the Trusts.
Concentration Risk: Certain Trusts may invest in securities that are rated below investment grade quality (sometimes called “junk bonds”), which are predominantly speculative, have greater credit risk and generally are less liquid and have more volatile prices than higher quality securities.
Certain Trusts invest a significant portion of their assets in fixed-income securities and/or use derivatives tied to the fixed-income markets. Changes in market interest rates or economic conditions may affect the value and/or liquidity of such investments. Interest rate risk is the risk that prices of bonds and other fixed-income securities will increase as interest rates fall and decrease as interest rates rise. The Trusts may be subject to a greater risk of rising interest rates due to the current period of historically low rates. The Federal Reserve has begun to raise the Federal Funds rate, and each increase results in more pronounced interest rate risk in the current market environment.
Certain Trusts invest a significant portion of their assets in securities backed by commercial or residential mortgage loans or in issuers that hold mortgage and other asset-backed securities. Investment percentages in these securities are presented in the Schedules of Investments. Changes in economic conditions, including delinquencies and/or defaults on assets underlying these securities, can affect the value, income and/or liquidity of such positions.
| 11. | CAPITAL SHARE TRANSACTIONS |
Each Trust is authorized to issue an unlimited numbers of shares, all of which were initially classified as Common Shares. The par value for each Trust’s shares is $0.001, respectively. The Board is authorized, however, to reclassify any unissued Common shares to Preferred shares without the approval of Common Shareholders.
Common Shares: For the years shown, shares issued and outstanding increased by the following amounts as a result of dividend reinvestment:
| | | | |
| Year Ended October 31 | | BGT | |
2018 | | | — | |
2017 | | | 3,790 | |
The Trusts participate in an open market share repurchase program (the “Repurchase Program”). Under the program, each Trust may repurchase up to 5% of its outstanding common shares from December 1, 2017 through November 30, 2018, based on common shares outstanding as of the close of business on November 30, 2017, subject to certain conditions. On September 7, 2018, the Trusts announced a continuation of the Repurchase Program. Commencing on December 1, 2018, each Trust may repurchase up to 5% of its outstanding common shares through November 30, 2019, based on common shares outstanding as of the close of business on November 30, 2018, subject to certain conditions. There is no assurance that the Trusts will purchase shares in any particular amounts. The total amount of the repurchase offer is reflected in each Trusts’ Statements of Changes in Net Assets.
| | | | |
| NOTESTO FINANCIAL STATEMENTS | | | 105 | |
Notes to Financial Statements (continued)
For the years shown, shares repurchased and cost, including transaction costs were as follows:
| | | | | | | | | | | | | | | | | | | | |
| | | BTZ | | | | | | BIT | |
| Year Ended October 31 | | Shares | | | Amount | | | | | | Shares | | | Amount | |
2018 | | | 2,489,141 | | | $ | 30,991,477 | | | | | | | | 345,071 | | | $ | 5,842,460 | |
2017 | | | 676,066 | | | | 8,822,801 | | | | | | | | 254,873 | | | | 4,354,046 | |
| 12. | REGULATION S-X AMENDMENTS |
On August 17, 2018, the SEC adopted amendments to certain disclosure requirements in Securities Act Release No. 33-10532, Disclosure Update and Simplification. The Trusts have adopted the amendments pertinent to Regulation S-X in this shareholder report. The amendments impacted certain disclosure presentation on the Statements of Assets and Liabilities, Statements of Changes in Net Assets and Notes to the Financial Statements.
Prior year distribution information and undistributed net investment income in the Statements of Changes in Net Assets has been modified to conform to the current year presentation in accordance with the Regulation S-X changes.
Distributions for the year ended October 31, 2017 were classified as follows:
| | | | | | | | |
| | | Net Investment Income | | | Return of Capital | |
BTZ | | $ | 84,934,828 | | | $ | 5,757,690 | |
BGT | | | 18,141,462 | | | | — | |
BIT | | | 67,788,341 | | | | — | |
Undistributed net investment income as of October 31, 2017 is as follows:
| | | | |
| | | Undistributed Net
Investment Income | |
BTZ | | $ | 1,644,068 | |
BGT | | | 661,158 | |
BIT | | | 4,002,210 | |
Management’s evaluation of the impact of all subsequent events on the Trusts’ financial statements was completed through the date the financial statements were issued and the following items were noted:
| | | | | | | | | | | | | | | | |
| | | Common Dividend Per Share | |
| | | Paid (a) | | | Declared (b) | | | Declared (c) | | | Declared (d) | |
BTZ | | $ | 0.0670 | | | $ | 0.0670 | | | $ | 0.0670 | | | $ | — | |
BGT | | | 0.0618 | | | | 0.0618 | | | | 0.0618 | | | | 0.0425 | |
BIT | | | 0.1167 | | | | 0.1167 | | | | 0.1167 | | | | — | |
| | (a) | Net investment income dividend paid on December 3, 2018 to Common Shareholders of record on November 15, 2018. | |
| | (b) | Net investment income dividend declared on December 3, 2018, payable to Common Shareholders of record on December 13, 2018. | |
| | (c) | Net investment income dividend declared on December 19, 2018, payable to shareholders of record on December 31, 2018. | |
| | (d) | Net investment income special dividend declared on December 19, 2018, payable to shareholders of record on December 31, 2018. | |
| | |
| 106 | | 2018 BLACKROCK ANNUAL REPORTTO SHAREHOLDERS |
Report of Independent Registered Public Accounting Firm
To the Shareholders and Board of Trustees of
BlackRock Credit Allocation Income Trust, BlackRock Floating Rate Income Trust and BlackRock Multi-Sector Income Trust:
Opinion on the Financial Statements and Financial Highlights
We have audited the accompanying statements of assets and liabilities of BlackRock Credit Allocation Income Trust and BlackRock Floating Rate Income Trust, including the schedules of investments, as of October 31, 2018, the related statements of operations and cash flows for the year then ended, the statements of changes in net assets for each of the two years in the period then ended, the financial highlights for each of the five years in the period then ended, and the related notes. We have also audited the accompanying consolidated statement of assets and liabilities of BlackRock Multi-Sector Income Trust (collectively with BlackRock Credit Allocation Income Trust and BlackRock Floating Rate Income Trust, the “Funds”), including the consolidated schedule of investments, as of October 31, 2018, the related consolidated statement of operations and cash flows for the year then ended, the consolidated statements of changes in net assets for each of the two years in the period then ended, the consolidated financial highlights for each of the five years in the period then ended, and the related notes. In our opinion, the financial statements and financial highlights present fairly, in all material respects, the financial position of the Funds as of October 31, 2018, and the results of their operations and their cash flows for the year then ended, the changes in their net assets for each of the two years in the period then ended, and the financial highlights for each of the five years in the period then ended, in conformity with accounting principles generally accepted in the United States of America.
Basis for Opinion
These financial statements and financial highlights are the responsibility of the Funds’ management. Our responsibility is to express an opinion on the Funds’ financial statements and financial highlights based on our audits. We are a public accounting firm registered with the Public Company Accounting Oversight Board (United States) (PCAOB) and are required to be independent with respect to the Funds in accordance with the U.S. federal securities laws and the applicable rules and regulations of the Securities and Exchange Commission and the PCAOB.
We conducted our audits in accordance with the standards of the PCAOB. Those standards require that we plan and perform the audit to obtain reasonable assurance about whether the financial statements and financial highlights are free of material misstatement, whether due to error or fraud. The Funds are not required to have, nor were we engaged to perform, an audit of their internal control over financial reporting. As part of our audits we are required to obtain an understanding of internal control over financial reporting but not for the purpose of expressing an opinion on the effectiveness of the Funds’ internal control over financial reporting. Accordingly, we express no such opinion.
Our audits included performing procedures to assess the risks of material misstatement of the financial statements and financial highlights, whether due to error or fraud, and performing procedures that respond to those risks. Such procedures included examining, on a test basis, evidence regarding the amounts and disclosures in the financial statements and financial highlights. Our audits also included evaluating the accounting principles used and significant estimates made by management, as well as evaluating the overall presentation of the financial statements and financial highlights. Our procedures included confirmation of securities owned as of October 31, 2018, by correspondence with the custodian, agent banks and brokers; when replies were not received from brokers or agent banks, we performed other auditing procedures. We believe that our audits provide a reasonable basis for our opinion.
Deloitte & Touche LLP
Boston, Massachusetts
December 21, 2018
We have served as the auditor of one or more BlackRock investment companies since 1992.
Important Tax Information (unaudited)
During the fiscal year ended October 31, 2018, the following information is provided with respect to the ordinary income distributions paid by the Trusts:
| | | | | | | | | | | | | | |
| | | Payable Date(s) | | BTZ | | | BGT | | | BIT | |
Qualified Dividend Income for Individuals(a) | | November 2017 | | | 13.14 | % | | | — | % | | | 10.40 | % |
| | December 2017 | | | 13.14 | | | | — | | | | 12.50 | |
| | January 2018 | | | 13.14 | | | | — | | | | 15.00 | |
| | February 2018 — October 2018 | | | 18.64 | | | | — | | | | 13.51 | |
Dividends Qualifying for the Dividend Received Deduction for Corporations(a) | | November 2017 — October 2018 | | | 12.41 | | | | — | | | | 11.15 | |
Interest-Related Dividends and Qualified Short-Term Gains for Non-U.S. Residents(b) | | November 2017 — January 2018 | | | 79.78 | | | | 79.66 | | | | 58.16 | |
| | | February 2018 — October 2018 | | | 56.23 | | | | 75.91 | | | | 40.26 | |
| | (a) | The Trusts hereby designate the percentage indicated or the maximum amount allowable by law. | |
| | (b) | Represents the portion of the taxable ordinary income dividends eligible for exemption from U.S. withholding tax for nonresident aliens and foreign corporations. | |
| | | | |
| REPORTOF INDEPENDENT REGISTERED PUBLIC ACCOUNTING FIRM | | | 107 | |
Disclosure of Investment Advisory Agreements and Sub-Advisory Agreement
The Board of Trustees (the “Board,” the members of which are referred to as “Board Members”), of BlackRock Credit Allocation Income Trust (“BTZ”), BlackRock Floating Rate Income Trust (“BGT”) and BlackRock Multi-Sector Income Trust (“BIT,” and together with BGT and BTZ each, a “Trust,” and collectively, the “Trusts”) met in person on April 24, 2018 (the “April Meeting”) and June 6-7, 2018 (the “June Meeting”) to consider the approval of each Trust’s investment advisory agreement (each, an “Advisory Agreement,” and collectively, the “Advisory Agreements”) with BlackRock Advisors, LLC (the “Manager”), each Trust’s investment advisor. The Board of BIT also considered the approval of the sub-advisory agreement (the “Sub-Advisory Agreement”) among the Manager, BlackRock (Singapore) Limited (the “Sub-Advisor”) and the Trust. The Manager and the Sub-Advisor are referred to herein as “BlackRock.” The Advisory Agreements and the Sub-Advisory Agreement are referred to herein as the “Agreements.”
Activities and Composition of the Board
On the date of the June Meeting, the Board of each Trust consisted of ten individuals, eight of whom were not “interested persons” of the Trust as defined in the Investment Company Act of 1940, as amended (the “1940 Act”) (the “Independent Board Members”). The Board Members are responsible for the oversight of the operations of its Trust and perform the various duties imposed on the directors of investment companies by the 1940 Act. The Independent Board Members have retained independent legal counsel to assist them in connection with their duties. The Chair of each Board is an Independent Board Member. Each Board has established five standing committees: an Audit Committee, a Governance and Nominating Committee, a Compliance Committee, a Performance Oversight Committee, and an Executive Committee, each of which is chaired by an Independent Board Member and composed of Independent Board Members (except for the Executive Committee, which also has one interested Board Member).
The Agreements
Pursuant to the 1940 Act, each Board is required to consider the continuation of the Advisory Agreement for its Trust, and with respect to BIT, the Sub-Advisory Agreement, on an annual basis. Each Board has four quarterly meetings per year, each typically extending for two days, and additional in-person and telephonic meetings throughout the year, as needed. Each Board also has a fifth one-day meeting to consider specific information surrounding the consideration of renewing the Agreement(s) for its Trust. Each Board’s consideration of the Agreement(s) for its Trust is a year-long deliberative process, during which the Board assessed, among other things, the nature, extent and quality of the services provided to its Trust by BlackRock, BlackRock’s personnel and affiliates, including, as applicable; investment management, accounting, administrative, and shareholder services; oversight of the Trust’s service providers; marketing; risk management and oversight; legal and compliance services; and ability to meet applicable legal and regulatory requirements.
Each Board, acting directly and through its committees, considers at each of its meetings, and from time to time as appropriate, factors that are relevant to its annual consideration of the renewal of the Agreement(s) for its Trust, including the services and support provided by BlackRock to the Trust and its shareholders. BlackRock also furnished additional information to each Board in response to specific questions from the Board. This additional information is discussed further below in the section titled “Board Considerations in Approving the Agreements.” Among the matters each Board considered were: (a) investment performance for one-year, three-year, five-year, ten-year, and/or since inception periods, as applicable, against peer funds, applicable benchmarks, and performance metrics, as applicable, as well as senior management’s and portfolio managers’ analysis of the reasons for any over-performance or underperformance relative to its peers, benchmarks, and other performance metrics, as applicable; (b) leverage management, as applicable; (c) fees, including advisory, administration, if applicable, paid to BlackRock and its affiliates by the Trust for services; (d) Trust operating expenses and how BlackRock allocates expenses to the Trust; (e) the resources devoted to, risk oversight of, and compliance reports relating to, implementation of the Trust’s investment objective(s), policies and restrictions, and meeting regulatory requirements; (f) the Trust’s adherence to its compliance policies and procedures; (g) the nature, character and scope of non-investment management services provided by BlackRock and its affiliates and the estimated cost of such services; (h) BlackRock’s and other service providers’ internal controls and risk and compliance oversight mechanisms; (i) BlackRock’s implementation of the proxy voting policies approved by the Board; (j) execution quality of portfolio transactions; (k) BlackRock’s implementation of the Trust’s valuation and liquidity procedures; (l) an analysis of management fees for products with similar investment mandates across the open-end fund, closed-end fund, sub-advised mutual fund, collective investment trust, and institutional separate account product channels, as applicable, and the similarities and differences between these products and the services provided as compared to the Trust; (m) BlackRock’s compensation methodology for its investment professionals and the incentives and accountability it creates, along with investment professionals’ investments in the fund(s) they manage; and (n) periodic updates on BlackRock’s business.
The Board of each of BTZ and BGT considered BlackRock’s efforts during the past several years with regard to the redemption of outstanding auction rate preferred securities. Each of BTZ and BGT has redeemed all of its outstanding auction rate preferred securities.
Board Considerations in Approving the Agreements
The Approval Process: Prior to the April Meeting, each Board requested and received materials specifically relating to the Agreement(s) for its Trust. Each Board is continuously engaged in a process with its independent legal counsel and BlackRock to review the nature and scope of the information provided to better assist its deliberations. The materials provided to the Board of each Trust in connection with the April Meeting included, among other things: (a) information independently compiled and prepared by Broadridge Financial Solutions, Inc. (“Broadridge”), based on Lipper classifications, regarding the Trust’s fees and expenses as compared with a peer group of funds as determined by Broadridge (“Expense Peers”) and the investment performance of the Trust’s as compared with a peer group of funds (“Performance Peers”) and other metrics, as applicable; (b) information on the composition of the Expense Peers and Performance Peers, and a description of the Broadridge’s methodology; (c) information on the estimated profits realized by BlackRock and its affiliates pursuant to the Trust’s Agreement(s) and a discussion of fall-out benefits to BlackRock and its affiliates; (d) a general analysis provided by BlackRock concerning investment management fees received in connection with other types of investment products, such as institutional accounts, sub-advised mutual funds, closed-end funds, and open-end funds, under similar investment mandates, as applicable; (e) review of non-management fees; (f) the existence and impact and sharing of potential economies of scale, if any, and the sharing of potential economies of scale with the Trust; (g) a summary of aggregate amounts paid by the Trust to BlackRock; and (h) various additional information requested by the Board as appropriate regarding BlackRock’s and the Trust’s operations.
| | |
| 108 | | 2018 BLACKROCK ANNUAL REPORTTO SHAREHOLDERS |
Disclosure of Investment Advisory Agreements and Sub-Advisory Agreement (continued)
At the April Meeting, each Board reviewed materials relating to its consideration of the Agreement(s) for its Trust. As a result of the discussions that occurred during the April Meeting, and as a culmination of each Board’s year-long deliberative process, each Board presented BlackRock with questions and requests for additional information. BlackRock responded to these requests with additional written information in advance of the June Meeting.
At the June Meeting, each Board considered, among other things: (a) the nature, extent and quality of the services provided by BlackRock; (b) the investment performance of the Trust as compared with Performance Peers and other metrics, as applicable; (c) the advisory fee and the estimated cost of the services and estimated profits realized by BlackRock and its affiliates from their relationship with the Trust; (d) the Trust’s fees and expenses compared to Expense Peers; (e) the sharing of potential economies of scale; (f) fall-out benefits to BlackRock and its affiliates as a result of BlackRock’s relationship with the Trust; and (g) other factors deemed relevant by the Board Members.
Each Board also considered other matters it deemed important to the approval process, such as other payments made to BlackRock or its affiliates relating to securities lending and cash management, services related to the valuation and pricing of Trust portfolio holdings, and advice from independent legal counsel with respect to the review process and materials submitted for the Board’s review. Each Board noted the willingness of BlackRock personnel to engage in open, candid discussions with the Board. Each Board did not identify any particular information as determinative, and each Board Member may have attributed different weights to the various items considered.
A. Nature, Extent and Quality of the Services Provided by BlackRock: Each Board, including the Independent Board Members, reviewed the nature, extent and quality of services provided by BlackRock, including the investment advisory services and the resulting performance of its Trust. Throughout the year, each Board compared its Trust’s performance to the performance of a comparable group of closed-end funds, relevant benchmark, and performance metrics, as applicable. Each Board met with BlackRock’s senior management personnel responsible for investment activities, including the senior investment officers. Each Board also reviewed the materials provided by its Trust’s portfolio management team discussing the Trust’s performance and the Trust’s investment objective(s), strategies and outlook.
Each Board considered, among other factors, with respect to BlackRock: the number, education and experience of investment personnel generally and its Trust’s portfolio management team; BlackRock’s research capabilities; investments by portfolio managers in the funds they manage; portfolio trading capabilities; use of technology; commitment to compliance; credit analysis capabilities; risk analysis and oversight capabilities; and the approach to training and retaining portfolio managers and other research, advisory and management personnel. Each Board also considered BlackRock’s overall risk management program, including the continued efforts of BlackRock and its affiliates to address cybersecurity risks and the role of BlackRock’s Risk & Quantitative Analysis Group. Each Board engaged in a review of BlackRock’s compensation structure with respect to its Trust’s portfolio management team and BlackRock’s ability to attract and retain high-quality talent and create performance incentives.
In addition to investment advisory services, each Board considered the quality of the administrative and other non-investment advisory services provided to its Trust. BlackRock and its affiliates provide each Trust with certain administrative, shareholder, and other services (in addition to any such services provided to its Trust by third parties) and officers and other personnel as are necessary for the operations of the Trust. In particular, BlackRock and its affiliates provide each Trust with administrative services including, among others: (i) responsibility for disclosure documents, such as the prospectus and the statement of additional information in connection with the initial public offering and periodic shareholder reports; (ii) preparing communications with analysts to support secondary market trading of the Trust; (iii) oversight of daily accounting and pricing; (iv) responsibility for periodic filings with regulators and stock exchanges; (v) overseeing and coordinating the activities of other service providers including, among others, the Trust’s custodian, fund accountant, transfer agent, and auditor; (vi) organizing Board meetings and preparing the materials for such Board meetings; (vii) providing legal and compliance support; (viii) furnishing analytical and other support to assist the Board in its consideration of strategic issues such as the merger, consolidation or repurposing of certain closed-end funds; and (ix) performing administrative functions necessary for the operation of the Trust, such as tax reporting, expense management, fulfilling regulatory filing requirements, and shareholder call center and other services. Each Board reviewed the structure and duties of BlackRock’s fund administration, shareholder services, and legal & compliance departments and considered BlackRock’s policies and procedures for assuring compliance with applicable laws and regulations.
B. The Investment Performance of the Trusts and BlackRock: Each Board, including the Independent Board Members, also reviewed and considered the performance history of its Trust. In preparation for the April Meeting, the Board of each Trust was provided with reports independently prepared by Broadridge, which included a comprehensive analysis of its Trust’s performance as of December 31, 2017. The performance information is based on net asset value (NAV), and utilizes Lipper data. Lipper’s methodology calculates a fund’s total return assuming distributions are reinvested on the ex-date at a fund’s ex-date NAV. Broadridge ranks funds in quartiles, ranging from first to fourth, where first is the most desirable quartile position and fourth is the least desirable. In connection with its review, each Board received and reviewed information regarding the investment performance of its Trust as compared to its Performance Peers and a custom peer group of funds as defined by BlackRock (“Customized Peer Group”). Each Board and its Performance Oversight Committee regularly review, and meet with Trust management to discuss, the performance of the Trust throughout the year.
In evaluating performance, each Board recognized that the performance data reflects a snapshot of a period as of a particular date and that selecting a different performance period could produce significantly different results. Further, each Board recognized that it is possible that long-term performance can be impacted by even one period of significant outperformance or underperformance, so that a single investment theme has the ability to affect long-term performance disproportionately.
The Board of BTZ noted that for the one-, three- and five-year periods reported, BTZ ranked in the second, second and first quartiles, respectively, against its Customized Peer Group. BlackRock believes that the Customized Peer Group is an appropriate performance metric for BTZ.
The Board of BGT noted that for the one-, three- and five-year periods reported, BGT ranked in the third, second and second quartiles, respectively, against its Customized Peer Group. BlackRock believes that the Customized Peer Group is an appropriate performance metric for BGT. The Board and BlackRock reviewed the Trust’s underperformance during the applicable period.
The Board of BIT noted that for the one-year, three-year and since-inception periods reported, BIT ranked in the second, second and first quartiles, respectively, against its Customized Peer Group. BlackRock believes that the Customized Peer Group is an appropriate performance metric for BIT.
| | | | |
| DISCLOSUREOF INVESTMENT ADVISORY AGREEMENTSAND SUB-ADVISORY AGREEMENT | | | 109 | |
Disclosure of Investment Advisory Agreements and Sub-Advisory Agreement (continued)
C. Consideration of the Advisory/Management Fees and the Estimated Cost of the Services and Estimated Profits Realized by BlackRock and its Affiliates from their Relationship with the Trusts: Each Board, including the Independent Board Members, reviewed its Trust’s contractual management fee rate compared with those of its Expense Peers. The contractual management fee rate represents a combination of the advisory fee and any administrative fees, before taking into account any reimbursements or fee waivers. Each Board also compared its Trust’s total expense ratio, as well as its actual management fee rate as a percentage of total assets, to those of its Expense Peers. The total expense ratio represents a fund’s total net operating expenses, excluding any investment related expenses. The total expense ratio gives effect to any expense reimbursements or fee waivers that benefit a fund, and the actual management fee rate gives effect to any management fee reimbursements or waivers that benefit a fund. Each Board considered the services provided and the fees charged by BlackRock and its affiliates to other types of clients with similar investment mandates, as applicable, including institutional accounts and sub-advised mutual funds (including mutual funds sponsored by third parties).
Each Board received and reviewed statements relating to BlackRock’s financial condition. Each Board reviewed BlackRock’s profitability methodology and was also provided with an estimated profitability analysis that detailed the revenues earned and the expenses incurred by BlackRock for services provided to its Trust. Each Board reviewed BlackRock’s estimated profitability with respect to its Trust and other funds the Board currently oversees for the year ended December 31, 2017 compared to available aggregate estimated profitability data provided for the prior two years. Each Board reviewed BlackRock’s estimated profitability with respect to certain other U.S. fund complexes managed by the Manager and/or its affiliates. Each Board reviewed BlackRock’s assumptions and methodology of allocating expenses in the estimated profitability analysis, noting the inherent limitations in allocating costs among various advisory products. Each Board recognized that profitability may be affected by numerous factors including, among other things, fee waivers and expense reimbursements by the Manager, the types of funds managed, precision of expense allocations and business mix. As a result, calculating and comparing profitability at individual fund levels is difficult.
Each Board noted that, in general, individual fund or product line profitability of other advisors is not publicly available. Each Board reviewed BlackRock’s overall operating margin, in general, compared to that of certain other publicly-traded asset management firms. Each Board considered the differences between BlackRock and these other firms, including the contribution of technology at BlackRock, BlackRock’s expense management, and the relative product mix.
In addition, each Board considered the estimated cost of the services provided to its Trust by BlackRock, and BlackRock’s and its affiliates’ estimated profits relating to the management of its Trust and the other funds advised by BlackRock and its affiliates. As part of its analysis, each Board reviewed BlackRock’s methodology in allocating its costs of managing its Trust, to the Trust. Each Board considered whether BlackRock has the financial resources necessary to attract and retain high quality investment management personnel to perform its obligations under its Trust’s Agreement(s) and to continue to provide the high quality of services that is expected by the Board. Each Board further considered factors including but not limited to BlackRock’s commitment of time, assumption of risk, and liability profile in servicing its Trust in contrast to what is required of BlackRock with respect to other products with similar investment mandates across the open-end fund, closed-end fund, sub-advised mutual fund, collective investment trust, and institutional separate account product channels, as applicable.
The Board of BTZ noted that BTZ’s contractual management fee rate ranked in the third quartile, and that the actual management fee rate and total expense ratio ranked in the fourth and second quartiles, respectively, relative to the Expense Peers. The Board also noted, however, that given the comparability limitations of the Expense Peers, BlackRock provided the Board a supplemental peer group consisting of funds that are generally similar to BTZ. The Board noted that BTZ’s actual management fee rate and total expense ratio each ranked in the third quartile, relative to the supplemental peer group.
The Board of BGT noted that the Trust’s contractual management fee rate ranked in the first quartile, and that the actual management fee rate and total expense ratio each ranked in the first quartile, relative to the Expense Peers.
The Board of BIT noted that the Trust’s contractual management fee rate ranked in the third quartile, and that the actual management fee rate and total expense ratio each ranked in the third quartile, relative to the Expense Peers. The Board also noted, however, that given the comparability limitations of the Expense Peers, BlackRock provided the Board a supplemental peer group consisting of funds that are generally similar to BIT. The Board noted that the Trust’s actual management fee rate and total expense ratio ranked in the second and third quartiles, respectively, relative to the supplemental peer group.
D. Economies of Scale: The Board of each Trust, including the Independent Board Members, considered the extent to which economies of scale might be realized as the assets of its Trust increase. Each Board also considered the extent to which its Trust benefits from such economies in a variety of ways, and whether there should be changes in the advisory fee rate or breakpoint structure in order to enable the Trust to more fully participate in these economies of scale. Each Board considered its Trust’s asset levels and whether the current fee was appropriate.
Based on each Board’s review and consideration of the issue, each Board concluded that most closed-end funds do not have fund level breakpoints because closed-end funds generally do not experience substantial growth after the initial public offering. They are typically priced at scale at a fund’s inception.
E. Other Factors Deemed Relevant by the Board Members: Each Board, including the Independent Board Members, also took into account other ancillary or “fall-out” benefits that BlackRock or its affiliates may derive from BlackRock’s respective relationships with its Trust, both tangible and intangible, such as BlackRock’s ability to leverage its investment professionals who manage other portfolios and risk management personnel, an increase in BlackRock’s profile in the investment advisory community, and the engagement of BlackRock’s affiliates as service providers to the Trust, including for administrative, securities lending and cash management services. Each Board also considered BlackRock’s overall operations and its efforts to expand the scale of, and improve the quality of, its operations. Each Board also noted that, subject to applicable law, BlackRock may use and benefit from third party research obtained by soft dollars generated by certain registered fund transactions to assist in managing all or a number of its other client accounts.
In connection with its consideration of the Agreement(s) for its Trust, each Board also received information regarding BlackRock’s brokerage and soft dollar practices. Each Board received reports from BlackRock which included information on brokerage commissions and trade execution practices throughout the year.
Each Board noted the competitive nature of the closed-end fund marketplace, and that shareholders are able to sell their Trust shares in the secondary market if they believe that the Trust’s fees and expenses are too high or if they are dissatisfied with the performance of the Trust.
| | |
| 110 | | 2018 BLACKROCK ANNUAL REPORTTO SHAREHOLDERS |
Disclosure of Investment Advisory Agreements and Sub-Advisory Agreement (continued)
Each Board also considered the various notable initiatives and projects BlackRock performed in connection with its closed-end fund product line. These initiatives included the completion of the redemption of auction rate preferred securities for all of the BlackRock closed-end funds; developing equity shelf programs; efforts to eliminate product overlap with fund mergers; ongoing services to manage leverage that has become increasingly complex; periodic evaluation of share repurchases and other support initiatives for certain BlackRock funds; and continued communications efforts with shareholders, fund analysts and financial advisers. With respect to the latter, the Independent Board Members of each Trust noted BlackRock’s continued commitment to supporting the secondary market for the common shares of its closed-end funds through a comprehensive secondary market communication program designed to raise investor and analyst awareness and understanding of closed-end funds. BlackRock’s support services included, among other things: sponsoring and participating in conferences; communicating with closed-end fund analysts covering the BlackRock funds throughout the year; providing marketing and product updates for the closed-end funds; and maintaining and enhancing its closed-end fund website.
Conclusion
Each Board, including the Independent Board Members, unanimously approved the continuation of the Advisory Agreement between the Manager and its Trust for a one-year term ending June 30, 2019. The Board of BIT, including the Independent Board Members, also unanimously approved the continuation of the Sub-Advisory Agreement between the Manager and the Sub-Advisor, with respect to the Trust, for a one-year term ending June 30, 2019. Based upon its evaluation of all of the aforementioned factors in their totality, as well as other information, each Board, including the Independent Board Members, was satisfied that the terms of its Trust’s Agreement(s) were fair and reasonable and in the best interest of the Trust and its shareholders. In arriving at its decision to approve the Agreement(s), each Board did not identify any single factor or group of factors as, all-important or controlling, but considered all factors together, and different Board Members may have attributed different weights to the various factors considered. The Independent Board Members of each Trust were also assisted by the advice of independent legal counsel in making this determination.
| | | | |
| DISCLOSUREOF INVESTMENT ADVISORY AGREEMENTSAND SUB-ADVISORY AGREEMENT | | | 111 | |
Automatic Dividend Reinvestment Plan
Pursuant to each Trust’s Dividend Reinvestment Plan (the “Reinvestment Plan”), Common Shareholders are automatically enrolled to have all distributions of dividends and capital gains and other distributions reinvested by Computershare Trust Company, N.A. (the “Reinvestment Plan Agent”) in the respective Trust’s Common Shares pursuant to the Reinvestment Plan. Shareholders who do not participate in the Reinvestment Plan will receive all distributions in cash paid by check and mailed directly to the shareholders of record (or if the shares are held in street name or other nominee name, then to the nominee) by the Reinvestment Plan Agent, which serves as agent for the shareholders in administering the Reinvestment Plan.
After the Trusts declare a dividend or determine to make a capital gain or other distribution, the Reinvestment Plan Agent will acquire shares for the participants’ accounts, depending upon the following circumstances, either (i) through receipt of unissued but authorized shares from the Trusts (“newly issued shares”) or (ii) by purchase of outstanding shares on the open market or on the Trust’s primary exchange (“open-market purchases”). If, on the dividend payment date, the net asset value per share (“NAV”) is equal to or less than the market price per share plus estimated brokerage commissions (such condition often referred to as a “market premium”), the Reinvestment Plan Agent will invest the dividend amount in newly issued shares acquired on behalf of the participants. The number of newly issued shares to be credited to each participant’s account will be determined by dividing the dollar amount of the dividend by the NAV on the date the shares are issued. However, if the NAV is less than 95% of the market price on the dividend payment date, the dollar amount of the dividend will be divided by 95% of the market price on the dividend payment date. If, on the dividend payment date, the NAV is greater than the market price per share plus estimated brokerage commissions (such condition often referred to as a “market discount”), the Reinvestment Plan Agent will invest the dividend amount in shares acquired on behalf of the participants in open-market purchases. If the Reinvestment Plan Agent is unable to invest the full dividend amount in open-market purchases, or if the market discount shifts to a market premium during the purchase period, the Reinvestment Plan Agent will invest any un-invested portion in newly issued shares. Investments in newly issued shares made in this manner would be made pursuant to the same process described above and the date of issue for such newly issued shares will substitute for the dividend payment date.
You may elect not to participate in the Reinvestment Plan and to receive all dividends in cash by contacting the Reinvestment Plan Agent, at the address set forth below.
Participation in the Reinvestment Plan is completely voluntary and may be terminated or resumed at any time without penalty by notice if received and processed by the Reinvestment Plan Agent prior to the dividend record date. Additionally, the Reinvestment Plan Agent seeks to process notices received after the record date but prior to the payable date and such notices often will become effective by the payable date. Where late notices are not processed by the applicable payable date, such termination or resumption will be effective with respect to any subsequently declared dividend or other distribution.
The Reinvestment Plan Agent’s fees for the handling of the reinvestment of distributions will be paid by each Trust. However, each participant will pay a pro rata share of brokerage commissions incurred with respect to the Reinvestment Plan Agent’s open-market purchases in connection with the reinvestment of all distributions. The automatic reinvestment of all distributions will not relieve participants of any U.S. federal, state or local income tax that may be payable on such dividends or distributions.
Each Trust reserves the right to amend or terminate the Reinvestment Plan. There is no direct service charge to participants in the Reinvestment Plan; however, each Trust reserves the right to amend the Reinvestment Plan to include a service charge payable by the participants. Participants that request a sale of shares are subject to a $2.50 sales fee and a $0.15 per share fee. Per share fees include any applicable brokerage commissions the Reinvestment Plan Agent is required to pay. All correspondence concerning the Reinvestment Plan should be directed to Computershare Trust Company, N.A. through the internet at http://www.computershare.com/blackrock, or in writing to Computershare, P.O. Box 505000, Louisville, KY 40233, Telephone: (800) 699-1236. Overnight correspondence should be directed to the Reinvestment Plan Agent at Computershare, 462 South 4th Street, Suite 1600, Louisville, KY 40202.
| | |
| 112 | | 2018 BLACKROCK ANNUAL REPORTTO SHAREHOLDERS |
Trustee and Officer Information
| | | | | | | | |
| Independent Trustees (a) |
| | | | | |
Name
Year of Birth (b) | | Position(s) Held
(Length of Service) (c) | | Principal Occupation(s) During Past Five Years | | Number of BlackRock-Advised
Registered Investment Companies
(“RICs”) Consisting of
Investment Portfolios
(“Portfolios”) Overseen (d) | | Public Company and
Other Investment Company
Directorships Held During
Past Five Years |
Richard E. Cavanagh 1946 | | Chair of the Board and Trustee
(Since 2007) | | Director, The Guardian Life Insurance Company of America since 1998; Board Chair, Volunteers of America (a not-for-profit organization) from 2015 to 2018 (board member since 2009); Director, Arch Chemical (chemical and allied products) from 1999 to 2011; Trustee, Educational Testing Service from 1997 to 2009 and Chairman thereof from 2005 to 2009; Senior Advisor, The Fremont Group since 2008 and Director thereof since 1996; Faculty Member/Adjunct Lecturer, Harvard University since 2007 and Executive Dean from 1987 to 1995; President and Chief Executive Officer, The Conference Board, Inc. (global business research organization) from 1995 to 2007. | | 73 RICs consisting of 73 Portfolios | | None |
Karen P. Robards 1950 | | Vice Chair of the Board and Trustee
(Since 2007) | | Principal of Robards & Company, LLC (consulting and private investing) since 1987; Co-founder and Director of the Cooke Center for Learning and Development (a not-for-profit organization) since 1987; Investment Banker at Morgan Stanley from 1976 to 1987. | | 73 RICs consisting of 73 Portfolios | | Greenhill & Co., Inc.; AtriCure, Inc. (medical devices) from 2000 until 2017 |
Michael J. Castellano 1946 | | Trustee
(Since 2011) | | Chief Financial Officer of Lazard Group LLC from 2001 to 2011; Chief Financial Officer of Lazard Ltd from 2004 to 2011; Director, Support Our Aging Religious (non-profit) from 2009 to June 2015 and since 2017; Director, National Advisory Board of Church Management at Villanova University since 2010; Trustee, Domestic Church Media Foundation since 2012; Director, CircleBlack Inc. (financial technology company) since 2015. | | 73 RICs consisting of 73 Portfolios | | None |
Cynthia L. Egan 1955 | | Trustee
(Since 2016) | | Advisor, U.S. Department of the Treasury from 2014 to 2015; President, Retirement Plan Services for T. Rowe Price Group, Inc. from 2007 to 2012; executive positions within Fidelity Investments from 1989 to 2007. | | 73 RICs consisting of 73 Portfolios | | Unum (insurance); The Hanover Insurance Group (insurance); Envestnet (investment platform) from 2013 until 2016 |
Frank J. Fabozzi 1948 | | Trustee
(Since 2007) | | Editor of The Journal of Portfolio Management since 1986; Professor of Finance, EDHEC Business School (France) since 2011; Visiting Professor, Princeton University for the 2013 to 2014 academic year and Spring 2017 semester; Professor in the Practice of Finance, Yale University School of Management from 1994 to 2011 and currently a Teaching Fellow in Yale’s Executive Programs; affiliated professor Karlsruhe Institute of Technology from 2008 to 2011. | | 73 RICs consisting of 73 Portfolios | | None |
R. Glenn Hubbard 1958 | | Trustee
(Since 2007) | | Dean, Columbia Business School since 2004; Faculty member, Columbia Business School since 1988. | | 73 RICs consisting of 73 Portfolios | | ADP (data and information services); Metropolitan Life Insurance Company (insurance); KKR Financial Corporation (finance) from 2004 until 2014 |
W. Carl Kester 1951 | | Trustee
(Since 2007) | | George Fisher Baker Jr. Professor of Business Administration, Harvard Business School since 2008, Deputy Dean for Academic Affairs from 2006 to 2010, Chairman of the Finance Unit, from 2005 to 2006, Senior Associate Dean and Chairman of the MBA Program from 1999 to 2005; Member of the faculty of Harvard Business School since 1981. | | 73 RICs consisting of 73 Portfolios | | None |
| | | | |
| TRUSTEEAND OFFICER INFORMATION | | | 113 | |
Trustee and Officer Information (continued)
| | | | | | | | |
| Independent Trustees (a) (continued) |
| | | | | |
Name
Year of Birth (b) | | Position(s) Held
(Length of Service) (c) | | Principal Occupation(s) During Past Five Years | | Number of BlackRock-Advised
Registered Investment Companies
(“RICs”) Consisting of
Investment Portfolios
(“Portfolios”) Overseen (d) | | Public Company and
Other Investment Company
Directorships Held During
Past Five Years |
Catherine A. Lynch 1961 | | Trustee
(Since 2016) | | Chief Executive Officer, Chief Investment Officer and various other positions, National Railroad Retirement Investment Trust from 2003 to 2016; Associate Vice President for Treasury Management, The George Washington University from 1999 to 2003; Assistant Treasurer, Episcopal Church of America from 1995 to 1999. | | 73 RICs consisting of 73 Portfolios | | None |
|
| Interested Trustees (a)(e) |
| | | | | |
Name
Year of Birth (b) | | Position(s) Held
(Length of Service) (c) | | Principal Occupation(s) During Past Five Years | | Number of BlackRock-Advised
Registered Investment Companies
(“RICs”) Consisting of
Investment Portfolios
(“Portfolios”) Overseen (d) | | Public Company and
Investment Company
Directorships Held During
Past Five Years |
Robert Fairbairn 1965 | | Trustee
(Since 2018) | | Senior Managing Director of BlackRock, Inc. since 2010; oversees BlackRock’s Strategic Partner Program and Strategic Product Management Group; Member of BlackRock’s Global Executive and Global Operating Committees; Co-Chair of BlackRock’s Human Capital Committee; Member of the Board of Managers of BlackRock Investments, LLC since 2011; Global Head of BlackRock’s Retail and iShares® businesses from 2012 to 2016. | | 133 RICs consisting of 309 Portfolios | | None |
John M. Perlowski 1964 | | Trustee
(Since 2015);
President and Chief Executive Officer
(Since 2010) | | Managing Director of BlackRock, Inc. since 2009; Head of BlackRock Global Accounting and Product Services since 2009; Advisory Director of Family Resource Network (charitable foundation) since 2009. | | 133 RICs consisting of 309 Portfolios | | None |
(a) The address of each Trustee is c/o BlackRock, Inc., 55 East 52nd Street, New York, NY 10055. |
(b) Each Independent Trustee will serve until his or her successor is elected and qualifies, or until his or her earlier death, resignation, retirement or removal, or until December 31 of the year in which he or she turns 75. The maximum age limitation may be waived as to any Trustee by action of a majority of the Trustees upon finding of good cause therefor. |
(c) Following the combination of Merrill Lynch Investment Managers, L.P. (“MLIM”) and BlackRock, Inc. (“BlackRock”) in September 2006, the various legacy MLIM and legacy BlackRock fund boards were realigned and consolidated into three new fund boards in 2007. As a result, although the chart shows certain Independent Trustees as joining the Board in 2007, each Trustee first became a member of the boards of other legacy MLIM or legacy BlackRock funds as follows: Richard E. Cavanagh, 1994; Frank J. Fabozzi, 1988; R. Glenn Hubbard, 2004; W. Carl Kester, 1995 and Karen P. Robards, 1998. |
(d) For purposes of this chart, “RICs” refers to investment companies registered under the 1940 Act and “Portfolios” refers to the investment programs of the BlackRock-advised funds. The Closed-End Complex is comprised of 73 RICs consisting of 73 Portfolios. Mr. Fairbairn and Mr. Perlowski are also board members of the BlackRock Equity-Bond Complex and the BlackRock Equity-Liquidity Complex. |
(e) Mr. Fairbairn and Mr. Perlowski are both “interested persons,” as defined in the 1940 Act, of the Trust based on their positions with BlackRock and its affiliates. Mr. Fairbairn and Mr. Perlowski are also board members of the BlackRock Equity-Bond Complex and the BlackRock Equity-Liquidity Complex. Interested Trustees serve until their resignation, removal or death, or until December 31 of the year in which they turn 72. The maximum age limitation may be waived as to any Trustee by action of a majority of the Trustees upon a finding of good cause therefor. |
| | |
| 114 | | 2018 BLACKROCK ANNUAL REPORTTO SHAREHOLDERS |
Trustee and Officer Information (continued)
| | | | |
| Officers Who Are Not Trustees (a) |
| | | |
Name
Year of Birth (b) | | Position(s) Held
(Length of Service) | | Principal Occupation(s) During Past Five Years |
Jonathan Diorio 1980 | | Vice President
(Since 2015) | | Managing Director of BlackRock, Inc. since 2015; Director of BlackRock, Inc. from 2011 to 2015. |
Neal J. Andrews 1966 | | Chief Financial Officer
(Since 2007) | | Managing Director of BlackRock, Inc. since 2006. |
Jay M. Fife 1970 | | Treasurer
(Since 2007) | | Managing Director of BlackRock, Inc. since 2007. |
Charles Park 1967 | | Chief Compliance Officer
(Since 2014) | | Anti-Money Laundering Compliance Officer for the BlackRock-advised Funds in the Equity-Bond Complex, the Equity-Liquidity Complex and the Closed-End Complex from 2014 to 2015; Chief Compliance Officer of BlackRock Advisors, LLC and the BlackRock-advised Funds in the Equity-Bond Complex, the Equity-Liquidity Complex and the Closed-End Complex since 2014; Principal of and Chief Compliance Officer for iShares® Delaware Trust Sponsor LLC since 2012 and BlackRock Fund Advisors (“BFA”) since 2006; Chief Compliance Officer for the BFA-advised iShares® exchange traded funds since 2006; Chief Compliance Officer for BlackRock Asset Management International Inc. since 2012. |
Janey Ahn 1975 | | Secretary
(Since 2012) | | Managing Director of BlackRock, Inc. since 2018; Director of BlackRock, Inc. from 2009 to 2017. |
(a) The address of each Officer is c/o BlackRock, Inc., 55 East 52nd Street, New York, NY 10055. |
(b) Officers of the Trust serve at the pleasure of the Board. |
As of the date of this report, the portfolio managers of BGT are James Keenan, Josh Tarnow, David Delbos, Carly Wilson, Abigail Apistolas and Mitchell Garfin. Mr. Delbos, Ms. Wilson, Ms. Apistolas and Mr. Garfin each joined BGT’s portfolio management team effective August 31, 2018. Mr. Delbos has been a Managing Director of BlackRock, Inc. since 2012; a Director thereof from 2007 to 2011; and a Vice President from 2005 to 2006. Ms. Wilson has been a Director of BlackRock, Inc. since 2016; and a Vice President thereof from 2011 to 2015. Ms. Apistolas has been an Associate of BlackRock, Inc. since 2016; an Associate at Morgan Stanley from 2012 to 2016; and an Analyst thereof from 2012 to 2014. Mr. Garfin has been a Managing Director of BlackRock, Inc. since 2009.
As of the date of this report, the portfolio managers of BIT are Thomas Musmanno, Randy Robertson and Scott MacLellan. Mr. MacLellan joined BIT’s portfolio management team effective August 10, 2018. Mr. MacLellan has been a Director of BlackRock, Inc. since 2010.
Effective January 1, 2019, Henry Gabbay is appointed as an Independent Trustee of the Trusts.
Investment Adviser
BlackRock Advisors, LLC
Wilmington, DE 19809
Sub-Adviser
BlackRock (Singapore) Limited(a)
079912 Singapore
Accounting Agent and Custodian
State Street Bank and Trust Company
Boston, MA 02111
Transfer Agent
Computershare Trust Company, N.A.
Canton, MA 02021
Independent Registered Public Accounting Firm
Deloitte & Touche LLP
Boston, MA 02116
Legal Counsel
Skadden, Arps, Slate, Meagher & Flom LLP
Boston, MA 02116
Address of the Trusts
100 Bellevue Parkway
Wilmington, DE 19809
| | | | |
| TRUSTEEAND OFFICER INFORMATION | | | 115 | |
Additional Information
Proxy Results
The Annual Meeting of Shareholders was held on July 30, 2018 for shareholders of record on May 31, 2018, to elect trustee nominees for each Trust. There were no broker non-votes with regard to any of the Trusts.
Shareholders elected the Class II Trustees & Class III Trustee as follows:
| | | | | | | | | | | | | | | | | | | | | | | | | | | | | | | | |
| | | Frank J. Fabozzi (a) | | | Robert Fairbairn (b) | | | Catherine A. Lynch (a) | | | Karen P. Robards (a) | |
| | | Votes For | | | Votes Withheld | | | Votes For | | | Votes Withheld | | | Votes For | | | Votes Withheld | | | Votes For | | | Votes Withheld | |
BTZ | | | 94,340,171 | | | | 6,818,180 | | | | 96,200,439 | | | | 4,957,912 | | | | 96,352,248 | | | | 4,806,103 | | | | 96,332,330 | | | | 4,826,021 | |
BGT | | | 21,284,832 | | | | 569,080 | | | | 21,389,760 | | | | 464,152 | | | | 21,387,951 | | | | 465,961 | | | | 21,369,081 | | | | 484,831 | |
BIT | | | 34,083,702 | | | | 540,842 | | | | 34,091,758 | | | | 532,786 | | | | 34,076,133 | | | | 548,411 | | | | 34,068,920 | | | | 555,624 | |
For the Trusts listed above, Trustees whose term of office continued after the Annual Meeting of Shareholders because they were not up for election are Michael J. Castellano, Richard E. Cavanagh, Cynthia L. Egan, R. Glenn Hubbard, John M. Perlowski and W. Carl Kester.
Trust Certification
The Trusts are listed for trading on the NYSE and has filed with the NYSE its annual chief executive officer certification regarding compliance with the NYSE’s listing standards. The Trusts filed with the SEC the certification of their chief executive officer and chief financial officer required by section 302 of the Sarbanes-Oxley Act.
Dividend Policy
Each Trust’s dividend policy is to distribute all or a portion of its net investment income to its shareholders on a monthly basis. In order to provide shareholders with a more stable level of dividend distributions, the distributions paid by the Trusts for any particular month may be more or less than the amount of net investment income earned by the Trusts during such month. The portion of distributions that exceeds a Trust’s current and accumulated earnings and profits, which are measured on a tax basis, will constitute a nontaxable return of capital. Distributions in excess of a Trust’s taxable income and net capital gains, but not in excess of a Trust’s earnings and profits, will be taxable to shareholders as ordinary income and will not constitute a nontaxable return of capital. The Trusts’ current accumulated but undistributed net investment income, if any, is disclosed in the Statements of Assets and Liabilities, which comprises part of the financial information included in this report.
General Information
The Trusts do not make available copies of their Statements of Additional Information because the Trusts’ shares are not continuously offered, which means that the Statement of Additional Information of each Trust has not been updated after completion of the respective Trust’s offerings and the information contained in each Trust’s Statement of Additional Information may have become outdated.
During the period there were no material changes in the Trusts’ investment objectives or policies or to the Trusts’ charter or by-laws that would delay or prevent a change of control of the Trusts that were not approved by the shareholders or in the principal risk factors associated with investment in the Trusts. Except as disclosed on page 115, there have been no changes in the persons who are primarily responsible for the day-to-day management of the Trusts’ portfolios.
In accordance with Section 23(c) of the Investment Company Act of 1940, each Trust may from time to time purchase shares of its common shares in open market or in private transactions.
Quarterly performance, semi-annual and annual reports, current net asset value and other information regarding the Trusts may be found on BlackRock’s website, which can be accessed at http://www.blackrock.com. Any reference to BlackRock’s website in this report is intended to allow investors public access to information regarding the Trusts and does not, and is not intended to, incorporate BlackRock’s website in this report.
Electronic Delivery
Shareholders can sign up for e-mail notifications of quarterly statements, annual and semi-annual shareholder reports by enrolling in the electronic delivery program. Electronic copies of shareholder reports are available on BlackRock’s website.
To enroll in electronic delivery:
Shareholders Who Hold Accounts with Investment Advisers, Banks or Brokerages:
Please contact your financial adviser. Please note that not all investment advisers, banks or brokerages may offer this service.
Householding
The Trusts will mail only one copy of shareholder documents, annual and semi-annual reports and proxy statements, to shareholders with multiple accounts at the same address. This practice is commonly called “householding” and is intended to reduce expenses and eliminate duplicate mailings of shareholder documents. Mailings of your shareholder documents may be householded indefinitely unless you instruct us otherwise. If you do not want the mailing of these documents to be combined with those for other members of your household, please call the Trusts at (800) 882-0052.
| | |
| 116 | | 2018 BLACKROCK ANNUAL REPORTTO SHAREHOLDERS |
Additional Information (continued)
Availability of Quarterly Schedule of Investments
The Trusts file their complete schedule of portfolio holdings with the SEC for the first and third quarters of each fiscal year on Form N-Q. The Trusts’ Forms N-Q are available on the SEC’s website at http://www.sec.gov. The Trusts’ Forms N-Q may also be obtained upon request and without charge by calling (800) 882-0052.
Availability of Proxy Voting Policies and Procedures
A description of the policies and procedures that the Trusts use to determine how to vote proxies relating to portfolio securities is available upon request and without charge (1) by calling (800) 882-0052; (2) at http://www.blackrock.com; and (3) on the SEC’s website at http://www.sec.gov.
Availability of Proxy Voting Record
Information about how the Trusts voted proxies relating to securities held in the Trusts’ portfolios during the most recent 12-month period ended June 30 is available upon request and without charge (1) at http://www.blackrock.com or by calling (800) 882-0052 and (2) on the SEC’s website at http://www.sec.gov.
Availability of Trust Updates
BlackRock will update performance and certain other data for the Trusts on a monthly basis on its website in the “Closed-end Funds” section of http://www.blackrock.com as well as certain other material information as necessary from time to time. Investors and others are advised to check the website for updated performance information and the release of other material information about the Trusts. This reference to BlackRock’s website is intended to allow investors public access to information regarding the Trusts and does not, and is not intended to, incorporate BlackRock’s website in this report.
Section 19(a) Notices
The amounts and sources of distributions reported in this notice are for financial reporting purposes and are not being provided for tax reporting purposes. The actual amounts and character of the distributions for tax reporting purposes will be reported to shareholders on Form 1099-DIV which is sent to shareholders shortly after calendar year end.
October 31, 2018
| | | | | | | | | | | | | | | | | | | | | | | | | | | | | | | | | | | | | | | | |
| | | Total Fiscal Year to Date
Cumulative Distributions by Character | | | Percentage of Fiscal Year to Date
Cumulative Distributions by Character | |
| Ticker | | Net
Investment
Income | | | Net Realized
Capital Gains
Short Term | | | Net Realized
Capital Gains
Long Term | | | Return of
Capital | | | Total Per
Common
Share | | | Net
Investment
Income | | | Net Realized
Capital Gains
Short Term | | | Net Realized
Capital Gains
Long Term | | | Return of
Capital | | | Total Per
Common
Share | |
BTZ | | $ | 0.804000 | | | | — | | | | — | | | | — | | | $ | 0.804000 | | | | 100 | % | | | 0 | % | | | 0 | % | | | 0 | % | | | 100 | % |
BIT | | | 1.531405 | | | | — | | | | — | | | | — | | | | 1.531405 | | | | 100 | | | | 0 | | | | 0 | | | | 0 | | | | 100 | |
The Trusts estimate that they have distributed more than the amount of earned income and net realized gains; therefore, a portion of the distribution may be a return of capital. A return of capital may occur, for example, when some or all of the shareholder’s investment in the Trusts are returned to the shareholder. A return of capital does not necessarily reflect the Trusts’ investment performance and should not be confused with ‘yield’ or ‘income.’ When distributions exceed total return performance, the difference will reduce the Trusts’ NAV per share.
Section 19(a) notices for the Trusts, as applicable, are available on the BlackRock website at http://www.blackrock.com.
BlackRock Privacy Principles
BlackRock is committed to maintaining the privacy of its current and former fund investors and individual clients (collectively, “Clients”) and to safeguarding their non-public personal information. The following information is provided to help you understand what personal information BlackRock collects, how we protect that information and why in certain cases we share such information with select parties.
If you are located in a jurisdiction where specific laws, rules or regulations require BlackRock to provide you with additional or different privacy-related rights beyond what is set forth below, then BlackRock will comply with those specific laws, rules or regulations.
BlackRock obtains or verifies personal non-public information from and about you from different sources, including the following: (i) information we receive from you or, if applicable, your financial intermediary, on applications, forms or other documents; (ii) information about your transactions with us, our affiliates, or others; (iii) information we receive from a consumer reporting agency; and (iv) from visits to our websites.
BlackRock does not sell or disclose to non-affiliated third parties any non-public personal information about its Clients, except as permitted by law or as is necessary to respond to regulatory requests or to service Client accounts. These non-affiliated third parties are required to protect the confidentiality and security of this information and to use it only for its intended purpose.
We may share information with our affiliates to service your account or to provide you with information about other BlackRock products or services that may be of interest to you. In addition, BlackRock restricts access to non-public personal information about its Clients to those BlackRock employees with a legitimate business need for the information. BlackRock maintains physical, electronic and procedural safeguards that are designed to protect the non-public personal information of its Clients, including procedures relating to the proper storage and disposal of such information.
| | | | |
| ADDITIONAL INFORMATION | | | 117 | |
Glossary of Terms Used in this Report
| | |
| Currency |
| |
| EGP | | Egyptian Pound |
EUR | | Euro |
GBP | | British Pound |
IDR | | Indonesian Rupiah |
MXN | | Mexican Peso |
RUB | | Russian Ruble |
USD | | U.S. Dollar |
| ZAR | | South African Rand |
| | |
| Portfolio Abbreviations |
| |
ARB | | Airport Revenue Bonds |
CLO | | Collateralized Loan Obligation |
ETF | | Exchange-Traded Fund |
EURIBOR | | Euro Interbank Offered Rate |
LIBOR | | London Interbank Offered Rate |
MTN | | Medium-Term Note |
PIK | | Payment-In-Kind |
RB | | Revenue Bonds |
REMIC | | Real Estate Mortgage Investment Conduit |
| | |
| 118 | | 2018 BLACKROCK ANNUAL REPORTTO SHAREHOLDERS |
This report is intended for current holders. It is not a prospectus. Past performance results shown in this report should not be considered a representation of future performance. The Trusts have leveraged their Common Shares, which creates risks for Common Shareholders, including the likelihood of greater volatility of net asset value and market price of the Common Shares, and the risk that fluctuations in short-term interest rates may reduce the Common Shares’ yield. Statements and other information herein are as dated and are subject to change.

| | |
| CE-CAFRI-3-10/18-AR | |  |
| Item 2 – | Code of Ethics – The registrant (or the “Fund”) has adopted a code of ethics, as of the end of the period covered by this report, applicable to the registrant’s principal executive officer, principal financial officer, principal accounting officer or controller, or persons performing similar functions. During the period covered by this report, the code of ethics was amended to update certain information and to make other non-material changes. During the period covered by this report, there have been no waivers granted under the code of ethics. The registrant undertakes to provide a copy of the code of ethics to any person upon request, without charge, who calls 1-800-882-0052, option 4. |
| Item 3 – | Audit Committee Financial Expert – The registrant’s board of directors (the “board of directors”), has determined that (i) the registrant has the following audit committee financial experts serving on its audit committee and (ii) each audit committee financial expert is independent: |
Michael Castellano
Frank J. Fabozzi
Catherine A. Lynch
Karen P. Robards
The registrant’s board of directors has determined that Karen P. Robards qualifies as a financial experts pursuant to Item 3(c)(4) of Form N-CSR.
Ms. Robards has a thorough understanding of generally accepted accounting principles, financial statements and internal control over financial reporting as well as audit committee functions. Ms. Robards has been President of Robards & Company, a financial advisory firm, since 1987. Ms. Robards was formerly an investment banker for more than 10 years where she was responsible for evaluating and assessing the performance of companies based on their financial results. Ms. Robards has over 30 years of experience analyzing financial statements. She also is a member of the audit committee of one publicly held company and a non-profit organization.
Under applicable securities laws, a person determined to be an audit committee financial expert will not be deemed an “expert” for any purpose, including without limitation for the purposes of Section 11 of the Securities Act of 1933, as a result of being designated or identified as an audit committee financial expert. The designation or identification as an audit committee financial expert does not impose on such person any duties, obligations, or liabilities greater than the duties, obligations, and liabilities imposed on such person as a member of the audit committee and board of directors in the absence of such designation or identification. The designation or identification of a person as an audit committee financial expert does not affect the duties, obligations, or liability of any other member of the audit committee or board of directors.
| Item 4 – | Principal Accountant Fees and Services |
The following table presents fees billed by Deloitte & Touche LLP (“D&T”) in each of the last two fiscal years for the services rendered to the Fund:
| | | | | | | | | | | | | | | | |
| | | (a) Audit Fees | | (b) Audit-Related Fees1 | | (c) Tax Fees2 | | (d) All Other Fees |
| Entity Name | | Current | | Previous | | Current | | Previous | | Current | | Previous | | Current | | Previous |
2
| | | | | | | | | | | | | | | | |
| | | Fiscal Year
End | | Fiscal Year
End | | Fiscal Year
End | | Fiscal Year
End | | Fiscal Year
End | | Fiscal Year
End | | Fiscal Year
End | | Fiscal Year
End |
| BlackRock Floating Rate Income Trust | | $72,828 | | $72,841 | | $0 | | $0 | | $14,500 | | $14,484 | | $0 | | $0 |
The following table presents fees billed by D&T that were required to be approved by the registrant’s audit committee (the “Committee”) for services that relate directly to the operations or financial reporting of the Fund and that are rendered on behalf of BlackRock Advisors LLC ( the “Investment Adviser” or “BlackRock”) and entities controlling, controlled by, or under common control with BlackRock (not including any sub-adviser whose role is primarily portfolio management and is subcontracted with or overseen by another investment adviser) that provide ongoing services to the Fund (“Affiliated Service Providers”):
| | | | |
| | | Current Fiscal Year End | | Previous Fiscal Year End |
| (b) Audit-Related Fees1 | | $0 | | $0 |
| (c) Tax Fees2 | | $0 | | $0 |
| (d) All Other Fees3 | | $2,274,000 | | $2,129,000 |
1 The nature of the services includes assurance and related services reasonably related to the performance of the audit or review of financial statements not included in Audit Fees, including accounting consultations, agreed-upon procedure reports, attestation reports, comfort letters, out-of-pocket expenses and internal control reviews not required by regulators.
2 The nature of the services includes tax compliance and/or tax preparation, including services relating to the filing or amendment of federal, state or local income tax returns, regulated investment company qualification reviews, taxable income and tax distribution calculations.
3 Non-audit fees of $2,274,000 and $2,129,000 for the current fiscal year and previous fiscal year, respectively, were paid to the Fund’s principal accountant in their entirety by BlackRock, in connection with services provided to the Affiliated Service Providers of the Fund and of certain other funds sponsored and advised by BlackRock or its affiliates for a service organization review and an accounting research tool subscription. These amounts represent aggregate fees paid by BlackRock and were not allocated on a per fund basis.
(e)(1) Audit Committee Pre-Approval Policies and Procedures:
The Committee has adopted policies and procedures with regard to the pre-approval of services. Audit, audit-related and tax compliance services provided to the registrant on an annual basis require specific pre-approval by the Committee. The Committee also must approve other non-audit services provided to the registrant and those non-audit services provided to the Investment Adviser and Affiliated Service Providers that relate directly to the operations and the financial reporting of the registrant. Certain of these non-audit services that the Committee believes are (a) consistent with the SEC’s auditor independence rules and (b) routine and recurring services that will not impair the independence of the independent accountants may be approved by the Committee without consideration on a specific case-by-case basis (“general pre-approval”). The term of any general pre-approval is 12 months from the date of the pre-approval, unless the Committee provides for a different period. Tax or other non-audit services provided to the registrant which have a direct impact on the operations or financial reporting of the registrant will only be deemed pre-approved provided that any individual project does not exceed $10,000 attributable to the registrant or $50,000 per project. For this purpose, multiple projects will be aggregated to determine if they exceed the previously mentioned cost levels.
Any proposed services exceeding the pre-approved cost levels will require specific pre-approval by the Committee, as will any other services not subject to general pre-approval (e.g., unanticipated but permissible services). The Committee is informed of each service approved subject to general pre-approval at the next regularly scheduled in-person board meeting. At this meeting, an analysis of such services is presented to the Committee for ratification. The Committee may delegate to the Committee Chairman the authority to approve the provision of and fees for any
3
specific engagement of permitted non-audit services, including services exceeding pre-approved cost levels.
(e)(2) None of the services described in each of Items 4(b) through (d) were approved by the Committee pursuant to the de minimis exception in paragraph (c)(7)(i)(C) of Rule 2-01 of Regulation S-X.
(f) Not Applicable
(g) The aggregate non-audit fees, defined as the sum of the fees shown under “Audit-Related Fees,” “Tax Fees” and “All Other Fees,” paid to the accountant for services rendered by the accountant to the registrant, the Investment Adviser and the Affiliated Service Providers were:
| | | | | | |
| | | Entity Name | | Current Fiscal Year
End | | Previous Fiscal Year
End |
| | BlackRock Floating Rate Income Trust | | $14,500 | | $14,484 |
Additionally, the amounts billed by D&T in connection with services provided to the Affiliated Service Providers of the Fund and of other funds sponsored or advised by BlackRock or its affiliates during the current and previous fiscal years for a service organization review and an accounting research tool subscription were:
| | |
Current Fiscal Year End | | Previous Fiscal Year End |
$2,274,000 | | $2,129,000 |
These amounts represent aggregate fees paid by BlackRock and were not allocated on a per fund basis.
(h) The Committee has considered and determined that the provision of non-audit services that were rendered to the Investment Adviser, and the Affiliated Service Providers that were not pre-approved pursuant to paragraph (c)(7)(ii) of Rule 2-01 of Regulation S-X is compatible with maintaining the principal accountant’s independence.
| Item 5 – | Audit Committee of Listed Registrants |
| | (a) | The following individuals are members of the registrant’s separately-designated standing audit committee established in accordance with Section 3(a)(58)(A) of the Securities Exchange Act of 1934 (15 U.S.C. 78c(a)(58)(A)): | |
Michael Castellano
Frank J. Fabozzi
Catherine A. Lynch
Karen P. Robards
4
(a) The registrant’s Schedule of Investments is included as part of the Report to Stockholders filed under Item 1 of this Form.
(b) Not Applicable due to no such divestments during the semi-annual period covered since the previous Form N-CSR filing.
| Item 7 – | Disclosure of Proxy Voting Policies and Procedures for Closed-End Management Investment Companies – The board of directors has delegated the voting of proxies for the Fund’s portfolio securities to the Investment Adviser pursuant to the Investment Adviser’s proxy voting guidelines. Under these guidelines, the Investment Adviser will vote proxies related to Fund securities in the best interests of the Fund and its stockholders. From time to time, a vote may present a conflict between the interests of the Fund’s stockholders, on the one hand, and those of the Investment Adviser, or any affiliated person of the Fund or the Investment Adviser, on the other. In such event, provided that the Investment Adviser’s Equity Investment Policy Oversight Committee, or a sub-committee thereof (the “Oversight Committee”) is aware of the real or potential conflict or material non-routine matter and if the Oversight Committee does not reasonably believe it is able to follow its general voting guidelines (or if the particular proxy matter is not addressed in the guidelines) and vote impartially, the Oversight Committee may retain an independent fiduciary to advise the Oversight Committee on how to vote or to cast votes on behalf of the Investment Adviser’s clients. If the Investment Adviser determines not to retain an independent fiduciary, or does not desire to follow the advice of such independent fiduciary, the Oversight Committee shall determine how to vote the proxy after consulting with the Investment Adviser’s Portfolio Management Group and/or the Investment Adviser’s Legal and Compliance Department and concluding that the vote cast is in its client’s best interest notwithstanding the conflict. A copy of the Fund’s Proxy Voting Policy and Procedures are attached as Exhibit 99.PROXYPOL. Information on how the Fund voted proxies relating to portfolio securities during the most recent 12-month period ended June 30 is available without charge, (i) at www.blackrock.com and (ii) on the SEC’s website at http://www.sec.gov. |
| Item 8 – | Portfolio Managers of Closed-End Management Investment Companies |
.(a)(1) As of the date of filing this Report:
The registrant is managed by a team of investment professionals comprised of Joshua Tarnow, Managing Director at BlackRock, James E. Keenan, Managing Director at BlackRock, David Delbos, Managing Director at BlackRock, Mitchell S. Garfin, Managing Director at BlackRock, Carly Wilson, Director at BlackRock and Abigail Apistolas, Associate at Blackrock.. Messrs. Tarnow, Keenan, Delbos and Garfin and Mses. Wilson and Apistolas are the Fund’s co-portfolio managers and are responsible for the day-to-day management of the Fund’s portfolio and the selection of its investments. Messrs. Keenan and Tarnow have been members of the Fund’s management team since 2007 and 2016, respectively. Messrs. Delbos and Garfin and Mses. Wilson and Apistolas became portfolio managers to the Fund on August 31, 2018.
| | |
Portfolio Manager | | Biography |
Joshua Tarnow | | Managing Director of BlackRock, Inc. since 2009; Senior Partner at R3 Capital Partners from 2008 to 2009; Managing Director at Lehman Brothers from 2006 to 2008. |
5
| | |
| James E. Keenan | | Managing Director of BlackRock since 2008 and Head of the Leveraged Finance Portfolio team; Director of BlackRock from 2006 to 2007; Vice President of BlackRock, Inc. from 2004 to 2005. |
| David Delbos | | Managing Director of BlackRock, Inc. since 2012; Director of BlackRock, Inc. from 2007 to 2011; Vice President of BlackRock, Inc. from 2005 to 2006. |
| Mitchell S. Garfin | | Managing Director of BlackRock, Inc. since 2009; Director of BlackRock, Inc. from 2005 to 2008. |
| Carly Wilson | | Director of BlackRock, Inc. since 2016; Vice President of BlackRock, Inc. from 2011 to 2015; Associate at BlackRock, Inc. from 2009 to 2010; Associate at R3 Capital Partners from 2008 to 2009; Associate at Lehman Brothers from 2004 to 2008. |
| Abigail Apistolas | | Associate of BlackRock, Inc. since 2016; Associate at Morgan Stanley from 2012 to 2016; Analyst at Morgan Stanley from 2012 to 2014. |
(a)(2) As of October 31, 2018:
| | | | | | | | | | | | | | | | | | | | | | | | |
| | | (ii) Number of Other Accounts Managed and Assets by Account Type | | (iii) Number of Other Accounts and Assets for Which Advisory Fee is Performance-Based | | |
(i) Name of Portfolio Manager | | Other Registered Investment Companies | | | | Other
Pooled Investment Vehicles | | | | Other Accounts | | | | Other Registered Investment Companies | | | | Other
Pooled Investment Vehicles | | | | Other Accounts | | |
Joshua Tarnow | | 5 | | | | 4 | | | | 1 | | | | 0 | | | | 0 | | | | 0 | | |
| | | $8.39 Billion | | | | $88.76 Million | | | | $395.4 Million | | | | $0 | | | | $0 | | | | $0 | | |
James E. Keenan | | 14 | | | | 19 | | | | 19 | | | | 0 | | | | 0 | | | | 5 | | |
| | | $25.70 Billion | | | | $10.44 Billion | | | | $9.62 Billion | | | | $0 | | | | $0 | | | | $1.04 Billion | | |
David Delbos | | 15 | | | | 8 | | | | 24 | | | | 0 | | | | 0 | | | | 5 | | |
| | | $25.72 Billion | | | | $5.84 Billion | | | | $13.05 Billion | | | | $0 | | | | $0 | | | | $1.04 Billion | | |
Mitchell S. Garfin | | 16 | | | | 11 | | | | 25 | | | | 0 | | | | 0 | | | | 5 | | |
| | | $28.63 Billion | | | | $5.94 Billion | | | | $13.83 Billion | | | | $0 | | | | $0 | | | | $1.04 Billion | | |
Carly Wilson | | 8 | | | | 14 | | | | 3 | | | | 0 | | | | 0 | | | | 0 | | |
| | | $12.07 Billion | | | | $5.60 Billion | | | | $261.9 Billion | | | | $0 | | | | $0 | | | | $0 | | |
Abigail Apistolas | | 8 | | | | 9 | | | | 10 | | | | 0 | | | | 0 | | | | 0 | | |
| | | $4.17 Billion | | | | $3.93 Billion | | | | $2.49 Billion | | | | $0 | | | | $0 | | | | $0 | | |
(iv) Portfolio Manager Potential Material Conflicts of Interest
BlackRock has built a professional working environment, firm-wide compliance culture and compliance procedures and systems designed to protect against potential incentives that may favor one account over another. BlackRock has adopted policies and procedures that address the allocation of investment opportunities, execution of portfolio transactions, personal trading by employees and other potential conflicts of interest that are designed to ensure that all client accounts are treated equitably over time. Nevertheless, BlackRock furnishes investment management and advisory services to numerous clients in addition to the Fund, and BlackRock may, consistent with applicable law, make investment recommendations to other clients or accounts (including accounts which are hedge funds or have performance or higher fees paid to BlackRock, or in which portfolio managers have a personal interest in
6
the receipt of such fees), which may be the same as or different from those made to the Fund. In addition, BlackRock, Inc., its affiliates and significant shareholders and any officer, director, shareholder or employee may or may not have an interest in the securities whose purchase and sale BlackRock recommends to the Fund. BlackRock, Inc., or any of its affiliates or significant shareholders, or any officer, director, shareholder, employee or any member of their families may take different actions than those recommended to the Fund by BlackRock with respect to the same securities. Moreover, BlackRock may refrain from rendering any advice or services concerning securities of companies of which any of BlackRock, Inc.’s (or its affiliates’ or significant shareholders’) officers, directors or employees are directors or officers, or companies as to which BlackRock, Inc. or any of its affiliates or significant shareholders or the officers, directors and employees of any of them has any substantial economic interest or possesses material non-public information. Certain portfolio managers also may manage accounts whose investment strategies may at times be opposed to the strategy utilized for a fund. It should also be noted that Messrs. Tarnow, Keenan, Delbos and Garfin and Mses. Wilson and Apistolas may be managing hedge fund and/or long only accounts, or may be part of a team managing hedge fund and/or long only accounts, subject to incentive fees. Messrs. Tarnow, Keenan, Delbos and Garfin and Mses. Wilson and Apistolas may therefore be entitled to receive a portion of any incentive fees earned on such accounts.
As a fiduciary, BlackRock owes a duty of loyalty to its clients and must treat each client fairly. When BlackRock purchases or sells securities for more than one account, the trades must be allocated in a manner consistent with its fiduciary duties. BlackRock attempts to allocate investments in a fair and equitable manner among client accounts, with no account receiving preferential treatment. To this end, BlackRock, Inc. has adopted policies that are intended to ensure reasonable efficiency in client transactions and provide BlackRock with sufficient flexibility to allocate investments in a manner that is consistent with the particular investment discipline and client base, as appropriate.
(a)(3) As of October 31, 2018:
Portfolio Manager Compensation Overview
The discussion below describes the portfolio managers’ compensation as of October 31, 2018.
BlackRock’s financial arrangements with its portfolio managers, its competitive compensation and its career path emphasis at all levels reflect the value senior management places on key resources. Compensation may include a variety of components and may vary from year to year based on a number of factors. The principal components of compensation include a base salary, a performance-based discretionary bonus, participation in various benefits programs and one or more of the incentive compensation programs established by BlackRock.
Base Compensation. Generally, portfolio managers receive base compensation based on their position with the firm.
Discretionary Incentive Compensation
Discretionary incentive compensation is a function of several components: the performance of BlackRock, Inc., the performance of the portfolio manager’s group within BlackRock, the
7
investment performance, including risk-adjusted returns, of the firm’s assets under management or supervision by that portfolio manager relative to predetermined benchmarks, and the individual’s performance and contribution to the overall performance of these portfolios and BlackRock. In most cases, these benchmarks are the same as the benchmark or benchmarks against which the performance of the Funds or other accounts managed by the portfolio managers are measured. Among other things, BlackRock’s Chief Investment Officers make a subjective determination with respect to each portfolio manager’s compensation based on the performance of the funds and other accounts managed by each portfolio manager relative to the various benchmarks. Performance of fixed income funds is measured on a pre-tax and/or after-tax basis over various time periods including 1-, 3- and 5- year periods, as applicable. With respect to these portfolio managers, such benchmarks for the Fund and other accounts are:
| | |
| Portfolio Manager | | Benchmark |
James Keenan
David Delbos
Mitchell S. Garfin | | A combination of market-based indices (e.g., The Bloomberg Barclays U.S. Corporate High Yield 2% Issuer Cap Index), certain customized indices and certain fund industry peer groups. |
Joshua Tarnow Carly Wilson | | A combination of market-based indices (e.g. Bank of America Merrill Lynch 3 Month U.S. Treasury Bill Index). |
Abigail Apistolas | | A combination of market-based indices (e.g., S&P Leveraged All Loan Index), certain customized indices and certain fund industry peer groups. |
Distribution of Discretionary Incentive Compensation. Discretionary incentive compensation is distributed to portfolio managers in a combination of cash, deferred BlackRock, Inc. stock awards, and/or deferred cash awards that notionally track the return of certain BlackRock investment products.
Portfolio managers receive their annual discretionary incentive compensation in the form of cash. Portfolio managers whose total compensation is above a specified threshold also receive deferred BlackRock, Inc. stock awards annually as part of their discretionary incentive compensation. Paying a portion of discretionary incentive compensation in the form of deferred BlackRock, Inc. stock puts compensation earned by a portfolio manager for a given year “at risk” based on BlackRock’s ability to sustain and improve its performance over future periods. In some cases, additional deferred BlackRock, Inc. stock may be granted to certain key employees as part of a long-term incentive award to aid in retention, align interests with long-term shareholders and motivate performance. Deferred BlackRock, Inc. stock awards are generally granted in the form of BlackRock, Inc. restricted stock units that vest pursuant to the terms of the applicable plan and, once vested, settle in BlackRock, Inc. common stock. The portfolio managers of this Fund have deferred BlackRock, Inc. stock awards.
For certain portfolio managers, a portion of the discretionary incentive compensation is also distributed in the form of deferred cash awards that notionally track the returns of select BlackRock investment products they manage, which provides direct alignment of portfolio manager discretionary incentive compensation with investment product results. Deferred cash awards vest ratably over a number of years and, once vested, settle in the form of cash. Only portfolio managers who manage specified products and whose total compensation is above a specified threshold are eligible to participate in the deferred cash award program.
8
Other Compensation Benefits. In addition to base salary and discretionary incentive compensation, portfolio managers may be eligible to receive or participate in one or more of the following:
Incentive Savings Plans — BlackRock, Inc. has created a variety of incentive savings plans in which BlackRock, Inc. employees are eligible to participate, including a 401(k) plan, the BlackRock Retirement Savings Plan (RSP), and the BlackRock Employee Stock Purchase Plan (ESPP). The employer contribution components of the RSP include a company match equal to 50% of the first 8% of eligible pay contributed to the plan capped at $5,000 per year, and a company retirement contribution equal to 3-5% of eligible compensation up to the Internal Revenue Service limit ($275,000 for 2018). The RSP offers a range of investment options, including registered investment companies and collective investment funds managed by the firm. BlackRock, Inc. contributions follow the investment direction set by participants for their own contributions or, absent participant investment direction, are invested into a target date fund that corresponds to, or is closest to, the year in which the participant attains age 65. The ESPP allows for investment in BlackRock, Inc. common stock at a 5% discount on the fair market value of the stock on the purchase date. Annual participation in the ESPP is limited to the purchase of 1,000 shares of common stock or a dollar value of $25,000 based on its fair market value on the purchase date. All of the eligible portfolio managers are eligible to participate in these plans.
(a)(4) Beneficial Ownership of Securities – As of October 31, 2018.
| | | | | | | | |
| | Portfolio Manager | | | | Dollar Range of Equity Securities of the Fund Beneficially Owned | | |
| | Joshua Tarnow | | | | None |
| | James E. Keenan | | | | $100,001 - $500,000 |
| | David Delbos | | | | None |
| | Mitchell S. Garfin | | | | None |
| | Carly Wilson | | | | None |
| | Abigail Apistolas | | | | None |
(b) Not Applicable
| Item 9 – | Purchases of Equity Securities by Closed-End Management Investment Company and Affiliated Purchasers |
| | | | | | | | | | | | | | | | |
Period | | (a) Total | | | | (b) Average | | | | (c) Total Number of | | | | (d) Maximum Number of | | |
| | | Number of Shares Purchased | | | | Price Paid per Share | | | | Shares Purchased as Part of Publicly Announced Plans or Programs | | | | Shares that May Yet Be Purchased Under the Plans or Programs1 | | |
| May 1-31, 2018 | | N/A | | | | N/A | | | | N/A | | | | 1,183,161 | | |
| June 1-30, 2018 | | N/A | | | | N/A | | | | N/A | | | | 1,183,161 | | |
| July 1-31, 2018 | | N/A | | | | N/A | | | | N/A | | | | 1,183,161 | | |
| August 1-31, 2018 | | N/A | | | | N/A | | | | N/A | | | | 1,183,161 | | |
| September 1-30, 2018 | | N/A | | | | N/A | | | | N/A | | | | 1,183,161 | | |
| October 1-31, 2018 | | N/A | | | | N/A | | | | N/A | | | | 1,183,161 | | |
| Total: | | N/A | | | | N/A | | | | N/A | | | | 1,183,161 | | |
9
1On September 6, 2017, the Fund announced a continuation of the open market share repurchase program, pursuant to which the Fund may repurchase through November 30, 2018 up to 5% of its outstanding shares based on common shares outstanding on November 30, 2017, in open market transactions. On September 7, 2018, the Fund announced a further continuation of its open market share repurchase program. Commencing on December 1, 2018, the Fund may repurchase through November 30, 2019, up to 5% of its common shares outstanding as of the close of business on November 30, 2018, subject to certain conditions.
| Item 10 – | Submission of Matters to a Vote of Security Holders – There have been no material changes to these procedures. |
| Item 11 – | Controls and Procedures |
(a) The registrant’s principal executive and principal financial officers, or persons performing similar functions, have concluded that the registrant’s disclosure controls and procedures (as defined in Rule 30a-3(c) under the Investment Company Act of 1940, as amended (the “1940 Act”)) are effective as of a date within 90 days of the filing of this report based on the evaluation of these controls and procedures required by Rule 30a-3(b) under the 1940 Act and Rule 13a-15(b) under the Securities Exchange Act of 1934, as amended.
(b) There were no changes in the registrant’s internal control over financial reporting (as defined in Rule 30a-3(d) under the 1940 Act) that occurred during the second fiscal quarter of the period covered by this report that have materially affected, or are reasonably likely to materially affect, the registrant’s internal control over financial reporting.
| Item 12 – | Disclosure of Securities Lending Activities for Closed-End Management Investment Companies |
(a) The following table shows the dollar amounts of income, and dollar amounts of fees and/or compensation paid, relating to the Fund’s securities lending activities during the fiscal year ended October 31, 2018. The Fund did not engage in any securities lending activity during the fiscal year ended October 31, 2018.
| | | | | | | | |
| | | BlackRock Floating Rate Income Trust | | | | |
| (1) | | Gross income from securities lending activities | | | $0 | |
| (2) | | Fees and/or compensation for securities lending activities and related services | | | | |
| | (a) | | Securities lending income paid to BIM for services as securities lending agent | | | $0 | |
| | (b) | | Collateral management expenses (including fees deducted from a polled cash collateral vehicle) not included in (a) | | | $0 | |
| | (c) | | Administrative fees not included in (a) | | | $0 | |
| | (d) | | Indemnification fees not included in (a) | | | $0 | |
| | (e) | | Rebate (paid to borrowers) | | | $0 | |
| | (f) | | Other fees not included in (a) | | | $0 | |
| (3) | | Aggregate fees/compensation for securities lending activities | | | $0 | |
| (4) | | Net income from securities lending activities | | | $0 | |
(b) BlackRock Investment Management, LLC (“BIM”) serves as securities lending agent for the Fund and in that role administers the Fund’s securities lending program pursuant to the terms of a securities lending agency agreement entered into between the Fund and BIM.
10
| Item 13 – | Exhibits attached hereto |
(a)(1) – Code of Ethics – See Item 2
(a)(2) – Certifications – Attached hereto
(a)(3) – Not Applicable
(a)(4) – Not Applicable
(b) – Certifications – Attached hereto
11
Pursuant to the requirements of the Securities Exchange Act of 1934 and the Investment Company Act of 1940, the registrant has duly caused this report to be signed on its behalf by the undersigned, thereunto duly authorized.
| | | | |
| | BlackRock Floating Rate Income Trust |
| | |
| | By: | | /s/ John M. Perlowski |
| | | | John M. Perlowski |
| | | | Chief Executive Officer (principal executive officer) of |
| | | | BlackRock Floating Rate Income Trust |
| |
| | Date: January 4, 2019 |
Pursuant to the requirements of the Securities Exchange Act of 1934 and the Investment Company Act of 1940, this report has been signed below by the following persons on behalf of the registrant and in the capacities and on the dates indicated.
| | | | |
| | By: | | /s/ John M. Perlowski |
| | | | John M. Perlowski |
| | | | Chief Executive Officer (principal executive officer) of |
| | | | BlackRock Floating Rate Income Trust |
| |
| | Date: January 4, 2019 |
| | |
| | By: | | /s/ Neal J. Andrews |
| | | | Neal J. Andrews |
| | | | Chief Financial Officer (principal financial officer) of |
| | | | BlackRock Floating Rate Income Trust |
| |
| | Date: January 4, 2019 |