UNITED STATES
SECURITIES AND EXCHANGE COMMISSION
Washington, D.C. 20549
FORMN-CSR
CERTIFIED SHAREHOLDER REPORT OF REGISTERED MANAGEMENT
INVESTMENT COMPANIES
Investment Company Act file number:811-21566
Name of Fund: BlackRock Floating Rate Income Trust (BGT)
Fund Address: 100 Bellevue Parkway, Wilmington, DE 19809
Name and address of agent for service: John M. Perlowski, Chief Executive Officer, BlackRock Floating Rate Income Trust, 55 East 52nd Street, New York, NY 10055
Registrant’s telephone number, including area code: (800)882-0052, Option 4
Date of fiscal year end: 10/31/2019
Date of reporting period: 10/31/2019
| | | | |
| Item 1 | | – | | Report to Stockholders |
| | |
 | | OCTOBER 31, 2019 |
BlackRock Credit Allocation Income Trust (BTZ)
BlackRock Floating Rate Income Trust (BGT)
BlackRock Multi-Sector Income Trust (BIT)
Beginning on January 1, 2021, as permitted by regulations adopted by the Securities and Exchange Commission, paper copies of each Trust’s shareholder reports will no longer be sent by mail, unless you specifically request paper copies of the reports from BlackRock or from your financial intermediary, such as a broker-dealer or bank. Instead, the reports will be made available on a website, and you will be notified by mail each time a report is posted and provided with a website link to access the report.
You may elect to receive all future reports in paper free of charge. If you hold accounts directly with BlackRock, you can call Computershare at(800) 699-1236 to request that you continue receiving paper copies of your shareholder reports. If you hold accounts through a financial intermediary, you can follow the instructions included with this disclosure, if applicable, or contact your financial intermediary to request that you continue to receive paper copies of your shareholder reports. Please note that not all financial intermediaries may offer this service. Your election to receive reports in paper will apply to all funds advised by BlackRock Advisors, LLC or its affiliates, or all funds held with your financial intermediary, as applicable.
If you already elected to receive shareholder reports electronically, you will not be affected by this change and you need not take any action. You may elect to receive electronic delivery of shareholder reports and other communications by contacting your financial intermediary, if you hold accounts through a financial intermediary. Please note that not all financial intermediaries may offer this service.
|
| Not FDIC Insured • May Lose Value • No Bank Guarantee |
Supplemental Information
Section 19(a) Notices
BlackRock Credit Allocation Income Trust’s and BlackRock Multi-Sector Income Trust’samounts and sources of distributions reported are estimates and are being provided to you pursuant to regulatory requirements and are not being provided for tax reporting purposes. The actual amounts and sources for tax reporting purposes will depend upon each Trust’s investment experience during its fiscal year and may be subject to changes based on tax regulations. Each Trust will provide a Form1099-DIV each calendar year that will tell you how to report these distributions for U.S. federal income tax purposes.
| | | | | | | | | | | | | | | | | | | | | | | | | | | | | | | | | | | | | | | | |
| | | Total Fiscal Year to Date Cummulative
Distributions by Character | | | Percentage of Fiscal Year to Date Cumulative
Distributions by Character | |
| Ticker | | Net
Investment
Income | | | Net Realized
Capital Gains
Short Term | | | Net Realized
Capital Gains
Long Term | | | Return of
Capital | | | Total Per
Common
Share | | | Net
Investment
Income | | | Net Realized
Capital Gains
Short Term | | | Net Realized
Capital Gains
Long Term | | | Return of
Capital | | | Total Per
Common
Share | |
BTZ* | | $ | 0.797677 | | | $ | — | | | $ | — | | | $ | 0.023223 | | | $ | 0.820900 | | | | 97 | % | | | 0 | % | | | 0 | % | | | 3 | % | | | 100 | % |
BIT* | | | 1.043509 | | | | — | | | | — | | | | 0.363891 | | | | 1.407400 | | | | 74 | | | | 0 | | | | 0 | | | | 26 | | | | 100 | |
| | * | The Trust estimates that it has distributed more than its net investment income and net realized capital gains; therefore, a portion of the distribution may be a return of capital. A return of capital may occur, for example, when some or all of the shareholder’s investment in the Trust is returned to the shareholder. A return of capital does not necessarily reflect the Trust’s investment performance and should not be confused with “yield” or “income.” When distributions exceed total return performance, the difference will reduce the Trust’s net asset value per share. | |
Section 19(a) notices for the Trusts, as applicable, are available on the BlackRock website atblackrock.com.
Section 19(b) Disclosure
On September 5, 2019, the Trusts, acting pursuant to a U.S. Securities and Exchange Commission (“SEC”) exemptive order and with the approval of each Trust’s Board of Trustees (the “Board”), each adopted a managed distribution plan, consistent with its investment objectives and policies to support a level distribution of income, capital gains and/or return of capital (the “Plan”). In accordance with the Plans, starting in October 2019, BTZ will distribute a fixed amount of $0.0839 per share on a monthly basis, BGT will distribute a fixed amount of $0.0764 per share on a monthly basis and BIT will distribute a fixed amount of $0.1237 per share on a monthly basis.
The fixed amounts distributed per share are subject to change at the discretion of each Trust’s Board. Under its Plan, each Trust will distribute all available investment income to its shareholders as required by the Internal Revenue Code of 1986, as amended (the “Code”). If sufficient income (inclusive of net investment income and short-term capital gains) is not earned on a monthly basis, the Trusts will distribute long-term capital gains and/or return of capital to shareholders in order to maintain a level distribution.
Each monthly distribution to shareholders is expected to be at the fixed amount established by the Board; however, each Trust may make additional distributions from time to time, including additional capital gain distributions at the end of the taxable year, if required to meet requirements imposed by the Code and/or the Investment Company Act of 1940, as amended (the “1940 Act”).
Shareholders should not draw any conclusions about each Trust’s investment performance from the amount of these distributions or from the terms of the Plan. Each Trust’s total return performance is presented in its financial highlights table.
The Board may amend, suspend or terminate a Trust’s Plan at any time without prior notice to the Trust’s shareholders if it deems such actions to be in the best interests of the Trust or its shareholders. The suspension or termination of the Plan could have the effect of creating a trading discount (if the Trust’s stock is trading at or above net asset value) or widening an existing trading discount. The Trusts are subject to risks that could have an adverse impact on their ability to maintain level distributions. Examples of potential risks include, but are not limited to, economic downturns impacting the markets, changes in interest rates, decreased market volatility, companies suspending or decreasing corporate dividend distributions and changes in the Code.
| | |
| 2 | | 2019 BLACKROCK ANNUAL REPORTTO SHAREHOLDERS |
The Markets in Review
Dear Shareholder,
Investment performance in the 12 months ended October 31, 2019 was a tale of two markets. The first half of the reporting period was characterized by restrictive monetary policy, deteriorating economic growth, equity market volatility, and rising fear of an imminent recession. During the second half of the reporting period, stocks and bonds rebounded sharply, as influential central banks shifted toward accommodative monetary policy, which led to broad-based optimism that a near-term recession could be averted. Refer to each Fund’s performance section for detailed information on market price and net asset value based returns.
After the dust settled, equity and bond markets posted mixed returns while weathering significant volatility. U.S. large cap equities and U.S. bonds advanced, while equities at the high end of the risk spectrum — emerging markets and U.S. small cap — posted modest negative returns.
Fixed-income securities played an important role in diversified portfolios by delivering strong returns amid economic uncertainty, as interest rates declined (and bond prices rose). Long-term bonds, particularly long-term Treasuries, proved to be an effective ballast for diversified investors. Investment-grade and high-yield corporate bonds posted positive returns, as the credit fundamentals in corporate markets remained relatively solid.
In the U.S. equity market, volatility spiked in late 2018, as a wide variety of risks were brought to bear on markets, including rising interest rates, slowing global growth, and heightened trade tensions. Volatility also rose in emerging markets, as the appreciating U.S. dollar and higher interest rates in the U.S. disrupted economic growth abroad. Despite an economic slowdown in Europe and ongoing uncertainty about Brexit, European equities posted a modest positive return.
As equity performance faltered and global economic growth slowed, the U.S. Federal Reserve (the “Fed”) shifted away from policies designed to decrease inflation in favor of renewed efforts to stimulate economic activity. The Fed left interest rates unchanged in January 2019, then reduced interest rates three times thereafter, starting in July 2019. Similarly, the Fed took measures to support liquidity in short-term lending markets. Following in the Fed’s footsteps, the European Central Bank announced aggressive economic stimulus measures, including lower interest rates and the return of its bond purchasing program. The Bank of Japan signaled a continuation of accommodative monetary policy, while China committed to looser credit conditions and an increase in fiscal spending.
The outpouring of global economic stimulus led to a sharp rally in risk assets throughout the world despite the headwind of rising geopolitical and trade tensions. Hopes continued to remain high as the current economic expansion became the longest in U.S. history.
We continue to expect a slowing expansion with additional room to run. Despite a sharp slowdown in trade and manufacturing across the globe, U.S. consumers continued to spend at a relatively healthy pace, benefiting from the lowest unemployment rate in 50 years and rising wages. However, trade disputes and the resulting disruptions in global supply chains, as well as geopolitical tensions, particularly in the Middle East, continued to have a negative impact on global growth.
Overall, we favor reducing investment risk due to rising economic uncertainty. We believe U.S. equities remain relatively attractive, but we are shifting to a more cautious stance by emphasizing factors that seek lower-volatility and higher-quality stocks. In fixed income, government bonds continue to be important portfolio stabilizers, while emerging market bonds offer relatively attractive income opportunities.
In this environment, investors need to think globally, extend their scope across a broad array of asset classes, and be nimble as market conditions change. We encourage you to talk with your financial advisor and visitblackrock.com for further insight about investing in today’s markets.
Sincerely,

Rob Kapito
President, BlackRock Advisors, LLC

Rob Kapito
President, BlackRock Advisors, LLC
| | | | |
| Total Returns as of October 31, 2019 |
| | | 6-month | | 12-month |
U.S. large cap equities
(S&P 500® Index) | | 4.16% | | 14.33% |
U.S. small cap equities
(Russell 2000® Index) | | (1.09) | | 4.90 |
International equities
(MSCI Europe, Australasia, Far East Index) | | 3.35 | | 11.04 |
Emerging market equities
(MSCI Emerging Markets Index) | | (1.67) | | 11.86 |
3-month Treasury bills
(ICE BofAML3-Month U.S. Treasury Bill Index) | | 1.21 | | 2.40 |
U.S. Treasury securities
(ICE BofAML10-Year U.S. Treasury Index) | | 8.17 | | 15.85 |
U.S. investment grade bonds
(Bloomberg Barclays U.S. Aggregate Bond Index) | | 5.71 | | 11.51 |
Tax-exempt municipal bonds
(S&P Municipal Bond Index) | | 3.52 | | 9.07 |
U.S. high yield bonds
(Bloomberg Barclays U.S. Corporate High Yield 2% Issuer Capped Index) | | 2.69 | | 8.38 |
| Past performance is no guarantee of future results. Index performance is shown for illustrative purposes only. You cannot invest directly in an index. |
| | | | |
| THIS PAGEISNOT PARTOF YOUR FUND REPORT | | | 3 | |
Table of Contents
| | |
| Trust Summary as of October 31, 2019 | | BlackRock Credit Allocation Income Trust |
Investment Objective
BlackRock Credit Allocation Income Trust’s (BTZ) (the “Trust”) investment objective is to provide current income, current gains and capital appreciation. The Trust seeks to achieve its investment objective by investing, under normal market conditions, at least 80% of its assets in credit-related securities, including, but not limited to, investment grade corporate bonds, high yield bonds (commonly referred to as “junk” bonds), bank loans, preferred securities or convertible bonds or derivatives with economic characteristics similar to these credit-related securities. The Trust may invest directly in such securities or synthetically through the use of derivatives.
No assurance can be given that the Trust’s investment objective will be achieved.
On September 5, 2019, the Board approved a change in the fiscal year end of BTZ, effective as of December 31, 2019, from October 31 to December 31.
Trust Information
| | |
Symbol on New York Stock Exchange (“NYSE”) | | BTZ |
Initial Offering Date | | December 27, 2006 |
Current Distribution Rate on Closing Market Price as of October 31, 2019 ($13.55)(a) | | 7.43% |
Current Monthly Distribution per Common Share(b) | | $0.0839 |
Current Annualized Distribution per Common Share(b) | | $1.0068 |
Leverage as of October 31, 2019(c) | | 27% |
| | (a) | Current distribution rate on closing market price is calculated by dividing the current annualized distribution per share by the closing market price. The current distribution rate consists of income, net realized gains and/or a return of capital. Past performance does not guarantee future results. | |
| | (b) | The distribution rate is not constant and is subject to change. A portion of the distribution may be deemed a return of capital or net realized gain. | |
| | (c) | Represents reverse repurchase agreements as a percentage of total managed assets, which is the total assets of the Trust (including any assets attributable to borrowings) minus the sum of accrued liabilities (other than borrowings representing financial leverage). Does not reflect derivatives or other instruments that may give rise to economic leverage. For a discussion of leveraging techniques utilized by the Trust, please see The Benefits and Risks of Leveraging and Derivative Financial Instruments on page 14. | |
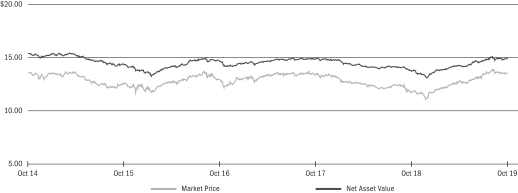
Market Price and Net Asset Value Per Share Summary
| | | | | | | | | | | | | | | | | | | | |
| | | 10/31/19 | | | 10/31/18 | | | Change | | | High | | | Low | |
Market Price | | $ | 13.55 | | | $ | 11.72 | | | | 15.61 | % | | $ | 13.91 | | | $ | 11.06 | |
Net Asset Value | | | 14.94 | | | | 13.72 | | | | 8.89 | | | | 15.04 | | | | 13.07 | |
Market Price and Net Asset Value History For the Past Five Years
| | |
| Trust Summary as of October 31, 2019 (continued) | | BlackRock Credit Allocation Income Trust |
Performance and Portfolio Management Commentary
Returns for the period ended October 31, 2019 were as follows:
| | | | | | | | | | | | | | | | |
| | | | | | Average Annual Total Returns | |
| | | | | | 1 Year | | | 3 Years | | | 5 Years | |
Trust at NAV(a)(b) | | | | | | | 16.17 | % | | | 7.41 | % | | | 6.42 | % |
Trust at Market Price(a)(b) | | | | | | | 23.34 | | | | 8.46 | | | | 7.02 | |
Reference Benchmark(c) | | | | | | | 13.23 | | | | 5.47 | | | | 4.95 | |
Bloomberg Barclays U.S. Credit Index(d) | | | | | | | 14.88 | | | | 4.83 | | | | 4.43 | |
Bloomberg Barclays U.S. Corporate High Yield 2% Issuer Capped Index(e) | | | | | | | 8.38 | | | | 6.03 | | | | 5.19 | |
Bloomberg Barclays USD Capital Securities Index(f) | | | | | | | 16.41 | | | | 6.15 | | | | 5.78 | |
| | (a) | All returns reflect reinvestment of dividends and/or distributions at actual reinvestment prices. Performance results reflect the Trust’s use of leverage. | |
| | (b) | The Trust’s discount to NAV narrowed during the period, which accounts for the difference between performance based on market price and performance based on NAV. | |
| | (c) | The Reference Benchmark is comprised of the Bloomberg Barclays U.S. Credit Index (50.36%), the Bloomberg Barclays U.S. Corporate High Yield 2% Issuer Capped Index (29.93%), and the Bloomberg Barclays USD Capital Securities Index (19.71%). | |
| | (d) | This unmanaged index measures the investment grade, U.S. dollar-denominated, fixed-rate, taxable corporate and government-related bond markets. | |
| | (e) | An unmanaged index comprised of issues that meet the following criteria: at least $150 million par value outstanding; maximum credit rating of Ba1; at least one year to maturity; and no issuer represents more than 2% of the index. | |
| | (f) | This unmanaged index tracks fixed-rate, investment grade capital securities denominated in USD. | |
Performance results may include adjustments made for financial reporting purposes in accordance with U.S. generally accepted accounting principles.
Past performance is not indicative of future results.
BTZ is presenting the Reference Benchmark to accompany trust performance. The Reference Benchmark is presented for informational purposes only, as the Trust is actively managed and does not seek to track or replicate the performance of the Reference Benchmark or any other index. The portfolio investments of the Trust may differ substantially from the securities that comprise the indices within the Reference Benchmark, which may cause the Trust’s performance to differ materially from that of the Reference Benchmark. The Trust employs leverage as part of its investment strategy, which may change over time at the discretion of BlackRock Advisors, LLC (the “Manager”) as market and other conditions warrant. In contrast, the Reference Benchmark is not adjusted for leverage. Therefore, leverage generally may result in the Trust outperforming the Reference Benchmark in rising markets and underperforming in declining markets. The Board considers additional factors to evaluate the Trust’s performance, such as the performance of the Trust relative to a peer group of funds, a leverage-adjusted benchmark and/or other information provided by the Manager.
More information about the Trust’s historical performance can be found in the “Closed End Funds” section of blackrock.com.
The following discussion relates to the Trust’s absolute performance based on NAV:
What factors influenced performance?
Positive contributions to the Trust’s absolute performance over the 12-month period came from a wide range of credit-oriented asset classes including U.S. investment grade corporate bonds, high yield corporate bonds and capital securities. Allocations to European investment grade corporate bonds also provided positive returns, as did exposure to emerging markets debt.
Detractors from the Trust’s performance were limited over the period, as both interest rate sensitive and credit sensitive assets performed well. Strategies to manage against risk and interest rates detracted modestly.
Describe recent portfolio activity.
The Trust made several changes to the portfolio’s positioning and composition over the period. These included reducing exposure to capital securities, U.S. high yield corporate bonds and collateralized loan obligations (“CLOs”), while adding to U.S. investment grade and European high yield corporate bonds.
Describe portfolio positioning at period end.
The Trust was positioned moderately “risk on” supported by the Fed’s accommodative policy stance and optimism around various geopolitical issues. The Trust remained constructive on credit markets, with core allocations to U.S. high yield corporates bond, U.S. investment grade corporate bonds and capital securities, along with exposure to CLOs and non-U.S. credit markets.
The views expressed reflect the opinions of BlackRock as of the date of this report and are subject to change based on changes in market, economic or other conditions. These views are not intended to be a forecast of future events and are no guarantee of future results.
| | |
| 6 | | 2019 BLACKROCK ANNUAL REPORTTO SHAREHOLDERS |
| | |
| Trust Summary as of October 31, 2019 (continued) | | BlackRock Credit Allocation Income Trust |
Overview of the Trust’s Total Investments
PORTFOLIO COMPOSITION
| | | | | | | | |
| | | 10/31/19 | | | 10/31/18 | |
Corporate Bonds | | | 75 | % | | | 74 | % |
Preferred Securities | | | 17 | | | | 17 | |
Asset-Backed Securities | | | 5 | | | | 6 | |
Foreign Agency Obligations | | | 2 | | | | 2 | |
Municipal Bonds | | | 1 | | | | 1 | |
Other | | | — | (a) | | | — | (b) |
| | (a) | Includes a less than 1% holding in each of the following investment types: Short-Term Securities, Options Purchased and Options Written. | |
| | (b) | Includes a less than 1% holding in each of the following investment types: Short-Term Securities, U.S. Government Sponsored Agency Securities, Options Purchased and Options Written. | |
CREDIT QUALITY ALLOCATION (c)(d)
| | | | | | | | |
| | | 10/31/19 | | | 10/31/18 | |
AAA/Aaa | | | 1 | % | | | 1 | %(e) |
AA/Aa | | | 2 | | | | 2 | |
A | | | 17 | | | | 18 | |
BBB/Baa | | | 49 | | | | 50 | |
BB/Ba | | | 20 | | | | 17 | |
B | | | 9 | | | | 10 | |
CCC/Caa | | | 2 | | | | 2 | |
CC/Ca(f) | | | — | | | | — | |
| | (c) | For financial reporting purposes, credit quality ratings shown above reflect the highest rating assigned by either S&P Global Ratings or Moody’s Investors Service (“Moody’s”) if ratings differ. These rating agencies are independent, nationally recognized statistical rating organizations and are widely used. Investment grade ratings are credit ratings of BBB/Baa or higher. Below investment grade ratings are credit ratings of BB/Ba or lower. Investments designated N/R are not rated by either rating agency. Unrated investments do not necessarily indicate low credit quality. Credit quality ratings are subject to change. | |
| | (d) | Excludes Short-Term Securities, Options Purchased and Options Written. | |
| | (e) | The investment adviser evaluates the credit quality of not-rated investments based upon certain factors including, but not limited to, credit ratings for similar investments and financial analysis of sectors, individual investments and/or issuer. Using this approach, the investment adviser has deemed U.S. Government Sponsored Agency Securities and U.S. Treasury Obligations as AAA/Aaa. | |
| | (f) | Represents less than 1% of the Trust’s total investments. | |
| | |
| Trust Summary as of October 31, 2019 | | BlackRock Floating Rate Income Trust |
Investment Objective
BlackRock Floating Rate Income Trust’s (BGT) (the “Trust”) primary investment objective is to provide a high level of current income. The Trust’s secondary investment objective is to seek the preservation of capital to the extent consistent with its primary objective of high current income. The Trust seeks to achieve its investment objectives by investing primarily, under normal conditions, at least 80% of its assets in floating and variable rate instruments of U.S. andnon-U.S. issuers, including a substantial portion of its assets in global floating and variable rate securities including senior secured floating rate loans made to corporate and other business entities. Under normal market conditions, the Trust expects that the average effective duration of its portfolio will be no more than 1.5 years. The Trust may invest directly in such securities or synthetically through the use of derivatives.
No assurance can be given that the Trust’s investment objectives will be achieved.
On September 5, 2019, the Board approved a change in the fiscal year end of BGT, effective as of December 31, 2019, from October 31 to December 31.
Trust Information
| | |
Symbol on NYSE | | BGT |
Initial Offering Date | | August 30, 2004 |
Current Distribution Rate on Closing Market Price as of October 31, 2019 ($12.42)(a) | | 7.38% |
Current Monthly Distribution per Common Share(b) | | $0.0764 |
Current Annualized Distribution per Common Share(b) | | $0.9168 |
Leverage as of October 31, 2019(c) | | 28% |
| | (a) | Current distribution rate on closing market price is calculated by dividing the current annualized distribution per share by the closing market price. The current distribution rate consists of income, net realized gains and/or a return of capital. Past performance does not guarantee future results. | |
| | (b) | The distribution rate is not constant and is subject to change. | |
| | (c) | Represents reverse repurchase agreements as a percentage of total managed assets, which is the total assets of the Trust (including any assets attributable to borrowings) minus the sum of accrued liabilities (other than borrowings representing financial leverage). Does not reflect derivatives or other instruments that may give rise to economic leverage. For a discussion of leveraging techniques utilized by the Trust, please see The Benefits and Risks of Leveraging and Derivative Financial Instruments on page 14. | |
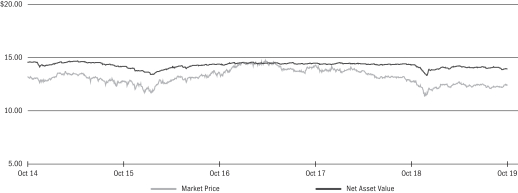
Market Price and Net Asset Value Per Share Summary
| | | | | | | | | | | | | | | | | | | | |
| | | 10/31/19 | | | 10/31/18 | | | Change | | | High | | | Low | |
Market Price | | $ | 12.42 | | | $ | 12.72 | | | | (2.36 | )% | | $ | 12.84 | | | $ | 11.28 | |
Net Asset Value | | | 13.95 | | | | 14.33 | | | | (2.65 | ) | | | 14.34 | | | | 13.33 | |
Market Price and Net Asset Value History For the Past Five Years
| | |
| 8 | | 2019 BLACKROCK ANNUAL REPORTTO SHAREHOLDERS |
| | |
| Trust Summary as of October 31, 2019 (continued) | | BlackRock Floating Rate Income Trust |
Performance and Portfolio Management Commentary
Returns for the period ended October 31, 2019 were as follows:
| | | | | | | | | | | | | | | | |
| | | | | | Average Annual Total Returns | |
| | | | | | 1 Year | | | 3 Years | | | 5 Years | |
Trust at NAV(a)(b) | | | | | | | 4.00 | % | | | 4.79 | % | | | 5.03 | % |
Trust at Market Price(a)(b) | | | | | | | 4.31 | | | | 2.82 | | | | 4.69 | |
S&P/LSTA Leveraged Loan Index(c) | | | | | | | 2.67 | | | | 4.08 | | | | 3.83 | |
| | (a) | All returns reflect reinvestment of dividends and/or distributions at actual reinvestment prices. Performance results reflect the Trust’s use of leverage. | |
| | (b) | The Trust’s discount to NAV narrowed during the period, which accounts for the difference between performance based on market price and performance based on NAV. | |
| | (c) | This unmanaged market value-weighted index (the “Reference Benchmark”) is designed to measure the performance of the U.S. leveraged loan market based upon market weightings, spreads and interest payments. | |
Performance results may include adjustments made for financial reporting purposes in accordance with U.S. generally accepted accounting principles.
Past performance is not indicative of future results.
BGT is presenting the Reference Benchmark to accompany trust performance. The Reference Benchmark is presented for informational purposes only, as the Trust is actively managed and does not seek to track or replicate the performance of the Reference Benchmark or any other index. The portfolio investments of the Trust may differ substantially from the securities that comprise the indices within the Reference Benchmark, which may cause the Trust’s performance to differ materially from that of the Reference Benchmark. The Trust employs leverage as part of its investment strategy, which may change over time at the discretion of BlackRock Advisors, LLC (the “Manager”) as market and other conditions warrant. In contrast, the Reference Benchmark is not adjusted for leverage. Therefore, leverage generally may result in the Trust outperforming the Reference Benchmark in rising markets and underperforming in declining markets. The Board considers additional factors to evaluate the Trust’s performance, such as the performance of the Trust relative to a peer group of funds, a leverage-adjusted benchmark and/or other information provided by the Manager.
More information about the Trust’s historical performance can be found in the “Closed End Funds” section of blackrock.com.
The following discussion relates to the Trust’s absolute performance based on NAV:
What factors influenced performance?
Credit markets performed well over the period, allowing the Trust’s core allocation to floating rate loan interests (“bank loans”) to generate positive results. A small allocation to high yield corporate bonds also contributed given the market’s outperformance versus loans during the investment period. In terms of ratings, B-rated andBB-rated loans were the most significant contributors to performance. By sector, exposure to names within technology, consumer cyclical services and health care were most additive to absolute performance.
From a ratings standpoint, the biggest laggards for the period were CCC-rated loans, which underperformed their mid-to-higher-quality peers. By sector, energy lagged other sectors over the period, and the Trust’s positioning within independent energy and oil field services detracted the most from Trust performance. In terms of asset mix, small exposures to collateralized loan obligations (“CLOs”) and equities constrained the Trust’s return.
Describe recent portfolio activity.
There were no significant changes to the Trust’s sector weightings over the period. The Trust added to positions in packaging, aerospace & defense and property & casualty insurance companies. Conversely, positions within consumer products, energy and wirelines were trimmed. Exposures by credit rating remained reasonably consistent over the period, although the Trust added to better quality single B-names towards the end of the period as relative value became increasingly more attractive compared to BB-rated issues. In terms of asset allocation, the Trust continued to reduce exposure to high yield corporate bonds.
Describe portfolio positioning at period end.
At period end, the majority of the Trust’s portfolio was in bank loans, with a small position in high yield corporate bonds. The Trust’s largest positions were within the technology, pharmaceuticals and cable & satellite sectors. The Trust remained underweight in low dollar, high spread names where business trends or operating conditions remained challenged. The Trust also remained underweight in energy (a smaller sector in the loan market versus high yield), with a focus on higher quality names within the sector. From a credit rating perspective, the Trust’s core positioning remained focused on BB-rated and B-rated issues, with a higher allocation to B-rated names at period end. The Trust had a bias for higher quality loans within the B-rated category as noted. As a major theme, the investment adviser remains focused on larger, more-liquid capital structures while keeping an underweight to loan-only issuers, which tend to offer lower liquidity and recovery rates.
The views expressed reflect the opinions of BlackRock as of the date of this report and are subject to change based on changes in market, economic or other conditions. These views are not intended to be a forecast of future events and are no guarantee of future results.
| | |
| Trust Summary as of October 31, 2019 (continued) | | BlackRock Floating Rate Income Trust |
Overview of the Trust’s Total Investments
PORTFOLIO COMPOSITION
| | | | | | | | |
| | | 10/31/19 | | | 10/31/18 | |
Floating Rate Loan Interests | | | 95 | % | | | 92 | % |
Investment Companies | | | 4 | | | | 1 | |
Corporate Bonds | | | 1 | | | | 2 | |
Asset-Backed Securities | | | — | | | | 5 | |
Other | | | — | (a) | | | — | (b) |
| | (a) | Includes a less than 1% holding in each of the following investment types: Common Stocks, Other Interests, Warrants, Short-Term Securities and Options Purchased. | |
| | (b) | Includes a less than 1% holding in each of the following investment types: Common Stocks, Other Interests, Rights, Warrants, Short-Term Securities and Options Purchased. | |
CREDIT QUALITY ALLOCATION (c)(d)
| | | | | | | | |
| | | 10/31/19 | | | 10/31/18 | |
AA/Aa | | | — | % | | | 1 | % |
A | | | — | | | | 1 | |
BBB/Baa | | | 8 | | | | 10 | |
BB/Ba | | | 30 | | | | 39 | |
B | | | 55 | | | | 43 | |
CCC/Caa | | | 2 | | | | 3 | |
N/R | | | 5 | | | | 3 | |
| | (c) | For financial reporting purposes, credit quality ratings shown above reflect the highest rating assigned by either S&P Global Ratings or Moody’s if ratings differ. These rating agencies are independent, nationally recognized statistical rating organizations and are widely used. Investment grade ratings are credit ratings of BBB/Baa or higher. Below investment grade ratings are credit ratings of BB/Ba or lower. Investments designated N/R are not rated by either rating agency. Unrated investments do not necessarily indicate low credit quality. Credit quality ratings are subject to change. | |
| | (d) | Excludes Common stocks, Warrants, Other Interests, Short-Term Securities and Options Purchased. | |
| | |
| 10 | | 2019 BLACKROCK ANNUAL REPORTTO SHAREHOLDERS |
| | |
| Trust Summary as of October 31, 2019 | | BlackRock Multi-Sector Income Trust |
Investment Objective
BlackRock Multi-Sector Income Trust’s (BIT) (the “Trust”) primary investment objective is to seek high current income, with a secondary objective of capital appreciation. The Trust seeks to achieve its investment objectives by investing, under normal market conditions, at least 80% of its assets in loan and debt instruments and other investments with similar economic characteristics. The Trust may invest directly in such securities or synthetically through the use of derivatives. Additionally, as part of the Trust’s investments in loans, the Trust may make loans directly to borrowers either as a sole lender or by acting as a member of a syndicate of original lenders.
No assurance can be given that the Trust’s investment objectives will be achieved.
Trust Information
| | |
Symbol on NYSE | | BIT |
Initial Offering Date | | February 27, 2013 |
Current Distribution Rate on Closing Market Price as of October 31, 2019 ($17.15)(a) | | 8.66% |
Current Monthly Distribution per Common Share(b) | | $0.1237 |
Current Annualized Distribution per Common Share(b) | | $1.4844 |
Leverage as of October 31, 2019(c) | | 37% |
| | (a) | Current distribution rate on closing market price is calculated by dividing the current annualized distribution per share by the closing market price. The current distribution rate consists of income, net realized gains and/or a return of capital. Past performance does not guarantee future results. | |
| | (b) | The distribution rate is not constant and is subject to change. A portion of the distribution may be deemed a return of capital or net realized gain. | |
| | (c) | Represents reverse repurchase agreements as a percentage of total managed assets, which is the total assets of the Trust (including any assets attributable to borrowings) minus the sum of accrued liabilities (other than borrowings representing financial leverage). Does not reflect derivatives or other instruments that may give rise to economic leverage. For a discussion of leveraging techniques utilized by the Trust, please see The Benefits and Risks of Leveraging and Derivative Financial Instruments on page 14. | |
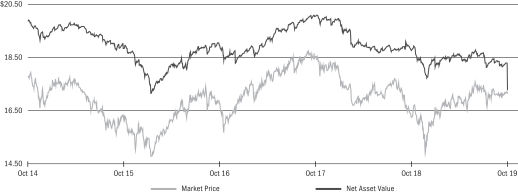
Market Price and Net Asset Value Per Share Summary
| | | | | | | | | | | | | | | | | | | | |
| | | 10/31/19 | | | 10/31/18 | | | Change | | | High | | | Low | |
Market Price | | $ | 17.15 | | | $ | 16.25 | | | | 5.54 | % | | $ | 17.65 | | | $ | 14.79 | |
Net Asset Value | | | 17.28 | (a) | | | 18.79 | | | | (8.04 | ) | | | 18.93 | | | | 17.28 | |
| | (a) | For financial reporting purposes, the market value of a certain investment was adjusted as of the report date. Accordingly, the net asset value (“NAV”) per share presented herein is different than the information previously published as of October 31, 2019. | |
Market Price and Net Asset Value History For the Past Five Years
| | |
| Trust Summary as of October 31, 2019 (continued) | | BlackRock Multi-Sector Income Trust |
Performance and Portfolio Management Commentary
Returns for the period ended October 31, 2019 were as follows:
| | | | | | | | | | | | | | | | |
| | | | | | Average Annual Total Returns | |
| | | | | | 1 Year | | | 3 Years | | | 5 Years | |
Trust at NAV(a)(b)(d) | | | | | | | 0.00 | %(e) | | | 6.23 | % | | | 6.56 | % |
Trust at Market Price(a)(b) | | | | | | | 14.76 | | | | 10.32 | | | | 8.81 | |
Lipper General Bond Funds at NAV(c) | | | | | | | 6.68 | | | | 7.16 | | | | 6.13 | |
Lipper General Bond Funds at Market Price(c) | | | | | | | 16.89 | | | | 10.11 | | | | 8.27 | |
| | (a) | All returns reflect reinvestment of dividends and/or distributions at actual reinvestment prices. Performance results reflect the Trust’s use of leverage. | |
| | (b) | The Trust’s discount to NAV narrowed during the period, which accounts for the difference between performance based on market price and performance based on NAV. | |
| | (c) | Average return. Returns reflect reinvestment of dividends and/or distributions at NAV on the ex-dividend date as calculated by Lipper. Historical performance shown is calculated based on the composition of the Lipper General Bond Fund category at the time of preparation of this report to shareholders. | |
| | (d) | For financial reporting purposes, the market value of a certain investment was adjusted as of the report date. Accordingly, the net asset value (“NAV”) per share and total return performance based on NAV presented herein are different than the information previously published as of October 31, 2019. | |
| | (e) | Amount is greater than (0.005)%. | |
Performance results may include adjustments made for financial reporting purposes in accordance with U.S. generally accepted accounting principles.
Past performance is not indicative of future results.
More information about the Trust’s historical performance can be found in the “Closed End Funds” section of blackrock.com.
The following discussion relates to the Trust’s absolute performance based on NAV:
What factors influenced performance?
The Trust’s positions in non-agency residential mortgage-backed securities (“MBS”), sovereign bonds, investment grade corporate credit (specifically industrials), capital securities and commercial mortgage-backed securities (“CMBS”) were the largest contributors to performance over the period.
The Trust’s position in corporate credit, notably an investment in Aviron Capital LLC, was the principal detractor from returns for the period.
The Trust held derivatives, including U.S. futures, forward foreign currency exchange contracts and swaps, primarily as a means to manage risk. The use of derivatives had a negative impact on Trust performance over the period.
Describe recent portfolio activity.
The Trust’s spread sector exposure was rotated out of investment grade corporate bonds and into 15- and 30-year agency pass-through MBS, high yield corporate bonds and municipal bonds. In addition, the Trust’s duration (sensitivity to interest rate changes) was modestly trimmed from 3.24 years to 3.18 years over the period.
Describe portfolio positioning at period end.
At period end, the Trust maintained diversified exposure within non-government spread sectors, including non-agency MBS, high yield corporate bonds, capital securities, asset-backed securities, CMBS and emerging market debt. The Trust also held marginal exposure to government-related sectors such as non-U.S. sovereign debt.
The views expressed reflect the opinions of BlackRock as of the date of this report and are subject to change based on changes in market, economic or other conditions. These views are not intended to be a forecast of future events and are no guarantee of future results.
| | |
| 12 | | 2019 BLACKROCK ANNUAL REPORTTO SHAREHOLDERS |
| | |
| Trust Summary as of October 31, 2019 (continued) | | BlackRock Multi-Sector Income Trust |
Overview of the Trust’s Total Investments
PORTFOLIO COMPOSITION
| | | | | | | | |
| | | 10/31/19 | | | 10/31/18 | |
Corporate Bonds | | | 49 | % | | | 42 | % |
Asset-Backed Securities | | | 13 | | | | 15 | |
Preferred Securities | | | 11 | | | | 11 | |
U.S. Government Sponsored Agency Securities | | | 9 | | | | 3 | |
Non-Agency Mortgage-Backed Securities | | | 9 | | | | 11 | |
Floating Rate Loan Interests | | | 3 | | | | 6 | |
Foreign Agency Obligations | | | 3 | | | | 10 | |
U.S. Treasury Obligation | | | 2 | | | | — | |
Short-Term Securities | | | 1 | | | | 2 | |
Other(a) | | | — | | | | — | |
| | (a) | Includes a less than 1% holding in Common Stocks. | |
CREDIT QUALITY ALLOCATION (b)(c)
| | | | | | | | |
| | | 10/31/19 | | | 10/31/18 | |
AAA/Aaa(d) | | | 12 | % | | | 2 | % |
AA/Aa | | | 1 | | | | 7 | |
A | | | 6 | | | | 5 | |
BBB/Baa | | | 19 | | | | 18 | |
BB/Ba | | | 23 | | | | 20 | |
B | | | 18 | | | | 17 | |
CCC/Caa | | | 7 | | | | 7 | |
CC/Ca | | | 10 | | | | 8 | |
C | | | — | | | | 4 | |
N/R | | | 4 | | | | 12 | |
| | (b) | For financial reporting purposes, credit quality ratings shown above reflect the highest rating assigned by either S&P Global Ratings or Moody’s if ratings differ. These rating agencies are independent, nationally recognized statistical rating organizations and are widely used. Investment grade ratings are credit ratings of BBB/Baa or higher. Below investment grade ratings are credit ratings of BB/Ba or lower. Investments designated N/R are not rated by either rating agency. Unrated investments do not necessarily indicate low credit quality. Credit quality ratings are subject to change. | |
| | (c) | Excludes Common Stocks, Warrants, Short-Term Securities, Options Purchased and Options Written. | |
| | (d) | The investment adviser evaluates the credit quality of not-rated investments based upon certain factors including, but not limited to, credit ratings for similar investments and financial analysis of sectors, individual investments and/or issuer. Using this approach, the investment adviser has deemed U.S. Government Sponsored Agency Securities and U.S. Treasury Obligations as AAA/Aaa. | |
The Benefits and Risks of Leveraging
The Trusts may utilize leverage to seek to enhance the distribution rate on, and net asset value (“NAV”) of, their common shares (“Common Shares”). However, there is no guarantee that these objectives can be achieved in all interest rate environments.
In general, the concept of leveraging is based on the premise that the financing cost of leverage, which is based on short-term interest rates, is normally lower than the income earned by a Trust on its longer-term portfolio investments purchased with the proceeds from leverage. To the extent that the total assets of the Trusts (including the assets obtained from leverage) are invested in higher-yielding portfolio investments, the Trusts’ shareholders benefit from the incremental net income. The interest earned on securities purchased with the proceeds from leverage (after paying the leverage costs) is paid to shareholders in the form of dividends, and the value of these portfolio holdings (less the leverage liability) is reflected in the per share NAV.
To illustrate these concepts, assume a Trust’s capitalization is $100 million and it utilizes leverage for an additional $30 million, creating a total value of $130 million available for investment in longer-term income securities. If prevailing short-term interest rates are 3% and longer-term interest rates are 6%, the yield curve has a strongly positive slope. In this case, a Trust’s financing costs on the $30 million of proceeds obtained from leverage are based on the lower short-term interest rates. At the same time, the securities purchased by a Trust with the proceeds from leverage earn income based on longer-term interest rates. In this case, a Trust’s financing cost of leverage is significantly lower than the income earned on a Trust’s longer-term investments acquired from such leverage proceeds, and therefore the holders of Common Shares (“Common Shareholders”) are the beneficiaries of the incremental net income.
However, in order to benefit shareholders, the return on assets purchased with leverage proceeds must exceed the ongoing costs associated with the leverage. If interest and other costs of leverage exceed the Trusts’ return on assets purchased with leverage proceeds, income to shareholders is lower than if the Trusts had not used leverage. Furthermore, the value of the Trusts’ portfolio investments generally varies inversely with the direction of long-term interest rates, although other factors can influence the value of portfolio investments. In contrast, the value of the Trusts’ obligations under their respective leverage arrangements generally does not fluctuate in relation to interest rates. As a result, changes in interest rates can influence the Trusts’ NAVs positively or negatively. Changes in the future direction of interest rates are very difficult to predict accurately, and there is no assurance that the Trusts’ intended leveraging strategy will be successful.
The use of leverage also generally causes greater changes in each Trust’s NAV, market price and dividend rates than comparable portfolios without leverage. In a declining market, leverage is likely to cause a greater decline in the NAV and market price of a Trust’s shares than if the Trust were not leveraged. In addition, each Trust may be required to sell portfolio securities at inopportune times or at distressed values in order to comply with regulatory requirements applicable to the use of leverage or as required by the terms of leverage instruments, which may cause the Trusts to incur losses. The use of leverage may limit a Trust’s ability to invest in certain types of securities or use certain types of hedging strategies. Each Trust incurs expenses in connection with the use of leverage, all of which are borne by shareholders and may reduce income to the shareholders. Moreover, to the extent the calculation of the Trusts’ investment advisory fees includes assets purchased with the proceeds of leverage, the investment advisory fees payable to the Trusts’ investment adviser will be higher than if the Trusts did not use leverage.
Each Trust may utilize leverage through a credit facility or reverse repurchase agreements as described in the Notes to Financial Statements.
Under the Investment Company Act of 1940, as amended (the “1940 Act”), each Trust is permitted to issue debt up to 33 1/3% of its total managed assets. A Trust may voluntarily elect to limit its leverage to less than the maximum amount permitted under the 1940 Act. In addition, BGT may also be subject to certain asset coverage, leverage or portfolio composition requirements imposed by its credit facility, which may be more stringent than those imposed by the 1940 Act.
If a Trust segregates or designates on its books and records cash or liquid assets having a value not less than the value of a Trust’s obligations under a reverse repurchase agreement (including accrued interest), then such transaction is not considered a senior security and is not subject to the foregoing limitations and requirements imposed by the 1940 Act.
Derivative Financial Instruments
The Trusts may invest in various derivative financial instruments. These instruments are used to obtain exposure to a security, commodity, index, market and/or other assets without owning or taking physical custody of securities, commodities and/or other referenced assets or to manage market, equity, credit, interest rate, foreign currency exchange rate, commodity and/or other risks. Derivative financial instruments may give rise to a form of economic leverage and involve risks, including the imperfect correlation between the value of a derivative financial instrument and the underlying asset, possible default of the counterparty to the transaction or illiquidity of the instrument. The Trusts’ successful use of a derivative financial instrument depends on the investment adviser’s ability to predict pertinent market movements accurately, which cannot be assured. The use of these instruments may result in losses greater than if they had not been used, may limit the amount of appreciation a Trust can realize on an investment and/or may result in lower distributions paid to shareholders. The Trusts’ investments in these instruments, if any, are discussed in detail in the Notes to Financial Statements.
| | |
| 14 | | 2019 BLACKROCK ANNUAL REPORTTO SHAREHOLDERS |
| | |
Schedule of Investments October 31, 2019 | | BlackRock Credit Allocation Income Trust (BTZ) (Percentages shown are based on Net Assets) |
| | | | | | | | | | | | |
Security | | Par
(000) | | | Value | |
|
| Asset-Backed Securities — 7.0% | |
Allegro CLOII-S Ltd., Series2014-1RA, Class B, (3 mo. LIBOR US + 2.15%), 4.12%, 10/21/28(a)(b) | | | USD | | | | 500 | | | $ | 490,314 | |
Allegro CLO VI Ltd., Series2017-2A(a)(b): | | | | | | | | | | | | |
Class B, (3 mo. LIBOR US + 1.50%), 3.50%, 01/17/31 | | | | | | | 360 | | | | 351,443 | |
Class C, (3 mo. LIBOR US + 1.80%), 3.80%, 01/17/31 | | | | | | | 2,400 | | | | 2,270,231 | |
ALM VI Ltd., Series2012-6A, Class BR3,
(3 mo. LIBOR US + 1.75%),
3.75%, 07/15/26(a)(b) | | | | | | | 1,500 | | | | 1,469,160 | |
ALM VII R Ltd., Series 2013-7R2A(a)(b): | | | | | | | | | | | | |
Class A2R2, (3 mo. LIBOR US + 1.65%), 3.64%, 10/15/27 | | | | | | | 750 | | | | 743,635 | |
Class BR2, (3 mo. LIBOR US + 2.20%), 4.19%, 10/15/27 | | | | | | | 400 | | | | 392,479 | |
ALM XVI Ltd./ALM XVI LLC, Series2015-16A(a)(b): | | | | | | | | | | | | |
Class BR2, (3 mo. LIBOR US + 1.90%), 3.90%, 07/15/27 | | | | | | | 1,000 | | | | 982,727 | |
Class CR2, (3 mo. LIBOR US + 2.70%), 4.70%, 07/15/27 | | | | | | | 1,000 | | | | 967,485 | |
AMMC CLO Ltd., Series2018-22A, Class D,
(3 mo. LIBOR US + 2.70%),
4.64%, 04/25/31(a)(b) | | | | | | | 1,000 | | | | 927,708 | |
Anchorage Capital CLO Ltd.(a)(b): | | | | | | | | | | | | |
Series2013-1A, Class BR, (3 mo. LIBOR US + 2.15%), 4.14%, 10/13/30 | | | | | | | 1,000 | | | | 978,400 | |
Series2014-3RA, Class C, (3 mo. LIBOR US + 1.85%), 3.79%, 01/28/31 | | | | | | | 1,000 | | | | 951,584 | |
Series2014-3RA, Class D, (3 mo. LIBOR US + 2.60%), 4.54%, 01/28/31 | | | | | | | 1,000 | | | | 906,233 | |
Series2015-7A, Class CR, (3 mo. LIBOR US + 1.70%), 3.70%, 10/15/27 | | | | | | | 1,750 | | | | 1,717,542 | |
Apidos CLO XV, Series2013-15A, Class DRR, (3 mo. LIBOR US + 2.70%), 4.67%, 04/20/31(a)(b) | | | | | | | 1,000 | | | | 907,948 | |
Apidos CLO XX, Series2015-20A, Class BRR, (3 mo. LIBOR US + 1.95%), 3.95%, 07/16/31(a)(b) | | | | | | | 1,000 | | | | 960,781 | |
Ares XLIX CLO Ltd., Series2018-49A, Class D, (3 mo. LIBOR US + 3.00%), 4.95%, 07/22/30(a)(b) | | | | | | | 1,000 | | | | 946,100 | |
Ares XLVII CLO Ltd.(a)(b): | | | | | | | | | | | | |
Series2018-47A, Class D, (3 mo. LIBOR US + 2.70%), 4.70%, 04/15/30 | | | | | | | 1,500 | | | | 1,387,858 | |
Series2018-48A, Class C, (3 mo. LIBOR US + 1.80%), 3.77%, 07/20/30 | | | | | | | 500 | | | | 475,658 | |
Ares XXXVII CLO Ltd., Series2015-4A(a)(b): | | | | | | | | | | | | |
Class A3R, (3 mo. LIBOR US + 1.50%), 3.50%, 10/15/30 | | | | | | | 1,000 | | | | 980,882 | |
Class BR, (3 mo. LIBOR US + 1.80%), 3.80%, 10/15/30 | | | | | | | 1,750 | | | | 1,675,130 | |
Ares XXXVR CLO Ltd., Series 2015-35RA, Class D, (3 mo. LIBOR US + 3.00%), 5.00%, 07/15/30(a)(b) | | | | | | | 1,000 | | | | 948,023 | |
Atlas Senior Loan Fund VII Ltd., Series2016-7A(a)(b): | | | | | | | | | | | | |
Class A1R, (3 mo. LIBOR US + 1.28%), 3.41%, 11/27/31 | | | | | | | 2,000 | | | | 1,988,187 | |
Class B1R, (3 mo. LIBOR US + 1.80%), 3.93%, 11/27/31 | | | | | | | 550 | | | | 542,859 | |
Atlas Senior Loan Fund X Ltd., Series2018-10A(a)(b): | | | | | | | | | | | | |
Class B, (3 mo. LIBOR US + 1.50%), 3.50%, 01/15/31 | | | | | | | 500 | | | | 487,301 | |
Class C, (3 mo. LIBOR US + 1.85%), 3.85%, 01/15/31 | | | | | | | 1,000 | | | | 950,737 | |
Class D, (3 mo. LIBOR US + 2.75%), 4.75%, 01/15/31 | | | | | | | 1,700 | | | | 1,529,565 | |
Atlas Senior Loan Fund XII Ltd., Series2018-12A, Class A1, (3 mo. LIBOR US + 1.18%), 3.12%, 10/24/31(a)(b) | | | | | | | 400 | | | | 395,498 | |
| | | | | | | | | | | | |
Security | | Par
(000) | | | Value | |
|
| Asset-Backed Securities (continued) | |
Atrium XV, Series 15A, Class C, (3 mo. LIBOR US + 2.20%), 4.13%, 01/23/31(a)(b) | | | USD | | | | 250 | | | $ | 244,316 | |
Benefit Street Partners CLO XII Ltd., Series2017-12A(a)(c): | | | | | | | | | | | | |
Class B, (3 mo. LIBOR US + 2.00%), 4.00%, 10/15/30 | | | | | | | 1,000 | | | | 959,697 | |
Class C, (3 mo. LIBOR US + 3.05%), 5.05%, 10/15/30 | | | | | | | 2,000 | | | | 1,859,202 | |
Bowman Park CLO Ltd., Series2014-1A, Class D2R, (3 mo. LIBOR US + 3.35%), 5.50%, 11/23/25(a)(b) | | | | | | | 1,000 | | | | 1,001,392 | |
Carlyle Global Market Strategies CLO Ltd.(a)(b): | | | | | | | | | | | | |
Series2013-4A, Class DRR, (3 mo. LIBOR US + 2.65%), 4.65%, 01/15/31 | | | | | | | 1,000 | | | | 852,923 | |
Series2014-5A, Class A1RR, (3 mo. LIBOR US + 1.14%), 3.14%, 07/15/31 | | | | | | | 2,300 | | | | 2,289,133 | |
Series2016-3A, Class C, (3 mo. LIBOR US + 4.00%), 5.97%, 10/20/29 | | | | | | | 1,000 | | | | 981,514 | |
Carlyle US CLO Ltd.(a)(b): | | | | | | | | | | | | |
Series2016-4A, Class BR, (3 mo. LIBOR US + 2.10%), 4.07%, 10/20/27 | | | | | | | 250 | | | | 245,619 | |
Series2017-2A, Class C, (3 mo. LIBOR US + 3.70%), 5.67%, 07/20/31 | | | | | | | 500 | | | | 475,385 | |
Cedar Funding VI CLO Ltd., Series2016-6A, Class BR, (3 mo. LIBOR US + 1.60%), 3.57%, 10/20/28(a)(b) | | | | | | | 250 | | | | 246,283 | |
Cent CLO Ltd., Series C17A, Class BR,
(3 mo. LIBOR US + 1.85%),
3.79%, 04/30/31(a)(b) | | | | | | | 1,000 | | | | 956,674 | |
CIFC Funding Ltd.(a): | | | | | | | | | | | | |
(3 mo. LIBOR US + 2.65%),
4.65%, 04/18/31(c) | | | | | | | 1,200 | | | | 1,111,744 | |
Series2013-2A, Class A3LR, (3 mo. LIBOR US + 1.95%), 3.95%, 10/18/30(b) | | | | | | | 1,000 | | | | 952,046 | |
Series2013-2A, Class B1LR, (3 mo. LIBOR US + 3.05%), 5.05%, 10/18/30(b) | | | | | | | 1,000 | | | | 922,051 | |
Series2014-4RA, Class A2, (3 mo. LIBOR US + 1.65%), 3.65%, 10/17/30(b) | | | | | | | 600 | | | | 594,151 | |
Series2014-4RA, Class B, (3 mo. LIBOR US + 2.20%), 4.20%, 10/17/30(b) | | | | | | | 400 | | | | 392,735 | |
Series2014-4RA, Class C, (3 mo. LIBOR US + 3.20%), 5.20%, 10/17/30(b) | | | | | | | 400 | | | | 383,975 | |
Series2018-1A, Class C, 3.75%, 04/18/31(c) | | | | | | | 1,000 | | | | 941,171 | |
Elevation CLO Ltd., Series2017-7A, Class C, (3 mo. LIBOR US + 1.90%),
3.90%, 07/15/30(a)(b) | | | | | | | 1,500 | | | | 1,439,532 | |
Galaxy XX CLO Ltd., Series2015-20A, Class D1R, (3 mo. LIBOR US + 2.60%), 4.57%, 04/20/31(a)(b) | | | | | | | 1,000 | | | | 910,045 | |
Greenwood Park CLO Ltd., Series2018-1A, Class D, (3 mo. LIBOR US + 2.50%),
4.64%, 04/15/31(a)(c) | | | | | | | 1,000 | | | | 900,362 | |
Highbridge Loan Management Ltd.(a)(b): | | | | | | | | | | | | |
Series12A-18, Class B, (3 mo. LIBOR US + 1.85%), 3.85%, 07/18/31 | | | | | | | 1,250 | | | | 1,193,889 | |
Series4A-2014, Class A2R, (3 mo. LIBOR US + 1.50%), 3.44%, 01/28/30 | | | | | | | 650 | | | | 639,109 | |
Series6A-2015, Class BR, (3 mo. LIBOR US + 1.75%), 4.04%, 02/05/31 | | | | | | | 1,500 | | | | 1,416,336 | |
Series7A-2015, Class CR, (3 mo. LIBOR US + 1.70%), 3.86%, 03/15/27 | | | | | | | 2,000 | | | | 1,949,201 | |
Series7A-2015, Class DR, (3 mo. LIBOR US + 2.40%), 4.56%, 03/15/27 | | | | | | | 1,000 | | | | 971,973 | |
Limerock CLO III LLC, Series2014-3A, Class C, (3 mo. LIBOR US + 3.60%),
5.57%, 10/20/26(a)(b) | | | | | | | 1,000 | | | | 965,557 | |
Long Point Park CLO Ltd., Series2017-1A, Class B, (3 mo. LIBOR US + 1.70%), 3.70%, 01/17/30(a)(b) | | | | | | | 1,000 | | | | 958,681 | |
Madison Park Funding XIII Ltd., Series2014-13A, Class CR2, (3 mo. LIBOR US + 1.90%), 3.87%, 04/19/30(a)(b) | | | | | | | 1,000 | | | | 971,663 | |
| | | | |
| SCHEDULES OF INVESTMENTS | | | 15 | |
| | |
Schedule of Investments (continued) October 31, 2019 | | BlackRock Credit Allocation Income Trust (BTZ) (Percentages shown are based on Net Assets) |
| | | | | | | | | | | | |
Security | | Par
(000) | | | Value | |
|
| Asset-Backed Securities (continued) | |
Madison Park Funding XV Ltd.,Series 2014-15A, Class B1R, (3 mo. LIBOR US + 2.20%), 4.14%, 01/27/26(a)(b) | | | USD | | | | 2,000 | | | $ | 1,988,935 | |
Madison Park Funding XXVII Ltd.,Series 2018-27A(a)(b): | | | | | | | | | | | | |
Class B, (3 mo. LIBOR US + 1.80%), 3.77%, 04/20/30 | | | | | | | 1,000 | | | | 951,176 | |
Class C, (3 mo. LIBOR US + 2.60%), 4.57%, 04/20/30 | | | | | | | 1,000 | | | | 922,453 | |
Madison Park Funding XXX Ltd.,Series 2018-30A, Class D, (3 mo. LIBOR US + 2.50%), 4.50%, 04/15/29(a)(b) | | | | | | | 1,000 | | | | 927,467 | |
Marble Point CLO XI Ltd.,Series 2017-2A, Class B, (3 mo. LIBOR US + 1.50%), 3.50%, 12/18/30(a)(b) | | | | | | | 1,000 | | | | 973,715 | |
MP CLO III Ltd., Series2013-1A, Class CR,
(3 mo. LIBOR US + 2.00%), 3.97%, 10/20/30(a)(b) | | | | | | | 1,000 | | | | 947,661 | |
Neuberger Berman CLO XV Ltd.,Series 2013-15A, Class CR, (3 mo. LIBOR US + 2.05%), 4.05%, 10/15/29(a)(b) | | | | | | | 1,000 | | | | 954,785 | |
Neuberger Berman CLO XXI Ltd.,Series 2016-21A(a)(b): | | | | | | | | | | | | |
Class CR, (3 mo. LIBOR US + 1.60%), 3.57%, 04/20/27 | | | | | | | 1,000 | | | | 953,331 | |
Class DR, (3 mo. LIBOR US + 2.40%), 4.37%, 04/20/27 | | | | | | | 1,000 | | | | 972,361 | |
Neuberger Berman CLO XXII Ltd.,Series 2016-22A(a)(b): | | | | | | | | | | | | |
Class BR, (3 mo. LIBOR US + 1.65%), 3.65%, 10/17/30 | | | | | | | 400 | | | | 396,789 | |
Class CR, (3 mo. LIBOR US + 2.20%), 4.20%, 10/17/30 | | | | | | | 1,000 | | | | 971,803 | |
Neuberger Berman Loan Advisers CLO
Ltd.(a)(b): | | | | | | | | | | | | |
Series2017-26A, Class A, (3 mo. LIBOR US + 1.17%), 3.17%, 10/18/30 | | | | | | | 2,000 | | | | 1,993,810 | |
Series2017-26A, Class B, (3 mo. LIBOR US + 1.50%), 3.50%, 10/18/30 | | | | | | | 1,000 | | | | 980,493 | |
Series2017-26A, Class C, (3 mo. LIBOR US + 1.75%), 3.75%, 10/18/30 | | | | | | | 1,500 | | | | 1,429,165 | |
Series2018-27A, Class D, (3 mo. LIBOR US + 2.60%), 4.60%, 01/15/30 | | | | | | | 1,000 | | | | 902,841 | |
Oak Hill Credit PartnersX-R Ltd., Series 2014-10RA, Class C, (3 mo. LIBOR US + 2.20%), 4.17%, 12/12/30(a)(b) | | | | | | | 300 | | | | 288,228 | |
Oak Hill Credit Partners XII Ltd.,Series 2015-12A, Class DR, (3 mo. LIBOR US + 2.90%), 4.83%, 07/23/30(a)(b) | | | | | | | 600 | | | | 548,154 | |
OCP CLO Ltd.(a): | | | | | | | | | | | | |
Series2016-11A, Class BR, (3 mo. LIBOR US + 2.45%), 4.39%, 10/26/30(b) | | | | | | | 1,500 | | | | 1,469,036 | |
Series2016-12A, Class BR, (3 mo. LIBOR US + 2.20%), 4.20%, 10/18/28(c) | | | | | | | 1,000 | | | | 975,190 | |
Series2017-14A, Class B, (3 mo. LIBOR US + 1.95%), 4.09%, 11/20/30(b) | | | | | | | 1,000 | | | | 962,682 | |
Octagon Investment Partners Ltd.(a)(b): | | | | | | | | | | | | |
Series2016-1A, Class DR, (3 mo. LIBOR US + 2.85%), 4.85%, 07/15/30 | | | | | | | 500 | | | | 453,609 | |
Series2017-1A, Class B1, (3 mo. LIBOR US + 1.40%), 3.37%, 01/20/30 | | | | | | | 1,000 | | | | 974,866 | |
Series2017-1A, Class C, (3 mo. LIBOR US + 2.75%), 4.72%, 01/20/31 | | | | | | | 1,000 | | | | 916,228 | |
Octagon Investment Partners XIV Ltd.,Series 2012-1A, Class A1AR, (3 mo. LIBOR US + 1.17%), 3.17%, 07/15/29(a)(c) | | | | | | | 1,000 | | | | 999,172 | |
Octagon Investment Partners XVII Ltd., Series2013-1A(a)(b): | | | | | | | | | | | | |
Class BR2, (3 mo. LIBOR US + 1.40%), 3.34%, 01/25/31 | | | | | | | 1,000 | | | | 974,448 | |
Class CR2, (3 mo. LIBOR US + 1.70%), 3.64%, 01/25/31 | | | | | | | 1,000 | | | | 933,076 | |
| | | | | | | | | | | | |
Security | | Par
(000) | | | Value | |
|
| Asset-Backed Securities (continued) | |
Octagon Investment Partners XXII Ltd., Series2014-1A, Class CRR, (3 mo. LIBOR US + 1.90%), 3.85%, 01/22/30(a)(b) | | | USD | | | | 900 | | | $ | 851,008 | |
OZLM Funding IV Ltd., Series2013-4A, Class BR,
(3 mo. LIBOR US + 2.20%), 4.15%, 10/22/30(a)(b) | | | | | | | 1,000 | | | | 962,051 | |
OZLM VI Ltd., Series2014-6A, Class CS,
(3 mo. LIBOR US + 3.13%), 5.13%, 04/17/31(a)(b) | | | | | | | 500 | | | | 462,168 | |
OZLM XIX Ltd., Series2017-19A, Class C,
(3 mo. LIBOR US + 3.10%), 5.09%, 11/22/30(a)(b) | | | | | | | 1,000 | | | | 930,698 | |
OZLM XXI Ltd., Series2017-21A, Class B,
(3 mo. LIBOR US + 1.90%), 3.87%, 01/20/31(a)(b) | | | | | | | 1,800 | | | | 1,723,394 | |
Palmer Square CLO Ltd.(a): | | | | | | | | | | | | |
Series2013-2A, Class A2RR, (3 mo. LIBOR US + 1.75%), 4.05%, 10/17/31(b) | | | | | | | 650 | | | | 642,806 | |
Series2013-2A, Class BRR, (3 mo. LIBOR US + 2.20%), 4.50%, 10/17/31(b) | | | | | | | 750 | | | | 723,687 | |
Series2013-2A, Class CRR, (3 mo. LIBOR US + 3.20%), 5.50%, 10/17/31(b) | | | | | | | 250 | | | | 238,774 | |
Series2018-1A, Class A2, (3 mo. LIBOR US + 1.45%), 3.45%, 04/18/31(c) | | | | | | | 1,500 | | | | 1,460,090 | |
Series2019-1A, Class C, (3 mo. LIBOR US + 3.75%), 5.68%, 11/14/32(b)(d) | | | | | | | 1,000 | | | | 1,000,000 | |
Park Avenue Institutional Advisers CLO Ltd.,Series 2019-1A, Class C, (3 mo. LIBOR US + 3.88%), 6.41%, 05/15/32(a)(b) | | | | | | | 1,500 | | | | 1,438,202 | |
Recette CLO Ltd., Series2015-1A(a)(b): | | | | | | | | | | | | |
Class CR, (3 mo. LIBOR US + 1.70%), 3.67%, 10/20/27 | | | | | | | 1,500 | | | | 1,484,184 | |
Class DR, (3 mo. LIBOR US + 2.75%), 4.72%, 10/20/27 | | | | | | | 1,000 | | | | 989,164 | |
Regatta VII Funding Ltd., Series2016-1A, Class DR,
(3 mo. LIBOR US + 2.75%), 4.91%, 12/20/28(a)(b) | | | | | | | 500 | | | | 468,503 | |
Rockford Tower CLO Ltd., Series
2017-3A(a)(b): | | | | | | | | | | | | |
Class A, (3 mo. LIBOR US + 1.19%), 3.16%, 10/20/30 | | | | | | | 2,000 | | | | 1,995,243 | |
Class D, (3 mo. LIBOR US + 2.65%), 4.62%, 10/20/30 | | | | | | | 1,000 | | | | 913,927 | |
Sound Point CLO XXI Ltd., Series2018-3A, Class A1A, (3 mo. LIBOR US + 1.18%), 3.12%, 10/26/31(a)(b) | | | | | | | 1,400 | | | | 1,382,899 | |
Stewart Park CLO Ltd., Series2015-1A, Class DR,
(3 mo. LIBOR US + 2.60%), 4.60%, 01/15/30(a)(b) | | | | | | | 1,500 | | | | 1,368,750 | |
Tiaa CLO III Ltd., Series2017-2A, Class A,
(3 mo. LIBOR US + 1.15%), 3.15%, 01/16/31(a)(b) | | | | | | | 2,500 | | | | 2,473,190 | |
Voya CLO Ltd., Series2018-1A, Class C,
(3 mo. LIBOR US + 2.60%), 4.57%, 04/19/31(a)(b) | | | | | | | 1,000 | | | | 905,097 | |
York CLO Ltd.(a)(b): | | | | | | | | | | | | |
Series2014-1A, Class ARR, (3 mo. LIBOR US + 1.12%), 3.07%, 10/22/29 | | | | | | | 2,000 | | | | 1,986,863 | |
Series2015-1A, Class CR, (3 mo. LIBOR US + 1.85%), 3.80%, 01/22/31 | | | | | | | 1,500 | | | | 1,431,382 | |
Series2015-1A, Class DR, (3 mo. LIBOR US + 2.60%), 4.55%, 01/22/31 | | | | | | | 1,800 | | | | 1,623,970 | |
| | | | | | | | | | | | |
| |
Total Asset-Backed Securities — 7.0%
(Cost — $112,899,332) | | | | 108,269,351 | |
| | | | | | | | | | | | |
|
Corporate Bonds — 101.3% | |
|
Aerospace & Defense — 2.4% | |
Arconic, Inc.: | | | | | | | | | | | | |
5.40%, 04/15/21 | | | | | | | 46 | | | | 47,457 | |
5.13%, 10/01/24 | | | | | | | 2,411 | | | | 2,585,798 | |
BBA US Holdings, Inc.(a): | | | | | | | | | | | | |
5.38%, 05/01/26 | | | | | | | 672 | | | | 702,240 | |
4.00%, 03/01/28 | | | | | | | 945 | | | | 937,913 | |
| | |
| 16 | | 2019 BLACKROCK ANNUAL REPORTTO SHAREHOLDERS |
| | |
Schedule of Investments (continued) October 31, 2019 | | BlackRock Credit Allocation Income Trust (BTZ) (Percentages shown are based on Net Assets) |
| | | | | | | | | | | | |
Security | | Par
(000) | | | Value | |
|
| Aerospace & Defense (continued) | |
Bombardier, Inc.(a): | | | | | | | | | | | | |
8.75%, 12/01/21 | | | USD | | | | 1,601 | | | $ | 1,695,059 | |
5.75%, 03/15/22 | | | | | | | 280 | | | | 274,400 | |
6.00%, 10/15/22 | | | | | | | 5 | | | | 4,875 | |
6.13%, 01/15/23 | | | | | | | 52 | | | | 50,570 | |
7.50%, 12/01/24 | | | | | | | 166 | | | | 160,916 | |
7.50%, 03/15/25 | | | | | | | 771 | | | | 736,613 | |
7.88%, 04/15/27 | | | | | | | 3,111 | | | | 2,932,117 | |
Level 3 Financing, Inc., 4.63%, 09/15/27(a) | | | | | | | 507 | | | | 515,873 | |
TransDigm UK Holdings PLC, 6.88%, 05/15/26 | | | | | | | 599 | | | | 637,935 | |
TransDigm, Inc.: | | | | | | | | | | | | |
6.00%, 07/15/22 | | | | | | | 1,904 | | | | 1,936,368 | |
6.25%, 03/15/26(a) | | | | | | | 15,004 | | | | 16,073,035 | |
5.50%, 11/15/27(a)(e) | | | | | | | 3,259 | | | | 3,248,213 | |
Triumph Group, Inc., 6.25%, 09/15/24(a) | | | | | | | 859 | | | | 901,950 | |
United Technologies Corp., 4.63%, 11/16/48 | | | | | | | 2,805 | | | | 3,540,431 | |
| | | | | | | | | | | | |
| | | | | | | | | | | 36,981,763 | |
|
| Air Freight & Logistics — 0.0% | |
XPO Logistics, Inc., 6.75%, 08/15/24(a) | | | | | | | 43 | | | | 46,548 | |
| | | | | | | | |
|
| Airlines — 0.8% | |
American Airlines Group, Inc.: | | | | | | | | | | | | |
4.63%, 03/01/20(a) | | | | | | | 692 | | | | 695,460 | |
5.18%, 08/15/23(d) | | | | | | | 2,406 | | | | 2,448,282 | |
5.18%, 10/15/23(d) | | | | | | | 2,332 | | | | 2,372,447 | |
Delta Air Lines Pass-Through Trust, Series2002-1,Class G-1, 6.72%, 01/02/23 | | | | | | | 2,391 | | | | 2,533,916 | |
Turkish Airlines Pass-Through Trust, Series2015-1 Class A, 4.20%, 03/15/27(a) | | | | | | | 2,228 | | | | 2,062,042 | |
United Airlines Pass-Through Trust, Series2014-1, Class B, 4.75%, 04/11/22(f) | | | | | | | 2,477 | | | | 2,557,662 | |
| | | | | | | | | | | | |
| | | | | | | | | | | 12,669,809 | |
|
| Auto Components — 0.7% | |
Allison Transmission, Inc.(a): | | | | | | | | | | | | |
5.00%, 10/01/24 | | | | | | | 68 | | | | 69,615 | |
5.88%, 06/01/29 | | | | | | | 803 | | | | 865,233 | |
Goodyear Tire & Rubber Co., 5.00%, 05/31/26 | | | | | | | 535 | | | | 553,056 | |
Panther BF Aggregator 2 LP/Panther Finance Co., Inc.(a): | | | | | | | | | | | | |
6.25%, 05/15/26 | | | | | | | 3,726 | | | | 3,939,127 | |
8.50%, 05/15/27 | | | | | | | 4,190 | | | | 4,221,425 | |
Tesla, Inc., 5.30%, 08/15/25(a) | | | | | | | 384 | | | | 362,880 | |
| | | | | | | | |
| | | | | | | | | | | 10,011,336 | |
|
| Automobiles — 0.7% | |
Ford Motor Co., 7.45%, 07/16/31(f) | | | | | | | 3,660 | | | | 4,255,078 | |
General Motors Co.: | | | | | | | | | | | | |
4.88%, 10/02/23 | | | | | | | 1,875 | | | | 2,013,970 | |
6.25%, 10/02/43 | | | | | | | 940 | | | | 1,050,262 | |
5.95%, 04/01/49 | | | | | | | 3,455 | | | | 3,800,748 | |
| | | | | | | | |
| | | | | | | | | | | 11,120,058 | |
|
| Banks — 5.8% | |
Barclays PLC: | | | | | | | | | | | | |
4.84%, 05/09/28 | | | | | | | 4,000 | | | | 4,270,633 | |
(3 mo. LIBOR US + 1.90%), 4.97%, 05/16/29(f)(g) | | | | | | | 3,220 | | | | 3,627,317 | |
CIT Bank NA (Secured Overnight Financing Rate + 1.72%), 2.97%, 09/27/25(g) | | | | | | | 795 | | | | 801,459 | |
CIT Group, Inc., 5.00%, 08/01/23 | | | | | | | 370 | | | | 398,675 | |
Cooperatieve Rabobank UA, 3.95%, 11/09/22(f) | | | | | | | 3,775 | | | | 3,940,349 | |
Credit Suisse Group AG,
6.50%, 08/08/23(a)(f) | | | | | | | 6,000 | | | | 6,667,500 | |
Discover Bank/Greenwood, 8.70%, 11/18/19 | | | | | | | 748 | | | | 749,849 | |
Fifth Third Bancorp (3 mo. LIBOR US + 3.03%),
5.10%(g)(h) | | | | | | | 5,000 | | | | 5,075,000 | |
HSBC Finance Corp., 6.68%, 01/15/21 | | | | | | | 5,150 | | | | 5,386,706 | |
| | | | | | | | | | | | |
Security | | Par
(000) | | | Value | |
|
| Banks (continued) | |
Intesa Sanpaolo SpA, 5.71%, 01/15/26(a) | | | USD | | | | 9,840 | | | $ | 10,548,522 | |
Lloyds Banking Group PLC(f): | | | | | | | | | | | | |
4.45%, 05/08/25 | | | | | | | 3,665 | | | | 4,001,743 | |
4.65%, 03/24/26 | | | | | | | 8,650 | | | | 9,348,014 | |
RBC USA Holdco Corp., 5.25%, 09/15/20 | | | | | | | 2,900 | | | | 2,986,732 | |
Santander Holdings USA, Inc., 4.40%, 07/13/27 | | | | | | | 830 | | | | 893,406 | |
SunTrust Banks, Inc. (3 mo. LIBOR US + 3.10%), 5.05%(g)(h) | | | | | | | 5,270 | | | | 5,362,225 | |
Wells Fargo & Co.(f): | | | | | | | | | | | | |
4.13%, 08/15/23 | | | | | | | 4,000 | | | | 4,250,787 | |
4.10%, 06/03/26 | | | | | | | 15,000 | | | | 16,139,873 | |
5.61%, 01/15/44 | | | | | | | 4,119 | | | | 5,392,569 | |
| | | | | | | | |
| | | | | | | | | | | 89,841,359 | |
|
| Beverages — 1.1% | |
Anheuser-Busch Cos. LLC/Anheuser-Busch InBev Worldwide, Inc., 4.90%, 02/01/46 | | | | | | | 6,170 | | | | 7,401,303 | |
Anheuser-Busch InBev Worldwide, Inc., 5.55%, 01/23/49 | | | | | | | 5,000 | | | | 6,603,039 | |
Keurig Dr. Pepper, Inc., 4.60%, 05/25/28 | | | | | | | 3,215 | | | | 3,645,062 | |
| | | | | | | | |
| | | | | | | | | | | 17,649,404 | |
|
| Biotechnology — 1.0% | |
Amgen, Inc., 4.66%, 06/15/51(f) | | | | | | | 6,709 | | | | 7,843,615 | |
Baxalta, Inc., 5.25%, 06/23/45(f) | | | | | | | 6,000 | | | | 7,744,448 | |
| | | | | | | | |
| | | | | | | | | | | 15,588,063 | |
|
| Building Products — 0.2% | |
Masonite International Corp.(a): | | | | | | | | | | | | |
5.75%, 09/15/26 | | | | | | | 282 | | | | 299,272 | |
5.38%, 02/01/28 | | | | | | | 271 | | | | 286,583 | |
Standard Industries, Inc.(a): | | | | | | | | | | | | |
5.50%, 02/15/23 | | | | | | | 335 | | | | 342,437 | |
5.38%, 11/15/24 | | | | | | | 410 | | | | 421,808 | |
6.00%, 10/15/25 | | | | | | | 1,965 | | | | 2,063,250 | |
| | | | | | | | |
| | | | | | | | | | | 3,413,350 | |
|
| Capital Markets — 1.5% | |
Goldman Sachs Group, Inc.: | | | | | | | | | | | | |
5.25%, 07/27/21 | | | | | | | 1,175 | | | | 1,238,613 | |
5.75%, 01/24/22(f) | | | | | | | 5,500 | | | | 5,926,844 | |
Morgan Stanley, 5.00%, 11/24/25(f) | | | | | | | 15,000 | | | | 16,862,047 | |
| | | | | | | | |
| | | | | | | | | | | 24,027,504 | |
|
| Chemicals — 2.0% | |
Axalta Coating Systems LLC, 4.88%, 08/15/24(a) | | | | | | | 715 | | | | 738,238 | |
Chemours Co., 6.63%, 05/15/23 | | | | | | | 569 | | | | 565,973 | |
Dow Chemical Co., 5.55%, 11/30/48(a) | | | | | | | 4,820 | | | | 5,895,950 | |
DuPont de Nemours, Inc., 5.42%, 11/15/48 | | | | | | | 7,500 | | | | 9,331,787 | |
Element Solutions, Inc., 5.88%, 12/01/25(a) | | | | | | | 2,722 | | | | 2,841,516 | |
GCP Applied Technologies, Inc., 5.50%, 04/15/26(a) | | | | | | | 299 | | | | 306,475 | |
LYB Finance Co. BV, 8.10%, 03/15/27(a)(f) | | | | | | | 6,000 | | | | 7,765,180 | |
NOVA Chemicals Corp., 4.88%, 06/01/24(a) | | | | | | | 240 | | | | 243,600 | |
PQ Corp., 6.75%, 11/15/22(a) | | | | | | | 935 | | | | 965,387 | |
WR Grace &Co-Conn, 5.63%, 10/01/24(a) | | | | | | | 1,660 | | | | 1,792,800 | |
| | | | | | | | |
| | | | | | | | | | | 30,446,906 | |
|
| Commercial Services & Supplies — 3.2% | |
ADT Security Corp.: | | | | | | | | | | | | |
3.50%, 07/15/22 | | | | | | | 32 | | | | 32,074 | |
4.13%, 06/15/23 | | | | | | | 251 | | | | 254,451 | |
4.88%, 07/15/32(a) | | | | | | | 1,140 | | | | 986,442 | |
Allied Universal Holdco LLC/Allied Universal Finance Corp.(a): | | | | | | | | | | | | |
6.63%, 07/15/26 | | | | | | | 2,776 | | | | 2,963,380 | |
9.75%, 07/15/27 | | | | | | | 228 | | | | 238,260 | |
| | | | |
| SCHEDULES OF INVESTMENTS | | | 17 | |
| | |
Schedule of Investments (continued) October 31, 2019 | | BlackRock Credit Allocation Income Trust (BTZ) (Percentages shown are based on Net Assets) |
| | | | | | | | | | | | |
Security | | Par
(000) | | | Value | |
|
| Commercial Services & Supplies (continued) | |
Aviation Capital Group LLC(a): | | | | | | | | | | | | |
7.13%, 10/15/20(f) | | | USD | | | | 31,000 | | | $ | 32,390,472 | |
6.75%, 04/06/21 | | | | | | | 7,850 | | | | 8,316,274 | |
Core & Main LP, 6.13%, 08/15/25(a) | | | | | | | 1,215 | | | | 1,234,744 | |
GFL Environmental, Inc., 8.50%, 05/01/27(a) | | | | | | | 979 | | | | 1,076,900 | |
KAR Auction Services, Inc.,
5.13%, 06/01/25(a) | | | | | | | 446 | | | | 465,513 | |
United Rentals North America, Inc.: | | | | | | | | | | | | |
4.63%, 10/15/25 | | | | | | | 646 | | | | 660,535 | |
4.88%, 01/15/28 | | | | | | | 877 | | | | 905,502 | |
| | | | | | | | |
| | | | | | | | | | | 49,524,547 | |
|
| Communications Equipment — 0.4% | |
CommScope, Inc.(a): | | | | | | | | | | | | |
5.50%, 03/01/24 | | | | | | | 2,000 | | | | 2,027,000 | |
6.00%, 03/01/26 | | | | | | | 654 | | | | 671,985 | |
Gogo Intermediate Holdings LLC/Gogo Finance Co., Inc., 9.88%, 05/01/24(a) | | | | | | | 351 | | | | 369,428 | |
ViaSat, Inc., 5.63%, 04/15/27(a) | | | | | | | 1,250 | | | | 1,316,812 | |
Zayo Group LLC/Zayo Capital, Inc.: | | | | | | | | | | | | |
6.38%, 05/15/25 | | | | | | | 750 | | | | 771,000 | |
5.75%, 01/15/27(a) | | | | | | | 1,479 | | | | 1,503,226 | |
| | | | | | | | |
| | | | | | | | | | | 6,659,451 | |
|
| Construction & Engineering — 0.1% | |
Brand Industrial Services, Inc., 8.50%, 07/15/25(a) | | | | | | | 814 | | | | 789,580 | |
SRS Distribution, Inc., 8.25%, 07/01/26(a) | | | | | | | 429 | | | | 429,000 | |
| | | | | | | | |
| | | | | | | | | | | 1,218,580 | |
|
| Construction Materials — 0.6% | |
American Builders & Contractors Supply Co., Inc.(a): | | | | | | | | | | | | |
5.75%, 12/15/23 | | | | | | | 371 | | | | 381,574 | |
5.88%, 05/15/26 | | | | | | | 101 | | | | 106,080 | |
4.00%, 01/15/28 | | | | | | | 864 | | | | 861,840 | |
Core & Main Holdings LP, (8.625% Cash or 9.38% PIK), 8.63%, 09/15/24(a)(i) | | | | | | | 1,085 | | | | 1,079,575 | |
HD Supply, Inc., 5.38%, 10/15/26(a) | | | | | | | 4,350 | | | | 4,600,125 | |
Performance Food Group, Inc., 5.50%, 10/15/27(a) | | | | | | | 640 | | | | 676,800 | |
Williams Scotsman International, Inc.,
6.88%, 08/15/23(a) | | | | | | | 951 | | | | 998,550 | |
| | | | | | | | |
| | | | | | | | | | | 8,704,544 | |
|
| Consumer Discretionary — 0.1% | |
Viking Cruises Ltd., 5.88%, 09/15/27(a) | | | | | | | 2,159 | | | | 2,293,937 | |
| | | | | | | | |
|
| Consumer Finance — 1.6% | |
Ally Financial, Inc.: | | | | | | | | | | | | |
5.13%, 09/30/24(f) | | | | | | | 273 | | | | 300,164 | |
8.00%, 11/01/31 | | | | | | | 4,237 | | | | 5,894,726 | |
Capital One Bank USA NA, 3.38%, 02/15/23 | | | | | | | 2,000 | | | | 2,060,604 | |
Discover Financial Services, 3.85%, 11/21/22 | | | | | | | 3,252 | | | | 3,406,535 | |
Navient Corp.: | | | | | | | | | | | | |
6.63%, 07/26/21 | | | | | | | 461 | | | | 486,931 | |
7.25%, 09/25/23 | | | | | | | 498 | | | | 544,055 | |
6.13%, 03/25/24 | | | | | | | 59 | | | | 61,673 | |
Refinitiv US Holdings, Inc.(a): | | | | | | | | | | | | |
6.25%, 05/15/26 | | | | | | | 3,324 | | | | 3,610,695 | |
8.25%, 11/15/26 | | | | | | | 1,389 | | | | 1,559,152 | |
Springleaf Finance Corp.: | | | | | | | | | | | | |
7.13%, 03/15/26 | | | | | | | 1,231 | | | | 1,403,340 | |
6.63%, 01/15/28 | | | | | | | 506 | | | | 560,395 | |
Total System Services, Inc., 3.80%, 04/01/21 | | | | | | | 1,630 | | | | 1,664,422 | |
Verscend Escrow Corp., 9.75%, 08/15/26(a) | | | | | | | 2,484 | | | | 2,642,355 | |
| | | | | | | | |
| | | | | | | | | | | 24,195,047 | |
| | | | | | | | | | | | |
Security | | Par
(000) | | | Value | |
|
| Containers & Packaging — 0.8% | |
Ardagh Packaging Finance PLC/Ardagh Holdings USA, Inc.(a): | | | | | | | | | | | | |
4.63%, 05/15/23 | | | USD | | | | 760 | | | $ | 778,050 | |
4.13%, 08/15/26(f) | | | | | | | 605 | | | | 611,625 | |
Berry Global, Inc., 4.88%, 07/15/26(a) | | | | | | | 1,014 | | | | 1,065,968 | |
Crown Americas LLC/Crown Americas Capital Corp. V, 4.25%, 09/30/26 | | | | | | | 724 | | | | 755,675 | |
Crown Americas LLC/Crown Americas Capital Corp. VI, 4.75%, 02/01/26(f) | | | | | | | 947 | | | | 993,687 | |
Greif, Inc., 6.50%, 03/01/27(a) | | | | | | | 207 | | | | 222,525 | |
LABL Escrow Issuer LLC, 6.75%, 07/15/26(a) | | | | | | | 742 | | | | 767,970 | |
Reynolds Group Issuer, Inc./Reynolds Group Issuer LLC/Reynolds Group Issuer Lu: | | | | | | | | | | | | |
6.88%, 02/15/21 | | | | | | | 36 | | | | 36,432 | |
5.13%, 07/15/23(a) | | | | | | | 317 | | | | 325,226 | |
7.00%, 07/15/24(a) | | | | | | | 1,455 | | | | 1,505,925 | |
Sealed Air Corp., 6.88%, 07/15/33(a) | | | | | | | 182 | | | | 212,030 | |
Trivium Packaging Finance BV(a): | | | | | | | | | | | | |
5.50%, 08/15/26 | | | | | | | 2,495 | | | | 2,613,512 | |
8.50%, 08/15/27 | | | | | | | 2,517 | | | | 2,683,751 | |
| | | | | | | | |
| | | | | | | | | | | 12,572,376 | |
|
| Diversified Consumer Services — 0.3% | |
APX Group, Inc., 8.75%, 12/01/20 | | | | | | | 493 | | | | 485,605 | |
Ascend Learning LLC, 6.88%, 08/01/25(a) | | | | | | | 1,611 | | | | 1,682,543 | |
Prime Security Services Borrower LLC/Prime Finance, Inc.(a): | | | | | | | | | | | | |
5.25%, 04/15/24 | | | | | | | 520 | | | | 532,350 | |
5.75%, 04/15/26 | | | | | | | 1,168 | | | | 1,196,850 | |
Service Corp. International, 5.13%, 06/01/29 | | | | | | | 468 | | | | 498,420 | |
ServiceMaster Co. LLC, 5.13%, 11/15/24(a) | | | | | | | 137 | | | | 141,795 | |
| | | | | | | | |
| | | | | | | | | | | 4,537,563 | |
| | | |
| Diversified Financial Services — 5.9% | | | | | | | | | |
Bank of America Corp.(f): | | | | | | | | | | | | |
5.00%, 05/13/21 | | | | | | | 17,100 | | | | 17,890,807 | |
4.45%, 03/03/26 | | | | | | | 11,765 | | | | 12,847,616 | |
BNP Paribas SA (5 year USD Swap + 1.48%), 4.38%, 03/01/33(a)(g) | | | | | | | 4,000 | | | | 4,250,186 | |
Citigroup, Inc., 6.68%, 09/13/43(f) | | | | | | | 4,125 | | | | 5,985,920 | |
F-BrasileSpA/F-Brasile US LLC, Series XR, 7.38%, 08/15/26(a) | | | | | | | 516 | | | | 539,220 | |
Ford Motor Credit Co. LLC, 5.88%, 08/02/21(f) | | | | | | | 9,420 | | | | 9,882,675 | |
General Motors Financial Co., Inc.: | | | | | | | | | | | | |
4.38%, 09/25/21(f) | | | | | | | 2,260 | | | | 2,342,678 | |
4.25%, 05/15/23 | | | | | | | 1,681 | | | | 1,757,809 | |
4.35%, 01/17/27(f) | | | | | | | 4,710 | | | | 4,860,053 | |
Jefferies Financial Group, Inc., 5.50%, 10/18/23 | | | | | | | 4,000 | | | | 4,372,787 | |
Macquarie Group Ltd. (3 mo. LIBOR US + 1.33%), 4.15%, 03/27/24(a)(g) | | | | | | | 4,000 | | | | 4,221,189 | |
Murphy Oil USA, Inc., 4.75%, 09/15/29 | | | | | | | 383 | | | | 399,756 | |
Resparcs Funding LP I, 8.00%(h)(j)(k) | | | | | | | 4,000 | | | | 705,776 | |
Royal Bank of Scotland Group PLC: | | | | | | | | | | | | |
6.10%, 06/10/23 | | | | | | | 2,500 | | | | 2,753,753 | |
6.00%, 12/19/23 | | | | | | | 10,080 | | | | 11,193,706 | |
5.13%, 05/28/24 | | | | | | | 5,250 | | | | 5,663,305 | |
Tempo Acquisition LLC/Tempo Acquisition Finance Corp., 6.75%, 06/01/25(a) | | | | | | | 2,164 | | | | 2,226,215 | |
| | | | | | | | |
| | | | | | | | | | | 91,893,451 | |
|
| Diversified Telecommunication Services — 6.2% | |
AT&T, Inc.: | | | | | | | | | | | | |
6.30%, 01/15/38(f) | | | | | | | 12,000 | | | | 15,592,433 | |
5.15%, 03/15/42 | | | | | | | 250 | | | | 290,445 | |
| | |
| 18 | | 2019 BLACKROCK ANNUAL REPORTTO SHAREHOLDERS |
| | |
Schedule of Investments (continued) October 31, 2019 | | BlackRock Credit Allocation Income Trust (BTZ) (Percentages shown are based on Net Assets) |
| | | | | | | | | | | | |
Security | | Par
(000) | | | Value | |
|
| Diversified Telecommunication Services (continued) | |
4.65%, 06/01/44 | | | USD | | | | 28 | | | $ | 30,457 | |
4.35%, 06/15/45 | | | | | | | 367 | | | | 388,723 | |
4.85%, 07/15/45 | | | | | | | 97 | | | | 109,855 | |
CenturyLink, Inc.: | | | | | | | | | | | | |
5.63%, 04/01/25(f) | | | | | | | 1,909 | | | | 2,011,800 | |
Series P, 7.60%, 09/15/39 | | | | | | | 164 | | | | 166,870 | |
Series S, 6.45%, 06/15/21 | | | | | | | 1,176 | | | | 1,237,740 | |
Series U, 7.65%, 03/15/42 | | | | | | | 683 | | | | 693,245 | |
Series Y, 7.50%, 04/01/24(f) | | | | | | | 945 | | | | 1,072,575 | |
Embarq Corp., 8.00%, 06/01/36 | | | | | | | 502 | | | | 496,980 | |
Frontier Communications Corp.(a): | | | | | | | | | | | | |
8.50%, 04/01/26 | | | | | | | 711 | | | | 712,777 | |
8.00%, 04/01/27 | | | | | | | 3,736 | | | | 3,922,800 | |
Level 3 Financing, Inc.: | | | | | | | | | | | | |
5.38%, 08/15/22 | | | | | | | 1,761 | | | | 1,767,604 | |
5.13%, 05/01/23 | | | | | | | 1,183 | | | | 1,197,787 | |
5.38%, 05/01/25 | | | | | | | 614 | | | | 634,723 | |
5.25%, 03/15/26 | | | | | | | 137 | | | | 142,994 | |
Telecom Italia Capital SA: | | | | | | | | | | | | |
6.38%, 11/15/33 | | | | | | | 64 | | | | 70,541 | |
6.00%, 09/30/34 | | | | | | | 674 | | | | 719,495 | |
7.20%, 07/18/36 | | | | | | | 45 | | | | 52,650 | |
7.72%, 06/04/38 | | | | | | | 136 | | | | 166,600 | |
Telecom Italia SpA, 5.30%, 05/30/24(a) | | | | | | | 1,662 | | | | 1,778,340 | |
Telefonica Emisiones SAU, 5.21%, 03/08/47 | | | | | | | 6,000 | | | | 6,977,680 | |
Verizon Communications, Inc.(f): | | | | | | | | | | | | |
5.15%, 09/15/23 | | | | | | | 8,775 | | | | 9,800,624 | |
6.40%, 09/15/33 | | | | | | | 9,475 | | | | 12,859,045 | |
6.55%, 09/15/43 | | | | | | | 13,225 | | | | 19,697,829 | |
5.01%, 04/15/49 | | | | | | | 10,578 | | | | 13,658,617 | |
| | | | | | | | |
| | | | | | | | | | | 96,251,229 | |
| | | |
| Electric Utilities — 4.6% | | | | | | | | | |
CMS Energy Corp., 5.05%, 03/15/22 | | | | | | | 9,900 | | | | 10,499,251 | |
Duke Energy Corp., 3.55%, 09/15/21(f) | | | | | | | 3,650 | | | | 3,743,583 | |
Emera, Inc., Series16-A, (3 mo. LIBOR US + 5.44%),
6.75%, 06/15/76(g) | | | | | | | 7,500 | | | | 8,433,450 | |
Evergy, Inc., 5.29%, 06/15/22(f)(l) | | | | | | | 5,550 | | | | 5,934,295 | |
Midland Cogeneration Venture LP, 5.25%, 03/15/25(a)(f) | | | | | | | 2,940 | | | | 2,942,556 | |
NextEra Energy Capital Holdings, Inc.
(3 mo. LIBOR US + 2.41%),
4.80%, 12/01/77(g) | | | | | | | 5,000 | | | | 5,146,500 | |
NextEra Energy Operating Partners LP(a): | | | | | | | | | | | | |
4.25%, 07/15/24 | | | | | | | 1,215 | | | | 1,248,048 | |
4.25%, 09/15/24 | | | | | | | 290 | | | | 301,600 | |
4.50%, 09/15/27 | | | | | | | 474 | | | | 483,480 | |
Oncor Electric Delivery Co. LLC: | | | | | | | | | | | | |
4.10%, 06/01/22(f) | | | | | | | 4,150 | | | | 4,355,757 | |
5.30%, 06/01/42 | | | | | | | 2,750 | | | | 3,655,582 | |
Progress Energy, Inc., 7.00%, 10/30/31(f) | | | | | | | 12,000 | | | | 16,582,927 | |
Puget Energy, Inc.: | | | | | | | | | | | | |
6.00%, 09/01/21 | | | | | | | 275 | | | | 293,441 | |
5.63%, 07/15/22(f) | | | | | | | 5,550 | | | | 5,956,850 | |
TerraForm Power Operating LLC(a): | | | | | | | | | | | | |
4.25%, 01/31/23 | | | | | | | 470 | | | | 484,100 | |
5.00%, 01/31/28 | | | | | | | 470 | | | | 495,709 | |
4.75%, 01/15/30 | | | | | | | 768 | | | | 793,920 | |
| | | | | | | | |
| | | | | | | | | | | 71,351,049 | |
|
| Electronic Equipment, Instruments & Components — 0.2% | |
CDW LLC/CDW Finance Corp.: | | | | | | | | | | | | |
5.50%, 12/01/24 | | | | | | | 2,653 | | | | 2,952,948 | |
4.25%, 04/01/28 | | | | | | | 308 | | | | 318,811 | |
| | | | | | | | |
| | | | | | | | | | | 3,271,759 | |
| | | | | | | | | | | | |
Security | | Par
(000) | | | Value | |
| | | |
| Energy Equipment & Services — 0.7% | | | | | | | | | |
Archrock Partners LP/Archrock Partners Finance Corp., 6.88%, 04/01/27(a) | | | USD | | | | 231 | | | $ | 238,484 | |
Halliburton Co., 5.00%, 11/15/45(f) | | | | | | | 6,615 | | | | 7,291,372 | |
Transocean, Inc.(a): | | | | | | | | | | | | |
9.00%, 07/15/23 | | | | | | | 2,039 | | | | 2,077,231 | |
7.50%, 01/15/26 | | | | | | | 497 | | | | 442,330 | |
USA Compression Partners LP/USA Compression Finance Corp.: | | | | | | | | | | | | |
6.88%, 04/01/26 | | | | | | | 707 | | | | 714,070 | |
6.88%, 09/01/27(a) | | | | | | | 815 | | | | 815,000 | |
| | | | | | | | |
| | | | | | | | | | | 11,578,487 | |
|
| Environmental, Maintenance, & Security Service — 0.1% | |
GFL Environmental, Inc., 7.00%, 06/01/26(a) | | | | | | | 743 | | | | 787,580 | |
Waste Pro USA, Inc., 5.50%, 02/15/26(a) | | | | | | | 303 | | | | 312,848 | |
| | | | | | | | |
| | | | | | | | | | | 1,100,428 | |
|
| Equity Real Estate Investment Trusts (REITs) — 1.9% | |
American Tower Corp.: | | | | | | | | | | | | |
5.90%, 11/01/21(f) | | | | | | | 3,770 | | | | 4,047,286 | |
3.60%, 01/15/28 | | | | | | | 4,000 | | | | 4,206,871 | |
Brookfield Property REIT, Inc./BPR Cumulus LLC/BPR Nimbus LLC/GGSI Sellco LL, 5.75%, 05/15/26(a) | | | | | | | 383 | | | | 399,756 | |
Five Point Operating Co. LP/Five Point Capital Corp., 7.88%, 11/15/25(a) | | | | | | | 183 | | | | 172,966 | |
Host Hotels & Resorts LP, 3.75%, 10/15/23(f) | | | | | | | 3,600 | | | | 3,754,844 | |
Iron Mountain, Inc., 4.88%, 09/15/27(a) | | | | | | | 1,016 | | | | 1,050,290 | |
Marriott Ownership Resorts, Inc./ILG LLC, 6.50%, 09/15/26 | | | | | | | 186 | | | | 201,109 | |
MGM Growth Properties Operating Partnership LP/MGP FinanceCo-Issuer, Inc.: | | | | | | | | | | | | |
5.63%, 05/01/24 | | | | | | | 4,627 | | | | 5,095,484 | |
4.50%, 09/01/26 | | | | | | | 2,600 | | | | 2,762,500 | |
4.50%, 01/15/28 | | | | | | | 545 | | | | 570,888 | |
MPT Operating Partnership LP/MPT Finance Corp.: | | | | | | | | | | | | |
5.00%, 10/15/27 | | | | | | | 1,948 | | | | 2,050,270 | |
4.63%, 08/01/29 | | | | | | | 1,047 | | | | 1,092,168 | |
SBA Communications Corp., 4.88%, 09/01/24 | | | | | | | 2,995 | | | | 3,111,056 | |
Starwood Property Trust, Inc., 5.00%, 12/15/21 | | | | | | | 627 | | | | 648,945 | |
| | | | | | | | |
| | | | | | | | | | | 29,164,433 | |
| | | |
| Food & Staples Retailing — 1.0% | | | | | | | | | |
Albertsons Cos. LLC/Safeway, Inc./New Albertson’s, Inc./Albertson’s LLC: | | | | | | | | | | | | |
6.63%, 06/15/24 | | | | | | | 425 | | | | 445,719 | |
5.75%, 03/15/25 | | | | | | | 307 | | | | 317,653 | |
Albertsons Cos. LLC/Safeway, Inc./New Albertsons LP/Albertson’s LLC,
5.88%, 02/15/28(a) | | | | | | | 1,000 | | | | 1,067,500 | |
General Mills, Inc., 4.20%, 04/17/28 | | | | | | | 620 | | | | 695,871 | |
Kraft Heinz Foods Co., 7.13%, 08/01/39(a) | | | | | | | 4,415 | | | | 5,684,629 | |
Post Holdings, Inc., 5.50%, 12/15/29(a) | | | | | | | 391 | | | | 412,192 | |
Walmart, Inc., 5.25%, 09/01/35(f) | | | | | | | 5,150 | | | | 6,789,936 | |
| | | | | | | | |
| | | | | | | | | | | 15,413,500 | |
| | | |
| Food Products — 0.8% | | | | | | | | | |
1011778 BC ULC/New Red Finance, Inc.,
3.88%, 01/15/28(a) | | | | | | | 987 | | | | 992,231 | |
Aramark Services, Inc., 5.00%, 02/01/28(a) | | | | | | | 228 | | | | 238,260 | |
Darling Ingredients, Inc., 5.25%, 04/15/27(a) | | | | | | | 569 | | | | 597,450 | |
JBS USA LUX SA/JBS USA Finance, Inc.(a): | | | | | | | | | | | | |
5.88%, 07/15/24 | | | | | | | 537 | | | | 555,790 | |
5.75%, 06/15/25 | | | | | | | 2,093 | | | | 2,180,644 | |
6.75%, 02/15/28 | | | | | | | 699 | | | | 771,084 | |
JBS USA LUX SA/JBS USA Food Co./JBS USA Finance, Inc.(a): | | | | | | | | | | | | |
6.50%, 04/15/29 | | | | | | | 2,222 | | | | 2,472,042 | |
5.50%, 01/15/30 | | | | | | | 1,398 | | | | 1,504,597 | |
| | | | |
| SCHEDULES OF INVESTMENTS | | | 19 | |
| | |
Schedule of Investments (continued) October 31, 2019 | | BlackRock Credit Allocation Income Trust (BTZ) (Percentages shown are based on Net Assets) |
| | | | | | | | | | | | |
Security | | Par
(000) | | | Value | |
| | | |
| Food Products (continued) | | | | | | | | | |
Kraft Heinz Foods Co., 4.38%, 06/01/46 | | | USD | | | | 2,475 | | | $ | 2,418,164 | |
Post Holdings, Inc., 5.63%, 01/15/28(a) | | | | | | | 428 | | | | 457,960 | |
Simmons Foods, Inc., 7.75%, 01/15/24(a) | | | | | | | 395 | | | | 427,094 | |
| | | | | | | | |
| | | | | | | | | | | 12,615,316 | |
|
| Health Care Equipment & Supplies — 0.6% | |
Avantor, Inc.(a): | | | | | | | | | | | | |
6.00%, 10/01/24 | | | | | | | 6,180 | | | | 6,605,678 | |
9.00%, 10/01/25 | | | | | | | 1,616 | | | | 1,805,395 | |
Hologic, Inc.(a): | | | | | | | | | | | | |
4.38%, 10/15/25 | | | | | | | 209 | | | | 214,127 | |
4.63%, 02/01/28 | | | | | | | 226 | | | | 236,453 | |
Medtronic, Inc., 4.63%, 03/15/45(f) | | | | | | | 647 | | | | 830,912 | |
| | | | | | | | |
| | | | | | | | | | | 9,692,565 | |
|
| Health Care Providers & Services — 4.1% | |
Acadia Healthcare Co., Inc., 5.13%, 07/01/22 | | | | | | | 191 | | | | 192,671 | |
Aetna, Inc., 3.88%, 08/15/47 | | | | | | | 3,500 | | | | 3,389,404 | |
AHP Health Partners, Inc.,
9.75%, 07/15/26(a) | | | | | | | 402 | | | | 433,155 | |
Anthem, Inc., 4.55%, 03/01/48 | | | | | | | 5,000 | | | | 5,495,657 | |
Centene Corp.: | | | | | | | | | | | | |
6.13%, 02/15/24 | | | | | | | 1,370 | | | | 1,424,375 | |
5.38%, 06/01/26(a) | | | | | | | 2,322 | | | | 2,457,837 | |
CHS/Community Health Systems, Inc.(a): | | | | | | | | | | | | |
8.63%, 01/15/24 | | | | | | | 1,392 | | | | 1,416,360 | |
8.00%, 03/15/26(f) | | | | | | | 1,151 | | | | 1,125,102 | |
Encompass Health Corp., 5.75%, 11/01/24 | | | | | | | 372 | | | | 376,185 | |
Envision Healthcare Crop.,
8.75%, 10/15/26(a) | | | | | | | 613 | | | | 352,475 | |
HCA, Inc.: | | | | | | | | | | | | |
7.50%, 02/15/22 | | | | | | | 2,214 | | | | 2,456,433 | |
5.38%, 02/01/25 | | | | | | | 1,108 | | | | 1,217,415 | |
5.38%, 09/01/26 | | | | | | | 665 | | | | 724,850 | |
5.63%, 09/01/28 | | | | | | | 2,084 | | | | 2,341,895 | |
5.88%, 02/01/29 | | | | | | | 1,245 | | | | 1,411,519 | |
5.25%, 06/15/49 | | | | | | | 3,500 | | | | 3,873,205 | |
MEDNAX, Inc.(a): | | | | | | | | | | | | |
5.25%, 12/01/23 | | | | | | | 323 | | | | 327,038 | |
6.25%, 01/15/27 | | | | | | | 1,749 | | | | 1,731,510 | |
Molina Healthcare, Inc., 5.38%, 11/15/22 | | | | | | | 395 | | | | 416,725 | |
MPH Acquisition Holdings LLC, 7.13%, 06/01/24(a) | | | | | | | 1,201 | | | | 1,110,985 | |
NVA Holdings, Inc., 6.88%, 04/01/26(a) | | | | | | | 439 | | | | 470,827 | |
Polaris Intermediate Corp., (8.50% Cash), 8.50%, 12/01/22(a)(i) | | | | | | | 1,435 | | | | 1,201,534 | |
Regional Care Hospital Partners Holdings, Inc., 8.25%, 05/01/23(a) | | | | | | | 1,977 | | | | 2,110,447 | |
Surgery Center Holdings, Inc., 10.00%, 04/15/27(a) | | | | | | | 444 | | | | 449,550 | |
Tenet Healthcare Corp.: | | | | | | | | | | | | |
8.13%, 04/01/22 | | | | | | | 2,108 | | | | 2,279,380 | |
4.63%, 07/15/24 | | | | | | | 1,145 | | | | 1,179,350 | |
4.63%, 09/01/24(a) | | | | | | | 882 | | | | 904,579 | |
4.88%, 01/01/26(a) | | | | | | | 3,422 | | | | 3,541,770 | |
6.25%, 02/01/27(a) | | | | | | | 945 | | | | 1,001,313 | |
5.13%, 11/01/27(a) | | | | | | | 2,342 | | | | 2,435,680 | |
UnitedHealth Group, Inc., 6.88%, 02/15/38(f) | | | | | | | 10,000 | | | | 14,841,753 | |
WellCare Health Plans, Inc.: | | | | | | | | | | | | |
5.25%, 04/01/25 | | | | | | | 776 | | | | 812,132 | |
5.38%, 08/15/26(a) | | | | | | | 757 | | | | 805,259 | |
| | | | | | | | |
| | | | | | | | | | | 64,308,370 | |
| | | |
| Health Care Technology — 0.2% | | | | | | | | | |
Change Healthcare Holdings LLC/Change Healthcare Finance, Inc.,
5.75%, 03/01/25(a) | | | | | | | 650 | | | | 665,080 | |
IQVIA, Inc.(a): | | | | | | | | | | | | |
5.00%, 10/15/26 | | | | | | | 554 | | | | 584,470 | |
5.00%, 05/15/27 | | | | | | | 1,192 | | | | 1,263,520 | |
| | | | | | | | |
| | | | | | | | | | | 2,513,070 | |
| | | | | | | | | | | | |
Security | | Par
(000) | | | Value | |
| | | |
| Hotels, Restaurants & Leisure — 2.3% | | | | | | | | | |
1011778 BC ULC/New Red Finance, Inc.(a): | | | | | | | | | | | | |
4.25%, 05/15/24 | | | USD | | | | 943 | | | $ | 967,754 | |
5.00%, 10/15/25 | | | | | | | 2,019 | | | | 2,069,475 | |
Boyd Gaming Corp., 6.00%, 08/15/26 | | | | | | | 330 | | | | 348,975 | |
Cedar Fair LP, 5.25%, 07/15/29(a) | | | | | | | 710 | | | | 761,475 | |
Churchill Downs, Inc.(a): | | | | | | | | | | | | |
5.50%, 04/01/27 | | | | | | | 2,042 | | | | 2,164,520 | |
4.75%, 01/15/28 | | | | | | | 520 | | | | 538,200 | |
Eldorado Resorts, Inc., 6.00%, 09/15/26 | | | | | | | 277 | | | | 303,661 | |
Golden Nugget, Inc., 6.75%, 10/15/24(a) | | | | | | | 1,562 | | | | 1,609,016 | |
Hilton Domestic Operating Co., Inc.: | | | | | | | | | | | | |
4.25%, 09/01/24 | | | | | | | 1,133 | | | | 1,152,827 | |
5.13%, 05/01/26 | | | | | | | 1,492 | | | | 1,566,600 | |
4.88%, 01/15/30(a) | | | | | | | 1,979 | | | | 2,102,687 | |
Hilton Worldwide Finance LLC/Hilton Worldwide Finance Corp., 4.88%, 04/01/27 | | | | | | | 123 | | | | 130,070 | |
IRB Holding Corp., 6.75%, 02/15/26(a) | | | | | | | 156 | | | | 158,730 | |
KFC Holding Co./Pizza Hut Holdings LLC/Taco Bell of America LLC(a): | | | | | | | | | | | | |
5.00%, 06/01/24 | | | | | | | 600 | | | | 622,500 | |
5.25%, 06/01/26 | | | | | | | 650 | | | | 687,375 | |
4.75%, 06/01/27 | | | | | | | 817 | | | | 852,499 | |
Lions Gate Capital Holdings LLC, 6.38%, 02/01/24(a) | | | | | | | 253 | | | | 241,141 | |
MGM Resorts International: | | | | | | | | | | | | |
6.63%, 12/15/21 | | | | | | | 4,552 | | | | 4,933,230 | |
7.75%, 03/15/22 | | | | | | | 1,059 | | | | 1,183,432 | |
6.00%, 03/15/23 | | | | | | | 1,335 | | | | 1,472,265 | |
5.75%, 06/15/25 | | | | | | | 200 | | | | 221,750 | |
Sabre GLBL, Inc.(a): | | | | | | | | | | | | |
5.38%, 04/15/23 | | | | | | | 594 | | | | 609,593 | |
5.25%, 11/15/23 | | | | | | | 434 | | | | 444,850 | |
Scientific Games International, Inc.(a): | | | | | | | | | | | | |
5.00%, 10/15/25 | | | | | | | 1,300 | | | | 1,339,000 | |
8.25%, 03/15/26 | | | | | | | 3,430 | | | | 3,627,225 | |
Six Flags Entertainment Corp., 4.88%, 07/31/24(a) | | | | | | | 289 | | | | 298,393 | |
Station Casinos LLC, 5.00%, 10/01/25(a) | | | | | | | 662 | | | | 671,102 | |
Wyndham Destinations, Inc.: | | | | | | | | | | | | |
5.40%, 04/01/24 | | | | | | | 883 | | | | 935,980 | |
5.75%, 04/01/27 | | | | | | | 308 | | | | 336,490 | |
Wyndham Hotels & Resorts, Inc., 5.38%, 04/15/26(a) | | | | | | | 453 | | | | 477,915 | |
Wynn Las Vegas LLC/Wynn Las Vegas Capital Corp., 5.25%, 05/15/27(a) | | | | | | | 541 | | | | 563,993 | |
Wynn Resorts Finance LLC/Wynn Resorts Capital Corp., 5.13%, 10/01/29(a) | | | | | | | 934 | | | | 976,030 | |
Yum! Brands, Inc., 4.75%, 01/15/30(a) | | | | | | | 918 | | | | 962,752 | |
| | | | | | | | | | | | |
| | | | | | | | | | | 35,331,505 | |
|
| Household Durables — 0.8% | |
Brookfield Residential Properties, Inc./Brookfield Residential US Corp., 6.13%, 07/01/22(a) | | | | | | | 1,314 | | | | 1,335,353 | |
Lennar Corp.: | | | | | | | | | | | | |
2.95%, 11/29/20 | | | | | | | 520 | | | | 520,650 | |
8.38%, 01/15/21 | | | | | | | 3,015 | | | | 3,210,975 | |
4.75%, 11/15/22 | | | | | | | 1,805 | | | | 1,899,762 | |
4.88%, 12/15/23 | | | | | | | 466 | | | | 498,620 | |
5.25%, 06/01/26 | | | | | | | 890 | | | | 979,000 | |
Newell Brands, Inc.: | | | | | | | | | | | | |
4.00%, 12/01/24 | | | | | | | 3,000 | | | | 3,097,476 | |
4.20%, 04/01/26 | | | | | | | 955 | | | | 998,117 | |
| | | | | | | | | | | | |
| | | | | | | | | | | 12,539,953 | |
|
| Household Products — 0.2% | |
Energizer Holdings, Inc.(a): | | | | | | | | | | | | |
6.38%, 07/15/26 | | | | | | | 222 | | | | 236,719 | |
7.75%, 01/15/27(f) | | | | | | | 595 | | | | 658,962 | |
| | |
| 20 | | 2019 BLACKROCK ANNUAL REPORTTO SHAREHOLDERS |
| | |
Schedule of Investments (continued) October 31, 2019 | | BlackRock Credit Allocation Income Trust (BTZ) (Percentages shown are based on Net Assets) |
| | | | | | | | | | | | |
Security | | Par
(000) | | | Value | |
|
| Household Products (continued) | |
Spectrum Brands, Inc.: | | | | | | | | | | | | |
6.63%, 11/15/22 | | | USD | | | | 555 | | | $ | 560,550 | |
6.13%, 12/15/24 | | | | | | | 231 | | | | 238,796 | |
5.75%, 07/15/25 | | | | | | | 1,002 | | | | 1,044,585 | |
| | | | | | | | | | | | |
| | | | | | | | | | | 2,739,612 | |
|
| Independent Power and Renewable Electricity Producers — 0.9% | |
Calpine Corp.: | | | | | | | | | | | | |
6.00%, 01/15/22(a) | | | | | | | 1,858 | | | | 1,860,601 | |
5.38%, 01/15/23 | | | | | | | 2,431 | | | | 2,470,382 | |
5.88%, 01/15/24(a) | | | | | | | 628 | | | | 641,816 | |
5.75%, 01/15/25 | | | | | | | 674 | | | | 691,693 | |
5.25%, 06/01/26(a) | | | | | | | 1,371 | | | | 1,425,840 | |
Clearway Energy Operating LLC: | | | | | | | | | | | | |
5.38%, 08/15/24 | | | | | | | 457 | | | | 463,284 | |
5.75%, 10/15/25 | | | | | | | 545 | | | | 559,306 | |
NRG Energy, Inc.: | | | | | | | | | | | | |
6.63%, 01/15/27 | | | | | | | 3,042 | | | | 3,296,767 | |
5.75%, 01/15/28 | | | | | | | 428 | | | | 463,310 | |
5.25%, 06/15/29(a) | | | | | | | 1,384 | | | | 1,484,340 | |
| | | | | | | | | | | | |
| | | | | | | | | | | 13,357,339 | |
|
| Industrial Conglomerates — 0.2% | |
BWX Technologies, Inc., 5.38%, 07/15/26(a) | | | | | | | 862 | | | | 912,901 | |
Icahn Enterprises LP/Icahn Enterprises Finance Corp., 4.75%, 09/15/24(a) | | | | | | | 191 | | | | 192,910 | |
Icahn Enterprises LP/Icahn Enterprises Finance Corp., 6.38%, 12/15/25 | | | | | | | 316 | | | | 331,800 | |
Icahn Enterprises LP/Icahn Enterprises Finance Corp, 6.25%, 05/15/26 | | | | | | | 860 | | | | 911,600 | |
Vertiv Group Corp., 9.25%, 10/15/24(a) | | | | | | | 989 | | | | 932,133 | |
| | | | | | | | | | | | |
| | | | | | | | | | | 3,281,344 | |
|
| Insurance — 3.5% | |
Alliant Holdings Intermediate LLC/Alliant HoldingsCo-Issuer, 6.75%, 10/15/27(a) | | | | | | | 2,271 | | | | 2,362,090 | |
American International Group, Inc., 6.40%, 12/15/20(f) | | | | | | | 8,710 | | | | 9,134,829 | |
Aon Corp., 5.00%, 09/30/20(f) | | | | | | | 7,700 | | | | 7,908,223 | |
Aon PLC, 4.25%, 12/12/42 | | | | | | | 6,500 | | | | 6,923,328 | |
Global Atlantic Fin Co., 8.63%, 04/15/21(a) | | | | | | | 3,400 | | | | 3,661,482 | |
HUB International Ltd., 7.00%, 05/01/26(a) | | | | | | | 1,824 | | | | 1,876,440 | |
Nationstar Mortgage Holdings, Inc.(a): | | | | | | | | | | | | |
8.13%, 07/15/23 | | | | | | | 552 | | | | 585,120 | |
9.13%, 07/15/26 | | | | | | | 262 | | | | 287,217 | |
Northwestern Mutual Life Insurance Co.,
6.06%, 03/30/40(a)(f) | | | | | | | 12,000 | | | | 16,514,630 | |
Progressive Corp., Series B, (3 mo. LIBOR US + 2.54%), 5.38%(g)(h) | | | | | | | 5,000 | | | | 5,223,800 | |
| | | | | | | | | | | | |
| | | | | | | | | | | 54,477,159 | |
|
| Interactive Media & Services — 0.8% | |
Booking Holdings, Inc., 3.55%, 03/15/28 | | | | | | | 3,375 | | | | 3,635,710 | |
Equinix, Inc., 5.88%, 01/15/26 | | | | | | | 1,169 | | | | 1,241,712 | |
Go Daddy Operating Co. LLC/GD Finance Co., Inc., 5.25%, 12/01/27(a) | | | | | | | 695 | | | | 736,700 | |
Netflix, Inc.: | |
5.88%, 11/15/28 | | | | | | | 1,682 | | | | 1,852,303 | |
5.38%, 11/15/29(a) | | | | | | | 1,934 | | | | 2,035,535 | |
4.88%, 06/15/30(a) | | | | | | | 1,185 | | | | 1,198,035 | |
Rackspace Hosting, Inc.,
8.63%, 11/15/24(a)(f) | | | | | | | 402 | | | | 367,830 | |
Uber Technologies, Inc.(a): | |
7.50%, 11/01/23(f) | | | | | | | 588 | | | | 598,437 | |
7.50%, 09/15/27 | | | | | | | 811 | | | | 798,835 | |
| | | | | | | | | | | | |
| | | | | | | | | | | 12,465,097 | |
| | | | | | | | | | | | |
Security | | Par
(000) | | | Value | |
|
| Internet & Direct Marketing Retail — 0.1% | |
Alibaba Group Holding Ltd., 4.20%, 12/06/47 | | | USD | | | | 1,470 | | | $ | 1,650,325 | |
| | | | | | | | | | | | |
|
| IT Services — 0.4% | |
Banff Merger Sub, Inc., 9.75%, 09/01/26(a) | | | | | | | 2,328 | | | | 2,167,950 | |
Fidelity National Information Services, Inc., 5.00%, 10/15/25 | | | | | | | 538 | | | | 614,825 | |
Gartner, Inc., 5.13%, 04/01/25(a) | | | | | | | 399 | | | | 418,431 | |
Outfront Media Capital LLC/Outfront Media Capital Corp., 5.00%, 08/15/27(a) | | | | | | | 1,734 | | | | 1,816,417 | |
WEX, Inc., 4.75%, 02/01/23(a) | | | | | | | 760 | | | | 767,608 | |
| | | | | | | | |
| | | | | | | | | | | 5,785,231 | |
|
| Leisure Products — 0.1% | |
Mattel, Inc., 6.75%, 12/31/25(a)(f) | | | | | | | 746 | | | | 778,638 | |
| | | | | | | | |
|
| Machinery — 0.3% | |
Colfax Corp.(a): | | | | | | | | | | | | |
6.00%, 02/15/24 | | | | | | | 983 | | | | 1,041,980 | |
6.38%, 02/15/26 | | | | | | | 517 | | | | 559,653 | |
RBS Global, Inc./Rexnord LLC, 4.88%, 12/15/25(a) | | | | | | | 878 | | | | 905,437 | |
Titan Acquisition Ltd./TitanCo-Borrower LLC, 7.75%, 04/15/26(a) | | | | | | | 1,464 | | | | 1,372,500 | |
| | | | | | | | |
| | | | | | | | | | | 3,879,570 | |
|
| Media — 8.3% | |
Altice Financing SA(a): | | | | | | | | | | | | |
6.63%, 02/15/23 | | | | | | | 834 | | | | 856,685 | |
7.50%, 05/15/26 | | | | | | | 2,172 | | | | 2,307,750 | |
Altice France SA(a): | | | | | | | | | | | | |
7.38%, 05/01/26 | | | | | | | 5,039 | | | | 5,395,988 | |
8.13%, 02/01/27 | | | | | | | 485 | | | | 537,744 | |
Altice Luxembourg SA(a): | | | | | | | | | | | | |
7.63%, 02/15/25 | | | | | | | 447 | | | | 460,969 | |
10.50%, 05/15/27 | | | | | | | 1,683 | | | | 1,903,894 | |
AMC Networks, Inc.: | | | | | | | | | | | | |
4.75%, 12/15/22 | | | | | | | 685 | | | | 689,281 | |
4.75%, 08/01/25 | | | | | | | 1,104 | | | | 1,113,660 | |
CCO Holdings LLC/CCO Holdings Capital Corp.(a): | | | | | | | | | | | | |
4.00%, 03/01/23 | | | | | | | 1,216 | | | | 1,237,280 | |
5.13%, 05/01/27 | | | | | | | 4,156 | | | | 4,379,385 | |
5.00%, 02/01/28 | | | | | | | 201 | | | | 210,226 | |
5.38%, 06/01/29 | | | | | | | 2,616 | | | | 2,792,580 | |
4.75%, 03/01/30 | | | | | | | 507 | | | | 516,988 | |
Charter Communications Operating LLC/Charter Communications Operating Capital: | | | | | | | | | | | | |
6.38%, 10/23/35 | | | | | | | 479 | | | | 588,922 | |
6.48%, 10/23/45 | | | | | | | 9,584 | | | | 11,785,719 | |
5.38%, 05/01/47 | | | | | | | 1,500 | | | | 1,647,926 | |
6.83%, 10/23/55 | | | | | | | 3,540 | | | | 4,521,964 | |
Cinemark USA, Inc., 5.13%, 12/15/22 | | | | | | | 349 | | | | 352,054 | |
Clear Channel Worldwide Holdings, Inc.(a): | | | | | | | | | | | | |
9.25%, 02/15/24 | | | | | | | 2,531 | | | | 2,784,100 | |
5.13%, 08/15/27 | | | | | | | 3,834 | | | | 3,990,926 | |
Comcast Corp., 4.95%, 10/15/58 | | | | | | | 3,795 | | | | 4,902,134 | |
Connect Finco Sarl/Connect US Finco LLC,
6.75%, 10/01/26(a) | | | | | | | 3,389 | | | | 3,520,324 | |
Cox Communications, Inc.(a): | | | | | | | | | | | | |
8.38%, 03/01/39 | | | | | | | 5,000 | | | | 7,438,178 | |
4.60%, 08/15/47 | | | | | | | 625 | | | | 682,540 | |
CSC Holdings LLC: | | | | | | | | | | | | |
5.38%, 07/15/23(a) | | | | | | | 2,432 | | | | 2,492,751 | |
5.25%, 06/01/24 | | | | | | | 1,061 | | | | 1,143,227 | |
7.75%, 07/15/25(a) | | | | | | | 4,129 | | | | 4,428,352 | |
6.63%, 10/15/25(a) | | | | | | | 1,072 | | | | 1,141,680 | |
10.88%, 10/15/25(a) | | | | | | | 620 | | | | 699,645 | |
| | | | |
| SCHEDULES OF INVESTMENTS | | | 21 | |
| | |
Schedule of Investments (continued) October 31, 2019 | | BlackRock Credit Allocation Income Trust (BTZ) (Percentages shown are based on Net Assets) |
| | | | | | | | | | | | |
Security | | Par
(000) | | | Value | |
|
| Media (continued) | |
5.50%, 05/15/26(a) | | | USD | | | | 1,041 | | | $ | 1,096,954 | |
5.38%, 02/01/28(a) | | | | | | | 800 | | | | 846,000 | |
7.50%, 04/01/28 (a) | | | | | | | 877 | | | | 988,817 | |
5.75%, 01/15/30(a) | | | | | | | 1,406 | | | | 1,478,057 | |
Diamond Sports Group LLC/Diamond Sports Finance Co., 5.38%, 08/15/26(a) | | | | | | | 1,891 | | | | 1,976,095 | |
Discovery Communications LLC: | | | | | | | | | | | | |
3.95%, 03/20/28(f) | | | | | | | 8,515 | | | | 8,967,348 | |
4.88%, 04/01/43 | | | | | | | 4,000 | | | | 4,148,351 | |
DISH DBS Corp.: | | | | | | | | | | | | |
5.88%, 07/15/22 | | | | | | | 2,406 | | | | 2,516,219 | |
5.88%, 11/15/24 | | | | | | | 164 | | | | 164,410 | |
Gray Television, Inc., 7.00%, 05/15/27(a) | | | | | | | 415 | | | | 453,906 | |
Hughes Satellite Systems Corp., 5.25%, 08/01/26 | | | | | | | 391 | | | | 418,859 | |
iHeartCommunications, Inc.: | | | | | | | | | | | | |
6.38%, 05/01/26 | | | | | | | 370 | | | | 396,806 | |
5.25%, 08/15/27(a) | | | | | | | 755 | | | | 778,934 | |
Intelsat Jackson Holdings SA: | | | | | | | | | | | | |
5.50%, 08/01/23 | | | | | | | 2 | | | | 1,870 | |
8.50%, 10/15/24(a) | | | | | | | 696 | | | | 701,359 | |
9.75%, 07/15/25(a) | | | | | | | 2,262 | | | | 2,347,232 | |
Interpublic Group of Cos., Inc.: | | | | | | | | | | | | |
3.75%, 02/15/23(f) | | | | | | | 6,025 | | | | 6,302,368 | |
5.40%, 10/01/48 | | | | | | | 2,215 | | | | 2,685,283 | |
Lamar Media Corp., 5.75%, 02/01/26 | | | | | | | 282 | | | | 299,273 | |
LCPR Senior Secured Financing DAC,
6.75%, 10/15/27(a) | | | | | | | 800 | | | | 821,000 | |
Live Nation Entertainment, Inc., 4.75%, 10/15/27(a) | | | | | | | 560 | | | | 583,856 | |
MDC Partners, Inc., 6.50%, 05/01/24(a) | | | | | | | 330 | | | | 315,563 | |
Meredith Corp., 6.88%, 02/01/26 | | | | | | | 144 | | | | 148,425 | |
Outfront Media Capital LLC/Outfront Media Capital Corp., 5.63%, 02/15/24 | | | | | | | 126 | | | | 129,308 | |
Qualitytech LP/QTS Finance Corp., 4.75%, 11/15/25(a) | | | | | | | 105 | | | | 109,725 | |
Sirius XM Radio, Inc.(a): | | | | | | | | | | | | |
4.63%, 07/15/24 | | | | | | | 182 | | | | 190,190 | |
5.00%, 08/01/27 | | | | | | | 597 | | | | 627,596 | |
5.50%, 07/01/29 | | | | | | | 1,282 | | | | 1,385,778 | |
TEGNA, Inc., 5.50%, 09/15/24(a) | | | | | | | 351 | | | | 361,858 | |
Telenet Finance Luxembourg Notes Sarl,
5.50%, 03/01/28(a) | | | | | | | 1,000 | | | | 1,063,500 | |
Time Warner Cable LLC, 6.55%, 05/01/37 | | | | | | | 3,519 | | | | 4,269,112 | |
Univision Communications, Inc., 5.13%, 05/15/23(a) | | | | | | | 750 | | | | 750,000 | |
Viacom, Inc., 5.85%, 09/01/43 | | | | | | | 1,300 | | | | 1,591,553 | |
Videotron Ltd., 5.13%, 04/15/27(a) | | | | | | | 1,099 | | | | 1,167,687 | |
Virgin Media Secured Finance PLC(a): | | | | | | | | | | | | |
5.50%, 08/15/26 | | | | | | | 487 | | | | 511,959 | |
5.50%, 05/15/29 | | | | | | | 904 | | | | 960,500 | |
Ziggo Bond Co. BV, 6.00%, 01/15/27(a) | | | | | | | 955 | | | | 997,975 | |
Ziggo BV(a): | | | | | | | | | | | | |
5.50%, 01/15/27 | | | | | | | 972 | | | | 1,025,460 | |
4.88%, 01/15/30 | | | | | | | 421 | | | | 428,502 | |
| | | | | | | | |
| | | | | | | | | | | 128,530,560 | |
|
| Metals & Mining — 2.2% | |
AngloGold Ashanti Holdings PLC, 5.13%, 08/01/22 | | | | | | | 5,000 | | | | 5,257,812 | |
Commercial Metals Co., 4.88%, 05/15/23(f) | | | | | | | 2,194 | | | | 2,265,305 | |
Constellium SE: | | | | | | | | | | | | |
4.63%, 05/15/21 | | | EUR | | | | 327 | | | | 365,104 | |
6.63%, 03/01/25(a)(f) | | | USD | | | | 609 | | | | 637,349 | |
5.88%, 02/15/26(a) | | | | | | | 1,701 | | | | 1,773,293 | |
Freeport-McMoRan, Inc.: | | | | | | | | | | | | |
4.00%, 11/14/21 | | | | | | | 500 | | | | 509,375 | |
3.55%, 03/01/22 | | | | | | | 221 | | | | 223,486 | |
| | | | | | | | | | | | |
Security | | Par
(000) | | | Value | |
|
| Metals & Mining (continued) | |
3.88%, 03/15/23 | | | USD | | | | 6,265 | | | $ | 6,358,975 | |
5.00%, 09/01/27 | | | | | | | 466 | | | | 475,903 | |
5.25%, 09/01/29 | | | | | | | 588 | | | | 598,466 | |
5.40%, 11/14/34 | | | | | | | 2,250 | | | | 2,196,562 | |
5.45%, 03/15/43 | | | | | | | 4,252 | | | | 3,954,360 | |
Grinding Media,Inc./Moly-Cop AltaSteel Ltd., 7.38%, 12/15/23(a) | | | | | | | 817 | | | | 788,405 | |
Novelis Corp.(a): | | | | | | | | | | | | |
6.25%, 08/15/24 | | | | | | | 2,381 | | | | 2,494,097 | |
5.88%, 09/30/26 | | | | | | | 1,876 | | | | 1,969,988 | |
Southern Copper Corp., 5.88%, 04/23/45 | | | | | | | 3,870 | | | | 4,680,523 | |
| | | | | | | | |
| | | | | | | | | | | 34,549,003 | |
|
| Oil, Gas & Consumable Fuels — 14.7% | |
Aker BP ASA(a): | | | | | | | | | | | | |
4.75%, 06/15/24 | | | | | | | 1,169 | | | | 1,215,760 | |
5.88%, 03/31/25 | | | | | | | 570 | | | | 602,775 | |
Antero Resources Corp., 5.38%, 11/01/21 | | | | | | | 457 | | | | 407,873 | |
Ascent Resources Utica Holdings LLC/ARU Finance Corp., 10.00%, 04/01/22(a) | | | | | | | 492 | | | | 465,580 | |
Berry Petroleum Co. LLC, 7.00%, 02/15/26(a) | | | | | | | 312 | | | | 290,160 | |
Callon Petroleum Co., Series WI, 6.38%, 07/01/26 | | | | | | | 8 | | | | 7,460 | |
Carrizo Oil & Gas, Inc.: | | | | | | | | | | | | |
6.25%, 04/15/23 | | | | | | | 258 | | | | 239,940 | |
8.25%, 07/15/25 | | | | | | | 817 | | | | 776,150 | |
Cheniere Energy Partners LP: | | | | | | | | | | | | |
5.63%, 10/01/26 | | | | | | | 596 | | | | 629,525 | |
4.50%, 10/01/29(a) | | | | | | | 1,497 | | | | 1,525,069 | |
Chesapeake Energy Corp.: | | | | | | | | | | | | |
6.63%, 08/15/20 | | | | | | | 1,182 | | | | 1,163,915 | |
4.88%, 04/15/22 | | | | | | | 3,299 | | | | 2,620,643 | |
5.75%, 03/15/23 | | | | | | | 205 | | | | 149,650 | |
7.00%, 10/01/24 | | | | | | | 584 | | | | 394,200 | |
CNX Resources Corp., 5.88%, 04/15/22 | | | | | | | 5,500 | | | | 5,376,250 | |
Concho Resources, Inc., 4.88%, 10/01/47 | | | | | | | 3,815 | | | | 4,325,981 | |
CONSOL Energy, Inc., 11.00%, 11/15/25(a) | | | | | | | 318 | | | | 266,325 | |
Continental Resources, Inc., 4.90%, 06/01/44 | | | | | | | 3,500 | | | | 3,452,829 | |
Covey Park Energy LLC/Covey Park Finance Corp., 7.50%, 05/15/25(a) | | | | | | | 569 | | | | 421,060 | |
Crestwood Midstream Partners LP/Crestwood Midstream Finance Corp., 5.63%, 05/01/27(a) | | | | | | | 1,025 | | | | 1,031,427 | |
CrownRock LP/CrownRock Finance, Inc.,
5.63%, 10/15/25(a)(f) | | | | | | | 2,479 | | | | 2,423,272 | |
DCP Midstream Operating LP: | | | | | | | | | | | | |
5.38%, 07/15/25 | | | | | | | 120 | | | | 126,186 | |
5.13%, 05/15/29 | | | | | | | 48 | | | | 48,565 | |
6.45%, 11/03/36(a) | | | | | | | 247 | | | | 253,793 | |
6.75%, 09/15/37(a) | | | | | | | 1,527 | | | | 1,591,897 | |
Denbury Resources, Inc.(a): | | | | | | | | | | | | |
9.00%, 05/15/21 | | | | | | | 754 | | | | 659,750 | |
9.25%, 03/31/22 | | | | | | | 544 | | | | 446,080 | |
Devon Energy Corp., 5.85%, 12/15/25 | | | | | | | 4,000 | | | | 4,754,953 | |
El Paso Natural Gas Co. LLC, 8.63%, 01/15/22 | | | | | | | 2,345 | | | | 2,650,189 | |
Enbridge, Inc. (3 mo. LIBOR US + 3.64%), 6.25%, 03/01/78(g) | | | | | | | 5,000 | | | | 5,377,400 | |
Endeavor Energy Resources LP/EER Finance, Inc.(a): | | | | | | | | | | | | |
5.50%, 01/30/26 | | | | | | | 1,978 | | | | 2,037,380 | |
5.75%, 01/30/28 | | | | | | | 369 | | | | 388,380 | |
Energy Transfer Operating LP: | | | | | | | | | | | | |
7.50%, 10/15/20 | | | | | | | 598 | | | | 627,456 | |
5.20%, 02/01/22 | | | | | | | 10,200 | | | | 10,740,263 | |
4.25%, 03/15/23 | | | | | | | 553 | | | | 579,668 | |
5.88%, 01/15/24 | | | | | | | 3,366 | | | | 3,737,270 | |
5.50%, 06/01/27 | | | | | | | 406 | | | | 455,827 | |
6.13%, 12/15/45 | | | | | | | 3,579 | | | | 4,177,940 | |
| | |
| 22 | | 2019 BLACKROCK ANNUAL REPORTTO SHAREHOLDERS |
| | |
Schedule of Investments (continued) October 31, 2019 | | BlackRock Credit Allocation Income Trust (BTZ) (Percentages shown are based on Net Assets) |
| | | | | | | | | | | | |
Security | | Par
(000) | | | Value | |
|
| Oil, Gas & Consumable Fuels (continued) | |
EnLink Midstream LLC, 5.38%, 06/01/29 | | | USD | | | | 188 | | | $ | 166,850 | |
EnLink Midstream Partners LP: | | | | | | | | | | | | |
4.40%, 04/01/24 | | | | | | | 613 | | | | 574,688 | |
4.15%, 06/01/25 | | | | | | | 66 | | | | 59,556 | |
4.85%, 07/15/26 | | | | | | | 70 | | | | 64,050 | |
5.60%, 04/01/44 | | | | | | | 399 | | | | 306,233 | |
5.05%, 04/01/45 | | | | | | | 334 | | | | 250,500 | |
5.45%, 06/01/47 | | | | | | | 112 | | | | 85,680 | |
Enterprise Products Operating LLC: | | | | | | | | | | | | |
4.90%, 05/15/46(f) | | | | | | | 5,375 | | | | 6,204,934 | |
Series E, (3 mo. LIBOR US + 3.03%),
5.25%, 08/16/77(g) | | | | | | | 4,800 | | | | 4,896,000 | |
Extraction Oil & Gas, Inc.(a): | | | | | | | | | | | | |
7.38%, 05/15/24 | | | | | | | 756 | | | | 309,960 | |
5.63%, 02/01/26 | | | | | | | 1,546 | | | | 657,050 | |
Hess Corp., 5.80%, 04/01/47 | | | | | | | 5,000 | | | | 5,808,832 | |
Hess Infrastructure Partners LP/Hess Infrastructure Partners Finance Corp., 5.63%, 02/15/26(a) | | | | | | | 402 | | | | 420,593 | |
Indigo Natural Resources LLC, 6.88%, 02/15/26(a) | | | | | | | 713 | | | | 648,830 | |
Kinder Morgan Energy Partners LP: | | | | | | | | | | | | |
6.50%, 04/01/20(f) | | | | | | | 5,075 | | | | 5,163,181 | |
6.85%, 02/15/20(f) | | | | | | | 12,000 | | | | 12,156,699 | |
4.25%, 09/01/24 | | | | | | | 2,170 | | | | 2,326,153 | |
5.40%, 09/01/44 | | | | | | | 3,615 | | | | 4,059,796 | |
Kinder Morgan, Inc.: | | | | | | | | | | | | |
7.80%, 08/01/31 | | | | | | | 197 | | | | 267,403 | |
7.75%, 01/15/32 | | | | | | | 4,586 | | | | 6,314,850 | |
Marathon Petroleum Corp.: | | | | | | | | | | | | |
4.75%, 12/15/23 | | | | | | | 1,230 | | | | 1,344,501 | |
5.13%, 12/15/26 | | | | | | | 937 | | | | 1,070,832 | |
Matador Resources Co., 5.88%, 09/15/26 | | | | | | | 1,030 | | | | 987,512 | |
MEG Energy Corp.(a): | | | | | | | | | | | | |
6.38%, 01/30/23 | | | | | | | 571 | | | | 539,595 | |
7.00%, 03/31/24 | | | | | | | 217 | | | | 203,438 | |
6.50%, 01/15/25 | | | | | | | 2,332 | | | | 2,425,280 | |
MPLX LP: | | | | | | | | | | | | |
4.13%, 03/01/27 | | | | | | | 825 | | | | 865,827 | |
5.20%, 03/01/47 | | | | | | | 3,500 | | | | 3,755,192 | |
4.70%, 04/15/48(f) | | | | | | | 5,000 | | | | 5,093,551 | |
5.50%, 02/15/49 | | | | | | | 2,640 | | | | 2,967,100 | |
Murphy Oil Corp.: | | | | | | | | | | | | |
5.75%, 08/15/25 | | | | | | | 210 | | | | 212,892 | |
5.63%, 12/01/42 | | | | | | | 169 | | | | 143,848 | |
Nabors Industries, Inc., 4.63%, 09/15/21 | | | | | | | 779 | | | | 722,523 | |
Nexen, Inc., 6.40%, 05/15/37 | | | | | | | 2,000 | | | | 2,798,125 | |
NGPL PipeCo LLC, 7.77%, 12/15/37(a) | | | | | | | 1,117 | | | | 1,440,115 | |
Noble Energy, Inc., 5.05%, 11/15/44 | | | | | | | 3,500 | | | | 3,702,469 | |
Noble Holding International Ltd.: | | | | | | | | | | | | |
7.75%, 01/15/24(f) | | | | | | | 157 | | | | 94,200 | |
7.88%, 02/01/26(a) | | | | | | | 131 | | | | 86,460 | |
NuStar Logistics LP, 6.00%, 06/01/26 | | | | | | | 373 | | | | 398,625 | |
Pacific Drilling SA, 8.38%, 10/01/23(a) | | | | | | | 823 | | | | 655,828 | |
Parsley Energy LLC/Parsley Finance
Corp.(a): | | | | | | | | | | | | |
6.25%, 06/01/24 | | | | | | | 228 | | | | 237,405 | |
5.25%, 08/15/25 | | | | | | | 598 | | | | 612,962 | |
5.63%, 10/15/27 | | | | | | | 951 | | | | 981,907 | |
Petroleos Mexicanos: | | | | | | | | | | | | |
3.50%, 01/30/23(f) | | | | | | | 5,000 | | | | 5,025,000 | |
4.63%, 09/21/23 | | | | | | | 3,965 | | | | 4,147,390 | |
4.88%, 01/18/24(f) | | | | | | | 2,000 | | | | 2,094,500 | |
Plains All American Pipeline LP, Series B,
(3 mo. LIBOR US + 4.11%), 6.13%(g)(h) | | | | | | | 2,215 | | | | 2,065,487 | |
| | | | | | | | | | | | |
Security | | Par
(000) | | | Value | |
|
| Oil, Gas & Consumable Fuels (continued) | |
Plains All American Pipeline LP/PAA Finance Corp.: | | | | | | | | | | | | |
4.70%, 06/15/44 | | | USD | | | | 1,498 | | | $ | 1,398,868 | |
4.90%, 02/15/45 | | | | | | | 2,102 | | | | 2,019,831 | |
QEP Resources, Inc.: | | | | | | | | | | | | |
6.88%, 03/01/21 | | | | | | | 133 | | | | 133,166 | |
5.38%, 10/01/22 | | | | | | | 1,791 | | | | 1,755,323 | |
5.25%, 05/01/23 | | | | | | | 188 | | | | 178,600 | |
5.63%, 03/01/26 | | | | | | | 493 | | | | 441,235 | |
Range Resources Corp.: | | | | | | | | | | | | |
5.75%, 06/01/21 | | | | | | | 422 | | | | 419,363 | |
5.88%, 07/01/22 | | | | | | | 280 | | | | 266,000 | |
5.00%, 08/15/22 | | | | | | | 265 | | | | 245,125 | |
Rockies Express Pipeline LLC(a): | | | | | | | | | | | | |
5.63%, 04/15/20 | | | | | | | 295 | | | | 299,955 | |
6.88%, 04/15/40 | | | | | | | 580 | | | | 611,958 | |
Rowan Cos., Inc., 4.88%, 06/01/22 | | | | | | | 1,705 | | | | 1,142,350 | |
Sabine Pass Liquefaction LLC: | | | | | | | | | | | | |
5.63%, 02/01/21 | | | | | | | 405 | | | | 418,008 | |
5.63%, 04/15/23 | | | | | | | 10,510 | | | | 11,434,366 | |
5.75%, 05/15/24 | | | | | | | 2,575 | | | | 2,873,790 | |
5.88%, 06/30/26 | | | | | | | 1,481 | | | | 1,700,561 | |
SM Energy Co.: | | | | | | | | | | | | |
6.13%, 11/15/22 | | | | | | | 202 | | | | 192,405 | |
5.00%, 01/15/24 | | | | | | | 64 | | | | 56,640 | |
5.63%, 06/01/25 | | | | | | | 138 | | | | 116,958 | |
6.75%, 09/15/26 | | | | | | | 426 | | | | 365,295 | |
6.63%, 01/15/27 | | | | | | | 243 | | | | 204,728 | |
Southwestern Energy Co.: | | | | | | | | | | | | |
6.20%, 01/23/25 | | | | | | | 725 | | | | 638,000 | |
7.75%, 10/01/27 | | | | | | | 22 | | | | 18,920 | |
SRC Energy, Inc., 6.25%, 12/01/25 | | | | | | | 135 | | | | 126,198 | |
Sunoco LP/Sunoco Finance Corp.: | | | | | | | | | | | | |
6.00%, 04/15/27 | | | | | | | 317 | | | | 332,850 | |
Series WI, 4.88%, 01/15/23 | | | | | | | 672 | | | | 689,640 | |
Series WI, 5.88%, 03/15/28 | | | | | | | 317 | | | | 332,856 | |
Tallgrass Energy Partners LP/Tallgrass Energy Finance Corp.(a): | | | | | | | | | | | | |
5.50%, 09/15/24 | | | | | | | 284 | | | | 276,190 | |
5.50%, 01/15/28 | | | | | | | 744 | | | | 699,360 | |
Targa Resources Partners LP/Targa Resources Partners Finance Corp.: | | | | | | | | | | | | |
6.75%, 03/15/24 | | | | | | | 184 | | | | 190,830 | |
5.13%, 02/01/25 | | | | | | | 136 | | | | 139,403 | |
5.88%, 04/15/26 | | | | | | | 669 | | | | 698,336 | |
5.38%, 02/01/27 | | | | | | | 5 | | | | 5,119 | |
6.50%, 07/15/27(a) | | | | | | | 770 | | | | 823,915 | |
5.00%, 01/15/28 | | | | | | | 651 | | | | 644,490 | |
6.88%, 01/15/29(a) | | | | | | | 2,255 | | | | 2,438,219 | |
TransCanada PipeLines Ltd.: | | | | | | | | | | | | |
4.88%, 01/15/26(f) | | | | | | | 4,485 | | | | 5,019,290 | |
4.88%, 05/15/48 | | | | | | | 4,000 | | | | 4,645,449 | |
TransCanada Trust (3 mo. LIBOR US + 3.53%), 5.63%, 05/20/75(g) | | | | | | | 2,755 | | | | 2,889,306 | |
Transocean, Inc., 7.25%, 11/01/25(a) | | | | | | | 83 | | | | 73,248 | |
Viper Energy Partners LP, 5.38%, 11/01/27(a) | | | | | | | 285 | | | | 287,850 | |
Western Midstream Operating LP, 5.38%, 06/01/21 | | | | | | | 5,125 | | | | 5,290,544 | |
Whiting Petroleum Corp., 6.63%, 01/15/26 | | | | | | | 81 | | | | 50,220 | |
Williams Cos., Inc.: | | | | | | | | | | | | |
3.70%, 01/15/23 | | | | | | | 2,245 | | | | 2,323,324 | |
4.55%, 06/24/24 | | | | | | | 527 | | | | 568,526 | |
8.75%, 03/15/32 | | | | | | | 2,478 | | | | 3,542,666 | |
5.10%, 09/15/45(f) | | | | | | | 5,075 | | | | 5,567,282 | |
| | | | |
| SCHEDULES OF INVESTMENTS | | | 23 | |
| | |
Schedule of Investments (continued) October 31, 2019 | | BlackRock Credit Allocation Income Trust (BTZ) (Percentages shown are based on Net Assets) |
| | | | | | | | | | | | |
Security | | Par
(000) | | | Value | |
|
| Oil, Gas & Consumable Fuels (continued) | |
WPX Energy, Inc.: | | | | | | | | | | | | |
6.00%, 01/15/22 | | | USD | | | | 72 | | | $ | 74,160 | |
8.25%, 08/01/23 | | | | | | | 811 | | | | 904,265 | |
5.25%, 09/15/24 | | | | | | | 22 | | | | 22,220 | |
5.75%, 06/01/26 | | | | | | | 428 | | | | 430,140 | |
| | | | | | | | |
| | | | | | | | | | | 227,870,584 | |
| | | |
| Oil: Crude Producers — 0.1% | | | | | | | | | |
Ryman Hospitality Properties, Inc., 4.75%, 10/15/27(a) | | | | | | | 1,570 | | | | 1,623,144 | |
| | | | | | | | |
| | | |
| Paper & Forest Products — 1.8% | | | | | | | | | |
International Paper Co.(f): | | | | | | | | | | | | |
7.50%, 08/15/21 | | | | | | | 7,209 | | | | 7,867,357 | |
8.70%, 06/15/38 | | | | | | | 4,000 | | | | 5,922,509 | |
7.30%, 11/15/39 | | | | | | | 10,000 | | | | 13,715,545 | |
| | | | | | | | |
| | | | | | | | | | | 27,505,411 | |
| | | |
| Pharmaceuticals — 4.6% | | | | | | | | | |
Abbott Laboratories, 4.90%, 11/30/46(f) | | | | | | | 5,500 | | | | 7,028,697 | |
AbbVie, Inc., 4.70%, 05/14/45 | | | | | | | 3,255 | | | | 3,481,887 | |
Allergan Funding SCS, 4.75%, 03/15/45(f) | | | | | | | 5,485 | | | | 5,837,946 | |
Allergan Sales LLC, 5.00%, 12/15/21(a)(f) | | | | | | | 1,631 | | | | 1,712,245 | |
Allergan, Inc., 2.80%, 03/15/23 | | | | | | | 3,000 | | | | 3,034,537 | |
Bausch Health Americas, Inc., 8.50%, 01/31/27(a) | | | | | | | 1,552 | | | | 1,741,654 | |
Bausch Health Cos., Inc.(a): | | | | | | | | | | | | |
5.50%, 03/01/23 | | | | | | | 2,365 | | | | 2,385,694 | |
5.88%, 05/15/23 | | | | | | | 587 | | | | 595,805 | |
7.00%, 03/15/24 | | | | | | | 1,303 | | | | 1,363,166 | |
6.13%, 04/15/25 | | | | | | | 677 | | | | 702,811 | |
5.50%, 11/01/25 | | | | | | | 2,416 | | | | 2,524,744 | |
9.00%, 12/15/25 | | | | | | | 1,531 | | | | 1,718,854 | |
5.75%, 08/15/27 | | | | | | | 326 | | | | 354,016 | |
7.00%, 01/15/28 | | | | | | | 1,175 | | | | 1,267,531 | |
7.25%, 05/30/29 | | | | | | | 1,242 | | | | 1,367,753 | |
Bayer US Finance II LLC,
4.88%, 06/25/48(a)(f) | | | | | | | 7,500 | | | | 8,362,646 | |
Catalent Pharma Solutions, Inc., 5.00%, 07/15/27(a) | | | | | | | 777 | | | | 811,965 | |
Charles River Laboratories International, Inc.(a): | | | | | | | | | | | | |
5.50%, 04/01/26 | | | | | | | 806 | | | | 858,390 | |
4.25%, 05/01/28 | | | | | | | 331 | | | | 337,239 | |
CVS Health Corp.: | | | | | | | | | | | | |
4.75%, 12/01/22 | | | | | | | 289 | | | | 308,386 | |
5.00%, 12/01/24 | | | | | | | 183 | | | | 201,565 | |
5.13%, 07/20/45 | | | | | | | 3,879 | | | | 4,471,164 | |
5.05%, 03/25/48(f) | | | | | | | 8,205 | | | | 9,457,338 | |
Eagle Holding Co. II LLC, (7.750% Cash or 8.50% PIK), 7.75%, 05/15/22(a)(f)(i) | | | | | | | 784 | | | | 795,760 | |
Elanco Animal Health, Inc., 4.90%, 08/28/28 | | | | | | | 447 | | | | 486,005 | |
Merck & Co., Inc., 6.50%, 12/01/33(f) | | | | | | | 6,420 | | | | 9,268,593 | |
Par Pharmaceutical, Inc.,
7.50%, 04/01/27(a) | | | | | | | 1,643 | | | | 1,560,850 | |
| | | | | | | | |
| | | | | | | | | | | 72,037,241 | |
| | | |
| Professional Services — 0.2% | | | | | | | | | |
Dun & Bradstreet Corp.(a): | | | | | | | | | | | | |
6.88%, 08/15/26 | | | | | | | 1,759 | | | | 1,923,334 | |
10.25%, 02/15/27 | | | | | | | 1,233 | | | | 1,351,701 | |
| | | | | | | | |
| | | | | | | | | | | 3,275,035 | |
| | | |
| Real Estate — 0.0% | | | | | | | | | |
Iron Mountain, Inc., 4.88%, 09/15/29(a) | | | | | | | 547 | | | | 559,991 | |
| | | | | | | | |
| | | |
| Real Estate Management & Development — 0.3% | | | | | | | | | |
Greystar Real Estate Partners LLC, 5.75%, 12/01/25(a) | | | | | | | 460 | | | | 479,550 | |
Northwest Florida Timber Finance LLC, 4.75%, 03/04/29(a) | | | | | | | 4,485 | | | | 4,555,308 | |
| | | | | | | | |
| | | | | | | | | | | 5,034,858 | |
| | | | | | | | | | | | |
Security | | Par
(000) | | | Value | |
|
| Road & Rail — 1.4% | |
Herc Holdings, Inc., 5.50%, 07/15/27(a) | | | USD | | | | 883 | | | $ | 915,009 | |
Hertz Corp., 7.63%, 06/01/22(a) | | | | | | | 977 | | | | 1,014,859 | |
Norfolk Southern Corp., 6.00%, 03/15/05(f) | | | | | | | 12,700 | | | | 17,145,684 | |
United Rentals North America, Inc.: | | | | | | | | | | | | |
4.63%, 07/15/23 | | | | | | | 1,616 | | | | 1,650,744 | |
5.88%, 09/15/26 | | | | | | | 133 | | | | 140,903 | |
3.88%, 11/15/27(e) | | | | | | | 609 | | | | 615,242 | |
5.25%, 01/15/30 | | | | | | | 44 | | | | 46,255 | |
| | | | | | | | |
| | | | | | | | | | | 21,528,696 | |
|
| Semiconductors & Semiconductor Equipment — 1.1% | |
Broadcom Corp./Broadcom Cayman Finance Ltd., 3.88%, 01/15/27(f) | | | | | | | 7,500 | | | | 7,573,479 | |
Lam Research Corp., 4.88%, 03/15/49 | | | | | | | 875 | | | | 1,077,840 | |
NXP BV/NXP Funding LLC,
4.63%, 06/15/22(a) | | | | | | | 490 | | | | 514,651 | |
QUALCOMM, Inc.: | | | | | | | | | | | | |
3.25%, 05/20/27(f) | | | | | | | 2,500 | | | | 2,630,194 | |
4.30%, 05/20/47 | | | | | | | 3,500 | | | | 3,932,383 | |
Sensata Technologies BV(a): | | | | | | | | | | | | |
5.63%, 11/01/24 | | | | | | | 695 | | | | 762,762 | |
5.00%, 10/01/25 | | | | | | | 772 | | | | 831,984 | |
| | | | | | | | |
| | | | | | | | | | | 17,323,293 | |
|
| Software — 1.4% | |
Camelot Finance SA, 4.50%, 11/01/26(a) | | | | | | | 1,575 | | | | 1,591,380 | |
CDK Global, Inc.: | | | | | | | | | | | | |
5.88%, 06/15/26 | | | | | | | 378 | | | | 404,460 | |
4.88%, 06/01/27 | | | | | | | 1,041 | | | | 1,096,954 | |
5.25%, 05/15/29(a) | | | | | | | 423 | | | | 449,173 | |
Genesys Telecommunications Laboratories, Inc./Greeneden Lux 3 Sarl/Greeneden US Ho, 10.00%, 11/30/24(a) | | | | | | | 1,430 | | | | 1,544,400 | |
Infor US, Inc., 6.50%, 05/15/22 | | | | | | | 8,723 | | | | 8,842,941 | |
Informatica LLC, 7.13%, 07/15/23(a) | | | | | | | 1,599 | | | | 1,624,984 | |
PTC, Inc., 6.00%, 05/15/24 | | | | | | | 313 | | | | 332,562 | |
Solera LLC/Solera Finance, Inc., 10.50%, 03/01/24(a) | | | | | | | 1,831 | | | | 1,915,684 | |
Sophia LP/Sophia Finance, Inc., 9.00%, 09/30/23(a) | | | | | | | 480 | | | | 492,898 | |
SS&C Technologies, Inc., 5.50%, 09/30/27(a) | | | | | | | 3,159 | | | | 3,380,130 | |
Veritas US, Inc./Veritas Bermuda Ltd., 7.50%, 02/01/23(a) | | | | | | | 684 | | | | 672,030 | |
| | | | | | | | |
| | | | | | | | | | | 22,347,596 | |
|
| Specialty Retail — 0.6% | |
eG Global Finance PLC, 6.75%, 02/07/25(a) | | | | | | | 906 | | | | 906,000 | |
eG Global Finance PLC, 8.50%, 10/30/25(a) | | | | | | | 587 | | | | 616,573 | |
IAA, Inc., 5.50%, 06/15/27(a) | | | | | | | 1,054 | | | | 1,129,256 | |
L Brands, Inc., 6.88%, 11/01/35 | | | | | | | 1,119 | | | | 951,150 | |
Penske Automotive Group, Inc., 5.50%, 05/15/26 | | | | | | | 1,160 | | | | 1,212,200 | |
PetSmart, Inc.(a): | | | | | | | | | | | | |
7.13%, 03/15/23 | | | | | | | 391 | | | | 361,675 | |
5.88%, 06/01/25 | | | | | | | 2,317 | | | | 2,282,546 | |
Staples, Inc., 7.50%, 04/15/26(a) | | | | | | | 2,608 | | | | 2,712,841 | |
| | | | | | | | |
| | | | | | | | | | | 10,172,241 | |
|
| Technology Hardware, Storage & Peripherals — 0.5% | |
Dell International LLC/EMC Corp.(a): | | | | | | | | | | | | |
5.88%, 06/15/21 | | | | | | | 407 | | | | 413,260 | |
7.13%, 06/15/24 | | | | | | | 1,800 | | | | 1,908,450 | |
8.35%, 07/15/46 | | | | | | | 2,355 | | | | 3,135,858 | |
NCR Corp.(a): | | | | | | | | | | | | |
5.75%, 09/01/27 | | | | | | | 512 | | | | 524,800 | |
6.13%, 09/01/29 | | | | | | | 512 | | | | 536,320 | |
Western Digital Corp., 4.75%, 02/15/26 | | | | | | | 1,104 | | | | 1,128,177 | |
| | | | | | | | |
| | | | | | | | | | | 7,646,865 | |
| | |
| 24 | | 2019 BLACKROCK ANNUAL REPORTTO SHAREHOLDERS |
| | |
Schedule of Investments (continued) October 31, 2019 | | BlackRock Credit Allocation Income Trust (BTZ) (Percentages shown are based on Net Assets) |
| | | | | | | | | | | | |
Security | | Par
(000) | | | Value | |
|
| Textiles, Apparel & Luxury Goods — 0.1% | |
Levi Strauss & Co., 5.00%, 05/01/25 | | | USD | | | | 699 | | | $ | 725,213 | |
William Carter Co., 5.63%, 03/15/27(a) | | | | | | | 365 | | | | 390,550 | |
| | | | | | | | |
| | | | | | | | | | | 1,115,763 | |
|
| Thrifts & Mortgage Finance — 0.1% | |
Ladder Capital Finance Holdings LLLP/Ladder Capital Finance Corp.(a): | | | | | | | | | | | | |
5.25%, 03/15/22 | | | | | | | 480 | | | | 497,400 | |
5.25%, 10/01/25 | | | | | | | 268 | | | | 272,020 | |
| | | | | | | | |
| | | | | | | | | | | 769,420 | |
|
| Tobacco — 2.1% | |
Altria Group, Inc., 10.20%, 02/06/39 | | | | | | | 13,392 | | | | 21,273,132 | |
BAT Capital Corp., 4.54%, 08/15/47 | | | | | | | 8,000 | | | | 7,736,967 | |
Reynolds American, Inc.: | | | | | | | | | | | | |
4.85%, 09/15/23 | | | | | | | 1,120 | | | | 1,211,636 | |
5.85%, 08/15/45 | | | | | | | 2,335 | | | | 2,596,197 | |
| | | | | | | | |
| | | | | | | | | | | 32,817,932 | |
|
| Trading Companies & Distributors — 0.1% | |
Doric Nimrod Air Alpha Ltd. Pass-Through Trust,Series 2013-1(a): | | | | | | | | | | | | |
Class A, 5.25%, 05/30/25 | | | | | | | 1,415 | | | | 1,453,866 | |
Class B, 6.13%, 11/30/21 | | | | | | | 384 | | | | 384,778 | |
| | | | | | | | |
| | | | | | | | | | | 1,838,644 | |
|
| Transportation Infrastructure — 0.7% | |
Penske Truck Leasing Co. LP/PTL Finance Corp., 4.88%, 07/11/22(a)(f) | | | | | | | 10,500 | | | | 11,213,496 | |
| | | | | | | | |
|
| Utilities — 0.1% | |
Vistra Operations Co. LLC(a): | | | | | | | | | | | | |
5.50%, 09/01/26 | | | | | | | 70 | | | | 73,970 | |
5.63%, 02/15/27 | | | | | | | 812 | | | | 860,720 | |
5.00%, 07/31/27 | | | | | | | 436 | | | | 450,170 | |
| | | | | | | | |
| | | | | | | | | | | 1,384,860 | |
|
| Wireless Telecommunication Services — 1.7% | |
Altice France SA, 5.50%, 01/15/28(a) | | | | | | | 2,327 | | | | 2,370,631 | |
Crown Castle International Corp.: | | | | | | | | | | | | |
4.88%, 04/15/22 | | | | | | | 2,500 | | | | 2,659,075 | |
3.65%, 09/01/27(f) | | | | | | | 8,000 | | | | 8,498,853 | |
Digicel International Finance Ltd./Digicel Holdings Bermuda Ltd., 8.75%, 05/25/24(a) | | | | | | | 635 | | | | 600,869 | |
SBA Communications Corp., 4.00%, 10/01/22 | | | | | | | 1,045 | | | | 1,066,057 | |
Sprint Capital Corp.: | | | | | | | | | | | | |
6.88%, 11/15/28 | | | | | | | 864 | | | | 941,484 | |
8.75%, 03/15/32 | | | | | | | 758 | | | | 924,290 | |
Sprint Corp.: | | | | | | | | | | | | |
7.88%, 09/15/23 | | | | | | | 1,233 | | | | 1,360,924 | |
7.13%, 06/15/24 | | | | | | | 1,333 | | | | 1,446,305 | |
7.63%, 02/15/25 | | | | | | | 36 | | | | 39,555 | |
7.63%, 03/01/26 | | | | | | | 2,029 | | | | 2,244,581 | |
T-Mobile USA, Inc.: | | | | | | | | | | | | |
6.50%, 01/15/26 | | | | | | | 960 | | | | 1,027,296 | |
4.50%, 02/01/26 | | | | | | | 645 | | | | 665,156 | |
4.75%, 02/01/28 | | | | | | | 1,323 | | | | 1,394,111 | |
Telesat Canada/Telesat LLC, 6.50%, 10/15/27(a) | | | | | | | 349 | | | | 364,373 | |
| | | | | | | | |
| | | | | | | | | | | 25,603,560 | |
| | | | | | | | |
| |
Total Corporate Bonds — 101.3%
(Cost — $1,434,593,606) | | | | 1,571,689,768 | |
| | | | | | | | |
|
Foreign Agency Obligations — 2.1% | |
|
Brazil — 0.4% | |
Brazilian Government International Bond, 5.00%, 01/27/45 | | | | | | | 6,525 | | | | 6,788,039 | |
| | | | | | | | |
| | | | | | | | | | | | |
Security | | Par
(000) | | | Value | |
| | | |
| Colombia — 0.3% | | | | | | | | | |
Colombia Government International Bond, 5.63%, 02/26/44 | | | USD | | | | 4,000 | | | $ | 4,971,250 | |
| | | | | | | | |
|
| Indonesia — 0.3% | |
Indonesia Government International Bond, 5.88%, 01/15/24(a) | | | | | | | 4,400 | | | | 4,958,250 | |
| | | | | | | | | | | | |
| | | |
| Mexico — 0.8% | | | | | | | | | |
Mexico Government International Bond: | | | | | | | | | | | | |
4.75%, 03/08/44 | | | | | | | 5,800 | | | | 6,340,125 | |
4.60%, 02/10/48 | | | | | | | 5,000 | | | | 5,414,062 | |
| | | | | | | | |
| | | | | | | | | | | 11,754,187 | |
| | | |
| Uruguay — 0.3% | | | | | | | | | |
Uruguay Government International Bond, 5.10%, 06/18/50 | | | | | | | 3,500 | | | | 4,183,594 | |
| | | | | | | | |
| |
Total Foreign Agency Obligations — 2.1%
(Cost — $28,611,023) | | | | 32,655,320 | |
| | | | | | | | |
|
Municipal Bonds — 1.2% | |
|
Illinois — 0.3% | |
Chicago O’Hare International Airport, Refunding ARB, O’Hare International Airport, General 3rd Lien, Build America Bonds, Series B, 6.85%, 01/01/38 | | | | | | | 5,000 | | | | 5,040,200 | |
| | | | | | | | | | | | |
|
| New York — 0.9% | |
Metropolitan Transportation Authority, RB, Build America Bonds, SeriesB-1, 6.55%, 11/15/31 | | | | | | | 10,000 | | | | 13,007,100 | |
| | | | | | | | | | | | |
| |
Total Municipal Bonds — 1.2%
(Cost — $14,835,533) | | | | 18,047,300 | |
| | | | | | | | | | | | |
|
Preferred Securities — 23.8% | |
|
Capital Trusts — 21.5% | |
|
| Banks — 6.2% | |
Barclays PLC, 8.00%(g)(h) | | | | | | | 4,500 | | | | 4,910,625 | |
BNP Paribas SA(a)(g)(h): | | | | | | | | | | | | |
7.20% | | | | | | | 5,000 | | | | 5,562,500 | |
7.38% | | | | | | | 4,535 | | | | 5,124,550 | |
Capital One Financial Corp., Series E,
5.55%(g)(h) | | | | | | | 5,000 | | | | 5,091,600 | |
CIT Group, Inc., Series A, 5.80%(g)(h) | | | | | | | 3,000 | | | | 3,078,750 | |
Citigroup, Inc., 5.90%(g)(h) | | | | | | | 2,210 | | | | 2,339,838 | |
Credit Suisse Group AG, 7.50%(a)(g)(h) | | | | | | | 3,250 | | | | 3,603,242 | |
HSBC Capital Funding LP, 10.18%(a)(f)(g)(h) | | | | | | | 11,835 | | | | 19,453,781 | |
Lloyds Banking Group PLC, 7.50%(g)(h) | | | | | | | 8,285 | | | | 9,115,074 | |
Macquarie Bank Ltd., 6.13%(a)(g)(h) | | | | | | | 1,885 | | �� | | 1,932,125 | |
Nordea Bank AB, 6.13%(a)(g)(h) | | | | | | | 5,540 | | | | 5,837,775 | |
U.S. Bancorp, Series J, 5.30%(f)(g)(h) | | | | | | | 10,415 | | | | 11,209,664 | |
Wells Fargo & Co.,(g)(h): | | | | | | | | | | | | |
Series K, 5.89% | | | | | | | 435 | | | | 440,438 | |
Series Q, 5.85% | | | | | | | 551 | | | | 14,824,965 | |
Series S, 5.90% | | | | | | | 281 | | | | 303,480 | |
Series U, 5.88% | | | | | | | 2,655 | | | | 2,940,413 | |
| | | | | | | | | | | | |
| | | | | | | | | | | 95,768,820 | |
|
| Capital Markets — 2.6% | |
Charles Schwab Corp., Series E, 4.63%(g)(h) | | | | | | | 6,805 | | | | 6,924,088 | |
Goldman Sachs Group, Inc., Series L,
6.07%(g)(h) | | | | | | | 2,156 | | | | 2,161,821 | |
Morgan Stanley, Series H, 5.61%(g)(h) | | | | | | | 8,675 | | | | 8,727,050 | |
State Street Corp.: | | | | | | | | | | | | |
3.12%, 06/15/47(b) | | | | | | | 17,845 | | | | 15,190,556 | |
Series D, 5.90%(g)(h) | | | | | | | 220 | | | | 6,085,662 | |
Series F, 5.25%(g)(h) | | | | | | | 1,855 | | | | 1,900,522 | |
| | | | | | | | | | | | |
| | | | | | | | | | | 40,989,699 | |
| | | | |
| SCHEDULES OF INVESTMENTS | | | 25 | |
| | |
Schedule of Investments (continued) October 31, 2019 | | BlackRock Credit Allocation Income Trust (BTZ) (Percentages shown are based on Net Assets) |
| | | | | | | | | | | | |
Security | | Par
(000) | | | Value | |
|
| Commercial Services & Supplies — 0.3% | |
AerCap Global Aviation Trust, 6.50%,(a)(g) | | | USD | | | | 5,000 | | | $ | 5,481,250 | |
| | | | | | | | | | | | |
|
| Consumer Finance — 0.3% | |
American Express Co., Series C,
4.90%(g)(h) | | | | | | | 4,510 | | | | 4,532,550 | |
| | | | | | | | | | | | |
|
| Diversified Financial Services — 6.0% | |
Bank of America Corp.,(g)(h): | | | | | | | | | | | | |
Series AA, 6.10% | | | | | | | 8,630 | | | | 9,551,555 | |
Series U, 5.20%(f) | | | | | | | 5,785 | | | | 6,030,862 | |
BNP Paribas SA, 6.75%(a)(g)(h) | | | | | | | 5,000 | | | | 5,262,500 | |
Credit Agricole SA, 8.13%(a)(g)(h) | | | | | | | 5,000 | | | | 5,987,500 | |
Credit Suisse Group AG(a)(g)(h): | | | | | | | | | | | | |
6.25% | | | | | | | 7,255 | | | | 7,735,644 | |
7.50% | | | | | | | 1,865 | | | | 2,011,216 | |
HSBC Holdings PLC(g)(h): | | | | | | | | | | | | |
6.00% | | | | | | | 1,550 | | | | 1,608,900 | |
6.50% | | | | | | | 2,615 | | | | 2,768,631 | |
JPMorgan Chase & Co.: | | | | | | | | | | | | |
8.75%, 09/01/30 | | | | | | | 2,000 | | | | 3,001,024 | |
Series 1, 5.41%(g)(h) | | | | | | | 1,785 | | | | 1,795,710 | |
Series Q, 5.15%(g)(h) | | | | | | | 4,000 | | | | 4,145,000 | |
Series R, 6.00%(f)(g)(h) | | | | | | | 14,130 | | | | 15,166,012 | |
Series S, 6.75%(f)(g)(h) | | | | | | | 9,775 | | | | 10,906,261 | |
Royal Bank of Scotland Group PLC(g)(h): | | | | | | | | | | | | |
8.00% | | | | | | | 970 | | | | 1,109,437 | |
8.63% | | | | | | | 5,135 | | | | 5,532,962 | |
Societe Generale SA, 7.38%(a)(g)(h) | | | | | | | 1,980 | | | | 2,083,950 | |
UBS Group Funding Switzerland AG, 7.00%(a)(g)(h) | | | | | | | 7,500 | | | | 8,043,750 | |
| | | | | | | | | | | | |
| | | | | | | | | | | 92,740,914 | |
|
| Electric Utilities — 0.5% | |
PPL Capital Funding, Inc., Series A, 4.77%, 03/30/67(g) | | | | | | | 8,300 | | | | 7,404,498 | |
| | | | | | | | | | | | |
|
| Insurance — 2.8% | |
ACE Capital Trust II, 9.70%, 04/01/30 | | | | | | | 7,000 | | | | 10,430,000 | |
Allstate Corp., Series B, 5.75%, 08/15/53(g) | | | | | | | 5,000 | | | | 5,376,800 | |
American International Group, Inc., 8.18%, 05/15/58(g) | | | | | | | 3,755 | | | | 5,031,700 | |
Equitable of Iowa Cos. Capital Trust II, Series B, 8.42%, 04/01/27 | | | | | | | 5,000 | | | | 5,770,550 | |
Farmers Exchange Capital II, 6.15%, 11/01/53(a)(g) | | | | | | | 4,890 | | | | 5,954,835 | |
MetLife, Inc., 6.40%, 12/15/36 | | | | | | | 5,000 | | | | 6,073,050 | |
Principal Financial Group, Inc., 4.70%, 05/15/55(g) | | | | | | | 5,000 | | | | 4,987,500 | |
| | | | | | | | | | | | |
| | | | | | | | | | | 43,624,435 | |
|
| Media — 0.1% | |
Viacom, Inc., 5.88%, 02/28/57(g) | | | | | | | 2,111 | | | | 2,192,801 | |
| | | | | | | | | | | | |
|
| Oil, Gas & Consumable Fuels — 0.9% | |
Enbridge, Inc., Series16-A, 6.00%, 01/15/77(g) | | | | | | | 5,880 | | | | 6,203,400 | |
Energy Transfer Partners LP, Series B, 6.63%(g)(h) | | | | | | | 5,000 | | | | 4,768,750 | |
Enterprise Products Operating LLC, 4.91%, 06/01/67(g) | | | | | | | 2,500 | | | | 2,312,500 | |
| | | | | | | | | | | | |
| | | | | | | | | | | 13,284,650 | |
|
| Road & Rail — 0.4% | |
BNSF Funding Trust I, 6.61%, 12/15/55(g) | | | | | | | 6,125 | | | | 6,829,375 | |
| | | | | | | | | | | | |
|
| Wireless Telecommunication Services — 1.4% | |
Centaur Funding Corp., 9.08%, 04/21/20(a) | | | | | | | 15 | | | | 15,748,720 | |
Vodafone Group PLC, 7.00%, 04/04/79(g) | | | | | | | 4,745 | | | | 5,496,408 | |
| | | | | | | | | | | | |
| | | | | | | | | | | 21,245,128 | |
| | | | | | | | | | | | |
| |
Total Capital Trusts — 21.5%
(Cost — $311,477,455) | | | | 334,094,120 | |
| | | | | | | | | | | | |
| | | | | | | | |
Security | | Shares | | | Value | |
|
Preferred Stocks — 1.8% | |
|
| Banks — 0.9% | |
Citigroup, Inc., Series K, 6.88%(g)(h) | | | 488,320 | | | $ | 13,819,456 | |
| | | | | | | | |
|
| Capital Markets — 0.3% | |
Goldman Sachs Group, Inc., Series J,
5.50%(g)(h) | | | 162,450 | | | | 4,408,893 | |
| | | | | | | | |
|
| Electric Utilities — 0.1% | |
Entergy Louisiana LLC, 5.25%, 07/01/52 | | | 90,000 | | | | 2,334,600 | |
| | | | | | | | |
|
| Equity Real Estate Investment Trusts (REITs) — 0.1% | |
Vornado Realty Trust, Series K, 5.70%(h) | | | 50,000 | | | | 1,266,500 | |
| | | | | | | | |
|
| Media — 0.4% | |
NBCUniversal Enterprise, Inc., 5.25%(a)(h) | | | 5,600,000 | | | | 5,754,000 | |
| | | | | | | | |
| |
Total Preferred Stocks — 1.8%
(Cost — $25,436,903) | | | | 27,583,449 | |
| | | | | | | | |
|
Trust Preferred — 0.5% | |
|
| Diversified Financial Services — 0.5% | |
GMAC Capital Trust I, Series 2, 7.94%, 2/15/40(g) | | | 297,048 | | | | 7,845,038 | |
| | | | | | | | |
| |
Total Trust Preferred — 0.5%
(Cost — $7,219,606) | | | | 7,845,038 | |
| | | | | | | | |
| |
Total Preferred Securities — 23.8%
(Cost — $344,133,964) | | | | 369,522,607 | |
| | | | | | | | |
| |
Total Long-Term Investments — 135.4%
(Cost — $1,935,073,458) | | | | 2,100,184,346 | |
| | | | | | | | |
|
Short-Term Securities — 0.3% | |
BlackRock Liquidity Funds,T-Fund, Institutional Class,
1.70%(m)(n) | | | 4,783,450 | | | | 4,783,450 | |
| | | | | | | | |
| |
Total Short-Term Securities — 0.3%
(Cost — $4,783,450) | | | | 4,783,450 | |
| | | | | | | | |
| |
Options Purchased — 0.1%
(Cost — $3,549,500) | | | | 1,980,907 | |
| | | | | | | | |
| |
Total Investments Before Options Written — 135.8%
(Cost — $1,943,406,408) | | | | 2,106,948,703 | |
| | | | | | | | |
| |
Options Written — (0.1)%
(Premiums Received — $1,810,000) | | | | (1,278,426 | ) |
| | | | | | | | |
| |
Total Investments, Net of Options Written — 135.7%
(Cost — $1,941,596,408) | | | | 2,105,670,277 | |
| |
Liabilities in Excess of Other Assets — (35.7)% | | | | (554,427,669 | ) |
| | | | | | | | |
| |
Net Assets — 100.0% | | | $ | 1,551,242,608 | |
| | | | | | | | |
| (a) | Security exempt from registration pursuant to Rule 144A under the Securities Act of 1933, as amended. These securities may be resold in transactions exempt from registration to qualified institutional investors. |
| (b) | Variable rate security. Rate shown is the rate in effect as of period end. |
| (c) | Variable or floating rate security, which interest rate adjusts periodically based on changes in current interest rates and prepayments on the underlying pool of assets. Rate shown is the rate in effect as of period end. |
| (d) | Security is valued using significant unobservable inputs and is classified as Level 3 in the fair value hierarchy. |
| (e) | When-issued security. |
| (f) | All or a portion of the security has been pledged as collateral in connection with outstanding reverse repurchase agreements. |
| (g) | Variable rate security. Security may be issued at a fixed coupon rate, which converts to a variable rate at a specified date. Rate shown is the rate in effect as of period end. |
| (h) | Perpetual security with no stated maturity date. |
| (i) | Payment-in-kind security which may pay interest/dividends in additional par/shares and/or in cash. Rates shown are the current rate and possible payment rates. |
| (j) | Issuer filed for bankruptcy and/or is in default. |
| (k) | Non-income producing security. |
| (l) | Step-up bond that pays an initial coupon rate for the first period and then a higher coupon rate for the following periods. Rate as of period end. |
| (m) | Annualized7-day yield as of period end. |
| | |
| 26 | | 2019 BLACKROCK ANNUAL REPORTTO SHAREHOLDERS |
| | |
Schedule of Investments (continued) October 31, 2019 | | BlackRock Credit Allocation Income Trust (BTZ) |
| (n) | During the year ended October 31, 2019, investments in issuers considered to be an affiliate/affiliates of the Trust for purposes of Section 2(a)(3) of the Investment Company Act of 1940, as amended, were as follows: |
| | | | | | | | | | | | | | | | | | | | | | | | | | | | |
| Affiliate | | Shares
Held at
10/31/18 | | | Net
Activity | | | Shares
Held at
10/31/19 | | | Value at
10/31/19 | | | Income | | | Net
Realized
Gain (Loss) (a) | | | Change in
Unrealized
Appreciation
(Depreciation) | |
BlackRock Liquidity Funds,T-Fund, Institutional Class | | | 7,903,560 | | | | (3,120,110 | ) | | | 4,783,450 | | | $ | 4,783,450 | | | $ | 376,314 | | | $ | — | | | $ | — | |
| | | | | | | | | | | | | | | | | | | | | | | | | | | | |
| | (a) | Includes net capital gain distributions, if applicable. | |
For Trust compliance purposes, the Trust’s industry classifications refer to one or more of the industrysub-classifications used by one or more widely recognized market indexes or rating group indexes, and/or as defined by the investment adviser. These definitions may not apply for purposes of this report, which may combine such industrysub-classifications for reporting ease.
Reverse Repurchase Agreements
| | | | | | | | | | | | | | | | | | | | | | | | |
| Counterparty | | Interest
Rate | | | Trade
Date | | | Maturity
Date (a) | | | Face Value | | | Face Value
Including
Accrued Interest | | | Type of Non-Cash Underlying Collateral | | Remaining Contractual
Maturity of the Agreements (a) |
Goldman Sachs & Co. LLC | | | 2.00 | % | | | 02/12/19 | | | | Open | | | $ | 755,284 | | | $ | 768,801 | | | Corporate Bonds | | Open/Demand |
BNP Paribas S.A. | | | 2.20 | | | | 07/16/19 | | | | Open | | | | 6,289,438 | | | | 6,336,547 | | | Corporate Bonds | | Open/Demand |
BNP Paribas S.A. | | | 2.20 | | | | 07/16/19 | | | | Open | | | | 11,649,023 | | | | 11,736,277 | | | Corporate Bonds | | Open/Demand |
BNP Paribas S.A. | | | 2.20 | | | | 07/16/19 | | | | Open | | | | 5,053,000 | | | | 5,090,848 | | | Corporate Bonds | | Open/Demand |
BNP Paribas S.A. | | | 2.20 | | | | 07/16/19 | | | | Open | | | | 9,400,219 | | | | 9,470,629 | | | Corporate Bonds | | Open/Demand |
BNP Paribas S.A. | | | 2.20 | | | | 07/16/19 | | | | Open | | | | 3,090,000 | | | | 3,113,145 | | | Corporate Bonds | | Open/Demand |
BNP Paribas S.A. | | | 2.20 | | | | 07/16/19 | | | | Open | | | | 4,591,047 | | | | 4,625,435 | | | Corporate Bonds | | Open/Demand |
BNP Paribas S.A. | | | 2.20 | | | | 07/16/19 | | | | Open | | | | 1,888,010 | | | | 1,902,152 | | | Corporate Bonds | | Open/Demand |
BNP Paribas S.A. | | | 2.20 | | | | 07/16/19 | | | | Open | | | | 5,465,625 | | | | 5,506,564 | | | Corporate Bonds | | Open/Demand |
BNP Paribas S.A. | | | 2.20 | | | | 07/16/19 | | | | Open | | | | 2,877,650 | | | | 2,899,204 | | | Corporate Bonds | | Open/Demand |
BNP Paribas S.A. | | | 2.20 | | | | 07/16/19 | | | | Open | | | | 1,633,039 | | | | 1,644,386 | | | Corporate Bonds | | Open/Demand |
BNP Paribas S.A. | | | 2.20 | | | | 07/16/19 | | | | Open | | | | 3,252,200 | | | | 3,274,798 | | | Corporate Bonds | | Open/Demand |
BNP Paribas S.A. | | | 2.20 | | | | 07/16/19 | | | | Open | | | | 17,440,469 | | | | 17,571,103 | | | Corporate Bonds | | Open/Demand |
Barclays Capital, Inc. | | | 0.67 | | | | 08/26/19 | | | | Open | | | | 84,388 | | | | 84,511 | | | Corporate Bonds | | Open/Demand |
Barclays Capital, Inc. | | | 1.00 | | | | 08/26/19 | | | | Open | | | | 297,480 | | | | 296,548 | | | Corporate Bonds | | Open/Demand |
Barclays Capital, Inc. | | | 1.50 | | | | 08/26/19 | | | | Open | | | | 1,117,005 | | | | 1,120,341 | | | Corporate Bonds | | Open/Demand |
Barclays Capital, Inc. | | | 1.75 | | | | 08/26/19 | | | | Open | | | | 700,400 | | | | 702,105 | | | Corporate Bonds | | Open/Demand |
Barclays Capital, Inc. | | | 2.15 | | | | 08/26/19 | | | | Open | | | | 14,700,000 | | | | 14,761,413 | | | Corporate Bonds | | Open/Demand |
Barclays Capital, Inc. | | | 2.15 | | | | 08/26/19 | | | | Open | | | | 17,338,275 | | | | 17,410,710 | | | Capital Trusts | | Open/Demand |
Barclays Capital, Inc. | | | 2.15 | | | | 08/26/19 | | | | Open | | | | 13,617,788 | | | | 13,674,680 | | | Capital Trusts | | Open/Demand |
Barclays Capital, Inc. | | | 2.15 | | | | 08/26/19 | | | | Open | | | | 10,050,475 | | | | 10,092,464 | | | Capital Trusts | | Open/Demand |
Barclays Capital, Inc. | | | 2.15 | | | | 08/26/19 | | | | Open | | | | 9,872,750 | | | | 9,913,996 | | | Capital Trusts | | Open/Demand |
Barclays Capital, Inc. | | | 2.15 | | | | 08/26/19 | | | | Open | | | | 15,356,250 | | | | 15,420,405 | | | Corporate Bonds | | Open/Demand |
Barclays Capital, Inc. | | | 2.15 | | | | 08/26/19 | | | | Open | | | | 11,853,238 | | | | 11,902,758 | | | Corporate Bonds | | Open/Demand |
Barclays Capital, Inc. | | | 2.25 | | | | 08/26/19 | | | | Open | | | | 6,465,000 | | | | 6,493,195 | | | Corporate Bonds | | Open/Demand |
Barclays Capital, Inc. | | | 2.25 | | | | 08/26/19 | | | | Open | | | | 6,641,250 | | | | 6,670,213 | | | Corporate Bonds | | Open/Demand |
Barclays Capital, Inc. | | | 2.25 | | | | 08/26/19 | | | | Open | | | | 4,725,000 | | | | 4,745,606 | | | Corporate Bonds | | Open/Demand |
Barclays Capital, Inc. | | | 2.25 | | | | 08/26/19 | | | | Open | | | | 4,917,250 | | | | 4,938,695 | | | Capital Trusts | | Open/Demand |
Barclays Capital, Inc. | | | 2.25 | | | | 08/26/19 | | | | Open | | | | 2,950,000 | | | | 2,962,865 | | | Corporate Bonds | | Open/Demand |
Barclays Capital, Inc. | | | 2.25 | | | | 08/26/19 | | | | Open | | | | 5,217,606 | | | | 5,240,361 | | | Corporate Bonds | | Open/Demand |
Barclays Capital, Inc. | | | 2.25 | | | | 08/26/19 | | | | Open | | | | 6,817,500 | | | | 6,847,232 | | | Corporate Bonds | | Open/Demand |
Barclays Capital, Inc. | | | 2.25 | | | | 08/26/19 | | | | Open | | | | 946,250 | | | | 950,377 | | | Corporate Bonds | | Open/Demand |
Barclays Capital, Inc. | | | 2.25 | | | | 08/26/19 | | | | Open | | | | 2,411,955 | | | | 2,422,473 | | | Corporate Bonds | | Open/Demand |
Barclays Capital, Inc. | | | 2.25 | | | | 08/26/19 | | | | Open | | | | 5,220,906 | | | | 5,243,675 | | | Corporate Bonds | | Open/Demand |
Barclays Capital, Inc. | | | 2.25 | | | | 08/26/19 | | | | Open | | | | 7,284,375 | | | | 7,316,143 | | | Corporate Bonds | | Open/Demand |
RBC Capital Markets, LLC | | | 2.29 | | | | 08/26/19 | | | | Open | | | | 9,361,120 | | | | 9,403,299 | | | Corporate Bonds | | Open/Demand |
RBC Capital Markets, LLC | | | 2.29 | | | | 08/26/19 | | | | Open | | | | 5,645,000 | | | | 5,670,032 | | | Corporate Bonds | | Open/Demand |
RBC Capital Markets, LLC | | | 2.29 | | | | 08/26/19 | | | | Open | | | | 4,662,900 | | | | 4,683,577 | | | Corporate Bonds | | Open/Demand |
RBC Capital Markets, LLC | | | 2.29 | | | | 08/26/19 | | | | Open | | | | 4,085,475 | | | | 4,103,592 | | | Corporate Bonds | | Open/Demand |
RBC Capital Markets, LLC | | | 2.29 | | | | 08/26/19 | | | | Open | | | | 4,770,919 | | | | 4,792,075 | | | Corporate Bonds | | Open/Demand |
RBC Capital Markets, LLC | | | 2.29 | | | | 08/26/19 | | | | Open | | | | 4,150,000 | | | | 4,168,403 | | | Corporate Bonds | | Open/Demand |
RBC Capital Markets, LLC | | | 2.29 | | | | 08/26/19 | | | | Open | | | | 17,078,625 | | | | 17,154,359 | | | Corporate Bonds | | Open/Demand |
RBC Capital Markets, LLC | | | 2.29 | | | | 08/26/19 | | | | Open | | | | 16,005,000 | | | | 16,075,973 | | | Corporate Bonds | | Open/Demand |
RBC Capital Markets, LLC | | | 2.29 | | | | 08/26/19 | | | | Open | | | | 11,535,000 | | | | 11,586,151 | | | Corporate Bonds | | Open/Demand |
RBC Capital Markets, LLC | | | 2.29 | | | | 08/26/19 | | | | Open | | | | 3,911,306 | | | | 3,928,651 | | | Corporate Bonds | | Open/Demand |
| | | | |
| SCHEDULES OF INVESTMENTS | | | 27 | |
| | |
Schedule of Investments (continued) October 31, 2019 | | BlackRock Credit Allocation Income Trust (BTZ) |
Reverse Repurchase Agreements (continued)
| | | | | | | | | | | | | | | | | | | | | | | | |
| Counterparty | | Interest
Rate | | | Trade
Date | | | Maturity
Date (a) | | | Face Value | | | Face Value
Including
Accrued Interest | | | Type of Non-Cash Underlying Collateral | | Remaining Contractual
Maturity of the Agreements (a) |
RBC Capital Markets, LLC | | | 2.29 | % | | | 08/26/19 | | | | Open | | | $ | 10,618,125 | | | $ | 10,665,210 | | | Corporate Bonds | | Open/Demand |
RBC Capital Markets, LLC | | | 2.29 | | | | 08/26/19 | | | | Open | | | | 7,603,750 | | | | 7,637,468 | | | Corporate Bonds | | Open/Demand |
RBC Capital Markets, LLC | | | 2.29 | | | | 08/26/19 | | | | Open | | | | 30,801,780 | | | | 30,938,369 | | | Corporate Bonds | | Open/Demand |
RBC Capital Markets, LLC | | | 2.29 | | | | 08/26/19 | | | | Open | | | | 3,572,438 | | | | 3,588,279 | | | Corporate Bonds | | Open/Demand |
RBC Capital Markets, LLC | | | 2.29 | | | | 08/26/19 | | | | Open | | | | 7,843,219 | | | | 7,877,999 | | | Corporate Bonds | | Open/Demand |
RBC Capital Markets, LLC | | | 2.29 | | | | 08/26/19 | | | | Open | | | | 7,087,500 | | | | 7,118,929 | | | Corporate Bonds | | Open/Demand |
RBC Capital Markets, LLC | | | 2.29 | | | | 08/26/19 | | | | Open | | | | 7,350,000 | | | | 7,382,593 | | | Corporate Bonds | | Open/Demand |
RBC Capital Markets, LLC | | | 2.29 | | | | 08/26/19 | | | | Open | | | | 3,573,000 | | | | 3,588,844 | | | Corporate Bonds | | Open/Demand |
RBC Capital Markets, LLC | | | 2.29 | | | | 08/26/19 | | | | Open | | | | 7,111,125 | | | | 7,142,659 | | | Corporate Bonds | | Open/Demand |
RBC Capital Markets, LLC | | | 2.29 | | | | 08/26/19 | | | | Open | | | | 2,478,125 | | | | 2,489,114 | | | Corporate Bonds | | Open/Demand |
RBC Capital Markets, LLC | | | 2.29 | | | | 08/26/19 | | | | Open | | | | 8,010,000 | | | | 8,045,520 | | | Corporate Bonds | | Open/Demand |
RBC Capital Markets, LLC | | | 2.29 | | | | 08/26/19 | | | | Open | | | | 8,714,875 | | | | 8,753,521 | | | Corporate Bonds | | Open/Demand |
RBC Capital Markets, LLC | | | 2.29 | | | | 08/26/19 | | | | Open | | | | 3,751,406 | | | | 3,768,042 | | | Corporate Bonds | | Open/Demand |
RBC Capital Markets, LLC | | | 2.29 | | | | 08/26/19 | | | | Open | | | | 9,128,063 | | | | 9,168,540 | | | Corporate Bonds | | Open/Demand |
RBC Capital Markets, LLC | | | 2.29 | | | | 08/26/19 | | | | Open | | | | 5,633,250 | | | | 5,658,230 | | | Corporate Bonds | | Open/Demand |
RBC Capital Markets, LLC | | | 2.29 | | | | 08/26/19 | | | | Open | | | | 14,550,000 | | | | 14,614,521 | | | Corporate Bonds | | Open/Demand |
RBC Capital Markets, LLC | | | 2.29 | | | | 08/26/19 | | | | Open | | | | 5,637,500 | | | | 5,662,499 | | | Corporate Bonds | | Open/Demand |
RBC Capital Markets, LLC | | | 2.29 | | | | 08/26/19 | | | | Open | | | | 8,130,000 | | | | 8,166,052 | | | Corporate Bonds | | Open/Demand |
RBC Capital Markets, LLC | | | 2.29 | | | | 08/26/19 | | | | Open | | | | 8,979,975 | | | | 9,019,796 | | | Corporate Bonds | | Open/Demand |
RBC Capital Markets, LLC | | | 2.29 | | | | 08/26/19 | | | | Open | | | | 4,937,500 | | | | 4,959,395 | | | Corporate Bonds | | Open/Demand |
RBC Capital Markets, LLC | | | 2.29 | | | | 08/26/19 | | | | Open | | | | 5,957,219 | | | | 5,983,636 | | | Corporate Bonds | | Open/Demand |
RBC Capital Markets, LLC | | | 2.29 | | | | 08/26/19 | | | | Open | | | | 4,010,000 | | | | 4,027,782 | | | Corporate Bonds | | Open/Demand |
RBC Capital Markets, LLC | | | 2.29 | | | | 08/26/19 | | | | Open | | | | 16,275,000 | | | | 16,347,171 | | | Corporate Bonds | | Open/Demand |
RBC Capital Markets, LLC | | | 2.29 | | | | 08/26/19 | | | | Open | | | | 8,731,775 | | | | 8,770,496 | | | Corporate Bonds | | Open/Demand |
RBC Capital Markets, LLC | | | 2.29 | | | | 08/26/19 | | | | Open | | | | 5,616,875 | | | | 5,641,783 | | | Corporate Bonds | | Open/Demand |
RBC Capital Markets, LLC | | | 2.29 | | | | 08/26/19 | | | | Open | | | | 10,400,000 | | | | 10,446,118 | | | Corporate Bonds | | Open/Demand |
RBC Capital Markets, LLC | | | 2.29 | | | | 08/26/19 | | | | Open | | | | 5,062,500 | | | | 5,084,949 | | | Corporate Bonds | | Open/Demand |
RBC Capital Markets, LLC | | | 2.29 | | | | 08/26/19 | | | | Open | | | | 7,440,000 | | | | 7,472,992 | | | Corporate Bonds | | Open/Demand |
RBC Capital Markets, LLC | | | 2.29 | | | | 08/26/19 | | | | Open | | | | 14,312,500 | | | | 14,375,968 | | | Corporate Bonds | | Open/Demand |
RBC Capital Markets, LLC | | | 2.29 | | | | 08/26/19 | | | | Open | | | | 802,280 | | | | 805,838 | | | Corporate Bonds | | Open/Demand |
Barclays Capital, Inc. | | | 1.80 | | | | 09/13/19 | | | | Open | | | | 499,800 | | | | 500,998 | | | Corporate Bonds | | Open/Demand |
BNP Paribas S.A. | | | 1.95 | | | | 10/02/19 | | | | Open | | | | 3,825,344 | | | | 3,831,146 | | | Corporate Bonds | | Open/Demand |
J.P. Morgan Securities LLC | | | 2.00 | | | | 10/11/19 | | | | Open | | | | 1,842,960 | | | | 1,844,701 | | | Corporate Bonds | | Open/Demand |
J.P. Morgan Securities LLC | | | 2.00 | | | | 10/11/19 | | | | Open | | | | 477,304 | | | | 477,755 | | | Corporate Bonds | | Open/Demand |
J.P. Morgan Securities LLC | | | 2.00 | | | | 10/11/19 | | | | Open | | | | 594,935 | | | | 595,497 | | | Corporate Bonds | | Open/Demand |
J.P. Morgan Securities LLC | | | 2.00 | | | | 10/11/19 | | | | Open | | | | 861,811 | | | | 862,625 | | | Corporate Bonds | | Open/Demand |
J.P. Morgan Securities LLC | | | 2.00 | | | | 10/11/19 | | | | Open | | | | 462,825 | | | | 463,262 | | | Corporate Bonds | | Open/Demand |
J.P. Morgan Securities LLC | | | 2.10 | | | | 10/11/19 | | | | Open | | | | 571,340 | | | | 571,907 | | | Corporate Bonds | | Open/Demand |
J.P. Morgan Securities LLC | | | 2.25 | | | | 10/11/19 | | | | Open | | | | 1,828,263 | | | | 1,830,099 | | | Corporate Bonds | | Open/Demand |
J.P. Morgan Securities LLC | | | 2.00 | | | | 10/16/19 | | | | Open | | | | 502,775 | | | | 503,194 | | | Corporate Bonds | | Open/Demand |
J.P. Morgan Securities LLC | | | 2.00 | | | | 10/25/19 | | | | Open | | | | 428,619 | | | | 428,714 | | | Corporate Bonds | | Open/Demand |
RBC Capital Markets, LLC | | | 2.29 | | | | 10/25/19 | | | | Open | | | | 4,674,375 | | | | 4,676,456 | | | Corporate Bonds | | Open/Demand |
RBC Capital Markets, LLC | | | 2.29 | | | | 10/31/19 | | | | Open | | | | 1,955,000 | | | | 1,955,124 | | | Corporate Bonds | | Open/Demand |
| | | | | | | | | | | | | | | | | | | | | | | | |
| | | $ | 565,820,621 | | | $ | 568,460,558 | | | | | |
| | | | | | | | | | | | | | | | | | | | | | | | |
| | (a) | Certain agreements have no stated maturity and can be terminated by either party at any time. | |
Derivative Financial Instruments Outstanding as of Period End
Futures Contracts
| | | | | | | | | | | | | | | | |
| Description | | Number of
Contracts | | | Expiration
Date | | | Notional
Amount (000) | | | Value /
Unrealized
Appreciation
(Depreciation) | |
Long Contracts | | | | | | | | | | | | | | | | |
Ultra Long U.S. Treasury Bond | | | 302 | | | | 12/19/19 | | | $ | 57,305 | | | $ | (1,849,739 | ) |
| | | | | | | | | | | | | | | | |
Short Contracts | | | | | | | | | | | | | | | | |
10-Year U.S. Treasury Note | | | 958 | | | | 12/19/19 | | | | 124,824 | | | | 1,084,662 | |
Long U.S. Treasury Bond | | | 114 | | | | 12/19/19 | | | | 18,397 | | | | 381,501 | |
| | | | | | | | | | | | | | | | |
| | | | | | | | | | | | | | | 1,466,163 | |
| | | | | | | | | | | | | | | | |
| | | | | | | | | | | | | | $ | (383,576 | ) |
| | | | | | | | | | | | | | | | |
| | |
| 28 | | 2019 BLACKROCK ANNUAL REPORTTO SHAREHOLDERS |
| | |
Schedule of Investments (continued) October 31, 2019 | | BlackRock Credit Allocation Income Trust (BTZ) |
OTC Interest Rate Swaptions Purchased
| | | | | | | | | | | | | | | | | | | | | | | | | | | | | | | | | | |
| | | Paid by the Trust | | Received by the Trust | | Counterparty | | Expiration
Date | | | Exercise
Rate | | | Notional
Amount (000) | | | Value | |
| Description | | Rate | | | Frequency | | Rate | | | Frequency |
Put | | | | | | | | | | | | | | | | | | | | | | | | | | | | | | | | | | |
10-Year Interest Rate Swap, 03/20/30 | | | 2.90 | % | | Semi-annual | | | 3-Month LIBOR, 1.90 | % | | Quarterly | | Citibank N.A. | | | 03/18/20 | | | | 2.90 | % | | | USD | | | | 78,000 | | | $ | 6,795 | |
10-Year Interest Rate Swap, 07/19/30 | | | 2.35 | | | Semi-annual | | | 3-Month LIBOR, 1.90 | % | | Quarterly | | Barclays Bank PLC | | | 07/17/20 | | | | 2.35 | | | | USD | | | | 462,000 | | | | 1,105,917 | |
30-Year Interest Rate Swap, 08/15/51 | | | 2.50 | | | Semi-annual | | | 3-Month LIBOR, 1.90 | % | | Quarterly | | JPMorgan Chase Bank N.A. | | | 08/13/21 | | | | 2.50 | | | | USD | | | | 40,000 | | | | 868,195 | |
| | | | | | | | | | | | | | | | | | | | | | | | | | | | | | | | | | |
| | | $ | 1,980,907 | |
| | | | | |
OTC Interest Rate Swaptions Written
| | | | | | | | | | | | | | | | | | | | | | | | | | | | | | | | | | |
| | | Paid by the Trust | | Received by the Trust | | Counterparty | | Expiration
Date | | | Exercise
Rate | | | Notional
Amount (000) | | | Value | |
| Description | | Rate | | | Frequency | | Rate | | | Frequency |
Put | | | | | | | | | | | | | | | | | | | | | | | | | | | | | | | | | | |
10-Year Interest Rate Swap, 07/19/30 | | | 3-Month LIBOR, 1.90 | % | | Quarterly | | | 1.95 | % | | Semi-annual | | Barclays Bank PLC | | | 07/17/20 | | | | 1.95 | % | | | USD | | | | 154,000 | | | $ | (1,278,426 | ) |
| | | | | |
OTC Credit Default Swaps — Buy Protection
| | | | | | | | | | | | | | | | | | | | | | | | | | | | | | | | | | | | |
| Reference Obligation/Index | | Financing
Rate Paid
by the Trust | | | Payment
Frequency | | | Counterparty | | | Termination
Date | | | Notional
Amount (000) | | | Value | | | Upfront
Premium
Paid
(Received) | | | Unrealized
Appreciation
(Depreciation) | |
Prudential Financial, Inc. | | | 1.00 | % | | | Quarterly | | | | Citibank N.A. | | | | 06/20/21 | | | | USD | | | | 1,920 | | | $ | (28,223 | ) | | $ | 9,283 | | | $ | (37,506 | ) |
Prudential Financial, Inc. | | | 1.00 | | | | Quarterly | | | | Goldman Sachs International | | | | 06/20/21 | | | | USD | | | | 1,155 | | | | (16,979 | ) | | | 5,939 | | | | (22,918 | ) |
Prudential Financial, Inc. | | | 1.00 | | | | Quarterly | | | | JPMorgan Chase Bank N.A. | | | | 06/20/21 | | | | USD | | | | 9,500 | | | | (139,647 | ) | | | 40,183 | | | | (179,830 | ) |
| | | | | | | | | | | | | | | | | | | | | | | | | | | | | | | | | | | | |
| | | | | | | | | | | | | | | | | | | | | | | | | | $ | (184,849 | ) | | $ | 55,405 | | | $ | (240,254 | ) |
| | | | | | | | | | | | | | | | | | | | | | | | | | | | | | | | | | | | |
Balances Reported in the Statements of Assets and Liabilities for OTC Swaps and Options Written
| | | | | | | | | | | | | | | | | | | | |
| | | Swap
Premiums
Paid | | | Swap
Premiums
Received | | | Unrealized
Appreciation | | | Unrealized
Depreciation | | | Value | |
OTC Swaps | | $ | 55,405 | | | $ | — | | | $ | — | | | $ | (240,254 | ) | | $ | — | |
Options Written | | | N/A | | | | N/A | | | | 531,574 | | | | — | | | | (1,278,426 | ) |
Derivative Financial Instruments Categorized by Risk Exposure
As of year end, the fair values of derivative financial instruments located in the Statements of Assets and Liabilities were as follows:
| | | | | | | | | | | | | | | | | | | | | | | | | | | | |
| | | Commodity
Contracts | | | Credit
Contracts | | | Equity
Contracts | | | Foreign
Currency
Exchange
Contracts | | | Interest
Rate
Contracts | | | Other
Contracts | | | Total | |
Assets — Derivative Financial Instruments | |
Futures contracts | | | | | | | | | | | | | | | | | | | | | | | | | | | | |
Unrealized appreciation on futures contracts(a) | | $ | — | | | $ | — | | | $ | — | | | $ | — | | | $ | 1,466,163 | | | $ | — | | | $ | 1,466,163 | |
Options purchased | | | | | | | | | | | | | | | | | | | | | | | | | | | | |
Investments at value — unaffiliated(b) | | | — | | | | — | | | | — | | | | — | | | | 1,980,907 | | | | — | | | | 1,980,907 | |
Swaps — OTC | | | | | | | | | | | | | | | | | | | | | | | | | | | | |
Unrealized appreciation on OTC swaps; Swap premiums paid | | | — | | | | 55,405 | | | | — | | | | — | | | | — | | | | — | | | | 55,405 | |
| | | | | | | | | | | | | | | | | | | | | | | | | | | | |
| | $ | — | | | $ | 55,405 | | | $ | — | | | $ | — | | | $ | 3,447,070 | | | $ | — | | | $ | 3,502,475 | |
| | | | | | | | | | | | | | | | | | | | | | | | | | | | |
Liabilities — Derivative Financial Instruments | |
Futures contracts | | | | | | | | | | | | | | | | | | | | | | | | | | | | |
Unrealized depreciation on futures contracts(a) | | $ | — | | | $ | — | | | $ | — | | | $ | — | | | $ | 1,849,739 | | | $ | — | | | $ | 1,849,739 | |
Options written | | | | | | | | | | | | | | | | | | | | | | | | | | | | |
Options written at value | | | — | | | | — | | | | — | | | | — | | | | 1,278,426 | | | | — | | | | 1,278,426 | |
Swaps — OTC | | | | | | | | | | | | | | | | | | | | | | | | | | | | |
Unrealized depreciation on OTC swaps; Swap premiums received | | | — | | | | 240,254 | | | | — | | | | — | | | | — | | | | — | | | | 240,254 | |
| | | | | | | | | | | | | | | | | | | | | | | | | | | | |
| | $ | — | | | $ | 240,254 | | | $ | — | | | $ | — | | | $ | 3,128,165 | | | $ | — | | | $ | 3,368,419 | |
| | | | | | | | | | | | | | | | | | | | | | | | | | | | |
| | (a) | Net cumulative unrealized appreciation (depreciation) on futures contracts, if any, are reported in the Schedule of Investments. In the Statements of Assets and Liabilities, only current day’s variation margin is reported in receivables or payables and the net cumulative unrealized appreciation (depreciation) is included in accumulated earnings (loss). | |
| | (b) | Includes options purchased at value as reported in the Schedule of Investments. | |
| | | | |
| SCHEDULES OF INVESTMENTS | | | 29 | |
| | |
Schedule of Investments (continued) October 31, 2019 | | BlackRock Credit Allocation Income Trust (BTZ) |
For the year ended October 31, 2019, the effect of derivative financial instruments in the Statements of Operations was as follows:
| | | | | | | | | | | | | | | | | | | | | | | | | | | | |
| | | Commodity
Contracts | | | Credit
Contracts | | | Equity
Contracts | | | Foreign
Currency
Exchange
Contracts | | | Interest
Rate Contracts | | | Other Contracts | | | Total | |
Net Realized Gain (Loss) from: | | | | | | | | | | | | | | | | | | | | | | | | | | | | |
Futures contracts | | $ | — | | | $ | — | | | $ | — | | | $ | — | | | $ | (9,988,823 | ) | | $ | — | | | $ | (9,988,823 | ) |
Options purchased(a) | | | — | | | | 359,539 | | | | (3,935,600 | ) | | | (960,784 | ) | | | (3,569,628 | ) | | | — | | | | (8,106,473 | ) |
Options written | | | — | | | | (40,589 | ) | | | 3,052,439 | | | | 316,194 | | | | 584,317 | | | | — | | | | 3,912,361 | |
Swaps | | | — | | | | 1,740,636 | | | | — | | | | — | | | | (775,452 | ) | | | — | | | | 965,184 | |
| | | | | | | | | | | | | | | | | | | | | | | | | | | | |
| | $ | — | | | $ | 2,059,586 | | | $ | (883,161 | ) | | $ | (644,590 | ) | | $ | (13,749,586 | ) | | $ | — | | | $ | (13,217,751 | ) |
| | | | | | | | | | | | | | | | | | | | | | | | | | | | |
| | | | | | | |
Net Change in Unrealized Appreciation (Depreciation)
on: | | | | | | | | | | | | | | | | | | | | | |
Futures contracts | | $ | — | | | $ | — | | | $ | — | | | $ | — | | | $ | (7,001,598 | ) | | $ | — | | | $ | (7,001,598 | ) |
Options purchased(b) | | | — | | | | — | | | | 173,474 | | | | — | | | | (1,232,856 | ) | | | — | | | | (1,059,382 | ) |
Options written | | | — | | | | — | | | | (53,104 | ) | | | — | | | | 531,574 | | | | — | | | | 478,470 | |
Swaps | | | — | | | | (244,069 | ) | | | — | | | | — | | | | 1,051,938 | | | | — | | | | 807,869 | |
| | | | | | | | | | | | | | | | | | | | | | | | | | | | |
| | $ | — | | | $ | (244,069 | ) | | $ | 120,370 | | | $ | — | | | $ | (6,650,942 | ) | | $ | — | | | $ | (6,774,641 | ) |
| | | | | | | | | | | | | | | | | | | | | | | | | | | | |
| | (a) | Options purchased are included in net realized gain (loss) from investments. | |
| | (b) | Options purchased are included in net change in unrealized appreciation (depreciation) on investments. | |
Average Quarterly Balances of Outstanding Derivative Financial Instruments
| | | | |
Futures contracts: | | | | |
Average notional value of contracts — long | | $ | 123,209,772 | |
Average notional value of contracts — short | | $ | 251,340,250 | |
Options: | | | | |
Average value of option contracts purchased | | $ | 333,721 | |
Average value of option contracts written | | $ | 17,110 | |
Average notional value of swaption contracts purchased | | $ | 288,657,500 | |
Average notional value of swaption contracts written | | $ | 102,142,500 | |
Credit default swaps: | | | | |
Average notional value — buy protection | | $ | 16,750,000 | |
Average notional value — sell protection | | $ | 25,000,000 | |
Interest rate swaps: | | | | |
Average notional value — receives fixed rate | | $ | 75,277,500 | |
For more information about the Trust’s investment risks regarding derivative financial instruments, refer to the Notes to Financial Statements.
Derivative Financial Instruments — Offsetting as of Period End
The Trust’s derivative assets and liabilities (by type) were as follows:
| | | | | | | | |
| | | Assets | | | Liabilities | |
Derivative Financial Instruments: | | | | | | | | |
Futures contracts | | $ | 1,009,813 | | | $ | 979,504 | |
Options | | | 1,980,907 | (a) | | | 1,278,426 | |
Swaps — OTC(b) | | | 55,405 | | | | 240,254 | |
| | | | | | | | |
Total derivative assets and liabilities in the Statements of Assets and Liabilities | | $ | 3,046,125 | | | $ | 2,498,184 | |
Derivatives not subject to a Master Netting Agreement or similar agreement (“MNA”) | | | (1,009,813 | ) | | | (979,504 | ) |
| | | | | | | | |
Total derivative assets and liabilities subject to an MNA | | $ | 2,036,312 | | | $ | 1,518,680 | |
| | | | | | | | |
| | (a) | Includes options purchased at value which is included in Investments at value — unaffiliated in the Statements of Assets and Liabilities and reported in the Schedule of Investments. | |
| | (b) | Includes unrealized appreciation (depreciation) on OTC swaps and swap premiums paid in the Statements of Assets and Liabilities. | |
| | |
| 30 | | 2019 BLACKROCK ANNUAL REPORTTO SHAREHOLDERS |
| | |
Schedule of Investments (continued) October 31, 2019 | | BlackRock Credit Allocation Income Trust (BTZ) |
The following tables present the Trust’s derivative assets (and liabilities) by counterparty net of amounts available for offset under an MNA and net of the related collateral received (and pledged) by the Trust:
| | | | | | | | | | | | | | | | | | | | |
| Counterparty | | Derivative Assets Subject to an MNA by
Counterparty | | | Derivatives Available for Offset (a) | | | Non-cash
Collateral Received | | | Cash
Collateral Received (b) | | | Net Amount of Derivative Assets | |
Barclays Bank PLC | | $ | 1,105,917 | | | $ | (1,105,917 | ) | | $ | — | | | $ | — | | | $ | — | |
Citibank N.A. | | | 16,078 | | | | (16,078 | ) | | | — | | | | — | | | | — | |
Goldman Sachs International | | | 5,939 | | | | (5,939 | ) | | | — | | | | — | | | | — | |
JPMorgan Chase Bank N.A. | | | 908,378 | | | | (179,830 | ) | | | — | | | | (728,548 | ) | | | — | |
| | | | | | | | | | | | | | | | | | | | |
| | $ | 2,036,312 | | | $ | (1,307,764 | ) | | $ | — | | | $ | (728,548 | ) | | $ | — | |
| | | | | | | | | | | | | | | | | | | | |
| | | | | | | | | | | | | | | | | | | | |
| Counterparty | | Derivative Liabilities Subject to an MNA by Counterparty | | | Derivatives Available for Offset (a) | | | Non-cash Collateral Pledged | | | Cash Collateral Pledged | | | Net Amount of Derivative Liabilities (c) | |
Barclays Bank PLC | | $ | 1,278,426 | | | $ | (1,105,917 | ) | | $ | — | | | $ | — | | | $ | 172,509 | |
Citibank N.A. | | | 37,506 | | | | (16,078 | ) | | | — | | | | — | | | | 21,428 | |
Goldman Sachs International | | | 22,918 | | | | (5,939 | ) | | | — | | | | — | | | | 16,979 | |
JPMorgan Chase Bank N.A. | | | 179,830 | | | | (179,830 | ) | | | — | | | | — | | | | — | |
| | | | | | | | | | | | | | | | | | | | |
| | $ | 1,518,680 | | | $ | (1,307,764 | ) | | $ | — | | | $ | — | | | $ | 210,916 | |
| | | | | | | | | | | | | | | | | | | | |
| | (a) | The amount of derivatives available for offset is limited to the amount of derivative assets and/or liabilities that are subject to an MNA. | |
| | (b) | Excess of collateral received from the individual counterparty is not shown for financial reporting purposes. | |
| | (c) | Net amount represents the net amount payable due to counterparty in the event of default. Net amount may be offset further by the options written receivable/payable on the Statements of Assets and Liabilities. | |
Fair Value Hierarchy as of Period End
Various inputs are used in determining the fair value of investments and derivative financial instruments. For information about the Trust’s policy regarding valuation of investments and derivative financial instruments, refer to the Notes to Financial Statements.
The following tables summarize the Trust’s investments and derivative financial instruments categorized in the disclosure hierarchy:
| | | | | | | | | | | | | | | | |
| | | Level 1 | | | Level 2 | | | Level 3 | | | Total | |
Assets: | |
Investments: | |
Long-Term Investments | |
Asset-Backed Securities | | $ | — | | | $ | 107,269,351 | | | $ | 1,000,000 | | | $ | 108,269,351 | |
Corporate Bonds(a) | | | — | | | | 1,566,869,039 | | | | 4,820,729 | | | | 1,571,689,768 | |
Foreign Agency Obligations(a) | | | — | | | | 32,655,320 | | | | — | | | | 32,655,320 | |
Municipal Bonds(a) | | | — | | | | 18,047,300 | | | | — | | | | 18,047,300 | |
Preferred Securities(a) | | | 50,585,114 | | | | 318,937,493 | | | | — | | | | 369,522,607 | |
Options Purchased | |
Interest rate contracts | | | — | | | | 1,980,907 | | | | — | | | | 1,980,907 | |
Short-Term Securities | | | 4,783,450 | | | | — | | | | — | | | | 4,783,450 | |
| | | | | | | | | | | | | | | | |
| | $ | 55,368,564 | | | $ | 2,045,759,410 | | | $ | 5,820,729 | | | $ | 2,106,948,703 | |
| | | | | | | | | | | | | | | | |
Derivative Financial Instruments(b) | |
Assets: | |
Interest rate contracts | | $ | 1,466,163 | | | $ | — | | | $ | — | | | $ | 1,466,163 | |
Liabilities: | |
Credit contracts | | | — | | | | (240,254 | ) | | | — | | | | (240,254 | ) |
Interest rate contracts | | | (1,849,739 | ) | | | (1,278,426 | ) | | | — | | | | (3,128,165 | ) |
| | | | | | | | | | | | | | | | |
| | $ | (383,576 | ) | | $ | (1,518,680 | ) | | $ | — | | | $ | (1,902,256 | ) |
| | | | | | | | | | | | | | | | |
| | (a) | See above Schedule of Investments for values in each industry, state, country or political subdivision. | |
| | (b) | Derivative financial instruments are swaps, futures contracts, and options written. Swaps and futures contracts are valued at the unrealized appreciation (depreciation) on the instrument and options written are shown at value. | |
The Trust may hold liabilities in which the fair value approximates the carrying amount or face value, including accrued interest, for financial statement Purposes. As of period end, reverse repurchase agreements of $568,460,558 are categorized as Level 2 within the disclosure hierarchy.
See notes to financial statements.
| | | | |
| SCHEDULES OF INVESTMENTS | | | 31 | |
| | |
Schedule of Investments October 31, 2019 | | BlackRock Floating Rate Income Trust (BGT) (Percentages shown are based on Net Assets) |
| | | | | | | | | | | | |
Security | | | | | Shares | | | Value | |
|
Common Stocks — 0.2% | |
|
| Auto Components — 0.0% | |
Lear Corp. | | | | | | | 89 | | | $ | 10,482 | |
| | | | | | | | | | | | |
|
| Health Care Management Services — 0.0% | |
New Millennium HoldCo, Inc.(a) | | | | | | | 9,191 | | | | 55 | |
| | | | | | | | | | | | |
|
| Household Durables — 0.0% | |
Berkline Benchcraft Equity LLC(a)(b) | | | | | | | 6,155 | | | | — | |
| | | | | | | | | | | | |
|
| Media — 0.1% | |
Clear Channel Outdoor Holdings, Inc.(a) | | | | | | | 72,096 | | | | 167,984 | |
iHeartMedia, Inc., Class A (a) | | | | | | | 3,601 | | | | 51,638 | |
| | | | | | | | | | | | |
| | | | 219,622 | |
|
| Metals & Mining — 0.0% | |
Ameriforge Group, Inc.(a) | | | | | | | 832 | | | | 45,760 | |
Preferred Proppants LLC(b) | | | | | | | 7,476 | | | | 16,821 | |
| | | | | | | | | | | | |
| | | | 62,581 | |
|
| Software — 0.0% | |
Avaya Holdings Corp.(a) | | | | | | | 38 | | | | 459 | |
| | | | | | | | | | | | |
|
| Utilities — 0.1% | |
Texgen LLC(a)(b) | | | | | | | 5,193 | | | | 228,492 | |
| | | | | | | | | | | | |
| |
Total Common Stocks — 0.2%
(Cost — $799,516) | | | | 521,691 | |
| | | | | | | | | | | | |
| | |
| | | Par
(000) | | | | |
|
Corporate Bonds — 1.1% | |
|
| Diversified Consumer Services — 0.0% | |
Prime Security Services Borrower LLC/Prime Finance, Inc., 9.25%, 05/15/23(c) | | | USD | | | | 106 | | | | 111,512 | |
| | | | | | | | | | | | |
|
| Electric Utilities — 0.0% | |
Texas Competitive Electric Holdings Co. LLC/TCEH Finance, Inc., 11.50%, 10/01/20(b)(c) | | | | | | | 654 | | | | — | |
| | | | | | | | | | | | |
|
| Electrical Equipment — 0.2% | |
Vertiv Group Corp., (Acquired 05/09/19,
cost $529,177), 10.00%, 06/30/24(b)(d) | | | | | | | 544 | | | | 553,520 | |
| | | | | | | | | | | | |
|
| Health Care Services — 0.0% | |
Avaya, Inc. Escrow, 7.00%, 04/01/19(a)(b)(c)(e) | | | | | | | 827 | | | | — | |
| | | | | | | | | | | | |
|
| Household Products — 0.0% | |
Berkline Benchcraft LLC, 4.50%, 06/01/20(a)(b)(e) | | | | | | | 400 | | | | — | |
| | | | | | | | | | | | |
|
| Media — 0.0% | |
CSC Holdings LLC, 10.88%, 10/15/25(c) | | | | | | | 65 | | | | 73,350 | |
| | | | | | | | | | | | |
|
| Metals & Mining — 0.1% | |
Freeport-McMoRan, Inc., 3.88%, 03/15/23 | | | | | | | 375 | | | | 380,625 | |
| | | | | | | | | | | | |
|
| Oil, Gas & Consumable Fuels — 0.3% | |
CNX Resources Corp., 5.88%, 04/15/22 | | | | | | | 485 | | | | 474,087 | |
CONSOL Energy, Inc., 11.00%, 11/15/25(c) | | | | | | | 485 | | | | 406,188 | |
| | | | | | | | | | | | |
| | | | 880,275 | |
|
| Software — 0.4% | |
Infor US, Inc., 6.50%, 05/15/22 | | | | | | | 720 | | | | 729,900 | |
Informatica LLC, 7.13%, 07/15/23(c) | | | | | | | 405 | | | | 411,581 | |
| | | | | | | | | | | | |
| | | | 1,141,481 | |
|
| Specialty Retail — 0.1% | |
eG Global Finance PLC, 8.50%, 10/30/25(c) | | | | | | | 350 | | | | 367,633 | |
| | | | | | | | | | | | |
| |
Total Corporate Bonds — 1.1%
(Cost — $3,585,993) | | | | 3,508,396 | |
| | | | | | | | | | | | |
| | | | | | | | | | | | |
Security | | Par
(000) | | | Value | |
|
Floating Rate Loan Interests(f) — 135.9% | |
|
| Aerospace & Defense — 2.8% | |
1199169 B.C. Unlimited Liability Co., 2019 Term Loan B2, (3 mo. LIBOR + 4.00%), 6.10%, 04/06/26 | | | USD | | | | 1,132 | | | $ | 1,133,644 | |
Atlantic Aviation FBO, Inc., 2018 Term Loan B, (1 mo. LIBOR + 3.75%), 5.54%, 12/06/25(b) | | | | | | | 716 | | | | 718,276 | |
Bleriot US Bidco, Inc.(b)(g): | | | | | | | | | | | | |
Delayed Draw Term Loan, 10/23/26 | | | | | | | 110 | | | | 109,924 | |
Term Loan B, 10/23/26 | | | | | | | 703 | | | | 703,515 | |
Dynasty Acquisition Co., Inc., 2019 Term Loan B1, (3 mo. LIBOR + 4.00%), 6.10%, 04/06/26 | | | | | | | 2,106 | | | | 2,108,578 | |
Nordam Group, Inc., Term Loan B, (1 mo. LIBOR + 5.50%), 7.44%, 04/09/26(b) | | | | | | | 470 | | | | 468,466 | |
TransDigm, Inc., 2018 Term Loan F, (1 mo. LIBOR + 2.50%), 4.29%, 06/09/23 | | | | | | | 3,860 | | | | 3,840,438 | |
| | | | | | | | |
| | | | | | | | | | | 9,082,841 | |
|
| Air Freight & Logistics — 0.3% | |
Avolon TLB Borrower 1 (US) LLC, Term Loan B3, (1 mo. LIBOR + 1.75%), 3.60%, 01/15/25 | | | | | | | 1,077 | | | | 1,080,732 | |
| | | | | | | | |
|
| Airlines — 1.5% | |
Allegiant Travel Co., Term Loan B, (3 mo. LIBOR + 4.50%), 6.71%, 02/05/24 | | | | | | | 921 | | | | 921,757 | |
American Airlines, Inc.: | | | | | | | | | | | | |
2017 Incremental Term Loan, (1 mo. LIBOR + 2.00%), 3.92%, 12/14/23 | | | | | | | 1,142 | | | | 1,140,204 | |
Repriced TL B due 2023, (1 mo. LIBOR + 2.00%), 3.80%, 04/28/23 | | | | | | | 665 | | | | 664,308 | |
WestJet Airlines Ltd., Term Loan B, 08/07/26(g) | | | | | | | 1,976 | | | | 1,984,240 | |
| | | | | | | | |
| | | | | | | | | | | 4,710,509 | |
|
| Auto Components — 2.1% | |
Panther BF Aggregator 2 LP, USD Term Loan B, (1 mo. LIBOR + 3.50%), 5.30%, 04/30/26 | | | | | | | 3,610 | | | | 3,557,366 | |
USI, Inc., 2017 Repriced Term Loan, 05/16/24(g) | | | | | | | 2,326 | | | | 2,255,164 | |
Wand NewCo 3, Inc., 2019 1st Lien Term Loan, (1 mo. LIBOR + 3.50%), 5.29%, 02/05/26 | | | | | | | 876 | | | | 878,652 | |
| | | | | | | | |
| | | | | | | | | | | 6,691,182 | |
|
| Banks — 0.6% | |
Capri Finance LLC, 2017 1st Lien Term Loan, 11/01/24(g) | | | | | | | 2,082 | | | | 1,996,399 | |
| | | | | | | | |
|
| Building Materials — 1.0% | |
Allied Universal Holdco LLC: | | | | | | | | | | | | |
2019 Delayed Draw Term Loan, (3 mo. LIBOR + 4.25%), 4.25%, 07/10/26 | | | | | | | 335 | | | | — | |
2019 Term Loan B, (6 mo. LIBOR + 4.25%), 6.51%, 07/10/26 | | | | | | | 3,385 | | | | 3,358,661 | |
| | | | | | | | |
| | | | | | | | | | | 3,358,661 | |
|
| Building Products — 0.8% | |
CPG International, Inc., 2017 Term Loan,
(3 mo. LIBOR + 3.75%, 1.00% Floor), 5.93%, 05/05/24 | | | | | | | 876 | | | | 861,711 | |
Wilsonart LLC, 2017 Term Loan B, (3 mo. LIBOR + 3.25%, 1.00% Floor), 5.36%, 12/19/23 | | | | | | | 1,715 | | | | 1,676,791 | |
| | | | | | | | |
| | | | | | | | | | | 2,538,502 | |
|
| Capital Markets — 2.3% | |
Duff & Phelps Corp., 2017 Term Loan B, 02/13/25(g) | | | | | | | 1,936 | | | | 1,864,004 | |
Fortress Investment Group LLC, 2018 Term Loan B, (1 mo. LIBOR + 2.00%), 3.79%, 12/27/22 | | | | | | | 748 | | | | 747,908 | |
Greenhill & Co., Inc., Term Loan B, (1 mo. LIBOR + 3.25%), 5.16%, 04/12/24(b) | | | | | | | 703 | | | | 674,856 | |
Jefferies Finance LLC, 2019 Term Loan, (1 mo. LIBOR + 3.75%), 5.75%, 06/03/26(b) | | | | | | | 832 | | | | 816,316 | |
RPI Finance Trust, Term Loan B6, (1 mo. LIBOR + 2.00%), 3.79%, 03/27/23 | | | | | | | 1,554 | | | | 1,560,153 | |
| | |
| 32 | | 2019 BLACKROCK ANNUAL REPORTTO SHAREHOLDERS |
| | |
Schedule of Investments (continued) October 31, 2019 | | BlackRock Floating Rate Income Trust (BGT) (Percentages shown are based on Net Assets) |
| | | | | | | | | | | | |
Security | | Par
(000) | | | Value | |
|
| Capital Markets (continued) | |
Travelport Finance (Luxembourg) Sarl: | | | | | | | | | | | | |
2019 2nd Lien Term Loan, (3 mo. LIBOR + 9.00%), 11.10%, 05/28/27(b) | | | USD | | | | 705 | | | $ | 599,250 | |
2019 Term Loan, (3 mo. LIBOR + 5.00%), 7.10%, 05/29/26 | | | | | | | 1,172 | | | | 1,089,779 | |
| | | | | | | | |
| | | | | | | | | | | 7,352,266 | |
|
| Chemicals — 5.8% | |
Alpha 3 BV, 2017 Term Loan B1, (3 mo. LIBOR + 3.00%, 1.00% Floor), 5.10%, 01/31/24 | | | | | | | 2,632 | | | | 2,576,378 | |
Ascend Performance Materials Operations LLC, 2019 Term Loan B, (3 mo. LIBOR + 5.25%, 1.00% Floor), 7.35%, 08/27/26 | | | | | | | 1,537 | | | | 1,537,000 | |
Axalta Coating Systems US Holdings, Inc., Term Loan, (3 mo. LIBOR + 1.75%), 3.85%, 06/01/24 | | | | | | | 2,160 | | | | 2,156,276 | |
Charter NEX US Holdings, Inc., 2017 Term Loan B, 05/16/24(g) | | | | | | | 1,884 | | | | 1,832,273 | |
Chemours Co., 2018 Term Loan B, (1 mo. LIBOR + 1.75%), 3.54%, 04/03/25 | | | | | | | 629 | | | | 593,025 | |
Element Materials Technology Group US Holdings, Inc., 2017 Term Loan B, (3 mo. LIBOR + 3.50%, 1.00% Floor), 5.60%, 06/28/24 | | | | | | | 373 | | | | 373,350 | |
Encapsys LLC, 1st Lien Term Loan, (1 mo. LIBOR + 3.50%, 1.00% Floor), 5.29%, 11/07/24 | | | | | | | 774 | | | | 772,902 | |
Invictus US LLC: | | | | | | | | | | | | |
1st Lien Term Loan, (3 mo. LIBOR + 3.00%), 4.93%, 03/28/25 | | | | | | | 996 | | | | 969,358 | |
2nd Lien Term Loan, (3 mo. LIBOR + 6.75%), 8.68%, 03/30/26 | | | | | | | 265 | | | | 246,450 | |
Messer Industries GmbH, 2018 USD Term Loan, (3 mo. LIBOR + 2.50%), 4.60%, 03/01/26 | | | | | | | 1,790 | | | | 1,773,399 | |
Momentive Performance Materials, Inc., Term Loan B, (1 mo. LIBOR + 3.25%), 5.04%, 05/15/24 | | | | | | | 654 | | | | 641,685 | |
Oxea Holding Drei GmbH, 2017 Term Loan B2, (3 mo. LIBOR + 3.50%), 5.56%, 10/14/24 | | | | | | | 2,219 | | | | 2,202,109 | |
Plaskolite LLC, 1st Lien Term Loan, (1 mo. LIBOR + 4.25%, 1.00% Floor), 6.10%, 12/15/25 | | | | | | | 511 | | | | 464,166 | |
PQ Corp., 2018 Term Loan B, (3 mo. LIBOR + 2.50%), 4.43%, 02/08/25 | | | | | | | 1,529 | | | | 1,526,287 | |
Tata Chemicals North America, Inc., Term Loan B, (3 mo. LIBOR + 2.75%, 1.00% Floor), 4.88%, 08/07/20 | | | | | | | 254 | | | | 252,957 | |
Vectra Co., 1st Lien Term Loan, (1 mo. LIBOR + 3.25%), 5.04%, 03/08/25 | | | | | | | 574 | | | | 554,888 | |
| | | | | | | | |
| | | | | | | | | | | 18,472,503 | |
|
| Commercial Services & Supplies — 6.1% | |
Advanced Disposal Services, Inc., Term Loan B3, (1 Week LIBOR + 2.25%), 4.09%, 11/10/23 | | | | | | | 1,888 | | | | 1,890,474 | |
Aramark Services, Inc., 2018 Term Loan B3, (1 mo. LIBOR + 1.75%), 3.54%, 03/11/25 | | | | | | | 169 | | | | 168,683 | |
Asurion LLC: | | | | | | | | | | | | |
2017 2nd Lien Term Loan, (1 mo. LIBOR + 6.50%), 8.29%, 08/04/25 | | | | | | | 1,166 | | | | 1,170,664 | |
2017 Term Loan B4, (1 mo. LIBOR + 3.00%), 4.79%, 08/04/22 | | | | | | | 961 | | | | 961,339 | |
2018 Term Loan B6, (1 mo. LIBOR + 3.00%), 4.79%, 11/03/23 | | | | | | | 1,819 | | | | 1,820,948 | |
2018 Term Loan B7, (1 mo. LIBOR + 3.00%), 4.79%, 11/03/24 | | | | | | | 714 | | | | 714,412 | |
Creative Artists Agency LLC, 2018 Term Loan B, (1 mo. LIBOR + 3.00%), 4.80%, 02/15/24 | | | | | | | 2,130 | | | | 2,136,731 | |
Diamond (BC) BV, Term Loan, 09/06/24(g) | | | | | | | 1,342 | | | | 1,247,322 | |
EnergySolutions LLC, 2018 Term Loan B, (3 mo. LIBOR + 3.75%, 1.00% Floor), 5.85%, 05/09/25 | | | | | | | 355 | | | | 330,583 | |
| | | | | | | | | | | | |
Security | | Par
(000) | | | Value | |
|
| Commercial Services & Supplies (continued) | |
GFL Environmental, Inc., 2018 USD Term Loan B, (1 mo. LIBOR + 3.00%, 1.00% Floor), 4.79%, 05/30/25 | | | USD | | | | 1,536 | | | $ | 1,530,439 | |
Harland Clarke Holdings Corp., Term Loan B7, (3 mo. LIBOR + 4.75%, 1.00% Floor), 6.85%, 11/03/23 | | | | | | | 297 | | | | 230,676 | |
KAR Auction Services, Inc., 2019 Term Loan B6, (1 mo. LIBOR + 2.25%), 4.13%, 09/19/26 | | | | | | | 618 | | | | 619,496 | |
Prime Security Services Borrower LLC, 2019 Term Loan B1, (1 mo. LIBOR + 3.25%, 1.00% Floor), 5.25%, 09/23/26 | | | | | | | 1,535 | | | | 1,480,855 | |
US Ecology, Inc., Term Loan B, 08/14/26(g) | | | | | | | 252 | | | | 252,945 | |
Verscend Holding Corp., 2018 Term Loan B,
(1 mo. LIBOR + 4.50%), 6.29%, 08/27/25 | | | | | | | 3,364 | | | | 3,364,004 | |
West Corp., 2017 Term Loan, (3 mo. LIBOR + 4.00%, 1.00% Floor), 5.93%, 10/10/24 | | | | | | | 1,984 | | | | 1,646,287 | |
| | | | | | | | |
| | | | | | | | | | | 19,565,858 | |
|
| Communications Equipment — 0.6% | |
Avantor, Inc., 2017 1st Lien Term Loan, (1 mo. LIBOR + 3.00%, 1.00% Floor), 4.79%, 11/21/24 | | | | | | | 960 | | | | 966,012 | |
Ciena Corp., 2018 Term Loan B, (PRIME + 1.00%), 5.75%, 09/26/25 | | | | | | | 812 | | | | 813,569 | |
| | | | | | | | |
| | | | | | | | | | | 1,779,581 | |
|
| Construction & Engineering — 1.3% | |
AECOM, Term Loan B, (1 mo. LIBOR + 1.75%), 3.54%, 03/13/25 | | | | | | | 433 | | | | 433,581 | |
Brand Energy & Infrastructure Services, Inc., 2017 Term Loan, (3 mo. LIBOR + 4.25%, 1.00% Floor), 6.18%,��06/21/24 | | | | | | | 1,773 | | | | 1,719,488 | |
Ply Gem Midco, Inc., 2018 Term Loan, (1 mo. LIBOR + 3.75%), 5.66%, 04/12/25 | | | | | | | 267 | | | | 258,160 | |
SRS Distribution, Inc., 2018 1st Lien Term Loan,
05/23/25(g) | | | | | | | 1,353 | | | | 1,307,129 | |
USIC Holdings, Inc., 2017 Term Loan B, (1 mo. LIBOR + 3.25%, 1.00% Floor), 5.04%, 12/08/23 | | | | | | | 557 | | | | 541,140 | |
| | | | | | | | |
| | | | | | | | | | | 4,259,498 | |
|
| Construction Materials — 1.8% | |
Core & Main LP, 2017 Term Loan B, (3 mo. LIBOR + 2.75%, 1.00% Floor), 4.76%, 08/01/24 | | | | | | | 2,812 | | | | 2,745,655 | |
Filtration Group Corp., 2018 1st Lien Term Loan, (1 mo. LIBOR + 3.00%), 4.79%, 03/29/25 | | | | | | | 1,922 | | | | 1,918,782 | |
Forterra Finance LLC, 2017 Term Loan B, 10/25/23(g) | | | | | | | 175 | | | | 165,133 | |
Foundation Building Materials LLC, 2018 Term Loan B, (1 mo. LIBOR + 3.00%), 4.79%, 08/13/25 | | | | | | | 494 | | | | 493,139 | |
Tamko Building Products, Inc., Term Loan B,
(3 mo. LIBOR + 3.25%), 5.37%, 06/01/26 | | | | | | | 450 | | | | 450,121 | |
| | | | | | | | |
| | | | | | | | | | | 5,772,830 | |
|
| Containers & Packaging — 2.8% | |
Berry Global, Inc.: | | | | | | | | | | | | |
Term Loan W, (3 mo. LIBOR + 2.00%), 3.88%, 10/01/22 | | | | | | | 2,946 | | | | 2,952,927 | |
USD Term Loan U, (1 mo. LIBOR + 2.50%), 4.44%, 07/01/26 | | | | | | | 1,616 | | | | 1,620,669 | |
BWAY Holding Co., 2017 Term Loan B, (3 mo. LIBOR + 3.25%), 5.23%, 04/03/24 | | | | | | | 1,665 | | | | 1,618,576 | |
Charter NEX US, Inc., Incremental Term Loan, (1 mo. LIBOR + 3.50%), 5.29%, 05/16/24 | | | | | | | 656 | | | | 648,767 | |
Flex Acquisition Co., Inc., 1st Lien Term Loan, (3 mo. LIBOR + 3.00%, 1.00% Floor), 5.10%, 12/29/23 | | | | | | | 1,669 | | | | 1,574,954 | |
Pregis TopCo Corp., 1st Lien Term Loan, (3 mo. LIBOR + 4.00%), 5.79%, 07/31/26 | | | | | | | 519 | | | | 510,997 | |
| | | | | | | | |
| | | | | | | | | | | 8,926,890 | |
| | | | |
| SCHEDULES OF INVESTMENTS | | | 33 | |
| | |
Schedule of Investments (continued) October 31, 2019 | | BlackRock Floating Rate Income Trust (BGT) (Percentages shown are based on Net Assets) |
| | | | | | | | | | | | |
Security | | Par
(000) | | | Value | |
|
| Distributors — 1.3% | |
American Builders & Contractors Supply Co., Inc., 2019 Term Loan, 01/15/27(g) | | | USD | | | | 2,833 | | | $ | 2,828,137 | |
TriMark USA LLC, 2017 1st Lien Term Loan, (6 mo. LIBOR + 3.50%), 5.70%, 08/28/24 | | | | | | | 1,699 | | | | 1,364,826 | |
| | | | | | | | |
| | | | | | | | | | | 4,192,963 | |
|
| Diversified Consumer Services — 4.4% | |
Ascend Learning LLC, 2017 Term Loan B, 07/12/24(g) | | | | | | | 978 | | | | 970,585 | |
BidFair MergerRight, Inc., Term Loan B, 01/15/27(g) | | | | | | | 1,542 | | | | 1,504,311 | |
Bright Horizons Family Solutions, Inc., 2017 Term Loan B, (1 mo. LIBOR + 1.75%), 3.54%, 11/07/23 | | | | | | | 1,960 | | | | 1,961,355 | |
Genuine Financial Holdings LLC, 2018 1st Lien Term Loan, 07/12/25(g) | | | | | | | 1,067 | | | | 1,022,579 | |
J.D. Power and Associates, 1st Lien Term Loan, (1 mo. LIBOR + 3.75%, 1.00% Floor), 5.54%, 09/07/23 | | | | | | | 845 | | | | 844,569 | |
Nomad Foods Europe Midco Ltd., 2017 Term Loan B4, (1 mo. LIBOR + 2.25%), 4.16%, 05/15/24 | | | | | | | 708 | | | | 704,896 | |
Serta Simmons Bedding LLC, 1.00% Floor): | | | | | | | | | | | | |
1st Lien Term Loan, (1 mo. LIBOR + 3.50%, 5.42%, 11/08/23 | | | | | | | 583 | | | | 342,472 | |
2nd Lien Term Loan, (1 mo. LIBOR + 8.00%, 9.85%, 11/08/24 | | | | | | | 79 | | | | 20,748 | |
ServiceMaster Co., 2016 Term Loan B, (1 mo. LIBOR + 2.50%), 4.29%, 11/08/23 | | | | | | | 157 | | | | 156,668 | |
Spin Holdco, Inc., 2017 Term Loan B, (3 mo. LIBOR + 3.25%, 1.00% Floor), 5.25%, 11/14/22 | | | | | | | 2,863 | | | | 2,773,472 | |
TruGreen LP, 2019 Term Loan, (1 mo. LIBOR + 3.75%, 1.00% Floor), 5.54%, 03/19/26(b) | | | | | | | 1,391 | | | | 1,392,528 | |
Uber Technologies, Inc., 2018 Incremental Term Loan, (1 mo. LIBOR + 3.50%), 5.30%, 07/13/23 | | | | | | | 2,452 | | | | 2,412,289 | |
| | | | | | | | | | | | |
| | | | | | | | | | | 14,106,472 | |
|
| Diversified Financial Services — 4.3% | |
Advisor Group, Inc., 2019 Term Loan, 07/31/26(g) | | | | | | | 1,254 | | | | 1,190,259 | |
AlixPartners LLP, 2017 Term Loan B, (1 mo. LIBOR + 2.75%, 1.00% Floor), 4.54%, 04/04/24 | | | | | | | 2,614 | | | | 2,609,626 | |
Connect Finco Sarl, Term Loan B, 09/23/26(g) | | | | | | | 6,323 | | | | 6,222,211 | |
CRCI Longhorn Holdings, Inc., 2018 1st Lien Term Loan, (1 mo. LIBOR + 3.50%), 5.50%, 08/08/25 | | | | | | | 445 | | | | 430,063 | |
EG Finco Ltd., 2018 Term Loan, (3 mo. LIBOR + 4.00%), 6.10%, 02/07/25 | | | | | | | 726 | | | | 699,653 | |
Kingpin Intermediate Holdings LLC, 2018 Term Loan B, (1 mo. LIBOR + 3.50%, 1.00% Floor), 5.29%, 07/03/24 | | | | | | | 1,179 | | | | 1,176,069 | |
LTI Holdings, Inc., 2018 Add On 1st Lien Term Loan, (1 mo. LIBOR + 3.50%), 5.29%, 09/06/25 | | | | | | | 354 | | | | 324,667 | |
SSH Group Holdings, Inc., 2018 1st Lien Term Loan, (1 mo. LIBOR + 4.25%), 6.04%, 07/30/25 | | | | | | | 682 | | | | 676,339 | |
Starwood Property Trust, Inc., 2019 Term Loan B, (1 mo. LIBOR + 2.50%), 4.30%, 07/27/26(b) | | | | | | | 377 | | | | 377,942 | |
| | | | | | | | | | | | |
| | | | | | | | | | | 13,706,829 | |
|
| Diversified Telecommunication Services — 3.4% | |
CenturyLink, Inc., 2017 Term Loan B, (1 mo. LIBOR + 2.75%), 4.54%, 01/31/25 | | | | | | | 1,153 | | | | 1,140,557 | |
Consolidated Communications, Inc., 2016 Term Loan B, (1 mo. LIBOR + 3.00%, 1.00% Floor), 4.79%, 10/04/23 | | | | | | | 106 | | | | 98,444 | |
Hargray Communications Group, Inc., 2017 Term Loan B, (1 mo. LIBOR + 3.00%, 1.00% Floor), 4.79%, 05/16/24 | | | | | | | 720 | | | | 718,165 | |
Iridium Satellite LLC, Term Loan, 10/17/26(g) | | | | | | | 700 | | | | 703,717 | |
Level 3 Financing, Inc., 2017 Term Loan B, (1 mo. LIBOR + 2.25%), 4.04%, 02/22/24 | | | | | | | 1,753 | | | | 1,754,569 | |
MTN Infrastructure TopCo, Inc., 1st Lien Term Loan B, (1 mo. LIBOR + 3.00%, 1.00% Floor), 4.79%, 11/15/24 | | | | | | | 1,366 | | | | 1,348,098 | |
| | | | | | | | | | | | |
Security | | Par
(000) | | | Value | |
|
| Diversified Telecommunication Services (continued) | |
Sprint Communications, Inc., 1st Lien Term Loan B, (1 mo. LIBOR + 2.50%), 4.31%, 02/02/24 | | | USD | | | | 664 | | | $ | 656,459 | |
TDC A/S, Term Loan, (EURIBOR + 2.75%), 2.75%, 06/04/25 | | | EUR | | | | 819 | | | | 915,176 | |
Telenet Financing USD LLC, Term Loan AN, (1 mo. LIBOR + 2.25%), 4.17%, 08/15/26 | | | USD | | | | 845 | | | | 843,068 | |
Telesat Canada, Term Loan B4, (3 mo. LIBOR + 2.50%), 4.61%, 11/17/23 | | | | | | | 496 | | | | 495,895 | |
Virgin Media Investment Holdings Ltd., Term Loan L,(LIBOR - GBP + 3.25%), 3.96%, 01/15/27 | | | GBP | | | | 600 | | | | 773,029 | |
Zayo Group LLC: | | | | | | | | | | | | |
2017 Incremental Term Loan, (1 mo. LIBOR + 2.25%, 1.00% Floor), 4.04%, 01/19/24 | | | USD | | | | 175 | | | | 175,163 | |
2017 Term Loan B1, (1 mo. LIBOR + 2.00%), 3.79%, 01/19/21 | | | | | | | 1,433 | | | | 1,435,361 | |
| | | | | | | | | | | | |
| | | | | | | | | | | 11,057,701 | |
|
| Electric Utilities — 0.6% | |
TEX Operations Co. LLC, Exit Term Loan B, (1 mo. LIBOR + 2.00%), 3.79%, 08/04/23 | | | | | | | 843 | | | | 845,723 | |
Texas Competitive Electric Holdings Co. LLC/TCEH Finance, Inc., Term Loan, 1.00%, 11/10/19(b) | | | | | | | 1,050 | | | | — | |
Vistra Energy Corp., 1st Lien Term Loan B3, (1 mo. LIBOR + 2.00%), 3.89%, 12/31/25 | | | | | | | 1,133 | | | | 1,136,471 | |
| | | | | | | | | | | | |
| | | | | | | | | | | 1,982,194 | |
|
| Electrical Equipment — 1.2% | |
Dell International LLC, 2019 Term Loan B, (1 mo. LIBOR + 2.00%), 3.79%, 09/19/25 | | | | | | | 1,599 | | | | 1,604,358 | |
Gates Global LLC, 2017 Repriced Term Loan B, (1 mo. LIBOR + 2.75%, 1.00% Floor), 4.54%, 04/01/24 | | | | | | | 2,293 | | | | 2,242,572 | |
| | | | | | | | | | | | |
| | | | | | | | | | | 3,846,930 | |
|
| Energy Equipment & Services — 0.5% | |
GrafTech Finance, Inc., 2018 Term Loan B, (1 mo. LIBOR + 3.50%, 1.00% Floor), 5.29%, 02/12/25(b) | | | | | | | 1,109 | | | | 1,066,200 | |
Pioneer Energy Services Corp., Term Loan, (1 mo. LIBOR + 7.75%, 1.00% Floor), 9.55%, 11/08/22(b) | | | | | | | 520 | | | | 499,200 | |
| | | | | | | | |
| | | | | | | | | | | 1,565,400 | |
|
| Equity Real Estate Investment Trusts (REITs) — 2.7% | |
Claros Mortgage Trust, Inc., Term Loan B, (1 mo. LIBOR + 3.25%), 5.19%, 08/10/26(b) | | | | | | | 997 | | | | 997,000 | |
Iron Mountain, Inc., 2018 Term Loan B, (1 mo. LIBOR + 1.75%), 3.54%, 01/02/26 | | | | | | | 1,173 | | | | 1,155,364 | |
MGM Growth Properties Operating Partnership LP, 2016 Term Loan B, (1 mo. LIBOR + 2.00%), 3.79%, 03/21/25 | | | | | | | 2,458 | | | | 2,464,553 | |
RHP Hotel Properties LP, 2017 Term Loan B, (1 mo. LIBOR + 2.00%), 3.79%, 05/11/24 | | | | | | | 651 | | | | 650,388 | |
VICI Properties 1 LLC, Replacement Term Loan B, (3 mo. LIBOR + 2.00%), 3.85%, 12/20/24 | | | | | | | 3,293 | | | | 3,302,544 | |
| | | | | | | | |
| | | | | | | | | | | 8,569,849 | |
|
| Food & Staples Retailing — 1.8% | |
Albertsons LLC: | | | | | | | | | | | | |
2019 Term Loan B7, (1 mo. LIBOR + 2.75%), 4.54%, 11/17/25 | | | | | | | 544 | | | | 546,629 | |
2019 Term Loan B8, (1 mo. LIBOR + 2.75%), 4.54%, 08/17/26 | | | | | | | 7 | | | | 7,168 | |
BCPE Empire Holdings, Inc.: | | | | | | | | | | | | |
2019 Delayed Draw Term Loan, (3 mo. LIBOR + 2.00%), 4.00%, 06/11/26 | | | | | | | 129 | | | | 7,307 | |
2019 Term Loan B, (1 mo. LIBOR + 4.00%), 5.79%, 06/11/26 | | | | | | | 655 | | | | 642,992 | |
| | |
| 34 | | 2019 BLACKROCK ANNUAL REPORTTO SHAREHOLDERS |
| | |
Schedule of Investments (continued) October 31, 2019 | | BlackRock Floating Rate Income Trust (BGT) (Percentages shown are based on Net Assets) |
| | | | | | | | | | | | |
Security | | Par
(000) | | | Value | |
|
| Food & Staples Retailing (continued) | |
Hearthside Food Solutions LLC: | | | | | | | | | | | | |
2018 Incremental Term Loan, (1 mo. LIBOR + 4.00%), 5.79%, 05/23/25 | | | USD | | | | 1,159 | | | $ | 1,086,301 | |
2018 Term Loan B, (1 mo. LIBOR + 3.69%), 5.47%, 05/23/25 | | | | | | | 354 | | | | 327,818 | |
US Foods, Inc.: | | | | | | | | | | | | |
2016 Term Loan B, (1 mo. LIBOR + 2.00%), 3.79%, 06/27/23 | | | | | | | 1,639 | | | | 1,643,481 | |
2019 Term Loan B, (1 mo. LIBOR + 2.00%), 3.79%, 09/13/26 | | | | | | | 1,585 | | | | 1,589,184 | |
| | | | | | | | |
| | | | | | | | | | | 5,850,880 | |
|
| Food Products — 2.6% | |
8th Avenue Food & Provisions, Inc., 2018 1st Lien Term Loan, (3 mo. LIBOR + 3.75%), 5.69%, 10/01/25 | | | | | | | 350 | | | | 350,352 | |
Chobani LLC, 2017 Term Loan B, (1 mo. LIBOR + 3.50%, 1.00% Floor), 5.29%, 10/10/23 | | | | | | | 2,321 | | | | 2,264,613 | |
JBS USA LUX SA, 2019 Term Loan B, (1 mo. LIBOR + 2.50%), 4.29%, 05/01/26 | | | | | | | 1,407 | | | | 1,410,602 | |
Post Holdings, Inc., 2017 Series A Incremental Term Loan, (1 mo. LIBOR + 2.00%), 3.83%, 05/24/24 | | | | | | | 64 | | | | 63,734 | |
Reynolds Group Holdings, Inc., 2017 Term Loan, (1 mo. LIBOR + 2.75%), 4.54%, 02/05/23 | | | | | | | 4,274 | | | | 4,271,497 | |
| | | | | | | | |
| | | | | | | | | | | 8,360,798 | |
|
| Gas Utilities — 0.1% | |
AL Midcoast Holdings LLC, 2018 Term Loan B, (3 mo. LIBOR + 5.50%), 7.60%, 07/31/25 | | | | | | | 426 | | | | 413,370 | |
| | | | | | | | |
|
| Health Care Equipment & Supplies — 1.9% | |
Immucor, Inc., Extended Term Loan B, (3 mo. LIBOR + 5.00%, 1.00% Floor), 7.10%, 06/15/21 | | | | | | | 2,846 | | | | 2,830,003 | |
Mallinckrodt International Finance SA, Term Loan B, (3 mo. LIBOR + 2.75%), 4.85%, 09/24/24 | | | | | | | 496 | | | | 387,592 | |
Ortho-Clinical Diagnostics SA, 2018 Term Loan B,
06/30/25(g) | | | | | | | 2,954 | | | | 2,818,418 | |
| | | | | | | | |
| | | | | | | | | | | 6,036,013 | |
|
| Health Care Providers & Services — 7.0% | |
AHP Health Partners, Inc., 2018 Term Loan, (1 mo. LIBOR + 4.50%, 1.00% Floor), 6.29%, 06/30/25 | | | | | | | 502 | | | | 501,023 | |
CHG Healthcare Services, Inc., 2017 1st Lien Term Loan B, (1 mo. LIBOR + 3.00%, 1.00% Floor), 4.79%, 06/07/23 | | | | | | | 1,644 | | | | 1,640,412 | |
Concentra, Inc., 2018 1st Lien Term Loan, (3 mo. LIBOR + 2.50%), 4.54%, 06/01/22 | | | | | | | 490 | | | | 489,794 | |
DentalCorp Perfect Smile ULC, 1st Lien Term Loan, (1 mo. LIBOR + 3.75%, 1.00% Floor), 5.54%, 06/06/25 | | | | | | | 656 | | | | 640,327 | |
Diplomat Pharmacy, Inc., 2017 Term Loan B, (1 mo. LIBOR + 4.50%, 1.00% Floor), 6.29%, 12/20/24 | | | | | | | 520 | | | | 460,869 | |
DuPage Medical Group Ltd.: | | | | | | | | | | | | |
2018 Term Loan, (1 mo. LIBOR + 2.75%), 4.54%, 08/15/24 | | | | | | | 524 | | | | 512,989 | |
2nd Lien Term Loan, (1 mo. LIBOR + 7.00%), 8.79%, 08/15/25 | | | | | | | 245 | | | | 237,037 | |
Emerald TopCo., Inc., Term Loan, 07/24/26(g) | | | | | | | 1,174 | | | | 1,154,629 | |
Envision Healthcare Corp., 2018 1st Lien Term Loan, (1 mo. LIBOR + 3.75%), 5.54%, 10/10/25 | | | | | | | 1,360 | | | | 1,095,961 | |
Explorer Holdings, Inc., 2016 Term Loan B, (3 mo. LIBOR + 3.75%, 1.00% Floor), 5.85%, 05/02/23 | | | | | | | 650 | | | | 648,463 | |
Femur Buyer, Inc., 1st Lien Term Loan, (3 mo. LIBOR + 4.50%), 6.63%, 03/05/26(b) | | | | | | | 376 | | | | 370,417 | |
Gentiva Health Services, Inc., 2018 1st Lien Term Loan, (1 mo. LIBOR + 3.75%), 5.56%, 07/02/25(b) | | | | | | | 1,467 | | | | 1,462,951 | |
HC Group Holdings II, Inc., Term Loan B, 08/06/26(g) | | | | | | | 786 | | | | 772,897 | |
| | | | | | | | | | | | |
Security | | Par
(000) | | | Value | |
|
| Health Care Providers & Services (continued) | |
HCA, Inc.: | | | | | | | | | | | | |
Term Loan B11, (1 mo. LIBOR + 1.75%), 3.54%, 03/17/23 | | | USD | | | | 1,373 | | | $ | 1,377,556 | |
Term Loan B12, (1 mo. LIBOR + 1.75%), 3.54%, 03/13/25 | | | | | | | 586 | | | | 588,454 | |
MPH Acquisition Holdings LLC, 2016 Term Loan B, (3 mo. LIBOR + 2.75%, 1.00% Floor), 4.85%, 06/07/23 | | | | | | | 2,052 | | | | 1,919,978 | |
nThrive, Inc., 2016 1st Lien Term Loan, (1 mo. LIBOR + 4.50%, 1.00% Floor), 6.29%, 10/20/22 | | | | | | | 1,897 | | | | 1,602,908 | |
NVA Holdings, Inc., Term Loan B3, (1 mo. LIBOR + 2.75%, 1.00% Floor), 4.54%, 02/02/25 | | | | | | | 1,241 | | | | 1,239,603 | |
Sotera Health Holdings LLC, 1.00% Floor): | | | | | | | | | | | | |
2017 Term Loan, (3 mo. LIBOR + 3.00%, 4.93%, 05/15/22 | | | | | | | 2,118 | | | | 2,078,506 | |
2019 Incremental Term Loan, (1 mo. LIBOR + 3.50%, 5.43%, 05/15/22 | | | | | | | 743 | | | | 738,493 | |
Team Health Holdings, Inc., 1st Lien Term Loan, (1 mo. LIBOR + 2.75%, 1.00% Floor), 4.54%, 02/06/24 | | | | | | | 954 | | | | 732,123 | |
Vizient, Inc., 2019 Term Loan B5, (1 mo. LIBOR + 2.50%), 4.29%, 05/06/26 | | | | | | | 533 | | | | 533,270 | |
WP CityMD Bidco LLC, 2019 Term Loan B, 08/13/26(g) | | | | | | | 1,110 | | | | 1,085,580 | |
Zotec Partners LLC, 2018 Term Loan, (1 mo. LIBOR + 5.00%, 1.00% Floor), 6.79%, 02/14/24(b) | | | | | | | 727 | | | | 727,596 | |
| | | | | | | | |
| | | | | | | | | | | 22,611,836 | |
|
| Health Care Technology — 2.0% | |
Athenahealth, Inc., 2019 Term Loan B, (3 mo. LIBOR + 4.50%), 6.68%, 02/11/26 | | | | | | | 3,017 | | | | 2,989,884 | |
Change Healthcare Holdings, Inc., 2017 Term Loan B, (1 mo. LIBOR + 2.50%, 1.00% Floor), 4.29%, 03/01/24 | | | | | | | 2,330 | | | | 2,315,004 | |
GoodRx, Inc., 1st Lien Term Loan, (1 mo. LIBOR + 2.75%), 4.60%, 10/10/25 | | | | | | | 652 | | | | 649,592 | |
Quintiles IMS, Inc., 2017 Term Loan B, (3 mo. LIBOR + 2.00%), 4.10%, 03/07/24 | | | | | | | 307 | | | | 307,323 | |
| | | | | | | | |
| | | | | | | | | | | 6,261,803 | |
|
| Hotels, Restaurants & Leisure — 9.3% | |
Aimbridge Acquisition Co., Inc., 2019 Term Loan B,
02/02/26(b)(g) | | | | | | | 270 | | | | 269,227 | |
Aristocrat Technologies, Inc., 2018 1st Lien Term Loan, (3 mo. LIBOR + 1.75%), 3.72%, 10/19/24 | | | | | | | 878 | | | | 879,785 | |
Boyd Gaming Corp., Term Loan B3, (1 Week LIBOR + 2.25%), 3.96%, 09/15/23 | | | | | | | 967 | | | | 967,339 | |
Burger King Newco Unlimited Liability Co., Term Loan B3, (1 mo. LIBOR + 2.25%, 1.00% Floor), 4.04%, 02/16/24 | | | | | | | 3,123 | | | | 3,125,535 | |
Caesars Resort Collection LLC, 2017 1st Lien Term Loan B, (1 mo. LIBOR + 2.75%), 4.54%, 12/23/24 | | | | | | | 3,008 | | | | 2,961,669 | |
CCM Merger, Inc., Term Loan B, (1 mo. LIBOR + 2.25%), 4.04%, 08/08/21 | | | | | | | 829 | | | | 827,961 | |
Four Seasons Hotels Ltd., 1st Lien Term Loan, (1 mo. LIBOR + 2.00%), 3.79%, 11/30/23 | | | | | | | 1,908 | | | | 1,913,616 | |
Gateway Casinos & Entertainment Ltd., 2018 Term Loan B, (3 mo. LIBOR + 3.00%), 5.10%, 03/13/25(b) | | | | | | | 94 | | | | 91,467 | |
Golden Nugget LLC, 2017 Incremental Term Loan B, (3 mo. LIBOR + 2.75%), 4.72%, 10/04/23 | | | | | | | 1,177 | | | | 1,173,676 | |
Hilton Worldwide Finance LLC, 2019 Term Loan B2, (1 mo. LIBOR + 1.75%), 3.57%, 06/22/26 | | | | | | | 1,818 | | | | 1,824,850 | |
IRB Holding Corp., 1st Lien Term Loan, (3 mo. LIBOR + 3.25%, 1.00% Floor), 5.22%, 02/05/25 | | | | | | | 2,305 | | | | 2,285,236 | |
KFC Holding Co., 2018 Term Loan B, (1 mo. LIBOR + 1.75%), 3.63%, 04/03/25 | | | | | | | 873 | | | | 873,247 | |
Lakeland Tours LLC, 2017 1st Lien Term Loan B, (3 mo. LIBOR + 3.75%, 1.00% Floor), 5.90%, 12/15/24(b) | | | | | | | 481 | | | | 476,545 | |
| | | | |
| SCHEDULES OF INVESTMENTS | | | 35 | |
| | |
Schedule of Investments (continued) October 31, 2019 | | BlackRock Floating Rate Income Trust (BGT) (Percentages shown are based on Net Assets) |
| | | | | | | | | | | | |
Security | | Par
(000) | | | Value | |
|
| Hotels, Restaurants & Leisure (continued) | |
Penn National Gaming, Inc., 2018 1st Lien Term Loan B, (1 mo. LIBOR + 2.25%), 4.04%, 10/15/25 | | | USD | | | | 367 | | | $ | 368,327 | |
Playa Resorts Holding BV, 2017 Term Loan B, (1 mo. LIBOR + 2.75%, 1.00% Floor), 4.54%, 04/29/24 | | | | | | | 770 | | | | 749,551 | |
Sabre GLBL, Inc., 2018 Term Loan B, (1 mo. LIBOR + 2.00%), 3.79%, 02/22/24 | | | | | | | 1,747 | | | | 1,748,983 | |
Scientific Games International, Inc., 2018 Term Loan B5, (1 mo. LIBOR + 2.75%), 4.54%, 08/14/24 | | | | | | | 1,978 | | | | 1,954,331 | |
Stars Group Holdings BV, 2018 USD Incremental Term Loan, (3 mo. LIBOR + 3.50%), 5.60%, 07/10/25 | | | | | | | 3,281 | | | | 3,292,548 | |
Station Casinos LLC, 2016 Term Loan B, (1 mo. LIBOR + 2.50%), 4.29%, 06/08/23 | | | | | | | 1,818 | | | | 1,819,019 | |
Whatabrands LLC, Term Loan B, (3 mo. LIBOR + 3.25%), 5.52%, 08/02/26 | | | | | | | 1,627 | | | | 1,630,840 | |
Wyndham Hotels & Resorts, Inc., Term Loan B, (1 mo. LIBOR + 1.75%), 3.54%, 05/30/25 | | | | | | | 960 | | | | 964,304 | |
| | | | | | | | |
| | | | | | | | | | | 30,198,056 | |
|
| Independent Power and Renewable Electricity Producers — 1.0% | |
AES Corp., 2018 Term Loan B, (3 mo. LIBOR + 1.75%), 3.87%, 05/31/22 | | | | | | | 24 | | | | 23,634 | |
Calpine Construction Finance Co. LP, 2017 Term Loan B, (1 mo. LIBOR + 2.50%), 4.29%, 01/15/25 | | | | | | | 147 | | | | 146,633 | |
Calpine Corp.: | | | | | | | | | | | | |
2019 Term Loan B10, (1 mo. LIBOR + 2.50%), 4.29%, 08/12/26 | | | | | | | 812 | | | | 809,983 | |
Term Loan B9, 04/05/26(g) | | | | | | | 2,261 | | | | 2,262,143 | |
| | | | | | | | |
| | | | | | | | | | | 3,242,393 | |
|
| Industrial Conglomerates — 1.6% | |
Cortes NP Acquisition Corp., 2017 Term Loan B, (3 mo. LIBOR + 4.00%, 1.00% Floor), 5.93%, 11/30/23 | | | | | | | 3,099 | | | | 2,911,945 | |
Sequa Mezzanine Holdings LLC, 1st Lien Term Loan, (3 mo. LIBOR + 5.00%, 1.00% Floor), 7.19%, 11/28/21 | | | | | | | 983 | | | | 968,545 | |
Sundyne US Purchaser, Inc., Term Loan, 05/15/26(b)(g) | | | | | | | 1,362 | | | | 1,341,296 | |
| | | | | | | | |
| | | | | | | | | | | 5,221,786 | |
|
| Insurance — 4.8% | |
Alliant Holdings I, Inc., 2018 Term Loan B, (3 mo. LIBOR + 3.00%), 4.80%, 05/09/25 | | | | | | | 2,219 | | | | 2,159,652 | |
Alliant Holdings Intermediate LLC, Term Loan B, (1 mo. LIBOR + 3.25%), 5.17%, 05/09/25 | | | | | | | 1,111 | | | | 1,091,213 | |
AmWINS Group, Inc., 2017 Term Loan B, (1 mo. LIBOR + 2.75%, 1.00% Floor), 4.54%, 01/25/24 | | | | | | | 1,611 | | | | 1,607,692 | |
AssuredPartners, Inc., 2017 1st LienAdd-On Term Loan, (1 mo. LIBOR + 3.50%), 5.29%, 10/22/24 | | | | | | | 1,768 | | | | 1,735,029 | |
Davis Vision, Inc., 1st Lien Term Loan B, (1 mo. LIBOR + 3.00%, 1.00% Floor), 4.79%, 12/02/24 | | | | | | | 1,116 | | | | 1,089,378 | |
Hub International Ltd.: | | | | | | | | | | | | |
2018 Term Loan B, (3 mo. LIBOR + 3.00%), 4.90%, 04/25/25 | | | | | | | 1,941 | | | | 1,896,601 | |
2019 Incremental Term Loan B, 04/25/25(g) | | | | | | | 962 | | | | 960,076 | |
Sedgwick Claims Management Services, Inc.: | | | | | | | | | | | | |
2019 Term Loan B, (1 mo. LIBOR + 4.00%), 5.79%, 09/03/26 | | | | | | | 1,595 | | | | 1,581,381 | |
Term Loan B, (1 mo. LIBOR + 3.25%), 5.04%, 12/31/25 | | | | | | | 3,484 | | | | 3,376,321 | |
| | | | | | | | |
| | | | | | | | | | | 15,497,343 | |
|
| Interactive Media & Services — 1.1% | |
Ancestry.com Operations, Inc.,Non-Extended Term Loan B, 10/19/23(g) | | | | | | | 835 | | | | 764,025 | |
Rackspace Hosting, Inc., 2017 Incremental 1st Lien Term Loan, (3 mo. LIBOR + 3.00%, 1.00% Floor), 5.27%, 11/03/23 | | | | | | | 828 | | | | 735,311 | |
| | | | | | | | | | | | |
Security | | Par
(000) | | | Value | |
|
| Interactive Media & Services (continued) | |
TierPoint LLC, 2017 1st Lien Term Loan, (1 mo. LIBOR + 3.75%, 1.00% Floor), 5.54%, 05/06/24 | | | USD | | | | 774 | | | $ | 693,556 | |
ZPG PLC, 2018 Term Loan B, (LIBOR - GBP + 4.50%), 5.21%, 07/23/25 | | | GBP | | | | 1,000 | | | | 1,248,860 | |
| | | | | | | | | | | | |
| | | | | | | | | | | 3,441,752 | |
|
| IT Services — 3.1% | |
Altran Technologies SA, 1st Lien Term Loan, (3 mo. LIBOR + 2.25%), 4.41%, 03/20/25 | | | USD | | | | 409 | | | | 408,775 | |
Epicor Software Corp., 1st Lien Term Loan, (1 mo. LIBOR + 3.25%, 1.00% Floor), 5.04%, 06/01/22 | | | | | | | 1,462 | | | | 1,456,793 | |
Evertec Group LLC, 2018 Term Loan B, (1 mo. LIBOR + 3.50%), 5.29%, 11/27/24 | | | | | | | 562 | | | | 563,513 | |
Flexential Intermediate Corp., 2nd Lien Term Loan, (3 mo. LIBOR + 7.25%, 1.00% Floor), 9.38%, 08/01/25 | | | | | | | 687 | | | | 489,796 | |
Greeneden US Holdings II LLC, 2018 Term Loan B, (1 mo. LIBOR + 3.25%), 5.04%, 12/01/23 | | | | | | | 986 | | | | 962,335 | |
Optiv Security, Inc., 1st Lien Term Loan, (1 mo. LIBOR + 3.25%, 1.00% Floor), 5.04%, 02/01/24 | | | | | | | 402 | | | | 323,845 | |
Outfront Media Capital LLC, 2017 Term Loan B, (3 mo. LIBOR + 2.00%), 3.94%, 03/18/24 | | | | | | | 120 | | | | 120,561 | |
Trans Union LLC: | | | | | | | | | | | | |
2018 Term Loan B4, (1 mo. LIBOR + 2.00%), 3.80%, 06/19/25 | | | | | | | 11 | | | | 10,873 | |
Term Loan B3, (1 mo. LIBOR + 2.00%), 3.79%, 04/10/23 | | | | | | | 2,673 | | | | 2,676,493 | |
WEX, Inc., Term Loan B3, (1 mo. LIBOR + 2.25%), 4.04%, 05/15/26 | | | | | | | 2,842 | | | | 2,850,895 | |
| | | | | | | | | | | | |
| | | | | | | | | | | 9,863,879 | |
|
| Leisure Products — 0.2% | |
MND Holdings III Corp., 2018 1st Lien Term Loan, (3 mo. LIBOR + 3.50%, 1.00% Floor),
5.60%, 06/19/24(b) | | | | | | | 631 | | | | 611,929 | |
| | | | | | | | | | | | |
|
| Life Sciences Tools & Services — 0.3% | |
Albany Molecular Research, Inc., 1.00% Floor): | | | | | | | | | | | | |
2017 1st Lien Term Loan, 08/30/24(g) | | | | | | | 840 | | | | 814,139 | |
2017 2nd Lien Term Loan, (1 mo. LIBOR + 7.00%, 8.79%, 08/30/25 | | | | | | | 240 | | | | 237,600 | |
| | | | | | | | | | | | |
| | | | | | | | | | | 1,051,739 | |
|
| Machinery — 1.8% | |
Clark Equipment Co., 2018 Term Loan B, (3 mo. LIBOR + 2.00%), 4.10%, 05/18/24 | | | | | | | 397 | | | | 396,348 | |
Columbus McKinnon Corp., 2018 Term Loan B, (3 mo. LIBOR + 2.50%, 1.00% Floor),
4.60%, 01/31/24(b) | | | | | | | 89 | | | | 89,621 | |
Gardner Denver, Inc., 2017 Term Loan B, (1 mo. LIBOR + 2.75%), 4.54%, 07/30/24 | | | | | | | 1,408 | | | | 1,409,891 | |
Terex Corp., 2019 Term Loan B1, (1 mo. LIBOR + 2.75%), 4.54%, 01/31/24 | | | | | | | 199 | | | | 199,623 | |
Titan Acquisition Ltd., 2018 Term Loan B, (1 mo. LIBOR + 3.00%), 4.79%, 03/28/25 | | | | | | | 3,093 | | | | 2,920,405 | |
Welbilt, Inc., 2018 Term Loan B, (1 mo. LIBOR + 2.50%), 4.29%, 10/23/25 | | | | | | | 604 | | | | 598,913 | |
| | | | | | | | | | | | |
| | | | | | | | | | | 5,614,801 | |
|
| Media — 11.3% | |
Altice Financing SA: | | | | | | | | | | | | |
2017 1st Lien Term Loan, (1 mo. LIBOR + 2.75%), 4.60%, 01/31/26 | | | | | | | 423 | | | | 406,679 | |
2017 Term Loan B, (1 mo. LIBOR + 2.75%), 4.66%, 07/15/25 | | | | | | | 164 | | | | 158,351 | |
| | |
| 36 | | 2019 BLACKROCK ANNUAL REPORTTO SHAREHOLDERS |
| | |
Schedule of Investments (continued) October 31, 2019 | | BlackRock Floating Rate Income Trust (BGT) (Percentages shown are based on Net Assets) |
| | | | | | | | | | | | |
Security | | Par
(000) | | | Value | |
|
| Media (continued) | |
Altice France SA: | | | | | | | | | | | | |
2018 Term Loan B13, (1 mo. LIBOR + 4.00%), 5.92%, 08/14/26 | | | USD | | | | 2,197 | | | $ | 2,158,959 | |
USD Term Loan B12, (1 mo. LIBOR + 3.69%), 5.61%, 01/31/26 | | | | | | | 331 | | | | 322,840 | |
Charter Communications Operating LLC, 2019 Term Loan B1, (1 mo. LIBOR + 1.75%), 3.58%, 04/30/25 | | | | | | | 2,757 | | | | 2,763,456 | |
Clear Channel Outdoor Holdings, Inc., Term Loan B, (1 mo. LIBOR + 3.50%), 5.29%, 08/21/26 | | | | | | | 4,744 | | | | 4,751,638 | |
CSC Holdings LLC: | | | | | | | | | | | | |
2017 1st Lien Term Loan, (1 mo. LIBOR + 2.25%), 4.17%, 07/17/25 | | | | | | | 829 | | | | 823,603 | |
2019 Term Loan B5, (2 mo. LIBOR + 2.50%), 4.33%, 04/15/27 | | | | | | | 1,032 | | | | 1,030,090 | |
Diamond Sports Group LLC, Term Loan, (1 mo. LIBOR + 3.25%), 5.08%, 08/24/26 | | | | | | | 1,908 | | | | 1,915,155 | |
Gray Television, Inc.: | | | | | | | | | | | | |
2017 Term Loan B, (1 mo. LIBOR + 2.25%), 4.26%, 02/07/24 | | | | | | | 371 | | | | 370,831 | |
2018 Term Loan C, (1 mo. LIBOR + 2.50%), 4.51%, 01/02/26 | | | | | | | 588 | | | | 588,975 | |
iHeartCommunications, Inc., Exit Term Loan, (1 mo. LIBOR + 4.00%), 6.03%, 05/01/26 | | | | | | | 2,049 | | | | 2,054,602 | |
Intelsat Jackson Holdings SA, 2017 Term Loan B4, (6 mo. LIBOR + 4.50%, 1.00% Floor), 6.43%, 01/02/24 | | | | | | | 1,182 | | | | 1,193,751 | |
Learfield Communications LLC, 2016 1st Lien Term Loan, (1 mo. LIBOR + 3.25%, 1.00% Floor), 5.04%, 12/01/23 | | | | | | | 1,525 | | | | 1,525,572 | |
Liberty Latin America Ltd., Term Loan B, 10/22/26(g) | | | | | | | 799 | | | | 803,498 | |
Lions Gate Capital Holdings LLC, 2018 Term Loan B, (1 mo. LIBOR + 2.25%), 4.04%, 03/24/25 | | | | | | | 887 | | | | 858,165 | |
MCC Iowa LLC, Term Loan N, (1 Week LIBOR + 1.75%), 3.57%, 02/15/24 | | | | | | | 485 | | | | 484,062 | |
MH Sub I LLC, 2017 1st Lien Term Loan, 09/13/24(g) | | | | | | | 1,381 | | | | 1,344,614 | |
Midcontinent Communications, 2019 Term Loan B, (1 mo. LIBOR + 2.25%), 4.16%, 08/15/26 | | | | | | | 458 | | | | 460,294 | |
Nexstar Broadcasting, Inc., 2019 Term Loan B4, (1 mo. LIBOR + 2.75%), 4.55%, 09/18/26 | | | | | | | 960 | | | | 963,062 | |
PCI Gaming Authority, Term Loan, (1 mo. LIBOR + 3.00%), 4.79%, 05/29/26 | | | | | | | 916 | | | | 921,212 | |
PSAV Holdings LLC, 2018 1st Lien Term Loan,
03/03/25(g) | | | | | | | 1,627 | | | | 1,562,735 | |
Radiate Holdco LLC, 1st Lien Term Loan, (1 mo. LIBOR + 3.00%), 4.79%, 02/01/24 | | | | | | | 1,273 | | | | 1,258,868 | |
Sinclair Television Group, Inc., Term Loan B2, (1 mo. LIBOR + 2.25%), 4.04%, 01/03/24 | | | | | | | 617 | | | | 615,066 | |
Trader Corp., 2017 Term Loan B, (1 mo. LIBOR + 3.00%, 1.00% Floor), 4.80%, 09/28/23(b) | | | | | | | 2,254 | | | | 2,245,608 | |
Univision Communications, Inc., Term Loan C5, (1 mo. LIBOR + 2.75%, 1.00% Floor), 4.54%, 03/15/24 | | | | | | | 707 | | | | 680,696 | |
William Morris Endeavor Entertainment LLC, 2018 1st Lien Term Loan, (1 mo. LIBOR + 2.75%), 4.54%, 05/18/25 | | | | | | | 2,557 | | | | 2,467,892 | |
Ziggo Secured Finance Partnership, Term Loan E, (1 mo. LIBOR + 2.50%), 4.42%, 04/15/25 | | | | | | | 1,476 | | | | 1,456,812 | |
| | | | | | | | |
| | | | | | | | | | | 36,187,086 | |
|
| Metals & Mining — 0.9% | |
Ball Metalpack LLC, 2018 1st Lien Term Loan B, (3 mo. LIBOR + 4.50%), 6.62%, 07/24/25 | | | | | | | 709 | | | | 644,049 | |
Equinox Holdings, Inc., 2017 1st Lien Term Loan,
03/08/24(g) | | | | | | | 2,104 | | | | 2,094,048 | |
| | | | | | | | |
| | | | | | | | | | | 2,738,097 | |
| | | | | | | | | | | | |
Security | | Par
(000) | | | Value | |
|
| Multiline Retail — 0.3% | |
Eyemart Express LLC, 2017 Term Loan B, (1 mo. LIBOR + 3.00%, 1.00% Floor), 4.81%, 08/04/24 | | | USD | | | | 593 | | | $ | 590,428 | |
Neiman Marcus Group Ltd. LLC, Cash Pay Extended Term Loan, (1 mo. LIBOR + 6.00%), 7.99%, 10/25/23 | | | | | | | 593 | | | | 431,054 | |
| | | | | | | | |
| | | | | | | | | | | 1,021,482 | |
|
| Oil & Gas Equipment & Services — 0.4% | |
McDermott Technology Americas, Inc.: | | | | | | | | | | | | |
2018 1st Lien Term Loan, (3 mo. LIBOR + 5.00%, 1.00% Floor), 7.10%, 05/09/25 | | | | | | | 1,065 | | | | 637,829 | |
2019 Term Loan A, 10/21/21(g) | | | | | | | 732 | | | | 753,606 | |
| | | | | | | | |
| | | | | | | | | | | 1,391,435 | |
|
| Oil, Gas & Consumable Fuels — 0.9% | |
BCP Raptor II LLC, 1st Lien Term Loan, (1 mo. LIBOR + 4.75%), 6.54%, 11/03/25 | | | | | | | 512 | | | | 448,392 | |
California Resources Corp., Second Out Term Loan, (1 mo. LIBOR + 10.38%, 1.00% Floor), 12.17%, 12/31/21 | | | | | | | 1,073 | | | | 708,156 | |
CONSOL Energy, Inc., 1st Lien Term Loan B, (1 mo. LIBOR + 4.50%, 1.00% Floor), 6.29%, 09/27/24(b) | | | | | | | 497 | | | | 457,063 | |
Edgewater Generation LLC, Term Loan, (1 mo. LIBOR + 3.75%), 5.54%, 12/13/25 | | | | | | | 804 | | | | 768,563 | |
EG Group Ltd., 2018 Term Loan B, (3 mo. LIBOR + 4.00%), 6.10%, 02/07/25 | | | | | | | 488 | | | | 469,657 | |
| | | | | | | | |
| | | | | | | | | | | 2,851,831 | |
|
| Personal Products — 0.5% | |
Sunshine Luxembourg VII Sarl, USD 1st Lien Term Loan, 10/01/26(g) | | | | | | | 1,749 | | | | 1,749,847 | |
| | | | | | | | |
|
| Pharmaceuticals — 4.6% | |
Amneal Pharmaceuticals LLC, 2018 Term Loan B,
05/04/25(g) | | | | | | | 792 | | | | 603,001 | |
Catalent Pharma Solutions, Inc., Term Loan B2, (1 mo. LIBOR + 2.25%, 1.00% Floor), 4.04%, 05/18/26 | | | | | | | 1,282 | | | | 1,281,819 | |
Endo Luxembourg Finance Co. I Sarl, 2017 Term Loan B, (1 mo. LIBOR + 4.25%), 6.06%, 04/29/24 | | | | | | | 987 | | | | 906,364 | |
Grifols Worldwide Operations USA, Inc., 2017 Acquisition Term Loan, (1 Week LIBOR + 2.25%), 4.09%, 01/31/25 | | | | | | | 1,992 | | | | 1,993,764 | |
Jaguar Holding Co. II, 2018 Term Loan, (1 mo. LIBOR + 2.50%, 1.00% Floor), 4.29%, 08/18/22 | | | | | | | 4,711 | | | | 4,699,511 | |
Valeant Pharmaceuticals International, Inc., 2018 Term Loan B, (1 mo. LIBOR + 3.00%), 4.92%, 06/02/25 | | | | | | | 5,202 | | | | 5,219,245 | |
| | | | | | | | |
| | | | | | | | | | | 14,703,704 | |
|
| Professional Services — 1.7% | |
Cast and Crew Payroll LLC, 2019 1st Lien Term Loan, (1 mo. LIBOR + 4.00%), 5.79%, 02/09/26 | | | | | | | 1,277 | | | | 1,281,908 | |
Dun & Bradstreet Corp., Term Loan, (1 mo. LIBOR + 5.00%), 6.80%, 02/06/26 | | | | | | | 2,569 | | | | 2,574,883 | |
ON Assignment, Inc., 2018 Term Loan B, (1 mo. LIBOR + 2.00%), 3.79%, 04/02/25 | | | | | | | 721 | | | | 722,166 | |
SIRVA Worldwide, Inc., 2018 1st Lien Term Loan, (3 mo. LIBOR + 5.50%), 7.62%, 08/04/25(b) | | | | | | | 786 | | | | 742,999 | |
| | | | | | | | |
| | | | | | | | | | | 5,321,956 | |
|
| Real Estate Management & Development — 2.5% | |
CityCenter Holdings LLC, 2017 Term Loan B, (1 mo. LIBOR + 2.25%), 4.04%, 04/18/24 | | | | | | | 2,877 | | | | 2,876,080 | |
DTZ US Borrower LLC, 2018 Add On Term Loan B, (1 mo. LIBOR + 3.25%), 5.04%, 08/21/25 | | | | | | | 1,924 | | | | 1,925,862 | |
ESH Hospitality, Inc., 2019 Term Loan B, (1 mo. LIBOR + 2.00%), 3.79%, 09/18/26 | | | | | | | 683 | | | | 683,471 | |
| | | | |
| SCHEDULES OF INVESTMENTS | | | 37 | |
| | |
Schedule of Investments (continued) October 31, 2019 | | BlackRock Floating Rate Income Trust (BGT) (Percentages shown are based on Net Assets) |
| | | | | | | | | | | | |
Security | | Par
(000) | | | Value | |
|
| Real Estate Management & Development (continued) | |
Forest City Enterprises LP, Term Loan B, (1 mo. LIBOR + 4.00%), 5.79%, 12/07/25 | | | USD | | | | 1,296 | | | $ | 1,302,362 | |
Realogy Corp., 2018 Term Loan B, (1 mo. LIBOR + 2.25%), 4.07%, 02/08/25 | | | | | | | 482 | | | | 456,196 | |
SMG Holdings, Inc., 2017 1st Lien Term Loan, (1 mo. LIBOR + 3.00%), 4.79%, 01/23/25 | | | | | | | 733 | | | | 732,599 | |
| | | | | | | | |
| | | | | | | | | | | 7,976,570 | |
|
| Road & Rail — 0.2% | |
Moda Ingleside Energy Center LLC, 2018 Term Loan B, (1 mo. LIBOR + 3.25%), 5.04%, 09/29/25 | | | | | | | 450 | | | | 448,478 | |
Road Infrastructure Investment LLC, 2016 1st Lien Term Loan, 06/13/23(g) | | | | | | | 377 | | | | 344,701 | |
| | | | | | | | |
| | | | | | | | | | | 793,179 | |
|
| Semiconductors & Semiconductor Equipment — 0.3% | |
Microchip Technology, Inc., 2018 Term Loan B, (1 mo. LIBOR + 2.00%), 3.79%, 05/29/25 | | | | | | | 528 | | | | 529,143 | |
ON Semiconductor Corp., 2019 Term Loan B, (1 mo. LIBOR + 2.00%), 3.79%, 09/19/26 | | | | | | | 396 | | | | 397,917 | |
| | | | | | | | |
| | | | | | | | | | | 927,060 | |
|
| Software — 18.4% | |
Applied Systems, Inc., 1.00% Floor): | | | | | | | | | | | | |
2017 1st Lien Term Loan, 09/19/24(g) | | | | | | | 1,948 | | | | 1,934,719 | |
2017 2nd Lien Term Loan, (3 mo. LIBOR + 7.00%, 9.10%, 09/19/25 | | | | | | | 302 | | | | 304,266 | |
BMC Software Finance, Inc., 2017 Term Loan, (1 mo. LIBOR + 4.25%), 6.04%, 10/02/25 | | | | | | | 1,816 | | | | 1,677,536 | |
Camelot U.S. Acquisition 1 Co., Term Loan B,
10/25/26(b)(g) | | | | | | | 1,680 | | | | 1,684,200 | |
Cerence, Inc., Term Loan B, (3 mo. LIBOR + 6.00%, 1.00% Floor), 8.03%, 10/01/24 | | | | | | | 531 | | | | 498,147 | |
Cypress Intermediate Holdings III, Inc., 1.00% Floor): | | | | | | | | | | | | |
2017 1st Lien Term Loan, (1 mo. LIBOR + 2.75%, 4.54%, 04/29/24 | | | | | | | 1,497 | | | | 1,470,030 | |
2017 2nd Lien Term Loan, (1 mo. LIBOR + 6.75%, 8.54%, 04/27/25 | | | | | | | 496 | | | | 497,488 | |
Digicel International Finance Ltd., 2017 Term Loan B, (6 mo. LIBOR + 3.25%), 5.34%, 05/28/24 | | | | | | | 899 | | | | 762,303 | |
DTI Holdco, Inc., 2018 Term Loan B, (2 mo. LIBOR + 4.75%, 1.00% Floor), 6.68%, 09/30/23 | | | | | | | 874 | | | | 748,476 | |
Ellie Mae, Inc., Term Loan, 04/17/26(g) | | | | | | | 1,430 | | | | 1,420,462 | |
Financial & Risk US Holdings, Inc., 2018 USD Term Loan, (1 mo. LIBOR + 3.75%), 5.54%, 10/01/25 | | | | | | | 3,791 | | | | 3,809,294 | |
Help/Systems Holdings, Inc., 2018 1st Lien Term Loan, (1 mo. LIBOR + 3.75%), 5.54%, 03/28/25 | | | | | | | 716 | | | | 715,043 | |
Infor (US), Inc., Term Loan B6, (3 mo. LIBOR + 2.75%, 1.00% Floor), 4.85%, 02/01/22 | | | | | | | 4,424 | | | | 4,423,749 | |
Informatica Corp., 2018 Term Loan, (1 mo. LIBOR + 3.25%), 5.04%, 08/05/22 | | | | | | | 2,570 | | | | 2,573,349 | |
Kronos, Inc., 1.00% Floor): | | | | | | | | | | | | |
2017 Term Loan B, 11/01/23(g) | | | | | | | 3,729 | | | | 3,719,802 | |
2nd Lien Term Loan, (3 mo. LIBOR + 8.25%, 10.50%, 11/01/24 | | | | | | | 1,315 | | | | 1,320,168 | |
McAfee LLC, 2018 Term Loan B, (1 mo. LIBOR + 3.75%), 5.55%, 09/30/24 | | | | | | | 2,620 | | | | 2,617,678 | |
Mitchell International, Inc.: | | | | | | | | | | | | |
2017 1st Lien Term Loan, 11/29/24(g) | | | | | | | 2,438 | | | | 2,290,242 | |
2017 2nd Lien Term Loan, (1 mo. LIBOR + 7.25%), 9.04%, 12/01/25 | | | | | | | 523 | | | | 473,617 | |
Renaissance Holding Corp., 2018 Add On Term Loan, (1 mo. LIBOR + 3.25%), 5.04%, 05/30/25 | | | | | | | 430 | | | | 415,602 | |
RP Crown Parent LLC, 2016 Term Loan B, (1 mo. LIBOR + 2.75%, 1.00% Floor), 4.54%, 10/12/23 | | | | | | | 1,935 | | | | 1,931,039 | |
| | | | | | | | | | | | |
Security | | Par
(000) | | | Value | |
|
| Software (continued) | |
Severin Acquisition LLC, 2018 Term Loan B, (3 mo. LIBOR + 3.25%), 5.46%, 08/01/25 | | | USD | | | | 614 | | | $ | 591,319 | |
SolarWinds Holdings, Inc., 2018 Term Loan B, (1 mo. LIBOR + 2.75%), 4.54%, 02/05/24 | | | | | | | 2,868 | | | | 2,862,424 | |
Solera LLC, Term Loan B, (1 mo. LIBOR + 2.75%), 4.54%, 03/03/23 | | | | | | | 3,304 | | | | 3,271,340 | |
Sophia LP, 2017 Term Loan B, (3 mo. LIBOR + 3.25%, 1.00% Floor), 5.35%, 09/30/22 | | | | | | | 3,670 | | | | 3,665,161 | |
SS&C Technologies Holdings Europe Sarl, 2018 Term Loan B4, (1 mo. LIBOR + 2.25%), 4.04%, 04/16/25 | | | | | | | 979 | | | | 980,443 | |
SS&C Technologies, Inc.: | | | | | | | | | | | | |
2017 Term Loan B1, (1 mo. LIBOR + 2.25%), 4.04%, 07/08/22 | | | | | | | 551 | | | | 554,570 | |
2018 Term Loan B3, (1 mo. LIBOR + 2.25%), 4.04%, 04/16/25 | | | | | | | 1,500 | | | | 1,502,058 | |
2018 Term Loan B5, (1 mo. LIBOR + 2.25%), 4.04%, 04/16/25 | | | | | | | 1,090 | | | | 1,092,456 | |
Tempo Acquisition LLC, Term Loan, (1 mo. LIBOR + 3.00%), 4.79%, 05/01/24 | | | | | | | 2,614 | | | | 2,613,185 | |
Tibco Software, Inc., 2019 Term Loan B, (1 mo. LIBOR + 4.00%), 6.00%, 06/30/26 | | | | | | | 2,761 | | | | 2,743,308 | |
Ultimate Software Group, Inc., Term Loan B, (1 mo. LIBOR + 3.75%), 5.54%, 05/04/26 | | | | | | | 1,774 | | | | 1,776,714 | |
Vertafore, Inc., 2018 1st Lien Term Loan, (1 mo. LIBOR + 3.25%), 5.04%, 07/02/25 | | | | | | | 2,199 | | | | 2,126,086 | |
| | | | | | | | |
| | | | | | | | | | | 59,066,274 | |
|
| Specialty Retail — 2.8% | |
Belron Finance US LLC: | | | | | | | | | | | | |
2018 Term Loan B, (3 mo. LIBOR + 2.25%), 4.43%, 11/13/25 | | | | | | | 277 | | | | 276,561 | |
2019 USD Term Loan B, 11/07/26(g) | | | | | | | 675 | | | | 674,791 | |
Term Loan B, (3 mo. LIBOR + 2.25%), 4.46%, 11/07/24 | | | | | | | 1,484 | | | | 1,481,721 | |
CD&R Firefly Bidco Ltd., 2018 GBP Term Loan B1, (LIBOR - GBP + 4.25%), 5.06%, 06/23/25 | | | GBP | | | | 1,000 | | | | 1,273,938 | |
IAA, Inc., Term Loan B, (1 mo. LIBOR + 2.25%), 4.06%, 06/28/26 | | | USD | | | | 515 | | | | 516,603 | |
Leslie’s Poolmart, Inc., 2018 Term Loan, (1 mo. LIBOR + 3.50%, 1.00% Floor), 5.29%, 08/16/23 | | | | | | | 517 | | | | 484,359 | |
MED ParentCo LP: | | | | | | | | | | | | |
1st Lien Delayed Draw Term Loan, (1 mo. LIBOR + 4.25%), 6.19%, 08/31/26 | | | | | | | 205 | | | | 28,640 | |
1st Lien Term Loan, (1 mo. LIBOR + 4.25%), 6.04%, 08/31/26 | | | | | | | 820 | | | | 806,690 | |
Midas Intermediate Holdco II LLC, Incremental Term Loan B, 08/18/21(g) | | | | | | | 762 | | | | 732,387 | |
PetSmart, Inc., Term Loan B2, 03/11/22(g) | | | | | | | 1,885 | | | | 1,835,123 | |
Research Now Group, Inc., 2017 1st Lien Term Loan, (3 mo. LIBOR + 5.50%, 1.00% Floor), 7.75%, 12/20/24 | | | | | | | 766 | | | | 761,882 | |
| | | | | | | | |
| | | | | | | | | | | 8,872,695 | |
|
| Technology Hardware, Storage & Peripherals — 0.7% | |
Western Digital Corp., 2018 Term Loan B4, (1 mo. LIBOR + 1.75%), 3.75%, 04/29/23 | | | | | | | 2,282 | | | | 2,272,022 | |
| | | | | | | | |
|
| Thrifts & Mortgage Finance — 0.7% | |
IG Investment Holdings LLC, 2018 1st Lien Term Loan, (1 mo. LIBOR + 4.00%, 1.00% Floor), 5.79%, 05/23/25 | | | | | | | 2,295 | | | | 2,256,103 | |
| | | | | | | | |
|
| Trading Companies & Distributors — 1.0% | |
Beacon Roofing Supply, Inc., 2017 Term Loan B, (1 mo. LIBOR + 2.25%), 4.04%, 01/02/25 | | | | | | | 652 | | | | 646,309 | |
| | |
| 38 | | 2019 BLACKROCK ANNUAL REPORTTO SHAREHOLDERS |
| | |
Schedule of Investments (continued) October 31, 2019 | | BlackRock Floating Rate Income Trust (BGT) (Percentages shown are based on Net Assets) |
| | | | | | | | | | | | |
Security | | Par
(000) | | | Value | |
|
| Trading Companies & Distributors (continued) | |
HD Supply, Inc., Term Loan B5, (1 mo. LIBOR + 1.75%), 3.54%, 10/17/23 | | | USD | | | | 2,402 | | | $ | 2,409,754 | |
United Rentals, Inc., Term Loan B, (1 mo. LIBOR + 1.75%), 3.54%, 10/31/25 | | | | | | | 136 | | | | 136,958 | |
| | | | | | | | | | | | |
| | | | 3,193,021 | |
|
| Transportation — 0.2% | |
Safe Fleet Holdings LLC, 2018 1st Lien Term Loan, (1 mo. LIBOR + 3.00%, 1.00% Floor), 4.93%, 02/03/25 | | | | | | | 510 | | | | 484,610 | |
| | | | | | | | | | | | |
|
| Utilities — 0.3% | |
ExGen Renewables IV LLC, Term Loan B, (3 mo. LIBOR + 3.00%, 1.00% Floor), 5.13%, 11/28/24 | | | | | | | 1,178 | | | | 1,103,288 | |
| | | | | | | | | | | | |
|
| Wireless Telecommunication Services — 1.4% | |
Geo Group, Inc., 2018 Term Loan B, (1 mo. LIBOR + 2.00%), 3.79%, 03/22/24 | | | | | | | 1,213 | | | | 1,091,237 | |
Ligado Networks LLC, PIK Exit Term Loan (9.75% PIK), 9.75%, 12/07/20(h) | | | | | | | 929 | | | | 727,233 | |
SBA Senior Finance II LLC, 2018 Term Loan B, (1 mo. LIBOR + 2.00%), 3.79%, 04/11/25 | | | | | | | 2,608 | | | | 2,613,742 | |
| | | | | | | | | | | | |
| | | | 4,432,212 | |
| | | | | | | | | | | | |
| |
Total Floating Rate Loan Interests — 135.9%
(Cost — $442,878,163) | | | | 436,237,440 | |
| | | | | | | | | | | | |
| | |
| | | | Shares | | | | |
|
| Investment Companies — 5.9% | |
Invesco Senior Loan ETF | | | | | | | 850,000 | | | | 19,048,500 | |
| | | | | | | | | | | | |
| |
Total Investment Companies — 5.9%
(Cost — $19,242,902) | | | | 19,048,500 | |
| | | | | | | | | | | | |
| | |
| | | Beneficial Interests
(000) | | | | |
|
Other Interests(i) — 0.0% | |
|
| Afghanistan — 0.0% | |
Lear Corp. Escrow(b) | | | USD | | | | 500 | | | | 5 | |
| | | | | | | | | | | | |
|
| United States — 0.0% | |
Millennium Corp.(b) | | | | | | | 991 | | | | — | |
Millennium Lender Claims(b) | | | | | | | 930 | | | | — | |
| | | | | | | | | | | | |
| | | | — | |
| | | | | | | | | | | | |
| |
Total Other Interests — 0.0%
(Cost — $0) | | | | 5 | |
| | | | | | | | | | | | |
|
Warrants — 0.1% | |
|
Media — 0.1% | |
iHeartMedia, Inc. (Expires 05/01/39) | | | | | | | 27,059 | | | | 387,999 | |
| | | | | | | | | | | | |
| | | | | | | | | | | | |
| Security | | | Beneficial Interests
(000) | | | Value | |
|
| Metals & Mining — 0.0% | |
AFGlobal Corp. (Expires 12/20/20)(b) | | | USD | | | | 2,642 | | | $ | — | |
| | | | | | | | | | | | |
|
| Software — 0.0% | |
Bankruptcy Management Solutions, Inc. (Expires 07/01/20)(b) | | | | | | | 292 | | | | — | |
| | | | | | | | | | | | |
| |
Total Warrants — 0.1%
(Cost — $489,778) | | | | 387,999 | |
| | | | | | | | | | | | |
| |
Total Long-Term Investments — 143.2%
(Cost — $466,996,352) | | | | 459,704,031 | |
| | | | | | | | | | | | |
| | |
| | | | Share | | | | |
|
| Short-Term Securities — 0.2% | |
BlackRock Liquidity Funds,T-Fund, Institutional Class, 1.70%(j)(k) | | | | | | | 740,873 | | | | 740,873 | |
| | | | | | | | | | | | |
| |
Total Short-Term Securities — 0.2%
(Cost — $740,873) | | | | 740,873 | |
| | | | | | | | | | | | |
| |
Options Purchased — 0.0%
(Cost — $24,321) | | | | 10,103 | |
| | | | | | | | | | | | |
| |
Total Investments — 143.4%
(Cost — $467,761,546) | | | | 460,455,007 | |
| |
Liabilities in Excess of Other Assets — (43.4)% | | | | (139,364,172 | ) |
| | | | | | | | | | | | |
| |
Net Assets — 100.0% | | | $ | 321,090,835 | |
| | | | | | | | | | | | |
| (a) | Non-income producing security. |
| (b) | Security is valued using significant unobservable inputs and is classified as Level 3 in the fair value hierarchy. |
| (c) | Security exempt from registration pursuant to Rule 144A under the Securities Act of 1933, as amended. These securities may be resold in transactions exempt from registration to qualified institutional investors. |
| (d) | Restricted security as to resale, excluding 144A securities. The Trust held restricted securities with a current value of $553,520, representing 0.2% of its net assets as of period end, and an original cost of $529,177. |
| (e) | Issuer filed for bankruptcy and/or is in default. |
| (f) | Variable rate security. Rate shown is the rate in effect as of period end. |
| (g) | Represents an unsettled loan commitment at period end. Certain details associated with this purchase are not known prior to the settlement date, including coupon rate. |
| (h) | Payment-in-kind security which may pay interest/dividends in additional par/shares and/or in cash. Rates shown are the current rate and possible payment rates. |
| (i) | Other interests represent beneficial interests in liquidation trusts and other reorganization or private entities. |
| (j) | Annualized7-day yield as of period end. |
| | | | |
| SCHEDULES OF INVESTMENTS | | | 39 | |
| | |
Schedule of Investments (continued) October 31, 2019 | | BlackRock Floating Rate Income Trust (BGT) |
| (k) | During the year ended October 31, 2019, investments in issuers considered to be an affiliate/affiliates of the Trust for purposes of Section 2(a)(3) of the Investment Company Act of 1940, as amended, were as follows: |
| | | | | | | | | | | | | | | | | | | | | | | | | | | | | | | | |
Affiliated Persons and/or Related Parties | |
| Shares
Held at
10/31/18 |
| |
| Shares
Purchased |
| |
| Shares
Sold |
| |
| Shares
Held at
10/31/19 |
| |
| Value at
10/31/19 |
| | | Income | | |
| Net
Realized
Gain (Loss) |
(a) | |
| Change in
Unrealized
Appreciation(Depreciation |
) |
BlackRock Liquidity Funds,T-Fund, Institutional Class(b) | | | 282,908 | | | | 457,965 | | | | — | | | | 740,873 | | | $ | 740,873 | | | $ | 24,699 | | | $ | — | | | $ | — | |
iShares iBoxx $ High Yield Corporate Bond ETF(c) | | | — | | | | 10,000 | | | | (10,000 | ) | | | — | | | | — | | | | — | | | | (88,607 | ) | | | — | |
| | | | | | | | | | | | | | | | | | | | | | | | | | | | | | | | |
| | | | | | | | | | | | | | | | | | $ | 740,873 | | | $ | 24,699 | | | $ | (88,607 | ) | | $ | — | |
| | | | | | | | | | | | | | | | | | | | | | | | | | | | | | | | |
| | (a) | Includes net capital gain distributions, if applicable. | |
| | (b) | Represents net shares purchased (sold). | |
| | (c) | As of period end, the entity is no longer held by the Trust. | |
For Trust compliance purposes, the Trust’s industry classifications refer to one or more of the industrysub-classifications used by one or more widely recognized market indexes or rating group indexes, and/or as defined by the investment adviser. These definitions may not apply for purposes of this report, which may combine such industrysub-classifications for reporting ease.
Derivative Financial Instruments Outstanding as of Period End
Forward Foreign Currency Exchange Contracts
| | | | | | | | | | | | | | | | | | | | | | |
Currency
Purchased | | | Currency
Sold | | | Counterparty | | | Settlement Date | | | Unrealized
Appreciation
(Depreciation) | |
| EUR | | | 775,000 | | | USD | | | 860,800 | | | | State Street Bank and Trust Co. | | | | 11/05/19 | | | $ | 3,613 | |
| GBP | | | 2,443,000 | | | USD | | | 3,148,560 | | | | State Street Bank and Trust Co. | | | | 11/05/19 | | | | 16,078 | |
| | | | | | | | | | | | | | | | | | | | | | |
| | | | | | | | | | | | | | | | | | | | | 19,691 | |
| | | | | | | | | | | | | | | | | | | | | | |
| USD | | | 850,979 | | | EUR | | | 777,000 | | | | State Street Bank and Trust Co. | | | | 11/05/19 | | | | (15,665 | ) |
| USD | | | 3,013,665 | | | GBP | | | 2,461,000 | | | | State Street Bank and Trust Co. | | | | 11/05/19 | | | | (174,290 | ) |
| USD | | | 862,428 | | | EUR | | | 775,000 | | | | State Street Bank and Trust Co. | | | | 12/04/19 | | | | (3,604 | ) |
| USD | | | 3,151,435 | | | GBP | | | 2,443,000 | | | | State Street Bank and Trust Co. | | | | 12/04/19 | | | | (16,061 | ) |
| | | | | | | | | | | | | | | | | | | | | | |
| | | | | | | | | | | | | | | | | | | | | (209,620 | ) |
| | | | | | | | | | | | | | | | | | | | | | |
| | | | | | | | | | | | | | | | | $ | (189,929 | ) |
| | | | | | | | | | | | | | | | | | | | | | |
Exchange-Traded Options Purchased
| | | | | | | | | | | | | | | | | | | | | | | | |
| Description | | Number of
Contracts | | | Expiration
Date | | | Exercise
Price | | | Notional
Amount (000) | | | Value | |
| Call | |
Energy Select Sector SPDR Fund | | | 155 | | | | 11/15/19 | | | USD | | | 61.00 | | | USD | | | 898 | | | $ | 1,860 | |
| | | | | | | | | | | | | | | | | | | | | | | | |
| Put | |
SPDR S&P 500 ETF Trust | | | 105 | | | | 11/15/19 | | | USD | | | 280.00 | | | USD | | | 3,185 | | | | 1,628 | |
iShares iBoxx High Yield Corporate Bond ETF | | | 105 | | | | 11/15/19 | | | USD | | | 87.00 | | | USD | | | 912 | | | | 6,615 | |
| | | | | | | | | | | | | | | | | | | | | | | | |
| | | | | | | | | | | | | | | | | | | | | | | 8,243 | |
| | | | | | | | | | | | | | | | | | | | | | | | |
| | | $ | 10,103 | |
| | | | | |
Derivative Financial Instruments Categorized by Risk Exposure
As of period end, the fair values of derivative financial instruments located in the Statements of Assets and Liabilities were as follows:
| | | | | | | | | | | | | | | | | | | | | | | | | | | | |
| | | Commodity
Contracts | | | Credit
Contracts | | | Equity
Contracts | | | Foreign
Currency
Exchange
Contracts | | | Interest
Rate
Contracts | | | Other
Contracts | | | Total | |
Assets — Derivative Financial Instruments | | | | | | | | | | | | | | | | | | | | | | | | | | | | |
Forward foreign currency exchange contracts | | | | | | | | | | | | | | | | | | | | | | | | | | | | |
Unrealized appreciation on forward foreign currency exchange contracts | | $ | — | | | $ | — | | | $ | — | | | $ | 19,691 | | | $ | — | | | $ | — | | | $ | 19,691 | |
Options purchased | | | | | | | | | | | | | | | | | | | | | | | | | | | | |
Investments at value — unaffiliated(a) | | | — | | | | — | | | | 10,103 | | | | — | | | | — | | | | — | | | | 10,103 | |
| | | | | | | | | | | | | | | | | | | | | | | | | | | | |
| | $ | — | | | $ | — | | | $ | 10,103 | | | $ | 19,691 | | | $ | — | | | $ | — | | | $ | 29,794 | |
| | | | | | | | | | | | | | | | | | | | | | | | | | | | |
| | |
| 40 | | 2019 BLACKROCK ANNUAL REPORTTO SHAREHOLDERS |
| | |
Schedule of Investments (continued) October 31, 2019 | | BlackRock Floating Rate Income Trust (BGT) |
Derivative Financial Instruments Categorized by Risk Exposure (continued)
| | | | | | | | | | | | | | | | | | | | | | | | | | | | |
| | | Commodity
Contracts | | | Credit
Contracts | | | Equity
Contracts | | | Foreign
Currency
Exchange
Contracts | | | Interest
Rate
Contracts | | | Other
Contracts | | | Total | |
Liabilities — Derivative Financial Instruments | | | | | | | | | | | | | | | | | | | | | | | | | | | | |
Forward foreign currency exchange contracts | | | | | | | | | | | | | | | | | | | | | | | | | | | | |
Unrealized depreciation on forward foreign currency exchange contracts | | $ | — | | | $ | — | | | $ | — | | | $ | 209,620 | | | $ | — | | | $ | — | | | $ | 209,620 | |
| | | | | | | | | | | | | | | | | | | | | | | | | | | | |
| | (a) | Includes options purchased at value as reported in the Schedule of Investments. | |
For the year ended October 31, 2019, the effect of derivative financial instruments in the Statements of Operations was as follows:
| | | | | | | | | | | | | | | | | | | | | | | | | | | | |
| | | Commodity
Contracts | | | Credit
Contracts | | | Equity
Contracts | | | Foreign
Currency
Exchange
Contracts | | | Interest
Rate
Contracts | | | Other
Contracts | | | Total | |
Net Realized Gain (Loss) from: | | | | | | | | | | | | | | | | | | | | | | | | | | | | |
Forward foreign currency exchange contracts | | $ | — | | | $ | — | | | $ | — | | | $ | 344,009 | | | $ | — | | | $ | — | | | $ | 344,009 | |
Options purchased(a) | | | — | | | | — | | | | 68,665 | | | | — | | | | — | | | | — | | | | 68,665 | |
Swaps | | | — | | | | — | | | | — | | | | — | | | | (369,288 | ) | | | — | | | | (369,288 | ) |
| | | | | | | | | | | | | | | | | | | | | | | | | | | | |
| | $ | — | | | $ | — | | | $ | 68,665 | | | $ | 344,009 | | | $ | (369,288 | ) | | $ | — | | | $ | 43,386 | |
| | | | | | | | | | | | | | | | | | | | | | | | | | | | |
Net Change in Unrealized Appreciation (Depreciation) on: | | | | | | | | | | | | | | | | | | | | | | | | | | | | |
Forward foreign currency exchange contracts | | $ | — | | | $ | — | | | $ | — | | | $ | (289,694 | ) | | $ | — | | | $ | — | | | $ | (289,694 | ) |
Options purchased(b) | | | — | | | | — | | | | 11,204 | | | | — | | | | — | | | | — | | | | 11,204 | |
Swaps | | | — | | | | — | | | | — | | | | — | | | | (2,500 | ) | | | — | | | | (2,500 | ) |
| | | | | | | | | | | | | | | | | | | | | | | | | | | | |
| | $ | — | | | $ | — | | | $ | 11,204 | | | $ | (289,694 | ) | | $ | (2,500 | ) | | $ | — | | | $ | (280,990 | ) |
| | | | | | | | | | | | | | | | | | | | | | | | | | | | |
| | (a) | Options purchased are included in net realized gain (loss) from investments. | |
| | (b) | Options purchased are included in net change in unrealized appreciation (depreciation) on investments. | |
Average Quarterly Balances of Outstanding Derivative Financial Instruments
| | | | |
Forward foreign currency exchange contracts: | |
Average amounts purchased — in USD | | $ | 7,334,980 | |
Average amounts sold — in USD | | $ | 3,254,211 | |
Options: | |
Average value of option contracts purchased | | $ | 13,343 | |
Total return swaps: | | | | |
Average notional value | | $ | 586,000 | |
For more information about the Trust’s investment risks regarding derivative financial instruments, refer to the Notes to Financial Statements.
Derivative Financial Instruments — Offsetting as of Period End
The Trust’s derivative assets and liabilities (by type) were as follows:
| | | | | | | | |
| | | Assets | | | Liabilities | |
Forward foreign currency exchange contracts | | $ | 19,691 | | | $ | 209,620 | |
Options | | | 10,103 | (a) | | | — | |
| | | | | | | | |
Total derivative assets and liabilities in the Statements of Assets and Liabilities | | $ | 29,794 | | | $ | 209,620 | |
Derivatives not subject to a Master Netting Agreement or similar agreement (“MNA”) | | | (10,103 | ) | | | — | |
| | | | | | | | |
Total derivative assets and liabilities subject to an MNA | | $ | 19,691 | | | $ | 209,620 | |
| | | | | | | | |
| | (a) | Includes options purchased at value which is included in Investments at value — unaffiliated in the Statements of Assets and Liabilities and reported in the Schedule of Investments. | |
| | | | | | | | | | | | | | | | | | | | |
Counterparty | |
| Derivative
Assets
Subject to an
MNA by
Counterparty |
| |
| Derivatives
Available
for Offset |
(a) | |
| Non-cash
Collateral
Received |
| |
| Cash
Collateral
Received |
| |
| Net Amount
of Derivative
Assets |
|
State Street Bank and Trust Co. | | $ | 19,691 | | | $ | (19,691 | ) | | $ | — | | | $ | — | | | $ | — | |
| | | | | | | | | | | | | | | | | | | | |
| | | | |
| SCHEDULES OF INVESTMENTS | | | 41 | |
| | |
Schedule of Investments (continued) October 31, 2019 | | BlackRock Floating Rate Income Trust (BGT) |
Derivative Financial Instruments — Offsetting as of Period End (continued)
| | | | | | | | | | | | | | | | | | | | |
| Counterparty | |
| Derivative
Liabilities
Subject to an
MNA by
Counterparty |
| |
| Derivatives
Available
for Offset |
(a) | |
| Non-cash
Collateral
Pledged |
| |
| Cash
Collateral
Pledged |
| |
| Net Amount
of Derivative
Liabilities |
(b) |
State Street Bank and Trust Co. | | $ | 209,620 | | | $ | (19,691 | ) | | $ | — | | | $ | — | | | $ | 189,929 | |
| | | | | | | | | | | | | | | | | | | | |
| | (a) | The amount of derivatives available for offset is limited to the amount of derivative assets and/or liabilities that are subject to an MNA. | |
| | (b) | Net amount represents the net amount payable due to the counterparty in the event of default. | |
Fair Value Hierarchy as of Period End
Various inputs are used in determining the fair value of investments and derivative financial instruments. For information about the Trust’s policy regarding valuation of investments and derivative financial instruments, refer to the Notes to Financial Statements.
The following tables summarize the Trust’s investments and derivative financial instruments categorized in the disclosure hierarchy:
| | | | | | | | | | | | | | | | |
| | | Level 1 | | | Level 2 | | | Level 3 | | | Total | |
Assets: | |
Investments: | |
Long-Term Investments: | |
Common Stocks(a) | | $ | 230,563 | | | $ | 45,815 | | | $ | 245,313 | | | $ | 521,691 | |
Corporate Bonds(a) | | | — | | | | 2,954,876 | | | | 553,520 | | | | 3,508,396 | |
Floating Rate Loan Interests(a) | | | — | | | | 417,243,048 | | | | 18,994,392 | | | | 436,237,440 | |
Investment Companies(a) | | | 19,048,500 | | | | — | | | | — | | | | 19,048,500 | |
Other Interests(a) | | | — | | | | — | | | | 5 | | | | 5 | |
Warrants(a) | | | — | | | | 387,999 | | | | — | | | | 387,999 | |
Options Purchased | | | | | | | | | | | | | | | | |
Equity Contracts | | | 10,103 | | | | — | | | | — | | | | 10,103 | |
Short-Term Securities | | | 740,873 | | | | — | | | | — | | | | 740,873 | |
Liabilities: | |
Unfunded Floating Rate Loan Interests(b) | | | — | | | | (5,911 | ) | | | — | | | | (5,911 | ) |
| | | | | | | | | | | | | | | | |
| | $ | 20,030,039 | | | $ | 420,625,827 | | | $ | 19,793,230 | | | $ | 460,449,096 | |
| | | | | | | | | | | | | | | | |
Derivative Financial Instruments(c) | |
Assets: | |
Forward foreign currency contracts | | $ | — | | | $ | 19,691 | | | $ | — | | | $ | 19,691 | |
Liabilities: | |
Forward foreign currency contracts | | | — | | | | (209,620 | ) | | | — | | | | (209,620 | ) |
| | | | | | | | | | | | | | | | |
| | $ | — | | | $ | (189,929 | ) | | $ | — | | | $ | (189,929 | ) |
| | | | | | | | | | | | | | | | |
| | (a) | See above Schedule of Investments for values in each industry and country. | |
| | (b) | Unfunded floating rate loan interests are valued at the unrealized appreciation (depreciation) on the commitment. | |
| | (c) | Derivative financial instruments are forward foreign currency exchange contracts. Forward foreign currency exchange contracts are valued at the unrealized appreciation (depreciation) on the instrument. | |
The Trust may hold assets and/or liabilities in which the fair value approximates the carrying amount for financial statement purposes. As of period end, bank borrowings payable of $123,000,000 are categorized as Level 2 within the disclosure hierarchy.
| | |
| 42 | | 2019 BLACKROCK ANNUAL REPORTTO SHAREHOLDERS |
| | |
Schedule of Investments (continued) October 31, 2019 | | BlackRock Floating Rate Income Trust (BGT) |
A reconciliation of Level 3 investments is presented when the Trust had a significant amount of Level 3 investments at the beginning and/or end of the period in relation to net assets. The following table is a reconciliation of Level 3 investments for which significant unobservable inputs were used in determining fair value:
| | | | | | | | | | | | | | | | | | | | | | | | | | | | | | | | | | | | |
| | | Asset-
Backed
Securities | | | Common
Stocks | | | Corporate Bonds | | | Floating
Rate Loan
Interests | | | Other
Interests | | | Unfunded
Floating Rate
Loan Interests | | | Warrants | | | Options
Purchased | | | Total | |
Assets: | | | | | | | | | | | | | | | | | | | | | | | | | | | | | | | | | | | | |
Opening balance, as of October 31, 2018 | | $ | 2,699,975 | | | $ | 529,149 | | | $ | — | | | $ | 27,220,796 | | | $ | 5 | | | $ | (138 | ) | | $ | — | | | $ | — | | | $ | 30,449,787 | |
Transfers into Level 3(a) | | | — | | | | — | | | | — | | | | 3,933,901 | | | | — | | | | — | | | | — | | | | — | | | | 3,933,901 | |
Transfers out of Level 3(b) | | | — | | | | — | | | | — | | | | (10,728,242 | ) | | | — | | | | — | | | | — | | | | — | | | | (10,728,242 | ) |
Accrued discounts/premiums | | | — | | | | — | | | | 1,497 | | | | 8,626 | | | | — | | | | — | | | | — | | | | — | | | | 10,123 | |
Net realized gain (loss) | | | (65,300 | ) | | | (238,995 | ) | | | 1,822 | | | | (453,287 | ) | | | — | | | | — | | | | (46,375 | ) | | | (25,422 | ) | | | (827,557 | ) |
Net change in unrealized appreciation (depreciation)(c)(d) | | | 25 | | | | 163,673 | | | | 24,343 | | | | 104,388 | | | | — | | | | 138 | | | | 46,375 | | | | 25,422 | | | | 364,364 | |
Purchases | | | — | | | | 131,156 | | | | 527,680 | | | | 13,504,477 | | | | — | | | | — | | | | — | | | | — | | | | 14,163,313 | |
Sales | | | (2,634,700 | ) | | | (339,670 | ) | | | (1,822 | ) | | | (14,596,267 | ) | | | — | | | | — | | | | — | | | | — | | | | (17,572,459 | ) |
| | | | | | | | | | | | | | | | | | | | | | | | | | | | | | | | | | | | |
Closing Balance, as of October 31, 2019 | | $ | — | | | $ | 245,313 | | | $ | 553,520 | | | $ | 18,994,392 | | | $ | 5 | | | $ | — | | | $ | — | | | $ | — | | | $ | 19,793,230 | |
| | | | | | | | | | | | | | | | | | | | | | | | | | | | | | | | | | | | |
Net change in unrealized appreciation (depreciation) on investments still held at October 31, 2019(c)(d) | | $ | — | | | $ | (132,453 | ) | | $ | 24,343 | | | $ | (290,497 | ) | | $ | — | | | $ | — | | | $ | — | | | $ | — | | | $ | (398,607 | ) |
| | | | | | | | | | | | | | | | | | | | | | | | | | | | | | | | | | | | |
| | (a) | As of October 31, 2018, the Trust used observable inputs in determining the value of certain investments. As of October 31, 2019, the Trust used significant unobservable inputs in determining the value of the same investments. As a result, investments at beginning of period value were transferred from Level 2 to Level 3 in the disclosure hierarchy. | |
| | (b) | As of October 31, 2018, the Trust used significant unobservable inputs in determining the value of certain investments. As of October 31, 2019, the Trust used observable inputs in determining the value of the same investments. As a result, investments at beginning of period value were transferred from Level 3 to Level 2 in the disclosure hierarchy. | |
| | (c) | Included in the related net change in unrealized appreciation (depreciation) in the Statements of Operations. | |
| | (d) | Any difference between net change in unrealized appreciation (depreciation) and net change in unrealized appreciation (depreciation) on investments still held at October 31, 2019 is generally due to investments no longer held or categorized as Level 3 at period end. | |
The Trust’s investments that are categorized as Level 3 were valued utilizing third party pricing information without adjustment. Such valuations are based on unobservable inputs. A significant change in third party information could result in a significantly lower or higher value of such Level 3 investments.
See notes to financial statements.
| | | | |
| SCHEDULES OF INVESTMENTS | | | 43 | |
| | |
Consolidated Schedule of Investments October 31, 2019 | | BlackRock Multi-Sector Income Trust (BIT) (Percentages shown are based on Net Assets) |
| | | | | | | | | | | | |
| Security | |
Shares | | | Value | |
|
Common Stocks — 0.6% | |
| | | |
Aerospace & Defense — 0.6% | | | | | | | | | | | | |
United Technologies Corp. | | | | | | | 25,647 | | | $ | 3,683,211 | |
| | | | | | | | |
| |
Total Common Stocks — 0.6%
(Cost — $2,968,842) | | | | 3,683,211 | |
| | | | | | | | |
| | |
| | | Par
(000) | | | | |
|
| Asset-Backed Securities — 19.4% | |
Ajax Mortgage Loan Trust, Series2017-D(a): | | | | | | | | | | | | |
Class A, 3.75%, 12/25/57 | | | USD | | | | 3,020 | | | | 3,118,329 | |
Class B, 0.00%, 12/25/57(b)(c)(j) | | | | | | | 933 | | | | 419,989 | |
ALM VI Ltd.(a)(d): | | | | | | | | | | | | |
(3 mo. LIBOR US + 2.70%), 4.70%, 07/15/26 | | | | | | | 1,010 | | | | 996,731 | |
Series2012-6A, Class BR3, (3 mo. LIBOR US + 1.75%), 3.75%, 07/15/26 | | | | | | | 1,200 | | | | 1,175,328 | |
ALM XII Ltd., Series2015-12A, Class C1R2, 4.65%, 04/16/27(a) | | | | | | | 545 | | | | 539,246 | |
American Homes 4 Rent Trust,
Series 2014-SFR2, Class E, 6.23%, 10/17/36(a) | | | | | | | 2,000 | | | | 2,227,780 | |
AMMC CLO 19 Ltd., Series2016-1A, Class E, (3 mo. LIBOR US + 7.00%), 9.00%, 10/15/28(a)(d) | | | | | | | 1,000 | | | | 948,509 | |
Anchorage Capital CLO Ltd.(a)(d): | | | | | | | | | | | | |
Series2014-3RA, Class C, (3 mo. LIBOR US + 1.85%), 3.79%, 01/28/31 | | | | | | | 1,000 | | | | 951,584 | |
Series2014-5RA, Class E, (3 mo. LIBOR US + 5.40%), 7.40%, 01/15/30 | | | | | | | 860 | | | | 786,926 | |
Series2015-6A, Class DR, (3 mo. LIBOR US + 3.55%), 5.55%, 07/15/30 | | | | | | | 1,000 | | | | 969,963 | |
Series2016-8A, Class DR, (3 mo. LIBOR US + 3.00%), 4.94%, 07/28/28 | | | | | | | 1,000 | | | | 994,539 | |
Ares CLO Ltd., Series2016-41A, Class D, (3 mo. LIBOR US + 4.20%), 6.20%, 01/15/29(a)(d) | | | | | | | 900 | | | | 895,652 | |
Battalion CLO XI Ltd., Series2017-11A, Class E, (3 mo. LIBOR US + 5.98%), 7.92%, 10/24/29(a)(d) | | | | | | | 325 | | | | 301,106 | |
Bear Stearns Asset-Backed Securities I Trust,Series 2006-HE9, Class 2A, (1 mo. LIBOR US + 0.14%), 1.96%, 11/25/36(d) | | | | | | | 2,705 | | | | 2,643,945 | |
Benefit Street Partners CLO II Ltd.,Series 2013-IIA, Class CR, (3 mo. LIBOR US + 3.70%), 5.70%, 07/15/29(a)(d) | | | | | | | 1,750 | | | | 1,678,052 | |
Benefit Street Partners CLO VI Ltd.,Series 2015-VIA(a)(d): | | | | | | | | | | | | |
Class BR, (3 mo. LIBOR US + 2.40%), 4.40%, 10/18/29 | | | | | | | 1,000 | | | | 985,082 | |
Class CR, (3 mo. LIBOR US + 3.45%), 5.45%, 10/18/29 | | | | | | | 1,000 | | | | 964,427 | |
Benefit Street Partners CLO X Ltd.,Series 2016-10A, Class CR, (3 mo. LIBOR US + 3.50%), 5.50%, 01/15/29(a)(d) | | | | | | | 420 | | | | 406,534 | |
C-BASS Trust, Series2006-CB7, Class A4, (1 mo. LIBOR US + 0.16%), 1.98%, 10/25/36(d) | | | | | | | 6,636 | | | | 5,081,983 | |
Carrington Mortgage Loan Trust, Series 2006-FRE2(d): | | | | | | | | | | | | |
Class A2, (1 mo. LIBOR US + 0.12%), 1.94%, 10/25/36 | | | | | | | 4,204 | | | | 3,364,781 | |
Class A5, (1 mo. LIBOR US + 0.08%), 1.90%, 03/25/35 | | | | | | | 8,661 | | | | 6,895,215 | |
DCP Rights LLC, Series2014-1A, Class A, 5.46%, 10/25/44(a)(b) | | | | | | | 3,473 | | | | 3,478,932 | |
Fremont Home Loan Trust(d): | | | | | | | | | | | | |
Series2006-A, Class 2A3, (1 mo. LIBOR US + 0.16%), 1.98%, 05/25/36 | | | | | | | 22,253 | | | | 15,068,905 | |
Series2006-D, Class 2A3, (1 mo. LIBOR US + 0.15%), 1.97%, 11/25/36 | | | | | | | 20,406 | | | | 9,204,524 | |
| | | | | | | | | | | | |
| Security | | Par
(000) | | | Value | |
|
| Asset-Backed Securities (continued) | |
Galaxy CLO Ltd., Series2015-21A, (3 mo. LIBOR US + 5.25%), 7.22%, 04/20/31(a)(d) | | | USD | | | | 500 | | | $ | 416,222 | |
Galaxy CLO XXIX Ltd., Series2018-29A, Class D, (3 mo. LIBOR US + 2.40%), 4.56%, 11/15/26(a)(d) | | | | | | | 530 | | | | 522,295 | |
Highbridge Loan Management Ltd.(a)(d): | | | | | | | | | | | | |
Series4A-2014, Class BR, (3 mo. LIBOR US + 1.85%), 3.79%, 01/28/30 | | | | | | | 1,750 | | | | 1,674,043 | |
Series8A-2016, Class ER, (3 mo. LIBOR US + 5.50%), 7.47%, 07/20/30 | | | | | | | 1,000 | | | | 833,337 | |
Home Equity Mortgage Loan Asset-Backed Trust,Series 2006-E, Class 2A3, (1 mo. LIBOR US + 0.17%), 1.99%, 04/25/37(d) | | | | | | | 10,494 | | | | 7,756,072 | |
HPS Loan Management Ltd., Series10A-16, Class C, (3 mo. LIBOR US + 3.65%), 5.62%, 01/20/28(a)(d) | | | | | | | 2,500 | | | | 2,410,164 | |
Invitation Homes Trust, Series 2018-SFR2, Class E, (1 mo. LIBOR US + 2.00%), 3.91%, 06/17/37(a)(d) | | | | | | | 3,000 | | | | 2,999,992 | |
Long Beach Mortgage Loan Trust(d): | | | | | | | | | | | | |
Series2006-10, Class 2A3, (1 mo. LIBOR US + 0.16%), 1.98%, 11/25/36 | | | | | | | 11,472 | | | | 5,429,017 | |
Series2006-7, Class 2A3, (1 mo. LIBOR US + 0.16%), 1.98%, 08/25/36 | | | | | | | 6,468 | | | | 3,590,538 | |
Madison Park Funding X Ltd.,
Series2012-10A(a)(d): | | | | | | | | | | | | |
Class DR2, (3 mo. LIBOR US + 3.25%), 5.22%, 01/20/29 | | | | | | | 750 | | | | 736,435 | |
Class ER2, (3 mo. LIBOR US + 6.40%), 8.37%, 01/20/29 | | | | | | | 1,500 | | | | 1,417,193 | |
Madison Park Funding XVI Ltd.,Series 2015-16A, Class C, (3 mo. LIBOR US + 3.70%), 5.67%, 04/20/26(a)(d) | | | | | | | 1,000 | | | | 997,504 | |
Mastr Asset-Backed Securities Trust,Series 2006-HE2, Class A3, (1 mo. LIBOR US + 0.15%), 1.97%, 06/25/36(d) | | | | | | | 9,553 | | | | 5,463,152 | |
Neuberger Berman CLO XX Ltd.,Series 2015-20A, Class ER, (3 mo. LIBOR US + 5.00%), 7.00%, 01/15/28(a)(d) | | | | | | | 710 | | | | 620,984 | |
Oaktree CLO Ltd., Series2015-1A, Class DR, (3 mo. LIBOR US + 5.20%),
7.17%, 10/20/27(a)(d) | | | | | | | 1,000 | | | | 950,069 | |
Octagon Investment Partners LLC,Series 2017-1A, Class E, (3 mo. LIBOR US + 6.30%), 8.27%, 07/20/30(a)(d) | | | | | | | 500 | | | | 453,488 | |
Octagon Investment Partners XXII Ltd.,Series 2014-1A, Class DRR, (3 mo. LIBOR US + 2.75%), 4.70%, 01/22/30(a)(d) | | | | | | | 500 | | | | 456,796 | |
OHA Credit Partners VII Ltd., Series2012-7A, Class DR, (3 mo. LIBOR US + 4.20%), 6.34%, 11/20/27(a)(d) | | | | | | | 590 | | | | 590,672 | |
OHA Credit Partners XIII Ltd.,Series 2016-13A, Class E, (3 mo. LIBOR US + 7.15%), 9.12%, 01/21/30(a)(d) | | | | | | | 405 | | | | 395,018 | |
OZLM XIV Ltd., Series2015-14A, Class CR, (3 mo. LIBOR US + 3.00%),
5.30%, 01/15/29(a)(d) | | | | | | | 1,000 | | | | 944,266 | |
OZLM XV Ltd., Series2016-15A, Class D, (3 mo. LIBOR US + 7.15%),
9.12%, 01/20/29(a)(d) | | | | | | | 1,000 | | | | 944,903 | |
OZLM XXI Ltd., Series2017-21A, Class D, (3 mo. LIBOR US + 5.54%),
7.51%, 01/20/31(a)(d) | | | | | | | 250 | | | | 210,966 | |
Palmer Square Loan Funding Ltd.,Series 2018-5A, Class D, (3 mo. LIBOR US + 4.25%), 6.22%, 01/20/27(a)(d) | | | | | | | 500 | | | | 494,301 | |
Park Avenue Institutional Advisers CLO Ltd.,Series 2017-1A, Class D, (3 mo. LIBOR US + 6.22%), 8.40%, 11/14/29(a)(d) | | | | | | | 1,750 | | | | 1,631,873 | |
Renaissance Home Equity Loan Trust,Series 2007-3, Class AF2, 7.00%, 09/25/37 | | | | | | | 4,111 | | | | 2,377,238 | |
Rockford Tower CLO Ltd., Series2017-2A, Class D, (3 mo. LIBOR US + 3.45%), 5.45%, 10/15/29(a)(d) | | | | | | | 500 | | | | 496,214 | |
| | |
| 44 | | 2019 BLACKROCK ANNUAL REPORTTO SHAREHOLDERS |
| | |
Consolidated Schedule of Investments (continued) October 31, 2019 | | BlackRock Multi-Sector Income Trust (BIT) (Percentages shown are based on Net Assets) |
| | | | | | | | | | | | |
| Security | | Par
(000) | | | Value | |
|
| Asset-Backed Securities (continued) | |
Saxon Asset Securities Trust,Series 2007-3, Class 2A3, (1 mo. LIBOR US + 0.40%), 2.22%, 09/25/47(d) | | | USD | | | | 5,000 | | | $ | 4,781,655 | |
Scholar Funding Trust, Series2013-A, Class R, 0.00%(b) | | | | | | | — | (o) | | | 1,614,536 | |
TICP CLO VII Ltd., Series2017-7A, Class E, (3 mo. LIBOR US + 6.51%), 8.51%, 07/15/29(a)(d) | | | | | | | 500 | | | | 474,082 | |
Treman Park CLO Ltd., Series2015-1A, Class DRR, (3 mo. LIBOR US + 2.65%), 4.62%, 10/20/28(a)(d) | | | | | | | 1,500 | | | | 1,443,124 | |
TRESTLES CLO II Ltd., Series2017-1A, Class C, (3 mo. LIBOR US + 3.65%), 5.59%, 07/25/29(a)(d) | | | | | | | 250 | | | | 248,248 | |
WaMu Asset-Backed Certificates Trust,Series 2007-HE3, Class 2A3, (1 mo. LIBOR US + 0.24%), 2.06%, 05/25/37(d) | | | | | | | 8,526 | | | | 7,665,028 | |
Wellfleet CLO Ltd., Series2017-3A, Class B, (3 mo. LIBOR US + 1.95%), 3.95%, 01/17/31(a)(d) | | | | | | | 500 | | | | 462,453 | |
Westcott Park CLO Ltd., Series2016-1A, Class DR, (3 mo. LIBOR US + 3.25%), 5.22%, 07/20/28(a)(d) | | | | | | | 300 | | | | 292,609 | |
YorkCLO-2 Ltd., Series2015-1A, Class ER, (3 mo. LIBOR US + 5.65%), 7.60%, 01/22/31(a)(d) | | | | | | | 250 | | | | 221,823 | |
| | | | | | | | |
| |
Total Asset-Backed Securities — 19.4%
(Cost — $120,849,643) | | | | 126,114,372 | |
| | | | | | | | |
|
Corporate Bonds — 75.5% | |
|
| Aerospace & Defense — 2.9% | |
Amsted Industries, Inc., 5.63%, 07/01/27(a) | | | | | | | 185 | | | | 195,638 | |
Arconic, Inc.: | | | | | | | | | | | | |
5.40%, 04/15/21 | | | | | | | 12 | | | | 12,380 | |
5.87%, 02/23/22 | | | | | | | 1,065 | | | | 1,138,815 | |
5.13%, 10/01/24(e) | | | | | | | 808 | | | | 866,580 | |
BBA US Holdings, Inc.(a): | | | | | | | | | | | | |
5.38%, 05/01/26 | | | | | | | 322 | | | | 336,490 | |
4.00%, 03/01/28 | | | | | | | 487 | | | | 483,347 | |
Bombardier, Inc.(a): | | | | | | | | | | | | |
8.75%, 12/01/21 | | | | | | | 709 | | | | 750,654 | |
5.75%, 03/15/22 | | | | | | | 120 | | | | 117,600 | |
6.00%, 10/15/22 | | | | | | | 10 | | | | 9,750 | |
6.13%, 01/15/23 | | | | | | | 408 | | | | 396,780 | |
7.50%, 12/01/24 | | | | | | | 181 | | | | 175,457 | |
7.50%, 03/15/25(e) | | | | | | | 369 | | | | 352,543 | |
7.88%, 04/15/27(e) | | | | | | | 1,759 | | | | 1,657,857 | |
Kratos Defense & Security Solutions, Inc., 6.50%, 11/30/25(a)(e) | | | | | | | 448 | | | | 474,880 | |
Level 3 Financing, Inc.,
4.63%, 09/15/27(a) | | | | | | | 258 | | | | 262,515 | |
Lockheed Martin Corp., 4.09%, 09/15/52(e) | | | | | | | 451 | | | | 525,408 | |
TransDigm UK Holdings PLC, 6.88%, 05/15/26 | | | | | | | 431 | | | | 459,015 | |
TransDigm, Inc.: | | | | | | | | | | | | |
6.00%, 07/15/22(e) | | | | | | | 325 | | | | 330,525 | |
6.25%, 03/15/26(a)(e) | | | | | | | 6,814 | | | | 7,299,497 | |
5.50%, 11/15/27(a)(f) | | | | | | | 1,679 | | | | 1,673,443 | |
Triumph Group, Inc., 6.25%, 09/15/24(a) | | | | | | | 409 | | | | 429,450 | |
United Technologies Corp., 3.75%, 11/01/46(e) | | | | | | | 700 | | | | 776,296 | |
| | | | | | | | |
| | | | | | | | | | | 18,724,920 | |
| | | |
| Air Freight & Logistics — 0.2% | | | | | | | | | |
FedEx Corp.(e): | | | | | | | | | | | | |
3.90%, 02/01/35 | | | | | | | 500 | | | | 511,717 | |
4.75%, 11/15/45 | | | | | | | 500 | | | | 539,111 | |
XPO Logistics, Inc., 6.75%, 08/15/24(a) | | | | | | | 22 | | | | 23,815 | |
| | | | | | | | |
| | | | | | | | | | | 1,074,643 | |
| | | |
| Airlines — 2.2% | | | | | | | | | |
Air Canada Pass-Through Trust,Series 2013-1, Class B,
5.38%, 5/15/21(a) | | | | | | | 1,963 | | | | 2,019,930 | |
| | | | | | | | | | | | |
| Security | | Par
(000) | | | Value | |
| | | |
| Airlines (continued) | | | | | | | | | |
American Airlines Group, Inc.,
5.00%, 06/01/22(a) | | | USD | | | | 1,300 | | | $ | 1,355,250 | |
American Airlines Pass-Through Trust: | | | | | | | | | | | | |
Series2013-2, Class A, 4.95%, 01/15/23 | | | | | | | 1,242 | | | | 1,302,218 | |
Series2017-1, Class B, 4.95%, 02/15/25 | | | | | | | 1,365 | | | | 1,441,425 | |
Avianca Holdings SA/Avianca Leasing LLC/Grupo Taca Holdings Ltd., 8.38%, 05/10/20 | | | | | | | 465 | | | | 443,494 | |
Continental Airlines Pass-Through Trust, Class B: | | | | | | | | | | | | |
Series2007-1, 6.90%, 04/19/22 | | | | | | | 102 | | | | 106,678 | |
Series2012-1, 6.25%, 04/11/20 | | | | | | | 196 | | | | 198,675 | |
Delta Air Lines Pass-Through Trust,Series 2007-1, Class B, 8.02%, 08/10/22 | | | | | | | 1,085 | | | | 1,199,224 | |
Latam Finance Ltd., 6.88%, 04/11/24(a) | | | | | | | 737 | | | | 779,378 | |
United Airlines Pass-Through Trust(e): | | | | | | | | | | | | |
Series2014-2, Class B, 4.63%, 09/03/22 | | | | | | | 1,723 | | | | 1,775,140 | |
Series2015-1, Class A, 3.70%, 12/01/22 | | | | | | | 3,570 | | | | 3,678,731 | |
| | | | | | | | |
| | | | | | | | | | | 14,300,143 | |
| |
| Auto Components — 1.0% | | | | |
Allison Transmission, Inc.(a): | | | | | | | | | | | | |
5.00%, 10/01/24 | | | | | | | 38 | | | | 38,903 | |
5.88%, 06/01/29 | | | | | | | 373 | | | | 401,907 | |
Aptiv PLC(e): | | | | | | | | | | | | |
4.25%, 01/15/26 | | | | | | | 400 | | | | 428,715 | |
4.40%, 10/01/46 | | | | | | | 280 | | | | 272,223 | |
GKN Holdings Ltd., 4.63%, 05/12/32 | | | GBP | | | | 100 | | | | 132,914 | |
Goodyear Tire & Rubber Co., 5.00%, 05/31/26 | | | USD | | | | 77 | | | | 79,599 | |
Icahn Enterprises LP/Icahn Enterprises Finance Corp.(e): | | | | | | | | | | | | |
6.25%, 02/01/22 | | | | | | | 341 | | | | 349,099 | |
6.75%, 02/01/24 | | | | | | | 354 | | | | 369,045 | |
6.38%, 12/15/25 | | | | | | | 231 | | | | 242,550 | |
IHO Verwaltungs GmbH(g): | | | | | | | | | | | | |
(4.38% PIK), 3.63%, 05/15/25 | | | EUR | | | | 100 | | | | 113,900 | |
(4.63% PIK), 3.88%, 05/15/27 | | | | | | | 100 | | | | 111,953 | |
Panther BF Aggregator 2 LP/Panther Finance Co., Inc.: | | | | | | | | | | | | |
4.38%, 05/15/26 | | | | | | | 101 | | | | 113,490 | |
6.25%, 05/15/26(a)(e) | | | USD | | | | 1,526 | | | | 1,613,287 | |
8.50%, 05/15/27(a)(e) | | | | | | | 2,068 | | | | 2,083,510 | |
Tesla, Inc., 5.30%, 08/15/25(a) | | | | | | | 324 | | | | 306,180 | |
| | | | | | | | |
| | | | | | | | | | | 6,657,275 | |
| | | |
| Automobiles — 0.4% | | | | | | | | | |
General Motors Co., 6.25%, 10/02/43(e) | | | | | | | 2,194 | | | | 2,451,356 | |
| | | | | | | | |
| | | |
| Banks — 0.7% | | | | | | | | | |
Allied Irish Banks PLC (5 year EUR Swap + 3.95%), 4.13%, 11/26/25(h) | | | EUR | | | | 100 | | | | 115,684 | |
Banco BPM SpA: | | | | | | | | | | | | |
1.75%, 04/24/23 | | | | | | | 100 | | | | 113,327 | |
2.50%, 06/21/24 | | | | | | | 100 | | | | 115,945 | |
Barclays PLC: | | | | | | | | | | | | |
4.38%, 09/11/24 | | | USD | | | | 720 | | | | 755,268 | |
5.20%, 05/12/26 | | | | | | | 200 | | | | 216,913 | |
BBVA Bancomer SA, 6.75%, 09/30/22(a) | | | | | | | 682 | | | | 747,932 | |
CIT Bank NA (Secured Overnight Financing Rate + 1.72%), 2.97%, 09/27/25(h) | | | | | | | 292 | | | | 294,373 | |
CIT Group, Inc.: | | | | | | | | | | | | |
5.00%, 08/01/23(e) | | | | | | | 847 | | | | 912,642 | |
6.13%, 03/09/28 | | | | | | | 115 | | | | 135,700 | |
HSBC Holdings PLC, 4.38%, 11/23/26(e) | | | | | | | 370 | | | | 399,809 | |
Promerica Financial Corp., 9.70%, 05/14/24(a) | | | | | | | 200 | | | | 207,188 | |
Standard Chartered PLC (5 year USD ICE Swap + 1.97%), 4.87%, 03/15/33(a)(e)(h) | | | | | | | 500 | | | | 540,042 | |
| | | | | | | | |
| | | | | | | | | | | 4,554,823 | |
| | | | |
| CONSOLIDATED SCHEDULES OF INVESTMENTS | | | 45 | |
| | |
Consolidated Schedule of Investments (continued) October 31, 2019 | | BlackRock Multi-Sector Income Trust (BIT) (Percentages shown are based on Net Assets) |
| | | | | | | | | | | | |
| Security | | Par
(000) | | | Value | |
| | | |
| Beverages — 0.5% | | | | | | | | | |
Anheuser-Busch Cos. LLC/Anheuser-Busch InBev Worldwide, Inc., 4.90%, 02/01/46(e) | | | USD | | | | 2,160 | | | $ | 2,591,056 | |
Central American Bottling Corp., 5.75%, 01/31/27(a) | | | | | | | 637 | | | | 670,044 | |
| | | | | | | | |
| | | | | | | | | | | 3,261,100 | |
| | | |
| Biotechnology — 0.3% | | | | | | | | | |
Amgen, Inc., 4.40%, 05/01/45(e) | | | | | | | 1,100 | | | | 1,237,501 | |
Gilead Sciences, Inc., 4.75%, 03/01/46(e) | | | | | | | 700 | | | | 837,886 | |
| | | | | | | | |
| | | | | | | | | | | 2,075,387 | |
| | | |
| Building Materials — 0.0% | | | | | | | | | |
Cemex SAB de CV, 3.13%, 03/19/26 | | | EUR | | | | 100 | | | | 114,804 | |
Jeld-Wen, Inc., 4.63%, 12/15/25(a) | | | USD | | | | 163 | | | | 161,370 | |
| | | | | | | | |
| | | | | | | | | | | 276,174 | |
| | | |
| Building Products — 0.4% | | | | | | | | | |
Advanced Drainage Systems, Inc., 5.00%, 09/30/27(a) | | | | | | | 310 | | | | 316,975 | |
American Builders & Contractors Supply Co., Inc., 5.88%, 05/15/26(a) | | | | | | | 317 | | | | 332,945 | |
Beacon Roofing Supply, Inc.(a): | | | | | | | | | | | | |
4.88%, 11/01/25 | | | | | | | 21 | | | | 20,634 | |
4.50%, 11/15/26 | | | | | | | 104 | | | | 106,080 | |
Jeld-Wen, Inc., 4.88%, 12/15/27(a) | | | | | | | 23 | | | | 22,540 | |
Masonite International Corp.(a): | | | | | | | | | | | | |
5.75%, 09/15/26 | | | | | | | 106 | | | | 112,492 | |
5.38%, 02/01/28 | | | | | | | 146 | | | | 154,395 | |
PGT Escrow Issuer, Inc., 6.75%, 08/01/26(a) | | | | | | | 98 | | | | 105,350 | |
Standard Industries, Inc.(a): | | | | | | | | | | | | |
5.50%, 02/15/23 | | | | | | | 72 | | | | 73,598 | |
5.38%, 11/15/24 | | | | | | | 522 | | | | 537,034 | |
6.00%, 10/15/25(e) | | | | | | | 659 | | | | 691,950 | |
5.00%, 02/15/27 | | | | | | | 48 | | | | 50,100 | |
4.75%, 01/15/28 | | | | | | | 68 | | | | 70,550 | |
| | | | | | | | |
| | | | | | | | | | | 2,594,643 | |
| | | |
| Cable Television Services — 0.0% | | | | | | | | | |
Cincinnati Bell, Inc., 8.00%, 10/15/25(a)(e) | | | | | | | 173 | | | | 154,403 | |
| | | | | | | | |
| | | |
| Capital Markets — 0.2% | | | | | | | | | |
Intercorp Peru Ltd., 3.88%, 08/15/29(a) | | | | | | | 200 | | | | 200,875 | |
Intertrust Group BV, 3.38%, 11/15/25 | | | EUR | | | | 100 | | | | 116,705 | |
Owl Rock Capital Corp., 5.25%, 04/15/24 | | | USD | | | | 106 | | | | 112,675 | |
Raymond James Financial, Inc., 4.95%, 07/15/46(e) | | | | | | | 400 | | | | 484,624 | |
Stevens Holding Co., Inc., 6.13%, 10/01/26(a) | | | | | | | 197 | | | | 211,775 | |
| | | | | | | | |
| | | | | | | | | | | 1,126,654 | |
| | | |
| Chemicals — 1.6% | | | | | | | | | |
Alpha 2 BV, (8.75% Cash or 9.50% PIK), 8.75%, 06/01/23(a)(g) | | | | | | | 306 | | | | 300,645 | |
Alpha 3 BV/Alpha US Bidco, Inc., 6.25%, 02/01/25(a) | | | | | | | 2,170 | | | | 2,180,850 | |
Axalta Coating Systems LLC,
4.88%, 08/15/24(a) | | | | | | | 265 | | | | 273,613 | |
Blue Cube Spinco LLC: | | | | | | | | | | | | |
9.75%, 10/15/23 | | | | | | | 915 | | | | 997,350 | |
10.00%, 10/15/25 | | | | | | | 430 | | | | 480,525 | |
Chemours Co.: | | | | | | | | | | | | |
6.63%, 05/15/23 | | | | | | | 266 | | | | 264,585 | |
4.00%, 05/15/26 | | | EUR | | | | 100 | | | | 100,438 | |
5.38%, 05/15/27 | | | USD | | | | 229 | | | | 203,487 | |
Cydsa SAB de CV, 6.25%, 10/04/27(a)(e) | | | | | | | 914 | | | | 942,277 | |
Element Solutions, Inc., 5.88%, 12/01/25(a)(e) | | | | | | | 1,716 | | | | 1,791,345 | |
GCP Applied Technologies, Inc., 5.50%, 04/15/26(a) | | | | | | | 199 | | | | 203,975 | |
Monitchem HoldCo 3 SA, 5.25%, 03/15/25 | | | EUR | | | | 100 | | | | 113,342 | |
NOVA Chemicals Corp., 4.88%, 06/01/24(a) | | | USD | | | | 80 | | | | 81,200 | |
OCI NV, 3.13%, 11/01/24 | | | EUR | | | | 100 | | | | 113,905 | |
Orbia Advance Corp SAB de CV,
5.50%, 01/15/48(a)(e) | | | USD | | | | 526 | | | | 533,364 | |
| | | | | | | | | | | | |
| Security | | Par
(000) | | | Value | |
| | | |
| Chemicals (continued) | | | | | | | | | |
PQ Corp.(a)(e): | | | | | | | | | | | | |
6.75%, 11/15/22 | | | USD | | | | 437 | | | $ | 451,202 | |
5.75%, 12/15/25 | | | | | | | 644 | | | | 666,540 | |
Sherwin-Williams Co., 4.50%, 06/01/47(e) | | | | | | | 310 | | | | 347,723 | |
WR Grace &Co-Conn(a)(e): | | | | | | | | | | | | |
5.13%, 10/01/21 | | | | | | | 277 | | | | 287,388 | |
5.63%, 10/01/24 | | | | | | | 300 | | | | 324,000 | |
| | | | | | | | |
| | | | | | | | | | | 10,657,754 | |
|
| Commercial Services & Supplies — 2.0% | |
ADT Security Corp.: | | | | | | | | | | | | |
6.25%, 10/15/21 | | | | | | | 234 | | | | 249,503 | |
3.50%, 07/15/22 | | | | | | | 71 | | | | 71,165 | |
4.13%, 06/15/23 | | | | | | | 83 | | | | 84,141 | |
4.88%, 07/15/32(a) | | | | | | | 685 | | | | 592,730 | |
Advanced Disposal Services, Inc., 5.63%, 11/15/24(a) | | | | | | | 176 | | | | 183,700 | |
Allied Universal Holdco LLC/Allied Universal Finance Corp.(a): | | | | | | | | | | | | |
6.63%, 07/15/26(e) | | | | | | | 1,390 | | | | 1,483,825 | |
9.75%, 07/15/27 | | | | | | | 116 | | | | 121,220 | |
Aviation Capital Group LLC,
6.75%, 04/06/21(a)(e) | | | | | | | 5,000 | | | | 5,296,990 | |
Booz Allen Hamilton, Inc., 5.13%, 05/01/25(a) | | | | | | | 455 | | | | 469,219 | |
Clean Harbors, Inc.(a): | | | | | | | | | | | | |
4.88%, 07/15/27 | | | | | | | 329 | | | | 342,963 | |
5.13%, 07/15/29 | | | | | | | 205 | | | | 218,325 | |
Core & Main LP, 6.13%, 08/15/25(a) | | | | | | | 1,079 | | | | 1,096,534 | |
Fortress Transportation & Infrastructure Investors LLC(a): | | | | | | | | | | | | |
6.75%, 03/15/22 | | | | | | | 85 | | | | 88,506 | |
6.50%, 10/01/25 | | | | | | | 92 | | | | 92,920 | |
GFL Environmental, Inc., 8.50%, 05/01/27(a) | | | | | | | 542 | | | | 596,200 | |
Harland Clarke Holdings Corp., 8.38%, 08/15/22(a) | | | | | | | 470 | | | | 374,825 | |
KAR Auction Services, Inc.,
5.13%, 06/01/25(a)(e) | | | | | | | 283 | | | | 295,381 | |
Mobile Mini, Inc., 5.88%, 07/01/24(e) | | | | | | | 585 | | | | 608,400 | |
Ritchie Bros Auctioneers, Inc.,
5.38%, 01/15/25(a)(e) | | | | | | | 188 | | | | 195,990 | |
United Rentals North America, Inc.: | | | | | | | | | | | | |
4.63%, 10/15/25(e) | | | | | | | 343 | | | | 350,717 | |
5.88%, 09/15/26 | | | | | | | 60 | | | | 63,565 | |
5.50%, 05/15/27 | | | | | | | 345 | | | | 364,406 | |
| | | | | | | | |
| | | | | | | | | | | 13,241,225 | |
|
| Communications Equipment — 0.8% | |
CommScope, Inc.(a): | | | | | | | | | | | | |
5.50%, 03/01/24(e) | | | | | | | 1,124 | | | | 1,139,174 | |
6.00%, 03/01/26 | | | | | | | 225 | | | | 231,187 | |
Gogo Intermediate Holdings LLC/Gogo Finance Co., Inc., 9.88%, 05/01/24(a) | | | | | | | 176 | | | | 185,240 | |
Nokia OYJ(e): | | | | | | | | | | | | |
3.38%, 06/12/22 | | | | | | | 126 | | | | 127,418 | |
4.38%, 06/12/27 | | | | | | | 177 | | | | 180,275 | |
6.63%, 05/15/39 | | | | | | | 245 | | | | 279,912 | |
ViaSat, Inc., 5.63%, 04/15/27(a) | | | | | | | 677 | | | | 713,186 | |
Zayo Group LLC/Zayo Capital, Inc.(e): | | | | | | | | | | | | |
6.38%, 05/15/25 | | | | | | | 343 | | | | 352,604 | |
5.75%, 01/15/27(a) | | | | | | | 1,764 | | | | 1,792,894 | |
| | | | | | | | |
| | | | | | | | | | | 5,001,890 | |
|
| Construction & Engineering — 0.2% | |
Brand Industrial Services, Inc., 8.50%, 07/15/25(a) | | | | | | | 403 | | | | 390,910 | |
frontdoor, Inc., 6.75%, 08/15/26(a) | | | | | | | 436 | | | | 474,695 | |
SRS Distribution, Inc., 8.25%, 07/01/26(a) | | | | | | | 315 | | | | 315,000 | |
| | | | | | | | |
| | | | | | | | | | | 1,180,605 | |
|
| Construction Materials — 0.8% | |
American Builders & Contractors Supply Co., Inc.(a): | | | | | | | | | | | | |
5.75%, 12/15/23 | | | | | | | 136 | | | | 139,876 | |
4.00%, 01/15/28 | | | | | | | 444 | | | | 442,890 | |
| | |
| 46 | | 2019 BLACKROCK ANNUAL REPORTTO SHAREHOLDERS |
| | |
Consolidated Schedule of Investments (continued) October 31, 2019 | | BlackRock Multi-Sector Income Trust (BIT) (Percentages shown are based on Net Assets) |
| | | | | | | | | | | | |
| Security | | Par
(000) | | | Value | |
|
| Construction Materials (continued) | |
Core & Main Holdings LP, (8.625% Cash or 9.38% PIK), 8.63%, 09/15/24(a)(g) | | | USD | | | | 551 | | | $ | 548,245 | |
HD Supply, Inc., 5.38%, 10/15/26(a)(e) | | | | | | | 2,397 | | | | 2,534,827 | |
Navistar International Corp.,
6.63%, 11/01/25(a)(e) | | | | | | | 375 | | | | 382,500 | |
New Enterprise Stone & Lime Co., Inc.(a): | | | | | | | | | | | | |
10.13%, 04/01/22 | | | | | | | 162 | | | | 167,670 | |
6.25%, 03/15/26 | | | | | | | 88 | | | | 91,520 | |
Performance Food Group, Inc., 5.50%, 10/15/27(a) | | | | | | | 331 | | | | 350,032 | |
Williams Scotsman International, Inc.(a): | | | | | | | | | | | | |
7.88%, 12/15/22 | | | | | | | 129 | | | | 134,483 | |
6.88%, 08/15/23 | | | | | | | 464 | | | | 487,200 | |
| | | | | | | | |
| | | | | | | | | | | 5,279,243 | |
|
| Consumer Discretionary — 0.3% | |
Nielsen Co. Luxembourg Sarl, 5.00%, 02/01/25(a)(e) | | | | | | | 156 | | | | 155,220 | |
Viking Cruises Ltd.(a)(e): | | | | | | | | | | | | |
6.25%, 05/15/25 | | | | | | | 300 | | | | 312,750 | |
5.88%, 09/15/27 | | | | | | | 1,118 | | | | 1,187,875 | |
| | | | | | | | |
| | | | | | | | | | | 1,655,845 | |
|
| Consumer Finance — 1.6% | |
Ally Financial, Inc., 8.00%, 11/01/31(e) | | | | | | | 2,670 | | | | 3,714,637 | |
Credit Acceptance Corp., 6.63%, 03/15/26(a) | | | | | | | 47 | | | | 49,938 | |
Credivalores-Crediservicios SAS, 9.75%, 07/27/22(a) | | | | | | | 457 | | | | 470,710 | |
Iron Mountain UK PLC, 3.88%, 11/15/25 | | | GBP | | | | 100 | | | | 129,567 | |
Mulhacen Pte Ltd., (6.5% Cash or 7.25% PIK), 6.50%, 08/01/23(g) | | | EUR | | | | 144 | | | | 130,892 | |
Muthoot Finance Ltd., 6.13%, 10/31/22(a) | | | USD | | | | 481 | | | | 487,734 | |
Navient Corp.: | | | | | | | | | | | | |
5.00%, 10/26/20(e) | | | | | | | 370 | | | | 376,826 | |
6.63%, 07/26/21(e) | | | | | | | 141 | | | | 148,931 | |
7.25%, 09/25/23(e) | | | | | | | 153 | | | | 167,149 | |
6.13%, 03/25/24 | | | | | | | 105 | | | | 109,756 | |
5.88%, 10/25/24 | | | | | | | 137 | | | | 141,110 | |
Refinitiv US Holdings, Inc.(a): | | | | | | | | | | | | |
4.50%, 05/15/26 | | | EUR | | | | 480 | | | | 579,644 | |
6.25%, 05/15/26 | | | USD | | | | 50 | | | | 54,313 | |
8.25%, 11/15/26(e) | | | | | | | 1,152 | | | | 1,293,120 | |
Springleaf Finance Corp.: | | | | | | | | | | | | |
6.13%, 05/15/22 | | | | | | | 85 | | | | 91,375 | |
6.88%, 03/15/25 | | | | | | | 334 | | | | 378,255 | |
7.13%, 03/15/26 | | | | | | | 443 | | | | 505,020 | |
6.63%, 01/15/28 | | | | | | | 262 | | | | 290,165 | |
Verscend Escrow Corp., 9.75%, 08/15/26(a)(e) | | | | | | | 1,453 | | | | 1,545,629 | |
| | | | | | | | |
| | | | | | | | | | | 10,664,771 | |
|
| Containers & Packaging — 1.8% | |
Ardagh Packaging Finance PLC/Ardagh Holdings USA, Inc.: | | | | | | | | | | | | |
4.63%, 05/15/23(a) | | | | | | | 1,312 | | | | 1,343,160 | |
4.13%, 08/15/26(a)(e) | | | | | | | 310 | | | | 313,395 | |
4.75%, 07/15/27(a) | | | GBP | | | | 100 | | | | 133,583 | |
4.75%, 07/15/27 | | | | | | | 100 | | | | 133,583 | |
Berry Global, Inc., 4.88%, 07/15/26(a) | | | USD | | | | 526 | | | | 552,957 | |
Crown Americas LLC/Crown Americas Capital Corp. V, 4.25%, 09/30/26 | | | | | | | 513 | | | | 535,444 | |
Crown Americas LLC/Crown Americas Capital Corp. VI, 4.75%, 02/01/26(e) | | | | | | | 543 | | | | 569,770 | |
Graphic Packaging International LLC, 4.75%, 07/15/27(a) | | | | | | | 160 | | | | 169,200 | |
Greif, Inc., 6.50%, 03/01/27(a) | | | | | | | 73 | | | | 78,475 | |
Intertape Polymer Group, Inc., 7.00%, 10/15/26(a) | | | | | | | 237 | | | | 247,926 | |
LABL Escrow Issuer LLC, 6.75%, 07/15/26(a) | | | | | | | 374 | | | | 387,090 | |
Mauser Packaging Solutions Holding Co., 5.50%, 04/15/24(a)(e) | | | | | | | 1,537 | | | | 1,581,189 | |
| | | | | | | | | | | | |
| Security | | Par
(000) | | | Value | |
|
| Containers & Packaging (continued) | |
Reynolds Group Issuer, Inc./Reynolds Group Issuer LLC/Reynolds Group Issuer Lu(a): | | | | | | | | | | | | |
5.13%, 07/15/23 | | | USD | | | | 172 | | | $ | 176,463 | |
7.00%, 07/15/24 | | | | | | | 881 | | | | 911,835 | |
Sealed Air Corp.(a): | | | | | | | | | | | | |
5.13%, 12/01/24 | | | | | | | 54 | | | | 58,185 | |
6.88%, 07/15/33 | | | | | | | 44 | | | | 51,260 | |
Suzano Austria GmbH, 6.00%, 01/15/29 | | | | | | | 1,201 | | | | 1,324,703 | |
Trivium Packaging Finance BV: | | | | | | | | | | | | |
3.75%, 08/15/26 | | | EUR | | | | 100 | | | | 115,835 | |
5.50%, 08/15/26(a) | | | USD | | | | 1,189 | | | | 1,245,477 | |
8.50%, 08/15/27(a) | | | | | | | 1,508 | | | | 1,607,905 | |
| | | | | | | | |
| | | | | | | | | | | 11,537,435 | |
|
| Diversified Consumer Services — 0.7% | |
APX Group, Inc.: | | | | | | | | | | | | |
8.75%, 12/01/20 | | | | | | | 289 | | | | 284,665 | |
7.88%, 12/01/22 | | | | | | | 185 | | | | 184,769 | |
8.50%, 11/01/24(a) | | | | | | | 166 | | | | 164,755 | |
Ascend Learning LLC(a): | | | | | | | | | | | | |
6.88%, 08/01/25(e) | | | | | | | 374 | | | | 391,298 | |
6.88%, 08/01/25 | | | | | | | 823 | | | | 859,006 | |
Graham Holdings Co., 5.75%, 06/01/26(a) | | | | | | | 204 | | | | 217,770 | |
Laureate Education, Inc., 8.25%, 05/01/25(a) | | | | | | | 138 | | | | 149,730 | |
Pinnacle Bidco PLC, 6.38%, 02/15/25 | | | GBP | | | | 100 | | | | 137,793 | |
Prime Security Services Borrower LLC/Prime Finance, Inc.(a): | | | | | | | | | | | | |
9.25%, 05/15/23(e) | | | USD | | | | 236 | | | | 248,272 | |
5.25%, 04/15/24 | | | | | | | 407 | | | | 416,666 | |
5.75%, 04/15/26(e) | | | | | | | 622 | | | | 637,363 | |
Service Corp. International, 5.13%, 06/01/29 | | | | | | | 294 | | | | 313,110 | |
ServiceMaster Co. LLC, 5.13%, 11/15/24(a)(e) | | | | | | | 546 | | | | 565,110 | |
Verisure Holding AB, 3.50%, 05/15/23 | | | EUR | | | | 100 | | | | 114,894 | |
| | | | | | | | |
| | | | | | | | | | | 4,685,201 | |
| | | |
| Diversified Financial Services — 1.3% | | | | | | | | | |
Arrow Global Finance PLC, 5.13%, 09/15/24 | | | GBP | | | | 100 | | | | 129,460 | |
Cabot Financial Luxembourg II SA (3 mo. EURIBOR + 6.38%), 6.38%, 06/14/24(d) | | | EUR | | | | 100 | | | | 115,294 | |
F-BrasileSpA/F-Brasile US LLC, Series XR, 7.38%, 08/15/26(a) | | | USD | | | | 264 | | | | 275,880 | |
Ford Motor Credit Co. LLC, 4.39%, 01/08/26(e) | | | | | | | 1,250 | | | | 1,246,483 | |
Garfunkelux Holdco 3 SA, 7.50%, 08/01/22 | | | EUR | | | | 100 | | | | 105,383 | |
General Motors Financial Co., Inc., 4.25%, 05/15/23 | | | USD | | | | 326 | | | | 340,896 | |
Gilex Holding Sarl, 8.50%, 05/02/23(a) | | | | | | | 256 | | | | 277,760 | |
Intesa Sanpaolo SpA, 5.02%, 06/26/24(a) | | | | | | | 2,888 | | | | 3,014,572 | |
Intrum AB, 3.00%, 09/15/27 | | | EUR | | | | 100 | | | | 107,905 | |
LHC3 PLC, (4.13% Cash or 4.88% PIK), 4.13%, 08/15/24(g) | | | | | | | 101 | | | | 116,008 | |
Lloyds Banking Group PLC (5 year CMT + 4.82%), 6.75%(h)(i) | | | USD | | | | 515 | | | | 547,831 | |
MSCI, Inc., 5.25%, 11/15/24(a) | | | | | | | 127 | | | | 130,492 | |
Murphy Oil USA, Inc., 4.75%, 09/15/29 | | | | | | | 194 | | | | 202,487 | |
Spectrum Brands, Inc., 5.00%, 10/01/29(a) | | | | | | | 132 | | | | 135,135 | |
Tempo Acquisition LLC/Tempo Acquisition Finance Corp., 6.75%, 06/01/25(a)(e) | | | | | | | 953 | | | | 980,399 | |
Verisure Midholding AB, 5.75%, 12/01/23 | | | EUR | | | | 100 | | | | 114,847 | |
WMG Acquisition Corp.: | | | | | | | | | | | | |
4.13%, 11/01/24 | | | | | | | 90 | | | | 103,406 | |
5.50%, 04/15/26(a) | | | USD | | | | 197 | | | | 206,850 | |
| | | | | | | | |
| | | | | | | | | | | 8,151,088 | |
| |
| Diversified Telecommunication Services — 3.7% | | | | |
AT&T, Inc.(e): | | | | | | | | | | | | |
4.65%, 06/01/44 | | | | | | | 111 | | | | 120,741 | |
| | | | |
| CONSOLIDATED SCHEDULES OF INVESTMENTS | | | 47 | |
| | |
Consolidated Schedule of Investments (continued) October 31, 2019 | | BlackRock Multi-Sector Income Trust (BIT) (Percentages shown are based on Net Assets) |
| | | | | | | | | | | | |
| Security | | Par
(000) | | | Value | |
| | | |
| Diversified Telecommunication Services (continued) | | | | | | | | | |
4.85%, 07/15/45 | | | USD | | | | 389 | | | $ | 440,551 | |
4.75%, 05/15/46 | | | | | | | 2,545 | | | | 2,825,560 | |
Axtel SAB de CV, 6.38%, 11/14/24(a)(e) | | | | | | | 525 | | | | 543,237 | |
CenturyLink, Inc.: | | | | | | | | | | | | |
5.63%, 04/01/25 | | | | | | | 211 | | | | 222,362 | |
Series P, 7.60%, 09/15/39 | | | | | | | 168 | | | | 170,940 | |
Series U, 7.65%, 03/15/42 | | | | | | | 379 | | | | 384,685 | |
Series W, 6.75%, 12/01/23(e) | | | | | | | 886 | | | | 984,656 | |
Series Y, 7.50%, 04/01/24(e) | | | | | | | 934 | | | | 1,060,090 | |
Cincinnati Bell, Inc., 7.00%, 07/15/24(a)(e) | | | | | | | 452 | | | | 407,930 | |
DKT Finance ApS, 7.00%, 06/17/23 | | | EUR | | | | 100 | | | | 117,943 | |
Embarq Corp., 8.00%, 06/01/36 | | | USD | | | | 243 | | | | 240,570 | |
Frontier Communications Corp., 8.00%, 04/01/27(a)(e) | | | | | | | 2,173 | | | | 2,281,650 | |
GCI LLC, 6.63%, 06/15/24(a) | | | | | | | 182 | | | | 197,243 | |
Level 3 Financing, Inc.: | | | | | | | | | | | | |
5.38%, 08/15/22 | | | | | | | 91 | | | | 91,341 | |
5.63%, 02/01/23 | | | | | | | 146 | | | | 147,460 | |
5.13%, 05/01/23(e) | | | | | | | 360 | | | | 364,500 | |
5.38%, 05/01/25 | | | | | | | 146 | | | | 150,928 | |
5.25%, 03/15/26(e) | | | | | | | 864 | | | | 901,800 | |
Oi SA, (8.00% Cash or 4.00% PIK), 10.00%, 07/27/25(g) | | | | | | | 507 | | | | 460,736 | |
Telecom Argentina SA, 8.00%, 07/18/26(a) | | | | | | | 262 | | | | 234,408 | |
Telecom Italia Capital SA: | | | | | | | | | | | | |
6.38%, 11/15/33 | | | | | | | 82 | | | | 90,381 | |
6.00%, 09/30/34 | | | | | | | 473 | | | | 504,928 | |
7.20%, 07/18/36 | | | | | | | 23 | | | | 26,910 | |
7.72%, 06/04/38 | | | | | | | 71 | | | | 86,975 | |
Telecom Italia SpA: | | | | | | | | | | | | |
4.00%, 04/11/24 | | | EUR | | | | 100 | | | | 123,387 | |
5.30%, 05/30/24(a)(e) | | | USD | | | | 800 | | | | 856,000 | |
2.75%, 04/15/25 | | | EUR | | | | 100 | | | | 117,385 | |
SoftBank Group Corp.: | | | | | | | | | | | | |
4.00%, 04/20/23 | | | | | | | 240 | | | | 285,378 | |
4.50%, 04/20/25 | | | | | | | 100 | | | | 120,456 | |
Verizon Communications, Inc.,
6.55%, 09/15/43(e) | | | USD | | | | 6,500 | | | | 9,681,353 | |
| | | | | | | | |
| | | | | | | | | | | 24,242,484 | |
| | | |
| Electric Utilities — 1.2% | | | | | | | | | |
Duke Energy Corp., 4.80%, 12/15/45(e) | | | | | | | 1,500 | | | | 1,805,919 | |
Emera US Finance LP, 4.75%, 06/15/46(e) | | | | | | | 200 | | | | 234,769 | |
Empresas Publicas de Medellin ESP, 4.25%, 07/18/29(a) | | | | | | | 309 | | | | 322,496 | |
Enel Finance International NV, 3.63%, 05/25/27(a)(e) | | | | | | | 1,250 | | | | 1,305,044 | |
Energuate Trust, 5.88%, 05/03/27(a)(e) | | | | | | | 375 | | | | 376,875 | |
Inkia Energy Ltd., 5.88%, 11/09/27(a)(e) | | | | | | | 455 | | | | 472,347 | |
NextEra Energy Operating Partners LP(a): | | | | | | | | | | | | |
4.25%, 07/15/24 | | | | | | | 626 | | | | 643,027 | |
4.25%, 09/15/24 | | | | | | | 119 | | | | 123,760 | |
4.50%, 09/15/27 | | | | | | | 150 | | | | 153,000 | |
Southern Co., 4.40%, 07/01/46(e) | | | | | | | 1,000 | | | | 1,127,559 | |
Talen Energy Supply LLC: | | | | | | | | | | | | |
6.50%, 06/01/25 | | | | | | | 60 | | | | 45,001 | |
10.50%, 01/15/26(a) | | | | | | | 60 | | | | 51,600 | |
TerraForm Power Operating LLC, 4.75%, 01/15/30(a) | | | | | | | 410 | | | | 423,838 | |
Virginia Electric & Power Co., Series A,
6.00%, 05/15/37(e) | | | | | | | 750 | | | | 1,009,319 | |
| | | | | | | | |
| | | | | | | | | | | 8,094,554 | |
|
| Electronic Equipment, Instruments & Components — 0.5% | |
CDW LLC/CDW Finance Corp.: | | | | | | | | | | | | |
5.50%, 12/01/24(e) | | | | | | | 724 | | | | 805,855 | |
5.00%, 09/01/25 | | | | | | | 127 | | | | 132,715 | |
4.25%, 04/01/28 | | | | | | | 134 | | | | 138,703 | |
Corning, Inc., 4.38%, 11/15/57(e) | | | | | | | 1,915 | | | | 2,027,279 | |
Itron, Inc., 5.00%, 01/15/26(a) | | | | | | | 29 | | | | 30,015 | |
| | | | | | | | |
| | | | | | | | | | | 3,134,567 | |
| | | | | | | | | | | | |
| Security | | Par
(000) | | | Value | |
|
| Energy Equipment & Services — 0.5% | |
Apergy Corp., 6.38%, 05/01/26 | | | USD | | | | 283 | | | $ | 276,633 | |
Archrock Partners LP/Archrock Partners Finance Corp., 6.88%, 04/01/27(a) | | | | | | | 173 | | | | 178,605 | |
Gates Global LLC/Gates Global Co.,
6.00%, 07/15/22(a)(e) | | | | | | | 466 | | | | 465,417 | |
Odebrecht Oil & Gas Finance Ltd.,
0.00%, 12/31/49(a)(i)(j) | | | BRL | | | | 155 | | | | 1,159 | |
Pattern Energy Group, Inc., 5.88%, 02/01/24(a) | | | USD | | | | 263 | | | | 269,575 | |
Transocean, Inc.: | | | | | | | | | | | | |
8.38%, 12/15/21 | | | | | | | 47 | | | | 47,705 | |
9.00%, 07/15/23(a) | | | | | | | 1,046 | | | | 1,065,612 | |
7.25%, 11/01/25(a) | | | | | | | 81 | | | | 71,483 | |
7.50%, 01/15/26(a) | | | | | | | 183 | | | | 162,870 | |
USA Compression Partners LP/USA Compression Finance Corp.: | | | | | | | | | | | | |
6.88%, 04/01/26(e) | | | | | | | 329 | | | | 332,290 | |
6.88%, 09/01/27(a) | | | | | | | 567 | | | | 567,000 | |
| | | | | | | | |
| | | | | | | | | | | 3,438,349 | |
|
| Environmental, Maintenance, & Security Service — 0.2% | |
GFL Environmental, Inc., 7.00%, 06/01/26(a) | | | | | | | 609 | | | | 645,540 | |
Tervita Corp., 7.63%, 12/01/21(a)(e) | | | | | | | 383 | | | | 378,212 | |
Waste Pro USA, Inc., 5.50%, 02/15/26(a) | | | | | | | 177 | | | | 182,753 | |
| | | | | | | | |
| | | | | | | | | | | 1,206,505 | |
|
| Equity Real Estate Investment Trusts (REITs) — 1.5% | |
Brookfield Property REIT, Inc./BPR Cumulus LLC/BPR Nimbus LLC/GGSI Sellco LL, 5.75%, 05/15/26(a) | | | | | | | 199 | | | | 207,706 | |
Five Point Operating Co. LP/Five Point Capital Corp., 7.88%, 11/15/25(a)(e) | | | | | | | 265 | | | | 250,470 | |
Hilton Worldwide Finance LLC/Hilton Worldwide Finance Corp., 4.63%, 04/01/25 | | | | | | | 34 | | | | 34,935 | |
Iron Mountain, Inc., 4.88%, 09/15/27(a) | | | | | | | 471 | | | | 486,896 | |
iStar, Inc.(e): | | | | | | | | | | | | |
6.00%, 04/01/22 | | | | | | | 96 | | | | 98,520 | |
5.25%, 09/15/22 | | | | | | | 81 | | | | 82,924 | |
Marriott Ownership Resorts, Inc./ILG LLC,
6.50%, 09/15/26 | | | | | | | 48 | | | | 51,899 | |
MGM Growth Properties Operating Partnership LP/MGP FinanceCo-Issuer, Inc.: | | | | | | | | | | | | |
5.63%, 05/01/24(e) | | | | | | | 1,713 | | | | 1,886,441 | |
4.50%, 09/01/26(e) | | | | | | | 715 | | | | 759,688 | |
5.75%, 02/01/27(a) | | | | | | | 32 | | | | 36,160 | |
MPT Operating Partnership LP/MPT Finance Corp.: | | | | | | | | | | | | |
5.50%, 05/01/24 | | | | | | | 88 | | | | 90,310 | |
5.00%, 10/15/27(e) | | | | | | | 1,095 | | | | 1,152,488 | |
4.63%, 08/01/29 | | | | | | | 539 | | | | 562,252 | |
SBA Communications Corp.,
4.88%, 09/01/24(e) | | | | | | | 1,636 | | | | 1,699,395 | |
Starwood Property Trust, Inc.,
5.00%, 12/15/21(e) | | | | | | | 278 | | | | 287,730 | |
Trust F/1401, 6.95%, 01/30/44 | | | | | | | 1,738 | | | | 2,007,390 | |
VICI Properties 1 LLC/VICI FC, Inc.,
8.00%, 10/15/23(e) | | | | | | | 168 | | | | 182,583 | |
Wyndham Hotels & Resorts, Inc.,
5.38%, 04/15/26(a) | | | | | | | 148 | | | | 156,140 | |
| | | | | | | | |
| | | | | | | | | | | 10,033,927 | |
|
| Food & Staples Retailing — 0.4% | |
Albertsons Cos. LLC/Safeway, Inc./New Albertson’s, Inc./Albertson’s LLC: | | | | | | | | | | | | |
6.63%, 06/15/24(e) | | | | | | | 206 | | | | 216,042 | |
5.75%, 03/15/25 | | | | | | | 94 | | | | 97,262 | |
Albertsons Cos. LLC/Safeway, Inc./New Albertsons LP/Albertson’s LLC(a): | | | | | | | | | | | | |
7.50%, 03/15/26 | | | | | | | 127 | | | | 141,129 | |
5.88%, 02/15/28 | | | | | | | 414 | | | | 441,945 | |
| | |
| 48 | | 2019 BLACKROCK ANNUAL REPORTTO SHAREHOLDERS |
| | |
Consolidated Schedule of Investments (continued) October 31, 2019 | | BlackRock Multi-Sector Income Trust (BIT) (Percentages shown are based on Net Assets) |
| | | | | | | | | | | | |
| Security | | Par
(000) | | | Value | |
|
| Food & Staples Retailing (continued) | |
B&M European Value Retail SA,
4.13%, 02/01/22 | | | GBP | | | | 100 | | | $ | 131,238 | |
BRF GmbH, 4.35%, 09/29/26 | | | USD | | | | 200 | | | | 199,313 | |
Post Holdings, Inc., 5.50%, 12/15/29(a) | | | | | | | 323 | | | | 340,507 | |
Tesco Corporate Treasury Services PLC,
2.50%, 05/02/25 | | | GBP | | | | 100 | | | | 132,536 | |
Walgreens Boots Alliance, Inc.,
4.80%, 11/18/44(e) | | | USD | | | | 750 | | | | 800,476 | |
| | | | | | | | |
| | | | | | | | | | | 2,500,448 | |
|
| Food Products — 1.4% | |
1011778 BC ULC/New Red Finance, Inc.,
3.88%, 01/15/28(a) | | | | | | | 501 | | | | 503,655 | |
Aramark Services, Inc.: | | | | | | | | | | | | |
5.00%, 04/01/25(a) | | | | | | | 347 | | | | 361,314 | |
4.75%, 06/01/26 | | | | | | | 252 | | | | 258,615 | |
5.00%, 02/01/28(a)(e) | | | | | | | 681 | | | | 711,645 | |
Chobani LLC/Chobani Finance Corp., Inc.,
7.50%, 04/15/25(a)(e) | | | | | | | 492 | | | | 472,320 | |
Darling Ingredients, Inc., 5.25%, 04/15/27(a) | | | | | | | 146 | | | | 153,300 | |
JBS Investments II GmbH, 5.75%, 01/15/28(a) | | | | | | | 395 | | | | 411,590 | |
JBS USA LUX SA/JBS USA Finance, Inc.(a): | | | | | | | | | | | | |
5.88%, 07/15/24 | | | | | | | 594 | | | | 614,784 | |
5.75%, 06/15/25(e) | | | | | | | 1,153 | | | | 1,201,282 | |
6.75%, 02/15/28 | | | | | | | 464 | | | | 511,850 | |
JBS USA LUX SA/JBS USA Food Co./JBS USA Finance, Inc.(a): | | | | | | | | | | | | |
6.50%, 04/15/29 | | | | | | | 822 | | | | 914,499 | |
5.50%, 01/15/30 | | | | | | | 715 | | | | 769,519 | |
MARB BondCo PLC: | | | | | | | | | | | | |
7.00%, 03/15/24 | | | | | | | 229 | | | | 238,017 | |
6.88%, 01/19/25(a) | | | | | | | 637 | | | | 662,878 | |
MHP Lux SA, 6.25%, 09/19/29(a) | | | | | | | 600 | | | | 573,750 | |
Post Holdings, Inc.(a): | | | | | | | | | | | | |
5.50%, 03/01/25(e) | | | | | | | 273 | | | | 285,995 | |
5.75%, 03/01/27(e) | | | | | | | 294 | | | | 313,001 | |
5.63%, 01/15/28 | | | | | | | 86 | | | | 92,020 | |
Simmons Foods, Inc., 7.75%, 01/15/24(a) | | | | | | | 279 | | | | 301,669 | |
| | | | | | | | | | | | |
| | | | | | | | | | | 9,351,703 | |
|
| Health Care Equipment & Supplies — 1.0% | |
Avantor, Inc.(a)(e): | | | | | | | | | | | | |
6.00%, 10/01/24 | | | | | | | 2,057 | | | | 2,198,686 | |
9.00%, 10/01/25 | | | | | | | 1,305 | | | | 1,457,946 | |
Hill-Rom Holdings, Inc., 4.38%, 09/15/27(a) | | | | | | | 109 | | | | 112,270 | |
Hologic, Inc.(a): | | | | | | | | | | | | |
4.38%, 10/15/25 | | | | | | | 225 | | | | 230,519 | |
4.63%, 02/01/28 | | | | | | | 179 | | | | 187,279 | |
Immucor, Inc., 11.13%, 02/15/22(a) | | | | | | | 112 | | | | 112,056 | |
Ortho-Clinical Diagnostics, Inc./Ortho-Clinical Diagnostics SA, 6.63%, 05/15/22(a)(e) | | | | | | | 2,001 | | | | 1,925,963 | |
Teleflex, Inc.: | | | | | | | | | | | | |
4.88%, 06/01/26 | | | | | | | 284 | | | | 297,756 | |
4.63%, 11/15/27 | | | | | | | 72 | | | | 75,420 | |
| | | | | | | | | | | | |
| | | | | | | | | | | 6,597,895 | |
|
| Health Care Providers & Services — 3.5% | |
Acadia Healthcare Co., Inc., 5.13%, 07/01/22 | | | | | | | 72 | | | | 72,630 | |
AHP Health Partners, Inc., 9.75%, 07/15/26(a) | | | | | | | 252 | | | | 271,530 | |
Centene Corp.: | | | | | | | | | | | | |
6.13%, 02/15/24 | | | | | | | 40 | | | | 41,588 | |
5.38%, 06/01/26(a)(e) | | | | | | | 1,820 | | | | 1,926,470 | |
CHS/Community Health Systems, Inc.(a): | | | | | | | | | | | | |
8.63%, 01/15/24 | | | | | | | 836 | | | | 850,630 | |
8.00%, 03/15/26(e) | | | | | | | 876 | | | | 856,290 | |
Eagle Holding Co. II LLC, (7.63% Cash or 8.38% PIK), 7.63%, 05/15/22(a)(e)(g) | | | | | | | 116 | | | | 117,015 | |
| | | | | | | | | | | | |
| Security | | Par
(000) | | | Value | |
|
| Health Care Providers & Services (continued) | |
Encompass Health Corp., 5.75%, 11/01/24 | | | USD | | | | 45 | | | $ | 45,506 | |
Envision Healthcare Crop., 8.75%, 10/15/26(a) | | | | | | | 252 | | | | 144,900 | |
HCA, Inc.: | | | | | | | | | | | | |
5.38%, 02/01/25(e) | | | | | | | 1,326 | | | | 1,456,942 | |
5.88%, 02/15/26 | | | | | | | 54 | | | | 60,750 | |
5.38%, 09/01/26(e) | | | | | | | 403 | | | | 439,270 | |
5.63%, 09/01/28 | | | | | | | 1,080 | | | | 1,213,650 | |
5.88%, 02/01/29 | | | | | | | 655 | | | | 742,606 | |
MEDNAX, Inc.(a): | | | | | | | | | | | | |
5.25%, 12/01/23(e) | | | | | | | 198 | | | | 200,475 | |
6.25%, 01/15/27 | | | | | | | 673 | | | | 666,270 | |
Molina Healthcare, Inc.: | | | | | | | | | | | | |
5.38%, 11/15/22 | | | | | | | 207 | | | | 218,385 | |
4.88%, 06/15/25(a) | | | | | | | 279 | | | | 283,534 | |
MPH Acquisition Holdings LLC,
7.13%, 06/01/24(a)(e) | | | | | | | 667 | | | | 617,008 | |
Northwell Healthcare, Inc., 4.26%, 11/01/47(e) | | | | | | | 686 | | | | 759,102 | |
NVA Holdings, Inc., 6.88%, 04/01/26(a) | | | | | | | 206 | | | | 220,935 | |
Polaris Intermediate Corp., (8.50% Cash),
8.50%, 12/01/22(a)(e)(g) | | | | | | | 698 | | | | 584,575 | |
Regional Care Hospital Partners Holdings, Inc., 8.25%, 05/01/23(a)(e) | | | | | | | 711 | | | | 758,993 | |
Sotera Health Holdings LLC,
6.50%, 05/15/23(a) | | | | | | | 433 | | | | 441,119 | |
Surgery Center Holdings, Inc.(a): | | | | | | | | | | | | |
6.75%, 07/01/25(e) | | | | | | | 513 | | | | 474,525 | |
10.00%, 04/15/27 | | | | | | | 317 | | | | 320,963 | |
Team Health Holdings, Inc.,
6.38%, 02/01/25(a)(e) | | | | | | | 313 | | | | 201,885 | |
Tenet Healthcare Corp.: | | | | | | | | | | | | |
8.13%, 04/01/22(e) | | | | | | | 1,295 | | | | 1,400,283 | |
4.63%, 07/15/24(e) | | | | | | | 447 | | | | 460,410 | |
4.63%, 09/01/24(a) | | | | | | | 446 | | | | 457,418 | |
4.88%, 01/01/26(a) | | | | | | | 1,736 | | | | 1,796,760 | |
6.25%, 02/01/27(a)(e) | | | | | | | 683 | | | | 723,700 | |
5.13%, 11/01/27(a) | | | | | | | 1,184 | | | | 1,231,360 | |
UnitedHealth Group, Inc., 4.38%, 03/15/42(e) | | | | | | | 750 | | | | 860,030 | |
Vizient, Inc., 6.25%, 05/15/27(a) | | | | | | | 483 | | | | 520,882 | |
WellCare Health Plans, Inc.: | | | | | | | | | | | | |
5.25%, 04/01/25 | | | | | | | 543 | | | | 568,283 | |
5.38%, 08/15/26(a) | | | | | | | 387 | | | | 411,671 | |
| | | | | | | | |
| | | | | | | | | | | 22,418,343 | |
|
| Health Care Technology — 0.4% | |
Change Healthcare Holdings LLC/Change Healthcare Finance, Inc., 5.75%, 03/01/25(a) | | | | | | | 842 | | | | 861,535 | |
IQVIA, Inc.: | | | | | | | | | | | | |
3.25%, 03/15/25 | | | EUR | | | | 194 | | | | 221,230 | |
3.25%, 03/15/25(a) | | | | | | | 100 | | | | 114,036 | |
5.00%, 10/15/26(a) | | | USD | | | | 548 | | | | 578,140 | |
5.00%, 05/15/27(a) | | | | | | | 717 | | | | 760,020 | |
| | | | | | | | |
| | | | | | | | | | | 2,534,961 | |
|
| Hotels, Restaurants & Leisure — 5.4% | |
1011778 BC ULC/New Red Finance, Inc.(a)(e): | | | | | | | | | | | | |
4.25%, 05/15/24 | | | | | | | 28 | | | | 28,735 | |
5.00%, 10/15/25 | | | | | | | 1,959 | | | | 2,007,975 | |
Boyd Gaming Corp., 6.00%, 08/15/26 | | | | | | | 133 | | | | 140,648 | |
Boyne USA, Inc., 7.25%, 05/01/25(a) | | | | | | | 260 | | | | 284,050 | |
Cedar Fair LP, 5.25%, 07/15/29(a) | | | | | | | 329 | | | | 352,852 | |
Churchill Downs, Inc.(a): | | | | | | | | | | | | |
5.50%, 04/01/27 | | | | | | | 965 | | | | 1,022,900 | |
4.75%, 01/15/28 | | | | | | | 309 | | | | 319,815 | |
Cirsa Finance International Sarl, 7.88%, 12/20/23(a) | | | | | | | 200 | | | | 211,308 | |
EI Group PLC, 6.00%, 10/06/23 | | | GBP | | | | 3,320 | | | | 4,345,397 | |
Eldorado Resorts, Inc.: | | | | | | | | | | | | |
6.00%, 04/01/25 | | | USD | | | | 106 | | | | 111,433 | |
6.00%, 09/15/26 | | | | | | | 138 | | | | 151,283 | |
| | | | |
| CONSOLIDATED SCHEDULES OF INVESTMENTS | | | 49 | |
| | |
Consolidated Schedule of Investments (continued) October 31, 2019 | | BlackRock Multi-Sector Income Trust (BIT) (Percentages shown are based on Net Assets) |
| | | | | | | | | | | | |
| Security | | Par
(000) | | | Value | |
|
| Hotels, Restaurants & Leisure (continued) | |
GLP Capital LP/GLP Financing II, Inc.: | | | | | | | | | | | | |
5.25%, 06/01/25 | | | USD | | | | 124 | | | $ | 135,968 | |
5.38%, 04/15/26 | | | | | | | 208 | | | | 228,727 | |
Golden Nugget, Inc., 6.75%, 10/15/24(a)(e) | | | | | | | 1,507 | | | | 1,552,361 | |
Hilton Domestic Operating Co., Inc.: | | | | | | | | | | | | |
4.25%, 09/01/24(e) | | | | | | | 382 | | | | 388,685 | |
5.13%, 05/01/26(e) | | | | | | | 852 | | | | 894,600 | |
4.88%, 01/15/30(a) | | | | | | | 1,208 | | | | 1,283,500 | |
Hilton Worldwide Finance LLC/Hilton Worldwide Finance Corp., 4.88%, 04/01/27 | | | | | | | 246 | | | | 260,140 | |
IRB Holding Corp., 6.75%, 02/15/26(a) | | | | | | | 139 | | | | 141,433 | |
KFC Holding Co./Pizza Hut Holdings LLC/Taco Bell of America LLC(a): | | | | | | | | | | | | |
5.00%, 06/01/24 | | | | | | | 45 | | | | 46,688 | |
5.25%, 06/01/26(e) | | | | | | | 406 | | | | 429,345 | |
4.75%, 06/01/27 | | | | | | | 9 | | | | 9,391 | |
LHMC Finco 2 Sarl, (7.25% Cash or 8.00% PIK), 7.25%, 10/02/25(g) | | | EUR | | | | 100 | | | | 111,948 | |
Lions Gate Capital Holdings LLC(a): | | | | | | | | | | | | |
6.38%, 02/01/24 | | | USD | | | | 30 | | | | 28,594 | |
5.88%, 11/01/24 | | | | | | | 203 | | | | 191,328 | |
McDonald’s Corp., 3.70%, 01/30/26(e) | | | | | | | 750 | | | | 809,794 | |
MGM Resorts International: | | | | | | | | | | | | |
6.63%, 12/15/21(e) | | | | | | | 1,419 | | | | 1,537,841 | |
7.75%, 03/15/22(e) | | | | | | | 438 | | | | 489,465 | |
6.00%, 03/15/23 | | | | | | | 494 | | | | 544,793 | |
5.75%, 06/15/25 | | | | | | | 52 | | | | 57,655 | |
4.63%, 09/01/26 | | | | | | | 38 | | | | 39,900 | |
Motion Bondco DAC, 6.63%, 11/15/27(a)(f) | | | | | | | 200 | | | | 203,500 | |
Scientific Games International, Inc.: | | | | | | | | | | | | |
10.00%, 12/01/22(e) | | | | | | | 380 | | | | 390,925 | |
5.00%, 10/15/25(a)(e) | | | | | | | 872 | | | | 898,160 | |
3.38%, 02/15/26 | | | EUR | | | | 300 | | | | 338,772 | |
8.25%, 03/15/26(a) | | | USD | | | | 1,008 | | | | 1,065,960 | |
Six Flags Entertainment Corp.(a): | | | | | | | | | | | | |
4.88%, 07/31/24(e) | | | | | | | 1,683 | | | | 1,737,697 | |
5.50%, 04/15/27 | | | | | | | 30 | | | | 31,425 | |
Station Casinos LLC, 5.00%, 10/01/25(a) | | | | | | | 330 | | | | 334,537 | |
Stonegate Pub Co. Financing PLC: | | | | | | | | | | | | |
(3 mo. LIBOR GBP + 6.25%),
7.03%, 03/15/22(d) | | | GBP | | | | 100 | | | | 129,859 | |
4.88%, 03/15/22 | | | | | | | 100 | | | | 132,194 | |
Unique Pub Finance Co. PLC: | | | | | | | | | | | | |
Series M, 7.40%, 03/28/24 | | | | | | | 6,400 | | | | 9,493,968 | |
Series N, 6.46%, 03/30/32 | | | | | | | 100 | | | | 157,495 | |
Wyndham Destinations, Inc.: | | | | | | | | | | | | |
5.40%, 04/01/24 | | | USD | | | | 16 | | | | 16,960 | |
5.75%, 04/01/27 | | | | | | | 76 | | | | 83,030 | |
Wynn Las Vegas LLC/Wynn Las Vegas Capital Corp., 5.25%, 05/15/27(a) | | | | | | | 201 | | | | 209,542 | |
Wynn Macau Ltd., 5.50%, 10/01/27(a) | | | | | | | 600 | | | | 616,125 | |
Wynn Resorts Finance LLC/Wynn Resorts Capital Corp., 5.13%, 10/01/29(a) | | | | | | | 586 | | | | 612,370 | |
Yum! Brands, Inc.: | | | | | | | | | | | | |
3.88%, 11/01/23 | | | | | | | 110 | | | | 113,870 | |
4.75%, 01/15/30(a) | | | | | | | 463 | | | | 485,571 | |
5.35%, 11/01/43 | | | | | | | 85 | | | | 83,300 | |
| | | | | | | | |
| | | | | | | | | | | 35,293,812 | |
|
| Household Durables — 0.8% | |
Brookfield Residential Properties, Inc./Brookfield Residential US Corp.(a): | | | | | | | | | | | | |
6.13%, 07/01/22(e) | | | | | | | 599 | | | | 608,734 | |
6.25%, 09/15/27 | | | | | | | 288 | | | | 293,760 | |
Controladora Mabe SA de CV,
5.60%, 10/23/28(a) | | | | | | | 624 | | | | 685,776 | |
| | | | | | | | | | | | |
| Security | | Par
(000) | | | Value | |
|
| Household Durables (continued) | |
Lennar Corp.: | | | | | | | | | | | | |
6.25%, 12/15/21(e) | | | USD | | | | 450 | | | $ | 474,750 | |
4.88%, 12/15/23 | | | | | | | 146 | | | | 156,220 | |
4.75%, 05/30/25(e) | | | | | | | 410 | | | | 438,700 | |
5.25%, 06/01/26 | | | | | | | 32 | | | | 35,200 | |
4.75%, 11/29/27(e) | | | | | | | 425 | | | | 459,000 | |
Mattamy Group Corp.(a): | | | | | | | | | | | | |
6.88%, 12/15/23 | | | | | | | 133 | | | | 137,821 | |
6.50%, 10/01/25 | | | | | | | 205 | | | | 216,787 | |
MDC Holdings, Inc., 6.00%, 01/15/43 | | | | | | | 144 | | | | 149,940 | |
Meritage Homes Corp., 5.13%, 06/06/27 | | | | | | | 91 | | | | 98,053 | |
PulteGroup, Inc.: | | | | | | | | | | | | |
6.38%, 05/15/33(e) | | | | | | | 469 | | | | 532,315 | |
6.00%, 02/15/35 | | | | | | | 48 | | | | 52,800 | |
Taylor Morrison Communities, Inc.,
5.88%, 06/15/27(a) | | | | | | | 312 | | | | 348,410 | |
Tempur Sealy International, Inc.,
5.50%, 06/15/26(e) | | | | | | | 191 | | | | 199,834 | |
Toll Brothers Finance Corp., 3.80%, 11/01/29 | | | | | | | 78 | | | | 76,635 | |
TRI Pointe Group, Inc., 4.88%, 07/01/21 | | | | | | | 66 | | | | 67,815 | |
| | | | | | | | |
| | | | | | | | | | | 5,032,550 | |
|
| Household Products — 0.1% | |
ACCO Brands Corp., 5.25%, 12/15/24(a) | | | | | | | 102 | | | | 105,825 | |
Energizer Holdings, Inc.(a): | | | | | | | | | | | | |
6.38%, 07/15/26 | | | | | | | 54 | | | | 57,580 | |
7.75%, 01/15/27(e) | | | | | | | 505 | | | | 559,288 | |
Summer BC Holdco B Sarl, 5.75%, 10/31/26 | | | EUR | | | | 100 | | | | 111,669 | |
| | | | | | | | |
| | | | | | | | | | | 834,362 | |
|
| Independent Power and Renewable Electricity Producers — 1.2% | |
Calpine Corp.: | | | | | | | | | | | | |
5.38%, 01/15/23(e) | | | USD | | | | 1,331 | | | | 1,352,562 | |
5.88%, 01/15/24(a)(e) | | | | | | | 453 | | | | 462,966 | |
5.50%, 02/01/24 | | | | | | | 77 | | | | 77,193 | |
5.75%, 01/15/25(e) | | | | | | | 513 | | | | 526,466 | |
5.25%, 06/01/26(a)(e) | | | | | | | 654 | | | | 680,160 | |
Clearway Energy Operating LLC: | | | | | | | | | | | | |
5.38%, 08/15/24(e) | | | | | | | 379 | | | | 384,211 | |
5.75%, 10/15/25 | | | | | | | 255 | | | | 261,694 | |
Genneia SA, 8.75%, 01/20/22(a)(e) | | | | | | | 1,061 | | | | 715,843 | |
NRG Energy, Inc.: | | | | | | | | | | | | |
6.63%, 01/15/27(e) | | | | | | | 1,326 | | | | 1,437,053 | |
5.75%, 01/15/28(e) | | | | | | | 461 | | | | 499,033 | |
5.25%, 06/15/29(a) | | | | | | | 676 | | | | 725,010 | |
QEP Resources, Inc., 5.38%, 10/01/22 | | | | | | | 192 | | | | 188,175 | |
TerraForm Power Operating LLC(a): | | | | | | | | | | | | |
4.25%, 01/31/23 | | | | | | | 214 | | | | 220,420 | |
5.00%, 01/31/28 | | | | | | | 214 | | | | 225,706 | |
| | | | | | | | |
| | | | | | | | | | | 7,756,492 | |
|
| Industrial Conglomerates — 0.3% | |
Algeco Global Finance PLC, 6.50%, 02/15/23 | | | EUR | | | | 100 | | | | 110,983 | |
BWX Technologies, Inc., 5.38%, 07/15/26(a) | | | USD | | | | 470 | | | | 497,754 | |
Icahn Enterprises LP/Icahn Enterprises Finance Corp, 6.25%, 05/15/26 | | | | | | | 510 | | | | 540,600 | |
Icahn Enterprises LP/Icahn Enterprises Finance Corp., 4.75%, 09/15/24(a) | | | | | | | 96 | | | | 96,960 | |
Vertiv Group Corp., 9.25%, 10/15/24(a) | | | | | | | 490 | | | | 461,825 | |
| | | | | | | | |
| | | | | | | | | | | 1,708,122 | |
|
| Insurance — 1.3% | |
Acrisure LLC/Acrisure Finance, Inc.,
8.13%, 02/15/24(a) | | | | | | | 206 | | | | 218,556 | |
Algeco Global Finance PLC, 8.00%, 02/15/23(a) | | | | | | | 200 | | | | 197,000 | |
Alliant Holdings Intermediate LLC/Alliant HoldingsCo-Issuer, 6.75%, 10/15/27(a) | | | | | | | 1,159 | | | | 1,205,487 | |
AmWINS Group, Inc., 7.75%, 07/01/26(a) | | | | | | | 262 | | | | 281,650 | |
| | |
| 50 | | 2019 BLACKROCK ANNUAL REPORTTO SHAREHOLDERS |
| | |
Consolidated Schedule of Investments (continued) October 31, 2019 | | BlackRock Multi-Sector Income Trust (BIT) (Percentages shown are based on Net Assets) |
| | | | | | | | | | | | |
| Security | | Par
(000) | | | Value | |
|
| Insurance (continued) | |
Aon PLC, 3.88%, 12/15/25(e) | | | USD | | | | 1,280 | | | $ | 1,384,586 | |
Assicurazioni Generali SpA, 2.12%, 10/01/30 | | | EUR | | | | 100 | | | | 113,125 | |
CNO Financial Group, Inc., 5.25%, 05/30/29 | | | USD | | | | 417 | | | | 459,897 | |
GTCR AP Finance, Inc., 8.00%, 05/15/27(a) | | | | | | | 334 | | | | 341,515 | |
HUB International Ltd., 7.00%, 05/01/26(a) | | | | | | | 1,466 | | | | 1,508,148 | |
Nationstar Mortgage Holdings, Inc.(a): | | | | | | | | | | | | |
8.13%, 07/15/23 | | | | | | | 846 | | | | 896,760 | |
9.13%, 07/15/26 | | | | | | | 171 | | | | 187,459 | |
Nationwide Building Society (5 year USD ICE Swap + 1.85%), 4.13%, 10/18/32(a)(e)(h) | | | | | | | 690 | | | | 703,496 | |
Teachers Insurance & Annuity Association of America, 4.27%, 05/15/47(a)(e) | | | | | | | 700 | | | | 810,351 | |
| | | | | | | | |
| | | | | | | | | | | 8,308,030 | |
|
| Interactive Media & Services — 0.7% | |
Go Daddy Operating Co. LLC/GD Finance Co., Inc., 5.25%, 12/01/27(a) | | | | | | | 359 | | | | 380,540 | |
Match Group, Inc., 5.63%, 02/15/29(a) | | | | | | | 209 | | | | 223,891 | |
Netflix, Inc.: | | | | | | | | | | | | |
4.88%, 04/15/28 | | | | | | | 89 | | | | 91,963 | |
5.88%, 11/15/28(e) | | | | | | | 904 | | | | 995,530 | |
3.88%, 11/15/29 | | | EUR | | | | 100 | | | | 114,112 | |
5.38%, 11/15/29(a) | | | USD | | | | 700 | | | | 736,750 | |
3.63%, 06/15/30 | | | EUR | | | | 100 | | | | 111,403 | |
4.88%, 06/15/30(a) | | | USD | | | | 610 | | | | 616,710 | |
Rackspace Hosting, Inc., 8.63%, 11/15/24(a)(e) | | | | | | | 182 | | | | 166,530 | |
Sabre GLBL, Inc., 5.25%, 11/15/23(a)(e) | | | | | | | 305 | | | | 312,625 | |
Uber Technologies, Inc.(a): | | | | | | | | | | | | |
7.50%, 11/01/23(e) | | | | | | | 301 | | | | 306,343 | |
7.50%, 09/15/27 | | | | | | | 414 | | | | 407,790 | |
| | | | | | | | | | | | |
| | | | | | | | | | | 4,464,187 | |
|
| IT Services — 0.6% | |
Banff Merger Sub, Inc.: | | | | | | | | | | | | |
8.38%, 09/01/26 | | | EUR | | | | 130 | | | | 135,907 | |
9.75%, 09/01/26(a) | | | USD | | | | 1,899 | | | | 1,768,444 | |
Gartner, Inc., 5.13%, 04/01/25(a)(e) | | | | | | | 207 | | | | 217,081 | |
InterXion Holding NV, 4.75%, 06/15/25 | | | EUR | | | | 100 | | | | 121,273 | |
Outfront Media Capital LLC/Outfront Media Capital Corp., 5.00%, 08/15/27(a) | | | USD | | | | 912 | | | | 955,347 | |
WEX, Inc., 4.75%, 02/01/23(a) | | | | | | | 108 | | | | 109,081 | |
Xerox Corp., 4.80%, 03/01/35 | | | | | | | 398 | | | | 337,305 | |
| | | | | | | | | | | | |
| | | | | | | | | | | 3,644,438 | |
|
| Leisure Products — 0.1% | |
Mattel, Inc., 6.75%, 12/31/25(a)(e) | | | | | | | 846 | | | | 883,013 | |
| | | | | | | | | | | | |
|
| Machinery — 0.7% | |
Colfax Corp.(a): | | | | | | | | | | | | |
6.00%, 02/15/24 | | | | | | | 680 | | | | 720,800 | |
6.38%, 02/15/26 | | | | | | | 321 | | | | 347,483 | |
Manitowoc Co., Inc., 9.00%, 04/01/26(a) | | | | | | | 262 | | | | 252,070 | |
Mueller Water Products, Inc.,
5.50%, 06/15/26(a) | | | | | | | 377 | | | | 395,379 | |
Platin 1426 GmbH, 5.38%, 06/15/23 | | | EUR | | | | 118 | | | | 123,635 | |
RBS Global, Inc./Rexnord LLC,
4.88%, 12/15/25(a)(e) | | | USD | | | | 607 | | | | 625,969 | |
SPX FLOW, Inc.(a): | | | | | | | | | | | | |
5.63%, 08/15/24 | | | | | | | 228 | | | | 237,405 | |
5.88%, 08/15/26 | | | | | | | 93 | | | | 97,418 | |
Terex Corp., 5.63%, 02/01/25(a)(e) | | | | | | | 419 | | | | 420,047 | |
Titan Acquisition Ltd./TitanCo-Borrower LLC, 7.75%, 04/15/26(a)(e) | | | | | | | 946 | | | | 886,875 | |
Wabash National Corp., 5.50%, 10/01/25(a)(e) | | | | | | | 286 | | | | 278,850 | |
| | | | | | | | | | | | |
| | | | | | | | | | | 4,385,931 | |
| | | | | | | | | | | | |
| Security | | Par
(000) | | | Value | |
|
| Media — 7.9% | |
Altice Financing SA(a): | | | | | | | | | | | | |
6.63%, 02/15/23 | | | USD | | | | 633 | | | $ | 650,218 | |
7.50%, 05/15/26 | | | | | | | 1,249 | | | | 1,327,062 | |
Altice France SA: | | | | | | | | | | | | |
7.38%, 05/01/26(a)(e) | | | | | | | 2,017 | | | | 2,159,894 | |
5.88%, 02/01/27 | | | EUR | | | | 100 | | | | 122,956 | |
8.13%, 02/01/27(a) | | | USD | | | | 780 | | | | 864,825 | |
Altice Luxembourg SA: | | | | | | | | | | | | |
7.63%, 02/15/25(a) | | | | | | | 798 | | | | 822,937 | |
8.00%, 05/15/27 | | | EUR | | | | 100 | | | | 122,279 | |
10.50%, 05/15/27(a) | | | USD | | | | 1,362 | | | | 1,540,762 | |
AMC Networks, Inc., 4.75%, 08/01/25 | | | | | | | 878 | | | | 885,682 | |
CCO Holdings LLC/CCO Holdings Capital
Corp.(a): | | | | | | | | | | | | |
4.00%, 03/01/23 | | | | | | | 421 | | | | 428,367 | |
5.13%, 05/01/27(e) | | | | | | | 1,639 | | | | 1,727,096 | |
5.88%, 05/01/27 | | | | | | | 54 | | | | 57,240 | |
5.00%, 02/01/28(e) | | | | | | | 145 | | | | 151,656 | |
5.38%, 06/01/2(e) | | | | | | | 1,661 | | | | 1,773,117 | |
4.75%, 03/01/30 | | | | | | | 261 | | | | 266,142 | |
Charter Communications Operating LLC/Charter Communications Operating Capital,
6.48%, 10/23/45 | | | | | | | 3,000 | | | | 3,689,186 | |
Clear Channel Worldwide Holdings, Inc.(a): | | | | | | | | | | | | |
9.25%, 02/15/24(e) | | | | | | | 1,631 | | | | 1,794,100 | |
5.13%, 08/15/27 | | | | | | | 2,104 | | | | 2,190,117 | |
Comcast Corp.(e): | | | | | | | | | | | | |
4.60%, 08/15/45 | | | | | | | 1,750 | | | | 2,096,555 | |
4.70%, 10/15/48 | | | | | | | 2,750 | | | | 3,386,455 | |
Connect Finco Sarl/Connect US Finco LLC,
6.75%, 10/01/26(a)(I) | | | | | | | 1,737 | | | | 1,804,309 | |
CSC Holdings LLC: | | | | | | | | | | | | |
5.38%, 07/15/23(a)(e) | | | | | | | 980 | | | | 1,004,480 | |
5.25%, 06/01/24 | | | | | | | 633 | | | | 682,057 | |
7.75%, 07/15/25(a)(e) | | | | | | | 284 | | | | 304,590 | |
6.63%, 10/15/25(a) | | | | | | | 288 | | | | 306,720 | |
10.88%, 10/15/25(a)(e) | | | | | | | 1,603 | | | | 1,808,921 | |
5.50%, 05/15/26(a) | | | | | | | 200 | | | | 210,750 | |
5.38%, 02/01/28(a) | | | | | | | 200 | | | | 211,500 | |
6.50%, 02/01/29(a) | | | | | | | 368 | | | | 411,010 | |
5.75%, 01/15/30(a) | | | | | | | 1,057 | | | | 1,111,171 | |
Diamond Sports Group LLC/Diamond Sports Finance Co., 5.38%, 08/15/26(a) | | | | | | | 999 | | | | 1,043,955 | |
Discovery Communications LLC,
4.95%, 05/15/42(e) | | | | | | | 400 | | | | 422,508 | |
DISH DBS Corp.(e): | | | | | | | | | | | | |
6.75%, 06/01/21 | | | | | | | 397 | | | | 416,850 | |
5.88%, 07/15/22 | | | | | | | 1,207 | | | | 1,262,293 | |
5.00%, 03/15/23 | | | | | | | 303 | | | | 305,272 | |
5.88%, 11/15/24 | | | | | | | 214 | | | | 214,535 | |
Entercom Media Corp., 6.50%, 05/01/27(a) | | | | | | | 338 | | | | 353,210 | |
Gray Television, Inc., 7.00%, 05/15/27(a) | | | | | | | 270 | | | | 295,312 | |
Hughes Satellite Systems Corp.,
5.25%, 08/01/26(e) | | | | | | | 217 | | | | 232,461 | |
iHeartCommunications, Inc.: | | | | | | | | | | | | |
6.38%, 05/01/26 | | | | | | | 192 | | | | 205,721 | |
5.25%, 08/15/27(a) | | | | | | | 386 | | | | 398,236 | |
Intelsat Jackson Holdings SA: | | | | | | | | | | | | |
5.50%, 08/01/23 | | | | | | | 757 | | | | 707,795 | |
8.50%, 10/15/24(a)(e) | | | | | | | 768 | | | | 773,914 | |
9.75%, 07/15/25(a) | | | | | | | 685 | | | | 710,811 | |
Lamar Media Corp., 5.75%, 02/01/26 | | | | | | | 146 | | | | 154,943 | |
LCPR Senior Secured Financing DAC,
6.75%, 10/15/27(a) | | | | | | | 400 | | | | 410,500 | |
Level 3 Parent LLC, 5.75%, 12/01/22 | | | | | | | 99 | | | | 99,248 | |
| | | | |
| CONSOLIDATED SCHEDULES OF INVESTMENTS | | | 51 | |
| | |
Consolidated Schedule of Investments (continued) October 31, 2019 | | BlackRock Multi-Sector Income Trust (BIT) (Percentages shown are based on Net Assets) |
| | | | | | | | | | | | |
| Security | | Par
(000) | | | Value | |
|
| Media (continued) | |
Live Nation Entertainment, Inc.(a): | | | | | | | | | | | | |
4.88%, 11/01/24 | | | USD | | | | 34 | | | $ | 35,190 | |
4.75%, 10/15/27 | | | | | | | 286 | | | | 298,184 | |
MDC Partners, Inc., 6.50%, 05/01/24(a) | | | | | | | 126 | | | | 120,488 | |
Meredith Corp., 6.88%, 02/01/26 | | | | | | | 68 | | | | 70,090 | |
Midcontinent Communications/Midcontinent Finance Corp., 5.38%, 08/15/27(a) | | | | | | | 209 | | | | 218,928 | |
Outfront Media Capital LLC/Outfront Media Capital Corp., 5.88%, 03/15/25 | | | | | | | 64 | | | | 66,080 | |
Qualitytech LP/QTS Finance Corp.,
4.75%, 11/15/25(a) | | | | | | | 203 | | | | 212,135 | |
Radiate Holdco LLC/Radiate Finance, Inc.,
6.88%, 02/15/23(a) | | | | | | | 71 | | | | 72,598 | |
Sable International Finance Ltd.,
5.75%, 09/07/27(a) | | | | | | | 200 | | | | 208,250 | |
SES SA (5 year EUR Swap + 5.40%),
5.63%(h)(i) | | | EUR | | | | 100 | | | | 126,587 | |
Sirius XM Radio, Inc.(a): | | | | | | | | | | | | |
4.63%, 07/15/24 | | | USD | | | | 181 | | | | 189,145 | |
5.00%, 08/01/27(e) | | | | | | | 308 | | | | 323,785 | |
5.50%, 07/01/29 | | | | | | | 579 | | | | 625,870 | |
TEGNA, Inc., 5.50%, 09/15/24(a) | | | | | | | 79 | | | | 81,444 | |
Telenet Finance Luxembourg Notes Sarl,
5.50%, 03/01/28(a) | | | | | | | 600 | | | | 638,100 | |
United Group BV, 4.88%, 07/01/24 | | | EUR | | | | 100 | | | | 115,155 | |
Univision Communications, Inc.(a): | | | | | | | | | | | | |
5.13%, 05/15/23(e) | | | USD | | | | 593 | | | | 593,000 | |
5.13%, 02/15/25 | | | | | | | 70 | | | | 68,338 | |
UPC Holding BV, 3.88%, 06/15/29 | | | EUR | | | | 100 | | | | 115,555 | |
Viacom, Inc., 5.85%, 09/01/43(e) | | | USD | | | | 645 | | | | 789,655 | |
Videotron Ltd., 5.13%, 04/15/27(a)(e) | | | | | | | 519 | | | | 551,437 | |
Virgin Media Finance PLC,
5.75%, 01/15/25(a)(e) | | | | | | | 1,050 | | | | 1,081,500 | |
Virgin Media Secured Finance PLC: | | | | | | | | | | | | |
4.88%, 01/15/27 | | | GBP | | | | 130 | | | | 174,289 | |
6.25%, 03/28/29 | | | | | | | 158 | | | | 217,024 | |
5.50%, 05/15/29(a) | | | USD | | | | 400 | | | | 425,000 | |
VZ Vendor Financing BV, 2.50%, 01/31/24(f) | | | EUR | | | | 100 | | | | 111,675 | |
Ziggo Bond Co. BV, 6.00%, 01/15/27(a) | | | USD | | | | 638 | | | | 666,710 | |
Ziggo BV(a): | | | | | | | | | | | | |
5.50%, 01/15/27(e) | | | | | | | 613 | | | | 646,715 | |
4.88%, 01/15/30 | | | | | | | 217 | | | | 220,867 | |
| | | | | | | | |
| | | | | | | | | | | 50,983,512 | |
|
| Metals & Mining — 2.1% | |
BHP Billiton Finance USA Ltd.,
4.13%, 02/24/42(e) | | | | | | | 250 | | | | 289,789 | |
Big River Steel LLC/BRS Finance Corp.,
7.25%, 09/01/25(a) | | | | | | | 263 | | | | 270,233 | |
Constellium SE(a): | | | | | | | | | | | | |
5.75%, 05/15/24 | | | | | | | 256 | | | | 263,386 | |
6.63%, 03/01/25(e) | | | | | | | 300 | | | | 313,965 | |
5.88%, 02/15/26(e) | | | | | | | 1,693 | | | | 1,764,952 | |
Freeport-McMoRan, Inc.: | | | | | | | | | | | | |
3.55%, 03/01/22 | | | | | | | 751 | | | | 759,449 | |
3.88%, 03/15/23 | | | | | | | 1,246 | | | | 1,264,690 | |
5.00%, 09/01/27 | | | | | | | 259 | | | | 264,504 | |
5.25%, 09/01/29 | | | | | | | 282 | | | | 287,020 | |
5.40%, 11/14/34 | | | | | | | 184 | | | | 179,630 | |
5.45%, 03/15/43 | | | | | | | 2,132 | | | | 1,982,760 | |
Gold Fields Orogen Holdings BVI Ltd.,
5.13%, 05/15/24(a) | | | | | | | 254 | | | | 269,089 | |
Grinding Media,Inc./Moly-Cop AltaSteel Ltd., 7.38%, 12/15/23(a)(e) | | | | | | | 322 | | | | 310,730 | |
Joseph T Ryerson & Son, Inc.,
11.00%, 05/15/22(a) | | | | | | | 155 | | | | 164,106 | |
Kaiser Aluminum Corp., 5.88%, 05/15/24 | | | | | | | 124 | | | | 128,960 | |
Nexa Resources SA, 5.38%, 05/04/27(a)(e) | | | | | | | 857 | | | | 907,349 | |
| | | | | | | | | | | | |
| Security | | Par
(000) | | | Value | |
|
| Metals & Mining (continued) | |
Novelis Corp.(a): | | | | | | | | | | | | |
6.25%, 08/15/24(e) | | | USD | | | | 1,739 | | | $ | 1,821,602 | |
5.88%, 09/30/26 | | | | | | | 538 | | | | 564,954 | |
Rio Tinto Finance USA PLC,
4.75%, 03/22/42(e) | | | | | | | 400 | | | | 497,195 | |
thyssenkrupp AG: | | | | | | | | | | | | |
1.88%, 03/06/23 | | | EUR | | | | 43 | | | | 47,869 | |
2.88%, 02/22/24 | | | | | | | 100 | | | | 114,751 | |
Usiminas International Sarl, 5.88%, 07/18/26(a) | | | | | | | 200 | | | | 203,500 | |
Vale Overseas Ltd., 6.25%, 08/10/26(e) | | | USD | | | | 680 | | | | 792,744 | |
| | | | | | | | | | | | |
| | | | | | | | | | | 13,463,227 | |
|
| Multi-Utilities — 0.1% | |
Superior Plus LP/Superior General Partner, Inc., 7.00%, 07/15/26(a) | | | | | | | 371 | | | | 398,825 | |
| | | | | | | | | | | | |
|
| Multiline Retail — 0.1% | |
Target Corp., 4.00%, 07/01/42(e) | | | | | | | 300 | | | | 347,781 | |
| | | | | | | | | | | | |
|
| Offshore Drilling & Other Services — 0.0% | |
Entegris, Inc., 4.63%, 02/10/26(a) | | | | | | | 225 | | | | 231,644 | |
| | | | | | | | | | | | |
|
| Oil, Gas & Consumable Fuels — 7.8% | |
Aker BP ASA, 4.75%, 06/15/24(a) | | | | | | | 604 | | | | 628,160 | |
Antero Midstream Partners LP/Antero Midstream Finance Corp., 5.38%, 09/15/24 | | | | | | | 65 | | | | 53,788 | |
Antero Resources Corp., 5.38%, 11/01/21 | | | | | | | 194 | | | | 173,145 | |
Apache Corp., 4.75%, 04/15/43(e) | | | | | | | 800 | | | | 729,928 | |
Ascent Resources Utica Holdings LLC/ARU Finance Corp., 10.00%, 04/01/22(a) | | | | | | | 285 | | | | 269,696 | |
Berry Petroleum Co. LLC, 7.00%, 02/15/26(a) | | | | | | | 244 | | | | 226,920 | |
Brazos Valley Longhorn LLC/Brazos Valley Longhorn Finance Corp., 6.88%, 02/01/25 | | | | | | | 188 | | | | 147,580 | |
Callon Petroleum Co.: | | | | | | | | | | | | |
6.13%, 10/01/24 | | | | | | | 216 | | | | 205,200 | |
Series WI, 6.38%, 07/01/26 | | | | | | | 366 | | | | 341,295 | |
Carrizo Oil & Gas, Inc.: | | | | | | | | | | | | |
6.25%, 04/15/23(e) | | | | | | | 374 | | | | 347,820 | |
8.25%, 07/15/25 | | | | | | | 229 | | | | 217,550 | |
Centennial Resource Production LLC,
6.88%, 04/01/27(a) | | | | | | | 302 | | | | 295,960 | |
Cheniere Energy Partners LP: | | | | | | | | | | | | |
5.63%, 10/01/26 | | | | | | | 492 | | | | 519,675 | |
4.50%, 10/01/29(a) | | | | | | | 759 | | | | 773,231 | |
Series WI, 5.25%, 10/01/25 | | | | | | | 57 | | | | 58,995 | |
Chesapeake Energy Corp.: | | | | | | | | | | | | |
6.63%, 08/15/20 | | | | | | | 352 | | | | 346,614 | |
4.88%, 04/15/22 | | | | | | | 773 | | | | 614,052 | |
5.75%, 03/15/23 | | | | | | | 248 | | | | 181,040 | |
7.00%, 10/01/24(e) | | | | | | | 164 | | | | 110,700 | |
8.00%, 03/15/26(a) | | | | | | | 167 | | | | 106,045 | |
CNX Resources Corp., 5.88%, 04/15/22(e) | | | | | | | 1,473 | | | | 1,439,857 | |
Comstock Resources, Inc., 9.75%, 08/15/26 | | | | | | | 266 | | | | 210,140 | |
CONSOL Energy, Inc., 11.00%, 11/15/25(a)(e) | | | | | | | 498 | | | | 417,075 | |
Covey Park Energy LLC/Covey Park Finance Corp., 7.50%, 05/15/25(a) | | | | | | | 341 | | | | 252,340 | |
Crestwood Midstream Partners LP/Crestwood Midstream Finance Corp.: | | | | | | | | | | | | |
6.25%, 04/01/23 | | | | | | | 18 | | | | 18,310 | |
5.63%, 05/01/27(a) | | | | | | | 471 | | | | 473,953 | |
CrownRock LP/CrownRock Finance, Inc.,
5.63%, 10/15/25(a)(e) | | | | | | | 1,295 | | | | 1,265,888 | |
DCP Midstream Operating LP: | | | | | | | | | | | | |
5.38%, 07/15/25 | | | | | | | 262 | | | | 275,506 | |
5.13%, 05/15/29 | | | | | | | 186 | | | | 188,189 | |
6.45%, 11/03/36(a)(e) | | | | | | | 254 | | | | 260,985 | |
6.75%, 09/15/37(a)(e) | | | | | | | 418 | | | | 435,765 | |
| | |
| 52 | | 2019 BLACKROCK ANNUAL REPORTTO SHAREHOLDERS |
| | |
Consolidated Schedule of Investments (continued) October 31, 2019 | | BlackRock Multi-Sector Income Trust (BIT) (Percentages shown are based on Net Assets) |
| | | | | | | | | | | | |
| Security | | Par
(000) | | | Value | |
|
| Oil, Gas & Consumable Fuels (continued) | |
Denbury Resources, Inc.(a): | | | | | | | | | | | | |
9.00%, 05/15/21 | | | USD | | | | 333 | | | $ | 291,375 | |
9.25%, 03/31/22 | | | | | | | 356 | | | | 291,920 | |
eG Global Finance PLC, 6.75%, 02/07/25(a) | | | | | | | 470 | | | | 470,000 | |
Enbridge, Inc. (3 mo. LIBOR US + 3.64%), 6.25%, 03/01/78(h) | | | | | | | 1,865 | | | | 2,005,770 | |
Endeavor Energy Resources LP/EER Finance, Inc.(a): | | | | | | | | | | | | |
5.50%, 01/30/26 | | | | | | | 670 | | | | 690,113 | |
5.75%, 01/30/28 | | | | | | | 424 | | | | 446,268 | |
Energy Transfer Operating LP(e): | | | | | | | | | | | | |
6.13%, 12/15/45 | | | | | | | 500 | | | | 583,674 | |
5.30%, 04/15/47 | | | | | | | 350 | | | | 368,683 | |
EnLink Midstream LLC, 5.38%, 06/01/29 | | | | | | | 98 | | | | 86,975 | |
EnLink Midstream Partners LP: | | | | | | | | | | | | |
4.40%, 04/01/24 | | | | | | | 281 | | | | 263,438 | |
4.15%, 06/01/25 | | | | | �� | | 28 | | | | 25,266 | |
4.85%, 07/15/26 | | | | | | | 127 | | | | 116,205 | |
5.60%, 04/01/44 | | | | | | | 211 | | | | 161,943 | |
5.05%, 04/01/45 | | | | | | | 264 | | | | 198,000 | |
5.45%, 06/01/47 | | | | | | | 33 | | | | 25,245 | |
Enterprise Products Operating LLC (3 mo. LIBOR US + 2.57%), 5.38%, 02/15/78(h) | | | | | | | 420 | | | | 412,650 | |
Extraction Oil & Gas, Inc.(a): | | | | | | | | | | | | |
7.38%, 05/15/24 | | | | | | | 349 | | | | 143,090 | |
5.63%, 02/01/26(e) | | | | | | | 706 | | | | 300,050 | |
Frontera Energy Corp., 9.70%, 06/25/23(a) | | | | | | | 697 | | | | 741,434 | |
Genesis Energy LP/Genesis Energy Finance Corp.: | | | | | | | | | | | | |
6.00%, 05/15/23 | | | | | | | 93 | | | | 90,675 | |
5.63%, 06/15/24 | | | | | | | 48 | | | | 44,880 | |
6.50%, 10/01/25(e) | | | | | | | 111 | | | | 105,450 | |
6.25%, 05/15/26 | | | | | | | 133 | | | | 123,025 | |
Geopark Ltd., 6.50%, 09/21/24(a) | | | | | | | 228 | | | | 234,911 | |
Great Western Petroleum LLC/Great Western Finance, Inc., 9.00%, 09/30/21(a)(e) | | | | | | | 636 | | | | 516,750 | |
Hess Corp., 4.30%, 04/01/27(e) | | | | | | | 750 | | | | 788,142 | |
Hess Infrastructure Partners LP/Hess Infrastructure Partners Finance Corp., 5.63%, 02/15/26(a) | | | | | | | 249 | | | | 260,516 | |
Impulsora Pipeline LLC, 6.05%, 12/31/42(b) | | | | | | | 1,665 | | | | 1,798,893 | |
Indigo Natural Resources LLC, 6.88%, 02/15/26(a) | | | | | | | 352 | | | | 320,320 | |
Kinder Morgan Energy Partners LP,
4.25%, 09/01/24(e) | | | | | | | 2,500 | | | | 2,679,899 | |
Matador Resources Co., 5.88%, 09/15/26 | | | | | | | 399 | | | | 382,541 | |
MEG Energy Corp.(a): | | | | | | | | | | | | |
6.38%, 01/30/23 | | | | | | | 302 | | | | 285,390 | |
7.00%, 03/31/24 | | | | | | | 96 | | | | 90,000 | |
6.50%, 01/15/25(e) | | | | | | | 906 | | | | 942,240 | |
MGM Growth Properties Operating Partnership LP/MGP FinanceCo-Issuer, Inc.,
4.50%, 01/15/28 | | | | | | | 432 | | | | 452,520 | |
MPLX LP, 4.25%, 12/01/27(a) | | | | | | | 235 | | | | 247,119 | |
Murphy Oil Corp.: | | | | | | | | | | | | |
5.75%, 08/15/25 | | | | | | | 118 | | | | 119,625 | |
5.63%, 12/01/42 | | | | | | | 126 | | | | 107,247 | |
Nabors Industries, Inc., 4.63%, 09/15/21 | | | | | | | 221 | | | | 204,978 | |
Neptune Energy Bondco PLC,
6.63%, 05/15/25(a) | | | | | | | 200 | | | | 199,000 | |
NGPL PipeCo LLC, 7.77%, 12/15/37(a)(e) | | | | | | | 270 | | | | 348,103 | |
Noble Holding International Ltd.(e): | | | | | | | | | | | | |
7.75%, 01/15/24 | | | | | | | 21 | | | | 12,600 | |
7.88%, 02/01/26(a) | | | | | | | 214 | | | | 141,240 | |
NuStar Logistics LP, 6.00%, 06/01/26 | | | | | | | 194 | | | | 207,328 | |
Occidental Petroleum Corp., 4.50%, 07/15/44 | | | | | | | 500 | | | | 506,187 | |
Odebrecht Offshore Drilling Finance Ltd.(a): | | | | | | | | | | | | |
6.72%, 12/01/22(e) | | | BRL | | | | 254 | | | | 248,739 | |
(7.72% PIK), 7.72%, 12/01/26(g) | | | | | | | 31 | | | | 7,632 | |
Pacific Drilling SA, 8.38%, 10/01/23(a)(e) | | | USD | | | | 735 | | | | 585,703 | |
| | | | | | | | | | | | |
| Security | | Par
(000) | | | Value | |
|
| Oil, Gas & Consumable Fuels (continued) | |
Parsley Energy LLC/Parsley Finance Corp.(a): | | | | | | | | | | | | |
6.25%, 06/01/24 | | | USD | | | | 163 | | | $ | 169,724 | |
5.38%, 01/15/25(e) | | | | | | | 284 | | | | 292,372 | |
5.25%, 08/15/25 | | | | | | | 70 | | | | 71,751 | |
5.63%, 10/15/27 | | | | | | | 340 | | | | 351,050 | |
PBF Holding Co. LLC/PBF Finance Corp., 7.25%, 06/15/25(e) | | | | | | | 163 | | | | 170,335 | |
PDC Energy, Inc.: | | | | | | | | | | | | |
1.13%, 09/15/21(k) | | | | | | | 1,047 | | | | 942,182 | |
6.13%, 09/15/24 | | | | | | | 132 | | | | 128,123 | |
5.75%, 05/15/26 | | | | | | | 121 | | | | 113,135 | |
Petrobras Global Finance BV: | | | | | | | | | | | | |
8.38%, 05/23/21(e) | | | | | | | 126 | | | | 137,852 | |
6.13%, 01/17/22(e) | | | | | | | 310 | | | | 332,365 | |
5.30%, 01/27/25 | | | | | | | 908 | | | | 985,634 | |
8.75%, 05/23/26(e) | | | | | | | 637 | | | | 815,360 | |
7.38%, 01/17/27 | | | | | | | 80 | | | | 96,880 | |
6.00%, 01/27/28(e) | | | | | | | 1,093 | | | | 1,226,414 | |
7.25%, 03/17/44 | | | | | | | 480 | | | | 583,200 | |
Petroleos Mexicanos: | | | | | | | | | | | | |
6.50%, 03/13/27(e) | | | | | | | 424 | | | | 449,639 | |
5.35%, 02/12/28 | | | | | | | 199 | | | | 196,513 | |
QEP Resources, Inc.: | | | | | | | | | | | | |
6.88%, 03/01/21 | | | | | | | 410 | | | | 410,512 | |
5.25%, 05/01/23 | | | | | | | 198 | | | | 188,100 | |
5.63%, 03/01/26 | | | | | | | 312 | | | | 279,240 | |
Range Resources Corp.: | | | | | | | | | | | | |
5.75%, 06/01/21 | | | | | | | 102 | | | | 101,363 | |
5.88%, 07/01/22 | | | | | | | 149 | | | | 141,550 | |
5.00%, 08/15/22(e) | | | | | | | 255 | | | | 235,875 | |
Rowan Cos., Inc., 4.88%, 06/01/22 | | | | | | | 630 | | | | 422,100 | |
Sabine Pass Liquefaction LLC, 5.75%, 05/15/24 | | | | | | | 10 | | | | 11,160 | |
Saudi Arabian Oil Co.: | | | | | | | | | | | | |
3.50%, 04/16/29(a) | | | | | | | 225 | | | | 232,840 | |
3.50%, 04/16/29 | | | | | | | 449 | | | | 464,645 | |
Shell International Finance BV,
4.38%, 05/11/45(e) | | | | | | | 450 | | | | 545,933 | |
SM Energy Co.: | | | | | | | | | | | | |
6.13%, 11/15/22 | | | | | | | 176 | | | | 167,640 | |
5.00%, 01/15/24 | | | | | | | 165 | | | | 146,025 | |
5.63%, 06/01/25(e) | | | | | | | 147 | | | | 124,585 | |
6.75%, 09/15/26 | | | | | | | 143 | | | | 122,623 | |
6.63%, 01/15/27 | | | | | | | 41 | | | | 34,543 | |
Southwestern Energy Co.: | | | | | | | | | | | | |
6.20%, 01/23/25 | | | | | | | 136 | | | | 119,680 | |
7.75%, 10/01/27(e) | | | | | | | 144 | | | | 123,840 | |
SRC Energy, Inc., 6.25%, 12/01/25 | | | | | | | 144 | | | | 134,611 | |
Suncor Energy, Inc., 6.50%, 06/15/38(e) | | | | | | | 800 | | | | 1,099,094 | |
Sunoco LP/Sunoco Finance Corp.: | | | | | | | | | | | | |
6.00%, 04/15/27 | | | | | | | 168 | | | | 176,400 | |
Series WI, 4.88%, 01/15/23 | | | | | | | 253 | | | | 259,641 | |
Series WI, 5.50%, 02/15/26 | | | | | | | 38 | | | | 39,286 | |
Series WI, 5.88%, 03/15/28 | | | | | | | 147 | | | | 154,353 | |
Tallgrass Energy Partners LP/Tallgrass Energy Finance Corp.(a): | | | | | | | | | | | | |
4.75%, 10/01/23 | | | | | | | 31 | | | | 30,225 | |
5.50%, 09/15/24(e) | | | | | | | 572 | | | | 556,270 | |
5.50%, 01/15/28 | | | | | | | 385 | | | | 361,900 | |
Targa Resources Partners LP/Targa Resources Partners Finance Corp.: | | | | | | | | | | | | |
5.13%, 02/01/25 | | | | | | | 156 | | | | 159,903 | |
5.88%, 04/15/26(e) | | | | | | | 325 | | | | 339,251 | |
5.38%, 02/01/27 | | | | | | | 2 | | | | 2,048 | |
6.50%, 07/15/27(a) | | | | | | | 384 | | | | 410,888 | |
| | | | |
| CONSOLIDATED SCHEDULES OF INVESTMENTS | | | 53 | |
| | |
Consolidated Schedule of Investments (continued) October 31, 2019 | | BlackRock Multi-Sector Income Trust (BIT) (Percentages shown are based on Net Assets) |
| | | | | | | | | | | | |
| Security | | Par
(000) | | | Value | |
|
| Oil, Gas & Consumable Fuels (continued) | |
5.00%, 01/15/28(e) | | | USD | | | | 301 | | | $ | 297,990 | |
6.88%, 01/15/29(a) | | | | | | | 1,204 | | | | 1,301,825 | |
Viper Energy Partners LP, 5.38%, 11/01/27(a) | | | | | | | 145 | | | | 146,450 | |
Whiting Petroleum Corp., 6.63%, 01/15/26 | | | | | | | 21 | | | | 13,020 | |
Williams Partners LP, 4.50%, 11/15/23(e) | | | | | | | 1,750 | | | | 1,870,518 | |
WPX Energy, Inc.: | | | | | | | | | | | | |
8.25%, 08/01/23 | | | | | | | 123 | | | | 137,145 | |
5.25%, 09/15/24(e) | | | | | | | 143 | | | | 144,430 | |
5.75%, 06/01/26 | | | | | | | 50 | | | | 50,250 | |
YPF SA, 8.50%, 07/28/25 | | | | | | | 906 | | | | 717,552 | |
| | | | | | | | |
| | | | | | | | | | | 50,596,987 | |
|
| Oil: Crude Producers — 0.1% | |
Ryman Hospitality Properties, Inc.,
4.75%, 10/15/27(a) | | | | | | | 691 | | | | 714,390 | |
| | | | | | | | |
|
| Paper & Forest Products — 0.0% | |
Norbord, Inc., 6.25%, 04/15/23(a) | | | | | | | 182 | | | | 193,603 | |
| | | | | | | | |
|
| Pharmaceuticals — 2.7% | |
AbbVie, Inc., 4.45%, 05/14/46(e) | | | | | | | 1,000 | | | | 1,033,550 | |
Allergan Funding SCS, 4.75%, 03/15/45(e) | | | | | | | 500 | | | | 532,174 | |
Allergan Sales LLC, 5.00%, 12/15/21(a)(e) | | | | | | | 718 | | | | 753,766 | |
Bausch Health Americas, Inc.(a): | | | | | | | | | | | | |
8.50%, 01/31/27 | | | | | | | 997 | | | | 1,118,833 | |
9.25%, 04/01/26 | | | | | | | 61 | | | | 69,008 | |
Bausch Health Cos., Inc.: | | | | | | | | | | | | |
5.50%, 03/01/23(a)(e) | | | | | | | 876 | | | | 883,665 | |
4.50%, 05/15/23 | | | EUR | | | | 552 | | | | 622,418 | |
5.88%, 05/15/23(a)(e) | | | USD | | | | 207 | | | | 210,105 | |
7.00%, 03/15/24(a)(e) | | | | | | | 566 | | | | 592,135 | |
6.13%, 04/15/25(a) | | | | | | | 331 | | | | 343,619 | |
5.50%, 11/01/25(a)(e) | | | | | | | 1,854 | | | | 1,937,449 | |
9.00%, 12/15/25(a) | | | | | | | 608 | | | | 682,602 | |
5.75%, 08/15/27(a) | | | | | | | 423 | | | | 459,352 | |
7.00%, 01/15/28(a) | | | | | | | 592 | | | | 638,620 | |
7.25%, 05/30/29(a) | | | | | | | 697 | | | | 767,571 | |
Catalent Pharma Solutions, Inc., 5.00%, 07/15/27(a) | | | | | | | 399 | | | | 416,955 | |
Charles River Laboratories International,
Inc.(a): | | | | | | | | | | | | |
5.50%, 04/01/26 | | | | | | | 514 | | | | 547,410 | |
4.25%, 05/01/28 | | | | | | | 171 | | | | 174,223 | |
CVS Health Corp., 5.05%, 03/25/48(e) | | | | | | | 1,110 | | | | 1,279,420 | |
Eagle Holding Co. II LLC, (7.750% Cash or 8.50% PIK), 7.75%, 05/15/22(a)(e)(g) | | | | | | | 407 | | | | 413,105 | |
Elanco Animal Health, Inc., 4.90%, 08/28/28 | | | | | | | 363 | | | | 394,675 | |
Jaguar Holding Co. II/Pharmaceutical Product Development LLC, 6.38%, 08/01/23(a)(e) | | | | | | | 1,770 | | | | 1,831,950 | |
Mylan NV, 3.95%, 06/15/26(e) | | | | | | | 650 | | | | 676,237 | |
Nidda BondCo GmbH, 7.25%, 09/30/25 | | | EUR | | | | 100 | | | | 117,674 | |
Par Pharmaceutical, Inc., 7.50%, 04/01/27(a) | | | USD | | | | 821 | | | | 779,950 | |
Rossini Sarl, 6.75%, 10/30/25 | | | EUR | | | | 166 | | | | 204,635 | |
| | | | | | | | |
| | | | | | | | | | | 17,481,101 | |
|
| Professional Services — 0.3% | |
Dun & Bradstreet Corp.(a): | | | | | | | | | | | | |
6.88%, 08/15/26 | | | USD | | | | 1,077 | | | | 1,177,619 | |
10.25%, 02/15/27 | | | | | | | 480 | | | | 526,209 | |
| | | | | | | | |
| | | | | | | | | | | 1,703,828 | |
|
| Real Estate — 0.0% | |
Iron Mountain, Inc., 4.88%, 09/15/29(a) | | | | | | | 277 | | | | 283,579 | |
| | | | | | | | |
|
| Real Estate Management & Development — 0.1% | |
ADLER Real Estate AG: | | | | | | | | | | | | |
1.88%, 04/27/23 | | | EUR | | | | 100 | | | | 111,998 | |
3.00%, 04/27/26 | | | | | | | 100 | | | | 114,992 | |
Greystar Real Estate Partners LLC, 5.75%, 12/01/25(a) | | | USD | | | | 208 | | | | 216,840 | |
| | | | | | | | | | | | |
| Security | | Par
(000) | | | Value | |
|
| Real Estate Management & Development (continued) | |
Howard Hughes Corp., 5.38%, 03/15/25(a)(e) | | | USD | | | | 218 | | | $ | 226,448 | |
Newmark Group, Inc., 6.13%, 11/15/23 | | | | | | | 128 | | | | 139,601 | |
Residomo SRO, 3.38%, 10/15/24 | | | EUR | | | | 100 | | | | 116,026 | |
| | | | | | | | |
| | | | | | | | | | | 925,905 | |
|
| Road & Rail — 0.9% | |
Burlington Northern Santa Fe LLC,
4.38%, 09/01/42(e) | | | USD | | | | 500 | | | | 578,947 | |
Europcar Mobility Group, 4.00%, 04/30/26 | | | EUR | | | | 100 | | | | 103,727 | |
Flexi-Van Leasing, Inc., 10.00%, 02/15/23(a) | | | USD | | | | 203 | | | | 192,850 | |
Herc Holdings, Inc., 5.50%, 07/15/27(a) | | | | | | | 511 | | | | 529,524 | |
Hertz Corp., 7.63%, 06/01/22(a)(e) | | | | | | | 599 | | | | 622,211 | |
Hertz Holdings Netherlands BV,
5.50%, 03/30/23 | | | EUR | | | | 100 | | | | 114,584 | |
Lima Metro Line 2 Finance Ltd.,
5.88%, 07/05/34(a)(e) | | | USD | | | | 2,201 | | | | 2,580,136 | |
Union Pacific Corp., 4.05%, 11/15/45(e) | | | | | | | 500 | | | | 545,916 | |
United Rentals North America, Inc.: | | | | | | | | | | | | |
3.88%, 11/15/27(f) | | | | | | | 314 | | | | 317,218 | |
5.25%, 01/15/30 | | | | | | | 170 | | | | 178,712 | |
| | | | | | | | |
| | | | | | | | | | | 5,763,825 | |
|
| Semiconductors & Semiconductor Equipment — 0.7% | |
Advanced Micro Devices, Inc., 7.50%, 08/15/22 | | | | | | | 89 | | | | 100,349 | |
Broadcom Corp./Broadcom Cayman Finance Ltd., 3.88%, 01/15/27(e) | | | | | | | 2,600 | | | | 2,625,473 | |
Qorvo, Inc., 5.50%, 07/15/26 | | | | | | | 452 | | | | 482,501 | |
QUALCOMM, Inc., 4.65%, 05/20/35(e) | | | | | | | 400 | | | | 469,013 | |
Sensata Tech, Inc., 4.38%, 02/15/30(a) | | | | | | | 241 | | | | 242,657 | |
Sensata Technologies BV, 5.00%, 10/01/25(a) | | | | | | | 368 | | | | 396,594 | |
Sensata Technologies UK Financing Co. PLC, 6.25%, 02/15/26(a) | | | | | | | 222 | | | | 237,401 | |
| | | | | | | | |
| | | | | | | | | | | 4,553,988 | |
|
| Software — 2.9% | |
ACI Worldwide, Inc., 5.75%, 08/15/26(a) | | | | | | | 833 | | | | 882,980 | |
CA, Inc., 3.60%, 08/15/22(e) | | | | | | | 660 | | | | 674,057 | |
Camelot Finance SA, 4.50%, 11/01/26(a) | | | | | | | 810 | | | | 818,424 | |
CDK Global, Inc.: | | | | | | | | | | | | |
4.88%, 06/01/27 | | | | | | | 858 | | | | 904,117 | |
5.25%, 05/15/29(a) | | | | | | | 164 | | | | 174,148 | |
Genesys Telecommunications Laboratories, Inc./Greeneden Lux 3 Sarl/Greeneden US Ho, 10.00%, 11/30/24(a)(e) | | | | | | | 1,244 | | | | 1,343,520 | |
Infor US, Inc., 6.50%, 05/15/22(e) | | | | | | | 2,690 | | | | 2,726,987 | |
Informatica LLC, 7.13%, 07/15/23(a)(e) | | | | | | | 1,011 | | | | 1,027,429 | |
Microsoft Corp., 3.70%, 08/08/46(e) | | | | | | | 1,750 | | | | 1,991,423 | |
Nuance Communications, Inc.,
5.63%, 12/15/26 | | | | | | | 153 | | | | 162,379 | |
Oracle Corp., 4.00%, 07/15/46(e) | | | | | | | 1,500 | | | | 1,668,376 | |
PTC, Inc., 6.00%, 05/15/24(e) | | | | | | | 269 | | | | 285,812 | |
Refinitiv US Holdings, Inc., 4.50%, 05/15/26 | | | EUR | | | | 118 | | | | 142,496 | |
RP Crown Parent LLC, 7.38%, 10/15/24(a)(e) | | | USD | | | | 900 | | | | 933,579 | |
Solera LLC/Solera Finance, Inc.,
10.50%, 03/01/24(a)(e) | | | | | | | 1,872 | | | | 1,958,580 | |
Sophia LP/Sophia Finance, Inc.,
9.00%, 09/30/23(a) | | | | | | | 54 | | | | 55,451 | |
SS&C Technologies, Inc., 5.50%, 09/30/27(a)(e) | | | | | | | 1,710 | | | | 1,829,700 | |
TIBCO Software, Inc., 11.38%, 12/01/21(a) | | | | | | | 929 | | | | 960,354 | |
Veritas US, Inc./Veritas Bermuda Ltd.,
7.50%, 02/01/23(a) | | | | | | | 404 | | | | 396,930 | |
| | | | | | | | |
| | | | | | | | | | | 18,936,742 | |
|
| Specialty Retail — 0.9% | |
Asbury Automotive Group, Inc.,
6.00%, 12/15/24 | | | | | | | 395 | | | | 407,837 | |
Catalent Pharma Solutions, Inc.,
4.88%, 01/15/26(a) | | | | | | | 384 | | | | 396,480 | |
eG Global Finance PLC: | | | | | | | | | | | | |
6.25%, 10/30/25 | | | EUR | | | | 142 | | | | 163,520 | |
8.50%, 10/30/25(a) | | | USD | | | | 299 | | | | 314,064 | |
Group 1 Automotive, Inc., 5.25%, 12/15/23(a) | | | | | | | 53 | | | | 54,325 | |
IAA, Inc., 5.50%, 06/15/27(a) | | | | | | | 443 | | | | 474,630 | |
| | |
| 54 | | 2019 BLACKROCK ANNUAL REPORTTO SHAREHOLDERS |
| | |
Consolidated Schedule of Investments (continued) October 31, 2019 | | BlackRock Multi-Sector Income Trust (BIT) (Percentages shown are based on Net Assets) |
| | | | | | | | | | | | |
| Security | | Par
(000) | | | Value | |
|
| Specialty Retail (continued) | |
L Brands, Inc.: | | | | | | | | | | | | |
6.88%, 11/01/35(e) | | | USD | | | | 478 | | | $ | 406,300 | |
6.75%, 07/01/36 | | | | | | | 79 | | | | 65,570 | |
Lowe’s Cos., Inc., 4.65%, 04/15/42(e) | | | | | | | 400 | | | | 457,659 | |
Penske Automotive Group, Inc.,
5.50%, 05/15/26 | | | | | | | 32 | | | | 33,440 | |
PetSmart, Inc.(a): | | | | | | | | | | | | |
7.13%, 03/15/23 | | | | | | | 194 | | | | 179,450 | |
5.88%, 06/01/25(e) | | | | | | | 1,074 | | | | 1,058,030 | |
Staples, Inc.(a): | | | | | | | | | | | | |
7.50%, 04/15/26(e) | | | | | | | 1,472 | | | | 1,531,174 | |
10.75%, 04/15/27 | | | | | | | 293 | | | | 304,720 | |
| | | | | | | | |
| | | | | | | | | | | 5,847,199 | |
|
| Technology Hardware, Storage & Peripherals — 0.7% | |
Apple, Inc., 4.65%, 02/23/46(e) | | | | | | | 1,500 | | | | 1,879,869 | |
Dell International LLC/EMC Corp.(a): | | | | | | | | | | | | |
4.42%, 06/15/21 | | | | | | | 25 | | | | 25,819 | |
7.13%, 06/15/24(e) | | | | | | | 1,104 | | | | 1,170,516 | |
NCR Corp.(a): | | | | | | | | | | | | |
5.75%, 09/01/27 | | | | | | | 259 | | | | 265,475 | |
6.13%, 09/01/29 | | | | | | | 280 | | | | 293,300 | |
Western Digital Corp., 4.75%, 02/15/26 | | | | | | | 698 | | | | 713,286 | |
| | | | | | | | |
| | | | | | | | | | | 4,348,265 | |
|
| Textiles, Apparel & Luxury Goods — 0.0% | |
William Carter Co., 5.63%, 03/15/27(a) | | | | | | | 189 | | | | 202,230 | |
| | | | | | | | |
|
| Thrifts & Mortgage Finance — 0.1% | |
Ladder Capital Finance Holdings LLLP/Ladder Capital Finance Corp.(a)(e): | | | | | | | | | | | | |
5.25%, 03/15/22 | | | | | | | 27 | | | | 27,979 | |
5.25%, 10/01/25 | | | | | | | 338 | | | | 343,070 | |
| | | | | | | | |
| | | | | | | | | | | 371,049 | |
|
| Tobacco — 0.4% | |
Altria Group, Inc., 4.50%, 05/02/43(e) | | | | | | | 750 | | | | 755,153 | |
Philip Morris International, Inc.,
4.38%, 11/15/41(e) | | | | | | | 900 | | | | 988,899 | |
Reynolds American, Inc., 5.85%, 08/15/45 | | | | | | | 715 | | | | 794,981 | |
| | | | | | | | |
| | | | | | | | | | | 2,539,033 | |
|
| Transportation Infrastructure — 0.3% | |
Rumo Luxembourg Sarl, 7.38%, 02/09/24(a)(e) | | | | | | | 1,061 | | | | 1,136,649 | |
Swissport Financing Sarl, 5.25%, 08/15/24 | | | EUR | | | | 100 | | | | 114,597 | |
Transurban Finance Co. Property Ltd., 4.13%, 02/02/26(a)(e) | | | USD | | | | 520 | | | | 553,159 | |
| | | | | | | | |
| | | | | | | | | | | 1,804,405 | |
|
| Utilities — 0.3% | |
ContourGlobal Power Holdings SA: | | | | | | | | | | | | |
3.38%, 08/01/23 | | | EUR | | | | 100 | | | | 114,908 | |
4.13%, 08/01/25 | | | | | | | 100 | | | | 117,458 | |
Generacion Mediterranea SA/Generacion Frias SA/Central Termica Roca SA,
9.63%, 07/27/23(a) | | | USD | | | | 1,061 | | | | 591,839 | |
Orano SA, 3.38%, 04/23/26 | | | EUR | | | | 100 | | | | 119,890 | |
Stoneway Capital Corp., 10.00%, 03/01/27(a) | | | USD | | | | 940 | | | | 468,627 | |
Vistra Operations Co. LLC(a): | | | | | | | | | | | | |
5.50%, 09/01/26 | | | | | | | 80 | | | | 84,538 | |
5.63%, 02/15/27 | | | | | | | 428 | | | | 453,680 | |
5.00%, 07/31/27 | | | | | | | 195 | | | | 201,337 | |
| | | | | | | | |
| | | | | | | | | | | 2,152,277 | |
|
| Wireless Telecommunication Services — 1.7% | |
Altice France SA: | | | | | | | | | | | | |
3.38%, 01/15/28 | | | EUR | | | | 100 | | | | 111,736 | |
5.50%, 01/15/28(a) | | | USD | | | | 1,193 | | | | 1,215,369 | |
C&W Senior Financing DAC,
6.88%, 09/15/27(a) | | | | | | | 1,143 | | | | 1,203,007 | |
| | | | | | | | | | | | |
| Security | | Par
(000) | | | Value | |
|
| Wireless Telecommunication Services (continued) | |
Comunicaciones Celulares SA Via Comcel Trust, 6.88%, 02/06/24(a) | | | USD | | | | 1,000 | | | $ | 1,029,687 | |
Digicel International Finance Ltd./Digicel Holdings Bermuda Ltd., 8.75%, 05/25/24(a) | | | | | | | 250 | | | | 236,563 | |
Equinix, Inc., 2.88%, 03/15/24 | | | EUR | | | | 100 | | | | 115,335 | |
Iron Mountain, Inc., 3.00%, 01/15/25 | | | | | | | 100 | | | | 113,761 | |
Matterhorn Telecom SA, 4.00%, 11/15/27 | | | | | | | 100 | | | | 116,403 | |
Radiate Holdco LLC/Radiate Finance, Inc., 6.63%, 02/15/25(a) | | | USD | | | | 160 | | | | 161,600 | |
SBA Communications Corp.,
4.00%, 10/01/22(e) | | | | | | | 475 | | | | 484,571 | |
Sprint Capital Corp.: | | | | | | | | | | | | |
6.88%, 11/15/28 | | | | | | | 445 | | | | 484,908 | |
8.75%, 03/15/32 | | | | | | | 242 | | | | 295,090 | |
Sprint Corp.: | | | | | | | | | | | | |
7.88%, 09/15/23 | | | | | | | 604 | | | | 666,665 | |
7.13%, 06/15/24(e) | | | | | | | 558 | | | | 605,430 | |
7.63%, 02/15/25 | | | | | | | 242 | | | | 265,898 | |
7.63%, 03/01/26(e) | | | | | | | 1,228 | | | | 1,358,475 | |
T-Mobile USA, Inc.: | | | | | | | | | | | | |
4.00%, 04/15/22(e) | | | | | | | 234 | | | | 241,537 | |
6.38%, 03/01/25 | | | | | | | 220 | | | | 228,296 | |
6.50%, 01/15/26 | | | | | | | 286 | | | | 306,049 | |
4.50%, 02/01/26(e) | | | | | | | 570 | | | | 587,812 | |
4.75%, 02/01/28(e) | | | | | | | 800 | | | | 843,000 | |
Telesat Canada/Telesat LLC,
6.50%, 10/15/27(a) | | | | | | | 179 | | | | 186,885 | |
Vodafone Group PLC, 3.10%, 01/03/79 | | | EUR | | | | 100 | | | | 116,688 | |
| | | | | | | | |
| | | | | | | | | | | 10,974,765 | |
| | | | | | | | |
| |
Total Corporate Bonds — 75.5%
(Cost — $470,196,919) | | | | 489,989,411 | |
| | | | | | | | |
|
Floating Rate Loan Interests(d) — 4.6% | |
|
Aerospace & Defense — 0.0% | |
Atlantic Aviation FBO, Inc., 2018 Term Loan B, (1 mo. LIBOR + 3.75%),
5.54%, 12/06/25(b) | | | USD | | | | 65 | | | | 64,754 | |
| | | | | | | | |
|
| Auto Components — 0.1% | |
Panther BF Aggregator 2 LP, USD Term Loan B, (1 mo. LIBOR + 3.50%),
5.30%, 04/30/26 | | | | | | | 390 | | | | 384,503 | |
| | | | | | | | |
|
| Building Products — 0.0% | |
CPG International, Inc., 2017 Term Loan, (3 mo. LIBOR + 3.75%, 1.00% Floor),
5.93%, 05/05/24 | | | | | | | 142 | | | | 139,304 | |
| | | | | | | | |
|
| Capital Markets — 0.1% | |
Jefferies Finance LLC, 2019 Term Loan, (1 mo. LIBOR + 3.75%), 5.75%, 06/03/26(b) | | | | | | | 232 | | | | 228,060 | |
| | | | | | | | |
|
| Chemicals — 0.2% | |
Alpha 3 BV, 2017 Term Loan B1, (3 mo. LIBOR + 3.00%, 1.00% Floor),
5.10%, 01/31/24 | | | | | | | 663 | | | | 648,548 | |
Ascend Performance Materials Operations LLC, 2019 Term Loan B, (3 mo. LIBOR + 5.25%, 1.00% Floor), 7.35%, 08/27/26 | | | | | | | 500 | | | | 500,000 | |
Invictus US LLC, 2nd Lien Term Loan, (3 mo. LIBOR + 6.75%), 8.68%, 03/30/26 | | | | | | | 60 | | | | 55,335 | |
Momentive Performance Materials, Inc., Term Loan B, (1 mo. LIBOR + 3.25%),
5.04%, 05/15/24 | | | | | | | 97 | | | | 95,056 | |
| | | | | | | | |
| | | | 1,298,939 | |
|
| Commercial Services & Supplies — 0.4% | |
Asurion LLC, 2017 2nd Lien Term Loan, (1 mo. LIBOR + 6.50%), 8.29%, 08/04/25 | | | | | | | 514 | | | | 516,056 | |
Diamond (BC) BV, Term Loan, (3 mo. LIBOR + 3.00%), 4.86%, 09/06/24 | | | | | | | 254 | | | | 236,421 | |
| | | | |
| CONSOLIDATED SCHEDULES OF INVESTMENTS | | | 55 | |
| | |
Consolidated Schedule of Investments (continued) October 31, 2019 | | BlackRock Multi-Sector Income Trust (BIT) (Percentages shown are based on Net Assets) |
| | | | | | | | | | | | |
| Security | | Par
(000) | | | Value | |
|
| Commercial Services & Supplies (continued) | |
GFL Environmental, Inc., 2018 USD Term Loan B, (1 mo. LIBOR + 3.00%, 1.00% Floor), 4.79%, 05/30/25 | | | USD | | | | 353 | | | $ | 351,696 | |
KAR Auction Services, Inc., 2019 Term Loan B6, (1 mo. LIBOR + 2.25%), 4.13%, 09/19/26 | | | | | | | 67 | | | | 67,353 | |
Verscend Holding Corp., 2018 Term Loan B, (1 mo. LIBOR + 4.50%), 6.29%, 08/27/25 | | | | | | | 1,550 | | | | 1,549,640 | |
| | | | | | | | |
| | | | 2,721,166 | |
|
| Construction & Engineering — 0.4% | |
Brand Energy & Infrastructure Services, Inc., 2017 Term Loan, 06/21/24(f)(l) | | | | | | | 1,991 | | | | 1,931,117 | |
SRS Distribution, Inc., 2018 1st Lien Term Loan, (1 mo. LIBOR + 3.25%), 5.04%, 05/23/25 | | | | | | | 350 | | | | 338,614 | |
| | | | | | | | |
| | | | 2,269,731 | |
|
| Containers & Packaging — 0.0% | |
BWAY Holding Co., 2017 Term Loan B, (3 mo. LIBOR + 3.25%), 5.23%, 04/03/24 | | | | | | | 193 | | | | 187,639 | |
Charter NEX US, Inc., Incremental Term Loan, (1 mo. LIBOR + 3.50%), 5.29%, 05/16/24 | | | | | | | 99 | | | | 97,611 | |
| | | | | | | | |
| | | | 285,250 | |
|
| Diversified Consumer Services — 0.0% | |
Ascend Learning LLC, 2017 Term Loan B, (1 mo. LIBOR + 3.00%, 1.00% Floor), 4.79%, 07/12/24 | | | | | | | 71 | | | | 70,001 | |
BidFair MergerRight, Inc., Term Loan B, (3 mo. LIBOR + 5.50%, 1.00% Floor), 7.39%, 01/15/27 | | | | | | | 160 | | | | 155,750 | |
| | | | | | | | |
| | | | 225,751 | |
|
| Diversified Financial Services — 0.1% | |
Connect Finco Sarl, Term Loan B, 09/23/26(f)(l) | | | | | | | 728 | | | | 716,396 | |
| | | | | | | | |
|
| Diversified Telecommunication Services — 0.2% | |
CenturyLink, Inc., 2017 Term Loan B, (1 mo. LIBOR + 2.75%), 4.54%, 01/31/25 | | | | | | | 799 | | | | 790,129 | |
Iridium Satellite LLC, Term Loan, 10/17/26(f)(l) | | | | | | | 146 | | | | 146,775 | |
| | | | | | | | |
| | | | 936,904 | |
|
| Energy Equipment & Services — 0.1% | |
Pioneer Energy Services Corp., Term Loan, (1 mo. LIBOR + 7.75%, 1.00% Floor), 9.55%, 11/08/22(b) | | | | | | | 865 | | | | 830,400 | |
| | | | | | | | |
|
| Entertainment — 0.0% | |
Aviron Capital LLC, 2017 Term Loan, 5.00%, 07/17/20(b)(q)(r) | | | | | | | 73,311 | | | | — | |
| | | | | | | | |
|
| Food & Staples Retailing — 0.0% | |
US Foods, Inc., 2019 Term Loan B, (1 mo. LIBOR + 2.00%), 3.79%, 09/13/26 | | | | | | | 119 | | | | 119,314 | |
| | | | | | | | |
|
| Food Products — 0.0% | |
Chobani LLC, 2017 Term Loan B, (1 mo. LIBOR + 3.50%, 1.00% Floor), 5.29%, 10/10/23 | | | | | | | 69 | | | | 67,551 | |
| | | | | | | | |
|
| Gas Utilities — 0.0% | |
AL Midcoast Holdings LLC, 2018 Term Loan B, (3 mo. LIBOR + 5.50%), 7.60%, 07/31/25 | | | | | | | 54 | | | | 52,218 | |
| | | | | | | | |
|
| Health Care Equipment & Supplies — 0.1% | |
Immucor, Inc., Extended Term Loan B, (3 mo. LIBOR + 5.00%, 1.00% Floor), 7.10%, 06/15/21 | | | | | | | 841 | | | | 836,269 | |
| | | | | | | | |
|
| Health Care Providers & Services — 0.4% | |
AHP Health Partners, Inc., 2018 Term Loan, (1 mo. LIBOR + 4.50%, 1.00% Floor), 6.29%, 06/30/25 | | | | | | | 172 | | | | 171,610 | |
Emerald TopCo., Inc., Term Loan, (1 mo. LIBOR + 3.50%), 5.29%, 07/24/26 | | | | | | | 419 | | | | 412,086 | |
Envision Healthcare Corp., 2018 1st Lien Term Loan, (1 mo. LIBOR + 3.75%), 5.54%, 10/10/25 | | | | | | | 1,164 | | | | 938,293 | |
| | | | | | | | | | | | |
| Security | | Par
(000) | | | Value | |
|
| Health Care Providers & Services (continued) | |
Gentiva Health Services, Inc., 2018 1st Lien Term Loan, (1 mo. LIBOR + 3.75%), 5.56%, 07/02/25(b) | | | USD | | | | 270 | | | $ | 269,254 | |
Quorum Health Corporation, Term Loan B, (3 mo. LIBOR + 6.75%, 1.00% Floor), 8.68%, 04/29/22 | | | | | | | 235 | | | | 226,099 | |
Sotera Health Holdings LLC, 2017 Term Loan, (3 mo. LIBOR + 3.00%, 1.00% Floor), 4.93%, 05/15/22 | | | | | | | 831 | | | | 815,168 | |
| | | | | | | | |
| | | | | | | | | | | 2,832,510 | |
|
| Health Care Technology — 0.1% | |
Athenahealth, Inc., 2019 Term Loan B, (3 mo. LIBOR + 4.50%), 6.68%, 02/11/26 | | | | | | | 938 | | | | 929,048 | |
| | | | | | | | |
|
| Hotels, Restaurants & Leisure — 0.1% | |
Stars Group Holdings BV, 2018 USD Incremental Term Loan, (3 mo. LIBOR + 3.50%), 5.60%, 07/10/25 | | | | | | | 561 | | | | 562,592 | |
| | | | | | | | |
|
| Independent Power and Renewable Electricity Producers — 0.0% | |
Calpine Corp., 2019 Term Loan B10, (1 mo. LIBOR + 2.50%), 4.29%, 08/12/26 | | | | | | | 95 | | | | 95,070 | |
| | | | | | | | |
|
| Industrial Conglomerates — 0.2% | |
Cortes NP Acquisition Corp., 2017 Term Loan B, (3 mo. LIBOR + 4.00%, 1.00% Floor), 5.79%, 11/30/23 | | | | | | | 985 | | | | 925,797 | |
Sequa Mezzanine Holdings LLC, 1st Lien Term Loan, (3 mo. LIBOR + 5.00%, 1.00% Floor), 7.19%, 11/28/21 | | | | | | | 198 | | | | 195,539 | |
| | | | | | | | |
| | | | | | | | | | | 1,121,336 | |
|
| Insurance — 0.2% | |
Alliant Holdings I, Inc., 2018 Term Loan B, (3 mo. LIBOR + 3.00%), 4.80%, 05/09/25 | | | | | | | 60 | | | | 58,628 | |
Hub International Ltd., 2019 Incremental Term Loan B, 04/25/25(f)(l) | | | | | | | 301 | | | | 300,398 | |
Sedgwick Claims Management Services, Inc.: | | | | | | | | | | | | |
2019 Term Loan B, (1 mo. LIBOR + 4.00%), 5.79%, 09/03/26 | | | | | | | 280 | | | | 277,904 | |
Term Loan B, (1 mo. LIBOR + 3.25%), 5.04%, 12/31/25 | | | | | | | 469 | | | | 454,439 | |
| | | | | | | | |
| | | | | | | | | | | 1,091,369 | |
|
| Interactive Media & Services — 0.0% | |
TierPoint LLC, 2017 1st Lien Term Loan, (1 mo. LIBOR + 3.75%, 1.00% Floor), 5.54%, 05/06/24 | | | | | | | 171 | | | | 153,615 | |
| | | | | | | | |
|
| IT Services — 0.0% | |
Flexential Intermediate Corp.: | | | | | | | | | | | | |
2017 1st Lien Term Loan, (3 mo. LIBOR + 3.50%), 5.60%, 08/01/24 | | | | | | | 174 | | | | 146,748 | |
2nd Lien Term Loan, (3 mo. LIBOR + 7.25%, 1.00% Floor), 9.38%, 08/01/25 | | | | | | | 75 | | | | 53,437 | |
| | | | | | | | |
| | | | | | | | | | | 200,185 | |
|
| Machinery — 0.2% | |
MHI Holdings LLC, Term Loan B, (1 mo. LIBOR + 5.00%), 6.79%, 09/21/26(b) | | | | | | | 256 | | | | 253,440 | |
Titan Acquisition Ltd., 2018 Term Loan B, (1 mo. LIBOR + 3.00%), 4.79%, 03/28/25 | | | | | | | 806 | | | | 761,241 | |
| | | | | | | | |
| | | | | | | | | | | 1,014,681 | |
|
| Media — 0.6% | |
Altice France SA, 2018 Term Loan B13, (1 mo. LIBOR + 4.00%), 5.92%, 08/14/26 | | | | | | | 279 | | | | 274,200 | |
Clear Channel Outdoor Holdings, Inc., Term Loan B, (1 mo. LIBOR + 3.50%), 5.29%, 08/21/26 | | | | | | | 986 | | | | 987,587 | |
Intelsat Jackson Holdings SA: | | | | | | | | | | | | |
2017 Term Loan B3, (6 mo. LIBOR + 3.75%, 1.00% Floor), 5.68%, 11/27/23 | | | | | | | 107 | | | | 106,900 | |
| | |
| 56 | | 2019 BLACKROCK ANNUAL REPORTTO SHAREHOLDERS |
| | |
Consolidated Schedule of Investments (continued) October 31, 2019 | | BlackRock Multi-Sector Income Trust (BIT) (Percentages shown are based on Net Assets) |
| | | | | | | | | | | | |
| Security | | Par
(000) | | | Value | |
|
| Media (continued) | |
2017 Term Loan B4, (6 mo. LIBOR + 4.50%, 1.00% Floor), 6.43%, 01/02/24 | | | USD | | | | 330 | | | $ | 333,138 | |
2017 Term Loan B5, (Fixed + 6.62%),
6.63%, 01/02/24 | | | | | | | 1,841 | | | | 1,881,619 | |
PSAV Holdings LLC, 2018 2nd Lien Term Loan, 09/01/25(f)(l) | | | | | | | 178 | | | | 166,781 | |
| | | | | | | | |
| | | | | | | | | | | 3,750,225 | |
|
| Oil & Gas Equipment & Services — 0.1% | |
McDermott Technology Americas, Inc., 2018 1st Lien Term Loan, 10/21/21(f)(I) | | | | | | | 505 | | | | 545,009 | |
| | | | | | | | |
|
| Oil, Gas & Consumable Fuels — 0.2% | |
BCP Raptor II LLC, 1st Lien Term Loan, (1 mo. LIBOR + 4.75%), 6.54%, 11/03/25 | | | | | | | 87 | | | | 76,537 | |
California Resources Corp., Second Out Term Loan, (1 mo. LIBOR + 10.38%, 1.00% Floor), 12.17%, 12/31/21 | | | | | | | 612 | | | | 403,809 | |
CITGO Holding Inc., 2019 Term Loan B, (1 mo. LIBOR + 7.00%, 1.00% Floor), 8.79%, 08/01/23 | | | | | | | 243 | | | | 244,823 | |
CONSOL Energy, Inc., 1st Lien Term Loan B, (1 mo. LIBOR + 4.50%, 1.00% Floor), 6.29%, 09/27/24(b) | | | | | | | 247 | | | | 227,019 | |
| | | | | | | | |
| | | | | | | | | | | 952,188 | |
| | | |
| Pharmaceuticals — 0.1% | | | | | | | | | |
Endo Luxembourg Finance Co. I Sarl, 2017 Term Loan B, (1 mo. LIBOR + 4.25%), 6.06%, 04/29/24 | | | | | | | 306 | | | | 280,642 | |
Jaguar Holding Co. II, 2018 Term Loan, (1 mo. LIBOR + 2.50%, 1.00% Floor), 4.29%, 08/18/22 | | | | | | | 88 | | | | 87,551 | |
Valeant Pharmaceuticals International, Inc., 2018 Term Loan B, (1 mo. LIBOR + 3.00%), 4.92%, 06/02/25 | | | | | | | 216 | | | | 216,795 | |
| | | | | | | | |
| | | | | | | | | | | 584,988 | |
| | | |
| Professional Services — 0.1% | | | | | | | | | |
Dun & Bradstreet Corp., Term Loan, (1 mo. LIBOR + 5.00%), 6.80%, 02/06/26 | | | | | | | 364 | | | | 364,834 | |
| | | | | | | | |
| |
| Semiconductors & Semiconductor Equipment — 0.0% | | | | |
ON Semiconductor Corp., 2019 Term Loan B, (1 mo. LIBOR + 2.00%), 3.79%, 09/19/26 | | | | | | | 136 | | | | 136,407 | |
| | | | | | | | |
| | | |
| Software — 0.6% | | | | | | | | | |
Camelot U.S. Acquisition 1 Co., Term Loan B, 10/25/26(b)(f)(l) | | | | | | | 206 | | | | 206,515 | |
Cypress Intermediate Holdings III, Inc., 1.00% Floor): | | | | | | | | | | | | |
2017 1st Lien Term Loan, (1 mo. LIBOR + 2.75%, 4.54%, 04/29/24 | | | | | | | 130 | | | | 127,987 | |
2017 2nd Lien Term Loan, (1 mo. LIBOR + 6.75%, 8.54%, 04/27/25 | | | | | | | 40 | | | | 40,120 | |
DCert Buyer, Inc., 2019 Term Loan B, (1 mo. LIBOR + 4.00%), 5.79%, 10/16/26 | | | | | | | 145 | | | | 142,561 | |
Financial & Risk US Holdings, Inc., 2018 USD Term Loan, (1 mo. LIBOR + 3.75%), 5.54%, 10/01/25 | | | | | | | 1,609 | | | | 1,616,190 | |
Infor (US), Inc., Term Loan B6, (3 mo. LIBOR + 2.75%, 1.00% Floor), 4.85%, 02/01/22 | | | | | | | 164 | | | | 163,704 | |
Kronos, Inc., 2nd Lien Term Loan, (3 mo. LIBOR + 8.25%, 1.00% Floor), 10.50%, 11/01/24 | | | | | | | 624 | | | | 625,950 | |
Mitchell International, Inc., 2017 1st Lien Term Loan, (1 mo. LIBOR + 3.25%), 5.04%, 11/29/24 | | | | | | | 240 | | | | 225,229 | |
Renaissance Holding Corp., 2018 Add On Term Loan, (1 mo. LIBOR + 3.25%), 5.04%, 05/30/25 | | | | | | | 71 | | | | 69,092 | |
SS&C Technologies Holdings Europe Sarl, 2018 Term Loan B4, (1 mo. LIBOR + 2.25%), 4.04%, 04/16/25 | | | | | | | 125 | | | | 124,800 | |
SS&C Technologies, Inc., 2018 Term Loan B3, (1 mo. LIBOR + 2.25%), 4.04%, 04/16/25 | | | | | | | 208 | | | | 208,358 | |
| | | | | | | | | | | | |
| Security | | Par
(000) | | | Value | |
| | | |
| Software (continued) | | | | | | | | | |
Tibco Software, Inc., 2019 Term Loan B, (1 mo. LIBOR + 4.00%), 6.00%, 06/30/26 | | | USD | | | | 238 | | | $ | 236,512 | |
Ultimate Software Group, Inc., Term Loan B, (1 mo. LIBOR + 3.75%), 5.54%, 05/04/26 | | | | | | | 104 | | | | 104,390 | |
Veritas Bermuda Ltd., Repriced Term Loan B, (3 mo. LIBOR + 4.50%, 1.00% Floor), 6.60%, 01/27/23 | | | | | | | 102 | | | | 94,518 | |
| | | | | | | | |
| | | | | | | | | | | 3,985,926 | |
| | |
| Wireless Telecommunication Services — 0.0% | | | | | | | |
Xplornet Communications, Inc., Term Loan B, (3 mo. LIBOR + 4.00%, 1.00% Floor), 6.10%, 09/09/21(b) | | | | | | | 219 | | | | 218,207 | |
| | | | | | | | |
| |
Total Floating Rate Loan Interests — 4.6%
(Cost — $103,574,010) | | | | 29,714,700 | |
| | | | | | | | |
|
Foreign Agency Obligations — 4.9% | |
| | | |
Argentina — 0.0% | | | | | | | | | | | | |
Argentine Republic Government International Bond: | | | | | | | | | | | | |
6.88%, 04/22/21 | | | | | | | 272 | | | | 122,655 | |
4.63%, 01/11/23 | | | | | | | 136 | | | | 54,825 | |
| | | | | | | | |
| | | | | | | | | | | 177,480 | |
| | | |
| Colombia — 0.4% | | | | | | | | | |
Colombia Government International Bond: | | | | | | | | | | | | |
8.13%, 05/21/24 | | | | | | | 826 | | | | 1,022,175 | |
4.50%, 01/28/26(e) | | | | | | | 337 | | | | 369,226 | |
3.88%, 04/25/27(e) | | | | | | | 944 | | | | 1,004,770 | |
| | | | | | | | |
| | | | | | | | | | | 2,396,171 | |
| | | |
| Cyprus — 0.5% | | | | | | | | | |
Cyprus Government International Bond, 4.63%, 02/03/20(a) | | | EUR | | | | 2,950 | | | | 3,326,260 | |
| | | | | | | | |
| | | |
| Dominican Republic — 0.1% | | | | | | | | | |
Dominican Republic International Bond,
5.50%, 01/27/25 | | | USD | | | | 445 | | | | 476,011 | |
| | | | | | | | |
| | | |
| Egypt — 0.7% | | | | | | | | | |
Egypt Government Bond: | | | | | | | | | | | | |
16.00%, 06/11/22 | | | EGP | | | | 7,418 | | | | 475,792 | |
14.30%, 09/03/22 | | | | | | | 16,070 | | | | 993,897 | |
Egypt Government International Bond: | | | | | | | | | | | | |
5.75%, 04/29/20 | | | USD | | | | 2,360 | | | | 2,393,187 | |
7.60%, 03/01/29(a)(e) | | | | | | | 256 | | | | 271,360 | |
6.38%, 04/11/31(a) | | | EUR | | | | 130 | | | | 151,015 | |
| | | | | | | | |
| | | | | | | | | | | 4,285,251 | |
| | | |
| Iceland — 0.6% | | | | | | | | | |
Iceland Government International Bond,
5.88%, 05/11/22 | | | USD | | | | 3,415 | | | | 3,742,902 | |
| | | | | | | | |
| | | |
| Indonesia — 0.5% | | | | | | | | | |
Indonesia Government International Bond: | | | | | | | | | | | | |
4.75%, 01/08/26 | | | | | | | 670 | | | | 739,931 | |
4.10%, 04/24/28 | | | | | | | 774 | | | | 834,711 | |
5.35%, 02/11/49(e) | | | | | | | 295 | | | | 375,480 | |
Indonesia Treasury Bond, 8.38%, 09/15/26 | | | IDR | | | | 17,965,000 | | | | 1,397,576 | |
| | | | | | | | |
| | | | | | | | | | | 3,347,698 | |
| | | |
| Mexico — 0.2% | | | | | | | | | |
Mexico Government International Bond: | | | | | | | | | | | | |
4.15%, 03/28/27 | | | USD | | | | 730 | | | | 781,556 | |
3.75%, 01/11/28(e) | | | | | | | 200 | | | | 208,563 | |
| | | | | | | | |
| | | | | | | | | | | 990,119 | |
| | | |
| Nigeria — 0.2% | | | | | | | | | |
Nigeria Government International Bond: | | | | | | | | | | | | |
6.38%, 07/12/23 | | | | | | | 223 | | | | 234,638 | |
| | | | |
| CONSOLIDATED SCHEDULES OF INVESTMENTS | | | 57 | |
| | |
Consolidated Schedule of Investments (continued) October 31, 2019 | | BlackRock Multi-Sector Income Trust (BIT) (Percentages shown are based on Net Assets) |
| | | | | | | | | | | | |
| Security | | Par
(000) | | | Value | |
| | | |
| Nigeria (continued) | | | | | | | | | |
7.63%, 11/21/25 | | | USD | | | | 767 | | | $ | 835,550 | |
| | | | | | | | |
| | | | | | | | | | | 1,070,188 | |
| | | |
| Paraguay — 0.0% | | | | | | | | | |
Paraguay Government International Bond, 5.40%, 03/30/50(a) | | | | | | | 200 | | | | 226,875 | |
| | | | | | | | |
| | | |
| Portugal — 0.6% | | | | | | | | | |
Portugal Government International Bond, 5.13%, 10/15/24(a) | | | | | | | 3,680 | | | | 4,181,536 | |
| | | | | | | | |
| | | |
| Qatar — 0.4% | | | | | | | | | |
Qatar Government International Bond: | | | | | | | | | | | | |
4.50%, 04/23/28 | | | | | | | 970 | | | | 1,109,437 | |
4.00%, 03/14/29(a)(e) | | | | | | | 1,335 | | | | 1,483,936 | |
| | | | | | | | |
| | | | | | | | | | | 2,593,373 | |
| | | |
| Russia — 0.2% | | | | | | | | | |
Russian Foreign Bond — Eurobond: | | | | | | | | | | | | |
4.75%, 05/27/26 | | | | | | | 600 | | | | 660,000 | |
4.25%, 06/23/27 | | | | | | | 800 | | | | 858,400 | |
| | | | | | | | |
| | | | | | | | | | | 1,518,400 | |
| | | |
| Saudi Arabia — 0.2% | | | | | | | | | |
Saudi Government International Bond: | | | | | | | | | | | | |
4.38%, 04/16/29(a) | | | | | | | 200 | | | | 223,400 | |
4.50%, 04/17/30 | | | | | | | 764 | | | | 865,230 | |
| | | | | | | | |
| | | | | | | | | | | 1,088,630 | |
| | | |
| South Africa — 0.1% | | | | | | | | | |
Republic of South Africa Government International Bond, 5.88%, 05/30/22 | | | | | | | 667 | | | | 718,276 | |
| | | | | | | | |
| | | |
| Turkey — 0.1% | | | | | | | | | |
Turkey Government International Bond,
6.25%, 09/26/22 | | | | | | | 467 | | | | 483,345 | |
| | | | | | | | |
| | | |
| Ukraine — 0.1% | | | | | | | | | |
Ukraine Government International Bond: | | | | | | | | | | | | |
7.75%, 09/01/22 | | | | | | | 136 | | | | 144,568 | |
7.75%, 09/01/23 | | | | | | | 221 | | | | 236,470 | |
8.99%, 02/01/24 | | | | | | | 224 | | | | 248,976 | |
9.75%, 11/01/28 | | | | | | | 272 | | | | 323,765 | |
| | | | | | | | |
| | | | | | | | | | | 953,779 | |
| | | | | | | | |
| |
Total Foreign Agency Obligations — 4.9%
(Cost — $30,868,479) | | | | 31,576,294 | |
| | | | | | | | |
|
Non-Agency Mortgage-Backed Securities — 14.1% | |
|
| Collateralized Mortgage Obligations — 14.1% | |
American Home Mortgage Assets Trust, Series2006-5, Class A1, (12 mo. MTA + 0.92%),
3.31%, 11/25/46(d) | | | | | | | 5,174 | | | | 2,535,995 | |
CHL Mortgage Pass-Through Trust: | | | | | | | | | | | | |
Series2006-3, Class 1A1, (1 mo. LIBOR US + 0.24%), 2.06%, 03/25/36(d) | | | | | | | 8,175 | | | | 8,019,471 | |
Series2007-J2, Class 2A1, (1 mo. LIBOR US + 0.65%), 2.47%, 07/25/37(d) | | | | | | | 3,716 | | | | 1,690,220 | |
Series2007-J2, Class 2A8, 6.00%, 07/25/37 | | | | | | | 2,052 | | | | 1,372,765 | |
Citigroup Mortgage Loan Trust, Series2006-AR7, Class 2A3A, 4.04%, 11/25/36(c) | | | | | | | 3,470 | | | | 3,327,698 | |
Countrywide Alternative Loan Trust: | | | | | | | | | | | | |
Series2005-9CB, Class 1A3, (1 mo. LIBOR US + 0.45%), 2.27%, 05/25/35(d) | | | | | | | 2,645 | | | | 2,409,556 | |
Series 2006-40T1, Class 2A5, (1 mo. LIBOR US + 0.40%), 2.22%, 12/25/36(d) | | | | | | | 2,337 | | | | 509,178 | |
| | | | | | | | | | | | |
| Security | | Par
(000) | | | Value | |
|
| Collateralized Mortgage Obligations (continued) | |
Series2006-7CB, Class 2A1, 6.50%, 05/25/36 | | | USD | | | | 2,236 | | | $ | 1,483,987 | |
Series2006-J7, Class 2A1, (11th District Cost of Funds + 1.50%), 2.66%, 11/20/46(d) | | | | | | | 5,184 | | | | 3,691,498 | |
Series2006-J8, Class A5, 6.00%, 02/25/37 | | | | | | | 1,664 | | | | 1,145,703 | |
Series 2006-OA14, Class 3A1, (12 mo. MTA + 0.85%), 3.24%, 11/25/46(d) | | | | | | | 7,445 | | | | 6,829,039 | |
Series 2006-OA16, Class A2, (1 mo. LIBOR US + 0.19%), 2.01%, 10/25/46(d) | | | | | | | 5,018 | | | | 4,874,836 | |
Series 2006-OA18, Class A1, (1 mo. LIBOR US + 0.12%), 1.94%, 12/25/46(d) | | | | | | | 3,154 | | | | 3,081,407 | |
Series2006-OA6, Class 1A1A, (1 mo. LIBOR US + 0.21%), 2.03%, 07/25/46(d) | | | | | | | 5,719 | | | | 4,895,111 | |
Series2006-OA8, Class 1A1, (1 mo. LIBOR US + 0.19%), 2.01%, 07/25/46(d) | | | | | | | 2,246 | | | | 2,201,053 | |
Series 2007-12T1, Class A22, 5.75%, 06/25/37 | | | | | | | 4,512 | | | | 3,212,764 | |
Series 2007-12T1, Class A5, 6.00%, 06/25/37 | | | | | | | 2,190 | | | | 1,604,584 | |
Series2007-22, Class 2A16, 6.50%, 09/25/37 | | | | | | | 8,512 | | | | 5,624,419 | |
Series 2007-23CB, Class A1, 6.00%, 09/25/37 | | | | | | | 5,827 | | | | 4,615,985 | |
Series2007-4CB, Class 1A3, (1 mo. LIBOR US + 0.35%), 2.17%, 04/25/37(d) | | | | | | | 3,148 | | | | 2,482,141 | |
Series2007-OA2, Class 1A1, (12 mo. MTA + 0.84%), 3.23%, 03/25/47(d) | | | | | | | 3,709 | | | | 3,201,765 | |
Countrywide Home Loan Mortgage Pass-Through Trust, Series2006-OA5, Class 3A1, (1 mo. LIBOR US + 0.20%), 2.02%, 04/25/46(d) | | | | | | | 7,093 | | | | 6,793,553 | |
Morgan StanleyRe-REMIC Trust, Series2010-R5, Class 7B, 3.44%, 05/26/37(a)(b) | | | | | | | 8,468 | | | | 8,255,880 | |
Nomura Asset Acceptance Corp. Alternative Loan Trust, Series2006-AF1, Class 1A2, 6.16%, 05/25/36(c) | | | | | | | 7,682 | | | | 2,845,901 | |
Residential Asset Securitization Trust, Series2006-A8, Class 2A5, (1 mo. LIBOR US + 0.60%),
2.42%, 08/25/36(d) | | | | | | | 6,505 | | | | 1,479,239 | |
WaMu Mortgage Pass-Through Certificates, Series2007-OA4, Class 1A, (12 mo. MTA + 0.77%),
3.16%, 05/25/47(d) | | | | | | | 3,480 | | | | 3,330,364 | |
| | | | | | | | |
| |
TotalNon-Agency Mortgage-Backed Securities — 14.1%
(Cost — $91,667,268) | | | | 91,514,112 | |
| | | | | | | | |
|
Preferred Securities — 17.5% | |
|
Capital Trusts — 13.0% | |
|
| Banks — 3.9% | |
AIB Group PLC, 5.25%(h)(i) | | | | | | | 200 | | | | 231,074 | |
Banco Bilbao Vizcaya Argentaria SA(h)(i): | | | | | | | | | | | | |
6.13%(e) | | | | | | | 2,000 | | | | 1,967,500 | |
8.88% | | | | | | | 200 | | | | 245,397 | |
Banco de Sabadell SA, 6.50%(h)(i) | | | | | | | 200 | | | | 228,571 | |
Bankia SA, 6.38%(h)(i) | | | | | | | 200 | | | | 236,372 | |
BNP Paribas SA, 7.20%(a)(e)(h)(i) | | | | | | | 4,000 | | | | 4,450,000 | |
Capital One Financial Corp., Series E, 5.55%(e)(h)(i) | | | | | | | 3,500 | | | | 3,564,120 | |
CIT Group, Inc., Series A, 5.80%(e)(h)(i) | | | | | | | 282 | | | | 289,403 | |
Fifth Third Bancorp, Series J, 5.23%(h)(i) | | | | | | | 3,000 | | | | 3,003,750 | |
Hongkong & Shanghai Banking Corp. Ltd., Series 3H, 2.13%(d)(i) | | | | | | | 100 | | | | 75,731 | |
ING Groep NV, 6.75%(h)(i) | | | | | | | 200 | | | | 212,250 | |
Wells Fargo & Co.,(h)(i): | | | | | | | | | | | | |
Series S, 5.90%(e) | | | | | | | 8,800 | | | | 9,504,000 | |
Series U, 5.88% | | | | | | | 1,150 | | | | 1,273,625 | |
| | | | | | | | |
| | | | | | | | | | | 25,281,793 | |
|
| Building Materials — 0.0% | |
Holcim Finance Luxembourg SA, 3.00%(h)(i) | | | | | | | 100 | | | | 116,372 | |
| | | | | | | | |
| | |
| 58 | | 2019 BLACKROCK ANNUAL REPORTTO SHAREHOLDERS |
| | |
Consolidated Schedule of Investments (continued) October 31, 2019 | | BlackRock Multi-Sector Income Trust (BIT) (Percentages shown are based on Net Assets) |
| | | | | | | | | | | | |
| Security | | Par
(000) | | | Value | |
|
| Capital Markets — 1.1% | |
Goldman Sachs Group, Inc., Series P, 5.00%(e)(h)(i) | | | USD | | | | 144 | | | $ | 142,848 | |
Morgan Stanley, Series H, 5.61%(e)(h)(i) | | | | | | | 5,007 | | | | 5,037,042 | |
State Street Corp., Series F, 5.25%(h)(i) | | | | | | | 1,875 | | | | 1,921,013 | |
UBS Group Funding Switzerland AG, 5.75%(h)(i) | | | | | | | 200 | | | | 243,851 | |
| | | | | | | | | | | | |
| | | | | | | | | | | 7,344,754 | |
|
| Diversified Financial Services — 5.5% | |
Bank of America Corp.,(h)(i): | | | | | | | | | | | | |
Series AA, 6.10% | | | | | | | 3,890 | | | | 4,305,394 | |
Series DD, 6.30% | | | | | | | 205 | | | | 233,093 | |
Series U, 5.20%(e) | | | | | | | 1,750 | | | | 1,824,375 | |
Series X, 6.25%(e) | | | | | | | 6,175 | | | | 6,829,550 | |
Series Z, 6.50% | | | | | | | 170 | | | | 192,758 | |
Bank of New York Mellon Corp., Series D, 4.50%(e)(h)(i) | | | | | | | 4,567 | | | | 4,608,560 | |
Credit Agricole SA, 6.50%(h)(i) | | | | | | | 100 | | | | 120,345 | |
Credit Suisse Group AG(a)(h)(i): | | | | | | | | | | | | |
6.38% | | | | | | | 585 | | | | 616,444 | |
7.50% | | | | | | | 200 | | | | 215,680 | |
HBOS Capital Funding LP, 6.85%(i) | | | | | | | 200 | | | | 203,251 | |
HSBC Holdings PLC(e)(h)(i): | | | | | | | | | | | | |
6.00% | | | | | | | 695 | | | | 721,410 | |
6.50% | | | | | | | 655 | | | | 693,481 | |
JPMorgan Chase & Co.,(h)(i): | | | | | | | | | | | | |
Series 1, 5.41% | | | | | | | 181 | | | | 182,086 | |
Series FF, 5.00% | | | | | | | 1,595 | | | | 1,658,800 | |
Series Q, 5.15%(e) | | | | | | | 5,500 | | | | 5,699,375 | |
Series R, 6.00% | | | | | | | 228 | | | | 244,717 | |
Series S, 6.75% | | | | | | | 180 | | | | 200,831 | |
Series V, 5.42%(e) | | | | | | | 3,830 | | | | 3,856,810 | |
Royal Bank of Scotland Group PLC, 8.63%(h)(i) | | | | | | | 200 | | | | 215,500 | |
Societe Generale SA, 6.75%(a)(e)(h)(i) | | | | | | | 3,000 | | | | 3,163,185 | |
| | | | | | | | | | | | |
| | | | | | | | | | | 35,785,645 | |
|
| Diversified Telecommunication Services — 0.1% | |
Koninklijke KPN NV, 2.00%,(f)(i) | | | | | | | 100 | | | | 110,931 | |
Telefonica Europe BV(h)(i): | | | | | | | | | | | | |
3.75% | | | | | | | 100 | | | | 117,606 | |
4.38% | | | | | | | 100 | | | | 122,404 | |
5.88% | | | | | | | 100 | | | | 128,841 | |
| | | | | | | | |
| | | | | | | | | | | 479,782 | |
|
| Electric Utilities — 1.6% | |
Electricite de France SA, 5.25%(a)(e)(h)(i) | | | | | | | 7,500 | | | | 7,743,750 | |
NextEra Energy Capital Holdings, Inc., 5.65%,(h) | | | | | | | 2,500 | | | | 2,758,129 | |
RWE AG, 2.75%,(h) | | | | | | | 20 | | | | 22,695 | |
| | | | | | | | |
| | | | | | | | | | | 10,524,574 | |
|
| Electronic Equipment, Instruments & Components — 0.0% | |
Belden, Inc., 4.13%, | | | | | | | 100 | | | | 116,040 | |
| | | | | | | | |
|
| Industrial Conglomerates — 0.2% | |
General Electric Co., Series D, 5.00%(e)(h)(i) | | | | | | | 1,383 | | | | 1,332,866 | |
| | | | | | | | |
|
| Insurance — 0.6% | |
Allstate Corp., Series B, 5.75%,(h) | | | | | | | 2,000 | | | | 2,150,720 | |
Voya Financial, Inc., 5.65%,(e)(h) | | | | | | | 1,090 | | | | 1,152,675 | |
| | | | | | | | |
| | | | | | | | | | | 3,303,395 | |
|
| Oil, Gas & Consumable Fuels — 0.0% | |
Naturgy Finance BV, 4.13%(h)(i) | | | | | | | 100 | | | | 120,713 | |
| | | | | | | | |
| |
Total Capital Trusts — 13.0%
(Cost — $80,526,493) | | | | 84,405,934 | |
| | | | | | | | |
| | | | | | | | | | | | |
| Security | | | | |
Shares | | | Value | |
|
Preferred Stocks — 4.5% | |
|
| Capital Markets — 2.4% | |
Goldman Sachs Group, Inc., Series J, 5.50%(h)(i) | | | | | | | 395,017 | | | $ | 10,720,761 | |
Morgan Stanley,(h)(i): | | | | | | | | | | | | |
Series F, 6.88% | | | | | | | 100,000 | | | | 2,846,000 | |
Series K, 5.85% | | | | | | | 60,125 | | | | 1,663,058 | |
SCE Trust III, Series H, 5.75%(h)(i) | | | | | | | 23,730 | | | | 566,435 | |
| | | | | | | | |
| | | | | | | | | | | 15,796,254 | |
|
| Equity Real Estate Investment Trusts (REITs) — 2.1% | |
Firstar Realty LLC, 8.88%(a)(i) | | | | | | | 10,000 | | | | 11,450,000 | |
SunTrust Real Estate Investment Corp., 9.00%(a)(b)(i) | | | | | | | 15 | | | | 1,581,148 | |
| | | | | | | | |
| | | | | | | | | | | 13,031,148 | |
| | | | | | | | | | | | |
| |
Total Preferred Stocks — 4.5%
(Cost — $29,328,114) | | | | 28,827,402 | |
| | | | | | | | |
| |
Total Preferred Securities — 17.5%
(Cost — $109,854,607) | | | | 113,233,336 | |
| | | | | | | | |
| | |
| | | | Par
(000) | | | | |
|
| U.S. Government Sponsored Agency Securities — 14.8% | |
|
| Collateralized Mortgage Obligations — 0.9% | |
Freddie Mac Mortgage-Backed Securities, Series 4480, Class ZX, 4.00%, 11/15/44 | | | USD | | | | 5,350 | | | | 6,026,061 | |
| | | | | | | | |
|
| Mortgage-Backed Securities — 13.9% | |
Fannie Mae Mortgage-Backed Securities(e): | | | | | | | | | | | | |
4.00%, 02/01/34 - 04/01/56 | | | | | | | 36,308 | | | | 38,911,233 | |
4.50%, 09/01/48 - 07/01/55 | | | | | | | 47,510 | | | | 50,934,233 | |
| | | | | | | | |
| | | | | | | | | | | 89,845,466 | |
| | | | | | | | |
| |
Total U.S. Government Sponsored Agency Securities — 14.8%
(Cost — $94,166,621) | | | 95,871,527 | |
| | | | | | | | |
|
| U.S. Treasury Obligations — 3.1% | |
U.S. Treasury Note(e): | | | | | | | | | | | | |
2.75%, 09/30/20 | | | | | | | 2,700 | | | | 2,727,422 | |
2.75%, 08/31/25 | | | | | | | 7,000 | | | | 7,453,906 | |
3.00%, 09/30/25 | | | | | | | 4,500 | | | | 4,858,067 | |
U.S. Treasury Notes, 2.88%, 10/31/20(e) | | | | | | | 5,000 | | | | 5,061,328 | |
| | | | | | | | |
| |
Total U.S. Treasury Obligations — 3.1%
(Cost — $19,089,160) | | | | 20,100,723 | |
| �� | | | | | | | |
| | | |
| | | | | | Shares | | | | |
|
| Warrants — 0.0% | |
|
| Entertainment — 0.0% | |
Aviron Capital LLC(b)(m)(q) | | | | | | | 10 | | | | — | |
| | | | | | | | |
| |
Total Warrants — 0.0%
(Cost — $0) | | | | — | |
| | | | | | | | |
| |
Total Long-Term Investments — 154.5%
(Cost — $1,043,235,549) | | | | 1,001,797,686 | |
| | | | | | | | |
| | |
| | | | Par
(000) | | | | |
|
| Short-Term Securities — 1.3% | |
|
| Foreign Agency Obligations — 0.1% | |
Nigeria Treasury Bills, 10.65%-10.79%, 02/27/20(p) | | | NGN | | | | 207,906 | | | | 552,278 | |
| | | | | | | | |
| |
Total Foreign Agency Obligations — 0.1%
(Cost — $553,142) | | | | 552,278 | |
| | | | |
| CONSOLIDATED SCHEDULES OF INVESTMENTS | | | 59 | |
| | |
Consolidated Schedule of Investments (continued) October 31, 2019 | | BlackRock Multi-Sector Income Trust (BIT) (Percentages shown are based on Net Assets) |
| | | | | | | | | | | | |
| Security | | | Par
(000) | | | Value | |
|
| Money Market Funds — 1.2% | |
BlackRock Liquidity Funds,T-Fund, Institutional Class, 1.70%(n)(s) | | | USD | | | | 7,913,547 | | | $ | 7,913,547 | |
| |
Total Money Market Funds — 1.2%
(Cost — $7,913,547) | | | | 7,913,547 | |
| | | | | | | | |
| |
Total Short-Term Securities — 1.3%
(Cost — $8,466,689) | | | | 8,465,825 | |
| | | | | | | | |
| |
Total Investments — 155.8%
(Cost — $1,051,702,238) | | | | 1,010,263,511 | |
| |
Liabilities in Excess of Other Assets — (55.8)% | | | | (361,646,211 | ) |
| | | | | | | | |
| |
Net Assets — 100.0% | | | $ | 648,617,300 | |
| | | | | | | | |
| (a) | Security exempt from registration pursuant to Rule 144A under the Securities Act of 1933, as amended. These securities may be resold in transactions exempt from registration to qualified institutional investors. |
| (b) | Security is valued using significant unobservable inputs and is classified as Level 3 in the fair value hierarchy. |
| (c) | Variable or floating rate security, which interest rate adjusts periodically based on changes in current interest rates and prepayments on the underlying pool of assets. Rate shown is the rate in effect as of period end. |
| (d) | Variable rate security. Rate shown is the rate in effect as of period end. |
| (e) | All or a portion of the security has been pledged as collateral in connection with outstanding reverse repurchase agreements. |
| (f) | When-issued security. |
| (g) | Payment-in-kind security which may pay interest/dividends in additional par/shares and/or in cash. Rates shown are the current rate and possible payment rates. |
| (h) | Variable rate security. Security may be issued at a fixed coupon rate, which converts to a variable rate at a specified date. Rate shown is the rate in effect as of period end. |
| (i) | Perpetual security with no stated maturity date. |
| (k) | Convertible security. |
| (l) | Represents an unsettled loan commitment at period end. Certain details associated with this purchase are not known prior to the settlement date, including coupon rate. |
| (m) | All or a portion of the security is held by a wholly-owned subsidiary. See Note 1 of the Notes to Consolidated Financial Statements for details on the wholly-owned subsidiary. |
| (n) | Annualized7-day yield as of period end. |
| (o) | Amount is less than $500. |
| (p) | Rates are the current rate or a range of current rates as of period end. |
| (q) | Non-income producing security. Issuer filed for bankruptcy and/or is in default. |
| (s) | During the year ended October 31, 2019, investments in issuers considered to be an affiliate/affiliates of the Trust for purposes of Section 2(a)(3) of the Investment Company Act of 1940, as amended, were as follows: |
| | | | | | | | | | | | | | | | | | | | | | | | | | | | |
| Affiliate | | Shares
Held at
10/31/18 | | | Net
Activity | | | Shares
Held at
10/31/19 | | | Value at
10/31/19 | | | Income | | | Net
Realized
Gain (Loss) (a) | | | Change in
Unrealized
Appreciation
(Depreciation) | |
BlackRock Liquidity Funds,T-Fund, Institutional Class | | | — | | | | 7,913,547 | | | | 7,913,547 | | | $ | 7,913,547 | | | $ | 163,742 | | | $ | — | | | $ | — | |
| | | | | | | | | | | | | | | | | | | | | | | | | | | | |
| | (a) | Includes net capital gain distributions, if applicable. | |
Reverse Repurchase Agreements
| | | | | | | | | | | | | | | | | | | | | | | | |
| Counterparty | | Interest
Rate | | | Trade
Date | | | Maturity
Date (a) | | | Face Value | | | Face Value
Including
Accrued Interest | | | Type of Non-Cash Underlying Collateral | | Remaining Contractual
Maturity of the Agreements (a) |
UBS Securities LLC | | | 2.45 | % | | | 03/05/19 | | | | Open | | | $ | 540,078 | | | $ | 550,452 | | | Corporate Bonds | | Open/Demand |
UBS Ltd. | | | 2.30 | | | | 09/20/18 | | | | Open | | | | 3,410,731 | | | | 3,514,105 | | | Foreign Agency Obligations | | Open/Demand |
UBS Ltd. | | | 2.45 | | | | 09/20/18 | | | | Open | | | | 279,650 | | | | 288,599 | | | Corporate Bonds | | Open/Demand |
UBS Ltd. | | | 2.45 | | | | 09/20/18 | | | | Open | | | | 379,225 | | | | 391,360 | | | Corporate Bonds | | Open/Demand |
UBS Ltd. | | | 2.45 | | | | 09/20/18 | | | | Open | | | | 405,350 | | | | 418,321 | | | Corporate Bonds | | Open/Demand |
UBS Ltd. | | | 2.45 | | | | 09/20/18 | | | | Open | | | | 283,511 | | | | 292,584 | | | Corporate Bonds | | Open/Demand |
UBS Ltd. | | | 2.45 | | | | 09/20/18 | | | | Open | | | | 3,468,400 | | | | 3,579,389 | | | Foreign Agency Obligations | | Open/Demand |
UBS Ltd. | | | 2.45 | | | | 09/20/18 | | | | Open | | | | 273,700 | | | | 282,458 | | | Corporate Bonds | | Open/Demand |
HSBC Securities (USA), Inc. | | | 2.15 | | | | 10/09/18 | | | | Open | | | | 2,545,000 | | | | 2,614,836 | | | Corporate Bonds | | Open/Demand |
HSBC Securities (USA), Inc. | | | 2.15 | | | | 11/30/18 | | | | Open | | | | 708,000 | | | | 724,922 | | | Corporate Bonds | | Open/Demand |
HSBC Securities (USA), Inc. | | | 2.15 | | | | 12/14/18 | | | | Open | | | | 3,318,000 | | | | 3,393,466 | | | Corporate Bonds | | Open/Demand |
UBS Securities LLC | | | 2.20 | | | | 12/18/18 | | | | Open | | | | 337,344 | | | | 345,142 | | | Corporate Bonds | | Open/Demand |
UBS Securities LLC | | | 2.20 | | | | 12/18/18 | | | | Open | | | | 4,812,500 | | | | 4,923,756 | | | Corporate Bonds | | Open/Demand |
UBS Securities LLC | | | 2.20 | | | | 12/18/18 | | | | Open | | | | 7,050,000 | | | | 7,212,982 | | | Capital Trusts | | Open/Demand |
UBS Securities LLC | | | 2.20 | | | | 12/18/18 | | | | Open | | | | 3,860,000 | | | | 3,949,236 | | | Corporate Bonds | | Open/Demand |
UBS Securities LLC | | | 2.25 | | | | 12/18/18 | | | | Open | | | | 314,550 | | | | 321,961 | | | Corporate Bonds | | Open/Demand |
UBS Securities LLC | | | 2.45 | | | | 12/18/18 | | | | Open | | | | 1,697,850 | | | | 1,740,850 | | | Corporate Bonds | | Open/Demand |
UBS Securities LLC | | | 2.45 | | | | 12/18/18 | | | | Open | | | | 382,235 | | | | 391,916 | | | Corporate Bonds | | Open/Demand |
UBS Securities LLC | | | 2.45 | | | | 12/18/18 | | | | Open | | | | 407,340 | | | | 417,656 | | | Corporate Bonds | | Open/Demand |
UBS Securities LLC | | | 2.45 | | | | 12/18/18 | | | | Open | | | | 491,175 | | | | 503,615 | | | Corporate Bonds | | Open/Demand |
UBS Securities LLC | | | 2.45 | | | | 12/18/18 | | | | Open | | | | 387,838 | | | | 397,660 | | | Corporate Bonds | | Open/Demand |
UBS Securities LLC | | | 2.45 | | | | 12/18/18 | | | | Open | | | | 451,920 | | | | 463,366 | | | Corporate Bonds | | Open/Demand |
UBS Securities LLC | | | 2.45 | | | | 12/18/18 | | | | Open | | | | 246,986 | | | | 253,242 | | | Corporate Bonds | | Open/Demand |
UBS Securities LLC | | | 2.45 | | | | 12/18/18 | | | | Open | | | | 3,730,000 | | | | 3,824,467 | | | Capital Trusts | | Open/Demand |
| | |
| 60 | | 2019 BLACKROCK ANNUAL REPORTTO SHAREHOLDERS |
| | |
Consolidated Schedule of Investments (continued) October 31, 2019 | | BlackRock Multi-Sector Income Trust (BIT) |
Reverse Repurchase Agreements (continued)
| | | | | | | | | | | | | | | | | | | | | | | | |
| Counterparty | | Interest
Rate | | | Trade
Date | | | Maturity
Date (a) | | | Face Value | | | Face Value
Including
Accrued Interest | | | Type of Non-Cash Underlying Collateral | | Remaining Contractual
Maturity of the Agreements (a) |
UBS Securities LLC | | | 2.45 | % | | | 12/18/18 | | | | Open | | | $ | 275,558 | | | $ | 282,536 | | | Corporate Bonds | | Open/Demand |
UBS Securities LLC | | | 2.45 | | | | 12/18/18 | | | | Open | | | | 337,871 | | | | 346,428 | | | Corporate Bonds | | Open/Demand |
UBS Securities LLC | | | 2.45 | | | | 12/18/18 | | | | Open | | | | 509,400 | | | | 522,301 | | | Corporate Bonds | | Open/Demand |
UBS Securities LLC | | | 2.45 | | | | 12/18/18 | | | | Open | | | | 388,578 | | | | 398,419 | | | Corporate Bonds | | Open/Demand |
Credit Suisse Securities (USA) LLC | | | 2.25 | | | | 02/12/19 | | | | Open | | | | 167,500 | | | | 170,605 | | | Foreign Agency Obligations | | Open/Demand |
RBC Capital Markets, LLC | | | 2.55 | | | | 08/29/19 | | | | Open | | | | 167,500 | | | | 168,284 | | | Foreign Agency Obligations | | Open/Demand |
Goldman Sachs & Co LLC | | | 2.00 | | | | 02/12/19 | | | | Open | | | | 393,992 | | | | 401,043 | | | Corporate Bonds | | Open/Demand |
Goldman Sachs & Co LLC | | | 2.25 | | | | 02/12/19 | | | | Open | | | | 1,043,954 | | | | 1,062,643 | | | Capital Trusts | | Open/Demand |
Goldman Sachs & Co LLC | | | 2.35 | | | | 02/12/19 | | | | Open | | | | 971,473 | | | | 985,317 | | | Corporate Bonds | | Open/Demand |
Goldman Sachs & Co LLC | | | 2.35 | | | | 02/20/19 | | | | Open | | | | 671,138 | | | | 678,084 | | | Capital Trusts | | Open/Demand |
Goldman Sachs & Co LLC | | | 2.35 | | | | 02/20/19 | | | | Open | | | | 560,686 | | | | 570,022 | | | Corporate Bonds | | Open/Demand |
Goldman Sachs & Co LLC | | | 2.00 | | | | 03/04/19 | | | | Open | | | | 242,685 | | | | 246,529 | | | Corporate Bonds | | Open/Demand |
Goldman Sachs & Co LLC | | | 2.00 | | | | 03/04/19 | | | | Open | | | | 608,747 | | | | 619,202 | | | Corporate Bonds | | Open/Demand |
Goldman Sachs & Co LLC | | | 2.00 | | | | 03/04/19 | | | | Open | | | | 284,346 | | | | 289,229 | | | Corporate Bonds | | Open/Demand |
Goldman Sachs & Co LLC | | | 2.05 | | | | 03/04/19 | | | | Open | | | | 209,576 | | | | 212,756 | | | Foreign Agency Obligations | | Open/Demand |
Goldman Sachs & Co LLC | | | 2.10 | | | | 03/04/19 | | | | Open | | | | 220,314 | | | | 224,099 | | | Corporate Bonds | | Open/Demand |
Goldman Sachs & Co LLC | | | 2.25 | | | | 03/11/19 | | | | Open | | | | 348,317 | | | | 353,852 | | | Foreign Agency Obligations | | Open/Demand |
UBS Ltd. | | | 2.45 | | | | 03/15/19 | | | | Open | | | | 500,650 | | | | 509,797 | | | Corporate Bonds | | Open/Demand |
Credit Suisse Securities (USA) LLC | | | 2.20 | | | | 04/01/19 | | | | Open | | | | 617,094 | | | | 626,412 | | | Corporate Bonds | | Open/Demand |
Goldman Sachs & Co LLC | | | 2.00 | | | | 04/04/19 | | | | Open | | | | 327,837 | | | | 332,662 | | | Corporate Bonds | | Open/Demand |
Credit Suisse Securities (USA) LLC | | | 1.95 | | | | 04/05/19 | | | | Open | | | | 279,513 | | | | 283,206 | | | Foreign Agency Obligations | | Open/Demand |
Credit Suisse Securities (USA) LLC | | | 2.25 | | | | 05/07/19 | | | | Open | | | | 388,300 | | | | 393,073 | | | Corporate Bonds | | Open/Demand |
UBS Securities LLC | | | 2.28 | | | | 06/19/19 | | | | Open | | | | 271,795 | | | | 274,428 | | | Corporate Bonds | | Open/Demand |
BNP Paribas S.A. | | | 2.20 | | | | 07/11/19 | | | | Open | | | | 492,500 | | | | 496,531 | | | Corporate Bonds | | Open/Demand |
BNP Paribas S.A. | | | 2.20 | | | | 07/11/19 | | | | Open | | | | 705,938 | | | | 711,715 | | | Corporate Bonds | | Open/Demand |
BNP Paribas S.A. | | | 2.20 | | | | 07/11/19 | | | | Open | | | | 501,250 | | | | 505,286 | | | Corporate Bonds | | Open/Demand |
BNP Paribas S.A. | | | 2.20 | | | | 07/11/19 | | | | Open | | | | 8,596,212 | | | | 8,663,926 | | | Corporate Bonds | | Open/Demand |
BNP Paribas S.A. | | | 2.20 | | | | 07/11/19 | | | | Open | | | | 351,323 | | | | 354,151 | | | Foreign Agency Obligations | | Open/Demand |
BNP Paribas S.A. | | | 2.20 | | | | 07/11/19 | | | | Open | | | | 5,369,375 | | | | 5,413,322 | | | Capital Trusts | | Open/Demand |
BNP Paribas S.A. | | | 2.20 | | | | 07/11/19 | | | | Open | | | | 498,739 | | | | 502,766 | | | Corporate Bonds | | Open/Demand |
BNP Paribas S.A. | | | 2.40 | | | | 07/11/19 | | | | Open | | | | 1,088,901 | | | | 1,098,128 | | | Corporate Bonds | | Open/Demand |
BNP Paribas S.A. | | | 2.40 | | | | 07/11/19 | | | | Open | | | | 706,875 | | | | 712,900 | | | Corporate Bonds | | Open/Demand |
BNP Paribas S.A. | | | 2.40 | | | | 07/11/19 | | | | Open | | | | 2,180,050 | | | | 2,198,281 | | | Corporate Bonds | | Open/Demand |
BNP Paribas S.A. | | | 2.20 | | | | 07/15/19 | | | | Open | | | | 987,998 | | | | 995,453 | | | Capital Trusts | | Open/Demand |
BNP Paribas S.A. | | | 2.40 | | | | 07/15/19 | | | | Open | | | | 263,160 | | | | 265,276 | | | Corporate Bonds | | Open/Demand |
BNP Paribas S.A. | | | 2.40 | | | | 07/15/19 | | | | Open | | | | 1,075,436 | | | | 1,084,287 | | | Corporate Bonds | | Open/Demand |
BNP Paribas S.A. | | | 2.40 | | | | 07/15/19 | | | | Open | | | | 1,231,811 | | | | 1,242,079 | | | Capital Trusts | | Open/Demand |
BNP Paribas S.A. | | | 2.40 | | | | 07/15/19 | | | | Open | | | | 949,000 | | | | 956,630 | | | Corporate Bonds | | Open/Demand |
BNP Paribas S.A. | | | 2.40 | | | | 07/15/19 | | | | Open | | | | 1,449,315 | | | | 1,461,427 | | | Corporate Bonds | | Open/Demand |
BNP Paribas S.A. | | | 2.40 | | | | 07/15/19 | | | | Open | | | | 188,233 | | | | 189,802 | | | Corporate Bonds | | Open/Demand |
BNP Paribas S.A. | | | 2.40 | | | | 07/15/19 | | | | Open | | | | 1,503,480 | | | | 1,515,854 | | | Capital Trusts | | Open/Demand |
BNP Paribas S.A. | | | 2.40 | | | | 07/15/19 | | | | Open | | | | 286,259 | | | | 288,651 | | | Corporate Bonds | | Open/Demand |
BNP Paribas S.A. | | | 2.40 | | | | 07/15/19 | | | | Open | | | | 271,950 | | | | 274,137 | | | Corporate Bonds | | Open/Demand |
BNP Paribas S.A. | | | 2.40 | | | | 07/15/19 | | | | Open | | | | 547,336 | | | | 551,841 | | | Corporate Bonds | | Open/Demand |
BNP Paribas S.A. | | | 2.40 | | | | 07/15/19 | | | | Open | | | | 243,100 | | | | 245,055 | | | Corporate Bonds | | Open/Demand |
BNP Paribas S.A. | | | 2.40 | | | | 07/15/19 | | | | Open | | | | 77,919 | | | | 78,553 | | | Corporate Bonds | | Open/Demand |
BNP Paribas S.A. | | | 2.40 | | | | 07/15/19 | | | | Open | | | | 1,265,863 | | | | 1,276,174 | | | Corporate Bonds | | Open/Demand |
BNP Paribas S.A. | | | 2.40 | | | | 07/15/19 | | | | Open | | | | 1,603,875 | | | | 1,617,109 | | | Corporate Bonds | | Open/Demand |
BNP Paribas S.A. | | | 2.40 | | | | 07/15/19 | | | | Open | | | | 6,224,895 | | | | 6,274,813 | | | Corporate Bonds | | Open/Demand |
BNP Paribas S.A. | | | 2.40 | | | | 07/15/19 | | | | Open | | | | 675,000 | | | | 680,641 | | | Corporate Bonds | | Open/Demand |
BNP Paribas S.A. | | | 2.40 | | | | 07/15/19 | | | | Open | | | | 126,000 | | | | 127,050 | | | Capital Trusts | | Open/Demand |
BNP Paribas S.A. | | | 2.40 | | | | 07/15/19 | | | | Open | | | | 1,675,961 | | | | 1,689,401 | | | Corporate Bonds | | Open/Demand |
BNP Paribas S.A. | | | 2.40 | | | | 07/15/19 | | | | Open | | | | 928,150 | | | | 935,711 | | | Corporate Bonds | | Open/Demand |
BNP Paribas S.A. | | | 2.40 | | | | 07/16/19 | | | | Open | | | | 447,578 | | | | 450,767 | | | Corporate Bonds | | Open/Demand |
BNP Paribas S.A. | | | 2.40 | | | | 07/16/19 | | | | Open | | | | 399,474 | | | | 402,362 | | | Corporate Bonds | | Open/Demand |
BNP Paribas S.A. | | | 2.40 | | | | 07/16/19 | | | | Open | | | | 186,000 | | | | 187,345 | | | Corporate Bonds | | Open/Demand |
BNP Paribas S.A. | | | 2.40 | | | | 07/16/19 | | | | Open | | | | 759,000 | | | | 764,488 | | | Corporate Bonds | | Open/Demand |
| | | | |
| CONSOLIDATED SCHEDULES OF INVESTMENTS | | | 61 | |
| | |
Consolidated Schedule of Investments (continued) October 31, 2019 | | BlackRock Multi-Sector Income Trust (BIT) |
Reverse Repurchase Agreements (continued)
| | | | | | | | | | | | | | | | | | | | | | | | |
| Counterparty | | Interest
Rate | | | Trade
Date | | | Maturity
Date (a) | | | Face Value | | | Face Value
Including
Accrued Interest | | | Type of Non-Cash Underlying Collateral | | Remaining Contractual
Maturity of the Agreements (a) |
HSBC Securities (USA), Inc. | | | 1.91 | % | | | 07/17/19 | | | | Open | | | $ | 7,412,000 | | | $ | 7,461,037 | | | U.S. Treasury Obligations | | Open/Demand |
HSBC Securities (USA), Inc. | | | 1.91 | | | | 07/17/19 | | | | Open | | | | 2,747,000 | | | | 2,765,174 | | | U.S. Treasury Obligations | | Open/Demand |
HSBC Securities (USA), Inc. | | | 1.91 | | | | 07/17/19 | | | | Open | | | | 5,089,000 | | | | 5,122,668 | | | U.S. Treasury Obligations | | Open/Demand |
BNP Paribas S.A. | | | 2.20 | | | | 07/18/19 | | | | Open | | | | 941,640 | | | | 948,912 | | | Foreign Agency Obligations | | Open/Demand |
BNP Paribas S.A. | | | 2.40 | | | | 08/08/19 | | | | Open | | | | 262,999 | | | | 264,551 | | | Corporate Bonds | | Open/Demand |
BNP Paribas S.A. | | | 2.40 | | | | 08/19/19 | | | | Open | | | | 355,320 | | | | 357,009 | | | Corporate Bonds | | Open/Demand |
RBC Capital Markets, LLC | | | 2.55 | | | | 08/26/19 | | | | Open | | | | 1,578,218 | | | | 1,586,091 | | | Corporate Bonds | | Open/Demand |
Barclays Bank PLC | | | 2.25 | | | | 08/27/19 | | | | Open | | | | 187,163 | | | | 187,979 | | | Capital Trusts | | Open/Demand |
Barclays Bank PLC | | | 2.25 | | | | 08/27/19 | | | | Open | | | | 1,487,500 | | | | 1,493,987 | | | Capital Trusts | | Open/Demand |
Barclays Bank PLC | | | 2.40 | | | | 08/27/19 | | | | Open | | | | 701,250 | | | | 704,501 | | | Corporate Bonds | | Open/Demand |
Barclays Bank PLC | | | 2.45 | | | | 08/27/19 | | | | Open | | | | 129,465 | | | | 130,077 | | | Corporate Bonds | | Open/Demand |
Barclays Bank PLC | | | 2.45 | | | | 08/27/19 | | | | Open | | | | 398,073 | | | | 399,955 | | | Corporate Bonds | | Open/Demand |
Barclays Bank PLC | | | 2.50 | | | | 08/27/19 | | | | Open | | | | 1,141,913 | | | | 1,147,416 | | | Corporate Bonds | | Open/Demand |
Barclays Bank PLC | | | 2.50 | | | | 08/27/19 | | | | Open | | | | 705,128 | | | | 708,526 | | | Corporate Bonds | | Open/Demand |
Barclays Bank PLC | | | 2.50 | | | | 08/27/19 | | | | Open | | | | 2,325,000 | | | | 2,336,205 | | | Capital Trusts | | Open/Demand |
Barclays Bank PLC | | | 2.50 | | | | 08/27/19 | | | | Open | | | | 517,450 | | | | 519,944 | | | Capital Trusts | | Open/Demand |
Barclays Bank PLC | | | 2.50 | | | | 08/27/19 | | | | Open | | | | 3,045,000 | | | | 3,059,675 | | | Capital Trusts | | Open/Demand |
Barclays Bank PLC | | | 2.50 | | | | 08/27/19 | | | | Open | | | | 843,173 | | | | 847,237 | | | Corporate Bonds | | Open/Demand |
Barclays Bank PLC | | | 2.50 | | | | 08/27/19 | | | | Open | | | | 8,547,000 | | | | 8,588,192 | | | Capital Trusts | | Open/Demand |
Barclays Bank PLC | | | 2.50 | | | | 08/27/19 | | | | Open | | | | 500,755 | | | | 503,169 | | | Corporate Bonds | | Open/Demand |
Barclays Bank PLC | | | 2.50 | | | | 08/27/19 | | | | Open | | | | 328,125 | | | | 329,706 | | | Corporate Bonds | | Open/Demand |
Barclays Bank PLC | | | 2.50 | | | | 08/27/19 | | | | Open | | | | 497,933 | | | | 500,333 | | | Corporate Bonds | | Open/Demand |
Barclays Bank PLC | | | 2.50 | | | | 08/27/19 | | | | Open | | | | 692,860 | | | | 696,199 | | | Corporate Bonds | | Open/Demand |
Barclays Bank PLC | | | 2.50 | | | | 08/27/19 | | | | Open | | | | 175,673 | | | | 176,519 | | | Corporate Bonds | | Open/Demand |
Barclays Bank PLC | | | 2.50 | | | | 08/27/19 | | | | Open | | | | 872,000 | | | | 876,203 | | | Capital Trusts | | Open/Demand |
Barclays Bank PLC | | | 2.50 | | | | 08/27/19 | | | | Open | | | | 1,831,219 | | | | 1,840,044 | | | Corporate Bonds | | Open/Demand |
Barclays Bank PLC | | | 2.50 | | | | 08/27/19 | | | | Open | | | | 4,203,750 | | | | 4,224,010 | | | Capital Trusts | | Open/Demand |
Barclays Bank PLC | | | 2.55 | | | | 08/27/19 | | | | Open | | | | 991,203 | | | | 996,070 | | | Corporate Bonds | | Open/Demand |
Barclays Bank PLC | | | 2.55 | | | | 08/27/19 | | | | Open | | | | 432,819 | | | | 434,944 | | | Corporate Bonds | | Open/Demand |
RBC Capital Markets, LLC | | | 2.29 | | | | 08/27/19 | | | | Open | | | | 225,500 | | | | 226,484 | | | Corporate Bonds | | Open/Demand |
RBC Capital Markets, LLC | | | 2.29 | | | | 08/27/19 | | | | Open | | | | 421,093 | | | | 422,930 | | | Corporate Bonds | | Open/Demand |
RBC Capital Markets, LLC | | | 2.29 | | | | 08/27/19 | | | | Open | | | | 1,007,500 | | | | 1,011,897 | | | Corporate Bonds | | Open/Demand |
RBC Capital Markets, LLC | | | 2.29 | | | | 08/27/19 | | | | Open | | | | 533,125 | | | | 535,452 | | | Corporate Bonds | | Open/Demand |
RBC Capital Markets, LLC | | | 2.29 | | | | 08/27/19 | | | | Open | | | | 2,019,063 | | | | 2,027,873 | | | Corporate Bonds | | Open/Demand |
RBC Capital Markets, LLC | | | 2.29 | | | | 08/27/19 | | | | Open | | | | 2,460,250 | | | | 2,470,986 | | | Corporate Bonds | | Open/Demand |
RBC Capital Markets, LLC | | | 2.29 | | | | 08/27/19 | | | | Open | | | | 787,706 | | | | 791,144 | | | Corporate Bonds | | Open/Demand |
RBC Capital Markets, LLC | | | 2.29 | | | | 08/27/19 | | | | Open | | | | 406,000 | | | | 407,772 | | | Corporate Bonds | | Open/Demand |
RBC Capital Markets, LLC | | | 2.29 | | | | 08/27/19 | | | | Open | | | | 2,424,370 | | | | 2,434,950 | | | Corporate Bonds | | Open/Demand |
RBC Capital Markets, LLC | | | 2.29 | | | | 08/27/19 | | | | Open | | | | 1,809,375 | | | | 1,817,271 | | | Corporate Bonds | | Open/Demand |
RBC Capital Markets, LLC | | | 2.29 | | | | 08/27/19 | | | | Open | | | | 822,500 | | | | 826,089 | | | Corporate Bonds | | Open/Demand |
RBC Capital Markets, LLC | | | 2.29 | | | | 08/27/19 | | | | Open | | | | 2,462,400 | | | | 2,473,146 | | | Corporate Bonds | | Open/Demand |
RBC Capital Markets, LLC | | | 2.29 | | | | 08/27/19 | | | | Open | | | | 115,301 | | | | 115,804 | | | Corporate Bonds | | Open/Demand |
RBC Capital Markets, LLC | | | 2.29 | | | | 08/27/19 | | | | Open | | | | 494,375 | | | | 496,532 | | | Corporate Bonds | | Open/Demand |
RBC Capital Markets, LLC | | | 2.29 | | | | 08/27/19 | | | | Open | | | | 1,207,250 | | | | 1,212,518 | | | Corporate Bonds | | Open/Demand |
RBC Capital Markets, LLC | | | 2.29 | | | | 08/27/19 | | | | Open | | | | 279,063 | | | | 280,280 | | | Corporate Bonds | | Open/Demand |
RBC Capital Markets, LLC | | | 2.29 | | | | 08/27/19 | | | | Open | | | | 437,500 | | | | 439,409 | | | Corporate Bonds | | Open/Demand |
RBC Capital Markets, LLC | | | 2.29 | | | | 08/27/19 | | | | Open | | | | 2,704,063 | | | | 2,715,863 | | | Corporate Bonds | | Open/Demand |
RBC Capital Markets, LLC | | | 2.29 | | | | 08/27/19 | | | | Open | | | | 1,221,875 | | | | 1,227,207 | | | Corporate Bonds | | Open/Demand |
RBC Capital Markets, LLC | | | 2.29 | | | | 08/27/19 | | | | Open | | | | 770,625 | | | | 773,988 | | | Corporate Bonds | | Open/Demand |
RBC Capital Markets, LLC | | | 2.29 | | | | 08/27/19 | | | | Open | | | | 1,749,375 | | | | 1,757,009 | | | Corporate Bonds | | Open/Demand |
RBC Capital Markets, LLC | | | 2.29 | | | | 08/27/19 | | | | Open | | | | 1,206,250 | | | | 1,211,514 | | | Corporate Bonds | | Open/Demand |
RBC Capital Markets, LLC | | | 2.29 | | | | 08/27/19 | | | | Open | | | | 268,100 | | | | 269,270 | | | Corporate Bonds | | Open/Demand |
RBC Capital Markets, LLC | | | 2.29 | | | | 08/27/19 | | | | Open | | | | 379,713 | | | | 381,370 | | | Corporate Bonds | | Open/Demand |
RBC Capital Markets, LLC | | | 2.29 | | | | 08/27/19 | | | | Open | | | | 639,438 | | | | 642,228 | | | Corporate Bonds | | Open/Demand |
RBC Capital Markets, LLC | | | 2.29 | | | | 08/27/19 | | | | Open | | | | 519,778 | | | | 522,046 | | | Corporate Bonds | | Open/Demand |
RBC Capital Markets, LLC | | | 2.29 | | | | 08/27/19 | | | | Open | | | | 413,000 | | | | 414,802 | | | Corporate Bonds | | Open/Demand |
RBC Capital Markets, LLC | | | 2.29 | | | | 08/27/19 | | | | Open | | | | 737,000 | | | | 740,216 | | | Corporate Bonds | | Open/Demand |
RBC Capital Markets, LLC | | | 2.29 | | | | 08/27/19 | | | | Open | | | | 631,950 | | | | 634,708 | | | Corporate Bonds | | Open/Demand |
RBC Capital Markets, LLC | | | 2.29 | | | | 08/27/19 | | | | Open | | | | 570,000 | | | | 572,487 | | | Corporate Bonds | | Open/Demand |
| | |
| 62 | | 2019 BLACKROCK ANNUAL REPORTTO SHAREHOLDERS |
| | |
Consolidated Schedule of Investments (continued) October 31, 2019 | | BlackRock Multi-Sector Income Trust (BIT) |
Reverse Repurchase Agreements (continued)
| | | | | | | | | | | | | | | | | | | | | | | | |
| Counterparty | | Interest
Rate | | | Trade
Date | | | Maturity
Date (a) | | | Face Value | | | Face Value
Including
Accrued Interest | | | Type of Non-Cash Underlying Collateral | | Remaining Contractual
Maturity of the Agreements (a) |
RBC Capital Markets, LLC | | | 2.29 | % | | | 08/27/19 | | | | Open | | | $ | 1,315,200 | | | $ | 1,320,939 | | | Corporate Bonds | | Open/Demand |
RBC Capital Markets, LLC | | | 2.29 | | | | 08/27/19 | | | | Open | | | | 1,949,063 | | | | 1,957,568 | | | Corporate Bonds | | Open/Demand |
RBC Capital Markets, LLC | | | 2.29 | | | | 08/27/19 | | | | Open | | | | 575,625 | | | | 578,137 | | | Corporate Bonds | | Open/Demand |
RBC Capital Markets, LLC | | | 2.29 | | | | 08/27/19 | | | | Open | | | | 2,571,875 | | | | 2,583,098 | | | Corporate Bonds | | Open/Demand |
RBC Capital Markets, LLC | | | 2.29 | | | | 08/27/19 | | | | Open | | | | 369,688 | | | | 371,301 | | | Corporate Bonds | | Open/Demand |
RBC Capital Markets, LLC | | | 2.29 | | | | 08/27/19 | | | | Open | | | | 782,813 | | | | 786,229 | | | Corporate Bonds | | Open/Demand |
RBC Capital Markets, LLC | | | 2.29 | | | | 08/27/19 | | | | Open | | | | 652,913 | | | | 655,762 | | | Corporate Bonds | | Open/Demand |
RBC Capital Markets, LLC | | | 2.29 | | | | 08/27/19 | | | | Open | | | | 850,313 | | | | 854,023 | | | Corporate Bonds | | Open/Demand |
RBC Capital Markets, LLC | | | 2.29 | | | | 08/27/19 | | | | Open | | | | 1,621,875 | | | | 1,628,953 | | | Corporate Bonds | | Open/Demand |
RBC Capital Markets, LLC | | | 2.29 | | | | 08/27/19 | | | | Open | | | | 335,188 | | | | 336,650 | | | Corporate Bonds | | Open/Demand |
RBC Capital Markets, LLC | | | 2.29 | | | | 08/27/19 | | | | Open | | | | 1,068,750 | | | | 1,073,414 | | | Corporate Bonds | | Open/Demand |
RBC Capital Markets, LLC | | | 2.29 | | | | 08/27/19 | | | | Open | | | | 526,500 | | | | 528,798 | | | Corporate Bonds | | Open/Demand |
RBC Capital Markets, LLC | | | 2.29 | | | | 08/27/19 | | | | Open | | | | 529,375 | | | | 531,685 | | | Corporate Bonds | | Open/Demand |
RBC Capital Markets, LLC | | | 2.29 | | | | 08/27/19 | | | | Open | | | | 335,250 | | | | 336,713 | | | Corporate Bonds | | Open/Demand |
RBC Capital Markets, LLC | | | 2.29 | | | | 08/27/19 | | | | Open | | | | 530,438 | | | | 532,752 | | | Corporate Bonds | | Open/Demand |
RBC Capital Markets, LLC | | | 2.29 | | | | 08/27/19 | | | | Open | | | | 741,125 | | | | 744,359 | | | Corporate Bonds | | Open/Demand |
RBC Capital Markets, LLC | | | 2.29 | | | | 08/27/19 | | | | Open | | | | 461,000 | | | | 463,012 | | | Corporate Bonds | | Open/Demand |
RBC Capital Markets, LLC | | | 2.29 | | | | 08/27/19 | | | | Open | | | | 1,789,375 | | | | 1,797,184 | | | Corporate Bonds | | Open/Demand |
RBC Capital Markets, LLC | | | 2.29 | | | | 08/27/19 | | | | Open | | | | 448,500 | | | | 450,457 | | | Corporate Bonds | | Open/Demand |
RBC Capital Markets, LLC | | | 2.29 | | | | 08/27/19 | | | | Open | | | | 961,875 | | | | 966,073 | | | Corporate Bonds | | Open/Demand |
RBC Capital Markets, LLC | | | 2.29 | | | | 08/27/19 | | | | Open | | | | 976,875 | | | | 981,138 | | | Corporate Bonds | | Open/Demand |
RBC Capital Markets, LLC | | | 2.29 | | | | 08/27/19 | | | | Open | | | | 1,060,000 | | | | 1,064,626 | | | Corporate Bonds | | Open/Demand |
RBC Capital Markets, LLC | | | 2.29 | | | | 08/27/19 | | | | Open | | | | 778,750 | | | | 782,148 | | | Corporate Bonds | | Open/Demand |
RBC Capital Markets, LLC | | | 2.29 | | | | 08/27/19 | | | | Open | | | | 486,000 | | | | 488,121 | | | Corporate Bonds | | Open/Demand |
RBC Capital Markets, LLC | | | 2.40 | | | | 08/28/19 | | | | Open | | | | 1,476,764 | | | | 1,483,393 | | | Corporate Bonds | | Open/Demand |
RBC Capital Markets, LLC | | | 2.55 | | | | 08/28/19 | | | | Open | | | | 1,045,620 | | | | 1,050,593 | | | Corporate Bonds | | Open/Demand |
RBC Capital Markets, LLC | | | 2.55 | | | | 08/28/19 | | | | Open | | | | 244,744 | | | | 245,908 | | | Corporate Bonds | | Open/Demand |
RBC Capital Markets, LLC | | | 2.55 | | | | 08/28/19 | | | | Open | | | | 330,779 | | | | 332,352 | | | Corporate Bonds | | Open/Demand |
RBC Capital Markets, LLC | | | 2.55 | | | | 08/28/19 | | | | Open | | | | 157,450 | | | | 158,199 | | | Corporate Bonds | | Open/Demand |
RBC Capital Markets, LLC | | | 2.55 | | | | 08/28/19 | | | | Open | | | | 451,051 | | | | 453,196 | | | Corporate Bonds | | Open/Demand |
RBC Capital Markets, LLC | | | 2.55 | | | | 08/28/19 | | | | Open | | | | 161,395 | | | | 162,163 | | | Corporate Bonds | | Open/Demand |
RBC Capital Markets, LLC | | | 2.55 | | | | 08/28/19 | | | | Open | | | | 169,830 | | | | 170,638 | | | Corporate Bonds | | Open/Demand |
RBC Capital Markets, LLC | | | 2.55 | | | | 08/28/19 | | | | Open | | | | 181,583 | | | | 182,446 | | | Corporate Bonds | | Open/Demand |
RBC Capital Markets, LLC | | | 2.55 | | | | 08/28/19 | | | | Open | | | | 151,300 | | | | 152,020 | | | Corporate Bonds | | Open/Demand |
RBC Capital Markets, LLC | | | 2.55 | | | | 08/28/19 | | | | Open | | | | 134,438 | | | | 135,077 | | | Corporate Bonds | | Open/Demand |
RBC Capital Markets, LLC | | | 2.55 | | | | 08/28/19 | | | | Open | | | | 212,288 | | | | 213,297 | | | Corporate Bonds | | Open/Demand |
RBC Capital Markets, LLC | | | 2.55 | | | | 08/28/19 | | | | Open | | | | 385,313 | | | | 387,145 | | | Corporate Bonds | | Open/Demand |
RBC Capital Markets, LLC | | | 2.55 | | | | 08/28/19 | | | | Open | | | | 121,613 | | | | 122,191 | | | Corporate Bonds | | Open/Demand |
RBC Capital Markets, LLC | | | 2.55 | | | | 08/28/19 | | | | Open | | | | 430,669 | | | | 432,717 | | | Corporate Bonds | | Open/Demand |
RBC Capital Markets, LLC | | | 2.55 | | | | 08/28/19 | | | | Open | | | | 709,750 | | | | 713,125 | | | Corporate Bonds | | Open/Demand |
RBC Capital Markets, LLC | | | 2.55 | | | | 08/28/19 | | | | Open | | | | 394,450 | | | | 396,326 | | | Corporate Bonds | | Open/Demand |
RBC Capital Markets, LLC | | | 2.55 | | | | 08/28/19 | | | | Open | | | | 661,770 | | | | 664,917 | | | Corporate Bonds | | Open/Demand |
RBC Capital Markets, LLC | | | 2.55 | | | | 08/28/19 | | | | Open | | | | 102,848 | | | | 103,337 | | | Corporate Bonds | | Open/Demand |
RBC Capital Markets, LLC | | | 2.55 | | | | 08/28/19 | | | | Open | | | | 229,994 | | | | 231,087 | | | Corporate Bonds | | Open/Demand |
RBC Capital Markets, LLC | | | 2.55 | | | | 08/28/19 | | | | Open | | | | 239,080 | | | | 240,217 | | | Corporate Bonds | | Open/Demand |
RBC Capital Markets, LLC | | | 2.55 | | | | 08/28/19 | | | | Open | | | | 616,690 | | | | 619,623 | | | Corporate Bonds | | Open/Demand |
RBC Capital Markets, LLC | | | 2.55 | | | | 08/28/19 | | | | Open | | | | 204,345 | | | | 205,317 | | | Corporate Bonds | | Open/Demand |
RBC Capital Markets, LLC | | | 2.55 | | | | 08/28/19 | | | | Open | | | | 735,831 | | | | 739,331 | | | Corporate Bonds | | Open/Demand |
RBC Capital Markets, LLC | | | 2.55 | | | | 08/28/19 | | | | Open | | | | 282,178 | | | | 283,519 | | | Corporate Bonds | | Open/Demand |
RBC Capital Markets, LLC | | | 2.55 | | | | 08/28/19 | | | | Open | | | | 234,439 | | | | 235,554 | | | Corporate Bonds | | Open/Demand |
RBC Capital Markets, LLC | | | 2.55 | | | | 08/28/19 | | | | Open | | | | 705,175 | | | | 708,528 | | | Corporate Bonds | | Open/Demand |
RBC Capital Markets, LLC | | | 2.55 | | | | 08/28/19 | | | | Open | | | | 224,279 | | | | 225,345 | | | Corporate Bonds | | Open/Demand |
RBC Capital Markets, LLC | | | 2.55 | | | | 08/28/19 | | | | Open | | | | 229,163 | | | | 230,252 | | | Corporate Bonds | | Open/Demand |
RBC Capital Markets, LLC | | | 2.55 | | | | 08/28/19 | | | | Open | | | | 341,485 | | | | 343,109 | | | Corporate Bonds | | Open/Demand |
RBC Capital Markets, LLC | | | 2.55 | | | | 08/28/19 | | | | Open | | | | 140,006 | | | | 140,672 | | | Corporate Bonds | | Open/Demand |
RBC Capital Markets, LLC | | | 2.55 | | | | 08/28/19 | | | | Open | | | | 391,219 | | | | 393,079 | | | Corporate Bonds | | Open/Demand |
RBC Capital Markets, LLC | | | 2.55 | | | | 08/28/19 | | | | Open | | | | 212,836 | | | | 213,848 | | | Corporate Bonds | | Open/Demand |
RBC Capital Markets, LLC | | | 2.55 | | | | 08/28/19 | | | | Open | | | | 22,984 | | | | 23,093 | | | Corporate Bonds | | Open/Demand |
RBC Capital Markets, LLC | | | 2.55 | | | | 08/28/19 | | | | Open | | | | 344,338 | | | | 345,975 | | | Corporate Bonds | | Open/Demand |
RBC Capital Markets, LLC | | | 2.55 | | | | 08/28/19 | | | | Open | | | | 244,294 | | | | 245,456 | | | Corporate Bonds | | Open/Demand |
RBC Capital Markets, LLC | | | 2.55 | | | | 08/28/19 | | | | Open | | | | 211,494 | | | | 212,500 | | | Corporate Bonds | | Open/Demand |
RBC Capital Markets, LLC | | | 2.55 | | | | 08/28/19 | | | | Open | | | | 1,506,088 | | | | 1,513,250 | | | Corporate Bonds | | Open/Demand |
| | | | |
| CONSOLIDATED SCHEDULES OF INVESTMENTS | | | 63 | |
| | |
Consolidated Schedule of Investments (continued) October 31, 2019 | | BlackRock Multi-Sector Income Trust (BIT) |
Reverse Repurchase Agreements (continued)
| | | | | | | | | | | | | | | | | | | | | | | | |
| Counterparty | | Interest
Rate | | | Trade
Date | | | Maturity
Date (a) | | | Face Value | | | Face Value
Including
Accrued Interest | | | Type of Non-Cash Underlying Collateral | | Remaining Contractual
Maturity of the Agreements (a) |
RBC Capital Markets, LLC | | | 2.55 | % | | | 08/28/19 | | | | Open | | | $ | 124,128 | | | $ | 124,718 | | | Corporate Bonds | | Open/Demand |
RBC Capital Markets, LLC | | | 2.55 | | | | 08/28/19 | | | | Open | | | | 67,838 | | | | 68,160 | | | Corporate Bonds | | Open/Demand |
RBC Capital Markets, LLC | | | 2.55 | | | | 08/28/19 | | | | Open | | | | 116,009 | | | | 116,560 | | | Corporate Bonds | | Open/Demand |
RBC Capital Markets, LLC | | | 2.55 | | | | 08/28/19 | | | | Open | | | | 148,238 | | | | 148,942 | | | Corporate Bonds | | Open/Demand |
RBC Capital Markets, LLC | | | 2.55 | | | | 08/28/19 | | | | Open | | | | 231,783 | | | | 232,885 | | | Corporate Bonds | | Open/Demand |
RBC Capital Markets, LLC | | | 2.55 | | | | 08/28/19 | | | | Open | | | | 229,323 | | | | 230,413 | | | Corporate Bonds | | Open/Demand |
RBC Capital Markets, LLC | | | 2.55 | | | | 08/28/19 | | | | Open | | | | 235,450 | | | | 236,570 | | | Corporate Bonds | | Open/Demand |
RBC Capital Markets, LLC | | | 2.55 | | | | 08/28/19 | | | | Open | | | | 165,063 | | | | 165,847 | | | Corporate Bonds | | Open/Demand |
RBC Capital Markets, LLC | | | 2.55 | | | | 08/28/19 | | | | Open | | | | 87,875 | | | | 88,293 | | | Corporate Bonds | | Open/Demand |
RBC Capital Markets, LLC | | | 2.55 | | | | 08/28/19 | | | | Open | | | | 71,213 | | | | 71,551 | | | Corporate Bonds | | Open/Demand |
Barclays Capital, Inc. | | | (0.50 | ) | | | 08/29/19 | | | | Open | | | | 169,020 | | | | 169,018 | | | Corporate Bonds | | Open/Demand |
Barclays Capital, Inc. | | | 0.50 | | | | 08/29/19 | | | | Open | | | | 119,130 | | | | 119,260 | | | Corporate Bonds | | Open/Demand |
Barclays Capital, Inc. | | | 0.67 | | | | 08/29/19 | | | | Open | | | | 11,340 | | | | 11,356 | | | Corporate Bonds | | Open/Demand |
Barclays Capital, Inc. | | | 1.00 | | | | 08/29/19 | | | | Open | | | | 139,685 | | | | 139,268 | | | Corporate Bonds | | Open/Demand |
Barclays Capital, Inc. | | | 1.70 | | | | 08/29/19 | | | | Open | | | | 464,348 | | | | 465,829 | | | Corporate Bonds | | Open/Demand |
Barclays Capital, Inc. | | | 1.75 | | | | 08/29/19 | | | | Open | | | | 421,406 | | | | 422,388 | | | Corporate Bonds | | Open/Demand |
Barclays Capital, Inc. | | | 1.80 | | | | 08/29/19 | | | | Open | | | | 125,013 | | | | 125,433 | | | Corporate Bonds | | Open/Demand |
Barclays Capital, Inc. | | | 2.25 | | | | 08/29/19 | | | | Open | | | | 953,438 | | | | 957,397 | | | Corporate Bonds | | Open/Demand |
Barclays Capital, Inc. | | | 2.25 | | | | 08/29/19 | | | | Open | | | | 378,975 | | | | 380,549 | | | Capital Trusts | | Open/Demand |
Barclays Capital, Inc. | | | 2.50 | | | | 08/29/19 | | | | Open | | | | 262,629 | | | | 263,834 | | | Corporate Bonds | | Open/Demand |
Barclays Capital, Inc. | | | 2.50 | | | | 08/29/19 | | | | Open | | | | 2,211,233 | | | | 2,221,383 | | | Corporate Bonds | | Open/Demand |
Barclays Capital, Inc. | | | 2.50 | | | | 08/29/19 | | | | Open | | | | 167,315 | | | | 168,083 | | | Corporate Bonds | | Open/Demand |
Barclays Capital, Inc. | | | 2.50 | | | | 08/29/19 | | | | Open | | | | 252,919 | | | | 254,080 | | | Corporate Bonds | | Open/Demand |
Barclays Capital, Inc. | | | 2.50 | | | | 08/29/19 | | | | Open | | | | 187,690 | | | | 188,552 | | | Corporate Bonds | | Open/Demand |
Barclays Capital, Inc. | | | 2.50 | | | | 08/29/19 | | | | Open | | | | 246,030 | | | | 247,159 | | | Corporate Bonds | | Open/Demand |
Barclays Capital, Inc. | | | 2.50 | | | | 08/29/19 | | | | Open | | | | 160,788 | | | | 161,526 | | | Corporate Bonds | | Open/Demand |
Barclays Capital, Inc. | | | 2.50 | | | | 08/29/19 | | | | Open | | | | 994,175 | | | | 998,739 | | | Corporate Bonds | | Open/Demand |
Barclays Capital, Inc. | | | 2.50 | | | | 08/29/19 | | | | Open | | | | 1,112,280 | | | | 1,117,386 | | | Corporate Bonds | | Open/Demand |
Barclays Capital, Inc. | | | 2.50 | | | | 08/29/19 | | | | Open | | | | 280,125 | | | | 281,411 | | | Corporate Bonds | | Open/Demand |
Barclays Capital, Inc. | | | 2.50 | | | | 08/29/19 | | | | Open | | | | 232,298 | | | | 233,364 | | | Capital Trusts | | Open/Demand |
Barclays Capital, Inc. | | | 2.50 | | | | 08/29/19 | | | | Open | | | | 286,875 | | | | 288,192 | | | Corporate Bonds | | Open/Demand |
Barclays Capital, Inc. | | | 2.50 | | | | 08/29/19 | | | | Open | | | | 277,183 | | | | 278,455 | | | Corporate Bonds | | Open/Demand |
Barclays Capital, Inc. | | | 2.50 | | | | 08/29/19 | | | | Open | | | | 1,248,750 | | | | 1,254,482 | | | Corporate Bonds | | Open/Demand |
Barclays Capital, Inc. | | | 2.50 | | | | 08/29/19 | | | | Open | | | | 318,533 | | | | 319,995 | | | Corporate Bonds | | Open/Demand |
RBC Capital Markets, LLC | | | 2.29 | | | | 08/29/19 | | | | Open | | | | 867,191 | | | | 870,853 | | | Corporate Bonds | | Open/Demand |
RBC Capital Markets, LLC | | | 2.55 | | | | 08/29/19 | | | | Open | | | | 316,933 | | | | 318,415 | | | Corporate Bonds | | Open/Demand |
RBC Capital Markets, LLC | | | 2.55 | | | | 08/29/19 | | | | Open | | | | 536,389 | | | | 538,898 | | | Corporate Bonds | | Open/Demand |
RBC Capital Markets, LLC | | | 2.55 | | | | 08/29/19 | | | | Open | | | | 167,000 | | | | 167,781 | | | Corporate Bonds | | Open/Demand |
RBC Capital Markets, LLC | | | 2.55 | | | | 08/29/19 | | | | Open | | | | 194,110 | | | | 195,018 | | | Corporate Bonds | | Open/Demand |
RBC Capital Markets, LLC | | | 2.55 | | | | 08/29/19 | | | | Open | | | | 119,048 | | | | 119,604 | | | Corporate Bonds | | Open/Demand |
RBC Capital Markets, LLC | | | 2.55 | | | | 08/29/19 | | | | Open | | | | 132,458 | | | | 133,077 | | | Corporate Bonds | | Open/Demand |
RBC Capital Markets, LLC | | | 2.55 | | | | 08/29/19 | | | | Open | | | | 372,593 | | | | 374,335 | | | Corporate Bonds | | Open/Demand |
RBC Capital Markets, LLC | | | 2.55 | | | | 08/29/19 | | | | Open | | | | 184,450 | | | | 185,313 | | | Corporate Bonds | | Open/Demand |
RBC Capital Markets, LLC | | | 2.55 | | | | 08/29/19 | | | | Open | | | | 308,025 | | | | 309,466 | | | Corporate Bonds | | Open/Demand |
RBC Capital Markets, LLC | | | 2.55 | | | | 08/29/19 | | | | Open | | | | 88,523 | | | | 88,937 | | | Corporate Bonds | | Open/Demand |
RBC Capital Markets, LLC | | | 2.55 | | | | 08/29/19 | | | | Open | | | | 751,765 | | | | 755,282 | | | Corporate Bonds | | Open/Demand |
RBC Capital Markets, LLC | | | 2.55 | | | | 08/29/19 | | | | Open | | | | 246,400 | | | | 247,553 | | | Corporate Bonds | | Open/Demand |
RBC Capital Markets, LLC | | | 2.55 | | | | 08/29/19 | | | | Open | | | | 264,750 | | | | 265,988 | | | Corporate Bonds | | Open/Demand |
RBC Capital Markets, LLC | | | 2.55 | | | | 08/29/19 | | | | Open | | | | 2,229,338 | | | | 2,239,766 | | | Corporate Bonds | | Open/Demand |
RBC Capital Markets, LLC | | | 2.55 | | | | 08/29/19 | | | | Open | | | | 1,372,963 | | | | 1,379,385 | | | Corporate Bonds | | Open/Demand |
RBC Capital Markets, LLC | | | 2.55 | | | | 08/29/19 | | | | Open | | | | 716,450 | | | | 719,801 | | | Corporate Bonds | | Open/Demand |
RBC Capital Markets, LLC | | | 2.55 | | | | 08/29/19 | | | | Open | | | | 183,393 | | | | 184,250 | | | Corporate Bonds | | Open/Demand |
RBC Capital Markets, LLC | | | 2.55 | | | | 08/29/19 | | | | Open | | | | 269,280 | | | | 270,540 | | | Corporate Bonds | | Open/Demand |
RBC Capital Markets, LLC | | | 2.55 | | | | 08/29/19 | | | | Open | | | | 177,244 | | | | 178,073 | | | Corporate Bonds | | Open/Demand |
RBC Capital Markets, LLC | | | 2.55 | | | | 08/29/19 | | | | Open | | | | 235,951 | | | | 237,055 | | | Corporate Bonds | | Open/Demand |
RBC Capital Markets, LLC | | | 2.55 | | | | 08/29/19 | | | | Open | | | | 172,525 | | | | 173,332 | | | Corporate Bonds | | Open/Demand |
RBC Capital Markets, LLC | | | 2.55 | | | | 08/29/19 | | | | Open | | | | 266,094 | | | | 267,338 | | | Corporate Bonds | | Open/Demand |
RBC Capital Markets, LLC | | | 2.55 | | | | 08/29/19 | | | | Open | | | | 413,931 | | | | 415,868 | | | Corporate Bonds | | Open/Demand |
RBC Capital Markets, LLC | | | 2.55 | | | | 08/29/19 | | | | Open | | | | 809,725 | | | | 813,513 | | | Corporate Bonds | | Open/Demand |
RBC Capital Markets, LLC | | | 2.55 | | | | 08/29/19 | | | | Open | | | | 195,098 | | | | 196,010 | | | Corporate Bonds | | Open/Demand |
RBC Capital Markets, LLC | | | 2.55 | | | | 08/29/19 | | | | Open | | | | 296,475 | | | | 297,862 | | | Corporate Bonds | | Open/Demand |
RBC Capital Markets, LLC | | | 2.55 | | | | 08/29/19 | | | | Open | | | | 165,850 | | | | 166,626 | | | Corporate Bonds | | Open/Demand |
| | |
| 64 | | 2019 BLACKROCK ANNUAL REPORTTO SHAREHOLDERS |
| | |
Consolidated Schedule of Investments (continued) October 31, 2019 | | BlackRock Multi-Sector Income Trust (BIT) |
Reverse Repurchase Agreements (continued)
| | | | | | | | | | | | | | | | | | | | | | | | |
| Counterparty | | Interest
Rate | | | Trade
Date | | | Maturity
Date (a) | | | Face Value | | | Face Value
Including
Accrued Interest | | | Type of Non-Cash Underlying Collateral | | Remaining Contractual
Maturity of the Agreements (a) |
RBC Capital Markets, LLC | | | 2.55 | % | | | 08/29/19 | | | | Open | | | $ | 354,650 | | | $ | 356,309 | | | Corporate Bonds | | Open/Demand |
RBC Capital Markets, LLC | | | 2.55 | | | | 08/29/19 | | | | Open | | | | 327,499 | | | | 329,031 | | | Corporate Bonds | | Open/Demand |
RBC Capital Markets, LLC | | | 2.55 | | | | 08/29/19 | | | | Open | | | | 393,656 | | | | 395,498 | | | Corporate Bonds | | Open/Demand |
RBC Capital Markets, LLC | | | 2.55 | | | | 08/29/19 | | | | Open | | | | 80,760 | | | | 81,138 | | | Corporate Bonds | | Open/Demand |
RBC Capital Markets, LLC | | | 2.55 | | | | 08/29/19 | | | | Open | | | | 1,227,808 | | | | 1,233,551 | | | Corporate Bonds | | Open/Demand |
BNP Paribas S.A. | | | 2.40 | | | | 09/04/19 | | | | Open | | | | 1,417,460 | | | | 1,423,043 | | | Corporate Bonds | | Open/Demand |
BNP Paribas S.A. | | | 2.40 | | | | 09/04/19 | | | | Open | | | | 441,840 | | | | 443,580 | | | Corporate Bonds | | Open/Demand |
Barclays Capital, Inc. | | | 1.75 | | | | 09/05/19 | | | | Open | | | | 102,295 | | | | 102,608 | | | Corporate Bonds | | Open/Demand |
RBC Capital Markets, LLC | | | 2.55 | | | | 09/09/19 | | | | Open | | | | 1,652,906 | | | | 1,659,224 | | | Corporate Bonds | | Open/Demand |
Barclays Capital, Inc. | | | 2.50 | | | | 09/10/19 | | | | Open | | | | 210,210 | | | | 210,982 | | | Corporate Bonds | | Open/Demand |
BNP Paribas S.A. | | | 2.40 | | | | 09/11/19 | | | | Open | | | | 307,930 | | | | 309,009 | | | Corporate Bonds | | Open/Demand |
RBC Capital Markets, LLC | | | 2.55 | | | | 09/11/19 | | | | Open | | | | 23,135 | | | | 23,220 | | | Corporate Bonds | | Open/Demand |
RBC Capital Markets, LLC | | | 2.55 | | | | 09/11/19 | | | | Open | | | | 1,102,495 | | | | 1,106,537 | | | Corporate Bonds | | Open/Demand |
RBC Capital Markets, LLC | | | 2.55 | | | | 09/16/19 | | | | Open | | | | 1,474,875 | | | | 1,479,709 | | | Corporate Bonds | | Open/Demand |
RBC Capital Markets, LLC | | | 2.55 | | | | 09/16/19 | | | | Open | | | | 399,341 | | | | 400,650 | | | Corporate Bonds | | Open/Demand |
RBC Capital Markets, LLC | | | 2.55 | | | | 09/16/19 | | | | Open | | | | 542,820 | | | | 544,599 | | | Corporate Bonds | | Open/Demand |
RBC Capital Markets, LLC | | | 2.55 | | | | 09/16/19 | | | | Open | | | | 731,160 | | | | 733,557 | | | Corporate Bonds | | Open/Demand |
RBC Capital Markets, LLC | | | 2.55 | | | | 09/18/19 | | | | Open | | | | 1,391,101 | | | | 1,395,445 | | | Corporate Bonds | | Open/Demand |
RBC Capital Markets, LLC | | | 2.55 | | | | 09/18/19 | | | | Open | | | | 120,169 | | | | 120,544 | | | Corporate Bonds | | Open/Demand |
RBC Capital Markets, LLC | | | 2.55 | | | | 09/20/19 | | | | Open | | | | 500,805 | | | | 502,188 | | | Corporate Bonds | | Open/Demand |
BNP Paribas S.A. | | | 2.55 | | | | 09/30/19 | | | | Open | | | | 1,337,875 | | | | 1,340,908 | | | Corporate Bonds | | Open/Demand |
RBC Capital Markets, LLC | | | 2.55 | | | | 09/30/19 | | | | Open | | | | 137,735 | | | | 138,037 | | | Corporate Bonds | | Open/Demand |
RBC Capital Markets, LLC | | | 2.80 | | | | 10/01/19 | | | | Open | | | | 994,534 | | | | 996,854 | | | Corporate Bonds | | Open/Demand |
RBC Capital Markets, LLC | | | 2.80 | | | | 10/01/19 | | | | Open | | | | 226,029 | | | | 226,556 | | | Corporate Bonds | | Open/Demand |
RBC Capital Markets, LLC | | | 2.80 | | | | 10/01/19 | | | | Open | | | | 242,625 | | | | 243,191 | | | Corporate Bonds | | Open/Demand |
RBC Capital Markets, LLC | | | 2.80 | | | | 10/01/19 | | | | Open | | | | 208,810 | | | | 209,297 | | | Corporate Bonds | | Open/Demand |
RBC Capital Markets, LLC | | | 2.80 | | | | 10/01/19 | | | | Open | | | | 96,280 | | | | 96,505 | | | Corporate Bonds | | Open/Demand |
RBC Capital Markets, LLC | | | 2.80 | | | | 10/01/19 | | | | Open | | | | 100,800 | | | | 101,035 | | | Corporate Bonds | | Open/Demand |
RBC Capital Markets, LLC | | | 2.80 | | | | 10/01/19 | | | | Open | | | | 624,791 | | | | 626,249 | | | Corporate Bonds | | Open/Demand |
RBC Capital Markets, LLC | | | 2.80 | | | | 10/01/19 | | | | Open | | | | 205,025 | | | | 205,503 | | | Corporate Bonds | | Open/Demand |
RBC Capital Markets, LLC | | | 2.80 | | | | 10/01/19 | | | | Open | | | | 1,117,090 | | | | 1,119,697 | | | Corporate Bonds | | Open/Demand |
RBC Capital Markets, LLC | | | 2.80 | | | | 10/01/19 | | | | Open | | | | 561,850 | | | | 563,161 | | | Corporate Bonds | | Open/Demand |
RBC Capital Markets, LLC | | | 2.80 | | | | 10/01/19 | | | | Open | | | | 445,784 | | | | 446,824 | | | Corporate Bonds | | Open/Demand |
RBC Capital Markets, LLC | | | 2.80 | | | | 10/01/19 | | | | Open | | | | 1,119,195 | | | | 1,121,806 | | | Corporate Bonds | | Open/Demand |
RBC Capital Markets, LLC | | | 2.80 | | | | 10/01/19 | | | | Open | | | | 703,316 | | | | 704,957 | | | Corporate Bonds | | Open/Demand |
RBC Capital Markets, LLC | | | 2.80 | | | | 10/01/19 | | | | Open | | | | 1,180,465 | | | | 1,183,219 | | | Corporate Bonds | | Open/Demand |
RBC Capital Markets, LLC | | | 2.80 | | | | 10/01/19 | | | | Open | | | | 1,165,223 | | | | 1,167,941 | | | Corporate Bonds | | Open/Demand |
RBC Capital Markets, LLC | | | 2.80 | | | | 10/01/19 | | | | Open | | | | 102,165 | | | | 102,403 | | | Corporate Bonds | | Open/Demand |
RBC Capital Markets, LLC | | | 2.80 | | | | 10/01/19 | | | | Open | | | | 574,574 | | | | 575,914 | | | Corporate Bonds | | Open/Demand |
RBC Capital Markets, LLC | | | 2.80 | | | | 10/01/19 | | | | Open | | | | 171,810 | | | | 172,211 | | | Corporate Bonds | | Open/Demand |
RBC Capital Markets, LLC | | | 2.80 | | | | 10/01/19 | | | | Open | | | | 304,515 | | | | 305,226 | | | Corporate Bonds | | Open/Demand |
RBC Capital Markets, LLC | | | 2.80 | | | | 10/01/19 | | | | Open | | | | 1,097,525 | | | | 1,100,086 | | | Corporate Bonds | | Open/Demand |
RBC Capital Markets, LLC | | | 2.80 | | | | 10/01/19 | | | | Open | | | | 728,484 | | | | 730,184 | | | Corporate Bonds | | Open/Demand |
RBC Capital Markets, LLC | | | 2.80 | | | | 10/01/19 | | | | Open | | | | 1,403,201 | | | | 1,406,475 | | | Corporate Bonds | | Open/Demand |
RBC Capital Markets, LLC | | | 2.80 | | | | 10/01/19 | | | | Open | | | | 528,124 | | | | 529,356 | | | Corporate Bonds | | Open/Demand |
RBC Capital Markets, LLC | | | 2.80 | | | | 10/01/19 | | | | Open | | | | 674,000 | | | | 675,573 | | | Corporate Bonds | | Open/Demand |
BNP Paribas S.A. | | | 1.95 | | | | 10/02/19 | | | | Open | | | | 4,372,903 | | | | 4,379,535 | | | Capital Trusts | | Open/Demand |
BNP Paribas S.A. | | | 2.48 | | | | 10/03/19 | | | | Open | | | | 912,900 | | | | 914,724 | | | Corporate Bonds | | Open/Demand |
BNP Paribas S.A. | | | 2.07 | | | | 10/09/19 | | | | 11/13/19 | | | | 10,512,865 | | | | 10,526,164 | | | U.S. Government Sponsored Agency Securities | | Up to 60 Days |
BNP Paribas S.A. | | | 2.07 | | | | 10/09/19 | | | | 11/13/19 | | | | 7,944,257 | | | | 7,954,306 | | | U.S. Government Sponsored Agency Securities | | Up to 60 Days |
BNP Paribas S.A. | | | 2.07 | | | | 10/09/19 | | | | 11/13/19 | | | | 8,693,728 | | | | 8,704,726 | | | U.S. Government Sponsored Agency Securities | | Up to 60 Days |
Citigroup Global Markets, Inc. | | | 2.08 | | | | 10/09/19 | | | | 11/13/19 | | | | 3,207,206 | | | | 3,211,282 | | | U.S. Government Sponsored Agency Securities | | Up to 60 Days |
Citigroup Global Markets, Inc. | | | 2.08 | | | | 10/09/19 | | | | 11/13/19 | | | | 12,537,018 | | | | 12,552,954 | | | U.S. Government Sponsored Agency Securities | | Up to 60 Days |
Citigroup Global Markets, Inc. | | | 2.08 | | | | 10/09/19 | | | | 11/13/19 | | | | 3,956,178 | | | | 3,961,207 | | | U.S. Government Sponsored Agency Securities | | Up to 60 Days |
Citigroup Global Markets, Inc. | | | 2.08 | | | | 10/09/19 | | | | 11/13/19 | | | | 4,694,823 | | | | 4,700,790 | | | U.S. Government Sponsored Agency Securities | | Up to 60 Days |
| | | | |
| CONSOLIDATED SCHEDULES OF INVESTMENTS | | | 65 | |
| | |
Consolidated Schedule of Investments (continued) October 31, 2019 | | BlackRock Multi-Sector Income Trust (BIT) |
Reverse Repurchase Agreements (continued)
| | | | | | | | | | | | | | | | | | | | | | | | |
| Counterparty | | Interest
Rate | | | Trade
Date | | | Maturity
Date (a) | | | Face Value | | | Face Value
Including
Accrued Interest | | | Type of Non-Cash Underlying Collateral | | Remaining Contractual
Maturity of the Agreements (a) |
Citigroup Global Markets, Inc. | | | 2.08 | % | | | 10/09/19 | | | | 11/13/19 | | | $ | 14,179,475 | | | $ | 14,197,499 | | | U.S. Government Sponsored Agency Securities | | Up to 60 Days |
Citigroup Global Markets, Inc. | | | 2.08 | | | | 10/09/19 | | | | 11/13/19 | | | | 9,820,756 | | | | 9,833,240 | | | U.S. Government Sponsored Agency Securities | | Up to 60 Days |
Citigroup Global Markets, Inc. | | | 2.08 | | | | 10/09/19 | | | | 11/13/19 | | | | 4,310,291 | | | | 4,315,770 | | | U.S. Government Sponsored Agency Securities | | Up to 60 Days |
Citigroup Global Markets, Inc. | | | 2.08 | | | | 10/09/19 | | | | 11/13/19 | | | | 1,342,890 | | | | 1,344,597 | | | U.S. Government Sponsored Agency Securities | | Up to 60 Days |
Citigroup Global Markets, Inc. | | | 2.08 | | | | 10/09/19 | | | | 11/13/19 | | | | 1,945,953 | | | | 1,948,426 | | | U.S. Government Sponsored Agency Securities | | Up to 60 Days |
Citigroup Global Markets, Inc. | | | 2.08 | | | | 10/09/19 | | | | 11/13/19 | | | | 3,932,859 | | | | 3,937,858 | | | U.S. Government Sponsored Agency Securities | | Up to 60 Days |
RBC Capital Markets, LLC | | | 2.55 | | | | 10/09/19 | | | | Open | | | | 285,119 | | | | 285,563 | | | Corporate Bonds | | Open/Demand |
J.P. Morgan Securities LLC | | | 2.00 | | | | 10/11/19 | | | | Open | | | | 237,150 | | | | 237,374 | | | Corporate Bonds | | Open/Demand |
J.P. Morgan Securities LLC | | | 2.00 | | | | 10/11/19 | | | | Open | | | | 545,400 | | | | 545,915 | | | Corporate Bonds | | Open/Demand |
J.P. Morgan Securities LLC | | | 2.00 | | | | 10/11/19 | | | | Open | | | | 674,685 | | | | 675,322 | | | Corporate Bonds | | Open/Demand |
J.P. Morgan Securities LLC | | | 2.00 | | | | 10/11/19 | | | | Open | | | | 655,905 | | | | 656,524 | | | Corporate Bonds | | Open/Demand |
J.P. Morgan Securities LLC | | | 2.10 | | | | 10/11/19 | | | | Open | | | | 296,601 | | | | 296,895 | | | Corporate Bonds | | Open/Demand |
J.P. Morgan Securities LLC | | | 2.25 | | | | 10/11/19 | | | | Open | | | | 298,688 | | | | 298,988 | | | Corporate Bonds | | Open/Demand |
J.P. Morgan Securities LLC | | | 2.00 | | | | 10/16/19 | | | | Open | | | | 426,725 | | | | 427,081 | | | Corporate Bonds | | Open/Demand |
RBC Capital Markets, LLC | | | 2.80 | | | | 10/16/19 | | | | Open | | | | 231,460 | | | | 231,730 | | | Corporate Bonds | | Open/Demand |
RBC Capital Markets, LLC | | | 2.55 | | | | 10/24/19 | | | | Open | | | | 282,825 | | | | 282,965 | | | Corporate Bonds | | Open/Demand |
Barclays Capital, Inc. | | | 2.50 | | | | 10/28/19 | | | | Open | | | | 390,469 | | | | 390,550 | | | Corporate Bonds | | Open/Demand |
BNP Paribas S.A. | | | 2.40 | | | | 10/28/19 | | | | Open | | | | 1,781,325 | | | | 1,781,681 | | | Corporate Bonds | | Open/Demand |
BNP Paribas S.A. | | | 2.40 | | | | 10/28/19 | | | | Open | | | | 812,543 | | | | 812,705 | | | Corporate Bonds | | Open/Demand |
RBC Capital Markets, LLC | | | 2.55 | | | | 10/28/19 | | | | Open | | | | 1,461,784 | | | | 1,462,094 | | | Corporate Bonds | | Open/Demand |
RBC Capital Markets, LLC | | | 2.55 | | | | 10/28/19 | | | | Open | | | | 135,214 | | | | 135,242 | | | Corporate Bonds | | Open/Demand |
BNP Paribas S.A. | | | 1.90 | | | | 10/29/19 | | | | Open | | | | 4,831,875 | | | | 4,832,640 | | | U.S. Treasury Obligations | | Open/Demand |
BNP Paribas S.A. | | | 2.40 | | | | 10/29/19 | | | | Open | | | | 321,953 | | | | 321,995 | | | Corporate Bonds | | Open/Demand |
RBC Capital Markets, LLC | | | 2.55 | | | | 10/29/19 | | | | Open | | | | 1,237,031 | | | | 1,237,206 | | | Corporate Bonds | | Open/Demand |
RBC Capital Markets, LLC | | | 2.55 | | | | 10/29/19 | | | | Open | | | | 120,643 | | | | 120,660 | | | Corporate Bonds | | Open/Demand |
BNP Paribas S.A. | | | 0.00 | | | | 10/31/19 | | | | Open | | | | 762,065 | | | | 762,065 | | | Corporate Bonds | | Open/Demand |
RBC Capital Markets, LLC | | | 0.00 | | | | 10/31/19 | | | | Open | | | | 924,490 | | | | 925,329 | | | Corporate Bonds | | Open/Demand |
| | | | | | | | | | | | | | | | | | | | | | | | |
| | | | | | | | | | | | | | $ | 370,933,111 | | | $ | 373,344,902 | | | | | |
| | | | | | | | | | | | | | | | | | | | | | | | |
| | (a) | Certain agreements have no stated maturity and can be terminated by either party at any time. | |
| | |
| 66 | | 2019 BLACKROCK ANNUAL REPORTTO SHAREHOLDERS |
| | |
Consolidated Schedule of Investments (continued) October 31, 2019 | | BlackRock Multi-Sector Income Trust (BIT) |
Derivative Financial Instruments Outstanding as of Period End
Futures Contracts
| | | | | | | | | | | | | | | | |
| Description | | Number of
Contracts | | | Expiration
Date | | | Notional
Amount (000) | | | Value /
Unrealized
Appreciation
(Depreciation) | |
Long Contracts | | | | | | | | | | | | | | | | |
10-Year U.S. Ultra Long Treasury Note | | | 167 | | | | 12/19/19 | | | $ | 23,732 | | | $ | (455,179 | ) |
5-Year U.S. Treasury Note | | | 604 | | | | 12/31/19 | | | | 71,999 | | | | (467,858 | ) |
| | | | | | | | | | | | | | | | |
| | | | | | | | | | | | | | | (923,037 | ) |
| | | | | | | | | | | | | | | | |
Short Contracts | | | | | | | | | | | | | | | | |
10-Year U.S. Treasury Note | | | 248 | | | | 12/19/19 | | | | 32,314 | | | | 337,163 | |
Long U.S. Treasury Bond | | | 29 | | | | 12/19/19 | | | | 4,680 | | | | 97,043 | |
U.S. Ultra Treasury Bond | | | 168 | | | | 12/19/19 | | | | 31,878 | | | | 1,061,092 | |
Long Gilt | | | 2 | | | | 12/27/19 | | | | 344 | | | | (805 | ) |
2-Year U.S. Treasury Note | | | 1,600 | | | | 12/31/19 | | | | 344,963 | | | | 671,184 | |
| | | | | | | | | | | | | | | | |
| | | | | | | | | | | | | | | 2,165,677 | |
| | | | | | | | | | | | | | | | |
| | | | | | | | | | | | | | $ | 1,242,640 | |
| | | | | | | | | | | | | | | | |
Forward Foreign Currency Exchange Contracts
| | | | | | | | | | | | | | | | | | | | |
Currency
Purchased | | | Currency
Sold | | | Counterparty | | Settlement Date | | | Unrealized
Appreciation
(Depreciation) | |
| EUR | | | 100,000 | | | USD | | | 111,143 | | | Bank of America N.A. | | | 11/04/19 | | | $ | 387 | |
| EUR | | | 8,968,778 | | | USD | | | 9,955,971 | | | Citibank N.A. | | | 11/05/19 | | | | 47,554 | |
| EUR | | | 1,168,000 | | | USD | | | 1,297,309 | | | State Street Bank and Trust Co. | | | 11/05/19 | | | | 5,446 | |
| EUR | | | 3,088,000 | | | USD | | | 3,432,930 | | | UBS AG | | | 11/05/19 | | | | 11,340 | |
| GBP | | | 176,000 | | | USD | | | 226,204 | | | BNP Paribas S.A. | | | 11/05/19 | | | | 1,785 | |
| GBP | | | 1,958,000 | | | USD | | | 2,517,700 | | | Citibank N.A. | | | 11/05/19 | | | | 18,674 | |
| GBP | | | 9,666,000 | | | USD | | | 12,450,388 | | | Citibank N.A. | | | 11/05/19 | | | | 70,854 | |
| GBP | | | 1,022,000 | | | USD | | | 1,315,518 | | | JPMorgan Chase Bank N.A. | | | 11/05/19 | | | | 8,370 | |
| GBP | | | 409,000 | | | USD | | | 527,123 | | | State Street Bank and Trust Co. | | | 11/05/19 | | | | 2,692 | |
| NOK | | | 31,508,980 | | | CAD | | | 4,500,000 | | | JPMorgan Chase Bank N.A. | | | 12/18/19 | | | | 9,980 | |
| | | | | | | | | | | | | | | | | | | | |
| | | | | | | | | | | | | | | | | | | 177,082 | |
| | | | | | | | | | | | | | | | | | | | |
| USD | | | 46,177 | | | EUR | | | 42,000 | | | BNP Paribas S.A. | | | 11/05/19 | | | | (668 | ) |
| USD | | | 812,008 | | | EUR | | | 738,700 | | | Citibank N.A. | | | 11/05/19 | | | | (11,918 | ) |
| USD | | | 9,880,679 | | | EUR | | | 8,968,778 | | | Citibank N.A. | | | 11/05/19 | | | | (122,847 | ) |
| USD | | | 1,423,011 | | | EUR | | | 1,294,000 | | | Goldman Sachs International | | | 11/05/19 | | | | (20,281 | ) |
| USD | | | 110,225 | | | EUR | | | 99,000 | | | Morgan Stanley & Co. International PLC | | | 11/05/19 | | | | (197 | ) |
| USD | | | 61,779 | | | EUR | | | 56,000 | | | State Street Bank and Trust Co. | | | 11/05/19 | | | | (682 | ) |
| USD | | | 100,507 | | | EUR | | | 91,000 | | | State Street Bank and Trust Co. | | | 11/05/19 | | | | (992 | ) |
| USD | | | 156,817 | | | EUR | | | 142,000 | | | State Street Bank and Trust Co. | | | 11/05/19 | | | | (1,566 | ) |
| USD | | | 1,965,412 | | | EUR | | | 1,794,000 | | | State Street Bank and Trust Co. | | | 11/05/19 | | | | (35,566 | ) |
| USD | | | 218,268 | | | GBP | | | 176,000 | | | BNP Paribas S.A. | | | 11/05/19 | | | | (9,721 | ) |
| USD | | | 1,248,211 | | | GBP | | | 1,022,000 | | | Citibank N.A. | | | 11/05/19 | | | | (75,678 | ) |
| USD | | | 2,428,488 | | | GBP | | | 1,958,000 | | | Citibank N.A. | | | 11/05/19 | | | | (107,886 | ) |
| USD | | | 11,988,643 | | | GBP | | | 9,666,000 | | | Citibank N.A. | | | 11/05/19 | | | | (532,599 | ) |
| USD | | | 149,334 | | | GBP | | | 121,000 | | | Standard Chartered Bank | | | 11/05/19 | | | | (7,408 | ) |
| USD | | | 352,676 | | | GBP | | | 288,000 | | | State Street Bank and Trust Co. | | | 11/05/19 | | | | (20,396 | ) |
| USD | | | 1,596,180 | | | MXN | | | 31,780,000 | | | State Street Bank and Trust Co. | | | 11/05/19 | | | | (55,636 | ) |
| USD | | | 142,668 | | | EUR | | | 130,000 | | | Citibank N.A. | | | 11/06/19 | | | | (2,340 | ) |
| USD | | | 9,704,552 | | | EUR | | | 8,716,000 | | | BNP Paribas S.A. | | | 12/04/19 | | | | (35,226 | ) |
| USD | | | 111,362 | | | EUR | | | 100,000 | | | Bank of America N.A. | | | 12/04/19 | | | | (384 | ) |
| USD | | | 1,299,762 | | | EUR | | | 1,168,000 | | | State Street Bank and Trust Co. | | | 12/04/19 | | | | (5,431 | ) |
| USD | | | 3,439,353 | | | EUR | | | 3,088,000 | | | UBS AG | | | 12/04/19 | | | | (11,363 | ) |
| USD | | | 1,316,686 | | | GBP | | | 1,022,000 | | | JPMorgan Chase Bank N.A. | | | 12/04/19 | | | | (8,399 | ) |
| USD | | | 1,329,031 | | | GBP | | | 1,030,000 | | | Morgan Stanley & Co. International PLC | | | 12/04/19 | | | | (6,426 | ) |
| USD | | | 12,455,443 | | | GBP | | | 9,666,000 | | | Natwest Markets PLC | | | 12/04/19 | | | | (77,108 | ) |
| USD | | | 527,604 | | | GBP | | | 409,000 | | | State Street Bank and Trust Co. | | | 12/04/19 | | | | (2,689 | ) |
| AUD | | | 5,100,000 | | | CAD | | | 4,644,658 | | | BNP Paribas S.A. | | | 12/18/19 | | | | (7,426 | ) |
| CAD | | | 4,608,908 | | | AUD | | | 5,100,000 | | | State Street Bank and Trust Co. | | | 12/18/19 | | | | (19,723 | ) |
| | | | | | | | | | | | | | | | | | | | |
| | | | | | | | | | | | | | | | | | | (1,180,556 | ) |
| | | | | | | | | | | | | | | | | | | | |
Net Unrealized depreciation | | | $ | (1,003,474 | ) |
| | | | | | | | | | | | | | | | | | | | |
| | | | |
| CONSOLIDATED SCHEDULES OF INVESTMENTS | | | 67 | |
| | |
Consolidated Schedule of Investments (continued) October 31, 2019 | | BlackRock Multi-Sector Income Trust (BIT) |
Centrally Cleared Credit Default Swaps — Buy Protection
| | | | | | | | | | | | | | | | | | | | | | | | | | | | | | | | |
| Reference Obligation/Index | | Financing
Rate Paid
by the Trust | | | Payment
Frequency | | | Termination
Date | | | Notional
Amount (000) | | | Value | | | Upfront
Premium
Paid
(Received) | | | Unrealized
Appreciation
(Depreciation) | |
CDX.NA.IG.33.V1 | | | 1.00 | % | | | Quarterly | | | | 12/20/24 | | | | USD | | | | 74,100 | | | $ | (1,708,573 | ) | | $ | (1,362,155 | ) | | $ | (346,418 | ) |
CDX.NA.IG.33.V1 | | | 5.00 | % | | | Quarterly | | | | 12/20/24 | | | | USD | | | | 2,950 | | | | (223,562 | ) | | | (187,518 | ) | | | (36,044 | ) |
| | | | | | | | | | | | | | | | | | | | | | | | | | | | | | | | |
| | | | | | | | | | | | | | | | | | | | | | $ | (1,932,135 | ) | | $ | (1,549,673 | ) | | $ | (382,462 | ) |
| | | | | | | | | | | | | | | | | | | | | | | | | | | | | | | | |
Centrally Cleared Credit Default Swaps — Sell Protection
| | | | | | | | | | | | | | | | | | | | | | | | | | | | | | | | |
| Reference Obligation/Index | |
| Financing
Rate Received
by the Trust |
| |
| Payment
Frequency |
| |
| Termination
Date |
| | Credit
Rating (a) | | Notional
Amount (000) (b) | | | | Value | | |
| Upfront
Premium
Paid
(Received) |
| |
| Unrealized
Appreciation
(Depreciation) |
|
iTraxx.XO.31.V1 | | | 5.00 | % | | | Quarterly | | | | 06/20/24 | | | B- | | EUR | | | 109 | | | $ | 12,058 | | | $ | 10,312 | | | $ | 1,746 | |
| | | | | | | | | | | | | | | | | | | | | | | | | | | | | | | | |
| | (a) | Using the rating of the issuer or the underlying securities of the index, as applicable, provided by S&P Global Ratings. | |
| | (b) | The maximum potential amount the Trust may pay should a negative credit event take place as defined under the terms of the agreement. | |
Centrally Cleared Interest Rate Swaps
| | | | | | | | | | | | | | | | | | | | | | | | | | | | | | | | |
| Paid by the Trust | | Received by the Trust | | Effective
Date (a) | | | Termination
Date | | | Notional
Amount (000) | | | Value | | | Upfront
Premium
Paid
(Received) | | | Unrealized
Appreciation
(Depreciation) | |
| Rate | | Frequency | | Rate | | Frequency |
| 3-Month LIBOR, 1.90% | | Quarterly | | 2.39% | | Semi-annual | | | 02/08/18 | | | | 02/12/20 | | | USD | | | 185,500 | | | $ | 261,708 | | | $ | 362 | | | $ | 261,346 | |
| 3-Month LIBOR, 1.90% | | Quarterly | | 2.36 | | Semi-annual | | | 02/09/18 | | | | 02/13/20 | | | USD | | | 150,000 | | | | 195,213 | | | | 296 | | | | 194,917 | |
| | | | | | | | | | | | | | | | | | | | | | | | | | | | | | | | |
| | | | | | | | | | | | | | | | | | | | | | $ | 456,921 | | | $ | 658 | | | $ | 456,263 | |
| | | | | | | | | | | | | | | | | | | | | | | | | | | | | | | | |
OTC Credit Default Swaps — Buy Protection
| | | | | | | | | | | | | | | | | | | | | | | | | | | | | | |
| Reference Obligation/Index | | Financing
Rate Paid
by the Trust | | | Payment
Frequency | | | Counterparty | | Termination
Date | | Notional
Amount (000) | | | Value | | | Upfront
Premium
Paid
(Received) | | | Unrealized
Appreciation
(Depreciation) | |
United Mexican States | | | 1.00 | % | | | Quarterly | | | Citibank N.A. | | 06/20/20 | | USD | | | 604 | | | $ | (3,747 | ) | | $ | 766 | | | $ | (4,513 | ) |
United Mexican States | | | 1.00 | | | | Quarterly | | | Bank of America N.A. | | 09/20/20 | | USD | | | 604 | | | | (4,807 | ) | | | 1,386 | | | | (6,193 | ) |
UPC Holding BV | | | 5.00 | | | | Quarterly | | | JPMorgan Chase Bank N.A. | | 06/20/24 | | EUR | | | 30 | | | | (6,274 | ) | | | (6,613 | ) | | | 339 | |
UPC Holding BV | | | 5.00 | | | | Quarterly | | | BNP Paribas S.A. | | 06/20/24 | | EUR | | | 6 | | | | (1,295 | ) | | | (1,443 | ) | | | 148 | |
UPC Holding BV | | | 5.00 | | | | Quarterly | | | Bank of America N.A. | | 06/20/24 | | EUR | | | 20 | | | | (4,183 | ) | | | (4,601 | ) | | | 418 | |
CMBX.NA.7 | | | 3.00 | | | | Monthly | | | Deutsche Bank AG | | 01/17/47 | | USD | | | 25,000 | | | | 106,354 | | | | 1,820,661 | | | | (1,714,307 | ) |
| | | | | | | | | | | | | | | | | | | | | | | | | | | | | | |
| | | | | | $ | 86,048 | | | $ | 1,810,156 | | | $ | (1,724,108 | ) |
| | | | | | | | | | | | | | | | |
OTC Credit Default Swaps — Sell Protection
| | | | | | | | | | | | | | | | | | | | | | | | | | | | | | | | | | | | |
| Reference Obligation/Index | | Financing
Rate Received
by the Trust | | | Payment
Frequency | | | Counterparty | | Termination
Date | | | Credit
Rating (a) | | Notional
Amount (000) (b) | | | Value | | | Upfront
Premium
Paid
(Received) | | | Unrealized
Appreciation
(Depreciation) | |
United Mexican States | | | 1.00 | % | | | Quarterly | | | Bank of America N.A. | | | 06/20/20 | | | BBB+ | | | USD | | | | 604 | | | $ | 3,748 | | | $ | (802 | ) | | $ | 4,550 | |
United Mexican States | | | 1.00 | | | | Quarterly | | | Citibank N.A. | | | 09/20/20 | | | BBB+ | | | USD | | | | 604 | | | | 4,807 | | | | 1,314 | | | | 3,493 | |
Casino Guichard Perrachon SA | | | 1.00 | | | | Quarterly | | | JPMorgan Chase Bank N.A. | | | 06/20/23 | | | B | | | EUR | | | | 10 | | | | (1,989 | ) | | | (759 | ) | | | (1,230 | ) |
Casino Guichard Perrachon SA | | | 1.00 | | | | Quarterly | | | Citibank N.A. | | | 06/20/23 | | | B | | | EUR | | | | 28 | | | | (5,503 | ) | | | (3,052 | ) | | | (2,451 | ) |
Casino Guichard Perrachon SA | | | 1.00 | | | | Quarterly | | | Barclays Bank PLC | | | 12/20/23 | | | B | | | EUR | | | | 30 | | | | (6,894 | ) | | | (4,020 | ) | | | (2,874 | ) |
Chesapeake Energy Corp. | | | 5.00 | | | | Quarterly | | | Barclays Bank PLC | | | 12/20/23 | | | B+ | | | USD | | | | 94 | | | | (26,499 | ) | | | 151 | | | | (26,650 | ) |
Chesapeake Energy Corp. | | | 5.00 | | | | Quarterly | | | Barclays Bank PLC | | | 12/20/23 | | | B+ | | | USD | | | | 402 | | | | (113,325 | ) | | | 3,253 | | | | (116,578 | ) |
Casino Guichard Perrachon SA | | | 5.00 | | | | Quarterly | | | Credit Suisse International | | | 06/20/24 | | | B | | | EUR | | | | 11 | | | | (1,079 | ) | | | (738 | ) | | | (341 | ) |
Casino Guichard Perrachon SA | | | 5.00 | | | | Quarterly | | | Credit Suisse International | | | 06/20/24 | | | B | | | EUR | | | | 9 | | | | (953 | ) | | | (752 | ) | | | (201 | ) |
Telecom Italia SpA | | | 1.00 | | | | Quarterly | | | Citibank N.A. | | | 06/20/24 | | | BB+ | | | EUR | | | | 5 | | | | (106 | ) | | | (165 | ) | | | 59 | |
| | |
| 68 | | 2019 BLACKROCK ANNUAL REPORTTO SHAREHOLDERS |
| | |
Consolidated Schedule of Investments (continued) October 31, 2019 | | BlackRock Multi-Sector Income Trust (BIT) |
OTC Credit Default Swaps — Sell Protection (continued)
| | | | | | | | | | | | | | | | | | | | | | | | | | | | | | | | | | | | |
| Reference Obligation/Index | | Financing
Rate Received
by the Trust | | | Payment
Frequency | | | Counterparty | | Termination
Date | | | Credit
Rating (a) | | Notional
Amount (000) (b) | | | Value | | | Upfront
Premium
Paid
(Received) | | | Unrealized
Appreciation
(Depreciation) | |
Telecom Italia SpA | | | 1.00 | % | | | Quarterly | | | Bank of America N.A. | | | 06/20/24 | | | BB+ | | | EUR | | | | 5 | | | $ | (105 | ) | | $ | (163 | ) | | $ | 58 | |
Telecom Italia SpA | | | 1.00 | | | | Quarterly | | | Citibank N.A. | | | 06/20/24 | | | BB+ | | | EUR | | | | 5 | | | | (106 | ) | | | (170 | ) | | | 64 | |
Telecom Italia SpA | | | 1.00 | | | | Quarterly | | | Morgan Stanley & Co. International PLC | | | 06/20/24 | | | BB+ | | | EUR | | | | 5 | | | | (102 | ) | | | (168 | ) | | | 66 | |
Garfunkelux Holdco 2 SA | | | 5.00 | | | | Quarterly | | | Credit Suisse International | | | 12/20/24 | | | B- | | | EUR | | | | 10 | | | | (82 | ) | | | (138 | ) | | | 56 | |
Garfunkelux Holdco 2 SA | | | 5.00 | | | | Quarterly | | | Credit Suisse International | | | 12/20/24 | | | B- | | | EUR | | | | 30 | | | | (245 | ) | | | — | | | | (245 | ) |
Telecom Italia SpA | | | 1.00 | | | | Quarterly | | | Citibank N.A. | | | 06/20/26 | | | BB+ | | | EUR | | | | 10 | | | | (788 | ) | | | (1,451 | ) | | | 663 | |
Virgin Media Finance PLC | | | 5.00 | | | | Quarterly | | | Credit Suisse International | | | 12/20/26 | | | B | | | EUR | | | | 20 | | | | 4,826 | | | | 4,992 | | | | (166 | ) |
Tesco PLC | | | 1.00 | | | | Quarterly | | | Morgan Stanley & Co. International PLC | | | 12/20/28 | | | BB+ | | | EUR | | | | 70 | | | | (4,589 | ) | | | (6,555 | ) | | | 1,966 | |
CMBX.NA.7 | | | 3.00 | | | | Monthly | | | Barclays Bank PLC | | | 01/17/47 | | | | | | USD | | | | 10,000 | | | | (37,543 | ) | | | (506,334 | ) | | | 468,791 | |
CMBX.NA.7 | | | 3.00 | | | | Monthly | | | Barclays Bank PLC | | | 01/17/47 | | | BBB- | | | USD | | | | 5,000 | | | | (18,771 | ) | | | (252,812 | ) | | | 234,041 | |
CMBX.NA.7 | | | 3.00 | | | | Monthly | | | Barclays Bank PLC | | | 01/17/47 | | | BBB- | | | USD | | | | 10,000 | | | | (37,541 | ) | | | (245,167 | ) | | | 207,626 | |
CMBX.NA.9 | | | 2.00 | | | | Monthly | | | Morgan Stanley & Co. International PLC | | | 09/17/58 | | | NR | | | USD | | | | 2,500 | | | | 48,151 | | | | (338,890 | ) | | | 387,041 | |
CMBX.NA.9 | | | 2.00 | | | | Monthly | | | Credit Suisse International | | | 09/17/58 | | | NR | | | USD | | | | 2,500 | | | | 48,151 | | | | (342,194 | ) | | | 390,345 | |
CMBX.NA.9 | | | 2.00 | | | | Monthly | | | Morgan Stanley & Co. International PLC | | | 09/17/58 | | | NR | | | USD | | | | 5,000 | | | | 96,302 | | | | (671,468 | ) | | | 767,770 | |
CMBX.NA.9 | | | 3.00 | | | | Monthly | | | Morgan Stanley & Co. International PLC | | | 09/17/58 | | | NR | | | USD | | | | 2,500 | | | | (50,149 | ) | | | (547,708 | ) | | | 497,559 | |
CMBX.NA.9 | | | 3.00 | | | | Monthly | | | Deutsche Bank AG | | | 09/17/58 | | | NR | | | USD | | | | 15,000 | | | | (300,893 | ) | | | (1,468,014 | ) | | | 1,167,121 | |
CMBX.NA.9 | | | 3.00 | | | | Monthly | | | Goldman Sachs International | | | 09/17/58 | | | NR | | | USD | | | | 5,000 | | | | (100,297 | ) | | | (525,041 | ) | | | 424,744 | |
CMBX.NA.9 | | | 3.00 | | | | Monthly | | | Credit Suisse International | | | 09/17/58 | | | NR | | | USD | | | | 5,000 | | | | (100,297 | ) | | | (540,369 | ) | | | 440,072 | |
CMBX.NA.9 | | | 3.00 | | | | Monthly | | | Morgan Stanley & Co. International PLC | | | 09/17/58 | | | NR | | | USD | | | | 5,000 | | | | (100,297 | ) | | | (539,743 | ) | | | 439,446 | |
| | | | | | | | | | | | | | | | | | | | | | | | | | | | | | | | | | | | |
| | | | | | | | | | | | | | | | | | | | | | | | | | $ | (702,168 | ) | | $ | (5,986,963 | ) | | $ | 5,284,795 | |
| | | | | | | | | | | | | | | | | | | | | | | | | | | | | | | | | | | | |
| | (a) | Using the rating of the issuer or the underlying securities of the index, as applicable, provided by S&P Global Ratings. | |
| | (b) | The maximum potential amount the Trust may pay should a negative credit event take place as defined under the terms of the agreement. | |
Balances Reported in the Statements of Assets and Liabilities for Centrally Cleared Swaps and OTC Swaps
| | | | | | | | | | | | | | | | |
| | | Swap
Premiums
Paid | | | Swap
Premiums
Received | | | Unrealized
Appreciation | | | Unrealized
Depreciation | |
Centrally Cleared Swaps(a) | | $ | 10,970 | | | $ | (1,549,673 | ) | | $ | 458,009 | | | $ | (382,462 | ) |
OTC Swaps | | | 1,832,523 | | | | (6,009,330 | ) | | | 5,436,436 | | | | (1,875,749 | ) |
| | (a) | Includes cumulative appreciation (depreciation) on centrally cleared swaps, as reported in the Consolidated Schedule of Investments. Only current day’s variation margin is reported within the Consolidated Statement of Assets and Liabilities and is net of any previously paid (received) swap premium amounts. | |
Derivative Financial Instruments Categorized by Risk Exposure
As of period end, the fair values of derivative financial instruments located in the Consolidated Statement of Assets and Liabilities were as follows:
| | | | | | | | | | | | | | | | | | | | | | | | | | | | |
| | | Commodity
Contracts | | | Credit
Contracts | | | Equity
Contracts | | | Foreign
Currency
Exchange
Contracts | | | Interest
Rate
Contracts | | | Other Contracts | | | Total | |
Assets — Derivative Financial Instruments | | | | | | | | | | | | | | | | | | | | | | | | | | | | |
Futures contracts | | | | | | | | | | | | | | | | | | | | | | | | | | | | |
Net unrealized appreciation(a) | | $ | — | | | $ | — | | | $ | — | | | $ | — | | | $ | 2,166,482 | | | $ | — | | | $ | 2,166,482 | |
Forward foreign currency exchange contracts | | | | | | | | | | | | | | | | | | | | | | | | | | | | |
Unrealized appreciation on forward foreign currency exchange contracts | | | — | | | | — | | | | — | | | | 177,082 | | | | — | | | | — | | | | 177,082 | |
Swaps — centrally cleared | | | | | | | | | | | | | | | | | | | | | | | | | | | | |
Net unrealized appreciation(a) | | | — | | | | 1,746 | | | | — | | | | — | | | | 456,263 | | | | — | | | | 458,009 | |
Swaps — OTC | | | — | | | | | | | | | | | | | | | | | | | | | | | | | |
Unrealized appreciation on OTC swaps; Swap premiums paid | | | — | | | | 7,268,959 | | | | — | | | | — | | | | — | | | | — | | | | 7,268,959 | |
| | | | | | | | | | | | | | | | | | | | | | | | | | | | |
| | $ | — | | | $ | 7,270,705 | | | $ | — | | | $ | 177,082 | | | $ | 2,622,745 | | | $ | — | | | $ | 10,070,532 | |
| | | | | | | | | | | | | | | | | | | | | | | | | | | | |
| | | | |
| CONSOLIDATED SCHEDULES OF INVESTMENTS | | | 69 | |
| | |
Consolidated Schedule of Investments (continued) October 31, 2019 | | BlackRock Multi-Sector Income Trust (BIT) |
Derivative Financial Instruments Categorized by Risk Exposure (continued)
| | | | | | | | | | | | | | | | | | | | | | | | | | | | |
| | | Commodity
Contracts | | | Credit
Contracts | | | Equity
Contracts | | | Foreign
Currency
Exchange
Contracts | | | Interest
Rate
Contracts | | | Other Contracts | | | Total | |
Liabilities — Derivative Financial Instruments | | | | | | | | | | | | | | | | | | | | | | | | | | | | |
Futures contracts | | | | | | | | | | | | | | | | | | | | | | | | | | | | |
Net unrealized depreciation(a) | | $ | — | | | $ | — | | | $ | — | | | $ | — | | | $ | 923,842 | | | $ | — | | | $ | 923,842 | |
Forward foreign currency exchange contracts | | | | | | | | | | | | | | | | | | | | | | | | | | | | |
Unrealized depreciation on forward foreign currency exchange contracts | | | — | | | | — | | | | — | | | | 1,180,556 | | | | — | | | | — | | | | 1,180,556 | |
Swaps — centrally cleared | | | | | | | | | | | | | | | | | | | | | | | | | | | | |
Net unrealized depreciation(a) | | | — | | | | 382,462 | | | | — | | | | — | | | | — | | | | — | | | | 382,462 | |
Swaps — OTC | | | | | | | | | | | | | | | | | | | | | | | | | | | | |
Unrealized depreciation on OTC swaps; Swap premiums received | | | — | | | | 7,885,079 | | | | — | | | | — | | | | — | | | | — | | | | 7,885,079 | |
| | | | | | | | | | | | | | | | | | | | | | | | | | | | |
| | $ | — | | | $ | 8,267,541 | | | $ | — | | | $ | 1,180,556 | | | $ | 923,842 | | | $ | — | | | $ | 10,371,939 | |
| | | | | | | | | | | | | | | | | | | | | | | | | | | | |
| | (a) | Includes cumulative appreciation (depreciation) on futures contracts and centrally cleared swaps, if any, as reported in the Consolidated Schedule of Investments. Only current day’s variation margin is reported within the Consolidated Statement of Assets and Liabilities. | |
For the year ended October 31, 2019, the effect of derivative financial instruments in the Consolidated Statement of Operations was as follows:
| | | | | | | | | | | | | | | | | | | | | | | | | | | | |
| | | Commodity
Contracts | | | Credit
Contracts | | | Equity
Contracts | | | Foreign
Currency
Exchange
Contracts | | | Interest
Rate
Contracts | | | Other
Contracts | | | Total | |
Net Realized Gain (Loss) from: | | | | | | | | | | | | | | | | | | | | | | | | | | | | |
Futures contracts | | $ | — | | | $ | — | | | $ | (928 | ) | | $ | — | | | $ | (2,846,090 | ) | | $ | — | | | $ | (2,847,018 | ) |
Forward foreign currency exchange contracts | | | — | | | | — | | | | — | | | | 3,248,221 | | | | — | | | | — | | | | 3,248,221 | |
Swaps | | | — | | | | 2,311,575 | | | | — | | | | — | | | | (9,919,166 | ) | | | 1,667 | | | | (7,605,924 | ) |
| | | | | | | | | | | | | | | | | | | | | | | | | | | | |
| | $ | — | | | $ | 2,311,575 | | | $ | (928 | ) | | $ | 3,248,221 | | | $ | (12,765,256 | ) | | $ | 1,667 | | | $ | (7,204,721 | ) |
| | | | | | | | | | | | | | | | | | | | | | | | | | | | |
| | | | | | | |
| Net Change in Unrealized Appreciation (Depreciation) on: | | | | | | | | | | | | | | | | | | | | | |
Futures contracts | | $ | — | | | $ | — | | | $ | 670 | | | $ | — | | | $ | 1,340,341 | | | $ | — | | | $ | 1,341,011 | |
Forward foreign currency exchange contracts | | | — | | | | — | | | | — | | | | (2,482,122 | ) | | | — | | | | — | | | | (2,482,122 | ) |
Swaps | | | — | | | | 907,958 | | | | — | | | | — | | | | (5,117,900 | ) | | | — | | | | (4,209,942 | ) |
| | | | | | | | | | | | | | | | | | | | | | | | | | | | |
| | $ | — | | | $ | 907,958 | | | $ | 670 | | | $ | (2,482,122 | ) | | $ | (3,777,559 | ) | | $ | — | | | $ | (5,351,053 | ) |
| | | | | | | | | | | | | | | | | | | | | | | | | | | | |
Average Quarterly Balances of Outstanding Derivative Financial Instruments
| | | | |
Futures contracts: | |
Average notional value of contracts — long | | $ | 74,531,099 | |
Average notional value of contracts — short | | $ | 145,024,512 | |
Forward foreign currency exchange contracts: | |
Average amounts purchased — in USD | | $ | 96,766,665 | |
Average amounts sold — in USD | | $ | 58,112,029 | |
Credit default swaps: | |
Average notional value — buy protection | | $ | 78,466,014 | |
Average notional value — sell protection | | $ | 80,925,145 | |
Interest rate swaps: | |
Average notional value — pay fixed rate | | $ | 227,557,500 | |
Average notional value — receives fixed rate | | $ | 475,450,000 | |
Inflation swaps: | | | | |
Average notional amount-receives | | $ | — | (a) |
| | (a) | Derivative not held atquarter-end. The risk expoure table serves as an indicator of activity during the period. | |
For more information about the Trust’s investment risks regarding derivative financial instruments, refer to the Notes to Financial Statements.
| | |
| 70 | | 2019 BLACKROCK ANNUAL REPORTTO SHAREHOLDERS |
| | |
Consolidated Schedule of Investments (continued) October 31, 2019 | | BlackRock Multi-Sector Income Trust (BIT) |
Derivative Financial Instruments — Offsetting as of Period End
| | | | | | | | |
| | | Assets | | | Liabilities | |
Futures contracts | | $ | 541,172 | | | $ | 1,402,870 | |
Swaps — Centrally cleared | | | 20,523 | | | | — | |
Forward foreign currency exchange contracts | | | 177,082 | | | | 1,180,556 | |
Swaps — OTC(a) | | | 7,268,959 | | | | 7,885,079 | |
| | | | | | | | |
Total derivative assets and liabilities in the Consolidated Statement of Assets and Liabilities | | $ | 8,007,736 | | | $ | 10,468,505 | |
Derivatives not subject to a Master Netting Agreement or similar agreement (“MNA”) | | | (561,695 | ) | | | (1,402,870 | ) |
| | | | | | | | |
Total derivative assets and liabilities subject to an MNA | | $ | 7,446,041 | | | $ | 9,065,635 | |
| | | | | | | | |
| | (a) | Includes unrealized appreciation (depreciation) on OTC swaps and swap premiums (paid/received) in the Consolidated Statement of Assets and Liabilities. | |
The following tables present the Trust’s derivative assets (and liabilities) by counterparty net of amounts available for offset under an MNA and net of the related collateral received (and pledged) by the Trust:
| | | | | | | | | | | | | | | | | | | | |
Counterparty | |
| Derivative
Assets
Subject to an MNA by
Counterparty |
| |
| Derivatives
Available
for Offset |
(a) | |
| Non-cash
Collateral
Received |
| |
| Cash
Collateral
Received |
| |
| Net Amount
of Derivative
Assets |
(b)(c) |
Bank of America N.A. | | $ | 6,799 | | | $ | (6,799 | ) | | | — | | | | — | | | | — | |
Barclays Bank PLC | | | 913,862 | | | | (913,862 | ) | | | — | | | | — | | | | — | |
BNP Paribas S.A. | | | 1,933 | | | | (1,933 | ) | | | — | | | | — | | | | — | |
Citibank N.A. | | | 143,441 | | | | (143,441 | ) | | | — | | | | — | | | | — | |
Credit Suisse International | | | 835,465 | | | | (835,465 | ) | | | — | | | | — | | | | — | |
Deutsche Bank AG | | | 2,987,782 | | | | (2,987,782 | ) | | | — | | | | — | | | | — | |
Goldman Sachs International | | | 424,744 | | | | (424,744 | ) | | | — | | | | — | | | | — | |
JPMorgan Chase Bank N.A. | | | 18,689 | | | | (17,001 | ) | | | — | | | | — | | | | 1,688 | |
Morgan Stanley & Co. International PLC | | | 2,093,848 | | | | (2,093,848 | ) | | | — | | | | — | | | | — | |
State Street Bank and Trust Co. | | | 8,138 | | | | (8,138 | ) | | | — | | | | — | | | | — | |
UBS AG | | | 11,340 | | | | (11,340 | ) | | | — | | | | — | | | | — | |
| | | | | | | | | | | | | | | | | | | | |
| | $ | 7,446,041 | | | $ | (7,444,353 | ) | | $ | — | | | $ | — | | | $ | 1,688 | |
| | | | | | | | | | | | | | | | | | | | |
| | | | | | | | | | | | | | | | | | | | |
Counterparty | |
| Derivative
Liabilities Subject to an MNA by
Counterparty |
| |
| Derivatives
Available for Offset |
(a) | |
| Non-cash
Collateral Pledged |
| |
| Cash
Collateral Pledged |
(d) | |
| Net Amount
of DerivativeLiabilities |
(c)(e) |
Bank of America N.A. | | $ | 12,143 | | | $ | (6,799 | ) | | $ | — | | | $ | — | | | $ | 5,344 | |
Barclays Bank PLC | | | 1,154,435 | | | | (913,862 | ) | | | — | | | | (240,573 | ) | | | — | |
BNP Paribas S.A. | | | 54,484 | | | | (1,933 | ) | | | — | | | | — | | | | 52,551 | |
Citibank N.A. | | | 865,070 | | | | (143,441 | ) | | | — | | | | (721,629 | ) | | | — | |
Credit Suisse International | | | 885,144 | | | | (835,465 | ) | | | — | | | | (49,679 | ) | | | — | |
Deutsche Bank AG | | | 3,182,321 | | | | (2,987,782 | ) | | | — | | | | (194,539 | ) | | | — | |
Goldman Sachs International | | | 545,322 | | | | (424,744 | ) | | | — | | | | (120,578 | ) | | | — | |
JPMorgan Chase Bank N.A. | | | 17,001 | | | | (17,001 | ) | | | — | | | | — | | | | — | |
Morgan Stanley & Co. International PLC | | | 2,111,155 | | | | (2,093,848 | ) | | | — | | | | (17,307 | ) | | | — | |
Natwest Markets PLC | | | 77,108 | | | | — | | | | — | | | | — | | | | 77,108 | |
Standard Chartered Bank | | | 7,408 | | | | — | | | | — | | | | — | | | | 7,408 | |
State Street Bank and Trust Co. | | | 142,681 | | | | (8,138 | ) | | | — | | | | — | | | | 134,543 | |
UBS AG | | | 11,363 | | | | (11,340 | ) | | | — | | | | — | | | | 23 | |
| | | | | | | | | | | | | | | | | | | | |
| | $ | 9,065,635 | | | $ | (7,444,353 | ) | | $ | — | | | $ | (1,344,305 | ) | | $ | 276,977 | |
| | | | | | | | | | | | | | | | | | | | |
| | (a) | The amount of derivatives available for offset is limited to the amount of derivative assets and/or liabilities that are subject to an MNA. | |
| | (b) | Net amount represents the net amount receivable from the counterparty in the event of default. | |
| | (c) | Net amount may also include forward foreign currency exchange contracts and currency options that are not required to be collateralized. | |
| | (d) | Excess of collateral pledged to the individual counterparty is not shown for financial reporting purposes. | |
| | (e) | Net amount represents the net amount payable due to counterparty in the event of default. | |
| | | | |
| CONSOLIDATED SCHEDULES OF INVESTMENTS | | | 71 | |
| | |
Consolidated Schedule of Investments (continued) October 31, 2019 | | BlackRock Multi-Sector Income Trust (BIT) |
Fair Value Hierarchy as of Period End
Various inputs are used in determining the fair value of investments and derivative financial instruments. For information about the Trust’s policy regarding valuation of investments and derivative financial instruments, refer to the Notes to Financial Statements.
The following tables summarize the Trust’s investments and derivative financial instruments categorized in the disclosure hierarchy:
| | | | | | | | | | | | | | | | |
| | | Level 1 | | | Level 2 | | | Level 3 | | | Total | |
Assets: | | | | | | | | | | | | | | | | |
Investments: | | | | | | | | | | | | | | | | |
Long-Term Investments: | | | | | | | | | | | | | | | | |
Common Stocks(a) | | $ | 3,683,211 | | | $ | — | | | $ | — | | | $ | 3,683,211 | |
Asset-Backed Securities | | | — | | | | 120,600,915 | | | | 5,513,457 | | | | 126,114,372 | |
Corporate Bonds(a) | | | — | | | | 488,190,518 | | | | 1,798,893 | | | | 489,989,411 | |
Floating Rate Loan Interests(a) | | | — | | | | 27,417,051 | | | | 2,297,649 | | | | 29,714,700 | |
Foreign Agency Obligations(a) | | | — | | | | 31,576,294 | | | | — | | | | 31,576,294 | |
Non-Agency Mortgage-Backed Securities(a) | | | — | | | | 83,258,232 | | | | 8,255,880 | | | | 91,514,112 | |
Preferred Securities(a) | | | 15,796,254 | | | | 95,855,934 | | | | 1,581,148 | | | | 113,233,336 | |
U.S. Government Sponsored Agency Securities(a) | | | — | | | | 95,871,527 | | | | — | | | | 95,871,527 | |
U.S. Treasury Obligations | | | — | | | | 20,100,723 | | | | — | | | | 20,100,723 | |
Short-Term Securities: | | | | | | | | | | | | | | | | |
Foreign Agency Obligations | | | — | | | | 552,278 | | | | — | | | | 552,278 | |
Money Market Funds | | | 7,913,547 | | | | — | | | | — | | | | 7,913,547 | |
| | | | | | | | | | | | | | | | |
| | $ | 27,393,012 | | | $ | 963,423,472 | | | $ | 19,447,027 | | | $ | 1,010,263,511 | |
| | | | | | | | | | | | | | | | |
Derivative Financial Instruments(b) | | | | | | | | | | | | | | | | |
Assets: | | | | | | | | | | | | | | | | |
Credit contracts | | $ | — | | | $ | 5,438,182 | | | $ | — | | | $ | 5,438,182 | |
Forward foreign currency contracts | | | — | | | | 177,082 | | | | — | | | | 177,082 | |
Interest rate contracts | | | 2,166,482 | | | | 456,263 | | | | — | | | | 2,622,745 | |
Liabilities: | | | | | | | | | | | | | | | | |
Credit contracts | | | — | | | | (2,258,211 | ) | | | — | | | | (2,258,211 | ) |
Forward foreign currency contracts | | | — | | | | (1,180,556 | ) | | | — | | | | (1,180,556 | ) |
Interest rate contracts | | | (923,842 | ) | | | — | | | | — | | | | (923,842 | ) |
| | | | | | | | | | | | | | | | |
| | $ | 1,242,640 | | | $ | 2,632,760 | | | $ | — | | | $ | 3,875,400 | |
| | | | | | | | | | | | | | | | |
| | (a) | See above Schedule of Investments for values in each industry, country or political subdivision. | |
| | (b) | Derivative financial instruments are swaps, futures contracts, forward foreign currency exchange contracts and options written. Swaps, futures contracts and forward foreign currency exchange contracts are valued at the unrealized appreciation (depreciation) on the instrument and options written are shown at value. | |
The Trust may hold liabilities in which the fair value approximates the carrying amount or face value, including accrued interest, for financial statement Purposes. As of period end, reverse repurchase agreements of $373,344,902 are categorized as Level 2 within the disclosure hierarchy.
A reconciliation of Level 3 investments is presented when the Trust had a significant amount of Level 3 investments at the beginning and/or end of the period in relation to net assets. The following table is a reconciliation of Level 3 investments for which significant unobservable inputs were used in determining fair value:
| | | | | | | | | | | | | | | | | | | | | | | | | | | | |
| | | Asset-Backed
Securities | | | Corporate
Bonds | | | Floating Rate
Loan Interests | | | Non-Agency Mortgage-Backed Securities | | | Preferred
Securities | | | Unfunded
Floating Rate
Loan Interests | | | Total | |
Assets: | | | | | | | | | | | | | | | | | | | | | | | | | | | | |
Opening balance, as of October 31, 2018 | | $ | 3,692,359 | | | $ | 1,798,304 | | | $ | 66,230,887 | | | $ | 17,447,723 | | | $ | 1,637,441 | | | $ | (60 | ) | | $ | 90,806,654 | |
Transfers into Level 3(a) | | | 3,488,865 | | | | — | | | | 366,422 | | | | — | | | | — | | | | — | | | | 3,855,287 | |
Transfers out of Level 3(b) | | | (1,500,000 | ) | | | (145,407 | ) | | | (169,718 | ) | | | — | | | | — | | | | — | | | | (1,815,125 | ) |
Accrued discounts/premiums | | | 29,713 | | | | — | | | | (3,509 | ) | | | 150,879 | | | | — | | | | — | | | | 177,083 | |
Net realized gain (loss) | | | (10,563 | ) | | | — | | | | 2,583 | | | | 479,890 | | | | — | | | | — | | | | 471,910 | |
Net change in unrealized appreciation (depreciation)(c)(d) | | | 147,860 | | | | 181,472 | | | | (73,164,222 | ) | | | 983,220 | | | | (56,293 | ) | | | 60 | | | | (71,907,903 | ) |
Purchases | | | 17,673 | | | | — | | | | 11,265,899 | | | | — | | | | — | | | | — | | | | 11,283,572 | |
Sales | | | (352,450 | ) | | | (35,476 | ) | | | (2,230,693 | ) | | | (10,805,832 | ) | | | — | | | | — | | | | (13,424,451 | ) |
| | | | | | | | | | | | | | | | | | | | | | | | | | | | |
Closing Balance, as of October 31, 2019 | | $ | 5,513,457 | | | $ | 1,798,893 | | | $ | 2,297,649 | | | $ | 8,255,880 | | | $ | 1,581,148 | | | $ | — | | | $ | 19,447,027 | |
| | | | | | | | | | | | | | | | | | | | | | | | | | | | |
Net change in unrealized appreciation (depreciation) on investments still held at October 31, 2019(d) | | $ | 147,860 | | | $ | 181,472 | | | $ | (73,153,002 | ) | | $ | 620,449 | | | $ | (56,292 | ) | | $ | — | | | $ | (72,259,513 | ) |
| | | | | | | | | | | | | | | | | | | | | | | | | | | | |
| | (a) | As of October 31, 2018, the Trust used observable inputs in determining the value of certain investments. As of October 31, 2019, the Trust used significant unobservable inputs in determining the value of the same investments. As a result, investments at beginning of period value were transferred from Level 2 to Level 3 in the disclosure hierarchy. | |
| | (b) | As of October 31, 2018, the Trust used significant unobservable inputs in determining the value of certain investments. As of October 31, 2019, the Trust used observable inputs in determining the value of the same investments. As a result, investments at beginning of period value were transferred from Level 3 to Level 2 in the disclosure hierarchy. | |
| | (c) | Included in the related net change in unrealized appreciation (depreciation) in the Statements of Operations. | |
| | (d) | Any difference between net change in unrealized appreciation (depreciation) and net change in unrealized appreciation (depreciation) on investments still held at October 31, 2019 is generally due to investments no longer held or categorized as Level 3 at period end. | |
| | |
| 72 | | 2019 BLACKROCK ANNUAL REPORTTO SHAREHOLDERS |
| | |
Consolidated Schedule of Investments (continued) October 31, 2019 | | BlackRock Multi-Sector Income Trust (BIT) |
The following table summarizes the valuation approaches used and unobservable inputs utilized by the BlackRock Global Valuation Methodologies Committee (the “Global Valuation Committee”) to determine the value of certain of the Trust’s Level 3 investments as of period end. The table does not include Level 3 investments with values based upon unadjusted third party pricing information in the amount of $16,066,986. A significant change in the third party information could result in a significantly lower or higher value of such Level 3 investments.
| | | | | | | | | | | | | | |
| | | Value | | | Valuation Approaches | | Unobservable Inputs | | | Range of Unobservable
Inputs Utilized (a) | |
Assets: | | | | | | | | | | | | | | |
Floating Rate Loan Interests(b) | | $ | — | | | Market | | | Estimated Recovery Value | | | | — | |
Corporate Bond | | | 1,798,893 | | | Income | | | Credit Spread | | | | 315 | |
Preferred Securities | | | 1,581,148 | | | Market | | | Illiquidity Discount | | | | 1 | % |
| | | | | | | | | | | | | | |
| | $ | 3,380,041 | | | | | | | | | | | |
| | | | | | | | | | | | | | |
| | (a) | A significant change in unobservable input would have resulted in a correlated (inverse) significant change to value. | |
| | (b) | During the period ended October 31, 2019, the valuation technique for an investment classified as Floating Rate Loan Interests with a value of $0 changed from an Income Approach, Discounted Cash Flow to the Market Approach, Estimated Recovery Value. The change was made as the Estimated Recovery Value Approach was deemed more appropriate with respect to the circumstances of this investment. | |
| | | | |
| CONSOLIDATED SCHEDULES OF INVESTMENTS | | | 73 | |
Statements of Assets and Liabilities
October 31, 2019
| | | | | | | | | | | | |
| | | BTZ | | | BGT | | | BIT (a) | |
| | | |
ASSETS | | | | | | | | | | | | |
Investments at value — unaffiliated(b) | | $ | 2,102,165,253 | | | $ | 459,714,134 | | | $ | 1,002,349,964 | |
Investments at value — affiliated(c) | | | 4,783,450 | | | | 740,873 | | | | 7,913,547 | |
Cash | | | 804 | | | | 4,974,126 | | | | 4,020 | |
Cash Pledged: | | | | | | | | | | | | |
Collateral — for reverse repurchase agreements | | | — | | | | — | | | | 1,635,000 | |
Collateral — OTC derivatives | | | — | | | | — | | | | 2,820,000 | |
Futures contracts | | | 608,000 | | | | — | | | | 1,735,977 | |
Centrally cleared swaps | | | — | | | | — | | | | 1,000,590 | |
Foreign currency at value(d) | | | 426 | | | | 45,267 | | | | 2,036,940 | |
Receivables: | | | | | | | | | | | | |
Investments sold | | | 1,160,816 | | | | 6,855,816 | | | | 3,221,696 | |
Reverse repurchase agreements | | | — | | | | — | | | | 1,686,555 | |
Dividends — affiliated | | | 31,971 | | | | 1,354 | | | | 10,401 | |
Dividends — unaffiliated | | | 265,667 | | | | — | | | | 135,716 | |
Interest — unaffiliated | | | 25,183,955 | | | | 954,748 | | | | 10,043,359 | |
Variation margin on futures contracts | | | 1,009,813 | | | | — | | | | 541,172 | |
Variation margin on centrally cleared swaps | | | — | | | | — | | | | 20,523 | |
Swap premiums paid | | | 55,405 | | | | — | | | | 1,832,523 | |
Unrealized appreciation on: | | | | | | | | | | | | |
Forward foreign currency exchange contracts | | | — | | | | 19,691 | | | | 177,082 | |
OTC swaps | | | — | | | | — | | | | 5,436,436 | |
Prepaid expenses | | | 7,747 | | | | 1,692 | | | | 2,717 | |
| | | | | | | | | | | | |
Total assets | | | 2,135,273,307 | | | | 473,307,701 | | | | 1,042,604,218 | |
| | | | | | | | | | | | |
| | | |
LIABILITIES | | | | | | | | | | | | |
Cash Received: | | | | | | | | | | | | |
Collateral — reverse repurchase agreements | | | 2,941,436 | | | | — | | | | 2,423,749 | |
Collateral — OTC derivatives | | | 940,000 | | | | — | | | | — | |
Options written at value(e) | | | 1,278,426 | | | | — | | | | — | |
Reverse repurchase agreements at value | | | 568,460,558 | | | | — | | | | 373,344,902 | |
Payables: | | | | | | | | | | | | |
Investments purchased | | | 5,777,152 | | | | 27,719,243 | | | | 6,143,445 | |
Bank borrowings | | | — | | | | 123,000,000 | | | | — | |
Capital shares redeemed | | | — | | | | 207,666 | | | | — | |
Income dividend distributions | | | 291,184 | | | | 42,272 | | | | 160,884 | |
Interest expense | | | — | | | | 280,143 | | | | — | |
Investment advisory fees | | | 1,126,637 | | | | 281,250 | | | | 717,304 | |
Trustees’ and Officer’s fees | | | 879,432 | | | | 260,559 | | | | 137,299 | |
Other accrued expenses | | | 1,116,116 | | | | 210,202 | | | | 430,372 | |
Principal payups | | | — | | | | — | | | | 160,458 | |
Variation margin on futures contracts | | | 979,504 | | | | — | | | | 1,402,870 | |
Swap premiums received | | | — | | | | — | | | | 6,009,330 | |
Unrealized depreciation on: | | | | | | | | | | | | |
Forward foreign currency exchange contracts | | | — | | | | 209,620 | | | | 1,180,556 | |
OTC swaps | | | 240,254 | | | | — | | | | 1,875,749 | |
Unfunded floating rate loan interests | | | — | | | | 5,911 | | | | — | |
| | | | | | | | | | | | |
Total liabilities | | | 584,030,699 | | | | 152,216,866 | | | | 393,986,918 | |
| | | | | | | | | | | | |
| | | |
NET ASSETS | | $ | 1,551,242,608 | | | $ | 321,090,835 | | | $ | 648,617,300 | |
| | | | | | | | | | | | |
| | | |
NET ASSETS CONSIST OF | | | | | | | | | | | | |
Paid-in capital(f)(g)(h) | | $ | 1,438,733,710 | | | $ | 342,998,752 | | | $ | 701,178,117 | |
Accumulated earnings (loss) | | | 112,508,898 | | | | (21,907,917 | ) | | | (52,560,817 | ) |
| | | | | | | | | | | | |
NET ASSETS | | $ | 1,551,242,608 | | | $ | 321,090,835 | | | $ | 648,617,300 | |
| | | | | | | | | | | | |
| | | |
Net asset value | | $ | 14.94 | | | $ | 13.95 | | | $ | 17.28 | |
| | | | | | | | | | | | |
| | | |
(a) Consolidated Statement of Assets and Liabilities | | | | | | | | | | | | |
(b) Investments at cost — unaffiliated | | $ | 1,938,622,958 | | | $ | 467,020,673 | | | $ | 1,043,788,691 | |
(c) Investments at cost — affiliated | | $ | 4,783,450 | | | $ | 740,873 | | | $ | 7,913,547 | |
(d) Foreign currency at cost | | $ | 428 | | | $ | 45,129 | | | $ | 2,086,780 | |
(e) Premiums received | | $ | 1,810,000 | | | $ | — | | | $ | — | |
(f) Par value | | $ | 0.001 | | | $ | $ 0.001 | | | $ | 0.001 | |
(g) Shares outstanding | | | 103,865,554 | | | | 23,017,947 | | | | 37,537,596 | |
(h) Shares authorized | | | Unlimited | | | | Unlimited | | | | Unlimited | |
See notes to financial statements.
| | |
| 74 | | 2019 BLACKROCK ANNUAL REPORTTO SHAREHOLDERS |
Statements of Operations
Year Ended October 31, 2019
| | | | | | | | | | | | |
| | | BTZ | | | BGT | | | BIT (a) | |
| | | |
INVESTMENT INCOME | | | | | | | | | | | | |
Dividends — affiliated | | $ | 376,314 | | | $ | 24,699 | | | $ | 163,742 | |
Dividends — unaffiliated | | | 5,057,180 | | | | 757,275 | | | | 2,122,049 | |
Interest — unaffiliated | | | 110,005,322 | | | | 25,295,471 | | | | 62,159,479 | |
Other income | | | — | | | | 357,995 | | | | 44,041 | |
Foreign taxes withheld | | | — | | | | — | | | | (53,799 | ) |
| | | | | | | | | | | | |
Total investment income | | | 115,438,816 | | | | 26,435,440 | | | | 64,435,512 | |
| | | | | | | | | | | | |
| | | |
EXPENSES | | | | | | | | | | | | |
Investment advisory | | | 13,145,020 | | | | 3,415,038 | | | | 8,613,272 | |
Professional | | | 1,072,228 | | | | 162,433 | | | | 214,735 | |
Transfer agent | | | 1,023,944 | | | | 37,170 | | | | 63,048 | |
Accounting services | | | 243,739 | | | | 35,272 | | | | 160,488 | |
Trustees and Officer | | | 206,314 | | | | 61,667 | | | | 68,237 | |
Printing | | | 59,034 | | | | 19,015 | | | | 25,457 | |
Registration | | | 39,510 | | | | 9,164 | | | | 14,189 | |
Custodian | | | 37,620 | | | | 17,007 | | | | 62,939 | |
Miscellaneous | | | 89,694 | | | | 21,297 | | | | 92,841 | |
| | | | | | | | | | | | |
Total expenses excluding interest expense and fees | | | 15,917,103 | | | | 3,778,063 | | | | 9,315,206 | |
Interest expense and fees | | | 17,340,318 | | | | 4,092,128 | | | | 10,650,972 | |
| | | | | | | | | | | | |
Total expenses | | | 33,257,421 | | | | 7,870,191 | | | | 19,966,178 | |
Less fees waived and/or reimbursed by the Manager | | | (13,006 | ) | | | (896 | ) | | | (5,450 | ) |
| | | | | | | | | | | | |
Total expenses after fees waived and/or reimbursed | | | 33,244,415 | | | | 7,869,295 | | | | 19,960,728 | |
| | | | | | | | | | | | |
Net investment income | | | 82,194,401 | | | | 18,566,145 | | | | 44,474,784 | |
| | | | | | | | | | | | |
| | | |
REALIZED AND UNREALIZED GAIN (LOSS) | | | | | | | | | | | | |
Net realized gain (loss) from: | | | | | | | | | | | | |
Futures contracts | | | (9,988,823 | ) | | | — | | | | (2,847,018 | ) |
Forward foreign currency exchange contracts | | | — | | | | 344,009 | | | | 3,248,221 | |
Foreign currency transactions | | | (1,133 | ) | | | 2,826 | | | | (193,415 | ) |
Investments — unaffiliated | | | (14,322,621 | ) | | | (5,859,368 | ) | | | (7,321,467 | ) |
Investments — affiliated | | | — | | | | (88,607 | ) | | | — | |
Options written | | | 3,912,361 | | | | — | | | | — | |
Swaps | | | 965,184 | | | | (369,288 | ) | | | (7,605,924 | ) |
| | | | | | | | | | | | |
| | | (19,435,032 | ) | | | (5,970,428 | ) | | | (14,719,603 | ) |
| | | | | | | | | | | | |
Net change in unrealized appreciation (depreciation) on: | | | | | | | | | | | | |
Investments — unaffiliated | | | 152,234,057 | | | | (3,339,546 | ) | | | (29,533,037 | ) |
Futures contracts | | | (7,001,598 | ) | | | — | | | | 1,341,011 | |
Forward foreign currency exchange contracts | | | — | | | | (289,694 | ) | | | (2,482,122 | ) |
Foreign currency translations | | | 1,450 | | | | 838 | | | | 340,084 | |
Options written | | | 478,470 | | | | — | | | | — | |
Swaps | | | 807,869 | | | | (2,500 | ) | | | (4,209,942 | ) |
Unfunded floating rate loan interests | | | — | | | | (5,097 | ) | | | 44 | |
| | | | | | | | | | | | |
| | | 146,520,248 | | | | (3,635,999 | ) | | | (34,543,962 | ) |
| | | | | | | | | | | | |
Net realized and unrealized gain (loss) | | | 127,085,216 | | | | (9,606,427 | ) | | | (49,263,565 | ) |
| | | | | | | | | | | | |
NET INCREASE (DECREASE) IN NET ASSETS RESULTING FROM OPERATIONS | | $ | 209,279,617 | | | $ | 8,959,718 | | | $ | (4,788,781 | ) |
| | | | | | | | | | | | |
| (a) | Consolidated Statement of Operations. |
See notes to financial statements.
Statements of Changes in Net Assets
| | | | | | | | |
| | | BTZ | |
| | | Year Ended October 31, | |
| | | 2019 | | | 2018 | |
| | |
INCREASE (DECREASE) IN NET ASSETS | | | | | | | | |
| | |
OPERATIONS | | | | | | | | |
Net investment income | | $ | 82,194,401 | | | $ | 86,735,652 | |
Net realized gain (loss) | | | (19,435,032 | ) | | | 3,195,391 | |
Net change in unrealized appreciation (depreciation) | | | 146,520,248 | | | | (131,405,935 | ) |
| | | | | | | | |
Net increase (decrease) in net assets resulting from operations | | | 209,279,617 | | | | (41,474,892 | ) |
| | | | | | | | |
| | |
DISTRIBUTIONS TO SHAREHOLDERS(a) | | | | | | | | |
From net investment income | | | (82,221,384 | ) | | | (85,614,025 | ) |
From return of capital | | | (3,261,831 | ) | | | — | |
| | | | | | | | |
Decrease in net assets resulting from distributions to shareholders | | | (85,483,215 | ) | | | (85,614,025 | ) |
| | | | | | | | |
| | |
CAPITAL SHARE TRANSACTIONS | | | | | | | | |
Redemption of shares resulting from share repurchase program (including transaction costs) | | | (12,507,349 | ) | | | (30,991,477 | ) |
| | | | | | | | |
| | |
NET ASSETS | | | | | | | | |
Total increase (decrease) in net assets | | | 111,289,053 | | | | (158,080,394 | ) |
Beginning of year | | | 1,439,953,555 | | | | 1,598,033,949 | |
| | | | | | | | |
End of year | | $ | 1,551,242,608 | | | $ | 1,439,953,555 | |
| | | | | | | | |
| (a) | Distributions for annual periods determined in accordance with U.S. federal income tax regulations. |
See notes to financial statements.
| | |
| 76 | | 2019 BLACKROCK ANNUAL REPORTTO SHAREHOLDERS |
Statements of Changes in Net Assets (continued)
| | | | | | | | |
| | | BGT | |
| | | Year Ended October 31, | |
| | | 2019 | | | 2018 | |
| | |
INCREASE (DECREASE) IN NET ASSETS | | | | | | | | |
| | |
OPERATIONS | | | | | | | | |
Net investment income | | $ | 18,566,145 | | | $ | 17,968,020 | |
Net realized loss | | | (5,970,428 | ) | | | (624,311 | ) |
Net change in unrealized appreciation (depreciation) | | | (3,635,999 | ) | | | (4,248,811 | ) |
| | | | | | | | |
Net increase in net assets resulting from operations | | | 8,959,718 | | | | 13,094,898 | |
| | | | | | | | |
| | |
DISTRIBUTIONS TO SHAREHOLDERS(a) | | | | | | | | |
Decrease in net assets resulting from distributions to shareholders | | | (18,989,845 | ) | | | (16,888,787 | ) |
| | | | | | | | |
| | |
CAPITAL SHARE TRANSACTIONS | | | | | | | | |
Redemption of shares resulting from share repurchase program (including transaction costs) | | | (7,974,829 | ) | | | — | |
| | | | | | | | |
| | |
NET ASSETS | | | | | | | | |
Total decrease in net assets | | | (18,004,956 | ) | | | (3,793,889 | ) |
Beginning of year | | | 339,095,791 | | | | 342,889,680 | |
| | | | | | | | |
End of year | | $ | 321,090,835 | | | $ | 339,095,791 | |
| | | | | | | | |
| (a) | Distributions for annual periods determined in accordance with U.S. federal income tax regulations. |
See notes to financial statements.
Consolidated Statements of Changes in Net Assets
| | | | | | | | |
| | | BIT | |
| | | Year Ended October 31, | |
| | | 2019 | | | 2018 | |
| | |
INCREASE (DECREASE) IN NET ASSETS | | | | | | | | |
| | |
OPERATIONS | | | | | | | | |
Net investment income | | $ | 44,474,784 | | | $ | 52,379,994 | |
Net realized gain (loss) | | | (14,719,603 | ) | | | 5,463,485 | |
Net change in unrealized appreciation (depreciation) | | | (34,543,962 | ) | | | (48,816,423 | ) |
| | | | | | | | |
Net increase (decrease) in net assets resulting from operations | | | (4,788,781 | ) | | | 9,027,056 | |
| | | | | | | | |
| | |
DISTRIBUTIONS TO SHAREHOLDERS(a) | | | | | | | | |
From net investment income | | | (42,727,454 | ) | | | (56,503,375 | ) |
From return of capital | | | (10,172,236 | ) | | | (1,708,837 | ) |
| | | | | | | | |
Decrease in net assets resulting from distributions to shareholders | | | (52,899,690 | ) | | | (58,212,212 | ) |
| | | | | | | | |
| | |
CAPITAL SHARE TRANSACTIONS | | | | | | | | |
Redemption of shares resulting from share repurchase program (including transaction costs) | | | (4,525,759 | ) | | | (5,842,460 | ) |
| | | | | | | | |
| | |
NET ASSETS | | | | | | | | |
Total decrease in net assets | | | (62,214,230 | ) | | | (55,027,616 | ) |
Beginning of year | | | 710,831,530 | | | | 765,859,146 | |
| | | | | | | | |
End of year | | $ | 648,617,300 | | | $ | 710,831,530 | |
| | | | | | | | |
| (a) | Distributions for annual periods determined in accordance with U.S. federal income tax regulations. |
See notes to financial statements.
| | |
| 78 | | 2019 BLACKROCK ANNUAL REPORTTO SHAREHOLDERS |
Statements of Cash Flows
Year Ended October 31, 2019
| | | | | | | | | | | | |
| | | BTZ | | | BGT | | | BIT(a) | |
| | | |
CASH PROVIDED BY (USED FOR) OPERATING ACTIVITIES | | | | | | | | | | | | |
Net increase (decrease) in net assets resulting from operations | | $ | 209,279,617 | | | $ | 8,959,718 | | | $ | (4,788,781 | ) |
Adjustments to reconcile net increase in net assets resulting from operations to net cash provided by operating activities: | | | | | | | | | | | | |
Proceeds from sales of long-term investments and principal paydowns | | | 544,442,678 | | | | 275,159,564 | | | | 400,946,491 | |
Purchases of long-term investments | | | (389,214,183 | ) | | | (244,123,208 | ) | | | (368,657,787 | ) |
Net proceeds from sales (purchases) of short-term securities | | | 3,120,110 | | | | (457,965 | ) | | | (6,136,900 | ) |
Amortization of premium and accretion of discount on investments and other fees | | | 1,881,605 | | | | (226,297 | ) | | | (6,912,544 | ) |
Premiums paid on closing options written | | | (516,637 | ) | | | — | | | | — | |
Premiums received from options written | | | 6,174,930 | | | | — | | | | — | |
Net realized loss on investments and options written | | | 10,410,260 | | | | 5,947,975 | | | | 7,321,467 | |
Net unrealized (appreciation) depreciation on investments, options written, swaps, unfunded floating rate loan interests and foreign currency translations | | | (152,601,140 | ) | | | 3,635,999 | | | | 30,407,383 | |
| | | |
(Increase) Decrease in Assets: | | | | | | | | | | | | |
Receivables: | | | | | | | | | | | | |
Dividends — affiliated | | | (9,275 | ) | | | 1,030 | | | | 2,476 | |
Dividends — unaffiliated | | | (209,825 | ) | | | — | | | | 5,687 | |
Interest — unaffiliated | | | 2,154,895 | | | | 293,464 | | | | 1,095,653 | |
Variation margin on futures contracts | | | 252,438 | | | | — | | | | (533,973 | ) |
Variation margin on centrally cleared swaps | | | — | | | | — | | | | 718,377 | |
Swap premiums paid | | | 43,495 | | | | — | | | | 76,075 | |
Prepaid expenses | | | 79,353 | | | | 1,011 | | | | 1,051 | |
| | | |
Increase (Decrease) in Liabilities: | | | | | | | | | | | | |
Cash received: | | | | | | | | | | | | |
Collateral — reverse repurchase agreements | | | 2,941,436 | | | | — | | | | 2,278,749 | |
Collateral — OTC derivatives | | | 270,000 | | | | — | | | | (1,360,000 | ) |
Payables: | | | | | | | | | | | | |
Investment advisory fees | | | (17,554 | ) | | | (25,415 | ) | | | (40,818 | ) |
Interest expense | | | (1,154,092 | ) | | | (87,223 | ) | | | 1,017,931 | |
Trustees’ and Officer’s fees | | | 84,550 | | | | 30,200 | | | | 26,014 | |
Other accrued expenses | | | 637,141 | | | | (110,941 | ) | | | (155,902 | ) |
Variation margin on futures contracts | | | 828,660 | | | | — | | | | 1,346,341 | |
Variation margin on centrally cleared swaps | | | (992 | ) | | | — | | | | — | |
Swaps | | | — | | | | — | | | | (6,277 | ) |
Due to counterparty | | | — | | | | (212,836 | ) | | | (306,330 | ) |
Swap premiums received | | | (224,817 | ) | | | — | | | | (1,661,299 | ) |
| | | | | | | | | | | | |
Net cash provided by operating activities | | | 238,652,653 | | | | 48,785,076 | | | | 54,683,084 | |
| | | | | | | | | | | | |
| | | |
CASH PROVIDED BY (USED FOR) FINANCING ACTIVITIES | | | | | | | | | | | | |
Cash dividends paid to Common Shareholders | | | (85,428,548 | ) | | | (18,975,103 | ) | | | (52,896,955 | ) |
Payments for bank borrowings | | | — | | | | (190,000,000 | ) | | | — | |
Payments on Common Shares redeemed | | | (13,027,870 | ) | | | (7,767,163 | ) | | | (4,525,759 | ) |
Proceeds from bank borrowings | | | — | | | | 171,000,000 | | | | — | |
Decrease in bank overdraft | | | — | | | | — | | | | (220,196 | ) |
Net borrowing of reverse repurchase agreements | | | (145,467,241 | ) | | | — | | | | (7,639,819 | ) |
| | | | | | | | | | | | |
Net cash used for financing activities | | | (243,923,659 | ) | | | (45,742,266 | ) | | | (65,282,729 | ) |
| | | | | | | | | | | | |
| | | |
CASH IMPACT FROM FOREIGN EXCHANGE FLUCTUATIONS | | | | | | | | | | | | |
Cash impact from foreign exchange fluctuations | | $ | 1,163 | | | $ | 171 | | | $ | 324,407 | |
| | | | | | | | | | | | |
| | | |
CASH AND FOREIGN CURRENCY | | | | | | | | | | | | |
Net increase (decrease) in restricted and unrestricted cash and foreign currency | | | (5,269,843 | ) | | | 3,042,981 | | | | (10,275,238 | ) |
Restricted and unrestricted cash and foreign currency at beginning of year | | | 5,879,073 | | | | 1,976,412 | | | | 19,507,765 | |
| | | | | | | | | | | | |
Restricted and unrestricted cash and foreign currency at end of year | | $ | 609,230 | | | $ | 5,019,393 | | | $ | 9,232,527 | |
| | | | | | | | | | | | |
| | | |
SUPPLEMENTAL DISCLOSURE OF CASH FLOW INFORMATION | | | | | | | | | | | | |
Cash paid during the year for interest expense | | $ | 17,340,318 | | | $ | 4,179,351 | | | $ | 10,650,972 | |
| | | | | | | | | | | | |
| (a) | Consolidated Statement of Cash Flows. |
See notes to financial statements.
Statements of Cash Flows (continued)
Year Ended October 31, 2019
| | | | | | | | | | | | |
| | | BTZ | | | BGT | | | BIT(a) | |
| | | |
RECONCILIATION OF RESTRICTED AND UNRESTRICTED CASH AND FOREIGN CURRENCY AT THE END OF YEAR TO THE STATEMENTS OF ASSETS AND LIABILITIES | | | | | | | | | | | | |
Cash | | $ | 804 | | | $ | 4,974,126 | | | $ | 4,020 | |
Cash pledged: | | | | | | | | | | | | |
Collateral — reverse repurchase agreements | | | — | | | | — | | | | 1,635,000 | |
Collateral — OTC derivatives | | | — | | | | — | | | | 2,820,000 | |
Futures contracts | | | 608,000 | | | | — | | | | 1,735,977 | |
Centrally cleared swaps | | | — | | | | — | | | | 1,000,590 | |
Foreign currency at value | | | 426 | | | | 45,267 | | | | 2,036,940 | |
| | | | | | | | | | | | |
| | $ | 609,230 | | | $ | 5,019,393 | | | $ | 9,232,527 | |
| | | | | | | | | | | | |
| | | |
RECONCILIATION OF RESTRICTED AND UNRESTRICTED CASH AND FOREIGN CURRENCY AT THE BEGINNING OF YEAR TO THE STATEMENTS OF ASSETS AND LIABILITIES | | | | | | | | | | | | |
Cash | | $ | 69,768 | | | $ | 793,986 | | | $ | — | |
Cash pledged: | | | | | | | | | | | | |
Collateral — reverse repurchase agreements | | | — | | | | — | | | | 2,953,000 | |
Collateral — OTC derivatives | | | — | | | | — | | | | 3,320,000 | |
Futures contracts | | | 3,774,000 | | | | — | | | | 156,329 | |
Centrally cleared swaps | | | 2,011,000 | | | | — | | | | 6,565,590 | |
Foreign currency at value | | | 24,305 | | | | 1,182,426 | | | | 6,512,846 | |
| | | | | | | | | | | | |
| | $ | 5,879,073 | | | $ | 1,976,412 | | | $ | 19,507,765 | |
| | | | | | | | | | | | |
| (a) | Consolidated Statement of Cash Flows. |
See notes to financial statements.
| | |
| 80 | | 2019 BLACKROCK ANNUAL REPORTTO SHAREHOLDERS |
Financial Highlights
(For a share outstanding throughout each period)
| | | | | | | | | | | | | | | | | | | | |
| | | BTZ | |
| |
| | | Year Ended October 31, | |
| | | 2019 | | | 2018 | | | 2017 | | | 2016 | | | 2015 | |
| | | | | |
Net asset value, beginning of year | | $ | 13.72 | | | $ | 14.88 | | | $ | 14.61 | | | $ | 14.33 | | | $ | 15.36 | |
| | | | | | | | | | | | | | | | | | | | |
Net investment income(a) | | | 0.79 | | | | 0.81 | | | | 0.81 | | | | 0.88 | | | | 0.96 | |
Net realized and unrealized gain (loss) | | | 1.25 | | | | (1.17 | ) | | | 0.30 | | | | 0.32 | | | | (1.02 | ) |
| | | | | | | | | | | | | | | | | | | | |
Net increase (decrease) from investment operations | | | 2.04 | | | | (0.36 | ) | | | 1.11 | | | | 1.20 | | | | (0.06 | ) |
| | | | | | | | | | | | | | | | | | | | |
|
Distributions(b) | |
From net investment income | | | (0.79 | ) | | | (0.80 | ) | | | (0.79 | ) | | | (0.86 | ) | | | (0.91 | ) |
From return of capital | | | (0.03 | ) | | | — | | | | (0.05 | ) | | | (0.06 | ) | | | (0.06 | ) |
| | | | | | | | | | | | | | | | | | | | |
Total distributions | | | (0.82 | ) | | | (0.80 | ) | | | (0.84 | ) | | | (0.92 | ) | | | (0.97 | ) |
| | | | | | | | | | | | | | | | | | | | |
| | | | | |
Net asset value, end of year | | $ | 14.94 | | | $ | 13.72 | | | $ | 14.88 | | | $ | 14.61 | | | $ | 14.33 | |
| | | | | | | | | | | | | | | | | | | | |
| | | | | |
Market price, end of year | | $ | 13.55 | | | $ | 11.72 | | | $ | 13.36 | | | $ | 12.87 | | | $ | 12.53 | |
| | | | | | | | | | | | | | | | | | | | |
|
Total Return(c) | |
Based on net asset value | | | 16.17 | % | | | (1.72 | )% | | | 8.53 | % | | | 9.61 | % | | | 0.48 | % |
| | | | | | | | | | | | | | | | | | | | |
Based on market price | | | 23.34 | % | | | (6.49 | )% | | | 10.62 | % | | | 10.43 | % | | | (0.33 | )% |
| | | | | | | | | | | | | | | | | | | | |
|
Ratios to Average Net Assets | |
Total expenses | | | 2.26 | % | | | 1.82 | % | | | 1.23 | % | | | 1.20 | % | | | 1.16 | % |
| | | | | | | | | | | | | | | | | | | | |
Total expenses after fees waived and/or reimbursed | | | 2.25 | % | | | 1.82 | % | | | 1.23 | % | | | 1.20 | % | | | 1.15 | % |
| | | | | | | | | | | | | | | | | | | | |
Total expenses after fees waived and/or reimbursed and excluding interest expense | | | 1.08 | % | | | 0.94 | % | | | 0.87 | % | | | 0.95 | % | | | 0.97 | % |
| | | | | | | | | | | | | | | | | | | | |
Net investment income | | | 5.57 | % | | | 5.69 | % | | | 5.53 | % | | | 6.21 | % | | | 6.40 | % |
| | | | | | | | | | | | | | | | | | | | |
|
Supplemental Data | |
Net assets, end of year (000) | | $ | 1,551,243 | | | $ | 1,439,954 | | | $ | 1,598,034 | | | $ | 1,579,170 | | | $ | 1,549,123 | |
| | | | | | | | | | | | | | | | | | | | |
Borrowings outstanding, end of year (000) | | $ | 568,461 | | | $ | 707,102 | | | $ | 477,822 | | | $ | 638,327 | | | $ | 685,716 | |
| | | | | | | | | | | | | | | | | | | | |
Portfolio turnover rate | | | 18 | % | | | 30 | % | | | 25 | % | | | 29 | % | | | 19 | % |
| | | | | | | | | | | | | | | | | | | | |
| (a) | Based on average shares outstanding. |
| (b) | Distributions for annual periods determined in accordance with U.S. federal income tax regulations. |
| (c) | Total returns based on market price, which can be significantly greater or less than the net asset value, may result in substantially different returns. Where applicable, excludes the effects of any sales charges and assumes the reinvestment of distributions at actual reinvestment prices. |
See notes to financial statements.
Financial Highlights (continued)
(For a share outstanding throughout each period)
| | | | | | | | | | | | | | | | | | | | |
| | | BGT | |
| |
| | | Year Ended October 31, | |
| | | 2019 | | | 2018 | | | 2017 | | | 2016 | | | 2015(a) | |
| | | | | |
Net asset value, beginning of year | | $ | 14.33 | | | $ | 14.49 | | | $ | 14.41 | | | $ | 14.18 | | | $ | 14.57 | |
| | | | | | | | | | | | | | | | | | | | |
Net investment income(b) | | | 0.80 | | | | 0.76 | | | | 0.73 | | | | 0.74 | | | | 0.78 | |
Net realized and unrealized gain (loss) | | | (0.37 | ) | | | (0.21 | ) | | | 0.12 | | | | 0.19 | | | | (0.36 | ) |
| | | | | | | | | | | | | | | | | | | | |
Net increase from investment operations | | | 0.43 | | | | 0.55 | | | | 0.85 | | | | 0.93 | | | | 0.42 | |
| | | | | | | | | | | | | | | | | | | | |
Distributions from net investment income (c) | | | (0.81 | ) | | | (0.71 | ) | | | (0.77 | ) | | | (0.70 | ) | | | (0.81 | ) |
| | | | | | | | | | | | | | | | | | | | |
| | | | | |
Net asset value, end of year | | $ | 13.95 | | | $ | 14.33 | | | $ | 14.49 | | | $ | 14.41 | | | $ | 14.18 | |
| | | | | | | | | | | | | | | | | | | | |
| | | | | |
Market price, end of year | | $ | 12.42 | | | $ | 12.72 | | | $ | 14.31 | | | $ | 13.58 | | | $ | 12.77 | |
| | | | | | | | | | | | | | | | | | | | |
| | | | | |
Total Return(d) | | | | | | | | | | | | | | | | | | | | |
Based on net asset value | | | 4.00 | % | | | 4.25 | % | | | 6.13 | % | | | 7.27 | % | | | 3.54 | % |
| | | | | | | | | | | | | | | | | | | | |
Based on market price | | | 4.31 | % | | | (6.30 | )% | | | 11.21 | % | | | 12.25 | % | | | 3.08 | % |
| | | | | | | | | | | | | | | | | | | | |
|
Ratios to Average Net Assets(e) | |
Total expenses | | | 2.41 | % | | | 2.29 | % | | | 1.92 | % | | | 1.58 | % | | | 1.55 | % |
| | | | | | | | | | | | | | | | | | | | |
Total expenses after fees waived and/or reimbursed | | | 2.41 | % | | | 2.29 | % | | | 1.92 | % | | | 1.58 | % | | | 1.54 | % |
| | | | | | | | | | | | | | | | | | | | |
Total expenses after fees waived and/or reimbursed and excluding interest expense | | | 1.16 | % | | | 1.21 | % | | | 1.20 | % | | | 1.16 | % | | | 1.19 | % |
| | | | | | | | | | | | | | | | | | | | |
Net investment income | | | 5.68 | % | | | 5.27 | % | | | 5.02 | % | | | 5.29 | % | | | 5.37 | % |
| | | | | | | | | | | | | | | | | | | | |
|
Supplemental Data | |
Net assets, end of year (000) | | $ | 321,091 | | | $ | 339,096 | | | $ | 342,890 | | | $ | 340,944 | | | $ | 335,444 | |
| | | | | | | | | | | | | | | | | | | | |
Borrowings outstanding, end of year (000) | | $ | 123,000 | | | $ | 142,000 | | | $ | 150,000 | | | $ | 148,000 | | | $ | 104,000 | |
| | | | | | | | | | | | | | | | | | | | |
Asset coverage, end of year per $1,000 of bank borrowings | | $ | 3,610 | | | $ | 3,389 | | | $ | 3,287 | | | $ | 3,304 | | | $ | 4,225 | |
| | | | | | | | | | | | | | | | | | | | |
Portfolio turnover rate | | | 53 | % | | | 57 | % | | | 63 | % | | | 47 | % | | | 42 | % |
| | | | | | | | | | | | | | | | | | | | |
| (a) | Consolidated Financial Highlights. |
| (b) | Based on average shares outstanding. |
| (c) | Distributions for annual periods determined in accordance with U.S. federal income tax regulations. |
| (d) | Total returns based on market price, which can be significantly greater or less than the net asset value, may result in substantially different returns. Where applicable, excludes the effects of any sales charges and assumes the reinvestment of distributions at actual reinvestment prices. |
| (e) | Excludes expenses incurred indirectly as a result of investments in underlying funds as follows: |
| | | | | | | | | | | | | | | | | | | | |
| | | Year Ended October 31, | |
| | | 2019 | | | 2018 | | | 2017 | | | 2016 | | | 2015(a) | |
Investments in underlying funds | | | 0.04 | % | | | 0.01 | % | | | — | % | | | — | % | | | — | % |
| | | | | | | | | | | | | | | | | | | | |
See notes to financial statements.
| | |
| 82 | | 2019 BLACKROCK ANNUAL REPORTTO SHAREHOLDERS |
Financial Highlights (continued)
(For a share outstanding throughout each period)
| | | | | | | | | | | | | | | | | | | | |
| | | BIT | |
| |
| | | Year Ended October 31, | |
| | | 2019(a) | | | 2018(a) | | | 2017(a) | | | 2016(a) | | | 2015 | |
| | | | | |
Net asset value, beginning of year | | $ | 18.79 | | | $ | 20.07 | | | $ | 18.91 | | | $ | 18.91 | | | $ | 19.87 | |
| | | | | | | | | | | | | | | | | | | | |
Net investment income(b) | | | 1.18 | | | | 1.38 | | | | 1.51 | | | | 1.69 | | | | 1.55 | |
Net realized and unrealized gain (loss) | | | (1.28 | ) | | | (1.13 | ) | | | 1.42 | | | | (0.05 | ) | | | (1.03 | ) |
| | | | | | | | | | | | | | | | | | | | |
Net increase (decrease) from investment operations | | | (0.10 | ) | | | 0.25 | | | | 2.93 | | | | 1.64 | | | | 0.52 | |
| | | | | | | | | | | | | | | | | | | | |
|
Distributions(c) | |
From net investment income | | | (1.14 | ) | | | (1.49 | ) | | | (1.77 | ) | | | (1.64 | ) | | | (1.40 | ) |
From net realized gain | | | — | | | | — | | | | — | | | | — | | | | (0.08 | ) |
From return of capital | | | (0.27 | ) | | | (0.04 | ) | | | — | | | | — | | | | — | |
| | | | | | | | | | | | | | | | | | | | |
Total distributions | | | (1.41 | ) | | | (1.53 | ) | | | (1.77 | ) | | | (1.64 | ) | | | (1.48 | ) |
| | | | | | | | | | | | | | | | | | | | |
| | | | | |
Net asset value, end of year | | $ | 17.28 | (i) | | $ | 18.79 | | | $ | 20.07 | | | $ | 18.91 | | | $ | 18.91 | (d) |
| | | | | | | | | | | | | | | | | | | | |
| | | | | |
Market price, end of year | | $ | 17.15 | | | $ | 16.25 | | | $ | 18.55 | | | $ | 16.76 | | | $ | 16.31 | |
| | | | | | | | | | | | | | | | | | | | |
|
Total Return(e) | |
Based on net asset value | | | 0.00 | %(i)(j) | | | 2.18 | %(f) | | | 17.34 | %(g) | | | 10.51 | %(f) | | | 3.87 | %(d) |
| | | | | | | | | | | | | | | | | | | | |
Based on market price | | | 14.76 | % | | | (4.40 | )% | | | 22.36 | % | | | 13.56 | % | | | 0.06 | % |
| | | | | | | | | | | | | | | | | | | | |
|
Ratios to Average Net Assets(h) | |
Total expenses | | | 2.89 | % | | | 2.90 | % | | | 2.33 | % | | | 2.05 | % | | | 2.09 | % |
| | | | | | | | | | | | | | | | | | | | |
Total expenses after fees waived and/or reimbursed | | | 2.89 | % | | | 2.89 | % | | | 2.33 | % | | | 2.05 | % | | | 2.09 | % |
| | | | | | | | | | | | | | | | | | | | |
Total expenses after fees waived and/or reimbursed and excluding interest expense and fees | | | 1.35 | % | | | 1.42 | % | | | 1.39 | % | | | 1.43 | % | | | 1.53 | % |
| | | | | | | | | | | | | | | | | | | | |
Net investment income | | | 6.43 | % | | | 7.17 | % | | | 7.86 | % | | | 9.24 | % | | | 7.97 | % |
| | | | | | | | | | | | | | | | | | | | |
|
Supplemental Data | |
Net assets, end of year (000) | | $ | 648,617 | | | $ | 710,832 | | | $ | 765,859 | | | $ | 726,381 | | | $ | 726,432 | |
| | | | | | | | | | | | | | | | | | | | |
Borrowings outstanding, end of year (000) | | $ | 373,345 | | | $ | 376,302 | | | $ | 471,082 | | | $ | 427,329 | | | $ | 510,352 | |
| | | | | | | | | | | | | | | | | | | | |
Portfolio turnover rate | | | 32 | % | | | 38 | % | | | 53 | % | | | 52 | % | | | 21 | % |
| | | | | | | | | | | | | | | | | | | | |
| (a) | Consolidated Financial Highlights. |
| (b) | Based on average shares outstanding. |
| (c) | Distributions for annual periods determined in accordance with U.S. federal income tax regulations. |
| (d) | For financial reporting purposes, the market value of certain investments was adjusted as of report date. Accordingly, the net asset value (“NAV”) per share and total return performance based on net asset value presented herein are different than the information previously published on October 31, 2015. |
| (e) | Total returns based on market price, which can be significantly greater or less than the net asset value, may result in substantially different returns. Where applicable, excludes the effects of any sales charges and assumes the reinvestment of distributions at actual reinvestment prices. |
| (f) | Includes payment received from an affiliate, which had no impact on the Trust’s total return. |
| (g) | Includes payment received from a settlement of litigation, which impacted the Trust’s total return. Excluding the payment from a settlement of litigation, the Trust’s total return is 16.70%. |
| (h) | Excludes expenses incurred indirectly as a result of investments in underlying funds as follows: |
| | | | | | | | | | | | | | | | | | | | |
| | | Year Ended October 31, | |
| | | 2019 | | | 2018 | | | 2017 | | | 2016 | | | 2015(a) | |
Investments in underlying funds | | | — | % | | | — | % | | | — | % | | | 0.01 | % | | | 0.01 | % |
| | | | | | | | | | | | | | | | | | | | |
| (i) | For financial reporting purposes, the market value of a certain investment was adjusted as of the report date. Accordingly, the net asset value (“NAV”) per share and total return performance based on NAV presented herein are different than the information previously published as of October 31, 2019. |
| (j) | Amount is greater than (0.005)%. |
See notes to financial statements.
Notes to Financial Statements
The following are registered under the Investment Company Act of 1940, as amended (the “1940 Act”), asclosed-end management investment companies and are referred to herein collectively as the “Trusts”, or individually as a “Trust”:
| | | | | | |
| Trust Name | | Herein Referred To
As | | Organized | | Diversification
Classification |
BlackRock Credit Allocation Income Trust | | BTZ | | Delaware | | Diversified |
BlackRock Floating Rate Income Trust | | BGT | | Delaware | | Diversified |
BlackRock Multi-Sector Income Trust | | BIT | | Delaware | | Diversified |
The Boards of Trustees of the Trusts are collectively referred to throughout this report as the “Board of Trustees” or the “Board,” and the trustees thereof are collectively referred to throughout this report as “Trustees”. The Trusts determine and make available for publication the net asset values (“NAVs”) of their Common Shares on a daily basis.
The Trusts, together with certain other registered investment companies advised by BlackRock Advisors, LLC (the “Manager”) or its affiliates, are included in a complex ofopen-endnon-index fixed-income mutual funds and all BlackRock-advisedclosed-end funds referred to as the BlackRock Fixed-Income Complex.
On September 5, 2019, the Board approved a change in the fiscal year end of BTZ and BGT, effective as of the opening of business on December 31, 2019, from October 31 to December 31.
Basis of Consolidation:The accompanying consolidated financial statements of BIT include the accounts of BIT Subsidiary, LLC (the “Taxable Subsidiary”), which is a wholly-owned taxable subsidiary of BIT. The Taxable Subsidiary enables BIT to hold an investment in an operating partnership and satisfy Regulated Investment Company (“RIC”) tax requirements. Income earned and gains realized on the investment held by the Taxable Subsidiary are taxable to such subsidiary. A tax provision for income, if any, is shown as income tax in the Consolidated Statements of Operations for BIT. A tax provision for realized and unrealized gains, if any, is included as a reduction of realized and/or unrealized gain (loss) in the Consolidated Statement of Operations for BIT. BIT may invest up to 25% of its total assets in the Taxable Subsidiary. The net assets of the Taxable Subsidiary as of period end were $0, which is 0.0% of BIT’s consolidated net assets. Intercompany accounts and transactions, if any, have been eliminated. The Taxable Subsidiary is subject to the same investment policies and restrictions that apply to BIT.
| 2. | SIGNIFICANT ACCOUNTING POLICIES |
The financial statements are prepared in conformity with accounting principles generally accepted in the United States of America (“U.S. GAAP”), which may require management to make estimates and assumptions that affect the reported amounts of assets and liabilities in the financial statements, disclosure of contingent assets and liabilities at the date of the financial statements and the reported amounts of increases and decreases in net assets from operations during the reporting period. Actual results could differ from those estimates. Each Trust is considered an investment company under U.S. GAAP and follows the accounting and reporting guidance applicable to investment companies. Below is a summary of significant accounting policies:
Investment Transactions and Income Recognition:For financial reporting purposes, investment transactions are recorded on the dates the transactions are executed. Realized gains and losses on investment transactions are determined on the identified cost basis. Dividend income is recorded on theex-dividend date. Dividends from foreign securities where theex-dividend date may have passed are subsequently recorded when the Trusts are informed of theex-dividend date. Under the applicable foreign tax laws, a withholding tax at various rates may be imposed on capital gains, dividends and interest. Upon notification from issuers, a portion of the dividend income received from a real estate investment trust may be redesignated as a reduction of cost of the related investment and/or realized gain. Interest income, including amortization and accretion of premiums and discounts on debt securities, is recognized on an accrual basis.
Foreign Currency Translation:Each Trust’s books and records are maintained in U.S. dollars. Securities and other assets and liabilities denominated in foreign currencies are translated into U.S. dollars using exchange rates determined as of the close of trading on the New York Stock Exchange (“NYSE”). Purchases and sales of investments are recorded at the rates of exchange prevailing on the respective dates of such transactions. Generally, when the U.S. dollar rises in value against a foreign currency, the investments denominated in that currency will lose value; the opposite effect occurs if the U.S. dollar falls in relative value.
Each Trust does not isolate the portion of the results of operations arising as a result of changes in the exchange rates from the changes in the market prices of investments held or sold for financial reporting purposes. Accordingly, the effects of changes in exchange rates on investments are not segregated in the Statements of Operations from the effects of changes in market prices of those investments, but are included as a component of net realized and unrealized gain (loss) from investments. Each Trust reports realized currency gains (losses) on foreign currency related transactions as components of net realized gain (loss) for financial reporting purposes, whereas such components are generally treated as ordinary income for U.S. federal income tax purposes.
Segregation and Collateralization:In cases where a Trust enters into certain investments (e.g., futures contracts, forward foreign currency exchange contracts, options written and swaps) or certain borrowings (e.g., reverse repurchase transactions) that would be treated as “senior securities” for 1940 Act purposes, a Trust may segregate or designate on itsbooks and records cash or liquid assets having a market value at least equal to the amount of its future obligations under such investments or borrowings. Doing so allows the investment or borrowings to be excluded from treatment as a “senior security.” Furthermore, if required by an exchange or counterparty agreement, the Trusts may be required to deliver/deposit cash and/or securities to/with an exchange, or broker-dealer or custodian as collateral for certain investments or obligations.
Distributions: Distributions paid by the Trusts are recorded on the ex-dividend date. Subject to the Trusts’ managed distribution plan, the Trusts intend to make monthly cash distributions to shareholders, which may consist of net investment income, net options premium and net realized and unrealized gains on investments and/or return of capital.
| | |
| 84 | | 2019 BLACKROCK ANNUAL REPORTTO SHAREHOLDERS |
Notes to Financial Statements (continued)
The character of distributions is determined in accordance with U.S. federal income tax regulations, which may differ from U.S. GAAP. The portion of distributions that exceeds a Trust’s current and accumulated earnings and profits, which are measured on a tax basis, will constitute a non-taxable return of capital. See Note 8, Income Tax Information, for the tax character of each Trust’s distributions paid during the period.
Deferred Compensation Plan:Under the Deferred Compensation Plan (the “Plan”) approved by the Board, the trustees who are not “interested persons” of the Trusts, as defined in the 1940 Act (“Independent Trustees”), may defer a portion of their annual complex-wide compensation. Deferred amounts earn an approximate return as though equivalent dollar amounts had been invested in common shares of certain funds in the BlackRock Fixed-Income Complex selected by the Independent Trustees. This has the same economic effect for the Independent Trustees as if the Independent Trustees had invested the deferred amounts directly in certain funds in the BlackRock Fixed-Income Complex.
The Plan is not funded and obligations thereunder represent general unsecured claims against the general assets of each Trust, as applicable. Deferred compensation liabilities are included in the Trustees’ and Officer’s fees payable in the Statements of Assets and Liabilities and will remain as a liability of the Trusts until such amounts are distributed in accordance with the Plan.
Recent Accounting Standards:In March 2017, the Financial Accounting Standards Board issued Accounting Standards Update “Premium Amortization of Purchased Callable Debt Securities” which amends the amortization period for certain purchased callable debt securities. Under the new guidance, the premium amortization of purchased callable debt securities that have explicit,non-contingent call features and are callable at fixed prices will be amortized to the earliest call date. The guidance will be applied on a modified retrospective basis and is effective for fiscal years, and their interim periods, beginning after December 15, 2018. Management continues to evaluate the impact of this guidance on the Trusts.
Indemnifications:In the normal course of business, a Trust enters into contracts that contain a variety of representations that provide general indemnification. A Trust’s maximum exposure under these arrangements is unknown because it involves future potential claims against a Trust, which cannot be predicted with any certainty.
Other: Expenses directly related to a Trust are charged to that Trust. Other operating expenses shared by several funds, including other funds managed by the Manager, are prorated among those funds on the basis of relative net assets or other appropriate methods.
| 3. | INVESTMENT VALUATION AND FAIR VALUE MEASUREMENTS |
Investment Valuation Policies: The Trusts’ investments are valued at fair value (also referred to as “market value” within the financial statements) as of the close of trading on the NYSE (generally 4:00 p.m., Eastern time). U.S. GAAP defines fair value as the price the Trusts would receive to sell an asset or pay to transfer a liability in an orderly transaction between market participants at the measurement date. The Trusts determine the fair values of their financial instruments using various independent dealers or pricing services under policies approved by each Board. The BlackRock Global Valuation Methodologies Committee (the “Global Valuation Committee”) is the committee formed by management to develop global pricing policies and procedures and to oversee the pricing function for all financial instruments.
Fair Value Inputs and Methodologies: The following methods and inputs are used to establish the fair value of each Trust’s assets and liabilities:
| | • | | Equity investments traded on a recognized securities exchange are valued at the official closing price each day, if available. For equity investments traded on more than one exchange, the official closing price on the exchange where the stock is primarily traded is used. Equity investments traded on a recognized exchange for which there were no sales on that day may be valued at the last available bid (long positions) or ask (short positions) price. |
| | • | | Fixed-income securities for which market quotations are readily available are generally valued using the last available bid prices or current market quotations provided by independent dealers or third party pricing services. Floating rate loan interests are valued at the mean of the bid prices from one or more independent brokers or dealers as obtained from a third party pricing service. Pricing services generally value fixed-income securities assuming orderly transactions of an institutional round lot size, but a fund may hold or transact in such securities in smaller, odd lot sizes. Odd lots may trade at lower prices than institutional round lots. The pricing services may use matrix pricing or valuation models that utilize certain inputs and assumptions to derive values, including transaction data (e.g., recent representative bids and offers), credit quality information, perceived market movements, news, and other relevant information. Certain fixed-income securities, including asset-backed and mortgage related securities may be valued based on valuation models that consider the estimated cash flows of each tranche of the entity, establish a benchmark yield and develop an estimated tranche specific spread to the benchmark yield based on the unique attributes of the tranche. The amortized cost method of valuation may be used with respect to debt obligations with sixty days or less remaining to maturity unless the Manager determines such method does not represent fair value. |
Generally, trading in foreign instruments is substantially completed each day at various times prior to the close of trading on the NYSE. Occasionally, events affecting the values of such instruments may occur between the foreign market close and the close of trading on the NYSE that may not be reflected in the computation of the Trusts’ net assets. Each business day, the Trusts use a pricing service to assist with the valuation of certain foreign exchange-traded equity securities and foreign exchange-traded andover-the-counter (“OTC”) options (the “Systematic Fair Value Price”). Using current market factors, the Systematic Fair Value Price is designed to value such foreign securities and foreign options at fair value as of the close of trading on the NYSE, which follows the close of the local markets.
| | • | | Municipal investments (including commitments to purchase such investments on a “when-issued” basis) are valued on the basis of prices provided by dealers or pricing services. In determining the value of a particular investment, pricing services may use certain information with respect to transactions in such investments, quotations from dealers, pricing matrixes, market transactions in comparable investments and information with respect to various relationships between investments. |
| | • | | Investments inopen-end U.S. mutual funds are valued at NAV each business day. |
| | • | | Futures contracts traded on exchanges are valued at their last sale price. |
| | | | |
| NOTESTO FINANCIAL STATEMENTS | | | 85 | |
Notes to Financial Statements (continued)
| | • | | Forward foreign currency exchange contracts are valued at the mean between the bid and ask prices and are determined as of the close of trading on the NYSE based on that day’s prevailing forward exchange rate for the underlying currencies. Interpolated values are derived when the settlement date of the contract is an interim date for which quotations are not available. |
| | • | | Exchange-traded options are valued at the mean between the last bid and ask prices at the close of the options market in which the options trade. An exchange-traded option for which there is no mean price is valued at the last bid (long positions) or ask (short positions) price. If no bid or ask price is available, the prior day’s price will be used, unless it is determined that the prior day’s price no longer reflects the fair value of the option. OTC and options on swaps (“swaptions”) are valued by an independent pricing service using a mathematical model, which incorporates a number of market data factors, such as the trades and prices of the underlying instruments. |
| | • | | Swap agreements are valued utilizing quotes received daily by the Trusts’ pricing service or through brokers, which are derived using daily swap curves and models that incorporate a number of market data factors, such as discounted cash flows, trades and values of the underlying reference instruments. |
If events (e.g., a company announcement, market volatility or a natural disaster) occur that are expected to materially affect the value of such investments, or in the event that the application of these methods of valuation results in a price for an investment that is deemed not to be representative of the market value of such investment, or if a price is not available, the investment will be valued by the Global Valuation Committee, or its delegate, in accordance with a policy approved by the Board as reflecting fair value (“Fair Valued Investments”). The fair valuation approaches that may be used by the Global Valuation Committee will include market approach, income approach and cost approach. Valuation techniques such as discounted cash flow, use of market comparables and matrix pricing are types of valuation approaches and are typically used in determining fair value. When determining the price for Fair Valued Investments, the Global Valuation Committee, or its delegate, seeks to determine the price that each Fund might reasonably expect to receive or pay from the current sale or purchase of that asset or liability in anarm’s-length transaction. Fair value determinations shall be based upon all available factors that the Global Valuation Committee, or its delegate, deems relevant and consistent with the principles of fair value measurement. The pricing of all Fair Valued Investments is subsequently reported to the Board or a committee thereof on a quarterly basis.
For investments in equity or debt issued by privately held companies or funds (“Private Company” or collectively, the “Private Companies”) and other Fair Valued Investments, the fair valuation approaches that are used by the Global Valuation Committee and third party pricing services utilize one or a combination of, but not limited to, the following inputs.
| | |
| | | Standard Inputs Generally Considered By Third Party Pricing Services |
Market approach | | (i) recent market transactions, including subsequent rounds of financing, in the underlying investment or comparable issuers; (ii) recapitalizations and other transactions across the capital structure; and (iii) market multiples of comparable issuers. |
Income approach | | (i) future cash flows discounted to present and adjusted as appropriate for liquidity, credit, and/or market risks; (ii) quoted prices for similar investments or assets in active markets; and (iii) other risk factors, such as interest rates, yield curves, volatilities, prepayment speeds, loss severities, credit risks, recovery rates, liquidation amounts and/or default rates. |
Cost approach | | (i) audited or unaudited financial statements, investor communications and financial or operational metrics issued by the Private Company; (ii) changes in the valuation of relevant indices or publicly traded companies comparable to the Private Company; (iii) relevant news and other public sources; and (iv) known secondary market transactions in the Private Company’s interests and merger or acquisition activity in companies comparable to the Private Company. |
Investments in series of preferred stock issued by Private Companies are typically valued utilizing market approach in determining the enterprise value of the company. Such investments often contain rights and preferences that differ from other series of preferred and common stock of the same issuer. Valuation techniques such as an option pricing model (“OPM”), a probability weighted expected return model (“PWERM”) or a hybrid of those techniques are used in allocating enterprise value of the company, as deemed appropriate under the circumstances. The use of OPM and PWERM techniques involve a determination of the exit scenarios of the investment in order to appropriately allocate the enterprise value of the company among the various parts of its capital structure.
The Private Companies are not subject to the public company disclosure, timing, and reporting standards as other investments held by a Trust. Typically, the most recently available information by a Private Company is as of a date that is earlier than the date a Trust is calculating its NAV. This factor may result in a difference between the value of the investment and the price a Trust could receive upon the sale of the investment.
Fair Value Hierarchy: Various inputs are used in determining the fair value of investments and derivative financial instruments. These inputs to valuation techniques are categorized into a fair value hierarchy consisting of three broad levels for financial statement purposes as follows:
| | • | | Level 1 — Unadjusted price quotations in active markets/exchanges for identical assets or liabilities that each Trust has the ability to access |
| | • | | Level 2 — Other observable inputs (including, but not limited to, quoted prices for similar assets or liabilities in markets that are active, quoted prices for identical or similar assets or liabilities in markets that are not active, inputs other than quoted prices that are observable for the assets or liabilities (such as interest rates, yield curves, volatilities, prepayment speeds, loss severities, credit risks and default rates) or other market-corroborated inputs) |
| | • | | Level 3 — Unobservable inputs based on the best information available in the circumstances, to the extent observable inputs are not available (including the Global Valuation Committee’s assumptions used in determining the fair value of investments and derivative financial instruments) |
| | |
| 86 | | 2019 BLACKROCK ANNUAL REPORTTO SHAREHOLDERS |
Notes to Financial Statements (continued)
The hierarchy gives the highest priority to unadjusted quoted prices in active markets for identical assets or liabilities (Level 1 measurements) and the lowest priority to unobservable inputs (Level 3 measurements). Accordingly, the degree of judgment exercised in determining fair value is greatest for instruments categorized in Level 3. The inputs used to measure fair value may fall into different levels of the fair value hierarchy. In such cases, for disclosure purposes, the fair value hierarchy classification is determined based on the lowest level input that is significant to the fair value measurement in its entirety. Investments classified within Level 3 have significant unobservable inputs used by the Global Valuation Committee in determining the price for Fair Valued Investments. Level 3 investments include equity or debt issued by Private Companies. There may not be a secondary market, and/or there are a limited number of investors. The categorization of a value determined for investments and derivative financial instruments is based on the pricing transparency of the investments and derivative financial instruments and is not necessarily an indication of the risks associated with investing in those securities.
| 4. | SECURITIES AND OTHER INVESTMENTS |
Asset-Backed and Mortgage-Backed Securities:Asset-backed securities are generally issued as pass-through certificates or as debt instruments. Asset-backed securities issued as pass-through certificates represent undivided fractional ownership interests in an underlying pool of assets. Asset-backed securities issued as debt instruments, which are also known as collateralized obligations, are typically issued as the debt of a special purpose entity organized solely for the purpose of owning such assets and issuing such debt. Asset-backed securities are often backed by a pool of assets representing the obligations of a number of different parties. The yield characteristics of certain asset-backed securities may differ from traditional debt securities. One such major difference is that all or a principal part of the obligations may be prepaid at any time because the underlying assets (i.e., loans) may be prepaid at any time. As a result, a decrease in interest rates in the market may result in increases in the level of prepayments as borrowers, particularly mortgagors, refinance and repay their loans. An increased prepayment rate with respect to an asset-backed security will have the effect of shortening the maturity of the security. In addition, a fund may subsequently have to reinvest the proceeds at lower interest rates. If a fund has purchased such an asset-backed security at a premium, a faster than anticipated prepayment rate could result in a loss of principal to the extent of the premium paid.
For mortgage pass-through securities (the “Mortgage Assets”) there are a number of important differences among the agencies and instrumentalities of the U.S. Government that issue mortgage-related securities and among the securities that they issue. For example, mortgage-related securities guaranteed by Ginnie Mae are guaranteed as to the timely payment of principal and interest by Ginnie Mae and such guarantee is backed by the full faith and credit of the United States.
However, mortgage-related securities issued by Freddie Mac and Fannie Mae, including Freddie Mac and Fannie Mae guaranteed mortgage pass-through certificates, which are solely the obligations of Freddie Mac and Fannie Mae, are not backed by or entitled to the full faith and credit of the United States, but are supported by the right of the issuer to borrow from the U.S. Treasury.
Non-agency mortgage-backed securities are securities issued bynon-governmental issuers and have no direct or indirect government guarantees of payment and are subject to various risks.Non-agency mortgage loans are obligations of the borrowers thereunder only and are not typically insured or guaranteed by any other person or entity. The ability of a borrower to repay a loan is dependent upon the income or assets of the borrower. A number of factors, including a general economic downturn, acts of God, terrorism, social unrest and civil disturbances, may impair a borrower’s ability to repay its loans.
Collateralized Debt Obligations:Collateralized debt obligations (“CDOs”), including collateralized bond obligations (“CBOs”) and collateralized loan obligations (“CLOs”), are types of asset-backed securities. A CDO is an entity that is backed by a diversified pool of debt securities (CBOs) or syndicated bank loans (CLOs). The cash flows of the CDO can be split into multiple segments, called “tranches,” which will vary in risk profile and yield. The riskiest segment is the subordinated or “equity” tranche. This tranche bears the greatest risk of defaults from the underlying assets in the CDO and serves to protect the other, more senior, tranches from default in all but the most severe circumstances. Since it is shielded from defaults by the more junior tranches, a “senior” tranche will typically have higher credit ratings and lower yields than their underlying securities, and often receive investment grade ratings from one or more of the nationally recognized rating agencies. Despite the protection from the more junior tranches, senior tranches can experience substantial losses due to actual defaults, increased sensitivity to future defaults and the disappearance of one or more protecting tranches as a result of changes in the credit profile of the underlying pool of assets.
Inflation-Indexed Bonds: Inflation-indexed bonds (other than municipal inflation-indexed and certain corporate inflation-indexed bonds) are fixed-income securities whose principal value is periodically adjusted according to the rate of inflation. If the index measuring inflation rises or falls, the principal value of inflation-indexed bonds (other than municipal inflation-indexed and certain corporate inflation-indexed bonds) will be adjusted upward or downward, and consequently the interest payable on these securities (calculated with respect to a larger or smaller principal amount) will be increased or reduced, respectively. Any upward or downward adjustment in the principal amount of an inflation-indexed bond will be included as interest income in the Statements of Operations, even though investors do not receive their principal until maturity. Repayment of the original bond principal upon maturity (as adjusted for inflation) is guaranteed in the case of U.S. Treasury inflation-indexed bonds. For bonds that do not provide a similar guarantee, the adjusted principal value of the bond repaid at maturity may be less than the original principal. With regard to municipal inflation-indexed bonds and certain corporate inflation-indexed bonds, the inflation adjustment is typically reflected in the semi-annual coupon payment. As a result, the principal value of municipal inflation-indexed bonds and such corporate inflation-indexed bonds does not adjust according to the rate of inflation.
Multiple Class Pass-Through Securities: Multiple class pass-through securities, including collateralized mortgage obligations (“CMOs”) and commercial mortgage-backed securities, may be issued by Ginnie Mae, U.S. Government agencies or instrumentalities or by trusts formed by private originators of, or investors in, mortgage loans. In general, CMOs are debt obligations of a legal entity that are collateralized by a pool of residential or commercial mortgage loans or mortgage pass-through securities the Mortgage Assets. The payments on these are used to make payments on the CMOs or multiple pass-through securities. Multiple class pass-through securities represent direct ownership interests in the Mortgage Assets. Classes of CMOs include interest only (“IOs”), principal only (“POs”), planned amortization classes and targeted amortization classes. IOs and POs are stripped mortgage-backed securities representing interests in a pool of mortgages, the cash flow from which has been separated into interest and principal components. IOs receive the interest portion of the cash flow while POs receive the principal portion. IOs and POs can be extremely volatile in response to changes in interest rates. As interest rates rise and fall, the value of IOs tends to move in the same direction as interest rates. POs perform best when prepayments on the underlying mortgages rise since this increases the rate at which the principal is returned and the yield to maturity on the PO. When payments on mortgages underlying a PO are slower than anticipated, the life of the PO is lengthened and the yield to maturity is reduced. If the underlying Mortgage Assets experience greater than anticipated prepayments of principal, a trust’s initial investment in the IOs may not fully recoup.
| | | | |
| NOTESTO FINANCIAL STATEMENTS | | | 87 | |
Notes to Financial Statements (continued)
Zero-Coupon Bonds: Zero-coupon bonds are normally issued at a significant discount from face value and do not provide for periodic interest payments. These bonds may experience greater volatility in market value than other debt obligations of similar maturity which provide for regular interest payments.
Capital Securities and Trust Preferred Securities: Capital securities, including trust preferred securities, are typically issued by corporations, generally in the form of interest-bearing notes with preferred securities characteristics. In the case of trust preferred securities, an affiliated business trust of a corporation issues these securities, generally in the form of beneficial interests in subordinated debentures or similarly structured securities. The securities can be structured with either a fixed or adjustable coupon that can have either a perpetual or stated maturity date. For trust preferred securities, the issuing bank or corporation pays interest to the trust, which is then distributed to holders of these securities as a dividend. Dividends can be deferred without creating an event of default or acceleration, although maturity cannot take place unless all cumulative payment obligations have been met. The deferral of payments does not affect the purchase or sale of these securities in the open market. These securities generally are rated below that of the issuing company’s senior debt securities and are freely callable at the issuer’s option.
Preferred Stocks:Preferred stock has a preference over common stock in liquidation (and generally in receiving dividends as well), but is subordinated to the liabilities of the issuer in all respects. As a general rule, the market value of preferred stock with a fixed dividend rate and no conversion element varies inversely with interest rates and perceived credit risk, while the market price of convertible preferred stock generally also reflects some element of conversion value. Because preferred stock is junior to debt securities and other obligations of the issuer, deterioration in the credit quality of the issuer will cause greater changes in the value of a preferred stock than in a more senior debt security with similar stated yield characteristics. Unlike interest payments on debt securities, preferred stock dividends are payable only if declared by the issuer’s board of directors. Preferred stock also may be subject to optional or mandatory redemption provisions.
Warrants:Warrants entitle a fund to purchase a specified number of shares of common stock and arenon-income producing. The purchase price and number of shares are subject to adjustment under certain conditions until the expiration date of the warrants, if any. If the price of the underlying stock does not rise above the strike price before the warrant expires, the warrant generally expires without any value and a fund will lose any amount it paid for the warrant. Thus, investments in warrants may involve more risk than investments in common stock. Warrants may trade in the same markets as their underlying stock; however, the price of the warrant does not necessarily move with the price of the underlying stock.
Floating Rate Loan Interests: Floating rate loan interests are typically issued to companies (the “borrower”) by banks, other financial institutions, or privately and publicly offered corporations (the “lender”). Floating rate loan interests are generallynon-investment grade, often involve borrowers whose financial condition is troubled or uncertain and companies that are highly leveraged or in bankruptcy proceedings. In addition, transactions in floating rate loan interests may settle on a delayed basis, which may result in proceeds from the sale not being readily available for a trust to make additional investments or meet its redemption obligations. Floating rate loan interests may include fully funded term loans or revolving lines of credit. Floating rate loan interests are typically senior in the corporate capital structure of the borrower. Floating rate loan interests generally pay interest at rates that are periodically determined by reference to a base lending rate plus a premium. Since the rates reset only periodically, changes in prevailing interest rates (and particularly sudden and significant changes) can be expected to cause some fluctuations in the NAV of a trust to the extent that it invests in floating rate loan interests. The base lending rates are generally the lending rate offered by one or more European banks, such as the London Interbank Offered Rate (“LIBOR”), the prime rate offered by one or more U.S. banks or the certificate of deposit rate. Floating rate loan interests may involve foreign borrowers, and investments may be denominated in foreign currencies. These investments are treated as investments in debt securities for purposes of a fund’s investment policies.
When a trust purchases a floating rate loan interest, it may receive a facility fee and when it sells a floating rate loan interest, it may pay a facility fee. On an ongoing basis, a trust may receive a commitment fee based on the undrawn portion of the underlying line of credit amount of a floating rate loan interest. Facility and commitment fees are typically amortized to income over the term of the loan or term of the commitment, respectively. Consent and amendment fees are recorded to income as earned. Prepayment penalty fees, which may be received by a trust upon the prepayment of a floating rate loan interest by a borrower, are recorded as realized gains. A trust may invest in multiple series or tranches of a loan. A different series or tranche may have varying terms and carry different associated risks.
Floating rate loan interests are usually freely callable at the borrower’s option. A trust may invest in such loans in the form of participations in loans (“Participations”) or assignments (“Assignments”) of all or a portion of loans from third parties. Participations typically will result in a trust having a contractual relationship only with the lender, not with the borrower. A trust has the right to receive payments of principal, interest and any fees to which it is entitled only from the lender selling the Participation and only upon receipt by the lender of the payments from the borrower. In connection with purchasing Participations, a trust generally will have no right to enforce compliance by the borrower with the terms of the loan agreement, nor any rights of offset against the borrower. A trust may not benefit directly from any collateral supporting the loan in which it has purchased the Participation. As a result, a trust assumes the credit risk of both the borrower and the lender that is selling the Participation. A trust’s investment in loan participation interests involves the risk of insolvency of the financial intermediaries who are parties to the transactions. In the event of the insolvency of the lender selling the Participation, a trust may be treated as a general creditor of the lender and may not benefit from any offset between the lender and the borrower. Assignments typically result in a trust having a direct contractual relationship with the borrower, and a trust may enforce compliance by the borrower with the terms of the loan agreement.
In connection with floating rate loan interests, certain Trusts may also enter into unfunded floating rate loan interests (“commitments”). In connection with these commitments, a Trust earns a commitment fee, typically set as a percentage of the commitment amount. Such fee income, which is included in interest income in the Statements of Operations, is recognized ratably over the commitment period. Unfunded floating rate loan interests aremarked-to-market daily, and any unrealized appreciation (depreciation) is included in the Statements of Assets and Liabilities and Statements of Operations. As of period end, the Trusts had the following unfunded floating rate loan interests:
| | | | | | | | | | | | | | | | | | |
| Fund Name | | Borrower | | Par | | | Commitment Amount | | | Value | | | Unrealized
(Depreciation) | |
BGT | | Allied Universal Holdco LLC | | $ | 335,175 | | | $ | 335,189 | | | $ | 332,541 | | | $ | (2,648 | ) |
| | BCPE Empire Holdings, Inc. | | | 121,546 | | | | 121,546 | | | | 119,343 | | | | (2,203 | ) |
| | | MED ParentCo LP | | | 175,611 | | | | 173,854 | | | | 172,794 | | | | (1,060 | ) |
| | |
| 88 | | 2019 BLACKROCK ANNUAL REPORTTO SHAREHOLDERS |
Notes to Financial Statements (continued)
Forward Commitments, When-Issued and Delayed Delivery Securities: Certain trusts may purchase securities on a when-issued basis and may purchase or sell securities on a forward commitment basis. Settlement of such transactions normally occurs within a month or more after the purchase or sale commitment is made. A trust may purchase securities under such conditions with the intention of actually acquiring them, but may enter into a separate agreement to sell the securities before the settlement date. Since the value of securities purchased may fluctuate prior to settlement, a trust may be required to pay more at settlement than the security is worth. In addition, a fund is not entitled to any of the interest earned prior to settlement. When purchasing a security on a delayed delivery basis, a trust assumes the rights and risks of ownership of the security, including the risk of price and yield fluctuations. In the event of default by the counterparty, a trust’s maximum amount of loss is the unrealized appreciation of unsettled when-issued transactions.
Reverse Repurchase Agreements: Reverse repurchase agreements are agreements with qualified third party broker dealers in which a trust sells securities to a bank or broker-dealer and agrees to repurchase the same securities at a mutually agreed upon date and price. A trust receives cash from the sale to use for other investment purposes. During the term of the reverse repurchase agreement, a trust continues to receive the principal and interest payments on the securities sold. Certain agreements have no stated maturity and can be terminated by either party at any time. Interest on the value of the reverse repurchase agreements issued and outstanding is based upon competitive market rates determined at the time of issuance. A trust may utilize reverse repurchase agreements when it is anticipated that the interest income to be earned from the investment of the proceeds of the transaction is greater than the interest expense of the transaction. Reverse repurchase agreements involve leverage risk. If a trust suffers a loss on its investment of the transaction proceeds from a reverse repurchase agreement, a trust would still be required to pay the full repurchase price. Further, a trust remains subject to the risk that the market value of the securities repurchased declines below the repurchase price. In such cases, a trust would be required to return a portion of the cash received from the transaction or provide additional securities to the counterparty.
Cash received in exchange for securities delivered plus accrued interest due to the counterparty is recorded as a liability in the Statements of Assets and Liabilities at face value including accrued interest. Due to the short-term nature of the reverse repurchase agreements, face value approximates fair value. Interest payments made by a trust to the counterparties are recorded as a component of interest expense in the Statements of Operations. In periods of increased demand for the security, a trust may receive a fee for the use of the security by the counterparty, which may result in interest income to a trust.
For the year ended October 31, 2019, the average amount of reverse repurchase agreements outstanding and the daily weighted average interest rate for the Trusts were as follows:
| | | | | | | | |
| | | Average Amount
Outstanding | | | Daily Weighted Average Interest Rate | |
BTZ | | $ | 644,414,648 | | | | 2.69 | % |
BIT | | | 384,768,170 | | | | 2.77 | |
Reverse repurchase transactions are entered into by a trust under Master Repurchase Agreements (each, an “MRA”), which permit a trust, under certain circumstances, including an event of default (such as bankruptcy or insolvency), to offset payables and/or receivables under the MRA with collateral held and/or posted to the counterparty and create one single net payment due to or from a trust. With reverse repurchase transactions, typically a trust and counterparty under an MRA are permitted to sell,re-pledge, or use the collateral associated with the transaction. Bankruptcy or insolvency laws of a particular jurisdiction may impose restrictions on or prohibitions against such a right of offset in the event of the MRA counterparty’s bankruptcy or insolvency. Pursuant to the terms of the MRA, a trust receives or posts securities and cash as collateral with a market value in excess of the repurchase price to be paid or received by a trust upon the maturity of the transaction. Upon a bankruptcy or insolvency of the MRA counterparty, a trust is considered an unsecured creditor with respect to excess collateral and, as such, the return of excess collateral may be delayed.
As of period end, the following table is a summary of a Trust’s open reverse repurchase agreements by counterparty which are subject to offset under an MRA on a net basis:
| | | | | | | | | | | | | | | | |
| BTZ | | | | | | | | | | | | |
| Counterparty | |
| Reverse
Repurchase Agreements |
| |
| Fair Value of
Non-cash Collateral Pledged Including Accrued Interest |
(a) | |
| Cash Collateral
Pledged/Received |
| |
| Net
Amount |
|
Barclays Capital, Inc. | | $ | 149,711,764 | | | $ | (149,711,764 | ) | | $ | — | | | $ | — | |
BNP Paribas S.A. | | | 77,002,234 | | | | (77,002,234 | ) | | | — | | | | — | |
Goldman Sachs & Co. LLC | | | 768,801 | | | | (768,801 | ) | | | — | | | | — | |
J.P. Morgan Securities LLC | | | 7,577,754 | | | | (7,577,754 | ) | | | — | | | | — | |
RBC Capital Markets, LLC | | | 333,400,005 | | | | (333,400,005 | ) | | | — | | | | — | |
| | | | | | | | | | | | | | | | |
| | $ | 568,460,558 | | | $ | (568,460,558 | ) | | $ | — | | | $ | — | |
| | | | | | | | | | | | | | | | |
| | (a) | Net collateral, including accrued interest, with a value of $619,077,397 has been pledged/received in connection with open reverse repurchase agreements. Excess of net collateral pledged to the individual counterparty is not shown for financial reporting purposes. | |
| | | | |
| NOTESTO FINANCIAL STATEMENTS | | | 89 | |
Notes to Financial Statements (continued)
| | | | | | | | | | | | | | | | |
| BIT | | | | | | | | | | | | |
| Counterparty | |
| Reverse
Repurchase Agreements |
| |
| Fair Value of
Non-cash Collateral Pledged Including Accrued Interest |
(a) | |
| Cash Collateral
Pledged/Received |
| |
| Net
Amount |
|
Barclays Bank PLC | | $ | 30,700,891 | | | $ | (30,700,891 | ) | | $ | — | | | $ | — | |
Barclays Capital, Inc. | | | 11,771,279 | | | | (11,771,279 | ) | | | — | | | | — | |
BNP Paribas S.A. | | | 90,289,465 | | | | (90,289,465 | ) | | | — | | | | — | |
Citigroup Global Markets, Inc. | | | 60,003,623 | | | | (60,003,623 | ) | | | — | | | | — | |
Credit Suisse Securities (USA) LLC | | | 1,473,296 | | | | (1,473,296 | ) | | | — | | | | — | |
Goldman Sachs & Co LLC | | | 5,975,438 | | | | (5,975,438 | ) | | | — | | | | — | |
HSBC Securities (USA), Inc. | | | 22,082,103 | | | | (22,082,103 | ) | | | — | | | | — | |
J.P. Morgan Securities LLC | | | 3,138,099 | | | | (3,138,099 | ) | | | — | | | | — | |
RBC Capital Markets, LLC | | | 111,513,682 | | | | (111,513,682 | ) | | | — | | | | — | |
UBS Ltd. | | | 9,276,613 | | | | (9,276,613 | ) | | | — | | | | — | |
UBS Securities LLC | | | 27,120,413 | | | | (27,120,413 | ) | | | — | | | | — | |
| | | | | | | | | | | | | | | | |
| | $ | 373,344,902 | | | $ | (373,344,902 | ) | | $ | — | | | $ | — | |
| | | | | | | | | | | | | | | | |
| | (a) | Net collateral, including accrued interest, with a value of $412,465,141 has been pledged/received in connection with open reverse repurchase agreements. Excess of net collateral pledged to the individual counterparty is not shown for financial reporting purposes. | |
In the event the counterparty of securities under an MRA files for bankruptcy or becomes insolvent, a trust’s use of the proceeds from the agreement may be restricted while the counterparty, or its trustee or receiver, determines whether or not to enforce a trust’s obligation to repurchase the securities.
| 5. | DERIVATIVE FINANCIAL INSTRUMENTS |
The Trusts engage in various portfolio investment strategies using derivative contracts both to increase the returns of the Trusts and/or to manage their exposure to certain risks such as credit risk, equity risk, interest rate risk, foreign currency exchange rate risk, commodity price risk or other risks (e.g., inflation risk). Derivative financial instruments categorized by risk exposure are included in the Schedules of Investments. These contracts may be transacted on an exchange or OTC.
Futures Contracts:Futures contracts are purchased or sold to gain exposure to, or manage exposure to, changes in interest rates (interest rate risk) and changes in the value of equity securities (equity risk) or foreign currencies (foreign currency exchange rate risk).
Futures contracts are agreements between the Trusts and a counterparty to buy or sell a specific quantity of an underlying instrument at a specified price and on a specified date. Depending on the terms of a contract, it is settled either through physical delivery of the underlying instrument on the settlement date or by payment of a cash amount on the settlement date. Upon entering into a futures contract, the Trusts are required to deposit initial margin with the broker in the form of cash or securities in an amount that varies depending on a contract’s size and risk profile. The initial margin deposit must then be maintained at an established level over the life of the contract. Amounts pledged, which are considered restricted, are included in cash pledged for futures contracts in the Statements of Assets and Liabilities.
Securities deposited as initial margin are designated in the Schedules of Investments and cash deposited, if any, are shown as cash pledged for futures contracts in the Statements of Assets and Liabilities. Pursuant to the contract, the Trusts agree to receive from or pay to the broker an amount of cash equal to the daily fluctuation in market value of the contract (“variation margin”). Variation margin is recorded as unrealized appreciation (depreciation) and, if any, shown as variation margin receivable (or payable) on futures contracts in the Statements of Assets and Liabilities. When the contract is closed, a realized gain or loss is recorded in the Statements of Operations equal to the difference between the notional amount of the contract at the time it was opened and the notional amount at the time it was closed. The use of futures contracts involves the risk of an imperfect correlation in the movements in the price of futures contracts and interest, foreign currency exchange rates or underlying assets.
Forward Foreign Currency Exchange Contracts: Forward foreign currency exchange contracts are entered into to gain or reduce exposure to foreign currencies (foreign currency exchange rate risk).
A forward foreign currency exchange contract is an agreement between two parties to buy and sell a currency at a set exchange rate on a specified date. These contracts help to manage the overall exposure to the currencies in which some of the investments held by the Trusts are denominated and in some cases, may be used to obtain exposure to a particular market.
The contract ismarked-to-market daily and the change in market value is recorded as unrealized appreciation (depreciation) in the Statements of Assets and Liabilities. When a contract is closed, a realized gain or loss is recorded in the Statements of Operations equal to the difference between the value at the time it was opened and the value at the time it was closed.Non-deliverable forward foreign currency exchange contracts are settled with the counterparty in cash without the delivery of foreign currency. The use of forward foreign currency exchange contracts involves the risk that the value of a forward foreign currency exchange contract changes unfavorably due to movements in the value of the referenced foreign currencies, and such value may exceed the amount(s) reflected in the Statements of Assets and Liabilities. Cash amounts pledged for forward foreign currency exchange contracts are considered restricted and are included in cash pledged as collateral for OTC derivatives in the Statements of Assets and Liabilities.
Options:Certain Trusts purchase and write call and put options to increase or decrease their exposure to the risks of underlying instruments, including equity risk, interest rate risk and/or commodity price risk and/or, in the case of options written, to generate gains from options premiums.
| | |
| 90 | | 2019 BLACKROCK ANNUAL REPORTTO SHAREHOLDERS |
Notes to Financial Statements (continued)
A call option gives the purchaser (holder) of the option the right (but not the obligation) to buy, and obligates the seller (writer) to sell (when the option is exercised) the underlying instrument at the exercise or strike price at any time or at a specified time during the option period. A put option gives the holder the right to sell and obligates the writer to buy the underlying instrument at the exercise or strike price at any time or at a specified time during the option period.
Premiums paid on options purchased and premiums received on options written, as well as the daily fluctuation in market value, are included in investments at value — unaffiliated and options written at value, respectively, in the Statements of Assets and Liabilities. When an instrument is purchased or sold through the exercise of an option, the premium is offset against the cost or proceeds of the underlying instrument. When an option expires, a realized gain or loss is recorded in the Statements of Operations to the extent of the premiums received or paid. When an option is closed or sold, a gain or loss is recorded in the Statements of Operations to the extent the cost of the closing transaction exceeds the premiums received or paid. When the Trusts write a call option, such option is typically “covered,” meaning that they hold the underlying instrument subject to being called by the option counterparty. When the Trusts write a put option, such option is covered by cash in an amount sufficient to cover the obligation. These amounts, which are considered restricted, are included in cash pledged as collateral for options written in the Statements of Assets and Liabilities.
| | • | | Swaptions — Certain Trusts purchase and write options on swaps (“swaptions”) primarily to preserve a return or spread on a particular investment or portion of the Trusts’ holdings, as a duration management technique or to protect against an increase in the price of securities it anticipates purchasing at a later date. The purchaser and writer of a swaption is buying or granting the right to enter into a previously agreed upon interest rate or credit default swap agreement (interest rate risk and/or credit risk) at any time before the expiration of the option. |
In purchasing and writing options, the Trusts bear the risk of an unfavorable change in the value of the underlying instrument or the risk that they may not be able to enter into a closing transaction due to an illiquid market. Exercise of a written option could result in the Trusts purchasing or selling a security when they otherwise would not, or at a price different from the current market value.
Swaps:Swap contracts are entered into to manage exposure to issuers, markets and securities. Such contracts are agreements between the Trusts and a counterparty to make periodic net payments on a specified notional amount or a net payment upon termination. Swap agreements are privately negotiated in the OTC market and may be entered into as a bilateral contract (“OTC swaps”) or centrally cleared (“centrally cleared swaps”).
For OTC swaps, any upfront premiums paid and any upfront fees received are shown as swap premiums paid and swap premiums received, respectively, in the Statements of Assets and Liabilities and amortized over the term of the contract. The daily fluctuation in market value is recorded as unrealized appreciation (depreciation) on OTC Swaps in the Statements of Assets and Liabilities. Payments received or paid are recorded in the Statements of Operations as realized gains or losses, respectively. When an OTC swap is terminated, a realized gain or loss is recorded in the Statements of Operations equal to the difference between the proceeds from (or cost of) the closing transaction and the Trusts’ basis in the contract, if any. Generally, the basis of the contract is the premium received or paid.
In a centrally cleared swap, immediately following execution of the swap contract, the swap contract is novated to a central counterparty (the “CCP”) and the Trusts’ counterparty on the swap agreement becomes the CCP. The Trusts are required to interface with the CCP through the broker. Upon entering into a centrally cleared swap, the Trusts are required to deposit initial margin with the broker in the form of cash or securities in an amount that varies depending on the size and risk profile of the particular swap. Securities deposited as initial margin are designated in the Schedules of Investments and cash deposited is shown as cash pledged for centrally cleared swaps in the Statements of Assets and Liabilities. Amounts pledged, which are considered restricted cash, are included in cash pledged for centrally cleared swaps in the Statements of Assets and Liabilities. Pursuant to the contract, the Trusts agree to receive from or pay to the broker an amount of cash equal to the daily fluctuation in market value of the contract (“variation margin”). Variation margin is recorded as unrealized appreciation (depreciation) and shown as variation margin receivable (or payable) on centrally cleared swaps in the Statements of Assets and Liabilities. Payments received from (paid to) the counterparty, including at termination, are recorded as realized gains (losses) in the Statements of Operations.
| | • | | Credit default swaps — Credit default swaps are entered into to manage exposure to the market or certain sectors of the market, to reduce risk exposure to defaults of corporate and/or sovereign issuers or to create exposure to corporate and/or sovereign issuers to which a trust is not otherwise exposed (credit risk). |
The Trusts may either buy or sell (write) credit default swaps on single-name issuers (corporate or sovereign), a combination or basket of single-name issuers or traded indexes. Credit default swaps are agreements in which the protection buyer pays fixed periodic payments to the seller in consideration for a promise from the protection seller to make a specific payment should a negative credit event take place with respect to the referenced entity (e.g., bankruptcy, failure to pay, obligation acceleration, repudiation, moratorium or restructuring). As a buyer, if an underlying credit event occurs, the Trusts will either (i) receive from the seller an amount equal to the notional amount of the swap and deliver the referenced security or underlying securities comprising the index, or (ii) receive a net settlement of cash equal to the notional amount of the swap less the recovery value of the security or underlying securities comprising the index. As a seller (writer), if an underlying credit event occurs, the Trusts will either pay the buyer an amount equal to the notional amount of the swap and take delivery of the referenced security or underlying securities comprising the index or pay a net settlement of cash equal to the notional amount of the swap less the recovery value of the security or underlying securities comprising the index.
| | • | | Total return swaps — Total return swaps are entered into to obtain exposure to a security or market without owning such security or investing directly in such market or to exchange the risk/return of one security or market (e.g., fixed-income) with another security or market (e.g., equity or commodity prices) (equity risk, commodity price risk and/or interest rate risk). |
Total return swaps are agreements in which there is an exchange of cash flows whereby one party commits to make payments based on the total return (distributions plus capital gains/losses) of an underlying instrument, or basket of underlying instruments, in exchange for fixed or floating rate interest payments. If the total return of the instrument or index underlying the transaction exceeds or falls short of the offsetting fixed or floating interest rate obligation, the Trusts receive payment from or make a payment to the counterparty.
| | • | | Interest rate swaps — Interest rate swaps are entered into to gain or reduce exposure to interest rates or to manage duration, the yield curve or interest rate (interest rate risk). |
| | | | |
| NOTESTO FINANCIAL STATEMENTS | | | 91 | |
Notes to Financial Statements (continued)
Interest rate swaps are agreements in which one party pays a stream of interest payments, either fixed or floating, in exchange for another party’s stream of interest payments, either fixed or floating, on the same notional amount for a specified period of time. In more complex interest rate swaps, the notional principal amount may decline (or amortize) over time.
| | • | | Forward swaps — Certain Trusts enter into forward interest rate swaps and forward total return swaps. In a forward swap, each Trust and the counterparty agree to make periodic net payments beginning on a specified date or a net payment at termination. |
| | • | | Inflation swaps — Inflation swaps are entered into to gain or reduce exposure to inflation (inflation risk). In an inflation swap, one party makes fixed interest payments on a notional principal amount in exchange for another party’s variable payments based on an inflation index, such as the Consumer Price Index. |
Swap transactions involve, to varying degrees, elements of interest rate, credit and market risk in excess of the amounts recognized in the Statements of Assets and Liabilities. Such risks involve the possibility that there will be no liquid market for these agreements, that the counterparty to the agreements may default on its obligation to perform or disagree as to the meaning of the contractual terms in the agreements, and that there may be unfavorable changes in interest rates and/or market values associated with these transactions.
Master Netting Arrangements: In order to define their contractual rights and to secure rights that will help them mitigate their counterparty risk, the Trusts may enter into an International Swaps and Derivatives Association, Inc. Master Agreement (“ISDA Master Agreement”) or similar agreement with their counterparties. An ISDA Master Agreement is a bilateral agreement between each Trust and a counterparty that governs certain OTC derivatives and typically contains, among other things, collateral posting terms and netting provisions in the event of a default and/or termination event. Under an ISDA Master Agreement, each Trust may, under certain circumstances, offset with the counterparty certain derivative financial instruments’ payables and/or receivables with collateral held and/or posted and create one single net payment. The provisions of the ISDA Master Agreement typically permit a single net payment in the event of default including the bankruptcy or insolvency of the counterparty. Bankruptcy or insolvency laws of a particular jurisdiction may restrict or prohibit the right of offset in bankruptcy, insolvency or other events.
Collateral Requirements: For derivatives traded under an ISDA Master Agreement, the collateral requirements are typically calculated by netting themark-to-market amount for each transaction under such agreement and comparing that amount to the value of any collateral currently pledged by the Trusts and the counterparty.
Cash collateral that has been pledged to cover obligations of the Trusts and cash collateral received from the counterparty, if any, is reported separately in the Statements of Assets and Liabilities as cash pledged as collateral and cash received as collateral, respectively.Non-cash collateral pledged by the Trusts, if any, is noted in the Schedules of Investments. Generally, the amount of collateral due from or to a counterparty is subject to a certain minimum transfer amount threshold before a transfer is required, which is determined at the close of business of the Trusts. Any additional required collateral is delivered to/pledged by the Trusts on the next business day. Typically, the counterparty is not permitted to sell,re-pledge or use cash andnon-cash collateral it receives. A Trust generally agrees not to usenon-cash collateral that it receives but may, absent default or certain other circumstances defined in the underlying ISDA Master Agreement, be permitted to use cash collateral received. In such cases, interest may be paid pursuant to the collateral arrangement with the counterparty. To the extent amounts due to the Trusts from their counterparties are not fully collateralized, they bear the risk of loss from counterpartynon-performance. Likewise, to the extent the Trusts have delivered collateral to a counterparty and stand ready to perform under the terms of their agreement with such counterparty, they bear the risk of loss from a counterparty in the amount of the value of the collateral in the event the counterparty fails to return such collateral. Based on the terms of agreements, collateral may not be required for all derivative contracts.
For financial reporting purposes, the Trusts do not offset derivative assets and derivative liabilities that are subject to netting arrangements, if any, in the Statements of Assets and Liabilities.
| 6. | INVESTMENT ADVISORY AGREEMENT AND OTHER TRANSACTIONS WITH AFFILIATES |
Investment Advisory:Each Trust entered into an Investment Advisory Agreement with the Manager, the Trusts’ investment adviser and an indirect, wholly-owned subsidiary of BlackRock, Inc. (“BlackRock”) to provide investment advisory and administrative services. The Manager is responsible for the management of each Trust’s portfolio and provides the personnel, facilities, equipment and certain other services necessary to the operations of each Trust.
For such services, BTZ and BGT each pays the Manager a monthly fee at an annual rate equal to 0.62% and 0.75%, respectively, of the average weekly value of each Trust’s managed assets. For purposes of calculating these fees, “managed assets” are determined as total assets of the Trust (including any assets attributable to money borrowed for investment purposes) less the sum of its accrued liabilities (other than money borrowed for investment purposes).
For such services, BIT pays the Manager a monthly fee at an annual rate equal to 0.80% of the average daily value of Trust’s managed assets.
The Manager provides investment management and other services to the Taxable Subsidiary. The Manager does not receive separate compensation from the Taxable Subsidiary for providing investment management or administrative services. However, BIT pays the Manager based on BIT’s net assets, plus the proceeds of any debt securities or outstanding borrowings used for leverage, which includes the assets of the Taxable Subsidiary.
With respect to BIT, the Manager entered into asub-advisory agreement with BlackRock (Singapore) Limited (“BRS”), an affiliate of the Manager. The Manager pays BRS, for services it provides for that portion of BIT for which BRS acts assub-adviser, a monthly fee that is equal to a percentage of the investment advisory fees paid by BIT to the Manager.
Expense Waivers:With respect to each Trust, the Manager voluntarily agreed to waive its investment advisory fees by the amount of investment advisory fees each Trust pays to the Manager indirectly through its investment in affiliated money market funds (the “affiliated money market fund waiver”). These amounts are included in fees waived and/or reimbursed by the Manager in the Statements of Operations. For the year ended October 31, 2019, the amounts waived were as follows:
| | | | | | | | | | | | |
| | | BTZ | | | BGT | | | BIT | |
Amounts waived | | $ | 13,006 | | | $ | 771 | | | $ | 5,450 | |
| | |
| 92 | | 2019 BLACKROCK ANNUAL REPORTTO SHAREHOLDERS |
Notes to Financial Statements (continued)
The Manager contractually agreed to waive its investment advisory fee with respect to any portion of each Trust’s assets invested in affiliated equity and fixed-income mutual funds and affiliated exchange-traded funds that have a contractual management fee through June 30, 2020. The agreement can be renewed for annual periods thereafter, and may be terminated on 90 days’ notice, each subject to approval by a majority of the Trusts’ Independent Trustees. For the year ended October 31, 2019, the Manager, with respect to BGT, waived $125 in investment advisory fees pursuant to these arrangements.
Trustees and Officers:Certain trustees and/or officers of the Trusts are trustees and/or officers of BlackRock or its affiliates. The Trusts reimburse the Manager for a portion of the compensation paid to the Trusts’ Chief Compliance Officer, which is included in Trustees and Officer in the Statements of Operations.
Other Transactions: The Trusts may purchase securities from, or sell securities to, an affiliated fund provided the affiliation is due solely to having a common investment adviser, common officers, or common trustees. For the year ended October 31, 2019, the purchase and sale transactions and any net realized gains (losses) with affiliated funds in compliance with Rule17a-7 under the 1940 Act were as follows:
| | | | | | | | | | | | |
| | | Purchases | | | Sales | | | Net
Realized
Gain (Loss) | |
BTZ | | $ | 2,914,193 | | | $ | — | | | $ | — | |
BIT | | | 228,113 | | | | — | | | | — | |
For the year ended October 31, 2019, purchases and sales of investments, including paydowns and excluding short-term securities, were as follows:
| | | | | | | | | | | | |
| | | BTZ | | | BGT | | | BIT | |
Purchases | | $ | 377,880,583 | | | $ | 249,051,881 | | | $ | 339,291,425 | |
Sales | | | 529,143,018 | | | | 270,715,470 | | | | 392,176,169 | |
It is each Trust’s policy to comply with the requirements of the Internal Revenue Code of 1986, as amended, applicable to regulated investment companies, and to distribute substantially all of its taxable income to its shareholders. Therefore, no U.S. federal income tax provision is required.
Each Trust files U.S. federal and various state and local tax returns. No income tax returns are currently under examination. The statute of limitations on each Trust’s U.S. federal tax returns generally remains open for each of the four years ended October 31, 2019. The statutes of limitations on each Trust’s state and local tax returns may remain open for an additional year depending upon the jurisdiction.
Management has analyzed tax laws and regulations and their application to the Trusts as of October 31, 2019, inclusive of the open tax return years, and does not believe that there are any uncertain tax positions that require recognition of a tax liability in the Trusts’ financial statements.
U.S. GAAP requires that certain components of net assets be adjusted to reflect permanent differences between financial and tax reporting. These reclassifications have no effect on net assets or NAVs per share. As of period end, the following permanent differences attributable to the expiration of capital loss carryforwards were reclassified to the following accounts:
| | | | | | | | | | | | |
| | | BTZ | | | BGT | | | BIT | |
Paid-in capital | | $ | (10,353,275 | ) | | $ | (409,424 | ) | | $ | — | |
Accumulated earnings (loss) | | | 10,353,275 | | | | 409,424 | | | | — | |
The tax character of distributions paid was as follows:
| | | | | | | | | | | | | | | | | | |
| | | | | | BTZ | | | BGT | | | BIT | |
Ordinary income | | | 10/31/19 | | | | | $ | 82,221,384 | | | $ | 18,989,845 | | | $ | 42,727,454 | |
| | | 10/31/18 | | | | | | 85,614,025 | | | | 16,888,787 | | | | 56,503,375 | |
| | | | | | | | | | | | | | | | | | |
Return of capital | | | 10/31/19 | | | | | | 3,261,831 | | | | — | | | | 10,172,236 | |
| | | 10/31/18 | | | | | | — | | | | — | | | | 1,708,837 | |
| | | | | | | | | | | | | | | | | | |
Total | | | 10/31/19 | | | | | $ | 85,483,215 | | | $ | 18,989,845 | | | $ | 52,899,690 | |
| | | | | | | | | | | | | | | | | | |
| | | 10/31/18 | | | | | $ | 85,614,025 | | | $ | 16,888,787 | | | $ | 58,212,212 | |
| | | | | | | | | | | | | | | | | | |
| | | | |
| NOTESTO FINANCIAL STATEMENTS | | | 93 | |
Notes to Financial Statements (continued)
As of period end, the tax components of accumulated net earnings (losses) were as follows:
| | | | | | | | | | | | |
| | | BTZ | | | BGT | | | BIT | |
Undistributed ordinary income | | $ | — | | | $ | 1,577,486 | | | $ | — | |
Non-expiring capital loss carryforwards(a) | | | (51,848,146 | ) | | | (15,760,562 | ) | | | (34,962,619 | ) |
Net unrealized gains (losses)(b) | | | 164,357,044 | | | | (7,724,841 | ) | | | (17,598,198 | ) |
| | | | | | | | | | | | |
Total | | $ | 112,508,898 | | | $ | (21,907,917 | ) | | $ | (52,560,817 | ) |
| | | | | | | | | | | | |
| | (a) | Amounts available to offset future realized capital gains. | |
| | (b) | The difference between book-basis and tax-basis net unrealized gains (losses) was attributable primarily to the tax deferral of losses on wash sales and straddles, the realization for tax purposes of unrealized gains/losses on certain futures, options and foreign currency exchange contracts, amortization methods for premiums and discounts on fixed income securities, the accrual of income on securities in default, the timing and recognition of partnership income, the accounting for swap agreements, the deferral of compensation to Trustees and the classification of investments. | |
As of October 31, 2019, gross unrealized appreciation and depreciation for investments and derivatives based on cost for U.S. federal income tax purposes were as follows:
| | | | | | | | | | | | |
| | | BTZ | | | BGT | | | BIT | |
Tax cost | | $ | 1,942,212,507 | | | $ | 467,915,703 | | | $ | 1,030,825,050 | |
| | | | | | | | | | | | |
Gross unrealized appreciation | | $ | 183,514,617 | | | $ | 1,297,483 | | | $ | 64,180,488 | |
Gross unrealized depreciation | | | (19,048,538 | ) | | | (8,758,179 | ) | | | (81,111,699 | ) |
| | | | | | | | | | | | |
Net unrealized appreciation (depreciation) | | $ | 164,466,079 | | | $ | (7,460,696 | ) | | $ | (16,931,211 | ) |
| | | | | | | | | | | | |
BGT is party to a senior committed secured,360-day rolling line of credit facility and a separate security agreement (the “SSB Agreement”) with State Street Bank and Trust Company (“SSB”). SSB may elect to terminate its commitment upon360-days written notice to BGT. As of period end, BGT has not received any notice to terminate. BGT has granted a security interest in substantially all of its assets to SSB.
The SSB Agreement allows for the maximum commitment amount of $168,000,000 for BGT.
Advances will be made by SSB to BGT, at BGT’s option of (a) the higher of (i) 0.80% above the Fed Funds rate and (ii) 0.80% above Overnight LIBOR or (b) 0.80% above7-day,30-day,60-day or90-day LIBOR. Overnight LIBOR and LIBOR rates are subject to a 0% floor.
In addition, BGT paid a commitment fee (based on the daily unused portion of the commitments). The fees associated with each of the agreements are included in the Statements of Operations as borrowing costs, if any. Advances to BGT as of period end, if any, are shown in the Statements of Assets and Liabilities as bank borrowings payable. Based on the short-term nature of the borrowings under the line of credit and the variable interest rate, the carrying amount of the borrowings approximates fair value.
BGT may not declare dividends or make other distributions on shares or purchase any such shares if, at the time of the declaration, distribution or purchase, asset coverage with respect to the outstanding short-term borrowings is less than 300%.
For the year ended October 31, 2019, the average amount of bank borrowings and the daily weighted average interest rates for BGT for loans under the revolving credit agreements were $128,378,082 and 3.19%, respectively.
In the normal course of business, the Trusts invest in securities or other instruments and may enter into certain transactions, and such activities subject each Trust to various risks, including among others, fluctuations in the market (market risk) or failure of an issuer to meet all of its obligations. The value of securities or other instruments may also be affected by various factors, including, without limitation: (i) the general economy; (ii) the overall market as well as local, regional or global political and/or social instability; (iii) regulation, taxation or international tax treaties between various countries; or (iv) currency, interest rate and price fluctuations.
Each Trust may be exposed to prepayment risk, which is the risk that borrowers may exercise their option to prepay principal earlier than scheduled during periods of declining interest rates, which would force each Trust to reinvest in lower yielding securities. Each Trust may also be exposed to reinvestment risk, which is the risk that income from each Trust’s portfolio will decline if each Trust invests the proceeds from matured, traded or called fixed-income securities at market interest rates that are below each Trust portfolio’s current earnings rate.
Each Fund may invest without limitation in illiquid or less liquid investments or investments in which no secondary market is readily available or which are otherwise illiquid, including private placement securities. A Fund may not be able to readily dispose of such investments at prices that approximate those at which a Fund could sell such investments if they were more widely traded and, as a result of such illiquidity, a Fund may have to sell other investments or engage in borrowing transactions if necessary to raise funds to meet its obligations. Limited liquidity can also affect the market price of investments, thereby adversely affecting a Fund’s net asset value and ability to make dividend distributions. Privately issued debt securities are often of below investment grade quality, frequently are unrated and present many of the same risks as investing in below investment grade public debt securities.
| | |
| 94 | | 2019 BLACKROCK ANNUAL REPORTTO SHAREHOLDERS |
Notes to Financial Statements (continued)
Valuation Risk: The market values of equities, such as common stocks and preferred securities or equity related investments, such as futures and options, may decline due to general market conditions which are not specifically related to a particular company. They may also decline due to factors which affect a particular industry or industries. A Trust may invest in illiquid investments. An illiquid investment is any investment that a Trust reasonably expects cannot be sold or disposed of in current market conditions in seven calendar days or less without the sale or disposition significantly changing the market value of the investment. A Trust may experience difficulty in selling illiquid investments in a timely manner at the price that they believe the investments are worth. Prices may fluctuate widely over short or extended periods in response to company, market or economic news. Markets also tend to move in cycles, with periods of rising and falling prices. This volatility may cause each Trust’s NAV to experience significant increases or decreases over short periods of time. If there is a general decline in the securities and other markets, the NAV of a Trust may lose value, regardless of the individual results of the securities and other instruments in which a Trust invests.
The price a Trust could receive upon the sale of any particular portfolio investment may differ from a Trust’s valuation of the investment, particularly for securities that trade in thin or volatile markets or that are valued using a fair valuation technique or a price provided by an independent pricing service. Changes to significant unobservable inputs and assumptions (i.e., publicly traded company multiples, growth rate, time to exit) due to the lack of observable inputs may significantly impact the resulting fair value and therefore a Trust’s results of operations. As a result, the price received upon the sale of an investment may be less than the value ascribed by a Trust, and a Trust could realize a greater than expected loss or lesser than expected gain upon the sale of the investment. A Trust’s ability to value its investments may also be impacted by technological issues and/or errors by pricing services or other third party service providers.
Counterparty Credit Risk:The Trusts may be exposed to counterparty credit risk, or the risk that an entity may fail to or be unable to perform on its commitments related to unsettled or open transactions. The Trusts manage counterparty credit risk by entering into transactions only with counterparties that the Manager believes have the financial resources to honor their obligations and by monitoring the financial stability of those counterparties. Financial assets, which potentially expose the Trusts to market, issuer and counterparty credit risks, consist principally of financial instruments and receivables due from counterparties. The extent of the Trusts’ exposure to market, issuer and counterparty credit risks with respect to these financial assets is approximately their value recorded in the Statements of Assets and Liabilities, less any collateral held by the Trusts.
A derivative contract may suffer amark-to-market loss if the value of the contract decreases due to an unfavorable change in the market rates or values of the underlying instrument. Losses can also occur if the counterparty does not perform under the contract.
A Trust’s risk of loss from counterparty credit risk on OTC derivatives is generally limited to the aggregate unrealized gain less the value of any collateral held by such Trust.
For OTC options purchased, each Trust bears the risk of loss in the amount of the premiums paid plus the positive change in market values net of any collateral held by the Trusts should the counterparty fail to perform under the contracts. Options written by the Trusts do not typically give rise to counterparty credit risk, as options written generally obligate the Trusts, and not the counterparty, to perform. The Trusts may be exposed to counterparty credit risk with respect to options written to the extent each Trust deposits collateral with its counterparty to a written option.
With exchange-traded options purchased and futures and centrally cleared swaps, there is less counterparty credit risk to the Trusts since the exchange or clearinghouse, as counterparty to such instruments, guarantees against a possible default. The clearinghouse stands between the buyer and the seller of the contract; therefore, credit risk is limited to failure of the clearinghouse. While offset rights may exist under applicable law, a Trust does not have a contractual right of offset against a clearing broker or clearinghouse in the event of a default (including the bankruptcy or insolvency). Additionally, credit risk exists inexchange-traded futures and centrally cleared swaps with respect to initial and variation margin that is held in a clearing broker’s customer accounts. While clearing brokers are required to segregate customer margin from their own assets, in the event that a clearing broker becomes insolvent or goes into bankruptcy and at that time there is a shortfall in the aggregate amount of margin held by the clearing broker for all its clients, typically the shortfall would be allocated on a pro rata basis across all the clearing broker’s customers, potentially resulting in losses to the Trusts.
Concentration Risk:Certain Trusts may invest in securities that are rated below investment grade quality (sometimes called “junk bonds”), which are predominantly speculative, have greater credit risk and generally are less liquid than, and have more volatile prices than, higher quality securities.
Certain Trusts invest a significant portion of their assets in fixed-income securities and/or use derivatives tied to the fixed-income markets. Changes in market interest rates or economic conditions may affect the value and/or liquidity of such investments. Interest rate risk is the risk that prices of bonds and other fixed-income securities will increase as interest rates fall and decrease as interest rates rise. The Trusts may be subject to a greater risk of rising interest rates due to the current period of historically low rates.
Certain Trusts invest a significant portion of their assets in securities backed by commercial or residential mortgage loans or in issuers that hold mortgage and other asset-backed securities. Investment percentages in these securities are presented in the Schedules of Investments. Changes in economic conditions, including delinquencies and/or defaults on assets underlying these securities, can affect the value, income and/or liquidity of such positions.
| 11. | CAPITAL SHARE TRANSACTIONS |
Each Trust is authorized to issue an unlimited number of shares, all of which were initially classified as Common Shares. The par value for each Trust’s shares is $0.001. The Board is authorized, however, to reclassify any unissued Common Shares to Preferred Shares without the approval of Common Shareholders.
Common Shares: The Trusts participate in an open market share repurchase program (the “Repurchase Program”). From December 1, 2017 through November 30, 2018, each Trust was permitted to repurchase up to 5% of its outstanding common shares under the Repurchase Program, based on common shares outstanding as of the close of business on November 30, 2017, subject to certain conditions. From December 1, 2018 through November 30, 2019, each Trust may repurchase up to 5% of its outstanding common shares under the Repurchase Program, based on common shares outstanding as of the close of business on November 30, 2018, subject to certain conditions. There is no assurance that the Trusts will purchase shares in any particular amounts.
| | | | |
| NOTESTO FINANCIAL STATEMENTS | | | 95 | |
Notes to Financial Statements (continued)
The total cost of the shares repurchased is reflected in the Trusts’ Statements of Changes in Net Assets. For the periods shown, shares repurchased and cost, including transaction costs were as follows:
| | | | | | | | | | | | | | | | | | | | | | | | |
| | | BTZ | | | BGT | | | BIT | |
| Year Ended October 31, | | Shares | | | Amount | | | Shares | | | Amount | | | Shares | | | Amount | |
2019 | | | 1,057,409 | | | $ | 12,507,349 | | | | 649,075 | | | $ | 7,974,829 | | | | 284,084 | | | $ | 4,525,759 | |
2018 | | | 2,489,141 | | | | 30,991,477 | | | | — | | | | — | | | | 345,071 | | | | 5,842,460 | |
On September 5, 2019, the Trusts announced a continuation of their Repurchase Program. Commencing on December 1, 2019, each Trust may repurchase through November 30, 2020, up to 5% of its common shares outstanding as of the close of business on November 30, 2019, subject to certain conditions. There is no assurance that the Trusts will purchase shares in any particular amounts.
Management’s evaluation of the impact of all subsequent events on the Trusts’ financial statements was completed through the date the financial statements were issued and the following items were noted:
| | | | | | | | |
| | | Common Dividend
Per Share | |
| | | Paid (a) | | | Declared (b) | |
BTZ | | $ | 0.0839 | | | $ | 0.0839 | |
BGT | | | 0.0764 | | | | 0.0764 | |
BIT | | | 0.1237 | | | | 0.1237 | |
| | (a) | Net investment income dividend paid on November 29, 2019 to Shareholders of record on November 15, 2019. | |
| | (b) | Net investment income dividend declared on December 6, 2019, payable to Shareholders of record on December 16, 2019. | |
| | |
| 96 | | 2019 BLACKROCK ANNUAL REPORTTO SHAREHOLDERS |
Report of Independent Registered Public Accounting Firm
To the Shareholders and Board of Trustees of BlackRock Credit Allocation Income Trust, BlackRock Floating Rate Income Trust and BlackRock Multi-Sector Income Trust:
Opinion on the Financial Statements and Financial Highlights
We have audited the accompanying statements of assets and liabilities of BlackRock Credit Allocation Income Trust and BlackRock Floating Rate Income Trust, including the schedules of investments, as of October 31, 2019, the related statements of operations and cash flows for the year then ended, the statements of changes in net assets for each of the two years in the period then ended, the financial highlights for each of the five years in the period then ended, and the related notes. We have also audited the accompanying consolidated statement of assets and liabilities of BlackRock Multi-Sector Income Trust (collectively with BlackRock Credit Allocation Income Trust and BlackRock Floating Rate Income Trust, the “Funds”), including the consolidated schedule of investments, as of October 31, 2019, the related consolidated statement of operations and cash flows for the year then ended, the consolidated statements of changes in net assets for each of the two years in the period then ended, the consolidated financial highlights for each of the five years in the period then ended, and the related notes. In our opinion, the financial statements and financial highlights present fairly, in all material respects, the financial position of the Funds as of October 31, 2019, and the results of their operations and their cash flows for the year then ended, the changes in their net assets for each of the two years in the period then ended, and the financial highlights for each of the five years in the period then ended, in conformity with accounting principles generally accepted in the United States of America.
Basis for Opinion
These financial statements and financial highlights are the responsibility of the Funds’ management. Our responsibility is to express an opinion on the Funds’ financial statements and financial highlights based on our audits. We are a public accounting firm registered with the Public Company Accounting Oversight Board (United States) (PCAOB) and are required to be independent with respect to the Funds in accordance with the U.S. federal securities laws and the applicable rules and regulations of the Securities and Exchange Commission and the PCAOB.
We conducted our audits in accordance with the standards of the PCAOB. Those standards require that we plan and perform the audit to obtain reasonable assurance about whether the financial statements and financial highlights are free of material misstatement, whether due to error or fraud. The Funds are not required to have, nor were we engaged to perform, an audit of their internal control over financial reporting. As part of our audits we are required to obtain an understanding of internal control over financial reporting but not for the purpose of expressing an opinion on the effectiveness of the Funds’ internal control over financial reporting. Accordingly, we express no such opinion.
Our audits included performing procedures to assess the risks of material misstatement of the financial statements and financial highlights, whether due to error or fraud, and performing procedures that respond to those risks. Such procedures included examining, on a test basis, evidence regarding the amounts and disclosures in the financial statements and financial highlights. Our audits also included evaluating the accounting principles used and significant estimates made by management, as well as evaluating the overall presentation of the financial statements and financial highlights. Our procedures included confirmation of securities owned as of October 31, 2019, by correspondence with the custodian, agent banks and brokers; when replies were not received from brokers or agent banks, we performed other auditing procedures. We believe that our audits provide a reasonable basis for our opinion.
Deloitte & Touche LLP
Boston, Massachusetts
December 20, 2019
We have served as the auditor of one or more BlackRock investment companies since 1992.
Important Tax Information (unaudited)
During the fiscal year ended October 31, 2019, the following information is provided with respect to the ordinary income distributions paid by the Trusts:
| | | | | | | | | | | | | | |
| | | Payable Dates | | BTZ | | | BGT | | | BIT | |
Qualified Dividend Income for Individuals(a) | | November 2018 | | | 13.26 | % | | | — | % | | | 11.83 | % |
| | December 2018 — January 2019 | | | 12.38 | | | | — | | | | 11.83 | |
| | February 2019 — October 2019 | | | 18.92 | | | | — | | | | 16.51 | |
Dividends Qualifying for the Dividend Received Deduction for Corporations(a) | | November 2018 — October 2019 | | | 11.37 | | | | — | | | | 12.05 | |
Interest-Related Dividends and Qualified Short-Term Gains for Non-U.S. Residents(b) | | November 2018 — January 2019 | | | 56.23 | | | | 75.91 | | | | 40.26 | |
| | February 2019 — October 2019 | | | 61.23 | | | | 77.82 | | | | 54.29 | |
Federal Obligation Interest(c) | | November 2018 — October 2019 | | | 0.16 | | | | — | | | | 0.98 | |
| | (a) | The Trusts hereby designate the percentage indicated or the maximum amount allowable by law. | |
| | (b) | Represents the portion of the taxable ordinary income dividends eligible for exemption from U.S. withholding tax for nonresident aliens and foreign corporations. | |
| | (c) | The law varies in each state as to whether and what percentage of dividend income attributable to federal obligations is exempt from state income tax. We recommend that you consult your tax advisor to determine if any portion of the dividends you received is exempt from state income taxes. | |
| | | | |
| REPORTOF INDEPENDENT REGISTERED PUBLIC ACCOUNTING FIRM / IMPORTANT TAX INFORMATION | | | 97 | |
Disclosure of Investment Advisory Agreements and Sub-Advisory Agreement
The Boards of Trustees (collectively, the “Board,” the members of which are referred to as “Board Members”) of each of BlackRock Credit Allocation Income Trust (“BTZ”), BlackRock Floating Rate Income Trust (“BGT”) and BlackRock Multi-Sector Income Trust (“BIT” and together with BTZ and BGT, the “Funds” and each, a “Fund”) met in person on May 1, 2019 (the “May Meeting”) and June5-6, 2019 (the “June Meeting”) to consider the approval of each Fund’s investment advisory agreement (collectively, the “Advisory Agreements”) with BlackRock Advisors, LLC (the “Manager”), each Fund’s investment advisor. The Board of BIT also considered the approval of thesub-advisory agreement (the“Sub-Advisory Agreement”) among the Manager, BlackRock (Singapore) Limited (the“Sub-Advisor”) and BIT. The Manager and theSub-Advisor are referred to herein as “BlackRock.” The Advisory Agreements and theSub-Advisory Agreement are referred to herein as the “Agreements.”
Activities and Composition of the Board
On the date of the June Meeting, the Board consisted of eleven individuals, nine of whom were not “interested persons” of each Fund as defined in the Investment Company Act of 1940, as amended (the “1940 Act”) (the “Independent Board Members”). The Board Members are responsible for the oversight of the operations of each Fund and perform the various duties imposed on the directors of investment companies by the 1940 Act. The Independent Board Members have retained independent legal counsel to assist them in connection with their duties. TheCo-Chairs of the Board are Independent Board Members. The Board has established five standing committees: an Audit Committee, a Governance and Nominating Committee, a Compliance Committee, a Performance Oversight Committee and an Executive Committee, each of which is chaired by an Independent Board Member and composed of Independent Board Members (except for the Executive Committee, which also has one interested Board Member).
The Agreements
Consistent with the requirements of the 1940 Act, the Board considers the continuation of the Agreements on an annual basis. The Board has four quarterly meetings per year, each typically extending for two days, and additionalin-person and telephonic meetings throughout the year, as needed. While the Board also has a fifthone-day meeting to consider specific information surrounding the renewal of the Agreements, the Board’s consideration entails a year-long deliberative process whereby the Board and its committees assess BlackRock’s services to each Fund. In particular, the Board assessed, among other things, the nature, extent and quality of the services provided to each Fund by BlackRock, BlackRock’s personnel and affiliates, including (as applicable): investment management; accounting, administrative and shareholder services; oversight of each Fund’s service providers; risk management and oversight; legal and compliance services; and ability to meet applicable legal and regulatory requirements. Throughout the year, including during the contract renewal process, the Independent Board Members were advised by independent legal counsel, and met with independent legal counsel in various executive sessions outside of the presence of management.
During the year, the Board, acting directly and through its committees, considers information that is relevant to its annual consideration of the renewal of the Agreements, including the services and support provided by BlackRock to each Fund and its shareholders. BlackRock also furnished additional information to the Board in response to specific questions from the Board. This additional information is discussed further below in the section titled “Board Considerations in Approving the Agreements.” Among the matters the Board considered were: (a) investment performance forone-year, three-year, five-year,ten-year, and/or since inception periods, as applicable, against peer funds, applicable benchmarks, and performance metrics, as applicable, as well as senior management’s and portfolio managers’ analyses of the reasons for any over-performance or underperformance relative to its peers, benchmarks, and other performance metrics, as applicable; (b) leverage management, as applicable; (c) fees, including advisory, administration, if applicable, and other amounts paid to BlackRock and its affiliates by each Fund for services; (d) Fund operating expenses and how BlackRock allocates expenses to each Fund; (e) the resources devoted to, risk oversight of, and compliance reports relating to, implementation of each Fund’s investment objective, policies and restrictions, and meeting regulatory requirements; (f) BlackRock and each Fund’s adherence to applicable compliance policies and procedures; (g) the nature, character and scope ofnon-investment management services provided by BlackRock and its affiliates and the estimated cost of such services; (h) BlackRock’s and other service providers’ internal controls and risk and compliance oversight mechanisms; (i) BlackRock’s implementation of the proxy voting policies approved by the Board; (j) execution quality of portfolio transactions; (k) BlackRock’s implementation of each Fund’s valuation and liquidity procedures; (l) an analysis of management fees for products with similar investment mandates across theopen-end fund,closed-end fund,sub-advised mutual fund, collective investment trust, and institutional separate account product channels, as applicable, and the similarities and differences between these products and the services provided as compared to each Fund; (m) BlackRock’s compensation methodology for its investment professionals and the incentives and accountability it creates, along with investment professionals’ investments in the fund(s) they manage; (n) periodic updates on BlackRock’s business; and (o) each Fund’s market discount/premium compared to peer funds.
Board Considerations in Approving the Agreements
The Approval Process: Prior to the May Meeting, the Board requested and received materials specifically relating to the Agreements. The Independent Board Members are continuously engaged in a process with their independent legal counsel and BlackRock to review the nature and scope of the information provided to better assist its deliberations. The materials provided in connection with the May Meeting included, among other things: (a) information independently compiled and prepared by Broadridge Financial Solutions, Inc. (“Broadridge”), based on Lipper classifications, regarding each Fund’s fees and expenses as compared with a peer group of funds as determined by Broadridge (“Expense Peers”), the investment performance of each Fund as compared with a peer group of funds (“Performance Peers”) and other metrics, as applicable; (b) information on the composition of the Expense Peers and Performance Peers, and a description of Broadridge’s methodology; (c) information on the estimated profits realized by BlackRock and its affiliates pursuant to the Agreements and a discussion offall-out benefits to BlackRock and its affiliates; (d) a general analysis provided by BlackRock concerning investment management fees received in connection with other types of investment products, such as institutional accounts,sub-advised mutual funds,closed-end funds, andopen-end funds, under similar investment mandates, as applicable; (e) review ofnon-management fees; (f) the existence, impact and sharing of potential economies of scale, if any, with each Fund; (g) a summary of aggregate amounts paid by each Fund to BlackRock; and (h) various additional information requested by the Board as appropriate regarding BlackRock’s and each Fund’s operations.
At the May Meeting, the Board reviewed materials relating to its consideration of the Agreements. As a result of the discussions that occurred during the May Meeting, and as a culmination of the Board’s year-long deliberative process, the Board presented BlackRock with questions and requests for additional information. BlackRock responded to these requests with additional written information in advance of the June Meeting. Topics covered included: (a) the methodology for measuring estimated
| | |
| 98 | | 2019 BLACKROCK ANNUAL REPORTTO SHAREHOLDERS |
Disclosure of Investment Advisory Agreements and Sub-Advisory Agreement (continued)
fund profitability; (b) fund expenses and potential fee waivers; (c) differences in services provided and management fees betweenclosed-end funds and other product channels; and (d) BlackRock’s option overwrite strategy.
At the June Meeting, the Board concluded its assessment of, among other things: (a) the nature, extent and quality of the services provided by BlackRock; (b) the investment performance of each Fund as compared with Performance Peers and other metrics, as applicable; (c) the advisory fee and the estimated cost of the services and estimated profits realized by BlackRock and its affiliates from their relationship with each Fund; (d) each Fund’s fees and expenses compared to Expense Peers; (e) the sharing of potential economies of scale;(f) fall-out benefits to BlackRock and its affiliates as a result of BlackRock’s relationship with each Fund; and (g) other factors deemed relevant by the Board Members.
The Board also considered other matters it deemed important to the approval process, such as other payments made to BlackRock or its affiliates relating to securities lending and cash management, and BlackRock’s services related to the valuation and pricing of Fund portfolio holdings. The Board noted the willingness of BlackRock personnel to engage in open, candid discussions with the Board. The Board did not identify any particular information as determinative, and each Board Member may have attributed different weights to the various items considered.
A. Nature, Extent and Quality of the Services Provided by BlackRock: The Board, including the Independent Board Members, reviewed the nature, extent and quality of services provided by BlackRock, including the investment advisory services and the resulting performance of each Fund. Throughout the year, the Board compared Fund performance to the performance of a comparable group ofclosed-end funds, relevant benchmarks, and performance metrics, as applicable. The Board met with BlackRock’s senior management personnel responsible for investment activities, including the senior investment officers. The Board also reviewed the materials provided by each Fund’s portfolio management team discussing each Fund’s performance and each Fund’s investment objective, strategies and outlook.
The Board considered, among other factors, with respect to BlackRock: the number, education and experience of investment personnel generally and each Fund’s portfolio management team; BlackRock’s research capabilities; investments by portfolio managers in the funds they manage; portfolio trading capabilities; use of technology; commitment to compliance; credit analysis capabilities; risk analysis and oversight capabilities; and the approach to training and retaining portfolio managers and other research, advisory and management personnel. The Board also considered BlackRock’s overall risk management program, including the continued efforts of BlackRock and its affiliates to address cybersecurity risks and the role of BlackRock’s Risk & Quantitative Analysis Group. The Board engaged in a review of BlackRock’s compensation structure with respect to each Fund’s portfolio management team and BlackRock’s ability to attract and retain high-quality talent and create performance incentives.
In addition to investment advisory services, the Board considered the nature and quality of the administrative and othernon-investment advisory services provided to each Fund. BlackRock and its affiliates provide each Fund with certain administrative, shareholder and other services (in addition to any such services provided to each Fund by third parties) and officers and other personnel as are necessary for the operations of each Fund. In particular, BlackRock and its affiliates provide each Fund with administrative services including, among others: (i) responsibility for disclosure documents, such as the prospectus and the statement of additional information in connection with the initial public offering and periodic shareholder reports; (ii) preparing communications with analysts to support secondary market trading of each Fund; (iii) oversight of daily accounting and pricing; (iv) responsibility for periodic filings with regulators and stock exchanges; (v) overseeing and coordinating the activities of other service providers including, among others, each Fund’s custodian, fund accountant, transfer agent, and auditor; (vi) organizing Board meetings and preparing the materials for such Board meetings; (vii) providing legal and compliance support; (viii) furnishing analytical and other support to assist the Board in its consideration of strategic issues such as the merger, consolidation or repurposing of certainclosed-end funds; and (ix) performing or managing administrative functions necessary for the operation of each Fund, such as tax reporting, expense management, fulfilling regulatory filing requirements, and shareholder call center and other services. The Board reviewed the structure and duties of BlackRock’s fund administration, shareholder services, and legal & compliance departments and considered BlackRock’s policies and procedures for assuring compliance with applicable laws and regulations.
B. The Investment Performance of each Fund and BlackRock: The Board, including the Independent Board Members, also reviewed and considered the performance history of each Fund. In preparation for the May Meeting, the Board was provided with reports independently prepared by Broadridge, which included a comprehensive analysis of each Fund’s performance as of December 31, 2018. The performance information is based on net asset value (NAV), and utilizes Lipper data. Lipper’s methodology calculates a fund’s total return assuming distributions are reinvested on theex-date at a fund’sex-date NAV. Broadridge ranks funds in quartiles, ranging from first to fourth, where first is the most desirable quartile position and fourth is the least desirable. In connection with its review, the Board received and reviewed information regarding the investment performance of each Fund as compared to its Performance Peers and a custom peer group of funds as defined by BlackRock (“Customized Peer Group”). The Board and its Performance Oversight Committee regularly review, and meet with Fund management to discuss, the performance of each Fund throughout the year.
In evaluating performance, the Board focused particular attention on funds with less favorable performance records. The Board also noted that while it found the data provided by Broadridge generally useful, it recognized the limitations of such data, including in particular, that notable differences may exist between a fund and the Performance Peer funds (for example, the investment objective(s) and investment strategies). Further, the Board recognized that the performance data reflects a snapshot of a period as of a particular date and that selecting a different performance period could produce significantly different results. The Board also acknowledged thatlong-term performance could be impacted by even one period of significant outperformance or underperformance, and that a single investment theme could have the ability to affect long-term performance disproportionately.
The Board noted that for theone-, three- and five-year periods reported, BTZ ranked in the fourth, second and fourth quartiles, respectively, against its Customized Peer Group. The Board noted that BlackRock believes that the Customized Peer Group is an appropriate performance metric for BTZ, and that BlackRock has explained its rationale for this belief to the Board. The Board and BlackRock reviewed BTZ’s underperformance during the applicable periods. While performance for theone- andfive-year periods was in the fourth quartile, results for the five-year period were heavily impacted byone-year performance; in respect of five-year performance, the gap between BTZ’s performance and the median is relatively small. The Board also noted that BTZ’s Customized Peer Group is relatively small (four funds), which can result in volatile quartile standings.
| | | | |
| DISCLOSUREOF INVESTMENT ADVISORY AGREEMENTSAND SUB-ADVISORY AGREEMENT | | | 99 | |
Disclosure of Investment Advisory Agreements and Sub-Advisory Agreement (continued)
The Board noted that for theone-, three- and five-year periods reported, BGT ranked in the third, fourth and second quartiles, respectively, against its Customized Peer Group. The Board noted that BlackRock believes that the Customized Peer Group is an appropriate performance metric for BGT, and that BlackRock has explained its rationale for this belief to the Board. The Board and BlackRock reviewed BGT’s underperformance during the applicable period.
The Board noted that for theone-, three- and five-year periods reported, BIT ranked in the third, third and second quartiles, respectively, against its Customized Peer Group. The Board noted that BlackRock believes that the Customized Peer Group is an appropriate performance metric for BIT, and that BlackRock has explained its rationale for this belief to the Board. The Board and BlackRock reviewed BIT’s underperformance during the applicable periods.
C. Consideration of the Advisory/Management Fees and the Estimated Cost of the Services and Estimated Profits Realized by BlackRock and its Affiliates from their Relationship with each Fund: The Board, including the Independent Board Members, reviewed each Fund’s contractual management fee rate compared with those of its Expense Peers. The contractual management fee rate represents a combination of the advisory fee and any administrative fees, before taking into account any reimbursements or fee waivers. The Board also compared each Fund’s total expense ratio, as well as its actual management fee rate as a percentage of total assets, to those of its Expense Peers. The total expense ratio represents a fund’s total net operating expenses, excluding any investment related expenses. The total expense ratio gives effect to any expense reimbursements or fee waivers that benefit a fund, and the actual management fee rate gives effect to any management fee reimbursements or waivers that benefit a fund. The Board considered the services provided and the fees charged by BlackRock and its affiliates to other types of clients with similar investment mandates, as applicable, including institutional accounts andsub-advised mutual funds (including mutual funds sponsored by third parties).
The Board received and reviewed statements relating to BlackRock’s financial condition. The Board reviewed BlackRock’s profitability methodology and was also provided with an estimated profitability analysis that detailed the revenues earned and the expenses incurred by BlackRock for services provided to each Fund. The Board reviewed BlackRock’s estimated profitability with respect to each Fund and other funds the Board currently oversees for the year ended December 31, 2018 compared to available aggregate estimated profitability data provided for the prior two years. The Board reviewed BlackRock’s estimated profitability with respect to certain other U.S. fund complexes managed by the Manager and/or its affiliates. The Board reviewed BlackRock’s assumptions and methodology of allocating expenses in the estimated profitability analysis, noting the inherent limitations in allocating costs among various advisory products. The Board recognized that profitability may be affected by numerous factors including, among other things, fee waivers and expense reimbursements by the Manager, the types of funds managed, precision of expense allocations and business mix. The Board thus recognized that calculating and comparing profitability at individual fund levels is difficult.
The Board noted that, in general, individual fund or product line profitability of other advisors is not publicly available. The Board reviewed BlackRock’s overall operating margin, in general, compared to that of certain other publicly-traded asset management firms. The Board considered the differences between BlackRock and these other firms, including the contribution of technology at BlackRock, BlackRock’s expense management, and the relative product mix.
In addition, the Board considered the estimated cost of the services provided to each Fund by BlackRock, and BlackRock’s and its affiliates’ estimated profits relating to the management of each Fund and the other funds advised by BlackRock and its affiliates. As part of its analysis, the Board reviewed BlackRock’s methodology in allocating its costs of managing the Funds, to each Fund. The Board considered whether BlackRock has the financial resources necessary to attract and retain high quality investment management personnel to perform its obligations under the Agreements and to continue to provide the high quality of services that is expected by the Board. The Board further considered factors including but not limited to BlackRock’s commitment of time, assumption of risk, and liability profile in servicing each Fund, including in contrast to what is required of BlackRock with respect to other products with similar investment mandates across theopen-end fund,closed-end fund,sub-advised mutual fund, collective investment trust, and institutional separate account product channels, as applicable.
The Board noted that BTZ’s contractual management fee rate ranked in the fourth quartile, and that the actual management fee rate and total expense ratio ranked in the fourth and third quartiles, respectively, relative to the Expense Peers. The Board also noted, however, that given the comparability limitations of the Expense Peers, BlackRock provided the Board a supplemental peer group consisting of funds that are generally similar to BTZ. The Board noted that BTZ’s actual management fee rate and total expense ratio each ranked in the second quartile, relative to the supplemental peer group.
The Board noted that BGT’s contractual management fee rate ranked in the first quartile, and that the actual management fee rate and total expense ratio each ranked in the first quartile, relative to the Expense Peers.
The Board noted that BIT’s contractual management fee rate ranked in the third quartile, and that the actual management fee rate and total expense ratio each ranked in the third quartile, relative to the Expense Peers. The Board also noted, however, that given the comparability limitations of the Expense Peers, BlackRock provided the Board a supplemental peer group consisting of funds that are generally similar to BIT. The Board noted that BIT’s actual management fee rate and total expense ratio ranked in the second and third quartiles, respectively, relative to the supplemental peer group.
D. Economies of Scale: The Board, including the Independent Board Members, considered the extent to which economies of scale might be realized as the assets of each Fund increase. The Board also considered the extent to which each Fund benefits from such economies in a variety of ways, and whether there should be changes in the advisory fee rate or breakpoint structure in order to enable each Fund to more fully participate in these economies of scale. The Board considered each Fund’s asset levels and whether the current fee was appropriate.
Based on the Board’s review and consideration of the issue, the Board concluded that mostclosed-end funds do not have fund level breakpoints becauseclosed-end funds generally do not experience substantial growth after the initial public offering. They are typically priced at scale at a fund’s inception.
E. Other Factors Deemed Relevant by the Board Members: The Board, including the Independent Board Members, also took into account other ancillary or“fall-out” benefits that BlackRock or its affiliates may derive from BlackRock’s respective relationships with each Fund, both tangible and intangible, such as BlackRock’s ability to leverage its investment professionals who manage other portfolios and risk management personnel, an increase in BlackRock’s profile in the investment advisory community, and the engagement of BlackRock’s affiliates as service providers to each Fund, including for administrative, securities lending and cash management services. The Board also considered BlackRock’s overall operations and its efforts to expand the scale of, and improve the quality of, its operations. The Board also noted
| | |
| 100 | | 2019 BLACKROCK ANNUAL REPORTTO SHAREHOLDERS |
Disclosure of Investment Advisory Agreements and Sub-Advisory Agreement (continued)
that, subject to applicable law, BlackRock may use and benefit from third party research obtained by soft dollars generated by certain registered fund transactions to assist in managing all or a number of its other client accounts.
In connection with its consideration of the Agreements, the Board also received information regarding BlackRock’s brokerage and soft dollar practices. The Board received reports from BlackRock which included information on brokerage commissions and trade execution practices throughout the year.
The Board noted the competitive nature of theclosed-end fund marketplace, and that shareholders are able to sell their Fund shares in the secondary market if they believe that each Fund’s fees and expenses are too high or if they are dissatisfied with the performance of each Fund.
The Board also considered the various notable initiatives and projects BlackRock performed in connection with itsclosed-end fund product line. These initiatives included developing equity shelf programs; efforts to eliminate product overlap with fund mergers; ongoing services to manage leverage that has become increasingly complex; periodic evaluation of share repurchases and other support initiatives for certain BlackRock funds; and continued communications efforts with shareholders, fund analysts and financial advisers. With respect to the latter, the Independent Board Members noted BlackRock’s continued commitment to supporting the secondary market for the common shares of itsclosed-end funds through a comprehensive secondary market communication program designed to raise investor and analyst awareness and understanding ofclosed-end funds. BlackRock’s support services included, among other things: sponsoring and participating in conferences; communicating withclosed-end fund analysts covering the BlackRock funds throughout the year; providing marketing and product updates for theclosed-end funds; and maintaining and enhancing itsclosed-end fund website.
Conclusion
The Board, including the Independent Board Members, approved the continuation of the Advisory Agreements between the Manager and each Fund for aone-year term ending June 30, 2020, and theSub-Advisory Agreement between BIT, the Manager and theSub-Advisor for aone-year term ending June 30, 2020. Based upon its evaluation of all of the aforementioned factors in their totality, as well as other information, the Board, including the Independent Board Members, was satisfied that the terms of the Agreements were fair and reasonable and in the best interest of each Fund and its shareholders. In arriving at its decision to approve the Agreements, the Board did not identify any single factor or group of factors asall-important or controlling, but considered all factors together, and different Board Members may have attributed different weights to the various factors considered. The Independent Board Members were also assisted by the advice of independent legal counsel in making this determination.
| | | | |
| DISCLOSUREOF INVESTMENT ADVISORY AGREEMENTSAND SUB-ADVISORY AGREEMENT | | | 101 | |
Automatic Dividend Reinvestment Plan
Pursuant to each Trust’s Dividend Reinvestment Plan (the “Reinvestment Plan”), Common Shareholders are automatically enrolled to have all distributions of dividends and capital gains and other distributions reinvested by Computershare Trust Company, N.A. (the “Reinvestment Plan Agent”) in the respective Trust’s Common Shares pursuant to the Reinvestment Plan. Shareholders who do not participate in the Reinvestment Plan will receive all distributions in cash paid by check and mailed directly to the shareholders of record (or if the shares are held in street name or other nominee name, then to the nominee) by the Reinvestment Plan Agent, which serves as agent for the shareholders in administering the Reinvestment Plan.
After the Trusts declare a dividend or determine to make a capital gain or other distribution, the Reinvestment Plan Agent will acquire shares for the participants’ accounts, depending upon the following circumstances, either (i) through receipt of unissued but authorized shares from the Trusts (“newly issued shares”) or (ii) by purchase of outstanding shares on the open market or on the Trust’s primary exchange (“open-market purchases”). If, on the dividend payment date, the net asset value per share (“NAV”) is equal to or less than the market price per share plus estimated brokerage commissions (such condition often referred to as a “market premium”), the Reinvestment Plan Agent will invest the dividend amount in newly issued shares acquired on behalf of the participants. The number of newly issued shares to be credited to each participant’s account will be determined by dividing the dollar amount of the dividend by the NAV on the date the shares are issued. However, if the NAV is less than 95% of the market price on the dividend payment date, the dollar amount of the dividend will be divided by 95% of the market price on the dividend payment date. If, on the dividend payment date, the NAV is greater than the market price per share plus estimated brokerage commissions (such condition often referred to as a “market discount”), the Reinvestment Plan Agent will invest the dividend amount in shares acquired on behalf of the participants in open-market purchases. If the Reinvestment Plan Agent is unable to invest the full dividend amount in open-market purchases, or if the market discount shifts to a market premium during the purchase period, the Reinvestment Plan Agent will invest any un-invested portion in newly issued shares. Investments in newly issued shares made in this manner would be made pursuant to the same process described above and the date of issue for such newly issued shares will substitute for the dividend payment date.
You may elect not to participate in the Reinvestment Plan and to receive all dividends in cash by contacting the Reinvestment Plan Agent, at the address set forth below.
Participation in the Reinvestment Plan is completely voluntary and may be terminated or resumed at any time without penalty by notice if received and processed by the Reinvestment Plan Agent prior to the dividend record date. Additionally, the Reinvestment Plan Agent seeks to process notices received after the record date but prior to the payable date and such notices often will become effective by the payable date. Where late notices are not processed by the applicable payable date, such termination or resumption will be effective with respect to any subsequently declared dividend or other distribution.
The Reinvestment Plan Agent’s fees for the handling of the reinvestment of distributions will be paid by each Trust However, each participant will pay a pro rata share of brokerage commissions incurred with respect to the Reinvestment Plan Agent’s open-market purchases in connection with the reinvestment of all distributions. The automatic reinvestment of all distributions will not relieve participants of any U.S. federal, state or local income tax that may be payable on such dividends or distributions.
Each Trust reserves the right to amend or terminate the Reinvestment Plan. There is no direct service charge to participants in the Reinvestment Plan; however, each Trust reserves the right to amend the Reinvestment Plan to include a service charge payable by the participants. Participants that request a sale of shares are subject to a $2.50 sales fee and a $0.15 per share sold brokerage commission fee. All correspondence concerning the Reinvestment Plan should be directed to Computershare Trust Company, N.A. through the internet at computershare.com/blackrock, or in writing to Computershare, P.O. Box 505000, Louisville, KY 40233, Telephone: (800) 699-1236. Overnight correspondence should be directed to the Reinvestment Plan Agent at Computershare, 462 South 4th Street, Suite 1600, Louisville, KY 40202.
| | |
| 102 | | 2019 BLACKROCK ANNUAL REPORTTO SHAREHOLDERS |
Trustee and Officer Information
| | | | | | | | |
| Independent Trustees (a) |
| | | | | |
Name
Year of Birth (b) | | Position(s) Held
(Length of Service) (c) | | Principal Occupation(s) During Past Five Years | | Number of BlackRock-Advised
Registered Investment Companies
(“RICs”) Consisting of
Investment Portfolios
(“Portfolios”) Overseen (d) | | Public Company and Other
Investment Company
Directorships Held During
Past Five Years |
Richard E. Cavanagh 1946 | | Co-Chair of the Board and Trustee (Since 2007) | | Director, The Guardian Life Insurance Company of America since 1998; Board Chair, Volunteers of America (anot-for-profit organization) from 2015 to 2018 (board member since 2009); Director, Arch Chemicals (chemical and allied products) from 1999 to 2011; Trustee, Educational Testing Service from 1997 to 2009 and Chairman thereof from 2005 to 2009; Senior Advisor, The Fremont Group since 2008 and Director thereof since 1996; Faculty Member/Adjunct Lecturer, Harvard University since 2007 and Executive Dean from 1987 to 1995; President and Chief Executive Officer, The Conference Board, Inc. (global business research organization) from 1995 to 2007. | | 86 RICs consisting of 110 Portfolios | | None |
Karen P. Robards 1950 | | Co-Chair of the Board and Trustee (Since 2007) | | Principal of Robards & Company, LLC (consulting and private investing) since 1987;Co-founder and Director of the Cooke Center for Learning and Development (anot-for-profit organization) since 1987; Director of Enable Injections, LLC (medical devices) since 2019; Investment Banker at Morgan Stanley from 1976 to 1987. | | 86 RICs consisting of 110 Portfolios | | Greenhill & Co., Inc.; AtriCure, Inc. (medical devices) from 2000 until 2017
|
Michael J. Castellano 1946 | | Trustee (Since 2011) | | Chief Financial Officer of Lazard Group LLC from 2001 to 2011; Chief Financial Officer of Lazard Ltd from 2004 to 2011; Director, Support Our Aging Religious(non-profit) from 2009 to June 2015 and since 2017; Director, National Advisory Board of Church Management at Villanova University since 2010; Trustee, Domestic Church Media Foundation since 2012; Director, CircleBlack Inc. (financial technology company) since 2015. | | 86 RICs consisting of 110 Portfolios | | None |
Cynthia L. Egan 1955 | | Trustee (Since 2016) | | Advisor, U.S. Department of the Treasury from 2014 to 2015; President, Retirement Plan Services, for T. Rowe Price Group, Inc. from 2007 to 2012; executive positions within Fidelity Investments from 1989 to 2007. | | 86 RICs consisting of 110 Portfolios | | Unum (insurance); The Hanover Insurance Group (insurance); Envestnet (investment platform) from 2013 until 2016
|
Frank J. Fabozzi (d) 1948 | | Trustee (Since 2007) | | Editor of The Journal of Portfolio Management since 1986; Professor of Finance, EDHEC Business School (France) since 2011; Visiting Professor, Princeton University for the 2013 to 2014 academic year and Spring 2017 semester; Professor in the Practice of Finance, Yale University School of Management from 1994 to 2011 and currently a Teaching Fellow in Yale’s Executive Programs; Board Member, BlackRock Equity-Liquidity Funds from 2014 to 2016; affiliated professor Karlsruhe Institute of Technology from 2008 to 2011. | | 87 RICs consisting of 111 Portfolios | | None |
Henry Gabbay 1947 | | Trustee (Since 2019) | | Board Member, BlackRock Equity-Bond Board from 2007 to 2018; Board Member, BlackRock Equity-Liquidity and BlackRockClosed-End Fund Boards from 2007 through 2014; Consultant, BlackRock, Inc. from 2007 to 2008; Managing Director, BlackRock, Inc. from 1989 to 2007; Chief Administrative Officer, BlackRock Advisors, LLC from 1998 to 2007; President of BlackRock Funds and BlackRock Allocation Target Shares (formerly, BlackRock Bond Allocation Target Shares) from 2005 to 2007 and Treasurer of certainclosed-end funds in the BlackRock fund complex from 1989 to 2006. | | 86 RICs consisting of 110 Portfolios | | None |
| | | | |
| TRUSTEEAND OFFICER INFORMATION | | | 103 | |
Trustee and Officer Information (continued)
| | | | | | | | |
| Independent Trustees (a)(continued) |
| | | | | |
Name
Year of Birth (b) | | Position(s) Held
(Length of Service) (c) | | Principal Occupation(s) During Past Five Years | | Number of BlackRock-Advised
Registered Investment Companies
(“RICs”) Consisting of
Investment Portfolios
(“Portfolios”) Overseen (d) | | Public Company and Other
Investment Company
Directorships Held During
Past Five Years |
R. Glenn Hubbard 1958 | | Trustee (Since 2007) | | Dean, Columbia Business School from 2004 to 2019; Faculty member, Columbia Business School since 1988. | | 86 RICs consisting of 110 Portfolios | | ADP (data and information services); Metropolitan Life Insurance Company (insurance); KKR Financial Corporation (finance) from 2004 until 2014 |
W. Carl Kester (d) 1951 | | Trustee (Since 2007) | | George Fisher Baker Jr. Professor of Business Administration, Harvard Business School since 2008; Deputy Dean for Academic Affairs from 2006 to 2010; Chairman of the Finance Unit, from 2005 to 2006; Senior Associate Dean and Chairman of the MBA Program from 1999 to 2005; Member of the faculty of Harvard Business School since 1981. | | 87 RICs consisting of 111 Portfolios | | None |
Catherine A. Lynch (d) 1961 | | Trustee (Since 2016) | | Chief Executive Officer, Chief Investment Officer and various other positions, National Railroad Retirement Investment Trust from 2003 to 2016; Associate Vice President for Treasury Management, The George Washington University from 1999 to 2003; Assistant Treasurer, Episcopal Church of America from 1995 to 1999. | | 87 RICs consisting of 111 Portfolios | | None |
|
| Interested Trustees (a)(e) |
| | | | | |
Name
Year of Birth (b) | | Position(s) Held
(Length of Service) (c) | | Principal Occupation(s) During Past Five Years | | Number of BlackRock-Advised
Registered Investment Companies
(“RICs”) Consisting of
Investment Portfolios
(“Portfolios”) Overseen (d) | | Public Company and Other
Investment Company
Directorships Held During
Past Five Years |
Robert Fairbairn 1965 | | Trustee (Since 2018) | | Vice Chairman of BlackRock, Inc. since 2019; Member of BlackRock’s Global Executive and Global Operating Committees;Co-Chair of BlackRock’s Human Capital Committee; Senior Managing Director of BlackRock, Inc. from 2010 to 2019; oversaw BlackRock’s Strategic Partner Program and Strategic Product Management Group from 2012 to 2019; Member of the Board of Managers of BlackRock Investments, LLC from 2011 to 2018; Global Head of BlackRock’s Retail and iShares® businesses from 2012 to 2016. | | 123 RICs consisting of 291 Portfolios | | None |
John M. Perlowski (d) 1964 | | Trustee (Since 2015); President and Chief Executive Officer (Since 2010) | | Managing Director of BlackRock, Inc. since 2009; Head of BlackRock Global Accounting and Product Services since 2009; Advisory Director of Family Resource Network (charitable foundation) since 2009. | | 124 RICs consisting of 292 Portfolios | | None |
(a) The address of each Trustee is c/o BlackRock, Inc., 55 East 52nd Street, New York, New York 10055. |
(b) Each Independent Trustee holds office until his or her successor is duly elected and qualifies or until his or her earlier death, resignation, retirement or removal as provided by the Trust’sby-laws or charter or statute, or until December 31 of the year in which he or she turns 75. Trustees who are “interested persons,” as defined in the Investment Company Act serve until their successor is duly elected and qualifies or until their earlier death, resignation, retirement or removal as provided by the Trust’sby-laws or statute, or until December 31 of the year in which they turn 72. The Board may determine to extend the terms of Independent Trustees on acase-by-case basis, as appropriate. |
(c) Following the combination of Merrill Lynch Investment Managers, L.P. (“MLIM”) and BlackRock, Inc. in September 2006, the various legacy MLIM and legacy BlackRock fund boards were realigned and consolidated into three new fund boards in 2007. Certain Independent Trustees first became members of the boards of other legacy MLIM or legacy BlackRock funds as follows: Richard E. Cavanagh, 1994; Frank J. Fabozzi, 1988; R. Glenn Hubbard, 2004; W. Carl Kester, 1995; and Karen P. Robards, 1998. Mr. Gabbay became a member of the boards of theopen-end funds in the BlackRock Fixed-Income Complex in 2007. |
(d) Dr. Fabozzi, Dr. Kester, Ms. Lynch and Mr. Perlowski are also trustees of the BlackRock Credit Strategies Fund. |
(e) Mr. Fairbairn and Mr. Perlowski are both “interested persons,” as defined in the 1940 Act, of the Trust based on their positions with BlackRock, Inc. and its affiliates. Mr. Fairbairn and Mr. Perlowski are also board members of the BlackRock Multi-Asset Complex. |
| | |
| 104 | | 2019 BLACKROCK ANNUAL REPORTTO SHAREHOLDERS |
Trustee and Officer Information (continued)
| | | | |
| Officers Who Are Not Trustees (a) |
| | | |
Name
Year of Birth (b) | | Position(s) Held
(Length of Service) | | Principal Occupation(s) During Past Five Years |
Jonathan Diorio 1980 | | Vice President (Since 2015) | | Managing Director of BlackRock, Inc. since 2015; Director of BlackRock, Inc. from 2011 to 2015. |
Neal J. Andrews 1966 | | Chief Financial Officer (Since 2007) | | Chief Financial Officer of the iShares® exchange traded funds since 2019; Managing Director of BlackRock, Inc. since 2006. |
Jay M. Fife 1970 | | Treasurer (Since 2007) | | Managing Director of BlackRock, Inc. since 2007. |
Charles Park 1967 | | Chief Compliance Officer (Since 2014) | | Anti-Money Laundering Compliance Officer for certain BlackRock-advised Funds from 2014 to 2015; Chief Compliance Officer of BlackRock Advisors, LLC and the BlackRock-advised Funds in the BlackRock Multi-Asset Complex and the BlackRock Fixed-Income Complex since 2014; Principal of and Chief Compliance Officer for iShares® Delaware Trust Sponsor LLC since 2012 and BlackRock Fund Advisors (“BFA”) since 2006; Chief Compliance Officer for theBFA-advised iShares® exchange traded funds since 2006; Chief Compliance Officer for BlackRock Asset Management International Inc. since 2012. |
Janey Ahn 1975 | | Secretary (Since 2012) | | Managing Director of BlackRock, Inc. since 2018; Director of BlackRock, Inc. from 2009 to 2017. |
(a) The address of each Officer is c/o BlackRock, Inc., 55 East 52nd Street, New York, New York 10055. |
(b) Officers of the Trust serve at the pleasure of the Board. |
Investment Adviser
BlackRock Advisors, LLC
Wilmington, DE 19809
Sub-Adviser
BlackRock (Singapore) Limited(a)
079912 Singapore
Accounting Agent and Custodian
State Street Bank and Trust Company
Boston, MA 02111
Transfer Agent
Computershare Trust Company, N.A.
Canton, MA 02021
Independent Registered Public Accounting Firm
Deloitte & Touche LLP
Boston, MA 02116
Legal Counsel
Willkie Farr & Gallagher LLP
New York, NY 10019
Address of the Trusts
100 Bellevue Parkway
Wilmington, DE 19809
| | | | |
| TRUSTEEAND OFFICER INFORMATION | | | 105 | |
Additional Information
Proxy Results
BlackRock Credit Allocation Income Trust (BTZ)
The Annual Meeting of Shareholders for BTZ was held on July 8, 2019 for shareholders of record on May 30, 2019, to elect Trustee nominees and to vote on a non-binding shareholder proposal to declassify the Board of Trustees so that all Trustees are elected on an annual basis. There were no brokernon-votes with regard to the Trust.
The vote results in the election of Class III Trustees were as follows:
| | | | | | | | | | | | | | | | | | | | | | | | | | | | | | | | | | | | |
| Richard E. Cavanagh | | | | | Cynthia L. Egan | | | | | Robert Fairbairn | | | | | Henry Gabbay | |
| Votes For | | | Votes Withheld | | | | | Votes For | | | Votes Withheld | | | | | Votes For | | | Votes Withheld | | | | | Votes For | | | Votes Withheld | |
| | 46,696,884 | | | | 2,698,627 | | | | | | 46,775,497 | | | | 2,620,014 | | | | | | 46,700,259 | | | | 2,695,252 | | | | | | 46,692,474 | | | | 2,703,037 | |
| | | | | | | | | | | | | | | | | | | | | | | | | | | | | | | | | | | | |
| Stephen J. Flanagan | | | | | Frederic Gabriel | | | | | Thomas H. McGlade | | | | | Jassen Trenkow | |
| Votes For | | | Votes Withheld | | | | | Votes For | | | Votes Withheld | | | | | Votes For | | | Votes Withheld | | | | | Votes For | | | Votes Withheld | |
| | 12,934,308 | | | | 155,472 | | | | | | 12,932,625 | | | | 157,155 | | | | | | 12,934,191 | | | | 155,589 | | | | | | 12,932,305 | | | | 157,475 | |
None of the individuals listed above received the sufficient number of votes required in a contested election. Messrs. Cavanagh, Fairbairn and Gabbay and Ms. Egan, incumbent Class III Trustees, will continue to serve as Class III Trustees until their successors are duly elected and qualify. The Trust remains a party to litigation in Delaware with respect to the 2019 Annual Meeting of Shareholders. The Trustees whose term of office continued after the Annual Meeting of Shareholders because they were not up for election are Michael J. Castellano, R. Glenn Hubbard, Catherine A. Lynch, John M. Perlowski, Karen P. Robards, Frank J. Fabozzi and W. Carl Kester.
Shareholders voted on the non-binding proposal as follows:
| | | | | | | | | | | | | | |
| Votes For | | | | | Votes Against | | | | | Abstain | |
| | 37,911,873 | | | | | | 23,795,534 | | | | | | 777,873 | |
BlackRock Floating Rate Income Trust (BGT) and BlackRock Multi-Sector Income Trust (BIT)
The Annual Meeting of Shareholders for BGT and BIT was held on July 29, 2019 for shareholders of record on May 30, 2019, to elect trustee nominees. There were no brokernon-votes with regard to the Trust.
Shareholders elected the Class III Trustees as follows:
| | | | | | | | | | | | | | | | | | | | | | | | | | | | | | | | |
| | | Richard E. Cavanagh | | | Cynthia L. Egan | | | Robert Fairbairn | | | Henry Gabbay | |
| | Votes For | | | Votes Withheld | | | Votes For | | | Votes Withheld | | | Votes For | | | Votes Withheld | | | Votes For | | | Votes Withheld | |
BGT | | | 19,151,359 | | | | 2,455,425 | | | | 19,459,122 | | | | 2,147,662 | | | | 19,454,213 | | | | 2,152,571 | | | | 19,439,549 | | | | 2,167,235 | |
BIT | | | 32,861,480 | | | | 1,513,636 | | | | 33,107,780 | | | | 1,267,336 | | | | 33,964,606 | | | | 410,510 | | | | 33,947,276 | | | | 427,840 | |
For the Trusts listed above, Trustees whose term of office continued after the Annual Meeting of Shareholders because they were not up for election are Michael J. Castellano, R. Glenn Hubbard, Catherine A. Lynch, John M. Perlowski, Karen P. Robards, Frank J. Fabozzi and W. Carl Kester.
Trust Certification
The Trusts are listed for trading on the NYSE and have filed with the NYSE their annual chief executive officer certification regarding compliance with the NYSE’s listing standards. The Trusts filed with the SEC the certification of their chief executive officer and chief financial officer required by section 302 of the Sarbanes-Oxley Act.
Dividend Policy
Each Trust’s dividend policy is to distribute all or a portion of its net investment income to its shareholders on a monthly basis. In order to provide shareholders with a more stable level of dividend distributions, the distributions paid by the Trusts for any particular month may be more or less than the amount of net investment income earned by the Trusts during such month. The portion of distributions that exceeds a Trust’s current and accumulated earnings and profits, which are measured on a tax basis, will constitute a nontaxable return of capital. Distributions in excess of a Trust’s taxable income and net capital gains, but not in excess of a Trust’s earnings and profits, will be taxable to shareholders as ordinary income and will not constitute a nontaxable return of capital. The Trusts’ current accumulated but undistributed net investment income, if any, is disclosed as accumulated earnings (loss) in the Statements of Assets and Liabilities, which comprises part of the financial information included in this report.
General Information
On July 29, 2019, the Board approved the elimination of BTZ’s non-fundamental policy limiting investments in illiquid securities to 10% of BTZ’s managed assets. As a result, BTZ may invest without limit in illiquid securities.
| | |
| 106 | | 2019 BLACKROCK ANNUAL REPORTTO SHAREHOLDERS |
Additional Information (continued)
The Trusts do not make available copies of their Statements of Additional Information because the Trusts’ shares are not continuously offered, which means that the Statement of Additional Information of each Trust has not been updated after completion of the respective Trust’s offerings and the information contained in each Trust’s Statement of Additional Information may have become outdated.
Except as described above, there were no material changes in the Trusts’ investment objectives or policies or to the Trusts’ charters or by-laws that would delay or prevent a change of control of the Trusts that were not approved by the shareholders or in the principal risk factors associated with investment in the Trusts. There have been no changes in the persons who are primarily responsible for the day-to-day management of the Trusts’ portfolios.
In accordance with Section 23(c) of the Investment Company Act of 1940, each Trust may from time to time purchase shares of its common stock in the open market or in private transactions.
Quarterly performance, semi-annual and annual reports, current net asset value and other information regarding the Trusts may be found on BlackRock’s website, which can be accessed atblackrock.com. Any reference to BlackRock’s website in this report is intended to allow investors public access to information regarding the Trusts and does not, and is not intended to, incorporate BlackRock’s website in this report.
Electronic Delivery
Shareholders can sign up for e-mail notifications of quarterly statements, annual and semi-annual shareholder reports by enrolling in the electronic delivery program. Electronic copies of shareholder reports are available on BlackRock’s website.
To enroll in electronic delivery:
Shareholders Who Hold Accounts with Investment Advisers, Banks or Brokerages:
Please contact your financial advisor. Please note that not all investment advisers, banks or brokerages may offer this service.
Householding
The Trusts will mail only one copy of shareholder documents, annual and semi-annual reports and proxy statements, to shareholders with multiple accounts at the same address. This practice is commonly called “householding” and is intended to reduce expenses and eliminate duplicate mailings of shareholder documents. Mailings of your shareholder documents may be householded indefinitely unless you instruct us otherwise. If you do not want the mailing of these documents to be combined with those for other members of your household, please call the Trusts at (800) 882-0052.
Availability of Quarterly Schedule of Investments
The Trusts file their complete schedule of portfolio holdings with the SEC for the first and third quarters of each fiscal year as an exhibit to its reports on Form N-PORT, and for reporting periods ended prior to March 31, 2019, filed such information on Form N-Q. The Trusts’ Forms N-PORT andN-Q are available on the SEC’s website at sec.gov. The Trusts’ FormsN-Q may also be obtained upon request and without charge by calling (800) 882-0052.
Availability of Proxy Voting Policies and Procedures
A description of the policies and procedures that the Trusts use to determine how to vote proxies relating to portfolio securities is available upon request and without charge (1) by calling (800) 882-0052; (2) atblackrock.com; and (3) on the SEC’s website at sec.gov.
Availability of Proxy Voting Record
Information about how the Trusts voted proxies relating to securities held in the Trusts’ portfolios during the most recent 12-month period ended June 30 is available upon request and without charge (1) atblackrock.com; or by calling (800) 882-0052 and (2) on the SEC’s website at sec.gov.
Availability of Trust Updates
BlackRock will update performance and certain other data for the Trusts on a monthly basis on its website in the “Closed-end Funds” section ofblackrock.com as well as certain other material information as necessary from time to time. Investors and others are advised to check the website for updated performance information and the release of other material information about the Trusts. This reference to BlackRock’s website is intended to allow investors public access to information regarding the Trusts and does not, and is not intended to, incorporate BlackRock’s website in this report.
| | | | |
| ADDITIONAL INFORMATION | | | 107 | |
Additional Information (continued)
BlackRock Privacy Principles
BlackRock is committed to maintaining the privacy of its current and former fund investors and individual clients (collectively, “Clients”) and to safeguarding their non-public personal information. The following information is provided to help you understand what personal information BlackRock collects, how we protect that information and why in certain cases we share such information with select parties.
If you are located in a jurisdiction where specific laws, rules or regulations require BlackRock to provide you with additional or different privacy-related rights beyond what is set forth below, then BlackRock will comply with those specific laws, rules or regulations.
BlackRock obtains or verifies personal non-public information from and about you from different sources, including the following: (i) information we receive from you or, if applicable, your financial intermediary, on applications, forms or other documents; (ii) information about your transactions with us, our affiliates, or others; (iii) information we receive from a consumer reporting agency; and (iv) from visits to our websites.
BlackRock does not sell or disclose to non-affiliated third parties any non-public personal information about its Clients, except as permitted by law or as is necessary to respond to regulatory requests or to service Client accounts. These non-affiliated third parties are required to protect the confidentiality and security of this information and to use it only for its intended purpose.
We may share information with our affiliates to service your account or to provide you with information about other BlackRock products or services that may be of interest to you. In addition, BlackRock restricts access to non-public personal information about its Clients to those BlackRock employees with a legitimate business need for the information. BlackRock maintains physical, electronic and procedural safeguards that are designed to protect the non-public personal information of its Clients, including procedures relating to the proper storage and disposal of such information.
Glossary of Terms Used in this Report
| | |
| Currency |
| |
| AUD | | Australian Dollar |
| |
| BRL | | Brazilian Real |
| |
| CAD | | Canadian Dollar |
| |
| EUR | | Euro |
| |
| GBP | | British Pound |
| |
| IDR | | Indonesian Rupiah |
| |
| MXN | | Mexican Peso |
| |
| NGN | | Nigerian Naira |
| |
| NOK | | Norwegian Krone |
| |
| USD | | U.S. Dollar |
| | |
| Portfolio Abbreviations |
| |
| ALL | | Albanian Lek |
| |
| ARB | | Airport Revenue Bonds |
| |
| CR | | Custodian Receipt |
| |
| CLO | | Collateralized Loan Obligation |
| |
| ETF | | Exchange-Traded Fund |
| |
| EURIBOR | | Euro Interbank Offered Rate |
| |
| FNMA | | Federal National Mortgage Association |
| |
| LIBOR | | London Interbank Offered Rate |
| |
| MSCI | | Morgan Stanley Capital International |
| |
| MTN | | Medium-Term Note |
| |
| PIK | | Payment-In-Kind |
| |
| RB | | Revenue Bonds |
| |
| REIT | | Real Estate Investment Trust |
| |
| REMIC | | Real Estate Mortgage Investment Conduit |
| |
| S&P | | Standard & Poor’s |
| |
| SPDR | | Standard & Poor’s Depository Receipts |
| | |
| 108 | | 2019 BLACKROCK ANNUAL REPORTTO SHAREHOLDERS |
Want to know more?
blackrock.com | 877-275-1255 (1-877-ASK-1BLK)
This report is intended for current holders. It is not a prospectus. Past performance results shown in this report should not be considered a representation of future performance. Statements and other information herein are as dated and are subject to change.
CE-CAFRI-3-10/19-AR
| | |
| |  |
| | | | |
| Item 2 | | – | | Code of Ethics – The registrant (or the “Fund”) has adopted a code of ethics, as of the end of the period covered by this report, applicable to the registrant’s principal executive officer, principal financial officer, principal accounting officer or controller, or persons performing similar functions. During the period covered by this report, the code of ethics was amended to update certain information and to make othernon-material changes. During the period covered by this report, there have been no waivers granted under the code of ethics. The registrant undertakes to provide a copy of the code of ethics to any person upon request, without charge, who calls1-800-882-0052, option 4. |
| | |
| Item 3 | | – | | Audit Committee Financial Expert – The registrant’s board of directors (the “board of directors”), has determined that (i) the registrant has the following audit committee financial experts serving on its audit committee and (ii) each audit committee financial expert is independent: |
| | |
| | | | Michael Castellano |
| | | | Frank J. Fabozzi |
| | | | Henry Gabbay |
| | | | Catherine A. Lynch |
| | | | Karen P. Robards |
| | |
| | | | The registrant’s board of directors has determined that Karen P. Robards qualifies as an audit committee financial expert pursuant to Item 3(c)(4) of FormN-CSR. |
| | |
| | | | Ms. Robards has a thorough understanding of generally accepted accounting principles, financial statements and internal control over financial reporting as well as audit committee functions. Ms. Robards has been President of Robards & Company, a financial advisory firm, since 1987. Ms. Robards was formerly an investment banker for more than 10 years where she was responsible for evaluating and assessing the performance of companies based on their financial results. Ms. Robards has over 30 years of experience analyzing financial statements. She also is a member of the audit committee of one publicly held company and anon-profit organization. |
| | |
| | | | Under applicable securities laws, a person determined to be an audit committee financial expert will not be deemed an “expert” for any purpose, including without limitation for the purposes of Section 11 of the Securities Act of 1933, as a result of being designated or identified as an audit committee financial expert. The designation or identification of a person as an audit committee financial expert does not impose on such person any duties, obligations, or liabilities greater than the duties, obligations, and liabilities imposed on such person as a member of the audit committee and board of directors in the absence of such designation or identification. The designation or identification of a person as an audit committee financial expert does not affect the duties, obligations, or liability of any other member of the audit committee or board of directors. |
| | |
| Item 4 | | – | | Principal Accountant Fees and Services |
| | |
| | | | The following table presents fees billed by Deloitte & Touche LLP (“D&T”) in each of the last two fiscal years for the services rendered to the Fund: |
| | | | | | | | | | | | | | | | |
| | | (a) Audit Fees | | (b) Audit-Related Fees1 | | (c) Tax Fees2 | | (d) All Other Fees |
| Entity Name | | Current
Fiscal Year
End | | Previous
Fiscal Year
End | | Current
Fiscal Year
End | | Previous
Fiscal Year
End | | Current
Fiscal Year
End | | Previous
Fiscal Year
End | | Current
Fiscal Year
End | | Previous
Fiscal Year
End |
BlackRock Floating Rate Income Trust | | $72,828 | | $72,828 | | $0 | | $0 | | $14,500 | | $14,500 | | $0 | | $0 |
2
The following table presents fees billed by D&T that were required to be approved by the registrant’s audit committee (the “Committee”) for services that relate directly to the operations or financial reporting of the Fund and that are rendered on behalf of BlackRock Advisors LLC (“Investment Adviser” or “BlackRock”) and entities controlling, controlled by, or under common control with BlackRock (not including anysub-adviser whose role is primarily portfolio management and is subcontracted with or overseen by another investment adviser) that provide ongoing services to the Fund (“Affiliated Service Providers”):
| | | | |
| | | Current Fiscal Year End | | Previous Fiscal Year End |
(b) Audit-Related Fees1 | | $0 | | $0 |
(c) Tax Fees2 | | $0 | | $0 |
(d) All Other Fees3 | | $2,050,500 | | $2,274,000 |
1 The nature of the services includes assurance and related services reasonably related to the performance of the audit or review of financial statements not included in Audit Fees, including accounting consultations, agreed-upon procedure reports, attestation reports, comfort letters,out-of-pocket expenses and internal control reviews not required by regulators.
2 The nature of the services includes tax compliance and/or tax preparation, including services relating to the filing or amendment of federal, state or local income tax returns, regulated investment company qualification reviews, taxable income and tax distribution calculations.
3Non-audit fees of $2,050,500 and $2,274,000 for the current fiscal year and previous fiscal year, respectively, were paid to the Fund’s principal accountant in their entirety by BlackRock, in connection with services provided to the Affiliated Service Providers of the Fund and of certain other funds sponsored and advised by BlackRock or its affiliates for a service organization review and an accounting research tool subscription. These amounts represent aggregate fees paid by BlackRock and were not allocated on a per fund basis.
(e)(1) Audit CommitteePre-Approval Policies and Procedures:
The Committee has adopted policies and procedures with regard to thepre-approval of services. Audit, audit-related and tax compliance services provided to the registrant on an annual basis require specificpre-approval by the Committee. The Committee also must approve othernon-audit services provided to the registrant and thosenon-audit services provided to the Investment Adviser and Affiliated Service Providers that relate directly to the operations and the financial reporting of the registrant. Certain of thesenon-audit services that the Committee believes are (a) consistent with the SEC’s auditor independence rules and (b) routine and recurring services that will not impair the independence of the independent accountants may be approved by the Committee without consideration on a specificcase-by-case basis (“generalpre-approval”). The term of any generalpre-approval is 12 months from the date of thepre-approval, unless the Committee provides for a different period. Tax or othernon-audit services provided to the registrant which have a direct impact on the operations or financial reporting of the registrant will only be deemedpre-approved provided that any individual project does not exceed $10,000 attributable to the registrant or $50,000 per project. For this purpose, multiple projects will be aggregated to determine if they exceed the previously mentioned cost levels.
Any proposed services exceeding thepre-approved cost levels will require specificpre-approval by the Committee, as will any other services not subject to generalpre-approval (e.g., unanticipated but permissible services). The Committee is informed of each service approved subject to generalpre-approval at the next regularly scheduledin-person board meeting. At this meeting, an analysis of such services is presented to the Committee for ratification. The Committee may delegate to the Committee Chairman the authority to approve the provision of and fees for any specific engagement of permittednon-audit services, including services exceedingpre-approved cost levels.
3
(e)(2) None of the services described in each of Items 4(b) through (d) were approved by the Committee pursuant to the de minimis exception in paragraph (c)(7)(i)(C) of Rule2-01 of RegulationS-X.
(f) Not Applicable
(g) The aggregatenon-audit fees, defined as the sum of the fees shown under “Audit-Related Fees,” “Tax Fees” and “All Other Fees,” paid to the accountant for services rendered by the accountant to the registrant, the Investment Adviser and the Affiliated Service Providers were:
| | | | | | |
| | | Entity Name | | Current Fiscal Year End | | Previous Fiscal Year End |
| | | BlackRock Floating Rate Income Trust | | $14,500 | | $14,500 |
Additionally, the amounts billed by D&T in connection with services provided to the Affiliated Service Providers of the Fund and of other funds sponsored or advised by BlackRock or its affiliates during the current and previous fiscal years for a service organization review and an accounting research tool subscription were:
| | |
Current Fiscal Year End | | Previous Fiscal Year End |
$2,050,500 | | $2,274,000 |
These amounts represent aggregate fees paid by BlackRock and were not allocated on a per fund basis.
(h) The Committee has considered and determined that the provision ofnon-audit services that were rendered to the Investment Adviser, and the Affiliated Service Providers that were notpre-approved pursuant to paragraph (c)(7)(ii) of Rule2-01 of RegulationS-X is compatible with maintaining the principal accountant’s independence.
| | | | |
| Item 5 | | – | | Audit Committee of Listed Registrants |
| | (a) | The following individuals are members of the registrant’s separately designated standing audit committee established in accordance with Section 3(a)(58)(A) of the Securities Exchange Act of 1934 (15 U.S.C. 78c(a)(58)(A)): |
Michael Castellano
Frank J. Fabozzi
Henry Gabbay
Catherine A. Lynch
Karen P. Robards
4
| | |
| Item 6 – | | Investments |
| | (a) The registrant’s Schedule of Investments is included as part of the Report to Stockholders filed under Item 1 of this Form. |
| |
| | (b) Not Applicable due to no such divestments during the semi-annual period covered since the previous FormN-CSR filing. |
| |
| Item 7 – | | Disclosure of Proxy Voting Policies and Procedures forClosed-End Management Investment Companies – The board of directors has delegated the voting of proxies for the Fund’s portfolio securities to the Investment Adviser pursuant to the Investment Adviser’s proxy voting guidelines. Under these guidelines, the Investment Adviser will vote proxies related to Fund securities in the best interests of the Fund and its stockholders. From time to time, a vote may present a conflict between the interests of the Fund’s stockholders, on the one hand, and those of the Investment Adviser, or any affiliated person of the Fund or the Investment Adviser, on the other. In such event, provided that the Investment Adviser’s Equity Investment Policy Oversight Committee, or asub-committee thereof (the “Oversight Committee”) is aware of the real or potential conflict or materialnon-routine matter and if the Oversight Committee does not reasonably believe it is able to follow its general voting guidelines (or if the particular proxy matter is not addressed in the guidelines) and vote impartially, the Oversight Committee may retain an independent fiduciary to advise the Oversight Committee on how to vote or to cast votes on behalf of the Investment Adviser’s clients. If the Investment Adviser determines not to retain an independent fiduciary, or does not desire to follow the advice of such independent fiduciary, the Oversight Committee shall determine how to vote the proxy after consulting with the Investment Adviser’s Portfolio Management Group and/or the Investment Adviser’s Legal and Compliance Department and concluding that the vote cast is in its client’s best interest notwithstanding the conflict. A copy of the Fund’s Proxy Voting Policy and Procedures are attached as Exhibit 99.PROXYPOL. Information on how the Fund voted proxies relating to portfolio securities during the most recent12-month period ended June 30 is available without charge, (i) at www.blackrock.com and (ii) on the SEC’s website athttp://www.sec.gov. |
| |
Item 8 – | | Portfolio Managers ofClosed-End Management Investment Companies |
|
| (a)(1) As of the date of filing this Report: |
| |
| | The registrant is managed by a team of investment professionals comprised James E. Keenan, Managing Director at BlackRock, David Delbos, Managing Director at BlackRock, Mitchell S. Garfin, Managing Director at BlackRock, Carly Wilson, Managing Director at BlackRock and Abigail Apistolas, Vice President at Blackrock. Messrs. Keenan, Delbos and Garfin and Mses. Wilson and Apistolas are the Fund’sco-portfolio managers and are responsible for theday-to-day management of the Fund’s portfolio and the selection of its investments. Mr. Keenan has been a member of the Fund’s management team since 2007. Messrs. Delbos and Garfin and Mses. Wilson and Apistolas have been members of the Fund’s management team since2018. |
5
| | |
| Portfolio Manager | | Biography |
| James E. Keenan | | Managing Director of BlackRock since 2008 and Head of the Leveraged Finance Portfolio team; Director of BlackRock from 2006 to 2007; Vice President of BlackRock, Inc. from 2004 to 2005. |
| David Delbos | | Managing Director of BlackRock, Inc. since 2012; Director of BlackRock, Inc. from 2007 to 2011; Vice President of BlackRock, Inc. from 2005 to 2006. |
| Mitchell S. Garfin | | Managing Director of BlackRock, Inc. since 2009; Director of BlackRock, Inc. from 2005 to 2008. |
| Carly Wilson | | Managing Director of BlackRock, Inc. since 2019; Director of BlackRock, Inc. from 2016 to 2018; Vice President of BlackRock, Inc. from 2011 to 2015; Associate at BlackRock, Inc. from 2009 to 2010; Associate at R3 Capital Partners from 2008 to 2009; Associate at Lehman Brothers from 2004 to 2008. |
| Abigail Apistolas | | Vice President of BlackRock, Inc. since 2019; Associate of BlackRock, Inc. from 2016 to 2018; Associate at Morgan Stanley from 2012 to 2016; Analyst at Morgan Stanley from 2012 to 2014. |
(a)(2) As of October 31, 2019:
| | | | | | | | | | | | |
| | | (ii) Number of Other Accounts Managed
and Assets by Account Type | | (iii) Number of Other Accounts and
Assets for Which Advisory Fee is Performance-Based |
(i) Name of Portfolio Manager | | Other
Registered Investment Companies | | Other Pooled
Investment Vehicles | | Other
Accounts | | Other
Registered Investment Companies | | Other Pooled
Investment Vehicles | | Other
Accounts |
| | | | | | | |
| James E. Keenan | | 18 | | 32 | | 15 | | 0 | | 11 | | 13 |
| | | | | | | |
| | | $30.33 Billion | | $15.38 Billion | | $7.21 Billion | | $0 | | $9.13 Billion | | $7.15 Billion |
| | | | | | | |
| David Delbos | | 19 | | 13 | | 30 | | 0 | | 4 | | 29 |
| | | | | | | |
| | | $29.48 Billion | | $11.99 Billion | | $12.26 Billion | | $0 | | $6.32 Billion | | $12.24 Billion |
| | | | | | | |
| Mitchell S. Garfin | | 19 | | 20 | | 30 | | 0 | | 4 | | 30 |
| | | | | | | |
| | | $32.43 Billion | | $12.34 Billion | | $12.30 Billion | | $0 | | $6.32 Billion | | $12.30 Billion |
| | | | | | | |
| Carly Wilson | | 7 | | 14 | | 4 | | 0 | | 4 | | 3 |
| | | | | | | |
| | | $8.32 Billion | | $3.67 Billion | | $379.3 Million | | $0 | | $2.13 Billion | | $244.6 Million |
| | | | | | | |
| Abigail Apistolas | | 9 | | 11 | | 8 | | 0 | | 5 | | 7 |
| | | | | | | |
| | | $7.91 Billion | | $3.70 Billion | | $989.9 Million | | $0 | | $2.23 Billion | | $855.2 Million |
| | (iv) | Portfolio Manager Potential Material Conflicts of Interest |
BlackRock has built a professional working environment, firm-wide compliance culture and compliance procedures and systems designed to protect against potential incentives that may favor one account over another. BlackRock has adopted policies and procedures that address the allocation of investment opportunities, execution of portfolio transactions, personal trading by employees and other potential conflicts of interest that are designed to ensure that all client accounts are treated equitably over time. Nevertheless, BlackRock furnishes investment management and advisory services to numerous clients in addition to the Fund, and BlackRock may, consistent with applicable law, make investment recommendations to other clients or accounts (including accounts which are hedge funds or have performance or higher fees paid to BlackRock, or in which portfolio managers have a personal interest in the receipt of such fees), which may be the same as or different from those made to the Fund. In addition, BlackRock, Inc., its affiliates and significant shareholders and any officer, director, shareholder or employee may or may not have an interest in the securities whose purchase and sale BlackRock
6
recommends to the Fund. BlackRock, Inc., or any of its affiliates or significant shareholders, or any officer, director, shareholder, employee or any member of their families may take different actions than those recommended to the Fund by BlackRock with respect to the same securities. Moreover, BlackRock may refrain from rendering any advice or services concerning securities of companies of which any of BlackRock, Inc.’s (or its affiliates’ or significant shareholders’) officers, directors or employees are directors or officers, or companies as to which BlackRock, Inc. or any of its affiliates or significant shareholders or the officers, directors and employees of any of them has any substantial economic interest or possesses materialnon-public information. Certain portfolio managers also may manage accounts whose investment strategies may at times be opposed to the strategy utilized for a fund. It should also be noted that Messrs. Keenan, Delbos and Garfin and Mses. Wilson and Apistolas may be managing hedge fund and/or long only accounts, or may be part of a team managing hedge fund and/or long only accounts, subject to incentive fees. Messrs. Keenan, Delbos and Garfin and Mses. Wilson and Apistolas may therefore be entitled to receive a portion of any incentive fees earned on such accounts.
As a fiduciary, BlackRock owes a duty of loyalty to its clients and must treat each client fairly. When BlackRock purchases or sells securities for more than one account, the trades must be allocated in a manner consistent with its fiduciary duties. BlackRock attempts to allocate investments in a fair and equitable manner among client accounts, with no account receiving preferential treatment. To this end, BlackRock, Inc. has adopted policies that are intended to ensure reasonable efficiency in client transactions and provide BlackRock with sufficient flexibility to allocate investments in a manner that is consistent with the particular investment discipline and client base, as appropriate.
(a)(3) As of October 31, 2019:
Portfolio Manager Compensation Overview
The discussion below describes the portfolio managers’ compensation as of October 31, 2019.
BlackRock’s financial arrangements with its portfolio managers, its competitive compensation and its career path emphasis at all levels reflect the value senior management places on key resources. Compensation may include a variety of components and may vary from year to year based on a number of factors. The principal components of compensation include a base salary, a performance-based discretionary bonus, participation in various benefits programs and one or more of the incentive compensation programs established by BlackRock.
Base Compensation. Generally, portfolio managers receive base compensation based on their position with the firm.
Discretionary Incentive Compensation
Discretionary incentive compensation is a function of several components: the performance of BlackRock, Inc., the performance of the portfolio manager’s group within BlackRock, the investment performance, including risk-adjusted returns, of the firm’s assets under management or supervision by that portfolio manager relative to predetermined benchmarks, and the individual’s performance and contribution to the overall performance of these portfolios and BlackRock. In most cases, these benchmarks are the same as the benchmark or benchmarks against which the
7
performance of the Funds or other accounts managed by the portfolio managers are measured. Among other things, BlackRock’s Chief Investment Officers make a subjective determination with respect to each portfolio manager’s compensation based on the performance of the funds and other accounts managed by each portfolio manager relative to the various benchmarks. Performance of fixed income funds is measured on apre-tax and/orafter-tax basis over various time periods including1-,3- and5- year periods, as applicable. With respect to these portfolio managers, such benchmarks for the Fund and other accounts are:
| | |
| Portfolio Manager | | Benchmark |
James Keenan
David Delbos
Mitchell S. Garfin | | A combination of market-based indices (e.g., The Bloomberg Barclays U.S. Corporate High Yield 2% Issuer Cap Index), certain customized indices and certain fund industry peer groups. |
| Carly Wilson | | A combination of market-based indices (e.g. ICE BofAML 3 Month U.S. Treasury Bill Index). |
| Abigail Apistolas | | A combination of market-based indices (e.g., S&P Leveraged All Loan Index), certain customized indices and certain fund industry peer groups. |
Distribution of Discretionary Incentive Compensation.Discretionary incentive compensation is distributed to portfolio managers in a combination of cash, deferred BlackRock, Inc. stock awards, and/or deferred cash awards that notionally track the return of certain BlackRock investment products.
Portfolio managers receive their annual discretionary incentive compensation in the form of cash. Portfolio managers whose total compensation is above a specified threshold also receive deferred BlackRock, Inc. stock awards annually as part of their discretionary incentive compensation. Paying a portion of discretionary incentive compensation in the form of deferred BlackRock, Inc. stock puts compensation earned by a portfolio manager for a given year “at risk” based on BlackRock’s ability to sustain and improve its performance over future periods. In some cases, additional deferred BlackRock, Inc. stock may be granted to certain key employees as part of a long-term incentive award to aid in retention, align interests with long-term shareholders and motivate performance. Deferred BlackRock, Inc. stock awards are generally granted in the form of BlackRock, Inc. restricted stock units that vest pursuant to the terms of the applicable plan and, once vested, settle in BlackRock, Inc. common stock. The portfolio managers of this Fund have deferred BlackRock, Inc. stock awards.
For certain portfolio managers, a portion of the discretionary incentive compensation is also distributed in the form of deferred cash awards that notionally track the returns of select BlackRock investment products they manage, which provides direct alignment of portfolio manager discretionary incentive compensation with investment product results. Deferred cash awards vest ratably over a number of years and, once vested, settle in the form of cash. Only portfolio managers who manage specified products and whose total compensation is above a specified threshold are eligible to participate in the deferred cash award program.
Other Compensation Benefits.In addition to base salary and discretionary incentive compensation, portfolio managers may be eligible to receive or participate in one or more of the following:
8
Incentive Savings Plans — BlackRock, Inc. has created a variety of incentive savings plans in which BlackRock, Inc. employees are eligible to participate, including a 401(k) plan, the BlackRock Retirement Savings Plan (RSP), and the BlackRock Employee Stock Purchase Plan (ESPP). The employer contribution components of the RSP include a company match equal to 50% of the first 8% of eligible pay contributed to the plan capped at $5,000 per year, and a company retirement contribution equal to3-5% of eligible compensation up to the Internal Revenue Service limit ($280,000 for 2019). The RSP offers a range of investment options, including registered investment companies and collective investment funds managed by the firm. BlackRock, Inc. contributions follow the investment direction set by participants for their own contributions or, absent participant investment direction, are invested into a target date fund that corresponds to, or is closest to, the year in which the participant attains age 65. The ESPP allows for investment in BlackRock, Inc. common stock at a 5% discount on the fair market value of the stock on the purchase date. Annual participation in the ESPP is limited to the purchase of 1,000 shares of common stock or a dollar value of $25,000 based on its fair market value on the purchase date. All of the eligible portfolio managers are eligible to participate in these plans.
(a)(4)Beneficial Ownership of Securities – As of October 31, 2019.
| | |
| Portfolio Manager | | Dollar Range of Equity Securities of the Fund Beneficially Owned |
| James E. Keenan | | $100,001 - $500,000 |
| David Delbos | | None |
| Mitchell S. Garfin | | None |
| Carly Wilson | | None |
| Abigail Apistolas | | None |
(b) Not Applicable
Item 9 – Purchases of Equity Securities byClosed-End Management Investment Company and Affiliated Purchasers
| | | | | | | | |
| Period | | (a) Total Number of Shares Purchased | | (b) Average Price Paid per Share | | (c) Total Number of Shares Purchased as Part of Publicly Announced Plans or Programs | | (d) Maximum Number ofShares that May Yet BePurchased Under the Plans or Programs1 |
| May1-31, 2019 | | 0 | | $0 | | 0 | | 766,776 |
| June1-30, 2019 | | 0 | | $0 | | 0 | | 766,776 |
| July1-31,2019 | | 55,307 | | $12.4802 | | 55,307 | | 711,469 |
| August1-31, 2019 | | 0 | | $0 | | 0 | | 711,469 |
| September1-30, 2019 | | 50,935 | | $12.2958 | | 50,935 | | 660,534 |
| October1-31, 2019 | | 80,428 | | $12.4092 | | 80,428 | | 580,106 |
| Total: | | 186,670 | | $12.3993 | | 186,670 | | 580,106 |
1On September 7, 2018, the Fund announced a continuation of its open market share repurchase program. Commencing on December 1, 2018, the Fund may repurchase through November 30, 2019, up to 5% of its common shares outstanding as of the close of business on November 30, 2018, subject to certain conditions. On September 5, 2019, the Fund announced a further continuation of its open market share repurchase program. Commencing on December 1, 2019, the Fund may repurchase through November 30, 2020, up to 5% of its common shares outstanding as of the close of business on November 30, 2019, subject to certain conditions.
9
| | |
| Item 10 – | | Submission of Matters to a Vote of Security Holders – There have been no material changes to these procedures. |
| |
| Item 11 – | | Controls and Procedures |
| |
| | (a) The registrant’s principal executive and principal financial officers, or persons performing similar functions, have concluded that the registrant’s disclosure controls and procedures (as defined in Rule30a-3(c) under the Investment Company Act of 1940, as amended (the “1940 Act”)) are effective as of a date within 90 days of the filing of this report based on the evaluation of these controls and procedures required by Rule30a-3(b) under the 1940 Act and Rule 13a-15(b) under the Securities Exchange Act of 1934, as amended. |
| |
| | (b) There were no changes in the registrant’s internal control over financial reporting (as defined in Rule30a-3(d) under the 1940 Act) that occurred during the period covered by this report that have materially affected, or are reasonably likely to materially affect, the registrant’s internal control over financial reporting. |
| |
| Item 12 – | | Disclosure of Securities Lending Activities for Closed-End Management Investment Companies--Not Applicable |
| |
| Item 13 – | | Exhibits attached hereto |
| |
| | (a)(1) – Code of Ethics – See Item 2 |
| |
| | (a)(2) – Certifications – Attached hereto |
| |
| | (a)(3) – Not Applicable |
| |
| | (a)(4) – Not Applicable |
| |
| | (b) – Certifications – Attached hereto |
10
Pursuant to the requirements of the Securities Exchange Act of 1934 and the Investment Company Act of 1940, the registrant has duly caused this report to be signed on its behalf by the undersigned, thereunto duly authorized.
| | | | |
| | | BlackRock Floating Rate Income Trust |
| | |
| | By: | | /s/ John M. Perlowski |
| | | | John M. Perlowski |
| | | | Chief Executive Officer (principal executive officer) of |
| | | | BlackRock Floating Rate Income Trust |
Date: January 3, 2020
Pursuant to the requirements of the Securities Exchange Act of 1934 and the Investment Company Act of 1940, this report has been signed below by the following persons on behalf of the registrant and in the capacities and on the dates indicated.
| | | | |
| | | By: | | /s/ John M. Perlowski |
| | | | John M. Perlowski |
| | | | Chief Executive Officer (principal executive officer) of |
| | | | BlackRock Floating Rate Income Trust |
| |
| | Date: January 3, 2020 |
| | |
| | | By: | | /s/ Neal J. Andrews |
| | | | Neal J. Andrews |
| | | | Chief Financial Officer (principal financial officer) of |
| | | | BlackRock Floating Rate Income Trust |
Date: January 3, 2020
11