UNITED STATES
SECURITIES AND EXCHANGE COMMISSION
Washington, D.C. 20549
FormN-CSR
CERTIFIED SHAREHOLDER REPORT OF REGISTERED
MANAGEMENT INVESTMENT COMPANIES
Investment Company Act File Number:811-21563
Eaton Vance Short Duration Diversified Income Fund
(Exact Name of Registrant as Specified in Charter)
Two International Place, Boston, Massachusetts 02110
(Address of Principal Executive Offices)
Maureen A. Gemma
Two International Place, Boston, Massachusetts 02110
(Name and Address of Agent for Services)
(617)482-8260
(Registrant’s Telephone Number)
October 31
Date of Fiscal Year End
April 30, 2020
Date of Reporting Period
| Item 1. | Reports to Stockholders |

Eaton Vance
Short Duration Diversified Income Fund (EVG)
Semiannual Report
April 30, 2020
Important Note. Beginning on January 1, 2021, as permitted by regulations adopted by the Securities and Exchange Commission, paper copies of the Fund’s annual and semi-annual shareholder reports will no longer be sent by mail unless you specifically request paper copies of the reports. Instead, the reports will be made available on the Fund’s website (funds.eatonvance.com/closed-end-fund-and-term-trust-documents.php), and you will be notified by mail each time a report is posted and provided with a website address to access the report.
If you already elected to receive shareholder reports electronically, you will not be affected by this change and you need not take any action. If you hold shares at the Fund’s transfer agent, American Stock Transfer & Trust Company, LLC (“AST”), you may elect to receive shareholder reports and other communications from the Fund electronically by contacting AST. If you own your shares through a financial intermediary (such as a broker-dealer or bank), you must contact your financial intermediary to sign up.
You may elect to receive all future Fund shareholder reports in paper free of charge. If you hold shares at AST, you can inform AST that you wish to continue receiving paper copies of your shareholder reports by calling 1-866-439-6787. If you own these shares through a financial intermediary, you must contact your financial intermediary or follow instructions included with this disclosure, if applicable, to elect to continue to receive paper copies of your shareholder reports. Your election to receive reports in paper will apply to all funds held with AST or to all funds held through your financial intermediary, as applicable.

Commodity Futures Trading Commission Registration. Effective December 31, 2012, the Commodity Futures Trading Commission (“CFTC”) adopted certain regulatory changes that subject registered investment companies and advisers to regulation by the CFTC if a fund invests more than a prescribed level of its assets in certain CFTC-regulated instruments (including futures, certain options and swap agreements) or markets itself as providing investment exposure to such instruments. The investment adviser has claimed an exclusion from the definition of “commodity pool operator” under the Commodity Exchange Act with respect to its management of the Fund. Accordingly, neither the Fund nor the adviser with respect to the operation of the Fund is subject to CFTC regulation. Because of its management of other strategies, the Fund’s adviser is registered with the CFTC as a commodity pool operator. The adviser is also registered as a commodity trading advisor.
Fund shares are not insured by the FDIC and are not deposits or other obligations of, or guaranteed by, any depository institution. Shares are subject to investment risks, including possible loss of principal invested.
Semiannual ReportApril 30, 2020
Eaton Vance
Short Duration Diversified Income Fund
| | | | |
| |
Table of Contents | | | | |
| |
Performance | | | 2 | |
| |
Fund Profile | | | 2 | |
| |
Endnotes and Additional Disclosures | | | 3 | |
| |
Financial Statements | | | 4 | |
| |
Annual Meeting of Shareholders | | | 47 | |
| |
Board of Trustees’ Contract Approval | | | 48 | |
| |
Officers and Trustees | | | 52 | |
| |
Important Notices | | | 53 | |
Eaton Vance
Short Duration Diversified Income Fund
April 30, 2020
Performance1, 2
Portfolio ManagersPayson F. Swaffield, CFA, Catherine C. McDermott, Andrew Szczurowski, CFA, Eric Stein, CFA and Sarah C. Orvin, CFA
| | | | | | | | | | | | | | | | | | | | |
| % Average Annual Total Returns | | Inception Date | | | Six Months | | | One Year | | | Five Years | | | Ten Years | |
Fund at NAV | | | 02/28/2005 | | | | –13.17 | % | | | –12.36 | % | | | 1.24 | % | | | 2.78 | % |
Fund at Market Price | | | — | | | | –11.15 | | | | –6. 55 | | | | 1.76 | | | | 2.56 | |
Blended Index | | | — | | | | –4.35 | % | | | –1.11 | % | | | 2.72 | % | | | 4.00 | % |
| | | | | |
| % Premium/ Discount to NAV3 | | | | | | | | | | | | | | | |
| | | | | | | | | | | | | | | | | | | –6.91 | % |
| | | | | |
| Distributions4 | | | | | | | | | | | | | | | |
Total Distributions per share for the period | | | | | | | | | | | | | | | | | | $ | 0.455 | |
Distribution Rate at NAV | | | | | | | | | | | | | | | | | | | 7.40 | % |
Distribution Rate at Market Price | | | | | | | | | | | | | | | | | | | 7.95 | % |
| | | | | |
| % Total Leverage5 | | | | | | | | | | | | | | | |
Derivatives | | | | | | | | | | | | | | | | | | | 24.83 | % |
Borrowings | | | | | | | | | | | | | | | | | | | 16.47 | |
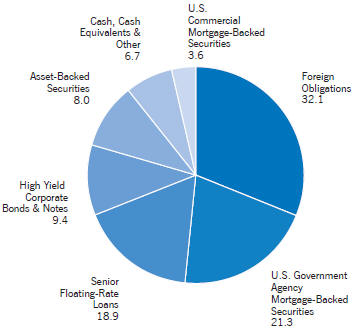
Fund Profile
Asset Allocation (% of total leveraged assets)6
See Endnotes and Additional Disclosures in this report.
Past performance is no guarantee of future results. Returns are historical and are calculated net of management fees and other expenses by determining the percentage change in net asset value (NAV) or market price (as applicable) with all distributions reinvested in accordance with the Fund’s Dividend Reinvestment Plan. Performance at market price will differ from performance at NAV due to variations in the Fund’s market price versus NAV, which may reflect factors such as fluctuations in supply and demand for Fund shares, changes in Fund distributions, shifting market expectations for the Fund’s future returns and distribution rates, and other considerations affecting the trading prices ofclosed-end funds. Investment return and principal value will fluctuate so that shares, when sold, may be worth more or less than their original cost. Performance for periods less than or equal to one year is cumulative. Performance is for the stated time period only; due to market volatility, current Fund performance may be lower or higher than the quoted return. For performance as of the most recentmonth-end, please refer to eatonvance.com.
Eaton Vance
Short Duration Diversified Income Fund
April 30, 2020
Endnotes and Additional Disclosures
| 1 | S&P/LSTA Leveraged Loan Index is an unmanaged index of the institutional leveraged loan market. S&P/ LSTA Leveraged Loan indices are a product of S&P Dow Jones Indices LLC (“S&P DJI”) and have been licensed for use. S&P® is a registered trademark of S&P DJI; Dow Jones® is a registered trademark of Dow Jones Trademark Holdings LLC (“Dow Jones”); LSTA is a trademark of Loan Syndications and Trading Association, Inc. S&P DJI, Dow Jones, their respective affiliates and their third party licensors do not sponsor, endorse, sell or promote the Fund, will not have any liability with respect thereto and do not have any liability for any errors, omissions, or interruptions of the S&P Dow Jones Indices. ICE BofA U.S. Mortgage-Backed Securities Index is an unmanaged index of fixed rate residential mortgage pass- through securities issued by U.S. agencies. ICE® BofA® indices are not for redistribution or other uses; provided “as is”, without warranties, and with no liability. Eaton Vance has prepared this report and ICE Data Indices, LLC does not endorse it, or guarantee, review, or endorse Eaton Vance’s products. BofA® is a licensed registered trademark of Bank of America Corporation in the United States and other countries. J.P. Morgan Emerging Market Bond Index (EMBI) Global Diversified is a market-cap weighted index that measures USD-denominated Brady Bonds, Eurobonds, and traded loans issued by sovereign entities. Information has been obtained from sources believed to be reliable but J. P. Morgan does not warrant its completeness or accuracy. The Index is used with permission. The Index may not be copied, used, or distributed without J. P. Morgan’s prior written approval. Copyright 2019, J.P. Morgan Chase & Co. All rights reserved. The Blended Index consists of 33.33% S&P/LSTA Leveraged Loan Index, 33.33% ICE BofA U.S. Mortgage-Backed Securities Index and 33.34% J.P. Morgan Emerging Market Bond Index (EMBI) Global Diversified, rebalanced monthly. Unless otherwise stated, index returns do not reflect the effect of any applicable sales charges, commissions, expenses, taxes or leverage, as applicable. It is not possible to invest directly in an index. |
| 2 | Performance results reflect the effects of leverage. Absent an expense waiver by the investment adviser, if applicable, the returns would be lower. |
| 3 | The shares of the Fund often trade at a discount or premium to their net asset value. The discount or premium may vary over time and may be higher or lower than what is quoted in this report. Forup-to-date premium/discount information, please refer tohttps://funds.eatonvance.com/closed-end-fund-prices. php. |
| 4 | The Distribution Rate is based on the Fund’s last regular distribution per share in the period (annualized) divided by the Fund’s NAV or market price at the end of the period. The Fund’s distributions may be comprised of amounts characterized for federal income tax purposes as qualified andnon-qualified ordinary dividends, capital gains and nondividend distributions, also known as return of capital. The Fund will determine the federal income tax character of distributions paid to a shareholder after the end of the calendar year. This is reported on the IRS form1099-DIV and provided to the shareholder shortly after eachyear-end. For information about the tax character of distributions made in prior calendar years, please refer toPerformance-Tax Character of Distributions on the Fund’s webpage available at eatonvance.com. The Fund’s distributions are determined by the investment adviser. Fund distributions may be affected by numerous factors including changes in Fund performance, the cost of financing for leverage, portfolio holdings, realized and projected returns, and other factors. As portfolio and market conditions change, the rate of distributions paid by the Fund could change. |
| 5 | The Fund employs leverage through derivatives and borrowings. Total leverage is shown as a percentage of the Fund’s aggregate net assets plus the absolute notional value of long and short derivatives and borrowings outstanding. Use of leverage creates an opportunity for income, but creates risks including greater price volatility. The cost of borrowings rises and falls with changes in short-term interest rates. The Fund may be required to maintain prescribed asset coverage for its leverage and may be required to reduce its leverage at an inopportune time. |
| 6 | Total leveraged assets include all assets of the Fund (including those acquired with financial leverage) and derivatives held by the Fund. Asset Allocation as a percentage of the Fund’s net assets amounted to 170.3%. Please refer to the definition of total leveraged assets within the Notes to Financial Statements included herein. |
| | Fund profile subject to change due to active management. |
Important Notice to Shareholders
Effective January 1, 2020, the ICE BofAML indices were rebranded as ICE BofA indices.
Effective November 1, 2020, the Fund will be managed by Catherine C. McDermott, Andrew Szczurowski, Eric A. Stein and Sarah C. Orvin. Payson F. Swaffield will serve as a member of the portfolio management team of the Fund through October 31, 2020.
Eaton Vance
Short Duration Diversified Income Fund
April 30, 2020
Portfolio of Investments (Unaudited)
| | | | | | | | | | | | |
| Senior Floating-Rate Loans — 32.2%(1) | |
| Borrower/Tranche Description | | | | | Principal
Amount*
(000’s omitted) | | | Value | |
|
| Aerospace and Defense — 0.7% | |
| | | |
| AI Convoy (Luxembourg) S.a.r.l. | | | | | | | | | |
| | | |
Term Loan, 4.65%, (USD LIBOR + 3.50%), Maturing January 17, 2027(2) | | | | | | | 100 | | | $ | 95,125 | |
| | | |
| Dynasty Acquisition Co., Inc. | | | | | | | | | |
| | | |
Term Loan, 4.95%, (3 mo. USD LIBOR + 3.50%), Maturing April 6, 2026 | | | | | | | 44 | | | | 38,488 | |
| | | |
Term Loan, 4.95%, (3 mo. USD LIBOR + 3.50%), Maturing April 6, 2026 | | | | | | | 81 | | | | 71,587 | |
| | | |
| TransDigm, Inc. | | | | | | | | | |
| | | |
Term Loan, 2.65%, (1 mo. USD LIBOR + 2.25%), Maturing August 22, 2024 | | | | | | | 483 | | | | 425,409 | |
| | | |
Term Loan, 2.65%, (1 mo. USD LIBOR + 2.25%), Maturing December 9, 2025 | | | | | | | 953 | | | | 837,912 | |
| | | |
| | | | | | | | | | | $ | 1,468,521 | |
|
| Automotive — 0.8% | |
| | | |
| Adient US, LLC | | | | | | | | | |
| | | |
Term Loan, 5.52%, (3 mo. USD LIBOR + 4.00%), Maturing May 6, 2024 | | | | | | | 99 | | | $ | 90,100 | |
| | | |
| Autokiniton US Holdings, Inc. | | | | | | | | | |
| | | |
Term Loan, 6.78%, (1 mo. USD LIBOR + 6.38%), Maturing May 22, 2025 | | | | | | | 123 | | | | 98,250 | |
| | | |
| Dayco Products, LLC | | | | | | | | | |
| | | |
Term Loan, 5.86%, (3 mo. USD LIBOR + 4.25%), Maturing May 19, 2023 | | | | | | | 170 | | | | 127,641 | |
| | | |
| Goodyear Tire & Rubber Company (The) | | | | | | | | | |
| | | |
Term Loan - Second Lien, 3.20%, (3 mo. USD LIBOR + 2.00%), Maturing March 7, 2025 | | | | | | | 383 | | | | 356,260 | |
| | | |
| IAA, Inc. | | | | | | | | | |
| | | |
Term Loan, 2.69%, (1 mo. USD LIBOR + 2.25%), Maturing June 28, 2026 | | | | | | | 97 | | | | 92,759 | |
| | | |
| Panther BF Aggregator 2 L.P. | | | | | | | | | |
| | | |
Term Loan, 3.90%, (1 mo. USD LIBOR + 3.50%), Maturing April 30, 2026 | | | | | | | 547 | | | | 497,314 | |
| | | |
| Tenneco, Inc. | | | | | | | | | |
| | | |
Term Loan, 3.40%, (1 mo. USD LIBOR + 3.00%), Maturing October 1, 2025 | | | | | | | 518 | | | | 401,897 | |
| | | |
| Thor Industries, Inc. | | | | | | | | | |
| | | |
Term Loan, 4.75%, (1 mo. USD LIBOR + 3.75%, Floor 1.00%), Maturing February 1, 2026 | | | | | | | 143 | | | | 131,638 | |
| | | |
| | | | | | | | | | | $ | 1,795,859 | |
| | | | | | | | | | | | |
| Borrower/Tranche Description | | | | | Principal
Amount*
(000’s omitted) | | | Value | |
|
| Beverage and Tobacco — 0.1% | |
| | | |
| Flavors Holdings, Inc. | | | | | | | | | |
| | | |
Term Loan, 7.20%, (3 mo. USD LIBOR + 5.75%), Maturing June 30, 2020 | | | | | | | 294 | | | $ | 280,834 | |
| | | |
| | | | | | | | | | | $ | 280,834 | |
|
| Brokerage / Securities Dealers / Investment Houses — 0.1% | |
| | | |
| Advisor Group, Inc. | | | | | | | | | |
| | | |
Term Loan, 5.40%, (1 mo. USD LIBOR + 5.00%), Maturing July 31, 2026 | | | | | | | 175 | | | $ | 145,432 | |
| | | |
| OZ Management L.P. | | | | | | | | | |
| | | |
Term Loan, 5.50%, (1 mo. USD LIBOR + 4.75%), Maturing April 10, 2023 | | | | | | | 7 | | | | 7,128 | |
| | | |
| | | | | | | | | | | $ | 152,560 | |
|
| Building and Development — 1.3% | |
| | | |
| American Builders & Contractors Supply Co., Inc. | | | | | | | | | |
| | | |
Term Loan, 2.40%, (1 mo. USD LIBOR + 2.00%), Maturing January 15, 2027 | | | | | | | 348 | | | $ | 329,314 | |
| | | |
| APi Group DE, Inc. | | | | | | | | | |
| | | |
Term Loan, 2.90%, (1 mo. USD LIBOR + 2.50%), Maturing October 1, 2026 | | | | | | | 224 | | | | 218,196 | |
| | | |
| Brookfield Property REIT, Inc. | | | | | | | | | |
| | | |
Term Loan, 2.90%, (1 mo. USD LIBOR + 2.50%), Maturing August 27, 2025 | | | | | | | 148 | | | | 112,132 | |
| | | |
| Core & Main L.P. | | | | | | | | | |
| | | |
Term Loan, 3.99%, (USD LIBOR + 2.75%), Maturing August 1, 2024(2) | | | | | | | 172 | | | | 163,145 | |
| | | |
| CPG International, Inc. | | | | | | | | | |
| | | |
Term Loan, 5.93%, (12 mo. USD LIBOR + 3.75%), Maturing May 5, 2024 | | | | | | | 380 | | | | 348,046 | |
| | | |
| Cushman & Wakefield U.S. Borrower, LLC | | | | | | | | | |
| | | |
Term Loan, 3.15%, (1 mo. USD LIBOR + 2.75%), Maturing August 21, 2025 | | | | | | | 790 | | | | 735,546 | |
| | | |
| NCI Building Systems, Inc. | | | | | | | | | |
| | | |
Term Loan, 4.58%, (1 mo. USD LIBOR + 3.75%), Maturing April 12, 2025 | | | | | | | 98 | | | | 85,117 | |
| | | |
| Quikrete Holdings, Inc. | | | | | | | | | |
| | | |
Term Loan, 2.90%, (1 mo. USD LIBOR + 2.50%), Maturing February 1, 2027 | | | | | | | 432 | | | | 404,365 | |
| | | |
| RE/MAX International, Inc. | | | | | | | | | |
| | | |
Term Loan, 3.50%, (1 mo. USD LIBOR + 2.75%, Floor 0.75%), Maturing December 15, 2023 | | | | | | | 389 | | | | 365,269 | |
| | | |
| Summit Materials Companies I, LLC | | | | | | | | | |
| | | |
Term Loan, 2.40%, (1 mo. USD LIBOR + 2.00%), Maturing November 21, 2024 | | | | | | | 122 | | | | 116,002 | |
| | | |
| | | | | | | | | | | $ | 2,877,132 | |
| | | | |
| | 4 | | See Notes to Financial Statements. |
Eaton Vance
Short Duration Diversified Income Fund
April 30, 2020
Portfolio of Investments (Unaudited) — continued
| | | | | | | | | | |
| Borrower/Tranche Description | | | | Principal
Amount*
(000’s omitted) | | | Value | |
|
| Business Equipment and Services — 3.0% | |
| | | |
| Airbnb, Inc. | | | | | | | | |
| | | |
Term Loan, 8.50%, (1 mo. USD LIBOR + 7.50%, Floor 1.00%), Maturing April 17, 2025 | | | | | 125 | | | $ | 127,656 | |
| | | |
| AlixPartners, LLP | | | | | | | | |
| | | |
Term Loan, 3.50%, (1 mo. USD LIBOR + 2.50%, Floor 1.00%), Maturing April 4, 2024 | | | | | 124 | | | | 119,898 | |
| | | |
| Allied Universal Holdco, LLC | | | | | | | | |
| | | |
Term Loan, 4.65%, (1 mo. USD LIBOR + 4.25%), Maturing July 10, 2026 | | | | | 474 | | | | 444,622 | |
| | | |
| AppLovin Corporation | | | | | | | | |
| | | |
Term Loan, 3.90%, (1 mo. USD LIBOR + 3.50%), Maturing August 15, 2025 | | | | | 321 | | | | 307,334 | |
| | | |
Term Loan, Maturing August 15, 2025(3) | | | | | 100 | | | | 95,750 | |
| | | |
| ASGN Incorporated | | | | | | | | |
| | | |
Term Loan, 2.15%, (1 mo. USD LIBOR + 1.75%), Maturing April 2, 2025 | | | | | 45 | | | | 43,952 | |
| | | |
| Bracket Intermediate Holding Corp. | | | | | | | | |
| | | |
Term Loan, 5.70%, (3 mo. USD LIBOR + 4.25%), Maturing September 5, 2025 | | | | | 123 | | | | 112,506 | |
| | | |
| Camelot U.S. Acquisition 1 Co. | | | | | | | | |
| | | |
Term Loan, 3.65%, (1 mo. USD LIBOR + 3.25%), Maturing October 31, 2026 | | | | | 274 | | | | 264,597 | |
| | | |
| CCC Information Services, Inc. | | | | | | | | |
| | | |
Term Loan, 3.75%, (1 mo. USD LIBOR + 2.75%, Floor 1.00%), Maturing April 29, 2024 | | | | | 294 | | | | 278,756 | |
| | | |
| Ceridian HCM Holding, Inc. | | | | | | | | |
| | | |
Term Loan, 2.64%, (1 week USD LIBOR + 2.50%), Maturing April 30, 2025 | | | | | 222 | | | | 210,267 | |
| | | |
| Deerfield Dakota Holding, LLC | | | | | | | | |
| | | |
Term Loan, 4.75%, (1 mo. USD LIBOR + 3.75%, Floor 1.00%), Maturing April 9, 2027 | | | | | 325 | | | | 312,542 | |
| | | |
| EAB Global, Inc. | | | | | | | | |
| | | |
Term Loan, 4.88%, (USD LIBOR + 3.75%), Maturing November 15, 2024(2) | | | | | 196 | | | | 186,690 | |
| | | |
| EIG Investors Corp. | | | | | | | | |
| | | |
Term Loan, 5.39%, (3 mo. USD LIBOR + 3.75%), Maturing February 9, 2023 | | | | | 463 | | | | 428,978 | |
| | | |
| Garda World Security Corporation | | | | | | | | |
| | | |
Term Loan, 6.39%, (3 mo. USD LIBOR + 4.75%), Maturing October 30, 2026 | | | | | 120 | | | | 116,344 | |
| | | |
| IG Investment Holdings, LLC | | | | | | | | |
| | | |
Term Loan, 5.45%, (3 mo. USD LIBOR + 4.00%), Maturing May 23, 2025 | | | | | 426 | | | | 355,647 | |
| | | |
| IRI Holdings, Inc. | | | | | | | | |
| | | |
Term Loan, 5.86%, (3 mo. USD LIBOR + 4.25%), Maturing December 1, 2025 | | | | | 222 | | | | 190,526 | |
| | | | | | | | | | | | |
| Borrower/Tranche Description | | | | | Principal
Amount*
(000’s omitted) | | | Value | |
|
| Business Equipment and Services (continued) | |
| | | |
| Iron Mountain, Inc. | | | | | | | | | |
| | | |
Term Loan, 2.15%, (1 mo. USD LIBOR + 1.75%), Maturing January 2, 2026 | | | | | | | 123 | | | $ | 115,456 | |
| | | |
| KAR Auction Services, Inc. | | | | | | | | | |
| | | |
Term Loan, 2.88%, (1 mo. USD LIBOR + 2.25%), Maturing September 19, 2026 | | | | | | | 100 | | | | 91,043 | |
| | | |
| Kronos Incorporated | | | | | | | | | |
| | | |
Term Loan, 4.76%, (3 mo. USD LIBOR + 3.00%), Maturing November 1, 2023 | | | | | | | 1,019 | | | | 986,257 | |
| | | |
| KUEHG Corp. | | | | | | | | | |
| | | |
Term Loan, 5.20%, (3 mo. USD LIBOR + 3.75%), Maturing February 21, 2025 | | | | | | | 313 | | | | 255,931 | |
| | | |
Term Loan - Second Lien, 9.70%, (3 mo. USD LIBOR + 8.25%), Maturing August 18, 2025 | | | | | | | 50 | | | | 38,750 | |
| | | |
| Monitronics International, Inc. | | | | | | | | | |
| | | |
Term Loan, 7.75%, (1 mo. USD LIBOR + 6.50%, Floor 1.25%), Maturing March 29, 2024 | | | | | | | 200 | | | | 136,225 | |
| | | |
| PGX Holdings, Inc. | | | | | | | | | |
| | | |
Term Loan, 0.00%, Maturing September 29, 2020(4) | | | | | | | 315 | | | | 133,957 | |
| | | |
| Pre-Paid Legal Services, Inc. | | | | | | | | | |
| | | |
Term Loan, 3.65%, (1 mo. USD LIBOR + 3.25%), Maturing May 1, 2025 | | | | | | | 67 | | | | 61,341 | |
| | | |
| Red Ventures, LLC | | | | | | | | | |
| | | |
Term Loan, 2.90%, (1 mo. USD LIBOR + 2.50%), Maturing November 8, 2024 | | | | | | | 235 | | | | 218,055 | |
| | | |
| Spin Holdco, Inc. | | | | | | | | | |
| | | |
Term Loan, 4.25%, (1 mo. USD LIBOR + 3.25%, Floor 1.00%), Maturing November 14, 2022 | | | | | | | 600 | | | | 554,568 | |
| | | |
| Techem Verwaltungsgesellschaft 675 mbH | | | | | | | | | |
| | | |
Term Loan, 2.88%, (2 mo. EURIBOR + 2.88%), Maturing July 15, 2025 | | | EUR | | | | 111 | | | | 118,470 | |
| | | |
| Tempo Acquisition, LLC | | | | | | | | | |
| | | |
Term Loan, 3.15%, (1 mo. USD LIBOR + 2.75%), Maturing May 1, 2024 | | | | | | | 146 | | | | 134,934 | |
| | | |
| West Corporation | | | | | | | | | |
| | | |
Term Loan, 5.45%, (3 mo. USD LIBOR + 4.00%), Maturing October 10, 2024 | | | | | | | 171 | | | | 134,872 | |
| | | |
| | | | | | | | | | | $ | 6,575,924 | |
|
| Cable and Satellite Television — 1.5% | |
| | | |
| Charter Communications Operating, LLC | | | | | | | | | |
| | | |
Term Loan, 2.16%, (1 mo. USD LIBOR + 1.75%), Maturing February 1, 2027 | | | | | | | 538 | | | $ | 519,143 | |
| | | |
| CSC Holdings, LLC | | | | | | | | | |
| | | |
Term Loan, 3.06%, (1 mo. USD LIBOR + 2.25%), Maturing July 17, 2025 | | | | | | | 446 | | | | 428,216 | |
| | | | |
| | 5 | | See Notes to Financial Statements. |
Eaton Vance
Short Duration Diversified Income Fund
April 30, 2020
Portfolio of Investments (Unaudited) — continued
| | | | | | | | | | | | |
| Borrower/Tranche Description | | | | | Principal
Amount*
(000’s omitted) | | | Value | |
|
| Cable and Satellite Television (continued) | |
| | | |
| CSC Holdings, LLC (continued) | | | | | | | | | |
| | | |
Term Loan, 3.06%, (1 mo. USD LIBOR + 2.25%), Maturing January 15, 2026 | | | | | | | 148 | | | $ | 141,783 | |
| | | |
Term Loan, 3.31%, (1 mo. USD LIBOR + 2.50%), Maturing April 15, 2027 | | | | | | | 197 | | | | 189,290 | |
| | | |
| Numericable Group S.A. | | | | | | | | | |
| | | |
Term Loan, 3.15%, (1 mo. USD LIBOR + 2.75%), Maturing July 31, 2025 | | | | | | | 315 | | | | 291,764 | |
| | | |
| Radiate Holdco, LLC | | | | | | | | | |
| | | |
Term Loan, 3.75%, (1 mo. USD LIBOR + 3.00%, Floor 0.75%), Maturing February 1, 2024 | | | | | | | 171 | | | | 164,345 | |
| | | |
| Telenet Financing USD, LLC | | | | | | | | | |
| | | |
Term Loan, 2.81%, (1 mo. USD LIBOR + 2.00%), Maturing April 30, 2028 | | | | | | | 575 | | | | 549,412 | |
| | | |
| UPC Broadband Holding B.V. | | | | | | | | | |
| | | |
Term Loan, 3.06%, (1 mo. USD LIBOR + 2.25%), Maturing April 30, 2028 | | | | | | | 125 | | | | 118,438 | |
| | | |
| Virgin Media Bristol, LLC | | | | | | | | | |
| | | |
Term Loan, 3.31%, (1 mo. USD LIBOR + 2.50%), Maturing January 31, 2028 | | | | | | | 650 | | | | 616,455 | |
| | | |
| Virgin Media SFA Finance Limited | | | | | | | | | |
| | | |
Term Loan, 2.50%, (6 mo. EURIBOR + 2.50%), Maturing January 31, 2029 | | | EUR | | | | 175 | | | | 185,781 | |
| | | |
| | | | | | | | | | | $ | 3,204,627 | |
|
| Chemicals and Plastics — 1.4% | |
| | | |
| Emerald Performance Materials, LLC | | | | | | | | | |
| | | |
Term Loan, 4.50%, (1 mo. USD LIBOR + 3.50%, Floor 1.00%), Maturing August 1, 2021 | | | | | | | 328 | | | $ | 311,178 | |
| | | |
| Ferro Corporation | | | | | | | | | |
| | | |
Term Loan, 3.70%, (3 mo. USD LIBOR + 2.25%), Maturing February 14, 2024 | | | | | | | 48 | | | | 46,898 | |
| | | |
Term Loan, 3.70%, (3 mo. USD LIBOR + 2.25%), Maturing February 14, 2024 | | | | | | | 50 | | | | 47,917 | |
| | | |
| Gemini HDPE, LLC | | | | | | | | | |
| | | |
Term Loan, 3.27%, (3 mo. USD LIBOR + 2.50%), Maturing August 7, 2024 | | | | | | | 329 | | | | 315,708 | |
| | | |
| H.B. Fuller Company | | | | | | | | | |
| | | |
Term Loan, 2.72%, (1 mo. USD LIBOR + 2.00%), Maturing October 20, 2024 | | | | | | | 251 | | | | 241,958 | |
| | | |
| Hexion, Inc. | | | | | | | | | |
| | | |
Term Loan, 4.94%, (3 mo. USD LIBOR + 3.50%), Maturing July 1, 2026 | | | | | | | 124 | | | | 119,100 | |
| | | |
| INEOS Enterprises Holdings II Limited | | | | | | | | | |
| | | |
Term Loan, 3.25%, (3 mo. EURIBOR + 3.25%), Maturing August 28, 2026 | | | EUR | | | | 25 | | | | 26,386 | |
| | | | | | | | | | | | |
| Borrower/Tranche Description | | | | | Principal
Amount*
(000’s omitted) | | | Value | |
|
| Chemicals and Plastics (continued) | |
| | | |
| INEOS US Finance, LLC | | | | | | | | | |
| | | |
Term Loan, 2.40%, (1 mo. USD LIBOR + 2.00%), Maturing April 1, 2024 | | | | | | | 513 | | | $ | 487,448 | |
| | | |
| Messer Industries GmbH | | | | | | | | | |
| | | |
Term Loan, 3.95%, (3 mo. USD LIBOR + 2.50%), Maturing March 1, 2026 | | | | | | | 173 | | | | 164,696 | |
| | | |
| PQ Corporation | | | | | | | | | |
| | | |
Term Loan, 2.65%, (1 mo. USD LIBOR + 2.25%), Maturing February 7, 2027 | | | | | | | 259 | | | | 248,663 | |
| | | |
| Pregis TopCo Corporation | | | | | | | | | |
| | | |
Term Loan, 4.40%, (1 mo. USD LIBOR + 4.00%), Maturing July 31, 2026 | | | | | | | 100 | | | | 90,274 | |
| | | |
| Spectrum Holdings III Corp. | | | | | | | | | |
| | | |
Term Loan, 4.70%, (3 mo. USD LIBOR + 3.25%), Maturing January 31, 2025 | | | | | | | 87 | | | | 74,639 | |
| | | |
| Starfruit Finco B.V. | | | | | | | | | |
| | | |
Term Loan, 3.86%, (1 mo. USD LIBOR + 3.00%), Maturing October 1, 2025 | | | | | | | 362 | | | | 330,545 | |
| | | |
| Tata Chemicals North America, Inc. | | | | | | | | | |
| | | |
Term Loan, 3.75%, (1 mo. USD LIBOR + 2.75%, Floor 1.00%), Maturing August 7, 2020 | | | | | | | 161 | | | | 156,101 | |
| | | |
| Tronox Finance, LLC | | | | | | | | | |
| | | |
Term Loan, 3.59%, (USD LIBOR + 2.75%), Maturing September 23, 2024(2) | | | | | | | 443 | | | | 416,570 | |
| | | |
| | | | | | | | | | | $ | 3,078,081 | |
|
| Containers and Glass Products — 0.6% | |
| | | |
| Berry Global, Inc. | | | | | | | | | |
| | | |
Term Loan, 2.83%, (1 mo. USD LIBOR + 2.00%), Maturing July 1, 2026 | | | | | | | 149 | | | $ | 142,723 | |
| | | |
| BWAY Holding Company | | | | | | | | | |
| | | |
Term Loan, 4.56%, (3 mo. USD LIBOR + 3.25%), Maturing April 3, 2024 | | | | | | | 234 | | | | 202,982 | |
| | | |
| Consolidated Container Company, LLC | | | | | | | | | |
| | | |
Term Loan, 3.75%, (1 mo. USD LIBOR + 2.75%, Floor 1.00%), Maturing May 22, 2024 | | | | | | | 244 | | | | 235,842 | |
| | | |
| Flex Acquisition Company, Inc. | | | | | | | | | |
| | | |
Term Loan, 4.68%, (3 mo. USD LIBOR + 3.25%), Maturing June 29, 2025 | | | | | | | 220 | | | | 206,578 | |
| | | |
| Pelican Products, Inc. | | | | | | | | | |
| | | |
Term Loan, 4.50%, (3 mo. USD LIBOR + 3.50%, Floor 1.00%), Maturing May 1, 2025 | | | | | | | 98 | | | | 81,793 | |
| | | |
| Reynolds Consumer Products, Inc. | | | | | | | | | |
| | | |
Term Loan, 2.15%, (1 mo. USD LIBOR + 1.75%), Maturing February 4, 2027 | | | | | | | 350 | | | | 338,000 | |
| | | |
| | | | | | | | | | | $ | 1,207,918 | |
| | | | |
| | 6 | | See Notes to Financial Statements. |
Eaton Vance
Short Duration Diversified Income Fund
April 30, 2020
Portfolio of Investments (Unaudited) — continued
| | | | | | | | | | | | |
| Borrower/Tranche Description | | | | | Principal
Amount*
(000’s omitted) | | | Value | |
|
| Cosmetics / Toiletries — 0.1% | |
| | | |
| Kronos Acquisition Holdings, Inc. | | | | | | | | | |
| | | |
Term Loan, 5.00%, (1 mo. USD LIBOR + 4.00%, Floor 1.00%), Maturing May 15, 2023 | | | | | | | 296 | | | $ | 266,719 | |
| | | |
| | | | | | | | | | | $ | 266,719 | |
|
| Drugs — 1.7% | |
| | | |
| Akorn, Inc. | | | | | | | | | |
| | | |
Term Loan, 15.50%, (1 mo. USD LIBOR + 14.50%, Floor 1.00%), 14.75% cash, 0.75% PIK, Maturing April 16, 2021 | | | | | | | 164 | | | $ | 140,071 | |
| | | |
| Alkermes, Inc. | | | | | | | | | |
| | | |
Term Loan, 3.01%, (1 mo. USD LIBOR + 2.25%), Maturing March 27, 2023 | | | | | | | 70 | | | | 64,580 | |
| | | |
| Amneal Pharmaceuticals, LLC | | | | | | | | | |
| | | |
Term Loan, 3.94%, (1 mo. USD LIBOR + 3.50%), Maturing May 4, 2025 | | | | | | | 516 | | | | 463,477 | |
| | | |
| Arbor Pharmaceuticals, Inc. | | | | | | | | | |
| | | |
Term Loan, 6.00%, (2 mo. USD LIBOR + 5.00%, Floor 1.00%), Maturing July 5, 2023 | | | | | | | 191 | | | | 160,398 | |
| | | |
| Bausch Health Companies, Inc. | | | | | | | | | |
| | | |
Term Loan, 3.72%, (1 mo. USD LIBOR + 3.00%), Maturing June 2, 2025 | | | | | | | 719 | | | | 697,085 | |
| | | |
| Catalent Pharma Solutions, Inc. | | | | | | | | | |
| | | |
Term Loan, 3.25%, (1 mo. USD LIBOR + 2.25%, Floor 1.00%), Maturing May 18, 2026 | | | | | | | 124 | | | | 122,203 | |
| | | |
| Elanco Animal Health, Inc. | | | | | | | | | |
| | | |
Term Loan, Maturing February 4, 2027(3) | | | | | | | 300 | | | | 290,187 | |
| | | |
| Endo Luxembourg Finance Company I S.a.r.l. | | | | | | | | | |
| | | |
Term Loan, 5.00%, (1 mo. USD LIBOR + 4.25%, Floor 0.75%), Maturing April 29, 2024 | | | | | | | 754 | | | | 693,016 | |
| | | |
| Grifols Worldwide Operations USA, Inc. | | | | | | | | | |
| | | |
Term Loan, 2.14%, (1 week USD LIBOR + 2.00%), Maturing November 15, 2027 | | | | | | | 125 | | | | 120,947 | |
| | | |
| Horizon Therapeutics USA, Inc. | | | | | | | | | |
| | | |
Term Loan, 3.25%, (1 mo. USD LIBOR + 2.25%, Floor 1.00%), Maturing May 22, 2026 | | | | | | | 331 | | | | 324,228 | |
| | | |
| Mallinckrodt International Finance S.A. | | | | | | | | | |
| | | |
Term Loan, 4.20%, (3 mo. USD LIBOR + 2.75%), Maturing September 24, 2024 | | | | | | | 697 | | | | 497,483 | |
| | | |
Term Loan, 4.70%, (3 mo. USD LIBOR + 3.00%), Maturing February 24, 2025 | | | | | | | 233 | | | | 163,923 | |
| | | |
| | | | | | | | | | | $ | 3,737,598 | |
|
| Ecological Services and Equipment — 0.2% | |
| | | |
| EnergySolutions, LLC | | | | | | | | | |
| | | |
Term Loan, 5.20%, (3 mo. USD LIBOR + 3.75%), Maturing May 9, 2025 | | | | | | | 172 | | | $ | 156,463 | |
| | | | | | | | | | | | |
| Borrower/Tranche Description | | | | | Principal
Amount*
(000’s omitted) | | | Value | |
|
| Ecological Services and Equipment (continued) | |
| | | |
| GFL Environmental, Inc. | | | | | | | | | |
| | | |
Term Loan, 4.00%, (1 mo. USD LIBOR + 3.00%, Floor 1.00%), Maturing May 30, 2025 | | | | | | | 275 | | | $ | 270,676 | |
| | | |
| | | | | | | | | | | $ | 427,139 | |
|
| Electronics / Electrical — 4.2% | |
| | | |
| Almonde, Inc. | | | | | | | | | |
| | | |
Term Loan, 4.50%, (6 mo. USD LIBOR + 3.50%, Floor 1.00%), Maturing June 13, 2024 | | | | | | | 394 | | | $ | 343,717 | |
| | | |
| Applied Systems, Inc. | | | | | | | | | |
| | | |
Term Loan, 4.70%, (3 mo. USD LIBOR + 3.25%), Maturing September 19, 2024 | | | | | | | 415 | | | | 399,288 | |
| | | |
Term Loan - Second Lien, 8.45%, (3 mo. USD LIBOR + 7.00%), Maturing September 19, 2025 | | | | | | | 75 | | | | 72,375 | |
| | | |
| Astra Acquisition Corp. | | | | | | | | | |
| | | |
Term Loan, 6.50%, (1 mo. USD LIBOR + 5.50%, Floor 1.00%), Maturing March 1, 2027 | | | | | | | 125 | | | | 116,875 | |
| | | |
| Avast Software B.V. | | | | | | | | | |
| | | |
Term Loan, 3.70%, (3 mo. USD LIBOR + 2.25%), Maturing September 29, 2023 | | | | | | | 91 | | | | 88,571 | |
| | | |
| Banff Merger Sub, Inc. | | | | | | | | | |
| | | |
Term Loan, 4.65%, (1 mo. USD LIBOR + 4.25%), Maturing October 2, 2025 | | | | | | | 370 | | | | 321,863 | |
| | | |
| Blackhawk Network Holdings, Inc. | | | | | | | | | |
| | | |
Term Loan, 3.15%, (1 mo. USD LIBOR + 2.75%), Maturing June 15, 2025 | | | | | | | 123 | | | | 106,310 | |
| | | |
| Castle US Holding Corporation | | | | | | | | | |
| | | |
Term Loan, 5.20%, (1 mo. USD LIBOR + 3.75%), Maturing January 29, 2027 | | | | | | | 142 | | | | 120,458 | |
| | | |
| CDW, LLC | | | | | | | | | |
| | | |
Term Loan, 2.16%, (1 mo. USD LIBOR + 1.75%), Maturing October 13, 2026 | | | | | | | 548 | | | | 543,517 | |
| | | |
| Cohu, Inc. | | | | | | | | | |
| | | |
Term Loan, 3.40%, (1 mo. USD LIBOR + 3.00%), Maturing October 1, 2025 | | | | | | | 99 | | | | 81,755 | |
| | | |
| CommScope, Inc. | | | | | | | | | |
| | | |
Term Loan, 3.65%, (1 mo. USD LIBOR + 3.25%), Maturing April 6, 2026 | | | | | | | 274 | | | | 259,875 | |
| | | |
| ECI Macola/Max Holdings, LLC | | | | | | | | | |
| | | |
Term Loan, 5.70%, (3 mo. USD LIBOR + 4.25%), Maturing September 27, 2024 | | | | | | | 122 | | | | 108,244 | |
| | | |
| Electro Rent Corporation | | | | | | | | | |
| | | |
Term Loan, 6.02%, (USD LIBOR + 5.00%), Maturing January 31, 2024(2) | | | | | | | 268 | | | | 248,105 | |
| | | |
| Epicor Software Corporation | | | | | | | | | |
| | | |
Term Loan, 3.66%, (1 mo. USD LIBOR + 3.25%), Maturing June 1, 2022 | | | | | | | 24 | | | | 23,676 | |
| | | | |
| | 7 | | See Notes to Financial Statements. |
Eaton Vance
Short Duration Diversified Income Fund
April 30, 2020
Portfolio of Investments (Unaudited) — continued
| | | | | | | | | | |
| Borrower/Tranche Description | | | | Principal
Amount*
(000’s omitted) | | | Value | |
|
| Electronics / Electrical (continued) | |
| | | |
| EXC Holdings III Corp. | | | | | | | | |
| | | |
Term Loan, 4.95%, (3 mo. USD LIBOR + 3.50%), Maturing December 2, 2024 | | | | | 73 | | | $ | 68,914 | |
| | | |
| Flexera Software, LLC | | | | | | | | |
| | | |
Term Loan, 4.50%, (3 mo. USD LIBOR + 3.50%, Floor 1.00%), Maturing February 26, 2025 | | | | | 25 | | | | 23,677 | |
| | | |
| Go Daddy Operating Company, LLC | | | | | | | | |
| | | |
Term Loan, 2.15%, (1 mo. USD LIBOR + 1.75%), Maturing February 15, 2024 | | | | | 603 | | | | 586,891 | |
| | | |
| Hyland Software, Inc. | | | | | | | | |
| | | |
Term Loan, 4.00%, (1 mo. USD LIBOR + 3.25%, Floor 0.75%), Maturing July 1, 2024 | | | | | 171 | | | | 165,266 | |
| | | |
| Infoblox, Inc. | | | | | | | | |
| | | |
Term Loan, 4.90%, (1 mo. USD LIBOR + 4.50%), Maturing November 7, 2023 | | | | | 142 | | | | 136,330 | |
| | | |
| Informatica, LLC | | | | | | | | |
| | | |
Term Loan, 3.65%, (1 mo. USD LIBOR + 3.25%), Maturing February 25, 2027 | | | | | 925 | | | | 872,969 | |
| | | |
| MA FinanceCo., LLC | | | | | | | | |
| | | |
Term Loan, 2.65%, (1 mo. USD LIBOR + 2.25%), Maturing November 19, 2021 | | | | | 815 | | | | 785,549 | |
| | | |
Term Loan, 2.90%, (1 mo. USD LIBOR + 2.50%), Maturing June 21, 2024 | | | | | 25 | | | | 22,987 | |
| | | |
| MTS Systems Corporation | | | | | | | | |
| | | |
Term Loan, 4.00%, (1 mo. USD LIBOR + 3.25%, Floor 0.75%), Maturing July 5, 2023 | | | | | 93 | | | | 90,355 | |
| | | |
| NCR Corporation | | | | | | | | |
| | | |
Term Loan, 2.91%, (1 mo. USD LIBOR + 2.50%), Maturing August 28, 2026 | | | | | 149 | | | | 142,534 | |
| | | |
| Refinitiv US Holdings, Inc. | | | | | | | | |
| | | |
Term Loan, 3.65%, (1 mo. USD LIBOR + 3.25%), Maturing October 1, 2025 | | | | | 173 | | | | 169,486 | |
| | | |
| Renaissance Holding Corp. | | | | | | | | |
| | | |
Term Loan, 4.01%, (3 mo. USD LIBOR + 3.25%), Maturing May 30, 2025 | | | | | 172 | | | | 157,323 | |
| | | |
| Seattle Spinco, Inc. | | | | | | | | |
| | | |
Term Loan, 2.90%, (1 mo. USD LIBOR + 2.50%), Maturing June 21, 2024 | | | | | 167 | | | | 155,237 | |
| | | |
| SkillSoft Corporation | | | | | | | | |
| | | |
Term Loan, 5.75%, (3 mo. USD LIBOR + 4.75%, Floor 1.00%), Maturing April 28, 2021 | | | | | 667 | | | | 399,416 | |
| | | |
| SolarWinds Holdings, Inc. | | | | | | | | |
| | | |
Term Loan, 3.15%, (1 mo. USD LIBOR + 2.75%), Maturing February 5, 2024 | | | | | 171 | | | | 166,643 | |
| | | |
| Solera, LLC | | | | | | | | |
| | | |
Term Loan, 4.36%, (3 mo. USD LIBOR + 2.75%), Maturing March 3, 2023 | | | | | 122 | | | | 116,234 | |
| | | | | | | | | | | | |
| Borrower/Tranche Description | | | | | Principal
Amount*
(000’s omitted) | | | Value | |
|
| Electronics / Electrical (continued) | |
| | | |
| SS&C Technologies Holdings Europe S.a.r.l. | | | | | | | | | |
| | | |
Term Loan, 2.15%, (1 mo. USD LIBOR + 1.75%), Maturing April 16, 2025 | | | | | | | 168 | | | $ | 162,362 | |
| | | |
| SS&C Technologies, Inc. | | | | | | | | | |
| | | |
Term Loan, 2.15%, (1 mo. USD LIBOR + 1.75%), Maturing April 16, 2025 | | | | | | | 235 | | | | 227,512 | |
| | | |
| SurveyMonkey, Inc. | | | | | | | | | |
| | | |
Term Loan, 3.91%, (1 week USD LIBOR + 3.75%), Maturing October 10, 2025 | | | | | | | 217 | | | | 199,364 | |
| | | |
| Tibco Software, Inc. | | | | | | | | | |
| | | |
Term Loan, 4.16%, (1 mo. USD LIBOR + 3.75%), Maturing June 30, 2026 | | | | | | | 196 | | | | 185,047 | |
| | | |
| TriTech Software Systems | | | | | | | | | |
| | | |
Term Loan, 5.20%, (3 mo. USD LIBOR + 3.75%), Maturing August 29, 2025 | | | | | | | 123 | | | | 106,979 | |
| | | |
| Uber Technologies, Inc. | | | | | | | | | |
| | | |
Term Loan, 3.90%, (1 mo. USD LIBOR + 3.50%), Maturing July 13, 2023 | | | | | | | 314 | | | | 297,496 | |
| | | |
Term Loan, 5.00%, (1 mo. USD LIBOR + 4.00%, Floor 1.00%), Maturing April 4, 2025 | | | | | | | 221 | | | | 209,825 | |
| | | |
| Ultimate Software Group, Inc. (The) | | | | | | | | | |
| | | |
Term Loan, 4.15%, (1 mo. USD LIBOR + 3.75%), Maturing May 4, 2026 | | | | | | | 249 | | | | 238,489 | |
| | | |
| Ultra Clean Holdings, Inc. | | | | | | | | | |
| | | |
Term Loan, 4.90%, (1 mo. USD LIBOR + 4.50%), Maturing August 27, 2025 | | | | | | | 106 | | | | 101,044 | |
| | | |
| Verifone Systems, Inc. | | | | | | | | | |
| | | |
Term Loan, 5.69%, (3 mo. USD LIBOR + 4.00%), Maturing August 20, 2025 | | | | | | | 173 | | | | 135,185 | |
| | | |
| Vero Parent, Inc. | | | | | | | | | |
| | | |
Term Loan, 7.86%, (3 mo. USD LIBOR + 6.25%), Maturing August 16, 2024 | | | | | | | 219 | | | | 200,485 | |
| | | |
| VS Buyer, LLC | | | | | | | | | |
| | | |
Term Loan, 4.86%, (3 mo. USD LIBOR + 3.25%), Maturing February 28, 2027 | | | | | | | 175 | | | | 166,687 | |
| | | |
| Vungle, Inc. | | | | | | | | | |
| | | |
Term Loan, 5.99%, (1 mo. USD LIBOR + 5.50%), Maturing September 30, 2026 | | | | | | | 100 | | | | 94,525 | |
| | | |
| | | | | | | | | | | $ | 9,219,440 | |
|
| Equipment Leasing — 0.2% | |
| | | |
| Delos Finance S.a.r.l. | | | | | | | | | |
| | | |
Term Loan, 3.20%, (3 mo. USD LIBOR + 1.75%), Maturing October 6, 2023 | | | | | | | 298 | | | $ | 283,679 | |
| | | |
| IBC Capital Limited | | | | | | | | | |
| | | |
Term Loan, 4.64%, (3 mo. USD LIBOR + 3.75%), Maturing September 11, 2023 | | | | | | | 49 | | | | 42,614 | |
| | | |
| | | | | | | | | | | $ | 326,293 | |
| | | | |
| | 8 | | See Notes to Financial Statements. |
Eaton Vance
Short Duration Diversified Income Fund
April 30, 2020
Portfolio of Investments (Unaudited) — continued
| | | | | | | | | | | | |
| Borrower/Tranche Description | | | | | Principal
Amount*
(000’s omitted) | | | Value | |
|
| Financial Intermediaries — 1.3% | |
| | | |
| Aretec Group, Inc. | | | | | | | | | |
| | | |
Term Loan, 4.65%, (1 mo. USD LIBOR + 4.25%), Maturing October 1, 2025 | | | | | | | 198 | | | $ | 165,129 | |
| | | |
| Citco Funding, LLC | | | | | | | | | |
| | | |
Term Loan, 3.57%, (3 mo. USD LIBOR + 2.50%), Maturing September 28, 2023 | | | | | | | 643 | | | | 625,754 | |
| | | |
| Claros Mortgage Trust, Inc. | | | | | | | | | |
| | | |
Term Loan, 4.11%, (1 mo. USD LIBOR + 3.25%), Maturing August 9, 2026 | | | | | | | 124 | | | | 111,938 | |
| | | |
| Ditech Holding Corporation | | | | | | | | | |
| | | |
Term Loan, 0.00%, Maturing June 30, 2022(4) | | | | | | | 474 | | | | 189,742 | |
| | | |
| EIG Management Company, LLC | | | | | | | | | |
| | | |
Term Loan, 4.50%, (1 mo. USD LIBOR + 3.75%, Floor 0.75%), Maturing February 22, 2025 | | | | | | | 49 | | | | 44,406 | |
| | | |
| FinCo. I, LLC | | | | | | | | | |
| | | |
Term Loan, 2.40%, (1 mo. USD LIBOR + 2.00%), Maturing December 27, 2022 | | | | | | | 147 | | | | 142,394 | |
| | | |
| Focus Financial Partners, LLC | | | | | | | | | |
| | | |
Term Loan, 2.40%, (1 mo. USD LIBOR + 2.00%), Maturing July 3, 2024 | | | | | | | 419 | | | | 400,194 | |
| | | |
| Franklin Square Holdings L.P. | | | | | | | | | |
| | | |
Term Loan, 2.69%, (1 mo. USD LIBOR + 2.25%), Maturing August 1, 2025 | | | | | | | 74 | | | | 68,704 | |
| | | |
| Greenhill & Co., Inc. | | | | | | | | | |
| | | |
Term Loan, 3.97%, (1 mo. USD LIBOR + 3.25%), Maturing April 12, 2024 | | | | | | | 140 | | | | 129,500 | |
| | | |
| GreenSky Holdings, LLC | | | | | | | | | |
| | | |
Term Loan, 3.69%, (1 mo. USD LIBOR + 3.25%), Maturing March 31, 2025 | | | | | | | 196 | | | | 179,340 | |
| | | |
| Guggenheim Partners, LLC | | | | | | | | | |
| | | |
Term Loan, 3.50%, (1 mo. USD LIBOR + 2.75%, Floor 0.75%), Maturing July 21, 2023 | | | | | | | 186 | | | | 176,674 | |
| | | |
| Harbourvest Partners, LLC | | | | | | | | | |
| | | |
Term Loan, 3.06%, (1 mo. USD LIBOR + 2.25%), Maturing March 3, 2025 | | | | | | | 61 | | | | 57,942 | |
| | | |
| LPL Holdings, Inc. | | | | | | | | | |
| | | |
Term Loan, 2.24%, (1 mo. USD LIBOR + 1.75%), Maturing November 12, 2026 | | | | | | | 200 | | | | 193,515 | |
| | | |
| StepStone Group L.P. | | | | | | | | | |
| | | |
Term Loan, 5.00%, (1 mo. USD LIBOR + 4.00%, Floor 1.00%), Maturing March 27, 2025 | | | | | | | 98 | | | | 95,550 | |
| | | |
| Victory Capital Holdings, Inc. | | | | | | | | | |
| | | |
Term Loan, 3.94%, (3 mo. USD LIBOR + 2.50%), Maturing July 1, 2026 | | | | | | | 166 | | | | 159,846 | |
| | | |
| | | | | | | | | | | $ | 2,740,628 | |
| | | | | | | | | | | | |
| Borrower/Tranche Description | | | | | Principal
Amount*
(000’s omitted) | | | Value | |
|
| Food Products — 1.0% | |
| | | |
| Alphabet Holding Company, Inc. | | | | | | | | | |
| | | |
Term Loan, 3.90%, (1 mo. USD LIBOR + 3.50%), Maturing September 26, 2024 | | | | | | | 366 | | | $ | 329,672 | |
| | | |
| CHG PPC Parent, LLC | | | | | | | | | |
| | | |
Term Loan, 3.15%, (1 mo. USD LIBOR + 2.75%), Maturing March 31, 2025 | | | | | | | 74 | | | | 68,529 | |
| | | |
| Del Monte Foods, Inc. | | | | | | | | | |
| | | |
Term Loan, 4.86%, (3 mo. USD LIBOR + 3.25%), Maturing February 18, 2021 | | | | | | | 118 | | | | 115,885 | |
| | | |
| Froneri International PLC | | | | | | | | | |
| | | |
Term Loan, 2.65%, (1 mo. USD LIBOR + 2.25%), Maturing January 29, 2027 | | | | | | | 300 | | | | 279,563 | |
| | | |
| Hearthside Food Solutions, LLC | | | | | | | | | |
| | | |
Term Loan, 4.09%, (1 mo. USD LIBOR + 3.69%), Maturing May 23, 2025 | | | | | | | 98 | | | | 90,697 | |
| | | |
Term Loan, 4.40%, (1 mo. USD LIBOR + 4.00%), Maturing May 23, 2025 | | | | | | | 49 | | | | 45,939 | |
| | | |
| HLF Financing S.a.r.l. | | | | | | | | | |
| | | |
Term Loan, 3.15%, (1 mo. USD LIBOR + 2.75%), Maturing August 18, 2025 | | | | | | | 148 | | | | 139,365 | |
| | | |
| Jacobs Douwe Egberts International B.V. | | | | | | | | | |
| | | |
Term Loan, 3.00%, (1 mo. USD LIBOR + 2.00%, Floor 1.00%), Maturing November 1, 2025 | | | | | | | 233 | | | | 228,967 | |
| | | |
| JBS USA Lux S.A. | | | | | | | | | |
| | | |
Term Loan, 3.07%, (6 mo. USD LIBOR + 2.00%), Maturing May 1, 2026 | | | | | | | 693 | | | | 672,535 | |
| | | |
| Nomad Foods Europe Midco Limited | | | | | | | | | |
| | | |
Term Loan, 3.06%, (1 mo. USD LIBOR + 2.25%), Maturing May 15, 2024 | | | | | | | 197 | | | | 190,946 | |
| | | |
| | | | | | | | | | | $ | 2,162,098 | |
|
| Food Service — 0.8% | |
| | | |
| 1011778 B.C. Unlimited Liability Company | | | | | | | | | |
| | | |
Term Loan, 2.15%, (1 mo. USD LIBOR + 1.75%), Maturing November 19, 2026 | | | | | | | 873 | | | $ | 825,172 | |
| | | |
| Aramark Services, Inc. | | | | | | | | | |
| | | |
Term Loan, 2.15%, (1 mo. USD LIBOR + 1.75%), Maturing March 11, 2025 | | | | | | | 140 | | | | 131,995 | |
| | | |
| IRB Holding Corp. | | | | | | | | | |
| | | |
Term Loan, 3.75%, (1 mo. USD LIBOR + 2.75%, Floor 1.00%), Maturing February 5, 2025 | | | | | | | 270 | | | | 237,405 | |
| | | |
| KFC Holding Co. | | | | | | | | | |
| | | |
Term Loan, 2.47%, (1 mo. USD LIBOR + 1.75%), Maturing April 3, 2025 | | | | | | | 169 | | | | 162,522 | |
| | | |
| Restaurant Technologies, Inc. | | | | | | | | | |
| | | |
Term Loan, 4.70%, (3 mo. USD LIBOR + 3.25%), Maturing October 1, 2025 | | | | | | | 25 | | | | 22,095 | |
| | | | |
| | 9 | | See Notes to Financial Statements. |
Eaton Vance
Short Duration Diversified Income Fund
April 30, 2020
Portfolio of Investments (Unaudited) — continued
| | | | | | | | | | | | |
| Borrower/Tranche Description | | | | | Principal
Amount*
(000’s omitted) | | | Value | |
|
| Food Service (continued) | |
| | | |
| US Foods, Inc. | | | | | | | | | |
| | | |
Term Loan, 2.15%, (1 mo. USD LIBOR + 1.75%), Maturing June 27, 2023 | | | | | | | 122 | | | $ | 113,635 | |
| | | |
Term Loan, 3.07%, (6 mo. USD LIBOR + 2.00%), Maturing September 13, 2026 | | | | | | | 249 | | | | 223,952 | |
| | | |
| | | | | | | | | | | $ | 1,716,776 | |
|
| Health Care — 2.9% | |
| | | |
| Accelerated Health Systems, LLC | | | | | | | | | |
| | | |
Term Loan, 4.33%, (1 mo. USD LIBOR + 3.50%), Maturing October 31, 2025 | | | | | | | 74 | | | $ | 64,434 | |
| | | |
| ADMI Corp. | | | | | | | | | |
| | | |
Term Loan, 4.20%, (3 mo. USD LIBOR + 2.75%), Maturing April 30, 2025 | | | | | | | 246 | | | | 211,472 | |
| | | |
| Alliance Healthcare Services, Inc. | | | | | | | | | |
| | | |
Term Loan, 5.50%, (1 mo. USD LIBOR + 4.50%, Floor 1.00%), Maturing October 24, 2023 | | | | | | | 117 | | | | 64,453 | |
| | | |
| athenahealth, Inc. | | | | | | | | | |
| | | |
Term Loan, 5.28%, (3 mo. USD LIBOR + 4.50%), Maturing February 11, 2026 | | | | | | | 223 | | | | 207,993 | |
| | | |
| Avantor, Inc. | | | | | | | | | |
| | | |
Term Loan, 3.25%, (1 mo. USD LIBOR + 2.25%, Floor 1.00%), Maturing November 21, 2024 | | | | | | | 69 | | | | 68,309 | |
| | | |
| BW NHHC Holdco, Inc. | | | | | | | | | |
| | | |
Term Loan, 6.62%, (3 mo. USD LIBOR + 5.00%), Maturing May 15, 2025 | | | | | | | 147 | | | | 91,870 | |
| | | |
| Change Healthcare Holdings, LLC | | | | | | | | | |
| | | |
Term Loan, 3.50%, (1 mo. USD LIBOR + 2.50%, Floor 1.00%), Maturing March 1, 2024 | | | | | | | 877 | | | | 849,058 | |
| | | |
| Ensemble RCM, LLC | | | | | | | | | |
| | | |
Term Loan, 5.51%, (3 mo. USD LIBOR + 3.75%), Maturing August 3, 2026 | | | | | | | 75 | | | | 71,951 | |
| | | |
| Envision Healthcare Corporation | | | | | | | | | |
| | | |
Term Loan, 4.15%, (1 mo. USD LIBOR + 3.75%), Maturing October 10, 2025 | | | | | | | 669 | | | | 470,003 | |
| | | |
| Gentiva Health Services, Inc. | | | | | | | | | |
| | | |
Term Loan, 3.69%, (1 mo. USD LIBOR + 3.25%), Maturing July 2, 2025 | | | | | | | 339 | | | | 321,483 | |
| | | |
| Greatbatch Ltd. | | | | | | | | | |
| | | |
Term Loan, 3.50%, (1 mo. USD LIBOR + 2.50%, Floor 1.00%), Maturing October 27, 2022 | | | | | | | 95 | | | | 93,247 | |
| | | |
| Hanger, Inc. | | | | | | | | | |
| | | |
Term Loan, 3.90%, (1 mo. USD LIBOR + 3.50%), Maturing March 6, 2025 | | | | | | | 147 | | | | 134,137 | |
| | | |
| Inovalon Holdings, Inc. | | | | | | | | | |
| | | |
Term Loan, 3.88%, (1 mo. USD LIBOR + 3.00%), Maturing April 2, 2025 | | | | | | | 163 | | | | 158,526 | |
| | | | | | | | | | | | |
| Borrower/Tranche Description | | | | | Principal
Amount*
(000’s omitted) | | | Value | |
|
| Health Care (continued) | |
| | | |
| IQVIA, Inc. | | | | | | | | | |
| | | |
Term Loan, 2.50%, (1 mo. USD LIBOR + 1.75%, Floor 0.75%), Maturing March 7, 2024 | | | | | | | 258 | | | $ | 249,551 | |
| | | |
Term Loan, 2.15%, (1 mo. USD LIBOR + 1.75%), Maturing January 17, 2025 | | | | | | | 219 | | | | 212,026 | |
| | | |
| MPH Acquisition Holdings, LLC | | | | | | | | | |
| | | |
Term Loan, 4.20%, (3 mo. USD LIBOR + 2.75%), Maturing June 7, 2023 | | | | | | | 351 | | | | 324,581 | |
| | | |
| Navicure, Inc. | | | | | | | | | |
| | | |
Term Loan, 4.40%, (1 mo. USD LIBOR + 4.00%), Maturing October 22, 2026 | | | | | | | 150 | | | | 141,000 | |
| | | |
| One Call Corporation | | | | | | | | | |
| | | |
Term Loan, 6.95%, (3 mo. USD LIBOR + 5.25%), Maturing November 25, 2022 | | | | | | | 198 | | | | 168,656 | |
| | | |
| Ortho-Clinical Diagnostics S.A. | | | | | | | | | |
| | | |
Term Loan, 4.27%, (1 mo. USD LIBOR + 3.25%), Maturing June 30, 2025 | | | | | | | 506 | | | | 453,132 | |
| | | |
| Parexel International Corporation | | | | | | | | | |
| | | |
Term Loan, 3.15%, (1 mo. USD LIBOR + 2.75%), Maturing September 27, 2024 | | | | | | | 352 | | | | 325,179 | |
| | | |
| Phoenix Guarantor, Inc. | | | | | | | | | |
| | | |
Term Loan, 4.08%, (1 mo. USD LIBOR + 3.25%), Maturing March 5, 2026 | | | | | | | 273 | | | | 255,541 | |
| | | |
| Select Medical Corporation | | | | | | | | | |
| | | |
Term Loan, 3.07%, (1 mo. USD LIBOR + 2.50%), Maturing March 6, 2025 | | | | | | | 374 | | | | 356,231 | |
| | | |
| Surgery Center Holdings, Inc. | | | | | | | | | |
| | | |
Term Loan, 4.25%, (1 mo. USD LIBOR + 3.25%, Floor 1.00%), Maturing September 3, 2024 | | | | | | | 146 | | | | 131,137 | |
| | | |
| Tecomet, Inc. | | | | | | | | | |
| | | |
Term Loan, 4.43%, (3 mo. USD LIBOR + 3.25%), Maturing May 1, 2024 | | | | | | | 171 | | | | 157,148 | |
| | | |
| U.S. Anesthesia Partners, Inc. | | | | | | | | | |
| | | |
Term Loan, 4.00%, (6 mo. USD LIBOR + 3.00%, Floor 1.00%), Maturing June 23, 2024 | | | | | | | 220 | | | | 188,813 | |
| | | |
| Verscend Holding Corp. | | | | | | | | | |
| | | |
Term Loan, 4.90%, (1 mo. USD LIBOR + 4.50%), Maturing August 27, 2025 | | | | | | | 222 | | | | 210,094 | |
| | | |
| Wink Holdco, Inc. | | | | | | | | | |
| | | |
Term Loan, 4.45%, (3 mo. USD LIBOR + 3.00%), Maturing December 2, 2024 | | | | | | | 318 | | | | 297,832 | |
| | | |
| | | | | | | | | | | $ | 6,277,857 | |
|
| Home Furnishings — 0.2% | |
| | | |
| Serta Simmons Bedding, LLC | | | | | | | | | |
| | | |
Term Loan, 4.61%, (USD LIBOR + 3.50%), Maturing November 8, 2023(2) | | | | | | | 774 | | | $ | 335,400 | |
| | | |
| | | | | | | | | | | $ | 335,400 | |
| | | | |
| | 10 | | See Notes to Financial Statements. |
Eaton Vance
Short Duration Diversified Income Fund
April 30, 2020
Portfolio of Investments (Unaudited) — continued
| | | | | | | | | | | | |
| Borrower/Tranche Description | | | | | Principal
Amount*
(000’s omitted) | | | Value | |
|
| Industrial Equipment — 1.3% | |
| | | |
| Altra Industrial Motion Corp. | | | | | | | | | |
| | | |
Term Loan, 2.40%, (1 mo. USD LIBOR + 2.00%), Maturing October 1, 2025 | | | | | | | 88 | | | $ | 84,051 | |
| | | |
| Apex Tool Group, LLC | | | | | | | | | |
| | | |
Term Loan, 6.50%, (1 mo. USD LIBOR + 5.25%, Floor 1.25%), Maturing August 1, 2024 | | | | | | | 354 | | | | 285,882 | |
| | | |
| CPM Holdings, Inc. | | | | | | | | | |
| | | |
Term Loan, 4.84%, (USD LIBOR + 3.75%), Maturing November 17, 2025(2) | | | | | | | 49 | | | | 40,025 | |
| | | |
| DexKo Global, Inc. | | | | | | | | | |
| | | |
Term Loan, 4.50%, (1 mo. USD LIBOR + 3.50%, Floor 1.00%), Maturing July 24, 2024 | | | | | | | 122 | | | | 105,076 | |
| | | |
| EWT Holdings III Corp. | | | | | | | | | |
| | | |
Term Loan, 3.45%, (2 mo. USD LIBOR + 2.75%), Maturing December 20, 2024 | | | | | | | 667 | | | | 646,934 | |
| | | |
| Filtration Group Corporation | | | | | | | | | |
| | | |
Term Loan, 3.40%, (1 mo. USD LIBOR + 3.00%), Maturing March 29, 2025 | | | | | | | 236 | | | | 225,878 | |
| | | |
| Gardner Denver, Inc. | | | | | | | | | |
| | | |
Term Loan, 2.15%, (1 mo. USD LIBOR + 1.75%), Maturing March 1, 2027 | | | | | | | 169 | | | | 160,787 | |
| | | |
| Gates Global, LLC | | | | | | | | | |
| | | |
Term Loan, 3.75%, (1 mo. USD LIBOR + 2.75%, Floor 1.00%), Maturing April 1, 2024 | | | | | | | 363 | | | | 337,105 | |
| | | |
| Ingersoll-Rand Services Company | | | | | | | | | |
| | | |
Term Loan, 2.15%, (1 mo. USD LIBOR + 1.75%), Maturing March 1, 2027 | | | | | | | 200 | | | | 189,906 | |
| | | |
| LTI Holdings, Inc. | | | | | | | | | |
| | | |
Term Loan, 5.15%, (1 mo. USD LIBOR + 4.75%), Maturing July 24, 2026 | | | | | | | 25 | | | | 20,315 | |
| | | |
| Quimper AB | | | | | | | | | |
| | | |
Term Loan, 4.25%, (6 mo. EURIBOR + 4.25%), Maturing February 13, 2026 | | | EUR | | | | 275 | | | | 283,936 | |
| | | |
| Robertshaw US Holding Corp. | | | | | | | | | |
| | | |
Term Loan, 4.25%, (6 mo. USD LIBOR + 3.25%, Floor 1.00%), Maturing February 28, 2025 | | | | | | | 147 | | | | 108,550 | |
| | | |
| Titan Acquisition Limited | | | | | | | | | |
| | | |
Term Loan, 4.45%, (3 mo. USD LIBOR + 3.00%), Maturing March 28, 2025 | | | | | | | 415 | | | | 367,209 | |
| | | |
| | | | | | | | | | | $ | 2,855,654 | |
|
| Insurance — 1.5% | |
| | | |
| Alliant Holdings Intermediate, LLC | | | | | | | | | |
| | | |
Term Loan, 3.15%, (1 mo. USD LIBOR + 2.75%), Maturing May 9, 2025 | | | | | | | 242 | | | $ | 227,495 | |
| | | |
Term Loan, 3.97%, (1 mo. USD LIBOR + 3.25%), Maturing May 9, 2025 | | | | | | | 74 | | | | 70,325 | |
| | | | | | | | | | | | |
| Borrower/Tranche Description | | | | | Principal
Amount*
(000’s omitted) | | | Value | |
|
| Insurance (continued) | |
| | | |
| AmWINS Group, Inc. | | | | | | | | | |
| | | |
Term Loan, 3.75%, (1 mo. USD LIBOR + 2.75%, Floor 1.00%), Maturing January 25, 2024 | | | | | | | 347 | | | $ | 336,856 | |
| | | |
| AssuredPartners, Inc. | | | | | | | | | |
| | | |
Term Loan, 3.90%, (1 mo. USD LIBOR + 3.50%), Maturing February 12, 2027 | | | | | | | 25 | | | | 23,479 | |
| | | |
| Asurion, LLC | | | | | | | | | |
| | | |
Term Loan, 4.00%, (1 mo. USD LIBOR + 3.00%, Floor 1.00%), Maturing August 4, 2022 | | | | | | | 748 | | | | 723,875 | |
| | | |
Term Loan, 3.40%, (1 mo. USD LIBOR + 3.00%), Maturing November 3, 2023 | | | | | | | 410 | | | | 393,012 | |
| | | |
Term Loan - Second Lien, 6.90%, (1 mo. USD LIBOR + 6.50%), Maturing August 4, 2025 | | | | | | | 100 | | | | 96,458 | |
| | | |
| Hub International Limited | | | | | | | | | |
| | | |
Term Loan, 4.02%, (3 mo. USD LIBOR + 2.75%), Maturing April 25, 2025 | | | | | | | 712 | | | | 675,984 | |
| | | |
| NFP Corp. | | | | | | | | | |
| | | |
Term Loan, 3.65%, (1 mo. USD LIBOR + 3.25%), Maturing February 15, 2027 | | | | | | | 49 | | | | 44,633 | |
| | | |
| Sedgwick Claims Management Services, Inc. | | | | | | | | | |
| | | |
Term Loan, 3.65%, (1 mo. USD LIBOR + 3.25%), Maturing December 31, 2025 | | | | | | | 173 | | | | 159,679 | |
| | | |
| USI, Inc. | | | | | | | | | |
| | | |
Term Loan, 3.40%, (1 mo. USD LIBOR + 3.00%), Maturing May 16, 2024 | | | | | | | 390 | | | | 367,250 | |
| | | |
Term Loan, 4.40%, (1 mo. USD LIBOR + 4.00%), Maturing December 2, 2026 | | | | | | | 200 | | | | 190,897 | |
| | | |
| | | | | | | | | | | $ | 3,309,943 | |
|
| Leisure Goods / Activities / Movies — 1.7% | |
| | | |
| AMC Entertainment Holdings, Inc. | | | | | | | | | |
| | | |
Term Loan, 4.08%, (3 mo. USD LIBOR + 3.00%), Maturing April 22, 2026 | | | | | | | 272 | | | $ | 201,788 | |
| | | |
| Amer Sports Oyj | | | | | | | | | |
| | | |
Term Loan, 4.50%, (6 mo. EURIBOR + 4.50%), Maturing March 30, 2026 | | | EUR | | | | 525 | | | | 448,391 | |
| | | |
| Ancestry.com Operations, Inc. | | | | | | | | | |
| | | |
Term Loan, 4.66%, (1 mo. USD LIBOR + 4.25%), Maturing August 27, 2026 | | | | | | | 124 | | | | 108,762 | |
| | | |
| Bombardier Recreational Products, Inc. | | | | | | | | | |
| | | |
Term Loan, 2.40%, (1 mo. USD LIBOR + 2.00%), Maturing May 24, 2027 | | | | | | | 798 | | | | 727,266 | |
| | | |
| ClubCorp Holdings, Inc. | | | | | | | | | |
| | | |
Term Loan, 4.20%, (3 mo. USD LIBOR + 2.75%), Maturing September 18, 2024 | | | | | | | 268 | | | | 201,345 | |
| | | | |
| | 11 | | See Notes to Financial Statements. |
Eaton Vance
Short Duration Diversified Income Fund
April 30, 2020
Portfolio of Investments (Unaudited) — continued
| | | | | | | | | | | | |
| Borrower/Tranche Description | | | | | Principal
Amount*
(000’s omitted) | | | Value | |
|
| Leisure Goods / Activities / Movies (continued) | |
| | | |
| Crown Finance US, Inc. | | | | | | | | | |
| | | |
Term Loan, 3.32%, (6 mo. USD LIBOR + 2.25%), Maturing February 28, 2025 | | | | | | | 244 | | | $ | 161,288 | |
| | | |
Term Loan, 3.57%, (6 mo. USD LIBOR + 2.50%), Maturing September 30, 2026 | | | | | | | 224 | | | | 141,041 | |
| | | |
| Delta 2 (LUX) S.a.r.l. | | | | | | | | | |
| | | |
Term Loan, 3.50%, (1 mo. USD LIBOR + 2.50%, Floor 1.00%), Maturing February 1, 2024 | | | | | | | 110 | | | | 100,897 | |
| | | |
| Emerald Expositions Holding, Inc. | | | | | | | | | |
| | | |
Term Loan, 3.15%, (1 mo. USD LIBOR + 2.75%), Maturing May 22, 2024 | | | | | | | 164 | | | | 128,871 | |
| | | |
| Lindblad Expeditions, Inc. | | | | | | | | | |
| | | |
Term Loan, 3.65%, (1 mo. USD LIBOR + 3.25%), Maturing March 27, 2025 | | | | | | | 77 | | | | 59,392 | |
| | | |
Term Loan, 3.65%, (1 mo. USD LIBOR + 3.25%), Maturing March 27, 2025 | | | | | | | 307 | | | | 237,569 | |
| | | |
| Match Group, Inc. | | | | | | | | | |
| | | |
Term Loan, 3.46%, (3 mo. USD LIBOR + 1.75%), Maturing February 15, 2027 | | | | | | | 100 | | | | 95,578 | |
| | | |
| NASCAR Holdings, Inc. | | | | | | | | | |
| | | |
Term Loan, 3.37%, (1 mo. USD LIBOR + 2.75%), Maturing October 19, 2026 | | | | | | | 118 | | | | 110,485 | |
| | | |
| Playtika Holding Corp. | | | | | | | | | |
| | | |
Term Loan, 7.07%, (6 mo. USD LIBOR + 6.00%), Maturing December 10, 2024 | | | | | | | 494 | | | | 490,047 | |
| | | |
| SRAM, LLC | | | | | | | | | |
| | | |
Term Loan, 3.75%, (1 mo. USD LIBOR + 2.75%, Floor 1.00%), Maturing March 15, 2024 | | | | | | | 168 | | | | 161,683 | |
| | | |
| Steinway Musical Instruments, Inc. | | | | | | | | | |
| | | |
Term Loan, 4.54%, (1 mo. USD LIBOR + 3.75%), Maturing February 14, 2025 | | | | | | | 70 | | | | 65,513 | |
| | | |
| Travel Leaders Group, LLC | | | | | | | | | |
| | | |
Term Loan, 4.49%, (1 mo. USD LIBOR + 4.00%), Maturing January 25, 2024 | | | | | | | 123 | | | | 93,338 | |
| | | |
| Vue International Bidco PLC | | | | | | | | | |
| | | |
Term Loan, 4.25%, (3 mo. EURIBOR + 4.25%), Maturing July 3, 2026 | | | EUR | | | | 106 | | | | 99,015 | |
| | | |
| | | | | | | | | | | $ | 3,632,269 | |
|
| Lodging and Casinos — 1.1% | |
| | | |
| Aristocrat Technologies, Inc. | | | | | | | | | |
| | | |
Term Loan, 2.86%, (3 mo. USD LIBOR + 1.75%), Maturing October 19, 2024 | | | | | | | 82 | | | $ | 77,784 | |
| | | |
| CityCenter Holdings, LLC | | | | | | | | | |
| | | |
Term Loan, 3.00%, (1 mo. USD LIBOR + 2.25%, Floor 0.75%), Maturing April 18, 2024 | | | | | | | 414 | | | | 368,037 | |
| | | | | | | | | | | | |
| Borrower/Tranche Description | | | | | Principal
Amount*
(000’s omitted) | | | Value | |
|
| Lodging and Casinos (continued) | |
| | | |
| GBT III B.V. | | | | | | | | | |
| | | |
Term Loan, Maturing February 26, 2027(3) | | | | | | | 194 | | | $ | 173,357 | |
| | | |
Term Loan, Maturing February 26, 2027(3) | | | | | | | 231 | | | | 207,018 | |
| | | |
| Golden Nugget, Inc. | | | | | | | | | |
| | | |
Term Loan, 3.46%, (USD LIBOR + 2.50%), Maturing October 4, 2023(2) | | | | | | | 234 | | | | 191,579 | |
| | | |
| GVC Holdings PLC | | | | | | | | | |
| | | |
Term Loan, 3.31%, (6 mo. USD LIBOR + 2.25%), Maturing March 29, 2024 | | | | | | | 147 | | | | 141,365 | |
| | | |
| Hanjin International Corp. | | | | | | | | | |
| | | |
Term Loan, 2.90%, (1 mo. USD LIBOR + 2.50%), Maturing October 18, 2020 | | | | | | | 75 | | | | 64,125 | |
| | | |
| Playa Resorts Holding B.V. | | | | | | | | | |
| | | |
Term Loan, 3.75%, (1 mo. USD LIBOR + 2.75%, Floor 1.00%), Maturing April 29, 2024 | | | | | | | 365 | | | | 303,300 | |
| | | |
| Stars Group Holdings B.V. (The) | | | | | | | | | |
| | | |
Term Loan, 4.95%, (3 mo. USD LIBOR + 3.50%), Maturing July 10, 2025 | | | | | | | 497 | | | | 492,220 | |
| | | |
| VICI Properties 1, LLC | | | | | | | | | |
| | | |
Term Loan, 2.42%, (1 mo. USD LIBOR + 1.75%), Maturing December 20, 2024 | | | | | | | 239 | | | | 222,603 | |
| | | |
| Wyndham Hotels & Resorts, Inc. | | | | | | | | | |
| | | |
Term Loan, 2.15%, (1 mo. USD LIBOR + 1.75%), Maturing May 30, 2025 | | | | | | | 197 | | | | 182,286 | |
| | | |
| | | | | | | | | | | $ | 2,423,674 | |
|
| Nonferrous Metals / Minerals — 0.1% | |
| | | |
| Murray Energy Corporation | | | | | | | | | |
| | | |
DIP Loan, 13.00%, (1 mo. USD LIBOR + 11.00%, Floor 2.00%), Maturing July 31, 2020 | | | | | | | 97 | | | $ | 96,890 | |
| | | |
Term Loan, 0.00%, Maturing October 17, 2022(4) | | | | | | | 349 | | | | 6,104 | |
| | | |
| Noranda Aluminum Acquisition Corporation | | | | | | | | | |
| | | |
Term Loan, 0.00%, Maturing February 28, 2021(4) | | | | | | | 75 | | | | 5,271 | |
| | | |
| Oxbow Carbon, LLC | | | | | | | | | |
| | | |
Term Loan, 4.15%, (1 mo. USD LIBOR + 3.75%), Maturing January 4, 2023 | | | | | | | 89 | | | | 80,319 | |
| | | |
| | | | | | | | | | | $ | 188,584 | |
|
| Oil and Gas — 0.9% | |
| | | |
| Ameriforge Group, Inc. | | | | | | | | | |
| | | |
Term Loan, 8.45%, (3 mo. USD LIBOR + 7.00%), Maturing June 8, 2022 | | | | | | | 76 | | | $ | 66,655 | |
| | | |
| Apergy Corporation | | | | | | | | | |
| | | |
Term Loan, 2.94%, (1 mo. USD LIBOR + 2.50%), Maturing May 9, 2025 | | | | | | | 32 | | | | 28,735 | |
| | | | |
| | 12 | | See Notes to Financial Statements. |
Eaton Vance
Short Duration Diversified Income Fund
April 30, 2020
Portfolio of Investments (Unaudited) — continued
| | | | | | | | | | | | |
| Borrower/Tranche Description | | | | | Principal
Amount*
(000’s omitted) | | | Value | |
|
| Oil and Gas (continued) | |
| | | |
| Blackstone CQP Holdco L.P. | | | | | | | | | |
| | | |
Term Loan, 4.62%, (3 mo. USD LIBOR + 3.50%), Maturing September 30, 2024 | | | | | | | 149 | | | $ | 137,895 | |
| | | |
| Buckeye Partners L.P. | | | | | | | | | |
| | | |
Term Loan, 3.77%, (1 mo. USD LIBOR + 2.75%), Maturing November 1, 2026 | | | | | | | 400 | | | | 377,500 | |
| | | |
| CITGO Petroleum Corporation | | | | | | | | | |
| | | |
Term Loan, 6.00%, (6 mo. USD LIBOR + 5.00%, Floor 1.00%), Maturing March 28, 2024 | | | | | | | 371 | | | | 334,125 | |
| | | |
| Fieldwood Energy, LLC | | | | | | | | | |
| | | |
Term Loan, 6.25%, (3 mo. USD LIBOR + 5.25%, Floor 1.00%), Maturing April 11, 2022 | | | | | | | 196 | | | | 49,884 | |
| | | |
| Matador Bidco S.a.r.l. | | | | | | | | | |
| | | |
Term Loan, 0.50%, Maturing October 15, 2026(5) | | | | | | | 75 | | | | 69,750 | |
| | | |
Term Loan, 5.15%, (1 mo. USD LIBOR + 4.75%), Maturing October 15, 2026 | | | | | | | 75 | | | | 69,750 | |
| | | |
| McDermott Technology Americas, Inc. | | | | | | | | | |
| | | |
DIP Loan, 10.37%, (USD LIBOR + 9.00%), Maturing October 21, 2020(2) | | | | | | | 75 | | | | 72,125 | |
| | | |
DIP Loan, 10.65%, (3 mo. USD LIBOR + 9.00%), Maturing October 21, 2020 | | | | | | | 67 | | | | 64,021 | |
| | | |
Term Loan, 0.00%, Maturing May 9, 2025(4) | | | | | | | 172 | | | | 55,593 | |
| | | |
| Prairie ECI Acquiror L.P. | | | | | | | | | |
| | | |
Term Loan, 6.20%, (3 mo. USD LIBOR + 4.75%), Maturing March 11, 2026 | | | | | | | 75 | | | | 54,477 | |
| | | |
Term Loan, 6.20%, (3 mo. USD LIBOR + 4.75%), Maturing March 11, 2026 | | | | | | | 119 | | | | 86,111 | |
| | | |
| PSC Industrial Holdings Corp. | �� | | | | | | | | |
| | | |
Term Loan, 4.98%, (6 mo. USD LIBOR + 3.75%), Maturing October 11, 2024 | | | | | | | 122 | | | | 99,583 | |
| | | |
| RDV Resources Properties, LLC | | | | | | | | | |
| | | |
Term Loan, 6.87%, (3 mo. USD LIBOR + 5.50%), Maturing March 29, 2024(6) | | | | | | | 63 | | | | 35,912 | |
| | | |
| Sunrise Oil & Gas Properties, LLC | | | | | | | | | |
| | | |
Term Loan, 8.00%, (1 mo. USD LIBOR + 7.00%, Floor 1.00%), Maturing January 17, 2023 | | | | | | | 63 | | | | 59,728 | |
| | | |
TermLoan - Second Lien, 8.00%, (1 mo. USD LIBOR + 7.00%, Floor 1.00%), Maturing January 17, 2023 | | | | | | | 63 | | | | 53,595 | |
| | | |
TermLoan - Third Lien, 8.00%, (1 mo. USD LIBOR + 7.00%, Floor 1.00%), Maturing January 17, 2023 | | | | | | | 73 | | | | 51,659 | |
| | | |
| UGI Energy Services, LLC | | | | | | | | | |
| | | |
Term Loan, 4.15%, (1 mo. USD LIBOR + 3.75%), Maturing August 13, 2026 | | | | | | | 149 | | | | 134,732 | |
| | | |
| | | | | | | | | | | $ | 1,901,830 | |
| | | | | | | | | | | | |
| Borrower/Tranche Description | | | | | Principal
Amount*
(000’s omitted) | | | Value | |
|
| Publishing — 0.3% | |
| | | |
| Ascend Learning, LLC | | | | | | | | | |
| | | |
Term Loan, 4.00%, (1 mo. USD LIBOR + 3.00%, Floor 1.00%), Maturing July 12, 2024 | | | | | | | 171 | | | $ | 160,921 | |
| | | |
| Getty Images, Inc. | | | | | | | | | |
| | | |
Term Loan, 4.94%, (1 mo. USD LIBOR + 4.50%), Maturing February 19, 2026 | | | | | | | 147 | | | | 123,459 | |
| | | |
Harland Clarke Holdings Corp. | | | | | | | | | | | | |
| | | |
Term Loan, 6.46%, (3 mo. USD LIBOR + 4.75%), Maturing November 3, 2023 | | | | | | | 75 | | | | 47,038 | |
| | | |
| LSC Communications, Inc. | | | | | | | | | |
| | | |
Term Loan, 0.00%, Maturing September 30, 2022(4) | | | | | | | 133 | | | | 10,206 | |
| | | |
| ProQuest, LLC | | | | | | | | | |
| | | |
Term Loan, 3.90%, (1 mo. USD LIBOR + 3.50%), Maturing October 23, 2026 | | | | | | | 274 | | | | 261,283 | |
| | | |
| Tweddle Group, Inc. | | | | | | | | | |
| | | |
Term Loan, 5.50%, (1 mo. USD LIBOR + 4.50%, Floor 1.00%), Maturing September 17, 2023 | | | | | | | 35 | | | | 27,536 | |
| | | |
| | | | | | | | | | | $ | 630,443 | |
|
| Radio and Television — 0.6% | |
| | | |
| Diamond Sports Group, LLC | | | | | | | | | |
| | | |
Term Loan, 3.82%, (1 mo. USD LIBOR + 3.25%), Maturing August 24, 2026 | | | | | | | 448 | | | $ | 367,435 | |
| | | |
| Entercom Media Corp. | | | | | | | | | |
| | | |
Term Loan, 2.90%, (1 mo. USD LIBOR + 2.50%), Maturing November 18, 2024 | | | | | | | 112 | | | | 98,823 | |
| | | |
| Entravision Communications Corporation | | | | | | | | | |
| | | |
Term Loan, 3.15%, (1 mo. USD LIBOR + 2.75%), Maturing November 29, 2024 | | | | | | | 127 | | | | 119,659 | |
| | | |
| Gray Television, Inc. | | | | | | | | | |
| | | |
Term Loan, 3.49%, (1 mo. USD LIBOR + 2.50%), Maturing January 2, 2026 | | | | | | | 85 | | | | 80,645 | |
| | | |
| Hubbard Radio, LLC | | | | | | | | | |
| | | |
Term Loan, 4.50%, (3 mo. USD LIBOR + 3.50%, Floor 1.00%), Maturing March 28, 2025 | | | | | | | 95 | | | | 73,493 | |
| | | |
| iHeartCommunications, Inc. | | | | | | | | | |
| | | |
Term Loan, 3.40%, (1 mo. USD LIBOR + 3.00%), Maturing May 1, 2026 | | | | | | | 75 | | | | 67,331 | |
| | | |
| Mission Broadcasting, Inc. | | | | | | | | | |
| | | |
Term Loan, 3.23%, (1 mo. USD LIBOR + 2.25%), Maturing January 17, 2024 | | | | | | | 48 | | | | 44,953 | |
| | | |
| Nexstar Broadcasting, Inc. | | | | | | | | | |
| | | |
Term Loan, 2.65%, (1 mo. USD LIBOR + 2.25%), Maturing January 17, 2024 | | | | | | | 185 | | | | 174,736 | |
| | | |
| Sinclair Television Group, Inc. | | | | | | | | | |
| | | |
Term Loan, 3.32%, (1 mo. USD LIBOR + 2.50%), Maturing September 30, 2026 | | | | | | | 100 | | | | 93,157 | |
| | | | |
| | 13 | | See Notes to Financial Statements. |
Eaton Vance
Short Duration Diversified Income Fund
April 30, 2020
Portfolio of Investments (Unaudited) — continued
| | | | | | | | | | | | |
| Borrower/Tranche Description | | | | | Principal
Amount*
(000’s omitted) | | | Value | |
|
| Radio and Television (continued) | |
| | | |
| Terrier Media Buyer, Inc. | | | | | | | | | |
| | | |
Term Loan, 5.70%, (3 mo. USD LIBOR + 4.25%), Maturing December 17, 2026 | | | | | | | 274 | | | $ | 256,025 | |
| | | |
| | | | | | | | | | | $ | 1,376,257 | |
|
| Retailers (Except Food and Drug) — 0.4% | |
| | | |
| Ascena Retail Group, Inc. | | | | | | | | | |
| | | |
Term Loan, 5.63%, (USD LIBOR + 4.50%), Maturing August 21, 2022(2) | | | | | | | 238 | | | $ | 56,403 | |
| | | |
| Bass Pro Group, LLC | | | | | | | | | |
| | | |
Term Loan, 6.07%, (6 mo. USD LIBOR + 5.00%), Maturing September 25, 2024 | | | | | | | 244 | | | | 204,019 | |
| | | |
| BJ’s Wholesale Club, Inc. | | | | | | | | | |
| | | |
Term Loan, 3.08%, (1 mo. USD LIBOR + 2.25%), Maturing February 3, 2024 | | | | | | | 139 | | | | 135,480 | |
| | | |
| David’s Bridal, Inc. | | | | | | | | | |
| | | |
Term Loan, 7.65%, (3 mo. USD LIBOR + 6.00%), 1.00% Cash, 6.65% PIK, Maturing June 30, 2023 | | | | | | | 58 | | | | 47,897 | |
| | | |
| Hoya Midco, LLC | | | | | | | | | |
| | | |
Term Loan, 4.57%, (6 mo. USD LIBOR + 3.50%), Maturing June 30, 2024 | | | | | | | 170 | | | | 123,368 | |
| | | |
| J. Crew Group, Inc. | | | | | | | | | |
| | | |
Term Loan, 4.31%, (USD LIBOR + 3.00%), Maturing March 5, 2021(2) | | | | | | | 513 | | | | 271,041 | |
| | | |
| LSF9 Atlantis Holdings, LLC | | | | | | | | | |
| | | |
Term Loan, 7.00%, (1 mo. USD LIBOR + 6.00%, Floor 1.00%), Maturing May 1, 2023 | | | | | | | 161 | | | | 127,643 | |
| | | |
| Pier 1 Imports (U.S.), Inc. | | | | | | | | | |
| | | |
Term Loan, 0.00%, Maturing April 30, 2021(4) | | | | | | | 95 | | | | 12,403 | |
| | | |
| | | | | | | | | | | $ | 978,254 | |
|
| Steel — 0.4% | |
| | | |
| Atkore International, Inc. | | | | | | | | | |
| | | |
Term Loan, 4.02%, (3 mo. USD LIBOR + 2.75%), Maturing December 22, 2023 | | | | | | | 232 | | | $ | 223,300 | |
| | | |
| GrafTech Finance, Inc. | | | | | | | | | |
| | | |
Term Loan, 4.50%, (1 mo. USD LIBOR + 3.50%, Floor 1.00%), Maturing February 12, 2025 | | | | | | | 307 | | | | 279,636 | |
| | | |
| Neenah Foundry Company | | | | | | | | | |
| | | |
Term Loan, 7.45%, (USD LIBOR + 6.50%), Maturing December 13,
2022(2) | | | | | | | 104 | | | | 90,802 | |
| | | |
| Phoenix Services International, LLC | | | | | | | | | |
| | | |
Term Loan, 4.75%, (1 mo. USD LIBOR + 3.75%, Floor 1.00%), Maturing March 1, 2025 | | | | | | | 123 | | | | 102,402 | |
| | | | | | | | | | | | |
| Borrower/Tranche Description | | | | | Principal
Amount*
(000’s omitted) | | | Value | |
|
| Steel (continued) | |
| | | |
| Zekelman Industries, Inc. | | | | | | | | | |
| | | |
Term Loan, 2.82%, (1 mo. USD LIBOR + 2.25%), Maturing January 24, 2027 | | | | | | | 125 | | | $ | 118,750 | |
| | | |
| | | | | | | | | | | $ | 814,890 | |
|
| Surface Transport — 0.0%(7) | |
| | | |
| XPO Logistics, Inc. | | | | | | | | | |
| | | |
Term Loan, 3.61%, (3 mo. USD LIBOR + 2.00%), Maturing February 24, 2025 | | | | | | | 100 | | | $ | 97,250 | |
| | | |
| | | | | | | | | | | $ | 97,250 | |
|
| Telecommunications — 1.4% | |
| | | |
| CenturyLink, Inc. | | | | | | | | | |
| | | |
Term Loan, 2.65%, (1 mo. USD LIBOR + 2.25%), Maturing March 15, 2027 | | | | | | | 1,047 | | | $ | 994,744 | |
| | | |
| Digicel International Finance Limited | | | | | | | | | |
| | | |
Term Loan, 4.87%, (3 mo. USD LIBOR + 3.25%), Maturing May 28, 2024 | | | | | | | 122 | | | | 100,395 | |
| | | |
| Global Eagle Entertainment, Inc. | | | | | | | | | |
| | | |
Term Loan, 8.72%, (3 mo. USD LIBOR + 7.50%), Maturing January 6, 2023 | | | | | | | 209 | | | | 119,534 | |
| | | |
| Intelsat Jackson Holdings S.A. | | | | | | | | | |
| | | |
Term Loan, 6.75%, (3 mo. USD Prime + 3.50%), Maturing January 2, 2024 | | | | | | | 250 | | | | 248,125 | |
| | | |
| IPC Corp. | | | | | | | | | |
| | | |
Term Loan, 5.50%, (3 mo. USD LIBOR + 4.50%, Floor 1.00%), Maturing August 6, 2021 | | | | | | | 181 | | | | 126,461 | |
| | | |
| Onvoy, LLC | | | | | | | | | |
| | | |
Term Loan, 5.50%, (1 mo. USD LIBOR + 4.50%, Floor 1.00%), Maturing February 10, 2024 | | | | | | | 121 | | | | 102,456 | |
| | | |
| Plantronics, Inc. | | | | | | | | | |
| | | |
Term Loan, 2.99%, (USD LIBOR + 2.50%), Maturing July 2, 2025(2) | | | | | | | 180 | | | | 148,861 | |
| | | |
| Syniverse Holdings, Inc. | | | | | | | | | |
| | | |
Term Loan, 6.87%, (3 mo. USD LIBOR + 5.00%), Maturing March 9, 2023 | | | | | | | 147 | | | | 104,223 | |
| | | |
| Telesat Canada | | | | | | | | | |
| | | |
Term Loan, 3.16%, (1 mo. USD LIBOR + 2.75%), Maturing December 7, 2026 | | | | | | | 200 | | | | 189,743 | |
| | | |
| Zayo Group Holdings, Inc. | | | | | | | | | |
| | | |
Term Loan, 3.40%, (1 mo. USD LIBOR + 3.00%), Maturing March 9, 2027 | | | | | | | 375 | | | | 353,321 | |
| | | |
| Ziggo Financing Partnership | | | | | | | | | |
| | | |
Term Loan, 3.31%, (1 mo. USD LIBOR + 2.50%), Maturing April 30, 2028 | | | | | | | 625 | | | | 587,761 | |
| | | |
| | | | | | | | | | | $ | 3,075,624 | |
| | | | |
| | 14 | | See Notes to Financial Statements. |
Eaton Vance
Short Duration Diversified Income Fund
April 30, 2020
Portfolio of Investments (Unaudited) — continued
| | | | | | | | | | | | |
| Borrower/Tranche Description | | | | | Principal
Amount*
(000’s omitted) | | | Value | |
|
| Utilities — 0.4% | |
| | | |
| Brookfield WEC Holdings, Inc. | | | | | | | | | |
| | | |
Term Loan, 3.40%, (1 mo. USD LIBOR + 3.00%), Maturing August 1, 2025 | | | | | | | 321 | | | $ | 305,533 | |
| | | |
| Calpine Construction Finance Company L.P. | | | | | | | | | |
| | | |
Term Loan, 2.40%, (1 mo. USD LIBOR + 2.00%), Maturing January 15, 2025 | | | | | | | 165 | | | | 158,698 | |
| | | |
| Calpine Corporation | | | | | | | | | |
| | | |
Term Loan, 2.66%, (1 mo. USD LIBOR + 2.25%), Maturing January 15, 2024 | | | | | | | 187 | | | | 181,288 | |
| | | |
| Lightstone Holdco, LLC | | | | | | | | | |
| | | |
Term Loan, 4.75%, (3 mo. USD LIBOR + 3.75%, Floor 1.00%), Maturing January 30, 2024 | | | | | | | 7 | | | | 5,660 | |
| | | |
Term Loan, 4.75%, (3 mo. USD LIBOR + 3.75%, Floor 1.00%), Maturing January 30, 2024 | | | | | | | 126 | | | | 100,353 | |
| | | |
| Talen Energy Supply, LLC | | | | | | | | | |
| | | |
Term Loan, 4.15%, (1 mo. USD LIBOR + 3.75%), Maturing July 8, 2026 | | | | | | | 75 | | | | 68,540 | |
| | | |
| USIC Holdings, Inc. | | | | | | | | | |
| | | |
Term Loan, 4.25%, (1 mo. USD LIBOR + 3.25%, Floor 1.00%), Maturing December 8, 2023 | | | | | | | 172 | | | | 153,127 | |
| | | |
| | | | | | | | | | | $ | 973,199 | |
| | | |
Total Senior Floating-Rate Loans
(identified cost $78,826,770) | | | | | | | | | | $ | 70,109,275 | |
|
| Corporate Bonds & Notes — 16.0% | |
| Security | | | | | Principal
Amount*
(000’s omitted) | | | Value | |
|
| Aerospace and Defense — 0.8% | |
| | | |
| Bombardier, Inc. | | | | | | | | | |
| | | |
6.00%, 10/15/22 (8) | | | | | | | 429 | | | $ | 324,431 | |
| | | |
6.125%, 1/15/23 (8) | | | | | | | 113 | | | | 81,383 | |
| | | |
| TransDigm, Inc. | | | | | | | | | |
| | | |
6.50%, 7/15/24 | | | | | | | 250 | | | | 232,237 | |
| | | |
6.50%, 5/15/25 | | | | | | | 1,000 | | | | 900,200 | |
| | | |
6.25%, 3/15/26 (8) | | | | | | | 179 | | | | 176,038 | |
| | | |
| | | | | | | | | | | $ | 1,714,289 | |
|
| Automotive — 0.4% | |
| | | |
| Navistar International Corp. | | | | | | | | | |
| | | |
6.625%, 11/1/25(8) | | | | | | | 208 | | | $ | 179,483 | |
| | | |
Panther BF Aggregator 2 L.P./Panther
Finance Co., Inc. | | | | | | | | | |
| | | |
6.25%, 5/15/26(8) | | | | | | | 129 | | | | 129,968 | |
| | | | | | | | | | | | |
| Security | | | | | Principal
Amount*
(000’s omitted) | | | Value | |
|
| Automotive (continued) | |
| | | |
Panther BF Aggregator 2 L.P./Panther
Finance Co., Inc. (continued) | | | | | | | | | |
| | | |
8.50%, 5/15/27(8) | | | | | | | 642 | | | $ | 547,080 | |
| | | |
| | | | | | | | | | | $ | 856,531 | |
| | | |
| Building and Development — 0.6% | | | | | | | | | |
| | | |
| Core & Main Holdings, L.P. | | | | | | | | | |
| | | |
8.625%, (8.625% cash or 9.375% PIK), 9/15/24(8)(9) | | | | | | | 69 | | | $ | 66,054 | |
| | | |
Five Point Operating Co., L.P./Five Point
Capital Corp. | | | | | | | | | |
| | | |
7.875%, 11/15/25(8) | | | | | | | 84 | | | | 81,795 | |
| | | |
| Greystar Real Estate Partners, LLC | | | | | | | | | |
| | | |
5.75%, 12/1/25(8) | | | | | | | 187 | | | | 173,209 | |
| | | |
| Reliance Intermediate Holdings, L.P. | | | | | | | | | |
| | | |
6.50%, 4/1/23(8) | | | | | | | 675 | | | | 683,302 | |
| | | |
| Standard Industries, Inc. | | | | | | | | | |
| | | |
6.00%, 10/15/25(8) | | | | | | | 350 | | | | 362,687 | |
| | | |
| | | | | | | | | | | $ | 1,367,047 | |
| | | |
| Business Equipment and Services — 0.9% | | | | | | | | | |
| | | |
| EIG Investors Corp. | | | | | | | | | |
| | | |
10.875%, 2/1/24 | | | | | | | 960 | | | $ | 832,608 | |
| | | |
| KAR Auction Services, Inc. | | | | | | | | | |
| | | |
5.125%, 6/1/25(8) | | | | | | | 132 | | | | 114,538 | |
| | | |
| ServiceMaster Co., LLC (The) | | | | | | | | | |
| | | |
7.45%, 8/15/27 | | | | | | | 1,000 | | | | 1,079,150 | |
| | | |
| | | | | | | | | | | $ | 2,026,296 | |
| | | |
| Cable and Satellite Television — 0.9% | | | | | | | | | |
| | | |
| CCO Holdings, LLC/CCO Holdings Capital Corp. | | | | | | | | | |
| | | |
5.50%, 5/1/26(8) | | | | | | | 1,000 | | | $ | 1,045,910 | |
| | | |
4.75%, 3/1/30(8) | | | | | | | 75 | | | | 76,849 | |
| | | |
| CSC Holdings, LLC | | | | | | | | | |
| | | |
7.50%, 4/1/28(8) | | | | | | | 500 | | | | 552,369 | |
| | | |
5.75%, 1/15/30(8) | | | | | | | 200 | | | | 208,567 | |
| | | |
| TEGNA, Inc. | | | | | | | | | |
| | | |
5.00%, 9/15/29(8) | | | | | | | 74 | | | | 66,384 | |
| | | |
| | | | | | | | | | | $ | 1,950,079 | |
| | | |
| Conglomerates — 0.3% | | | | | | | | | |
| | | |
| Spectrum Brands, Inc. | | | | | | | | | |
| | | |
5.00%, 10/1/29(8) | | | | | | | 530 | | | $ | 509,913 | |
| | | | |
| | 15 | | See Notes to Financial Statements. |
Eaton Vance
Short Duration Diversified Income Fund
April 30, 2020
Portfolio of Investments (Unaudited) — continued
| | | | | | | | | | | | |
| Security | | | | | Principal
Amount*
(000’s omitted) | | | Value | |
| | | |
| Conglomerates (continued) | | | | | | | | | |
| | | |
| TMS International Holding Corp. | | | | | | | | | |
| | | |
7.25%, 8/15/25(8) | | | | | | | 239 | | | $ | 180,098 | |
| | | |
| | | | | | | | | | | $ | 690,011 | |
|
| Containers and Glass Products — 0.6% | |
| | | |
Reynolds Group Issuer, Inc./Reynolds Group
Issuer, LLC | | | | | | | | | |
| | | |
7.00%, 7/15/24(8) | | | | | | | 1,332 | | | $ | 1,343,189 | |
| | | |
| | | | | | | | | | | $ | 1,343,189 | |
| | | |
| Distribution & Wholesale — 0.0%(7) | | | | | | | | | |
| | | |
| Performance Food Group, Inc. | | | | | | | | | |
| | | |
5.50%, 10/15/27(8) | | | | | | | 69 | | | $ | 65,986 | |
| | | |
| | | | | | | | | | | $ | 65,986 | |
| | | |
| Diversified Financial Services — 0.2% | | | | | | | | | |
| | | |
GEMS MENASA Cayman, Ltd./GEMS Education
Delaware, LLC | | | | | | | | | |
| | | |
7.125%, 7/31/26(8) | | | | | | | 460 | | | $ | 441,600 | |
| | | |
| | | | | | | | | | | $ | 441,600 | |
| | | |
| Drugs — 0.4% | | | | | | | | | |
| | | |
| Bausch Health Companies, Inc. | | | | | | | | | |
| | | |
5.875%, 5/15/23(8) | | | | | | | 24 | | | $ | 23,857 | |
| | | |
9.00%, 12/15/25(8) | | | | | | | 338 | | | | 370,279 | |
| | | |
8.50%, 1/31/27(8) | | | | | | | 63 | | | | 69,744 | |
| | | |
5.75%, 8/15/27(8) | | | | | | | 31 | | | | 32,836 | |
| | | |
| Catalent Pharma Solutions, Inc. | | | | | | | | | |
| | | |
4.875%, 1/15/26(8) | | | | | | | 400 | | | | 408,840 | |
| | | |
| | | | | | | | | | | $ | 905,556 | |
| | | |
| Ecological Services and Equipment — 0.7% | | | | | | | | | |
| | | |
| Covanta Holding Corp. | | | | | | | | | |
| | | |
5.875%, 7/1/25 | | | | | | | 1,000 | | | $ | 974,800 | |
| | | |
| GFL Environmental, Inc. | | | | | | | | | |
| | | |
7.00%, 6/1/26(8) | | | | | | | 96 | | | | 100,627 | |
| | | |
8.50%, 5/1/27(8) | | | | | | | 285 | | | | 312,315 | |
| | | |
| Waste Pro USA, Inc. | | | | | | | | | |
| | | |
5.50%, 2/15/26(8) | | | | | | | 25 | | | | 24,895 | |
| | | |
| | | | | | | | | | | $ | 1,412,637 | |
| | | |
| Electronics / Electrical — 1.0% | | | | | | | | | |
| | | |
| Infor (US), Inc. | | | | | | | | | |
| | | |
6.50%, 5/15/22 | | | | | | | 1,000 | | | $ | 1,005,350 | |
| | | | | | | | | | | | |
| Security | | | | | Principal
Amount*
(000’s omitted) | | | Value | |
| | | |
| Electronics / Electrical (continued) | | | | | | | | | |
| | | |
| Perusahaan Listrik Negara PT | | | | | | | | | |
| | | |
5.25%, 10/24/42(10) | | | | | | | 1,000 | | | $ | 1,029,100 | |
| | | |
| Sensata Technologies, Inc. | | | | | | | | | |
| | | |
4.375%, 2/15/30(8) | | | | | | | 45 | | | | 43,934 | |
| | | |
| | | | | | | | | | | $ | 2,078,384 | |
| | | |
| Energy — 0.0%(7) | | | | | | | | | |
| | | |
| Sunoco, L.P./Sunoco Finance Corp. | | | | | | | | | |
| | | |
4.875%, 1/15/23 | | | | | | | 75 | | | $ | 73,485 | |
| | | |
| | | | | | | | | | | $ | 73,485 | |
| | | |
| Financial Intermediaries — 0.2% | | | | | | | | | |
| | | |
Icahn Enterprises, L.P./Icahn Enterprises
Finance Corp. | | | | | | | | | |
| | | |
6.25%, 2/1/22 | | | | | | | 435 | | | $ | 441,286 | |
| | | |
| | | | | | | | | | | $ | 441,286 | |
| | | |
| Financial Services — 0.4% | | | | | | | | | |
| | | |
| Debt and Asset Trading Corp. | | | | | | | | | |
| | | |
1.00%, 10/10/25(10) | | | | | | | 1,060 | | | $ | 813,550 | |
| | | |
| | | | | | | | | | | $ | 813,550 | |
| | | |
| Food Products — 0.3% | | | | | | | | | |
| | | |
| Iceland Bondco PLC | | | | | | | | | |
| | | |
4.881%, (3 mo. GBP LIBOR + 4.25%), 7/15/20(8)(11) | | | GBP | | | | 31 | | | $ | 39,001 | |
| | | |
JBS USA LUX S.A./JBS USA Food Co./JBS USA
Finance, Inc. | | | | | | | | | |
| | | |
5.50%, 1/15/30(8) | | | | | | | 537 | | | | 546,209 | |
| | | |
| | | | | | | | | | | $ | 585,210 | |
| | | |
| Health Care — 1.0% | | | | | | | | | |
| | | |
| Centene Corp. | | | | | | | | | |
| | | |
5.25%, 4/1/25(8) | | | | | | | 635 | | | $ | 665,162 | |
| | | |
5.375%, 8/15/26(8) | | | | | | | 113 | | | | 121,419 | |
| | | |
| HCA, Inc. | | | | | | | | | |
| | | |
5.875%, 2/1/29 | | | | | | | 753 | | | | 865,159 | |
| | | |
| MPH Acquisition Holdings, LLC | | | | | | | | | |
| | | |
7.125%, 6/1/24(8) | | | | | | | 691 | | | | 620,152 | |
| | | |
| | | | | | | | | | | $ | 2,271,892 | |
| | | |
| Industrial Equipment — 0.1% | | | | | | | | | |
| | | |
| Colfax Corp. | | | | | | | | | |
| | | |
6.00%, 2/15/24(8) | | | | | | | 36 | | | $ | 36,727 | |
| | | | |
| | 16 | | See Notes to Financial Statements. |
Eaton Vance
Short Duration Diversified Income Fund
April 30, 2020
Portfolio of Investments (Unaudited) — continued
| | | | | | | | | | | | |
| Security | | | | | Principal
Amount*
(000’s omitted) | | | Value | |
| | | |
| Industrial Equipment (continued) | | | | | | | | | |
| | | |
| Colfax Corp. (continued) | | | | | | | | | |
| | | |
6.375%, 2/15/26(8) | | | | | | | 59 | | | $ | 61,027 | |
| | | |
| | | | | | | | | | | $ | 97,754 | |
| | | |
| Insurance — 0.4% | | | | | | | | | |
| | | |
| Hub International, Ltd. | | | | | | | | | |
| | | |
7.00%, 5/1/26(8) | | | | | | | 948 | | | $ | 941,127 | |
| | | |
| | | | | | | | | | | $ | 941,127 | |
| | | |
| Internet Software & Services — 0.2% | | | | | | | | | |
| | | |
| Netflix, Inc. | | | | | | | | | |
| | | |
5.875%, 11/15/28 | | | | | | | 230 | | | $ | 261,165 | |
| | | |
| Riverbed Technology, Inc. | | | | | | | | | |
| | | |
8.875%, 3/1/23(8) | | | | | | | 260 | | | | 159,900 | |
| | | |
| | | | | | | | | | | $ | 421,065 | |
| | | |
| Leisure Goods / Activities / Movies — 0.3% | | | | | | | | | |
| | | |
| AMC Entertainment Holdings, Inc. | | | | | | | | | |
| | | |
6.125%, 5/15/27 | | | | | | | 2,000 | | | $ | 485,000 | |
| | | |
| Viking Cruises, Ltd. | | | | | | | | | |
| | | |
5.875%, 9/15/27(8) | | | | | | | 320 | | | | 219,306 | |
| | | |
| | | | | | | | | | | $ | 704,306 | |
| | | |
| Lodging and Casinos — 1.2% | | | | | | | | | |
| | | |
| Caesars Resort Collection, LLC/CRC Finco, Inc. | | | | | | | | | |
| | | |
5.25%, 10/15/25(8) | | | | | | | 657 | | | $ | 520,048 | |
| | | |
| ESH Hospitality, Inc. | | | | | | | | | |
| | | |
4.625%, 10/1/27(8) | | | | | | | 91 | | | | 82,582 | |
| | | |
| Golden Nugget, Inc. | | | | | | | | | |
| | | |
8.75%, 10/1/25(8) | | | | | | | 297 | | | | 168,176 | |
| | | |
| Hilton Domestic Operating Co., Inc. | | | | | | | | | |
| | | |
4.25%, 9/1/24 | | | | | | | 55 | | | | 53,786 | |
| | | |
Hilton Worldwide Finance, LLC/Hilton Worldwide
Finance Corp. | | | | | | | | | |
| | | |
4.625%, 4/1/25 | | | | | | | 1,000 | | | | 994,800 | |
| | | |
MGM Growth Properties Operating Partnership,
L.P./MGP Finance Co-Issuer, Inc. | | | | | | | | | |
| | | |
5.75%, 2/1/27 | | | | | | | 44 | | | | 44,689 | |
| | | |
Stars Group Holdings B.V./Stars Group
US Co-Borrower, LLC | | | | | | | | | |
| | | |
7.00%, 7/15/26(8) | | | | | | | 500 | | | | 516,325 | |
| | | |
| Wynn Las Vegas, LLC/Wynn Las Vegas Capital Corp. | | | | | | | | | |
| | | |
5.25%, 5/15/27(8) | | | | | | | 243 | | | | 208,379 | |
| | | |
| | | | | | | | | | | $ | 2,588,785 | |
| | | | | | | | | | | | |
| Security | | | | | Principal
Amount*
(000’s omitted) | | | Value | |
| | | |
| Media — 0.2% | | | | | | | | | |
| | | |
| Scripps Escrow, Inc. | | | | | | | | | |
| | | |
5.875%, 7/15/27(8) | | | | | | | 477 | | | $ | 405,283 | |
| | | |
| | | | | | | | | | | $ | 405,283 | |
| | | |
| Metals / Mining — 0.1% | | | | | | | | | |
| | | |
| Cleveland-Cliffs, Inc. | | | | | | | | | |
| | | |
6.75%, 3/15/26(8) | | | | | | | 112 | | | $ | 98,246 | |
| | | |
| | | | | | | | | | | $ | 98,246 | |
| | | |
| Nonferrous Metals / Minerals — 0.2% | | | | | | | | | |
| | | |
| First Quantum Minerals, Ltd. | | | | | | | | | |
| | | |
7.25%, 4/1/23(8) | | | | | | | 441 | | | $ | 402,545 | |
| | | |
| New Gold, Inc. | | | | | | | | | |
| | | |
6.25%, 11/15/22(8) | | | | | | | 89 | | | | 89,111 | |
| | | |
| | | | | | | | | | | $ | 491,656 | |
| | | |
| Oil and Gas — 1.6% | | | | | | | | | |
| | | |
Archrock Partners L.P./Archrock Partners
Finance Corp. | | | | | | | | | |
| | | |
6.875%, 4/1/27(8) | | | | | | | 250 | | | $ | 188,950 | |
| | | |
| Cheniere Energy Partners, L.P. | | | | | | | | | |
| | | |
4.50%, 10/1/29(8) | | | | | | | 71 | | | | 65,828 | |
| | | |
Great Western Petroleum, LLC/Great Western
Finance Corp. | | | | | | | | | |
| | | |
9.00%, 9/30/21(8) | | | | | | | 1,000 | | | | 680,000 | |
| | | |
| Hilcorp Energy I, L.P./Hilcorp Finance Co. | | | | | | | | | |
| | | |
6.25%, 11/1/28(8) | | | | | | | 267 | | | | 140,068 | |
| | | |
| Petroleos Mexicanos | | | | | | | | | |
| | | |
6.49%, 1/23/27(10) | | | | | | | 512 | | | | 417,869 | |
| | | |
6.50%, 3/13/27 | | | | | | | 1,256 | | | | 1,024,896 | |
| | | |
5.35%, 2/12/28 | | | | | | | 212 | | | | 159,002 | |
| | | |
5.95%, 1/28/31(10) | | | | | | | 371 | | | | 270,570 | |
| | | |
| Tervita Corp. | | | | | | | | | |
| | | |
7.625%, 12/1/21(8) | | | | | | | 620 | | | | 412,703 | |
| | | |
| | | | | | | | | | | $ | 3,359,886 | |
| | | |
| Packaging & Containers — 0.2% | | | | | | | | | |
| | | |
| ARD Finance SA | | | | | | | | | |
| | | |
6.50%, (6.50% cash or 7.25% PIK),
6/30/27(8)(9) | | | | | | | 520 | | | $ | 485,082 | |
| | | |
| | | | | | | | | | | $ | 485,082 | |
| | | | |
| | 17 | | See Notes to Financial Statements. |
Eaton Vance
Short Duration Diversified Income Fund
April 30, 2020
Portfolio of Investments (Unaudited) — continued
| | | | | | | | | | | | |
| Security | | | | | Principal
Amount*
(000’s omitted) | | | Value | |
| | | |
| Pipelines — 0.0%(7) | | | | | | | | | |
| | | |
Crestwood Midstream Partners L.P./Crestwood
Midstream Finance Corp. | | | | | | | | | |
| | | |
5.625%, 5/1/27(8) | | | | | | | 83 | | | $ | 54,473 | |
| | | |
| EnLink Midstream, LLC | | | | | | | | | |
| | | |
5.375%, 6/1/29 | | | | | | | 50 | | | | 31,290 | |
| | | |
| | | | | | | | | | | $ | 85,763 | |
| | | |
| Radio and Television — 0.6% | | | | | | | | | |
| | | |
Diamond Sports Group, LLC/Diamond Sports
Finance Co. | | | | | | | | | |
| | | |
5.375%, 8/15/26(8) | | | | | | | 146 | | | $ | 111,646 | |
| | | |
| iHeartCommunications, Inc. | | | | | | | | | |
| | | |
6.375%, 5/1/26 | | | | | | | 27 | | | | 25,732 | |
| | | |
8.375%, 5/1/27 | | | | | | | 49 | | | | 41,235 | |
| | | |
| Nexstar Broadcasting, Inc. | | | | | | | | | |
| | | |
5.625%, 7/15/27(8) | | | | | | | 62 | | | | 59,499 | |
| | | |
| Sirius XM Radio, Inc. | | | | | | | | | |
| | | |
4.625%, 7/15/24(8) | | | | | | | 124 | | | | 127,075 | |
| | | |
5.50%, 7/1/29(8) | | | | | | | 500 | | | | 529,800 | |
| | | |
| Terrier Media Buyer, Inc. | | | | | | | | | |
| | | |
8.875%, 12/15/27(8) | | | | | | | 500 | | | | 415,625 | |
| | | |
| | | | | | | | | | | $ | 1,310,612 | |
| | | |
| Steel — 0.3% | | | | | | | | | |
| | | |
| Allegheny Technologies, Inc. | | | | | | | | | |
| | | |
7.875%, 8/15/23 | | | | | | | 700 | | | $ | 645,463 | |
| | | |
| Infrabuild Australia Pty, Ltd. | | | | | | | | | |
| | | |
12.00%, 10/1/24(8) | | | | | | | 73 | | | | 62,583 | |
| | | |
| | | | | | | | | | | $ | 708,046 | |
| | | |
| Surface Transport — 0.2% | | | | | | | | | |
| | | |
| XPO Logistics, Inc. | | | | | | | | | |
| | | |
6.125%, 9/1/23(8) | | | | | | | 346 | | | $ | 352,124 | |
| | | |
| | | | | | | | | | | $ | 352,124 | |
| | | |
| Technology — 0.4% | | | | | | | | | |
| | | |
| Dell International, LLC/EMC Corp. | | | | | | | | | |
| | | |
7.125%, 6/15/24(8) | | | | | | | 895 | | | $ | 930,218 | |
| | | |
| | | | | | | | | | | $ | 930,218 | |
| | | |
| Telecommunications — 1.1% | | | | | | | | | |
| | | |
| Altice France Holding SA | | | | | | | | | |
| | | |
10.50%, 5/15/27(8) | | | | | | | 269 | | | $ | 291,219 | |
| | | | | | | | | | | | |
| Security | | | | | Principal
Amount*
(000’s omitted) | | | Value | |
| | | |
| Telecommunications (continued) | | | | | | | | | |
| | | |
| Altice France SA | | | | | | | | | |
| | | |
7.375%, 5/1/26(8) | | | | | | | 355 | | | $ | 372,626 | |
| | | |
| CenturyLink, Inc. | | | | | | | | | |
| | | |
7.50%, 4/1/24 | | | | | | | 66 | | | | 71,953 | |
| | | |
| Connect Finco S.a.r.l./Connect US Finco, LLC | | | | | | | | | |
| | | |
6.75%, 10/1/26(8) | | | | | | | 200 | | | | 191,630 | |
| | | |
| Hughes Satellite Systems Corp. | | | | | | | | | |
| | | |
6.625%, 8/1/26 | | | | | | | 470 | | | | 506,237 | |
| | | |
| Sprint Capital Corp. | | | | | | | | | |
| | | |
6.875%, 11/15/28 | | | | | | | 191 | | | | 230,919 | |
| | | |
| Sprint Communications, Inc. | | | | | | | | | |
| | | |
6.00%, 11/15/22 | | | | | | | 25 | | | | 26,552 | |
| | | |
| Sprint Corp. | | | | | | | | | |
| | | |
7.875%, 9/15/23 | | | | | | | 605 | | | | 683,650 | |
| | | |
| ViaSat, Inc. | | | | | | | | | |
| | | |
5.625%, 4/15/27(8) | | | | | | | 62 | | | | 61,358 | |
| | | |
| | | | | | | | | | | $ | 2,436,144 | |
| | | |
| Utilities — 0.2% | | | | | | | | | |
| | | |
| AES Corp. (The) | | | | | | | | | |
| | | |
5.50%, 4/15/25 | | | | | | | 14 | | | $ | 14,438 | |
| | | |
| Calpine Corp. | | | | | | | | | |
| | | |
5.75%, 1/15/25 | | | | | | | 104 | | | | 104,126 | |
| | | |
5.25%, 6/1/26(8) | | | | | | | 75 | | | | 76,723 | |
| | | |
| TerraForm Power Operating, LLC | | | | | | | | | |
| | | |
4.25%, 1/31/23(8) | | | | | | | 45 | | | | 46,384 | |
| | | |
5.00%, 1/31/28(8) | | | | | | | 70 | | | | 73,758 | |
| | | |
| | | | | | | | | | | $ | 315,429 | |
| | | |
Total Corporate Bonds & Notes
(identified cost $38,877,329) | | | | | | | | | | $ | 34,768,554 | |
|
| Foreign Government Securities — 10.8% | |
| Security | | | | | Principal
Amount*
(000’s omitted) | | | Value | |
| | | |
| Argentina — 0.4% | | | | | | | | | |
| | | |
| Republic of Argentina | | | | | | | | | |
| | | |
3.75%, 12/31/38 | | | | | | | 947 | | | $ | 303,039 | |
| | | |
6.875%, 1/11/48 | | | | | | | 1,615 | | | | 381,560 | |
| | | |
7.625%, 4/22/46 | | | | | | | 1,089 | | | | 272,261 | |
| | | |
Total Argentina | | | | | | | | | | $ | 956,860 | |
| | | | |
| | 18 | | See Notes to Financial Statements. |
Eaton Vance
Short Duration Diversified Income Fund
April 30, 2020
Portfolio of Investments (Unaudited) — continued
| | | | | | | | | | | | |
| Security | | | | | Principal
Amount*
(000’s omitted) | | | Value | |
| | | |
| Armenia — 0.5% | | | | | | | | | |
| | | |
| Republic of Armenia | | | | | | | | | |
| | | |
3.95%, 9/26/29(10) | | | | | | | 484 | | | $ | 451,773 | |
| | | |
7.15%, 3/26/25(10) | | | | | | | 552 | | | | 590,498 | |
| | | |
Total Armenia | | | | | | | | | | $ | 1,042,271 | |
| | | |
| Bahrain — 0.4% | | | | | | | | | |
| | | |
| Kingdom of Bahrain | | | | | | | | | |
| | | |
6.75%, 9/20/29(10) | | | | | | | 251 | | | $ | 244,308 | |
| | | |
7.00%, 1/26/26(10) | | | | | | | 393 | | | | 393,229 | |
| | | |
7.00%, 10/12/28(10) | | | | | | | 200 | | | | 199,582 | |
| | | |
Total Bahrain | | | | | | | | | | $ | 837,119 | |
| | | |
| Barbados — 0.5% | | | | | | | | | |
| | | |
| Government of Barbados | | | | | | | | | |
| | | |
6.50%, 10/1/29(8) | | | | | | | 1,316 | | | $ | 1,138,600 | |
| | | |
Total Barbados | | | | | | | | | | $ | 1,138,600 | |
| | | |
| Belarus — 0.5% | | | | | | | | | |
| | | |
| Republic of Belarus | | | | | | | | | |
| | | |
6.875%, 2/28/23(10) | | | | | | | 1,185 | | | $ | 1,163,357 | |
| | | |
Total Belarus | | | | | | | | | | $ | 1,163,357 | |
| | | |
| Benin — 0.4% | | | | | | | | | |
| | | |
| Benin Government International Bond | | | | | | | | | |
| | | |
5.75%, 3/26/26(10) | | | EUR | | | | 904 | | | $ | 826,656 | |
| | | |
Total Benin | | | | | | | | | | $ | 826,656 | |
| | | |
| Ecuador — 0.2% | | | | | | | | | |
| | | |
| Republic of Ecuador | | | | | | | | | |
| | | |
7.875%, 3/27/25(10) | | | | | | | 1,080 | | | $ | 313,200 | |
| | | |
9.50%, 3/27/30(10) | | | | | | | 200 | | | | 58,500 | |
| | | |
9.625%, 6/2/27(10) | | | | | | | 200 | | | | 57,752 | |
| | | |
Total Ecuador | | | | | | | | | | $ | 429,452 | |
| | | |
| Egypt — 1.8% | | | | | | | | | |
| | | |
| Arab Republic of Egypt | | | | | | | | | |
| | | |
8.15%, 11/20/59(10) | | | | | | | 1,599 | | | $ | 1,404,530 | |
| | | |
8.50%, 1/31/47(10) | | | | | | | 1,500 | | | | 1,347,525 | |
| | | |
8.70%, 3/1/49(10) | | | | | | | 1,331 | | | | 1,200,305 | |
| | | |
Total Egypt | | | | | | | | | | $ | 3,952,360 | |
| | | | | | | | | | | | |
| Security | | | | | Principal
Amount*
(000’s omitted) | | | Value | |
| | | |
| Fiji — 0.4% | | | | | | | | | |
| | | |
| Republic of Fiji | | | | | | | | | |
| | | |
6.625%, 10/2/20(10) | | | | | | | 929 | | | $ | 935,093 | |
| | | |
Total Fiji | | | | | | | | | | $ | 935,093 | |
| | | |
| Ghana — 0.4% | | | | | | | | | |
| | | |
| Ghana Government International Bond | | | | | | | | | |
| | | |
8.95%, 3/26/51(10) | | | | | | | 1,250 | | | $ | 954,851 | |
| | | |
Total Ghana | | | | | | | | | | $ | 954,851 | |
|
| Guatemala — 0.1% | |
| | | |
| Republic of Guatemala | | | | | | | | | |
| | | |
6.125%, 6/1/50(10) | | | | | | | 200 | | | $ | 209,700 | |
| | | |
Total Guatemala | | | | | | | | | | $ | 209,700 | |
| | | |
| Jordan — 0.5% | | | | | | | | | |
| | | |
| Jordan Government International Bond | | | | | | | | | |
| | | |
7.375%, 10/10/47(10) | | | | | | | 1,200 | | | $ | 1,117,489 | |
| | | |
Total Jordan | | | | | | | | | | $ | 1,117,489 | |
| | | |
| Lebanon — 0.1% | | | | | | | | | |
| | | |
| Lebanon Government International Bond | | | | | | | | | |
| | | |
6.65%, 4/22/24(4)(10) | | | | | | | 316 | | | $ | 50,165 | |
| | | |
7.00%, 3/20/28(4)(10) | | | | | | | 129 | | | | 21,607 | |
| | | |
7.15%, 11/20/31(4)(10) | | | | | | | 89 | | | | 14,908 | |
| | | |
8.20%, 5/17/33(4) | | | | | | | 70 | | | | 11,725 | |
| | | |
8.25%, 5/17/34(4) | | | | | | | 58 | | | | 9,715 | |
| | | |
Total Lebanon | | | | | | | | | | $ | 108,120 | |
| | | |
| Paraguay — 0.1% | | | | | | | | | |
| | | |
| Republic of Paraguay | | | | | | | | | |
| | | |
4.95%, 4/28/31(10) | | | | | | | 230 | | | $ | 238,481 | |
| | | |
Total Paraguay | | | | | | | | | | $ | 238,481 | |
| | | |
| Peru — 0.1% | | | | | | | | | |
| | | |
| Republic of Peru | | | | | | | | | |
| | | |
2.392%, 1/23/26 | | | | | | | 200 | | | $ | 203,400 | |
| | | |
Total Peru | | | | | | | | | | $ | 203,400 | |
| | | |
| Poland — 0.5% | | | | | | | | | |
| | | |
| Republic of Poland | | | | | | | | | |
| | | |
5.125%, 4/21/21 | | | | | | | 1,100 | | | $ | 1,142,941 | |
| | | |
Total Poland | | | | | | | | | | $ | 1,142,941 | |
| | | | |
| | 19 | | See Notes to Financial Statements. |
Eaton Vance
Short Duration Diversified Income Fund
April 30, 2020
Portfolio of Investments (Unaudited) — continued
| | | | | | | | | | | | |
| Security | | | | | Principal
Amount*
(000’s omitted) | | | Value | |
| | | |
| Romania — 1.0% | | | | | | | | | |
| | | |
| Romanian Government International Bond | | | | | | | | | |
| | | |
3.375%, 1/28/50(10) | | | EUR | | | | 938 | | | $ | 876,413 | |
| | | |
4.625%, 4/3/49(10) | | | EUR | | | | 1,075 | | | | 1,192,617 | |
| | | |
Total Romania | | | | | | | | | | $ | 2,069,030 | |
| | | |
| Seychelles — 0.3% | | | | | | | | | |
| | | |
| Republic of Seychelles | | | | | | | | | |
| | | |
8.00%, 1/1/26(10) | | | | | | | 834 | | | $ | 627,306 | |
| | | |
Total Seychelles | | | | | | | | | | $ | 627,306 | |
| | | |
| Suriname — 0.1% | | | | | | | | | |
| | | |
| Republic of Suriname | | | | | | | | | |
| | | |
9.25%, 10/26/26(10) | | | | | | | 664 | | | $ | 253,980 | |
| | | |
Total Suriname | | | | | | | | | | $ | 253,980 | |
|
| Ukraine — 2.0% | |
| | | |
| Ukraine Government International Bond | | | | | | | | | |
| | | |
0.00%, GDP-Linked, 5/31/40(8)(10)(12) | | | | | | | 1,836 | | | $ | 1,366,015 | |
| | | |
7.75%, 9/1/20(10) | | | | | | | 160 | | | | 156,041 | |
| | | |
9.75%, 11/1/28(10) | | | | | | | 2,864 | | | | 2,816,094 | |
| | | |
Total Ukraine | | | | | | | | | | $ | 4,338,150 | |
|
| Uruguay — 0.5% | |
| | | |
| Republica Orient Uruguay | | | | | | | | | |
| | | |
4.375%, 10/27/27 | | | | | | | 900 | | | $ | 988,524 | |
| | | |
Total Uruguay | | | | | | | | | | $ | 988,524 | |
| |
Total Foreign Government Securities
(identified cost $27,362,579) | | | $ | 23,533,740 | |
|
| Sovereign Loans — 1.5% | |
| Borrower | | | | | Principal
Amount
(000’s omitted) | | | Value | |
|
| Kenya — 0.8% | |
| | | |
| Government of Kenya | | | | | | | | | |
| | | |
Term Loan, 8.37%, (6 mo. USD LIBOR + 6.45%), Maturing June 29, 2025(11) | | | | | | $ | 1,850 | | | $ | 1,664,758 | |
| | | |
Total Kenya | | | | | | | | | | $ | 1,664,758 | |
| | | | | | | | | | | | |
| Borrower | | | | | Principal
Amount
(000’s omitted) | | | Value | |
|
| Nigeria — 0.1% | |
| | | |
| Bank of Industry Limited | | | | | | | | | |
| | | |
Term Loan, 7.31%, (3 mo. USD LIBOR + 6.00%), Maturing April 11, 2021(11)(13) | | | | | | $ | 360 | | | $ | 328,033 | |
| | | |
Total Nigeria | | | | | | | | | | $ | 328,033 | |
|
| Tanzania — 0.6% | |
| | | |
| Government of the United Republic of Tanzania | | | | | | | | | |
| | | |
Term Loan, 7.12%, (6 mo. USD LIBOR + 5.20%), Maturing June 23, 2022(11) | | | | | | $ | 1,357 | | | $ | 1,301,798 | |
| | | |
Total Tanzania | | | | | | | | | | $ | 1,301,798 | |
| |
Total Sovereign Loans
(identified cost $3,558,894) | | | $ | 3,294,589 | |
|
| Mortgage Pass-Throughs — 10.8% | |
| Security | | | | | Principal
Amount
(000’s omitted) | | | Value | |
| | | |
| Federal Home Loan Mortgage Corp.: | | | | | | | | | |
| | | |
2.845%, (COF + 1.25%), with maturity at 2035(14) | | | | | | $ | 976 | | | $ | 983,446 | |
| | | |
3.00%, with maturity at 2050 | | | | | | | 3,943 | | | | 4,179,441 | |
| | | |
4.50%, with various maturities to 2048 | | | | | | | 471 | | | | 495,168 | |
| | | |
6.00%, with maturity at 2029 | | | | | | | 829 | | | | 940,938 | |
| | | |
6.15%, with maturity at 2027 | | | | | | | 175 | | | | 192,703 | |
| | | |
6.50%, with maturity at 2032 | | | | | | | 763 | | | | 862,258 | |
| | | |
7.00%, with maturity at 2036 | | | | | | | 875 | | | | 1,008,117 | |
| | | |
7.50%, with maturity at 2024 | | | | | | | 282 | | | | 295,308 | |
| | | |
9.00%, with maturity at 2031 | | | | | | | 21 | | | | 23,900 | |
| | | |
9.50%, with maturity at 2022 | | | | | | | 1 | | | | 1,148 | |
| | | |
| | | | | | | | | | | $ | 8,982,427 | |
| | | |
| Federal National Mortgage Association: | | | | | | | | | |
| | | |
3.511%, (6 mo. USD LIBOR + 1.54%), with maturity at 2037(14) | | | | | | $ | 277 | | | $ | 283,974 | |
| | | |
4.50%, with maturity at 2049 | | | | | | | 4,406 | | | | 4,753,785 | |
| | | |
5.00%, with various maturities to 2040 | | | | | | | 1,417 | | | | 1,612,109 | |
| | | |
5.50%, with various maturities to 2033 | | | | | | | 974 | | | | 1,100,545 | |
| | | |
6.00%, with maturity at 2023 | | | | | | | 364 | | | | 385,933 | |
| | | |
6.328%, (COF + 2.00%, Floor 6.328%), with maturity at 2032(14) | | | | | | | 308 | | | | 334,156 | |
| | | |
6.50%, with various maturities to 2036 | | | | | | | 1,876 | | | | 2,129,023 | |
| | | |
7.00%, with various maturities to 2037 | | | | | | | 869 | | | | 985,325 | |
| | | |
10.00%, with various maturities to 2031 | | | | | | | 13 | | | | 14,327 | |
| | | |
| | | | | | | | | | | $ | 11,599,177 | |
| | | | |
| | 20 | | See Notes to Financial Statements. |
Eaton Vance
Short Duration Diversified Income Fund
April 30, 2020
Portfolio of Investments (Unaudited) — continued
| | | | | | | | | | | | |
| Security | | | | | Principal
Amount
(000’s omitted) | | | Value | |
| | | |
| Government National Mortgage Association: | | | | | | | | | |
| | | |
4.50%, with maturity at 2047 | | | | | | $ | 1,445 | | | $ | 1,593,533 | |
| | | |
7.50%, with maturity at 2025 | | | | | | | 368 | | | | 391,527 | |
| | | |
8.00%, with maturity at 2034 | | | | | | | 789 | | | | 886,810 | |
| | | |
9.50%, with maturity at 2025 | | | | | | | 8 | | | | 8,768 | |
| | | |
| | | | | | | | | | | $ | 2,880,638 | |
| |
Total Mortgage Pass-Throughs
(identified cost $22,457,366) | | | $ | 23,462,242 | |
|
| Collateralized Mortgage Obligations — 25.6% | |
| Security | | | | | Principal
Amount
(000’s omitted) | | | Value | |
| | | |
| Federal Home Loan Mortgage Corp.: | | | | | | | | | |
| | | |
Series 2113, Class QG, 6.00%, 1/15/29 | | | | | | $ | 373 | | | $ | 425,229 | |
| | | |
Series 2167, Class BZ, 7.00%, 6/15/29 | | | | | | | 348 | | | | 401,144 | |
| | | |
Series 2182, Class ZB, 8.00%, 9/15/29 | | | | | | | 577 | | | | 676,666 | |
| | | |
Series 4273, Class PU, 4.00%, 11/15/43 | | | | | | | 420 | | | | 489,068 | |
| | | |
Series 4337, Class YT, 3.50%, 4/15/49 | | | | | | | 1,384 | | | | 1,407,739 | |
| | | |
Series 4416, Class SU, 6.631%, (8.60% - 1 mo. USD LIBOR x 2.00),
12/15/44(15) | | | | | | | 266 | | | | 270,770 | |
| | | |
Series 4452, Class ZJ, 3.00%, 11/15/44 | | | | | | | 1,145 | | | | 1,154,983 | |
| | | |
Series 4584, Class PM, 3.00%, 5/15/46 | | | | | | | 616 | | | | 631,875 | |
| | | |
Series 4608, Class TV, 3.50%, 1/15/55 | | | | | | | 1,307 | | | | 1,322,645 | |
| | | |
Series 4626, Class UZ, 3.50%, 1/15/55 | | | | | | | 1,929 | | | | 1,931,112 | |
| | | |
Series 4630, Class CZ, 3.00%, 12/15/43 | | | | | | | 728 | | | | 733,203 | |
| | | |
Series 4677, Class SB, 12.062%, (16.00% - 1 mo. USD LIBOR x 4.00), 4/15/47(15) | | | | | | | 387 | | | | 399,693 | |
| | | |
Series 4751, Class ZC, 4.00%, 11/15/47 | | | | | | | 4 | | | | 3,630 | |
| | | |
Series 4774, Class QD, 4.50%, 1/15/43 | | | | | | | 1,462 | | | | 1,509,935 | |
| | | |
Series 4776, Class C, 4.50%, 3/15/43 | | | | | | | 1,419 | | | | 1,442,916 | |
| | | |
Series 4858, Class LA, 4.50%, 8/15/43 | | | | | | | 838 | | | | 844,472 | |
| | | |
Series 4941, Class ZD, 3.50%, 9/25/49 | | | | | | | 322 | | | | 322,383 | |
| | | |
| Interest Only:(16) | | | | | | | | | |
| | | |
Series 362, Class C7, 3.50%, 9/15/47 | | | | | | | 4,429 | | | | 350,712 | |
| | | |
Series 2631, Class DS, 6.286%, (7.10% - 1 mo. USD LIBOR),
6/15/33(15) | | | | | | | 725 | | | | 114,563 | |
| | | |
Series 2770, Class SH, 6.286%, (7.10% - 1 mo. USD LIBOR),
3/15/34(15) | | | | | | | 1,069 | | | | 270,388 | |
| | | |
Series 2981, Class CS, 5.906%, (6.72% - 1 mo. USD LIBOR), 5/15/35(15) | | | | | | | 593 | | | | 120,147 | |
| | | |
Series 3114, Class TS, 5.836%, (6.65% - 1 mo. USD LIBOR),
9/15/30(15) | | | | | | | 1,360 | | | | 220,565 | |
| | | |
Series 3339, Class JI, 5.776%, (6.59% - 1 mo. USD LIBOR), 7/15/37(15) | | | | | | | 1,827 | | | | 422,840 | |
| | | |
Series 4109, Class ES, 5.336%, (6.15% - 1 mo. USD LIBOR), 12/15/41(15) | | | | | | | 33 | | | | 8,717 | |
| | | | | | | | | | |
| Security | | | | Principal
Amount
(000’s omitted) | | | Value | |
| | | |
| Federal Home Loan Mortgage Corp.: (continued) | | | | | | | | |
| | | |
| Interest Only: (continued) | | | | | | | | |
| | | |
Series 4121, Class IM, 4.00%, 10/15/39 | | | | $ | 1,712 | | | $ | 41,354 | |
| | | |
Series 4163, Class GS, 5.386%, (6.20% - 1 mo. USD LIBOR), 11/15/32(15) | | | | | 2,914 | | | | 648,933 | |
| | | |
Series 4169, Class AS, 5.436%, (6.25% - 1 mo. USD LIBOR), 2/15/33(15) | | | | | 1,562 | | | | 316,715 | |
| | | |
Series 4180, Class GI, 3.50%, 8/15/26 | | | | | 1,000 | | | | 48,407 | |
| | | |
Series 4203, Class QS, 5.436%, (6.25% - 1 mo. USD LIBOR), 5/15/43(15) | | | | | 1,595 | | | | 284,249 | |
| | | |
Series 4212, Class SA, 5.386%, (6.20% - 1 mo. USD LIBOR), 7/15/38(15) | | | | | 1,352 | | | | 22,506 | |
| | | |
Series 4332, Class KI, 4.00%, 9/15/43 | | | | | 651 | | | | 32,782 | |
| | | |
Series 4370, Class IO, 3.50%, 9/15/41 | | | | | 993 | | | | 45,731 | |
| | | |
Series 4497, Class CS, 5.386%, (6.20% - 1 mo. USD LIBOR), 9/15/44(15) | | | | | 2,517 | | | | 252,360 | |
| | | |
Series 4507, Class EI, 4.00%, 8/15/44 | | | | | 2,702 | | | | 247,439 | |
| | | |
Series 4535, Class JS, 5.286%, (6.10% - 1 mo. USD LIBOR), 11/15/43(15) | | | | | 2,743 | | | | 196,828 | |
| | | |
Series 4548, Class JS, 5.286%, (6.10% - 1 mo. USD LIBOR), 9/15/43(15) | | | | | 2,754 | | | | 208,932 | |
| | | |
Series 4629, Class QI, 3.50%, 11/15/46 | | | | | 2,760 | | | | 181,660 | |
| | | |
Series 4644, Class TI, 3.50%, 1/15/45 | | | | | 2,120 | | | | 108,628 | |
| | | |
Series 4653, Class PI, 3.50%, 7/15/44 | | | | | 1,775 | | | | 41,561 | |
| | | |
Series 4667, Class PI, 3.50%, 5/15/42 | | | | | 3,075 | | | | 95,636 | |
| | | |
Series 4676, Class DI, 4.00%, 7/15/44 | | | | | 3,345 | | | | 111,589 | |
| | | |
Series 4744, Class IO, 4.00%, 11/15/47 | | | | | 2,170 | | | | 201,581 | |
| | | |
Series 4749, Class IL, 4.00%, 12/15/47 | | | | | 1,659 | | | | 157,767 | |
| | | |
Series 4767, Class IM, 4.00%, 5/15/45 | | | | | 1,856 | | | | 68,731 | |
| | | |
Series 4768, Class IO, 4.00%, 3/15/48 | | | | | 2,014 | | | | 193,488 | |
| | | |
Series 4772, Class PI, 4.00%, 1/15/48 | | | | | 1,459 | | | | 140,144 | |
| | | |
| Principal Only:(17) | | | | | | | | |
| | | |
Series 3309, Class DO, 0.00%, 4/15/37 | | | | | 970 | | | | 916,622 | |
| | | |
Series 4478, Class PO, 0.00%, 5/15/45 | | | | | 542 | | | | 512,241 | |
| |
| | | | $ | 20,551,279 | |
| | | |
Federal Home Loan Mortgage Corp. Structured
Agency Credit Risk Debt Notes: | | | | | | | | |
| | | |
Series 2018-DNA1, Class M2, 2.287%, (1 mo. USD LIBOR + 1.80%), 7/25/30(11) | | | | $ | 1,503 | | | $ | 1,337,707 | |
| |
| | | | $ | 1,337,707 | |
| | | |
| Federal National Mortgage Association: | | | | | | | | |
| | | |
Series G-33, Class PT, 7.00%, 10/25/21 | | | | $ | 6 | | | $ | 6,183 | |
| | | |
Series 1991-122, Class N, 7.50%, 9/25/21 | | | | | 8 | | | | 8,522 | |
| | | |
Series 1994-42, Class K, 6.50%, 4/25/24 | | | | | 108 | | | | 116,735 | |
| | | |
Series 1997-38, Class N, 8.00%, 5/20/27 | | | | | 200 | | | | 230,778 | |
| | | |
Series 2007-74, Class AC, 5.00%, 8/25/37 | | | | | 1,035 | | | | 1,168,479 | |
| | | |
Series 2011-49, Class NT, 6.00%, (66.00% - 1 mo. USD LIBOR x 10.00, Cap 6.00%), 6/25/41(15) | | | | | 297 | | | | 334,529 | |
| | | | |
| | 21 | | See Notes to Financial Statements. |
Eaton Vance
Short Duration Diversified Income Fund
April 30, 2020
Portfolio of Investments (Unaudited) — continued
| | | | | | | | | | |
| Security | | | | Principal
Amount
(000’s omitted) | | | Value | |
| | | |
| Federal National Mortgage Association: (continued) | | | | | | | | |
| | | |
Series 2012-134, Class ZT, 2.00%, 12/25/42 | | | | $ | 1,057 | | | $ | 1,023,991 | |
| | | |
Series 2013-6, Class TA, 1.50%, 1/25/43 | | | | | 1,025 | | | | 1,025,086 | |
| | | |
Series 2013-52, Class MD, 1.25%, 6/25/43 | | | | | 1,086 | | | | 1,067,729 | |
| | | |
Series 2013-99, Class CF, 1.487%, (1 mo. USD LIBOR + 1.00%), 7/25/43(11) | | | | | 437 | | | | 451,392 | |
| | | |
Series 2015-74, Class SL, 2.063%, (2.349% - 1 mo. USD LIBOR x 0.587), 10/25/45(15) | | | | | 867 | | | | 764,946 | |
| | | |
Series 2017-15, Class LE, 3.00%, 6/25/46 | | | | | 899 | | | | 922,687 | |
| | | |
Series 2017-66, Class ZJ, 3.00%, 9/25/57 | | | | | 706 | | | | 706,500 | |
| | | |
Series 2017-96, Class Z, 3.00%, 12/25/57 | | | | | 165 | | | | 165,145 | |
| | | |
Series 2017-110, Class Z, 3.00%, 2/25/57 | | | | | 168 | | | | 166,607 | |
| | | |
Series 2018-18, Class QD, 4.50%, 5/25/45 | | | | | 1,215 | | | | 1,268,984 | |
| | | |
| Interest Only:(16) | | | | | | | | |
| | | |
Series 2004-46, Class SI, 5.513%, (6.00% - 1 mo. USD LIBOR),
5/25/34(15) | | | | | 842 | | | | 147,340 | |
| | | |
Series 2005-17, Class SA, 6.213%, (6.70% - 1 mo. USD LIBOR),
3/25/35(15) | | | | | 915 | | | | 234,579 | |
| | | |
Series 2006-42, Class PI, 6.103%, (6.59% - 1 mo. USD LIBOR),
6/25/36(15) | | | | | 1,361 | | | | 318,210 | |
| | | |
Series 2006-44, Class IS, 6.113%, (6.60% - 1 mo. USD LIBOR),
6/25/36(15) | | | | | 1,120 | | | | 268,548 | |
| | | |
Series 2007-50, Class LS, 5.963%, (6.45% - 1 mo. USD LIBOR),
6/25/37(15) | | | | | 972 | | | | 211,960 | |
| | | |
Series 2008-26, Class SA, 5.713%, (6.20% - 1 mo. USD LIBOR),
4/25/38(15) | | | | | 1,321 | | | | 298,945 | |
| | | |
Series 2008-61, Class S, 5.613%, (6.10% - 1 mo. USD LIBOR), 7/25/38(15) | | | | | 1,945 | | | | 383,103 | |
| | | |
Series 2010-109, Class PS, 6.113%, (6.60% - 1 mo. USD LIBOR),
10/25/40(15) | | | | | 2,091 | | | | 454,544 | |
| | | |
Series 2010-124, Class SJ, 5.563%, (6.05% - 1 mo. USD LIBOR),
11/25/38(15) | | | | | 604 | | | | 20,808 | |
| | | |
Series 2010-147, Class KS, 5.463%, (5.95% - 1 mo. USD LIBOR),
1/25/41(15) | | | | | 2,659 | | | | 456,503 | |
| | | |
Series 2010-150, Class GS, 6.263%, (6.75% - 1 mo. USD LIBOR),
1/25/21(15) | | | | | 150 | | | | 2,847 | |
| | | |
Series 2012-52, Class AI, 3.50%, 8/25/26 | | | | | 1,032 | | | | 53,084 | |
| | | |
Series 2012-56, Class SU, 6.263%, (6.75% - 1 mo. USD LIBOR),
8/25/26(15) | | | | | 57 | | | | 1,038 | |
| | | |
Series 2012-63, Class EI, 3.50%, 8/25/40 | | | | | 1,774 | | | | 32,585 | |
| | | |
Series 2012-103, Class GS, 5.613%, (6.10% - 1 mo. USD LIBOR),
2/25/40(15) | | | | | 1,221 | | | | 33,855 | |
| | | |
Series 2012-112, Class SB, 5.663%, (6.15% - 1 mo. USD LIBOR),
9/25/40(15) | | | | | 2,956 | | | | 170,745 | |
| | | |
Series 2012-118, Class IN, 3.50%, 11/25/42 | | | | | 3,148 | | | | 358,806 | |
| | | |
Series 2012-150, Class PS, 5.663%, (6.15% - 1 mo. USD LIBOR),
1/25/43(15) | | | | | 3,306 | | | | 663,367 | |
| | | |
Series 2012-150, Class SK, 5.663%, (6.15% - 1 mo. USD LIBOR),
1/25/43(15) | | | | | 1,842 | | | | 348,840 | |
| | | | | | | | | | |
| Security | | | | Principal
Amount
(000’s omitted) | | | Value | |
| | | |
| Federal National Mortgage Association: (continued) | | | | | | | | |
| | | |
| Interest Only: (continued) | | | | | | | | |
| | | |
Series 2013-23, Class CS, 5.763%, (6.25% - 1 mo. USD LIBOR), 3/25/33(15) | | | | $ | 1,592 | | | $ | 323,026 | |
| | | |
Series 2013-54, Class HS, 5.813%, (6.30% - 1 mo. USD LIBOR), 10/25/41(15) | | | | | 850 | | | | 66,253 | |
| | | |
Series 2014-32, Class EI, 4.00%, 6/25/44 | | | | | 682 | | | | 82,558 | |
| | | |
Series 2014-55, Class IN, 3.50%, 7/25/44 | | | | | 1,794 | | | | 180,673 | |
| | | |
Series 2014-80, Class BI, 3.00%, 12/25/44 | | | | | 3,294 | | | | 292,808 | |
| | | |
Series 2014-89, Class IO, 3.50%, 1/25/45 | | | | | 1,401 | | | | 108,626 | |
| | | |
Series 2015-14, Class KI, 3.00%, 3/25/45 | | | | | 3,428 | | | | 297,233 | |
| | | |
Series 2015-17, Class SA, 5.713%, (6.20% - 1 mo. USD LIBOR), 11/25/43(15) | | | | | 2,376 | | | | 195,945 | |
| | | |
Series 2015-52, Class MI, 3.50%, 7/25/45 | | | | | 1,652 | | | | 165,408 | |
| | | |
Series 2015-57, Class IO, 3.00%, 8/25/45 | | | | | 8,989 | | | | 771,409 | |
| | | |
Series 2015-93, Class BS, 5.663%, (6.15% - 1 mo. USD LIBOR), 8/25/45(15) | | | | | 2,743 | | | | 384,771 | |
| | | |
Series 2017-46, Class NI, 3.00%, 8/25/42 | | | | | 2,435 | | | | 81,718 | |
| | | |
Series 2018-21, Class IO, 3.00%, 4/25/48 | | | | | 3,789 | | | | 286,106 | |
| | | |
| Principal Only:(17) | | | | | | | | |
| | | |
Series 2006-8, Class WQ, 0.00%, 3/25/36 | | | | | 763 | | | | 728,110 | |
| |
| | | | $ | 17,852,644 | |
| | | |
| Government National Mortgage Association: | | | | | | | | |
| | | |
Series 2011-156, Class GA, 2.00%, 12/16/41 | | | | $ | 396 | | | $ | 399,749 | |
| | | |
Series 2013-131, Class GS, 2.516%, (3.50% - 1 mo. USD LIBOR), 6/20/43(15) | | | | | 756 | | | | 766,178 | |
| | | |
Series 2017-82, Class TZ, 2.50%, 2/16/43 | | | | | 40 | | | | 40,198 | |
| | | |
Series 2019-97, Class ZC, 3.50%, 8/20/49 | | | | | 1,813 | | | | 1,814,089 | |
| | | |
Series 2019-110, Class ZD, 3.50%, 9/20/49 | | | | | 2,422 | | | | 2,425,297 | |
| | | |
Series 2019-123, Class Z, 5.00%, 10/20/49 | | | | | 2,980 | | | | 2,987,167 | |
| | | |
Series 2019-151, Class HZ, 3.50%, 12/20/49 | | | | | 1,994 | | | | 1,993,361 | |
| | | |
Series 2019-152, Class HZ, 3.50%, 12/20/49 | | | | | 187 | | | | 186,580 | |
| | | |
Series 2019-158, Class ZJ, 3.50%, 12/20/49 | | | | | 4,985 | | | | 4,995,975 | |
| | | |
| Interest Only:(16) | | | | | | | | |
| | | |
Series 2017-121, Class DS, 3.782%, (4.50% - 1 mo. USD LIBOR), 8/20/47(15)(16) | | | | | 2,836 | | | | 341,307 | |
| |
| | | | $ | 15,949,901 | |
| |
Total Collateralized Mortgage Obligations
(identified cost $63,400,114) | | | $ | 55,691,531 | |
|
| Commercial Mortgage-Backed Securities — 6.1% | |
| Security | | | | Principal
Amount
(000’s omitted) | | | Value | |
| | | |
| BAMLL Commercial Mortgage Securities Trust | | | | | | | | |
| | | |
Series 2019-BPR, Class ENM, 3.843%,
11/5/32(8)(18) | | | | $ | 795 | | | $ | 555,264 | |
| | | |
Series 2019-BPR, Class FNM, 3.843%,
11/5/32(8)(18) | | | | | 1,605 | | | | 1,080,919 | |
| | | | |
| | 22 | | See Notes to Financial Statements. |
Eaton Vance
Short Duration Diversified Income Fund
April 30, 2020
Portfolio of Investments (Unaudited) — continued
| | | | | | | | | | |
| Security | | | | Principal
Amount
(000’s omitted) | | | Value | |
| | | |
| Citigroup Commercial Mortgage Trust | | | | | | | | |
| | | |
Series 2015-P1, Class D, 3.225%, 9/15/48(8) | | | | $ | 2,000 | | | $ | 1,330,299 | |
| | | |
Federal National Mortgage Association Multifamily
Connecticut Avenue Securities Trust | | | | | | | | |
| | | |
Series 2020-01, Class M10, 4.237%, (1 mo. USD LIBOR + 3.75%),
3/25/50(8)(11) | | | | | 1,000 | | | | 814,463 | |
| | | |
| JPMBB Commercial Mortgage Securities Trust | | | | | | | | |
| | | |
Series 2014-C22, Class D, 4.706%, 9/15/47(8)(18) | | | | | 1,850 | | | | 642,379 | |
| | | |
JPMorgan Chase Commercial Mortgage
Securities Trust | | | | | | | | |
| | | |
Series 2011-C5, Class D, 5.599%, 8/15/46(8)(18) | | | | | 1,850 | | | | 1,683,384 | |
| | | |
Morgan Stanley Bank of America Merrill
Lynch Trust | | | | | | | | |
| | | |
Series 2015-C23, Class D, 4.293%, 7/15/50(8)(18) | | | | | 1,500 | | | | 1,083,903 | |
| | | |
Series 2016-C29, Class D, 3.00%, 5/15/49(8) | | | | | 1,000 | | | | 637,045 | |
| | | |
Series 2016-C32, Class D, 3.396%, 12/15/49(8)(18) | | | | | 250 | | | | 156,328 | |
| | | |
| Morgan Stanley Capital I Trust | | | | | | | | |
| | | |
Series 2016-UBS12, Class D, 3.312%, 12/15/49(8) | | | | | 1,000 | | | | 624,994 | |
| | | |
| RETL Trust | | | | | | | | |
| | | |
Series 2019-RVP, Class B, 2.364%, (1 mo. USD LIBOR + 1.55%),
3/15/36(8)(11) | | | | | 545 | | | | 484,060 | |
| | | |
| UBS Commercial Mortgage Trust | | | | | | | | |
| | | |
Series 2012-C1, Class D, 5.755%, 5/10/45(8)(18) | | | | | 2,000 | | | | 1,585,645 | |
| | | |
| UBS-Barclays Commercial Mortgage Trust | | | | | | | | |
| | | |
Series 2013-C6, Class D, 4.452%, 4/10/46(8)(18) | | | | | 1,000 | | | | 586,921 | |
| | | |
| Wells Fargo Commercial Mortgage Trust | | | | | | | | |
| | | |
Series 2013-LC12, Class D, 4.412%, 7/15/46(8)(18) | | | | | 2,000 | | | | 522,463 | |
| | | |
Series 2015-C31, Class D, 3.852%, 11/15/48 | | | | | 922 | | | | 636,726 | |
| | | |
Series 2016-C35, Class D, 3.142%, 7/15/48(8) | | | | | 1,000 | | | | 657,651 | |
| | | |
Series 2016-C36, Class D, 2.942%, 11/15/59(8) | | | | | 500 | | | | 256,570 | |
| |
Total Commercial Mortgage-Backed Securities
(identified cost $18,657,088) | | | $ | 13,339,014 | |
|
| Asset-Backed Securities — 13.6% | |
| Security | | | | Principal
Amount
(000’s omitted) | | | Value | |
| | | |
| AMMC CLO 15, Ltd. | | | | | | | | |
| | | |
Series 2014-15A, Class ERR, 8.129%, (3 mo. USD LIBOR + 6.91%),
1/15/32(8)(11) | | | | $ | 2,000 | | | $ | 1,150,068 | |
| | | |
| AMMC CLO XII, Ltd. | | | | | | | | |
| | | |
Series 2013-12A, Class ER, 7.914%, (3 mo. USD LIBOR + 6.18%),
11/10/30(8)(11) | | | | | 1,000 | | | | 563,957 | |
| | | |
| Ares LII CLO, Ltd. | | | | | | | | |
| | | |
Series 2019-52A, Class E, 7.648%, (3 mo. USD LIBOR + 6.55%),
4/22/31(8)(11) | | | | | 1,000 | | | | 742,235 | |
| | | | | | | | | | |
| Security | | | | Principal
Amount
(000’s omitted) | | | Value | |
| | | |
| Ares XL CLO, Ltd. | | | | | | | | |
| | | |
Series 2016-40A, Class DR, 7.569%, (3 mo. USD LIBOR + 6.35%), 1/15/29(8)(11) | | | | $ | 1,000 | | | $ | 727,858 | |
| | | |
| Ares XXXIIR CLO, Ltd. | | | | | | | | |
| | | |
Series 2014-32RA, Class D, 7.542%, (3 mo. USD LIBOR + 5.85%), 5/15/30(8)(11) | | | | | 1,000 | | | | 660,859 | |
| | | |
| Barings CLO, Ltd. | | | | | | | | |
| | | |
Series 2017-1A, Class E, 7.135%, (3 mo. USD LIBOR + 6.00%), 7/18/29(8)(11) | | | | | 2,000 | | | | 1,481,996 | |
| | | |
| BlueMountain CLO XXIV, Ltd. | | | | | | | | |
| | | |
Series 2019-24A, Class E, 7.895%, (3 mo. USD LIBOR + 6.76%), 4/20/31(8)(11) | | | | | 1,250 | | | | 951,795 | |
| | | |
| Carlyle Global Market Strategies CLO, Ltd. | | | | | | | | |
| | | |
Series 2012-3A, Class DR2, 7.811%, (3 mo. USD LIBOR + 6.50%), 1/14/32(8)(11) | | | | | 2,000 | | | | 1,118,124 | |
| | | |
Series 2014-4RA, Class D, 6.869%, (3 mo. USD LIBOR + 5.65%), 7/15/30(8)(11) | | | | | 1,000 | | | | 554,907 | |
| | | |
Series 2015-5A, Class DR, 7.835%, (3 mo. USD LIBOR + 6.70%), 1/20/32(8)(11) | | | | | 1,000 | | | | 576,913 | |
| | | |
| Cole Park CLO, Ltd. | | | | | | | | |
| | | |
Series 2015-1A, Class ER, 7.735%, (3 mo. USD LIBOR + 6.60%), 10/20/28(8)(11) | | | | | 3,000 | | | | 2,011,119 | |
| | | |
| Dryden Senior Loan Fund | | | | | | | | |
| | | |
Series 2015-40A, Class ER, 7.442%, (3 mo. USD LIBOR + 5.75%), 8/15/31(8)(11) | | | | | 1,150 | | | | 795,432 | |
| | | |
| Galaxy XV CLO, Ltd. | | | | | | | | |
| | | |
Series 2013-15A, Class ER, 7.864%, (3 mo. USD LIBOR + 6.65%), 10/15/30(8)(11) | | | | | 1,440 | | | | 1,014,305 | |
| | | |
| Galaxy XXI CLO, Ltd. | | | | | | | | |
| | | |
Series 2015-21A, Class ER, 6.385%, (3 mo. USD LIBOR + 5.25%), 4/20/31(8)(11) | | | | | 1,000 | | | | 633,937 | |
| | | |
| Galaxy XXV CLO, Ltd. | | | | | | | | |
| | | |
Series 2018-25A, Class E, 6.941%, (3 mo. USD LIBOR + 5.95%), 10/25/31(8)(11) | | | | | 1,250 | | | | 857,581 | |
| | | |
| Golub Capital Partners CLO 22B, Ltd. | | | | | | | | |
| | | |
Series 2015-22A, Class ER, 7.135%, (3 mo. USD LIBOR + 6.00%), 1/20/31(8)(11) | | | | | 2,000 | | | | 1,050,126 | |
| | | |
| Golub Capital Partners CLO 23M, Ltd. | | | | | | | | |
| | | |
Series 2015-23A, Class ER, 6.885%, (3 mo. USD LIBOR + 5.75%), 1/20/31(8)(11) | | | | | 2,000 | | | | 1,057,970 | |
| | | |
| Madison Park Funding XXV, Ltd. | | | | | | | | |
| | | |
Series 2017-25A, Class D, 7.091%, (3 mo. USD LIBOR + 6.10%), 4/25/29(8)(11) | | | | | 3,000 | | | | 1,874,367 | |
| | | |
| Magnetite XXII, Ltd. | | | | | | | | |
| | | |
Series 2019-22A, Class E, 7.969%, (3 mo. USD LIBOR + 6.75%), 4/15/31(8)(11) | | | | | 1,000 | | | | 770,295 | |
| | | |
| Neuberger Berman CLO XVIII, Ltd. | | | | | | | | |
| | | |
Series 2014-18A, Class DR2, 7.029%, (3 mo. USD LIBOR + 5.92%), 10/21/30(8)(11) | | | | | 3,000 | | | | 2,037,405 | |
| | | | |
| | 23 | | See Notes to Financial Statements. |
Eaton Vance
Short Duration Diversified Income Fund
April 30, 2020
Portfolio of Investments (Unaudited) — continued
| | | | | | | | | | |
| Security | | | | Principal
Amount
(000’s omitted) | | | Value | |
| | | |
| OHA Credit Partners VII, Ltd. | | | | | | | | |
| | | |
Series 2012-7A, Class ER, 9.195%, (3 mo. USD LIBOR + 7.50%),
11/20/27(8)(11) | | | | $ | 4,000 | | | $ | 2,978,760 | |
| | | |
| Palmer Square CLO, Ltd. | | | | | | | | |
| | | |
Series 2013-2A, Class DRR, 6.985%, (3 mo. USD LIBOR + 5.85%),
10/17/31(8)(11) | | | | | 2,000 | | | | 1,400,814 | |
| | | |
Series 2015-1A, Class DR2, 7.946%, (3 mo. USD LIBOR + 6.25%),
5/21/29(8)(11) | | | | | 2,000 | | | | 1,459,670 | |
| | | |
| Regatta IX Funding, Ltd. | | | | | | | | |
| | | |
Series 2017-1A, Class E, 7.135%, (3 mo. USD LIBOR + 6.00%), 4/17/30(8)(11) | | | | | 2,000 | | | | 1,355,414 | |
| | | |
| THL Credit Wind River CLO, Ltd. | | | | | | | | |
| | | |
Series 2017-1A, Class E, 7.555%, (3 mo. USD LIBOR + 6.42%), 4/18/29(8)(11) | | | | | 1,050 | | | | 636,157 | |
| | | |
| Voya CLO, Ltd. | | | | | | | | |
| | | |
Series 2015-3A, Class DR, 7.335%, (3 mo. USD LIBOR + 6.20%),
10/20/31(8)(11) | | | | | 2,000 | | | | 1,089,828 | |
| |
Total Asset-Backed Securities
(identified cost $44,361,390) | | | $ | 29,551,892 | |
|
| Common Stocks — 0.5% | |
| Security | | | | Shares | | | Value | |
|
| Automotive — 0.0%(7) | |
| | | |
Dayco Products, LLC(19)(20) | | | | | 8,898 | | | $ | 66,735 | |
| |
| | | | $ | 66,735 | |
|
| Electronics / Electrical — 0.0%(7) | |
| | | |
Answers Corp.(6)(19) | | | | | 5,814 | | | $ | 10,756 | |
| |
| | | | $ | 10,756 | |
|
| Health Care — 0.0% | |
| | | |
New Millennium Holdco, Inc.(6)(19)(20) | | | | | 8,641 | | | $ | 0 | |
| |
| | | | $ | 0 | |
|
| Oil and Gas — 0.1% | |
| | | |
AFG Holdings, Inc.(6)(19)(20) | | | | | 3,122 | | | $ | 65,936 | |
| | | |
RDV Resources, Inc., Class A(6)(19)(20) | | | | | 4,228 | | | | 0 | |
| | | |
Samson Resources II, LLC, Class A(19)(20) | | | | | 4,171 | | | | 76,121 | |
| | | |
Sunrise Oil Gas, Inc., Class A(19)(20) | | | | | 9,281 | | | | 64,967 | |
| |
| | | | $ | 207,024 | |
|
| Publishing — 0.3% | |
| | | |
ION Media Networks, Inc.(6)(19) | | | | | 1,357 | | | $ | 559,844 | |
| | | |
Tweddle Group, Inc.(6)(19)(20) | | | | | 333 | | | | 2,244 | |
| |
| | | | $ | 562,088 | |
| | | | | | | | | | | | |
| Security | | | | | Shares | | | Value | |
| | | |
| Radio and Television — 0.1% | | | | | | | | | |
| | | |
Clear Channel Outdoor Holdings, Inc.(19)(20) | | | | | | $ | 11,266 | | | $ | 10,869 | |
| | | |
Cumulus Media, Inc., Class A(19)(20) | | | | | | | 6,722 | | | | 29,779 | |
| | | |
iHeartMedia, Inc., Class A(19)(20) | | | | | | | 4,791 | | | | 33,633 | |
| |
| | | | $ | 74,281 | |
|
| Retailers (Except Food and Drug) — 0.0%(7) | |
| | | |
David’s Bridal, LLC(6)(19)(20) | | | | | | | 4,108 | | | $ | 31,303 | |
| | | |
| | | | | | | | | | | $ | 31,303 | |
| | | |
Total Common Stocks
(identified cost $806,249) | | | | | | | | | | $ | 952,187 | |
|
| Preferred Stocks — 0.0%(7) | |
| Security | | | | | Shares | | | Value | |
|
| Retailers (Except Food and Drug) — 0.0%(7) | |
| | | |
David’s Bridal, LLC, Series A, 8.00% (PIK)(6)(19)(20) | | | | | | | 114 | | | $ | 9,120 | |
| | | |
David’s Bridal, LLC, Series B, 10.00% (PIK)(6)(19)(20) | | | | | | | 466 | | | | 37,727 | |
| |
Total Preferred Stocks
(identified cost $37,727) | | | $ | 46,847 | |
|
| Warrants — 0.0% | |
| Security | | | | | Shares | | | Value | |
|
| Retailers (Except Food and Drug) — 0.0% | |
| | | |
David’s Bridal, LLC, Exp. 11/26/22(6)(19)(20) | | | | | | | 793 | | | $ | 0 | |
| |
Total Warrants
(identified cost $0) | | | $ | 0 | |
|
| Miscellaneous — 0.0%(7) | |
| Security | | | | | Shares | | | Value | |
|
| Oil and Gas — 0.0%(7) | |
| | | |
Paragon Offshore Finance Company,
Class A(19)(20) | | | | | | | 270 | | | $ | 81 | |
| | | |
Paragon Offshore Finance Company,
Class B(19)(20) | | | | | | | 135 | | | | 2,599 | |
| |
Total Miscellaneous
(identified cost $2,936) | | | $ | 2,680 | |
| | | | |
| | 24 | | See Notes to Financial Statements. |
Eaton Vance
Short Duration Diversified Income Fund
April 30, 2020
Portfolio of Investments (Unaudited) — continued
| | | | | | | | | | | | |
| Short-Term Investments — 6.3% | |
| U.S. Treasury Obligations — 0.5% | | | | | | | | | | | | |
| Security | | | | | Principal
Amount
(000’s omitted) | | | Value | |
| | | |
U.S. Treasury Bill , 0.00%, 5/21/20 | | | | | | $ | 1,000 | | | $ | 999,951 | |
| |
Total U.S. Treasury Obligations
(identified cost $999,933) | | | $ | 999,951 | |
|
| Other — 5.8% | |
| Description | | | | | Units | | | Value | |
| | | |
Eaton Vance Cash Reserves Fund, LLC, 0.47%(21) | | | | | | | 12,574,236 | | | $ | 12,574,236 | |
| |
Total Other
(identified cost $12,572,367) | | | $ | 12,574,236 | |
| |
Total Short-Term Investments
(identified cost $13,572,300) | | | $ | 13,574,187 | |
| |
Total Investments — 123.4%
(identified cost $311,920,742) | | | $ | 268,326,738 | |
| |
Less Unfunded Loan Commitments — (0.1)% | | | $ | (75,000 | ) |
| |
Net Investments — 123.3%
(identified cost $311,845,742) | | | $ | 268,251,738 | |
| |
Other Assets, Less Liabilities — (23.3)% | | | $ | (50,760,640 | ) |
| |
Net Assets — 100.0% | | | $ | 217,491,098 | |
The percentage shown for each investment category in the Portfolio of Investments is based on net assets.
| | * | In U.S. dollars unless otherwise indicated. |
| | (1) | Senior floating-rate loans (Senior Loans) often require prepayments from excess cash flows or permit the borrowers to repay at their election. The degree to which borrowers repay, whether as a contractual requirement or at their election, cannot be predicted with accuracy. As a result, the actual remaining maturity may be substantially less than the stated maturities shown. However, Senior Loans will typically have an expected average life of approximately two to four years. Senior Loans typically have rates of interest which are redetermined periodically by reference to a base lending rate, plus a spread. These base lending rates are primarily the London Interbank Offered Rate (“LIBOR”) and secondarily, the prime rate offered by one or more major United States banks (the “Prime Rate”). Base lending rates may be subject to a floor, or minimum rate. |
| | (2) | The stated interest rate represents the weighted average interest rate at April 30, 2020 of contracts within the senior loan facility. Interest rates on contracts are primarily redetermined either weekly, monthly or quarterly by reference to the indicated base lending rate and spread and the reset period. |
| | (3) | This Senior Loan will settle after April 30, 2020, at which time the interest rate will be determined. |
| | (4) | Issuer is in default with respect to interest and/or principal payments or has declared bankruptcy. For a variable rate security, interest rate has been adjusted to reflect non-accrual status. |
| | (5) | Unfunded or partially unfunded loan commitments. The stated interest rate reflects the weighted average of the reference rate and spread for the funded portion, if any, and the commitment fees on the portion of the loan that is unfunded. At April 30, 2020, the total value of unfunded loan commitments is $69,750. See Note 1F for description. |
| | (6) | For fair value measurement disclosure purposes, security is categorized as Level 3 (see Note 9). |
| | (7) | Amount is less than 0.05%. |
| | (8) | Security exempt from registration pursuant to Rule 144A under the Securities Act of 1933, as amended. These securities may be sold in certain transactions in reliance on an exemption from registration (normally to qualified institutional buyers). At April 30, 2020, the aggregate value of these securities is $65,187,052 or 30.0% of the Fund’s net assets. |
| | (9) | Represents a payment-in-kind security which may pay interest in additional principal at the issuer’s discretion. |
| (10) | Security exempt from registration under Regulation S of the Securities Act of 1933, which exempts from registration securities offered and sold outside the United States. Security may not be offered or sold in the United States except pursuant to an exemption from, or in a transaction not subject to, the registration requirements of the Securities Act of 1933. At April 30, 2020, the aggregate value of these securities is $21,613,064 or 9.9% of the Fund’s net assets. |
| (11) | Variable rate security. The stated interest rate represents the rate in effect at April 30, 2020. |
| (12) | Amounts payable in respect of the security are contingent upon and determined by reference to Ukraine’s GDP and Real GDP Growth Rate. Principal amount represents the notional amount used to calculate payments due to the security holder and does not represent an entitlement for payment. |
| (13) | Loan is subject to scheduled mandatory prepayments. Maturity date shown reflects the final maturity date. |
| (14) | Adjustable rate mortgage security whose interest rate generally adjusts monthly based on a weighted average of interest rates on the underlying mortgages. The coupon rate may not reflect the applicable index value as interest rates on the underlying mortgages may adjust on various dates and at various intervals and may be subject to lifetime ceilings and lifetime floors and lookback periods. Rate shown is the coupon rate at April 30, 2020. |
| (15) | Inverse floating-rate security whose coupon varies inversely with changes in the interest rate index. The stated interest rate represents the coupon rate in effect at April 30, 2020. |
| (16) | Interest only security that entitles the holder to receive only interest payments on the underlying mortgages. Principal amount shown is the notional amount of the underlying mortgages on which coupon interest is calculated. |
| (17) | Principal only security that entitles the holder to receive only principal payments on the underlying mortgages. |
| (18) | Weighted average fixed-rate coupon that changes/updates monthly. Rate shown is the rate at April 30, 2020. |
| (19) | Security was acquired in connection with a restructuring of a Senior Loan and may be subject to restrictions on resale. |
| (20) | Non-income producing security. |
| (21) | Affiliated investment company, available to Eaton Vance portfolios and funds, which invests in high quality, U.S. dollar denominated money market instruments. The rate shown is the annualized seven-day yield as of April 30, 2020. |
| | | | |
| | 25 | | See Notes to Financial Statements. |
Eaton Vance
Short Duration Diversified Income Fund
April 30, 2020
Portfolio of Investments (Unaudited) — continued
| | | | | | | | | | | | | | | | | | | | | | |
| Centrally Cleared Forward Foreign Currency Exchange Contracts | |
| Currency Purchased | | | Currency Sold | | | | | | | Settlement
Date | | | Value/Unrealized
Appreciation
(Depreciation) | |
| | | | | | | |
| EUR | | | 279,008 | | | USD | | | 303,785 | | | | | | | | 5/8/20 | | | $ | 1,981 | |
| | | | | | | |
| USD | | | 311,346 | | | EUR | | | 279,009 | | | | | | | | 5/8/20 | | | | 5,579 | |
| | | | | | | |
| USD | | | 2,113,575 | | | EUR | | | 1,941,187 | | | | | | | | 5/8/20 | | | | (13,783 | ) |
| | | | | | | |
| USD | | | 912,472 | | | EUR | | | 844,343 | | | | | | | | 7/6/20 | | | | (13,974 | ) |
| | | | | | | |
| EUR | | | 113,598 | | | USD | | | 128,119 | | | | | | | | 7/17/20 | | | | (3,445 | ) |
| | | | | | | |
| USD | | | 955,403 | | | EUR | | | 847,116 | | | | | | | | 7/17/20 | | | | 25,690 | |
| |
| | | | $ | 2,048 | |
| | | | | | | | | | | | | | | | | | | | | | | | |
| Forward Foreign Currency Exchange Contracts | |
| Currency Purchased | | | Currency Sold | | | Counterparty | | Settlement
Date | | | Unrealized
Appreciation | | | Unrealized
(Depreciation) | |
| | | | | | | |
| EUR | | | 733,518 | | | USD | | | 803,325 | | | Bank of America, N.A. | | | 5/5/20 | | | $ | 500 | | | $ | — | |
| | | | | | | |
| EUR | | | 1,266,177 | | | USD | | | 1,386,843 | | | Standard Chartered Bank | | | 5/5/20 | | | | 696 | | | | — | |
| | | | | | | |
| USD | | | 62,687 | | | EUR | | | 57,406 | | | HSBC Bank USA, N.A. | | | 5/5/20 | | | | — | | | | (221 | ) |
| | | | | | | |
| USD | | | 1,225,720 | | | EUR | | | 1,115,696 | | | Standard Chartered Bank | | | 5/5/20 | | | | 3,085 | | | | — | |
| | | | | | | |
| USD | | | 41,027 | | | EUR | | | 37,792 | | | Standard Chartered Bank | | | 5/5/20 | | | | — | | | | (388 | ) |
| | | | | | | |
| USD | | | 60,101 | | | EUR | | | 55,282 | | | State Street Bank and Trust Company | | | 5/5/20 | | | | — | | | | (480 | ) |
| | | | | | | |
| USD | | | 796,819 | | | EUR | | | 733,518 | | | UBS AG | | | 5/5/20 | | | | — | | | | (7,006 | ) |
| | | | | | | |
| USD | | | 38,441 | | | GBP | | | 30,897 | | | State Street Bank and Trust Company | | | 5/29/20 | | | | — | | | | (477 | ) |
| | | | | | | |
| EUR | | | 733,518 | | | USD | | | 797,272 | | | UBS AG | | | 6/2/20 | | | | 6,983 | | | | — | |
| | | | | | | |
| USD | | | 1,387,564 | | | EUR | | | 1,266,177 | | | Standard Chartered Bank | | | 6/2/20 | | | | — | | | | (717 | ) |
| | |
| | | | $ | 11,264 | | | $ | (9,289 | ) |
| | | | | | | | | | | | | | | | | | | | |
| Futures Contracts | |
| | | | | |
| Description | | Number of
Contracts | | | Position | | | Expiration
Date | | | Notional
Amount | | | Value/
Unrealized
Appreciation
(Depreciation) | |
| | | | | |
Interest Rate Futures | | | | | | | | | | | | | | | | | | | | |
| | | | | |
| U.S. 10-Year Treasury Note | | | 148 | | | | Long | | | | 6/19/20 | | | $ | 20,581,250 | | | $ | 810,266 | |
| | | | | |
| U.S. Long Treasury Bond | | | 23 | | | | Long | | | | 6/19/20 | | | | 4,163,719 | | | | 336,784 | |
| | | | | |
| U.S. Ultra 10-Year Treasury Note | | | 68 | | | | Long | | | | 6/19/20 | | | | 10,678,125 | | | | 271,880 | |
| | | | | |
| U.S. Ultra-Long Treasury Bond | | | 7 | | | | Long | | | | 6/19/20 | | | | 1,573,469 | | | | 156,014 | |
| | | | | |
| 5-Year USD Deliverable Interest Rate Swap | | | (6 | ) | | | Short | | | | 6/15/20 | | | | (625,547 | ) | | | (4,922 | ) |
| | | | | |
| 10-Year USD Deliverable Interest Rate Swap | | | (7 | ) | | | Short | | | | 6/15/20 | | | | (742,328 | ) | | | 1,805 | |
| | | | | |
| Euro-Bobl | | | (4 | ) | | | Short | | | | 6/8/20 | | | | (595,923 | ) | | | 921 | |
| | | | | |
| U.S. 5-Year Treasury Note | | | (2 | ) | | | Short | | | | 6/30/20 | | | | (250,969 | ) | | | (469 | ) |
| | | | | |
| U.S. Long Treasury Bond | | | (7 | ) | | | Short | | | | 6/19/20 | | | | (1,267,219 | ) | | | (94,802 | ) |
| | | | | |
| | | | | | | | | | | | | | | | | | | $ | 1,477,477 | |
| | | | |
| | 26 | | See Notes to Financial Statements. |
Eaton Vance
Short Duration Diversified Income Fund
April 30, 2020
Portfolio of Investments (Unaudited) — continued
| | | | | | | | | | | | | | | | | | | | | | |
| Centrally Cleared Interest Rate Swaps | |
| | | | | | | |
Notional
Amount
(000’s omitted) | | Fund
Pays/
Receives
Floating
Rate | | | Floating Rate | | Annual
Fixed Rate | | Termination
Date | | Value | | Unamortized
Upfront
Receipts
(Payments) | | | Unrealized
Appreciation
(Depreciation) | |
| | | | | | | | |
| EUR | | 550 | | | Receives | | | 6-month EURIBOR
(pays semi-annually) | | (0.53)%
(pays annually) | | 8/22/24 | | $ 6,345 | | $ | — | | | $ | 6,345 | |
| | | | | | | | |
| EUR | | 108 | | | Receives | | | 6-month EURIBOR
(pays semi-annually) | | 0.37%
(pays annually) | | 2/12/50 | | (15,479) | | | — | | | | (15,479 | ) |
| | | | | | | | |
| EUR | | 91 | | | Receives | | | 6-month EURIBOR
(pays semi-annually) | | 0.38%
(pays annually) | | 2/13/50 | | (13,241) | | | 2 | | | | (13,239 | ) |
| | | | | | | | |
| EUR | | 106 | | | Receives | | | 6-month EURIBOR
(pays semi-annually) | | 0.39%
(pays annually) | | 2/13/50 | | (15,651) | | | — | | | | (15,651 | ) |
| | | | | | | | |
| EUR | | 27 | | | Receives | | | 6-month EURIBOR (pays semi-annually) | | 0.38%
(pays annually) | | 2/13/50 | | (3,955) | | | — | | | | (3,955 | ) |
| | | | | | | | |
| EUR | | 141 | | | Receives | | | 6-month EURIBOR (pays semi-annually) | | 0.35%
(pays annually) | | 2/18/50 | | (19,388) | | | — | | | | (19,388 | ) |
| | | | | | | | |
| EUR | | 217 | | | Receives | | | 6-month EURIBOR (pays semi-annually) | | 0.34%
(pays annually) | | 2/20/50 | | (28,856) | | | — | | | | (28,856 | ) |
| | | | | | | | |
| EUR | | 310 | | | Receives | | | 6-month EURIBOR (pays semi-annually) | | 0.32%
(pays annually) | | 2/21/50 | | (39,118) | | | — | | | | (39,118 | ) |
| | | | | | | | |
| USD | | 335 | | | Receives | | | 3-month USD-LIBOR (pays quarterly) | | 1.93%
(pays semi-annually) | | 11/3/20 | | (4,316) | | | — | | | | (4,316 | ) |
| | | | | | | | |
| USD | | 1,220 | | | Receives | | | 3-month USD-LIBOR (pays quarterly) | | 0.55%
(pays semi-annually) | | 3/12/23 | | (7,140) | | | — | | | | (7,140 | ) |
| | | | | | | | |
| USD | | 188 | | | Receives | | | 3-month USD-LIBOR (pays quarterly) | | 1.46%
(pays semi-annually) | | 1/30/25 | | (10,014) | | | — | | | | (10,014 | ) |
| | | | | | | | |
| USD | | 400 | | | Receives | | | 3-month USD-LIBOR (pays quarterly) | | 1.41%
(pays semi-annually) | | 2/3/25 | | (18,692) | | | — | | | | (18,692 | ) |
| | | | | | | | |
| USD | | 500 | | | Receives | | | 3-month USD-LIBOR (pays quarterly) | | 0.43%
(pays semi-annually) | | 4/30/25 | | (101) | | | — | | | | (101 | ) |
| | | | | | | | |
| USD | | 1,042 | | | Receives | | | 3-month USD-LIBOR (pays quarterly) | | 1.74%
(pays semi-annually) | | 12/16/26 | | (88,327) | | | — | | | | (88,327 | ) |
| | | | | | | | |
| USD | | 850 | | | Receives | | | 3-month USD-LIBOR (pays quarterly) | | 0.68%
(pays semi-annually) | | 4/16/27 | | (7,907) | | | — | | | | (7,907 | ) |
| | | | | | | | |
| USD | | 730 | | | Receives | | | 3-month USD-LIBOR (pays quarterly) | | 0.57%
(pays semi-annually) | | 4/17/27 | | (1,475) | | | — | | | | (1,475 | ) |
| | | | | | | | |
| USD | | 796 | | | Receives | | | 3-month USD-LIBOR (pays quarterly) | | 2.63%
(pays semi-annually) | | 3/25/29 | | (140,268) | | | 6,724 | | | | (133,544 | ) |
| | | | | | | | |
| USD | | 2,309 | | | Receives | | | 3-month USD-LIBOR (pays quarterly) | | 2.09%
(pays semi-annually) | | 7/15/29 | | (313,667) | | | 722 | | | | (312,945 | ) |
| | | | | | | | |
| USD | | 1,390 | | | Receives | | | 3-month USD-LIBOR (pays quarterly) | | 1.74%
(pays semi-annually) | | 12/12/29 | | (150,865) | | | — | | | | (150,865 | ) |
| | | | | | | | |
| USD | | 170 | | | Receives | | | 3-month USD-LIBOR (pays quarterly) | | 1.58%
(pays semi-annually) | | 2/14/30 | | (15,107) | | | — | | | | (15,107 | ) |
| | | | | | | | |
| USD | | 350 | | | Receives | | | 3-month USD-LIBOR (pays quarterly) | | 1.57%
(pays semi-annually) | | 2/14/30 | | (30,796) | | | — | | | | (30,796 | ) |
| | | | | | | | |
| USD | | 430 | | | Receives | | | 3-month USD-LIBOR (pays quarterly) | | 1.56%
(pays semi-annually) | | 2/18/30 | | (37,839) | | | — | | | | (37,839 | ) |
| | | | | | | | |
| USD | | 255 | | | Receives | | | 3-month USD-LIBOR (pays quarterly) | | 0.80%
(pays semi-annually) | | 4/15/30 | | (3,384) | | | — | | | | (3,384 | ) |
| | | | |
| | 27 | | See Notes to Financial Statements. |
Eaton Vance
Short Duration Diversified Income Fund
April 30, 2020
Portfolio of Investments (Unaudited) — continued
| | | | | | | | | | | | | | | | | | | | | | |
| Centrally Cleared Interest Rate Swaps (continued) | |
| | | | | | | |
Notional
Amount
(000’s omitted) | | Fund
Pays/
Receives
Floating
Rate | | | Floating Rate | | Annual
Fixed Rate | | Termination
Date | | Value | | Unamortized
Upfront
Receipts
(Payments) | | | Unrealized
Appreciation
(Depreciation) | |
| | | | | | | | |
| USD | | 190 | | | Receives | | | 3-month USD-LIBOR (pays quarterly) | | 0.63%
(pays semi-annually) | | 4/27/30 | | $ 488 | | $ | — | | | $ | 488 | |
| | | | | | | | |
| USD | | 525 | | | Receives | | | 3-month USD-LIBOR (pays quarterly) | | 2.88%
(pays semi-annually) | | 1/31/49 | | (278,904) | | | (265 | ) | | | (279,169 | ) |
| | | | | | | | |
| USD | | 68 | | | Receives | | | 3-month USD-LIBOR (pays quarterly) | | 1.70%
(pays semi-annually) | | 8/27/49 | | (15,313) | | | — | | | | (15,313 | ) |
| | | | | | | | |
| USD | | 30 | | | Receives | | | 3-month USD-LIBOR (pays quarterly) | | 1.65%
(pays semi-annually) | | 8/28/49 | | (6,303) | | | — | | | | (6,303 | ) |
| | | | | | | | |
| USD | | 41 | | | Receives | | | 3-month USD-LIBOR (pays quarterly) | | 1.70%
(pays semi-annually) | | 9/12/49 | | (9,261) | | | — | | | | (9,261 | ) |
| | | | | | | | |
| USD | | 650 | | | Receives | | | 3-month USD-LIBOR (pays quarterly) | | 1.87%
(pays semi-annually) | | 10/25/49 | | (175,745) | | | — | | | | (175,745 | ) |
| | | | | | | | |
| USD | | 294 | | | Receives | | | 3-month USD-LIBOR (pays quarterly) | | 1.82%
(pays semi-annually) | | 12/6/49 | | (75,890) | | | — | | | | (75,890 | ) |
| | | | | | | | |
| USD | | 41 | | | Receives | | | 3-month USD-LIBOR (pays quarterly) | | 1.81%
(pays semi-annually) | | 12/6/49 | | (10,565) | | | — | | | | (10,565 | ) |
| | | | | | | | |
| USD | | 15 | | | Receives | | | 3-month USD-LIBOR (pays quarterly) | | 1.90%
(pays semi-annually) | | 1/8/50 | | (4,285) | | | — | | | | (4,285 | ) |
| | | | | | | | |
| USD | | 100 | | | Receives | | | 3-month USD-LIBOR (pays quarterly) | | 0.79%
(pays semi-annually) | | 4/23/50 | | 1,375 | | | — | | | | 1,375 | |
| | | | | | | | |
Total | | | | | | | | | | | | | | $(1,533,644) | | $ | 7,183 | | | $ | (1,526,461 | ) |
| | | | | | | | | | | | | | | | | | | | | | | | |
| Centrally Cleared Credit Default Swaps — Sell Protection | | | | |
| | | | | | | |
Reference
Entity | | Notional
Amount*
(000’s omitted) | | | Contract Annual
Fixed Rate** | | Termination
Date | | | Current
Market Annual
Fixed Rate*** | | Value | | | Unamortized
Upfront
Receipts
(Payments) | | | Unrealized
Appreciation
(Depreciation) | |
| | | | | | | |
| Colombia | | $ | 5,000 | | | 1.00% (pays quarterly)(1) | | | 6/20/25 | | | 2.39% | | $ | (332,597 | ) | | $ | 462,141 | | | $ | 129,544 | |
| | | | | | | |
| Indonesia | | | 4,760 | | | 1.00% (pays quarterly)(1) | | | 6/20/25 | | | 2.09 | | | (247,550 | ) | | | 328,570 | | | | 81,020 | |
| | | | | | | |
| Mexico | | | 2,500 | | | 1.00% (pays quarterly)(1) | | | 6/20/25 | | | 2.55 | | | (184,298 | ) | | | 187,325 | | | | 3,027 | |
| | | | | | | |
| Peru | | | 5,000 | | | 1.00% (pays quarterly)(1) | | | 6/20/25 | | | 1.05 | | | (7,272 | ) | | | 97,647 | | | | 90,375 | |
| | | | | | | |
| Poland | | | 2,500 | | | 1.00% (pays quarterly)(1) | | | 6/20/23 | | | 0.41 | | | 49,564 | | | | (29,948 | ) | | | 19,616 | |
| | | | | | | |
| Turkey | | | 500 | | | 1.00% (pays quarterly)(1) | | | 6/20/20 | | | 5.13 | | | (2,329 | ) | | | 2,273 | | | | (56 | ) |
| | | | | | | |
| Turkey | | | 220 | | | 1.00% (pays quarterly)(1) | | | 6/20/21 | | | 5.62 | | | (11,012 | ) | | | 12,518 | | | | 1,506 | |
| | | | | | | |
| Turkey | | | 1,160 | | | 1.00% (pays quarterly)(1) | | | 6/20/25 | | | 5.77 | | | (236,200 | ) | | | 213,413 | | | | (22,787 | ) |
| | | | | | | |
Total | | $ | 21,640 | | | | | | | | | | | $ | (971,694 | ) | | $ | 1,273,939 | | | $ | 302,245 | |
| | | | |
| | 28 | | See Notes to Financial Statements. |
Eaton Vance
Short Duration Diversified Income Fund
April 30, 2020
Portfolio of Investments (Unaudited) — continued
| | | | | | | | | | | | | | | | | | | | | | | | |
| Credit Default Swaps — Sell Protection | |
Reference
Entity | | Counterparty | | Notional
Amount*
(000’s omitted) | | | Contract
Annual
Fixed Rate** | | Termination
Date | | Current
Market
Annual
Fixed
Rate*** | | | Value | | Unamortized
Upfront
Receipts
(Payments) | | | Unrealized
Appreciation
(Depreciation) | |
| | | | | | | | |
| Croatia | | Nomura International PLC | | $ | 5,000 | | | 1.00%
(pays quarterly)(1) | | 12/20/21 | | | 0.30 | % | | $ 64,108 | | $ | 75,353 | | | $ | 139,461 | |
| | | | | | | | |
| Cyprus | | Goldman Sachs International | | | 5,000 | | | 1.00%
(pays quarterly)(1) | | 12/20/21 | | | 0.68 | | | 32,508 | | | 88,820 | | | | 121,328 | |
| | | | | | | | |
| Dubai | | Bank of America, N.A. | | | 2,000 | | | 1.00%
(pays quarterly)(1) | | 12/20/22 | | | 2.50 | | | (74,439) | | | 16,842 | | | | (57,597 | ) |
| | | | | | | | |
| Dubai | | Bank of America, N.A. | | | 3,000 | | | 1.00%
(pays quarterly)(1) | | 6/20/23 | | | 2.57 | | | (138,559) | | | 8,552 | | | | (130,007 | ) |
| | | | | | | | |
| Hungary | | Barclays Bank PLC | | | 2,200 | | | 1.00%
(pays quarterly)(1) | | 12/20/21 | | | 0.35 | | | 26,142 | | | 3,381 | | | | 29,523 | |
| | | | | | | | |
| Kazakhstan | | Barclays Bank PLC | | | 2,500 | | | 1.00%
(pays quarterly)(1) | | 12/20/22 | | | 0.94 | | | 7,147 | | | 20,104 | | | | 27,251 | |
| | | | | | | | |
| Romania | | Barclays Bank PLC | | | 2,200 | | | 1.00%
(pays quarterly)(1) | | 12/20/21 | | | 1.41 | | | (12,272) | | | (1,698 | ) | | | (13,970 | ) |
| | | | | | | | |
Total | | | | $ | 21,900 | | | | | | | | | | | $(95,365) | | $ | 211,354 | | | $ | 115,989 | |
| * | If the Fund is the seller of credit protection, the notional amount is the maximum potential amount of future payments the Fund could be required to make if a credit event, as defined in the credit default swap agreement, were to occur. At April 30, 2020, such maximum potential amount for all open credit default swaps in which the Fund is the seller was $43,540,000. |
| ** | The contract annual fixed rate represents the fixed rate of interest received by the Fund (as a seller of protection) on the notional amount of the credit default swap contract. |
| *** | Current market annual fixed rates, utilized in determining the net unrealized appreciation or depreciation as of period end, serve as an indicator of the market’s perception of the current status of the payment/performance risk associated with the credit derivative. The current market annual fixed rate of a particular reference entity reflects the cost, as quoted by the pricing vendor, of selling protection against default of that entity as of period end and may include upfront payments required to be made to enter into the agreement. The higher the fixed rate, the greater the market perceived risk of a credit event involving the reference entity. A rate identified as “Defaulted” indicates a credit event has occurred for the reference entity. |
| (1) | Upfront payment is exchanged with the counterparty as a result of the standardized trading coupon. |
Abbreviations:
| | | | |
| | |
| COF | | – | | Cost of Funds 11th District |
| | |
| DIP | | – | | Debtor In Possession |
| | |
| EURIBOR | | – | | Euro Interbank Offered Rate |
| | |
| GDP | | – | | Gross Domestic Product |
| | |
| LIBOR | | – | | London Interbank Offered Rate |
| | |
| PIK | | – | | Payment In Kind |
Currency Abbreviations:
| | | | |
| | |
| EUR | | – | | Euro |
| | |
| GBP | | – | | British Pound Sterling |
| | |
| USD | | – | | United States Dollar |
| | | | |
| | 29 | | See Notes to Financial Statements. |
Eaton Vance
Short Duration Diversified Income Fund
April 30, 2020
Statement of Assets and Liabilities (Unaudited)
| | | | |
| Assets | | April 30, 2020 | |
| |
Unaffiliated investments, at value (identified cost, $299,273,375) | | $ | 255,677,502 | |
| |
Affiliated investment, at value (identified cost, $12,572,367) | | | 12,574,236 | |
| |
Cash | | | 1,186,860 | |
| |
Deposits for derivatives collateral — | | | | |
| |
Financial futures contracts | | | 724,567 | |
| |
Centrally cleared derivatives | | | 6,003,903 | |
| |
OTC derivatives | | | 110,000 | |
| |
Foreign currency, at value (identified cost, $292,746) | | | 295,078 | |
| |
Interest receivable | | | 2,276,821 | |
| |
Dividends receivable from affiliated investment | | | 6,104 | |
| |
Receivable for investments sold | | | 1,601,942 | |
| |
Receivable for variation margin on open financial futures contracts | | | 52,831 | |
| |
Receivable for variation margin on open centrally cleared derivatives | | | 4,778 | |
| |
Receivable for open forward foreign currency exchange contracts | | | 11,264 | |
| |
Receivable for open swap contracts | | | 317,563 | |
| |
Upfront payments on open non-centrally cleared swap contracts | | | 1,698 | |
| |
Prepaid upfront fees on notes payable | | | 50,390 | |
| |
Prepaid expenses and other assets | | | 11,834 | |
| |
Total assets | | $ | 280,907,371 | |
| |
| Liabilities | | | | |
| |
Notes payable | | $ | 61,000,000 | |
| |
Cash collateral due to broker | | | 110,000 | |
| |
Payable for investments purchased | | | 1,226,528 | |
| |
Payable for open forward foreign currency exchange contracts | | | 9,289 | |
| |
Payable for open swap contracts | | | 201,574 | |
| |
Upfront receipts on open non-centrally cleared swap contracts | | | 213,052 | |
| |
Payable to affiliates: | | | | |
| |
Investment adviser fee | | | 224,421 | |
| |
Trustees’ fees | | | 1,822 | |
| |
Accrued expenses | | | 429,587 | |
| |
Total liabilities | | $ | 63,416,273 | |
| |
Net Assets | | $ | 217,491,098 | |
| |
| Sources of Net Assets | | | | |
| |
Common shares, $0.01 par value, unlimited number of shares authorized, 17,880,596 shares issued and outstanding | | $ | 178,806 | |
| |
Additional paid-in capital | | | 271,593,248 | |
| |
Accumulated loss | | | (54,280,956 | ) |
| |
Net Assets | | $ | 217,491,098 | |
| |
| Net Asset Value | | | | |
| |
($217,491,098 ÷ 17,880,596 common shares issued and outstanding) | | $ | 12.16 | |
| | | | |
| | 30 | | See Notes to Financial Statements. |
Eaton Vance
Short Duration Diversified Income Fund
April 30, 2020
Statement of Operations (Unaudited)
| | | | |
| Investment Income | | Six Months Ended
April 30, 2020 | |
| |
Interest and other income | | $ | 7,689,968 | |
| |
Dividends from affiliated investment | | | 107,787 | |
| |
Total investment income | | $ | 7,797,755 | |
|
| Expenses | |
| |
Investment adviser fee | | $ | 1,557,077 | |
| |
Trustees’ fees and expenses | | | 10,900 | |
| |
Custodian fee | | | 112,755 | |
| |
Transfer and dividend disbursing agent fees | | | 8,988 | |
| |
Legal and accounting services | | | 74,413 | |
| |
Printing and postage | | | 20,844 | |
| |
Interest expense and fees | | | 989,512 | |
| |
Miscellaneous | | | 31,082 | |
| |
Total expenses | | $ | 2,805,571 | |
| |
Net investment income | | $ | 4,992,184 | |
|
| Realized and Unrealized Gain (Loss) | |
|
Net realized gain (loss) — | |
| |
Investment transactions | | $ | (4,031,272 | ) |
| |
Investment transactions — affiliated investment | | | (682 | ) |
| |
Financial futures contracts | | | 3,186,981 | |
| |
Swap contracts | | | (3,481,322 | ) |
| |
Foreign currency transactions | | | 2,140 | |
| |
Forward foreign currency exchange contracts | | | 71,004 | |
| |
Net realized loss | | $ | (4,253,151 | ) |
|
Change in unrealized appreciation (depreciation) — | |
| |
Investments | | $ | (34,942,966 | ) |
| |
Investments — affiliated investment | | | 357 | |
| |
Financial futures contracts | | | 1,601,561 | |
| |
Swap contracts | | | (1,439,333 | ) |
| |
Foreign currency | | | 6,468 | |
| |
Forward foreign currency exchange contracts | | | 7,345 | |
| |
Net change in unrealized appreciation (depreciation) | | $ | (34,766,568 | ) |
| |
Net realized and unrealized loss | | $ | (39,019,719 | ) |
| |
Net decrease in net assets from operations | | $ | (34,027,535 | ) |
| | | | |
| | 31 | | See Notes to Financial Statements. |
Eaton Vance
Short Duration Diversified Income Fund
April 30, 2020
Statements of Changes in Net Assets
| | | | | | | | |
| Increase (Decrease) in Net Assets | | Six Months Ended
April 30, 2020
(Unaudited) | | | Year Ended
October 31, 2019 | |
| | |
From operations — | | | | | | | | |
| | |
Net investment income | | $ | 4,992,184 | | | $ | 13,070,042 | |
| | |
Net realized gain (loss) | | | (4,253,151 | ) | | | 165,914 | |
| | |
Net change in unrealized appreciation (depreciation) | | | (34,766,568 | ) | | | (2,278,648 | ) |
| | |
Net increase (decrease) in net assets from operations | | $ | (34,027,535 | ) | | $ | 10,957,308 | |
| | |
Distributions to shareholders | | $ | (8,130,307 | ) | | $ | (15,019,701 | ) |
| | |
Net decrease in net assets | | $ | (42,157,842 | ) | | $ | (4,062,393 | ) |
| | |
| Net Assets | | | | | | | | |
| | |
At beginning of period | | $ | 259,648,940 | | | $ | 263,711,333 | |
| | |
At end of period | | $ | 217,491,098 | | | $ | 259,648,940 | |
| | | | |
| | 32 | | See Notes to Financial Statements. |
Eaton Vance
Short Duration Diversified Income Fund
April 30, 2020
Statement of Cash Flows (Unaudited)
| | | | |
| Cash Flows From Operating Activities | | Six Months Ended
April 30, 2020 | |
| |
Net decrease in net assets from operations | | $ | (34,027,535 | ) |
| |
Adjustments to reconcile net decrease in net assets from operations to net cash provided by operating activities: | | | | |
| |
Investments purchased | | | (75,133,419 | ) |
| |
Investments sold and principal repayments | | | 83,877,424 | |
| |
Decrease in short-term investments, net | | | 12,396,659 | |
| |
Net amortization/accretion of premium (discount) | | | 3,202,400 | |
| |
Amortization of prepaid upfront fees on notes payable | | | 29,655 | |
| |
Decrease in interest receivable | | | 566,925 | |
| |
Decrease in dividends receivable from affiliated investment | | | 20,839 | |
| |
Decrease in receivable for variation margin on open financial futures contracts | | | 489,928 | |
| |
Increase in receivable for variation margin on open centrally cleared derivatives | | | (4,778 | ) |
| |
Increase in receivable for open forward foreign currency exchange contracts | | | (7,877 | ) |
| |
Decrease in receivable for open swap contracts | | | 211,367 | |
| |
Decrease in upfront payments on open non-centrally swap contracts | | | 518 | |
| |
Decrease in prepaid expenses and other assets | | | 1,471 | |
| |
Decrease in cash collateral due to broker | | | (19 | ) |
| |
Decrease in payable for variation margin on open centrally cleared derivatives | | | (207,191 | ) |
| |
Decrease in payable for open forward foreign currency exchange contracts | | | (4,541 | ) |
| |
Increase in payable for open swap contracts | | | 201,574 | |
| |
Decrease in upfront receipts on open non-centrally cleared swap contracts | | | (59,337 | ) |
| |
Decrease in payable to affiliate for investment adviser fee | | | (51,958 | ) |
| |
Decrease in payable to affiliate for Trustees’ fees | | | (28 | ) |
| |
Decrease in accrued expenses | | | (70,902 | ) |
| |
Increase in unfunded loan commitments | | | 63,739 | |
| |
Net change in unrealized (appreciation) depreciation from investments | | | 34,942,609 | |
| |
Net realized loss from investments | | | 4,031,954 | |
| |
Net cash provided by operating activities | | $ | 30,469,477 | |
| |
| Cash Flows From Financing Activities | | | | |
| |
Cash distributions paid | | $ | (8,130,307 | ) |
| |
Payment of upfront fees on notes payable | | | (57,500 | ) |
| |
Proceeds from notes payable | | | 20,000,000 | |
| |
Repayments of notes payable | | | (44,000,000 | ) |
| |
Net cash used in financing activities | | $ | (32,187,807 | ) |
| |
Net decrease in cash and restricted cash* | | $ | (1,718,330 | ) |
| |
Cash and restricted cash at beginning of period (including foreign currency) | | $ | 10,038,738 | |
| |
Cash and restricted cash at end of period (including foreign currency) | | $ | 8,320,408 | |
| |
| Supplemental disclosure of cash flow information | | | | |
| |
Cash paid for interest and fees on borrowings | | $ | 1,145,481 | |
| * | Includes net change in unrealized appreciation (depreciation) on foreign currency of $2,498. |
| | | | |
| | 33 | | See Notes to Financial Statements. |
Eaton Vance
Short Duration Diversified Income Fund
April 30, 2020
Statement of Cash Flows (Unaudited) — continued
The following table provides a reconciliation of cash and restricted cash reported within the Statement of Assets and Liabilities that sum to the total of such amounts shown on the Statement of Cash Flows.
| | | | |
| | | April 30, 2020 | |
| |
Cash | | $ | 1,186,860 | |
| |
Deposits for derivatives collateral — | | | | |
| |
Financial futures contracts | | | 724,567 | |
| |
Centrally cleared derivatives | | | 6,003,903 | |
| |
OTC derivatives | | | 110,000 | |
| |
Foreign currency | | | 295,078 | |
| |
Total cash and restricted cash as shown on the Statement of Cash Flows | | $ | 8,320,408 | |
| | | | |
| | 34 | | See Notes to Financial Statements. |
Eaton Vance
Short Duration Diversified Income Fund
April 30, 2020
Financial Highlights
| | | | | | | | | | | | | | | | | | | | | | | | |
| | |
| | | Six Months Ended
April 30, 2020
(Unaudited) | | | Year Ended October 31, | |
| | | 2019 | | | 2018 | | | 2017 | | | 2016 | | | 2015 | |
| | | | | | | |
Net asset value — Beginning of period | | $ | 14.520 | | | $ | 14.750 | | | $ | 15.310 | | | $ | 15.050 | | | $ | 15.370 | | | $ | 16.460 | |
| | | | | | |
| Income (Loss) From Operations | | | | | | | | | | | | | | | | | | | | | | | | |
| | | | | | |
Net investment income(1) | | $ | 0.279 | | | $ | 0.731 | | | $ | 0.688 | | | $ | 0.702 | | | $ | 0.723 | | | $ | 0.777 | |
| | | | | | |
Net realized and unrealized gain (loss) | | | (2.184 | ) | | | (0.121 | ) | | | (0.399 | ) | | | 0.544 | | | | 0.030 | | | | (0.860 | ) |
| | | | | | |
Total income (loss) from operations | | $ | (1.905 | ) | | $ | 0.610 | | | $ | 0.289 | | | $ | 1.246 | | | $ | 0.753 | | | $ | (0.083 | ) |
| | | | | | |
| Less Distributions | | | | | | | | | | | | | | | | | | | | | | | | |
| | | | | | |
From net investment income | | $ | (0.455 | ) | | $ | (0.840 | ) | | $ | (0.849 | ) | | $ | (0.913 | ) | | $ | (0.635 | ) | | $ | (0.512 | ) |
| | | | | | |
Tax return of capital | | | — | | | | — | | | | — | | | | (0.073 | ) | | | (0.445 | ) | | | (0.568 | ) |
| | | | | | |
Total distributions | | $ | (0.455 | ) | | $ | (0.840 | ) | | $ | (0.849 | ) | | $ | (0.986 | ) | | $ | (1.080 | ) | | $ | (1.080 | ) |
| | | | | | |
Anti-dilutive effect of share repurchase program (see Note 5)(1) | | $ | — | | | $ | — | | | $ | — | | | $ | — | | | $ | 0.007 | | | $ | 0.073 | |
| | | | | | |
Net asset value — End of period | | $ | 12.160 | | | $ | 14.520 | | | $ | 14.750 | | | $ | 15.310 | | | $ | 15.050 | | | $ | 15.370 | |
| | | | | | |
Market value — End of period | | $ | 11.320 | | | $ | 13.210 | | | $ | 12.700 | | | $ | 14.190 | | | $ | 13.360 | | | $ | 13.580 | |
| | | | | | |
Total Investment Return on Net Asset Value(2) | | | (13.17 | )%(3) | | | 4.93 | % | | | 2.56 | % | | | 9.16 | % | | | 6.10 | % | | | 0.84 | % |
| | | | | | |
Total Investment Return on Market Value(2) | | | (11.15 | )%(3) | | | 10.87 | % | | | (4.63 | )% | | | 13.86 | % | | | 6.60 | % | | | 0.87 | % |
|
| Ratios/Supplemental Data | |
| | | | | | |
Net assets, end of period (000’s omitted) | | $ | 217,491 | | | $ | 259,649 | | | $ | 263,711 | | | $ | 273,837 | | | $ | 269,154 | | | $ | 275,694 | |
| | | | | | |
Ratios (as a percentage of average daily net assets): | | | | | | | | | | | | | | | | | | | | | | | | |
| | | | | | |
Expenses excluding interest and fees(5) | | | 1.46 | %(4) | | | 1.41 | % | | | 1.43 | % | | | 1.49 | % | | | 1.53 | % | | | 1.51 | % |
| | | | | | |
Interest and fee expense(6) | | | 0.80 | %(4) | | | 1.14 | % | | | 0.93 | % | | | 0.72 | % | | | 0.61 | % | | | 0.48 | % |
| | | | | | |
Total expenses(5) | | | 2.26 | %(4) | | | 2.55 | % | | | 2.36 | % | | | 2.21 | % | | | 2.14 | % | | | 1.99 | % |
| | | | | | |
Net investment income | | | 4.02 | %(4) | | | 4.97 | % | | | 4.57 | % | | | 4.61 | % | | | 4.81 | % | | | 4.84 | % |
| | | | | | |
Portfolio Turnover | | | 23 | %(3) | | | 46 | % | | | 32 | % | | | 50 | % | | | 42 | % | | | 34 | % |
|
Senior Securities: | |
| | | | | | |
Total notes payable outstanding (in 000’s) | | $ | 61,000 | | | $ | 85,000 | | | $ | 76,000 | | | $ | 83,000 | | | $ | 102,000 | | | $ | 123,000 | |
| | | | | | |
Asset coverage per $1,000 of notes payable(7) | | $ | 4,565 | | | $ | 4,055 | | | $ | 4,470 | | | $ | 4,299 | | | $ | 3,639 | | | $ | 3,241 | |
| (1) | Computed using average common shares outstanding. |
| (2) | Returns are historical and are calculated by determining the percentage change in net asset value or market value with all distributions reinvested. Distributions are assumed to be reinvested at prices obtained under the Fund’s dividend reinvestment plan. |
| (5) | Excludes the effect of custody fee credits, if any, of less than 0.005%. Effective September 1, 2015, custody fee credits, which were earned on cash deposit balances, were discontinued by the custodian. |
| (6) | Interest and fee expense relates to borrowings for the purpose of financial leverage (see Note 7). |
| (7) | Calculated by subtracting the Fund’s total liabilities (not including the notes payable) from the Fund’s total assets, and dividing the result by the notes payable balance in thousands. |
| | | | |
| | 35 | | See Notes to Financial Statements. |
Eaton Vance
Short Duration Diversified Income Fund
April 30, 2020
Notes to Financial Statements (Unaudited)
1 Significant Accounting Policies
Eaton Vance Short Duration Diversified Income Fund (the Fund) is a Massachusetts business trust registered under the Investment Company Act of 1940, as amended (the 1940 Act), as a diversified, closed-end management investment company. The Fund’s investment objective is to provide a high level of current income. The Fund may, as a secondary objective, also seek capital appreciation to the extent consistent with its primary goal of high current income.
The following is a summary of significant accounting policies of the Fund. The policies are in conformity with accounting principles generally accepted in the United States of America (U.S. GAAP). The Fund is an investment company and follows accounting and reporting guidance in the Financial Accounting Standards Board (FASB) Accounting Standards Codification Topic 946.
A Investment Valuation — The following methodologies are used to determine the market value or fair value of investments.
Senior Floating-Rate Loans. Interests in senior floating-rate loans (Senior Loans) for which reliable market quotations are readily available are valued generally at the average mean of bid and ask quotations obtained from a third party pricing service. Other Senior Loans are valued at fair value by the investment adviser under procedures approved by the Trustees. In fair valuing a Senior Loan, the investment adviser utilizes one or more of the valuation techniques described in (i) through (iii) below to assess the likelihood that the borrower will make a full repayment of the loan underlying such Senior Loan relative to yields on other Senior Loans issued by companies of comparable credit quality. If the investment adviser believes that there is a reasonable likelihood of full repayment, the investment adviser will determine fair value using a matrix pricing approach that considers the yield on the Senior Loan. If the investment adviser believes there is not a reasonable likelihood of full repayment, the investment adviser will determine fair value using analyses that include, but are not limited to: (i) a comparison of the value of the borrower’s outstanding equity and debt to that of comparable public companies; (ii) a discounted cash flow analysis; or (iii) when the investment adviser believes it is likely that a borrower will be liquidated or sold, an analysis of the terms of such liquidation or sale. In certain cases, the investment adviser will use a combination of analytical methods to determine fair value, such as when only a portion of a borrower’s assets are likely to be sold. In conducting its assessment and analyses for purposes of determining fair value of a Senior Loan, the investment adviser will use its discretion and judgment in considering and appraising relevant factors. Fair value determinations are made by the portfolio managers of the Fund based on information available to such managers. The portfolio managers of other funds managed by the investment adviser that invest in Senior Loans may not possess the same information about a Senior Loan borrower as the portfolio managers of the Fund. At times, the fair value of a Senior Loan determined by the portfolio managers of other funds managed by the investment adviser that invest in Senior Loans may vary from the fair value of the same Senior Loan determined by the portfolio managers of the Fund. The fair value of each Senior Loan is periodically reviewed and approved by the investment adviser’s Valuation Committee and by the Trustees based upon procedures approved by the Trustees. Junior Loans (i.e., subordinated loans and second lien loans) are valued in the same manner as Senior Loans.
Debt Obligations. Debt obligations are generally valued on the basis of valuations provided by third party pricing services, as derived from such services’ pricing models. Inputs to the models may include, but are not limited to, reported trades, executable bid and ask prices, broker/dealer quotations, prices or yields of securities with similar characteristics, interest rates, anticipated prepayments, benchmark curves or information pertaining to the issuer, as well as industry and economic events. The pricing services may use a matrix approach, which considers information regarding securities with similar characteristics to determine the valuation for a security. Short-term debt obligations purchased with a remaining maturity of sixty days or less for which a valuation from a third party pricing service is not readily available may be valued at amortized cost, which approximates fair value.
Equity Securities. Equity securities listed on a U.S. securities exchange generally are valued at the last sale or closing price on the day of valuation or, if no sales took place on such date, at the mean between the closing bid and ask prices on the exchange where such securities are principally traded. Equity securities listed on the NASDAQ Global or Global Select Market generally are valued at the NASDAQ official closing price. Unlisted or listed securities for which closing sales prices or closing quotations are not available are valued at the mean between the latest available bid and ask prices.
Derivatives. Financial futures contracts are valued at the closing settlement price established by the board of trade or exchange on which they are traded. Forward foreign currency exchange contracts are generally valued at the mean of the average bid and average ask prices that are reported by currency dealers to a third party pricing service at the valuation time. Such third party pricing service valuations are supplied for specific settlement periods and the Fund’s forward foreign currency exchange contracts are valued at an interpolated rate between the closest preceding and subsequent settlement period reported by the third party pricing service. Swaps are normally valued using valuations provided by a third party pricing service. Such pricing service valuations are based on the present value of fixed and projected floating rate cash flows over the term of the swap contract, and in the case of credit default swaps, based on credit spread quotations obtained from broker/dealers and expected default recovery rates determined by the pricing service using proprietary models. Future cash flows on swaps are discounted to their present value using swap rates provided by electronic data services or by broker/dealers.
Foreign Securities and Currencies. Foreign securities and currencies are valued in U.S. dollars, based on foreign currency exchange rate quotations supplied by a third party pricing service. The pricing service uses a proprietary model to determine the exchange rate. Inputs to the model include reported trades and implied bid/ask spreads. The daily valuation of exchange-traded foreign securities generally is determined as of the close of trading on the principal exchange on which such securities trade. Events occurring after the close of trading on foreign exchanges may result in adjustments to the valuation of foreign securities to more accurately reflect their fair value as of the close of regular trading on the New York Stock Exchange.
Affiliated Fund. The Fund may invest in Eaton Vance Cash Reserves Fund, LLC (Cash Reserves Fund), an affiliated investment company managed by Eaton Vance Management (EVM). While Cash Reserves Fund is not a registered money market mutual fund, it conducts all of its investment activities in
Eaton Vance
Short Duration Diversified Income Fund
April 30, 2020
Notes to Financial Statements (Unaudited) — continued
accordance with the requirements of Rule 2a-7 under the 1940 Act. Investments in Cash Reserves Fund are valued at the closing net asset value per unit on the valuation day. Cash Reserves Fund generally values its investment securities based on available market quotations provided by a third party pricing service.
Fair Valuation. Investments for which valuations or market quotations are not readily available or are deemed unreliable are valued at fair value using methods determined in good faith by or at the direction of the Trustees of the Fund in a manner that most fairly reflects the security’s “fair value”, which is the amount that the Fund might reasonably expect to receive for the security upon its current sale in the ordinary course. Each such determination is based on a consideration of relevant factors, which are likely to vary from one pricing context to another. These factors may include, but are not limited to, the type of security, the existence of any contractual restrictions on the security’s disposition, the price and extent of public trading in similar securities of the issuer or of comparable companies or entities, quotations or relevant information obtained from broker/dealers or other market participants, information obtained from the issuer, analysts, and/or the appropriate stock exchange (for exchange-traded securities), an analysis of the company’s or entity’s financial statements, and an evaluation of the forces that influence the issuer and the market(s) in which the security is purchased and sold.
B Investment Transactions — Investment transactions for financial statement purposes are accounted for on a trade date basis. Realized gains and losses on investments sold are determined on the basis of identified cost.
C Income — Interest income is recorded on the basis of interest accrued, adjusted for amortization of premium or accretion of discount. Fees associated with loan amendments are recognized immediately. Dividend income is recorded on the ex-dividend date for dividends received in cash and/or securities. Withholding taxes on foreign interest, if any, have been provided for in accordance with the Fund’s understanding of the applicable countries’ tax rules and rates.
D Federal Taxes — The Fund’s policy is to comply with the provisions of the Internal Revenue Code applicable to regulated investment companies and to distribute to shareholders each year substantially all of its net investment income, and all or substantially all of its net realized capital gains. Accordingly, no provision for federal income or excise tax is necessary.
As of April 30, 2020, the Fund had no uncertain tax positions that would require financial statement recognition, de-recognition, or disclosure. The Fund files a U.S. federal income tax return annually after its fiscal year-end, which is subject to examination by the Internal Revenue Service for a period of three years from the date of filing.
E Foreign Currency Translation — Investment valuations, other assets, and liabilities initially expressed in foreign currencies are translated each business day into U.S. dollars based upon current exchange rates. Purchases and sales of foreign investment securities and income and expenses denominated in foreign currencies are translated into U.S. dollars based upon currency exchange rates in effect on the respective dates of such transactions. Recognized gains or losses on investment transactions attributable to changes in foreign currency exchange rates are recorded for financial statement purposes as net realized gains and losses on investments. That portion of unrealized gains and losses on investments that results from fluctuations in foreign currency exchange rates is not separately disclosed.
F Unfunded Loan Commitments — The Fund may enter into certain loan agreements all or a portion of which may be unfunded. The Fund is obligated to fund these commitments at the borrower’s discretion. These commitments, if any, are disclosed in the accompanying Portfolio of Investments. At April 30, 2020, the Fund had sufficient cash and/or securities to cover these commitments.
G Use of Estimates — The preparation of the financial statements in conformity with U.S. GAAP requires management to make estimates and assumptions that affect the reported amounts of assets and liabilities at the date of the financial statements and the reported amounts of income and expense during the reporting period. Actual results could differ from those estimates.
H Indemnifications — Under the Fund’s organizational documents, its officers and Trustees may be indemnified against certain liabilities and expenses arising out of the performance of their duties to the Fund. Under Massachusetts law, if certain conditions prevail, shareholders of a Massachusetts business trust (such as the Fund) could be deemed to have personal liability for the obligations of the Fund. However, the Fund’s Declaration of Trust contains an express disclaimer of liability on the part of Fund shareholders and the By-laws provide that the Fund shall assume, upon request by the shareholder, the defense on behalf of any Fund shareholders. Moreover, the By-laws also provide for indemnification out of Fund property of any shareholder held personally liable solely by reason of being or having been a shareholder for all loss or expense arising from such liability. Additionally, in the normal course of business, the Fund enters into agreements with service providers that may contain indemnification clauses. The Fund’s maximum exposure under these arrangements is unknown as this would involve future claims that may be made against the Fund that have not yet occurred.
I Financial Futures Contracts — Upon entering into a financial futures contract, the Fund is required to deposit with the broker, either in cash or securities, an amount equal to a certain percentage of the contract amount (initial margin). Subsequent payments, known as variation margin, are made or received by the Fund each business day, depending on the daily fluctuations in the value of the underlying security, and are recorded as unrealized gains or losses by the Fund. Gains (losses) are realized upon the expiration or closing of the financial futures contracts. Should market conditions change unexpectedly, the Fund may not achieve the anticipated benefits of the financial futures contracts and may realize a loss. Futures contracts have minimal counterparty risk as they are exchange traded and the clearinghouse for the exchange is substituted as the counterparty, guaranteeing counterparty performance.
Eaton Vance
Short Duration Diversified Income Fund
April 30, 2020
Notes to Financial Statements (Unaudited) — continued
J Forward Foreign Currency Exchange Contracts — The Fund may enter into forward foreign currency exchange contracts for the purchase or sale of a specific foreign currency at a fixed price on a future date. The forward foreign currency exchange contracts are adjusted by the daily exchange rate of the underlying currency and any gains or losses are recorded as unrealized until such time as the contracts have been closed. While forward foreign currency exchange contracts are privately negotiated agreements between the Fund and a counterparty, certain contracts may be “centrally cleared”, whereby all payments made or received by the Fund pursuant to the contract are with a central clearing party (CCP) rather than the original counterparty. The CCP guarantees the performance of the original parties to the contract. Upon entering into centrally cleared contracts, the Fund is required to deposit with the CCP, either in cash or securities, an amount of initial margin determined by the CCP, which is subject to adjustment. For centrally cleared contracts, the daily change in valuation is recorded as a receivable or payable for variation margin and settled in cash with the CCP daily. Risks may arise upon entering forward foreign currency exchange contracts from the potential inability of counterparties to meet the terms of their contracts and from movements in the value of a foreign currency relative to the U.S. dollar. In the case of centrally cleared contracts, counterparty risk is minimal due to protections provided by the CCP.
K Interest Rate Swaps — Pursuant to interest rate swap agreements, the Fund either makes floating-rate payments to the counterparty (or CCP in the case of centrally cleared swaps) based on a benchmark interest rate in exchange for fixed-rate payments or the Fund makes fixed-rate payments to the counterparty (or CCP in the case of a centrally cleared swap) in exchange for payments on a floating benchmark interest rate. Payments received or made, including amortization of upfront payments/receipts, are recorded as realized gains or losses. During the term of the outstanding swap agreement, changes in the underlying value of the swap are recorded as unrealized gains or losses. For centrally cleared swaps, the daily change in valuation is recorded as a receivable or payable for variation margin and settled in cash with the CCP daily. The value of the swap is determined by changes in the relationship between two rates of interest. The Fund is exposed to credit loss in the event of non-performance by the swap counterparty. In the case of centrally cleared swaps, counterparty risk is minimal due to protections provided by the CCP. Risk may also arise from movements in interest rates.
L Credit Default Swaps — When the Fund is the buyer of a credit default swap contract, the Fund is entitled to receive the par (or other agreed-upon) value of a referenced debt obligation (or basket of debt obligations) from the counterparty (or CCP in the case of a centrally cleared swap) to the contract if a credit event by a third party, such as a U.S. or foreign corporate issuer or sovereign issuer, on the debt obligation occurs. In return, the Fund pays the counterparty a periodic stream of payments over the term of the contract provided that no credit event has occurred. If no credit event occurs, the Fund would have spent the stream of payments and received no proceeds from the contract. When the Fund is the seller of a credit default swap contract, it receives the stream of payments, but is obligated to pay to the buyer of the protection an amount up to the notional amount of the swap and in certain instances take delivery of securities of the reference entity upon the occurrence of a credit event, as defined under the terms of that particular swap agreement. Credit events are contract specific but may include bankruptcy, failure to pay, restructuring, obligation acceleration and repudiation/moratorium. If the Fund is a seller of protection and a credit event occurs, the maximum potential amount of future payments that the Fund could be required to make would be an amount equal to the notional amount of the agreement. This potential amount would be partially offset by any recovery value of the respective referenced obligation, or net amount received from the settlement of a buy protection credit default swap agreement entered into by the Fund for the same referenced obligation. As the seller, the Fund may create economic leverage to its portfolio because, in addition to its total net assets, the Fund is subject to investment exposure on the notional amount of the swap. The interest fee paid or received on the swap contract, which is based on a specified interest rate on a fixed notional amount, is accrued daily as a component of unrealized appreciation (depreciation) and is recorded as realized gain upon receipt or realized loss upon payment. The Fund also records an increase or decrease to unrealized appreciation (depreciation) in an amount equal to the daily valuation. For centrally cleared swaps, the daily change in valuation is recorded as a receivable or payable for variation margin and settled in cash with the CCP daily. All upfront payments and receipts, if any, are amortized over the life of the swap contract as realized gains or losses. Those upfront payments or receipts for non-centrally cleared swaps are recorded as other assets or other liabilities, respectively, net of amortization. For financial reporting purposes, unamortized upfront payments or receipts, if any, are netted with unrealized appreciation or depreciation on swap contracts to determine the market value of swaps as presented in Notes 6 and 9. The Fund segregates assets in the form of cash or liquid securities in an amount equal to the notional amount of the credit default swaps of which it is the seller. The Fund segregates assets in the form of cash or liquid securities in an amount equal to any unrealized depreciation of the credit default swaps of which it is the buyer, marked-to-market on a daily basis. These transactions involve certain risks, including the risk that the seller may be unable to fulfill the transaction. In the case of centrally cleared swaps, counterparty risk is minimal due to protections provided by the CCP.
M Stripped Mortgage-Backed Securities — The Fund may invest in Interest Only (IO) and Principal Only (PO) securities, a form of stripped mortgage-backed securities, whereby the IO security receives all the interest and the PO security receives all the principal on a pool of mortgage assets. The yield to maturity on an IO security is extremely sensitive to the rate of principal payments (including prepayments) on the related underlying mortgage assets, and a rapid rate of principal payments may have a material adverse effect on the yield to maturity from these securities. If the underlying mortgages experience greater than anticipated prepayments of principal, the Fund may fail to recoup its initial investment in an IO security. The market value of IO and PO securities can be unusually volatile due to changes in interest rates.
N Interim Financial Statements — The interim financial statements relating to April 30, 2020 and for the six months then ended have not been audited by an independent registered public accounting firm, but in the opinion of the Fund’s management, reflect all adjustments, consisting only of normal recurring adjustments, necessary for the fair presentation of the financial statements.
Eaton Vance
Short Duration Diversified Income Fund
April 30, 2020
Notes to Financial Statements (Unaudited) — continued
2 Distributions to Shareholders and Income Tax Information
The Fund intends to make monthly distributions to shareholders and at least one distribution annually of all or substantially all of its net realized capital gains. In its distributions, the Fund intends to include amounts attributable to the imputed interest on foreign currency exposures through long and short positions in forward currency exchange contracts (represented by the difference between the foreign currency spot rate and the foreign currency forward rate) and the imputed interest derived from certain other derivative positions. Distributions are recorded on the ex-dividend date. Distributions to shareholders are determined in accordance with income tax regulations, which may differ from U.S. GAAP. As required by U.S. GAAP, only distributions in excess of tax basis earnings and profits are reported in the financial statements as a return of capital. Permanent differences between book and tax accounting relating to distributions are reclassified to paid-in capital. For tax purposes, distributions from short-term capital gains are considered to be from ordinary income. In certain circumstances, a portion of distributions to shareholders may include a return of capital component.
At October 31, 2019, the Fund, for federal income tax purposes, had deferred capital losses of $2,881,330 which would reduce its taxable income arising from future net realized gains on investment transactions, if any, to the extent permitted by the Internal Revenue Code, and thus would reduce the amount of distributions to shareholders, which would otherwise be necessary to relieve the Fund of any liability for federal income or excise tax. The deferred capital losses are treated as arising on the first day of the Fund’s next taxable year, can be carried forward for an unlimited period, and retain the same short-term or long-term character as when originally deferred. Of the deferred capital losses at October 31, 2019, $819,542 are short-term and $2,061,788 are long-term.
The cost and unrealized appreciation (depreciation) of investments, including open derivative contracts, of the Fund at April 30, 2020, as determined on a federal income tax basis, were as follows:
| | | | |
| |
Aggregate cost | | $ | 314,362,691 | |
| |
Gross unrealized appreciation | | $ | 6,641,495 | |
| |
Gross unrealized depreciation | | | (52,379,175 | ) |
| |
Net unrealized depreciation | | $ | (45,737,680 | ) |
3 Investment Adviser Fee and Other Transactions with Affiliates
The investment adviser fee is earned by EVM as compensation for investment advisory services rendered to the Fund. Pursuant to the investment advisory agreement between the Fund and EVM, the fee is computed at an annual rate of 0.75% of the Fund’s average daily total leveraged assets, subject to the limitation described below, and is payable monthly. Total leveraged assets as referred to herein represent net assets plus liabilities or obligations attributable to investment leverage and the notional value of long and short forward foreign currency contracts, futures contracts and swaps held by the Fund. The notional value of a contract for purposes of calculating total leveraged assets is the stated dollar value of the underlying reference instrument at the time the derivative position is entered into and remains constant throughout the life of the derivative contract. However, the derivative contracts are marked-to-market daily and any unrealized appreciation or depreciation is reflected in the Fund’s net assets. When the Fund holds both long and short forward currency contracts in the same foreign currency, the offsetting positions are netted for purposes of determining total leveraged assets. When the Fund holds other long and short positions in foreign obligations in a given country denominated in the same currency, total leveraged assets are calculated by excluding the smaller of the long or short position.
The investment advisory agreement provides that if investment leverage exceeds 40% of the Fund’s total leveraged assets, EVM will not receive a management fee on total leveraged assets in excess of this amount. As of April 30, 2020, the Fund’s investment leverage was 41% of its total leveraged assets. For the six months ended April 30, 2020, the Fund’s investment adviser fee amounted to $1,557,077 or 0.72% (annualized) of the Fund’s average daily total leveraged assets and 1.25% (annualized) of the Fund’s average daily net assets. The Fund invests its cash in Cash Reserves Fund. EVM does not currently receive a fee for advisory services provided to Cash Reserves Fund. EVM also serves as administrator of the Fund, but receives no compensation.
Trustees and officers of the Fund who are members of EVM’s organization receive remuneration for their services to the Fund out of the investment adviser fee. Trustees of the Fund who are not affiliated with EVM may elect to defer receipt of all or a percentage of their annual fees in accordance with the terms of the Trustees Deferred Compensation Plan. For the six months ended April 30, 2020, no significant amounts have been deferred. Certain officers and Trustees of the Fund are officers of EVM.
Eaton Vance
Short Duration Diversified Income Fund
April 30, 2020
Notes to Financial Statements (Unaudited) — continued
4 Purchases and Sales of Investments
Purchases and sales of investments, other than short-term obligations and including maturities, paydowns and principal repayments on Senior Loans, for the six months ended April 30, 2020 were as follows:
| | | | | | | | |
| | | Purchases | | | Sales | |
| | |
Investments (non-U.S. Government) | | $ | 16,490,452 | | | $ | 24,473,970 | |
| | |
U.S. Government and Agency Securities | | | 51,637,900 | | | | 60,869,469 | |
| | |
| | | $ | 68,128,352 | | | $ | 85,343,439 | |
5 Common Shares of Beneficial Interest
The Fund may issue common shares pursuant to its dividend reinvestment plan. There were no common shares issued by the Fund for the six months ended April 30, 2020 and the year ended October 31, 2019.
In November 2013, the Board of Trustees initially approved a share repurchase program for the Fund. Pursuant to the reauthorization of the share repurchase program by the Board of Trustees in March 2019, the Fund is authorized to repurchase up to 10% of its common shares outstanding as of the last day of the prior calendar year at market prices when shares are trading at a discount to net asset value. The repurchase program does not obligate the Fund to purchase a specific amount of shares. There were no repurchases of common shares by the Fund for the six months ended April 30, 2020 and the year ended October 31, 2019.
According to filings made on Schedule 13D and 13G pursuant to Sections 13(d) and 13(g) of the Securities Exchange Act of 1934, as amended, one shareholder owned 36.6% of the Fund’s common shares.
6 Financial Instruments
The Fund may trade in financial instruments with off-balance sheet risk in the normal course of its investing activities. These financial instruments may include financial futures contracts, forward foreign currency exchange contracts and swap contracts and may involve, to a varying degree, elements of risk in excess of the amounts recognized for financial statement purposes. The notional or contractual amounts of these instruments represent the investment the Fund has in particular classes of financial instruments and do not necessarily represent the amounts potentially subject to risk. The measurement of the risks associated with these instruments is meaningful only when all related and offsetting transactions are considered. A summary of obligations under these financial instruments at April 30, 2020 is included in the Portfolio of Investments. At April 30, 2020, the Fund had sufficient cash and/or securities to cover commitments under these contracts.
In the normal course of pursuing its investment objectives, the Fund is subject to the following risks:
Credit Risk: The Fund enters into credit default swap contracts to enhance total return and/or as a substitute for the purchase of securities.
Foreign Exchange Risk: The Fund holds foreign currency denominated investments. The value of these investments and related receivables and payables may change due to future changes in foreign currency exchange rates. To hedge against this risk, the Fund enters into forward foreign currency exchange contracts.
Interest Rate Risk: The Fund utilizes various interest rate derivatives including futures contracts and interest rate swaps to manage the duration of its portfolio and to hedge against fluctuations in securities prices due to interest rates.
The Fund enters into over-the-counter (OTC) derivatives that may contain provisions whereby the counterparty may terminate the contract under certain conditions, including but not limited to a decline in the Fund’s net assets below a certain level over a certain period of time, which would trigger a payment by the Fund for those derivatives in a liability position. At April 30, 2020, the fair value of derivatives with credit-related contingent features in a net liability position was $234,559. The aggregate fair value of assets pledged as collateral by the Fund for such liability was $210,990 at April 30, 2020.
The OTC derivatives in which the Fund invests are subject to the risk that the counterparty to the contract fails to perform its obligations under the contract. To mitigate this risk, the Fund has entered into an International Swaps and Derivatives Association, Inc. Master Agreement (“ISDA Master Agreement”) or similar agreement with substantially all its derivative counterparties. An ISDA Master Agreement is a bilateral agreement between the Fund and a counterparty that governs certain OTC derivatives and typically contains, among other things, set-off provisions in the event of a default and/or termination event as defined under the relevant ISDA Master Agreement. Under an ISDA Master Agreement, the Fund may, under certain circumstances, offset with the counterparty certain derivative financial instruments’ payables and/or receivables with collateral held and/or posted and create one single net payment. The provisions of the ISDA Master Agreement typically permit a single net payment in the event of default including the bankruptcy or insolvency of the counterparty. However, bankruptcy or insolvency laws of a particular jurisdiction may impose restrictions on or prohibitions against the right of offset
Eaton Vance
Short Duration Diversified Income Fund
April 30, 2020
Notes to Financial Statements (Unaudited) — continued
in bankruptcy or insolvency. Certain ISDA Master Agreements allow counterparties to OTC derivatives to terminate derivative contracts prior to maturity in the event the Fund’s net assets decline by a stated percentage or the Fund fails to meet the terms of its ISDA Master Agreements, which would cause the counterparty to accelerate payment by the Fund of any net liability owed to it.
The collateral requirements for derivatives traded under an ISDA Master Agreement are governed by a Credit Support Annex to the ISDA Master Agreement. Collateral requirements are determined at the close of business each day and are typically based on changes in market values for each transaction under an ISDA Master Agreement and netted into one amount for such agreement. Generally, the amount of collateral due from or to a counterparty is subject to a minimum transfer threshold amount before a transfer is required, which may vary by counterparty. Collateral pledged for the benefit of the Fund and/or counterparty is held in segregated accounts by the Fund’s custodian and cannot be sold, re-pledged, assigned or otherwise used while pledged. The portion of such collateral representing cash, if any, is reflected as deposits for derivatives collateral and, in the case of cash pledged by a counterparty for the benefit of the Fund, a corresponding liability on the Statement of Assets and Liabilities. Securities pledged by the Fund as collateral, if any, are identified as such in the Portfolio of Investments. The carrying amount of the liability for cash collateral due to broker at April 30, 2020 approximated its fair value. If measured at fair value, such liability would have been considered as Level 2 in the fair value hierarchy (see Note 9) at April 30, 2020.
The fair value of open derivative instruments (not considered to be hedging instruments for accounting disclosure purposes) by risk exposure at April 30, 2020 was as follows:
| | | | | | | | | | | | | | | | |
| | | Fair Value | |
| Statement of Assets and Liabilities Caption | | Credit | | | Foreign
Exchange | | | Interest
Rate | | | Total | |
| | | | |
Accumulated loss | | $ | 49,564 | * | | $ | 33,250 | * | | $ | 1,585,878 | * | | $ | 1,668,692 | |
| | | | |
Receivable for open forward foreign currency exchange contracts | | | — | | | | 11,264 | | | | — | | | | 11,264 | |
| | | | |
Receivable/Payable for open swap contracts; Upfront payments/receipts on open non-centrally cleared swap contracts | | | 129,905 | | | | — | | | | — | | | | 129,905 | |
| | | | |
Total Asset Derivatives | | $ | 179,469 | | | $ | 44,514 | | | $ | 1,585,878 | | | $ | 1,809,861 | |
| | | | |
Derivatives not subject to master netting or similar agreements | | $ | 49,564 | | | $ | 33,250 | | | $ | 1,585,878 | | | $ | 1,668,692 | |
| | | | |
Total Asset Derivatives subject to master netting or similar agreements | | $ | 129,905 | | | $ | 11,264 | | | $ | — | | | $ | 141,169 | |
| | | | |
Accumulated loss | | $ | (1,021,258 | )* | | $ | (31,202 | )* | | $ | (1,642,045 | )* | | $ | (2,694,505 | ) |
| | | | |
Payable for open forward foreign currency exchange contracts | | | — | | | | (9,289 | ) | | | — | | | | (9,289 | ) |
| | | | |
Payable/Receivable for open swap contracts; Upfront payments/receipts on open non-centrally cleared swap contracts | | | (225,270 | ) | | | — | | | | — | | | | (225,270 | ) |
| | | | |
Total Liability Derivatives | | $ | (1,246,528 | ) | | $ | (40,491 | ) | | $ | (1,642,045 | ) | | $ | (2,929,064 | ) |
| | | | |
Derivatives not subject to master netting or similar agreements | | $ | (1,021,258 | ) | | $ | (31,202 | ) | | $ | (1,642,045 | ) | | $ | (2,694,505 | ) |
| | | | |
Total Liability Derivatives subject to master netting or similar agreements | | $ | (225,270 | ) | | $ | (9,289 | ) | | $ | — | | | $ | (234,559 | ) |
| * | For futures contracts and centrally cleared derivatives, amount represents value as shown in the Portfolio of Investments. Only the current day’s variation margin on open futures contracts and centrally cleared derivatives is reported within the Statement of Assets and Liabilities as Receivable or Payable for variation margin on open financial futures contracts and centrally cleared derivatives, as applicable. |
Eaton Vance
Short Duration Diversified Income Fund
April 30, 2020
Notes to Financial Statements (Unaudited) — continued
The Fund’s derivative assets and liabilities at fair value by risk, which are reported gross in the Statement of Assets and Liabilities, are presented in the table above. The following tables present the Fund’s derivative assets and liabilities by counterparty, net of amounts available for offset under a master netting agreement and net of the related collateral received by the Fund for such assets and pledged by the Fund for such liabilities as of April 30, 2020.
| | | | | | | | | | | | | | | | | | | | | | | | |
| Counterparty | | Derivative
Assets Subject to
Master Netting
Agreement | | | Derivatives
Available
for Offset | | | Non-cash
Collateral
Received(a) | | | Cash
Collateral
Received(a) | | | Net Amount
of Derivative
Assets(b) | | | Total Cash
Collateral
Received | |
| | | | | | |
Bank of America, N.A. | | $ | 500 | | | $ | (500 | ) | | $ | — | | | $ | — | | | $ | — | | | $ | — | |
| | | | | | |
Barclays Bank PLC | | | 33,289 | | | | (12,272 | ) | | | — | | | | (21,017 | ) | | | — | | | | 110,000 | |
| | | | | | |
Goldman Sachs International | | | 32,508 | | | | — | | | | — | | | | — | | | | 32,508 | | | | — | |
| | | | | | |
Nomura International PLC | | | 64,108 | | | | — | | | | (64,108 | ) | | | — | | | | — | | | | — | |
| | | | | | |
Standard Chartered Bank | | | 3,781 | | | | (1,105 | ) | | | — | | | | — | | | | 2,676 | | | | — | |
| | | | | | |
UBS AG | | | 6,983 | | | | (6,983 | ) | | | — | | | | — | | | | — | | | | — | |
| | | | | | |
| | | $ | 141,169 | | | $ | (20,860 | ) | | $ | (64,108 | ) | | $ | (21,017 | ) | | $ | 35,184 | | | $ | 110,000 | |
| | | | | | |
| Counterparty | | Derivative
Liabilities Subject to
Master Netting
Agreement | | | Derivatives
Available
for Offset | | | Non-cash
Collateral
Pledged(a) | | | Cash
Collateral
Pledged(a) | | | Net Amount
of Derivative
Liabilities(c) | | | Total Cash
Collateral
Pledged | |
| | | | | | |
Bank of America, N.A. | | $ | (212,998 | ) | | $ | 500 | | | $ | 210,990 | | | $ | — | | | $ | (1,508 | ) | | $ | — | |
| | | | | | |
Barclays Bank PLC | | | (12,272 | ) | | | 12,272 | | | | — | | | | — | | | | — | | | | — | |
| | | | | | |
HSBC Bank USA, N.A. | | | (221 | ) | | | — | | | | — | | | | — | | | | (221 | ) | | | — | |
| | | | | | |
Standard Chartered Bank | | | (1,105 | ) | | | 1,105 | | | | — | | | | — | | | | — | | | | — | |
| | | | | | |
State Street Bank and Trust Company | | | (957 | ) | | | — | | | | — | | | | — | | | | (957 | ) | | | — | |
| | | | | | |
UBS AG | | | (7,006 | ) | | | 6,983 | | | | — | | | | — | | | | (23 | ) | | | — | |
| | | | | | |
| | | $ | (234,559 | ) | | $ | 20,860 | | | $ | 210,990 | | | $ | — | | | $ | (2,709 | ) | | $ | — | |
| | |
Total — Deposits for derivatives collateral — OTC derivatives | | | | | | | $ | 110,000 | |
| (a) | In some instances, the total collateral received and/or pledged may be more than the amount shown due to overcollateralization. |
| (b) | Net amount represents the net amount due from the counterparty in the event of default. |
| (c) | Net amount represents the net amount payable to the counterparty in the event of default. |
Eaton Vance
Short Duration Diversified Income Fund
April 30, 2020
Notes to Financial Statements (Unaudited) — continued
The effect of derivative instruments (not considered to be hedging instruments for accounting disclosure purposes) on the Statement of Operations by risk exposure for the six months ended April 30, 2020 was as follows:
| | | | | | | | | | | | | | | | |
| Statement of Operations Caption | | Credit | | | Foreign
Exchange | | | Interest
Rate | | | Total | |
| | | | |
Net realized gain (loss) — | | | | | | | | | | | | | | | | |
| | | | |
Financial futures contracts | | $ | — | | | $ | — | | | $ | 3,186,981 | | | $ | 3,186,981 | |
| | | | |
Swap contracts | | | (1,954,585 | ) | | | — | | | | (1,526,737 | ) | | | (3,481,322 | ) |
| | | | |
Forward foreign currency exchange contracts | | | — | | | | 71,004 | | | | — | | | | 71,004 | |
| | | | |
Total | | $ | (1,954,585 | ) | | $ | 71,004 | | | $ | 1,660,244 | | | $ | (223,337 | ) |
| | | | |
Change in unrealized appreciation (depreciation) — | | | | | | | | | | | | | | | | |
| | | | |
Financial futures contracts | | $ | — | | | $ | — | | | $ | 1,601,561 | | | $ | 1,601,561 | |
| | | | |
Swap contracts | | | (441,489 | ) | | | — | | | | (997,844 | ) | | | (1,439,333 | ) |
| | | | |
Forward foreign currency exchange contracts | | | — | | | | 7,345 | | | | — | | | | 7,345 | |
| | | | |
Total | | $ | (441,489 | ) | | $ | 7,345 | | | $ | 603,717 | | | $ | 169,573 | |
The average notional cost of futures contracts and average notional amounts of other derivative contracts outstanding during the six months ended April 30, 2020, which are indicative of the volume of these derivative types, were approximately as follows:
| | | | | | | | | | | | | | |
Futures
Contracts — Long | | | Futures
Contracts — Short | | | Forward
Foreign Currency
Exchange Contracts* | | | Swap
Contracts | |
| | | |
| | $36,150,000 | | | $ | 5,237,000 | | | $ | 11,512,000 | | | $ | 69,939,000 | |
| * | The average notional amount of forward foreign currency exchange contracts is based on the absolute value of notional amounts of currency purchased and currency sold. |
7 Credit Agreement
The Fund has entered into a Credit Agreement (the Agreement) with a bank to borrow up to a limit of $115 million ($120 million prior to March 17, 2020) pursuant to a 364-day revolving line of credit. Borrowings under the Agreement are secured by the assets of the Fund. Interest is charged at a rate above the London Interbank Offered Rate (LIBOR) and is payable monthly. Under the terms of the Agreement, in effect through March 16, 2021, the Fund pays a commitment fee of 0.15% on the borrowing limit. In connection with the renewal of the Agreement on March 19, 2020, the Fund paid an upfront fee of $57,500, which is being amortized to interest expense through March 16, 2021. The unamortized balance at April 30, 2020 is approximately $50,000 and is included in prepaid upfront fees on notes payable on the Statement of Assets and Liabilities. Also included in interest expense is $22,545 of amortization of previously paid upfront fees related to the period from November 1, 2019 through March 17, 2020 when the Agreement was renewed. The Fund is required to maintain certain net asset levels during the term of the Agreement. At April 30, 2020, the Fund had borrowings outstanding under the Agreement of $61,000,000 at an annual interest rate of 0.98%. Based on the short-term nature of the borrowings under the Agreement and the variable interest rate, the carrying amount of the borrowings at April 30, 2020 approximated its fair value. If measured at fair value, borrowings under the Agreement would have been considered as Level 2 in the fair value hierarchy (see Note 9) at April 30, 2020. For the six months ended April 30, 2020, the average borrowings under the Agreement and the average annual interest rate (excluding fees) were $77,532,967 and 2.23%, respectively.
Eaton Vance
Short Duration Diversified Income Fund
April 30, 2020
Notes to Financial Statements (Unaudited) — continued
8 Investments in Affiliated Funds
At April 30, 2020, the value of the Fund’s investment in affiliated funds was $12,574,236, which represents 5.8% of the Fund’s net assets. Transactions in affiliated funds by the Fund for the six months ended April 30, 2020 were as follows:
| | | | | | | | | | | | | | | | | | | | | | | | | | | | | | | | |
| Name of affiliated fund | | Value,
beginning of
period | | | Purchases | | | Sales proceeds | | | Net
realized
gain (loss) | | | Change in
unrealized
appreciation
(depreciation) | | | Value, end
of period | | | Dividend
income | | | Units, end
of period | |
| | | | | | | | |
Short-Term Investments | | | | | | | | | | | | | | | | | | | | | | | | | | | | | | | | |
| | | | | | | | |
Eaton Vance Cash Reserves Fund, LLC | | $ | 24,972,867 | | | $ | 114,721,826 | | | $ | (127,120,132 | ) | | $ | (682 | ) | | $ | 357 | | | $ | 12,574,236 | | | $ | 107,787 | | | | 12,574,236 | |
9 Fair Value Measurements
Under generally accepted accounting principles for fair value measurements, a three-tier hierarchy to prioritize the assumptions, referred to as inputs, is used in valuation techniques to measure fair value. The three-tier hierarchy of inputs is summarized in the three broad levels listed below.
| • | | Level 1 – quoted prices in active markets for identical investments |
| • | | Level 2 – other significant observable inputs (including quoted prices for similar investments, interest rates, prepayment speeds, credit risk, etc.) |
| • | | Level 3 – significant unobservable inputs (including a fund’s own assumptions in determining the fair value of investments) |
In cases where the inputs used to measure fair value fall in different levels of the fair value hierarchy, the level disclosed is determined based on the lowest level input that is significant to the fair value measurement in its entirety. The inputs or methodology used for valuing securities are not necessarily an indication of the risk associated with investing in those securities.
Eaton Vance
Short Duration Diversified Income Fund
April 30, 2020
Notes to Financial Statements (Unaudited) — continued
At April 30, 2020, the hierarchy of inputs used in valuing the Fund’s investments and open derivative instruments, which are carried at value, were as follows:
| | | | | | | | | | | | | | | | |
| Asset Description | | Level 1 | | | Level 2 | | | Level 3* | | | Total | |
| | | | |
Senior Floating-Rate Loans (Less Unfunded Loan Commitments) | | $ | — | | | $ | 69,998,363 | | | $ | 35,912 | | | $ | 70,034,275 | |
| | | | |
Corporate Bonds & Notes | | | — | | | | 34,768,554 | | | | — | | | | 34,768,554 | |
| | | | |
Foreign Government Securities | | | — | | | | 23,533,740 | | | | — | | | | 23,533,740 | |
| | | | |
Sovereign Loans | | | — | | | | 3,294,589 | | | | — | | | | 3,294,589 | |
| | | | |
Mortgage Pass-Throughs | | | — | | | | 23,462,242 | | | | — | | | | 23,462,242 | |
| | | | |
Collateralized Mortgage Obligations | | | — | | | | 55,691,531 | | | | — | | | | 55,691,531 | |
| | | | |
Commercial Mortgage-Backed Securities | | | — | | | | 13,339,014 | | | | — | | | | 13,339,014 | |
| | | | |
Asset-Backed Securities | | | — | | | | 29,551,892 | | | | — | | | | 29,551,892 | |
| | | | |
Common Stocks | | | 74,281 | | | | 207,823 | | | | 670,083 | | | | 952,187 | |
| | | | |
Preferred Stocks | | | — | | | | — | | | | 46,847 | | | | 46,847 | |
| | | | |
Warrants | | | — | | | | — | | | | 0 | | | | 0 | |
| | | | |
Miscellaneous | | | — | | | | 2,680 | | | | — | | | | 2,680 | |
| | | | |
Short-Term Investments — | | | | | | | | | | | | | | | | |
| | | | |
U.S. Treasury Obligations | | | — | | | | 999,951 | | | | — | | | | 999,951 | |
| | | | |
Other | | | — | | | | 12,574,236 | | | | — | | | | 12,574,236 | |
| | | | |
Total Investments | | $ | 74,281 | | | $ | 267,424,615 | | | $ | 752,842 | | | $ | 268,251,738 | |
| | | | |
Forward Foreign Currency Exchange Contracts | | $ | — | | | $ | 44,514 | | | $ | — | | | $ | 44,514 | |
| | | | |
Futures Contracts | | | 1,577,670 | | | | — | | | | — | | | | 1,577,670 | |
| | | | |
Swap Contracts | | | — | | | | 187,677 | | | | — | | | | 187,677 | |
| | | | |
Total | | $ | 1,651,951 | | | $ | 267,656,806 | | | $ | 752,842 | | | $ | 270,061,599 | |
| | | | |
Liability Description | | | | | | | | | | | | | | | | |
| | | | |
Forward Foreign Currency Exchange Contracts | | $ | — | | | $ | (40,491 | ) | | $ | — | | | $ | (40,491 | ) |
| | | | |
Futures Contracts | | | (100,193 | ) | | | — | | | | — | | | | (100,193 | ) |
| | | | |
Swap Contracts | | | — | | | | (2,788,380 | ) | | | — | | | | (2,788,380 | ) |
| | | | |
Total | | $ | (100,193 | ) | | $ | (2,828,871 | ) | | $ | — | | | $ | (2,929,064 | ) |
| * | None of the unobservable inputs for Level 3 assets, individually or collectively, had a material impact on the Fund. |
Level 3 investments at the beginning and/or end of the period in relation to net assets were not significant and accordingly, a reconciliation of Level 3 assets for the six months ended April 30, 2020 is not presented.
10 Risks and Uncertainties
Risks Associated with Foreign Investments
The Fund’s investments in foreign instruments can be adversely affected by changes in currency exchange rates and political, economic and market developments abroad. In emerging or less developed countries, these risks can be more significant. Investment markets in emerging market countries are typically substantially smaller, less liquid and more volatile than the major markets in developed countries. Emerging market countries may have relatively unstable governments and economies. Emerging market investments often are subject to speculative trading, which typically contributes to volatility.
The Fund may have difficulties enforcing its legal or contractual rights in a foreign country. Economic data as reported by foreign governments and other issuers may be delayed, inaccurate or fraudulent. In the event of a default by a sovereign entity, there are typically no assets to be seized or cash flows to be attached. Furthermore, the willingness or ability of a foreign government to renegotiate defaulted debt may be limited.
Eaton Vance
Short Duration Diversified Income Fund
April 30, 2020
Notes to Financial Statements (Unaudited) — continued
Pandemic Risk
An outbreak of respiratory disease caused by a novel coronavirus that was first detected in China in December 2019 has spread rapidly internationally. This coronavirus has resulted in closing borders, enhanced health screenings, changes to healthcare service preparation and delivery, quarantines, cancellations, disruptions to supply chains and customer activity, as well as general concern and uncertainty. The impact of this outbreak has negatively affected the worldwide economy, as well as the economies of individual countries and individual companies and can affect the market in general in significant and unforeseen ways. Health crises caused by outbreaks, such as the coronavirus outbreak, may exacerbate other pre-existing political, social and economic risks and disrupt normal market conditions and operations. The near-term impact of this coronavirus has resulted in substantial market volatility, which may have an adverse effect on the Fund’s investments.
Eaton Vance
Short Duration Diversified Income Fund
April 30, 2020
Annual Meeting of Shareholders (Unaudited)
The Fund held its Annual Meeting of Shareholders on February 13, 2020. The following action was taken by the shareholders:
Item 1: The election of Mark R. Fetting, Valerie A. Mosley, Helen Frame Peters and Marcus L. Smith as Class III Trustees of the Fund, each for a three-year term expiring in 2023.
| | | | | | |
Nominee for Trustee Elected by All Shareholders | | Number of Shares | |
| | For | | Withheld | |
| | |
Mark R. Fetting | | 16,558,655 | | | 150,768 | |
| | |
Valerie A. Mosley | | 16,544,372 | | | 165,051 | |
| | |
Helen Frame Peters | | 16,522,858 | | | 186,565 | |
| | |
Marcus L. Smith | | 16,541,724 | | | 167,699 | |
Eaton Vance
Short Duration Diversified Income Fund
April 30, 2020
Board of Trustees’ Contract Approval
Overview of the Contract Review Process – Eaton Vance Funds
The Investment Company Act of 1940, as amended (the “1940 Act”), provides, in substance, that the investment advisory agreement between a fund and its investment adviser will continue in effect fromyear-to-year only if its continuation is approved on an annual basis by a vote of the fund’s board of trustees, including a majority of the trustees who are not “interested persons” of the fund (“independent trustees”), cast in person at a meeting called for the purpose of considering such approval.
At a meeting held on April 22, 2020 (the “April 2020 Meeting”), the Boards of Trustees/Directors comprised of the same individuals (collectively, the “Board”) that oversees a majority of the registered investment companies advised by Eaton Vance Management or its affiliate, Boston Management and Research (the “Eaton Vance Funds”), including a majority of the independent trustees (the “Independent Trustees”), voted to approve the continuation of existing investment advisory agreements andsub-advisory agreements(1) for each of the Eaton Vance Funds for an additionalone-year period. The Board relied upon the affirmative recommendation of its Contract Review Committee, which is a committee exclusively comprised of Independent Trustees. Prior to making its recommendation, the Contract Review Committee reviewed information furnished by the adviser andsub-adviser to each of the Eaton Vance Funds (including information specifically requested by the Board) for a series of formal meetings held between February and April 2020. Members of the Contract Review Committee also considered information received at prior meetings of the Board and its committees, to the extent such information was relevant to the Contract Review Committee’s annual evaluation of the investment advisory agreements andsub-advisory agreements.
In connection with its evaluation of the investment advisory agreements andsub-advisory agreements, the Board considered various information relating to the Eaton Vance Funds. This included information applicable to all or groups of Eaton Vance Funds, which is referenced immediately below, and information applicable to the particular Eaton Vance Fund covered by this report (additional fund-specific information is referenced below under “Results of the Contract Review Process”). (For funds that invest through one or more underlying portfolios, references to “each fund” in this section may include information that was considered at the portfolio-level.)
Information about Fees, Performance and Expenses
| | • | | A report from an independent data provider comparing advisory and other fees paid by each fund to such fees paid by comparable funds, as identified by the independent data provider (“comparable funds”); |
| | • | | A report from an independent data provider comparing each fund’s total expense ratio (and its components) to those of comparable funds; |
| | • | | A report from an independent data provider comparing the investment performance of each fund (including, as relevant, total return data, income data, Sharpe ratios and information ratios) to the investment performance of comparable funds and, as applicable, benchmark indices, over various time periods; |
| | • | | In certain instances, data regarding investment performance relative to customized groups of peer funds and blended indices identified by the adviser in consultation with the Portfolio Management Committee of the Board; |
| | • | | Comparative information concerning the fees charged and services provided by the adviser andsub-adviser to each fund in managing other accounts (which may include other mutual funds, collective investment funds and institutional accounts) using investment strategies and techniques similar to those used in managing such fund(s), if any; |
| | • | | Profitability analyses with respect to the adviser andsub-adviser to each of the funds; |
Information about Portfolio Management and Trading
| | • | | Descriptions of the investment management services provided to each fund, as well as each of the funds’ investment strategies and policies; |
| | • | | The procedures and processes used to determine the fair value of fund assets, when necessary, and actions taken to monitor and test the effectiveness of such procedures and processes; |
| | • | | Information about the policies and practices of each fund’s adviser andsub-adviser (in the context of asub-adviser, only those with trading responsibilities) with respect to trading, including their processes for seeking best execution of portfolio transactions; |
| | • | | Information about the allocation of brokerage transactions and the benefits, if any, received by the adviser andsub-adviser (in the context of asub-adviser, only those with trading responsibilities) to each fund as a result of brokerage allocation, including, as applicable, information concerning the acquisition of research through client commission arrangements and policies with respect to “soft dollars”; |
| | • | | Data relating to the portfolio turnover rate of each fund; |
Information about each Adviser andSub-adviser
| | • | | Reports detailing the financial results and condition of the adviser andsub-adviser to each fund; |
| | • | | Information regarding the individual investment professionals whose responsibilities include portfolio management and investment research for the funds, and, for portfolio managers and certain other investment professionals, information relating to their responsibilities with respect to managing other mutual funds and investment accounts, as applicable; |
| (1) | Not all Eaton Vance Funds have entered into asub-advisory agreement with asub-adviser. Accordingly, references to“sub-adviser” or“sub-advisory agreement” in this “Overview” section may not be applicable to the particular Eaton Vance Fund covered by this report. |
Eaton Vance
Short Duration Diversified Income Fund
April 30, 2020
Board of Trustees’ Contract Approval — continued
| | • | | The Code of Ethics of the adviser and its affiliates and thesub-adviser of each fund, together with information relating to compliance with, and the administration of, such codes; |
| | • | | Policies and procedures relating to proxy voting and the handling of corporate actions and class actions; |
| | • | | Information concerning the resources devoted to compliance efforts undertaken by the adviser and its affiliates and thesub-adviser of each fund, if any, including descriptions of their various compliance programs and their record of compliance; |
| | • | | Information concerning the business continuity and disaster recovery plans of the adviser and its affiliates and thesub-adviser of each fund, if any; |
| | • | | A description of Eaton Vance Management’s and Boston Management and Research’s oversight ofsub-advisers, including with respect to regulatory and compliance issues, investment management and other matters; |
Other Relevant Information
| | • | | Information concerning the nature, cost and character of the administrative and othernon-investment advisory services provided by Eaton Vance Management and its affiliates; |
| | • | | Information concerning oversight of the relationship with the custodian, subcustodians and fund accountants by the adviser and/or administrator to each of the funds; |
| | • | | For an Eaton Vance Fund structured as an exchange-listedclosed-end fund, information concerning the benefits of theclosed-end fund structure, as well as, where relevant, theclosed-end fund’s market prices, trading volume data, distribution rates and other relevant matters; and |
| | • | | The terms of each investment advisory agreement andsub-advisory agreement. |
During the various meetings of the Board and its committees throughout the twelve months ended April 2020, the Trustees received information from portfolio managers and other investment professionals of the advisers andsub-advisers of the funds regarding investment and performance matters, and considered various investment and trading strategies used in pursuing the funds’ investment objectives. The Trustees also received information regarding risk management techniques employed in connection with the management of the funds. The Board and its committees evaluated issues pertaining to industry and regulatory developments, compliance procedures, fund governance and other issues with respect to the funds, and received and participated in reports and presentations provided by Eaton Vance Management, Boston Management and Research and fundsub-advisers, with respect to such matters. In addition to the formal meetings of the Board and its committees, the Independent Trustees held regular teleconferences to discuss, among other topics, matters relating to the continuation of investment advisory agreements andsub-advisory agreements.
The Contract Review Committee was advised throughout the contract review process by Goodwin Procter LLP, independent legal counsel for the Independent Trustees. The members of the Contract Review Committee, with the advice of such counsel, exercised their own business judgment in determining the material factors to be considered in evaluating each investment advisory agreement andsub-advisory agreement and the weight to be given to each such factor. The conclusions reached with respect to each investment advisory agreement andsub-advisory agreement were based on a comprehensive evaluation of all the information provided and not any single factor. Moreover, each member of the Contract Review Committee may have placed varying emphasis on particular factors in reaching conclusions with respect to each investment advisory agreement andsub-advisory agreement. In evaluating each investment advisory agreement andsub-advisory agreement, including the fee structures and other terms contained in such agreements, the members of the Contract Review Committee were also informed by multiple years of analysis and discussion with the adviser andsub-adviser to each of the Eaton Vance Funds.
In voting its approval of the continuation of existing investment advisory agreements andsub-advisory agreements at the April 2020 Meeting, the Board relied on an order issued by the Securities and Exchange Commission on March 25, 2020, which provided temporary relief from thein-person voting requirements under Section 15 of the 1940 Act in response to the impacts of theCOVID-19 pandemic.
Results of the Contract Review Process
Based on its consideration of the foregoing, and such other information it deemed relevant, including the factors and conclusions described below, the Contract Review Committee concluded that the continuation of the investment advisory agreement between Eaton Vance Short Duration Diversified Income Fund (the “Fund”) and Eaton Vance Management (the “Adviser”), including its fee structure, is in the interests of shareholders and, therefore, recommended to the Board approval of the agreement. Based on the recommendation of the Contract Review Committee, the Board, including a majority of the Independent Trustees, voted to approve continuation of the investment advisory agreement for the Fund.
Nature, Extent and Quality of Services
In considering whether to approve the investment advisory agreement for the Fund, the Board evaluated the nature, extent and quality of services provided to the Fund by the Adviser.
The Board considered the Adviser’s management capabilities and investment processes in light of the types of investments held by the Fund, including the education, experience and number of investment professionals and other personnel who provide portfolio management, investment research, and similar services to the Fund. In particular, the Board considered the abilities and experience of the Adviser’s investment professionals in analyzing factors such as credit risk and special considerations relevant to investing in senior, secured floating rate loans, foreign debt obligations, including debt of emerging market
Eaton Vance
Short Duration Diversified Income Fund
April 30, 2020
Board of Trustees’ Contract Approval — continued
issuers, and mortgage-backed securities. The Board considered the Adviser’sin-house research capabilities as well as other resources available to personnel of the Adviser. The Board also took into account the resources dedicated to portfolio management and other services, the compensation methods of the Adviser and other factors, including the reputation and resources of the Adviser to recruit and retain highly qualified research, advisory and supervisory investment professionals. In addition, the Board considered the time and attention devoted to the Eaton Vance Funds, including the Fund, by senior management, as well as the infrastructure, operational capabilities and support staff in place to assist in the portfolio management and operations of the Fund, including the provision of administrative services. The Board also considered the business-related and other risks to which the Adviser or its affiliates may be subject in managing the Fund. The Board considered the deep experience of the Adviser and its affiliates with managing and operating funds organized as exchange-listedclosed-end funds, such as the Fund. In this regard, the Board considered, among other things, the Adviser’s and its affiliates’ experience with implementing leverage arrangements, monitoring and assessing trading price discounts and premiums and adhering to the requirements of securities exchanges.
The Board considered the compliance programs of the Adviser and relevant affiliates thereof. The Board considered compliance and reporting matters regarding, among other things, personal trading by investment professionals, disclosure of portfolio holdings, late trading, frequent trading, portfolio valuation, business continuity and the allocation of investment opportunities. The Board also considered the responses of the Adviser and its affiliates to requests in recent years from regulatory authorities, such as the Securities and Exchange Commission and the Financial Industry Regulatory Authority.
The Board considered other administrative services provided or overseen by Eaton Vance Management and its affiliates, including transfer agency and accounting services. The Board evaluated the benefits to shareholders of investing in a fund that is a part of a large fund complex offering exposure to a variety of asset classes and investment disciplines.
After consideration of the foregoing factors, among others, the Board concluded that the nature, extent and quality of services provided by the Adviser, taken as a whole, are appropriate and consistent with the terms of the investment advisory agreement.
Fund Performance
The Board compared the Fund’s investment performance to that of comparable funds identified by an independent data provider (the peer group), as well as a custom benchmark index and a custom peer group of similarly managed funds. The Board’s review included comparative performance data with respect to the Fund for theone-, three-, five- andten-year periods ended September 30, 2019. In this regard, the Board noted that the performance of the Fund was consistent with the median performance of the Fund’s custom peer group and lower than the median performance of the Fund’s peer group for the three-year period. The Board also noted that the performance of the Fund was lower than its custom benchmark index for the three-year period. On the basis of the foregoing and other relevant information provided by the Adviser in response to inquiries from the Contract Review Committee, the Board concluded that the performance of the Fund was satisfactory.
Management Fees and Expenses
The Board considered contractual fee rates payable by the Fund for advisory and administrative services (referred to collectively as “management fees”). As part of its review, the Board considered the Fund’s management fees and total expense ratio for theone-year period ended September 30, 2019, as compared to those of comparable funds, before and after giving effect to any undertaking to waive fees or reimburse expenses. The Board also considered factors that had an impact on the Fund’s total expense ratio relative to comparable funds.
After considering the foregoing information, and in light of the nature, extent and quality of the services provided by the Adviser, the Board concluded that the management fees charged for advisoryand related services are reasonable.
Profitability and“Fall-Out” Benefits
The Board considered the level of profits realized by the Adviser and relevant affiliates thereof in providing investment advisory and administrative services to the Fund and to all Eaton Vance Funds as a group. The Board considered the level of profits realized without regard to marketing support or other payments by the Adviser and its affiliates to third parties in respect of distribution or other services.
The Board concluded that, in light of the foregoing factors and the nature, extent and quality of the services rendered, the profits realized by the Adviser and its affiliates are deemed not to be excessive.
The Board also considered direct or indirectfall-out benefits received by the Adviser and its affiliates in connection with their respective relationships with the Fund, including the benefits of research services that may be available to the Adviser as a result of securities transactions effected for the Fund and other investment advisory clients.
Economies of Scale
In reviewing management fees and profitability, the Board also considered the extent to which the Adviser and its affiliates, on the one hand, and the Fund, on the other hand, can expect to realize benefits from economies of scale as the assets of the Fund increase. The Board acknowledged the difficulty
Eaton Vance
Short Duration Diversified Income Fund
April 30, 2020
Board of Trustees’ Contract Approval — continued
in accurately measuring the benefits resulting from economies of scale, if any, with respect to the management of any specific fund or group of funds. The Board reviewed data summarizing the increases and decreases in the assets of the Fund and of all Eaton Vance Funds as a group over various time periods, and evaluated the extent to which the total expense ratio of the Fund and the profitability of the Adviser and its affiliates may have been affected by such increases or decreases. Based upon the foregoing, the Board concluded that the Fund currently shares in the benefits from economies of scale, if any, when they are realized by the Adviser. The Board also considered the fact that the Fund is not continuously offered and that the Fund’s assets are not expected to increase materially in the foreseeable future. Accordingly, the Board concluded that the implementation of breakpoints in the advisory fee schedule is not warranted at this time.
Eaton Vance
Short Duration Diversified Income Fund
April 30, 2020
Officers and Trustees
Officers
Payson F. Swaffield
President
Maureen A. Gemma
Vice President, Secretary and Chief Legal Officer
James F. Kirchner
Treasurer
Richard F. Froio
Chief Compliance Officer
Trustees
William H. Park
Chairperson
Thomas E. Faust Jr.*
Mark R. Fetting
Cynthia E. Frost
George J. Gorman
Valerie A. Mosley
Helen Frame Peters
Keith Quinton
Marcus L. Smith
Susan J. Sutherland
Scott E. Wennerholm
Eaton Vance Funds
IMPORTANT NOTICES
Privacy. The Eaton Vance organization is committed to ensuring your financial privacy. Each entity listed below has adopted a privacy policy and procedures (“Privacy Program”) Eaton Vance believes is reasonably designed to protect your personal information and to govern when and with whom Eaton Vance may share your personal information.
| • | | At the time of opening an account, Eaton Vance generally requires you to provide us with certain information such as name, address, social security number, tax status, account numbers, and account balances. This information is necessary for us to both open an account for you and to allow us to satisfy legal requirements such as applicable anti-money laundering reviews and know-your-customer requirements. |
| • | | On an ongoing basis, in the normal course of servicing your account, Eaton Vance may share your information with unaffiliated third parties that perform various services for Eaton Vance and/or your account. These third parties include transfer agents, custodians, broker/dealers and our professional advisers, including auditors, accountants, and legal counsel. Eaton Vance may additionally share your personal information with our affiliates. |
| • | | We believe our Privacy Program is reasonably designed to protect the confidentiality of your personal information and to prevent unauthorized access to that information. |
| • | | We reserve the right to change our Privacy Program at any time upon proper notification to you. You may want to review our Privacy Program periodically for changes by accessing the link on our homepage: www.eatonvance.com. |
Our pledge of protecting your personal information applies to the following entities within the Eaton Vance organization: the Eaton Vance Family of Funds, Eaton Vance Management, Eaton Vance Investment Counsel, Eaton Vance Distributors, Inc., Eaton Vance Trust Company, Eaton Vance Management (International) Limited, Eaton Vance Advisers International Limited, Eaton Vance Global Advisors Limited, Eaton Vance Management’s Real Estate Investment Group, Boston Management and Research, Calvert Research and Management, and Calvert Funds. This Privacy Notice supersedes all previously issued privacy disclosures. For more information about our Privacy Program or about how your personal information may be used, please call 1-800-262-1122.
Delivery of Shareholder Documents. The Securities and Exchange Commission (SEC) permits funds to deliver only one copy of shareholder documents, including prospectuses, proxy statements and shareholder reports, to fund investors with multiple accounts at the same residential or post office box address. This practice is often called “householding” and it helps eliminate duplicate mailings to shareholders. American Stock Transfer & Trust Company, LLC (“AST”), the closed-end funds transfer agent, or your financial intermediary, may household the mailing of your documents indefinitely unless you instruct AST, or your financial intermediary, otherwise. If you would prefer that your Eaton Vance documents not be householded, please contact AST or your financial intermediary. Your instructions that householding not apply to delivery of your Eaton Vance documents will typically be effective within 30 days of receipt by AST or your financial intermediary.
Portfolio Holdings. Each Eaton Vance Fund and its underlying Portfolio(s) (if applicable) files a schedule of portfolio holdings on Part F toForm N-PORT with the SEC for the first and third quarters of each fiscal year. The Form N-PORT will be available on the Eaton Vance website at www.eatonvance.com, by calling Eaton Vance at 1-800-262-1122 or in the EDGAR database on the SEC’s website at www.sec.gov.
Proxy Voting. From time to time, funds are required to vote proxies related to the securities held by the funds. The Eaton Vance Funds or their underlying Portfolios (if applicable) vote proxies according to a set of policies and procedures approved by the Funds’ and Portfolios’ Boards. You may obtain a description of these policies and procedures and information on how the Funds or Portfolios voted proxies relating to portfolio securities during the most recent 12-month period ended June 30, without charge, upon request, by calling 1-800-262-1122 and by accessing the SEC’s website at www.sec.gov.
Share Repurchase Program. The Fund’s Board of Trustees has approved a share repurchase program authorizing the Fund to repurchase up to 10% of its common shares outstanding as of the last day of the prior calendar year in open-market transactions at a discount to net asset value. The repurchase program does not obligate the Fund to purchase a specific amount of shares. The Fund’s repurchase activity, including the number of shares purchased, average price and average discount to net asset value, is disclosed in the Fund’s annual and semi-annual reports to shareholders.
Additional Notice to Shareholders. If applicable, a Fund may also redeem or purchase its outstanding preferred shares in order to maintain compliance with regulatory requirements, borrowing or rating agency requirements or for other purposes as it deems appropriate or necessary.
Closed-End Fund Information. Eaton Vance closed-end funds make fund performance data and certain information about portfolio characteristics available on the Eaton Vance website shortly after the end of each month. Other information about the funds is available on the website. The funds’ net asset value per share is readily accessible on the Eaton Vance website. Portfolio holdings for the most recent month-end are also posted to the website approximately 30 days following the end of the month. This information is available at www.eatonvance.com on the fund information pages under “Individual Investors — Closed-End Funds”.
This Page Intentionally Left Blank
This Page Intentionally Left Blank
This Page Intentionally Left Blank
Investment Adviser and Administrator
Eaton Vance Management
Two International Place
Boston, MA 02110
Custodian
State Street Bank and Trust Company
State Street Financial Center, One Lincoln Street
Boston, MA 02111
Transfer Agent
American Stock Transfer & Trust Company, LLC
6201 15th Avenue
Brooklyn, NY 11219
Fund Offices
Two International Place
Boston, MA 02110

7741 4.30.20
Not required in this filing.
| Item 3. | Audit Committee Financial Expert |
Not required in this filing.
| Item 4. | Principal Accountant Fees and Services |
Not required in this filing.
| Item 5. | Audit Committee of Listed Registrants |
Not required in this filing.
| Item 6. | Schedule of Investments |
Please see schedule of investments contained in the Report to Stockholders included under Item 1 of this FormN-CSR.
| Item 7. | Disclosure of Proxy Voting Policies and Procedures forClosed-End Management Investment Companies |
Not required in this filing.
| Item 8. | Portfolio Managers ofClosed-End Management Investment Companies |
Not required in this filing.
| Item 9. | Purchases of Equity Securities byClosed-End Management Investment Company and Affiliated Purchasers |
No such purchases this period.
| Item 10. | Submission of Matters to a Vote of Security Holders |
No material changes.
| Item 11. | Controls and Procedures |
(a) It is the conclusion of the registrant’s principal executive officer and principal financial officer that the effectiveness of the registrant’s current disclosure controls and procedures (such disclosure controls and procedures having been evaluated within 90 days of the date of this filing) provide reasonable assurance that the information required to be disclosed by the registrant has been recorded, processed, summarized and reported within the time period specified in the Commission’s rules and forms and that the information required to be disclosed by the registrant has been accumulated and communicated to the registrant’s principal executive officer and principal financial officer in order to allow timely decisions regarding required disclosure.
(b) There have been no changes in the registrant’s internal controls over financial reporting during the period covered by this report that has materially affected, or is reasonably likely to materially affect, the registrant’s internal control over financial reporting.
| Item 12. | Disclosure of Securities Lending Activities forClosed-End Management Investment Companies |
No activity to report for the Registrant’s most recent fiscal year end.
Signatures
Pursuant to the requirements of the Securities Exchange Act of 1934 and the Investment Company Act of 1940, the registrant has duly caused this report to be signed on its behalf by the undersigned, thereunto duly authorized.
| | |
| Eaton Vance Short Duration Diversified Income Fund |
| |
| By: | | /s/ Payson F. Swaffield |
| | Payson F. Swaffield |
| | President |
| |
| Date: | | June 24, 2020 |
Pursuant to the requirements of the Securities Exchange Act of 1934 and the Investment Company Act of 1940, this report has been signed below by the following persons on behalf of the registrant and in the capacities and on the dates indicated.
| | |
| By: | | /s/ James F. Kirchner |
| | James F. Kirchner |
| | Treasurer |
| |
| Date: | | June 24, 2020 |
| |
| By: | | /s/ Payson F. Swaffield |
| | Payson F. Swaffield |
| | President |
| |
| Date: | | June 24, 2020 |