Exhibit 99.1

Link to searchable text of slide shown above

Link to searchable text of slide shown above
Link to searchable text of slide shown above
Link to searchable text of slide shown above
Link to searchable text of slide shown above
Link to searchable text of slide shown above
Link to searchable text of slide shown above
Link to searchable text of slide shown above
Link to searchable text of slide shown above

Link to searchable text of slide shown above

Link to searchable text of slide shown above
Link to searchable text of slide shown above

Link to searchable text of slide shown above
Searchable text section of graphics shown above
[GRAPHIC]
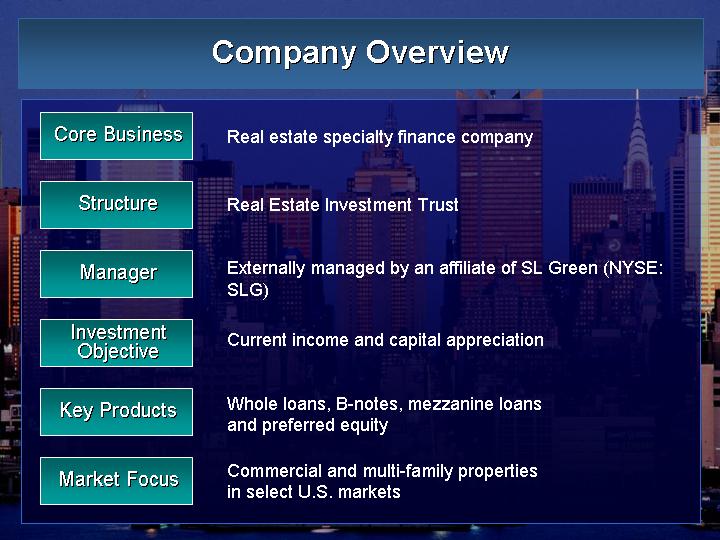
Company Overview
Core Business |
| Real estate specialty finance company |
|
|
|
Structure |
| Real Estate Investment Trust |
|
|
|
Manager |
| Externally managed by an affiliate of SL Green (NYSE: SLG) |
|
|
|
Investment |
| Current income and capital appreciation |
|
|
|
Key Products |
| Whole loans, B-notes, mezzanine loans and preferred equity |
|
|
|
Market Focus |
| Commercial and multi-family properties in select U.S. markets |
[GRAPHIC]
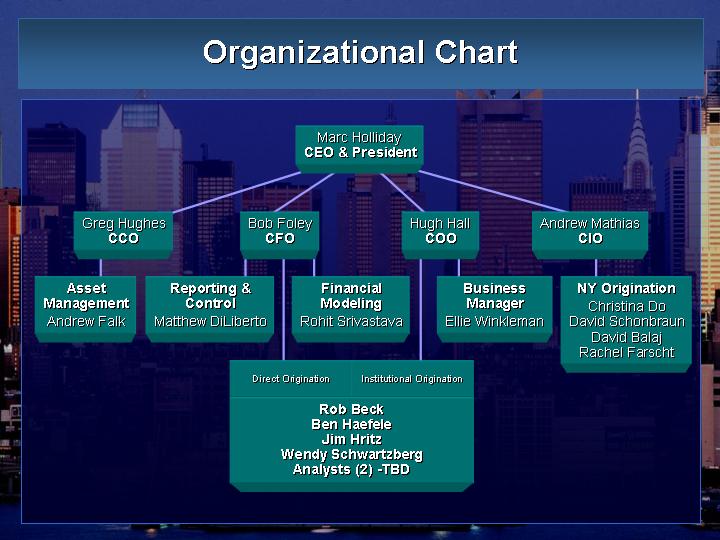
Organizational Chart
Marc Holliday | ||||||||||
CEO & President | ||||||||||
|
|
|
|
|
|
|
|
|
| |
Greg Hughes |
| Bob Foley |
| Hugh Hall |
| Andrew Mathias |
| |||
CCO |
| CFO |
| COO |
| CIO |
| |||
|
|
|
|
|
|
|
|
|
| |
Asset |
| Reporting & |
| Financial |
| Business |
| NY Origination |
| |
Management |
| Control |
| Modeling |
| Manager |
| Christina Do |
| |
Andrew Falk |
| Matthew DiLiberto |
| Rohit Srivastava |
| Ellie Winkleman |
| David Schonbraun |
| |
|
|
|
|
|
|
|
| David Balaj |
| |
|
|
|
|
|
|
|
| Rachel Farscht |
| |
|
|
|
|
|
|
|
|
|
| |
|
| Direct Origination | Institutional Origination |
|
|
| ||||
|
| Rob Beck |
|
|
| |||||
|
| Ben Haefele |
|
|
| |||||
|
| Jim Hritz |
|
|
| |||||
|
| Wendy Schwartzberg |
|
|
| |||||
|
| Analysts (2) -TBD |
|
|
| |||||
[GRAPHIC]
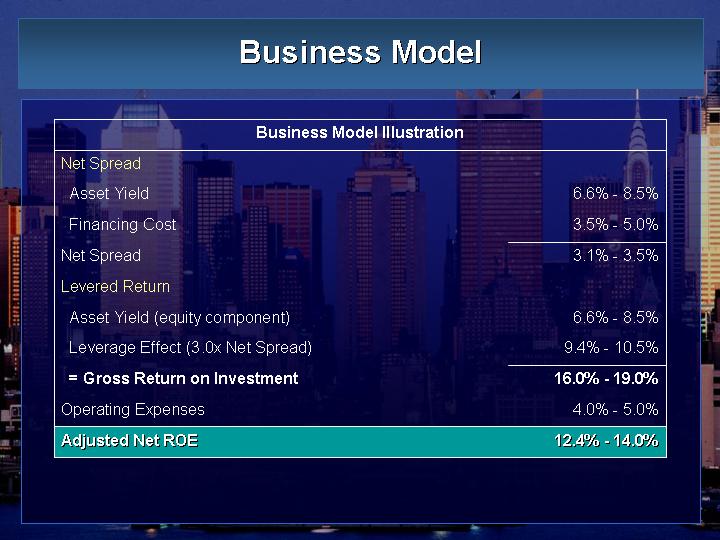
Business Model
Business Model Illustration
Net Spread |
|
|
|
Asset Yield |
| 6.6% - 8.5 | % |
Financing Cost |
| 3.5% - 5.0 | % |
Net Spread |
| 3.1% - 3.5 | % |
Levered Return |
|
|
|
Asset Yield (equity component) |
| 6.6% - 8.5 | % |
Leverage Effect (3.0x Net Spread) |
| 9.4% - 10.5 | % |
= Gross Return on Investment |
| 16.0% -19.0 | % |
Operating Expenses |
| 4.0% - 5.0 | % |
Adjusted Net ROE |
| 12.4% - 14.0 | % |
[GRAPHIC]
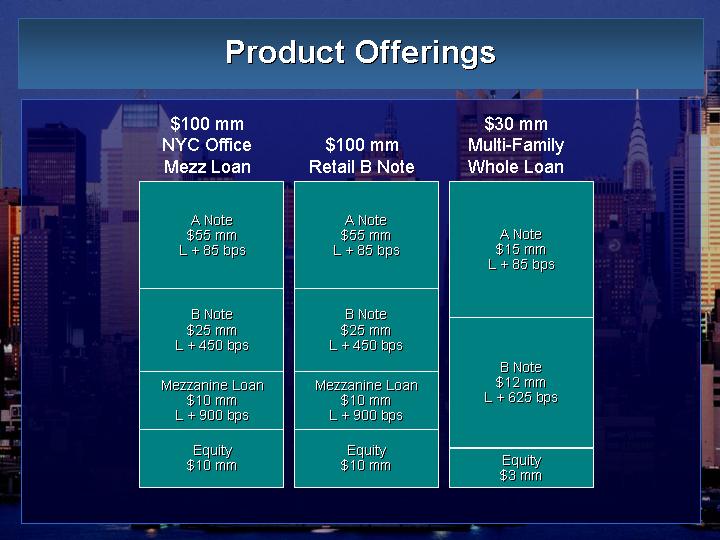
Product Offerings
$100 mm |
| $30 mm |
NYC Office | $100 mm | Multi-Family |
MezzLoan | Retail B Note | Whole Loan |
|
|
|
A Note | A Note |
|
$55 mm | $55 mm | A Note |
L + 85 bps | L + 85 bps | $15 mm |
|
| L + 85 bps |
|
|
|
B Note | B Note |
|
$25 mm | $25 mm |
|
L + 450 bps | L + 450 bps |
|
|
| B Note |
Mezzanine Loan | Mezzanine Loan | $12 mm |
$10 mm | $10 mm | L + 625 bps |
L + 900 bps | L + 900 bps |
|
|
|
|
Equity | Equity |
|
$10 mm | $10 mm | Equity |
|
| $3 mm |
[GRAPHIC]
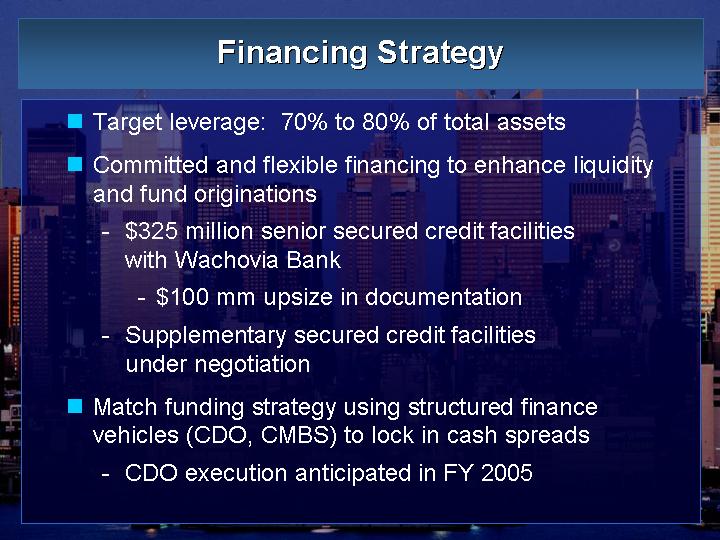
Financing Strategy
• Target leverage: 70% to 80% of total assets
• Committed and flexible financing to enhance liquidity and fund originations
• $325 million senior secured credit facilities with Wachovia Bank
• $100 mm upsize in documentation
• Supplementary secured credit facilities under negotiation
• Match funding strategy using structured finance vehicles (CDO, CMBS) to lock in cash spreads
• CDO execution anticipated in FY 2005
[GRAPHIC]
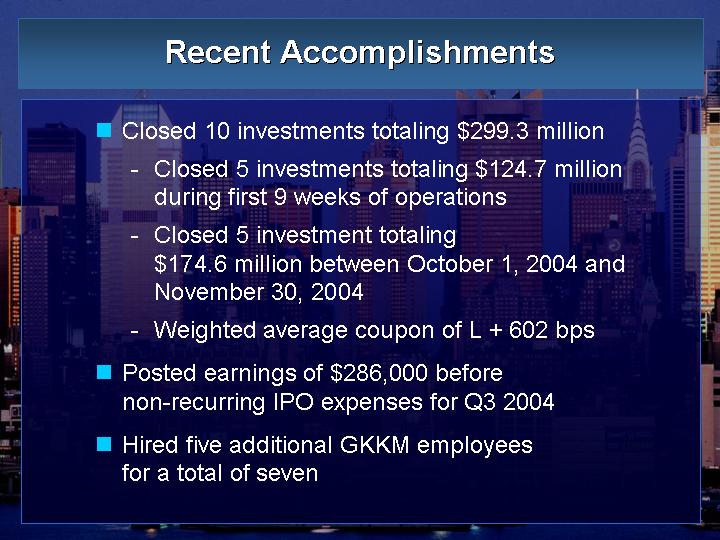
Recent Accomplishments
• Closed 10 investments totaling $299.3 million
• Closed 5 investments totaling $124.7 million during first 9 weeks of operations
•�� Closed 5 investment totaling $174.6 million between October 1, 2004 and November 30, 2004
• Weighted average coupon of L + 602 bps
• Posted earnings of $286,000 before non-recurring IPO expenses for Q3 2004
• Hired five additional GKKM employees for a total of seven
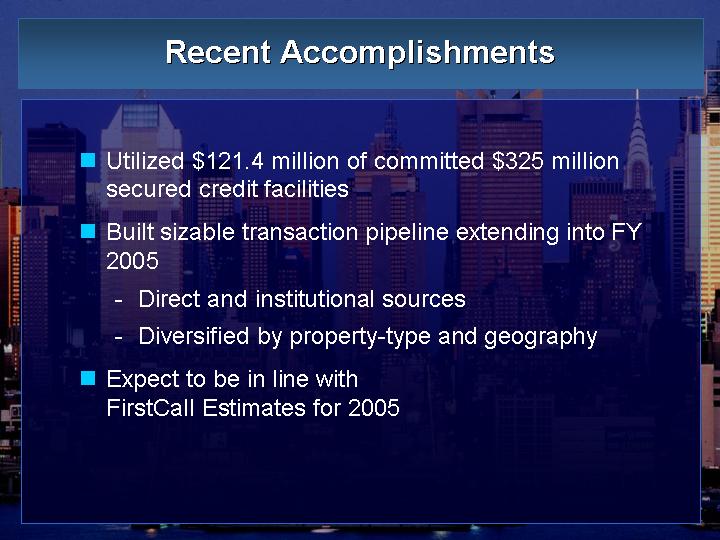
[GRAPHIC]
• Utilized $121.4 million of committed $325 million secured credit facilities
• Built sizable transaction pipeline extending into FY 2005
• Direct and institutional sources
• Diversified by property-type and geography
• Expect to be in line with FirstCall Estimates for 2005
[GRAPHIC]
Private Placement of Equity
Security: |
| Common shares with par value of $0.01 per share |
|
|
|
Purchasers: |
| Institutional investors and SL Green Realty Corp. |
|
|
|
Shares Issued: |
| 5,500,000 |
|
|
|
Issue Price: |
| $17.27 |
|
|
|
Net Proceeds: |
| $94,985,000 |
|
|
|
Closing Date: |
| December 3, 2004 |
|
|
|
Settlement Date: |
| January 3, 2005 |
|
|
|
Use of Proceeds: |
| To fund investment activity and general corporate purposes |
[GRAPHIC]
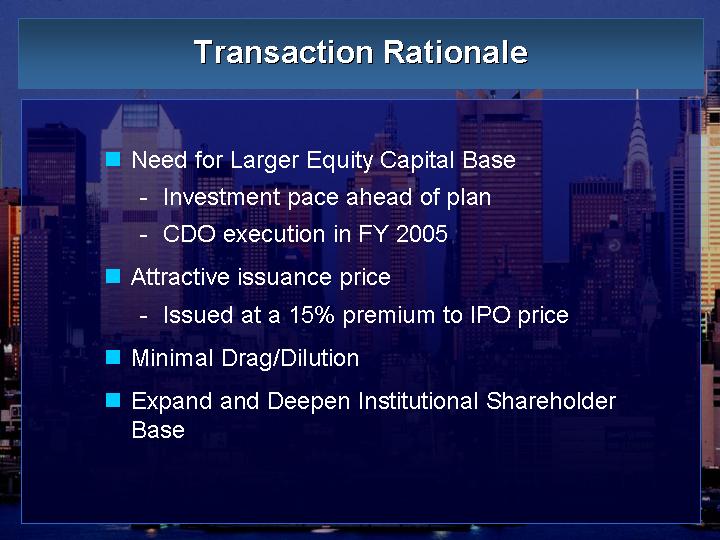
Transaction Rationale
• Need for Larger Equity Capital Base
• Investment pace ahead of plan
• CDO execution in FY 2005
• Attractive issuance price
• Issued at a 15% premium to IPO price
• Minimal Drag/Dilution
• Expand and Deepen Institutional Shareholder Base